A framework for automatic IT architecture modeling - DIVA
59
Manuscript A framework for automatic IT architecture modeling: applying truth discovery Margus V¨ alja · Robert Lagerstr¨ om · Ulrik Franke · G¨ oran Ericsson Received: date / Accepted: date Abstract Modeling IT architecture is a complex, time consuming, and error prone task. However, many systems produce information that can be used in order to automate modeling. Early studies show that this is a feasible approach if we can overcome certain obstacles. Often more than one source is needed in order to cover the data requirements of an IT architecture model and the use of multiple sources means that heterogeneous data needs to be merged. Moreover, the same collection of data might be useful for creating more than one kind of model for decision support. IT architecture is constantly changing and data sources provide informa- tion that can deviate from reality to some degree. There can be problems with varying accuracy (e.g. actuality and coverage), representation (e.g. data syntax and file format), or inconsistent semantics. Thus, integration of het- erogeneous data from different sources needs to handle data quality problems of the sources. This can be done by using probabilistic models. In the field of truth discovery, these models have been developed to track data source trustworthiness in order to help solving conflicts while making quality issues manageable for automatic modeling. MargusV¨alja,RobertLagerstr¨om,G¨oranEricsson KTH Royal Institute of Technology 100 44 Stockholm, Sweden E-mail: {margusv, robertl, ergo}@kth.se Ulrik Franke RISE SICS – Swedish Institute of Computer Science 164 40 Kista, Sweden E-mail: [email protected]
-
Upload
khangminh22 -
Category
Documents
-
view
2 -
download
0
Transcript of A framework for automatic IT architecture modeling - DIVA
Manuscript
A framework for automatic IT architecture
modeling: applying truth discovery
Margus Valja · Robert Lagerstrom ·Ulrik Franke · Goran Ericsson
Received: date / Accepted: date
Abstract Modeling IT architecture is a complex, time consuming, and error
prone task. However, many systems produce information that can be used in
order to automate modeling. Early studies show that this is a feasible approach
if we can overcome certain obstacles. Often more than one source is needed
in order to cover the data requirements of an IT architecture model and the
use of multiple sources means that heterogeneous data needs to be merged.
Moreover, the same collection of data might be useful for creating more than
one kind of model for decision support.
IT architecture is constantly changing and data sources provide informa-
tion that can deviate from reality to some degree. There can be problems
with varying accuracy (e.g. actuality and coverage), representation (e.g. data
syntax and file format), or inconsistent semantics. Thus, integration of het-
erogeneous data from different sources needs to handle data quality problems
of the sources. This can be done by using probabilistic models. In the field
of truth discovery, these models have been developed to track data source
trustworthiness in order to help solving conflicts while making quality issues
manageable for automatic modeling.
Margus Valja, Robert Lagerstrom, Goran Ericsson
KTH Royal Institute of Technology
100 44 Stockholm, Sweden
E-mail: {margusv, robertl, ergo}@kth.se
Ulrik Franke
RISE SICS – Swedish Institute of Computer Science
164 40 Kista, Sweden
E-mail: [email protected]
2 Margus Valja et al.
We build upon previous research in modeling automation and propose a
framework for merging data from multiple sources with a truth discovery al-
gorithm to create multiple IT architecture models. The usefulness of the pro-
posed framework is demonstrated in a study where models using three tools
are created, namely; Archi, securiCAD, and EMFTA.
Keywords IT architecture modeling · System modeling · Automatic data
collection · Automatic modeling
1 Introduction
Modern enterprise architecture is complex [25]. Systems and software that
have a prevalent role in everyday tasks are interconnected and used in dif-
ferent ways by employees, partners, and suppliers. Moreover, these software
and systems change when an organization keeps evolving. Models, represen-
tations that explain and characterize real system entities, can be employed
to understand and manage such a complex reality. However, in order to base
important decisions on models, the models need to be created using updated
information [17]. For large organizations with many interconnected systems
and software this is difficult, time consuming, and error prone.
Currently, many available approaches for enterprise modeling are manual.
At the same time there is a vast amount of data available within organizations
that could be used for modeling. The availability of this data makes automa-
tion of modeling possible, and helps to capture and evaluate dynamic changes
in enterprise IT architecture with less effort. There have been attempts to
collect data for automatic modeling in previous studies. Buschle et al. [5] use
data collected with a vulnerability scanner to instantiate a metamodel for IT
architecture security evaluation. In another study, Holm et al. [21] utilize a
similar method to generate an ArchiMate model. The authors in the two stud-
ies show that the proposed method is applicable and can be used to generate
sufficiently accurate models much faster than with manual modeling. However,
the authors in both papers conclude that while the data sources they used were
providing good enough data, only a subset of all the metamodel entities could
be instantiated. To create more complete models additional data sources are
needed. The need for multiple data sources for enterprise system modeling has
been mentioned by multiple authors such as [34,9,46,36]. Thus, modeling au-
A framework for automatic IT architecture modeling: applying truth discovery 3
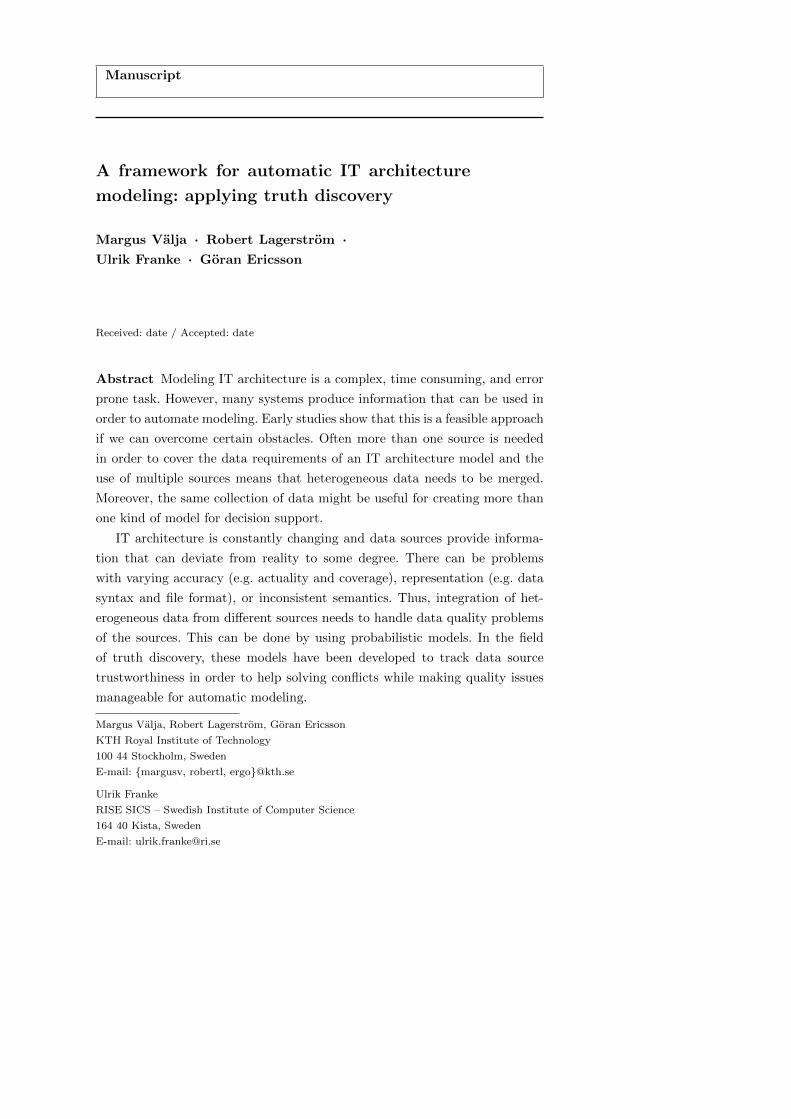
Fig. 1 Mainly the technology and partly the application enterprise layers are studied in
the paper. The studied elements are highlighted with dark red rectangles.
tomation would benefit from using multiple data sources. However, the sources
often provide data with different scope and representation.
Niemi and Pekkola [35] state that artifacts like architecture models need
to cover multiple domains. According to Frank [12], an enterprise can be rep-
resented with a set of domain specific interrelated diagrams that represent
domain models and are connected through shared concepts. Various enter-
prise models are described in [43]. A logical conclusion is that an automated
modeling approach would not only benefit from using multiple data sources,
but also from being able to support the creation of more than one model rep-
resenting multiple enterprise domains. In our work we focus on IT architecture
modeling that covers application components, data, users and IT infrastruc-
ture on a holistic enterprise level. The main reason for this delimitation is the
availability of data that easily can be automated. However, we believe that
the framework supports inclusion of other layers of enterprise architecture as
well. Fig. 1 shows the scope of the enterprise modeling covered in this paper
using an ArchiMate standard 1 inspired figure. This leads to our first research
question: How can automated system modelling use multiple and heterogeneous
sources in an extensible way?
To ensure successful data integration, different data sets must have, or be
given, a common semantic and structural representation [39], [38]. Data needs
to be transformed to the same granularity level (the same level of abstraction)
1 http://pubs.opengroup.org/architecture/archimate2-doc
4 Margus Valja et al.
[9] and the conflicts between different data sets need to be resolved. Sources
from different domains, however, provide data about various aspects of an
enterprise, with varying accuracy (e.g. actuality and coverage) and represen-
tation (e.g. data syntax and file format). Data semantics can be inconsistent
from one data source to another. Thus, data sets from different sources can be
attributed varying degrees of trustworthiness. To manage the quality of data
this trustworthiness should be taken into account when an unknown number
of heterogeneous data sources are used for automated model creation. There
is much literature that deals with data integration e.g. [39,38,8] and trust
in data sources such as [37,49,40,29,3,30]. While some of the techniques for
data source trustworthiness management described by the authors could be
extended to the enterprise domain, none of the authors have investigated this
explicitly, leading to our second research question: How can trustworthiness
of multiple and heterogeneous sources be included in automated system mod-
elling?
The authors have not found a solution in the existing literature that ad-
dresses the research questions in an integrated manner. Thus, there is a gap
in the field, which we aim to address by proposing a novel framework. The
proposed framework stores data in a hybrid database, supports multiple meta-
models with model adapters, and uses among other methods truth discovery
for conflict resolution and prioritization of data from certain sources.
The applicability of the proposed framework is shown in a study gener-
ating three different models using ArchiMate (enterprise modeling), securi-
CAD (holistic threat modeling), and FTA (Fault Tree Analysis modeling).
The study uses empirical data gathered from a virtualized Supervisory Con-
trol and Data Acquisition (SCADA) environment that depicts the systems and
software setup of a small electric utility with a substation.
The remainder of the paper is structured as follows. Section 2 gives an
overview of the related literature. Section 3 presents the proposed framework.
Section 4 describes a study, where three different system models are auto-
matically generated using the framework. Section 5 discusses the findings and
future work, and Section 6 concludes our paper.
2 Related work
The following sections describe the related work on automated modeling and
data integration with the focus on conflict resolution.
A framework for automatic IT architecture modeling: applying truth discovery 5
2.1 Automated and multi-source modeling
Enterprise systems architectures are complex. An organization uses various
architectural elements such as information systems, business processes and
technical components that have different relationships with each other [27].
Complex architecture also means that the management of the architecture
becomes complicated. Enterprise architecture management needs to consider
the impact that changes to an element have to the architecture as a whole.
Enterprise architecture metamodels are often used to run different simulations
and analyses [13,24], which requires granular and up-to-date information [33].
Up to date information is critical for the success of enterprise transformation
projects [36].
The stakeholders involved in enterprise architecture management tend to
be experts in their own fields and therefore need different viewpoints [42] of
the enterprise to make decisions [25]. According to Niemi and Pekkola [35],
artifacts – such as enterprise architecture models, need to cover multiple en-
terprise areas. Thus, enterprise architecture management is a complex process
that needs granular and up to date information from various domains. Sup-
port from automation is therefore welcome to facilitate accurate and timely
decisions.
Some authors have studied the requirements for automation in enterprise
architecture management. Farwick et al. [9] investigated the requirements for
architecture model maintenance through surveying. The authors found that
the respondents were not happy with the amount of enterprise architecture
items covered in the enterprise architecture repository. For collecting more
items in time, automation was deemed important. The respondents prioritized
correct data granularity, consistency, and being able to identify the source of
data. Nowakowski et al. [36] found in their enterprise architecture manage-
ment requirements study that optimal tools need to support heterogeneous
data because enterprise data are available in different forms and spread over
multiple repositories.
Various types of data are available for automation. Farwick et al. [10]
looked into some potential information sources, measuring the data quality of
the sources through actuality, completeness, correctness, and granularity. The
most vital data sources for automatic data collection in an enterprise are found
to be existing databases (including configuration management database), sen-
sors in business process engines and application servers, and project portfolio
6 Margus Valja et al.
management tools. The main participants in the process of model creation
are data providers, domain experts and enterprise architects [31]. Given the
studied requirements and the multitude of available data sources, it would be
preferable if an automated modeling solution uses more than one data source.
There have been attempts to generate models automatically from available
data. Farwick et al. [11] propose a semi automated way of maintaining enter-
prise architecture models using technical interfaces and humans. The technical
interfaces are assumed to be web services and the data used should be in a
machine readable format. Alegria and Vasconcelos [2] propose a framework for
IT architecture verification using passive network traffic analysis. The frame-
work uses logical inference rules to infer facts about the architecture. The
framework is implemented as a prototype and applied to a case study. The
framework uses only a single data source and adding additional ones is listed
as future work. Buschle et al. [5] generate an IT architecture model with the
modeling language CySeMoL. The model is created by mapping Nexpose2
vulnerability scanning results to the CySeMoL metamodel. Holm et al. [21]
use a similar data set to populate an ArchiMate based enterprise architecture
model. Both approaches use a single data source and leave some metamodel
entities uninstantiated.
Veneberg et al. [48] propose a method to match operational data with en-
terprise architecture objects to support better decision making. The proposed
method is suitable for creating enriched enterprise architecture models with
six phases to solve a specific business problem. Enterprise architecture and
operational data are required as input to the proposed solution. However, the
solution does not describe how to do model-to-model transformations, which
is important for model reuse and has been deemed an important aspect of
model based system engineering by some authors [50]. Veneberg et al. regard
model-to-model transformations future work.
Hinkelmann et al. [20] propose a new paradigm for the alignment of IT
and business. In their approach, the alignment is done continuously in an agile
manner. Hinkelmann et al. write that engineering an agile enterprise requires
continuous design and redesign. Their approach is a version of the Plan-Do-
Check-Act cycle. Enterprise models are used for identifying the adaption needs
and for supporting change implementations. The authors combine machine
interpretable ontology models with human interpretable graphical enterprise
2 https://www.rapid7.com/products/nexpose
A framework for automatic IT architecture modeling: applying truth discovery 7
Table 1 Kuhn’s four integration patterns [26].
Pattern Description
Reference pattern Links exactly one element in one metamodel to another
element in another metamodel
Extension pattern Describes how one metamodel can be extended with con-
cepts of another metamodel
Transformation pattern Rules are used to create parts of one metamodel from an-
other
Merge pattern Specialization of the transformation pattern where two or
more metamodels are used as sources
architecture models. They use Kuhn’s patterns [26] for integrating different
types of metamodels. We use these patterns to create transformation mappings
between different model languages for the data source and the model adapters.
The patterns are described in Table 1 and are part of the model adapter
functionality that is described in Section 3.5.2.
To summarize, existing attempts to automate modeling have not attempted
automated and generic multi-source multi-model creation. Moreover, some at-
tempts have not covered model reuse at all and others have left parts of the
metamodel uninstantiated. Many have used only one data source. In the pro-
posed framework the authors of this paper address these issues.
2.2 Conflict resolution and evaluation of data sources
If data are collected from multiple heterogeneous data sources, information
about the same object may differ between the data sources. This leads to
conflicts that need to be resolved when the data are being merged into a single
set. There are various strands of literature available on the topic, ranging from
database schema matching to truth discovery.
Rahm and Bernstein [38] studied automatic schema matching, which is a
basic problem in data integration of heterogeneous data. They claim that the
structure and terminology of two schemas needs to be reconciled in order to
integrate into one. Rahm and Bernstein propose a taxonomy that explains
common schema matching techniques. The authors write that a match is pos-
sible for individual elements but also for combinations of elements. They also
mention that most schema matching algorithms rely on auxiliary informa-
tion, like dictionaries, previous decisions and user input. The authors stay on
8 Margus Valja et al.
a theoretical level and write that hopefully their ideas are useful for future
implementations.
Haas et al. [16] study how to integrate diverse data from multiple sources
where the data from each source is represented differently. The approach cen-
ters around database middleware systems. They conclude that for integration
the data structure needs to be changed and the data must be cleaned so that
duplicates and errors are eliminated. The authors combine schema and data
transformation as a uniform mechanism to achieve data integration from mul-
tiple sources. Rundernsteiner et al. [41] survey how to integrate data from
changing information sources. They find that data warehouses offer flexibility
in a variety of environments, which could be monolithic, distributed or open
ones. Data warehouses are built to handle autonomy, heterogeneity, and dy-
namicity of data sources. Tools such as filtering and merging of data from
individual sources are used through a middle layer. In this type of integration
approach, schema and interface changes are common. Our approach follows the
basic principles described here, such as data cleaning and schema transforma-
tion, and the data are stored in a central database, although not a relational
one.
Halevy et al. [18] survey bodies of work on data integration in large en-
terprises. They describe a multitude of different approaches such as auto-
mated schema mapping using linguistic similarities and overlaps in data types,
schema mapping with machine learning based on a mediated schema, recon-
ciling data on the instance level by automatically detecting references to the
same object, adaptive query processing over unified architectures, model man-
agement that is using algebra for manipulating mappings and schemas, and
semi-automatically generating semantic mappings for data integration sys-
tems. The authors conclude that data integration is a necessity and needs to
be part of an organization’s infrastructure. The work provides references to
relevant methods, some of which have been tested e.g. model management for
the proposed automated modeling framework.
Data provenance techniques are seen as a way to reduce ambiguity in
data integration and enable data reuse by multiple authors. Simmhan et al.
[45] propose a taxonomy of data provenance characteristics and demonstrate
its use on scientific workflow approaches. Glavic et al. [15] present a catego-
rization scheme for provenance models by surveying the existing approaches.
They write that provenance is related to data annotation and temporal data
management and versioning. Cheney et al. [6] describe three main database
A framework for automatic IT architecture modeling: applying truth discovery 9
provenance notations and compare their applications in confidence computa-
tion, view maintenance and annotation propagation. Our framework builds on
simple data annotation and temporal versioning to reduce ambiguity in data
integration.
Dayal et al. [7] look at how data from heterogeneous and distributed data
sources is used for business intelligence. The work centers around a data in-
tegration pipeline, which needs a lot of manual effort when implemented us-
ing extract-transform-load tools. The authors find that traditional extract-
transform-load tools do not provide support for collecting business require-
ments and fail to support optimized designs that meet quality and correctness
requirements. The authors propose a layered methodology for the data inte-
gration flow life cycle to facilitate the design and implementation of optimal
flows. The work is theoretic and addressed to the community at large.
While data warehouse based approaches focus mainly on data transforma-
tion and merging, there is also research directed at conflict resolution that
considers the characteristics of data sources in a probabilistic and dynamic
way. Some of these approaches look at the trustworthiness of the data sources
and credibility of the data in conflict resolution. Truth discovery has emerged
as a field to integrate multi-source noisy data. Li et al. [29] propose a frame-
work to resolve conflicts in heterogeneous data from multiple sources using
optimization. They claim that common approaches that are based on voting,
where the data with the highest number of occurrences is seen as correct,
are not good enough. These approaches do not take source reliability into ac-
count – if a data source is producing low quality information, it will affect
the end result negatively. Instead, Li et al. propose an approach where a data
source’s reliability is estimated – a truth discovery model. The model is tested
on weather, flight, and stock data. Adapting the model for more complicated
conflict resolution scenarios is described as future work.
Li et al. [28] present a literature review on truth discovery models. They
describe the main principles of truth discovery as the ability to estimate source
reliability and the ability to select credible claims based on the reliability
of each data source included in the comparison. For example, if a claim is
supported by sources with high reliability then the claim will be assigned a
high credibility value. The authors write that truth discovery algorithms make
different assumptions about input data, relationships between sources and
objects. Several of the truth discovery algorithms require data preprocessing
before they can be used. Some of the differences are for example what is
10 Margus Valja et al.
allowed in the input data like duplicates or objects without conflicts. Most
of the algorithms also assume that the input data are given in a way that is
comparable – standardized format and textual representation.
Merging heterogeneous data is a challenge. Data warehouse principles help
to clean, filter, and merge data, and data provenance principles help to reduce
ambiguity about where the data originate from. Truth discovery methods of-
fer a way to keep track of the data credibility in a probabilistic way and help
to prioritize certain data sources in data conflict resolution [3]. To the au-
thors’ knowledge, no one has attempted to use truth discovery methods for
automated modeling as we are proposing in our framework.
3 A framework for automatic model creation
This section describes our proposed framework for automatic model creation.
First, a general overview is provided and then details are discussed in each
subsection.
The purpose of the framework is to support automatic model creation of
IT architectures using heterogeneous non-streaming data. The framework pro-
vides a structured way of addressing conflicts and filling gaps in the modeling
data captured in multiple data sources. The framework relies on a common
language and a common data structure. We define the common language as
the language that describes the elements that are stored and the common
structure as the way the elements are stored. The main components of the
framework and the process of setting up the framework are shown in Fig 2.
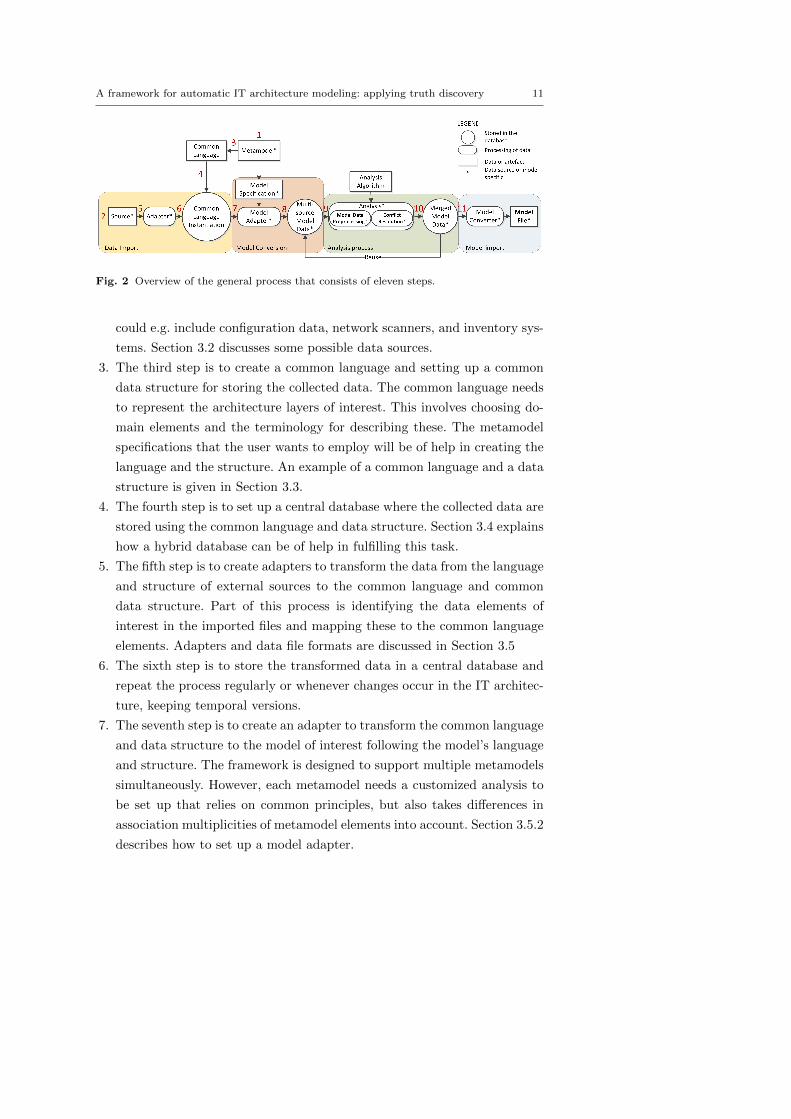
The main process of automation follows a series of steps, which are de-
noted with corresponding numbers in Fig. 2. While we see this study as an
independent contribution, it is a continuation of an earlier work [47].
1. The proposed approach is designed to be tool, metamodel, and model in-
dependent. The first step of setting up the framework is to decide what
metamodels to use. More metamodels with similar semantics can later be
iteratively added. Each metamodel used with the framework needs to be
represented by a specification, which describes elements, associations be-
tween the elements, and properties. Section 3.1 discusses some potential
metamodels.
2. The second step is to identify relevant data sources for modeling. These
sources should cover the architecture layers that are to be modeled and
A framework for automatic IT architecture modeling: applying truth discovery 11
Fig. 2 Overview of the general process that consists of eleven steps.
could e.g. include configuration data, network scanners, and inventory sys-
tems. Section 3.2 discusses some possible data sources.
3. The third step is to create a common language and setting up a common
data structure for storing the collected data. The common language needs
to represent the architecture layers of interest. This involves choosing do-
main elements and the terminology for describing these. The metamodel
specifications that the user wants to employ will be of help in creating the
language and the structure. An example of a common language and a data
structure is given in Section 3.3.
4. The fourth step is to set up a central database where the collected data are
stored using the common language and data structure. Section 3.4 explains
how a hybrid database can be of help in fulfilling this task.
5. The fifth step is to create adapters to transform the data from the language
and structure of external sources to the common language and common
data structure. Part of this process is identifying the data elements of
interest in the imported files and mapping these to the common language
elements. Adapters and data file formats are discussed in Section 3.5
6. The sixth step is to store the transformed data in a central database and
repeat the process regularly or whenever changes occur in the IT architec-
ture, keeping temporal versions.
7. The seventh step is to create an adapter to transform the common language
and data structure to the model of interest following the model’s language
and structure. The framework is designed to support multiple metamodels
simultaneously. However, each metamodel needs a customized analysis to
be set up that relies on common principles, but also takes differences in
association multiplicities of metamodel elements into account. Section 3.5.2
describes how to set up a model adapter.
12 Margus Valja et al.
8. The transformed model is saved in the database separately in step eight.
9. The ninth step is to run the analysis in order to resolve conflicts in the data.
Each data source is making a set of claims about the architecture and these
claims might confirm each other or be contradictory. The analysis process
includes the preparation of the data (preprocessing) by transforming the
data into individual claims about the instances of metamodel elements,
associations between the metamodel elements, and their properties. Once
the claims are created, it is possible to reason over the credibility of these
claims and the trustworthiness of the data sources making the claims using
various algorithms. This paper focuses on solving the conflicts between the
claims with a truth discovery algorithm. Section 3.6 describes the general
analysis process.
10. The result of the analysis is a set of non-conflicting and unique claims about
the architecture as the model structure. These claims are written back to
the database in step ten, storing them for future analysis, consistency check
and troubleshooting.
11. The final step is to create a file out of the analyzed data that can be
imported into the modeling tool(s) of interest. This means using the im-
port functionality of the chosen tool. Some common import formats are
discussed in Section 3.7.
3.1 Supported models
The term metamodel is used for describing a model of a model, i.e. the model’s
structure and language. For the proposed framework, the metamodel(s) must
meet a set of requirements. It must allow defining a metalayer and include the
metaelements common in object-oriented languages. The structure needs to be
based on classes (objects are instantiations of classes), associations between
the classes, and properties of the classes.
The framework described here is meant only for data processing and visu-
alization of data using a database system. Thus, a separate software tool for
modeling is needed. Several metamodels and software tools are available on the
market for IT architecture modeling. Three accessible and useful tools, which
are used in the case study in Section 4, are (i) Archi for enterprise modeling
using ArchiMate, (ii) securiCAD by foreseeti for holistic threat modeling and
A framework for automatic IT architecture modeling: applying truth discovery 13
attack simulation, and (iii) the Eclipse Modeling Framework based Fault-Tree
Analysis (EMFTA)3.
3.2 Data sources
Different types of data are available in a typical enterprise system environment.
Farwick et al. [10] and Johnson et al. [23] mention network monitors and
scanners, configuration management databases, project portfolio management
tools, enterprise service buses, change management tools, license management
tools, directory services, business process engines, and release management
tools as potential data sources. The trustworthiness of the data depends on the
source type and collection frequency. For example, configuration data obtained
directly from any system reflects a likely configuration of that system at that
point in time, while data obtained using network scanners are somewhat less
credible due to the dependence on a less accurate method called fingerprinting.
Fingerprinting is a technique where UDP and TCP packets are sent to a host
and the responses are compared to a database of known responses to determine
the name of the operating system4 running on the host, or a service5. Since
there are constant changes in the architecture the data need to be up-to-date
in order for it to be useful [1]. Some of the data sources are able to provide
constant data streams, e.g. syslog solutions. This framework does not support
the collection of streaming data at the moment.
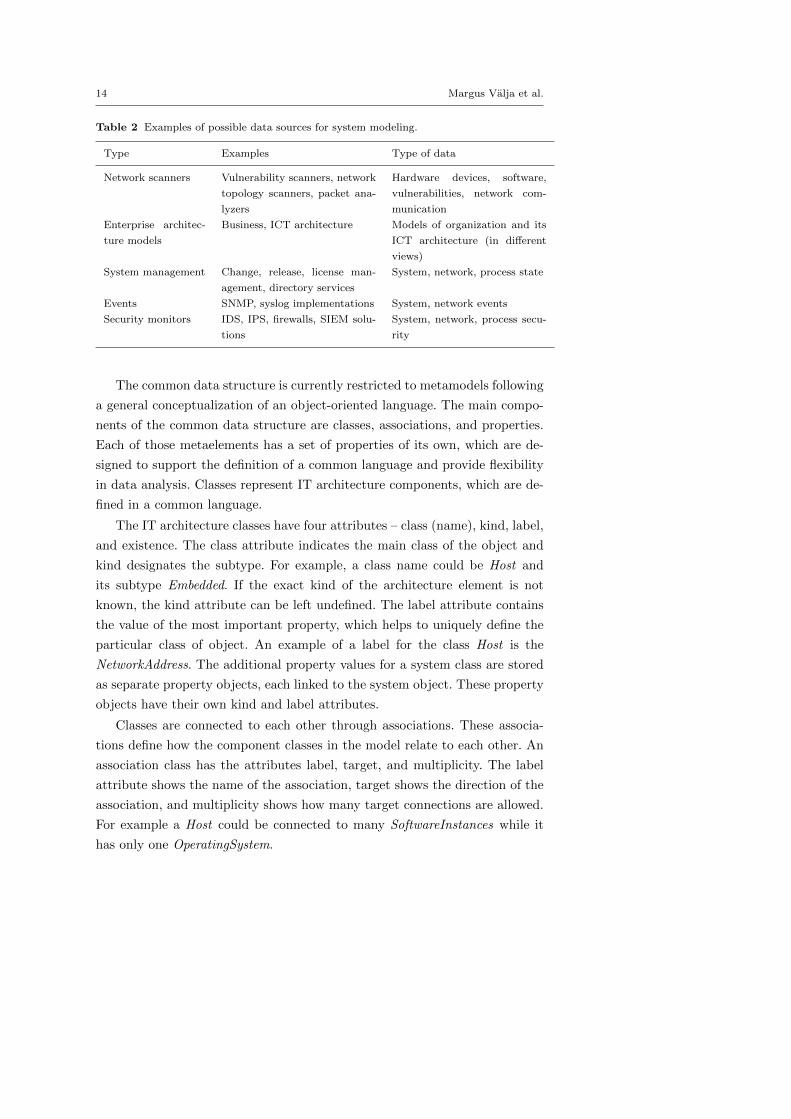
A non-comprehensive list of data sources is presented in Table 2.
3.3 Common language and data structure
The framework relies on (i) a common data structure describing the way the
data are stored and (ii) on a common language describing the elements of the
architecture layers of interest. Both are needed to support automatic model
creation of multiple models and need to be general enough so that transforma-
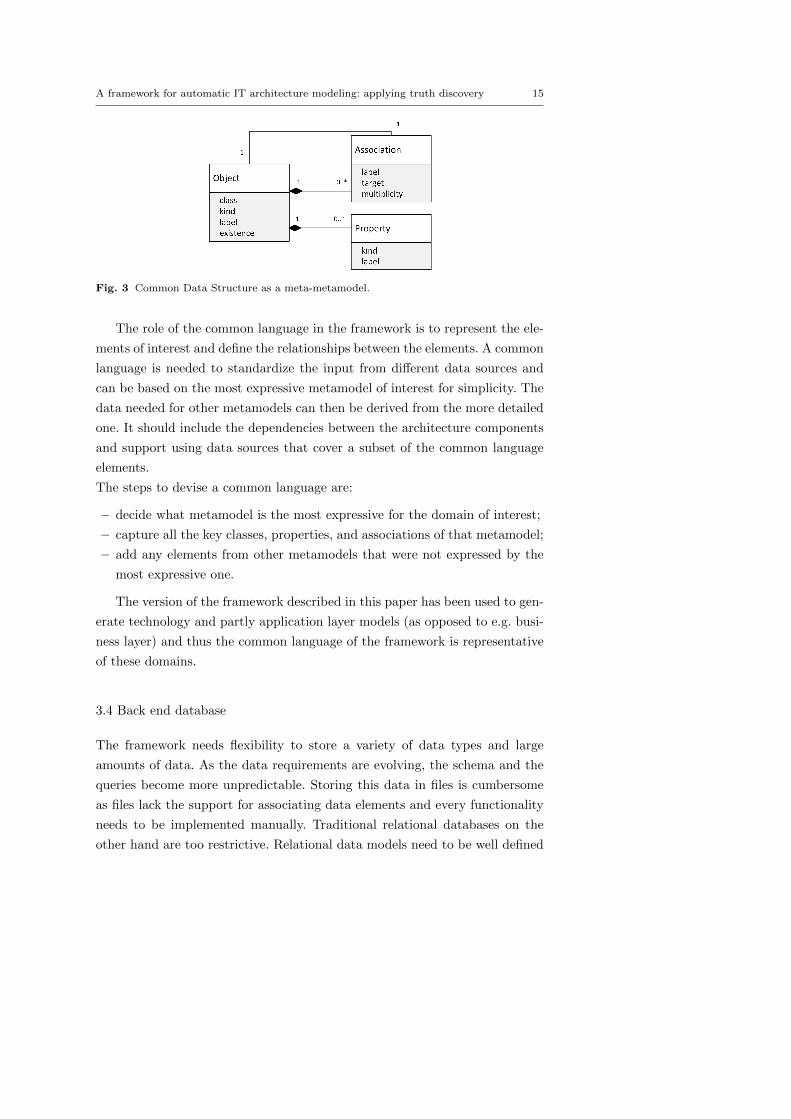
tion from one IT architecture metamodel to another is possible. Fig. 3 shows
a common data structure as a meta-metamodel, meaning that the elements
defined in the meta-metamodel are the building blocks of the metamodel.
3 https://github.com/cmu-sei/emfta4 https://nmap.org/book/man-os-detection.html5 https://nmap.org/book/man-version-detection.html
14 Margus Valja et al.
Table 2 Examples of possible data sources for system modeling.
Type Examples Type of data
Network scanners Vulnerability scanners, network
topology scanners, packet ana-
lyzers
Hardware devices, software,
vulnerabilities, network com-
munication
Enterprise architec-
ture models
Business, ICT architecture Models of organization and its
ICT architecture (in different
views)
System management Change, release, license man-
agement, directory services
System, network, process state
Events SNMP, syslog implementations System, network events
Security monitors IDS, IPS, firewalls, SIEM solu-
tions
System, network, process secu-
rity
The common data structure is currently restricted to metamodels following
a general conceptualization of an object-oriented language. The main compo-
nents of the common data structure are classes, associations, and properties.
Each of those metaelements has a set of properties of its own, which are de-
signed to support the definition of a common language and provide flexibility
in data analysis. Classes represent IT architecture components, which are de-
fined in a common language.
The IT architecture classes have four attributes – class (name), kind, label,
and existence. The class attribute indicates the main class of the object and
kind designates the subtype. For example, a class name could be Host and
its subtype Embedded. If the exact kind of the architecture element is not
known, the kind attribute can be left undefined. The label attribute contains
the value of the most important property, which helps to uniquely define the
particular class of object. An example of a label for the class Host is the
NetworkAddress. The additional property values for a system class are stored
as separate property objects, each linked to the system object. These property
objects have their own kind and label attributes.
Classes are connected to each other through associations. These associa-
tions define how the component classes in the model relate to each other. An
association class has the attributes label, target, and multiplicity. The label
attribute shows the name of the association, target shows the direction of the
association, and multiplicity shows how many target connections are allowed.
For example a Host could be connected to many SoftwareInstances while it
has only one OperatingSystem.
A framework for automatic IT architecture modeling: applying truth discovery 15
Fig. 3 Common Data Structure as a meta-metamodel.
The role of the common language in the framework is to represent the ele-
ments of interest and define the relationships between the elements. A common
language is needed to standardize the input from different data sources and
can be based on the most expressive metamodel of interest for simplicity. The
data needed for other metamodels can then be derived from the more detailed
one. It should include the dependencies between the architecture components
and support using data sources that cover a subset of the common language
elements.
The steps to devise a common language are:
– decide what metamodel is the most expressive for the domain of interest;
– capture all the key classes, properties, and associations of that metamodel;
– add any elements from other metamodels that were not expressed by the
most expressive one.
The version of the framework described in this paper has been used to gen-
erate technology and partly application layer models (as opposed to e.g. busi-
ness layer) and thus the common language of the framework is representative
of these domains.
3.4 Back end database
The framework needs flexibility to store a variety of data types and large
amounts of data. As the data requirements are evolving, the schema and the
queries become more unpredictable. Storing this data in files is cumbersome
as files lack the support for associating data elements and every functionality
needs to be implemented manually. Traditional relational databases on the
other hand are too restrictive. Relational data models need to be well defined
16 Margus Valja et al.
and implement integrity checks. Null values need to be handled consistently
and doing this can be cumbersome. Therefore an alternative system for stor-
ing data is needed. Hybrid databases meet our flexibility and data scalability
requirements.
The hybrid databases studied for the proposed framework support storing
collections of JSON6 type nested documents of arbitrary and varying formats.
Relationship modeling is supported with graph elements (edges) or links be-
tween documents. The structure of the data in the studied databases can
be changed effortlessly. A database schema does not need to be defined al-
though having a predefined structure simplifies constructing queries and data
quality checks. Two database systems were found suitable for the framework
due to functionality requirements and licensing terms, namely OrientDB7 and
ArangoDB8. Both of these hybrid database systems have built-in support for
graph visualization, which allows quick data quality control of the imported
data.
To simplify queries and enable consistency checks, a database schema is
implemented. It is implemented in a treelike manner. The data are stored in
separate collections and metanodes have been added to support constructing
graphs and queries. The metanodes also allow storing information about the
data sources and the data in the database. These metanodes are Collected-
Data, TimePoint, and Source. The role of the CollectedData metanode is to
tie all the graph elements together and therefore there is only one such metan-
ode. It is the starting point of the graph. The creation time of each collected
file is stored as a TimePoint metanode, which is linked to a Source metan-
ode that designates the name of the particular data source (of the collected
file). The Source metanode in turn is connected to the collected data (from
the collected file), which are stored following the common data structure and
common language notation. There can be multiple instantiations of the com-
mon language from different sources at different time points. Usually each
data source covers only a part of the common language, thus multiple data
sources of different types are needed to reach completeness in the sense of IT
architecture metamodel coverage.
The data are written back to the database at three separate occasions
during the process shown in Fig. 2. In the first two cases no merging is done
6 http://www.json.org7 http://orientdb.com8 https://www.arangodb.com
A framework for automatic IT architecture modeling: applying truth discovery 17
and each data source (at a time point) has its own subset of data even after
model-to-model transformation. The data are merged only after the analysis
step (Step 10 in Fig. 2) and then saved back as one merged set. The data at
all three steps is kept for quality assurance and troubleshooting reasons. Data
consistency is ensured by consistency checks. Each claim can be tracked by a
unique identifier. The implemented consistency checks count conflicting and
non-conflicting claims after different operations, check for duplicates, missing
and irregular values. An irregular value might be for example a data flow
without any client or server software association.
3.5 Adapters
Two different kinds of adapters are needed as described in Section 3. The first
type of adapter is for transforming data from the format of the data sources
to the common data structure and language (step 5 in Fig. 2). The second
type of adapter is for transforming the common language format to a specific
model language for a model language based analysis (step 7 in Fig. 2).
3.5.1 Data Source Adapter
Holistic systems and software data are available in different file formats from
various sources. Some data can be exported as a file, which is the main input
type for the proposed framework. The role of a data source adapter is to
transform data from the source format and language to the common language
and data structure. For that purpose a mapping between the data source file
structure and the common language is needed. An example of such a mapping
is described in the case study section of this paper and has also been covered
in previous work [5,21].
After the mapping between the input format and the common language
has been created, the captured data can be parsed and stored in the back end
database for further processing. Depending on the data format of the file, data
format specific parsers like XML or regular expression based parsers can be
used for extracting information. For example HP9 and Cisco10 devices allow
to save running configuration files in text formats which can then be parsed
with regular expression matching. The data gathered with network scanners
9 ftp://ftp.hp.com/pub/networking/software/MgmtOct2005-59906023Chap06.pdf10 http://www.cisco.com/c/en/us/td/docs/ios/12 2/configfun/configuration/guide/ffun c/fcf007.html
18 Margus Valja et al.
like Nmap can be exported using XML11 and JSON syntax. The stored data
from each data source includes the metadata describing when it was collected
and also source details.
An important functionality for the data source adapters is checking whether
a file has already been imported to avoid duplicating data. One way to do this
is to create a hash of each file and when importing files, to check for the exis-
tence of that hash in the database and import the file only when the hash does
not exist. Once the data from a file has been stored in a database, metanodes
TimePoint and Source can be used to determine what data source at what
time point is included in the model creation process. The assumption of the
framework is that data from each unique data source (like Nexpose) is used
only at a single point of time, in order to not bias the conflict resolution.
3.5.2 Model Adapter
Model adapters are needed if more than one type of model is to be auto-
matically created with the framework. The role of the model adapter is to
map the data from the common language to the modeling language and to
account for the differences between the common language and the metamodel
(class names, allowed associations between classes, and multiplicities of those
associations). Kuhn et al. have devised a pattern system for metamodel inte-
gration and in their paper [26] they describe three different types of integration
patterns: (i) loose integration patterns, (ii) intermediate integration patterns,
and (iii) strong integration patterns. The patterns are summarized in Table 1.
Their work can be used as inspiration to devise a model adapter.
An implementation of the model adapter relies on the information about
the metamodel and the methods that transform the source data to the model
format and language. The information about the metamodel needs to be de-
fined as a model specification. The specification needs to contain information
about three things:
1. Model classes. E.g. Network or Router.
2. Associations and their multiplicities between the classes. For example, a
Router has a one-to-many relationship with a Network, i.e. there can be
many routers in a network. An OperatingSystem on the other hand has a
one-to-one relationship with a Host as a host can have only one running
operating system at a time (if we don’t consider virtualization).
11 https://www.w3schools.com/xml/default.asp
A framework for automatic IT architecture modeling: applying truth discovery 19
3. Dependencies between the classes. E.g. to be able to reason over the exis-
tence of SoftwareProducts they need to be defined in terms of the Host they
are running on, thus every claim about the existence of a software product
should contain information about the host the software is running on. A
chain of dependent classes could be: (Network)(Host)(Software). A model
specification needs to capture all these dependencies between classes.
The adapter changes the class names, the type and amount of properties
the classes have, and associations between the classes. The transformation, as
it is implemented in the framework, uses a separate function to transform each
model class. Depending on the metamodel, no derivation is sometimes needed
as there is a one-to-one match between the language and metamodel elements.
At other times multiple common language elements might be combined into a
single one, for example a network interface and a host in a common language
might be represented in the metamodel only as a Host with multiple links to
different NetworkZone objects.
The model adapter is implemented in the following way.
1. First a mapping between the common language and the model elements
is created manually. The model specification is needed as input to the
mapping process.
2. Secondly, a general function is created to query common language elements
of a certain type from the database. Another general function is created
that gets the associated elements of a certain type for an individual com-
mon language element using the element’s identity value.
3. Thirdly, a separate transformation function that uses the general func-
tions is created for each model class. The task for the transformation func-
tion is to transform every common language element to the appropriate
metamodel element(s). Each transformation function is designed using the
mapping logic between the common language elements and metamodel
elements. The transformation of related associations and properties is in-
cluded in the transformation process.
4. The fourth function joins all the individual model classes from the trans-
formation functions and the fifth function saves the transformed and joined
data back to the database as a separate collection.
During the transformation, the data needed for a particular model class is
queried from the back end database in the chain of connected graph elements,
class properties, and associations. To keep the uniqueness of the collected data
20 Margus Valja et al.
elements and allow traceability, unique identification numbers that identify
each graph element are kept and reused. The associations between the elements
are retained using the same unique id numbers.
3.6 Analysis
The core module of the framework is the analysis that is described in this
section. The purpose of this analysis is to resolve conflicts in the data col-
lected from multiple sources and to merge these into one coherent data set.
Conflicts arise from the allowed multiplicities of associations between differ-
ent model classes as defined in each model specification. For example, if the
allowed association between some model classes is one-to-one and more than
one connected class value exists, there is a conflict that needs to be resolved.
Associations and conflicts are further explained in 3.6.4.
In the following parts of the paper the terms claim, entity, and value are
used. Claim means a statement that a source makes about some element,
which can be about a model object, model property or a model association. A
claim consists of an entity – the target that the claim is about – and the claim’s
value. An entity is a unique model element and the value is a data value taken
from the collected data that characterizes a particular model object, such
as a network address for a host. We call this chosen data value the default
(primary) property value. Default properties and associations are included
in the entity representations implicitly (explained in 3.6.1). If there is more
than one property or association, then these too are represented as individual
claims.
It is the data sources, as explained in Section 3.2, that make claims. These
claims from the data sources are either non-conflicting or conflicting. Imagine
for example that one source claims that an operating system Windows XP is
running on a host with a certain network address (for example 192.168.1.10).
Another source might claim that the particular host is running a different
operating system – Windows 7. The target of the claim (entity) is in this case
the operating system of 192.168.1.10 and the value of the claim the name of the
operating system. If the model specification we use allows only one operating
system name at a time, the claims are conflicting.
The analysis consists mainly of two parts: (i) creation of claims from the
collected data and (ii) resolution of conflicts between the claims. The first part
is called “Model Data Preprocessing” and the second “Conflict Resolution” as
A framework for automatic IT architecture modeling: applying truth discovery 21
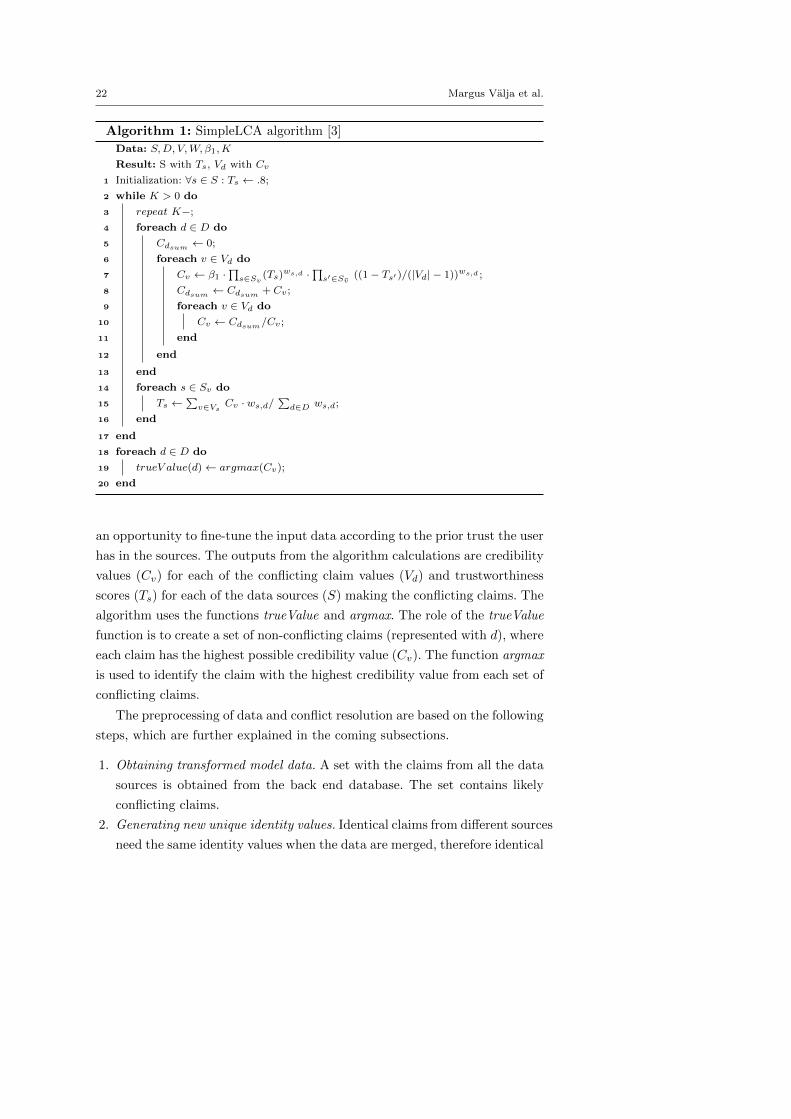
showed in Fig. 2. The conflict resolution part of the framework relies on a
truth discovery algorithm, and is modular. Other algorithms can be used and
for the sake of comparison, a naive algorithm based on common sense is also
presented. The framework supports one algorithm at a time.
The quality of data varies between sources and the reliability of each source
can be seen as an unknown variable that needs to be calculated. Truth dis-
covery algorithms infer the trustworthiness of a data source from the data it
provides and the credibility of the data from the reliability of the data source.
There are different truth discovery algorithms available, some of them are
summarized by Berti-quille and Borge-Holthoefer in [3]. The chosen truth dis-
covery model is Latent Credibility Analysis (LCA) [37]. LCA is a probabilistic
model that considers that a source can be fallible and thus provide wrong in-
formation. The model assumes that the sources are independent. LCA relies on
Expectation Maximization as the main technique to calculate the probability
of a claim to be true. The goal is to find correctness expectation, maximiz-
ing latent variables using the reliability of the source making the claim. The
version of the algorithm, which has been implemented in the framework, is
presented as Algorithm 1. The algorithm compares the data from the sources
and based on prior evidence concludes that, given disagreement between the
sources, one source is right (trustworthiness = 1) and the other is constantly
wrong (trustworthiness = 0). The algorithm averages the trustworthiness of
the values that each source provides. These values are weighted by the cer-
tainty the source has in its assertions. The LCA algorithm can only reason
over mutually exclusive claims.
The input data for Algorithm 1 are the set of sources making claims (S),
set of data objects (strings) that the claims relate to (D), set of conflicting
values (strings) for each of the data objects (V ), confidence matrix of the
values (W ) with confidence that each data source has in its claim expressed as
(ws,d). There is also the parameter of the prior claim credibility values (β1),
which can be a uniform scalar or set separately for each claim to resemble
the beliefs of the user. K denotes the number of iterations for calculation.
The recommended number of iterations is according to [37] around 100. The
prior trustworthiness (Ts) and credibility values (β1) should remain between
0 and 1. The confidence values (ws,d) should start from 0, but have no upper
limit. If the data source has full confidence in a claim, then that value is 1 or
bigger, if the data source says nothing about the entity, the value is 0. The
parameters (β1, ws,d) influence the outcome of the calculations. They provide
22 Margus Valja et al.
Algorithm 1: SimpleLCA algorithm [3]
Data: S,D, V,W, β1,K
Result: S with Ts, Vd with Cv
1 Initialization: ∀s ∈ S : Ts ← .8;
2 while K > 0 do
3 repeat K−;
4 foreach d ∈ D do
5 Cdsum ← 0;
6 foreach v ∈ Vd do
7 Cv ← β1 ·∏
s∈Sv(Ts)ws,d ·
∏s′∈Sv
((1− Ts′ )/(|Vd| − 1))ws,d ;
8 Cdsum ← Cdsum + Cv ;
9 foreach v ∈ Vd do
10 Cv ← Cdsum/Cv ;
11 end
12 end
13 end
14 foreach s ∈ Sv do
15 Ts ←∑
v∈VsCv · ws,d/
∑d∈D ws,d;
16 end
17 end
18 foreach d ∈ D do
19 trueV alue(d)← argmax(Cv);
20 end
an opportunity to fine-tune the input data according to the prior trust the user
has in the sources. The outputs from the algorithm calculations are credibility
values (Cv) for each of the conflicting claim values (Vd) and trustworthiness
scores (Ts) for each of the data sources (S) making the conflicting claims. The
algorithm uses the functions trueValue and argmax. The role of the trueValue
function is to create a set of non-conflicting claims (represented with d), where
each claim has the highest possible credibility value (Cv). The function argmax
is used to identify the claim with the highest credibility value from each set of
conflicting claims.
The preprocessing of data and conflict resolution are based on the following
steps, which are further explained in the coming subsections.
1. Obtaining transformed model data. A set with the claims from all the data
sources is obtained from the back end database. The set contains likely
conflicting claims.
2. Generating new unique identity values. Identical claims from different sources
need the same identity values when the data are merged, therefore identical
A framework for automatic IT architecture modeling: applying truth discovery 23
claim values need to be grouped and a common identity value needs to be
assigned to each group.
3. Merging data into long strings. Preparation of claims for truth analysis by
turning the claims into long strings that represent claims with all the ele-
ments (classes) involved. Long strings needed for textual string comparison
in the conflict resolution analysis.
4. Dividing claim data based on association multiplicities. The model specifi-
cation is used to classify elements based on their association types. One-
to-one association means that there is only one possible right value and
one-to-many means that many (all) values can exist.
5. Generating negative values. Negative values are generated based on each
source’s scope, claimed classes, and user specified data source capability,
in order for the probabilistic truth analysis to express the likelihood that
a value might not exist. For other types of analyses (like naive) negative
values are not needed.
6. Separating conflicting from non-conflicting claims. Part of the analysis is
identifying conflicts in claims and solving them. Non-conflicting claims are
used without any further processing.
7. Running truth analysis on conflicting claims. Our framework uses truth
analysis for conflict resolution, but it also supports other approaches. To
demonstrate this, a naive approach is also introduced.
8. Storing the results. The results are stored in the back end database so that
they can be, at any point of time, transformed into a model file.
3.6.1 Obtaining transformed model data
Before analyzing data, data first needs to be queried from the database. Classes
and their dependencies in the model specification are used to construct the
queries. For example, a network zone might be defined only using the class
Network, while an operating system installed on a particular system is defined
by the sequence of connected objects Network, Host, SoftwareProduct and their
values.
The associations between metamodel elements are represented in different
ways, depending on whether there is one or there are several named associa-
tions between the elements. If there is only one, the association is first stored
between the connecting metamodel elements (as shown below) and later stored
implicitly in long string format. We call the associations that are stored implic-
24 Margus Valja et al.
( ’ Network ’ , ’ Host ’ , ’ S e r v i c e ’ ) :
[ [ { ’ c l a s s ’ : ’ Network ’ ,
’ e x i s t e n c e ’ : None ,
’ id ’ : ’ co l l e c t edMode l /15291713 ’ ,
’ l a b e l ’ : ’ 1 9 2 . 1 6 8 . 1 0 9 . 0 ’ ,
’ source ’ : [ ’ 2017−04−25 Nmap ’ , ’ subnet ’ ]} ,
{ ’ c l a s s ’ : ’ As soc i a t i on ’ ,
’ t a r g e t ’ : ’ Host ’ ,
’ kind ’ : ’ Connection ’ } ,
{ ’ c l a s s ’ : ’ Host ’ ,
’ e x i s t e n c e ’ : None ,
’ id ’ : ’ co l l e c t edMode l /15293715 ’ ,
’ l a b e l ’ : ’ 1 92 . 168 . 109 . 21 ’ ,
’ source ’ : [ ’ 2017−04−25 Nmap ’ , ’ subnet ’ ]} ,
{ ’ c l a s s ’ : ’ As soc i a t i on ’ ,
’ t a r g e t ’ : ’ S e r v i c e ’ ,
’ kind ’ : ’ App l i ca t ion execut ion ’ } ,
{ ’ c l a s s ’ : ’ S e r v i c e ’ ,
’ e x i s t e n c e ’ : None ,
’ id ’ : ’ co l l e c t edMode l /15294101 ’ ,
’ l a b e l ’ : ’ 49157− tcp−ncacn http ’ ,
’ source ’ : [ ’ 2017−04−25 Nmap ’ , ’ subnet ’ ] } ] , . . .
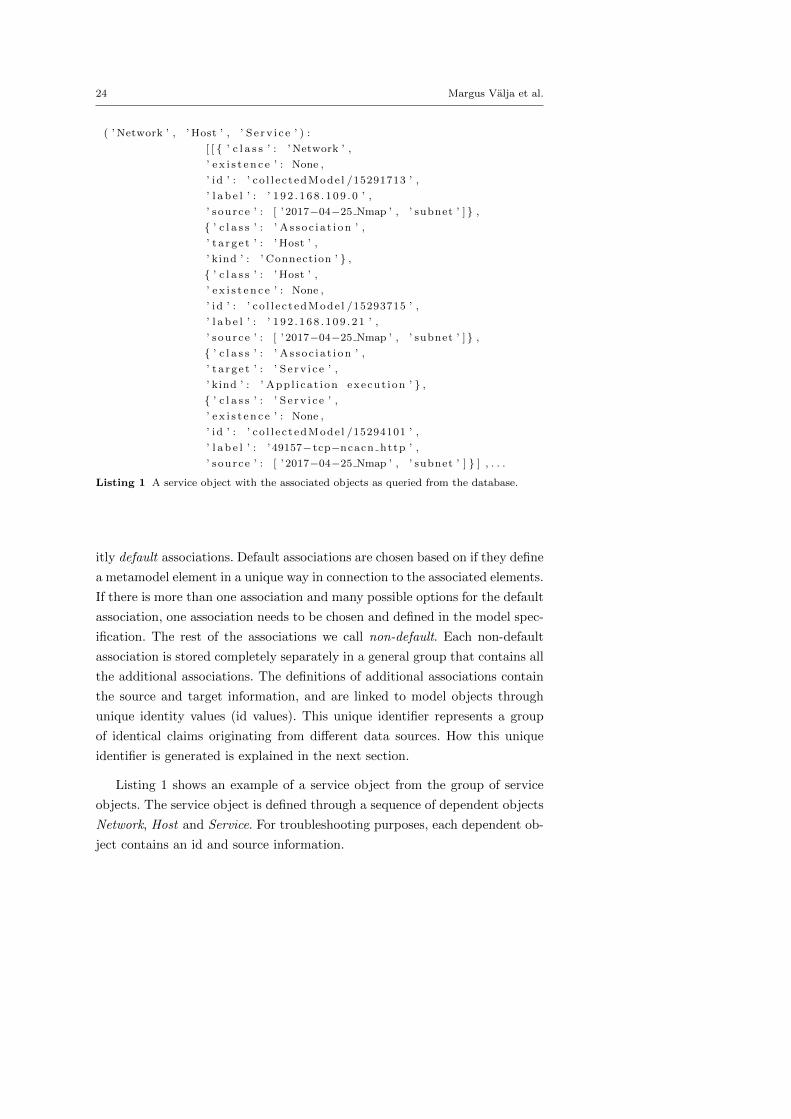
Listing 1 A service object with the associated objects as queried from the database.
itly default associations. Default associations are chosen based on if they define
a metamodel element in a unique way in connection to the associated elements.
If there is more than one association and many possible options for the default
association, one association needs to be chosen and defined in the model spec-
ification. The rest of the associations we call non-default. Each non-default
association is stored completely separately in a general group that contains all
the additional associations. The definitions of additional associations contain
the source and target information, and are linked to model objects through
unique identity values (id values). This unique identifier represents a group
of identical claims originating from different data sources. How this unique
identifier is generated is explained in the next section.
Listing 1 shows an example of a service object from the group of service
objects. The service object is defined through a sequence of dependent objects
Network, Host and Service. For troubleshooting purposes, each dependent ob-
ject contains an id and source information.
A framework for automatic IT architecture modeling: applying truth discovery 25
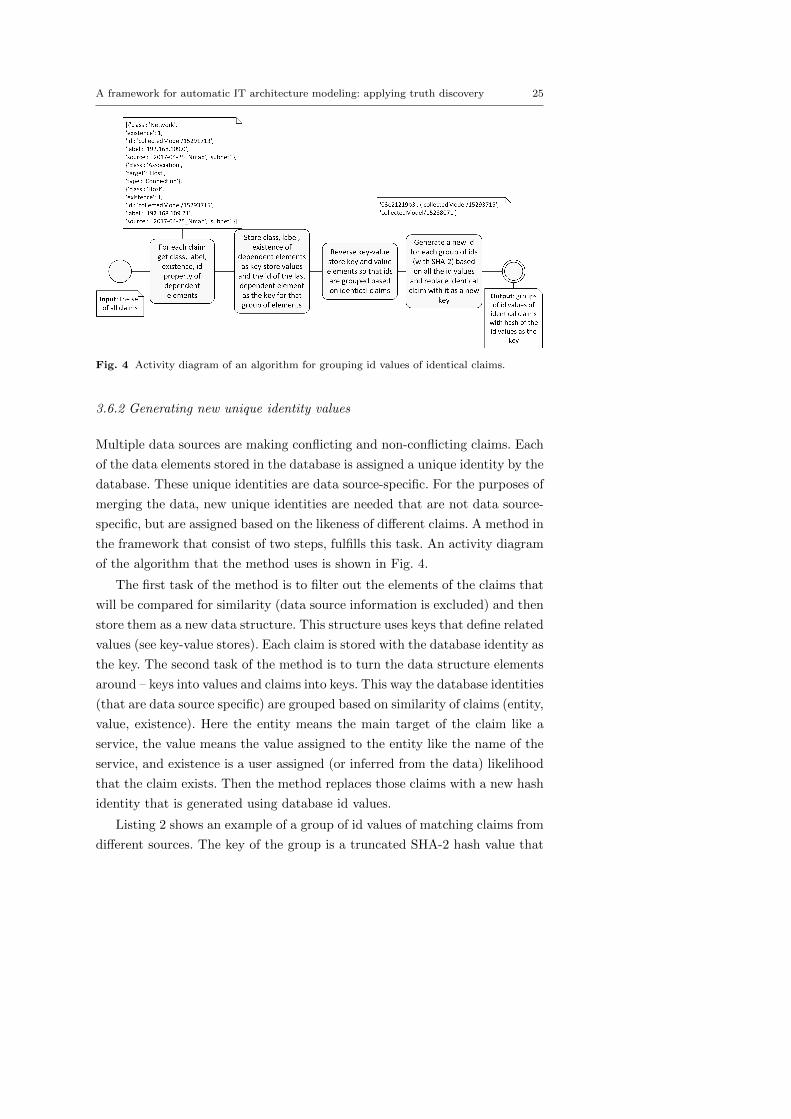
Fig. 4 Activity diagram of an algorithm for grouping id values of identical claims.
3.6.2 Generating new unique identity values
Multiple data sources are making conflicting and non-conflicting claims. Each
of the data elements stored in the database is assigned a unique identity by the
database. These unique identities are data source-specific. For the purposes of
merging the data, new unique identities are needed that are not data source-
specific, but are assigned based on the likeness of different claims. A method in
the framework that consist of two steps, fulfills this task. An activity diagram
of the algorithm that the method uses is shown in Fig. 4.
The first task of the method is to filter out the elements of the claims that
will be compared for similarity (data source information is excluded) and then
store them as a new data structure. This structure uses keys that define related
values (see key-value stores). Each claim is stored with the database identity as
the key. The second task of the method is to turn the data structure elements
around – keys into values and claims into keys. This way the database identities
(that are data source specific) are grouped based on similarity of claims (entity,
value, existence). Here the entity means the main target of the claim like a
service, the value means the value assigned to the entity like the name of the
service, and existence is a user assigned (or inferred from the data) likelihood
that the claim exists. Then the method replaces those claims with a new hash
identity that is generated using database id values.
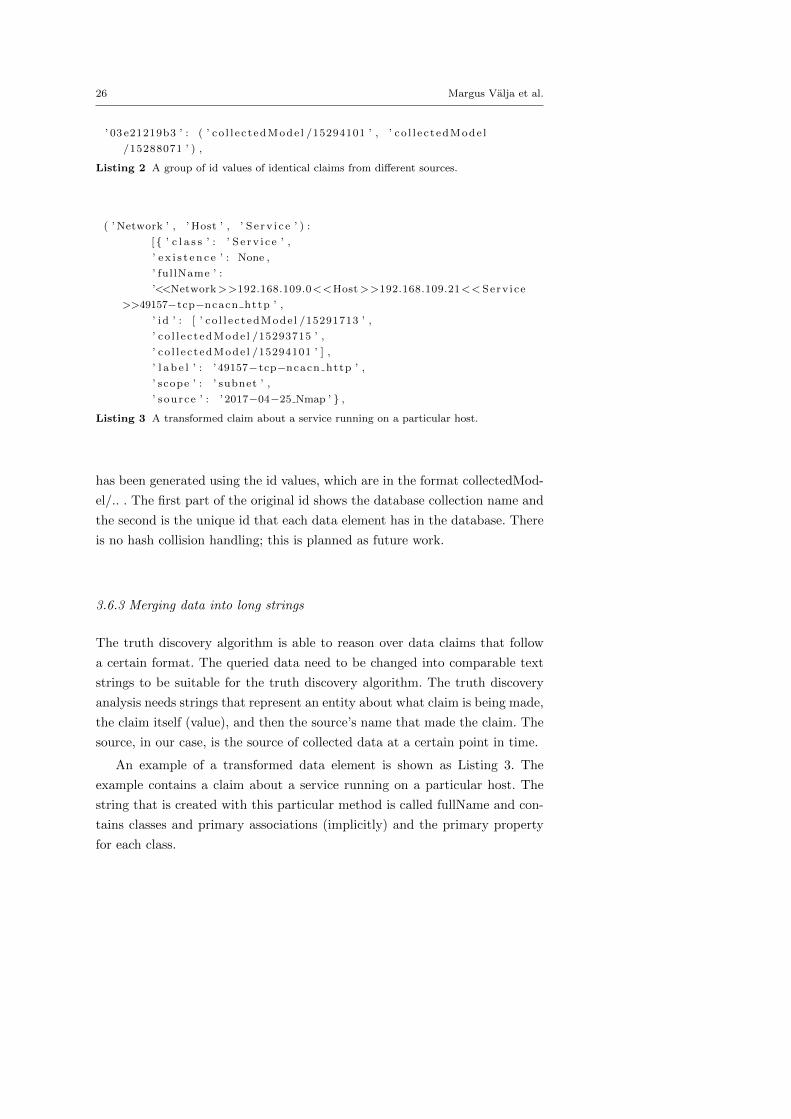
Listing 2 shows an example of a group of id values of matching claims from
different sources. The key of the group is a truncated SHA-2 hash value that
26 Margus Valja et al.
’ 03 e21219b3 ’ : ( ’ co l l e c t edMode l /15294101 ’ , ’ co l l e c t edMode l
/15288071 ’ ) ,
Listing 2 A group of id values of identical claims from different sources.
( ’ Network ’ , ’ Host ’ , ’ S e r v i c e ’ ) :
[{ ’ c l a s s ’ : ’ S e r v i c e ’ ,
’ e x i s t e n c e ’ : None ,
’ ful lName ’ :
’<<Network>>192.168.109.0<<Host>>192.168.109.21<< Serv i ce
>>49157−tcp−ncacn http ’ ,
’ id ’ : [ ’ co l l e c t edMode l /15291713 ’ ,
’ co l l e c t edMode l /15293715 ’ ,
’ co l l e c t edMode l /15294101 ’ ] ,
’ l a b e l ’ : ’ 49157− tcp−ncacn http ’ ,
’ scope ’ : ’ subnet ’ ,
’ source ’ : ’ 2017−04−25 Nmap ’ } ,
Listing 3 A transformed claim about a service running on a particular host.
has been generated using the id values, which are in the format collectedMod-
el/.. . The first part of the original id shows the database collection name and
the second is the unique id that each data element has in the database. There
is no hash collision handling; this is planned as future work.
3.6.3 Merging data into long strings
The truth discovery algorithm is able to reason over data claims that follow
a certain format. The queried data need to be changed into comparable text
strings to be suitable for the truth discovery algorithm. The truth discovery
analysis needs strings that represent an entity about what claim is being made,
the claim itself (value), and then the source’s name that made the claim. The
source, in our case, is the source of collected data at a certain point in time.
An example of a transformed data element is shown as Listing 3. The
example contains a claim about a service running on a particular host. The
string that is created with this particular method is called fullName and con-
tains classes and primary associations (implicitly) and the primary property
for each class.
A framework for automatic IT architecture modeling: applying truth discovery 27
3.6.4 Dividing claim data based on association multiplicities
Each data source makes a claim about the value of some model object (entity).
The claims made can be mutually exclusive, meaning that at most one value in
the set of claims about one entity can be true. The claims can be also mutually
non-exclusive, which means that all values can be true or false independently
of each other. For example, a mutually exclusive claim about a node is that
it runs a certain operating system. So if one source says that the node runs
Linux and another source says that it runs Windows, both cannot be correct
at the same time (though dual boot allows the truth values to change over
time). An example of a non-exclusive claim is that a certain software applica-
tion is installed. So if one source says that the node runs Emacs and another
that it runs Apache, there is no contradiction and both can be true or false
independently.
The exclusiveness of the claim depends on the association multiplicity be-
tween two model classes. If the multiplicity in the metamodel is one-to-many,
then this is sufficient for the claims to be non-exclusive, for there could be many
different objects (class instantiations) associated with the object at hand. As
in the example above, many pieces of software could run on a single node,
and the multiplicity of the “runs-on” relation is thus one-to-many. However
if the association in the metamodel is one-to-one, it is unfortunately not suf-
ficient to know that differing claims from different data sources are mutually
exclusive, at least not under a primitive string comparison notion of differing
claims. For even though the string-different claims “Windows” and “Linux”
are mutually exclusive, the string-different claims “Windows” and “Windows
7” are not. To solve this complication, a refined notion of differing claims is
needed. We believe that this could be accomplished using ontologies, and aim
to do so in future work. However, in this paper, we disregard this difficulty and
proceed as if one-to-one multiplicities were sufficient to establish the mutual
exclusiveness of claims. For the data we use, this is a reasonable simplification,
as will be seen in Sections 4 and 5. However, there is no guarantee that this
simplification will always be reasonable. It depends, among other things, on
the particularities of the data sources used and the system analyzed.
In conclusion, the task of this step of the analysis is to divide the model data
into two sets based on the multiplicities of associations defined in the model
specification, where one set contains exclusive and the other non-exclusive
claims.
28 Margus Valja et al.
3.6.5 Generating negative values
There are truth algorithms that only can reason over the credibility of mutually
exclusive claims, like LCA. That means there needs to be one or more subsets
of mutually exclusive claims, where only one claim in each subset is determined
to be true. There are also algorithms that are not limited to mutually exclusive
claims and can find more than one claim in a set of claims to be true. The
Latent Truth Model (LTM) [3] is such an algorithm. The problem with the
LTM type of algorithms is that they treat all claims as mutually non-exclusive.
While it is not possible to restrict LTM to reason over the credibility of a
mutually exclusive set in a way that only one claim is true, it is possible to use
LCA to reason over mutually non-exclusive claims with a small modification
– the addition of negative claims.
The authors of this paper preferred to use a single truth algorithm to reason
over the credibility of the whole data set instead of using multiple algorithms
simultaneously, because the truth discovery models behind the algorithms are
based on different assumptions and their results might not be comparable.
Therefore the simple version of the LCA is chosen as the main truth algorithm.
To be able to use the LCA algorithm, each mutually non-exclusive claim needs
to be treated as an individual claim that can have a positive or negative
outcome. For that purpose additional negative claims need to be added to
the data set. Negative claims can be added for each mutually non-exclusive
claim that meets certain requirements, which are explained below. While the
generation of negative claims is needed to transform a mutually non-exclusive
data set into a mutually exclusive set, for consistency reasons, negative claims
should also be added to the already mutually exclusive claims.
A negative claim expresses the likelihood that an object (alternatively
value) might not exist. A negative claim must be made by a data source
that has the potential to make it. To be able to generate negative claim values
for a data source, certain criteria need to be met. The data source needs to
have the capability to make a positive claim although it is not doing it. The
capability is defined first by scope (assigned to each source), which can have
two values – “system” or “subnet”. “System” means that the data source has
knowledge only about one particular system. Many configuration files fall un-
der this category. “Subnet” on the other hand means that the data source has
knowledge about other nodes on a particular subnet. For example, network
scanners. The second criterion is the data source’s capability to make claims
A framework for automatic IT architecture modeling: applying truth discovery 29
about the model class in question. If the source makes other claims about a
particular class of elements, then it is assumed that it has that capability. The
third criterion is the similarity of data sources. The data sources need to have
similar capabilities to find information, to be able to qualify for negative claim
making. For example Nessus and Nmap qualify for making negative claims
about claims from Nexpose. The similarity of the data sources included in the
analysis needs to be decided by the user and defined beforehand manually.
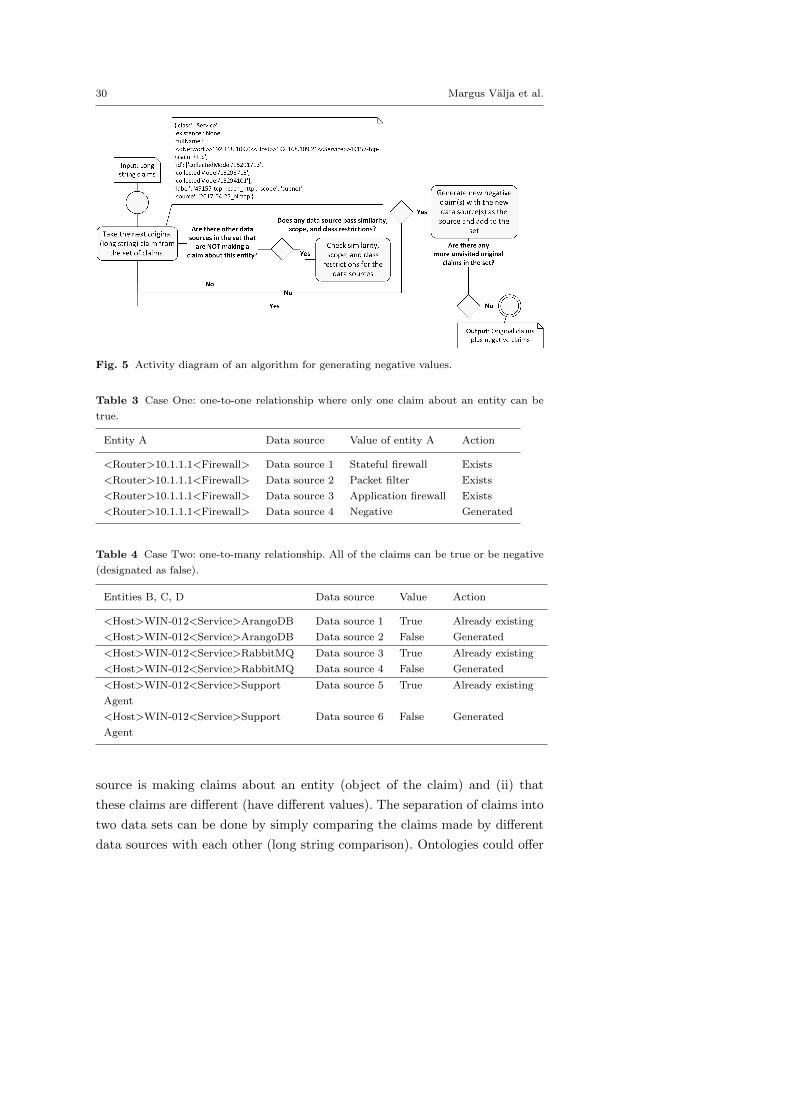
Tables 3 and 4 show how the entity values could be complemented in
both cases. For example, that a router has a firewall installed (Case One)
or a computer has different software programs running on it (Case Two).
A negative value designates the non-existence/non-credibility of a particular
entity. As explained, a negative value is generated only if there is a data source
that meets the three criteria.
Case One describes a one-to-one relationship where only one claim about
an entity can be true. However, as any claim means that the entity exists, the
real question is if there is any source that meets the criteria to claim it does
not exist. In this case ‘Data source 4’ meets the criteria and thus a negative
value is generated. Case Two describes a one-to-many relationship. All of the
claims can be either true or negative (designated as false), thus the claims
need to be treated like the entities in the first case. Simply put, the claims
about an entity are divided into smaller groups where each claim becomes
an entity itself. If there are data sources that meet the criteria to be able to
make negative claims, the negative claims are generated, otherwise the claim
is considered to be true (non-conflicting) and moved to the results data set.
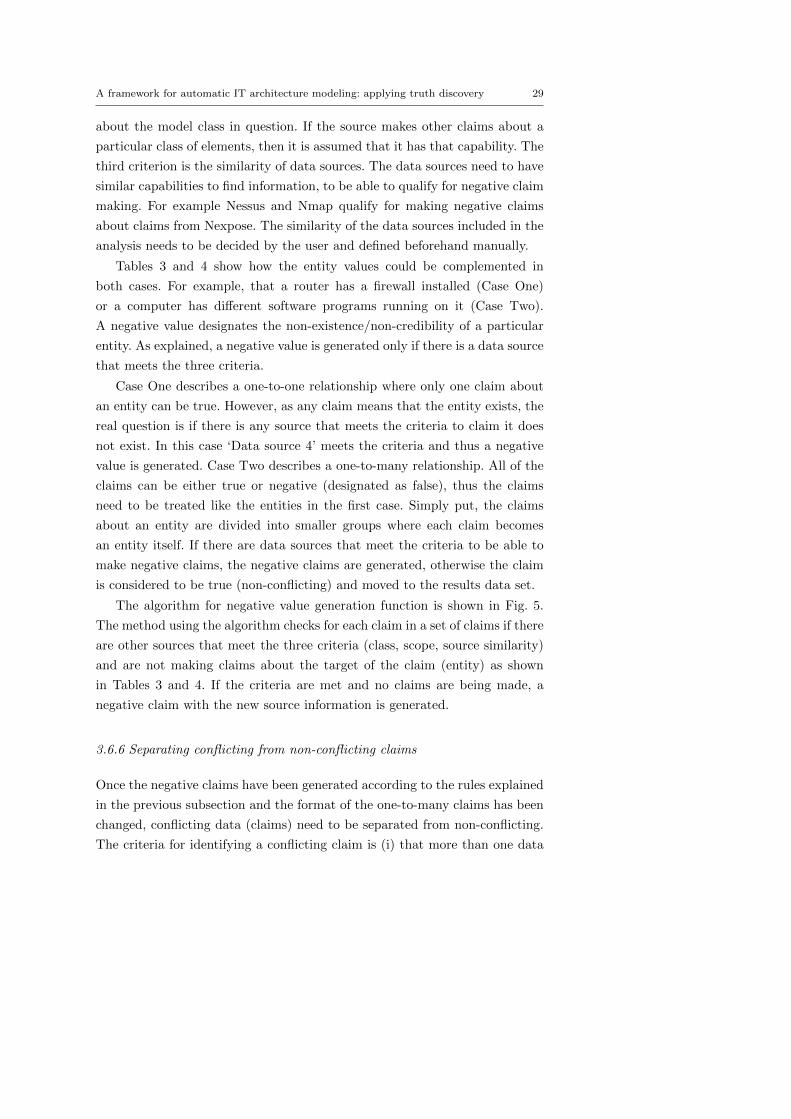
The algorithm for negative value generation function is shown in Fig. 5.
The method using the algorithm checks for each claim in a set of claims if there
are other sources that meet the three criteria (class, scope, source similarity)
and are not making claims about the target of the claim (entity) as shown
in Tables 3 and 4. If the criteria are met and no claims are being made, a
negative claim with the new source information is generated.
3.6.6 Separating conflicting from non-conflicting claims
Once the negative claims have been generated according to the rules explained
in the previous subsection and the format of the one-to-many claims has been
changed, conflicting data (claims) need to be separated from non-conflicting.
The criteria for identifying a conflicting claim is (i) that more than one data
30 Margus Valja et al.
Fig. 5 Activity diagram of an algorithm for generating negative values.
Table 3 Case One: one-to-one relationship where only one claim about an entity can be
true.
Entity A Data source Value of entity A Action
<Router>10.1.1.1<Firewall> Data source 1 Stateful firewall Exists
<Router>10.1.1.1<Firewall> Data source 2 Packet filter Exists
<Router>10.1.1.1<Firewall> Data source 3 Application firewall Exists
<Router>10.1.1.1<Firewall> Data source 4 Negative Generated
Table 4 Case Two: one-to-many relationship. All of the claims can be true or be negative
(designated as false).
Entities B, C, D Data source Value Action
<Host>WIN-012<Service>ArangoDB Data source 1 True Already existing
<Host>WIN-012<Service>ArangoDB Data source 2 False Generated
<Host>WIN-012<Service>RabbitMQ Data source 3 True Already existing
<Host>WIN-012<Service>RabbitMQ Data source 4 False Generated
<Host>WIN-012<Service>Support
Agent
Data source 5 True Already existing
<Host>WIN-012<Service>Support
Agent
Data source 6 False Generated
source is making claims about an entity (object of the claim) and (ii) that
these claims are different (have different values). The separation of claims into
two data sets can be done by simply comparing the claims made by different
data sources with each other (long string comparison). Ontologies could offer
A framework for automatic IT architecture modeling: applying truth discovery 31
a more powerful comparison than just string comparison, but this is not in the
scope of this paper.
What gets compared is an entity and the values of an entity. An entity is
for example a certain operating system running on a host and the value of the
entity is the operating system’s name. If there are more than one non-identical
claim about the host operating system value, both claims are classified as
conflicting. If there are no contradicting entity values for a claim, then it is
classified as non-conflicting and stored. The stored non-conflicting claims are
later merged with the claims from the truth analysis.
3.6.7 Running truth analysis on conflicting claims
Conflict resolution is possible once the data has been preprocessed, trans-
formed into claims, and sorted. The chosen algorithm for conflict resolution
– LCA, is presented as Algorithm 1. However, other approaches are also sup-
ported by the framework and for comparison, a naive algorithm is introduced
in this subsection.
The naive algorithm is based on common sense. It does not support using
prior probability values to describe the data sets and does not support using
negative claims. Therefore only mutually exclusive claims can be included
in the naive conflict resolution analysis and mutually non-exclusive ones are
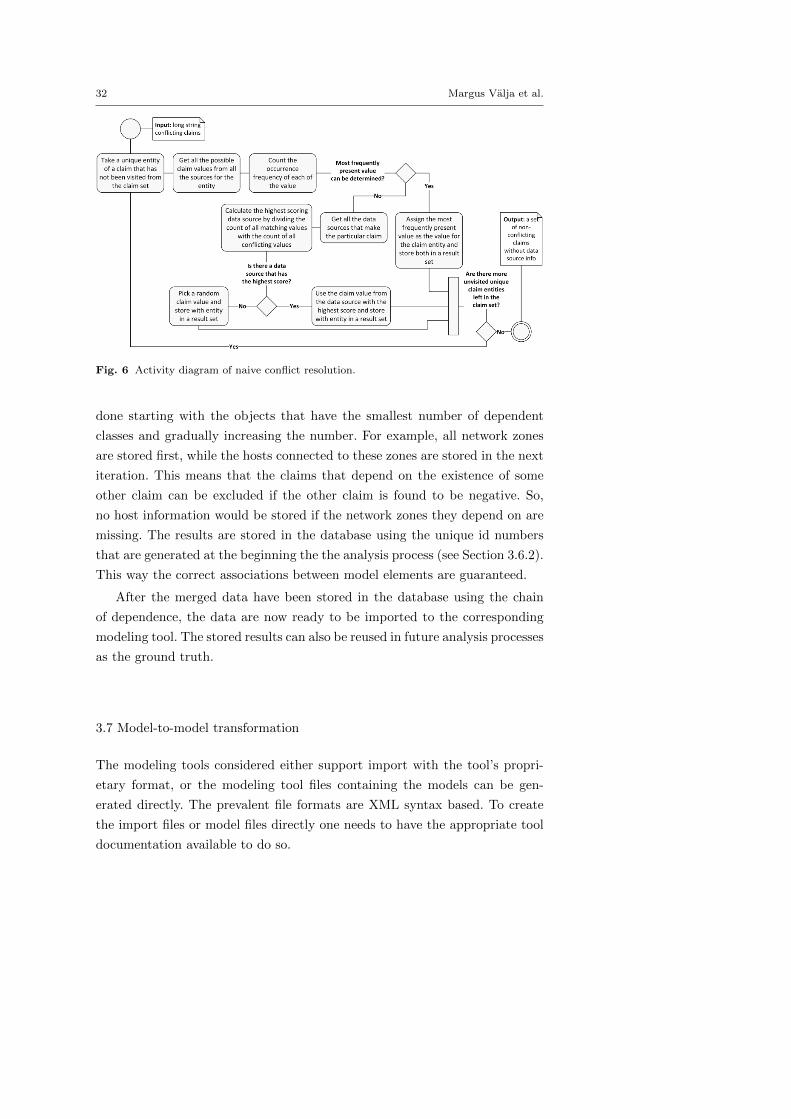
treated as non-conflicting data. The goal for the naive algorithm (see Fig. 6)
is to find, for each entity (object) of the claim, the most frequently occurring
value. If the most frequently occurring value cannot be determined because the
conflicting values occur equally often, then two other steps are possible. Firstly,
the claim from the most trustworthy source can be picked. The trustworthiness
of a source is in this case determined by dividing the total amount of matching
values by the total amount of conflicting values. These amounts are counted
from the whole data set, not only from a particular claim subset. If the scores
for all the data sources making the particular claim are the same, then instead
a random value is picked.
3.6.8 Storing the results
The last step in the analysis process is storing the results in the back end
database. Before the results are written to the database, the truth discovery
results are merged with the non-conflicting data set. This way the chain of class
dependencies can be followed while storing the data. The storing of claims is
32 Margus Valja et al.
Fig. 6 Activity diagram of naive conflict resolution.
done starting with the objects that have the smallest number of dependent
classes and gradually increasing the number. For example, all network zones
are stored first, while the hosts connected to these zones are stored in the next
iteration. This means that the claims that depend on the existence of some
other claim can be excluded if the other claim is found to be negative. So,
no host information would be stored if the network zones they depend on are
missing. The results are stored in the database using the unique id numbers
that are generated at the beginning the the analysis process (see Section 3.6.2).
This way the correct associations between model elements are guaranteed.
After the merged data have been stored in the database using the chain
of dependence, the data are now ready to be imported to the corresponding
modeling tool. The stored results can also be reused in future analysis processes
as the ground truth.
3.7 Model-to-model transformation
The modeling tools considered either support import with the tool’s propri-
etary format, or the modeling tool files containing the models can be gen-
erated directly. The prevalent file formats are XML syntax based. To create
the import files or model files directly one needs to have the appropriate tool
documentation available to do so.
A framework for automatic IT architecture modeling: applying truth discovery 33
4 Study: testing the framework on a SCADA environment
This section presents our implementation of the proposed framework and em-
ploys it in a study of a SCADA environment. The prototype of the framework
is available for download12.
4.1 SCADA environment
The purpose of Supervisory Control and Data Acquisition (SCADA) systems
is to monitor and control large scale processes like industrial production, elec-
tricity distribution, or building automation systems. SCADA systems offer
a link between (i) the embedded software in various sensors and actuators,
and (ii) a remote operator control room. The typical setup consists of a mas-
ter station, Remote Terminal Units (RTUs), and a communication system
[4]. A master station (SCADA server) is responsible for communicating with
the geographically dispersed field equipment. Data from the field is acquired
through the system part called Front End (FE). Human users operate the
SCADA system through a human machine interface (HMI) with different so
called consoles. Operator consoles are used by system operators for controlling
the supervised process. Engineering consoles (alternative name: maintenance
consoles) are used for control system maintenance; database and situational
picture maintenance. RTUs are the sources of measurements and states for a
SCADA system.
The experimental setup was designed as part of the European Union FP7
project SEGRID13 and aims to represent the SCADA setup of a small electric
utility. The central part of the architecture is a SCADA system running on
four servers. Two of the servers are the main SCADA servers in a redundant
setup that run on Red Hat Enterprise Linux. The control system includes
functions for remote real time data acquisition and remote control of process
devices. The servers also run electric grid specific tools for monitoring, con-
trol, and performance optimization of the grid and historians to store historic
process data. There is a separate Windows 2012 Server for Active Directory
and Kerberos14 based authentication. The fourth machine, also Windows 2012
Server, has data engineering software installed and an HMI. This machine is
12 https://www.kth.se/profile/robertl/page/automatic-data-collection-and-modeling13 https://segrid.eu14 https://web.mit.edu/kerberos
34 Margus Valja et al.
also set to perform the tasks of a FE. With the help of the FE software the
SCADA system regularly fetches measurements and sends control signals to
one destination which simulates a substation through a wide area network.
The substation is represented in the environment by an RTU.
The servers and the local network are running in a virtual environment, but
the wide area network and the RTU are running on physical hardware. The
wide area network has been set up using industrial wireless mesh routers. The
network is separated using virtual local area networks (VLAN)15. An open
source pfSense firewall16 is routing and blocking the traffic between different
VLANs. The setup is shown in Fig. 7 and summarized in Tables 5 and 6.
In Fig. 7 DMZ stands for DeMilitarized Zone, EMS for Tropos Control
Element Management System, ERP for Enterprise Resource Planning system,
RTU for Remote Terminal Unit, and ICC for Inter-Control Center Communi-
cations.
The environment is representative of a small power utility and the software
and equipment run are designed for this purpose. The network environment has
been segmented to different functionality oriented zones to achieve conformity
to real environments. A major difference from a real environment is that the
systems are not connected to any real power processes, i.e. they have not been
set up to control any cyber-physical system. However, the goal of the paper
is to study data collection from systems and software (IT) environments, thus
having a working power system is not required for meeting this particular goal.
Another difference is that virtualization is used extensively here, however this
does not drastically influence the data collection either.
4.2 Data collection in SCADA setup
Three different types of data are collected for model creation: (i) configuration
data obtained from systems directly, (ii) data from network scanners, and
(iii) network traffic. The following subsections provide an overview of the data
collected and the methods used.
15 http://www.ieee802.org/1/pages/802.1Q-2014.html16 https://www.pfsense.org/download
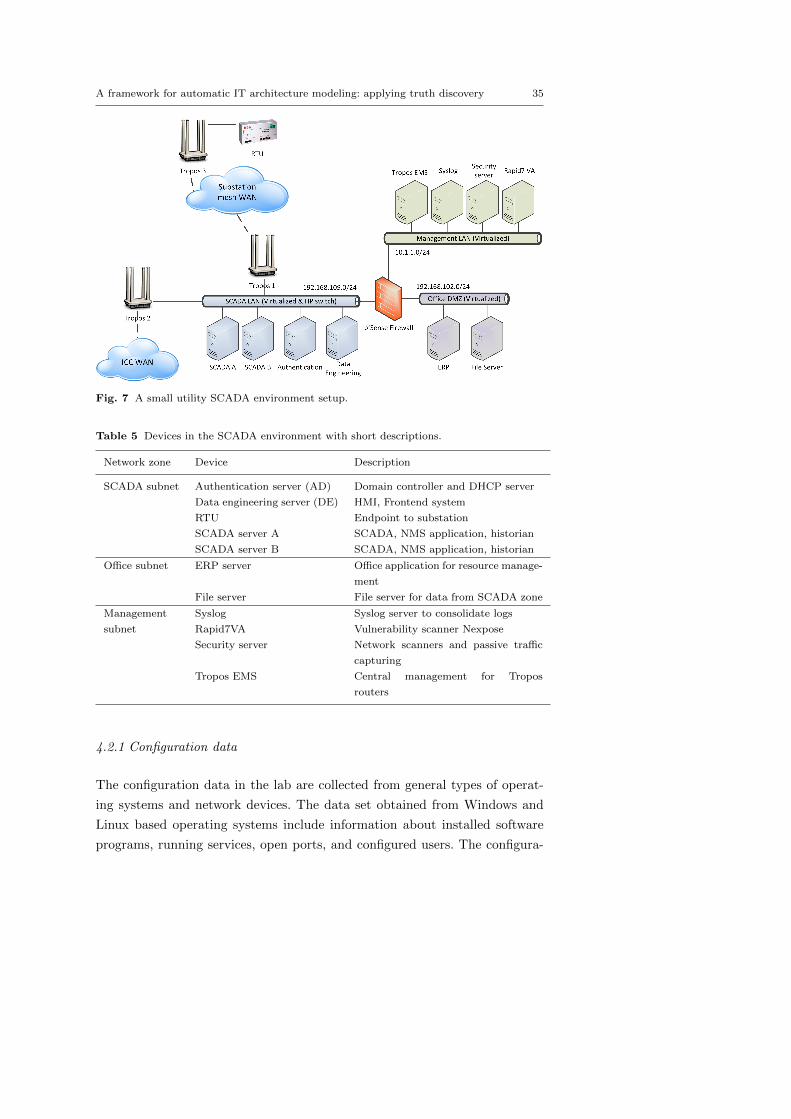
A framework for automatic IT architecture modeling: applying truth discovery 35
Fig. 7 A small utility SCADA environment setup.
Table 5 Devices in the SCADA environment with short descriptions.
Network zone Device Description
SCADA subnet Authentication server (AD) Domain controller and DHCP server
Data engineering server (DE) HMI, Frontend system
RTU Endpoint to substation
SCADA server A SCADA, NMS application, historian
SCADA server B SCADA, NMS application, historian
Office subnet ERP server Office application for resource manage-
ment
File server File server for data from SCADA zone
Management Syslog Syslog server to consolidate logs
subnet Rapid7VA Vulnerability scanner Nexpose
Security server Network scanners and passive traffic
capturing
Tropos EMS Central management for Tropos
routers
4.2.1 Configuration data
The configuration data in the lab are collected from general types of operat-
ing systems and network devices. The data set obtained from Windows and
Linux based operating systems include information about installed software
programs, running services, open ports, and configured users. The configura-
36 Margus Valja et al.
Table 6 Network devices in the SCADA environment.
Device Network zones Description
pfSense Management, office, SCADA Router and firewall between dif-
ferent subnets
Tropos Wifi routers Management, SCADA, sub-
station
Substation wide area networks
and subnets
Vmware switches Management, office, SCADA SCADA, Office and manage-
ment subnets
HP Procurve switch SCADA SCADA subnet extension for
compatibility reason
Table 7 Collected configuration data and collection methods for Windows20 and Linux21.
Operating system – Windows 2012 Server
Method PowerShell cmdlets (PS)
Data Installed Software, running services, local user accounts, open ports
Operating system – Red Hat Enterprise Linux 7
Methods getent, netstat, systemctl, yum
Data local users, open ports, services, installed software
Firewall – pfSense
Method Backup file
Data interfaces, IP address ranges, running services, firewall rules
Switch – HP Procurve
Method Running configuration file
Data VLAN ports and IPs
tion data set collected from the HP Procurve switch and the pfSense firewall
gives an overview of the network zones and management of IP addresses. Some
of the devices in the lab use proprietary data formats for storing configuration
data and do not support exporting this data into a machine readable format.
This problem relates to for instance ABB Tropos 17 routers. Table 7 gives a
brief overview of the methods used and data obtained.
17 http://new.abb.com/network-management/communication-networks/wireless-
networks18 https://technet.microsoft.com/en-us/library/dd772285.aspx19 https://highon.coffee/blog/linux-commands-cheat-sheet20 https://technet.microsoft.com/en-us/library/dd772285.aspx21 https://highon.coffee/blog/linux-commands-cheat-sheet
A framework for automatic IT architecture modeling: applying truth discovery 37
4.2.2 Scanner data
Three different scanners are used for examining the SCADA environment.
Two vulnerability scanners, Nessus22 and Nexpose23, and the network scan-
ner Nmap24. We run Nexpose on a separate virtual machine, Rapid7VA, while
Nmap and Nessus are installed on a Microsoft Windows server that has access
to all the network zones. The scanners use a variety of methods for obtaining
information about the system scanned, including pattern recognition. They
are able to authenticate themselves to certain systems in order to obtain de-
tailed configurations. The information collected includes installed software, the
patch level of the software, open ports, existing vulnerabilities, and potential
configuration problems.
4.2.3 Other data
Two network capturing tools are used to gather network traffic information.
Wireshark25 can capture network traffic, allows filtering based on types of pro-
tocols, and can follow sessions. p0f26 is a tool that does passive network traffic
monitoring to identify the operating systems on both endpoints of a TCP
connection. The tool can detect network address translation and connection
sharing.
4.3 Applying the framework
In the following subsections the proposed framework is applied to find answers
to the two research questions posed in the introduction. We study whether the
framework allows to automate modeling when multiple heterogeneous data
sources are needed and if the automation can be done in a way where data
source trustworthiness is tracked in conflict resolution. For this, three different
tools for holistic systems and software (enterprise) modeling are employed.
22 https://www.tenable.com/products/nessus-vulnerability-scanner23 https://www.rapid7.com/products/nexpose24 https://nmap.org25 https://www.wireshark.org26 http://lcamtuf.coredump.cx/p0f3
38 Margus Valja et al.
4.3.1 Tools and metamodels
For the study three different metamodels are used – ArchiMate27, Eclipse Mod-
eling Framework based Fault-Tree Analysis (EMFTA)28 and securiLANG29.
A short introduction to each metamodel is provided below.
ArchiMate is a technical standard from The Open Group for the descrip-
tion, analysis, and visualization of three interconnected enterprise architec-
ture domains – business, application and technology. The technology domain
which is the main focus in this study (together with software and data), deals
with an enterprise’s hardware and communication infrastructure. There are
commercial and open source tools available that implement ArchiMate, e.g.,
BiZZdesign Enterprise Studio and Archi. In this study we use Archi30.
EMFTA is a simple fault tree analysis extension for Eclipse. The extension
supports fault tree probability analysis and visualization, and it is open-source.
securiLANG is a metamodel for quantitative threat modeling and attack
simulations, and is implemented in a modeling tool called securiCAD31. It
has its foundation in more than 10 years of dedicated research conducted
by a full team of researchers at KTH Royal Institute of Technology. The core
concept in securiCAD is the use of attack graphs, which are rendered under the
modeling surface. As a user, you model the software and systems architecture,
then the tool simulates all possible attacks. The tool has built in statistical
expertise on how hard it is to make a specific type of attack, to a certain
type of system, given the security features of this system. The key measure is
Time-To-Compromise (TTC).
EMFTA and securiCAD are tools for simulation and unlike Archi they
need evidence from the real world to run the simulations. This means that
these two tools have additional data needs, over and above what is collected
in the following case studies. The main role of Archi is to document existing
architectures and communicate ideas for new ones.
27 http://pubs.opengroup.org/architecture/archimate2-doc28 https://github.com/cmu-sei/emfta29 https://www.foreseeti.com/products30 https://www.archimatetool.com31 https://www.foreseeti.com/products
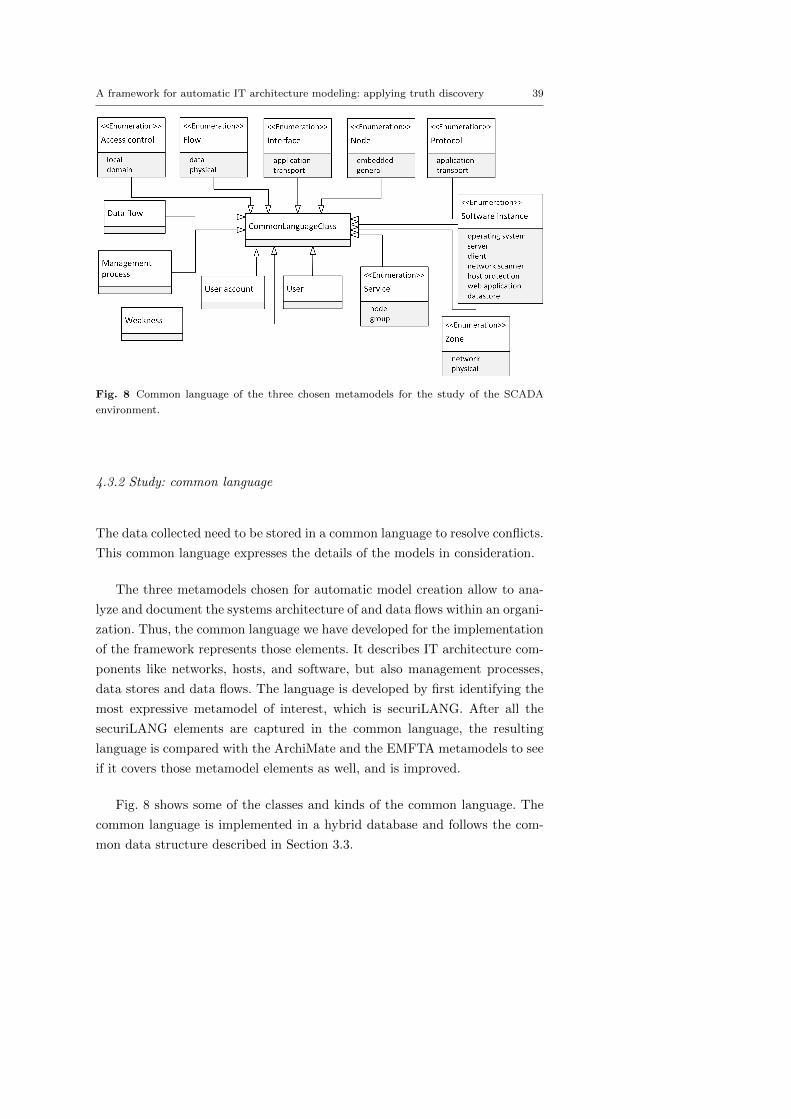
A framework for automatic IT architecture modeling: applying truth discovery 39
Fig. 8 Common language of the three chosen metamodels for the study of the SCADA
environment.
4.3.2 Study: common language
The data collected need to be stored in a common language to resolve conflicts.
This common language expresses the details of the models in consideration.
The three metamodels chosen for automatic model creation allow to ana-
lyze and document the systems architecture of and data flows within an organi-
zation. Thus, the common language we have developed for the implementation
of the framework represents those elements. It describes IT architecture com-
ponents like networks, hosts, and software, but also management processes,
data stores and data flows. The language is developed by first identifying the
most expressive metamodel of interest, which is securiLANG. After all the
securiLANG elements are captured in the common language, the resulting
language is compared with the ArchiMate and the EMFTA metamodels to see
if it covers those metamodel elements as well, and is improved.
Fig. 8 shows some of the classes and kinds of the common language. The
common language is implemented in a hybrid database and follows the com-
mon data structure described in Section 3.3.
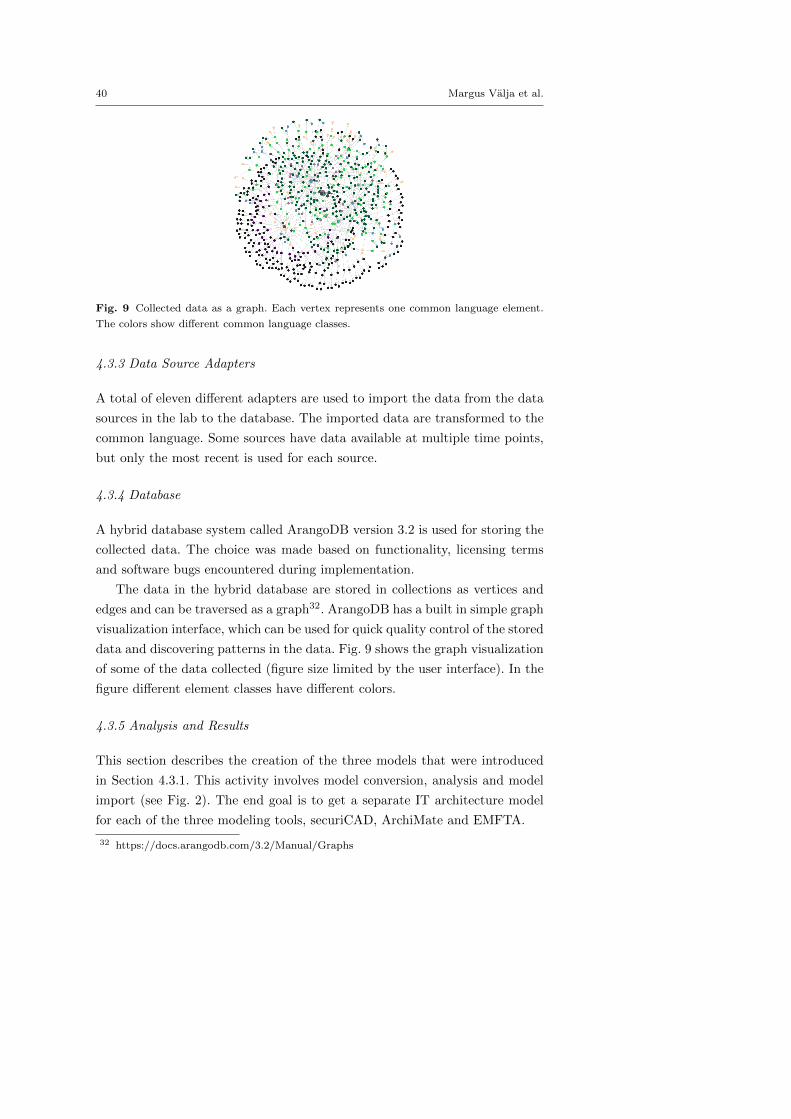
40 Margus Valja et al.
Fig. 9 Collected data as a graph. Each vertex represents one common language element.
The colors show different common language classes.
4.3.3 Data Source Adapters
A total of eleven different adapters are used to import the data from the data
sources in the lab to the database. The imported data are transformed to the
common language. Some sources have data available at multiple time points,
but only the most recent is used for each source.
4.3.4 Database
A hybrid database system called ArangoDB version 3.2 is used for storing the
collected data. The choice was made based on functionality, licensing terms
and software bugs encountered during implementation.
The data in the hybrid database are stored in collections as vertices and
edges and can be traversed as a graph32. ArangoDB has a built in simple graph
visualization interface, which can be used for quick quality control of the stored
data and discovering patterns in the data. Fig. 9 shows the graph visualization
of some of the data collected (figure size limited by the user interface). In the
figure different element classes have different colors.
4.3.5 Analysis and Results
This section describes the creation of the three models that were introduced
in Section 4.3.1. This activity involves model conversion, analysis and model
import (see Fig. 2). The end goal is to get a separate IT architecture model
for each of the three modeling tools, securiCAD, ArchiMate and EMFTA.
32 https://docs.arangodb.com/3.2/Manual/Graphs
A framework for automatic IT architecture modeling: applying truth discovery 41
The purpose of the model conversion part of the framework is to prepare
the collected data set for model specific analysis. The model conversion starts
with the transformation of the data set that is in common language to the
three model languages in focus, securiLANG, ArchiMate and EMFTA. For
that purpose model language specific model adapters need to be configured
and run. The model adapters use model specifications to support the trans-
formation process. A model specification contains the definitions of elements,
associations, and dependencies between the elements. The central elements for
example in securiLANG are networks and hosts. A Host object typically has
connections to other objects such as Network, various types of software, and
AccessControl. Unique Hosts are defined through the chain of dependency in-
cluding the connected Network object while instances of software are defined
through connections to Host objects.
The transformation logic of all three model adapters follows Kuhn’s in-
tegration patterns presented in Table 1. The adapters are implemented in a
way that there is a separate function for the transformation of each of the
model classes. For some common language elements there are direct equals,
so the “Reference pattern” can be followed. In securiCAD’s case Network ob-
jects belong to this category. For other model elements transformation rules
(“Transformation pattern”) are needed in order to transform multiple common
language elements to a single metamodel element. For example, Hosts are cre-
ated combining the common language elements Interface and Node. There are
also elements that do not always have direct equals like the class Software
Product. It would be possible to generate Software Product elements auto-
matically, as they represent the static versions of software instances, but that
would skew the truth analysis results. Such a generation step should there-
fore, if at all, be done after the conflict analysis has taken place. A detailed
explanation of model adapters is given in Section 3.5.2.
Because of the limited expressiveness of the ArchiMate model, the Archi-
Mate specification needs to be customized – two different versions of the class
System Software are needed in the model specification. This is because Sys-
tem Software can represent both operating systems and installed software.
The need comes from real life. Due to the way the lab has been set up we
need to restrict the number of operating systems that can be modeled on one
host. There are no restrictions to the amount of software a host can run, how-
ever. Thus, a device can be connected to only one System Software element
that expresses the operating system software running on it while it can be
42 Margus Valja et al.
connected to multiple System Software elements that express other installed
software. Another issue is that some of the ArchiMate model elements can
express logical groups of other elements. For example, a Node can express the
logical grouping of a Device and System Software. Therefore Node elements
should be generated when Device, System Software and associations between
them are known. To avoid this element generation influencing truth discov-
ery analysis, Node elements are generated after the truth discovery conflict
analysis has taken place. The reasoning behind adding new elements is based
on logical deduction. While there is a possibility of accuracy problems, based
on the authors’ experience of using the framework, no such problems were
evident.
The EMFTA metamodel contains a limited amount of elements designed
only for availability modeling and the metamodel lacks technology domain
knowledge. Therefore, the technology layer elements from the common lan-
guage are used to complement the EMFTA model. The model adapter trans-
forms the data from the common language to the EMFTA model for analysis.
The EMFTA adapter makes no changes to the common language.
The purpose of the analysis part of the framework is to solve conflicts in
the model specific data sets. Thus, the analysis part of the framework needs to
be configured to support each metamodel. The analysis needs to use a correct
model specification together with the right multiplicities and class names, and
the analyzed data needs to be stored in the designated database collections.
For truth discovery analysis, the capability of the data sources to negate each
other’s claims on certain conditions (as discussed in Section 3.6.5) needs to be
configured as well. The capability configuration answers the questions like the
following: If network scanner Nexpose claims that a certain host in a certain
network zone exists, could Nessus, having scanned the same network zone,
but not having detected that particular host, reasonably claim that the host
in fact does not exist?
Once the analysis process has been configured the framework can be run,
which means first running the preprocessing to transform data into claims
and separate conflicts. The preprocessing is analysis algorithm specific. The
framework supports two different algorithms (truth discovery, naive) for con-
flict resolution as alternatives to each other. Both algorithms are described in
Section 3.6. The truth discovery analysis can be fine-tuned with parameters,
as explained in Section 3.6.7.
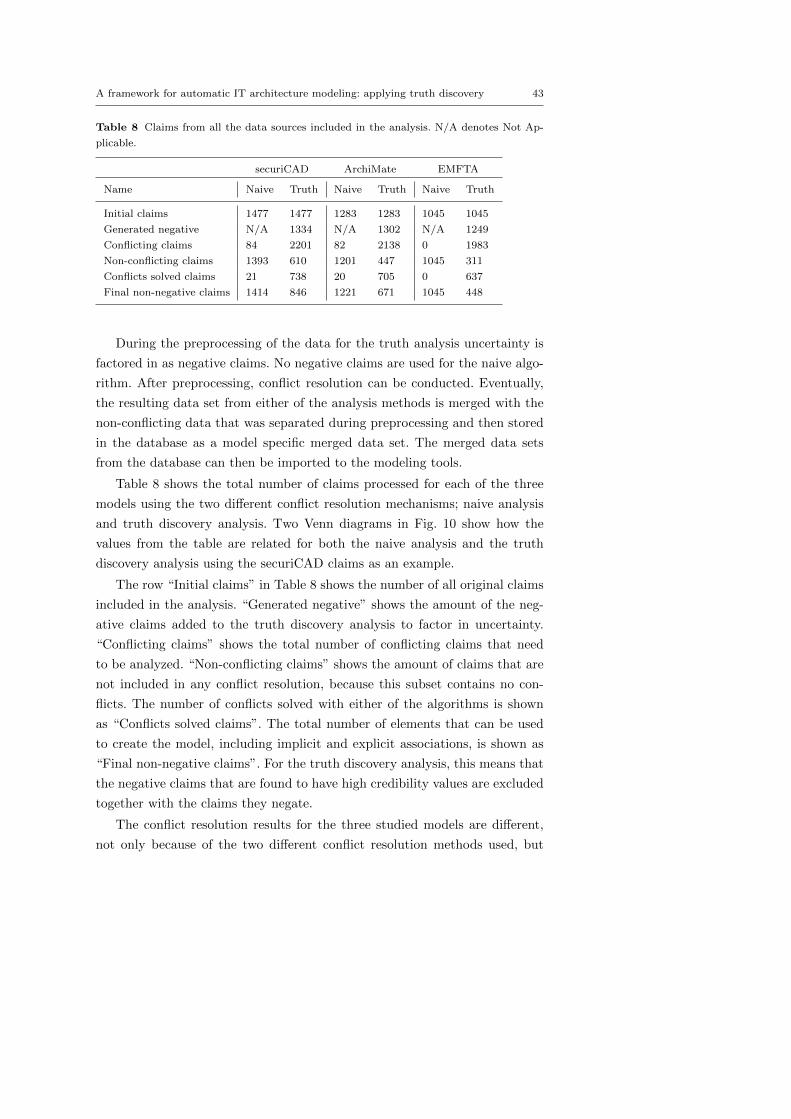
A framework for automatic IT architecture modeling: applying truth discovery 43
Table 8 Claims from all the data sources included in the analysis. N/A denotes Not Ap-
plicable.
securiCAD ArchiMate EMFTA
Name Naive Truth Naive Truth Naive Truth
Initial claims 1477 1477 1283 1283 1045 1045
Generated negative N/A 1334 N/A 1302 N/A 1249
Conflicting claims 84 2201 82 2138 0 1983
Non-conflicting claims 1393 610 1201 447 1045 311
Conflicts solved claims 21 738 20 705 0 637
Final non-negative claims 1414 846 1221 671 1045 448
During the preprocessing of the data for the truth analysis uncertainty is
factored in as negative claims. No negative claims are used for the naive algo-
rithm. After preprocessing, conflict resolution can be conducted. Eventually,
the resulting data set from either of the analysis methods is merged with the
non-conflicting data that was separated during preprocessing and then stored
in the database as a model specific merged data set. The merged data sets
from the database can then be imported to the modeling tools.
Table 8 shows the total number of claims processed for each of the three
models using the two different conflict resolution mechanisms; naive analysis
and truth discovery analysis. Two Venn diagrams in Fig. 10 show how the
values from the table are related for both the naive analysis and the truth
discovery analysis using the securiCAD claims as an example.
The row “Initial claims” in Table 8 shows the number of all original claims
included in the analysis. “Generated negative” shows the amount of the neg-
ative claims added to the truth discovery analysis to factor in uncertainty.
“Conflicting claims” shows the total number of conflicting claims that need
to be analyzed. “Non-conflicting claims” shows the amount of claims that are
not included in any conflict resolution, because this subset contains no con-
flicts. The number of conflicts solved with either of the algorithms is shown
as “Conflicts solved claims”. The total number of elements that can be used
to create the model, including implicit and explicit associations, is shown as
“Final non-negative claims”. For the truth discovery analysis, this means that
the negative claims that are found to have high credibility values are excluded
together with the claims they negate.
The conflict resolution results for the three studied models are different,
not only because of the two different conflict resolution methods used, but
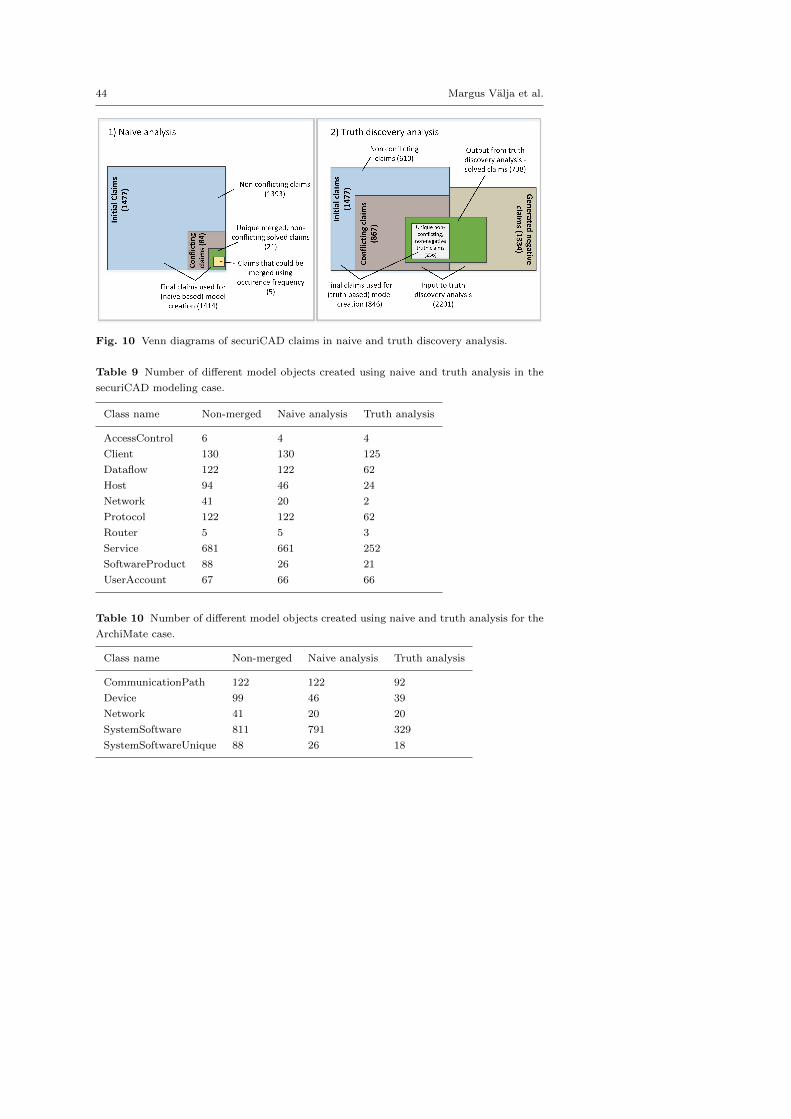
44 Margus Valja et al.
Fig. 10 Venn diagrams of securiCAD claims in naive and truth discovery analysis.
Table 9 Number of different model objects created using naive and truth analysis in the
securiCAD modeling case.
Class name Non-merged Naive analysis Truth analysis
AccessControl 6 4 4
Client 130 130 125
Dataflow 122 122 62
Host 94 46 24
Network 41 20 2
Protocol 122 122 62
Router 5 5 3
Service 681 661 252
SoftwareProduct 88 26 21
UserAccount 67 66 66
Table 10 Number of different model objects created using naive and truth analysis for the
ArchiMate case.
Class name Non-merged Naive analysis Truth analysis
CommunicationPath 122 122 92
Device 99 46 39
Network 41 20 20
SystemSoftware 811 791 329
SystemSoftwareUnique 88 26 18
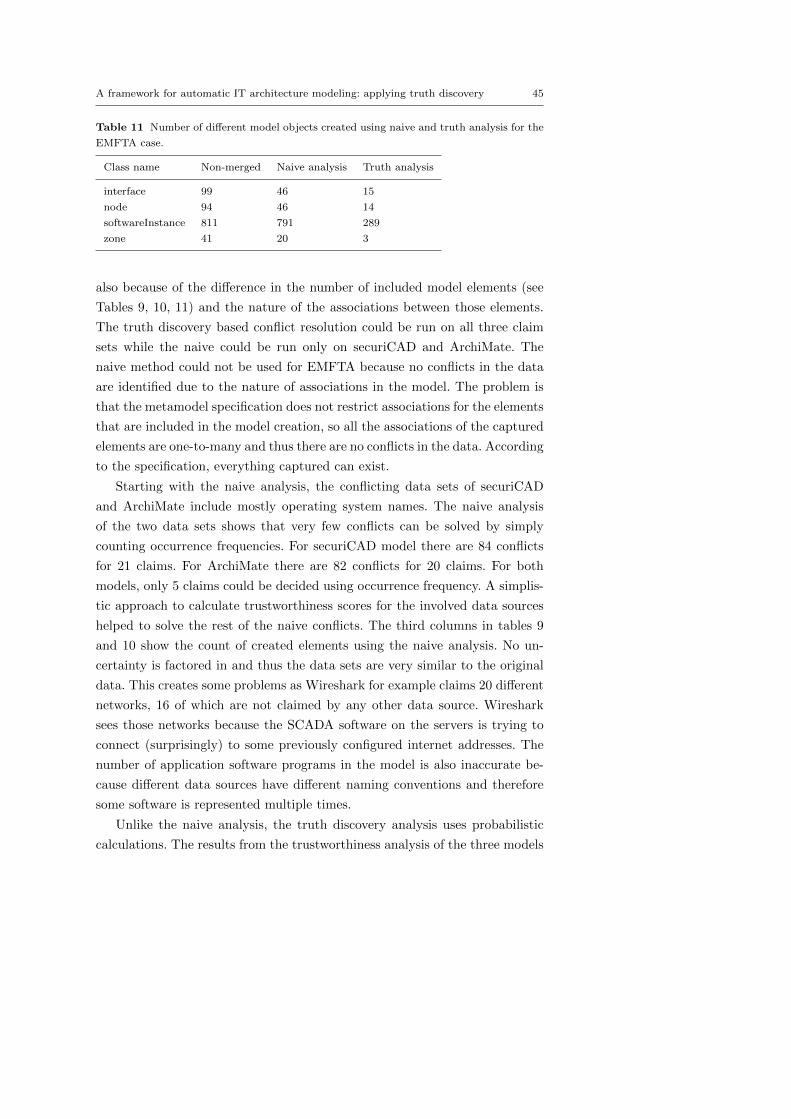
A framework for automatic IT architecture modeling: applying truth discovery 45
Table 11 Number of different model objects created using naive and truth analysis for the
EMFTA case.
Class name Non-merged Naive analysis Truth analysis
interface 99 46 15
node 94 46 14
softwareInstance 811 791 289
zone 41 20 3
also because of the difference in the number of included model elements (see
Tables 9, 10, 11) and the nature of the associations between those elements.
The truth discovery based conflict resolution could be run on all three claim
sets while the naive could be run only on securiCAD and ArchiMate. The
naive method could not be used for EMFTA because no conflicts in the data
are identified due to the nature of associations in the model. The problem is
that the metamodel specification does not restrict associations for the elements
that are included in the model creation, so all the associations of the captured
elements are one-to-many and thus there are no conflicts in the data. According
to the specification, everything captured can exist.
Starting with the naive analysis, the conflicting data sets of securiCAD
and ArchiMate include mostly operating system names. The naive analysis
of the two data sets shows that very few conflicts can be solved by simply
counting occurrence frequencies. For securiCAD model there are 84 conflicts
for 21 claims. For ArchiMate there are 82 conflicts for 20 claims. For both
models, only 5 claims could be decided using occurrence frequency. A simplis-
tic approach to calculate trustworthiness scores for the involved data sources
helped to solve the rest of the naive conflicts. The third columns in tables 9
and 10 show the count of created elements using the naive analysis. No un-
certainty is factored in and thus the data sets are very similar to the original
data. This creates some problems as Wireshark for example claims 20 different
networks, 16 of which are not claimed by any other data source. Wireshark
sees those networks because the SCADA software on the servers is trying to
connect (surprisingly) to some previously configured internet addresses. The
number of application software programs in the model is also inaccurate be-
cause different data sources have different naming conventions and therefore
some software is represented multiple times.
Unlike the naive analysis, the truth discovery analysis uses probabilistic
calculations. The results from the trustworthiness analysis of the three models
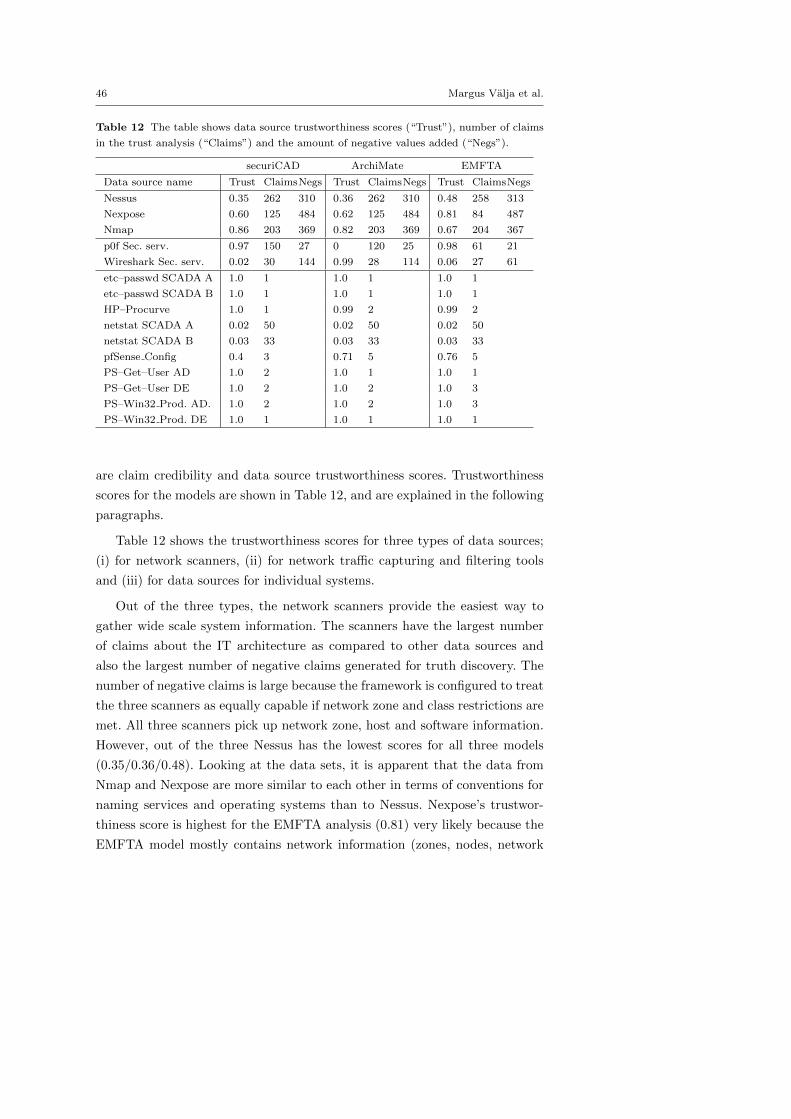
46 Margus Valja et al.
Table 12 The table shows data source trustworthiness scores (“Trust”), number of claims
in the trust analysis (“Claims”) and the amount of negative values added (“Negs”).
securiCAD ArchiMate EMFTA
Data source name Trust ClaimsNegs Trust ClaimsNegs Trust ClaimsNegs
Nessus 0.35 262 310 0.36 262 310 0.48 258 313
Nexpose 0.60 125 484 0.62 125 484 0.81 84 487
Nmap 0.86 203 369 0.82 203 369 0.67 204 367
p0f Sec. serv. 0.97 150 27 0 120 25 0.98 61 21
Wireshark Sec. serv. 0.02 30 144 0.99 28 114 0.06 27 61
etc–passwd SCADA A 1.0 1 1.0 1 1.0 1
etc–passwd SCADA B 1.0 1 1.0 1 1.0 1
HP–Procurve 1.0 1 0.99 2 0.99 2
netstat SCADA A 0.02 50 0.02 50 0.02 50
netstat SCADA B 0.03 33 0.03 33 0.03 33
pfSense Config 0.4 3 0.71 5 0.76 5
PS–Get–User AD 1.0 2 1.0 1 1.0 1
PS–Get–User DE 1.0 2 1.0 2 1.0 3
PS–Win32 Prod. AD. 1.0 2 1.0 2 1.0 3
PS–Win32 Prod. DE 1.0 1 1.0 1 1.0 1
are claim credibility and data source trustworthiness scores. Trustworthiness
scores for the models are shown in Table 12, and are explained in the following
paragraphs.
Table 12 shows the trustworthiness scores for three types of data sources;
(i) for network scanners, (ii) for network traffic capturing and filtering tools
and (iii) for data sources for individual systems.
Out of the three types, the network scanners provide the easiest way to
gather wide scale system information. The scanners have the largest number
of claims about the IT architecture as compared to other data sources and
also the largest number of negative claims generated for truth discovery. The
number of negative claims is large because the framework is configured to treat
the three scanners as equally capable if network zone and class restrictions are
met. All three scanners pick up network zone, host and software information.
However, out of the three Nessus has the lowest scores for all three models
(0.35/0.36/0.48). Looking at the data sets, it is apparent that the data from
Nmap and Nexpose are more similar to each other in terms of conventions for
naming services and operating systems than to Nessus. Nexpose’s trustwor-
thiness score is highest for the EMFTA analysis (0.81) very likely because the
EMFTA model mostly contains network information (zones, nodes, network
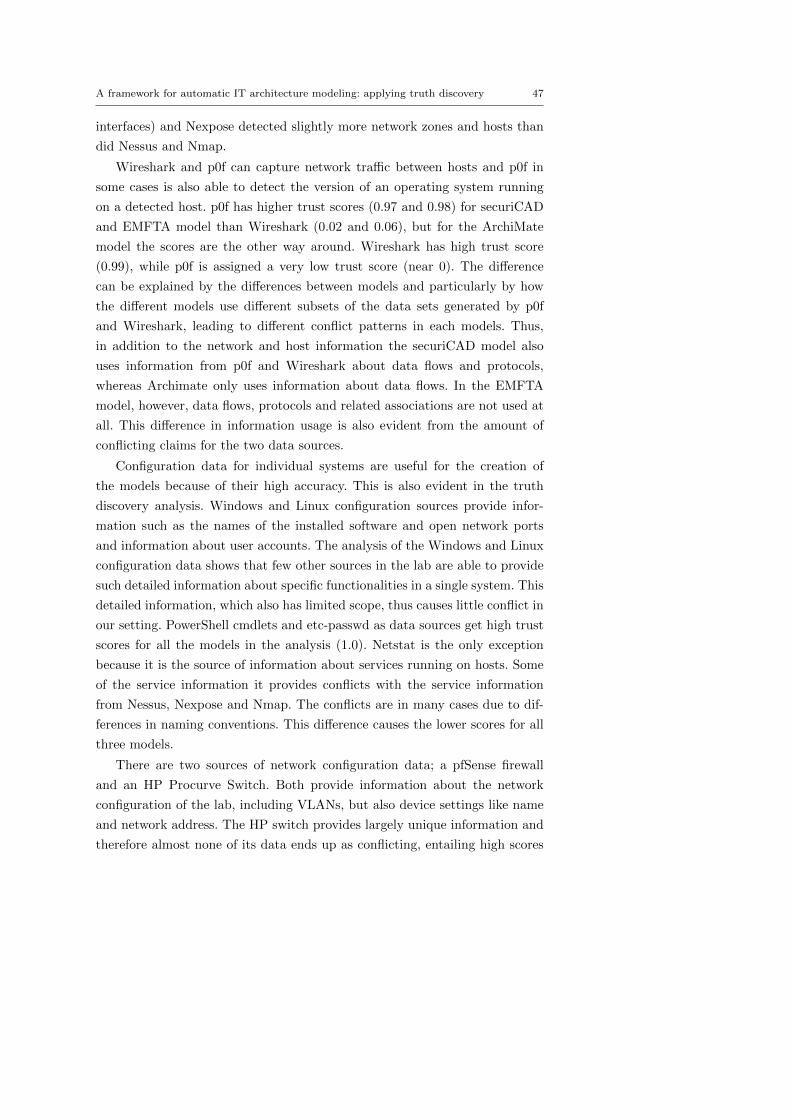
A framework for automatic IT architecture modeling: applying truth discovery 47
interfaces) and Nexpose detected slightly more network zones and hosts than
did Nessus and Nmap.
Wireshark and p0f can capture network traffic between hosts and p0f in
some cases is also able to detect the version of an operating system running
on a detected host. p0f has higher trust scores (0.97 and 0.98) for securiCAD
and EMFTA model than Wireshark (0.02 and 0.06), but for the ArchiMate
model the scores are the other way around. Wireshark has high trust score
(0.99), while p0f is assigned a very low trust score (near 0). The difference
can be explained by the differences between models and particularly by how
the different models use different subsets of the data sets generated by p0f
and Wireshark, leading to different conflict patterns in each models. Thus,
in addition to the network and host information the securiCAD model also
uses information from p0f and Wireshark about data flows and protocols,
whereas Archimate only uses information about data flows. In the EMFTA
model, however, data flows, protocols and related associations are not used at
all. This difference in information usage is also evident from the amount of
conflicting claims for the two data sources.
Configuration data for individual systems are useful for the creation of
the models because of their high accuracy. This is also evident in the truth
discovery analysis. Windows and Linux configuration sources provide infor-
mation such as the names of the installed software and open network ports
and information about user accounts. The analysis of the Windows and Linux
configuration data shows that few other sources in the lab are able to provide
such detailed information about specific functionalities in a single system. This
detailed information, which also has limited scope, thus causes little conflict in
our setting. PowerShell cmdlets and etc-passwd as data sources get high trust
scores for all the models in the analysis (1.0). Netstat is the only exception
because it is the source of information about services running on hosts. Some
of the service information it provides conflicts with the service information
from Nessus, Nexpose and Nmap. The conflicts are in many cases due to dif-
ferences in naming conventions. This difference causes the lower scores for all
three models.
There are two sources of network configuration data; a pfSense firewall
and an HP Procurve Switch. Both provide information about the network
configuration of the lab, including VLANs, but also device settings like name
and network address. The HP switch provides largely unique information and
therefore almost none of its data ends up as conflicting, entailing high scores
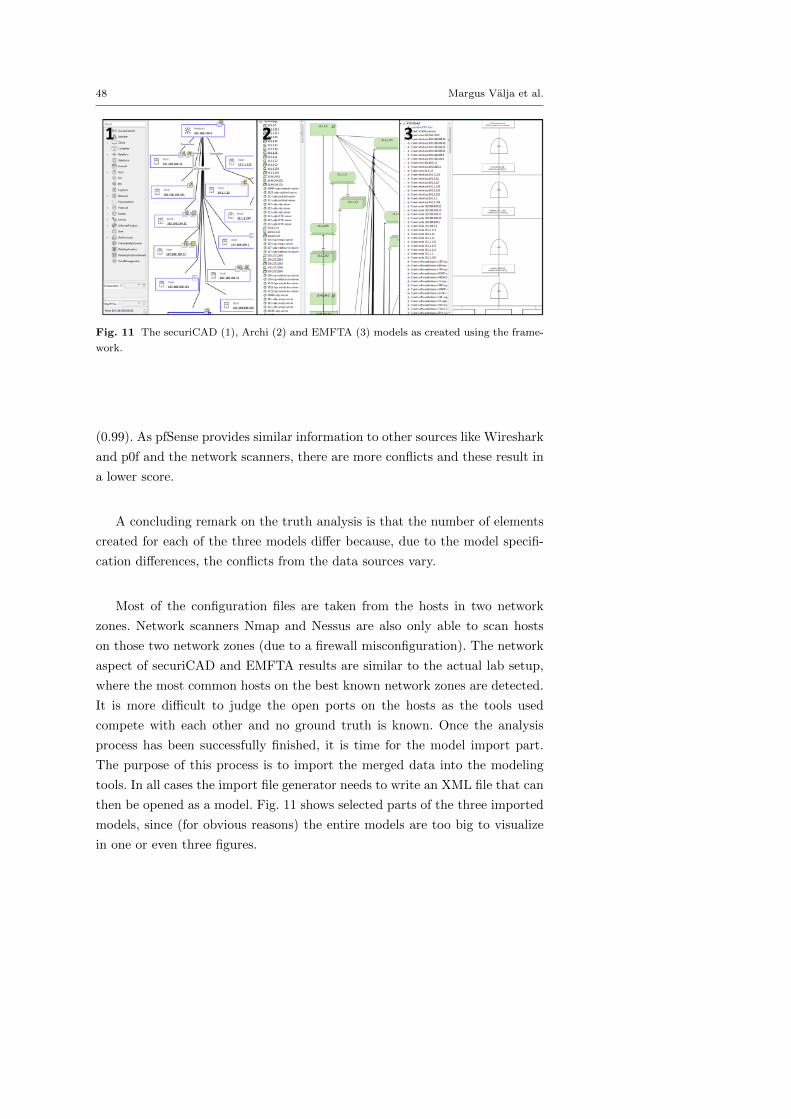
48 Margus Valja et al.
Fig. 11 The securiCAD (1), Archi (2) and EMFTA (3) models as created using the frame-
work.
(0.99). As pfSense provides similar information to other sources like Wireshark
and p0f and the network scanners, there are more conflicts and these result in
a lower score.
A concluding remark on the truth analysis is that the number of elements
created for each of the three models differ because, due to the model specifi-
cation differences, the conflicts from the data sources vary.
Most of the configuration files are taken from the hosts in two network
zones. Network scanners Nmap and Nessus are also only able to scan hosts
on those two network zones (due to a firewall misconfiguration). The network
aspect of securiCAD and EMFTA results are similar to the actual lab setup,
where the most common hosts on the best known network zones are detected.
It is more difficult to judge the open ports on the hosts as the tools used
compete with each other and no ground truth is known. Once the analysis
process has been successfully finished, it is time for the model import part.
The purpose of this process is to import the merged data into the modeling
tools. In all cases the import file generator needs to write an XML file that can
then be opened as a model. Fig. 11 shows selected parts of the three imported
models, since (for obvious reasons) the entire models are too big to visualize
in one or even three figures.
A framework for automatic IT architecture modeling: applying truth discovery 49
5 Discussion and Future Work
The following subsections discuss the work in relation to the research questions,
effort required for using the framework and the metamodels’ coverage, choice
of the truth algorithm and future work.
5.1 Extensible automated modeling using heterogeneous data sources
We raised two research questions: The first goal was to investigate how auto-
mated modelling can use multiple heterogeneous data sources in an extensible
manner. The second one was how to keep track of the trustworthiness of the
data sources when merging data. As a result of a literature review and ex-
tensive testing, a framework is proposed and a study with three metamodels
is conducted to demonstrate the viability of the approach. This subsection
discusses the two research questions raised in the introduction.
How can automated system modelling use multiple and heterogeneous sources
in an extensible way?
A previous study showed that it is possible and preferable to collect data for
automatic modeling [21]. The authors use data from one single network scanner
to generate an ArchiMate model. However, there are other useful data sources
that can be employed for model generation. The possibility to merge data
from multiple sources is not explored in the previous work. This is instead the
focus of our current study. It leads us to the question of the extensibility of the
approach, which we define as the support for multiple changing heterogeneous
data sources and the support of multiple metamodels.
In our study there are a variety of data sources used that have different
degrees of granularity and credibility. There are firewall and switch configura-
tion files that describe particular devices in an idealized way (assuming that a
device works correctly) and then there is information from network scanners.
The methods that network scanners use to obtain data can in some cases be
considered less trustworthy (like fingerprinting) and also disruptive. Obtain-
ing individual configuration files takes more time and effort than setting up
network scanners, but configuration files can contain more precise information.
The metamodels considered in this paper are very different in terms of
complexity. For example, securiCAD is a graph based approach that has a
very elaborate structure with many classes and rules for how these relate.
EMFTA, on the other hand, has only a handful of classes used to build a
50 Margus Valja et al.
tree structure that can be applied in different contexts. To use EMFTA for
system modeling one also needs to define the dependencies between all the
systems. Given the varying complexity, all three metamodels have different
data needs, but it is difficult to see how any one single data source would suffice
for instantiating any of them. Moreover, different models might be required for
enterprise decision support. Therefore, it can be concluded that by supporting
model generation of multiple models based on multiple heterogeneous data
sources, the authors have improved the previous approach.
The quality of the output models depends on the quality of the input data.
Heterogeneous data comes in different representations and coverage. Data from
different sources can be conflicting and these conflicts need to be resolved
during a merging process. For conflict resolution it is important that data
from different sources is comparable. Therefore, steps need to be taken to
make sure that the same properties are used for describing the same elements
and that data are on the same formats.
In order to make the collected data comparable, it is transformed into sets
of dependent claims. These claims are eventually transformed into long textual
strings (see 3.6.3) so that they can be compared with each other and so that
their occurrences can be counted. This method is successfully applied to all
three metamodels in the study. However, only fairly simple data warehousing
techniques are used to clean and standardize the data and this affects the
results. There are likely multiple representations in the data for the same
object. Another issue is that it is difficult to classify some model elements,
such as software. Both of these problems need external help to be solved, e.g.
using an ontology. Some missing values in the data are approximated. One of
the reasons for this is that the data sets are stored as a graph in the database.
Other reasons are the dependencies of model classes and the need to construct
long strings for comparison. For example, if a scanner like Wireshark says that
there is a data flow then it is also assumed that there is a network(s) where
this data flow travels and hosts with software allowing this flow.
The database facilitates consolidating similar data and tracing back origi-
nal claims. Tracing back original claims becomes possible by storing data sets
after each transformation and using the same database-assigned identification
numbers for claims at each step of the process. These identification numbers
are needed to support data provenance. The identification numbers are kept
even after the conflict resolution and data merging. The identical claims from
A framework for automatic IT architecture modeling: applying truth discovery 51
different sources are grouped and each group is assigned a new identification
number and the source info is discarded.
In conclusion, we can say that the tests with the framework show that het-
erogeneous data can be merged in an extensible way to create multiple models.
The data sets first need to be transformed to a common representation and
granularity level and stored in a database for further analysis. Then resolution
of conflicts in the data becomes possible.
How can trustworthiness of multiple and heterogeneous sources be included
in automated system modelling?
Data warehouses are often used for integrating distributed information
sources. A data warehouse is very labor intensive to set up and to our knowl-
edge it is difficult to track (and express) the trustworthiness of different data
sources. Truth discovery is a mature field and its probabilistic methods, which
mostly have been applied in a World Wide Web context, can also be used in
an enterprise to automate modeling. For the sake of comparison, the authors
developed an additional simple non-probabilistic method, which we call the
naive approach, to track the trustworthiness of data sources. The naive ap-
proach counts occurrences of identical textual values (strings) and uses those
counts to calculate scores for data sources. The idea for developing the naive
approach is to evaluate the usefulness of truth discovery as compared to more
conventional frequency analysis.
The results show that a naive approach using frequency based analysis
for conflict resolution has limited use. The naive approach can only handle
mutually exclusive claims and cannot express the reliability problems a data
source could have. In the securiCAD and ArchiMate cases only approximately
20% of the conflicts can be resolved with simple frequency analysis, where the
most frequent value is identified. In the remaining cases the naive algorithm
has to resort to alternative methods. A probabilistic approach is preferable if
there is doubt about the trustworthiness of data sources. A truth algorithm,
such as LCA, is able to calculate the trustworthiness of data sources and the
credibility of claims even if there are only a few frequent values. The truth
discovery algorithm that was chosen calculates the probability that a data
source asserts the correct claim, while prioritizing claims from the data sources
that have the most matching claims.
Another important benefit of using the truth discovery algorithm over the
naive one is that it allows to use prior values and factor in uncertainty with
negative claims. As a result of using negative claims, some data get excluded
52 Margus Valja et al.
from the final results. These are the claims that originate from the data sources
that have been attributed the lowest trustworthiness values and that have the
highest number of conflicts that are removed. The extent to which data gets
excluded can be regulated with negative claim generation and prior values that
describe the user’s trust in the data sources.
In summary, we can say that a probabilistic approach is preferable if the
goal of the model generation is to have an abstract model with less disputed
claims. On the other hand, if the goal is to keep all the information and not
to take the probabilistic characteristics such as trustworthiness of the data
sources and the credibility of the claims into account in the model creation,
then a simpler approach would work as well.
5.2 Effort and coverage
The results show that when setting up the framework for usage with the three
metamodels time and effort is needed to configure it. However, given that
about a thousand model elements are created, manual modeling would have
taken much longer. Since frequent updating is beneficial, most likely required,
manual modeling also becomes unfeasible from a life-cycle perspective. A com-
parison of how much time manual and automated modeling can take has been
done by Holm et al.[21]. Regarding the time spent setting up the framework,
most of it was spent creating mappings between different model languages, in-
cluding the mapping between data source elements and the common language.
Correct mappings between the different data and metamodel elements are vi-
tal to obtain an accurate holistic systems and software (enterprise) model.
Other issues that took time include finding the right abstraction level for the
input data and common representation of data values. For example, only the
network traffic that captures values that described application protocols from
Wireshark are imported and the protocol port numbers are replaced with
known application protocol names.
Although our study tries to improve the coverage of the data for the three
chosen metamodels, this is only partly achieved due to multiple factors: 1)
Limited to the devices and services running in the studied SCADA environ-
ment, some types of devices and software like an IDS or IPS are simply not
present. 2) No business process data are included in the analysis, which means
that the ArchiMate model is only partially covered. If there would have been
a data source for business processes then the framework would have allowed
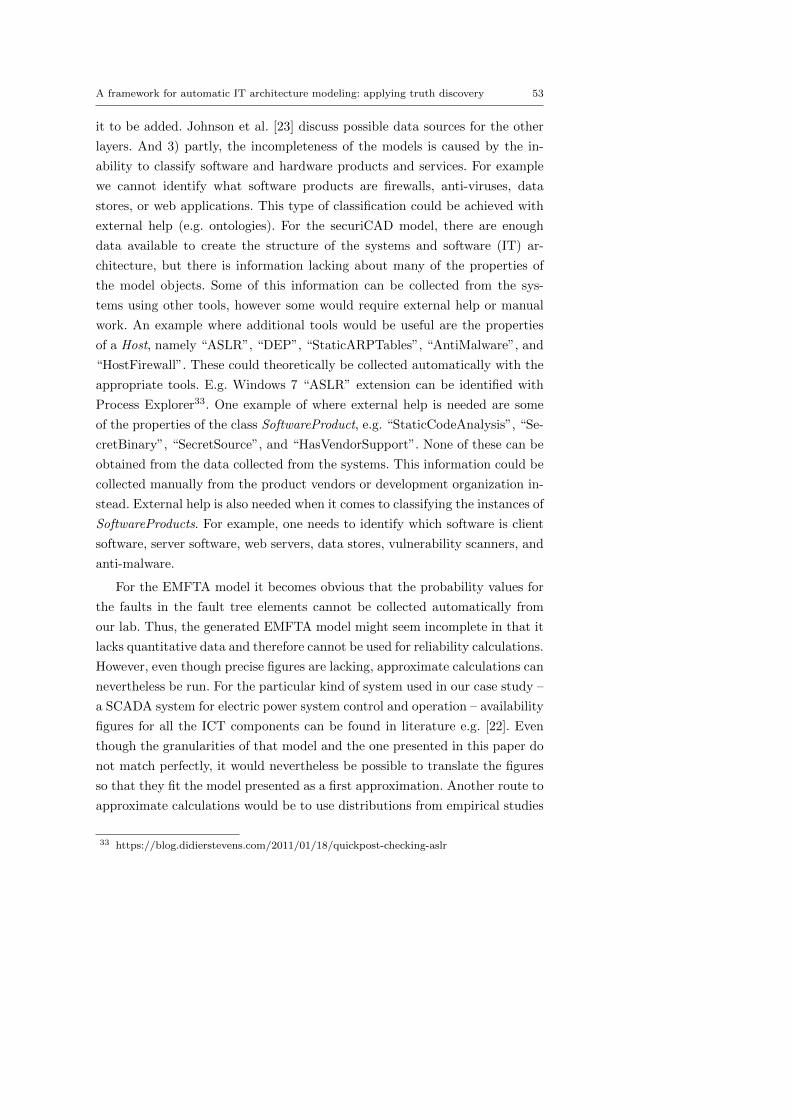
A framework for automatic IT architecture modeling: applying truth discovery 53
it to be added. Johnson et al. [23] discuss possible data sources for the other
layers. And 3) partly, the incompleteness of the models is caused by the in-
ability to classify software and hardware products and services. For example
we cannot identify what software products are firewalls, anti-viruses, data
stores, or web applications. This type of classification could be achieved with
external help (e.g. ontologies). For the securiCAD model, there are enough
data available to create the structure of the systems and software (IT) ar-
chitecture, but there is information lacking about many of the properties of
the model objects. Some of this information can be collected from the sys-
tems using other tools, however some would require external help or manual
work. An example where additional tools would be useful are the properties
of a Host, namely “ASLR”, “DEP”, “StaticARPTables”, “AntiMalware”, and
“HostFirewall”. These could theoretically be collected automatically with the
appropriate tools. E.g. Windows 7 “ASLR” extension can be identified with
Process Explorer33. One example of where external help is needed are some
of the properties of the class SoftwareProduct, e.g. “StaticCodeAnalysis”, “Se-
cretBinary”, “SecretSource”, and “HasVendorSupport”. None of these can be
obtained from the data collected from the systems. This information could be
collected manually from the product vendors or development organization in-
stead. External help is also needed when it comes to classifying the instances of
SoftwareProducts. For example, one needs to identify which software is client
software, server software, web servers, data stores, vulnerability scanners, and
anti-malware.
For the EMFTA model it becomes obvious that the probability values for
the faults in the fault tree elements cannot be collected automatically from
our lab. Thus, the generated EMFTA model might seem incomplete in that it
lacks quantitative data and therefore cannot be used for reliability calculations.
However, even though precise figures are lacking, approximate calculations can
nevertheless be run. For the particular kind of system used in our case study –
a SCADA system for electric power system control and operation – availability
figures for all the ICT components can be found in literature e.g. [22]. Even
though the granularities of that model and the one presented in this paper do
not match perfectly, it would nevertheless be possible to translate the figures
so that they fit the model presented as a first approximation. Another route to
approximate calculations would be to use distributions from empirical studies
33 https://blog.didierstevens.com/2011/01/18/quickpost-checking-aslr
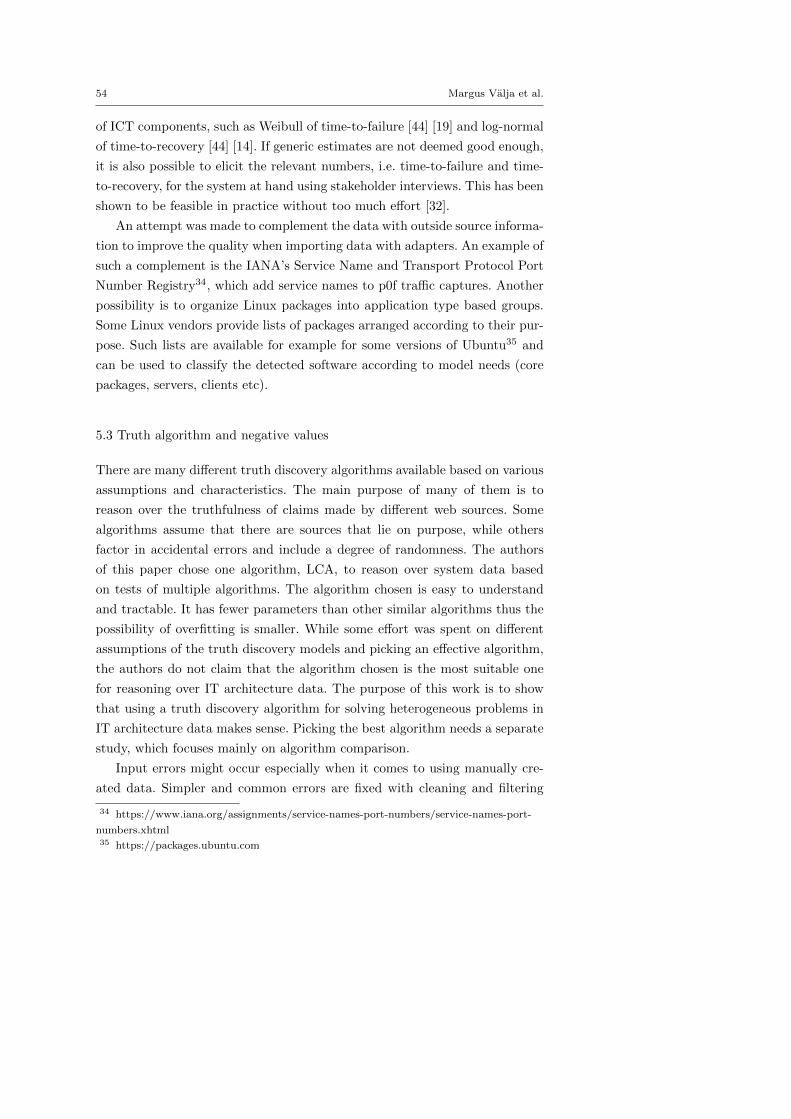
54 Margus Valja et al.
of ICT components, such as Weibull of time-to-failure [44] [19] and log-normal
of time-to-recovery [44] [14]. If generic estimates are not deemed good enough,
it is also possible to elicit the relevant numbers, i.e. time-to-failure and time-
to-recovery, for the system at hand using stakeholder interviews. This has been
shown to be feasible in practice without too much effort [32].
An attempt was made to complement the data with outside source informa-
tion to improve the quality when importing data with adapters. An example of
such a complement is the IANA’s Service Name and Transport Protocol Port
Number Registry34, which add service names to p0f traffic captures. Another
possibility is to organize Linux packages into application type based groups.
Some Linux vendors provide lists of packages arranged according to their pur-
pose. Such lists are available for example for some versions of Ubuntu35 and
can be used to classify the detected software according to model needs (core
packages, servers, clients etc).
5.3 Truth algorithm and negative values
There are many different truth discovery algorithms available based on various
assumptions and characteristics. The main purpose of many of them is to
reason over the truthfulness of claims made by different web sources. Some
algorithms assume that there are sources that lie on purpose, while others
factor in accidental errors and include a degree of randomness. The authors
of this paper chose one algorithm, LCA, to reason over system data based
on tests of multiple algorithms. The algorithm chosen is easy to understand
and tractable. It has fewer parameters than other similar algorithms thus the
possibility of overfitting is smaller. While some effort was spent on different
assumptions of the truth discovery models and picking an effective algorithm,
the authors do not claim that the algorithm chosen is the most suitable one
for reasoning over IT architecture data. The purpose of this work is to show
that using a truth discovery algorithm for solving heterogeneous problems in
IT architecture data makes sense. Picking the best algorithm needs a separate
study, which focuses mainly on algorithm comparison.
Input errors might occur especially when it comes to using manually cre-
ated data. Simpler and common errors are fixed with cleaning and filtering
34 https://www.iana.org/assignments/service-names-port-numbers/service-names-port-
numbers.xhtml35 https://packages.ubuntu.com
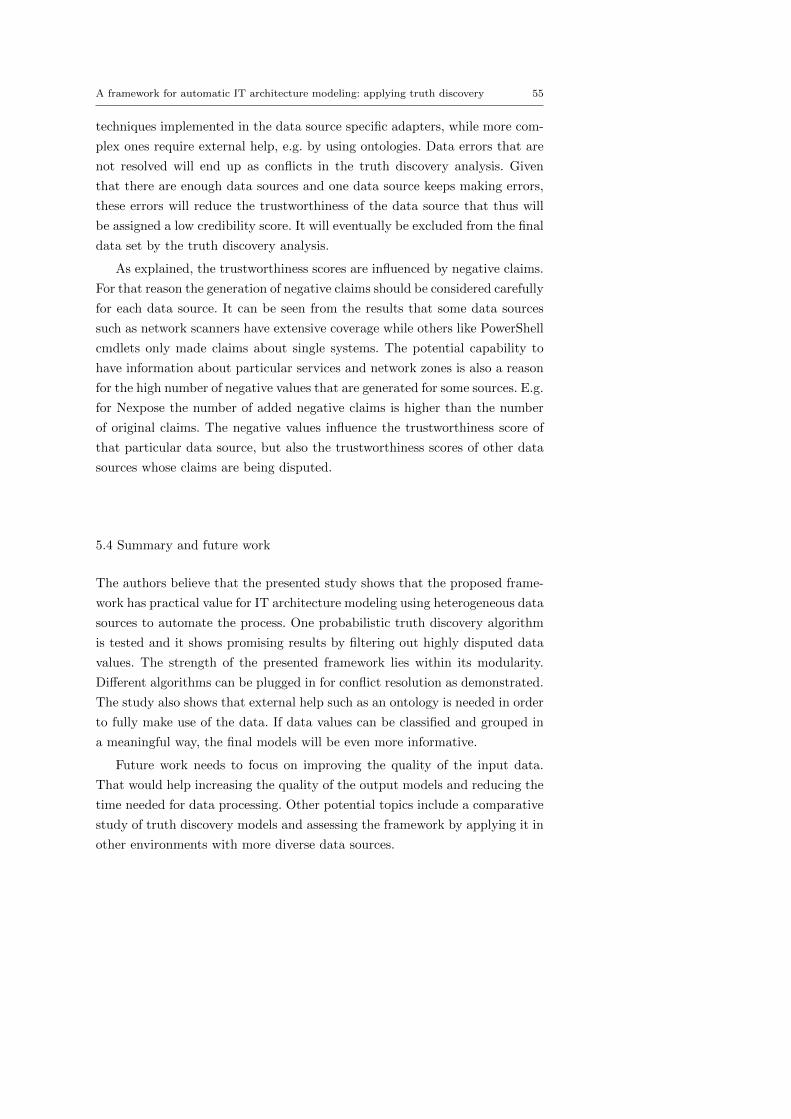
A framework for automatic IT architecture modeling: applying truth discovery 55
techniques implemented in the data source specific adapters, while more com-
plex ones require external help, e.g. by using ontologies. Data errors that are
not resolved will end up as conflicts in the truth discovery analysis. Given
that there are enough data sources and one data source keeps making errors,
these errors will reduce the trustworthiness of the data source that thus will
be assigned a low credibility score. It will eventually be excluded from the final
data set by the truth discovery analysis.
As explained, the trustworthiness scores are influenced by negative claims.
For that reason the generation of negative claims should be considered carefully
for each data source. It can be seen from the results that some data sources
such as network scanners have extensive coverage while others like PowerShell
cmdlets only made claims about single systems. The potential capability to
have information about particular services and network zones is also a reason
for the high number of negative values that are generated for some sources. E.g.
for Nexpose the number of added negative claims is higher than the number
of original claims. The negative values influence the trustworthiness score of
that particular data source, but also the trustworthiness scores of other data
sources whose claims are being disputed.
5.4 Summary and future work
The authors believe that the presented study shows that the proposed frame-
work has practical value for IT architecture modeling using heterogeneous data
sources to automate the process. One probabilistic truth discovery algorithm
is tested and it shows promising results by filtering out highly disputed data
values. The strength of the presented framework lies within its modularity.
Different algorithms can be plugged in for conflict resolution as demonstrated.
The study also shows that external help such as an ontology is needed in order
to fully make use of the data. If data values can be classified and grouped in
a meaningful way, the final models will be even more informative.
Future work needs to focus on improving the quality of the input data.
That would help increasing the quality of the output models and reducing the
time needed for data processing. Other potential topics include a comparative
study of truth discovery models and assessing the framework by applying it in
other environments with more diverse data sources.
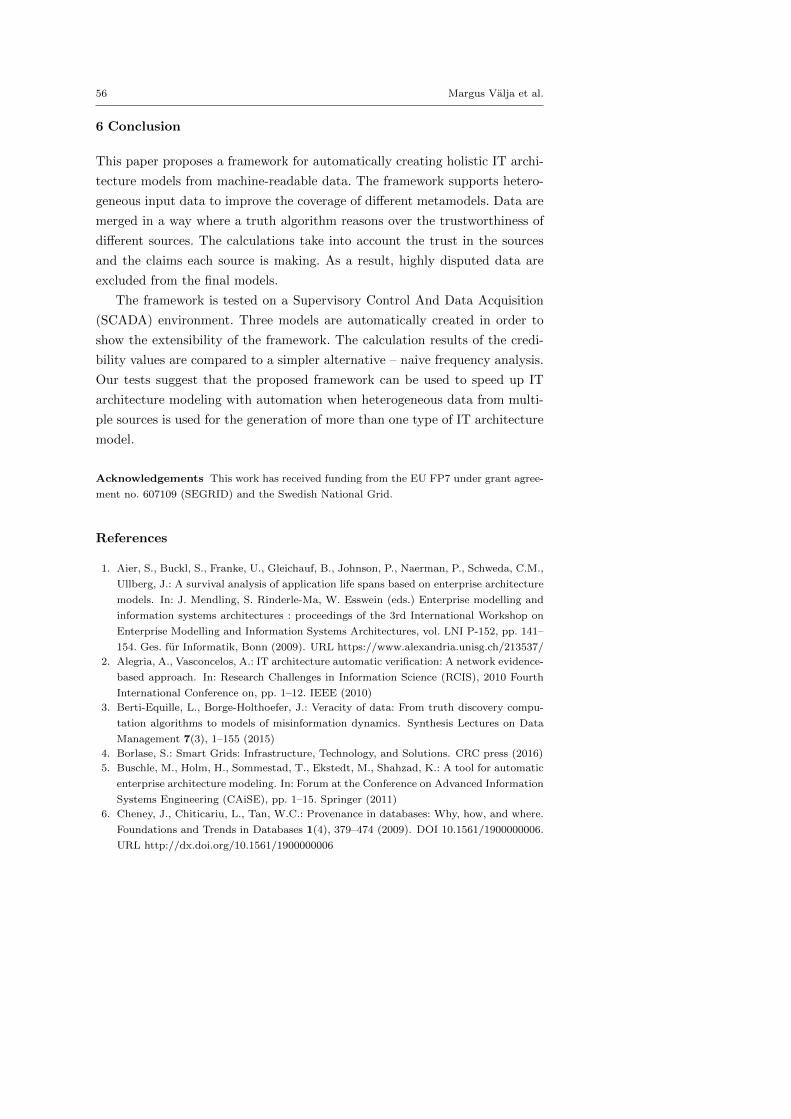
56 Margus Valja et al.
6 Conclusion
This paper proposes a framework for automatically creating holistic IT archi-
tecture models from machine-readable data. The framework supports hetero-
geneous input data to improve the coverage of different metamodels. Data are
merged in a way where a truth algorithm reasons over the trustworthiness of
different sources. The calculations take into account the trust in the sources
and the claims each source is making. As a result, highly disputed data are
excluded from the final models.
The framework is tested on a Supervisory Control And Data Acquisition
(SCADA) environment. Three models are automatically created in order to
show the extensibility of the framework. The calculation results of the credi-
bility values are compared to a simpler alternative – naive frequency analysis.
Our tests suggest that the proposed framework can be used to speed up IT
architecture modeling with automation when heterogeneous data from multi-
ple sources is used for the generation of more than one type of IT architecture
model.
Acknowledgements This work has received funding from the EU FP7 under grant agree-
ment no. 607109 (SEGRID) and the Swedish National Grid.
References
1. Aier, S., Buckl, S., Franke, U., Gleichauf, B., Johnson, P., Naerman, P., Schweda, C.M.,
Ullberg, J.: A survival analysis of application life spans based on enterprise architecture
models. In: J. Mendling, S. Rinderle-Ma, W. Esswein (eds.) Enterprise modelling and
information systems architectures : proceedings of the 3rd International Workshop on
Enterprise Modelling and Information Systems Architectures, vol. LNI P-152, pp. 141–
154. Ges. fur Informatik, Bonn (2009). URL https://www.alexandria.unisg.ch/213537/
2. Alegria, A., Vasconcelos, A.: IT architecture automatic verification: A network evidence-
based approach. In: Research Challenges in Information Science (RCIS), 2010 Fourth
International Conference on, pp. 1–12. IEEE (2010)
3. Berti-Equille, L., Borge-Holthoefer, J.: Veracity of data: From truth discovery compu-
tation algorithms to models of misinformation dynamics. Synthesis Lectures on Data
Management 7(3), 1–155 (2015)
4. Borlase, S.: Smart Grids: Infrastructure, Technology, and Solutions. CRC press (2016)
5. Buschle, M., Holm, H., Sommestad, T., Ekstedt, M., Shahzad, K.: A tool for automatic
enterprise architecture modeling. In: Forum at the Conference on Advanced Information
Systems Engineering (CAiSE), pp. 1–15. Springer (2011)
6. Cheney, J., Chiticariu, L., Tan, W.C.: Provenance in databases: Why, how, and where.
Foundations and Trends in Databases 1(4), 379–474 (2009). DOI 10.1561/1900000006.
URL http://dx.doi.org/10.1561/1900000006
A framework for automatic IT architecture modeling: applying truth discovery 57
7. Dayal, U., Castellanos, M., Simitsis, A., Wilkinson, K.: Data integration flows for
business intelligence. In: Proceedings of the 12th International Conference on Ex-
tending Database Technology: Advances in Database Technology, EDBT ’09, pp.
1–11. ACM, New York, NY, USA (2009). DOI 10.1145/1516360.1516362. URL
http://doi.acm.org/10.1145/1516360.1516362
8. El-Sappagh, S.H.A., Hendawi, A.M.A., Bastawissy, A.H.E.: A proposed model for data
warehouse etl processes. Journal of King Saud University - Computer and Information
Sciences 23(2), 91 – 104 (2011). DOI https://doi.org/10.1016/j.jksuci.2011.05.005. URL
http://www.sciencedirect.com/science/article/pii/S131915781100019X
9. Farwick, M., Agreiter, B., Breu, R., Ryll, S., Voges, K., Hanschke, I.: Requirements for
automated enterprise architecture model maintenance. In: 13th International Confer-
ence on Enterprise Information Systems (ICEIS), Beijing (2011)
10. Farwick, M., Breu, R., Hauder, M., Roth, S., Matthes, F.: Enterprise architecture doc-
umentation: Empirical analysis of information sources for automation. In: System Sci-
ences (HICSS), 2013 46th Hawaii International Conference on, pp. 3868–3877. IEEE
(2013)
11. Farwick, M., Schweda, C.M., Breu, R., Hanschke, I.: A situational method for semi-
automated enterprise architecture documentation. Software & Systems Modeling 15(2),
397–426 (2016)
12. Frank, U.: Enterprise modelling: The next steps. Enterprise Modelling and Information
Systems Architectures–International Journal of Conceptual Modeling 9(1), 22–37 (2014)
13. Franke, U., Ekstedt, M., Lagerstrom, R., Saat, J., Winter, R.: Trends in enterprise
architecture practice–a survey. Trends in Enterprise Architecture Research pp. 16–29
(2010)
14. Franke, U., Holm, H., Konig, J.: The distribution of time to recovery of enterprise IT
services. IEEE Transactions on Reliability 63(4), 858–867 (2014)
15. Glavic, B., Dittrich, K.R.: Data provenance: A categorization of existing approaches.
In: A. Kemper, H. Schning, T. Rose, M. Jarke, T. Seidl, C. Quix, C. Brochhaus
(eds.) BTW, LNI, vol. 103, pp. 227–241. GI (2007). URL http://dblp.uni-
trier.de/db/conf/btw/btw2007.html#GlavicD07
16. Haas, L., Miller, R., Niswonger, B., Roth, M.T., Schwarz, P., Wimmers, E.: Transform-
ing heterogeneous data with database middleware: Beyond integration. Data Engineer-
ing 22(1), 31–36 (1999)
17. Hacks, S., Lichter, H.: Distributed enterprise architecture evolution–a roundtrip ap-
proach. In: Wirtschaftsinformatik 2017 Proceedings. AIS (2017)
18. Halevy, A., Rajaraman, A., Ordille, J.: Data integration: The teenage
years. In: Proceedings of the 32Nd International Conference on Very
Large Data Bases, VLDB ’06, pp. 9–16. VLDB Endowment (2006). URL
http://dl.acm.org/citation.cfm?id=1182635.1164130
19. Heath, T., Martin, R.P., Nguyen, T.D.: Improving cluster availability using workstation
validation. In: ACM SIGMETRICS Performance Evaluation Review, vol. 30, pp. 217–
227. ACM (2002)
20. Hinkelmann, K., Gerber, A., Karagiannis, D., Thoenssen, B., Van der Merwe, A.,
Woitsch, R.: A new paradigm for the continuous alignment of business and IT: Combin-
ing enterprise architecture modelling and enterprise ontology. Computers in Industry
79, 77–86 (2016)
58 Margus Valja et al.
21. Holm, H., Buschle, M., Lagerstrom, R., Ekstedt, M.: Automatic data collection for
enterprise architecture models. Software & Systems Modeling 13(2), 825–841 (2014)
22. Jensen, M., Sel, C., Franke, U., Holm, H., Nordstrom, L.: Availability of a SCADA/OM-
S/DMS system – a case study. In: Innovative Smart Grid Technologies Conference
Europe (ISGT Europe), 2010 IEEE PES, pp. 1–8. IEEE (2010)
23. Johnson, P., Ekstedt, M., Lagerstrom, R.: Automatic probabilistic enterprise it archi-
tecture modeling: A dynamic bayesian networks approach. In: Trends in Enterprise
Architecture Research (TEAR), Enterprise Distributed Object Computing Workshop
(EDOCW), 2016 IEEE 20th International. IEEE (2016)
24. Johnson, P., Lagerstrom, R., Narman, P., Simonsson, M.: Extended influence diagrams
for system quality analysis. Journal of Software 2(3), 30–42 (2007)
25. Jugel, D., Schweda, C.M.: Interactive functions of a cockpit for enterprise architecture
planning. In: Enterprise Distributed Object Computing Conference Workshops and
Demonstrations (EDOCW), 2014 IEEE 18th International, pp. 33–40. IEEE (2014)
26. Kuhn, H., Bayer, F., Junginger, S., Karagiannis, D.: Enterprise model integration. E-
Commerce and Web Technologies pp. 379–392 (2003)
27. Lagerstrom, R., Baldwin, C., MacCormack, A., Dreyfus, D.: Visualizing and measuring
enterprise architecture: an exploratory biopharma case. In: IFIP Working Conference
on The Practice of Enterprise Modeling, pp. 9–23. Springer, Berlin, Heidelberg (2013)
28. Li, Y., Gao, J., Meng, C., Li, Q., Su, L., Zhao, B., Fan, W., Han, J.: A survey on truth
discovery. Acm Sigkdd Explorations Newsletter 17(2), 1–16 (2016)
29. Li, Y., Li, Q., Gao, J., Su, L., Zhao, B., Fan, W., Han, J.: On the discovery of evolv-
ing truth. In: Proceedings of the 21th ACM SIGKDD International Conference on
Knowledge Discovery and Data Mining, pp. 675–684. ACM (2015)
30. Lozano, M.G., Franke, U., Rosell, M., Vlassov, V.: Towards automatic veracity assess-
ment of open source information. In: 2015 IEEE International Congress on Big Data,
pp. 199–206 (2015). DOI 10.1109/BigDataCongress.2015.36
31. Moser, C., Junginger, S., Bruckmann, M., Schone, K.M.: Some process patterns for
enterprise architecture management. In: Software Engineering (Workshops), pp. 19–30
(2009)
32. Narman, P., Franke, U., Konig, J., Buschle, M., Ekstedt, M.: Enterprise architecture
availability analysis using fault trees and stakeholder interviews. Enterprise Information
Systems 8(1), 1–25 (2014)
33. Narman, P., Johnson, P., Lagerstrom, R., Franke, U., Ekstedt, M.: Data collection
prioritization for system quality analysis. Electronic Notes in Theoretical Computer
Science 233, 29–42 (2009)
34. Neaga, E.I., *, J.A.H.: An enterprise modeling and integration framework based
on knowledge discovery and data mining. International Journal of Production
Research 43(6), 1089–1108 (2005). DOI 10.1080/00207540412331322939. URL
https://doi.org/10.1080/00207540412331322939
35. Niemi, E., Pekkola, S.: Using enterprise architecture artefacts in an organisation. En-
terprise Information Systems 11(3), 313–338 (2017)
36. Nowakowski, E., Farwick, M., Trojer, T., Hausler, M., Kessler, J., Breu, R.: Enter-
prise architecture planning: Analyses of requirements from practice and research. In:
Proceedings of the 50th Hawaii International Conference on System Sciences (HICSS)
(2017)
A framework for automatic IT architecture modeling: applying truth discovery 59
37. Pasternack, J., Roth, D.: Latent credibility analysis. In: Proceedings of the 22nd inter-
national conference on World Wide Web, pp. 1009–1020. ACM (2013)
38. Rahm, E., Bernstein, P.A.: A survey of approaches to automatic schema matching. the
VLDB Journal 10(4), 334–350 (2001)
39. Rahm, E., Do, H.H.: Data cleaning: Problems and current approaches. IEEE Data Eng.
Bull. 23(4), 3–13 (2000)
40. Rekatsinas, T., Dong, X.L., Srivastava, D.: Characterizing and selecting fresh data
sources. In: Proceedings of the 2014 ACM SIGMOD international conference on Man-
agement of data, pp. 919–930. ACM (2014)
41. Rundensteiner, E.A., Koeller, A., Zhang, X.: Maintaining data warehouses over changing
information sources. Commun. ACM 43(6), 57–62 (2000). DOI 10.1145/336460.336475.
URL http://doi.acm.org/10.1145/336460.336475
42. Saat, J., Winter, R., Franke, U., Lagerstrom, R., Ekstedt, M.: Analysis of it/business
alignment situations as a precondition for the design and engineering of situated it/busi-
ness alignment solutions. In: System Sciences (HICSS), 2011 44th Hawaii International
Conference on, pp. 1–9. IEEE (2011)
43. Sandkuhl, K., Stirna, J., Persson, A., Wißotzki, M.: Enterprise modeling. Springer
(2014)
44. Schroeder, B., Gibson, G.: A large-scale study of failures in high-performance computing
systems. IEEE Transactions on Dependable and Secure Computing 7(4), 337–350 (2010)
45. Simmhan, Y.L., Plale, B., Gannon, D.: A survey of data provenance in e-
science. SIGMOD Rec. 34(3), 31–36 (2005). DOI 10.1145/1084805.1084812. URL
http://doi.acm.org/10.1145/1084805.1084812
46. Trojer, T., Farwick, M., Hausler, M., Breu, R.: Living modeling of it architectures:
challenges and solutions. In: Software, Services, and Systems, pp. 458–474. Springer
(2015)
47. Valja, M., Lagerstrom, R., Ekstedt, M., Korman, M.: A requirements based approach
for automating enterprise it architecture modeling using multiple data sources. In:
2015 IEEE 19th International Enterprise Distributed Object Computing Workshop, pp.
79–87 (2015). DOI 10.1109/EDOCW.2015.33
48. Veneberg, R., Iacob, M.E., van Sinderen, M.J., Bodenstaff, L.: Enterprise architecture
intelligence: combining enterprise architecture and operational data. In: Enterprise
Distributed Object Computing Conference (EDOC), 2014 IEEE 18th International, pp.
22–31. IEEE (2014)
49. Waguih, D.A., Berti-Equille, L.: Truth discovery algorithms: An experimental evalua-
tion. arXiv preprint arXiv:1409.6428 (2014)
50. Wang, T., Truptil, S., Benaben, F.: An automatic model-to-model mapping and
transformation methodology to serve model-based systems engineering. Inf. Syst.
E-bus. Manag. 15(2), 323–376 (2017). DOI 10.1007/s10257-016-0321-z. URL
https://doi.org/10.1007/s10257-016-0321-z