A fifty-year retrospective on credit risk models, the Altman Z ...
34
Journal of Credit Risk 14(4), 1–34 DOI: 10.21314/JCR.2018.243 Copyright Infopro Digital Limited 2018. All rights reserved. You may share using our article tools. This article may be printed for the sole use of the Authorised User (named subscriber), as outlined in our terms and condi- tions. https:/www.infopro-insight.com/termsconditions/insight-subscriptions Research Paper A fifty-year retrospective on credit risk models, the Altman Z -score family of models and their applications to financial markets and managerial strategies Edward I. Altman Salomon Center, NYU Stern School of Business, 44 West 4th Street, Suite 9-160, New York, NY 10012, USA; email: [email protected] (Received August 8, 2017; revised January 27, 2018; accepted June 8, 2018) ABSTRACT Fifty years ago, in 1967, I completed my PhD dissertation, which involved the first multivariate model for predicting the financial health of US manufacturing firms and whether or not they were likely to file for bankruptcy. That work was followed shortly afterward (in 1968) by the publication of the model’s specifications. Despite its “old age”, the Altman Z-score is still the standard against which most other bankruptcy or default prediction models are measured and is clearly the most used by financial market practitioners and academic scholars for a variety of purposes. The objective of this paper is to reflect upon the evolution of the Altman family of bankruptcy prediction models, as well as their extensions and multiple applications in financial markets and managerial decision making. Keywords: Altman Z-score; bankruptcy prediction; credit risk; probability of default (PD); equity investment strategy; bond strategies. Print ISSN 1744-6619 j Online ISSN 1755-9723 c 2018 Infopro Digital Risk (IP) Limited 1
-
Upload
khangminh22 -
Category
Documents
-
view
0 -
download
0
Transcript of A fifty-year retrospective on credit risk models, the Altman Z ...
Journal of Credit Risk 14(4), 1–34DOI: 10.21314/JCR.2018.243
Copyright Infopro Digital Limited 2018. All rights reserved. You may shareusing our article tools. This article may be printed for the sole use of theAuthorised User (named subscriber), as outlined in our terms and condi-tions. https://www.infopro-insight.com/termsconditions/insight-subscriptions
Research Paper
A fifty-year retrospective on credit riskmodels, the Altman Z -score family ofmodels and their applications to financialmarkets and managerial strategies
Edward I. Altman
Salomon Center, NYU Stern School of Business, 44 West 4th Street, Suite 9-160,New York, NY 10012, USA; email: [email protected]
(Received August 8, 2017; revised January 27, 2018; accepted June 8, 2018)
ABSTRACT
Fifty years ago, in 1967, I completed my PhD dissertation, which involved the firstmultivariate model for predicting the financial health of US manufacturing firms andwhether or not they were likely to file for bankruptcy. That work was followed shortlyafterward (in 1968) by the publication of the model’s specifications. Despite its “oldage”, the Altman Z-score is still the standard against which most other bankruptcyor default prediction models are measured and is clearly the most used by financialmarket practitioners and academic scholars for a variety of purposes. The objectiveof this paper is to reflect upon the evolution of the Altman family of bankruptcyprediction models, as well as their extensions and multiple applications in financialmarkets and managerial decision making.
Keywords: AltmanZ-score; bankruptcy prediction; credit risk; probability of default (PD); equityinvestment strategy; bond strategies.
Print ISSN 1744-6619 jOnline ISSN 1755-9723c 2018 Infopro Digital Risk (IP) Limited
1
2 E. I. Altman
1 THE EVOLUTION OF CORPORATE CREDIT-SCORING SYSTEMS
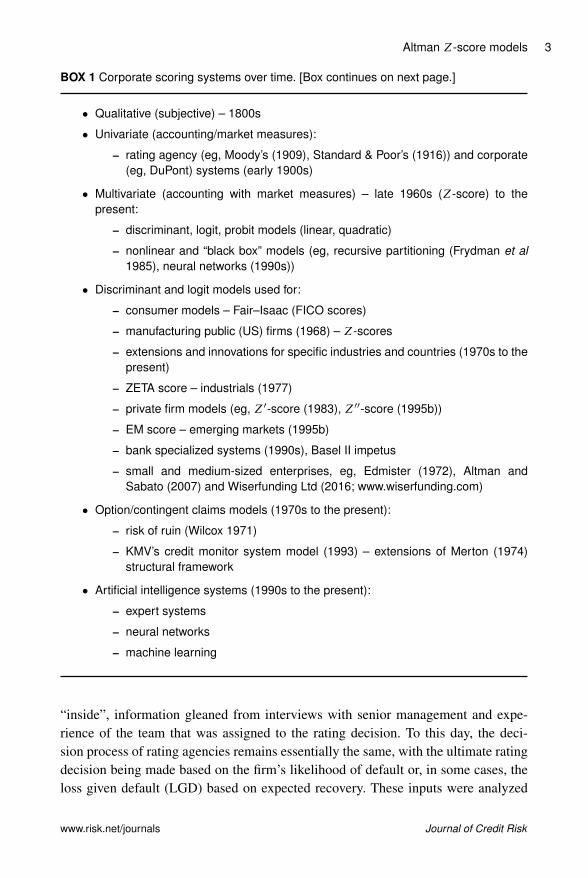
Credit scoring systems for identifying the determinants of a firm’s repayment likeli-hood probably go back to the days of the Crusades, when travelers needed “loans”to finance their travels. They were certainly used much later in the United States ascompanies and entrepreneurs helped to grow the economy, especially in its westwardexpansion. Primitive financial information was usually evaluated by lending institu-tions in the 1800s, with the primary types of information required being subjectiveor qualitative in nature, revolving around ownership and management variables aswell as collateral (see Box 1). It was not until the early 1900s that rating agenciesand some more financially oriented corporate entities (eg, the DuPont system of cor-porate ROE growth) introduced univariate accounting measures and industry peergroup comparisons with rating designations (see Figure 1). The key aspect of these“revolutionary” techniques was that they enabled the analyst to compare an individ-ual corporate entity’s financial performance metrics to a reference database of timeseries (same entity) and cross-section (industry) data. Then, and even more so today,data and databases were the key elements of meaningful diagnostics. There is nodoubt that in the credit-scoring field, data is “king” and models for capturing theprobability of default (PD) ultimately succeed, or not, based on whether they can beapplied to databases of various sizes and relevance.
The original Altman Z-score model (Altman 1968) was based on a sample ofsixty-six manufacturing companies in two groups, bankrupt and nonbankrupt firms,and a holdout sample of fifty companies. In those “primitive” days, there were noelectronic databases and the researcher/analyst had to construct their own databasefrom primary (annual report) or secondary (Moody’s and Standard & Poor’s (S&P)industrial manuals and reports) sources. To this day, instructors and researchersoftentimes ask me for my original sixty-six-firm database, mainly for instructionalor reference exercises. It is not unheard of today for researchers to have access todatabases of thousands, even millions, of firms (especially in countries where allfirms must file their financial statements in a public database, eg, in the United King-dom). To illustrate the importance of databases, Moody’s purchased extensive dataon 200 million firms and customer access from Bureau van Dijk Electronic Pub-lishing (EQT) for US$3.3 billion in 2017, while S&P purchased SNL Financial’sextensive database, management structure and customer book for US$2.2 billion in2015. As indicated in Figure 1, the three major rating agencies established a hier-archy of creditworthiness that was descriptive, but not quantified, in its depiction ofthe likelihood of default. The determination of these ratings was based on a combi-nation of (1) financial statement ratio analytics, usually on a univariate, one-ratio-at-a-time basis; (2) industry health discussions; and (3) qualitative factors evaluatingthe firm’s management plans and capabilities, strategic directions and other, perhaps
Journal of Credit Risk www.risk.net/journals
Altman Z-score models 3
BOX 1 Corporate scoring systems over time. [Box continues on next page.]
� Qualitative (subjective) – 1800s
� Univariate (accounting/market measures):
– rating agency (eg, Moody’s (1909), Standard & Poor’s (1916)) and corporate(eg, DuPont) systems (early 1900s)
� Multivariate (accounting with market measures) – late 1960s (Z-score) to thepresent:
– discriminant, logit, probit models (linear, quadratic)
– nonlinear and “black box” models (eg, recursive partitioning (Frydman et al1985), neural networks (1990s))
� Discriminant and logit models used for:
– consumer models – Fair–Isaac (FICO scores)
– manufacturing public (US) firms (1968) – Z-scores
– extensions and innovations for specific industries and countries (1970s to thepresent)
– ZETA score – industrials (1977)
– private firm models (eg, Z0-score (1983), Z00-score (1995b))
– EM score – emerging markets (1995b)
– bank specialized systems (1990s), Basel II impetus
– small and medium-sized enterprises, eg, Edmister (1972), Altman andSabato (2007) and Wiserfunding Ltd (2016; www.wiserfunding.com)
� Option/contingent claims models (1970s to the present):
– risk of ruin (Wilcox 1971)
– KMV’s credit monitor system model (1993) – extensions of Merton (1974)structural framework
� Artificial intelligence systems (1990s to the present):
– expert systems
– neural networks
– machine learning
“inside”, information gleaned from interviews with senior management and expe-rience of the team that was assigned to the rating decision. To this day, the deci-sion process of rating agencies remains essentially the same, with the ultimate ratingdecision being made based on the firm’s likelihood of default or, in some cases, theloss given default (LGD) based on expected recovery. These inputs were analyzed
www.risk.net/journals Journal of Credit Risk
4 E. I. Altman
BOX 1 Continued.
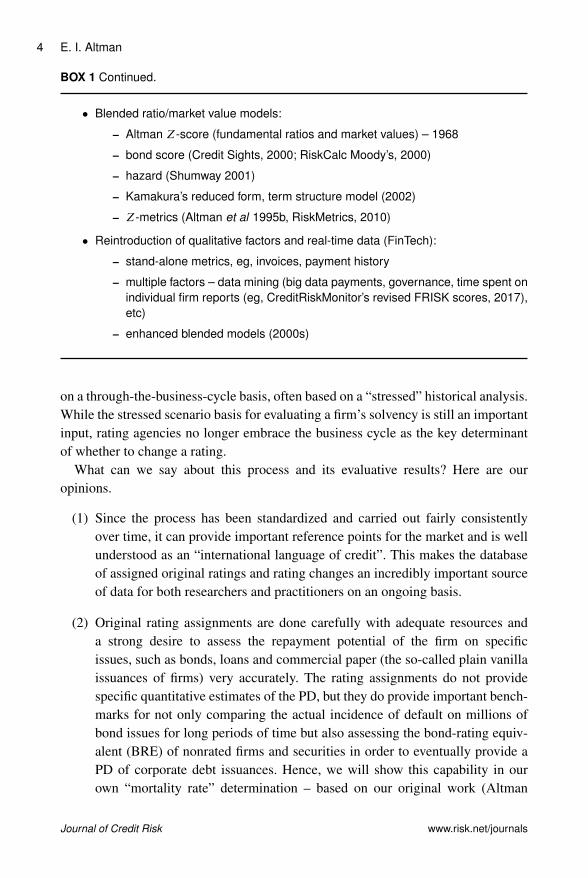
� Blended ratio/market value models:
– Altman Z-score (fundamental ratios and market values) – 1968
– bond score (Credit Sights, 2000; RiskCalc Moody’s, 2000)
– hazard (Shumway 2001)
– Kamakura’s reduced form, term structure model (2002)
– Z-metrics (Altman et al 1995b, RiskMetrics, 2010)
� Reintroduction of qualitative factors and real-time data (FinTech):
– stand-alone metrics, eg, invoices, payment history
– multiple factors – data mining (big data payments, governance, time spent onindividual firm reports (eg, CreditRiskMonitor’s revised FRISK scores, 2017),etc)
– enhanced blended models (2000s)
on a through-the-business-cycle basis, often based on a “stressed” historical analysis.While the stressed scenario basis for evaluating a firm’s solvency is still an importantinput, rating agencies no longer embrace the business cycle as the key determinantof whether to change a rating.
What can we say about this process and its evaluative results? Here are ouropinions.
(1) Since the process has been standardized and carried out fairly consistentlyover time, it can provide important reference points for the market and is wellunderstood as an “international language of credit”. This makes the databaseof assigned original ratings and rating changes an incredibly important sourceof data for both researchers and practitioners on an ongoing basis.
(2) Original rating assignments are done carefully with adequate resources anda strong desire to assess the repayment potential of the firm on specificissues, such as bonds, loans and commercial paper (the so-called plain vanillaissuances of firms) very accurately. The rating assignments do not providespecific quantitative estimates of the PD, but they do provide important bench-marks for not only comparing the actual incidence of default on millions ofbond issues for long periods of time but also assessing the bond-rating equiv-alent (BRE) of nonrated firms and securities in order to eventually provide aPD of corporate debt issuances. Hence, we will show this capability in ourown “mortality rate” determination – based on our original work (Altman
Journal of Credit Risk www.risk.net/journals
Altman Z-score models 5
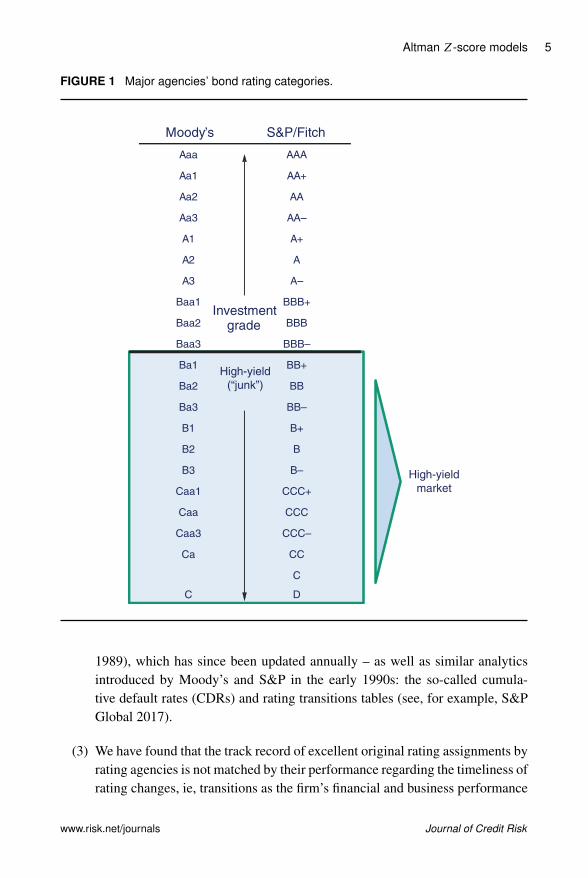
FIGURE 1 Major agencies’ bond rating categories.
Moody’s S&P/Fitch
Aaa AAA
Aa1 AA+
Aa2 AA
Aa3 AA–
A1 A+
A2 A
A3 A–
Baa1 BBB+
Baa2 BBB
Baa3 BBB–
Ba1 BB+
Ba2 BB
Ba3 BB–
B1 B+
B2 B
B3 B–
Caa1 CCC+
Caa CCC
Caa3 CCC–
Ca CC
C
C D
High-yield
market
Investmentgrade
High-yield
(“junk”)
1989), which has since been updated annually – as well as similar analyticsintroduced by Moody’s and S&P in the early 1990s: the so-called cumula-tive default rates (CDRs) and rating transitions tables (see, for example, S&PGlobal 2017).
(3) We have found that the track record of excellent original rating assignments byrating agencies is not matched by their performance regarding the timeliness ofrating changes, ie, transitions as the firm’s financial and business performance
www.risk.net/journals Journal of Credit Risk
6 E. I. Altman
evolves. Studies such as Altman and Rijken (2004, 2006) clearly show thatagency ratings are generally slower to react to changes, primarily deteriora-tions in performance, than established models based on point-in-time estima-tions, eg, Z-score-type models or KMV structural estimates. Indeed, ratingagencies openly admit that stability of ratings is a very important attribute oftheir systems and volatile changes are to be avoided. So, it is no surprise thatwhen rating changes do occur, they are slower than those an objective, unemo-tional model would produce, and these changes, principally downgrades, aretypically smaller (ie, have fewer notches) than those a model would have pro-duced. The latter implies that if another rating change were to follow an initialdowngrade, it is highly likely that this second change would be in the samedirection as the first, ie, there is strong autocorrelation between rating down-grades (see Altman and Kao 1992). We have not encountered much, if any,denial from rating agencies on this observation. After all, the agencies’ clients(firms issuing debt) are more comfortable with a system that provides more sta-ble ratings than one that changes, especially negatively, frequently. In addition,those using the service, such as pensions and mutual funds, prefer stability tovolatile ratings.
(4) These observations illustrate the ongoing discussions and heated argumentsregarding the objectivity and potential bias of ratings based on agencies’ busi-ness models, namely, that the entity being rated (firms) also pays for the rat-ing. Critics of rating agencies point to this potential conflict of interest andcall for other structures, such as the investor-pay model, or for governmentagencies to provide ratings. These ideas have been floated but do not seem tohave resonated well with the protagonist of the rating industry, ie, the usersof ratings, primarily investors. Moreover, investors, in some cases, prefer thestability of ratings over short-term volatility, especially if the changes involvea switch from investment grade to noninvestment grade, or vice versa. Hence,despite efforts by regulators to encourage alternative systems for estimatingPDs, such as internally generated or vendor models, ratings from the majorrating agencies continue to be an important source of third-party assessmentfor the market. We feel that models such as the Altman Z-score family canstill play a very important role in the investment process, despite the continuedprominence of agency ratings.
2 MULTIVARIATE ACCOUNTING/MARKET MEASURES
Continuing the evolutionary history of credit-scoring systems beyond univariate sys-tems (such as those followed by rating agencies and prominent scholarly research
Journal of Credit Risk www.risk.net/journals
Altman Z-score models 7
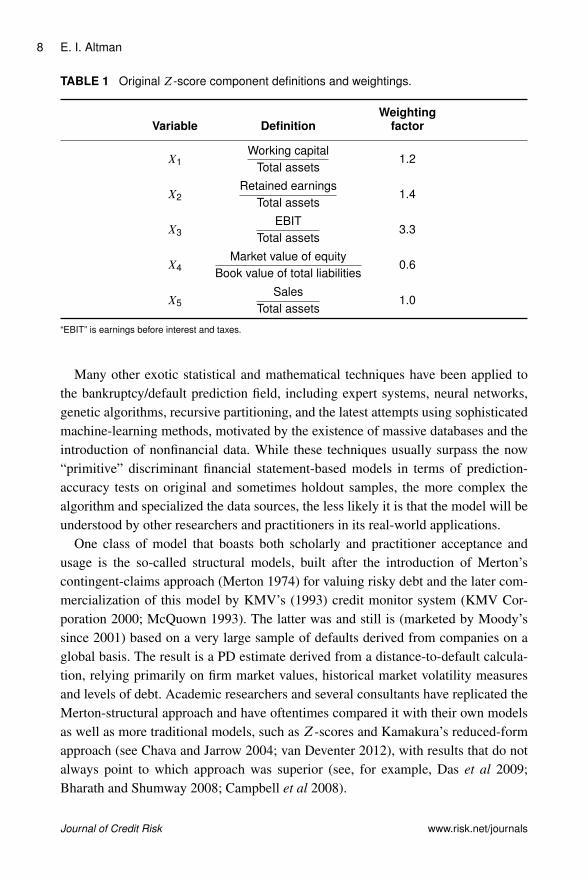
studies by numerous academics, such as Beaver (1966)), we move to the firstmultivariate study to attack the bankruptcy prediction subjects: my initial Z-scoremodel (1968). Utilizing one of the first discriminant analysis models applied to theeconomic–financial social sciences, I (Altman 1968) combined traditional financialstatement variables with new and more powerful statistical techniques and, aidedby early editions of mainframe computers, constructed the original Z-score model.Consisting of five financial indicators, four of which required only one year of finan-cial statements and one that needed equity market values, the original model (Table 1)demonstrated outstanding original and holdout sample accuracies of type I (predict-ing bankruptcy) and type II (predicting nonbankruptcy) based on a derived cutoff-score approach (discussed later) and using financial data from one annual state-ment prior to bankruptcy. The original sample of firms utilized only manufacturingcompanies that filed for bankruptcy-reorganization under the “old” system, calledChapter X or Chapter XI (now combined under Chapter 11). All firms were pub-licly held and, given the economy in the United States prior to 1966, all had assetsunder US$25 million. The sample sizes were small, with only thirty-three firms ineach grouping; this is remarkable, as the model is still being used extensively, fiftyyears after its introduction, on firms of all sizes, including those with billions of dol-lars in assets. Deakin (1972) compared Beaver’s univariate variables with Altman’smultivariate structure.
The original Z-score model was linear and did not require more than one set offinancial statements. Subsequent to its introduction, similar models utilizing linearand nonlinear variable structures as well as different classification techniques, suchas quadratic, logit, probit and hazard model structures, were introduced to attempt notonly to classify a firm as bankrupt or not, but also to express the outcome in termsof the PD based on the characteristics of the sample of firms used in the model’sdevelopment. An alternative approach for developing PDs, based on the Altman BREmethod, combined with empirically derived estimates of default incidence for longhorizons (eg, 1–10 years) will be discussed shortly.
These discriminant, or logit, models were applied to consumer credit applications(eg, Fair–Isaac (FICO) scores); to nonmanufacturers (eg, ZETA scores (Altman et al1977)); to private and publicly owned firms, in many other countries (built over sev-eral decades and continuing to be derived even in current years); to emerging mar-kets (see, for example, Altman et al 1995b); to the internal rating systems (IRBs) ofbanks (starting in the mid-1990s and especially since Basel II was first introducedfor discussion in 1999); and to various industries and sizes of firms, including mod-els specifically derived for SMEs (see, for example, Edmister (1972), Altman andSabato (2007), Altman et al (2010b) and, most recently for mini-bond issuers inItaly, Altman et al (2016)).
www.risk.net/journals Journal of Credit Risk
8 E. I. Altman
TABLE 1 Original Z-score component definitions and weightings.
WeightingVariable Definition factor
X1Working capital
Total assets1.2
X2Retained earnings
Total assets1.4
X3EBIT
Total assets3.3
X4Market value of equity
Book value of total liabilities0.6
X5Sales
Total assets1.0
“EBIT” is earnings before interest and taxes.
Many other exotic statistical and mathematical techniques have been applied tothe bankruptcy/default prediction field, including expert systems, neural networks,genetic algorithms, recursive partitioning, and the latest attempts using sophisticatedmachine-learning methods, motivated by the existence of massive databases and theintroduction of nonfinancial data. While these techniques usually surpass the now“primitive” discriminant financial statement-based models in terms of prediction-accuracy tests on original and sometimes holdout samples, the more complex thealgorithm and specialized the data sources, the less likely it is that the model will beunderstood by other researchers and practitioners in its real-world applications.
One class of model that boasts both scholarly and practitioner acceptance andusage is the so-called structural models, built after the introduction of Merton’scontingent-claims approach (Merton 1974) for valuing risky debt and the later com-mercialization of this model by KMV’s (1993) credit monitor system (KMV Cor-poration 2000; McQuown 1993). The latter was and still is (marketed by Moody’ssince 2001) based on a very large sample of defaults derived from companies on aglobal basis. The result is a PD estimate derived from a distance-to-default calcula-tion, relying primarily on firm market values, historical market volatility measuresand levels of debt. Academic researchers and several consultants have replicated theMerton-structural approach and have oftentimes compared it with their own modelsas well as more traditional models, such as Z-scores and Kamakura’s reduced-formapproach (see Chava and Jarrow 2004; van Deventer 2012), with results that do notalways point to which approach was superior (see, for example, Das et al 2009;Bharath and Shumway 2008; Campbell et al 2008).
Journal of Credit Risk www.risk.net/journals
Altman Z-score models 9
The most recent attempts at building both accurate and practically acceptable mod-els have utilized what we call a blended ratio/market value/macro-variable approach,with some attempts to also include nonfinancial variables, where data exists. Theseblended models, eg, Z-metrics (Altman et al 2010), introduced by Riskmetrics, areprobably those that consultants and many financial lenders are either considering orutilizing today, at least compared with more traditionally derived models, sometimeswith judgmental adjustments by lending officers. Finally, the latest financial tech-nology (FinTech) innovations explore the use of big data and nontraditional metrics,such as invoice analysis, payable history and governance attributes; “clicks” on neg-ative information events and data (see, for example, CreditRiskMonitor’s revisedFRISKT scoring system (2017)); and social media inputs, in order to capture, on areal-time basis, changes in the credit quality of firms and individuals.
2.1 Machine-learning methods
As for machine-learning and big data techniques, I remain somewhat skeptical asto whether practitioners will accept black-box methods for assessing the credit riskof counterparties. Yes, it is undeniable that the current surge in applications of suchtechniques has captured the interest of many academics and several start-ups in theFinTech space. Indeed, I collaborated with some colleagues (Barboza et al 2017)using several machine-learning models (eg, support vector machines (SVMs), boost-ing, random forest, etc) to predict bankruptcy from one year prior to the event andcompared the results to discriminant analysis, logistical regression and neural net-work methods. Using data from 1985 to 2013, we found a substantial improvementin prediction accuracy (of about 10%) using machine-learning techniques, especiallywhen, in addition to the five Z-score variables, six indicators were included. Ourresults add one more study to the growing debate of the last few years (2014–17)about the superiority of SVMs versus other machine-learning methods. Almost allof the machine-learning credit models have been published in expert systems andcomputational journals, with the most prominent being found in Expert Systems withApplications (see Barboza et al (2017) in our reference list).
3 FROM A SCORING MODEL TO DEFAULT PREDICTION
The construction of a credit-scoring model is relatively straightforward with an ade-quate and appropriate database of default and nondefault securities, or firms, andaccurate predictive variables. In the case of our first model, the Z-score method(named in association with statistical Z-measures and also chosen because it is thelast letter in the English alphabet), the classification as to whether a corporate entitywas likely to go bankrupt or not was determined based on cutoff scores between a
www.risk.net/journals Journal of Credit Risk
10 E. I. Altman
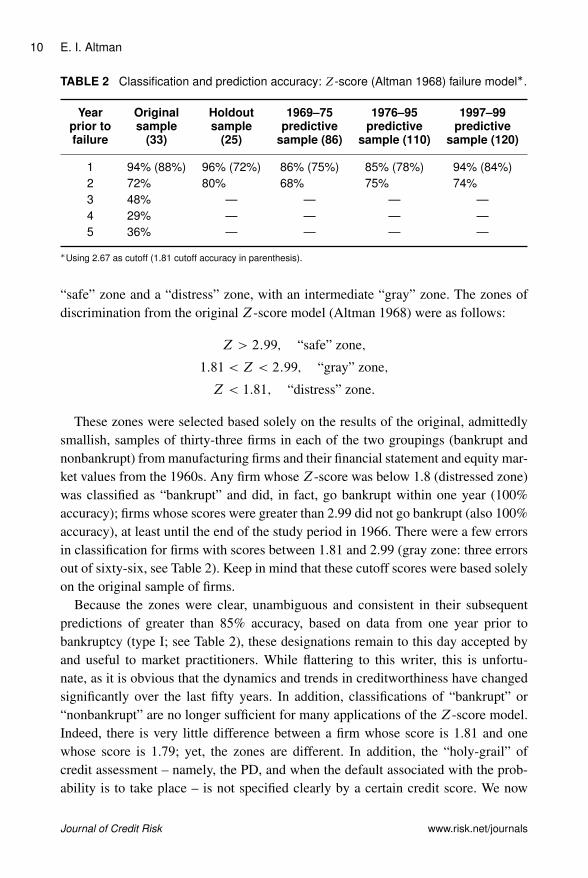
TABLE 2 Classification and prediction accuracy: Z-score (Altman 1968) failure model�.
Year Original Holdout 1969–75 1976–95 1997–99prior to sample sample predictive predictive predictivefailure (33) (25) sample (86) sample (110) sample (120)
1 94% (88%) 96% (72%) 86% (75%) 85% (78%) 94% (84%)2 72% 80% 68% 75% 74%3 48% — — — —4 29% — — — —5 36% — — — —
�Using 2.67 as cutoff (1.81 cutoff accuracy in parenthesis).
“safe” zone and a “distress” zone, with an intermediate “gray” zone. The zones ofdiscrimination from the original Z-score model (Altman 1968) were as follows:
Z > 2:99; “safe” zone;
1:81 < Z < 2:99; “gray” zone;
Z < 1:81; “distress” zone:
These zones were selected based solely on the results of the original, admittedlysmallish, samples of thirty-three firms in each of the two groupings (bankrupt andnonbankrupt) from manufacturing firms and their financial statement and equity mar-ket values from the 1960s. Any firm whose Z-score was below 1.8 (distressed zone)was classified as “bankrupt” and did, in fact, go bankrupt within one year (100%accuracy); firms whose scores were greater than 2.99 did not go bankrupt (also 100%accuracy), at least until the end of the study period in 1966. There were a few errorsin classification for firms with scores between 1.81 and 2.99 (gray zone: three errorsout of sixty-six, see Table 2). Keep in mind that these cutoff scores were based solelyon the original sample of firms.
Because the zones were clear, unambiguous and consistent in their subsequentpredictions of greater than 85% accuracy, based on data from one year prior tobankruptcy (type I; see Table 2), these designations remain to this day accepted byand useful to market practitioners. While flattering to this writer, this is unfortu-nate, as it is obvious that the dynamics and trends in creditworthiness have changedsignificantly over the last fifty years. In addition, classifications of “bankrupt” or“nonbankrupt” are no longer sufficient for many applications of the Z-score model.Indeed, there is very little difference between a firm whose score is 1.81 and onewhose score is 1.79; yet, the zones are different. In addition, the “holy-grail” ofcredit assessment – namely, the PD, and when the default associated with the prob-ability is to take place – is not specified clearly by a certain credit score. We now
Journal of Credit Risk www.risk.net/journals
Altman Z-score models 11
examine how credit dynamics have changed over our relevant time periods and howwe have moved on to precise PD and timing of default estimates.
4 TIME SERIES IMPACT ON CORPORATE Z -SCORES
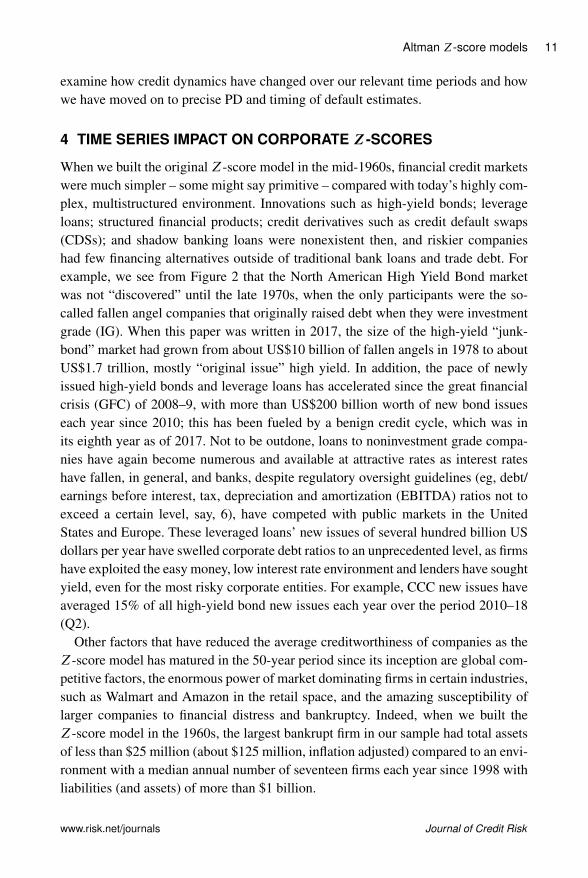
When we built the originalZ-score model in the mid-1960s, financial credit marketswere much simpler – some might say primitive – compared with today’s highly com-plex, multistructured environment. Innovations such as high-yield bonds; leverageloans; structured financial products; credit derivatives such as credit default swaps(CDSs); and shadow banking loans were nonexistent then, and riskier companieshad few financing alternatives outside of traditional bank loans and trade debt. Forexample, we see from Figure 2 that the North American High Yield Bond marketwas not “discovered” until the late 1970s, when the only participants were the so-called fallen angel companies that originally raised debt when they were investmentgrade (IG). When this paper was written in 2017, the size of the high-yield “junk-bond” market had grown from about US$10 billion of fallen angels in 1978 to aboutUS$1.7 trillion, mostly “original issue” high yield. In addition, the pace of newlyissued high-yield bonds and leverage loans has accelerated since the great financialcrisis (GFC) of 2008–9, with more than US$200 billion worth of new bond issueseach year since 2010; this has been fueled by a benign credit cycle, which was inits eighth year as of 2017. Not to be outdone, loans to noninvestment grade compa-nies have again become numerous and available at attractive rates as interest rateshave fallen, in general, and banks, despite regulatory oversight guidelines (eg, debt/earnings before interest, tax, depreciation and amortization (EBITDA) ratios not toexceed a certain level, say, 6), have competed with public markets in the UnitedStates and Europe. These leveraged loans’ new issues of several hundred billion USdollars per year have swelled corporate debt ratios to an unprecedented level, as firmshave exploited the easy money, low interest rate environment and lenders have soughtyield, even for the most risky corporate entities. For example, CCC new issues haveaveraged 15% of all high-yield bond new issues each year over the period 2010–18(Q2).
Other factors that have reduced the average creditworthiness of companies as theZ-score model has matured in the 50-year period since its inception are global com-petitive factors, the enormous power of market dominating firms in certain industries,such as Walmart and Amazon in the retail space, and the amazing susceptibility oflarger companies to financial distress and bankruptcy. Indeed, when we built theZ-score model in the 1960s, the largest bankrupt firm in our sample had total assetsof less than $25 million (about $125 million, inflation adjusted) compared to an envi-ronment with a median annual number of seventeen firms each year since 1998 withliabilities (and assets) of more than $1 billion.
www.risk.net/journals Journal of Credit Risk
12 E. I. Altman
FIGURE 2 Size of the US high-yield bond market: 1978–2017 (mid-year; US$ billions).
US$1622 197
8197
9198
0198
1198
2198
3198
4198
5198
6198
7198
8198
9199
0199
1199
2199
3199
4199
5199
6199
7199
8199
9200
0200
1200
2200
3200
4200
5200
6200
7200
8200
9201
0201
1201
2201
3201
4201
5201
6201
7
0
200
400
600
800
1000
1200
1400
1600
1800
US
$ (
bill
ions)
Source: NYU Salomon Center estimates using Credit Suisse, S&P and Chili data.
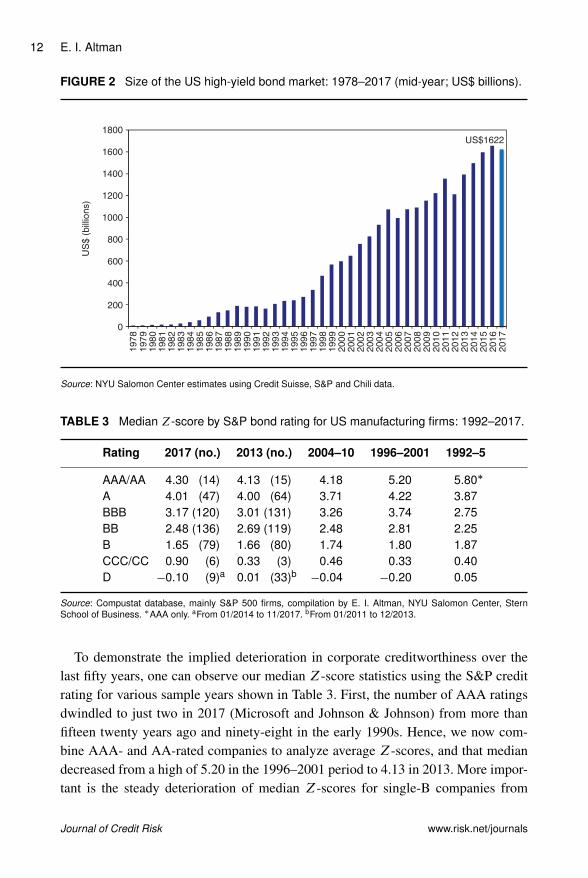
TABLE 3 Median Z-score by S&P bond rating for US manufacturing firms: 1992–2017.
Rating 2017 (no.) 2013 (no.) 2004–10 1996–2001 1992–5
AAA/AA 4.30 (14) 4.13 (15) 4.18 5.20 5.80�
A 4.01 (47) 4.00 (64) 3.71 4.22 3.87BBB 3.17 (120) 3.01 (131) 3.26 3.74 2.75BB 2.48 (136) 2.69 (119) 2.48 2.81 2.25B 1.65 (79) 1.66 (80) 1.74 1.80 1.87CCC/CC 0.90 (6) 0.33 (3) 0.46 0.33 0.40D �0.10 (9)a 0.01 (33)b �0.04 �0.20 0.05
Source: Compustat database, mainly S&P 500 firms, compilation by E. I. Altman, NYU Salomon Center, SternSchool of Business. �AAA only. aFrom 01/2014 to 11/2017. bFrom 01/2011 to 12/2013.
To demonstrate the implied deterioration in corporate creditworthiness over thelast fifty years, one can observe our median Z-score statistics using the S&P creditrating for various sample years shown in Table 3. First, the number of AAA ratingsdwindled to just two in 2017 (Microsoft and Johnson & Johnson) from more thanfifteen twenty years ago and ninety-eight in the early 1990s. Hence, we now com-bine AAA- and AA-rated companies to analyze average Z-scores, and that mediandecreased from a high of 5.20 in the 1996–2001 period to 4.13 in 2013. More impor-tant is the steady deterioration of median Z-scores for single-B companies from
Journal of Credit Risk www.risk.net/journals
Altman Z-score models 13
1.87 in 1992–5 to 1.65 in 2017. Recall that a score of below 1.8 in 1966 classifieda firm as in the distress zone and a strong bankruptcy threat. However, in the lastfifteen or so years, the dominant and largest percentage of issuance in the high-yieldmarket was for single-Bs, and surely all single-Bs do not default! True, a mediansingle-B has a distribution in which 50% of its issues are higher than 1.65, but theprobability that all Bs default within five years of issuance is, approximately, “only”28% (see our mortality rate discussion below). Finally, the median D (default-ratedcompany) had a Z-score of �0:10 in 2017, while the median Z-score in 1966 forbankruptcy entities was C0:65 (see Altman 1968; Altman and Hotchkiss 2006). Inall time periods of late, the median D firm’s Z-score was zero or below (Table 3).Hence, we suggest that a score below zero is consistent with a defaulted company.The cutoff of 1.8, based on our original sample, will place an increasing number,perhaps as much as 25% of all firms, in the old distress zone. Since only a verysmall percentage of all firms fail each year and an average of about 3.5% of high-yield bond companies default each year, based on data over the last (almost) fiftyyears (see our default rate calculations in Altman and Kuehne (2017)), the so-calledtype II error (predicting default when the firm does not) has increased from about5% in our original analysis to possibly 25–30% in recent periods. Hence, we donot recommend that users of our Z-score model make their assessments of a firm’sdefault likelihood based on a cutoff score of 1.8. Instead, we recommend using BREsbased on the most recent median Z-scores by bond rating, such as the data listed inTable 3. These BREs can then be converted into more granular PD estimates, as wenow discuss.
4.1 PD estimation methods
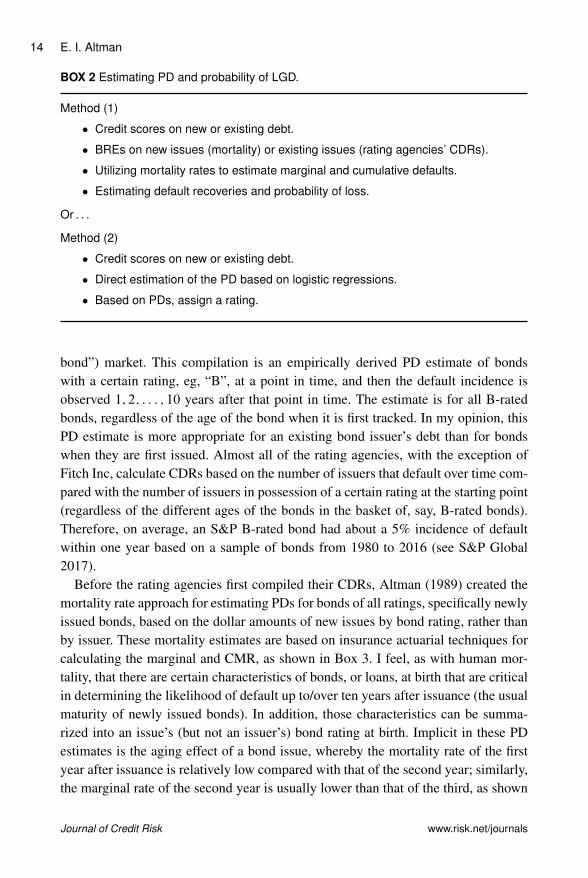
Box 2 lists two methods that we have used over the years to estimate the PD andLGD of a firm’s bond issue at any point in time. The starting point in both meth-ods is a well-constructed and, if possible, intuitively understandable credit-scoringmodel. For example, in method (1), the Z-score on a new or existing debt issueris assigned a BRE on a representative sample of bond issues for each of the majorrating categories (see Table 3) or, if available, more granular ratings with (C) or(�) “notches” (S&P/Fitch), or 1, 2, 3 (Moody’s). See Table 6, later in the paper,for the more granular categorization of another of the Altman Z-score models:Z00-scores.
In addition to the matching of Z-scores by rating category, we can also assessthe PD of an issue for various periods of time in the future. The more traditionaltime-dependent method is called the CDR. Such rates are provided by all of therating agencies and by several of the investment banks, who provide continuousresearch on defaults, particularly for the speculative grade or high-yield (“junk
www.risk.net/journals Journal of Credit Risk
14 E. I. Altman
BOX 2 Estimating PD and probability of LGD.
Method (1)
� Credit scores on new or existing debt.
� BREs on new issues (mortality) or existing issues (rating agencies’ CDRs).
� Utilizing mortality rates to estimate marginal and cumulative defaults.
� Estimating default recoveries and probability of loss.
Or . . .
Method (2)
� Credit scores on new or existing debt.
� Direct estimation of the PD based on logistic regressions.
� Based on PDs, assign a rating.
bond”) market. This compilation is an empirically derived PD estimate of bondswith a certain rating, eg, “B”, at a point in time, and then the default incidence isobserved 1; 2; : : : ; 10 years after that point in time. The estimate is for all B-ratedbonds, regardless of the age of the bond when it is first tracked. In my opinion, thisPD estimate is more appropriate for an existing bond issuer’s debt than for bondswhen they are first issued. Almost all of the rating agencies, with the exception ofFitch Inc, calculate CDRs based on the number of issuers that default over time com-pared with the number of issuers in possession of a certain rating at the starting point(regardless of the different ages of the bonds in the basket of, say, B-rated bonds).Therefore, on average, an S&P B-rated bond had about a 5% incidence of defaultwithin one year based on a sample of bonds from 1980 to 2016 (see S&P Global2017).
Before the rating agencies first compiled their CDRs, Altman (1989) created themortality rate approach for estimating PDs for bonds of all ratings, specifically newlyissued bonds, based on the dollar amounts of new issues by bond rating, rather thanby issuer. These mortality estimates are based on insurance actuarial techniques forcalculating the marginal and CMR, as shown in Box 3. I feel, as with human mor-tality, that there are certain characteristics of bonds, or loans, at birth that are criticalin determining the likelihood of default up to/over ten years after issuance (the usualmaturity of newly issued bonds). In addition, those characteristics can be summa-rized into an issue’s (but not an issuer’s) bond rating at birth. Implicit in these PDestimates is the aging effect of a bond issue, whereby the mortality rate of the firstyear after issuance is relatively low compared with that of the second year; similarly,the marginal rate of the second year is usually lower than that of the third, as shown
Journal of Credit Risk www.risk.net/journals

Altman Z-score models 15
BOX 3 Marginal and cumulative mortality rate actuarial approach.
MMR.r;t/ Dtotal value of defaulting debt from rating r in year ttotal value of the population at the start of year t
;
where MMR is the marginal mortality rate.
One can measure the cumulative mortality rate (CMR) over a specific time period(1;2; : : : ; T years) by subtracting the product of the surviving populations of each of theprevious years from one (1.0), that is,
CMR.r;t/ D 1 �˘SR.r;t/; t D 1; : : : ; N; r D AAA; : : : ;CCC:
Here, CMR.r;t/ is the cumulative mortality rate of r in t , and SR.r;t/ is the survival rate in.r; t/, 1 �MMR.r;t/.
TABLE 4 Mortality rates by original rating: all rated corporate bonds�, 1971–2016 (allvalues are percentages).
Years after issuance‚ …„ ƒ1 2 3 4 5 6 7 8 9 10
AAA Marginal 0.00 0.00 0.00 0.00 0.01 0.02 0.01 0.00 0.00 0.00Cumulative 0.00 0.00 0.00 0.00 0.01 0.03 0.04 0.04 0.04 0.04
AA Marginal 0.00 0.00 0.20 0.06 0.02 0.01 0.01 0.01 0.02 0.01Cumulative 0.00 0.00 0.20 0.26 0.28 0.29 0.30 0.31 0.33 0.34
A Marginal 0.01 0.03 0.11 0.12 0.09 0.05 0.02 0.24 0.07 0.04Cumulative 0.01 0.04 0.15 0.27 0.36 0.41 0.43 0.67 0.74 0.78
BBB Marginal 0.32 2.34 1.24 0.98 0.49 0.22 0.25 0.16 0.17 0.33Cumulative 0.32 2.65 3.86 4.80 5.27 5.48 5.71 5.86 6.02 6.33
BB Marginal 0.92 2.04 3.85 1.95 2.42 1.56 1.44 1.10 1.41 3.11Cumulative 0.92 2.94 6.68 8.50 10.71 12.11 13.37 14.32 15.53 18.16
B Marginal 2.86 7.67 7.78 7.75 5.74 4.46 3.60 2.05 1.73 0.75Cumulative 2.86 10.31 17.29 23.70 28.08 31.29 33.76 35.12 36.24 36.72
CCC Marginal 8.11 12.40 17.75 16.25 4.90 11.62 5.40 4.75 0.64 4.26Cumulative 8.11 19.50 33.79 44.55 47.27 53.40 55.91 58.01 58.28 60.05
Source: S&P (New York) and author’s compilation. �Rated by S&P at issuance. Based on 3280 defaulted issues.
in Table 4. Note that the mortality rates in Table 4 are based on the incidence ofdefault for a forty-six-year period, 1971–2016. For example, the marginal default (ormortality) rate of a BB-rated issue for years 1, 2 and 3 after issuance is 0.92%, 2.04%and 3.85%, respectively. After three years, the marginal rates seem to flatten out atbetween 1.5% and 2.5% per year.
www.risk.net/journals Journal of Credit Risk
16 E. I. Altman
TABLE 5 Mortality losses by original rating: all rated corporate bonds�, 1971–2016 (allvalues are percentages).
Years after issuance‚ …„ ƒ1 2 3 4 5 6 7 8 9 10
AAA Marginal 0.00 0.00 0.00 0.00 0.01 0.01 0.01 0.00 0.00 0.00Cumulative 0.00 0.00 0.00 0.00 0.01 0.02 0.03 0.03 0.03 0.03
AA Marginal 0.00 0.00 0.03 0.02 0.01 0.01 0.00 0.01 0.01 0.01Cumulative 0.00 0.00 0.03 0.05 0.06 0.07 0.07 0.08 0.09 0.10
A Marginal 0.00 0.01 0.04 0.05 0.05 0.04 0.02 0.02 0.05 0.03Cumulative 0.00 0.01 0.05 0.10 0.15 0.19 0.21 0.23 0.28 0.31
BBB Marginal 0.23 1.53 0.70 0.58 0.26 0.16 0.10 0.09 0.10 0.18Cumulative 0.23 1.76 2.44 3.01 3.26 3.42 3.51 3.60 3.70 3.87
BB Marginal 0.55 1.18 2.30 1.11 1.38 0.74 0.78 0.48 0.73 1.09Cumulative 0.55 1.72 3.98 5.05 6.36 7.05 7.78 8.22 8.89 9.88
B Marginal 1.92 5.38 5.32 5.20 3.79 2.45 2.34 1.13 0.91 0.53Cumulative 1.92 7.20 12.13 16.70 19.86 21.82 23.65 24.52 25.20 25.60
CCC Marginal 5.37 8.68 12.49 11.45 3.42 8.61 2.32 3.34 0.40 2.72Cumulative 5.37 13.58 24.38 33.04 35.33 40.89 42.27 44.19 44.42 45.93
Source: S&P (New York) and author’s compilation. �Rated by S&P at issuance. Based on 2714 issues.
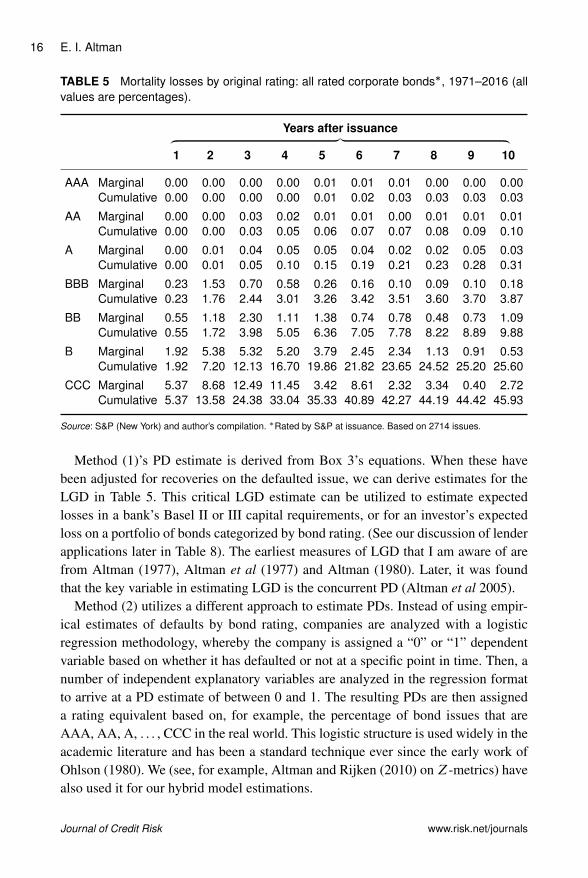
Method (1)’s PD estimate is derived from Box 3’s equations. When these havebeen adjusted for recoveries on the defaulted issue, we can derive estimates for theLGD in Table 5. This critical LGD estimate can be utilized to estimate expectedlosses in a bank’s Basel II or III capital requirements, or for an investor’s expectedloss on a portfolio of bonds categorized by bond rating. (See our discussion of lenderapplications later in Table 8). The earliest measures of LGD that I am aware of arefrom Altman (1977), Altman et al (1977) and Altman (1980). Later, it was foundthat the key variable in estimating LGD is the concurrent PD (Altman et al 2005).
Method (2) utilizes a different approach to estimate PDs. Instead of using empir-ical estimates of defaults by bond rating, companies are analyzed with a logisticregression methodology, whereby the company is assigned a “0” or “1” dependentvariable based on whether it has defaulted or not at a specific point in time. Then, anumber of independent explanatory variables are analyzed in the regression formatto arrive at a PD estimate of between 0 and 1. The resulting PDs are then assigneda rating equivalent based on, for example, the percentage of bond issues that areAAA, AA, A, . . . , CCC in the real world. This logistic structure is used widely in theacademic literature and has been a standard technique ever since the early work ofOhlson (1980). We (see, for example, Altman and Rijken (2010) on Z-metrics) havealso used it for our hybrid model estimations.
Journal of Credit Risk www.risk.net/journals
Altman Z-score models 17
So, which is the superior technique for estimating PD: method (1) or method (2)?I favor the BRE approach for newly issued debt (the mortality rate approach), butfor existing issues the CDR method seems to be more appropriate. The reasons areas follows. The mapping of PDs to BREs using mortality rates, or CDRs, is basedon over one million issues and about 3500 defaults over the last forty-five years.Logistical regression models’ PDs are solely a function of the sample characteristicsused to build the model, and the results are based on the logistic structure, which maynot be representative of large sample properties. The beauty of logistical regressionestimates, however, is that the analyst can access PDs directly from the results andavoid the mapping of scores as an intermediate step. Tests of type I and type IIaccuracies are available for both methods, along with statistical area under the curve(AUC) accuracy measures on both original and holdout samples. The latter is veryimportant in helping to validate the empirical results from samples over time andfrom different industrial groups. From my experience, both methods have yieldedvery impressive type I accuracies in numerous empirical tests.
5 Z -SCORE MODEL FOR INDUSTRIALS AND PRIVATE FIRMS
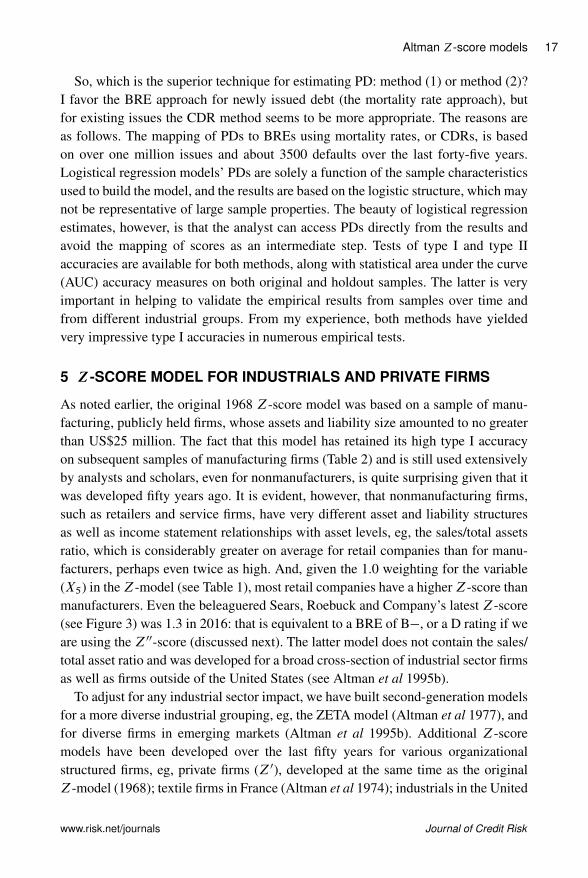
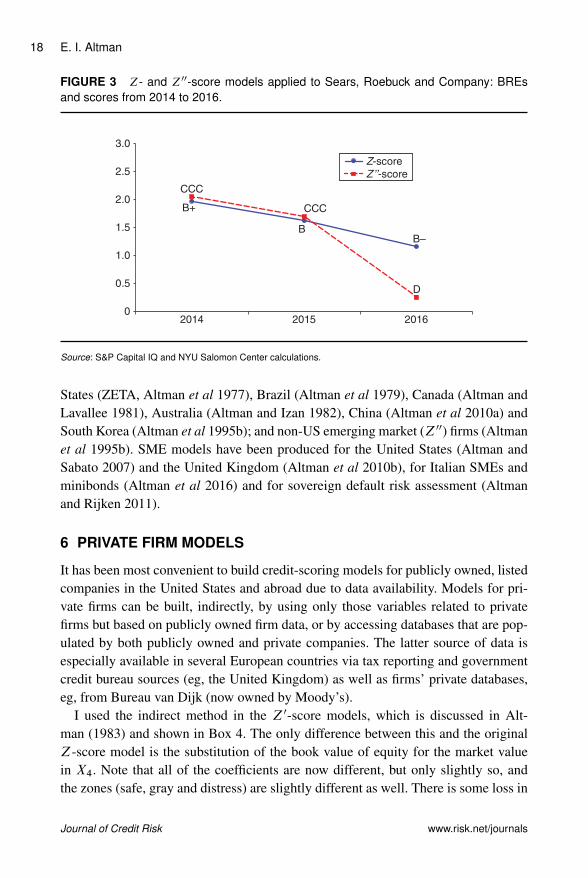
As noted earlier, the original 1968 Z-score model was based on a sample of manu-facturing, publicly held firms, whose assets and liability size amounted to no greaterthan US$25 million. The fact that this model has retained its high type I accuracyon subsequent samples of manufacturing firms (Table 2) and is still used extensivelyby analysts and scholars, even for nonmanufacturers, is quite surprising given that itwas developed fifty years ago. It is evident, however, that nonmanufacturing firms,such as retailers and service firms, have very different asset and liability structuresas well as income statement relationships with asset levels, eg, the sales/total assetsratio, which is considerably greater on average for retail companies than for manu-facturers, perhaps even twice as high. And, given the 1.0 weighting for the variable(X5) in theZ-model (see Table 1), most retail companies have a higherZ-score thanmanufacturers. Even the beleaguered Sears, Roebuck and Company’s latest Z-score(see Figure 3) was 1.3 in 2016: that is equivalent to a BRE of B�, or a D rating if weare using the Z00-score (discussed next). The latter model does not contain the sales/total asset ratio and was developed for a broad cross-section of industrial sector firmsas well as firms outside of the United States (see Altman et al 1995b).
To adjust for any industrial sector impact, we have built second-generation modelsfor a more diverse industrial grouping, eg, the ZETA model (Altman et al 1977), andfor diverse firms in emerging markets (Altman et al 1995b). Additional Z-scoremodels have been developed over the last fifty years for various organizationalstructured firms, eg, private firms (Z0), developed at the same time as the originalZ-model (1968); textile firms in France (Altman et al 1974); industrials in the United
www.risk.net/journals Journal of Credit Risk
18 E. I. Altman
FIGURE 3 Z- and Z00-score models applied to Sears, Roebuck and Company: BREsand scores from 2014 to 2016.
0
0.5
1.0
1.5
2.0
2.5
3.0
2014 2015 2016
Z-score
Z ’’-score
B+
BB–
D
CCC
CCC
Source: S&P Capital IQ and NYU Salomon Center calculations.
States (ZETA, Altman et al 1977), Brazil (Altman et al 1979), Canada (Altman andLavallee 1981), Australia (Altman and Izan 1982), China (Altman et al 2010a) andSouth Korea (Altman et al 1995b); and non-US emerging market (Z00) firms (Altmanet al 1995b). SME models have been produced for the United States (Altman andSabato 2007) and the United Kingdom (Altman et al 2010b), for Italian SMEs andminibonds (Altman et al 2016) and for sovereign default risk assessment (Altmanand Rijken 2011).
6 PRIVATE FIRM MODELS
It has been most convenient to build credit-scoring models for publicly owned, listedcompanies in the United States and abroad due to data availability. Models for pri-vate firms can be built, indirectly, by using only those variables related to privatefirms but based on publicly owned firm data, or by accessing databases that are pop-ulated by both publicly owned and private companies. The latter source of data isespecially available in several European countries via tax reporting and governmentcredit bureau sources (eg, the United Kingdom) as well as firms’ private databases,eg, from Bureau van Dijk (now owned by Moody’s).
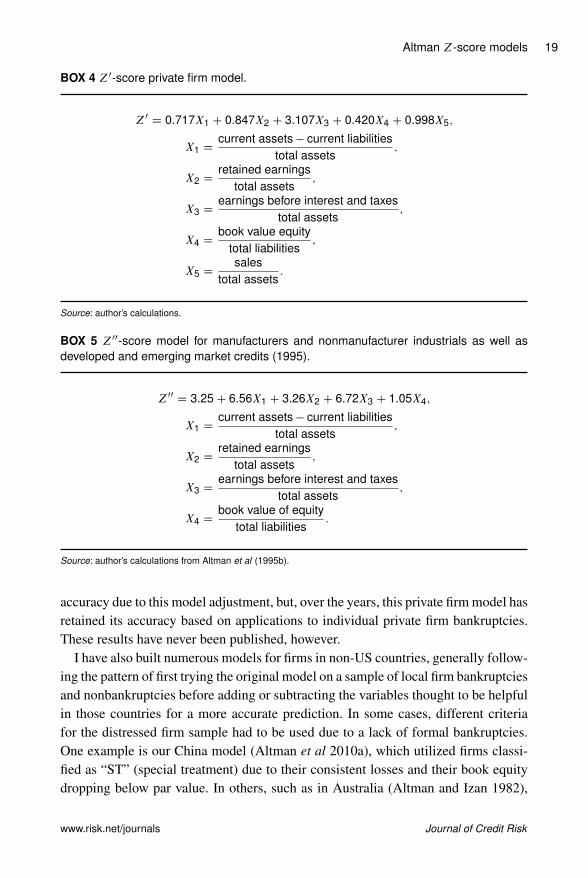
I used the indirect method in the Z0-score models, which is discussed in Alt-man (1983) and shown in Box 4. The only difference between this and the originalZ-score model is the substitution of the book value of equity for the market valuein X4. Note that all of the coefficients are now different, but only slightly so, andthe zones (safe, gray and distress) are slightly different as well. There is some loss in
Journal of Credit Risk www.risk.net/journals
Altman Z-score models 19
BOX 4 Z0-score private firm model.
Z0 D 0.717X1 C 0.847X2 C 3.107X3 C 0.420X4 C 0.998X5;
X1 Dcurrent assets � current liabilities
total assets;
X2 Dretained earnings
total assets;
X3 Dearnings before interest and taxes
total assets;
X4 Dbook value equity
total liabilities;
X5 Dsales
total assets:
Source: author’s calculations.
BOX 5 Z00-score model for manufacturers and nonmanufacturer industrials as well asdeveloped and emerging market credits (1995).
Z00 D 3.25C 6.56X1 C 3.26X2 C 6.72X3 C 1.05X4;
X1 Dcurrent assets � current liabilities
total assets;
X2 Dretained earnings
total assets;
X3 Dearnings before interest and taxes
total assets;
X4 Dbook value of equity
total liabilities:
Source: author’s calculations from Altman et al (1995b).
accuracy due to this model adjustment, but, over the years, this private firm model hasretained its accuracy based on applications to individual private firm bankruptcies.These results have never been published, however.
I have also built numerous models for firms in non-US countries, generally follow-ing the pattern of first trying the original model on a sample of local firm bankruptciesand nonbankruptcies before adding or subtracting the variables thought to be helpfulin those countries for a more accurate prediction. In some cases, different criteriafor the distressed firm sample had to be used due to a lack of formal bankruptcies.One example is our China model (Altman et al 2010a), which utilized firms classi-fied as “ST” (special treatment) due to their consistent losses and their book equitydropping below par value. In others, such as in Australia (Altman and Izan 1982),
www.risk.net/journals Journal of Credit Risk
20 E. I. Altman
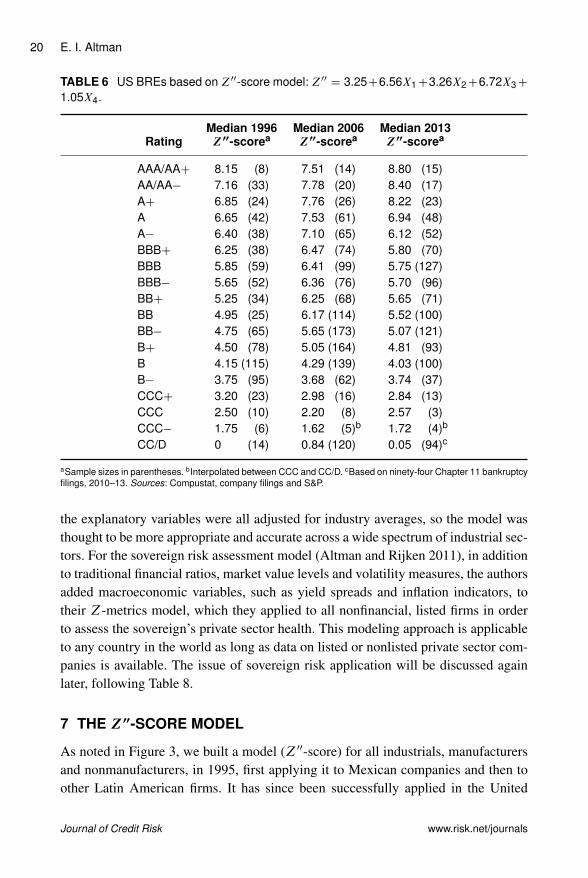
TABLE 6 US BREs based on Z00-score model: Z00 D 3.25C6.56X1C3.26X2C6.72X3C
1.05X4.
Median 1996 Median 2006 Median 2013Rating Z 00-scorea Z 00-scorea Z 00-scorea
AAA/AAC 8.15 (8) 7.51 (14) 8.80 (15)AA/AA� 7.16 (33) 7.78 (20) 8.40 (17)AC 6.85 (24) 7.76 (26) 8.22 (23)A 6.65 (42) 7.53 (61) 6.94 (48)A� 6.40 (38) 7.10 (65) 6.12 (52)BBBC 6.25 (38) 6.47 (74) 5.80 (70)BBB 5.85 (59) 6.41 (99) 5.75 (127)BBB� 5.65 (52) 6.36 (76) 5.70 (96)BBC 5.25 (34) 6.25 (68) 5.65 (71)BB 4.95 (25) 6.17 (114) 5.52 (100)BB� 4.75 (65) 5.65 (173) 5.07 (121)BC 4.50 (78) 5.05 (164) 4.81 (93)B 4.15 (115) 4.29 (139) 4.03 (100)B� 3.75 (95) 3.68 (62) 3.74 (37)CCCC 3.20 (23) 2.98 (16) 2.84 (13)CCC 2.50 (10) 2.20 (8) 2.57 (3)CCC� 1.75 (6) 1.62 (5)b 1.72 (4)b
CC/D 0 (14) 0.84 (120) 0.05 (94)c
aSample sizes in parentheses. bInterpolated between CCC and CC/D. cBased on ninety-four Chapter 11 bankruptcyfilings, 2010–13. Sources: Compustat, company filings and S&P.
the explanatory variables were all adjusted for industry averages, so the model wasthought to be more appropriate and accurate across a wide spectrum of industrial sec-tors. For the sovereign risk assessment model (Altman and Rijken 2011), in additionto traditional financial ratios, market value levels and volatility measures, the authorsadded macroeconomic variables, such as yield spreads and inflation indicators, totheir Z-metrics model, which they applied to all nonfinancial, listed firms in orderto assess the sovereign’s private sector health. This modeling approach is applicableto any country in the world as long as data on listed or nonlisted private sector com-panies is available. The issue of sovereign risk application will be discussed againlater, following Table 8.
7 THE Z 00-SCORE MODEL
As noted in Figure 3, we built a model (Z00-score) for all industrials, manufacturersand nonmanufacturers, in 1995, first applying it to Mexican companies and then toother Latin American firms. It has since been successfully applied in the United
Journal of Credit Risk www.risk.net/journals
Altman Z-score models 21
States and many other countries, usually with superior accuracy compared with theoriginal Z-score model if the data includes nonmanufacturers. This Z00-score modelis also applicable to privately owned firms, since X4 is denominated in book equityto total liabilities, not market values. This substitution is particularly important forenvironments where the stock market is not considered a good valuation measure dueto its size, scope, liquidity or trading factors. In addition, note that the original fifthvariable, sales/total assets, is no longer in this model. We found that the X5 variablewas particularly sensitive to industrial sector differences, eg, retail or service firmsversus manufacturing companies, and in countries where the capital for investment infixed assets was inadequate. Finally, this version of the Altman family of models thatuse discriminant analysis also has a constant term (3.25). This constant standardizesthe results such that scores slightly above or below zero are in the D-rated BRE (seeTable 6 for BREs that are even more granular than the major rating categories). Thetype I accuracy of the Z00-score model over time is shown in Table 7.
8 SCHOLARLY IMPACT
Perhaps because of their simplicity, transparency and consistent accuracy over theyears, the Z-score models have been referenced and used as benchmarks in a largenumber of academic and practitioner studies in finance and accounting. These ref-erences and comparisons have taken at least three forms. The first involves con-structing alternative models and frameworks to predict bankruptcy or defaults. Theoriginal model and its success using a combination of financial and market valu-ation data with robust statistical analysis made the task of default risk assessmentmore attractive to scientific researchers in many disciplines. It opened the doorfor not only finance and accounting scholars but also statisticians and mathemati-cians to find better and more efficient indexes and to examine new indicators andtechniques, especially as more expansive and easily accessible databases becameavailable.
New frameworks have involved seemingly more powerful statistical and mathe-matical techniques, such as logit, probit or quadratic nonlinear regressions; artificialintelligence; neural networks; genetic algorithms; recursive partitioning; machinelearning; and structural, distance-to-default or hazard models, among others. Sincethe Z-score model is easily replicable, it was chosen by many researchers to becompared in terms of accuracy of classification and prediction. These studies aretoo numerous to list individually, but they probably number in the hundreds, includ-ing several by this author with numerous coauthors (see the bibliography).1 This
1 Indeed, Bellovary et al (2007) review 165 bankruptcy prediction models from 1965 to 2006,including many by this author, and a large number of similar articles. They conclude that multiple
www.risk.net/journals Journal of Credit Risk
22 E. I. Altman
combination of simple, but theoretically well-grounded, empirical analysis providednew and attractive avenues in bankruptcy research, laying the foundation for anexpanded modern understanding of bankruptcy prediction. For example, recent stud-ies (by Altman, Iwanicz-Drozdowska, Laitinen and Suvas in 2016 and 2017) havelooked at several dimensions of bankruptcy prediction research for (a) long dis-tance (ten years) time series accuracy, (b) a number (five) of different statisticaltechniques, and (c) numerous (thirty-four) different country databases and environ-ments. The results, covering thirty-one European countries and three others (China,Colombia and the United States), showed that, while models built specifically forindividual countries usually outperformed the original Z-models, the added valueof new country-specific variables and data as well as numerous frameworks was notdramatic. Despite somewhat higher accuracies using the Z00-score variables on dataspecific to each country, we found that the original weightings continued to exhibitremarkable performances, despite their being determined more than two decadesearlier. Duffie et al (2007) also explored the multiperiod aspects of a bankruptcyprediction model.
Studies using accounting data, among other variables, potentially suffer when thatdata either is not very reliable, eg, from emerging markets, or is subject to earn-ings management manipulations. A recent study by Cho et al (2012) reconstructedZ-scores for this manipulation with the resulting accuracy improved.
The second dimension of the Z-score’s scholarly impact is its international“reach”. Since the original model and its derivatives (eg, Z00-score) have stoodthe test of time, the model has been widely applied in multiple settings, includingapplications across all domains, with its sharp focus on a few key variables. Also
discriminant analysis and neural networks are the most promising methods for bankruptcy predic-tion, but caution that higher model accuracy is not guaranteed by using a greater number of factors.According to the authors, “since Altman’s study, the number and complexity of bankruptcy pre-diction models have dramatically increased”. Keasey and Watson (1991) describe discriminantanalysis as the main technique used in this knowledge field. Willer do Prado et al (2016) foundthat logistic regression and neural networks became popular after the 1990s, with logistic regres-sion and discriminant analysis being the most-used techniques up to the end date of their article’ssample period in 2014. Willer do Prado et al used bibliometric evaluation (see Pinto et al 2014) toevaluate research about credit risk and bankruptcy using Reuters “Web of Science” database from1968 to 2014. They found, through their exhaustive investigation, that the bankruptcy predictionfield appeared to be multidisciplinary, spanning not only finance and accounting but also operationsresearch, management, mathematics, data processing, engineering and a broad range of statisticalfields. Unsurprisingly, they discovered an increased number of bankruptcy studies after the 2008crisis. Finally, Willer do Prado et al (2016) listed the ten most-cited articles in the bankruptcy pre-diction field (Table 3 in their study), with Altman (1968) registering 1483 Web of Science cites.The next most-cited article was Huang et al (2004) with 250, and Hillegeist et al (2004) came inthird with 165 cites.
Journal of Credit Risk www.risk.net/journals
Altman Z-score models 23
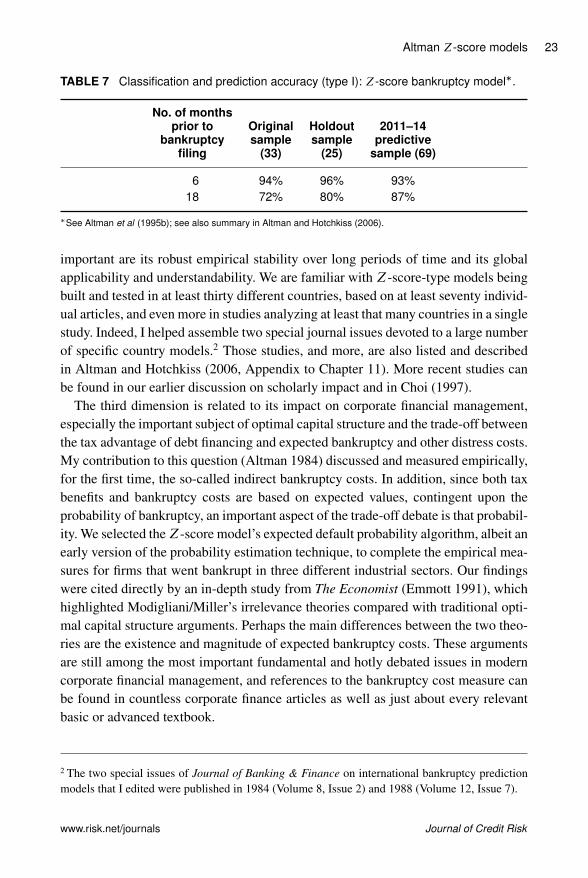
TABLE 7 Classification and prediction accuracy (type I): Z-score bankruptcy model�.
No. of monthsprior to Original Holdout 2011–14
bankruptcy sample sample predictivefiling (33) (25) sample (69)
6 94% 96% 93%18 72% 80% 87%
�See Altman et al (1995b); see also summary in Altman and Hotchkiss (2006).
important are its robust empirical stability over long periods of time and its globalapplicability and understandability. We are familiar with Z-score-type models beingbuilt and tested in at least thirty different countries, based on at least seventy individ-ual articles, and even more in studies analyzing at least that many countries in a singlestudy. Indeed, I helped assemble two special journal issues devoted to a large numberof specific country models.2 Those studies, and more, are also listed and describedin Altman and Hotchkiss (2006, Appendix to Chapter 11). More recent studies canbe found in our earlier discussion on scholarly impact and in Choi (1997).
The third dimension is related to its impact on corporate financial management,especially the important subject of optimal capital structure and the trade-off betweenthe tax advantage of debt financing and expected bankruptcy and other distress costs.My contribution to this question (Altman 1984) discussed and measured empirically,for the first time, the so-called indirect bankruptcy costs. In addition, since both taxbenefits and bankruptcy costs are based on expected values, contingent upon theprobability of bankruptcy, an important aspect of the trade-off debate is that probabil-ity. We selected theZ-score model’s expected default probability algorithm, albeit anearly version of the probability estimation technique, to complete the empirical mea-sures for firms that went bankrupt in three different industrial sectors. Our findingswere cited directly by an in-depth study from The Economist (Emmott 1991), whichhighlighted Modigliani/Miller’s irrelevance theories compared with traditional opti-mal capital structure arguments. Perhaps the main differences between the two theo-ries are the existence and magnitude of expected bankruptcy costs. These argumentsare still among the most important fundamental and hotly debated issues in moderncorporate financial management, and references to the bankruptcy cost measure canbe found in countless corporate finance articles as well as just about every relevantbasic or advanced textbook.
2 The two special issues of Journal of Banking & Finance on international bankruptcy predictionmodels that I edited were published in 1984 (Volume 8, Issue 2) and 1988 (Volume 12, Issue 7).
www.risk.net/journals Journal of Credit Risk
24 E. I. Altman
9 FINANCIAL DISTRESS PREDICTION APPLICATIONS
Over the last fifty years, we have gleaned numerous insights and ideas from manyhelpful, interested financial market practitioners and academic colleagues withrespect to applications of the Z-score models.3 I will be forever grateful for theseinsights, because it means so much to a researcher to see his or her scholarly con-tributions make their way into the real world and be applied in a constructive way.4
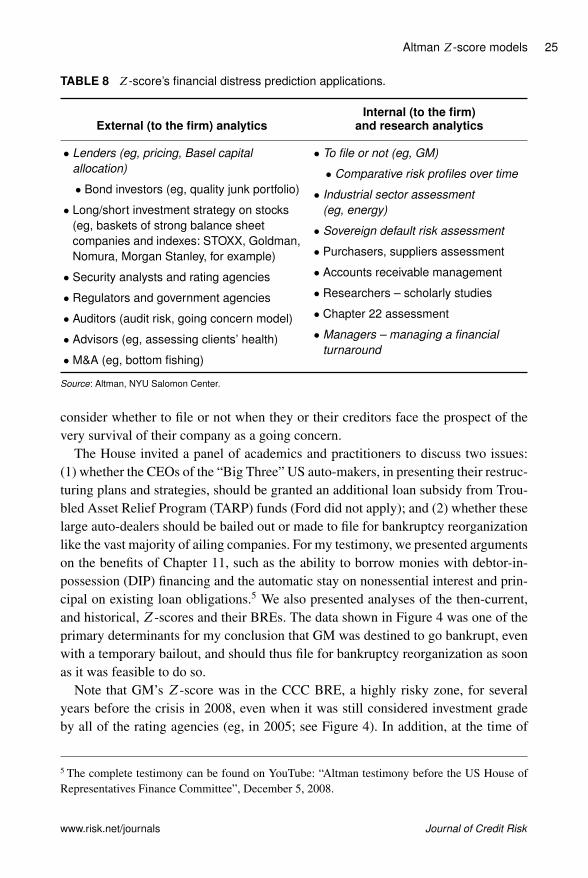
Table 8 provides lists of those applications whereby I, and others, have utilized theAltman Z-score family of models for both external-to-the-firm (left column) andinternal-to-the-firm (right column) and research (right column) analytics and appli-cations. There is no time or space in this paper to discuss all of these applications, soI defer a more comprehensive discussion to our revised text (Altman et al 2019). Inthis paper, however, we will discuss just those listed in italics in Table 8.
10 LENDER APPLICATIONS
Throughout this paper, I have discussed a number of important applications of creditrisk models, such asZ-scores for lending institutions. These include the accept/rejectdecision (Altman 1970), estimates of the PD and LGD (Altman 1989), and costs oferrors in default loss estimation (see, for example, Altman et al 1977). In additionto these generalized applications, the introduction of Basel II in 1999 drew uponZ-scores and the structure proposed in CreditMetrics (Gupton et al 1977). Later,Gordy (2000, 2003), among others, discussed the anatomy of credit risk models andcapital allocation under Basel II.
11 TO FILE CHAPTER 11 OR NOT
One of the most interesting and rewarding applications of theZ-score model, at leastfor me, was the essence of my testimony on December 5, 2008 before the US Houseof Representatives Finance Committee’s deliberation on whether to continue to bailout General Motors, Inc (GM) and Chrysler Corporation, or to “suggest” that thesefirms file for the “privilege” or “right” to reorganize under the protective confinesof Chapter 11 of the US Bankruptcy Code. In the history of the US financial andlegal systems, this choice had been given to very few firms that had the opportunityto qualify for bailout with taxpayers’ monies. However, countless distressed firms
3 I apologize to the many authors whose published studies are not specifically cited; I also appre-ciate immensely their interest in and the attention paid to our models’ extensions and tests overtime.4 Indeed, the Z-score model has even made its way into a novel written by a bestselling author: seeThomas Pynchon’s Bleeding Edge (2013, p. 63).
Journal of Credit Risk www.risk.net/journals
Altman Z-score models 25
TABLE 8 Z-score’s financial distress prediction applications.
Internal (to the firm)External (to the firm) analytics and research analytics
� Lenders (eg, pricing, Basel capitalallocation)
� Bond investors (eg, quality junk portfolio)
� Long/short investment strategy on stocks(eg, baskets of strong balance sheetcompanies and indexes: STOXX, Goldman,Nomura, Morgan Stanley, for example)
� Security analysts and rating agencies
� Regulators and government agencies
� Auditors (audit risk, going concern model)
� Advisors (eg, assessing clients’ health)
� M&A (eg, bottom fishing)
� To file or not (eg, GM)
� Comparative risk profiles over time
� Industrial sector assessment(eg, energy)
� Sovereign default risk assessment
� Purchasers, suppliers assessment
� Accounts receivable management
� Researchers – scholarly studies
� Chapter 22 assessment
� Managers – managing a financialturnaround
Source: Altman, NYU Salomon Center.
consider whether to file or not when they or their creditors face the prospect of thevery survival of their company as a going concern.
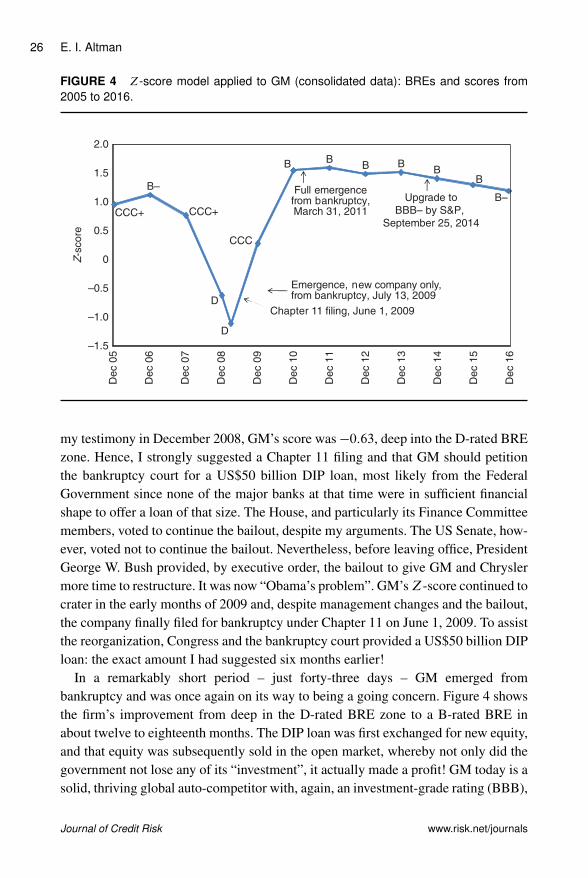
The House invited a panel of academics and practitioners to discuss two issues:(1) whether the CEOs of the “Big Three” US auto-makers, in presenting their restruc-turing plans and strategies, should be granted an additional loan subsidy from Trou-bled Asset Relief Program (TARP) funds (Ford did not apply); and (2) whether theselarge auto-dealers should be bailed out or made to file for bankruptcy reorganizationlike the vast majority of ailing companies. For my testimony, we presented argumentson the benefits of Chapter 11, such as the ability to borrow monies with debtor-in-possession (DIP) financing and the automatic stay on nonessential interest and prin-cipal on existing loan obligations.5 We also presented analyses of the then-current,and historical, Z-scores and their BREs. The data shown in Figure 4 was one of theprimary determinants for my conclusion that GM was destined to go bankrupt, evenwith a temporary bailout, and should thus file for bankruptcy reorganization as soonas it was feasible to do so.
Note that GM’s Z-score was in the CCC BRE, a highly risky zone, for severalyears before the crisis in 2008, even when it was still considered investment gradeby all of the rating agencies (eg, in 2005; see Figure 4). In addition, at the time of
5 The complete testimony can be found on YouTube: “Altman testimony before the US House ofRepresentatives Finance Committee”, December 5, 2008.
www.risk.net/journals Journal of Credit Risk
26 E. I. Altman
FIGURE 4 Z-score model applied to GM (consolidated data): BREs and scores from2005 to 2016.
Chapter 11 filing, June 1, 2009
Upgrade to
BBB– by S&P,
September 25, 2014
Full emergencefrom bankruptcy,March 31, 2011
Emergence, new company only,from bankruptcy, July 13, 2009
CCC+
B–
CCC+
D
CCC
B B
D
B BB
B
B–
–1.5
–1.0
–0.5
0
0.5
1.0
1.5
2.0
Dec 0
5
Z-s
core
Dec 0
6
Dec 0
7
Dec 0
8
Dec 0
9
Dec 1
0
Dec 1
1
Dec 1
2
Dec 1
3
Dec 1
4
Dec 1
5
Dec 1
6
my testimony in December 2008, GM’s score was �0:63, deep into the D-rated BREzone. Hence, I strongly suggested a Chapter 11 filing and that GM should petitionthe bankruptcy court for a US$50 billion DIP loan, most likely from the FederalGovernment since none of the major banks at that time were in sufficient financialshape to offer a loan of that size. The House, and particularly its Finance Committeemembers, voted to continue the bailout, despite my arguments. The US Senate, how-ever, voted not to continue the bailout. Nevertheless, before leaving office, PresidentGeorge W. Bush provided, by executive order, the bailout to give GM and Chryslermore time to restructure. It was now “Obama’s problem”. GM’sZ-score continued tocrater in the early months of 2009 and, despite management changes and the bailout,the company finally filed for bankruptcy under Chapter 11 on June 1, 2009. To assistthe reorganization, Congress and the bankruptcy court provided a US$50 billion DIPloan: the exact amount I had suggested six months earlier!
In a remarkably short period – just forty-three days – GM emerged frombankruptcy and was once again on its way to being a going concern. Figure 4 showsthe firm’s improvement from deep in the D-rated BRE zone to a B-rated BRE inabout twelve to eighteenth months. The DIP loan was first exchanged for new equity,and that equity was subsequently sold in the open market, whereby not only did thegovernment not lose any of its “investment”, it actually made a profit! GM today is asolid, thriving global auto-competitor with, again, an investment-grade rating (BBB),
Journal of Credit Risk www.risk.net/journals
Altman Z-score models 27
TABLE 9 Comparing the financial strength of high-yield bond issuers in 2007 and 2012,2014 and 2016 (3Q).
Number of firms Average Median Median Median‚ …„ ƒ Z -score/ Z -score/ Z 0-score/ Z 00-score/Year Z -score Z 00-score (BRE)� (BRE)� (BRE)� (BRE)�
2007 294 378 1.95 (BC) 1.84 (BC) 4.68 (BC) 4.82 (BC)2012 396 486 1.76 (B) 1.73 (B) 4.54 (B) 4.63 (B)2014 577 741 2.03 (BC) 1.85 (BC) 4.66 (BC) 4.74 (BC)2016 (3Q) 581 742 1.97 (BC) 1.70 (B) 4.44 (B) 4.63 (B)
Source: author’s calculations, and data from Altman and Hotchkiss (2006) and S&P Capital IQ/Compustat. �BRE.
which it achieved in 2014. However, note that the Z-score model placed GM in thesingle-B BRE at the end of 2014, not at investment grade. This low BRE continuedthrough the end of 2016. So, while GM has indeed improved considerably since itsbankruptcy, it was still, to me, of a noninvestment grade.
12 COMPARATIVE RISK PROFILE OVER TIME
Students of history often ask to compare a current situation with that of some pastperiod(s). This query is particularly relevant in financial markets, when a benchmarkperiod in the past is related to some financial crisis, and it is discussed whether wecan learn from the environment that existed then. Such is the case of the financialcrisis of 2008–9 and whether credit conditions today are similar, or not, to thosejust prior to that crisis. One metric that I have found useful in comparing creditmarket conditions over time is ourZ-score models. Was the average (or median) firmcreditworthiness better, worse or about the same in, say, 2016 compared with 2007?One might have some priors based on related macro- or micro-observations, such ascash on the balance sheet, interest rates or GDP growth. A more holistic, objectivemeasure, in my opinion, is one based on default probabilities that consider multipleattributes, such as the Z-scores of relevant samples of firms in the two periods.
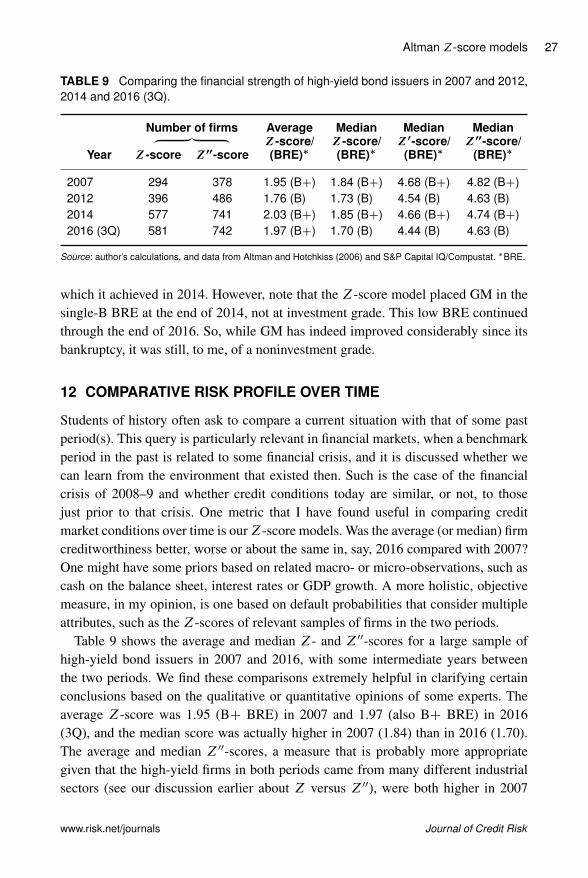
Table 9 shows the average and median Z- and Z00-scores for a large sample ofhigh-yield bond issuers in 2007 and 2016, with some intermediate years betweenthe two periods. We find these comparisons extremely helpful in clarifying certainconclusions based on the qualitative or quantitative opinions of some experts. Theaverage Z-score was 1.95 (BC BRE) in 2007 and 1.97 (also BC BRE) in 2016(3Q), and the median score was actually higher in 2007 (1.84) than in 2016 (1.70).The average and median Z00-scores, a measure that is probably more appropriategiven that the high-yield firms in both periods came from many different industrialsectors (see our discussion earlier about Z versus Z00), were both higher in 2007
www.risk.net/journals Journal of Credit Risk
28 E. I. Altman
than in 2016. Tests of the means between 2007 and 2016 showed that they wereinsignificantly different, so our conclusion is that the average credit profile of riskydebt-issuing firms was about the same in 2007 and 2016. I leave it up to the readerto determine if this was good or bad news for default estimates in 2017 and beyond.
13 PREDICTING DEFAULTS IN SPECIFIC SECTORS
Over time, default cycles have produced carnage in one or more industrial sectors. Ifthis has persisted for several years, these sectors have tended to draw the particularattention of researchers and practitioners. Hence, the textile industry model (Altmanet al 1974), the broker–dealer model (Altman and Lorris (1976), US airlines (Altmanand Gritta 1984) and most recently the US energy and mining sectors have motivatedspecific analyses and tests.
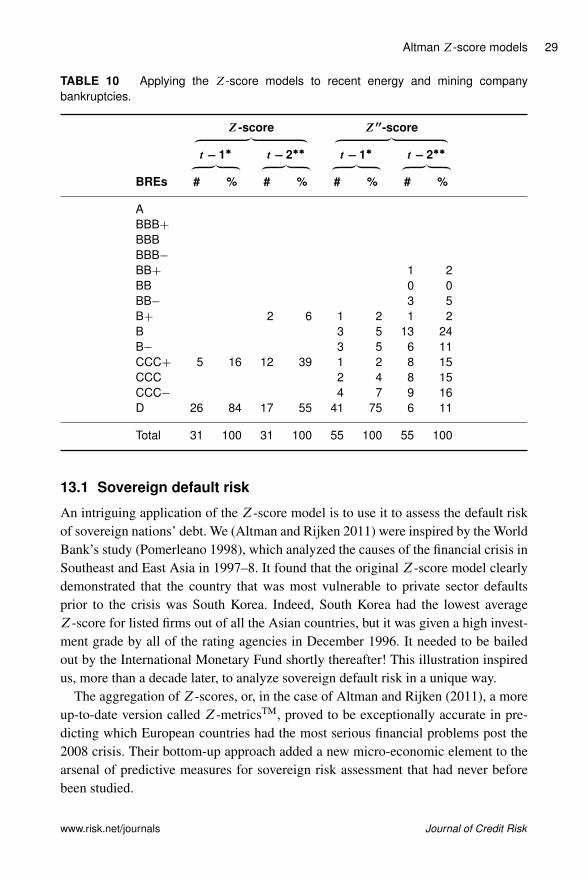
A recent empirical test (Altman and Kuehne 2017 (updated)) of Z-score modelsanalyzed this score’s accuracy in the energy and mining sectors. Rather than builda model based on energy firm data only, we decided to assess both the Z- and Z00-score models on a sample of bankruptcies in 2015, 2016 and 2017, a period in whichenergy-related firms accounted for more than half of the total defaults. Table 10shows the results of just the bankruptcies, ie, type I accuracy, for two periods priorto the filing of the thirty-one firms with data available for a Z-score test as well asthe larger number of firms (fifty-four) with data available for the Z00-score test. Ourresults were quite impressive, especially for the Z-score model, which we built, asnoted earlier, based only on manufacturing firm data. Indeed, 84% of the energy andmining companies had Z-scores in the D-rated zone (defaulted BRE) based on datafrom one or two quarters prior to the filing, and the remaining five firms in the samplehad a CCC or B� BRE. For data from five or six quarters prior to filing, the resultswere still impressive, with 55% in the D-rated BRE zone and most of the remainingfirms at CCC, ie, only two out of the thirty-one firms had a BC BRE. While theresults for the Z00-score model were not as accurate – 75% had a D-rated BRE andthe remaining firms had at most a B-rated BRE, based on data from the last quarterprior to filing for bankruptcy – they were still impressive and quite accurate.6
So, it appears that our original Z- and Z00-score models retain their high accu-racy level for distress prediction, even for some industries that were not includedin our original tests. However, we are not able to generalize our results to cover allnonmanufacturers, especially service firms.
6 We have also tested our models for the type II error. Results show a reasonably high type II error,although the overall accuracy is still impressive. Note that the sample sizes are different for thecomparison of Z and Z00 models.
Journal of Credit Risk www.risk.net/journals
Altman Z-score models 29
TABLE 10 Applying the Z-score models to recent energy and mining companybankruptcies.
Z -score Z 00-score‚ …„ ƒ ‚ …„ ƒt � 1� t � 2�� t � 1� t � 2��‚ …„ ƒ ‚ …„ ƒ ‚ …„ ƒ ‚ …„ ƒ
BREs # % # % # % # %
ABBBCBBBBBB�BBC 1 2BB 0 0BB� 3 5BC 2 6 1 2 1 2B 3 5 13 24B� 3 5 6 11CCCC 5 16 12 39 1 2 8 15CCC 2 4 8 15CCC� 4 7 9 16D 26 84 17 55 41 75 6 11
Total 31 100 31 100 55 100 55 100
13.1 Sovereign default risk
An intriguing application of the Z-score model is to use it to assess the default riskof sovereign nations’ debt. We (Altman and Rijken 2011) were inspired by the WorldBank’s study (Pomerleano 1998), which analyzed the causes of the financial crisis inSoutheast and East Asia in 1997–8. It found that the original Z-score model clearlydemonstrated that the country that was most vulnerable to private sector defaultsprior to the crisis was South Korea. Indeed, South Korea had the lowest averageZ-score for listed firms out of all the Asian countries, but it was given a high invest-ment grade by all of the rating agencies in December 1996. It needed to be bailedout by the International Monetary Fund shortly thereafter! This illustration inspiredus, more than a decade later, to analyze sovereign default risk in a unique way.
The aggregation of Z-scores, or, in the case of Altman and Rijken (2011), a moreup-to-date version called Z-metricsTM, proved to be exceptionally accurate in pre-dicting which European countries had the most serious financial problems post the2008 crisis. Their bottom-up approach added a new micro-economic element to thearsenal of predictive measures for sovereign risk assessment that had never beforebeen studied.
www.risk.net/journals Journal of Credit Risk
30 E. I. Altman
14 MANAGING A FINANCIAL TURNAROUND
One of the most interesting and important applications of theZ-score model, from aninternal and active perspective, rather than the passive standpoint of a distressed firm,is using it to guide the successful turnaround of a firm. I suggested this applicationand wrote up a case study on the GTI Corporation (see Altman and LaFleur (1981);it can also be found in Altman and Hotchkiss (2006) and Altman et al (2019)). Theidea is a simple one: if a model is effective in predicting bankruptcy, why wouldit not be helpful in the management of distressed firms, in identifying strategiesand their impact on performance metrics? In the case of the GTI Corporation, thenew CEO, James LaFleur, strategically simulated the impact of his managementchanges on the resulting Z-scores and only made those changes that resulted in animproved Z-score. His strategy did result in a remarkably successful turnaround.Here, again, was an application of the Z-score model that I had never considereduntil a practitioner suggested its use.
15 CONCLUSION
This paper has assessed the statistical and fundamental characteristics of the Altman(1968) Z-score model over the fifty years since its creation. In addition, I have listeda large number of proposed and experienced applications of the original Z-model aswell as several subsequent ones, with a more detailed discussion on the specifics andimportance of several of these applications. This fifty-year-old model has demon-strated an impressive resilience over the years and, notwithstanding massive growthin the size and complexity of global debt markets and corporate balance sheets, hasnot only exhibited longevity as an accurate predictor of corporate distress, but alsoshown that it can be successfully modified for a number of applications beyond itsoriginal focus. The list, shown in Table 8, is almost assuredly incomplete, especiallyin view of the large number of scholarly works that have cited Z-score models for awide range of empirical research investigations. While I am surprised at the longevityof the Z-score models’ usefulness, I cannot help but wonder what some analystsmight conclude in the year 2068 about its 100-year track record.
DECLARATION OF INTEREST
The author reports no conflicts of interest. The author alone is responsible for thecontent and writing of the paper.
ACKNOWLEDGEMENTS
The author thanks Robert Benhenni, Alessandro Danovi, Sanjiv Das, Martin Fridson,Michael Gordy, Malgorzata Iwanicz-Drozdowski, Tony Kao, Erkki Laitinen, Stuart
Journal of Credit Risk www.risk.net/journals
Altman Z-score models 31
Kovensky, Frederick Lundtofte, Herbert Rijken and Arto Suvas for their helpful com-ments and edits of this paper, and Lourdes Tanglao and Brenda Kuehne of the NYUSalomon Center for their technical assistance. The resulting work is still very muchthe responsibility of the author.
REFERENCES
Altman, E. I. (1967). The prediction of corporate bankruptcy: a discriminant analysis. Jour-nal of Finance 23(1), 193–194 (https://doi.org/10.1111/j.1540-6261.1968.tb03007.x).
Altman, E. I. (1968). Financial ratios, discriminant analysis and the prediction of corporatebankruptcy. Journal of Finance 23(4), 589–609 (https://doi.org/10.1111/j.1540-6261.1968.tb00843.x).
Altman, E. I. (1970). Corporate bankruptcy prediction and its implications for commercialloan evaluation. Journal of Commercial Bank Lending, December.
Altman, E. I. (1973). Predicting railroad bankruptcies in America. Bell Journal of Eco-nomics & Management Science 4(1), 184–211 (https://doi.org/10.2307/3003144).
Altman, E. I., and Lorris, B. (1976). A financial early warning system for over-the-counterbroker–dealers. Journal of Finance 31(4), 1201–1217 (https://doi.org/10.1111/j.1540-6261.1976.tb01969.x).
Altman, E. I. (1977). The cost of lending errors for commercial banks: some conceptualand empirical issues. Journal of Commercial Bank Lending, October.
Altman, E. I. (1980). Commercial bank lending: process, credit scoring and lending errorcosts. Journal of Financial and Quantitative Analysis 15(4), 813–832 (https://doi.org/10.2307/2330559).
Altman, E. I. (1983). Corporate Financial Distress and Bankruptcy. Wiley.Altman, E. I. (1984). A further empirical investigation of the bankruptcy cost ques-
tion. Journal of Finance 39(4), 1067–1089 (https://doi.org/10.1111/j.1540-6261.1984.tb03893.x).
Altman, E. I. (1989). Measuring corporate bond mortality and performance. Journal ofFinance 39(4), 909–922 (https://doi.org/10.1111/j.1540-6261.1989.tb02630.x).
Altman, E. I., and Gritta, R. (1984). Airline bankruptcies propensity: a ZETA analysis.Journal of the Transportation Research Forum 25(1), 150–154.
Altman, E. I., and Hotchkiss, E. (2006). Corporate Financial Distress and Bankruptcy,3rd edn. Wiley.
Altman, E. I., and Izan, H. Y. (1982). Identifying corporate distress in Australia: anindustry relative analysis. Working Paper, Australian Graduate School of Management,University of New South Wales, Sydney.
Altman, E. I., and Kao, D. L. (1992). The implications of corporate bond ratings drift.Financial Analysis Journal 48(3), 64–75 (https://doi.org/10.2469/faj.v48.n3.64).
Altman, E. I., and Kuehne, B. (2017). Defaults and returns in the high-yield bond and dis-tressed debt markets. Special Report, February, New York University Salomon Center,New York.
Altman, E. I., and LaFleur, J. (1981). Managing a return to financial health. Journal ofBusiness Strategy 2(1), 31–38 (https://doi.org/10.1108/eb038922).
www.risk.net/journals Journal of Credit Risk
32 E. I. Altman
Altman, E. I., and Lavallee, M. (1981). Business failure classification in Canada. Journalof Business Administration 12, 79–91.
Altman, E. I., and Rijken, H. (2004). How rating agencies achieve rating stability. Journal ofBanking & Finance 28(11), 2679–2714 (https://doi.org/10.1016/j.jbankfin.2004.06.006).
Altman, E. I., and Rijken, H. (2006). A point-in-time perspective on through-the-cycle rat-ings. Financial Analysts Journal 62(1), 54–70 (https://doi.org/10.2469/faj.v62.n1.4058).
Altman, E. I., and Rijken, H. (2010). A New Default Prediction Model: The Z-MetricsApproach. Risk Metrics Corporation.
Altman, E. I., and Rijken, H. (2011). Toward a bottom-up approach to assessing sovereigndefault risk. Journal of Applied Corporate Finance 21(2), 5–19.
Altman, E. I., and Sabato, G. (2007). Modeling credit risk of SMEs: evidence from the USmarket. Abacus 43(2), 332–357 (https://doi.org/10.1111/j.1467-6281.2007.00234.x).
Altman, E. I., Margaine, M., Schlosser, M., and Vernimmen, P. (1974). Financial and stat-istical analysis for textile commercial loan evaluations: a French experience. Journal ofFinancial and Quantitative Analysis 9(2), 195–211 (https://doi.org/10.2307/2330096).
Altman, E. I., Haldeman, R., and Narayanan, P. (1977). ZETA analysis: a new modelto identify bankruptcy risk of corporations. Journal of Banking & Finance 1(1), 29–54(https://doi.org/10.1016/0378-4266(77)90017-6).
Altman, E. I., Baidya, T. K. N., and Riberio-Dias, L. M. (1979). Assessing potential finan-cial problems of firms in Brazil. Journal of International Business Studies 10(2), 9–24(https://doi.org/10.1057/palgrave.jibs.8490787).
Altman, E. I., Eom, Y. H., and Kim, D. W. (1995a). Failure prediction: evidence from Korea.Journal of International Financial Management & Accounting 6(3), 230–249.
Altman, E. I., Hartzell, J., and Peck, M. (1995b). A scoring system for emerging marketcorporate bonds. Report, May, Salomon Brothers.
Altman, E. I., Brady, B., Resti, A., and Sironi, A. (2005). The link between default andrecovery rates: theory, empirical evidence and implications. Journal of Business 78(6),2203–2228 (https://doi.org/10.1086/497044).
Altman, E. I., Ling, J., and Yen, J. (2010a). Corporate distress diagnostic model and ratingsin China. Frontiers of Computer Science in China 4(2), 220–236.
Altman, E. I., Sabato, G., and Wilson, N. (2010b). The value of non-financial information insmall and medium-sized enterprise risk management. The Journal of Credit Risk 6(2),95–127 (https://doi.org/10.21314/JCR.2010.110).
Altman, E. I., Sabato, G., and Esentato, M. (2016). Assessing the creditworthiness ofItalian SMEs and mini-bond issuers. Newsletter, April, Borsa Italiana, Milan.
Altman, E. I., Drozdowska, M., Laitinen, E., and Suvas, A. (2017a). Financial and non-financial variables as long-horizon predictors of bankruptcy. The Journal of Credit Risk12(4), 49–78 (https://doi.org/10.21314/JCR.2016.216).
Altman, E. I., Sabato, G., and Wilson, N. (2017b). Assessing SME default risk in the UnitedKingdom. Working Paper, Wiserfunding, London.
Altman, E. I., Iwanicz-Drozdowska, M., Laitinen, E. K., and Suvas, A. (2017c). Finan-cial distress prediction in an international context: a review and empirical analysis ofAltman’s Z-score model. Journal of International Financial Management & Accounting28(2), 131–171.
Altman, E. I., Hotchkiss, E., and Wang, W. (2019). Corporate Financial Distress, Restruc-turing, and Bankruptcy, 4th edn. Wiley, forthcoming.
Journal of Credit Risk www.risk.net/journals
Altman Z-score models 33
Barboza, F., Kumar, H., and Altman, E. I. (2017). Machine learning models and bankruptcyprediction. Expert Systems with Applications 83, 405–417 (https://doi.org/10.1016/j.eswa.2017.04.006).
Beaver, W. H. (1966). Financial ratios as predictors of failure. Journal of AccountingResearch 4, 71–111 (https://doi.org/10.2307/2490171).
Bellovary, J. L., Giacomino, D., and Akers, M. (2007). A review of bankruptcy predictionstudies: 1930 to present. Journal of Financial Education 33, 1–42.
Bharath, S., and Shumway, T. (2008). Forecasting default with the Merton distance todefault model. Review of Financial Studies 21, 1339–1369 (https://doi.org/10.1093/rfs/hhn044).
Campbell, J. Y., Hilscher, J., and Szilagi, J. (2008). In search of distress risk. Journal ofFinance 63(6), 2899–2939 (https://doi.org/10.1111/j.1540-6261.2008.01416.x).
Caouette, J., Altman, E. I., and Narayanan, P. (1988). Managing Credit Risk: The NextGreat Financial Challenge. Wiley.
Caouette, J., Altman, E. I., Narayanan, P., and Nimmo, R. (2008). Managing Credit Risk:The Next Great Financial Challenge, 2nd edn. Wiley.
Chava, S., and Jarrow, R. (2004). Bankruptcy prediction with industry effects. Review ofFinance 8, 537–569 (https://doi.org/10.1093/rof/8.4.537).
Cho, S., Fu, L., and Yu, Y. (2012). New risk analysis tools with accounting changes:adjusted Z-score. The Journal of Credit Risk 8(1), 89–108 (https://doi.org/10.21314/JCR.2012.137).
Choi, F. (1997). International Accounting and Finance Handbook, 2nd edn. Wiley.Das, S. R., Hanouna, P., and Sarin, A. (2009). Accounting-based versus market-based
cross-sectional models of CDS spreads. Journal of Banking & Finance 33(4), 719–730(https://doi.org/10.1016/j.jbankfin.2008.11.003).
Deakin, E. (1972). A discriminant analysis of predictors of business failure. Journal ofAccounting Research 10(1), 167–179 (https://doi.org/10.2307/2490225).
Duffie, D., Saita, L., and Wang, K. (2007). Multi-period default prediction with stochas-tic covariates. Journal of Financial Economics 83, 635–662 (https://doi.org/10.1016/j.jfineco.2005.10.011).
Edmister, R. (1972). An empirical test of financial ratio analysis for small business: fail-ure prediction. Journal of Financial Education Analysis 7(2), 1477–1493 (https://doi.org/10.2307/2329929).
Emmott, W. (1991). Theories at the bottom of their jargon: international finance survey.The Economist, April 27.
Frydman, H., Altman, E. I., and Kao, D.-L. (1985). Introducing recursive partitioning analy-sis for financial classification: the case of financial distress. Journal of Finance 50(1),269–291 (https://doi.org/10.1111/j.1540-6261.1985.tb04949.x).
Gordy, M. (2000). A comparative anatomy of credit risk models. Journal of Banking &Finance 24(1–2), 119–149 (https://doi.org/10.1016/S0378-4266(99)00054-0).
Gordy, M. (2003). A risk-factor model foundation for ratings-based capital rules. Journalof Financial Intermediation 12(3), 199–232 (https://doi.org/10.1016/S1042-9573(03)00040-8).
Gupton, G., Finger, C., and Bhatia, M. (1977). CreditMetrics: the benchmark for under-standing credit risk. Technical Document, April, JP Morgan.
www.risk.net/journals Journal of Credit Risk
34 E. I. Altman
Hillegeist, S. A., Keating, E. K., Kram, D. P., and Lundstedt, K. G. (2004). Assessingthe probability of bankruptcy. Review of Accounting Studies 9(1), 5–34 (https://doi.org/10.1023/B:RAST.0000013627.90884.b7).
Huang, Z., Chen, H., Hsu, C., Chen, W., and Wu, S. (2004). Credit rating analysis withsupport vector machines and neural networks: a market comparative study. DecisionSupport Systems 37(4), 543–558 (https://doi.org/10.1016/S0167-9236(03)00086-1).
Jarrow, R. A., and Turnbull, S. (1995). Pricing derivatives on financial securities subject tocredit risk. Journal of Finance 50(1), 53–85 (https://doi.org/10.1111/j.1540-6261.1995.tb05167.x).
Keasey, K., and Watson, R. (1991). Financial distress prediction models: a review oftheir usefulness. British Journal of Management 2(2), 89–102 (https://doi.org/10.1111/j.1467-8551.1991.tb00019.x).
KMV Corporation (2000). The KMV EDF Credit Measure and probabilities of default.Report, KMV Corporation, San Francisco, CA.
McQuown, J. (1993). A comment on market vs. accounting based measures of defaultrisk. Report, KMV Corporation, San Francisco, CA.
Merton, R. C. (1974). On the pricing of corporate debt: the risk structure of interest rates.Journal of Finance 29(2), 449–472.
Ohlson, J. A. (1980). Financial ratios and the probalistic prediction of bankruptcy. Journalof Accounting Research 18(1), 109–131 (https://doi.org/10.2307/2490395).
Pinto, C., Serra, F., and Ferreira, M. (2014). A bibliometric study on culture research ininternational business. Brazilian Administrative Review 11(3), 340–363 (https://doi.org/10.1590/1807-7692bar2014309).
Pomerleano, M. (1998). Corporate finance lessons from the East Asian crisis. In View-point: Public Policy for the Private Sector. Knowledge Note 155, World Bank Group,Washington, DC. URL: https://bit.ly/2Odxwnq.
Pynchon, T. (2013). Bleeding Edge. Penguin, New York.Scott, J. (1981). The probability of bankruptcy: a comparison of empirical predictions
and theoretical models. Journal of Banking & Finance 5(3), 317–344 (https://doi.org/10.1016/0378-4266(81)90029-7).
Shumway, T. (2001). Forecasting bankruptcy more accurately: a simple hazard model.Journal of Business 74(1), 101–124 (https://doi.org/10.1086/209665).
S&P Global (2017). 2016 annual global corporate default study and rating transitions.Report, April 13, S&P Global. URL: https://bit.ly/2j8HMNm.
van Deventer, D. R. (2012). A 10-step program to replace legacy credit ratings withmodern default probabilities for counterparty and credit risk assessment. Blog Post,November 27, Kamakura Corporation. URL: https://bit.ly/2N1rpOv.
Wilcox, J. W. (1971). A gambler’s ruin prediction of business failure using accounting data.Sloan Management Review 12(3), 1–10.
Willer do Prado, J., de Castro Alcantara, V., de Melo Carvalho, F., Carvalho Vieira, K.,Machado, L. K. C., and Tonelli, D. F. (2016). Multivariate analysis of credit risk andbankruptcy research data: a bibliometric study involving different knowledge fields(1984–2014). Scientometrics 106(3), 1007–1029 (https://doi.org/10.1007/s11192-015-1829-6).
Journal of Credit Risk www.risk.net/journals