A Detailed study on Performance Evaluation of Multiple Co-Axial Nozzles
26
JoEAM (2015) 1-26 © STM Journals 2015. All Rights Reserved Page 1 Journal of Experimental & Applied Mechanics ISSN: 2230-9845(online), ISSN: 2321-516X(print) Volume 6, Issue 1 www.stmjournals.com A Detailed study on Performance Evaluation of Multiple Co-Axial Nozzles Tridib Kumar Mahata* Department of Mechanical Engineering, Manipal Institute of Technology, Manipal-576104, Karnataka, India Abstract A nozzle is a device which converts the PE (Pressure Energy) of flowing jet into KE (Kinetic Energy). In this paper we tried to determine the performance of various types of nozzles i.e with varying the inlet cross section dimension (square, circular, hexagon etc.) and keeping the outlet condition same i.e circular cross section and analysis by using CFD (Computational fluid dynamics) tools (Gambit, Catia and Ansys Fluent). Keywords: nozzles, CFD) tools, fluid flow *Author for Correspondence E-mail: [email protected] INTRODUCTION A nozzle is a device designed to control the direction or characteristics of a fluid flow (especially to increase velocity) as it exits (or enters) an enclosed chamber or pipe via an orifice. The total energy at the end of the pipe consists of pressure energy and kinectic energy [1–5]. Fig. 1: Converging-Diverging Nozzle Configuration. Fig. 2: Showing Flow Velocity Increase from Green to Red.
-
Upload
manipaluniversity -
Category
Documents
-
view
1 -
download
0
Transcript of A Detailed study on Performance Evaluation of Multiple Co-Axial Nozzles

JoEAM (2015) 1-26 © STM Journals 2015. All Rights Reserved Page 1
Journal of Experimental & Applied Mechanics ISSN: 2230-9845(online), ISSN: 2321-516X(print)
Volume 6, Issue 1
www.stmjournals.com
A Detailed study on Performance Evaluation of Multiple
Co-Axial Nozzles
Tridib Kumar Mahata* Department of Mechanical Engineering, Manipal Institute of Technology,
Manipal-576104, Karnataka, India
Abstract A nozzle is a device which converts the PE (Pressure Energy) of flowing jet into KE (Kinetic
Energy). In this paper we tried to determine the performance of various types of nozzles i.e
with varying the inlet cross section dimension (square, circular, hexagon etc.) and keeping the
outlet condition same i.e circular cross section and analysis by using CFD (Computational
fluid dynamics) tools (Gambit, Catia and Ansys Fluent).
Keywords: nozzles, CFD) tools, fluid flow
*Author for Correspondence E-mail: [email protected]
INTRODUCTION A nozzle is a device designed to control the
direction or characteristics of a fluid flow
(especially to increase velocity) as it exits (or
enters) an enclosed chamber or pipe via an
orifice. The total energy at the end of the pipe
consists of pressure energy and kinectic
energy [1–5].
Fig. 1: Converging-Diverging Nozzle Configuration.
Fig. 2: Showing Flow Velocity Increase from Green to Red.

Performance Evaluation of Multiple Co-Axial Nozzles Mahata Tridib Kumar
JoEAM (2015) 1-26 © STM Journals 2015. All Rights Reserved Page 2
In Figure 1 the converging-diverging nozzle is
shown and Figure 2 shows the velocity
increase in the above nozzle.
TYPES OF NOZZLES Aero-spike nozzle; Liquid nozzles; High-
speed gas nozzles; Propelling nozzles;
Magnetic nozzles; Rocket engine.
Fig. 3: Rocket Engine.
A typical rocket engine consists of the nozzle,
the combustion chamber, and the injector
(Figure 3).
Gas velocities from 2 to 4.5 km/s can be
achieved in rocket nozzles. The nozzles which
perform this feat are called DE laval nozzles
and consist of a convergent and divergent
section.
The minimum flow area between the
convergent and divergent section is called the
nozzle throat [4–9]. The flow area at the end of
the divergent section is called the nozzle exit.
The basic equation of thrust used is as follows:
* – *e e a eF V P P AM
where, F=Thrust, M =Propellant mass flow
rate, Ve=Velocity of exhaust gases,
Pe=Pressure at nozzle exit, Pa=Ambient
pressure, Ae=Area of nozzle exit.
Fig. 4: Thrust in Nozzle.
Fig. 5: Action of Exit Pressure and Atmospheric Pressure on Nozzle Surface.
PRINCIPLE OF OPERATION OF
ROCKET ENGINE Rocket engines produce thrust by creating a
high-speed fluid exhaust. This fluid is
generally always a gas which is created by
high pressure (10–200 bars) combustion of
solid or liquid propellants, consisting of fuel
and oxidizer components, within a combustion
chamber. The fluid exhaust is then passed
through a supersonic propelling nozzle which
uses heat energy of the gas to accelerate the
exhaust gases to a very high speed, and from
the Newton’s third law the reaction to this
pushes the engine in the opposite direction [6–
12].

Journal of Experimental & Applied Mechanics
Volume 6, Issue 1
ISSN: 2230-9845(online), ISSN: 2321-516X(print)
JoEAM (2015) 1-26 © STM Journals 2015. All Rights Reserved Page 3
CO-AXIAL NOZZLES
Co-axial nozzles are nozzles where pipe and
nozzle are having or being mounted on a
common axis. The pipe supplies at very high
pressure fuel to the nozzle and compressed air
is passed through the nozzle, they react and
combust. The products are water, carbon
dioxide and carbon monoxide.
Fig. 6: Co-axial Flow Gaseous Nuclear Rocket.
Figure 6 shows a NASA-Lewis concept for a
gas core nuclear rocket engine, circa 1960.
Specific impulse was to be 2200 sec, thrust
98,000 pounds, T/W 0.68, reactor diameter
16.6 feet, overall reactor length, 16.6 feet. The
fuel would reach 20,000 degrees R, while the
hydrogen would get to 10,000 degrees R.
Coaxial jet nozzles are an integral part of
many engineering systems where mixing of
streams of different fluids are required. They
are widely used to mix the fuel and oxidizers
inside the combustors of gas turbine power
plant of aircraft. A properly designed jet will
be desired to mix efficiently, while providing
the best overall combustion efficiencies.
Characteristics of non-circular co-flow jets
have been analyzed for different types of
orifices, i.e. circular, crusi-form, hexagon, and
square [13–20].
Potential Core
In the developing zone of a circular jet
diffusing in a co-flowing stream, the flow
velocity changes from the jet velocity U0 to the
uniform ambient velocity Ua. The thickness of
the potential core gradually diminishes in the
streamwise direction and beyond the potential
core length; no uniform flow region exists
across the jet. The excess velocity within the
shear layer exhibits similarity and the integral
technique is often adopted for prediction of the
length of the potential core. Length of
potential core decreases with increase in
Reynolds number.
Jet Half-Width
The jet half-width is defined as the distance
from the jet centerline to the lateral location
where the local mean velocity has fallen to
one-half its centerline value.
Pressure Far-Field
Pressure far-field conditions are used in fluent
to model a free-stream condition at infinity,
with free-stream mach number and static
conditions being specified. The pressure far-
field boundary condition is often called a
characteristic boundary condition, since it uses
characteristic information to determine the
flow variables at the boundaries [18–26].
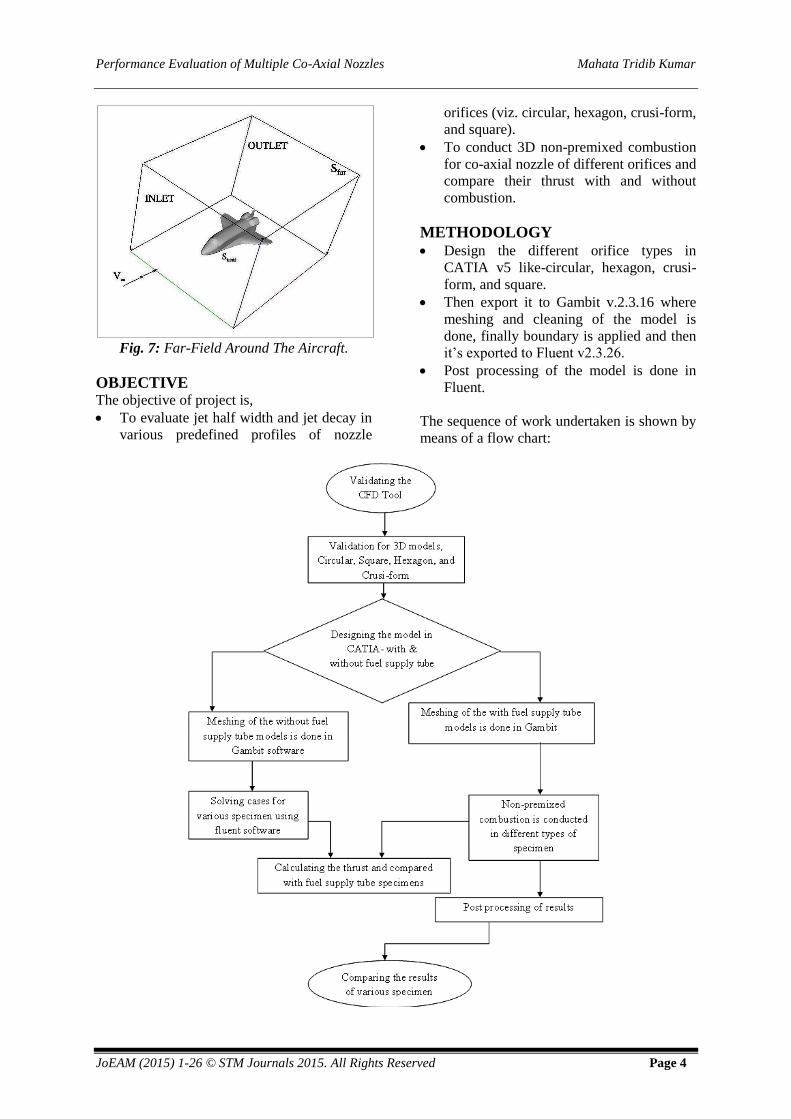
Figure 7 is the pictorial representation of far-
field and near field around the aircraft, with
inlet and outlet.
Performance Evaluation of Multiple Co-Axial Nozzles Mahata Tridib Kumar
JoEAM (2015) 1-26 © STM Journals 2015. All Rights Reserved Page 4
Fig. 7: Far-Field Around The Aircraft.
OBJECTIVE The objective of project is,
To evaluate jet half width and jet decay in
various predefined profiles of nozzle
orifices (viz. circular, hexagon, crusi-form,
and square).
To conduct 3D non-premixed combustion
for co-axial nozzle of different orifices and
compare their thrust with and without
combustion.
METHODOLOGY Design the different orifice types in
CATIA v5 like-circular, hexagon, crusi-
form, and square.
Then export it to Gambit v.2.3.16 where
meshing and cleaning of the model is
done, finally boundary is applied and then
it’s exported to Fluent v2.3.26.
Post processing of the model is done in
Fluent.
The sequence of work undertaken is shown by
means of a flow chart:

Journal of Experimental & Applied Mechanics
Volume 6, Issue 1
ISSN: 2230-9845(online), ISSN: 2321-516X(print)
JoEAM (2015) 1-26 © STM Journals 2015. All Rights Reserved Page 5
TURBULENCE MODEL Turbulence models are developed based on
time-averaged statistical models. The local
velocities are defined as time-averaged
component and a time dependent fluctuating
component:
U (local velocity)=u (time averaged)+u′
(fluctuating component)
In the present work, standard k–ε models used
for the simulation. This two-equation model is
the most widely used turbulence model for
engineering simulations. Some of the features
of this model are,
It is robust,
Suitable for initial iterations, initial
screening of alternative designs, and
parametric studies.
SUMMARY This chapter reveals the methodology adopted
for the present work. Different types of flow
through pipe or a nozzle and the nozzle
equations. The fundamental governing
equations for flow and even flow passage are
explained for the modeling the turbulence
quantities. Solution flow-chart is shown in
hierarchy. Brief introduction about turbulence
model is explained.
VALIDATION OF THE TOOL Figure 8 shows the nozzle used for getting the
experimental values. It is run by 1 HP and
3000 rpm motor. On the right corner of picture
is the pressure distribution reader throughout
the nozzle. Motor is switched ‘on’ and the
regulator is controlled for different amount of
air supply-(30, 60, 90, and 100%) and the
manometer reading is taken.
Fig 8: Photo of the Experimental Nozzle Setup.
Table 1: Shows the Specification.
Density of water, (ρw) 1000 Kg/m³
Density of air, (ρa) 1.225 Kg/m³
Acceleration due to gravity, (g) 9.81 m/s
Diameter of the supply tube, (de) 25 mm
Area of the thin film of supply pipe is,
ρw=1000 Kg/m³, ρa=1.225 Kg/m³, g=9.81 m/s, A=( d²)/4, d=25 mm, A=4.906e–4 m²

Performance Evaluation of Multiple Co-Axial Nozzles Mahata Tridib Kumar
JoEAM (2015) 1-26 © STM Journals 2015. All Rights Reserved Page 6
Table 2: Experimental Values of the Nozzle.
% Manometer
Reading (mm)
(h1-h2)=h
(m) Pressure (Pa) Velocity (m/s)
Mass Flow Rate
(Kg/s)
h1 h2 P=ρaw.g.h V=√(2∆P/ρa) =AVρa
30 11.1 10.4 7e–3 68.67 10.58 6.358e–3
60 12.9 8.6 43e–3 421.83 26.24 1.57e–2
90 17.2 4.4 128e–3 1256.68 45.29 2.72e–2
100 20 1.9 181e–3 1775.61 53.84 3.23e–2
VALIDATION OF 2D-MODEL The nozzle dimension is measured and using
that value model was designed in Catia v5.
Then it was exported to the Gambit where it
was meshed using mapped meshing scheme
and boundary conditions were applied. Then
the model was exported to Fluent where values
were entered for post-processing.
Fig. 9: CATIA Model of the Nozzle. Fig. 10: Nozzle Dimension.
Fig. 11: 2D Model with Mapped Mesh Done in Gambit.

Journal of Experimental & Applied Mechanics
Volume 6, Issue 1
ISSN: 2230-9845(online), ISSN: 2321-516X(print)
JoEAM (2015) 1-26 © STM Journals 2015. All Rights Reserved Page 7
Fig. 12: Boundary Condition.
Figure 12 displays the boundary condition that
was applied to the 2D model.
Table 3: Boundary Condition for Validation of
Tool.
Working fluid Ideal gas
Material Aluminum
Viscous model K-ε model
Temperature 300 K
In post processing the iteration were
conducted until the convergence was attained.
After the convergence the pressure and
velocity contour plot was taken and values
were taken and graphs were plotted.
Table 4: CFD Values of 2D-Nozzle from
Fluent.
% Pressure
(Pa)
Velocity
(m/s)
Mass Flow
Rate (Kg/s)
30 68.97 10.533 5.98e–3
60 424.73 26.01 1.47e–2
90 1266.69 44.65 2.54e–2
100 1789.75 52.95 3.02e–2
Fig. 13: Pressure Comparison. Fig. 14: Velocity Comparison.
0
500
1000
1500
2000
30 60 90 100
Pre
ssu
re (
in P
a)
Speed at which air passes through the
nozzle (%)
Pressure
Expt
CFD
0
10
20
30
40
50
60
30 60 90 100
Vel
oci
ty (
in m
/s)
Speed at which air passes through the
nozzle (%)
Velocity
Expt
CFD

Performance Evaluation of Multiple Co-Axial Nozzles Mahata Tridib Kumar
JoEAM (2015) 1-26 © STM Journals 2015. All Rights Reserved Page 8
Fig. 15: Mass Flow Rate Comparison.
Figure 13 is pressure comparison graph for
experimental values and CFD values it depicts
that there is very little difference between the
experimental CFD values, for different amount
of air supply (–30, 60, 90, and 100%).
Similarly Figure 14 and 15 depict the velocity
and mass flow rate comparison where the
values are almost similar.
Fig. 16: Pressure (in Pa) Contour Plot for 2D-Validation Tool.
0.00E+00
5.00E-03
1.00E-02
1.50E-02
2.00E-02
2.50E-02
3.00E-02
3.50E-02
30 60 90 100
Ma
ss f
low
ra
te (
in K
g/s
)
Speed at which air passes through the nozzle (%)
Mass Flow Rate
Expt
CFD

Journal of Experimental & Applied Mechanics
Volume 6, Issue 1
ISSN: 2230-9845(online), ISSN: 2321-516X(print)
JoEAM (2015) 1-26 © STM Journals 2015. All Rights Reserved Page 9
Fig. 17: Velocity (in m/s) Contour Plot for 2D-Validation Tool.
Figure 17 contour plot of the 2D–model it can be seen that as speed of the air increases from 30 to
100%, the spread of flow is increasing in length and reducing in width.
Fig. 18: Axial Velocity Variation Plot and Pressure Variation Plot in Radial Direction.

Performance Evaluation of Multiple Co-Axial Nozzles Mahata Tridib Kumar
JoEAM (2015) 1-26 © STM Journals 2015. All Rights Reserved Page 10
Fig. 19: Pressure Variation Plot and Axial Velocity Variation Plot along Center Line.
Fig. 20: Comparison of Jet Half-Width.
Figure 19 shows the potential core along the
axial direction and indicates that 100% air
supply has more potential core than others
(like 30, 60, 90%). And it was even observed
from same plot that 100% air supply has less
jet decay too. The 60% air supply has larger
jet half width than the others as shown in plot
Figure 20.
MODELLING AND MESHING Gambit–CFD preprocessor is powerful design
tool to define CFD simulations which can be
later exported to CFD solvers and
postprocessors like Fluent, Polyflow and Star-
Cd for analysis purpose. This paper includes
detailed modeling descriptions of nozzle
orifice of different configurations. It also

Journal of Experimental & Applied Mechanics
Volume 6, Issue 1
ISSN: 2230-9845(online), ISSN: 2321-516X(print)
JoEAM (2015) 1-26 © STM Journals 2015. All Rights Reserved Page 11
includes meshing details which is done in
gambit software.
Modeling Process
Modeling the Without Combustion
Specimens.
The different specimens are modeled in Catia
and then exported to Gambit, where the very
large cylinder is constructed connecting to the
nozzle as it is defined as pressure far-field.
Using Fluent the simulation is done.
Methodology of the Literature review [1] was
followed to find jet half-width and potential
core for different profiles of nozzles. All the
orifices shown in the Figure 21 are having
Equivalent diameter [1] (De=26 mm). These
orifices are designed and exported to Gambit.
In Gambit a flow region is defined as pressure
far-field for knowing the flow characteristics
of the nozzle outlet. The pressure far-field is
the cylindrical as in Figure 23, it is meshed in
tetrahedral scheme mesh and boundary
condition is applied. Fluid and solid region is
defined for identifying the fluid flow region.
Then it is exported to fluent for further
analysis. The models shown in the Figure 22
are the nozzle configuration used. And were
designed in Catia v5.
Fig. 21: Co-Axial Jet Flow Configuration.
Fig. 22: Different Orifices are Constructed in Catia.

Performance Evaluation of Multiple Co-Axial Nozzles Mahata Tridib Kumar
JoEAM (2015) 1-26 © STM Journals 2015. All Rights Reserved Page 12
Fig. 23: 3D-Model with Far-Field.
Fig. 24: 3D-Model After Meshing With Tetrahedral Mesh.
Fig. 25: 3D-Model Showing The Boundary Conditions.

Journal of Experimental & Applied Mechanics
Volume 6, Issue 1
ISSN: 2230-9845(online), ISSN: 2321-516X(print)
JoEAM (2015) 1-26 © STM Journals 2015. All Rights Reserved Page 13
Table 5: Brief Information of Model with
Boundary Condition.
Air inlet Diameter (Da) 94 mm
The width of cylindrical object(wc) 1600 mm
The radius of cylindrical object (rc) 300 mm
No. cells for different configuration 2000000 cells
Meshing Tet/hybrid mesh
Type T-grid
The spacing for nozzle .6
Viscous model K-ε model
Fluid Ideal gas
Density of ideal gas (air) 1.225 Kg/m
3
(remains constant )
Material Aluminum
An ideal gas is one that follows the gas laws at
all conditions of pressure and temperature. An
ideal gas is a substance that does not really
exist. Kinetic theory presumes that the
particles of an ideal gas have no volume and
that the particles are not attracted to each
other. There is no gas for which this is true.
Never the less, under many conditions, the
behavior of a real gas is similar to that of an
ideal gas [27–33].
Modeling with Combustion Specimens
A simple pipe is designed and placed in centre
exactly on the centre axis of different orifice
configurations. The pipe has 18 holes the
spray the fuel all around the nozzle.
Fig. 26: Different Specimens with Fuel Inlet Pipe Supply.

Performance Evaluation of Multiple Co-Axial Nozzles Mahata Tridib Kumar
JoEAM (2015) 1-26 © STM Journals 2015. All Rights Reserved Page 14
Fig. 27: Co-Axial Nozzle with Far-Field Region to Find the Flow Characteristics.
The liquid petroleum gas (LPG) is passed
through the pipe which has equal parts of
butane (C4H10) and propane (C3H8), the nozzle
will be supplied with compressed air. The
combustion takes place when the compressed
air meets the high speed fuel same as in diesel
engines. The fuel inlet and air inlets entry
being different it is known as non-premixed
combustion. The pdf table for non-premixed
combustion model is generated by entering the
chemical contents of (CH4, C2H6, C3H8, C4H10,
N2, and CO2). Many of nozzles used are made
from refractory metal such as Tungsten alloys
or Niobium alloys. These alloys can withstand
high temperature and wear.
Fig. 28: Meshed Using Tet/Hybrid Mesh. Fig. 29: Boundary Condition is Applied.
Table 6: Boundary Condition.
Fuel inlet diameter (Df) 13 mm [1]
Length of fuel tube (Lf) 60 mm [1]
Material Nickel
Viscous model K-ε model
Fluid PDF mixture (CH4, C2H6, C3H8, C4H10, N2, and CO2) [19, 28]
Air inlet pressure 2 bar [33]
Air inlet temperature 312 K [19, 28]
Fuel inlet temperature 308 K [19, 28]
Fuel inlet pressure 6.06 bar [32]
Fuel inlet temperature 308 [19, 28]
Species model Non-premixed combustion [19, 28]
Radiation model P1 [19, 28]

Journal of Experimental & Applied Mechanics
Volume 6, Issue 1
ISSN: 2230-9845(online), ISSN: 2321-516X(print)
JoEAM (2015) 1-26 © STM Journals 2015. All Rights Reserved Page 15
SUMMARY In this paper we discussed about designing and
meshing of the different configuration of
nozzles using Catia V5 and Gambit software.
Also, boundary conditions are applied.
RESULT AND ANALYSIS This paper discusses about results which are
obtained for various nozzle configuration with
and without fuel supply pipe. The jet half-
width for without combustion nozzle
configuration is determined from the graph.
And with fuel supply pipe co-axial nozzle
configuration the combustion product graph is
plotted.
Figures 30, 31, and 32 show the comparison
between experimental and different types of
nozzle configuration (circular, hexagon, crusi-
form, and square) for different amount of air
supply (in %). There is very less difference
between the experimental and other non-
circular nozzle orifices and thus, tool
validation is done for all the specimens.
Fig. 30: Pressure Comparison for 3D. Fig. 31: Velocity Comparison for 3D.
Fig. 32: Mass Flow Rate Comparison for 3D.
Grid Independent Test
Grid independent test has been performed for
the model. The Tet/Hybrid grid is used for
meshing. The plot in Figure 33 shows the
different types of grid spacing (0.5, 0.6, and
0.7), the plot is in terms of total pressure
variation in the axial direction. There isn’t
much difference in different types of grid
spacing used but for optimum use 0.6 spacing
is adopted for simulation.

Performance Evaluation of Multiple Co-Axial Nozzles Mahata Tridib Kumar
JoEAM (2015) 1-26 © STM Journals 2015. All Rights Reserved Page 16
Fig. 33: Grid Sensitivity Study.
Results of Without Fuel Supply Pipe Nozzle
Configuration
Simulation for without fuel was carried out for
different specimens: circular, crusi-form,
hexagon, and square in commercial software
Fluent 6.3.26. The velocity and pressure
contour was taken, from which the graph of jet
half-width along the centerline plotted.
Graph
The Figures 34, 35, 36, and 37 depict the jet
half-width in X-Y and X-Z direction, these
profiles represents the radial velocity
component of different configurations. And
comparison is done for circular, crusi-form,
hexagon, and square profiles. The Figure 38
gives the pressure and velocity plot along the
centerline axis.
Fig. 34: Dispersion Plot 30% Air Supply in X-Y and X-Z Direction for Different Nozzle Orifices.
Fig. 35: Dispersion Plot 60% Air Supply in X-Y and X-Z Direction for Different Nozzle Orifices.

Journal of Experimental & Applied Mechanics
Volume 6, Issue 1
ISSN: 2230-9845(online), ISSN: 2321-516X(print)
JoEAM (2015) 1-26 © STM Journals 2015. All Rights Reserved Page 17
Fig. 36: Dispersion Plot 90% Air Supply in X-Y and X-Z Direction for Different Nozzle Orifices.
Fig. 37: Dispersion Plot 100% Air Supply in X-Y and X-Z Direction for Different Nozzle Orifices.
Table 7: Effect of Jet Shapes in the Spreading
Rate Along the Radial Direction.
Name of profiles (R/De)
Circular 2.9
Hexagon 2.4
Crusi-form 2.96
Square 2.55
The effect of jet shapes in the spreading rate
along the radial direction was shown in
Table 7. From the Table 7 it can be easily
noted that the single crusi-form and circular jet
has larger spreading rate when compare to the
other two profiles. In case of non-circular
profiles, the hexagonal jet have less spreading
rate than the other configurations due to the
concave corners attached.
Fig. 38: Pressure and Velocity Plot Alon Centerline for Different Orifices.

Performance Evaluation of Multiple Co-Axial Nozzles Mahata Tridib Kumar
JoEAM (2015) 1-26 © STM Journals 2015. All Rights Reserved Page 18
Table 8: The Potential Core Length of All the
Profiles.
Profiles Z/De
Circular 1.96
Square 4.04
Hexagon 4.76
Crusi-Form 5.11
Briefing for the Without Combustion Nozzle
Configurations
The Figures 34, 35, 36, and 37 due to the
different surface of the nozzle exit there is
change is dispersion of the fluid flow for
the different air supply (30, 60, 90 and
100%). The crusi-form has more half
width than other specimens in X-Y
direction. But in the X-Z direction the
circular jet half-width is more.
As the jet progresses the circular and
square orifices are having equal jet half-
width in X-Y direction. Due to
complicated shape of the cruciform orifice
the jet drops after certain distance as seen
in X-Y plot in Figure 37. As there is
maximum velocity obtained in square
orifice the jet gradually increases after
certain distance.
The Figure 38 the velocity along the
centerline from the nozzle exit has no
variation of velocity up to the distance of
Z/De=9 where the circular nozzle shows a
drop in velocity. The potential core and
velocity decay of the circular specimen is
lesser compared to other specimens.
Single circular nozzle has very less
potential core.
RESULTS OF WITH COMBUSTION,
CO-AXIAL NOZZLE
CONFIGURATIONS The fuel supply pipe is introduced, it has 18
fuel holes and each hole is of 1.5 mm diameter
[26]. The contour plot as well as graph is
plotted to know the characteristics of the fuel
combustion in nozzles.
Contour Plots
The contour plot of different specimen taken.
For 3D models even the cros-sectional view
was also taken. Figure 39 represents velocity
plot along the x-axis, Figure 40 shows cross-
sectional view for different nozzle
configuration.
Fig. 39: Velocity (in m/s) Contour Plot for All Co-Axial Nozzle Configuration.
Journal of Experimental & Applied Mechanics
Volume 6, Issue 1
ISSN: 2230-9845(online), ISSN: 2321-516X(print)
JoEAM (2015) 1-26 © STM Journals 2015. All Rights Reserved Page 19
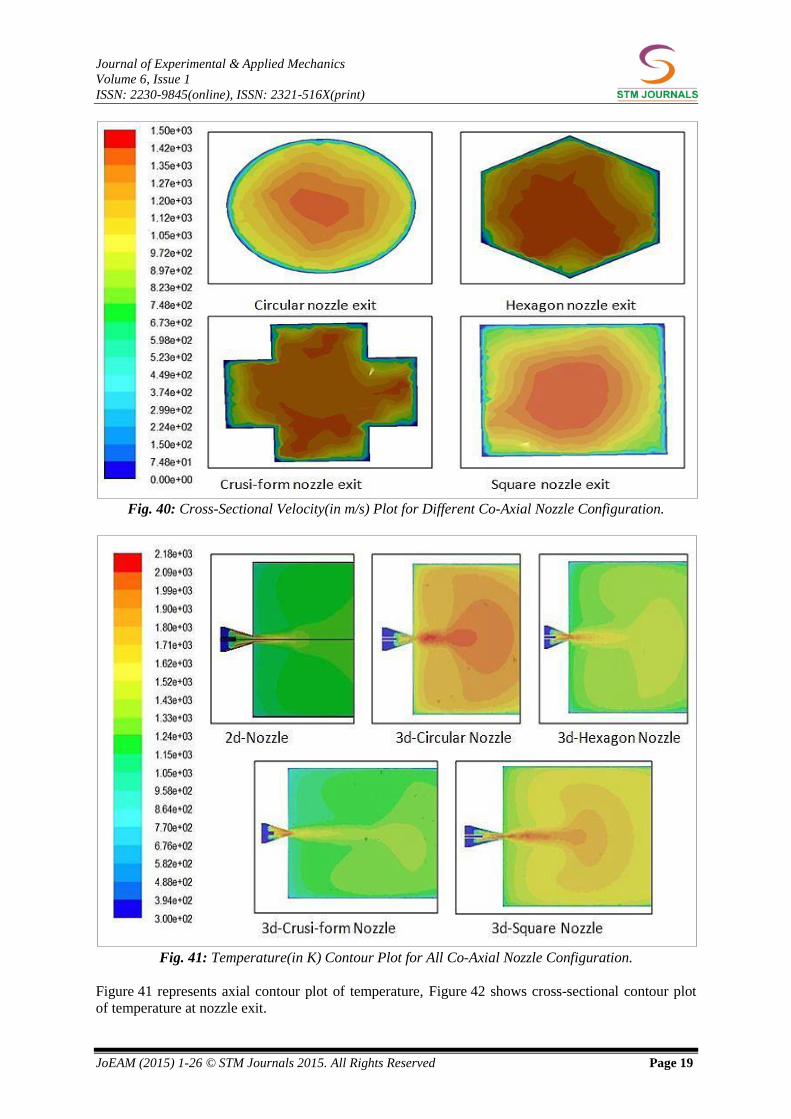
Fig. 40: Cross-Sectional Velocity(in m/s) Plot for Different Co-Axial Nozzle Configuration.
Fig. 41: Temperature(in K) Contour Plot for All Co-Axial Nozzle Configuration.
Figure 41 represents axial contour plot of temperature, Figure 42 shows cross-sectional contour plot
of temperature at nozzle exit.

Performance Evaluation of Multiple Co-Axial Nozzles Mahata Tridib Kumar
JoEAM (2015) 1-26 © STM Journals 2015. All Rights Reserved Page 20
Fig. 42: Cross-Sectional Temperature (in K) Plot for Different Co-Axial Nozzle Configuration.
Fig. 43: Mass Fraction O2 Contour Plot for All Co-Axial Nozzle Configuration.
Fig. 44: Mass Fraction of O2 in Cross-Sectional Contour Plot for All Co-Axial Nozzle Configuration.
Journal of Experimental & Applied Mechanics
Volume 6, Issue 1
ISSN: 2230-9845(online), ISSN: 2321-516X(print)
JoEAM (2015) 1-26 © STM Journals 2015. All Rights Reserved Page 21
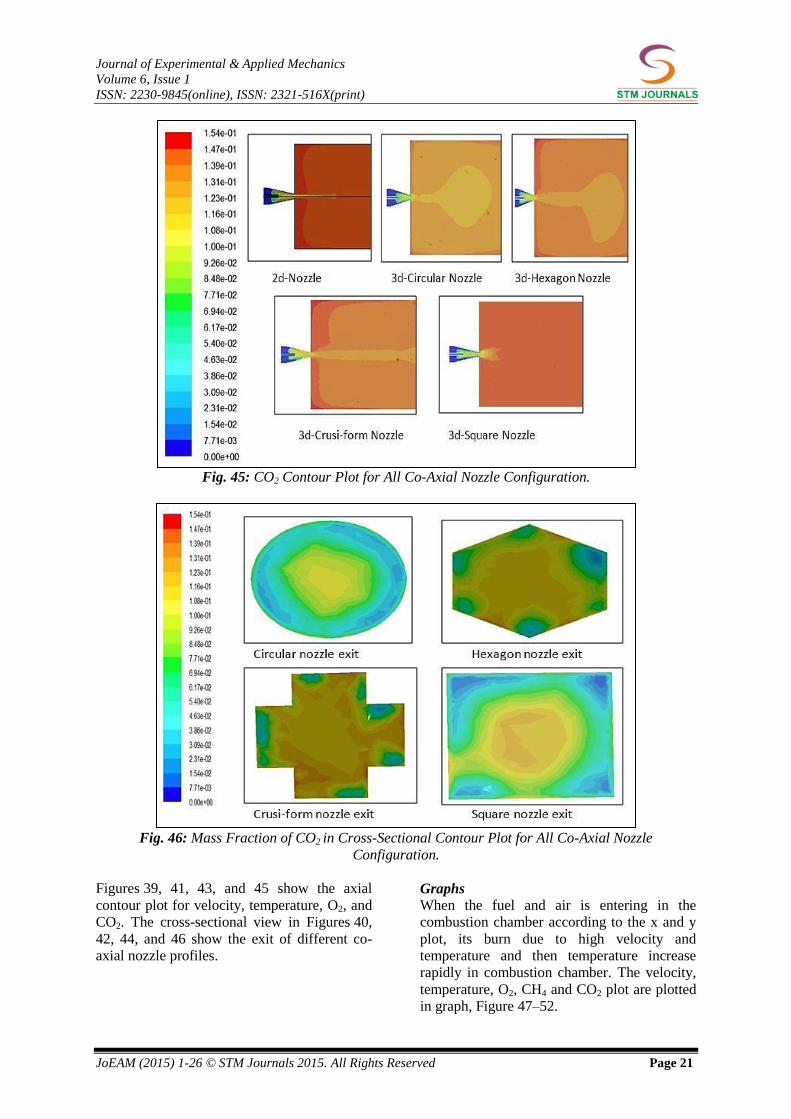
Fig. 45: CO2 Contour Plot for All Co-Axial Nozzle Configuration.
Fig. 46: Mass Fraction of CO2 in Cross-Sectional Contour Plot for All Co-Axial Nozzle
Configuration.
Figures 39, 41, 43, and 45 show the axial
contour plot for velocity, temperature, O2, and
CO2. The cross-sectional view in Figures 40,
42, 44, and 46 show the exit of different co-
axial nozzle profiles.
Graphs
When the fuel and air is entering in the
combustion chamber according to the x and y
plot, its burn due to high velocity and
temperature and then temperature increase
rapidly in combustion chamber. The velocity,
temperature, O2, CH4 and CO2 plot are plotted
in graph, Figure 47–52.

Performance Evaluation of Multiple Co-Axial Nozzles Mahata Tridib Kumar
JoEAM (2015) 1-26 © STM Journals 2015. All Rights Reserved Page 22
Fig. 47: Velocity Plot for Different Co-Axial Configuration At Nozzle Exit.
Fig. 48: Temperature Plot for Different Co-Axial Nozzle Configuration.
Fig. 49: Mass Fraction of CH4 for Different Co-Axial Nozzle Configuration.

Journal of Experimental & Applied Mechanics
Volume 6, Issue 1
ISSN: 2230-9845(online), ISSN: 2321-516X(print)
JoEAM (2015) 1-26 © STM Journals 2015. All Rights Reserved Page 23
Fig. 50: Mass Fraction of CO2 for Different Co-Axial Nozzle Configuration.
Fig. 51: Mass Fraction of O2 for Different Co-Axial Nozzle Configuration.
Fig. 52: Total Pressure Plot for Different Co-Axial Nozzle Configuration.

Performance Evaluation of Multiple Co-Axial Nozzles Mahata Tridib Kumar
JoEAM (2015) 1-26 © STM Journals 2015. All Rights Reserved Page 24
Briefing for the With Combustion, Co-Axial
Nozzle Configurations
From Figure 50 we can see that square co-
axial nozzle produces more CO2 than other
co-axial nozzles.
Crusi-form and circular co-axial nozzles
have maximum temperature.
The cruciform has maximum velocity as
seen in graph.
Combustion of oxygen is very good in the
nozzle, Figure 50 shows crusi-form has a
good O2 consumption, and so, complete
combustion takes place when the fuel
reaches the exit of the nozzle.
For the same value of air and fuel if
increase the fuel inlet the amount of air is
decrease compared to fuel amount.
When the air enters the combustion
chamber and burned with fuel, then mass
fraction is high of value 2.33e–01 in the
combustion chamber and minimum value
2.10e–02, and goes on decreasing in part
of the nozzle, while near to the nozzle wall
mass fraction of oxygen is zero.
But in case of square profile O2
consumption was not complete.
Mass fraction of CO2 goes on decreasing
in part of the nozzle, while near to the
nozzle wall mass fraction CO2 is zero.
Thrust Comparison
The Figure 51 shows that square co-axial
nozzle has maximum thrust as its area is more
and thus the thrust is maximum for it. The
Table 9 gives the basic formula to calculate
thrust. The crusi-form and square profiles are
giving maximum thrust. 2D and 3D-Circular
co-axial nozzles are having almost similar
thrust. Hexagon produces least thrust due to its
concave edges shape the there is no expansion
freely and annular flow moves to the centre of
the jet, thus, the thrust is less. There is
complete combustion of oxygen in crusi-form
co-axial nozzle, which gives out maximum
velocity.
Table 9: The Important Formulas.
Thrust e e a eF= *V + P –Pm *A
Area of circle 2 2A= r /4=530.6e–6 mm r=13 mmπ
Area of square A=a*a=576e–6 mm a=24 mm
Area of crusi-form A= b*x*4 + x*x =507e–6 mm x=13 mm, b=6.5 mm
Area of hexagon 2A= =475.87e–6 mm t=13 3
t2
5 mm
Fig. 53: Thrust for Different Configuration with Fuel Co-Axial Nozzle and Without Fuel.

Journal of Experimental & Applied Mechanics
Volume 6, Issue 1
ISSN: 2230-9845(online), ISSN: 2321-516X(print)
JoEAM (2015) 1-26 © STM Journals 2015. All Rights Reserved Page 25
SUMMARY The graph and contour plot were plotted, the
without fuel nozzle configuration were
compared with each other. With fuel co-axial
nozzles were compared with each other and
finally the thrust for both with and with
combustion were compared.
REFERENCE 1. P. Manivannan, P.K. Dash, B.T.N.
Sridhar. An Experimental Study on
Comparison of Non-circular Co-flow Jet
with Co-axial Jets and Computational
Verification. Space Res. J. 2011; 4(2):
60-70p.
2. K.M.Pandey, Virendra Kumar. CFD
Analysis of Twin Jet Flow At Mach 1.74
with Fluent Software. International
Journal of Environmental Science and
Development (IJESD). Dec 2010; 1(5):
423-428p.
3. K.M.Pandey, S.K.Yadav. CFD Analysis of
a Rocket Nozzle with Four Inlets at Mach
2.1. International Journal of Chemical
Engineering and Applications (IJCEA).
Dec 2010; 1(4): 319-325p.
4. Khanbabaei B., A. Ghasemizad, H.
Farajollahi. CFD-Calculation of Fluid
Flow in VVER-1000 Reactors. J. Applied
Sci. 2008; 8: 780-787p.
5. M. Scheuerer, M. Heitsch, F. Menter, et
al. Evaluation of Computational Fluid
Dynamic Methods for Reactor Safety
Analysis (ECORA). EVOL-ECORA-D02.
2003.
6. J.M. Khodadadi, N. S. Vlachos.
Experimental and Numerical Study of
Confined Coaxial Turbulent Jets. AIAA J.
1989; 27(5): 532-541p.
7. JiřiVondal, JiřiHajek. Experimental and
Numerical Analysis of Wall Heat Transfer
in Non-Premixed Gas Combustor Institute
of Process and Environmental
Engineering. Brno University of
Technology (UPEI VUT), Technicka 2,
616 69 Brno, Czech Republic
8. M.S.U.Chowdhury, J.U. Ahamed, P.M.O.
Faruque, et al. Computational Study of
Supersonic Flow through a Converging
Diverging Nozzle. Engineering e-
Transaction. Jun 2011; 6(1): 37-42p.
9. P. Manivannan, B.T.N. Sridhar.
Characteristic Study of Non-Circular
Incompressible Free Jet. AIAA J. 2004;
27(10): 1347-1353p.
10. Au H., Ko N. W. M. Coaxial Jets of
Different Mean Velocity Ratios. J. Sound
Vibration. 1985; 100(2): 211-232p.
11. J. C. Hewson, D. O. Lignelland A. R.
Kerstein. Modeling Differential Diffusion
In Non-Premixed Combustion: Soot
Transport In The Mixture Fraction
Coordinate. Center for Turbulence
Research (CTR). Proceedings of the
Summer Program 2008; 225-236p.
12. S.P. Khare, T.F. Wall, A.Z. Farida, et al.
Factors Influencing the Ignition of Flames
from Air-Fired Swirl PF Burners
Retrofitted to Oxy-Fuel. Fuel. 2008;
87(7): 1042–1049p.
13. Abolfazl F., Shiriand William K. George,
Jonathan W. Naughton. An Experimental
Study of The Far-Field of Incompressible
Swirling Jets, 36th AIAA Fluid Dynamics
Conference and Exhibit. 5-8 Jun 2006. San
Francisco, California.
14. Oboetswe S. Motsamai, Jan A. Snyman,
Josua P. Meyer. Optimization of Gas
Turbine Combustor Mixing for Improved
Exit Temperature Profile. Department of
Mechanical and Aeronautical
Engineering, University of Pretoria,
Pretoria, South Africa.
15. Roman Webber. Scaling Characteristics of
Aerodynamics, Heat Transfer, and
Pollutant Emissions in Industrial Flames.
Twenty-Sixth Symposium (International)
on Combustion/The Combustion Institute.
1996; 3343–3354p.
16. Eddy Rusly, Mirek Piechowski. CFD
Modeling for Swirl Diffuser and its
Implications on Air Change Effectiveness
Assessment to Green Star's IEQ-2. 12th
Conference of International Building
Performance Simulation Association.
Sydney, 14_16 Nov 2011.
17. C. A. Lin. Modeling of Confined Swirling
Coaxial Jet. Center for Turbulence
Research Annual Research Briefs. 1998;
211-219p.

Performance Evaluation of Multiple Co-Axial Nozzles Mahata Tridib Kumar
JoEAM (2015) 1-26 © STM Journals 2015. All Rights Reserved Page 26
18. S. S. Aloysius, L. C. Wrobel. Comparison
of Flow and Dispersion Properties of Free
and Wall. School of Engineering and
Design, Brunel University, Uxbridge UB8
3PH, UK.
19. Sayre A., Lallemant N., Dugufe, J., et al.
Scaling Characteristics of Aerodynamics
and Low-NOx Properties of Industrial
Natural Gas Burners, The SCALING 400
Study, Part IV: The 300 kW BERL Test
Results, IFRF Doc No F40/y/11,
International Flame Research Foundation,
The Netherlands.
20. Seong Ryong Koh, Wolfgang Schroder,
Matthias Meinke. Turbulence and Heat
Excited Noise Sources in Single and
Coaxial Jets. J Sound Vibration. 2010;
329: 786–803p.
21. Dimitri Papamoschou, Rebecca S. Shupe.
Effect of Nozzle Geometry on Jet Noise
Reduction Using Fan. 12th AIAA/CEAS
Aero-acoustics Conference (27th AIAA
Aero-acoustics Conference). 8-10 May
2006, Cambridge, Massachusetts.
22. R. Palm, S. Grundmann, S. Jakirlić, et al.
Experimental Investigation and Modeling
of Flow and Turbulence in a Swirl
Combustor. Chair of Fluid Mechanics and
Aerodynamics. Darmstadt University of
Technology Petersenstr. 30, D-64287
Darmstadt, Germany.
23. John D. Anderson. Jr. Fundamentals of
Aerodynamics. McGraw-Hill Book Co.,
5th Edn, 2011.
24. Dr. R.K. Bhansal. Fluid Dynamics, A
Textbook of Fluid Mechanics and
Hydraulic Machines. 9th Edn. Lakshmi
Publication. 2005.
25. John D. Anderson. Jr. Computational
Fluid Dynamics-The Basic with
Applications. International Edition 1995.
26. George P. Sutton. Rocket Propulsion
Elements. John Wiley and Sons, Inc.
Canada, 7th Edn. 2001.
27. Addison-Wesley. Chemistry. 2nd Edn.
Copyright. 1990.
28. Fluent 6.3 Tutorial Guide, Tutorial 14.
Using the Non-Premixed Combustion
Model. Sep 2006.
29. Leroy J. Krzycki. How to Design, Build
and Test Small Liquid-fuel Rocket
Engines. Printed in the United States of
America. Mar 1971.
30. Rajesh Bhaskaran, Lance Collins.
Introduction to CFD Basics.
31. Vigor Yang, Mohammed Habiballah,
James Hulka, et al. Liquid Rocket Thrust
Chambers:Aspects of Modeling, Analysis.
Published by the American Institute of
Aeronautics and Astronautics, Inc:
Progress in Astronautics and Aeronautics.
2004.
32. Pressure for Different Types of Propane-
butane Mix.
.http://www.engineeringtoolbox.com/prop
ane-butane-mix-d_1043.html.
33. Compressor Types by Application,
http://www.hitachi-
pt.com/products/si/compressor/radial/h_de
composition.html
Cite this Article
Tridib Kumar Mahata. A Detailed Study
on Performance Evaluation of a Multiple
Co-Axial Nozzles. Journal of
Experimental & Applied Mechanics.
2015; 6(1):