A Covering Method for Detecting Genetic Associations between Rare Variants and Common Phenotypes
12
A Covering Method for Detecting Genetic Associations between Rare Variants and Common Phenotypes Gaurav Bhatia 1,2 *, Vikas Bansal 3 , Olivier Harismendy 3 , Nicholas J. Schork 3 , Eric J. Topol 4 , Kelly Frazer 3,4 , Vineet Bafna 1,5 1 Department of Computer Science and Engineering, University of California San Diego, La Jolla, California, United States of America, 2 Harvard-MIT Division of Health Sciences and Technology, Cambridge, Massachusetts, United States of America, 3 Scripps Translational Science Institute, La Jolla, California, United States of America, 4 Department of Pediatrics, University of California San Diego, La Jolla, California, United States of America, 5 Institute for Genomic Medicine, University of California San Diego, La Jolla, California, United States of America Abstract Genome wide association (GWA) studies, which test for association between common genetic markers and a disease phenotype, have shown varying degrees of success. While many factors could potentially confound GWA studies, we focus on the possibility that multiple, rare variants (RVs) may act in concert to influence disease etiology. Here, we describe an algorithm for RV analysis, RARECOVER. The algorithm combines a disparate collection of RVs with low effect and modest penetrance. Further, it does not require the rare variants be adjacent in location. Extensive simulations over a range of assumed penetrance and population attributable risk (PAR) values illustrate the power of our approach over other published methods, including the collapsing and weighted-collapsing strategies. To showcase the method, we apply RARECOVER to re-sequencing data from a cohort of 289 individuals at the extremes of Body Mass Index distribution (NCT00263042). Individual samples were re-sequenced at two genes, FAAH and MGLL, known to be involved in endocannabinoid metabolism (187Kbp for 148 obese and 150 controls). The RARECOVER analysis identifies exactly one significantly associated region in each gene, each about 5 Kbp in the upstream regulatory regions. The data suggests that the RVs help disrupt the expression of the two genes, leading to lowered metabolism of the corresponding cannabinoids. Overall, our results point to the power of including RVs in measuring genetic associations. Citation: Bhatia G, Bansal V, Harismendy O, Schork NJ, Topol EJ, et al. (2010) A Covering Method for Detecting Genetic Associations between Rare Variants and Common Phenotypes. PLoS Comput Biol 6(10): e1000954. doi:10.1371/journal.pcbi.1000954 Editor: Christian von Mering, University of Zurich, Switzerland Received January 19, 2010; Accepted September 8, 2010; Published October 14, 2010 Copyright: ß 2010 Bhatia et al. This is an open-access article distributed under the terms of the Creative Commons Attribution License, which permits unrestricted use, distribution, and reproduction in any medium, provided the original author and source are credited. Funding: V. Bafna was supported in part by grant (IIS-0810905). V. Bansal, N.J.S., and E.T. were supported in part by the following grants: U19 AG023122-05; R01 MH078151-03; N01 MH22005, U01 DA024417-01, P50 MH081755-01, R01 AG030474-02, N01 MH022005, R01 HL089655-02, R01 MH080134-03, U54 CA143906-01; UL1 RR025774-03, the Price Foundation, and Scripps Genomic Medicine. This publication was made possible by Grant Number T32 HG002295 from the National Human Genome Research Institute (NHGRI). The funders had no role in study design, data collection and analysis, decision to publish, or preparation of the manuscript. Competing Interests: The authors have declared that no competing interests exist. * E-mail: [email protected] Introduction The Common Disease, Common Variant (CDCV) hypothesis [1–3] postulates that the etiology of common diseases is mediated by commonly occurring genomic variants in a population. This has served as the basis for genome wide association (GWA) studies that test for association between individual genomic markers and the disease phenotype. Using genome-wide panels of common SNPs, GWA studies have been successful in identifying hundreds of statistically significant associations for many common diseases as well as several quantitative traits [4–7]. Nevertheless, the success of GWA studies has been mixed. Significant genetic loci have not been detected for several common diseases that are known to have a strong genetic component [4]. Additionally, for many common diseases, associations discovered in GWA studies can account for only a small fraction of the heritability of the disease. While many factors could potentially confound GWA studies, we focus on the possibility that multiple, rare variants may act in concert to influence disease etiology. The alternative to the CDCV hypothesis, the ‘Common Disease, Rare Variant (CDRV)’ hypothesis has been the topic of much recent debate [8], and has shown promise in explaining disease etiology in multiple studies. For example, rare variants (RVs) have been implicated in reduced sterol absorption and, consequently, lower plasma levels of LDL [9,10] and colorectal cancer [11]. While some studies have shown RVs to increase risk, a recent study indicates that RVs also act ‘protectively’, with multiple RVs in renal salt handling genes showing association with reduced renal salt resorption and reduced risk of hypertension [12]. Additionally, rare mutations in IFIH1 have been shown to act protectively against type 1 diabetes [13]. The aforementioned studies and others focused on re-sequencing of the coding regions of candidate genes using Sanger sequencing (see Table 1 in Schork et al. [8] for a summary). Recent technological advances in DNA sequencing have made it possible to re-sequence large stretches of a genome in a cost-effective manner. This is enabling large-scale studies of the impact of RVs on complex diseases. However, several properties of rare variants make their genetic effects difficult to detect with current approaches. Bodmer and Bonilla provide an excellent review of the properties of RVs, and the differences between rare, and common variant analysis [14]. As an example, if a causal variant is rare (10 {4 ƒ MAF ƒ10 {1 ), and the disease is common, then the allele’s Population-Attributable-Risk (PAR), and consequently the odds- ratio (OR), will be low. Additionally, even highly penetrant RVs are PLoS Computational Biology | www.ploscompbiol.org 1 October 2010 | Volume 6 | Issue 10 | e1000954
-
Upload
independent -
Category
Documents
-
view
0 -
download
0
Transcript of A Covering Method for Detecting Genetic Associations between Rare Variants and Common Phenotypes

A Covering Method for Detecting Genetic Associationsbetween Rare Variants and Common PhenotypesGaurav Bhatia1,2*, Vikas Bansal3, Olivier Harismendy3, Nicholas J. Schork3, Eric J. Topol4, Kelly Frazer3,4,
Vineet Bafna1,5
1 Department of Computer Science and Engineering, University of California San Diego, La Jolla, California, United States of America, 2 Harvard-MIT Division of Health
Sciences and Technology, Cambridge, Massachusetts, United States of America, 3 Scripps Translational Science Institute, La Jolla, California, United States of America,
4 Department of Pediatrics, University of California San Diego, La Jolla, California, United States of America, 5 Institute for Genomic Medicine, University of California San
Diego, La Jolla, California, United States of America
Abstract
Genome wide association (GWA) studies, which test for association between common genetic markers and a diseasephenotype, have shown varying degrees of success. While many factors could potentially confound GWA studies, we focuson the possibility that multiple, rare variants (RVs) may act in concert to influence disease etiology. Here, we describe analgorithm for RV analysis, RARECOVER. The algorithm combines a disparate collection of RVs with low effect and modestpenetrance. Further, it does not require the rare variants be adjacent in location. Extensive simulations over a range ofassumed penetrance and population attributable risk (PAR) values illustrate the power of our approach over otherpublished methods, including the collapsing and weighted-collapsing strategies. To showcase the method, we applyRARECOVER to re-sequencing data from a cohort of 289 individuals at the extremes of Body Mass Index distribution(NCT00263042). Individual samples were re-sequenced at two genes, FAAH and MGLL, known to be involved inendocannabinoid metabolism (187Kbp for 148 obese and 150 controls). The RARECOVER analysis identifies exactly onesignificantly associated region in each gene, each about 5 Kbp in the upstream regulatory regions. The data suggests thatthe RVs help disrupt the expression of the two genes, leading to lowered metabolism of the corresponding cannabinoids.Overall, our results point to the power of including RVs in measuring genetic associations.
Citation: Bhatia G, Bansal V, Harismendy O, Schork NJ, Topol EJ, et al. (2010) A Covering Method for Detecting Genetic Associations between Rare Variants andCommon Phenotypes. PLoS Comput Biol 6(10): e1000954. doi:10.1371/journal.pcbi.1000954
Editor: Christian von Mering, University of Zurich, Switzerland
Received January 19, 2010; Accepted September 8, 2010; Published October 14, 2010
Copyright: � 2010 Bhatia et al. This is an open-access article distributed under the terms of the Creative Commons Attribution License, which permitsunrestricted use, distribution, and reproduction in any medium, provided the original author and source are credited.
Funding: V. Bafna was supported in part by grant (IIS-0810905). V. Bansal, N.J.S., and E.T. were supported in part by the following grants: U19 AG023122-05; R01MH078151-03; N01 MH22005, U01 DA024417-01, P50 MH081755-01, R01 AG030474-02, N01 MH022005, R01 HL089655-02, R01 MH080134-03, U54 CA143906-01; UL1RR025774-03, the Price Foundation, and Scripps Genomic Medicine. This publication was made possible by Grant Number T32 HG002295 from the National HumanGenome Research Institute (NHGRI). The funders had no role in study design, data collection and analysis, decision to publish, or preparation of the manuscript.
Competing Interests: The authors have declared that no competing interests exist.
* E-mail: [email protected]
Introduction
The Common Disease, Common Variant (CDCV) hypothesis
[1–3] postulates that the etiology of common diseases is mediated by
commonly occurring genomic variants in a population. This has
served as the basis for genome wide association (GWA) studies that
test for association between individual genomic markers and the
disease phenotype. Using genome-wide panels of common SNPs,
GWA studies have been successful in identifying hundreds of
statistically significant associations for many common diseases as well
as several quantitative traits [4–7]. Nevertheless, the success of GWA
studies has been mixed. Significant genetic loci have not been
detected for several common diseases that are known to have a strong
genetic component [4]. Additionally, for many common diseases,
associations discovered in GWA studies can account for only a small
fraction of the heritability of the disease. While many factors could
potentially confound GWA studies, we focus on the possibility that
multiple, rare variants may act in concert to influence disease etiology.
The alternative to the CDCV hypothesis, the ‘Common
Disease, Rare Variant (CDRV)’ hypothesis has been the topic of
much recent debate [8], and has shown promise in explaining
disease etiology in multiple studies. For example, rare variants
(RVs) have been implicated in reduced sterol absorption and,
consequently, lower plasma levels of LDL [9,10] and colorectal
cancer [11]. While some studies have shown RVs to increase risk,
a recent study indicates that RVs also act ‘protectively’, with
multiple RVs in renal salt handling genes showing association with
reduced renal salt resorption and reduced risk of hypertension
[12]. Additionally, rare mutations in IFIH1 have been shown to
act protectively against type 1 diabetes [13].
The aforementioned studies and others focused on re-sequencing
of the coding regions of candidate genes using Sanger sequencing
(see Table 1 in Schork et al. [8] for a summary). Recent
technological advances in DNA sequencing have made it possible
to re-sequence large stretches of a genome in a cost-effective
manner. This is enabling large-scale studies of the impact of RVs on
complex diseases. However, several properties of rare variants make
their genetic effects difficult to detect with current approaches.
Bodmer and Bonilla provide an excellent review of the properties of
RVs, and the differences between rare, and common variant
analysis [14]. As an example, if a causal variant is rare (10{4ƒ
MAF ƒ10{1), and the disease is common, then the allele’s
Population-Attributable-Risk (PAR), and consequently the odds-
ratio (OR), will be low. Additionally, even highly penetrant RVs are
PLoS Computational Biology | www.ploscompbiol.org 1 October 2010 | Volume 6 | Issue 10 | e1000954

unlikely to be in Linkage Disequilibrium (LD) with more common
genetic variations that might be genotyped for an association study
of a common disease. Therefore, single-marker tests of association,
which exploit LD-based associations, are likely to have low power. If
the CDRV hypothesis holds, a combination of multiple RVs must
contribute to population risk. In this case, there is a challenge of
detecting multi-allelic association between a locus and the disease.
Methods to detect such associations are only just being
developed. A natural approach is a collapsing strategy, where
multiple RVs at a locus are collapsed into a single variant. Such
strategies have low power when ‘causal’ and neutral RVs are
combined (See for example, Li and Leal [15]). Madsen and
Browning have recently proposed a weighted-sum statistic to detect
loci in which disease individuals are enriched for rare variants [16].
In their approach, variants are weighted according to their
frequency in the unaffected sample, with low frequency variants
being weighted more heavily. Each individual is scored as a sum of
the weights of the mutations carried. The test then determines if the
diseased individuals are weighted more heavily than expected in a
null-model. Madsen and Browning show that with 50% of variants
in a group being causal and a combined odds ratio w15, the
weighted-sum statistic detects associations with high power. While
effective, this approach depends upon the inclusion of high
proportion of causal rare variants in the formation of the test
statistics and strong penetrance to detect significant association. In
their simulations, the PAR of the locus is partitioned equally among
all variants, an assumption that may not always hold.
The Combined Multivariate and Collapsing Method (CMC),
proposed by Li and Leal, combines variants into groups based upon
predefined criteria (e.g. allele frequency, function) [15]. An
individual has a ‘1’ for a group if any variant in the group is
carried and a ‘0’ otherwise. The CMC approach then considers
each of the groups in a multivariate analysis to explain disease risk.
This combination of the collapsing approach and multivariate
analysis results in an increase of power over single-marker and
multiple marker approaches. However, as Li and Leal point out, the
method relies on correct grouping of variants. The power is reduced
as functional variants are excluded and non-functional variants are
included in a group. Assignment of SNPs to incorrect groups may,
in fact, decrease power below that attainable through single marker
analysis. Indeed, a recent analysis by Manolio and colleagues
suggests that new methods might be needed when the causal
variants have both low PAR and low penetrance values [17].
Here, we focus on a model-free method, RARECOVER, that
collapses only a subset of the variants at a locus. Informally,
consider a locus L encoding a set S of rare variants. RARECOVER
associates L with a phenotype by measuring the strongest possible
association formed by collapsing any subset S’(S of variants at L.
At first glance, such an approach has many problems. First,
selecting an optimal subset of SNPs is computationally intensive,
scaling as 2DSD. We show that a greedy approach to selecting the
optimal subset scales linearly, making it feasible to conduct
associations on a large set of candidate loci.
A second confounding factor is that the large number of
different tests at a locus increase the likelihood of false association.
The adjustment required to control the type I error could decrease
the power of the method. However, extensive simulations show
otherwise. Our results suggest that moderately penetrant alleles
(RR§1:25) with small PAR (ƒ10%), and moderately sized
cohorts (*500 cases and *500 controls) are sufficient for
RARECOVER to detect significant association. This compares well
with the current power of single-marker GWA studies on common
variants, and outperforms other methods for RV detection.
We also applied RARECOVER to the analysis of two genes, FAAH,
and MGLL, in the endocannabinoid pathway in a large sequencing
study of obese and non-obese individuals. The endocannabinoid path-
way is an important mediator of a variety of neurological functions
[18,19]. Endocannabinoids, acting upon CB1 receptors in the brain,
the gastrointestinal tract, and a variety of other tissues, have been
shown to influence food intake and weight gain in animal models of
obesity. Using a selective endocannabinoid receptor (CB1) antagonist,
SR141716 (Rimonanabt; Sanofi-Synthelabo) leads to reduced food
intake in mice. Correspondingly, elevation of leptin levels have been
shown to decrease concentrations of endogenous CB1 agonists,
Anandamide, and 2-AG in mice, thereby reducing food-intake [20].
The FAAH and MGLL enzymes serve as regulators of endocanna-
binoid signaling in the brain [21], by catalyzing the hydrolysis of
endocannabinoid including anandamide (AEA), and 2-AG. Gene
expression studies in lean and obese women show significantly
decreased levels of AEA and 2-AG, as well as over-expression of CB1
and FAAH in lean, as opposed to obese women [22]. While evidence
points to a genetic association of these loci with obesity, multiple
recent studies using common SNPs in the FAAH region have failed to
confirm an association [23–26]. A Pro129Thr polymorphism was
tentatively associated with obesity in a cohort of Europe and and
Asian ancestry, but has not been replicated in other data [27].
We tested the hypothesis that multiple, rare alleles at these loci
are associated with obesity. We have used unpublished (submitted)
data from Frazer and colleagues, where the FAAH (31Kbp) and
MGLL (156Kbp) regions were re-sequenced using next generation
technologies in 148 obese and 150 non-obese individuals taken as
extremes of the body mass index distribution from subjects in a large
clinical trial (the CRESCENDO cohort, NCT00263042). The
resequencing identified a number of common, and rare variants in
the region. We applied RARECOVER to determine if multiple RVs,
i.e., allelic heterogeneity, mediated the genetic effects of FAAH and
MGLL on obesity. RARECOVER identified a single region at each
locus with permutation adjusted p-values of 0:002 and 0:001. In
each case, the significant locus was immediately upstream of the
gene, consistent with a regulatory function for the rare variants.
Author Summary
We focus on the problem of detecting multiple rare variants(RVs) that act together to influence disease phenotypes. Inconsidering this problem, we argue that the detection ofcausal rare variants must necessarily be different fromtypical single-marker analysis used for common variantsand propose a novel algorithm, RARECOVER, to accomplishthis analysis. RARECOVER combines a disparate collection ofRVs, each with very low effect and modest penetrance.Extensive simulations over a range of values for penetranceand population attributable risk (PAR) illustrate the powerof our approach over other published methods, includingthe collapsing and weighted-sum strategies. To showcasethe method, we applied RARECOVER to data from 289individuals at the extremes of Body Mass Index distribution(NCT00263042), sequenced around the FAAH and MGLLgenes. RARECOVER analysis identified exactly one significantlyassociated region in each gene, each about 5Kbp in theupstream regulatory regions. The data suggests that theRVs help disrupt the expression of the two genes leading tolowered metabolism of the corresponding endocannabi-noids previously linked with obesity. Overall, our resultspoint to the power of including RVs in measuring geneticassociations, and suggest that whole genome, DNAsequencing-based association studies investigating RVeffects are feasible.
Covering Method for Rare Variant Analysis
PLoS Computational Biology | www.ploscompbiol.org 2 October 2010 | Volume 6 | Issue 10 | e1000954
Methods
Modeling RV associationWe define a locus as a genomic region of fixed size (nucleotides).
Let S denote the set of RVs in the locus. We abuse notation
slightly by using S to also denote the locus itself. A case-control
study at S includes a set of individual genotypes. For genotype I ,
and RV s [S, let Is [ f0, 1, 2g denote the number of minor alleles
that genotype I carries for variant s. Extending the notation to
subsets, C(S of RVs, define IC~P
s[C Is. For a subset C(S,
denote a union-variant AC as follows: individual I has the allele
AC~1 if and only if ICw0. Otherwise, AC~0. The union-variant
is a virtual construct that helps combine the effect of multiple RVs.
Let D~1 (respectively, D~0) represent the case (respectively,
control) status of an individual.
For an individual chosen at random, and C(S, let XCORR
(AC ,D) denote an association test statistic between the union-variant
AC and the disease status D. Here, we will use Pearson’s x2 as the
test-statistic, but the method remains unchanged for other measures.
Using this notation, the collapsing strategy described by Li and Leal
[15] uses the test-statistic XCORR (AS, D) to associate a locus S with
the disease. Instead, we define the association statistic for locus S by
Xcorr(S, D)~ maxC(S
Xcorr(AC , D) ð1Þ
The RARECOVER methodOur method, RARECOVER, accepts a locus containing a set S of
RVs in a window of fixed size (nucleotides). It returns the test-
statistic, XCORR (S, D), a p-value on the statistic, and the subset
C(S of RVs that contribute to the union variant. The window
size C(S is a parameter. When the input locus is larger than the
window size, RARECOVER looks at overlapping windows of size
C(S, where each window is shifted one RV away from the
previous window. For each window, the XCORR statistic is output,
along with a non-adjusted p-value.
The computation for the XCORR statistic on a single window is
described in the Algorithm below. Given a set S of RVs over nindividuals, the naive computation for computing XCORR (S, D)needs *n2DSD computations. A reduction from the MAX-COVER
problem can be used to show that the problem is NP-hard,
indicating that no provably efficient algorithm is likely [28].
Similar reductions can also be used to show the hardness result for
a variety of other proposed association statistics. Therefore, we
employ a greedy heuristic that is fast (*DSDn computations), and
does well in practice. In each step, (see Algorithm), we select the
variant that adds the most to the statistic, until no further
improvement is possible. On a standard Linux workstation, the
computation is fast, about 100 windows per second.
Computing significance. While the test-statistic is a x2 test
on the union-variant AC , significance cannot be computed
directly, as C is optimized over many possibilities. The multiple-
tests will increase the statistic for non-associated loci as well. We
compute significance by applying RARECOVER to permutations of
the case-control genotypes.
The number of permuted trials required to achieve genome-
wide significance can be large. We make the computation
tractable using two ideas: first, empirical tests show that the x2
statistic on AC correlates tightly with the permutation p-value
(Figure 1). Note that the saturation at the end is due to limited
trials. Let t denote the value of XCORR for a window, S. When t is
less than a pre-determined threshold (t), no permutation test is
done, as the window is unlikely to be significant. When t§t, the
statistic is recomputed after permuting case and control labels
(default 104 permutations), and a p-value is computed as the
fraction of the permuted samples whose XCORR value matches or
exceeds t. To save time on this computation, we run permutations
in a data-driven fashion. We run a maximum of 104 permutations,
but stop as soon as we obtain 2 samples for which the RARECOVER
statistic exceeds t.
p{val(t)~2=k0
if 2 samples match or exceed t in
k0 v 104 iterations
10{4 otherwise
8><>: ð2Þ
Both, the parameter t, and the maximum number of iterations can
be adjusted, based on desired level of significance, and the size of
the genomic region. Here, we set parameter t~20, which
corresponds to a permutation adjusted p-value of 10{3:5 in
Figure 1. This ensures fast computation with no loss of power (See
Results).
RARECOVER for genic regions. RARECOVER can also be
applied to a locus containing a single gene. The definition of a
procedure RARECOVER (S, Q)Set C~ 6 0, u~ 6 0repeat
Set C~CzfugSelect u[S{C that maximizes XCORR (SCzfug,D)
while Xcorr(SCzfug,D){Xcorr(SC ,D)§Q� �
return XCORR (SC , D).The RARECOVER method for detecting locus association. Cdescribes the current subset of ‘causal’ SNPs. Initially C isempty. In each iteration, the RV u that maximizes the teststatistic is chosen, and added to C. When the improvedstatistic Xcorr(SCzfug, D) is not significantly better thanthe current statistic (Xcorr(SC , D)), the method stops, andoutputs C.
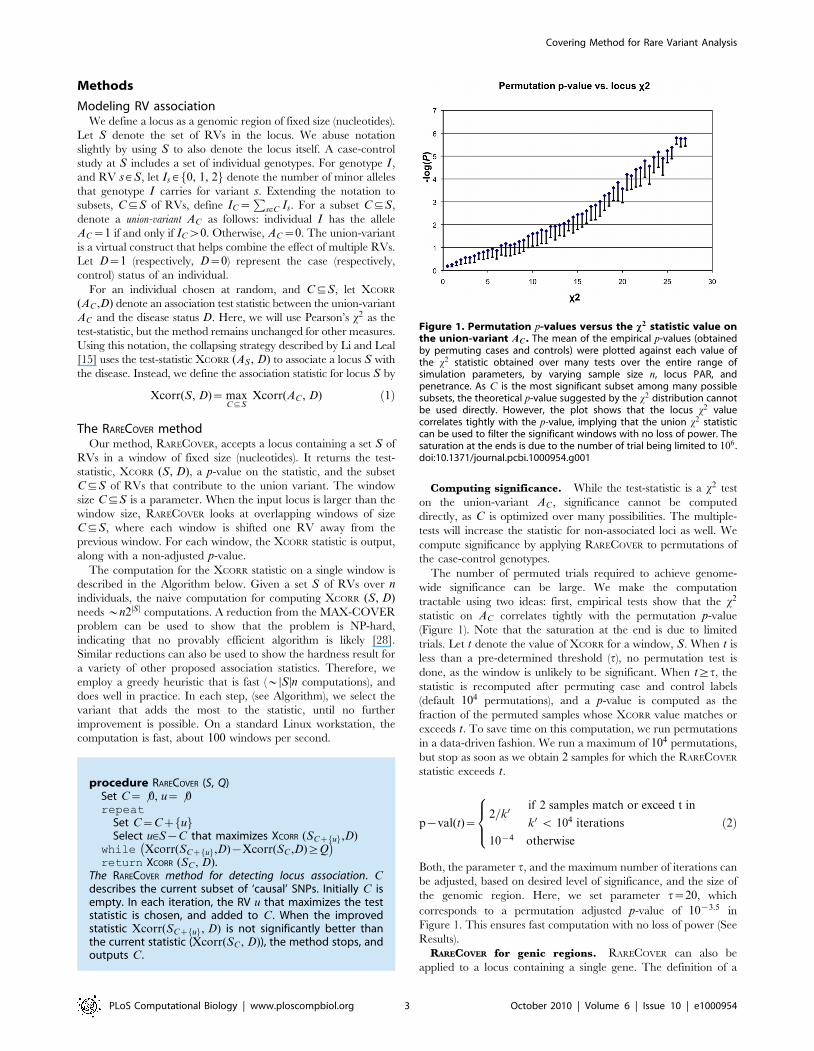
Figure 1. Permutation p-values versus the x2 statistic value onthe union-variant AC . The mean of the empirical p-values (obtainedby permuting cases and controls) were plotted against each value ofthe x2 statistic obtained over many tests over the entire range ofsimulation parameters, by varying sample size n, locus PAR, andpenetrance. As C is the most significant subset among many possiblesubsets, the theoretical p-value suggested by the x2 distribution cannotbe used directly. However, the plot shows that the locus x2 valuecorrelates tightly with the p-value, implying that the union x2 statisticcan be used to filter the significant windows with no loss of power. Thesaturation at the ends is due to the number of trial being limited to 106 .doi:10.1371/journal.pcbi.1000954.g001
Covering Method for Rare Variant Analysis
PLoS Computational Biology | www.ploscompbiol.org 3 October 2010 | Volume 6 | Issue 10 | e1000954

gene varies; it sometimes includes only the coding exons, or it can
include all exons including UTRs, and even regulatory regions.
While the scanning window approach of RARECOVER can be
applied unchanged for any genic locus, we must correct for
multiple windows at a locus. Given a genic locus, we permute cases
and controls multiple times and score every window in the locus.
Then, the adjusted (locus) p-value of a window with XCORR value tis the fraction of all permuted windows in the locus with an XCORR
score of t or higher.
RARECOVER parameters. RARECOVER is a model-free
approach, and has only 2 parameters: the window size W , and
a convergence cut-off Q (see procedure above). Empirical tests by
simulation show that the performance is similar despite large
variations in window size 5-10Kbp, as well as a choice of Q.
Hence, no explicit training was performed, and the parameters
were set to W~5Kbp, and Q~0:5. The performance of
RARECOVER was extensively tested over a wide range of
simulation parameters.
Parameters for RV simulationConsider a locus with a set S of rare-variants. Let a subset C of
RVs be causal, in the sense that a mutation at any s [ C increases
the likelihood of disease. For an individual, I , we use AC and AC
as short-forms of the events AC~1 (or,ICw0), and AC~0,
respectively. Similarly, events D, D reflect case-control status for
the individual. We work with the following 3 parameters for power
calculations:
1. Disease prevalence in the population, denoted by PD.
2. Penetrance of the locus, denoted by r~Pr(DDAC)
3. Locus-PAR, denoted by R~Pr(AC DD)
Note that the PAR for a variant is often described by the
following (Ex:Bodmer and Bonilla, 1999 [14])
R~K{y
K~1{
y
Kð3Þ
where K is the number of individuals with the phenotype, and y is
the number of individuals that show the phenotype, but do not
have the variant allele. In our terminology
R~1{Pr(AC\D)
PD
~1{Pr(AC DD)~Pr(AC DD)
The choice of these parameters is intuitive as we expect an RV
to have moderate penetrance, but very low PAR (Pr(AsDD)).However, the multiple RVs in C have roughly additive effect,
leading to moderate locus-PARs. These parameters are tightly
related to other, more common measures of locus association, such
as the Odds-Ratio (OR), as shown below:
OR(S)~Pr(DjAC)
Pr(DjAC)
�Pr(DjAC)
Pr(DjAC)
~r
1{r
�Pr(DjAC)
Pr(DjAC)
To compute Pr(DDAC), we start with a Bayesian relation for
computing the likelihood of a genotype containing a causal RV as
Pr(AC)~Pr(AC DD)Pr(D)
Pr(DDAC)~
RPD
rð4Þ
Then,
Pr(DDAC)~Pr(AC DD)PD
Pr(AC)~
(1{R)PD
Pr(AC)~
(1{R)PD
1{RPD
r
� � ð5Þ
and,
Pr(DDAC)~1{Pr(DDAC): ð6Þ
Simulating constant sized populations (CP)We simulate multiple case-control studies over a range
PD, r, R. A simulation of N individuals begins with the division
of the individuals into qN
2r cases and t
N
2s controls. Once this is
done two additional steps take place.
1. Generate a set of RVs for the simulated locus containing
causal, and neutral RVs.
2. Simulate the genotypes for each individual.
We start by generating causal RVs. As RVs do not show high
LD, we can model the population by generating each RV
independently. We adapt Pritchard’s argument that the frequency
distribution of rare, deleterious, RVs must follow Wright’s model
under purifying selection [29]. Therefore, the allele frequencies pare sampled according to:
f (p)!p(bS{1)(1{p)(bN {1)es(1{p) ð7Þ
where,
N p, allelic frequency
N s, selection coefficient
N bS , rate of mutation from normal allele to causal
N bN , rate of repair from causal allele to normal
We choose s~30:0, bS~0:2, bN~0:002 [29]. Note that we do
not control the number of causal RVs, DCD, directly, in our
simulation. Recall that
Pr(AC DD)~1{Pr(AC DD)~1{ Ps[C
Pr(AfsgDD)
Further,
Pr(�AAfsgjD)~1{Pr(AfsgjD)~1{Pr(Afsg)Pr(DjAfsg)
Pr(D)
� �~1{
psr
PD
Therefore, setting a value for R limits the size of the causal RV.
R~Pr(AC DD)~1{ Ps[C
(1{psr
PD
) ð8Þ
Further, the sampling procedure occasionally generates SNPs with
a high individual PAR. These variants would show up as being
significant even with a single marker analysis. Therefore, these are
discarded. The procedure SIMULATERV describes the method to
generate causal RVs. To generate neutral RVs, we use Fu’s model
of allele distributions [30] on a coalescent, which suggests that the
number of mutations that affect i individuals in a population with
mutation rate h is given by h=i. For the purposes of our simulation
we use h~5:0.
Covering Method for Rare Variant Analysis
PLoS Computational Biology | www.ploscompbiol.org 4 October 2010 | Volume 6 | Issue 10 | e1000954
Simulating genotypesFor both cases and controls, each RV is sampled independently.
For non-causal variants s [ S{C, the probability of picking a
minor allele is ps, for both case and control individuals. To sample
alleles from causal SNPs, recall that under the union model,
Pr(DDAfsg)~Pr(DDAC)~r for all s [ C. Therefore, the minor
allele frequencies are given by
Pr(AfsgDD)~rps
PD
Pr(AfsgDD)~(1{r)ps
(1{PD)
We assume HW equilibrium to sample genotypes for case and
control individuals.
Simulating populations with bottleneck and recentexpansion (BRE)
Recently, Kryukov and colleagues [31] described a demographic
model that explicitly models European ancestry. The population is
assumed to be relatively stable for a long period, but is followed by a
bottleneck, and rapid expansion after the bottleneck (about 7500–
9000 years ago, with 20–25 years per generation). They validate
their model by comparing observed versus predicted allelic
frequencies. To this model, they add ‘causal’ (mostly deleterious)
mutations using a distribution of selection coefficients from a
gamma distribution. The causal alleles are associated with a change
in a quantitative trait (QT). The QT values are normally
distributed. Individuals carrying any causal mutation have QT
values drawn from a Normal distribution with a shifted mean. For
Rare variant analysis, individuals are chosen from the lower
(Control) and upper (Case) tails of the QT distribution.
For our study, the authors provided us with individual genotypes
simulated according to their demographic model, with causal
mutations contributing to the following shifts: 0:125s (Low), 0:25s(Medium), 0:5s (High). The highest and lowest 5%, and 10% of the
QT distributions were used for the Case and Control populations.
For the 5% population (500 controls, 500 cases), the locus PAR
varied as 0:01–0:05. For the 10% populations, the number of
individuals is larger (1000 controls, 1000 cases), but the PAR values
decrease to 0:013 (Low), 0:017 (Medium), and 0:02 (High).
Reimplementing alternative strategiesFor the purposes of comparison, we reimplemented the collapsing
statistic proposed by Li and Leal [15] as well as the weighted-sum
statistic used by Madsen and Browning [16]. Both publications
discuss the separation of variants into groups based upon function
(i.e. non-synonymous coding SNPs) or other property. However,
because we are performing our studies on model free, unannotated
data, we do not perform any such grouping.
As a result, the CMC approach proposed by Li and Leal [15] is
equivalent to collapsing all variants in the locus and calculating the
association. Li and Leal show that the assignment of variants to
functional groups, separately collapsing these groups, and finally
performing a multivariate analysis improves power to detect causal
loci. However, separation of variants into groups is inexact and the
authors show that errors in group assignment can confound tests
for significance. Additionally, performing this separation on a
genome wide scale may be intractable.
The weighted-sum statistic proposed by Madsen and Browning
[16] is used to detect association between a pre-defined group and
a disease state. To compare fairly we defined the group of
mutations as all mutations at a locus. We reimplemented the
weighting approach based upon allele frequency as well as the sum
and ranking approach to determine a score. Finally, we
implemented a single-marker test as a bi-allelic x2-statistic with
1df. The tests were used to score windows over a wide range of
simulation parameters to better understand how RARECOVER
performed in comparison to the collapsing, and weighted
strategies. For each strategy, a p-value of significance was
established by doing 104 randomized trials using permuted case
and control data. All three methods were run on the same sets of
permuted data, and the p-values were used to compare. Code for
all methods is available upon request from the authors.
MSMB gene resequencingRecently, Yeager and colleagues [32] resequenced a *97Kbp
region including the micro-seminoprotein-b (MSMB) gene
(chr10:51, 168, 025–51, 265, 101) for 36 prostate cancer cases, 26controls, plus another 8 CEPH individuals. While the number of
individuals is too small to derive rare variants, we used the prediced
genotypes supplied by the authors for RV analysis. For this analysis,
we used 26z8 individuals together as controls, and all 284 variants
with MAF v5% were used as input to RARECOVER.
CRESCENDO dataIn a recently submitted study 40 LR-PCR amplicons (Har-
ismendy et al., unpublished) were used to re-sequence 31Kbp from
the FAAH locus (NCBI36 chr1:46621328–46653043) and 157Kbp
from the MGLL locus (NCBI36 chr3:128880456–129037011). A
total of 289 individuals were selected for sequencing from two tails
of the BMI distribution of the CRESCENDO cohort (http://
clinicaltrials.gov/ct/show/NCT00263042). 147 individuals had
BMI lower than 30 kg/m2 and 142 individuals a BMI greater than
40 kg/m2. DNA sequencing libraries were prepared, and sequenced
as previously described in Harismendy, 2009 [33] with the following
modifications: sequencing libraries were indexed by 4nt barcode
located downstream of the adapter [34] and between one and six
libraries were loaded per lane of the Illumina GAII instrument. The
reads obtained from several lanes were merged, aligned and the
variant called using MAQ mapmerge, map and cnsview+SNPfilter
options respectively [35]. All samples had an average coverage
greater than 60|. Allowing for a minimum coverage of 3 reads and
a minimum base quality (Phred §10), a raw set of 1451 single
nucleotides variants (SNVs) were identified in the population. The
SNVs were filtered for Hardy Weinberg Equilibrium in the controls
(pv0:001) and genotyping rate §90% of the samples to obtain a
final set of 1393 SNVs (220 FAAH, 1173 MGLL). Of these,
165z935~1100 SNVs had MAF ƒ0:1, and were selected for RV
analysis. The list and location of the RVs identified by RARECOVER
as supporting the association is available in Supplemental Table S1.
procedure SIMULATERV()Set P~1Set C~ 6 0Repeat
Sample ps of low PAR (ƒ0:01) from Wright’s distributionGenerate a SNP s with MAF ps
C~CzfsgP~P � (1{
psr
PD
)
while Pw(1{R)Generating Case-Control genotypes for RV simulation.Note that there is no explicit control of the number ofcausal RVs, but the choice of parameters helps to boundthe number.
Covering Method for Rare Variant Analysis
PLoS Computational Biology | www.ploscompbiol.org 5 October 2010 | Volume 6 | Issue 10 | e1000954
Results
Simulations (CP)We simulated cases and controls for a collection of sample sizes,
ranging from n~100 to over n~5000 individuals with equal
numbers of cases and controls. The MAF for rare variants ranged
from 10{4 to 10{1. Throughout, we assume the disease
prevalence in the population to be PD~0:05. The PAR for the
locus was set to R [ f0:1, 0:2g. The penetrance, r was varied in
the interval ½0:075, 0:25�, corresponding to OR values of 1:6–7.
The dependence on parameters is somewhat non-trivial. To see
this, note thatr
PD
is a lower bound on relative risk. Reducing PD
would increase the relative risk, only making association easier. In
other words if the disease incidence is low, and a causal variant is
low frequency, then the presence of the causal variant is a strong
indicator of disease status.
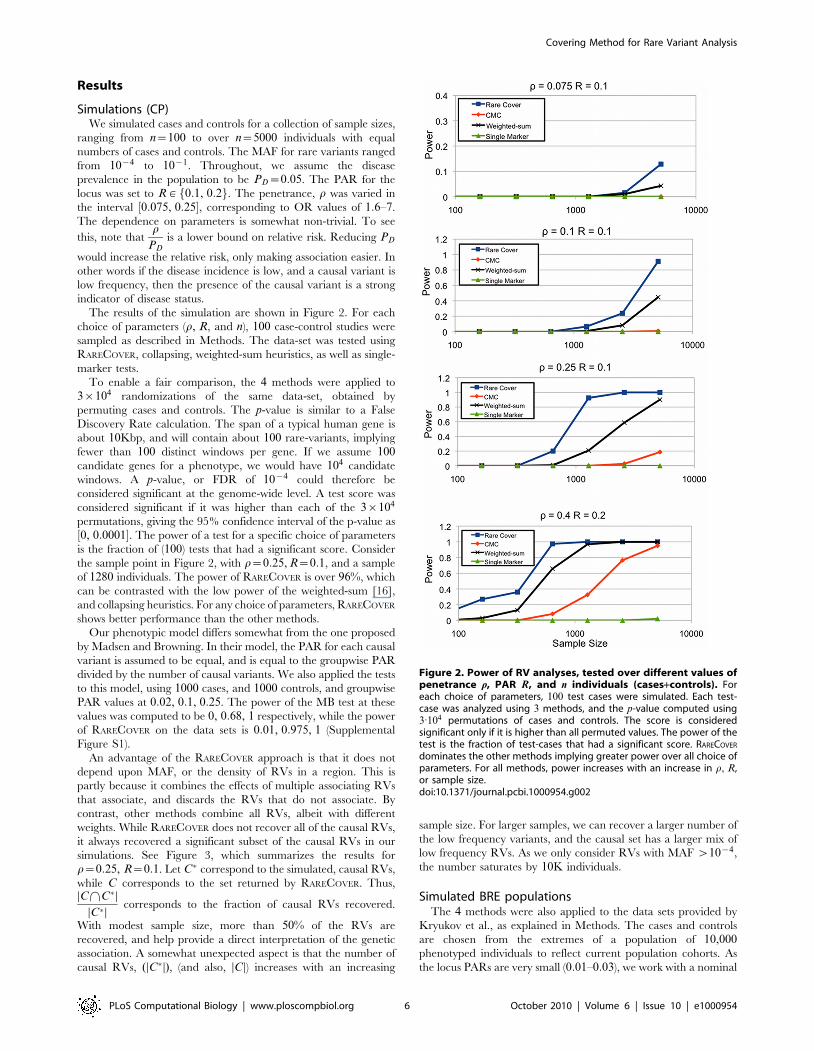
The results of the simulation are shown in Figure 2. For each
choice of parameters (r, R, and n), 100 case-control studies were
sampled as described in Methods. The data-set was tested using
RARECOVER, collapsing, weighted-sum heuristics, as well as single-
marker tests.
To enable a fair comparison, the 4 methods were applied to
3|104 randomizations of the same data-set, obtained by
permuting cases and controls. The p-value is similar to a False
Discovery Rate calculation. The span of a typical human gene is
about 10Kbp, and will contain about 100 rare-variants, implying
fewer than 100 distinct windows per gene. If we assume 100candidate genes for a phenotype, we would have 104 candidate
windows. A p-value, or FDR of 10{4 could therefore be
considered significant at the genome-wide level. A test score was
considered significant if it was higher than each of the 3|104
permutations, giving the 95% confidence interval of the p-value as
½0, 0:0001�. The power of a test for a specific choice of parameters
is the fraction of (100) tests that had a significant score. Consider
the sample point in Figure 2, with r~0:25, R~0:1, and a sample
of 1280 individuals. The power of RARECOVER is over 96%, which
can be contrasted with the low power of the weighted-sum [16],
and collapsing heuristics. For any choice of parameters, RARECOVER
shows better performance than the other methods.
Our phenotypic model differs somewhat from the one proposed
by Madsen and Browning. In their model, the PAR for each causal
variant is assumed to be equal, and is equal to the groupwise PAR
divided by the number of causal variants. We also applied the tests
to this model, using 1000 cases, and 1000 controls, and groupwise
PAR values at 0:02, 0:1, 0:25. The power of the MB test at these
values was computed to be 0, 0:68, 1 respectively, while the power
of RARECOVER on the data sets is 0:01, 0:975, 1 (Supplemental
Figure S1).
An advantage of the RARECOVER approach is that it does not
depend upon MAF, or the density of RVs in a region. This is
partly because it combines the effects of multiple associating RVs
that associate, and discards the RVs that do not associate. By
contrast, other methods combine all RVs, albeit with different
weights. While RARECOVER does not recover all of the causal RVs,
it always recovered a significant subset of the causal RVs in our
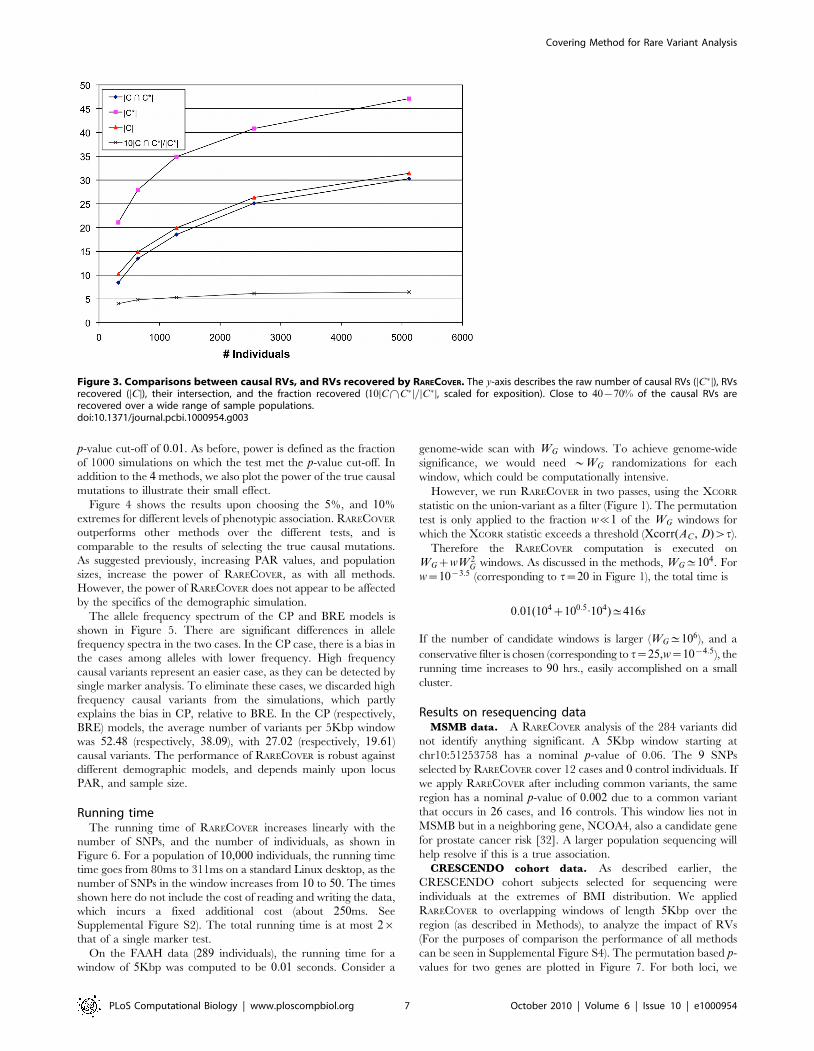
simulations. See Figure 3, which summarizes the results for
r~0:25, R~0:1. Let C� correspond to the simulated, causal RVs,
while C corresponds to the set returned by RARECOVER. Thus,DC\C�D
DC�Dcorresponds to the fraction of causal RVs recovered.
With modest sample size, more than 50% of the RVs are
recovered, and help provide a direct interpretation of the genetic
association. A somewhat unexpected aspect is that the number of
causal RVs, (DC�D), (and also, DCD) increases with an increasing
sample size. For larger samples, we can recover a larger number of
the low frequency variants, and the causal set has a larger mix of
low frequency RVs. As we only consider RVs with MAF w10{4,
the number saturates by 10K individuals.
Simulated BRE populationsThe 4 methods were also applied to the data sets provided by
Kryukov et al., as explained in Methods. The cases and controls
are chosen from the extremes of a population of 10,000phenotyped individuals to reflect current population cohorts. As
the locus PARs are very small (0:01–0:03), we work with a nominal
Figure 2. Power of RV analyses, tested over different values ofpenetrance r, PAR R, and n individuals (cases+controls). Foreach choice of parameters, 100 test cases were simulated. Each test-case was analyzed using 3 methods, and the p-value computed using3:104 permutations of cases and controls. The score is consideredsignificant only if it is higher than all permuted values. The power of thetest is the fraction of test-cases that had a significant score. RARECOVER
dominates the other methods implying greater power over all choice ofparameters. For all methods, power increases with an increase in r, R,or sample size.doi:10.1371/journal.pcbi.1000954.g002
Covering Method for Rare Variant Analysis
PLoS Computational Biology | www.ploscompbiol.org 6 October 2010 | Volume 6 | Issue 10 | e1000954
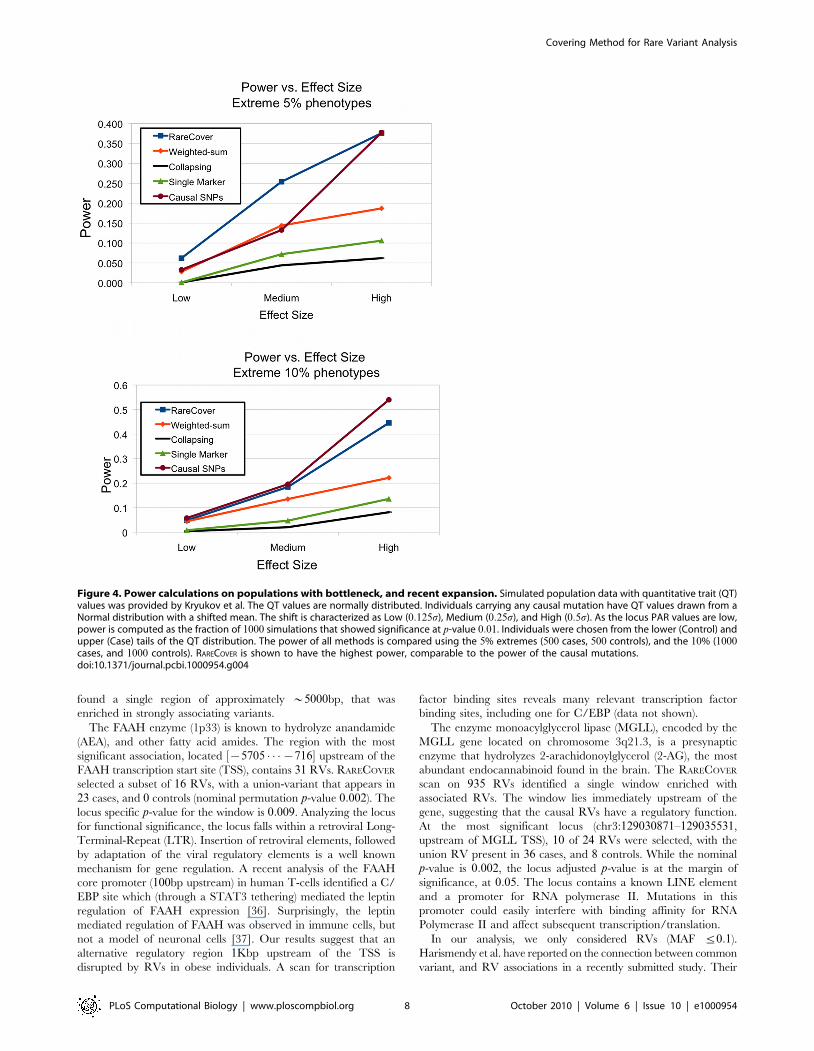
p-value cut-off of 0:01. As before, power is defined as the fraction
of 1000 simulations on which the test met the p-value cut-off. In
addition to the 4 methods, we also plot the power of the true causal
mutations to illustrate their small effect.
Figure 4 shows the results upon choosing the 5%, and 10%
extremes for different levels of phenotypic association. RARECOVER
outperforms other methods over the different tests, and is
comparable to the results of selecting the true causal mutations.
As suggested previously, increasing PAR values, and population
sizes, increase the power of RARECOVER, as with all methods.
However, the power of RARECOVER does not appear to be affected
by the specifics of the demographic simulation.
The allele frequency spectrum of the CP and BRE models is
shown in Figure 5. There are significant differences in allele
frequency spectra in the two cases. In the CP case, there is a bias in
the cases among alleles with lower frequency. High frequency
causal variants represent an easier case, as they can be detected by
single marker analysis. To eliminate these cases, we discarded high
frequency causal variants from the simulations, which partly
explains the bias in CP, relative to BRE. In the CP (respectively,
BRE) models, the average number of variants per 5Kbp window
was 52:48 (respectively, 38:09), with 27:02 (respectively, 19:61)
causal variants. The performance of RARECOVER is robust against
different demographic models, and depends mainly upon locus
PAR, and sample size.
Running timeThe running time of RARECOVER increases linearly with the
number of SNPs, and the number of individuals, as shown in
Figure 6. For a population of 10,000 individuals, the running time
time goes from 80ms to 311ms on a standard Linux desktop, as the
number of SNPs in the window increases from 10 to 50. The times
shown here do not include the cost of reading and writing the data,
which incurs a fixed additional cost (about 250ms. See
Supplemental Figure S2). The total running time is at most 2|that of a single marker test.
On the FAAH data (289 individuals), the running time for a
window of 5Kbp was computed to be 0:01 seconds. Consider a
genome-wide scan with WG windows. To achieve genome-wide
significance, we would need *WG randomizations for each
window, which could be computationally intensive.
However, we run RARECOVER in two passes, using the XCORR
statistic on the union-variant as a filter (Figure 1). The permutation
test is only applied to the fraction w%1 of the WG windows for
which the XCORR statistic exceeds a threshold (Xcorr(AC , D)wt).
Therefore the RARECOVER computation is executed on
WGzwW 2G windows. As discussed in the methods, WG^104. For
w~10{3:5 (corresponding to t~20 in Figure 1), the total time is
0:01(104z100:5:104)^416s
If the number of candidate windows is larger (WG^106), and a
conservative filter is chosen (corresponding to t~25,w~10{4:5), the
running time increases to 90 hrs., easily accomplished on a small
cluster.
Results on resequencing dataMSMB data. A RARECOVER analysis of the 284 variants did
not identify anything significant. A 5Kbp window starting at
chr10:51253758 has a nominal p-value of 0.06. The 9 SNPs
selected by RARECOVER cover 12 cases and 0 control individuals. If
we apply RARECOVER after including common variants, the same
region has a nominal p-value of 0:002 due to a common variant
that occurs in 26 cases, and 16 controls. This window lies not in
MSMB but in a neighboring gene, NCOA4, also a candidate gene
for prostate cancer risk [32]. A larger population sequencing will
help resolve if this is a true association.
CRESCENDO cohort data. As described earlier, the
CRESCENDO cohort subjects selected for sequencing were
individuals at the extremes of BMI distribution. We applied
RARECOVER to overlapping windows of length 5Kbp over the
region (as described in Methods), to analyze the impact of RVs
(For the purposes of comparison the performance of all methods
can be seen in Supplemental Figure S4). The permutation based p-
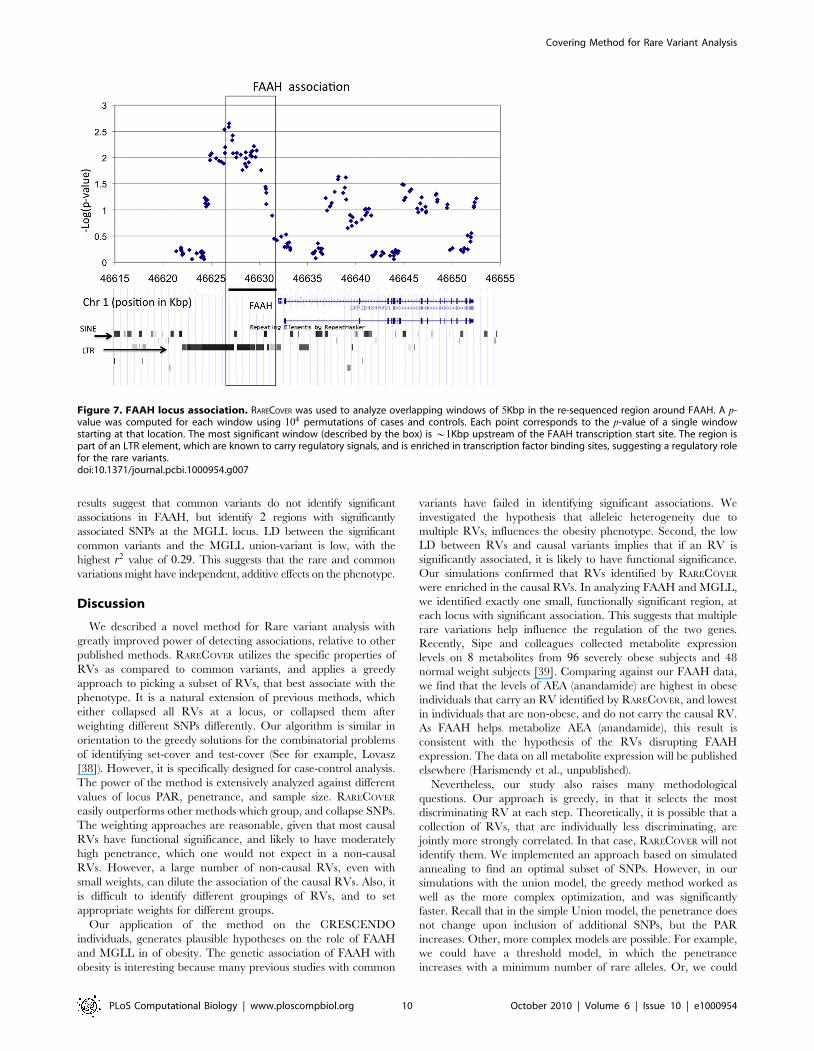
values for two genes are plotted in Figure 7. For both loci, we
Figure 3. Comparisons between causal RVs, and RVs recovered by RARECOVER. The y-axis describes the raw number of causal RVs (DC�D), RVsrecovered (DCD), their intersection, and the fraction recovered (10DC\C�D=DC�D, scaled for exposition). Close to 40{70% of the causal RVs arerecovered over a wide range of sample populations.doi:10.1371/journal.pcbi.1000954.g003
Covering Method for Rare Variant Analysis
PLoS Computational Biology | www.ploscompbiol.org 7 October 2010 | Volume 6 | Issue 10 | e1000954
found a single region of approximately *5000bp, that was
enriched in strongly associating variants.
The FAAH enzyme (1p33) is known to hydrolyze anandamide
(AEA), and other fatty acid amides. The region with the most
significant association, located ½{5705 � � �{716� upstream of the
FAAH transcription start site (TSS), contains 31 RVs. RARECOVER
selected a subset of 16 RVs, with a union-variant that appears in
23 cases, and 0 controls (nominal permutation p-value 0:002). The
locus specific p-value for the window is 0:009. Analyzing the locus
for functional significance, the locus falls within a retroviral Long-
Terminal-Repeat (LTR). Insertion of retroviral elements, followed
by adaptation of the viral regulatory elements is a well known
mechanism for gene regulation. A recent analysis of the FAAH
core promoter (100bp upstream) in human T-cells identified a C/
EBP site which (through a STAT3 tethering) mediated the leptin
regulation of FAAH expression [36]. Surprisingly, the leptin
mediated regulation of FAAH was observed in immune cells, but
not a model of neuronal cells [37]. Our results suggest that an
alternative regulatory region 1Kbp upstream of the TSS is
disrupted by RVs in obese individuals. A scan for transcription
factor binding sites reveals many relevant transcription factor
binding sites, including one for C/EBP (data not shown).
The enzyme monoacylglycerol lipase (MGLL), encoded by the
MGLL gene located on chromosome 3q21.3, is a presynaptic
enzyme that hydrolyzes 2-arachidonoylglycerol (2-AG), the most
abundant endocannabinoid found in the brain. The RARECOVER
scan on 935 RVs identified a single window enriched with
associated RVs. The window lies immediately upstream of the
gene, suggesting that the causal RVs have a regulatory function.
At the most significant locus (chr3:129030871–129035531,
upstream of MGLL TSS), 10 of 24 RVs were selected, with the
union RV present in 36 cases, and 8 controls. While the nominal
p-value is 0:002, the locus adjusted p-value is at the margin of
significance, at 0:05. The locus contains a known LINE element
and a promoter for RNA polymerase II. Mutations in this
promoter could easily interfere with binding affinity for RNA
Polymerase II and affect subsequent transcription/translation.
In our analysis, we only considered RVs (MAF ƒ0:1).
Harismendy et al. have reported on the connection between common
variant, and RV associations in a recently submitted study. Their
Figure 4. Power calculations on populations with bottleneck, and recent expansion. Simulated population data with quantitative trait (QT)values was provided by Kryukov et al. The QT values are normally distributed. Individuals carrying any causal mutation have QT values drawn from aNormal distribution with a shifted mean. The shift is characterized as Low (0:125s), Medium (0:25s), and High (0:5s). As the locus PAR values are low,power is computed as the fraction of 1000 simulations that showed significance at p-value 0:01. Individuals were chosen from the lower (Control) andupper (Case) tails of the QT distribution. The power of all methods is compared using the 5% extremes (500 cases, 500 controls), and the 10% (1000cases, and 1000 controls). RARECOVER is shown to have the highest power, comparable to the power of the causal mutations.doi:10.1371/journal.pcbi.1000954.g004
Covering Method for Rare Variant Analysis
PLoS Computational Biology | www.ploscompbiol.org 8 October 2010 | Volume 6 | Issue 10 | e1000954
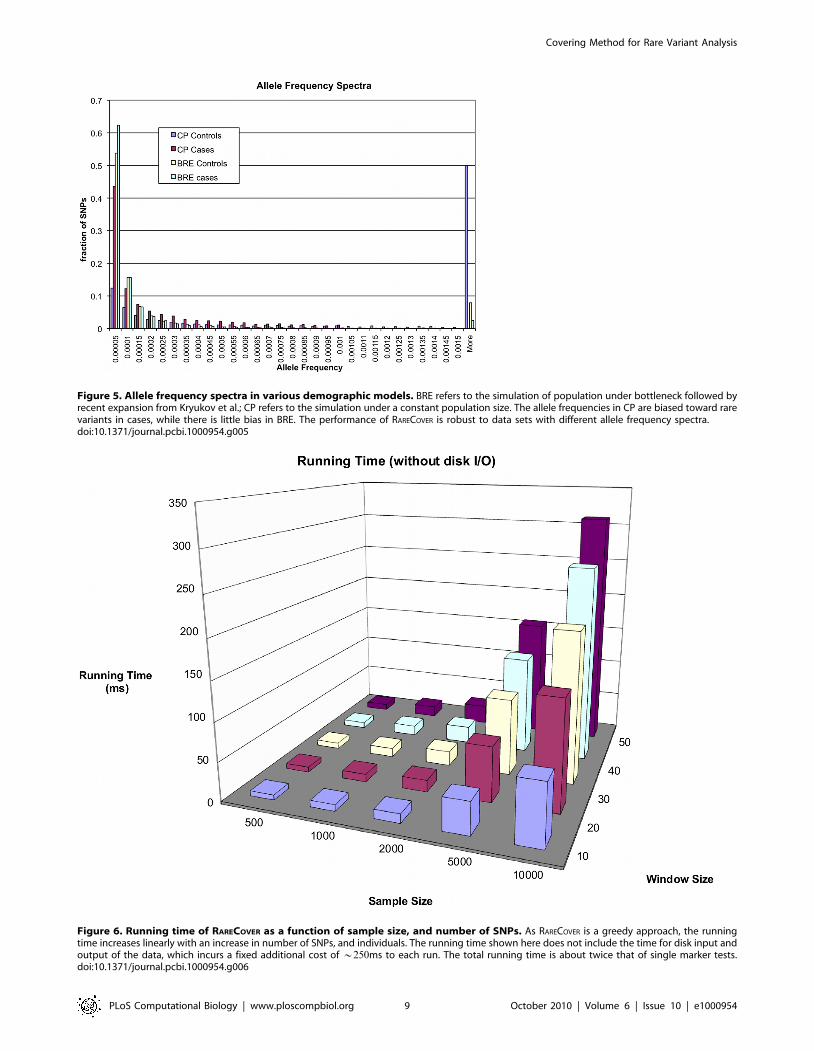
Figure 5. Allele frequency spectra in various demographic models. BRE refers to the simulation of population under bottleneck followed byrecent expansion from Kryukov et al.; CP refers to the simulation under a constant population size. The allele frequencies in CP are biased toward rarevariants in cases, while there is little bias in BRE. The performance of RARECOVER is robust to data sets with different allele frequency spectra.doi:10.1371/journal.pcbi.1000954.g005
Figure 6. Running time of RARECOVER as a function of sample size, and number of SNPs. As RARECOVER is a greedy approach, the runningtime increases linearly with an increase in number of SNPs, and individuals. The running time shown here does not include the time for disk input andoutput of the data, which incurs a fixed additional cost of *250ms to each run. The total running time is about twice that of single marker tests.doi:10.1371/journal.pcbi.1000954.g006
Covering Method for Rare Variant Analysis
PLoS Computational Biology | www.ploscompbiol.org 9 October 2010 | Volume 6 | Issue 10 | e1000954
results suggest that common variants do not identify significant
associations in FAAH, but identify 2 regions with significantly
associated SNPs at the MGLL locus. LD between the significant
common variants and the MGLL union-variant is low, with the
highest r2 value of 0:29. This suggests that the rare and common
variations might have independent, additive effects on the phenotype.
Discussion
We described a novel method for Rare variant analysis with
greatly improved power of detecting associations, relative to other
published methods. RARECOVER utilizes the specific properties of
RVs as compared to common variants, and applies a greedy
approach to picking a subset of RVs, that best associate with the
phenotype. It is a natural extension of previous methods, which
either collapsed all RVs at a locus, or collapsed them after
weighting different SNPs differently. Our algorithm is similar in
orientation to the greedy solutions for the combinatorial problems
of identifying set-cover and test-cover (See for example, Lovasz
[38]). However, it is specifically designed for case-control analysis.
The power of the method is extensively analyzed against different
values of locus PAR, penetrance, and sample size. RARECOVER
easily outperforms other methods which group, and collapse SNPs.
The weighting approaches are reasonable, given that most causal
RVs have functional significance, and likely to have moderately
high penetrance, which one would not expect in a non-causal
RVs. However, a large number of non-causal RVs, even with
small weights, can dilute the association of the causal RVs. Also, it
is difficult to identify different groupings of RVs, and to set
appropriate weights for different groups.
Our application of the method on the CRESCENDO
individuals, generates plausible hypotheses on the role of FAAH
and MGLL in of obesity. The genetic association of FAAH with
obesity is interesting because many previous studies with common
variants have failed in identifying significant associations. We
investigated the hypothesis that alleleic heterogeneity due to
multiple RVs, influences the obesity phenotype. Second, the low
LD between RVs and causal variants implies that if an RV is
significantly associated, it is likely to have functional significance.
Our simulations confirmed that RVs identified by RARECOVER
were enriched in the causal RVs. In analyzing FAAH and MGLL,
we identified exactly one small, functionally significant region, at
each locus with significant association. This suggests that multiple
rare variations help influence the regulation of the two genes.
Recently, Sipe and colleagues collected metabolite expression
levels on 8 metabolites from 96 severely obese subjects and 48
normal weight subjects [39]. Comparing against our FAAH data,
we find that the levels of AEA (anandamide) are highest in obese
individuals that carry an RV identified by RARECOVER, and lowest
in individuals that are non-obese, and do not carry the causal RV.
As FAAH helps metabolize AEA (anandamide), this result is
consistent with the hypothesis of the RVs disrupting FAAH
expression. The data on all metabolite expression will be published
elsewhere (Harismendy et al., unpublished).
Nevertheless, our study also raises many methodological
questions. Our approach is greedy, in that it selects the most
discriminating RV at each step. Theoretically, it is possible that a
collection of RVs, that are individually less discriminating, are
jointly more strongly correlated. In that case, RARECOVER will not
identify them. We implemented an approach based on simulated
annealing to find an optimal subset of SNPs. However, in our
simulations with the union model, the greedy method worked as
well as the more complex optimization, and was significantly
faster. Recall that in the simple Union model, the penetrance does
not change upon inclusion of additional SNPs, but the PAR
increases. Other, more complex models are possible. For example,
we could have a threshold model, in which the penetrance
increases with a minimum number of rare alleles. Or, we could
Figure 7. FAAH locus association. RARECOVER was used to analyze overlapping windows of 5Kbp in the re-sequenced region around FAAH. A p-value was computed for each window using 104 permutations of cases and controls. Each point corresponds to the p-value of a single windowstarting at that location. The most significant window (described by the box) is *1Kbp upstream of the FAAH transcription start site. The region ispart of an LTR element, which are known to carry regulatory signals, and is enriched in transcription factor binding sites, suggesting a regulatory rolefor the rare variants.doi:10.1371/journal.pcbi.1000954.g007
Covering Method for Rare Variant Analysis
PLoS Computational Biology | www.ploscompbiol.org 10 October 2010 | Volume 6 | Issue 10 | e1000954

have additive models, where the penetrance increases as a function
of the number of rare alleles. As more re-sequencing data becomes
available, these will be the focus of additional investigation. A
second issue is that our definition of a locus is set arbitrarily as a
window of fixed length, much like in other methods. However,
empirical tests with a small range of window-sizes did not
significantly change the results. It is possible that a dynamic
assignment of the size of the locus could increase power, but at the
cost of additional computations.
In this study, we analyze only the rare variants. While the
RARECOVER algorithm can work unchanged with rare and
common variants, a correct test for power of such an approach
would require a biological model that combines the effect of RV
and common variants. It is hard to speculate on such models in the
absence of empirical data. However, preliminary results on
comparing common and rare variants at the MGLL locus suggest
an independent, additive effect.
GWA studies have shown that identifying the genetic basis of
disease depends upon many factors. For this reason, algorithms
have been devised to deal with population substructure issues,
epistatic interactions between loci, as well as rare variant analysis.
Our results indicate that RV analysis is useful in many contexts,
and novel methods may have to be developed to include the effect
of RVs in all of the above.
Supporting Information
Figure S1 Madsen and Browning models. RareCover perfor-
mance on the phenotypic models proposed by Madsen and
Browning. In this model, the PAR for each causal variant is
assumed to be equal, and is equal to the groupwise PAR divided
by the number of causal variants. The power of RareCover and
other methods is applied on populations with 1000 cases, and 1000
controls, and groupwise PAR values at 0.02, 0.1, and 0.25.
Found at: doi:10.1371/journal.pcbi.1000954.s001 (0.46 MB TIF)
Figure S2 RareCover running time including I/O. Running
time of RareCover as a function of number of individuals, and
number of SNPs, including time for input and output of data. The
time for input and output dominates when the number of
individuals is less than 2000. Otherwise, the time increases linearly
with an increase in number of SNPs, and number of individuals.
Found at: doi:10.1371/journal.pcbi.1000954.s002 (1.51 MB TIF)
Figure S3 RareCover on MGLL. Performance of RareCover on
MGLL. The most significant window (described by the box)
appears upstream of the MGLL gene, near the promoter region.
Found at: doi:10.1371/journal.pcbi.1000954.s003 (0.55 MB TIF)
Figure S4 Method comparison. Performance of RareCover the
weighted-sum statistic, and collapsing on the FAAH and MGLL.
Some peaks are replicated in only a subset of methods. RareCover
is the only method that identifies a significant hit in a region in
MGLL containing common variants associated with the disease
phenotype. Common variants were excluded from this analysis.
Found at: doi:10.1371/journal.pcbi.1000954.s004 (1.62 MB TIF)
Table S1 Detailed SNP information for the windows highlighted
in Figure 3 and Figure S3. The columns indicate the SNP id,
position, and relative risk of each SNP within the selected 5000 bp
windows. Case Matches refers to the number of case samples that
carry the SNP, and similarly for Control Matches. The worksheets
containing raw data give the genotype at each SNP (0,1, or 2)
within each 5000 bp window as well as disease status. Individual
ids have been removed.
Found at: doi:10.1371/journal.pcbi.1000954.s005 (0.15 MB XLS)
Acknowledgments
We would like to thank Dr. Gregory Kryukov and Dr. Shamil Sunyaev for
kindly providing simulated population genotypes based on demographic
models of European populations, and Dr. Quan Chen and Dr. Meredith
Yeager for providing the MSMB resequencing data.
Author Contributions
Conceived and designed the experiments: G. Bhatia, V. Bafna. Performed
the experiments: G. Bhatia, V. Bafna. Analyzed the data: G. Bhatia,
O. Harismendy, N.J. Schork, E. J. Topol, K. Frazer, V. Bafna. Wrote the
paper: G. Bhatia, O. Harismendy, N.J. Schork, J. Topol, K. Frazer,
V. Bafna. Helped with algorithm development and statistical analysis:
V. Bansal.
References
1. Lander ES (1996) The new genomics: global views of biology. Science 274:
536–539.
2. Pritchard JK, Cox NJ (2002) The allelic architecture of human disease genes:
common disease-common variant…or not? Hum Mol Genet 11: 2417–2423.
3. Reich DE, Lander ES (2001) On the allelic spectrum of human disease. Trends
Genet 17: 502–510.
4. Consortium TWTCC (2007) Genome-wide association study of 14,000 cases of
seven common diseases and 3,000 shared controls. Nature 447: 661–678.
5. Frayling TM, Timpson NJ, Weedon MN, Zeggini E, Freathy RM, et al. (2007)
A common variant in the FTO gene is associated with body mass index and
predisposes to childhood and adult obesity. Science 316: 889–894.
6. Helgadottir A, Thorleifsson G, Manolescu A, Gretarsdottir S, Blondal T, et al.
(2007) A common variant on chromosome 9p21 affects the risk of myocardial
infarction. Science 316: 1491–1493.
7. McPherson R, Pertsemlidis A, Kavaslar N, Stewart A, Roberts R, et al. (2007) A
common allele on chromosome 9 associated with coronary heart disease. Science
316: 1488–1491.
8. Schork NJ, Murray SS, Frazer KA, Topol EJ (2009) Common vs. rare allele
hypotheses for complex diseases. Curr Opin Genet Dev 19: 212–219.
9. Cohen JC, Pertsemlidis A, Fahmi S, Esmail S, Vega GL, et al. (2006) Multiple
rare variants in NPC1L1 associated with reduced sterol absorption and plasma
low-density lipoprotein levels. Proc Natl Acad Sci USA 103: 1810–1815.
10. Cohen JC, Kiss RS, Pertsemlidis A, Marcel YL, McPherson R, et al. (2004)
Multiple rare alleles contribute to low plasma levels of HDL cholesterol. Science
305: 869–872.
11. Fearnhead NS, Wilding JL, Winney B, Tonks S, Bartlett S, et al. (2004)
Multiple rare variants in different genes account for multifactorial inherited
susceptibility to colorectal adenomas. Proc Natl Acad Sci USA 101: 15992–
15997.
12. Ji W, Foo JN, O’Roak BJ, Zhao H, Larson MG, et al. (2008) Rare independent
mutations in renal salt handling genes contribute to blood pressure variation.
Nat Genet 40: 592–599.
13. Nejentsev S, Walker N, Riches D, Egholm M, Todd JA (2009) Rare variants of
IFIH1, a gene implicated in antiviral responses, protect against type 1 diabetes.
Science 324: 387–389.
14. Bodmer W, Bonilla C (2008) Common and rare variants in multifactorial
susceptibility to common diseases. Nat Genet 40: 695–701.
15. Li B, Leal SM (2008) Methods for detecting associations with rare variants for
common diseases: application to analysis of sequence data. Am J Hum Genet 83:
311–321.
16. Madsen BE, Browning SR (2009) A groupwise association test for rare mutations
using a weighted sum statistic. PLoS Genet 5: e1000384.
17. Manolio TA, Collins FS, Cox NJ, Goldstein DB, Hindorff LA, et al. (2009)
Finding the missing heritability of complex diseases. Nature 461: 747–753.
18. Di Marzo V, Bifulco M, De Petrocellis L (2004) The endocannabinoid system
and its therapeutic exploitation. Nat Rev Drug Discov 3: 771–784.
19. Di Marzo V (2009) The endocannabinoid system: its general strategy of action,
tools for its pharmacological manipulation and potential therapeutic exploita-
tion. Pharmacol Res 60: 77–84.
20. Di Marzo V, Goparaju SK, Wang L, Liu J, Batkai S, et al. (2001) Leptin-
regulated endocannabinoids are involved in maintaining food intake. Nature
410: 822–825.
21. Cravatt BF, Giang DK, Mayfield SP, Boger DL, Lerner RA, et al. (1996)
Molecular characterization of an enzyme that degrades neuromodulatory fatty-
acid amides. Nature 384: 83–87.
22. Engeli S, Bohnke J, Feldpausch M, Gorzelniak K, Janke J, et al. (2005)
Activation of the peripheral endocannabinoid system in human obesity. Diabetes
54: 2838–2843.
Covering Method for Rare Variant Analysis
PLoS Computational Biology | www.ploscompbiol.org 11 October 2010 | Volume 6 | Issue 10 | e1000954

23. Jensen DP, Andreasen CH, Andersen MK, Hansen L, Eiberg H, et al. (2007)
The functional Pro129Thr variant of the FAAH gene is not associated with
various fat accumulation phenotypes in a population-based cohort of 5,801
whites. J Mol Med 85: 445–449.
24. Emmanuelle Durand E, Lecoeur C, Delplanque J, Benzinou M, Degraeve F,
et al. (2008) Evaluating the Association of FAAH Common Gene Variation with
Childhood, Adult Severe Obesity and Type 2 Diabetes in the French
Population. Obesity Facts 1: 305–309.
25. Muller TD, Reichwald K, Bronner G, Kirschner J, Nguyen TT, et al. (2008)
Lack of association of genetic variants in genes of the endocannabinoid system
with anorexia nervosa. Child Adolesc Psychiatry Ment Health 2: 33.
26. Lieb W, Manning AK, Florez JC, Dupuis J, Cupples LA, et al. (2009) Variants in
the CNR1 and the FAAH genes and adiposity traits in the community. Obesity
(Silver Spring) 17: 755–760.
27. Sipe JC, Waalen J, Gerber A, Beutler E (2005) Overweight and obesity
associated with a missense polymorphism in fatty acid amide hydrolase (FAAH).
Int J Obes (Lond) 29: 755–759.
28. Garey MR, Johnson DS (1979) Computers and Intractability: A Guide to the
Theory of NP-completeness W.H. Freeman and Company.
29. Pritchard JK (2001) Are rare variants responsible for susceptibility to complex
diseases? Am J Hum Genet 69: 124–137.
30. Fu YX (1995) Statistical properties of segregating sites. Theor Popul Biol 48:
172–197.
31. Kryukov GV, Shpunt A, Stamatoyannopoulos JA, Sunyaev SR (2009) Power of
deep, all-exon resequencing for discovery of human trait genes. Proc Natl AcadSci USA 106: 3871–3876.
32. Yeager M, Deng Z, Boland J, Matthews C, Bacior J, et al. (2009) Comprehensive
resequence analysis of a 97 kb region of chromosome 10q11.2 containing theMSMB gene associated with prostate cancer. Hum Genet.
33. Harismendy O, Ng PC, Strausberg RL, Wang X, Stockwell TB, et al. (2009)Evaluation of next generation sequencing platforms for population targeted
sequencing studies. Genome Biol 10: R32.
34. Craig DW, Pearson JV, Szelinger S, Sekar A, Redman M, et al. (2008)Identification of genetic variants using bar-coded multiplexed sequencing. Nat
Methods 5: 887–893.35. Li H, Ruan J, Durbin R (2008) Mapping short DNA sequencing reads and
calling variants using mapping quality scores. Genome Res 18: 1851–1858.36. Maccarrone M, Di Rienzo M, Finazzi-Agro A, Rossi A (2003) Leptin activates
the anandamide hydrolase promoter in human T lymphocytes through STAT3.
J Biol Chem 278: 13318–13324.37. Maccarrone M, Gasperi V, Fezza F, Finazzi-Agro A, Rossi A (2004) Differential
regulation of fatty acid amide hydrolase promoter in human immune cells andneuronal cells by leptin and progesterone. Eur J Biochem 271: 4666–4676.
38. Lovasz L (1975) On the ratio of optimal integral and fractional covers. Discrete
Mathematics 13: 383–390.39. Sipe JC, Scott TM, Murray S, Harismendy O, Simon GM, et al. (2010)
Biomarkers of endocannabinoid system activation in severe obesity. PLoS ONE5: e8792.
Covering Method for Rare Variant Analysis
PLoS Computational Biology | www.ploscompbiol.org 12 October 2010 | Volume 6 | Issue 10 | e1000954