A CONSUMER PROFILE OF FIRST YEAR ... - CiteSeerX
248
A CONSUMER PROFILE OF FIRST YEAR MARKETING STUDENTS AT THE PRETORIA CAMPUS OF THE TSHWANE UNIVERSITY OF TECHNOLOGY by TANIA HOLTZHAUSEN Submitted in fulfillment of the requirements for the degree of MASTER OF COMMERCE in the subject BUSINESS MANAGEMENT at the UNIVERSITY OF SOUTH AFRICA PROMOTER: PROF JW STRYDOM DATE: MARCH 2006
-
Upload
khangminh22 -
Category
Documents
-
view
0 -
download
0
Transcript of A CONSUMER PROFILE OF FIRST YEAR ... - CiteSeerX
A CONSUMER PROFILE OF FIRST YEAR MARKETING STUDENTS AT
THE PRETORIA CAMPUS OF THE TSHWANE UNIVERSITY OF
TECHNOLOGY
by
TANIA HOLTZHAUSEN
Submitted in fulfillment of the requirements for the degree of
MASTER OF COMMERCE
in the subject
BUSINESS MANAGEMENT
at the
UNIVERSITY OF SOUTH AFRICA
PROMOTER: PROF JW STRYDOM
DATE: MARCH 2006
ii
ACKNOWLEDGEMENTS
My heartfelt gratitude to the following people who played fundamental roles in
the success of my study:
• God, to Whom all praise is due
• My study leader Prof Strydom, for his patience, guidance, encouragement
and above all, his mentorship
• My late mother Marésa, whose unfailing love and belief in me has carried
me throughout
• My father Pieter for his encouragement
• My sister Natasja, whose support, love and advice is priceless
• My friends and colleagues at TUT for their encouragement
• My language editor Ingrid Swanepoel
• Emmanuel Sibanda for his statistical support and advice
iii
SUMMARY
This study provides a consumer profile of first year Tshwane University of
Technology (TUT) Marketing students. To determine influences on students’
tertiary education choices, a literature study was undertaken on consumer
behaviour, influencing factors and consumer decision-making.
An empirical study established consumer behaviour variables impacting on
tertiary students, and revealed students’ future perspective. A structured
questionnaire was distributed. The main findings are: preferred media are E-
TV, Metro FM, Drum magazine and The Sunday Times; Internet access is
low; most prefer TUT for tertiary education; parents and academic standards
predominantly impact tertiary institution choice; the majority will continue their
studies and apply for a marketing job in South Africa; their future perspective
is predominantly optimistic.
In conclusion, the students are impacted by reference groups and institutional
marketing efforts. Primary concerns include: successful communication with
this group; the effectiveness of the Open Day; and the lack of using reference
groups in marketing.
iv
KEYWORDS
Consumer
Consumer behaviour
First-year students
Tshwane University of Technology
Consumer profile
Generation Y
v
CONTENTS
Page
CHAPTER 1
INTRODUCTION AND PROBLEM STATEMENT
1.1 Introduction 2
1.2 A background of Tshwane University of Technology 3
1.2.1 History 3
1.2.2 TUT Today 3
1.2.3 Challenges for TUT in a changing tertiary education
landscape 6
1.3 Problem statement 8
1.4 Research objectives 11
1.4.1 Primary objective 11
1.4.2 Secondary objectives 12
1.5 Research methodology 12
1.5.1 Data required 13
1.5.2 Universe and census information 14
1.5.3 Data collection 15
1.6 Chapter outline 15

vi
CHAPTER 2
A BACKGROUND TO THE SOUTH AFRICAN TERTIARY EDUCATION
ENVIRONMENT
2.1 Introduction 18
2.2 Universities 18
2.3 Technikons 19
2.4 Tshwane University of Technology (previously
Technikon Pretoria) TUT 20
2.4.1 Overview of Tshwane University of Technology’s products 23
2.5 Review of existing secondary information regarding
the Tshwane University of Technology 34
2.6 Conclusion 42
CHAPTER 3
CONSUMER BEHAVIOUR
3.1 Introduction 45
3.2 Consumer, Consumer behaviour and the Consumer
decision-making process 45
3.2.1 Consumer 45
3.2.2 Consumer behaviour 45
3.2.3 Consumer decision-making 46
3.2.4 Factors influencing consumer behaviour 47
3.3 Internal factors affecting consumer behaviour 49
vii
3.3.1 Motivation 49
3.3.2 Learning 51
3.3.3 Memory 52
3.3.4 Emotions 53
3.3.5 Perception 53
3.3.6 Attitudes 56
3.3.7 Personality 58
3.3.8 Lifestyle 58
3.4 External factors affecting consumer behaviour 61
3.4.1 Culture 61
3.4.2 Subcultures 61
3.4.3 Demographics 62
3.4.4 Family and non-family households 64
3.4.5 Reference groups 65
3.4.6 Opinion leaders 67
3.4.7 Social class 67
3.4.8 Marketing campaigns 68
3.5 The consumer decision-making process 71
3.5.1 Step 1: Need/problem recognition 72
3.5.2 Step 2: Information Search 73
3.5.3 Step 3: Evaluation of alternatives 74
3.5.4 Step 4: Decision/purchase 76
3.5.5 Step 5: Post-purchase 76
3.6 Conclusion 77
viii
CHAPTER 4
RESEARCH METHODOLOGY
4.1 Introduction 79
4.2 Research design development (step three) 82
4.2.1 Research Designs 82
4.3 Primary research methods (step five) 83
4.4 Determine the research frame (step six) 84
4.4.1 Census 85
4.4.2 Sampling 85
4.5 Gathering data through field collection (step seven) 86
4.5.1 Focus group interview 86
4.5.2 The survey instrument: structured questionnaire 87
4.5.3 Types of questions used in questionnaire 88
4.6 Data processing (step eight) 94
4.6.1 Data preparation 95
4.6.2 Data analysis and description 99
4.7 Report the research findings (step nine) 103
4.8 Conclusion 103
CHAPTER 5
DATA ANALYSIS AND INTERPRETATION
5.1 Introduction 106
5.2 Demographic analysis 107
ix
5.2.1 Gender analysis 107
5.2.2 Age 108
5.2.3 Living arrangements 109
5.2.4 Province of origin 111
5.2.5 Home language 112
5.2.6 Allowance 114
5.2.7 Payment of study fees 116
5.2.8 Modes of transport 118
5.2.9 Credit facilities 122
5.3 Consumer Behaviour Variables 124
5.3.1 Spending of leisure time 125
5.3.2 Media usage 132
5.3.3 Internet access 163
5.3.4 Commercial Banks 164
5.3.5 Cell Phone usage patterns 166
5.3.6 Non-Alcoholic Beverage consumption 170
5.3.7 Alcoholic Beverage consumption 174
5.3.8 Behavioural variances in respondents’ choice of tertiary
education 179
5.3.9 Influencing factors in respondents’ choice of tertiary
education 184
5.4 Future Outlook 198
5.4.1 Future studies 198
5.4.2 Employment plans 201
5.4.3 Personal future expectations 203
x
5.4.4 South Africa’s future 205
5.5 Conclusion 211
CHAPTER 6
CONCLUSIONS AND RECOMMENDATIONS
6.1 Introduction 213
6.2 Summary of the findings 214
6.3 Recommendations 218
6.3.1 Demographic and Lifestyle characteristics of first year
TUT students: low financial means and Internet usage 218
6.3.2 Communication and media 219
6.3.3 Specific needs of students 221
6.3.4 Perceptions and attitudes of first year students 221
6.3.5 Students’ future outlook 223
6.4 Areas for further studies 224
6.5 Summary 225
Bibliography 229
Annexure A: Questionnaire 233
xi
LIST OF TABLES
Page
2.1 Cultural diversity of the Tshwane University of Technology’s
student population 21
2.2(a) The programmes presented by the Faculty of Agricultural
Sciences 23
2.2(b) The programmes presented by the Faculty of Arts 24
2.2(c) The programmes presented by the Faculty of Management
Sciences 25
2.2(d) The programmes presented by the Faculty of Engineering 26
2.2(e) The programmes presented by the Faculty of Education 26
2.2(f) The programmes presented by the Faculty of Health Sciences 27
2.2(g) The programmes presented by the Faculty of Social Sciences 28
2.2(h) The programmes presented by the Faculty of Natural Sciences 29
2.2(i) The programmes presented by the Faculty of Economic
Sciences 30
2.2(j) The programmes presented by the Faculty of Information and
Communication Technology 31
2.2(k) The courses presented by the Faculty of Tourism, Hospitality
and Leisure 32
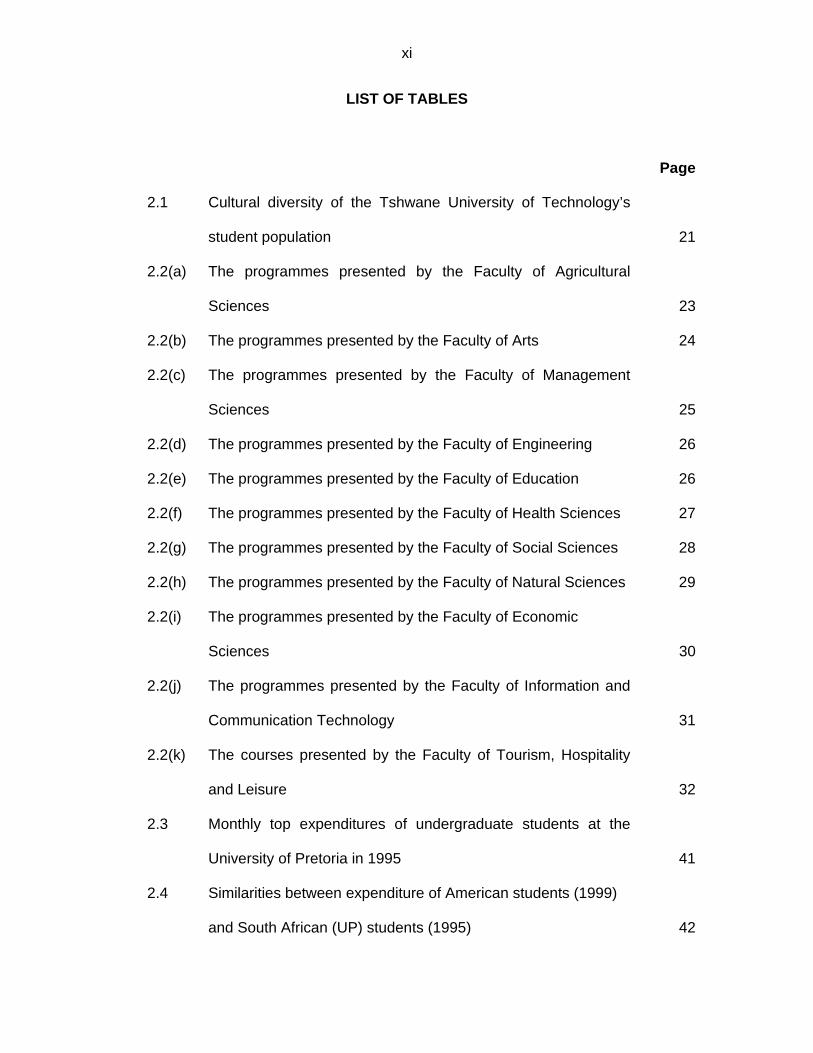
2.3 Monthly top expenditures of undergraduate students at the
University of Pretoria in 1995 41
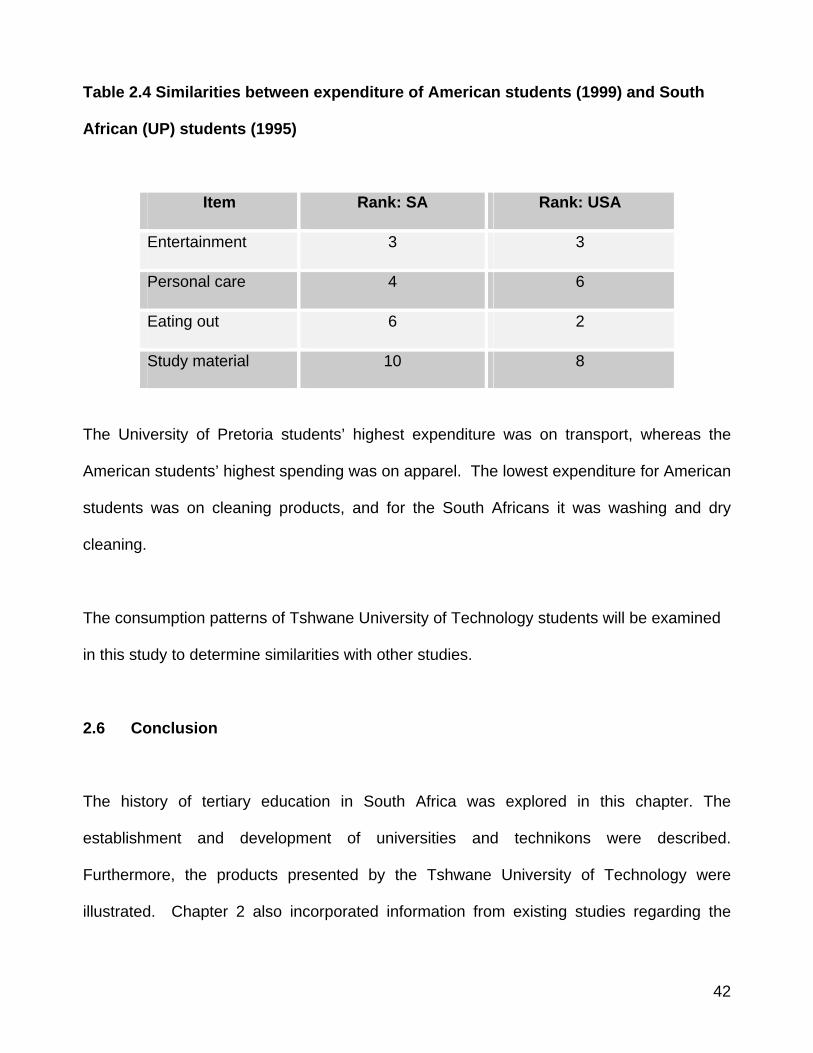
2.4 Similarities between expenditure of American students (1999)
and South African (UP) students (1995) 42
xii
3.1 Living Standards Measure 60
3.2 Probable evaluative criteria for a learner choosing a higher
education institution 75
4.1 Example of an ordinal scale 91
4.2 Question format used in study 93
5.1 Respondents’ means of payment of study fees 117
5.2 Cross-tabulation of modes of transport with “gender” 119
5.3 Respondents’ use of credit facilities 122
5.4 Leisure time spending of respondents 125
5.5 Leisure time spending of respondents: participation by gender
1275.6 Cross-tabulation of respondents' behavioural patterns with
“living arrangements” 129
5.7 Respondents' television usage per day 133
5.8 Types of programs watched 138
5.9 Types of programs preferred by males 139
5.10 Types of programs preferred by females 140
5.11 Radio Usage 141
5.12 Male radio listenership 142
5.13 Female radio listenership 142
5.14 Cross-tabulation of radio station preferences with “living
arrangements”: respondents living in a flat, room or communal
home 143
5.15 Cross-tabulation of radio station preferences with “language” 144
5.16 Radio preferences by language 145
xiii
5.17 Magazine readership of respondents 154
5.18 Readership of selected magazines 156
5.19 Cross-tabulation of cell phone brands with air-time provider 169
5.20 Correlations between gender and beer/lager, pilsner and
whisky 176
5.21 Influencing factors on Respondents' decision to study at TUT 184
5.22 Correlations between language and influencing factors 186
5.23 Cross-tabulation of information received directly from TUT with
“living arrangements” 189
5.24 Reference group influences on respondents' choice to study at
TUT 191
5.25 Cross-tabulation of reference group influences on respondents'
choice to study at TUT with “language”
192
5.26 Cross-tabulation of reference group influences on respondents'
choice to study at TUT with “gender” and “living arrangements” 193
5.27 Respondents' personal future expectations 204
5.28 Respondents' future outlook on South Africa 206
5.29 Means: language and personal future outlook 209
6.1 Main findings of the study: Demographics 214
6.2 Main findings of the study: Secondary objectives 215
xiv
LIST OF FIGURES
Page
1.1 Institution preferences of Grade 12 learners 10
2.1 Ethnic composition of the student population of the Tshwane
University of Technology 22
2.2 TUT faculties and departments 33
3.1 The consumer decision-making process 47
3.2 Maslow’s hierarchy of needs 50
3.3 The tri-component attitude model 57
3.4 Gender distribution of 15-34 year age groups in South Africa 64
3.5 The major consumer reference groups 66
3.6 The need recognition process of the potential tertiary student 73
4.1 The research process 81
4.2 Process of developing the questionnaire 86
5.1 Gender analysis of the respondents 108
5.2 Age of respondents 108
5.3 Living arrangements of respondents 110
5.4 Province of origin 111
5.5 Home languages of respondents 113
5.6 Average monthly allowance of respondents 114
5.7 Cross-tabulation of allowance with “living arrangements” 115
5.8 Modes of Transport 118
5.9 Availability of television set in home 132
xv
5.10 Viewership variances of SABC1 135
5.11 Viewership variances of SABC2 135
5.12 Viewership variances of MNet 136
5.13 Viewership variances of DSTV 137
5.14 Day listeners of commercial radio stations 147
5.15 Music preferences of respondents 149
5.16 Gender distribution of music preferences 150
5.17 Cross-tabulation of music preferences with “language” 151
5.18 Cross-tabulation of music preferences with “living arrangements” 153
5.19 Magazine readership of the male and female respondents 157
5.20 Newspaper readership 159
5.21 Readership of selected papers 160
5.22 Cross-tabulation of newspaper readership with “living
arrangements” 161
5.23 Internet access 163
5.24 Commercial banks: overall percentage 165
5.25 Cell phone brands 166
5.26 Cell phones: contract vs. prepaid 167
5.27 Cell phones: air time providers 169
5.28 Non-alcoholic beverage consumption 170
5.29 Gender distribution of mineral water consumption 171
5.30 Cross-tabulation of iced tea use with “language” 172
5.31 Cross-tabulation of tea consumption with “language” 173
5.32 Consumption of alcoholic beverages 174
5.33 Cross-tabulation of beer/lager consumption with “language” 177
xvi
5.34 Cross-tabulation of rum consumption with “language” 178
5.35 Cross-tabulation of shooter/cocktail consumption with “language” 179
5.36 Other institution first choices 181
5.37 Respondents' reasons for not attending alternative first-choice
institution 182
5.38 Respondents' future study plans 198
5.39 Responses to studying further at TUT 199
5.40 Respondents' future plans 201
5.41 Future plans of language groups 202
5.42 Respondents’ view of South Africa's future 207
5.43 Cross-tabulation of “poverty will be reduced” with “living
arrangements” 208

CHAPTER 1
INTRODUCTION AND PROBLEM STATEMENT
2
1.1 Introduction
In a nationwide survey conducted by the Human Sciences Research Council (HSRC)
(Cosser & Du Toit, 2002), Grade 12 learners named the Tshwane University of
Technology (formerly Technikon Pretoria) as the number one choice for tertiary education.
As Grade 12 learners are the primary source for the recruitment of new students, it is
important to understand their motives for choosing the Tshwane University of Technology
as preferred institution. It is also important to determine whether these perceptions are
predominant among first-year students currently studying at that institution.
The HSRC study also revealed that the positive reputation of a higher education institution
is the most important influencing factor for Grade 12 learners, which points to the possible
influence of consumer decision-making variables on their preferences. The next most
important factors mentioned were the reputation of the relevant school or department the
learner is interested in, as well as the opportunity to stay in a residence.
This study intends to focus on these influencing factors specifically in terms of first-year
students of the Tshwane University of Technology. It will endeavour to develop a
consumer profile and to examine possible sub segments in the group.
3
1.2 A background of the Tshwane University of Technology
1.2.1 History
The Tshwane University of Technology was one of fourteen technical colleges in South
Africa that stemmed from the Transvaal Technical Institute (Prinsloo, 2001:17). It was
known as the Pretoria Politechnic, which was the first technical educational organisation
established in Pretoria in 1907. It became the Pretoria Technical College in 1923, and
evolved into a full tertiary institution in 1967 as the Pretoria College for Advanced
Technical Education. This institution’s name was legally changed to Technikon Pretoria in
1988, although that name had already been used since 1979 (Jansen van Vuuren, 1988).
In January 2004, Technikon Pretoria merged with Technikon North-West and Technikon
Northern Gauteng, and became the institution now known as the Tshwane University of
Technology (TUT).
1.2.2 TUT today
According to the Tshwane University of Technology website (www.tut.ac.za), TUT is
currently the largest residential higher education institution in South Africa, with
approximately 60 000 students. It functions as a flourishing higher education institution
that has been focusing on career education and student development ever since its
establishment in 1979. It now has eleven faculties and offers full-time as well as part-time
courses. The faculties as follows:

4
• Faculty of Economic Sciences
• Faculty of Management Sciences
• Faculty of Engineering
• Faculty of Health Sciences
• Faculty of Information and Communication Technology
• Faculty of Agricultural Sciences
• Faculty of Natural Sciences
• Faculty of Tourism, Hospitality and Leisure
• Faculty of Arts
• Faculty of Education
• Faculty of Social Development Studies
TUT’s qualifications are acknowledged nationally, and in a number of cases also
internationally (www.tut.ac.za).
TUT emphasises the transfer of technology, at the same time upholding of the equilibrium
between scholarship and the practical application of learning. Partnerships with industry
ensure that its programmes are developed in cooperation with business and professional
bodies in order to ensure high-quality, career-focused curricula.
TUT’s vision statement declares that it aims “to be the leading higher education institution
with an entrepreneurial ethos that promotes knowledge and technology, and provides
professional career education of an international standard, which is relevant to the needs

5
and aspirations of Southern Africa’s people”. The TUT mission statement, taken from the
Tshwane University of Technology website (www.tut.ac.za), is as follows:
“In support of this vision, we –
• create, apply and transfer knowledge and technology of an international standard
through cooperative professional career education programmes at undergraduate
and postgraduate levels;
• serve and empower society by meeting the socio-economic development needs of
Southern Africa through the fruits of our teaching and skills of our staff and
students;
• extend the parameters of technological innovation by making knowledge useful
through focused applied research and development; and
• establish and maintain a strategic partnership network locally and internationally for
the mutual benefit of the institution and its partners. “
The institution lists strategic goals that aim to provide “… competent graduates with an
entrepreneurial focus who actively contribute to the economy and society”
(www.tut.ac.za). It endeavours to establish TUT as an institution acknowledged for “…
research and development, and technological innovation”. It also aims to become the
preferred employer for tertiary staff, to develop its learners holistically and aspires towards
building an effectual and resourceful higher education institution.
The Tshwane University of Technology cites quality, professionalism, excellence and care
as its core values in all its endeavours. These values are further reflected in a culture
6
exemplifying excellence in student development and the “…highest standards of ethics
and integrity” (www.tut.ac.za) as well as zero tolerance for unlawful behaviour.
1.2.3 Challenges for TUT in a changing tertiary education landscape
If the Tshwane University of Technology can meet student (customer) expectations, and
reach its stated mission objectives, it will ultimately be able to deliver skilled workers to
the labour force of the future. Prof. Kader Asmal, former Minister of Education, stated in
Transformation and restructuring: A new institutional landscape for higher education
(2002:5) that “The higher education system must be transformed to enable it to produce
graduates with the skills and competencies required for participation as citizens in a
democratic society and as workers and professionals in the economy”.
He identified several strategic goals, among others “To build new institutional identities
and organisational forms through restructuring the institutional landscape of the higher
education system”. Under these circumstances, obtaining and maintaining a competitive
advantage in a volatile market are challenges that will become even more apparent after
all the suggested changes and amalgamations have been implemented.
The strength of tertiary education brand names will be severely tested in the future due to
these alterations. With the possibility of new and combined institutions being founded, the
Tshwane University of Technology has to determine its brand’s strength, so as to build on
its current successes and its existing positive positioning in the market. The question is
whether its mission and objectives are communicated adequately to prospective students,
7
and whether the Tshwane University of Technology brand portrays this image to its
candidates.
As competition in the tertiary education market is tense and set to increase due to the
restructuring of higher education, it is necessary to determine the perceptions of target
groups of the Tshwane University of Technology brand. It is also important to identify the
factors that influence these perceptions – both non-marketing and, particularly, marketing
factors.
With student registrations adding up to 67 951 for 2004 (Tshwane University of
Technology Management Information System), it seems clear that TUT is drawing an
increasing number of secondary school learners (Grade 12 school leavers) to study at
one of its campuses, viz. the Pretoria Campus (previously Technikon Pretoria’s
Technikonrand Campus), Soshanguve Campus (previously Technikon Northern
Gauteng), Ga-Rankuwa Campus (previously Technikon North-West), Nelspruit Campus,
Polokwane Campus or Witbank Campus. TUT also has two other campuses in the city,
namely the Arts Campus and the Arcadia Campus, both formerly affiliated with Technikon
Pretoria.
Grade 12 learners form part of Generation Y consumers. Generation Y consumers “…
were born between 1978 and 1994 and are sometimes referred to as the ‘echo boom’”
(Hawkins et al., 2001:179). Typical of Generation Y consumers, there is a “…remarkable
degree of optimism about the social fabric of South Africa ten years hence” (Cosser & Du
Toit, 2002) among the Grade 12 learners studied. Undergraduate students, also being
8
mostly Generation Y, have definite perceptions and preferences when it comes to their
education needs. Students are the clients of tertiary institutions. Higher education
institutions, like any other business, have to be fine-tuned to their clients’ (students’)
perceptions in order to understand them better and to serve their client base satisfactorily.
1.3 Problem statement
In 2002 there were 36 competing higher education institutions in South Africa. The
restructuring of the higher education system was aimed at streamlining the system and
reducing the number of higher education institutions in South Africa to 21 (Ministry of
Education, 2002). Because of these changes, the Tshwane University of Technology will
undoubtedly need to focus on its competitiveness and its client service to retain its
competitive edge as preferred study choice.
The Student Choice Behaviour Study performed by the HSRC was conducted among a
total of 12 204 learners in 288 South African schools. Forty-eight per cent of the
respondents were male and 52% female. The composition according to population group
was as follows: 82% African, 8% White, 7% Coloured, and 3% Indian. The majority (73%)
of the learners surveyed indicated an intention to enter into higher education.
The sample of secondary schools in the abovementioned study was drawn using a two-
stage sampling procedure. In the first stage schools were stratified by province and pass
rate in the matric examinations, and in the second stage learners were selected in the
schools by using convenience sampling (Cosser & Du Toit, 2002:1).
9
Of the learners that participated in the HSRC study previously mentioned, 16,6%
indicated the Tshwane University of Technology (previously known as Technikon Pretoria)
as their first choice for tertiary studies. This percentage is three times more than the
number of students who chose the next most preferred institution (Cosser & Du Toit,
2002:5). This was a pleasant surprise for the management of TUT, but also led to
questions about what the institution’s success could be ascribed to. The report also
stated that the following factors, in order of importance, had an influence on the choice of
institution (Cosser & Du Toit, 2002:7):
• The organisation’s reputation
• The specific faculty’s reputation
• Not close to home, which allows accommodation in a residence
• Superior sport facilities
• Low tuition fees
• Friends’ recommendations
• Possibility of correspondence study
• Close enough to home to allow studying while living at home
• Relatives studied at institution
• Assignment of scholarship at institution
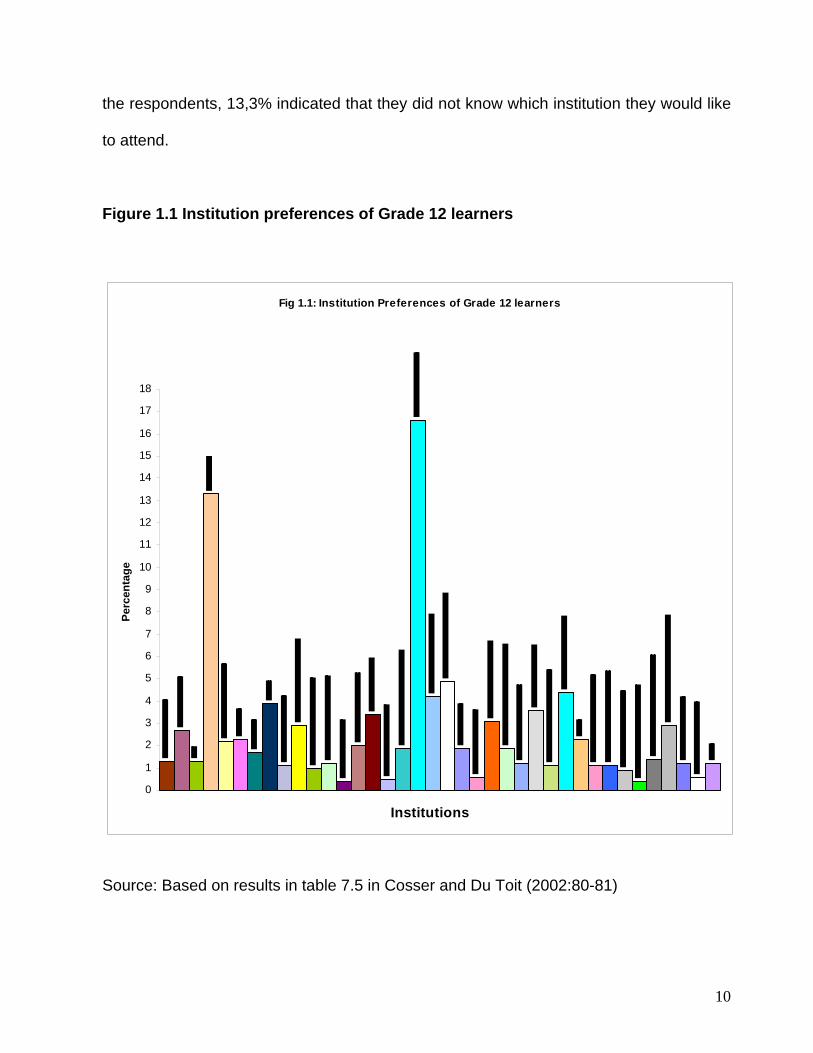
The learners’ preferences are depicted in Figure 1.1. The former Technikon Pretoria
(now the Tshwane University of Technology) was first with 16,6%, Technikon
Witwatersrand followed with 4,9%, and third was the University of Pretoria (4,4%). Of
10
the respondents, 13,3% indicated that they did not know which institution they would like
to attend.
Figure 1.1 Institution preferences of Grade 12 learners
Fig 1.1: Institution Preferences of Grade 12 learners
0
1
2
3
4
5
6
7
8
9
10
11
12
13
14
15
16
17
18
Institutions
Perc
enta
ge
Source: Based on results in table 7.5 in Cosser and Du Toit (2002:80-81)
11
The Tshwane University of Technology has the responsibility to remain true to its
objective of excellence and its dedication to delivering skilled workers to the South
African labour force. It needs to draw excellent students and therefore aim its marketing
activities at its consumers and satisfying the students’ needs. Its reputation is crucial in
attracting students, and this is linked to the building of a corporate image that catches
the attention of high-quality prospective students. To be able to do this, it has to
determine the factors that influenced learners to pick the Tshwane University of
Technology out of 36 (now restructured to 21) options for tertiary study.
The crux of the problem is therefore that, since TUT performed so well in the Cosser and
Du Toit (2002) study, it is imperative to determine from first-year students why they
decided to enrol at TUT. By obtaining this information, the questions arising from the
results of Cosser and Du Toit’s study can be answered, which will place TUT in a better
position to keep on attracting students and to maintain its success in the highly
competitive tertiary education market in South Africa.
From the abovementioned, the following research objectives have been identified:
1.4 Research objectives
1.4.1 Primary objective
The primary research objective was to develop a consumer profile of first-year marketing
students at TUT. Specifically first-years will be studied because their perceptions are still
12
untainted by involvement in TUT and they are not yet influenced by learned attitudes that
prevail after prolonged exposure to the institution.
1.4.2 Secondary objectives
The secondary objectives were –
• to determine the communication media habits of students;
• to investigate general consumption patterns of the students;
• to establish the perceptions and attitudes of first-year marketing students towards
the Tshwane University of Technology;
• to determine influencing factors on students’ consumer decision-making processes
in deciding to study at TUT;
• to determine the students’ views on their own future, as well as the future of South
Africa; and
• to identify new areas of research in the tertiary student market.
1.5 Research methodology
On the basis of the proposed problem statement and stated objectives of this study, the
researcher intends to use a three-step approach in the development of the survey
instrument:
13
i. Focus group interviews with first-time registering first-year students (8-12 people
from the student population group) at the Pretoria Campus of the Tshwane
University of Technology to assist in questionnaire development.
ii. A pilot study for testing the developed questionnaire.
iii. A primary survey utilising the structured questionnaire developed from the above
process.
1.5.1 Data required
The research project will gather of two types of data, namely primary and secondary data.
Primary data is defined by Tustin et al. (2005:89) as data “… collected specifically to
address the research objective”. The primary data of this study will be obtained from the
responses to the structured questionnaire. This questionnaire will provide insight into the
current perceptions and attitudes of the target group.
Secondary data can be described as data that “… are already available because they
were collected for another purpose” (Tustin et al., 2005:346). For the purpose of this
study, secondary data will be obtained from on-line sources, literature and accessible
research results from agencies such as the Bureau of Market Research, Statistics South
Africa, the Human Sciences Research Council (HSRC) and the National Research
Foundation (NRF). Also see the bibliography at the end of this dissertation for a list of
secondary data sources that were consulted.
14
1.5.2 Universe and census information
A comprehensive study of first-year students at the Department of Marketing will be done
on the Pretoria Campus of the Tshwane University of Technology. A census of all first-
time students registering at TUT for the National Diploma in Marketing will be conducted.
A census can be defined as “… an accounting of the entire population” (Tustin, Ligthelm,
Martins & van Wyk, 2005:337). Lists of registered first-year students will be drawn from
the Registration Division and the Tshwane University of Technology Management
Information System.
The population in this research consists of all the first-year students registered for the
programme National Diploma (N Dip) in Marketing at the Tshwane University of
Technology. Students of the Pretoria Campus will be surveyed. The total number of first-
year students enrolled at the Pretoria Campus of TUT in 2004 was 4 712. There were
237 marketing first-years – 5% of the total first-year population.
Tustin et al. (2005:346) describe judgemental sampling as a sampling process where “…
members are chosen on the basis of the researcher’s judgement on what constitutes a
representative sample of the population of interest”. This method will be used for the
initial focus group interviews, as well as for the pilot study that is utilised for the
development of the questionnaire and for testing the questionnaire. Focus group
interviews are described as “… face-to-face interviews carried out with a collected group
of respondents” (West, 1999:94), and will form part of the three-step approach to the
development of the survey instrument.
15
1.5.3 Data collection
Primary data will be collected through a structured questionnaire. The questionnaire will
be tested in a pilot study before final survey. The respondents will be the first-year
students enrolled for the N Dip: Marketing at the Pretoria Campus of the Tshwane
University of Technology.
The questionnaire containing multiple-choice, open-ended and scale questions is
structured in such a way that it covers in detail the objectives of the proposed study. The
design is prepared in a user-friendly manner.
1.6 Chapter outline
Chapter 2 presents a background to the South African tertiary education environment.
The present situation at higher education institutions is discussed. Furthermore, a review
of existing secondary information is done, and an overview of the Tshwane University of
Technology’s products and services is given.
In chapter 3, a theoretical clarification of general concepts and terminology regarding
consumer behaviour is provided. Concepts such as perception, motivation, attitudes and
the consumer decision-making process are explained.
Chapter 4 focuses on the research methodology used in the study. Concepts are
explained and the process is described.
16
In chapter 5, the results of the study are described in detail and the collected data is
analysed.
Chapter 6 presents conclusions from the research findings. It includes a summary and
recommendations concerning the study.

CHAPTER 2
A BACKGROUND TO THE SOUTH AFRICAN TERTIARY EDUCATION ENVIRONMENT
18
2.1 Introduction
In this chapter, the history of tertiary education in South Africa is explored. The origins and
development of universities and technikons are briefly discussed. The products offered by
the Tshwane University of Technology (previously Technikon Pretoria) are described.
Chapter 2 also incorporates information from existing studies regarding the tertiary
education sector in South Africa.
2.2 Universities
Tertiary education in South Africa has its origins in the South African College that was
established in 1829. Initially it served mainly as a body that prepared students for “…
matriculation and higher examinations of the University of London” (Behr & Macmillan,
1966:205). Several university colleges were also established. As interest in further
education increased, the University Incorporation Act was passed in 1872, which launched
the University of the Cape of Good Hope as an examining body in 1873. Later, the
University Act of South Africa, 1916 (Act 12 of 1916) made provision for a federal
examining university, namely the University of South Africa (Unisa), previously the
University of the Cape of Good Hope (Behr & Macmillan, 1966:209). This laid the
foundation for growth in South African tertiary education.
From the University of South Africa grew several constituent colleges, which later became
self-governing universities, such as the University of Pretoria in 1930 (previously Transvaal
University College). Many of the other existing South African universities also originate
19
from Unisa, namely the University of Cape Town and the University of Stellenbosch in
1916, the University of the Witwatersrand (1922), the University of Natal (1949), the
University of the Orange Free State (1950), and finally Rhodes University and the
Potchefstroom University for Christian Higher Education, in 1951 (Behr & Macmillan,
1966:210).
2.3 Technikons
Act 40 of 1967 (Advanced Technical Education Act, 1967) was aimed at establishing a
tertiary institution between a university and a technical college (Behr, 1988:142). This was
known as a college for advanced technical education (CATE). In 1979, the name CATE
was changed to “technikon”, describing institutions of technology. Technikon education is
defined in the Technikons Amendment Act, 1995 (Act 27 of 1995), as “education provided
partly or in full at or by a technikon … aimed at the preparation of students of the technikon
with a view to the advancement, application, development and transfer of technology”.
By the end of 2003, there were 15 technikons in South Africa, namely Technikon Pretoria,
Vaal Triangle Technikon, Technikon Witwatersrand, Technikon Natal, Port Elizabeth
Technikon, Cape Technikon, Mangosutho Technikon, Technikon Free State, Technikon
South Africa, Technikon Northern Gauteng, ML Sultan Technikon, Border Technikon,
Eastern Cape Technikon, Peninsula Technikon and Technikon North-West.
The National Working Group (NWG) proposed in Transformation and Restructuring: A New
Institutional Landscape for Higher Education (2002:8) that the number of tertiary institutions
20
in South Africa be reduced from 36 to 21. The proposed consolidation included the
merging of Technikon Pretoria with Technikon Northern Gauteng and Technikon North-
West. The new institution, named the Tshwane University of Technology, officially came
into being on 1 January 2004. The former Technikon Northern Gauteng is currently known
as the Soshanguve Campus of TUT, and Technikon North-West as the Ga-Rankuwa
Campus. The former Technikonrand Campus of Technikon Pretoria is now named the
Pretoria Campus.
2.4 Tshwane University of Technology (previously Technikon Pretoria)
The starting point of Tshwane University of Technology (Pretoria Campus) was as the first
technical institution established in Pretoria, in 1897 (www.techpta.ac.za1). In 1906, the
Pretoria Polytechnic School was established, and its name was changed to the Pretoria
Trades School and Polytechnic in 1909. In 1926 it was re-named the Pretoria Technical
College, and was known as such until 1968, when it became the Pretoria College for
Advanced Technical Education. Technikon Pretoria was officially established in 1979, and
was known as such until the transformation of higher education in South Africa, when the
Tshwane University of Technology was established in January 2004 through the merging of
Technikons Pretoria, Technikon Northern Gauteng and Technikon North-West.
The Tshwane University of Technology (TUT) is currently the largest residential tertiary
education institution in South Africa (www.tut.ac.za), with 67 951 students enrolled in 2004
on all campuses. The institution has eight campuses, namely the Pretoria, Arts, Arcadia,
1 Former website of the institution previously known as Technikon Pretoria
21
Ga-Rankuwa, Soshanguve, Nelspruit, Polokwane and Witbank campuses. Of the total
student population, 16 119 students were first-year students in 2004 (Tshwane University of
Technology MIS).
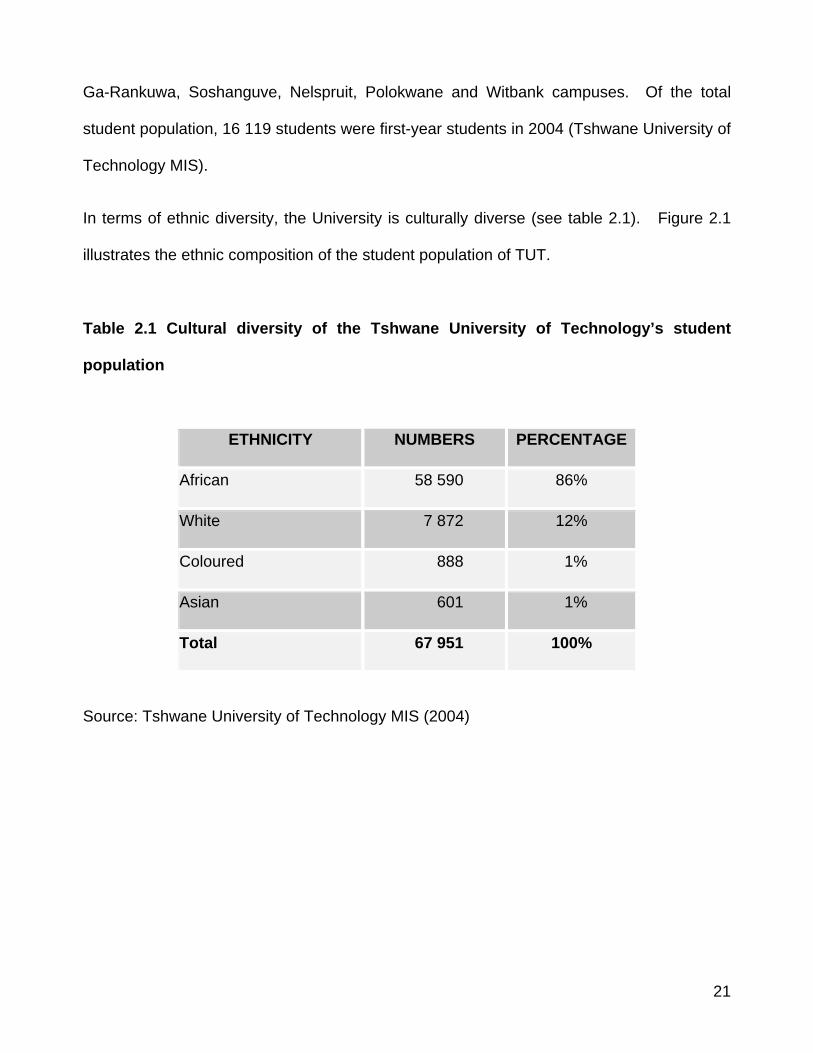
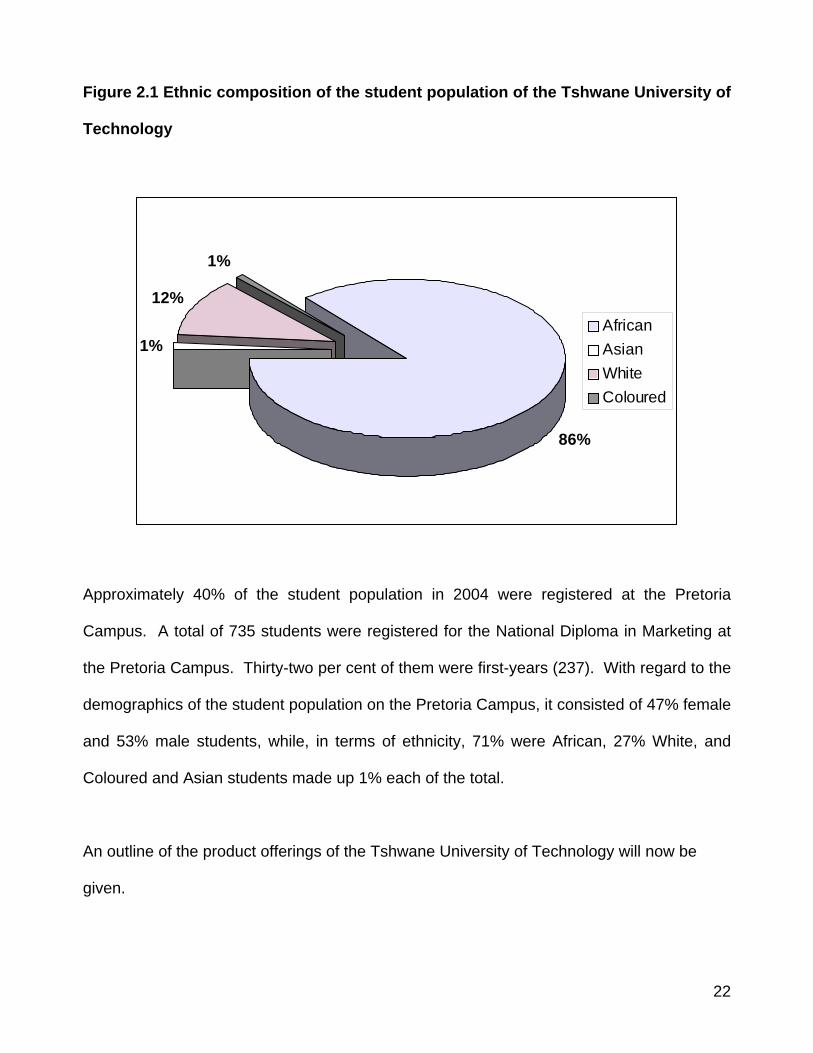
In terms of ethnic diversity, the University is culturally diverse (see table 2.1). Figure 2.1
illustrates the ethnic composition of the student population of TUT.
Table 2.1 Cultural diversity of the Tshwane University of Technology’s student
population
ETHNICITY NUMBERS PERCENTAGE
African 58 590 86%
White 7 872 12%
Coloured 888 1%
Asian 601 1%
Total 67 951 100%
Source: Tshwane University of Technology MIS (2004)
22
Figure 2.1 Ethnic composition of the student population of the Tshwane University of
Technology
86%
1%
12%
1%
AfricanAsianWhiteColoured
Approximately 40% of the student population in 2004 were registered at the Pretoria
Campus. A total of 735 students were registered for the National Diploma in Marketing at
the Pretoria Campus. Thirty-two per cent of them were first-years (237). With regard to the
demographics of the student population on the Pretoria Campus, it consisted of 47% female
and 53% male students, while, in terms of ethnicity, 71% were African, 27% White, and
Coloured and Asian students made up 1% each of the total.
An outline of the product offerings of the Tshwane University of Technology will now be
given.
23
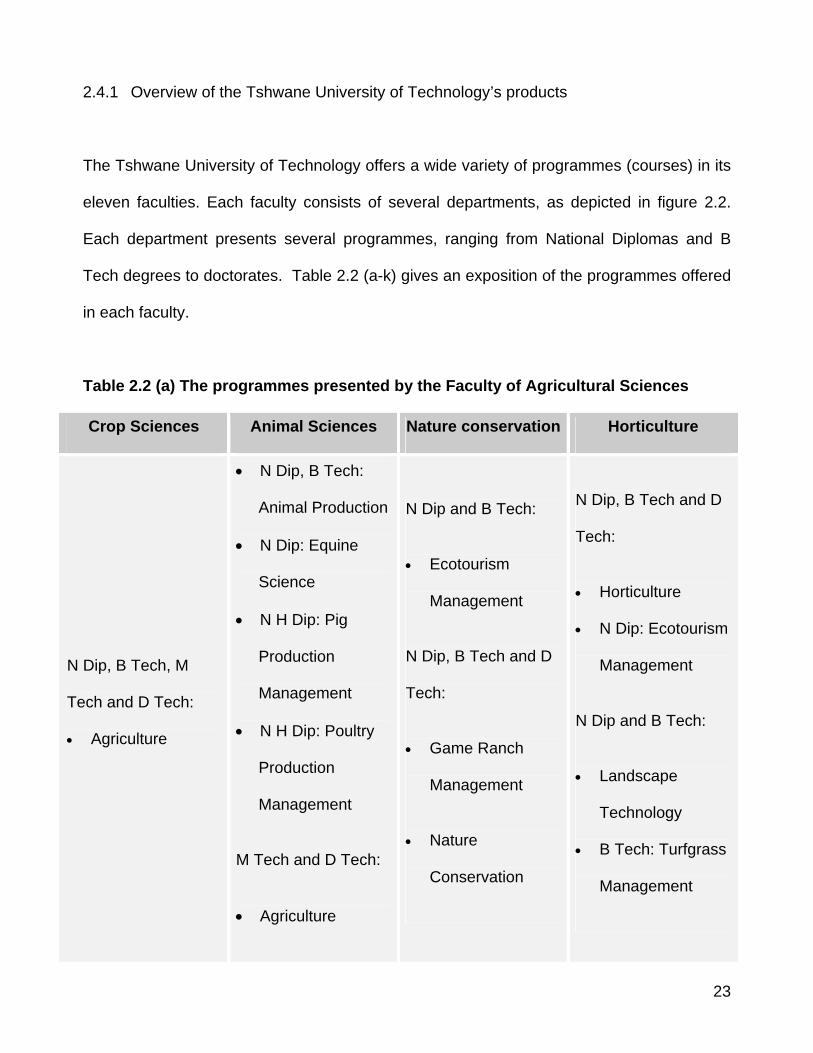
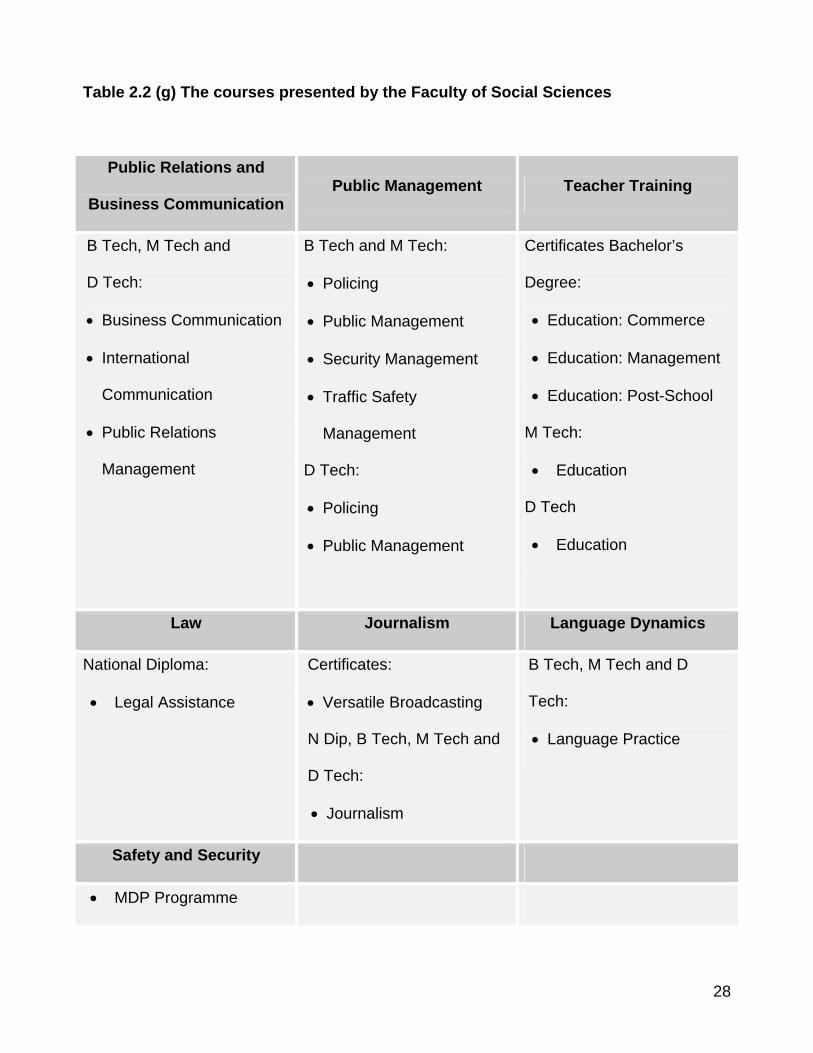
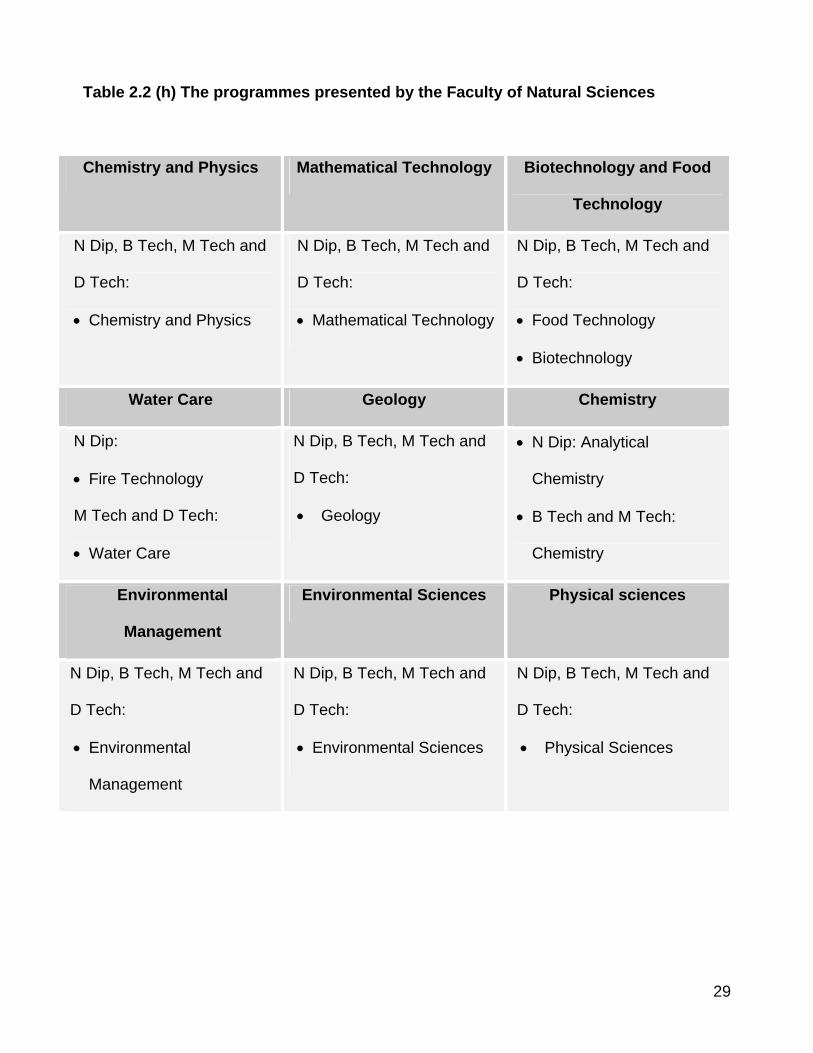
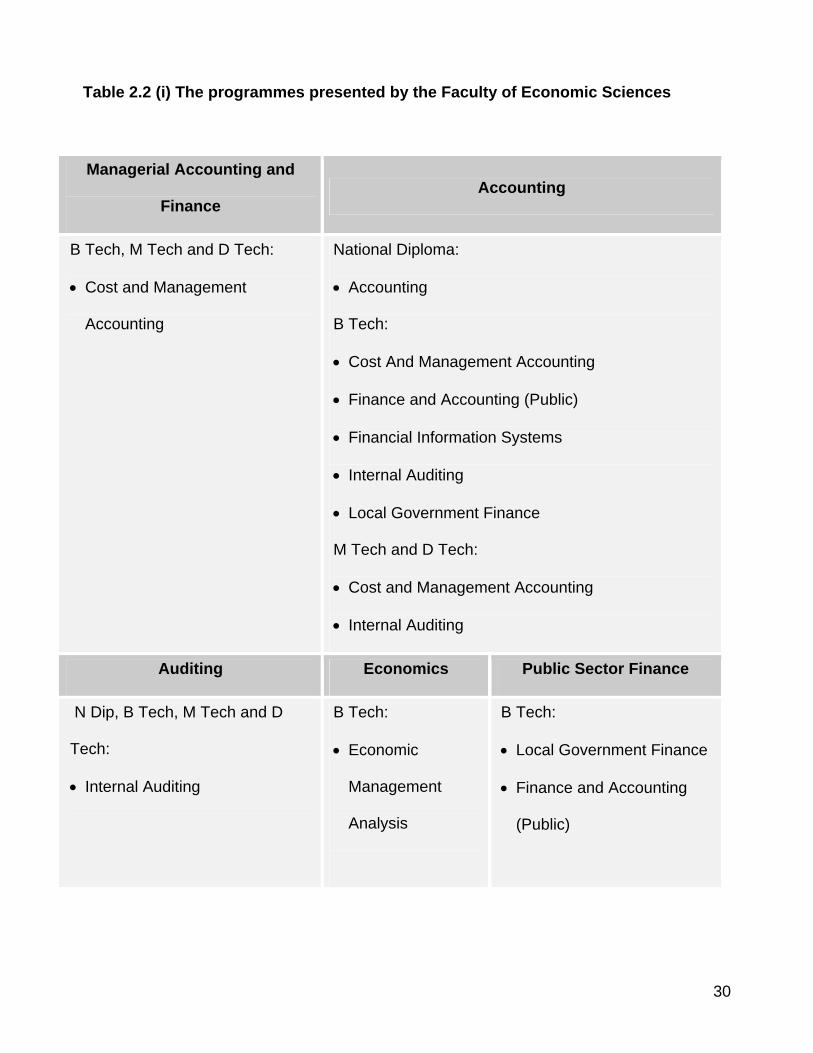
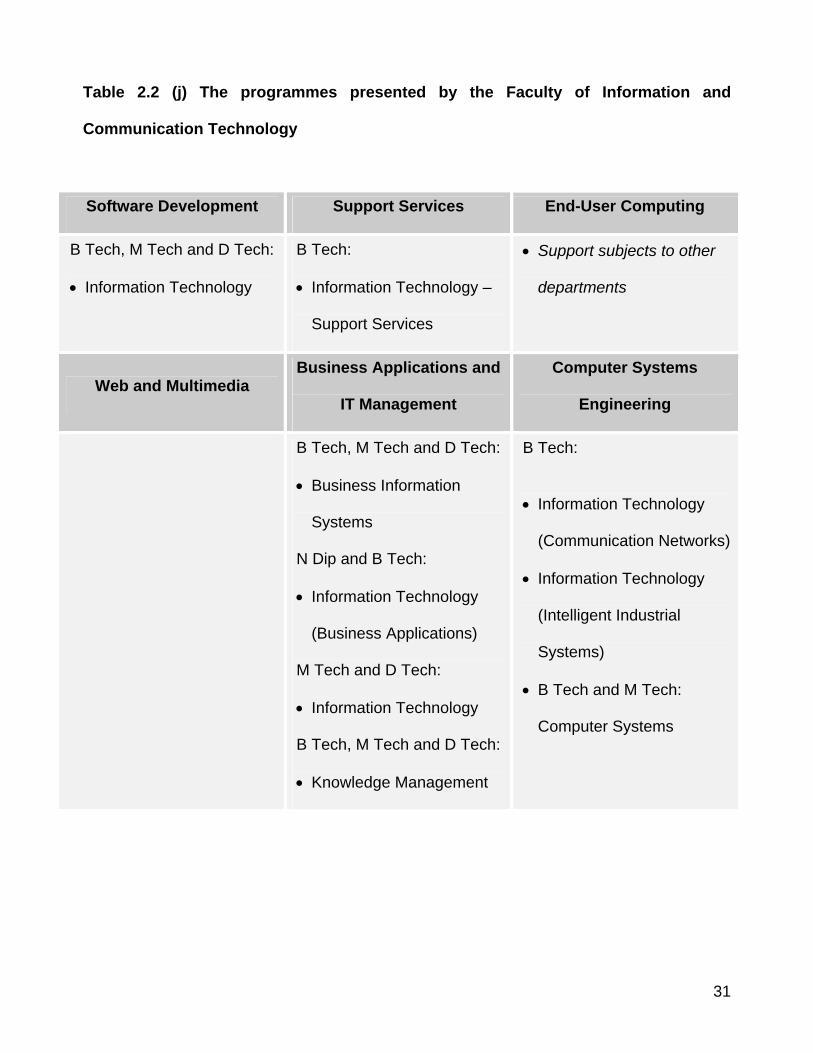
2.4.1 Overview of the Tshwane University of Technology’s products
The Tshwane University of Technology offers a wide variety of programmes (courses) in its
eleven faculties. Each faculty consists of several departments, as depicted in figure 2.2.
Each department presents several programmes, ranging from National Diplomas and B
Tech degrees to doctorates. Table 2.2 (a-k) gives an exposition of the programmes offered
in each faculty.
Table 2.2 (a) The programmes presented by the Faculty of Agricultural Sciences
Crop Sciences Animal Sciences Nature conservation Horticulture
N Dip, B Tech, M
Tech and D Tech:
• Agriculture
• N Dip, B Tech:
Animal Production
• N Dip: Equine
Science
• N H Dip: Pig
Production
Management
• N H Dip: Poultry
Production
Management
M Tech and D Tech:
• Agriculture
N Dip and B Tech:
• Ecotourism
Management
N Dip, B Tech and D
Tech:
• Game Ranch
Management
• Nature
Conservation
N Dip, B Tech and D
Tech:
• Horticulture
• N Dip: Ecotourism
Management
N Dip and B Tech:
• Landscape
Technology
• B Tech: Turfgrass
Management
24
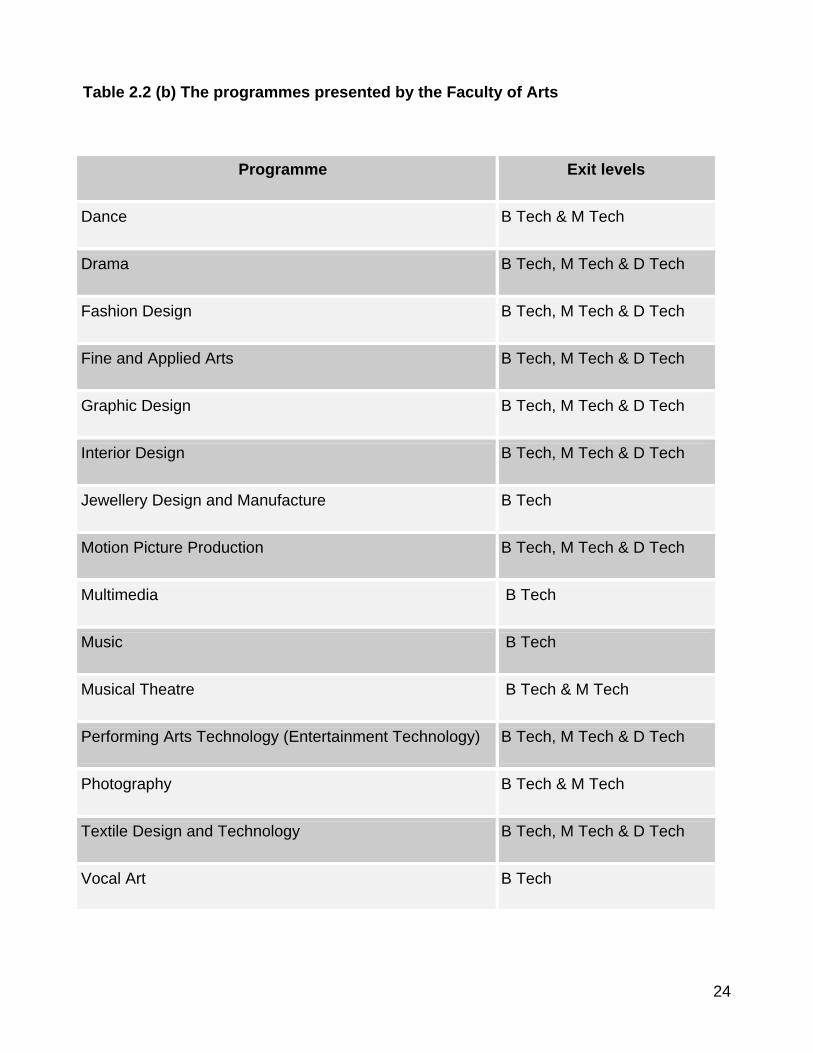
Table 2.2 (b) The programmes presented by the Faculty of Arts
Programme Exit levels
Dance B Tech & M Tech
Drama B Tech, M Tech & D Tech
Fashion Design B Tech, M Tech & D Tech
Fine and Applied Arts B Tech, M Tech & D Tech
Graphic Design B Tech, M Tech & D Tech
Interior Design B Tech, M Tech & D Tech
Jewellery Design and Manufacture B Tech
Motion Picture Production B Tech, M Tech & D Tech
Multimedia B Tech
Music B Tech
Musical Theatre B Tech & M Tech
Performing Arts Technology (Entertainment Technology) B Tech, M Tech & D Tech
Photography B Tech & M Tech
Textile Design and Technology B Tech, M Tech & D Tech
Vocal Art B Tech
25
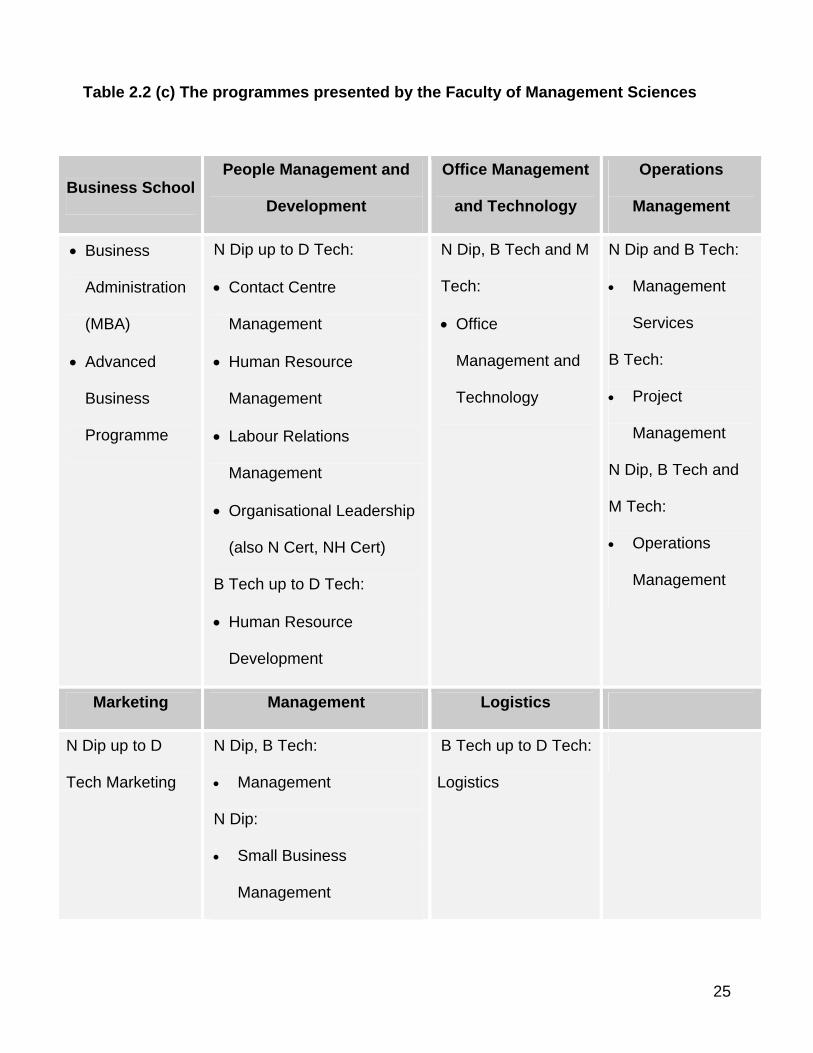
Table 2.2 (c) The programmes presented by the Faculty of Management Sciences
Business School People Management and
Development
Office Management
and Technology
Operations
Management
• Business
Administration
(MBA)
• Advanced
Business
Programme
N Dip up to D Tech:
• Contact Centre
Management
• Human Resource
Management
• Labour Relations
Management
• Organisational Leadership
(also N Cert, NH Cert)
B Tech up to D Tech:
• Human Resource
Development
N Dip, B Tech and M
Tech:
• Office
Management and
Technology
N Dip and B Tech:
• Management
Services
B Tech:
• Project
Management
N Dip, B Tech and
M Tech:
• Operations
Management
Marketing Management Logistics
N Dip up to D
Tech Marketing
N Dip, B Tech:
• Management
N Dip:
• Small Business
Management
B Tech up to D Tech:
Logistics
26
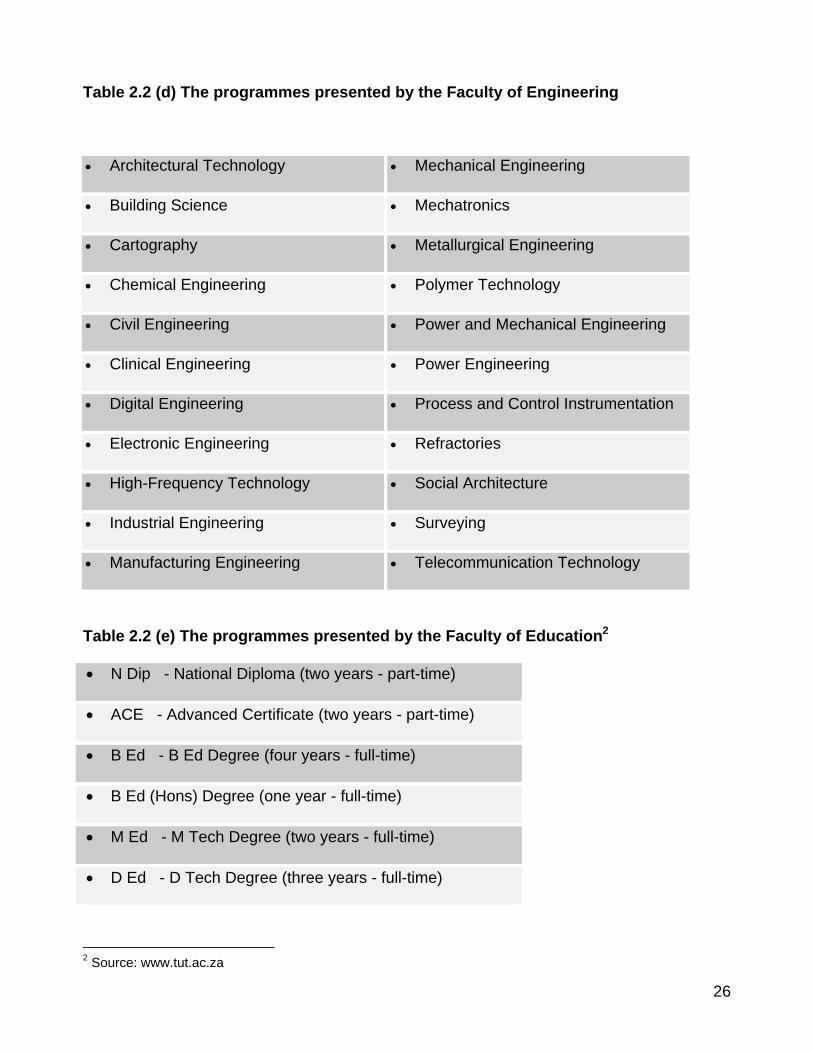
Table 2.2 (d) The programmes presented by the Faculty of Engineering
• Architectural Technology • Mechanical Engineering
• Building Science • Mechatronics
• Cartography • Metallurgical Engineering
• Chemical Engineering • Polymer Technology
• Civil Engineering • Power and Mechanical Engineering
• Clinical Engineering • Power Engineering
• Digital Engineering • Process and Control Instrumentation
• Electronic Engineering • Refractories
• High-Frequency Technology • Social Architecture
• Industrial Engineering • Surveying
• Manufacturing Engineering • Telecommunication Technology
Table 2.2 (e) The programmes presented by the Faculty of Education2
• N Dip - National Diploma (two years - part-time)
• ACE - Advanced Certificate (two years - part-time)
• B Ed - B Ed Degree (four years - full-time)
• B Ed (Hons) Degree (one year - full-time)
• M Ed - M Tech Degree (two years - full-time)
• D Ed - D Tech Degree (three years - full-time)
2 Source: www.tut.ac.za
27
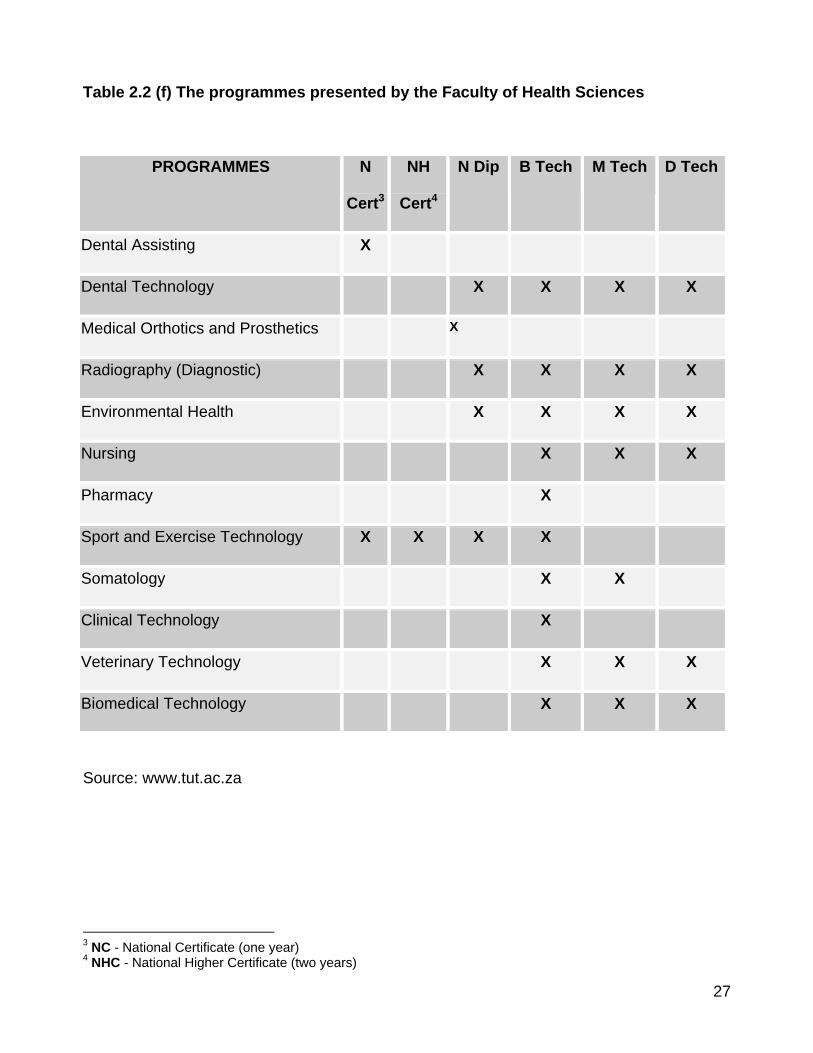
Table 2.2 (f) The programmes presented by the Faculty of Health Sciences
PROGRAMMES N
Cert3
NH
Cert4
N Dip B Tech M Tech D Tech
Dental Assisting X
Dental Technology X X X X
Medical Orthotics and Prosthetics X
Radiography (Diagnostic) X X X X
Environmental Health X X X X
Nursing X X X
Pharmacy X
Sport and Exercise Technology X X X X
Somatology X X
Clinical Technology X
Veterinary Technology X X X
Biomedical Technology X X X
Source: www.tut.ac.za
3 NC - National Certificate (one year) 4 NHC - National Higher Certificate (two years)
28
Table 2.2 (g) The courses presented by the Faculty of Social Sciences
Public Relations and
Business Communication Public Management Teacher Training
B Tech, M Tech and
D Tech:
• Business Communication
• International
Communication
• Public Relations
Management
B Tech and M Tech:
• Policing
• Public Management
• Security Management
• Traffic Safety
Management
D Tech:
• Policing
• Public Management
Certificates Bachelor’s
Degree:
• Education: Commerce
• Education: Management
• Education: Post-School
M Tech:
• Education
D Tech
• Education
Law Journalism Language Dynamics
National Diploma:
• Legal Assistance
Certificates:
• Versatile Broadcasting
N Dip, B Tech, M Tech and
D Tech:
• Journalism
B Tech, M Tech and D
Tech:
• Language Practice
Safety and Security
• MDP Programme
29
Table 2.2 (h) The programmes presented by the Faculty of Natural Sciences
Chemistry and Physics Mathematical Technology Biotechnology and Food
Technology
N Dip, B Tech, M Tech and
D Tech:
• Chemistry and Physics
N Dip, B Tech, M Tech and
D Tech:
• Mathematical Technology
N Dip, B Tech, M Tech and
D Tech:
• Food Technology
• Biotechnology
Water Care Geology Chemistry
N Dip:
• Fire Technology
M Tech and D Tech:
• Water Care
N Dip, B Tech, M Tech and
D Tech:
• Geology
• N Dip: Analytical
Chemistry
• B Tech and M Tech:
Chemistry
Environmental
Management
Environmental Sciences Physical sciences
N Dip, B Tech, M Tech and
D Tech:
• Environmental
Management
N Dip, B Tech, M Tech and
D Tech:
• Environmental Sciences
N Dip, B Tech, M Tech and
D Tech:
• Physical Sciences
30
Table 2.2 (i) The programmes presented by the Faculty of Economic Sciences
Managerial Accounting and
Finance Accounting
B Tech, M Tech and D Tech:
• Cost and Management
Accounting
National Diploma:
• Accounting
B Tech:
• Cost And Management Accounting
• Finance and Accounting (Public)
• Financial Information Systems
• Internal Auditing
• Local Government Finance
M Tech and D Tech:
• Cost and Management Accounting
• Internal Auditing
Auditing Economics Public Sector Finance
N Dip, B Tech, M Tech and D
Tech:
• Internal Auditing
B Tech:
• Economic
Management
Analysis
B Tech:
• Local Government Finance
• Finance and Accounting
(Public)
31
Table 2.2 (j) The programmes presented by the Faculty of Information and
Communication Technology
Software Development Support Services End-User Computing
B Tech, M Tech and D Tech:
• Information Technology
B Tech:
• Information Technology –
Support Services
• Support subjects to other
departments
Web and Multimedia Business Applications and
IT Management
Computer Systems
Engineering
B Tech, M Tech and D Tech:
• Business Information
Systems
N Dip and B Tech:
• Information Technology
(Business Applications)
M Tech and D Tech:
• Information Technology
B Tech, M Tech and D Tech:
• Knowledge Management
B Tech:
• Information Technology
(Communication Networks)
• Information Technology
(Intelligent Industrial
Systems)
• B Tech and M Tech:
Computer Systems

32
Table 2.2 (k) The programmes presented by the Faculty of Tourism, Hospitality and
Leisure
Tourism Management Hospitality Management Sport and Leisure
Management
N Dip and B Tech:
• Tourism Management
M Tech:
• Tourism And Hospitality
N Dip, B Tech, M Tech and D Tech:
• Adventure Tourism Management
• Ecotourism Management
N Dip and B Tech:
• Hospitality Management
M Tech:
• Hospitality and Tourism
Management
N Dip and B Tech:
• Sport Management
• Recreation
Management
B Tech:
• Outdoor Management
Figure 2.2 gives a graphical exposition of the departments in the eleven faculties of the
Tshwane University of Technology.
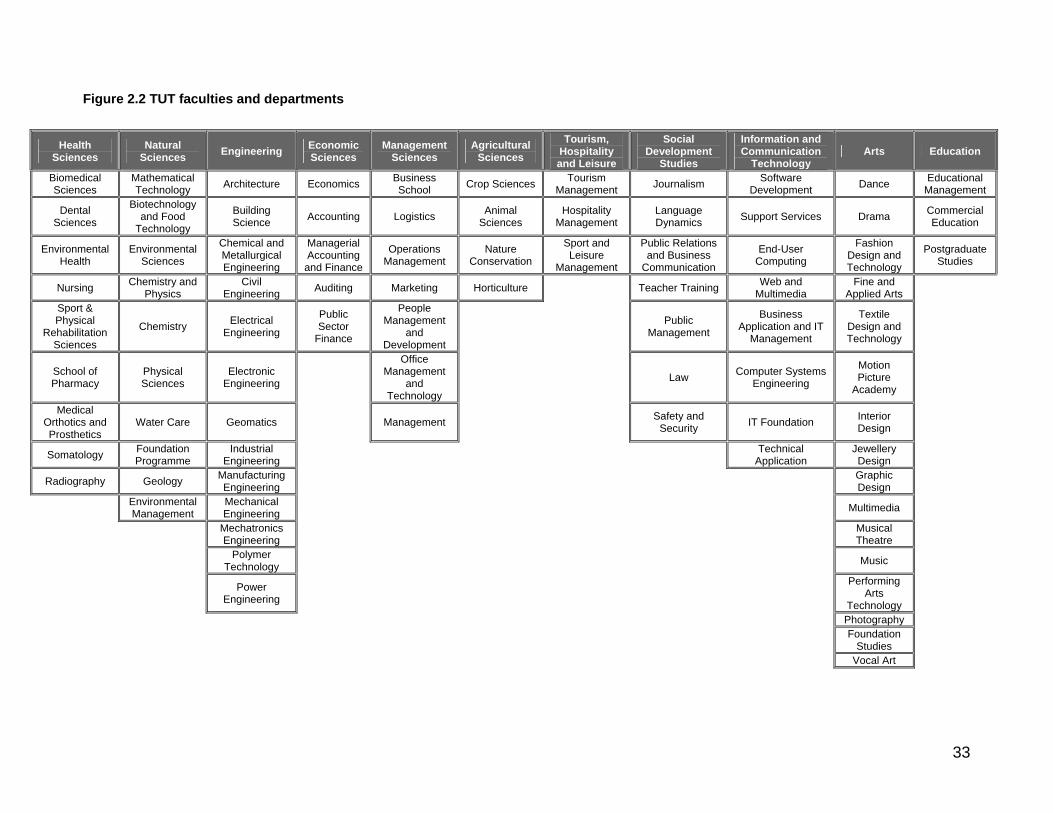
33
Figure 2.2 TUT faculties and departments
Health Sciences
Natural Sciences Engineering Economic
Sciences Management
Sciences Agricultural
Sciences Tourism,
Hospitality and Leisure
Social Development
Studies
Information and Communication
Technology Arts Education
Biomedical Sciences
Mathematical Technology Architecture Economics Business
School Crop Sciences Tourism Management Journalism Software
Development Dance Educational Management
Dental Sciences
Biotechnology and Food
Technology
Building Science Accounting Logistics Animal
Sciences Hospitality
Management Language Dynamics Support Services Drama Commercial
Education
Environmental Health
Environmental Sciences
Chemical and Metallurgical Engineering
Managerial Accounting
and Finance
Operations Management
Nature Conservation
Sport and Leisure
Management
Public Relations and Business
Communication
End-User Computing
Fashion Design and Technology
Postgraduate Studies
Nursing Chemistry and Physics
Civil Engineering Auditing Marketing Horticulture Teacher Training Web and
Multimedia Fine and
Applied Arts
Sport & Physical
Rehabilitation Sciences
Chemistry Electrical Engineering
Public Sector
Finance
People Management
and Development
Public Management
Business Application and IT
Management
Textile Design and Technology
School of Pharmacy
Physical Sciences
Electronic Engineering
Office Management
and Technology
Law Computer Systems Engineering
Motion Picture
Academy
Medical Orthotics and Prosthetics
Water Care Geomatics Management Safety and Security IT Foundation Interior
Design
Somatology Foundation Programme
Industrial Engineering Technical
Application Jewellery Design
Radiography Geology Manufacturing Engineering Graphic
Design
Environmental Management
Mechanical Engineering Multimedia
Mechatronics Engineering Musical
Theatre
Polymer Technology Music
Power Engineering
Performing Arts
Technology
Photography
Foundation Studies
Vocal Art
34
A review of secondary information regarding the Tshwane University of Technology will now
be given.
2.5 Review of existing secondary information regarding the Tshwane University of
Technology
The Human Sciences Research Council (HSRC) conducted a survey in August 2001
wherein Grade 12 learners nationwide nominated the Tshwane University of Technology
(then still named Technikon Pretoria) as their preferred choice for tertiary education (Cosser
& Du Toit, 2002). South African Grade 12 learners are a major target market for the
Tshwane University of Technology, as they are the primary source of prospective students.
In this particular study, the population under scrutiny was profiled; the choice of learners
aiming to enter tertiary education after school was determined. The factors that influenced
their choices were also established, and the preferred study fields were determined.
The population studied had the following characteristics (Cosser & Du Toit, 2002):
• Gender distribution: 48% male, 52% female
• Age distribution: 19 years old, on average
• Ethnic profile: Africans: 82%; Whites: 8%; Coloureds: 7%; and Indians 3%
• Most popular spoken languages: 20% IsiZulu; 17% IsiXhosa and 14% Sepedi. English
was the home language of 11% of the learners
• Socio-economic status (SES): 78% low SES; 17% middle SES; and 5% high SES
• Of these learners, 27% have siblings with higher education connections
35
The HSRC survey revealed that 73% of the respondents planned to enter higher education.
A further 14% were unsure. An examination of the factors that influence learners to enter
higher education brought to light the following (Cosser & Du Toit, 2002):
• Increased employability
• Interest in study area
• Increased income potential
• Family influences
• Bursary options
• Finance options
• Scholarships
• Teachers
• Peer influence
• Uncertainty about life direction
The most significant indicator of intention to enter higher education was having a sibling
who was studying or had studied at a tertiary institution. The majority (55%) of the Grade
12 learners indicated that they preferred a technikon to a university. A further 10% were
undecided. As to contact versus distance education, 86% of respondents favoured contact
education. The preferred institution was the Tshwane University of Technology (then
Technikon Pretoria), leading by 16,6%, followed by Technikon Witwatersrand (4,9%), and
the University of Pretoria (4,4%). Of the respondents, 13,3% were unsure which institution
to choose.
36
An assessment of the factors that affect learners’ choice of tertiary institution was also done
during the study. The variables considered included the following (Cosser & Du Toit,
2002:95):
• Reputation of the institution
• Reputation of the particular faculty or department
• Away from home, allowing housing in a residence
• Superior sporting facilities
• Lower fees
• Peer recommendation
• Permits correspondence study
• Close to home to enable studying from home
• Relatives’ alma mater
• Scholarship at the institution
The positive reputation of the institution was the most important factor, followed by the
faculty or department’s reputation. The three most preferred study fields were business,
commerce and management studies (25,6%), followed by manufacturing, engineering and
technology (15,6%), and health sciences and social services (14,1%). Studies in business,
commerce and management were the most popular for both males (24,2%) and females
(27%). Females showed only 8,7% interest in studying manufacturing, engineering and
technology, as opposed to 23,3% of males.
37
The following influencing factors on selection of a particular study field were provided by
Cosser and Du Toit (2002:110):
• Interest in specific study discipline
• South African job opportunities in this field
• Potential to contribute to development with this specific qualification
• Practical study programme
• International job opportunities
• Reputation of the particular school, faculty or department
• Income potential in particular field
• Theoretical study programme
• Availability of financial help
• Scholarships in the field
• Relatives’ influence
• Non-ability to study in first study-field choice
• Peer influence
• Relatives studied in this discipline
Interestingly, Africans and Coloureds were more encouraged by job opportunities in South
Africa than were Whites and Indians (Cosser & Du Toit, 2002). Africans were also more
affected by the potential of financial aid than the other three ethnic groups. The province
that the learner’s school is in was the most important predictor of the choice of institution
and study field (Cosser & Du Toit, 2002). With regard to family with higher education
connections, 26,9% of the respondents had siblings who were studying at or had graduated
from a tertiary institution.
38
The HSRC Student Choice Behaviour Project also indicated that the learners concerned
were idealistic and optimistic about their future career options. Their four highest career
desirables were philanthropy, proficiency, accordance with their interests, and earning a
high salary (Cosser & Du Toit, 2002:114). This corresponds with findings in the United
States of America, where Suzanne Kapner describes Generation Y as “idealistic” and
“socially conscious” in a cover story (Restaurant Business, 1997). Anderson (2002:31)
defines Generation Y as follows:
”Those in Generation Y:
• Were born between 1977 and 1995…
• [were] between 8 and 26 in 2003…”’
Kapner (1997:49) quotes one of the interviewees as observing that this generation is “…
less money-oriented, but more interested in being happy”. Cosser and Du Toit (2002:115)
agree with this view, finding that Grade 12 learners (part of Generation Y) “…see
themselves as being happy and successful in their work, and bettering their education”.
These aspects will be surveyed in the empirical phase of this dissertation.
Stone, Stanton, Kirkham and Pyne (2001:162) found that Generation Y is influenced heavily
by word of mouth and that peer groups are key influencers. This corresponds with the
findings of Cosser and Du Toit (2002:95), where the reputation of the institution and the
reputation of the department or faculty were revealed to be important factors affecting
South African learners’ choice of a specific tertiary training institution. Family and peer
39
influence played an important role in learners’ decision to enter higher education after
school (Cosser & Du Toit, 2002:71).
Various studies done in the United States of America, as well as the United Kingdom,
illustrate the buying behaviour of students. Marx (1995:40) maintains that students, typical
Generation Y’ers, are brand loyal and brand conscious. One of the reasons behind
businesses targeting the student market in America is that they are “… entry level to the
upscale adult market”, according to Stuart Himmelfarb of the American Passage Marketing
Corporation (Marx, 1995).
Students’ long-term potential as brand loyalists make them an attractive market indeed.
The student years are the time when brand preferences and loyalties are set that will
continue in the long term (Wolburg & Pokrywzcynski, 2001:33). Also, the distinctive
consumption patterns they display now will probably remain, as they become adult high-
spenders (Neuborne & Kerwin, 1999). Tertiary students are also seen as early adopters of
product innovations and are “… considered trendsetters who wield a strong influence on
their peers and families” (Rieger, 1992).
Generation Y is furthermore characterised as being “… highly consumption-oriented and
sophisticated in terms of their tastes, aspirations and shopping skills” (Schneidermann,
2000). Lois Huff of PriceWaterhouseCooper, in Schneidermann (2000:4), predicts that
Generation Y would be highly educated as well as technologically proficient. According to a
survey of American college freshmen in 1998, most of the respondents anticipated having
careers, and even then considered owning homes eventually (Neuborne, 1999).
40
Students buy new products mainly because of positive word-of-mouth (Heckman, 1999).
American students spent the largest part of their discretionary income on apparel in 1999
(Weissman, 1999), followed by eating out, entertainment, preparing food, music, books and
leisure, personal care, school supplies and software. Last on the list are cleaning supplies.
According to Greenfield Online, in Weissman (1999:80), this grouping also had positive
attitudes towards the following activities, products and trends:
• Internet surfing, working hard at school, making homemade CDs, swing dancing,
kickboxing
• Cargo pants, cell phones, Volkswagens
• Instant messaging, body piercing, spirituality
It is entirely possible that the behavioural patterns of students experienced in other parts of
the world, such as the USA and UK, could also be applicable to students in South Africa.
This aspect will therefore be investigated in the empirical study phase of this dissertation.
A study completed in 1995 by BINEB surveyed the income and expenditure patterns of
students at the University of Pretoria. They found the expenditure patterns detailed in
Table 2.3 below. The highest percentages of monthly spending on certain items are shown
for all respondents in the study, as well as the percentages for the Faculty of Economic
Sciences, which may later be compared to results from the consumption patterns of
Tshwane University of Technology marketing students, who form part of the Faculty of
Management Sciences at TUT.

41
Table 2.3 Monthly top expenditures of undergraduate students at the University of
Pretoria in 19955
Rank Item All students Faculty of Economic Sciences
1 Transport (incl. petrol) 22,4% 23,2%
2 Snacks (incl. cool drinks) 13,0% 11,5%
3 Entertainment 9,0% 8,9%
4 Personal care 8,9% 8,.3%
5 Alcoholic drinks 7,4% 8,9%
6 Eating out 6,4% 7,3%
7 Communication 4,6% 4,1%
8 Sport 4,0% 4,5%
9 Church contributions 3,9% 4,3%
10 Study material 3,8% 3,0%
There are some similarities between the findings of Weissman (1999) and those of BINEB
(1995) regarding students’ consumption patterns and the ranking thereof, as may be seen
in table 2.4.
5 Adapted from BINEB 1995 table A2.2
42
Table 2.4 Similarities between expenditure of American students (1999) and South
African (UP) students (1995)
Item Rank: SA Rank: USA
Entertainment 3 3
Personal care 4 6
Eating out 6 2
Study material 10 8
The University of Pretoria students’ highest expenditure was on transport, whereas the
American students’ highest spending was on apparel. The lowest expenditure for American
students was on cleaning products, and for the South Africans it was washing and dry
cleaning.
The consumption patterns of Tshwane University of Technology students will be examined
in this study to determine similarities with other studies.
2.6 Conclusion
The history of tertiary education in South Africa was explored in this chapter. The
establishment and development of universities and technikons were described.
Furthermore, the products presented by the Tshwane University of Technology were
illustrated. Chapter 2 also incorporated information from existing studies regarding the
43
consumption patterns of Generation Y consumers, which also fit the profile of students
studying at TUT.
In chapter 3, a closer look will be taken at the theory of consumer behaviour, which forms
part of the theoretical background to this study.

CHAPTER 3
CONSUMER BEHAVIOUR
45
3.1 Introduction
Chapter 3 gives an exposition of the general constructs and definitions in the field of
consumer behaviour. The internal and external factors influencing consumer behaviour
are described, as well as some demographic information. The process the consumer
goes through when making consumption decisions is detailed. The focus throughout will
be on the consumer behaviour patterns displayed by tertiary students in South Africa.
3.2 Consumer, consumer behaviour and the consumer decision-making process
3.2.1 Consumer
A consumer is described as “a buyer or user of a product or service” (Yadin, 2002: 85). In
the tertiary education market, the consumer is the student. The consumer displays
behavioural patterns that are studied by marketers to determine how to market to the
consumer.
3.2.2 Consumer behaviour
Hawkins (2001:7) defines consumer behaviour as “… the study of individuals, groups, or
organizations and the processes they use to select, secure, use, and dispose of products,
services, experiences or ideas to satisfy needs and the impacts that these processes
have on the consumer and society”. Yadin (2002:86) offers the following explanation of
consumer behaviour: “… the observation of the decision-making, purchasing patterns and
46
habits of the general public.” He also states “behavioural science is increasingly used in
the service of marketing, in the sense that consumer behaviour can be analysed and
predicted”.
3.2.3 Consumer decision-making process
Consumer decision-making is defined as “… the process of choosing between two or
more product alternatives that satisfy needs” (Schiffman & Kanuk, 1997:558). In higher
education, South African learners are now able to choose between 21 tertiary education
institutions, offering them a variety of alternative qualifications. Different types of buying
behaviour models exist. Chisnall (1995:193) refers to monadic and multi-variable models.
For the purpose of this study, a monadic model, namely a logical-flow model, or decision-
process model, will be used. Monadic models of consumer behaviour are established on
“… microeconomic theory, such as… utility or satisfaction which asserts that a consumer
acts rationally”. The decision-making process and the factors that affect this process are
depicted in Figure 3.1.
47
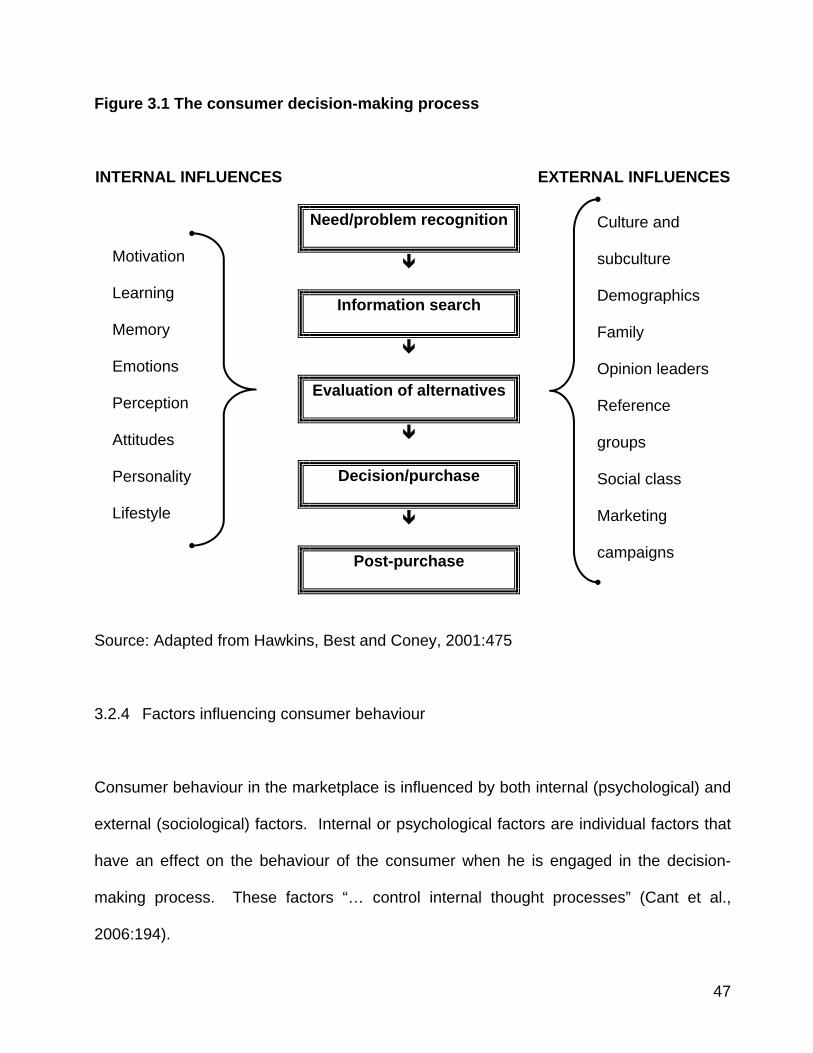
Figure 3.1 The consumer decision-making process
INTERNAL INFLUENCES EXTERNAL INFLUENCES
Need/problem recognition
Information search
Evaluation of alternatives
Decision/purchase
Motivation
Learning
Memory
Emotions
Perception
Attitudes
Personality
Lifestyle
Post-purchase
Culture and
subculture
Demographics
Family
Opinion leaders
Reference
groups
Social class
Marketing
campaigns
Source: Adapted from Hawkins, Best and Coney, 2001:475
3.2.4 Factors influencing consumer behaviour
Consumer behaviour in the marketplace is influenced by both internal (psychological) and
external (sociological) factors. Internal or psychological factors are individual factors that
have an effect on the behaviour of the consumer when he is engaged in the decision-
making process. These factors “… control internal thought processes” (Cant et al.,
2006:194).
48
As seen in figure 3.1, the internal factors that influence consumer behaviour include the
following:
• Motivation
• Learning
• Memory
• Emotions
• Perception
• Attitudes
• Personality
• Lifestyle
External or sociological factors influencing consumer behaviour are factors outside of the
individual consumer. These serve to “… direct internal thought processes” (Cant et al.,
2006:194) and include the following:
• Culture and subculture
• Demographics
• Family
• Opinion leaders
• Reference groups
• Social class
• Marketing campaigns by various companies promoting an assortment of brands
49
Subsequently, these specific internal and external influences on consumer behaviour will
be discussed. After that, the steps in the decision-making process, which are influenced
by these factors, will be described.
3.3 Internal factors affecting consumer behaviour
The internal or individual factors that affect the consumer play an important role in the
purchasing decision of the consumer. Each of these factors will be discussed next.
3.3.1 Motivation
Schiffman and Kanuk (2004:87) define motivation as “… the driving force within
individuals that impels them to action”. Chisnall (1995: 50) describes motivation as “… an
energising force which originates, sustains, and directs activities towards diverse objects”.
According to du Plessis et al. (2003:111), motives are “… inner states that energise,
activate, motivate and direct behaviour toward purchasing goals”. Motives are generally
backed by needs, which may be categorised into two general classifications: biogenic and
psychogenic needs (Chisnall, 1995:41).
Biogenic needs are basic physiological needs such as hunger and thirst. Psychogenic
needs are more complex psychological needs related to “… social, cultural, emotional and
intellectual interests [that] affect the behaviour of individuals” (Chisnall, 1995:43). The
tertiary student’s need to be educated may be classified as a psychogenic need.
Biogenic needs may be tailored by the psychogenic needs, as seen in the eating

50
behaviour of people. Asch, in Chisnall (1995:42), states: “Food ceases to be something
merely to be devoured ... it becomes connected with social and aesthetic requirements”.
Motives and needs exist interdependently and are inextricably linked (Chisnall, 1995:40).
Maslow’s hierarchy of needs is often used to indicate the levels of needs that motivate
consumers. According to Bennett (1995:171), Maslow’s theory proposes that consumers
“… satisfy their needs in a sequential order beginning with physiological needs… and
finally, self-actualisation needs”. Solomon (1999:110) mentions that the “hierarchical
approach implies that … a certain level must be attained before the next, higher one is
achieved”. Figure 3.2 illustrates this hierarchy.
Figure 3.2 Maslow’s hierarchy of needs1
1 Adapted from Solomon, 1999:110.
SSeellff--aaccttuuaalliissaattiioonn
EEggoo
BBeelloonnggiinnggnneessss
SSaaffeettyy
PPhhyyssiioollooggiiccaall
51
According to this hierarchy, the most basic needs, namely physiological needs such as
hunger and thirst, have to be satisfied before moving on to the next level of needs. Safety
needs refer to the need for physical safety, order, familiarity and stability (Schiffman &
Kanuk, 2004:104). Belongingness encompasses social needs like friendship, and ego
needs denote the desire for prestige and esteem. The last level, self-actualisation, means
reaching a level of self-fulfilment. In terms of Maslow’s hierarchy, the intention to study at
a tertiary institution may be classified, in most instances, as a need for self-actualisation.
Motives may be rational or emotional. Schiffman and Kanuk (2004:93) assert that a
rational motive “… implies that consumers select goals based on totally objective criteria,
such as size, weight, price, or miles per gallon”. Emotional motives, on the other hand,
“… imply the selection of goals according to personal or subjective criteria” (Schiffman &
Kanuk, 2004:94). Judging by the top three reasons Grade 12 learners gave for their
decision to enter higher education, namely increased employability, interest in study area,
and increased income potential (Cosser & Du Toit, 2002:61), it is clear that they were
influenced mainly by rational motives.
3.3.2 Learning
Mitchell, in du Plessis and Rousseau (2003: 250), describes learning as “any change in
the content or organisation of the long-term memory.” Another definition establishes
learning as “… more or less permanent change in behaviour that occurs as a result of
practice” (Bennett, 1995:152). Due to the learning process, “… a buyer of goods or
services will develop attitudes, if these are unfavourable, then the likelihood of repeat
52
purchases is problematical” (Chisnall, 1995:30). The goal of the tertiary institution is to
have the target market learn about the brand, for example, Tshwane University of
Technology, and to develop a favourable attitude towards it. The result of learning is that
the product or brand will be committed to the memory of the consumer.
3.3.3 Memory
Bettman, in du Plessis and Rousseau (2003:250), defines memory as “the total
accumulation of prior learning experiences and comprises of short-term memory and long-
term memory”. Memory comes into play especially where brand recognition is concerned.
Also, marketers endeavour to provoke positive reinforcement that enhances recall
(memory) because “…the probability [increases] that a given response… will reoccur
given the same stimuli and situation” (Cant et al., 2006:124), resulting in repeat
purchases.
The elements of the marketing communication mix aim to place the brand in the
consumer’s memory as a positive reinforcement. Advertisers, for example, utilise various
advertising approaches in order to stimulate the recollection of brands. Such approaches
include fear and humour appeals. They also often make use of emotional appeals in
advertisements (Hawkins et al., 2001). The Tshwane University of Technology utilises a
rational approach in its poster advertisements, which declare: “The leading brand in
higher education is born.”
53
3.3.4 Emotions
Neal, Quester and Hawkins (2002:20) describe an emotion as “the feelings or affective
responses to situations, products, advertisements and so forth.” Hawkins et al. (2001:378)
define emotion as “strong, relatively uncontrolled feelings that affect our behaviour”. An
emotional appeal or approach is described as an advertising appeal that “…is designed to
create a positive affective response” (Cant et al., 2006:157). Emotional appeals may
have an effect on the attitudes of consumers, as seen in the tri-component attitude model,
which will be examined later. The decision to enter tertiary study after school is not an
emotional decision, as seen from the results in Cosser and Du Toit (2002: 61). These
results show rational reasons for entering higher education, such as the enhancement of
employability and the possibility of earning a higher income after studying.
3.3.5 Perception
The consumer’s perceptual process may also affect his purchase decision. “Perception is
the process by which stimuli are selected, organised and interpreted” (Solomon,
1999:565). Bennett (1995:205) adds that perception “… is the cognitive impression that is
formed of “reality” which in turn influences the individual’s actions”. The perception
process consists of three steps, namely exposure, attention and interpretation (Hawkins et
al., 2001:284).
3.3.5.1 Exposure is the extent to which a person detects a stimulus that is within the
scope of his or her sensory receptors (Solomon, 1999:51). Thus, when the
54
consumer comes within sensory range of a stimulus, for instance, an
advertisement, exposure occurs. It is important to note that exposure is
selective in nature, in that consumers “… actively seek out messages that they
find pleasant or with which they are sympathetic …” (Schiffman & Kanuk,
2004:172). Similarly, consumers also seek to reduce cognitive dissonance
(discussed later) by choosing to expose themselves to advertisements that
support their purchase decisions.
3.3.5.2 Attention transpires “… when the stimuli activate one or more sensory receptor
nerves and the resulting sensations go to the brain for processing (Hawkins et
al., 2001:287). Three aspects determine attention, namely stimulus factors,
individual factors and situational influences. Stimulus factors influencing
perception include the following (Hawkins et al., 2001:287):
• Size and intensity
• Colour and movement
• Position
• Isolation
• Format
• Contrast
• Information quantity
Individual factors affecting the perceptual process comprise learning, expectations,
motives, interest and need. The fact that a sibling of a learner studies at a certain
55
institution causes the learner to expect certain things from that particular institution,
and will thus influence the way the learner perceives the institution as a brand.
Situational factors encompass the “… stimuli in the environment other than the
focal stimulus (Hawkins et al., 2001:292). These include competitive stimuli like
advertisements for rival tertiary institutions.
3.3.5.3 In the final step in the perception process, interpretation, the consumer assigns
meaning to the sensation (Hawkins et al., 2001:296). Interpretation “… relates
to how advertising messages are received and understood by consumers”
(Clemente, 1992:170). Schiffman and Kanuk (2004:176) define perceptual
interpretation as the interpretation of stimuli “… based on what individuals
expect to see in the light of their previous experience, on the number of
plausible explanations they can envision, and on their motives and interests at
the time of perception”.
Subsets of interpretation include cognitive and affective interpretation.
• Hawkins et al. (2001:296) define cognitive interpretation as the “… process
whereby stimuli are placed into existing categories of meaning”. If, for
example, a person sees and interprets an advertisement for the Tshwane
University of Technology, it will be placed in the category of “tertiary
institutions” in the mind of the consumer.
• They describe affective interpretation as “… emotional or feeling response
triggered by a stimulus such as an ad”, connecting with the theory on
emotional appeals in advertising, which may also be used to bring about
56
attitudinal changes in the consumer. A person studying at the Tshwane
University of Technology will experience a positive emotion when seeing an
advertisement for the institution, which is an example of affective
interpretation.
3.3.6 Attitudes
An attitude is a “learned disposition to respond in a consistently favourable or
unfavourable manner with respect to a given object, subject, idea or behaviour” (du
Plessis & Rousseau, 2003:261). Yadin (2002:32) asserts attitude “… can reflect positive
or negative thinking on [a] subject…” Furthermore, attitudes “… are not directly
observable, but must be inferred from what people say or what they do” (Schiffman &
Kanuk, 2004: 252). Schiffman and Kanuk (2004:253) also assert that attitudes are
learned tendencies, which have consistency and occur within and are affected by the
situation.
Du Plessis and Rousseau describe the tri-component attitude model (2003:262), which
illustrates that consumer attitudes consist of cognitive, behavioural and affective
components. Therefore, what a consumer thinks, in other words, the cognitive, what he
likes (the affective component) and what he buys (the behavioural component),
demonstrate his attitude. A Grade 12 learner may think that the Tshwane University of
Technology is the best tertiary institution (cognitive component), which leads to the
learner’s liking of the brand (affective component), and finally the learner chooses to study
at the Tshwane University of Technology (behavioural component).

57
These components are interrelated, and altering one or more of them may change overall
consumer attitudes (Hawkins et al., 2001:402). The tri-component model of attitude is
depicted in figure 3.3.
Figure 3.3 The tri-component attitude model2
3.3.7 Personality
Schiffman and Kanuk (2004:120) define consumer personality as “those inner
psychological characteristics that both determine and reflect how a person responds to his
or her environment”. The American Marketing Association in Cant et al. (2006:161)
describes personality as “…the consistent pattern of responses to the stimuli from both
internal and external sources”. Schiffman and Kanuk (2004:120) emphasise three 2 Adapted from Schiffman and Kanuk, 2000:203
Cognitive
Behav iouralAffective
58
properties of personality, namely that individual differences exist between personalities,
that a person’s personality is both consistent and enduring, and, finally, that personality
can alter under certain conditions.
Du Plessis et al. (2003:284) explain that personality characteristics are applied in
marketing for “… market segmentation, [and it] can direct product positioning, can guide
copy writing in advertising, and can act as media guidelines”. Hawkins et al. (2001:375)
assert that, in many instances, products attain distinctive brand personalities. People
assign human traits to brands, brand personality forms expectations about performance,
and these brand personalities are often the foundation for an enduring relationship with a
particular brand (Hawkins et al., 2001:376). The Tshwane University of Technology, for
example, will strive towards creating a brand personality that appeals to its target market.
3.3.8 Lifestyle
The last internal factor, lifestyle, is described as “a set of shared values or tastes exhibited
by a group of consumers, especially as these are reflected in consumption patterns”
(Solomon, 1999:656). Yadin (2002:212) defines lifestyle, as the way people “either prefer
to conduct their lives, or the way their lifestyle is determined by circumstances”. Lifestyle
segmentation is also termed psychographic segmentation. According to Schiffman and
Kanuk (2004:60), a “psychographic profile of a consumer segment can be thought of as a
composite of consumers’ measured activities, interests and opinions (AIOs)”.
59
In South Africa, the Living Standards Measure (LSM) is used as an added segmentation
tool that also helps to provide some sort of psychographic profile of consumers. The
South African Advertising Research Foundation (SAARF) Universal LSM “… quantifies
the ownership of certain durable goods, access to services and the like to yield a
composite measure of social class”. (du Plessis et al., 2003:87). It measures living
standards of people in South Africa and is divided into ten LSM groups, ranging from LSM
1 (lowest) to LSM 10 (highest). The South African LSM is comparable to the American
Values and Lifestyle System (VALS), which divides the market into segments based on
self-orientations and a definition of resources (Schiffman & Kanuk, 2004:74).
According to Cosser and Du Toit (2002:117), low fees compared to other institutions is
one of the five most important factors influencing Grade 12 learners’ decision of a tertiary
institution. This indicates that income will affect institutional choice. To be considered for
entrance into higher education, an applicant must have matric, therefore the primary
target market of the Tshwane University of Technology will mostly fall in the LSM 6
category (see Table 3.1), as this group has a Grade 12 educational level. It must
however be stated that persons in all LSM categories above and including LSM 6 (all
having at least matric, which is a prerequisite for tertiary studies) could be eligible for
study at a tertiary institution.
According to the latest census results, 12,6% (www.saarf.co.za) of the South African
population of 44 819 778 people (Statistics South Africa, 2003:7) fall in the LSM 6 group,
which translates to a possible target market size of approximately 5 647 292 people.
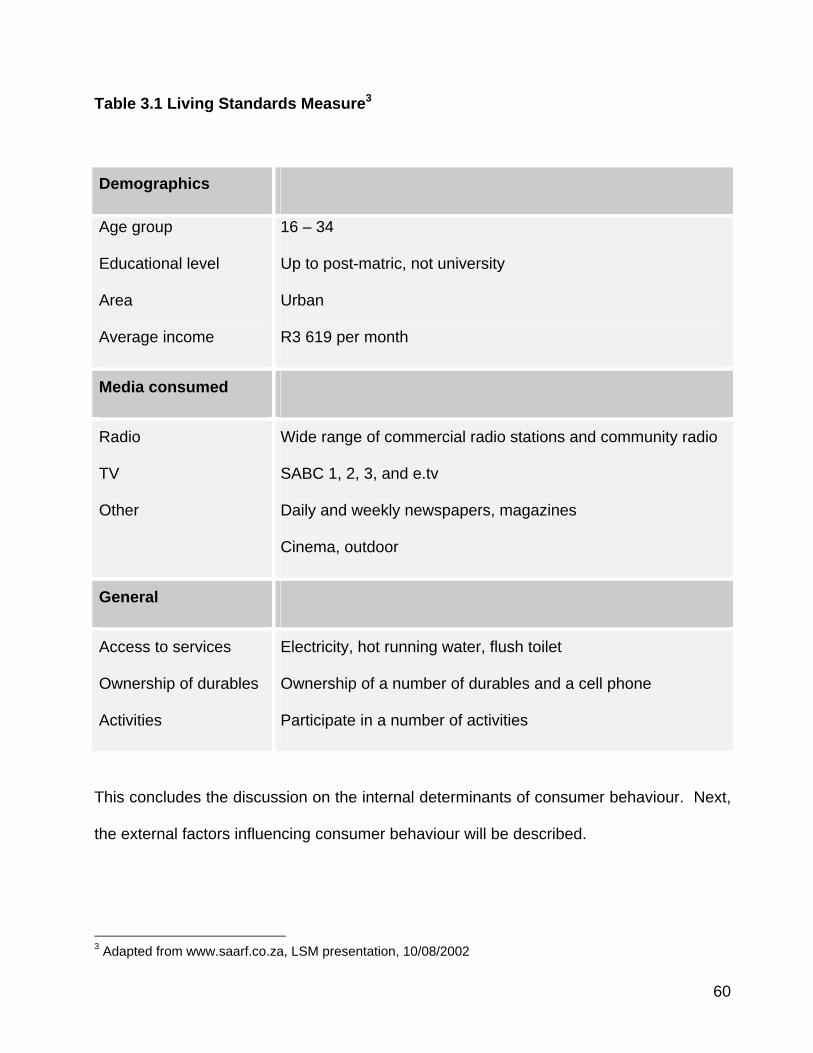
60
Table 3.1 Living Standards Measure3
Demographics
Age group
Educational level
Area
Average income
16 – 34
Up to post-matric, not university
Urban
R3 619 per month
Media consumed
Radio
TV
Other
Wide range of commercial radio stations and community radio
SABC 1, 2, 3, and e.tv
Daily and weekly newspapers, magazines
Cinema, outdoor
General
Access to services
Ownership of durables
Activities
Electricity, hot running water, flush toilet
Ownership of a number of durables and a cell phone
Participate in a number of activities
This concludes the discussion on the internal determinants of consumer behaviour. Next,
the external factors influencing consumer behaviour will be described.
3 Adapted from www.saarf.co.za, LSM presentation, 10/08/2002
61
3.4 External factors affecting consumer behaviour
Apart from the internal factors that affect decision-making, external or sociological factors
also have an effect on the consumption decision of the consumer.
3.4.1 Culture
Burgess (2002:31) describes culture as “a cohesive set of values, attitudes and beliefs
that emerge in adaptation to the environment.” Bennett (1995:72) offers the following
definition: “The set of learned values, norms and behaviors that are shared by a society
and are designed to increase the probability of the society’s survival”. These cultural
values and beliefs impact strongly on consumption behaviour, and several subcultures are
identified that further influence consumers.
3.4.2 Subcultures
“A subculture is a distinct cultural group that exists as an identifiable segment within a
larger, more complex society” (du Plessis & Rousseau, 2003: 402). The subcultures are
classified by age, geography and ethnicity. In South Africa, distinct ethnic subcultures
exist, as the population consists of 79% Black Africans, 9,6% Whites, 8,9% Coloureds
and 2,5% Indian or Asian people. Rix (2005:540) defines subculture as “a part of a total
culture that is reasonably homogeneous with regard to race, religion, nationality,
geographical location or particular interest”. Schiffman and Kanuk (2004:439) identify
further subcultures, among others, nationality, religion and gender.
62
Age subcultures, in particular, such as the generation-based subcultures (for example,
Generations X and Y), are of importance to this study, because the primary target market
of the Tshwane University of Technology consists of secondary school learners, who form
part of Generation Y.
Hawkins et al. define Generation Y as “… [people] born between 1978 and 1994”
(2001:179). This group is also called the Digerati (Stone et al., 2001), Echo Boomers
(Schneidermann, 2000), the Millennium Generation (Neuborne & Kerwin, 1999),
Millennials (Anderson, 2002), and N-Gen, derived from Net Generation (Anderson, 2002).
These age-based subcultures also exist in South Africa. The age composition of South
Africa forms part of its demographics, which are discussed next.
3.4.3 Demographics
Demographics describe a population in terms of its size, structure and distribution
(Hawkins et al., 2001:65). Size describes the number of people in the population, and
structure refers to its composition in terms of age, income, education and occupation.
Geographic region and the urban-rural allocation categorise the distribution of a society.
Another definition for demographics is that it is “the division and classification of
populations and target audiences, by age, sex, occupation, social status and other
characteristics” (Bennett, 1995:114). Schiffman and Kanuk (2004:55) assert that,
“demography refers to the vital and measurable statistics of a population”. Information on
demographics is accessible and inexpensive to obtain.
63
The demographic information set out below was gleaned from the results of the 2001
Census (Statistics South Africa, 2003).
3.4.3.1 Size of population
The South African population consists of 44 819 778 people.
3.4.3.2 Structure of population
• Age: in the 15-344 age group, which approximates the target group of the Tshwane
University of Technology, there are 16 552 084 people.
• Gender: 8 045 984 (49%) of the abovementioned are male, and 8 506 098 (51%) are
female (see figure 3.4).
• Education: 5 200 602 (20%) of South Africans aged 20 and older hold a Grade 12 or
Standard 10 qualification, which makes them eligible for entry into tertiary education.
4 In Census in Brief (Statistics SA, 2003:27), the age groups are given in five-year age groups.
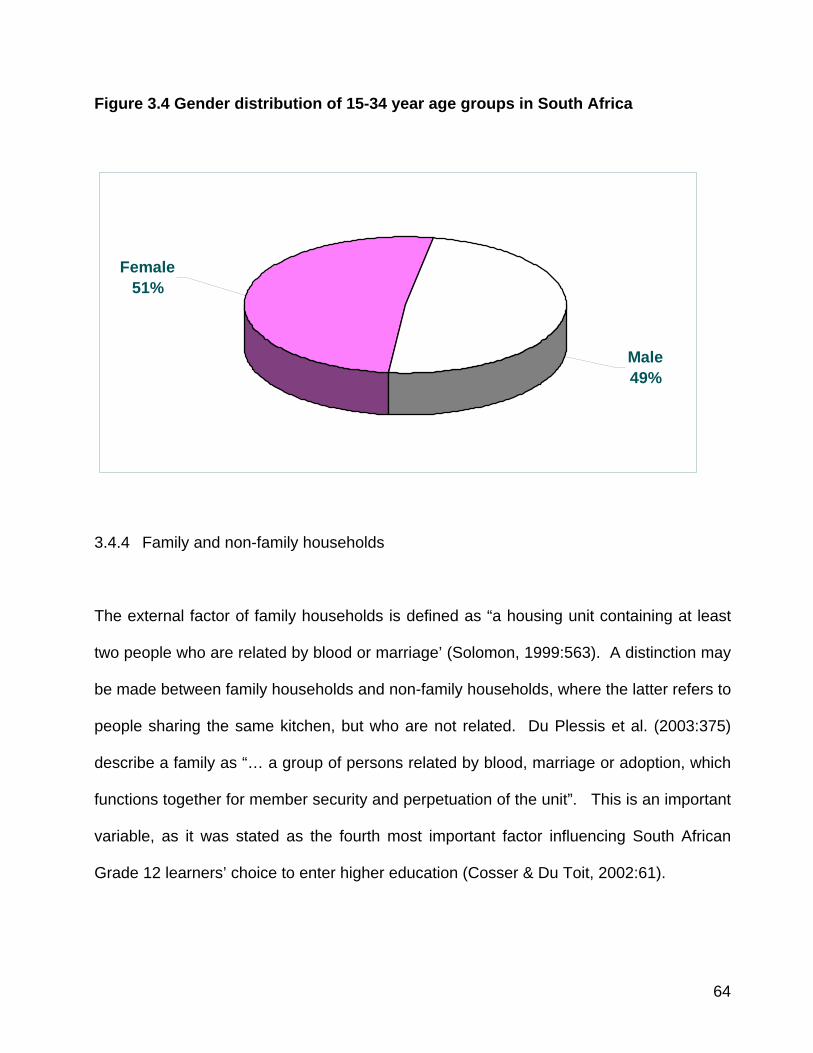
64
Figure 3.4 Gender distribution of 15-34 year age groups in South Africa
Female51%
Male49%
3.4.4 Family and non-family households
The external factor of family households is defined as “a housing unit containing at least
two people who are related by blood or marriage’ (Solomon, 1999:563). A distinction may
be made between family households and non-family households, where the latter refers to
people sharing the same kitchen, but who are not related. Du Plessis et al. (2003:375)
describe a family as “… a group of persons related by blood, marriage or adoption, which
functions together for member security and perpetuation of the unit”. This is an important
variable, as it was stated as the fourth most important factor influencing South African
Grade 12 learners’ choice to enter higher education (Cosser & Du Toit, 2002:61).
65
Walters and Bergiel, in Du Plessis et al. (2003:375), define a household as “… individuals
living alone or persons living together and functioning as a social and economic unit”. It
often happens that students choose to reside together to cut costs; in such a case they
are classified as households. This is seen where students live together in communes,
which is often the case in the TUT student community.
3.4.5 Reference groups
Reference groups “refer to any group with which an individual identifies in such a way that
he or she tends to use it as a standard for self-evaluation and as a source of personal
values and goals” (du Plessis & Rousseau, 2003:370). Chisnall (1995:158) offers an
additional definition that states that reference groups “… refer to groups with which
individuals closely identify themselves so that they become standards of evaluation, and
the sources of their personal behavioural norms”.
Schiffman and Kanuk (2004:330) identifies two general types of reference groups:
• Normative reference groups influence “… broadly defined values or behaviour”. They
include family.
• Comparative reference groups “… serve as benchmarks for specific or narrowly
defined attitudes or behaviour”. They include friends. Figure 3.5 illustrates the major
consumer reference groups according to Schiffman and Kanuk (2004:332).
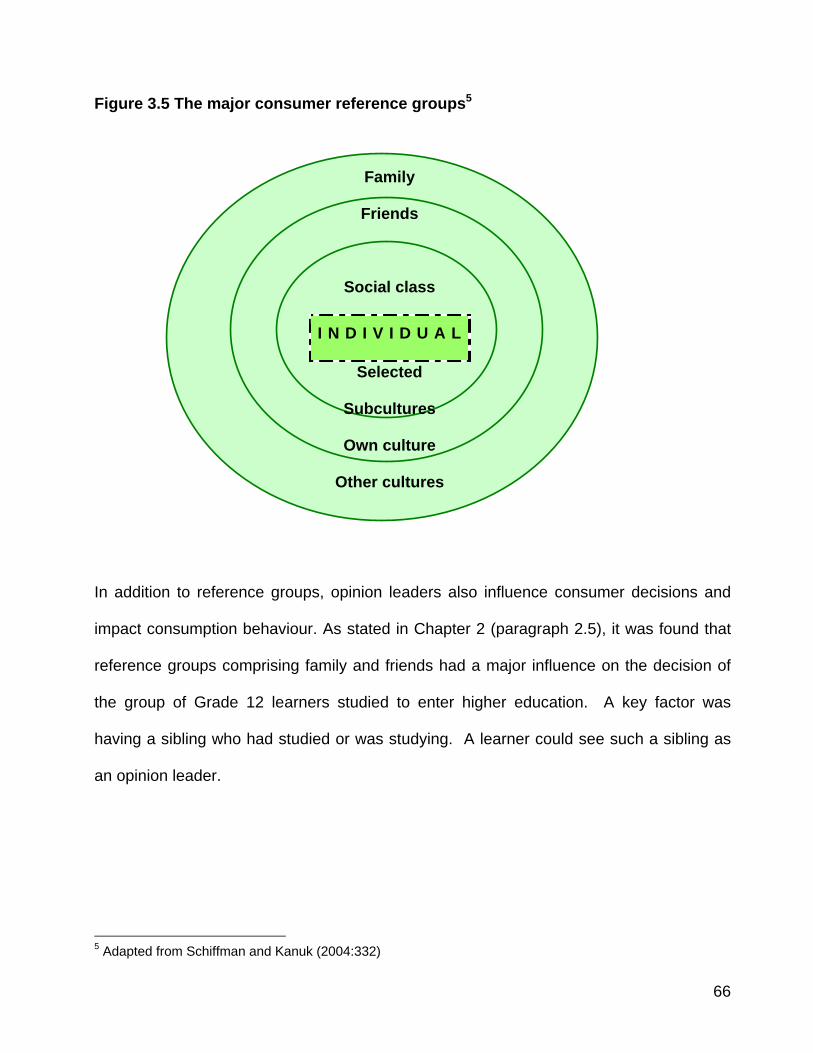
66
Figure 3.5 The major consumer reference groups5
Family
Friends
Social class
I N D I V I D U A L
Selected
Subcultures
Own culture
Other cultures
In addition to reference groups, opinion leaders also influence consumer decisions and
impact consumption behaviour. As stated in Chapter 2 (paragraph 2.5), it was found that
reference groups comprising family and friends had a major influence on the decision of
the group of Grade 12 learners studied to enter higher education. A key factor was
having a sibling who had studied or was studying. A learner could see such a sibling as
an opinion leader.
5 Adapted from Schiffman and Kanuk (2004:332)
67
3.4.6 Opinion leaders
Opinion leaders are defined as “people to who other look for advice and information (du
Plessis & Rousseau, 2003:386). Clemente (1992:242) describes them as “people who
wield influence over others in the same social group. That is, the opinion leader’s ideas
and behaviour serve as a model to others”. Marketers often make an effort to attract
opinion leaders through marketing messages, since consumers turn to opinion leaders “…
for advice and information” (Bennett, 1995:196), and “not all individuals in a group or all
consumers in a society wield equal personal influence on the attitudes, opinions, and
behaviors of others.”
It would seem logical that teachers may be regarded as important opinion leaders in
encouraging learners to study post-matric. Cosser and Du Toit (2002:61) show that 41%
of learners surveyed cited a teacher’s influence as being paramount in their decision to
enter tertiary education, compared to 43% stating that teachers have little or no influence.
This matter was investigated in the study and a question was asked about this issue in the
questionnaire.
3.4.7 Social class
Consumers are also classified into certain social classes, which Schiffman and Kanuk
define as “the division of members of a society into a hierarchy of distinct status classes,
so that members of each class have either higher or lower status than members of other
classes” (2004:372). Social class may be measured by utilising the socio-economic
68
variables of income, occupation and education. It is “a hierarchical division of a society
into relatively distinct and homogeneous groups with respect to attitudes, values and
lifestyles” (Hawkins et al., 2001:120). Grade 12 learners’ desire to earn a higher income,
which was the third most important factor affecting their choice for tertiary studies (Cosser
& Du Toit, 2002:61), may indicate an aspiration to upgrade to a higher social class.
Students with good marks from lower-income households may be drawn to tertiary
institutions such as TUT that offer various merit bursaries, as well as other forms of
financial aid that are available (TUT Financial Aid Bureau).
Cant et al. (2006:76) describes social class as “a group of people in a country who are
considered equal in status or community esteem, who socialise together on a regular
basis formally and informally, and who share behaviour patterns”. People who are in the
same social class are inclined to prefer similar brands, products and services, and engage
in similar recreational behaviour.
3.4.8 Marketing campaigns
Finally, marketing campaigns by companies influence consumer behaviour. These
campaigns include the elements of the marketing mix, namely product, price, promotion
and distribution. Marketing influences a learner’s decision to apply to a tertiary institution,
as seen in Cosser and Du Toit (2002:101). Particularly, receiving information directly from
an institution influences learners. The four elements of the marketing mix will now briefly
be discussed:
69
3.4.8.1 Bennett (1995:218) defines a product as “a bundle of attributes (features,
functions, benefits, and uses) capable of exchange or use; usually a mix of
tangible and intangible forms”. The Tshwane University of Technology delivers
products that can be classified as services. A service is defined as “… any act
or performance that one party can offer to another that is essentially intangible
and does not result in the ownership of anything” (Kotler, 2003: 444). An
overview of products (services) offered by TUT was given in chapter 2, figure
2.2.
3.4.8.2 Price is described as “the amount of money asked for in the transfer of products
and services from their providers to consumers” (Clemente, 1992:266). As fees
are also important when choosing a tertiary institution (Cosser & Du Toit,
2002:77), these institutions should set their prices very carefully. Cosser and
Du Toit also indicate that offering scholarships to ease financial strain will
attract 52% of South African learners.
3.4.8.3 Promotion includes all the variables of marketing communication. According to
Hawkins et al. (2001:19), marketing communication includes “… advertising, the
sales force, public relations, packaging, and any other signal that the firm
provides about itself and its products”. These elements are combined to
provide the target market with a market offering, and hope to influence the
consumer to purchase a specific brand. Marketers especially utilise various
forms of marketing communication to attract consumers. Marketing
communication is defined as “techniques and media for reaching target
70
audiences with promotional messages” (Yadin, 2002:227). According to Cant
et al. (2006:19), there are five forms of marketing communications: personal
selling; advertising; sales promotion; public relations and publicity.
Tshwane University of Technology holds an annual Open Day in May, and
learners from various schools are invited to attend. Schools are welcome to
arrange visits with Tshwane University of Technology Recruitment. TUT also
sends representatives to schools, and is a regular feature at career expositions.
Potential students are provided with brochures of various departments.
Incentives such as caps and t-shirts are also sometimes given away.
3.4.8.4 The last element in the marketing mix is distribution. Hawkins et al. (2001:21)
define distribution as “… having the product available where the target
customers can buy it”. Rix (2005:520) describes distribution as follows: “The
channel structure (institution and activities) used to transfer products and
services from an organisation to its markets.” Decisions on distribution affect
practically all the other marketing facets. The elements of the marketing mix
are integrated to provide a market offering that will attract consumers and aims
at brand-loyal clients.
An example of how distribution is applied to TUT is as follows: the institution
offers courses at the Pretoria, Arts, Arcadia, Soshanguve and Ga-Rankuwa
campuses in the Pretoria area, as well as at the Witbank, Nelspruit and
Polokwane campuses. In addition to those courses, selected courses are also
71
offered at Copam in the Pretoria city centre. This implies that different
distribution channels are used to deliver the TUT service to the client base.
The internal and external factors influencing the consumer decision-making process have
been detailed. The consumer decision-making process will now be described.
3.5 The consumer decision-making process
Schiffman and Kanuk (2004:547) define a decision as “… the selection of an option from
two or more alternative choices”. There are basically three types of consumer decision-
making, namely nominal, limited and extended decision-making (Hawkins et al.,
2001:504). Nominal or routine decision-making occurs with habitual purchases and no
alternative evaluation is made. Limited decision-making typically “… involves internal and
limited external search, few alternatives, simple decision rules on a few attributes, and
little post-purchase evaluation” (Hawkins et al., 2001:506).
The extended decision-making process “… involves extensive internal and external
search, followed by a complex evaluation of multiple alternatives” (Hawkins et al.,
2001:507), and can be divided into five steps, as depicted in figure 3.1. Schiffman and
Kanuk (2004:549) assert that at this level of decision-making, “the consumer needs a
great deal of information to establish a set of criteria in which to judge specific brands and
a correspondingly large amount of information concerning each of the brands to be
considered”.
72
These steps, namely need or problem recognition, pre-purchase information search,
alternative evaluation, alternative choice and purchase, and the post-purchase processes,
will be discussed next. All of these steps may be influenced by the internal and external
factors discussed in previous sections of this chapter.
3.5.1 Step 1: Need or problem recognition
Need recognition is defined in the glossary of Schiffman and Kanuk (2004:G-7) as “the
realisation by the consumer that there is a difference between ‘what is’ and ‘what should
be’.” Hawkins et al. (2001:508) describe problem recognition as “the result of a
discrepancy between a desired state and an actual state that is sufficient to arouse and
activate the decision process.” The desired state is the “… way an individual wants to feel
or be at the present time”, and the actual state is “… the way an individual perceives his
or her feelings and situation to be the present time” (Hawkins et al., 2001:508). If the
discrepancy is considered to be large enough, the search process is initialised.
In the case of a learner determining his or her future study plans after Grade 12, the
learner’s actual state would be not having a post-matric qualification that would enable
him or her to be gainfully employed. The desired state is to have such a qualification to
open doors to employment. A discrepancy or gap thus exists between the learner’s actual
state and his or her desired state, which indicates that a problem or need has been
identified. Therefore, the search for institutions offering suitable qualifications is initialised
(see figure 3.5).
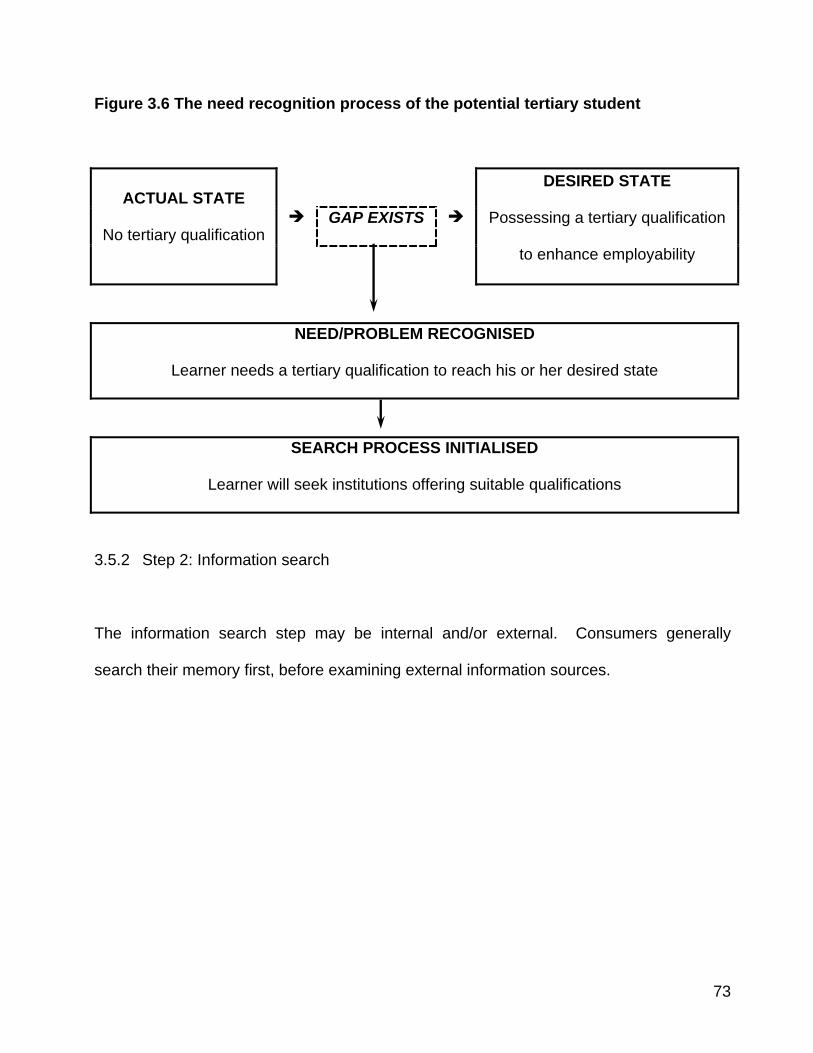
73
Figure 3.6 The need recognition process of the potential tertiary student
GAP EXISTS ACTUAL STATE
No tertiary qualification
DESIRED STATE
Possessing a tertiary qualification
to enhance employability
NEED/PROBLEM RECOGNISED
Learner needs a tertiary qualification to reach his or her desired state
SEARCH PROCESS INITIALISED
Learner will seek institutions offering suitable qualifications
3.5.2 Step 2: Information search
The information search step may be internal and/or external. Consumers generally
search their memory first, before examining external information sources.
74
3.5.2.1 This internal search focuses on “… relevant information from long-term memory
… to determine if a satisfactory solution is known” (Hawkins et al., 2001:528).
According to du Plessis (2003:118), internal search is most directly related to
the individual determinant, learning, as discussed in paragraph 3.3.2.
3.5.2.2 External search occurs when “… consumers consult sources outside their own
experience to obtain information they need for decision-making” (du Plessis et
al., 2003:118). External sources include the learner’s family, reference groups,
cultural and social groups, the economy, and business and marketing actions
by companies. Schiffman and Kanuk (2004:556) state: “The actual act of
‘shopping’ is an important form of external information.”
Schiffman and Kanuk (2004:557) also assert that as the importance of the purchase
increases, and the less the knowledge the consumer has about a product category, the
more widespread the search process will be. In the case of searching for a higher
education institution and choosing a field of study, the consumer (high school learner) will
be involved in an extensive search, since those are very important decisions and
secondary school learners rarely have sufficient internal information to make an informed
choice.
3.5.3 Step 3: Evaluation of alternatives
Alternative evaluation entails determining evaluative criteria that the consumer uses to
decide between various alternatives (Hawkins et al., 2001:566). In evaluating alternatives,

75
consumers are inclined to use two types of information, namely a list of brands from which
they will make a choice, also called the evoked set, and evaluation criteria (Schiffman &
Kanuk, 2004:559).
Based on these criteria, the consumer assesses the different alternatives and
subsequently chooses the one he or she thinks will best satisfy his or her needs.
Evaluative criteria for a high school learner will be related to the factors influencing his or
her choice of an institution, as seen in Cosser and Du Toit (2002:95). These criteria may
be listed as shown in table 3.2.
Table 3.2 Probable evaluative criteria for a learner choosing a higher education
institution6
Criteria Importance ranking
Reputation of institution 1
Reputation of school/faculty/department 2
Residences 3
Sporting facilities 4
Fees 5
6 Criteria based on findings in From School to Higher Education: Factors influencing learner choice of institution for higher education, table 7.13 (Cosser & Du Toit, 2002:95)
76
3.5.4 Step 4: Decision and purchase
According to Schiffman and Kanuk (2004:569), consumers may make three types of
purchases, namely trial, repeat or long-term commitment purchases. The first-time
purchase of a brand is considered a trial purchase. If the consumer is satisfied with the
brand, repeat purchases may occur, which may lead to brand loyalty.
Brand loyalty is the “allegiance by customers to a particular brand” (Yadin, 2002:54), and
is what companies aim at, since this results in greater stability in the market (Schiffman &
Kanuk, 2004:569). In the case of higher education institutions, brand loyalty translates to
graduates returning to the institution to complete postgraduate qualifications. Satisfied
graduates who are brand loyal may also communicate with opinion seekers about the
institution, leading to positive word-of-mouth. Assael (1998:604) defines word-of-mouth
as “… interpersonal communication between two or more individuals such as members of
a reference group”.
3.5.5 Step 5: Post-purchase
Post-purchase processes include usage, evaluation and satisfaction (Hawkins et al.,
2001:628). In post-purchase evaluation, the product may meet the consumer’s
expectations, or exceed expectations, or fall below expectations. In the latter case, the
probability of the brand being purchased again is extremely remote. If the product meets
expectations, it elicits a neutral response in the consumer. In the case of exceeded
expectations, the consumer will respond positively (du Plessis et al., 2003:121). In the
77
process of post-purchase evaluation, the consumer may experience post-purchase
dissonance, which occurs, according to Hawkins et al., “… when a consumer doubts the
wisdom of a purchase he or she has made” (2001:628).
The steps in the consumer decision-making process have now been described and will
provide the theoretical background in the development of the questionnaire used to
conduct the empirical research.
3.6 Conclusion
In this chapter, the general concepts in the field of consumer behaviour were defined and
explained. The internal and external factors that affect the consumer behaviour of
learners as a target market were described. A description of certain population statistics
in South Africa was given, with the aim to describe the potential target market for a tertiary
institution. Finally, the steps in the consumer decision-making process were discussed.
In chapter 4, the research methodology used in this study will be described, resulting,
inter alia, in the development of the survey instrument used for this study.

CHAPTER 4
RESEARCH METHODOLOGY
79
4.1 Introduction
This chapter focuses on the research methodology used in the study. As stated in
chapter 1, the primary research objective was to develop a consumer profile of first-year
marketing students at Tshwane University of Technology.
The secondary objectives were –
• to determine the communication media habits of students;
• to investigate general consumption patterns of the students;
• to establish the perceptions and attitudes of first-year marketing students towards
the Tshwane University of Technology;
• to determine influencing factors on students’ consumer decision-making processes
in deciding to study at TUT;
• to determine the students’ views on their own future, as well as the future of South
Africa; and
• to identify new areas of research in the tertiary student market.
An explanation of the research concepts will be given and the step-by-step research
process followed will be described. For the purposes of the study, both explorative and
descriptive research methods will be explained, as well as primary and secondary data-
collection methods.
80
The use of focus-group interviews and structured questionnaires will be explained as
instruments to collect the primary data. Census and sampling information will be
described. Chapter 4 also describes the development of the research instrument and the
questions used in the survey questionnaire.
Figure 4.1 depicts the research process used in this study. The first and second steps,
namely identifying and formulating the problem or opportunity, and determining the
research objectives, were discussed in chapter 1. The fourth step, conducting secondary
research, was detailed in chapters 2 and 3, where information gained from existing
sources was discussed.
Therefore, chapter 4 describes the third step, the development of a research design, as
well as the fifth to the eight steps, namely selecting the primary research method,
determining the research frame, and then gathering and processing the data.
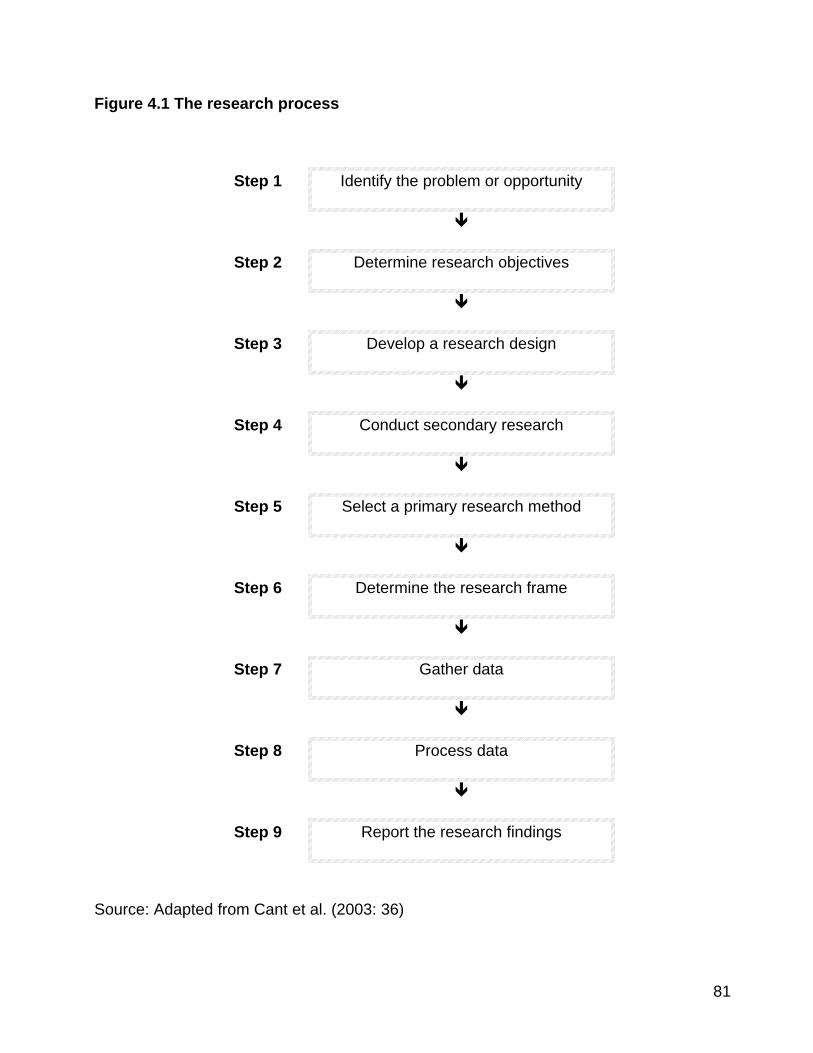
81
Figure 4.1 The research process
Step 1 Identify the problem or opportunity
Step 2 Determine research objectives
Step 3 Develop a research design
Step 4 Conduct secondary research
Step 5 Select a primary research method
Step 6 Determine the research frame
Step 7 Gather data
Step 8 Process data
Step 9 Report the research findings
Source: Adapted from Cant et al. (2003: 36)
82
4.2 Research design development (step three)
4.2.1 Research designs
According to Cant et al. (2003: 43), “a research design is a preliminary plan for conducting
research”. A distinction is made between explorative and descriptive research designs.
4.2.1.1 Explorative research: Churchill and Iacobucci (2005:674) define explorative
research as a research design that places emphasis “…on gaining ideas and
insights”. McDaniel and Gates (1998:27) describe exploratory research as “…
small-scale research undertaken to define the exact nature of the problem and
to gain a better understanding of the environment within which the problem has
occurred”. The collection of secondary information forms part of the explorative
phase of the study. Secondary data is described as “data that already exists as
it was gathered or collected for other research purposes” (Cant et al.,
2003:144). This enables the researcher to refine the problem for the primary
research, which is an element of descriptive research.
4.2.1.2 Descriptive research: Wegner (2000:20) defines descriptive research as “…
most appropriate … to describe the characteristics of a target market”.
Compiling a consumer profile of the first-year Tshwane University of
Technology marketing students is an example of a descriptive study.
Appropriately, McDaniel and Gates (1998:28) explain that “descriptive studies
are conducted to answer who, what, when, where, and how questions”.
83
The objective of the study is to conduct primary research by using a descriptive
research design. Cant et al. (2003:144) define primary research data as “data
that does not exist before the research and is collected by researchers to
address a specific research problem”. Therefore, all the new data gathered
from the empirical research in this particular study can be classified as primary
data.
This study contains both explorative and descriptive parts. The exploratory element of
this particular study consists of a comprehensive literature study (which forms part of step
four, the collection of secondary information), as well as focus-group interviews
(discussed later), with the purpose of questionnaire development.
4.3 Primary research methods (step five)
When conducting primary research, according to Cant et al. (2003:46), the researcher has
the option of conducting observational, experimental or survey research.
4.3.1 Observational research is defined by Tustin, Ligthelm, Martins and van Wyk
(2005:266) as the process of “… recording the behavioural patterns of people,
objects and occurrences without questioning or communicating with them”.
Churchill and Iacobucci (2005:677) describe observation as a data collection
method where “… the situation of interest is watched and the relevant facts, actions
or behaviours are recorded”. Observation is not used in the scope of this study,
since this would not provide a solution to the stated research problem.
84
4.3.2 Experimental research is “a test in which the researcher has control over one or
more independent variables and manipulates them” (McDaniel & Gates, 1998:203).
Churchill and Iacobucci (2005:674) define an experiment as a “scientific
investigation in which an investigator manipulates and controls one or more
independent variables and observes the dependent variable for variation
concomitant to the manipulation of the independent variables”. The stated
objectives of this study do not require the use of experimentation, since it would not
provide the required answers to the problem.
4.3.3 Cant et al. (2003:47) define survey research as “marketing research in which an
interviewer interacts with respondents to obtain facts, opinions and attitudes.”
According to McDaniel and Gates (1998:155), survey research “… is the use of a
questionnaire to gather facts, opinions and attitudes.” In the empirical phase of this
study, questionnaires will be used to gather facts, opinions and attitudes. This
study, therefore, uses survey research to solve the research problem.
The next step, determining the research frame, will now be discussed.
4.4 Determine the research frame (step six)
The research frame is “…all the elements from which the information can be gathered to
solve a marketing problem or opportunity” (Cant et al., 2003:47). Research can be
conducted by utilising a census or by drawing a representative sample.
85
4.4.1 Census
A census of all first-year students registered for the National Diploma in Marketing at the
Pretoria Campus of the Tshwane University of Technology is undertaken in this study.
Churchill and Iacobucci (2005:671) define a census as “a complete canvass of a
population”. Another explanation is provided by Wegner (2000:109), namely “… a census
provides complete data on the random variables under study”. The census in this study
consists of 237 respondents, the whole population of students enrolled for the first year of
the National Diploma (N Dip) in Marketing at the Pretoria Campus in 2004.
4.4.2 Sampling
To develop the survey instrument, a sample was drawn from the population and a focus-
group interview was conducted. Judgemental sampling was used to draw a sample from
the first-year population for the focus group interview. Tull and Hawkins (1990:802) define
judgemental sampling as “… a sampling process that uses ‘expert’ judgement to select a
representative sample”. McDaniel and Gates (1998:321) offer the following explanation:
“… judgemental sample is applied … where the researcher is attempting to draw a
representative sample based on judgmental selection criteria”. The researcher
interviewed the sample of students drawn for the focus groups and the data obtained was
used to develop the survey instrument (questionnaire). This process is depicted in figure
4.2.
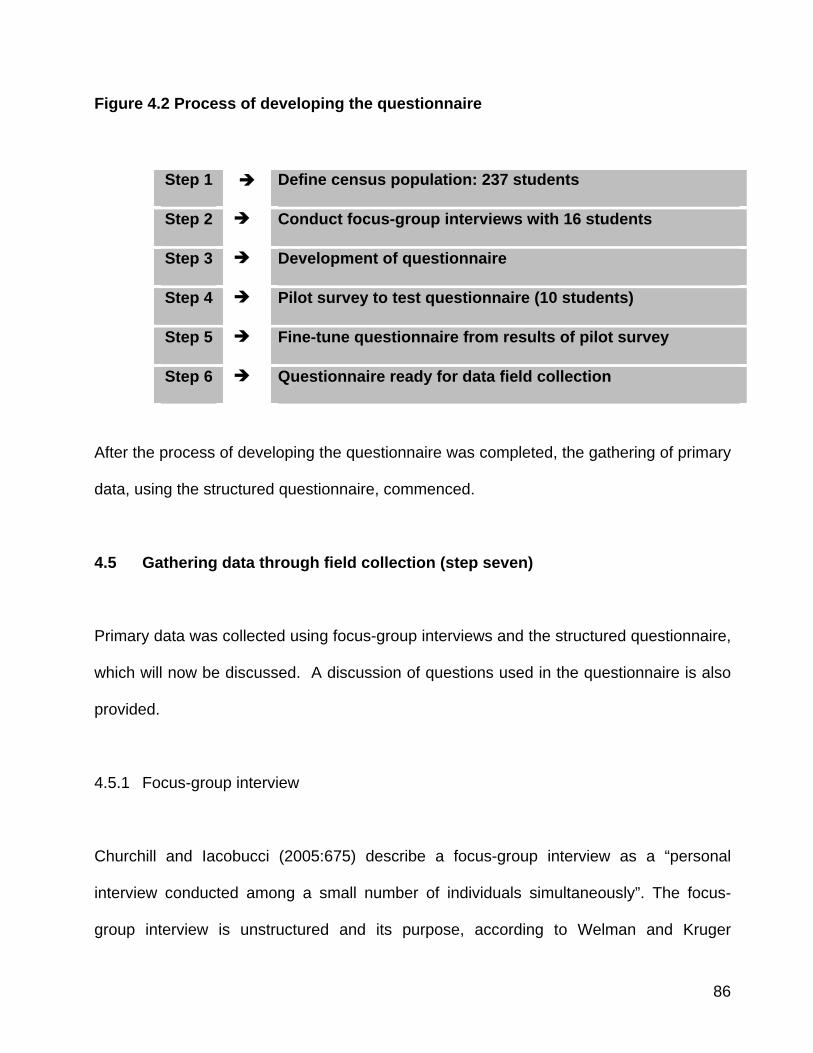
86
Figure 4.2 Process of developing the questionnaire
Step 1 Define census population: 237 students
Step 2 Conduct focus-group interviews with 16 students
Step 3 Development of questionnaire
Step 4 Pilot survey to test questionnaire (10 students)
Step 5 Fine-tune questionnaire from results of pilot survey
Step 6 Questionnaire ready for data field collection
After the process of developing the questionnaire was completed, the gathering of primary
data, using the structured questionnaire, commenced.
4.5 Gathering data through field collection (step seven)
Primary data was collected using focus-group interviews and the structured questionnaire,
which will now be discussed. A discussion of questions used in the questionnaire is also
provided.
4.5.1 Focus-group interview
Churchill and Iacobucci (2005:675) describe a focus-group interview as a “personal
interview conducted among a small number of individuals simultaneously”. The focus-
group interview is unstructured and its purpose, according to Welman and Kruger
87
(2001:50), is “… to identify important variables in a particular area; to formulate
penetrating questions on them; and to generate hypotheses for further investigation”.
A representative sample of students was interviewed, using a focus group of 16 students
in January 2004. Examples of questions asked in the focus group interviews are the
following:
1) Where did you hear about the Tshwane University of Technology?
2) Do you regard the Tshwane University of Technology as a preferred place of
learning? Why?
3) Where will you stay during your studies?
4) Will you continue your studies after obtaining your qualification?
5) What do you aim to do after studying (what line of work, own business, etc.)?
6) What magazines and newspapers do you read?
7) How do you spend your free time?
The results obtained in the focus-group interview were used in the development of the
structured questionnaire, which was tested on ten students during the pilot study. The
questionnaire was then refined to deliver the survey instrument.
4.5.2 The survey instrument: structured questionnaire
A structured questionnaire was used to collect descriptive data from the first-year
students. Wegner (2000:25) identifies a questionnaire as “… data collection instrument
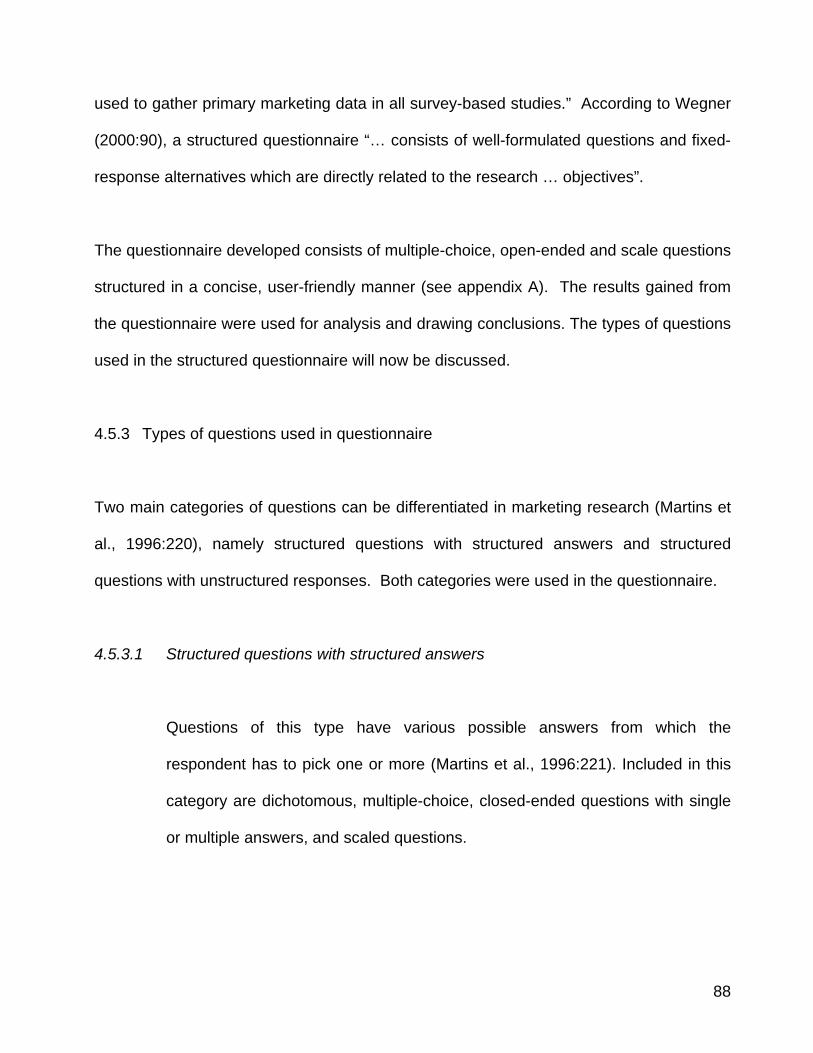
88
used to gather primary marketing data in all survey-based studies.” According to Wegner
(2000:90), a structured questionnaire “… consists of well-formulated questions and fixed-
response alternatives which are directly related to the research … objectives”.
The questionnaire developed consists of multiple-choice, open-ended and scale questions
structured in a concise, user-friendly manner (see appendix A). The results gained from
the questionnaire were used for analysis and drawing conclusions. The types of questions
used in the structured questionnaire will now be discussed.
4.5.3 Types of questions used in questionnaire
Two main categories of questions can be differentiated in marketing research (Martins et
al., 1996:220), namely structured questions with structured answers and structured
questions with unstructured responses. Both categories were used in the questionnaire.
4.5.3.1 Structured questions with structured answers
Questions of this type have various possible answers from which the
respondent has to pick one or more (Martins et al., 1996:221). Included in this
category are dichotomous, multiple-choice, closed-ended questions with single
or multiple answers, and scaled questions.

89
I) Dichotomous questions
Dichotomous questions offer a choice between two fixed alternative responses,
for example:
Indicate your gender: Male Female
II) Multiple-choice questions with single answers
These provide more than two fixed responses to choose from, for example:
Indicate your age:
Under 18 years
18-19
20-21
Older than 21
Multiple-choice questions with single answers are used where the information to
be gleaned can be classified into fixed categories (Martins et al., 1996:221), as
in the above example of age.
III) Multiple-choice questions with multiple answers
With this type of questions, respondents “… are asked to … indicate all
(alternatives) that apply” (McDaniel & Gates, 1998:274), for example:
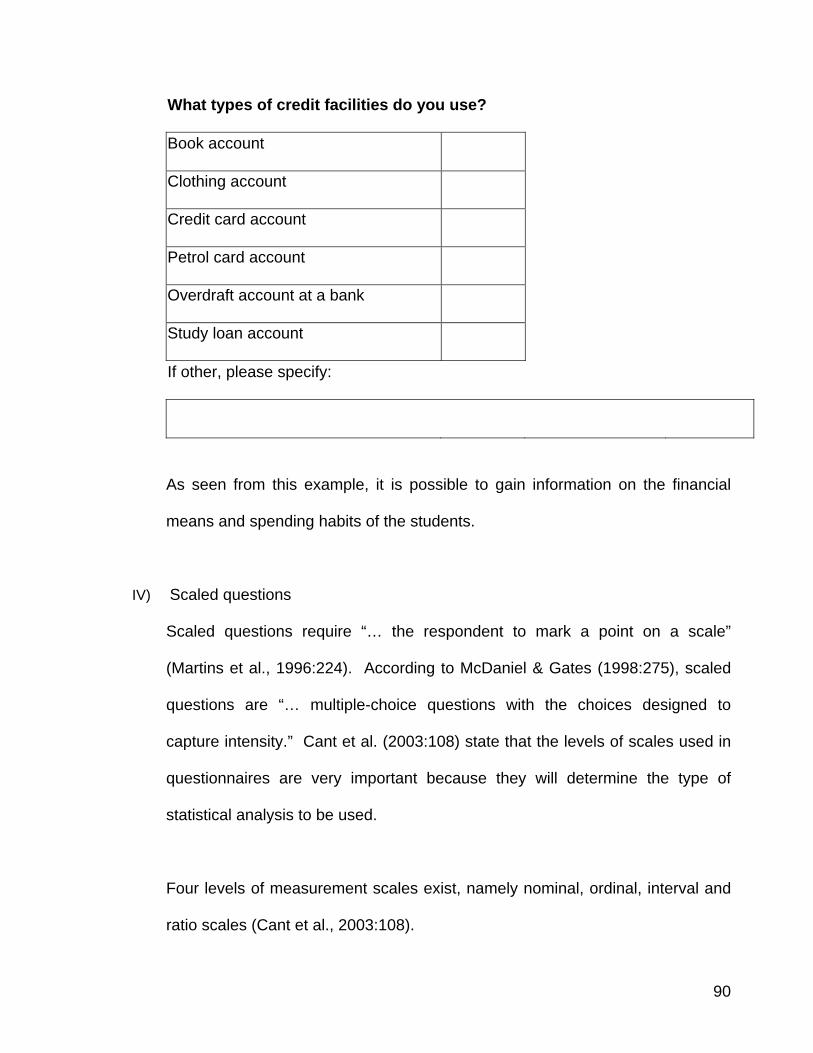
90
What types of credit facilities do you use?
Book account
Clothing account
Credit card account
Petrol card account
Overdraft account at a bank
Study loan account
If other, please specify:
As seen from this example, it is possible to gain information on the financial
means and spending habits of the students.
IV) Scaled questions
Scaled questions require “… the respondent to mark a point on a scale”
(Martins et al., 1996:224). According to McDaniel & Gates (1998:275), scaled
questions are “… multiple-choice questions with the choices designed to
capture intensity.” Cant et al. (2003:108) state that the levels of scales used in
questionnaires are very important because they will determine the type of
statistical analysis to be used.
Four levels of measurement scales exist, namely nominal, ordinal, interval and
ratio scales (Cant et al., 2003:108).
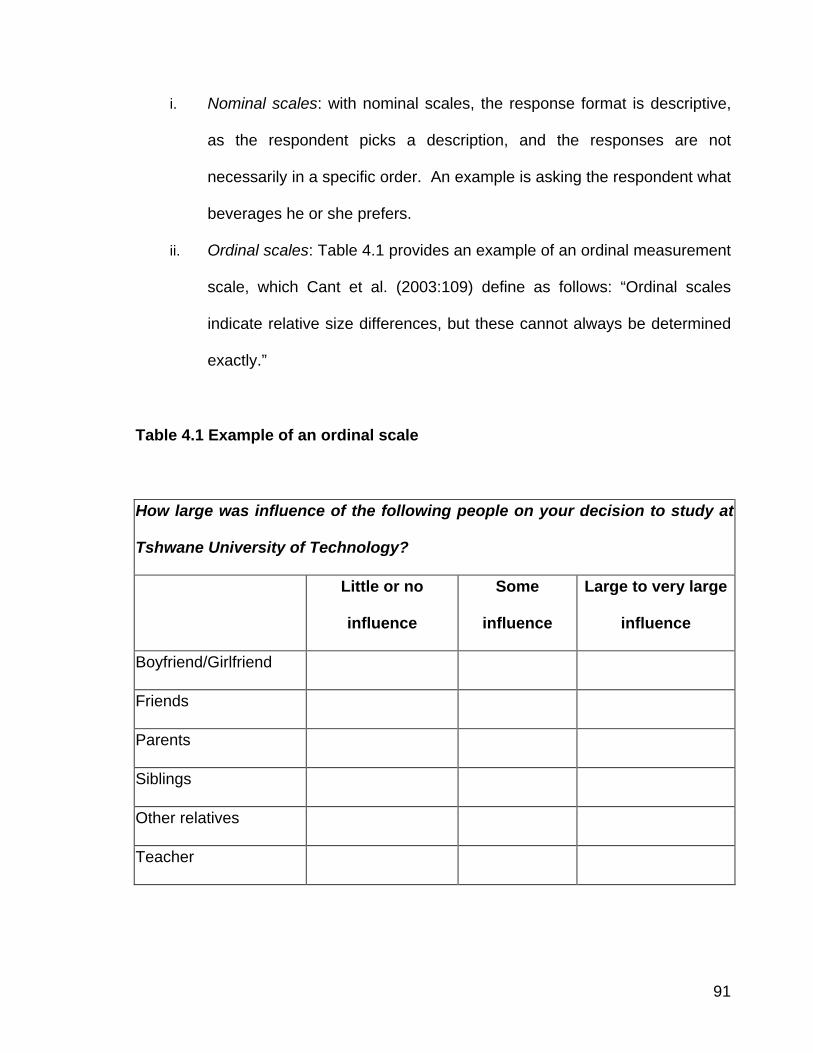
91
i. Nominal scales: with nominal scales, the response format is descriptive,
as the respondent picks a description, and the responses are not
necessarily in a specific order. An example is asking the respondent what
beverages he or she prefers.
ii. Ordinal scales: Table 4.1 provides an example of an ordinal measurement
scale, which Cant et al. (2003:109) define as follows: “Ordinal scales
indicate relative size differences, but these cannot always be determined
exactly.”
Table 4.1 Example of an ordinal scale
How large was influence of the following people on your decision to study at
Tshwane University of Technology?
Little or no
influence
Some
influence
Large to very large
influence
Boyfriend/Girlfriend
Friends
Parents
Siblings
Other relatives
Teacher
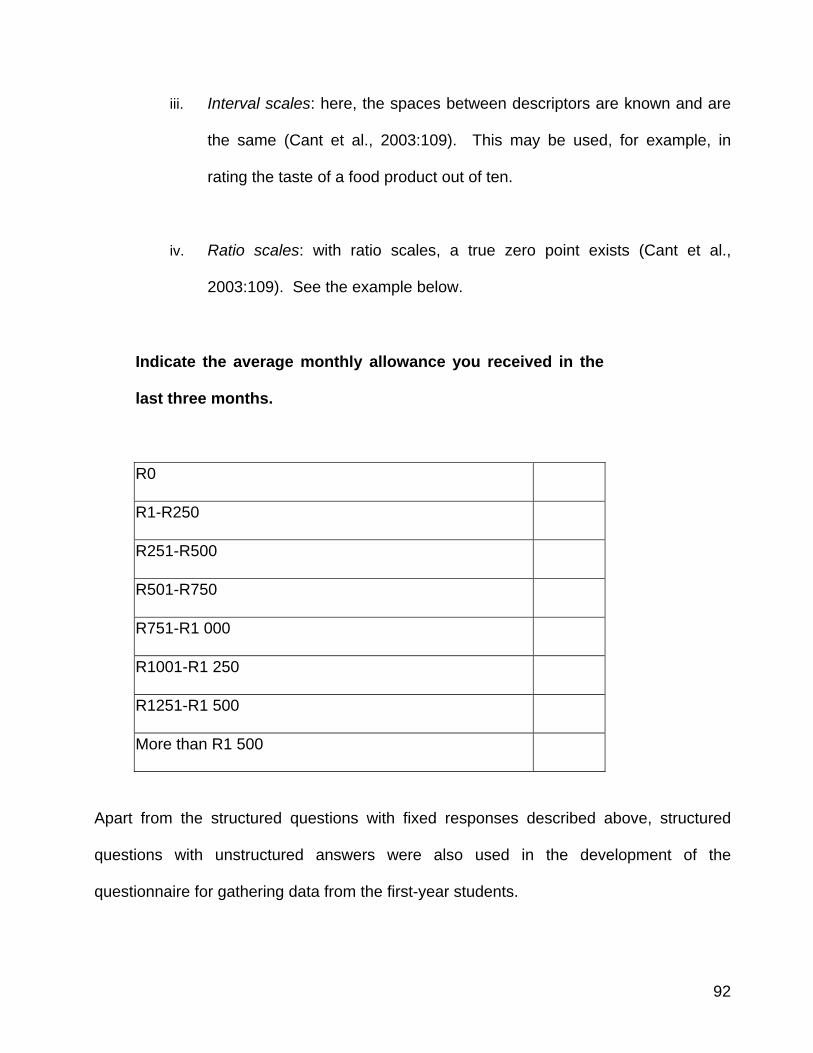
92
iii. Interval scales: here, the spaces between descriptors are known and are
the same (Cant et al., 2003:109). This may be used, for example, in
rating the taste of a food product out of ten.
iv. Ratio scales: with ratio scales, a true zero point exists (Cant et al.,
2003:109). See the example below.
Indicate the average monthly allowance you received in the
last three months.
R0
R1-R250
R251-R500
R501-R750
R751-R1 000
R1001-R1 250
R1251-R1 500
More than R1 500
Apart from the structured questions with fixed responses described above, structured
questions with unstructured answers were also used in the development of the
questionnaire for gathering data from the first-year students.
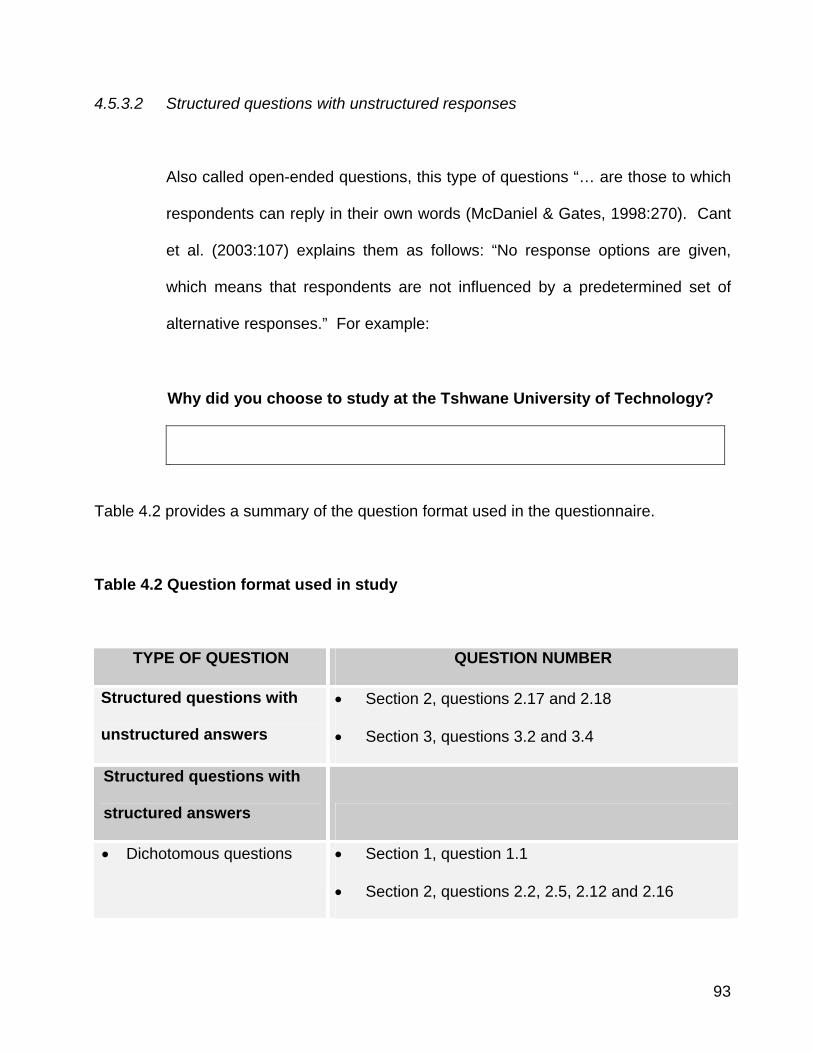
93
4.5.3.2 Structured questions with unstructured responses
Also called open-ended questions, this type of questions “… are those to which
respondents can reply in their own words (McDaniel & Gates, 1998:270). Cant
et al. (2003:107) explains them as follows: “No response options are given,
which means that respondents are not influenced by a predetermined set of
alternative responses.” For example:
Why did you choose to study at the Tshwane University of Technology?
Table 4.2 provides a summary of the question format used in the questionnaire.
Table 4.2 Question format used in study
TYPE OF QUESTION QUESTION NUMBER
Structured questions with
unstructured answers
• Section 2, questions 2.17 and 2.18
• Section 3, questions 3.2 and 3.4
Structured questions with
structured answers
• Dichotomous questions • Section 1, question 1.1
• Section 2, questions 2.2, 2.5, 2.12 and 2.16
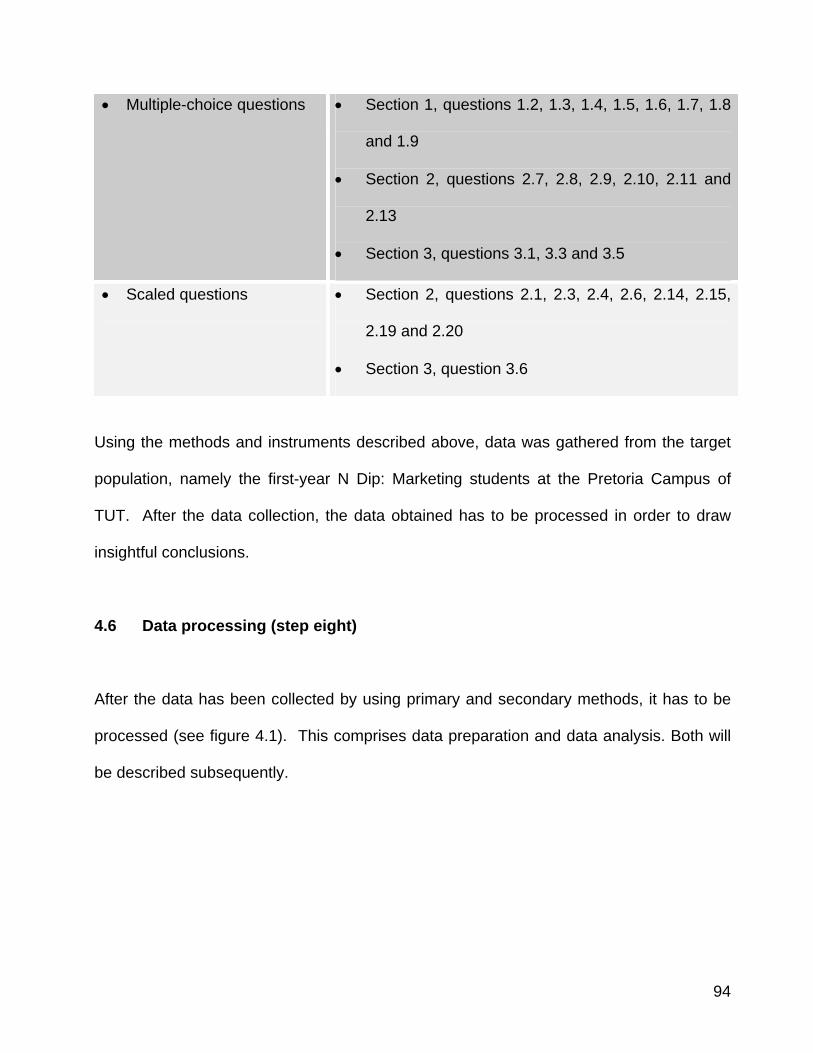
94
• Multiple-choice questions • Section 1, questions 1.2, 1.3, 1.4, 1.5, 1.6, 1.7, 1.8
and 1.9
• Section 2, questions 2.7, 2.8, 2.9, 2.10, 2.11 and
2.13
• Section 3, questions 3.1, 3.3 and 3.5
• Scaled questions
• Section 2, questions 2.1, 2.3, 2.4, 2.6, 2.14, 2.15,
2.19 and 2.20
• Section 3, question 3.6
Using the methods and instruments described above, data was gathered from the target
population, namely the first-year N Dip: Marketing students at the Pretoria Campus of
TUT. After the data collection, the data obtained has to be processed in order to draw
insightful conclusions.
4.6 Data processing (step eight)
After the data has been collected by using primary and secondary methods, it has to be
processed (see figure 4.1). This comprises data preparation and data analysis. Both will
be described subsequently.
95
4.6.1 Data preparation
Cant et al. (2003:150) propose the following five steps for the preparation of research
data:
• Validation
• Editing
• Coding
• Data entry
• Data cleaning
4.6.1.1 Validation
Validation entails determining that all interviews were performed appropriately
(McDaniel & Gates, 1998:351). Cant et al. (2003:199) define validation as “the
process of determining whether a survey’s interviews or observations were
conducted correctly, and are free of fraud or bias”. The focus-group interviews
were conducted by the researcher and checked for validity.
96
4.6.1.2 Editing
Editing involves ensuring that questionnaires “… have been filled out properly
and completely” (McDaniel & Gates, 1998:351). In this study, a number of
problems were manually checked for, namely:
• Determining if all answers were recorded
• Skip patterns in questionnaires
• Open-ended responses
4.6.1.3 Coding
Coding refers to a “… technical procedure by which data are categorised; it
involves specifying the alternative categories or classes into which the
responses are to be placed and assigning code numbers to the classes”
(Churchill & Iacobucci, 2005:672). Cant et al. describe coding as a process
where a code or symbol is assigned to each answer to a question. The aim is
“… to transform respondents’ answers to survey questions into codes or
symbols that can easily be entered into and read by a statistical analysis
software package” (2003:198).
All closed-ended questions in the questionnaire were pre-coded. The open-
ended questions were post-coded after editing, using the following procedure
(McDaniel & Gates, 1998:357):
97
• List the responses
• Consolidate the responses
• Setting of codes
• Enter codes
4.6.1.4 Data entry
Cant et al. (2003:198) define data entry as the “tasks involved in the direct input
of coded data into a software package that will ultimately allow the research
analyst to manipulate and transform the raw data into useful information.” It is
also referred to as “… the process of converting information from a form that
cannot be read by a computer to a form that can” (McDaniel & Gates,
1998:358). A personal computer was used as a data-entry device. Data was
entered directly from the questionnaires after the first-year students had
completed them and the fieldworker had collected them.
4.6.1.5 Cleaning of data
Data cleaning is “an error-checking process conducted after data entry and
before data analysis, with the aim of identifying and correcting errors made
during data entry” (Cant et al., 2003:198). Data capturing and coding errors
98
are cleared in this step (Martins et al., 1996:302). Running wild-code,
consistency and extreme-case checks will achieve the cleaning of the data.
I) Wild-code checks
Wild codes are “…codes that are not defined in the codebook for a particular
variable” (Martins et al., 1996:302). They are usually the result of a coding
error. For example, the variable “cell phone air time provider” has three
legitimate codes. A variable number of four or larger will thus be a wild code.
II) Consistency checks
In this step, the consistency of responses is checked. In the case of this
particular study, the researcher checked, for example, that those students that
indicated that they paid for their studies by means of a study loan also indicated
that they had a student loan account at a banking institution.
III) Extreme-case checks
Extreme cases refer to variables that are well out of the ordinary range (Martins
et al., 1996:302). For example, the computer program may be instructed to
identify questionnaire numbers where the allowance indicated by a student
exceeds a specified amount.
After the data has been cleaned, it can be analysed and described. This process will
be discussed subsequently, and the research findings will follow in chapter 5.
99
4.6.2 Data analysis and description
Aczel, in Cant et al. (2003:166), describes data analysis as “… the name given to a
large body of statistical and graphicaol techniques. These techniques provide
ways of looking at data to determine relationships and trends, identify outliers and
influential observations, and quickly describe or summarise data sets”.
Statistical packages that may be used in this step include STATISTICA, SPSS and
Statistical Analysis System (SAS). The spreadsheet program MS Excel 2000 has
built-in statistical functions that could assist in basic exploratory analysis (Cant et
al., 2003:166) and is used in this study. The statistical package SAS is also used
in the analysis.
Cant et al. (2003:167) provide several objectives for exploratory data analysis,
including the following:
• Investigate the value distribution for variables of import
• Detect errors in coding
• Present data in table and graphic format, which is easily understandable
• Provide summary measures to describe average responses to questions, and
response variations
100
In this step of the procedure, the researcher makes use of statistical and graphical
techniques, including one-way frequency tables, cross-tabulation, graphic
presentations of data and summary descriptive statistics.
4.6.2.1 One-way frequency tables
Such a table “… shows the number of respondents who gave each possible
answer to each question (McDaniel & Gates, 1998:361). This can be used, for
example, to display the ages of the respondents.
4.6.2.2 Cross-tabulation
Churchill and Iacobucci (2005:673) describe cross-tabulation as ”… [counting]
the number of cases that fall into each of several categories when the
categories are based on two or more variables considered simultaneously”.
McDaniel and Gates’ (1998:365) definition states that it is an “examination of
the responses to one question relative to responses to one or more other
questions”. In this way, for example, the province of origin of the students may
be related to their living arrangements while studying.
101
4.6.2.3 Graphic presentations
Graphic illustrations or representations are used to relay information easily and
powerfully through illustrative means. They include pie and bar charts, which
are discussed below.
I) Pie charts
Pie charts are used to display research results in a broad scope of situations
(McDaniel & Gates, 1998:369). They can be used, for example, to display the
age, gender and province of origin information of respondents in the study.
II) Bar chart
Kinnear and Taylor, in Martins et al. (1998:417), describe bar charts as “…
depicting magnitudes of the data by the length of the various bars that have
been laid out with reference to a horizontal or vertical scale”. Plain and
clustered bar charts are used to illustrate information. For example, bar charts
can be used to depict students’ monthly allowances.
4.6.2.4 Summary descriptive statistics
Descriptive statistics present another powerful way of summarising information
(McDaniel & Gates, 1998:370). They include the measures of central tendency.
102
Measures of central tendency
The mean, median and mode compile the measures of central tendency,
measures of variability and measures of shape.
(a) The mean
The mean (or average) is the “… sum of a set of values divided by their
number” (Tustin et al., 2005:538). The average age of the respondents in the
survey is the mean of their ages.
(b) The median
The median is “… that value above or below which half of the observations fall”
(Tustin et al., 2005:540). The median may be used for the allowances of the
respondents, as there could be a few extreme values that do not provide an
appropriate central tendency, should only the mean be used to measure central
tendency (McDaniel & Gates, 1998:372).
(c) The mode
The mode is the value that occurs most frequently (Tustin et al., 2005:544).
More than one mode may exist where more than one value occur with the same
frequency (McDaniel & Gates, 1998:372). Again, the variable of students’
allowances may have more that one mode.
103
Data analysis and description enabled the researcher to summarise the large amount of
information gained from the survey of 237 people into more easily understandable
elements, which could also be depicted graphically to be more easily understandable.
4.7 Reporting the research findings (step nine)
Leedy and Ormrod (2005:284) propose that a research report should reach four
objectives:
• Provide a clear understanding of the research problem
• Describe the data collection
• Present the data accurately and completely
• Interpret the data and explain how the research problem is resolved by the research
results
The researcher aimed at reaching such objectives in the reporting of the research results
that will be detailed in chapter 5.
The steps in the research process have now been described.
4.8 Conclusion
In chapter 4, the research objectives were stated and the research process followed was
described. The research design used in the study was explained, namely explorative and

104
descriptive research. The use of focus-group interviews and structured questionnaires to
collect the primary data needed to attain the research objectives was described. The
census and sampling details of all first-time entering students were administered, and the
process of data preparation and analysis was explained.
The research results will be discussed in chapter 5.
CHAPTER 5
DATA ANALYSIS AND INTERPRETATION
106
5.1 Introduction
In chapter 4, the research methodology used in the study was discussed. The primary
objective of the study is to determine a consumer profile of the first-year marketing student
at the institution previously known as Technikon Pretoria, and now known as the Tshwane
University of Technology (TUT). Secondary objectives were to establish the communication
media habits of the students; to investigate general consumption patterns; to determine the
attitudes and perceptions of the students regarding TUT; to establish influencing factors on
students’ consumer decision-making; to determine students’ perceptions of their own future
and the future of South Africa, and, lastly, to identify new areas of research in this particular
field.
Structured questionnaires were used to collect the data. A total of the 237 registered first-
year marketing students formed the population of the study, and a total of 167
questionnaires were returned. This translates to a 71% response rate. The returned
questionnaires were scrutinised and capturing was done. The captured data was analysed
using the statistical package SAS (Statistical Analysis System).
Statistical analyses were conducted to aid the discussion of the results gained from the
study. One-way frequency tables, cross-tabulations, graphic presentations and summary
descriptive statistics were used in the data-analysis.
The data analysis will now be discussed according to the sections in which the
questionnaire was structured, namely:
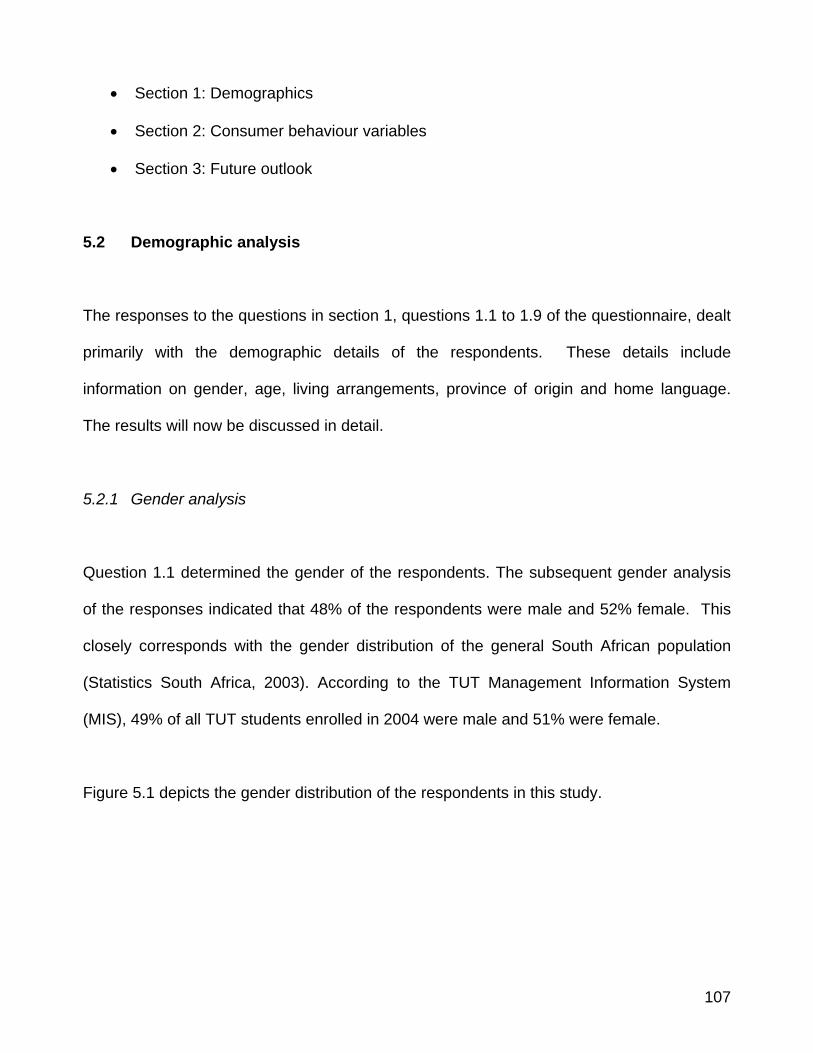
107
• Section 1: Demographics
• Section 2: Consumer behaviour variables
• Section 3: Future outlook
5.2 Demographic analysis
The responses to the questions in section 1, questions 1.1 to 1.9 of the questionnaire, dealt
primarily with the demographic details of the respondents. These details include
information on gender, age, living arrangements, province of origin and home language.
The results will now be discussed in detail.
5.2.1 Gender analysis
Question 1.1 determined the gender of the respondents. The subsequent gender analysis
of the responses indicated that 48% of the respondents were male and 52% female. This
closely corresponds with the gender distribution of the general South African population
(Statistics South Africa, 2003). According to the TUT Management Information System
(MIS), 49% of all TUT students enrolled in 2004 were male and 51% were female.
Figure 5.1 depicts the gender distribution of the respondents in this study.
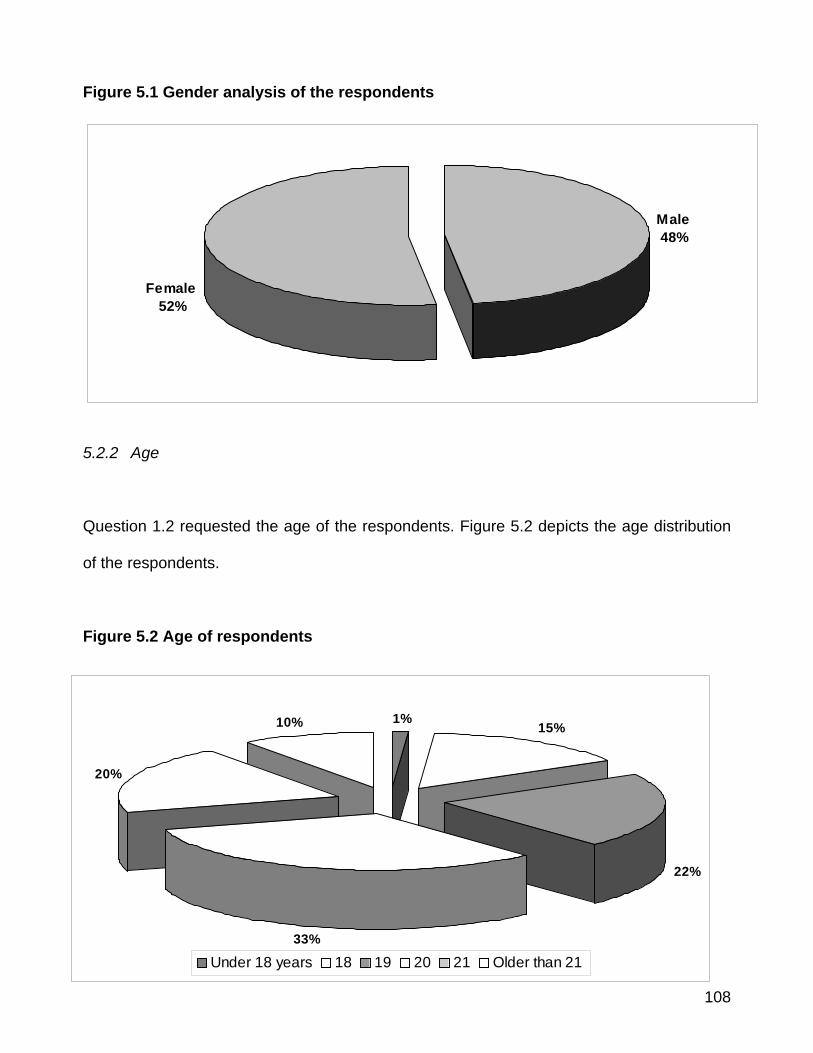
108
Figure 5.1 Gender analysis of the respondents
Female52%
Male48%
5.2.2 Age
Question 1.2 requested the age of the respondents. Figure 5.2 depicts the age distribution
of the respondents.
Figure 5.2 Age of respondents
1%15%
22%
20%
10%
33%
Under 18 years 18 19 20 21 Older than 21
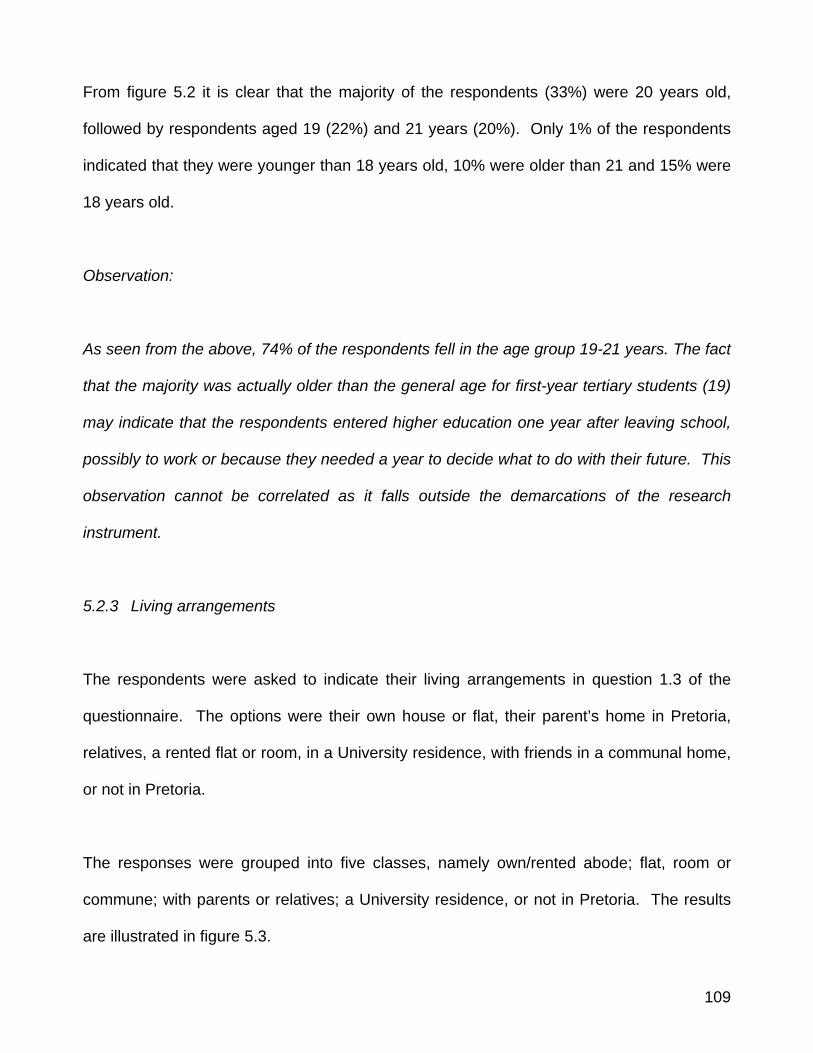
109
From figure 5.2 it is clear that the majority of the respondents (33%) were 20 years old,
followed by respondents aged 19 (22%) and 21 years (20%). Only 1% of the respondents
indicated that they were younger than 18 years old, 10% were older than 21 and 15% were
18 years old.
Observation:
As seen from the above, 74% of the respondents fell in the age group 19-21 years. The fact
that the majority was actually older than the general age for first-year tertiary students (19)
may indicate that the respondents entered higher education one year after leaving school,
possibly to work or because they needed a year to decide what to do with their future. This
observation cannot be correlated as it falls outside the demarcations of the research
instrument.
5.2.3 Living arrangements
The respondents were asked to indicate their living arrangements in question 1.3 of the
questionnaire. The options were their own house or flat, their parent’s home in Pretoria,
relatives, a rented flat or room, in a University residence, with friends in a communal home,
or not in Pretoria.
The responses were grouped into five classes, namely own/rented abode; flat, room or
commune; with parents or relatives; a University residence, or not in Pretoria. The results
are illustrated in figure 5.3.
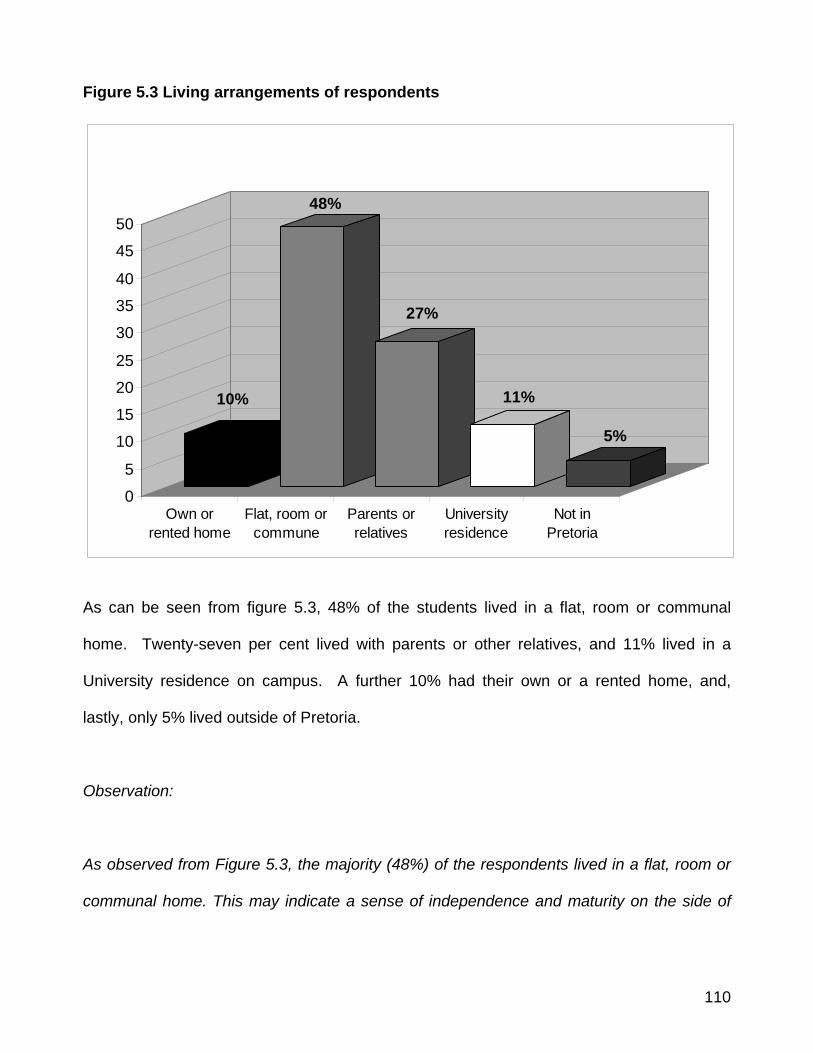
110
Figure 5.3 Living arrangements of respondents
10%
48%
27%
11%
5%
0
5
10
15
20
25
30
35
40
45
50
Own orrented home
Flat, room orcommune
Parents orrelatives
Universityresidence
Not inPretoria
As can be seen from figure 5.3, 48% of the students lived in a flat, room or communal
home. Twenty-seven per cent lived with parents or other relatives, and 11% lived in a
University residence on campus. A further 10% had their own or a rented home, and,
lastly, only 5% lived outside of Pretoria.
Observation:
As observed from Figure 5.3, the majority (48%) of the respondents lived in a flat, room or
communal home. This may indicate a sense of independence and maturity on the side of
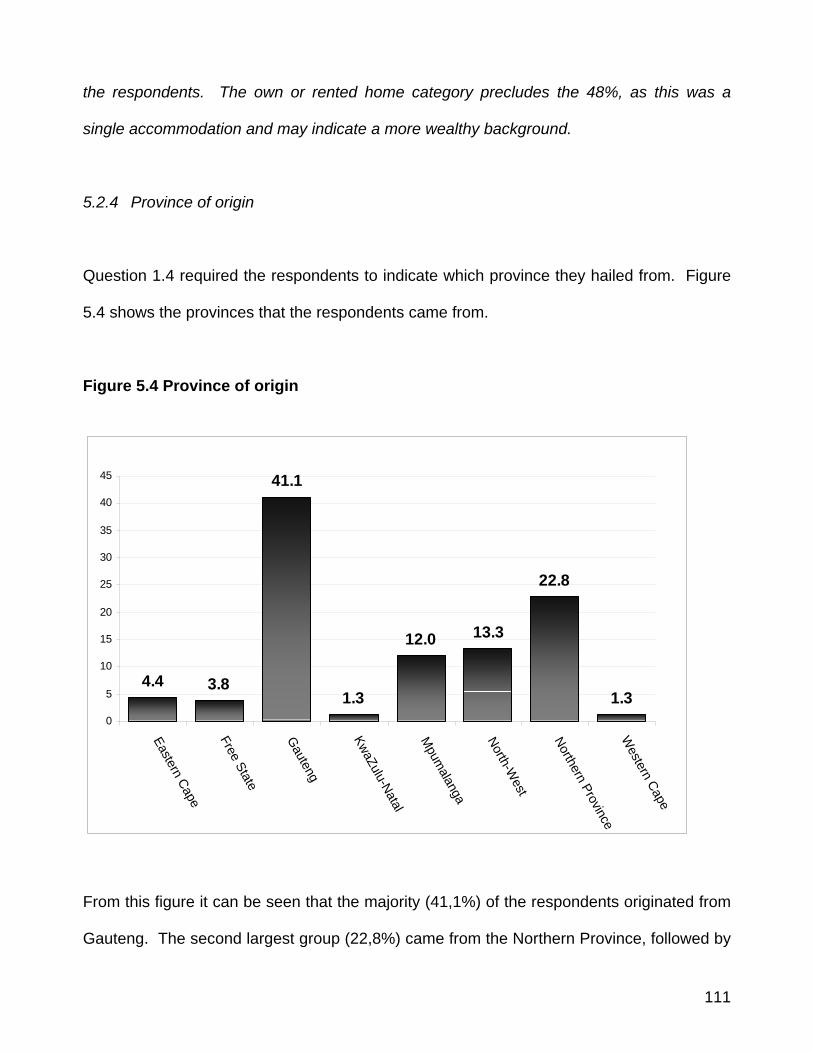
111
the respondents. The own or rented home category precludes the 48%, as this was a
single accommodation and may indicate a more wealthy background.
5.2.4 Province of origin
Question 1.4 required the respondents to indicate which province they hailed from. Figure
5.4 shows the provinces that the respondents came from.
Figure 5.4 Province of origin
4.4 3.8
41.1
1.3
12.0 13.3
22.8
1.30
5
10
15
20
25
30
35
40
45
Eastern Cape
Free State
Gauteng
KwaZulu-Natal
Mpum
alanga
North-West
Northern ProvinceW
estern Cape
From this figure it can be seen that the majority (41,1%) of the respondents originated from
Gauteng. The second largest group (22,8%) came from the Northern Province, followed by
112
the North-West Province (13,3%). An additional 12% originated in Mpumalanga, 4,4% in
the Eastern Cape and 3,8% in the Free State Province. Only 1,3% came from respectively
KwaZulu-Natal and the Western Cape. There were no respondents from the Northern Cape
Province.
Observation:
The prevalence of students from Gauteng is not surprising, since the respondents surveyed
studied at the Pretoria Campus of TUT. In addition, a total of 93% of the respondents
originated from the northern provinces (Free State, Gauteng, Mpumalanga, North-West and
Northern Province). Only 7% of the respondents hailed from the southern provinces.
Interestingly, the fourth largest group (12%) came from the Mpumalanga Province. The fact
that those students chose to study at the Pretoria Campus, rather than at one of the
distance learning sites of TUT situated in Mpumalanga, gives rise to a range of questions
regarding the reasons for this occurrence. This was, however, not investigated in the
questionnaire.
5.2.5 Home language
The eleven official languages of South Africa were listed in question 1.5, and the
respondents were asked to pick their home language. In the analysis, these home
languages were grouped into four major categories, namely Afrikaans, English, African
languages and other. The responses are illustrated in figure 5.5.
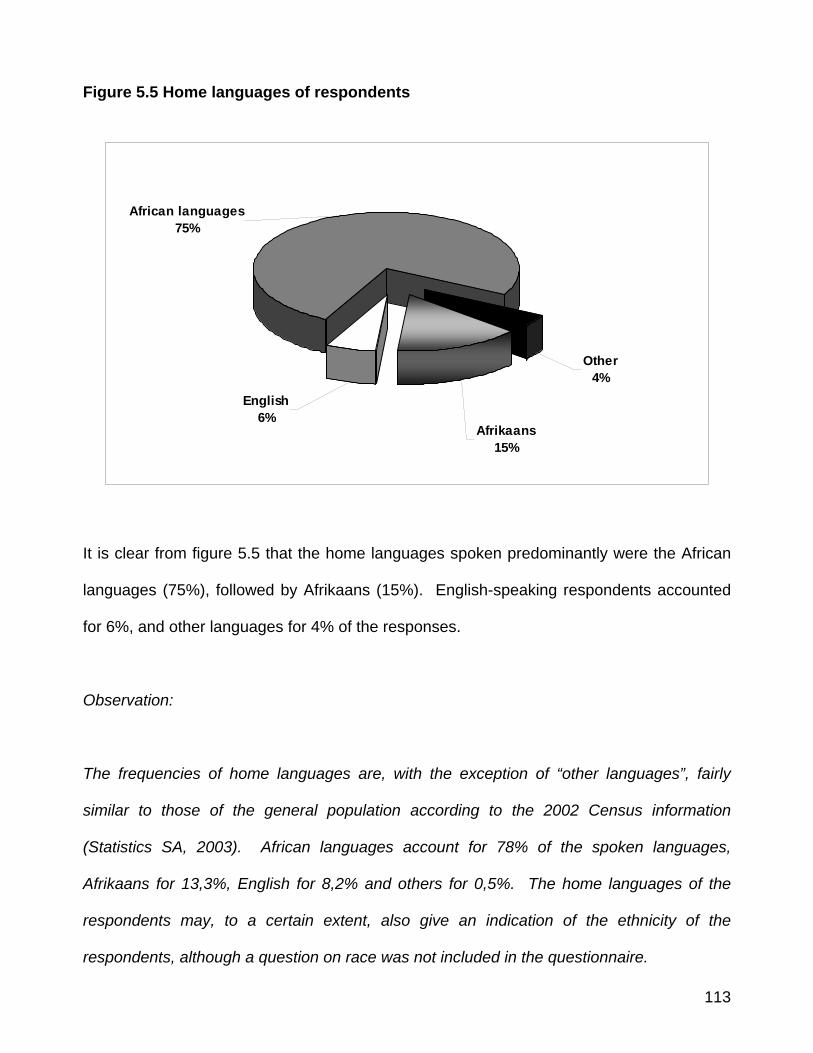
113
Figure 5.5 Home languages of respondents
African languages75%
English6%
Afrikaans15%
Other4%
It is clear from figure 5.5 that the home languages spoken predominantly were the African
languages (75%), followed by Afrikaans (15%). English-speaking respondents accounted
for 6%, and other languages for 4% of the responses.
Observation:
The frequencies of home languages are, with the exception of “other languages”, fairly
similar to those of the general population according to the 2002 Census information
(Statistics SA, 2003). African languages account for 78% of the spoken languages,
Afrikaans for 13,3%, English for 8,2% and others for 0,5%. The home languages of the
respondents may, to a certain extent, also give an indication of the ethnicity of the
respondents, although a question on race was not included in the questionnaire.
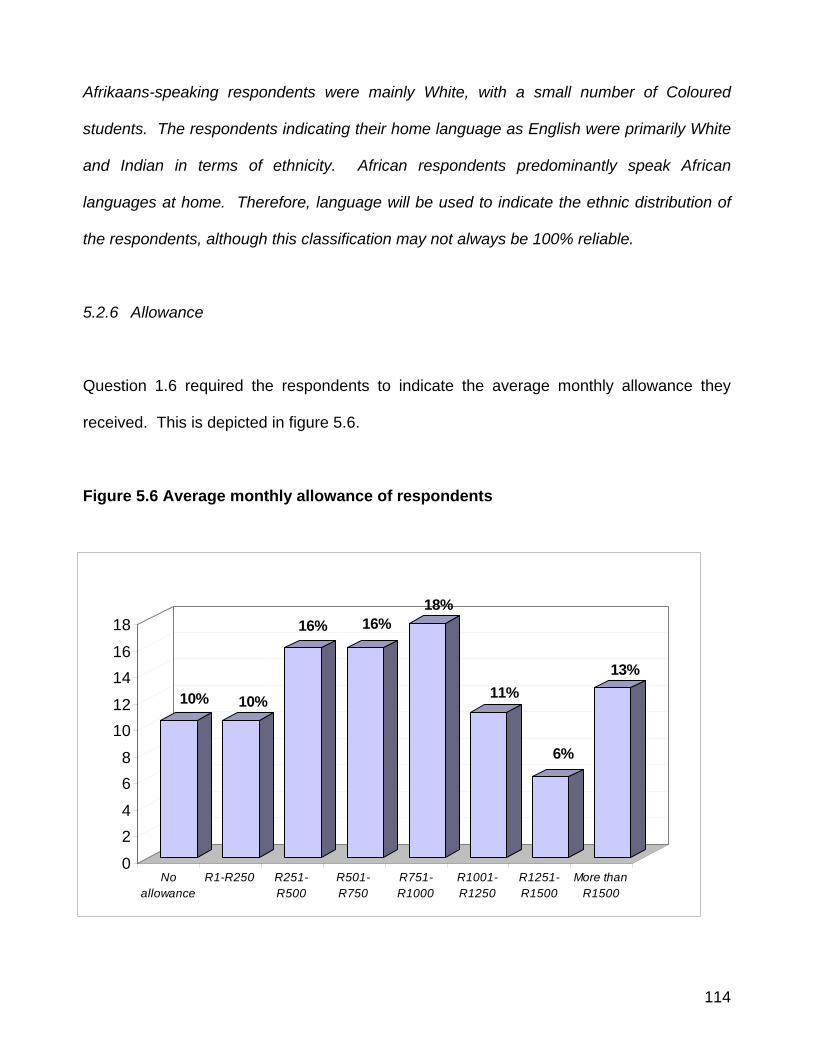
114
Afrikaans-speaking respondents were mainly White, with a small number of Coloured
students. The respondents indicating their home language as English were primarily White
and Indian in terms of ethnicity. African respondents predominantly speak African
languages at home. Therefore, language will be used to indicate the ethnic distribution of
the respondents, although this classification may not always be 100% reliable.
5.2.6 Allowance
Question 1.6 required the respondents to indicate the average monthly allowance they
received. This is depicted in figure 5.6.
Figure 5.6 Average monthly allowance of respondents
10% 10%
16% 16%18%
11%
6%
13%
0
24
68
1012
1416
18
Noallowance
R1-R250 R251-R500
R501-R750
R751-R1000
R1001-R1250
R1251-R1500
More thanR1500
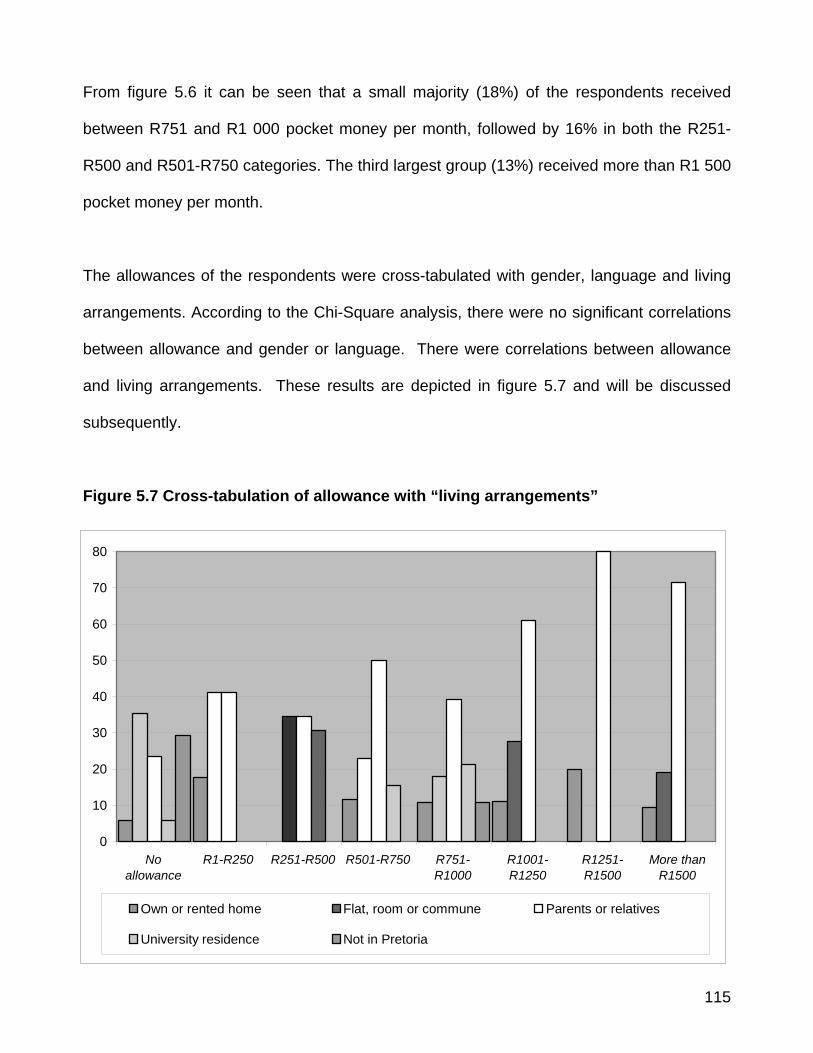
115
From figure 5.6 it can be seen that a small majority (18%) of the respondents received
between R751 and R1 000 pocket money per month, followed by 16% in both the R251-
R500 and R501-R750 categories. The third largest group (13%) received more than R1 500
pocket money per month.
The allowances of the respondents were cross-tabulated with gender, language and living
arrangements. According to the Chi-Square analysis, there were no significant correlations
between allowance and gender or language. There were correlations between allowance
and living arrangements. These results are depicted in figure 5.7 and will be discussed
subsequently.
Figure 5.7 Cross-tabulation of allowance with “living arrangements”
0
10
20
30
40
50
60
70
80
Noallowance
R1-R250 R251-R500 R501-R750 R751-R1000
R1001-R1250
R1251-R1500
More thanR1500
Own or rented home Flat, room or commune Parents or relatives
University residence Not in Pretoria
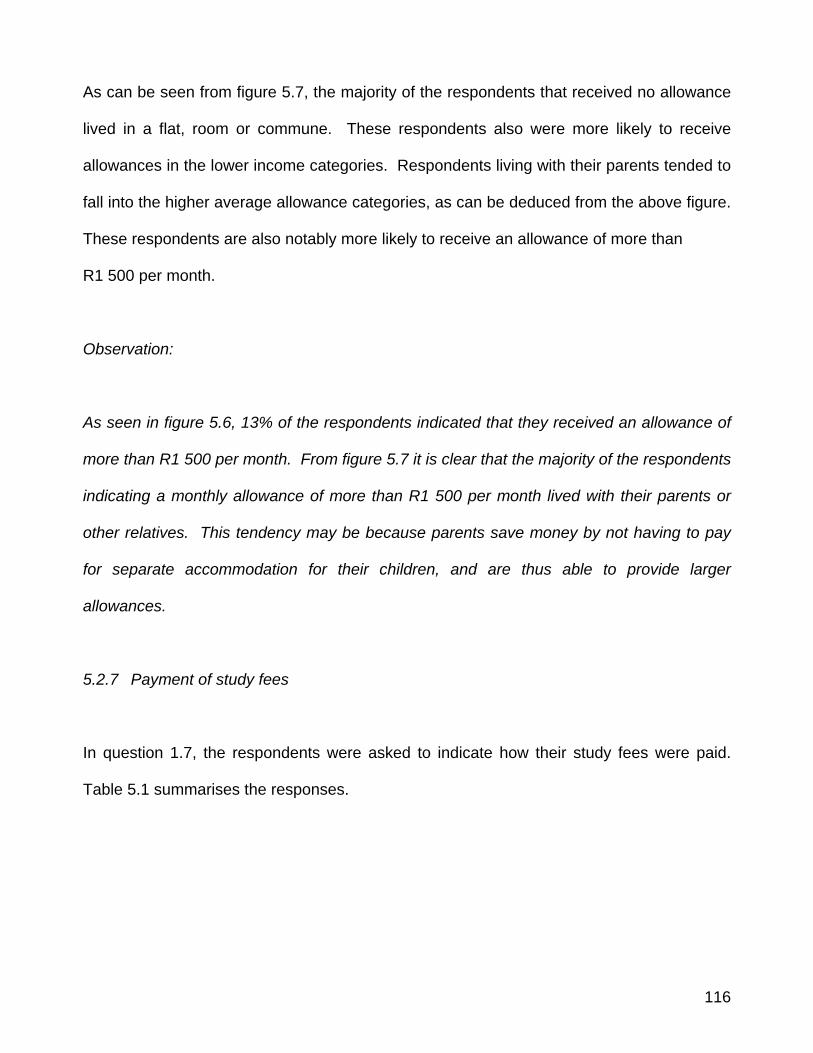
116
As can be seen from figure 5.7, the majority of the respondents that received no allowance
lived in a flat, room or commune. These respondents also were more likely to receive
allowances in the lower income categories. Respondents living with their parents tended to
fall into the higher average allowance categories, as can be deduced from the above figure.
These respondents are also notably more likely to receive an allowance of more than
R1 500 per month.
Observation:
As seen in figure 5.6, 13% of the respondents indicated that they received an allowance of
more than R1 500 per month. From figure 5.7 it is clear that the majority of the respondents
indicating a monthly allowance of more than R1 500 per month lived with their parents or
other relatives. This tendency may be because parents save money by not having to pay
for separate accommodation for their children, and are thus able to provide larger
allowances.
5.2.7 Payment of study fees
In question 1.7, the respondents were asked to indicate how their study fees were paid.
Table 5.1 summarises the responses.
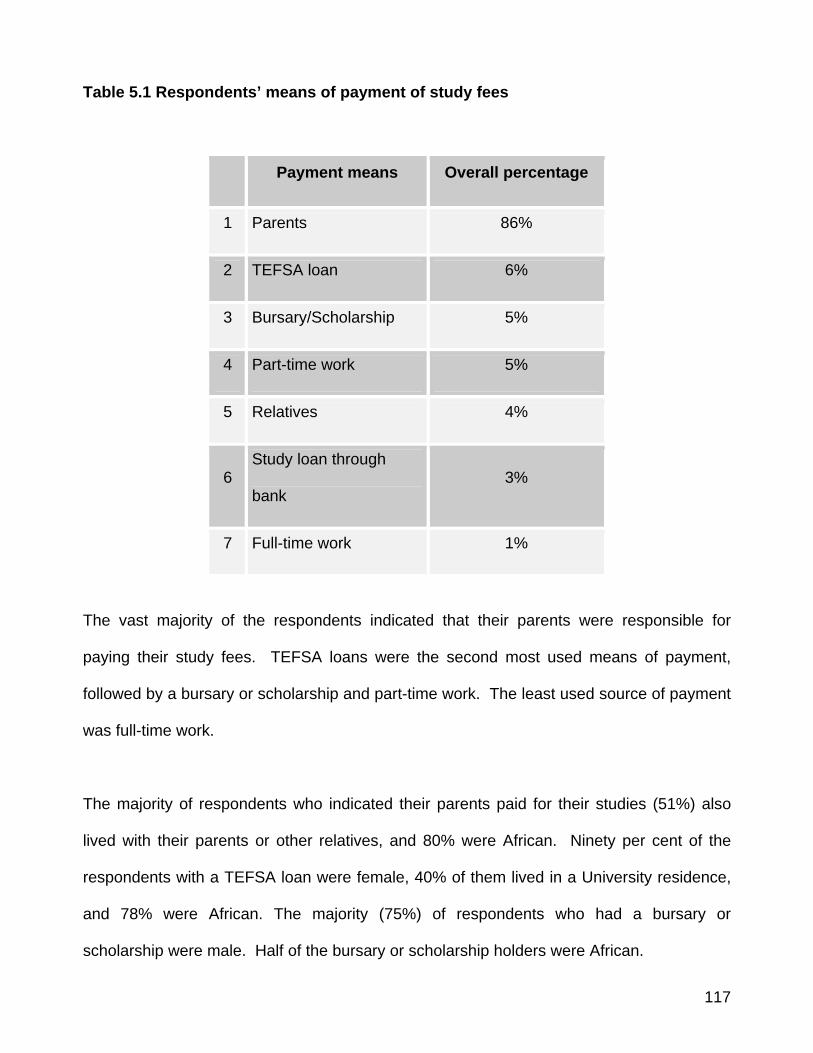
117
Table 5.1 Respondents’ means of payment of study fees
Payment means Overall percentage
1 Parents 86%
2 TEFSA loan 6%
3 Bursary/Scholarship 5%
4 Part-time work 5%
5 Relatives 4%
6 Study loan through
bank 3%
7 Full-time work 1%
The vast majority of the respondents indicated that their parents were responsible for
paying their study fees. TEFSA loans were the second most used means of payment,
followed by a bursary or scholarship and part-time work. The least used source of payment
was full-time work.
The majority of respondents who indicated their parents paid for their studies (51%) also
lived with their parents or other relatives, and 80% were African. Ninety per cent of the
respondents with a TEFSA loan were female, 40% of them lived in a University residence,
and 78% were African. The majority (75%) of respondents who had a bursary or
scholarship were male. Half of the bursary or scholarship holders were African.
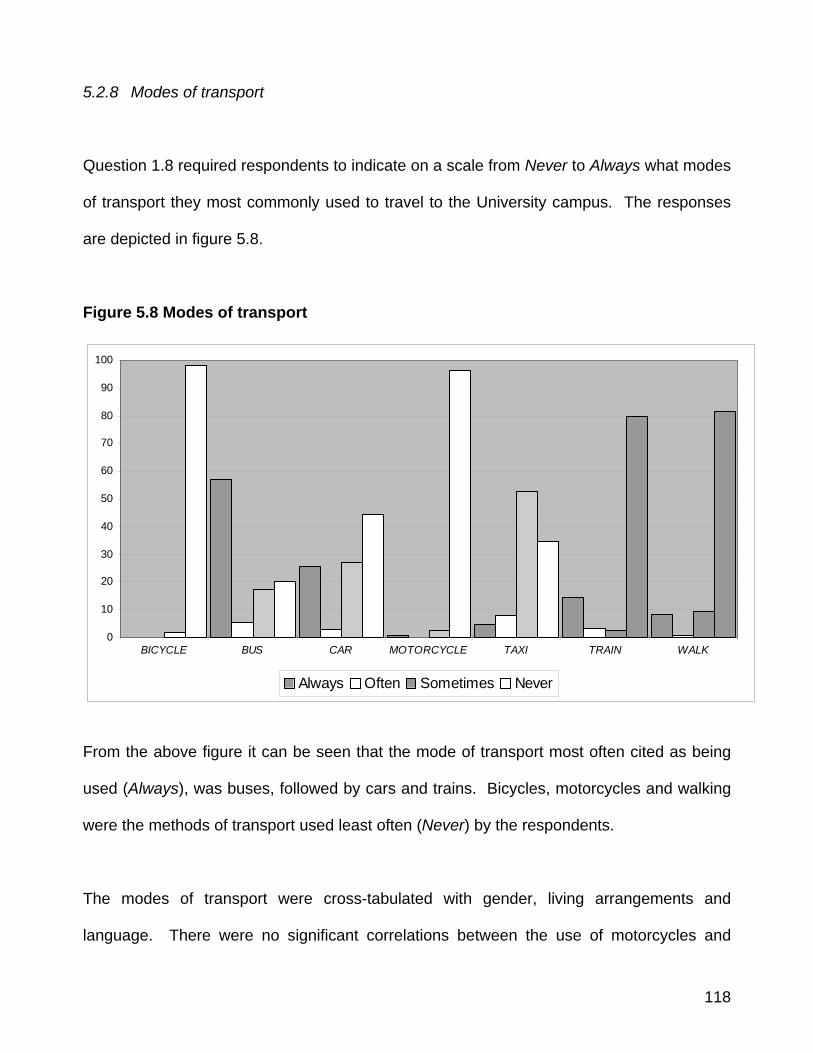
118
5.2.8 Modes of transport
Question 1.8 required respondents to indicate on a scale from Never to Always what modes
of transport they most commonly used to travel to the University campus. The responses
are depicted in figure 5.8.
Figure 5.8 Modes of transport
0
10
20
30
40
50
60
70
80
90
100
BICYCLE BUS CAR MOTORCYCLE TAXI TRAIN WALK
Always Often Sometimes Never
From the above figure it can be seen that the mode of transport most often cited as being
used (Always), was buses, followed by cars and trains. Bicycles, motorcycles and walking
were the methods of transport used least often (Never) by the respondents.
The modes of transport were cross-tabulated with gender, living arrangements and
language. There were no significant correlations between the use of motorcycles and
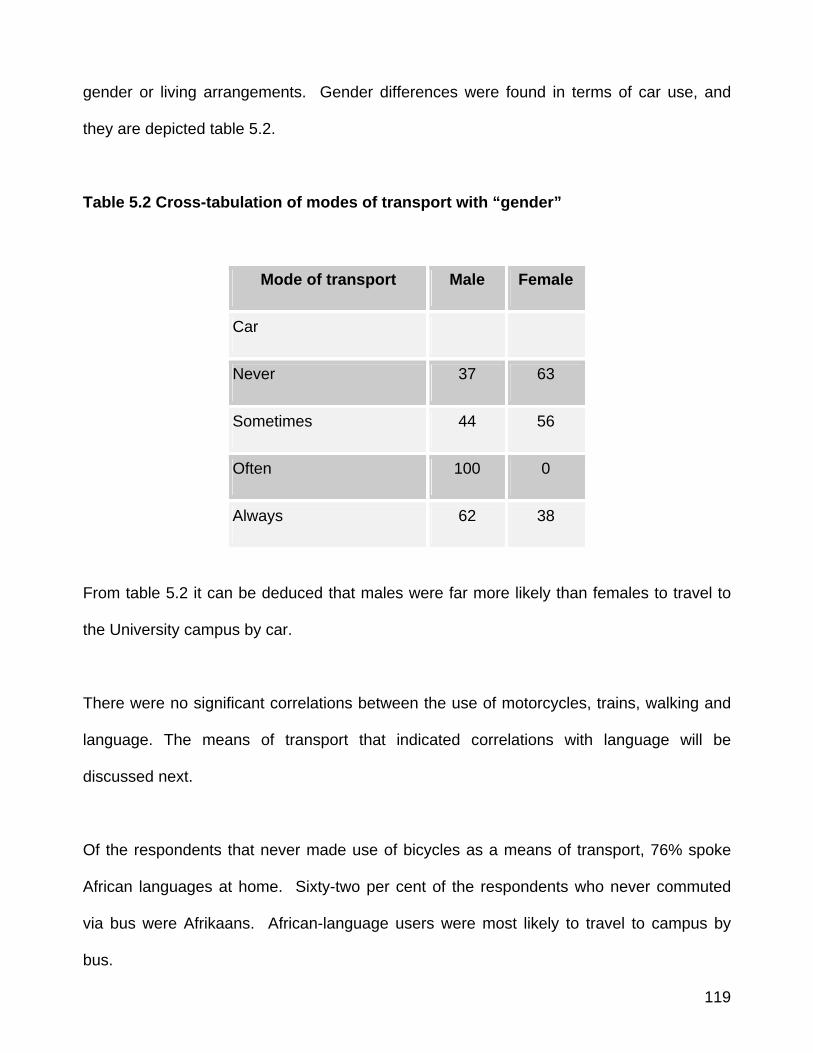
119
gender or living arrangements. Gender differences were found in terms of car use, and
they are depicted table 5.2.
Table 5.2 Cross-tabulation of modes of transport with “gender”
Mode of transport Male Female
Car
Never 37 63
Sometimes 44 56
Often 100 0
Always 62 38
From table 5.2 it can be deduced that males were far more likely than females to travel to
the University campus by car.
There were no significant correlations between the use of motorcycles, trains, walking and
language. The means of transport that indicated correlations with language will be
discussed next.
Of the respondents that never made use of bicycles as a means of transport, 76% spoke
African languages at home. Sixty-two per cent of the respondents who never commuted
via bus were Afrikaans. African-language users were most likely to travel to campus by
bus.

120
The majority (62%) of the respondents that indicated habitual car use were Afrikaans. The
majority of regular taxi users were African.
Observation:
It may be thought that African-language speaking respondents used cars less often than
other language groups because of a less wealthy background. This cannot be correlated
because that falls outside the demarcations of the research instrument, and there were no
significant correlations between home language and allowances received by the
respondents as per the Chi-Square analysis. The fact that African-language speakers were
most likely always to use taxis may be because Africans generally more often use taxis
than any other population group.
The correlations between living arrangements and various modes of transport are
discussed next.
Respondents living with their parents or other relatives were the most likely to use the bus
to travel to campus, while those living in a University residence were the least likely to
commute by bus. The respondents most likely to travel by taxi were those living in a flat,
room or commune, but those living in a University residence or outside Pretoria indicated
no inclination to use taxis as a means of transport to reach the campus.
121
The respondents most likely to use a train to travel to campus lived in a flat, room or
commune. Respondents who lived in a University residence indicated no inclination to
travel by train, but they were notably more likely than any other group to walk to campus.
Observation:
Most of the University residences are situated on the campus, making it unnecessary to use
a taxi to reach the campus. The residences that are not situated on the campus are on bus
routes that are run by the University, which may be the reason that some use of buses as
means of transport was indicated by respondents living in TUT residences. Respondents
living outside of Pretoria prefer alternative means of transport than taxis because travelling
a long way by taxi is expensive.
As with the use of taxis by respondents living in University residences, trains were in all
probability not a chosen means of transport because the residences are either situated on
the campus, or they are located on TUT bus routes that are run by the University.
That respondents living in University residences indicated walking to campus as the
greatest likelihood is not surprising, since most of the University’s residences are situated
on the campus itself. Respondents living outside of Pretoria live too far away to walk to
campus and thus rather make use of alternative means of transport such as buses.
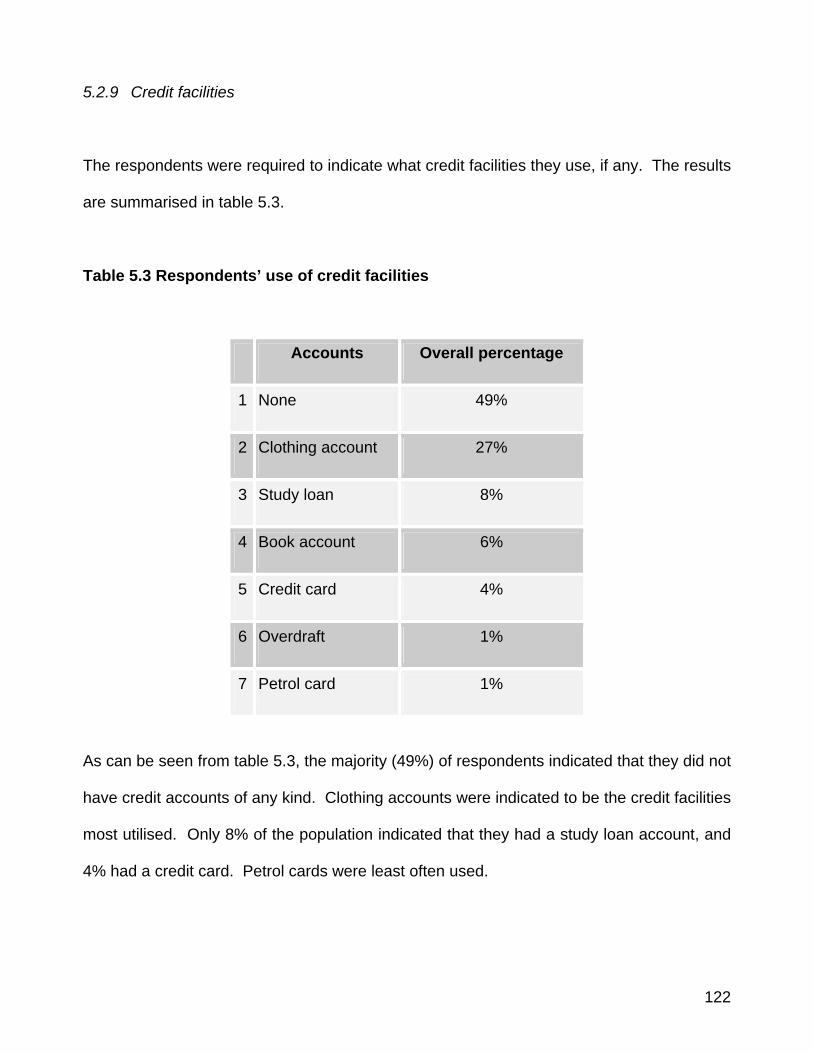
122
5.2.9 Credit facilities
The respondents were required to indicate what credit facilities they use, if any. The results
are summarised in table 5.3.
Table 5.3 Respondents’ use of credit facilities
Accounts Overall percentage
1 None 49%
2 Clothing account 27%
3 Study loan 8%
4 Book account 6%
5 Credit card 4%
6 Overdraft 1%
7 Petrol card 1%
As can be seen from table 5.3, the majority (49%) of respondents indicated that they did not
have credit accounts of any kind. Clothing accounts were indicated to be the credit facilities
most utilised. Only 8% of the population indicated that they had a study loan account, and
4% had a credit card. Petrol cards were least often used.
123
Observation:
This is a market segment that does not make use of a variety of banking services –
therefore, it can be said that they are under-banked, to a certain extent. The low use of
petrol cards makes sense in view of the fact that cars are relatively seldom used as a
means of travelling. Also, petrol cards are usually linked to a credit card, and the
possession of credit cards among the respondents was also low.
There were no significant correlations between the use of credit facilities and gender, living
arrangements or home language, according to the Chi-Square analysis.
Conclusion of the demographic variables of the respondents
In conclusion of the demographic variables it can be recapitulated that females constituted
the majority (52%) of the respondents. The majority (33%) of the respondents were 20
years old. Forty-eight per cent of the respondents lived in a flat, room or commune, 27%
lived with their parents or other relatives, and the smallest percentage (5%) did not reside in
Pretoria. The greater part of the respondents (41%) hailed from Gauteng Province, and
there were no respondents from the Northern Cape.
The vast majority (75%) of the respondents spoke one of the official African languages at
home. With regard to the average allowances the respondents received, a small majority
indicated that they received R751 to R1 000 pocket money per month. Of them, those
124
living with their parents or other relatives received the largest allowances. Eighty-six per
cent of the respondents indicated that their parents paid their study fees.
Buses were the preferred means of transport for the respondents, while bicycles were used
least often. Males were more likely to use cars to drive to campus, and Afrikaans
respondents indicted the largest likelihood to use cars. African respondents were the most
likely to use a bus or taxi to travel to campus. Respondents who lived with their parents
indicated the largest likelihood of travelling by bus, while those living in a flat, room or
commune mostly used taxis. Respondents living in a University residence were by far the
most likely to be found walking to class.
The majority of respondents indicated no use of credit facilities. Those that did make use of
credit indicted a clothing account as the most often used facility, and the least used credit
service utilised by the respondents was a petrol card.
This concludes the discussion on demographics. The information regarding consumer
behaviour variables as drawn from the responses will now be described.
5.3 Consumer behaviour variables
Section 2, questions 2.1 to 2.20, dealt with the variables describing the consumption
behaviour of the respondents. They included, among others, the spending of leisure time,
media usage, bank and cell phone use, consumption patterns of beverages, Internet
access and behavioural variances. These variables will now be discussed.
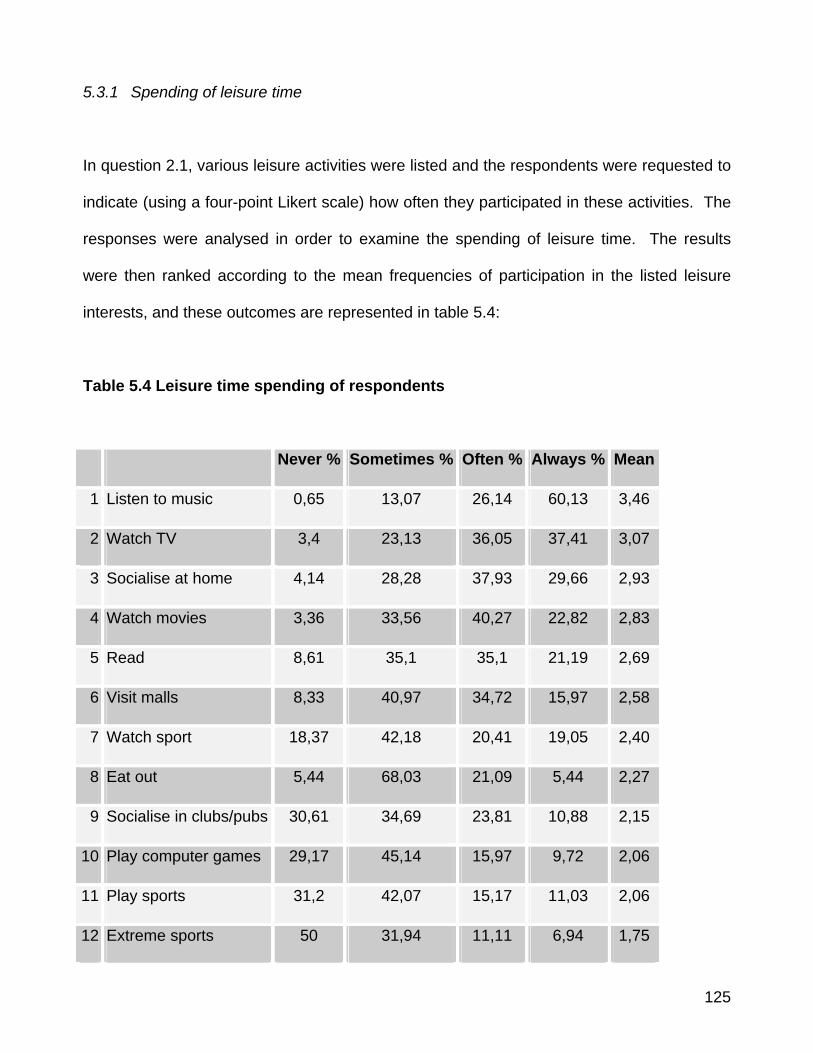
125
5.3.1 Spending of leisure time
In question 2.1, various leisure activities were listed and the respondents were requested to
indicate (using a four-point Likert scale) how often they participated in these activities. The
responses were analysed in order to examine the spending of leisure time. The results
were then ranked according to the mean frequencies of participation in the listed leisure
interests, and these outcomes are represented in table 5.4:
Table 5.4 Leisure time spending of respondents
Never % Sometimes % Often % Always % Mean
1 Listen to music 0,65 13,07 26,14 60,13 3,46
2 Watch TV 3,4 23,13 36,05 37,41 3,07
3 Socialise at home 4,14 28,28 37,93 29,66 2,93
4 Watch movies 3,36 33,56 40,27 22,82 2,83
5 Read 8,61 35,1 35,1 21,19 2,69
6 Visit malls 8,33 40,97 34,72 15,97 2,58
7 Watch sport 18,37 42,18 20,41 19,05 2,40
8 Eat out 5,44 68,03 21,09 5,44 2,27
9 Socialise in clubs/pubs 30,61 34,69 23,81 10,88 2,15
10 Play computer games 29,17 45,14 15,97 9,72 2,06
11 Play sports 31,2 42,07 15,17 11,03 2,06
12 Extreme sports 50 31,94 11,11 6,94 1,75
126
13 Surf the internet 47,22 38,19 10,42 4,17 1,72
As seen from the above, the respondents spent most of their leisure time listening to music,
followed by watching TV and socialising at home. Fourth was watching movies. Listening
to music, watching TV and movies may be classified as entertainment activities. These
results show similarities with the American survey by Weissman (1999), and the South
African BINEB study completed among University of Pretoria students in 1995. Both
studies indicated eating out and entertainment as some of the main activities the students
took part in (table 2.3).
The American respondents in Weissman (1999) also signified a high interest in music,
which is the activity with the highest frequency in this study. The activities least taken part
in by the respondents were playing extreme sports and surfing the Internet.
Observation:
The respondents seemed to lead relatively inactive lives, as the top five activities were all
passive (for example, watching sport as opposed to participating). There was a very low
frequency of using the Internet, which was expected, since only 22% had access to the
Internet at their place of residence (see figure 5.31).
In most of the leisure time activities the respondents participated in, there were no
significant differences in terms of gender and living arrangements. The Chi-Square values
of the data were used to cross-tabulate significant differences between the spending of
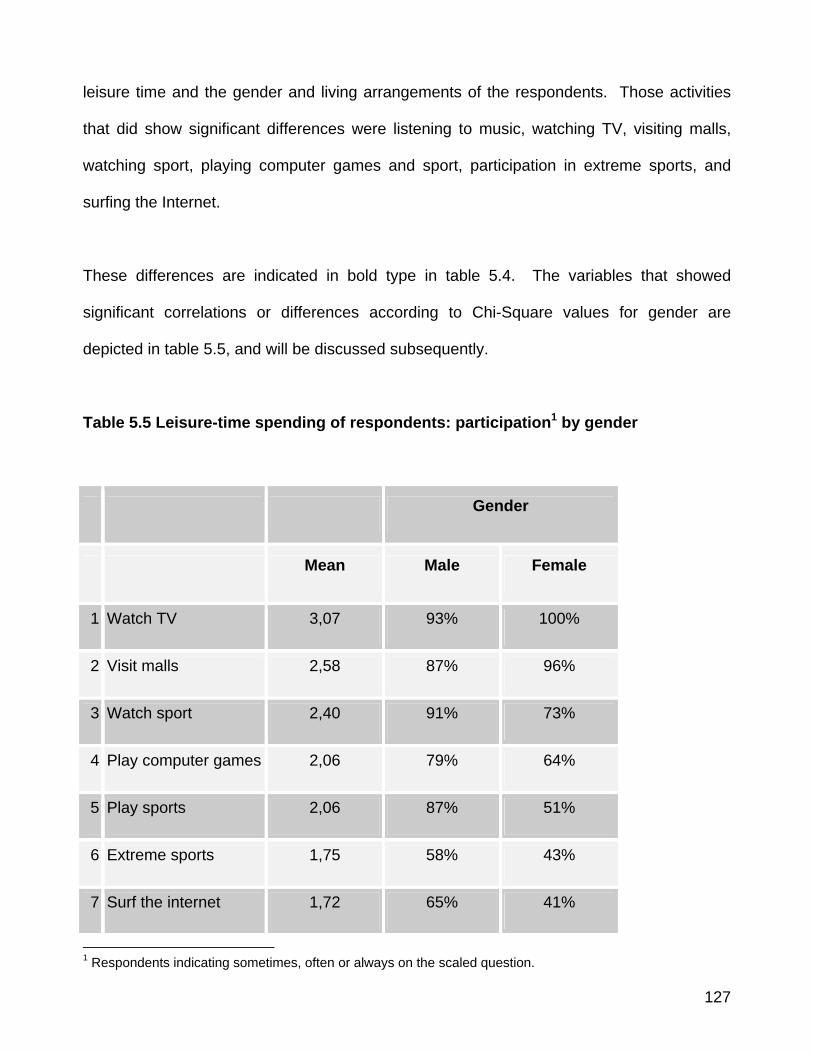
127
leisure time and the gender and living arrangements of the respondents. Those activities
that did show significant differences were listening to music, watching TV, visiting malls,
watching sport, playing computer games and sport, participation in extreme sports, and
surfing the Internet.
These differences are indicated in bold type in table 5.4. The variables that showed
significant correlations or differences according to Chi-Square values for gender are
depicted in table 5.5, and will be discussed subsequently.
Table 5.5 Leisure-time spending of respondents: participation1 by gender
Gender
Mean Male Female
1 Watch TV 3,07 93% 100%
2 Visit malls 2,58 87% 96%
3 Watch sport 2,40 91% 73%
4 Play computer games 2,06 79% 64%
5 Play sports 2,06 87% 51%
6 Extreme sports 1,75 58% 43%
7 Surf the internet 1,72 65% 41%
1 Respondents indicating sometimes, often or always on the scaled question.
128
From table 5.5 it is evident that the female respondents were more likely than the male
respondents to watch television, and more predisposed to visit malls. Interestingly, 7% of
the male respondents indicated that they never watched television, whereas all females
specified television usage.
Males were considerably more likely to watch sport and to participate in sport. They played
computer games and did extreme sports much more often than the females. With regard to
surfing the Internet, males were more likely than females to do so.
Observation:
Men are generally more attracted to sport than women. The fact that the males in this
study were far more likely to be interested in sport is therefore not surprising. Also, women
are generally more likely to visit a mall, which explains the female respondents’ having a
higher probability of being found in a mall. That male respondents were more likely than
females to surf the Internet is interesting, as there was no marked difference between male
and female access to the Internet at their places of residence (see 5.3.3).
The respondents’ behavioural patterns as cross-tabulated with living arrangements are
depicted in table 5.6.
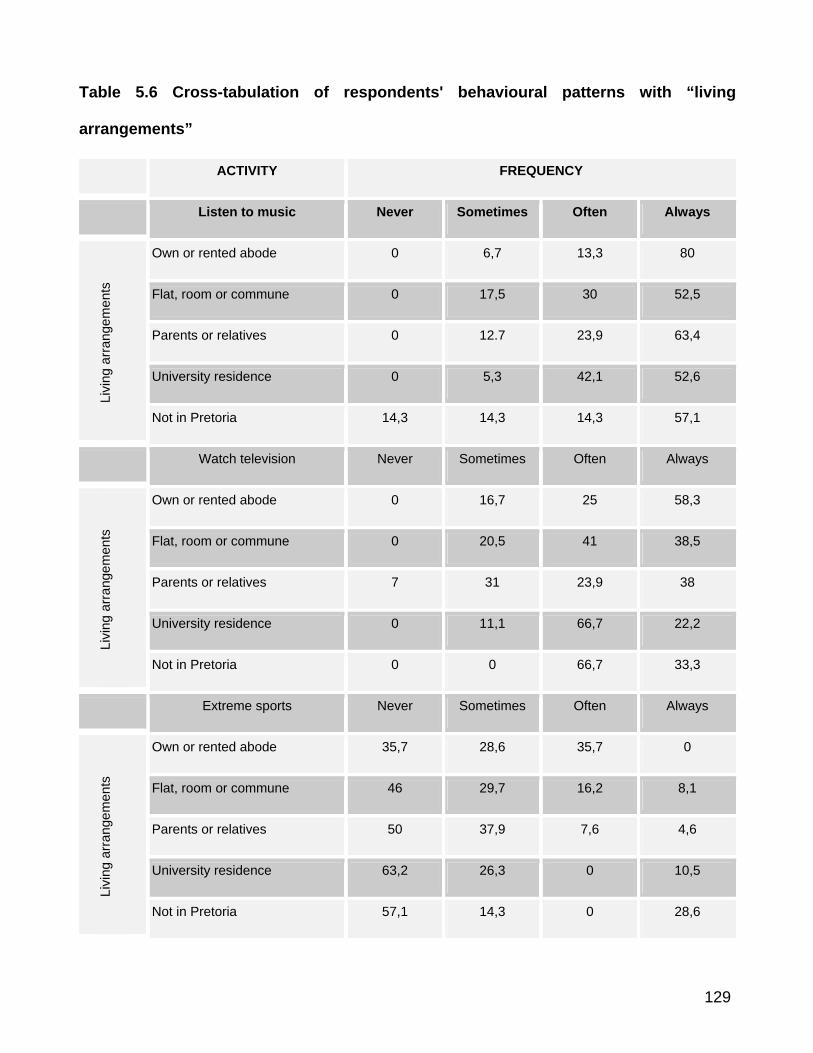
129
Table 5.6 Cross-tabulation of respondents' behavioural patterns with “living
arrangements”
ACTIVITY FREQUENCY
Listen to music Never Sometimes Often Always
Own or rented abode 0 6,7 13,3 80
Flat, room or commune 0 17,5 30 52,5
Parents or relatives 0 12.7 23,9 63,4
University residence 0 5,3 42,1 52,6
Livi
ng a
rran
gem
ents
Not in Pretoria 14,3 14,3 14,3 57,1
Watch television Never Sometimes Often Always
Own or rented abode 0 16,7 25 58,3
Flat, room or commune 0 20,5 41 38,5
Parents or relatives 7 31 23,9 38
University residence 0 11,1 66,7 22,2
Livi
ng a
rran
gem
ents
Not in Pretoria 0 0 66,7 33,3
Extreme sports Never Sometimes Often Always
Own or rented abode 35,7 28,6 35,7 0
Flat, room or commune 46 29,7 16,2 8,1
Parents or relatives 50 37,9 7,6 4,6
University residence 63,2 26,3 0 10,5
Livi
ng a
rran
gem
ents
Not in Pretoria 57,1 14,3 0 28,6
130
It is apparent from table 5.6 that 80% of the respondents living in their own or a rented
home and 63% of the respondents who lived with their parents or relatives indicated that
they always listened to music. Of those not living in Pretoria, 57% signified that they always
listened to music. This was the only group where some respondents (14%) indicated that
they never listened to music. Fifty-three per cent of those who lived in a University
residence and 53% of those who lived in a flat, room or commune always enjoyed music.
With regard to the respondents’ television usage, the respondents living with their parents
were the only group where some (7%) never watched television. The respondents living in
their own or a rented place were most likely to always watch television (58%), followed by
those living in a flat, room or commune (38%). All the respondents living outside of Pretoria
indicated that they often or always watched television.
The last variable that showed a significant Chi-Square variance was the respondents’
tendency to participate in extreme sports. As this was one of the activities rated lowest
overall by the respondents, the probability of respondent groups not doing extreme sports is
examined in particular.
As can be discerned from table 5.6, the respondents living in a University residence were
most likely never to take part in extreme sports, followed by those not living in Pretoria.
Those living in their own or a rented abode were the only group where none indicated that
they always participated in extreme sports.

131
Observation:
The fact that the respondents living on their own or in a rented home had the highest music
listening habit, may be due to the fact that they lived alone and were therefore able to play
music at any time without having to take into consideration other individuals in the
household. The reason for those not living in Pretoria who showed no inclination to listen to
music may be that they come from underprivileged rural areas and may not have owned a
radio. A cross-tabulation of living arrangements with allowances (see figure 5.7) indicated a
relatively low allowance level for respondents living outside Pretoria.
Regarding television-watching tendencies, the respondents living in their parents’ homes
may not be allowed by their parents to watch television, or their parents might not own a
television set.
In summary of the respondents’ leisure time spending: the activity most respondents
participated in was listening to music, followed by watching television and socialising at
home. They were least interested in playing sports, participating in extreme sports and
surfing the Internet.
The discussion of the analysis of the respondents’ spending of their leisure time is herewith
concluded. The media consumption habits of the respondents will now be examined.
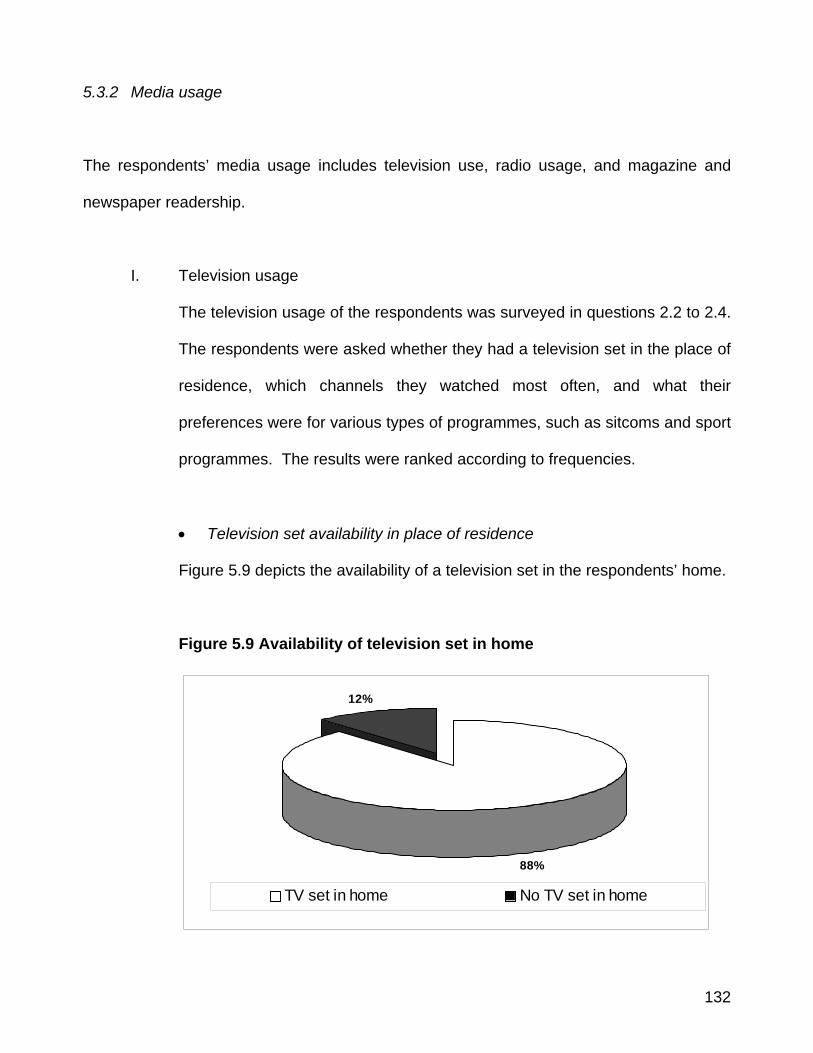
132
5.3.2 Media usage
The respondents’ media usage includes television use, radio usage, and magazine and
newspaper readership.
I. Television usage
The television usage of the respondents was surveyed in questions 2.2 to 2.4.
The respondents were asked whether they had a television set in the place of
residence, which channels they watched most often, and what their
preferences were for various types of programmes, such as sitcoms and sport
programmes. The results were ranked according to frequencies.
• Television set availability in place of residence
Figure 5.9 depicts the availability of a television set in the respondents’ home.
Figure 5.9 Availability of television set in home
88%
12%
TV set in home No TV set in home
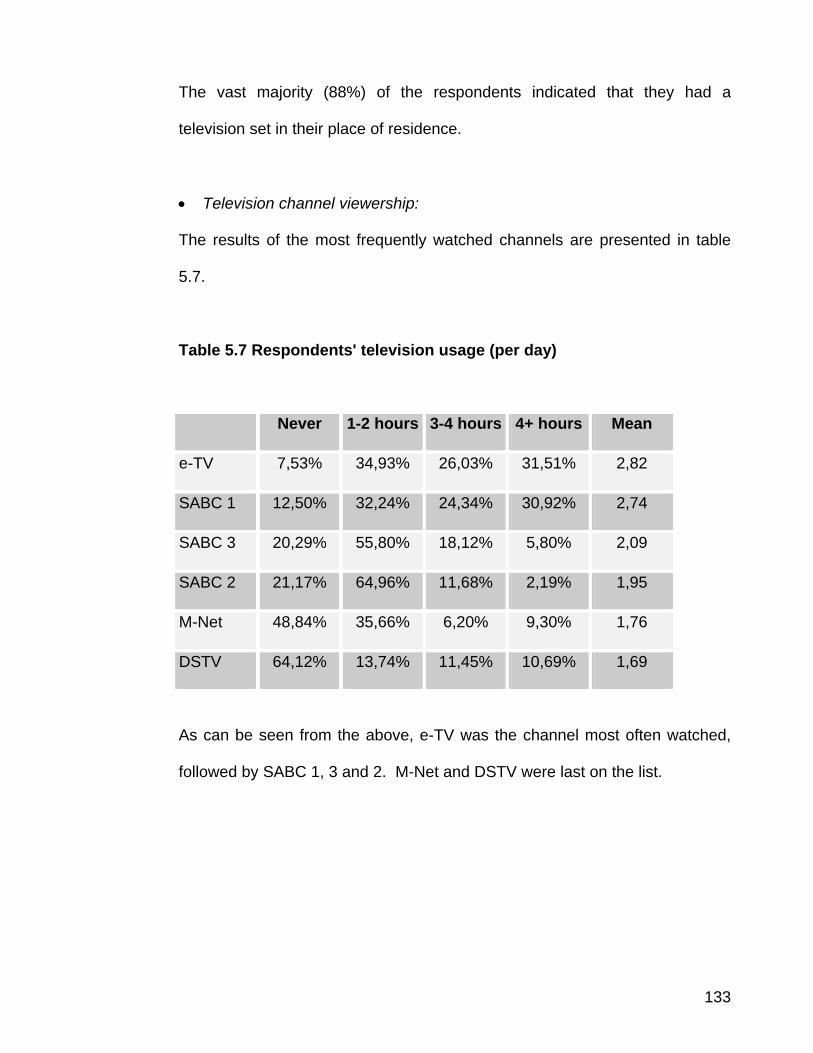
133
The vast majority (88%) of the respondents indicated that they had a
television set in their place of residence.
• Television channel viewership:
The results of the most frequently watched channels are presented in table
5.7.
Table 5.7 Respondents' television usage (per day)
Never 1-2 hours 3-4 hours 4+ hours Mean
e-TV 7,53% 34,93% 26,03% 31,51% 2,82
SABC 1 12,50% 32,24% 24,34% 30,92% 2,74
SABC 3 20,29% 55,80% 18,12% 5,80% 2,09
SABC 2 21,17% 64,96% 11,68% 2,19% 1,95
M-Net 48,84% 35,66% 6,20% 9,30% 1,76
DSTV 64,12% 13,74% 11,45% 10,69% 1,69
As can be seen from the above, e-TV was the channel most often watched,
followed by SABC 1, 3 and 2. M-Net and DSTV were last on the list.
134
Observation:
The fact that M-Net and DSTV were watched least frequently may be due to
those two options requiring additional subscription, which would mean an
additional expense for the student or his/her parents.
Figures 5.10 to 5.13 depict the variables that showed variances according to
the Chi-Square values in the statistical analysis. There were no significant
differences in the viewership of e-TV and SABC3 between the genders, or
between the different places of residence.
The variables that did have significant differences are showed as no
viewership (never) and overall viewership, which includes 1 to 2 hours, 3 to 4
hours and 4 and more hours of viewership per day of a particular channel.
There were no correlations between language and viewership of any of the
channels.
Viewership variances of SABC1 are revealed in Figure 5.10.
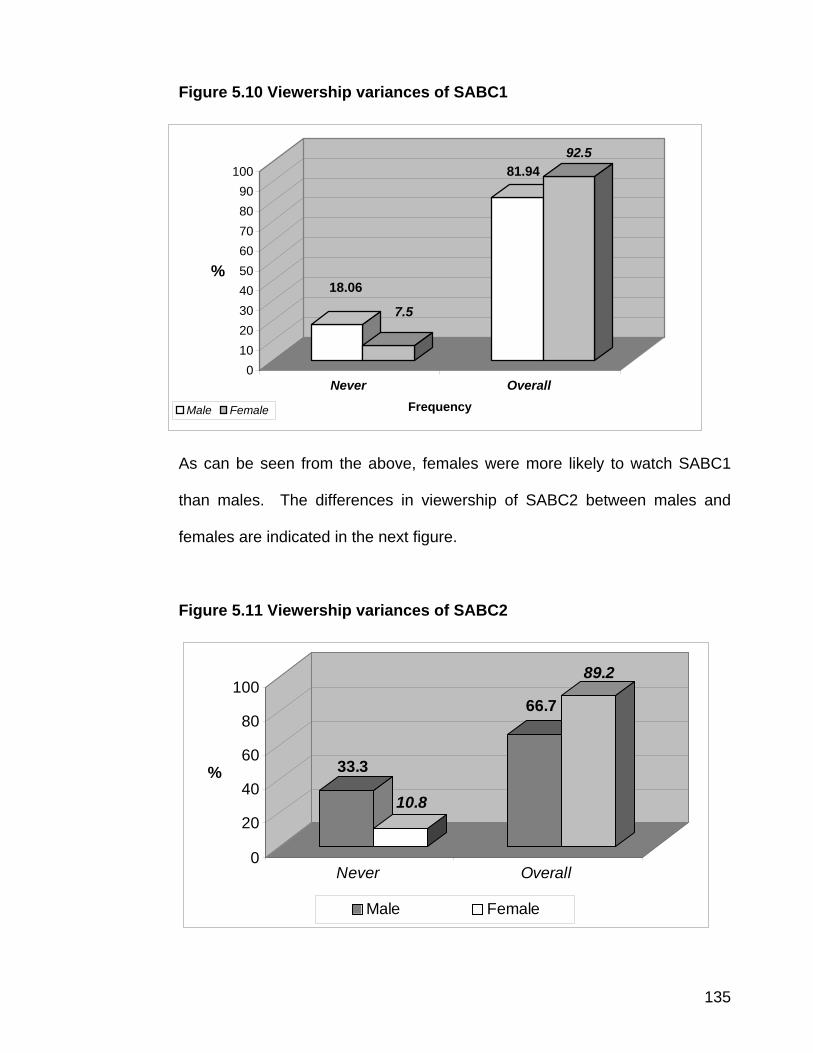
135
Figure 5.10 Viewership variances of SABC1
18.06
7.5
81.9492.5
0102030405060708090
100
%
Never OverallFrequencyMale Female
As can be seen from the above, females were more likely to watch SABC1
than males. The differences in viewership of SABC2 between males and
females are indicated in the next figure.
Figure 5.11 Viewership variances of SABC2
33.3
10.8
66.7
89.2
0
20
40
60
80
100
%
Never Overall
Male Female
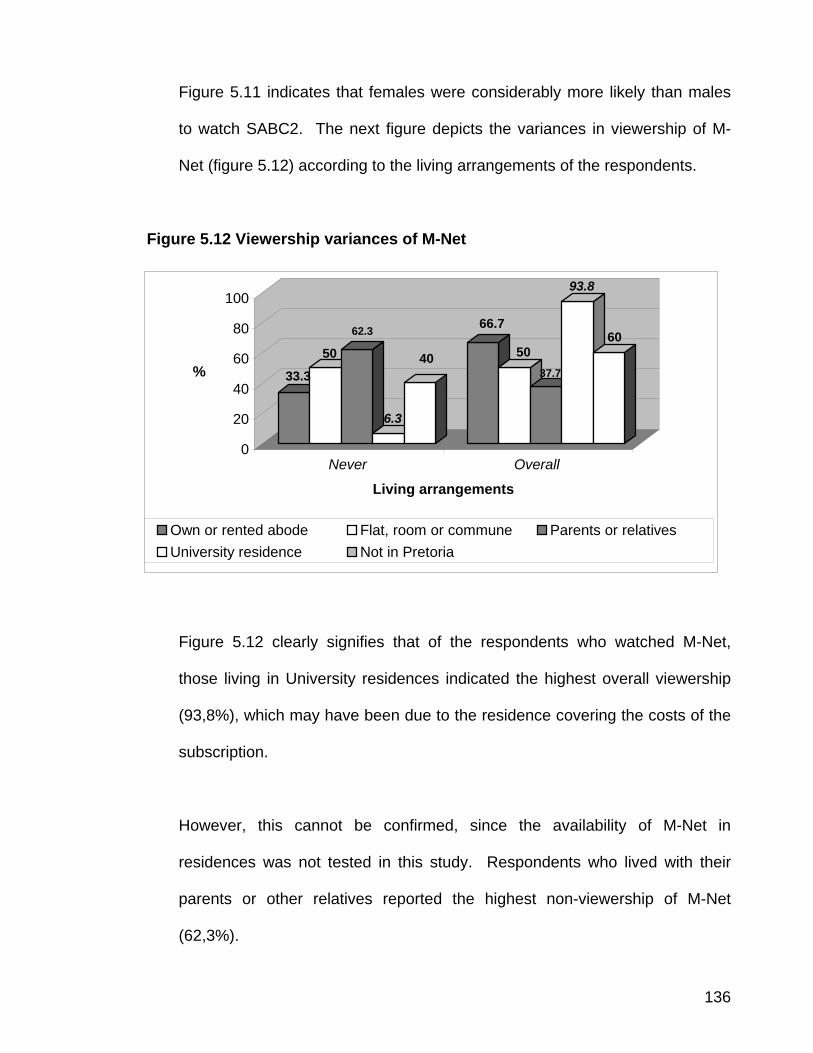
136
Figure 5.11 indicates that females were considerably more likely than males
to watch SABC2. The next figure depicts the variances in viewership of M-
Net (figure 5.12) according to the living arrangements of the respondents.
Figure 5.12 Viewership variances of M-Net
33.3
50
62.3
6.3
40
66.7
5037.7
93.8
60
0
20
40
60
80
100
%
Never Overall
Living arrangements
Own or rented abode Flat, room or commune Parents or relativesUniversity residence Not in Pretoria
Figure 5.12 clearly signifies that of the respondents who watched M-Net,
those living in University residences indicated the highest overall viewership
(93,8%), which may have been due to the residence covering the costs of the
subscription.
However, this cannot be confirmed, since the availability of M-Net in
residences was not tested in this study. Respondents who lived with their
parents or other relatives reported the highest non-viewership of M-Net
(62,3%).
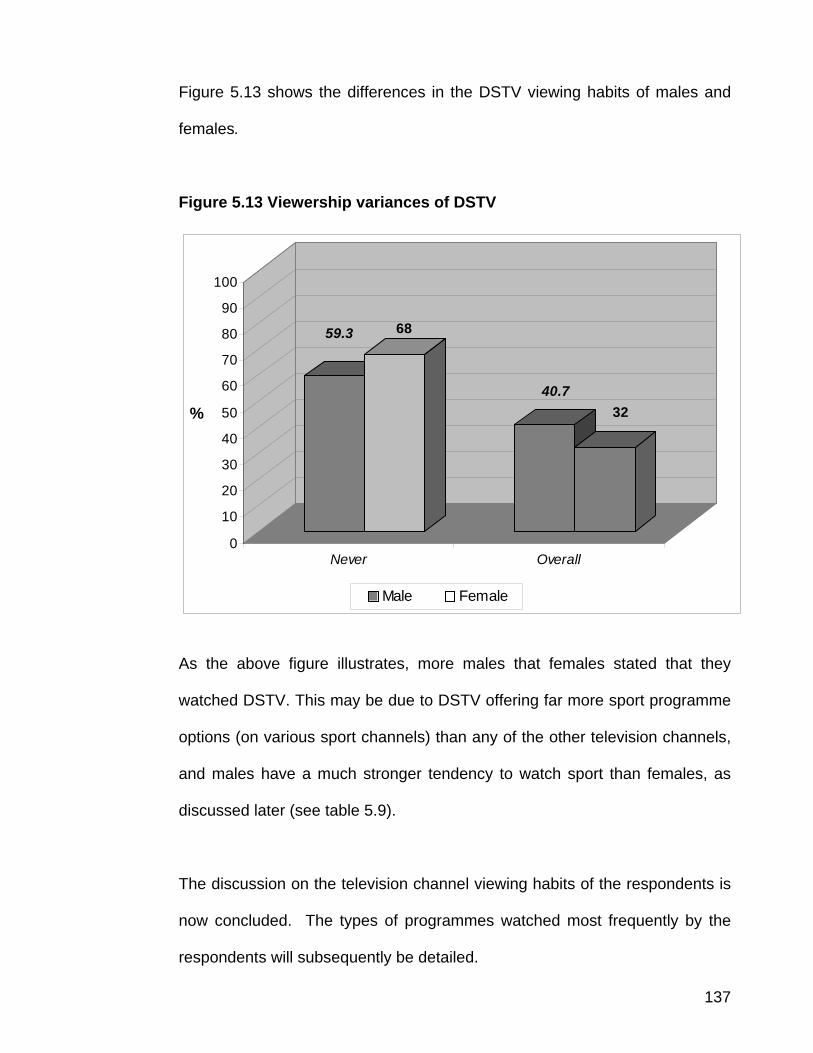
137
Figure 5.13 shows the differences in the DSTV viewing habits of males and
females.
Figure 5.13 Viewership variances of DSTV
59.3 68
40.732
0
10
20
30
40
50
60
70
80
90
100
%
Never Overall
Male Female
As the above figure illustrates, more males that females stated that they
watched DSTV. This may be due to DSTV offering far more sport programme
options (on various sport channels) than any of the other television channels,
and males have a much stronger tendency to watch sport than females, as
discussed later (see table 5.9).
The discussion on the television channel viewing habits of the respondents is
now concluded. The types of programmes watched most frequently by the
respondents will subsequently be detailed.
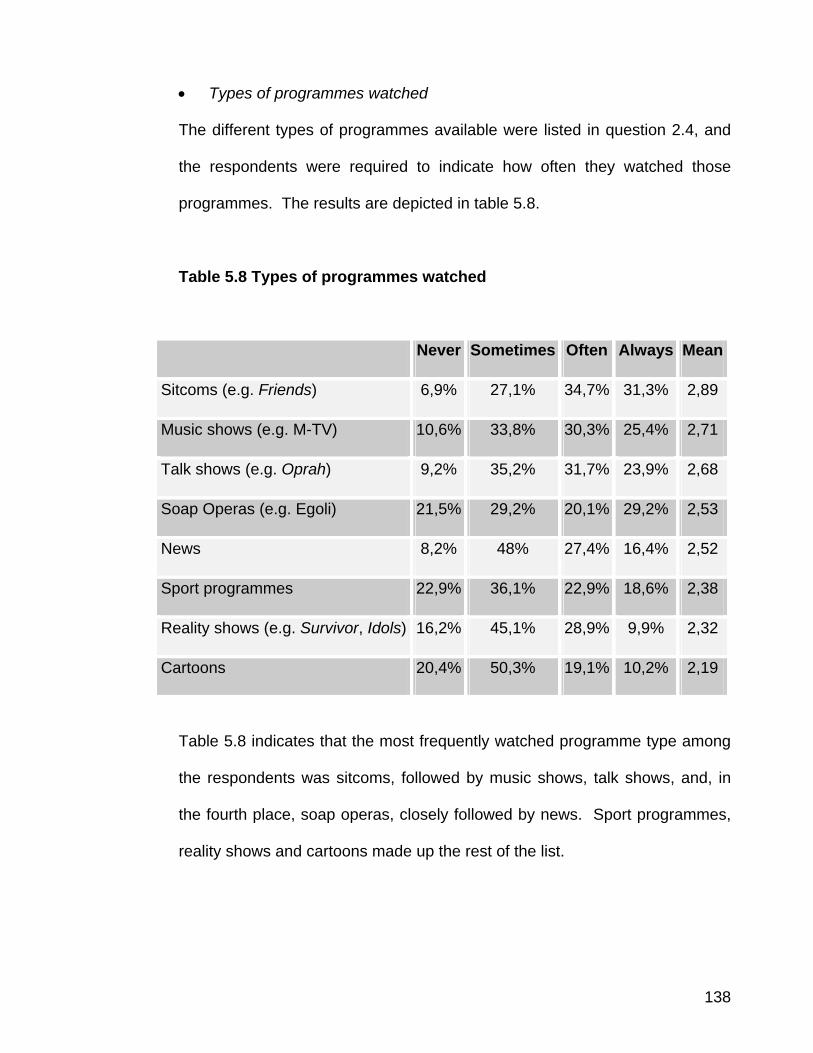
138
• Types of programmes watched
The different types of programmes available were listed in question 2.4, and
the respondents were required to indicate how often they watched those
programmes. The results are depicted in table 5.8.
Table 5.8 Types of programmes watched
Never Sometimes Often Always Mean
Sitcoms (e.g. Friends) 6,9% 27,1% 34,7% 31,3% 2,89
Music shows (e.g. M-TV) 10,6% 33,8% 30,3% 25,4% 2,71
Talk shows (e.g. Oprah) 9,2% 35,2% 31,7% 23,9% 2,68
Soap Operas (e.g. Egoli) 21,5% 29,2% 20,1% 29,2% 2,53
News 8,2% 48% 27,4% 16,4% 2,52
Sport programmes 22,9% 36,1% 22,9% 18,6% 2,38
Reality shows (e.g. Survivor, Idols) 16,2% 45,1% 28,9% 9,9% 2,32
Cartoons 20,4% 50,3% 19,1% 10,2% 2,19
Table 5.8 indicates that the most frequently watched programme type among
the respondents was sitcoms, followed by music shows, talk shows, and, in
the fourth place, soap operas, closely followed by news. Sport programmes,
reality shows and cartoons made up the rest of the list.
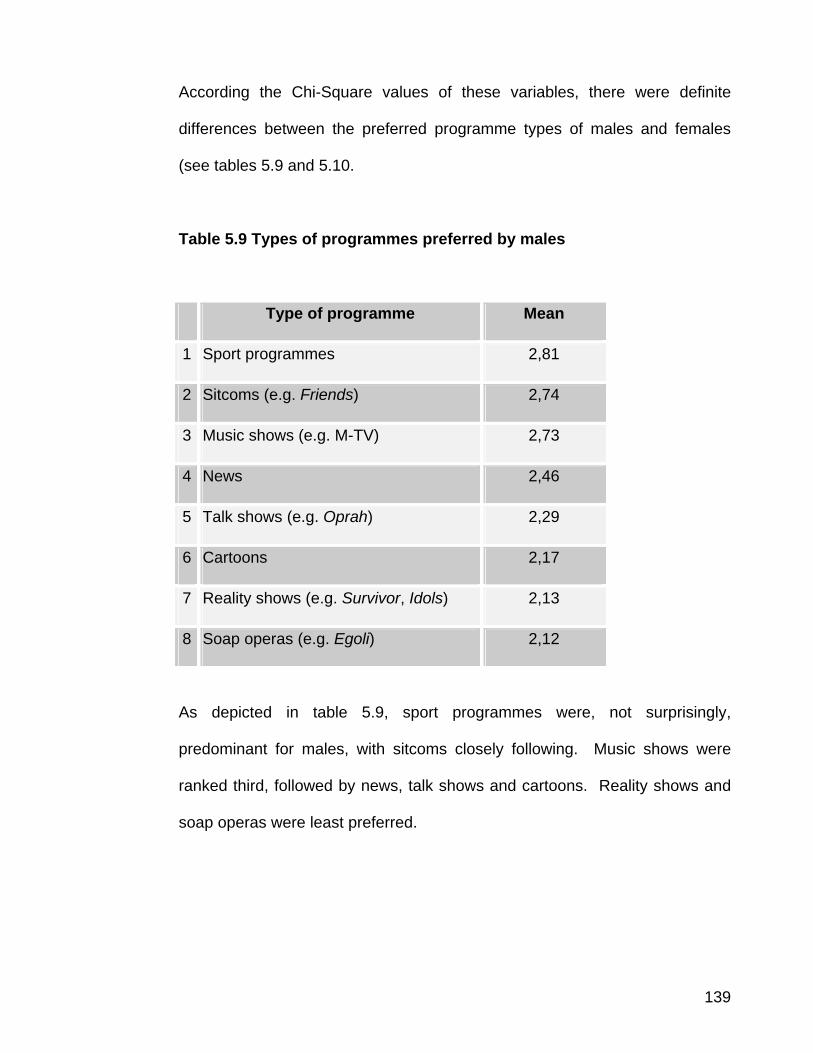
139
According the Chi-Square values of these variables, there were definite
differences between the preferred programme types of males and females
(see tables 5.9 and 5.10.
Table 5.9 Types of programmes preferred by males
Type of programme Mean
1 Sport programmes 2,81
2 Sitcoms (e.g. Friends) 2,74
3 Music shows (e.g. M-TV) 2,73
4 News 2,46
5 Talk shows (e.g. Oprah) 2,29
6 Cartoons 2,17
7 Reality shows (e.g. Survivor, Idols) 2,13
8 Soap operas (e.g. Egoli) 2,12
As depicted in table 5.9, sport programmes were, not surprisingly,
predominant for males, with sitcoms closely following. Music shows were
ranked third, followed by news, talk shows and cartoons. Reality shows and
soap operas were least preferred.
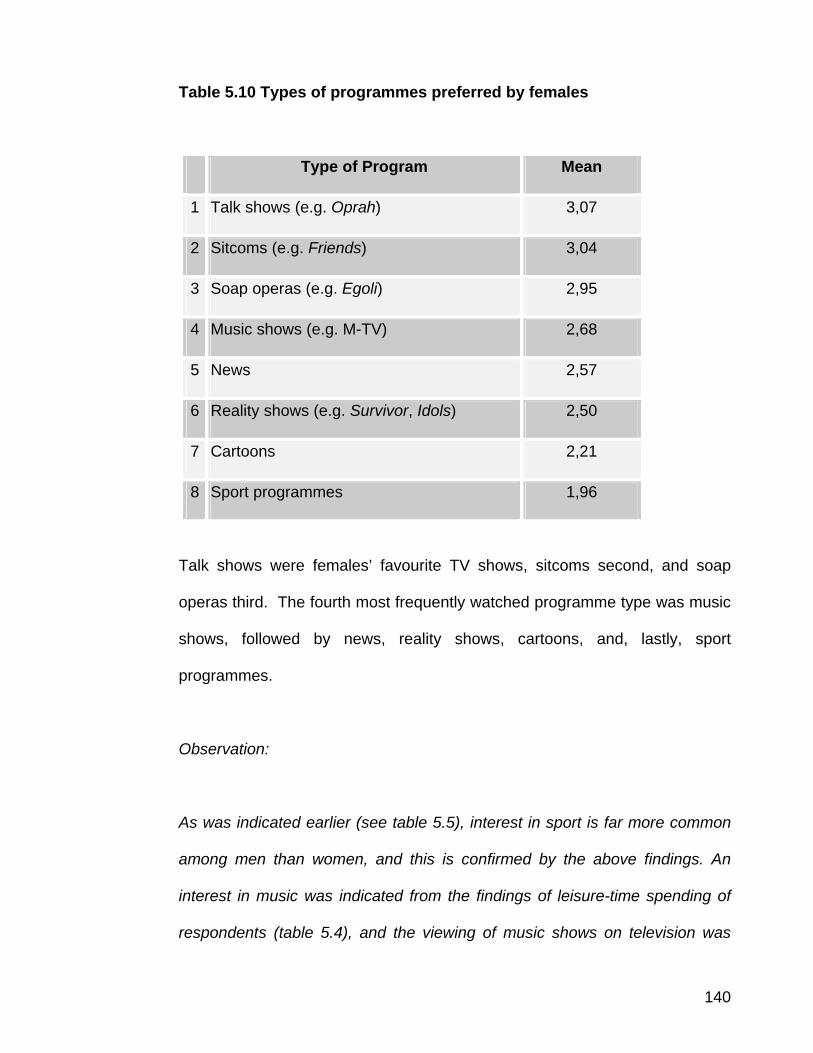
140
Table 5.10 Types of programmes preferred by females
Type of Program Mean
1 Talk shows (e.g. Oprah) 3,07
2 Sitcoms (e.g. Friends) 3,04
3 Soap operas (e.g. Egoli) 2,95
4 Music shows (e.g. M-TV) 2,68
5 News 2,57
6 Reality shows (e.g. Survivor, Idols) 2,50
7 Cartoons 2,21
8 Sport programmes 1,96
Talk shows were females’ favourite TV shows, sitcoms second, and soap
operas third. The fourth most frequently watched programme type was music
shows, followed by news, reality shows, cartoons, and, lastly, sport
programmes.
Observation:
As was indicated earlier (see table 5.5), interest in sport is far more common
among men than women, and this is confirmed by the above findings. An
interest in music was indicated from the findings of leisure-time spending of
respondents (table 5.4), and the viewing of music shows on television was
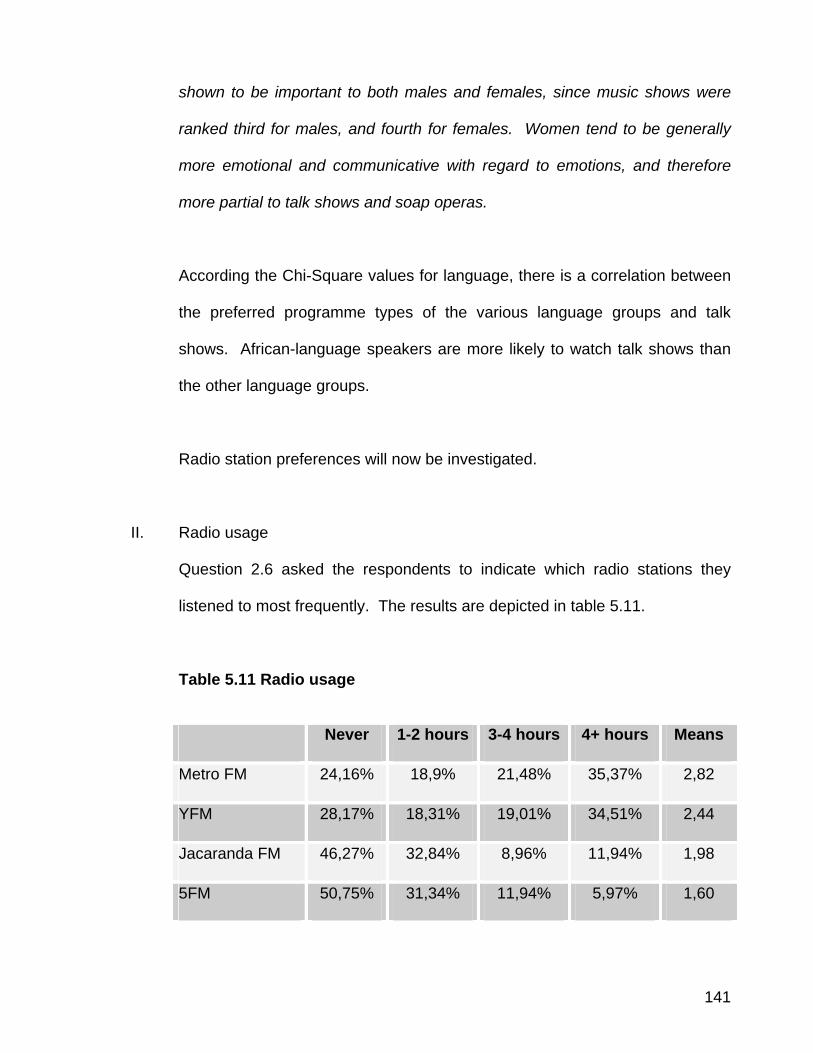
141
shown to be important to both males and females, since music shows were
ranked third for males, and fourth for females. Women tend to be generally
more emotional and communicative with regard to emotions, and therefore
more partial to talk shows and soap operas.
According the Chi-Square values for language, there is a correlation between
the preferred programme types of the various language groups and talk
shows. African-language speakers are more likely to watch talk shows than
the other language groups.
Radio station preferences will now be investigated.
II. Radio usage
Question 2.6 asked the respondents to indicate which radio stations they
listened to most frequently. The results are depicted in table 5.11.
Table 5.11 Radio usage
Never 1-2 hours 3-4 hours 4+ hours Means
Metro FM 24,16% 18,9% 21,48% 35,37% 2,82
YFM 28,17% 18,31% 19,01% 34,51% 2,44
Jacaranda FM 46,27% 32,84% 8,96% 11,94% 1,98
5FM 50,75% 31,34% 11,94% 5,97% 1,60
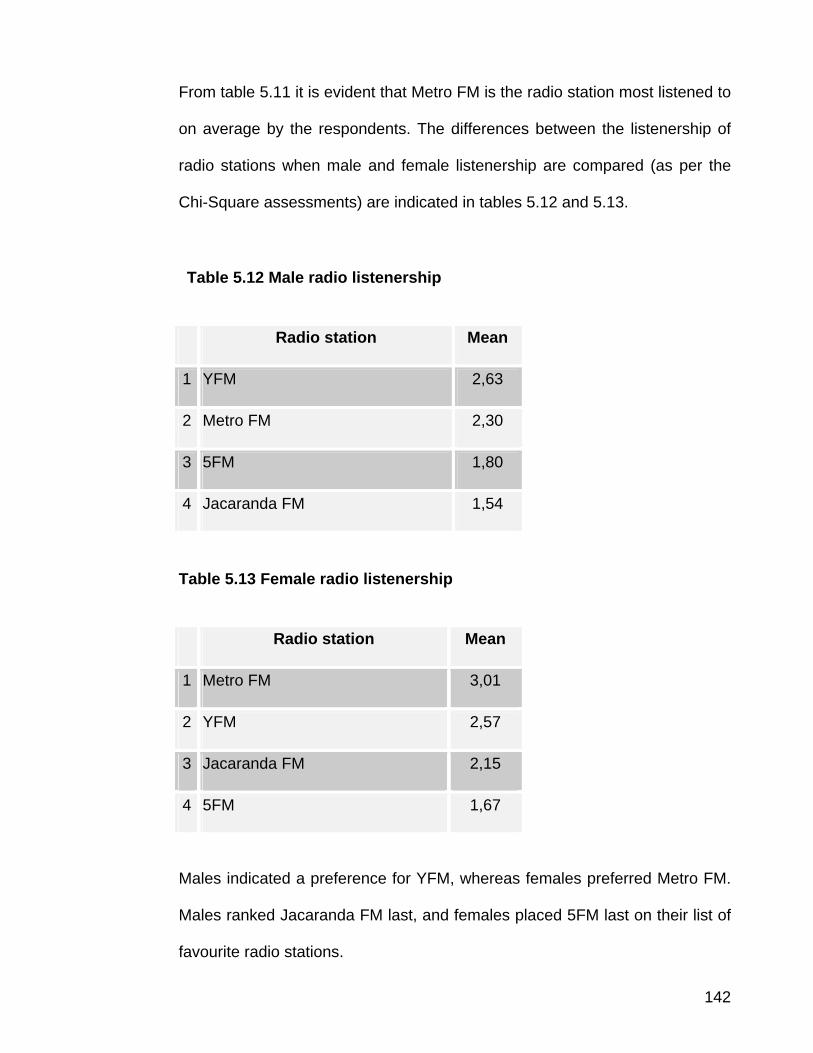
142
From table 5.11 it is evident that Metro FM is the radio station most listened to
on average by the respondents. The differences between the listenership of
radio stations when male and female listenership are compared (as per the
Chi-Square assessments) are indicated in tables 5.12 and 5.13.
Table 5.12 Male radio listenership
Radio station Mean
1 YFM 2,63
2 Metro FM 2,30
3 5FM 1,80
4 Jacaranda FM 1,54
Table 5.13 Female radio listenership
Radio station Mean
1 Metro FM 3,01
2 YFM 2,57
3 Jacaranda FM 2,15
4 5FM 1,67
Males indicated a preference for YFM, whereas females preferred Metro FM.
Males ranked Jacaranda FM last, and females placed 5FM last on their list of
favourite radio stations.
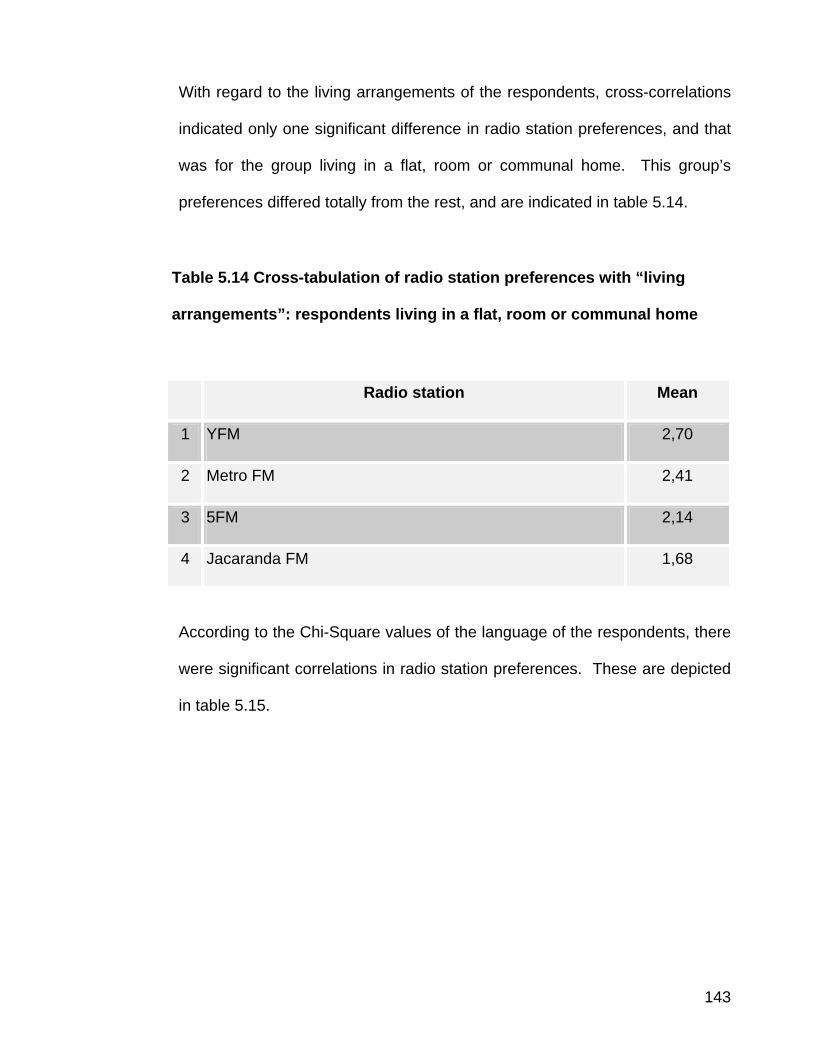
143
With regard to the living arrangements of the respondents, cross-correlations
indicated only one significant difference in radio station preferences, and that
was for the group living in a flat, room or communal home. This group’s
preferences differed totally from the rest, and are indicated in table 5.14.
Table 5.14 Cross-tabulation of radio station preferences with “living
arrangements”: respondents living in a flat, room or communal home
Radio station Mean
1 YFM 2,70
2 Metro FM 2,41
3 5FM 2,14
4 Jacaranda FM 1,68
According to the Chi-Square values of the language of the respondents, there
were significant correlations in radio station preferences. These are depicted
in table 5.15.
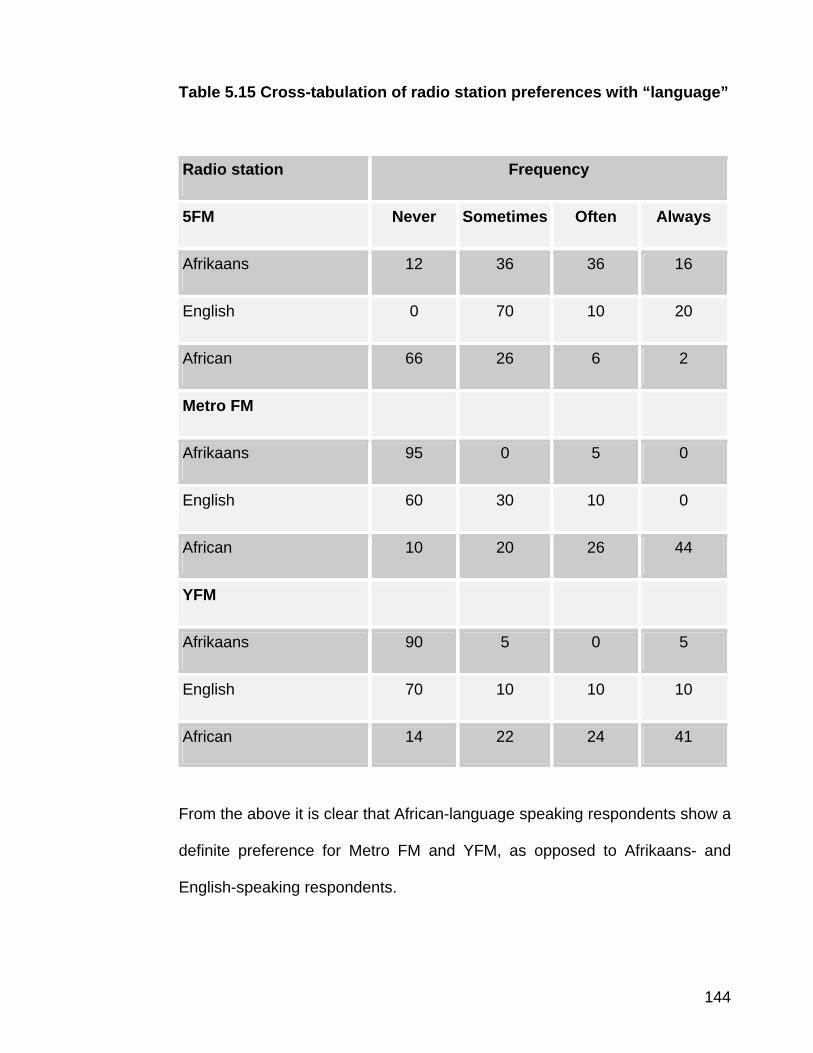
144
Table 5.15 Cross-tabulation of radio station preferences with “language”
Radio station Frequency
5FM Never Sometimes Often Always
Afrikaans 12 36 36 16
English 0 70 10 20
African 66 26 6 2
Metro FM
Afrikaans 95 0 5 0
English 60 30 10 0
African 10 20 26 44
YFM
Afrikaans 90 5 0 5
English 70 10 10 10
African 14 22 24 41
From the above it is clear that African-language speaking respondents show a
definite preference for Metro FM and YFM, as opposed to Afrikaans- and
English-speaking respondents.
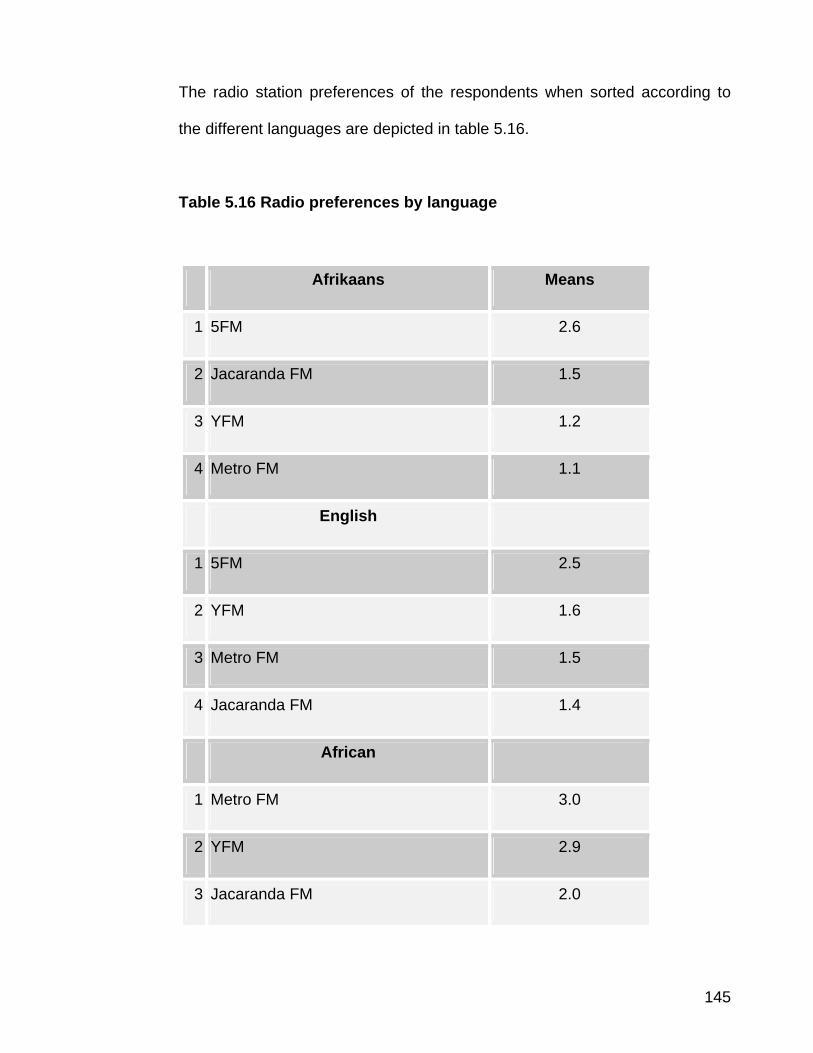
145
The radio station preferences of the respondents when sorted according to
the different languages are depicted in table 5.16.
Table 5.16 Radio preferences by language
Afrikaans Means
1 5FM 2.6
2 Jacaranda FM 1.5
3 YFM 1.2
4 Metro FM 1.1
English
1 5FM 2.5
2 YFM 1.6
3 Metro FM 1.5
4 Jacaranda FM 1.4
African
1 Metro FM 3.0
2 YFM 2.9
3 Jacaranda FM 2.0
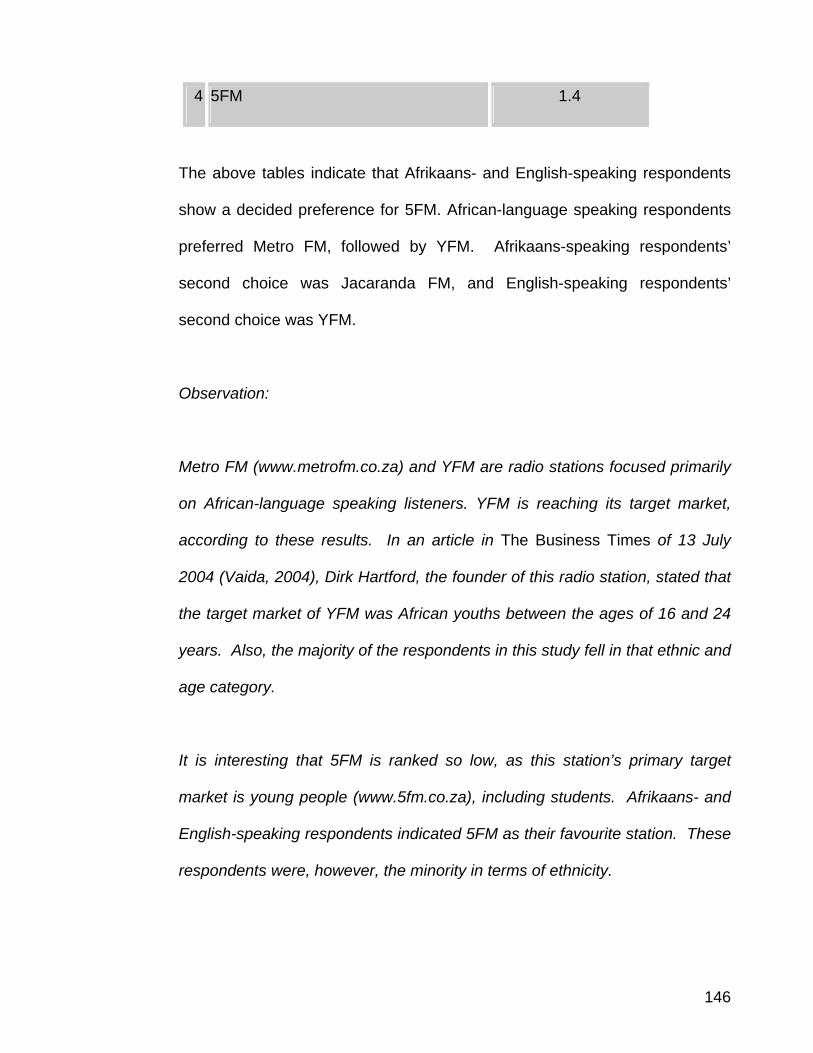
146
4 5FM 1.4
The above tables indicate that Afrikaans- and English-speaking respondents
show a decided preference for 5FM. African-language speaking respondents
preferred Metro FM, followed by YFM. Afrikaans-speaking respondents’
second choice was Jacaranda FM, and English-speaking respondents’
second choice was YFM.
Observation:
Metro FM (www.metrofm.co.za) and YFM are radio stations focused primarily
on African-language speaking listeners. YFM is reaching its target market,
according to these results. In an article in The Business Times of 13 July
2004 (Vaida, 2004), Dirk Hartford, the founder of this radio station, stated that
the target market of YFM was African youths between the ages of 16 and 24
years. Also, the majority of the respondents in this study fell in that ethnic and
age category.
It is interesting that 5FM is ranked so low, as this station’s primary target
market is young people (www.5fm.co.za), including students. Afrikaans- and
English-speaking respondents indicated 5FM as their favourite station. These
respondents were, however, the minority in terms of ethnicity.
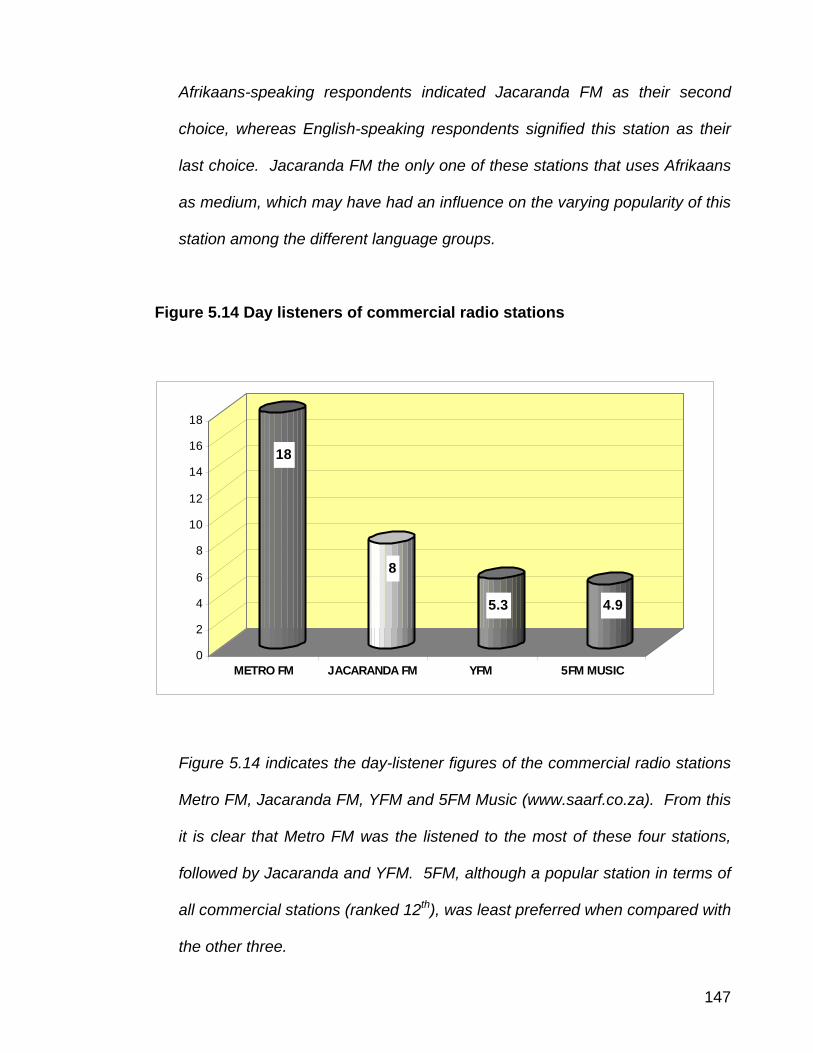
147
Afrikaans-speaking respondents indicated Jacaranda FM as their second
choice, whereas English-speaking respondents signified this station as their
last choice. Jacaranda FM the only one of these stations that uses Afrikaans
as medium, which may have had an influence on the varying popularity of this
station among the different language groups.
Figure 5.14 Day listeners of commercial radio stations
18
8
5.3 4.9
0
2
4
6
8
10
12
14
16
18
METRO FM JACARANDA FM YFM 5FM MUSIC
Figure 5.14 indicates the day-listener figures of the commercial radio stations
Metro FM, Jacaranda FM, YFM and 5FM Music (www.saarf.co.za). From this
it is clear that Metro FM was the listened to the most of these four stations,
followed by Jacaranda and YFM. 5FM, although a popular station in terms of
all commercial stations (ranked 12th), was least preferred when compared with
the other three.
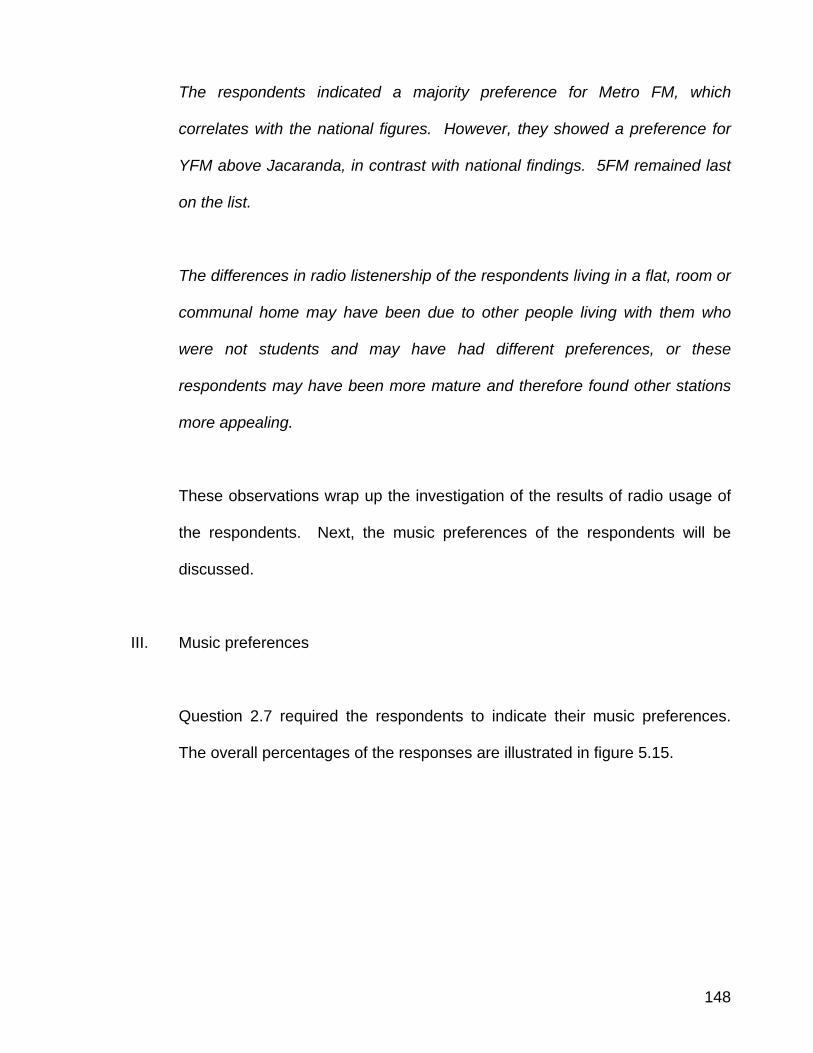
148
The respondents indicated a majority preference for Metro FM, which
correlates with the national figures. However, they showed a preference for
YFM above Jacaranda, in contrast with national findings. 5FM remained last
on the list.
The differences in radio listenership of the respondents living in a flat, room or
communal home may have been due to other people living with them who
were not students and may have had different preferences, or these
respondents may have been more mature and therefore found other stations
more appealing.
These observations wrap up the investigation of the results of radio usage of
the respondents. Next, the music preferences of the respondents will be
discussed.
III. Music preferences
Question 2.7 required the respondents to indicate their music preferences.
The overall percentages of the responses are illustrated in figure 5.15.
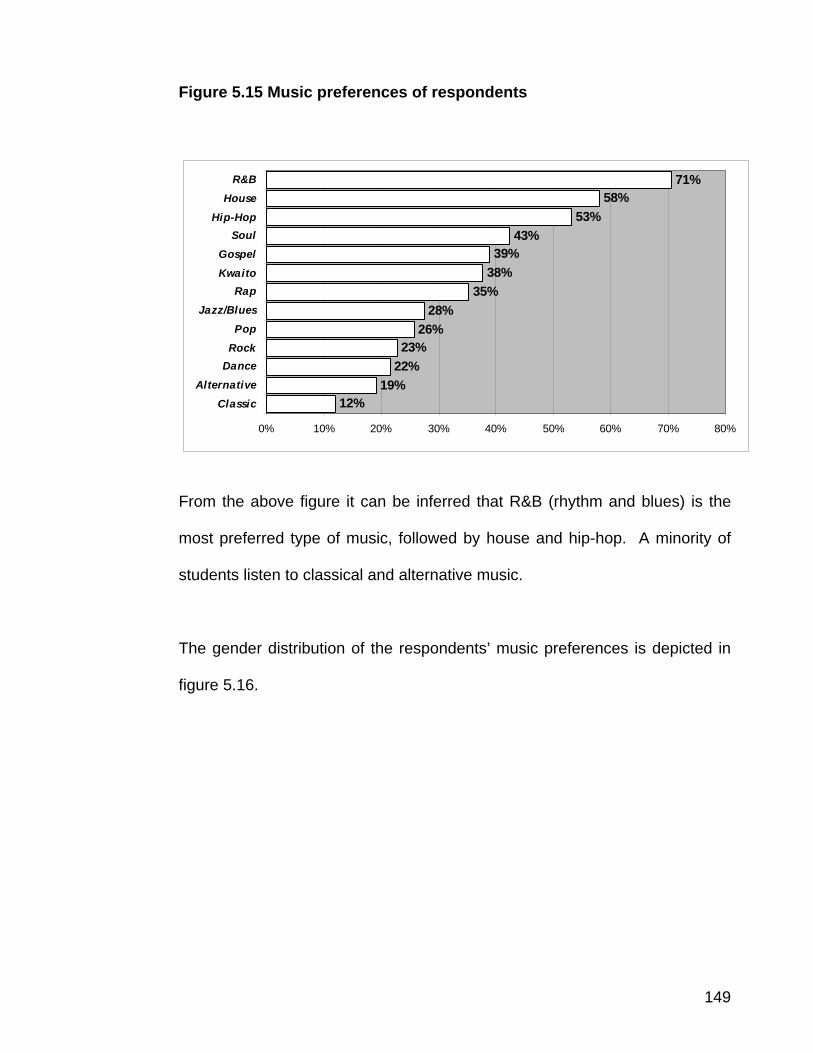
149
Figure 5.15 Music preferences of respondents
12%19%
22%23%
26%28%
35%38%39%
43%53%
58%71%
0% 10% 20% 30% 40% 50% 60% 70% 80%
Classic
Alternative
DanceRock
Pop
Jazz/Blues
RapKwaito
Gospel
SoulHip-Hop
House
R&B
From the above figure it can be inferred that R&B (rhythm and blues) is the
most preferred type of music, followed by house and hip-hop. A minority of
students listen to classical and alternative music.
The gender distribution of the respondents’ music preferences is depicted in
figure 5.16.
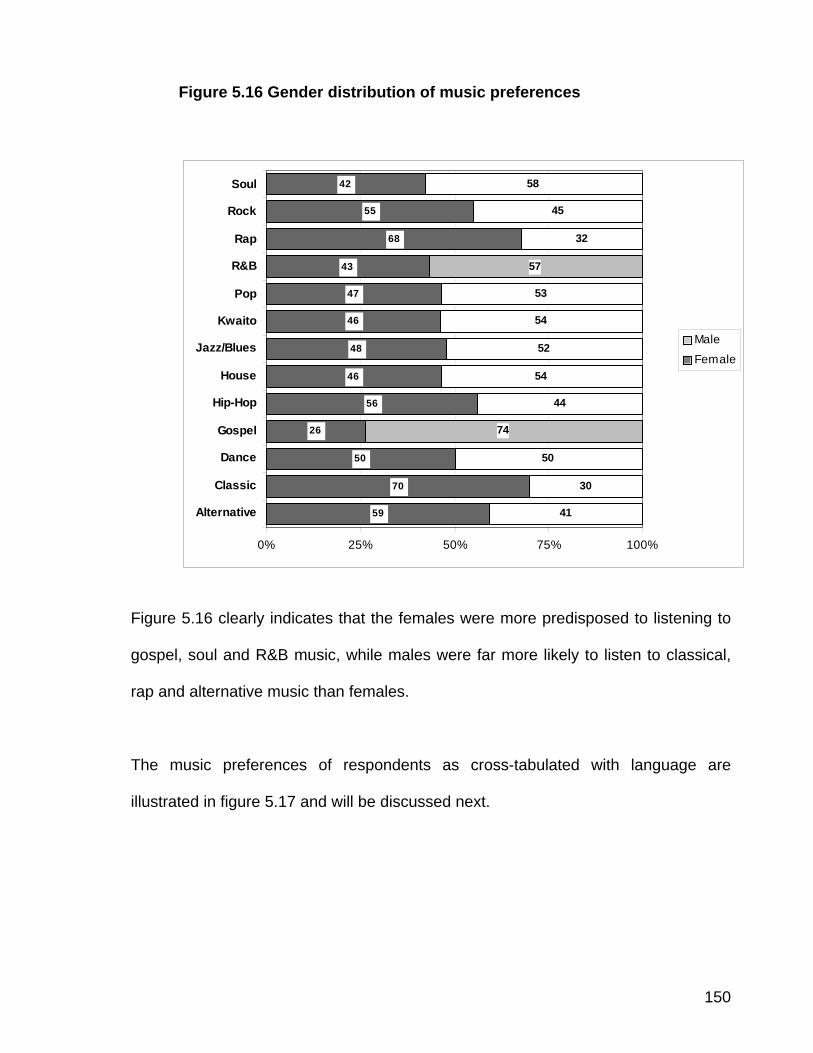
150
Figure 5.16 Gender distribution of music preferences
59
70
50
26
56
46
48
46
47
43
68
42
41
30
50
74
44
54
52
54
53
57
32
45
58
55
0% 25% 50% 75% 100%
Alternative
Classic
Dance
Gospel
Hip-Hop
House
Jazz/Blues
Kwaito
Pop
R&B
Rap
Rock
Soul
Male
Female
Figure 5.16 clearly indicates that the females were more predisposed to listening to
gospel, soul and R&B music, while males were far more likely to listen to classical,
rap and alternative music than females.
The music preferences of respondents as cross-tabulated with language are
illustrated in figure 5.17 and will be discussed next.
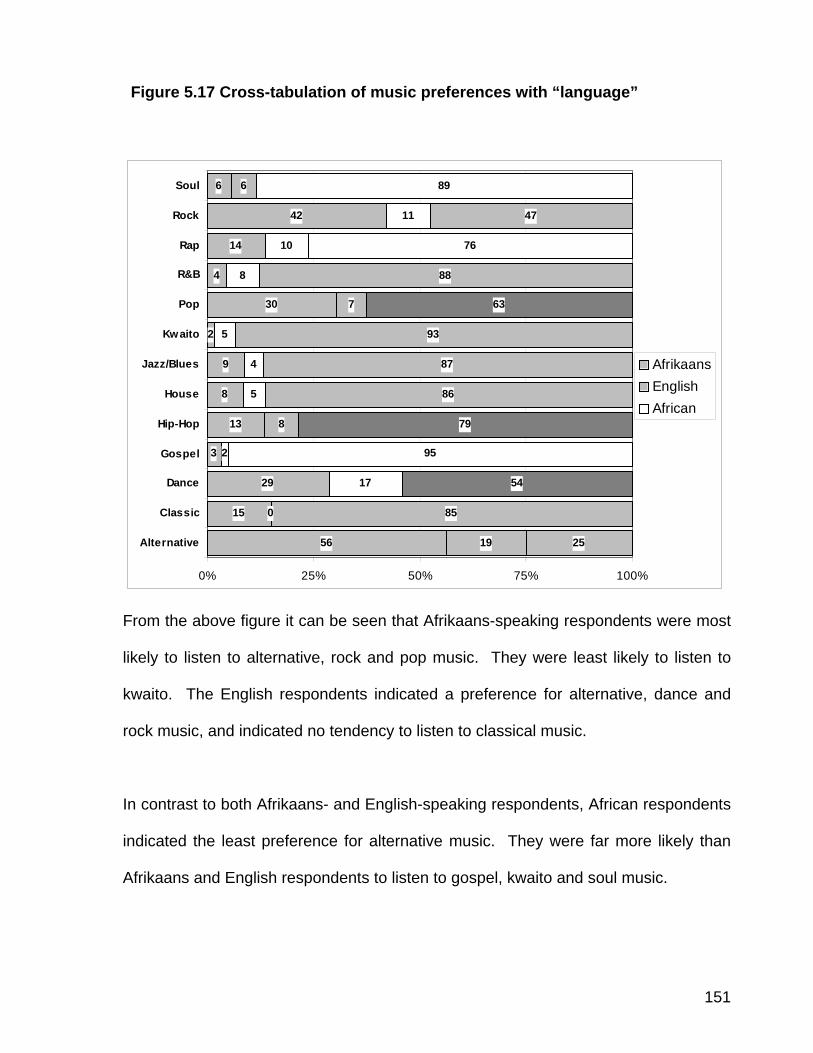
151
Figure 5.17 Cross-tabulation of music preferences with “language”
56
15
29
3
13
8
9
2
30
4
14
42
6
19
0
17
2
8
5
4
5
7
8
10
11
6
25
85
54
95
79
86
87
93
63
88
76
47
89
0% 25% 50% 75% 100%
Alternative
Classic
Dance
Gospel
Hip-Hop
House
Jazz/Blues
Kwaito
Pop
R&B
Rap
Rock
Soul
AfrikaansEnglishAfrican
From the above figure it can be seen that Afrikaans-speaking respondents were most
likely to listen to alternative, rock and pop music. They were least likely to listen to
kwaito. The English respondents indicated a preference for alternative, dance and
rock music, and indicated no tendency to listen to classical music.
In contrast to both Afrikaans- and English-speaking respondents, African respondents
indicated the least preference for alternative music. They were far more likely than
Afrikaans and English respondents to listen to gospel, kwaito and soul music.
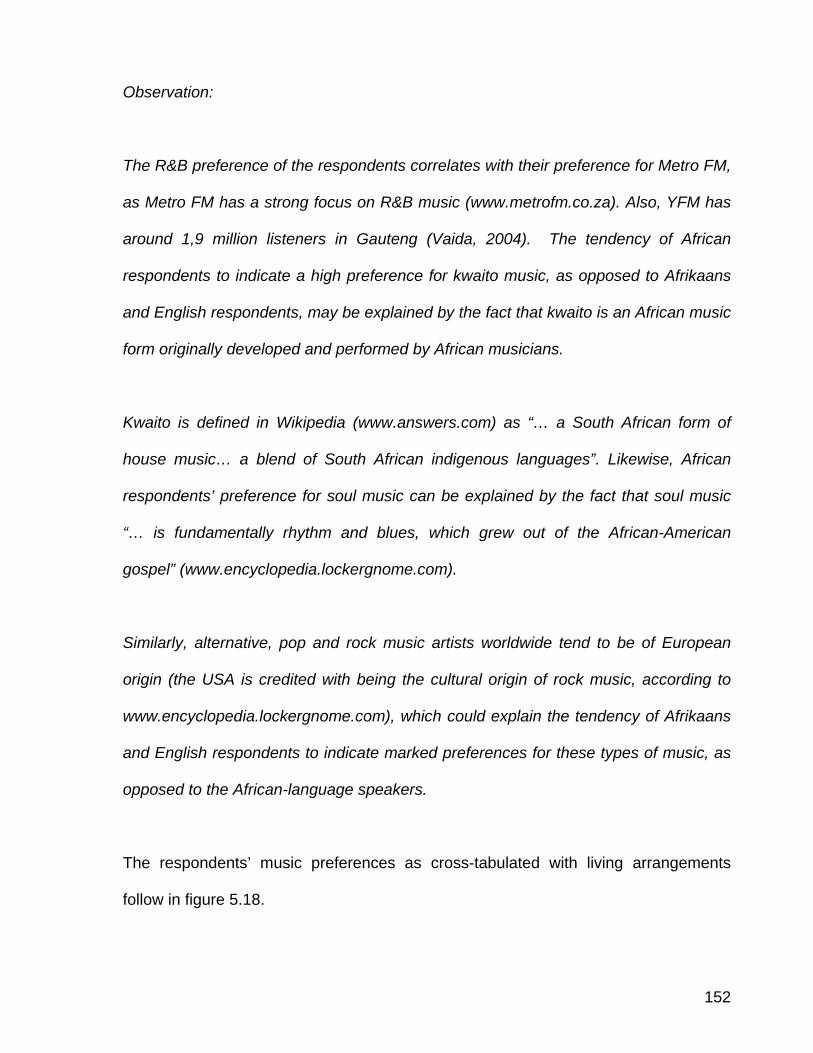
152
Observation:
The R&B preference of the respondents correlates with their preference for Metro FM,
as Metro FM has a strong focus on R&B music (www.metrofm.co.za). Also, YFM has
around 1,9 million listeners in Gauteng (Vaida, 2004). The tendency of African
respondents to indicate a high preference for kwaito music, as opposed to Afrikaans
and English respondents, may be explained by the fact that kwaito is an African music
form originally developed and performed by African musicians.
Kwaito is defined in Wikipedia (www.answers.com) as “… a South African form of
house music… a blend of South African indigenous languages”. Likewise, African
respondents’ preference for soul music can be explained by the fact that soul music
“… is fundamentally rhythm and blues, which grew out of the African-American
gospel” (www.encyclopedia.lockergnome.com).
Similarly, alternative, pop and rock music artists worldwide tend to be of European
origin (the USA is credited with being the cultural origin of rock music, according to
www.encyclopedia.lockergnome.com), which could explain the tendency of Afrikaans
and English respondents to indicate marked preferences for these types of music, as
opposed to the African-language speakers.
The respondents’ music preferences as cross-tabulated with living arrangements
follow in figure 5.18.
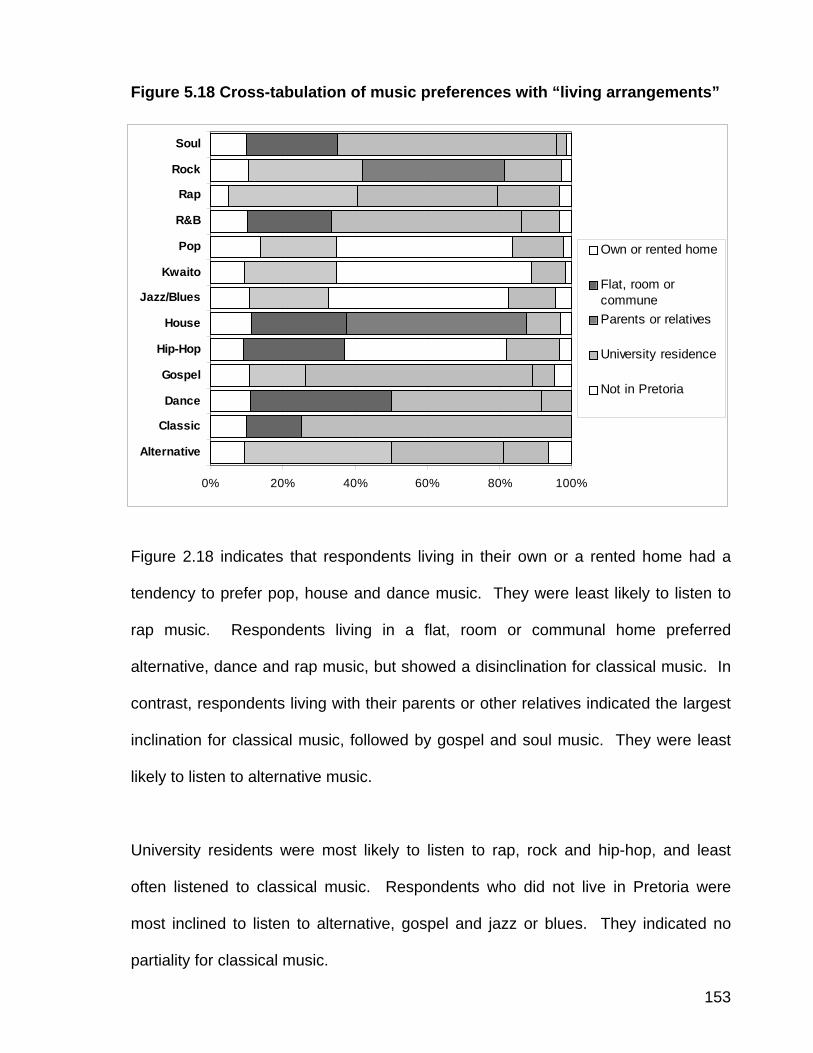
153
Figure 5.18 Cross-tabulation of music preferences with “living arrangements”
0% 20% 40% 60% 80% 100%
Alternative
Classic
Dance
Gospel
Hip-Hop
House
Jazz/Blues
Kwaito
Pop
R&B
Rap
Rock
Soul
Own or rented home
Flat, room orcommuneParents or relatives
University residence
Not in Pretoria
Figure 2.18 indicates that respondents living in their own or a rented home had a
tendency to prefer pop, house and dance music. They were least likely to listen to
rap music. Respondents living in a flat, room or communal home preferred
alternative, dance and rap music, but showed a disinclination for classical music. In
contrast, respondents living with their parents or other relatives indicated the largest
inclination for classical music, followed by gospel and soul music. They were least
likely to listen to alternative music.
University residents were most likely to listen to rap, rock and hip-hop, and least
often listened to classical music. Respondents who did not live in Pretoria were
most inclined to listen to alternative, gospel and jazz or blues. They indicated no
partiality for classical music.
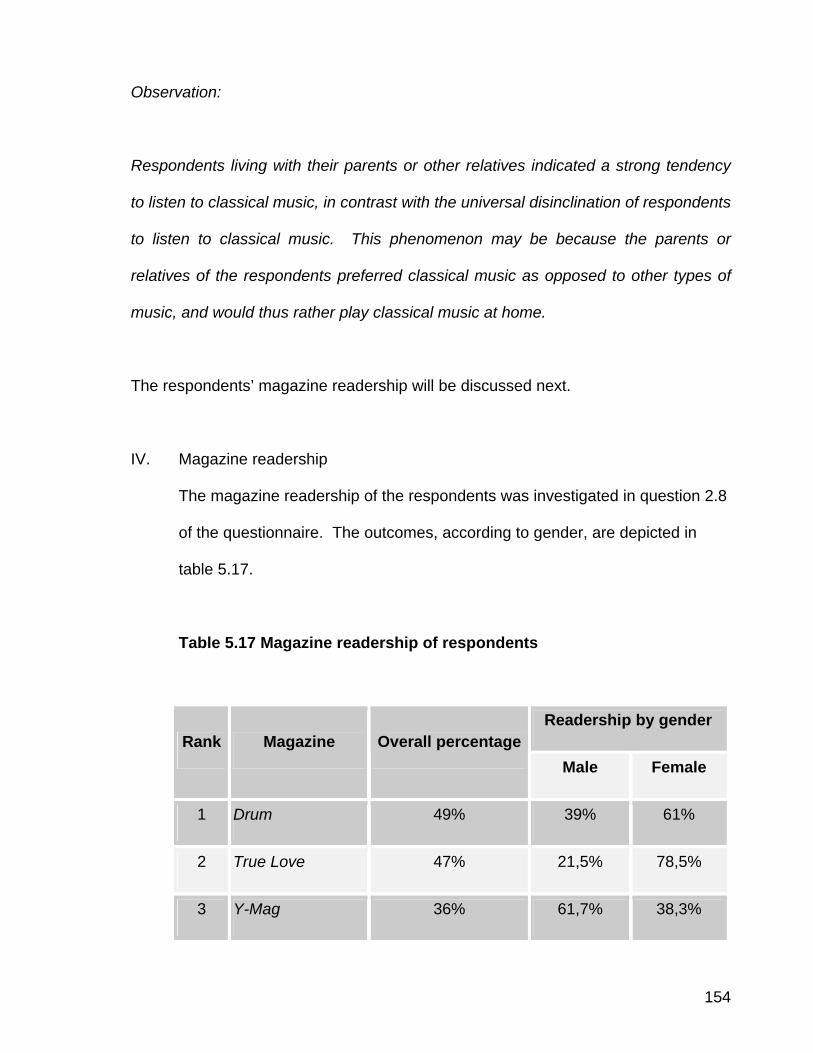
154
Observation:
Respondents living with their parents or other relatives indicated a strong tendency
to listen to classical music, in contrast with the universal disinclination of respondents
to listen to classical music. This phenomenon may be because the parents or
relatives of the respondents preferred classical music as opposed to other types of
music, and would thus rather play classical music at home.
The respondents’ magazine readership will be discussed next.
IV. Magazine readership
The magazine readership of the respondents was investigated in question 2.8
of the questionnaire. The outcomes, according to gender, are depicted in
table 5.17.
Table 5.17 Magazine readership of respondents
Readership by gender Rank Magazine Overall percentage
Male Female
1 Drum 49% 39% 61%
2 True Love 47% 21,5% 78,5%
3 Y-Mag 36% 61,7% 38,3%

155
4 Cosmopolitan 27% 17,8% 82,2%
5 Men's Health 22% 91,9% 8,1%
6 FHM 22% 77,8% 22,2%
7 People Magazine 14% 41,7% 58,3%
8 Elle 7% 36,4% 63,6%
9 O-Mag 6% 20% 80%
10 Other 18% - -
As can be seen from Table 5.17, Drum (49%) and True Love (47%) were the
most commonly read magazines, followed by Y-Mag (36%). When magazine
readership is analysed by gender, it can be seen that Men’s Health and FHM
(For Him Mainly) showed an overwhelming male readership (91,9% and
77,8% respectively). True Love (78.5%) and Cosmopolitan (82.2%) had
predominantly female readers.
Observation:
According to AMPS (www.amps.co.za), the magazine (of those in the study)
that is most widely read nationally is True Love, followed by Drum and
Cosmopolitan (see table 5.17). Fourth was Men’s Health and fifth People
magazine. Sixth place was filled by FHM, which correlates with the national
figures, and Y-Mag followed. O-Mag and Elle were the last two magazines,
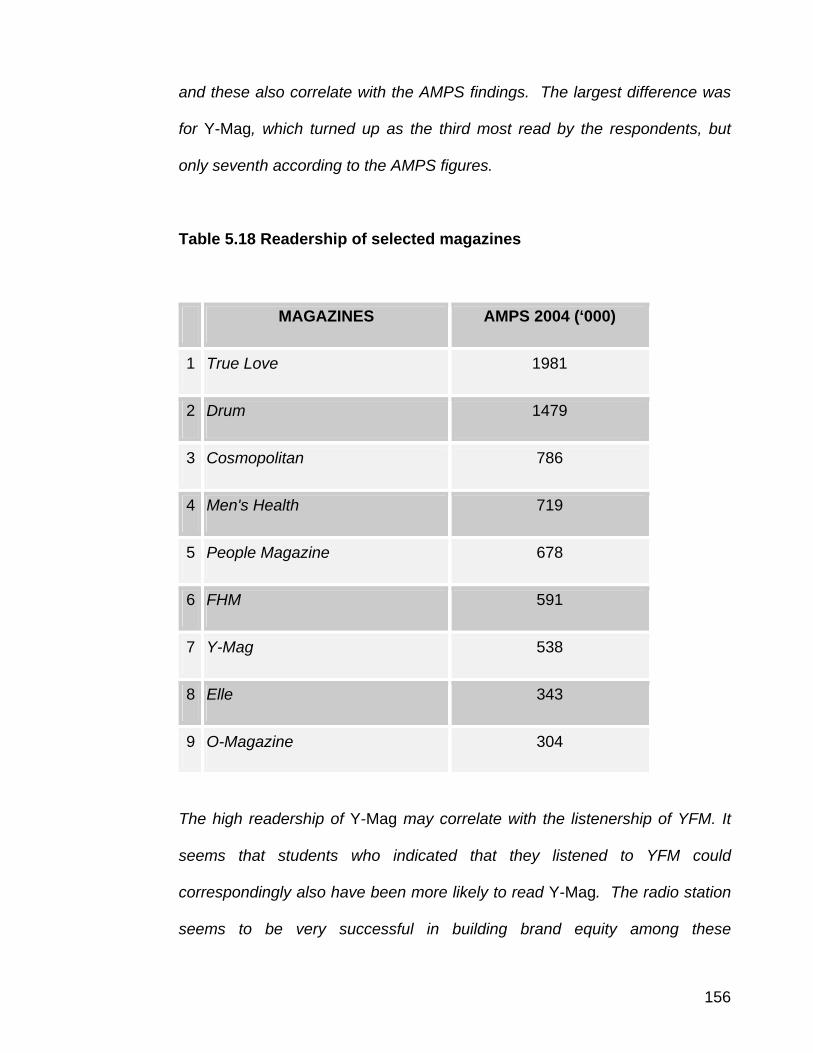
156
and these also correlate with the AMPS findings. The largest difference was
for Y-Mag, which turned up as the third most read by the respondents, but
only seventh according to the AMPS figures.
Table 5.18 Readership of selected magazines
MAGAZINES AMPS 2004 (‘000)
1 True Love 1981
2 Drum 1479
3 Cosmopolitan 786
4 Men's Health 719
5 People Magazine 678
6 FHM 591
7 Y-Mag 538
8 Elle 343
9 O-Magazine 304
The high readership of Y-Mag may correlate with the listenership of YFM. It
seems that students who indicated that they listened to YFM could
correspondingly also have been more likely to read Y-Mag. The radio station
seems to be very successful in building brand equity among these
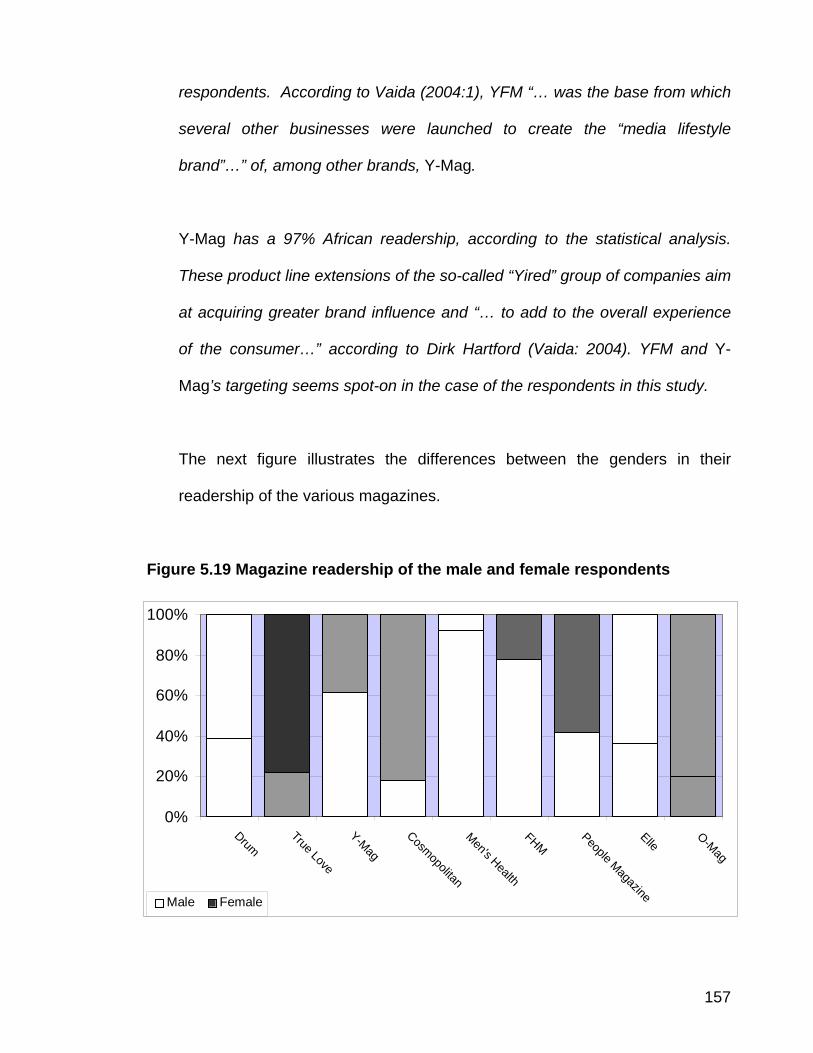
157
respondents. According to Vaida (2004:1), YFM “… was the base from which
several other businesses were launched to create the “media lifestyle
brand”…” of, among other brands, Y-Mag.
Y-Mag has a 97% African readership, according to the statistical analysis.
These product line extensions of the so-called “Yired” group of companies aim
at acquiring greater brand influence and “… to add to the overall experience
of the consumer…” according to Dirk Hartford (Vaida: 2004). YFM and Y-
Mag’s targeting seems spot-on in the case of the respondents in this study.
The next figure illustrates the differences between the genders in their
readership of the various magazines.
Figure 5.19 Magazine readership of the male and female respondents
0%
20%
40%
60%
80%
100%
DrumTrue Love
Y-Mag
Cosmopolitan
Men's Health
FHMPeople Magazine
ElleO-Mag
Male Female
158
Observation:
The cross-tabulation of male and female readership indicates a high male
readership of Men’s Health and FHM, and a high female readership of True
Love and Cosmopolitan. Men’s Health and FHM target males, and True Love
and Cosmopolitan target mainly women readers. Magazines such as Drum
and Y-Mag are not specifically targeted at one gender. Interestingly, Drum
had a larger female readership (61%), and Y-Mag a larger male readership
(61,7%)
It is important to note that YFM was males’ first radio station choice (see table
5.12), and males also indicated a higher readership of this radio station’s
magazine, namely Y-Mag.
This concludes the analysis of magazine readership. The results of the
respondents’ newspaper reading habits follow.
V. Newspaper readership
Figure 5.20 indicates the newspapers that the respondents read most often.
These results were drawn from the responses to question 2.9 in the structured
questionnaire.
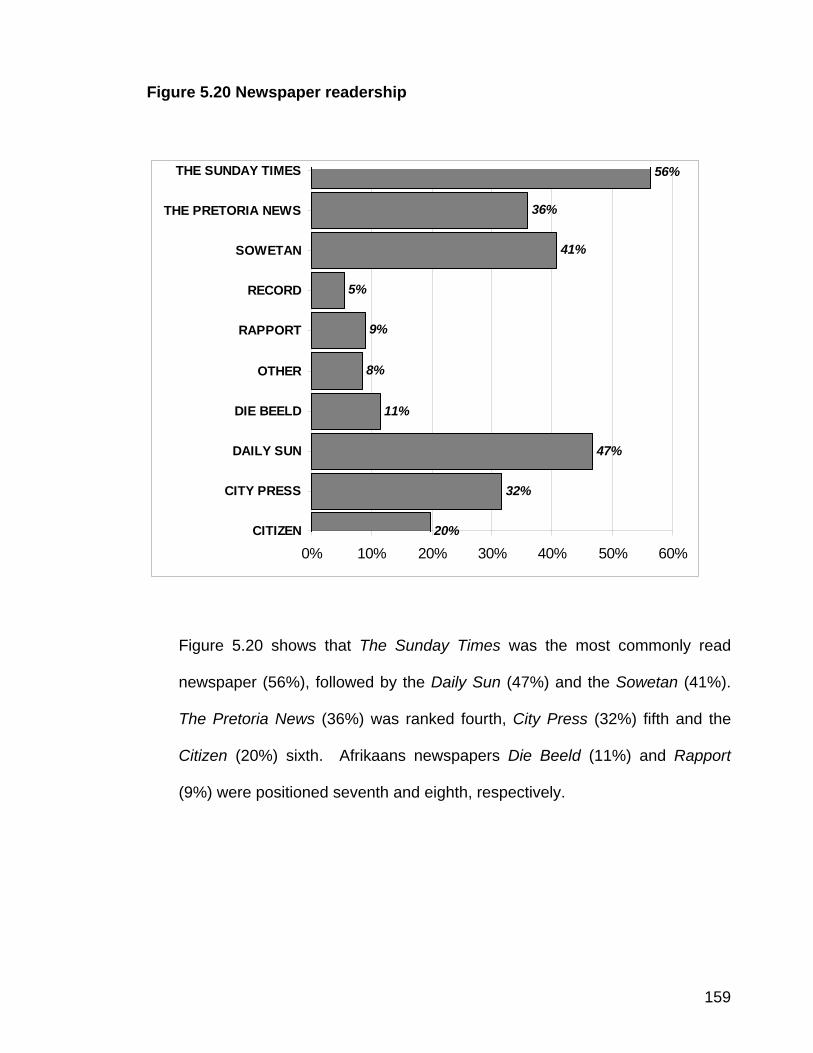
159
Figure 5.20 Newspaper readership
20%
32%
47%
11%
8%
9%
5%
41%
36%
56%
0% 10% 20% 30% 40% 50% 60%CITIZEN
CITY PRESS
DAILY SUN
DIE BEELD
OTHER
RAPPORT
RECORD
SOWETAN
THE PRETORIA NEWS
THE SUNDAY TIMES
Figure 5.20 shows that The Sunday Times was the most commonly read
newspaper (56%), followed by the Daily Sun (47%) and the Sowetan (41%).
The Pretoria News (36%) was ranked fourth, City Press (32%) fifth and the
Citizen (20%) sixth. Afrikaans newspapers Die Beeld (11%) and Rapport
(9%) were positioned seventh and eighth, respectively.
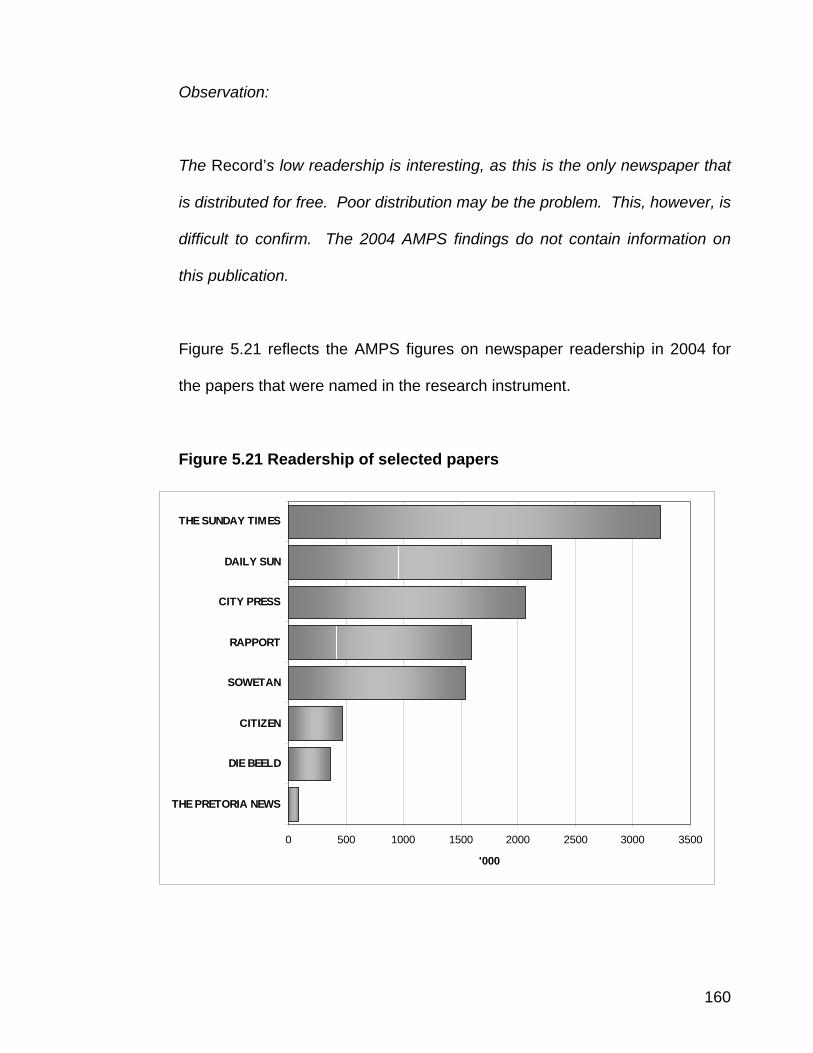
160
Observation:
The Record’s low readership is interesting, as this is the only newspaper that
is distributed for free. Poor distribution may be the problem. This, however, is
difficult to confirm. The 2004 AMPS findings do not contain information on
this publication.
Figure 5.21 reflects the AMPS figures on newspaper readership in 2004 for
the papers that were named in the research instrument.
Figure 5.21 Readership of selected papers
0 500 1000 1500 2000 2500 3000 3500
THE PRETORIA NEWS
DIE BEELD
CITIZEN
SOWETAN
RAPPORT
CITY PRESS
DAILY SUN
THE SUNDAY TIMES
'000
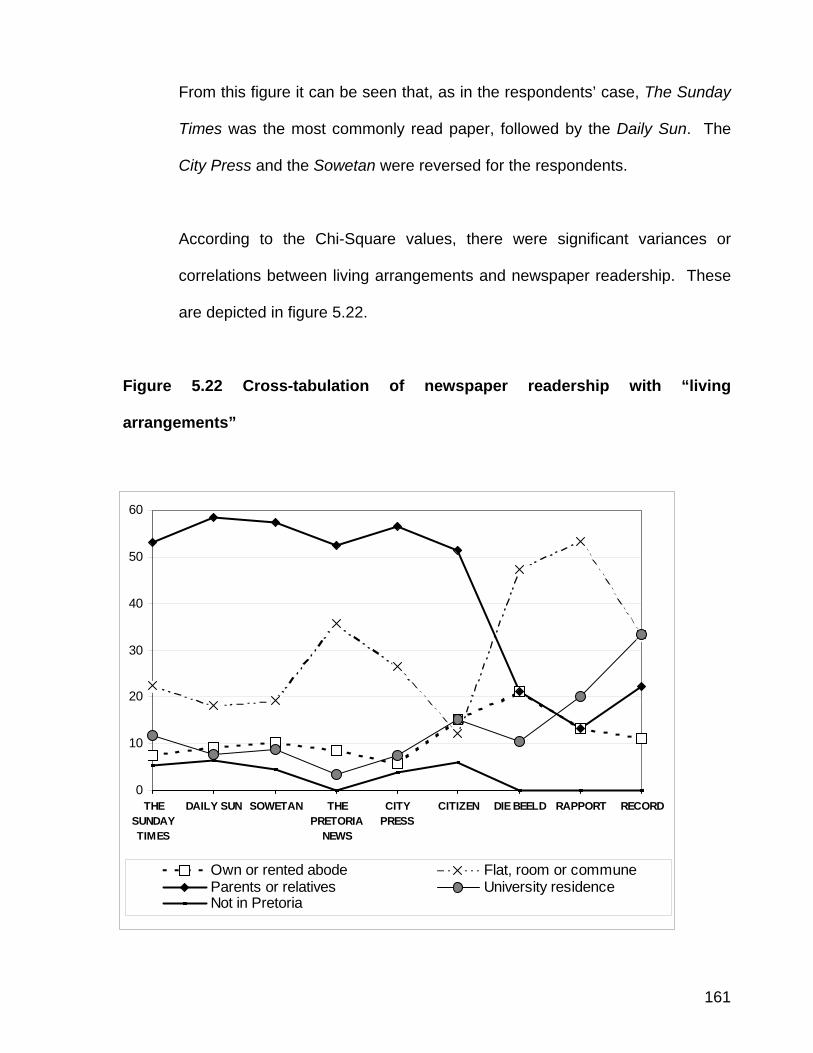
161
From this figure it can be seen that, as in the respondents’ case, The Sunday
Times was the most commonly read paper, followed by the Daily Sun. The
City Press and the Sowetan were reversed for the respondents.
According to the Chi-Square values, there were significant variances or
correlations between living arrangements and newspaper readership. These
are depicted in figure 5.22.
Figure 5.22 Cross-tabulation of newspaper readership with “living
arrangements”
0
10
20
30
40
50
60
THESUNDAYTIMES
DAILY SUN SOWETAN THEPRETORIA
NEWS
CITYPRESS
CITIZEN DIE BEELD RAPPORT RECORD
Own or rented abode Flat, room or communeParents or relatives University residenceNot in Pretoria
162
Observation:
As seen from Figure 5.22, the majority of the respondents indicating
readership of particular newspapers were living with their parents or other
relatives. This may be due to parents subscribing to or buying these specific
newspapers, thus providing easy access to them. Interestingly, the two
Afrikaans newspapers (Die Beeld and Rapport) had the highest readership
(47% and 53% respectively) among respondents living in a flat, room or
communal home, as opposed to the relatively low readership of these two
papers for the average of the respondents.
This concludes the discussion on the respondents’ newspaper usage.
To summarise the discussion on the respondents’ media usage: it can be concluded that e-
TV is the television channel most frequently watched by the respondents, followed by
SABC1, SABC3 and SABC2. M-Net and DSTV are least regularly watched. Sitcoms were
the favourite programme types, music shows second most favourite, and talk shows were
ranked third. Cartoons were watched least often.
The radio stations most often listened to, in order of preference, were Metro FM, YFM,
Jacaranda FM and lastly, 5FM. R&B was the type of music most often listened to by the
respondents, then house and hip-hop music. Drum was the most widely read magazine,
followed by True Love, Y-Mag and Cosmopolitan. The magazine on the list that was read
least often was O-Mag.
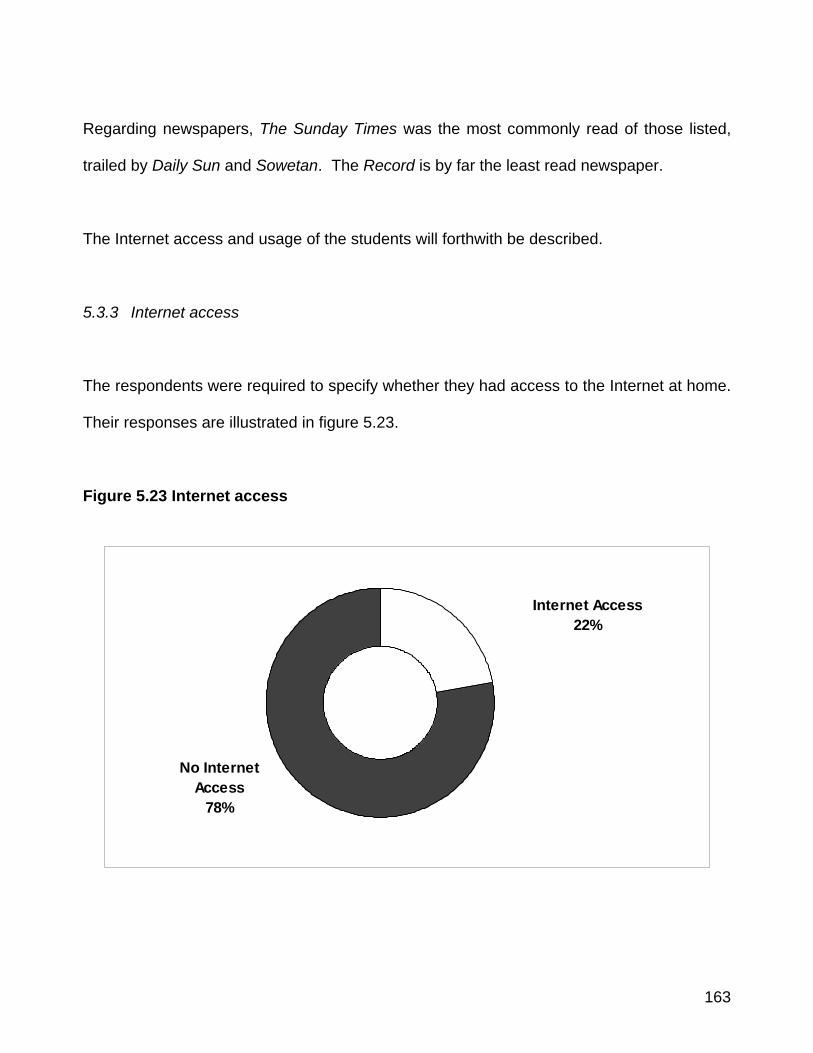
163
Regarding newspapers, The Sunday Times was the most commonly read of those listed,
trailed by Daily Sun and Sowetan. The Record is by far the least read newspaper.
The Internet access and usage of the students will forthwith be described.
5.3.3 Internet access
The respondents were required to specify whether they had access to the Internet at home.
Their responses are illustrated in figure 5.23.
Figure 5.23 Internet access
Internet Access22%
No Internet Access
78%
164
As can be seen from Figure 5.23, the bulk (78%) of the respondents did not have ready
access to the Internet at home. This will explain why 47% of the respondents indicated that
they never surfed the Internet (see Table 5.1). The fact that 38% indicated that they
sometimes used the Internet, suggests that they might possibly visit the Internet Café
situated on the Pretoria Campus. Of the 22% indicating access to the Internet, 56% were
male and 44% female.
According to AMPS (www.saarf.co.za), only 2,8% of South Africans access the Internet
from home. The respondents in this study therefore had much better access to the Internet
in their place of residence than the general population.
The Chi-Square analysis for Internet usage showed correlations for place of residence and
language, but reflected none for gender. Respondents living in a flat, room or commune
indicated the highest Internet access (39%). More than half (60%) of English respondents
indicated that they had access to the Internet at home, and 44% of Afrikaans respondents
had Internet access. African respondents had the lowest Internet access (only 15%).
The commercial banks that the respondents used will be discussed next.
5.3.4 Commercial banks
In question 2.10, the respondents were asked to indicate which commercial banks they
used. The responses are illustrated in figure 5.24.

165
Figure 5.24 Commercial banks: overall percentage
57%
17%
5%
0%
20%1% ABSA
FNBNedbankPermanent BankStandard BankPeople's Bank
The majority of the respondents (57%) indicated that they used ABSA bank. Second most
used bank was Standard Bank (20%), followed by First National Bank (FNB), which 17% of
respondents utilised. Relating to gender, more females than males used ABSA, FNB and
People’s Bank. No males indicated use of People’s Bank. Nedbank was the only bank
used by an equal number of both genders.
The respondents’ cell phone usage will be described next.
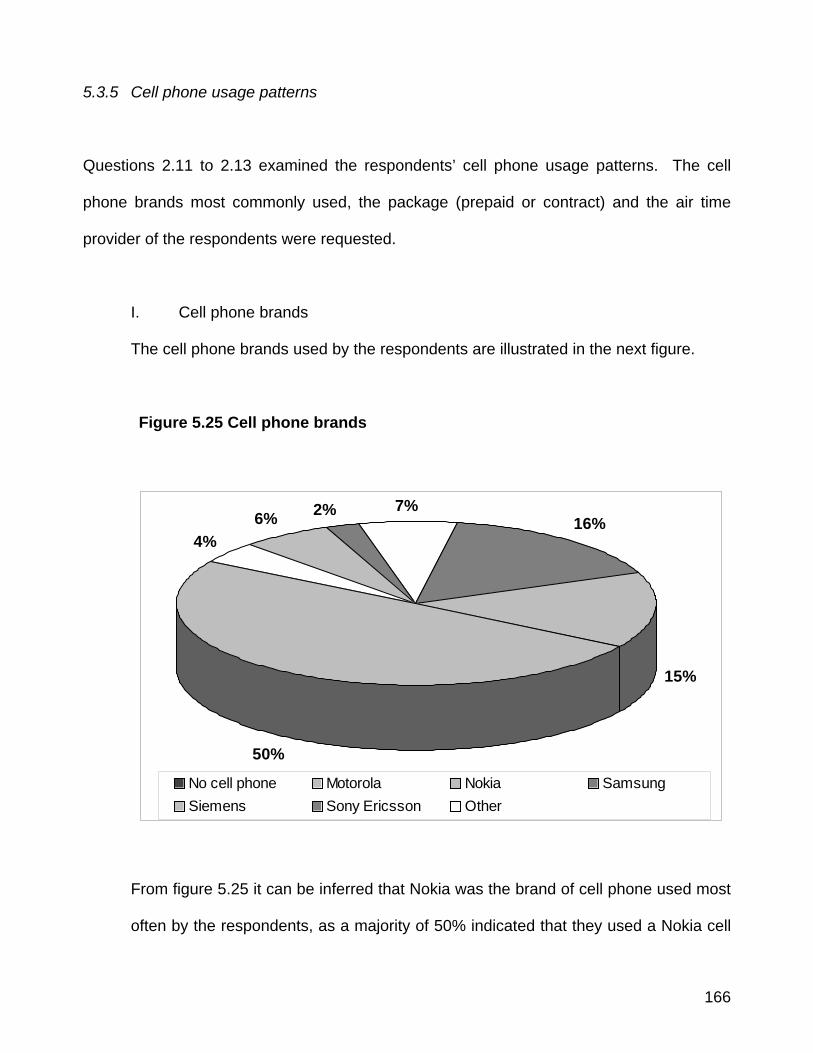
166
5.3.5 Cell phone usage patterns
Questions 2.11 to 2.13 examined the respondents’ cell phone usage patterns. The cell
phone brands most commonly used, the package (prepaid or contract) and the air time
provider of the respondents were requested.
I. Cell phone brands
The cell phone brands used by the respondents are illustrated in the next figure.
Figure 5.25 Cell phone brands
16%
15%
50%
4%6% 2% 7%
No cell phone Motorola Nokia SamsungSiemens Sony Ericsson Other
From figure 5.25 it can be inferred that Nokia was the brand of cell phone used most
often by the respondents, as a majority of 50% indicated that they used a Nokia cell
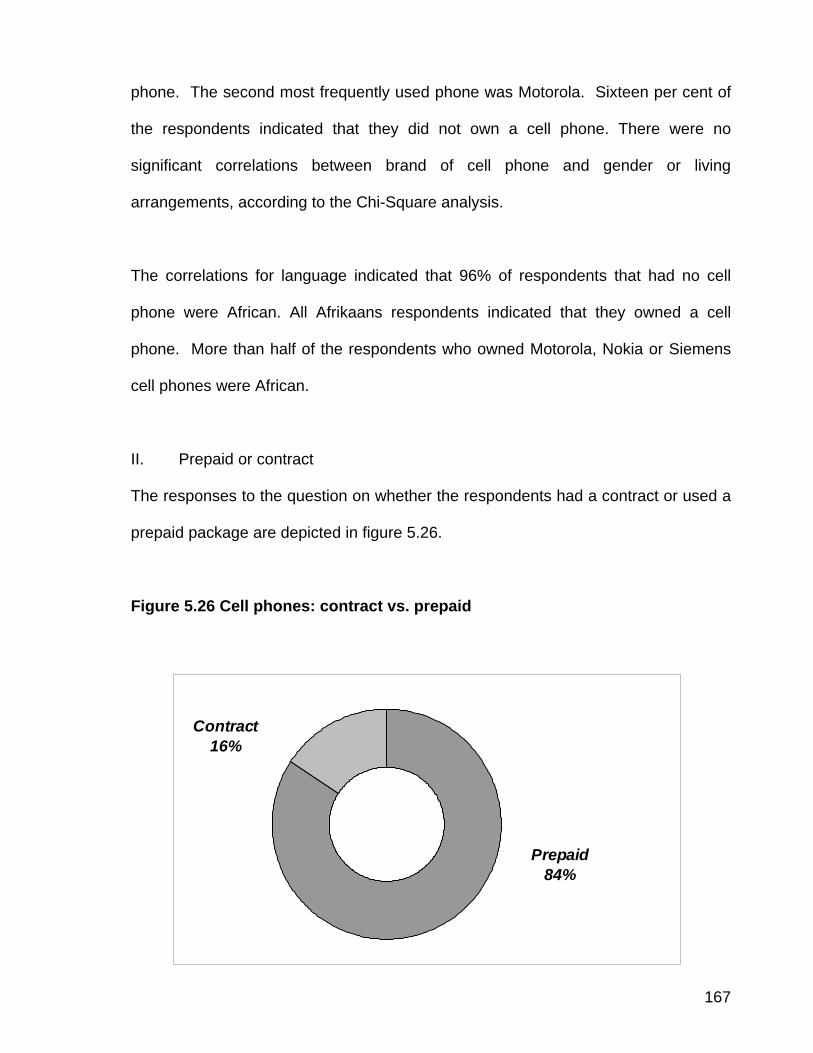
167
phone. The second most frequently used phone was Motorola. Sixteen per cent of
the respondents indicated that they did not own a cell phone. There were no
significant correlations between brand of cell phone and gender or living
arrangements, according to the Chi-Square analysis.
The correlations for language indicated that 96% of respondents that had no cell
phone were African. All Afrikaans respondents indicated that they owned a cell
phone. More than half of the respondents who owned Motorola, Nokia or Siemens
cell phones were African.
II. Prepaid or contract
The responses to the question on whether the respondents had a contract or used a
prepaid package are depicted in figure 5.26.
Figure 5.26 Cell phones: contract vs. prepaid
Prepaid84%
Contract16%
168
It is obvious from the above figure that the vast majority of the respondents that have
a cell phone use a prepaid package as opposed to a contract. The Chi-Square
analysis for cell phone package indicated correlations between gender, living
arrangements and language.
According to those correlations, more female than male respondents and all
respondents that lived outside Pretoria had pre-paid cell phone packages. With
regard to language, the majority of Afrikaans and English respondents had cell
phone contracts, as opposed to African respondents, 97% of whom had prepaid
packages.
Observation:
The fact that the majority of respondents had prepaid phones may indicate a desire
to control cell phone expenses. This may have been from the parents’ side (if they
paid for the phone), or from the respondents’ side. However, the payment of cell
phones cannot be correlated, since this falls outside the limits of the research
instrument.
III. Air-time provider
The air-time providers used by the respondents are indicated in figure 5.27.
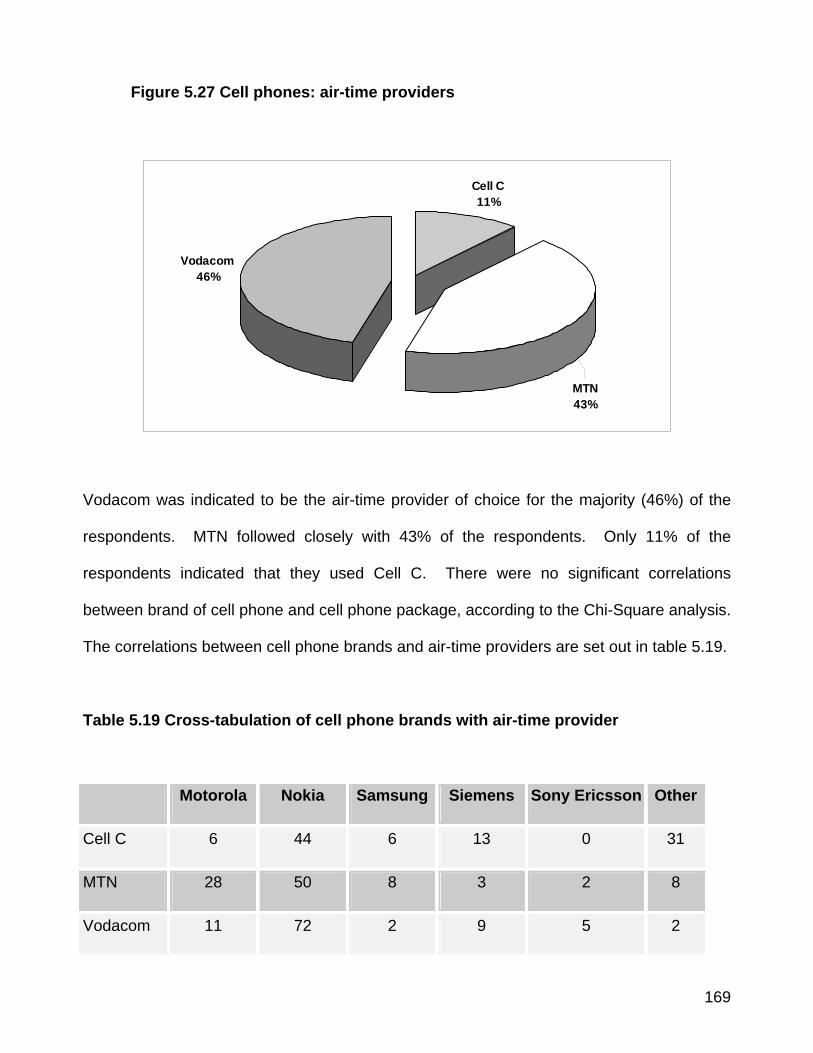
169
Figure 5.27 Cell phones: air-time providers
Cell C11%
Vodacom46%
MTN43%
Vodacom was indicated to be the air-time provider of choice for the majority (46%) of the
respondents. MTN followed closely with 43% of the respondents. Only 11% of the
respondents indicated that they used Cell C. There were no significant correlations
between brand of cell phone and cell phone package, according to the Chi-Square analysis.
The correlations between cell phone brands and air-time providers are set out in table 5.19.
Table 5.19 Cross-tabulation of cell phone brands with air-time provider
Motorola Nokia Samsung Siemens Sony Ericsson Other
Cell C 6 44 6 13 0 31
MTN 28 50 8 3 2 8
Vodacom 11 72 2 9 5 2
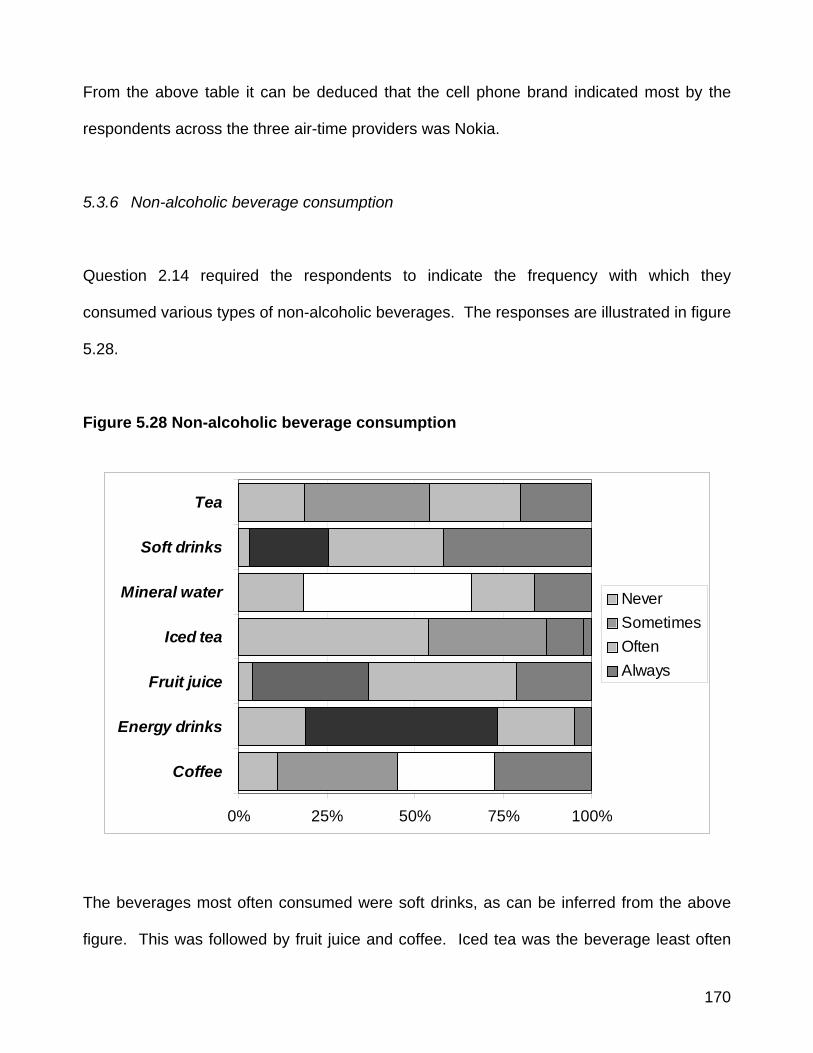
170
From the above table it can be deduced that the cell phone brand indicated most by the
respondents across the three air-time providers was Nokia.
5.3.6 Non-alcoholic beverage consumption
Question 2.14 required the respondents to indicate the frequency with which they
consumed various types of non-alcoholic beverages. The responses are illustrated in figure
5.28.
Figure 5.28 Non-alcoholic beverage consumption
0% 25% 50% 75% 100%
Coffee
Energy drinks
Fruit juice
Iced tea
Mineral water
Soft drinks
Tea
NeverSometimesOftenAlways
The beverages most often consumed were soft drinks, as can be inferred from the above
figure. This was followed by fruit juice and coffee. Iced tea was the beverage least often
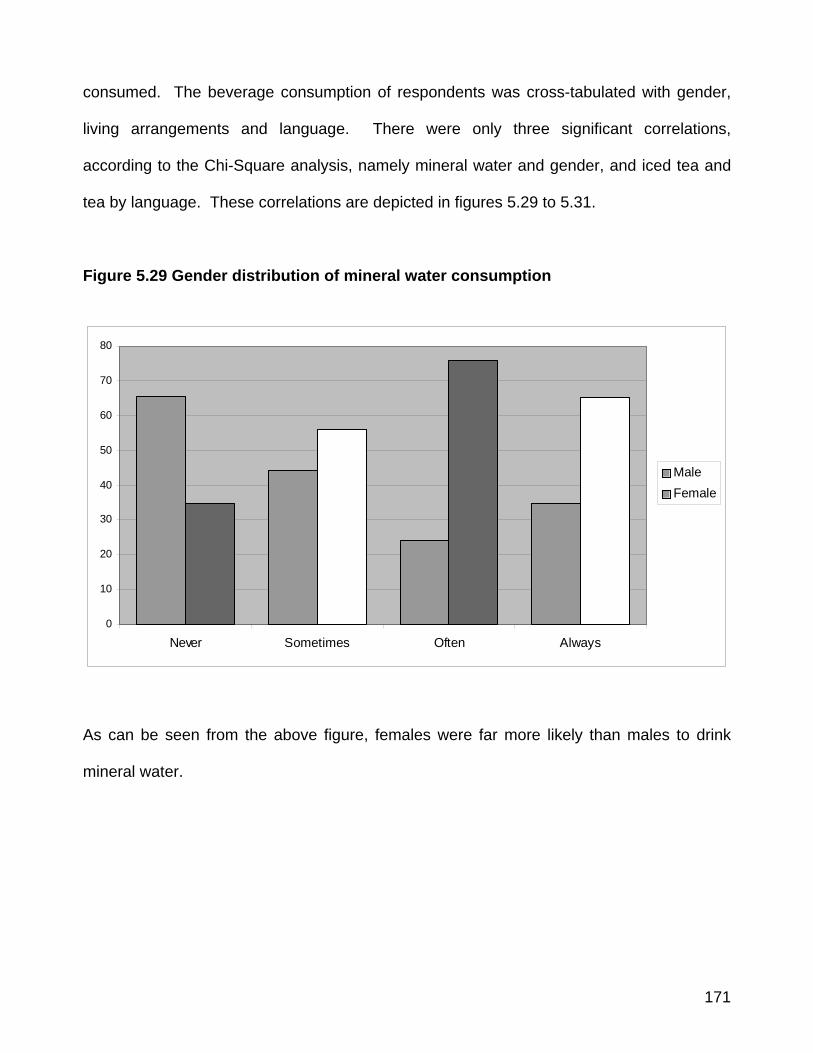
171
consumed. The beverage consumption of respondents was cross-tabulated with gender,
living arrangements and language. There were only three significant correlations,
according to the Chi-Square analysis, namely mineral water and gender, and iced tea and
tea by language. These correlations are depicted in figures 5.29 to 5.31.
Figure 5.29 Gender distribution of mineral water consumption
0
10
20
30
40
50
60
70
80
Never Sometimes Often Always
MaleFemale
As can be seen from the above figure, females were far more likely than males to drink
mineral water.
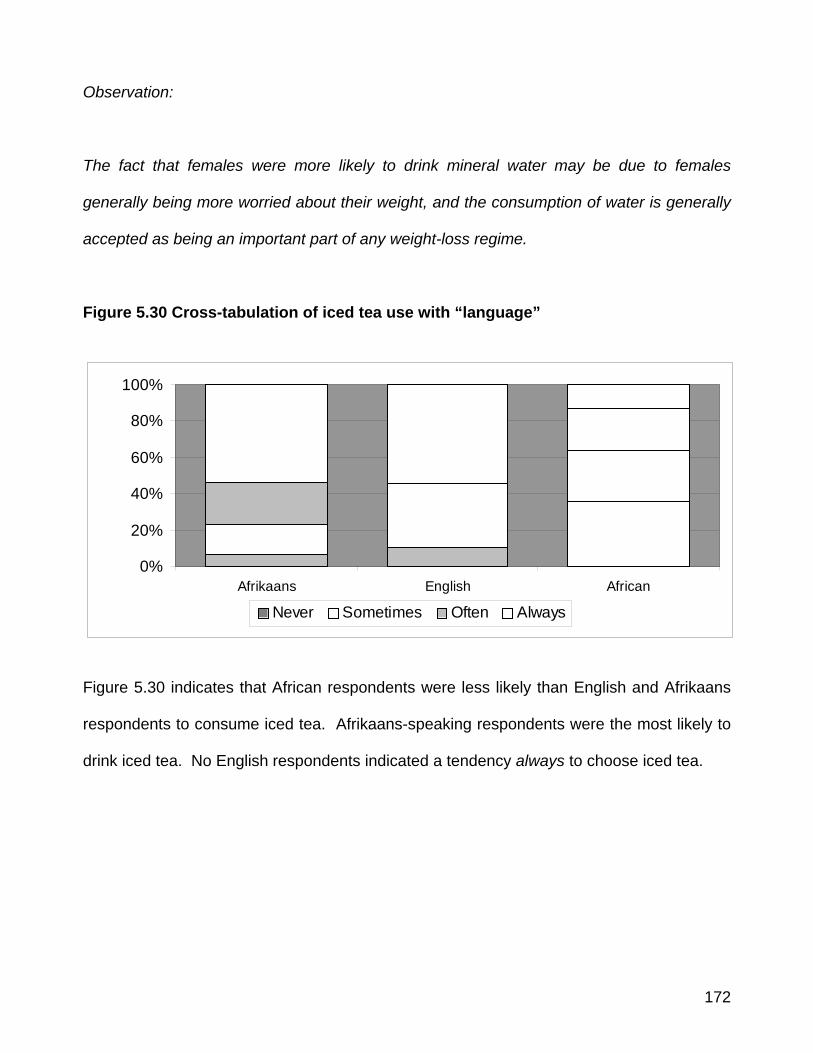
172
Observation:
The fact that females were more likely to drink mineral water may be due to females
generally being more worried about their weight, and the consumption of water is generally
accepted as being an important part of any weight-loss regime.
Figure 5.30 Cross-tabulation of iced tea use with “language”
0%
20%
40%
60%
80%
100%
Afrikaans English African
Never Sometimes Often Always
Figure 5.30 indicates that African respondents were less likely than English and Afrikaans
respondents to consume iced tea. Afrikaans-speaking respondents were the most likely to
drink iced tea. No English respondents indicated a tendency always to choose iced tea.
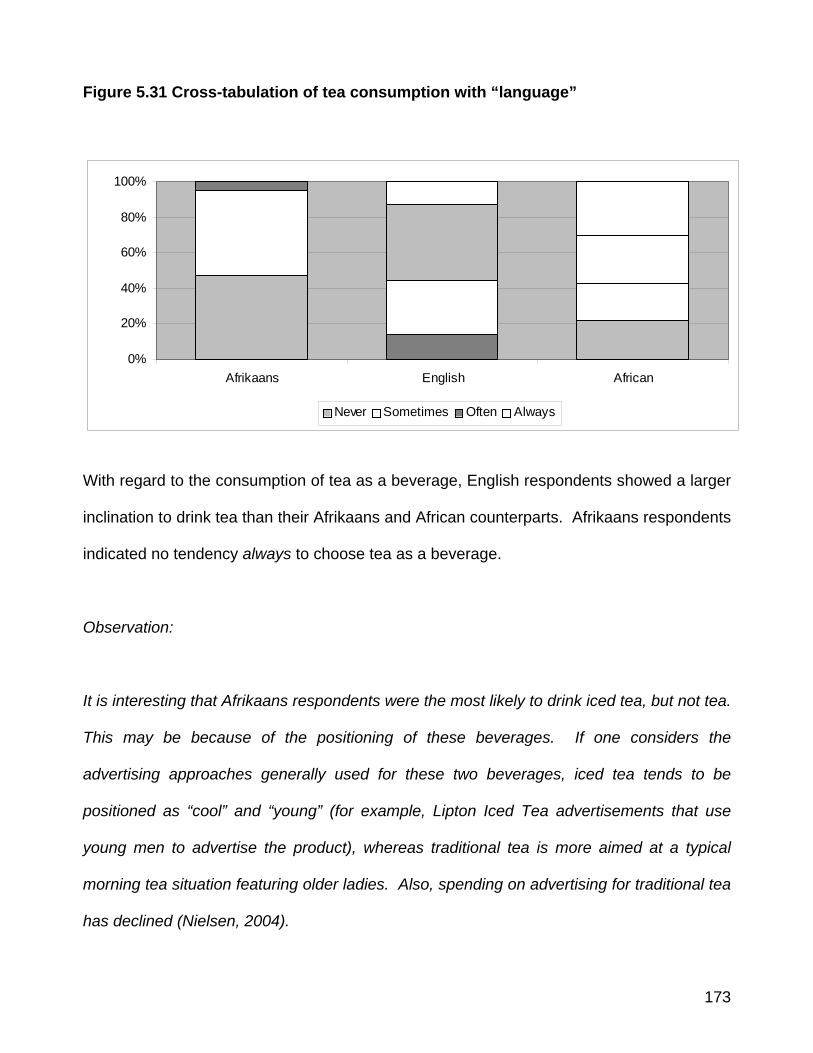
173
Figure 5.31 Cross-tabulation of tea consumption with “language”
0%
20%
40%
60%
80%
100%
Afrikaans English African
Never Sometimes Often Always
With regard to the consumption of tea as a beverage, English respondents showed a larger
inclination to drink tea than their Afrikaans and African counterparts. Afrikaans respondents
indicated no tendency always to choose tea as a beverage.
Observation:
It is interesting that Afrikaans respondents were the most likely to drink iced tea, but not tea.
This may be because of the positioning of these beverages. If one considers the
advertising approaches generally used for these two beverages, iced tea tends to be
positioned as “cool” and “young” (for example, Lipton Iced Tea advertisements that use
young men to advertise the product), whereas traditional tea is more aimed at a typical
morning tea situation featuring older ladies. Also, spending on advertising for traditional tea
has declined (Nielsen, 2004).
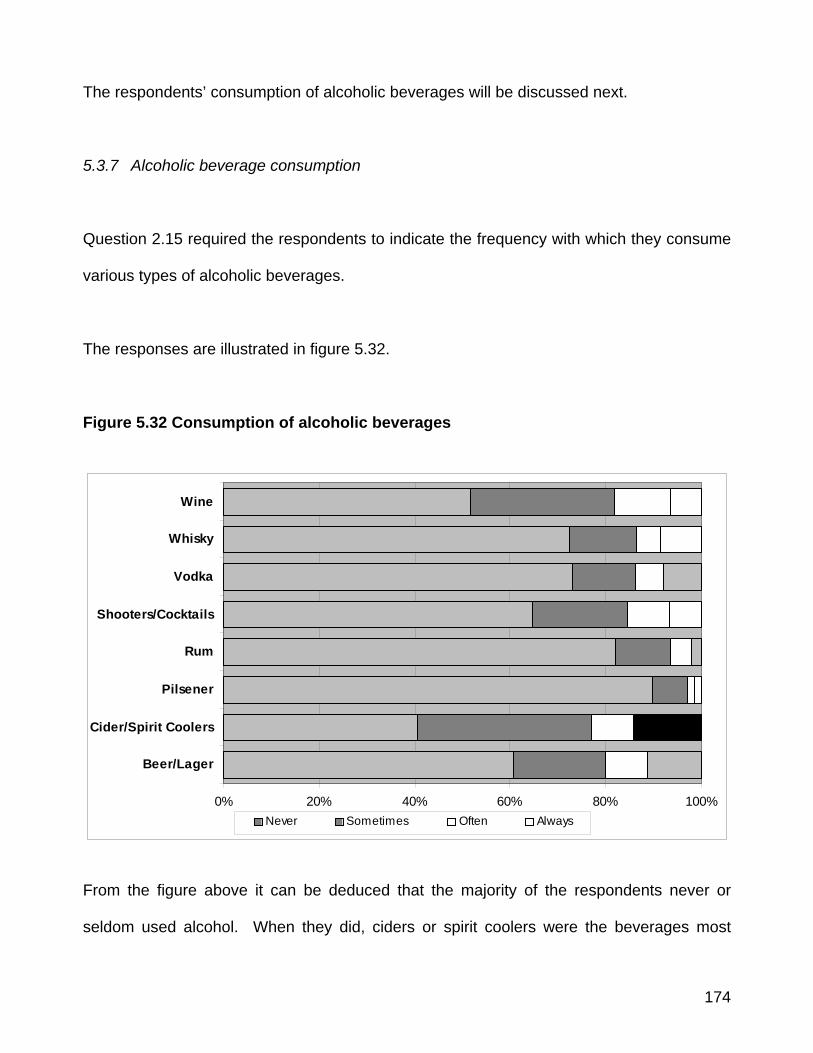
174
The respondents’ consumption of alcoholic beverages will be discussed next.
5.3.7 Alcoholic beverage consumption
Question 2.15 required the respondents to indicate the frequency with which they consume
various types of alcoholic beverages.
The responses are illustrated in figure 5.32.
Figure 5.32 Consumption of alcoholic beverages
0% 20% 40% 60% 80% 100%
Beer/Lager
Cider/Spirit Coolers
Pilsener
Rum
Shooters/Cocktails
Vodka
Whisky
Wine
Never Sometimes Often Always
From the figure above it can be deduced that the majority of the respondents never or
seldom used alcohol. When they did, ciders or spirit coolers were the beverages most
175
likely to be consumed, followed by wine and beer or lager. Pilsners were the beverages
least likely to be consumed, followed by rum, vodka and whisky. Ciders or spirit coolers
were the only alcoholic beverages that more than half of the respondents indicated a
preference for. It must be stressed that there is usually underreporting when alcohol
consumption is researched. This is due to social mores and norms that that frown upon
people consuming excessive alcohol.
Observation:
Sweeter drinks such as ciders and spirit coolers are generally targeted at younger drinkers,
and their consumption has increased over the last decade or so. According to Michael
Farr, SAB Ltd spokesperson, “... South Africa has seen tremendous growth in the flavoured
alcoholic beverages category” (Green, 2005). This may explain why ciders and similar
beverages were the preferred drinks of the respondents.
In contrast, hard liquor such as rum, vodka and whisky were generally targeted at more
mature drinkers, whereas younger drinkers also tend to prefer fruitier, sweeter drinks, and
ciders or spirit coolers are sweeter and often fruity. Farr (Green, 2005) also stated “… the
market moved to trendy spirit coolers and designer alcoholic beverages”.
The alcoholic beverage consumption of the respondents was cross-tabulated with gender,
living arrangements and language. The only significant correlations with gender were for
beer/lager, pilsner and whisky. There were also correlations between language and
beer/lager, rum and shooters/cocktails. These correlations will be discussed next.
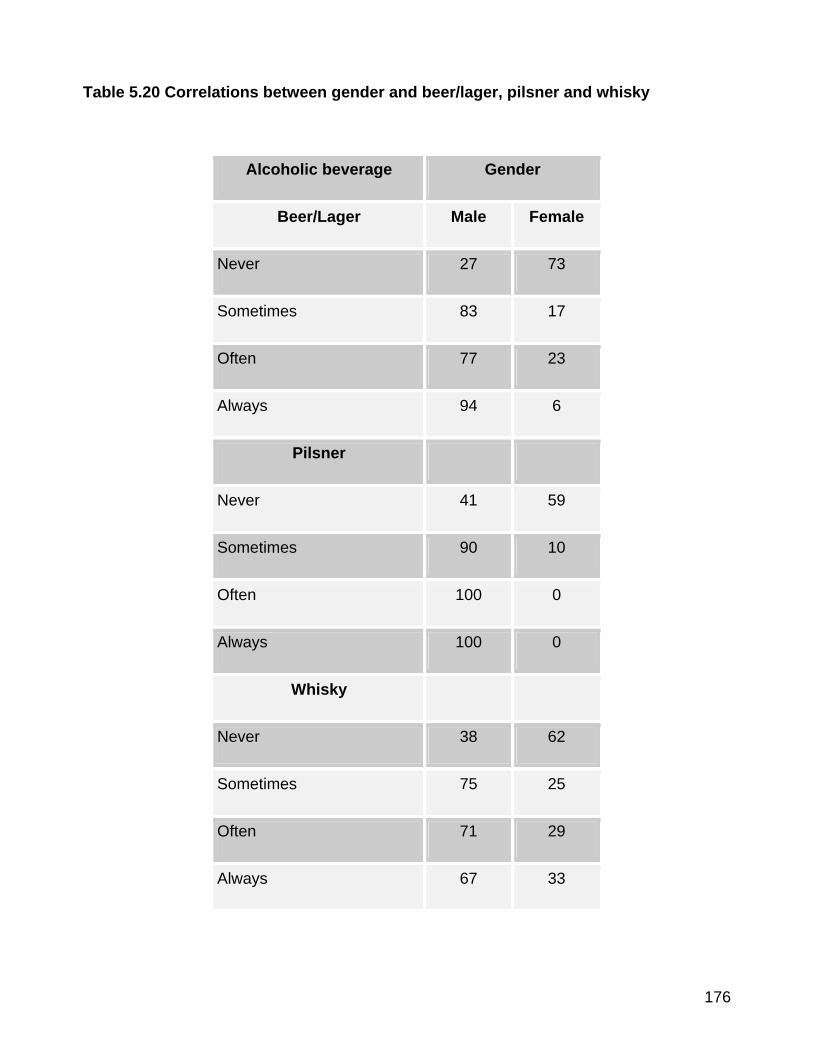
176
Table 5.20 Correlations between gender and beer/lager, pilsner and whisky
Alcoholic beverage Gender
Beer/Lager Male Female
Never 27 73
Sometimes 83 17
Often 77 23
Always 94 6
Pilsner
Never 41 59
Sometimes 90 10
Often 100 0
Always 100 0
Whisky
Never 38 62
Sometimes 75 25
Often 71 29
Always 67 33
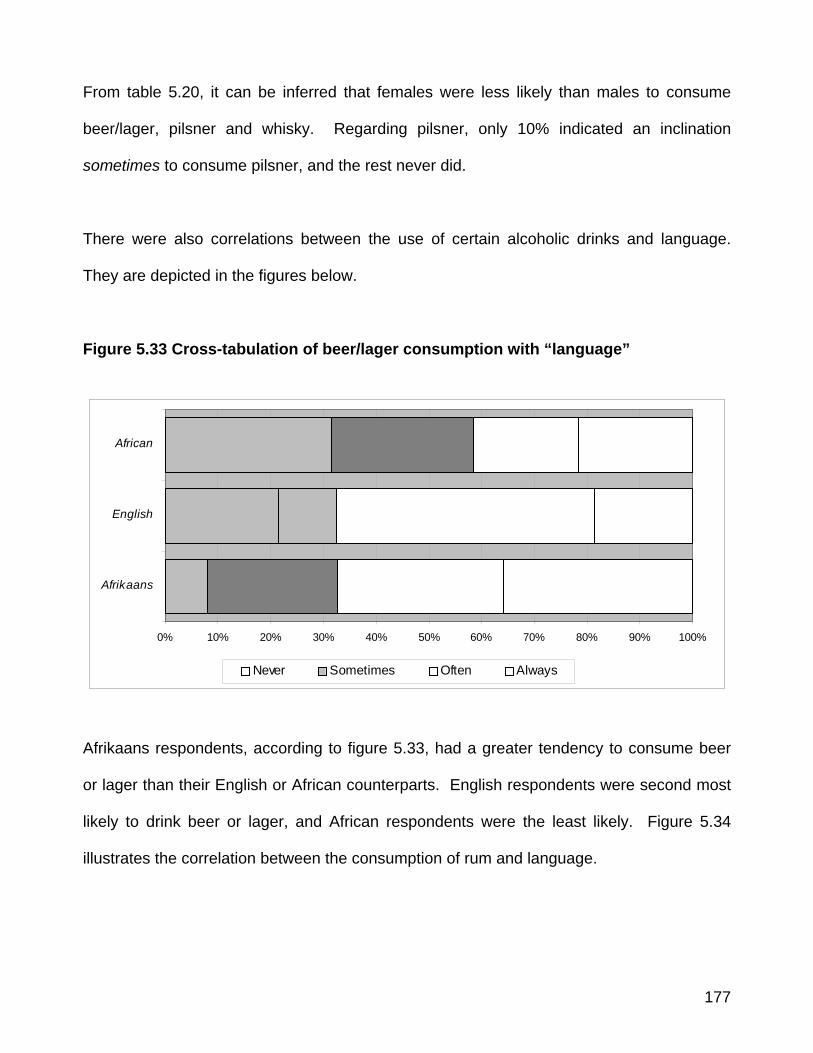
177
From table 5.20, it can be inferred that females were less likely than males to consume
beer/lager, pilsner and whisky. Regarding pilsner, only 10% indicated an inclination
sometimes to consume pilsner, and the rest never did.
There were also correlations between the use of certain alcoholic drinks and language.
They are depicted in the figures below.
Figure 5.33 Cross-tabulation of beer/lager consumption with “language”
0% 10% 20% 30% 40% 50% 60% 70% 80% 90% 100%
Afrikaans
English
African
Never Sometimes Often Always
Afrikaans respondents, according to figure 5.33, had a greater tendency to consume beer
or lager than their English or African counterparts. English respondents were second most
likely to drink beer or lager, and African respondents were the least likely. Figure 5.34
illustrates the correlation between the consumption of rum and language.
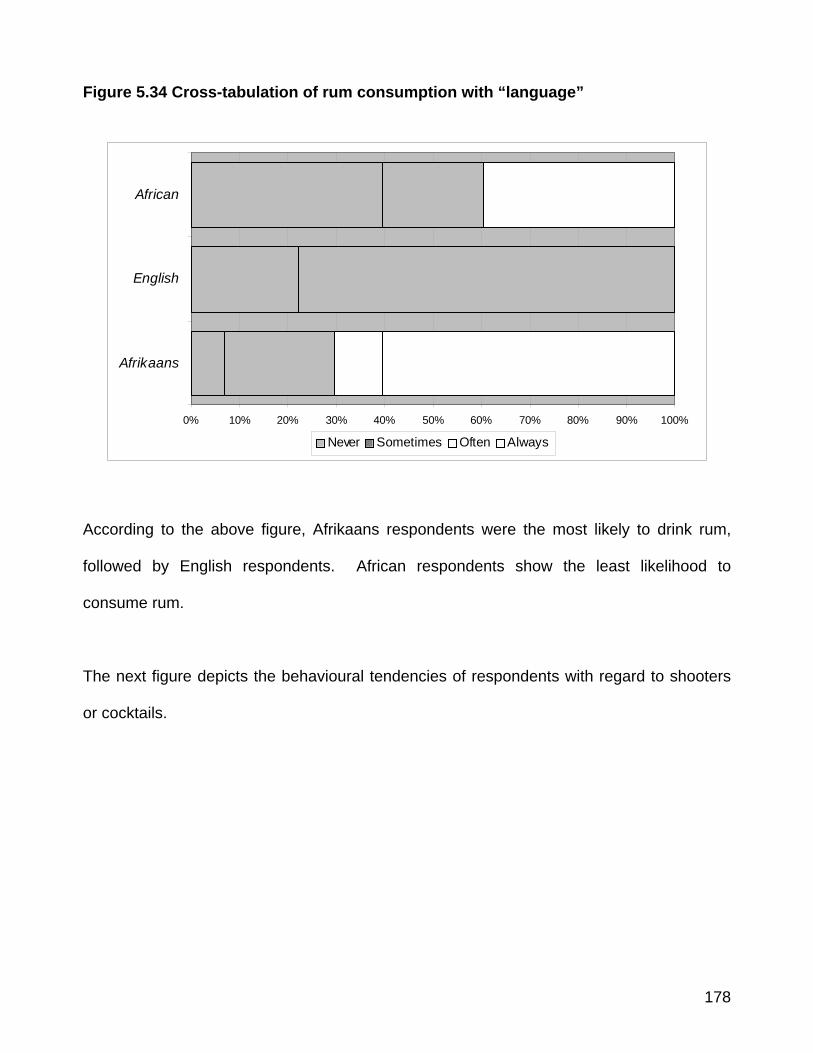
178
Figure 5.34 Cross-tabulation of rum consumption with “language”
0% 10% 20% 30% 40% 50% 60% 70% 80% 90% 100%
Afrikaans
English
African
Never Sometimes Often Always
According to the above figure, Afrikaans respondents were the most likely to drink rum,
followed by English respondents. African respondents show the least likelihood to
consume rum.
The next figure depicts the behavioural tendencies of respondents with regard to shooters
or cocktails.
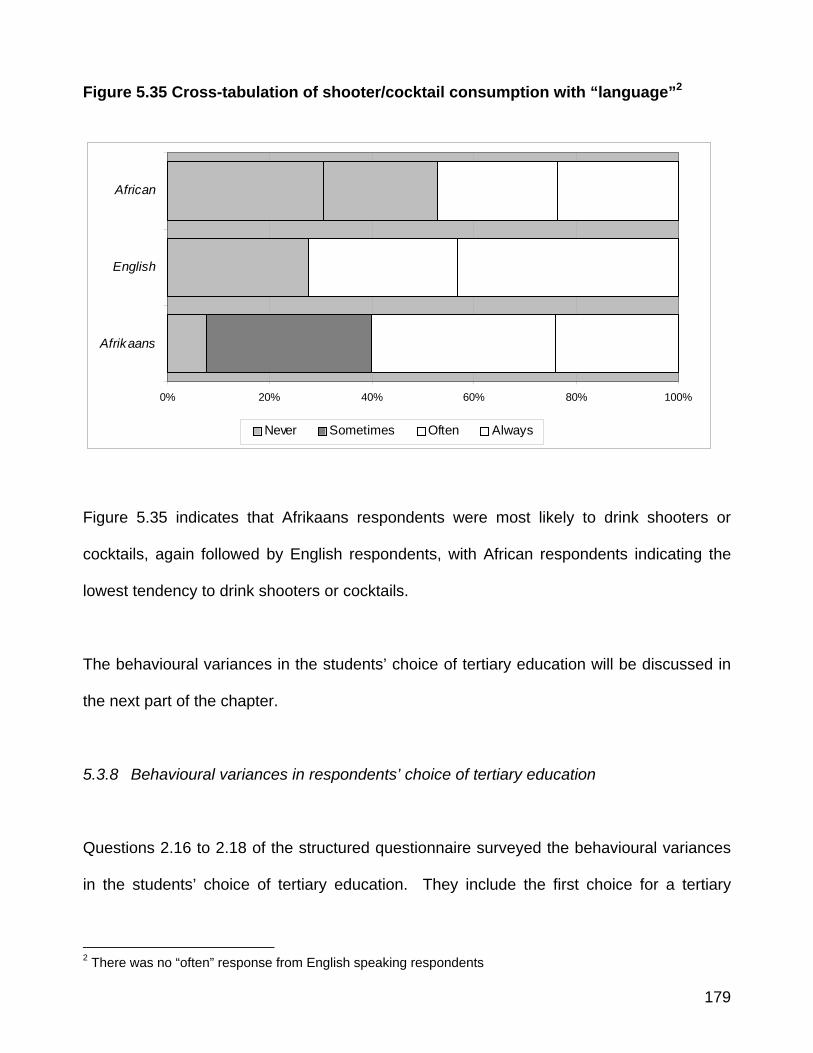
179
Figure 5.35 Cross-tabulation of shooter/cocktail consumption with “language”2
0% 20% 40% 60% 80% 100%
Afrikaans
English
African
Never Sometimes Often Always
Figure 5.35 indicates that Afrikaans respondents were most likely to drink shooters or
cocktails, again followed by English respondents, with African respondents indicating the
lowest tendency to drink shooters or cocktails.
The behavioural variances in the students’ choice of tertiary education will be discussed in
the next part of the chapter.
5.3.8 Behavioural variances in respondents’ choice of tertiary education
Questions 2.16 to 2.18 of the structured questionnaire surveyed the behavioural variances
in the students’ choice of tertiary education. They include the first choice for a tertiary
2 There was no “often” response from English speaking respondents
180
education institution, as well as the reasons for not attending the first choice in cases where
the Tshwane University of Technology was not the respondent’s preferred institution.
5.3.8.1 Respondents’ first choice for tertiary education
Question 2.16 required the respondents to indicate whether or not TUT was their first
choice for a higher education institution. Seventy-four per cent of the respondents in the
study named TUT as their first choice for tertiary education. The 26% that gave a negative
reply to the question indicated the following as their first-choice institutions:
• Wits University
• Wits Technikon
• University of Pretoria
• Other miscellaneous institutions
Figure 5.36 depicts the preferences of students among these options.
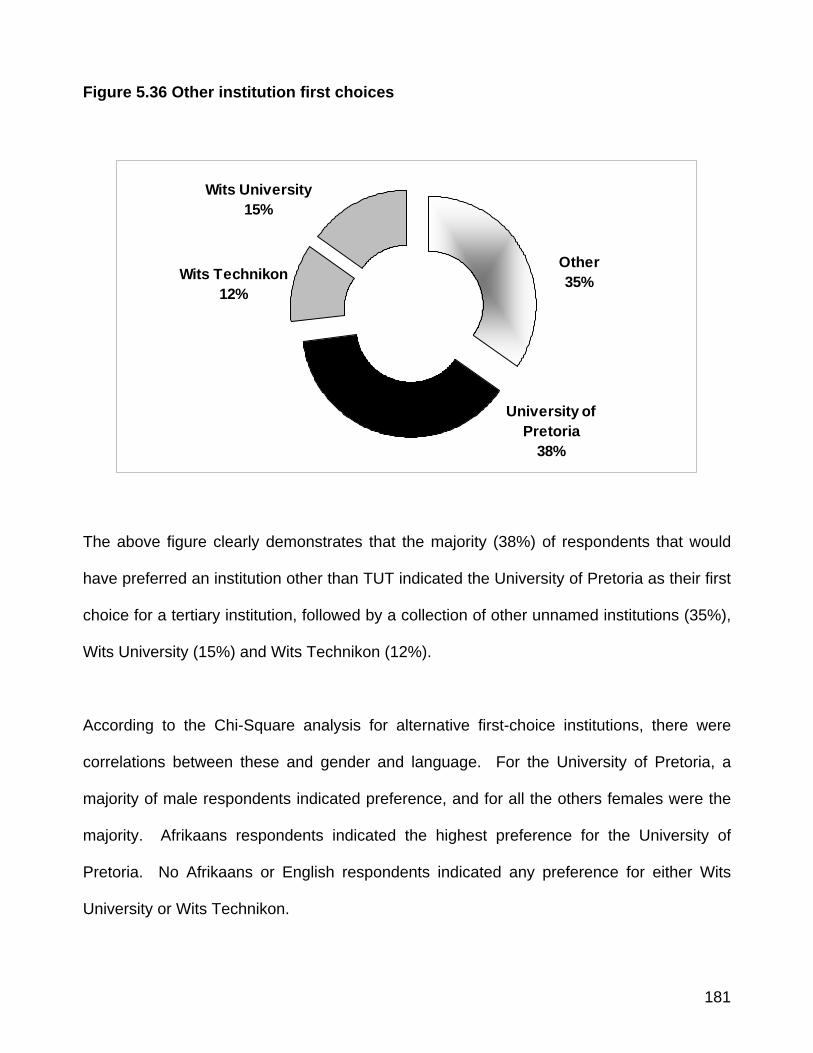
181
Figure 5.36 Other institution first choices
University of Pretoria
38%
Other35%
Wits University15%
Wits Technikon12%
The above figure clearly demonstrates that the majority (38%) of respondents that would
have preferred an institution other than TUT indicated the University of Pretoria as their first
choice for a tertiary institution, followed by a collection of other unnamed institutions (35%),
Wits University (15%) and Wits Technikon (12%).
According to the Chi-Square analysis for alternative first-choice institutions, there were
correlations between these and gender and language. For the University of Pretoria, a
majority of male respondents indicated preference, and for all the others females were the
majority. Afrikaans respondents indicated the highest preference for the University of
Pretoria. No Afrikaans or English respondents indicated any preference for either Wits
University or Wits Technikon.
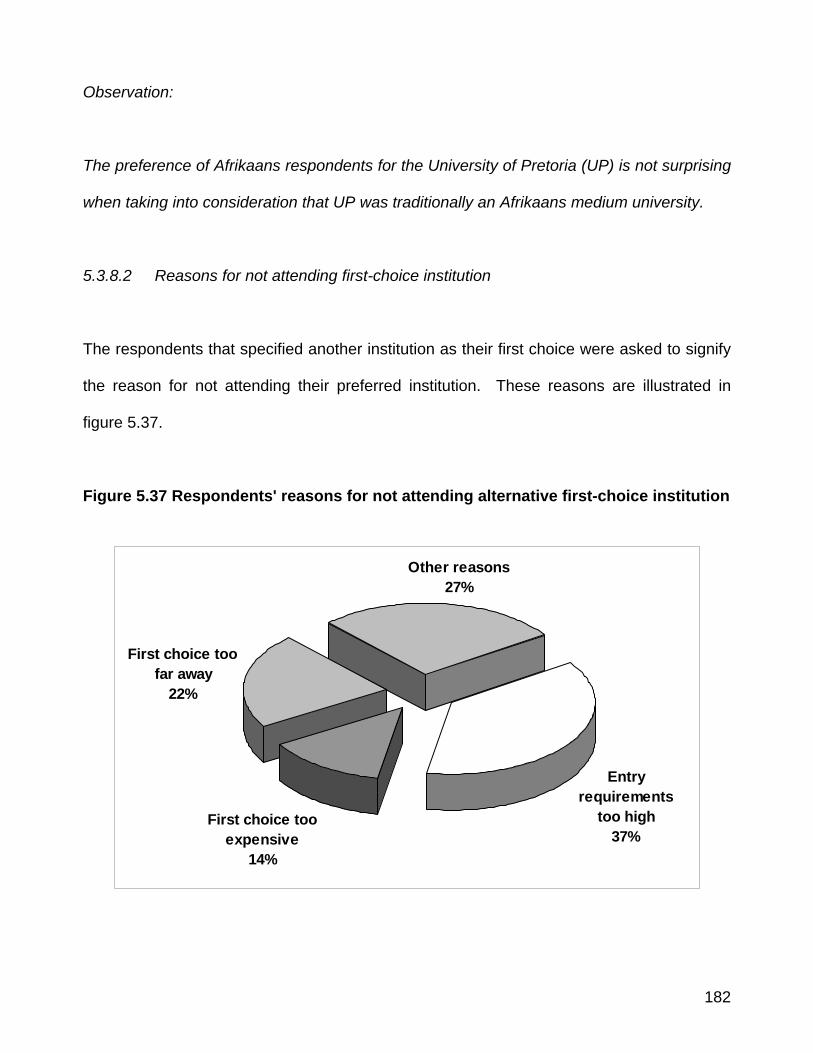
182
Observation:
The preference of Afrikaans respondents for the University of Pretoria (UP) is not surprising
when taking into consideration that UP was traditionally an Afrikaans medium university.
5.3.8.2 Reasons for not attending first-choice institution
The respondents that specified another institution as their first choice were asked to signify
the reason for not attending their preferred institution. These reasons are illustrated in
figure 5.37.
Figure 5.37 Respondents' reasons for not attending alternative first-choice institution
First choice too expensive
14%
First choice too far away
22%
Other reasons27%
Entry requirements
too high37%
183
The most common reason, indicated by 37% of the respondents, was that the entry
requirements for that particular institution were too high. Miscellaneous other unrelated
reasons accounted for 27% of the responses. Thirdly, 22% declared that the other
institution was situated too far away, and, lastly, 14% stated that their first choice was too
expensive.
Observation:
These results are significant, especially in the light of the Department of Marketing at TUT’s
desire to draw high-quality students for tertiary studies in the field of marketing. If some
students are attracted to TUT because of lower entry requirements, this could influence the
quality of students choosing to study at this institution. This is, however, not a large group
of the respondent pool and should not be seen as problematic at this stage.
The entry requirements of both the University of Pretoria (www.up.ac.za) and Wits
University (www.wits.ac.za) are indeed higher than those of TUT. Both of those institutions
require Mathematics as a school subject, which is not a prerequisite for studying marketing
at TUT.
In summarising the behavioural variances of the respondents’ choice of a tertiary education
institution, it can be said that the vast majority (74%) of the respondents indicated that TUT
was their preferred higher education institution. Of the respondents who indicated an
alternative first choice, most (38%) signified a partiality for the University of Pretoria. The
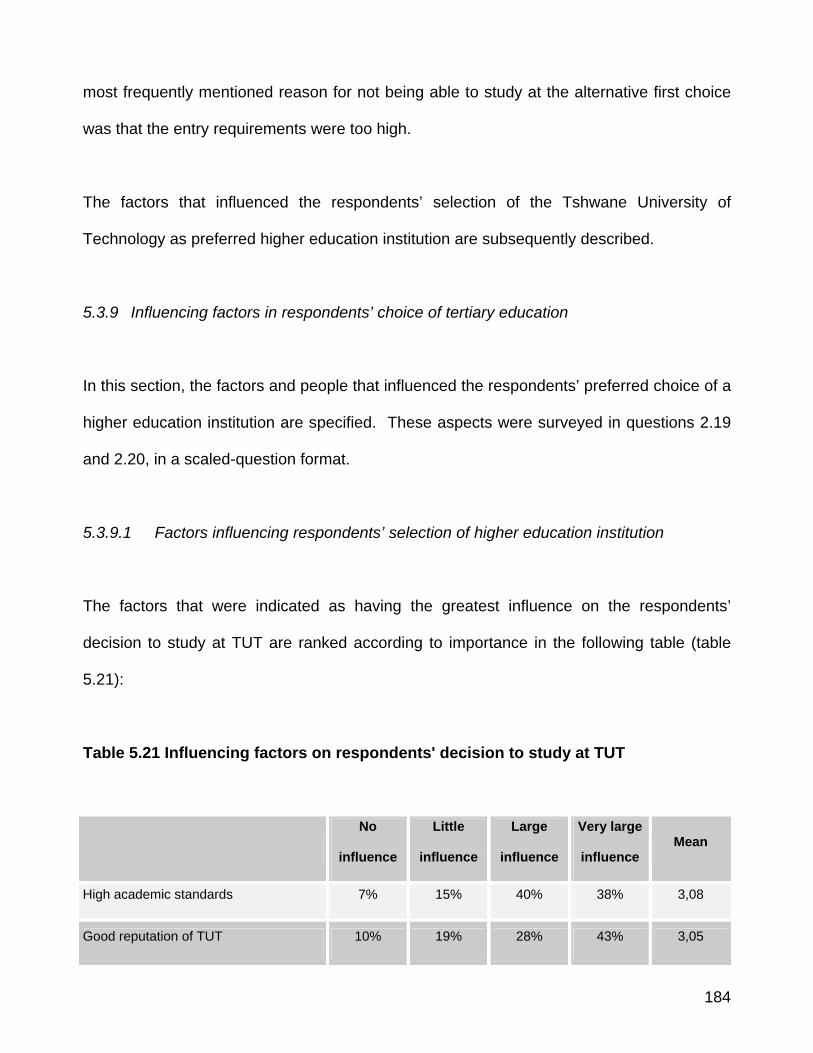
184
most frequently mentioned reason for not being able to study at the alternative first choice
was that the entry requirements were too high.
The factors that influenced the respondents’ selection of the Tshwane University of
Technology as preferred higher education institution are subsequently described.
5.3.9 Influencing factors in respondents’ choice of tertiary education
In this section, the factors and people that influenced the respondents’ preferred choice of a
higher education institution are specified. These aspects were surveyed in questions 2.19
and 2.20, in a scaled-question format.
5.3.9.1 Factors influencing respondents’ selection of higher education institution
The factors that were indicated as having the greatest influence on the respondents’
decision to study at TUT are ranked according to importance in the following table (table
5.21):
Table 5.21 Influencing factors on respondents' decision to study at TUT
No
influence
Little
influence
Large
influence
Very large
influence Mean
High academic standards 7% 15% 40% 38% 3,08
Good reputation of TUT 10% 19% 28% 43% 3,05
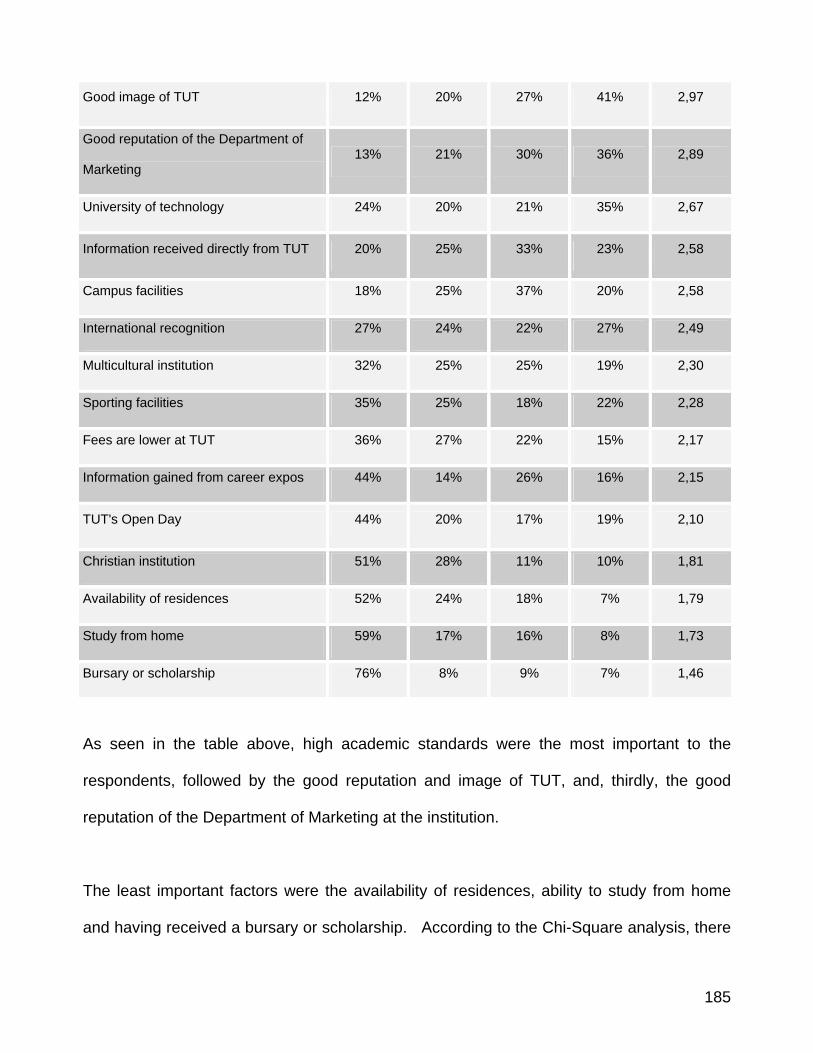
185
Good image of TUT 12% 20% 27% 41% 2,97
Good reputation of the Department of
Marketing 13% 21% 30% 36% 2,89
University of technology 24% 20% 21% 35% 2,67
Information received directly from TUT 20% 25% 33% 23% 2,58
Campus facilities 18% 25% 37% 20% 2,58
International recognition 27% 24% 22% 27% 2,49
Multicultural institution 32% 25% 25% 19% 2,30
Sporting facilities 35% 25% 18% 22% 2,28
Fees are lower at TUT 36% 27% 22% 15% 2,17
Information gained from career expos 44% 14% 26% 16% 2,15
TUT's Open Day 44% 20% 17% 19% 2,10
Christian institution 51% 28% 11% 10% 1,81
Availability of residences 52% 24% 18% 7% 1,79
Study from home 59% 17% 16% 8% 1,73
Bursary or scholarship 76% 8% 9% 7% 1,46
As seen in the table above, high academic standards were the most important to the
respondents, followed by the good reputation and image of TUT, and, thirdly, the good
reputation of the Department of Marketing at the institution.
The least important factors were the availability of residences, ability to study from home
and having received a bursary or scholarship. According to the Chi-Square analysis, there
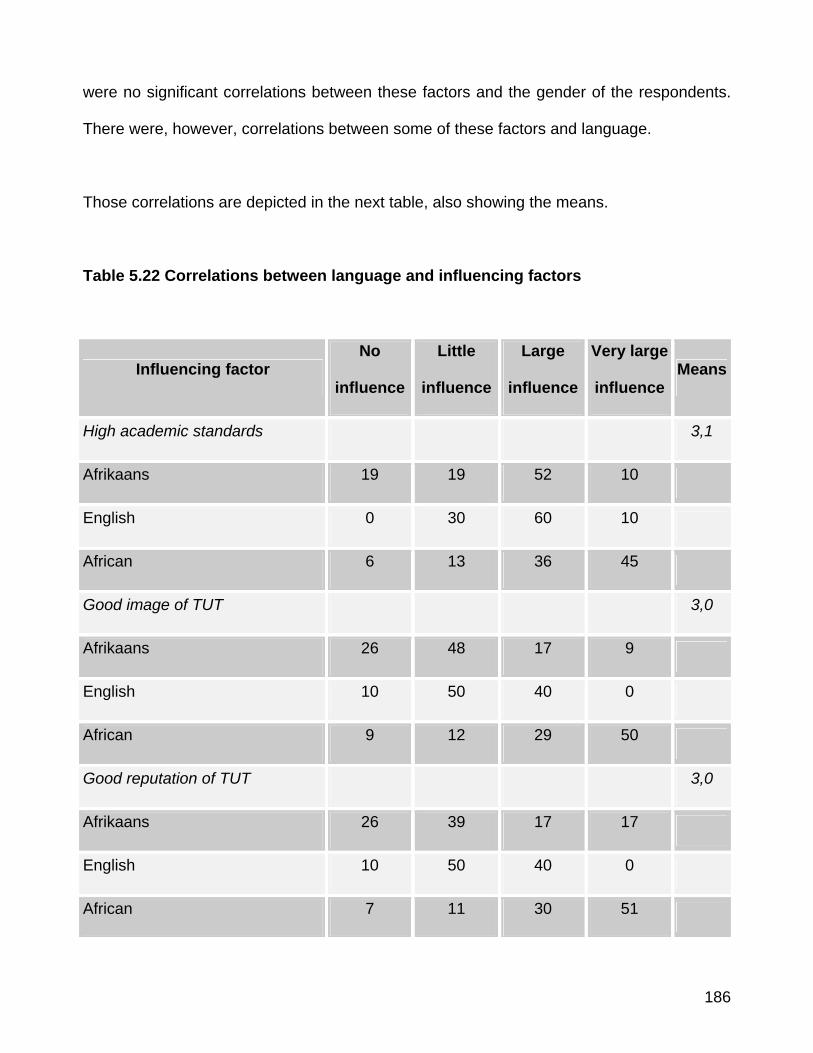
186
were no significant correlations between these factors and the gender of the respondents.
There were, however, correlations between some of these factors and language.
Those correlations are depicted in the next table, also showing the means.
Table 5.22 Correlations between language and influencing factors
Influencing factor No
influence
Little
influence
Large
influence
Very large
influenceMeans
High academic standards 3,1
Afrikaans 19 19 52 10
English 0 30 60 10
African 6 13 36 45
Good image of TUT 3,0
Afrikaans 26 48 17 9
English 10 50 40 0
African 9 12 29 50
Good reputation of TUT 3,0
Afrikaans 26 39 17 17
English 10 50 40 0
African 7 11 30 51
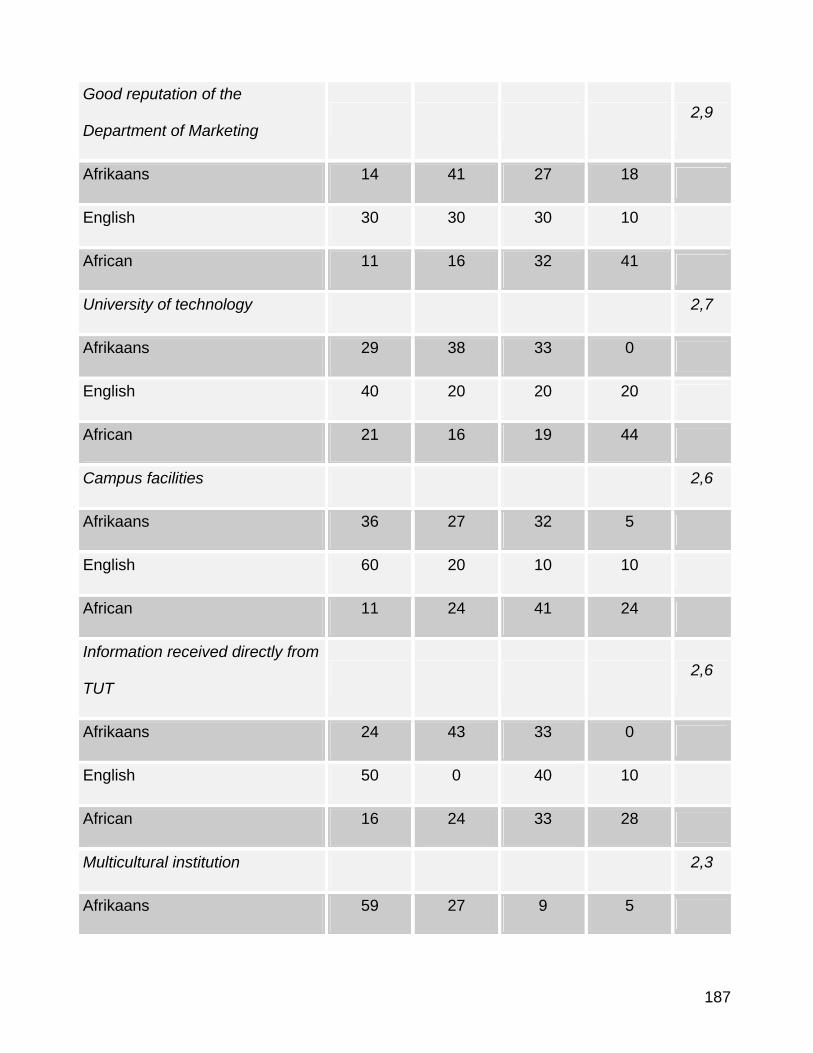
187
Good reputation of the
Department of Marketing 2,9
Afrikaans 14 41 27 18
English 30 30 30 10
African 11 16 32 41
University of technology 2,7
Afrikaans 29 38 33 0
English 40 20 20 20
African 21 16 19 44
Campus facilities 2,6
Afrikaans 36 27 32 5
English 60 20 10 10
African 11 24 41 24
Information received directly from
TUT 2,6
Afrikaans 24 43 33 0
English 50 0 40 10
African 16 24 33 28
Multicultural institution 2,3
Afrikaans 59 27 9 5
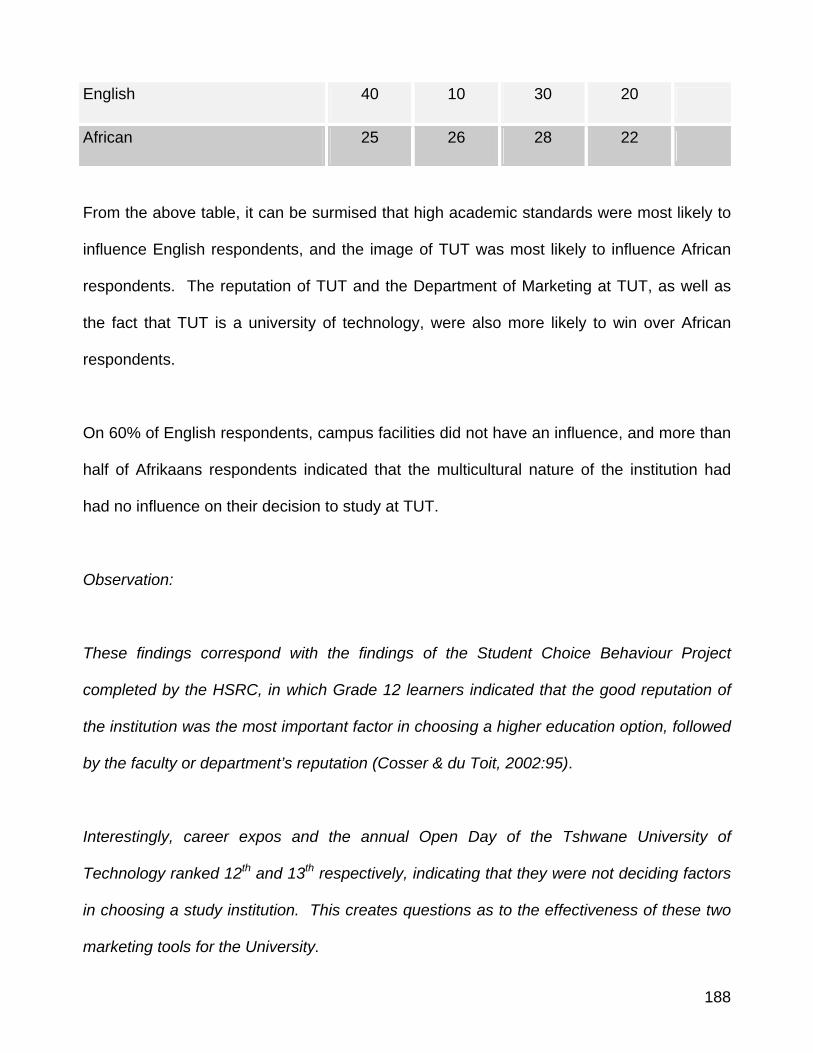
188
English 40 10 30 20
African 25 26 28 22
From the above table, it can be surmised that high academic standards were most likely to
influence English respondents, and the image of TUT was most likely to influence African
respondents. The reputation of TUT and the Department of Marketing at TUT, as well as
the fact that TUT is a university of technology, were also more likely to win over African
respondents.
On 60% of English respondents, campus facilities did not have an influence, and more than
half of Afrikaans respondents indicated that the multicultural nature of the institution had
had no influence on their decision to study at TUT.
Observation:
These findings correspond with the findings of the Student Choice Behaviour Project
completed by the HSRC, in which Grade 12 learners indicated that the good reputation of
the institution was the most important factor in choosing a higher education option, followed
by the faculty or department’s reputation (Cosser & du Toit, 2002:95).
Interestingly, career expos and the annual Open Day of the Tshwane University of
Technology ranked 12th and 13th respectively, indicating that they were not deciding factors
in choosing a study institution. This creates questions as to the effectiveness of these two
marketing tools for the University.
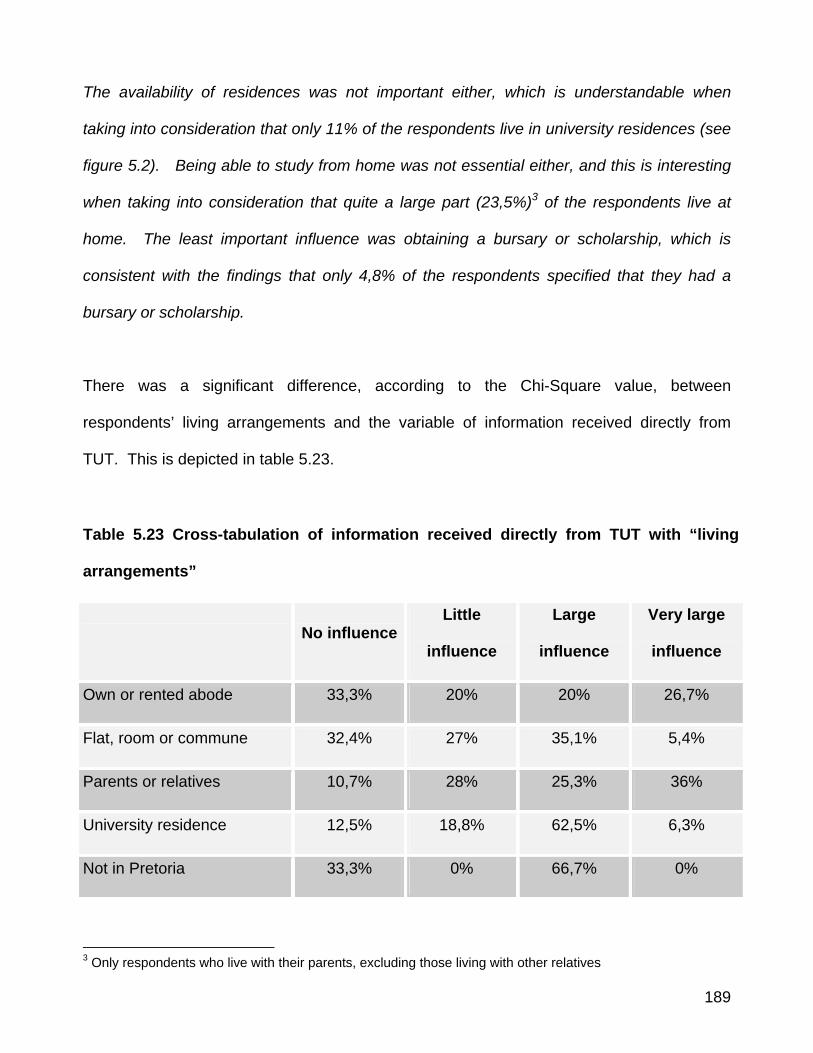
189
The availability of residences was not important either, which is understandable when
taking into consideration that only 11% of the respondents live in university residences (see
figure 5.2). Being able to study from home was not essential either, and this is interesting
when taking into consideration that quite a large part (23,5%)3 of the respondents live at
home. The least important influence was obtaining a bursary or scholarship, which is
consistent with the findings that only 4,8% of the respondents specified that they had a
bursary or scholarship.
There was a significant difference, according to the Chi-Square value, between
respondents’ living arrangements and the variable of information received directly from
TUT. This is depicted in table 5.23.
Table 5.23 Cross-tabulation of information received directly from TUT with “living
arrangements”
No influenceLittle
influence
Large
influence
Very large
influence
Own or rented abode 33,3% 20% 20% 26,7%
Flat, room or commune 32,4% 27% 35,1% 5,4%
Parents or relatives 10,7% 28% 25,3% 36%
University residence 12,5% 18,8% 62,5% 6,3%
Not in Pretoria 33,3% 0% 66,7% 0%
3 Only respondents who live with their parents, excluding those living with other relatives
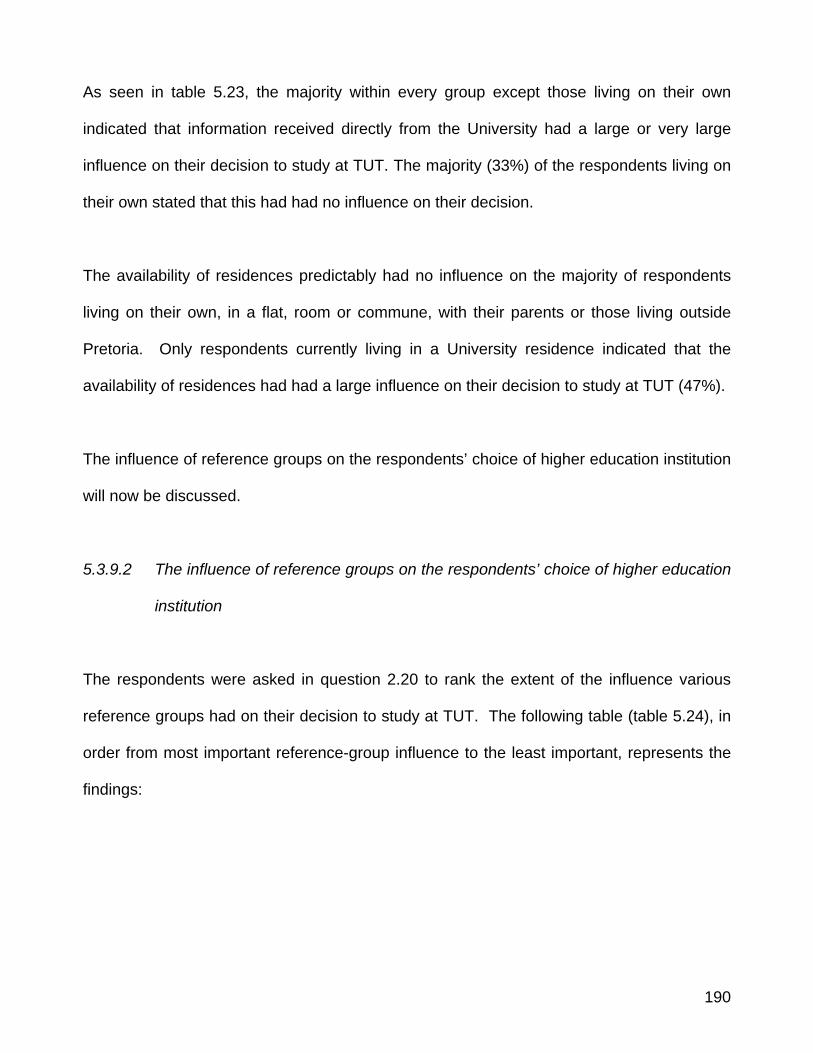
190
As seen in table 5.23, the majority within every group except those living on their own
indicated that information received directly from the University had a large or very large
influence on their decision to study at TUT. The majority (33%) of the respondents living on
their own stated that this had had no influence on their decision.
The availability of residences predictably had no influence on the majority of respondents
living on their own, in a flat, room or commune, with their parents or those living outside
Pretoria. Only respondents currently living in a University residence indicated that the
availability of residences had had a large influence on their decision to study at TUT (47%).
The influence of reference groups on the respondents’ choice of higher education institution
will now be discussed.
5.3.9.2 The influence of reference groups on the respondents’ choice of higher education
institution
The respondents were asked in question 2.20 to rank the extent of the influence various
reference groups had on their decision to study at TUT. The following table (table 5.24), in
order from most important reference-group influence to the least important, represents the
findings:
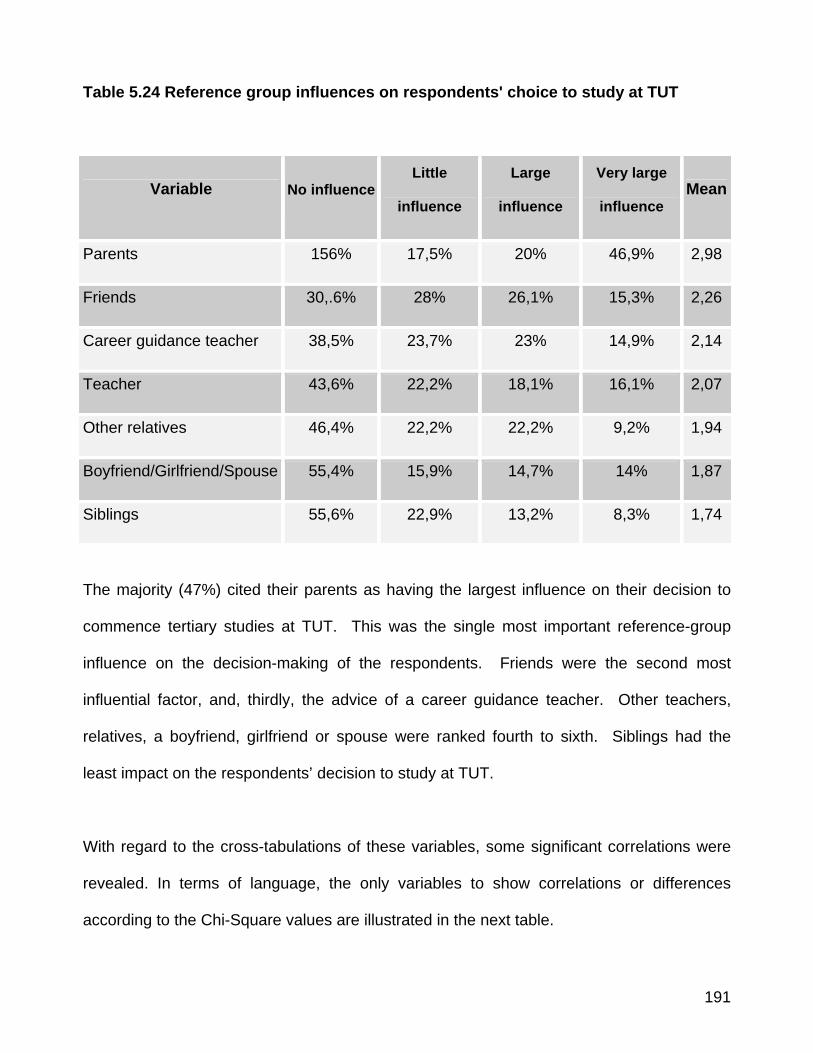
191
Table 5.24 Reference group influences on respondents' choice to study at TUT
Variable No influenceLittle
influence
Large
influence
Very large
influence Mean
Parents 156% 17,5% 20% 46,9% 2,98
Friends 30,.6% 28% 26,1% 15,3% 2,26
Career guidance teacher 38,5% 23,7% 23% 14,9% 2,14
Teacher 43,6% 22,2% 18,1% 16,1% 2,07
Other relatives 46,4% 22,2% 22,2% 9,2% 1,94
Boyfriend/Girlfriend/Spouse 55,4% 15,9% 14,7% 14% 1,87
Siblings 55,6% 22,9% 13,2% 8,3% 1,74
The majority (47%) cited their parents as having the largest influence on their decision to
commence tertiary studies at TUT. This was the single most important reference-group
influence on the decision-making of the respondents. Friends were the second most
influential factor, and, thirdly, the advice of a career guidance teacher. Other teachers,
relatives, a boyfriend, girlfriend or spouse were ranked fourth to sixth. Siblings had the
least impact on the respondents’ decision to study at TUT.
With regard to the cross-tabulations of these variables, some significant correlations were
revealed. In terms of language, the only variables to show correlations or differences
according to the Chi-Square values are illustrated in the next table.
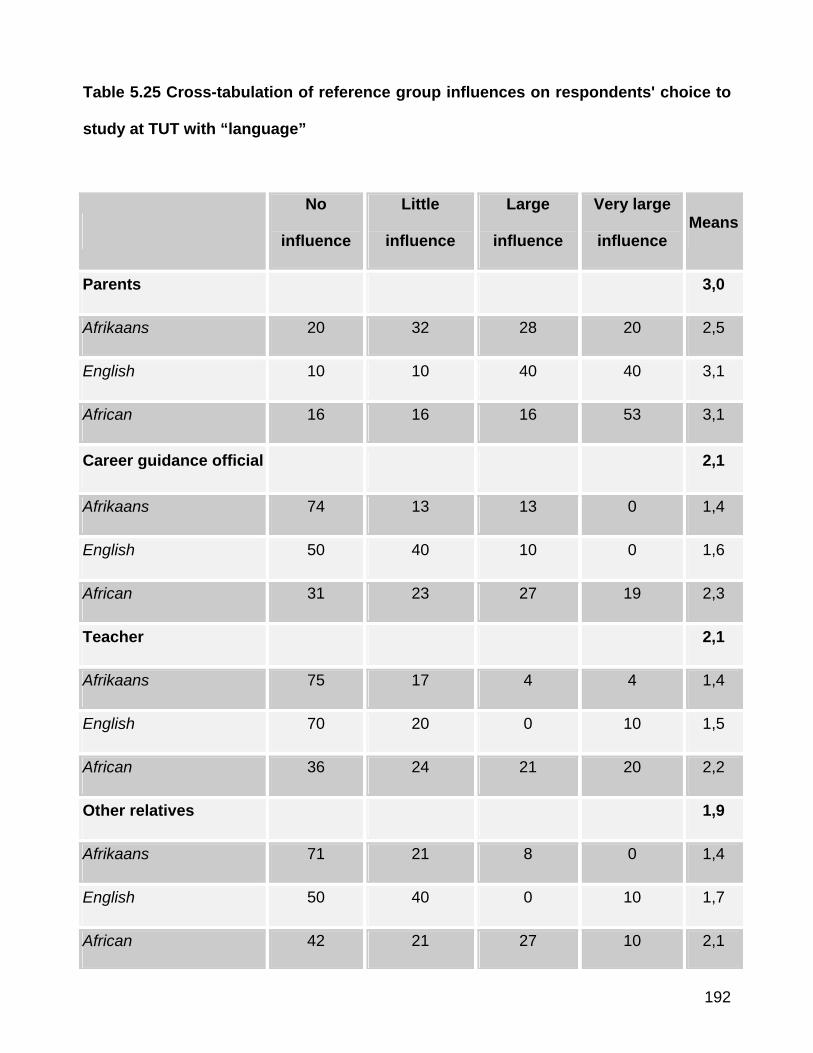
192
Table 5.25 Cross-tabulation of reference group influences on respondents' choice to
study at TUT with “language”
No
influence
Little
influence
Large
influence
Very large
influence Means
Parents 3,0
Afrikaans 20 32 28 20 2,5
English 10 10 40 40 3,1
African 16 16 16 53 3,1
Career guidance official 2,1
Afrikaans 74 13 13 0 1,4
English 50 40 10 0 1,6
African 31 23 27 19 2,3
Teacher 2,1
Afrikaans 75 17 4 4 1,4
English 70 20 0 10 1,5
African 36 24 21 20 2,2
Other relatives 1,9
Afrikaans 71 21 8 0 1,4
English 50 40 0 10 1,7
African 42 21 27 10 2,1
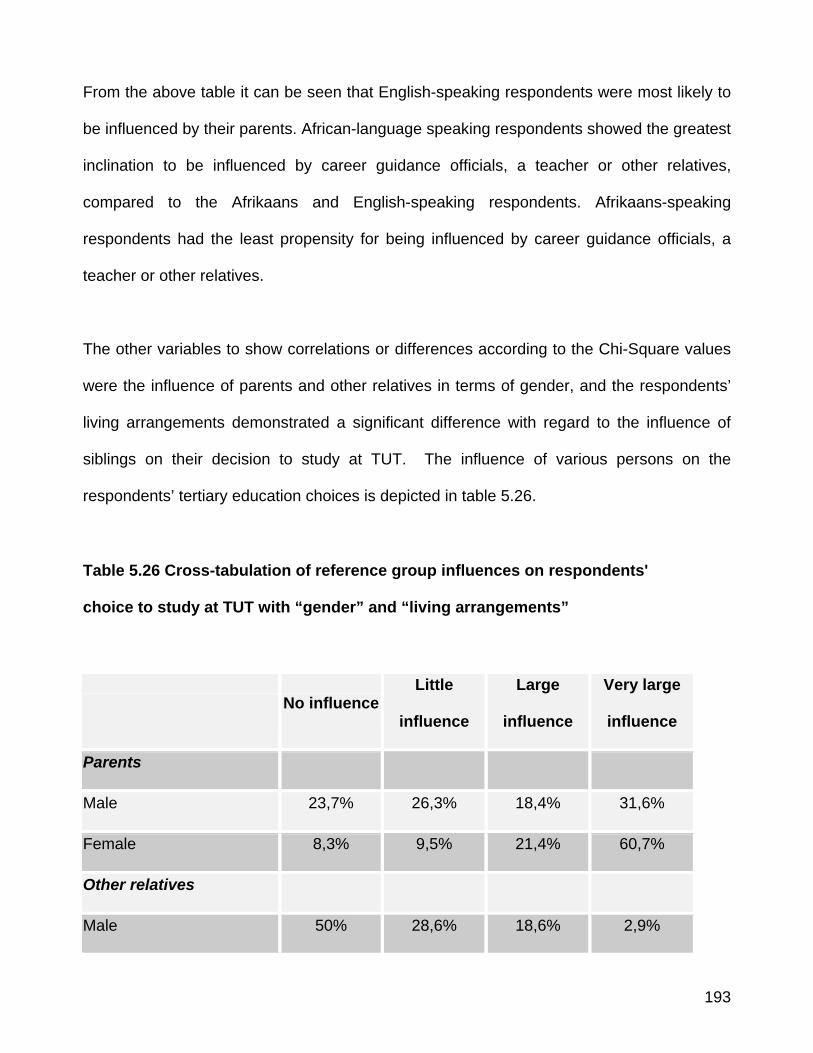
193
From the above table it can be seen that English-speaking respondents were most likely to
be influenced by their parents. African-language speaking respondents showed the greatest
inclination to be influenced by career guidance officials, a teacher or other relatives,
compared to the Afrikaans and English-speaking respondents. Afrikaans-speaking
respondents had the least propensity for being influenced by career guidance officials, a
teacher or other relatives.
The other variables to show correlations or differences according to the Chi-Square values
were the influence of parents and other relatives in terms of gender, and the respondents’
living arrangements demonstrated a significant difference with regard to the influence of
siblings on their decision to study at TUT. The influence of various persons on the
respondents’ tertiary education choices is depicted in table 5.26.
Table 5.26 Cross-tabulation of reference group influences on respondents'
choice to study at TUT with “gender” and “living arrangements”
No influenceLittle
influence
Large
influence
Very large
influence
Parents
Male 23,7% 26,3% 18,4% 31,6%
Female 8,3% 9,5% 21,4% 60,7%
Other relatives
Male 50% 28,6% 18,6% 2,9%
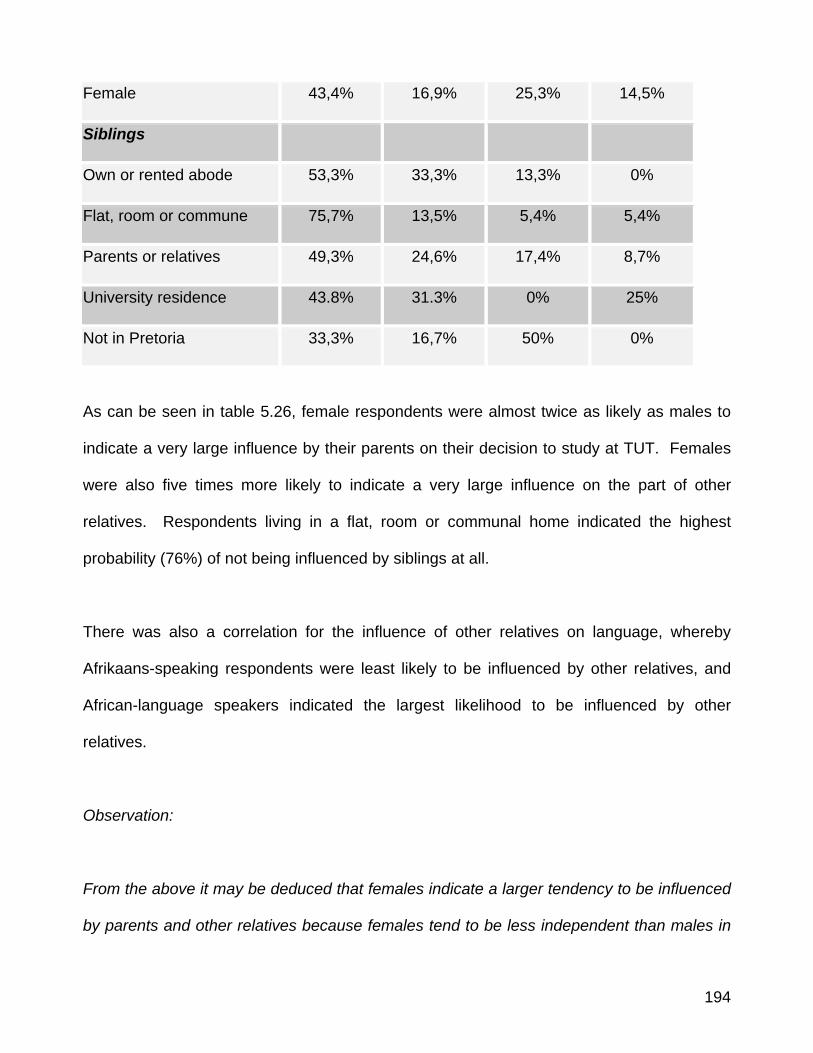
194
Female 43,4% 16,9% 25,3% 14,5%
Siblings
Own or rented abode 53,3% 33,3% 13,3% 0%
Flat, room or commune 75,7% 13,5% 5,4% 5,4%
Parents or relatives 49,3% 24,6% 17,4% 8,7%
University residence 43.8% 31.3% 0% 25%
Not in Pretoria 33,3% 16,7% 50% 0%
As can be seen in table 5.26, female respondents were almost twice as likely as males to
indicate a very large influence by their parents on their decision to study at TUT. Females
were also five times more likely to indicate a very large influence on the part of other
relatives. Respondents living in a flat, room or communal home indicated the highest
probability (76%) of not being influenced by siblings at all.
There was also a correlation for the influence of other relatives on language, whereby
Afrikaans-speaking respondents were least likely to be influenced by other relatives, and
African-language speakers indicated the largest likelihood to be influenced by other
relatives.
Observation:
From the above it may be deduced that females indicate a larger tendency to be influenced
by parents and other relatives because females tend to be less independent than males in
195
the social context. There is a possibility that siblings may have less influence on
respondents living in a flat, room or communal home, because these respondents are more
mature and thus more independent. This deduction, however, cannot be correlated, as it
falls outside the demarcations of the research instrument.
As per the HSRC survey, where family influence was important in learners deciding to enter
tertiary education (Cosser & du Toit, 2002:71), the respondents in this study also confirmed
that the deciding influence was the family, more specifically the parents. The fact that 86%
of the respondents indicated their parents as the source of payment of their study fees may
be an indication of the reason why parents had such a significant influence on the choice of
a specific tertiary institution.
Cosser and du Toit (2002:71) found that friends had a large influence on the decision-
making, and Stone et al. (2001:162) also concluded that Generation Y consumers were
strongly influenced by peer group pressure. Both these observations correspond with the
results of this study, which indicated that friends were the second most important factor to
influence the selection of a specific tertiary institution.
This concludes the influence of reference groups on respondents’ higher education choices.
In summary, the largest influencing factor was the high academic standards of TUT,
followed by the good reputation of TUT and its good image. The three least salient
influencing factors were the availability of residences, the possibility of studying from home
and the receipt of a bursary or scholarship.
196
The main factor for influencing the decision was the respondents’ parents, followed by the
influence of friends and a career guidance teacher. Siblings had the lowest influence on
respondents’ decision to study at TUT.
The discussion of the results of the influencing factors and reference-group influences on
respondents’ higher education choices has thus been completed.
Conclusion of the consumer behaviour variables influencing the respondents
(section 2):
To conclude the consumer behaviour variables influencing the respondents, as determined
by section 2, questions 2.1 to 2.20 of the structured questionnaire, the main findings are
summarised in the next few paragraphs.
With regard to the leisure-time spending of the respondents, it was found that listening to
music was the activity respondents spent the most time on. Surfing the Internet was the
pastime least time was spent on. The television viewing habits of the respondents
indicated that the channel most frequently watched was E-TV, and DSTV was last on the
list. Overall, the programme type most often viewed was sitcoms, and cartoons were least
frequently watched. Metro FM was the radio station primarily listened to, and 5FM least
often.
197
With regard to magazines, Drum was first on the list of magazines most respondents read,
and O-Mag last. The Sunday Times was the newspaper predominantly read, and the
Record had the lowest readership. Only 22% of the respondents had access to the Internet
at their place of residence, which correlates with their low Internet usage.
The behavioural variances in the respondents’ choice of tertiary institution revealed that
74% of the respondents were studying at their first-choice institution, namely TUT. Of the
26% that were not at their preferred institution, the majority (38%) wished to study at the
University of Pretoria. The reason cited most often for not studying at the alternative first-
choice educational establishment was that the entry requirements were too high.
Regarding the institutional factors that influenced the respondents’ choice to study at TUT,
the factor that had the largest influence was the high academic standards of TUT. The offer
of a bursary or scholarship from TUT was the factor with the least influence. In terms of
reference-group influences, the respondents were chiefly influenced by their parents in their
choice of TUT as a higher education institution, and least affected by their siblings.
This completes the discussion of the results of section 2 of the questionnaire. In the
following section, the future outlook of the respondents, as found in the study, will be
described.
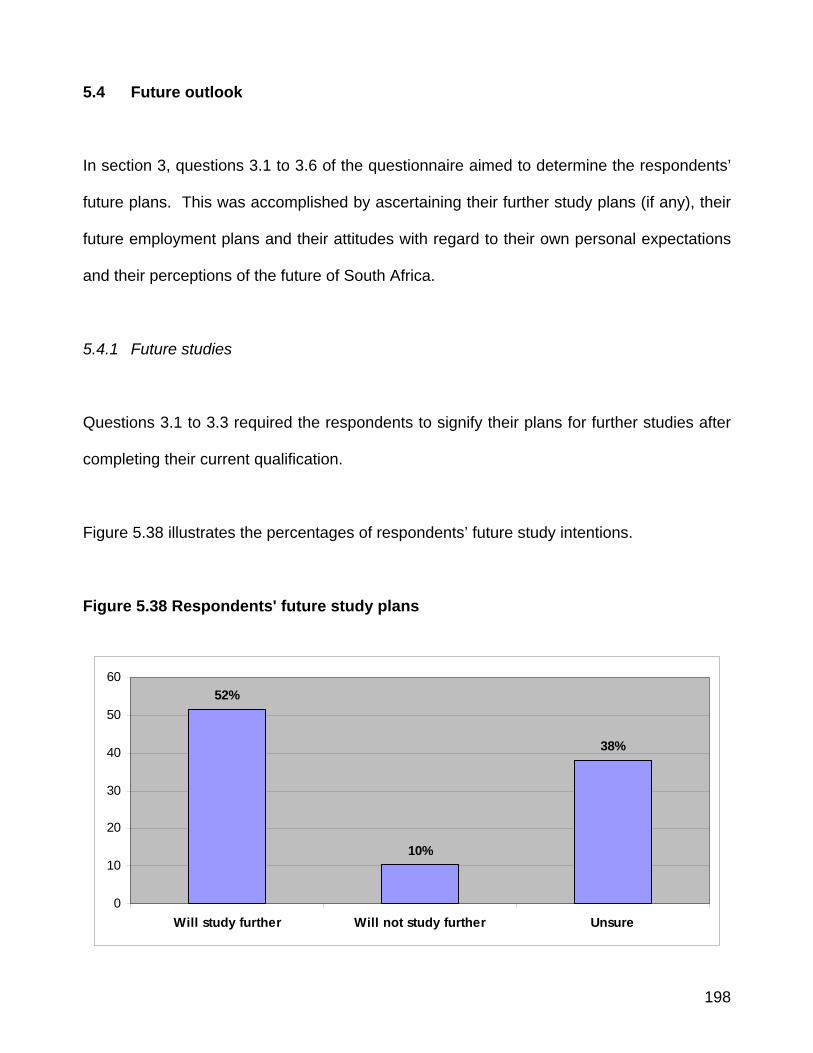
198
5.4 Future outlook
In section 3, questions 3.1 to 3.6 of the questionnaire aimed to determine the respondents’
future plans. This was accomplished by ascertaining their further study plans (if any), their
future employment plans and their attitudes with regard to their own personal expectations
and their perceptions of the future of South Africa.
5.4.1 Future studies
Questions 3.1 to 3.3 required the respondents to signify their plans for further studies after
completing their current qualification.
Figure 5.38 illustrates the percentages of respondents’ future study intentions.
Figure 5.38 Respondents' future study plans
52%
10%
38%
0
10
20
30
40
50
60
Will study further Will not study further Unsure
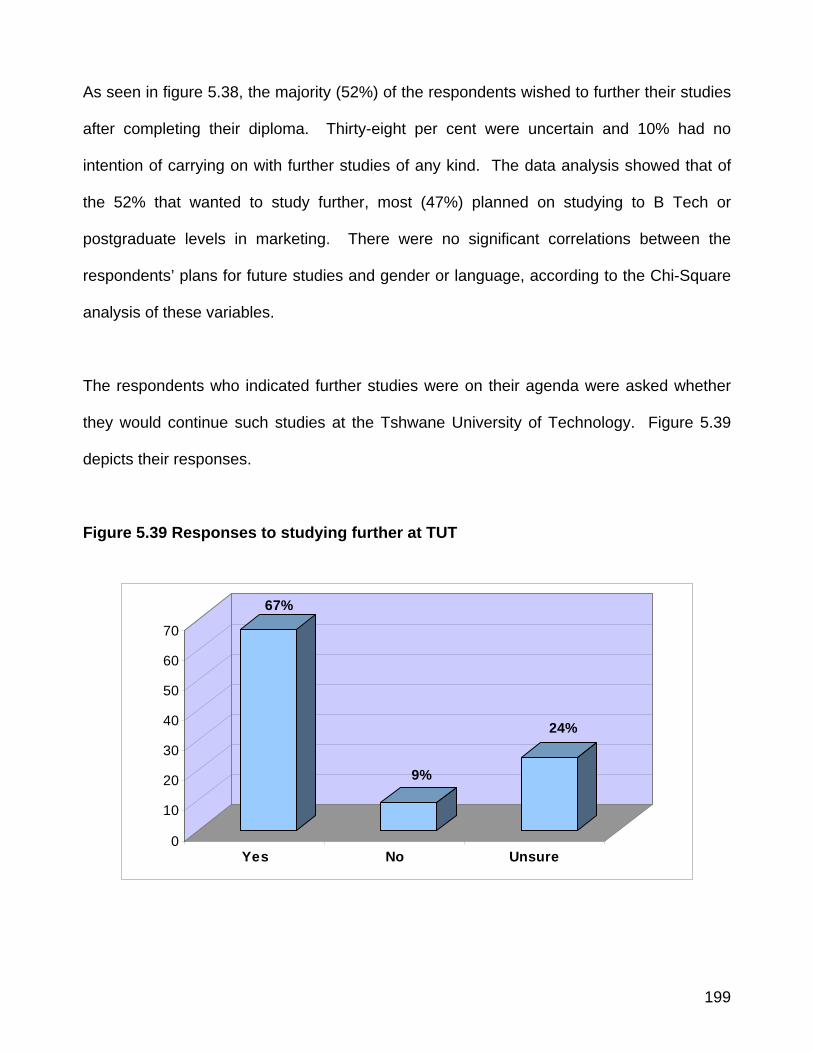
199
As seen in figure 5.38, the majority (52%) of the respondents wished to further their studies
after completing their diploma. Thirty-eight per cent were uncertain and 10% had no
intention of carrying on with further studies of any kind. The data analysis showed that of
the 52% that wanted to study further, most (47%) planned on studying to B Tech or
postgraduate levels in marketing. There were no significant correlations between the
respondents’ plans for future studies and gender or language, according to the Chi-Square
analysis of these variables.
The respondents who indicated further studies were on their agenda were asked whether
they would continue such studies at the Tshwane University of Technology. Figure 5.39
depicts their responses.
Figure 5.39 Responses to studying further at TUT
67%
9%
24%
0
10
20
30
40
50
60
70
Yes No Unsure
200
It is obvious from this figure that the majority (67%) of the respondents who wished to study
further wanted to do so at the Tshwane University of Technology. The reasons for this
varied from the high academic quality to the high quality of lecturers at the institution. From
this it can be inferred that the majority of respondents were highly satisfied with the
institution at present.
As indicated by the Chi-Square values determined by the statistical analysis of the data,
there were no significant correlations or variances between the respondents’ plans for
further studies and gender, living arrangements or language. The same was true for the
question of whether or not further studies would be carried out at TUT, specifically. It had
been thought that the amount of money respondents received as an allowance might
provide an indication of an inclination for further studies, but this was not the case, as
reflected in the Chi-Square analysis.
Observation:
Cosser and du Toit (2002:115) found in their study that Grade 12 learners’ future outlook
included bettering their education, among other things. This study correlates this indication
in terms of further education at the TUT Pretoria Campus for the marketing students.
The prospective employment plans of the respondents will subsequently be described.
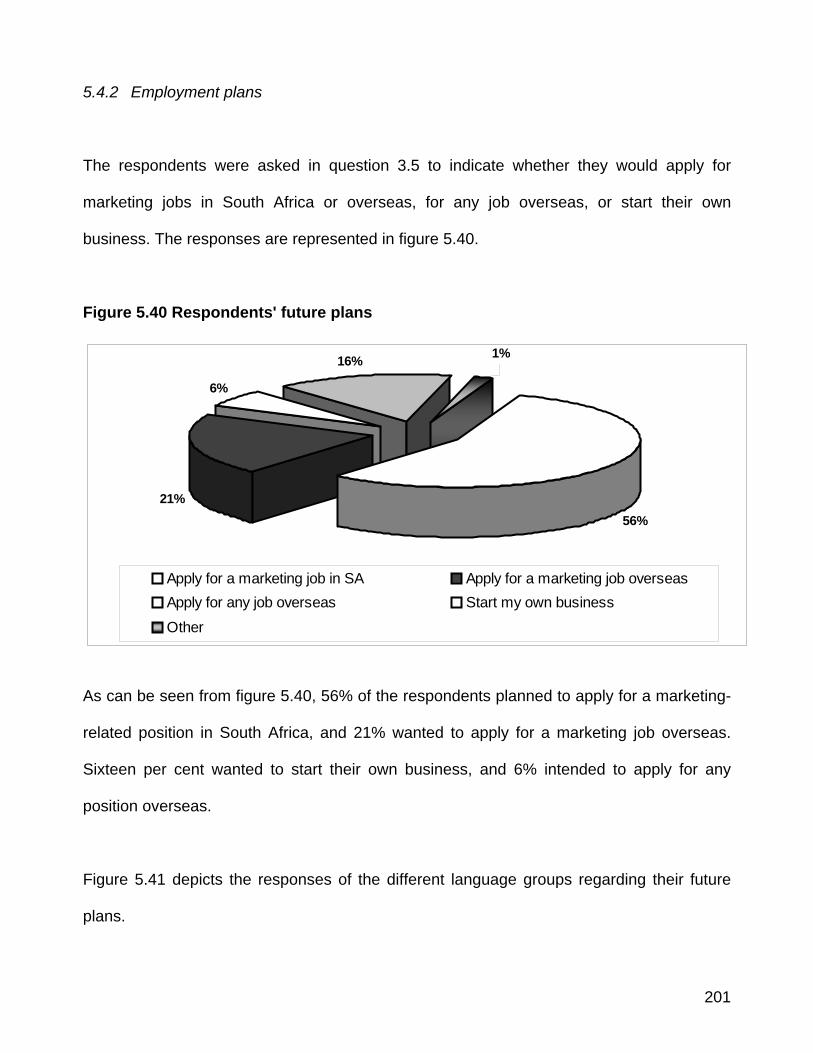
201
5.4.2 Employment plans
The respondents were asked in question 3.5 to indicate whether they would apply for
marketing jobs in South Africa or overseas, for any job overseas, or start their own
business. The responses are represented in figure 5.40.
Figure 5.40 Respondents' future plans
21%
6%
16% 1%
56%
Apply for a marketing job in SA Apply for a marketing job overseasApply for any job overseas Start my own business
Other
As can be seen from figure 5.40, 56% of the respondents planned to apply for a marketing-
related position in South Africa, and 21% wanted to apply for a marketing job overseas.
Sixteen per cent wanted to start their own business, and 6% intended to apply for any
position overseas.
Figure 5.41 depicts the responses of the different language groups regarding their future
plans.
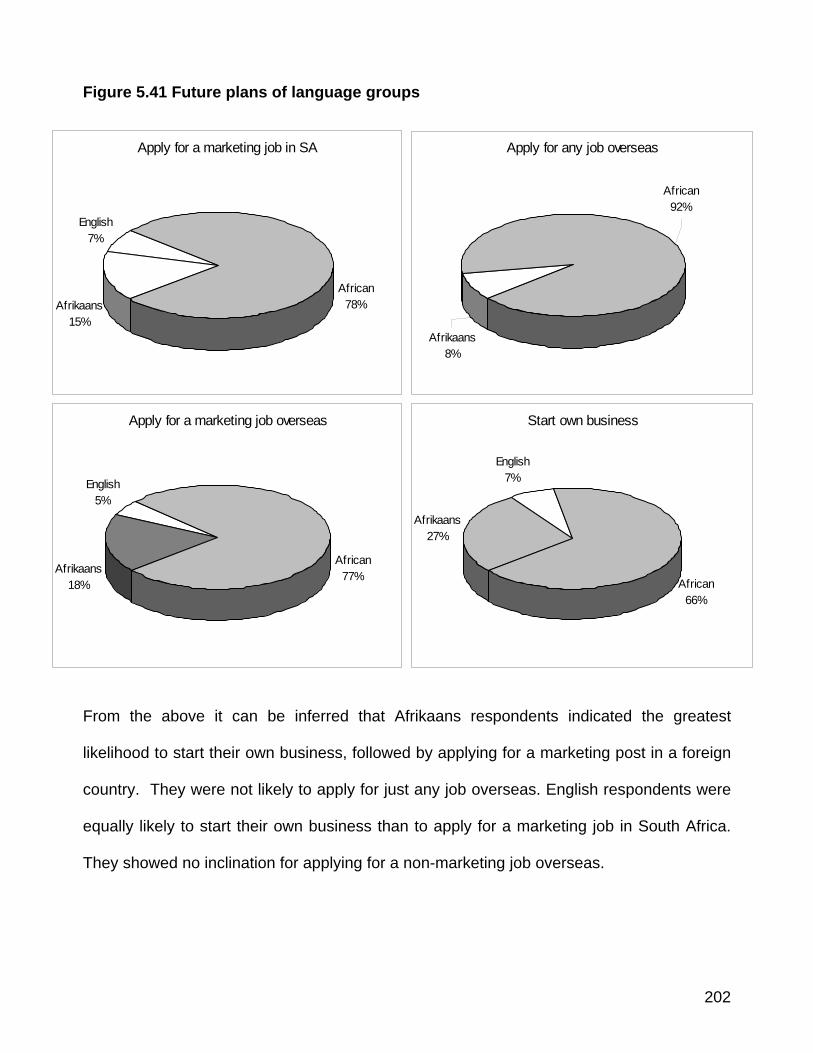
202
Figure 5.41 Future plans of language groups
From the above it can be inferred that Afrikaans respondents indicated the greatest
likelihood to start their own business, followed by applying for a marketing post in a foreign
country. They were not likely to apply for just any job overseas. English respondents were
equally likely to start their own business than to apply for a marketing job in South Africa.
They showed no inclination for applying for a non-marketing job overseas.
Apply for a marketing job overseas
Afrikaans18%
English5%
African77%
Apply for a marketing job in SA
Afrikaans15%
English7%
African78%
Apply for any job overseas
Afrikaans8%
African92%
Start own business
Afrikaans27%
English7%
African66%
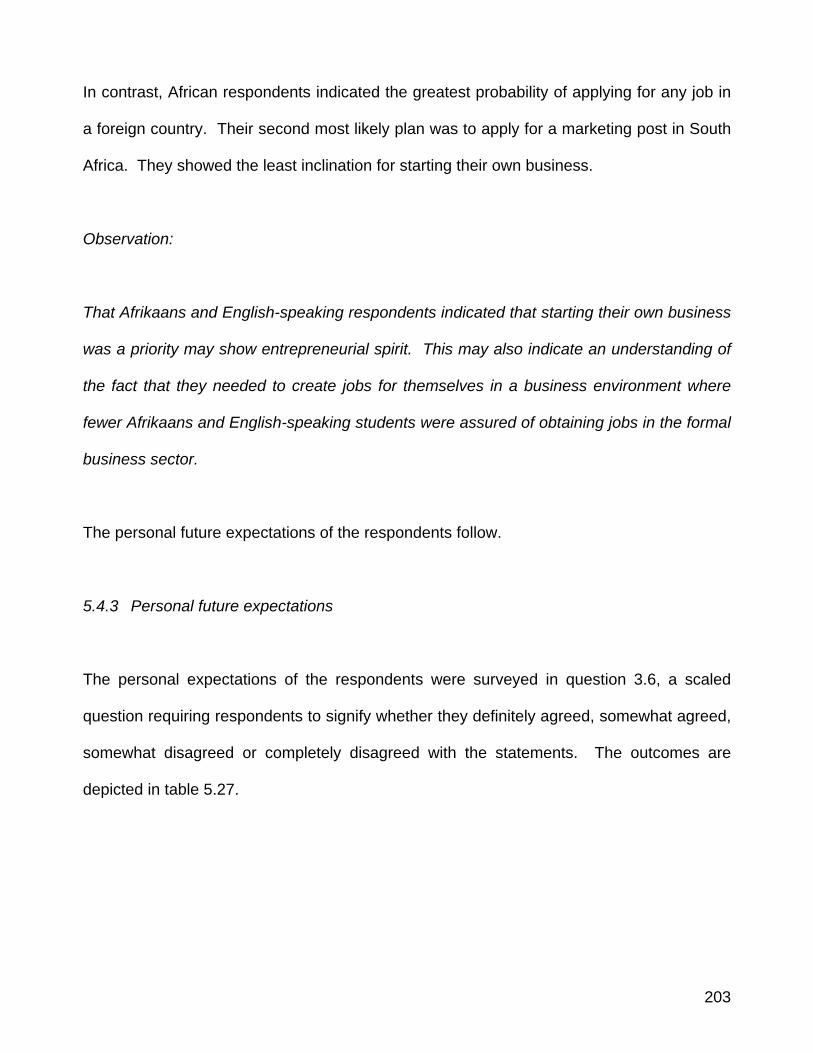
203
In contrast, African respondents indicated the greatest probability of applying for any job in
a foreign country. Their second most likely plan was to apply for a marketing post in South
Africa. They showed the least inclination for starting their own business.
Observation:
That Afrikaans and English-speaking respondents indicated that starting their own business
was a priority may show entrepreneurial spirit. This may also indicate an understanding of
the fact that they needed to create jobs for themselves in a business environment where
fewer Afrikaans and English-speaking students were assured of obtaining jobs in the formal
business sector.
The personal future expectations of the respondents follow.
5.4.3 Personal future expectations
The personal expectations of the respondents were surveyed in question 3.6, a scaled
question requiring respondents to signify whether they definitely agreed, somewhat agreed,
somewhat disagreed or completely disagreed with the statements. The outcomes are
depicted in table 5.27.
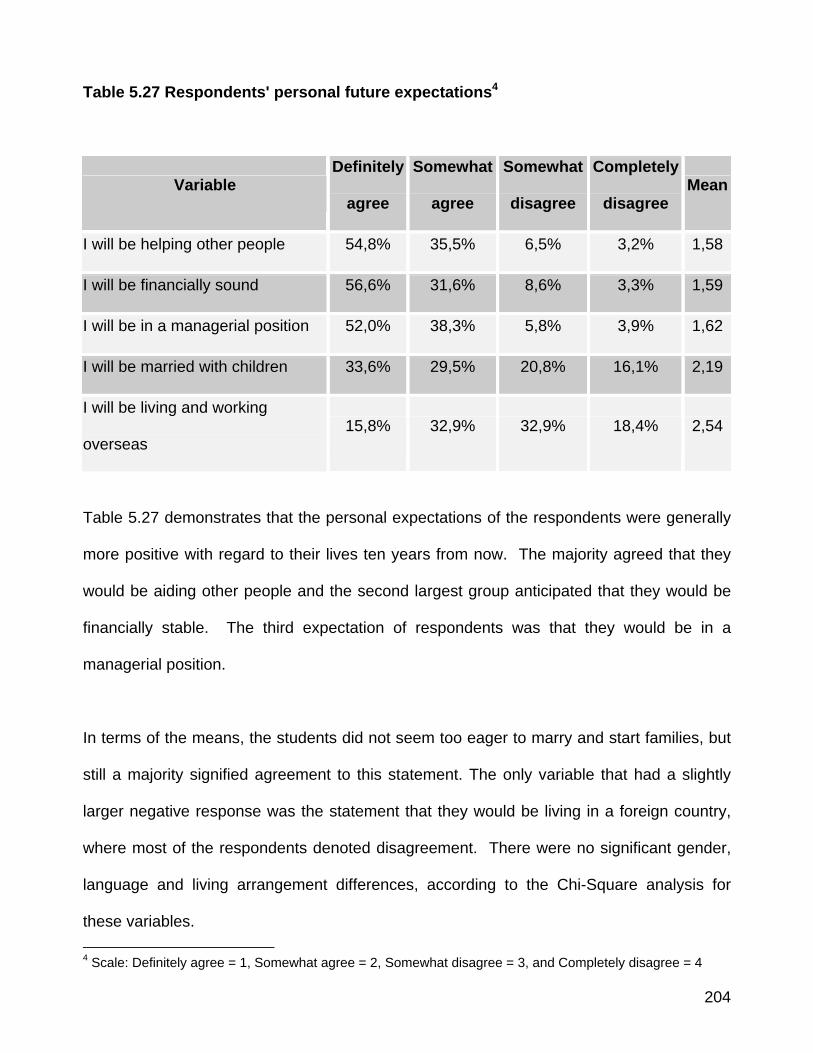
204
Table 5.27 Respondents' personal future expectations4
Variable Definitely
agree
Somewhat
agree
Somewhat
disagree
Completely
disagree Mean
I will be helping other people 54,8% 35,5% 6,5% 3,2% 1,58
I will be financially sound 56,6% 31,6% 8,6% 3,3% 1,59
I will be in a managerial position 52,0% 38,3% 5,8% 3,9% 1,62
I will be married with children 33,6% 29,5% 20,8% 16,1% 2,19
I will be living and working
overseas 15,8% 32,9% 32,9% 18,4% 2,54
Table 5.27 demonstrates that the personal expectations of the respondents were generally
more positive with regard to their lives ten years from now. The majority agreed that they
would be aiding other people and the second largest group anticipated that they would be
financially stable. The third expectation of respondents was that they would be in a
managerial position.
In terms of the means, the students did not seem too eager to marry and start families, but
still a majority signified agreement to this statement. The only variable that had a slightly
larger negative response was the statement that they would be living in a foreign country,
where most of the respondents denoted disagreement. There were no significant gender,
language and living arrangement differences, according to the Chi-Square analysis for
these variables. 4 Scale: Definitely agree = 1, Somewhat agree = 2, Somewhat disagree = 3, and Completely disagree = 4
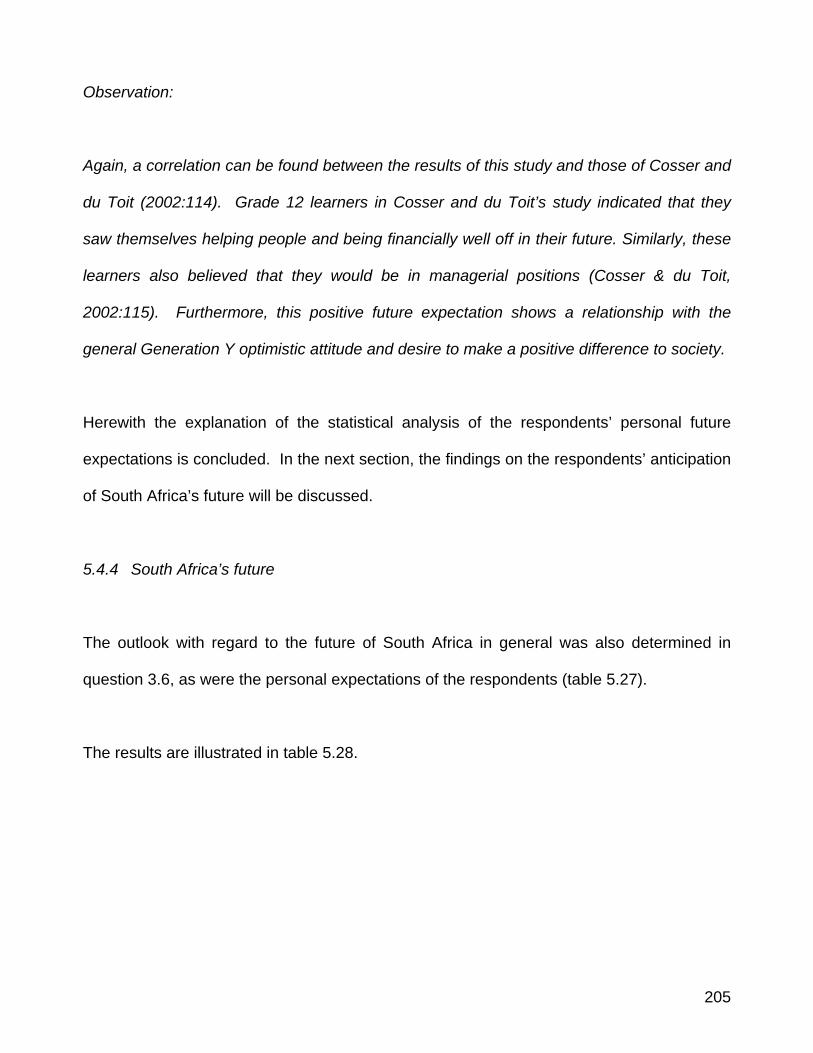
205
Observation:
Again, a correlation can be found between the results of this study and those of Cosser and
du Toit (2002:114). Grade 12 learners in Cosser and du Toit’s study indicated that they
saw themselves helping people and being financially well off in their future. Similarly, these
learners also believed that they would be in managerial positions (Cosser & du Toit,
2002:115). Furthermore, this positive future expectation shows a relationship with the
general Generation Y optimistic attitude and desire to make a positive difference to society.
Herewith the explanation of the statistical analysis of the respondents’ personal future
expectations is concluded. In the next section, the findings on the respondents’ anticipation
of South Africa’s future will be discussed.
5.4.4 South Africa’s future
The outlook with regard to the future of South Africa in general was also determined in
question 3.6, as were the personal expectations of the respondents (table 5.27).
The results are illustrated in table 5.28.
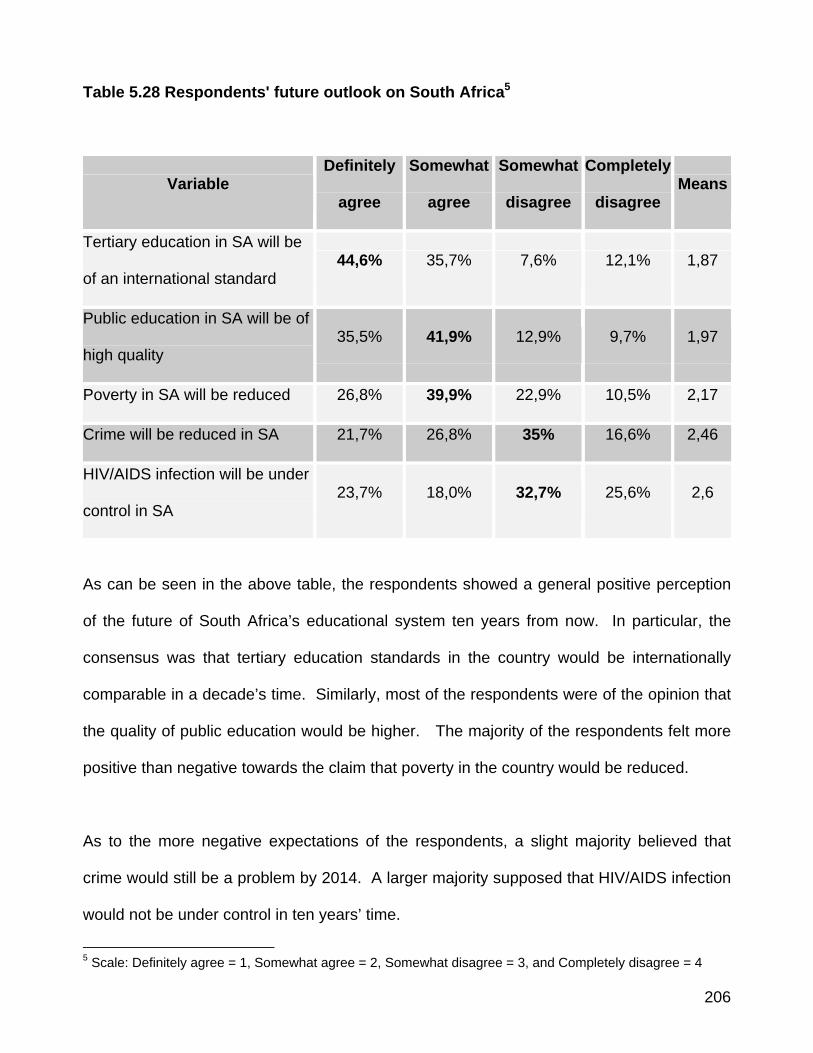
206
Table 5.28 Respondents' future outlook on South Africa5
Variable Definitely
agree
Somewhat
agree
Somewhat
disagree
Completely
disagree Means
Tertiary education in SA will be
of an international standard 44,6% 35,7% 7,6% 12,1% 1,87
Public education in SA will be of
high quality 35,5% 41,9% 12,9% 9,7% 1,97
Poverty in SA will be reduced 26,8% 39,9% 22,9% 10,5% 2,17
Crime will be reduced in SA 21,7% 26,8% 35% 16,6% 2,46
HIV/AIDS infection will be under
control in SA 23,7% 18,0% 32,7% 25,6% 2,6
As can be seen in the above table, the respondents showed a general positive perception
of the future of South Africa’s educational system ten years from now. In particular, the
consensus was that tertiary education standards in the country would be internationally
comparable in a decade’s time. Similarly, most of the respondents were of the opinion that
the quality of public education would be higher. The majority of the respondents felt more
positive than negative towards the claim that poverty in the country would be reduced.
As to the more negative expectations of the respondents, a slight majority believed that
crime would still be a problem by 2014. A larger majority supposed that HIV/AIDS infection
would not be under control in ten years’ time.
5 Scale: Definitely agree = 1, Somewhat agree = 2, Somewhat disagree = 3, and Completely disagree = 4
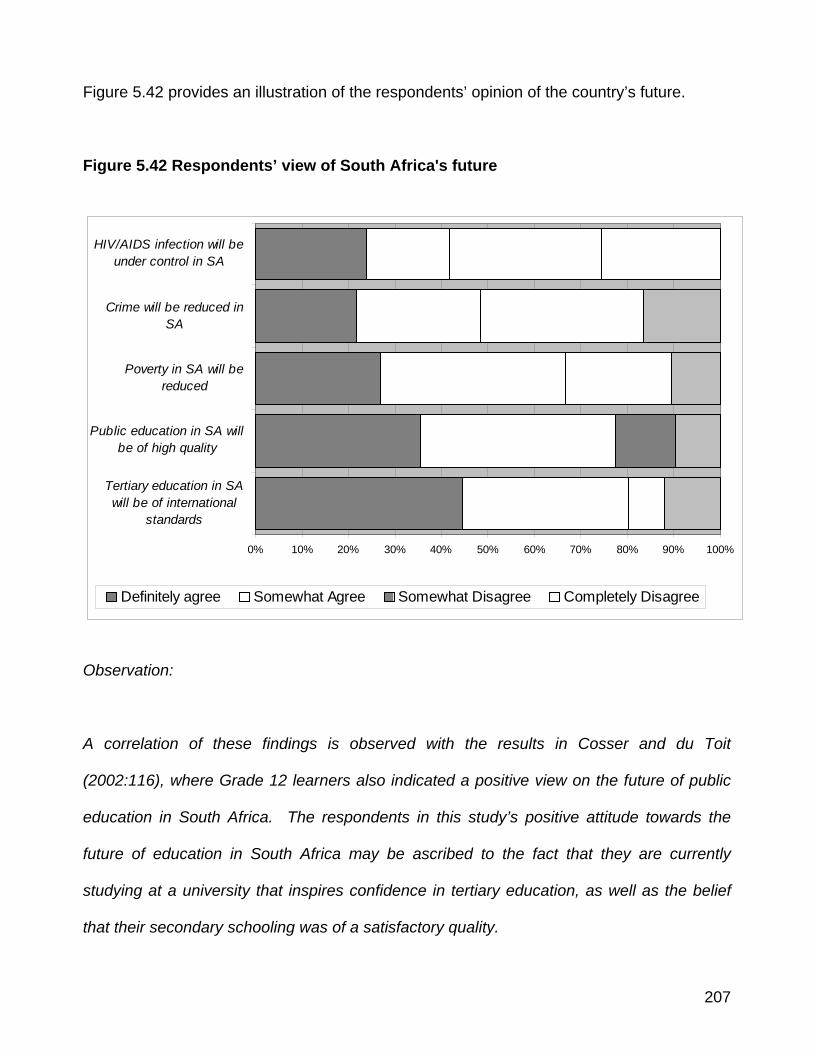
207
Figure 5.42 provides an illustration of the respondents’ opinion of the country’s future.
Figure 5.42 Respondents’ view of South Africa's future
0% 10% 20% 30% 40% 50% 60% 70% 80% 90% 100%
Tertiary education in SAwill be of international
standards
Public education in SA willbe of high quality
Poverty in SA will bereduced
Crime will be reduced inSA
HIV/AIDS infection will beunder control in SA
Definitely agree Somewhat Agree Somewhat Disagree Completely Disagree
Observation:
A correlation of these findings is observed with the results in Cosser and du Toit
(2002:116), where Grade 12 learners also indicated a positive view on the future of public
education in South Africa. The respondents in this study’s positive attitude towards the
future of education in South Africa may be ascribed to the fact that they are currently
studying at a university that inspires confidence in tertiary education, as well as the belief
that their secondary schooling was of a satisfactory quality.
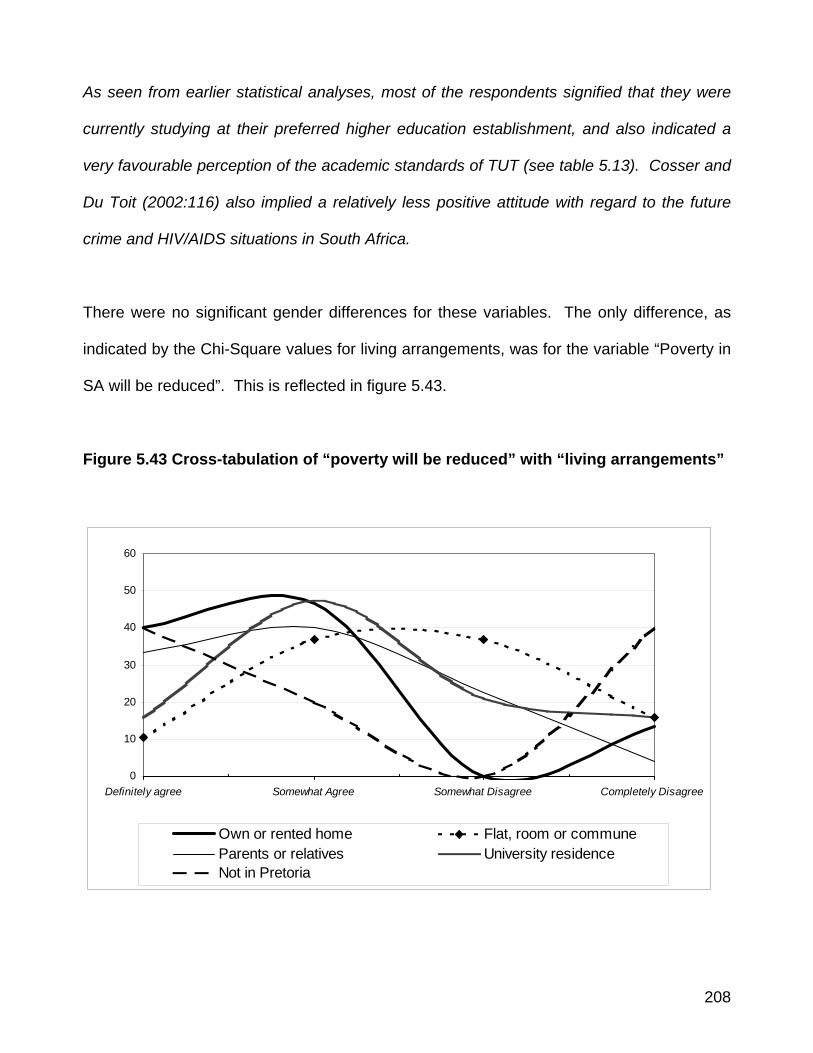
208
As seen from earlier statistical analyses, most of the respondents signified that they were
currently studying at their preferred higher education establishment, and also indicated a
very favourable perception of the academic standards of TUT (see table 5.13). Cosser and
Du Toit (2002:116) also implied a relatively less positive attitude with regard to the future
crime and HIV/AIDS situations in South Africa.
There were no significant gender differences for these variables. The only difference, as
indicated by the Chi-Square values for living arrangements, was for the variable “Poverty in
SA will be reduced”. This is reflected in figure 5.43.
Figure 5.43 Cross-tabulation of “poverty will be reduced” with “living arrangements”
0
10
20
30
40
50
60
Definitely agree Somewhat Agree Somewhat Disagree Completely Disagree
Own or rented home Flat, room or communeParents or relatives University residenceNot in Pretoria
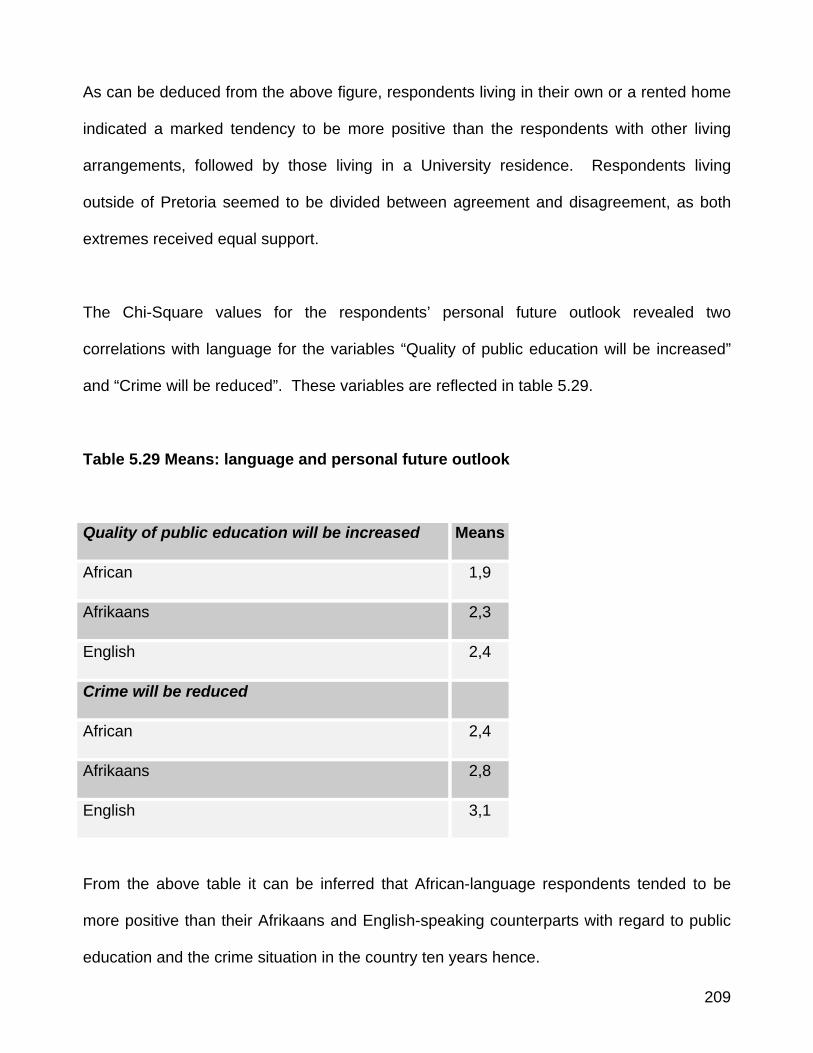
209
As can be deduced from the above figure, respondents living in their own or a rented home
indicated a marked tendency to be more positive than the respondents with other living
arrangements, followed by those living in a University residence. Respondents living
outside of Pretoria seemed to be divided between agreement and disagreement, as both
extremes received equal support.
The Chi-Square values for the respondents’ personal future outlook revealed two
correlations with language for the variables “Quality of public education will be increased”
and “Crime will be reduced”. These variables are reflected in table 5.29.
Table 5.29 Means: language and personal future outlook
Quality of public education will be increased Means
African 1,9
Afrikaans 2,3
English 2,4
Crime will be reduced
African 2,4
Afrikaans 2,8
English 3,1
From the above table it can be inferred that African-language respondents tended to be
more positive than their Afrikaans and English-speaking counterparts with regard to public
education and the crime situation in the country ten years hence.
210
Afrikaans and English-speaking respondents were notably more negative towards the
future crime situation in South Africa.
Observation:
The respondents’ attitudes regarding the variables in Table 5.29 also correspond with the
findings of Cosser and du Toit (2002:116), since, in that study, the respondents also
indicated a more positive attitude among African learners.
Conclusion of the future outlook of the respondents (section 3)
A majority of 52% of the surveyed respondents indicated that they would continue their
studies after completing their current qualification. Of them, 67% wished to continue these
further studies at TUT. In terms of their employment plans, a majority of 56% stated that
they would apply for a marketing job in South Africa, and only 6% planned to apply for any
position in a foreign country.
The respondents’ personal future outlook was generally more positive. A desire to help
other people in the future was ranked highest, and making a living overseas was placed
last. Pertaining to the respondents’ future perspective for the country, a very positive
perception of both the secondary and tertiary educational system was disclosed. The
respondents were not, however positive about the HIV/AIDS situation in South Africa in a
decade’s time.
211
This completes the discussion of the results of section 3 of the questionnaire, namely the
future outlook of the respondents.
5.5 Conclusion
In this chapter, the data analysis was described on the basis of the sections in which the
questionnaire was structured. Firstly, the demographic characteristics of the respondents
were explained. Secondly, the consumer-behaviour variables influencing the consumption
patterns of the respondents were discussed. Lastly, the future outlook of the respondents
was described. In chapter 6, these results will be summarised and recommendations
provided.

CHAPTER 6
CONCLUSIONS AND RECOMMENDATIONS
213
6.1 Introduction
The primary objective of this study was the development of a consumer profile
of Tshwane University of Technology Marketing first year students and the
identification of possible target market segments within the respondent group.
The major motivation for the study was the nationwide survey by the Human
Sciences Research Council (Cosser & Du Toit: 2002), in which Grade 12
learners named Tshwane University of Technology as the first choice for
tertiary education. The literature review also exposed important influencing
factors on tertiary education choices as well as consumption patterns of
tertiary students.
The secondary objectives that support the primary objective are listed next,
and the main findings of the survey on these are included in Table 6.2:
• To determine the communication media habits of students;
• To investigate general consumption patterns of the students;
• To establish the perceptions and attitudes of first year marketing
students towards Tshwane University of Technology;
• To determine influencing factors on students’ consumer decision-
making processes in deciding to study at TUT;
• To determine the students’ views on their own future, as well as the
future of South Africa; and
• To identify new areas of research in the tertiary student market.
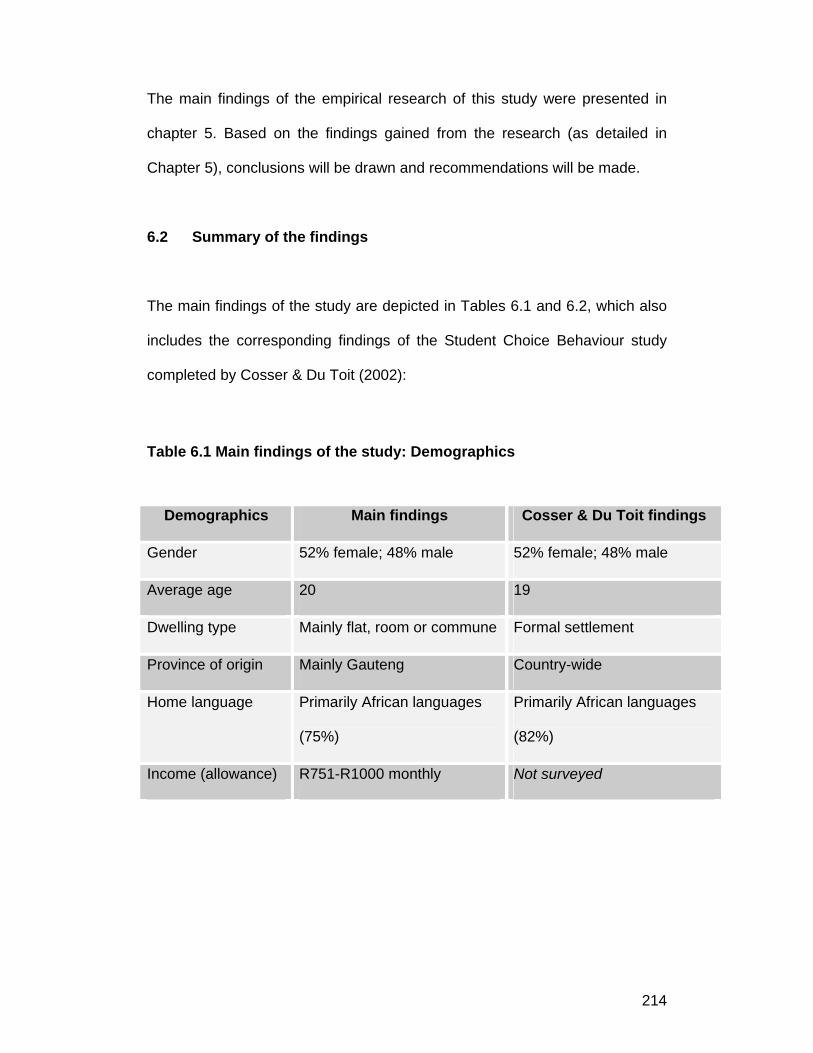
214
The main findings of the empirical research of this study were presented in
chapter 5. Based on the findings gained from the research (as detailed in
Chapter 5), conclusions will be drawn and recommendations will be made.
6.2 Summary of the findings
The main findings of the study are depicted in Tables 6.1 and 6.2, which also
includes the corresponding findings of the Student Choice Behaviour study
completed by Cosser & Du Toit (2002):
Table 6.1 Main findings of the study: Demographics
Demographics Main findings Cosser & Du Toit findings
Gender 52% female; 48% male 52% female; 48% male
Average age 20 19
Dwelling type Mainly flat, room or commune Formal settlement
Province of origin Mainly Gauteng Country-wide
Home language Primarily African languages
(75%)
Primarily African languages
(82%)
Income (allowance) R751-R1000 monthly Not surveyed
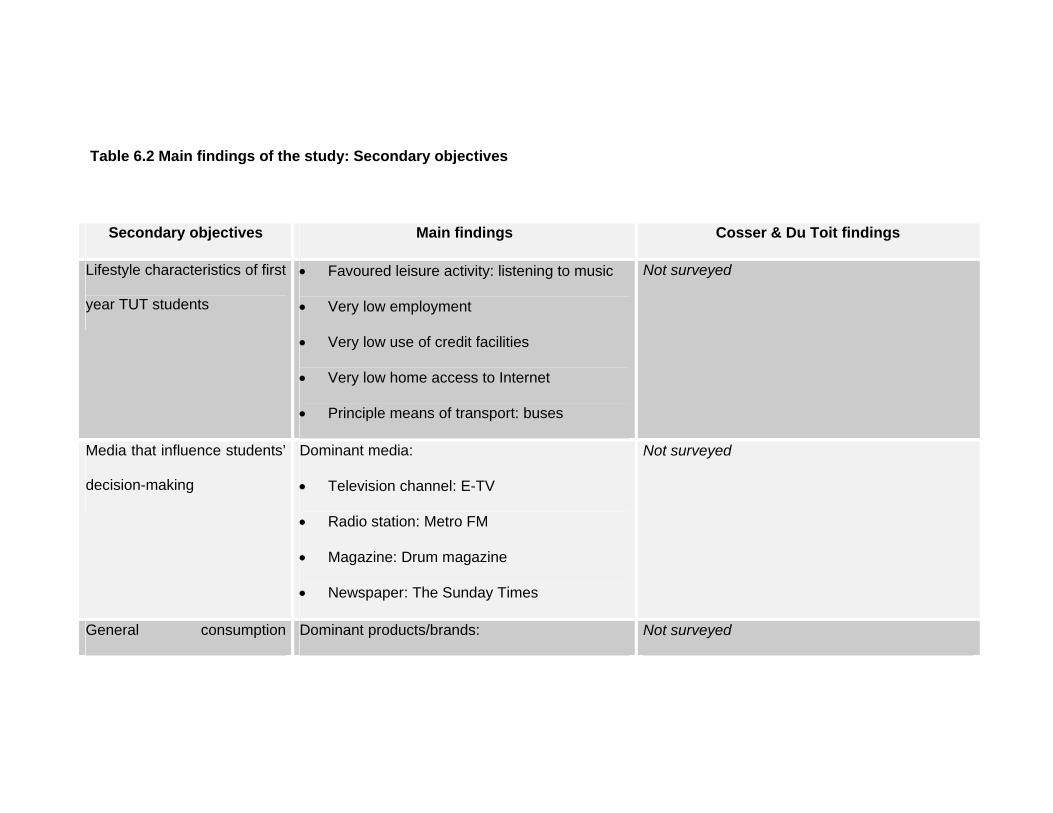
Table 6.2 Main findings of the study: Secondary objectives
Secondary objectives Main findings Cosser & Du Toit findings
Lifestyle characteristics of first
year TUT students
• Favoured leisure activity: listening to music
• Very low employment
• Very low use of credit facilities
• Very low home access to Internet
• Principle means of transport: buses
Not surveyed
Media that influence students’
decision-making
Dominant media:
• Television channel: E-TV
• Radio station: Metro FM
• Magazine: Drum magazine
• Newspaper: The Sunday Times
Not surveyed
General consumption Dominant products/brands: Not surveyed
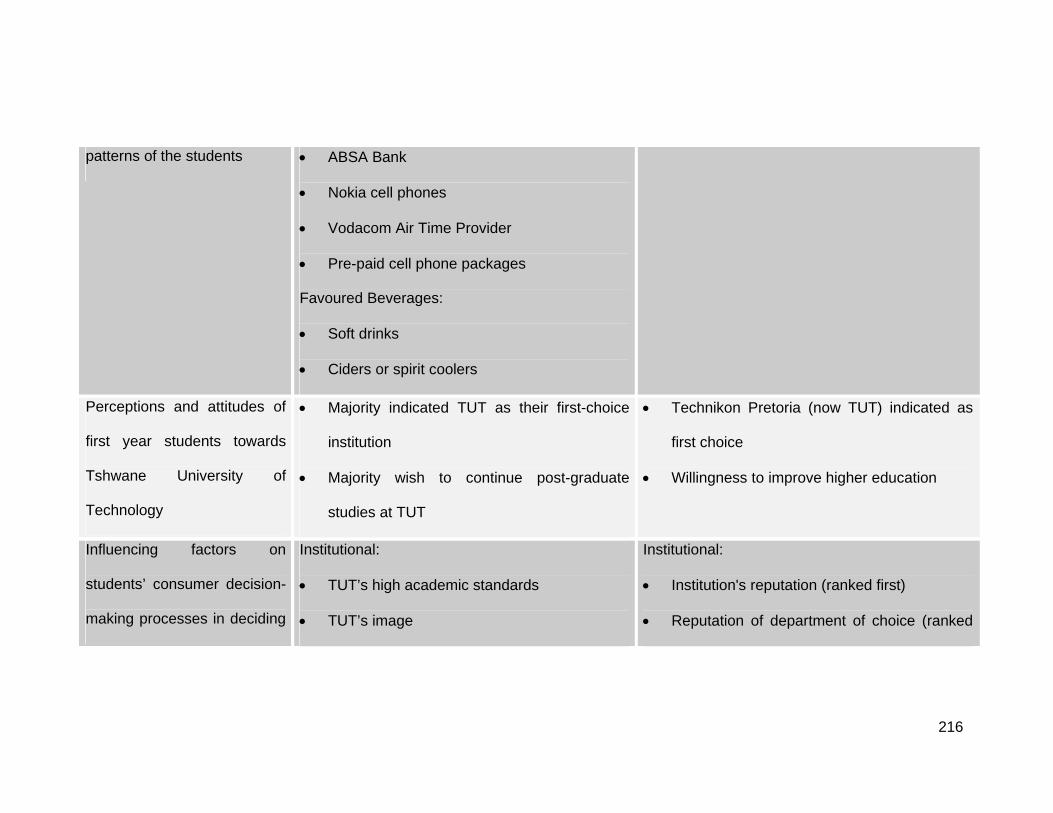
216
patterns of the students • ABSA Bank
• Nokia cell phones
• Vodacom Air Time Provider
• Pre-paid cell phone packages
Favoured Beverages:
• Soft drinks
• Ciders or spirit coolers
Perceptions and attitudes of
first year students towards
Tshwane University of
Technology
• Majority indicated TUT as their first-choice
institution
• Majority wish to continue post-graduate
studies at TUT
• Technikon Pretoria (now TUT) indicated as
first choice
• Willingness to improve higher education
Influencing factors on
students’ consumer decision-
making processes in deciding
Institutional:
• TUT’s high academic standards
• TUT’s image
Institutional:
• Institution's reputation (ranked first)
• Reputation of department of choice (ranked
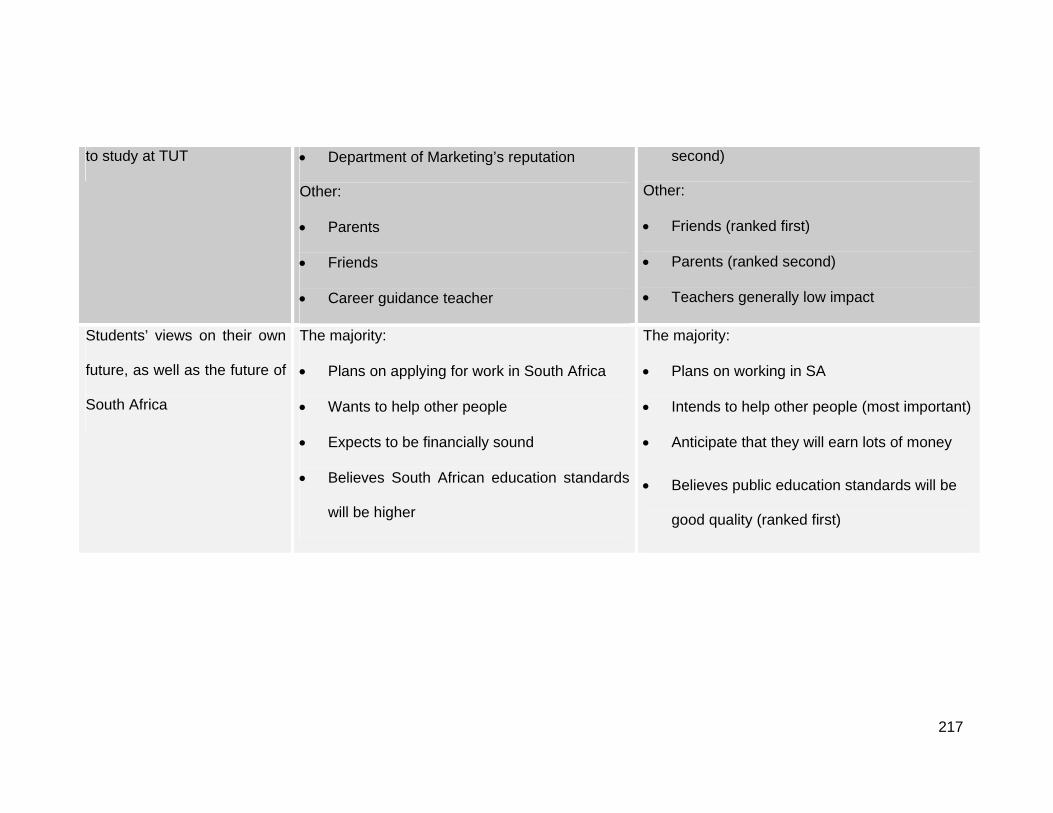
217
to study at TUT • Department of Marketing’s reputation
Other:
• Parents
• Friends
• Career guidance teacher
second)
Other:
• Friends (ranked first)
• Parents (ranked second)
• Teachers generally low impact
Students’ views on their own
future, as well as the future of
South Africa
The majority:
• Plans on applying for work in South Africa
• Wants to help other people
• Expects to be financially sound
• Believes South African education standards
will be higher
The majority:
• Plans on working in SA
• Intends to help other people (most important)
• Anticipate that they will earn lots of money
• Believes public education standards will be
good quality (ranked first)
6.3 Recommendations
The following recommendations must be considered by TUT, particularly the
corporate marketing department of TUT, to positively influence current and
future students to enrol at this university.
6.3.1 Demographic and Lifestyle characteristics of first year TUT students:
low financial means and Internet usage
As the majority of students receive relatively low allowances (see chapter
figure 5.6), the institution should look into helping students financially by, for
example, negotiating better prices for textbooks, stationery and other student-
related products. Another alternative is to investigate the adding of levies for
textbooks to class fees, which would enable the University to negotiate bulk
book prices, and would ensure that every student has the textbooks needed
for every subject. Similarly, bookshops on campus ought to provide easy
credit terms for students to enable them to buy textbooks even when they do
not have cash immediately. Both these options would alleviate the problem of
students having difficulty with studying due to not having the required study
material and the immediate financial means to afford this material.
The students indicated low access (22%) to Internet in their home
environment (chapter 5, paragraph 5.3.3). TUT should increase attempts to
help students access the Internet on campus, as this is an excellent source of
information that students can utilize in completing projects for their studies.
219
Lecturers should be encouraged to allocate time for students in the computer
laboratories on campus to use the Internet for study purposes.
There are two Internet cafés on the Pretoria Campus (buildings 6 and 44),
where students are allocated free time on the Internet. Approximately 170
computers are available in those Internet cafés. Thus it is clear that Internet
resources are available to the student population. The Pretoria Campus has
26 944 students (TUT MIS), which translates to a ratio of approximately 158
students per one Internet café computer. A booking system may be required
if the usage of the Internet cafés increases.
The Internet café’s are, however, not marketed extensively, which may
exacerbate the low usage of the Internet in general. TUT, or the Internet
café’s, should run an awareness campaign on campus, and work in
partnership with academic personnel to facilitate sensible use of the Internet
as a research and academic enrichment tool.
6.3.2 Communication and media:
• Correspondence:
Most of the official correspondence of TUT with students at this point is in
English, whereas a substantial majority of students indicate African languages
as their mother tongue (chapter 5, figure 5.5). Bearing this in mind, TUT
should consider whether its current communication efforts are reaching this
220
segment of its target market. It is recommended that TUT investigate the use
of correspondence in students’ home languages. This would go a long way in
building goodwill and image among the target market.
• Advertising and promotion:
Career guidance teachers (chapter 5, table 5.24) were indicated to have a
large impact on prospective students’ choice of a tertiary institution
(particularly in the case of African learners), whereas events such as the
annual Open Day at TUT do not provide evidence of influencing the student.
TUT is therefore advised to enhance its communication efforts by visiting
secondary schools and building relationships with teachers, particularly career
guidance officials. As the majority of the respondents (77,2%) originate from
the northern provinces, namely Gauteng, Northern Province and North-West
Province (chapter 5, figure 5.4), schools in those provinces should be
targeted.
Because students are social beings, portraying the social side of student life
in advertising aimed at future students is recommended. Broadcast
advertising designed for students at TUT should be aired on E-TV or Metro
FM for maximum exposure, as those are the broadcast media preferred by
the majority of the respondents (chapter 5, paragraph 5.3.2). For live
promotional efforts, TUT ought to make use of Metro FM DJs as celebrity
participants. Depictions of the student lifestyle for promotional purposes
should utilise R&B, house and hip-hop music. The characteristics of those
221
music subcultures could also be included in the visual aspects of promotions
or advertisements.
TUT is advised to consider using the above recommendations in marketing
efforts aimed at reaching potential students and building a student-life
advertising campaign to establish a strong brand presence in the existing and
future target market.
6.3.3 Specific needs of students
Small businesses on campus are advised to carry prepaid air-time vouchers
for all three cell phone air-time providers, as the majority of students have
prepaid packages.
It is recommended that the restaurants on campus that serve alcohol give
preference to stocking ciders, wine and beer, as those are the preferred
alcoholic beverages of the target group.
6.3.4 Perceptions and attitudes of first year students
In view of the fact that the reputation of the institution, as well as that of the
academic Department of Marketing (see chapter 5, table 5.21), is an
important influencing factor, it is recommended that TUT focus strongly on
image building in its corporate marketing campaign. In 2004, the Corporate
Relations Department of TUT focused on establishing the new TUT brand by
222
advertising in the printed media, and including the new logo and its meaning
in all articles and communication with external parties. Similarly, posters were
used that depicted the new brand and the tagline: “We empower people.”
This is also depicted on TUT buses.
Advertising to parents and peers, who have a large influence on prospective
students (see chapter 5, table 5.24), should also be integrated. Bearing in
mind the major impact that parents and peers have on the decision to study at
TUT, marketing to parents and portraying social situations in advertising are
recommended. TUT could consider sending marketing information to parents
of high-performing learners in secondary schools, as well as to the learners.
Such material could include congratulations on outstanding results. This
would require TUT’s Recruitment department to build good relations with
schools and guidance teachers who would be able to direct TUT to high-
quality learners in each school.
Rather than relying on only TUT’s annual Open Day (which usually coincides
with the open days of various other competing higher institutions) for
maximum exposure, TUT should contemplate organising information sessions
at secondary schools in its target areas. They could take the form of “mini
Open Days”, including stalls with both general and contact information for all
faculties. To streamline this process, a need-identification survey could be
completed at each target school before the information session, to enable
TUT to provide information relevant to the target schools’ needs, for example,
specific preferred courses, thus excluding unnecessary details.
223
6.3.5 Students’ future outlook
It is suggested that students who have completed diplomas or degrees be
encouraged to continue with postgraduate studies, as there was quite a
significant percentage (38%) of respondents who were unsure of whether or
not to study further (chapter 5, figure 5.38). TUT should consider providing
incentives for graduates to further their continued education (for example,
postgraduate studies) at the institution. Graduates could be contacted via
post or telephone after completing their diploma or degree, and information for
further studies provided. Lecturers for third- and fourth-years should be able
to identify promising students that could be targeted for postgraduate studies.
As most respondents indicated a desire to find a marketing post in South
Africa (chapter 5, figure 5.40), TUT is advised to endeavour facilitating the
job-finding process by helping students identify and apply for viable marketing
posts in the country. This could be achieved by offering assistance in
compiling résumés and preparing students for job hunting and the
interviewing process.
TUT should encourage students to become entrepreneurs and start their own
businesses, since employment is hard to find, and the Government provides
incentives for entrepreneurs. This process could also be facilitated by the
institution, and TUT could play a role in identifying such opportunities. This
could be accomplished by adding a compulsory entrepreneurship module to
all study courses.
224
This concludes the recommendations and suggestions based on the research
findings.
6.4 Areas for further studies
In the course of this study the following areas for further research were
identified:
• A study on the expenditure patterns of all TUT students (perhaps even in
various institutions for comparative purposes), is advisable. This will
provide a clear picture of the buying patterns of post-school students who
do not yet earn a salary.
• The impact of broadcast and print advertising in media utilized by the
youth in South Africa should be researched to enable companies,
including tertiary institutions, to maximize the effectiveness of their
promotional efforts.
• A survey to identify different subcultures in the student market will enable
marketers on campuses to refine their product and brand supplies to be
more appropriate for the student market preferences.
• With the exponential development in information technology and the
growth of online marketing, research determining the grounds for the low
Internet usage of these students would provide insight into the
225
perceptions that the students have with regard to the Internet, and identify
possible misconceptions.
• Research into examining the brand equity of thriving youth brands (such
as the Yired Group), concentrating specifically on Generation Y, would
offer valuable insight into the grounds for the success of such brands for
companies entering the youth market, including higher education
institutions.
• South African tertiary institutions are faced with an extremely competitive
market and a target market not susceptible to traditional marketing
strategies. The effectiveness of the current marketing efforts of tertiary
institutions should be investigated and suggestions for improvement
should be determined.
• A tracking study should be done on this group of first year students to
monitor how changes occur.
The above concludes possible areas for future research opportunities.
6.5 Summary
In view of the objectives of the study and the results gained from the research,
recommendations have been made in this chapter. The Tshwane University
of Technology was chosen as the preferred tertiary institution, according to
226
the research of Cosser and Du Toit (2002:5), and this study followed up on
this research. Compiling a consumer profile of the TUT first-year marketing
student (the primary objective of this study) included establishing the factors
influencing the students’ tertiary education choices. An understanding of
these factors would enable TUT to fine-tune its marketing to reach its target
market optimally.
An important consideration for TUT is the fact that the majority of the students
speak African languages. Therefore, TUT should consider the use of
language to segment the market. Sub cultural influences such as music and
media preferences should also play a role in the development of TUT’s
internal and external marketing strategies.
The annual Open Day should be reconsidered, as it does not have a
substantial effect on the target market’s decision-making process. Influencing
parents, peers and teachers should form part of TUT’s marketing, as these
reference groups have a significant impact on the students’ higher education
choices. TUT is advised to form vibrant partnerships with secondary schools,
particularly in Gauteng, Northern Province and the North-West Province – the
largest feeding areas for TUT – to facilitate attracting top-class learners and to
build goodwill and strong brand preference among the target market.
TUT’s Recruitment Department should establish measures to assist in
selecting the best learners (nor only for TUT, but specifically for the academic
Department of Marketing at TUT), such as scouting out and initiating personal

227
contact with top performers in secondary schools. Relationships with
secondary schools, including career guidance officials at those schools, would
enhance this process.
TUT has exerted considerable efforts in establishing the new logo via print
media and articles. Building strong brand awareness, establishing a vibrant
corporate image and extending the existing brand preference are important
marketing objectives that TUT should focus on in the highly competitive
tertiary education industry in South Africa. The Department of Marketing at
TUT should also focus on building an even more positive image, as this is
also a strong influencing factor in students’ decision-making.
Furthermore, TUT should facilitate the job-finding process for students, as
well as providing incentives for postgraduate studies at the institution.
Implementing an entrepreneurship module in all courses provided at TUT is
advisable, so as to empower the graduates to start their own businesses after
obtaining a qualification.
The Tshwane University of Technology (formerly Technikon Pretoria) has a
remarkable heritage and a competitive edge, due to its status as preferred
tertiary education brand. This provides a solid foundation for establishing a
commanding presence in the extremely competitive higher education industry.

228
Careful image building and creating strong brand equity would empower this
institution to reach its vision to become the leading higher education institution
in Southern Africa, and in committing to excellence, truly empower people.
229
BIBLIOGRAPHY
Anderson, Kay. 2002. A generation that will matter. Home Accents Today. 17
(11), November:31
Assael, H. 1998. Consumer Behavior and Marketing Action. 6th edition.
Cincinnati: South-Western College Publishing
Behr, A.L. & Macmillan, R.G. 1966. Education in South Africa. Pretoria: JL
Van Schaik, Ltd, Publishers
Behr, A.L. 1988. Education in South Africa. Origins, Issues and Trends:
1652-1988. Pretoria: Academica
Bennett, Peter D. 1995. Dictionary of marketing terms. Lincolnwood, Illinois:
NTC Business Books
BFA/BINEB. 1996. Inkomste- en bestedingspatrone van ongetroude
voorgraadse studente aan die Universiteit van Pretoria. Verslag A13
Burgess, S. 2002. SA Tribes. Who we are, how we live, what we want from
life. Claremont: New Africa Books
Cant, M., Brink, A., & Brijbal, S. 2006. Consumer behaviour. Caper Town:
Juta & Co. Ltd
Cant, M., Gerber-Nel, C., Nel, D & Kotzé T. 2003. Marketing Research.
Claremont: New Africa Books (Pty) Ltd
Chisnall, P.M. 1995. Consumer behaviour. 3rd edition. London: McGraw-Hill
Churchill, G.A. & Iacobucci, D. 2005. Marketing Research. Methodological
Foundations. 9th edition. South-Western Thomson
Clemente, M.N. 1992. The Marketing Glossary: key terms, concepts, and
applications in marketing management, advertising, sales promotion, public
230
relations, direct marketing, market research, sales. New York: American
Management Association
Cosser, M. & Du Toit, J. 2002. From school to higher education. Factors
affecting the choices of Grade 12 learners. HSRC Publishers
Du Plessis, P.J. & Rousseau, G.G. 2003. Buyer behaviour: A Multi-Cultural
Approach. 3rd edition. Cape Town: Oxford University Press Southern Africa
Green, Judy. 2005. Drinks for Chicks. Moneyweb Holdings Limited, 1997-
2005. 16 March
Hawkins, D.I., Best, R.J. & Coney, K.A. 2001. Consumer Behavior. Building
Marketing Strategy. 8th edition. Homewood, Illinois: Irwin
Heckman, James. 1999. Poor college students ain’t what they used to be.
Marketing News. 33 (17):3
http://www.answers.com/kwaito
http://www.encyclopedia.lockergnome.com
Internet Café: Pretoria Campus of Tshwane University of Technology. 2005.
Personal Interview. 30 August, Pretoria
Jansen Van Vuuren, P.E. 1988. Administrasie van die Technikon Pretoria.
Meestersgraadverhandeling vir UNISA
Kapner, S. & Cybulski, A. 1997. Under-standing. Restaurant Business.
96(14), 15 July
Kotler, P. 2003. Marketing Management. 11th edition. New Jersey: Prentice-
Hall
Leedy, P.D & Ormrod, J.E. 2005. Practical Research. Planning and Design.
8th edition. New Jersey: Pearson Prentice Hall
231
Martins J.H., Loubser, M. & Van Wyk, H. 1996. Marketing research: a South
African Approach. Pretoria: Unisa
Marx, Wendy. 1995. Marketing 101: smart marketers are now seeing college
students with dollar signs in their eyes. Management Review. 85(9),
September:40
McDaniel, C & Gates, R. 2004. Marketing Research Essentials. 4th edition.
Ohio: International Thomson Publishing
Neal, C.M., Quester, P., & Hawkins, D.I. 2002. Consumer Behavior.
Implications for Marketing Strategy. Roseville: McGraw-Hill Australia Pty Ltd
Neuborne, E & Kerwin, K. 1999. Generation Y. Business Week. 15 February
Nielsen, A.C. 2004. Do the top brands have the biggest budgets? www.biz-
community.com. 27 July
Rieger, Nancy. 1992. Does it take a heroic task to sell to collegiates? Ask
Hogan. Footwear News. 48(48), 30 November:2
Rix, Peter. 2005. Marketing. A practical approach. 5th edition. North Ryde:
McGraw-Hill Australia
Schiffman, L.G. & Kanuk, L.L. 1997. Consumer Behavior. 6th edition. New
Jersey: Prentice Hall
Schiffman, L.G. & Kanuk, L.L. 2004. Consumer Behavior. 8th edition. New
Jersey: Prentice Hall
Schneidermann, I.P. 2000. Echo Boomers: staggering spending power.
WWD. 3 February :4B
South Africa. 1995. Technikons Amendment Act, 1995 (Act 27 of 1995).
Pretoria: Government Printer
232
South Africa. Ministry of Education. 2002. Transformation and Restructuring:
A New Institutional Landscape for Higher Education. June. Pretoria:
Government Printer
Statistics South Africa. 2003. Census in Brief. Pretoria. P 7
Stone, M., Stanton, H., Kirkham, J., & Pyne, W. 2001. The digerati:
Generation Y finds its voice. Why cannot brands do the same? Journal of
Targeting, Measurement & Analysis for Marketing. 10(2), December:158
Technikon Financial Aid Bureau. 2004. Telephone interview. 9 January
Tshwane University of Technology Management Information System (MIS)
Tustin, D.H., Ligthelm, A.A., Martins, J.H., & Van Wyk, H de J. 2005.
Marketing Research in Practice. Pretoria: Unisa Press
Vaida, G. 2004. Business Times. Y a strategy is essential. 13 July
Wegner, T. 2000. Quantitative Methods for Marketing Decisions. Cape Town:
Juta & Co
Weissman, R.X. 1999. School daze. American Demographics. 21(8),
August:80
Welman, J.C. & Kruger, S.J. 2001. Research methodology for the business
and administrative sciences. Cape Town: Oxford University Press
West, Chris. 1999. Marketing Research. Hampshire: Macmillan Press Ltd
Wolburg, J.M. & Pokrywczynski, J. 2001. A psychographic analysis of
generation Y college students. Journal of Advertising Research. 41(5),
September/October
Yadin, Daniel L. 2002. The international dictionary of marketing: over 2,000
professional terms and techniques. London: Kogan Page