A computational model for the analysis of lipoprotein distributions in the mouse: translating FPLC...
17
A Computational Model for the Analysis of Lipoprotein Distributions in the Mouse: Translating FPLC Profiles to Lipoprotein Metabolism Fianne L. P. Sips 1,2 *, Christian A. Tiemann 1,2 , Maaike H. Oosterveer 3 , Albert K. Groen 2,3,4 , Peter A. J. Hilbers 1,2 , Natal A. W. van Riel 1,2 1 Department of Biomedical Engineering, Eindhoven University of Technology, Eindhoven, The Netherlands, 2 Netherlands Consortium for Systems Biology, University of Amsterdam, Amsterdam, The Netherlands, 3 Department of Pediatrics, University Groningen, University Medical Center Groningen, Groningen, The Netherlands, 4 Department of Laboratory Medicine, University Groningen, University Medical Center Groningen, Groningen, The Netherlands Abstract Disturbances of lipoprotein metabolism are recognized as indicators of cardiometabolic disease risk. Lipoprotein size and composition, measured in a lipoprotein profile, are considered to be disease risk markers. However, the measured profile is a collective result of complex metabolic interactions, which complicates the identification of changes in metabolism. In this study we aim to develop a method which quantitatively relates murine lipoprotein size, composition and concentration to the molecular mechanisms underlying lipoprotein metabolism. We introduce a computational framework which incorporates a novel kinetic model of murine lipoprotein metabolism. The model is applied to compute a distribution of plasma lipoproteins, which is then related to experimental lipoprotein profiles through the generation of an in silico lipoprotein profile. The model was first applied to profiles obtained from wild-type C57Bl/6J mice. The results provided insight into the interplay of lipoprotein production, remodelling and catabolism. Moreover, the concentration and metabolism of unmeasured lipoprotein components could be determined. The model was validated through the prediction of lipoprotein profiles of several transgenic mouse models commonly used in cardiovascular research. Finally, the framework was employed for longitudinal analysis of the profiles of C57Bl/6J mice following a pharmaceutical intervention with a liver X receptor (LXR) agonist. The multifaceted regulatory response to the administration of the compound is incompletely understood. The results explain the characteristic changes of the observed lipoprotein profile in terms of the underlying metabolic perturbation and resultant modifications of lipid fluxes in the body. The Murine Lipoprotein Profiler (MuLiP) presented here is thus a valuable tool to assess the metabolic origin of altered murine lipoprotein profiles and can be applied in preclinical research performed in mice for analysis of lipid fluxes and lipoprotein composition. Citation: Sips FLP, Tiemann CA, Oosterveer MH, Groen AK, Hilbers PAJ, et al. (2014) A Computational Model for the Analysis of Lipoprotein Distributions in the Mouse: Translating FPLC Profiles to Lipoprotein Metabolism. PLoS Comput Biol 10(5): e1003579. doi:10.1371/journal.pcbi.1003579 Editor: Vassily Hatzimanikatis, Ecole Polytechnique Fe ´de ´rale de Lausanne, Switzerland Received September 6, 2013; Accepted March 11, 2014; Published May 1, 2014 Copyright: ß 2014 Sips et al. This is an open-access article distributed under the terms of the Creative Commons Attribution License, which permits unrestricted use, distribution, and reproduction in any medium, provided the original author and source are credited. Funding: This study was supported by the Netherlands Consortium for Systems Biology, Top Institute Pharma (grant T2-110), and the European Union, FP7- HEALTH (nr. 305707). The funders had no role in study design, data collection and analysis, decision to publish, or preparation of the manuscript. Competing Interests: The authors have declared that no competing interests exist. * E-mail: [email protected] Introduction The transport of lipids between mammalian tissues is largely facilitated by lipoproteins. Lipoproteins are spherically organized protein-lipid compounds that, unlike the individual lipids, are soluble in blood. To achieve this vital property the outer shell of the lipoprotein is a surface layer consisting mainly of phospholipids (PL), free cholesterol (FC) and proteins. The most hydrophobic lipids are stored in the core of the particle which consists largely of triglycerides (TG) and cholesteryl ester (CE). The body produces three classes of lipoproteins [1], [2]. These classes differ with regard to size, lipid composition and protein content and have distinct origins [3], [4]. Chylomi- crons, produced in the intestine from dietary lipids, contain mainly TG and represent the largest, least dense particles [5], [6]. The liver excretes TG-rich lipoproteins of a smaller size, which are known as very low density lipoproteins (VLDL) [4], [7]. High density lipoproteins (HDL), the smallest class, exhibit a relatively high protein and cholesterol content and originate in the intestine and liver [3], [8], [9]. Further processing of circulating chylomicrons, VLDL and HDL, in turn, generates additional classes of lipoproteins which vary in size and composition and exhibit great metabolic diversity [7], [10], [11], [12], [13]. Abnormalities of lipoprotein concentration, size and composi- tion are known risk factors for cardiovascular diseases. More specifically, a low concentration of HDL cholesterol and/or a high concentration of low density lipoprotein (LDL) particles, as often observed in the Metabolic Syndrome and Type II Diabetes, is associated with an increased risk of atherosclerosis [2], [14], [15]. Preclinical research in mice is an important component in the search for treatment and prevention of these diseases [16], [17]. Despite the extensive use of mouse models the complex reactions determining plasma lipoprotein composition are not well under- stood. In this study we aim to develop a method which quantitatively relates murine lipoprotein size, composition and concentration to lipoprotein metabolism. PLOS Computational Biology | www.ploscompbiol.org 1 May 2014 | Volume 10 | Issue 5 | e1003579
-
Upload
independent -
Category
Documents
-
view
3 -
download
0
Transcript of A computational model for the analysis of lipoprotein distributions in the mouse: translating FPLC...

A Computational Model for the Analysis of LipoproteinDistributions in the Mouse: Translating FPLC Profiles toLipoprotein MetabolismFianne L. P. Sips1,2*, Christian A. Tiemann1,2, Maaike H. Oosterveer3, Albert K. Groen2,3,4,
Peter A. J. Hilbers1,2, Natal A. W. van Riel1,2
1 Department of Biomedical Engineering, Eindhoven University of Technology, Eindhoven, The Netherlands, 2 Netherlands Consortium for Systems Biology, University of
Amsterdam, Amsterdam, The Netherlands, 3 Department of Pediatrics, University Groningen, University Medical Center Groningen, Groningen, The Netherlands,
4 Department of Laboratory Medicine, University Groningen, University Medical Center Groningen, Groningen, The Netherlands
Abstract
Disturbances of lipoprotein metabolism are recognized as indicators of cardiometabolic disease risk. Lipoprotein size andcomposition, measured in a lipoprotein profile, are considered to be disease risk markers. However, the measured profile is acollective result of complex metabolic interactions, which complicates the identification of changes in metabolism. In thisstudy we aim to develop a method which quantitatively relates murine lipoprotein size, composition and concentration tothe molecular mechanisms underlying lipoprotein metabolism. We introduce a computational framework whichincorporates a novel kinetic model of murine lipoprotein metabolism. The model is applied to compute a distribution ofplasma lipoproteins, which is then related to experimental lipoprotein profiles through the generation of an in silicolipoprotein profile. The model was first applied to profiles obtained from wild-type C57Bl/6J mice. The results providedinsight into the interplay of lipoprotein production, remodelling and catabolism. Moreover, the concentration andmetabolism of unmeasured lipoprotein components could be determined. The model was validated through the predictionof lipoprotein profiles of several transgenic mouse models commonly used in cardiovascular research. Finally, theframework was employed for longitudinal analysis of the profiles of C57Bl/6J mice following a pharmaceutical interventionwith a liver X receptor (LXR) agonist. The multifaceted regulatory response to the administration of the compound isincompletely understood. The results explain the characteristic changes of the observed lipoprotein profile in terms of theunderlying metabolic perturbation and resultant modifications of lipid fluxes in the body. The Murine Lipoprotein Profiler(MuLiP) presented here is thus a valuable tool to assess the metabolic origin of altered murine lipoprotein profiles and canbe applied in preclinical research performed in mice for analysis of lipid fluxes and lipoprotein composition.
Citation: Sips FLP, Tiemann CA, Oosterveer MH, Groen AK, Hilbers PAJ, et al. (2014) A Computational Model for the Analysis of Lipoprotein Distributions in theMouse: Translating FPLC Profiles to Lipoprotein Metabolism. PLoS Comput Biol 10(5): e1003579. doi:10.1371/journal.pcbi.1003579
Editor: Vassily Hatzimanikatis, Ecole Polytechnique Federale de Lausanne, Switzerland
Received September 6, 2013; Accepted March 11, 2014; Published May 1, 2014
Copyright: � 2014 Sips et al. This is an open-access article distributed under the terms of the Creative Commons Attribution License, which permits unrestricteduse, distribution, and reproduction in any medium, provided the original author and source are credited.
Funding: This study was supported by the Netherlands Consortium for Systems Biology, Top Institute Pharma (grant T2-110), and the European Union, FP7-HEALTH (nr. 305707). The funders had no role in study design, data collection and analysis, decision to publish, or preparation of the manuscript.
Competing Interests: The authors have declared that no competing interests exist.
* E-mail: [email protected]
Introduction
The transport of lipids between mammalian tissues is
largely facilitated by lipoproteins. Lipoproteins are spherically
organized protein-lipid compounds that, unlike the individual
lipids, are soluble in blood. To achieve this vital property the outer
shell of the lipoprotein is a surface layer consisting mainly of
phospholipids (PL), free cholesterol (FC) and proteins. The
most hydrophobic lipids are stored in the core of the particle
which consists largely of triglycerides (TG) and cholesteryl ester
(CE).
The body produces three classes of lipoproteins [1], [2].
These classes differ with regard to size, lipid composition
and protein content and have distinct origins [3], [4]. Chylomi-
crons, produced in the intestine from dietary lipids, contain
mainly TG and represent the largest, least dense particles [5], [6].
The liver excretes TG-rich lipoproteins of a smaller size,
which are known as very low density lipoproteins (VLDL)
[4], [7]. High density lipoproteins (HDL), the smallest class,
exhibit a relatively high protein and cholesterol content and
originate in the intestine and liver [3], [8], [9]. Further processing
of circulating chylomicrons, VLDL and HDL, in turn, generates
additional classes of lipoproteins which vary in size and
composition and exhibit great metabolic diversity [7], [10], [11],
[12], [13].
Abnormalities of lipoprotein concentration, size and composi-
tion are known risk factors for cardiovascular diseases. More
specifically, a low concentration of HDL cholesterol and/or a high
concentration of low density lipoprotein (LDL) particles, as often
observed in the Metabolic Syndrome and Type II Diabetes, is
associated with an increased risk of atherosclerosis [2], [14], [15].
Preclinical research in mice is an important component in the
search for treatment and prevention of these diseases [16], [17].
Despite the extensive use of mouse models the complex reactions
determining plasma lipoprotein composition are not well under-
stood. In this study we aim to develop a method which
quantitatively relates murine lipoprotein size, composition and
concentration to lipoprotein metabolism.
PLOS Computational Biology | www.ploscompbiol.org 1 May 2014 | Volume 10 | Issue 5 | e1003579

Lipoprotein size, composition and concentration can be
quantified in a lipoprotein profile. In preclinical research, profiles
are generated to analyse the impact of genetic, dietary and
pharmacological interventions on the lipoprotein phenotype.
These profiles are generally generated by means of fast protein
liquid chromatography (FPLC), a method for size-based lipopro-
tein separation from serum or plasma [18], [19], [20]. The
retrieved size fractions are subsequently analysed using biochem-
ical assays to quantify lipid and protein contents. As lipoprotein
size and composition are determined by multiple metabolic
pathways, it is difficult to directly relate changes in lipoprotein
profiles to the mechanisms that provoke these quantitative and
qualitative differences.
The application of computational methods provides a powerful
tool to retrieve insight into the complex relationship between
lipoprotein metabolism and lipoprotein profiles. In recent years,
two detailed computational models of human lipoprotein metab-
olism have been developed that relate lipoprotein distributions to
underlying metabolism [21], [22]. Despite the importance of
mouse models in preclinical research, there is no computational
framework available to describe the emergence of lipoprotein
distributions from biological principles in mice. Here we develop
the Murine Lipoprotein Profiler (MuLiP), a computational
strategy that quantitatively relates changes in lipoprotein charac-
teristics to altered lipoprotein metabolism in mice. In the
mathematical model, the distribution of the lipoprotein core
composition is determined by kinetic models of VLDL, LDL and
HDL metabolism. The model integrates these kinetic models with
several sets of compositional information from literature [23], [24],
[25], [26] and VLDL-TG production rates to provide a
quantitative overview of the lipid fluxes between lipoproteins
and their relationship to lipoprotein content. The model outcome
is compared to experimental FPLC data by calculating an in silico
FPLC profile from the model.
Due to the common generation of FPLC profiles in preclinical
research of cardiometabolic diseases, MuLiP is widely applicable.
The availability of lipoprotein production and composition data
(e.g. in [24]) and FPLC profiles obtained from knock-out or
transgenic mice is necessary for model application and validation,
and therefore provides a further basis for the development and
validation of the model. The MuLiPs comprehensive description
of endogenous lipoprotein metabolism and compositional
versatility allow a detailed description of the lipid content and
associated metabolic state of plasma lipoproteins.
In this study, the model was first developed for wild-type
C57Bl/6J mouse data. Following the successful description of the
wild-type profile, model performance was evaluated by prediction
of the profiles of several transgenic mouse models commonly used
in preclinical cardiovascular research. Finally, the model was
applied to analyse phenotype changes in profiles obtained from
C57Bl/6J mice that were treated with the anti-atherosclerotic
Liver X receptor (LXR) agonist T0901317 [27]. LXR has been
identified as a central regulator of lipid metabolism [28], and its
activation leads to complex and time-dependent regulatory actions
which are incompletely understood.
Methods
Experimental data: FPLC profiles and VLDL-TGproduction
Two types of data were incorporated to develop the compu-
tational model: the experimentally determined VLDL-TG pro-
duction, and the FPLC profile of plasma lipoproteins.
The FPLC profile was obtained from moderately fasted C57Bl/
6J mice on a chow diet. The FPLC profile was collected as part of
an extensive dataset, which was previously published in [27] and
[29]. For the ethics statement and detailed experimental proce-
dures, we refer to [29]. In short, the lipoprotein profile was
determined by first separating lipoproteins through FPLC,
followed by quantification of the TG and total cholesterol (TC)
in each fraction.
VLDL-TG production was determined following administra-
tion of Triton WR-1339 (0.5 g/kg body weight).
FPLC profiles of three transgenic mouse models were retrieved
from literature for model analysis and validation. The scavenger
receptor class B type 1 (SR-B1) knock-out mouse [30] is a
commonly used mouse model in cardiovascular research which
has a plasma cholesterol concentration of between 50 and 200%
higher than wild-type counterparts [30],[31],[32],[33],[34],[35],
[36]. The HDL peak in the FPLC profile of SR-B1 knock-out mice
is shifted to the left, indicative of larger sized particles [30].
Phospholipid transfer protein (PLTP) knock-out mice display
decreased plasma cholesterol levels [37], [38] and smaller HDL
particles containing less cholesterol. The HDL peak in the FPLC
profile is shifted to the right in comparison to wild-type mice
profiles [37].
While the deficiency of both previous mouse models is found in
HDL metabolism, the low density lipoprotein receptor (LDLr)
knock-out mouse ([39], [40], [41], [42], [43]) has a deficiency
which mainly affects apolipoprotein (Apo) B containing lipoprotein
metabolism. In chow-fed, wild-type mice, this deficiency leads to
moderately increased plasma cholesterol concentrations, which are
mostly due to increased cholesterol levels in the LDL size range.
More moderate increases of VLDL and HDL cholesterol, as well
as an increase of plasma triglycerides are also perceived. These
profiles were reproduced in silico to qualitatively evaluate the
results of simulation of a transgenic mouse model.
For computational analysis of the changes in murine lipoprotein
metabolism in response to a pharmaceutical intervention, profiles
of C57Bl/6J mice treated with LXR agonist T0901317 were
analysed. FPLC profiles of treated mice, as well as the VLDL-TG
production, were taken from the dataset described in [27] and
[29]. The data set of treated mice consists of TC and TG FPLC
profiles of C57Bl/6J mice following 1, 2, 4, 7, 14 and 21 days
of treatment with T0901317. In addition to these profiles,
Author Summary
Lipids such as triglycerides and cholesterol are importantbuilding blocks and energy suppliers for the body.However, because lipids are hydrophobic they require amatrix to circulate in the bloodstream. This function isfulfilled by lipoproteins. Altered lipoprotein metabolism isknown to be associated with disease, for instance there is awell-known association between abnormal lipoprotein-mediated cholesterol transport and atherosclerosis. Thischange in lipoprotein metabolism is reflected in alteredlipoprotein size and lipid composition as illustrated by alipoprotein profile. We developed a mathematical ap-proach, the Murine Lipoprotein Profiler, that links changesin lipoprotein profiles to alterations in lipoprotein metab-olism. The model is developed to provide insight into themechanisms underlying altered lipoprotein profiles inpreclinical research in mice. The model can be used togain further understanding of how a change in thelipoprotein phenotype can result from changes in lipo-protein metabolism.
Computational Analysis of Murine Lipoproteins
PLOS Computational Biology | www.ploscompbiol.org 2 May 2014 | Volume 10 | Issue 5 | e1003579

measurements of the VLDL-TG production were performed in
mice treated for 1, 7 or 14 days.
Computational modelIn order to analyse the lipoprotein profiles, we developed a
computational framework which will be described in the following
three sections and is visualized in Figures 1 and 2 consecutively.
The lipoprotein composition model (Figure 1 B and C), the models
of lipoprotein metabolism (Figure 2 A and B) and the calculation
of the in silico profile (Figure 1A) will be discussed.
Lipoprotein compositional model. In the computational
model, we define a lipoprotein by three characteristics: type, CE
content and TG content. Two types of lipoproteins are
distinguished in the model: HDL and Apo B containing
lipoproteins. The Apo B type, which will be further referred to
as VLDL, comprises not only VLDL but also its derivative LDL.
The content of the remaining major lipid constituents FC and PL
as well as the size of the particle is then calculated from the
lipoprotein core contents as described in this section. The type of
lipoprotein and associated major Apo component are the basis for
the metabolism model.
The lipoprotein diameter is calculated based on the volume of
the two main core components TG and CE (as in [21], [44], [45],
[46]), according to equation (1). This calculation of the lipoprotein
sphere’s diameter based on core volume uses two assumptions: (1)
lipoprotein sphericity, and (2) a fixed surface layer thickness.
D~2| rcorezrpl
� �
~2|#TG:volTGz#CE:volCE
NA: 4
3:p
!13
zrpl
0@
1A ð1Þ
The calculation of lipoprotein diameter (D, in nm) is based on
the number of molecules of core components (denoted by # TG
and # CE respectively), the volumes of a TG and a CE molecule
(volTG and volCE , from [44], in nm3=molecule), Avogadro’s
number (NA) and the thickness of the surface layer (rpl , 2 nm, [44],
[46], [47], [48], [49]). rcore is the calculated radius of the
lipoprotein core.
For calculation of the TC profile, we must define the FC
content of the lipoprotein in addition to the CE content. The FC
and PL content are calculated based on the experimentally
determined ratio of surface lipids to core lipids for various
lipoprotein sizes, as derived from published data (7 classes in [25],
1 class of nascent VLDL from [24]). The FC content is determined
by linearly interpolating the ratio of # FC/(# CE+# TG) over
the logarithm of the radius of the lipoprotein. Extrapolation, when
necessary, is performed by taking the nearest ratios. An analogous
calculation is performed to determine the amount of PLs, now
using the ratio # PL/(# CE+# TG) (Text S1).
Figure 1. Relationship between modelled lipoprotein core composition and in silico lipoprotein profile. A. Representation of an FPLCprofile. The profile was generated through calculation of the euclidean norm of the TG and TC content (in nmol) in each fraction of the untreatedmouse FPLC profile, and is expressed in arbitrary units. B. Surface plot relating calculated VLDL diameter to CE and TG content. Contours representthe calculated positions of FPLC fraction boundaries. In addition to the depicted CE and TG contents the FC and PL contents are also determined forall lipoproteins. Figure 1 in Text S1 depicts the relationship between modelled lipoprotein core composition and surface components FC and PL. C.Surface plot relating calculated HDL diameter to CE and TG content. Contours represent FPLC fraction boundaries. A detailed description of thelipoprotein composition model is provided in Text S1. The calculation of the in silico lipoprotein profile is represented by the arrows, which connectFPLC fractions to the associated surface area in the model as bounded by the fraction boundary contours. All FPLC profiles are composed of discretedata points and are pictured as a series of dots, connected by a line which serves only to guide the eyes. For clarity, the highest measured fractions ofthe FPLC profile have not been pictured. Note that the highest pictured fraction, 37, corresponds to a diameter of 4 nm.doi:10.1371/journal.pcbi.1003579.g001
Computational Analysis of Murine Lipoproteins
PLOS Computational Biology | www.ploscompbiol.org 3 May 2014 | Volume 10 | Issue 5 | e1003579

Computational Analysis of Murine Lipoproteins
PLOS Computational Biology | www.ploscompbiol.org 4 May 2014 | Volume 10 | Issue 5 | e1003579
The absolute content of TG and CE molecules in a single
lipoprotein spans a very wide range [21], [46], [50]. By defining
the compositional model not in terms of absolute lipid content but
in terms of derived indices i and j as will be described, the model is
chosen to describe the metabolism and data more evenly. For the
VLDL and HDL models, the same relation between the indices
and lipid content is applied, but the model constants in this
relation have values unique to the lipoprotein type. The values of
the constants can be found in Text S2 and the diameters of the
modelled HDL and VLDL are visualized in Figure 1C and
Figure 1B respectively. In these figures, the diameter of the
lipoproteins is plotted against the TG and CE content of the
particle. In Text S1, the non-linear relationship between indices i
and j and the TG and CE content is further demonstrated.
The TG content of a particle can be assumed to decline in an
approximately exponential fashion when undergoing lipolysis [22],
and therefore the expected distribution of lipoproteins over the
triglyceride axis is not linear, but exponential. Using this
assumption we define TG index i which relates to the triglyceride
content via
TG(i)~#TGmin:(gTG)i{1 ð2Þ
Here gTG is the growth factor, which is fixed based on the
maximal (#TGmax) and minimal (#TGmin) TG content via
gTG~#TGmax
#TGmin
� � 1imax{1
#TGmax is the TG content at i~imax. As stated previously,
equation (2) is applicable to both the HDL and VLDL grids, but
#TGmax, #TGmin and imax (and therefore also the values of gTG
and TG(i)) are defined separately for VLDL and HDL.
In HDL, the main murine cholesterol carrier, cholesterol
metabolism is a dynamic process in which cholesterol is taken up
by the particle and esterified, but also removed from the particle
by a protein mediated selective lipid uptake process [3]. As
accumulation of CE in the lipoprotein cannot be assumed to be
proportional to its current CE content, an assumption that a
change in a lipoproteins CE content is proportional to its current
CE content is not appropriate. The equation that relates the CE
index j to the CE content must differ from the relation introduced
for TG. The CE index j is defined not on the basis of metabolism,
but such that the distribution of lipoprotein diameter over j
resembles the distribution of lipoprotein diameter over FPLC
fractions. This strategy is employed to more evenly distribute the
simulated lipoproteins over the data points in the FPLC profile.
We define the CE index j in equation (3), ensuring that for small
HDL (i.e., HDL with minimal CE content), the j index is linearly
related to the FPLC fraction number. In this equation, jmax
represents the maximal value of j (Text S2) and Dmin and Dmax are
the minimal and maximal lipoprotein diameters, which can be
calculated from the minimal and maximal CE and TG contents.
For a full derivation of this equation, we refer to Text S1.
CE(j)~NA
: 43
p
8:volCE
10I0 :10I1:j{2:rpl
� �3{
#TGmin:volTG
volCE
ð3Þ
with
I1~log10(Dmax){log10(Dmin)
jmax{1ð4Þ
and
I0~log10(Dmin){I1 ð5Þ
The parameters of the grid are defined for the physiological
ranges of the lipoproteins. In VLDL composition the maximal TG
content exceeds the maximal CE content and in HDL the
maximal CE content exceeds the maximal TG content. TG index
i therefore runs from 1 to 40 in VLDL and 1 to 8 in HDL whereas
the CE index j runs from 1 to 8 in VLDL and from 1 to 40 in
HDL.
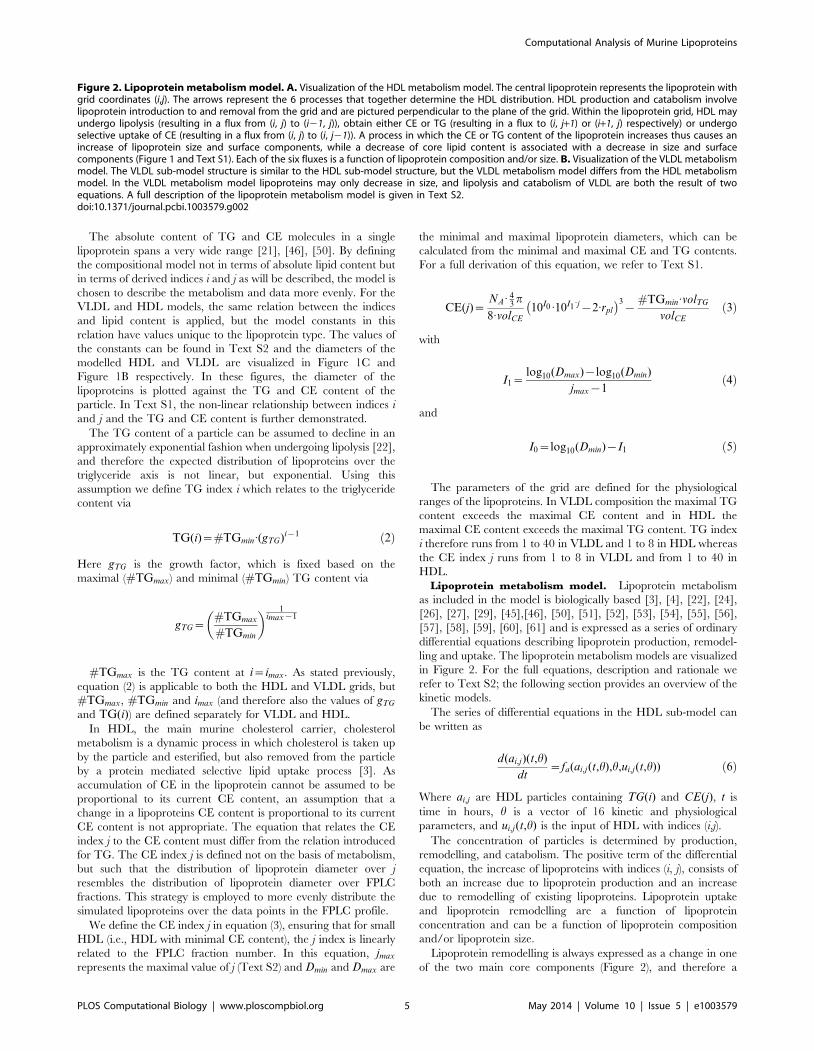
Lipoprotein metabolism model. Lipoprotein metabolism
as included in the model is biologically based [3], [4], [22], [24],
[26], [27], [29], [45],[46], [50], [51], [52], [53], [54], [55], [56],
[57], [58], [59], [60], [61] and is expressed as a series of ordinary
differential equations describing lipoprotein production, remodel-
ling and uptake. The lipoprotein metabolism models are visualized
in Figure 2. For the full equations, description and rationale we
refer to Text S2; the following section provides an overview of the
kinetic models.
The series of differential equations in the HDL sub-model can
be written as
d(ai,j)(t,h)
dt~fa(ai,j(t,h),h,ui,j(t,h)) ð6Þ
Where ai,j are HDL particles containing TG(i) and CE(j), t is
time in hours, h is a vector of 16 kinetic and physiological
parameters, and ui,j(t,h) is the input of HDL with indices (i,j).
The concentration of particles is determined by production,
remodelling, and catabolism. The positive term of the differential
equation, the increase of lipoproteins with indices (i, j), consists of
both an increase due to lipoprotein production and an increase
due to remodelling of existing lipoproteins. Lipoprotein uptake
and lipoprotein remodelling are a function of lipoprotein
concentration and can be a function of lipoprotein composition
and/or lipoprotein size.
Lipoprotein remodelling is always expressed as a change in one
of the two main core components (Figure 2), and therefore a
Figure 2. Lipoprotein metabolism model. A. Visualization of the HDL metabolism model. The central lipoprotein represents the lipoprotein withgrid coordinates (i,j). The arrows represent the 6 processes that together determine the HDL distribution. HDL production and catabolism involvelipoprotein introduction to and removal from the grid and are pictured perpendicular to the plane of the grid. Within the lipoprotein grid, HDL mayundergo lipolysis (resulting in a flux from (i, j) to (i21, j)), obtain either CE or TG (resulting in a flux to (i, j+1) or (i+1, j) respectively) or undergoselective uptake of CE (resulting in a flux from (i, j) to (i, j21)). A process in which the CE or TG content of the lipoprotein increases thus causes anincrease of lipoprotein size and surface components, while a decrease of core lipid content is associated with a decrease in size and surfacecomponents (Figure 1 and Text S1). Each of the six fluxes is a function of lipoprotein composition and/or size. B. Visualization of the VLDL metabolismmodel. The VLDL sub-model structure is similar to the HDL sub-model structure, but the VLDL metabolism model differs from the HDL metabolismmodel. In the VLDL metabolism model lipoproteins may only decrease in size, and lipolysis and catabolism of VLDL are both the result of twoequations. A full description of the lipoprotein metabolism model is given in Text S2.doi:10.1371/journal.pcbi.1003579.g002
Computational Analysis of Murine Lipoproteins
PLOS Computational Biology | www.ploscompbiol.org 5 May 2014 | Volume 10 | Issue 5 | e1003579

change in index i or index j. In order to prevent the lipoproteins
exiting the model through remodelling instead of catabolism all
model boundaries are closed. This is enforced by defining all fluxes
over model boundaries as 0. As the boundaries have been defined
much higher than the expected particle lipid content (Text S2),
this does not influence the simulation.
The production of HDL in the framework is determined based
on experimental data. The TC content of produced HDL is
defined by in vitro data of nascent HDL [26]. The TG content of
nascent HDL is chosen as the minimal TG content in the HDL
model. Due to the exponential relation between i and # TG the
model does not include particles without TG. The resulting
production is written as:
uprod Di,j~scaleA:Xkmax
k~1
ratioA,k:prodA,k i,jð Þ ð7Þ
Where kmax represents the number of different types of particles
that may enter the system (here, k = 2). prodA,k represents the
distribution of the k-th type of HDL particle, and scaleA is a model
parameter representing the amount of HDL particles produced (inmmolh:kg
). Finally, ratioA,k is a parameter that represents the relative
contribution of the k-th type of particle to the HDL production. In
order to preserve the definition of scaleA as the amount of particles
entering the system, it must also hold that:
Xkmax
k~1
ratioA,k~1 ð8Þ
In HDL remodelling four processes are defined (1) lipolysis of TG,
(2) removal of CE from the particle (selective uptake), (3) uptake of
peripheral FC by the lipoprotein and esterification of FC to CE
(TC accumulation) and (4) uptake of TGs by the lipoprotein (TG
accumulation). In general, the rate equations are phenomenolog-
ical equations that describe the remodelling process based on
lipoprotein size, composition and concentration. Remodelling
steps in which lipids are removed from the lipoprotein are a
function of the absolute amount of the targeted lipid in the
complex. A correction factor is included in the rate equations to
scale the fluxes to the rate of lipid content change (Text S2). This is
necessary to correct for the non-linearity of the relation between
indices i and j and lipid content and the variability of the grid
dimensions in the model.
The general differential equation of the HDL sub-model
(equation (6)) was extended to equation (9).
d(ai,j)
dt~ uprod Di,jzulipDi,jzuselDi,jzucholDi,jzutrigDi,j
{(rlipDi,jzrselDi,jzrcholDi,jzrtrigDi,jzruptDi,j)ai,j
ð9Þ
Where lipoprotein production is denoted by the subscript prod,
catabolism is represented by upt and the remodelling steps are
indicated by lip (lipolysis), sel (selective uptake), chol (accumulation
of TC) and trig (accumulation of TG).
HDL selective uptake is dependent on particle size and relative
CE content. HDL lipolysis is a function of relative TG content.
HDL TG and TC accumulation are a function of the rate of
surface remnant entry into the system. HDL catabolism is
inversely proportional to HDL size. Thus, HDL production is a
function of 2 parameters (scaleA and ratioA,1, as ratioA,2 is fixed
by equation (8)). HDL remodelling contains four equations, which
are defined by a total of 5 parameters, and HDL catabolism is a
single equation with a single parameter.
Analogous to equation 6, VLDL metabolism can be written as:
d(bi,j)(t,h)
dt~fb(bi,j(t,h),h,ui,j(t,h)) ð10Þ
In the VLDL sub-model, the lipoprotein core content does not
increase and equation 10 is extended to equation 11
d(bi,j)
dt~ uprod Di,jzulipDi,jzuselDi,j{(rlipDi,jzrselDi,jzruptDi,j)bi,j ð11Þ
The production of VLDL in the framework is based on
experimental data from [24], in which the ratio of TG and CE
content in nascent VLDL is published (Text S2). In short, VLDL
production is defined as a two-dimensional log-normal distribution
over the TG and CE contents (in # of molecules). The nascent
VLDL diameter is a model parameter which is used to calculate
the value of the mean and variance of lipid content. The
parameters of the log-normal distribution are then calculated
based on this absolute mean and variance [24]. The rate at which
lipoproteins are produced is finally scaled so that the simulated
VLDL-TG production is equal to the measured value of the
VLDL-TG. VLDL production is expressed by equation (12).
prod(TG,CE; m,S)~1
2p:TG:CE:sTGsCE
e
{12
(ln(TG){mTG )2
s T2
G
z(ln(CE){mCE )2
s C2
E
" # ð12Þ
with S~sTG
sCE
� �and m~
mTG
mCE
� �.
VLDL metabolism contains only two remodelling processes:
lipolysis and selective uptake. VLDL lipolysis and VLDL
catabolism, however, are each described by two equations, and
therefore the total VLDL metabolism model is composed of 6
equations. VLDL lipolysis comprises (1) the HDL lipolysis
equation, which is presumed to be active on VLDL as well as
HDL, and (2) a VLDL specific lipolysis equation, which is a
function of VLDL size. The function of CE uptake from VLDL is
chosen equivalent to HDL, but as the proteins involved are
presumed different the parameter of the function is estimated
separately for HDL and VLDL. VLDL catabolism is defined by (1)
a constant catabolism term and (2) a surface area dependent
catabolism function. VLDL production is defined by the single
diameter parameter. VLDL lipolysis is described by four
parameters. These are divided into the two parameters of the
universal lipolysis function which have the same values as in the
HDL sub-model and two parameters of the VLDL-specific
lipolysis function. VLDL selective uptake is described by one
parameter. The catabolism equations contain a total of four
parameters. This brings the total model to 266 equations defined
by 16 parameters, describing the concentration of 26320
lipoprotein state variables.
Calculation of the in silico profile. FPLC fractions have
been separated based on their diameter, according to equation (13)
[62]. In order to transform the computed concentrations to a
profile, we must therefore compare in silico size with FPLC fraction
size range. FPLC fractionated size range is determined by
ð12Þ
Computational Analysis of Murine Lipoproteins
PLOS Computational Biology | www.ploscompbiol.org 6 May 2014 | Volume 10 | Issue 5 | e1003579

calibrating the location of the VLDL, LDL and HDL peaks with
their experimentally determined sizes in [23] via least squares.
10log D~azb:kav0 ð13Þ
In this equation, D is the hydrodynamic diameter of the
lipoprotein, kav0 is the normalized value of the elution parameter
kav ([62]), and parameters a and b must be determined.
The calibration function is described by equation (13) with
values of a~1:97 and b~{1:95. This yields the following sizes
for (the median of) the three main lipoprotein classes: 41.5 nm
(VLDL), 22.6 nm (LDL) and 11.3 nm (HDL) (Text S3).
To calculate the in silico lipoprotein profile, the diameter of the
particles in the computational model is first calculated, according
to equation (1). For each FPLC fraction, the size boundaries are
calculated with the aid of equation (13). By combining both
equations, a relationship between the (boundary) diameter Db and
indices i and j is determined. Finally, numerical integration
between the fraction boundaries as expressed in i and j is
performed to determine the number of simulated lipoproteins in
each fraction. Multiplication by the TG or TC content of the
lipoproteins results in in silico TG and TC profiles. The in silico
profiles of PL, FC, CE, HDL and Apo B containing lipoproteins
are generated through the same procedure. The calculation of the
in silico profile is further visualized in Figure 1A and further
explained in Text S3 ([63]).
Model simulation and analysis. Parameter estimation is
performed using the FPLC profiles for control and LXR agonist
treated mice [27] by simulating the computational framework as
implemented in Matlab (7.10, The MathWorks, Natick, Massa-
chusetts) and minimizing the cost function (Sd ) based on a sum of
squared residuals. This is implemented using the non-linear least
squares function lsqnonlin. The cost function is composed of a sum
of squared residuals weighed with factors based on experimental
data from literature ([23]), a penalty for a failure to reach steady
state and a penalty for particles found in the unphysiological upper
model boundaries (Text S4).
The VLDL and HDL sub-models were simulated consecutively.
The rate of PL release from VLDL due to remodelling, which is an
input in the HDL sub-model, was fixed to the steady state value
calculated in the VLDL simulation. To estimate the 16 wild-type
C57Bl/6J mouse parameters, the optimisation was initialized 1000
times with random h (Text S4). For the optimisation, the
parameters are transformed to ensure a similar order of magnitude
of all parameters. Geometrical parameters are transformed linearly,
while kinetic parameters are transformed logarithmically. Details on
parameter bounds and transformation are found in Text S4.
Model performance was assessed for each optimized parameter
set by sampling the parameter space around the optimal
parameter set and re-optimising. The calculation of a profile
likelihood [64] and the generation of error plots of parameters of
interest were used to further assess model performance and quality
of the optimal parameter set.
Results
Computational analysis of lipoprotein metabolism inC57Bl/6J mice: From FPLC profiles to lipoproteinmetabolism
For model development, parameters were initially estimated
based on control C57Bl/6J mouse lipoprotein profiles. Figure 3 A
and B show the in silico TG and TC FPLC profiles with the
experimental data for an optimized parameter set. The model
describes the experimental data well in both the TG and the TC
profile. We initiated 1000 optimization runs with randomly chosen
initial parameter values. Two of the resulting optimized parameter
sets described the data well in terms of number, location and
height of the peaks. Moreover, these two optimized parameter sets
displayed very reasonable values for the nascent VLDL diameter
(Text S5). Figures 3 C–D demonstrate the added value of the model
by providing estimates of particle number (Figure 3C, HDL) and
unmeasured lipoprotein component (Figure 3D, PL) profiles.
We performed an analysis of the parameter space via re-
sampling, profile likelihood analysis and calculation of the local
error landscapes. The analysis revealed that the two parameter sets
found represent the two local optima of the VLDL sub-model.
While both optima result in a good fit of the FPLC profile and
both are included in further analysis, the optimal parameter sets
represent qualitatively different solutions. One of the solutions (to
which X2 belongs) is the global optimum, while the other (to
which X1 belongs) is a local optimum. The optima differ mainly in
the size of nascent VLDL and the selective uptake parameter, as is
illustrated in Text S5.
From analysis of the HDL sub-model parameter values, we
concluded that the optimized ratio between five kinetic HDL
parameters (scaleA, cchol , cselA, ctrig and cuptakeA) is consistent, but
they are not identifiable individually. Thus one optimal set of
correlated parameters and fluxes exists. This set can be
straightforwardly scaled to desired, physiological values in the
case that a single flux is known (Text S5). The sixth kinetic
parameter, clip, is found to not correlate with the remaining
parameters. As this parameter is also present in VLDL sub-model,
the value of clip is instead constrained by the VLDL sub-model.
The value of HDL production parameter ratioA,1 is found to be
almost one (Text S5). This indicates that of the two distinct sizes of
nascent HDL which were present in the experimental data on
which the HDL production is modelled (Text S2), only the smaller
particle is produced in the simulation. The wild-type model
therefore simulates one type of newly produced HDL, which
contains a mean of 24 cholesterol molecules. A comparison of
parameter values with literature is found in Text S5 ([38], [46],
[65], [66], [67]).
Prediction of FPLC profiles of transgenic mouse models:From lipoprotein metabolism to FPLC profiles
For model validation we performed a series of simulations to
generate lipoprotein profiles for three transgenic mouse models
commonly used in cardiovascular research. The first two in silico
transgenic mouse models have a deficiency in HDL metabolism,
whereas the final modelled deficiency is in Apo B containing
lipoprotein uptake.
SR-B1 deficient mice exhibit impaired cholesterol exchange
between HDL and tissues. To simulate SR-B1 deficiency the HDL
selective uptake parameter cselA was decreased. To examine the
results of the parameter perturbation for both a complete absence
of the selective uptake mechanism as well as for a small amount of
residual selective uptake, the simulation was performed for several
values of the parameter cselA. The results of the parameter
perturbations are presented in Figure 4A. The predicted in silico
SR-B1 knock-out lipoprotein profiles agree well qualitatively with
published FPLC profiles of SR-B1 knock-out mice [30]. Consistent
with phenotypes found in literature, the HDL particles of
simulated SR-B1 knock-out mice are larger compared to wild-
type mice. In the FPLC profile, this is visible as a shift to the left of
the HDL peak. In silico, this is accompanied by a rise in HDL TC
concentration of approximately 70% (Figure 4B).
Computational Analysis of Murine Lipoproteins
PLOS Computational Biology | www.ploscompbiol.org 7 May 2014 | Volume 10 | Issue 5 | e1003579

In PLTP knock-out mice, PL transfer activity is markedly
diminished as compared to wild-type mice [37], [38], [68], and
HDL particles may be catabolised more rapidly than in wild-type
mice [38], [68]. To simulate the PLTP knock-out mouse the HDL
growth cchol parameter was perturbed, representing a lower influx
of surface remnants.
Figure 3. In silico fast protein liquid chromatography profiles of untreated C57Bl/6J mice. A. Cholesterol FPLC profile of untreated mice,experimental data and simulated profile. FPLC profile (black) of pooled plasma of moderately fasted, untreated C57Bl/6J mice and simulated FPLCprofile (blue) total cholesterol content. The in silico profile was calculated with an optimized parameter set following model parametrisation (Text S4,parameter set X1). B. TG FPLC profile of untreated mice, experimental data and simulated profile. Experimental (black) and simulated (blue) TGprofiles as in A. C. Computed profile of HDL. In addition to calculation of the measured profiles (A and B), calculation of profiles of all included modelcomponents is facilitated by the model. The parameters used to generate this profile are provided in Text S4. D. Computed PL profile, computed withthe parameters provided in Text S4. For clarity, the highest measured fractions of the FPLC profile have not been pictured.doi:10.1371/journal.pcbi.1003579.g003
Computational Analysis of Murine Lipoproteins
PLOS Computational Biology | www.ploscompbiol.org 8 May 2014 | Volume 10 | Issue 5 | e1003579

cchol is a parameter that represents a process in which not only
PLTP, but also proteins such as Lecithin-cholesterol acyltransfer-
ase (LCAT) and ATP-binding cassette A1 (ABCA1) are involved.
Furthermore, free cholesterol transfer activity may not be
completely ablated in absence of PLTP [68]. Therefore, the
knock-out phenotype is presumed to result from a perturbation in
which cchol is in the range of 30 to 50% of the wild-type value.
Choosing a value in this range for the simulation results in a
reduction of plasma cholesterol corresponding to the 55%
reduction of plasma cholesterol observed in the PLTP knock-out
mouse [37]. The FPLC profile of the PLTP deficient mouse
displays a slight shift to the right and the aforementioned reduction
in plasma cholesterol [37]. The simulation results (Figure 4B) are
in qualitative agreement with the results published in [37].
The third in silico transgenic mouse model simulated is the
LDLr knock-out mouse ([39], [42], [43]). Experimental profiles of
LDLr deficient mice show a marked increase in the LDL TC
profile, a moderate increase in the VLDL and HDL size ranges
and in most cases, an increase of plasma TG ([42], [39], [43]). The
LDLr mediates both Apo E and Apo B dependent lipoprotein
uptake. The in silico profile (Figure 4E) is produced by moderating
both whole-particle uptake rate parameters cuptakeB and Aupt by
the same factor. As mice produce around 70% of VLDL with the
truncated Apo B48, around 30% is dependent on LDLr for uptake
following conversion to LDL and the rates would be expected to
decline by at least 30%. The resulting profiles (shown for different
attenuation factors in Figure 4E) show qualitatively the same
behaviour when compared to the wild-type profiles as seen in the
Figure 4. In silico cholesterol FPLC profiles of transgenic mice. A. Simulated cholesterol profile of the SR-B1 knock-out transgenic mouse. Tosimulate the SR-B1 knock-out mouse, the selective uptake parameter was set to between 1021% (black) and 5% (blue) of the original value. Forcomparison, the untreated C57Bl/6J mouse cholesterol profile is drawn in red. For comparison, we refer to the FPLC profile of SR-B1 deficient mice in[30]. B. Change in plasma cholesterol concentration for the in silico transgenic mice as depicted in A, C and E. C. Simulated cholesterol profile of thePLTP knock-out transgenic mouse. To simulate the PLTP knock-out mouse, the parameter cchol was diminished to values between 30% (black) and50% (light blue) of its original value, increasing in steps of 5. The untreated C57Bl/6J mouse profile is again shown in red. Note that because theperturbed parameter in this case cannot be presumed to be solely dependent on PLTP activity, the parameter value was not reduced below 30%. Forcomparison, we refer to the FPLC profile of PLTP deficient mice in [37]. D. Change in plasma triglyceride concentration for the in silico transgenicmice as depicted in A, C and E. E. Simulated cholesterol profile of the LDLr knock-out mouse. To simulate the LDLr knock-out mouse, both VLDL sub-model whole-uptake parameters cuptakeB and Aupt were diminished to a factor between 40% and 92.5% of their wild-type value. For comparison, werefer to the FPLC profile of LDLr deficient mice in [43]. The visualized in silico profiles have all been generated with parameter set X1. For clarity, thehighest measured fractions of the FPLC profile have not been pictured. Further quantitative analysis of the results as well as the corresponding insilico profiles generated with X2 are presented in Text S5.doi:10.1371/journal.pcbi.1003579.g004
Computational Analysis of Murine Lipoproteins
PLOS Computational Biology | www.ploscompbiol.org 9 May 2014 | Volume 10 | Issue 5 | e1003579

experimental profiles [42]. The LDL cholesterol is moderately
raised, and a lower increase is seen within VLDL and HDL size
ranges. Plasma triglycerides show an increase that is lower (in an
absolute sense) than the increase observed rise of plasma
cholesterol (Figure 4D).
Further information on the simulation of knock-out phenotypes
can be be found in Text S5.
Computational analysis of lipoprotein metabolism inC57Bl/6J mice treated with an LXR agonist
Treatment with an LXR agonist affects many aspects of lipid
and lipoprotein metabolism simultaneously [28], [69], [70]. The
many targets of LXR include PLTP, SR-B1, Lipoprotein lipase,
ApoE, ABCA1, ATP binding cassette G1 and other members of
the ABC transporter family [27], [28], [71]. The modulation of
lipoprotein metabolism is accompanied by changes in lipoprotein
size and lipid content, including the presence of both enlarged
VLDL [24], [58] and enlarged HDL [72], [71]. The enlargement
of VLDL has been found to be associated with increased PLTP
activity that results in the secretion of larger nascent VLDL, and
the increase in plasma TGs is normally ablated by particle uptake
[58]. The precise mechanism of HDL enlargement has not been
fully elucidated, but has been associated with ApoE [71].
To simulate the lipoprotein profile of mice that have been
treated with an LXR agonist several model constants were
modified to comply with the experimental value (Text S6, [2], [3],
[24], [51], [58], [59], [71], [73], [74]). The main modification
encompasses the VLDL production, which was modified such that
nascent VLDL in LXR agonist treated mice is of a larger size and
higher TG content than nascent VLDL of wild-type C57Bl/6J
mice. In Grefhorst et al. [24] the increase in VLDL-TG secretion
was found to result mainly from an increase in TG content. In the
simulation of T0901317 treated mice the nascent VLDL particles
were therefore enlarged in diameter by retaining untreated
particle secretion rate and nascent VLDL CE content while
increasing the TG content. To achieve this, the TG content of
nascent VLDL in treated mice was calculated by multiplying the
untreated TG content with the relative increase in VLDL-TG
production. The diameter of nascent VLDL was hereby fixed in
relation to the diameter of VLDL of untreated mice, and the
number of parameters in the model was reduced from 16 to 15.
Parameter optimization was performed by adding 50 random
variations to the parameter sets obtained for untreated mice and
re-optimizing as described for the untreated wild-type mouse (see
Methods, Text S6). While many optimized parameter sets were
successful in describing the general size of HDL, VLDL and LDL,
the model was not able to reproduce the characteristic enlarged
HDL, i.e. the second peak of the HDL which elutes in the LDL
size range. From these simulations, we concluded that the model is
unable to describe the mechanism responsible for the appearance
of these particles and an extension of the model was necessary. We
formulated three qualitatively different extensions to the model for
untreated mice based on biological mechanisms that could be
responsible for the appearance of large HDL particles.
The first model extension (E1) involves an extension in HDL
remodelling, in particular the HDL TC accumulation equation.
The cholesterol uptake equation is elaborated to include additional
uptake for large lipoproteins. The equations represent a mecha-
nism whereby Apo E may stimulate the uptake and esterification
of cholesterol, e.g. by activation of LCAT activity [73].
The second extension (E2) that was tested modifies HDL
catabolism by incorporating uptake of large, Apo E-containing
HDL by Apo E-binding receptors, such as the the LDL receptor
[73]. As such, it is represented by an equation (Text S6) similar to
the equation (Text S2) designed to simulate Apo E-dependent
uptake of VLDL.
The third extension (E3) expands HDL catabolism to include
the additional appearance of larger than normal HDL particles
[74]. This is simulated by including an input of very large,
relatively TG-poor and CE-rich particles.
The extended models comprise an addition of two or three to
the 15 parameters in the original model. The extensions to the
HDL model are visualized in Figure 5, and further details and
equations are provided in Text S6.
Parameter estimation of the extended models was performed by
optimizing the cost function as described in Text S4 for the profile
obtained following 14 days of treatment. The parameters were
initialized by initiating the 2, 3 or 3 parameters of the extended
equation randomly within their bounds while initiating the 15 core
model parameters at their wild-type value. The ability of a
parameter set to simulate a profile was judged on both quantitative
(i.e. TG and TC profile) and qualitative (i.e. appearance of the
‘‘enlarged HDL’’) considerations. For a description of the VLDL
in the profile on days one and two of treatment, it was necessary to
estimate separately the previously described fixed VLDL size and
TG content.
In Figure 6, the experimental and simulated profiles of the
T0901317-treated mice are plotted for each time point following
the initialization of treatment. Each of the three extended models
is able to describe the enlarged HDL peak observed in the
experimental data.
To identify differences between the three tested models, HDL
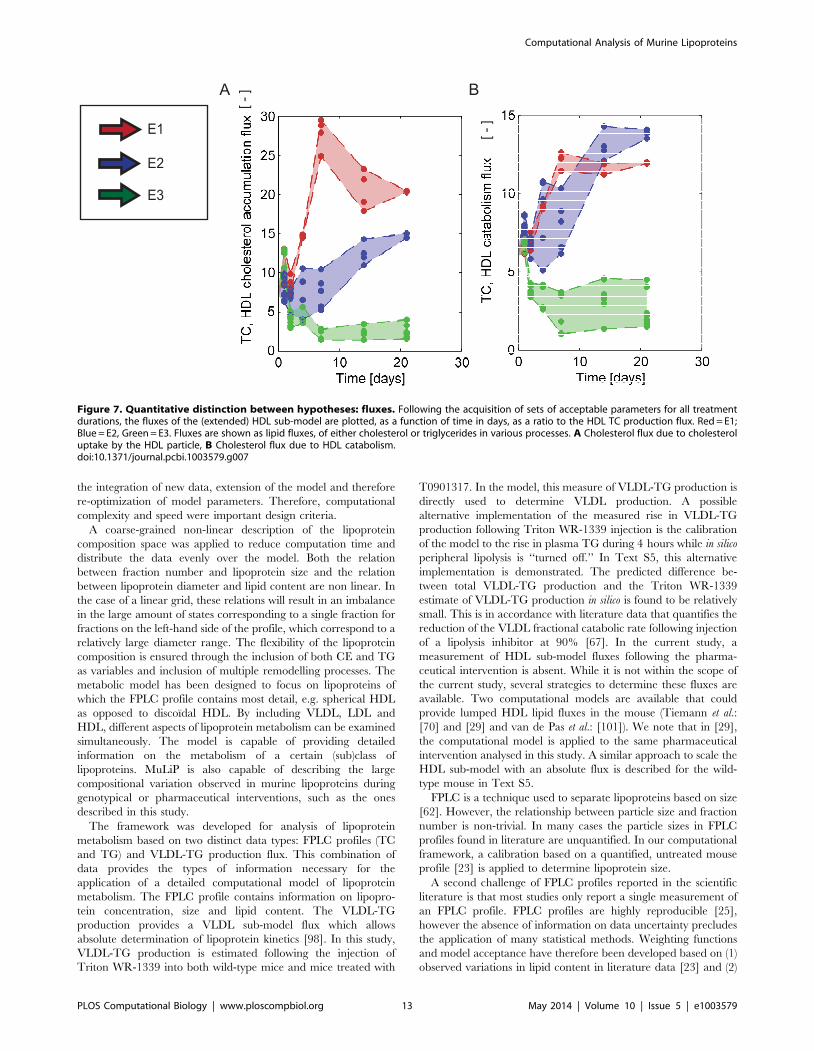
lipid fluxes are plotted for all accepted parameters sets in Figure 7.
As for the wild-type mouse, only the ratio between fluxes can be
identified and therefore in Figure 7 the ratio of fluxes to the HDL
TC production flux is depicted. Figure 7A shows the course of the
peripheral cholesterol efflux to existing particles relative to
cholesterol production. In Figure 7B, catabolism of HDL in terms
of TC content is plotted. The fluxes calculated from the three
extended models are distinguishable in their magnitude as well as
their development over time (Figure 7A and B). Although the three
different models yield equivalent lipoprotein profiles, there are
clear differences in the predictions of lipid fluxes and lipoprotein
metabolism. These differences can provide a basis for experimen-
tal differentiation between the mechanisms.
Discussion
The well-established association between plasma lipoprotein
concentrations and disease risk underscores the need to quantita-
tively analyse the factors determining lipoprotein distribution. In
preclinical research, mouse models are often used to study the effect
of a treatment on lipoprotein metabolism and disease risk. However
for mice the computational tools available for human lipoprotein
distributions ([21], [22]) are absent. In this study we have developed
and applied MuLiP, which is a computational framework to analyse
lipoprotein metabolism in mice. MuLiP can be used to expand
understanding of lipoprotein metabolism based on commonly
measured FPLC profiles. With this strategy, insight into lipoprotein
concentration and composition, lipid and lipoprotein fluxes and
lipoprotein remodelling processes can be gained. We showed that
the model is able to analyse wild-type murine lipoprotein
metabolism by deriving underlying metabolic processes from the
lipoprotein profile. Furthermore, the model was shown to predict
the profiles of transgenic mouse strains following a simulated
perturbation of the underlying metabolism. Finally, the model was
applied to provide novel insights into the metabolic adaptations
underlying the response to a pharmacological intervention.
Computational Analysis of Murine Lipoproteins
PLOS Computational Biology | www.ploscompbiol.org 10 May 2014 | Volume 10 | Issue 5 | e1003579

For many years, the interpretation of tracer experiments in
humans has been aided by compartmental models [2], which have
yielded valuable insights into lipoprotein life cycles. The applica-
tion of these models to describe long-term effects on lipoprotein
size and composition has limitations because the composition and
size of lipoprotein classes are generally predefined in such methods
[21], [22], [75]. Moreover, these models often focus on a single
lipoprotein class (e.g. HDL: [76], [77], [78], [79]; or VLDL: [80],
[81], [82], [83], [84], [85], [86], [87], [88], [89], [90], [91], [92]).
In addition to these tracer dynamics models several mathematical
models have been published which describe the dynamics of
isolated lipids, proteins or lipoproteins ([93], [94], [95], [96], [97]),
but cannot provide an integrated view of the relationship between
lipid fluxes and lipoprotein distributions.
Two models of human lipoprotein metabolism have been
proposed that assume a semi-continuous distribution of lipoprotein
components [21], [22]. These two models have been shown to
retrieve valuable insight into lipoprotein metabolism [21] and
disease risk [22], [98], [99] that can be extracted by quantitatively
evaluating human lipoprotein distributions. The Particle Profiler
developed by van Schalkwijk et al. [22], [98], [99] describes Apo B
containing lipoprotein metabolism and assumes that Apo B
containing lipoprotein metabolism and composition rely solely
on lipoprotein diameter. The computational model developed by
Hubner et al. [21] describes the detailed metabolism of HDL and
Apo B containing lipoprotein particles. Lipoprotein particles are
represented by a large number of possible configurations of TG,
TC and protein content.
Previous models are inapplicable to murine lipoprotein profiles
for several reasons. First of all, to create a complete FPLC profile
VLDL, LDL and HDL should all be described by the model.
However, the majority of existing models focus on a single major
lipoprotein class. Additionally, the models include assumptions of
lipoprotein composition which are not suitable to describe the
composition of murine lipoproteins. Finally, several differences
between human and mouse (fasting) lipoprotein metabolism
preclude human lipoprotein metabolism models from application
to murine physiology. For instance, in mice HDL contains the
majority of cholesterol present in plasma. In humans LDL is the
primary cholesterol carrier [100]. Also, several differences in
Figure 5. Overview of extended HDL metabolism. HDL metabolism, as depicted in Figure 2B, with extensions. For clarity, the original model ofHDL metabolism is shown in grey-scale, while the three extensions are shown in red, blue and green respectively. The additional cholesterolaccumulation of E1 is depicted in red. The additional lipoprotein uptake modelled in E2 is shown in blue. Finally the extension to include additionallarge nascent HDL as described by E3 is included via the green arrow. Note that while all extensions are shown here in the same figure, the threeextensions are included in the model separately. More details on the model extensions are provided in Text S6.doi:10.1371/journal.pcbi.1003579.g005
Computational Analysis of Murine Lipoproteins
PLOS Computational Biology | www.ploscompbiol.org 11 May 2014 | Volume 10 | Issue 5 | e1003579

protein presence and localization must be considered in the
development of the metabolic model. An important lipid
exchanger in HDL and LDL metabolism in humans, Cholestery-
lester transfer protein (CETP), is absent in wild-type mice [100].
Furthermore hepatic lipase is found mainly in the liver in humans,
but is present free in plasma in mice [100]. The non-specificity of
Apo B 48 to chylomicrons in mice can be considered a final
complicating factor.
In contrast to the aforementioned models, our novel compu-
tational model was designed specifically for the analysis of profiles
obtained from mice. This required a novel model of murine
lipoprotein metabolism. Future applications of MuLiP will require
Figure 6. In silico fast protein liquid chromatography profiles for the C57Bl/6J mouse, treated with LXR agonist T0901317.Cholesterol (A) and triglyceride (B) profiles of the treated mouse at all time points. The 3-dimensional plot shows the in silico and experimentalprofiles as measured and simulated at six time points following initiation of treatment. For clarity, the time axis is scaled logarithmically. At each timepoint, the experimental profile is shown in black and in silico profiles generated with all accepted parameters sets of E1 (red), E2 (blue) and E3(green)are shown in colour. The vertical axis represents the fraction lipid content in nmol. The number of acceptable fits differs per time point and/or modelextension, as optimized fits were evaluated for acceptability. Profiles from acceptable parameter sets are in many cases quite similar, and may not inall cases be distinguishable from each other. For clarity, the FPLC profiles have been pictured as lines; we note that both experimental and in silicoprofiles are in fact composed of discrete fraction measurements.doi:10.1371/journal.pcbi.1003579.g006
Computational Analysis of Murine Lipoproteins
PLOS Computational Biology | www.ploscompbiol.org 12 May 2014 | Volume 10 | Issue 5 | e1003579
the integration of new data, extension of the model and therefore
re-optimization of model parameters. Therefore, computational
complexity and speed were important design criteria.
A coarse-grained non-linear description of the lipoprotein
composition space was applied to reduce computation time and
distribute the data evenly over the model. Both the relation
between fraction number and lipoprotein size and the relation
between lipoprotein diameter and lipid content are non linear. In
the case of a linear grid, these relations will result in an imbalance
in the large amount of states corresponding to a single fraction for
fractions on the left-hand side of the profile, which correspond to a
relatively large diameter range. The flexibility of the lipoprotein
composition is ensured through the inclusion of both CE and TG
as variables and inclusion of multiple remodelling processes. The
metabolic model has been designed to focus on lipoproteins of
which the FPLC profile contains most detail, e.g. spherical HDL
as opposed to discoıdal HDL. By including VLDL, LDL and
HDL, different aspects of lipoprotein metabolism can be examined
simultaneously. The model is capable of providing detailed
information on the metabolism of a certain (sub)class of
lipoproteins. MuLiP is also capable of describing the large
compositional variation observed in murine lipoproteins during
genotypical or pharmaceutical interventions, such as the ones
described in this study.
The framework was developed for analysis of lipoprotein
metabolism based on two distinct data types: FPLC profiles (TC
and TG) and VLDL-TG production flux. This combination of
data provides the types of information necessary for the
application of a detailed computational model of lipoprotein
metabolism. The FPLC profile contains information on lipopro-
tein concentration, size and lipid content. The VLDL-TG
production provides a VLDL sub-model flux which allows
absolute determination of lipoprotein kinetics [98]. In this study,
VLDL-TG production is estimated following the injection of
Triton WR-1339 into both wild-type mice and mice treated with
T0901317. In the model, this measure of VLDL-TG production is
directly used to determine VLDL production. A possible
alternative implementation of the measured rise in VLDL-TG
production following Triton WR-1339 injection is the calibration
of the model to the rise in plasma TG during 4 hours while in silico
peripheral lipolysis is ‘‘turned off.’’ In Text S5, this alternative
implementation is demonstrated. The predicted difference be-
tween total VLDL-TG production and the Triton WR-1339
estimate of VLDL-TG production in silico is found to be relatively
small. This is in accordance with literature data that quantifies the
reduction of the VLDL fractional catabolic rate following injection
of a lipolysis inhibitor at 90% [67]. In the current study, a
measurement of HDL sub-model fluxes following the pharma-
ceutical intervention is absent. While it is not within the scope of
the current study, several strategies to determine these fluxes are
available. Two computational models are available that could
provide lumped HDL lipid fluxes in the mouse (Tiemann et al.:
[70] and [29] and van de Pas et al.: [101]). We note that in [29],
the computational model is applied to the same pharmaceutical
intervention analysed in this study. A similar approach to scale the
HDL sub-model with an absolute flux is described for the wild-
type mouse in Text S5.
FPLC is a technique used to separate lipoproteins based on size
[62]. However, the relationship between particle size and fraction
number is non-trivial. In many cases the particle sizes in FPLC
profiles found in literature are unquantified. In our computational
framework, a calibration based on a quantified, untreated mouse
profile [23] is applied to determine lipoprotein size.
A second challenge of FPLC profiles reported in the scientific
literature is that most studies only report a single measurement of
an FPLC profile. FPLC profiles are highly reproducible [25],
however the absence of information on data uncertainty precludes
the application of many statistical methods. Weighting functions
and model acceptance have therefore been developed based on (1)
observed variations in lipid content in literature data [23] and (2)
Figure 7. Quantitative distinction between hypotheses: fluxes. Following the acquisition of sets of acceptable parameters for all treatmentdurations, the fluxes of the (extended) HDL sub-model are plotted, as a function of time in days, as a ratio to the HDL TC production flux. Red = E1;Blue = E2, Green = E3. Fluxes are shown as lipid fluxes, of either cholesterol or triglycerides in various processes. A Cholesterol flux due to cholesteroluptake by the HDL particle, B Cholesterol flux due to HDL catabolism.doi:10.1371/journal.pcbi.1003579.g007
Computational Analysis of Murine Lipoproteins
PLOS Computational Biology | www.ploscompbiol.org 13 May 2014 | Volume 10 | Issue 5 | e1003579

analysis of the variability in the dataset applied in the current study
(Text S4).
Murine lipoprotein metabolism in MuLiP is described by the
interconnected VLDL and HDL sub-models. The VLDL sub-
model describes VLDL and LDL content, composition and
metabolism. We note that the lipoproteins in the VLDL sub-
model can be computationally separated into VLDL and LDL
metabolism. The low concentrations of LDL in mice complicate
the analysis of LDL metabolism via an FPLC profile. However, by
coupling VLDL and LDL metabolism we increase the information
available on LDL metabolism and the associated risk of
cardiovascular disease. The HDL sub-model describes the
metabolism of spherical HDL. Both metabolic sub-models take
into account lipoprotein heterogeneity as they are functions of
lipoprotein composition and size. The composition of lipoproteins
in the model is based on the TG and CE content of the particles.
The remaining lipid constituents of the lipoproteins are calculated
from the TG and CE content of the lipoprotein. The interpolation
functions for this calculation are obtained from experimental data
[25]. Computational model analysis revealed the existence of two
qualitatively and kinetically distinct local optima of the metabolic
model, which describe the data well (Text S5). The model was
further analysed by the simulation of several transgenic pheno-
types.
The SR-B1 and PLTP knock-out phenotypes have been
successfully reproduced by perturbing a single parameter in the
HDL sub-model. These transgenic models have been studied
extensively in cardiovascular research (SR-B1: [30], [31], [32],
[33], [35], [36], [34], PLTP: [37], [72]) and the predictions serve
as a validation of model performance. SR-B1 is the main protein
responsible for HDL cholesterol selective uptake and both
heterozygous and homozygous SR-B1 knock-out mice display
increased levels of plasma and HDL cholesterol [30]. In
homozygous SR-B1 knock-out mice, a shift of the HDL peak to
the left in the FPLC profile is observed [30], indicative of increased
HDL size. The in silico SR-B1 knock-out profiles (Figure 4) predict
the same behaviour as seen in the experimental models; the
plasma cholesterol concentration is increased by approximately
70% (Text S5). This increase is slightly lower than the typical value
of 100% ([35], [36]) and falls within the range of HDL cholesterol
increases observed in SR-B1 knock-out mice experimentally ([30],
[31], [32], [33], [34]). The shift to the left, indicating the presence
of larger HDL, can clearly be observed in the in silico profile
(Figure 4A).
Mice deficient for PLTP show clear reductions in all major
components of HDL, including reduced HDL C, Apo A1 and PL
levels [37]. This reduction of HDL cholesterol in PLTP deficient
mice has been attributed to reduced transfer of phospholipids from
triglyceride-rich lipoproteins to HDL [37] combined with
increased catabolism of HDL [38]. Such HDL ‘‘hypercatabolism’’
is thought to result from changes in HDL composition in PLTP
knock-out mice [38]. In the model, PLTP deficient mice have been
simulated by decreasing the PL flux to HDL by decreasing the
combined lipid accumulating parameter cchol . In Figure 4B, this
was shown to generate an in silico FPLC profile which predicts a
decrease of HDL cholesterol similar to that seen in literature.
The in silico PLTP and SR-B1 deficient mice demonstrate the
validity of the HDL sub-model cholesterol metabolism. However,
in preclinical research, mouse models deficient in Apo B
containing lipoprotein metabolism are often used due to their
higher, more human-like LDL cholesterol concentration and
propensity to develop atherosclerosis. The LDLr and Apo E
knock-out models, for example, are two of the models most often
used in cardiovascular research [40]. Therefore these models are
of interest for the validation of the model. Simulation of an Apo E
knock-out mouse, however, may require extension of the MuLiP
model. First of all, the clearance of chylomicron remnants requires
Apolipoprotein E [5], [40] and therefore, absence of Apo E results
in accumulation of chylomicron remnants. As the computational
model currently does not incorporate chylomicron metabolism, it
is unsuited to simulate chylomicron remnant accumulation.
Secondly, Apo E is known to have several functions in not only
chylomicron, but also VLDL and HDL metabolism. Apo E may
mediate the uptake of both VLDL and chylomicrons and regulate
LPL activity, and VLDL production is changed in Apo E knock-
out mice [40], [67]. Because the MuLiP model is based on
processes rather than genes or proteins, an in silico Apo E knock-
out mouse is possible only if data is available that will guide the
necessary parameter changes.
The LDL receptor is a related protein, however is not necessary
for chylomicron clearance and LDLr knock-out mice do not show
modulation of VLDL production [67]. The qualitative evaluation
of an in silico LDLr knock-out mouse requires the perturbation of
at least two parameters. By scaling both parameters with the same
factor the LDLr knock-out mouse is simulated in the most simple
way, however this results in qualitative agreement between the
experimental and in silico profiles (Figure 4 E). The in silico LDLr
deficiency reproduces the main characteristics of LDLr knock-out
FPLC profiles: moderately raised LDL cholesterol, mild increases
in cholesterol in the VLDL and HDL size ranges and an increase
in plasma triglyceride which is seen in vivo ([41], [42], [43]).
Application of the original model, developed with wild-type
mouse data to profiles of mice treated with pharmaceutical agent
T0901317 did not retrieve an accurate description of the data.
VLDL production was modified in accordance with experimental
data of VLDL production following treatment with an LXR
agonist [27], [29]. The model was applied to profiles of mice
treated with an LXR agonist for 14 days first without re-
optimizing parameters. The 15 model parameters were then re-
optimized. The model was not able to adequately reproduce the
data in either case (Text S6). In particular, the enlarged HDL
typically observed upon LXR activation ([72]) could not be
described. We concluded that the model was missing (a)
mechanism(s) involved in the generation of the enlarged HDL
and applied general extensions to the production (E3), remodelling
(E1) and catabolism models of HDL (E2).
From the results generated by the three extended models of
LXR-activation we conclude that all three models were equally
capable of simulating the appearance of larger HDL. Biologically,
the interpretation of each of the three extensions is distinct. E1
hypothesizes that an additional influx of cholesterol takes place in
particles of a certain size. We base this hypothesis on the possibility
of a mechanism that increases cholesterol accumulation of large-
Apo E-rich particles. Apo E is known to interact with a variety of
lipid metabolism related proteins [73]. In E2, we hypothesize that
the Apo E present on HDL may interact with lipoprotein receptors
[51], [73]. This results in increased catabolism of Apo E
containing particles. In E3 the appearance of the second peak is
caused by the sudden appearance of large particles. Kurano et al.
[74] found that hepatocytes, when stimulated with an LXR-
agonist in vitro, can produce larger, Apo E-rich HDL. However, as
with the previous two hypotheses, the implemented equation is of
a general nature and allows multiple biological interpretations.
The third extension, e.g., may represent a mechanism that
converts HDL to particles of a larger size. It is also conceivable
that a combination of mechanisms is responsible for the observed
size shift.
Computational Analysis of Murine Lipoproteins
PLOS Computational Biology | www.ploscompbiol.org 14 May 2014 | Volume 10 | Issue 5 | e1003579

The model results incorporate not only the parameter
perturbations. The results of the LXR agonist treated models
e.g. quantify the differences in the relationship between total HDL
production, remodelling and catabolism for the presented
mechanisms, and can also be used to create flux FPLC profiles,
which depict the simulated distribution of these processes over the
FPLC fractions. The differences between models can be quantified
for each of the lipids or processes included in the framework. The
results also quantify of which HDL particles (i.e. which diameter,
which composition) the catabolism or remodelling has been
changed. Finally, the extended models can be used to predict the
response of an LXR agonist treated mouse when a second
intervention or genetic perturbation is applied. In Text S8, for
instance, simulations of SR-B1 and PLTP knock-out mice treated
with T0901317 were generated. Comparison of the predicted
profiles with experimental results can give further insight into the
biological relevance of the proposed mechanisms.
In the future, MuLiP could be used as an additional analysis tool
for FPLC profiles. While processes are currently incorporated into
the model in a phenomenological manner, isolating the effect of a
gene or protein on lipoprotein metabolism will require the
inclusion of more (flux) data, model expansion and parameter
(re-)optimization. In cases where the VLDL production differs
substantially from the assumptions made in this study, the
implementation of a case-specific VLDL production distribution
may be necessary. We note that with data of nascent VLDL
composition and particle size distribution a novel VLDL
production type can be derived and implemented without further
model adaptation.
Another genetic modification commonly used in mouse models
is the addition of CETP [102]. This neutral lipid exchanger links
HDL and VLDL metabolism in humans, but is normally absent in
mice. To allow application of the framework to mouse models that
express CETP, the lipoprotein profile of which more closely
resembles human lipoprotein profiles, it will be necessary to
incorporate CETP in the model as a further link between HDL
and VLDL metabolism. Depending on the data available and
desired application, various implementations differing in complex-
ity could be included. The most simple implementation of such a
neutral lipid exchanger could entail a pair of coupled additional
remodelling functions, i.e. a VLDL remodelling function that
decreases TG content and increases CE content, quantitatively
coupled to an HDL function that decreases HDL CE content and
in turn increases HDL TG content. A more sophisticated equation
could entail the definition of an explicit CETP protein moiety (as
in [21]), the composition of which would determine the orientation
of both the remodelling functions.
In conclusion, we developed a computational strategy to analyse
FPLC profiles based on mouse lipoprotein metabolism and
composition. The model predicts lipoprotein production, remod-
elling and catabolism fluxes which collectively determine changes
in lipoprotein profiles. Following initial application of the model to
FPLC profiles of the C57Bl/6J mouse, it was used to successfully
predict phenotypes of transgenic mouse models commonly used in
cardiovascular research. Furthermore, the model was applied to
analyse and elucidate the complex phenotypes resulting from a
pharmacological activation of the nuclear receptor LXR. MuLiP
can contribute to insight into changes in lipoprotein metabolism
underlying observed changes of a lipoprotein profile.
Supporting Information
Text S1 Additional calculations. Extended calculation of CE
index j, calculation of the free cholesterol content and phospho-
lipid content and overview of the compositional model.
(PDF)
Text S2 Wild-type model equations. Derivation and
equations of the wild-type HDL and VLDL sub-models.
(PDF)
Text S3 FPLC profile calculation. Steps 2 and 3 of the
calculation of the FPLC profile. Both the calculation of the
concentration FPLC profiles and the calculation of the flux FPLC
profiles is explained.
(PDF)
Text S4 Wild-type model parametrisation. In this text the
cost function, the parameter transformation, model simulation and
the analysis of the results are discussed. Also, the resulting
parameter values are reported.
(PDF)
Text S5 Wild-type model analysis. This text describes the
performed re-sampling of parameter sets, the profile likelihood, the
comparison of parameters with values from literature and
additional information on the knock-out phenotypes.
(PDF)
Text S6 LXR model development. Derivation and equations
of the adaptations and extensions included in the computational
models of the LXR activated mouse.
(PDF)
Text S7 LXR model parametrisation. Parameters of the
extended LXR models.
(PDF)
Text S8 Supplemental analyses of the LXR model.Additional visualisations of the parameters and fluxes of the
LXR models. Simulations of a knock-out in the LXR activated
models.
(PDF)
Text S9 Flux FPLC profiles. Flux FPLC profiles of wild-type,
knock-out, and 14 days LXR activated models.
(PDF)
Acknowledgments
We are grateful to Aldo Grefhorst and Marije Boesjes for their contribution
to the experimental work.
Author Contributions
Conceived and designed the experiments: MHO AKG. Performed the
experiments: MHO. Wrote the paper: FLPS. Conceived and designed the
computational framework: FLPS CAT PAJH NAWvR. Developed the
model: FLPS. Performed the computational analysis: FLPS. Revised the
paper: CAT MHO AKG PAJH NAWvR. Supervised the study: CAT
AKG PAJH NAWvR.
References
1. Klop B, Elte JWF, Cabezas MC (2013) Dyslipidemia in obesity: Mechanismsand potential targets. Nutrients 5: 1218–1240.
2. Boren J, Taskinen MR, Adiels M (2012) Kinetic studies to investigatelipoprotein metabolism. J Intern Med 271: 166–173.
3. Rothblat GH, Phillips MC (2010) High-density lipoprotein heterogeneity and
function in reverse cholesterol transport. Curr Opin Lipidol 21: 229–238.
4. Packard CJ, Shepherd J (1997) Lipoprotein heterogeneity and apolipoprotein Bmetabolism. Arterioscler Thromb Vasc Biol 17: 3542–3556.
5. Redgrave T (2004) Chylomicron metabolism. Biochem Soc Trans 32:79–82.
6. Kindel T, Lee DM, Tso P (2010) The mechanism of the formation and
secretion of chylomicrons. Atheroscler Suppl 11: 11–16.
Computational Analysis of Murine Lipoproteins
PLOS Computational Biology | www.ploscompbiol.org 15 May 2014 | Volume 10 | Issue 5 | e1003579

7. Ginsberg HN, Fisher EA (2009) The ever-expanding role of degradation in the
regulation of apolipoprotein B metabolism. J Lipid Res 50: S162–S166.
8. Eisenberg S (1984) High density lipoprotein metabolism. J Lipid Res 25: 1017–
1058.
9. Soran H, Hama S, Yadav R, Durrington PN (2012) Hdl functionality. Curr
Opin Lipidol 23: 353–366.
10. Mahley RW, Ji ZS (1999) Remnant lipoprotein metabolism: key pathways
involving cell-surface heparan sulfate proteoglycans and apolipoprotein E. J
Lipid Res 40: 1–16.
11. Asztalos BF, Tani M, Schaefer EJ (2011) Metabolic and functional relevance of
HDL subspecies. Curr Opin Lipidol 22: 176–185.
12. Camont L, Chapman MJ, Kontush A (2011) Biological activities of HDL
subpopulations and their relevance to cardiovascular disease. Trends Mol Med
17: 594–603.
13. Rosenson RS, Brewer HB, Chapman MJ, Fazio S, Hussain MM, et al. (2011)
HDL measures, particle heterogeneity, proposed nomenclature, and relation to
atherosclerotic cardiovascular events. Clin Chem 57: 392–410.
14. Mooradian AD (2009) Dyslipidemia in type 2 diabetes mellitus. Nat Clin Pract
Endocrinol Metab 5: 150–159.
15. Tenenbaum A, Fisman E, Motro M, Adler Y (2006) Atherogenic dyslipidemia
in metabolic syndrome and type 2 diabetes: therapeutic options beyond statins.
Cardiovasc Diabetol 5: 20.
16. Daugherty A (2002) Mouse models of atherosclerosis. Am J Med Sci 323: 3–10.
17. Zaragoza C, Gomez-Guerrero C, Martin-Ventura JL, Blanco-Colio L, Lavin
B, et al. (2011) Animal models of cardiovascular diseases. J Biomed Biotechnol
2011: 497841.
18. Garber DW, Kulkarni KR, Anantharamaiah GM (2000) A sensitive and
convenient method for lipoprotein profile analysis of individual mouse plasma
samples. J Lipid Res 41: 1020–1026.
19. Kim KW, McCormick J, Helmering J, Veniant MM, Wang M (2008) An
optimized fastperformance liquid chromatography method for analyzing
lipoprotein profiles using microliter volumes of serum. Anal Biochem 376:
268–274.
20. Jiao S, Cole TG, Kitchens RT, Peger B, Schonfeld G (1990) Genetic
heterogeneity of lipoproteins in inbred strains of mice: Analysis by gel-
permeation chromatography. Metabolism 39: 155–160.
21. Hubner K, Schwager T, Winkler K, Reich JG, Holzhutter HG (2008)
Computational lipidology: predicting lipoprotein density profiles in human
blood plasma. PLoS Comput Biol 4: e1000079.
22. van Schalkwijk DB, de Graaf AA, van Ommen B, van Bochove K, Rensen
RCN, et al. (2009) Improved cholesterol phenotype analysis by a model relating
lipoprotein life cycle processes to particle size. J Lipid Res 50: 2398–2411.
23. Pratt SM, Chiu S, Espinal GM, Shibata NM, Wong H, et al. (2010) Mouse
hepatic lipase alleles with variable effects on lipoprotein composition and size.
J Lipid Res 51: 1035–1048.
24. Grefhorst A, Elzinga BM, Voshol PJ, Plosch T, Kok T, et al. (2002) Stimulation
of lipogenesis by pharmacological activation of the liver X receptor (LXR) leads
to production of large, triglyceriderich VLDL particles. J Biol Chem 277:
34182–34190.
25. de Silva HV, Mas-Oliva J, Taylor JM, Mahley RW (1994) Identification of
apolipoprotein B-100 low density lipoproteins, apolipoprotein B-48 remnants,
and apolipoprotein E-rich high density lipoproteins in the mouse. J Lipid Res
35: 1297–310.
26. Duong PT, Collins HL, Nickel M, Lund-Katz S, Rothblat GH, et al. (2006)
Characterization of nascent HDL particles and microparticles formed by
ABCA1-mediated efflux of cellular lipids to apoA-I. J Lipid Res 47: 832–843.
27. Grefhorst A, Oosterveer MH, Brufau G, Boesjes M, Kuipers F, et al. (2012)
Pharmacological LXR activation reduces presence of SR-B1 in liver
membranes contributing to LXR-mediated induction of HDL-cholesterol.
Atherosclerosis 222: 382–389.
28. Oosterveer MH, Grefhorst A, Groen AK, Kuipers F (2010) The liver X
receptor: Control of cellular lipid homeostasis and beyond: Implications for
drug design. Prog Lip Res 49: 343–352.
29. Tiemann CA, Vanlier J, Oosterveer MH, Groen AK, Hilbers PAJ, et al. (2013)
Parameter trajectory analysis to identify treatment effects of pharmacological
interventions. PLoS Comput Biol 9: e1003166.
30. Rigotti A, Trigatti BL, Penman M, Rayburn H, Herz J, et al. (1997) A targeted
mutation in the murine gene encoding the high density lipoprotein (HDL)
receptor scavenger receptor class B type I reveals its key role in HDL
metabolism. Proc Natl Acad Sci U S A 94: 12610–12615.
31. Van Eck M, Twisk J, Hoekstra M, Van Rij BT, Van der Lans CAC, et al.
(2003) Differential effects of scavenger receptor BI deficiency on lipid
metabolism in cells of the arterial wall and in the liver. J Biol Chem 278:
23699–23705.
32. Brundert M, Ewert A, Heeren J, Behrendt B, Ramakrishnan R, et al. (2005)
Scavenger receptor class B type I mediates the selective uptake of high-density
lipoprotein-associated cholesteryl ester by the liver in mice. Arterioscler
Thromb Vasc Biol 25: 143–148.
33. Mardones P, Quinones V, Amigo L, Moreno M, Miquel JF, et al. (2001)
Hepatic cholesterol and bile acid metabolism and intestinal cholesterol
absorption in scavenger receptor class B type I-deficient mice. J Lipid Res
42: 170–180.
34. Wiersma H, Nijstad N, Gautier T, Iqbal J, Kuipers F, et al. (2010) Scavengerreceptor B1 facilitates hepatic very low density lipoprotein production in mice.
J Lipid Res 51: 544–553.
35. Liadaki KN, Liu T, Xu S, Ishida BY, Duchateaux PN, et al. (2000) Binding ofhigh density lipoprotein (HDL) and discoidal reconstituted HDL to the HDL
receptor scavenger receptor class B type I. J Biol Chem 275: 21262–21271.
36. Leiva A, Verdejo H, Benıtez ML, Martınez A, Busso D, et al. (2011)Mechanisms regulating hepatic SR-BI expression and their impact on HDL
metabolism. Atherosclerosis 217: 299–307.
37. Jiang XC, Bruce C, Mar J, Lin M, Ji Y, et al. (1999) Targeted mutation ofplasma phospholipid transfer protein gene markedly reduces high-density
lipoprotein levels. J Clin Invest 103: 907–914.
38. Qin S, Kawano K, Bruce C, Lin M, Bisgaier C, et al. (2000) Phospholipidtransfer protein gene knock-out mice have low high density lipoprotein levels,
due to hypercatabolism, and accumulate apoA-IV-rich lamellar lipoproteins.J Lipid Res 41: 269–276.
39. Ishibashi S, Brown MS, Goldstein JL, Gerard RD, Hammer RE, et al. (1993)
Hypercholesterolemia in low density lipoprotein receptor knockout mice and itsreversal by adenovirus-mediated gene delivery. J Clin Invest 92: 883–893.
40. Wouters K, Shiri-Sverdlov R, van Gorp PJ, van Bilsen M, Hofker MH (2005)
Understanding hyperlipidemia and atherosclerosis: lessons from geneticallymodified apoe and ldlr mice. Clin Chem Lab Med 43: 470–479.
41. Hasty AH, Shimano H, Osuga Ji, Namatame I, Takahashi A, et al. (2001)
Severe hypercholesterolemia, hypertriglyceridemia, and atherosclerosis in micelacking both leptin and the low density lipoprotein receptor. J Biol Chem 276:
37402–37408.
42. Ishibashi S, Perrey S, Chen Z, Osuga J, Shimada M, et al. (1996) Role of thelow density lipoprotein (LDL) receptor pathway in the metabolism of
chylomicron remnants: A quantitative study in knockout mice lacking theLDL receptor, apolipoprotein E, or both. J Biol Chem 271: 22422–22427.
43. Ishibashi S, Herz J, Maeda N, Goldstein JL, Brown MS (1994) The two-
receptor model of lipoprotein clearance: tests of the hypothesis in ‘‘knockout’’mice lacking the low density lipoprotein receptor, apolipoprotein E, or both
proteins. Proc Natl Acad Sci U S A 91: 4431–4435.
44. Teerlink T, Scheffer PG, Bakker SJL, Heine RJ (2004) Combined data fromLDL composition and size measurement are compatible with a discoid particle
shape. J Lipid Res 45: 954–966.
45. Adiels M (2004) Compartmental models of lipoprotein kinetics. Ph.D. thesis,Chalmers University of Technology.
46. Shen BW, Scanu AM, Kezdy FJ (1977) Structure of human serum lipoproteins
inferred from compositional analysis. Proc Natl Acad Sci U S A 74: 837–841.
47. Soulages JL, Brenner RR (1991) Study on the composition-structure
relationship of lipophorins. J Lipid Res 32: 407–415.
48. Tuzikov FV, Tuzikova NA, Galimov RV, Panin LE, Nevinsky GA (2002)General model to describe the structure and dynamic balance between different
human serum lipoproteins and its practical application. Med Sci Monit 8:MT79–88.
49. Schnitzer E, Lichtenberg D (1994) Re-evaluation of the structure of low density
lipoproteins. Chem Phys Lipids 70: 63–74.
50. Kumpula L (2011) Computational models and methods for lipoproteinresearch. Ph.D. thesis, Aalto University, Dept. of Biomedical engineering and
Computational science.
51. Rader DJ (2006) Molecular regulation of hdl metabolism and function:
implications for novel therapies. J Clin Invest 116: 3090–3100.
52. Annema W, Tietge UJF (2011) Role of hepatic lipase and endothelial lipase inhigh-density lipoproteinmediated reverse cholesterol transport. Curr Ather-
oscler Rep 13: 257–265.
53. Dallinga-Thie GM, Zonneveld-de Boer AJ, van Vark-van der Zee LC, vanHaperen R, van Gent T, et al. (2007) Appraisal of hepatic lipase and
lipoprotein lipase activities in mice. J Lipid Res 48: 2788–2791.
54. Ehnholm C, editor (2009) Cellular Lipid Metabolism. Heidelberg: Springer,394 pp.
55. Grefhorst A, Hoekstra J, Derks TGJ, Ouwens DM, Baller JFW, et al. (2005)
Acute hepatic steatosis in mice by blocking b -oxidation does not reduce insulinsensitivity of very-low-density lipoprotein production. Am J Physiol Gastrointest
Liver Physiol 289: G592–G598.
56. Peterson J, Bengtsson-Olivecrona G, Olivecrona T (1986) Mouse preheparinplasma contains high levels of hepatic lipase with low affinity for heparin.
Biochim Biophys Acta 878: 65–70.
57. McCoy MG, Sun GS, Marchadier D, Maugeais C, Glick JM, et al. (2002)Characterization of the lipolytic activity of endothelial lipase. J Lipid Res 43:
921–929.
58. Okazaki H, Goldstein JL, Brown MS, Liang G (2010) LXR-SREBP-1c-phospholipid transfer protein axis controls very low density lipoprotein (VLDL)
particle size. J Biol Chem 285: 6801–6810.
59. Rensen PCN, Herijgers N, Netscher MH, Meskers SCJ, van Eck M, et al.
(1997) Particle size determines the specificity of apolipoprotein E-containing
triglyceride-rich emulsions for the LDL receptor versus hepatic remnantclearance in vivo. J Lipid Res 38: 1070–1084.
60. Valacchi G, Sticozzi C, Lim Y, Pecorelli A (2011) Scavenger receptor class B
type I: a multifunctional receptor. Ann N Y Acad Sci 1229: E1–E7.
61. Xiang SQ, Cianflone K, Kalant D, Sniderman AD (1999) Differential binding
of triglyceride-rich lipoproteins to lipoprotein lipase. J Lipid Res 40: 1655–
1663.
Computational Analysis of Murine Lipoproteins
PLOS Computational Biology | www.ploscompbiol.org 16 May 2014 | Volume 10 | Issue 5 | e1003579

62. Amersham Biosciences (2002) Gel filtration: principles and methods, Edition AI.
Handbook code no. 18-1022-18, Uppsala, Sweden: Amersham Biosciences. 123 p.63. Mora S (2009) Advanced lipoprotein testing and subfractionation are not (yet)
ready for routine clinical use. Circulation 119: 2396–2404.
64. Raue A, Kreutz C, Maiwald T, Bachmann J, Schilling M, et al. (2009)Structural and practical identifiability analysis of patially observed dynamical
models by exploiting the profile likelihood. Bioinformatics 25: 1923–1929.65. Ebara T, Conde K, Kako Y, Liu Y, Xu Y, et al. (2000) Delayed catabolism of
apoB-48 lipoproteins due to decreased heparan sulfate proteoglycan production
in diabetic mice. J Clin Invest 105: 1807–1818.66. Brodeur MR, Luangrath V, Bourret G, Falstrault L, Brissette L (2005)
Physiological importance of SR-BI in the in vivo metabolism of human HDLand LDL in male and female mice. J Lipid Res 46: 687–696.
67. Millar JS, Cromley DA, McCoy MG, Rader DJ, Billheimer JT (2005)Determining hepatic triglyceride production in mice: comparison of poloxamer
407 with triton wr-1339. J Lipid Res 46: 2023–2028.
68. Jiang XC, Jin W, Hussain MM (2012) The impact of phospholipid transferprotein (PLTP) on lipoprotein metabolism. Nutr Metab 9: 75.
69. Zelcer N, Tontonoz P (2006) Liver X receptors as integrators of metabolic andinflammatory signaling. J Clin Invest 116: 607–614.
70. Tiemann CA, Vanlier J, Hilbers PAJ, van Riel NAW (2011) Parameter
adaptations during phenotype transitions in progressive diseases. BMC Sys Biol5: 174.
71. Jiang XC, Beyer TP, Li Z, Liu J, Quan W, et al. (2003) Enlargement of highdensity lipoprotein in mice via liver X receptor activation requires
apolipoprotein E and is abolished by cholesteryl ester transfer proteinexpression. J Biol Chem 278: 49072–49078.
72. Cao G, Beyer TP, Yang XP, Schmidt RJ, Zhang Y, et al. (2002) Phospholipid
transfer protein is regulated by liver X receptors in vivo. J Biol Chem 277:39561–39565.
73. Bencharif K, Hoareau L, Murumalla RK, Tarnus E, Tallet F, et al. (2010)Effect of apoA-I on cholesterol release and apoE secretion in human mature
adipocytes. Lipids Health Dis 9: 75.
74. Kurano M, Iso-O N, Hara M, Ishizaka N, Moriya K, et al. (2011) LXR agonistincreases apoe secretion from HepG2 spheroid, together with an increased
production of VLDL and apoE-rich large HDL. Lipids Health Dis 10: 134.75. Knoblauch H, Schuster H, Luft FC, Reich J (2000) A pathway model of lipid
metabolism to predict the effect of genetic variability on lipid levels. J Mol Med78: 507–515.
76. Winkler K, Schaefer JR, Klima B, Nuber C, Friedrich I, et al. (2000) HDL
steady state levels are not affected, but HDL apoA-I turnover is enhanced byLifibrol in patients with hypercholesterolemia and mixed hyperlipidemia.
Atherosclerosis 150: 113–120.77. Frenais R, Ouguerram K, Maugeais C, Marchini JS, Benlian P, et al. (1999)
Apolipoprotein A-I kinetics in heterozygous familial hypercholesterolemia: a
stable isotope study. J Lipid Res 40: 1506–1511.78. Chetiveaux M, Ouguerram K, Zair Y, Maugere P, Falconi I, et al. (2004) New
model for kinetic studies of hdl metabolism in humans. Eur J Clin Invest 34:262–267.
79. Fisher WR, Venkatakrishnan V, Zech LA, Hall CM, Kilgore LL, et al. (1995)Kinetic evidence for both a fast and a slow secretory pathway for
apolipoprotein A-I in humans. J Lipid Res 36: 1618–1628.
80. Phair RD, Hammond MG, Bowden JA, Fried M, Fisher WR, et al. (1975)Preliminary model for human lipoprotein metabolism in hyperlipoproteinemia.
Fed Proc 34: 2263–2270.81. Berman M, Hall M, Levy RI, Eisenberg S, Bilheimer DW, et al. (1978)
Metabolism of apoB and apoC lipoproteins in man: kinetic studies in normal
and hyperlipoproteininemic subjects. J Lipid Res 19: 38–56.82. Fisher WR, Zech LA, Bardalaye P, Warmke G, Berman M (1980) The
metabolism of apolipoprotein B in subjects with hypertriglyceridemia andpolydisperse LDL. J Lipid Res 21: 760–774.
83. Zech LA, Grundy SM, Steinberg D, Berman M (1979) Kinetic model for
production and metabolism of very low density lipoprotein triglycerides.
Evidence for a slow production pathway and results for normolipidemic
subjects. J Clin Invest 63: 1262–1273.
84. Krul ES, Parhofer KG, Barrett PH, Wagner RD, Schonfeld G (1992) ApoB-75,
a truncation of apolipoprotein B associated with familial hypobetalipoprotei-
nemia: genetic and kinetic studies. J Lipid Res 33: 1037–1050.
85. Packard CJ, Gaw A, Demant T, Shepherd J (1995) Development and
application of a multicompartmental model to study very low density
lipoprotein subfraction metabolism. J Lipid Res 36: 172–187.
86. Patterson BW, Mittendorfer B, Elias N, Satyanarayana R, Klein S (2002) Use
of stable isotopically labeled tracers to measure very low density lipoprotein-
triglyceride turnover. J Lipid Res 43: 223–233.
87. Campos H, Perlov D, Khoo C, Sacks FM (2001) Distinct patterns of
lipoproteins with apoB defined by presence of apoE or apoC-III in
hypercholesterolemia and hypertriglyceridemia. J Lipid Res 42: 1239–1249.
88. Chan DC, Watts GF, Nguyen MN, Barrett PHR (2006) Apolipoproteins C-III
and A-V as predictors of very-low-density lipoprotein triglyceride and
apolipoprotein B-100 kinetics. Arterioscler Thromb Vasc Biol 26: 590–596.
89. Packard CJ, Demant T, Stewart JP, Bedford D, Caslake MJ, et al. (2000)
Apolipoprotein B metabolism and the distribution of VLDL and LDL
subfractions. J Lipid Res 41: 305–318.
90. Adiels M, Packard C, Caslake MJ, Stewart P, Soro A, et al. (2005) A new
combined multicompartmental model for apolipoprotein B-100 and triglycer-
ide metabolism in VLDL subfractions. J Lipid Res 46: 58–67.
91. Adiels M, Olofsson SO, Taskinen MR, Boren J (2008) Overproduction of very
low-density lipoproteins is the hallmark of the dyslipidemia in the metabolic
syndrome. Arterioscler Thromb Vasc Biol 28: 1225–1236.
92. Adiels M, Matikainen N, Westerbacka J, Soderlund S, Larsson T, et al. (2012)
Postprandial accumulation of chylomicrons and chylomicron remnants is
determined by the clearance capacity. Atherosclerosis 222: 222–228.
93. Bhattacharya BS (2011) Mathematical Modelling of Low Density Lipoprotein
Metabolism. Intracellular Cholesterol Regulation. Phd thesis, The University of
Reading.
94. Potter LK, Sprecher DL, Walker MC, Tobin FL (2009) Mechanism of
inhibition defines CETP activity: a mathematical model for CETP in vitro.
J Lipid Res 50: 2222–2234.
95. August E, Parker KH, Barahona M (2007) A dynamical model of lipoprotein
metabolism. Bull Math Biol 69: 1233–1254.
96. Tindall MJ, Wattis JAD, O’Malley BJ, Pickersgill L, Jackson KG (2009) A
continuum receptor model of hepatic lipoprotein metabolism. J Theor Biol
257: 371–384.
97. Balgi G, Kadambi A, Paterson TS. (2006) methods and models for cholesterol
metabolism, wo2006066051.
98. van Schalkwijk DB, van Ommen B, Freidig AP, van der Greef J, de Graaf AA
(2011) Diagnostic markers based on a computational model of lipoprotein
metabolism. J Clin Bioinforma 1: 29.
99. van Bochove K, van Schalkwijk DB, Parnell LD, Lai CQ, Ordovas JM, et al.
(2012) Clustering by plasma lipoprotein profile reveals two distinct subgroups
with positive lipid response to fenofibrate therapy. PLoS One 7: e38072.
100. Marschang P, Herz J (2003) Mouse models as tools for dissecting disorders of
lipoprotein metabolism. Semin Dev Biol 14: 25–35.
101. van de Pas NC (2011) A physiologically based kinetic model for the prediction
of plasma cholesterol concentrations in mice and man. Ph.D. thesis,
Wageningen University.
102. Westerterp M, van der Hoogt CC, de Haan W, Offerman EH, Dallinga-Thie
GM, et al. (2006) Cholesteryl ester transfer protein decreases high-density
lipoprotein and severely aggravates atherosclerosis in apoe*3-leiden mice.
Arterioscler Thromb Vasc Biol 26: 2552–2559.
Computational Analysis of Murine Lipoproteins
PLOS Computational Biology | www.ploscompbiol.org 17 May 2014 | Volume 10 | Issue 5 | e1003579