A comparison of dietary atherogenicities, energy balance, and physical activity levels of male and...
20
Nutrition Research, Vol. 16, Nos. 11112, pp. 18614880.1996 Copyright 0 1996 Elseviet Science Inc. Printed in the USA. All rights resend 0271-5317/96 $15.00 + .oO ELSEVIER PJIS0271-5317(%)00210-2 A COMPARISON OF DIETARY ATHEROGENICITIES, ENERGY BALANCE, AND PHYSICAL ACTIVITY LEVELS OF MALE AND FEMALE COLLEGE STUDENTS ChickF. Tam,M.S.,Dr. P.H.,C.N.S.*‘,ElenaMartinez,M.S.,R.D.*, SeanTsai,B.S.*,LiC. Chang,B.A.,R.D.*,LauraCalderon,M.A.,Dr.P.H.,R.D.*, Rebecca Davis, Ph.D.**, and I-Li Yeh, M.S.* Departments of Health and Nutritional Sciences* and Arts**, Schools of Health and Human Services and Arts and Letters, California State University at Los Angeles, CA 90032, USA. ABSTRACT The purpose of this study was to compare the differences in selected nutrient intakes, dietary atherogenicities, energy balance, and specific physical activity (SPA) as defined between 1.4 and 7.5 Kcal/kg/hr levels between male and female college students. A total of 122 (50 males and 72 females) completed their three-day dietary records. In addition, 89 (36 males and 53 females) of the 122 collected one-day physical activity journals along with one-day dietary records. The mean gram fiber intake was slightly higher for males than those of females, but females had higher values than males when expressed as fiber g/lOOOKcal and % dietary goal for fiber. The male had higher fat and cholesterol intakes than did the female, this was probably due to higher intakes of meat for males. Our findings of higher consumption of fat, cholesterol and sugar, lower fiber intakes, and higher atherogenic scores of diets such as Hegsted score and cholesterol index in males than in females, would place our male students at a higher risk for cardiovascular diseases. Most students participated in SPA at a light or moderate level (1.4-3 .O or 3. I-5.3 Kcal/lc&, respectively). Few students spent time at severe activity (5.4-7.4 Kcal/kg/hr) or very severe activity (7.5 or over Kcal/kg/hr). The male expended on the average more energy (612 Kcal/day) than did the female (348 Kctiday). We found that 25% of the 89 students were in positive energy balance, whereas 75% were in negative energy balance. Between genders, males had higher energy needs for daily basal metabolic rate (BMR), all physical activities, specific dynamic action (SDA) of food, total energy expenditure (TEE), and total energy intakes than females in both positive and negative energy balance categories. This may reflect gender differences, since males generally have more lean body mass, higher energy needs for all activities, and greater caloric intakes than females. Both genders with positive energy balance had decreased energy needs for BMR, all physical activities, SDA, and TEE, whereas they had increased energy, cholesterol and saturated fat intakes, and higher Hegsted score and cholesterol index than those of their counterparts with negative energy balance. These may lead students with positive energy balance to a greater risk of cardiovascular diseases than students with negative energy balance. Copyright Q 1996 Ekevier Science Inc. Key Words: dietary intakes, gender, cholesterol, fiber, sugar, fat ’Author to whom correspondence should be addressed. 1861
-
Upload
independent -
Category
Documents
-
view
1 -
download
0
Transcript of A comparison of dietary atherogenicities, energy balance, and physical activity levels of male and...

Nutrition Research, Vol. 16, Nos. 11112, pp. 18614880.1996 Copyright 0 1996 Elseviet Science Inc. Printed in the USA. All rights resend
0271-5317/96 $15.00 + .oO
ELSEVIER PJIS0271-5317(%)00210-2
A COMPARISON OF DIETARY ATHEROGENICITIES, ENERGY BALANCE, AND PHYSICAL ACTIVITY LEVELS OF MALE AND FEMALE COLLEGE STUDENTS
ChickF. Tam,M.S.,Dr. P.H.,C.N.S.*‘,ElenaMartinez,M.S.,R.D.*, SeanTsai,B.S.*,LiC. Chang,B.A.,R.D.*,LauraCalderon,M.A.,Dr.P.H.,R.D.*,
Rebecca Davis, Ph.D.**, and I-Li Yeh, M.S.* Departments of Health and Nutritional Sciences* and Arts**, Schools of Health and Human Services and Arts and Letters, California State University at Los Angeles, CA 90032, USA.
ABSTRACT
The purpose of this study was to compare the differences in selected nutrient intakes, dietary atherogenicities, energy balance, and specific physical activity (SPA) as defined between 1.4 and 7.5 Kcal/kg/hr levels between male and female college students. A total of 122 (50 males and 72 females) completed their three-day dietary records. In addition, 89 (36 males and 53 females) of the 122 collected one-day physical activity journals along with one-day dietary records. The mean gram fiber intake was slightly higher for males than those of females, but females had higher values than males when expressed as fiber g/lOOOKcal and % dietary goal for fiber. The male had higher fat and cholesterol intakes than did the female, this was probably due to higher intakes of meat for males. Our findings of higher consumption of fat, cholesterol and sugar, lower fiber intakes, and higher atherogenic scores of diets such as Hegsted score and cholesterol index in males than in females, would place our male students at a higher risk for cardiovascular diseases. Most students participated in SPA at a light or moderate level (1.4-3 .O or 3. I-5.3 Kcal/lc&, respectively). Few students spent time at severe activity (5.4-7.4 Kcal/kg/hr) or very severe activity (7.5 or over Kcal/kg/hr). The male expended on the average more energy (612 Kcal/day) than did the female (348 Kctiday). We found that 25% of the 89 students were in positive energy balance, whereas 75% were in negative energy balance. Between genders, males had higher energy needs for daily basal metabolic rate (BMR), all physical activities, specific dynamic action (SDA) of food, total energy expenditure (TEE), and total energy intakes than females in both positive and negative energy balance categories. This may reflect gender differences, since males generally have more lean body mass, higher energy needs for all activities, and greater caloric intakes than females. Both genders with positive energy balance had decreased energy needs for BMR, all physical activities, SDA, and TEE, whereas they had increased energy, cholesterol and saturated fat intakes, and higher Hegsted score and cholesterol index than those of their counterparts with negative energy balance. These may lead students with positive energy balance to a greater risk of cardiovascular diseases than students with negative energy balance. Copyright Q 1996 Ekevier Science Inc.
Key Words: dietary intakes, gender, cholesterol, fiber, sugar, fat
’ Author to whom correspondence should be addressed.
1861

1862 C.F. TAM et al.
Gender plays a significant role in food choices and eating patterns (1). Males tend to consume a larger amount of food, and have higher energy intakes than females (2). Men are also found to frequent fast food restaurants more often and eat more fast food meals per week than women (3).
Energy metabolism is not the same for males and females because of differences in lean body mass. Females have a higher average proportion of body fit (25%) compared to males (15%). Since basal metabolic rate is closely related to lean body mass, males therefore require more metabolic enagy than &males (4). Energy balance is a complex interaction with the two primary contributors being energy intake and energy expenditure which includes total energy needs for basal metabolism, physical activity and specific dynamic action of food or thermic effect of food. On the average, basal metabolism utilizes 60% of energy while thermic effect of food consumes lO%, and total daily physical activity only accounts for 30% of energy needs. The specific dynamic action of food can be estimated by taking 10% of energy needs for basal metabolism and physical activity (5). Another calculation of thermic &ect of food is 10% of the caloric value of a mixed diet consumed within 24 hours (6). Body weight can be increased, decreased or maintained depending on the energy balance status; positive, negative or reached equilibrium, respectively (6,7). Recent studies show that obesity is possibly being maintained by a diet composed of increased fat, added sugar and low dietary fiber (8).
Energy needs for physical activity encompass several other contributors as noted in the formula that total calorie of daily activity equals to the sum of calorie derived from sleep, occupation, and leisure (9,lO). Recent studies find spontaneous physical activity, small ‘fidgeting-type motions’, to be another significant contributor that varies among individuals (11). Expenditure for these small movements have been studied and reported to consume approximately 100-800 K&day (7,ll). Non-involvement in physical activity or sedentariness can also offset energy balance to result in positive energy balance. According to Hatziandreu et al., based on mortality estimates for coronary heart disease, the extrapolated cost of physical inactivity is $5.7 billion (12,13). One objective of the Healthy People 2000 is to reduce the estimated sedentary population (24%) to less than 15% with healthy initiatives to exercise regularly (14-16). For students, the components of school activities and schedule permit little time for a regular exercise program. In fact, one study showed low levels of cardiovascular fitness, particularly in men (17). Many of the medical students surveyed were at increased cardiovascular risk as a result of inactivity, hypertension, hyperlipidemia and stress (18).
Atherogenicity of a diet can be evaluated by Keys and Hegsted scores, cholesterol index, cholesterol saturated fat index, and the ratio of polyunsaturated fat to saturated fat (P:S ratio). Keys score and Hegsted score are based on the changes of calorie, saturated fat, polyunsaturated fat and cholesterol in the diet, whereas cholesterol index and cholesterol saturated fat index are based on calorie, saturated fat, and cholesterol in the diet (19-22). Keys score and Hegsted score have been used for predicting the changes of blood cholesterol (19,20). Males also have a significantly lower P:S ratio than females (1). A lower P:S ratio increases the risk of developing heart diseases.
Good diet and sensible exercise are both necessary components of a he&W lifestyle. It is recognized that the beneficial effects of the combined efforts can affect major chronic diseases by postponing or preventing them altogether (23). The purpose of this study is to examine the difference in selected dietary nutrient intakes, such as protein, carbohydrate, saturated and unsaturated as, cholesterol, sugar content, dietary fiber, dietary atherogenicities, energy balance, and physical activity levels between male and female college students. This may help to identify serious

ATHEROGENICITY PHYSICAL ACTIVITY 1883
dietary and lifestyle issues that can be addressed early on in hopes ofcontinued healthful living for the fbture. This study will: 1. Measure overall dietary patterns, energy balance, and physical activity levels in male and female
college students. 2. Assess atherogenic scores and indices of the diets in male and female college students. 3. Study the differences of energy balance and physical activity levels between male and female
college students.
Our experimental subjects consisted of college undergraduate students obtained from several basic nutrition classes during 1988-1989 at Ctiornia State University, Los Angeles. This was a non- randomized and biased study due to the subjects’ educational level and taking a nutrition course.
ecords All students were required to submit the following assignments. They completed a 3-day
dietary record, two weekdays and one weekend day, for a more accurate record of food consumption than a 24-hr record or recall. For each day, students documented their food intake with the time of day, amount, and type of food eaten. In addition, the students completed a separate one-day dietary record with physical activity journal on the same day. Students had been thoroughly instructed within the nutrition course on how to accurately complete the physical activity journal, including type and intensity of activity and time spent in the activity.
3. Analv.~s of Dietary Records The dietary records (3day and l-day) were analyzed using the Nutritionist III (version 6) and
compared with the respective NRC-RDA of 1989.
cal . .
Ac&&y (SPA) Levels SPA was divided into fbur levels according to McWtiams: light activity ( 1.4-3 .O Kcahkgjbr),
moderate activity (3.1-5.3 K&kg/l@, severe activity (5.4-7.4 Kcal/kg/hr), and very severe activity (7.5 Kcal&/hr or over) (24). Tie spent and calorie expended for students, who participated in one or more levels of SPA were all counted manually.
ce Calca The energy expenditure for physical activities were calculated using data from the one-day
physical activity journals by hand. Body surface area, basal metabolic rate, energy expenditure on physical activities, specific dynamic action of food, and total energy expenditure were calculated using the formulas from McWtiams (24). The energy intake and expenditure were compared to determine the energy balance in a day from the one-day dietary records and physical activity journals collected by the students.
6. Calc&&stns of Atherogenic Scores & Indices of Diets Keys and Hegsted Scores were calculated based on Keys and Hegsted equations which were
modified by Haffner et al. (1). Cholesterol index was calculated by the method of Zilversmit (21) and cholesterol saturated fat index by the method of Connor et al. (22).

1864
. . 7. Str&tlcal Analys is
C.F. TAM et al.
The results were analyzed using the Mystat and SPSS statistical computer programs. All data were expressed as mean + SD. The t test was used to test the differences between male and female college students. The Pearson correlation coefficients (r) were used to express any bivariate relationship among the variables. Statistical differences and correlations were considered to be significant at alpha level of 0.05.
This study included one hundred and twenty-two subjects with a collection of 122 sets of 3- day dietary records from 50 males and 72 fdes college students. The average age was 24.25 years old, ranging from 18 to 48 years (Table 1). The male population averaged 24.16 years old, ranging from 20 to 45 years, while the female population averaged 24.14 years old, ranging from 18 to 48 years. Energy balance was examined using both one-day dietary energy intakes and expenditure from 89 subjects (36 males and 53 females).
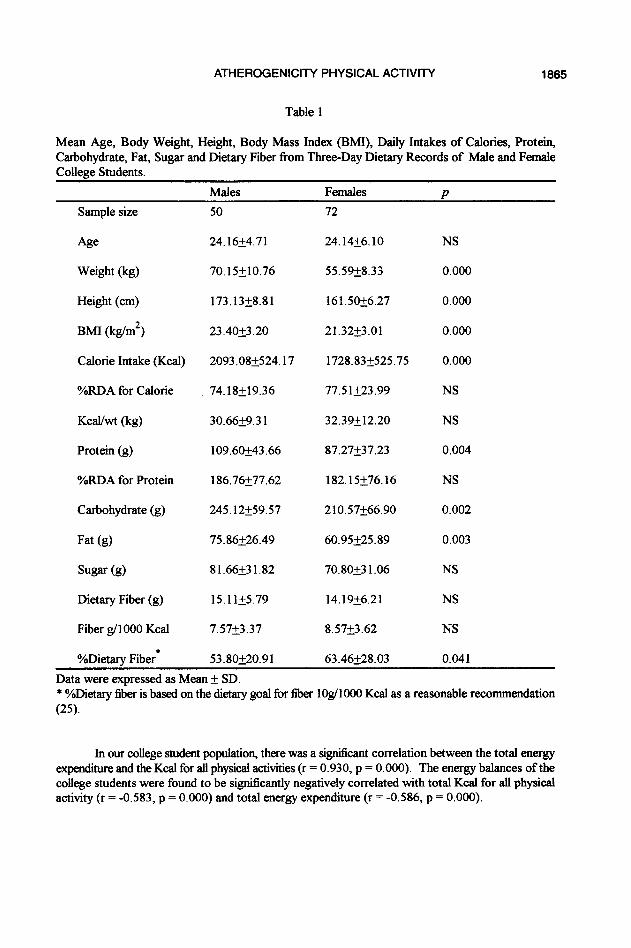
Significant dif?&nces between males and females were observed with males being higher in body weight, height, body mass index, energy intake, protein intake, carbohydrate consumption, and fat intake (Table 1). However, there was no difference between males and females when caloric intakes were normal&d by body weight or expressed by %RDA for calorie (Table 1). Sugar content of diets tended to be higher in males than females (p=O.O64). Dietary fiber consumption of males appeared slightly higher than those of females. In contrast, when fiber intakes were expressed as g/lOOOKcal, females tended to have slightly higher amounts than males (p=O. 126). Percent goal for dietary fiber (based on 10 g/l 000 Kcal) showed a significant difference between males and females, with females having a higher consumption of fiber than males (Table 1).
Energy nutrient distributions (%Kcal) for both male and female groups, all closely corresponded in Table 2. There were no significant differences between males and females in %Kcal fkom protein carbohydrates, fat, and sugar. Both male and female students had protein intakes, when expressed as % of total kilocalories, over the dietary goals set by the American Heart Association (26) (Table 2).
When compared to females, males had significantly higher dietary intakes of cholesterol and polyunsaturated fat, and with a higher tendency in the intake of saturated fat (p=O.O59) (Table 3). However, there were no differences in P:S ratios between genders (Table 3). Hegsted scores and cholesterol index of the diets were also significantly higher in males than in females whereas there were no significant differences between genders in Keys scores and cholesterol saturated fat index of the diets (Table 3).
Statistical differences were found in all components of energy balance (Table 4). Males expended signiticantIy more energy for basal metabolic rate, for all physical activities (0.1-7.5 or over Kcalkgkr), and specific dynamic action of food (Table 4). In sum, males expended a significantly larger amount of total energy expenditure in comparison to those of the females. Average daily energy intake was also significantly greater for males than for females. Overall, a negative energy balance was recorded for both genders (Table 4). Males spent an average of 612 K&day compared to females of 348 K&day for total calorie spent for four levels of specific physical activity (1.4-7.5 or over Kcalkgkr) with statistical significance (p=O.O07).
ATHEROGENICITY PHYSICAL ACTIVITY 1885
Table 1
Mean Age, Body Weight, Height, Body Mass Index (BMI), Daily Intakes of Calories, Protein Carbohydrate, Fat, Sugar and Dietary Fiber from Three-Day Dietary Records of Male and Female College Students.
Males Females z?
Sample size
Age
Weight (kg)
Height (cm)
BMI (kg/m’)
Calorie Intake (Kcal)
%RDA for Calorie
KcaVwt (kg)
Protein (g)
%RDA for Protein
Carbohydrate (g)
Fat (g)
Sugar (g)
Dietary Fiber (g)
Fiber g/l 000 Kcal
OhDietary Fiber*
50
24.16k4.71
70.15+10.76
173.13k8.81
23.4Ot3.20
2093.08+524.17
74.18L19.36
30.6629.31
109.6ti43.66
186.76k77.62
245.12+59.57
75.86k26.49
81.66231.82
15.11k5.79
7.57k3.37
53.80+20.91
72
24.14k6.10
55.59k8.33
161.50+6.27
21.32+3.01
1728.83+525.75
77.51223.99
32.3ti12.20
87.27237.23
182.15k76.16
210.57+66.90
60.95225.89
70.80+31.06
14.19+6.21
8.57k3.62
63.46k28.03
NS
0.000
0.000
0.000
0.000
NS
NS
0.004
NS
0.002
0.003
NS
NS
NS
0.041
Data were expressed as Mean + SD. * OhDietary fiber is based on the dietary goal for fiber lOg/lOOO Kcal as a reasonable recommendation (25).
In our college student population, there was a significant correlation between the total energy expenditure and the Kcal for all physical activities (r = 0.930, p = 0.000). The energy balances of the college students were found to be significantly negatively correlated with total Kcal for all physical activity (r = -0.583, p = 0.000) and total energy expenditure (r = -0.586, p = 0.000).

1866 C.F. TAM et al.
Table 2
Gverall Mean Values for Caloric Distributions of Energy Nutrients and Sugar for Male and Female College Students.
Dietary Goals* Male Female Sample size 50 72
Carbohydrate (o/OK&) 50-55 47.58+8.92 48.72k8.66
Protein (%Kcal) Cl5 20.3224.61 20.32t5.84
Fat (%Kcal) <30 3 1.9e6.03 30.75k7.58
Sugar (%Kcal) 16.35k6.85 16.87+6&l
Data were expressed as mean&SD. * Dietary goals for caloric distributions of energy nutrients recommended by the American Heart Association (26).
Table 3
Mean Cholesterol, Polyunsaturated Fat (PUSF), %Kcal from PUSF, Saturated Fat (SF), %Kcal from SF, Ratio of PUSF to SF (P:S ratio), and Atherogenic Scores and Indices Based on Three-day Dietary Records of College Students .
Males Females P Sample size 50 72
Cholesterol(mg) 430.4lkl92.79 317.432162.75 0.001
PUSF (iit) 10.82+6.12 8.5024.69 0.026
%Kcal from PUSF 4.53&l .96 4.30&l .77 NS
SF (tic) 25.61+8.97 22.06&l 1.51 NS
%Kcal from SF
P: S ratio
10.94k2.68 11.28k4.25 NS
0.45iO.24 0.44g.32 NS
Keys Score 42.84k8.50 42.86kl2.20 NS
Hegsted Score
CI
45.29214.84 38.76215.25 0.020
147.15+54.14 118.87k56.22 0.006
CSI 22.42k5.06
Data were expressed as mean&SD.
21.81k6.57 NS

ATHEFIOGENICITY PHYSICAL ACTIVITY 1887
There were low participation rates of college students in the severe activity (6%) and very severe activity (11%) levels (5.4 - 7.5 or over Kcalkg/hr), compared to the light activity (65%) and moderate activity (41%) levels (1.4 - 5.3 Kc&k&r). Sib&y-nine percent of 89 students (58 students) participated in light activity on an average of 1.65 hrlday, whereas 41% of 89 students (37 students) who participated in moderate activity were on an average of 2.04 hr/day. Only a small percent of students engaged in strenuous exercise, 6% (5 students) in severe activity for 1.30 hr/day and 11% (10 students) in very severe activity level for 0.64 hr/day. Five participants, 4 females and 1 male, spent an average of 1.30 hours and expended 726.962323.06 Kcalfday at severe activity level. At very severe activity level, there were 10 participants, including 6 females and 4 males, who spent averaged 0.64 hour and expended 506.09&220.20 K&day at this level.
Table 4
Basal Metabolic Kate (BMR), Kcal for All Physical Activity, Specific Dynamic Action @DA) of Food, Total Energy Expenditure (TEE), Calorie Intake, and Energy Balance of Male and Female College Students.
Sample size
Males Females
36 53 P
Age 24.36f4.30 23.77k5.16 NS
BMR (K&day) 1706.10~151.70 1327.26t115.49 0.000
Kcal for All Physical Activity*
1096.11 775.74 2393.69 i324.57 0.000
SDA (K&day) 280.24+45.07 210.34+38.87 0.000
TEE (K&lay)** 3082.45+494.90 23 14.532427.49
Total Calorie Intake @aday)
2231.535787.14 1800.09+556.67 0.011
Energy Balance -849.37k908.35
pata were expressed as mean + SD.
-530.54&790.96 NS
** Kcal for all physical activity refers to the activity between 0.1 to 7.5 Kcalikg/hr, or over. TEE includes BMR, Kcal for ah physical activity, and SDA.
The participation rates of males were higher in light activity (69%) and moderate activity (56%) levels compared to those of f&es (62% and 32%, respectively)(Table 5). There were same participation rates in very severe activity level between genders (1 l%), and higher participation rates in severe activity in females (8%) than in males (3%). In moderate activity (3.1 - 5.4 KcaI/kg/hr), femaks participated for a longer period of time than males. At moderate activity level, females spent 0.79 hour extra and expended over 400 Kcals at this level than did males (p=O.O22). Overall, males spent more time and expended significantly more calories than did females in light activity (p=O.O12)(Table 5).

1868 C.F. TAM et al.
Table 5
Four Specilic Physical Activity (SPA) Levels: Students’ Participation Bates for SPA, Time Spent for SPA Levels, and Total Calorie Expended for SPA Levels by Male (M) and Female (F) College Students.
M, N=25 F, N=33
P
Participation Bate for SPA (%)*
69 62
Time Spent for Total Calorie Expended SPA @r/day) for SPA &al/day)
. . iwtv Level (1.4 - 3.0 Kci~&&)
1.96k1.55 590.22k477.48 1.4221.47 327.785324.45
NS 0.012
M, N=20 F, N=17
P
56 32
Moderate Activity Level (3.1-5.3 K&k&r) 1.68+1.58 471.44k344.23 2.47k1.98 909.15+460.90
NS 0.022
M, N=l F, N=4
P
3 8
S rAi’ eve) 1.0 508.00 1.37&1.11 781.70k345.22
NS NS
M, N=4 F, N=6
D
11 11
v _ k r A ” 0.75+0.29 523.452203.27 0.56fl.37 494.5Q249.17
NS NS
Data were expressed as mean&SD. N: sample siie. * Participation rate (%) for SPA was calculated based on the 89 students, 36 males, or 53 females,
who performed specific levels of physical activities between 1.4 and 7.5 Kcalkg/hr or over. w: Because four levels of SPA as defined may vary throughout the day, it is possible that a student may have participated in several levels of SPA within the one-day period. Consequently, the counting of SPA based on his/her activities exceeded a total number of 89 and in fact, it was counted as 110 because of students’ participation at more than one level of activity. For example, 65% of 89 students actually participated in light activity; including 33 females, 25 males. Thirty-one students did not participate at light activity level during the day, whereas 41% of 89 students participated in moderate activity, including 20 males and 17 females. Fifty-two students did not participate at this level throughout the day, etc..
In analyzing positive and negative energy balances of the 89 students, 22 students (25%) were in positive energy balance (401.37k339.01 Gal/day) and 67 students (75%) were in negative energy balance (-1007.862654.66 KcaVday). Of the 22 students in positive energy balance, the average of total energy expenditure was 2331.12 Kctiday while their calorie intake average was 2732.50 Kcal/day. On the average, students who were in the negative energy balance group expended 272 1.70 Kc&lay at some level of activity with lower calorie intake (1725.74 K&day). Daily calorie intake and total energy expenditure were tkmd to be statistically ditkent for the males and females in both positive and negative energy balance groups. Males consumed significantly more calorie and also
ATHEROGENICITY PHYSICAL ACTIVITY 1889
expended significantly more calorie than the females in the positive energy balance group, Similarly, in the negative energy balance group, males expended significantly, more calorie throughout the day and had significantly higher calorie intake (p=O.O43) than did their female counterparts. Energy balance of these students ranged from -2489 to - 1.70 Kcal/day.
Table 6
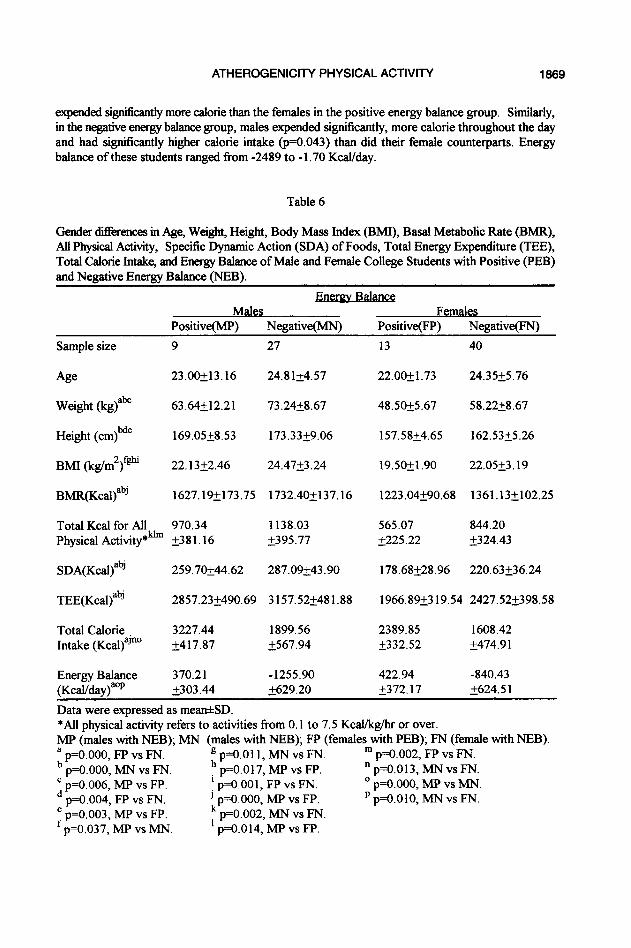
Gender di&rences in Age, Weight, Height, Body Mass Index (BMI), Basal Metabolic Kate (BMR), All Physical Activity, Specific Dynamic Action (SDA) of Foods, Total Energy Expenditure (TEE), Total Calorie Intake, and Energy Balance of Male and Female College Students with Positive (PEB) and Negative Energy Balance (NEB).
Males Females Positive(MP) Negative(MN) Positive(FP) Negative(FN)
Sample size 9
Age 23.00+13.16
Weight (kg)ab” 63.64212.21
Height (cm)bde 169.05+8.53
BMI (kg/m2)fr@ 22.1322.46
BMR(KcaBabj 1627.19+173.75
Total Kcal for All 970.34 Physical Activity*& &38 1.16
SDA(KcaQabJ 259.7Ok44.62
TEE(KcaQab’ 2857.232490.69
Total Calorie Intake (KcaBaJno
3227.44 1899.56 k417.87 2567.94
Energy Balance (KcaUday)aop
370.21 -1255.90 i303.44 5629.20
27
24.812457
73.2428.67
173.3359.06
24.47k3.24
1732.40+137.16
1138.03 2395.77
287.09+43.90
3157.52k481.88
13 40
22.OR1.73 24.3525.76
48.5Ok5.67 58.2258.67
157.58k4.65 162.53k5.26
19.50+1.90 22.05k3.19
1223.04+90.68 1361.13+102.25
565.07 844.20 2225.22 k324.43
178.68k28.96 220.63236.24
1966.8%3 19.54 2427.522398.58
2389.85 1608.42 t332.52 i474.91
422.94 -840.43 i372.17 i624.51
Data were expressed as mea&SD. *All physical activity refers to activities from 0.1 to 7.5 Kcal/kg/hr or over. MP (males with NEB); MN (males with NEB); FP (females with PEB); FN (female with NEB). a p=O.OOO, FP vs FN. b
g p=O.Oll, MN vs FN. ln p=o.o02, FP vs FN. p=O.OOO, MN vs FN. h p=O.O17, MP vs FP. * p=o.o13, MN vs FN.
; p=O.O06, MP vs FP. f p=O.OOl, FP vs FN. O p=o.ooo, MP vs MN. p=O.O04, FP vs FN. ’ p=O.OOO, MP vs FP. p p=O.OlO, MN vs FN.
$ p=O.O03, MP vs FP. p=o.o37, MP vs MN.
: p=O.o02, MN vs FN. p=O.O14, MP vs FP.

1870 C.F. TAM et al.
In male groups, there were no significant differences in basal metabolic rate, total calorie for all physical activities (from 0.1 to 7.5 Kcal/kg/hr or over), specific dynamic action of food, total energy expenditure, and energy balance between males with positive and negative energy balances, except males with positive energy balance had higher body mass index and total calorie intake than males with negative energy balance (Table 6).
On the other hand, in the female groups, students who were in the positive energy balance group were significantly lower in body weight, height, body mass index, basal metabolic rate, total calorie for all physical activity, specific dynamic action of food, total energy expenditure, except higher calorie intakes than those of females with negative energy balance (Table 6).
With respect to gender differences, in the positive energy balance groups, males were significantly higher in body weight, height, basal metabolic rate, total calorie for all physical activities, specific dynamic action of food, total energy expenditure, and total calorie intake than those of their female counterparts (Table 6).
Likewise, in the negative energy balance groups, males showed significantly higher body weight, height, body mass index, basal metabolic rate, total calorie for physical activities, specific dynamic action of food, total energy expenditure, and total calorie intake than those of females in negative enetgy balance (Table 6). With respect to energy balance @al/day), significant differences were found when compared between males and females with negative energy balance (p=O.OlO), between positive and negative energy balance groups in both males (p=O.OOO) and females (p=O.OOO).
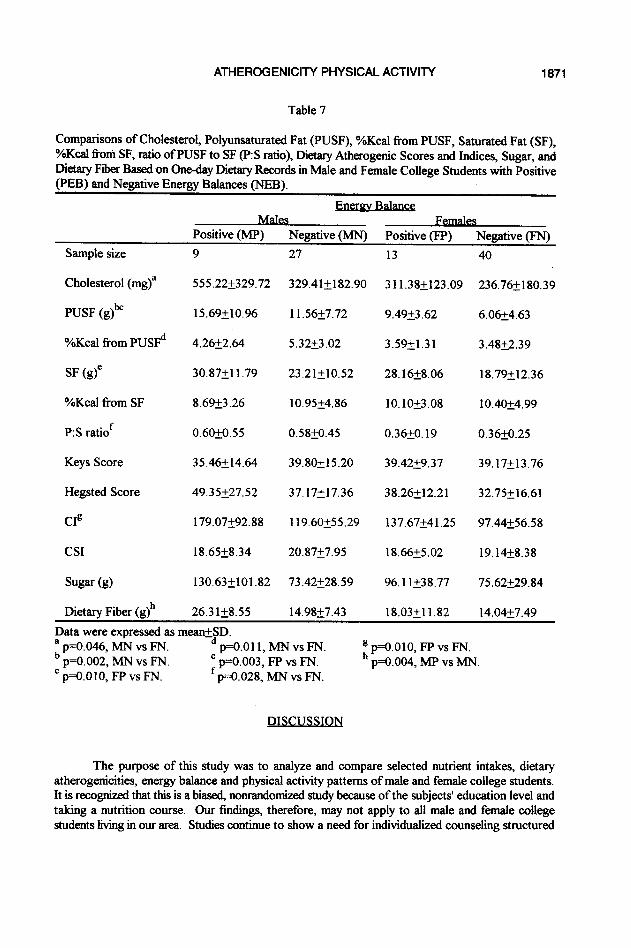
In the negative energy balance groups, by comparing to &males, males had significantly higher consumption of cholesterol, polyun&maM lht intake, percent calorie derived from polyunsaturated fat, and P:S ratio (Table 7). In the positive energy balance groups, there was no sign&ant ditference in any dietary atherogenic factor between genders, whereas cholesterol intake of males tended to be higher than those of females (p=O.O61).
In females, students with positive energy balance had significantly higher cholesterol index of the diets, signiticantly higher intakes of polyunsaturated fat, and saturated fat than those with negative energy balance (Table 7). In males, students with positive energy balance had significantly higher dietary fiber intakes and a higher tendency of cholesterol index than males with negative energy balance. The values of Keys scores and cholesterol saturated fat index were about the same between groups (Table 7).
The rankings of values of Hegsted scores and cholesterol index were highest in males with positive energy balance and lowest in females with negative energy balance. Based on one-day diet records, it was noteworthy that the rankings of values of P:S ratios were highest in males with positive or negative energy balance, and lowest in females with positive or negative energy balance (Table 7).
Respectively, the rankings of mean grams of dietary fiber and sugar were highest in males with positive energy balance, higher in females with positive energy balance, and lowest in both males and females with negative energy balances (Table 7).
ATHEROGENICITY PHYSICALACTIVITY 1871
Table 7
Comparisons of Cholesterol, Polyunsaturated Fat (PUSF), %Kcal from PUSF, Saturated Fat (SF), OAKcal from SF, ratio of PUSF to SF (P:S ratio), Dietary Atherogenic Scores and Indices, Sugar, and Dietary Fiber Based on One-day Dietary Records in Male and Female College Students with Positive (PEB) and Negative Energy Balances (NEB).
Positive (MP) Negative (MN) Positive (FP) Negative (FN)
Sample size
Cholesterol (mg)”
PUSF (g)b”
O/Kcal from PUSFd
SF (g)”
%Kcal from SF
P:S ratiof
Keys Score
Hegsted Score
CIR
CSI
Sugar (g)
Dietary Fiber (g)h
9
555.222329.72
15.69+10.96
4.26k2.64
30.87i11.79
8.69k3.26
0.60+0.55
3546+14&l
49.35k27.52
179.07292.88
18.65k8.34
130.63+101.82
27
329.41+182.90
11.56t7.72
5.3223.02
23.21210.52
10.95k4.86
0.58iO.45
39.80+15.20
37.17k17.36
119.6Ok55.29
20.8727.95
73.42228.59
26.31k8.55 14.98k7.43
13
311.38k123.09
9.49k3.62
3.59g.31
28.16+8.06
10.10&3.08
0.36+0.19
39.4229.37
38.26512.21
137.67k41.25
18.6625.02
96.11538.77
18.03+11.82
40
236.76k180.39
6.0624.63
3.48k2.39
18.7e12.36
10.4Ok4.99
0.36kO.25
39.17k13.76
32.75k16.61
97.44k56.58
19.14k8.38
75.62k29.84
14.04k7.49
Data were expressed as meanA$D. a p=O.O46, MN vs FN. b
p==O.Oll, MN vs FN. p=o.o02, MN vs FN.
c p=O.OlO, FP vs FN. ; p=O.O03, FP vs FN.
p=O.O28, MN vs FN.
E p=Q.OlO, FP vs FN. p=O.o04, MP vs MN.
DISCUSSION
The purpose of this study was to analyze and compare selected nutrient intakes, dietary atherogenicities, energy balance and physical activity patterns of male and female college students. It is recognized that this is a biased, nonrandomized study because of the subjects’ education level and taking a nutrition course. Our findings, therefore, may not apply to all male and female college students living in our area. Studies continue to show a need for individualized counseling structured

1872 C.F. TAM et al.
for college students’ personal circumstances. Cypel and Prather found that lack of nutritional guidance also played a role in poor food selections of college students (27). Even groups that have been introduced to basic nutrition have diiculty in making healthy food selections. Wilson and Quinn compared an undergraduate population with others that had chosen a health promotion course and found that 20-30% could not recognize foods high in fiber (28). They also concluded that both groups needed more education in nutrition. But even with accurate, up-to-date knowledge this does not guarantee change in behavior or good food choices (29,30).
From three-day dietary records, our results indicated that the males consumed, on the average, significantly more protein, carbohydrate, fat and overall calorie than the female population (Table 1). This finding is in agreement with other studies with college student populations (28,3 1,32).
. . Bietarv Fiber. Cholesterol_ Sugar. and AtherogeIllctv 1
The most common nutrition-related cause of death is heart disease, followed by cancer, strokes, and diabetes mellitus, which are specifically related to dietary fiber intake (33,34). There is no RDA for daily dietary fiber intakes, however, major health organizations such as the National Cancer Institute recommend a daily intake of 25-35 grams and not to exceed 35 grams (33,35). The % dietary goal for fiber was based on lOg/lOOO Kcal as a reasonable recommendation (25). With both males and females having 14 to 15 g/day dietary fiber intakes (Table l), this student population did not meet the low end of the recommendation from the National Cancer Institute. They were not dissimilar to the present American consumption of dietary fiber from 10 to 20 g per day (36). The findings of other studies fluctuated in amounts below the National Cancer Institute recommended daily intake. For example, the average dietary fiber intake for women 19-50 years old in the study of Thompson et al. was 10.8 grams per day, while women 19-28 years old consumed an average of 12 grams per day in the study of Bogalusa (37,38). A study of medical students proved to have similar results, with female intake of 12 grams per day and male intake at 16 grams per day (32). With respect to gender differences, the mean daily fiber intake was slightly higher for the males as compared to the females (15.1 lk5.79 vs 14.1956.21 g, respectively)(Table 1). However, when translated to fiber g/1000 Kcal or % dietary goal for fiber, females had higher intakes than males. This may be due to lower energy intakes in females (Table 1) or lower RDA for calorie in females.
Dietary fiber did positively affect utilization of tit and cholesterol. It has been suggested that an overall increase in whole grain products and decrease in animal protein intakes are reliable methods of obtaining higher fiber and lowering cholesterol in the diet (33, 39-41). The daily intake of cholesterol proved to be an area of concern in this study, especially for the male population (430.41?192.79 mg)(Table 3). It exceeded the recommendation of 300 mg/day from the American Dietetic Association and the American Heart Association by 43% (Table 3). Males had higher fat and cholesterol intakes (Tables 1 and 3) which were probably due to higher daily intakes of meats than their female counterparts. The servings of each food group in the diets were calculated in accordance with the diabetic exchange system. It was noteworthy that based on our study males indeed had significantly higher consumption of meat ( 10.1 w5.58 servings per day) when compared to those of females (7.68k4.38 servings per day)( P=O.O48). It was worthwhile to mention that cholesterol intakes of males with positive energy balance (555.22i329.72 mg/day) were more than those of males with negative energy balance (329.41+182.90 mg/day), although no significant difference was obtained (Table 7). Hence, the observation of an increased consumption of cholesterol in our males, when compared to females (Table 3), may be mainly contributed by the higher cholesterol intakes of males with positive energy balance. Protein intakes for males were averaged at 109.6 g/day (Table 1) of which 72% were found to be animal protein, whereas females had 87.3 g protein per day of which 70% were of animal origin. Both male and female groups had exceeded
ATHEROGENICITY PHYSICAL ACTIVITY 1873
100% of the RDAs for protein. This also proved true in the study by Glore et al., where men exceeded the FDA for protein and the dietary goal of cholesterol mg/day (32).
A diet composed of high fat with added sugar and low intakes of fiber can contribute to the maintenance of obesity as studied by Miller et al. (8). Sugar contents were found to be higher in diets of males than those of females (Table I), but the ditference was not sign&ant. However, when sugar was expressed as % of total Kcal, both male and female groups had about the same level at 16% (Table 2).
Dietary intake has also been associated with certain cancers (colon, breast and prostate), and diabetes mellitus. In 1990, actual causes of death in the U.S. that were nutrition-related approached 1.27 million. All dietary atherogenic scores and indices are used for predicting risks of having cardiovascular disease, in spite of their limited applications (42). Hegsted scores as well as the cholesterol index ofthe diets in our study were statistically higher in males than in females (Table 3). With respect to P:S ratios that were based on three-day dietary records, there was similarity between genders (Table 3). This was dissimilar to the San Antonio heart study of Mexican Americans and Anglo Americans, in that females consumed a less atherogenic diet than males (1). Furthermore, baaed on one-day dietary records, males with positive or negative energy balance had the highest P: S ratios when compared to those of &males with positive or negative energy balance (Table 7). These results may be explained by higher consumption of polyunsaturated fat in males than in females (Table 7). A lower P:S ratio increases the risk developing heart disease. Notwithstanding higher P: S ratios in males, based on our findings of higher consumption of fat, cholesterol and sugar, lower fiber intakes, higher cholesterol index, and Hegsted scores of males than those of females might place this male population at a higher risk for cardiovascular diseases than their female counterparts.
Balance
Since the total Kcal for energy expenditure or the total Kcal for all physical activities was negatively correlated with energy balances of our college students, it is unlikely that students who expended more Kcal for physical activities or involved in greater total energy expenditure could be in positive energy balance to gain weight.
Twenty-five percent of the 89 students (13 females and 9 males, a total of 22) were in positive energy balance. If this excessive daily rate of approximately 400 Kcals was to be continued on a regular basis, it is conceivable that this group could gain about 0.8 pound per week and up to 3.2 pounds per month. This calculation is accurate when using the static energy balance equation where change in energy stores is equal to energy intake less the energy expenditure. However, because it is static and unbounded it does not account for or allow for fluctuations in everyday living (7,43). However, in using the dynamic energy balance equation where rate of change of energy nutrient stores is equal to the rate of energy intake less the rate of energy expenditure, it is evident that a small positive energy balance will not lead to a large weight increase over a number of years. Instead, “after a short period of positive energy balance the energy stores (fat mass and fat free mass) will increase and cause an increase in energy expenditure which will balance the increased energy intake” (7). The equilibrium will occur, however, witlr increased energy intake, expenditure and stores. With this equation, it is possible to explain how adults can maintain a fairly constant body weight over long periods without extraordinary conscious effort in diet and activity. In other words, this equation explains how energy balance is achieved by varying food intake over hours and days to match energy needs, usually by appetite and satiety mechanisms (7).

1874 C.F. TAM et al.
Seventy-five percent of the 89 students (40 females and 27 males, a total of 67) who had negative energy balance (average -1008 K&day) would indicate that they lost their body weights at a rate of two pounds per week ifthey kept on this trend. Energy balance of these students, who were found to be in negative energy balance at the time of this study, ranged from loss of 2489 to 1.70 K&May. A three-day study by Rush and Sexsmith found similar results (44). Longer studies have also reported similar outcomes (45-47). Possible theories for the deficit in energy balance are that subjects tend to overestimate the time spent and the intensity of an activity, or that they underestimate portion size when accounting for energy intake. The idea of inaccurate selfreporting is always a variable in these types of surveys or questionnaires. Hensley et al. discussed the ability to recall precise and accurate information as a possible disadvantage (10). In addition, individuals may not feel inclined to completely record all information for 24 hours due to time constraints or increased awareness of behavior.
evels
Students in general spend a majority of their time in sitting and sleeping. Other study found that fitly percent of the students do not participate in strenuous exercise and fifty-one percent of students participate in moderate exercise approximately 30 minutes per week (18). Seventy-one percent of the day is spent in physical activity of low energy cost, 24% in light intensity and only 4.5% in moderate to heavy intensity activities (44). Of the 89 students in our study, f&y-eight students (65%) participated in light activity, thirty-seven students (41%) in moderate activity, five students (6%) in severe activity and ten students (11%) in the very severe activity level (Table 5), whereas ten students (11%) did not involve any one of the four levels of physical activity as defined (Tables 5). Although the last ten students did not have any activity level higher than 1.4 Kcd/kg/hr, they had activities which would be considered very light activities (0.5-l .3 Kcal/kg/hr) to sedentary activity (0.1-0.4 Kca&g/hr). Sedentary activity included studying, reading, writing, eating, lying or sitting down quietly (24). People with sedentary lifestyles have been identified as being at risk for many diseases (48,49). Furthermore, sedentary living has been shown to increase the risk for depression (15,50). Several studies also report sedentary energy expenditure in female subjects (44, 5 l-53). One study of 2 17 college subjects finds that 46% of the total subjects surveyed are inactive or do not exercise regularly (54). Recent data suggest that only 22% of American adults are adequately active, and that 25% are completely sedentary (23,55). Typically, age groups at 20,40, 50 and 60 show a significant increasing decline in physical activity. Even late adolescence and early adulthood show a decline in participation and prove to be the most vulnerable period for involvement in exercise (56,57).
Energy expenditure for daily specific physical activity was calculated using energy needs for activities that expended from 1.4 to 7.5 Kcal/kghr or over. Very light activity and sedentary activities that expended much less, such as studying, lying down or sleeping, were not included in any of the four physical activity levels. Seventy-nine students of the 89 students (89 %), who completed the one-day physical activity journals, did participate in some types of activity expending at least 1.4 K&k&lay. This is positive effort because some researches done on low intensity exercise (less than 300 Kcals at 50% of their Vo,max, 4 times a week) involving moderately overeat, weight-stable subjects, found a weight loss, and a loss of circumference measurements, especially at the gluteal and waist areas (58). Exercising at this low intensity level can still prove to be physically rewarding and health promoting. Overall, the seventy-nine students expended an average of 462 K&kg/day; with males expending a signiIicantly greater number of Kcal than did females in physical activity. For the female group, their expenditure of approximately 350 Kcal/day would meet the suggested 2,000 Kcal expended per week for positive health benefits (59,60). This is possible ifthey were able to continue this level of output daily for the week. In addition, the male population could easily meet this exercise

ATHEROGENICITY PHYSICAL ACTIVITY 1875
guideline if they continued to expend at the rate of about 600 KcaSlday for at least 3-4 days/week. However, since this study is based on a one-day physical activity journal, we cannot be sure that the data were collected on an active or inactive day or ifthe students were regularly exercising.
Contrary to common belie the benefits of exercise are not limited to a continuous 30 minutes of activity at moderate intensity. It has now been found that periods at moderate activity level as short as 8 to 10 minutes, but totaling 30 minutes daily, can achieve those same maximum health benefits (23). On further investigating the four activity levels, the most popular activity level was light activity, which included such activities as sweeping, light laundry, ironing or playing an instrument. Sixty-five percent of the students participated in the light activity, a larger portion being males who spent average 1.96 hours at this level (Table 5). Based on time for a healthy exercise program, 30 minutes per day as recommended goal (16,48), our study groups of 58 students who spent 1.65 hours in the light activity level and 37 students who spent 2.04 hours in the moderate activity level (Table 5) would have met this goal in our study.
Males or fties with positive energy balance had lower body mass index because they were lower in body weights and shorter in body heights when compared to their male or female counterparts with negative energy balance (Table 6). It was noteworthy that males or females in the positive energy balance group had higher total energy intakes than those males or females in the negative energy balance group (Table 6). In the positive energy balance group, males or females may consume more fbods because they had no major concern regarding their body weights, and this may help to explain why they had higher energy intakes than those males or females in the negative energy balance group (Table 6). The higher intakes of calorie by students with positive energy balance may lead to an increased cholesterol and saturated fat consumption, and hence contribute to the higher dietary atherogenicities such as increased Hegsted scores and cholesterol index than their counterparts with negative energy balance (Table 7). In consequence, students with positive energy balance, both male and female, would have higher risks than students with negative energy balance because of their higher atherogenic potential of diets, and decreased total physical activities.
Between genders, in both positive and negative energy balance groups, males had higher energy needs for basal metabolic rate, all physical activities, specific dynamic action of food and energy intakes than did females. This may indicate gender differences in body compositions, all physical activity levels as well as energy intakes, with males having more lean body mass (4), higher energy needs for all physical activities, and higher energy intakes (Table 6) than females.
In sum, the majority of college students surveyed in our study engaged in light to moderate activities. Although there was no sign&ant di&rence between genders in hours participation in light activities, males expended significantly higher energy than female participated in this activity level (Table 5). Males had higher participation rate in moderate activities, but spend less time and expended signiIicantly less Kcal in this activity level than females. Very few students participated in severe activity and very severe activity (Table 5). The compounded effects of inactivity, and an inappropriate dietary intake could lead to health problems such as obesity, hypertension, hyperlipidemia, chronic heart t%lure and diabetes mellitus (61). For college students, the number one reason given for lack of participation in any form of exercise is insuflicient time throughout the day (23,57,62). Maintaining fitness or body weight through physical activity or exercise is not always convenient as examined by Blair et al. ( 15). Other barriers in maintaining an exercise program are environmental factors such as safety, accessibility and convenience of the facility. Blair et al. also note that numerous factors intluence participation in exercise, such as psychological, biological, social

1876 C.F. TAM et al.
and environmental (15). Our male and female college students were living a relative sedentary lifestyle, whereas dietary atherogenicities of males, when compared to those of females (Table 7), pointed towards negative side. It merits to t%ther study the participation rates of physical activity levels and the fiber, cholesterol, saturated fat, and sugar contained in the regular meal and the snack foods eaten by male and female college students throughout the course of a quarter or semester, particularly, during stressful events pre- and post-exam time for college students.
ACKNOWLEDGEMENTS
This work was supported in part by a NIGMS-MBRS grant #08101 and a NIH grant #AGO5142.
1.
2.
3.
4.
5.
6.
7.
8.
9.
REFERENCES
Haffner SM, Knapp JA, Hazuda HP, Stem MP, Young EA. Dietary intakes of macronutrients among Mexican Americans and Anglo Americans: the San Antonio heart study. Am J Clin Nutr 1985,421 1266-1275.
Briefel RR, McDowell MA, Alaimo K, Caughman CC, Bischof AL, Carroll MD, Johnson CL. Total energy intake of the U.S. population: The third National Health and Nutrition Examination Survey, 1988-1991. Am J Clin Nutr 1995,62(suppl):S1072-S1080.
Sneed J, Holdt CS. Many factors influence college students’ eating patterns. J Am Diet Assoc, 1991,91:1380.
Linder MC. Energy metabolism, intake, and expenditure. In Linder MC, ed. Nutritional biochemistry and metabolism: with clinical applications (2nd ed.), New York: Elsevier Science Publishing Company, 1991:276-304.
Guthrie H. Introductory Nutrition. (5th ed.). St. Louis: Mosby College Publishing, 1983: 111.
Groff JL, Gropper SS, Hunt SM. Advanced Nutrition and Human Metabolism (2nd ed.). San Francisco: West Publishing Company, 1995:467.
Swinburn BA, Ravussin E. Energy and micronutrient metabolism. Bailliere’s Clin Endocrinol Metab, 1994, 8(3):527-548.
Miller WC, Niederpruem MG, Wallace JP, Lindeman AK. Dietary fat, sugar and fiber predict body fat content. J Am Diet Assoc, 1994, 94:612-615.
Caspersen CJ, Powell KE, Christenson GM. Physical activity, exercise, and physical fitness: definitions and distinctions for health-related research. Pub Health Rep, 1985, lOO(2): 126-130.
10. Hensley LD, Ainsworth BE, Ansorge CJ. Assessment of physical activity. J Phys Edu Recre Dance, 1993,64:56-64.
11. Zurlo F, Ferraro RT, Fontvielle AM, Rising R, Bogardus C, Ravussin E. Spontaneous physical
ATHEROGENICITY PHYSICAL ACTIVITY 1877
activity and obesity: cross-sectional and longitudinal studies in Pima Indians. Am J Physiol, 1992,263:E96-E300.
12. Hatziandreu EI, Koplan JP, Weinstein MC, Caspersen CJ, Warner KE. A cost-effectiveness analysis of exercise as a health promotion activity. Am J Pub Health, 1988, 78: 14 17- 142 1.
13. Division of Chronic Disease Control and Communi ty Intervention. Public health focus: physical activity and the prevention of coronary heart disease. JAMA, 1993,270: 1529-530.
14. Powell KE, Blair SN. The public health burdens of sedentary living habits: theoretical but realistic estimates. Med Sci Sports Exert, 1994,26:851-856.
15. Blair SN, Wood PD, Sallis JF. Workshop E: Physical activity and health. Prev Med, 1994, 23:558-559.
16. Public Health Service. Healthy People 2000: National Health Promotion and Disease Prevention Objectives. Washington, DC: U.S. Department of Health and Human Services, 1990; DHHS Pub. no. (PHS) 91-50213.
17. Pierce EF, Butterworth SW, Lynn TD, O’Shea J, Hammer WG. Fitness profiles and activity patterns of entering college students. J Am College Health, 1992,41:59-62.
18. Troyer D, Ullrich IH, Yeater RA, Hopewell R Physical activity and condition, dietary habits and serum lipids in second-year medical students. J Am College Nutr, 1990,9:303-307.
19. Keys A, Anderson JT, Grande F. Serum cholesterol response to changes in the diet. I. Iodine value of dietary fat versus 2S-P. Metabolism 1965, 14:747-758.
20. Hegsted DM, McGandy RB, Meyers ML, Stare FJ. Quantitative effects of dietary fat on serum cholesterol in men. Am J Clin Nutr 1965, 17:281-295.
21. Zilversmit DB. Cholesterol Index of foods. Teaching tool for fat-modified diets. J Am Diet Assoc 1979, 74:562-565.
22. Connor SL, Gustafson JR, Artaud-Wild SM, Classick-Kohn CJ, Connor WE. The cholesterol- saturated fat index for coronary prevention: Background, use, and a comprehensive table of foods. J Am Diet Assoc 1989, 89:807-816.
23. Blair S. Diet and activity: The synergistic merger. Nutrition Today, 1995, 30(3):108-l 13.
24. McWilliams M. Living nutrition. (4th ed.). Canada: John Wiley & Sons, Inc, 1984.
25. Wu-Tso P, Yeh I, Tam CF. Comparisons of dietary intake in young and old Asian Americans: A two-generation study. Nutr Res, 1995, 15:1445-1462.
26. American Heart Association. Dietary guidelines for healthy American adults. A statement for physicians and health professionals by the Nutrition Committee. Dallas, TX: American Heart Association, 1986.
27. Cypel YS, Prather ES. Assessment of the food perceptions of university student. J Am Diet

1878 C.F. TAM et al.
Assoc, 1993,93: 330-331.
28. Wilson BR, Quii TJ. Health characteristics of college students: A comparison of general undergraduate population and students who elected a health promotion course. Welhress Perspectives: Res Theory Pratt, 1990,6(4): 13-23.
29. Cotugna N, Vickery CE. College students’ awareness, knowledge, and compliance with Food Guide Pyramid recommendations. Worksite Health Promotion, 1994,8(6):417-419.
30. Acuff G. Eatin’ and cheatin’. Fruit Grower, 1995, 115:30-32.
3 1. Battistini N, Caselli D, Bedogni G, Gatti G. Food intake in university students and its impact on nutritional status. Nutr Res, 1992, 12:223-233.
32. Glore SR, Walker C, Chandler A. Brief communication: dietary habits of first-year medical students as determined by computer software analysis of three-day food records. J Am College Nutr, 1993, 12:517-520.
33. Anderson JW, De&ins DA, Floore TL, Smith BM, Whitis SE. Dietary fiber and coronary heart disease. Crit Rev Food Sci Nutr, 1990,29(2):95-147.
34. United States Department of Health and Human Services. The Surgeon General’s Report on Nutrition and Health. Washington, DC: US Dept of Health & Human Services, 1988.
35. Butrum RR, Clifford CR, Lanza E. NC1 dietary guidelines: Rationale. Am J Clin Nutr, 1988, 48:888-895.
36. Kris-Etherton PM, Krummel D, Russell ME, Dreon D, Mackey S, Borchers J, Wood PD. The et%& of diet on plasma lipids, lipoproteins, and coronary heart disease. J Am Diet Assoc 1988, 88: 1373-1400.
37. Thompson FE, Sowers MF, Frongillo EA, Parpia BJ. Sources of fiber and fats in diets of U.S. women aged 19 to 50: Implications for nutrition education and policy. Am J Pub Health, 1992, 82:695-702.
38. Nicklas TA, Farris RP, Myers L, Berenson GS. Dietary fiber intake of children and young adults: The Bogahrsa heart study. J Am Diet Assoc, 1995,95:209-214.
39. Demian PL. Fiber and health: an update for the 1990’s. J Am Acad Phys Assist, 1990,3:585- 590.
40. British Nutrition Foundation. The health benefits of dietary fibre. Nurs RSA Verpleging, 1991, 6(5):44-45.
4 1. Slavin JL. Epidemiological evidence for the impact of whole grains on health. Crit Rev Food Sci Nutr, 1994, 341427-434.
42. Anonymous. The Atherogenic potential of foods. Nutr Rev 1988, 46:3 13-3 15.
43. Alpert SS. Growth, thermogenesis, and hyperphagia. Am J Clin Nutr, 1990,52:784-792.

ATHEROGENICITY PHYSICAL ACTIVITY 1879
44. Rush KL, Sexsmith JR_ Energy balance of nutrition and activity in a group of nursing students. Can J Nurs Res, 1994,26:55-69.
45. Watson R, Jennings-White M. Energy intake and expenditure with reference to the female physical education student. Ergonomics, 1974, 17:23-30.
46. KalkwarfHJ, Haas JD, Belko AZ, Roach RC, Roe DA. Accuracy of heart-rate monitoring and activity diaries for estimating energy expenditure. Am J Clin Nutr, 1989,49:37-43.
47. Drougas HJ, Reed G, Hill JO. Comparison of dietary self-reports with energy expenditure measured using a whole-room indirect calorimeter. J Am Diet Assoc, 1992,92: 1073-1077.
48. McGinnis JM. The public health burden of a sedentary lifestyle. Med Sci sports Exert, 1992, 24(6)(suppl):S196-S200.
49. McGinnis JM, Foege WH. Actual causes of death in the United States. JAMA, 1993,270:2207- 2209.
50. Camacho TC, Roberts RE, Lazarus NB, Kaplan GA, Cohen RD. Physical activity and depression: evidence from the Alameda County Study. Am J Epidemiol, 199 1, 134(2):220-23 1.
5 1. Staten MA. The effect of exercise on food intake in men and women. Am J Clin Nutr, 1991, 53:27-3 1,
52. Webb P, Sangal S. Sedentary daily expenditure: a base for estimating individual energy requirements. Am J Clin Nutr, 1991, 50:606-611.
53. Meijer GA, Westerterp KR, van Hulsel AM, ten Hoor F. Physical activity and energy expenditure in lean and obese adult human subjects. Eur J Appl Physiol, 1992,65:525-528.
54. Pinto BM, Marcus BH. A stages of change approach to understanding college students’ physical activity. J Am College Health, 1995,44:27-3 1.
55. Pate RR, Pratt M, Blair SN, Haskell WL, Macera CA, Bouchard C, Buchner D, Ettinger W, Heath GW, King AC, Kriska A, Leon AS, Marcus BH, Morris J, Paifenbarger Jr RS, Patrick K, Pollock ML, Rippe JM, Sallis J, Wilmore JH. Physical activities and public health. A recommendation from the Center for Disease Control and Prevention and the American College of Sports Medicine. JAMA, 1995,273:402-407.
56. McPherson BD. Leisure lifestyles and physical activity in the later years of the life cycle. Recre Res Rev, 1982, 5:15.
57. Myers AM, Weigel C, Holliday P. Sex- and age-linked determinants of physical activity in adulthood. Can J Pub Health, 1989,80:256-260.
58. Grediagin MA, Cody M, Rupp J, Benardot D, Shem R. Exercise intensity does not effect body composition change in untrained, moderately overfat women. J Am Diet Assoc, 1995,95:661- 665.
59. Paffenbarger RS, Hyde RT, Wing WL, Hsieh C. Physical activity, all-cause mortality, and

1880 C.F. TAM et al.
longevity of college ahnnni. New Eng J Med, 1986,3 14:605-6 13.
60. Pemberton CL, McSwegin PJ. Sedentary living: A health hazard. J Phys Edu Recre Dance, 1993,64:27-30.
61. Zeman, F. Clinical Nutrition and Dietetics. (2nd ed.), New York: MacMillan Publishing Company, 1991.
62. Biddle S, Smith RA Motivating adults for physical activity: towards a healthier present. J Phys Exert Recre Dance, 199 1,62:39-43
Accepted for publication July 8, 1996.