a comparison of behavioral and conventional conceptions of ...
20
A COMPARISON OF BEHAVIORAL AND CONVENTIONAL CONCEPTIONS OF INVESTMENT Philip Ekomiley* I. INTRODUCTION Capital investment is a fundamental concern of economic theory. Yet, in spite of the enormous literature on the determinants of capital investment and the vigorous economic policies directed at influencing the size and composition of capital investment, researchers have been unable to demonstrate that the more advanced theories are superior to the traditional sales- based and sales-and-income-based flexible accelerators [see Jorgenson and Siebert, 1968a; Bischoff 1971b; Elliot, 1973; Clark, 1979; and Wisley and Johnson, 1985 for comparisons of alternative models of capital investment]. In sharp contrast to Jorgenson and Siebert’s view almost two decades ago that the determinants of capital investment are well understood and the area only needed refinement [1968a, p. 7101, recent papers continue basic disagreements over the proper specification of investment models [see for instance (i) the exchange between Chirinko and Eisner, 1983; and Sinai and Eckstein, 1983; and (ii) Feldstein, 1982 who, despairing of obtaining the “correct” model, estimates a number of models hoping to find some conclusions that are not sensitive to model specification]. Mairesse and Dormont [ 1985, p. 2221 report, “there are still doubts and debates among economists about the real importance of factor price elasticities,” factor price elasticities being a central feature of neoclassical investment models. In short, a generally satisfactory model of capital investment has not been found. Bromiley [1986a, 1986bl provides an alternative approach to the problem. Working in the tradition of behavioral economics, Bromiley attempts to identify the process by which capital expenditures are planned and implemented. in corporations.2 Based on interviews in four large corporations and econometric work that checked the inferences from the interviews’ for three of the firms, Bromiley developed a conceptual framework for the determinants of corporate capital investment. The framework is an empirically derived general model of the determinants of corporate capital investment. As currently presented, it is not directly testable (since functional forms have not been specified) and has not been tested. On the other hand, it does make a set of statements about the determinants of investment. Its validity is based on the empirical derivation presented in Bromiley [1986a, 1986b] but some additional relevant tindings are discussed below. Although subsequent empirical effort is needed to assess directly the validity and generality of the framework, this paper attempts to demonstrate that the conceptual framework differs substantially from previous models of investment and that the differences are important and reasonable. Section Two presents the conceptual framework. Section Three compares the conceptual framework to the most common models of corporate capital investment and uses it to discuss some solutions to two empirical anomalies in the literature.1 II. CONCEPTUAL FRAMEWORK Based on empirical results reported in Bromiley [1986a, 1986b1, the framework divides the investment process into two stages -- planning and implementation. Three constraints exist at each stage: the desire for capital investment; the ability to finance capital investment; and the ability to implement capital investment. Figure 1 identifies the combinations of these constraints and stages. The planning stage corresponds to the corporation’s development of aggregate level budgets and/or plans. At this stage, the corporation reconciles desires for new investment with corporate abilities to implement investment projects and to raise the funds needed for such projects. 1
-
Upload
khangminh22 -
Category
Documents
-
view
1 -
download
0
Transcript of a comparison of behavioral and conventional conceptions of ...

A COMPARISON OF BEHAVIORAL AND CONVENTIONAL CONCEPTIONS OF INVESTMENT
Philip Ekomiley*
I. INTRODUCTION
Capital investment is a fundamental concern of economic theory. Yet, in spite of the enormous literature on the determinants of capital investment and the vigorous economic policies directed at influencing the size and composition of capital investment, researchers have been unable to demonstrate that the more advanced theories are superior to the traditional sales- based and sales-and-income-based flexible accelerators [see Jorgenson and Siebert, 1968a; Bischoff 1971b; Elliot, 1973; Clark, 1979; and Wisley and Johnson, 1985 for comparisons of alternative models of capital investment]. In sharp contrast to Jorgenson and Siebert’s view almost two decades ago that the determinants of capital investment are well understood and the area only needed refinement [1968a, p. 7101, recent papers continue basic disagreements over the proper specification of investment models [see for instance (i) the exchange between Chirinko and Eisner, 1983; and Sinai and Eckstein, 1983; and (ii) Feldstein, 1982 who, despairing of obtaining the “correct” model, estimates a number of models hoping to find some conclusions that are not sensitive to model specification]. Mairesse and Dormont [ 1985, p. 2221 report, “there are still doubts and debates among economists about the real importance of factor price elasticities,” factor price elasticities being a central feature of neoclassical investment models. In short, a generally satisfactory model of capital investment has not been found.
Bromiley [1986a, 1986bl provides an alternative approach to the problem. Working in the tradition of behavioral economics, Bromiley attempts to identify the process by which capital expenditures are planned and implemented. in corporations.2 Based on interviews in four large corporations and econometric work that checked the inferences from the interviews’ for three of the firms, Bromiley developed a
conceptual framework for the determinants of corporate capital investment. The framework is an empirically derived general model of the determinants of corporate capital investment. As currently presented, it is not directly testable (since functional forms have not been specified) and has not been tested. On the other hand, it does make a set of statements about the determinants of investment. Its validity is based on the empirical derivation presented in Bromiley [1986a, 1986b] but some additional relevant tindings are discussed below.
Although subsequent empirical effort is needed to assess directly the validity and generality of the framework, this paper attempts to demonstrate that the conceptual framework differs substantially from previous models of investment and that the differences are important and reasonable. Section Two presents the conceptual framework. Section Three compares the conceptual framework to the most common models of corporate capital investment and uses it to discuss some solutions to two empirical anomalies in the literature.1
II. CONCEPTUAL FRAMEWORK
Based on empirical results reported in Bromiley [1986a, 1986b1, the framework divides the investment process into two stages -- planning and implementation. Three constraints exist at each stage: the desire for capital investment; the ability to finance capital investment; and the ability to implement capital investment. Figure 1 identifies the combinations of these constraints and stages.
The planning stage corresponds to the corporation’s development of aggregate level budgets and/or plans. At this stage, the corporation reconciles desires for new investment with corporate abilities to implement investment projects and to raise the funds needed for such projects.
1

JOURNAL OF BEHAVIORAL ECONOMICS (Spring 1987)
Figure 1
A Conceptual Framework for the Determinants of Corporate Capital Investment
DTAGE CONSTRAINT DETAILS
Planning l Desire for Investment Function of business sustaining needs, regulatory demands, cost reduction opportunities, business expansion/ capacity relationship, corporate strategy.
l Ability to Implement Function of management practices, technology, kind of investment, and current implementation resources.
l Financial Constraints Forecast cash inflows minus essential investments and other uses ofcash determine debt needs which are compared to bond rating variables.
Implementation l Desire for Investment Adjustments from previous desire depending on current and expected market conditions and corporate policy.
0 Ability to Implement Usually able to implement less than planned amount of investment, but not more than planned.
0 Financial Constraints Due to downturn in income, unanticipated acquisition, or other cash drain. Implement cost cutting programs, reduce inventories. increase accounts payable, reduce receivables prior to cutting investment. Increasing short-term debt possible but undesirable alternative.
2 Philip Bromiley
A COMPARISON OF BEHAVIORAL AND CONVENTIONAL CONCEPTIONS OF INVESTMENT
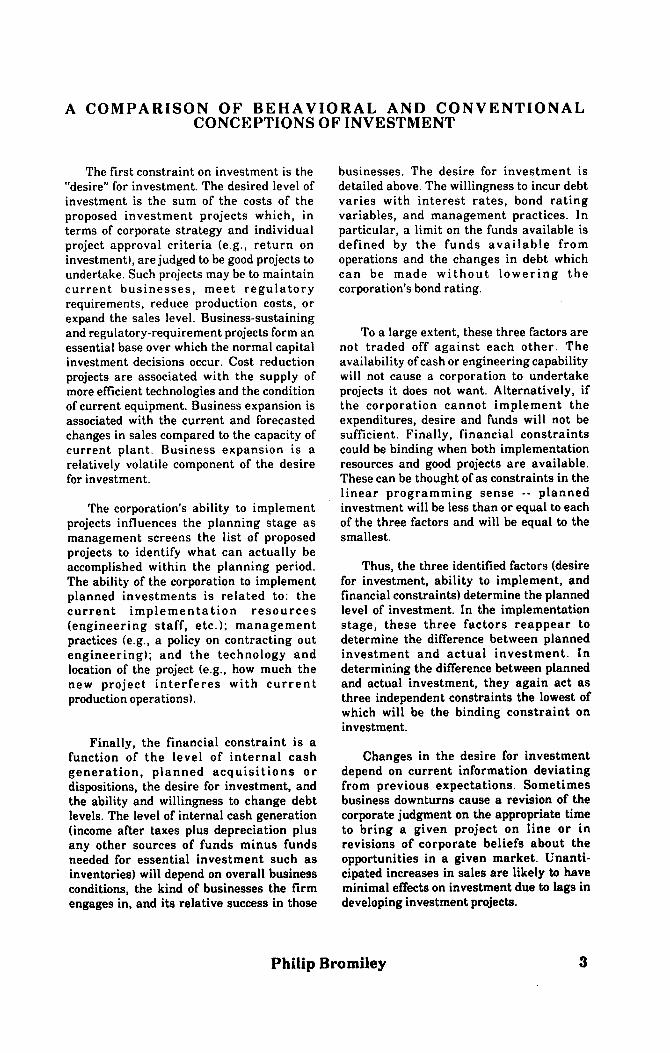
The first constraint on investment is the “desire” for investment. The desired level of investment is the sum of the costs of the proposed investment projects which, in terms of corporate strategy and individual project approval criteria (e.g., return on investment), are judged to be good projects to undertake. Such projects may be to maintain current businesses, meet regulatory requirements, reduce production costs, or expand the sales level. Business-sustaining and regulatory-requirement projects form an essential base over which the normal capital investment decisions occur. Cost reduction projects are associated with the supply of more efficient technologies and the condition of current equipment. Business expansion is associated with the current and forecasted changes in sales compared to the capacity of current plant. Business expansion is a relatively volatile component of the desire for investment.
The corporation’s ability to implement projects influences the planning stage as management screens the list of proposed projects to identify what can actually be accomplished within the planning period. The ability of the corporation to implement planned investments is related to: the current implementation resources (engineering staff, etc.); management practices (e.g., a policy on contracting out engineering); and the technology and location of the project (e.g., how much the new project interferes with current production operations).
Finally, the financial constraint is a function of the level of internal cash generation, planned acquisitions or dispositions, the desire for investment, and the ability and willingness to change debt levels. The level of internal cash generation (income after taxes plus depreciation plus any other sources of funds minus funds needed for essential investment such as inventories) will depend on overall business conditions, the kind of businesses the firm engages in, and its relative success in those
businesses. The desire for investment is detailed above. The willingness to incur debt varies with interest rates, bond rating variables, and management practices. In particular, a limit on the funds available is defined by the funds available from operations and the changes in debt which can be made without lowering the corporation’s bond rating.
To a large extent, these three factors are not traded off against each other. The availability of cash or engineering capability will not cause a corporation to undertake projects it does not want. Alternatively, if the corporation cannot implement the expenditures, desire and funds will not be sufficient. Finally, financial constraints could be binding when both implementation resources and good projects are available. These can be thought of as constraints in the linear programming sense -- planned investment will be less than or equal to each of the three factors and will be equal to the smallest.
Thus, the three identified factors (desire for investment, ability to implement, and financial constraints) determine the planned level of investment. In the implementation stage, these three factors reappear to determine the difference between planned investment and actual investment. In determining the difference between planned and actual investment, they again act as three independent constraints the lowest of which will be the binding constraint on investment.
Changes in the desire for investment depend on current information deviating from previous expectations. Sometimes business downturns cause a revision of the corporate judgment on the appropriate time to bring a given project on line or in revisions of corporate beliefs about the opportunities in a given market. L’nanti- cipated increases in sales are likely to have minimal effects on investment due to lags in developing investment projects.
Philip Bromiley 3

JOURNAL OF BEHAVIORAL ECONOMICS (Spring 1987)
Often divisions are unable to construct facilities as quickly as planned. Conse- quently, actual expenditures are less than planned expenditures. Engineering staffs and project managers may be overly optimistic about what they can accomplish in a given period of time.
Finally, the financial constraints can change from those anticipated .in the plan. Income can be below what was planned. An unanticipated major acquisition can drain a large amount of the firm’s cash. Normally, the corporation attempts to maintain the capital investment program by implementing cost savings programs and reducing inventory to generate funds. The financial constraints are influential on the down side only -- extra unanticipated funds normally will not spur investment since appropriate projects are not yet planned.
In the multiple constraint framework, different factors will be binding at different times and in different corporations. Industries differ in the amount of cash they generate compared to the level of capital investment they require. Firms differ in financial status and cash generation. One would expect that both internal corporate variables such as profitability, cash flow, managerial abilities, organizational structure and strategy, and external variables such as overall industry growth have strong ties to the binding constraints in a given corporation [see Cohen 19831. It would not be surprising to find changes in the binding constraints in the same corporation between the planning and implementation stages. The most common example would be firms that are either desire- or finance-constrained in planning but find they are unable to spend the funds as quickly as intended in the implementation stage. Thus, the conceptual framework suggests a relatively complex set of interactions among the various determinants of investment, with the effective determinants changing depending on external variables.
Although the framework presented here is based on qualitative work in a small number of firms, it is consistent with the empirical results of a number of researchers. In particular, the empirical findings of Anderson [1967], Meyer and Kuh [ 19591 and Dhrymes and Kurz [1967] are quite consistent with much of the structure presented above.
As is well known, during the 1950’s and 1960’s a controversy existed over the relative importance of profits and sales as determinants of investment. As Anderson [ 19671 notes, the accelerationists (sales) argued that the need for capital goods as generated by increased sales determined investment and the profiteers argued the need was not sufficient, money was required by buy capital goods. The three studies noted above employed empirical formulations that shed some light on the alternative approaches.
Anderson I19671 used aggregate data and a single equation model in which the explanatory variables for investment divided by capital stock in the previous year were (i) the average of current and previous year outputs divided by the capital stock of the previous year; (ii) a finance variable that included the difference between noncapital assets and liabilities plus the average of retained earnings in the current and previous year all divided by capital stock in the previous year; (iii) the annual average of Moody’s dividend/price ratio (equity yield); and (iv) the annual average of -Moody’s industrial bond yield. His annual data covered the years from 1918 to 1963. Anderson finds that all his variables have significant effects on investment, and concludes that both retained earnings and accelerator effects are important as well as the impact of other forms of finance such as the costs of external capital as reflected by equity yield and bond yield. He notes that the importance of equity yield is somewhat surprising since he would expect the cost of equity funds to have a threshold effect (only
4 Philip Bromiley

A COMPARISON OF BEHAVIORAL AND CONVENTIONAL CONCEPTIONS OF INVESTMENT
influential when the firm needs to obtain such funds) and so be highly non-linear and not very easily approximated by his aggregate linear model. He suggests that, “It seems likely therefore that it also measures expectational elements which influence both investment and stock prices” [Anderson, 1967, p. 4241.
Dhrymes and Kurz [1967J present a simultaneous equation model that links investment, dividends, and changes in long term debt. Using firm-level data on 181 firms, they estimated cross-sectional models with dummy variables for the firms’ industries. Although finding both cash availability and accelerator effects on investment, they emphasize that the effects estimated vary substantially across years, and attribute these variations to the business cycle. In addition, they note the extremely complex connections among profits, dividends, and external finance which imply significant indirect effects of profits on investment (through finance and dividends) as well as the direct effects estimated. In a manner that varies depending on the stage of the business cycle, profits, for instance, influence the extent to which firms must rely on external finance. They argue that “during periods of tight money or during the downswing when profits are generally squeezed . . . the more profitable firms . . tend to have access to the capital market” [Dhrymes and Kurz, 1967, p. 4621. In addition, the results indicate a high degree of instability over time in the various relations estimated. Indeed their primary recommendation for future work is to “elucidate more clearly the cyclical variation of the structure of the decision- making processes” [Dhrymes and Kurz, 1967, p. 4641 by which they mean the interactions and changes in interactions among investment, dividends, and finance outcomes. As they say, “The rather crude method of successive cross sections used here, while it does very definitely point to the presence of some cyclical pattern, nonetheless does not adequately pinpoint it” [Dhrymes and Kurz. 1967, p. 4641.
Meyer and Kuh [1959] execute a very large and careful exploratory analysis of investment data on over 500 firms over the time period 1946 to 1950 yielding 2,669 usable observations. A “principal finding” is that internal liquidity is of substantial importance, and it is probably more important for the smaller firm than the large firm, although it is still important for larger firms as well. In addition they find that different factors appeared to be most influential in different years. Thus the output accelerator,
“worked very well in 1946 and 1947 when almost every industry faced a seller’s market, had good prospects, and ample liquidity -- the presence of the latter being particularly important. On the other hand, the availability of liquidity became the paramount consideration in 1949. By contrast, the years 1948 and 1950 evidenced a mixture of acceleration and liquidity reactions. In 1948 technical acceleration continued to dominate in those industries with high liquidity inflows but, for those deficient in this respect, liquidity and anticipations became ascendant. In 1950 there were limited signs of acceleration influences on the investment decision at the same time that liquidity continued to be the prime consideration in most instances” [Meyer and Kuh, 1959, pp. 190-1911.
It is implicit in this description of their findings that whatever is shortest (liquidity or opportunity for investment) will be determining the level of investment. In addition they found that a number of other variables such as size and the speed with which a firm’s industry is growing influence investment, as well as financing abilities.
In addition to these studies that have been discussed in some detail, more recent studies also provide results consistent with portions of the conceptual framework. Sinai and Eckstein [1983], in their reply to Chirinko and Eisner [1983], estimate investment models using aggregate data. They hypothesize and find statistical
Philip Bromiley

JOURNAL OF BEHAVIORAL ECONOMICS (Spring 1987)
support for (i) the influence of cash availability in addition to the cost of capital, cash availability being represented by the ratio of interest charges to cash flow; and (ii) a “surprise in output” effect based on deviations in sales from expectations, represented by the difference between actual sales and an extrapolation of past sales. Sinai and Eckstein report that the addition of these variables provided “the greatest improvements” over the standard neoclassical model [1983, p. 1401. Using firm-level data from France, Germany, and the United States, Mairesse and Dormont [1985] estimate investment models where investment is a function of the change in output and level of profits. They find both sales and profits effects. They argue that “the finding that only current and one-year lagged past profits come out to be statistically significant . . . mainly supports the financial liquidity interpretation” [Mairesse and Dormont, 1985, p. 2071. Uri [1982], using industry-level data, found both liquidity effects on investment (represented by the ratio of non-capital to capital assets) and some structural change in the determinants of investment over time. Finally Eisner’s well known book on capital investment [Eisner, 19781 uses firm- reported expectations data as well as data on profits and sales in finding expected sales, sales, and profitability effects on investment. In addition to these effects, Eisner reports that (i) the response of investment to changes in sales is asymmetric having different parameters on increases in sales than decreases, (ii) the parameters change over time, and (iii) profits influence the lag between changes in sales and investment. All four of these studies agree with the conceptual framework in indicating the importance of liquidity in addition to sales. Sinai and Eckstein support the “deviation from expectations” portion of the framework. Consistent with the framework, Uri and Eisner both found instability in the determinants of investment over time, and Eisner also found asymmetries in responses to positive versus negative changes in sales
and an influence of profits on the speed of adjustment to changes in sales.
What is evident in these studies is their very strong consistency with the conceptual framework presented above. All find both desire for investment (sales growth) and ability to finance (liquidity, etc.) effects and the studies which allow annual differences [Dhrymes and Kurz, 1967; Eisner, 1978; Meyer and Kuh, 1959; and Uri, 19821 find substantial differences from year to year in which factor is dominant. Similarly, Meyer and Kuh find that other variables that one would expect to influence some of these constraints (size, speed of growth) do influence investment and financing abilities. Two primary differences exist between the conceptual framework presented above and these studies: (i) the framework is explicit about the multiple constraint process and how it works; and (ii) the framework provides for implementation lags and effects which were not visible in these other studies (but were not looked for either). In general, it can be concluded that some large sample results do exist which are consistent with the framework, but of course this is no substitute for formalization and estimation of the framework itself.
III.COMPARISON TO THE STANDARD ECONOMIC THEORIES OF INVESTMENT
This section compares the conceptual framework presented above to the most influential economic models of investment -- models which have been used in previous econometric attempts at model comparisons [Jorgenson and Siebert, 1968a; Jorgenson, Hunter, and Nadiri, 1970; Elliott, 1973; Bischoff, 1971b; Clark, 1979; Wisley and Johnson, 19851 as well as a formulation of Tobin’s q in a rational expectations framework [Malkiel, von Furstenberg, and Watson, 19791. The models to be considered are: (i) flexible accelerator (sales); (ii) accelerator-cash flow (sales and liquidity); (iii) Jorgenson’s “standard neoclassical;” (iv) Bischoffs putty-clay and (v) Tobin’s q.3 The
Philip Bromiley

A COMPARISON OF BEHAVIORAL AND CONVENTIONAL CONCEPTIONS OF INVESTMENT
“market value” model (that investment is a function of the price of the corporation’s stock) will be omitted. It has performed less well empirically than the other models and can be considered a part of Tobin’s 9.4
For simplicity, the presentations of the alternative models will follow Clark [1979]. Variable definitions will follow Jorgenson and Siebert [1968a, 1968b]. These definitions were also used in Elliott’s replication. The discussion addresses the models US they are specified, not the theoretical interpretations their authors may propose.
The basic framework for the comparisons of economic models is what is referred to as an accelerator [Jorgenson and Siebert, 1968a, p. 6881. The corporation has an actual level of capital at each time in the past Kt. It also has a desired level of capital at each time in the past K*t, and a rate at which capital depreciates, 8. Due to lags in investment (the exact explanation of which varies from author to author), the actual level of capital at any time may differ from the desired level of capital, and investment at any time may differ from that which would immediately move the firm to the desired level of capital. In addition, an allowance must be made for the amount of capital that will be “lost” through depreciation. The amount of investment at time t, It is a function of previous levels of capital, desired levels of capital, and depreciation. By substituting backwards, the actual level of capital stock is replaced by an infinite sum of changes in desired levels of capital stock. Thus,
It = f PJK* t-r - K*,-r-l~ + 6Ktsl r=O
where the Pr’s and 8 are parameters to be estimated. Investment at time t is equal to an infinite sum of lagged differences in desired levels of capital plus a term for replacement of depreciated capital. The
comparison of models is then executed by substituting different expressions for K*t.
Since the appropriate lag structure is unknown, researchers usually specify a general lag distribution (often Pascal or Almon) and then choose the lags to be included in the final model based on the data. Different lag structures are estimated for each alternative definition of K*t.
To begin with the determination of K*t, consider the accelerator model of investment. Desired capital at time t is proportional to output.
K*t = aI Ot
at is the desired capital to output ratio and Ot is the output at time t. In Jorgenson and Siebert [1968a], Ot was measured as the value of sales plus change in inventory (of all kinds) deflated to constant dollars.
The accelerator-cash Bow for sales and liquidity) model adds the possibility that the funds available influence investment. That is:
K*t = aI Ot + ap Lt.
Liquidity, Lt, was measured as profits after taxes plus depreciation less dividends paid, converted into constant dollars using an investment goods price index. Some researchers [Jorgenson and Siebert 1968a; Bischoff 1971b; Elliott 1973; Wisley and Johnson, 19851 simply used liquidity and omitted sales from the cash flow model. AS Clark notes, “No serious investigator of U.S. investment has proposed a model that is based on cash flow alone” [ 1979, p. 771.
The third model is referred to as the “standard neoclassical” model. This terminology was developed by Jorgenson and seems to be common in the field. It is clearly a misnomer since, as Nickel1 I19781 demonstrates, the other models presented here (and many others) can be justified on the basis of conventional economic assumptions. In Jorgenson’s standard
Philip Bromiley 7
JOU.RNAL OF BEHAVIORAL ECONOMICS (Spring 1987)
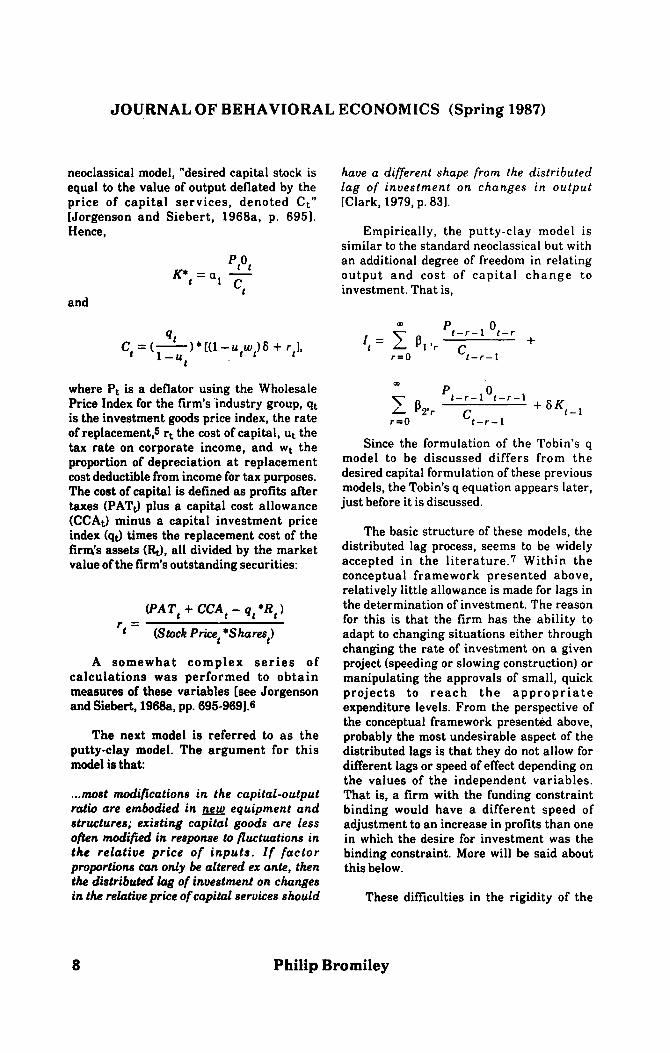
neoclassical model, “desired capital stock is equal to the value of output deflated by the price of capital services, denoted Ct” [Jorgenson and Siebert, 1968a. p. 6951. Hence,
and
Cp=& 1 l 10 - u&6 + fIl’ t
where Pt is a deflator using the Wholesale Price Index for the firm’s ‘industry group, qt is the investment goods price index, the rate of replacement,5 rt the cost of capital, ut the tax rate on corporate income, and wt the proportion of depreciation at replacement cost deductible from income for tax purposes. The cost of capital is defined as protits after taxes (PATS plus a capital cost allowance (CCAtl minus a capital investment price index (qt.) times the replacement cost of the firm’s assets (St.,), all divided by the market value of the firm’s outstanding securities:
(PAT, + CCA, - q, *R,)
rt = (Stock Pricet *Share$
A somewhat complex series of calculations was performed to obtain measures of these variables [see Jorgenson and Siebert, 1968a, pp. 695-9691.6
The next model is referred to as the putty-clay model. The argument for this model is that:
. ..most modifications in the capital-output ratio are embodied in new equipment and structures; existing capital goods are less o@n modipd in response to fluctuations in the relative price of inputs. Zf factor proportions can only be altered ex ante, then the distributed lag of investment on changes in the relative price of capital services should
have a different shape from the distributed lag of investment on changes in output [Clark, 1979, p. 831.
Empirically, the putty-clay model is similar to the standard neoclassical but with an additional degree of freedom in relating output and cost of capital change to investment. That is,
U D D n
zt = r p,,, a ,;-l “t--r + r=O t-r-1
m D l-l
x br
1 t-r-1”t-r-l
c + 54-1 r=O t-r-1
Since the formulation of the Tobin’s q model to be discussed differs from the desired capital formulation of these previous models, the Tobin’s q equation appears later, just before it is discussed.
The basic structure of these models, the distributed lag process, seems to be widely accepted in the literature.7 Within the conceptual framework presented above, relatively little allowance is made for lags in the determination of investment. The reason for this is that the firm has the ability to adapt to changing situations either through changing the rate of investment on a given project (speeding or slowing construction) or manipulating the approvals of small, quick projects to reach the appropriate expenditure levels. From the perspective of the conceptual framework presented above, probably the most undesirable aspect of the distributed lags is that they do not allow for different lags or speed of effect depending on the values of the independent variables. That is, a firm with the funding constraint binding would have a different speed of adjustment to an increase in profits than one in which the desire for investment was the binding constraint. More will be said about this below.
These difficulties in the rigidity of the
8 Philip Bromiley

A COMPARISON OF BEHAVIORAL AND CONVENTIONAL CONCEPTIONS OF INVESTMENT
lag structure have been addressed to some extent in the “adjustment costs” literature. By explicitly incorporating the costs of implementing investment, more complex and theoretically consistent investment models have been specified although under certain conditions they simply produce more consistent justifications for the conventional models [Galeotti, 19851. Such models have not been considered here since the approach has yielded many alternative formulations that focus on substantively different kinds of costs (cf., Epstein and Denny [1983] and Pindyck and Rotemberg [1983] which emphasize interrelated factor demands, Schankerman and Nadiri [1982] which emphasizes expectations, Abel [1981] which emphasizes uncertainty in a “q” style model, and Steigum [1983] which considers financial implications). As noted above, to restrict the conventional economic models to a manageable number, those models which had previously been used in model comparisons were chosen with the addition of a Tobin’s q model in place of the naive market model. Consequently, none of the adjustment costs models will be addressed here.
The accelerator model is the basis for all the other models -- sales are essential to investment. Although sales are clearly a necessity, the conceptual framework suggests that in some firms at some times sales are not the binding constraint. Consequently, one should be able to find better models than sales alone. Such models should allow for a switching of the binding constraints as noted in the conceptual framework -- sometimes sales and implementation and funds at other times.
The accelerator-cash flow model represents a rough attempt to combine both desire for investment (sales) and funding ability (liquidity) factors. In terms of the conceptual framework, the addition of liquidity improves on the representation in the simple sales model but there are two problems. The first problem appears in
Jorgenson and Siebert where liquidity alone was used. The variable used was the first difference in liquidity. That is, the amount of capital the firm desires is proportional to liquidity and investment is thus a function of changes in liquidity. If one interprets the liquidity variable as a source of funds rather than a measure of desire for capital, the appropriate variable is the level of liquidity not the difference in liquidity.8 Clark [1979] and Mairesse and Dormont [ 19851 remedied this fault by using the level of liquidity along with first differences in sales. They also allowed different lags to be estimated on liquidity than on sales -- a clear improvement on the Jorgenson and Siebert representation. The second problem is that the improvement possible from adding a profit variable should vary depending on the situation of the firm. Where funding is the problem, a substantial improvement in model quality should be achieved by the addition of the profit variable. Alternatively, where the firm is project-constrained or implementation constrained, no difference may be visible. If sales and profits are more highly correlated for individual firms over time than they are across firms, one might hope to see profit effects more in cross- sectional work than in time series from a single firm.
For the neoclassical models, the discussion will be structured in terms of the role of the rental cost of capital, the effect of capital rationing, the connection of capital rationing to sales and profits variables, the time frames for differing variables, and the relation of the conceptual framework presented to some contradictory results in the empirical literature. All references to neoclassical theory refer to the Jorgenson and Siebert and Bischoff models. These models include many assumptions which may not be consistent with what other researchers would consider “true” neoclassical assumptions. Given a choice of market imperfections and other ancillary assumptions, an immense set of alternative models could be justified using the neoclassical approach.
Philip Bromiley 9

JOURNAL OF BEHAVIORAL ECONOMICS (Spring 1987)
In the neoclassical models, desired capital is output divided by the rental cost of capital.9 In three of the firms studied by Bromiley [1986a, 1986b] a rental cost of capital was used to establish the appropriate hurdle rate for project returns. One firm used undiscounted return on investment and payback period. Thus the definition of a good project and the desired level of investment is influenced by the cost of capital. But the definition of cost of capital in the neoclassical models differs from the approach in these firms.
In the neoclassical models, the relevant cost of capital is the cost at the time the firm decides to undertake an investment. It is consequently an instantaneous cost of capital. In the Jorgenson models, all the lags are on the implementation side. In Bischoffs putty-clay model, the appropriate lags between cost of capital and investment are unspecified -- the ratios of a given year’s output to costs of capital in previous years are tried and the appropriate lags chosen by reference to goodness of fitlo The equation above, from Clark [19793, uses the empirical simplification of the lags that Bischoff I1971al proposed. In all of the corporations interviewed by Bromiley [1986a, 1986b], cost of capital as defined by the corporations was an average over a number of years and was not updated on a routine basis.
It seems very unlikely that, in the short- and mid-term, the variables in the rental cost of capital will influence investment through the firm’s definition of cost of capital. First, as noted, none of the firms examined or reevaluated their cost of capital on a routine basis. Two firms had not adjusted their hurdle rates in over five years. The other two were just completing reviews of hurdle rates (cost of capital) but reported that the previous rates had been in place for four years or more. Second, it is very likely that using the current cost of capital as a hurdle rate for investment would present serious managerial problems. A great deal of effort goes into a project before senior management sees it. Frequent
changes in the approval criteria would result in many projects being fully developed and then rejected, resulting in wasted effort.11 In addition, corporate strategic commitments include major projects that have to be approved as they come up. Group management could not be sure that such approvals would be forthcoming unless the approvals are made using very stable and well-defined criteria.
Consequently, the observations presented in Bromiley [1986a, 1986b] indicate that the effect of changes in the cost of capital on investment is slow. To the extent that changes in interest rates and so forth are influencing investment, they seem unlikely to do so in the short run through the cost of capital.
It seems far more likely that the variables in the rental cost of capital would influence investment through the availability of funds for investment rather than through the cost of capital. This has been referred to as a “capital rationing” effect in contrast to a cost of capital effect. The cost of capital effect says investment is influenced by the cost of capital which defines what are good projects. The capital rationing effect is that the firm has limits on its available funds and that these limits impact investment. The neoclassical models assume that as long as the ‘firm has projects that are profitable (above rental cost of capital) the firm can obtain sufficient funds to pay for them. That is, there is no capital rationing in Jorgenson and Siebert’s model.
For the moment, assume the firms of interest are financially constrained. The financial constraint is determined by the amount of funds generated internally (income after taxes plus depreciation minus changes in working capital minus dividends) plus the ability to obtain outside funding from debt markets. The use of equity markets was mentioned as a possibility but none of the firms studied by Bromiley had issued new equity in many years. All of the firms examined by Bromiley defined their
10 Philip Bromiley

A COMPARISON OF BEHAVIORAL AND CONVENTIONAL CONCEPTIONS OF INVESTMENT
debt problem in terms of a debt capacity -- either the amount of debt that can be added without damaging the firm’s bond rating or a rather permanent ratio determined by the corporate manage-ment. This debt capacity is expressed in terms of the bond rating variables, the most commonly mentioned ones being debt to equity and the ratio of profits before interest and taxes to interest costs incurred. Profit consequently has multiple roles:
l As an indicator of profitability of investment, profits may be related to the quality of investment opportunities within the corporation’s current areas of expertise.
0 As an indicator of actual cash from operations, profits contribute directly to the corporation’s ability to fund investment.
l As a component of various bond rating variables, profits influence the ability of the corporation to increase debt while maintaining its rating. 12
Most of the other variables in the rental cost of capital have obvious cash availability impacts: depreciation (since it is added back to profits in the determination of cash flow), tax rates, and investment tax credits all affect the cash available to the firm. Since the firms use current dollars, price indices were not considered in the conceptual framework. The real costs of replacement of equipment (if it could be measured) might be negatively associated with the choice to replace equipment instead of repairing it, but this seems to be a very minor factor in the conceptual framework.
Aside from the price indices, the only variable in the neoclassical model (as formulated by Jorgenson) that does not figure into the framework presented here is the market value of the firm. It would seem likely that the stock price incorporates some of the information in the other variables such as profits but also some information. that is obvious to businessmen and investors but not easily collected in a systematic,
quantifiable manner. For example, it is likely that stock prices are somewhat influenced by corporations’ forecasts of sales and earnings,and it would be surprising if stock prices were not influenced by quarterly reports of sales and income. It would also be surprising if stock prices were not influenced by substantive information about the firm’s prospects, e.g., after a large defense appropriation becomes likely, defense stocks should rise in price, and as it became evident that an oil shortage would be beneficial to oil companies, their stocks should rise. Stock prices may be influenced by actual corporate forecasts of investment where such investment looks profitable. These anticipated sales, profits, or investments should influence both actual investment and stock prices. Any of these situations would result in changes in stock prices predicting changes in capital investment without a causal relation from stock prices to capital investment. Consequently, it is not self- evident that the neoclassical explanation of the causality of stock prices (as a component of cost of capital) is the correct direction for causality. It seems more likely that-stock prices are just reacting to information relevant to the firm that our quantitative, annual observation framework makes invisible or only visible with a lag.
Although the conceptual framework presented above shares many variables with the neoclassical models. the rigidity of the neoclassical specification of the rental cost of capital (i.e., with the exception of depreciation, rental cost of capital has no parameters to be estimated, a point criticized by Feldstein [19821 in a tax and inflation centered analysis) does not allow for the differing sizes, signs, and lags on the effects of the independent variables that are postulated in the conceptual framework.*3
The role of profits is of particular interest. In Jorgenson and Siebert’s model as shown above, profits after taxes (PATt) increase the cost of capital frt) which increases the rental cost of capital (Ct) and consequently decreases desired investment
Philip Bromiley
JOURNAL OF BEHAVIORAL ECONOMICS (Spring 1987)
(K*tl. That is, higher profits imply a higher cost of capital (assuming stock prices remain constant). But a higher cost of capital implies a lower level of desired capital investment. In Jorgenson and Siebert, increasing profits lowers investment. Although the conceptual framework above allows for conditions where increases in profits will not affect investment, the framework has no conditions under which increases in profits would lower investment.
In Bischoff [1971bl, bond yields and the ratio of dividends to stock price (along with “price change expectations” and a corporate tax rate) are included in the cost of capital (called a discount rate). If dividends are directly related to income (as most researchers have concluded (see for instance Brittain [19661), then Bischoffs model also implies that higher income should be associated with lower investment. Although appropriate controls for the effects of stock prices and other variables are necessary, this opposite sign on the effect of proBits on investment is the most striking difference between the two conceptions of investment.14
Both the functional form and the lags with which independent variables affect investment are constant in the neoclassical models but the conceptual framework allows for substantial differences in lags and in the determinants of investment, depending on the condition of the firm. The effects of profits on investment should be relatively quick for firms that are cash-constrained. Profits, both as a direct supply of funds and as a bond rating variable, influence investment. Furthermore, high levels of cash generation should weaken the impact of interest rates, and, conversely, low rates of cash generation should increase the impact of interest rates (holding sales constant). That is, the more cash is generated, the less dependent the firm is on outside funds and the better able it is to afford any debt it wants to incur.
For firms that are project-constrained, sales will obviously have a strong influence on investment. Even a firm that is having just a temporary reduction in sales may be temporarily project-constrained in that none of the possible business expansion projects will have good expected returns at that time. If sales cannot be increased by new capacity, the plant would just add to excess capacity.15
For both the profits and sales variables, the effects of current year deviations from expectations can differ depending on the sign of the deviation. This differs substantially from the neoclassical theory where all effects are symmetric, i.e., increases in sales are treated identically to decreases. Thus at the firm level, one would expect to see effects on investment from current year changes in sales or profits although which variable causes the effect and the sign of the effect will vary from firm to firm.
In addition to these differences between neoclassical models and the framework, the conceptual framework presented here also provides a possible explanation for two empirical anomalies found in the investment literature. In Jorgenson and Siebert’s comparison of models at the firm level, they found that, based on the residual variance over the estimation period, the neoclassical models were superior to the other models.*s Jorgenson and Siebert used data on 15 firms over 16 years. The firms they used were intentionally chosen to be the largest in their industrial categories. In Elliott’s replication of the work [Elliott, 19731, the results are far more mixed but overall it appeared that an impoverished liquidity model (without the sales terms) had the best fit to the data over the estimation period as measured by residual variance. Elliott used a sample of 184 firms over a 14 year period. Is there a reasonable explanation for these differences or was it just a random occurrence?
12 Philip Bromiley

A COMPARISON OF BEHAVIORAL AND CONVENTIONAL CONCEPTIONS OF INVESTMENT
Figure 2
Differences Between Conceptual Framework and dorgenson’s Neoclassical Model
SUBJECT
Effects of Profits on Investment
NEOCLASSICAL MODEL CONCEPTUAL FRAMEWORK
Negative Positive
Effect of Stock Prices Positive None
Lag Structure Constant lag lengths, Variable lag lengths Estimated from the data Generally short No theoretical constraints or Some hypotheses and hypotheses constraints possible
Symmetry All effects symmetric Adaptation to deviations Positive changes the same as from expectations varies negative depending on sign of
deviation
Temporal Stability Constant Effects (both functional form and parameters constant over time)
Variable Effects: functional form and parameters vary
Interpretation of Parameters
Lag length and elasticity Substantive interpretation
Inter-firm Stability Constant functional form Lag distribution varies
Variable Effects: functional form and parameters vary
Cash Flow Constraint
None Often significant
Effect of Corporate None Important but poorly Strategy understood
Definition of Cost of Yearly Average over a number of Capital years
Role of Cost of Critical Secondary Capital
Philip Bromiley 13

JOURNAL OF BEHAVIORAL ECONOMICS (Spring 1987)
In the multiple constraint view of investment, it would not be surprising to find similarities among the constraints that are binding for various sets of firms. The classic examples are small, rapidly growing firms that are chronically short of cash. It is not at all unlikely that the firms Jorgenson and Siebert chose, being the largest, do differ from the average firm. It may be that the availability of funds was important for the average firm in the period studied by Elliott17 but the largest firms were not constrained by shortages of funds in most of the period that Jorgenson and Siebert studied.
The substantial differences Elliott found among years in cross-sectional estimates are amenable to explanation within the conceptual framework but are an anomaly in the neoclassical models. In the multiple constraint framework it would be very likely that the binding constraints for many firms would shift over time (perhaps as a function of the business cycle). But the normal assumptions used to develop the neoclassical models imply a fixed set of determinants actfng with a largely constant lag length -- any variation over time is just noise.
Thus the multiple constraint framework provides a plausible explanation for differences in Iindings between Jorgenson and Siebert and Elliott. Some caution in further explicating the implications of the framework in this situation is required due to the technical problems with both pieces of research. That is, when (i) multiple values for the same parameter are included in the same equation, (ii) variables are chosen by a step-wise regression procedure, and (iii) quality of the model is measured by the number of significant coefficients, residual variance over the estimation period, and prediction of turning points over the estimation period, excessive credence in the determination of model quality would be inappropriate. On the other hand, the conceptual framework does provide the possibility of a substantive explanation for
what must remain happenstance in the neoclassical models. The final model to be considered combines Tobin’s q with rational expectations [Malkiel et al, 19791. Unlike the other models discussed above, Malkiel et al focus on changes in investment using industry-level data (see also, von Furstenberg, Malkiel, and Watson [ 19801 for additional applications at the industry level and Chappell and Cheng [1982] for a direct application of Malkiel et al’s model at the firm level). Malkiel et al’s model was chosen from the large Tobin’s q literature (see for instance, Tobin and Brainard [1977], von Furstenberg [1977], Abel [1980], and Salinger and Summers [1983] for empirical work on q) because it incorporated the rational expectations framework into a q model. Malkiel et al estimate the following equation:
(It - It- 1) Q t-1 Q t-2 -bo+bl ---
Km, - I Qmt-l Qmt-2 I
I Qt-1 Qt-2 +6, T-T
Q Q 1 Where Kmt, the trend level of gross capital stock for an industry, was found by estimating Kt=alexp(a$)u on annual data and then letting u equal one and t equal the appropriate t. Likewise, using “annual averages of Federal Reserve indices of industrial production,” Qmt, the trend level of output, is derived from the estimates of Qt = as exp(a,&ut. Qt is an industry’s annual average of the Federal Reserve indices of industrial production. As is conventional, q is the market value of the firm divided by the replacement cost of its assets.
The discussion of Malkiel et al’s model will focus on two questions. First, what are the roles of Q and q in the conceptual framework? Second, how does the rational expectations framework relate to the conceptual framework?
Philip Bromiley

A COMPARISON OF BEHAVIORAL AND CONVENTIONAL CONCEPTIONS OF INVESTMENT
The variable q is the ratio of market valuation of the firm (value of common stock, preferred stock, and debt) divided by the replacement cost of the firm’s assets. As noted above, it is more likely that events influence both investment and stock prices rather than that stock prices influence investment. The only causal paths from stock prices to investment are (i) if the firm raises the funds needed for investment from the issuance of stock (not the most common route in recent years), (ii) if the firm uses a cost of capital hurdle rate which results in changes in hurdles as a function of changes in stock prices; or (iii) if changes in market value of already issued preferred stock and debt reflect changes in the cost and practicality of issuing new preferred stock or debt. In the sample of firms investigated by Bromiley [1986a, 1986b], the first two causal paths seemed of only marginal import since the firms finance almost all new capital through retained earnings and debt and they changed hurdle rates on average about every five years. In the third path q is not causing investment since some real changes in the corporate environment, current performance and prospects are influencing both current and prospective preferred stocks and bond prices. The replacement cost of a firm’s assets is of little interest since the firm is not replacing much of the capital. If the real replacement cost is high, one might expect some increase in maintenance instead of replacement but this is a minor factor compared to essential replacements, and other kinds of investment.
The variable Q is of course the output variable which drives all the other models and is of primary interest in the conceptual framework. The Qmt and Knit portions of the variables will be considered later. The investment and output variables (It and Qt) are similar to those in other models with one big exception. Whereas in the other models changes in output determine the level of investment, in Malkiel et al the change in output determines the change in the level of investment expenditure. It is not easy to determine the behavior of the equation
(since Kmt and Qmt changes are related to changes in Qt and It) but it appears that the equation might exhibit quite odd behavior in situations of growth followed by stable output: no change in sales might be associated with no change in expenditure levels rather than drops in investment to the depreciation level. In the conceptual framework it would be more likely that desired levels of investment would be proportional to changes in sales rather than changes in investment being proportional to changes in sales.
The rational expectations part of the equation (using Kmt and QmJ is even more difficult to connect to the conceptual framework. Both the dependent variables and the Qmt variable are functions not just of current and past events but of the entire time series of data. The model does not simply explain investment as most people would understand the term.
The dependent variable is, by construction, a function of its own current and future values. The dependent variable includes It, It-l, and Kmt. Kmt, the trend level of gross capital stock is determined using the industry’s entire gross capital stock series. But the industry’s capital stock series is at least partially a function of its investment. Thus the value of Kmt found in any observation in this equation is partially determined by future levels of capital (KS, s>t), which are functions of current and future levels of investment. That is, Kmt is a function of the entire gross capital stock series which is, of course, a function of the investment series including the value of the independent variable at time t.
The sales variables on the right hand side is not just changes in output but includes information from the entire future output series V&, s> 0. But far from being independent, QS is dependent on It since It produces the productive capacity which makes Q, possible. Although the rational expectations interpretation of these variables is an “expectation”, the fact of the
Philip Bromiley

JOURNAL OF BEHAVIORAL ECONOMICS (Spring 1987)
matter is that the data points for observation t cannot be specified without using data on output or capital from future years (s > t) and both these variables (output and capital) in future years are partially a function of the investment decision made in year t.
While Reinhart [1979] finds this equation “intuitively and logically sound,” the construction of these variables and their necessary relations make the equation extremely difficult for this author to understand. The future must be known to estimate the model at time t, so surely this cannot be a causal model. The model cannot predict since we would need to incorporate knowledge about the outcome of the prediction in order to specify the model. All the previous models and the conceptual framework attempt to explain investment in a causal manner and might be used to predict investment. Malkiel et al’s non- predictive, non-causal model clearly must be addressing a different (although unspecified) problem than the previous models and conceptual framework which are causal and predictive. Given they address different problems, it is hard to seriously compare this portion of Malkiel et al to the other works.
Additional difficulty comes in comparing Malkiel et al’s model to the conceptual framework and the other models since the main effect in all the other models is considered to be known a priori in the Malkiel et al model. Whatever is “explained” by fitting the trend is considered uninteresting in Malkiel et al but it probably constitutes the great majority of the variance in expenditures and is clearly non-trivial to explain or predict a priori.
In short, the output portion of the Malkiel et al model appears reasonable within the conceptual framework, and plausible explanations for q can be found although the predominant direction of causality is not likely to be from q to investment. On the other hand, the “rational expectations” portion of the model results in both dependent and independent variables
that at time t are dependent on knowing both decisions and other factors from time t on into the future. A straightforward attempt to analyze the causality inherent in this formulation indicates this cannot be a causal model.
IV. CONCLUDING REMARKS
The conceptual framework developed in Bromiley [1986a, 1986bl has been compared to the most common theories of investment and significant differences have been identified. Some of the differences are striking, for example the opposite signs on the influence of profits on investment between the neoclassical models and the conceptual framework. Other differences involve the additional complexity of the conceptual framework when compared to previous models. Indeed the conceptual framework bears a stronger resemblance to many of the explanations of actual investment outcomes provided by applied economists in government and financial industries then do the conventional theories. Such explanations often ascribe investment outcomes to lack of sales, availability of debt capital, or profits without undertaking the ratio approach the neoclassical models require. Although the results and comparisons are interesting in themselves, they also may be viewed as the foundation from which two related efforts can proceed: (i) the empirical validation of the conceptual framework on data from a larger set of firms; and (ii) the quantitative comparison of the behaviors implied by the conceptual framework to those implied by the conventional models.
*****
*The author is from the Department of Strategic Management and Organization at the University of Minnesota.
*****
16 Philip Bromiley

A COMPARISON OF BEHAVIORAL AND CONVENTIONAL CONCEPTIONS OF INVESTMENT
NOTES
IThis research was funded by the Sarah Scaiffe Foundation and the Naval Postgraduate School Research Foundation. I would like to thank Dan Boger, Richard M. Cyert, Otto A. Davis, Gregory Fischer, Steven Garber, Michele Govekar, Herbert A. Simon, and Bob Wiseman for their assis- tance, and the corporations which partici- pated in this study for their cooperation.
2Although most of the economic literature refers to capital investment in general and estimates models on changes in capital, the models used are derived in a manner more appropriate for expenditures on property, plant, and equipment. The total change in capital for a given firm includes acquisitions and dispositions of corporations or parts thereof. The normal model development (sales expectations leading to purchases of equipment with a capital intensity determined by factor prices, followed by lags in implementation) clearly differs from the acquisition of a corporation where the acquiring firm “purchases” expected sales, plant, profits, and debts as a single package. In this paper, capital investment and expenditures on property, plant, and equipment will be used synonymously but will refer to expenditures on property, plant, and equipment.
3The putty-clay model was not included in Jorgenson and Siebert [1968al, Jorgenson, Hunter, and Nadiri [1970], or Elliott [1973] (which replicates Jorgenson and Siebert). Bischoff [1971aj which seems to be the basic empirical reference on the putty-clay model in the literature was published after the Jorgenson et al studies.
4Market value is also discussed below in reference to its role in the cost of capital.
sCyert, DeGroot, and Hold [19791 observe that while a 6 is estimated in the actual model fitting, the rental cost of capital term is estimated previously
resulting in two different values of 6 in the same equation.
eTw0 forms of the price of capital services equation were provided in the original article. The one in the text is the simpler form. The second form provided for capital gains by the addition of another term. The more complex form is:
ct = qt/(l-lit) * [(l-utwt) 6 + r&k-qt.d/qt)l
7Comparing the conceptual framework presented here with the actual models used by others favors the framework since it has not been subjected to the simplifications necessary for estimation.
s1 would like to thank Herbert Simon for bringing this to my attention.
sWhile the rental price of capital services noted above is the price as defined in Jorgenson and Siebert, it should be remembered that a variety of definitions are available in the literature. This variable can include “true” depreciation rates, depreciation rates for tax purposes, price deflators, a discount rate (often a function of interest rates on corporate bonds and the ratio of either profits or dividends to stock prices), and a variety of tax variables (e.g., effective corporate income tax rate, allowance for investment tax credits, etc.).
loThe restriction of the ratios of output to cost of capital to include only the same year for both variables and one year difference (cost of capital one year earlier than sales) is an empirical simplification justified on the basis of results on national data [Bischoff, 1971aj. The theoretical form of the model included ratios of all previous outputs over all previous rental costs of capital. Although obviously some empirical simplification is necessary for estimation, it is not clear that a simplification justified on national data is appropriate for other kinds of data.
Philip Bromiley 17

JOURNAL OF BEHAVIORAL ECONOMICS (Spring 1987)
lIThis is not to judge how the firm handles sunk costs, but rather to say management systems are unlikely to be designed to put the firm frequently in the position of having to discontinue projects on which substantial expenditures have already been made.
t2Dhrymes and Kurz [ 19671 discuss in a similar fashion some of the alternative routes by which profits can influence investment through a number of different paths (for example by influencing dividend decisions and external debt decisions both of which Dhrymes and Kurz find influence investment). For related discussions, see also von Ungern-Stornberg [19801 and Mairesse and Dormont [ 19851.
1% spite of the substantial number of additional variables in the neoclassical models compared to the simple accelerator and the accelerator-cash flow models, the neoclassical models do not predict more accurately than the others on aggregate data [Bischoff, 1971b; Clark, 19791 and do not tit data from individual firms better [Elliott, 19731. To my knowledge, these models have not been compared on the basis of prediction using data from individual firms.
14With sufficiently strong assumptions, this problem can be assumed away. That is, if stock and bond markets are working perfectly, etc., other factors might compensate for this first order profits effect.
IsDiscounted cash flow measures emphasize the earliest returns from a project and consistently discourage plant construction when it appears the capacity will not be needed immediately.
IaJorgenson and Siebert also examined the number of significant coefficients in the fitted models and the “prediction” of turning points over the estimation period. There are many technical problems with the Jorgenson and Siebert work which will not be discussed
here. See Cyert, DeGroot, and Holt [1979] for a discussion of some of these issues.
17Jorgenson and Siebert used data from I947 to 1963 while Elliott used data from 1953 to 1967. The differences in findings may be due to using data from different time periods but this seems unlikely since most of the data used by both studies are from the same years (both studies include years 1953 to 1963).
1.
2.
3.
4.
5.
*****
REFERENCES
Abel, A.B. “Empirical Investment Equations: An Integrative Framework,” Carnegie-Rochester Conference Series on Public Policy, supplementary series to the Journal of Monetary Economics, Vol. 12, 1980, pp. 39-91.
Abel, A.B. “A Dynamic Model of Investment and Capacity Utilization,” Qwrterly Journal of Economics, Vol. 95, 1981, pp. 379-403.
Anderson, W.H. Locke. “Business Fixed Investment: A Marriage of Fact and Fancy,” in Robert Ferber fed.) Determinants of Investment Behavior, New York: National Bureau of Economic Research, 1967.
Bischoff, Charles W. “The Effect of Alternative Lag Distributions,” in C. Fromm fed.) Tax Incentives and Capituf Spending, Washington: The Brookings Institution, 197lf1971a).
Bischoff, Charles W. “Business Investment in the 1970’s: A Comparison of Models,” in Arthur AM. Okun and George L. Perry feds.) Brookings Papers on Economic Activity Xl, Washington, D.C: The Brookings Institution, 1971 (1971b).
18 Philip Bromiley

A COMPARISON OF BEHAVIORAL AND CONVENTIONAL CONCEPTIONS OF INVESTMENT
6. Brittain, John A. Corporate Dividend Policy, Washington, D.C.: The Brookings Institution, 1966.
7. Bromiley, Philip. Corporate Capital Investment: A Behavioral Approach, New York: Cambridge University Press, 1986a.
8. Bromiley, Philip. “Corporate Planning and Capital Investment,” Journal of Economic Behavior and Organization, Vol. 7 (2),1986, pp. 147-170 (1986b).
9. Chappell, H.W. Jr., and D.C. Cheng. “Expectations, Tobin’s q, and Investment: A Note,” Journal of Finance, Vol. 37 (11, March 1982, pp. 231-236.
10. Chirinko, R.W. and R. Eisner. “Tax Policy and Investment in Major U.S. Macoreconomic Economic Models,” Journal of Public Economics, Vol. 20, 1983, pp. 139-166.
11. Clark, Peter K. “Investment in the 1970’s: Theory, Performance, and Prediction,” in Arthur M. Okun and George L. Perry (eds.) Brookings Papers on Economic Activity, Washington, D.C.: The Brookings Institution, 1979.
12. Cohen, Wesley M. “Investment and Industrial Expansion: A Corporate Variables Framework,” Journal of Economic Behavior and Organization, Vol. 4,1983, pp. 91-111.
13. Cyert, Richard M., Morris H. DeGroot, and Charles A. Holt. “Capital Allocation within a Firm,” Behavioral Science, Vol. 24 (51, September 1979, pp. 287-295.
14. Dhrymes, Phoebus, J. and Mordecai Kurz. “Investment, Dividend, and External Finance Behavior of Firms,” in Robert Ferber (ed.) Determinants of lnvestment Behavior, New York: National Bureau of Economic Research, 1967.
15. Eisner, R. Factors in Business Investment, Cambridge, MA: Ballinger, 1978.
16. Elliott, J.W. “Theories of Corporate Investment Behavior Revisited,” American Economic Review, Vol. 63 (11, March 1973, pp. 195-207.
17. Epstein, L. and M. Denny. “The Multivariate Flexible Accelerator: Its Empirical Restrictions and an Application to U.S. Manufacturing,” Econometrica, Vol. 51 (3), May 1983, pp. 647-674.
18. Feldstein, M. “Inflation, Tax Rules and Investment: Some Econometric Evidence,” Econometrica, Vol. 50 (41, July 1982, pp. 825-862.
19. Galeotti, M. “Recent Developments in Investment Theory,” Giornale Delgli Economisti e Ann& Di Economia, Vol. 18, May-June 1984, pp. 393-415.
20. Jorgenson, Dale W., Jerald Hunter, and M. Ishag Nadiri. “The Predictive Performance of Econometric Models of Quarterly Investment Behavior,” Econometrica, Vol. 38 (2), March 1970, pp. 2 13-224.
21. Jorgenson, Dale W., and Calvin D. Siebert. “A Comparison of Alternative Theories of Corporate Investment Behavior,” American Economic Review, LVII (41, September 1968, pp. 681-712 (1968a).
22. Jorgenson, Dale W. and Calvin D. Siebert. “Optimal Capital Accumulation and Corporate Investment Behavior,” Journal of Political Economy, Vol. 76 (61, November/December 1968, pp. 1123- 1151 (1968b).
23. Mairesse, J. and B. Dormont. “Labor and Investment Demand at the Firm Level: A Comparison of French, German, and U.S. Manufacturing, 1970-1979,”
Philip Bromiley 19

JOURNAL OF BEHAVIORAL ECONOMICS (Spring 1987)
European Economic Review, Vol. 28, 1985, pp. 201-231.
24. Malkiel, Burton G., George M. Von Furstenberg and Harry S. Watson. “Expectations, Tobin’s q, and Industry Investment,” Journal of Finance, Vol. 34 (21, May 1979, pp. 549-561.
25. Meyer, John R. and Edwin Kuh. The Znvestment Decision, Cambridge, MA: Harvard University Press, 1959.
26. Nickell, Stephen J. The Investment Decisions of Firms, Oxford: James Nisbet and Company Ltd. and Cambridge University Press, 1978.
27. Pindyck, R. S. and J. J. Rotemberg. “Dynamic Factor Demands and the Effects of Energy Price Shocks,” American Economic Review, Vol. 73 (51, December 1983, pp. 10661079.
28. Reinhart, Walter J. “Discussion”, Journal of Finance, Vol. 34 (21, May 1979, pp. 561-564.
29. Salinger, M. A. and L. H. Summers. “Tax Reform and Corporate Invest-ment: A Microeconometric Simulation Study,” in Martin Feldstein fed.1 Behavioral Simultation Methods in Tax Policy Anulyais, Chicago: University of Chicago Press, 1983.
30. Schankerman, M. and M. 1. Nadiri. “Investment in R&D, Costs of Adjustment, and Expectations,” in Z. Griliches ted.) R&D, Patents. and Productivity, Chicago: University of Chicago Press, 1984, pp. 313-338.
31. Sii, A. and 0. Eckstein. “Tax Policy and Business Fixed Investment
Revisited,” Journal of Economic Behavior and Organization, Vol. 4, 1983, pp. 131-162.
32. Steigum, E. “A Financial Theory of Investment Behavior,” Econometrica, Vol. 51 (31, May 1983, pp. 637-645.
33. Tobin, J. and W. C. Brainard. “Asset Markets and the Cost of Capital,” in B. Belassa and R. Nelson teds.1 Economic Progress, Private Values, and Public Policy, Amsterdam: North Holland, 1977.
34. Uri, N.D. “Testing for the Stability of the Investment Function,” Review of Economics and Statistics, Vol. 64 (11, February 1982, pp. 117-125.
35. von Ungern-Sternberg, T. “Current Profits and Investment Behavior,” Bell Journal of Economics, Vol. 11 (21, Autumn 1980, pp. 745-748.
36. von Furstenberg, G. M. “Corporate Investment: Does Market Valuation Matter in the Aggregate?” Brookings Papers on Economic Activity, 1977, pp. 347-397.
37. von Furstenberg, G. M., B. G. .Malkiel and H. S. Watson. “The Distribution of Investment between Industries: A Microeconomic Application of the “q” Ratio,” in G.M. von Furstenberg ted.1 Capital, Efficiency, and Growth, Cambridge, MA: Ballinger, 1980.
38. Wisley, T.O. and S.R. Johnson. “An Evaluation of Alternative Investment Hypotheses Using Non-nested Tests,” Southern Economic Journal, Vol. 52 (21, October 1985, pp. 422-430.
20 Philip Bromiley