
AGING lifITHTELEVISION Conceptions of Social Reality The ...
57
AGING lifITHTELEVISION Images on Television Drama and Conceptions of Social Reality The final report of a research project conducted under grant No. 90-A-1299 from the Administration on Aging, Office of Human Development, Department of Health, Education and Helfare. by George Gerbner, Larry Gross, Nancy Signorielli and Michael Morgan The Annenberg School of Communications University of Pennsylvania Philadelphia, 19104 January, 1980 Copies of this report are available for $17.50 each (checks to be made payable to the Trustees of the University of Pennsylvania)
-
Upload
khangminh22 -
Category
Documents
-
view
4 -
download
0
Transcript of AGING lifITHTELEVISION Conceptions of Social Reality The ...

AGING lifITHTELEVISION Images on Television Drama and Conceptions of Social Reality
The final report of a research project conducted under grant No. 90-A-1299 from the
Administration on Aging, Office of Human Development, Department of Health, Education
and Helfare.
by
George Gerbner, Larry Gross, Nancy Signorielli and Michael Morgan
The Annenberg School of Communications University of Pennsylvania
Philadelphia, 19104
January, 1980
Copies of this report are available for $17.50 each (checks to be made payable to the Trustees of the University of Pennsylvania)

THE WASRIXGTO'1 'PO;;T Tuesday, September 18. I~:9 •.• R 2
Ola Age: TV
Tells It
Wrong By Michael Kernan
Older people are so badly short· changed in TV dr-ama that \'jewers actually believe they are disappearL'lg from the scene - though in real We they are inceasing.
Television's gross distortion of some basic f.ict3 abuut American life has been documented by a two-year pr~ ject at the Annenberg Schoo! of Communications, pan: of the Cniversity of Pennsylvania, on a $200,000 federal grant.
Hea'ii'Y-duty watchers-the ones on the high side of the national average of 30 bours a week-also believe that old age comes earlier in life, espe· cially to women.
Nearly 70 specialists in education, aging and communications tossed around some possible responses to the bleak picture presented by George Gerbner and some colleagues from Annenberg yesterday at the Hyatt Regency.
The saddest thing, Gel"bnE'r noted, is that "'the best and possibly only time to learn about growing old with de· cency and grace is in youth ... Images of old age we absorb throughout li!'e cultivate our concept of agin~:' And television, especially network· drama, is tel1.ing it wrong.
Curiously for this youth-worshipinJ5 country, TV also grossly unc.errepresent! ehildren and adolescents, Gerbner-,aid.
Some findings from the lQ'rear study of 1,365 programs and 16,633 characters:
-CharActers under 18 make up only 8 pe~nt of the fictional population. In reality they are 30 percent of the American populatictn. The over.65s, actually CGD.'ltituting 11 ';.lercent of Americans, appear to be hardlY more than 2 percent of the TV population, In other words, a view~r meeting more than 300 speaking characte" in
a week will be exposed to only seven: over 65,
-Furthermore, the older people are shown as eccentric, stubborn, nousexual, ineffectual and often silly. Old men are likely to possess power for e~'il ;nd accordingly must die, by TY's simple code. Old women have no su~h powers and usually wind up as VIe
tims, especially to the \iolence that occurs in almost 80 percent of primetime and children's programs.
, -In TV's "compelling, \'i\"id, translu, ~ent world," men outnumber women
by three to one, Fantasyland, indeed~
-Women are \'alued only under 3S, while men, the wielders of authori:Y; thrive ill the 35.44 age bracket. "Tne character population is structured to provide a relative abundance of younger women for older men," but not vice versa. ' -a
.• In children's programS. people or their parents' age group (:-:-5-35) at·e a:l but invisible. The grancparental age group is also extremely sparse.
But it is the older people who suffer most on TV, and it is the older non· whites and women who get the wornt of it. Respectful, serious i:reatment of the elderly, and women of all ages, is less likely than otherwise, ob$erved researcher Xancy Signorielli. The older are apt to ha"e more negatl\·e qualities. to be married but to ha\'e no) romantic interest. to be less SLlcces:;.. ful. attrac~i\'e or happy. With excep-tiOllS, of course. ,
"!lIarriage.' • the report adds, "at. lea.;t in the tele.'isicn wo.:,ld. is ;:>:z.ct."" cally dewid of rc.mance and 1s tGe domain of older people." '
One interesting aspect of tilis <:orr, sis tent skewing of !i'uth is the '1'v. watchers' notions about crime. In TV"; world, three out of 10 ohier peo~l~ are apt to be robbl'd or beaten. (Tne rp.al figure is less than one percent-i less than the rate for other ag. groups,) A special sun'ey of heary watchers indicated that TV culti\'ate! fear and a 6ense of dan~er, leadi:c.ll them to believe they mar be rnllgg~4 'or attacked at any time, that even walking at night in their O~'Il neigh;' horhood is "not safe at all."
"Heavy viewers in greater propor· tion than light viewers appear to gen, eralize from observation of television's meSS2.O!e system to realliie situ~ ations, despite facts to the contrary and despite the fictional nature of most TV."
Solutions were discussed only in a general sense. but they seemed to boil down to counterpromotion. alternatl\'e TV such as cable and ca:S3ette, pressure on licensing agencies.
Rep. ~rarc Lincoln )Iarks (R.pa.) sUfmested organizing campaigns against offending local stations and I>romo~ing minority stations. He noted that since programs are essentially bait used by advertisens, who concen· trate on the profitable 18,to49-year· old market, an effort could be made to interest advertisers in the 560 bibE!)n market represented by older peGpIe.
Fiction, he reminded the audience~ disarms its critic!. Theater makes lie!! appear harmles.~. even noble, while all the tilDe tr~Il:smitting and preserving biases, .

Acknowledgements
We would like to express our thanks to the following people:
Debra Giffen, Mark Gonzalez, Heather Harr-Mazer, Ann Marie Milczarski, Wendy Wolfenson, and Kendall Whitehouse for their assistance in data collection, preparation, and processing;
Maxine Beiderman 'and Margot Hillman fo.r"( report preparation;
Dr. Saadia Greenberg and other members of the Administration on Aging staff for their help in organizing the September 17, 1979 Conference to present the results of this research;
and The National Council on Aging for sharing the Myth and Reality of Aging Survey conducted in 1974 by Louis Harris and Associates.

TABLE OF CONTENTS
INTRODUCTION
MESSAGE SYSTEM ANALYSIS
Methodology Assessment of reliability The data Analysis procedures
The World of Television Drama
Demography and Power Sex and Casting Violence and Power
Personality and Living Role and Evaluation Home and Family Personality Attributes Health
Contingency Analysis
CULTIVATION ANALYSIS
Perceptions of Violence and Danger
Images of Older People
APPENDIX A: Figures
APPENDIX B: Tables
1
3
4 5 7 8
10
12 15 16
19 19 21 24 28
30
33
36
48

This is the final report of AoA grant No. 90-A-1299, "Aging with
Television." For the past two years this research has been an important
part of our ongoing research -- Cultural Indicators. Cultural Indicators is
a multi-faceted research project that has been examining trends in television
content and audience conceptions of social realty since 1969. The design consists
of two interrelated procedures: (1) message system analysis the periodic
content analysis of prime-time and weekend-daytime network dramatic pro-
gramming and (2) cultivation analysis -- determining conceptions of
social reality television viewing tends to cultivate in different groups
* of viewers.
Three progress reports have been previously submitted. These reports
used data from the existing Cultural Indicators data archives. Progress
Report No. 1 focused upon the image of older characters in prime-time
network dramatic programming. Report No. 2 discussed the image of the
elderly in weekend-daytime (children's) programming and Report' No.3 pre-
sented some of the conceptions of social reality these images cultivate in
different groups of vie"Ters.
This final report uses existing Cultural Indicators data archives
as well as data collected especially for this project. The report is
divided into two sections one for results from the message system analysis,
* A full description of the methodology employed in this research can be found in George Gerb,ner, Larry Gross, Marilyn Jackson-Beeck, Suzanne Jeffries-Fox and Nancy Signorielli, "Cultural Indicators: Violence Profile No.9." Journal of Communication, Summer, 1978
2
one for cultivation analysis. Each part of the report presents the
methodology and findings of the research as well as a discussion of its
general significance. Where appropriate, findings from earlier progress
reports are integrated into the text.
Aging is a process that starts with birth and goes on throughout life.
However, life styles associated with different stages of the life cycle
are roles learned in a culture.
The best time to learn about gro'"ing old with decency and grace is in
youth, in the everyday social and cultural environment. Images of old age we
absorb throughout life cultivate our concept of aging and of the age roles
into which we are placed.
Television i~ the wholesale distributor of images and the mainstream
of our popular culture. It is on in the average home for over 6 hours
each day. It presents a world of places, people, and roles which most
people experience with little selectivity or deviation an average of
30 hours a week. Network drama is where the bulk of this time and action
is. It is our nation's most common, constant, and vivid learning environment.
A third of television viewing takes place between 8: 00 and 11: 00 p. m.
each evening. During these hours, children and adults of all ages -
about 90 million each night -- gather at the set. That time is called
prime time. Another viewing time of special significance is weekend
daytime (8:00 a.m. to 2:00 p.m.), the children's hours. Although only
about 12 percent of the viewing time of children under 7 is spent watching
weekend daytime children's programs, it is a time when the audience is
composed primarily of children; the industry refers to this block
of programming as the "kidvid ghetto." Therefore, it is the best example

3
of a world television creates specifically for children.
1\fe are thought to be a "youth culture." Yet, we underrepresen~
and in many ways devalue children and adolescents, as well as old people.
As we shall see, culturally we treat age as a resource to be distributed
as other resources are distributed -- along lines of income, status, and
power.
It is difficult to understand one age group or role in isolation.
Our research looks at the entire pattern of the distribution of age roles
in the symbolic worlds of prime-time and weekend-daytime (children's) net
work television drama.
These patterns are not the creation of single individuals or groups.
They are the creation of a system of broadcasting and of story-telling with
deep historical, cultural, and commercial roots. It is a system which allows
very few degrees of freedom. But within those few degrees, the creative workers
and the executives of the industry can act -- provided they have the information
upon which to act. The purpose of this report is to provide and to continue
to amplify that information.
MESSAGE SYSTEM ANALYSIS
Message system analysis is designed to investigate the aggregate
and collective premises defining life in representative
samples of mass-produced symbolic material. This analysis rests upon the
reliable determination of unambiguouly perceived elements of communications.
Our data base and what we report does not reflect what a particular individual
sees but what large communities absorb over long periods of time. We also
do not attempt to interpret individual programs, networks or productions

4
nor draw conclusions about artistic merit. The analysis isolates the
patterns and symbolic structures that exist in the samples. The purpose
of message system analysis is to provide systematic, cumulative and
objective observations of the relevant aspects of the
world of television drama. The analysis and what it yields is somewhat
like flying over one's own neighborhood; the territory is familiar but the
patterns are different and are seen in a broader context.
Methodology
The process of message system analysis begins by selecting an annual
week-long sample of prime time (8 -lLp.m. EST) and weekend-daytime
(8 a.m. to 2 p.m. on Saturday and Sunday) network dramatic programming.
Each program in the sample is videotaped, logged and placed in the video
tape archive. Each year message analysis data is generated by subjecting each
program in the sample to an extensive recording instrument. In this
data gathering phase of the research each program is coded by two in
dependent pairs of highly trained observers who make detailed objective
records about different aspects of program content. Each program is coded
twice for the reliability analysis. The archived data used in all sub
sequent analyses are generated by randomly selecting one of the two in
dependent codings used in the reliability analysis.
Over the past ten years the Cultural Indicators recording instru
ment has generated data on many aspects of program content. The data
used in this aging-related project came from tvlO sections of this instrument
the program and the characters who populate the programs. These characters
include those who portray roles essential to the plot (major characters)
and all other characters with speaking parts (minor characters~. The
entire Cultural Indicators data archives contain information on 1365 programs

5
and 16,688 characters (see Table 1). The sample is made up of one week of prime-
time and weekend-daytime dramatic network programming broadcast in the fall of
each year from 1969 to ,1978. Two additional samples were collected and
analyzed in 1975 and 1976. These were samples of programs broadcast in
the spring of each of these years and were collected and analyzed on a number
of program dimensions as part of our research on sampling. Spring samples were dis-
continued because we found very little difference between the fall and spring
samples and we have thus concluded that the one week sample of programs broad-
cast in the fall is adequate to reflect the basic diflensionsof dramatic net-
work programming.
This report also includes findings of the analysis of a special sample
of data specifically collected as part of this research project. These data
were generated by the message system analysis of 426 programs (309 in prime-time
and 117 in weekend~daytime (children's programs) in the Cultural Indicators
videotape archives. These programs were selected because they had at least one
member of the cast who was either over 65 years of age or was categorized as an
elderly character. Each of these programs was subjected to a specially designed
recording instrument focusing upon the portrayal of aging and especially upon
how elderly characters are portrayed. This sample included about one-third of
the programs in the entire Cultural Indicators videotape archive. Moreover,
* the programs were just about evenly divided among each of the 11 sample weeks .
Assessment of reliability
Reliability measures are designed to ascertain the degree to which
*This part of the research was conducted in the spring of 1978, before the fall 1978 sample week was available for analysis. Thus, this analysis covers the years from 1969 to 1977.

6
the recorded data truly reflect the properties of the material being studied
and not the contamination of observer bias or of instrument ambiguity~
Theoretically, both types of contamination are correctable, either by refin-
ing the instrument or intensifying coder training; and as a last resort,
by eliminating the unsalvageable variable or dismissing the incorrigible
coder. Measures of relaibility thus serve two functions: as diagnostic
tools in the confirmation of the recording process, and as final evaluators
of the accuracy of a phenomenon's representation in the actual recorded data.
Our reliability assessment involves the calculation of an agreement
coefficient for each content item in the recording instrument. Five
computational formulae are currently available for calculating these
coefficients. The variations are distinguished by a difference function,
the form of which depends upon the scale type of the particular variable
being analyzed. Except for their respective scale-appropriate sensitivity
to deviations from perfect agreement, the coefficients make the same basic
" assumptions as the prototype for nominal scales devised by Scott. Thus,
*."' in the case of the binary variable, all formulae yield identical results.
The coefficients range from +1.00 to -1.00, where +1.00 indicates
perfect agreement and .00 is agreement due solely to chance. A coefficient
of .50 indicates that performance is 50% above the level expected by chance.
"William A. Scott, "Reliability of Content Analysis: The Case Of Nominal Scale Coding," Public Opinion Quarterly, 17:3, 321-325, 1955.
,'d, For the derivation of the formulae and discussion of their properties, see
Klaus Krippendorff, "A Computer Program for Analyzing Multivariate Agreements, Version 4," Memeo, Philadelphia: University of Pennsylvania, the Annenberg School of Communications, July 1973. For a more extended discussion by the same author of part of this family of coefficients see "Bivariate Agreement Coefficients for the Reliability of Date," in E.F. Borgatta, ed., Sociological Methodology,1970, San Francisco: Jossey-Bass.

7
Reliability is thus ascertained by a statistical procedure that
measures the agreement of trained analysts for each content item. If
one were to substitute the perceptions and impressions of casual observers,
no matter how sophisticated, the value of the investigation would be re-
duced, and its purpose confounded. Only an objective analysis of unambiguous
message elements, and their separation from personal impressions left by
unidentified clues, can nrovide the basis for isolating and understanding stable
images in symbolic materials.
The agreement coefficients calculated to assess the reliability for
each item used in the message analysis are presented in Table 2~ These
coefficients indicate the degree to which agreement among the independent
pairs of observers is above chance. The minimal acceptable agreement
coeficient for most of the items included in this analysis is .600.
Certain items, such as the personality trait scales 3 however, have, a
minimal level of .500. Only those items meeting these minimal levels
·are included in the analysis.
The data
The data used in this analysis come from two sources -- existing
Cultural Indicators project data archives for programs and characters
coded from 1969-1978, and specially generated data from the message system
analysis of the programs from 1969-1977 that had older characters in the
cast.
The character data consist of eight types of content items --
demographic, descriptive, health, living arrangements, home and family,
personality trait scales, personality attribute evaulation scales, and
activities performed by characters. The demographic items include
category schemes for sex, race, socia-economic status, employment and

8
chronological age. The descriptive items include category schemes to
differentiate character role, character type, success, social age, committing
violence and victimization. Health and living items focus upon physical
and mental illness, death, and living arrangements. Home and family items
include the following: marital status, performance of household duties for
other characters, having children, the importance of family life and whether or
not characters are romantically involved. Personality was assessed by two types
of items: personality traits coded on five point bi-polar adjective scales
and eight evaluation attributes, such as being treated with ·disrespect or pity
and being portrayed as lonely, a nuisance, stubborn, eccentric, foolish, or useful.
The final set of ite~s measures characters' performance of various activities.
Analysis Procedures
The data analysis consists primarily of simple descriptive statistical
techniques such as multi-dillmensional cross-tabulations. Host of the analyses
use character's social age and sex as the basic comparative variables.
Social age is a descriptive category scheme that serves to distinguish
characters by age role. It consists of four categories -- children and
adolescents, young adults (the age between adolescence and a more settled
vocational and personal life and responsibilities), settled adults, and
older adults (characters past the prime active years and obviously elderly).
These groupings provide the basic structure of the analysis and permit the
isolation and comparison of the image of men and women in different age
roles.
A second type of analysis called for the generation of personality

9
and attribute evaluation profiles. Personality trait profiles are the mean
score on each personality trait scale and are generated for characters
in each of the four social age classifications. These profiles are also
separately generated for male and female characters in the four age roles.
The evaluation attribute items were also measured by generating the mean
scores on each scale for characters in the age-sex role groupings. The
significance of differences between age-sex groups of characters on these
two types of items was tested by analysis of variance or t-tests. Where possible,
results are presented graphically to simplify presentation.
The third type of analytic procedure was a multi-variate statistical
* procedure called contingency analysis. This procedure permits a large
number of binary coded character attributes to be examined in tandem and
enables the discovery of which attributes of characterization are most likely
to occur at the same time. That is, the technique uncovers simultaneously occuring
clusters of characterization traits.
* A full discussion of this and similar multi-variable statistical procedures may be found in Nancy Signorielli (Tedesco), Men and Women In Television Drama: The Use of Two Multivariate Technigues for Isolatiu& Dimensions of Characterization. (A dissertation in Communications, University of Pennsylvania, 1975)

10
The Horld of Television Drama
Information conveyed by drama and fiction differs from information
conveyed by bits of fact, but plays an equally significant function.
Factual descriptions construct a selective image of what things
are. Drama and fiction demonstrate the invisible connections that show
how things work and why.
That story-telling process is essential to human socialization, the
introduction to and cultivation of concepts of roles and values. Televi
sion is the central and universal story-teller in our society. Its dramatic
programming presents a translucent and compelling world of times, places,
social types, strivings, powers, and fate. The world of television drama
is a highly structured, relatively stable and compelling ritual, encountered
nonselectively by most viewers. Our task is more to diagnose than to judge
it, but we report our findings in terms of general standards of equity,
fairness, and justice.
The world of television drama is also a highly controlled assembly
line product governed by relatively few formulas. Its people do not live ar
die but are created or destroyed to tell a story. The message of all
stories emerges from aggregate patterns of casting, characterization, and
fate. Moreover every dramatic program is structured to make its casting
seem natural--but casting has a message of its own. Roles are created in
direct relation to usefulness in the world of television. Those for whom
the world of television has more use--more jobs, adventures, sex, power,
and other opportunities and life chances--are created and cast in greater
number than those whose dramatic uses are more restricted. These values
are distributed as most resources are distributed: according to status
and power. Dominant social groups tend to be overrepresented and over-
endowed not only absolutely but even in relation to their numbers in the

11
real population. Minorities are defined by having less than their pro
portionate share of values and resources. In the world of television
drama this means less usefulness and fewer opportunities. Underrepresenta
tion means restricted scope of action, stereotyped roles, diminished life
chances, and undervaluation ranging from relative neglect to symbolic
annihilation.
We do not wish to imply that faithful proportional representation of
reality is necessarily fair or just. Artistic and dramatic functions
require selection, amplification, and invention, all of which may deviate
from what the census reports or what independent experience reflects.
Reality provides a standard by which the nature and extent of the deviations
can be measured. The important question is not so much whether there are
deviations as what kind and with what consequences fbr thinking, action,
and policy.

12
Demography and Power
Figure 1 (Table 3 and 4) shows the age distribution in real life and in the
world of prime-time dramatic television. In contrast to the distribution
of age groups in the American population, the television curve demonstrates
a pronounced central tendency: it bulges in the middle years and grossly
under-represents both young and old people. More than half of TV's drama-
tic population is between 25 and 45. Individuals under 18, who number
about 30 percent of the U.S. population, make up only 8 percent of the
fictional population. Those over 65, comprising about 11 percent of
the U.S. population, make up 2.3 percent of the fictional population.
Rather strikingly, while this pattern of distribution does not
exist in our real life population, it does appear to reflect the distri
bution of consumeor income by age. Television's prime-time population may
be seen as a mirror of the audience referred to by the industry as the
"prime demographic market."
Figure 2 (Table 4) compares weekend daytime and prime-time age distributions.
It shows that weekend daytime television is different in that the mid
teens (especially major characters) number more than their real-life
share. Children's viewing time has even fewer people over 65 than does
prime time; only 1.4 percent of all weekend daytime characters are 65
or older.
Another big difference is that characters in their twenties and
early thirties, prominent in prime time, are reduced by half in children's
program time. The age group of the parents of young children has a low
profile, as does the age group of their grandparents.
In the world of prime-time television drama -- as in most mass

13
media -- men outnumber women about three to one. This fact has profound
consequences for all that happens in that world, from patterns of aging
and employment to sex and violence. Women actually outnumber men
among characters in their early twenties, when their function as romantic
partners is supposed to peak, but then their numbers fall to 4 or 5
times below the number of men as their usefulness in the world of
television declines.
The percent of men and women in each age group is shown in Figure 3 (Table 4).
The age distribution of females, compared to that of males, favors young
girls and women under 35. While women are most concentrated, with almost
a third of their total numbers in the 25 to 35 age bracket, men are
the most concentrated, also with almost one-third of their numbers, in
the 35 to 44 age ,bracket. The character population is structured to
provide a relative abundance of younger women for older men, but no such
abundance of younger men for older women. Television perpetuates an
inequitable and unfair -- if conventional pattern.
Figure 4 (Table 4) shows the pattern in children's programs. Over half of
all females are under 21, but only 28 percent of all males are under 21.
The second hump is all male. Tbe most visible male age group is
between 35 and 45: fully one-third of all men in weekend daytime pro-
gramming are in this group.
The patterns of prime-time are even stronger in weekend daytime
programs, as men and women over 45 become progressively less visible.
Women over 65, over 12 percent of the real female population, are
4 percent of the women in the world of children's television; older

14
men account for only 2 percent of the men.
Figure 5 (Table 5) compares the age distributions of white and non-white
men and women in prime time. It shows that while white men dominate
the age of dramatic authority between 35 and 45, both non-white men and
all women tend to be younger. Minority males occupy an age-related
power position between white males and all females. Age as a resource
cuts two ways for race as well as for gender.
As noted above, coders judge the chronological age as well as the
social age of all characters. Social age is a functional category scheme
used to characterize life cycle as well as type of dramatic role. The
categories are children and adolescents, young adults, settled adult, and
older adult. The older adult role is one in which characters are portrayed
as past the prime ~nd active years of life and one in which characters are
visually old.
The distribution of these roles for all characters in all programs
can be seen in Figure 6 (Table 6). It confirms what we have seen
earlier. The bulk of the dramatic population is shows in settled
adulthood. The dramatic need for women as romantic partners makes
their percentage cast as young adults nearly double that of men.
Older men and women are grossly underrepresented.
Figure 7 (Table 6) shows that in prime-time the situation is
essentially the same. On weekend-daytime children's program, as
we can see on Figure 8 (Table 6), there are proportionately more

.15
females in childhood and adolescence as well as in young adulthood,
and fewer in old age. To find an older major character a child will
have to watch an average of two weeks for a male and six weeks for a
female.
The distributions we have found do not change much from year to
year. Figures 9 and 10 (Table 7) show that the age structure of
the world of television is a stable system.
The relationship of chronological age to the role a character
plays is not a fixed one. On the contrary, the use of age as a re
source means, as we have already seen, that some types of characters
play different roles than other characters of the same age. lve will
only sketch two types of differences that have to do with two great
dramatic -- and real life -- indicators of human and social relation
ships: sex and violence.
Sex and Casting
The aspect of sex that we will talk about is its basic raw material:
casting. We have seen the disproportionate use of young women to play
opposite older men. This means that women on television "agel! faster
than men. As ,,,omen age, they are cast for roles that decrease their
romantic possibilities. Figure 11 (table 8) presents comparisons
between chronological age and social age categories. It shows that
already in their teens, a larger percentage (38 percent) of female
major characters is assigned to the older social and dramatic age
category of young adults than males of the same age (30 percent). In
their twenties, only 26 percent of the men but 33 percent of the women
will be cast as settled adults (the rest are of course young adults).
Among prime time major characters from 55 through 64, only 22 percent
of the men but 33 percent of the women will be cast as old characters.

16
Among characters 65 and over, 28 percent of the men will still play
settled adult roles with romantic possibilities and 72 percent will be cast
as old but 90 percent of women of same chronological age will be cast as old.
Violence and Power
Dominated by males and masculine values, much of the world of
television drama revolves around questions of power. 1~o can get away with
what against whom? How secure are different social types when confronted with
conflict and danger? What hierarchies of risk and vulnerability define so
cial relations? In other words, does power work in society?
The simplest and cheapest dramatic demonstration of power is an
overt expression of physical force compelling action against one's will
on pain of being hurt or killed, or actually hurting or killing. That
is our definition of violence.
Violence rules the symbolic world of television. It occurs at an
average 10-year rate of 5 violent incidents per hour in prime time and 18
per hour in weekend daytime children's programming -- a triple dose.
Table 9 presents the distribution of prime-time characters on two violence
related items. Table 10 gives similar information for characters in weekend
daytime (children's) programming. These tables present the number and per
cent of characters who commit violence (i.e., who hurt of kill other char
acters), and who are victimized (i.e., who are hurt or killed), as well as
ratios indicating the relationship between these two roles. These risk
ratios are obtained by dividing the more numerous of the two roles by
the less numerous within each social group. A plus sign indicates that
there are more violen ts or killers than ,-,vic tims or killed, and a minus
sign indicates that there are more victims or killed than violents or

* killers.
17
Major characters are much more likely to both commit and/or be subjected
to violence than minor characters. Overall, 55 percent of all prime time major
characters and 80 percent of all weekend daytime major characters are involved
in violence. But involvement and its outcome -- as all other values and re-
sources -- are not equally distributed in prime-time programming. Older characters
are less likely to get involved either as violents ,(hurting or killing other
characters) or as victims (being hurt or killed) than younger characters, and
women less likely than men. Even so, 25 percent of older women and 46 percent
of older men are still involved in some violence. In children's programming,
however, older women are more likely than younger women, while older men are
less likely than younger men, to be involved in violence
Violence as '"a demonstration of power can be measured by relating
the percent of violents to the percent of victims within each social group.
These ratios show the chances of men and women, blacks and whites, young
and old, etc., to come out on top instead of 'the bottom. Conversely, it
shows the risks' of each group to end up as victims instead of victors.
In prime-time programming, the male victimization ratio declines
with age. Less than half of older men are involved in violence, but if
and when involved, they are the only group to actually hurt others more
than they get hurt themselves (12 inflict violence for every 10 that are hurt).
Their fate changes, however, when violence becomes lethal. Then, with as
many killed as killers, old men have the highest ratio of fatal victim-
ization among all male age groups.
*A ratio of zero proceeded by a (+0.00) or no violents (-0.00). violents and no victims.
sign m~ans that the group has either no victims A ratio of 0.00 means there are both no

18
Old men on television drama, especially when in a major prime-
time serious role, are more likely to be evil than any other age group.
Evil must have power to be credible. But in a world of happy endings
evil must also perish -- hence the high ratio of old men who are killed.
Women suffer a different fate. They are more likely to be victimized
than men at most ages. As they get old, their relative risks of being
hurt and being killed both rise even further. Old women rarely encounter
violence (or anything else,because they appear, on the average, less than
once a week), but when they do, the likelihood is that they will be the
victim -- the -0.00 violent-victim ratio means that older women were hurt
but none hurt other characters.
In weekend-daytime programming we find some but not all of the same
patterns. As me~,.age their victimization ratio decreases but older men
are also more likely to be hurt or killed than to hurt or kill others.
Older men, as well as boys, are not involved in killing -- none either were killec
or killed another character.
Old women are still prone to victimization in children's programming
but, as with old men, are not involved in killing. Young women fare the
worst in this regard -- they have the largest victimization ratio
(24 are hurt or killed for every 10 who commit violence) and when in
volved in killing they are the only age group who are the victims.

19
Per§.2.Ilality and Living
This section focuses specifically upon four specific aspects of
characrerization -- (1) role and evaluation, (2) home and family, (3)
personality attributes, and (4) health. The analysis concentrates pri-
marily upon the portrayal of !]l.8.jor characters in prime-time drama. Hhere
possible we discuss how these items are presented in weekend-daytime pro-
gramming.
Role and evaluation
We start with three evaluation characterizations items --
character type ("good" or ltbad"), a character's success (whether or not
the character achieves what he/she sets out to do or otherwise exhibits
characteristics indicative of success), and the type of role (comic or
serious) in which a character is cast.
Overall, most major characters are "good" or "good and bad," and
less then 15 percent are classified as "bad" (Table 11). Minor characters
are also more likely to be portrayed as "good" or "bad". Figure 12
illustrates the proportion of "good" and "bad" characters among male and
female major characters of different ages. The dotted line shows that,
except for the children and adOlescents, as males age, proportionately
more are portrayed as "bad." For females (the solid line) however, the
situation is reversed and, except for elderly women, proportionately
more girls are portrayed as "bad" than young or middle-aged women. More
* older women, though, are portrayed as "bad." The most obvious and
important difference is that proportionately fewer older characters are
"good," while the proportion of "bad" older characters is larger than in
the younger age groups. These findings reinforce the notions of ,",ho is
"good" and "evil" revealed in the patterns of committing violence and
*The number of female characters who are very young or very old is quite small.
20
being victimized.
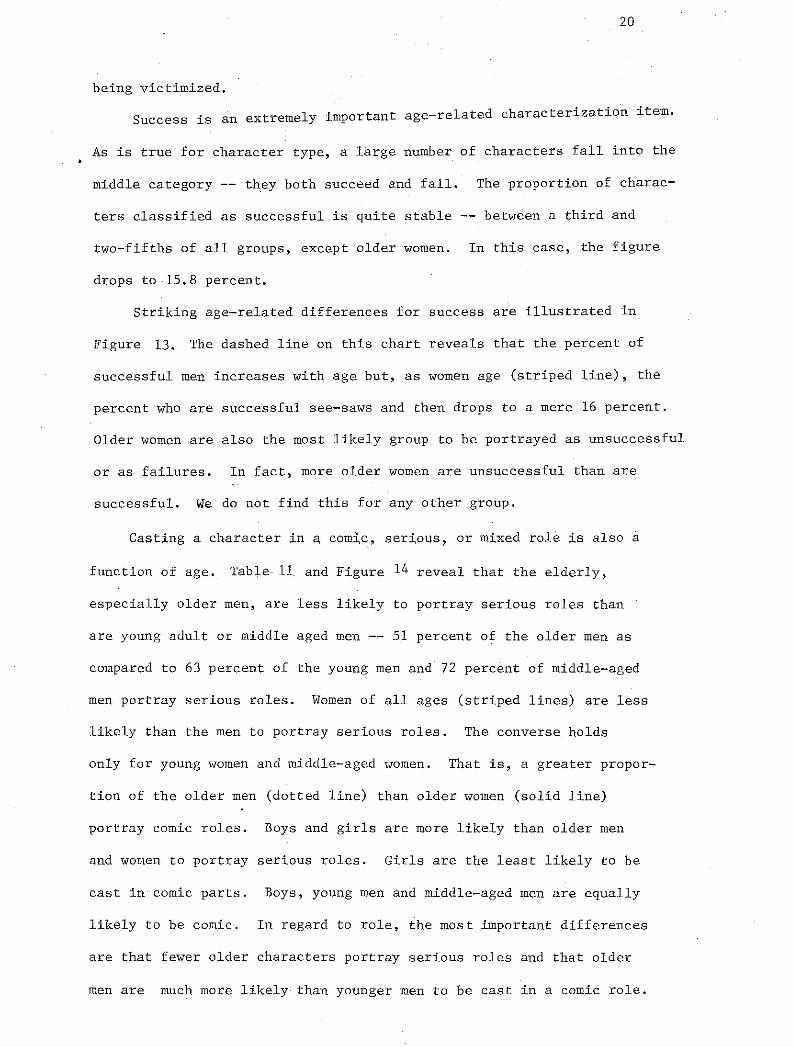
Success is an extremely important age-related characterization item.
As is true for character type, a large number of characters fall into the
middle category they both succeed and fail. The proportion of charac-
ters classified as successful is quite stable -- between a third and
two-fifths of all groups, except older women. In this case, the figure
drops to 15.8 percent.
Striking age-related differences for success are illustrated in
Figure 13. The dashed line on this chart reveals that the percent of
successful men increases with age but, as women age (striped line), the
percent who are successful see-saws and then drops to a mere 16 percent.
Older women are also the most likely group to be portrayed as unsuccessful
or as failures. In fact, more older women are unsuccessful than are
successful. We do not find this for any other group.
Casting a character in a, comi,c, serious, or mixed role is also a
function of age. Table 11. and Figure 14 reveal that the elderly,
especially older men, are less likely to portray serious roles than
are young adult or middle aged men -- 51 percent of the older men as
compared to 63 percent of the young men and 72 percent of middle-aged
men portray serious roles. Women of all ages (striped lines) are less
likely than the men to portray serious roles. The converse holds
only for young women and middle-aged women. That is, a greater propor
tion of the older men (dotted line) than older women (solid line)
portray comic roles. Boys and girls are more likely than older men
and women to portray serious roles. Girls are the least likely to be
cast in comic parts. Boys, young men and middle-aged men are equally
likely to be comic. In regard to role, the most important differences
are that fewer older characters portray serious roles and that older
men are much more likely- than younger men to be cast in a comic role.

21
In prime-time prograR~ing we found that considerably more characters
of all ages are portrayed positively i.e. are "good" or successful. The
only exception is for the success of older characters. In weekend-daytime
programming (see Table 12), however, the polarization on these content items
is less pronounced -- it exists only for younger characters -- the children
adolescents and the young adults. Proportionately more settled adults and
older adults are portrayed negatively on these two items. And, as il
lustrated on Figures 15 and 16, as characters get older, the lines begin
to merge. We thus find that in children's programming more of the young
characters are "good l1 or successful while when characters get older, es
pecially the older adults, more of the characters are presented negatively
they are '~badtt or unsuccessful.
The proportioTh of characters who portray a comic or serious role in
weekend-daytime programming is quite similar for all age groups except
older women. As Figure 17 illustrates, there are no outstanding differences.
This is in sharp contrast to the role portrayals found in prime-time pro
gramming as seen in Figure 14. In this case we found that a rather small
proportion of characters in all age-role groups were cast in comic roles
while most characters portrayed roles that are serious in nature.
Home and Family
The next aspect of portrayal that we will discuss is home and family
(Table 13). In prime-time programming we find that home and family are
especially important features of major roles but usually are omitted in
characterizations of minor roles. In children's programming, however, this
concept is relatively unimportant to all major as well as minor characters,
including the elderly, that is, most characters fall into the "cannot code"
category on most items.

22
Home and family are important parts of characterizations in all
age-groups in prime-time programming except young adults. We find that as
characters age they are more likely to be portrayed as married married
characters include 12.7 percent of the young adults, 37.7 percent of settled
adults, and 64.8 percent of the elderly. The proportion of married characters
is even greater among women; the married include 20 percent of the young
women and only 8 percent of the young men; 33 percent of middle-aged
men as compared to half of the middle-aged women; and 62 percent of the
older men as compared to 71 percent of older women.
Older characters are also more likely to be portrayed as having
children than are middle-aged characters -- 41.2 percent of the older
men and 57.1 percent of the older women as compared to 22.7 percent of the
middle-aged men and 32.5 percent of the middle-aged women. About the
same proportion of older and middle-aged characters are cast in roles
involving the care of children under 18 years of age.
Family life is especially important for children and adolescents,
the older adults, and middle-aged women. Family life is least important
for middle-aged men although in many characterizations coding cannot be
completed because family lefe is rarely presented as obiously unimportant.
Keeping house is a rare television world activity. Over the years we have
found that very few characters perform homemaking tasks for other characters
for example, cook for them. But, we have found that the largest proportion
of characters who actually take care of other characters are middle-aged
women (more than a third) and elderly women (about 25 percent).
1ffien we look at romantic involvement, however, we get a very
different picture of aging and age-roles. So far we have seen that home

23
and family are important aspects of the characterizations of older
adults -- they are married, have or care for children and feel that
family life is important. Romance, however, is not. Of the four age
groups, the elderly (especially older women) are the least likely to
" be portrayed as involved in a romantic relationship -- from 1973-1978,
only one older women and three older men had romantic relationships.
Moreover, the woman appeared in 1978.
The difference in the portrayal of marital status and romantic
involvement is illustrated in Figure 18. This graph reveals that as
characters age the proportion who are married increases, but the
.. ,,* proportion involved romantically declines. Thus, although most older
characters are married they are the group least likely to be involved
in a romantic relationship. This says something not only about age-
roles but also about the nature of marriage. Marriage, at least in the
television world, is pratically devoid of romance and is the domain of
older people. Young characters, especially young women, on the other
hand, are involved romantically but are not married.
The shape of the romantic involvement curve substantiates what the
basic casting norms reveal in the overall distribution of men and women
in the television world population. Although women, of all ages except for
the early 20's, make up a smaller segment of this population, their greatest
numbers are found in the younger age group -- the time when they are, for
television at least, available for and involved in romantic relationships.
" This content item (romantic involvement) was added to the recording instrument in 1973.
"*l1artial status and romantic involement are coded independly. A character who is married is not coded as involved in a romantic relationship unless there is evidence -- such as kissing, hugging, tendencies -- to substantiate the existance of romance in the marriage.

24
Finally, characters are rarely, if ever, portrayed as not having a
family -- only 4 characters in the 8 weekly samples generated from 1973
to 1978 were so portrayed. Often, however, the plot gives no information
about family status, especially for young and middle-aged characters.
Children and adolescents are usually seen in family-related settings and
older women are often portrayed as having family related interactions.
Finally, most characters, and even the older group are portrayed
as living with other family members -- spouse, and/or children. Al
though only 15.5 percent of the elderly are shown living alone this
information was not given for a fairly large proportion of characters
between 40 and 50 percent.
Personality Attributes
We now turn to an examination of several attributes of personality
of major characters in prime-time dramatic programming. These analyses
were conducted on data generated from the message system analysis of all
programs with elderly characters -- the AoA sample. The analysis focuses
upon two sets of data -- scores on a series of personality trait scales
and scores on a number of content items illuminating how characters of
different ages are evaluated (treated/portrayed) in dramatic prog11.amming.
The personality trait profiles of major characters are presented
in Table 14 and Figures 19-22. These profiles consist of scores on 5 point
bi-polar adjective scales.
Examination of the general age-role profile (Figure 19) reveals that
for the most part older characters tend to be portrayed less positively than
younger characters on these traits. Older characters are neither attractive
nor repulsive; they are also less fair,. sociable, warm, kind or pleasant
than the other age-groups. They are a little selfish, unhappy, and unwise.
25
They are, however, more extravagant than younger characters. Older characters
exhibit more qualities of leadership than children/adolescents or young
adults, but fewer than settled adults.
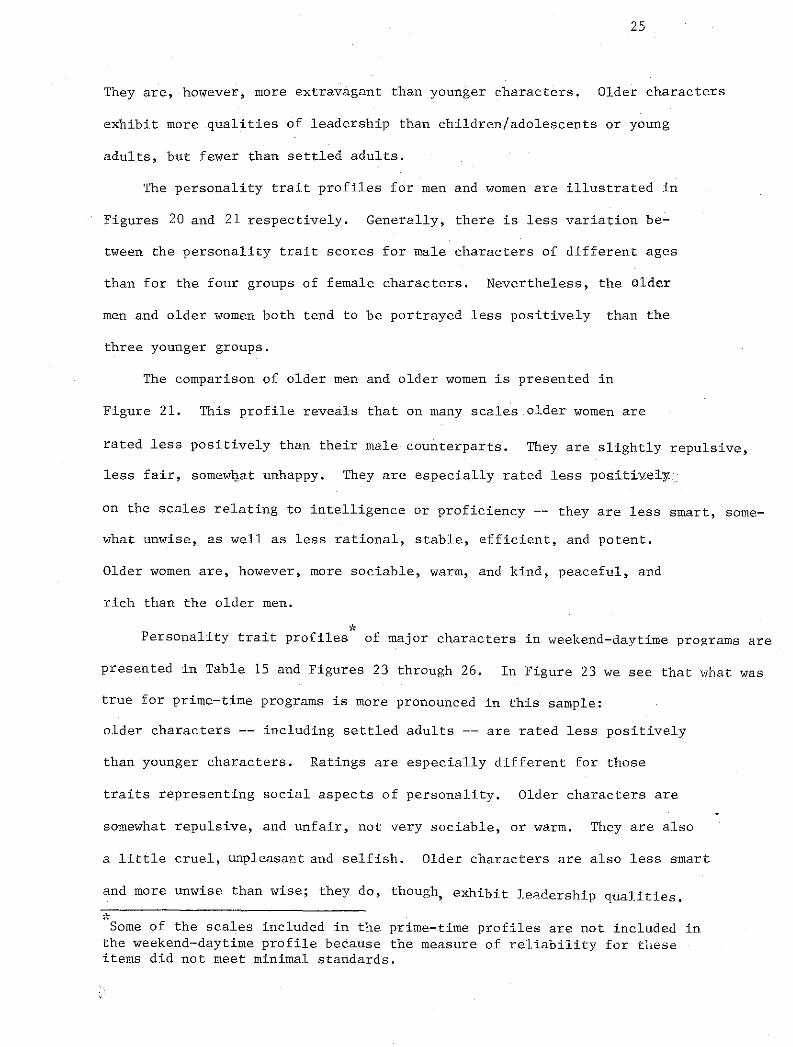
The personality trait profiles for men and women are illustrated in
Figures 20 and 21 respectively. Generally, there is less variation be-
tween the personality trait scores for male characters of different ages
than for the four groups of female characters. Nevertheless, the older
men and older women both tend to be portrayed less positively than the
three younger groups.
The comparison of older men and older women is presented in
Figure 21. This profile reveals that on many scales older women are
rated less positively than their male counterparts. They are slightly repulsive,
less fair, somewqat unhappy. They are especially rated less positivel~,
on the scales relating to intelligence or proficiency -- they are less smart, some-
what unwise, as well as less rational, stable, efficient, and potent.
Older women are, however, more sociable, warm, and kind, peaceful, and
rich than the older men.
Personality trait profiles* of major characters in weekend-daytime programs are
presented in Table 15 and Figures 23 through 26. In Figure 23 we see that what was
true for prime-time programs is more pronounced in this sample:
older characters -- including settled adults -- are rated less positively
than younger characters. Ratings are especially different for those
traits representing social aspects of personality. Older characters are
somewhat repulsive, and unfair, not very sociable, or warm. They are also
a little cruel, unpleasant and selfish. Older characters are also less smart
and more unwise than wise; they do, though, exhibit lee,dership qualities.
*Some of the scales included in the prime-time profiles are not included in the weekend-daytime profile because the measure of reliability for these items did not meet minimal standards.

26
The profiles for males (Figure :24) and females (Figure 25) exhibit some
what similar patterns even though there is more variation among the ratings
for women in the four age roles.
The profile for just older characters reveals some very interesting
differences in the portrayal of older men and older women (Figure 26). Older women
are rated as quite repulsive while older men appear to be more neutral
in this regard. Older women are also somewhat cold and cruel but are much
more potent than elderly men. The women are also more stable and exhibit
more qualities of leadership than the men.
Major characters in the AoA sample cif prime-time programs are also rated
on several other personality attribute scales. These scales include treating
characters with disrespect or pity, and portraying characters as useful,
lonely, a nuisanc,e, stubborn, eccentric, or foolish. The values range from
1 (neve~ to 5 (always). In Table 16 three measures are given -- the percent
of characters who are treated or portrayed as the scale suggests, the
mean score for each scale and its standard deviation.
More older characters are treated with disrespect than characters
in any other age group. About 70 percent of the older men and more
than 80 percent of the older women are not held in high esteem nor
treated courteously. This is quite different from younger characters,
where more than half are usually treated courteously, appear to be
admired, or are held in esteem. Of course, this disrespectful treat
ment does not occur every time an older character appears (the mean
score was only 2.1), but nevertheless more than three quarters of
the "lder characters are presented in a disrespectful manner. Similarly,
a much larger proportion of older characters than younger characters
are portrayed as eccentric or foolish. A larger proportion of older women
than older men -- two-thirds as compared to about half -- are presented

27
as lacking cornman sense, acting silly or eccentric. This male-female distinction
does not exist in the other age groups.
Two positive aspects of portrayal emerge from this analysis. First, t~e
older characters are not portrayed as more lonely than characters in younger age
groups. Also, the mean score on this scale for elderly characters is very low,
indicating that loneliness, as an attribute of characterization, occurs infrequently.
Second, most characters, including the elderly, are portrayed as useful.
In Table 17 we find that some of the patterns exist in regard to the treat
ment or portrayal of characters in weekend-daytime programming. Older characters,
and especially older women, are more likely to be portrayed as foolish or
eccentric. The portrayal of older characters as eccentric is especially strong
practically all older characters are portrayed in this way and the scale value
of 4.0 indicates that they were usually presented as eccentric. Most older
characters are also presented as nuisances and are stubborn. And again, old war.len
fare particulary poorly in this regard -- all old women are shown as stubborn
and their score on this indicates that they are often portrayed as stubborn
during the course of the program.
As is true in prime-time programming, loneliness is not presented as an
attribute of characterization -- only 20 percent of the older characters are
lonely. Proportionately more older women than older men are portrayed as lonely but
the mean score indicates that loneliness rarely occurs in the story.
The most consistant finding is that as characters get older, they are
presented as possessing more of these negative personality attributes. Older
characters are more likely to be treated with disrespect; they are portrayed as
flare of a nuisance, as more stubborn, eccentric and foolish than younger characters.
We do find, however, that most childern, and especially girls, are presented
positively.

28
Health
This section of the report looks at a number of health-related content
items. The analysis focuses primarily upon characters in prime-time programs
because most of these items could not be coded for characters in the sample
of weekend-daytime (children's) prograw~ing. That is, the portrayals generally
give little or no information about these issues or the portrayals are totally
positive -- characters are healthy, do not die, etc.
Illness and death are not a normal part of the television world population.
Most television characters, the elderly included, are very healthy and very
few die from natural or illness-related causes. Of course, it must be reflembered
that the television world is a fictional world in which a character's death or
illness is planned and usually an intergral part of the plot. In fiction, death
is often used to eiiminate a character, to create suspense, or to move the story
from one phase to another. Moreover, death when it does occur in television drama
is more often than not the end product of a violent encounter. And, death is
usually simple and pure -- it is rarely gory or presented as frightening.
Our 10 year analysis of prime-time television drama reveals that by and large
television characters are especially hardy and healthy. Only one in ten characters
is portrayed as sickly or with a physical illness requiring treatment. Moreover,
very few characters have physical handicaps, are mentally ill, alcoholics or
drug abusers.
Table 18 presents data for four health-related items -- smoking, drinking,
sight impairment, and mobility -- for characters in the AoA sample.
We found that very few characters are shown smoking -- only 10 percent o~ the
young and middle aged men and very few women (none of the young or elderly and
only 4.1 percent of the settled adults). About 9 percent of the children and
adolescents smoke.

29
Drinking alcoholic beverages increases with age -- 34.5 percent of the
young adults, 36.8 percent of the settled adults and 40.8 percent of the elderly
are sho,m consuming alcohol. A much larger proportion of the elderly women
than young or middle aged ,mmen drink -- 56.3 percent compared to about a
quarter of the younger females. But although characters. drink, very few are
portrayed as alcoholics; only 3 in the entire sample -- 1 middle aged man and
2 older men.
Television characters are also likely to have good eyesight -- almost
9 out of 10 characters in all age groups except the elderly do not wear glasses.
Very few of the elderly are portrayed wearing or needing to wear glasses -
only about a quarter, men as well as women.
And finally, very few characters suffer from problems of physical
mobility. And, physical mobility problems are also not included as part of
most characterizations for older as well as younger characters. In regard to
the e1der1y,on1y 2 characters, one man and one woman, were confined to wheel
chairs; six (8.5 percent) characters, all men, walked with canes, and 7
(9.9 percent), including 1 woman, walked with a limp -- the classic "old age
shuffle."
Television thus presents a rather gloomy although healthy picture of
aging. Older persons are practically invisible. Elderly women are quite likely
to be hurt or killed as well as be failures or unsuccessful. Older men do a
lot of hurting but, at the same time, are more likely to be killed than to kill
others. More older men than younger men or women of all ages are cast in
comic roles. Elderly characters are more likely to be treated with disrespect
and are portrayed as nuisances, as stubborn, eccentric and foolish. They
are rated as less attractive and more unhappy than younger characters. But,
they are also healthy. Finally, while home and family are important for
elderly characters, romance is the domain of the young.

30
Contingency Analysis
An interesting description of characterization comes from a statistical
technique called Contingency Analysis. The analysis uncovers clusters of
characterization attributes that appear simultaneously. This analysis was
performed for all characters in the AoA sample of prime-time programs and the
results are presented in Table 19 and Figure 27. Table 19 lists pairs of
significant association coefficients -- the measure of co-occurrance used in
the analysis. Figure 27 illustrates attributes of characterization that are
positively associated.
Finally in the graphic representation, the different size circles reflect
the degree of importance (measured by number of appearances) of the attributes
of characterization. Those attributes that appear only rarely are surrounded .,
by small circles while attributes that appear frequently are surrounded by
larger circles.
The results of this analysis reveal four basic clusters of characterization
traits. These clusters can be titled home and family, crime-violence including
"good" and "bad" age roles, and activities. Moreover, program type emerges
as an important item -- characters with certain attributes are only found in
adventure programs while others appear in non-adventure programs.
Home and family attributes emerge as one of the largest and strongest
clusters in the analysis. Moreover, most of the attributes within this cluster
are inter-related, that is they co-occur. Thus, we find characters who are
married, tend to have or take care of children, perform homemaking activities,
feel that family-life is important, etc. These characterization attributes
also are found primarily in non-action adventure programs. An interesting
and important cross-cluster association is the association between being an older
character and exhibiting characterization attributes related to family and home.

31
The attributes that co-occur in this cluster obviously substantiate
findings of the already presented cross-tabulation analysis. ,lhat is expecially
important is that cluster analysis reveals a groups of characters who exhibit
these traits. Thus these attributes seem to be part and parcel of a particular
type of character -- the one for whom home and family are important. More
over, there are no significant associations between this cluster and the
more negative attributes relating to crime-violence.
The crime-violence or "bad" cluster reveals the co-occurance of many
negative attributes of characterization. And, we find that characters who
are "bad" often are failures, commit crimes, commit violence and are also
victimized. Moreover, these five negative attributes are all interconnected
and it appears that the character who commits violence usually also commits
crimes, is victimized, is "bad", and so on.
The age role clusters are also very important. Older characters in
particular have very interesting patterns of co-occuring attributes of
characterization. In particular, older characters are those who portray
comic roles, are seen as foolish, lonely, eccentric and are likely to be treated
with disrespect. Again, the cluster analysis substantiates as well as
illuminates findings reported above. The cluster also reveals that the elderly
are often married and that family life is generally important to them.
The previous analysis revealed that very few characters, even older
characters, were sickly, handic.aped, etc. But the cluster analysis reveals
that being an older character is significantly associated with having a
physical handicap or restricted mobility. Thus, although these things occur
rarely, when they do appear they are all usually part of an older person's
role. Thus, we have even more evidence to support our contention that the
elderly are treated negatively in dramatic programming.

32
Other age-related associations include the following. Categorization
as a young adult is significantly associated with committing a crime or being
victimized. Settled adults work at occupations, have children or are responsible
for youngsters. And, finally, children and adolescents are shown participating
in sports, are with their parents and are cas"t in non-action adventure programs.

33
CULTIVATION ANALYSIS
Cultivation analysis is the study of what is usually called effects
or impact. Our approach considers the latter terms inappropriate to the
study of broad cultural influences. The "effects" of a pervasive medium
upon the composition and structure of the symbolic environment are subtle,
complex and mingled with other influences. Also, the concept of causation,
borrowed from simpler experimental studies in the physical and biological
sciences, is not fully applicable to the steady flow of images. and
messages that make up much of contemporary popular culture.
People are born into a culture that cultivates their needs as
well as their satisfactions. Culture affects assumptions about facts
as well as responses to facts. In modern cultures, demand is manufactured,
as well as the supply. Social and psychological characteristics draw
individuals to select certain types of content which, in turn, nourish
and cultivate those characteristics. Innumerable facts (and values)
outside of personal experience can only be learned -- and related values
derived -- from the mass media, or from others who have learned them from
the mass media. Increasingly, media-cultivated facts and values become
standards by which we judge personal experience as well as family and
community behavior.
A slight but pervasive shift in the cultivation of common perspectives
may not change much in personal outlook and behavior but may change the
relative meaning of much behavior. Furthermore, common perspectives
help structure the agenda of public (and often private) discourse and
provide a basis of interaction among different social groups. Just as a

34
barely perceptible change of a few degrees average temperature can lead
to an Ice Age or make the desert bloom, so a slight but pervasive change
in the cultural climate may create shifts in perspective that do not
amount to much measurable difference in single individuals but can have
major social and public policy consequences. That is ,,,hy we tend to
speak in terms of the contribution of television to the cultivation
of common perspectives rather than in terms of achieving any preconceived
goals, impact, or effects.
CuI tivation analysis begins with the patterns found in the "world"
of television drama. The message system composing that world presents
a coherent image of life and society. How is this image .reflected
in the assumptions and values held by its audiences? How are the "lessons ll
of symbolic behavior presented in fictional forms applied to conceptions
about real life? For example, our message system analysis shows that in
the world of television, close to 80 percent of all prime-time and week-
end-daytime dramatic programs contain some violence. He have also found
that almost four out of ten elderly characters (37 percent) are likely
to be victimized. In the real world, however, less than one out of a
hundred elderly citizens is ever likely to be victim of criminal violence,
robbery, or assault, which is less than the rate for other age groups.
Our cultivation analys.es are designed to determine whether respondents'
answers to questions about such matters as personal safety are more can-
gruent with the television world or with reality.
These days nearly everyone "lives" to some extent in the world of
*Report of the Special Committee on Aging, United States Senate, April 28, 1978, p. 193.

35
* television so that the problem of studying television's effects is a
difficult one. Without control groups of non-viewers, it is hard to
isolate television's impact. Experiments do not solve the problem,
for they are not comparable to people's day-to-day viewing of televi-
*"/. sion. Our approach reflects the hypothesis that heavier viewers of
television -- those exposed to a greater extent than lighter viewers
to its messages -- are more likely to understand social reality in
terms of the "facts of life" they see on television.
The next two sections of this report examine our cultivation
hypothesis in two specific areas -- (1) perceptions of fear and danger and
(2) images of older people.
*Marilyn Jackson-Beeck, "The Nonviel;olers: lfuo are They?" Journal of Communication, 1977, ~, 65-72 .
.;,-/. A full description of the methodology employed in this research, including samples, can be found in George Gerbner, Larry Gross, Marilyn Jackson-Beeck, Suzanne Jefferies-Fox, and Nancy Signorielli, "Cultural Indicators: Violence Profile No. 9,11 Journal of Communication, 1978, ~, 176-207.

36
Perceptions ££ Violence and Danger
Our prediction that heavy exposure to television cultivates an ex
aggerated sense of potential victimization has been supported by analyses
of numerous samples of respondents. This section looks more closely at
age-related implications of such relationships, particularly in terms
of assessing the elderly's susceptibility to cultivation in comparison
with other age groups.
The analysis uses data collected especially for the present project,
a national probability survey conducted by the Opinion Research Corporation
(March 1979 Caravan).
The most dominant aspects of violence in dramatic programming may
by summarized as follows. About 30 percent of all characters and over
60 percent of major characters are involved in violence, either as
perpetrators or victims, or both. Close to 80 percent of all prime-
time and weekend-daytime dramatic programs contain some violence. Many
dramatic programs are crime oriented, and characters who portray police and
detectives represent one of the largest occupational categories in the
entire television world. Patterns are often more pronounced and extreme
in weekend-daytime (children's) shows; this past year, almost nine out
of ten of all children's shows contained violence.
Unlike a sizable portion of violence-related research, we have not
investigated the question of whether television stimulates violence and
aggression. Hhile there are rare (but widely publicized) cases of
serious imitative violence, we would hardly need elaborate research
studies if the most likely and menacing effect of television violence
were the instigation of actual violence. Our research is based on the
premise that television violence serves as powerful socializer in our
society because it vividly demmonstrates a hierarchical power structure.

37
In this view, television violence is a simple and inexpensive way
to show the winners and the losers, as well as the rules of the game. Moreover,
*
a subtle and pervasive consequence of cumulative exposure to formulaic
symbolic violence may be the generation of fear -- and, ultimately, ac-
quiesence to the power than can be achieved because of it.
Our research has shown that even with other things held constant,
heavy viewers of all ages are more likely to give "television ans\Vers"
responses more congruent with the television image whan with the "facts."
Since many factors and processes could account for relationships between
viewing and responding in favor of the clusters of outlooks revealed in
"television answers," we implement controls for major demographic variables.
These controls have been used to elucidate aggregate patterns and relation-
ship~ between amount of viewing and audience conceptions of reality, as
well as to guard against spuriousness. For the most part, the relation-
ships we observe stand up well under these controls, and thus, we can
speak confidently about television's independent contribution to CODL~on
perspectives and widely-held assumptions of social reality.
Even though the variables and influences we hold constant via statistical
manipulations do not "explain" the observed associations, the existing re-
lationships and patterns are not always identical across all subgroups
of the population. Consequently, some of our recent research has been de-
voted to uncovering the conditioning and mediating variables that may
enhance or diminish cultivation. In this section we focus on age as a factor
* that may influence the cultivation process.
Of course, we cannot say whether age-related discrepancies and variations are due to historical or maturational processes. There are significant characteristics of people who are old today that may not always be true of the elderly; for example, the percentage of college-educated older people is certain to rise in the future. Therefore, to a certain extent it remains unclear whether the differences we obs~rve among age-groups can be interpreted as generalizable implications of the aging process, or as the results of being old at this particular social-historical point in time.

38
We constructed an index of five questions in the 1979 survey that measure
various perceptions of violence and danger in society. These questions
relate to matters such as perceived chances of involvement in violence,
expressed feali'. of walking alone at night in one 1 s own neighborhood, and
so on. While these variables reflect discrete bits of information, they
* also emerge as a unidimensional construct.
The overall correlation between amount of viewing and scores on this
index is .16 (p<.OOl). As seen on Table 20, individual controls for age,
education, newspaper reading, family income, sex, race, and urban proximity
produce virtually no deterioration in the overall relationship. Even when
all seven controls are simultaneously held constant, the correlation remains
positive and highly significant (r ~ .. 10, p(.OOl). Further, hierarchical
regression analysis shows that amount of viewing adds a significant in-
crement in total variance explained, even when all control variables
are entered into equation before it (F=67.01, d.L ,c. 8, 5526, p.(OOl).
Television viewing thus makes a ~ignificant overall independent
contribution to various perceptions of fear and danger. How does this
pattern vary for those of different ages? Broadly speaking, the intensity
of the association decreases with age, as can be seen on Table:n. The
simple correlation for those between 18 and 29 years old is .21; for those
between 30 and 54, it is .15, and for those over 55 it is .10. This is
not to say that the relationship disappears with age, for all three cor-
relations are highly significant. But the three correlations are also all
'i';.'i'~
significantly different from each other.
*Factor analysis reveals that there is only a single factor with an eigenvalue over 1.0 underlying the variables.
** For young vs. middle, z=59.73; for middle vs. old, z=38.70; and for young vs. old, z=84.53; all p(.OOl.

39
The magnitude of the association decreases monotonically across
the three age groups under each individual control, except education.
Yet, when all seven controls are implemented simultaneously, the resulting
partial correlations are identical for the older and middle age-groups.
The divergence between the simple and partial patterns suggest the association
is mediated by other variables in different ways at different ages. For
example, we found that income in particular is negatively related to
violence index scores among middle-aged more than among older respondents.
Canonical correlation enables us to examine television's contribution
relative to each age-group, in the context of other age-related variations.
We conducted this analysis for all respondents as well as within each age
group. The canonical outcome set is the five violence-related dependent
variables while television viewing and the seven demographic controls are
* the predictor set.
The results are shown in Table 22. The loadings of all five vari-
abIes in the outcome set are positive. Three of these variables clearly
load more strongly than do the other two: expressing fear about walking
alond at night in one's own neighborhood, feeling fear of crime is
a serious personal problem, and overestimating chances of involvement
in violence. The dominance of these three variables is found for re-
spondents in each age group as well as the entire sample. The analysis
also reveals that a demographic profile of respondents who generally score
higher on this index can be gleaned from variables within the predictor set.
* In every case, there are at least four statistically significant canonical variate pairs. Since the latter variates explain considerably less variance we will primarily report findings from the dominant pairs.

40
Specifically, high scorers on the violence index (those who tend to
express greater perceptions of fear and danger), tend to be women, urban residents,
less educated, low income, non-white, heavy viewers who are older and do
not often read newspapers. Conversely, those less likely to express an
exaggerated sense of fear and potential victimization are men, non-
metropolitan residents, more educated, with high incomes, white, light
viewers who are younger and read newspapers frequently.
This is the dominant profile; it does not imply that television
cultivates these attitudes only for women, urban residents, the less
educated, etc. This procedure serves simply to isolate the independent
(predictor) variables that most powerfully predict the dependent variables,
with every thing else held constant.
The real value of the analysis is to reveal concomitant processes and
how variables' predictive powers vary for respondents in different age
groups. The loadings indicate that the apparent contribution of television
declines as respondents get older. The influence of education and news
paper reading increase with age, while the effects of income and sex are
decreased. At the same time, the canonical correlation coefficients for
each group are quite similar. And, if anything, the predicators explain
slightly more variance among the oldest group of residents.
So far, we have seen that the relationship between viewing and per
ceptions of danger and victimization holds up significantly for all age
groups, if less so among the elderly. Basic patterns appear to apply to
all ages, in varying degrees. The analysis also reveals an interesting
reversal, one in which the elderly manifest a quite different pattern
from younger and middle-aged respondents.

41
The correlation between perceived chances of involvement in violence
and fear of walking alone in one's own neighborhood at night is .15 (p .001).
In other words, those who think their likelihood of encountering violence
is high are likely to be afraid in their own neighborhoods. But be-
cause the correlation is somewhat small there are many who think their
chances of victimization are high but are not afraid to walk around their
own neighborhoods.
This belief -- a general overestimation of the possibility of encounter
ing violence, coupled with not being afraid in one's own neighborhood -
emerges as the second major finding of the canonical correlation analysis for
all respondents and for the young and middle-aged subgroups. It is, however,
only the third outcome set for older people. The validity of this con
stellation receives support from the positive loading on this variate for
the "crime is rising" item and a negative loading for the item stating that
fear of crime is not a serious personal problem.
hold for the youngest respondent group, though.)
(this finding does not
Most importantly, as seen in Table 23, the implications of television
viewing (and certain demographics) in predicting this set of beliefs are
not the same for all age groups. For the younger and middle-aged groups,
those who think their chances of being involved in violence are high, but
not when in their own neighborhoods, are less educated, non-urban, younger
(within the broad age groupings), have lower incomes, and are heavy vi:ewers.
But for respondents over 55, those who feel safe in their neighborhoods
yet still think their chances of encountering violence are high are some
what likely to be lighter television viewers. Elderly heavier viewers are
more likely than light viewers to say that fear of crime is a serious problem
for them and their own neighborhoods are dangerous at night; but
they do not overestimate their chances of being involved in violence and are
not more likely to think that crime is rising.

42
The most conservative explanation is simply that television's contribution
to this attitude profile for respondents over 55 is much weaker than in the other
age groups. The coefficient is negative but it is quite small, and should
not be over-interpreted.
While television may cultivate the notion that the "world" is dangerous,
it does not necessarily lead people to think the same about their OvlU neighbor
hoods, at least when their own neighborhoods are safer. This fits well with
findings of some of our recent analyses; cultivation is most pronounced when
the respondent's environment is congruent with that seen in the television
world.
Younger and middle-aged respondents who do not live in urban centers
and who watch more television are more likely to perceive the world at large,
'but not necessarily their own neighborhoods, as dangerous. The role of
television in terms of this set of beliefs is cloudier for those over 55.
Thus, the relationship between viewing and the violence items is some~,;rhat
weaker for those over 55. Further, television does not seem to contribute to
expressing fear of the world, but not near home, for those over 55. But the
category of "over 55" itself contains a broad age span, representing considerable
internal variation in education, income, and other social characteristics. The
associa tions may not be weaker for the entire group. Are there meaning. fully
different patterns of cultivation between the "younger?! and "older" elderly?
In order to answer that question, we divided the sample into ten age
categories, each encompassing about ten percent of the entire sample.
Figure 28 shows the relationship betwnne amount of viewing and violence
index scores for each of these ten age groups. The solid line represents
the simple correlations, and the broken line illustrates the partial
correlations controlling for sex, education, income, urban proximity, news-

of: P~_f~~,r r.ead,ing, ~nd ~ac:e. It is not until ''1e examine the very oldest subgroups
(ages 70 to 93) that the relationship between amount of viewing and the violence
index fully disappears. Those from 54 to 69 years ol.~. (especially those between
51.) and 60; the "youngest" elderly) exhibit strong and significant associations.
Simultaneously controlling for the various demographic factors (via
partial correlation) only intensifies the patterns. The associations are
somewhat stronger for younger respondents, particularly those in their twenties 0
From thirty to forty, the relationship steadily weakens. It then steadily
intensifies (according to the partials), and peaks again in the late fifties;
it remains fairly strong for those in their sixties only and becomes negative
as well as non-significant after age 70.
Thus, it is not at all the case that television's cultivation of a sense
of fear disappears after age 55. Quite the contrary; those in their sixties
manifest far stronger associations than people in their thirties. It is ohly
after age 70 that the relationship disintegrates.
The lack of association among the oldest respondents may be the result
of a ceiling effect. From age 43 onwards, scores on the violence index
increase sharply and monotonically. The rate of increase levels off after
age 60, but scores still continue to rise; respondents in the 70 to 93 age
group have higher scores than any other age division. Therefore, at least in
terms of perceptions of fear and danger, it is not just that the elderly have
"lived longer without television" than others. The absence of a relationship
between amount of viewing and endorsing these conceptions may be due to the fact
that those over 70, as a group, are quite fearful -- they can score no higher
on this index.
1~ Inasmuch as both television viewing and violence index scores are related to age, each of these correlations was recalculated using HcNemar I s formula for the correction of heterogeneity of variance (variance curtailment) within subgroups. The resulting patterns natch the simple correlations almost exactly. (See Quinn McNemar, !sychological Statistics, 3rd. ed. New York: Wiley, 1962, pp 144-145.)

44
We have also suggested among different age groups, demographic
factors may mediate cultivation patterns in different ways. This is affirmed
by the broken line in Figure 28. The controls produce substantial declines in
the simple correlations for middle age groups (30 to 50). For people in their
sixties, however, the simple and partial correlations are essentially
equal. Therefore, those between 55 and 70 do exhibit evidence of cultivation;
and powerful demographic factors make virtually no difference.
This, however, does not mean that the patterns are identical for all
older subgroups. Rather, for respondents over 55 there are enormous
differences among the comparison groups. This is clearly illustrated by
the gamma coefficients in Table 24. These coefficients reveal the relation
ship between each violence index item and amount of viewing within each
demographic classification.
Two findings are particularly noteworthy. First, there is no underlying
trend in regard to which groups of elderly respondents are the most
susceptible to the cultivation of violence and fear-laden images. Table
24 shows a good number of moderate to large significant associations within
subgroups. And it is virtually impossible to target one group or another
as consistently more or less vulnerable. For some items, the associations
are stronger for males while for others females exhibit the largest
gamma's. Sometimes, the relationships are more powerful for the
college-educated, or for white respondents, or infrequent newspaper
readers, and sometimes the opposite holds. Thus, at least in terms of
these five variables, different groups are differentially susceptible
to cultivation on different questions. The only exception is that those
who do not live in metropolitan areas have consistently weak or even
negative associations. Besides that, the point is that while many subgroups.

45
of over age 55 respondents show evidence of cultivation, for the most part,
demographic factors do not systematically and consistently mediate the
process.
The second finding relates to the differential role of demographic
factors for respondents over 55 as compared to the rest of the sample
For example, in regard to perceived chances of violence, education makes no
difference for younger and middle-aged respondents; the associations are
virtually the same for those who did and did not attend college. Yet,
for those over 55, the relationship is stronger for those who did not
attend college. Similarly, in terms of whether respondents feel fear of
crime is a serious personal problem, education again makes no difference
for the younger age groups; and, in this case, the relationship is more
powerful for older respondents who did attend college. Finally, for
younger and middle-aged respondents, the association between viewing
and being afraid to walk alone in one's own neighborhood at night is
stronger for those without college; for those over 55, a college ~ducation
signals greater vulnerability.
To sum up these analyses, those over 55 as a group show somewhat
weaker, but frequently significant, relationships between viewing and images
of violence. The relationship disappears, moreover, only for the very
oldest respondents, those over 70. People in their 60's manifest some
of the strongest relationships; furthermore, relationships for people
in their 60's withstand powerful controls better than the relationships
for many other age groups. It is, however, difficult to specify older
subgroups that are consistently more and less likely to show evidence of
cultivation. Finally, demographic factors mediate the cultivation process
in different ways for those over 55 as compared to younger and middle-
aged respondents. Thus, old age does not imply immunity to television's
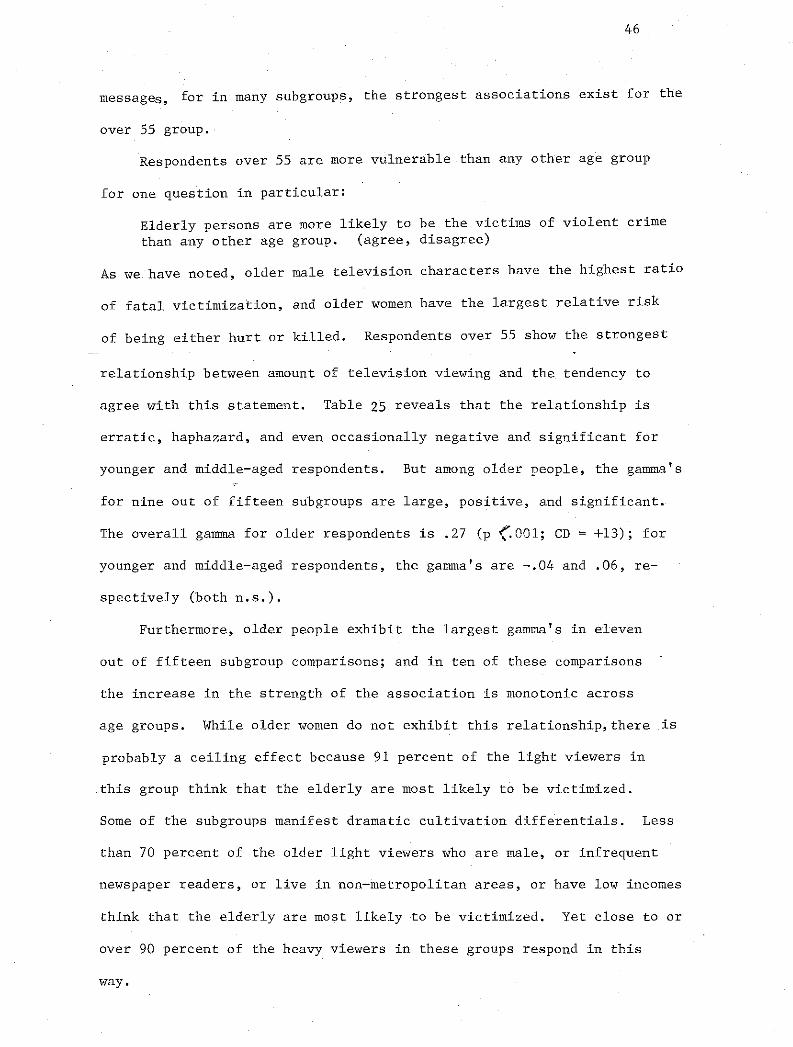
46
messages, for in many subgroups, the strongest associations exist for the
over 55 group.
Respondents over 55 are more vulnerable than any other age group
for one question in particular:
Elderly persons are more likely to be the victims of violent crime than any other age group. (agree, disagree)
As we have noted, older male television characters have the highest ratio
of fatal victimization, and older women have the largest relative risk
of being either hurt or killed. Respondents over 55 show the strongest
relationship between amount of television viewing and the tendency to
agree with this statement. Table 25 reveals that the relationship is
erratic, haphazard, and even occasionally negative and significant for
younger and middle-aged respondents. But among older people, the gamma's
for nine out of fifteen subgroups are large, positive, and significant.
The overall gamma for older respondents is .27 (p (.0-11; CD = +13); for
younger and middle-aged respondents, the gamma's are -.04 and .06, re-
spectively (both n.s.).
Furthermore, older people exhibit the largest gamma's in eleven
out of fifteen subgro.up comparisons; and in ten of these comparisons
the increase in the strength of the association is monotonic across
age groups. Hhile older women do not exhibit this relationship, there is
probably a ceiling effect because 91 percent of the light viewers in
this group think that the elderly are most likely to be victimized.
Some of the subgroups manifest dramatic cultivation dj~fferentials. Less
than 70 percent of the older light viewers who are male, or infrequent
newspaper readers, or live in non-metropolitan areas, or have low incomes
think that the elderly are most likely to be victimized. Yet close to or
over 90 percent of the heavy viewers in these groups respond in this
way.

47
Thus, older people may be vulnerable to the cultivation process
when television's messages are most salient to their lives. In this case,
older people may be most "receptive" to images concerning their personal
safety. The associations between amount of viewing and responding that
older people are more likely to be victimized, for those over 55, are some
of the strongest cultivation relationships we have ever found. And unlike
the violence index analyses, the most powerful relationships appear within
the very oldest group -- those over 70.
In conclusion, relationships between amount of viewing and images
of social reality are often more powerful among younger people. But having
lived longer without television clearly does not grant immunity to the
cultivation process. On the basis of these few variables, we cannot say
which demographic factors are mostly likely to enhance or diminish cul-
tivation among older people. It may be that such mediations depend entirely
on the specific question. But, the saliency of the topic for the respondent
may be the most critical aspect in regard to the intensity of the association.
The question concerning perceptions of the elderly's likelihood of victimization,
for example, produces some of the most dramatic and striking cultivation
differentials we have encountered in any of our studies. This fits well
with our ongoing analyses of other data bases. We have found that people
over 65 show considerable evidence of cultivation on aspects of social
reality that are directly related to their own lives; similar patterns
emerge in other samples for other questings pertaining to the problems of
crime for those over 65. Thus, while the elderly may reveal less evidence
of cultivation in some areas of analysis, they may also manifest enormous
associations between how much they watch television and their conceptions
of issues that have relevance and salience in their own lives.

Images 2i Older People
Hhat are the lessons viewers derive from television drama about what
it is like to grow old and be old in our society? ~'Jhat are the implica
tions of heavy viewing on people's perceptions of the qualities, the
abilities, the life styles, and the health and well-being of the elderly?
In short, are heavy viewers more likely than light viewers to incorporate
some of television's representations into their O1;m beliefs and assumptions
about aging and the elderly?
Our cultivation analysis of this area is based upon data from the
National Council on Aging's "Myth and Reality of Aging" survey (NCaA) con
ducted by Louis Harris and Associates in 1974. The main results are clear
and consistent. The more people, and esnecially young people, watch tele
vision, the more", they tend to perceive old people in generally negative
and unfavorable terms. Heavy viewers believe significantly more than light
viewers that old people are a vanishing breed. Furthermore, those who
watch more television believe that people (and especially women) become old
earlier in life. Most of these and other findings reflect a generalized set
of beliefs that relate to the ways television drama depicts old people and
their circumstances.
Of all of television's messages, our research has revealed that the
most telling and pervasive may be that of underrepresentation. We construct
ed an index from responses to statements in the NCOA Survey asserting that
the number of older people. the health of older people, and the longevity
of older people are declining.
Factor analysis revealed that indeed only a single dimension under
li,es these v<\riablesi they produce a moder<\te but <\cceptable alpha of ,56

and more than adequately pass a series of validity checks.* Thus a
high score on this index reflects a generalized belief that old people
represent a diminishing rather than growing segment of American society.
Tables 26, 27, and 28 indicate that there is a significant positive
relationship between amount of television viewing and scores on this index.
The more people, and especially young people, watch television, the more
they tend to perceive old people in generally negative and unfavorable
terms. Table 26 shows that the correlation of .10 (p.,.OOl) is not re-
duced by controls for education, income, sex or age. According to Table
27 it is much stronger for younger people; the correlation is .20 for
those under thirty.
Thus, even with important demographic varia.bles held constant, heavy
viewers are more likely to believe that old people are disappearing. The
more time one spends watching television, the more one thinks that there
are fewer older people around, and that those who are may be dying sooner.
Table 28 shows the means of a standardized residual variable, with educa-
tion and income removed, for light, medium, and heavy viewers in the dif-
ferent age groups. Again, the strongest relationshin is found among the
younger respondents, and a weaker but still significant relationship is
evident for those of middle age; older respondents show a slightly negative
but non-significant relationship.
A further indication that television cultivates images of how old
people live comes from our message finding that the elderly are more likely
to be shown living alone than is any other age group. Although few
*Mark Gonzalez, "Television and People's Images of Old Age". Unpublished M.A. Thesis, University of Pennsylvania, 1979.

50
characters of any age live by themselves, a higher proportion of the
elderly do. Accordingly, heavy viewers are significantly more likely to
believe that more old people are living alone today. Again, controlling
for demographic variables does not affect the relationship (Table 26) and
it is considerably stronger among the younger group and negligible among
older resDondents (Tables .. 27 and 28).
Finally, older people on television are not romantically involved.
Although they do tend to be married, their roles do not allow them roman
tic interactions and love relationships. To w2tch this finding, the NCOA
data show that the tendency to believe that old people are inactive sexu
ally increases with amount of viewing (TableZ6). Heavy viewers are more
likely than light to think that old people do not engage in sexual activity.
This relationship is strongest among middle-age respondents (Table 27).
There are other survey findings that suggest that television culti
vates negative images of the elderly. Heavy viewers are more likely to
think that older people are not open-minded and adaotable; that they are
not bright and alert; and that they are not good at getting things done.
All of these relationships are stronger among younger respondents, those
between the ages of 18 and 29. Perhaps, since young oeople are more "dis
tant" from old age, and tend to have less direct experience with it, they
are more vulnerable to television's messages. The absence of first-hand
information may increase the salience of the television imagery. In
fact, the relationships cited above are stronger -- even within the younr,-
est age group among those who have little contact with the elderly.
However, it is also possible that younger peo~le are more susceptible

51
to these messages because most of them have never lived without tele-
vision. It is not nece.ssarily the case that they v;rill "grow out" of
this as they age and learn more about aging. It is plausible to assume
that in the years to come we will no longer see these persistent varia-
tions between age groups in their vulnerability to the cultivation of
images of old people.
We found similar patterns in our own studies of adolescents.* We
asked about 600 students between the 6th and 9th grades, "At what age
does a man become elderly or old?" and "At what age does a woman become
elderly or old?"
Overall, these adolescents find that the transition to old age
happens rather early -- both men and women become old at about 55. But
for light viewers, as seen on Table 29, it is about 57, while for heavy
viewers people become elderly at age 51. (For almost every comparison
and within almost every subgroup, these adolescents believe women become
old before men do.) The partial correlations in Table 30 show that the
overall r's of about -.21 are only slightly reduced by controls for IQ,
social class, sex, and grade in school.
The functional form of the relationships is intriguing. The adoles-
cent patterns are rela.tively monotonic; adult patterns, from questions in
the NCOA survey, are not. Figure 29 plots the relationship between hours
of viewing and scores on the index of the three questions about the absence
of older people; other questions have similar patterns.
This chart shows that those who report watching no television at all
"~Described in George Gerbner, et. al., "Cultural Indicators: Violence Profile No.9", oP. cit.

52
are the least likely to think that there are fewer old people today and
that they will die sooner. Mean scores increase at one hour of daily viewing,
and remain fairly stable through two, three, and four hours. These means
then jump markedly at five hours and still continue to rise at viewing
levels of over five hours. One implication is that since there are so
few elderly people on TV, considerable viewing is required for the culti-·
vation of negative images of old people. Those who watch at all hold
more negative impressions than those who watch nothing; but the greatest
jump comes at the upper levels of viewing.
One final comparison is worthy of note. We used the respondents'
own perceptions about the way older people are presented on television as
a control variable. The NCOA study includes ten items about the portrayal
of elderly television characters. Two of these are "Television usually
makes old people look sick and helpless, and "Television usually makes
old people look pushy and meddling into their family's business." Re
sponses to the ten questions were summed (the index alpha is .83) and
sample divided into two groups: those who think that television shows old
people in a narrow, limited, or negative manner, and those who do not.
We used this variable as a control when examining the relationship
between amount of viewing and beliefs about older people. These dependent
variables (presented in Table 31) revolve around personal qualities and
attributes of the elderly -- e.g., are they bright and alert, open-minded,
etc. -- and also include the index of whether they are disappearing. Among
those who ~ not think that the image of older people on television is par
ticularly bad, the relationships between television viewing and the depend
ent variables are all positive and significant. Among those who do perceive
television's portrayals as negative, most of the relationships are zero;
one is even significantly reversed.

53
In other words, if you do not find the portrayal of old people on
television to be particularly bad, you are most susceptible to cultiva
tion. However, it is not simply the case that perceiving television's
portrayal of the elderly as negative "protects" you from cultivation.
Those who perceive the television norm for old people as negative are
far more likely to hold more derogatory opinions about old people, so
there may be a ceiling effect for this group. In any case, as those
who find television's treatment of the elderly relatively benign watch
more television, they have more negative images of old people in the
real world. This pattern tends to hold up within different education
and age groups.
To conclude, these relationships should not be overstated. Although
they all are significant, they range from small to moderate, at best.
Television viewing explains little of the variance in people's percep
tions about aging and the elderly.
However, amount of viewing does make a difference. In every case,
it makes a consistently negative contribution to the public's images of
the personal characteristics of the elderly, and the quality of their
lives. We did not find watching television to be associated with any
positive images of older people. Heavy viewers believe that the elderly
are unhealthy, in worse shape financially, not active sexually, closed
minded, not good at getting things done, and so on. At the same time,
television seems to be telling younger people that old age begins rela
tively early in life.