
a comparative study on service quality perception and ...
319
A COMPARATIVE STUDY ON SERVICE QUALITY PERCEPTION AND PREFERENCE OF CUSTOMERS ABOUT PUBLIC AND PRIVATE SECTOR BANKS IN TIRUNELVELI DISTRICT THESIS SUBMITTED TO MANONMANIAM SUNDARANAR UNIVERSITY IN PARTIAL FULFILMENT OF THE REQUIREMENTS FOR THE AWARD OF THE DEGREE OF DOCTOR OF PHILOSOPHY By G. BRIGHT JOWERTS (REG. NO. 11383) COMMERCE RESEARCH CENTER ST. XAVIER’S COLLEGE (AUTONOMOUS) PALAYAMKOTTAI - 627 002 MANONMANIAM SUNDARANAR UNIVERSITY TIRUNELVELI - 627 012 JUNE - 2017
-
Upload
khangminh22 -
Category
Documents
-
view
1 -
download
0
Transcript of a comparative study on service quality perception and ...
A COMPARATIVE STUDY ON SERVICE QUALITY
PERCEPTION AND PREFERENCE OF CUSTOMERS
ABOUT PUBLIC AND PRIVATE SECTOR BANKS
IN TIRUNELVELI DISTRICT
THESIS SUBMITTED TO
MANONMANIAM SUNDARANAR UNIVERSITY
IN PARTIAL FULFILMENT OF THE REQUIREMENTS
FOR THE AWARD OF THE DEGREE OF
DOCTOR OF PHILOSOPHY
By
G. BRIGHT JOWERTS
(REG. NO. 11383)
COMMERCE RESEARCH CENTER
ST. XAVIER’S COLLEGE (AUTONOMOUS)
PALAYAMKOTTAI - 627 002
MANONMANIAM SUNDARANAR UNIVERSITY
TIRUNELVELI - 627 012
JUNE - 2017
ii
Dr. C. EUGINE FRANCO, M.Com., M.Phil., M.Ed., Ph.D.
Associate Professor
P.G. & Research Department of Commerce
St. Xavier’s College (Autonomous)
Palayamkottai - 627 002.
CERTIFICATE
This thesis entitled “A COMPARATIVE STUDY ON SERVICE QUALITY
PERCEPTION AND PREFERENCE OF CUSTOMERS ABOUT PUBLIC AND
PRIVATE SECTOR BANKS IN TIRUNELVELI DISTRICT” submitted by
G. BRIGHT JOWERTS for the award of the Degree of Doctor of Philosophy in
Commerce of the Manonmaniam Sundaranar University is a record of bonafide record
work done by him and it has not been submitted for the award of any Degree, Diploma,
Associateship, Fellowship of any University/Institution.
Place : Palayamkottai Dr. C. EUGINE FRANCO
Date : .06.2017 (Signature of the Guide)
iii
G. BRIGHT JOWERTS
Reg. No. 11383
Assistant Professor in Commerce
St. Xavier’s College (Autonomous)
Palayamkottai, Tamilnadu.
DECLARATION
I hereby declare that the thesis entitled “A COMPARATIVE STUDY ON
SERVICE QUALITY PERCEPTION AND PREFERENCE OF CUSTOMERS
ABOUT PUBLIC AND PRIVATE SECTOR BANKS IN TIRUNELVELI
DISTRICT” submitted by me for the Degree of Doctor of Philosophy in Commerce is
the result of my original and independent research work carried out under the guidance
of Dr. C. EUGINE FRANCO, Associate professor, PG & Research Department of
Commerce, St. Xavier’s College (Autonomous), Palayamkottai and it has not been
submitted for the award of any Degree, Diploma, Associateship, Fellowship of any
University / Institution.
Place : Palayamkottai G. BRIGHT JOWERTS
Date : .06.2017 (Signature of the Candidate)
iv
ACKNOWLEDGEMENT
Prima facie, I am grateful to the God Almighty for the good health and
wellbeing that were necessary to complete this research endeavour.
I have been extremely lucky to have a supervisor who cared so much about my
work and who responded to my questions and queries so promptly. Still I search words
to say thank him but I can’t. However, I convey my sincere thanks from the bottom of
my heart to my guide, Dr. C. Eugine Franco, M.Com., M.Phil., M.Ed., Ph.D.,
Associate Professor, PG & Research Department of Commerce, St. Xavier’s College
(Autonomous), Tirunelveli district, for the patient guidance, encouragement and advice,
that he has been providing throughout my academic and career development.
I would like to thank the college management of St. Xavier’s College
(Autonomous) for given me an opportunity to do my research work. In a special way,
I thank Rev. Dr. Danis Ponniah, S.J., Rector, Rev. Dr. A. Antonysamy, S.J.,
Secretary and Rev. Dr. V. Britto, S.J., Principal for their encouragement and
motivation to do my research in Commerce Research Center.
I extend my sincere thanks to all members of the PG & Research Department of
Commerce who contributed directly and indirectly to the research work. In particular,
I wish to thank Dr. P. Lourdes Poobala Rayen, Head of the department for his
continuous support and motivation to complete this research within time. Many
thanks to Dr. A. Arockiadass, Dr. S. David Appathurai, Dr. F.X. Robert
Bellarmine, Dr. M. Julias Ceasar, Dr. C. Mahimai Arul Ignatius, Dr. J. Jeya Ani
and Dr. S. Prince Jebaraj for their 3600 support and help whenever I need.
v
I would like to acknowledge the moral assistance, support and timely help
rendered by my colleagues namely Dr. E. Angel Saral Rose, Dr. A. Saleth Mary
Vetriselvi, Mrs. Margaret Sangeetha, Mrs. K. Thanga Glara Mrs. J. Sahaya Mary
and Dr. S. Bulomine Regi. In a special way, I thank my well-wisher and colleague
Prof. K. Joe Pascal Xavier for his excellence support during this research period
I am particularly grateful for the assistance given by my student and friend
Mr. Ram Selva for his assistance in typewriting and in calculation works.
I thank from deep of my heart to the officials in Dean Office, St. Xavier’s
College (Autonomous), Palayamkottai for their timely help and support in
completing this piece of research work on time.
I also thank the staff of Research Department of Manonmaniam Sundaranar
University, Tirunelveli for their support and guidance. I also thank the Research
coordinator, Manonmaniam Sundaranar University for enabling me to finish this
research endeavour.
I am placing on record my gratitude and deep indebtedness to my parents and
siblings for their motivation and encouragement.
Finally, I am thankful to all those who helped me directly or indirectly to carry
out this research work successfully.
G. BRIGHT JOWERTS
vi
CONTENTS
CHAPTER
NO. CONTENT
PAGE
NO.
CERTIFICATE ii
DECLARATION iii
ACKNOWLEDGEMENT iv
LIST OF TABLES vii
LIST OF FIGURES xii
LIST OF ABBREVIATIONS xiii
I INTRODUCTION AND DESIGN OF THE STUDY 1 - 26
II REVIEW OF LITERATURE 27 - 60
III PROFILE OF THE BANKING SECTOR IN THE
STUDY AREA
61 - 79
IV CONCEPTUAL FRAMEWORK 80 - 109
V ANALYSIS OF SERVICE QUALITY GAP AND
CUSTOMERS’ SATISFACTION
110 - 172
VI ANALYSIS OF FACTORS INFLUENCING
CUSTOMERS’ PERCEPTION AND REASONS
FOR PREFERRING THE BANK
173 - 213
VII SUMMARY OF FINDINGS, SUGGESTIONS AND
CONCLUSION
214 - 242
BIBLIOGRAPHY
QUESTIONNAIRE
LIST OF PUBLICATIONS
vii
LIST OF TABLES
Table
No. Title
Page
No.
1.1 Composition of the total sample respondents 18
3.1 Tirunelveli district population 62
3.2 List of educational institutions 64
3.3 Public sectors banks and number of branches in Tirunelveli 67
3.4 Growth of deposits in public sector banks (in `) 68
3.5 Growth of advances in public sector banks (in `) 70
3.6 Private sector banks and number of branches in Tirunelveli 72
3.7 Growth of deposits in private sector banks (in `) 73
3.8 Growth of advances in private sector banks (in `) 74
3.9 Comparative analysis of public sector banks (in `) 76
3.10 Comparative analysis of private sector banks (in `) 78
5.1 Age wise classification of respondents 111
5.2 Gender wise classification of respondents 112
5.3 Marital status wise classification of respondents 113
5.4 Area of residence wise classification of respondents 114
5.5 Educational qualification wise classification of respondents 115
5.6 Occupation wise classification of respondents 116
5.7 Monthly family income wise classification of respondents 118
5.8 Monthly average savings wise classification of respondents 119
5.9 Monthly average savings in banks 120
5.10 Number of years of availing banking services 121
5.11 Kind of account maintained in the bank 122
5.12 Reasons for selecting public sector banks to safeguard hard
earned money 123
5.13 Ranking of reasons for select public sector banks to safeguard
hard earned money 124
viii
Table
No. Title
Page
No.
5.14 Reasons for select private sector banks to safeguard hard earned
money 125
5.15 Ranking of reasons for selecting public sector banks to safeguard
hard earned money 125
5.16 Bank caters to all the banking needs. 126
5.17 Banks conducting recreation facilities for the customers 127
5.18 Main features consider in the bank 128
5.19 Motivating factors to choose the bank among customers of
public sector banks and private sector banks 129
5.20 Motivating factors to choose the bank and demographic profile
variables of the customers of public sector banks 131
5.21 Motivating factors to choose the bank and demographic profile
variables of the customers of private sector banks 134
5.22 Service quality gap in public sector banks in Tirunelveli district 137
5.23 Service quality gap in private sector banks in Tirunelveli district 140
5.24 Service quality gap in public and private sector banks in
Tirunelveli district 142
5.25 Expectation towards tangibility aspect of service quality of
banks among customers of public sector banks and private sector
banks
145
5.26 Expectation towards reliability aspect of service quality of banks
among customers of public sector banks and private sector banks 147
5.27 Expectation towards responsiveness aspect of service quality of
banks among customers of public sector banks and private sector
banks
148
5.28 Expectation towards assurance aspect of service quality of banks
among customers of public sector banks and private sector banks 150
5.29 Expectation towards empathy aspect of service quality of banks
among customers of public sector banks and private sector
banks.
151
5.30 Perception towards tangibility aspect of service quality of banks
among customers of public sector banks and private sector banks 153
5.31 Perception towards reliability aspect of service quality of banks
among customers of public sector banks and private sector banks 154
ix
Table
No. Title
Page
No.
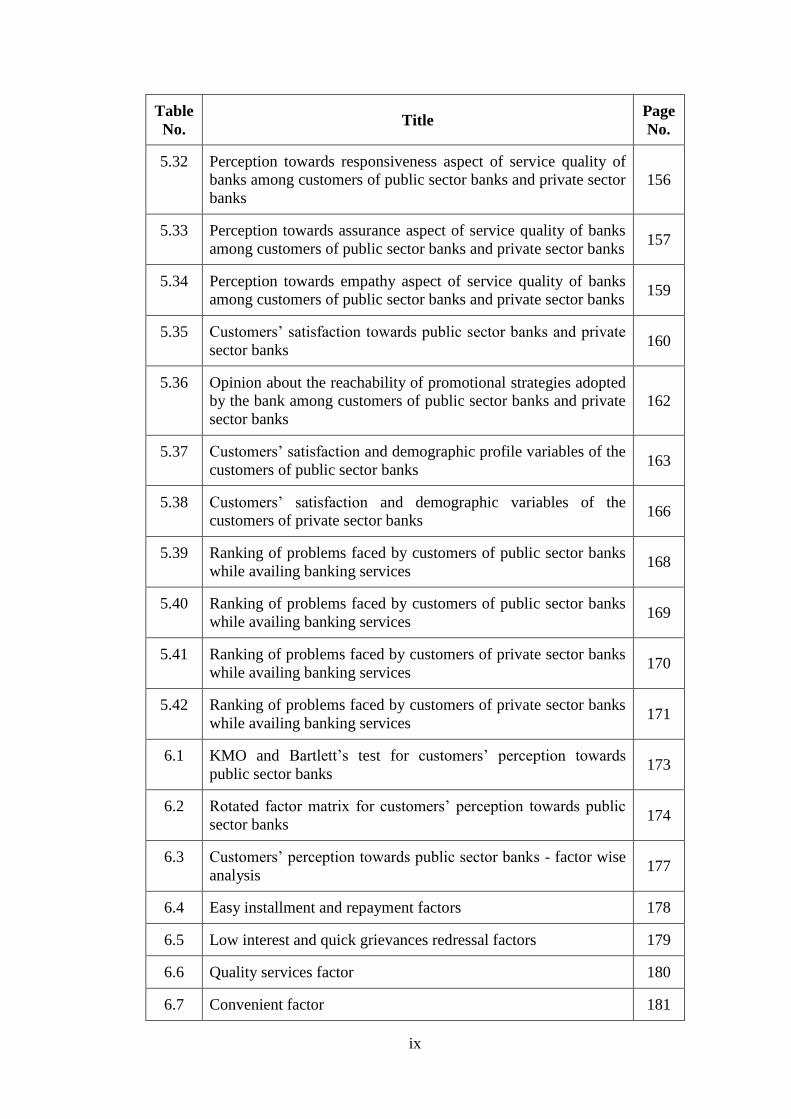
5.32 Perception towards responsiveness aspect of service quality of
banks among customers of public sector banks and private sector
banks
156
5.33 Perception towards assurance aspect of service quality of banks
among customers of public sector banks and private sector banks 157
5.34 Perception towards empathy aspect of service quality of banks
among customers of public sector banks and private sector banks 159
5.35 Customers’ satisfaction towards public sector banks and private
sector banks 160
5.36 Opinion about the reachability of promotional strategies adopted
by the bank among customers of public sector banks and private
sector banks
162
5.37 Customers’ satisfaction and demographic profile variables of the
customers of public sector banks 163
5.38 Customers’ satisfaction and demographic variables of the
customers of private sector banks 166
5.39 Ranking of problems faced by customers of public sector banks
while availing banking services 168
5.40 Ranking of problems faced by customers of public sector banks
while availing banking services 169
5.41 Ranking of problems faced by customers of private sector banks
while availing banking services 170
5.42 Ranking of problems faced by customers of private sector banks
while availing banking services 171
6.1 KMO and Bartlett’s test for customers’ perception towards
public sector banks 173
6.2 Rotated factor matrix for customers’ perception towards public
sector banks 174
6.3 Customers’ perception towards public sector banks - factor wise
analysis 177
6.4 Easy installment and repayment factors 178
6.5 Low interest and quick grievances redressal factors 179
6.6 Quality services factor 180
6.7 Convenient factor 181

x
Table
No. Title
Page
No.
6.8 Easy borrowing factor 182
6.9 Accessibility factor 183
6.10 Loans and advances factor 184
6.11 Ownership factor 185
6.12 Safety factor 186
6.13 KMO and Bartlett’s test for customers’ perception towards
private sector banks 187
6.14 Rotated factor matrix for customers’ perception towards private
sector banks 188
6.15 Customers’ perception towards private sector banks - factor wise
analysis 191
6.16 Convenient and repayment factor 192
6.17 Good installment and quality service factor 193
6.18 Accessibility factor 194
6.19 Time and loan availability factor 195
6.20 Easy borrowing and infrastructure facilities factor 197
6.21 Loans and advances and ATM facilities factor 198
6.22 Safety factor 199
6.23 Quick services factor 200
6.24 Quick grievance redressal and low charges factors 201
6.25 Reasons for preferring the public sector banks 202
6.26 Ranking of reasons for preferring the public sector banks 203
6.27 Reasons for preferring the private sector banks 204
6.28 Ranking of reasons for preferring the private sector banks 205
6.29 Ranking of preference of customers of public sector banks
towards banking services 206
6.30 Ranking of preference of customers of public sector banks
services 207
6.31 Preference of customers of private sector banks’ services 208
xi
Table
No. Title
Page
No.
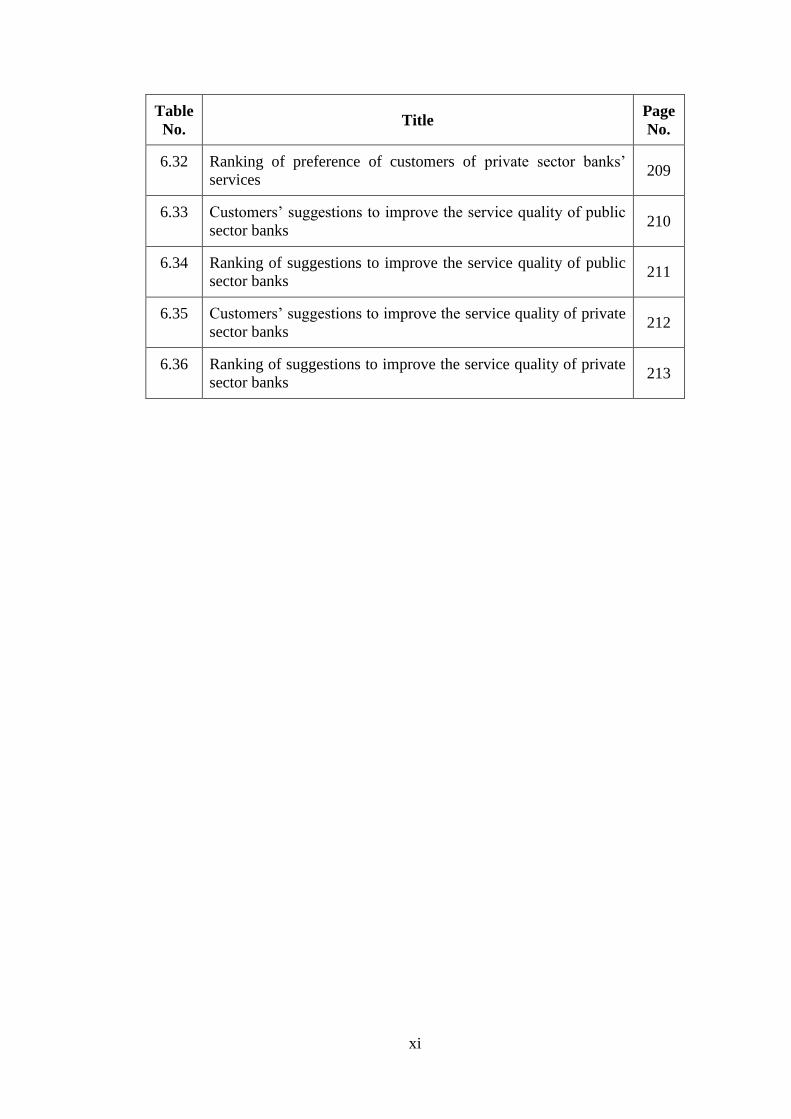
6.32 Ranking of preference of customers of private sector banks’
services 209
6.33 Customers’ suggestions to improve the service quality of public
sector banks 210
6.34 Ranking of suggestions to improve the service quality of public
sector banks 211
6.35 Customers’ suggestions to improve the service quality of private
sector banks 212
6.36 Ranking of suggestions to improve the service quality of private
sector banks 213

xii
LIST OF FIGURES
Figure
No. Title
Page
No.
3.1 District map 65
4.1 Dalay’s framework of service marketing issues 89
4.2 The scope and range of service dimensions for retail banks 97
4.3 Model of service quality gaps 103

xiii
LIST OF ABBREVIATION AND THEIR EXPANSION
S.No. Abbreviation Expansion
1. ANOVA Analysis of Variance
2. ATM Automatic Teller Machine
3. BC Before Christ
4. CAGR Compound Annual Growth Rate
5. CCI Controller of Capital Issues
6. CRAR Capital to Risk (Weighted) Assets Ratio(CRAR)
7. CRM Customer Relationship Management
8. CRR Cash Reserve Ratio
9. DFIs Development Finance Institutions
10. ESQ Electronic Service Quality
11. IFCI Industrial Finance Corporation of India
12. FY Fiscal Year
13. GDP Gross Domestic Product
14. GLM General Linear Model
15. HDFC Housing Development Finance Corporation
16. HRM Human Resource Management
17. ICICI Industrial Credit and Investment Corporation of India Bank
18. IDBI Industrial Development Bank of India
19. IFCI Industrial Finance Corporation of India
20. IMF International Monetary Fund
21. Km Kilometre
22. LIC Life Insurance Corporation
23. NABARD National Bank for Agriculture and Rural Development
24. NBFC Non-Banking Financial Corporation
25. NHB National Housing Bank
xiv
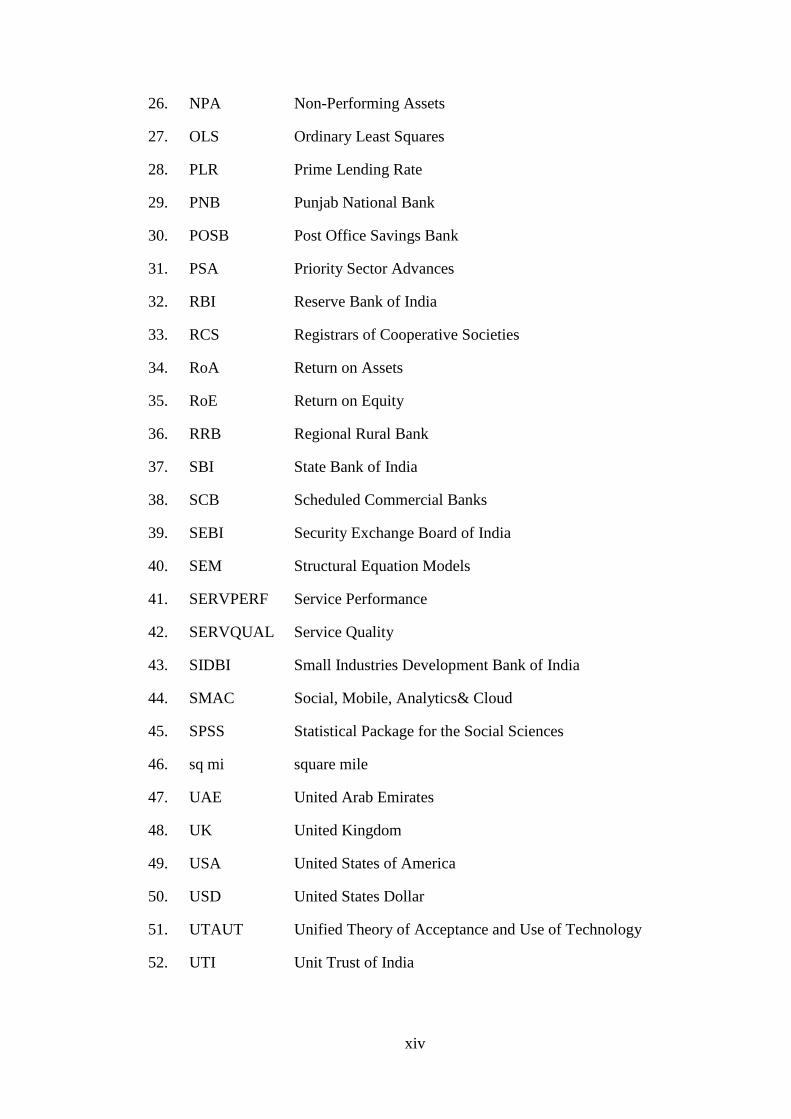
26. NPA Non-Performing Assets
27. OLS Ordinary Least Squares
28. PLR Prime Lending Rate
29. PNB Punjab National Bank
30. POSB Post Office Savings Bank
31. PSA Priority Sector Advances
32. RBI Reserve Bank of India
33. RCS Registrars of Cooperative Societies
34. RoA Return on Assets
35. RoE Return on Equity
36. RRB Regional Rural Bank
37. SBI State Bank of India
38. SCB Scheduled Commercial Banks
39. SEBI Security Exchange Board of India
40. SEM Structural Equation Models
41. SERVPERF Service Performance
42. SERVQUAL Service Quality
43. SIDBI Small Industries Development Bank of India
44. SMAC Social, Mobile, Analytics& Cloud
45. SPSS Statistical Package for the Social Sciences
46. sq mi square mile
47. UAE United Arab Emirates
48. UK United Kingdom
49. USA United States of America
50. USD United States Dollar
51. UTAUT Unified Theory of Acceptance and Use of Technology
52. UTI Unit Trust of India
1
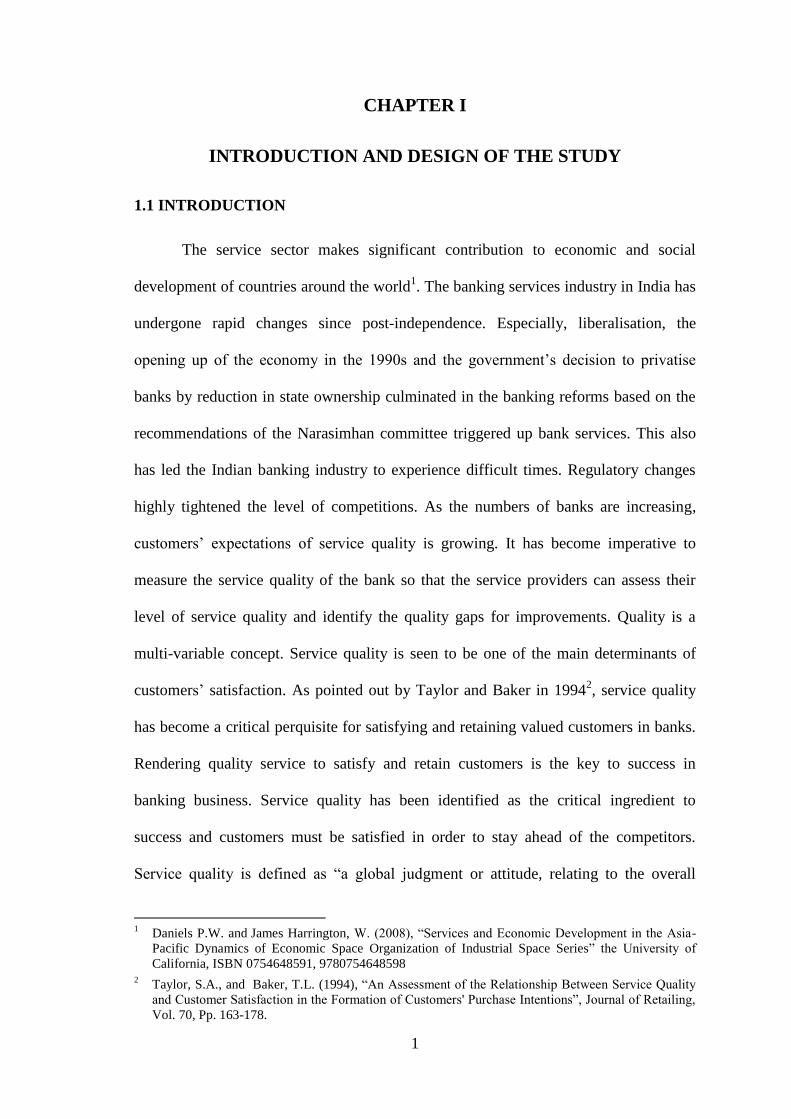
CHAPTER I
INTRODUCTION AND DESIGN OF THE STUDY
1.1 INTRODUCTION
The service sector makes significant contribution to economic and social
development of countries around the world1. The banking services industry in India has
undergone rapid changes since post-independence. Especially, liberalisation, the
opening up of the economy in the 1990s and the government‘s decision to privatise
banks by reduction in state ownership culminated in the banking reforms based on the
recommendations of the Narasimhan committee triggered up bank services. This also
has led the Indian banking industry to experience difficult times. Regulatory changes
highly tightened the level of competitions. As the numbers of banks are increasing,
customers‘ expectations of service quality is growing. It has become imperative to
measure the service quality of the bank so that the service providers can assess their
level of service quality and identify the quality gaps for improvements. Quality is a
multi-variable concept. Service quality is seen to be one of the main determinants of
customers‘ satisfaction. As pointed out by Taylor and Baker in 19942, service quality
has become a critical perquisite for satisfying and retaining valued customers in banks.
Rendering quality service to satisfy and retain customers is the key to success in
banking business. Service quality has been identified as the critical ingredient to
success and customers must be satisfied in order to stay ahead of the competitors.
Service quality is defined as ―a global judgment or attitude, relating to the overall
1 Daniels P.W. and James Harrington, W. (2008), ―Services and Economic Development in the Asia-
Pacific Dynamics of Economic Space Organization of Industrial Space Series‖ the University of
California, ISBN 0754648591, 9780754648598 2 Taylor, S.A., and Baker, T.L. (1994), ―An Assessment of the Relationship Between Service Quality
and Customer Satisfaction in the Formation of Customers' Purchase Intentions‖, Journal of Retailing,
Vol. 70, Pp. 163-178.
2
superiority of the service‖.3 Product differentiation is impossible in a competitive
environment like the banking industry. Banks everywhere are delivering the same
products. So bank management tends to differentiate them from competitor‘s through
service quality. Service quality is an imperative element impacting customers‘
satisfaction level in the banking industry. Since recognition of service quality being a
competitive weapon for overcoming existing competitions, every bank is strived their
maximum in differentiating its products. It is also noted that it is difficult to balance
between winning new customers and retaining old customers. Customer expectation is
still the major reason of bank customers‘ switch over to other banks.
In the present scenario, with the increased competition, service quality has
become a serious key factor that has to be examined, viewed, scrutinized, analysed and
focused in keeping competitive advantage and sustaining satisfied relationship with the
customers. When good service is extended to a customer, a loyal customer will work as
an ambassador to the bank and facilitate growth of business.4 The customer acts as a
propagandist in revealing the goodness of banking with a particular bank. A satisfied
customer becomes a source to attract new customers to a bank. This is understood as
customer loyalty. It is therefore, important to understand the customers‘ expectations
properly and delivering actual performances that exceed expectations so as to make
them delighted customers.5
It emphasises the need of effective marketing system and practices in bank.
3 Parasuraman, A., Zeithaml and V.A., Berry, L.L. (1988), ―SERQUAL: A Multiple-Item Scale for
Measuring Consumer Perceptions of Service Quality‖, Journal of Retailing. Vol. 64 (1), Pp. 12-37 4 Bhaskar P.V. (2004). ―Customer Service in Banks‖, IBA Bulletin, Vol. 36(8), Pp. 9- 13.
5 Ghodeswar B.M. (2002), ―Gaining Customer Loyalty through Superior Service‖, Search a Monthly
Business, Tata Infomedia Ltd., Vol. 2(2) Pp. 72-74.
3
1.2 BANKING INDUSTRY IN INDIA
Bank is a business of accepting deposits and lending money. It is carried out by
financial intermediaries, which performs the functions of safeguarding deposits and
providing loans to the public. Section 5 (b) of the Banking Regulation Act 1949 defines
―banking‖ as ―accepting for the purpose of lending and investment, deposits of money
from the public repayable on demand or otherwise and withdrawable by cheque, draft,
order or otherwise‖. Any company, which transacts the business of banking is called
banking company. Banking System is a principal mechanism through which the money
supply of the country is created and controlled.
As far as the evolution of banking in India is concerned, it came with the
establishment of Bank of Bengal, Bank of Bombay and Bank of Madras was
established in January 1868. In 1876, the Presidency Bank Act came into existence,
which brought the three above stated banks under the common statue. The Swadeshi
movement, which began in 1906, prompted the formation of a number of commercial
banks, such as the Peoples Bank of India Ltd., the Central Bank of India, the Indian
Bank Ltd., and the Bank of Banda Ltd. A series of banking crises during the years
1913-1917 witnessed the failure of as much as 588 banks in India.
In 1921, the three Presidency banks and their branches were merged to form the
Imperial Bank of India, which acquired the triple roles, namely, a commercial bank, a
banker's bank and a banker to the Government. RBI Act was passed in 1934 and the
Reserve Bank of India became the first central bank of our country w.e.f. April 1, 1935.
It took over the central banking activities from the Imperial Bank of India in which
majority of the shares were held by private people. The Reserve Bank of India was
nationalised with effect from 1st January, 1949 on the basis of the Reserve Bank of
India (Transfer to Public Ownership) Act, 1948. All shares in the capital of the Bank
4
were deemed transferred to the Central Government on payment of a suitable
compensation.
In 1951, when the first five year plan was launched, the development of rural
India was given the highest priority. The All India Rural Credit Survey Committee
recommended the creation of a State-partnered and State-sponsored bank by taking
over the Imperial Bank of India and integrating with the former State-owned or State-
associated banks. Accordingly, an Act was passed in the Parliament in May 1955 and
the State Bank of India was constituted on July I, 1955. Later, the State Bank of India
(Subsidiary Banks) Act passed in 1959, enabling the State Bank of India to take over
former State-associated banks as its subsidiaries, namely State Bank of Bikaner and
Jaipur, State Bank of Hyderabad, State Bank of Indore, State Bank of Mysore, State
Bank of Patiala, State Bank of Saurastra and State Bank of Travancore. The Indian
banking scene underwent significant changes, during the period 1969 to 1990. The
Government of India, on 19th
July, 1969 nationalised, 14 major Indian commercial
banks, by an ordinance, having deposits of Rs. 50 Crore and above. The acquisition of
ownership of banks was to enable banks to play more efficiently the role of a catalytic
agent for the economic growth by extending banking facilities to the most deserving
classes. Another important structural development was the formation of the Regional
Rural banks (RRBs) which were started in 1976. Their ownership vests with the
sponsoring commercial bank, the central Government and the State Government of the
area. Under This approach, 16 RRBs were set up.
Indian banking system is a mixed banking system consisting of two major
segments viz. public sector and private sector
Public sector banks are the one in which the government has a major holding.
Public sector in the banking industry emerged with the nationalization of Imperial Bank
5
of India (1921) and creating the State Bank of India (1955) as a part of integrated
scheme of rural credit proposed by the All India Rural Credit Survey Committee
(1951). One of the objectives of establishing the SBI was to provide extensive banking
facilities in rural areas by opening as a first step 400 branches within a period of 5 years
from July 1, 1955.
The Public sector in the Indian banking got widened with two rounds of
nationalization-first in July 1969 of 14 major private sector banks each with deposits of
` 50 crore or more and thereafter in April 1980, 6 more banks with deposits of not less
than ` 2 crore each. It resulted in the creation of public sector banking with a market
share of 76.87 per cent in deposits and 72.92 per cent of assets in the banking industry
at the end of March, 2003. With the merger of 'New Bank of India' with 'Punjab
National Bank' in 1993, the number of nationalized banks became 19 and the number of
public sector banks 27. The number of branches of public sector banks, which was
6,669 in June, 1969, increased to 41874 by March 1990 and again to 46,752 by March
30, 2003. The public sector banks thus came to occupy a predominant position in the
Indian banking scene.
The public sector banks are turning the spotlight on the customer and offering
quicker and better service. That includes everything from ATM machines and
computerized branches to never before seen marketing initiatives. Clearly, public sector
banks have woken up to competition. After, post-liberalization, several new generation
private sector banks changed the face of the industry, with a distinct customer focus.
These changes are now taking place in many public sector banks. Private sector banks
brought the concepts into existence like customer relation officers, focused marketing
teams and single window banking. Moreover, with new technology, private sector
banks like ICICI and HDFC Bank started to offer customer services like ATMs, phone
6
banking, internet banking, automatic money transfer, mobile banking, core banking
solutions and computerized monthly statements.
The private-sector banks are banks where greater parts of stake or equity are
held by the private shareholders and not by government. Banking in India has been
dominated by public sector banks since the 1969 when majority of then banks were
nationalised by the Indian government. Between 1969 and 1980 there was rapid
increase in the number of branches of the private banks. In April 1980, they accounted
for nearly 17.5 percent of bank branches in India. In 1980, another 6 more banks were
nationalized. In 1990s, RBI's liberalisation policy came in picture and with this the
government gave licenses to a few private banks, which came to be known as new
private sector banks. There are two categories of the private sector banks.
The old private sector banks have been operating since a long time and may be
referred to those banks, which are in operation from before 1991. All those banks that
have commenced their business after 1991 are called as new private sector banks.
Housing Development Finance Corporation Limited was the first private bank in India
to receive license from RBI as a part of the RBI's liberalization policy of the banking
sector, to set up a bank in the private sector banks in India. Narasimham Committee
(1991) which recommended the free entry of new banks in the financial market
provided they confirm the minimum startup capital of ` 500 crores and other
requirements by the permission of Reserve Bank of India.
1.3 MARKETING OF BANKING SERVICES
Bank marketing is the aggregate of functions of a bank related with satisfaction
of its customers It is the sum total of all individual activities consisting of an integrated
effort to discover, create, arouse and satisfy customer needs. To satisfy these financial

7
needs, customers want specific services. Indian banks are assigned a target marketing
approach whereby a specific target market is assigned to each bank branch and after the
identification of needs of the customers, all efforts of the bank are required to be
concentrated to satisfy the customers‘ needs to achieve the bank‘s social objectives.
Banks have to find out such financial needs and wants of the customers and offer the
services which can satisfy those needs. The individuals and corporate bodies have
certain needs in relation to money commodity.
Marketing for service industry like banks is a philosophy to be understood by
the whole organisation from the chief executive to the person working at the counter.
The first and most important step in applying the marketing concept is to have a whole
hearted commitment to customer orientation by all the employees. Marketing is an
attitude of mind. This means that the central focus of all the activities of a bank is
customer. Marketing is not a separate function for banks; it is required to be integrated
with operation.
1.4 IMPORTANCE OF MARKETING IN BANKING SECTOR
The various factors which have led to the increasing importance of marketing in
the banking industry are explained below:
Government Initiatives
The Indian economy embarked on the process of economic reform and various
policy measures initiated by the government resulted in the increasing competition in
the banking industry, thereby highlighting the importance of effective marketing. The
Narasimhan Committee Report shows the evidence of the Government‘s desire to
‗reregulate‘ the banking industry so as to encourage efficiency through competition.
8
Deregulation of Interest Rates
The bank may reduce their Minimum Lending Rates so as to attract customers
(individual and corporate). Such reduction in lending rates reduce the spread between
the deposit rates and lending rates, i.e. the banks margins would decline and they would
have to increase their volumes or provide attractive services so as to maintain profits.
This calls for bank marketing.
Increasing Emphasis on Bank Profitability
With the Narasimhan Committee Report, banks have been directed to improve
their efficiency, productivity and profitability. Banks are required to be self-sufficient.
In fact, the report has adopted the BIS standards of capital adequacy (though in a
phased manner).
Foreign Banks
Foreign banks offer stiff competition to the Indian Banks and with their superior
services and technology offers them a competitive advantage. Thus Indian Banks have
to effectively apply marketing concepts to attract customers.
Entry of New Private Banks
In the early ‗90s new competition emerged in the form of new Private Banks,
who brought along with them a high technology-based banking matching with
International Standards and have made a significant dent in the banking business by
capturing substantial share in the profits of the banking industry.
Reduction of Statutory Liquidity Ratio
With the Government‘s aim of reducing the SLR to 25 percent, the banks will
have surplus funds for which they will have to attract users.
9
Social Environment
The higher literacy levels, migration to urban areas and higher awareness due to
the boom in the mass media have important implications for the retail banker. He needs
to be conscious of the fact the increasing proportion of people are aware of financial
service and are, therefore demanding and expecting higher quality services.
Increasing Urbanization, Education and Awareness
The higher literacy levels, migration to urban areas and higher awareness due to
the boom in the mass media have important implications for the retail banker. He needs
to be conscious of the fact the increasing proportion of people are aware of financial
service and are, therefore demanding and expecting higher quality services.
Decline in Traditional Indian Values (Borrowing as Taboo), Rising
Consumerism, Rise in the Percentage of Working Women.
Technology Development
Modernization of Technology has facilitated the introduction of new banking
services as to attract new customers. An example of this is the ‗Automated Teller
Machines‘ or the facility of ‗Any Time Money‘. Also in foreign countries, banks are
experimenting with money transmission at Point of sale, e.g., petrol station linked with
banking network. Credit is Easier to Obtain Growing Importance of Non-Banking
Financial Institutions: Fixed Deposits being offered by the NBFC‘s are very attractive
for the public, because of the wide gap of interest rates offered by banks on term
deposits and that offered by the NBCS‘s. Further, they offer a variety of specialized
services to their customers so as to attract and retain them.
10
Disintermediation
The increasing role of capital markets in mobilizing funds is reducing the
importance of banks as intermediaries. Companies are directly approaching the savers
through the capital markets. Mutual funds help in attracting the small investors who do
not want to take much risk.
1.5 ROLE OF CUSTOMER SERVICE IN BANK MARKETING
Customer services are recognized as a key factor in bank marketing. They play
a vital role in banks‘ success. The following points justify the importance of customer
services in banking business today.
(i) No business can survive without customer. Any company that wants to
stay in business has to understand what constitute quality in the eyes of
its present and prospective customers.
(ii) Banks are facing competition from non-banking financial institutions
and other similar companies
(iii) Due to the trend of disintermediation which is visible throughout the
world, introduction of de-regulation and emergence of new financial
instruments. Banks have to seek business by aggressively marketing
their products.
(iv) A bank must the meet financial needs of customers, by acting as a
custodian of their assets.
(v) Customer services assumes special significance as in developing
countries like India, banks are not merely financial institution s aiming
at profit, but determined to achieve a social purpose.

11
(vi) Customer service in banks means satisfying the needs of customers at
the right time.
1.6 STATEMENT OF THE PROBLEM
Banks, either public sector banks or private sector banks, are highly competitive
with each other with their own objectives and targets. Banking is customer oriented
service industry. So, customer is the focus point for banks like any other organisation.
Customer service is not only a critical function but plays a vital role for the business.
Banking is a catalyst and life of modern trade and commerce. It is an integral part of all
the business and social activities. But, because of modern information era banking
services are meeting transformation every day. This unpredictable transformation of the
services in the banking system has led to the evolution of highly competitive and
complex market where there is continuous refinement of services. Every engagement
with the customer is an opportunity to either develop or destroy a customer‘s faith in
bank. The expectations of the customers increased many folds. Customer has become
the focus point for both achievement of winning confidence and get more market share.
In one hand, the need of banking in developing Indian economy is increasing. On the
other hand, change in business climate has put increased pressure on them. As a result
banks are compelled to reorganise themselves in order to cope with the present
condition. When expectations are greater than performance, then the perceived quality
is less than satisfaction and customers‘ dissatisfaction occurs.6 Delivering quality
service is imperative to have customer orientation as a culture in the bank. The
customer orientation builds long term relationship resulting in customer satisfaction.7
Generally customers from urban India no longer want to wait in long ques and spend
6 Parasuraman, A., Zeithaml, V.A. and Berry, L.L. (1985), ―A Conceptual Model of Service Quality
and its Implication‖, Journal of Marketing, Vol. 49, Pp. 41-50. 7 Swarup, K.S. (2004), ―Customer Orientation in Banks for Building Long Term Relationships‖, IBA
Bulletin, Vol. 26(8), Pp. 17-20
12
hours in banking transactions. On the other hand, customers from rural India don‘t have
such reservations since they are more money conscious. In addition, generally laymen
customers are quantity conscious whereas business customers are quality conscious.
Like other organisations, banks are also deploying innovative sales techniques and
advanced marketing tools to gain supremacy. As far as the public sector banks are
concerned they are under statutory obligations that they need to implement certain
schemes from time to time announced by the central government and RBI. Poor,
middle class and higher income group people are given equal importance inspite of
their volume of transactions. The working atmosphere is also quite normal except in
some public sector banks and are conducive in nature. Higher middle class and higher
income group of people are given much importance by the private sector banks. These
banks are usually concentrated in urban areas with spacious layout and adequate
infrastructure facilities. The amount spent per customer is quite high because the
coverage is limited in urban area. Individual attention and care will be given as the
number of customers may be less when compared to PSU‘s and the formalities,
procedures and time taken may be less, easy and simple for many of the transactions.
Private Banks has their own objectives and ways of attaining new customers.
The quality of services rendered may also vary.
Formalities in processing credit applications and availing loans, interest rates
for deposits and loans, spacious layout, adequate staff at counters, visible display of
information, coverage of geographical area, individual attention, attractive
advertisements, creative plans and policies and the friendly approach of staff towards
the customers are some of the common areas where the degree of satisfaction of
customers may vary in case of public sector and private sector banks.
13
As a result, need to study about the customers‘ satisfaction and the level of
satisfaction of customers becomes inevitable as these factors affect the working of the
industry in rendering fruitful and quality services and also for the upliftment of the
industry in general.
1.7 NEED OF THE STUDY
―If you cannot measure it, you cannot improve it" Lord William Thomson
Kelvin (1824-1907)
Increased competition, highly educated customers and increased in standard of
living are forcing many business to review their customer service strategy. Many
business firms are channeling more efforts to retain existing customers rather than to
acquire new one since the cost of acquiring new customer is greater than cost of
retaining existing customers. There is enough evidence that demonstrates the strategic
benefits of quality in contributing to market share and return on investment.
Maximising satisfaction of customer through quality customer service has been
described as ‗the ultimate weapon‘.8 According to them, in all industries, when
competitors are roughly matched, those with stress on customer‘s service will win. In
view of the above mentioned facts, an analysis of service quality perceptions from
customer‘s point of view may be sound and interesting at this juncture. Such an
analysis will provide banks, a quantitative estimate of their service being perceived
with intricate details such as whether banks are meeting the expectation of the
customers or not.
8 Davidow, A., and B. Uttal (1989), ―Total Customer Service: The Ultimate Weapon‖, New York:
Hopper and Row.
14
1.8 SCOPE OF THE STUDY
The researcher focused attention to identify the customers‘ perception towards
various service quality dimensions and their preference to the banks. In this research
work, the researcher attempted to measure the perception of the customers towards the
service quality dimensions, their expectations towards various facilities offered by the
banks and their level of satisfaction towards various services.
The researcher has also made an attempt to explore the relationship between the
demographic variables of customers and their perception of service quality dimensions
and customer satisfaction. The study was carried out within the city limit of Tirunelveli
district, Tamilnadu.
1.9 OBJECTIVES OF THE STUDY
To study the various customer services offered in the public sector
banks and private sector banks.
To study and compare the existing service quality dimensions in the
public and private sector banks.
To find out the service quality perception of customers towards the
public and private sector banks.
To find out the customers’ preference towards public and private sector
banks and their similarities and differences.
To study the impact of various demographic variables on their
selection of bank service.
To measure the service quality gap in providing the banking services.
15
To find out the problems faced by the customers in availing banking
services.
To offer better suggestions to banking companies for improving their
service quality.
1.10 HYPOTHESES
Ho: There is no significant difference in expectation towards tangibility
aspect of service quality of banks among customers of public sector
banks and private sector banks in Tirunelveli district.
Ho: There is no significant difference in expectation towards reliability aspect
of service quality of banks among customers of public sector banks and
private sector banks in Tirunelveli district.
Ho: There is no significant difference in expectation towards responsiveness
of banks among customers of public sector banks and private sector
banks in Tirunelveli district.
Ho: There is no significant difference in expectation towards assurance of
banks among customers of public sector banks and private sector banks
in Tirunelveli district.
Ho: There is no significant difference in expectation towards empathy of
banks among customers of public sector banks and private sector banks
in Tirunelveli district.
Ho: There is no significant difference in perception towards tangibility of
banks among customers of public sector banks and private sector banks
in Tirunelveli district.

16
Ho: There is no significant difference in perception towards reliability of
banks among customers of public sector banks and private sector banks
in Tirunelveli district.
Ho: There is no significant difference in perception towards responsiveness of
banks among customers of public sector banks and private sector banks
in Tirunelveli district.
Ho: There is no significant difference in perception towards assurance of
banks among customers of public sector banks and private sector banks
in Tirunelveli district.
Ho: There is no significant difference in perception towards empathy of banks
among customers of public sector banks and private sector banks in
Tirunelveli district.
Ho: There is no significant difference in customer satisfaction towards public
sector banks and private sector banks in Tirunelveli district.
Ho: There is no significant difference in opinion about the reachability of
promotional strategies adopted by the bank among customers of public
sector banks and private sector banks in Tirunelveli district.
1.11 RESEARCH DESIGN
The methodology of the study is based on both primary data and secondary
data. The primary data collected through well-framed and structured questionnaire to
elicit the well-considered opinion of both public sector and private sector banks‘
customers. Stratified random sampling method has been used to collect the responses
from the customers of both public and private sector banks.
17
This research is a combination of both exploratory and descriptive research
designs. Exploratory Research has conducted with the purpose of gaining better insight
about the banking sector scenario in study area. Since, the researcher has no control
over the variables; he can only report what has happened and what is happening. This
design refers to a set of methods and procedures that describe variables. It contains
reviews and facts verdict enquiry of different kinds.
1.12 SAMPLING DESIGN
In this study stratified random sampling method has been followed. A total of
672 sample respondents have been selected for the study. Based on the available
secondary data as regards, the number of both public and private sector banks, located
in the rural, semi-urban and urban areas of Tirunelveli district, 528 sample respondents
of public sector banks and 144 sample respondents of private sector banks have been
randomly selected from all the strata of rural, Semi-urban and urban banks. However,
as urban customers avail more number of banking services and as they transact with
their banks more frequently, more number of sample respondents were taken from
urban area, slightly lesser number of sample respondents from semi-urban area and still
lower number of respondents from rural area. The composition of the total sample
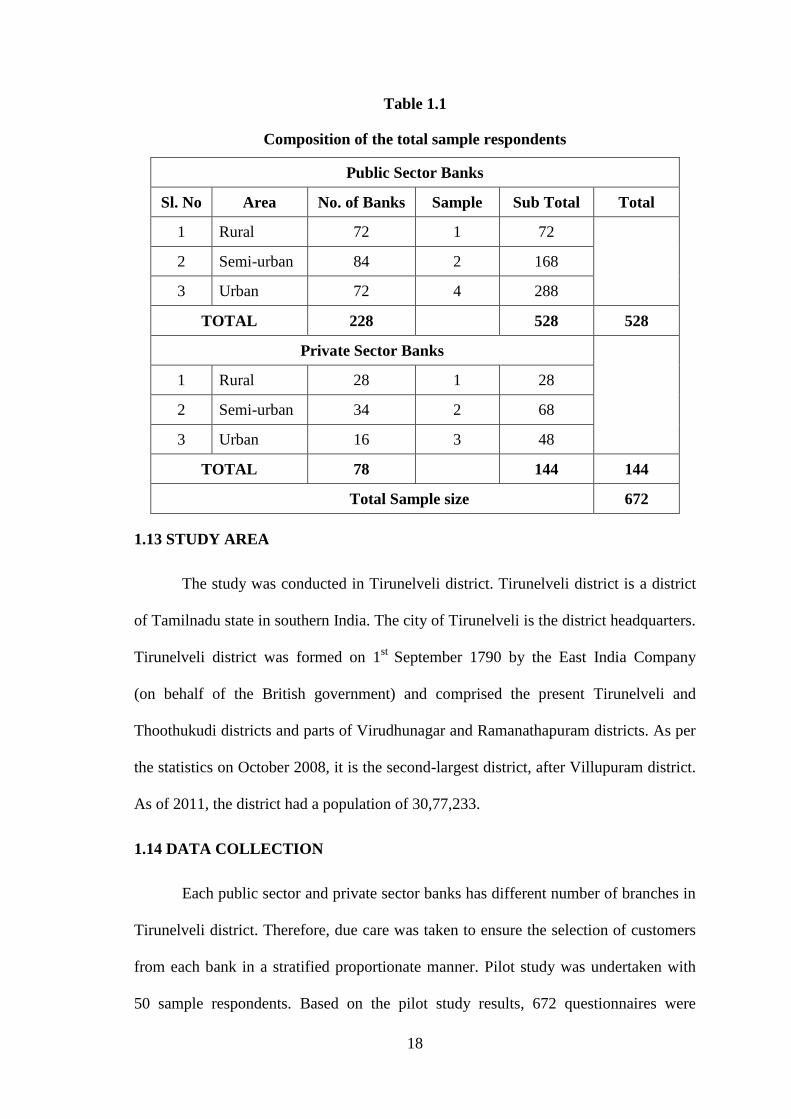
respondents 672, who have been randomly selected for the study is given in table 1.1.
18
Table 1.1
Composition of the total sample respondents
Public Sector Banks
Sl. No Area No. of Banks Sample Sub Total Total
1 Rural 72 1 72
2 Semi-urban 84 2 168
3 Urban 72 4 288
TOTAL 228 528 528
Private Sector Banks
1 Rural 28 1 28
2 Semi-urban 34 2 68
3 Urban 16 3 48
TOTAL 78 144 144
Total Sample size 672
1.13 STUDY AREA
The study was conducted in Tirunelveli district. Tirunelveli district is a district
of Tamilnadu state in southern India. The city of Tirunelveli is the district headquarters.
Tirunelveli district was formed on 1st
September 1790 by the East India Company
(on behalf of the British government) and comprised the present Tirunelveli and
Thoothukudi districts and parts of Virudhunagar and Ramanathapuram districts. As per
the statistics on October 2008, it is the second-largest district, after Villupuram district.
As of 2011, the district had a population of 30,77,233.
1.14 DATA COLLECTION
Each public sector and private sector banks has different number of branches in
Tirunelveli district. Therefore, due care was taken to ensure the selection of customers
from each bank in a stratified proportionate manner. Pilot study was undertaken with
50 sample respondents. Based on the pilot study results, 672 questionnaires were
19
distributed to the customers of 228 public sector bank branches and 78 private sector
bank branches. After consistent follow up, calculation to give proportionate weight was
done by the researcher. Finally, 528 questionnaires from the respondents of public
sector banks and 144 questionnaires from the respondents of private sector banks were
collected.
1.15 PERIOD OF DATA COLLECTION
The required primary data were collected through the structured questionnaire
from the sample respondents during the period between 1st April, 2016 and 31
st March,
2017.
1.16 FRAMEWORK OF ANALYSIS
The primary data collected through questionnaire were analysed using SPSS 15
computer package. The statistical tools used for data analysis based on the data
enumerated from the questionnaires are as follows:
1.16.1 Percentage Analysis
This tool is used to establish the contribution of variables in both optional and
multiple choice questions raised in the questionnaire regarding demographic variables
and different types of services offered by public sector and private sector banks.
1.16.2 SERVQUAL
SERVQUAL stands for Service Quality. Service quality (SQ) is a comparison
of expectations (E) with performance (P). In the SERVQUAL instrument, 33
statements (Appendix I) measure the performance across these five dimensions, using a
five point likert scale measuring both customer expectations and perceptions.

20
1.16.3 ANOVA
The Analysis of Variance, popularly known as the ANOVA can be used in
cases where there are more than two groups. When we have only two samples we can
use the t-test to compare the means of the samples. But, it might become unreliable in
case of more than two samples. ANOVA is used to compare the means of more than
two samples.
1.16.4 Garrett’s Ranking Analysis
Garrett‘s ranking technique was used to rank the preference indicated by the
respondents on different factors. As per this method, respondents have been asked to
assign the rank for all factors and the outcomes of such ranking have been converted
into score value with the help of the following formula:
Percent position: 100 (Rij - 0.5) / Nj
Where
Rij = Rank given for the ith
variable by jth
respondents
Nj = Number of variable ranked by jth
respondents
With the help of Garrett‘s table, the percent position estimated is converted into
scores. Then for each factor, the scores of each individual are added and then total
value of scores and mean values of score is calculated. The factors having highest mean
value is considered to be the most important factor
1.16.5 Factor Analysis
Factor analysis is a technique that is used to reduce a large number of variables
into fewer numbers of factors. This technique extracts maximum common variance
from all variables and puts them into a common score. As an index of all variables, we
21
can use this score for further analysis. Factor analysis is part of general linear model
(GLM) and this method also assumes several assumptions. They are, ‗there is linear
relationship‘, ‗there is no multi-co-linearity‘, ‗it includes relevant variables into
analysis‘ and ‗there is true correlation between variables and factors‘.
1.16.6 Chi-Square
This is a statistical test commonly used to compare observed data with data we
would expect to obtain according to a specific hypothesis. For example, you expected
10 of 20 offspring from a cross to be male and the actual observed number was 8
males, then you might want to know about the "goodness to fit" between the observed
and expected. Were the deviations (differences between observed and expected) the
result of chance or were they due to other factors. How much deviation can occur
before you, the investigator, must conclude that something other than chance is at
work, causing the observed to differ from the expected. The chi-square test is always
testing what scientists call the null hypothesis, which states that there is no significant
difference between the expected and observed result. This approach consists of four
steps: (1) state the hypotheses, (2) formulate an analysis plan, (3) analyze sample data,
and (4) interpret results.
1.16.7 K-Means Cluster Analysis
K-means cluster analysis is applied to classify the sample unit into disjoint
heterogeneous groups in public sector and private sector banks.
1.16.8 Multiple Regressions
Multiple regressions are used to find the influence of service quality dimensions
on customer satisfaction over customer loyalty. Multiple linear regression attempts to
model the relationship between two or more explanatory variables and a response
22
variable by fitting a linear equation to observed data. Every value of the independent
variable x is associated with a value of the dependent variable y. In statistics, regression
analysis is a statistical process for estimating the relationships among variables.
It includes many techniques for modeling and analyzing several variables. Classical
assumptions for regression analysis include:
The sample is representative of the population for the inference prediction.
The error is a random variable with a mean of zero conditional on the
explanatory variables.
The independent variables are measured with no error.
1.16.9 Cronbach’s Alpha
Cronbach‘s alpha is a measure of internal consistency, i.e. how closely related a
set of items are as a group. It is considered to be a measure of scale reliability. A "high"
value for alpha does not imply that the measure is unidimensional. If, in addition to
measuring internal consistency, Researcher wishes to provide evidence that the scale in
question is unidimensional, additional analyses can be performed. The formula for the
standardized Cronbach‘s alpha is given below:
α=
Where, N is equal to the number of items, c-bar is the average inter-item
covariance among the items and v-bar equals the average variance.

23
1.17 OPERATIONAL DEFINTIONS
Service Quality
Service quality is the customer‘s judgment of overall excellence of the service
or the difference between customer‘s expectation and the actual service performed or
perceived.
SERVQUAL
Twenty Two item scales is used to measure the perception of service quality;
whereas the SERVQUAL uses the scale twice. Once to measure the expected service
quality and once to measure the perceived service quality.
Measuring Service Quality
SERVQUAL is used to measure service quality as a multi-dimensional
construct across five dimensions: tangibility, reliability, responsiveness, assurance and
empathy
Tangibility
It means physical appearance of the facility which includes materials,
equipment and personnel. This enhances the image of the company and provides a
more positive image in the way the customer perceives the service.
Reliability
This refers to service reliability which is different from product reliability and
involves the service provider to be able to perform the services accurately and
dependably. This means that the company fulfils its promises with regard to the
delivery of the service, the price and solving the customer's problems

24
Responsiveness
This refers to the readiness of the service provider to provide timely services to
their customers. This includes paying attention to the customers and dealing with the
customer's complaints and problems in a timely manner. Responsiveness is being
flexible with the customer and trying to accommodate the customers‘ demands and
performing the service without delay.
Assurance
Assurance means the ability to deliver services at a professional level. This
includes the employees‘ knowledge and courtesy which inspires confidence in them.
Having trust and confidence in the employee leads to the customer having more trust in
the banking company itself.
Empathy
It means the ability to understand customer needs and to give personal attention.
This includes the ability to show the customer that the service provider cares about
him/her because the bankers know how valuable he/she is to the business. It is being
able to build a relationship with the customers, understanding their needs and providing
them with personalized services.
Preference
It is an individual‘s attitude towards a set of objects, typically reflected in an
explicit decision-making process in banking transaction. It could be also interpreted as
the evaluative judgment in the sense of liking or disliking towards banking process.
Preference can be affected by a customer‘s surroundings and upbringing in terms of
geographical location, cultural background, religious beliefs, and education.
25
Perception
It is the mental process of becoming aware of or recognizing banking offers and
transactions. They are primarily cognitive rather than affective or conative. Perception
allows banking customer to take the sensory information and make it into something
meaningful.
1.18 LIMITATIONS
Every research is conducted under some constraints and this research is not an
exception. Limitations of this study are as follows:
The present study is limited to analyse the service quality perception and
preference of customers in public sector and private sector banks in
Tirunelveli district.
A few respondents were reluctant to go in detail because of their busy
schedule and as they had the fear of whether their bank details would be
disclosed.
The study may suffer from the element of biasness.
No published data were available on the number of customers in the study
area and no banks provide such data.
1.9 CHAPTER SCHEME
Chapter I ―Introduction and Design of the Study‖ consists of introduction of
the present study, brief history of Indian banking industry, scope of the study, need and
importance of the study, statement of the problem, objectives of the study, hypotheses,
research methodology, limitations of the study and the chapter scheme.
26
Chapter II ―Review of Literature‖ presents the essence of various earlier
studies relating to service quality, customer perception and customer preference.
Chapter III ―Profile of the Banking Sector in the Study Area‖ deals with the
general profile of the banking sector in Tamilnadu state and study area, i.e. Tirunelveli
district.
Chapter IV ―Conceptual Framework‖ gives a brief account of the conceptual
framework of service, delivering quality services, service marketing, perception,
preference and expectations of customers towards service providers.
Chapter V ―Analysis of Service Quality Gap and Customers‘ Satisfaction‖
portrays a detailed analysis relating to analysis of service quality gap and customers‘
satisfaction based on data collected from respondents through questionnaire.
Chapter VI ―Analysis of Factors Influencing Customers‘ Perception and
Reasons for Preferring the Bank‖ presents a detailed analysis relating to analysis of
factors influencing customer perception and reasons for preferring the bank.
Chapter VII ―Summary of Findings, Suggestions and Conclusion‖ gives the
gist of the present study, its findings, suggestions based on the analysis conclusion and
scope for further research in relation to the present study.
27
CHAPTER II
REVIEW OF LITERATURE
This study has attempted to find out the service quality perception and
preference of customers about public and private sector banks in Tirunelveli district. In
order to find out the uncovered areas, reviews were collected and analysed from both
Indian studies and foreign studies.
FOREIGN STUDIES
Athanassopoulos (1997)1 in his study linked the operational capabilities with
quality of services and came out with the major conclusion that there is a close affinity
between the two.
Walfried M. Lassar, Chris Manolis and Robert D. Winsor (2000)2 examined
the effects of service quality on customer satisfaction from two distinct analysis viz.
SERVQUAL and Technical/Functional Quality. This research examined the potential
utility of employing separate measures for customer satisfaction from the perspectives
of both technical and functional aspects of the service delivery process.
Michael K Brady and Joseph Cronin Jr. (2001)3 through qualitative and
empirical research found that the service quality construct conforms to the structure of
a third-order factor model that ties service quality perceptions to distinct and actionable
dimensions: out-come, interaction, and environmental quality. In turn, each has three
sub dimensions that define the basis of service quality perceptions. From the above
1 Athanassopoulos, A.D. (1997), ―An Optimization Framework of the Triad: Capabilities, Service
Quality and Performance‖, Working paper, Warwick Business School, University of Warwick, U.K. 2 Walfried M. Lassar, Chris Manolis, Robert D. Winsor (2000), “Service Quality Perspectives and
Satisfaction in Private Banking‖, Journal of Services Marketing, Vol. 14(3), Pp.244-271. 3 Michael K. Brady and J. Joseph Cronin Jr (2001), ―Some New Thoughts on Conceptualizing
Perceived Service Quality: A Hierarchical Approach‖ The Journal of Marketing, Vol. 65(3),
Pp. 34-49.

28
reviews, it is evident that quality of service plays a vital role in attaining satisfaction.
It is also clear that service quality has a direct and strong impact on customer
satisfaction. Only when the customer‘s perception towards service quality is positive it
leads to customer satisfaction.
Lori S. Cook & Rohit Verma (2002)4 in the study entitled as, ―Exploring the
Linkages Between Quality System, Service Quality and Performance Excellence:
Service Providers Perspective‖, explore the linkages between quality system, employee
service quality culture, and performance excellence in the banking industry operating
in a turbulent business environment. Properly conducted quality culture and strategic
consensus assessment has the potential of informing a service organism of its current
position and possible area of improvement. The purpose of the study was to assess the
service employees‘ perception of an organization‘s quality management system on
service quality and on operational performance. As discussed in the case study and
shown by the survey results, the proposed relationship seem to hold for a large service
organization operating in the turbulent business environment.
Sadiq Sohail M. and Balachandran Shanmugham B. (2003)5 conducted a
study to analyse the preference and satisfaction level of customers. The study has three
aims. The first is to determine if the basic demographic factors influence the internet
usage for banking in Malaysia. The second is to examine the factors that affect the
adoption of e-banking. The third is to investigate if there are any differences between
the internet and non-internet users relating to the various factors. Results based on the
analysis of data relating to 300 respondents indicate that while there are no significant
4 Lori S. Cook and Rohit Verma (2002), ―Exploring the Linkages Between Quality System, Service
Quality‖ and Performance Excellence: Service Providers Perspective‖, Quality Management Journal,
UTAH. Vol. 9(2), Pp. 12-20. 5 Sadiq Sohail, M. and Balachandran Shanmugham, B. (2003) ―E-Banking and Customer Preferences
in Malaysia: An Empirical Investigation‖, Information Sciences Vol. 150(4), pages 207-217.
29
differences between the age and educational qualifications of the electronic and
conventional banking users, some differences exist on other demographic variables.
Analysis further reveals that accessibility of internet, awareness of e-banking and
customers' reluctance to change are the factors that significantly affected the usage of e-
banking in Malaysia.
Ding Hooi Ting (2004)6 conducted a study on the title ‗Service Quality and
Satisfaction Perceptions: Curvilinear and Interaction Effect‖. This study was focused
on service quality and satisfaction judgments of customers in banking institutions
throughout Malaysia. The study attempts to determine the relationship between service
quality and satisfaction, where service quality is the independent variable and
satisfaction is the dependent variable. Findings show that, service quality is the
antecedent of satisfaction. The findings also support a curvilinear relationship for the
variables under study. The results also show that bank‐ownership moderates the
relationship between service quality and satisfaction.
Gwo-Guang Lee, et al. (2005)7 developed a research model to examine the
relationship between e-service quality dimensions and overall service quality, customer
satisfaction and purchase intentions. Data of 297 online customers were used to test the
research model. Confirmatory factor analysis was conducted to examine the reliability
and validity of the measurement model and the structural equation modeling technique
was used to test the research model. The analytical results showed that the dimensions
of web site design, reliability, responsiveness, and trust affect overall service quality
and customer satisfaction. Moreover, the latter in turn are significantly related to
6 Ding Hooi Ting (2004), ―Service Quality and Satisfaction Perceptions Curvilinear and Interaction
Effect‖, International Journal of Bank Marketing, Vol. 22(6), Pp. 42-43. 7 Gwo-Guang Lee and Hsiu-Fen Lin, (2005), ―Customer Perceptions of E-Service Quality in Online
Shopping‖, International Journal of Retail & Distribution Management, Vol. 33(2) Pp.161-176.
30
customer purchase intentions. However, the personalization dimension is not
significantly related to overall service quality and customer satisfaction.
Huseyin Arasliet et al., (2005)8 analysed and compared the quality of service
in the commercial banking sector of Cyprus and investigated the relationship between
overall bank customer satisfaction in the Turkish and Greek-speaking areas of Cyprus.
The research results revealed that the assurance dimension had the largest influence on
customer satisfaction and overall satisfaction of bank customers in both areas of Cyprus
had a positive effect on their word-of-mouth and the expectations of bank customers in
both areas were not met and that the largest gap was found in the empathy dimension.
Essam E Ibrahim et al., (2006)9 conducted a study on the tile ―customers‘
perception of electronic service delivery in the UK retail banking sector‖. This study
aims to explore the key factors of the electronic service quality (ESQ) perceptions of
UK banking customers and to evaluate the customers‘ perceptions of their banks‘
actual performance on the identified ESQ dimensions. Exploratory factor analysis
uncovered six composite dimensions of electronic service quality. They are
convenient/accurate electronic banking operations, the accessibility and reliability of
service provision, good queue management, service personalization, the provision of
friendly and responsive customer service and the provision of targeted customer
service. Further analysis using importance performance analysis revealed that the UK
customers‘ perceptions of their bank actual performance on these revealed that ESQ
dimensions were largely modest.
8 Huseyin Arasli, Salih Turan Katircioglu and Salime Mehtap-Smadi, (2005), ―A Comparison of
Service Quality in the Banking Industry: Some Evidence from Turkish- and Greek-speaking areas in
Cyprus‖, International Journal of Bank Marketing, Vol. 23(7), Pp. 80-83. 9 Essam, E Ibrahim, Matthew Joseph and Kevin Ibeh, (2006), ―Customers‘ Perception of Electronic
Service Delivery in the UK Retail Banking Sector‖, International Journal of Bank Marketing,
Vol.24(7), Pp.475-493.
31
Abu Shanab E. and Pearson J.M (2007)10
investigated the key determinants
of the adoption of internet banking in Jordan. The author attempted to validate the
appropriateness of the Unified Theory of Acceptance and Use of Technology (UTAUT)
within the context of internet banking. The results of this study indicated that UTAUT
provides a good foundation for future technology acceptance research. The three main
predictors, viz. performance expectancy, effort expectancy and social influence were
significant and gender moderated the relationships between the three independent
variables and the dependent variable.
Durkin, et al., (2007)11
conducted a study on the title ―E-Banking Adoption:
from Banker Perception to Customer Reality‖. This study adopts a quantitative
methodology and examines customer communication preferences when interacting
with their bank. The customer satisfaction questionnaire was issued to over 2,000 retail
customers. Through regression analysis, the key predictors that indicate whether or not
customers will register as Internet banking users were identified. Twenty five senior
branch bank managers were then asked to rank the same set of issues to ascertain what
they felt to be the key influencers to customer registration for Internet banking.
The similarities and differences between the two sets of findings are identified and the
managerial implications for the case bank's marketing strategy discussed.
Istvan Szuts (2008)12
, in his report entitled as ―Customer Loyalty Problems in
Retail Banking‖ explains that to achieve higher business growth, banks must increase
10
Abu Shanab E. and Pearson J.M., (2007), ―Internet Banking in Jordan: The Unified Theory of
Acceptance and use of Technology (UTAUT) Perspective‖, Journal of Systems and Information
Technology, Vol. 9(1), Pp. 65-67. 11
Durkin, Mark1, Aodheen O'Donnell, Gwyneth Mullholl and Jospeh Crowe (2007), ―On E-Banking
Adoption: from Banker Perception to Customer Reality‖, Journal of Strategic Marketing,
Vol.15(16), Pp. 237-252. 12
Istvan Szuts (2008), ―Loyalty Problems in Retail Banking‖, 6th
International Conference on
Management, Enterprise and Bench Marketing, Budapest, Hungry.
32
customer loyalty by delivering a distinctive experience that combines the right mix of
convenience, value and service and forge an emotional bond with customers.
Muslim Amin and Zaidi Isa (2008)13
made an attempt to examine the
relationship between service quality perception and customers' satisfaction in
Malaysian Islamic banking using the SEM approach. This model begins with
SERVQUAL measurement scales consisting of six dimensions namely, tangibility,
reliability, responsiveness, assurance, empathy and the compliance to measure
Malaysian Islamic banking service quality. The results show that the proportion of
Malaysian Muslims' awareness of the Islamic banking products and services were high
compared to non-Muslim customers. The majority of the Islamic banking customers
were satisfied with the overall service quality provided by their banks. The relationship
between service quality and customer satisfaction was significant.
Akroush et al., (2009)14
in their study indicated that the service quality
dimensions (functional and technical) have positively and significantly affected banks
performance assessed based on financial performance and customer indicators.
The functional quality dimension has a stronger effect on all banks performance
indicators than the technical quality dimension. The effect of service quality
dimensions (functional and technical) on the banks financial performance is still
stronger than their effects on banks customer indicators.
13
Muslim Amin and Zaidi Isa (2008), ―An Examination of the Relationship Between Service Quality
Perception and Customer Satisfaction: A SEM Approach towards Malaysian Islamic Banking‖,
International Journal of Islamic and Middle Eastern Finance and Management, Vol. 1(3), Pp. 43-45. 14
Akroush, Mamoun N.; Khatib and Fahed, S. (2009), ―The Impact of Service Quality Dimensions on
Performance: An Empirical Investigation of Jordan's Commercial Banks‖, Journal of Accounting,
Business & Management, Vol. 16(1), Pp. 22-44.

33
Hummayoun Naeem et al., (2009)15
investigated the impact of service quality
on customer satisfaction in the Pakistani banking sector. The constructs of
SERVQUAL model developed by Zeithaml and Bitner (1996) and five point customer
satisfaction tool developed by Taylor and Baker (1994) were adopted and used for data
collection. Results of the study indicated that the service quality was proved to be a
strong predictor of customer satisfaction in case of foreign bank. They concluded that if
service quality is managed and maintained effectively, it can contribute significantly
towards customer satisfaction.
Barbara Culiberg (2010)16
explored service quality in a retail bank setting in
Slovenia and its influence on customer satisfaction. Based on SERVPERF a 28item
scale has been developed for this study. Through factor analysis four dimensions of
service quality have been obtained. The results of regression analysis suggest that all
four dimensions of service quality as well as service range influence customer
satisfaction.
Figen Yeilada et al., (2010)17
has three fold aim in his study. They are to test
the dimensionality of the SERVQUAL instrument in the Northern Cyprus health care
industry, to assess the service quality provided in public and private hospitals in
Northern Cyprus and to identify the service quality dimensions that play important role
in patient satisfaction. Data were collected in two phases from the same sample, which
consisted of 806 systematically selected people above the age of eighteen. Factor
analysis revealed a three factor solution, namely, reliability-confidence, empathy and
15
Hummayoun Naeem, Asma Akram and Iqbal Saif, M. (2009), ―Service Quality and its Impact on
Customer Satisfaction: An Empirical Evidence from the Pakistani Banking Sector‖, International
Business and Economics Research Journal, Vol. 8(12), Pp.99-104. 16
Barbara Culiberg, (2010), ―Identifying Service Quality Dimensions as Antecedents to Customer
Satisfaction in Retail Banking‖, Economic and Business Review, Vol. 12(3), Pp. 151–166. 17
Figen Yeilada and Ebru Direktör (2010), ―Health Care Service Quality: A Comparison of Public and
Private Hospitals‖, African Journal of Business Management Vol. 4(6), Pp. 962-971.
34
tangibles. Gap analysis showed that private hospitals have smaller gaps than public
hospitals in all three service quality dimensions. Finally, logistic regression findings
indicated that while all three dimensions are somewhat influential on patient
satisfaction, in public hospitals tangible dimension seems to exert no significant
influence on satisfaction.
H.Emari and S. Iranzadeh (2010)18
conducted a study entitled as,
―Determining the Dimension of Service Quality in Banking Industry: Examining the
Gronroos‘s Model in Iran‖. They suggested that service quality consists of three
dimensions, technical, functional and image. This research is an applied research and
the results of the study showed that in case of a banking service the overall service
quality is influenced more by a consumer‘s perception of technical quality than
functional quality.
Sadek and Kamaruzaman (2010)19
in their study present a comparative study
on the quality of service offered by the Cooperative Bank (CB) and Islamic Banks of
Britain (IBB) in Leicestershire, England. Both banks were compared based on the
similarities and differences of their customer preference in terms of service quality.
The findings of the study revealed that empathy and responsiveness are being
prioritized for the CB customers while the compliance issues are preferred by IBB
customers.
18
Emari, H. and Iranzadeh, S. (2010), ―Determining the Dimension of Service Quality the Banking
Industry: Examining the Gronroos‘s Model in Iran‖ The Authors Journal Compilation, East
Azarbaijan, Iran. 19
Sadek and Kamaruzaman (2010), ―Service Quality Perceptions between Cooperative and Islamic
Banks of Britain‖, American Journal of Economics & Business Administration, Vol. 2(1), Pp1-5.
35
Abed Abedniya, et al., (2011)20
investigated the direct impact of perceived
service quality on customer satisfaction in the context of Islamic banking system in
Malaysia. In this study researchers used CARTER instrument for measuring perceived
service quality and customer satisfaction. In addition, this study indicates the gap
between customer expectation and perception concerning service quality dimension
base on CARTER instrument. By measuring this gap, researchers find the level of
customers‘ perception service quality and compare it with customer satisfaction level.
Therefore, comparison of this result can indicate the relation between customer
satisfactions and perceive service quality.
Ahmad and Sultan (2011)21
in their study examine the relationship between
service quality and performance of conventional banks operating in Pakistan.
The researcher collected data from 864 respondents of 72 branches of selected banks.
The data were collected by a structured questionnaire developed in the light of existing
literature. The responses were analyzed through SPSS 15.0 version. The relationship
between service quality and performance of conventional banks was assessed by
Pearson's correlation and regression analysis. The results indicate that there is a weak
positive relationship between service quality and performance of conventional banks.
Bankers should improve their services by blending of traditional facilities and modern
technology to meet customers' expectation for better performance in future. Similarly,
bank managers should take quality initiatives to improve their products by considering
demographic characteristics of the customers to retain them as satisfied customers for
20
Abed Abedniya, Majid Nokhbeh Zaeim and Bardia Yousef Hakimi (2010), ―Investigating the
Relationship between Customers‘ Perceived Service Quality and Satisfaction: Islamic Bank in
Malaysia‖, European Journal of Social Sciences, Vol. 21(4), Pp. 603-624. 21
Ahmad and Sultan (2011), ―How Service Quality affects Performance of Conventional Banks in
Pakistan‖, Interdisciplinary Journal of Contemporary Research in Business, Vol. 2(9), Pp150-156.
36
better performance. It is also suggested that bankers should introduce new, diversified
and marketable products to meet requirements of different segments.
Ashfaq Ahmad, et al., (2011)22
analyzed the services quality of products
offered by Islamic banks with the mediating effect of customer satisfaction on bank
performance. There is an increasing competition among banks to capture new
customers as well as to retain existing customers. It requires a study to measure the
impact of service quality on customer satisfaction towards bank performance. Data
were collected from 720 respondents of 60 branches of six full-fledged Islamic banks
operating in Pakistan by simple random sampling method. The results indicate a strong
positive relationship between service quality and customer satisfaction, while weak
positive correlation exists between service quality and bank performance. But, negative
relationship was found between customer satisfaction and performance of Islamic
banks in Pakistan. Furthermore, it is found that customer satisfaction does not mediate
between service quality and bank performance. The gap between customer satisfaction
and bank performance may be due to bankers‘ concentration on network expansion
instead of customer orientation and customer focus.
Issham Ismail, et al., (2011)23
conducted a study to explore the level of
satisfaction of customers on service quality of the banking services in Malaysia. They
investigated the relationship between banking services and customer satisfaction. The
results revealed that branch banking services and mobile banking services have
significant relationship with customer satisfaction. Characteristics of customers and
banking information of respondents are also identified as important factors influencing
22
Ashfaq Ahmad, Kashif-ur-Rehman and Nadeem Safwan (2011), ―Testing a Model of Islamic
Banking Based on Service Quality, Customer Satisfaction and Bank Performance , African Journal of
Business Management, Vol. 5(5), Pp. 1880-1885. 23
Issham Ismail, Nadiatul Rosley and Soo Sin Ling, (2011), ―Banking Services and Customer
Satisfaction: Analysis in Malaysia‖, Crown Journal of Business Management, Vol. 1(1), Pp.01-07.
37
the level of satisfaction of customers. It was also noted that customer satisfaction not
only depends on the performance of the services but also on how it contributes to the
overall service offerings.
Muhammad Ehsan Malik, et al., (2011)24
in their study, it was hypothesized
that clients using commercial retail services of the banks with favorable perceptions of
service quality dimensions. Multiple regression of survey responses indicated that
assurance satisfied banking customers more than did reliability whereas favorable
perceptions regarding SERVQUAL remaining dimensions did not prove to be
instrumental in satisfying customers. Implications for banking practitioners and future
research were also discussed in the study.
Asma Abdul Rehman (2012)25
investigated the relationship between customer
satisfaction and six dimensions of service quality (CARTER model) in Islamic banks of
Pakistan, the UK and UAE. This study uses a sample of 225 customers of Islamic
banks. Seventy five responses have been taken from each country. The structured
questionnaire technique has been used to collect data. The findings reveal that Pakistani
and UK Islamic banking customers consider assurance, reliability and empathy as
significant factors for customer satisfaction, whereas UAE customers consider
assurance and tangible as significant dimensions of satisfaction.
Hua, L.Y. (2012)26
explored the antecedents of post recovery satisfaction
within the china's Big-4 commercial banks. The data were collected from 300
respondents from Changsha city. Factor Analysis was applied to test reliability /
24
Muhammad Ehsan Malik, Basharat Naeem and Zoune Arif (2011), ―How Do Service Quality
Perceptions Contribute in Satisfying Banking Customers?‖ Vol. 3(8), Pp. 646-653. 25
Asma Abdul Rehman (2012), ―Customer Satisfaction and Service Quality in Islamic Banking: A
Comparative Study in Pakistan, United Arab Emirates and United Kingdom‖, Qualitative Research in
Financial Markets, Vol. 4(3), Pp.165-175. 26
Hua, L.Y. (2012), ―Customer Satisfaction Antecedents within Service Recovery Context: Evidence
from ―Big 4‖ Banks in China‖ Nankai Business Review International, Vol. 3(3) Pp. 284-301.
38
validity of data and the structural equation modeling was used to estimate hypothesized
relationships among the latent constructs. The results found were consistent with most
precious researchers. It was achieved that recovery expectation negatively influenced
recovery quality perceptions, expectancy disconfirmation and recovery quality
perceptions had positive effect on recovery satisfaction.
Mersha and Yonatan (2012)27
in their study uses the SERVQUAL method to
assess perceived service quality in selected Ethiopian banks based on customer surveys
conducted in three private and the largest public bank in Addis Ababa. For all banks,
service expectations were not matched by perceived performance. While there were
only a few differences in service expectations between public and private banks, private
banks were perceived to be relatively better in delivering service. The findings also
indicate that perceived service quality falls short of customer expectations in all the five
dimensions of service quality with the largest perception-expectation gap observed for
the empathy dimension. As the banking sector becomes increasingly more competitive
in Ethiopia, these findings can provide valuable insight to bank managers regarding the
specific customer service issues that they need to address in their ongoing effort to
attract and retain more customers.
Paschal Wanzalla Soita (2012)28
pointed out that many service providers have
emerged on the Ugandan market offering health and fitness services. Therefore, this
study sought club customers‘ perception about service delivery in the sector with a
modified 26 item SERVQUAL questionnaire. Data were collected from a random
sample of 486 customers and 116 interviewees covering 58 purposively selected health-
27
Mersha and Yonatan (2012), ―Perceived Service Quality in Ethiopian Retail Banks‖, Thunderbird
International Business Review, Vol. 54(4), Pp. 551-565. 28
Paschal Wanzalla Soita (2012), ―Customers‘ Perception about Service Quality in Commercial Health
and Fitness Clubs‖, Uganda, Journal of Education and Practice, Vol. 3(4), Pp. 53-63.
39
and-fitness centers countrywide. Customers to gymnasia, aerobics clubs and aqua-
based activities where vulnerability is high were considered. Major findings were that
gaps exist in service delivery (Overall service perception μ= -1.73) and that the current
management model in most clubs falls far short of international standards. A single
authority for standardization is lacking for professional certification and regulation. It is
recommended that sport-specific Government of Uganda authorities must act promptly
in a joint effort with federations, academia and the leading international certifying
organizations to directly oversee and/or set standards of practice to meet the required
quality levels and fitness industry needs.
Sayani, et al., (2013)29
in their study aimed to identify the determinants of bank
selection for Islamic and conventional banks in the United Arab Emirates (UAE). Data
were collected from 246 respondents in the Emirates of Dubai and Sharjah and focused
on aspects such as bank products, service quality, profit and reputation, cultural and
religious factors, in addition to demographic attributes of the sample. Multiple
discriminant analysis is used to identify the most important determinants of bank
selection. The study concluded that the determinants for bank selection are more
distinguishable amongst Islamic bank customers. Bank reputation and expectation of
profit on deposits are not determinants of bank selection; however, religious
preferences are the most important considerations in selection between Islamic and
conventional banks.
29
Sayani, Hameedah, Miniaoui and Hela (2013), ―A Study on Identifying the Determinants of Bank
Selection for Islamic and Conventional Banks in the United Arab Emirates (UAE)‖, International
Journal of Bank Marketing, Vol. 31(3), Pp. 206-228.
40
Krystallia and Chrysochou (2014)30
said that good branding dramatically
influences customer satisfaction, behavior and attitudes toward service provision. The
communication element control has a direct effect on customer perceptions of many
brand dimensions, such as service quality and loyalty. This means the communication
elements, advertising and promotions must be carefully implemented
Tran Van Quyet, et al. (2015)31
opined that all five factors were positively
related to customer satisfaction. However, reliability had only partial support,
indicating a need to improve reliability for Vietnamese commercial banks wishing to be
more competitive in the market. According to the t-test and ANOVA results for
differences in the level of satisfaction based on respondent characteristics, there is a
difference in satisfaction between male and female respondents. More specifically, the
results suggest that female customers require higher service standards in the banking
industry than their male counterparts. Customer age and experience showed no
differences in the level of satisfaction. Vietnamese commercial banks have developed
banking services with many extra advantages, particularly for deposit services. This
study examines the relationships between the factors in the SERVQUAL model and
customer satisfaction with the use of deposit services of Vietnamese commercial banks.
INDIAN STUDIES
Parasuraman A, Valarie A. Zeithaml and Leonard L. Berry (1985)32
carried
out an extensive exploratory investigation of quality in four service business
organisations and developed a model of service quality. The research revealed ten
30
Krystallia and Chrysochou (2014), ―The Effects of Service Brand Dimensions on Brand Loyalty‖,
Journal of Retailing and Consumer Services, Vol. 21(2), Pp. 139-147. 31
Tran Van Quyet, Nguyen Quang Vinh and Taikoo Chang (2015), ―Service Quality and Its Effects on
Customer Satisfaction with Deposit Services in the Banking Industry‖, Advanced Science and
Technology Letters, Vol. 8(8) Pp.18-23. 32
Parasuraman A, Valarie A Zeithaml and Leonard L Berry, (1985) ―A Conceptual Model of Service
Quality and its Implications for Future Research‖, The Journal of Marketing, Vol. 49(4), Pp.41-50.

41
dimensions that consumers use to form expectation about services and perception about
services. The research also pinpointed four key areas or gaps on the service providers‘
side that are likely to affect service quality as perceived by consumers.
Parasuraman A et al., (1988)33
developed a 22-item instrument (called
SERVQUAL) for assessing customer perceptions of service quality in service
organizations, the procedures used in constructing and refining a multiple-item scale to
measure the construct and the scale‘s reliability, factor structure, and validity on the
basis of analyzing data from four independent samples are presented and concluded the
paper with a discussion of potential application of the scale.
Parasuraman A, Valarie A. Zeithaml and Leonard L. Berry (1993)34
developed a conceptual model that depicts the nature and determinants of customer
expectations of service. The model specified three different types of service
expectations: desired service, adequate service and predicted service. They have also
discussed about seventeen propositions about service expectations and their
antecedents.
Gupta (2000)35
stated all customers expect the bankers to be polite, courteous,
helpful and understanding. He also viewed that the customers also expect to be treated
as important individuals and would be satisfied if prompt, accurate and speedy attention
is given to their work and banking problems. He said that customer services are made
up of several aspects like technical, efficiency, advisory and behavioural, after sale
service and customer amenities.
33
Parasuraman A, Valarie A Zeithaml and Leonard L Berry (1988), ―The Service-Quality Puzzle‖,
Business Horizons, Pp.35-43. 34
Parasuraman A, Valarie A Zeithaml and Leonard L Berry (1993), ―The Nature and Determinants of
Customer Expectations of Service‖, Journal of the Academy of Marketing Science, Vol. 21(1),
Pp.1-12. 35
Gupta, V.K. (2000), ―Marketing of Financial Services‖, Mohit Publishers, New Delhi, Pp.206-22

42
Khong and Richardson (2001)36
opined that as products and customer services
within the banking industry become more and more similar and substitutable, switching
costs of customers are lower and affordable. The competitive nature within the industry
has become more challenging these days. Within an intense competitive industry ―the
bank that has the largest customer base and the highest customer retention rate will be a
market leader in the industry‖
Rohini Gupta Suri (2002)37
concluded in his study that the services available
in Indian banking industry is being fully utilized by the customers as the available
services are not supplied by the bank employees effectively. Hence, the study
suggested for an effective service provision by the bank officials.
Sureshchandar G.S, et al., (2003)38
conducted a research to compare and
contrast the three groups of banks in India with respect to the service quality factors
from the perspective of the customers. They found that customers in developing
economies seem to keep the technological factors of services as core service and
systematization of the service delivery as the yardstick in differentiating good and bad
service while the human factors play a lesser role in discriminating the three groups of
banks.
Bhaskar, P.V. (2004)39
said that, once good service is extended to a customer a
loyal customer will work as an ambassador to the bank and facilitate growth of
business.
36
Khong K.W. and Richardson, S. (2001), ―Business Process Re-Engineering: A Comparison with
Other Management Techniques‖, The Journal of the Institute of Bankers India, Vol.4(119), Pp. 32-44. 37
Rohin Gupta Suri (2002), ―Services Marketing‖, Ammal Publications Pvt., Ltd., New Delhi, 2002. 38
Sureshchandar, G.S., Rajendran, C., and Anantharaman, R.N. (2003) ―Customer perceptions of
Service Quality in the Banking Sector of a Developing Economy: A Critical Analysis‖, International
Journal of Bank Marketing, Vol. 21(5), Pp. 233-242. 39
Bhaskar P.V. (2004), ―Customer Service in Banks‖, IBA Bulletin, Vol., 26(8) Pp. 9-13.
43
Bhat and Mushtaq (2005)40
in their study stated delivering higher levels of
service quality is the strategy that is increasingly being offered as a key to service
provider's efforts to position themselves more effectively in the marketplace. Almost all
banks perform same functions. Therefore, customer takes into account the relative
efficiency while choosing a particular bank. Moreover, banks carry on business with
public money and customers expect better services from them. Under such
circumstances, customers‘ decision to patronize one and not the other is based on
quality service offered to them. The results of the study lead us to the conclusion that
customers perceive that service quality of all banks is below their expectations and
suggests heavy investment on tangibility and improvement in other dimensions of
service quality.
Chauhan, (2006)41
opined that the PSBs have been forced to adopt the way of
marketing to survive in the market which further compelled to the bank employees to
change their mindset towards more improved services. The future banking will be more
technological and innovation oriented.
Jaiswal K.S and Neetu Singh (2007)42
in their study, ―Retail Banking: Indian
Scenario‖, have elaborated that customer retention and customer share are the two very
important aspects for a concern apart from attracting new customers. Customer share is
the ratio of a customer‘s purchase of a category of products or services from supplier X
to the customer‘s total purchase of products or services of that category from all
suppliers. This, thus, discard dead or nearly dead accounts from customer retained
category. The authors have also elaborated upon demographics, value, attitude, belief,
40
Bhat and Mushtaq (2005), ―Service Quality Perceptions in Banks: A Comparative Analysis‖, Vol.
9(1), Pp. 11-20 41
Chauhan, M. (2006), ―Banking Industry in India: The developing Trends‖, Monthly Commentary,
Vol. 36(10), Pp. 28-32. 42
Jaiswa K.S. and Neetu Singh (2007), ―Retail Banking: Indian Scenario‖ Vol. 37(1), Pp. 1-13.
44
knowledge, needs and motivation as a base for designing CRM and successful
marketing.
Aruna Dhale and Manish Mittal (2008)43
carried out a study to obtain the
primary opinion of the customers of the State Bank of India, HDFC, ICICI, IDBI and
UTI (now Axis Bank) as representatives of public and private sector banks. It was
found from the study that the customers of private banks are more satisfied than the
customers of the SBI. It was also identified that customers of SBI are more sensitive
towards the processing time taken for account handling and technological updates
while in the case of private banks, nearby location of bank to residential area and delay
in the processing time are the reasons to change the existing bank with a new one.
Ashok Kumar and Rajesh (2009)44
found from the study that both public
sector banks and private sector banks bare lack in one or more aspect of service quality
and there is no significant difference between overall customer satisfactions in the
banks. They concluded that banks should aim at satisfying the customers by providing
maximum features in their banking services. Technological upgradation can be
undertaken through implementation of core banking solutions and development of
techno-savvy innovative products and services should be carried out.
In the RBI report on trends and progress of banking in India (2009)45
it is
clearly stated that commercial Banks need to become conscious as they are entering a
challenging environment and will have to redefine their position with the financial
industry. New ways and methods will have to be determined in order to successfully
43
Aruna Dhale and Manish Mittal (2008), ―Preferences, Satisfaction Level and Chances of Shifting: A
Study of the Customers of Public Sector and New Private Sector Banks‖, The ICFAI Journal of Bank
Management, Vol. 7(2), Pp.62-74. 44
Ashok Kumar and Rajesh (2009), ―Whether Today‘s Customers are Satisfied? - A Study with
Banks‖, Indian Journal of Marketing, Vol. 39(9), Pp.56-62. 45
The Hindu Editorial (2003), ―Trends and Progress of Banking in India – A Snapshot‖, The Hindu,
Nov.29.

45
response to the new challenges, particularly when there is a growing demand from
customers for high quality service.
Ramesh H Taxak and Manjeet Kaur (2009)46
analysed and compared the
customer satisfaction level in public and private sector banks. They concluded that
public sector bank provides better services to their customer than private sector banks.
The customer of public sector banks are more satisfied with traditional banking
service such as demand draft and cheque book facility as compared to private sector
banks whereas the customers of private sector banks are more satisfied with counter
services such as cash deposits, cash payments, issue of draft, cheque payment and
cheque deposit facilities provided by the bank.
Arun Kumar, et al., (2010)47
examined the service quality dimensions of
Indian private banks dealing with retail banking. The results revealed that
responsiveness and reliability of service quality dimensions determine customer
satisfaction more than assurance, empathy and tangible aspects. They concluded that
the overall perceived service quality leads to customer‘s attitudinal loyalty through
customer satisfaction.
Monica Bedi (2010)48
investigated the relationship between service quality,
overall customer satisfaction and behavioural intensions across public and private
banks in India. The findings indicated that service quality is the significant determinant
of customer satisfaction in public and private sector banks. Service quality dimensions
46
Ramesh, H Taxak and Manjeet Kaur (2009), ―A Study of Customer Satisfaction in Private and Public
Sector Banks‖, Gyan Management, Vol. 3(1), Pp. 43-53. 47
Arun Kumar, S. Tamil Mani, B. Mahalingam, S. and Vanjikovan, M. (2010), ―Influence of service
Quality on Attitudinal Loyalty in Private Retail Banking: An Empirical Study‖, The IUP Journal of
Management Research, Vol. 9(4), Pp.21-38. 48
Bedi and Monica (2010), ―An Integrated Framework for Service Quality, Customer Satisfaction and
Behavioral Responses in Indian Banking Industry - A Comparison of Public and Private Sector
Banks‖, Journal of Services Research, Vol. 10 (1), Pp. 15-17.
46
were found to be statistically significant in public and private banks and customer
satisfaction was strongly associated with propensity to recommend.
Ravichandran, et al., (2010)49
examined the influence of perceived service
quality on customer satisfaction using an adaptive Bayesian frame works in private
sector banks. Bayesian structural regression estimates are shown to provide a banking
institution with reliable information for use in positioning the private banks in its
market place. The study concludes that increase in service quality of the banks can
develop customer satisfaction which ultimately retains valued customers.
Uma Sankar Mishra, et al., (2010)50
proposed two structural equation models
(SEMs), one for the public and another for private sector banks in India, to show the
relationship between customer satisfaction on bank services and the attributes of the
perceived service quality. Specifically, the structural equation model is formulated to
explore the impact of the relationship between customer satisfaction and service quality
attributes. In this context, two proposed structural equation models (SEMs) show the
relationship between customer satisfaction on bank services and the attributes of the
perceived service quality. The proposed models was to identify the service quality
attributes to improve, with the aim of offering banking services characterized by higher
levels of quality.
49
Ravichandran, K. Tamil Mani, B. Arun Kumar, S. and Prabhakaran, S. (2010), ―Influence of Service
Quality on Customer Satisfaction Application of SERVQUAL Model‖, International Journal of
Business and Management‖, Vol. 5(4), Pp. 17-20. 50
Uma Sankar Mishra, Jyoti Ranjan Das, Sanjib Pattnaik, Ayasa Kanta Mohanty (2010), ―Service
Quality Attributes Affecting Customer Satisfaction in Banking Sector of India‖, European Journal of
Economics, Finance and Administrative Sciences, Vol. 24, Pp.89-99.

47
Haque and Imamul (2011)51
in their study stated service quality in Indian
banking sector is considered as main determinant of customer satisfaction. Before
liberalization the banking sector in India was mainly dominated by nationalized banks.
In the pre-liberalized era, the nationalized banks did not pay much attention on the
service quality performance and customer satisfaction. After liberalization and
implementation of the Narsimham Committee Report, Indian Banks are facing tough
competition from the new private and foreign banks. These new generation banks were
characterized by the usage of modern information technology network and modern
banking services, like ATM, debit card, online banking facilities. Customers were
offered and delivered by modern private sector banks and foreign banks, a wide range
of banking services. The need of hour for the Indian banking sector is to enhance their
services quality and shore up their competitive capabilities, making the banks more
market oriented and customer friendly.
Kajal Chaudhary and Monika Sharma (2011)52
in their article on evaluation
of the financial economy stated that Narashiman Committee enabled the setting up of
new banks in private sector which have grown considerably after its inception. But now
the situations have changed new generation banks with use of technology and
professional management has gained a reasonable position in the banking industry.
Narayan Swar and Biranchi (2011)53
in their study stated that the need of the
hour in the Indian banking sector is to build up competitiveness through service quality
51
Haque and Imamul, Service Quality in Retail Banking (2011), ―A Comparative Study Between Public
Sector Banks & Private Sector Banks‖, International Journal of Management & Innovation, Vol. 3(2),
Pp. 26-34. 52
Kajal Chaudhary and Monika Sharma (2011), ―Performance of Indian Public Sector Banks and
Private Sector Banks: A Comparative Study‖, International Journal of Innovation, Management and
Technology, Vol. 2(3), Pp. 249-256. 53
Narayan Swar and Biranchi (2011), ―A Study of Customer Satisfaction & Service Quality Gaps in
Selected Private, Public & Foreign Banks‖, SIES Journal of Management, Mar 2011, Vol. 7(2),
Pp. 62-73.
48
so as to making the banks more market oriented and customer friendly. Effective
service quality is increasingly being seen as a key strategic differentiator within the
financial services sector. Thus, the present study focuses on customer satisfaction and
service quality gap (customers' perceptions and expectations) measurement among
public, private & foreign banks in Orissa. The study conducted among six banks of the
state, namely State Bank of India (SBI) and Punjab National Bank (PNB) in public
sector banks, ICICI Bank & Axis Bank in the private sector banks, and Citi Bank and
Standard Chartered Bank among the foreign banks. A sample of 440 banking customers
was taken and 300 useable questionnaires were analyzed.
Pandit C. Bilamge (2011)54
conducted a comparative study on customer
satisfaction in ICICI bank and State Bank of India and found that the behavior of the
ICICI Bank staff is more cordial than the staff of SBI. The maintenance of ATMs and
token system in ICICI bank was much appreciated by all the customers where as it was
not up to the expected level of customers in SBI and the basic facilities are lacking in
both the banks.
Rama Mohana Rao K, et al., (2011)55
conducted the study to examine the
service quality perceptions of the customers of public sector and private sector banks in
the city of Visakhapatnam, India. A total of 300 respondents were surveyed using the
universally accepted SERVQUAL model in which 42 quality measurement parameters
are used under the five dimensions of service quality namely tangibility, reliability,
assurance, responsiveness and empathy. The study reveals that the reliability and
assurance dimensions of service quality scored the highest ratings while the tangibility
54
Pandit C. Bilamge (2011), ―A Comparative Study of Customer Perception Towards Services
Rendered by Public Sector and Private Sector Banks‖, Indian Journal of Commerce & Management
Studies, Vol. 2(2), Pp.110-113. 55
Rama Mohana Rao, K. and Tekeste Berhanu Lakew (2011), ―Service Quality Perceptions of
Customers: A Study of the Customers‘ of Public Sector and Private Sector Commercial Banks in
India‖, International Journal of Research in Commerce & Management, Vol. 2 (11) Pp.13-16.
49
dimension got the lowest score. Moreover, the study found a strong dissimilarity in
service quality perceptions between customers of private sector and public sector
banks.
Satendra Thakur, et al., (2011)56
examined the relationship between service
quality and customer satisfaction among group of customer towards the public sector
banking industries in India. The study is cross sectional and descriptive in nature.
Service quality consists of service product, service delivery and service environment,
whereas service product refers to the technical quality of service, service delivery refers
to functional quality and service environment refers to internal and external. 400
questionnaires distributed to the customer of different department and agency, where
304 is returned back. The hypotheses were tested using the multiple regressions.
The finding indicates that service product is significantly and positively related to
customer satisfaction. However, service delivery and service environment are not
significant predictors of customer satisfaction.
Uppal R.K (2011)57
examined the customer delightedness from different
banking services in Punjab through a well-structured and pre-tested questionnaire.
The results of the study indicated that customers of Indian private and foreign sector
banks are more delighted than their counterparts and suggested that certain strategies
are to be developed to enhance the quality of service in banks particularly in public
sector banks.
56
Satendra Thakur, A.P Singh (2011), ―Service Quality and Customer Satisfaction: A Study with
Special Reference to Public Sector Banking Industries in India‖, International Journal of Management
Research and Review, Vol. 1(1), Pp.24-38. 57
Uppal R.K. (2011), ―Customer Delight - A Milestone for the Banks‖, Journal of Arts, Science and
Commerce, Vol. 2(4), Pp.11-22.
50
Vanniarajan, T and Subbash Babu, K (2011)58
in his study stated
globalization leads to lot of changes in the financial service industry. The competitive
pressures in the service industry are mounting up. The service quality is recognised as
an only weapon to survive in modern banking industry. The service quality of
commercial banks rests on the internal service quality. It reflects the concept of high-
touch in banking activities. The study was conducted among the bank employees and
the customers' in the public and private sector banks at Madurai, Tamilnadu. The study
identified that the important internal service quality factors are their employees' and
customers' orientation, team orientation and employee orientation, learning
environment and outcome orientation.
Shobhana, V. K, et al., (2012)59
conducted a study based on this SERVQUAL
scale, covering 200 customers of the select commercial banks located in Erode District
of Tamilnadu. Factor Analysis has been employed to analyze the data. The findings of
the study indicated higher gaps for the service quality dimension empathy.
Jayant Kumar P.H. and Prajakta H. (2012)60
examined the service quality
aspects of public and private banks in north Gujarat region. Customer expectations and
perceptions were measured and analyzed from current research. 300 customers of
public and private banks were surveyed through questioner with 22 items on it.
Independent T Test was carried out to compare expectations of both the group of
customers. Multiple regressions was applied to understand the contributions of
independent variables like age, gender, occupations, annual incomes, education in
58
Vanniarajan, T. and Subbash Babu, K. (2011), ―Internal Service Quality and its Consequences in
Commercial Banks: A HR Perspective‖, Global Management Review, Vol. 6(1), Pp. 42-57. 59
Shobhana, V.K. and Poornima, D. (2012), ―Analysis of Gap in Service Quality of Banks Through
Servqual‖, Asian Journal of Research in Banking and Finance, Vol. 2(5), Pp.51- 63. 60
Jayant Kumar, H.P and Prajakta, H. (2012), ―Expectation and Perception of Customers Across the
Public and Private Sector Banks: An Empirical Study of Selected Banks in North Gujrat‖, Journal of
Applied Management & Computer Science, Vol. 1, Pp. 12-13.
51
explaining expectations and perception. Two Regression models were developed.
The result explained the in regression model for expectations, occupations and
education were found to be the most explanatory variables among all and expectations
was highly dependent or occupation and education.
Kailash, M. (2012)61
analyzed the performance among public and private
sector banks in Vijayawada city using the list of service attributes based on different
service dimensions such as tangibility, reliability, responsiveness, assurance and
empathy during December 2011. The simple random sampling technique is adopted
and 175 respondents taken as samples. The findings show that private sector banks
performed significantly by satisfying its customers with good services and they have
been successful in retaining its customers by providing better facilities than public
sector banks. The research revealed that new financial products and services have to be
continuously introduced in order to stay competent and that public sector banks have to
build long term strategic relationships with its customers.
Murugan (2012)62
conducted a study to compare the customers‘ perceptions of
service quality in public and private banks of Tirupati region. It was found from the
research that customers of public sector banks are more satisfied than the customers of
private sector banks as regards service quality.
Nirmaljeet Virk, et al., (2012)63
attempted to make a comparative analysis of
level of customer satisfaction towards services provided by public and private sector
61
Kailash, M. (2012), ―A Study on Customer Satisfaction with Service Quality in Indian Public and
Private Sector Banks‖, Golden Research Thoughts, Vol. 1(9) Pp.1- 4. 62
Murugan V.G. (2012), ―Customer Satisfaction with Service Quality: An Empirical Study of Public
and Private Sector Banks in Tirupati Region‖, International Journal of Research in Commerce and
Management, Vol. 3(1), Pp.106-110. 63
Nirmaljeet Virk and Prabhjot Kaur Mahal (2012), ―Customer Satisfaction: a Comparative Analysis of
Public and Private Sector Banks in India‖ Information and Knowledge Management, Vol. 2(3),
Pp. 1-7.
52
banks. The study has been conducted in Chandigarh city. This study is based on
questionnaire method. A sample of 160 customers has been selected using the
convenience sampling method. This study concluded that private sector banks are more
preferred by a majority of the customer as they emphasize more upon relationship
building with their clients and are better equipped with modern infrastructure as
compared to public sector banks.
Imamul Haque, S.M. (2013)64
made a research on the title ―Retail Banking in
India since 1991: A Comparative Study of Public Sector Banks and Private Sector
Banks‖. His study revealed that the service quality dimension of 'tangibility' measures
the physical features, physical appearance, physical material such as pamphlets etc. and
reception desk employees. The perception of customers regarding the dimension
‗tangibility‘ between public sector banks and private sector banks is different.
The mean value of private sector banks is higher in comparison to public sector banks
which indicate that there is significant variation in the perception of customers
regarding the service quality dimension of tangibility between public sector banks and
private sector banks. The customers of private sector banks have positive attitude
towards the physical facilities of their banks in comparison to the customers of public
sector banks. The mean values of private sector banks is higher in comparison to public
sector banks which identifies that there is significant variation in the perception of
customers regarding the service quality dimension of reliability between public and
private sector banks.
64
Imamuel Haque, S.M. (2013), ―Retail Banking in India Since 1991: A Comparative Study of Public
Sector Banks and Private Sector Banks‖, Aligarh University, Aligarh, India.
53
Mary Sujatha. S (2013)65
opined that the customers of both public sector and
private sector banks have strongly agreed for easy accessibility of their banks from
tangibility point of view and safety of transactions aspect of assurance. There is no
difference of opinion among the customers of public sector banks and private sector
banks as far as responsiveness aspect of quality of service and confidence building and
technology augmentations by their respective banks. Customer‘s of age above 55 years
in public sector banks have strongly agreed for the existence of assured quality with
regard to responsiveness, assurance and empathy factors in public sector banks and all
the customers whether married, single or others have strongly agreed for tangibility
aspect of service quality. There is no influence of age and marital status in case of
private sector banks.
Rashmi Sharma (2013)66
conducted a study on the title ―A Comparative Study
of E-Banking in Public and Private Sector Banks with Special Reference to SBI and
HDFC bank‖. This research was examined in Jaipur, Rajasthan. The major objectives
of the research were to assess the customers‘ and bank employees‘ satisfaction level
with the current banking facilities and to find the most important factor that is inducing
people towards e-banking. This study concluded with the message that There is greater
incidence of e-banking usage among the middle age men (26 to 50 years of age); and
women customers use such services much less frequently. Occupation-wise, the
professionals, followed by business class, make more use of e-banking services.
In order to make e-banking more popular, banks must separate their customers based
65
Mary Sujatha, S. (2013), ―A Comparative Study on the Customer Satisfaction in Private Sector and
Public Sector Banks with Reference to Chennai City‖ Mother Teresa Women‘s University,
Kodaikanal, Tamilnadu, India. 66
Rashmi Sharma (2013), ―A Comparative Study of E-Banking in Public and Private Sector Banks with
Special Reference to SBI and HDFC Bank‖, The IIS University, Jaipur, Tamilnadu, India.
54
on demographic priority (i.e., age, gender, occupation etc.) and customize e-banking
services as per their needs and requirements.
Sathya S. (2013)67
conducted a research on the title ―A Study on Service
Quality in Commercial Banks: A Comparative Study between Public and Private Sector
Banks in Salem city‖. The major objectives of the study were to analyze the customers‟
perceived and desired levels of service quality of their banks, to examine the service
quality gap prevailing between the public and private sector banks, to identify the
relationship between the socio economic status and the perceived level of service
quality of the customers. It is disclosed that the difference between the sample public
and private sector banks on the tangibility dimension was found to be more on modern
looking equipments. In the case reliability dimension factor, bank employees keep their
promises. On the responsiveness dimension factor, employees are never too busy to
respond to the request. On the assurance dimension factor, employees have knowledge
to answer the questions and on the empathy dimension factor, customers‘ interests have
recorded the highest difference in the service quality. This indicates the better
performance of the private sector banks in terms of these indicators on perceived level
of service quality when compared to the public sector banks.
Sivaraman, P. (2013)68
conducted a research on the title ―A Study on the Effect
of Service Quality on Customer Satisfaction in the Public Sector Banks in Tiruvarur
district of Tamilnadu‖.He found that the average score of total expectations is 24.18
and the overall perception score of tangibles is 1697. The score shows a -6.26
67
Sathya, S. (2013), ―A Study on Service Quality in Commercial Banks: a Comparative study Between
Public and Private Sector Banks in Salem City‖ Manonmaniam Sundaranar University, Tirunelveli,
Tamilnadu, India. 68
Sivaraman, P. (2013), ―A Study on the Effect of Service Quality on Customer Satisfaction in the
Public Sector Banks in Tiruvarur District of Tamilnadu‖, Khadir Mohideen College, Bharathidasan
University, Adirampattinam, Tamilnadu, India.
55
difference. It implies that the expectations are higher than the perceived service quality.
The respondents have a negative gap score for all the parameters except the parameter
‗bank employees are well dressed and appear neat‘. In this parameter perceptions of the
customers are close to their expectations. The average score for overall expectations
and perception about reliability was 18.33 and 32.01. The average service quality score
was -13.68. It is understood from the study that there is a gap in service quality with
regard to reliability. The respondents have secured negative gap score for all the
parameters except the parameter ‗bank keeps its records accurate‘. The respondents
have low perceived service quality for the parameter ‗when bank promises to do
something by a certain time, it does so‘ followed by the parameter ‗bank performs the
service right the first time‘. Therefore, it can be inferred from the study that the
customers are not at all satisfied with the service quality with regard to reliability.
Sunny et al., (2013)69
studied the difference in service quality between public
sector banks and new generation private sector banks in India based on SERVQUAL
scale. The results revealed that the new generation private banks provide better quality
of service when compared to the public sector banks.
Vinita Kaura (2013)70
analysed the effect of service quality, perceived price
and service convenience on customer satisfaction. The author identified employee
behaviour, tangibility, information technology, access convenience, transaction
convenience, decision convenience and benefit convenience as the dimensions of
service quality. The study revealed that except tangibility all the other dimensions have
positive impact on customer satisfaction in public sector banks and in case of private
69
Sunny Bose and Nitin Gupta (2013), ―Customer Perception of Services Based on the SERVQUAL
Dimensions: A Study of Indian Commercial Banks‖, Services Marketing Quarterly, Vol. 34(1). 70
Vinita Kaura (2013), ―Antecedents of Customer Satisfaction: A Study of Indian Public and Private
Sector Banks‖, International Journal of Bank Marketing, Vol. 31(3), Pp.167-186.
56
sector banks benefit, convenience and tangibility does not have a positive impact on
customer satisfaction.
Rengaswamy Nalini, et al., (2014)71
said that the State Bank of India (SBI)
ranks as 67th
in the list of largest banks in the world based on market capitalization as
of March 31st
2014. The quality of service extended by the SBI has resulted in customer
satisfaction and expanded customer base for the bank. Random sampling method is
adopted for the collection of data from the respondents. In Tiruchirappalli regional
office of State Bank of India, area operations are selected within 10 Kilometer radius
from the main branch and 60 questionnaires per branch have been distributed in 10
branches. Out of 600 questionnaires, 109 are found incomplete and 491 are fully
complete with 81.83 per cent of response rate. The data collected were analysed with
the help of MS Excel to identify the gaps. The Cronbach alpha, a measure of internal
consistency obtained is 0.925 which is considered to be excellent. This study aims to
identify the gaps in the dimensions of service quality by administering SERVQUAL
model among the customers in State Bank of India. An overall weighted SERVQUAL
score of –1.42866 was arrived, representing a significant inconsistency in meeting
customer expectations across all service dimensions. Highest gap scores for reliability
and empathy depicts that there is a need for courtesy and politeness among SBI
employees which in turn will help to establish a long term relationship with the
customers. The relatively low gap scores were found for responsiveness, tangibles and
assurance dimensions. The State Bank of India has to take steps to close the gaps and it
can be closed by establishing and implementing a service quality information system.
71
Rengaswamy Nalini, Ramachandran Amudha, Venkatarayareddiar Sujatha, Rengaswamy Radha
(2014), ―A Pragmatic Study on the Service Gap Analysis of an Indian Public Sector Bank‖, Business:
Theory and Practice‖, Vol. 15(4), Pp. 381-389.
57
Mukta Dewan and Sadhana Mahajan (2014)72
stated that the perception of
male and female customers varied significantly for the overall service quality and its
dimensions reliability, responsiveness, assurance and empathy. It was found that the
male customers had a more positive perception of service quality as compared to the
female counterparts. The differences on the basis of age were significant for tangibility,
responsiveness and empathy. The high mean scores of the older age groups for
tangibility and empathy indicated that they had a more positive perception about the
banks visually appealing facilities and personal attention they got from the staff.
Different income groups varied significantly for their perception of the tangibility,
reliability, responsiveness, assurance and empathy dimensions of the service quality of
the HDFC bank. It was observed that in the HDFC Bank the higher income customers
had a more positive perception regarding the overall service quality as compared to the
lower income groups. There was a significant difference in the perception of married
and unmarried customers for overall service quality. The married customers had a more
positive perception of the overall service quality than their unmarried counterparts
Navneet Kaur and Ravi Kiran (2015)73
opined that improvement in service
quality would induce higher customer loyalty. The initial part of their research
measures banking services through debit, credit, internet, telephone, mobile,
depository, investment and multicity facilities in three types of banks. The results of
ANOVA highlight that there is a significant difference in these facilities of public,
private and foreign banks. Factor analysis results help to reduce 12 features of service
72
Mukta Dewan, SadhanaMahajan (2014), ―A Study of the Perceived Service Quality and its
Dimensions in Private Sector Banks‖, IOSR Journal of Business and Management (IOSR-JBM)
E-ISSN: 2278-487X, Vol. 16(2), Pp. 44-51. 73
Navneet Kaur and Ravi Kiran (2015), ―E-Banking Service Quality and Customer Loyalty: Changing
Dynamics of Public, Private and Foreign Bank Consumers in India‖, School of Behavioral Sciences
and Business Studies, Thapar University, Patiala, Punjab, India.
58
quality into four factors. These four factors explain 84.014 per cent of variation. These
four factors are website interface, security, convenience and access.
Pinky Dholakiya (2015) made a study on the title ―A Comparative Study of
Customer Friendly Services of Indian Private and Public Sector Banks with Special
Reference to E-Banking and M-Banking‖. From the study, it is understood that a
majority of the respondents opined that service quality of private sector banks are
comparatively better than public sector banks. In addition, 45 per cent of the
respondents of private sector banks have been fast in keeping pace with the changing
technology, whereas only 22.67 per cent of the customers were in favour of public
sector banks and 32.33 per cent customers favour both the sectors.
Singh J.P. and Manish Seth (2016)74
opined that capital adequacy
performance of selected top 8 public and private sector banks in India (As per market
capitalization). Capital adequacy performance of public sector banks such as State
Bank of India, Bank of Baroda, Punjab National Bank and in private sector bank ICICI
Bank, HDFC Bank, AXIS Bank and Kotak Mahindra Bank having sound capital
adequacy performance. But there is a need to maintain adequate soundness to Central
Bank of India. This bank does not fulfill the criteria of minimum prescribed level of
percentage which is suggested by Reserve Bank of India of 12 per cent in several years
under the study period. This bank's average percentage of Capital Adequacy ratio is
also below the prescribed level of RBI. As per above study that Capital Adequacy
performance of private sector banks is good in comparison to public sector banks.
74
Singh, J.P., Manish Seth (2016), ―An Inclusive Study on Capital Adequacy Performance of Selected
Public Sector and Private Sector Banks in India‖, International Journal of Multifaceted and
Multilingual Studies, (Online): 2350-0476, Vol. 3(10).
59
Mahila Vasanthi Thangam (2016)75
stated that the banks‘ overall profitability
and productivity indices reveal that both public and private sector banks are profitable.
With the increasing competition in the banking sector, profitability and productivity has
become a greatest challenge to Indian commercial banks. Banks should explore every
possibility for improvement and increase the profitability. Attempts should be made to
control over expenses and also the resources should be utilised in a more efficient
manner.
Dilpreet Singh et al., (2017)76
stated that both private banks and public banks
are using different means to achieve new market entry. While private sector banks
make use of low cost innovative strategies to achieve penetration, the public sector
banks rely on traditional high cost means. Growth and profits are the two most
significant motivators that are driving new market entry in banking. But, while private
sector banks are only driven by these motives, public sector banks also seek market
penetration under regulatory and social obligations. This explains their interest in
pursuing strategies likely to benefit the society and economy more than the banks
themselves
RESEARCH GAP
Majority of the above said studies dealt with service quality of banking
companies. Some of the studies concentrated on preference aspect in banking
companies. A few of the studies focused on technical advancements in the field of
banking companies. However, there are only a very few studies on service quality
perception. Several earlier studies repeatedly stated that the respondents gave poor
75
Mahila Vasanthi Thangam (2016), ―Profitability Analysis of Selected Public and Private Banks in
India‖, International Journal of Scientific Engineering and Applied Science (IJSEAS), Vol. 2(2). 76
Dilpreet Singh, Dr. Harpreet Singh and Dr. Namrata Sandhu (2017), ―New Market Entry Strategies:
Public and Private Sector Banks in India‖, SCMS Journal of Indian Management, January - March,
ISSN: 0973-3167, Vol. 14(1), Pp. 123-134.
60
opinion towards public sector banks compared with private sector banks as regards
hospitality, technical advancement, reliability and the like. But the conundrum is that,
public sector banks are having more number of customer base. This fact denotes that
beyond customer satisfaction, there are some aspects which decide customers‘
perception and preference which haven‘t yet dealt with in the earlier studies.
Service quality, perception and preference are psychological phenomenons
which are driven by one another. Most of the above mentioned studies haven‘t included
these three aspects together. Further, most of the previous researches failed to address
the impact of poor service quality on customers‘ perception and preference. These three
dimensional factors namely service quality, perception and preference must be
discussed in the same floor in order to bring out the original mind map possessed by
customers about service providers. Hence, the present study has been undertaken by the
researcher for bridging the identified research gap.
61
CHAPTER III
PROFILE OF THE BANKING SECTOR IN THE STUDY AREA
3.1 GENERAL PROFILE OF TIRUNELVELI DISTRICT
Tirunelveli district was formed in 1790 by the East India company, later came
under the direct control of the British Crown Queen Victoria. The name Tirunelveli has
been composed from the three Tamil words i.e. ‗Thiru – Nel – Veli‘ meaning Sacred
Paddy Hedge. Tirunelveli District having geographical area of 6759 sq.kms, in the
south eastern portion of Tamilnadu is triangular in shape. It lies between 8°.05‘ and
9°.30‘ of the Northern latitude and 77°.05‘ and 78°.25‘ of Eastern longitude.
The district is located in the southern part of Tamilnadu and surrounded by
Virudhunagar District in the north, Western Ghats in the West, Kannyakumari district
in the south and Tuticorin district in the East. The lifeline of the district river
Tamiraparani feeds the district and quenches the thirst of residents of Tirunelveli and
Tuticorin district too and also supplying drinking water to Virudunagar district
3.2 POPULATION
The population of the district was 30,77,233 as per 2011 census. The Density of
Population per sq.km. was and 460 persons as per 2011 census. Tirunelveli, Tenkasi
and Ambasamudram are the most densely populated Taluks in the District as per 2011
census. The Sex ratio is 1,023 females for every 1,000 males. The Literacy rate is
82.50% in the District as per 2011 census. Out of total population, males are 13,33,939
and females 13,90,049 in 2001 census and males are 1520912 and females 1556321 as
per 2011 census. Total Schedule caste population is 5,69,714 which represent 18.5% to
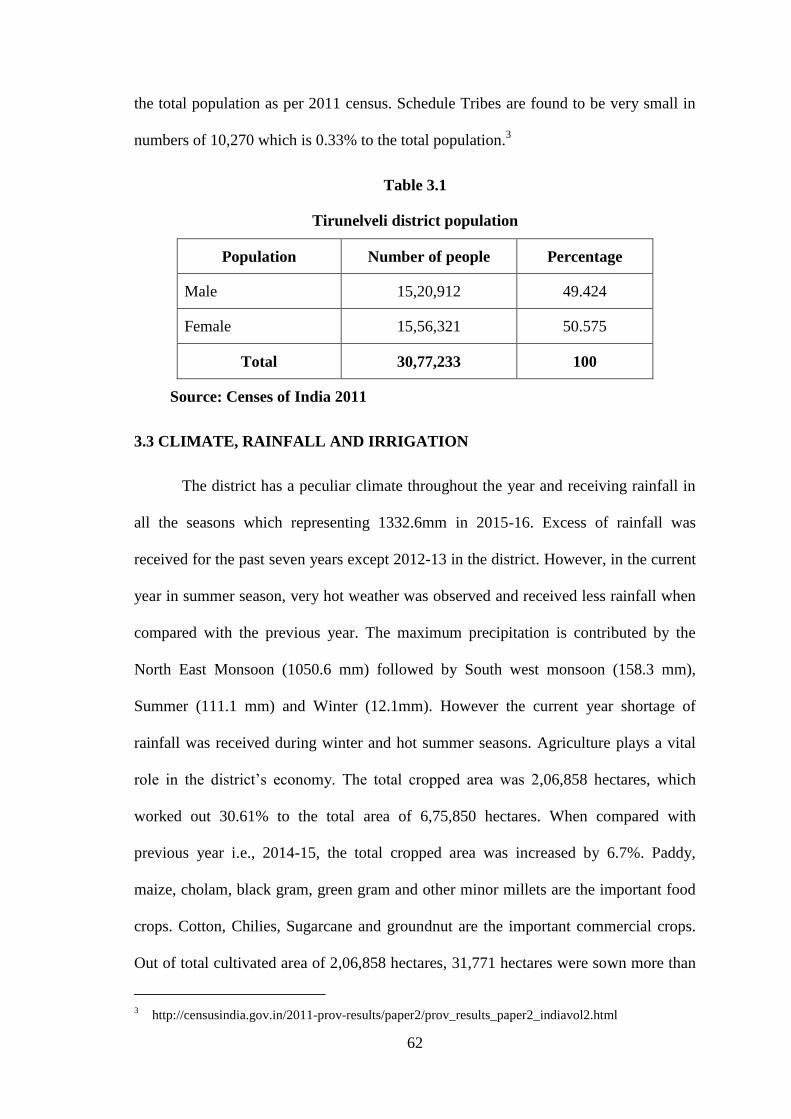
62
the total population as per 2011 census. Schedule Tribes are found to be very small in
numbers of 10,270 which is 0.33% to the total population.3
Table 3.1
Tirunelveli district population
Population Number of people Percentage
Male 15,20,912 49.424
Female 15,56,321 50.575
Total 30,77,233 100
Source: Censes of India 2011
3.3 CLIMATE, RAINFALL AND IRRIGATION
The district has a peculiar climate throughout the year and receiving rainfall in
all the seasons which representing 1332.6mm in 2015-16. Excess of rainfall was
received for the past seven years except 2012-13 in the district. However, in the current
year in summer season, very hot weather was observed and received less rainfall when
compared with the previous year. The maximum precipitation is contributed by the
North East Monsoon (1050.6 mm) followed by South west monsoon (158.3 mm),
Summer (111.1 mm) and Winter (12.1mm). However the current year shortage of
rainfall was received during winter and hot summer seasons. Agriculture plays a vital
role in the district‘s economy. The total cropped area was 2,06,858 hectares, which
worked out 30.61% to the total area of 6,75,850 hectares. When compared with
previous year i.e., 2014-15, the total cropped area was increased by 6.7%. Paddy,
maize, cholam, black gram, green gram and other minor millets are the important food
crops. Cotton, Chilies, Sugarcane and groundnut are the important commercial crops.
Out of total cultivated area of 2,06,858 hectares, 31,771 hectares were sown more than
3 http://censusindia.gov.in/2011-prov-results/paper2/prov_results_paper2_indiavol2.html
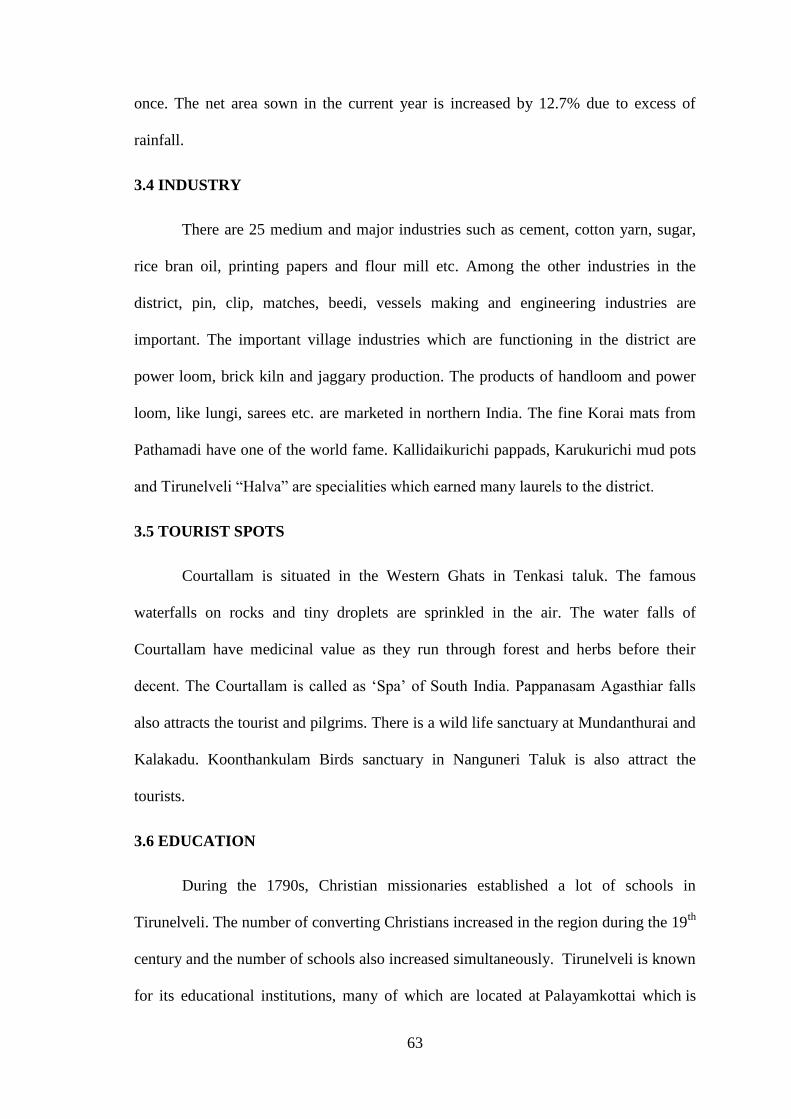
63
once. The net area sown in the current year is increased by 12.7% due to excess of
rainfall.
3.4 INDUSTRY
There are 25 medium and major industries such as cement, cotton yarn, sugar,
rice bran oil, printing papers and flour mill etc. Among the other industries in the
district, pin, clip, matches, beedi, vessels making and engineering industries are
important. The important village industries which are functioning in the district are
power loom, brick kiln and jaggary production. The products of handloom and power
loom, like lungi, sarees etc. are marketed in northern India. The fine Korai mats from
Pathamadi have one of the world fame. Kallidaikurichi pappads, Karukurichi mud pots
and Tirunelveli ―Halva‖ are specialities which earned many laurels to the district.
3.5 TOURIST SPOTS
Courtallam is situated in the Western Ghats in Tenkasi taluk. The famous
waterfalls on rocks and tiny droplets are sprinkled in the air. The water falls of
Courtallam have medicinal value as they run through forest and herbs before their
decent. The Courtallam is called as ‗Spa‘ of South India. Pappanasam Agasthiar falls
also attracts the tourist and pilgrims. There is a wild life sanctuary at Mundanthurai and
Kalakadu. Koonthankulam Birds sanctuary in Nanguneri Taluk is also attract the
tourists.
3.6 EDUCATION
During the 1790s, Christian missionaries established a lot of schools in
Tirunelveli. The number of converting Christians increased in the region during the 19th
century and the number of schools also increased simultaneously. Tirunelveli is known
for its educational institutions, many of which are located at Palayamkottai which is
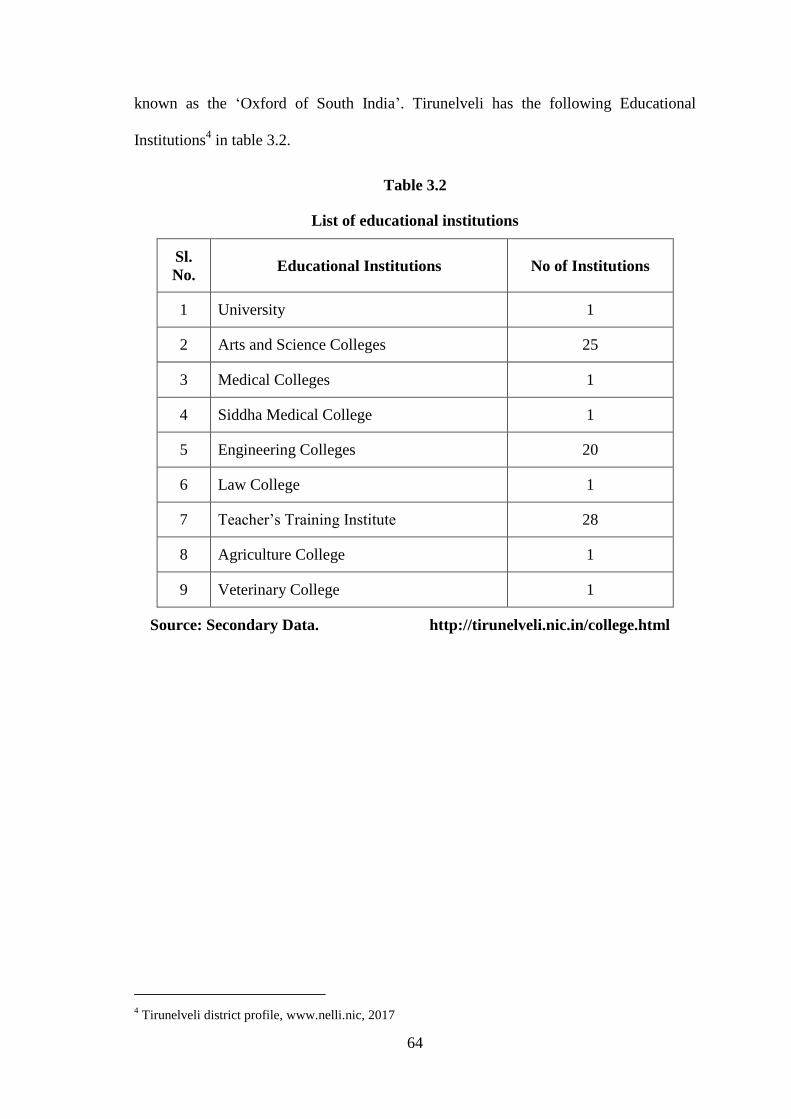
64
known as the ‗Oxford of South India‘. Tirunelveli has the following Educational
Institutions4 in table 3.2.
Table 3.2
List of educational institutions
Sl.
No. Educational Institutions No of Institutions
1 University 1
2 Arts and Science Colleges 25
3 Medical Colleges 1
4 Siddha Medical College 1
5 Engineering Colleges 20
6 Law College 1
7 Teacher‘s Training Institute 28
8 Agriculture College 1
9 Veterinary College 1
Source: Secondary Data. http://tirunelveli.nic.in/college.html
4 Tirunelveli district profile, www.nelli.nic, 2017
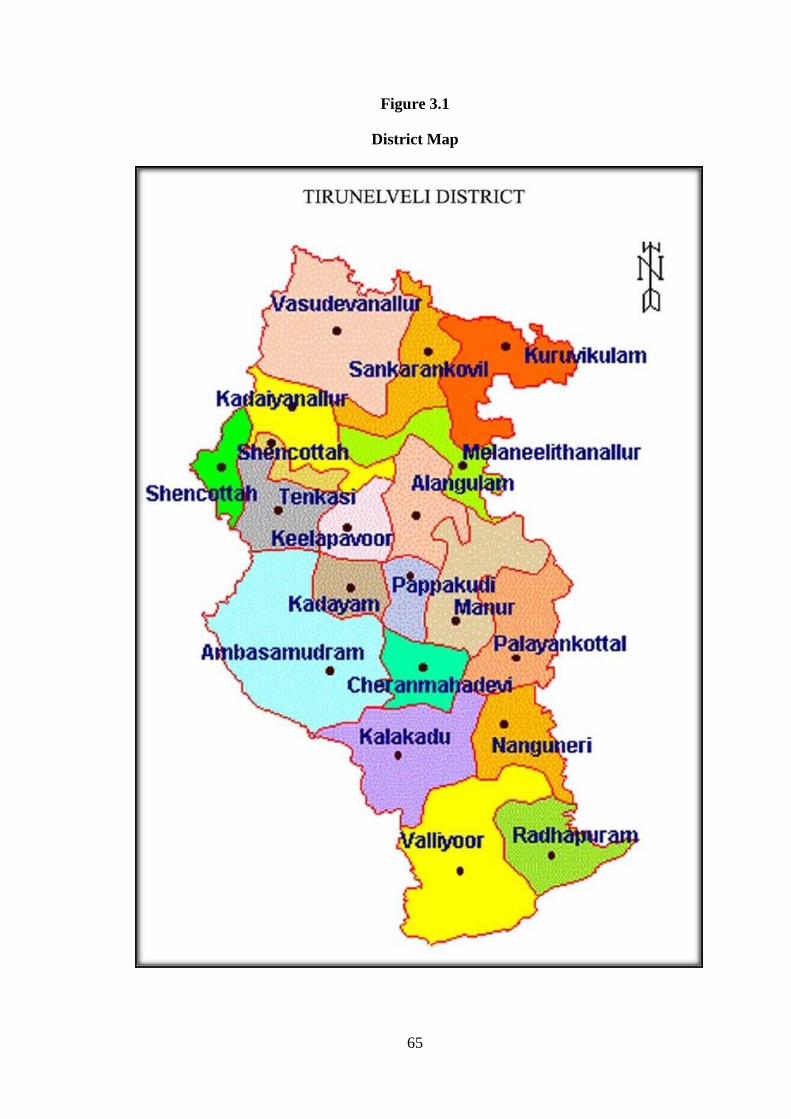
65
Figure 3.1
District Map
66
3.7 PUBLIC SECTOR BANKS IN TIRUNELVELI
In Tirunelveli district as on 31st March 2016, there are 20 public sector banks
which operates and performing various financial services through 228 branches. Apart
from state bank groups, Indian Overseas Banks had contributed to entrepreneurial
activities by providing ` 332,00,00,000 worth assistance to MSMEs.5 Indian Bank
provided ` 35,91,15,000 worth financial assistance as export credit to export related
units. Corporation banks contributed ` 2,40,000 worth financial assistance to social
infrastructure projects.
3.7.1 Growth of branches public sector banks
In case of nationalised bank branches in study area, Indian Overseas bank
stands first with having 67 branches in Tirunelveli. Next to Indian Overseas Bank,
Canara bank stands second place in no. of branches with second maximum no. of 35
branches. Total no.3.3 of state banks groups were 38.
5 Indian Overseas Bank, (Lead Bank, Tirunelveli) Statistics, 2017.
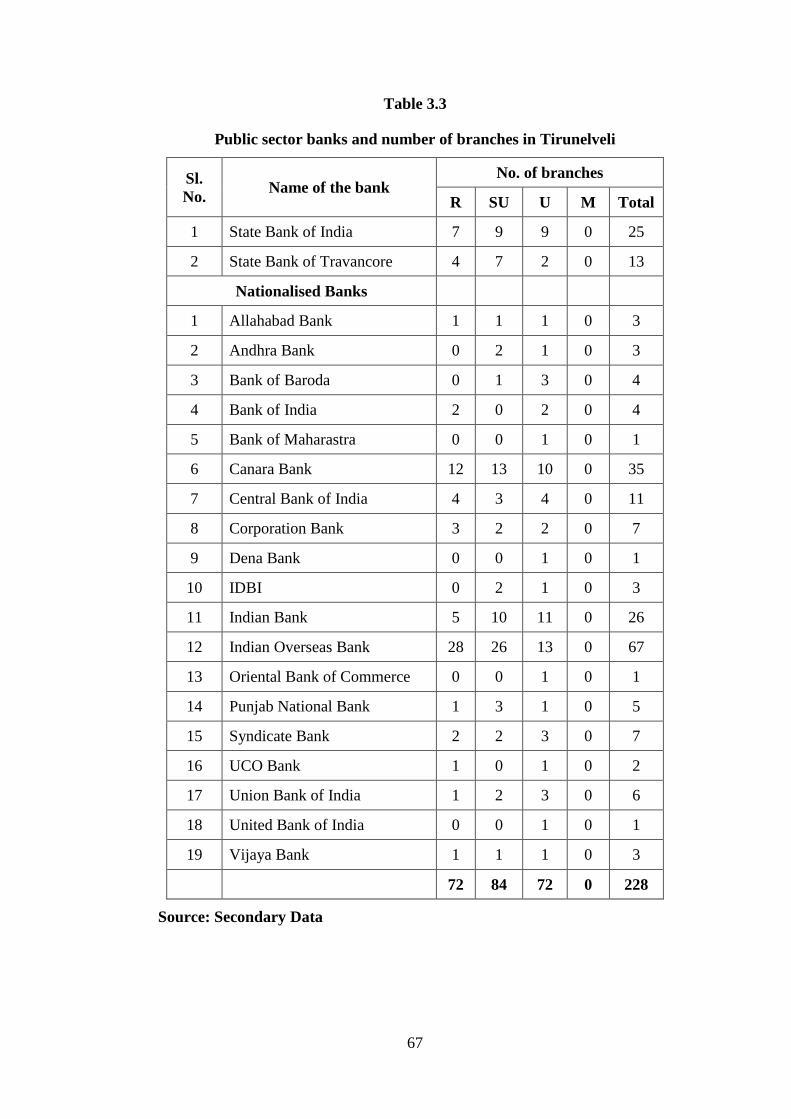
67
Table 3.3
Public sector banks and number of branches in Tirunelveli
Sl.
No. Name of the bank
No. of branches
R SU U M Total
1 State Bank of India 7 9 9 0 25
2 State Bank of Travancore 4 7 2 0 13
Nationalised Banks
1 Allahabad Bank 1 1 1 0 3
2 Andhra Bank 0 2 1 0 3
3 Bank of Baroda 0 1 3 0 4
4 Bank of India 2 0 2 0 4
5 Bank of Maharastra 0 0 1 0 1
6 Canara Bank 12 13 10 0 35
7 Central Bank of India 4 3 4 0 11
8 Corporation Bank 3 2 2 0 7
9 Dena Bank 0 0 1 0 1
10 IDBI 0 2 1 0 3
11 Indian Bank 5 10 11 0 26
12 Indian Overseas Bank 28 26 13 0 67
13 Oriental Bank of Commerce 0 0 1 0 1
14 Punjab National Bank 1 3 1 0 5
15 Syndicate Bank 2 2 3 0 7
16 UCO Bank 1 0 1 0 2
17 Union Bank of India 1 2 3 0 6
18 United Bank of India 0 0 1 0 1
19 Vijaya Bank 1 1 1 0 3
72 84 72 0 228
Source: Secondary Data
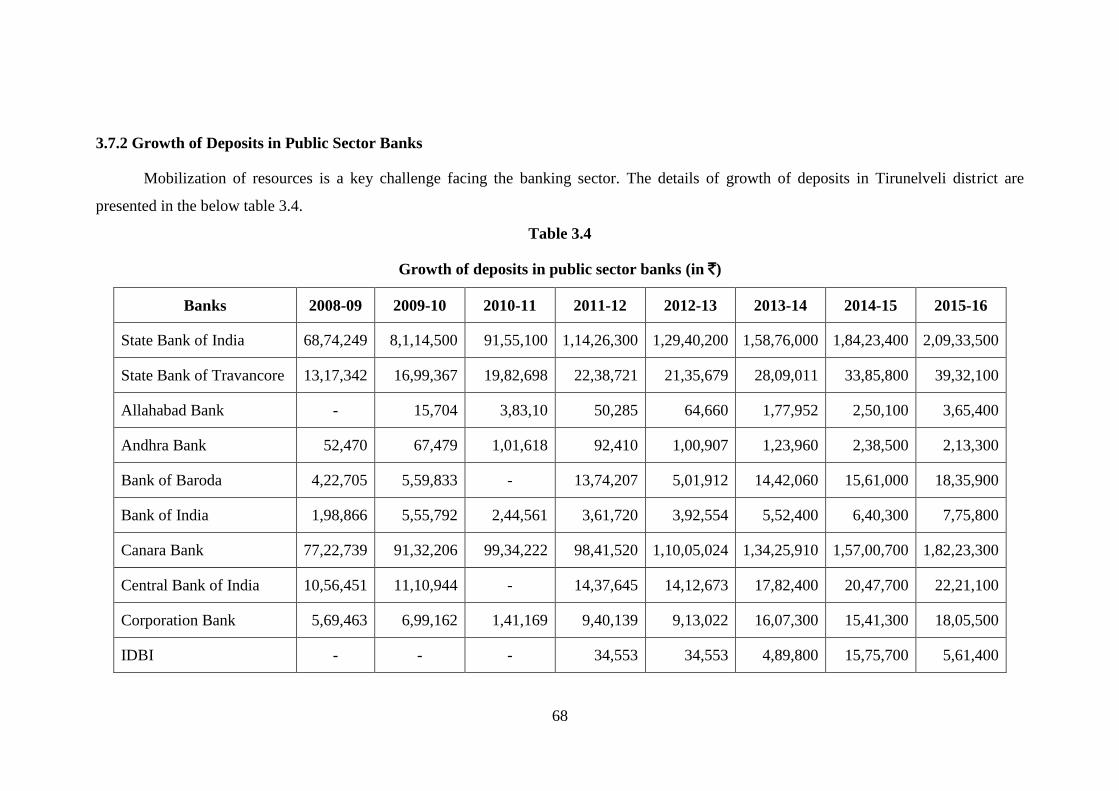
68
3.7.2 Growth of Deposits in Public Sector Banks
Mobilization of resources is a key challenge facing the banking sector. The details of growth of deposits in Tirunelveli district are
presented in the below table 3.4.
Table 3.4
Growth of deposits in public sector banks (in `)
Banks 2008-09 2009-10 2010-11 2011-12 2012-13 2013-14 2014-15 2015-16
State Bank of India 68,74,249 8,1,14,500 91,55,100 1,14,26,300 1,29,40,200 1,58,76,000 1,84,23,400 2,09,33,500
State Bank of Travancore 13,17,342 16,99,367 19,82,698 22,38,721 21,35,679 28,09,011 33,85,800 39,32,100
Allahabad Bank - 15,704 3,83,10 50,285 64,660 1,77,952 2,50,100 3,65,400
Andhra Bank 52,470 67,479 1,01,618 92,410 1,00,907 1,23,960 2,38,500 2,13,300
Bank of Baroda 4,22,705 5,59,833 - 13,74,207 5,01,912 14,42,060 15,61,000 18,35,900
Bank of India 1,98,866 5,55,792 2,44,561 3,61,720 3,92,554 5,52,400 6,40,300 7,75,800
Canara Bank 77,22,739 91,32,206 99,34,222 98,41,520 1,10,05,024 1,34,25,910 1,57,00,700 1,82,23,300
Central Bank of India 10,56,451 11,10,944 - 14,37,645 14,12,673 17,82,400 20,47,700 22,21,100
Corporation Bank 5,69,463 6,99,162 1,41,169 9,40,139 9,13,022 16,07,300 15,41,300 18,05,500
IDBI - - - 34,553 34,553 4,89,800 15,75,700 5,61,400
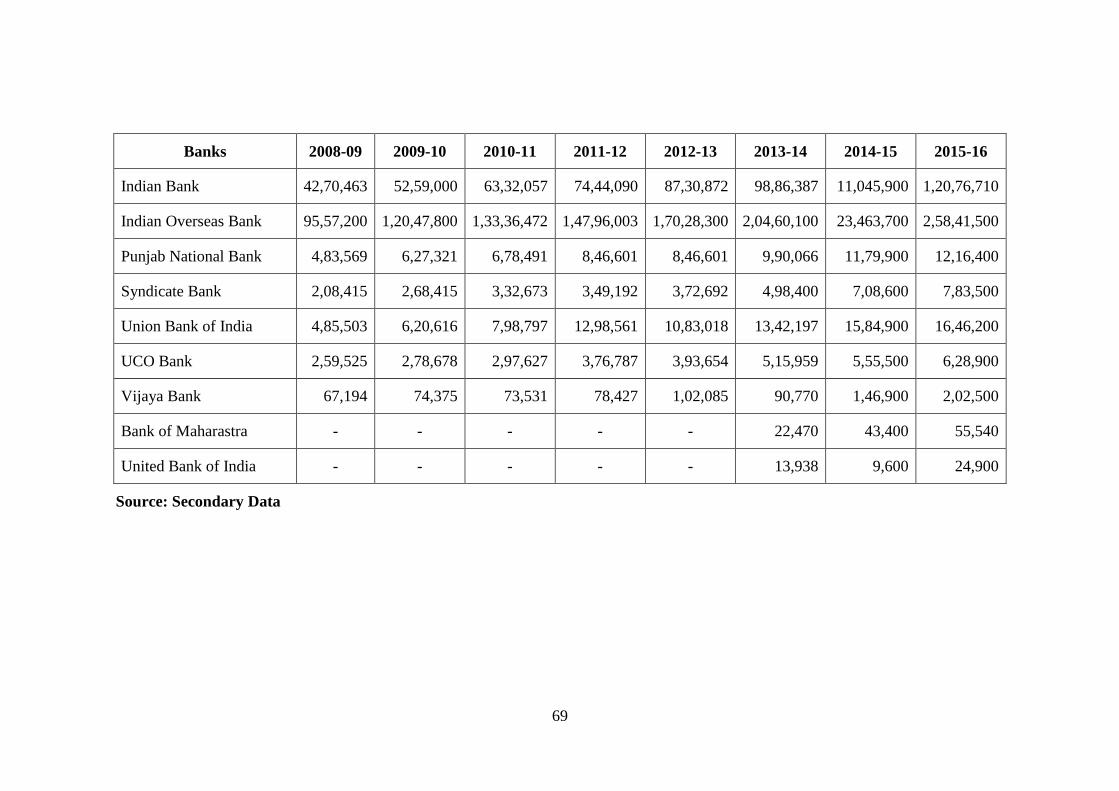
69
Banks 2008-09 2009-10 2010-11 2011-12 2012-13 2013-14 2014-15 2015-16
Indian Bank 42,70,463 52,59,000 63,32,057 74,44,090 87,30,872 98,86,387 11,045,900 1,20,76,710
Indian Overseas Bank 95,57,200 1,20,47,800 1,33,36,472 1,47,96,003 1,70,28,300 2,04,60,100 23,463,700 2,58,41,500
Punjab National Bank 4,83,569 6,27,321 6,78,491 8,46,601 8,46,601 9,90,066 11,79,900 12,16,400
Syndicate Bank 2,08,415 2,68,415 3,32,673 3,49,192 3,72,692 4,98,400 7,08,600 7,83,500
Union Bank of India 4,85,503 6,20,616 7,98,797 12,98,561 10,83,018 13,42,197 15,84,900 16,46,200
UCO Bank 2,59,525 2,78,678 2,97,627 3,76,787 3,93,654 5,15,959 5,55,500 6,28,900
Vijaya Bank 67,194 74,375 73,531 78,427 1,02,085 90,770 1,46,900 2,02,500
Bank of Maharastra - - - - - 22,470 43,400 55,540
United Bank of India - - - - - 13,938 9,600 24,900
Source: Secondary Data
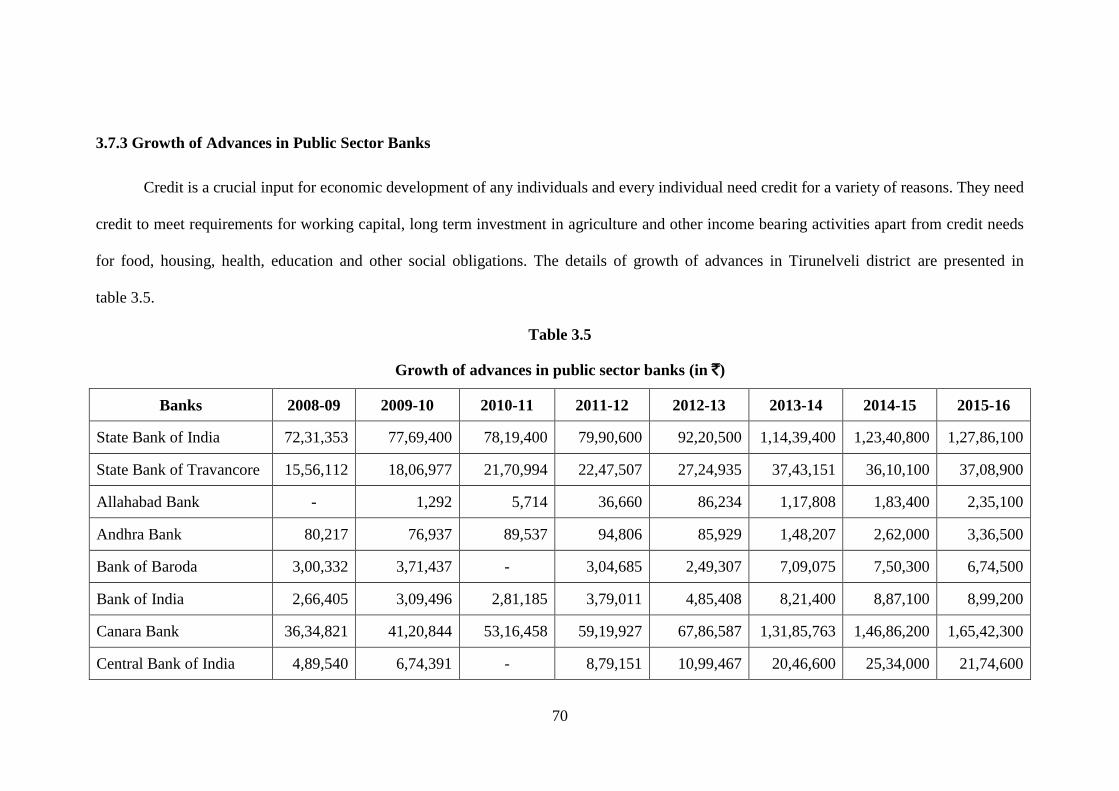
70
3.7.3 Growth of Advances in Public Sector Banks
Credit is a crucial input for economic development of any individuals and every individual need credit for a variety of reasons. They need
credit to meet requirements for working capital, long term investment in agriculture and other income bearing activities apart from credit needs
for food, housing, health, education and other social obligations. The details of growth of advances in Tirunelveli district are presented in
table 3.5.
Table 3.5
Growth of advances in public sector banks (in `)
Banks 2008-09 2009-10 2010-11 2011-12 2012-13 2013-14 2014-15 2015-16
State Bank of India 72,31,353 77,69,400 78,19,400 79,90,600 92,20,500 1,14,39,400 1,23,40,800 1,27,86,100
State Bank of Travancore 15,56,112 18,06,977 21,70,994 22,47,507 27,24,935 37,43,151 36,10,100 37,08,900
Allahabad Bank - 1,292 5,714 36,660 86,234 1,17,808 1,83,400 2,35,100
Andhra Bank 80,217 76,937 89,537 94,806 85,929 1,48,207 2,62,000 3,36,500
Bank of Baroda 3,00,332 3,71,437 - 3,04,685 2,49,307 7,09,075 7,50,300 6,74,500
Bank of India 2,66,405 3,09,496 2,81,185 3,79,011 4,85,408 8,21,400 8,87,100 8,99,200
Canara Bank 36,34,821 41,20,844 53,16,458 59,19,927 67,86,587 1,31,85,763 1,46,86,200 1,65,42,300
Central Bank of India 4,89,540 6,74,391 - 8,79,151 10,99,467 20,46,600 25,34,000 21,74,600

71
Banks 2008-09 2009-10 2010-11 2011-12 2012-13 2013-14 2014-15 2015-16
Corporation Bank 1,51,875 1,70,375 12,051 3,78,626 5,94,784 30,50,900 27,77,000 22,96,200
IDBI - - - 33,110 33,110 4,34,000 8,06,200 16,51,500
Indian Bank 32,86,086 39,31,900 50,97,492 63,49,582 71,34,197 82,56,187 82,86,100 81,03,294
Indian Overseas Bank 40,88,400 49,06,200 64,88,260 84,92,429 1,06,65,100 1,45,54,400 1,55,70,800 1,33,73,600
Punjab National Bank 4,53,226 6,23,835 6,48,892 10,40,749 10,40,749 15,21,156 14,64,500 17,13,000
Syndicate Bank 1,84,459 2,19,299 2,48,941 3,12,572 3,55,369 8,19,100 12,39,600 11,78,300
Union Bank of India 4,00,588 6,45,463 8,77,980 10,81,956 10,68,847 14,54,381 14,95,900 15,13,000
UCO Bank 2,53,267 2,62,418 2,81,936 3,11,251 4,09,485 7,29,028 7,80,000 7,13,900
Vijaya Bank 98,032 1,02,598 1,07,020 1,04,709 1,27,799 1,98,225 3,00,800 33,360
Source: Secondary Data
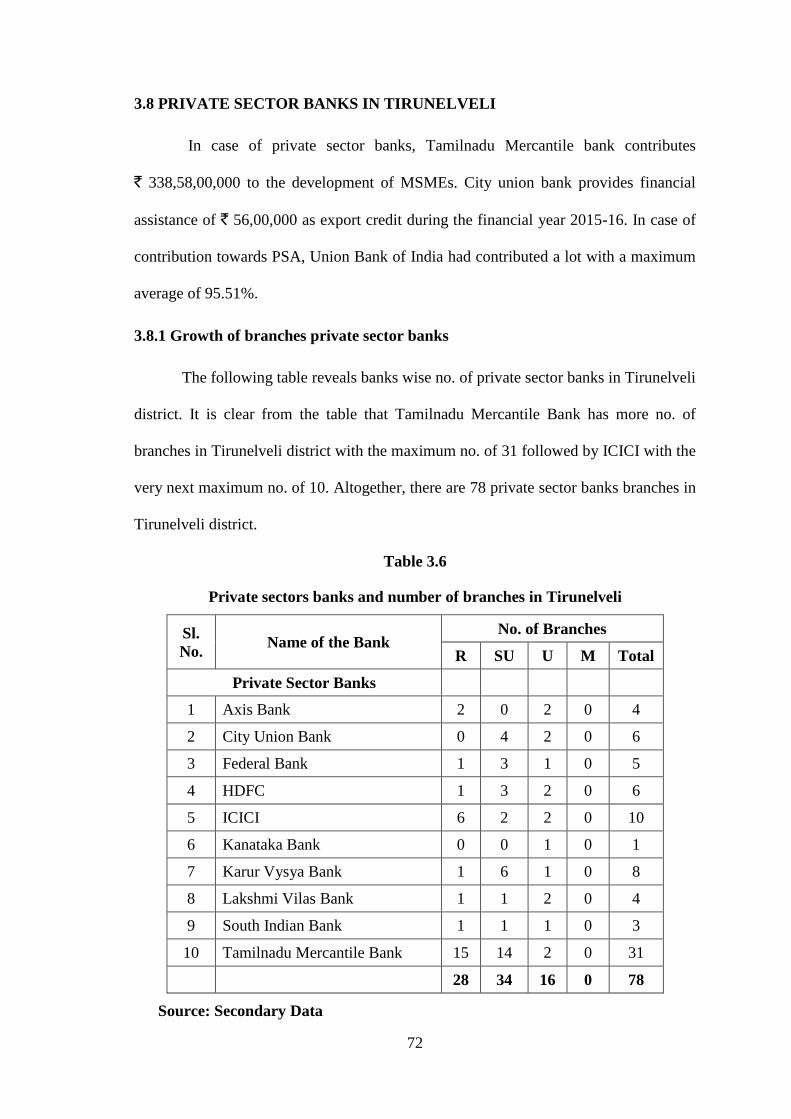
72
3.8 PRIVATE SECTOR BANKS IN TIRUNELVELI
In case of private sector banks, Tamilnadu Mercantile bank contributes
` 338,58,00,000 to the development of MSMEs. City union bank provides financial
assistance of ` 56,00,000 as export credit during the financial year 2015-16. In case of
contribution towards PSA, Union Bank of India had contributed a lot with a maximum
average of 95.51%.
3.8.1 Growth of branches private sector banks
The following table reveals banks wise no. of private sector banks in Tirunelveli
district. It is clear from the table that Tamilnadu Mercantile Bank has more no. of
branches in Tirunelveli district with the maximum no. of 31 followed by ICICI with the
very next maximum no. of 10. Altogether, there are 78 private sector banks branches in
Tirunelveli district.
Table 3.6
Private sectors banks and number of branches in Tirunelveli
Sl.
No. Name of the Bank
No. of Branches
R SU U M Total
Private Sector Banks
1 Axis Bank 2 0 2 0 4
2 City Union Bank 0 4 2 0 6
3 Federal Bank 1 3 1 0 5
4 HDFC 1 3 2 0 6
5 ICICI 6 2 2 0 10
6 Kanataka Bank 0 0 1 0 1
7 Karur Vysya Bank 1 6 1 0 8
8 Lakshmi Vilas Bank 1 1 2 0 4
9 South Indian Bank 1 1 1 0 3
10 Tamilnadu Mercantile Bank 15 14 2 0 31
28 34 16 0 78
Source: Secondary Data

73
3.8.2 Growth of Deposits in Private Sector Banks
The details of growth of deposits in private sector banks located in Tirunelveli district is given below:
Table 3.7
Growth of deposits in private sector banks (in `)
Private sector banks 2008-09 2009-10 2010-11 2011-12 2012-13 2013-14 2014-15 2015-16
Axis Bank Ltd. 4,54,374 7,89,900 7,89,900 7,89,900 9,77,285 19,19,049 16,87,400 19,44,000
City Union Bank Ltd. 9,35,006 10,17,603 10,17,603 12,59,621 13,74,614 21,07,071 24,72,200 27,89,400
Federal Bank Ltd. 11,746 1,43,165 1,43,165 1,78,431 2,68,912 7,20,399 7,86,900 8,14,400
HDFC Bank Ltd. 1,66,599 2,21,640 2,21,640 2,21,640 2,21,640 13,68,681 14,60,700 13,84,374
ICICI Bank Ltd. 12,09,100 13,41,700 13,41,700 17,14,723 19,12,000 19,29,600 22,61,700 25,50,000
Kanataka Bank - - - - - - 26,800 55,400
Karur Vysya Bank Ltd. 10,27,771 10,91,678 10,91,678 12,66,776 14,15,644 21,01,818 24,97,042 32,22,400
Lakshmi Vilas Bank Ltd. 4,15,730 5,106 5,106 5,106 6,68,179 10,07,731 11,88,676 12,15,000
South Indian Bank Ltd. 1,51,572 1,96,692 1,96,692 2,41,457 2,59,150 3,13,626 3,93,700 4,28,400
Tamilnad Mercantile Bank Ltd. 37,81,100 46,03,972 46,03,972 46,03,972 63,78,792 94,90,628 1,15,48,400 1,38,24,100
Source: Secondary Data
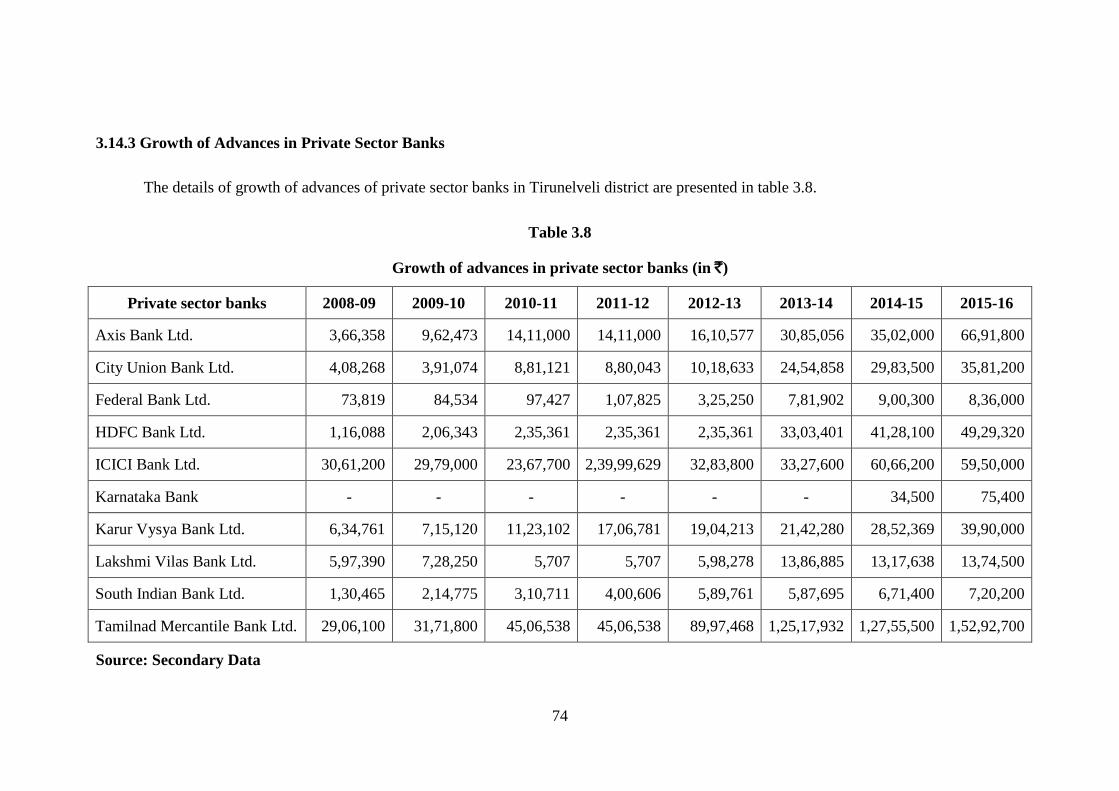
74
3.14.3 Growth of Advances in Private Sector Banks
The details of growth of advances of private sector banks in Tirunelveli district are presented in table 3.8.
Table 3.8
Growth of advances in private sector banks (in `)
Private sector banks 2008-09 2009-10 2010-11 2011-12 2012-13 2013-14 2014-15 2015-16
Axis Bank Ltd. 3,66,358 9,62,473 14,11,000 14,11,000 16,10,577 30,85,056 35,02,000 66,91,800
City Union Bank Ltd. 4,08,268 3,91,074 8,81,121 8,80,043 10,18,633 24,54,858 29,83,500 35,81,200
Federal Bank Ltd. 73,819 84,534 97,427 1,07,825 3,25,250 7,81,902 9,00,300 8,36,000
HDFC Bank Ltd. 1,16,088 2,06,343 2,35,361 2,35,361 2,35,361 33,03,401 41,28,100 49,29,320
ICICI Bank Ltd. 30,61,200 29,79,000 23,67,700 2,39,99,629 32,83,800 33,27,600 60,66,200 59,50,000
Karnataka Bank - - - - - - 34,500 75,400
Karur Vysya Bank Ltd. 6,34,761 7,15,120 11,23,102 17,06,781 19,04,213 21,42,280 28,52,369 39,90,000
Lakshmi Vilas Bank Ltd. 5,97,390 7,28,250 5,707 5,707 5,98,278 13,86,885 13,17,638 13,74,500
South Indian Bank Ltd. 1,30,465 2,14,775 3,10,711 4,00,606 5,89,761 5,87,695 6,71,400 7,20,200
Tamilnad Mercantile Bank Ltd. 29,06,100 31,71,800 45,06,538 45,06,538 89,97,468 1,25,17,932 1,27,55,500 1,52,92,700
Source: Secondary Data

75
3.9 ANALYSIS OF CREDIT-DEPOSIT RATIO
Credit Deposit ratio (CD ratio) is the ratio of how much a bank lends out of its
deposits. This ratio helps in assessing a bank‘s liquidity and indicates its health. If the
ratio is too low, it means banks may not be earning as much as they could be. If the
ratio is too high, it means that banks might not have enough liquidity to cover any
unforeseen fund requirements. CD ratio is computed through the following formula:
Credit-Deposit Ratio =
× 100
At all-India level the CD ratio of all SCBs stood at 75.9 per cent as on June 24,
2016. Among the 36 States/Union Territories, 6 States/ Union Territories had C-D
ratios higher than the all-India level. The CD ratio was the highest for Tamilnadu
(113.2 per cent) followed by Chandigarh (104.3 per cent), Andhra Pradesh (104.0 per
cent), Telangana (102.2 per cent), Maharashtra (99.9 per cent) and Delhi (91.6 per cent)
while the CD ratio for public sector banks was at 72.5 per cent, it stood at more than 80
per cent for private sector and foreign banks.6
Banks have been advised to achieve a credit deposit ratio of 60% in respect of
their rural and semi-urban branches separately on an all-India basis. It is not necessary
that this ratio should be achieved separately branch-wise, district-wise or region-wise,
the banks should nevertheless, ensure that wide disparity in the ratios between different
States / Regions is avoided in order to minimize regional imbalance in credit
deployment.7 The following tables, table 3.12 and table 2.13 shows the three years‘
accumulated CD ratio of the Public and private sector banks during the study period
2014-17.
6 RBI Press Release : 2016-2017/537, Quarterly Statistics on Deposits and Credit of Scheduled
Commercial Banks (SCBs) as on June 24, 2016. 7 Master Circulars-Lead Bank Scheme, Guidelines, RBI/2014-15/94, July 2014.

76
Table 3.9
Comparative analysis of public sector banks (in `)
Sl.
No Name of the Bank
Deposits Total Deposits
Advance Total
Advance
CD
ratio 2014 2015 2016 2014 2015 2016
1 State Bank of India 15,876,000 18,423,400 20,933,500 55,232,900 11,439,400 12,340,800 12,786,100 36,566,300 66.20
2 State Bank of Travancore 2,809,011 3,385,800 3,932,100 10,126,911 3,743,151 3,610,100 3,708,900 11,062,151 109.24
TOTAL 18,685,011 21,809,200 24,865,600 65,359,811 15,182,551 15,950,900 16,495,000 47,628,451 72.87
Nationalised Banks
1 Allahabad Bank 177,952 250,100 365,400 793,452 117,808 183,400 235,100 536,308 67.59
2 Andhra Bank 123,960 238,500 213,300 575,760 148,207 262,000 336,500 746,707 129.69
3 Bank of Baroda 1,442,060 1,561,000 1,835,900 4,838,960 709,075 750,300 674,500 2,133,875 44.10
4 Bank of India 552,400 640,300 775,800 1,968,500 821,400 887,100 899,200 2,607,700 132.47
5 Bank of Maharastra 22,470 43,400 55,540 121,410 29,005 51,500 52,610 133,115 109.64
6 Canara Bank 13,425,910 15,700,700 18,223,300 47,349,910 13,185,763 14,686,200 16,542,300 44,414,263 93.80
7 Central Bank of India 1,782,400 2,047,700 2,221,100 6,051,200 2,046,600 2,534,000 2,174,600 6,755,200 111.63
8 Corporation Bank 1,607,300 1,541,300 1,805,500 4,954,100 3,050,900 2,777,000 2,296,200 8,124,100 163.99
9 Dena Bank 9,133 18,100 42,000 69,233 15,961 18,700 39,000 73,661 106.40
10 IDBI 489,800 1,575,700 561,400 2,626,900 434,000 806,200 1,651,500 2,891,700 110.08
11 Indian Bank 9,886,387 11,045,900 12,076,710 33,008,997 8,256,187 8,286,100 8,103,294 24,645,581 74.66
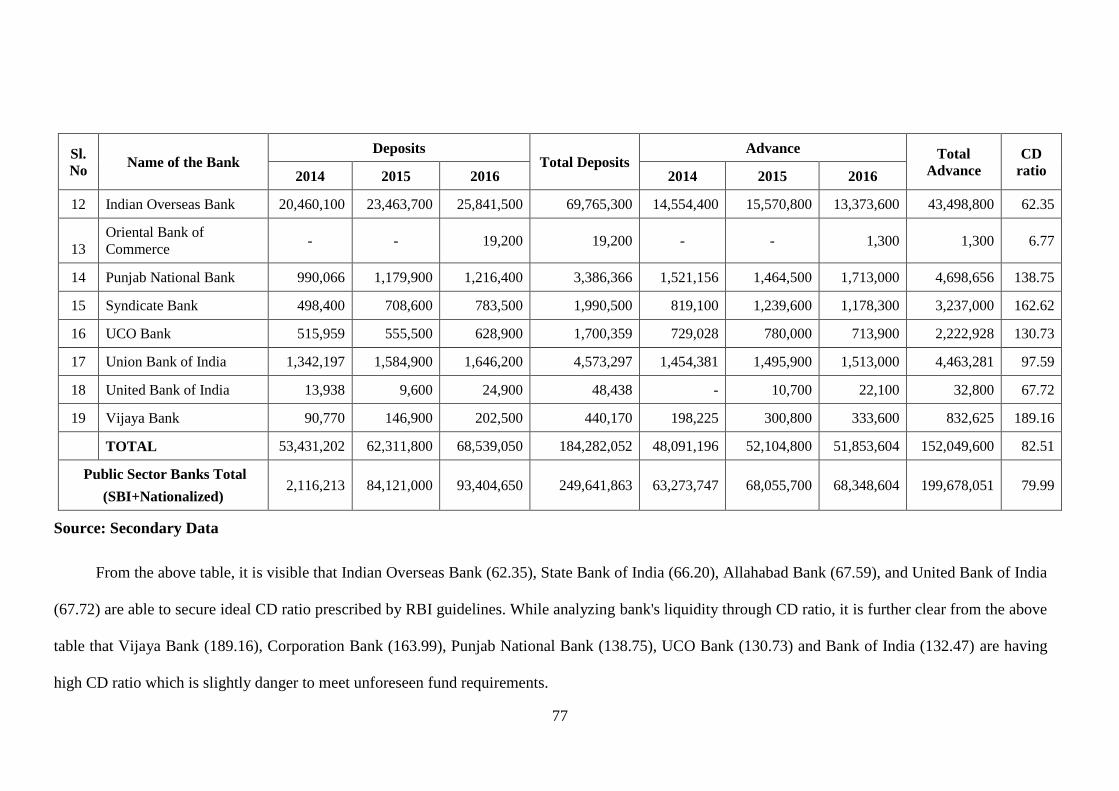
77
Sl.
No Name of the Bank
Deposits Total Deposits
Advance Total
Advance
CD
ratio 2014 2015 2016 2014 2015 2016
12 Indian Overseas Bank 20,460,100 23,463,700 25,841,500 69,765,300 14,554,400 15,570,800 13,373,600 43,498,800 62.35
13
Oriental Bank of
Commerce - - 19,200 19,200 - - 1,300 1,300 6.77
14 Punjab National Bank 990,066 1,179,900 1,216,400 3,386,366 1,521,156 1,464,500 1,713,000 4,698,656 138.75
15 Syndicate Bank 498,400 708,600 783,500 1,990,500 819,100 1,239,600 1,178,300 3,237,000 162.62
16 UCO Bank 515,959 555,500 628,900 1,700,359 729,028 780,000 713,900 2,222,928 130.73
17 Union Bank of India 1,342,197 1,584,900 1,646,200 4,573,297 1,454,381 1,495,900 1,513,000 4,463,281 97.59
18 United Bank of India 13,938 9,600 24,900 48,438 - 10,700 22,100 32,800 67.72
19 Vijaya Bank 90,770 146,900 202,500 440,170 198,225 300,800 333,600 832,625 189.16
TOTAL 53,431,202 62,311,800 68,539,050 184,282,052 48,091,196 52,104,800 51,853,604 152,049,600 82.51
Public Sector Banks Total
(SBI+Nationalized) 2,116,213 84,121,000 93,404,650 249,641,863 63,273,747 68,055,700 68,348,604 199,678,051 79.99
Source: Secondary Data
From the above table, it is visible that Indian Overseas Bank (62.35), State Bank of India (66.20), Allahabad Bank (67.59), and United Bank of India
(67.72) are able to secure ideal CD ratio prescribed by RBI guidelines. While analyzing bank's liquidity through CD ratio, it is further clear from the above
table that Vijaya Bank (189.16), Corporation Bank (163.99), Punjab National Bank (138.75), UCO Bank (130.73) and Bank of India (132.47) are having
high CD ratio which is slightly danger to meet unforeseen fund requirements.
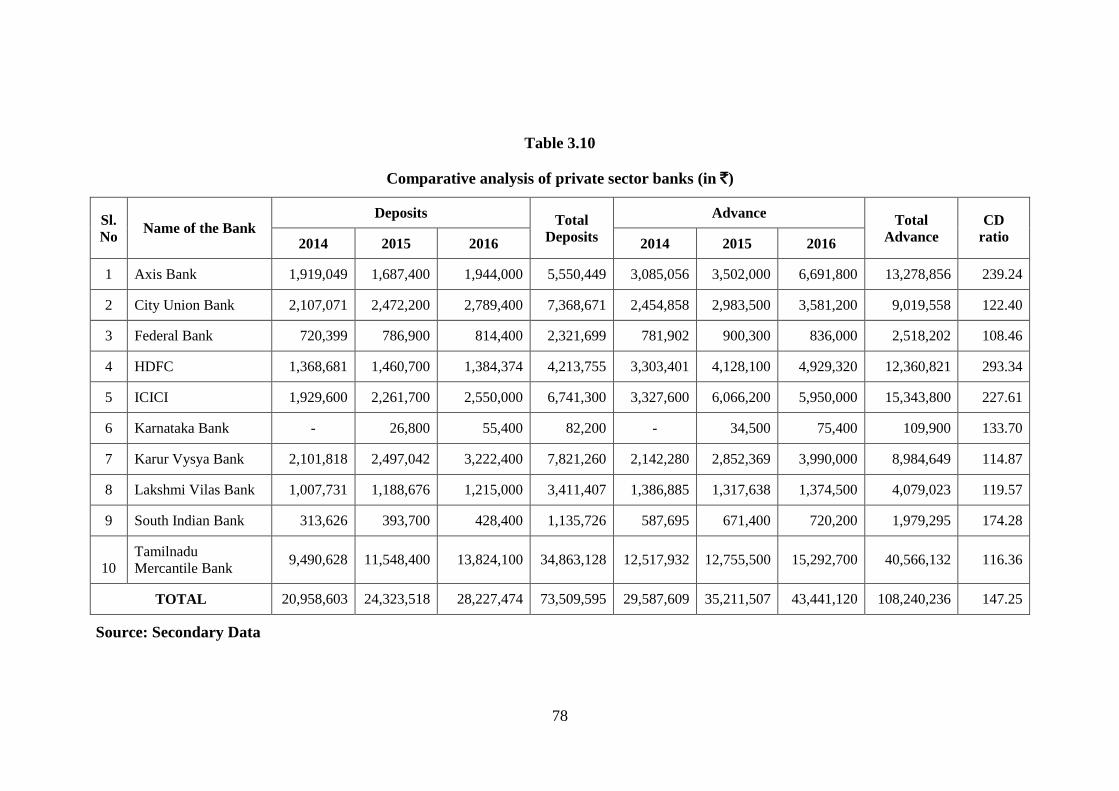
78
Table 3.10
Comparative analysis of private sector banks (in `)
Sl.
No Name of the Bank
Deposits Total
Deposits
Advance Total
Advance
CD
ratio 2014 2015 2016 2014 2015 2016
1 Axis Bank 1,919,049 1,687,400 1,944,000 5,550,449 3,085,056 3,502,000 6,691,800 13,278,856 239.24
2 City Union Bank 2,107,071 2,472,200 2,789,400 7,368,671 2,454,858 2,983,500 3,581,200 9,019,558 122.40
3 Federal Bank 720,399 786,900 814,400 2,321,699 781,902 900,300 836,000 2,518,202 108.46
4 HDFC 1,368,681 1,460,700 1,384,374 4,213,755 3,303,401 4,128,100 4,929,320 12,360,821 293.34
5 ICICI 1,929,600 2,261,700 2,550,000 6,741,300 3,327,600 6,066,200 5,950,000 15,343,800 227.61
6 Karnataka Bank - 26,800 55,400 82,200 - 34,500 75,400 109,900 133.70
7 Karur Vysya Bank 2,101,818 2,497,042 3,222,400 7,821,260 2,142,280 2,852,369 3,990,000 8,984,649 114.87
8 Lakshmi Vilas Bank 1,007,731 1,188,676 1,215,000 3,411,407 1,386,885 1,317,638 1,374,500 4,079,023 119.57
9 South Indian Bank 313,626 393,700 428,400 1,135,726 587,695 671,400 720,200 1,979,295 174.28
10 Tamilnadu
Mercantile Bank 9,490,628 11,548,400 13,824,100 34,863,128 12,517,932 12,755,500 15,292,700 40,566,132 116.36
TOTAL 20,958,603 24,323,518 28,227,474 73,509,595 29,587,609 35,211,507 43,441,120 108,240,236 147.25
Source: Secondary Data

79
From the above table, it is clear that all private banks are very liberal in lending
money, loans and advances. Financial experts and journalists said that private sector
banks have been more successful in raising low-cost funds, which are demand deposits
in their current and savings accounts and it creates their financial position strong.
As public sector banks are very rigid in sanctioning loan they posted a negative return
on assets and equity, the same for private banks was in double digits.8
8 Gayatri Nayak (2017), ―Higher Current and Savings Accounts, Credit-Deposit Ratio Helped Private
Banks‖ The Economic Times, January 11.
80
CHAPTER IV
CONCEPTUAL FRAMEWORK
4.1 INTRODUCTION
A service has been described as a deed, act or performance.1 The literature
suggests that differences between goods and services exist, resulting in four basic
characteristics of services: intangibility, inseparability of production and consumption,
heterogeneity and perishability. Intangibility is the key determinant of whether an
offering is a service or product.2 These service characteristics have created problems
and challenges for managers of services. A recurring theme in service companies is the
difficulty experienced in translating customers‘ expectations into service quality
specifications.
Shostack3 views service as fulfilling certain wants and needs. Further, he stated
that "services are those separately identifiable, essentially intangible activities, which
provide wan satisfaction and are not necessarily tied to the sale of a product or another
service. To produce a service may or may not require the use of tangible goods.
However, when such use is required, there is no transfer of title (permanent ownership)
to these tangible goods." In reality, it is found that many services contain at least some
goods elements, e.g., the written policy of insurance by an insurance company, bank
account statements from a bank, etc. On the other hand, take the example of a company
supplying a ubiquitous item like common salt to a grocer—the company may sell this
item in different innovative ways to differentiate its product from the competitors.
1 Berry, Leonard, L. (1983), ―Relationship Marketing in Emerging Perspectives on Services
Marketing‖, American Marketing Association, Chicago, Pp. 25-28. 2 Bebko, C.P. (2000), ―Service Intangibility and its Impact on Consumer Expectations of Service
Quality‖, Journal of Services Marketing, Vol. 14(1), Pp. 9-26. 3 Shostack, G. Lynn (1977), ―Breaking Free From Product Marketing‖, Journal of Marketing,
Vol. 41(2), Pp. 73-80.
81
Some companies do business in both goods and services. For example, General Motors
of USA which is known for its goods manufacturing activity generates nearly 20 per
cent of its revenues from services such as financial and insurance businesses. All these
make the meaning of goods and services as inter related. However, in general, goods
can be defined as objects, devices or things whereas services can be defined as deeds,
efforts or performances.
More amusingly, services have also been described as ‗something which can be
bought and sold, but which you cannot drop on your foot‘.4
Services have traditionally been difficult to define. The way in which services
are created and delivered to customers is often hard to grasp, since many inputs and
outputs are intangible. Here are two approaches that capture the essence of service.5
A service is an act or performance offered by one party to another. Although the
process may be tied to a physical product, the performance is essentially intangible and
does not normally result in ownership of any of the factors of production.
Services are economic activities that create value and provide benefits for
customers at specific times and places, as a result of bringing about a desired change in
– or on behalf of – the recipient of the service.
4.2 CLASSIFICATION OF SERVICES
The classifications of services, when undertaken on the basis of their marketing
and process dimensions like customer involvement, demand variations, capital
utilisation, manpower quality and its requirements, technology concentration and others
will give us an insight into the kind of services that can be developed by an economy
4 Christian Gronroos (1990), ―Service Management and Marketing‖, Lexington, MA: Lexington
Books, Pp. 7-26. 5 Evert Gummensson (1987), ―Lip Service - A Neglected Area in Services Marketing‖, Journal of
Services Marketing, Vol. 1, Pp. 22.
82
depending on the resources available to the economy. We have approaches of
classifying the services based on factors like, processing needs and marketability of
services that could also explain the uniqueness of services. Lovelock classified services
based on the theory of processing required for their marketing efforts.6 These categories
are:
1. People processing services
A service where physical evidence is more manifested for delivery of services
that is, the presence of the customer is necessary when the service is being rendered.
Such services include the beauty business, medical and health services, health spas,
airlines, travel and tourism, railways and road passenger services.
2. Possession processing services
These are the services that are linked to peoples' possessions. Such services do
not necessarily need a customer's presence and can be rendered effectively by the
services provider even in the absence of the customer. Motor garage services, goods
transportation, shipping, air transportation, laundry, warehousing are some of the
services that can be categorised as possession processing services.
3. Information processing services
These are the services that are aimed at peoples' cerebral assets. These services
need mental stimulus. The services relate to the process and delivery of information to
the customer and that can be done on the internet. Personal contact in such services is
not required. Technology has been a large factor in the marketing of such services
across the globe.
6 Lovelock, C.H and Yip (1996), ―Developing Global Strategies for Service Businesses‖, Californian
management Review, Vol. 38(2), Pp.64-86.
83
4.3 FACTORS FUELLING GROWTH OF SERVICES
Demographic changes taking place throughout the world are causing a chain
reaction, which is facilitating the growth of the service sector. Today's customers are
time pressured. This has led to an increase in time saving services such as
housekeeping, laundry, beauty parlours, restaurants, etc. The time that is saved through
use of these services is being spent on entertainment, travel and other recreation
services. Each area's demographic make-up is contributing to continuous growth of the
service sector throughout the world.
In the new millennium, supplemental services—peripheral services which are
outside the core, which assist a firm in differentiating its service from the competitor,
have grown. These can provide differential advantage to different service rendering
firms. These services could be of the nature of information, consultation and advice,
order taking, hospitality, billing, electronic transfer payments etc.
Technological advancement has also led to tremendous demand for services.
New and emerging occupations are those of conservation managers, event specialists,
web masters, environment specialists, desk top publishing specialists, job coaches,
customer credit counselors, to name a few.
4.5 COMPONENTS OF INTEGRATED SERVICE MANAGEMENT
Product Elements: Managers must select the features of both the core product
(either a good or a service) and the bundle of supplementary service elements
surrounding it, with reference to the benefits desired by customers and how well
competing products perform. In short, we need to be attentive to all aspects of the
service performance that have the potential to create value for customers.
84
Place and Time: Delivering product elements to customers involves decisions
on the place and time of delivery, as well as on the methods and channels used.
Delivery may involve physical or electronic distribution channels or both, depending
on the nature of the service being provided. Firms may deliver service directly to
customers or through intermediary organisations, such as retail outlets that receive a fee
or a percentage of the selling price, to perform certain tasks associated with sales,
service and customer contact. Speed and convenience of place and time for the
customer are becoming important determinants in service delivery strategy.
Process: Creating and delivering product elements to customers requires the
design and implementation of effective processes. A process is the method and
sequence of actions in the service performance. Badly designed processes often used to
slow, bureaucratic and ineffective service delivery and result in dissatisfied customer.
Similarly, poor processes make it difficult for front-line staff to do their jobs well,
resulting in low productivity and increased the likelihood of service failures.
Productivity and Quality: These elements, often treated separately, should be
seen as two sides of the same coin. No service firm can afford to address either element
in isolation. Productivity relates to how inputs are transformed into outputs that are
valued by customers, while quality refers to the degree to which a service satisfies
customers by meeting their needs, wants and expectations. Improving productivity is
essential to keep costs under control, but managers must beware of making
inappropriate cuts in service levels that are resented by customers (and perhaps by
employees, too). Service quality, as defined by customers, is essential for product
differentiation and for building customer loyalty. However, investing in quality
improvement without understanding the trade-off between incremental costs and
incremental revenues may place the profitability of the firm at risk.
85
People: Many services depend on direct, personal interaction between
customers and a firm‘s employees (like getting a haircut or eating at a restaurant. The
nature of these interactions strongly influences the customer‘s perceptions of service
quality. Customers will often judge the quality of the service they receive largely on
their assessment of the people providing the service. Successful service firms devote
significant effort to recruiting, training and motivating their personnel, especially – but
not exclusively – those who are in direct contact with customers.
Promotion and Education: No marketing programme can succeed without
effective communications. This component plays three vital roles: providing needed
information and advice, persuading target customers of the merits of a specific product,
and encouraging them to take action at specific times. In services marketing, much
communication is educational in nature, especially for new customers. Companies may
need to teach these customers about the benefits of the service, where and when to
obtain it, and provide instructions on how to participate in service processes.
Communications can be delivered by individuals, such as salespeople and trainers, or
through such media as TV, radio, newspapers, magazines, posters, brochures and
websites. Promotional activities may serve to marshal arguments in favour of selecting
a particular brand or use incentives to catch customers‘ attention and motivate them
to act.
Physical Evidence: The appearance of buildings, landscaping, vehicles, interior
furnishing, equipment, staff members, signs, printed materials and other visible cues all
provide tangible evidence of a firm‘s service quality. Service firms need to manage
physical evidence carefully, since it can have a profound impact on customers‘
impressions. In services with few tangible elements, such as insurance, advertising is
86
often employed to create meaningful symbols. For instance, an umbrella may
symbolise protection, and a fortress, security.
Price and Other Costs of Service: This component addresses management of
the costs incurred by customers in obtaining benefits from the service product.
Responsibilities are not limited to the traditional pricing tasks of establishing the selling
price to customers, setting trade margins and establishing credit terms. Service
managers also recognise and, where practical, seek to minimise other costs that
customers may bear in purchasing and using a service, including time, mental and
physical effort and unpleasant sensory experiences such as noises and smells.
4.7 MANAGEMENT OF THE THREE ADDITIONAL P'S OF SERVICES
MARKETING MIX
Marketing of services need a special arrangement of an additional 3 Ps namely,
people, processes, and physical evidence due to the special features inherent in the
marketing of services intangibility, inseparability, perishability and heterogeneity.
A customer as we understand from these features has to personally be present to savour
the services at a place where the service processing takes place before it is delivered to
him and confirm whether it has been delivered as per his expectations either overtly or
by implied post-purchase behaviour. That means marketing of services conceptually
will have a combination of the four traditional components and three additional
elements known as people, process and physical evidence.
People: There are three levels where people are involved in marketing of
services. At the first level we have the sales and service staff and the other front office
people who come in direct contact with the customer and are the interface of the firm
administering series to the customers. These people are the back bone of the services
marketing firm as the customer is either happy because of the interaction or he may not
87
come back if there was any mishandling. The firm has to provide skills for handling
customer relationship and communication. The next level comprises of the staff in the
back office. These people are the processing staff and need special technical skills in
understanding the need and expectation of the customer to create the right service
product and ambience. Lastly at the top most level we have the customer himself. He is
totally involved in the marketing of services as he has to manage the inseparable part of
the service delivery by being present at the service delivery point. Services marketing
firms today have woken up to the fact that they have to get the services marketing
particularly front office staff that comes in direct touch with the customer. He has to be
fully trained in various aspects of human soft skills in addition to the hardcore
requirements of marketing and selling. That is why companies are picking up their staff
young from the schools and colleges and getting them trained from professional
institutes. The exhibits below indicate how companies are sending them to training
schools before deploying them for services duties in retail mega malls and others.
Physical Evidence: The essential physical evidence has been explained as the
service environment framework that can be looked at from three different dimensions -
the ambient conditions, spatial layouts, and signs and symbols.7 The physical evidence
could be the essential physical framework of environmental evidence whereby the firm
establishes the evidence of services by way of providing the intangible component of
the services being offered. The product component of peripheral beauty products along
with the intangible services of face and body massage, the tangible component of the
operation theatre and the medicines along with the intangible services of curing for the
disease arc examples of the peripheral physical evidence without the framework too.
But most of the services firms prefer including tangibles to the intangible components
7 Bitner, Mary, J. (1992), ―Services Cape: The Impact of Physical Surroundings on Customers and
Employees‖, Journal of Marketing, Vol.56, Pp. 57-71.
88
to establish the evidence of having delivered a better service. Some of the airlines
supply free personal name tags, silver, gold, or platinum personal identity cards to the
members of elite travelling clubs to establish such physical evidence. Banks such as
Citibank, ICICI and IDBI provide cheque books to esteemed customers with their
names printed on the cheques, without charging any additional fee for the same.
Process: Process in services is the system established for the creation and
delivery of the services to the customer. It involves all those value addition steps that
are taken by the services firms to affect the delivery to the customer as expected by
him. Many a times, it is at this level that glaring service gaps can be noticed by the
services (inns. Process has been called the heart and matter of the services delivery and
operating system. That is why firms have to be extra careful in establishing the
expected quality standards in the process. While it could be easy to establish
standardised systems at the delivery places managed by the service vendor himself, the
problem and difficulty arises when many franchisees are also involved in the services
delivery systems and process. The franchise service staffs despite regular training by
the principles have many times faltered in providing service as per the norms laid down
due to short sighted policy of the franchisee on easy profits and earnings.
4.8 STRATEGIC ISSUES IN MARKETING OF SERVICES
The fundamental characteristics of services are quite different as compared to
those of the products. Products are tangible in nature. Products can be carried from one
place to another after they have been purchased by the customers. The legal ownership
of the product can be transferred once the price has been paid by the buyer. Services on
the other hand are intangible in nature. Services cannot be transferred or shipped from
one place to another. Services are perishable and have to be consumed instantly.
Services can be consumed only when the customer himself is physically present. Thus

89
inseparability of the services and its consumer is a major key factor that distinguishes
services from the products. Products are always solid, tangible elements whereas the
services are more of cerebral experiences. Only the person who has availed the services
can reflect on their quality too. Such exceptional and unique distinctiveness of services
come with many strategic issues in marketing of services.
These issues have been brought out very clearly by Daly, Aidan with
McDonnell, Juliana in the figure below.
Figure 4.1
Dalay’s framework of service marketing issues
Source: Kapoor, (2011) “Service Marketing: Concepts & Practices”, Tata
McGraw-Hill Education, ISBN 1259083853, 9781259083853, P. 36
The authors have discussed, besides the distinctive characteristics of the
services, other issues such as marketing information systems for services,
understanding consumer behaviour, looking at the market trends, analysing and
building rip the company perception through service quality. The strategic issues as
90
brought out by them can be identified namely managing differentiation in services,
managing productivity and managing service quality.8
4.9 MANAGING DIFFERENTIATION IN SERVICE MARKETING
Most of these services do have some tangible component that the customer has
to purchase along with the intangible services. The tangibles can be in the shape of the
décor, ambience and taste of food in a restaurant. It can he the comfort provided by the
airlines in their waiting lounges along with the care taken of the passengers during
travel.
Service Ambience
The ambience pertains to the atmosphere and the visual impression created at
the location determined and fixed by the services firm where the services are
administered to its customers. This is the premises where a service customer has to visit
to get in touch with the front line staff of the service provider. The customer comes
here to avail of the services on the offer. This may include service property like hotel,
restaurants, morns, lobbies, other amenities; airlines travel lounges, reception and
recovery rooms of nursing homes, the lobbies of shopping malls, waiting lounges at the
beauty parlours and the waiting areas of car service garages. A services provider is very
keen always to distinguish the tangible components by providing the ambience that is
pleasant to the senses and is pleasing to the eye. The difference of the darer at a
five-star hotel can be felt and seen when compared to other smaller hotels.
The difference can be felt and experienced from the plush carpets, cushy and
comfortable sofas, regular air conditioning and the pleasantly smiling courteous staff.
The lobby area is full of Indoor plants, fresh smelling flowers and a sweet smell
8 Daly, Aidan with McDonnell, Juliana (2005), ―Marketing Service Internationally - A rich Topic for
Much Needed Research‖, International Business & Economy, 4th
Annual Conference, Honolulu,
Hawaii, Vol. 6(9), Pp. 45-47.
91
surrounds the atmosphere. The first encounter should be so impressive that a customer
should distinctly feel the difference in value. Modern shopping malls exercise lots of
special emphasis on creating a very opulent yet functional ambience. International
airports at Mumbai, Delhi, Bangalore and Chennai have been able to create a difference
by providing facilities like vast spaces that are seamless unless and enclosed, shopping
and recreation amenities of International standards within the premises, neat and clean
public convenience systems and melodious piped music. Digital flight information
boards and kiosks have been introduced for providing flight schedule of all airlines.
A pleasant fragrance prevails all over the travel lounge and at the restaurants situated
within the premises.
Service Packaging
A warm pizza delivered by Domino's in a hot case within the stipulated time lag
of a few minutes all over the world fetch them orders for the pizzas repeatedly because
of the packaging involved in their home delivery service. Packaging does not include
only the container used; it is also the way this container has been used. An environment
friendly packaging material, information supportive covers and envelopes and smartly
dressed staff all form part of the packaging.
Service Personnel
The frontline employees will be coming directly in touch with the service
customers regularly. However, at the service delivery centre, many employees may
have to deal with the service customers through voice interactive systems, telephones,
internet and other modern gadgets of communication. The service personnel are the
symbol and ambassadors of the service providing firm. A service customer will
appreciate and participate in the services much later but in the beginning he comes in
92
contact with the front staff and makes up his mind and perception about the services
firm.
In order to gain a positive perceptive acceptance from the customer, the service
providing establishments have to undertake a complete grooming of its employees and
personnel involved in the delivery process of services at all points. The grooming
includes the use of identifiable corporate uniforms, the normal dressing etiquettes,
knowledge about the products, services, policy and plans of the firm. The normal
civilized attitude towards strangers, use of polite manners and language and an attitude
to be always helpful to the customers go a long way in differentiating one service from
the other. We have mentioned earlier that services marketing is relationship marketing.
Relationships will be built only when people involved in the delivery are of acceptable
and amiable nature. But learning the mannerisms and cultural traits of one's own
country may not be sufficient. The services today have to meet the expectations of
global customers and have to compete with the global level of excellence. The services
providers will have to get their people trained in mannerisms of different ethnicity and
traditions of the cultures of the world. International airlines, multinational hotel chains,
multinational service firms employ personnel from all kinds of nationalities to make
sure their people do not lag behind in any manner when it comes to attending to
foreigners and clients from other countries.
4.10 SERVICE SUPPORTING EQUIPMENT
The services supporting equipment could be the equipment that is used in
rendering services to the customers. An online reservation and ticket booking system of
a travel company will need an error free network system that does not drop after every
few minutes. A mobile telephone services system should provide a system whereby the
network should be available to everyone at all the places, unlike the system being
93
provided by some of the mobile telephone companies in India. This is happening
because companies have allotted more connections than their permissible and feasible
capacity. The service systems and the equipment attached providing the service must
run efficiently, economically and without frequent breakdowns to distinguish it from
other service providers. A roadways bus transport system that can reach its passengers
well in time and safely to their destination is definitely preferable to a luxurious
transport system that has no value for strict schedule or safety of its passengers.
Similarly, a hotel has to provide a breakdown free air conditioning, generation of
in-house electricity in case of frequent power cuts and round the clock room service to
cater to the needs of its guests. It is not that the breakdowns in services do not occur but
it depends with what speed, agility and honesty these collapses in services are attended
to by the service personnel of the firm. The total attitude towards providing a free from
trouble service will differentiate the best from the ordinary.
Customer References
The signing of endorsements by the customers who have already used the best
services of the firm and displaying them as certificates of merits definitely will help the
service firms differentiate their offers from others. Differentiation can also be managed
by maintaining a select club of distinguished and elite customers who use the services
of the firms. The airlines do it by inviting such select distinguished guests to become
members of their elite frequent fliers clubs. Some of the luxury chains of hotels also
maintain exclusive relationships with such highly valuable guests. The service firms
must however undertake such differentiation cautiously without offending the
sensibilities of the other ordinary guests. The intention is to use each Influence
positively and not create negative implosions of discrimination amongst the customers.
94
Service Conveniences
Service firms provide many kinds of conveniences to the service customers for
differentiating their services with the competitors. These conveniences are not the
normal expectations of the customers nor are these conveniences a part of the package
dad with the customers. Such conveniences are provided to the customers to maintain
good public relations and create favourable perceptions about the services offered.
Identity and Brand of Service
Nothing else can distinguish a service as better from its competitors than its
own exclusive name, identity and brand ownership. It takes ages to build a brand in the
memory of the user public and each service firm must guard its hard built brand and
identity very dearly. The identity can be created by adopting distinguishable insignia
that can be carved in the memory of the customers. Similarly, appropriate slogans that
define the service policy of the firm clearly distinguish it from their competition. Many
service firms adopt different mascots, cartoons characters and features to be put on
their corporate advertisings, stationery, signboards and corporate offices to differentiate
their identity from others. The first element that always creates a distinct identity for
everyone is always the name. The name of the service corporate must coincide with the
kind of business rendered by the organisation. This name must be easily pronounceable
easy to remember, easy to relate and easy to recall. Many a time similar sounding
mimes do create confusion in the mind of the customers. As far as possible the firm
must avoid common names and names that have already become very popular. This
will fail to gain a distinct identity for the firms' separate, identifiable name.
95
Managing Service Productivity
Service productivity refers to the contribution of the staff at two points of
service administration - The front line staff and the staff at the back office.
The staff at the back office is always involved in extending support to the
creation and delivery of the services. Their productivity does not suffer once they have
understood the need of the customer and his expectation. They then basically focus on
the creation of the service. It is not difficult to manage the back office support with an
efficient communication between both the wings. The productivity at the front office
definitely suffers on account of the nature of the jobs.
4.11 INNOVATIONS IN SERVICE MARKETING
The growth of new innovations in information and communication technology
has completely changed the definition and delivery system of many services. It has
given new meaning and scope to product and process of services. There are many kinds
of service systems that cannot run without the installation of the information and
communication technology infrastructure. But such highly technical infrastructure also
calls for creation of another level of services that is providing higher technical level
education and training to the staff involved in administering the new service.
4.12 SERVICE EMPLOYEES ARE CRUCIALLY IMPORTANT
Among the most demanding jobs in service businesses are the so-called frontline
jobs. Employees working in these customer-facing jobs span the boundary between
inside and outside the organization. They are expected to be fast and efficient in
executing operational tasks as well as courteous and helpful in dealing with customers.
In fact, frontline employees are a key input for delivering service excellence and
competitive advantage.
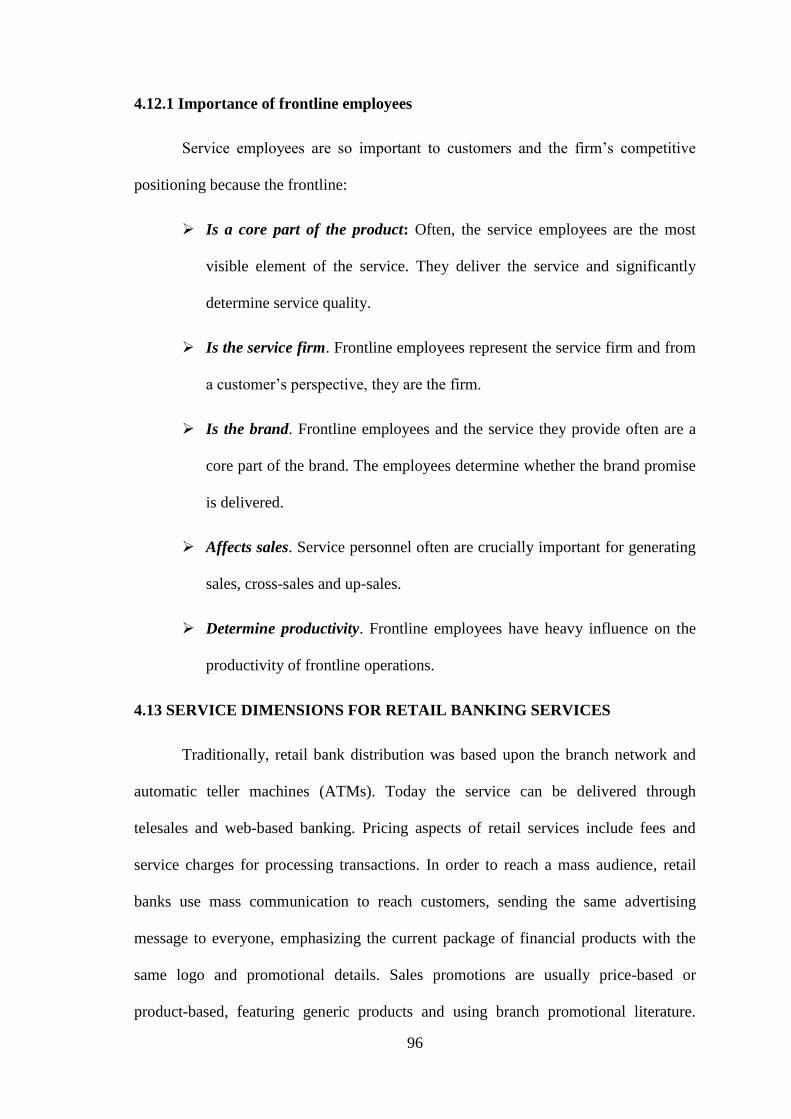
96
4.12.1 Importance of frontline employees
Service employees are so important to customers and the firm‘s competitive
positioning because the frontline:
Is a core part of the product: Often, the service employees are the most
visible element of the service. They deliver the service and significantly
determine service quality.
Is the service firm. Frontline employees represent the service firm and from
a customer‘s perspective, they are the firm.
Is the brand. Frontline employees and the service they provide often are a
core part of the brand. The employees determine whether the brand promise
is delivered.
Affects sales. Service personnel often are crucially important for generating
sales, cross-sales and up-sales.
Determine productivity. Frontline employees have heavy influence on the
productivity of frontline operations.
4.13 SERVICE DIMENSIONS FOR RETAIL BANKING SERVICES
Traditionally, retail bank distribution was based upon the branch network and
automatic teller machines (ATMs). Today the service can be delivered through
telesales and web-based banking. Pricing aspects of retail services include fees and
service charges for processing transactions. In order to reach a mass audience, retail
banks use mass communication to reach customers, sending the same advertising
message to everyone, emphasizing the current package of financial products with the
same logo and promotional details. Sales promotions are usually price-based or
product-based, featuring generic products and using branch promotional literature.
97
Publicity and sponsorship activities revolve around local and national events and
sporting associations. Personal communication and sales activities often use a similar
message, a message for the mass audience but sent to customers via the branch outlet
with a specific local manager's name attached.
Also for retail bank services, the physical evidence dimension of the branch
network - space, management of queues and ATMs - is important in the overall
marketing activity. Some banks have attempted to separate this dimension of service
delivery for relationship and transaction with customers. The service process is
inherently linked with the physical evidence and the whole management of the service
delivery will require careful integration of all the dimensions of marketing which are
often encapsulated in the interactions with front-line staff. Therefore the people
dimension in terms of managing staff and giving customers an effective and efficient
service is vital. The scope of service dimensions for retail banks is illustrated in
Figure 4.2.
Figure 4.2
The scope and range of service dimensions for retail banks
98
4.14 SERVICE QUALITY
Service quality is a concept that has aroused considerable interest and debate in
the research literature because of the difficulties in both defining it and measuring it
with no overall consensus emerging on either.9 There are a number of different
"definitions" as to what is meant by service quality. One that is commonly used defines
service quality as the extent to which a service meets customers‘ needs or
expectations).10
Service quality can thus be defined as the difference between customer
expectations of service and perceived service.
If expectations are greater than performance, then perceived quality is less than
satisfactory and hence customer dissatisfaction occurs.11
Always there exists an
important question that is why should service quality be measured? Measurement
allows for comparison before and after changes, for the location of quality related
problems and for the establishment of clear standards for service delivery. Edvardsen
et al.12
State that, in their experience, the starting point in developing quality in
services is analysis and measurement. The SERVQUAL approach, which is studied in
this paper, is the most common method for measuring service quality.
It is the principal instrument widely used to assess the service quality for a
variety of services rendered by banks. Parasuraman et.al has conceptualized a five
dimensional model of service quality such as reliability, tangibility, responsiveness,
9 Wisniewski, M. (2001), ―Using SERVQUAL to Assess Customer Satisfaction with Public Sector
Services‖, Managing Service Quality, Vol.11(6), Pp. 380-388. 10
Lewis, B.R. and Mitchell, V.W. (1990), ―Defining and Measuring the Quality of Customer Service‖,
Marketing Intelligence & Planning, Vol. 8(6), Pp. 11-17 11
Parasuraman, A., Zeithaml, V.A. and Berry, L.L. (1985), ―A Conceptual Model of Service Quality
and its Implication‖, Journal of Marketing, Vol. 49, Pp. 41-50. 12
Edvardsen, B., Tomasson, B. and Ovretveit, J. (1994), ―Quality of Service: Making it Really Work‖,
McGraw-Hill, New York, NY.
99
assurance and empathy. This has become almost the standard way of measuring
service quality. The five dimensions of service quality are:
Tangibility : physical facilities, equipment and appearance of personnel
Reliability : ability to perform the promised service dependably and
accurately
Responsiveness : willingness to help customers and provide prompt service
Assurance : knowledge and courtesy of employees and their ability to
inspire trust and confidence
Empathy : caring, individualized attention the firm provides to its
customers
It is commonly said that what is not measured is not managed. Without
measurement, managers can‘t be sure whether service quality gap exists, where they
exist and what potential corrective actions should be taken. In the present competitive
global environment, service industries, especially, the banking services are utilized by
almost each and every person irrespective of their nature of work. It becomes
necessary for the service provider, whether public sector or private sector, to maintain
the quality of their service in order to retain their customers. As a result measuring
service quality gains importance in all service industries.
4.15 IMPORTANCE OF SERVICE QUALITY
Londe et al, 198813
stated that it is the customer service management that will
derive the importance of service. In services marketing, customer service is regarded
as a component of marketing mix. Zeithaml and Bitner14
mentioned that high quality
13
La Londe B.L, M.C. Cooper and T.G. Noordewier (1988), ―Customer Service: A Management
Perspective‖, Council of Logistics Management. 14
Zeithaml, V.A. and Bitner, M.J. (1996), ―Services Marketing‖, McGraw-Hill, New York, NY.
100
customer service is not just customer service department but all levels of management
and staffs need to accept and have a state of mind regarding customer care.
On the other hand, Payne15
added that there is a pressure on delivering
customer service due to competition and technology. He also stated that higher
standards of service are being demanded by consumers as they are becoming more
sophisticated and updated in their requirements and to them service refers as customer
satisfaction, customer delight, service delivery, customer relationship. Hence, to
provide good service to customers, service companies need to take into consideration
the important variables of service quality namely, assurance, empathy, reliability,
responsiveness and tangibles.
As per Payne16
customer service and quality improvement initiatives are
closely related to each other. Moreover, marketing, customer service and relationship
marketing are brought together through relationship marketing and marketers are very
concerned about the attainment of quality. (Christopher and Ballantyne, 1991)17
Moreover, Anderson and Zeithmal, 1984; Philips, Chang and Buzzell, 1983
claimed that, customers‘ buying decisions are influenced by quality which is
considered as the most important purchase decision factor. It also contributes to market
share and return on investment. Garvin added that quality has strategic benefits in
terms of improving productivity and lowering manufacturing costs.18
15
Payne, Adrian (1995), ―The Essence of Service Marketing‖, Prentice-Hall international (UK) Ltd. 16
Ibid., 17
Christopher and Ballantyne (1991), ―The Essence of Service Marketing in Payne‖, Adrian, Prentice-
Hall International (UK) Ltd. 18
Garvin and David A. (1983), ―Quality on the Line‖, Harvard Business Review, Vol. 61, Pp. 65-73.
101
4.16 MODEL OF SERVICE QUALITY GAPS
There are seven major gaps in the service quality concept, which are shown in
Figure 4.3. The model is an extension of Parasuraman et al., (1985). According to the
following explanation (ASI Quality Systems, 1992; Curry, 1999; Luk and Layton,
2002), the three important gaps, which are more associated with the external
customers, are Gap1, Gap5 and Gap6; since they have a direct relationship with
customers.
Gap 1: Customers’ Expectations vs. Management Perceptions: as a result
of the lack of a marketing research orientation, inadequate upward communication and
too many layers of management.
Gap 2: Management Perceptions vs. Service Specifications: as a result of
inadequate commitment to service quality, a perception of unfeasibility, inadequate
task standardization and an absence of goal setting.
Gap 3: Service Specifications vs. Service Delivery: as a result of role
ambiguity and conflict, poor employee-job fit and poor technology-job fit,
inappropriate supervisory control systems, lack of perceived control and lack of
teamwork.
Gap 4: Service Delivery vs. External Communication: as a result of
inadequate horizontal communications and propensity to over-promise.
Gap 5: Discrepancy between Customers’ Expectations and Customers’
Perceptions of the Service Delivered: as a result of the influences exerted from the
customer side and the shortfalls (gaps) on the part of the service provider. In this case,
customer expectations are influenced by the extent of personal needs, word of mouth
recommendation and past service experiences.

102
Gap 6: The Discrepancy between Customers’ Expectations and
Employees’ Perceptions: as a result of the differences in the understanding of
customer expectations by front-line service providers.
Gap 7: The Discrepancy between Employee’s Perceptions and
Management Perceptions: as a result of the differences in the understanding of
customer expectations between managers and service providers.
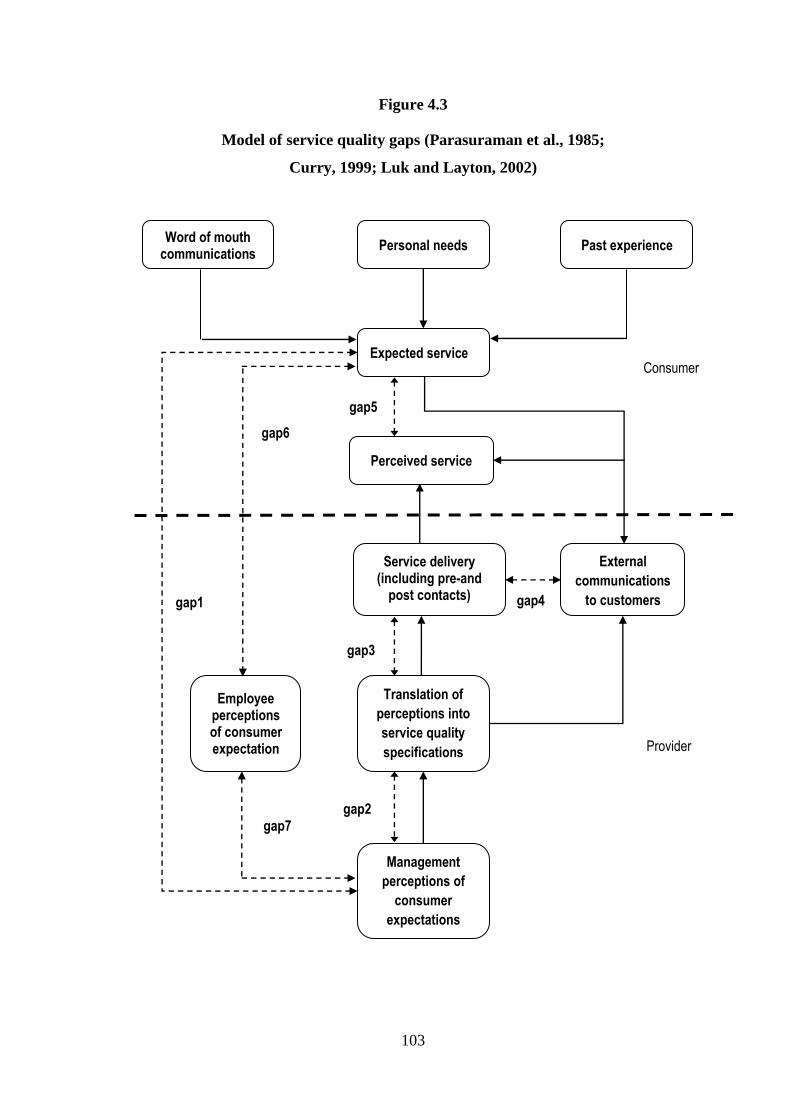
103
Figure 4.3
Model of service quality gaps (Parasuraman et al., 1985;
Curry, 1999; Luk and Layton, 2002)
gap1
gap5
gap4
gap2
gap3
Word of mouth communications
Personal needs Past experience
Expected service
Perceived service
Service delivery (including pre-and
post contacts)
Translation of
perceptions into
service quality
specifications
Management
perceptions of
consumer
expectations
External
communications
to customers
Employee perceptions of consumer expectation
Consumer
Provider
gap6
gap7

104
PERCEIVED SERVICE QUALITY
Expectation exceeds ES<PS (Excellent Quality)
Expectation met ES = PS (Satisfaction Quality)
Expectation not met S>PS (Unacceptable Quality)
4.17 PERCEPTION
Perception is defined as the process by which an individual selects, organises
and interprets stimuli into a meaningful and coherent picture of the world. No two
individuals are alike. Although two persons may be exposed to the same stimuli and
under the same environmental conditions, how each one of them recognises, selects,
organises, and interprets the stimuli will be a highly individualised process. Often the
perceptual process is based on each one's own needs, values and expectations.
Marketers are interested in knowing how each of these variables will influence the
perception process.
Sensation may be described as an immediate direct response of a physical
sensory organ. The physical senses are vision, hearing, touch, smell and taste. These
physical senses are continuously exposed to internal and external stimuli and human
sensation occurs because of them. The sensation may be in the form of reaction of the
eye to colour or mouth to taste and so on. Thus, sensation is related to a very
elementary or basic behaviour which is based on physiological functioning. Sensitivity
of the person to the stimuli will vary depending on the individual's sensory receptors
and the intensity of the stimuli to which he or she is exposed.
Perception is something more than sensation. It correlates, integrates and
comprehends the various sensations and information received from the different organs
of the body by means of which a person develops his sensitivity to various things and
105
objects. Perception is determined by both physiological and psychological factors. This
is because perception is developed based on previous experience (learning), feeling
and motives, whereas, sensation only activates the sensory organs of the body. Simply
stated, activation of the ears to hear what another person is saying is sensation and the
inference of what is heard is perception.
4.18 INTERNAL VS EXTERNAL FACTORS INFLUENCING PERCEPTION
The manner in which either a product or service is perceived will depend upon
both internal and external factors. This is to say that both external reality and internal
reality are intertwined. As los beings, we carry all of our experiences in our mind and
have our own selfish interests, sea motives and expectations in the way in which we
would like 'reality' to exist in the world. Now-a-days, no firm can make a strong claim
about having brand loyal customers because researches conducted have revealed that
for a number of products where there is strong brand loyalty id what taste would
appear to have a strong influence on the buying decisions, there is little sensory
difference between products.
4.19 THE PERCEPTION PROCESS
The perceptual process is a sequence of steps that begins with stimuli in the
environment and ends with our interpretation of those stimuli. This process is typically
unconscious and happens hundreds of thousands of times a day. An unconscious
process is simply one that happens without awareness or intention. When you open
your eyes, you do not need to tell your brain to interpret the light falling onto your
retinas from the object in front of you as ‗computer‘ because this has happened
unconsciously. When you step out into a chilly night, your brain does not need to be
told ‗cold‘ because the stimuli trigger the processes and categories automatically.

106
4.19.1 Selection
The world around us is filled with an infinite number of stimuli that we might
attend to, but our brains do not have the resources to pay attention to everything. Thus,
the first step of perception is the (usually unconscious, but sometimes intentional)
decision of what to attend to. Depending on the environment, and depending on us as
individuals, we might focus on a familiar stimulus or something new. When we attend
to one specific thing in our environment—whether it is a smell, a feeling, a sound, or
something else entirely—it becomes the attended stimulus.
4.19.2 Organization
Once we have chosen to attend to a stimulus in the environment (consciously or
unconsciously, though usually the latter), the choice sets off a series of reactions in our
brain. This neural process starts with the activation of our sensory receptors (touch,
taste, smell, sight, and hearing). The receptors transducer the input energy into neural
activity, which is transmitted to our brains, where we construct a mental representation
of the stimulus (or, in most cases, the multiple related stimuli) called a percept. An
ambiguous stimulus may be translated into multiple percepts, experienced randomly,
one at a time, in what is called "multi-stable perception."
4.19.3 Interpretation
After we have attended to a stimulus, and our brains have received and
organized the information, we interpret it in a way that makes sense using our existing
information about the world. Interpretation simply means that we take the information
that we have sensed and organized and turn it into something that we can categorize.
For instance, in the Rubin's Vase illusion mentioned earlier, some individuals will
interpret the sensory information as ‗vase‘, while some will interpret it as ‗faces‘. This
107
happens unconsciously thousands of times a day. By putting different stimuli into
categories, we can better understand and react to the world around u
4.20 EXPECTATIONS OF SERVICE
Customer expectations are beliefs about service delivery that serves as
standards or reference points against which performance is judged.19
Customers
evaluate service quality by comparing their perceptions of service with their
expectations. Service quality dimensions are those attributes of service about which
customers may have expectations and which need to be delivered at some specified
level.20
Service quality and customer service expectations respectively can be
categorized into five dimensions: tangibility, reliability, responsiveness, assurance, and
empathy.21
4.21 CUSTOMER PREFERENCE
Customer preference is a marketing term which means a customer likes one
thing over another. For instance, a trend may indicate customers prefer using debit
cards over credit cards to pay for goods. It is defined as the subjective tastes, as
measured by utility of various bundles of goods. They permit the customer to rank
these bundles of goods according to the levels of utility they give the customer. Note
that preference is independent of income and prices. Ability to purchase goods does
not determine a customer‘s likes or dislikes. One can have a preference for Porsches
over Fords but only have the financial means to drive a Ford.
19
Wilson A, Zeithaml V, Bitner M, Gremier D (2008), ―Service Marketing: Integrating Customer
Focus across the Firms‖, First European Edition, McGraw Hill, UK P 58. 20
Clark, G., Johnston, R., Shulver, M. (2000), ―Exploiting the Service Concept for Service Design and
Development in: New Service Design‖, Sage, Thousand Oaks, CA, Pp. 71–91. 21
Parasuraman, Berry and Zeithaml (1991), ―Understanding Customer Expectations of Service‖, Sloan
Management Review, Pp. 39-48.
108
4.21.1 Importance of studying customer preference
The preference of the customers is a positive motivation, expressed by the
affective compatibility towards a product, service or trading form. Preference can be
triggered by: the features related to the material substance of the goods (shape, size,
print, taste, colour, consistency, package, etc.); elements referring to label, name, use
instructions that accompany the product; the statute granted to the person owning and
using that particular product.22
Knowledge of customer preference is especially
important with respect to the various activities carried out at the organizational level,
necessary for its survival. For instance, if an entrepreneur must determine what
features must have the product he wants to create, he will interview more potential
buyers, asking them to mention the level of preference for each separate feature.
The customer preference and behavior represent the basis of the pretesting models for
the new products which implies determining the functional relationships between the
buyer‘s opinion concerning a product, testing it and the purchase behavior.
4.21.2 Factors affecting customer preference
Customer preference is the major reason for the choices people make when
selecting products and services. Analyzing the factors that determine customer
preference helps businesses target their products towards specific customer groups,
develop new products and identify why some products are more successful than others.
Advertising: It plays an important role in customer preference, especially for
non-durable goods such as food, magazines etc. Advertising informs customers about
available goods and services and also shapes their impressions of these products.
Advertising also creates demand.
22
Catoiu, I and Teodeorescu, N. (2004), ―Consumer Behavior‖, Uranus Publishing House, Second
Edition, Bucharest, P. 22
109
Social Institutions: Parents, friends, schools, religion and television shows
also influence customers' preference. For example, kids might want to have the same
toys their schoolmates have, while young adults may purchase the same products their
friends used to buy.
Cost: Customers usually choose to purchase more of a good if the price falls.
For example, a sale or reduced prices may increase consumption of a good. On the
other hand, an increase in price may cause reduced consumption, especially if the good
has available substitutes.
Customer Income: Customers often desire more expensive goods and services
when their income increases. If they suffer a decrease in income, they are more likely
to choose less expensive goods and services. For example, business selling luxury
goods, such as jewelry, will probably be more successful in a high-income area than a
low-income area.
Available Substitutes: If a product has several substitutes - alternative
products that customers may choose instead a particular brand of product - customers
will be more sensitive to changes in price.
110
CHAPTER V
ANALYSIS OF SERVICE QUALITY GAP AND CUSTOMERS’
SATISFACTION
5.1 INTRODUCTION
This chapter deals with the perception of customers towards the service quality
of public sector banks and private sector banks in Tirunelveli district. The researcher
has analysed the customers‘ preference towards public sector banks and private sector
banks, impact of various demographic variables of customers on their selection of
bank, service quality gap in availing the banking services and problems faced by the
customers in availing banking services.
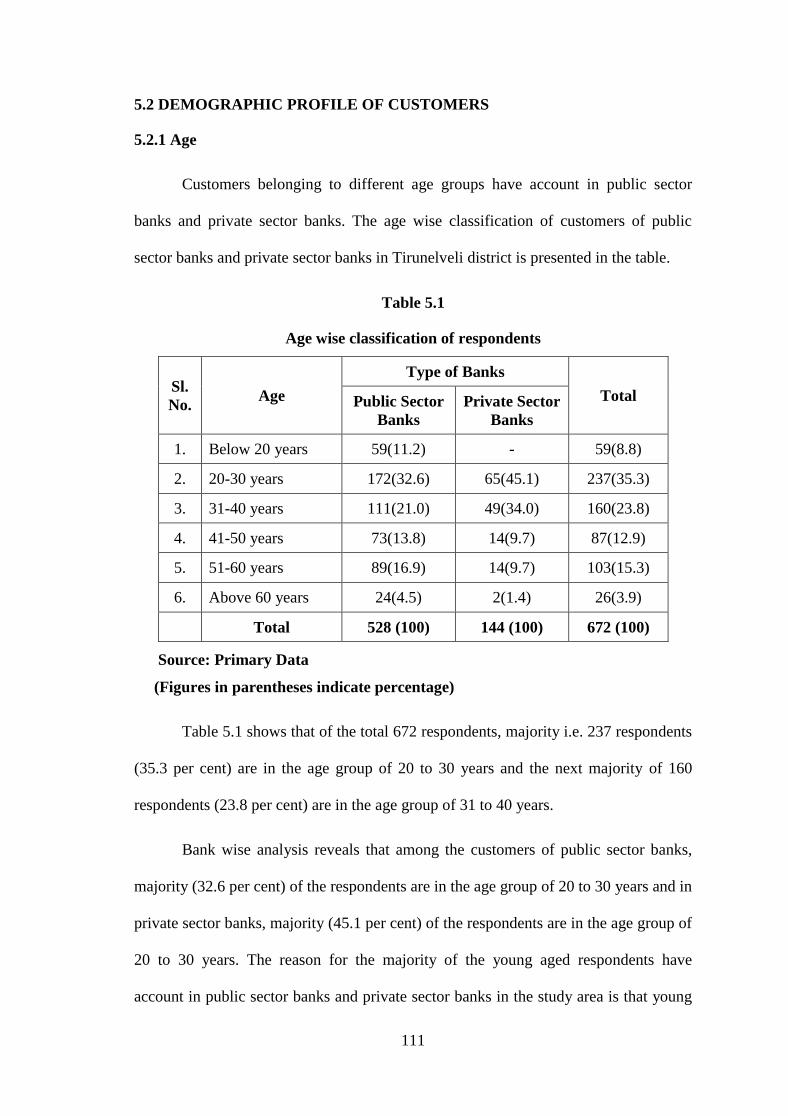
111
5.2 DEMOGRAPHIC PROFILE OF CUSTOMERS
5.2.1 Age
Customers belonging to different age groups have account in public sector
banks and private sector banks. The age wise classification of customers of public
sector banks and private sector banks in Tirunelveli district is presented in the table.
Table 5.1
Age wise classification of respondents
Sl.
No. Age
Type of Banks
Total Public Sector
Banks
Private Sector
Banks
1. Below 20 years 59(11.2) - 59(8.8)
2. 20-30 years 172(32.6) 65(45.1) 237(35.3)
3. 31-40 years 111(21.0) 49(34.0) 160(23.8)
4. 41-50 years 73(13.8) 14(9.7) 87(12.9)
5. 51-60 years 89(16.9) 14(9.7) 103(15.3)
6. Above 60 years 24(4.5) 2(1.4) 26(3.9)
Total 528 (100) 144 (100) 672 (100)
Source: Primary Data
(Figures in parentheses indicate percentage)
Table 5.1 shows that of the total 672 respondents, majority i.e. 237 respondents
(35.3 per cent) are in the age group of 20 to 30 years and the next majority of 160
respondents (23.8 per cent) are in the age group of 31 to 40 years.
Bank wise analysis reveals that among the customers of public sector banks,
majority (32.6 per cent) of the respondents are in the age group of 20 to 30 years and in
private sector banks, majority (45.1 per cent) of the respondents are in the age group of
20 to 30 years. The reason for the majority of the young aged respondents have
account in public sector banks and private sector banks in the study area is that young
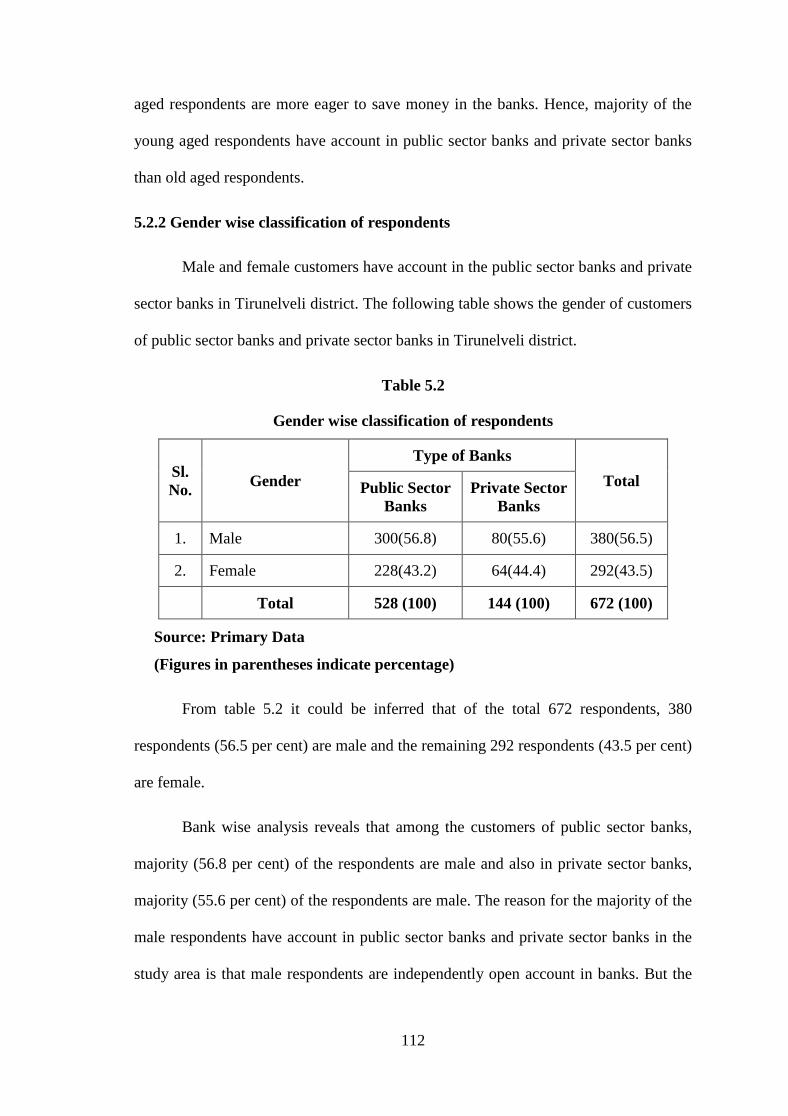
112
aged respondents are more eager to save money in the banks. Hence, majority of the
young aged respondents have account in public sector banks and private sector banks
than old aged respondents.
5.2.2 Gender wise classification of respondents
Male and female customers have account in the public sector banks and private
sector banks in Tirunelveli district. The following table shows the gender of customers
of public sector banks and private sector banks in Tirunelveli district.
Table 5.2
Gender wise classification of respondents
Sl.
No. Gender
Type of Banks
Total Public Sector
Banks
Private Sector
Banks
1. Male 300(56.8) 80(55.6) 380(56.5)
2. Female 228(43.2) 64(44.4) 292(43.5)
Total 528 (100) 144 (100) 672 (100)
Source: Primary Data
(Figures in parentheses indicate percentage)
From table 5.2 it could be inferred that of the total 672 respondents, 380
respondents (56.5 per cent) are male and the remaining 292 respondents (43.5 per cent)
are female.
Bank wise analysis reveals that among the customers of public sector banks,
majority (56.8 per cent) of the respondents are male and also in private sector banks,
majority (55.6 per cent) of the respondents are male. The reason for the majority of the
male respondents have account in public sector banks and private sector banks in the
study area is that male respondents are independently open account in banks. But the
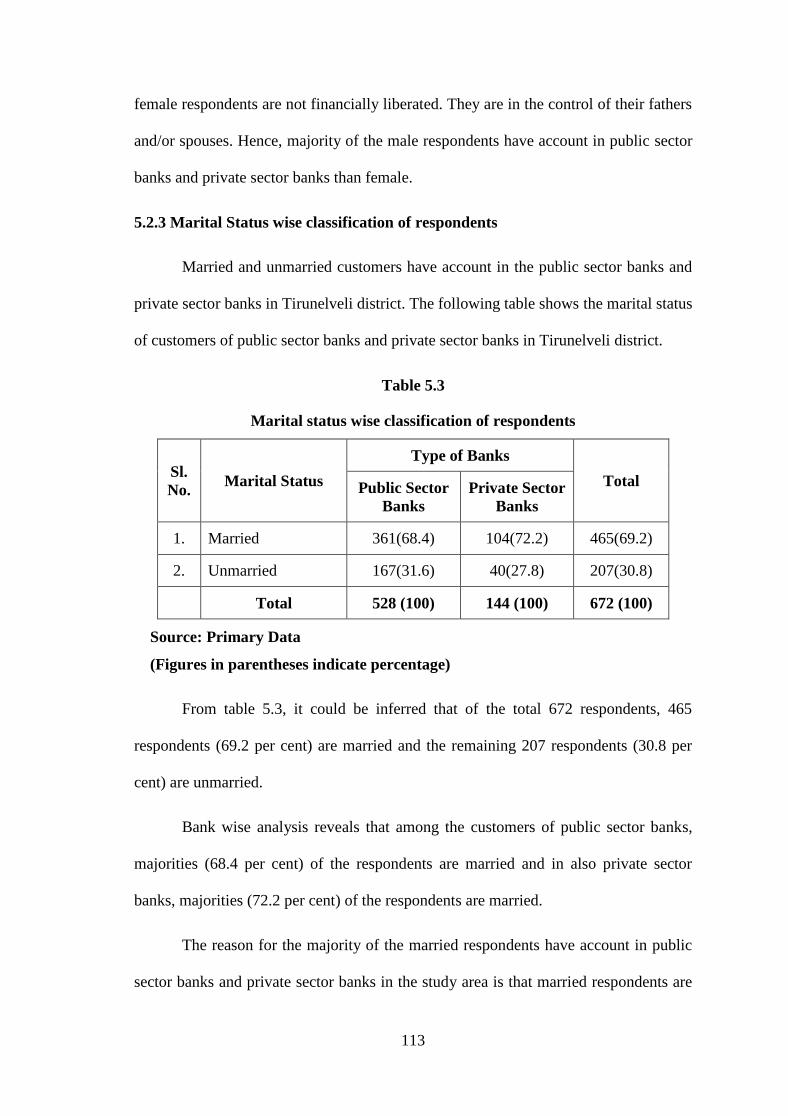
113
female respondents are not financially liberated. They are in the control of their fathers
and/or spouses. Hence, majority of the male respondents have account in public sector
banks and private sector banks than female.
5.2.3 Marital Status wise classification of respondents
Married and unmarried customers have account in the public sector banks and
private sector banks in Tirunelveli district. The following table shows the marital status
of customers of public sector banks and private sector banks in Tirunelveli district.
Table 5.3
Marital status wise classification of respondents
Sl.
No. Marital Status
Type of Banks
Total Public Sector
Banks
Private Sector
Banks
1. Married 361(68.4) 104(72.2) 465(69.2)
2. Unmarried 167(31.6) 40(27.8) 207(30.8)
Total 528 (100) 144 (100) 672 (100)
Source: Primary Data
(Figures in parentheses indicate percentage)
From table 5.3, it could be inferred that of the total 672 respondents, 465
respondents (69.2 per cent) are married and the remaining 207 respondents (30.8 per
cent) are unmarried.
Bank wise analysis reveals that among the customers of public sector banks,
majorities (68.4 per cent) of the respondents are married and in also private sector
banks, majorities (72.2 per cent) of the respondents are married.
The reason for the majority of the married respondents have account in public
sector banks and private sector banks in the study area is that married respondents are
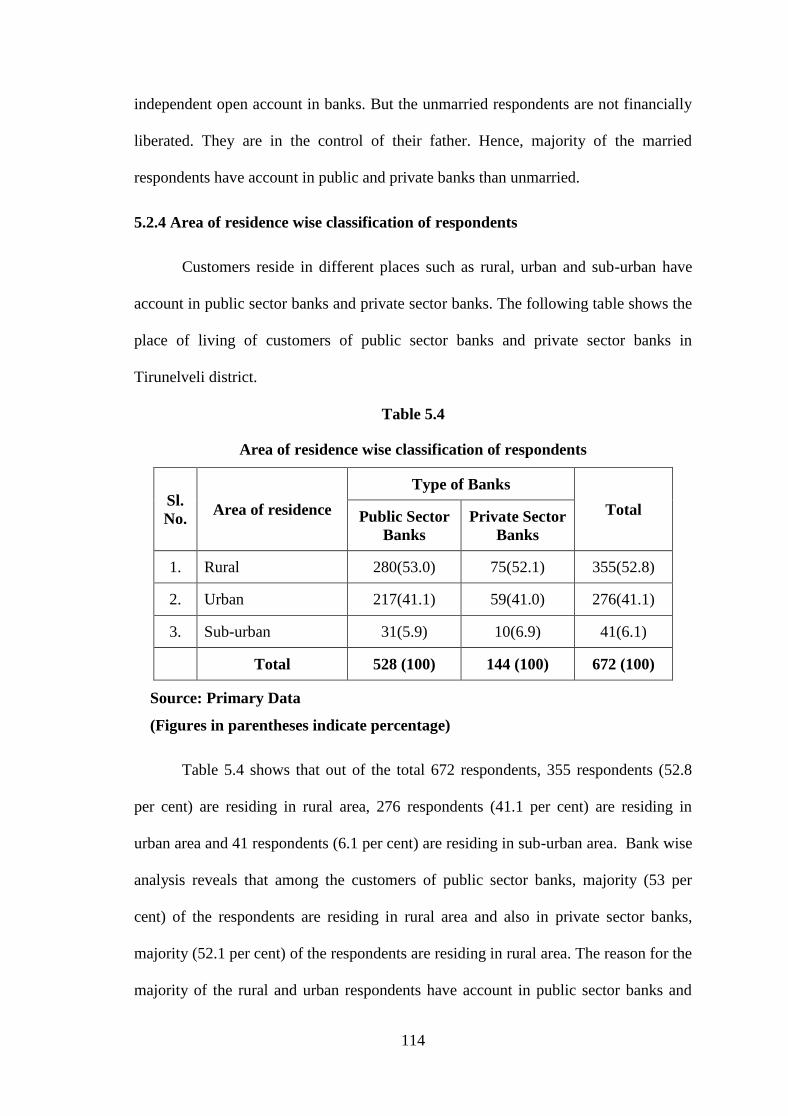
114
independent open account in banks. But the unmarried respondents are not financially
liberated. They are in the control of their father. Hence, majority of the married
respondents have account in public and private banks than unmarried.
5.2.4 Area of residence wise classification of respondents
Customers reside in different places such as rural, urban and sub-urban have
account in public sector banks and private sector banks. The following table shows the
place of living of customers of public sector banks and private sector banks in
Tirunelveli district.
Table 5.4
Area of residence wise classification of respondents
Sl.
No. Area of residence
Type of Banks
Total Public Sector
Banks
Private Sector
Banks
1. Rural 280(53.0) 75(52.1) 355(52.8)
2. Urban 217(41.1) 59(41.0) 276(41.1)
3. Sub-urban 31(5.9) 10(6.9) 41(6.1)
Total 528 (100) 144 (100) 672 (100)
Source: Primary Data
(Figures in parentheses indicate percentage)
Table 5.4 shows that out of the total 672 respondents, 355 respondents (52.8
per cent) are residing in rural area, 276 respondents (41.1 per cent) are residing in
urban area and 41 respondents (6.1 per cent) are residing in sub-urban area. Bank wise
analysis reveals that among the customers of public sector banks, majority (53 per
cent) of the respondents are residing in rural area and also in private sector banks,
majority (52.1 per cent) of the respondents are residing in rural area. The reason for the
majority of the rural and urban respondents have account in public sector banks and
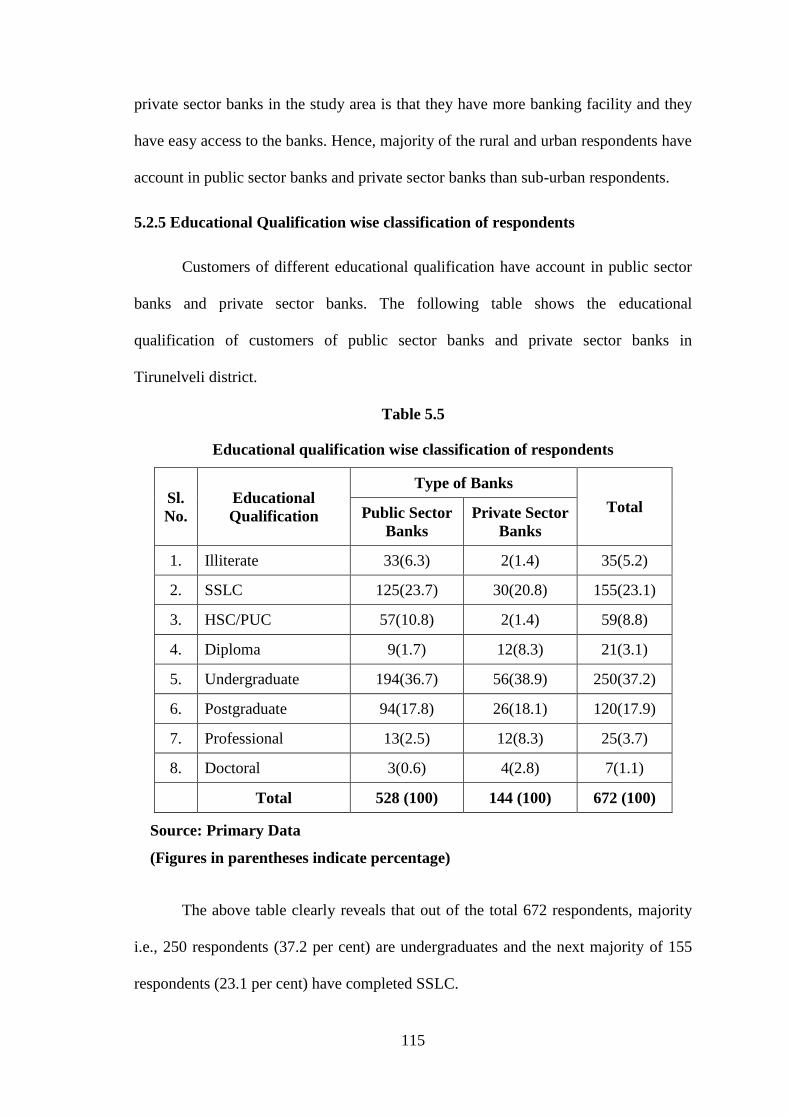
115
private sector banks in the study area is that they have more banking facility and they
have easy access to the banks. Hence, majority of the rural and urban respondents have
account in public sector banks and private sector banks than sub-urban respondents.
5.2.5 Educational Qualification wise classification of respondents
Customers of different educational qualification have account in public sector
banks and private sector banks. The following table shows the educational
qualification of customers of public sector banks and private sector banks in
Tirunelveli district.
Table 5.5
Educational qualification wise classification of respondents
Sl.
No.
Educational
Qualification
Type of Banks
Total Public Sector
Banks
Private Sector
Banks
1. Illiterate 33(6.3) 2(1.4) 35(5.2)
2. SSLC 125(23.7) 30(20.8) 155(23.1)
3. HSC/PUC 57(10.8) 2(1.4) 59(8.8)
4. Diploma 9(1.7) 12(8.3) 21(3.1)
5. Undergraduate 194(36.7) 56(38.9) 250(37.2)
6. Postgraduate 94(17.8) 26(18.1) 120(17.9)
7. Professional 13(2.5) 12(8.3) 25(3.7)
8. Doctoral 3(0.6) 4(2.8) 7(1.1)
Total 528 (100) 144 (100) 672 (100)
Source: Primary Data
(Figures in parentheses indicate percentage)
The above table clearly reveals that out of the total 672 respondents, majority
i.e., 250 respondents (37.2 per cent) are undergraduates and the next majority of 155
respondents (23.1 per cent) have completed SSLC.
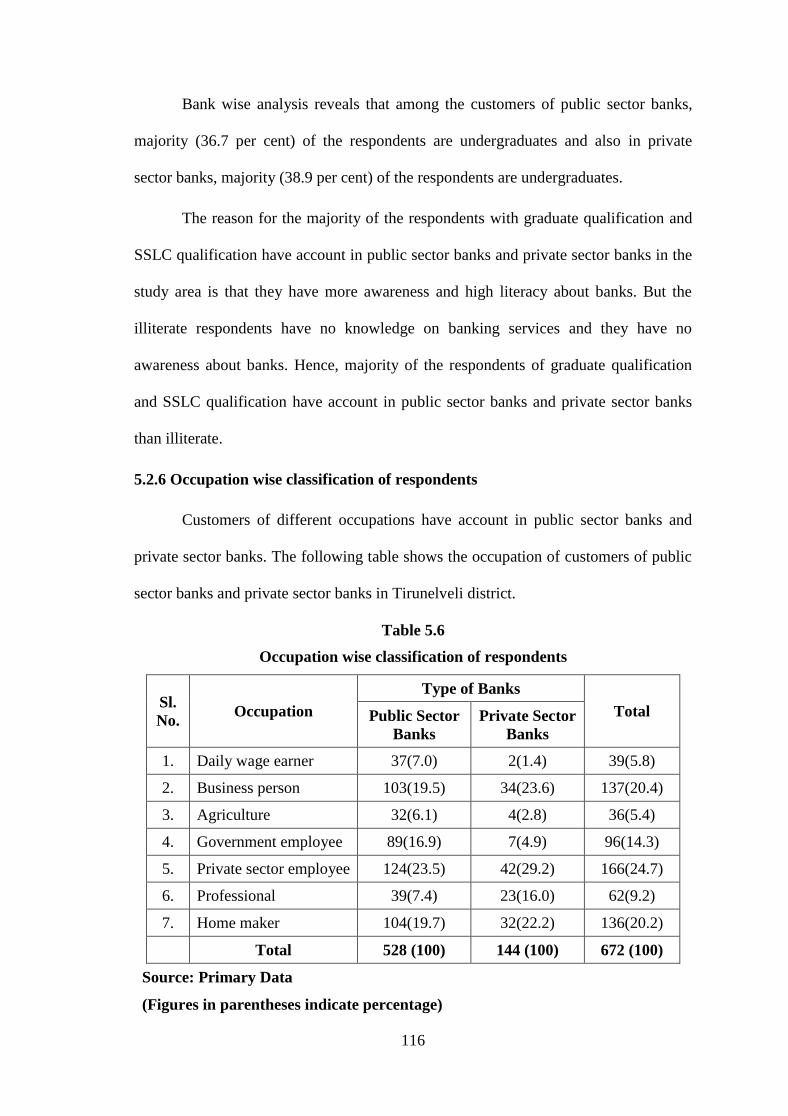
116
Bank wise analysis reveals that among the customers of public sector banks,
majority (36.7 per cent) of the respondents are undergraduates and also in private
sector banks, majority (38.9 per cent) of the respondents are undergraduates.
The reason for the majority of the respondents with graduate qualification and
SSLC qualification have account in public sector banks and private sector banks in the
study area is that they have more awareness and high literacy about banks. But the
illiterate respondents have no knowledge on banking services and they have no
awareness about banks. Hence, majority of the respondents of graduate qualification
and SSLC qualification have account in public sector banks and private sector banks
than illiterate.
5.2.6 Occupation wise classification of respondents
Customers of different occupations have account in public sector banks and
private sector banks. The following table shows the occupation of customers of public
sector banks and private sector banks in Tirunelveli district.
Table 5.6
Occupation wise classification of respondents
Sl.
No. Occupation
Type of Banks
Total Public Sector
Banks
Private Sector
Banks
1. Daily wage earner 37(7.0) 2(1.4) 39(5.8)
2. Business person 103(19.5) 34(23.6) 137(20.4)
3. Agriculture 32(6.1) 4(2.8) 36(5.4)
4. Government employee 89(16.9) 7(4.9) 96(14.3)
5. Private sector employee 124(23.5) 42(29.2) 166(24.7)
6. Professional 39(7.4) 23(16.0) 62(9.2)
7. Home maker 104(19.7) 32(22.2) 136(20.2)
Total 528 (100) 144 (100) 672 (100)
Source: Primary Data
(Figures in parentheses indicate percentage)
117
It is clear from the above table that out of the total 672 respondents, majority
i.e. 166 respondents (24.7 per cent) are private sector employees and the next majority
of 137 respondents (20.4 per cent) are business person.
Bank wise analysis reveals that among the customers of public sector banks,
majority (23.5 per cent) of the respondents are private sector employees and in private
sector banks also majority (29.2 per cent) of the respondents are private sector
employees.
The reason for the majority of the private sector employees have account in
public sector banks and private sector banks in the study area is that they must have
account for payment of salary. But the agricultural respondents have no such necessary
for payment of salary in their account. Hence, majority of the private employees have
account in public sector banks and private sector banks than others.
5.2.7 Monthly family income wise classification of respondents
Customers belonging to different monthly family income have account in
public sector banks and private sector banks. The following table shows the monthly
income of customers of public sector banks and private sector banks in Tirunelveli
district.
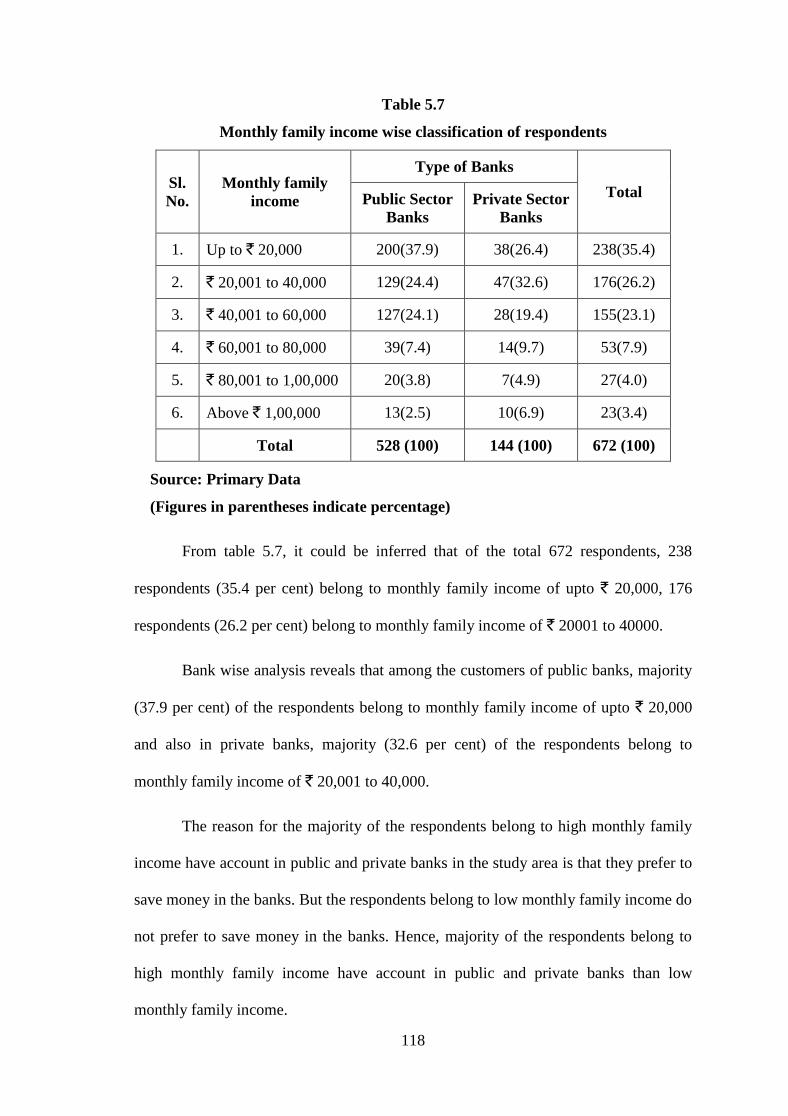
118
Table 5.7
Monthly family income wise classification of respondents
Sl.
No.
Monthly family
income
Type of Banks
Total Public Sector
Banks
Private Sector
Banks
1. Up to ` 20,000 200(37.9) 38(26.4) 238(35.4)
2. ` 20,001 to 40,000 129(24.4) 47(32.6) 176(26.2)
3. ` 40,001 to 60,000 127(24.1) 28(19.4) 155(23.1)
4. ` 60,001 to 80,000 39(7.4) 14(9.7) 53(7.9)
5. ` 80,001 to 1,00,000 20(3.8) 7(4.9) 27(4.0)
6. Above ` 1,00,000 13(2.5) 10(6.9) 23(3.4)
Total 528 (100) 144 (100) 672 (100)
Source: Primary Data
(Figures in parentheses indicate percentage)
From table 5.7, it could be inferred that of the total 672 respondents, 238
respondents (35.4 per cent) belong to monthly family income of upto ` 20,000, 176
respondents (26.2 per cent) belong to monthly family income of ` 20001 to 40000.
Bank wise analysis reveals that among the customers of public banks, majority
(37.9 per cent) of the respondents belong to monthly family income of upto ` 20,000
and also in private banks, majority (32.6 per cent) of the respondents belong to
monthly family income of ` 20,001 to 40,000.
The reason for the majority of the respondents belong to high monthly family
income have account in public and private banks in the study area is that they prefer to
save money in the banks. But the respondents belong to low monthly family income do
not prefer to save money in the banks. Hence, majority of the respondents belong to
high monthly family income have account in public and private banks than low
monthly family income.

119
5.2.8 Monthly average savings wise classification of respondents
Customers having account in public sector banks and private sector banks may
not have uniform amount of monthly average saving. The following table shows the
monthly average savings of customers of public sector banks and private sector banks
in Tirunelveli district.
Table 5.8
Monthly average savings wise classification of respondents
Sl.
No.
Monthly average
savings
Type of Banks
Total Public Sector
Banks
Private Sector
Banks
1. Below ` 5,000 250(47.3) 57(39.6) 307(45.7)
2. ` 5,000 to 10,000 158(29.9) 41(28.5) 199(29.6)
3. ` 10,001 to 15,000 13(2.5) 13(9.0) 26(3.9)
4. ` 15,001 to 20,000 40(7.6) 13(9.0) 53(7.9)
5. Above ` 20,000 67(12.7) 20(13.9) 87(12.9)
Total 528 (100) 144 (100) 672 (100)
Source: Primary Data (Figures in parentheses indicate percentage)
It could be inferred from the above table that of the total 672 respondents, 307
respondents (45.7 per cent) belong to the category of monthly average savings of
below ` 5,000 and 199 respondents (29.6 per cent) have monthly average savings of
between ` 5,000 to 10,000.
Bank wise analysis reveals that among the customers of public sector banks,
majority (47.3 per cent) of the respondents belong to the category of monthly average
savings of below ` 5,000 and also in private banks, majority (39.6 per cent) of the
respondents belong to the category of monthly average savings of below ` 5,000.
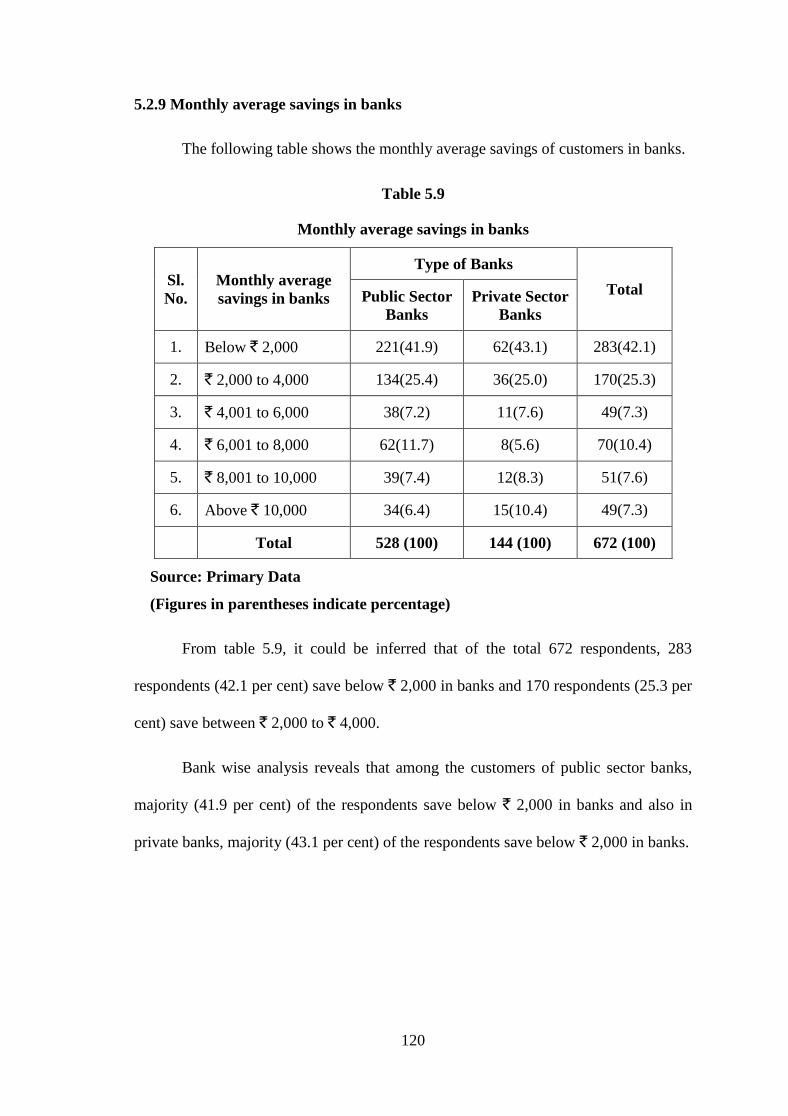
120
5.2.9 Monthly average savings in banks
The following table shows the monthly average savings of customers in banks.
Table 5.9
Monthly average savings in banks
Sl.
No.
Monthly average
savings in banks
Type of Banks
Total Public Sector
Banks
Private Sector
Banks
1. Below ` 2,000 221(41.9) 62(43.1) 283(42.1)
2. ` 2,000 to 4,000 134(25.4) 36(25.0) 170(25.3)
3. ` 4,001 to 6,000 38(7.2) 11(7.6) 49(7.3)
4. ` 6,001 to 8,000 62(11.7) 8(5.6) 70(10.4)
5. ` 8,001 to 10,000 39(7.4) 12(8.3) 51(7.6)
6. Above ` 10,000 34(6.4) 15(10.4) 49(7.3)
Total 528 (100) 144 (100) 672 (100)
Source: Primary Data
(Figures in parentheses indicate percentage)
From table 5.9, it could be inferred that of the total 672 respondents, 283
respondents (42.1 per cent) save below ` 2,000 in banks and 170 respondents (25.3 per
cent) save between ` 2,000 to ` 4,000.
Bank wise analysis reveals that among the customers of public sector banks,
majority (41.9 per cent) of the respondents save below ` 2,000 in banks and also in
private banks, majority (43.1 per cent) of the respondents save below ` 2,000 in banks.
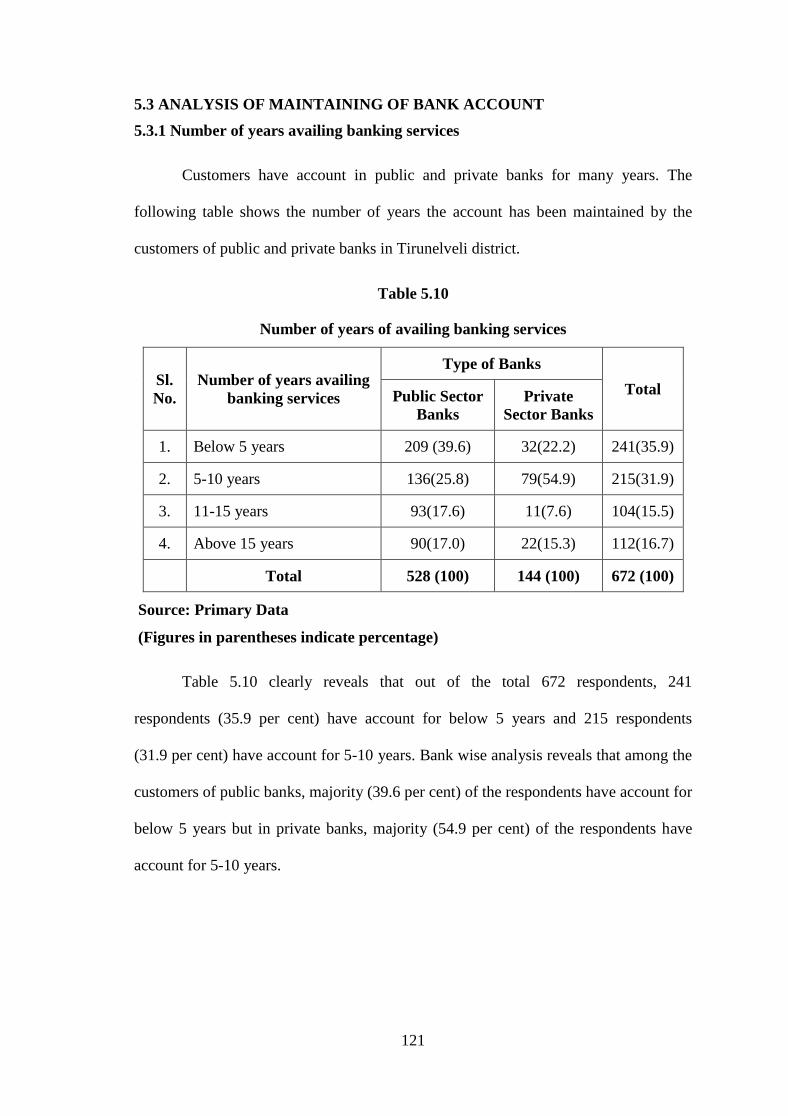
121
5.3 ANALYSIS OF MAINTAINING OF BANK ACCOUNT
5.3.1 Number of years availing banking services
Customers have account in public and private banks for many years. The
following table shows the number of years the account has been maintained by the
customers of public and private banks in Tirunelveli district.
Table 5.10
Number of years of availing banking services
Sl.
No.
Number of years availing
banking services
Type of Banks
Total Public Sector
Banks
Private
Sector Banks
1. Below 5 years 209 (39.6) 32(22.2) 241(35.9)
2. 5-10 years 136(25.8) 79(54.9) 215(31.9)
3. 11-15 years 93(17.6) 11(7.6) 104(15.5)
4. Above 15 years 90(17.0) 22(15.3) 112(16.7)
Total 528 (100) 144 (100) 672 (100)
Source: Primary Data
(Figures in parentheses indicate percentage)
Table 5.10 clearly reveals that out of the total 672 respondents, 241
respondents (35.9 per cent) have account for below 5 years and 215 respondents
(31.9 per cent) have account for 5-10 years. Bank wise analysis reveals that among the
customers of public banks, majority (39.6 per cent) of the respondents have account for
below 5 years but in private banks, majority (54.9 per cent) of the respondents have
account for 5-10 years.
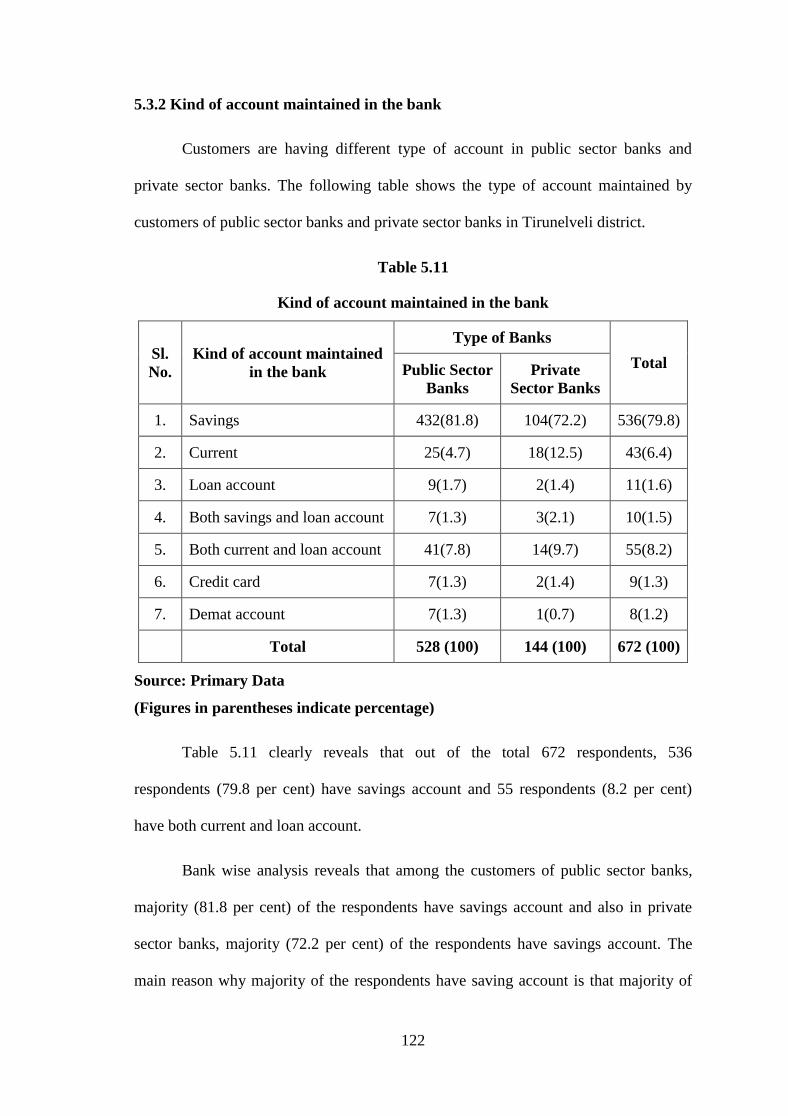
122
5.3.2 Kind of account maintained in the bank
Customers are having different type of account in public sector banks and
private sector banks. The following table shows the type of account maintained by
customers of public sector banks and private sector banks in Tirunelveli district.
Table 5.11
Kind of account maintained in the bank
Sl.
No.
Kind of account maintained
in the bank
Type of Banks
Total Public Sector
Banks
Private
Sector Banks
1. Savings 432(81.8) 104(72.2) 536(79.8)
2. Current 25(4.7) 18(12.5) 43(6.4)
3. Loan account 9(1.7) 2(1.4) 11(1.6)
4. Both savings and loan account 7(1.3) 3(2.1) 10(1.5)
5. Both current and loan account 41(7.8) 14(9.7) 55(8.2)
6. Credit card 7(1.3) 2(1.4) 9(1.3)
7. Demat account 7(1.3) 1(0.7) 8(1.2)
Total 528 (100) 144 (100) 672 (100)
Source: Primary Data
(Figures in parentheses indicate percentage)
Table 5.11 clearly reveals that out of the total 672 respondents, 536
respondents (79.8 per cent) have savings account and 55 respondents (8.2 per cent)
have both current and loan account.
Bank wise analysis reveals that among the customers of public sector banks,
majority (81.8 per cent) of the respondents have savings account and also in private
sector banks, majority (72.2 per cent) of the respondents have savings account. The
main reason why majority of the respondents have saving account is that majority of
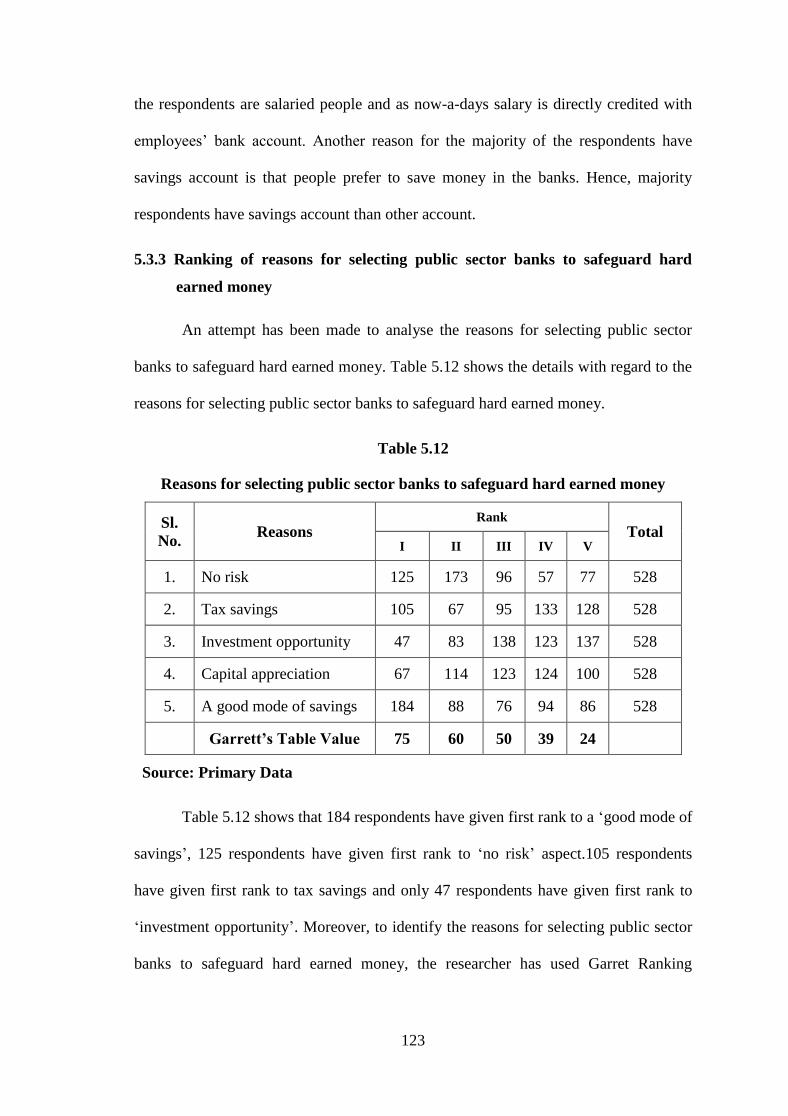
123
the respondents are salaried people and as now-a-days salary is directly credited with
employees‘ bank account. Another reason for the majority of the respondents have
savings account is that people prefer to save money in the banks. Hence, majority
respondents have savings account than other account.
5.3.3 Ranking of reasons for selecting public sector banks to safeguard hard
earned money
An attempt has been made to analyse the reasons for selecting public sector
banks to safeguard hard earned money. Table 5.12 shows the details with regard to the
reasons for selecting public sector banks to safeguard hard earned money.
Table 5.12
Reasons for selecting public sector banks to safeguard hard earned money
Sl.
No. Reasons
Rank Total
I II III IV V
1. No risk 125 173 96 57 77 528
2. Tax savings 105 67 95 133 128 528
3. Investment opportunity 47 83 138 123 137 528
4. Capital appreciation 67 114 123 124 100 528
5. A good mode of savings 184 88 76 94 86 528
Garrett’s Table Value 75 60 50 39 24
Source: Primary Data
Table 5.12 shows that 184 respondents have given first rank to a ‗good mode of
savings‘, 125 respondents have given first rank to ‗no risk‘ aspect.105 respondents
have given first rank to tax savings and only 47 respondents have given first rank to
‗investment opportunity‘. Moreover, to identify the reasons for selecting public sector
banks to safeguard hard earned money, the researcher has used Garret Ranking
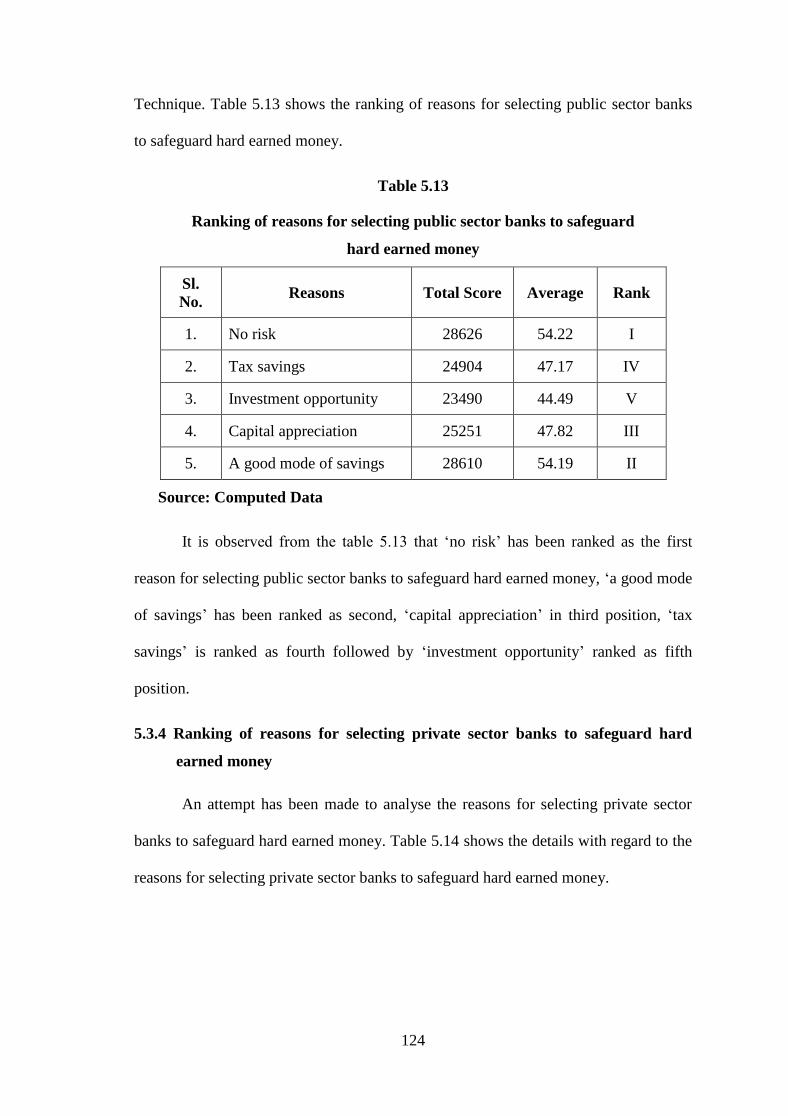
124
Technique. Table 5.13 shows the ranking of reasons for selecting public sector banks
to safeguard hard earned money.
Table 5.13
Ranking of reasons for selecting public sector banks to safeguard
hard earned money
Sl.
No. Reasons Total Score Average Rank
1. No risk 28626 54.22 I
2. Tax savings 24904 47.17 IV
3. Investment opportunity 23490 44.49 V
4. Capital appreciation 25251 47.82 III
5. A good mode of savings 28610 54.19 II
Source: Computed Data
It is observed from the table 5.13 that ‗no risk‘ has been ranked as the first
reason for selecting public sector banks to safeguard hard earned money, ‗a good mode
of savings‘ has been ranked as second, ‗capital appreciation‘ in third position, ‗tax
savings‘ is ranked as fourth followed by ‗investment opportunity‘ ranked as fifth
position.
5.3.4 Ranking of reasons for selecting private sector banks to safeguard hard
earned money
An attempt has been made to analyse the reasons for selecting private sector
banks to safeguard hard earned money. Table 5.14 shows the details with regard to the
reasons for selecting private sector banks to safeguard hard earned money.
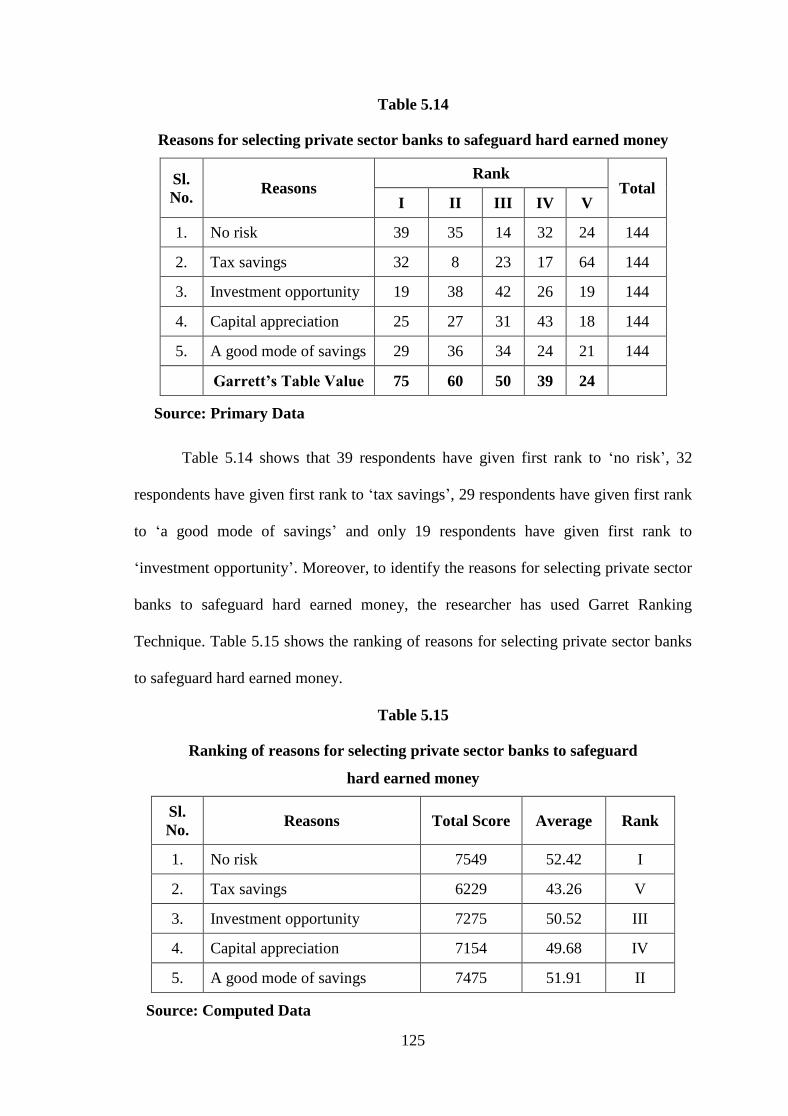
125
Table 5.14
Reasons for selecting private sector banks to safeguard hard earned money
Sl.
No. Reasons
Rank Total
I II III IV V
1. No risk 39 35 14 32 24 144
2. Tax savings 32 8 23 17 64 144
3. Investment opportunity 19 38 42 26 19 144
4. Capital appreciation 25 27 31 43 18 144
5. A good mode of savings 29 36 34 24 21 144
Garrett’s Table Value 75 60 50 39 24
Source: Primary Data
Table 5.14 shows that 39 respondents have given first rank to ‗no risk‘, 32
respondents have given first rank to ‗tax savings‘, 29 respondents have given first rank
to ‗a good mode of savings‘ and only 19 respondents have given first rank to
‗investment opportunity‘. Moreover, to identify the reasons for selecting private sector
banks to safeguard hard earned money, the researcher has used Garret Ranking
Technique. Table 5.15 shows the ranking of reasons for selecting private sector banks
to safeguard hard earned money.
Table 5.15
Ranking of reasons for selecting private sector banks to safeguard
hard earned money
Sl.
No. Reasons Total Score Average Rank
1. No risk 7549 52.42 I
2. Tax savings 6229 43.26 V
3. Investment opportunity 7275 50.52 III
4. Capital appreciation 7154 49.68 IV
5. A good mode of savings 7475 51.91 II
Source: Computed Data
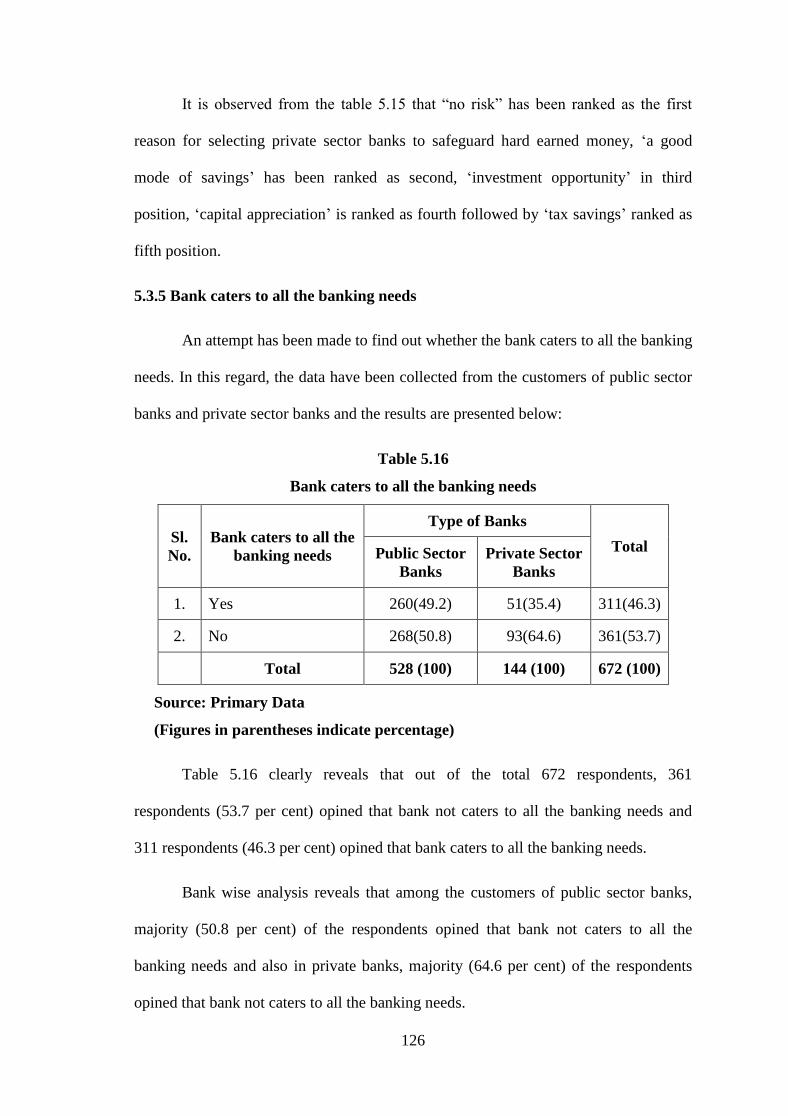
126
It is observed from the table 5.15 that ―no risk‖ has been ranked as the first
reason for selecting private sector banks to safeguard hard earned money, ‗a good
mode of savings‘ has been ranked as second, ‗investment opportunity‘ in third
position, ‗capital appreciation‘ is ranked as fourth followed by ‗tax savings‘ ranked as
fifth position.
5.3.5 Bank caters to all the banking needs
An attempt has been made to find out whether the bank caters to all the banking
needs. In this regard, the data have been collected from the customers of public sector
banks and private sector banks and the results are presented below:
Table 5.16
Bank caters to all the banking needs
Sl.
No.
Bank caters to all the
banking needs
Type of Banks
Total Public Sector
Banks
Private Sector
Banks
1. Yes 260(49.2) 51(35.4) 311(46.3)
2. No 268(50.8) 93(64.6) 361(53.7)
Total 528 (100) 144 (100) 672 (100)
Source: Primary Data
(Figures in parentheses indicate percentage)
Table 5.16 clearly reveals that out of the total 672 respondents, 361
respondents (53.7 per cent) opined that bank not caters to all the banking needs and
311 respondents (46.3 per cent) opined that bank caters to all the banking needs.
Bank wise analysis reveals that among the customers of public sector banks,
majority (50.8 per cent) of the respondents opined that bank not caters to all the
banking needs and also in private banks, majority (64.6 per cent) of the respondents
opined that bank not caters to all the banking needs.
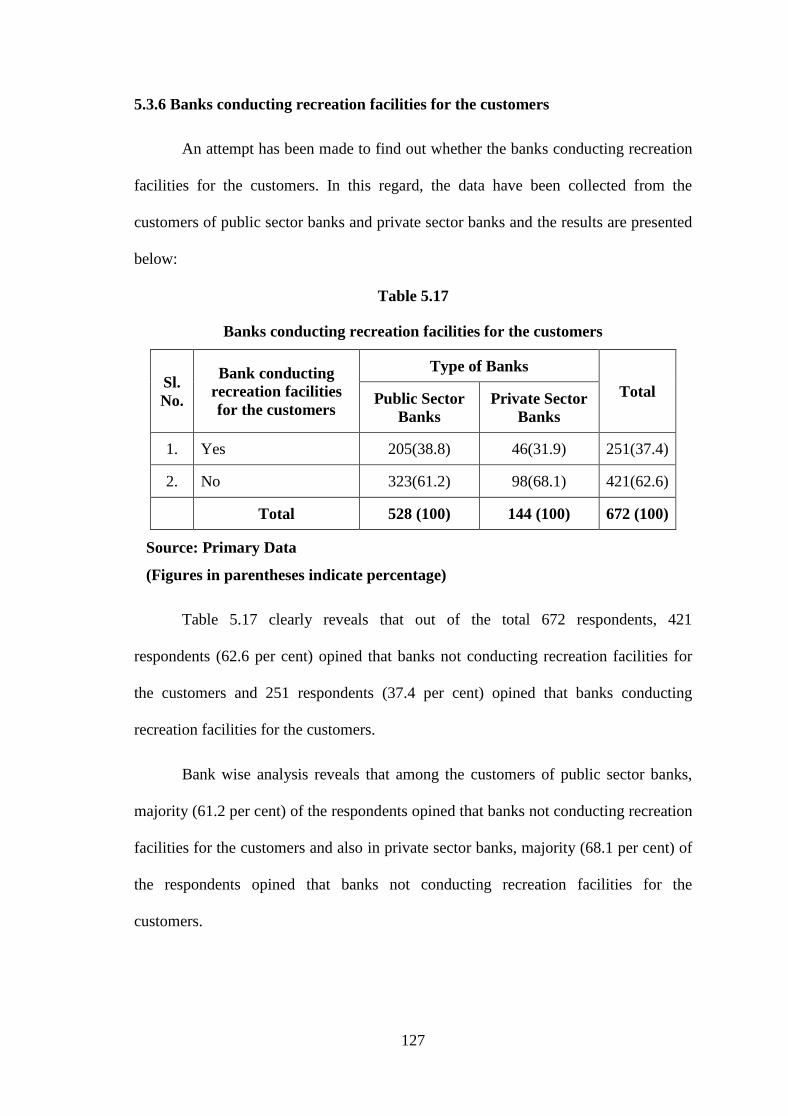
127
5.3.6 Banks conducting recreation facilities for the customers
An attempt has been made to find out whether the banks conducting recreation
facilities for the customers. In this regard, the data have been collected from the
customers of public sector banks and private sector banks and the results are presented
below:
Table 5.17
Banks conducting recreation facilities for the customers
Sl.
No.
Bank conducting
recreation facilities
for the customers
Type of Banks
Total Public Sector
Banks
Private Sector
Banks
1. Yes 205(38.8) 46(31.9) 251(37.4)
2. No 323(61.2) 98(68.1) 421(62.6)
Total 528 (100) 144 (100) 672 (100)
Source: Primary Data
(Figures in parentheses indicate percentage)
Table 5.17 clearly reveals that out of the total 672 respondents, 421
respondents (62.6 per cent) opined that banks not conducting recreation facilities for
the customers and 251 respondents (37.4 per cent) opined that banks conducting
recreation facilities for the customers.
Bank wise analysis reveals that among the customers of public sector banks,
majority (61.2 per cent) of the respondents opined that banks not conducting recreation
facilities for the customers and also in private sector banks, majority (68.1 per cent) of
the respondents opined that banks not conducting recreation facilities for the
customers.
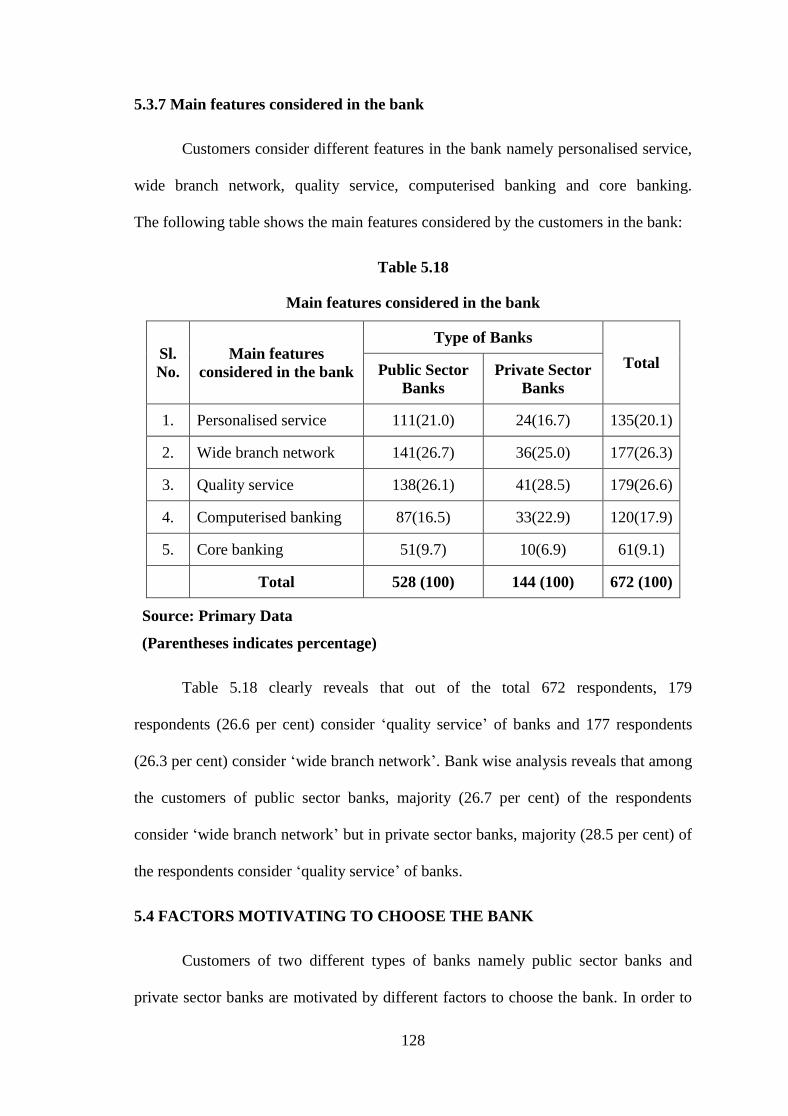
128
5.3.7 Main features considered in the bank
Customers consider different features in the bank namely personalised service,
wide branch network, quality service, computerised banking and core banking.
The following table shows the main features considered by the customers in the bank:
Table 5.18
Main features considered in the bank
Sl.
No.
Main features
considered in the bank
Type of Banks
Total Public Sector
Banks
Private Sector
Banks
1. Personalised service 111(21.0) 24(16.7) 135(20.1)
2. Wide branch network 141(26.7) 36(25.0) 177(26.3)
3. Quality service 138(26.1) 41(28.5) 179(26.6)
4. Computerised banking 87(16.5) 33(22.9) 120(17.9)
5. Core banking 51(9.7) 10(6.9) 61(9.1)
Total 528 (100) 144 (100) 672 (100)
Source: Primary Data
(Parentheses indicates percentage)
Table 5.18 clearly reveals that out of the total 672 respondents, 179
respondents (26.6 per cent) consider ‗quality service‘ of banks and 177 respondents
(26.3 per cent) consider ‗wide branch network‘. Bank wise analysis reveals that among
the customers of public sector banks, majority (26.7 per cent) of the respondents
consider ‗wide branch network‘ but in private sector banks, majority (28.5 per cent) of
the respondents consider ‗quality service‘ of banks.
5.4 FACTORS MOTIVATING TO CHOOSE THE BANK
Customers of two different types of banks namely public sector banks and
private sector banks are motivated by different factors to choose the bank. In order to
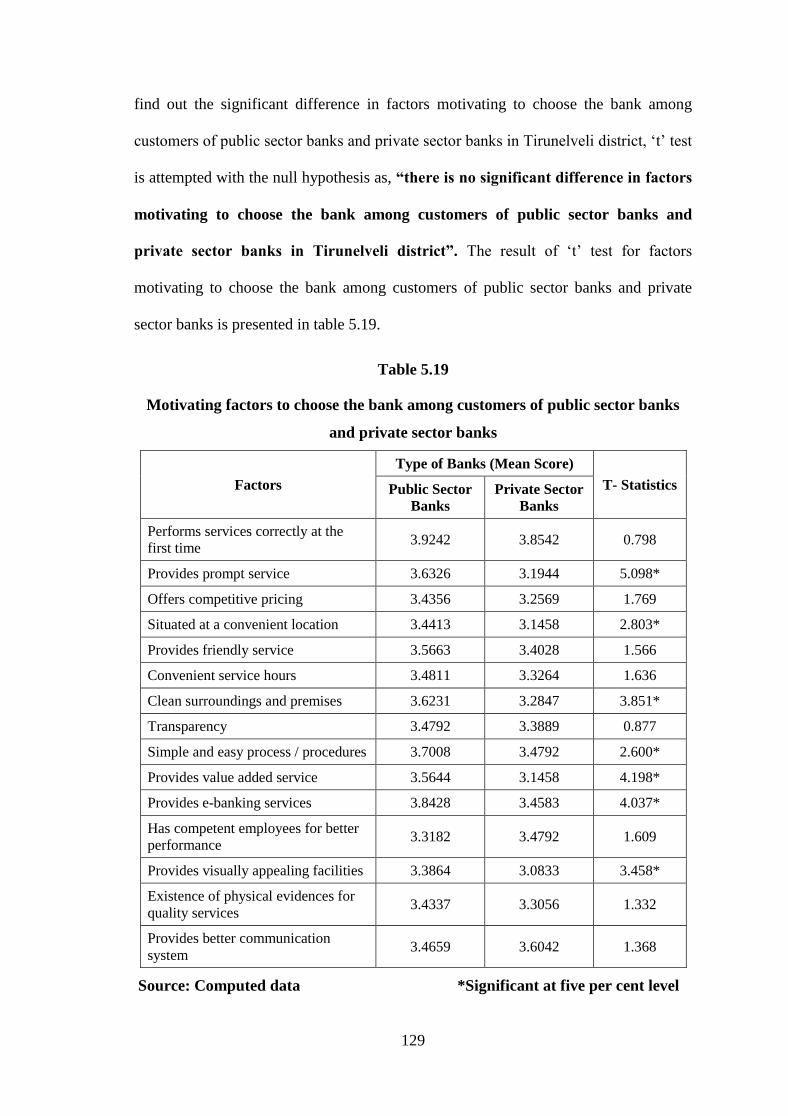
129
find out the significant difference in factors motivating to choose the bank among
customers of public sector banks and private sector banks in Tirunelveli district, ‗t‘ test
is attempted with the null hypothesis as, “there is no significant difference in factors
motivating to choose the bank among customers of public sector banks and
private sector banks in Tirunelveli district”. The result of ‗t‘ test for factors
motivating to choose the bank among customers of public sector banks and private
sector banks is presented in table 5.19.
Table 5.19
Motivating factors to choose the bank among customers of public sector banks
and private sector banks
Factors
Type of Banks (Mean Score)
T- Statistics Public Sector
Banks
Private Sector
Banks
Performs services correctly at the
first time 3.9242 3.8542 0.798
Provides prompt service 3.6326 3.1944 5.098*
Offers competitive pricing 3.4356 3.2569 1.769
Situated at a convenient location 3.4413 3.1458 2.803*
Provides friendly service 3.5663 3.4028 1.566
Convenient service hours 3.4811 3.3264 1.636
Clean surroundings and premises 3.6231 3.2847 3.851*
Transparency 3.4792 3.3889 0.877
Simple and easy process / procedures 3.7008 3.4792 2.600*
Provides value added service 3.5644 3.1458 4.198*
Provides e-banking services 3.8428 3.4583 4.037*
Has competent employees for better
performance 3.3182 3.4792 1.609
Provides visually appealing facilities 3.3864 3.0833 3.458*
Existence of physical evidences for
quality services 3.4337 3.3056 1.332
Provides better communication
system 3.4659 3.6042 1.368
Source: Computed data *Significant at five per cent level
130
Table 5.19 shows the mean score of factors motivating to choose the bank
among customers of public sector banks and private sector banks along with its
respective ‗T‘ statistics. The important factors motivating to choose the bank among
customers of public sector banks are ‗performs services correctly at the first time‘ and
‗provides e-banking services‘ and their respective mean scores are 3.9242 and 3.8428
and among the customers of private sector banks, ‗performs services correctly at the
first time‘ and ‗provides better communication system‘ and their respective mean
scores are 3.8542 and 3.6042. Regarding the factors motivating to choose the bank, the
significant difference among the customers of public and private sector banks are
identified in the case of provides prompt service, situated at a convenient location,
clean surroundings and premises, simple and easy process / procedures, provides value
added service, provides e-banking services and provide visually appealing facilities
since the respective ‗T‘ statistics are significant at 5 per cent level, the null hypothesis
is rejected.
5.4.1 Factors motivating to choose the bank and Demographic Variables of the
Customers of Public Sector Banks
In order to find out the relationship between factors motivating to choose the
bank and demographic variables of the customers of public sector banks, the null
hypothesis is framed as, ―there is no significant relationship between the demographic
variables of customers of public sector banks and factors motivating to choose the
bank‖. The result is given in the table 5.20.
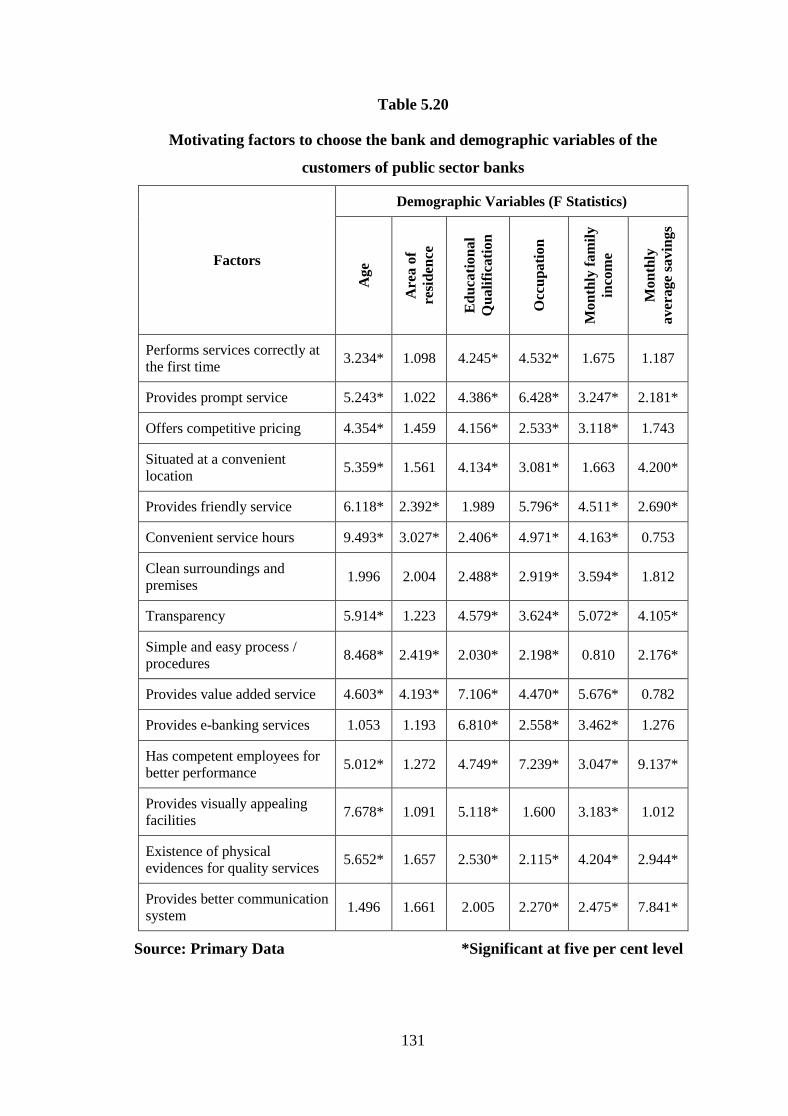
131
Table 5.20
Motivating factors to choose the bank and demographic variables of the
customers of public sector banks
Factors
Demographic Variables (F Statistics)
Ag
e
Are
a o
f
resi
den
ce
Ed
uca
tio
na
l
Qu
ali
fica
tio
n
Occ
up
ati
on
Mo
nth
ly f
am
ily
inco
me
Mo
nth
ly
av
era
ge
savin
gs
Performs services correctly at
the first time 3.234* 1.098 4.245* 4.532* 1.675 1.187
Provides prompt service 5.243* 1.022 4.386* 6.428* 3.247* 2.181*
Offers competitive pricing 4.354* 1.459 4.156* 2.533* 3.118* 1.743
Situated at a convenient
location 5.359* 1.561 4.134* 3.081* 1.663 4.200*
Provides friendly service 6.118* 2.392* 1.989 5.796* 4.511* 2.690*
Convenient service hours 9.493* 3.027* 2.406* 4.971* 4.163* 0.753
Clean surroundings and
premises 1.996 2.004 2.488* 2.919* 3.594* 1.812
Transparency 5.914* 1.223 4.579* 3.624* 5.072* 4.105*
Simple and easy process /
procedures 8.468* 2.419* 2.030* 2.198* 0.810 2.176*
Provides value added service 4.603* 4.193* 7.106* 4.470* 5.676* 0.782
Provides e-banking services 1.053 1.193 6.810* 2.558* 3.462* 1.276
Has competent employees for
better performance 5.012* 1.272 4.749* 7.239* 3.047* 9.137*
Provides visually appealing
facilities 7.678* 1.091 5.118* 1.600 3.183* 1.012
Existence of physical
evidences for quality services 5.652* 1.657 2.530* 2.115* 4.204* 2.944*
Provides better communication
system 1.496 1.661 2.005 2.270* 2.475* 7.841*
Source: Primary Data *Significant at five per cent level
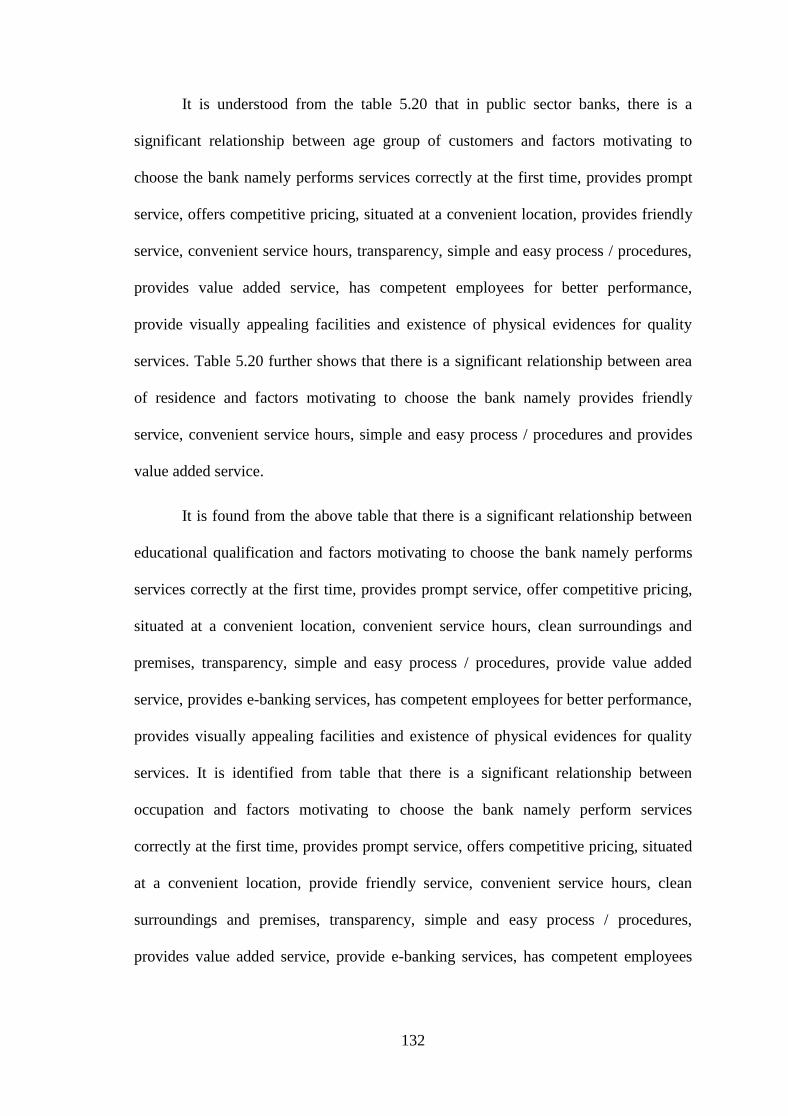
132
It is understood from the table 5.20 that in public sector banks, there is a
significant relationship between age group of customers and factors motivating to
choose the bank namely performs services correctly at the first time, provides prompt
service, offers competitive pricing, situated at a convenient location, provides friendly
service, convenient service hours, transparency, simple and easy process / procedures,
provides value added service, has competent employees for better performance,
provide visually appealing facilities and existence of physical evidences for quality
services. Table 5.20 further shows that there is a significant relationship between area
of residence and factors motivating to choose the bank namely provides friendly
service, convenient service hours, simple and easy process / procedures and provides
value added service.
It is found from the above table that there is a significant relationship between
educational qualification and factors motivating to choose the bank namely performs
services correctly at the first time, provides prompt service, offer competitive pricing,
situated at a convenient location, convenient service hours, clean surroundings and
premises, transparency, simple and easy process / procedures, provide value added
service, provides e-banking services, has competent employees for better performance,
provides visually appealing facilities and existence of physical evidences for quality
services. It is identified from table that there is a significant relationship between
occupation and factors motivating to choose the bank namely perform services
correctly at the first time, provides prompt service, offers competitive pricing, situated
at a convenient location, provide friendly service, convenient service hours, clean
surroundings and premises, transparency, simple and easy process / procedures,
provides value added service, provide e-banking services, has competent employees

133
for better performance, existence of physical evidences for quality services and
provide better communication system.
It is also clear from the table that there is a significant relationship between
monthly family income and factors motivating to choose the bank namely performs
services correctly at the first time, provides prompt service, offers competitive pricing,
provides friendly service, convenient service hours, clean surroundings and premises,
transparency, provides value added service, provides e-banking services, has
competent employees for better performance, provides visually appealing facilities,
existence of physical evidences for quality services and provides better communication
system.
It is further clear from the table that there is a significant relationship between
monthly average savings and factors motivating to choose the bank namely provides
prompt service, provide friendly service, transparency, has competent employees for
better performance, existence of physical evidences for quality services and provides
better communication system.
5.4.2 Factors motivating to choose the bank and Demographic Variables of the
Customers of Private Sector Banks
In order to find out the relationship between factors motivating to choose the
bank and demographic variables of the customers of private sector banks, the null
hypothesis is framed as, ―there is no significant relationship between the demographic
variables of customers of private sector banks and factors motivating to choose the
bank‖. The result is given in the table 5.21.
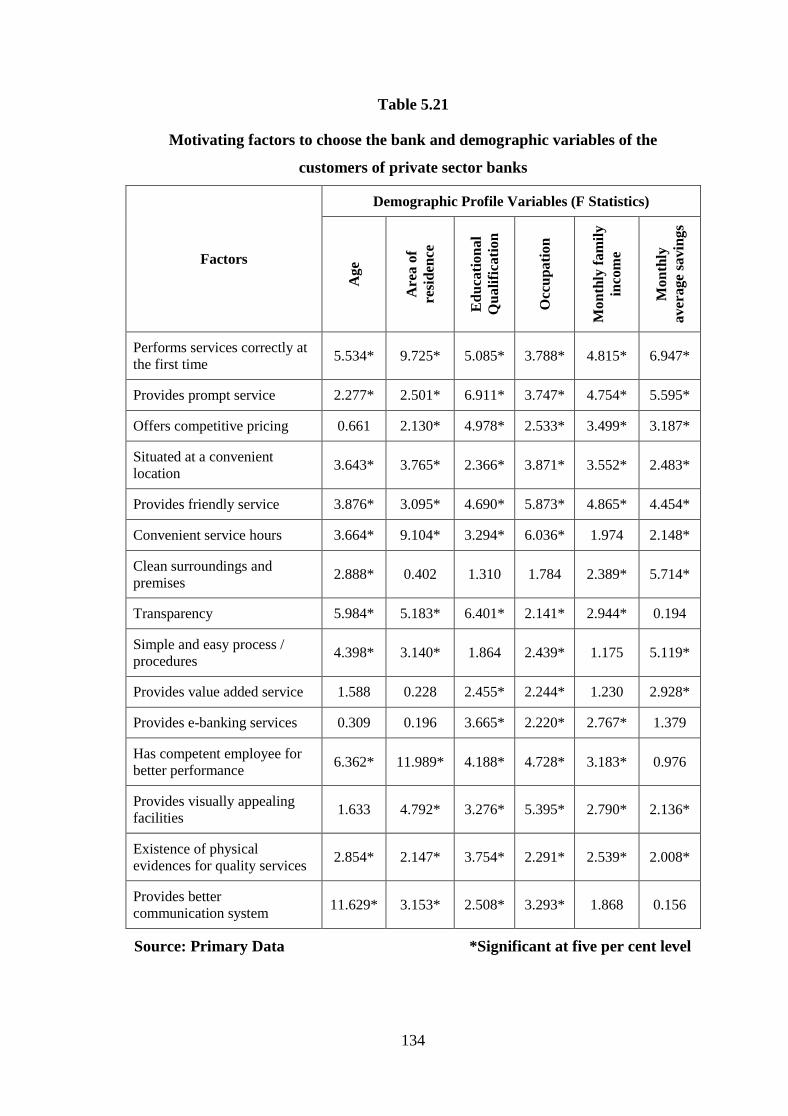
134
Table 5.21
Motivating factors to choose the bank and demographic variables of the
customers of private sector banks
Factors
Demographic Profile Variables (F Statistics)
Ag
e
Are
a o
f
resi
den
ce
Ed
uca
tio
na
l
Qu
ali
fica
tio
n
Occ
up
ati
on
Mo
nth
ly f
am
ily
inco
me
Mo
nth
ly
av
era
ge
savin
gs
Performs services correctly at
the first time 5.534* 9.725* 5.085* 3.788* 4.815* 6.947*
Provides prompt service 2.277* 2.501* 6.911* 3.747* 4.754* 5.595*
Offers competitive pricing 0.661 2.130* 4.978* 2.533* 3.499* 3.187*
Situated at a convenient
location 3.643* 3.765* 2.366* 3.871* 3.552* 2.483*
Provides friendly service 3.876* 3.095* 4.690* 5.873* 4.865* 4.454*
Convenient service hours 3.664* 9.104* 3.294* 6.036* 1.974 2.148*
Clean surroundings and
premises 2.888* 0.402 1.310 1.784 2.389* 5.714*
Transparency 5.984* 5.183* 6.401* 2.141* 2.944* 0.194
Simple and easy process /
procedures 4.398* 3.140* 1.864 2.439* 1.175 5.119*
Provides value added service 1.588 0.228 2.455* 2.244* 1.230 2.928*
Provides e-banking services 0.309 0.196 3.665* 2.220* 2.767* 1.379
Has competent employee for
better performance 6.362* 11.989* 4.188* 4.728* 3.183* 0.976
Provides visually appealing
facilities 1.633 4.792* 3.276* 5.395* 2.790* 2.136*
Existence of physical
evidences for quality services 2.854* 2.147* 3.754* 2.291* 2.539* 2.008*
Provides better
communication system 11.629* 3.153* 2.508* 3.293* 1.868 0.156
Source: Primary Data *Significant at five per cent level
135
It is understood from table 5.21 that in private sector banks, there is a
significant relationship between age group of customers and factors motivating to
choose the bank namely performs services correctly at the first time, provides prompt
service, situated at a convenient location, provides friendly service, convenient service
hours, clean surroundings and premises, transparency, simple and easy process /
procedures, has competent employees for better performance, existence of physical
evidences for quality services and provides better communication system.
The table further shows that there is a significant relationship between area of
residence and factors motivating to choose the bank namely performs services
correctly at the first time, provides prompt service, offers competitive pricing, situated
at a convenient location, provides friendly service, convenient service hours,
transparency, simple and easy process / procedures, has competent employees for
better performance, provides visually appealing facilities, existence of physical
evidences for quality services and provides better communication system.
It is found from the above table that there is a significant relationship between
educational qualification and factors motivating to choose the bank namely performs
services correctly at the first time, provides prompt service, offers competitive pricing,
situated at a convenient location, provides friendly service, convenient service hours,
transparency, provides value added service, provides e-banking services, has
competent employees for better performance, existence of physical evidences for
quality services and provides better communication system.
It is identified from the table that there is a significant relationship between
occupation and factors motivating to choose the bank namely performs services
correctly at the first time, provides prompt service, offers competitive pricing, situated
at a convenient location, provides friendly service, convenient service hours,
136
transparency, simple and easy process / procedures, provides value added service,
provides e-banking services, has competent employees for better performance,
existence of physical evidences for quality services and provides better communication
system.
It is clear from the table that there is a significant relationship between monthly
family income and factors motivating to choose the bank namely performs services
correctly at the first time, provides prompt service, offer competitive pricing, situated
at a convenient location, provides friendly service, transparency, simple and easy
process / procedures, provides e-banking services, has competent employees for better
performance and existence of physical evidences for quality services.
It is further clear from the table that there is a significant relationship between
monthly average savings and factors motivating to choose the bank namely performs
services correctly at the first time, provides prompt service, offers competitive pricing,
situated at a convenient location, provides friendly service, convenient service hours,
clean surroundings and premises, simple and easy process / procedures, provides value
added service, provides visually appealing facilities and existence of physical
evidences for quality services.
5.5 SERVICE QUALITY GAP IN BANKING SECTOR
In order to find out the service quality gap of banking sector such as public and
private banks in Tirunelveli district, the data have been collected from the customers.
The service quality gap is calculated by the simple formula i.e. Service quality gap =
Expectation – Perception

137
5.5.1 Service quality Gap in Public Sector Banks in Tirunelveli District
The following table shows the service quality gap in public sector banks in
Tirunelveli district:
Table 5.22
Service quality gap in public sector banks in Tirunelveli district
Sl.
No. Statements
Expectation
Mean
Perception
Mean
Service
quality gap
Tangibility 3.8885 2.8645 1.0240
1. Adequate infrastructural facilities 4.3144 2.9931 1.3213
2. Physical appearance of the staff is
professional 3.9261 2.6875 1.2386
3. Visually appealing features 3.7292 2.8333 0.8959
4. Location is easily accessible 3.8958 2.5486 1.3472
5. Location is free from pollution 3.9931 2.8889 1.1042
6. Bank uses latest technologies in
providing services 3.7639 2.9028 0.8611
7. Vehicle parking facility is available 3.8403 2.7431 1.0972
8. Information is easily available 3.8731 3.0972 0.7759
9. Bank is having a memorable
advertisement 3.7847 3.0833 0.7014
10. Beautiful elevation of the office
building 3.7652 2.8681 0.8971
Reliability 3.8653 2.9680 0.8973
11. Get things right at the first time 3.9186 2.9375 0.9811
12. Provides services at time promises to
do so it 3.8056 2.9306 0.875
13. Insists on error free records 3.8333 3.0278 0.8055
14. Bank has competitive pricing
compared to others 3.8542 3.0139 0.8403
15. Provision of documentary evidences
for banking services 3.9148 2.9306 0.9842
Responsiveness 4.0369 2.8694 1.1675
16. Staff tell exactly when the services
will be performed 4.2708 3.0833 1.1875

138
Sl.
No. Statements
Expectation
Mean
Perception
Mean
Service
quality gap
17. Staff are prompt in responding to
questions and queries 4.0069 2.6944 1.3125
18. Front office staff responding to phone
calls instantaneously 3.9318 2.8472 1.0846
19. Staff are willing to help anytime 3.9583 2.7778 1.1805
20. Organised time table 4.0170 2.9444 1.0726
Assurance 3.9863 2.9999 0.9864
21. Employees are trustworthy and honest 3.9931 2.8611 1.132
22. Employees in banks have knowledge
and competence to solve customer‘s
problem
3.9489 2.9722 0.9767
23. Bank is widely known 3.8681 3.1875 0.6806
24. Bank is well liked 3.8689 2.8194 1.0495
25. Bank is unique compared to others 3.9394 2.9444 0.995
26. Bank Staff give assurance as to
deliverance of the services 4.1477 3.1181 1.0296
27. Data revealed by customers are kept
confidential 4.0000 3.0208 0.9792
28. Bank staff give assurance with regard
to their efficient service 4.1250 3.0764 1.0486
Empathy 3.9920 3.0097 0.9823
29. Customers get individual attention 4.0455 3.0556 0.9899
30. Bank has its customer‘s best interest
in heart 3.9583 2.9306 1.0277
31. Client friendly service hours 4.2197 3.3056 0.9141
32. Bank staff have concern and they
understand customer problems 3.8655 2.9931 0.8724
33. Seeks to understand customer‘s need
and their problems 3.8712 2.7639 1.1073
Source: Computed data
It is clear from the table 4.22 that among the customers of public sector banks
in Tirunelveli district, the mean scores of expectations are high and ranged from
3.7292 for (item 3: Visually appealing features) to 4.3144 for (item 1: Adequate

139
infrastructural facilities). Among the five dimensions, the highest expectation related
to the responsiveness dimension (dimension‘s mean score = 4.0369) and the lowest
expectation related to the reliability dimension (dimension‘s mean score = 3.8653).
The mean score of the perceptions ranged from 2.6875 for (item 2: Physical
appearance of the staff is professional) to 3.3056 for (item 31: Client friendly service
hours). Among the five dimensions of quality, the highest perception related to the
empathy dimension (dimension‘s mean score = 3.0097) and the lowest perception
related to the tangibility dimension (dimension‘s mean score = 2.8645).
The gap score for each item and dimension was computed. Table 5.22 shows
that the highest gap of the quality relates to the responsiveness dimension (gap mean
score =1.1675), and there is a considerable gap between the customers‘ expectations
and perceptions. The lowest gap of the quality relates to the reliability dimension
(gap mean score = 0.8973).
5.5.2 Service quality Gap in Private Sector Banks in Tirunelveli District
The following table shows the service quality gap in private sector banks in
Tirunelveli district:
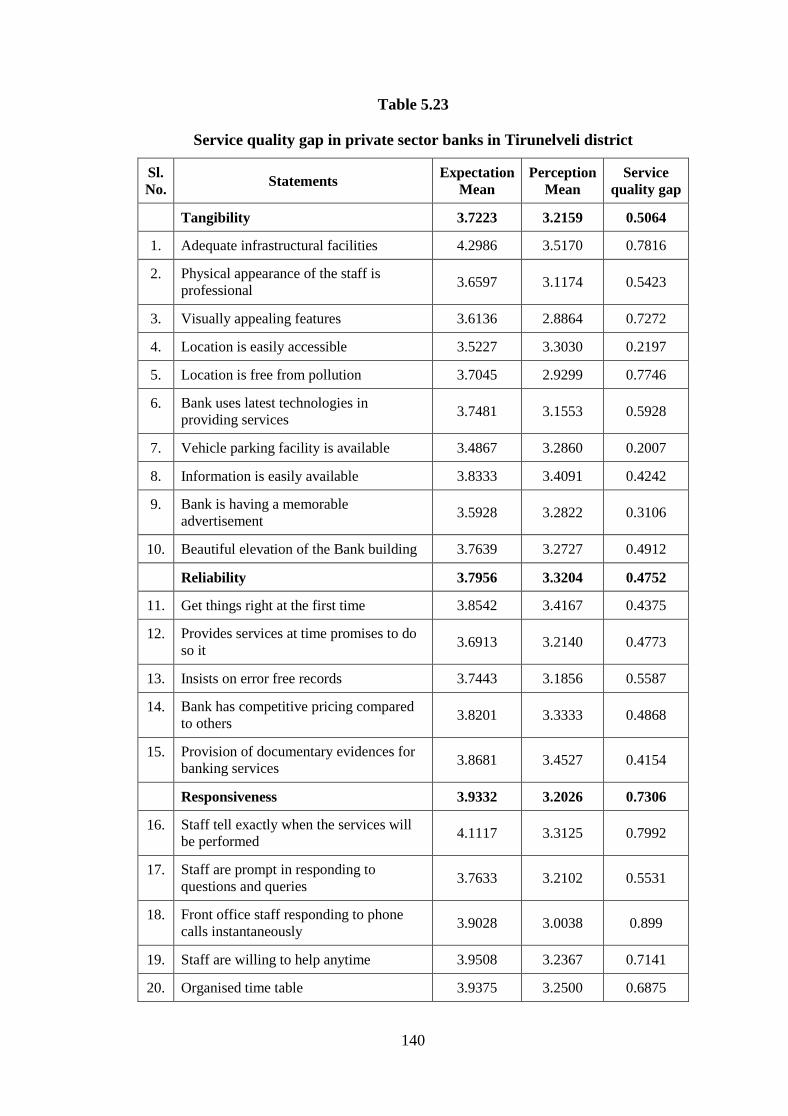
140
Table 5.23
Service quality gap in private sector banks in Tirunelveli district
Sl.
No. Statements
Expectation
Mean
Perception
Mean
Service
quality gap
Tangibility 3.7223 3.2159 0.5064
1. Adequate infrastructural facilities 4.2986 3.5170 0.7816
2. Physical appearance of the staff is
professional 3.6597 3.1174 0.5423
3. Visually appealing features 3.6136 2.8864 0.7272
4. Location is easily accessible 3.5227 3.3030 0.2197
5. Location is free from pollution 3.7045 2.9299 0.7746
6. Bank uses latest technologies in
providing services 3.7481 3.1553 0.5928
7. Vehicle parking facility is available 3.4867 3.2860 0.2007
8. Information is easily available 3.8333 3.4091 0.4242
9. Bank is having a memorable
advertisement 3.5928 3.2822 0.3106
10. Beautiful elevation of the Bank building 3.7639 3.2727 0.4912
Reliability 3.7956 3.3204 0.4752
11. Get things right at the first time 3.8542 3.4167 0.4375
12. Provides services at time promises to do
so it 3.6913 3.2140 0.4773
13. Insists on error free records 3.7443 3.1856 0.5587
14. Bank has competitive pricing compared
to others 3.8201 3.3333 0.4868
15. Provision of documentary evidences for
banking services 3.8681 3.4527 0.4154
Responsiveness 3.9332 3.2026 0.7306
16. Staff tell exactly when the services will
be performed 4.1117 3.3125 0.7992
17. Staff are prompt in responding to
questions and queries 3.7633 3.2102 0.5531
18. Front office staff responding to phone
calls instantaneously 3.9028 3.0038 0.899
19. Staff are willing to help anytime 3.9508 3.2367 0.7141
20. Organised time table 3.9375 3.2500 0.6875
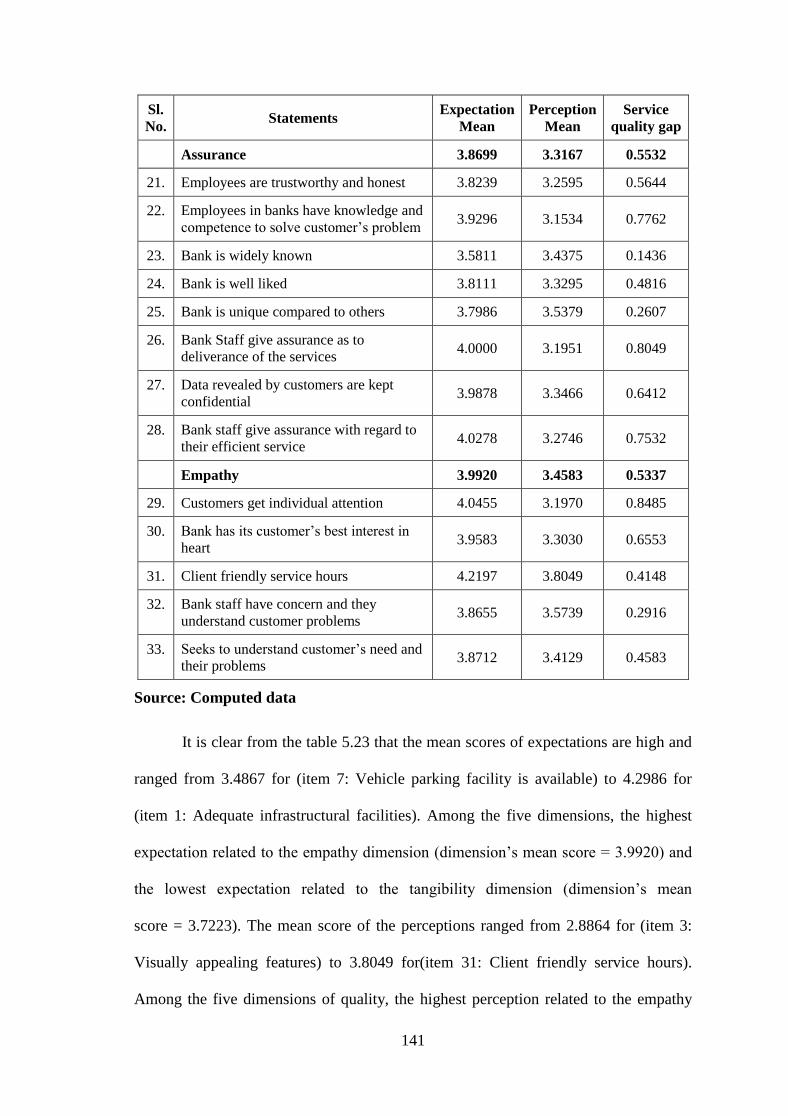
141
Sl.
No. Statements
Expectation
Mean
Perception
Mean
Service
quality gap
Assurance 3.8699 3.3167 0.5532
21. Employees are trustworthy and honest 3.8239 3.2595 0.5644
22. Employees in banks have knowledge and
competence to solve customer‘s problem 3.9296 3.1534 0.7762
23. Bank is widely known 3.5811 3.4375 0.1436
24. Bank is well liked 3.8111 3.3295 0.4816
25. Bank is unique compared to others 3.7986 3.5379 0.2607
26. Bank Staff give assurance as to
deliverance of the services 4.0000 3.1951 0.8049
27. Data revealed by customers are kept
confidential 3.9878 3.3466 0.6412
28. Bank staff give assurance with regard to
their efficient service 4.0278 3.2746 0.7532
Empathy 3.9920 3.4583 0.5337
29. Customers get individual attention 4.0455 3.1970 0.8485
30. Bank has its customer‘s best interest in
heart 3.9583 3.3030 0.6553
31. Client friendly service hours 4.2197 3.8049 0.4148
32. Bank staff have concern and they
understand customer problems 3.8655 3.5739 0.2916
33. Seeks to understand customer‘s need and
their problems 3.8712 3.4129 0.4583
Source: Computed data
It is clear from the table 5.23 that the mean scores of expectations are high and
ranged from 3.4867 for (item 7: Vehicle parking facility is available) to 4.2986 for
(item 1: Adequate infrastructural facilities). Among the five dimensions, the highest
expectation related to the empathy dimension (dimension‘s mean score = 3.9920) and
the lowest expectation related to the tangibility dimension (dimension‘s mean
score = 3.7223). The mean score of the perceptions ranged from 2.8864 for (item 3:
Visually appealing features) to 3.8049 for(item 31: Client friendly service hours).
Among the five dimensions of quality, the highest perception related to the empathy
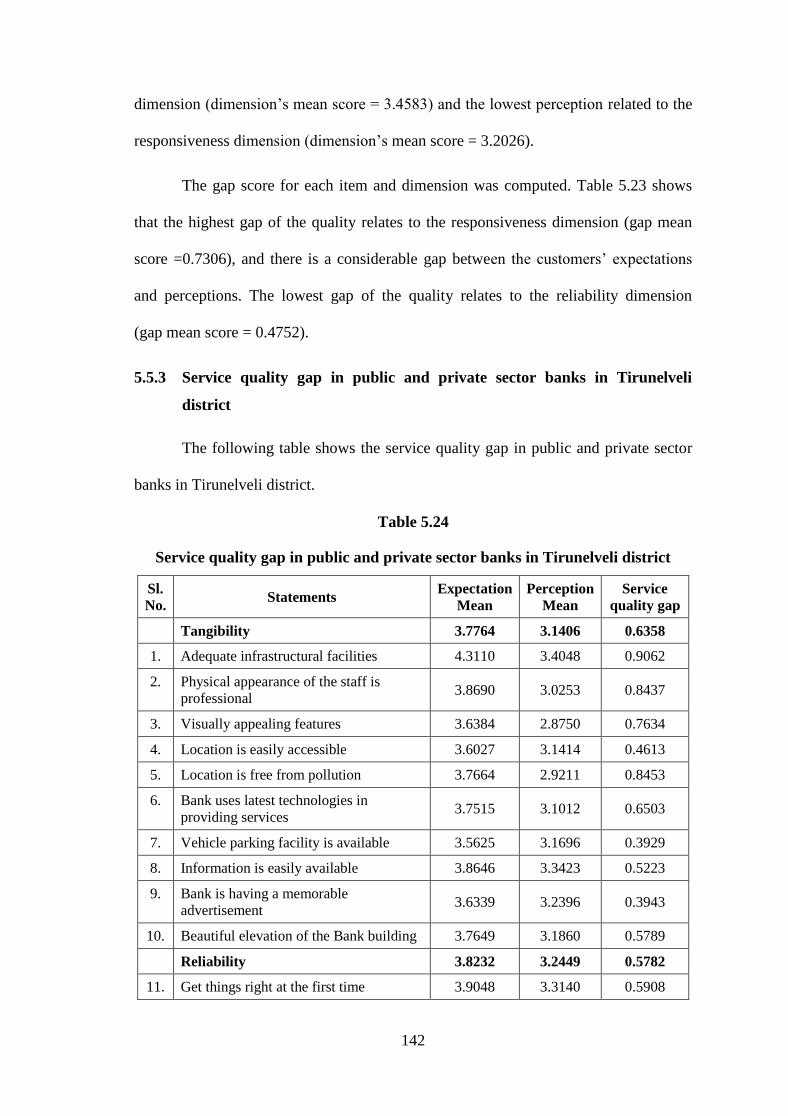
142
dimension (dimension‘s mean score = 3.4583) and the lowest perception related to the
responsiveness dimension (dimension‘s mean score = 3.2026).
The gap score for each item and dimension was computed. Table 5.23 shows
that the highest gap of the quality relates to the responsiveness dimension (gap mean
score =0.7306), and there is a considerable gap between the customers‘ expectations
and perceptions. The lowest gap of the quality relates to the reliability dimension
(gap mean score = 0.4752).
5.5.3 Service quality gap in public and private sector banks in Tirunelveli
district
The following table shows the service quality gap in public and private sector
banks in Tirunelveli district.
Table 5.24
Service quality gap in public and private sector banks in Tirunelveli district
Sl.
No. Statements
Expectation
Mean
Perception
Mean
Service
quality gap
Tangibility 3.7764 3.1406 0.6358
1. Adequate infrastructural facilities 4.3110 3.4048 0.9062
2. Physical appearance of the staff is
professional 3.8690 3.0253 0.8437
3. Visually appealing features 3.6384 2.8750 0.7634
4. Location is easily accessible 3.6027 3.1414 0.4613
5. Location is free from pollution 3.7664 2.9211 0.8453
6. Bank uses latest technologies in
providing services 3.7515 3.1012 0.6503
7. Vehicle parking facility is available 3.5625 3.1696 0.3929
8. Information is easily available 3.8646 3.3423 0.5223
9. Bank is having a memorable
advertisement 3.6339 3.2396 0.3943
10. Beautiful elevation of the Bank building 3.7649 3.1860 0.5789
Reliability 3.8232 3.2449 0.5782
11. Get things right at the first time 3.9048 3.3140 0.5908

143
Sl.
No. Statements
Expectation
Mean
Perception
Mean
Service
quality gap
12. Provides services at time promises to do
so it 3.7158 3.1533 0.5625
13. Insists on error free records 3.7634 3.1518 0.6116
14. Bank has competitive pricing compared
to others 3.8274 3.2649 0.5625
15. Provision of documentary evidences for
banking services 3.9048 3.3408 0.564
Responsiveness 3.9678 3.1312 0.8366
16. Staff tell exactly when the services will
be performed 4.1458 3.2634 0.8824
17. Staff are prompt in responding to
questions and queries 3.8155 3.0997 0.7158
18. Front office staff responding to phone
calls instantaneously 3.9256 2.9702 0.9554
19. Staff are willing to help anytime 3.9524 3.1384 0.814
20. Organised time table 4.0000 3.1845 0.8155
Assurance 3.9134 3.2488 0.6646
21. Employees are trustworthy and honest 3.8601 3.1741 0.686
22. Employees in banks have knowledge and
competence to solve customer‘s problem 3.9448 3.1146 0.8302
23. Bank is widely known 3.6473 3.3839 0.2634
24. Bank is well liked 3.8408 3.2202 0.6206
25. Bank is unique compared to others 3.9092 3.4107 0.4985
26. Bank Staff give assurance as to
deliverance of the services 4.1161 3.1786 0.9375
27. Data revealed by customers are kept
confidential 3.9881 3.2768 0.7113
28. Bank staff give assurance with regard to
their efficient service 4.0015 3.2321 0.7694
Empathy 3.9607 3.3622 0.5985
29. Customers get individual attention 4.0417 3.1667 0.875
30. Bank has its customer‘s best interest in
heart 3.8839 3.2232 0.6607
31. Client friendly service hours 4.1964 3.6979 0.4985
32. Bank staff have concern and they
understand customer problems 3.8423 3.4494 0.3929
33. Seeks to understand customer‘s need and
their problems 3.8393 3.2738 0.5655
Source: Computed Data
144
It is clear from the table 5.24 that the mean scores of expectations are high and
ranged from 3.5625 for (item 7: Vehicle parking facility is available) to 4.3110 for
(item 1: Adequate infrastructural facilities). Among the five dimensions, the highest
expectation related to the responsiveness dimension (dimension‘s mean score
= 3.9678) and the lowest expectation related to the tangibility dimension (dimension‘s
mean score = 3.7764).
The mean score of the perceptions ranged from 2.8750 for (item 3: Visually
appealing features) to 3.6979 for(item 31: Client friendly service hours). Among the
five dimensions of quality, the highest perception related to the empathy
dimension(dimension‘s mean score = 3.3622) and the lowest perception related to the
responsiveness dimension (dimension‘s mean score = 3.1312).
The gap score for each item and dimension was computed. Table 5.24 shows
that the highest gap of the quality relates to the responsiveness dimension (gap mean
score = 0.8366), and there is a considerable gap between the customers‘ expectations
and perceptions. The lowest gap of the quality relates to the reliability dimension
(gap mean score = 0.5782).
5.6 EXPECTATION OF CUSTOMERS TOWARDS BANKS
5.6.1 Expectation towards tangibility aspects of service quality of banks
Customers of public sector banks and private sector banks may have different
expectation towards tangibility aspect of service quality of banks. In order to find out
the significant difference in expectation towards tangibility aspects of service quality
of banks among customers of public sector banks and private sector banks in
Tirunelveli district, ‗t‘ test is attempted with the null hypothesis as, “there is no
significant difference in expectation towards tangibility aspect of service quality
of banks among customers of public sector banks and private sector banks in
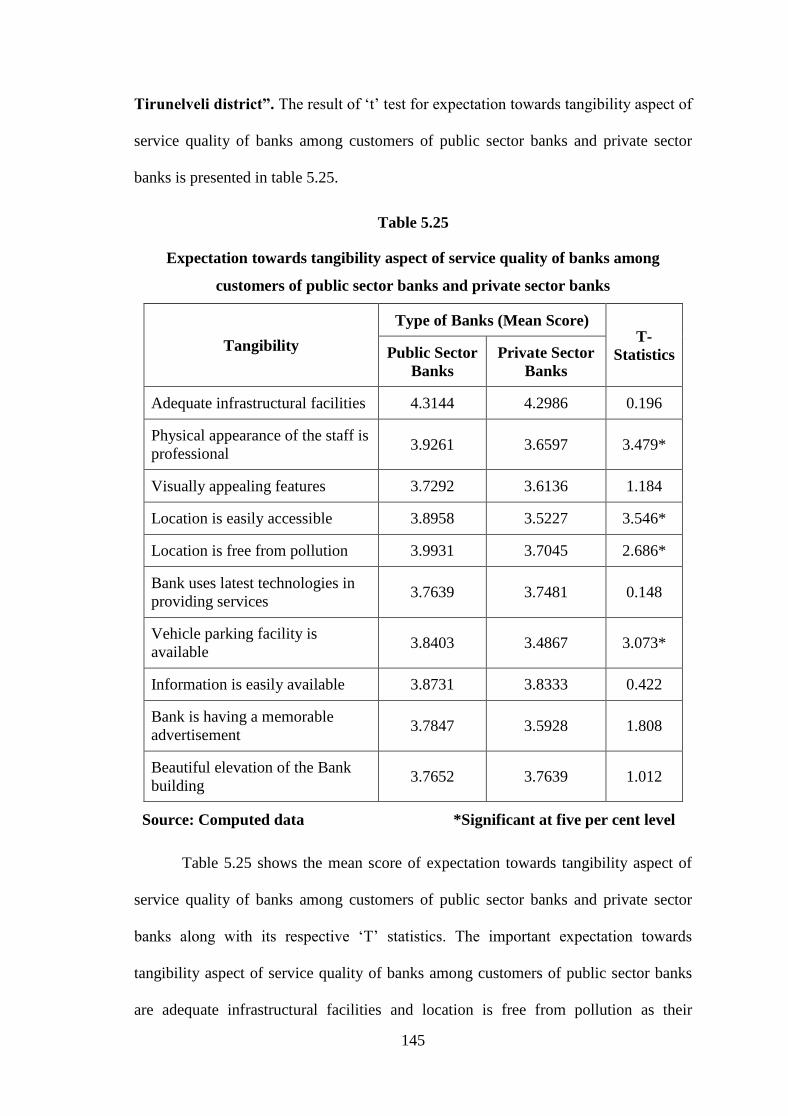
145
Tirunelveli district”. The result of ‗t‘ test for expectation towards tangibility aspect of
service quality of banks among customers of public sector banks and private sector
banks is presented in table 5.25.
Table 5.25
Expectation towards tangibility aspect of service quality of banks among
customers of public sector banks and private sector banks
Tangibility
Type of Banks (Mean Score) T-
Statistics Public Sector
Banks
Private Sector
Banks
Adequate infrastructural facilities 4.3144 4.2986 0.196
Physical appearance of the staff is
professional 3.9261 3.6597 3.479*
Visually appealing features 3.7292 3.6136 1.184
Location is easily accessible 3.8958 3.5227 3.546*
Location is free from pollution 3.9931 3.7045 2.686*
Bank uses latest technologies in
providing services 3.7639 3.7481 0.148
Vehicle parking facility is
available 3.8403 3.4867 3.073*
Information is easily available 3.8731 3.8333 0.422
Bank is having a memorable
advertisement 3.7847 3.5928 1.808
Beautiful elevation of the Bank
building 3.7652 3.7639 1.012
Source: Computed data *Significant at five per cent level
Table 5.25 shows the mean score of expectation towards tangibility aspect of
service quality of banks among customers of public sector banks and private sector
banks along with its respective ‗T‘ statistics. The important expectation towards
tangibility aspect of service quality of banks among customers of public sector banks
are adequate infrastructural facilities and location is free from pollution as their
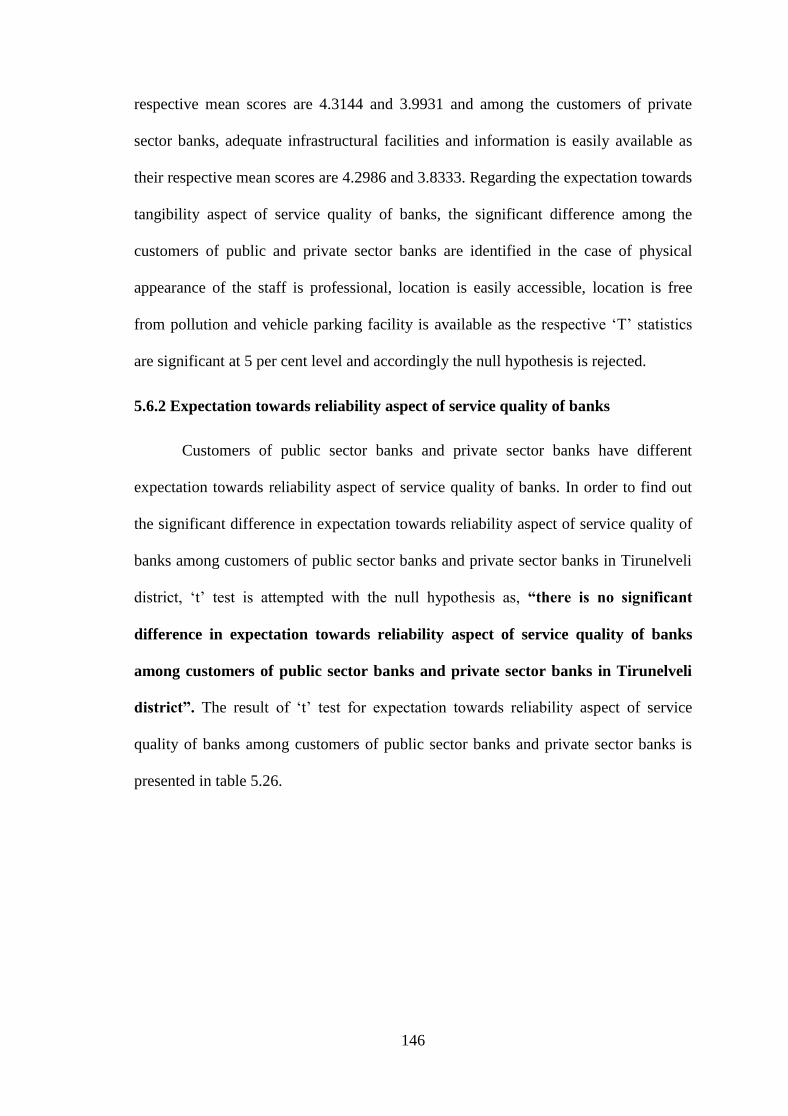
146
respective mean scores are 4.3144 and 3.9931 and among the customers of private
sector banks, adequate infrastructural facilities and information is easily available as
their respective mean scores are 4.2986 and 3.8333. Regarding the expectation towards
tangibility aspect of service quality of banks, the significant difference among the
customers of public and private sector banks are identified in the case of physical
appearance of the staff is professional, location is easily accessible, location is free
from pollution and vehicle parking facility is available as the respective ‗T‘ statistics
are significant at 5 per cent level and accordingly the null hypothesis is rejected.
5.6.2 Expectation towards reliability aspect of service quality of banks
Customers of public sector banks and private sector banks have different
expectation towards reliability aspect of service quality of banks. In order to find out
the significant difference in expectation towards reliability aspect of service quality of
banks among customers of public sector banks and private sector banks in Tirunelveli
district, ‗t‘ test is attempted with the null hypothesis as, “there is no significant
difference in expectation towards reliability aspect of service quality of banks
among customers of public sector banks and private sector banks in Tirunelveli
district”. The result of ‗t‘ test for expectation towards reliability aspect of service
quality of banks among customers of public sector banks and private sector banks is
presented in table 5.26.
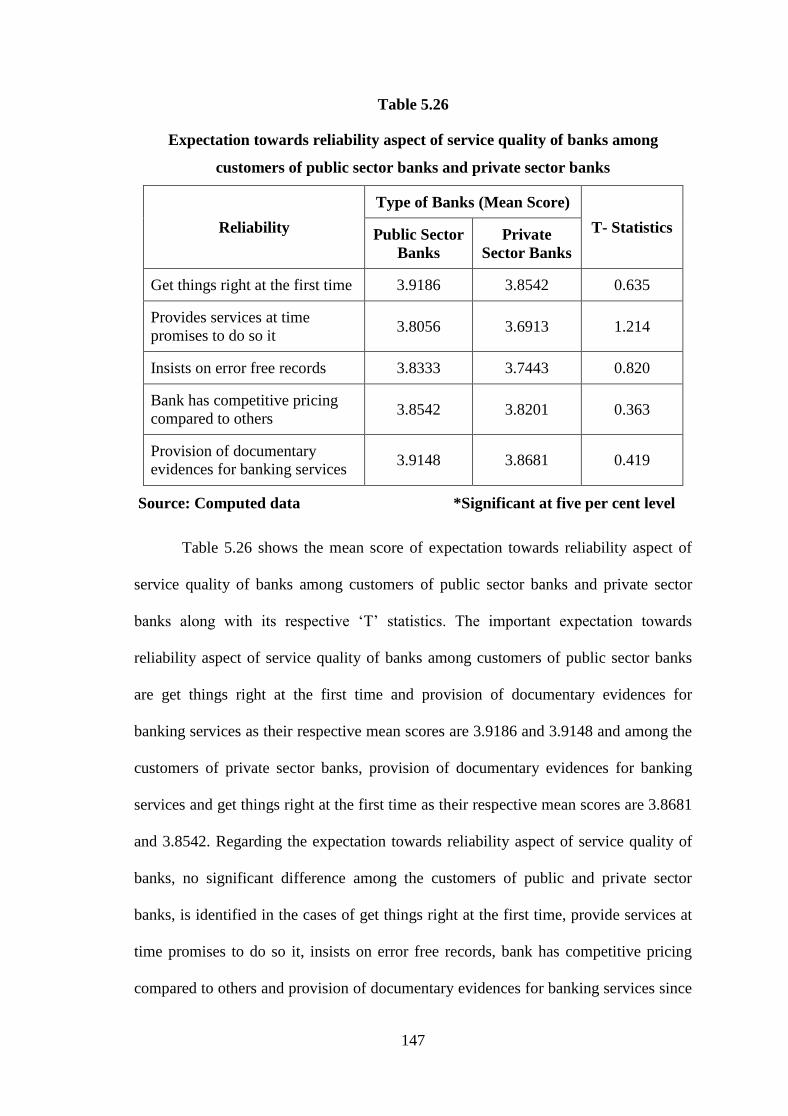
147
Table 5.26
Expectation towards reliability aspect of service quality of banks among
customers of public sector banks and private sector banks
Reliability
Type of Banks (Mean Score)
T- Statistics Public Sector
Banks
Private
Sector Banks
Get things right at the first time 3.9186 3.8542 0.635
Provides services at time
promises to do so it 3.8056 3.6913 1.214
Insists on error free records 3.8333 3.7443 0.820
Bank has competitive pricing
compared to others 3.8542 3.8201 0.363
Provision of documentary
evidences for banking services 3.9148 3.8681 0.419
Source: Computed data *Significant at five per cent level
Table 5.26 shows the mean score of expectation towards reliability aspect of
service quality of banks among customers of public sector banks and private sector
banks along with its respective ‗T‘ statistics. The important expectation towards
reliability aspect of service quality of banks among customers of public sector banks
are get things right at the first time and provision of documentary evidences for
banking services as their respective mean scores are 3.9186 and 3.9148 and among the
customers of private sector banks, provision of documentary evidences for banking
services and get things right at the first time as their respective mean scores are 3.8681
and 3.8542. Regarding the expectation towards reliability aspect of service quality of
banks, no significant difference among the customers of public and private sector
banks, is identified in the cases of get things right at the first time, provide services at
time promises to do so it, insists on error free records, bank has competitive pricing
compared to others and provision of documentary evidences for banking services since
148
the respective ‗T‘ statistics are not significant at 5 per cent level and therefore the null
hypothesis is accepted.
5.6.3 Expectation towards responsiveness aspects of service quality of banks
Customers of public sector banks and private sector banks have different
expectation towards responsiveness aspect of service quality of banks. In order to find
out the significant difference in expectation towards responsiveness of banks among
customers of public sector banks and private sector banks in Tirunelveli district, ‗t‘ test
is attempted with the null hypothesis as, “there is no significant difference in
expectation towards responsiveness of banks among customers of public sector
banks and private sector banks in Tirunelveli district”. The result of ‗t‘ test for
expectation towards responsiveness of banks among customers of public sector banks
and private sector banks is presented in table 5.27.
Table 5.27
Expectation towards responsiveness of banks among customers of public sector
banks and private sector banks
Responsiveness
Type of Banks (Mean Score)
T- Statistics Public Sector
Banks
Private Sector
Banks
Staff tell exactly when the
services will be performed 4.2708 4.1117 1.784
Staff are prompt in responding
to questions and queries 4.0069 3.7633 2.698*
Front office staff responding to
phone calls instantaneously 3.9318 3.9028 0.299
Staff are willing to help
anytime 3.9583 3.9508 0.078
Organised time table 4.0170 3.9375 0.838
Source: Computed data *Significant at five per cent level
149
Table 5.27 shows the mean score of expectation towards responsiveness of
banks among customers of public sector banks and private sector banks along with its
respective ‗T‘ statistics. The important expectation towards responsiveness of banks
among customers of public sector banks are staff tell exactly when the services will be
performed and organised time table as their respective mean scores are 4.2708 and
4.0170 and among the customers of private sector banks, staff tell exactly when the
services will be performed and staff are willing to help anytime as their respective
mean scores are 4.1117 and 3.9508. Regarding the expectation towards responsiveness
of banks, the significant difference among the customers of public and private sector
banks is identified in the case of staff are prompt in responding to questions and
queries since the respective ‗T‘ statistics is significant at 5 per cent level and the null
hypothesis is rejected.
5.6.4 Expectation towards assurance aspect of service quality of banks
Customers of public sector banks and private sector banks have different
expectation towards assurance of banks. In order to find out the significant difference
in expectation towards assurance of banks among customers of public sector banks and
private sector banks in Tirunelveli district, ‗t‘ test is attempted with the null hypothesis
as, “there is no significant difference in expectation towards assurance of banks
among customers of public sector banks and private sector banks in Tirunelveli
district”. The result of ‗t‘ test for expectation towards assurance of banks among
customers of public sector banks and private sector banks is presented in table 5.28.
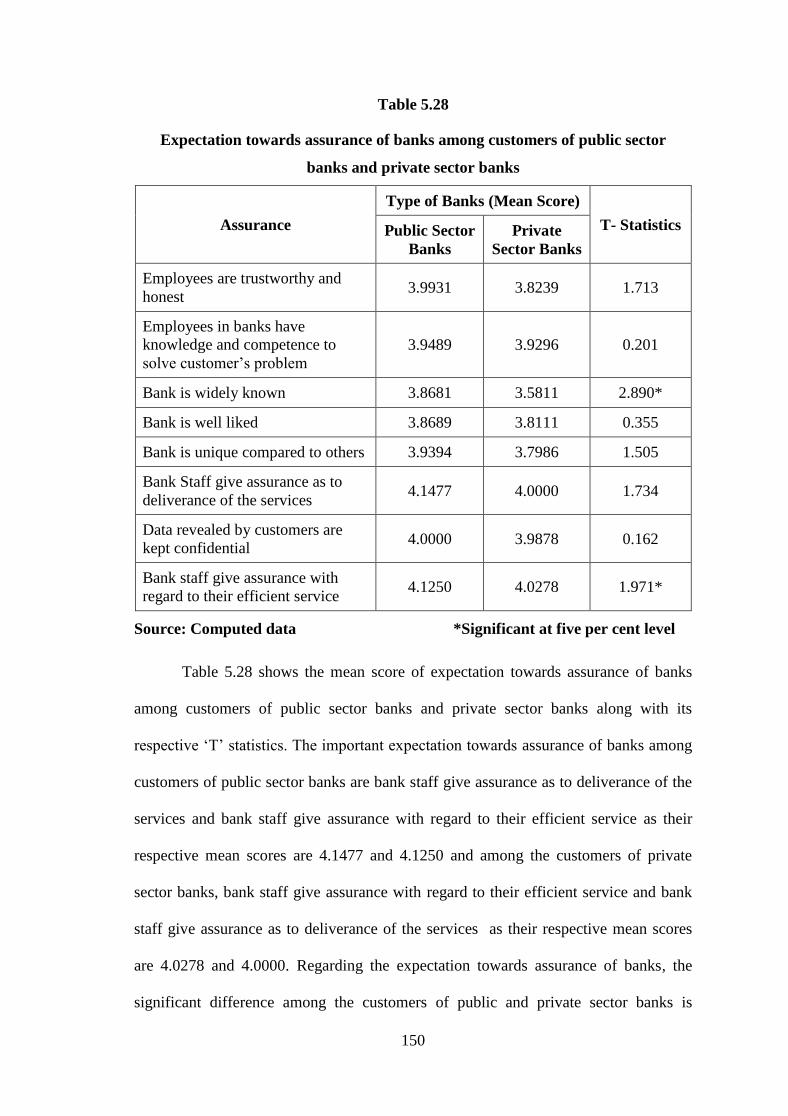
150
Table 5.28
Expectation towards assurance of banks among customers of public sector
banks and private sector banks
Assurance
Type of Banks (Mean Score)
T- Statistics Public Sector
Banks
Private
Sector Banks
Employees are trustworthy and
honest 3.9931 3.8239 1.713
Employees in banks have
knowledge and competence to
solve customer‘s problem
3.9489 3.9296 0.201
Bank is widely known 3.8681 3.5811 2.890*
Bank is well liked 3.8689 3.8111 0.355
Bank is unique compared to others 3.9394 3.7986 1.505
Bank Staff give assurance as to
deliverance of the services 4.1477 4.0000 1.734
Data revealed by customers are
kept confidential 4.0000 3.9878 0.162
Bank staff give assurance with
regard to their efficient service 4.1250 4.0278 1.971*
Source: Computed data *Significant at five per cent level
Table 5.28 shows the mean score of expectation towards assurance of banks
among customers of public sector banks and private sector banks along with its
respective ‗T‘ statistics. The important expectation towards assurance of banks among
customers of public sector banks are bank staff give assurance as to deliverance of the
services and bank staff give assurance with regard to their efficient service as their
respective mean scores are 4.1477 and 4.1250 and among the customers of private
sector banks, bank staff give assurance with regard to their efficient service and bank
staff give assurance as to deliverance of the services as their respective mean scores
are 4.0278 and 4.0000. Regarding the expectation towards assurance of banks, the
significant difference among the customers of public and private sector banks is
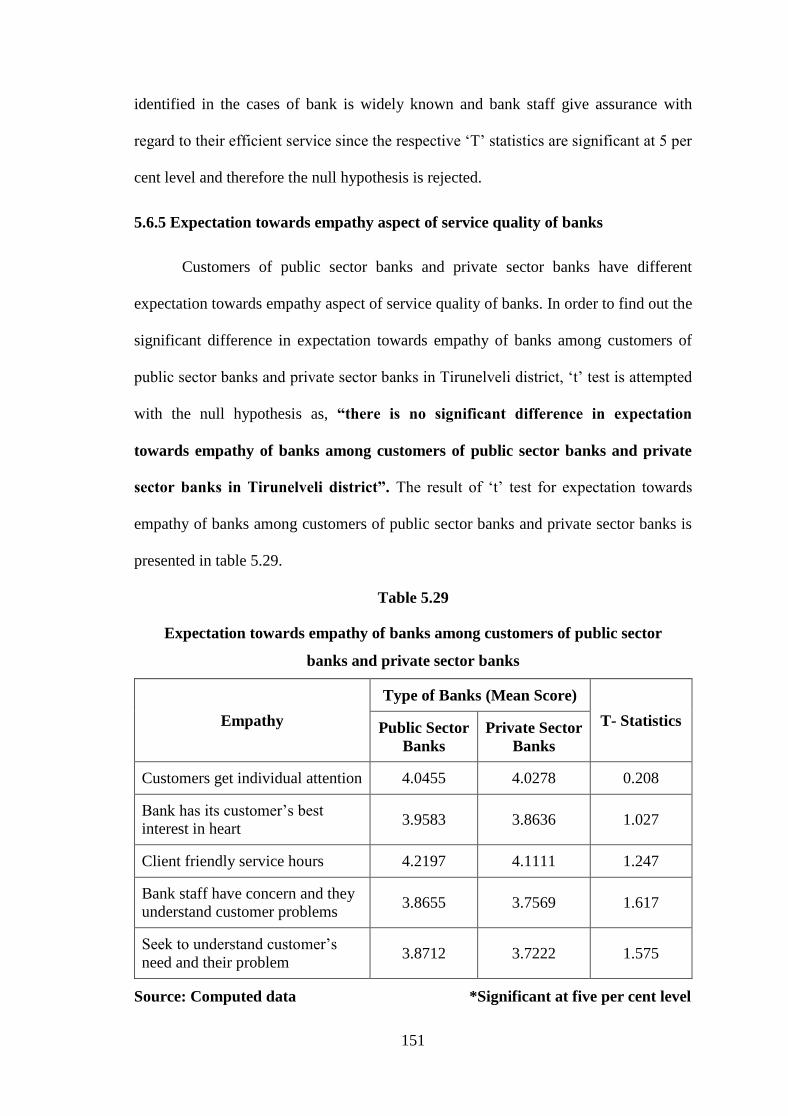
151
identified in the cases of bank is widely known and bank staff give assurance with
regard to their efficient service since the respective ‗T‘ statistics are significant at 5 per
cent level and therefore the null hypothesis is rejected.
5.6.5 Expectation towards empathy aspect of service quality of banks
Customers of public sector banks and private sector banks have different
expectation towards empathy aspect of service quality of banks. In order to find out the
significant difference in expectation towards empathy of banks among customers of
public sector banks and private sector banks in Tirunelveli district, ‗t‘ test is attempted
with the null hypothesis as, “there is no significant difference in expectation
towards empathy of banks among customers of public sector banks and private
sector banks in Tirunelveli district”. The result of ‗t‘ test for expectation towards
empathy of banks among customers of public sector banks and private sector banks is
presented in table 5.29.
Table 5.29
Expectation towards empathy of banks among customers of public sector
banks and private sector banks
Empathy
Type of Banks (Mean Score)
T- Statistics Public Sector
Banks
Private Sector
Banks
Customers get individual attention 4.0455 4.0278 0.208
Bank has its customer‘s best
interest in heart 3.9583 3.8636 1.027
Client friendly service hours 4.2197 4.1111 1.247
Bank staff have concern and they
understand customer problems 3.8655 3.7569 1.617
Seek to understand customer‘s
need and their problem 3.8712 3.7222 1.575
Source: Computed data *Significant at five per cent level

152
Table 5.29 shows the mean score of expectation towards empathy of banks
among customers of public sector banks and private sector banks along with its
respective ‗T‘ statistics. The important expectation towards empathy of banks among
customers of public sector banks are client friendly service hours and ‗customers get
individual attention‘ as their respective mean scores are 4.2197 and 4.0455 and among
the customers of private sector banks, ‗client friendly service hours‘ as ‗customers get
individual attention‘ as their respective mean scores are 4.1111 and 4.0278. Regarding
the expectation towards empathy of banks, no significant difference among the
customers of public and private sector banks has been identified in the cases of
customers get individual attention, bank has its customer‘s best interest in heart, client
friendly service hours, bank staff have concern and they understand customer problems
and seek to understand customers‘ need and their problems since the respective ‗T‘
statistics are not significant at 5 per cent level and accordingly the null hypothesis is
accepted.
5.7 PERCEPTION OF CUSTOMERS TOWARDS BANKS
5.7.1 Perception towards tangibility aspect of service quality of banks
Customers of public sector banks and private sector banks may have different
perception towards tangibility aspect of service quality of banks. In order to find out
the significant difference in perception towards tangibility of banks among customers
of public sector banks and private sector banks in Tirunelveli district, ‗t‘ test is
attempted with the null hypothesis as, “there is no significant difference in
perception towards tangibility of banks among customers of public sector banks
and private sector banks in Tirunelveli district”. The result of ‗t‘ test for perception
towards tangibility of banks among customers of public sector banks and private sector
banks is presented in table 5.30.
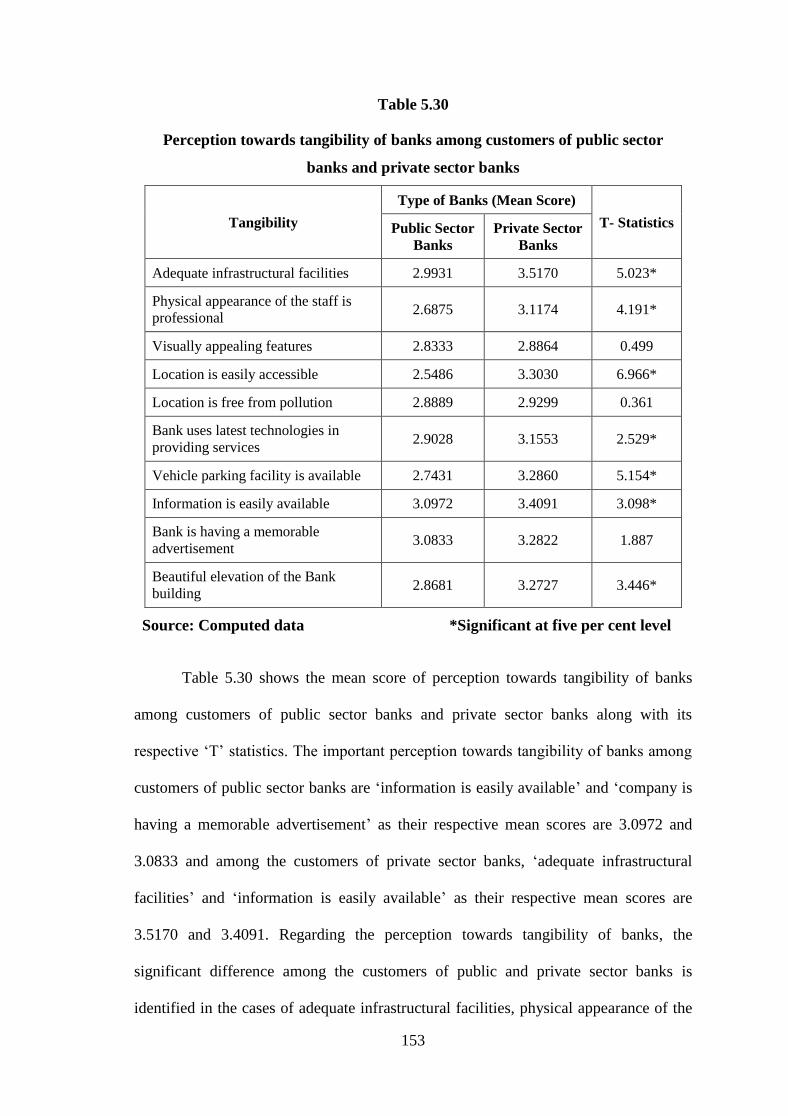
153
Table 5.30
Perception towards tangibility of banks among customers of public sector
banks and private sector banks
Tangibility
Type of Banks (Mean Score)
T- Statistics Public Sector
Banks
Private Sector
Banks
Adequate infrastructural facilities 2.9931 3.5170 5.023*
Physical appearance of the staff is
professional 2.6875 3.1174 4.191*
Visually appealing features 2.8333 2.8864 0.499
Location is easily accessible 2.5486 3.3030 6.966*
Location is free from pollution 2.8889 2.9299 0.361
Bank uses latest technologies in
providing services 2.9028 3.1553 2.529*
Vehicle parking facility is available 2.7431 3.2860 5.154*
Information is easily available 3.0972 3.4091 3.098*
Bank is having a memorable
advertisement 3.0833 3.2822 1.887
Beautiful elevation of the Bank
building 2.8681 3.2727 3.446*
Source: Computed data *Significant at five per cent level
Table 5.30 shows the mean score of perception towards tangibility of banks
among customers of public sector banks and private sector banks along with its
respective ‗T‘ statistics. The important perception towards tangibility of banks among
customers of public sector banks are ‗information is easily available‘ and ‗company is
having a memorable advertisement‘ as their respective mean scores are 3.0972 and
3.0833 and among the customers of private sector banks, ‗adequate infrastructural
facilities‘ and ‗information is easily available‘ as their respective mean scores are
3.5170 and 3.4091. Regarding the perception towards tangibility of banks, the
significant difference among the customers of public and private sector banks is
identified in the cases of adequate infrastructural facilities, physical appearance of the
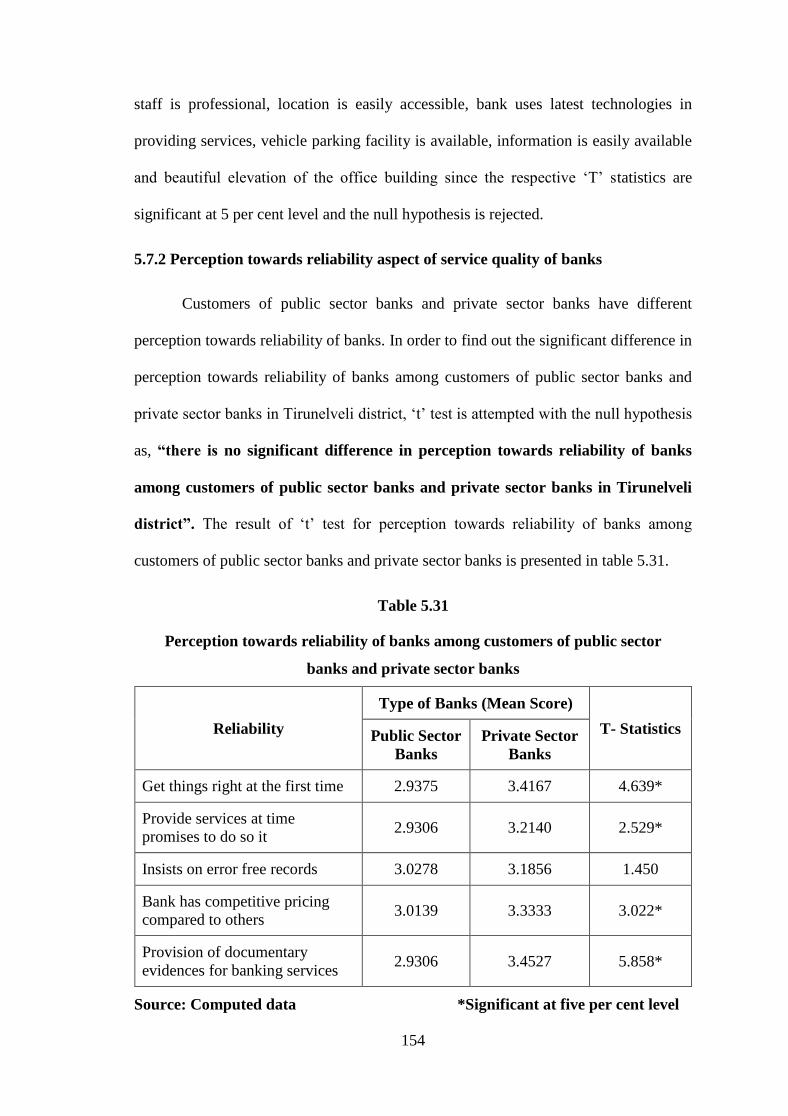
154
staff is professional, location is easily accessible, bank uses latest technologies in
providing services, vehicle parking facility is available, information is easily available
and beautiful elevation of the office building since the respective ‗T‘ statistics are
significant at 5 per cent level and the null hypothesis is rejected.
5.7.2 Perception towards reliability aspect of service quality of banks
Customers of public sector banks and private sector banks have different
perception towards reliability of banks. In order to find out the significant difference in
perception towards reliability of banks among customers of public sector banks and
private sector banks in Tirunelveli district, ‗t‘ test is attempted with the null hypothesis
as, “there is no significant difference in perception towards reliability of banks
among customers of public sector banks and private sector banks in Tirunelveli
district”. The result of ‗t‘ test for perception towards reliability of banks among
customers of public sector banks and private sector banks is presented in table 5.31.
Table 5.31
Perception towards reliability of banks among customers of public sector
banks and private sector banks
Reliability
Type of Banks (Mean Score)
T- Statistics Public Sector
Banks
Private Sector
Banks
Get things right at the first time 2.9375 3.4167 4.639*
Provide services at time
promises to do so it 2.9306 3.2140 2.529*
Insists on error free records 3.0278 3.1856 1.450
Bank has competitive pricing
compared to others 3.0139 3.3333 3.022*
Provision of documentary
evidences for banking services 2.9306 3.4527 5.858*
Source: Computed data *Significant at five per cent level
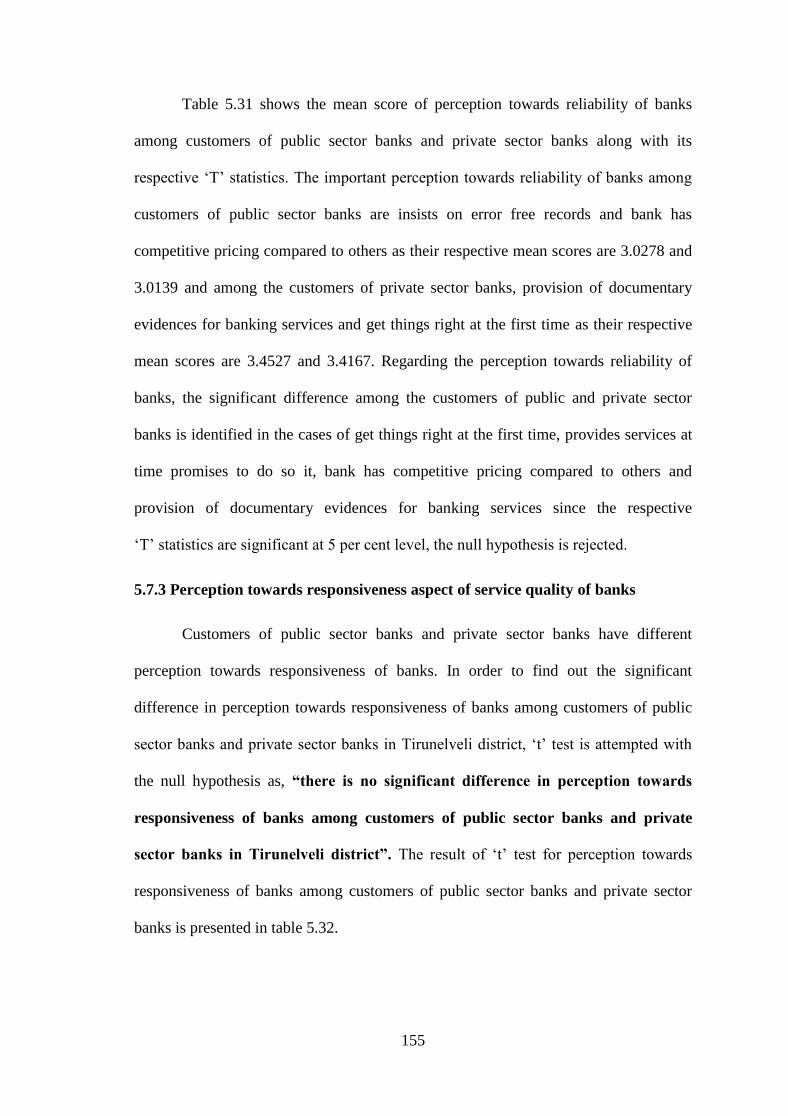
155
Table 5.31 shows the mean score of perception towards reliability of banks
among customers of public sector banks and private sector banks along with its
respective ‗T‘ statistics. The important perception towards reliability of banks among
customers of public sector banks are insists on error free records and bank has
competitive pricing compared to others as their respective mean scores are 3.0278 and
3.0139 and among the customers of private sector banks, provision of documentary
evidences for banking services and get things right at the first time as their respective
mean scores are 3.4527 and 3.4167. Regarding the perception towards reliability of
banks, the significant difference among the customers of public and private sector
banks is identified in the cases of get things right at the first time, provides services at
time promises to do so it, bank has competitive pricing compared to others and
provision of documentary evidences for banking services since the respective
‗T‘ statistics are significant at 5 per cent level, the null hypothesis is rejected.
5.7.3 Perception towards responsiveness aspect of service quality of banks
Customers of public sector banks and private sector banks have different
perception towards responsiveness of banks. In order to find out the significant
difference in perception towards responsiveness of banks among customers of public
sector banks and private sector banks in Tirunelveli district, ‗t‘ test is attempted with
the null hypothesis as, “there is no significant difference in perception towards
responsiveness of banks among customers of public sector banks and private
sector banks in Tirunelveli district”. The result of ‗t‘ test for perception towards
responsiveness of banks among customers of public sector banks and private sector
banks is presented in table 5.32.
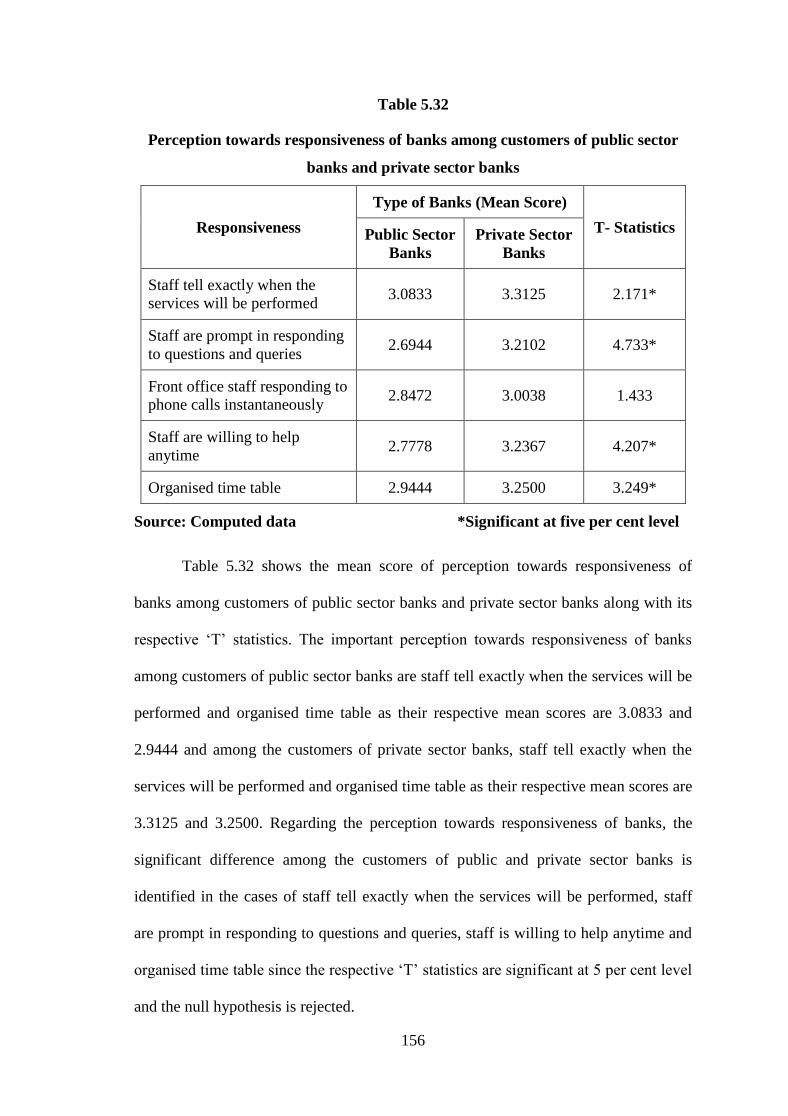
156
Table 5.32
Perception towards responsiveness of banks among customers of public sector
banks and private sector banks
Responsiveness
Type of Banks (Mean Score)
T- Statistics Public Sector
Banks
Private Sector
Banks
Staff tell exactly when the
services will be performed 3.0833 3.3125 2.171*
Staff are prompt in responding
to questions and queries 2.6944 3.2102 4.733*
Front office staff responding to
phone calls instantaneously 2.8472 3.0038 1.433
Staff are willing to help
anytime 2.7778 3.2367 4.207*
Organised time table 2.9444 3.2500 3.249*
Source: Computed data *Significant at five per cent level
Table 5.32 shows the mean score of perception towards responsiveness of
banks among customers of public sector banks and private sector banks along with its
respective ‗T‘ statistics. The important perception towards responsiveness of banks
among customers of public sector banks are staff tell exactly when the services will be
performed and organised time table as their respective mean scores are 3.0833 and
2.9444 and among the customers of private sector banks, staff tell exactly when the
services will be performed and organised time table as their respective mean scores are
3.3125 and 3.2500. Regarding the perception towards responsiveness of banks, the
significant difference among the customers of public and private sector banks is
identified in the cases of staff tell exactly when the services will be performed, staff
are prompt in responding to questions and queries, staff is willing to help anytime and
organised time table since the respective ‗T‘ statistics are significant at 5 per cent level
and the null hypothesis is rejected.
157
5.7.4 Perception towards assurance aspects of service quality of banks
Customers of public sector banks and private sector banks have different
perception towards assurance of banks. In order to find out the significant difference in
perception towards assurance of banks among customers of public sector banks and
private sector banks in Tirunelveli district, ‗t‘ test is attempted with the null hypothesis
as, “there is no significant difference in perception towards assurance of banks
among customers of public sector banks and private sector banks in Tirunelveli
district”. The result of ‗t‘ test for perception towards assurance of banks among
customers of public sector banks and private sector banks is presented in table 5.33.
Table 5.33
Perception towards assurance of banks among customers of public sector
banks and private sector banks
Assurance
Type of Banks (Mean Score)
T- Statistics Public Sector
Banks
Private Sector
Banks
Employees are trustworthy and
honest 2.8611 3.2595 3.910*
Employees in banks have
knowledge and competence to
solve customer‘s problem
2.9722 3.1534 1.977*
Bank is widely known 3.1875 3.4375 2.839*
Bank is well liked 2.8194 3.3295 4.881*
Bank is unique compared to
others 2.9444 3.5379 6.103*
Bank Staff give assurance as to
deliverance of the services 3.1181 3.1951 0.698
Data revealed by customers
are kept confidential 3.0208 3.3466 3.374*
Bank staff give assurance with
regard to their efficient service 3.0764 3.2746 1.963
Source: Computed data *Significant at five per cent level
158
Table 5.33 shows the mean score of perception towards assurance of banks
among customers of public sector banks and private sector banks along with its
respective ‗T‘ statistics. The important perception towards assurance of banks among
customers of public sector banks are bank is widely known and bank staff give
assurance as to deliverance of the services as their respective mean scores are 3.1875
and 3.1181 and among the customers of private sector banks, bank is unique compared
to others and bank is widely known as their respective mean scores are 3.5379 and
3.4375. Regarding the perception towards assurance of banks, the significant
difference among the customers of public and private sector banks is identified in the
cases of employees are trustworthy and honest, employees in banks have knowledge
and competence to solve customer‘s problem, bank is widely known, bank is well
liked, bank is unique compared to others and data revealed by customers are kept
confidential since the respective ‗T‘ statistics are significant at 5 per cent level and the
null hypothesis is rejected.
5.7.5 Perception towards empathy aspect of service quality of banks
Customers of public sector banks and private sector banks have different
perception towards empathy of banks. In order to find out the significant difference in
perception towards empathy of banks among customers of public sector banks and
private sector banks in Tirunelveli district, ‗t‘ test is attempted with the null hypothesis
as, “there is no significant difference in perception towards empathy of banks
among customers of public sector banks and private sector banks in Tirunelveli
district”. The result of ‗t‘ test for perception towards empathy of banks among
customers of public sector banks and private sector banks is presented in table 5.34.
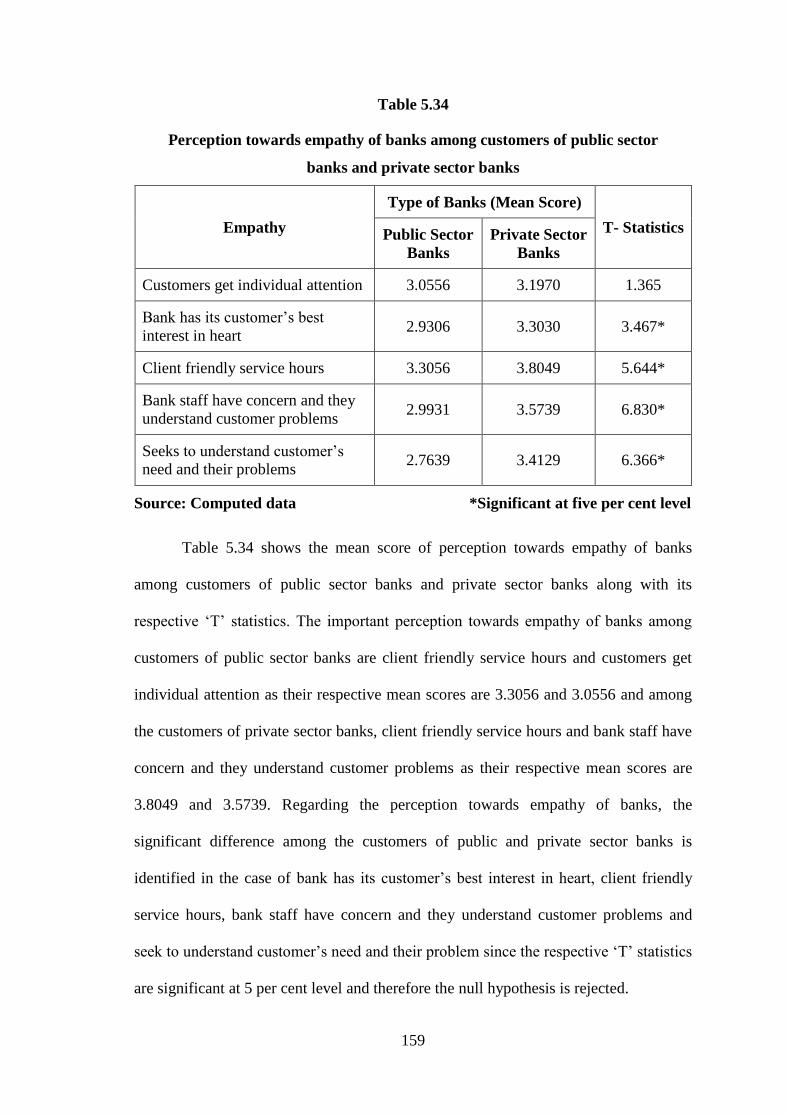
159
Table 5.34
Perception towards empathy of banks among customers of public sector
banks and private sector banks
Empathy
Type of Banks (Mean Score)
T- Statistics Public Sector
Banks
Private Sector
Banks
Customers get individual attention 3.0556 3.1970 1.365
Bank has its customer‘s best
interest in heart 2.9306 3.3030 3.467*
Client friendly service hours 3.3056 3.8049 5.644*
Bank staff have concern and they
understand customer problems 2.9931 3.5739 6.830*
Seeks to understand customer‘s
need and their problems 2.7639 3.4129 6.366*
Source: Computed data *Significant at five per cent level
Table 5.34 shows the mean score of perception towards empathy of banks
among customers of public sector banks and private sector banks along with its
respective ‗T‘ statistics. The important perception towards empathy of banks among
customers of public sector banks are client friendly service hours and customers get
individual attention as their respective mean scores are 3.3056 and 3.0556 and among
the customers of private sector banks, client friendly service hours and bank staff have
concern and they understand customer problems as their respective mean scores are
3.8049 and 3.5739. Regarding the perception towards empathy of banks, the
significant difference among the customers of public and private sector banks is
identified in the case of bank has its customer‘s best interest in heart, client friendly
service hours, bank staff have concern and they understand customer problems and
seek to understand customer‘s need and their problem since the respective ‗T‘ statistics
are significant at 5 per cent level and therefore the null hypothesis is rejected.
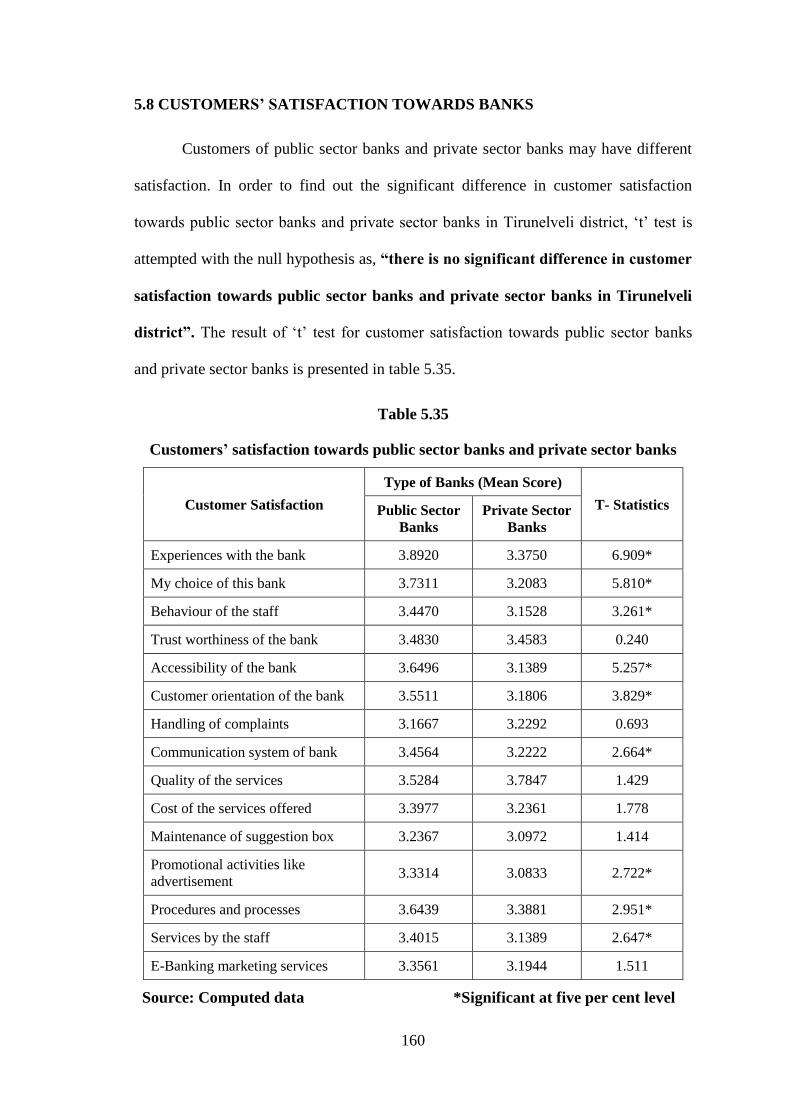
160
5.8 CUSTOMERS’ SATISFACTION TOWARDS BANKS
Customers of public sector banks and private sector banks may have different
satisfaction. In order to find out the significant difference in customer satisfaction
towards public sector banks and private sector banks in Tirunelveli district, ‗t‘ test is
attempted with the null hypothesis as, “there is no significant difference in customer
satisfaction towards public sector banks and private sector banks in Tirunelveli
district”. The result of ‗t‘ test for customer satisfaction towards public sector banks
and private sector banks is presented in table 5.35.
Table 5.35
Customers’ satisfaction towards public sector banks and private sector banks
Customer Satisfaction
Type of Banks (Mean Score)
T- Statistics Public Sector
Banks
Private Sector
Banks
Experiences with the bank 3.8920 3.3750 6.909*
My choice of this bank 3.7311 3.2083 5.810*
Behaviour of the staff 3.4470 3.1528 3.261*
Trust worthiness of the bank 3.4830 3.4583 0.240
Accessibility of the bank 3.6496 3.1389 5.257*
Customer orientation of the bank 3.5511 3.1806 3.829*
Handling of complaints 3.1667 3.2292 0.693
Communication system of bank 3.4564 3.2222 2.664*
Quality of the services 3.5284 3.7847 1.429
Cost of the services offered 3.3977 3.2361 1.778
Maintenance of suggestion box 3.2367 3.0972 1.414
Promotional activities like
advertisement 3.3314 3.0833 2.722*
Procedures and processes 3.6439 3.3881 2.951*
Services by the staff 3.4015 3.1389 2.647*
E-Banking marketing services 3.3561 3.1944 1.511
Source: Computed data *Significant at five per cent level
161
Table 5.35 shows the mean score of customer satisfaction towards public sector
banks and private sector banks along with its respective ‗T‘ statistics. The important
satisfaction among customers of public sector banks are experiences with the bank and
my choice of this bank as their respective mean scores are 3.8920 and 3.7311 and
among the customers of private sector banks, quality of the services and trust
worthiness of the bank as their respective mean scores are 3.7847 and 3.4583.
Regarding the satisfaction, the significant difference among the customers of public
and private sector banks is identified in the cases of experiences with the bank, my
choice of this bank, behaviour of the staff, accessibility of the bank, customer
orientation of the bank, communication system of bank, promotional activities like
advertisement, procedures and processes and services by the staff since the respective
‗T‘ statistics are significant at 5 per cent level and the null hypothesis is rejected.
5.9 OPINION ABOUT THE REACHABILITY OF PROMOTIONAL STRATEGIES
ADOPTED BY THE BANK
Customers of public sector banks and private sector banks have different
opinion about the reachability of promotional strategies adopted by the bank. In order
to find out whether there is a significant difference in their opinion about the
reachability of promotional strategies adopted by the bank among customers of public
sector banks and private sector banks in Tirunelveli district, ‗t‘ test is attempted with
the null hypothesis as, “there is no significant difference in opinion about the
reachability of promotional strategies adopted by the bank among customers of
public sector banks and private sector banks in Tirunelveli district”. The result of
‗t‘ test for opinion about the reachability of promotional strategies adopted by the bank
among customers of public sector banks and private sector banks is presented in
table 5.36.
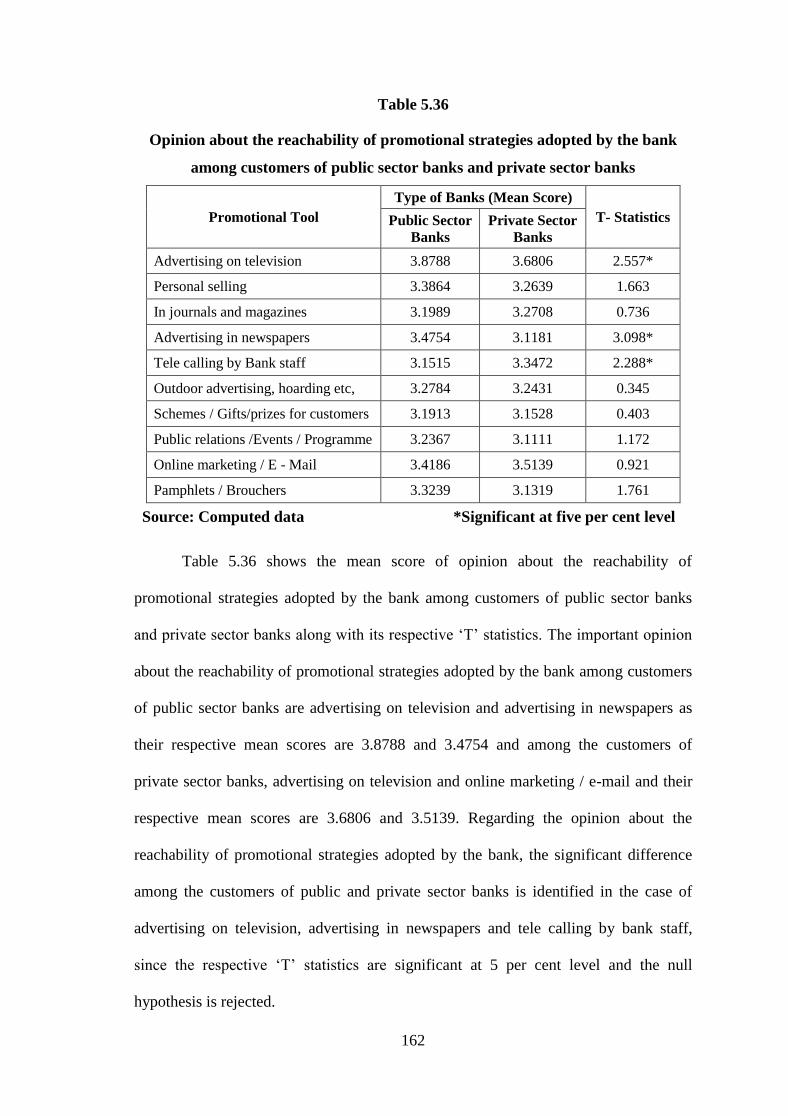
162
Table 5.36
Opinion about the reachability of promotional strategies adopted by the bank
among customers of public sector banks and private sector banks
Promotional Tool
Type of Banks (Mean Score)
T- Statistics Public Sector
Banks
Private Sector
Banks
Advertising on television 3.8788 3.6806 2.557*
Personal selling 3.3864 3.2639 1.663
In journals and magazines 3.1989 3.2708 0.736
Advertising in newspapers 3.4754 3.1181 3.098*
Tele calling by Bank staff 3.1515 3.3472 2.288*
Outdoor advertising, hoarding etc, 3.2784 3.2431 0.345
Schemes / Gifts/prizes for customers 3.1913 3.1528 0.403
Public relations /Events / Programme 3.2367 3.1111 1.172
Online marketing / E - Mail 3.4186 3.5139 0.921
Pamphlets / Brouchers 3.3239 3.1319 1.761
Source: Computed data *Significant at five per cent level
Table 5.36 shows the mean score of opinion about the reachability of
promotional strategies adopted by the bank among customers of public sector banks
and private sector banks along with its respective ‗T‘ statistics. The important opinion
about the reachability of promotional strategies adopted by the bank among customers
of public sector banks are advertising on television and advertising in newspapers as
their respective mean scores are 3.8788 and 3.4754 and among the customers of
private sector banks, advertising on television and online marketing / e-mail and their
respective mean scores are 3.6806 and 3.5139. Regarding the opinion about the
reachability of promotional strategies adopted by the bank, the significant difference
among the customers of public and private sector banks is identified in the case of
advertising on television, advertising in newspapers and tele calling by bank staff,
since the respective ‗T‘ statistics are significant at 5 per cent level and the null
hypothesis is rejected.
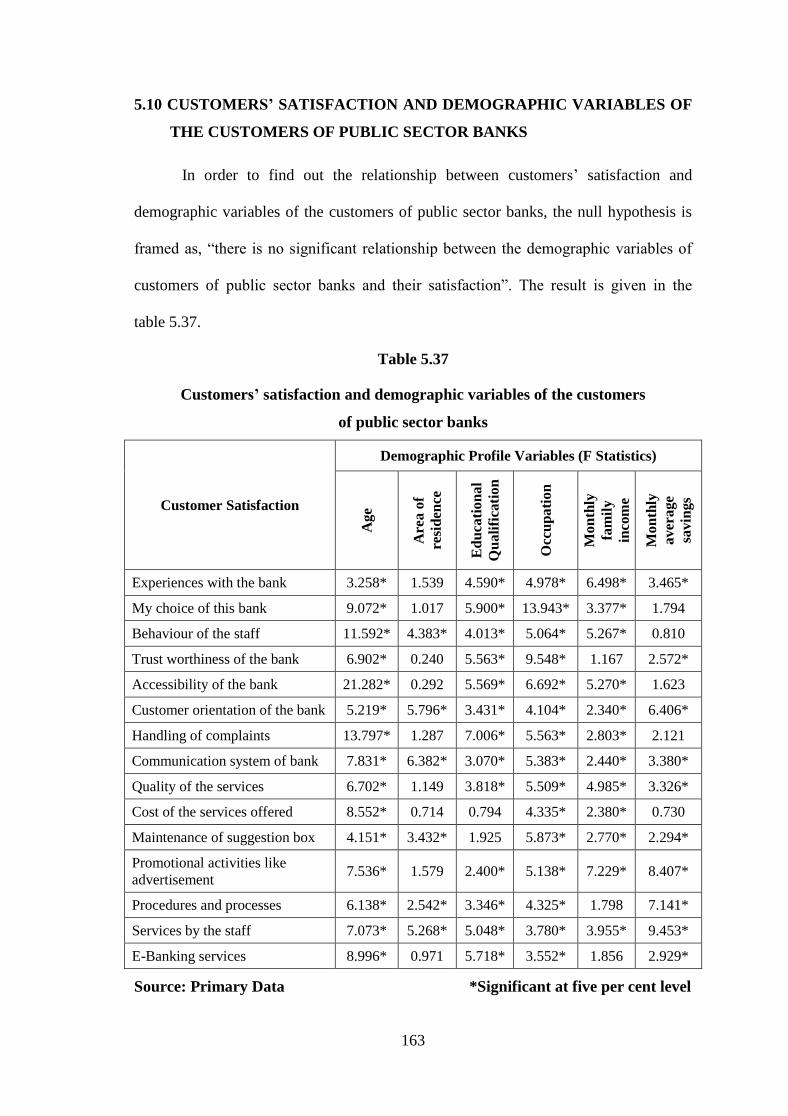
163
5.10 CUSTOMERS’ SATISFACTION AND DEMOGRAPHIC VARIABLES OF
THE CUSTOMERS OF PUBLIC SECTOR BANKS
In order to find out the relationship between customers‘ satisfaction and
demographic variables of the customers of public sector banks, the null hypothesis is
framed as, ―there is no significant relationship between the demographic variables of
customers of public sector banks and their satisfaction‖. The result is given in the
table 5.37.
Table 5.37
Customers’ satisfaction and demographic variables of the customers
of public sector banks
Customer Satisfaction
Demographic Profile Variables (F Statistics)
Age
Are
a o
f
resi
den
ce
Ed
uca
tion
al
Qu
ali
fica
tion
Occ
up
ati
on
Mon
thly
fam
ily
inco
me
Mon
thly
aver
age
savin
gs
Experiences with the bank 3.258* 1.539 4.590* 4.978* 6.498* 3.465*
My choice of this bank 9.072* 1.017 5.900* 13.943* 3.377* 1.794
Behaviour of the staff 11.592* 4.383* 4.013* 5.064* 5.267* 0.810
Trust worthiness of the bank 6.902* 0.240 5.563* 9.548* 1.167 2.572*
Accessibility of the bank 21.282* 0.292 5.569* 6.692* 5.270* 1.623
Customer orientation of the bank 5.219* 5.796* 3.431* 4.104* 2.340* 6.406*
Handling of complaints 13.797* 1.287 7.006* 5.563* 2.803* 2.121
Communication system of bank 7.831* 6.382* 3.070* 5.383* 2.440* 3.380*
Quality of the services 6.702* 1.149 3.818* 5.509* 4.985* 3.326*
Cost of the services offered 8.552* 0.714 0.794 4.335* 2.380* 0.730
Maintenance of suggestion box 4.151* 3.432* 1.925 5.873* 2.770* 2.294*
Promotional activities like
advertisement 7.536* 1.579 2.400* 5.138* 7.229* 8.407*
Procedures and processes 6.138* 2.542* 3.346* 4.325* 1.798 7.141*
Services by the staff 7.073* 5.268* 5.048* 3.780* 3.955* 9.453*
E-Banking services 8.996* 0.971 5.718* 3.552* 1.856 2.929*
Source: Primary Data *Significant at five per cent level
164
It is understood from the table 5.37 that in public sector banks, there is a
significant relationship between age group of customers and customer satisfaction with
regard to experiences with the bank, the choice of this bank, behaviour of the staff,
trust worthiness of the bank, accessibility of the bank, customer orientation of the
bank, handling of complaints, communication system of bank, quality of the services,
cost of the services offered, maintenance of suggestion box, promotional activities like
advertisement, procedures and processes, services by the staff and e-banking services.
The table further shows that there is a significant relationship between area of
residence and customer satisfaction with regard to behaviour of the staff, customer
orientation of the bank, communication system of bank, maintenance of suggestion
box, procedures and processes and services by the staff. It is also found from the above
table that there is a significant relationship between educational qualification and
customer satisfaction with regard to experiences with the banker, my choice of this
bank, behaviour of the staff, trust worthiness of the bank, accessibility of the bank,
customer orientation of the bank, handling of complaints, communication system of
bank, quality of the services, promotional activities like advertisement, procedures and
processes, services by the staff and e-banking services. It is identified from the table
that there is a significant relationship between occupation and customer satisfaction
with regard to experiences with the bank, the choice of this bank, behaviour of the
staff, trust worthiness of the bank, accessibility of the bank, customer orientation of the
bank, handling of complaints, communication system of bank, quality of the services,
cost of the services offered, maintenance of suggestion box, promotional activities like
advertisement, procedures and processes, services by the staff and e-banking services.
It is clear from table that there is a significant relationship between monthly family
income and customer satisfaction with regard to experiences with the banker, my
165
choice of this bank, behaviour of the staff, accessibility of the bank, customer
orientation of the bank, handling of complaints, communication system of bank,
quality of the services, cost of the services offered, maintenance of suggestion box,
promotional activities like advertisement, and services by the staff. It is further clear
from table that there is a significant relationship between monthly average savings and
customer satisfaction in experiences with the banker, trust worthiness of the bank,
customer orientation of the bank, communication system of bank, quality of the
services, maintenance of suggestion box, promotional activities like advertisement,
procedures and processes, services by the staff and e-banking services.
5.11 CUSTOMERS’ SATISFACTION AND DEMOGRAPHIC VARIABLES OF
THE CUSTOMERS OF PRIVATE SECTOR BANKS
In order to find out the relationship between customers‘ satisfaction and
demographic variables of the customers of private sector banks, the null hypothesis is
framed as, ―there is no significant relationship between the demographic variables of
customers of private sector banks and their satisfaction‖. The result is given in the
following table 5.38.
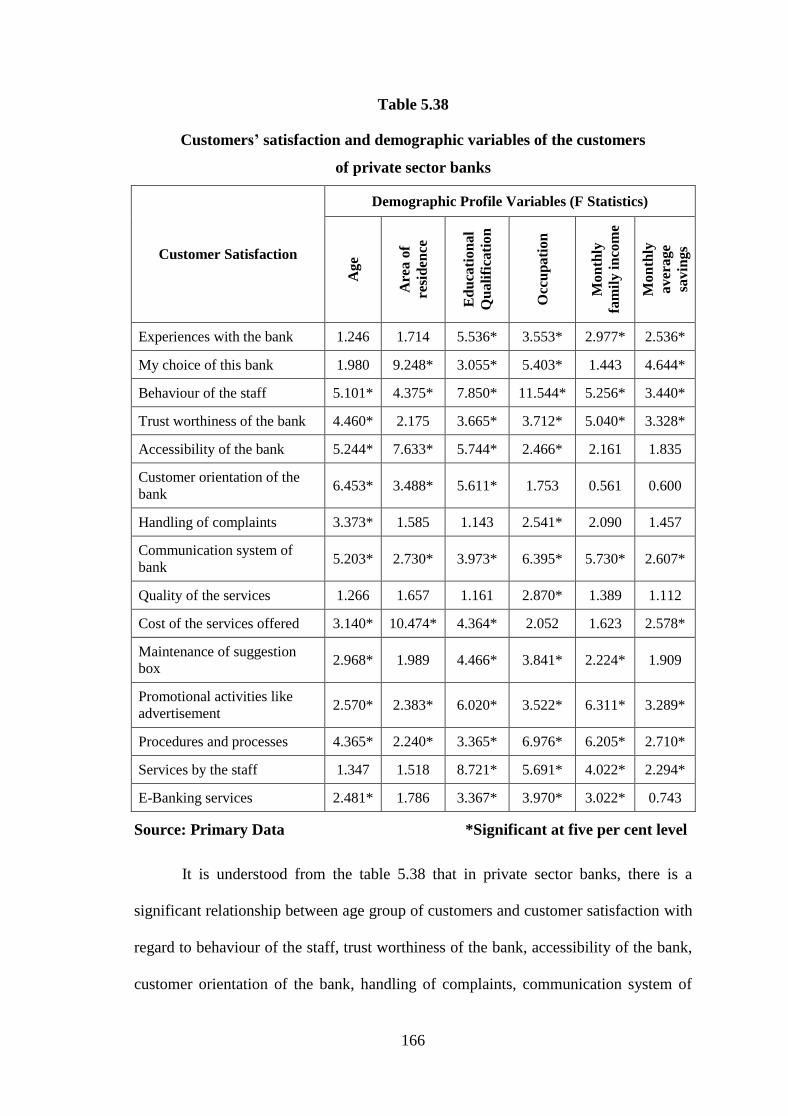
166
Table 5.38
Customers’ satisfaction and demographic variables of the customers
of private sector banks
Customer Satisfaction
Demographic Profile Variables (F Statistics)
Ag
e
Are
a o
f
resi
den
ce
Ed
uca
tio
na
l
Qu
ali
fica
tio
n
Occ
up
ati
on
Mo
nth
ly
fam
ily i
nco
me
Mo
nth
ly
av
era
ge
sav
ings
Experiences with the bank 1.246 1.714 5.536* 3.553* 2.977* 2.536*
My choice of this bank 1.980 9.248* 3.055* 5.403* 1.443 4.644*
Behaviour of the staff 5.101* 4.375* 7.850* 11.544* 5.256* 3.440*
Trust worthiness of the bank 4.460* 2.175 3.665* 3.712* 5.040* 3.328*
Accessibility of the bank 5.244* 7.633* 5.744* 2.466* 2.161 1.835
Customer orientation of the
bank 6.453* 3.488* 5.611* 1.753 0.561 0.600
Handling of complaints 3.373* 1.585 1.143 2.541* 2.090 1.457
Communication system of
bank 5.203* 2.730* 3.973* 6.395* 5.730* 2.607*
Quality of the services 1.266 1.657 1.161 2.870* 1.389 1.112
Cost of the services offered 3.140* 10.474* 4.364* 2.052 1.623 2.578*
Maintenance of suggestion
box 2.968* 1.989 4.466* 3.841* 2.224* 1.909
Promotional activities like
advertisement 2.570* 2.383* 6.020* 3.522* 6.311* 3.289*
Procedures and processes 4.365* 2.240* 3.365* 6.976* 6.205* 2.710*
Services by the staff 1.347 1.518 8.721* 5.691* 4.022* 2.294*
E-Banking services 2.481* 1.786 3.367* 3.970* 3.022* 0.743
Source: Primary Data *Significant at five per cent level
It is understood from the table 5.38 that in private sector banks, there is a
significant relationship between age group of customers and customer satisfaction with
regard to behaviour of the staff, trust worthiness of the bank, accessibility of the bank,
customer orientation of the bank, handling of complaints, communication system of
167
bank, cost of the services offered, maintenance of suggestion box, promotional
activities like advertisement, procedures and processes and e-banking services. The
table further shows that there is a significant relationship between area of residence
and customer satisfaction with regard to my choice of this bank, behaviour of the staff,
accessibility of the bank, customer orientation of the bank, communication system of
bank, cost of the services offered, promotional activities like advertisement and
procedures and processes. It is also found from the above table that there is significant
relationship between educational qualification and customer satisfaction with regard to
experiences with the banker, my choice of this bank, behaviour of the staff, trust
worthiness of the bank, accessibility of the bank, customer orientation of the bank,
communication system of bank, cost of the services offered, maintenance of suggestion
box, promotional activities like advertisement, procedures and processes and e-banking
services. It is identified from the table that there is a significant relationship between
occupation and customer satisfaction with regard to experiences with the bank, the
choice of this bank, behaviour of the staff, trust worthiness of the bank, accessibility of
the bank, handling of complaints, communication system of bank, quality of the
services, maintenance of suggestion box, promotional activities like advertisement,
procedures and processes, services by the staff and e-banking services. It is clear from
the table that there is a significant relationship between monthly family income and
customer satisfaction with regard to experiences with the banker, behaviour of the
staff, trust worthiness of the bank, communication system of bank, maintenance of
suggestion box, promotional activities like advertisement, procedures and processes,
services by the staff and e-banking services. It is further clear from the table that there
is a significant relationship between monthly average savings and customer
satisfaction with regard to experiences with the bank, the choice of this bank,
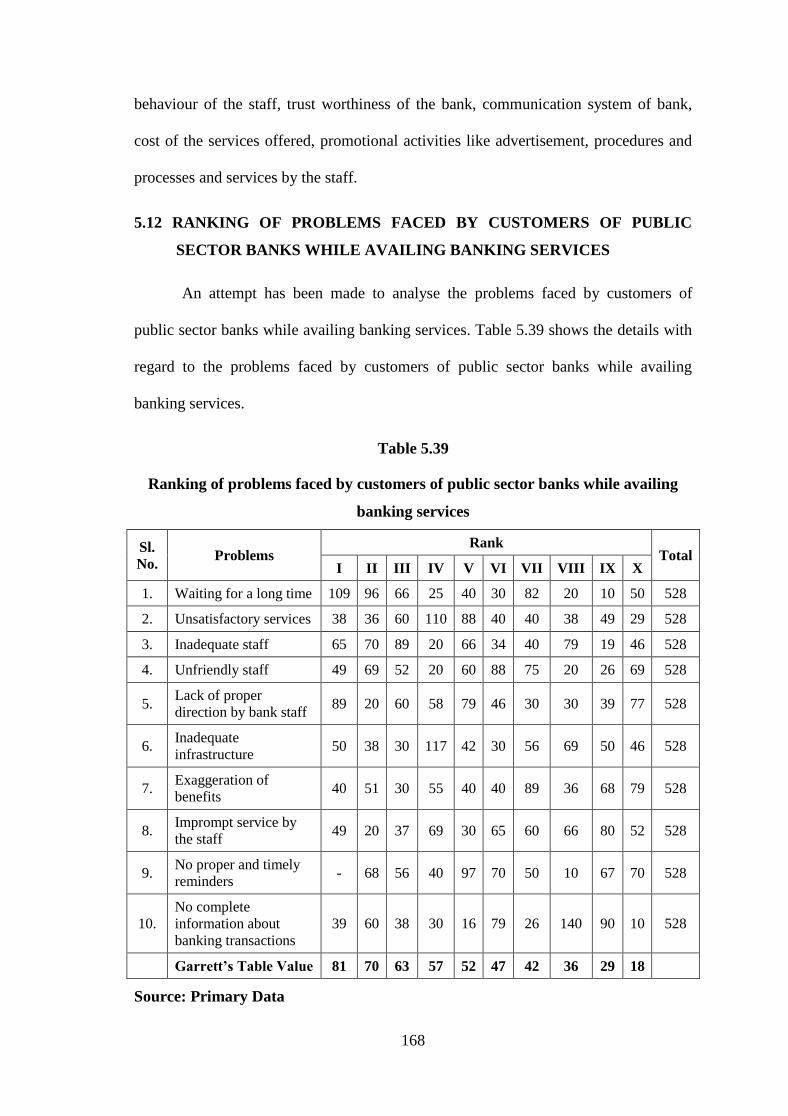
168
behaviour of the staff, trust worthiness of the bank, communication system of bank,
cost of the services offered, promotional activities like advertisement, procedures and
processes and services by the staff.
5.12 RANKING OF PROBLEMS FACED BY CUSTOMERS OF PUBLIC
SECTOR BANKS WHILE AVAILING BANKING SERVICES
An attempt has been made to analyse the problems faced by customers of
public sector banks while availing banking services. Table 5.39 shows the details with
regard to the problems faced by customers of public sector banks while availing
banking services.
Table 5.39
Ranking of problems faced by customers of public sector banks while availing
banking services
Sl.
No. Problems
Rank Total
I II III IV V VI VII VIII IX X
1. Waiting for a long time 109 96 66 25 40 30 82 20 10 50 528
2. Unsatisfactory services 38 36 60 110 88 40 40 38 49 29 528
3. Inadequate staff 65 70 89 20 66 34 40 79 19 46 528
4. Unfriendly staff 49 69 52 20 60 88 75 20 26 69 528
5. Lack of proper
direction by bank staff 89 20 60 58 79 46 30 30 39 77 528
6. Inadequate
infrastructure 50 38 30 117 42 30 56 69 50 46 528
7. Exaggeration of
benefits 40 51 30 55 40 40 89 36 68 79 528
8. Imprompt service by
the staff 49 20 37 69 30 65 60 66 80 52 528
9. No proper and timely
reminders - 68 56 40 97 70 50 10 67 70 528
10.
No complete
information about
banking transactions
39 60 38 30 16 79 26 140 90 10 528
Garrett’s Table Value 81 70 63 57 52 47 42 36 29 18
Source: Primary Data
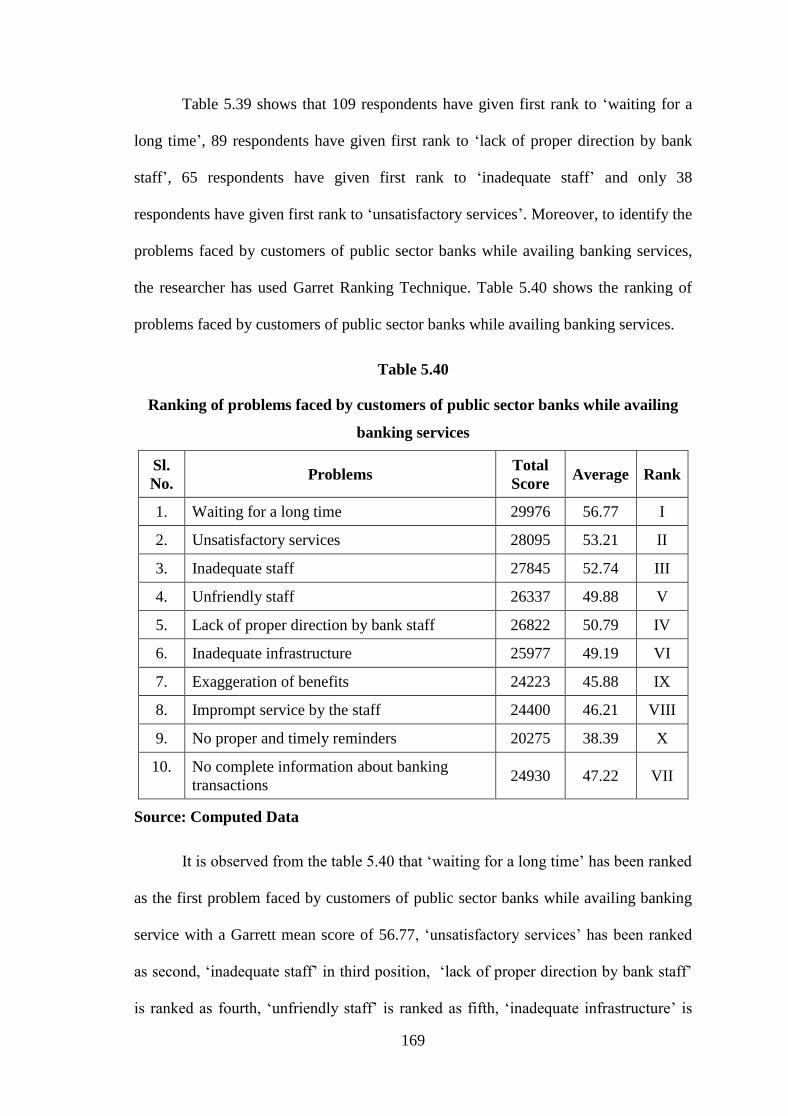
169
Table 5.39 shows that 109 respondents have given first rank to ‗waiting for a
long time‘, 89 respondents have given first rank to ‗lack of proper direction by bank
staff‘, 65 respondents have given first rank to ‗inadequate staff‘ and only 38
respondents have given first rank to ‗unsatisfactory services‘. Moreover, to identify the
problems faced by customers of public sector banks while availing banking services,
the researcher has used Garret Ranking Technique. Table 5.40 shows the ranking of
problems faced by customers of public sector banks while availing banking services.
Table 5.40
Ranking of problems faced by customers of public sector banks while availing
banking services
Sl.
No. Problems
Total
Score Average Rank
1. Waiting for a long time 29976 56.77 I
2. Unsatisfactory services 28095 53.21 II
3. Inadequate staff 27845 52.74 III
4. Unfriendly staff 26337 49.88 V
5. Lack of proper direction by bank staff 26822 50.79 IV
6. Inadequate infrastructure 25977 49.19 VI
7. Exaggeration of benefits 24223 45.88 IX
8. Imprompt service by the staff 24400 46.21 VIII
9. No proper and timely reminders 20275 38.39 X
10. No complete information about banking
transactions 24930 47.22 VII
Source: Computed Data
It is observed from the table 5.40 that ‗waiting for a long time‘ has been ranked
as the first problem faced by customers of public sector banks while availing banking
service with a Garrett mean score of 56.77, ‗unsatisfactory services‘ has been ranked
as second, ‗inadequate staff‘ in third position, ‗lack of proper direction by bank staff‘
is ranked as fourth, ‗unfriendly staff‘ is ranked as fifth, ‗inadequate infrastructure‘ is

170
ranked as sixth, ‗no complete information about banking transactions‘ is ranked as
seventh, ‗imprompt service by the staff‘ is ranked as eighth, ‗exaggeration of benefits‘
is ranked as nineth followed by ‗no proper and timely reminders‘ ranked as tenth
position with the least Garrett mean score of 38.39.
5.13 RANKING OF PROBLEMS FACED BY CUSTOMERS OF PRIVATE
SECTOR BANKS WHILE AVAILING BANKING SERVICES
An attempt has been made to analyse the problems faced by customers of
private sector banks while availing banking services. Table 5.41 shows the details with
regard to the problems faced by customers of private sector banks while availing
banking services.
Table 5.41
Ranking of problems faced by customers of private sector banks while availing
banking services
Sl.
No. Problems
Rank Total
I II III IV V VI VII VIII IX X
1. Waiting for a long time 12 20 25 21 5 12 9 12 18 10 144
2. Unsatisfactory services 26 23 12 13 8 11 13 8 14 16 144
3. Inadequate staff 20 11 13 11 13 8 18 12 12 26 144
4. Unfriendly staff 17 25 7 22 13 12 14 17 7 10 144
5. Lack of proper direction
by bank staff 16 14 15 16 23 8 14 14 12 12 144
6. Inadequate infrastructure 8 14 14 14 16 16 8 23 20 11 144
7. Exaggeration of benefits 7 9 24 11 16 12 21 23 14 7 144
8. Imprompt service by the
staff 10 8 8 17 29 22 12 17 12 9 144
9. No proper and timely
reminders 18 8 18 10 8 20 15 8 21 18 144
10. No complete information
about banking transactions 10 14 6 15 15 17 22 12 12 23 144
Garrett’s Table Value 81 70 63 57 52 47 42 36 29 18
Source: Primary Data
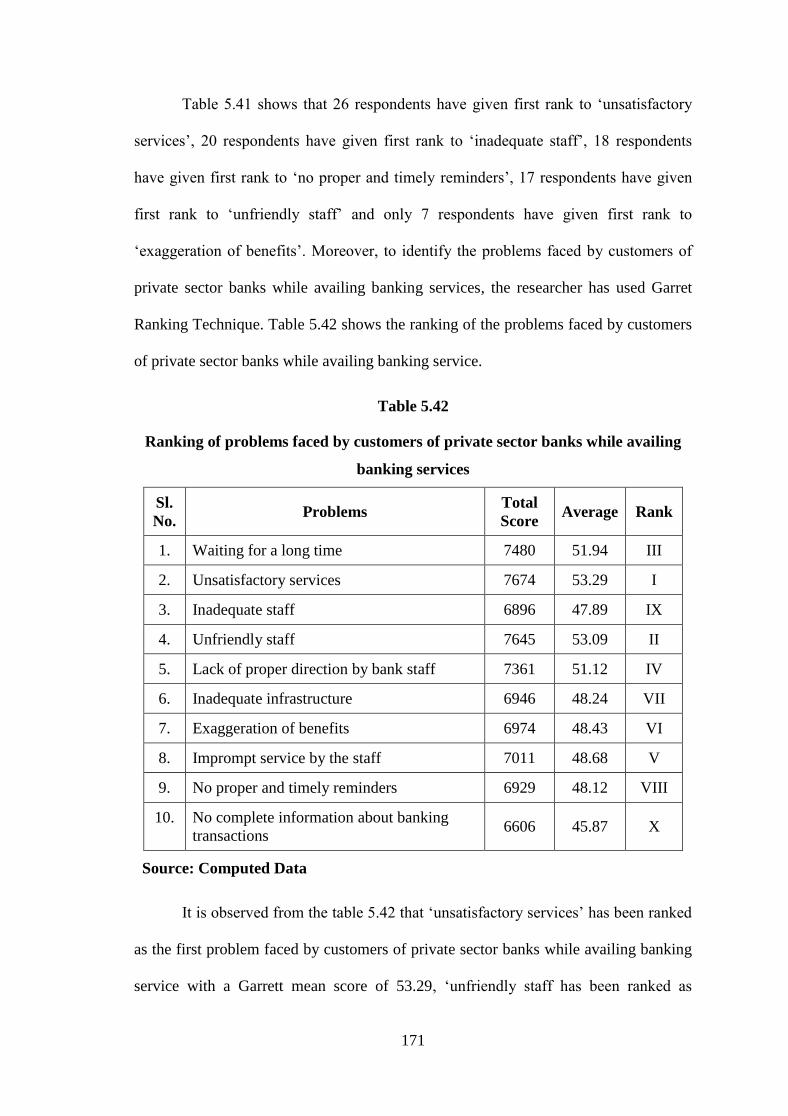
171
Table 5.41 shows that 26 respondents have given first rank to ‗unsatisfactory
services‘, 20 respondents have given first rank to ‗inadequate staff‘, 18 respondents
have given first rank to ‗no proper and timely reminders‘, 17 respondents have given
first rank to ‗unfriendly staff‘ and only 7 respondents have given first rank to
‗exaggeration of benefits‘. Moreover, to identify the problems faced by customers of
private sector banks while availing banking services, the researcher has used Garret
Ranking Technique. Table 5.42 shows the ranking of the problems faced by customers
of private sector banks while availing banking service.
Table 5.42
Ranking of problems faced by customers of private sector banks while availing
banking services
Sl.
No. Problems
Total
Score Average Rank
1. Waiting for a long time 7480 51.94 III
2. Unsatisfactory services 7674 53.29 I
3. Inadequate staff 6896 47.89 IX
4. Unfriendly staff 7645 53.09 II
5. Lack of proper direction by bank staff 7361 51.12 IV
6. Inadequate infrastructure 6946 48.24 VII
7. Exaggeration of benefits 6974 48.43 VI
8. Imprompt service by the staff 7011 48.68 V
9. No proper and timely reminders 6929 48.12 VIII
10. No complete information about banking
transactions 6606 45.87 X
Source: Computed Data
It is observed from the table 5.42 that ‗unsatisfactory services‘ has been ranked
as the first problem faced by customers of private sector banks while availing banking
service with a Garrett mean score of 53.29, ‗unfriendly staff has been ranked as

172
second, ‗waiting for a long time‘ is in third position, ‗lack of proper direction by bank
staff‘ is ranked as fourth, ‗imprompt service by the staff‘ is ranked as fifth,
‗exaggeration of benefits‘ is ranked as sixth, ‗inadequate infrastructure‘ is ranked as
seventh, ‗no proper and timely reminders‘ is ranked as eighth, ‗inadequate staff‘ is
ranked as nineth followed by ‗no complete information about banking transactions‘
ranked as tenth position with the least Garrett mean score of 45.87.
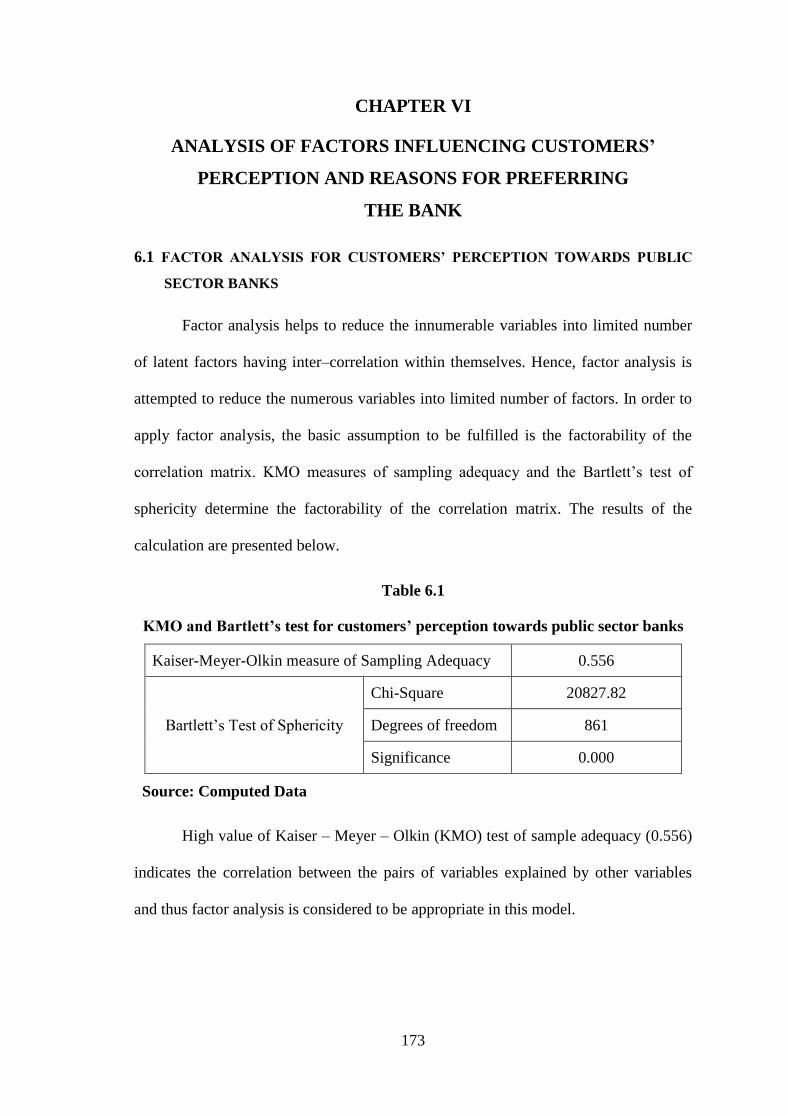
173
CHAPTER VI
ANALYSIS OF FACTORS INFLUENCING CUSTOMERS’
PERCEPTION AND REASONS FOR PREFERRING
THE BANK
6.1 FACTOR ANALYSIS FOR CUSTOMERS’ PERCEPTION TOWARDS PUBLIC
SECTOR BANKS
Factor analysis helps to reduce the innumerable variables into limited number
of latent factors having inter–correlation within themselves. Hence, factor analysis is
attempted to reduce the numerous variables into limited number of factors. In order to
apply factor analysis, the basic assumption to be fulfilled is the factorability of the
correlation matrix. KMO measures of sampling adequacy and the Bartlett‘s test of
sphericity determine the factorability of the correlation matrix. The results of the
calculation are presented below.
Table 6.1
KMO and Bartlett’s test for customers’ perception towards public sector banks
Kaiser-Meyer-Olkin measure of Sampling Adequacy 0.556
Bartlett‘s Test of Sphericity
Chi-Square 20827.82
Degrees of freedom 861
Significance 0.000
Source: Computed Data
High value of Kaiser – Meyer – Olkin (KMO) test of sample adequacy (0.556)
indicates the correlation between the pairs of variables explained by other variables
and thus factor analysis is considered to be appropriate in this model.
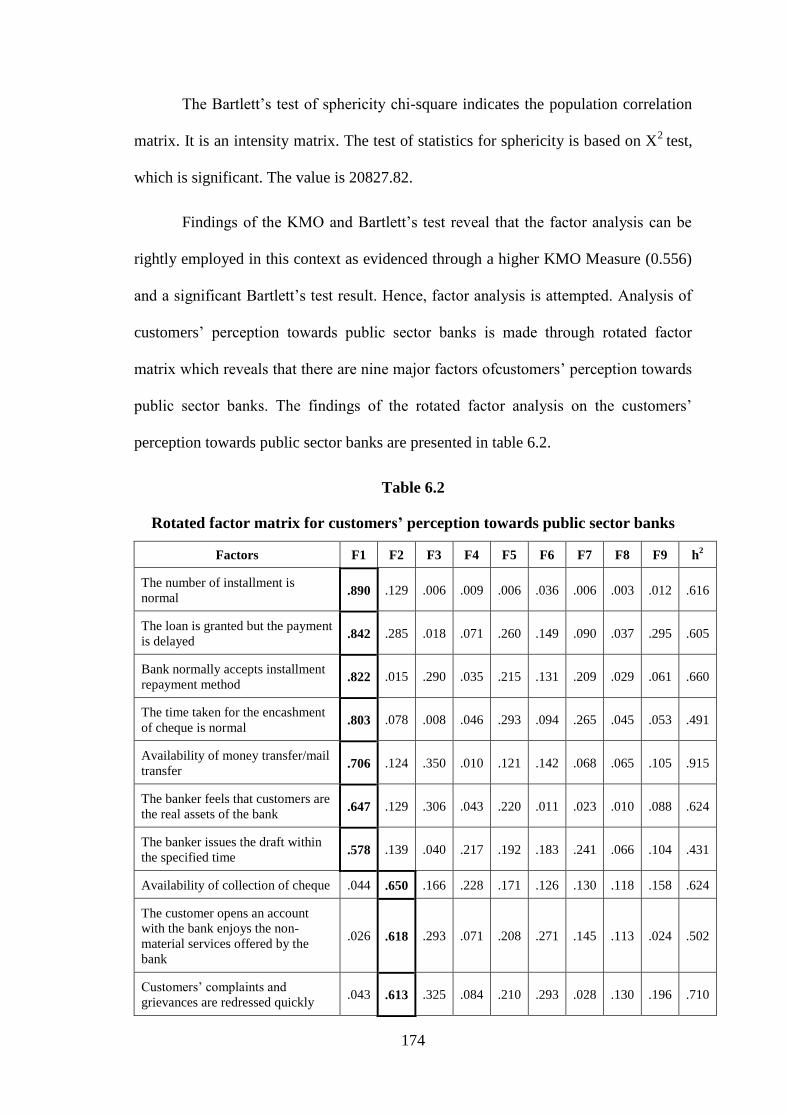
174
The Bartlett‘s test of sphericity chi-square indicates the population correlation
matrix. It is an intensity matrix. The test of statistics for sphericity is based on X2
test,
which is significant. The value is 20827.82.
Findings of the KMO and Bartlett‘s test reveal that the factor analysis can be
rightly employed in this context as evidenced through a higher KMO Measure (0.556)
and a significant Bartlett‘s test result. Hence, factor analysis is attempted. Analysis of
customers‘ perception towards public sector banks is made through rotated factor
matrix which reveals that there are nine major factors ofcustomers‘ perception towards
public sector banks. The findings of the rotated factor analysis on the customers‘
perception towards public sector banks are presented in table 6.2.
Table 6.2
Rotated factor matrix for customers’ perception towards public sector banks
Factors F1 F2 F3 F4 F5 F6 F7 F8 F9 h2
The number of installment is
normal .890 .129 .006 .009 .006 .036 .006 .003 .012 .616
The loan is granted but the payment
is delayed .842 .285 .018 .071 .260 .149 .090 .037 .295 .605
Bank normally accepts installment
repayment method .822 .015 .290 .035 .215 .131 .209 .029 .061 .660
The time taken for the encashment
of cheque is normal .803 .078 .008 .046 .293 .094 .265 .045 .053 .491
Availability of money transfer/mail
transfer .706 .124 .350 .010 .121 .142 .068 .065 .105 .915
The banker feels that customers are
the real assets of the bank .647 .129 .306 .043 .220 .011 .023 .010 .088 .624
The banker issues the draft within
the specified time .578 .139 .040 .217 .192 .183 .241 .066 .104 .431
Availability of collection of cheque .044 .650 .166 .228 .171 .126 .130 .118 .158 .624
The customer opens an account
with the bank enjoys the non-
material services offered by the
bank
.026 .618 .293 .071 .208 .271 .145 .113 .024 .502
Customers‘ complaints and
grievances are redressed quickly .043 .613 .325 .084 .210 .293 .028 .130 .196 .710
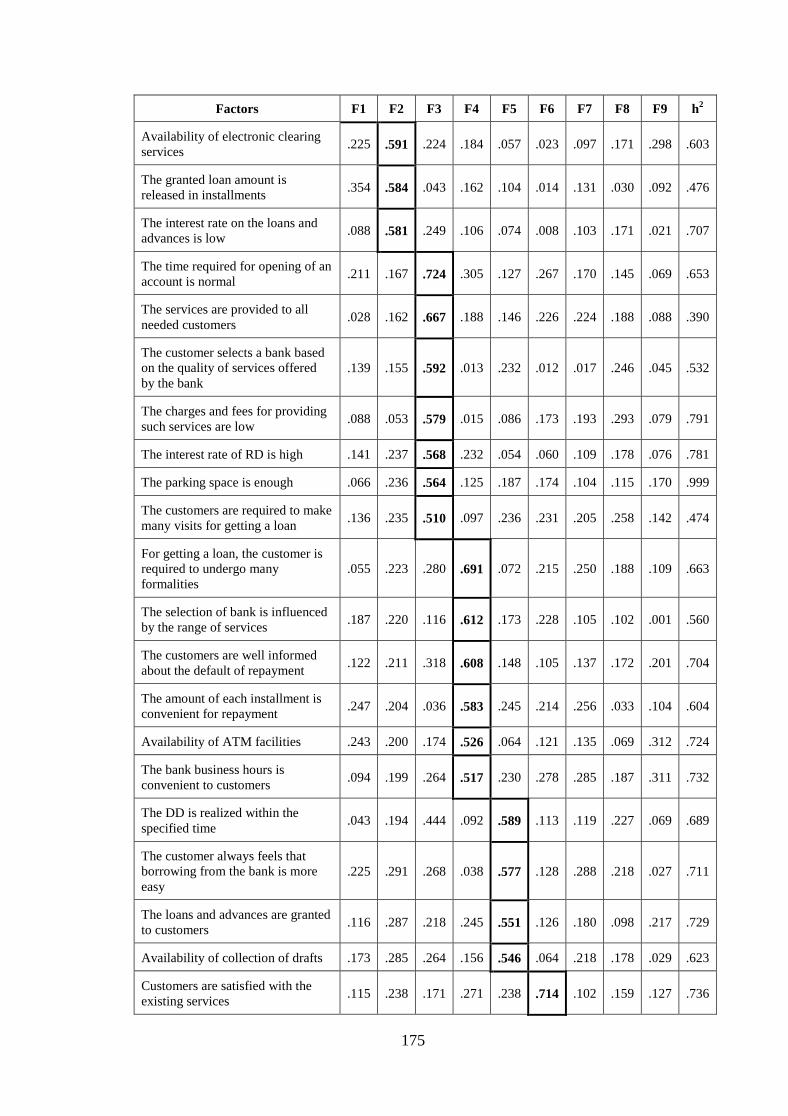
175
Factors F1 F2 F3 F4 F5 F6 F7 F8 F9 h2
Availability of electronic clearing
services .225 .591 .224 .184 .057 .023 .097 .171 .298 .603
The granted loan amount is
released in installments .354 .584 .043 .162 .104 .014 .131 .030 .092 .476
The interest rate on the loans and
advances is low .088 .581 .249 .106 .074 .008 .103 .171 .021 .707
The time required for opening of an
account is normal .211 .167 .724 .305 .127 .267 .170 .145 .069 .653
The services are provided to all
needed customers .028 .162 .667 .188 .146 .226 .224 .188 .088 .390
The customer selects a bank based
on the quality of services offered
by the bank
.139 .155 .592 .013 .232 .012 .017 .246 .045 .532
The charges and fees for providing
such services are low .088 .053 .579 .015 .086 .173 .193 .293 .079 .791
The interest rate of RD is high .141 .237 .568 .232 .054 .060 .109 .178 .076 .781
The parking space is enough .066 .236 .564 .125 .187 .174 .104 .115 .170 .999
The customers are required to make
many visits for getting a loan .136 .235 .510 .097 .236 .231 .205 .258 .142 .474
For getting a loan, the customer is
required to undergo many
formalities
.055 .223 .280 .691 .072 .215 .250 .188 .109 .663
The selection of bank is influenced
by the range of services .187 .220 .116 .612 .173 .228 .105 .102 .001 .560
The customers are well informed
about the default of repayment .122 .211 .318 .608 .148 .105 .137 .172 .201 .704
The amount of each installment is
convenient for repayment .247 .204 .036 .583 .245 .214 .256 .033 .104 .604
Availability of ATM facilities .243 .200 .174 .526 .064 .121 .135 .069 .312 .724
The bank business hours is
convenient to customers .094 .199 .264 .517 .230 .278 .285 .187 .311 .732
The DD is realized within the
specified time .043 .194 .444 .092 .589 .113 .119 .227 .069 .689
The customer always feels that
borrowing from the bank is more
easy
.225 .291 .268 .038 .577 .128 .288 .218 .027 .711
The loans and advances are granted
to customers .116 .287 .218 .245 .551 .126 .180 .098 .217 .729
Availability of collection of drafts .173 .285 .264 .156 .546 .064 .218 .178 .029 .623
Customers are satisfied with the
existing services .115 .238 .171 .271 .238 .714 .102 .159 .127 .736
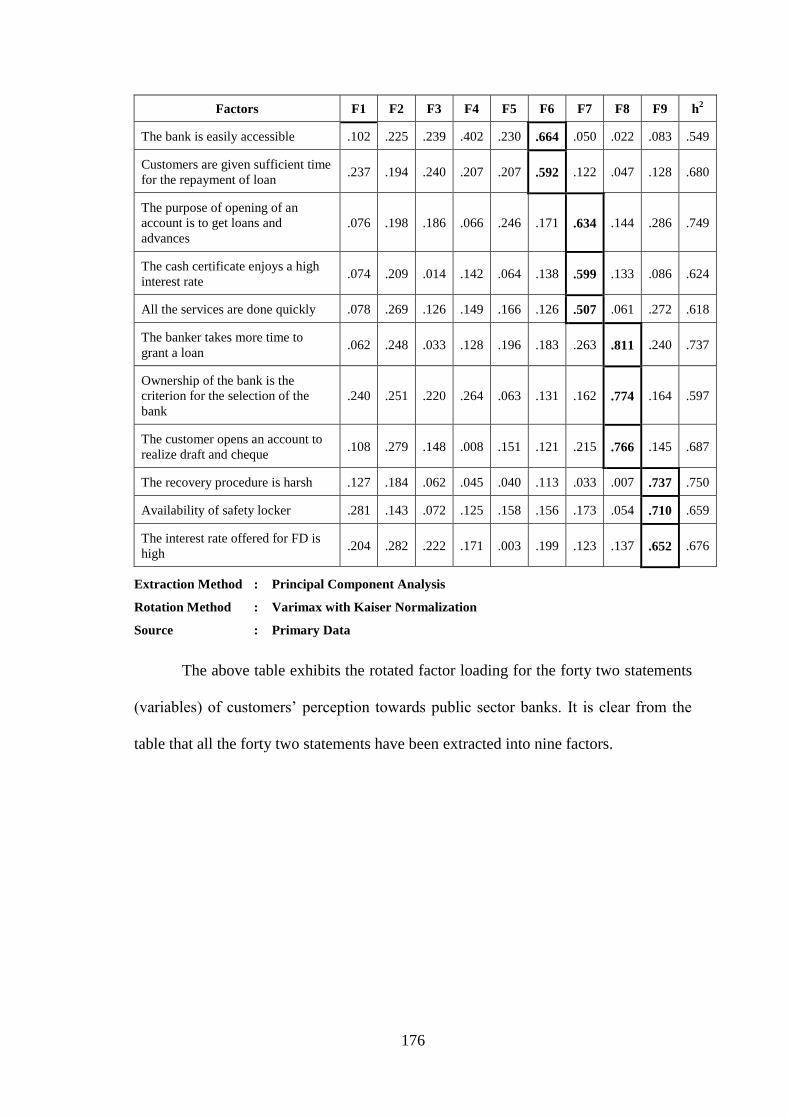
176
Factors F1 F2 F3 F4 F5 F6 F7 F8 F9 h2
The bank is easily accessible .102 .225 .239 .402 .230 .664 .050 .022 .083 .549
Customers are given sufficient time
for the repayment of loan .237 .194 .240 .207 .207 .592 .122 .047 .128 .680
The purpose of opening of an
account is to get loans and
advances
.076 .198 .186 .066 .246 .171 .634 .144 .286 .749
The cash certificate enjoys a high
interest rate .074 .209 .014 .142 .064 .138 .599 .133 .086 .624
All the services are done quickly .078 .269 .126 .149 .166 .126 .507 .061 .272 .618
The banker takes more time to
grant a loan .062 .248 .033 .128 .196 .183 .263 .811 .240 .737
Ownership of the bank is the
criterion for the selection of the
bank
.240 .251 .220 .264 .063 .131 .162 .774 .164 .597
The customer opens an account to
realize draft and cheque .108 .279 .148 .008 .151 .121 .215 .766 .145 .687
The recovery procedure is harsh .127 .184 .062 .045 .040 .113 .033 .007 .737 .750
Availability of safety locker .281 .143 .072 .125 .158 .156 .173 .054 .710 .659
The interest rate offered for FD is
high .204 .282 .222 .171 .003 .199 .123 .137 .652 .676
Extraction Method : Principal Component Analysis
Rotation Method : Varimax with Kaiser Normalization
Source : Primary Data
The above table exhibits the rotated factor loading for the forty two statements
(variables) of customers‘ perception towards public sector banks. It is clear from the
table that all the forty two statements have been extracted into nine factors.
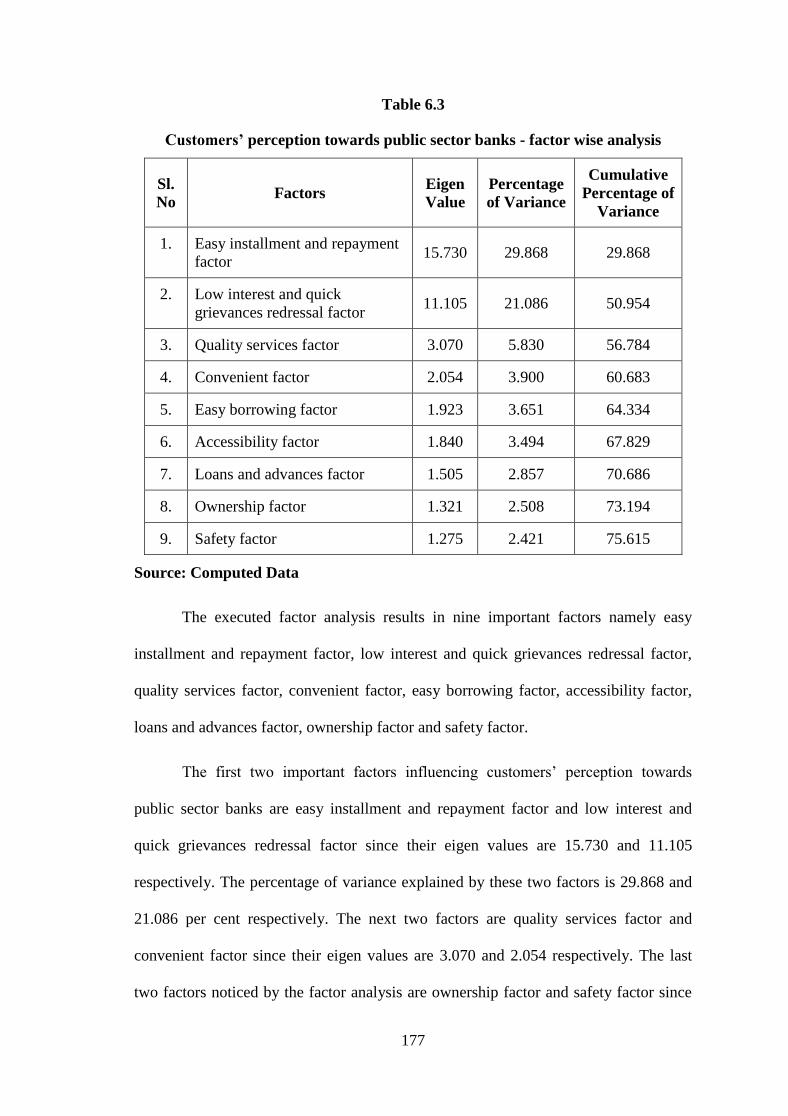
177
Table 6.3
Customers’ perception towards public sector banks - factor wise analysis
Sl.
No Factors
Eigen
Value
Percentage
of Variance
Cumulative
Percentage of
Variance
1. Easy installment and repayment
factor 15.730 29.868 29.868
2. Low interest and quick
grievances redressal factor 11.105 21.086 50.954
3. Quality services factor 3.070 5.830 56.784
4. Convenient factor 2.054 3.900 60.683
5. Easy borrowing factor 1.923 3.651 64.334
6. Accessibility factor 1.840 3.494 67.829
7. Loans and advances factor 1.505 2.857 70.686
8. Ownership factor 1.321 2.508 73.194
9. Safety factor 1.275 2.421 75.615
Source: Computed Data
The executed factor analysis results in nine important factors namely easy
installment and repayment factor, low interest and quick grievances redressal factor,
quality services factor, convenient factor, easy borrowing factor, accessibility factor,
loans and advances factor, ownership factor and safety factor.
The first two important factors influencing customers‘ perception towards
public sector banks are easy installment and repayment factor and low interest and
quick grievances redressal factor since their eigen values are 15.730 and 11.105
respectively. The percentage of variance explained by these two factors is 29.868 and
21.086 per cent respectively. The next two factors are quality services factor and
convenient factor since their eigen values are 3.070 and 2.054 respectively. The last
two factors noticed by the factor analysis are ownership factor and safety factor since
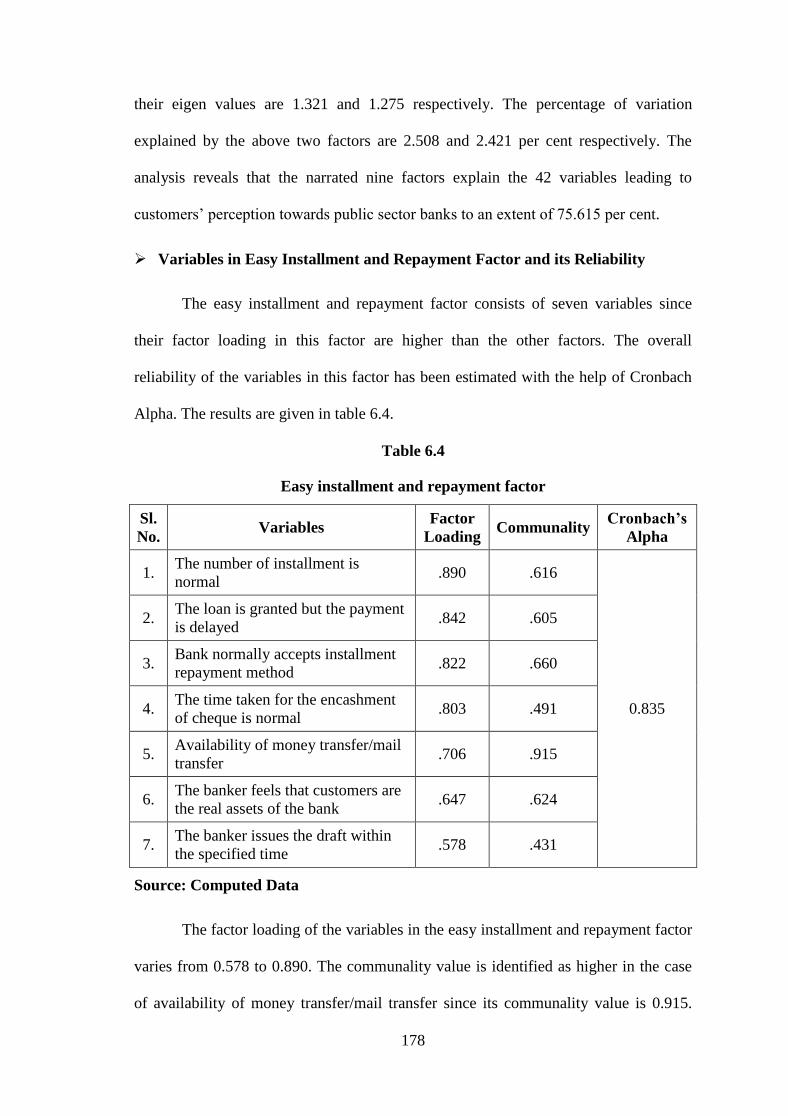
178
their eigen values are 1.321 and 1.275 respectively. The percentage of variation
explained by the above two factors are 2.508 and 2.421 per cent respectively. The
analysis reveals that the narrated nine factors explain the 42 variables leading to
customers‘ perception towards public sector banks to an extent of 75.615 per cent.
Variables in Easy Installment and Repayment Factor and its Reliability
The easy installment and repayment factor consists of seven variables since
their factor loading in this factor are higher than the other factors. The overall
reliability of the variables in this factor has been estimated with the help of Cronbach
Alpha. The results are given in table 6.4.
Table 6.4
Easy installment and repayment factor
Sl.
No. Variables
Factor
Loading Communality
Cronbach’s
Alpha
1. The number of installment is
normal .890 .616
0.835
2. The loan is granted but the payment
is delayed .842 .605
3. Bank normally accepts installment
repayment method .822 .660
4. The time taken for the encashment
of cheque is normal .803 .491
5. Availability of money transfer/mail
transfer .706 .915
6. The banker feels that customers are
the real assets of the bank .647 .624
7. The banker issues the draft within
the specified time .578 .431
Source: Computed Data
The factor loading of the variables in the easy installment and repayment factor
varies from 0.578 to 0.890. The communality value is identified as higher in the case
of availability of money transfer/mail transfer since its communality value is 0.915.
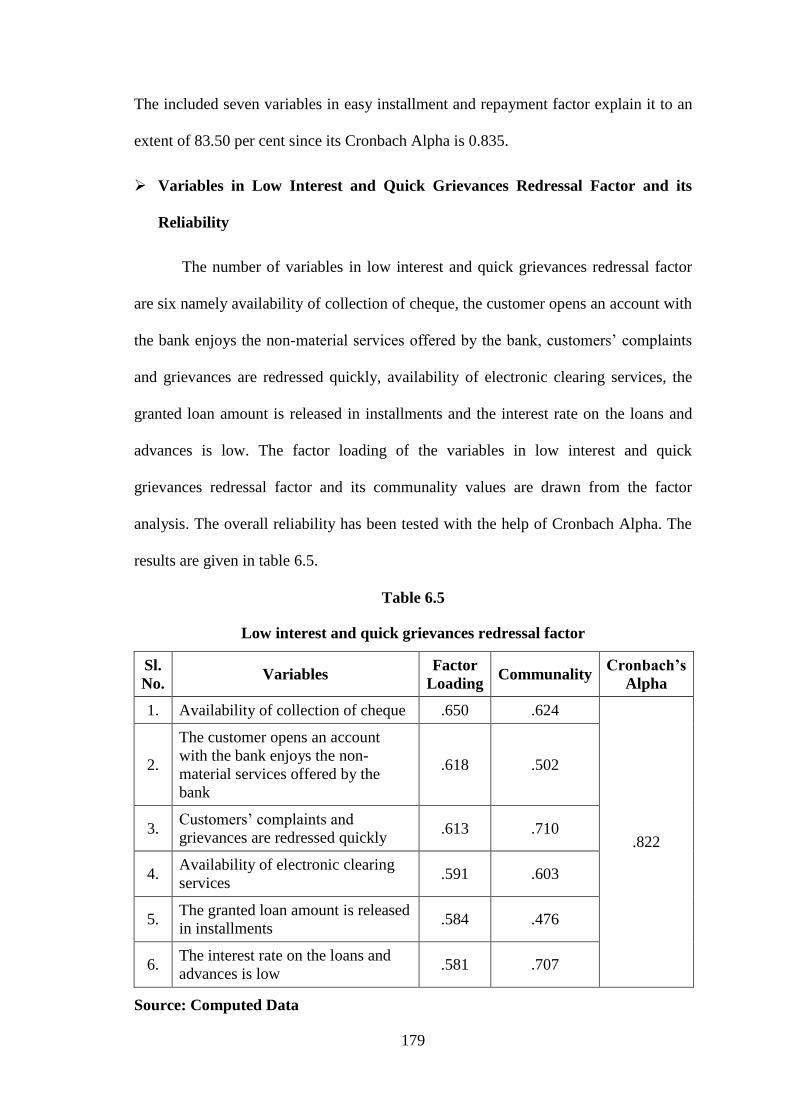
179
The included seven variables in easy installment and repayment factor explain it to an
extent of 83.50 per cent since its Cronbach Alpha is 0.835.
Variables in Low Interest and Quick Grievances Redressal Factor and its
Reliability
The number of variables in low interest and quick grievances redressal factor
are six namely availability of collection of cheque, the customer opens an account with
the bank enjoys the non-material services offered by the bank, customers‘ complaints
and grievances are redressed quickly, availability of electronic clearing services, the
granted loan amount is released in installments and the interest rate on the loans and
advances is low. The factor loading of the variables in low interest and quick
grievances redressal factor and its communality values are drawn from the factor
analysis. The overall reliability has been tested with the help of Cronbach Alpha. The
results are given in table 6.5.
Table 6.5
Low interest and quick grievances redressal factor
Sl.
No. Variables
Factor
Loading Communality
Cronbach’s
Alpha
1. Availability of collection of cheque .650 .624
.822
2.
The customer opens an account
with the bank enjoys the non-
material services offered by the
bank
.618 .502
3. Customers‘ complaints and
grievances are redressed quickly .613 .710
4. Availability of electronic clearing
services .591 .603
5. The granted loan amount is released
in installments .584 .476
6. The interest rate on the loans and
advances is low .581 .707
Source: Computed Data

180
The factor loading of the variables in the low interest and quick grievances
redressal factor varies from 0.581 to 0.650. The higher communality value is noticed in
the case of customers‘ complaints and grievances are redressed quickly since its value
is 0.710. The included variables in low interest and quick grievances redressal factors
explain it to an extent of 82.20 per cent since its Cronbach Alpha is 0.822.
Variables in Quality Services Factor and its Reliability
In total, there are seven variables noticed in the quality services factor since
their factor loadings are higher in this factor than in other factors. The Cronbach Alpha
is computed to find out the overall reliability. The factor loading of the variables in
quality services factor, its communality and Cronbach Alpha are given in table 6.6.
Table 6.6
Quality services factor
Sl.
No. Variables
Factors
Loading Communality
Cronbach’s
Alpha
1. The time required for opening of an
account is normal .724 .653
.817
2. The services are provided to all
needed customers .667 .390
3. The customer selects a bank based on
the quality of services offered by the
bank
.592 .532
4. The charges and fee for providing
such services is low .579 .791
5. The interest rate of RD is high .568 .781
6. The parking space is enough .564 .999
7. The customers are required to make
many visits for getting a loan .510 .474
Source: Computed Data
The included seven variables in quality services factor explain it to an extent of
81.70 per cent since its Cronbach Alpha is 0.817. The factor loading of the variables
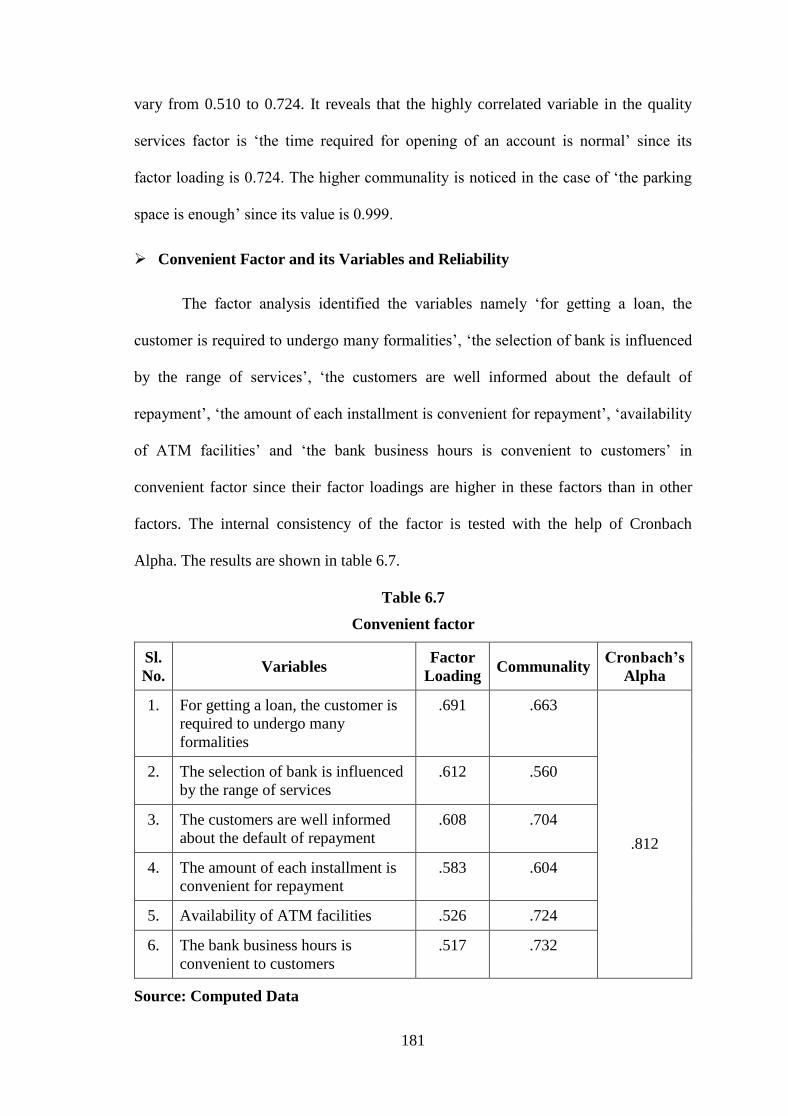
181
vary from 0.510 to 0.724. It reveals that the highly correlated variable in the quality
services factor is ‗the time required for opening of an account is normal‘ since its
factor loading is 0.724. The higher communality is noticed in the case of ‗the parking
space is enough‘ since its value is 0.999.
Convenient Factor and its Variables and Reliability
The factor analysis identified the variables namely ‗for getting a loan, the
customer is required to undergo many formalities‘, ‗the selection of bank is influenced
by the range of services‘, ‗the customers are well informed about the default of
repayment‘, ‗the amount of each installment is convenient for repayment‘, ‗availability
of ATM facilities‘ and ‗the bank business hours is convenient to customers‘ in
convenient factor since their factor loadings are higher in these factors than in other
factors. The internal consistency of the factor is tested with the help of Cronbach
Alpha. The results are shown in table 6.7.
Table 6.7
Convenient factor
Sl.
No. Variables
Factor
Loading Communality
Cronbach’s
Alpha
1. For getting a loan, the customer is
required to undergo many
formalities
.691 .663
.812
2. The selection of bank is influenced
by the range of services
.612 .560
3. The customers are well informed
about the default of repayment
.608 .704
4. The amount of each installment is
convenient for repayment
.583 .604
5. Availability of ATM facilities .526 .724
6. The bank business hours is
convenient to customers
.517 .732
Source: Computed Data
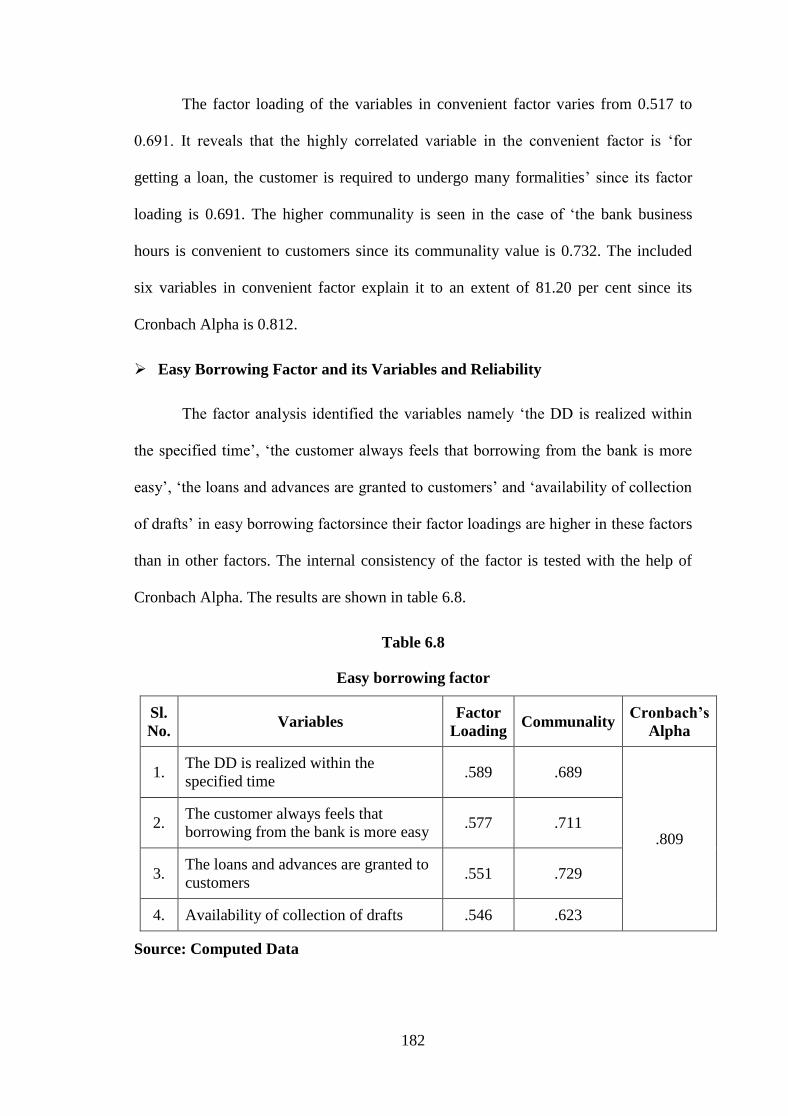
182
The factor loading of the variables in convenient factor varies from 0.517 to
0.691. It reveals that the highly correlated variable in the convenient factor is ‗for
getting a loan, the customer is required to undergo many formalities‘ since its factor
loading is 0.691. The higher communality is seen in the case of ‗the bank business
hours is convenient to customers since its communality value is 0.732. The included
six variables in convenient factor explain it to an extent of 81.20 per cent since its
Cronbach Alpha is 0.812.
Easy Borrowing Factor and its Variables and Reliability
The factor analysis identified the variables namely ‗the DD is realized within
the specified time‘, ‗the customer always feels that borrowing from the bank is more
easy‘, ‗the loans and advances are granted to customers‘ and ‗availability of collection
of drafts‘ in easy borrowing factorsince their factor loadings are higher in these factors
than in other factors. The internal consistency of the factor is tested with the help of
Cronbach Alpha. The results are shown in table 6.8.
Table 6.8
Easy borrowing factor
Sl.
No. Variables
Factor
Loading Communality
Cronbach’s
Alpha
1. The DD is realized within the
specified time .589 .689
.809 2.
The customer always feels that
borrowing from the bank is more easy .577 .711
3. The loans and advances are granted to
customers .551 .729
4. Availability of collection of drafts .546 .623
Source: Computed Data

183
The factor loading of the variables in easy borrowing factor varies from 0.546
to 0.589. It reveals that the highly correlated variable in the easy borrowing factor is
‗The DD is realized within the specified time‘ since its factor loading is 0.589.
The higher communality is seen in the case of ‗the loans and advances are granted to
customers‘ since its communality value is 0.729. The included four variables in easy
borrowing factor explain it to an extent of 80.90 per cent since its Cronbach Alpha
is 0.809.
Accessibility Factor and its Variables and Reliability
The factor analysis identified the variables namely ‗customers are satisfied with
the existing services‘, ‗the bank is easily accessible‘ and ‗customers are given
sufficient time for the repayment of loan‘ in accessibility factor since their factor
loadings are higher in these factors than in other factors. The internal consistency of
the factor is tested with the help of Cronbach Alpha. The results are shown in table 6.9.
Table 6.9
Accessibility factor
Sl.
No. Variables
Factor
Loading Communality
Cronbach’s
Alpha
1. Customers are satisfied with
the existing services .714 .736
.807
2. The bank is easily accessible .664 .549
3. Customers are given sufficient
time for the repayment of loan .592 .680
Source: Computed Data
The factor loading of the variables in accessibility factor varies from 0.592 to
0.714. It reveals that the highly correlated variable in the accessibility factor is
‗customers are satisfied with the existing services‘ since its factor loading is 0.714.
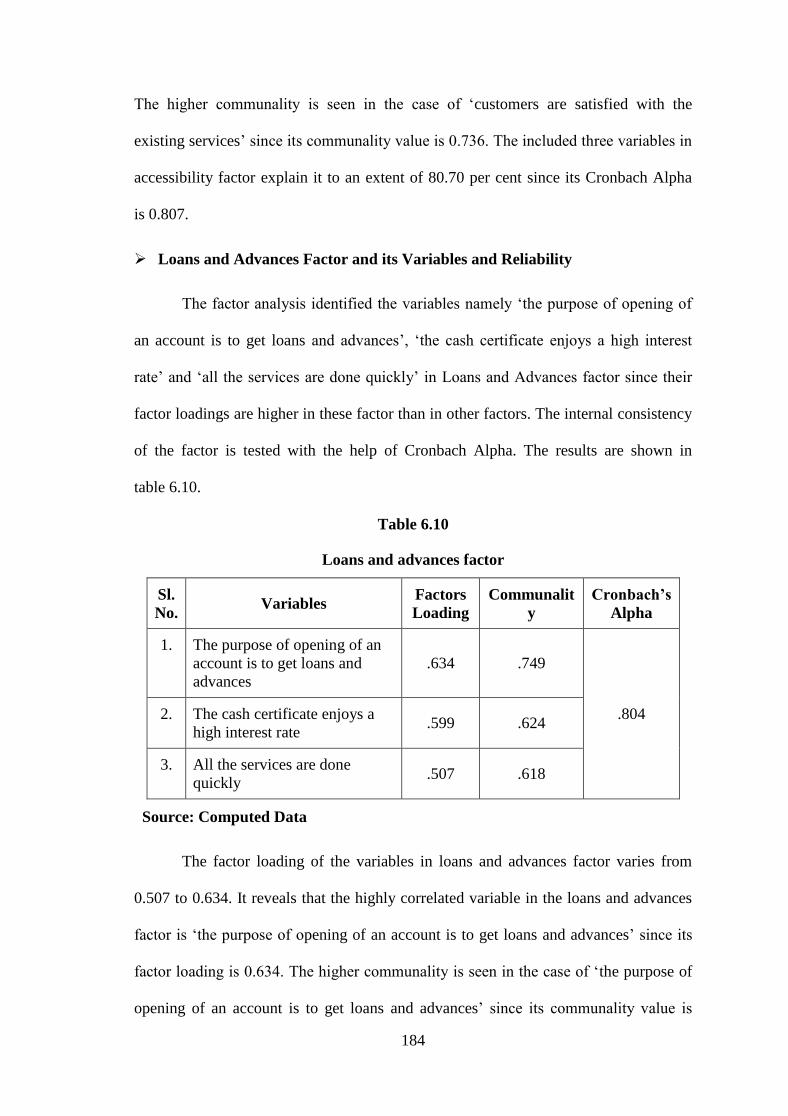
184
The higher communality is seen in the case of ‗customers are satisfied with the
existing services‘ since its communality value is 0.736. The included three variables in
accessibility factor explain it to an extent of 80.70 per cent since its Cronbach Alpha
is 0.807.
Loans and Advances Factor and its Variables and Reliability
The factor analysis identified the variables namely ‗the purpose of opening of
an account is to get loans and advances‘, ‗the cash certificate enjoys a high interest
rate‘ and ‗all the services are done quickly‘ in Loans and Advances factor since their
factor loadings are higher in these factor than in other factors. The internal consistency
of the factor is tested with the help of Cronbach Alpha. The results are shown in
table 6.10.
Table 6.10
Loans and advances factor
Sl.
No. Variables
Factors
Loading
Communalit
y
Cronbach’s
Alpha
1. The purpose of opening of an
account is to get loans and
advances
.634 .749
.804 2. The cash certificate enjoys a
high interest rate .599 .624
3. All the services are done
quickly .507 .618
Source: Computed Data
The factor loading of the variables in loans and advances factor varies from
0.507 to 0.634. It reveals that the highly correlated variable in the loans and advances
factor is ‗the purpose of opening of an account is to get loans and advances‘ since its
factor loading is 0.634. The higher communality is seen in the case of ‗the purpose of
opening of an account is to get loans and advances‘ since its communality value is
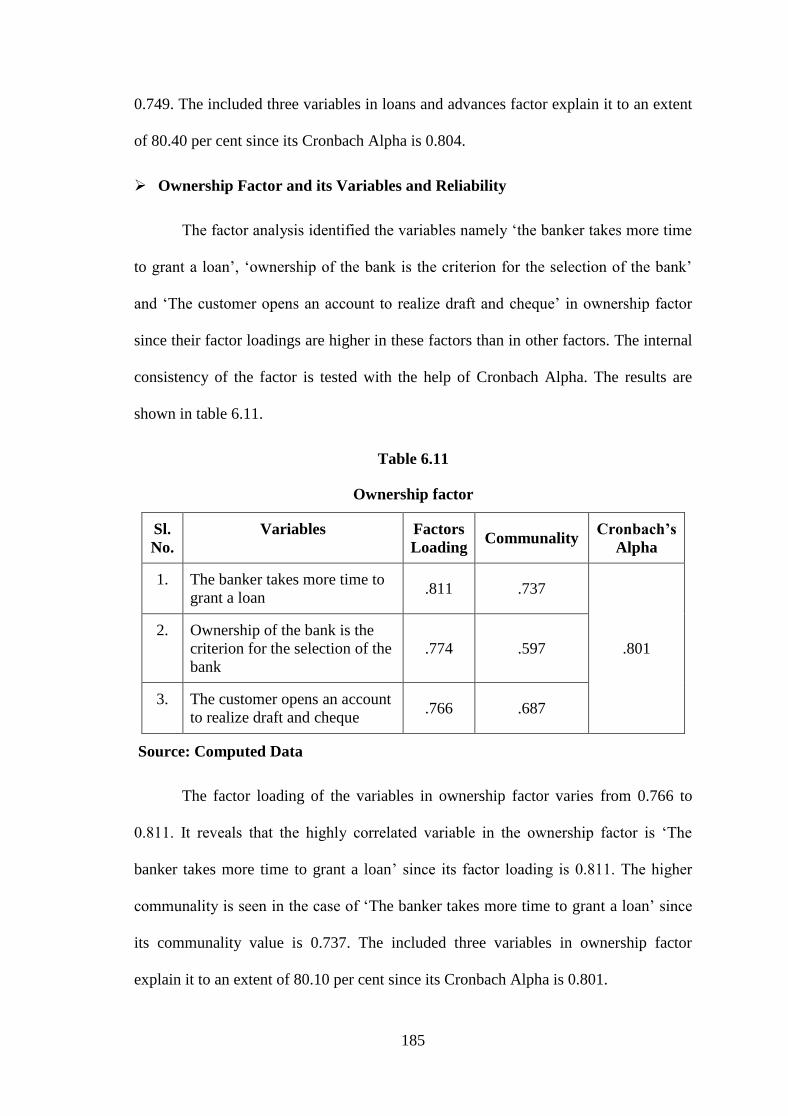
185
0.749. The included three variables in loans and advances factor explain it to an extent
of 80.40 per cent since its Cronbach Alpha is 0.804.
Ownership Factor and its Variables and Reliability
The factor analysis identified the variables namely ‗the banker takes more time
to grant a loan‘, ‗ownership of the bank is the criterion for the selection of the bank‘
and ‗The customer opens an account to realize draft and cheque‘ in ownership factor
since their factor loadings are higher in these factors than in other factors. The internal
consistency of the factor is tested with the help of Cronbach Alpha. The results are
shown in table 6.11.
Table 6.11
Ownership factor
Sl.
No.
Variables Factors
Loading Communality
Cronbach’s
Alpha
1. The banker takes more time to
grant a loan .811 .737
.801
2. Ownership of the bank is the
criterion for the selection of the
bank
.774 .597
3. The customer opens an account
to realize draft and cheque .766 .687
Source: Computed Data
The factor loading of the variables in ownership factor varies from 0.766 to
0.811. It reveals that the highly correlated variable in the ownership factor is ‗The
banker takes more time to grant a loan‘ since its factor loading is 0.811. The higher
communality is seen in the case of ‗The banker takes more time to grant a loan‘ since
its communality value is 0.737. The included three variables in ownership factor
explain it to an extent of 80.10 per cent since its Cronbach Alpha is 0.801.
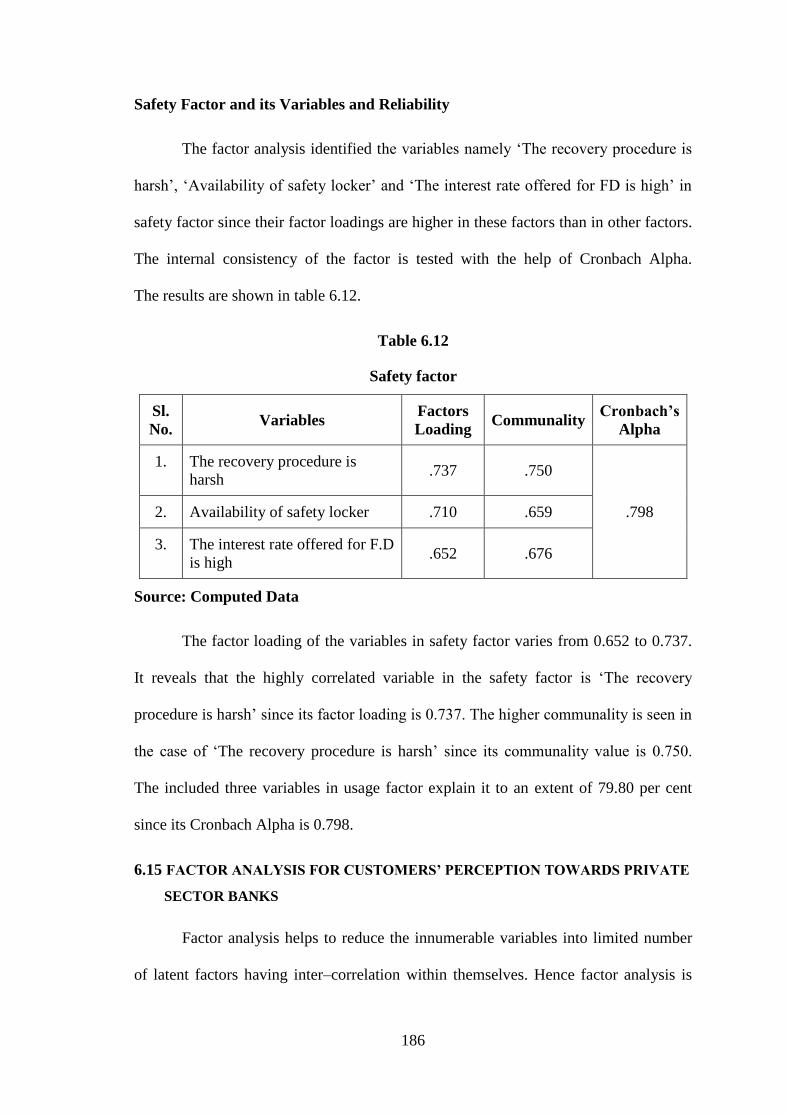
186
Safety Factor and its Variables and Reliability
The factor analysis identified the variables namely ‗The recovery procedure is
harsh‘, ‗Availability of safety locker‘ and ‗The interest rate offered for FD is high‘ in
safety factor since their factor loadings are higher in these factors than in other factors.
The internal consistency of the factor is tested with the help of Cronbach Alpha.
The results are shown in table 6.12.
Table 6.12
Safety factor
Sl.
No. Variables
Factors
Loading Communality
Cronbach’s
Alpha
1. The recovery procedure is
harsh .737 .750
.798 2. Availability of safety locker .710 .659
3. The interest rate offered for F.D
is high .652 .676
Source: Computed Data
The factor loading of the variables in safety factor varies from 0.652 to 0.737.
It reveals that the highly correlated variable in the safety factor is ‗The recovery
procedure is harsh‘ since its factor loading is 0.737. The higher communality is seen in
the case of ‗The recovery procedure is harsh‘ since its communality value is 0.750.
The included three variables in usage factor explain it to an extent of 79.80 per cent
since its Cronbach Alpha is 0.798.
6.15 FACTOR ANALYSIS FOR CUSTOMERS’ PERCEPTION TOWARDS PRIVATE
SECTOR BANKS
Factor analysis helps to reduce the innumerable variables into limited number
of latent factors having inter–correlation within themselves. Hence factor analysis is
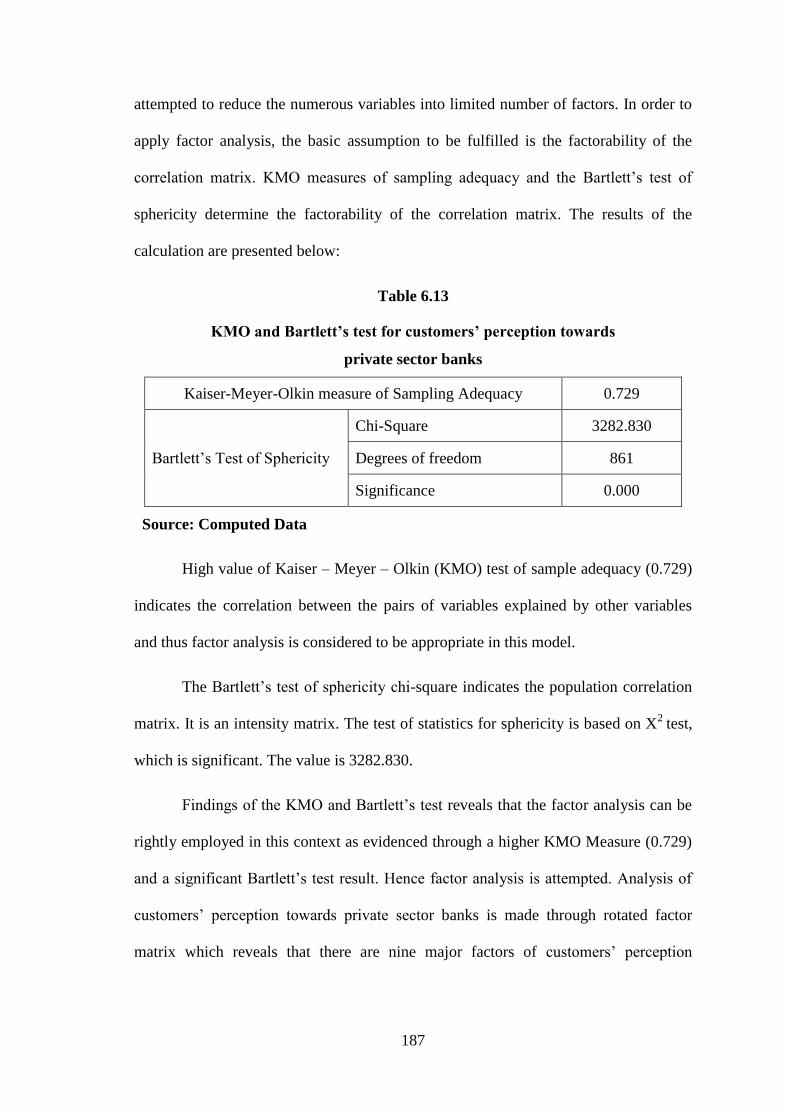
187
attempted to reduce the numerous variables into limited number of factors. In order to
apply factor analysis, the basic assumption to be fulfilled is the factorability of the
correlation matrix. KMO measures of sampling adequacy and the Bartlett‘s test of
sphericity determine the factorability of the correlation matrix. The results of the
calculation are presented below:
Table 6.13
KMO and Bartlett’s test for customers’ perception towards
private sector banks
Kaiser-Meyer-Olkin measure of Sampling Adequacy 0.729
Bartlett‘s Test of Sphericity
Chi-Square 3282.830
Degrees of freedom 861
Significance 0.000
Source: Computed Data
High value of Kaiser – Meyer – Olkin (KMO) test of sample adequacy (0.729)
indicates the correlation between the pairs of variables explained by other variables
and thus factor analysis is considered to be appropriate in this model.
The Bartlett‘s test of sphericity chi-square indicates the population correlation
matrix. It is an intensity matrix. The test of statistics for sphericity is based on X2
test,
which is significant. The value is 3282.830.
Findings of the KMO and Bartlett‘s test reveals that the factor analysis can be
rightly employed in this context as evidenced through a higher KMO Measure (0.729)
and a significant Bartlett‘s test result. Hence factor analysis is attempted. Analysis of
customers‘ perception towards private sector banks is made through rotated factor
matrix which reveals that there are nine major factors of customers‘ perception

188
towards private sector banks. The findings of the rotated factor analysis on the
customers‘ perception towards private sector banks are presented in table 6.14.
Table 6.14
Rotated factor matrix for customers’ perception towards private sector banks
Factors F1 F2 F3 F4 F5 F6 F7 F8 F9 h2
The amount of each
installment is convenient for
repayment .717 .043 .160 .284 .111 .096 .171 .135 .006 .639
The customer opens an
account to realize draft and
cheque
.713 .033 .173 .020 .209 .138 .017 .291 .059 .844
Availability of collection of
cheque .705 .361 .025 .233 .056 .233 .020 .033 .105 .612
The selection of bank is
influenced by the range of
services
.661 .110 .126 .162 .172 .144 .073 .049 .050 .759
The customers are well
informed about the default of
repayment .647 .215 .079 .197 .153 .066 .218 .177 .178 .775
The customer selects a bank
based on the quality of
services offered by the bank
.248 .646 .237 .102 .023 .068 .022 .019 .098 .734
The number of installment is
normal .260 .617 .042 .260 .082 .103 .014 .042 .292 .529
The granted loan amount is
released in installments .288 .615 .115 .133 .347 .085 .289 .271 .021 .811
The services are provided to
all needed customers .276 .605 .221 .100 .130 .191 .178 .064 .160 .569
Availability of electronic
clearing services .084 .604 .035 .048 .229 .238 .034 .265 .004 .666
Availability of money
transfer/mail transfer .122 .051 .589 .221 .078 .142 .380 .254 .196 .636
The purpose of opening of an
account is to get loans and
advances
.130 .131 .566 .165 .253 .262 .384 .150 .287 .673
Ownership of the bank is the
criterion for the
selection of the bank
.162 .085 .559 .060 .149 .046 .010 .007 .018 .693
Bank normally accepts
installment repayment method .105 .288 .557 .373 .258 .106 .171 .011 .007 .619

189
Factors F1 F2 F3 F4 F5 F6 F7 F8 F9 h2
The bank is easily accessible .194 .112 .554 .020 .262 .089 .036 .197 .205 .573
Customers are given
sufficient time for the
repayment of loan
.553 .092 .040 .579 .308 .016 .010 .110 .217 .864
Availability of collection of
drafts .009 .104 .121 .552 .195 .085 .024 .153 .176 .556
For getting a loan, the
customer is required to
undergo many formalities
.068 .170 .162 .527 .047 .278 .200 .042 .102 .717
The bank business hours is
convenient to customers .033 .371 .188 .525 .044 .031 .013 .041 .307 .710
The customers are required to
make many visits for getting a
loan
.082 .435 .060 .524 .057 .006 .004 .163 .041 .638
The DD is realized within the
specified time .398 .231 .029 .513 .176 .130 .101 .261 .291 .705
The interest rate offered for
FD is high .034 .153 .062 .511 .093 .171 .267 .215 .252 .607
The customer always feels
that borrowing from the bank
is more easy
.190 .125 .393 .101 .604 .021 .242 .039 .098 .760
The customer opens an
account with the bank enjoy
the non-material services
offered by the bank
.169 .214 .049 .025 .602 .024 .225 .077 .124 .782
The interest rate on the loans
and advances is low .108 .053 .383 .090 .601 .031 .184 .309 .022 .794
The time required for opening
of an account is normal .037 .004 .045 .049 .592 .180 .198 .033 .279 .690
The parking space is enough .249 .383 .054 .359 .586 .182 .087 .081 .185 .658
The cash certificate enjoys a
high interest rate .163 .237 .106 .200 .575 .095 .034 .079 .006 .494
The loans and advances are
granted to customers .087 .177 .350 .248 .009 .645 .081 .071 .193 .674
Availability of ATM facilities .249 .116 .147 .226 121 .635 .094 .049 .061 .783
Customers are satisfied with
the existing services .246 .244 .168 .240 .301 .621 .106 .273 .041 .680
The banker takes more time to
grant a loan .279 .259 .160 .238 .273 .202 .615 .154 .207 .777
The loan is granted but the
payment is delayed .016 .135 .025 .016 .100 .252 .594 .252 .170 .792
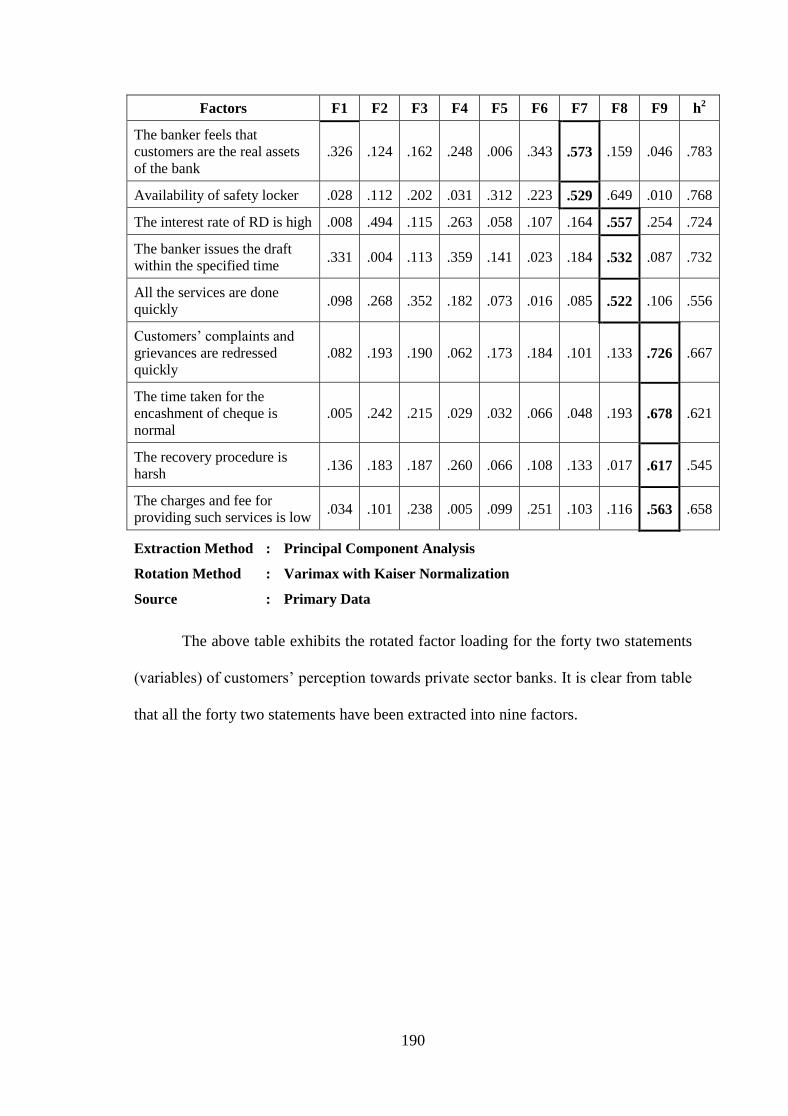
190
Factors F1 F2 F3 F4 F5 F6 F7 F8 F9 h2
The banker feels that
customers are the real assets
of the bank
.326 .124 .162 .248 .006 .343 .573 .159 .046 .783
Availability of safety locker .028 .112 .202 .031 .312 .223 .529 .649 .010 .768
The interest rate of RD is high .008 .494 .115 .263 .058 .107 .164 .557 .254 .724
The banker issues the draft
within the specified time .331 .004 .113 .359 .141 .023 .184 .532 .087 .732
All the services are done
quickly .098 .268 .352 .182 .073 .016 .085 .522 .106 .556
Customers‘ complaints and
grievances are redressed
quickly
.082 .193 .190 .062 .173 .184 .101 .133 .726 .667
The time taken for the
encashment of cheque is
normal
.005 .242 .215 .029 .032 .066 .048 .193 .678 .621
The recovery procedure is
harsh .136 .183 .187 .260 .066 .108 .133 .017 .617 .545
The charges and fee for
providing such services is low .034 .101 .238 .005 .099 .251 .103 .116 .563 .658
Extraction Method : Principal Component Analysis
Rotation Method : Varimax with Kaiser Normalization
Source : Primary Data
The above table exhibits the rotated factor loading for the forty two statements
(variables) of customers‘ perception towards private sector banks. It is clear from table
that all the forty two statements have been extracted into nine factors.
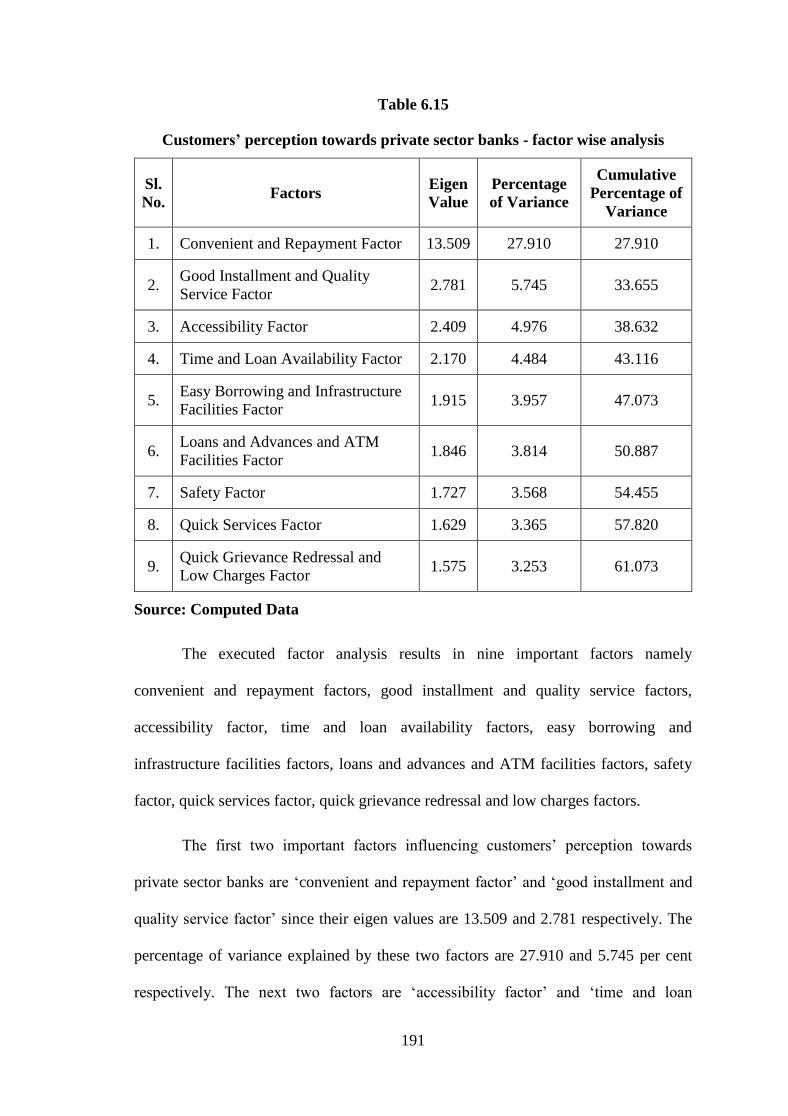
191
Table 6.15
Customers’ perception towards private sector banks - factor wise analysis
Sl.
No. Factors
Eigen
Value
Percentage
of Variance
Cumulative
Percentage of
Variance
1. Convenient and Repayment Factor 13.509 27.910 27.910
2. Good Installment and Quality
Service Factor 2.781 5.745 33.655
3. Accessibility Factor 2.409 4.976 38.632
4. Time and Loan Availability Factor 2.170 4.484 43.116
5. Easy Borrowing and Infrastructure
Facilities Factor 1.915 3.957 47.073
6. Loans and Advances and ATM
Facilities Factor 1.846 3.814 50.887
7. Safety Factor 1.727 3.568 54.455
8. Quick Services Factor 1.629 3.365 57.820
9. Quick Grievance Redressal and
Low Charges Factor 1.575 3.253 61.073
Source: Computed Data
The executed factor analysis results in nine important factors namely
convenient and repayment factors, good installment and quality service factors,
accessibility factor, time and loan availability factors, easy borrowing and
infrastructure facilities factors, loans and advances and ATM facilities factors, safety
factor, quick services factor, quick grievance redressal and low charges factors.
The first two important factors influencing customers‘ perception towards
private sector banks are ‗convenient and repayment factor‘ and ‗good installment and
quality service factor‘ since their eigen values are 13.509 and 2.781 respectively. The
percentage of variance explained by these two factors are 27.910 and 5.745 per cent
respectively. The next two factors are ‗accessibility factor‘ and ‗time and loan

192
availability factor‘ since their eigen values are 2.409 and 2.170 respectively. The last
two factors noticed by the factor analysis are ‗quick services factor‘ and ‗quick
grievance redressal and low charges factor‘ since its eigen values are 1.629 and 1.575
respectively. The percentage of variance explained by the above two factors are 3.365
and 3.253 per cent respectively. The analysis reveals that the narrated nine factors
explain the 42 variables leading to customers‘ perception towards private sector banks
to an extent of 61.073 per cent.
Variables in Convenient and Repayment Factor and its Reliability
The convenient and repayment factor consists of five variables since the factor
loading in this factor are higher than the other factors. The overall reliability of the
variables in this factor has been estimated with the help of Cronbach Alpha.
The results are given in table 6.16.
Table 6.16
Convenient and repayment factor
Sl.
No. Variables
Factors
Loading Communality
Cronbach’s
Alpha
1. The amount of each installment is
convenient for repayment .717 .639
0.780
2. The customer opens an account to
realize draft and cheque .713 .844
3. Availability of collection of
cheque .705 .612
4. The selection of bank is
influenced by the range of
services
.661 .759
5. The customers are well informed
about the default of repayment .647 .775
Source: Computed Data
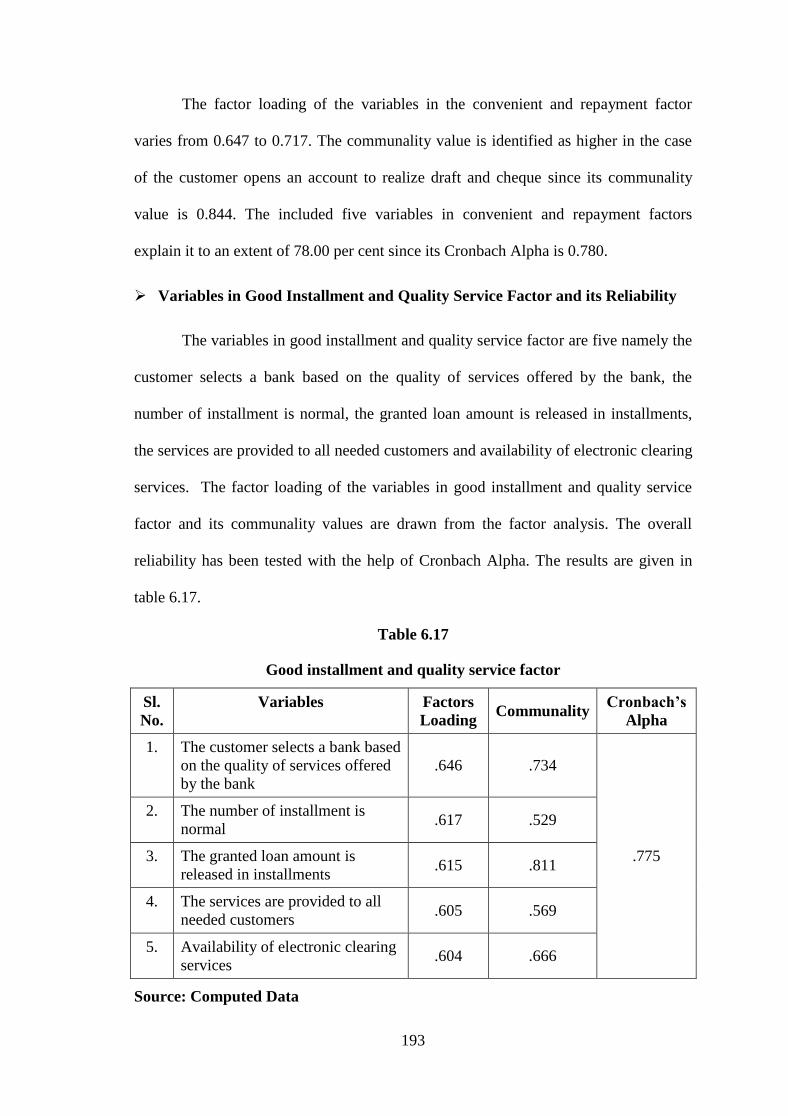
193
The factor loading of the variables in the convenient and repayment factor
varies from 0.647 to 0.717. The communality value is identified as higher in the case
of the customer opens an account to realize draft and cheque since its communality
value is 0.844. The included five variables in convenient and repayment factors
explain it to an extent of 78.00 per cent since its Cronbach Alpha is 0.780.
Variables in Good Installment and Quality Service Factor and its Reliability
The variables in good installment and quality service factor are five namely the
customer selects a bank based on the quality of services offered by the bank, the
number of installment is normal, the granted loan amount is released in installments,
the services are provided to all needed customers and availability of electronic clearing
services. The factor loading of the variables in good installment and quality service
factor and its communality values are drawn from the factor analysis. The overall
reliability has been tested with the help of Cronbach Alpha. The results are given in
table 6.17.
Table 6.17
Good installment and quality service factor
Sl.
No.
Variables Factors
Loading Communality
Cronbach’s
Alpha
1. The customer selects a bank based
on the quality of services offered
by the bank
.646 .734
.775
2. The number of installment is
normal .617 .529
3. The granted loan amount is
released in installments .615 .811
4. The services are provided to all
needed customers .605 .569
5. Availability of electronic clearing
services .604 .666
Source: Computed Data
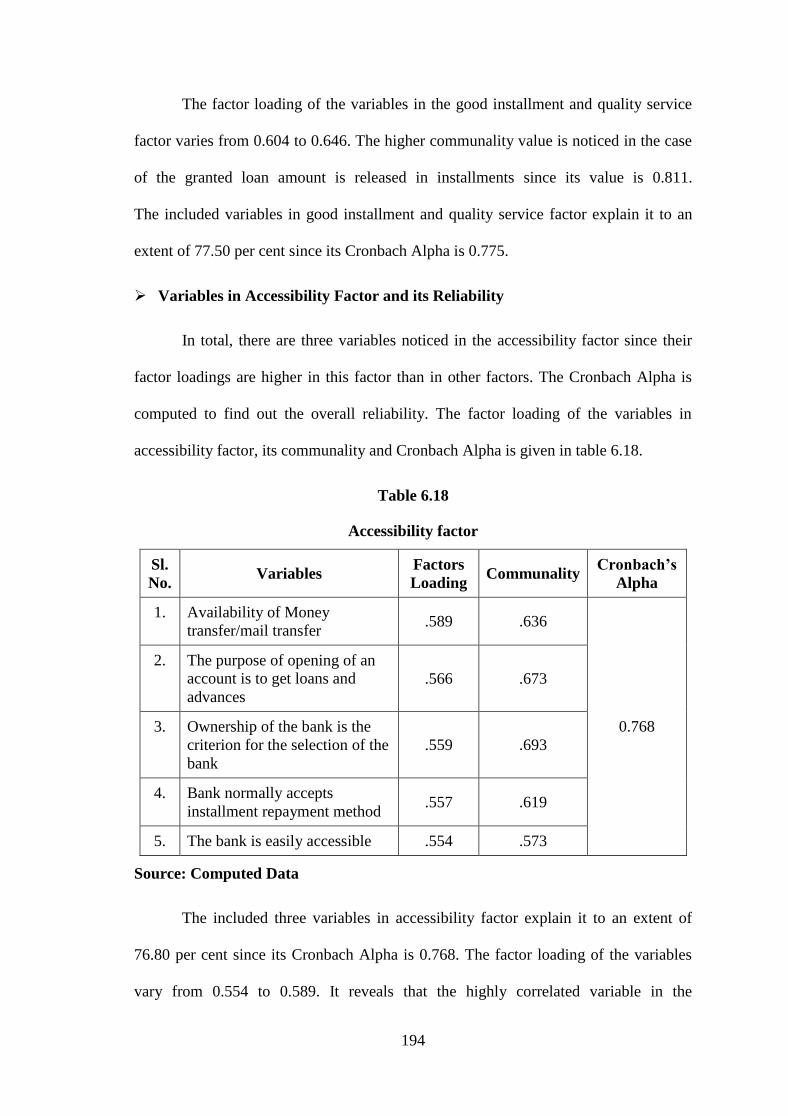
194
The factor loading of the variables in the good installment and quality service
factor varies from 0.604 to 0.646. The higher communality value is noticed in the case
of the granted loan amount is released in installments since its value is 0.811.
The included variables in good installment and quality service factor explain it to an
extent of 77.50 per cent since its Cronbach Alpha is 0.775.
Variables in Accessibility Factor and its Reliability
In total, there are three variables noticed in the accessibility factor since their
factor loadings are higher in this factor than in other factors. The Cronbach Alpha is
computed to find out the overall reliability. The factor loading of the variables in
accessibility factor, its communality and Cronbach Alpha is given in table 6.18.
Table 6.18
Accessibility factor
Sl.
No. Variables
Factors
Loading Communality
Cronbach’s
Alpha
1. Availability of Money
transfer/mail transfer .589 .636
0.768
2. The purpose of opening of an
account is to get loans and
advances
.566 .673
3. Ownership of the bank is the
criterion for the selection of the
bank
.559 .693
4. Bank normally accepts
installment repayment method .557 .619
5. The bank is easily accessible .554 .573
Source: Computed Data
The included three variables in accessibility factor explain it to an extent of
76.80 per cent since its Cronbach Alpha is 0.768. The factor loading of the variables
vary from 0.554 to 0.589. It reveals that the highly correlated variable in the

195
accessibility factor is ‗availability of money transfer/mail transfer‘ since its factor
loading is 0.589. The higher communality is noticed in the case of ‗ownership of the
bank is the criterion for the selection of the bank‘ since its value is 0.693.
Time and Loan Availability Factor and its Variables and Reliability
The factor analysis identified the variables namely ‗customers are given
sufficient time for the repayment of loan‘, ‗availability of collection of drafts‘, ‗for
getting a loan, the customer is required to undergo many formalities‘, ‗the bank
business hours is convenient to customers‘, ‗the customers are required to make many
visits for getting a loan‘, ‗the DD is realized within the specified time‘ and ‗the interest
rate offered for FD is high‘ in time and loan availability factor since their factor
loadings are higher in these factors than in other factors. The internal consistency of
the factor is tested with the help of Cronbach Alpha. The results are shown in
table 6.19.
Table 6.19
Time and loan availability factor
Sl.
No. Variables
Factors
Loading Communality
Cronbach’s
Alpha
1. Customers are given sufficient time for
the repayment of loan .579 .864
0.759
2. Availability of collection of drafts .552 .556
3. For getting a loan, the customer is
required to undergo many formalities .527 .717
4. The bank business hours is convenient
to customers .525 .710
5. The customers are required to make
many visits for getting a loan .524 .638
6. The DD is realized within the specified
time .513 .705
7. The interest rate offered for FD is high .511 .607
Source: Computed Data

196
The factor loading of the variables in time and loan availability factor varies
from 0.511 to 0.579. It reveals that the highly correlated variable in the time and loan
availability factor is ‗customers are given sufficient time for the repayment of loan‘
since its factor loading is 0.579. The higher communality is seen in the case of
‗customers are given sufficient time for the repayment of loan‘ since its communality
value is 0.864. The included seven variables in time and loan availability factor explain
it to an extent of 75.90 per cent since its Cronbach Alpha is 0.759.
Easy Borrowing and Infrastructure Facilities Factor and its Variables and
Reliability
The factor analysis identified the variables namely ‗the customer always feels
that borrowing from the bank is more easy‘, ‗the customer opens an account with the
bank enjoy the non-material services offered by the bank‘, ‗the interest rate on the
loans and advances is low‘, ‗The time required for opening of an account is normal‘,
‗the parking space is enough‘, and ‗the cash certificate enjoys a high interest rate‘ in
easy borrowing and infrastructure facilities factor since their factor loadings are higher
in these factors than in other factors. The internal consistency of the factor is tested
with the help of Cronbach Alpha. The results are shown in table 6.20.
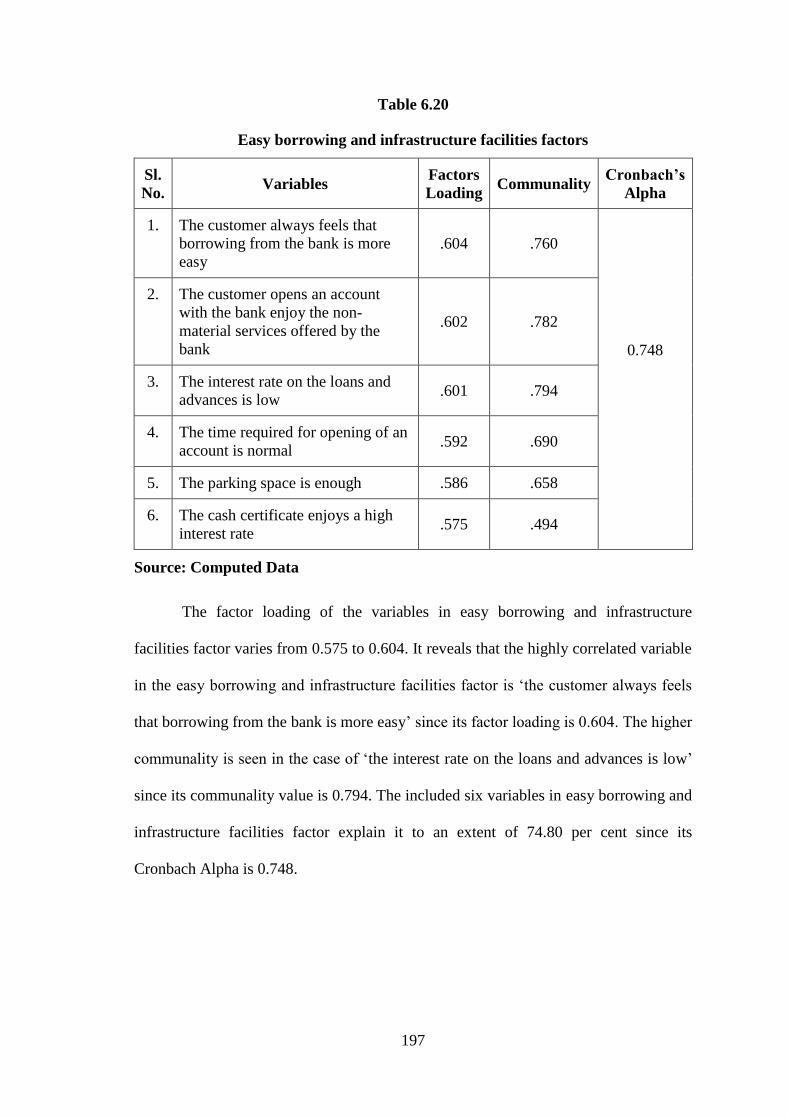
197
Table 6.20
Easy borrowing and infrastructure facilities factors
Sl.
No. Variables
Factors
Loading Communality
Cronbach’s
Alpha
1. The customer always feels that
borrowing from the bank is more
easy
.604 .760
0.748
2. The customer opens an account
with the bank enjoy the non-
material services offered by the
bank
.602 .782
3. The interest rate on the loans and
advances is low .601 .794
4. The time required for opening of an
account is normal .592 .690
5. The parking space is enough .586 .658
6. The cash certificate enjoys a high
interest rate .575 .494
Source: Computed Data
The factor loading of the variables in easy borrowing and infrastructure
facilities factor varies from 0.575 to 0.604. It reveals that the highly correlated variable
in the easy borrowing and infrastructure facilities factor is ‗the customer always feels
that borrowing from the bank is more easy‘ since its factor loading is 0.604. The higher
communality is seen in the case of ‗the interest rate on the loans and advances is low‘
since its communality value is 0.794. The included six variables in easy borrowing and
infrastructure facilities factor explain it to an extent of 74.80 per cent since its
Cronbach Alpha is 0.748.
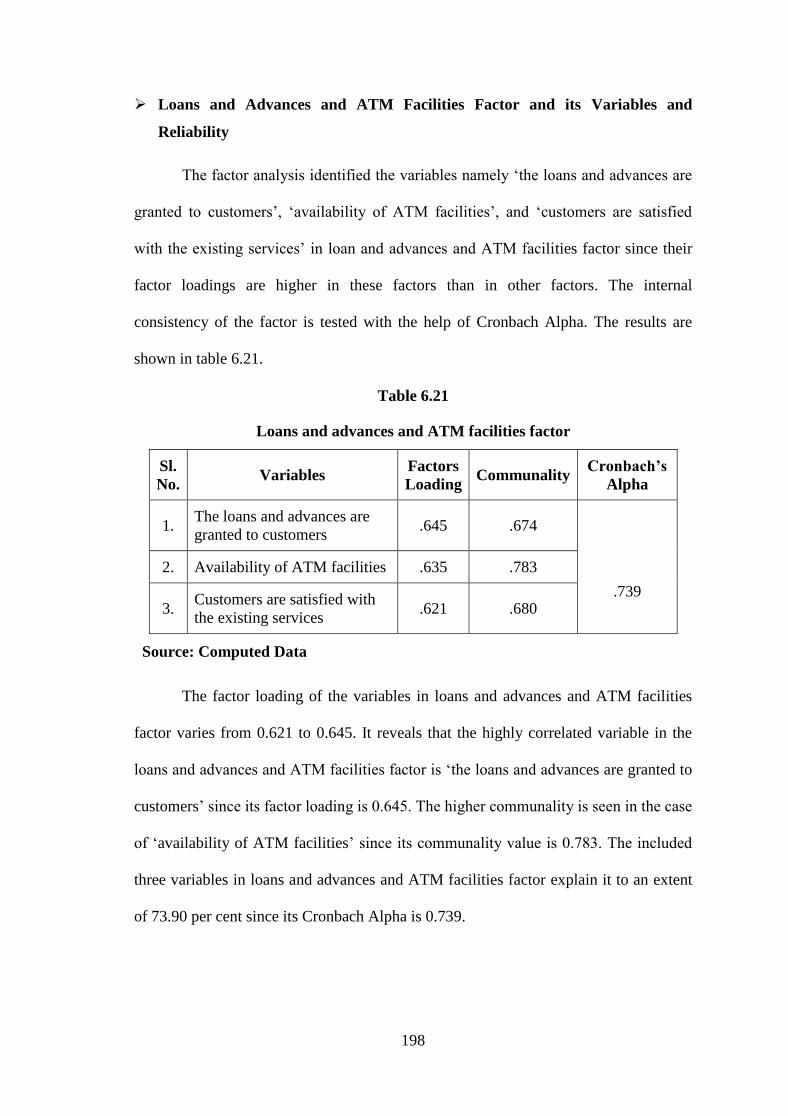
198
Loans and Advances and ATM Facilities Factor and its Variables and
Reliability
The factor analysis identified the variables namely ‗the loans and advances are
granted to customers‘, ‗availability of ATM facilities‘, and ‗customers are satisfied
with the existing services‘ in loan and advances and ATM facilities factor since their
factor loadings are higher in these factors than in other factors. The internal
consistency of the factor is tested with the help of Cronbach Alpha. The results are
shown in table 6.21.
Table 6.21
Loans and advances and ATM facilities factor
Sl.
No. Variables
Factors
Loading Communality
Cronbach’s
Alpha
1. The loans and advances are
granted to customers .645 .674
.739
2. Availability of ATM facilities .635 .783
3. Customers are satisfied with
the existing services .621 .680
Source: Computed Data
The factor loading of the variables in loans and advances and ATM facilities
factor varies from 0.621 to 0.645. It reveals that the highly correlated variable in the
loans and advances and ATM facilities factor is ‗the loans and advances are granted to
customers‘ since its factor loading is 0.645. The higher communality is seen in the case
of ‗availability of ATM facilities‘ since its communality value is 0.783. The included
three variables in loans and advances and ATM facilities factor explain it to an extent
of 73.90 per cent since its Cronbach Alpha is 0.739.
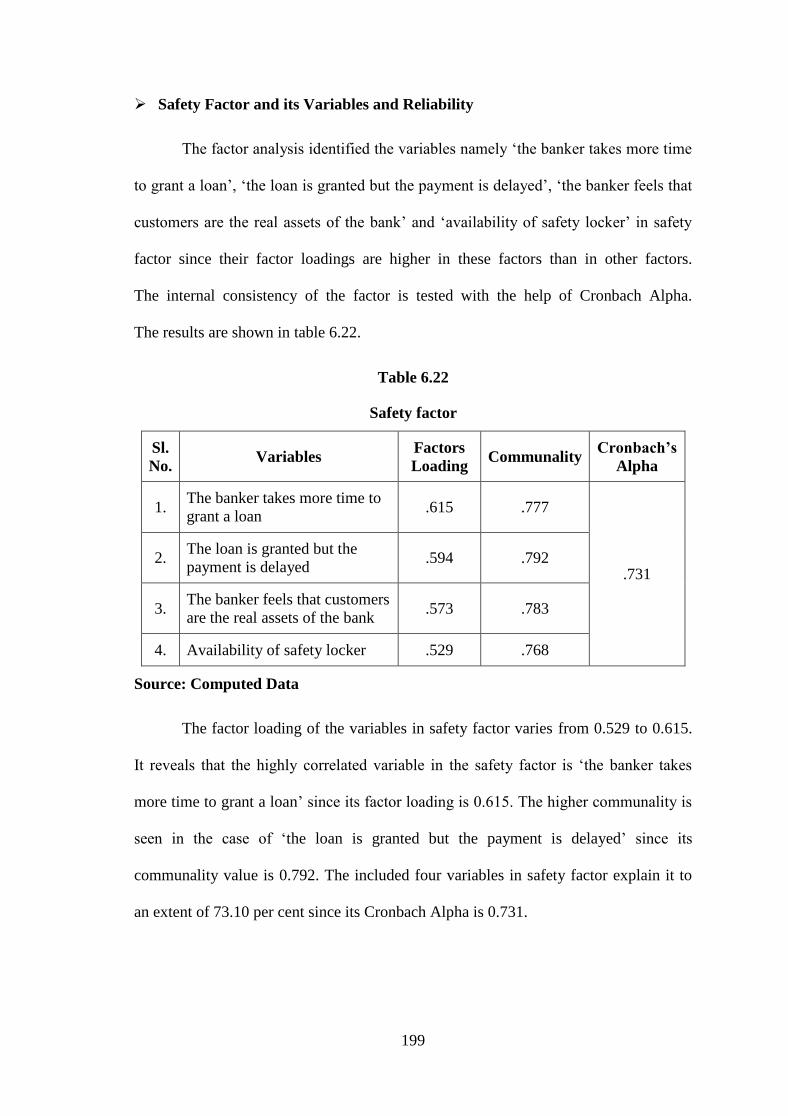
199
Safety Factor and its Variables and Reliability
The factor analysis identified the variables namely ‗the banker takes more time
to grant a loan‘, ‗the loan is granted but the payment is delayed‘, ‗the banker feels that
customers are the real assets of the bank‘ and ‗availability of safety locker‘ in safety
factor since their factor loadings are higher in these factors than in other factors.
The internal consistency of the factor is tested with the help of Cronbach Alpha.
The results are shown in table 6.22.
Table 6.22
Safety factor
Sl.
No. Variables
Factors
Loading Communality
Cronbach’s
Alpha
1. The banker takes more time to
grant a loan .615 .777
.731 2.
The loan is granted but the
payment is delayed .594 .792
3. The banker feels that customers
are the real assets of the bank .573 .783
4. Availability of safety locker .529 .768
Source: Computed Data
The factor loading of the variables in safety factor varies from 0.529 to 0.615.
It reveals that the highly correlated variable in the safety factor is ‗the banker takes
more time to grant a loan‘ since its factor loading is 0.615. The higher communality is
seen in the case of ‗the loan is granted but the payment is delayed‘ since its
communality value is 0.792. The included four variables in safety factor explain it to
an extent of 73.10 per cent since its Cronbach Alpha is 0.731.
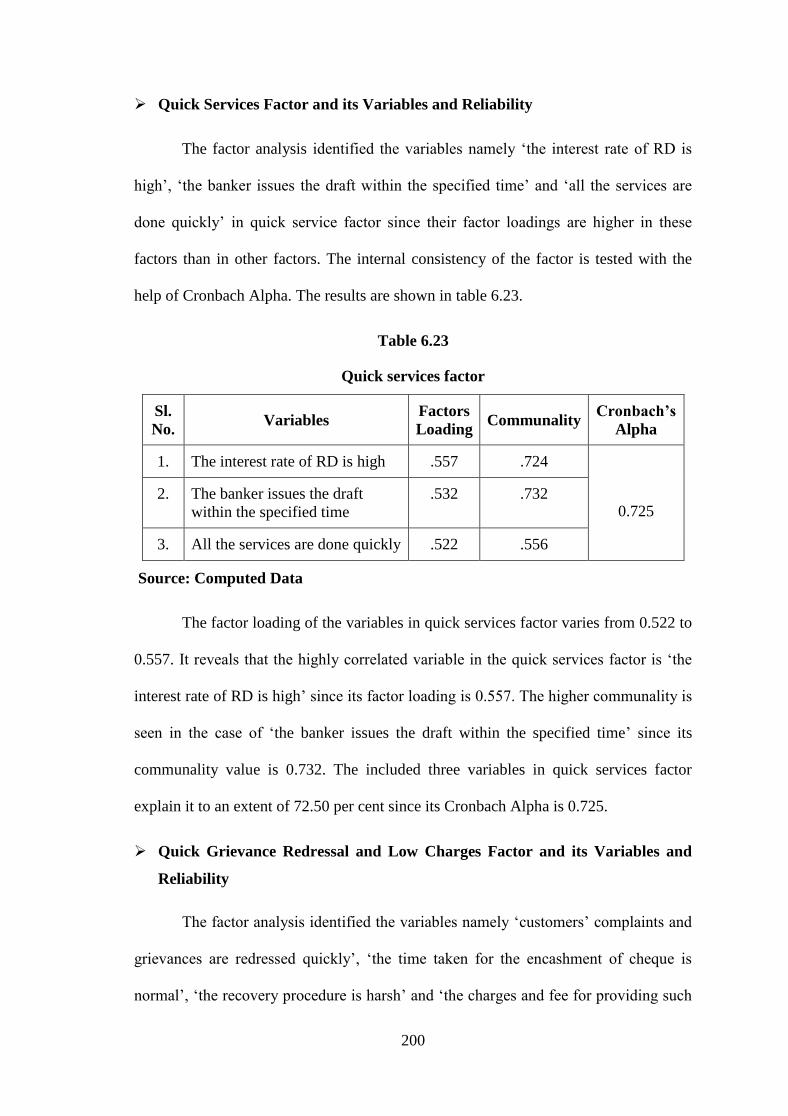
200
Quick Services Factor and its Variables and Reliability
The factor analysis identified the variables namely ‗the interest rate of RD is
high‘, ‗the banker issues the draft within the specified time‘ and ‗all the services are
done quickly‘ in quick service factor since their factor loadings are higher in these
factors than in other factors. The internal consistency of the factor is tested with the
help of Cronbach Alpha. The results are shown in table 6.23.
Table 6.23
Quick services factor
Sl.
No. Variables
Factors
Loading Communality
Cronbach’s
Alpha
1. The interest rate of RD is high .557 .724
0.725 2. The banker issues the draft
within the specified time
.532 .732
3. All the services are done quickly .522 .556
Source: Computed Data
The factor loading of the variables in quick services factor varies from 0.522 to
0.557. It reveals that the highly correlated variable in the quick services factor is ‗the
interest rate of RD is high‘ since its factor loading is 0.557. The higher communality is
seen in the case of ‗the banker issues the draft within the specified time‘ since its
communality value is 0.732. The included three variables in quick services factor
explain it to an extent of 72.50 per cent since its Cronbach Alpha is 0.725.
Quick Grievance Redressal and Low Charges Factor and its Variables and
Reliability
The factor analysis identified the variables namely ‗customers‘ complaints and
grievances are redressed quickly‘, ‗the time taken for the encashment of cheque is
normal‘, ‗the recovery procedure is harsh‘ and ‗the charges and fee for providing such

201
services is low‘ in quick grievance redressal and low charges factor since their factor
loadings are higher in these factor than in other factors. The internal consistency of the
factor is tested with the help of Cronbach Alpha. The results are shown in table 6.24.
Table 6.24
Quick grievance redressal and low charges factors
Sl.
No. Variables
Factors
Loading Communality
Cronbach’s
Alpha
1. Customers‘ complaints and
grievances are redressed quickly
.726 .667
.721
2. The time taken for the encashment
of cheque is normal
.678 .621
3. The recovery procedure is harsh .617 .545
4. The charges and fee for providing
such services is low
.563 .658
Source: Computed Data
The factor loading of the variables in quick grievance redressal and low
charges factor varies from 0.563 to 0.726. It reveals that the highly correlated variable
in the quick grievance redressal and low charges factors is ‗customers‘ complaints and
grievances are redressed quickly‘ since its factor loading is 0.726. The higher
communality is seen in the case of ‗customers‘ complaints and grievances are
redressed quickly‘ since its communality value is 0.667. The included four variables in
quick grievance redressal and low charges factor explain it to an extent of 72.10 per
cent since its Cronbach Alpha is 0.721.
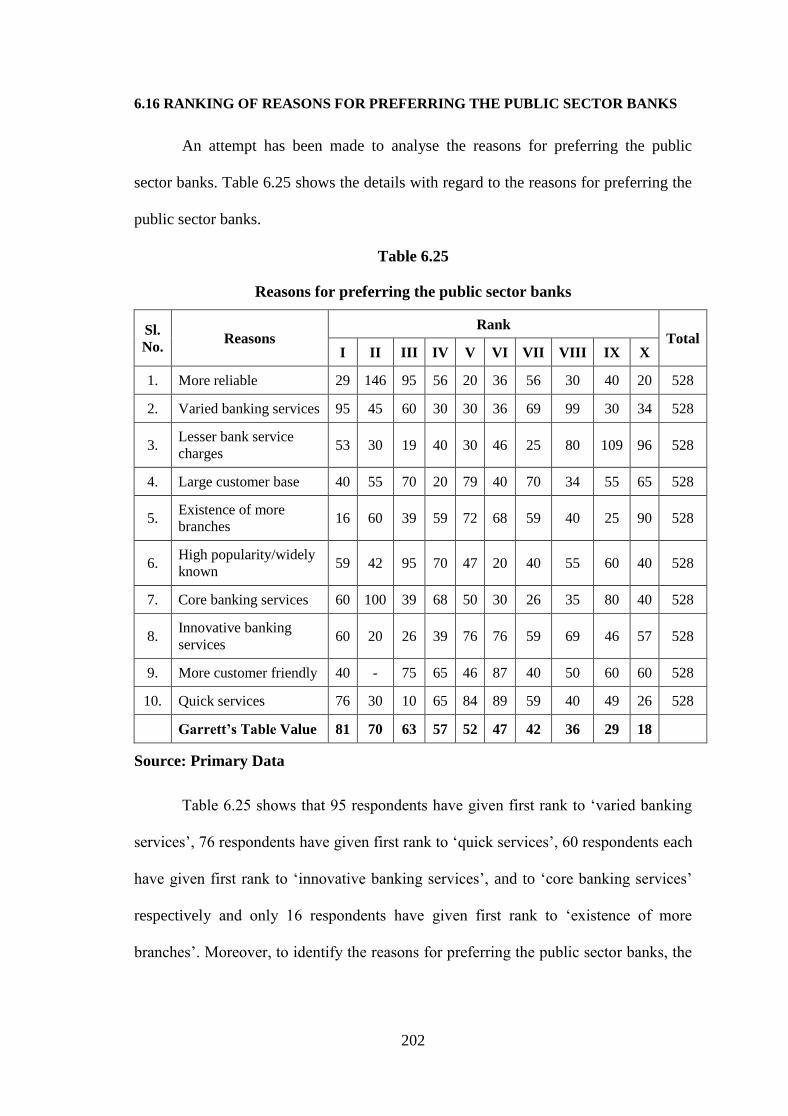
202
6.16 RANKING OF REASONS FOR PREFERRING THE PUBLIC SECTOR BANKS
An attempt has been made to analyse the reasons for preferring the public
sector banks. Table 6.25 shows the details with regard to the reasons for preferring the
public sector banks.
Table 6.25
Reasons for preferring the public sector banks
Sl.
No. Reasons
Rank Total
I II III IV V VI VII VIII IX X
1. More reliable 29 146 95 56 20 36 56 30 40 20 528
2. Varied banking services 95 45 60 30 30 36 69 99 30 34 528
3. Lesser bank service
charges 53 30 19 40 30 46 25 80 109 96 528
4. Large customer base 40 55 70 20 79 40 70 34 55 65 528
5. Existence of more
branches 16 60 39 59 72 68 59 40 25 90 528
6. High popularity/widely
known 59 42 95 70 47 20 40 55 60 40 528
7. Core banking services 60 100 39 68 50 30 26 35 80 40 528
8. Innovative banking
services 60 20 26 39 76 76 59 69 46 57 528
9. More customer friendly 40 - 75 65 46 87 40 50 60 60 528
10. Quick services 76 30 10 65 84 89 59 40 49 26 528
Garrett’s Table Value 81 70 63 57 52 47 42 36 29 18
Source: Primary Data
Table 6.25 shows that 95 respondents have given first rank to ‗varied banking
services‘, 76 respondents have given first rank to ‗quick services‘, 60 respondents each
have given first rank to ‗innovative banking services‘, and to ‗core banking services‘
respectively and only 16 respondents have given first rank to ‗existence of more
branches‘. Moreover, to identify the reasons for preferring the public sector banks, the

203
researcher has used Garret Ranking Technique. Table 6.26 shows the ranking of
reasons for preferring the public sector banks.
Table 6.26
Ranking of reasons for preferring the public sector banks
Sl.
No. Reasons Total Score Average Rank
1. More reliable 29431 55.74 I
2. Varied banking services 28253 53.51 II
3. Lesser bank service charges 22411 42.44 X
4. Large customer base 25557 48.40 VII
5. Existence of more branches 24519 46.44 IX
6. High popularity/widely known 27198 51.51 V
7. Core banking services 27595 52.26 IV
8. Innovative banking services 24967 47.29 VIII
9. More customer friendly 28006 53.04 III
10. Quick services 26949 51.04 VI
Source: Computed Data
It is observed from the table 6.26 that ‗more reliable‘ has been ranked as the
first reason for preferring the public sector banks with the highest Garrett mean score
of 55.74, ‗varied banking services‘ has been ranked as second, ‗more customer friendly
in third position, ‗core banking services‘ is ranked as fourth, ‗high popularity/widely
known‘ is ranked as fifth, ‗quick services‘ is ranked as sixth, ‗large customer base‘ is
ranked as seventh, ‗innovative banking services‘ is ranked as eighth, ‗existence of
more branches‘ is ranked as nineth followed by ‗lesser bank service charges‘ ranked as
tenth position with the Garrett mean score of 42.44.
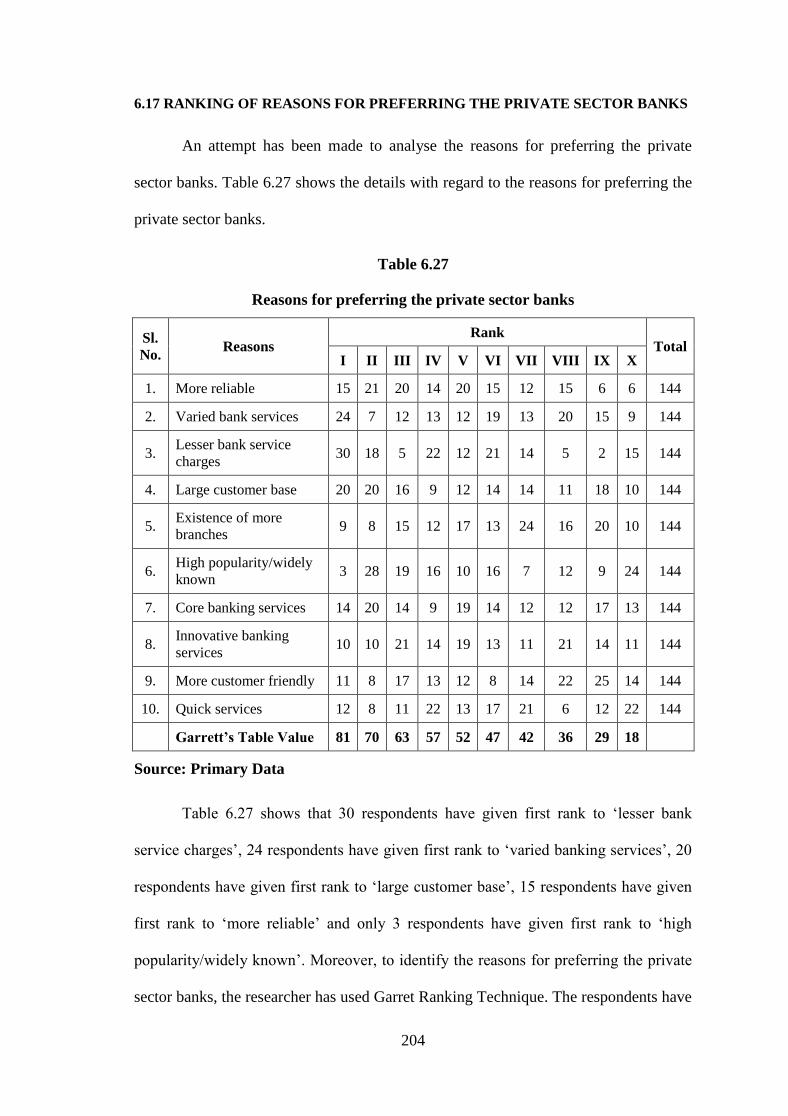
204
6.17 RANKING OF REASONS FOR PREFERRING THE PRIVATE SECTOR BANKS
An attempt has been made to analyse the reasons for preferring the private
sector banks. Table 6.27 shows the details with regard to the reasons for preferring the
private sector banks.
Table 6.27
Reasons for preferring the private sector banks
Sl.
No. Reasons
Rank Total
I II III IV V VI VII VIII IX X
1. More reliable 15 21 20 14 20 15 12 15 6 6 144
2. Varied bank services 24 7 12 13 12 19 13 20 15 9 144
3. Lesser bank service
charges 30 18 5 22 12 21 14 5 2 15 144
4. Large customer base 20 20 16 9 12 14 14 11 18 10 144
5. Existence of more
branches 9 8 15 12 17 13 24 16 20 10 144
6. High popularity/widely
known 3 28 19 16 10 16 7 12 9 24 144
7. Core banking services 14 20 14 9 19 14 12 12 17 13 144
8. Innovative banking
services 10 10 21 14 19 13 11 21 14 11 144
9. More customer friendly 11 8 17 13 12 8 14 22 25 14 144
10. Quick services 12 8 11 22 13 17 21 6 12 22 144
Garrett’s Table Value 81 70 63 57 52 47 42 36 29 18
Source: Primary Data
Table 6.27 shows that 30 respondents have given first rank to ‗lesser bank
service charges‘, 24 respondents have given first rank to ‗varied banking services‘, 20
respondents have given first rank to ‗large customer base‘, 15 respondents have given
first rank to ‗more reliable‘ and only 3 respondents have given first rank to ‗high
popularity/widely known‘. Moreover, to identify the reasons for preferring the private
sector banks, the researcher has used Garret Ranking Technique. The respondents have
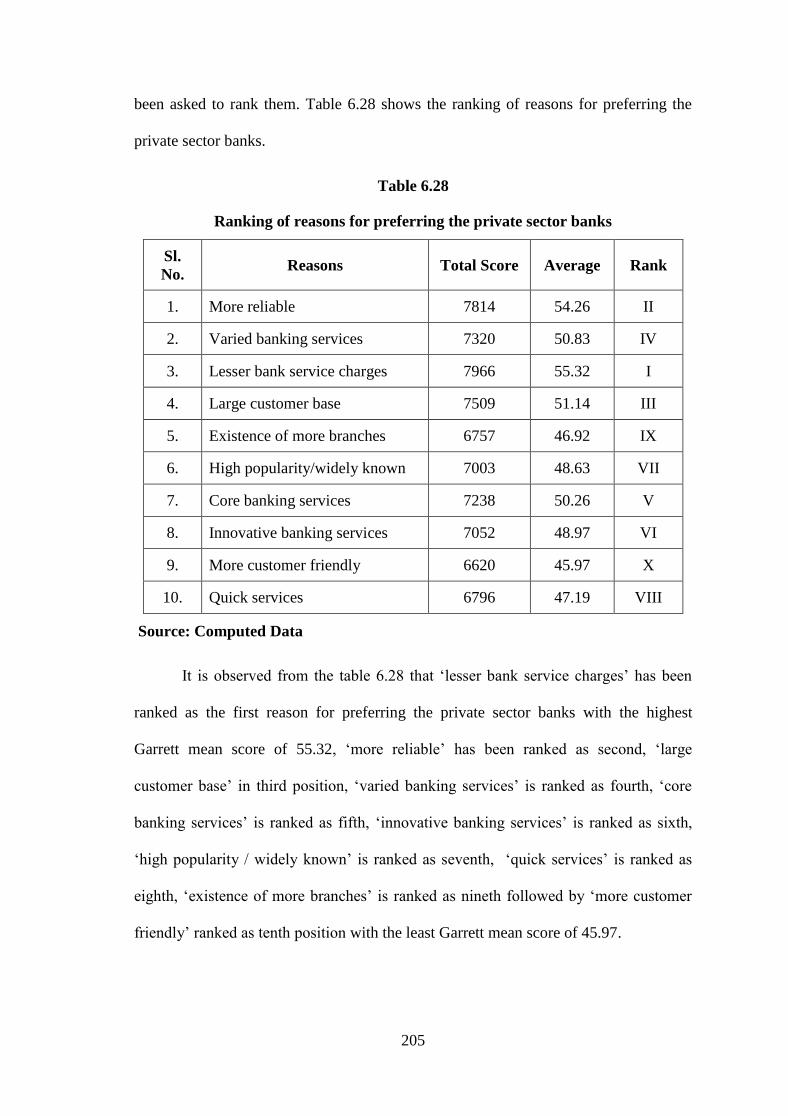
205
been asked to rank them. Table 6.28 shows the ranking of reasons for preferring the
private sector banks.
Table 6.28
Ranking of reasons for preferring the private sector banks
Sl.
No. Reasons Total Score Average Rank
1. More reliable 7814 54.26 II
2. Varied banking services 7320 50.83 IV
3. Lesser bank service charges 7966 55.32 I
4. Large customer base 7509 51.14 III
5. Existence of more branches 6757 46.92 IX
6. High popularity/widely known 7003 48.63 VII
7. Core banking services 7238 50.26 V
8. Innovative banking services 7052 48.97 VI
9. More customer friendly 6620 45.97 X
10. Quick services 6796 47.19 VIII
Source: Computed Data
It is observed from the table 6.28 that ‗lesser bank service charges‘ has been
ranked as the first reason for preferring the private sector banks with the highest
Garrett mean score of 55.32, ‗more reliable‘ has been ranked as second, ‗large
customer base‘ in third position, ‗varied banking services‘ is ranked as fourth, ‗core
banking services‘ is ranked as fifth, ‗innovative banking services‘ is ranked as sixth,
‗high popularity / widely known‘ is ranked as seventh, ‗quick services‘ is ranked as
eighth, ‗existence of more branches‘ is ranked as nineth followed by ‗more customer
friendly‘ ranked as tenth position with the least Garrett mean score of 45.97.

206
6.18 RANKING OF PREFERENCE OF CUSTOMERS OF PUBLIC SECTOR
BANKS’ SERVICES
An attempt has been made to analyse the preference of customers of public
sector banks services. Table 6.29 shows the details with regard to the preference
customers of customers of public sector banks services.
Table 6.29
Ranking of preference of customers of public sector banks towards
banking services
Sl.
No. Bank Services
Rank Total
I II III IV V VI VII VIII IX X
1. Fast transaction 26 168 76 104 20 - 29 40 49 16 528
2. Safe transaction 143 42 60 90 68 20 30 46 10 19 528
3. Bank service
charges 36 19 111 39 70 94 20 29 50 60 528
4. ATM 24 hours
service 180 70 19 10 105 19 25 - 41 59 528
5. Staff behaviour 49 105 15 60 26 80 66 20 39 68 528
6. Existence of loan
facility - 16 99 50 79 60 40 114 40 30 528
7. Reasonable
interest rate 10 10 48 60 49 39 91 56 79 86 528
8. Accuracy 25 40 60 50 36 91 58 89 59 20 528
9. Foreign exchange
transaction 19 38 20 - 30 46 89 95 40 151 528
10. Procedure for
bank account 40 20 20 55 45 79 80 39 131 19 528
Garrett’s Table
Value 81 70 63 57 52 47 42 36 29 18
Source: Primary Data
Table 6.29 shows that 180 respondents have given first rank to ‗ATM 24 hours
service‘, 143 respondents have given first rank to ‗safe transaction‘, 49 respondents
have given first rank to ‗staff behaviour‘, 40 respondents have given first rank to
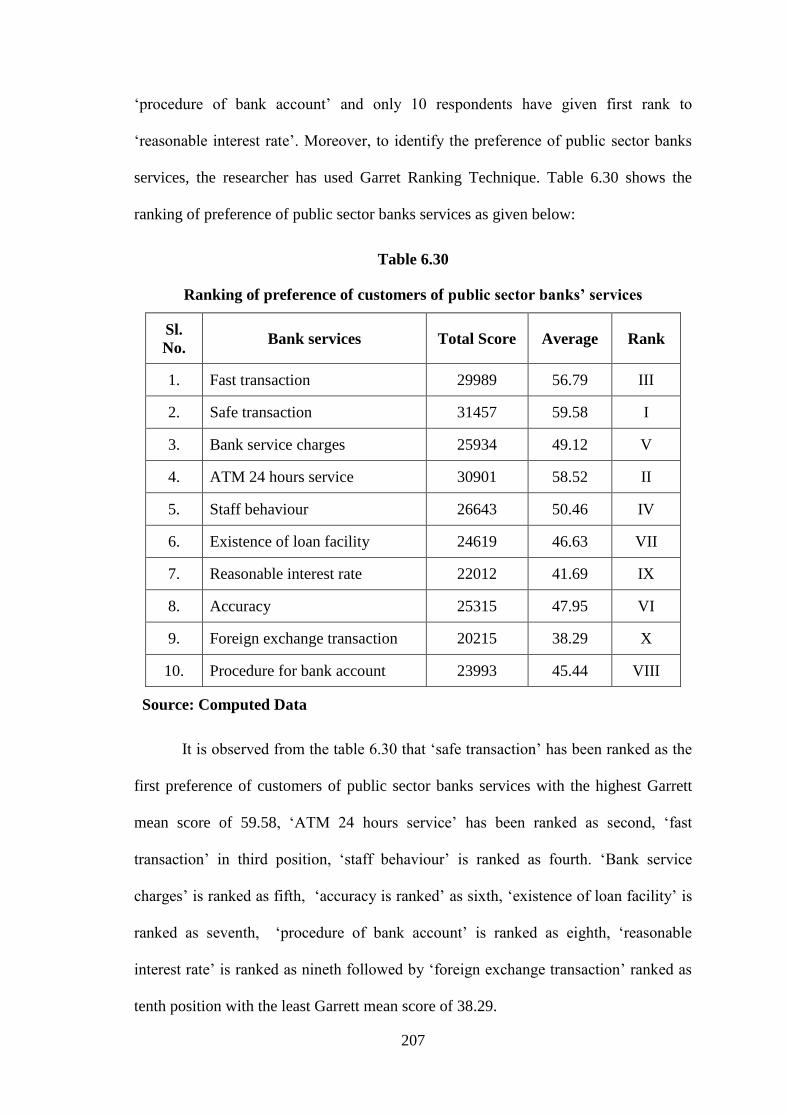
207
‗procedure of bank account‘ and only 10 respondents have given first rank to
‗reasonable interest rate‘. Moreover, to identify the preference of public sector banks
services, the researcher has used Garret Ranking Technique. Table 6.30 shows the
ranking of preference of public sector banks services as given below:
Table 6.30
Ranking of preference of customers of public sector banks’ services
Sl.
No. Bank services Total Score Average Rank
1. Fast transaction 29989 56.79 III
2. Safe transaction 31457 59.58 I
3. Bank service charges 25934 49.12 V
4. ATM 24 hours service 30901 58.52 II
5. Staff behaviour 26643 50.46 IV
6. Existence of loan facility 24619 46.63 VII
7. Reasonable interest rate 22012 41.69 IX
8. Accuracy 25315 47.95 VI
9. Foreign exchange transaction 20215 38.29 X
10. Procedure for bank account 23993 45.44 VIII
Source: Computed Data
It is observed from the table 6.30 that ‗safe transaction‘ has been ranked as the
first preference of customers of public sector banks services with the highest Garrett
mean score of 59.58, ‗ATM 24 hours service‘ has been ranked as second, ‗fast
transaction‘ in third position, ‗staff behaviour‘ is ranked as fourth. ‗Bank service
charges‘ is ranked as fifth, ‗accuracy is ranked‘ as sixth, ‗existence of loan facility‘ is
ranked as seventh, ‗procedure of bank account‘ is ranked as eighth, ‗reasonable
interest rate‘ is ranked as nineth followed by ‗foreign exchange transaction‘ ranked as
tenth position with the least Garrett mean score of 38.29.
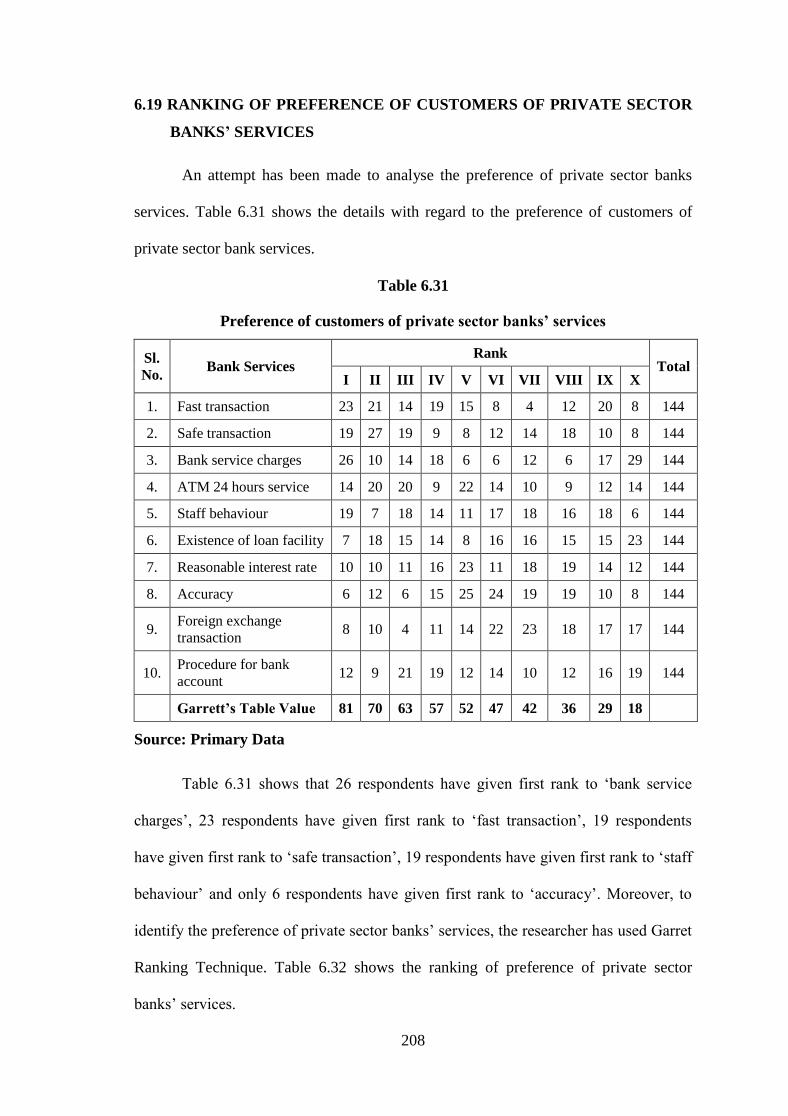
208
6.19 RANKING OF PREFERENCE OF CUSTOMERS OF PRIVATE SECTOR
BANKS’ SERVICES
An attempt has been made to analyse the preference of private sector banks
services. Table 6.31 shows the details with regard to the preference of customers of
private sector bank services.
Table 6.31
Preference of customers of private sector banks’ services
Sl.
No. Bank Services
Rank Total
I II III IV V VI VII VIII IX X
1. Fast transaction 23 21 14 19 15 8 4 12 20 8 144
2. Safe transaction 19 27 19 9 8 12 14 18 10 8 144
3. Bank service charges 26 10 14 18 6 6 12 6 17 29 144
4. ATM 24 hours service 14 20 20 9 22 14 10 9 12 14 144
5. Staff behaviour 19 7 18 14 11 17 18 16 18 6 144
6. Existence of loan facility 7 18 15 14 8 16 16 15 15 23 144
7. Reasonable interest rate 10 10 11 16 23 11 18 19 14 12 144
8. Accuracy 6 12 6 15 25 24 19 19 10 8 144
9. Foreign exchange
transaction 8 10 4 11 14 22 23 18 17 17 144
10. Procedure for bank
account 12 9 21 19 12 14 10 12 16 19 144
Garrett’s Table Value 81 70 63 57 52 47 42 36 29 18
Source: Primary Data
Table 6.31 shows that 26 respondents have given first rank to ‗bank service
charges‘, 23 respondents have given first rank to ‗fast transaction‘, 19 respondents
have given first rank to ‗safe transaction‘, 19 respondents have given first rank to ‗staff
behaviour‘ and only 6 respondents have given first rank to ‗accuracy‘. Moreover, to
identify the preference of private sector banks‘ services, the researcher has used Garret
Ranking Technique. Table 6.32 shows the ranking of preference of private sector
banks‘ services.
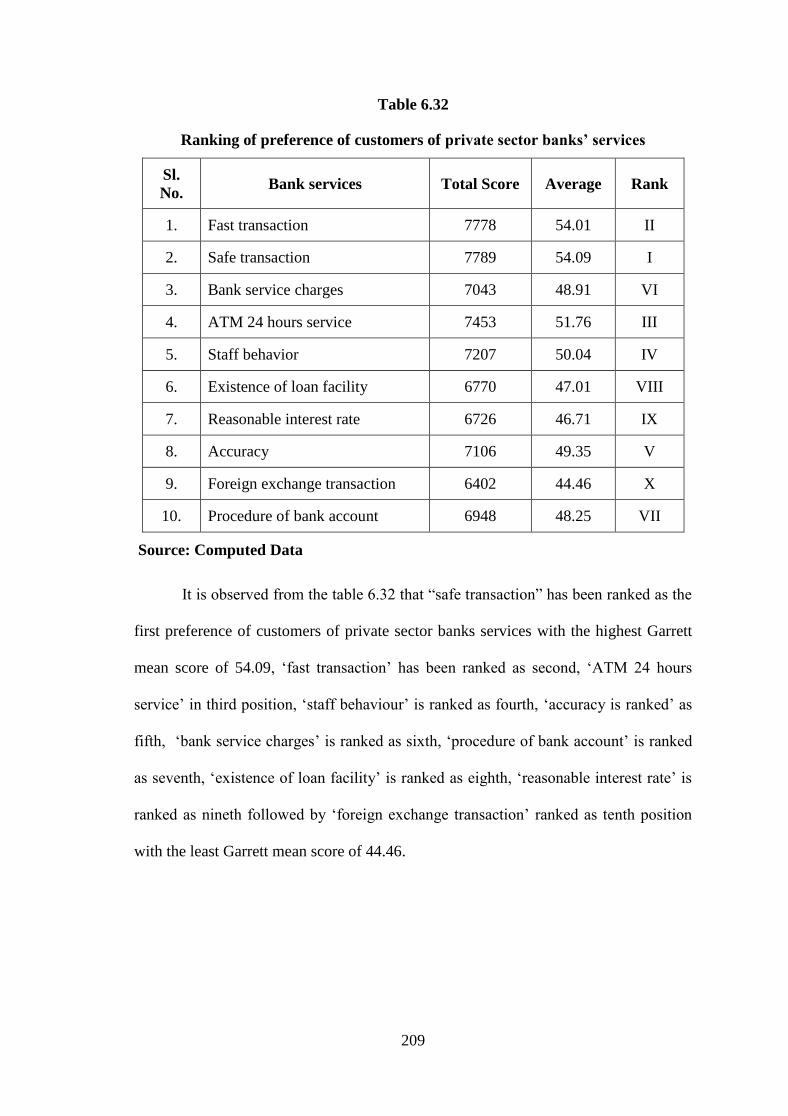
209
Table 6.32
Ranking of preference of customers of private sector banks’ services
Sl.
No. Bank services Total Score Average Rank
1. Fast transaction 7778 54.01 II
2. Safe transaction 7789 54.09 I
3. Bank service charges 7043 48.91 VI
4. ATM 24 hours service 7453 51.76 III
5. Staff behavior 7207 50.04 IV
6. Existence of loan facility 6770 47.01 VIII
7. Reasonable interest rate 6726 46.71 IX
8. Accuracy 7106 49.35 V
9. Foreign exchange transaction 6402 44.46 X
10. Procedure of bank account 6948 48.25 VII
Source: Computed Data
It is observed from the table 6.32 that ―safe transaction‖ has been ranked as the
first preference of customers of private sector banks services with the highest Garrett
mean score of 54.09, ‗fast transaction‘ has been ranked as second, ‗ATM 24 hours
service‘ in third position, ‗staff behaviour‘ is ranked as fourth, ‗accuracy is ranked‘ as
fifth, ‗bank service charges‘ is ranked as sixth, ‗procedure of bank account‘ is ranked
as seventh, ‗existence of loan facility‘ is ranked as eighth, ‗reasonable interest rate‘ is
ranked as nineth followed by ‗foreign exchange transaction‘ ranked as tenth position
with the least Garrett mean score of 44.46.
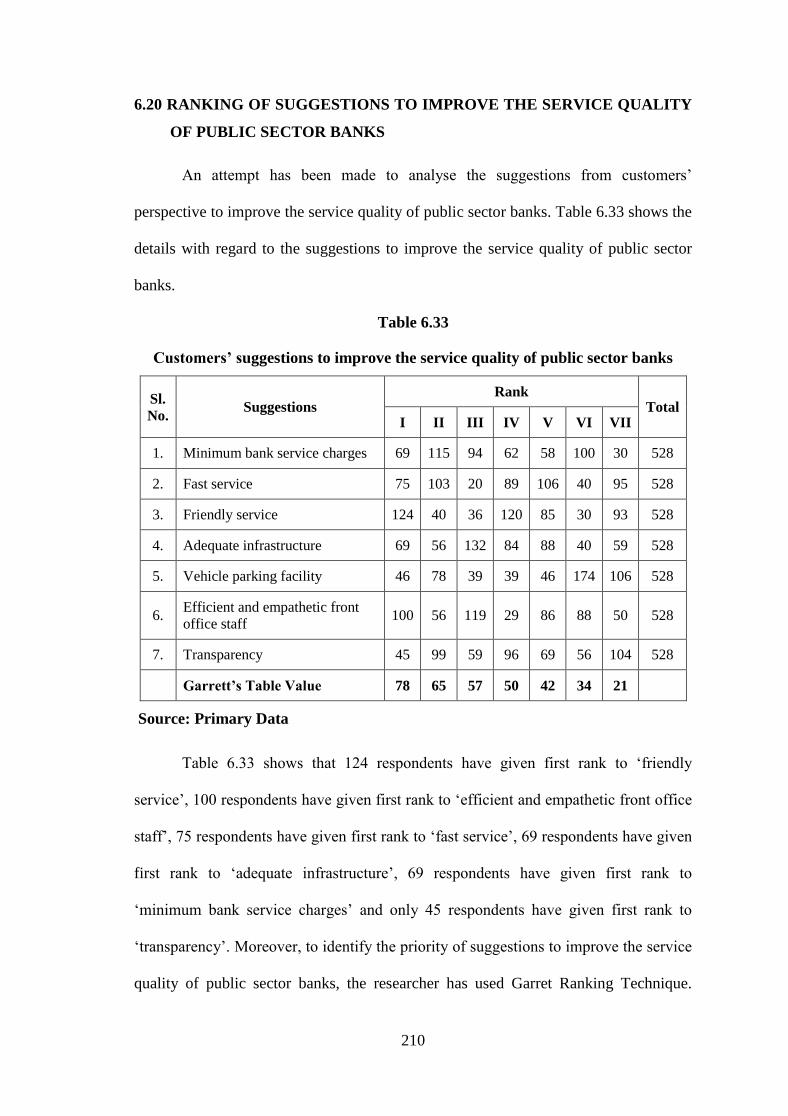
210
6.20 RANKING OF SUGGESTIONS TO IMPROVE THE SERVICE QUALITY
OF PUBLIC SECTOR BANKS
An attempt has been made to analyse the suggestions from customers‘
perspective to improve the service quality of public sector banks. Table 6.33 shows the
details with regard to the suggestions to improve the service quality of public sector
banks.
Table 6.33
Customers’ suggestions to improve the service quality of public sector banks
Sl.
No. Suggestions
Rank Total
I II III IV V VI VII
1. Minimum bank service charges 69 115 94 62 58 100 30 528
2. Fast service 75 103 20 89 106 40 95 528
3. Friendly service 124 40 36 120 85 30 93 528
4. Adequate infrastructure 69 56 132 84 88 40 59 528
5. Vehicle parking facility 46 78 39 39 46 174 106 528
6. Efficient and empathetic front
office staff 100 56 119 29 86 88 50 528
7. Transparency 45 99 59 96 69 56 104 528
Garrett’s Table Value 78 65 57 50 42 34 21
Source: Primary Data
Table 6.33 shows that 124 respondents have given first rank to ‗friendly
service‘, 100 respondents have given first rank to ‗efficient and empathetic front office
staff‘, 75 respondents have given first rank to ‗fast service‘, 69 respondents have given
first rank to ‗adequate infrastructure‘, 69 respondents have given first rank to
‗minimum bank service charges‘ and only 45 respondents have given first rank to
‗transparency‘. Moreover, to identify the priority of suggestions to improve the service
quality of public sector banks, the researcher has used Garret Ranking Technique.
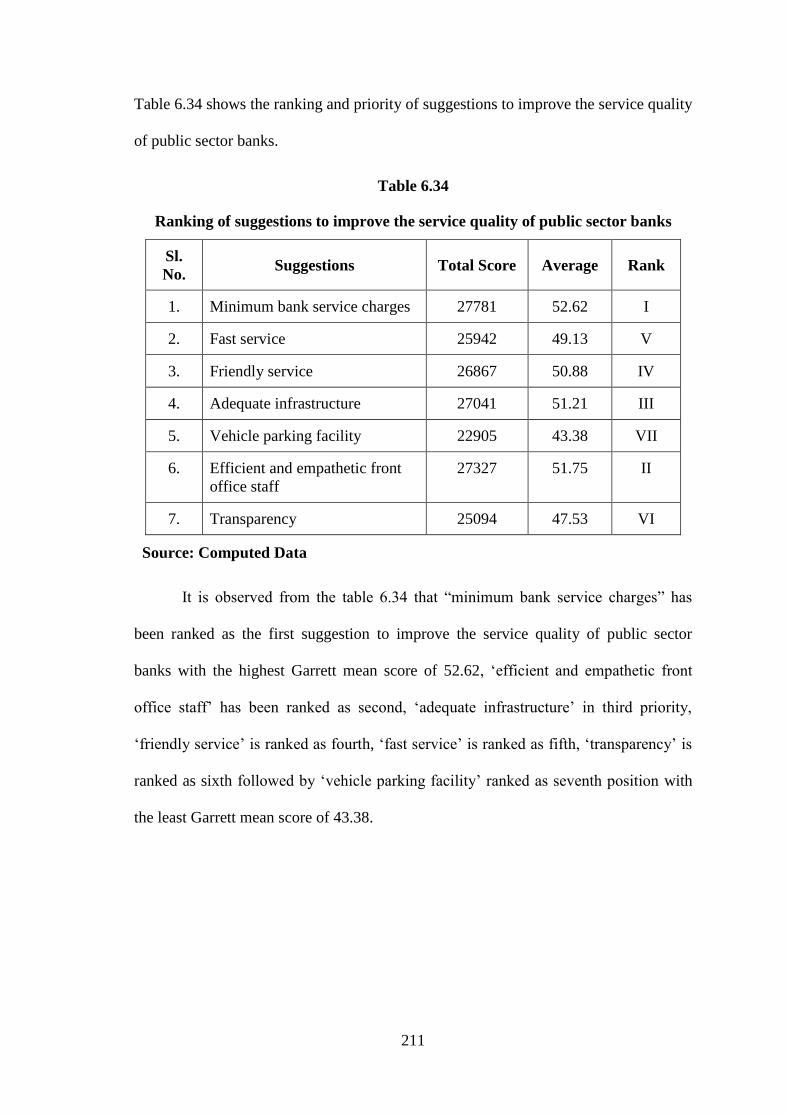
211
Table 6.34 shows the ranking and priority of suggestions to improve the service quality
of public sector banks.
Table 6.34
Ranking of suggestions to improve the service quality of public sector banks
Sl.
No. Suggestions Total Score Average Rank
1. Minimum bank service charges 27781 52.62 I
2. Fast service 25942 49.13 V
3. Friendly service 26867 50.88 IV
4. Adequate infrastructure 27041 51.21 III
5. Vehicle parking facility 22905 43.38 VII
6. Efficient and empathetic front
office staff
27327 51.75 II
7. Transparency 25094 47.53 VI
Source: Computed Data
It is observed from the table 6.34 that ―minimum bank service charges‖ has
been ranked as the first suggestion to improve the service quality of public sector
banks with the highest Garrett mean score of 52.62, ‗efficient and empathetic front
office staff‘ has been ranked as second, ‗adequate infrastructure‘ in third priority,
‗friendly service‘ is ranked as fourth, ‗fast service‘ is ranked as fifth, ‗transparency‘ is
ranked as sixth followed by ‗vehicle parking facility‘ ranked as seventh position with
the least Garrett mean score of 43.38.
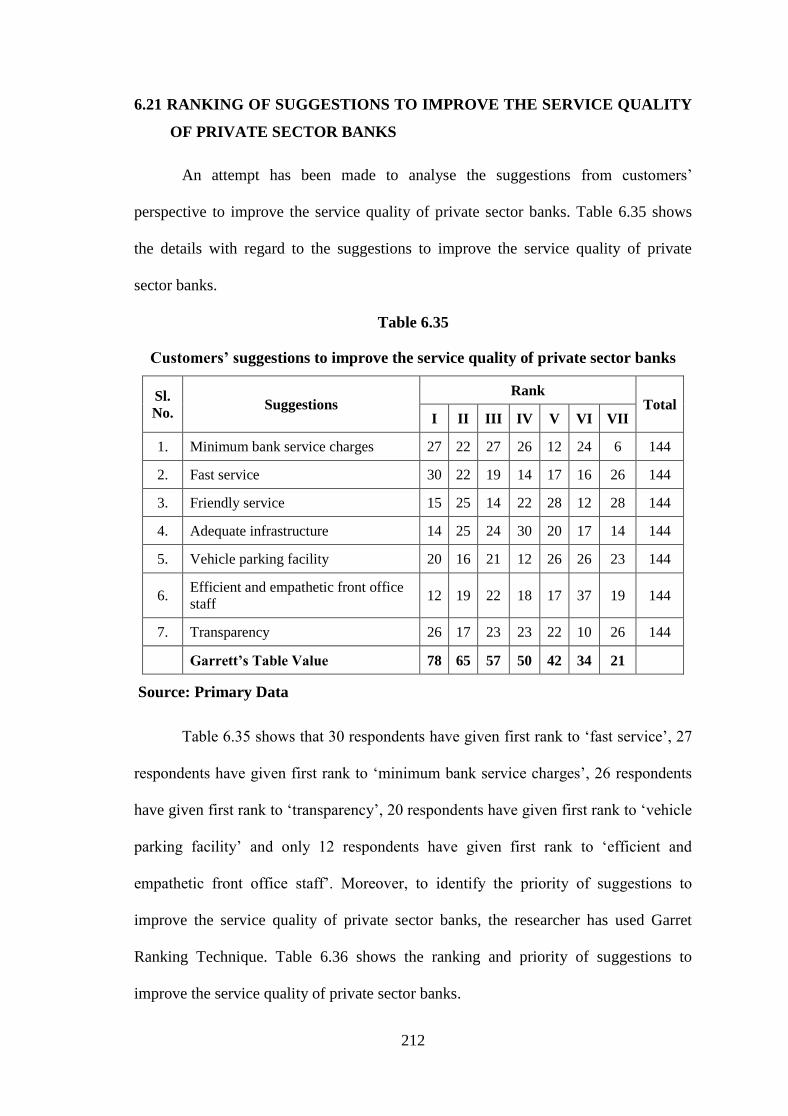
212
6.21 RANKING OF SUGGESTIONS TO IMPROVE THE SERVICE QUALITY
OF PRIVATE SECTOR BANKS
An attempt has been made to analyse the suggestions from customers‘
perspective to improve the service quality of private sector banks. Table 6.35 shows
the details with regard to the suggestions to improve the service quality of private
sector banks.
Table 6.35
Customers’ suggestions to improve the service quality of private sector banks
Sl.
No. Suggestions
Rank Total
I II III IV V VI VII
1. Minimum bank service charges 27 22 27 26 12 24 6 144
2. Fast service 30 22 19 14 17 16 26 144
3. Friendly service 15 25 14 22 28 12 28 144
4. Adequate infrastructure 14 25 24 30 20 17 14 144
5. Vehicle parking facility 20 16 21 12 26 26 23 144
6. Efficient and empathetic front office
staff 12 19 22 18 17 37 19 144
7. Transparency 26 17 23 23 22 10 26 144
Garrett’s Table Value 78 65 57 50 42 34 21
Source: Primary Data
Table 6.35 shows that 30 respondents have given first rank to ‗fast service‘, 27
respondents have given first rank to ‗minimum bank service charges‘, 26 respondents
have given first rank to ‗transparency‘, 20 respondents have given first rank to ‗vehicle
parking facility‘ and only 12 respondents have given first rank to ‗efficient and
empathetic front office staff‘. Moreover, to identify the priority of suggestions to
improve the service quality of private sector banks, the researcher has used Garret
Ranking Technique. Table 6.36 shows the ranking and priority of suggestions to
improve the service quality of private sector banks.
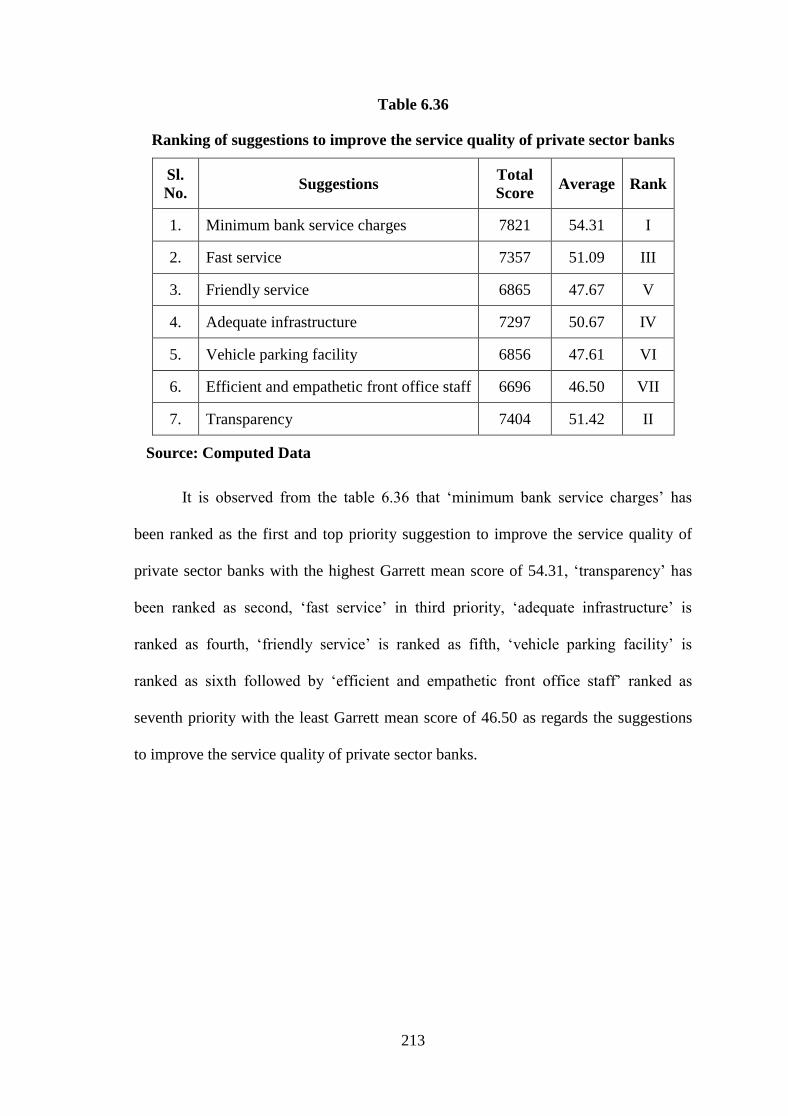
213
Table 6.36
Ranking of suggestions to improve the service quality of private sector banks
Sl.
No. Suggestions
Total
Score Average Rank
1. Minimum bank service charges 7821 54.31 I
2. Fast service 7357 51.09 III
3. Friendly service 6865 47.67 V
4. Adequate infrastructure 7297 50.67 IV
5. Vehicle parking facility 6856 47.61 VI
6. Efficient and empathetic front office staff 6696 46.50 VII
7. Transparency 7404 51.42 II
Source: Computed Data
It is observed from the table 6.36 that ‗minimum bank service charges‘ has
been ranked as the first and top priority suggestion to improve the service quality of
private sector banks with the highest Garrett mean score of 54.31, ‗transparency‘ has
been ranked as second, ‗fast service‘ in third priority, ‗adequate infrastructure‘ is
ranked as fourth, ‗friendly service‘ is ranked as fifth, ‗vehicle parking facility‘ is
ranked as sixth followed by ‗efficient and empathetic front office staff‘ ranked as
seventh priority with the least Garrett mean score of 46.50 as regards the suggestions
to improve the service quality of private sector banks.
214
CHAPTER VII
SUMMARY OF FINDINGS, SUGGESTIONS AND CONCLUSION
7.1 INTRODUCTION
This chapter presents the summary of findings, suggestions and conclusion.
This study is conducted with the main objective of finding out the service quality
perception and preference of customers about public and private sector banks in
Tirunelveli district. The findings of the study are briefly presented in this part. Purely
primary data have been collected through the questionnaire. To prepare, finalise and
fine tune, the questionnaire a preliminary survey has been conducted by the researcher.
The necessary secondary data have also been collected and included wherever it is
needed.
To be specific, the objectives of the study are: (i) to find out the perception of
customers towards the service quality of public and private sector banks (ii) to find out
the customers preference towards public and private sector banks (iii) to study the
impact of various demographic variables of customers on their selection of bank (iv) to
measure the service quality gap in availing the banking services (v) to find out the
problems faced by the customers in availing banking services and (vi) to offer
suggestions to the banks for improving their service quality.
The study was carried out with both primary and secondary data. The primary
data were collected from 672 customers of public sector banks and private sector banks
located in Tirunelveli district. The analysis was carried out with the responses of the
customers of the public sector banks and private sector banks by adopting stratified
random sampling through questionnaire and presented in the form of tabulation.
215
The tools for analysis like percentage analysis, factor analysis, mean score, ANOVA,
‗t‘ test and Garrett ranking technique were used.
7.2 SUMMARY OF FINDINGS
Banking play vital role in providing banking services to their customers.
Sustaining and enhancing the quality of banking services are the key aspects as to
retaining the existing customers and attracting new customers towards banking
companies. Bank of both the sector need to pay attention as to all the five dimensions
of service quality namely assurance and empathy. As stiff competition is prevailing in
the banking industry, banks should be very keen in providing quality services to their
customers. It is in this backdrop, this study has been concluded and the study has
brought out many facts and findings. The following are the summary of major
findings of the study.
7.2.1 Findings of Demographic Profile of Customers of Public Sector Banks and
Private Sector Banks
It is found that majority i.e. 35.3 per cent of the respondents are in the age group
of 20 to 30 years and the next majority of 23.8 per cent are in the age group of 31
to 40 years. Bank wise analysis reveals that among the customers of public
banks, majority (32.6 per cent) of the respondents are in the age group of 20 to 30
years and also in private banks, majority (45.1 per cent) of the respondents are in
the age group of 20 to 30 years. The reason for the majority of the young aged
respondents have account in public and private banks in the study area is that
young aged respondents are more eager to save money in the banks and also they
prefer to take money through ATM. But the old aged respondents are eager to
invest in other investment avenues other than banks. Hence, majority of the
216
young aged respondents have account in public and private banks than old aged
respondents.
It is identified that 56.5 per cent are male and the remaining 43.5 per cent are
female. Bank wise analysis reveals that among the customers of public banks,
majority of (56.8 per cent) the respondents are male and also in private banks,
majority of (55.6 per cent) the respondents are male. The reason for the majority
of the male respondents have account in public and private banks in the study
area is that male respondents are easily independently opening account in banks.
But the female respondents are not adequately financially liberated. They are in
the control of their fathers, spouses. Hence, majority of the male respondents
have account in public and private banks than female.
It is observed that 69.2 per cent are married and the remaining 30.8 per cent are
unmarried. Bank wise analysis reveals that among the customers of public sector
banks, majority of (68.4 per cent) the respondents are married and also in private
sector banks, majority of (72.2 per cent) the respondents are married. The reason
for the majority of the married respondents have account in public and private
banks in the study area is that married respondents are independently opening
account in banks. But the unmarried respondents are not financially liberated.
They are in the control of their fathers. Hence, majority of the married
respondents have account in public and private banks than unmarried.
It is learnt that 52.8 per cent are residing in rural area, 41.1 per cent are residing
in urban area and 6.1 per cent are residing in suburban area. Bank wise analysis
reveals that among the customers of public banks, majority (53 per cent) of the
respondents are residing in rural area and also in private banks, majority
(52.1 per cent) of the respondents are residing in rural area. The reason for the
217
majority of the rural and urban respondents have account in public and private
banks in the study area is that they have more banking facilities and they have
easy access to the banks. Hence, majority of the rural and urban respondents have
account in public and private banks than suburban respondents.
It is noted that majority of the respondents i.e. 37.2 per cent are undergraduates
and the next majority of 23.1 per cent have completed SSLC. Bank wise analysis
reveals that among the customers of public banks, majority (36.7 per cent) of the
respondents are undergraduates and also in private banks, majority (38.9 per
cent) of the respondents are undergraduates. The reason for the majority of the
respondents with graduate qualification and SSLC qualification have account in
public and private banks in the study area is that they have more knowledge and
awareness about banks. But, the illiterate respondents have no knowledge on
banking services and they have no awareness about banks. Hence, majority of the
respondents with graduate qualification and SSLC qualification have account in
public and private banks than illiterate.
The present study clearly shows that majority of the respondents i.e. 24.7 per cent
are private sector employees and the next majority of 20.4 per cent are business
persons. Bank wise analysis reveals that among the customers of public banks,
majority (23.5 per cent) of the respondents are private sector employees and also
in private banks, majority (29.2 per cent) of the respondents are private sector
employees. The reason for the majority of the private sector employees have
account in public and private banks in the study area is that they must have
account for the payment of salary. But, the agricultural respondents have no
necessary for payment of salary in their account. Hence, majority of the private
employees have account in public and private banks than others.

218
It is understood from the study that 35.4 per cent belong to monthly family
income of upto ` 20,000, 26.2 per cent belong to monthly income of ` 20,001 to
40,000. Bank wise analysis reveals that among the customers of public banks,
majority (37.9 per cent) of the respondents belong to monthly family income of
upto ` 20,000 and in private banks, majority (32.6 per cent) of the respondents
belong to monthly family income of ` 20,001 to 40,000.
It is noted that 45.7 per cent belong to monthly average savings of below ` 5,000
and 29.6 per cent belong to monthly average savings of ` 5,000 to 10000. Bank
wise analysis reveals that among the customers of public sector banks, majority
(47.3 per cent) of the respondents belong to monthly average savings of below
` 5,000 and also in private banks, majority (39.6 per cent) of the respondents
belong to monthly average savings of below ` 5,000.
It is understood from the study that 42.1 per cent save below ` 2,000 in banks
and 25.3 per cent save between ` 2,000 to 4,000. Bank wise analysis reveals that
among the customers of public sector banks, majority (41.9 per cent) of the
respondents save below ` 2,000 in banks and also in private banks, majority
(43.1 per cent) of the respondents save below ` 2,000 in banks.
7.2.2 Analysis of Maintaining of Bank Account
It is observed that 35.9 per cent have account for below 5 years and 31.9 per cent
have account for 5-10 years. Bank wise analysis reveals that among the
customers of public banks, majority (39.6 per cent) of the respondents have
account for below 5 years whereas in private banks, majority (54.9 per cent) of
the respondents have account for 5-10 years.
219
It is found that 79.8 per cent have savings account and 8.2 per cent have both
current and loan account. Bank wise analysis reveals that among the customers of
public banks, majority (81.8 per cent) of the respondents have savings account
and also in private banks, majority (72.2 per cent) of the respondents have
savings account. The reason for the majority of the respondents have savings
account is that people prefer to save money in the banks. Hence, majority
respondents have savings account than other accounts.
The present study clearly shows that 53.7 per cent mentioned that bank not caters
to all the banking needs and 46.3 per cent said that bank caters to all the banking
needs. Bank wise analysis reveals that among the customers of public banks,
majority (50.8 per cent) of the respondents opined that bank not caters to all the
banking needs and also in private banks, majority (64.6 per cent) of the
respondents opined that bank not caters to all the banking needs and also in
private banks, majority (64.6 per cent) of the respondents opined that bank not
caters all the banking needs.
It is understood from the study that 62.6 per cent mentioned that bank not
conducts recreation facilities for the customers and 37.4 per cent said that bank
conducts recreation facilities for the customers. Bank wise analysis reveals that
among the customers of public banks, majority (61.2 per cent) of the respondents
mentioned that bank not conducts recreation facilities for the customers and also
in private banks, majority (68.1 per cent) of the respondents mentioned that bank
not conducts recreation facilities for the customers.
It is found that 26.6 per cent consider ‗quality service‘ of banks and 26.3 per cent
consider ‗wide branch network‘ as main features. Bank wise analysis reveals that
among the customers of public banks, majority (26.7 per cent) of the respondents
220
consider ‗wide branch network‘ whereas in private banks, majority (28.5 per
cent) of the respondents consider ‗quality service‘ of banks as main features.
7.2.3 Findings of Ranking Analysis
―Risk Coverage‖ has been ranked as the first reason for selecting private sector
banks to safeguard hard earned money, ‗a good mode of savings‘ has been
ranked as second, ‗investment opportunity‘ in third position, ‗capital
appreciation‘ is ranked as fourth followed by ‗tax savings‘ ranked as fifth
position.
‗Waiting for a long time‘ has been ranked as the first and foremost problem faced
by customers of public sector banks while availing banking services,
‗unsatisfactory services‘ has been ranked as second, ‗inadequate staff‘ in third
position, ‗exaggeration of benefits‘ is ranked as nineth followed by no proper and
timely reminders‘ ranked as tenth position.
‗Unsatisfactory services‘ has been ranked as the first and foremost problem faced
by customers of private sector banks while availing banking service, ‗unfriendly
staff‘ has been ranked as second, waiting for a long time in third position,
‗inadequate staff‘ is ranked as nineth followed by ‗no complete information
about banking transactions‘ ranked as tenth position.
7.2.4 Factors motivating to choose the bank
The important factors motivating to choose the bank among customers of public
sector banks are ‗perform services correctly at the first time‘ and provide
‗e-banking services‘ as their respective mean scores are 3.9242 and 3.8428 and
among the customers of private sector banks, ‗perform services correctly at the
221
first time‘ and ‗provide better communication system‘ as their respective mean
scores are 3.8542 and 3.6042.
It is found that there is a significant difference in the factors motivating to choose
the bank among the customers of public and private sector banks, in the cases of
‗provides prompt service‘, ‗situated at convenient location‘, ‗clean surroundings
and premises‘, ‗simple and easy process / procedures‘, ‗provides value added
service‘, ‗provides e-banking services‘ and ‗provides visually appealing
facilities‘.
7.2.5 Factors motivating to choose the bank and Demographic Variables of the
Customers of Public Sector Banks
It is understood from the study that in public sector banks, there is a significant
relationship between age group of customers and factors motivating to choose the
bank namely ‗performs services correctly at the first time‘, ‗provides prompt
service‘, ‗offers competitive pricing‘, ‗situated at convenient location‘, ‗provides
friendly service‘, ‗convenient service hours‘, ‗transparency, simple and easy
process / procedures‘, ‗provides value added service‘, ‗has competent employees
for better performance‘, ‗provides visually appealing facilities‘ and ‗existence of
physical evidences‘ for quality services.
It is identified that there is a significant relationship between area of residence
and factors motivating to choose the bank namely provides friendly service,
convenient service hours, simple and easy process / procedures and provides
value added service.
It is found that there is significant relationship between educational qualification
and factors motivating to choose the bank namely perform services correctly at

222
the first time, provides prompt service, offer competitive pricing, situated at
convenient location, convenient service hours, clean surroundings and premises,
transparency, simple and easy process / procedures, provides value added
service, provides e-banking services, has competent employees for better
performance, provides visually appealing facilities and existence of physical
evidences for quality services.
It is identified that there is a significant relationship between occupation and
factors motivating to choose the bank namely performs services correctly at the
first time, provides prompt service, offer competitive pricing, situated at
convenient location, provides friendly service, convenient service hours, clean
surroundings and premises, transparency, simple and easy process / procedures,
provides value added service, provides e-banking services, has competent
employees for better performance, existence of physical evidences for quality
services and provides better communication system.
It is noted that there is a significant relationship between monthly family income
and factors motivating to choose the bank namely performs services correctly at
the first time, provides prompt service, offers competitive pricing, provides
friendly service, convenient service hours, clean surroundings and premises,
transparency, provides value added service, provides e-banking services, has
competent employee for better performance, provide visually appealing facilities,
existence of physical evidences for quality services and provide better
communication system.
It is learnt that there is a significant relationship between monthly average
savings and factors motivating to choose the bank namely provides prompt
service, provide friendly service, transparency, has competent employee for
223
better performance, existence of physical evidences for quality services and
provide better communication system.
7.2.6 Factors motivating to choose the bank and Demographic Variables of the
Customers of Private Sector Banks
It is understood from the study that in private sector banks, there is a significant
relationship between age group of customers and factors motivating to choose the
bank namely perform services correctly at the first time, provide prompt service,
situated at convenient location, provides friendly service, convenient service
hours, clean surroundings and premises, transparency, simple and easy process /
procedures, has competent employees for better performance, existence of
physical evidences for quality services and provides better communication
system.
It is identified that there is a significant relationship between area of residence
and factors motivating to choose the bank namely performs services correctly at
the first time, provides prompt service, offer competitive pricing, situated at
convenient location, provides friendly service, convenient service hours,
transparency, simple and easy process / procedures, has competent employees for
better performance, provides visually appealing facilities, existence of physical
evidences for quality services and provides better communication system.
It is found that there is significant relationship between educational qualification
and factors motivating to choose the bank namely performs services correctly at
the first time, provides prompt service, offer competitive pricing, situated at
convenient location, provides friendly service, convenient service hours,
transparency, provides value added service, provides e-banking services, has
224
competent employee for better performance, existence of physical evidences for
quality services and provides better communication system.
It is identified that there is a significant relationship between occupation and
factors motivating to choose the bank namely performs services correctly at the
first time, provides prompt service, offer competitive pricing, situated at
convenient location, provides friendly service, convenient service hours,
transparency, simple and easy process / procedures, provides value added
service, provide e-banking services, has competent employees for better
performance, existence of physical evidences for quality services and provides
better communication system.
It is noted that there is a significant relationship between monthly family income
and factors motivating to choose the bank namely performs services correctly at
the first time, provides prompt service, offer competitive pricing, situated at
convenient location, provides friendly service, transparency, simple and easy
process / procedures, provides e-banking services, has competent employees for
better performance and existence of physical evidences for quality services.
It is learnt that there is a significant relationship between monthly average
savings and factors motivating to choose the bank namely performs services
correctly at the first time, provide prompt service, offer competitive pricing,
situated at convenient location, provide friendly service, convenient service
hours, clean surroundings and premises, simple and easy process / procedures,
provides value added service, provides visually appealing facilities and existence
of physical evidences for quality services.

225
7.2.7 Expectation towards tangibility aspect of service quality of banks
The important expectation towards tangibility aspect of banks among customers
of public sector banks are adequate infrastructural facilities and location is free
from pollution as their respective mean scores are 4.3144 and 3.9931 and among
the customers of private sector banks, adequate infrastructural facilities and
information is easily available as their respective mean scores are 4.2986 and
3.8333.
It is found that there is a significant difference in expectation towards tangibility
of banks among the customers of public and private sector banks, in the cases of
physical appearance of the staff is professional, location is easily accessible,
location is free from pollution and vehicle parking facility is available.
7.2.8 Expectation towards reliability aspect of service quality of banks
The important expectation towards reliability of banks among customers of
public sector banks are get things right at the first time and provision of
documentary evidences for banking services as their respective mean scores are
3.9186 and 3.9148 and among the customers of private sector banks, provision of
documentary evidences for banking services as get things right at the first time as
their respective mean scores are 3.8681 and 3.8542.
It is learnt that there is no significant difference in expectation towards reliability
of banks among the customers of public and private sector banks, in the cases of
get things right at the first time, provides services at time promises to do so it,
insists on error free records, bank has competitive pricing compared to others and
provision of documentary evidences for banking services.
226
7.2.9 Expectation towards responsiveness aspect of service quality of banks
The important expectation towards responsiveness of banks among customers of
public sector banks are staff tell exactly when the services will be performed and
organised time table as their respective mean scores are 4.2708 and 4.0170 and
among the customers of private sector banks, staff tell exactly when the services
will be performed and staff are willing to help anytime as their respective mean
scores are 4.1117 and 3.9508.
It is noted that there is a significant difference in expectation towards
responsiveness of banks among the customers of public and private sector banks,
in the case of staff are prompt in responding to questions and queries.
7.2.10 Expectation towards assurance of banks
The important expectation towards assurance aspect of banks among customers
of public sector banks are bank staff give assurance as to deliverance of the
services and bank staff give assurance with regard to their efficient service as
their respective mean scores are 4.1477 and 4.1250 and among the customers of
private sector banks, bank staff give assurance with regard to their efficient
service and bank staff give assurance as to deliverance of the services as their
respective mean scores are 4.0278 and 4.0000.
It is understood from the study that there is a significant difference in expectation
towards assurance of banks among the customers of public and private sector
banks, in the cases of bank is widely known and bank staff give assurance with
regard to their efficient service.

227
7.2.11 Expectation towards empathy aspect of service quality of banks
The important expectation towards empathy of banks among customers of public
sector banks are client friendly service hours and customers get individual
attention as their respective mean scores are 4.2197 and 4.0455 and among the
customers of private sector banks, client friendly service hours and customers get
individual attention as their respective mean scores are 4.1111 and 4.0278.
It is noted that there is no significant difference in expectation towards empathy
of banks among the customers of public and private sector banks, in the case of
customers get individual attention, bank has its customer‘s best interest in heart,
client friendly service hours, bank staff have concern and they understand
customers‘ problems and seek to understand customer‘s need and their problems.
7.2.12 Perception towards tangibility aspect of service quality of banks
The important perception towards tangibility of banks among customers of public
sector banks are information is easily available and company is having a
memorable advertisement as their respective mean scores are 3.0972 and 3.0833
and among the customers of private sector banks, adequate infrastructural
facilities and information is easily available as their respective mean scores are
3.5170 and 3.4091.
It is noted that there is a significant difference in perception towards tangibility
of banks among the customers of public and private sector banks, in the cases of
adequate infrastructural facilities, physical appearance of the staff is professional,
location is easily accessible, bank uses latest technologies in providing services,
vehicle parking facility is available, information is easily available and beautiful
elevation of the office building.
228
7.2.13 Perception towards reliability aspect of service quality of banks
The important perception towards reliability of banks among customers of public
sector banks are insists on error free records and bank has competitive pricing
compared to others as their respective mean scores are 3.0278 and 3.0139 and
among the customers of private sector banks, provision of documentary
evidences for banking services and get things right at the first time as their
respective mean scores are 3.4527 and 3.4167.
It is identified that there is a significant difference in perception towards
reliability of banks among the customers of public and private sector banks, in
the cases of get things right at the first time, provides services at time promises to
do so it, bank has competitive pricing compared to others and provision of
documentary evidences for banking services.
7.2.14 Perception towards responsiveness aspect of service quality of banks
The important perception towards responsiveness of banks among customers of
public sector banks are staff tell exactly when the services will be performed and
organised time table as their respective mean scores are 3.0833 and 2.9444 and
among the customers of private sector banks, staff tell exactly when the services
will be performed and organised time table as their respective mean scores are
3.3125 and 3.2500.
It is noted that there is a significant difference in perception towards
responsiveness of banks among the customers of public and private sector banks,
in the cases of staff tell exactly when the services will be performed, staff are
prompt in responding to questions and queries, staff is willing to help anytime
and organised time table.
229
7.2.15 Perception towards assurance aspect of service quality of banks
The important perception towards assurance of banks among customers of public
sector banks are bank is widely known and bank staff give assurance as to
deliverance of the services as their respective mean scores are 3.1875 and 3.1181
and among the customers of private sector banks, bank is unique compared to
others and bank is widely known as their respective mean scores are 3.5379 and
3.4375.
It is found that there is a significant difference in perception towards assurance of
banks among the customers of public and private sector banks, in the cases of
employees are trustworthy and honest, employees in banks have knowledge and
competence to solve customers‘ problems, bank is widely known, bank is well
liked, bank is unique compared to others and data revealed by customers are kept
confidential.
7.2.16 Perception towards empathy aspect of service quality of banks
The important perception towards empathy of banks among customers of public
sector banks are client friendly service hours and customers get individual
attention as their respective mean scores are 3.3056 and 3.0556 and among the
customers of private sector banks, client friendly service hours and bank staff
have concern and they understand customer problems as their respective mean
scores are 3.8049 and 3.5739.
It is found that there is a significant difference in perception towards empathy of
banks among the customers of public and private sector banks, in the cases of
bank has its customer‘s best interest in heart, client friendly service hours, bank
230
staff have concern and they understand customer problems and seek to
understand customers‘ need and their problems.
7.2.17 Service quality Gap in Public Sector Banks in Tirunelveli District
It is found that among the customers of public sector banks in Tirunelveli district,
the mean scores of expectations are high and ranged from 3.7292 for (item
3: Visually appealing features) to 4.3144 for (item 1: Adequate infrastructural
facilities). Among the five dimensions, the highest expectation is related to the
responsiveness dimension (dimension‘s mean score = 4.0369) and the lowest
expectation is related to the reliability dimension (dimension‘s mean
score = 3.8653). It is further found that the mean score of the perceptions ranged
from 2.6875 for (item 2: Physical appearance of the staff is professional) to
3.3056 for (item 31: Client friendly service hours). Among the five dimensions of
quality, the highest perception is related to the empathy dimension (dimension‘s
mean score = 3.0097) and the lowest perception is related to the tangibility
dimension (dimension‘s mean score = 2.8645). It is learnt that the highest gap of
the quality relates to the responsiveness dimension (gap mean score =1.1675),
and there is a considerable gap between the customers‘ expectations and
perceptions. The lowest gap of the quality relates to the reliability dimension
(gap mean score = 0.8973).
7.2.18 Service quality Gap in Private Sector Banks in Tirunelveli District
It is understood from the study that the mean scores of expectations are high and
ranged from 3.4867 for (item 7: Vehicle parking facility is available) to 4.2986
for (item 1: Adequate infrastructural facilities). Among the five dimensions, the
highest expectation is related to the empathy dimension (dimension‘s mean
231
score = 3.9920) and the lowest expectation is related to the tangibility dimension
(dimension‘s mean score = 3.7223). The present study clearly shows that the
mean score of the perceptions has been ranged from 2.8864 for (item 3: Visually
appealing features) to 3.8049 for (item 31: Client friendly service hours). Among
the five dimensions of quality, the highest perception related to the empathy
dimension (dimension‘s mean score = 3.4583) and the lowest perception related
to the responsiveness dimension (dimension‘s mean score = 3.2026). It is noted
that the highest gap of the quality relates to the responsiveness dimension
(gap mean score = 0.7306), and there is a considerable gap between the
customers‘ expectations and perceptions. The lowest gap of the quality relates to
the reliability dimension (gap mean score = 0.4752).
7.2.19 Service quality Gap in public and private sector banks in Tirunelveli
district
It is found that the mean scores of expectations are high and ranged from 3.5625
for (item 7: Vehicle parking facility is available) to 4.3110 for (item 1: Adequate
infrastructural facilities). Among the five dimensions, the highest expectation is
related to the responsiveness dimension (dimension‘s mean score = 3.9678) and
the lowest expectation is related to the tangibility dimension (dimension‘s mean
score = 3.7764). It is further found that the mean score of the perceptions ranged
from 2.8750 for (item 3: Visually appealing features) to 3.6979 for (item 31:
Client friendly service hours). Among the five dimensions of quality, the highest
perception is related to the empathy dimension (dimension‘s mean score =
3.3622) and the lowest perception is related to the responsiveness dimension
(dimension‘s mean score = 3.1312). It is understood that the highest gap of the
quality relates to the responsiveness dimension (gap mean score = 0.8366), and
232
there is a considerable gap between the customers‘ expectations and perceptions.
The lowest gap of the quality relates to the reliability dimension (gap mean
score = 0.5782).
7.2.20 Customers’ satisfaction towards banks
The important satisfaction among customers of public sector banks are with
regard to ‗experiences with the banker‘ and ‗my choice of this bank‘ as their
respective mean scores are 3.8920 and 3.7311 and among the customers of
private sector banks, ‗quality of the services‘ and ‗trust worthiness‘ of the bank
as their respective mean scores are 3.7847 and 3.4583.
It is found that there is a significant difference in the satisfaction among the
customers of public and private sector banks, in the cases of ‗experiences with
the banker‘, ‗my choice of this bank‘, ‗behaviour of the staff‘, ‗accessibility of
the bank‘, ‗customer orientation of the bank‘, ‗communication system of bank‘,
‗promotional activities like advertisement‘, ‗procedures and processes‘ and
‗services by the staff‘.
7.2.21 Opinion about the reachability of promotional strategies by the bank
The important opinion about the reachability of promotional strategies by the
bank among customers of public sector banks are advertising on television and
advertising in newspapers as their respective mean scores are 3.8788 and 3.4754
and among the customers of private sector banks, advertising on television and
online marketing / e-mail as their respective mean scores are 3.6806 and 3.5139.
It is noted that there is a significant difference in the opinion about the
reachability of promotional strategies by the bank among the customers of public
233
and private sector banks in the cases of advertising on television, advertising in
newspapers and tele calling by bank staff.
7.2.22 Customers’ Satisfaction and Demographic Variables of the Customers of
Public Sector Banks
It is understood from the study that in public sector banks, there is a significant
relationship between age group of customers and customer satisfaction with
regard to experiences with the banker, my choice of this bank, behaviour of the
staff, trust worthiness of the bank, accessibility of the bank, customer orientation
of the bank, handling of complaints, communication system of bank, quality of
the services, cost of the services offered, maintenance of suggestion box,
promotional activities like advertisement, procedures and processes, services by
the staff and e-banking marketing services.
It is identified that there is a significant relationship between area of residence
and customer satisfaction with regard to behaviour of the staff, customer
orientation of the bank, communication system of bank, maintenance of
suggestion box, procedures and processes and services by the staff.
It is found that there is significant relationship between educational qualification
and customer satisfaction with regard to experiences with the banker, my choice
of this bank, behaviour of the staff, trust worthiness of the bank, accessibility of
the bank, customer orientation of the bank, handling of complaints,
communication system of bank, quality of the services, promotional activities
like advertisement, procedures and processes, services by the staff and e-banking
marketing services.
234
It is identified that there is a significant relationship between occupation and
customer satisfaction with regard to experiences with the banker, my choice of
this bank, behaviour of the staff, trust worthiness of the bank, accessibility of the
bank, customer orientation of the bank, handling of complaints, communication
system of bank, quality of the services, cost of the services offered, maintenance
of suggestion box, promotional activities like advertisement, procedures and
processes, services by the staff and e-banking marketing services.
It is noted that there is a significant relationship between monthly family income
and customer satisfaction with regard to experiences with the banker, my choice
of this bank, behaviour of the staff, accessibility of the bank, customer
orientation of the bank, handling of complaints, communication system of bank,
quality of the services, cost of the services offered, maintenance of suggestion
box, promotional activities like advertisement, and services by the staff.
It is learnt that there is a significant relationship between monthly average
savings and customer satisfaction with regard to experiences with the banker,
trust worthiness of the bank, customer orientation of the bank, communication
system of bank, quality of the services, maintenance of suggestion box,
promotional activities like advertisement, procedures and processes, services by
the staff and e-banking marketing services.
7.2.23 Customers’ Satisfaction and Demographic Variables of the Customers of
Private Sector Banks
It is understood from the study that in private sector banks, there is a significant
relationship between age group of customers and customer satisfaction with
regard to behaviour of the staff, trust worthiness of the bank, accessibility of the
bank, customer orientation of the bank, handling of complaints, communication
235
system of bank, cost of the services offered, maintenance of suggestion box,
promotional activities like advertisement, procedures and processes and
e-banking marketing services.
It is found that there is a significant relationship between area of residence and
customer satisfaction with regard to my choice of this bank, behaviour of the
staff, accessibility of the bank, customer orientation of the bank, communication
system of bank, cost of the services offered, promotional activities like
advertisement and procedures and processes.
It is found that there is significant relationship between educational qualification
and customer satisfaction with regard to experiences with the banker, my choice
of this bank, behaviour of the staff, trust worthiness of the bank, accessibility of
the bank, customer orientation of the bank, communication system of bank, cost
of the services offered, maintenance of suggestion box, promotional activities
like advertisement, procedures and processes and e-banking marketing services.
It is identified that there is a significant relationship between occupation and
customer satisfaction with regard to experiences with the banker, my choice of
this bank, behaviour of the staff, trust worthiness of the bank, accessibility of the
bank, handling of complaints, communication system of bank, quality of the
services, maintenance of suggestion box, promotional activities like
advertisement, procedures and processes, services by the staff and e-banking
marketing services.
It is learnt that there is a significant relationship between monthly family income
and customer satisfaction with regard to experiences with the banker, behaviour
of the staff, trust worthiness of the bank, communication system of bank,
236
maintenance of suggestion box, promotional activities like advertisement,
procedures and processes, services by the staff and e-banking marketing services.
It is noted that there is a significant relationship between monthly average
savings and customer satisfaction with regard to experiences with the banker, my
choice of this bank, behaviour of the staff, trust worthiness of the bank,
communication system of bank, cost of the services offered, promotional
activities like advertisement, procedures and processes and services by the staff.
7.2.24 Findings of Factor Analysis
Among the various factors of customer perception towards public sector banks,
‗Easy Installment and Repayment Factors‘ consisting of seven variables such as
the number of installment is normal, the loan is granted but the payment is
delayed, bank normally accepts installment repayment method, the time taken for
the encashment of cheque is normal, availability of Money transfer/mail transfer,
the banker feels that customers are the real assets of the bank and the banker
issues the draft within the specified time is found to be the most important factors
of customer perception towards public sector banks. The next important factor of
customer perception towards public sector banks is ‗Low Interest and Quick
Grievances Redressal Factors‘ which consists of the variables such as availability
of collection of cheque, the customer opens an account with the bank enjoy the
non-material services offered by the bank, customers‘ complaints and grievances
are redressed quickly, availability of electronic clearing services, the granted loan
amount is released in installments and the interest rate on the loans and advances
is low.

237
7.3 SUGGESTIONS
In the light of the above findings, the following suggestions are offered to
improve the service quality of public and private banks in Tirunelveli district.
7.3.1 Suggestions to the Banks
The customers‘ perception of tangibility dimension of service quality is lower
in public sector banks. So, the public sector banks may take steps to improve
latest technologies in providing services and also in providing adequate
infrastructural facilities.
The customers‘ perception of responsiveness dimension of service quality is
lower in private sector banks. So, the private sector banks‘ staff should be
prompt in responding to questions and queries of customers and the staff
should be willing to help any time by following organised time table.
Both the public and private sector banks must train all the employees in the
areas of customer care, customer approach, body language, customer
communication, customer need assessment and compliant management. This
will help to pave the way for maintaining cordial relationship and improving
the quality of services.
ATM services must be provided within the accessibility of the customers.
When ATM centers are available within a short distance, it will improve the
quality of services.
Bank employees of both the sectors have to be trained especially in the rural
branches to improve the quality of banking services.
238
As the results of the study reveal that reliable communication and
responsiveness have a direct bearing on perceptions of quality, banking
institutions should put emphasis on that service quality dimension.
As of responsiveness dimension of service quality, banks‘ employees must
have the desire, willingness and readiness to assist customers and deliver
prompt service. It is suggested that the employees should exhibit a pleasant,
courteous and friendly behaviour in service delivery.
It is also suggested that the knowledge and competency of service employees in
answering specific customers‘ queries and requests have to be enhanced by
providing due training to such employees.
It could be inferred that in this era of competition, for retaining their satisfied
customers, banks should maintain error-free customer‘s orders and records,
provide services as promised, and try to gain the first impression of the
customers. The public sector banks should also learn how to provide prompt
service to customers at once.
As banks‘ staff play an important role towards the sustenance and enhancement
of the service quality of the banks, issues related to staff must also be duly
considered. In order to improve banks‘ service quality, the banks should
conduct different programmes such as training courses and workshops to their
staff. These programmes would help the banks‘ staff to identify the needs of
customers and to offer the identified needs
Banks of both the sectors should extend services correlated to customers‘
demands and expectations.
239
Banks of both the sectors should employ active staff and utilize deserved,
responsible, effective and dynamic managers in the banks to sustain and
enhance service quality.
In most of the private sector banks, the infrastructural facilities such as
ventilation, seating arrangements and parking facilities etc. are very good and
more comfortable when compared to the public sector banks. Hence, these
facilities should be provided by the public sector banks too.
The banks‘ staff may necessarily have to know their customers and understand
their requirements and inform them about the various services and facilities
available with the banks. Further, the staff may guide the customers in making
the right choice from among the available range of services and facilities by
describing the product features effectively.
Now-a-days, most of the public and private sector banks are computerized. But
a few of staff working with the computer seem to be slow in carrying out their
work. They take more time for completing transactions. So, properly trained
staff must handle the systems. It will improve the quality of the banking
services.
It is revealed in this study that in public sector banks customer relationship
management is poor compared to private sector banks. The relationship
between customer and staff is not very fair. But the private sector banks are
following customer relationship management in a very good manner and the
customers are treated in a friendly manner. Thus, it is suggested that the public
sector banks should exercise effective customer relationship management.
240
The customers‘ perception of responsiveness dimension of service quality is
slightly lower both in public sector banks and private sector banks. Hence, it is
suggested that the employees of both public sector banks and private sector
banks may be motivated to provide prompt services to customers and assist the
customers in filling up the forms, challans. Further, it is suggested that the staff
should provide and display necessary information to the customers. This will
promote the service quality of the banks and build up the image of the banks in
the retention of existing customers and attraction of new customers.
Based on the customers‘ perspectives and their ranking of suggestions to
improve the service quality of private sector banks, it is suggested that the
banks should minimise the service charges, maintain transparency and provide
services in a fast manner.
Based on the customers‘ perspectives and their ranking of suggestions to
improve the service quality of public sector banks, it is suggested that the banks
should minimise service charges, employ efficient and empathetic front office
staff and provide adequate infrastructural facilities.
7.4 CONCLUSION
Banks are providing voluminous services to their customers in an effective and
efficient way due to heavy competition among banks and to sustain their business in
the banking industry. The performance of banks always primarily depends on the
quality of services that they provide to their customers. This study has focused to
assess and evaluate service quality aspects in various banking services and their
approaches to the customers. A universally accepted instrument to assess the service
quality called SERVQUAL was the base to frame variables and to assess the service
241
quality in banks on the five dimensions namely tangibility, reliability, responsiveness,
assurance and empathy. This study brought to light the fact that the customers were
satisfied on the service quality of the banks in the study area but at the same time they
expect a lot more from the banks in the present scenario of technological developments
in banks.
Based on the findings of the study, necessary specific suggestions have been
given by the researcher to public and private sector banks. Further, there are a few
common suggestions are given to both the public and private sector banks. If the given
suggestions are duly looked into by the responsible officer of the banks, the quality of
banking services will go up and he identified service quality gap could be redressed.
The researcher hope that this piece of research work will pave a better way for
providing quality banking services for the banks in general and in the study area in
specific. The researcher also hopes that this research work would be the key instrument
in the minds of potential researchers to pursue further studies on service quality
perception of customer of banking companies.
7.5 SCOPE FOR FURTHER RESEARCH
The present study has made an attempt to study the service quality perception
and preference of customers about public and private sector banks in Tirunelveli
district. There still remains a viable prospect for future research. They are:
(i) A Study on Service Quality Perception of Customers of Nationalized
Banks in Tamilnadu
(ii) A Comparative Study on Service Quality Perception and Preference of
Customers about Private Sector Banks and Foreign Banks in the
Southern District of Tamilnadu.
242
(iii) Service Quality Perception of Users of Innovative Banking Services in
Tirunelveli District.
(iv) A Study on Strategies for Sustaining and Enhancing Quality of Public
and Private Sector Banks in Tirunelveli District - Customers‘
Perspective.
(v) Strategies for Bridging Service Quality Gap Prevailing in Public and
Private Sector Banks in Tirunelveli District - A Comprehensive
Approach.
i
BIBLIOGRAPHY
BOOKS
Agarwal, P.K. (2011), “Consumer Behaviour: An Indian Perspective” Pragati
Prakashan, 9350063409, 9789350063408
Arulraj, A. (2009), “Methodology for Service Quality Measurement of Higher
Education In India” Serials Publications, ISBN 8183872468, 9788183872461
Asubonteng, P., McCleary, K.J. and Swan, J.E. (1996), "SERVQUAL revisited: a
critical review of service quality", Journal of Services Marketing.
Audrey Gilmore (2003), “Services Marketing and Management”, SAGE, ISBN
0761941584, 9780761941583.
Babbie, E. (2002), The basics of social research. Belmont, CA: Wadsworth Publishing.
Barbara Casu, Claudia Girardone (2015), Philip Molyneux “Introduction to Banking
2nd edn Pearson Education Limited, 2015, ISBN. 0273776568, 9780273776567
Benjamin Schneider, Susan S. White (2004), Service Quality: Research Perspectives,
Volume 107 of Foundations for Organizational Science, SAGE, 0761921478,
9780761921479
Berry, Leonard, L. (1983), “Relationship Marketing in Emerging Perspectives on
Services Marketing”, American Marketing Association, Chicago, Pp. 25-28.
Bhatia, B.S., Batra, G.S. (1996), “Management of Financial Services” Deep and Deep
Publications, ISBN 817100816X, 9788171008162
Bhattacharya, C. (2009), “Services Marketing”, Excel Books India ISBN
8174464778, 9788174464774
Catoiu, I and Teodeorescu, N. (2004), “Consumer Behavior”, Uranus Publishing
House, Second Edition, Bucharest.
ii
Charles H. Noble (2015), “Proceedings of the 1999 Academy of Marketing Science
(AMS) Annual Conference”, Developments in Marketing Science: Proceedings
of the Academy of Marketing Science, Springer, ISBN 3319130781,
9783319130781
Christian Gronroos (1990), “Service Management and Marketing”, Lexington, MA:
Lexington Books.
Constantin Zopounidis (2012), “New Trends in Banking Management: Contributions
to Management Science” Springer Science & Business Media, ISBN
3642574785, 9783642574788
Daniel Hischer (2008), “Service Marketing - an introduction”, GRIN Verlag, ISBN
3638065421, 9783638065429
Daniels P.W. and James Harrington, W. (2008), “Services and Economic
Development in the Asia-Pacific Dynamics of Economic Space Organization of
Industrial Space Series” the University of California, ISBN 0754648591,
9780754648598
Dotchin, J.A. and Oakland, J.S. (1994a), "Total quality management in services: Part
2 Service quality", International Journal of Quality & Reliability Management.
Douglas Hoffman, K. John E.G. Bateson (2016) “Services Marketing: Concepts,
Strategies, & Cases” Cengage Learning, ISBN 1285429788, 9781285429786
Edvardsen, B., Tomasson, B. and Ovretveit , J. (1994), Quality of Service: Making it
Really Work, McGraw-Hill, New York, NY.
Goodhart, C (2011), “The Basel Committee on Banking Supervision: A history of the
early years 1974-1997”, Cambridge University Press.
Greg Clarke, (2000) “Marketing a Service for Profit: A Practical Guide to Key Service
Marketing Concepts Marketing in action series” Kogan Page Publishers, ISBN
0749419199, 9780749419196
Gupta, V.K. (2000), “Marketing of Financial Services”, Mohit Publishers, New Delhi.
iii
Jain, P.C. & Monika Bhatt, (2004), “Consumer Behaviour in Indian Context, S.
Chand Limited, ISBN. 8121922143, 9788121922142
Kapoor, (2011) „Service Marketing: Concepts & Practices Tata McGraw-Hill
Education, 2011, ISBN. 1259083853, 9781259083853
Krishna Mohan, G. (2006), Health Care Marketing, Discovery Publishing House,
ISBN 8183561225, 9788183561228
Lewis, B.R. and Mitchell, V.W. (1990), "Defining and measuring the quality of
customer service", Marketing Intelligence & Planning.
Liang Fook Lye, John Wong, (2016) “The Challenge of Making Cities Liveable in
East Asia
Mamta Brahmbhatt (2015), “Service Quality Management in Banking Sector:
Research Perspective” Lap Lambert Academic Publishing GmbH KG, ISBN
3659341045, 9783659341045
Manoranjan Sharma, (2007) “India's Transforming Financial Sector” Atlantic
Publishers & Dist, ISBN 8126908084, 9788126908080
Michael Milakovich (1995), “Improving Service Quality: Achieving High
Performance in the Public and Private Sectors” CRC Press, ISBN 188401545X,
9781884015458
Parasuraman, A., Zeithaml, V.A. and Berry, L.L. (1988), "SERVQUAL: a multi-
item scale for measuring consumer perceptions of the service quality", Journal
of Retailing.
Peter D Mauch, (2009), “Service Quality Management”, ISBN 0557047013,
9780557047017
Peter Hernon, John R. Whitman (2001), “Delivering Satisfaction and Service
Quality: A Customer-based Approach for Libraries” American Library
Association, ISBN 083890789X, 9780838907894
iv
Priya Basu, (2005), “India's financial sector: recent reforms, future challenges”
ISBN1403927375, 9781403927378
Rakesh Mohan, Partha Ray (2017) “Indian Financial Sector: Structure, Trends and
Turns” International Monetary Fund, ISBN 1475570228, 9781475570229
Ramanuj Majumdar, (2010), “Consumer Behaviour: Insights From Indian Market”
PHI Learning Pvt. Ltd., 8120339630, 9788120339637
Ravi Shanker, (2002) “Services Marketing”, Excel Books India, ISBN 8174462678,
788174462671
Rohin Gupta Suri (2002), “Services Marketing”, Ammal Publications Pvt., Ltd., New
Delhi, 2002.
Roland T. Rust, Ming-Hui Huang, (2014) “Handbook of Service Marketing
Research, Elgar original reference, Elgar reference collection”, Edward Elgar
Publishing, ISBN 0857938851, 9780857938855
Sarah Cook (2000), “Measuring Customer Service Effectiveness”, Gower Publication
Ltd., ISBN 0566085380, 9780566085383
Srinivasan, R. (2004), “Services Marketing: The Indian Context” PHI Learning Pvt.
Ltd., ISBN 8120350340, 9788120350342
Stephen Walter Brown (1991) “Service Quality: Multidisciplinary and Multinational
Perspectives: Issues in organization and management series” Lexington books,
ISBN 0669211524, 9780669211528
Toniolo, G (2005), “Central bank cooperation at the Bank for International Settlements
1930-1973”, Cambridge University Press.
Valarie A. Zeithaml (2003), Delivering Quality Service Simon and Schuster, 2010
1439137471, 9781439137475
Vijayaragavan Iyengar, (2009), Introduction to Banking Excel Books India, ISBN.
8174465693, 9788174465696
v
Vyuptakesh Sharan (2009), “India's Financial Sector: An Era of Reforms” SAGE
Publications India, ISBN 8132104382, 9788132104384
Wilson A, Zeithaml V, Bitner M, Gremier D (2008), “Service Marketing: Integrating
Customer Focus across the Firms”, First European Edition, McGraw Hill, UK.
Wisniewski, M. and Donnelly, M. (1996), "Measuring service quality in the public
sector: the potential for SERVQUAL", Total Quality Management.
Zeithaml, V.A. and Bitner, M.J. (1996), “Services Marketing”, McGraw-Hill, New
York, NY.
JOURNALS
Abed Abedniya, Majid Nokhbeh Zaeim and Bardia Yousef Hakimi (2010),
“Investigating the Relationship between Customers‟ Perceived Service Quality
and Satisfaction: Islamic Bank in Malaysia”, European Journal of Social
Sciences, Vol. 21(4).
Abu Shanab E. and Pearson J.M., (2007), “Internet Banking in Jordan: The Unified
Theory of Acceptance and use of Technology (UTAUT) Perspective”, Journal
of Systems and Information Technology, Vol. 9(1).
Ahmad and Sultan (2011), “How Service Quality affects Performance of
Conventional Banks in Pakistan”, Interdisciplinary Journal of Contemporary
Research in Business, Vol. 2(9).
Akroush, Mamoun N.; Khatib and Fahed, S. (2009), “The Impact of Service Quality
Dimensions on Performance: An Empirical Investigation of Jordan's
Commercial Banks”, Journal of Accounting, Business & Management,
Vol. 16(1).
Arun Kumar, S. Tamil Mani, B. Mahalingam, S. and Vanjikovan, M. (2010),
“Influence of service Quality on Attitudinal Loyalty in Private Retail Banking:
An Empirical Study”, The IUP Journal of Management Research, Vol. 9(4).

vi
Aruna Dhale and Manish Mittal (2008), “Preferences, Satisfaction Level and
Chances of Shifting: A Study of the Customers of Public Sector and New
Private Sector Banks”, The ICFAI Journal of Bank Management, Vol. 7(2).
Ashfaq Ahmad, Kashif-ur-Rehman and Nadeem Safwan (2011), “Testing a Model
of Islamic Banking Based on Service Quality, Customer Satisfaction and Bank
Performance , African Journal of Business Management, Vol. 5(5).
Ashok Kumar and Rajesh (2009), “Whether Today‟s Customers are Satisfied? -
A Study with Banks”, Indian Journal of Marketing, Vol. 39(9).
Asma Abdul Rehman (2012), “Customer Satisfaction and Service Quality in Islamic
Banking: A Comparative Study in Pakistan, United Arab Emirates and United
Kingdom”, Qualitative Research in Financial Markets, Vol. 4(3).
Barbara Culiberg (2010), “Identifying Service Quality Dimensions as Antecedents to
Customer Satisfaction in Retail Banking”, Economic and Business Review,
Vol. 12(3).
Bebko, C.P. (2000), “Service Intangibility and its Impact on Consumer Expectations of
Service Quality”, Journal of Services Marketing, Vol. 14(1).
Bedi and Monica (2010), “An Integrated Framework for Service Quality, Customer
Satisfaction and Behavioral Responses in Indian Banking Industry - A
Comparison of Public and Private Sector Banks”, Journal of Services Research,
Vol. 10(1).
Bhaskar P.V. (2004), “Customer Service in Banks”, IBA Bulletin, Vol. 26(8).
Bhat and Mushtaq (2005), “Service Quality Perceptions in Banks: A Comparative
Analysis”, Vol. 9(1).
Bitner, Mary, J. (1992), “Services Cape: The Impact of Physical Surroundings on
Customers and Employees”, Journal of Marketing, Vol. 56.
Chauhan, M. (2006), “Banking Industry in India: The developing Trends”, Monthly
Commentary, Vol. 36(10).
vii
Clark, G., Johnston, R., Shulver, M. (2000), “Exploiting the Service Concept for
Service Design and Development in: New Service Design”, Sage, Thousand
Oaks, CA.
Daly, Aidan with McDonnell, Juliana (2005), “Marketing Service Internationally - A
rich Topic for Much Needed Research”, International Business & Economy, 4th
Annual Conference, Honolulu, Hawaii, Vol. 6(9).
Dilpreet Singh, Dr. Harpreet Singh and Dr. Namrata Sandhu (2017), “New Market
Entry Strategies: Public and Private Sector Banks in India”, SCMS Journal of
Indian Management, January - March, ISSN: 0973-3167, Vol. 14(1).
Ding Hooi Ting (2004), “Service Quality and Satisfaction Perceptions Curvilinear and
Interaction Effect”, International Journal of Bank Marketing, Vol. 22(6).
Durkin, Mark1, Aodheen O'Donnell, Gwyneth Mullholl and Jospeh Crowe (2007),
“On E-Banking Adoption: from Banker Perception to Customer Reality”,
Journal of Strategic Marketing, Vol.15(16).
Essam, E Ibrahim, Matthew Joseph and Kevin Ibeh (2006), “Customers‟ Perception
of Electronic Service Delivery in the UK Retail Banking Sector”, International
Journal of Bank Marketing, Vol. 24(7).
Evert Gummensson (1987), “Lip Service - A Neglected Area in Services Marketing”,
Journal of Services Marketing, Vol. 1.
Figen Yeilada and Ebru Direktör (2010), “Health Care Service Quality:
A Comparison of Public and Private Hospitals”, African Journal of Business
Management Vol. 4(6).
Garvin and David A. (1983), “Quality on the Line”, Harvard Business Review,
Vol. 61.
Ghodeswar B.M. (2002), “Gaining Customer Loyalty through Superior Service”,
Search a Monthly Business, Tata Infomedia Ltd., Vol. 2(2).

viii
Gwo-Guang Lee and Hsiu-Fen Lin (2005), “Customer Perceptions of E-Service
Quality in Online Shopping”, International Journal of Retail & Distribution
Management, Vol. 33(2).
Haque and Imamul, Service Quality in Retail Banking (2011), “A Comparative
Study Between Public Sector Banks & Private Sector Banks”, International
Journal of Management & Innovation, Vol. 3(2).
Hua, L.Y. (2012), “Customer Satisfaction Antecedents within Service Recovery
Context: Evidence from “Big 4” Banks in China” Nankai Business Review
International, Vol. 3(3).
Hummayoun Naeem, Asma Akram and Iqbal Saif, M. (2009), “Service Quality and
its Impact on Customer Satisfaction: An Empirical Evidence from the Pakistani
Banking Sector”, International Business and Economics Research Journal,
Vol. 8(12).
Huseyin Arasli, Salih Turan Katircioglu and Salime Mehtap-Smadi (2005),
“A Comparison of Service Quality in the Banking Industry: Some Evidence
from Turkish- and Greek-speaking areas in Cyprus”, International Journal of
Bank Marketing, Vol. 23(7).
Issham Ismail, Nadiatul Rosley and Soo Sin Ling (2011), “Banking Services and
Customer Satisfaction: Analysis in Malaysia”, Crown Journal of Business
Management, Vol. 1(1).
Istvan Szuts (2008), “Loyalty Problems in Retail Banking”, 6th
International
Conference on Management, Enterprise and Bench Marketing, Budapest,
Hungry.
Jaiswa K.S. and Neetu Singh (2007), “Retail Banking: Indian Scenario” Vol. 37(1).
Jayant Kumar, H.P and Prajakta, H. (2012), “Expectation and Perception of
Customers Across the Public and Private Sector Banks: An Empirical Study of
Selected Banks in North Gujrat”, Journal of Applied Management & Computer
Science, Vol. 1.
ix
Kailash, M. (2012), “A Study on Customer Satisfaction with Service Quality in Indian
Public and Private Sector Banks”, Golden Research Thoughts, Vol. 1(9).
Kajal Chaudhary and Monika Sharma (2011), “Performance of Indian Public Sector
Banks and Private Sector Banks: A Comparative Study”, International Journal
of Innovation, Management and Technology, Vol. 2(3).
Khong K.W. and Richardson, S. (2001), “Business Process Re-Engineering:
A Comparison with Other Management Techniques”, The Journal of the
Institute of Bankers India, Vol. 4(9).
Krystallia and Chrysochou (2014), “The Effects of Service Brand Dimensions on
Brand Loyalty”, Journal of Retailing and Consumer Services, Vol. 21(2).
Lewis, B.R. and Mitchell, V.W. (1990), “Defining and Measuring the Quality of
Customer Service”, Marketing Intelligence & Planning, Vol. 8(6).
Lori S. Cook and Rohit Verma (2002), “Exploring the Linkages between Quality
System, Service Quality” and Performance Excellence: Service Providers
Perspective”, Quality Management Journal, UTAH. Vol. 9(2).
Lovelock, C.H and Yip (1996), “Developing Global Strategies for Service
Businesses”, Californian management Review, Vol. 38(2).
Mahila Vasanthi Thangam (2016), “Profitability Analysis of Selected Public and
Private Banks in India”, International Journal of Scientific Engineering and
Applied Science (IJSEAS), Vol. 2(2).
Mersha and Yonatan (2012), “Perceived Service Quality in Ethiopian Retail Banks”,
Thunderbird International Business Review, Vol. 54(4).
Michael K. Brady and J. Joseph Cronin Jr (2001), “Some New Thoughts on
Conceptualizing Perceived Service Quality: A Hierarchical Approach” The
Journal of Marketing, Vol. 65(3).
Muhammad Ehsan Malik, Basharat Naeem and Zoune Arif (2011), “How Do
Service Quality Perceptions Contribute in Satisfying Banking Customers?”
Vol. 3(8).

x
Mukta Dewan, SadhanaMahajan (2014), “A Study of the Perceived Service Quality
and its Dimensions in Private Sector Banks”, IOSR Journal of Business and
Management (IOSR-JBM) E-ISSN: 2278-487X, Vol. 16(2).
Murugan V.G. (2012), “Customer Satisfaction with Service Quality: An Empirical
Study of Public and Private Sector Banks in Tirupati Region”, International
Journal of Research in Commerce and Management, Vol. 3(1).
Muslim Amin and Zaidi Isa (2008), “An Examination of the Relationship Between
Service Quality Perception and Customer Satisfaction: A SEM Approach
towards Malaysian Islamic Banking”, International Journal of Islamic and
Middle Eastern Finance and Management, Vol. 1(3).
Narayan Swar and Biranchi (2011), “A Study of Customer Satisfaction & Service
Quality Gaps in Selected Private, Public & Foreign Banks”, SIES Journal of
Management, Mar 2011, Vol. 7(2).
Nirmaljeet Virk and Prabhjot Kaur Mahal (2012), “Customer Satisfaction: a
Comparative Analysis of Public and Private Sector Banks in India” Information
and Knowledge Management, Vol. 2(3).
Pandit C. Bilamge (2011), “A Comparative Study of Customer Perception Towards
Services Rendered by Public Sector and Private Sector Banks”, Indian Journal
of Commerce & Management Studies, Vol. 2(2).
Parasuraman A, Valarie A Zeithaml and Leonard L Berry (1988), “The Service-
Quality Puzzle”, Business Horizons.
Parasuraman A, Valarie A Zeithaml and Leonard L Berry (1993), “The Nature and
Determinants of Customer Expectations of Service”, Journal of the Academy of
Marketing Science, Vol. 21(1).
Parasuraman A, Valarie A Zeithaml and Leonard L Berry (1985), “A Conceptual
Model of Service Quality and its Implications for Future Research”, The Journal
of Marketing, Vol. 49(4).
xi
Parasuraman, A., Zeithaml and V.A., Berry, L.L. (1988), “SERQUAL: A Multiple-
Item Scale for Measuring Consumer Perceptions of Service Quality”, Journal of
Retailing. Vol. 64(1).
Parasuraman, A., Zeithaml, V.A. and Berry, L.L. (1985), “A Conceptual Model of
Service Quality and its Implication”, Journal of Marketing, Vol. 49.
Parasuraman, Berry and Zeithaml (1991), “Understanding Customer Expectations of
Service”, Sloan Management Review.
Paschal Wanzalla Soita (2012), “Customers‟ Perception about Service Quality in
Commercial Health and Fitness Clubs”, Uganda, Journal of Education and
Practice, Vol. 3(4).
Rama Mohana Rao, K. and Tekeste Berhanu Lakew (2011), “Service Quality
Perceptions of Customers: A Study of the Customers‟ of Public Sector and
Private Sector Commercial Banks in India”, International Journal of Research in
Commerce & Management, Vol. 2 (11).
Ramesh, H Taxak and Manjeet Kaur (2009), “A Study of Customer Satisfaction in
Private and Public Sector Banks”, Gyan Management, Vol. 3(1).
Ravichandran, K. Tamil Mani, B. Arun Kumar, S. and Prabhakaran, S. (2010),
“Influence of Service Quality on Customer Satisfaction Application of
SERVQUAL Model”, International Journal of Business and Management”,
Vol. 5(4).
Rengaswamy Nalini, Ramachandran Amudha, Venkatarayareddiar Sujatha,
Rengaswamy Radha (2014), “A Pragmatic Study on the Service Gap Analysis
of an Indian Public Sector Bank”, Business: Theory and Practice”, Vol. 15(4).
Sadek and Kamaruzaman (2010), “Service Quality Perceptions between Cooperative
and Islamic Banks of Britain”, American Journal of Economics & Business
Administration, Vol. 2(1).
xii
Sadiq Sohail, M. and Balachandran Shanmugham, B. (2003) “E-Banking and
Customer Preferences in Malaysia: An Empirical Investigation”, Information
Sciences Vol. 150(4).
Satendra Thakur, A.P Singh (2011), “Service Quality and Customer Satisfaction:
A Study with Special Reference to Public Sector Banking Industries in India”,
International Journal of Management Research and Review, Vol. 1(1).
Sayani, Hameedah, Miniaoui and Hela (2013), “A Study on Identifying the
Determinants of Bank Selection for Islamic and Conventional Banks in the
United Arab Emirates (UAE)”, International Journal of Bank Marketing,
Vol. 31(3).
Shobhana, V.K. and Poornima, D. (2012), “Analysis of Gap in Service Quality of
Banks Through Servqual”, Asian Journal of Research in Banking and Finance,
Vol. 2(5).
Shostack, G. Lynn (1977), “Breaking Free From Product Marketing”, Journal of
Marketing, Vol. 41(2).
Singh, J.P., Manish Seth (2016), “An Inclusive Study on Capital Adequacy
Performance of Selected Public Sector and Private Sector Banks in India”,
International Journal of Multifaceted and Multilingual Studies, (Online): 2350-
0476, Vol. 3(10).
Sunny Bose and Nitin Gupta (2013), “Customer Perception of Services Based on the
SERVQUAL Dimensions: A Study of Indian Commercial Banks”, Services
Marketing Quarterly, Vol. 34(1).
Sureshchandar, G.S., Rajendran, C., and Anantharaman, R.N. (2003) “Customer
perceptions of Service Quality in the Banking Sector of a Developing Economy:
A Critical Analysis”, International Journal of Bank Marketing, Vol. 21(5).
Swarup, K.S. (2004), “Customer Orientation in Banks for Building Long Term
Relationships”, IBA Bulletin, Vol. 26(8).
xiii
Taylor, S.A., and Baker, T.L. (1994), “An Assessment of the Relationship Between
Service Quality and Customer Satisfaction in the Formation of Customers'
Purchase Intentions”, Journal of Retailing, Vol. 70.
The Hindu Editorial (2003), “Trends and Progress of Banking in India – A Snapshot”,
The Hindu, Nov.29.
Tran Van Quyet, Nguyen Quang Vinh and Taikoo Chang (2015), “Service Quality
and Its Effects on Customer Satisfaction with Deposit Services in the Banking
Industry”, Advanced Science and Technology Letters, Vol. 8(8).
Uma Sankar Mishra, Jyoti Ranjan Das, Sanjib Pattnaik, Ayasa Kanta Mohanty
(2010), “Service Quality Attributes Affecting Customer Satisfaction in Banking
Sector of India”, European Journal of Economics, Finance and Administrative
Sciences, Vol. 24.
Uppal R.K. (2011), “Customer Delight - A Milestone for the Banks”, Journal of Arts,
Science and Commerce, Vol. 2(4).
Vanniarajan, T. and Subbash Babu, K. (2011), “Internal Service Quality and its
Consequences in Commercial Banks: A HR Perspective”, Global Management
Review, Vol. 6(1).
Vinita Kaura (2013), “Antecedents of Customer Satisfaction: A Study of Indian Public
and Private Sector Banks”, International Journal of Bank Marketing, Vol. 31(3).
Wisniewski, M. (2001), “Using SERVQUAL to Assess Customer Satisfaction with
Public Sector Services”, Managing Service Quality, Vol.11(6).
xiv
THESIS
Imamuel Haque, S.M. (2013), “Retail Banking in India Since 1991: A Comparative
Study of Public Sector Banks and Private Sector Banks”, Aligarh University,
Aligarh, India.
Mary Sujatha, S. (2013), “A Comparative Study on the Customer Satisfaction in
Private Sector and Public Sector Banks with Reference to Chennai City”
Mother Teresa Women‟s University, Kodaikanal, Tamilnadu, India.
Rashmi Sharma (2013), “A Comparative Study of E-Banking in Public and Private
Sector Banks with Special Reference to SBI and HDFC Bank”, The IIS
University, Jaipur, Tamilnadu, India.
Sathya, S. (2013), “A Study on Service Quality in Commercial Banks: a Comparative
study Between Public and Private Sector Banks in Salem City” Manonmaniam
Sundaranar University, Tirunelveli, Tamilnadu, India.
Sivaraman, P. (2013), “A Study on the Effect of Service Quality on Customer
Satisfaction in the Public Sector Banks in Tiruvarur District of Tamilnadu”,
Khadir Mohideen College, Bharathidasan University, Adirampattinam,
Tamilnadu, India.
WEBSITES
https://www.ibef.org/download/Banking-March-2017.pdf
http://journals.plos.org/plosone/article?id=10.1371/journal.pone.0056515
http://www.businesstoday.in/sectors/banks/five-associate-banks-to-merge-with-
sbi-from-april-1/story/246918.html
http://economictimes.indiatimes.com/industry/banking/finance/banking/sbi-
pushes-merger-of-5-associate-banks-bmb-to-next-
fiscal/articleshow/56295671.cms
http://www.ndtv.com/topic/sbi-merger/news
http://www.ndtv.com/topic/sbi-merger]
xv
http://www.livemint.com/Industry/mf507dGEvv1gCGRknnY9GM/SBI-merger-
with-five-associate-banks-from-1-April.html
https://rbi.org.in/Scripts/AnnualPublications.aspx?head=Handbook%20of%20St
atistics%20on%20Indian%20Economy
https://www.rbi.org.in/scripts/AnnualPublications.aspx?head=Handbook+of+St
atistics+on+Indian+Economy%3E
https://dbie.rbi.org.in/DBIE/dbie.rbi?site=publications#!2
https://rbidocs.rbi.org.in/rdocs/Publications/PDFs/0HANDB_F0651BA902A52
44DFB75DA46261B53726.PDF
http://economictimes.indiatimes.com/industry/banking/finance/banking/higher-
current-and-savings-accounts-credit-deposit-ratio-helped-private-
banks/articleshow/56464297.cms
http://www.thehindubusinessline.com/money-and-banking/cashdeposit-ratio-of-
banks-still-too-high/article2866430.ece
http://www.thehindubusinessline.com/money-and-banking/cashdeposit-ratio-of-
banks-still-too-high/article2866430.ece
http://www.investopedia.com/terms/l/loan-to-deposit-ratio.asp
http://journals.plos.org/plosone/article?id=10.1371/journal.pone.0056515
https://asso-sherpa.org/sherpa-content/docs/programmes/FFID/GT/Debt.pdf
http://economictimes.indiatimes.com/industry/banking/finance/banking/higher-
current-and-savings-accounts-credit-deposit-ratio-helped-private-
banks/articleshow/56464297.cms
http://www.thehindubusinessline.com/money-and-banking/cashdeposit-ratio-of-
banks-still-too-high/article2866430.ece
xvi
http://www.thehindubusinessline.com/money-and-banking/cashdeposit-ratio-of-
banks-still-too-high/article2866430.ece
http://www.tn.gov.in/
https://www.questia.com/library/journal/1P3-2908513861/a-study-of-the-
factors-that-influence-customer-preference
https://www.scribd.com/doc/49705183/Study-on-consumer-preference-and-the-
factors-influencing-buying-decision-in-Colour-Television-w-s
http://tirunelveli.nic.in/
https://prezi.com/ncenyyjlvzul/customer-preference-the-factors-that-influence-
the-buying/
http://www.ehow.com/info_8116011_factors-affecting-consumer-
preferences.html
http://ageconsearch.umn.edu/bitstream/26515/1/32010097.pdf
http://citeseerx.ist.psu.edu/viewdoc/download?doi=10.1.1.681.9071&rep=rep1
&type=pdf
http://www.tarj.in/images/download/AJMMR/TAJMMR%20MAR.-
APR.2013,COMPLETE%20PDF/3-4.6,%20Pushpavathani.K.pdf
http://www.bioone.org/doi/abs/10.1579/0044-7447-34.4.352?journalCode=ambi
http://tirunelveli.nic.in/banks_tel.html
http://www.news18.com/news/business/agency-banks-rbi-offices-to-remain-
open-till-april-1-1363997.html
http://gulfnews.com/business/sectors/banking/banking-sector-delivers-healthy-
growth-1.1827915
http://www1.udel.edu/alex/chapt6.html
http://journals.sagepub.com/doi/abs/10.1177/0972150916645693
xvii
http://www.essay.uk.com/free-essays/finance/internet-banking.php
http://www.yourarticlelibrary.com/organization/perception/stages-involved-in-
perception-process/63815/
http://www.slbctn.com/Banking_Details.aspx
https://www.boundless.com/management/textbooks/boundless-management-
textbook/organizational-behavior-5/individual-perceptions-and-behavior-
41/the-perceptual-process-217-3560/
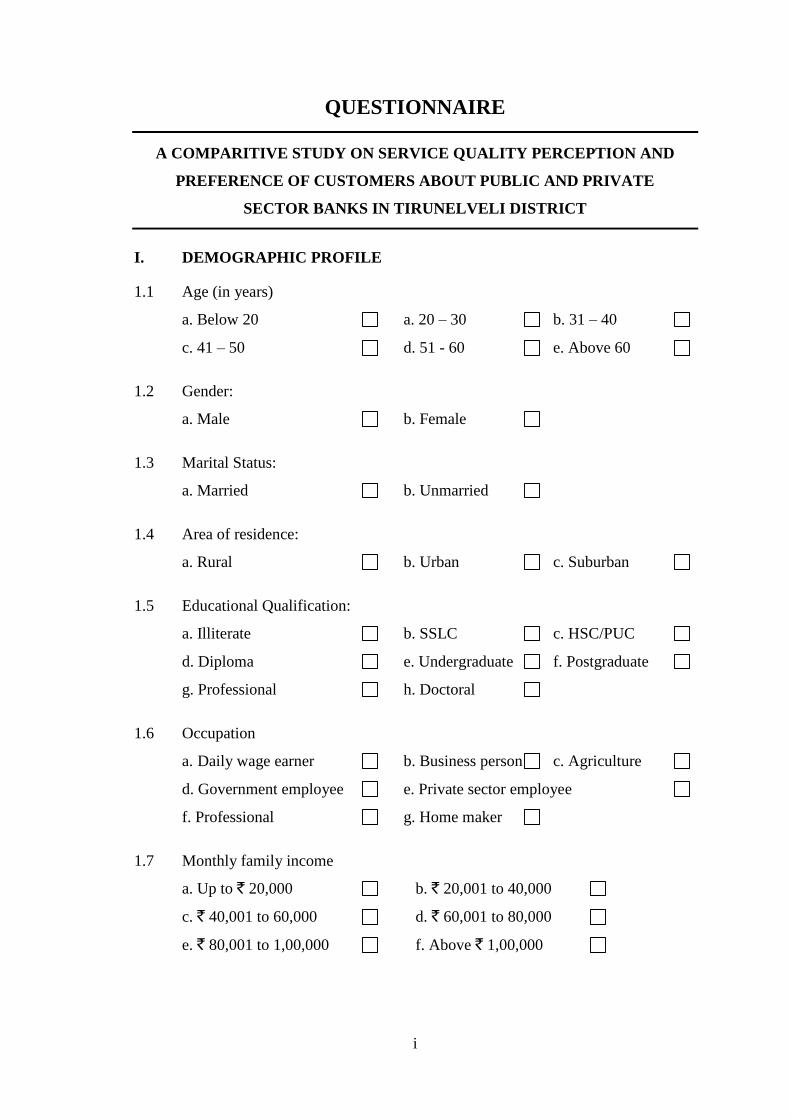
i
QUESTIONNAIRE
A COMPARITIVE STUDY ON SERVICE QUALITY PERCEPTION AND
PREFERENCE OF CUSTOMERS ABOUT PUBLIC AND PRIVATE
SECTOR BANKS IN TIRUNELVELI DISTRICT
I. DEMOGRAPHIC PROFILE
1.1 Age (in years)
a. Below 20 a. 20 – 30 b. 31 – 40
c. 41 – 50 d. 51 - 60 e. Above 60
1.2 Gender:
a. Male b. Female
1.3 Marital Status:
a. Married b. Unmarried
1.4 Area of residence:
a. Rural b. Urban c. Suburban
1.5 Educational Qualification:
a. Illiterate b. SSLC c. HSC/PUC
d. Diploma e. Undergraduate f. Postgraduate
g. Professional h. Doctoral
1.6 Occupation
a. Daily wage earner b. Business person c. Agriculture
d. Government employee e. Private sector employee
f. Professional g. Home maker
1.7 Monthly family income
a. Up to ` 20,000 b. ` 20,001 to 40,000
c. ` 40,001 to 60,000 d. ` 60,001 to 80,000
e. ` 80,001 to 1,00,000 f. Above ` 1,00,000
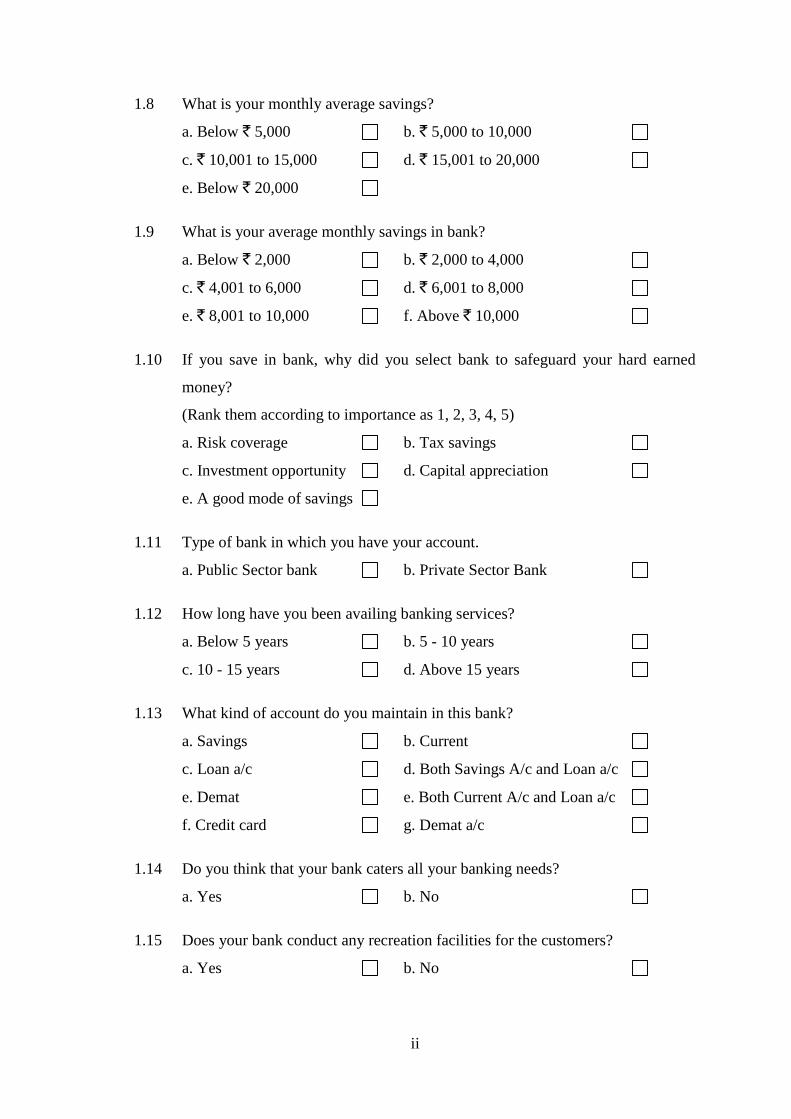
ii
1.8 What is your monthly average savings?
a. Below ` 5,000 b. ` 5,000 to 10,000
c. ` 10,001 to 15,000 d. ` 15,001 to 20,000
e. Below ` 20,000
1.9 What is your average monthly savings in bank?
a. Below ` 2,000 b. ` 2,000 to 4,000
c. ` 4,001 to 6,000 d. ` 6,001 to 8,000
e. ` 8,001 to 10,000 f. Above ` 10,000
1.10 If you save in bank, why did you select bank to safeguard your hard earned
money?
(Rank them according to importance as 1, 2, 3, 4, 5)
a. Risk coverage b. Tax savings
c. Investment opportunity d. Capital appreciation
e. A good mode of savings
1.11 Type of bank in which you have your account.
a. Public Sector bank b. Private Sector Bank
1.12 How long have you been availing banking services?
a. Below 5 years b. 5 - 10 years
c. 10 - 15 years d. Above 15 years
1.13 What kind of account do you maintain in this bank?
a. Savings b. Current
c. Loan a/c d. Both Savings A/c and Loan a/c
e. Demat e. Both Current A/c and Loan a/c
f. Credit card g. Demat a/c
1.14 Do you think that your bank caters all your banking needs?
a. Yes b. No
1.15 Does your bank conduct any recreation facilities for the customers?
a. Yes b. No
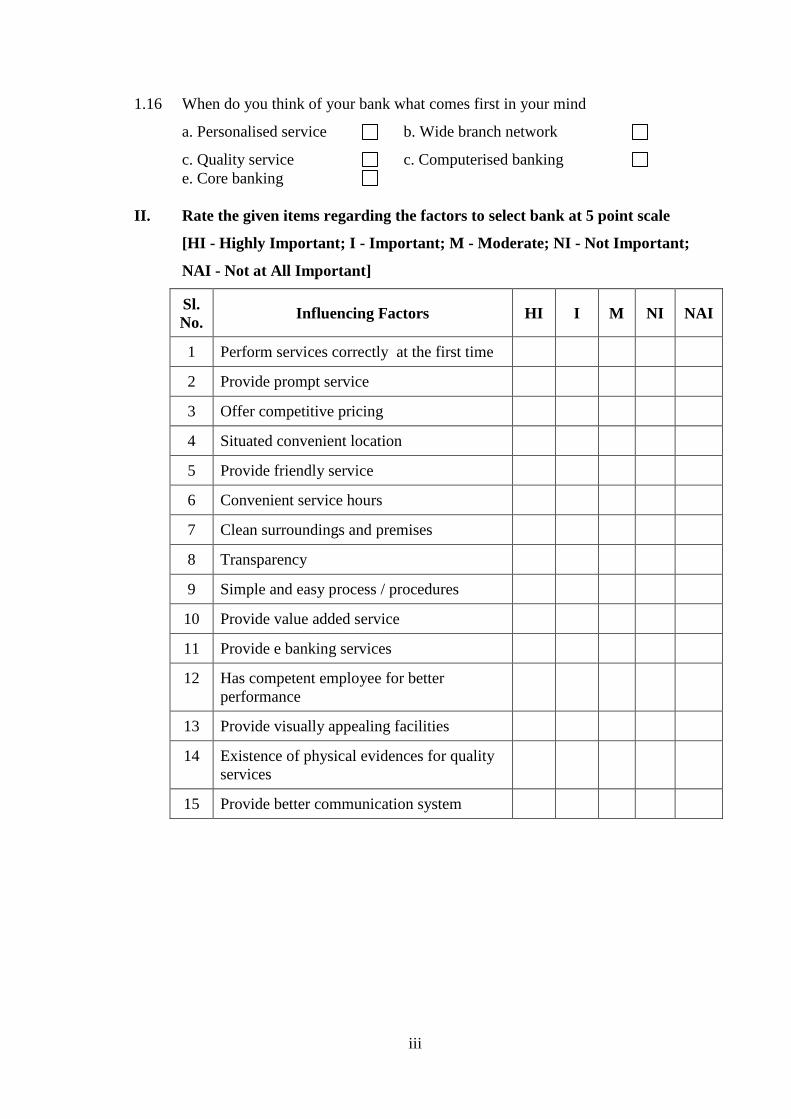
iii
1.16 When do you think of your bank what comes first in your mind
a. Personalised service b. Wide branch network
c. Quality service c. Computerised banking
e. Core banking
II. Rate the given items regarding the factors to select bank at 5 point scale
[HI - Highly Important; I - Important; M - Moderate; NI - Not Important;
NAI - Not at All Important]
Sl.
No. Influencing Factors HI I M NI NAI
1 Perform services correctly at the first time
2 Provide prompt service
3 Offer competitive pricing
4 Situated convenient location
5 Provide friendly service
6 Convenient service hours
7 Clean surroundings and premises
8 Transparency
9 Simple and easy process / procedures
10 Provide value added service
11 Provide e banking services
12 Has competent employee for better
performance
13 Provide visually appealing facilities
14 Existence of physical evidences for quality
services
15 Provide better communication system
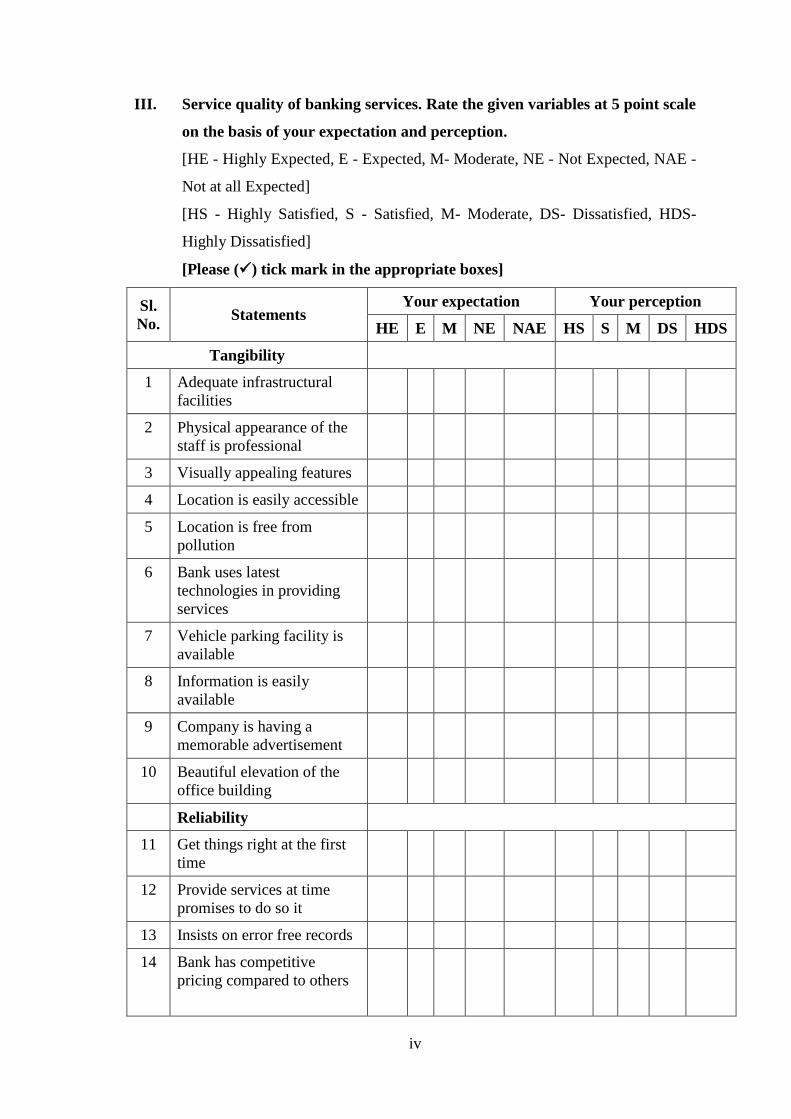
iv
III. Service quality of banking services. Rate the given variables at 5 point scale
on the basis of your expectation and perception.
[HE - Highly Expected, E - Expected, M- Moderate, NE - Not Expected, NAE -
Not at all Expected]
[HS - Highly Satisfied, S - Satisfied, M- Moderate, DS- Dissatisfied, HDS-
Highly Dissatisfied]
[Please () tick mark in the appropriate boxes]
Sl.
No. Statements
Your expectation Your perception
HE E M NE NAE HS S M DS HDS
Tangibility
1 Adequate infrastructural
facilities
2 Physical appearance of the
staff is professional
3 Visually appealing features
4 Location is easily accessible
5 Location is free from
pollution
6 Bank uses latest
technologies in providing
services
7 Vehicle parking facility is
available
8 Information is easily
available
9 Company is having a
memorable advertisement
10 Beautiful elevation of the
office building
Reliability
11 Get things right at the first
time
12 Provide services at time
promises to do so it
13 Insists on error free records
14 Bank has competitive
pricing compared to others
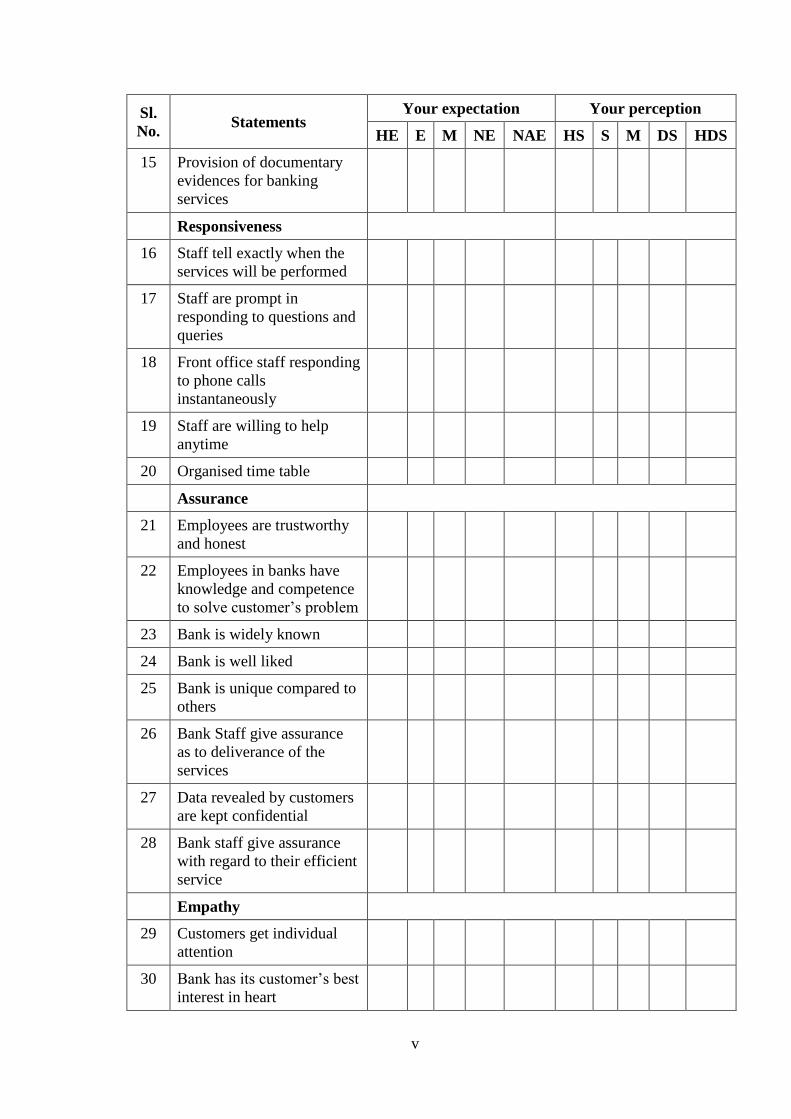
v
Sl.
No. Statements
Your expectation Your perception
HE E M NE NAE HS S M DS HDS
15 Provision of documentary
evidences for banking
services
Responsiveness
16 Staff tell exactly when the
services will be performed
17 Staff are prompt in
responding to questions and
queries
18 Front office staff responding
to phone calls
instantaneously
19 Staff are willing to help
anytime
20 Organised time table
Assurance
21 Employees are trustworthy
and honest
22 Employees in banks have
knowledge and competence
to solve customer’s problem
23 Bank is widely known
24 Bank is well liked
25 Bank is unique compared to
others
26 Bank Staff give assurance
as to deliverance of the
services
27 Data revealed by customers
are kept confidential
28 Bank staff give assurance
with regard to their efficient
service
Empathy
29 Customers get individual
attention
30 Bank has its customer’s best
interest in heart
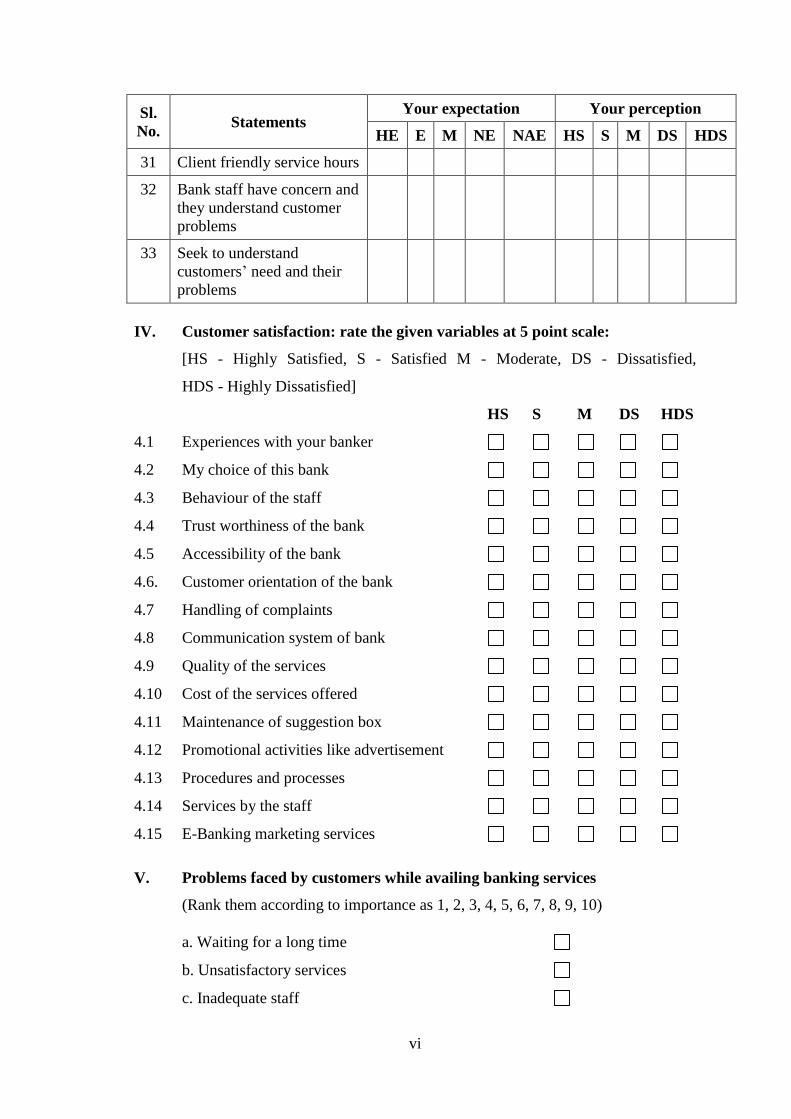
vi
Sl.
No. Statements
Your expectation Your perception
HE E M NE NAE HS S M DS HDS
31 Client friendly service hours
32 Bank staff have concern and
they understand customer
problems
33 Seek to understand
customers’ need and their
problems
IV. Customer satisfaction: rate the given variables at 5 point scale:
[HS - Highly Satisfied, S - Satisfied M - Moderate, DS - Dissatisfied,
HDS - Highly Dissatisfied]
HS S M DS HDS
4.1 Experiences with your banker
4.2 My choice of this bank
4.3 Behaviour of the staff
4.4 Trust worthiness of the bank
4.5 Accessibility of the bank
4.6. Customer orientation of the bank
4.7 Handling of complaints
4.8 Communication system of bank
4.9 Quality of the services
4.10 Cost of the services offered
4.11 Maintenance of suggestion box
4.12 Promotional activities like advertisement
4.13 Procedures and processes
4.14 Services by the staff
4.15 E-Banking marketing services
V. Problems faced by customers while availing banking services
(Rank them according to importance as 1, 2, 3, 4, 5, 6, 7, 8, 9, 10)
a. Waiting for a long time
b. Unsatisfactory services
c. Inadequate staff
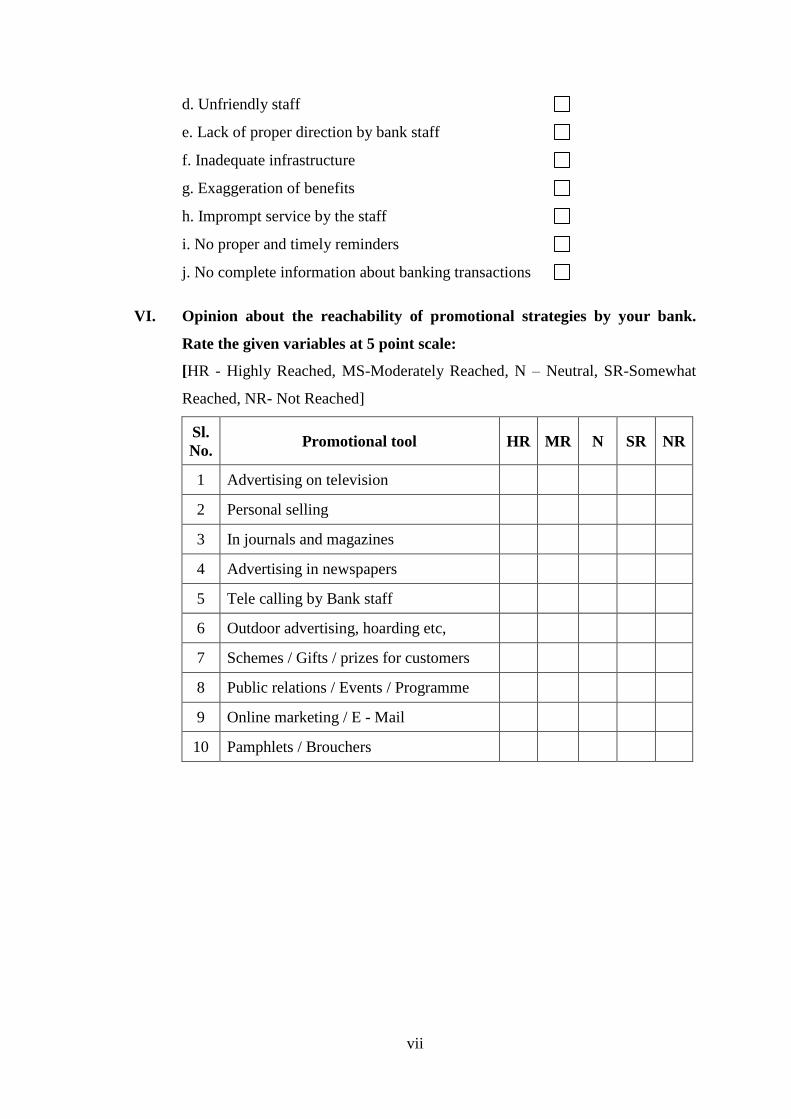
vii
d. Unfriendly staff
e. Lack of proper direction by bank staff
f. Inadequate infrastructure
g. Exaggeration of benefits
h. Imprompt service by the staff
i. No proper and timely reminders
j. No complete information about banking transactions
VI. Opinion about the reachability of promotional strategies by your bank.
Rate the given variables at 5 point scale:
[HR - Highly Reached, MS-Moderately Reached, N – Neutral, SR-Somewhat
Reached, NR- Not Reached]
Sl.
No. Promotional tool HR MR N SR NR
1 Advertising on television
2 Personal selling
3 In journals and magazines
4 Advertising in newspapers
5 Tele calling by Bank staff
6 Outdoor advertising, hoarding etc,
7 Schemes / Gifts / prizes for customers
8 Public relations / Events / Programme
9 Online marketing / E - Mail
10 Pamphlets / Brouchers
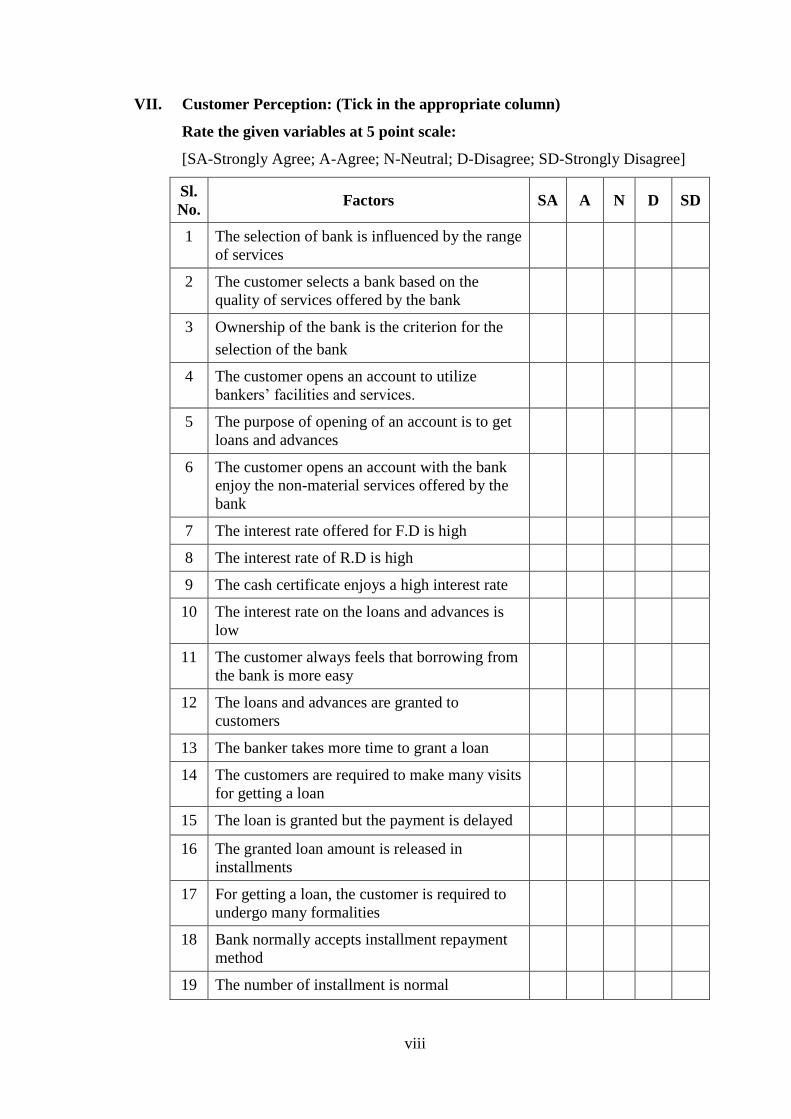
viii
VII. Customer Perception: (Tick in the appropriate column)
Rate the given variables at 5 point scale:
[SA-Strongly Agree; A-Agree; N-Neutral; D-Disagree; SD-Strongly Disagree]
Sl.
No. Factors SA A N D SD
1 The selection of bank is influenced by the range
of services
2 The customer selects a bank based on the
quality of services offered by the bank
3 Ownership of the bank is the criterion for the
selection of the bank
4 The customer opens an account to utilize
bankers’ facilities and services.
5 The purpose of opening of an account is to get
loans and advances
6 The customer opens an account with the bank
enjoy the non-material services offered by the
bank
7 The interest rate offered for F.D is high
8 The interest rate of R.D is high
9 The cash certificate enjoys a high interest rate
10 The interest rate on the loans and advances is
low
11 The customer always feels that borrowing from
the bank is more easy
12 The loans and advances are granted to
customers
13 The banker takes more time to grant a loan
14 The customers are required to make many visits
for getting a loan
15 The loan is granted but the payment is delayed
16 The granted loan amount is released in
installments
17 For getting a loan, the customer is required to
undergo many formalities
18 Bank normally accepts installment repayment
method
19 The number of installment is normal

ix
Sl.
No. Factors SA A N D SD
20 Customers are given sufficient time for the
repayment of loan
21 The amount of each installment is convenient
for repayment
22 The recovery procedure is harsh
23 The customers are well informed about the
default of repayment
24 Availability of Collection of cheque
25 Availability of Collection of drafts
26 Availability of Money transfer/mail transfer
27 Availability of ATM facilities
28 Availability of Safety locker
29 Availability of Electronic clearing services
30 All the services are done quickly
31 The services are provided to all needed
customers
32 Customers are satisfied with the existing
services
33 The charges and fee for providing such services
is low
34 The time required for opening of an account is
normal
35 The banker issues the draft within the specified
time
36 The D.D is realized within the specified time
37 The time taken for the encashment of cheque is
normal
38 The bank is easily accessible
39 The parking space is enough
40 The bank business hours is convenient to
customers
41 The banker feels that customers are the real
assets of the bank
42 Customers’ complaints and grievances are
redressed quickly
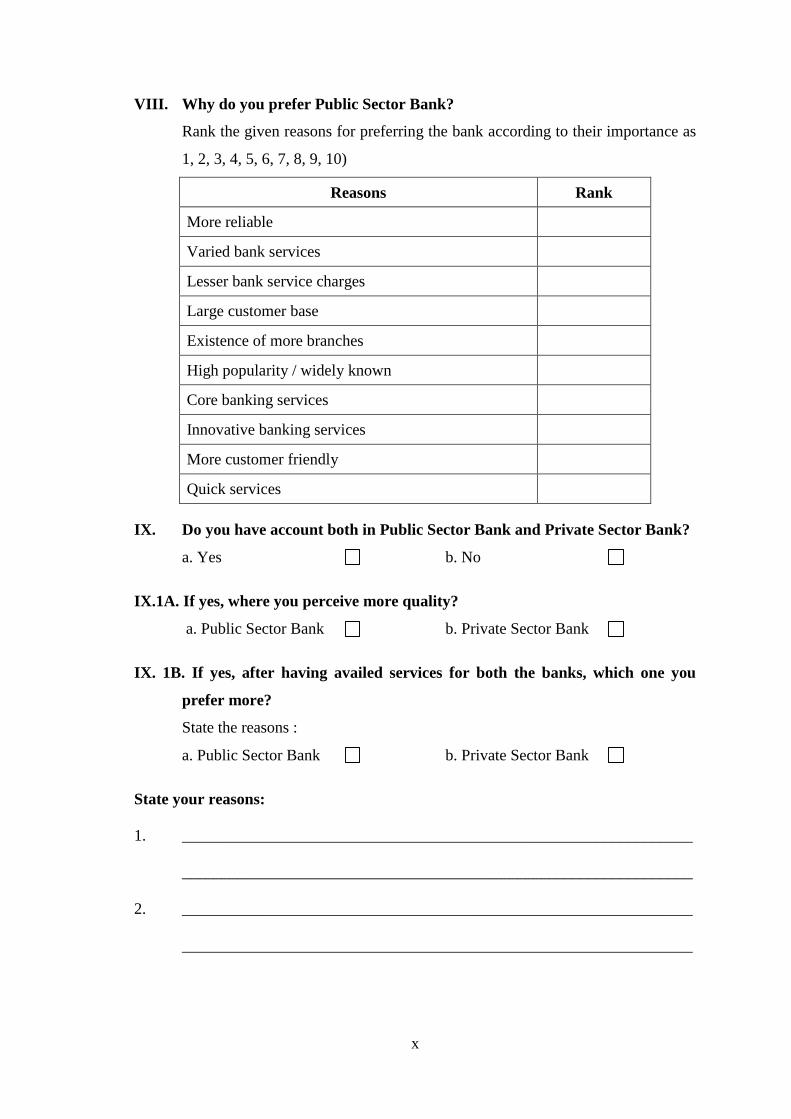
x
VIII. Why do you prefer Public Sector Bank?
Rank the given reasons for preferring the bank according to their importance as
1, 2, 3, 4, 5, 6, 7, 8, 9, 10)
Reasons Rank
More reliable
Varied bank services
Lesser bank service charges
Large customer base
Existence of more branches
High popularity / widely known
Core banking services
Innovative banking services
More customer friendly
Quick services
IX. Do you have account both in Public Sector Bank and Private Sector Bank?
a. Yes b. No
IX.1A. If yes, where you perceive more quality?
a. Public Sector Bank b. Private Sector Bank
IX. 1B. If yes, after having availed services for both the banks, which one you
prefer more?
State the reasons :
a. Public Sector Bank b. Private Sector Bank
State your reasons:
1. ________________________________________________________________
________________________________________________________________
2. ________________________________________________________________
________________________________________________________________
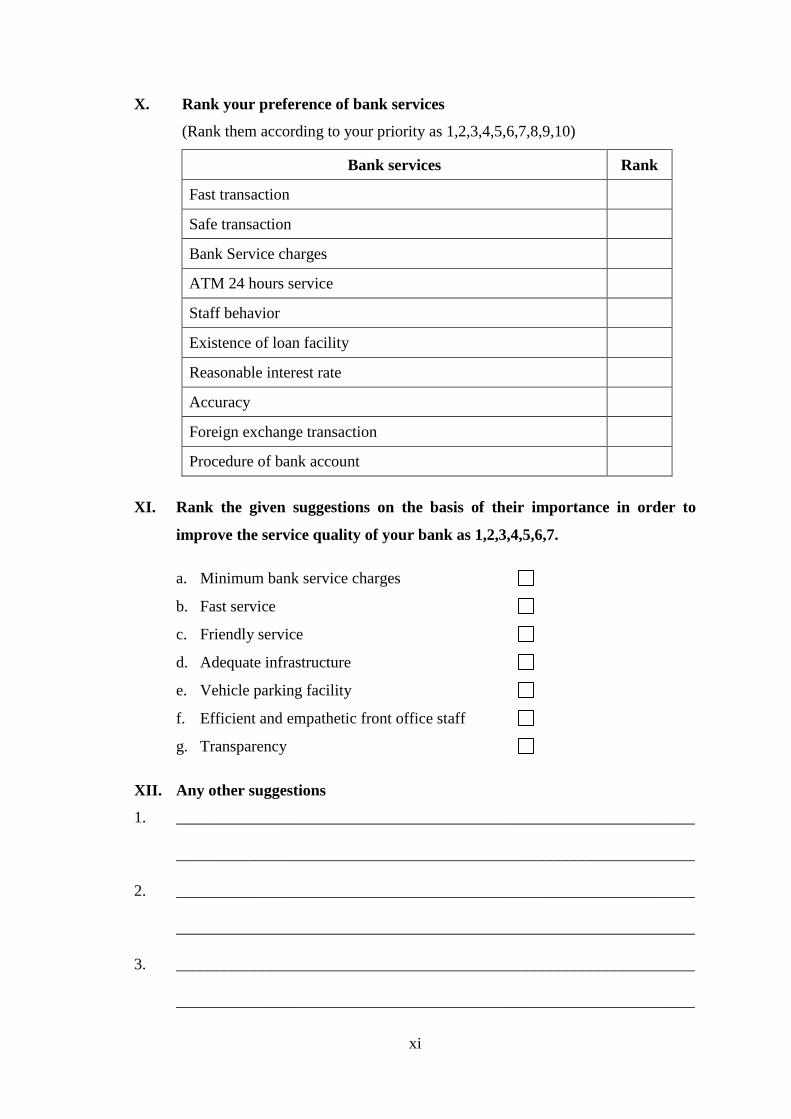
xi
X. Rank your preference of bank services
(Rank them according to your priority as 1,2,3,4,5,6,7,8,9,10)
Bank services Rank
Fast transaction
Safe transaction
Bank Service charges
ATM 24 hours service
Staff behavior
Existence of loan facility
Reasonable interest rate
Accuracy
Foreign exchange transaction
Procedure of bank account
XI. Rank the given suggestions on the basis of their importance in order to
improve the service quality of your bank as 1,2,3,4,5,6,7.
a. Minimum bank service charges
b. Fast service
c. Friendly service
d. Adequate infrastructure
e. Vehicle parking facility
f. Efficient and empathetic front office staff
g. Transparency
XII. Any other suggestions
1. _________________________________________________________________
_________________________________________________________________
2. _________________________________________________________________
_________________________________________________________________
3. _________________________________________________________________
_________________________________________________________________
[Jowerts et. al., Vol.5 (Iss.1: SE): January, 2017] ISSN- 2350-0530(O), ISSN- 2394-3629(P)
ICV (Index Copernicus Value) 2015: 71.21 IF: 4.321 (CosmosImpactFactor), 2.532 (I2OR)
InfoBase Index IBI Factor 3.86
Http://www.granthaalayah.com ©International Journal of Research - GRANTHAALAYAH [32]
Management
A COMPARITIVE STUDY ON SERVICE QUALITY PERCEPTION AND
PREFERENCE OF CUSTOMERS ABOUT PUBLIC AND PRIVATE
SECTOR BANKS IN TIRUNELVELI DISTRICT
G. Bright Jowerts *1
, Dr. C. Eugine Franco 2
*1 Assistant Professor in Commerce, St. Xavier’s College (Autonomous), Palayamkottai, India
2 Associate Professor in Commerce & Dean of students, St. Xavier’s College (Autonomous),
Palayamkottai, India
DOI: https://doi.org/10.5281/zenodo.321816
Abstract
Service Quality of the banks referred as an obligation of all banks to fulfill the objectives and
needs of the customers. The present need of banks is to have good relationship with customers
by providing quality services to retain the existing and generate or acquire new customers. Thus,
this study attempts to study the service quality in the banking sector in the present scenario. The
scope of this study is to identify the service quality of public and private banks in Tirunelveli
district. This research is based on primary data and secondary data. This study only focuses on
the dimensions of service quality i.e. reliability, assurance, tangibility, empathy and
responsiveness. The primary data was collected from 300 customers of banks located in
Tirunelveli district. The analysis was carried out with the responses of the customers of the
public sector banks and private sector banks by adopting stratified random sampling through
questionnaire and presented in the form of tabulation. This study brought to light the fact that the
customers were very much satisfied on the service quality of the banks in the region but at the
same time they expect a lot more from the banks in the present scenario of technological
developments in banks.
Keywords: Service Quality; Perception; Preference; Banking; Public & Private Sector.
Cite This Article: G. Bright Jowerts, and Dr. C. Eugine Franco. (2017). “A COMPARITIVE
STUDY ON SERVICE QUALITY PERCEPTION AND PREFERENCE OF CUSTOMERS
ABOUT PUBLIC AND PRIVATE SECTOR BANKS IN TIRUNELVELI DISTRICT.”
International Journal of Research - Granthaalayah, 5(1)SE, 32-42.
https://doi.org/10.5281/zenodo.321816.
1. Introduction
Across all service industries, service quality remains a critical issue in maintaining and
propagating business in the competitive marketplace. To survive in a highly competitive service

[Jowerts et. al., Vol.5 (Iss.1: SE): January, 2017] ISSN- 2350-0530(O), ISSN- 2394-3629(P)
ICV (Index Copernicus Value) 2015: 71.21 IF: 4.321 (CosmosImpactFactor), 2.532 (I2OR)
InfoBase Index IBI Factor 3.86
Http://www.granthaalayah.com ©International Journal of Research - GRANTHAALAYAH [33]
environment, it is apparent that service industries need to provide customer with high quality
services. Customer today demands quality and from their point of view, quality is nothing but an
integral and expected part of service that is service quality. In banking, quality means not just
meeting but exceeding customer expectations. For this reason, service quality is viewed as an
important aspect in the banking industry. Further, it is evident that over the years, bank
customers’ perception of service quality has been changed tremendously. Today, quality includes
a commitment towards continuous improvement and service relationships with customers. Also,
the need for technology based services, new and improved product services and e-services are
also viewed as important aspects of banking service quality that supports improved and superior
quality services provided to customers. Hence, these are the areas where banks have to focus
upon in order to satisfy their customers.
2. Statement of the Problem
Service Quality of the banks referred as an obligation of all banks to fulfill the objectives and
needs of the customers. In General it is perused that, service quality in private sector banks is
good compared to public sector banks. The various issues the banks are not able to provide
immediate response to customers, service time duration is more, long queue to deposit the
money, waiting for long time, staff behavior is not good, especially public sector banks are not
providing multitude services like payment of bills, payment of tax, Banc assurance etc. and
problem relating to banking service such as bank statements, error in the statements are not
provided immediate response to customers. Parking facility in banks is very poor compared to
private sector banks. The biggest challenge today for the bank is to establish customers intimacy
without which all other efforts towards operationed excellence are meaningless. The present
need of banks is to have good relationship with customers by providing quality services to retain
the existing and generate or acquire new customers. Thus, this study attempts to study the service
quality in the banking sector in the present scenario.
3. Scope of the Study
The scope of this research is to identify the service quality of public and private banks in
Tirunelveli district. This research is based on primary data and secondary data. This study only
focuses on the dimensions of service quality i.e. reliability, assurance, tangibility, empathy and
responsiveness. It aims to understand the skill of the banks in the area of service quality that are
performing well and shows those areas which require improvement. The study was done taking
two types of banks such as public and private banks in Tirunelveli district into consideration. The
survey was restricted to the bank customers in Tirunelveli district only.
4. Objectives of the Study
The study has the following objectives.
To examine the service quality gap determinants on the quality of services of banking
sector.
To compare the service quality provided by public and private sector banks in Tirunelveli
District.

[Jowerts et. al., Vol.5 (Iss.1: SE): January, 2017] ISSN- 2350-0530(O), ISSN- 2394-3629(P)
ICV (Index Copernicus Value) 2015: 71.21 IF: 4.321 (CosmosImpactFactor), 2.532 (I2OR)
InfoBase Index IBI Factor 3.86
Http://www.granthaalayah.com ©International Journal of Research - GRANTHAALAYAH [34]
5. Methodology of the Study
The study was carried out with both primary and secondary data. The primary data was collected
from 300 customers of banks located in Tirunelveli district. The analysis was carried out with the
responses of the customers of the public sector banks and private sector banks by adopting
stratified random sampling through questionnaire and presented in the form of tabulation.
6. Sampling Design
For the purpose of primary data collection, ten banks were selected. Five banks from public
sector banks namely State Bank of India (SBI), Indian Overseas Bank (IOB), Canara Bank (CB),
Indian Bank (INB) and State of Bank of Travancore (SBT) and five banks from private sector
namely Housing Development Finance Corporation Bank (HDFC), Industrial Credit and
Investment Corporation of India Bank (ICICI), AXIS Bank, Tamilnadu Mercantile Bank (TMB)
and Karur Vysya Bank (KVB) in Tirunelveli district. Out of these banks, 30 customers were
selected each from public sector banks and private sector banks in Tirunelveli district. Thus, 300
customers were selected on the basis of stratified random sampling method for the present study.
7. Limitations of the Study
All the answers given by the respondents have been assumed true.
Customers have provided necessary information for some questions from their memory
and experience whose accuracy is not satisfactory.
In this research, only 300 respondents are considered to suggest the five dimensions of
service quality of banking in Tirunelveli district. Large sample of respondents may
produce better results.
The service quality is a vast subject consisting of a number of dimensions. The most
common five service quality dimensions namely, Tangibility, Reliability,
Responsiveness, Assurance, and Empathy only were analyzed in the present study.
8. Analysis and Interpretation
Table 1: Gender wise classification of Respondents
Type of Banks Gender Total
Male Female
Public banks 92(61.3) 58(38.7) 150(100)
Private banks 133(88.7) 17(11.3) 150(100)
Total 225(75) 75(25) 300(100)
Source: Primary Data (Parentheses indicates percentage)
Bank wise analysis reveals that among the customers of public banks, a majority of 92
respondents (61.3 per cent) are male and in private banks, also a majority of 133 respondents
(88.7 per cent) are male. The simple reason for the majority of the male respondents having
account in public and private banks in the study area is that male respondents independently
open accounts in banks. But the female respondents are not financially liberated and they are
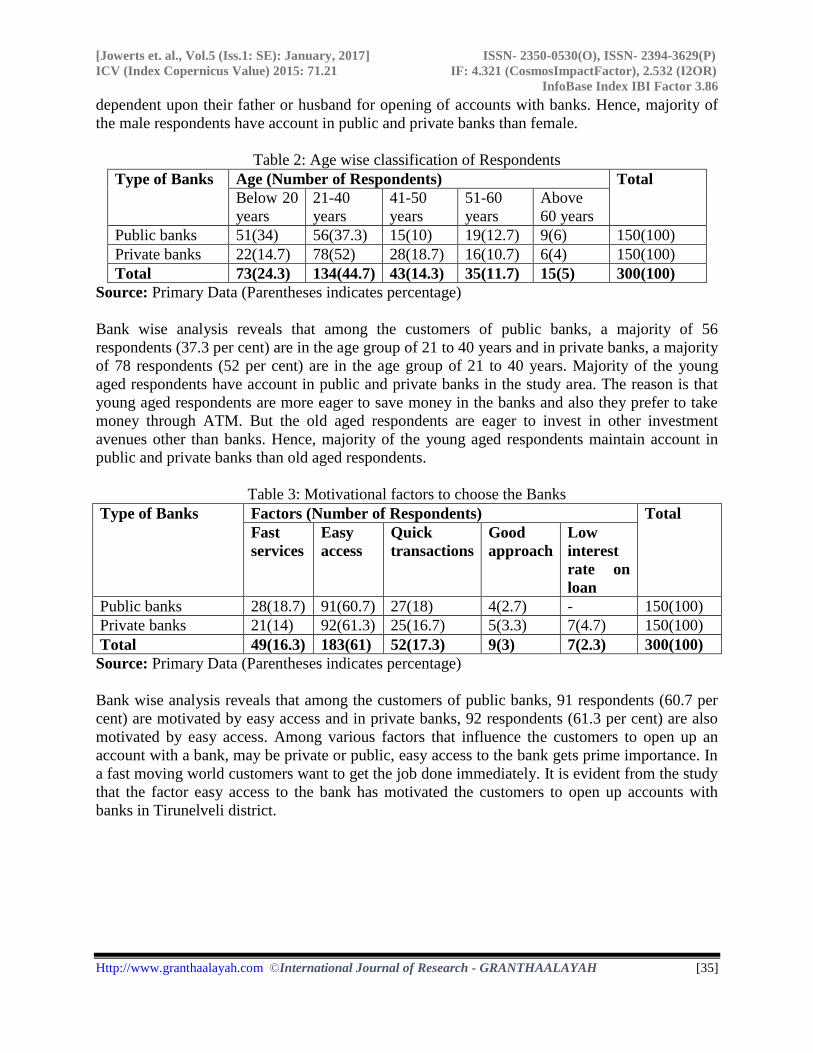
[Jowerts et. al., Vol.5 (Iss.1: SE): January, 2017] ISSN- 2350-0530(O), ISSN- 2394-3629(P)
ICV (Index Copernicus Value) 2015: 71.21 IF: 4.321 (CosmosImpactFactor), 2.532 (I2OR)
InfoBase Index IBI Factor 3.86
Http://www.granthaalayah.com ©International Journal of Research - GRANTHAALAYAH [35]
dependent upon their father or husband for opening of accounts with banks. Hence, majority of
the male respondents have account in public and private banks than female.
Table 2: Age wise classification of Respondents
Type of Banks Age (Number of Respondents) Total
Below 20
years
21-40
years
41-50
years
51-60
years
Above
60 years
Public banks 51(34) 56(37.3) 15(10) 19(12.7) 9(6) 150(100)
Private banks 22(14.7) 78(52) 28(18.7) 16(10.7) 6(4) 150(100)
Total 73(24.3) 134(44.7) 43(14.3) 35(11.7) 15(5) 300(100)
Source: Primary Data (Parentheses indicates percentage)
Bank wise analysis reveals that among the customers of public banks, a majority of 56
respondents (37.3 per cent) are in the age group of 21 to 40 years and in private banks, a majority
of 78 respondents (52 per cent) are in the age group of 21 to 40 years. Majority of the young
aged respondents have account in public and private banks in the study area. The reason is that
young aged respondents are more eager to save money in the banks and also they prefer to take
money through ATM. But the old aged respondents are eager to invest in other investment
avenues other than banks. Hence, majority of the young aged respondents maintain account in
public and private banks than old aged respondents.
Table 3: Motivational factors to choose the Banks
Type of Banks Factors (Number of Respondents) Total
Fast
services
Easy
access
Quick
transactions
Good
approach
Low
interest
rate on
loan
Public banks 28(18.7) 91(60.7) 27(18) 4(2.7) - 150(100)
Private banks 21(14) 92(61.3) 25(16.7) 5(3.3) 7(4.7) 150(100)
Total 49(16.3) 183(61) 52(17.3) 9(3) 7(2.3) 300(100)
Source: Primary Data (Parentheses indicates percentage)
Bank wise analysis reveals that among the customers of public banks, 91 respondents (60.7 per
cent) are motivated by easy access and in private banks, 92 respondents (61.3 per cent) are also
motivated by easy access. Among various factors that influence the customers to open up an
account with a bank, may be private or public, easy access to the bank gets prime importance. In
a fast moving world customers want to get the job done immediately. It is evident from the study
that the factor easy access to the bank has motivated the customers to open up accounts with
banks in Tirunelveli district.
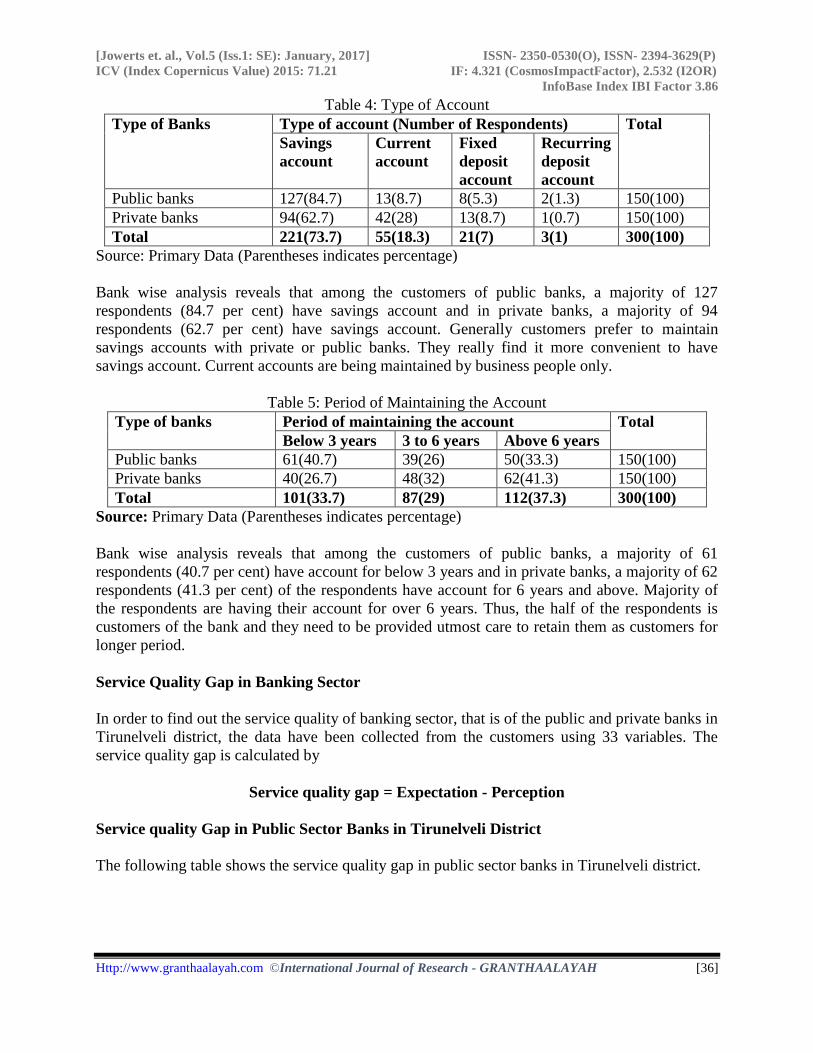
[Jowerts et. al., Vol.5 (Iss.1: SE): January, 2017] ISSN- 2350-0530(O), ISSN- 2394-3629(P)
ICV (Index Copernicus Value) 2015: 71.21 IF: 4.321 (CosmosImpactFactor), 2.532 (I2OR)
InfoBase Index IBI Factor 3.86
Http://www.granthaalayah.com ©International Journal of Research - GRANTHAALAYAH [36]
Table 4: Type of Account
Type of Banks Type of account (Number of Respondents) Total
Savings
account
Current
account
Fixed
deposit
account
Recurring
deposit
account
Public banks 127(84.7) 13(8.7) 8(5.3) 2(1.3) 150(100)
Private banks 94(62.7) 42(28) 13(8.7) 1(0.7) 150(100)
Total 221(73.7) 55(18.3) 21(7) 3(1) 300(100)
Source: Primary Data (Parentheses indicates percentage)
Bank wise analysis reveals that among the customers of public banks, a majority of 127
respondents (84.7 per cent) have savings account and in private banks, a majority of 94
respondents (62.7 per cent) have savings account. Generally customers prefer to maintain
savings accounts with private or public banks. They really find it more convenient to have
savings account. Current accounts are being maintained by business people only.
Table 5: Period of Maintaining the Account
Type of banks Period of maintaining the account Total
Below 3 years 3 to 6 years Above 6 years
Public banks 61(40.7) 39(26) 50(33.3) 150(100)
Private banks 40(26.7) 48(32) 62(41.3) 150(100)
Total 101(33.7) 87(29) 112(37.3) 300(100)
Source: Primary Data (Parentheses indicates percentage)
Bank wise analysis reveals that among the customers of public banks, a majority of 61
respondents (40.7 per cent) have account for below 3 years and in private banks, a majority of 62
respondents (41.3 per cent) of the respondents have account for 6 years and above. Majority of
the respondents are having their account for over 6 years. Thus, the half of the respondents is
customers of the bank and they need to be provided utmost care to retain them as customers for
longer period.
Service Quality Gap in Banking Sector
In order to find out the service quality of banking sector, that is of the public and private banks in
Tirunelveli district, the data have been collected from the customers using 33 variables. The
service quality gap is calculated by
Service quality gap = Expectation - Perception
Service quality Gap in Public Sector Banks in Tirunelveli District
The following table shows the service quality gap in public sector banks in Tirunelveli district.
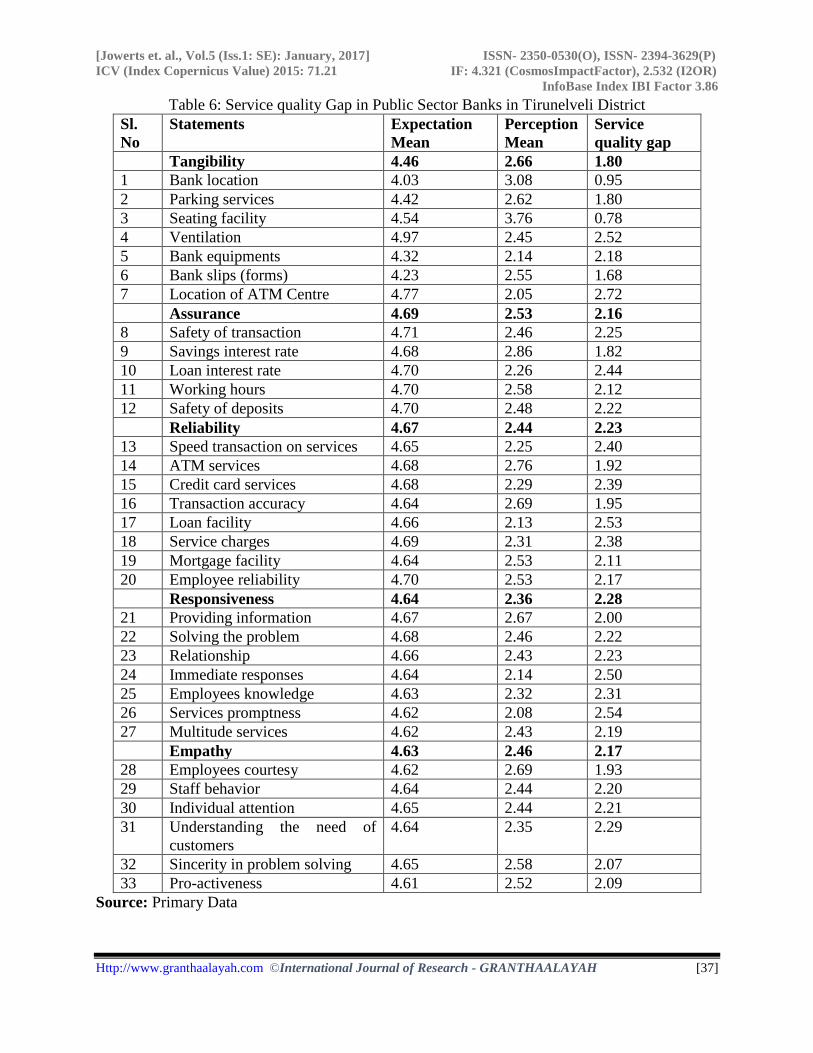
[Jowerts et. al., Vol.5 (Iss.1: SE): January, 2017] ISSN- 2350-0530(O), ISSN- 2394-3629(P)
ICV (Index Copernicus Value) 2015: 71.21 IF: 4.321 (CosmosImpactFactor), 2.532 (I2OR)
InfoBase Index IBI Factor 3.86
Http://www.granthaalayah.com ©International Journal of Research - GRANTHAALAYAH [37]
Table 6: Service quality Gap in Public Sector Banks in Tirunelveli District
Sl.
No
Statements Expectation
Mean
Perception
Mean
Service
quality gap
Tangibility 4.46 2.66 1.80
1 Bank location 4.03 3.08 0.95
2 Parking services 4.42 2.62 1.80
3 Seating facility 4.54 3.76 0.78
4 Ventilation 4.97 2.45 2.52
5 Bank equipments 4.32 2.14 2.18
6 Bank slips (forms) 4.23 2.55 1.68
7 Location of ATM Centre 4.77 2.05 2.72
Assurance 4.69 2.53 2.16
8 Safety of transaction 4.71 2.46 2.25
9 Savings interest rate 4.68 2.86 1.82
10 Loan interest rate 4.70 2.26 2.44
11 Working hours 4.70 2.58 2.12
12 Safety of deposits 4.70 2.48 2.22
Reliability 4.67 2.44 2.23
13 Speed transaction on services 4.65 2.25 2.40
14 ATM services 4.68 2.76 1.92
15 Credit card services 4.68 2.29 2.39
16 Transaction accuracy 4.64 2.69 1.95
17 Loan facility 4.66 2.13 2.53
18 Service charges 4.69 2.31 2.38
19 Mortgage facility 4.64 2.53 2.11
20 Employee reliability 4.70 2.53 2.17
Responsiveness 4.64 2.36 2.28
21 Providing information 4.67 2.67 2.00
22 Solving the problem 4.68 2.46 2.22
23 Relationship 4.66 2.43 2.23
24 Immediate responses 4.64 2.14 2.50
25 Employees knowledge 4.63 2.32 2.31
26 Services promptness 4.62 2.08 2.54
27 Multitude services 4.62 2.43 2.19
Empathy 4.63 2.46 2.17
28 Employees courtesy 4.62 2.69 1.93
29 Staff behavior 4.64 2.44 2.20
30 Individual attention 4.65 2.44 2.21
31 Understanding the need of
customers
4.64 2.35 2.29
32 Sincerity in problem solving 4.65 2.58 2.07
33 Pro-activeness 4.61 2.52 2.09
Source: Primary Data
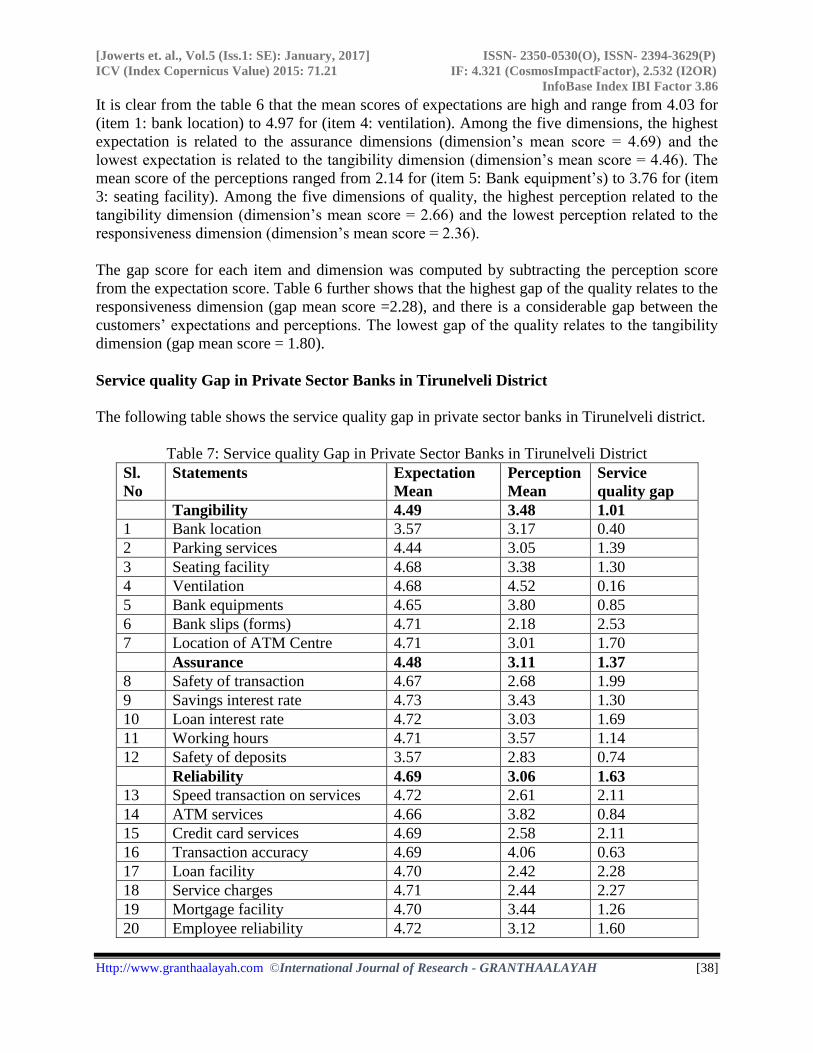
[Jowerts et. al., Vol.5 (Iss.1: SE): January, 2017] ISSN- 2350-0530(O), ISSN- 2394-3629(P)
ICV (Index Copernicus Value) 2015: 71.21 IF: 4.321 (CosmosImpactFactor), 2.532 (I2OR)
InfoBase Index IBI Factor 3.86
Http://www.granthaalayah.com ©International Journal of Research - GRANTHAALAYAH [38]
It is clear from the table 6 that the mean scores of expectations are high and range from 4.03 for
(item 1: bank location) to 4.97 for (item 4: ventilation). Among the five dimensions, the highest
expectation is related to the assurance dimensions (dimension’s mean score = 4.69) and the
lowest expectation is related to the tangibility dimension (dimension’s mean score = 4.46). The
mean score of the perceptions ranged from 2.14 for (item 5: Bank equipment’s) to 3.76 for (item
3: seating facility). Among the five dimensions of quality, the highest perception related to the
tangibility dimension (dimension’s mean score = 2.66) and the lowest perception related to the
responsiveness dimension (dimension’s mean score = 2.36).
The gap score for each item and dimension was computed by subtracting the perception score
from the expectation score. Table 6 further shows that the highest gap of the quality relates to the
responsiveness dimension (gap mean score =2.28), and there is a considerable gap between the
customers’ expectations and perceptions. The lowest gap of the quality relates to the tangibility
dimension (gap mean score = 1.80).
Service quality Gap in Private Sector Banks in Tirunelveli District
The following table shows the service quality gap in private sector banks in Tirunelveli district.
Table 7: Service quality Gap in Private Sector Banks in Tirunelveli District
Sl.
No
Statements Expectation
Mean
Perception
Mean
Service
quality gap
Tangibility 4.49 3.48 1.01
1 Bank location 3.57 3.17 0.40
2 Parking services 4.44 3.05 1.39
3 Seating facility 4.68 3.38 1.30
4 Ventilation 4.68 4.52 0.16
5 Bank equipments 4.65 3.80 0.85
6 Bank slips (forms) 4.71 2.18 2.53
7 Location of ATM Centre 4.71 3.01 1.70
Assurance 4.48 3.11 1.37
8 Safety of transaction 4.67 2.68 1.99
9 Savings interest rate 4.73 3.43 1.30
10 Loan interest rate 4.72 3.03 1.69
11 Working hours 4.71 3.57 1.14
12 Safety of deposits 3.57 2.83 0.74
Reliability 4.69 3.06 1.63
13 Speed transaction on services 4.72 2.61 2.11
14 ATM services 4.66 3.82 0.84
15 Credit card services 4.69 2.58 2.11
16 Transaction accuracy 4.69 4.06 0.63
17 Loan facility 4.70 2.42 2.28
18 Service charges 4.71 2.44 2.27
19 Mortgage facility 4.70 3.44 1.26
20 Employee reliability 4.72 3.12 1.60
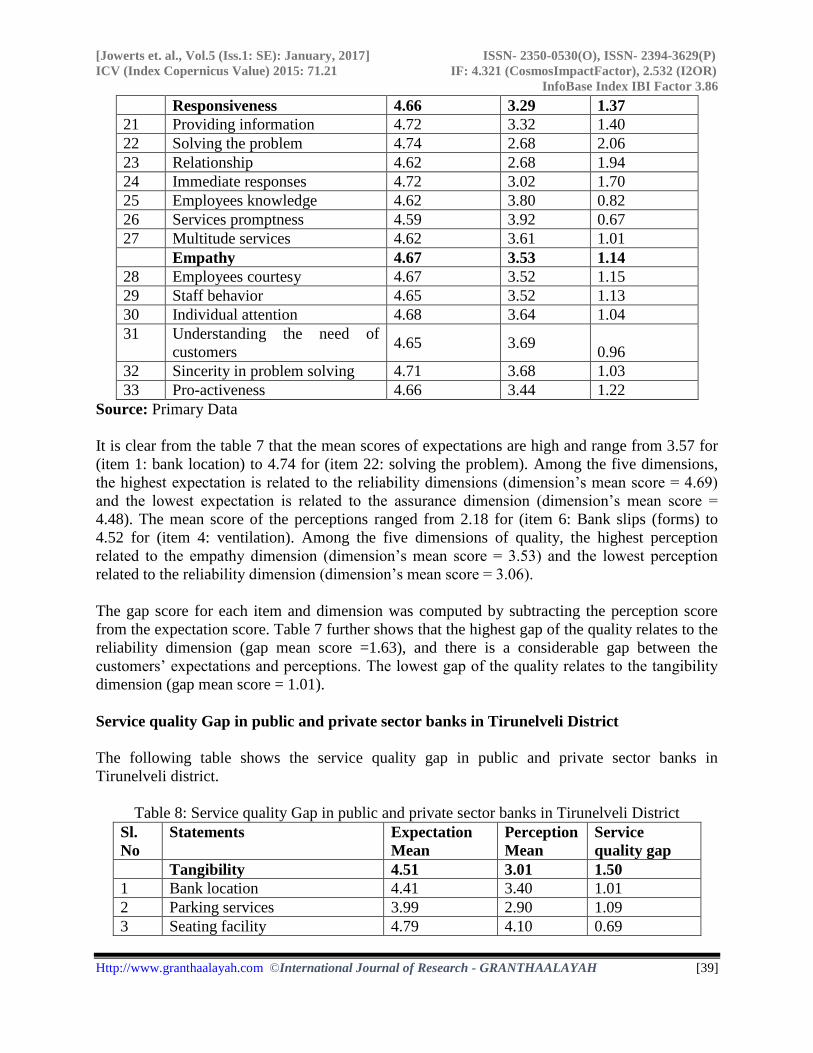
[Jowerts et. al., Vol.5 (Iss.1: SE): January, 2017] ISSN- 2350-0530(O), ISSN- 2394-3629(P)
ICV (Index Copernicus Value) 2015: 71.21 IF: 4.321 (CosmosImpactFactor), 2.532 (I2OR)
InfoBase Index IBI Factor 3.86
Http://www.granthaalayah.com ©International Journal of Research - GRANTHAALAYAH [39]
Responsiveness 4.66 3.29 1.37
21 Providing information 4.72 3.32 1.40
22 Solving the problem 4.74 2.68 2.06
23 Relationship 4.62 2.68 1.94
24 Immediate responses 4.72 3.02 1.70
25 Employees knowledge 4.62 3.80 0.82
26 Services promptness 4.59 3.92 0.67
27 Multitude services 4.62 3.61 1.01
Empathy 4.67 3.53 1.14
28 Employees courtesy 4.67 3.52 1.15
29 Staff behavior 4.65 3.52 1.13
30 Individual attention 4.68 3.64 1.04
31 Understanding the need of
customers 4.65 3.69
0.96
32 Sincerity in problem solving 4.71 3.68 1.03
33 Pro-activeness 4.66 3.44 1.22
Source: Primary Data
It is clear from the table 7 that the mean scores of expectations are high and range from 3.57 for
(item 1: bank location) to 4.74 for (item 22: solving the problem). Among the five dimensions,
the highest expectation is related to the reliability dimensions (dimension’s mean score = 4.69)
and the lowest expectation is related to the assurance dimension (dimension’s mean score =
4.48). The mean score of the perceptions ranged from 2.18 for (item 6: Bank slips (forms) to
4.52 for (item 4: ventilation). Among the five dimensions of quality, the highest perception
related to the empathy dimension (dimension’s mean score = 3.53) and the lowest perception
related to the reliability dimension (dimension’s mean score = 3.06).
The gap score for each item and dimension was computed by subtracting the perception score
from the expectation score. Table 7 further shows that the highest gap of the quality relates to the
reliability dimension (gap mean score =1.63), and there is a considerable gap between the
customers’ expectations and perceptions. The lowest gap of the quality relates to the tangibility
dimension (gap mean score = 1.01).
Service quality Gap in public and private sector banks in Tirunelveli District
The following table shows the service quality gap in public and private sector banks in
Tirunelveli district.
Table 8: Service quality Gap in public and private sector banks in Tirunelveli District
Sl.
No
Statements Expectation
Mean
Perception
Mean
Service
quality gap
Tangibility 4.51 3.01 1.50
1 Bank location 4.41 3.40 1.01
2 Parking services 3.99 2.90 1.09
3 Seating facility 4.79 4.10 0.69
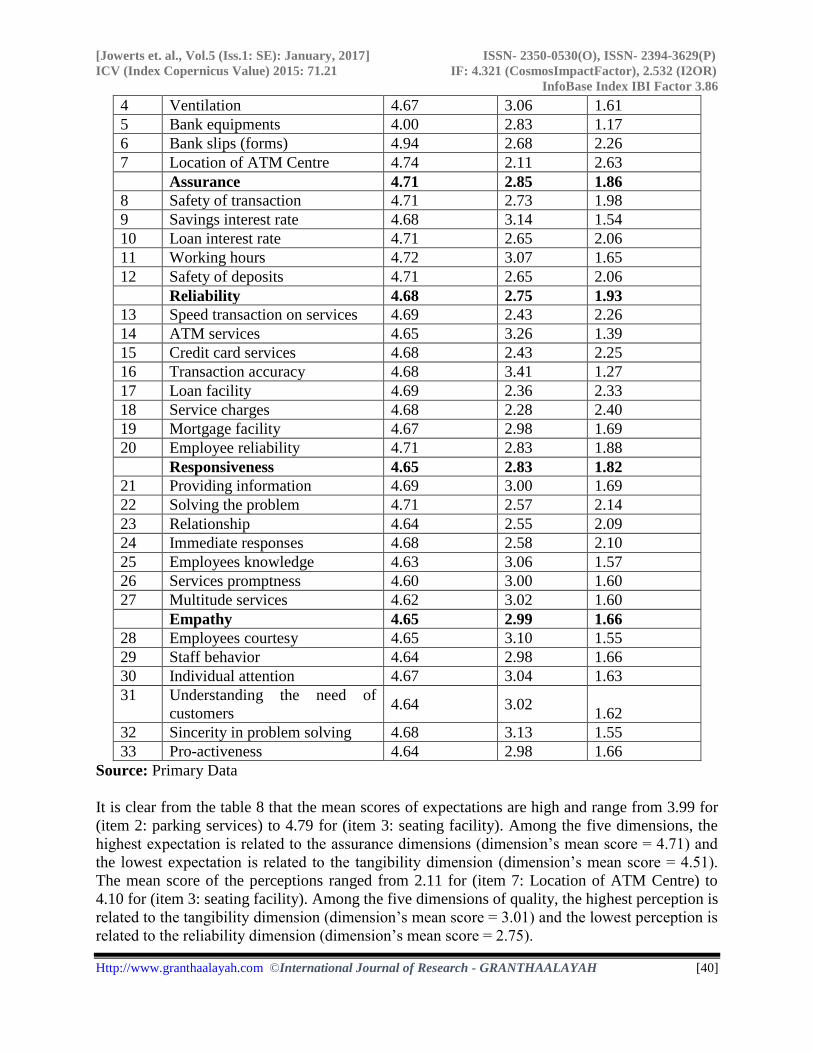
[Jowerts et. al., Vol.5 (Iss.1: SE): January, 2017] ISSN- 2350-0530(O), ISSN- 2394-3629(P)
ICV (Index Copernicus Value) 2015: 71.21 IF: 4.321 (CosmosImpactFactor), 2.532 (I2OR)
InfoBase Index IBI Factor 3.86
Http://www.granthaalayah.com ©International Journal of Research - GRANTHAALAYAH [40]
4 Ventilation 4.67 3.06 1.61
5 Bank equipments 4.00 2.83 1.17
6 Bank slips (forms) 4.94 2.68 2.26
7 Location of ATM Centre 4.74 2.11 2.63
Assurance 4.71 2.85 1.86
8 Safety of transaction 4.71 2.73 1.98
9 Savings interest rate 4.68 3.14 1.54
10 Loan interest rate 4.71 2.65 2.06
11 Working hours 4.72 3.07 1.65
12 Safety of deposits 4.71 2.65 2.06
Reliability 4.68 2.75 1.93
13 Speed transaction on services 4.69 2.43 2.26
14 ATM services 4.65 3.26 1.39
15 Credit card services 4.68 2.43 2.25
16 Transaction accuracy 4.68 3.41 1.27
17 Loan facility 4.69 2.36 2.33
18 Service charges 4.68 2.28 2.40
19 Mortgage facility 4.67 2.98 1.69
20 Employee reliability 4.71 2.83 1.88
Responsiveness 4.65 2.83 1.82
21 Providing information 4.69 3.00 1.69
22 Solving the problem 4.71 2.57 2.14
23 Relationship 4.64 2.55 2.09
24 Immediate responses 4.68 2.58 2.10
25 Employees knowledge 4.63 3.06 1.57
26 Services promptness 4.60 3.00 1.60
27 Multitude services 4.62 3.02 1.60
Empathy 4.65 2.99 1.66
28 Employees courtesy 4.65 3.10 1.55
29 Staff behavior 4.64 2.98 1.66
30 Individual attention 4.67 3.04 1.63
31 Understanding the need of
customers 4.64 3.02
1.62
32 Sincerity in problem solving 4.68 3.13 1.55
33 Pro-activeness 4.64 2.98 1.66
Source: Primary Data
It is clear from the table 8 that the mean scores of expectations are high and range from 3.99 for
(item 2: parking services) to 4.79 for (item 3: seating facility). Among the five dimensions, the
highest expectation is related to the assurance dimensions (dimension’s mean score = 4.71) and
the lowest expectation is related to the tangibility dimension (dimension’s mean score = 4.51).
The mean score of the perceptions ranged from 2.11 for (item 7: Location of ATM Centre) to
4.10 for (item 3: seating facility). Among the five dimensions of quality, the highest perception is
related to the tangibility dimension (dimension’s mean score = 3.01) and the lowest perception is
related to the reliability dimension (dimension’s mean score = 2.75).
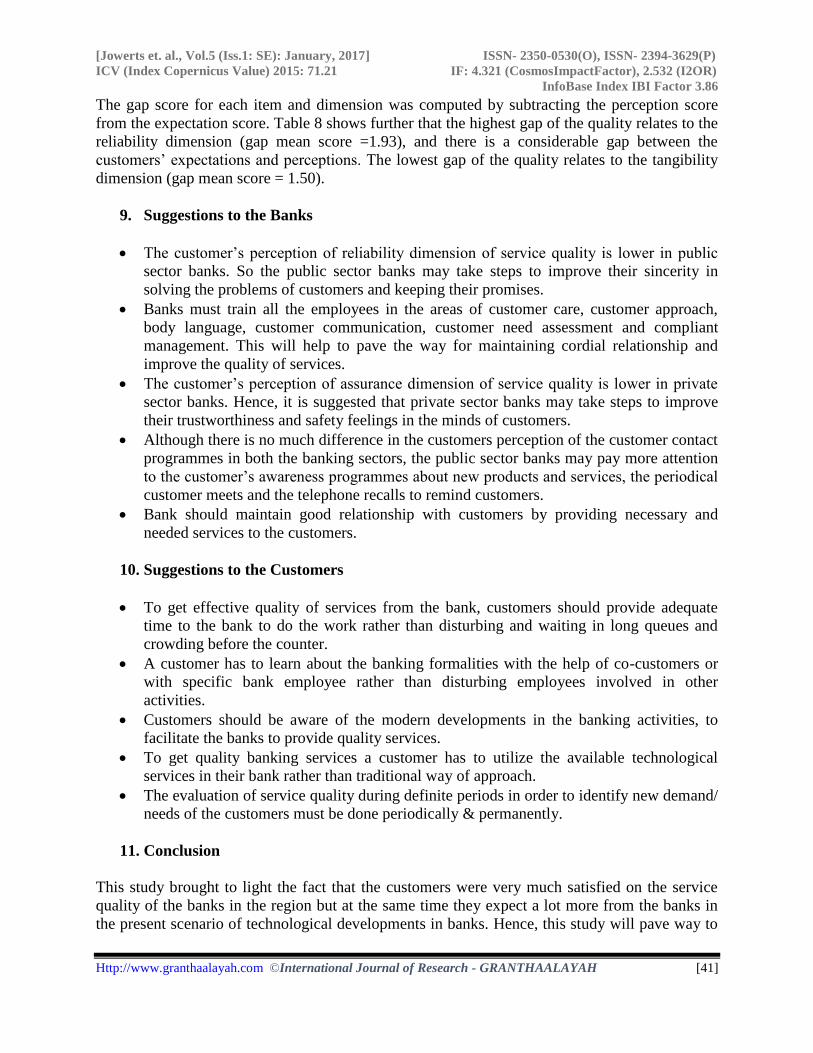
[Jowerts et. al., Vol.5 (Iss.1: SE): January, 2017] ISSN- 2350-0530(O), ISSN- 2394-3629(P)
ICV (Index Copernicus Value) 2015: 71.21 IF: 4.321 (CosmosImpactFactor), 2.532 (I2OR)
InfoBase Index IBI Factor 3.86
Http://www.granthaalayah.com ©International Journal of Research - GRANTHAALAYAH [41]
The gap score for each item and dimension was computed by subtracting the perception score
from the expectation score. Table 8 shows further that the highest gap of the quality relates to the
reliability dimension (gap mean score =1.93), and there is a considerable gap between the
customers’ expectations and perceptions. The lowest gap of the quality relates to the tangibility
dimension (gap mean score = 1.50).
9. Suggestions to the Banks
The customer’s perception of reliability dimension of service quality is lower in public
sector banks. So the public sector banks may take steps to improve their sincerity in
solving the problems of customers and keeping their promises.
Banks must train all the employees in the areas of customer care, customer approach,
body language, customer communication, customer need assessment and compliant
management. This will help to pave the way for maintaining cordial relationship and
improve the quality of services.
The customer’s perception of assurance dimension of service quality is lower in private
sector banks. Hence, it is suggested that private sector banks may take steps to improve
their trustworthiness and safety feelings in the minds of customers.
Although there is no much difference in the customers perception of the customer contact
programmes in both the banking sectors, the public sector banks may pay more attention
to the customer’s awareness programmes about new products and services, the periodical
customer meets and the telephone recalls to remind customers.
Bank should maintain good relationship with customers by providing necessary and
needed services to the customers.
10. Suggestions to the Customers
To get effective quality of services from the bank, customers should provide adequate
time to the bank to do the work rather than disturbing and waiting in long queues and
crowding before the counter.
A customer has to learn about the banking formalities with the help of co-customers or
with specific bank employee rather than disturbing employees involved in other
activities.
Customers should be aware of the modern developments in the banking activities, to
facilitate the banks to provide quality services.
To get quality banking services a customer has to utilize the available technological
services in their bank rather than traditional way of approach.
The evaluation of service quality during definite periods in order to identify new demand/
needs of the customers must be done periodically & permanently.
11. Conclusion
This study brought to light the fact that the customers were very much satisfied on the service
quality of the banks in the region but at the same time they expect a lot more from the banks in
the present scenario of technological developments in banks. Hence, this study will pave way to
[Jowerts et. al., Vol.5 (Iss.1: SE): January, 2017] ISSN- 2350-0530(O), ISSN- 2394-3629(P)
ICV (Index Copernicus Value) 2015: 71.21 IF: 4.321 (CosmosImpactFactor), 2.532 (I2OR)
InfoBase Index IBI Factor 3.86
Http://www.granthaalayah.com ©International Journal of Research - GRANTHAALAYAH [42]
further research to explore this mechanism in depth to provide quality banking services to
facilitate the customers, the society and the economy as a whole.
References
[1] Borcherding, T. E., Pommerehne, W. W., Schneider, F., & Schneider, F. (1982). Comparing the
efficiency of private and public production: The evidence from five countries (pp. 127-156).
Institute for Empirical Research in Economics University of Zurich.
[2] Golden, S. A. R. (2015). Regional Imbalance affecting quality of e-banking services with special
reference to Tuticorin District-An Analysis. International Journal of Research, 2(3), 788-798.
[3] Golden, S. A. R., & Regi, S. B. (2015). Satisfaction of Customers towards User Friendly
Technological Services offered by Public and Private Sector banks at Palayamkottai, Tirunelveli
District. International Journal of Research, 2(3), 775-787.
[4] Ismaila. Bootwala, Anjali Gokhru “A Study on Customers' Perception on Services Provided by
Banks in the City of Ahmedabad”, Pacific Business Review International, Volume.5, Issue.5,
November 2012, pp.109-121.
[5] Mohsin Zafar, Sana Zafar, Aasia Asif, Ahmed Imran Hunjra, H. Mushtaq Ahmad “Service
Quality, Customer Satisfaction and Loyalty: An Empirical Analysis of Banking Sector in
Pakistan”, Information Management and Business Review, Vol. 4, No. 3, Apr 2012, pp. 159-167.
[6] Rajiv Sindwani and Manisha Goel, “Developments in Electronic Banking Service Quality”,
International Journal of Research in IT & Management, Volume.2, Issue.5, May 2012, pp.37-43.
[7] Regi, S. B., & Golden, S. A. R. (2014). A Study On Attitude Of Employee Towards Working
Environment With Special Reference To RR Pvt Ltd. Review Of Research, 2 (2), 1, 5.
[8] Regi, S. B., & Golden, S. A. R. (2014). Customer Preference Towards Innovative Banking
Practices Available In State Bank Of India At Palayamkottai. Sankhya International Journal Of
Management And Technology, 3 (11 (A)), 31, 33.
[9] Regi, S. B., & Golden, S. A. R. (2014). Customer Preference Towards E-Channels Provided By
State Of Bank Of India.
[10] Regi, S. B., Golden, S. A. R., & Franco, C. E. (2014). ROLE OF COMMERCIAL BANK IN
THE GROWTH OF MICRO AND SMALL ENTERPRISES. Golden Research Thoughts, 3 (7),
1, 5.
[11] Sathish, G. A STUDY ON LOAN PORTFOLIO MANAGEMENT OF URBAN
COOPERATIVE BANKS IN TAMIL NADU.
[12] Vibhorjain, Sonia Gupta and Smrita Jain “Customer Perception on Service Quality in Banking
Sector: With Special Reference to Indian Private Banks in Moradabad Region”, International
Journal of Research in Finance & Marketing, Volume 2, Issue 2,February 2012, pp.597-610.
Journal for Studies in Management and Planning
Available at http://edupediapublications.org/journals/index.php/JSMaP/
I SSN: 23 95-0463 Vol ume 0 3 I s s ue 02
Februa ry 2017
Available online: http://edupediapublications.org/journals/index.php/JSMaP/ P a g e | 50
A Study on Perception of Banking Customers towards
Quality of Services in Tirunelveli District
G. Bright Jowerts1
Dr. C. Eugine Franco2
1Assistant professor in Commerce, St. Xavier’s College (Autonomous), Palayamkottai 1Associate Professor in Commerce & Dean of students, St. Xavier’s College (Autonomous),
Palayamkottai
ABSTRACT
Service quality is a critical element for establishing, sustaining and satisfying relationship with customers. Customer service is the process of ensuring customer satisfaction with a product or service. Perception means the way in which something is regarded, understood, or interpreted. Banking company means any company which carries on the business or which transacts the business of banking in India. With the increasing consumer demands, banks have to constantly thing of innovative customized services to remain competitive. This study focuses customers’ perception towards quality of banking services in Tirunelveli district. This study is limited to Tirunelveli area only, Tamil Nadu. The objectives of this study are to find out the demographic profile of the respondents, to find out the awareness level of the respondents, to find out opinion of the respondents about quality of banking services and to offer the suggestions for the improvement of modern banking. Convenience sampling method have adopted for this study. The primary data were collected from questionnaire method. This study has the limitations like inadequacy of respondents and non-applicability to other than Tirunelveli city. From the analysis, it is found that majority of the respondents are male, majority of the respondents are opined that the online banking is good. It is suggested that people should be educated about the use of demat accounts,
tax benefits too and awareness about cashless transaction should be gear up. Banking services are targeted from various corners by different types of competitors. Perception results in attitude. Attitude leads to behavior. If banks want of achieving maximum market share and profit retaining, customer and is necessary. Keywords: Attitude, Perception, Demat a/c,
Service quality.
INTRODUCTION
Service quality is a critical
element for establishing, sustaining
and satisfying relationship with
customers. The liberalisation of the
Indian economy in 1991 set off a chain
of paradigmatic changes in most
sectors especially in service sector.
One of the sectors that came in for
immediate structural changes was the
financial sector. The concept of quality
management in business organizations
is as old as the advent of the industrial
revolution, which change the pattern of
production processes from
personalised and integrated to mass
and assemble based ones. What could

Journal for Studies in Management and Planning
Available at http://edupediapublications.org/journals/index.php/JSMaP/
I SSN: 23 95-0463 Vol ume 0 3 I s s ue 02
Februa ry 2017
Available online: http://edupediapublications.org/journals/index.php/JSMaP/ P a g e | 51
not be accomplished in terms of
quality control in the pre- industrial
production processes could be easily
achieved in the industrial production
process through the standardization of
process and products. Unlike in the
case of manufacturing companies,
where the goods are manufactured and
then sold to customers, in the services
sector, the customer is a part and
parcel of the process that provides the
service. In this context, this study
attempts to assess the level of
perception of customers towards
banking companies and map out macro
level scenario.
IMPORTANT DEFINITIONS
Customer service:
Customer service is the process of
ensuring customer satisfaction with a
product or service. Often, customer
service takes place while performing a
transaction for the customer, such as
making a sale or returning an item.
Customer service in banks is the most
cliched phrase at the banks. Great
service can play a key role in customer
retention. Banks are service-based
businesses, so most of their activities
involve elements of service. While
they do sell banking and financial
products, there is often little tangible
product variation among their
offerings.
Perception
Perception means the way in
which something is regarded,
understood, or interpreted. I simple
words it means immediate or intuitive
recognition or appreciation, as of
moral, psychological.
Banking Company
Banking company means and
includes any company which carries on
the business or which transacts the
business of banking in India. Therefore,
any company which is engaged in
trade or manufacture, which accepts
deposits of money from the public for
the purpose of financing its business
only, shall not be deemed to carry on
the business of banking.
Demat A/C
Demat Account or dematerialized
account provides the facility of holding
shares and securities in electronic
format. During online trading, shares
are bought and held in a Demat
account, thus facilitating easy trade for
the users. A Demat Account holds all
the investments an individual makes in
shares, government securities,
exchange traded funds, bonds and
mutual funds in one place.
Journal for Studies in Management and Planning
Available at http://edupediapublications.org/journals/index.php/JSMaP/
I SSN: 23 95-0463 Vol ume 0 3 I s s ue 02
Februa ry 2017
Available online: http://edupediapublications.org/journals/index.php/JSMaP/ P a g e | 52
NEED FOR THE STUDY
India is a labour intensive country.
Here people are more money conscious.
Compared with tangible products,
service products i.e., financial products
are more difficult to convey. Most
cases, peoples are started using bank
services after making compulsion. For
example nowadays for receiving
scholarship, it is must to keep a bank
account. Workers of 100 days
employment schemes are given
salaries through their bank account.
People especially from rural and
semi-urban areas are hesitate to use
banking services. But as this paragraph
depicts earlier, the number of banking
customers are increasing gradually.
But the rate of motivation to the first
time customers is questionable. It is
cent percent true that customers with
rationale mentality and of long period
will not get dissatisfaction with
banking services. But initial customers
may feel dissatisfaction with it.
Banking services are more far
from personalized services. Nowadays,
banks are compelling customers to use
internet and plastics cards like ATM
card, credit card to all type of
transactions in order to gear up
dematerialization. If you cannot
measure it, you cannot improve it. This
is said by Edward Demings.
SCOPE OF THE STUDY
The study is limited to Tirunelveli
area only. Customers with long track
record also excluded for want of
fulfilling exact objectives of the
research. The scope of the study is
restricted to service provided by
commercial banks to the first time
bank customers in Tirunelveli district,
Tamil Nadu.
REVIEW OF LITERATURE
It is imperative for a researcher
scholar to do a review on the related
literature for the study to have an in
depth knowledge about the subject.
The literature on previous studies will
help the researcher on the limitations
of the study and there by the researcher
could take measure to overcome them.
The following earlier studies have
been conducted by various researchers
in the area of consumer attitude of
internet banking user. A review, of
these studies enabled the researcher to
formulate the research problem.
H.C and Avinash D. Pathardikar (2007)
said that the perceptions of the
consumers on different banks differ
due to the behavior of the individual
employees or officers. The five
Journal for Studies in Management and Planning
Available at http://edupediapublications.org/journals/index.php/JSMaP/
I SSN: 23 95-0463 Vol ume 0 3 I s s ue 02
Februa ry 2017
Available online: http://edupediapublications.org/journals/index.php/JSMaP/ P a g e | 53
dimensions of SERVQUAL were
observed as ideal in all the banks
except reliability of the employees.
Ramesh Kumar Miryala (2011)
evaluated the customer perceptions of
service quality in select private
sector banks. Gap analysis and Multi
regression were used for analysis of
data. The results indicated that
empathy and accessibility dimension
of service quality has more gap, as the
customer expectations are high to their
perceived service. The result also
indicated that Empathy, Reliability and
Assurance have a positive influence on
the service quality. The author
suggested that superior service
quality helps to retain existing
customers and attract new customers as
well.
Rama Mohana Rao K and Tekeste
Berhanu Lakew (2011) conducted a
study to examine the service quality
perceptions of customers of public
sector and private sector banks in the
city of Visakhapatnam, India. The
researcherused SERVQUAL model
with 42 items pertaining to the five
dimensions of service quality viz.
Tangibility, Reliability, Assurance,
Responsiveness and Empathy for the
study and found that the reliability and
assurance dimensions of service
quality scored the highest ratings while
the tangibles dimension got the lowest
score. The study also found a strong
dissimilarity in service quality
perceptions between customers of
private sector and public sector banks.
Premraj H and Sankaralingam N (2012)
analysed the service quality perception
of retail banking customers in Chennai
with reference to SBI group,
Nationalized banks, Private sector and
Co-operative banks to assess their
satisfaction level regarding the services
rendered by banks and identified the
factors which have the maximum
impact on customer satisfaction. The
research revealed that the satisfaction
level of customers is high in
Nationalised banks, followed by SBI
and its ssociates, Private sector and
Co-operative banks. The study also
indicated that reliability and
competitiveness have the maximum
impact on customer satisfaction.
RESEARCH GAP
Some researcher conducted the
research study on consumer perception
on specific aspects like internet
banking or retail banking. Some
researchers conducted study on urban
areas.Some researchers conducted the
Journal for Studies in Management and Planning
Available at http://edupediapublications.org/journals/index.php/JSMaP/
I SSN: 23 95-0463 Vol ume 0 3 I s s ue 02
Februa ry 2017
Available online: http://edupediapublications.org/journals/index.php/JSMaP/ P a g e | 54
study with educated people,
government employees, professionals,
Business man, and students this study
will be conducted in the district. But
most studies failed to concentrate on
identify the attitude and perception of
collective people in financial field.
This study will be focused only on first
time users of banking services in
Tirunelveli District, Tamil Nadu.
STATEMENT OF THE PROBLEM
The level of expectation differs
from person to person but everyone
wants the banks to provide the
products and services which can satisfy
their needs up to their expected level or
to a higher level so as to offer them a
higher satisfaction. The level of
satisfaction of customers is affected by
some other attributes also other than
the quality of service such as their
experience with the bank employees
etc. As there is a huge competition in
the banking sector in India, the
customer satisfaction is an important
factor in the success of the banks. So
with this background an attempt has
been made to study the satisfaction of
the customers of various banks taking
into consideration some important
attributes which customers consider for
rating their satisfaction with a
particular bank.
If banks have to retain their
competitiveness, they must focus not
only on acquisition of new customers
but also on retaining earned customers
With the increasing consumer demands,
banks have to constantly thing of
innovative customized services to
remain competitive. This study focus
on first time customers’ perception
towards quality of banking services in
Tirunelveli district.
OBJECTIVES OF THE STUDY
The overall objective of the
present study is to analyze the
consumer perception of quality of
banking services with reference to
Tirunelveli District. The specific
objectives of the study are enunciated
below.
To find out the demographic
profile of the respondents.
To analysis the factor influence the
respondents to use banking services.
To find out the awareness level of
the respondents.
To find out opinion of the
respondents about quality of banking services
To offer the suggestions for the improvement of Internet banking.
RESEARCH DESIGN
Research design refers to the
researchers over plan for obtaining
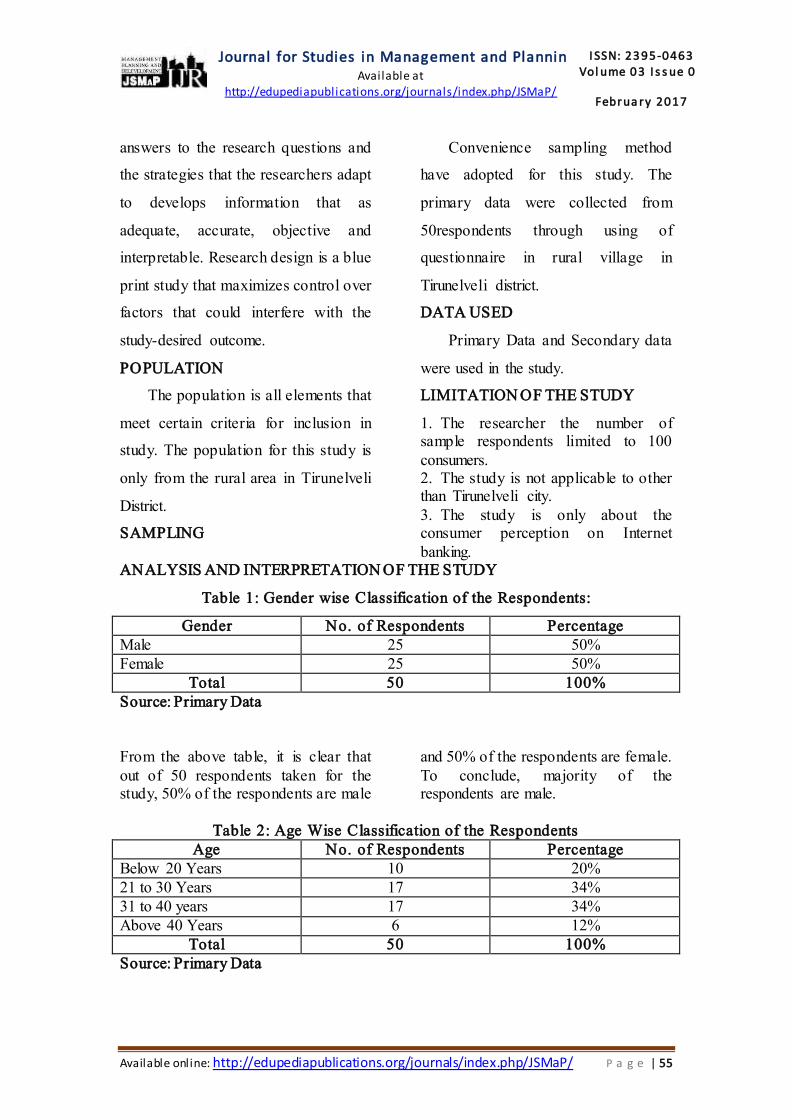
Journal for Studies in Management and Planning
Available at http://edupediapublications.org/journals/index.php/JSMaP/
I SSN: 23 95-0463 Vol ume 0 3 I s s ue 02
Februa ry 2017
Available online: http://edupediapublications.org/journals/index.php/JSMaP/ P a g e | 55
answers to the research questions and
the strategies that the researchers adapt
to develops information that as
adequate, accurate, objective and
interpretable. Research design is a blue
print study that maximizes control over
factors that could interfere with the
study-desired outcome.
POPULATION
The population is all elements that
meet certain criteria for inclusion in
study. The population for this study is
only from the rural area in Tirunelveli
District.
SAMPLING
Convenience sampling method
have adopted for this study. The
primary data were collected from
50respondents through using of
questionnaire in rural village in
Tirunelveli district.
DATA USED
Primary Data and Secondary data
were used in the study.
LIMITATION OF THE STUDY
1. The researcher the number of sample respondents limited to 100
consumers. 2. The study is not applicable to other than Tirunelveli city.
3. The study is only about the consumer perception on Internet
banking. ANALYSIS AND INTERPRETATION OF THE STUDY
Table 1: Gender wise Classification of the Respondents:
Gender No. of Respondents Percentage
Male 25 50%
Female 25 50%
Total 50 100%
Source: Primary Data
From the above table, it is clear that
out of 50 respondents taken for the study, 50% of the respondents are male
and 50% of the respondents are female.
To conclude, majority of the respondents are male.
Table 2: Age Wise Classification of the Respondents
Age No. of Respondents Percentage
Below 20 Years 10 20%
21 to 30 Years 17 34%
31 to 40 years 17 34%
Above 40 Years 6 12%
Total 50 100%
Source: Primary Data
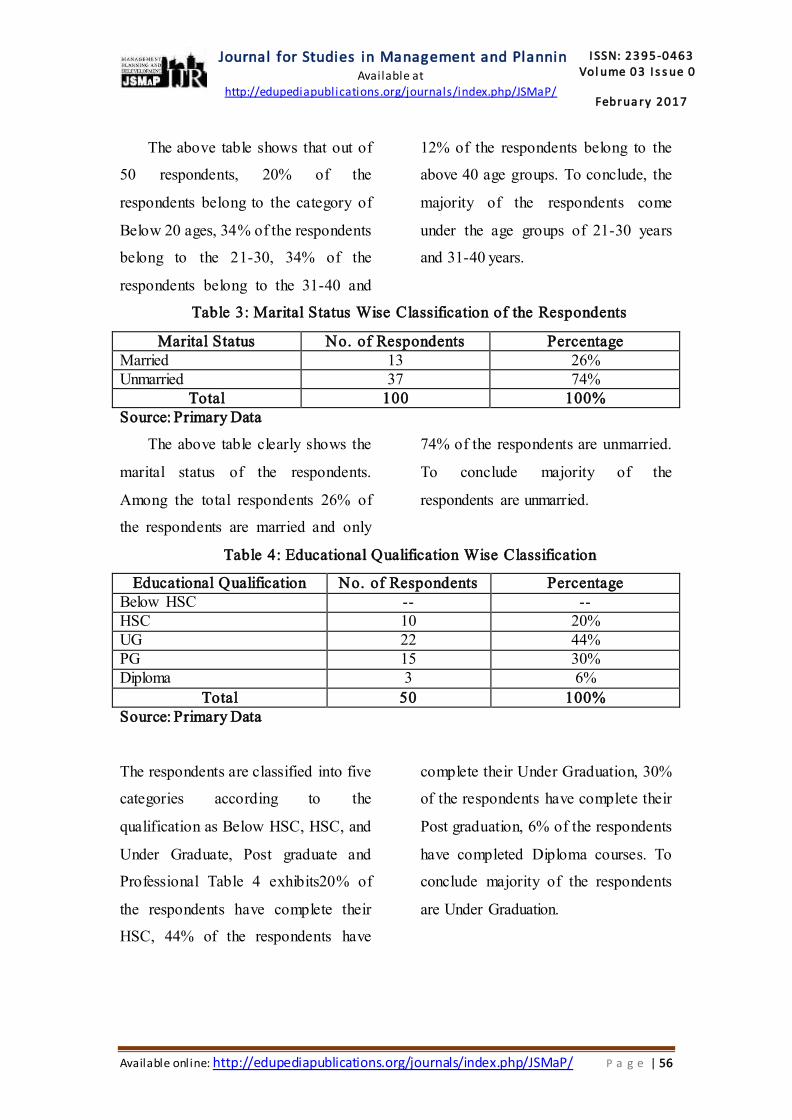
Journal for Studies in Management and Planning
Available at http://edupediapublications.org/journals/index.php/JSMaP/
I SSN: 23 95-0463 Vol ume 0 3 I s s ue 02
Februa ry 2017
Available online: http://edupediapublications.org/journals/index.php/JSMaP/ P a g e | 56
The above table shows that out of
50 respondents, 20% of the
respondents belong to the category of
Below 20 ages, 34% of the respondents
belong to the 21-30, 34% of the
respondents belong to the 31-40 and
12% of the respondents belong to the
above 40 age groups. To conclude, the
majority of the respondents come
under the age groups of 21-30 years
and 31-40 years.
Table 3: Marital Status Wise Classification of the Respondents
Marital Status No. of Respondents Percentage
Married 13 26%
Unmarried 37 74%
Total 100 100%
Source: Primary Data
The above table clearly shows the
marital status of the respondents.
Among the total respondents 26% of
the respondents are married and only
74% of the respondents are unmarried.
To conclude majority of the
respondents are unmarried.
Table 4: Educational Qualification Wise Classification
Educational Qualification No. of Respondents Percentage
Below HSC -- --
HSC 10 20%
UG 22 44%
PG 15 30%
Diploma 3 6%
Total 50 100%
Source: Primary Data
The respondents are classified into five
categories according to the
qualification as Below HSC, HSC, and
Under Graduate, Post graduate and
Professional Table 4 exhibits20% of
the respondents have complete their
HSC, 44% of the respondents have
complete their Under Graduation, 30%
of the respondents have complete their
Post graduation, 6% of the respondents
have completed Diploma courses. To
conclude majority of the respondents
are Under Graduation.
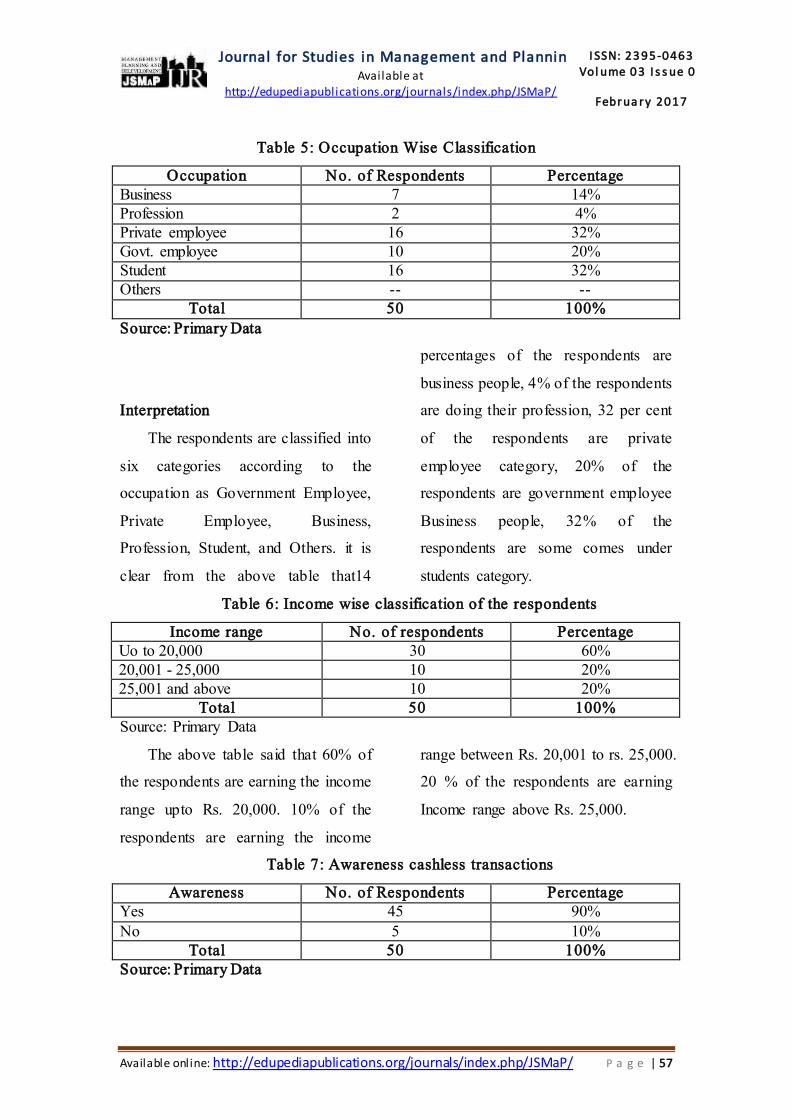
Journal for Studies in Management and Planning
Available at http://edupediapublications.org/journals/index.php/JSMaP/
I SSN: 23 95-0463 Vol ume 0 3 I s s ue 02
Februa ry 2017
Available online: http://edupediapublications.org/journals/index.php/JSMaP/ P a g e | 57
Table 5: Occupation Wise Classification
Occupation No. of Respondents Percentage
Business 7 14%
Profession 2 4%
Private employee 16 32%
Govt. employee 10 20%
Student 16 32%
Others -- --
Total 50 100%
Source: Primary Data
Interpretation
The respondents are classified into
six categories according to the
occupation as Government Employee,
Private Employee, Business,
Profession, Student, and Others. it is
clear from the above table that14
percentages of the respondents are
business people, 4% of the respondents
are doing their profession, 32 per cent
of the respondents are private
employee category, 20% of the
respondents are government employee
Business people, 32% of the
respondents are some comes under
students category.
Table 6: Income wise classification of the respondents
Income range No. of respondents Percentage
Uo to 20,000 30 60%
20,001 - 25,000 10 20%
25,001 and above 10 20%
Total 50 100%
Source: Primary Data
The above table said that 60% of
the respondents are earning the income
range upto Rs. 20,000. 10% of the
respondents are earning the income
range between Rs. 20,001 to rs. 25,000.
20 % of the respondents are earning
Income range above Rs. 25,000.
Table 7: Awareness cashless transactions
Awareness No. of Respondents Percentage
Yes 45 90%
No 5 10%
Total 50 100%
Source: Primary Data
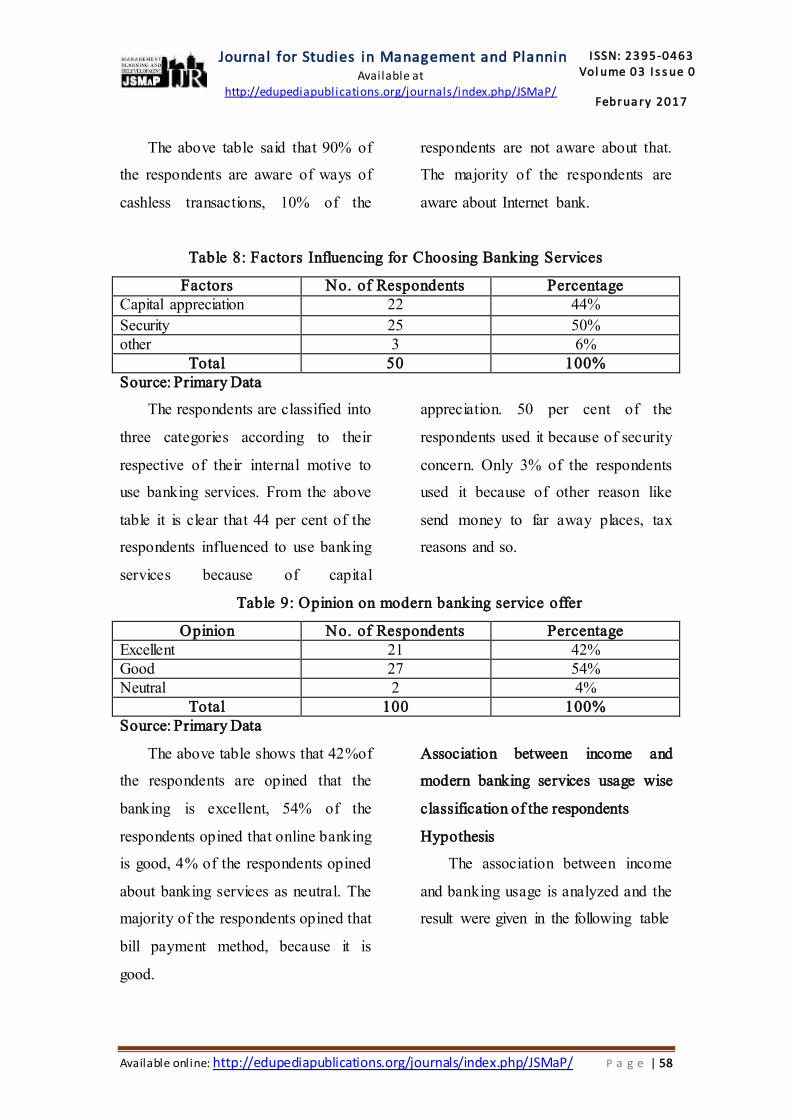
Journal for Studies in Management and Planning
Available at http://edupediapublications.org/journals/index.php/JSMaP/
I SSN: 23 95-0463 Vol ume 0 3 I s s ue 02
Februa ry 2017
Available online: http://edupediapublications.org/journals/index.php/JSMaP/ P a g e | 58
The above table said that 90% of
the respondents are aware of ways of
cashless transactions, 10% of the
respondents are not aware about that.
The majority of the respondents are
aware about Internet bank.
Table 8: Factors Influencing for Choosing Banking Services
Factors No. of Respondents Percentage
Capital appreciation 22 44%
Security 25 50%
other 3 6%
Total 50 100%
Source: Primary Data
The respondents are classified into
three categories according to their
respective of their internal motive to
use banking services. From the above
table it is clear that 44 per cent of the
respondents influenced to use banking
services because of capital
appreciation. 50 per cent of the
respondents used it because of security
concern. Only 3% of the respondents
used it because of other reason like
send money to far away places, tax
reasons and so.
Table 9: Opinion on modern banking service offer
Opinion No. of Respondents Percentage
Excellent 21 42%
Good 27 54%
Neutral 2 4%
Total 100 100%
Source: Primary Data
The above table shows that 42%of
the respondents are opined that the
banking is excellent, 54% of the
respondents opined that online banking
is good, 4% of the respondents opined
about banking services as neutral. The
majority of the respondents opined that
bill payment method, because it is
good.
Association between income and
modern banking services usage wise
classification of the respondents
Hypothesis
The association between income
and banking usage is analyzed and the
result were given in the following table
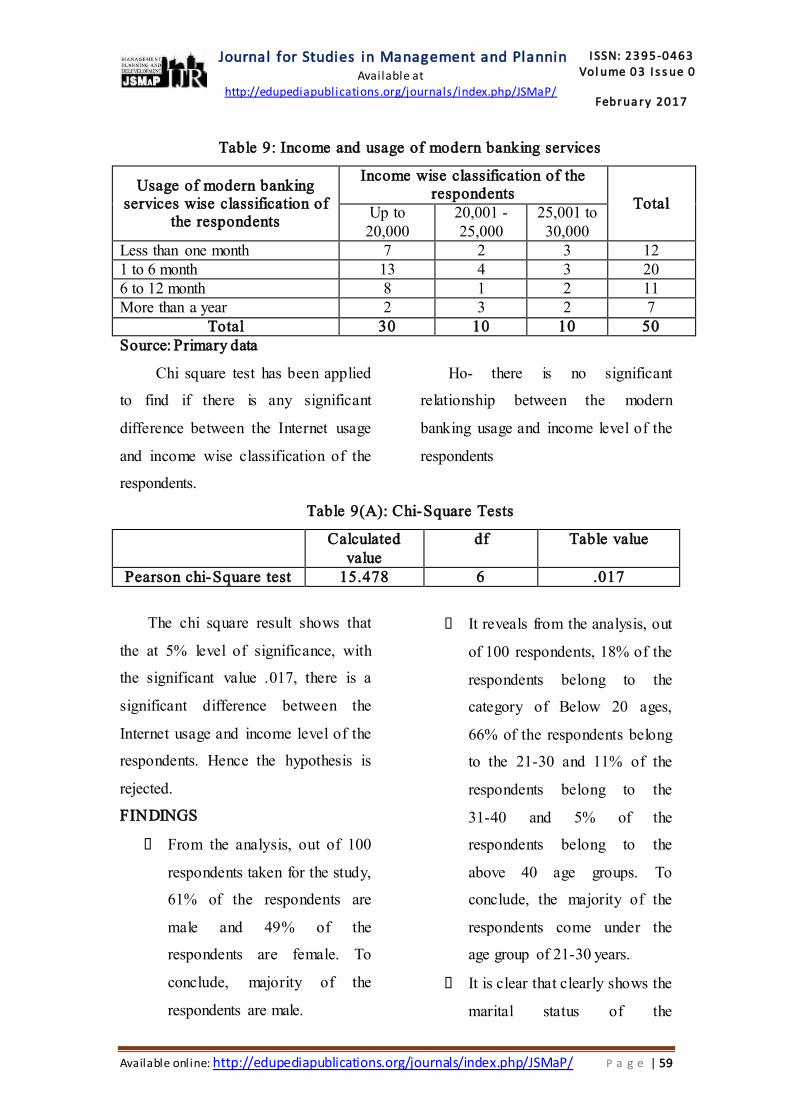
Journal for Studies in Management and Planning
Available at http://edupediapublications.org/journals/index.php/JSMaP/
I SSN: 23 95-0463 Vol ume 0 3 I s s ue 02
Februa ry 2017
Available online: http://edupediapublications.org/journals/index.php/JSMaP/ P a g e | 59
Table 9: Income and usage of modern banking services
Usage of modern banking services wise classification of
the respondents
Income wise classification of the respondents
Total Up to
20,000
20,001 -
25,000
25,001 to
30,000
Less than one month 7 2 3 12
1 to 6 month 13 4 3 20
6 to 12 month 8 1 2 11
More than a year 2 3 2 7
Total 30 10 10 50
Source: Primary data
Chi square test has been applied
to find if there is any significant
difference between the Internet usage
and income wise classification of the
respondents.
Ho- there is no significant
relationship between the modern
banking usage and income level of the
respondents
Table 9(A): Chi-Square Tests
Calculated
value
df Table value
Pearson chi-Square test 15.478 6 .017
The chi square result shows that
the at 5% level of significance, with
the significant value .017, there is a
significant difference between the
Internet usage and income level of the
respondents. Hence the hypothesis is
rejected.
FINDINGS
From the analysis, out of 100
respondents taken for the study,
61% of the respondents are
male and 49% of the
respondents are female. To
conclude, majority of the
respondents are male.
It reveals from the analysis, out
of 100 respondents, 18% of the
respondents belong to the
category of Below 20 ages,
66% of the respondents belong
to the 21-30 and 11% of the
respondents belong to the
31-40 and 5% of the
respondents belong to the
above 40 age groups. To
conclude, the majority of the
respondents come under the
age group of 21-30 years.
It is clear that clearly shows the
marital status of the

Journal for Studies in Management and Planning
Available at http://edupediapublications.org/journals/index.php/JSMaP/
I SSN: 23 95-0463 Vol ume 0 3 I s s ue 02
Februa ry 2017
Available online: http://edupediapublications.org/journals/index.php/JSMaP/ P a g e | 61
respondents. Among the total
respondents 24% of the
respondents are married and
only 75% of the respondents
are unmarried. To conclude
majority of the respondents are
unmarried.
The respondents are classified
into five categories according
to the qualification as Below
HSC, HSC, and Under
Graduate, Post graduate and
Professional Table 4 portrays
10% of the respondents are at
below HSC level, 7% of the
respondents have complete
their HSC, 24% of the
respondents have complete
their Under Graduation, 34% of
the respondents have complete
their Post graduation, 25% of
the respondents are
professional. To conclude
majority of the respondents are
Post Graduation.
The respondents are classified
into six categories according to
the occupation as Government
Employee, Private Employee,
Business, Profession, Student,
and Others. it is clear from the
table 5 that 35 percentages of
the respondents are students,
25% of the respondents are
private employee category,
19% of the respondents are
Business people, 10% of the
respondents are some others
category,6% of the respondents
are Govt employee and 5% of
the respondents are profession
people. To conclude that
Majority of the respondents
belongs to the category of
others such as student
The respondents are classified
into six categories according to
the occupation as Government
Employee, Private Employee,
Business, Profession, Student,
and Others. it is clear from the
table 5 that 35 percentages of
the respondents are students,
25% of the respondents are
private employee category,
19% of the respondents are
Business people, 10% of the
respondents are some others
category,6% of the respondents
are Govt employee and 5% of
the respondents are profession
people. To conclude that
Majority of the respondents
Journal for Studies in Management and Planning
Available at http://edupediapublications.org/journals/index.php/JSMaP/
I SSN: 23 95-0463 Vol ume 0 3 I s s ue 02
Februa ry 2017
Available online: http://edupediapublications.org/journals/index.php/JSMaP/ P a g e | 62
belongs to the category of
others such as student
The majority 54% of the
respondents are opined that the
online banking is good, 42% of
the respondents opined that the
online banking is excellent, 4%
of the respondents opined that
they used neutral category. The
majority of the respondents
opined that bill payment
method, because it is good.
The chi square result shows
that the at 5% level of
significance, with the
significant value .017, there is a
significant difference between
the Internet usage and income
level of the respondents. Hence
the hypothesis is rejected.
SUGGESTIONS
Most of the respondents opined
that they are using bank services
for security reasons and capital
appreciation alone. They should be
educated about the use of demat
accounts, tax benefits too.
Though the number of people who
have no idea about cashless
transaction is minimum bankers
should take it as the need of the
hour.
CONCLUSION
Keeping track of the ever
changing banking industry and the
latest update in Internet technology,
banks need to equip themselves for the
competition. Because banking services
are targeted from various corner by
different types of competitors. Because
perception results in attitude. Attitude
leads to behavior. So for the want of
achieving maximum market share and
profit retaining customer and is
necessary.
Bibliography
Borcherding, T. E., Pommerehne, W. W., Schneider, F., & Schneider, F. (1982). Comparing the efficiency of private and public production: The evidence from five countries (pp. 127-156). Institute for Empirical Research in Economics University of Zurich.
Golden, S. A. R. (2015). Regional Imbalance affecting quality of e-banking services with special reference to Tuticorin District-An Analysis. International Journal of Research, 2(3), 788-798.
https://www.cgap.org/blog/can-collecting-savings-rural-areas-be-prof
itable
Premraj H and Sankaralingam N,
“Customer satisfaction in Indian retail banking – A study with
reference to Chennai”, Indian Journal of Commerce and Management Studies, Volume III,
Issue 1, Jan 2012, pp.38-41
Journal for Studies in Management and Planning
Available at http://edupediapublications.org/journals/index.php/JSMaP/
I SSN: 23 95-0463 Vol ume 0 3 I s s ue 02
Februa ry 2017
Available online: http://edupediapublications.org/journals/index.php/JSMaP/ P a g e | 63
Purohit H C and Avinash D Pathardikar, “Service Quality
Measurement and Consumer Perception About the Services of Banking Institution”, Indian
Journal of Marketing, Mar 2007, Volume XXXVII, No. 3, pp. 12 -
18
Rama Mohana Rao K and Tekeste Berhanu Lakew, “service quality
perceptions of customers: A study of the customers’ of public sector
and private sector commercial banks in India”, International Journal of Research in Commerce
and Management, Volume No.2, Issue No.11, Nov 2011, pp.13-16.
Ramesh Kumar Miryala, “ A Customer Perspective Empirical
Study”, the International Journal of Business and management Research, Volume 3, Issue ,
Jan-June, 2009, pp. 43-53 ”
Regi, S. B., & Golden, S. A. R. (2014). A Study On Attitude Of Employee Towards Working Environment With Special Reference To RR Pvt Ltd. Review Of Research, 2 (2), 1, 5.
Regi, S. B., & Golden, S. A. R. (2014). Customer Preference Towards Innovative Banking Practices Available In State Bank Of India At Palayamkottai. Sankhya International Journal Of Management And Technology, 3 (11 (A)), 31, 33.
Regi, S. B., & Golden, S. A. R. (2014). Customer Preference Towards E-Channels Provided By State Of Bank Of India.
Regi, S. B., Golden, S. A. R., & Franco, C. E. (2014). ROLE OF COMMERCIAL BANK IN THE GROWTH OF MICRO AND SMALL
ENTERPRISES. Golden Research Thoughts, 3 (7), 1, 5.
Sathish, G. A STUDY ON LOAN PORTFOLIO MANAGEMENT OF URBAN COOPERATIVE BANKS IN TAMIL NADU.
[Franco et. al., Vol.5 (Iss.5: SE): May, 2017] ISSN- 2350-0530(O), ISSN- 2394-3629(P)
ICV (Index Copernicus Value) 2015: 71.21 IF: 4.321 (CosmosImpactFactor), 2.532 (I2OR)
InfoBase Index IBI Factor 3.86
Http://www.granthaalayah.com ©International Journal of Research - GRANTHAALAYAH [42]
Management
SERVICE QUALITY OF PUBLIC AND PRIVATE SECTOR BANKS IN
TIRUNELVELI DISTRICT
Dr. C. Eugine Franco *1
, G. Bright Jowerts 2
*1 Associate Professor, PG & Research Department of Commerce, St. Xavier’s (Autonomous)
College, Palayamkottai, India 2 Assistant Professor in Commerce, St. Xavier’s (Autonomous) College, Palayamkottai, India
DOI: https://doi.org/10.5281/zenodo.574862
Abstract
Service Quality of the banks referred as an obligation of all banks to fulfill the objectives and
needs of the customers. Service quality in private sector banks is good compare to public sector
banks. The various issues the banks are not able to provide immediate response to customers,
service time duration is more, long queue deposit the money, waiting for long time, staff
behavior is not good, especially public sector banks are not providing multitude services like
payment of bills, payment of tax, Banc assurance etc. and problem relating to banking service
such as bank statements, error in the statements are not provided immediate response to
customers. The scope of this research is to identify the service quality of public and private
sector banks in Tirunelveli district. This study only focuses on the dimensions of service quality
i.e. reliability, assurance, tangibility, empathy and responsiveness. The study was done taking
two types of banks such as public and private sector banks in Tirunelveli district into
consideration. The survey was restricted to the bank customers in Tirunelveli district only. As the
population size is infinite, 672 respondents are selected as sample among the population using
stratified random sampling. The sample has been stratified as 528 from public sector bank
customers and 144 from private sector bank customers in Tirunelveli district.
Keywords: Service Quality; Reliability; Assurance; Tangibility; Empathy And Responsiveness.
Cite This Article: Dr. C. Eugine Franco, and G. Bright Jowerts. (2017). “SERVICE QUALITY
OF PUBLIC AND PRIVATE SECTOR BANKS IN TIRUNELVELI DISTRICT.” International
Journal of Research - Granthaalayah, 5(5)SE, 42-52. https://doi.org/10.5281/zenodo.574862.
1. Introduction
SERVQUAL represents service quality as the discrepancy between a customer's expectations for
a service offering and the customer's perceptions of the service received, requiring respondents to
answer questions about both their expectations and their perceptions. SERVQUAL has been
proposed as a useful instrument for diagnostic purposes. It has been found to effectively identify
[Franco et. al., Vol.5 (Iss.5: SE): May, 2017] ISSN- 2350-0530(O), ISSN- 2394-3629(P)
ICV (Index Copernicus Value) 2015: 71.21 IF: 4.321 (CosmosImpactFactor), 2.532 (I2OR)
InfoBase Index IBI Factor 3.86
Http://www.granthaalayah.com ©International Journal of Research - GRANTHAALAYAH [43]
the gaps in the dimension and thus help the service organization to assess service quality and do
the needful to bridge the GAP. Service quality is an approach to manage business processes in
order to ensure full satisfaction of the customers which will help to increase competitiveness and
effectiveness of the industry. Quality in service is very important especially for the growth and
development of service sector business enterprises.
2. Statement of the Problem
Service Quality of the banks referred as an obligation of all banks to fulfill the objectives and
needs of the customers. In General it is perused that, service quality in private sector banks is
good compare to public sector banks. The various issues the banks are not able to provide
immediate response to customers, service time duration is more, long queue deposit the money,
waiting for long time, staff behavior is not good, especially public sector banks are not providing
multitude services like payment of bills, payment of tax, Banc assurance etc. and problem
relating to banking service such as bank statements, error in the statements are not provided
immediate response to customers. Parking facility in banks is very poor compared to private
sector banks. The biggest challenge today for the bank is to establish customers intimacy without
which all other efforts towards operationed excellence are meaningless. The present need of
banks is to have good relationship with customers by providing quality services to retain the
existing and generate or acquire new customers. Thus, this study attempts to study the service
quality of public and private sector banks in the present scenario.
3. Scope of the Study
The scope of this research is to identify the service quality of public and private sector banks in
Tirunelveli district. This study only focuses on the dimensions of service quality i.e. reliability,
assurance, tangibility, empathy and responsiveness. The study was done taking two types of
banks such as public and private sector banks in Tirunelveli district into consideration. The
survey was restricted to the bank customers in Tirunelveli district only.
4. Objectives of the Study
The study has the following objectives
i. To study the demographic profile of customers of public and private sector banks in
Tirunelveli district.
ii. To study and compare the existing service quality dimensions in the Public and Private
sector banks.
iii. To find out the problems faced by the customers in availing banking services.
5. Methodology
The methodology of the study is based on both primary data and secondary data. The primary
data collected through well-framed and structured questionnaire to elicit the well-considered
opinion of both public sector and private sector bank customers. Stratified random sampling
method has been used to collect the responses from the customers of both public and private
sector banks.

[Franco et. al., Vol.5 (Iss.5: SE): May, 2017] ISSN- 2350-0530(O), ISSN- 2394-3629(P)
ICV (Index Copernicus Value) 2015: 71.21 IF: 4.321 (CosmosImpactFactor), 2.532 (I2OR)
InfoBase Index IBI Factor 3.86
Http://www.granthaalayah.com ©International Journal of Research - GRANTHAALAYAH [44]
6. Sampling Design
As the population size is infinite, 672 respondents are selected as sample among the population
using stratified random sampling. The sample has been stratified as 528 from public sector bank
customers and 144 from private sector bank customers in Tirunelveli district.
Table 1: Sampling of the Study
Public Sector Banks
Sl. No Area No. of Banks Sample Sub Total Total
1 Rural 54 3 162
2 Semi-urban 66 3 198
3 Urban 56 3 168
TOTAL 176 3 528 528
Private Sector Banks
Sl. No Area No. of Banks Sample Sub Total Total
1 Rural 19 3 57
2 Semi-urban 19 3 57
3 Urban 10 3 30
TOTAL 48 3 144 144
Total Sample size 672
7. Limitations of the Study
In this research, 672 respondents are considered to suggest the five dimensions of service quality
of banking in Tirunelveli district. Large sample of respondents may produce better results.
The service quality is a vast subject consisting of a number of dimensions. The most common
five service quality dimensions namely, Tangibility, Reliability, Responsiveness, Assurance, and
Empathy only were analyzed in the present study.
8. Data Analysis and Interpretation
Table 2: Age wise classification of Respondents
Sl.
No
Age Type of Banks Total
Public Sector
Banks
Private Sector
Banks
1. Below 20 years 59(11.2) - 59(8.8)
2. 20-30 years 172(32.6) 65(45.1) 237(35.3)
3. 31-40 years 111(21.0) 49(34.0) 160(23.8)
4. 41-50 years 73(13.8) 14(9.7) 87(12.9)
5. 51-60 years 89(16.9) 14(9.7) 103(15.3)
6. Above 60 years 24(4.5) 2(1.4) 26(3.9)
Total 528 (100) 144 (100) 672 (100) Source: Primary data
(Parentheses indicates percentage)
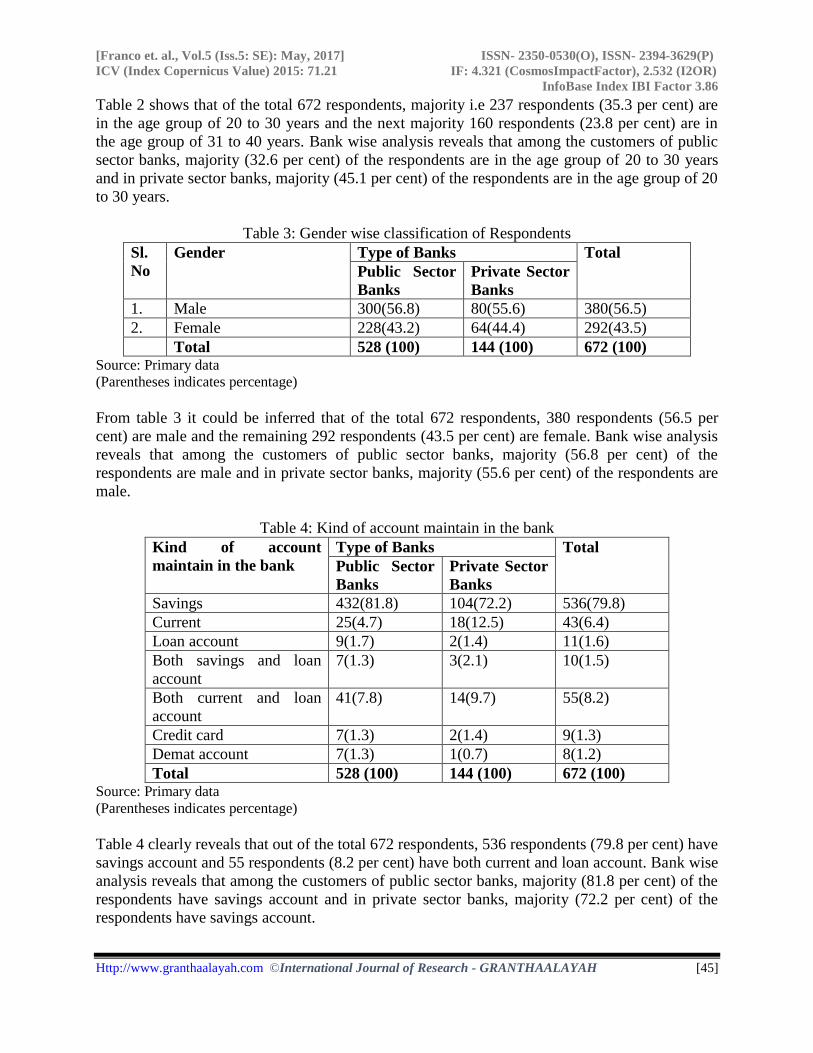
[Franco et. al., Vol.5 (Iss.5: SE): May, 2017] ISSN- 2350-0530(O), ISSN- 2394-3629(P)
ICV (Index Copernicus Value) 2015: 71.21 IF: 4.321 (CosmosImpactFactor), 2.532 (I2OR)
InfoBase Index IBI Factor 3.86
Http://www.granthaalayah.com ©International Journal of Research - GRANTHAALAYAH [45]
Table 2 shows that of the total 672 respondents, majority i.e 237 respondents (35.3 per cent) are
in the age group of 20 to 30 years and the next majority 160 respondents (23.8 per cent) are in
the age group of 31 to 40 years. Bank wise analysis reveals that among the customers of public
sector banks, majority (32.6 per cent) of the respondents are in the age group of 20 to 30 years
and in private sector banks, majority (45.1 per cent) of the respondents are in the age group of 20
to 30 years.
Table 3: Gender wise classification of Respondents
Sl.
No
Gender Type of Banks Total
Public Sector
Banks
Private Sector
Banks
1. Male 300(56.8) 80(55.6) 380(56.5)
2. Female 228(43.2) 64(44.4) 292(43.5)
Total 528 (100) 144 (100) 672 (100) Source: Primary data
(Parentheses indicates percentage)
From table 3 it could be inferred that of the total 672 respondents, 380 respondents (56.5 per
cent) are male and the remaining 292 respondents (43.5 per cent) are female. Bank wise analysis
reveals that among the customers of public sector banks, majority (56.8 per cent) of the
respondents are male and in private sector banks, majority (55.6 per cent) of the respondents are
male.
Table 4: Kind of account maintain in the bank
Kind of account
maintain in the bank
Type of Banks Total
Public Sector
Banks
Private Sector
Banks
Savings 432(81.8) 104(72.2) 536(79.8)
Current 25(4.7) 18(12.5) 43(6.4)
Loan account 9(1.7) 2(1.4) 11(1.6)
Both savings and loan
account
7(1.3) 3(2.1) 10(1.5)
Both current and loan
account
41(7.8) 14(9.7) 55(8.2)
Credit card 7(1.3) 2(1.4) 9(1.3)
Demat account 7(1.3) 1(0.7) 8(1.2)
Total 528 (100) 144 (100) 672 (100) Source: Primary data
(Parentheses indicates percentage)
Table 4 clearly reveals that out of the total 672 respondents, 536 respondents (79.8 per cent) have
savings account and 55 respondents (8.2 per cent) have both current and loan account. Bank wise
analysis reveals that among the customers of public sector banks, majority (81.8 per cent) of the
respondents have savings account and in private sector banks, majority (72.2 per cent) of the
respondents have savings account.
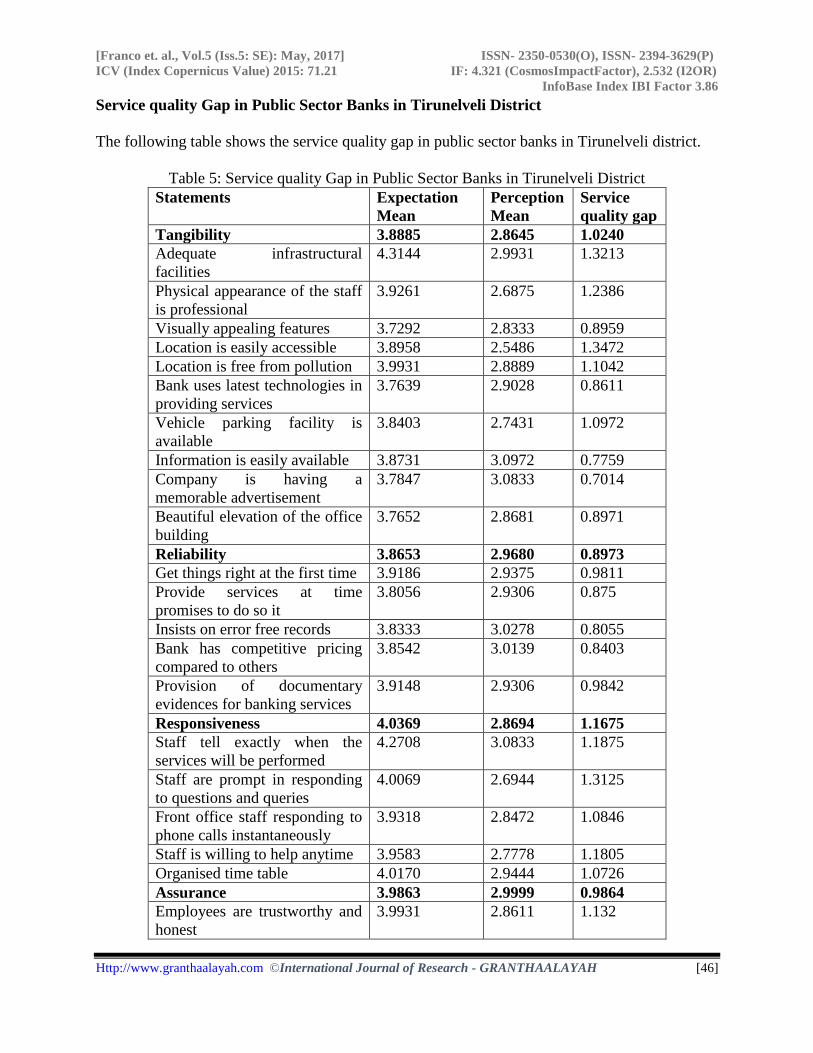
[Franco et. al., Vol.5 (Iss.5: SE): May, 2017] ISSN- 2350-0530(O), ISSN- 2394-3629(P)
ICV (Index Copernicus Value) 2015: 71.21 IF: 4.321 (CosmosImpactFactor), 2.532 (I2OR)
InfoBase Index IBI Factor 3.86
Http://www.granthaalayah.com ©International Journal of Research - GRANTHAALAYAH [46]
Service quality Gap in Public Sector Banks in Tirunelveli District
The following table shows the service quality gap in public sector banks in Tirunelveli district.
Table 5: Service quality Gap in Public Sector Banks in Tirunelveli District
Statements Expectation
Mean
Perception
Mean
Service
quality gap
Tangibility 3.8885 2.8645 1.0240
Adequate infrastructural
facilities
4.3144 2.9931 1.3213
Physical appearance of the staff
is professional
3.9261 2.6875 1.2386
Visually appealing features 3.7292 2.8333 0.8959
Location is easily accessible 3.8958 2.5486 1.3472
Location is free from pollution 3.9931 2.8889 1.1042
Bank uses latest technologies in
providing services
3.7639 2.9028 0.8611
Vehicle parking facility is
available
3.8403 2.7431 1.0972
Information is easily available 3.8731 3.0972 0.7759
Company is having a
memorable advertisement
3.7847 3.0833 0.7014
Beautiful elevation of the office
building
3.7652 2.8681 0.8971
Reliability 3.8653 2.9680 0.8973
Get things right at the first time 3.9186 2.9375 0.9811
Provide services at time
promises to do so it
3.8056 2.9306 0.875
Insists on error free records 3.8333 3.0278 0.8055
Bank has competitive pricing
compared to others
3.8542 3.0139 0.8403
Provision of documentary
evidences for banking services
3.9148 2.9306 0.9842
Responsiveness 4.0369 2.8694 1.1675
Staff tell exactly when the
services will be performed
4.2708 3.0833 1.1875
Staff are prompt in responding
to questions and queries
4.0069 2.6944 1.3125
Front office staff responding to
phone calls instantaneously
3.9318 2.8472 1.0846
Staff is willing to help anytime 3.9583 2.7778 1.1805
Organised time table 4.0170 2.9444 1.0726
Assurance 3.9863 2.9999 0.9864
Employees are trustworthy and
honest
3.9931 2.8611 1.132
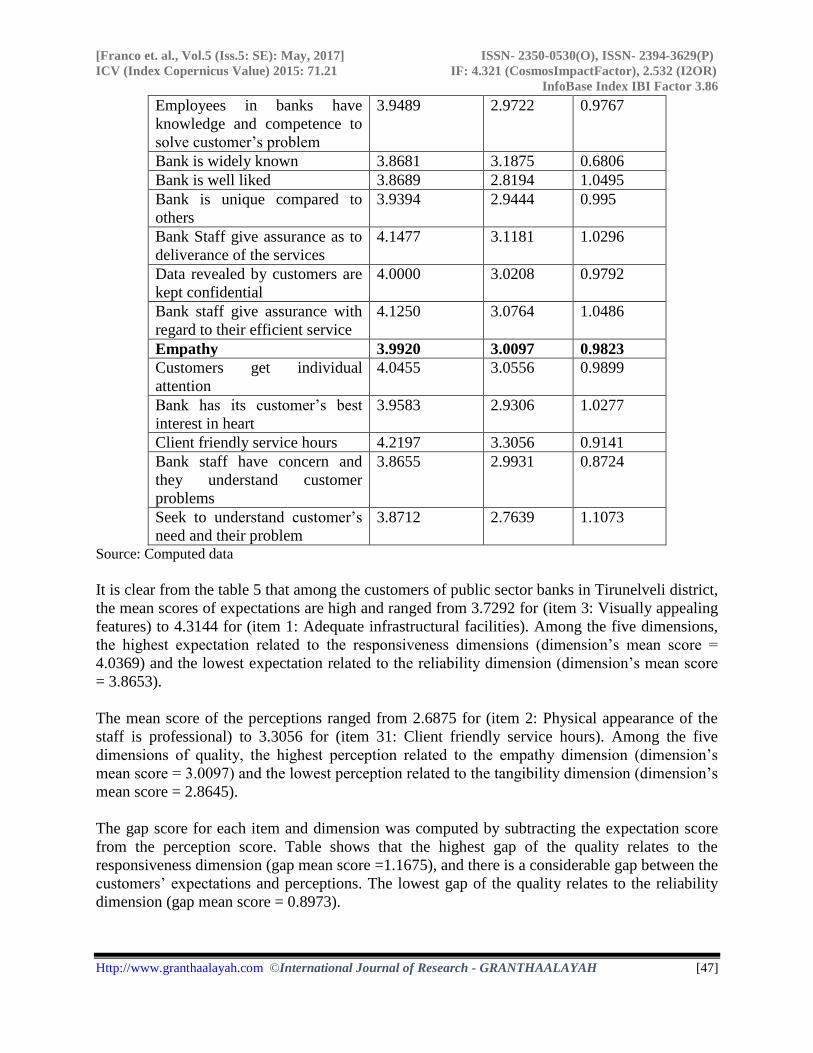
[Franco et. al., Vol.5 (Iss.5: SE): May, 2017] ISSN- 2350-0530(O), ISSN- 2394-3629(P)
ICV (Index Copernicus Value) 2015: 71.21 IF: 4.321 (CosmosImpactFactor), 2.532 (I2OR)
InfoBase Index IBI Factor 3.86
Http://www.granthaalayah.com ©International Journal of Research - GRANTHAALAYAH [47]
Employees in banks have
knowledge and competence to
solve customer’s problem
3.9489 2.9722 0.9767
Bank is widely known 3.8681 3.1875 0.6806
Bank is well liked 3.8689 2.8194 1.0495
Bank is unique compared to
others
3.9394 2.9444 0.995
Bank Staff give assurance as to
deliverance of the services
4.1477 3.1181 1.0296
Data revealed by customers are
kept confidential
4.0000 3.0208 0.9792
Bank staff give assurance with
regard to their efficient service
4.1250 3.0764 1.0486
Empathy 3.9920 3.0097 0.9823
Customers get individual
attention
4.0455 3.0556 0.9899
Bank has its customer’s best
interest in heart
3.9583 2.9306 1.0277
Client friendly service hours 4.2197 3.3056 0.9141
Bank staff have concern and
they understand customer
problems
3.8655 2.9931 0.8724
Seek to understand customer’s
need and their problem
3.8712 2.7639 1.1073
Source: Computed data
It is clear from the table 5 that among the customers of public sector banks in Tirunelveli district,
the mean scores of expectations are high and ranged from 3.7292 for (item 3: Visually appealing
features) to 4.3144 for (item 1: Adequate infrastructural facilities). Among the five dimensions,
the highest expectation related to the responsiveness dimensions (dimension’s mean score =
4.0369) and the lowest expectation related to the reliability dimension (dimension’s mean score
= 3.8653).
The mean score of the perceptions ranged from 2.6875 for (item 2: Physical appearance of the
staff is professional) to 3.3056 for (item 31: Client friendly service hours). Among the five
dimensions of quality, the highest perception related to the empathy dimension (dimension’s
mean score = 3.0097) and the lowest perception related to the tangibility dimension (dimension’s
mean score = 2.8645).
The gap score for each item and dimension was computed by subtracting the expectation score
from the perception score. Table shows that the highest gap of the quality relates to the
responsiveness dimension (gap mean score =1.1675), and there is a considerable gap between the
customers’ expectations and perceptions. The lowest gap of the quality relates to the reliability
dimension (gap mean score = 0.8973).

[Franco et. al., Vol.5 (Iss.5: SE): May, 2017] ISSN- 2350-0530(O), ISSN- 2394-3629(P)
ICV (Index Copernicus Value) 2015: 71.21 IF: 4.321 (CosmosImpactFactor), 2.532 (I2OR)
InfoBase Index IBI Factor 3.86
Http://www.granthaalayah.com ©International Journal of Research - GRANTHAALAYAH [48]
Service quality Gap in Private Sector Banks in Tirunelveli District
The following table shows the service quality gap in private sector banks in Tirunelveli district.
Table 6: Service quality Gap in Private Sector Banks in Tirunelveli District
Statements Expectation
Mean
Perception
Mean
Service
quality gap
Tangibility 3.7223 3.2159 0.5064
Adequate infrastructural
facilities
4.2986 3.5170 0.7816
Physical appearance of the staff
is professional
3.6597 3.1174 0.5423
Visually appealing features 3.6136 2.8864 0.7272
Location is easily accessible 3.5227 3.3030 0.2197
Location is free from pollution 3.7045 2.9299 0.7746
Bank uses latest technologies in
providing services
3.7481 3.1553 0.5928
Vehicle parking facility is
available
3.4867 3.2860 0.2007
Information is easily available 3.8333 3.4091 0.4242
Company is having a
memorable advertisement
3.5928 3.2822 0.3106
Beautiful elevation of the office
building
3.7639 3.2727 0.4912
Reliability 3.7956 3.3204 0.4752
Get things right at the first time 3.8542 3.4167 0.4375
Provide services at time
promises to do so it
3.6913 3.2140 0.4773
Insists on error free records 3.7443 3.1856 0.5587
Bank has competitive pricing
compared to others
3.8201 3.3333 0.4868
Provision of documentary
evidences for banking services
3.8681 3.4527 0.4154
Responsiveness 3.9332 3.2026 0.7306
Staff tell exactly when the
services will be performed
4.1117 3.3125 0.7992
Staff are prompt in responding
to questions and queries
3.7633 3.2102 0.5531
Front office staff responding to
phone calls instantaneously
3.9028 3.0038 0.899
Staff is willing to help anytime 3.9508 3.2367 0.7141
Organised time table 3.9375 3.2500 0.6875
Assurance 3.8699 3.3167 0.5532
Employees are trustworthy and
honest
3.8239 3.2595 0.5644
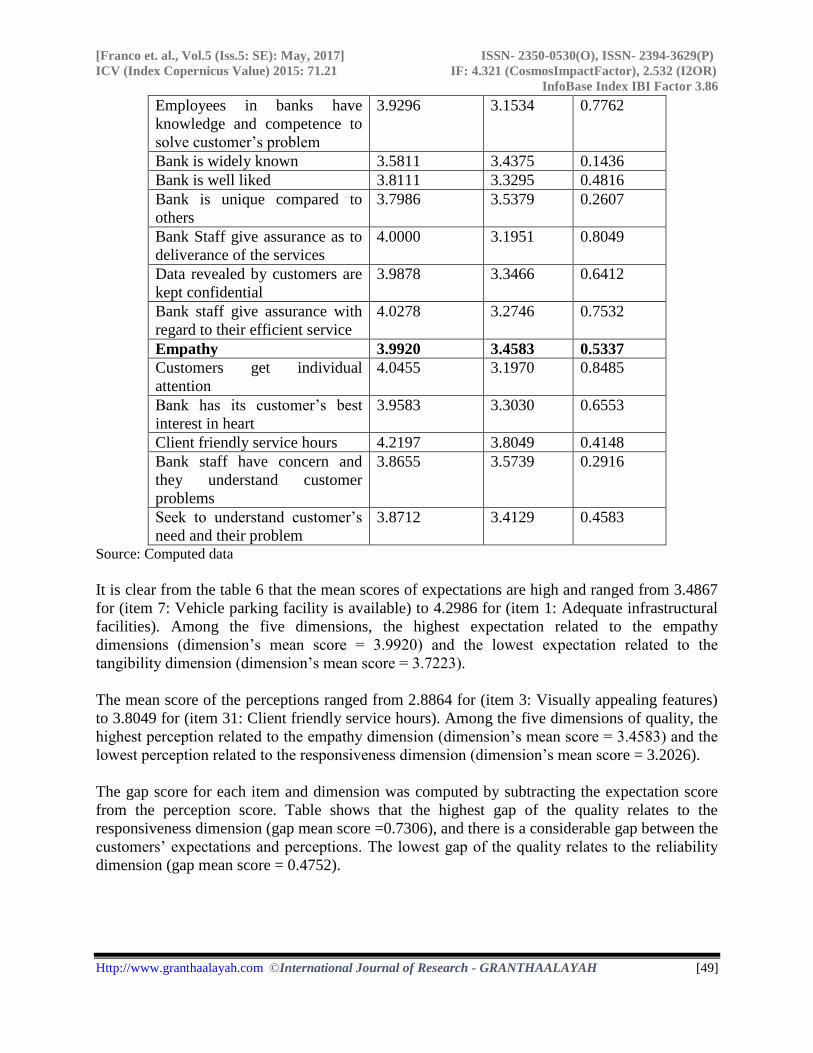
[Franco et. al., Vol.5 (Iss.5: SE): May, 2017] ISSN- 2350-0530(O), ISSN- 2394-3629(P)
ICV (Index Copernicus Value) 2015: 71.21 IF: 4.321 (CosmosImpactFactor), 2.532 (I2OR)
InfoBase Index IBI Factor 3.86
Http://www.granthaalayah.com ©International Journal of Research - GRANTHAALAYAH [49]
Employees in banks have
knowledge and competence to
solve customer’s problem
3.9296 3.1534 0.7762
Bank is widely known 3.5811 3.4375 0.1436
Bank is well liked 3.8111 3.3295 0.4816
Bank is unique compared to
others
3.7986 3.5379 0.2607
Bank Staff give assurance as to
deliverance of the services
4.0000 3.1951 0.8049
Data revealed by customers are
kept confidential
3.9878 3.3466 0.6412
Bank staff give assurance with
regard to their efficient service
4.0278 3.2746 0.7532
Empathy 3.9920 3.4583 0.5337
Customers get individual
attention
4.0455 3.1970 0.8485
Bank has its customer’s best
interest in heart
3.9583 3.3030 0.6553
Client friendly service hours 4.2197 3.8049 0.4148
Bank staff have concern and
they understand customer
problems
3.8655 3.5739 0.2916
Seek to understand customer’s
need and their problem
3.8712 3.4129 0.4583
Source: Computed data
It is clear from the table 6 that the mean scores of expectations are high and ranged from 3.4867
for (item 7: Vehicle parking facility is available) to 4.2986 for (item 1: Adequate infrastructural
facilities). Among the five dimensions, the highest expectation related to the empathy
dimensions (dimension’s mean score = 3.9920) and the lowest expectation related to the
tangibility dimension (dimension’s mean score = 3.7223).
The mean score of the perceptions ranged from 2.8864 for (item 3: Visually appealing features)
to 3.8049 for (item 31: Client friendly service hours). Among the five dimensions of quality, the
highest perception related to the empathy dimension (dimension’s mean score = 3.4583) and the
lowest perception related to the responsiveness dimension (dimension’s mean score = 3.2026).
The gap score for each item and dimension was computed by subtracting the expectation score
from the perception score. Table shows that the highest gap of the quality relates to the
responsiveness dimension (gap mean score =0.7306), and there is a considerable gap between the
customers’ expectations and perceptions. The lowest gap of the quality relates to the reliability
dimension (gap mean score = 0.4752).
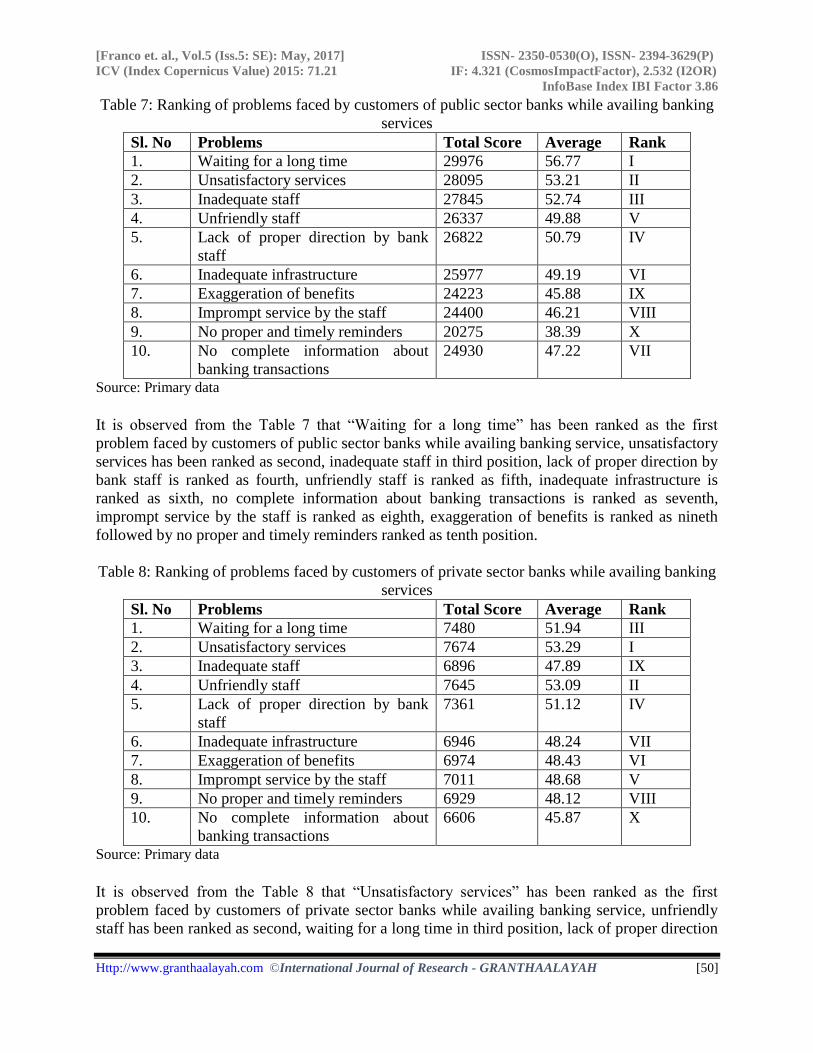
[Franco et. al., Vol.5 (Iss.5: SE): May, 2017] ISSN- 2350-0530(O), ISSN- 2394-3629(P)
ICV (Index Copernicus Value) 2015: 71.21 IF: 4.321 (CosmosImpactFactor), 2.532 (I2OR)
InfoBase Index IBI Factor 3.86
Http://www.granthaalayah.com ©International Journal of Research - GRANTHAALAYAH [50]
Table 7: Ranking of problems faced by customers of public sector banks while availing banking
services
Sl. No Problems Total Score Average Rank
1. Waiting for a long time 29976 56.77 I
2. Unsatisfactory services 28095 53.21 II
3. Inadequate staff 27845 52.74 III
4. Unfriendly staff 26337 49.88 V
5. Lack of proper direction by bank
staff
26822 50.79 IV
6. Inadequate infrastructure 25977 49.19 VI
7. Exaggeration of benefits 24223 45.88 IX
8. Imprompt service by the staff 24400 46.21 VIII
9. No proper and timely reminders 20275 38.39 X
10. No complete information about
banking transactions
24930 47.22 VII
Source: Primary data
It is observed from the Table 7 that “Waiting for a long time” has been ranked as the first
problem faced by customers of public sector banks while availing banking service, unsatisfactory
services has been ranked as second, inadequate staff in third position, lack of proper direction by
bank staff is ranked as fourth, unfriendly staff is ranked as fifth, inadequate infrastructure is
ranked as sixth, no complete information about banking transactions is ranked as seventh,
imprompt service by the staff is ranked as eighth, exaggeration of benefits is ranked as nineth
followed by no proper and timely reminders ranked as tenth position.
Table 8: Ranking of problems faced by customers of private sector banks while availing banking
services
Sl. No Problems Total Score Average Rank
1. Waiting for a long time 7480 51.94 III
2. Unsatisfactory services 7674 53.29 I
3. Inadequate staff 6896 47.89 IX
4. Unfriendly staff 7645 53.09 II
5. Lack of proper direction by bank
staff
7361 51.12 IV
6. Inadequate infrastructure 6946 48.24 VII
7. Exaggeration of benefits 6974 48.43 VI
8. Imprompt service by the staff 7011 48.68 V
9. No proper and timely reminders 6929 48.12 VIII
10. No complete information about
banking transactions
6606 45.87 X
Source: Primary data
It is observed from the Table 8 that “Unsatisfactory services” has been ranked as the first
problem faced by customers of private sector banks while availing banking service, unfriendly
staff has been ranked as second, waiting for a long time in third position, lack of proper direction
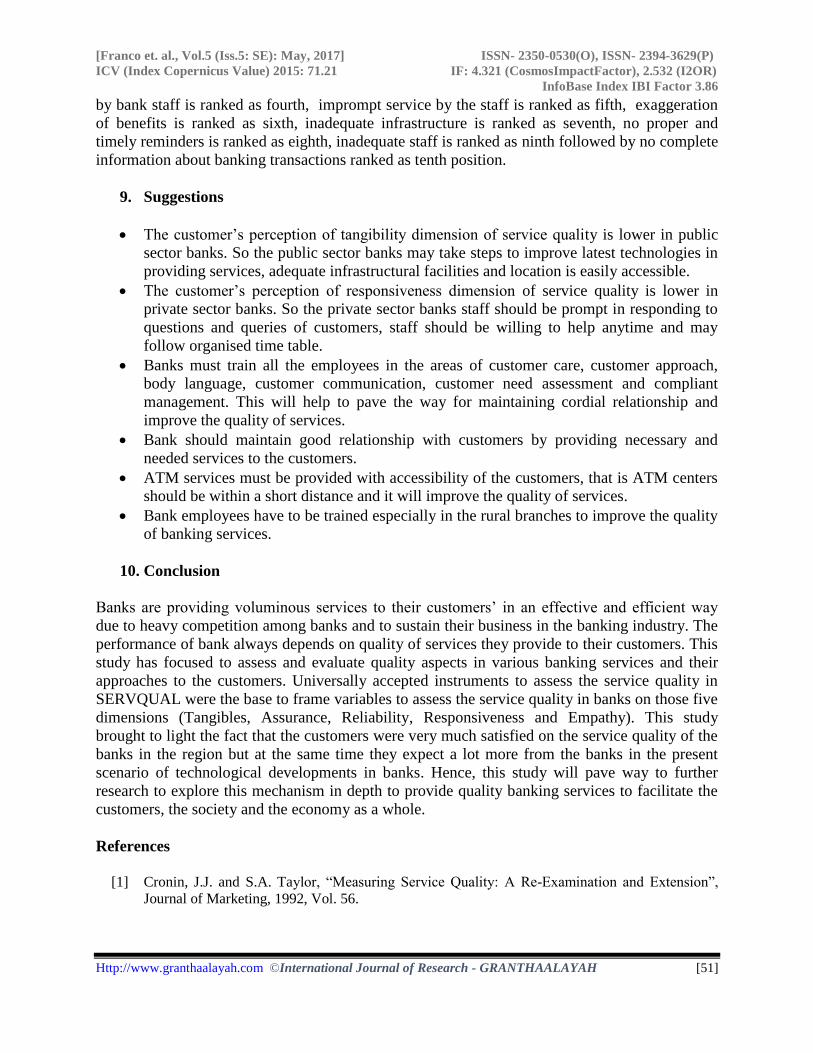
[Franco et. al., Vol.5 (Iss.5: SE): May, 2017] ISSN- 2350-0530(O), ISSN- 2394-3629(P)
ICV (Index Copernicus Value) 2015: 71.21 IF: 4.321 (CosmosImpactFactor), 2.532 (I2OR)
InfoBase Index IBI Factor 3.86
Http://www.granthaalayah.com ©International Journal of Research - GRANTHAALAYAH [51]
by bank staff is ranked as fourth, imprompt service by the staff is ranked as fifth, exaggeration
of benefits is ranked as sixth, inadequate infrastructure is ranked as seventh, no proper and
timely reminders is ranked as eighth, inadequate staff is ranked as ninth followed by no complete
information about banking transactions ranked as tenth position.
9. Suggestions
The customer’s perception of tangibility dimension of service quality is lower in public
sector banks. So the public sector banks may take steps to improve latest technologies in
providing services, adequate infrastructural facilities and location is easily accessible.
The customer’s perception of responsiveness dimension of service quality is lower in
private sector banks. So the private sector banks staff should be prompt in responding to
questions and queries of customers, staff should be willing to help anytime and may
follow organised time table.
Banks must train all the employees in the areas of customer care, customer approach,
body language, customer communication, customer need assessment and compliant
management. This will help to pave the way for maintaining cordial relationship and
improve the quality of services.
Bank should maintain good relationship with customers by providing necessary and
needed services to the customers.
ATM services must be provided with accessibility of the customers, that is ATM centers
should be within a short distance and it will improve the quality of services.
Bank employees have to be trained especially in the rural branches to improve the quality
of banking services.
10. Conclusion
Banks are providing voluminous services to their customers’ in an effective and efficient way
due to heavy competition among banks and to sustain their business in the banking industry. The
performance of bank always depends on quality of services they provide to their customers. This
study has focused to assess and evaluate quality aspects in various banking services and their
approaches to the customers. Universally accepted instruments to assess the service quality in
SERVQUAL were the base to frame variables to assess the service quality in banks on those five
dimensions (Tangibles, Assurance, Reliability, Responsiveness and Empathy). This study
brought to light the fact that the customers were very much satisfied on the service quality of the
banks in the region but at the same time they expect a lot more from the banks in the present
scenario of technological developments in banks. Hence, this study will pave way to further
research to explore this mechanism in depth to provide quality banking services to facilitate the
customers, the society and the economy as a whole.
References
[1] Cronin, J.J. and S.A. Taylor, “Measuring Service Quality: A Re-Examination and Extension”,
Journal of Marketing, 1992, Vol. 56.
[Franco et. al., Vol.5 (Iss.5: SE): May, 2017] ISSN- 2350-0530(O), ISSN- 2394-3629(P)
ICV (Index Copernicus Value) 2015: 71.21 IF: 4.321 (CosmosImpactFactor), 2.532 (I2OR)
InfoBase Index IBI Factor 3.86
Http://www.granthaalayah.com ©International Journal of Research - GRANTHAALAYAH [52]
[2] Golden, S. A. R., & Regi, S. B. (2015). Satisfaction of Customers towards User Friendly
Technological Services offered by Public and Private Sector banks at Palayamkottai, Tirunelveli
District. International Journal of Research, 2(3), 775-787.
[3] Golden, S. A. R. (2015). Regional Imbalance affecting quality of e-banking services with special
reference to Tuticorin District- An Analysis. International Journal of Research, 2(3), 788-799.
[4] Parasuraman,;V. A. Zeithaml,; and L.L. Berry., “Reassessment of Expectations as a Comparison
Standard in Measuring Service Quality – Implications for Further Research”, Journal of
Marketing, 1994, Vol. 58, No.1.
Ananth, A. and Ramesh, R., “Service Quality Gap Analysis in Private Sector Banks a Customers
Perspective”, Internationally Indexed Journal, 2011, Vol.II, Issue.1.
[5] Regi, S. B., & Golden, S. A. R. (2014). Customer Preference Towards Innovative Banking
Practices Available In State Bank Of India At Palayamkottai. Sankhya International Journal Of
Management And Technology, 3(11 (A)), 31-33.
[6] Regi, S. B., Golden, S. A. R., & Franco, C. E. (2014). A STUDY ON IMPACT OF
INFORMATION TECHNOLOGY (IT) IN MODERN BANKING SECTOR. Golden Research
Thoughts, 3(9), 1-4.
[7] Regi, S. B., Golden, S. A. R., & Franco, C. E. (2014). EMPLOYEE PERCEPTION TOWARDS
EFFECTIVENESS OF HR PRACTICES IN PUBLIC SECTOR BANKS IN TIRUNELVELI
DISTRICT. Tactful Management Research Journal, 2(6), 1-4.
[8] Zeithamal, V.A., A. Parasuraman and L.L. Berry, “Delivering Quality Service: Balancing
Customer Perceptions, and Experiences”, Free Press, New York, 1990.