Apparel Students' Perception of Denim Quality in Relation to ...
43
University of Arkansas, Fayetteville University of Arkansas, Fayetteville ScholarWorks@UARK ScholarWorks@UARK Apparel Merchandising and Product Development Undergraduate Honors Theses Apparel Merchandising and Product Development 5-2022 Apparel Students' Perception of Denim Quality in Relation to Price Apparel Students' Perception of Denim Quality in Relation to Price and Brand and Brand Karli Haws Follow this and additional works at: https://scholarworks.uark.edu/ampduht Part of the Fashion Business Commons, Fashion Design Commons, Fiber, Textile, and Weaving Arts Commons, Industrial and Product Design Commons, and the Sales and Merchandising Commons Citation Citation Haws, K. (2022). Apparel Students' Perception of Denim Quality in Relation to Price and Brand. Apparel Merchandising and Product Development Undergraduate Honors Theses Retrieved from https://scholarworks.uark.edu/ampduht/20 This Thesis is brought to you for free and open access by the Apparel Merchandising and Product Development at ScholarWorks@UARK. It has been accepted for inclusion in Apparel Merchandising and Product Development Undergraduate Honors Theses by an authorized administrator of ScholarWorks@UARK. For more information, please contact [email protected].
-
Upload
khangminh22 -
Category
Documents
-
view
0 -
download
0
Transcript of Apparel Students' Perception of Denim Quality in Relation to ...

University of Arkansas, Fayetteville University of Arkansas, Fayetteville
ScholarWorks@UARK ScholarWorks@UARK
Apparel Merchandising and Product Development Undergraduate Honors Theses
Apparel Merchandising and Product Development
5-2022
Apparel Students' Perception of Denim Quality in Relation to Price Apparel Students' Perception of Denim Quality in Relation to Price
and Brand and Brand
Karli Haws
Follow this and additional works at: https://scholarworks.uark.edu/ampduht
Part of the Fashion Business Commons, Fashion Design Commons, Fiber, Textile, and Weaving Arts
Commons, Industrial and Product Design Commons, and the Sales and Merchandising Commons
Citation Citation Haws, K. (2022). Apparel Students' Perception of Denim Quality in Relation to Price and Brand. Apparel Merchandising and Product Development Undergraduate Honors Theses Retrieved from https://scholarworks.uark.edu/ampduht/20
This Thesis is brought to you for free and open access by the Apparel Merchandising and Product Development at ScholarWorks@UARK. It has been accepted for inclusion in Apparel Merchandising and Product Development Undergraduate Honors Theses by an authorized administrator of ScholarWorks@UARK. For more information, please contact [email protected].

1
ScholarWorks@UARK
Apparel Merchandising and Product Development Undergraduate Honors Theses
4/2022
Apparel Students’ Perception of Denim Quality in Relation to Price and Brand Karli Haws

2
Apparel Students’ Perception of Denim Quality in Relation to Price and Brand
Karli Haws
Mentor: Dr. Leigh Southward
University of Arkansas
3
Table of Contents
Introduction……………………………………………………………………………….………4
Literature Review……………………………………………………………………………...….5
Methods and Materials………………………………………………………………………...….9
Data Analysis…………………………………………………………………………..…….…..12
Results……………………………………………………………………………….…..……….13
Conclusions………………..……………………………………………………………………..15
References…………………………………………………………………………….……….…18
Appendix……………………………………………………………………………………...….20

4
Introduction Background and Need
Students in an apparel and textiles program at a large mid-southwest university learn
about the quality of apparel products in a variety of areas. In an introductory, students focus on
basic principles of apparel production and analysis of garment components. Students who have
taken such courses should be knowledgeable of stitch types, seam finishes, and proper
installation of findings (such as zippers and buttons). Next level courses may address quality
assessment of and explore concepts like structure, aesthetics, cost and product performance.
Students become aware of the procedures and factors that go into the construction of a high-
quality garment as compared to a low-quality garment (As well as determining whether garment
cost is a reflection of the level of quality). Depending on a student’s level of completion in a
program, they should have a base knowledge of what quality means in the apparel industry.
Students’ ability to assess the true quality of a garment should increase as they move through the
programs.
This study aims to determine apparel students’ perception of quality in denim jeans on
price and brand. According to the price-quality-value model developed by Monroe and Krishnan
(1985) a higher price automatically increases the level of quality perceived by the consumer. The
model is shown as model 1in the appendix. During data collection students were asked to
evaluate the quality of three pairs of denim jeans. The pairs were from three different store types
at varying price points: one from a department store, one from a specialty store, and one from a
mass merchandiser. Based on the identified store, students may or may not have had
preconceived opinions regarding the quality of the garment. Past research shows that consumers
believe there is significant correlation between price and quality (Fowler & Clodfelter, 2001).
5
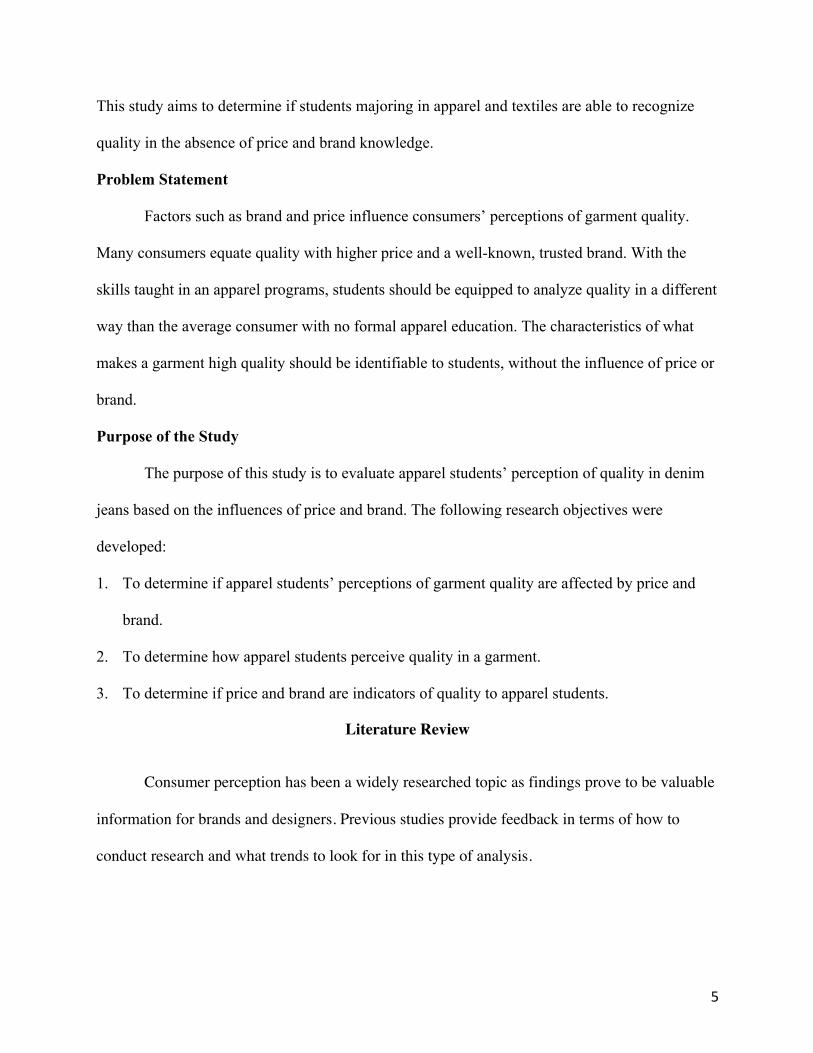
This study aims to determine if students majoring in apparel and textiles are able to recognize
quality in the absence of price and brand knowledge.
Problem Statement
Factors such as brand and price influence consumers’ perceptions of garment quality.
Many consumers equate quality with higher price and a well-known, trusted brand. With the
skills taught in an apparel programs, students should be equipped to analyze quality in a different
way than the average consumer with no formal apparel education. The characteristics of what
makes a garment high quality should be identifiable to students, without the influence of price or
brand.
Purpose of the Study
The purpose of this study is to evaluate apparel students’ perception of quality in denim
jeans based on the influences of price and brand. The following research objectives were
developed:
1. To determine if apparel students’ perceptions of garment quality are affected by price and
brand.
2. To determine how apparel students perceive quality in a garment.
3. To determine if price and brand are indicators of quality to apparel students.
Literature Review
Consumer perception has been a widely researched topic as findings prove to be valuable
information for brands and designers. Previous studies provide feedback in terms of how to
conduct research and what trends to look for in this type of analysis.

6
Consumer Perception of Quality
Consumer perception is a vast concept encompassing brand, value, price, customer
loyalty and more. Consumer perception can be defined as how a consumer views an apparel
garment or store based on the price point and brand image associated with it. This concept is
broad because different things matter to each consumer. Every shopper has his or her own set of
expectations and associations. A study by Rao and Monroe (1989) hypothesized that quality in
relation to price and perceived quality in relation to brand, were significant. However, they found
that the correlation of quality and store name was not significant, but price greatly influenced
perceived quality. This is an example of findings in which brand was not significant factor in
perception, while price was. Another study by Morganosky and Lazarde (1987) gathered
information regarding consumers’ perceptions of quality for three brand types and four store
types via phone interview. Designer brands made in the United States were seen as having the
best quality over other name brand and in-store brands. In-store brands were perceived to be of
higher quality than the brand they carried. As far as store type, department stores were seen as
offering the highest quality merchandise and discount stores had the lowest. While price was not
specifically looked at in this study, findings make it clear that brand and store type have impact
consumer perception of quality.
In a study conducted by Paulins and Geistfeld, (2003) consumers ranked 13 retail stores.
Their rankings and other questions were used to determine what attributes were associated with
each store, and what impact this had on store preference. Factors that influence preference were
found to be: Type of garment the shopper is pursuing, clothing in stock, outside store
appearance, shopping hours and advertising. Type of clothing preferred by the individual was
found to be the key factor. Since many factors influence perception, purchase intentions are
7
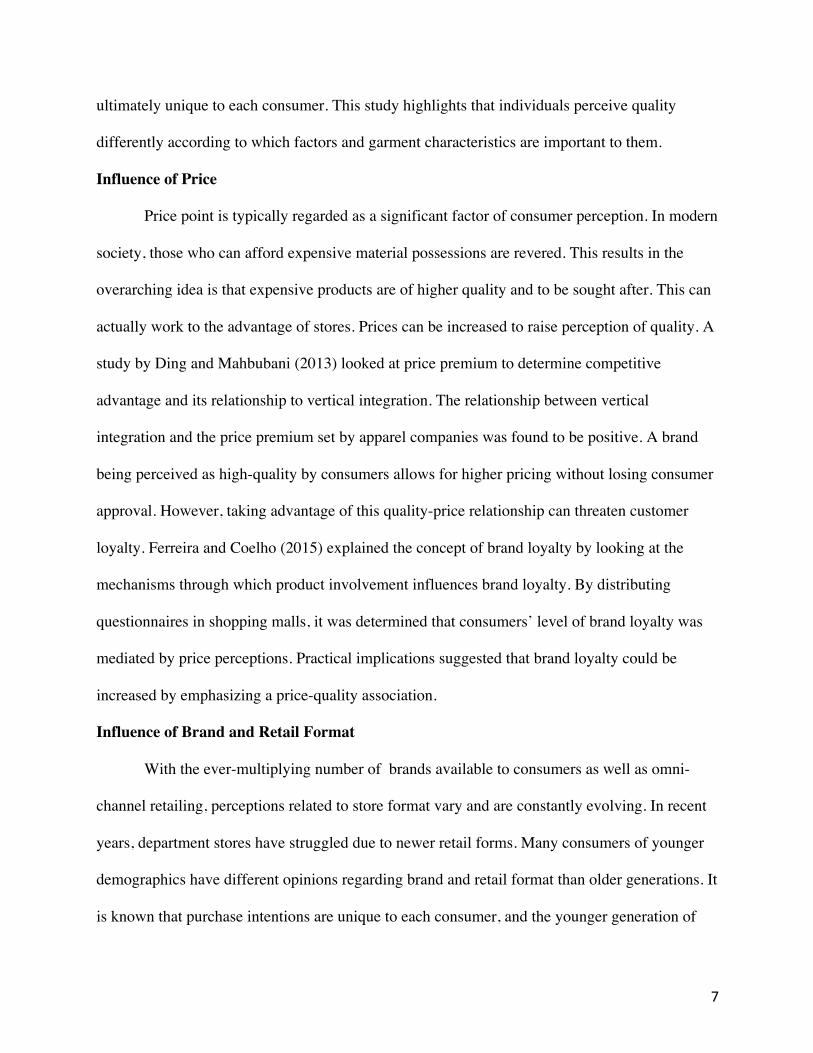
ultimately unique to each consumer. This study highlights that individuals perceive quality
differently according to which factors and garment characteristics are important to them.
Influence of Price
Price point is typically regarded as a significant factor of consumer perception. In modern
society, those who can afford expensive material possessions are revered. This results in the
overarching idea is that expensive products are of higher quality and to be sought after. This can
actually work to the advantage of stores. Prices can be increased to raise perception of quality. A
study by Ding and Mahbubani (2013) looked at price premium to determine competitive
advantage and its relationship to vertical integration. The relationship between vertical
integration and the price premium set by apparel companies was found to be positive. A brand
being perceived as high-quality by consumers allows for higher pricing without losing consumer
approval. However, taking advantage of this quality-price relationship can threaten customer
loyalty. Ferreira and Coelho (2015) explained the concept of brand loyalty by looking at the
mechanisms through which product involvement influences brand loyalty. By distributing
questionnaires in shopping malls, it was determined that consumers’ level of brand loyalty was
mediated by price perceptions. Practical implications suggested that brand loyalty could be
increased by emphasizing a price-quality association.
Influence of Brand and Retail Format
With the ever-multiplying number of brands available to consumers as well as omni-
channel retailing, perceptions related to store format vary and are constantly evolving. In recent
years, department stores have struggled due to newer retail forms. Many consumers of younger
demographics have different opinions regarding brand and retail format than older generations. It
is known that purchase intentions are unique to each consumer, and the younger generation of

8
consumers more impressionable as their buying behaviors are not set in stone. Superstores have
taken opportunity to try and excel in the apparel sector. A study by Ross and Harradine (2010)
examines young consumers’ perceptions of supermarket value branded apparel products.
Interestingly, respondents exhibited a particularly positive perception towards supermarket brand
denim. The study predicted that value play an increased role in fashion in the future. A growth in
sales indicated the growing acceptance of supermarket apparel among all age groups. For
American college students, brand awareness, perceived value, organizational associations and
brand uniqueness are the factors that contribute towards their loyalty to fashion brands. Fast
fashion experienced such rapid growth in recent years because of customer association.
Consumers view fast fashion as quick, easy, and trendy (Jin & Chang, 2018). They are okay with
purchasing low quality garments because of their purchase intentions, which are influenced by
the low price.
Perception is Multidimensional
By reviewing multiple factors that go into determining consumer perception, it can be
concluded that perception is multidimensional. A study by Swinker and Hines (2005) applied the
survey method to determine the types of informational cues consumers used in evaluation of
clothing quality and what expectations they had of high-quality garments. The results supported
that consumer perception is multidimensional in nature, with the majority indicating that product
quality was the most important factor in their purchase decisions.
Consumer Satisfaction
Overall, consumer satisfaction has a large impact on loyalty towards retail brands. Binninger
(2008) analyzed three dimensions of brand management: satisfaction, loyalty and attitude. It was
discovered that loyalty is the differentiator between a well-known retail brand and an

9
unidentifiable retail brand. Such findings serve as examples of the many dimensions contributing
towards consumer perception. A study by d’Astous and Saint-Louis (2005) had customers
evaluate national brands and store brands by looking at the product usage situation, price, store
type and social image. Retailers of upper-class brands use social image to emphasize what a
product symbolizes and promote items to be needed for special occasions. The product usage
situation, and therefore, purchase intentions differ between brands and stores. Stores of a lower
level, like superstores, place more importance on showing quality in an item of reasonable price.
There is no single factor influencing customer perception. Therefore, it is necessary to
study each factor and gather information, as many factors are intertwined, and perceptions differ
by individual. Different factors matter to a different degree to each person. This study breaks
separates these factors and gauges perception.
Methods and Materials
A questionnaire was developed to answer the research objectives. Materials used and the
instrumentation of those materials allowed for a research structure that was perfect for dividing
factors of perceptions to determine which matter to students.
Research Design
Data was gathered using the survey method. This research design is quantitative and non-
experimental. Since the data in this study was the opinions and perceptions of students, the
survey method helped to accurately gauge and record student responses. Upon presentation of
the garments, participants completed an electronic survey using Qualtrics software. The survey
questions were formulated to determine respondents’ perception of quality in pairs of denim
jeans. Questions covered some demographics and then three categories of quality: fabric,
construction and aesthetics. A copy of the survey is included at the end of the appendix.

10
Students were surveyed under two conditions. A group of participants saw the jeans and
answered the survey with price and brand knowledge. The jeans were presented with all original
identifiers and tags intact. Another group of participants had this information hidden from them.
All identifiable information was covered, and the garments were evaluated purely on what
participants could determine with their senses.
Population and Sampling
The survey method aims to describe certain characteristics of population (Jackson, 2011).
The population in this study was students majoring in apparel and textiles at a large, mid-
southwest universities. The sample included a convenience sample of students from varying
levels in the program , who were willing to participate. Data was collected in classes related to
apparel and textiles. In addition to a verbal explanation of the study’s purpose and expectations,
the start of the survey featured an informational page which told students what their responses
would be used for and provided a check-box option to agree to participate. Thus, the sample type
was convenience sampling. This method of sampling was beneficial to the study as participants
who self-select “are likely to be committed to take part in the study, which can help in improving
attendance and greater willingness to provide more insight into the phenomenon being studied”
(Sharma, 2017).
Rigor
The necessary steps have been taken to ensure the rigor of this research project. The
convenience sampling method was successful in attaining an appropriate amount of responses, as
“low response rates are among the most difficult of problems in survey research” (Trochim,
2020). It is not uncommon to come across issues when using human subjects, as students who
participated in this study had the choice to withdraw at any time. In the case of a survey, this is
11
most often accomplished by failing to answer all questions. However, attrition was accounted for
by initially aiming to attain enough participants. Additionally, this study was designed to be an
immersive experience for students. Reviewing these garments for quality standards is practice
for what they may be doing in the industry. This helped ensure that the study was not a waste of
valuable class time. This study was designed to be engaging as well as concise, as to not lose
participants due to lengthy, confusing questions. While there was the issue of not all students in a
class being present on the days of data collection and some did not fully complete the survey, an
adequate amount of data was obtained
Materials
Three pairs of denim jeans were purchased using department funding. A key was created
assigning the identity of a number to each pair. The first pair was purchased from a department
store in a mall, Dillard’s. Known as Jean 1, this pair represented the highest price point and were
J BRAND. Their original price at Dillard’s was $228. Jean 2 represented denim from a store that
specialized in the product and was purchased from Buckle at a mall. They were branded as
Buckle Black by Buckle and were priced at $84.95. Jean 3 was purchased from Walmart. They
represent denim from a superstore at a low price point. The brand was Time and True by
Walmart and the cost was $16.87. All three pairs had the same fiber content. For the students that
had knowledge of price and brand while completing the survey, all original tags and stickers
were left on the jeans. For the students from which this information was hidden, duck-tape was
used to cover hang tags, sewn in tags and findings that identified brand.
Instrumentation
While examining the three pairs of denim jeans presented, students completed a survey to
evaluate their perception of quality. Participants completed the electronic survey on university
12
Surface Pro tablets. The same questions were answered about each pair; questions considered
fabric, construction, aesthetics, and the overall rating of quality. Each pair of jeans were set on
their own table in a classroom setting. Three participants at a time cycled through pairs and
completed the survey section for each pair as they were at the corresponding table.
Data Collection
The first step of data collection was finding participants. Faculty assisted in this by
allowing for their classes to be surveyed. Providing an entire class period for this process ensured
that each student got a chance to review the garments. The pairs of jeans were presented, and
participants cycled through completing the survey questions for each. Participants remained at
each table for about five minutes, and each cycle of three participants were able to view and
survey all three pairs in 15 minutes.
The data from students whose responses were not recorded or who did not to finish the
survey was not included in the data analysis. This method proved to be the most fitting for this
type of research as participants were able to express their individual opinions of garments and
what they deemed quality.
Data Analysis
Data collected from the survey was transferred into JMP software for analysis. The first
step of analysis was cleaning the data. This process entailed organizing the data in two sets: the
responses of those who saw the price and brand and the responses of those who did not see price
or brand. Decisions were made about which data was usable. The data of surveys that featured
the same answer value across all questions was thrown out. This raises suspicion that the
participant was not answering questions properly and presents inaccurate data. Decisions then
had to be made about what to do with responses that included one blank or mistake. These are

13
different from incomplete responses in which just a portion of the survey was taken, and those
have already been discarded. Responses such as these, raise the question of whether it can be
assumed what the respondent meant to say or if the data is unusable. Several responses that
included holes were deleted from both sets of data to ensure accurate analysis.
Of the students surveyed who did not see the price and brand of the garments, thirty-six
responses were deemed workable. Of the students surveyed who saw price and brand, thirty-six
responses were also usable. The majority of the analysis compared these two groups. While the
number of individual responses in the happens to be equal, there is disparity between the two
groups in the following ways: in the group that did not see price or brand, twelve were freshmen,
two were sophomores, eight were juniors and 10 were seniors. Of the group that did see price
and brand, none of the responses used belonged to freshmen, 24 were sophomores, 10 were
juniors and two were seniors. Nevertheless, the sample can still be used to determine information
about the population as the response set as a whole contains sizeable portions of each class level.
Several interesting trends emerged during data analysis that gave way to the results of the
study. Tools in JMP that were used in data analysis include fit and mixed models, bar graphs and
dot plot graphs. These provided basic individual analysis of the responses to the input question.
Demographics
Of the thirty-six workable responses from the group that did not see price or brand,
twenty-four were female and twelve were male. Of the thirty-six who did see price and brand, all
where female
Results
Upon viewing the data as it was run, the following observations were made in the order
that different results were viewed. Of the group that saw price and brand, most rated all three
14
pairs highly in the fabric category. Most either “strongly agreed” or “somewhat agreed” that all
three pairs had desirable fiber content, were free of defects, resilient, soft, stretchy and smooth.
The group had more diverse responses to questions considering the aesthetic quality of the jeans.
Responses were split between “somewhat agree” and “somewhat disagree” as to whether the
pairs were fashionable, and many chose “neither agree nor disagree” as to whether the jeans were
interesting. Looking at all three pairs, most received quality marks of 5, 6 and 7 as shown in
table 1.
Of the group that did not see price or brand, all three pairs received high fabric and
construction marks, with most answering “strongly agree” to the questions concerning both
categories. However, responses to the aesthetics questions were on the opposite end. Responses
to whether the three pairs were fashionable varied, and most would “somewhat disagree” that
any of the pairs were interesting or unique. All together the pairs received quality ratings of 4, 5
and 6 as shown in table 2.
When students had knowledge of price and brand they rated the garments as higher
quality overall and less disparity existed between individual pairs (students rated individual pairs
more similarly). Lower ratings overall and greater disparity existed between ratings of the three
pairs when price and brand were hidden.
In both tests, Jean 1 was consistently rated highly on fabric indicators of quality.
Most students strongly agreed that the fabric was soft, stretchy and smooth.
In both tests, Jean 2 received the highest amount of middle ground answers of “somewhat
agree,” “somewhat disagree” and “neither agree nor disagree.” Therefore, it was the most
confusing pair to both groups of respondents whether or not they had price and brand knowledge.
It was the middle pair of the three samples of jeans, which had a price point between the other

15
two. It stood out as the middle pair in both tests, not receiving high quality marks in any
category, but is not seen having poor quality overall.
Conclusions
J In both tests, Jeans 3 was rated as the least fashionable, interesting and unique.
Respondents strongly disagreed that Jean 3 had these characteristics. Likewise, as opposed to
Jean 1 which students found to be high quality in terms of fabric, Jean 3 received opposite
ratings. Students in both groups strongly disagreed that Jean 3 was smooth, soft or stretchy.
Therefore, it can be inferred that the positive fabric attributes of being smooth, soft and stretchy
also made a garment fashionable and unique to students. Jean 1 was consistently rated as the
highest quality, having an average overall quality rating of 6 between both groups. It was rated as
the best, followed by Jean 2 and Jean 3 in both cases. This is interesting because it aligns with
the price and category of the jeans. Therefore, apparel students are able to recognize indicators of
quality regardless of price and brand knowledge. Additionally, price point and store type act as
accurate indicators of quality. These findings conform with the price-quality-value model
developed by Monroe and Krishnan (1985).
Discussion
Students who saw price and brand marked “strongly agree” and “strongly disagree”
answers more than their counterparts. Students who did not see price and brand used more
“somewhat agree” and “somewhat disagree” answers. It can be concluded that students were less
confident in their answers when they did not have price and brand knowledge upon which to
base their opinions, and that students use price and brand as factors in their purchasing decisions.
Both groups of participants provided similar answers and “correctly” evaluated the jeans in a

16
way that aligned with price. In this way, the group with no price and brand knowledge was
“right,” but answered less confidently.
In drawing conclusions, it is important to look at things from an imaginative perspective
in addition to the obvious. Apparent conclusions that exist within the data are that Jean 1 was
consistently rated as the highest quality, that price and brand knowledge resulted in higher
ratings overall and that quality rating aligned with price point. However, drawing more abstract
conclusions promotes discussion and raises new questions for future research.
Limitations
It can be observed that at least 83% of participants experienced virtual or remote learning
if freshmen are subtracted, as they may have had an in-person experience so far. As courses went
remote during the Spring 2020 semester, most current students had their learning experience
affected and altered at some point. A study by Joia and Lorenzo (2021) looked at the impact of
COVID-19 on the classroom, and how skill set development differed in the online environment.
Results found that “soft skill” classes were easier to transition to online as opposed to “hard
skill” courses, and that students were more likely to be successful in them. Hard skill includes
courses linked to working with equipment and being hands-on. With decreased interaction in the
virtual environment, students in these courses are more challenged. Another significant factor of
learning quality was found to be instructors’ attitudes towards virtual learning and competency
using the software.
Due to the abrupt shutdown, instructors and students were thrown into a virtual classroom
that they had little to no experience with. Going off of this study, it is likely that many students
experienced difficulty in virtual classes as apparel can be categorized as a hard skill discipline. It
can be hypothesized that students of hands-on, creative majors who partook in virtual learning
17
for an extended period of time may have underdeveloped skill sets and less confidence in
knowledge of material. Thus, they look for context clues like price and brand to confirm their
answers.
Future Direction
Also worthy of discussion is the gender demographic of the sample. Of the thirty-six
workable responses from the group that did not see price or brand, twenty-four were female and
twelve were male. Of the thirty-six who did see price and brand, all where female. Although
such a demographic could present an issue in certain studies, it was concluded that the sample
accurately reflected the population. The group with male respondents also included freshmen,
while the all-female group had no freshmen. An observation made while surveying classes was
that there were more male students in lower level courses compared to past years. Although
apparel programs at universities remain largely female, progress has been made towards this
discipline being seen as less traditionally feminine and as a viable career for males as well.
Future studies could determine the percentage of males studying fashion at universities, and if it
increases each year as acceptance grows. Additional research could be done if the process of
determining quality differs between male and female students.

18
References
Binninger, A. (2008). Exploring the relationships between retail brands and consumer store
loyalty. International Journal of Retail and Distribution Management, 36, 94-110 doi:
10.1108/09590550810853057 Retrieved from https://search.proquest.com/
d’Astous, A., Saint-Louis, O. (2005). National versus store brand effects on consumer evaluation
of a garment. Journal of Fashion Marketing and Management, 9, 306-317. doi:
10.1108/13612020510610435 Retrieved from https://search.proquest.com/
Ding, L., Mahbubani, J. (2013). The two-stage decision model of vertical integration.
Management Decision. Retrieved from https://www.emerald.com/
Ferreira, A., Coelho, F. (2015). Product involvement, price perceptions, and brand loyalty.
Journal of Product and Brand Management. Retrieved from https://www.emerald.com/
Fowler, D., Clodfelter, R. (2001). A comparison of apparel quality: outlet stores versus
department stores, Journal of Fashion Marketing and Management, Vol. 5 No. 1, pp. 57-
66. https://doi.org/10.1108/EUM0000000007279
Jackson, S. (2011). Research Methods and Statistics: A Critical Approach (4th ed.). Cengage
Learning.
Jin, S., Chang, A. (2018). Factors affecting college students’ brand loyalty towards fast fashion.
International Journal of Retail & Distribution. Retrieved from https://www.emerald.com/
Joia, L., Lorenzo, M. (2021). "Zoom In, Zoom Out: The Impact of the COVID-19 Pandemic in
the Classroom. Sustainability 13, no. 5: 2531. Retrieved from
https://doi.org/10.3390/su13052531

19
Monroe, K. B., Krishnan, R. (1985). The effect of price on subjective product evaluation. In J.
Jacoby & J. Olson (Eds.), The perception of merchandise and store quality. Price Quality
Value Model. Retrieved from
https://link.springer.com/article/10.1186/s40691-018-0128-2
Morganosky, M., Lazarde, M. (1987). Foreign-made apparel: influences on consumers’
perceptions of brand and store quality. International Journal of Advertising, 6,339.
Retrieved from https://search.proquest.com/
Paulins, V., Geistfeld, L. (2003). The effect of consumer perceptions of store attributes on
apparel store preferences. Journal of Fashion Marketing and Management, 7, 371-385.
doi: 10.1108/13612020310496967
Rao, A., Monroe. K. (1989). The effect of price, brand name, and store name on buyers’
perceptions of product quality: an integrative review. Journal of Marketing Research, 26,
351-357. doi: 10.2307/3172907 Retrieved from https://www.jstor.org/
Ross, J., Harradine, R. (2010). Value brands: cheap or trendy? An investigation into young
consumers and supermarket clothing. Journal of Fashion Marketing and Management,
14, 350-366. doi: 10.1108/13612021011061834 Retrieved from
https://search.proquest.com/
Sharma, G. (2017). Pros and Cons of Different Sampling Techniques. International Journal of
Applied Research, 3, 749-752. Retrieved from
https://www.scirp.org/reference/referencespapers.aspx?referenceid=2667413
Swinker, M., Hines, D. (2005). Understanding consumer perception of clothing quality: a
multidimensional approach. International journal of consumer studies, 30, 218-223.
Retrieved from https://onlinelibrary.wiley.com/

20
Trochim, W. (2020, January 22). Selecting the Survey Method. Retrieved from
https://socialresearchmethods.net/kb/selecting-survey-method/

21
APPENDIX
Model 1: Price Quality Value model developed by Monroe and Krishnan (1985).
Table 1: refers to respondents who saw price and brand

22
Table 2: refers to respondents who did not see price or brand
23
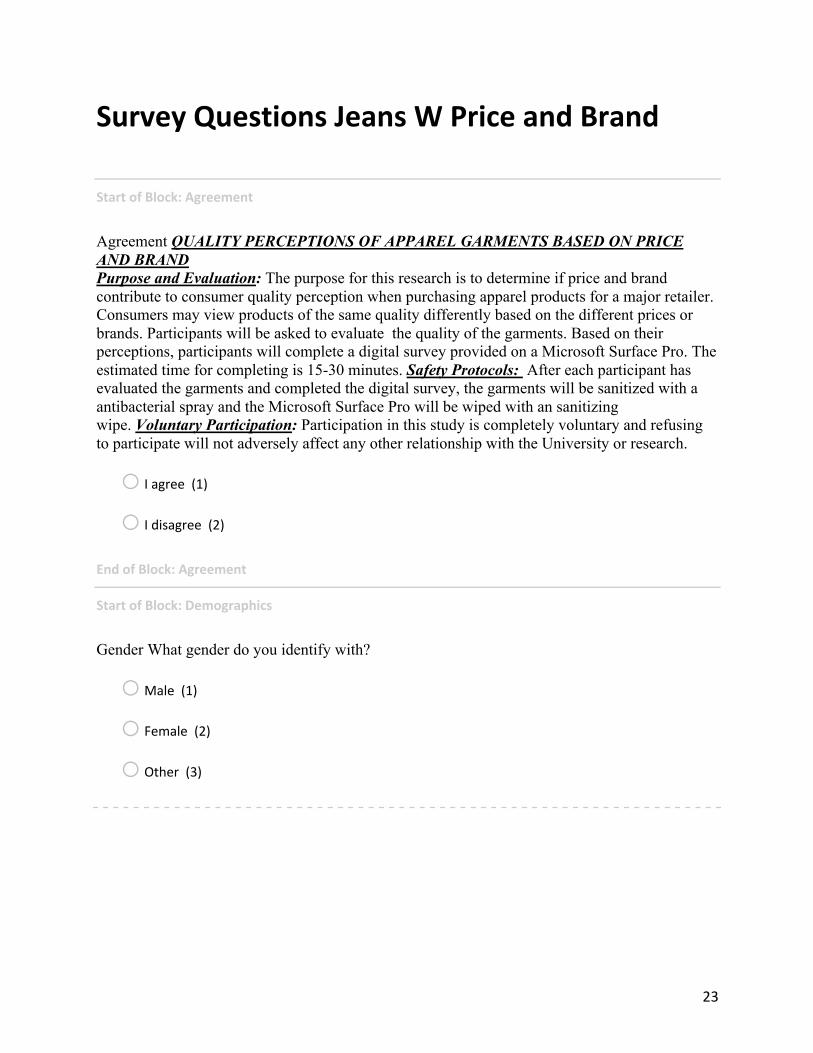
Survey Questions Jeans W Price and Brand
Start of Block: Agreement
Agreement QUALITY PERCEPTIONS OF APPAREL GARMENTS BASED ON PRICE AND BRAND Purpose and Evaluation: The purpose for this research is to determine if price and brand contribute to consumer quality perception when purchasing apparel products for a major retailer. Consumers may view products of the same quality differently based on the different prices or brands. Participants will be asked to evaluate the quality of the garments. Based on their perceptions, participants will complete a digital survey provided on a Microsoft Surface Pro. The estimated time for completing is 15-30 minutes. Safety Protocols: After each participant has evaluated the garments and completed the digital survey, the garments will be sanitized with a antibacterial spray and the Microsoft Surface Pro will be wiped with an sanitizing wipe. Voluntary Participation: Participation in this study is completely voluntary and refusing to participate will not adversely affect any other relationship with the University or research.
o I agree (1)
o I disagree (2) End of Block: Agreement
Start of Block: Demographics
Gender What gender do you identify with?
o Male (1)
o Female (2)
o Other (3)

24
Age How old are you?
o Under 18 (1)
o 18-24 (2)
o 25-34 (4)
o 35-44 (5)
o Above 44 (6)
Class What classification are you in college?
o Freshman (1)
o Sophomore (2)
o Junior (3)
o Senior (4)
o Grad Student (5)
o Non-Degree Student (6)
o Other (7)

25
Ethinicty How would you describe your ethnicity? Select all that apply.
o White (1)
o Black or African American (2)
o American Indian or Alaska Native (3)
o Asian (4)
o Native Hawaiian or Pacific Islander (5)
o Other (6) End of Block: Demographics
Start of Block: Garment 1 ID
Fab ID Please choose the number on the garment you are evaluating.
o 1 (1)
o 2 (2)
o 3 (3) End of Block: Garment 1 ID
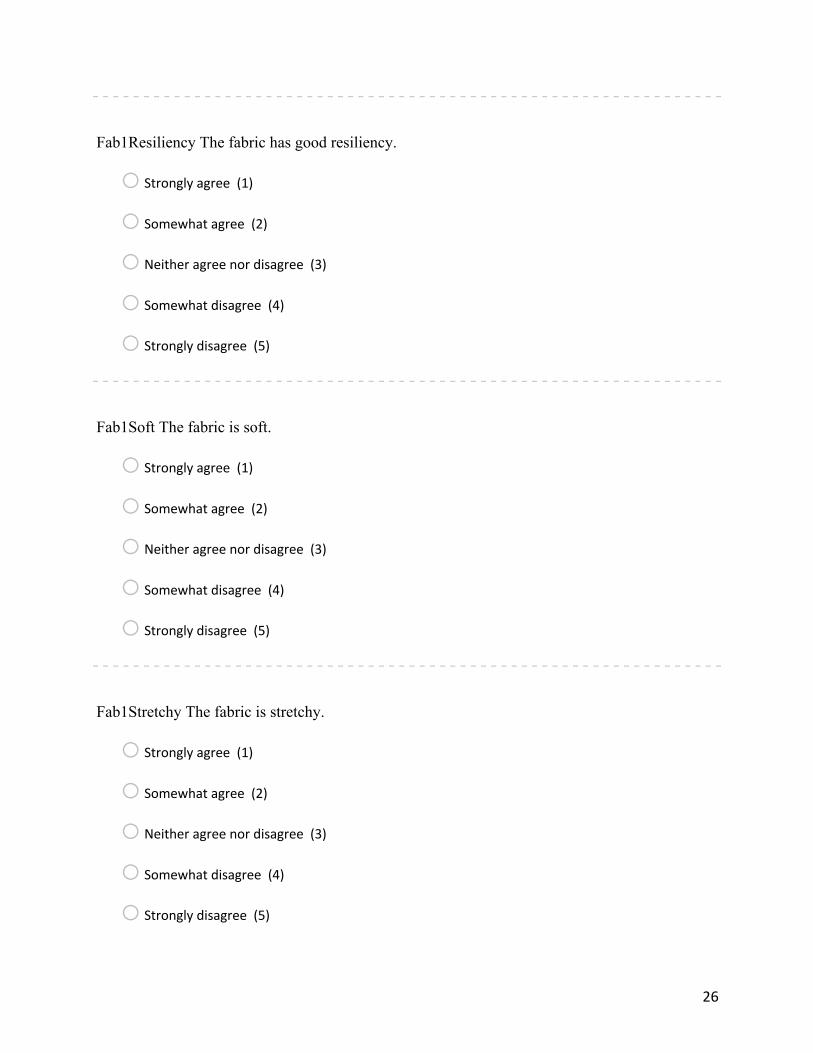
Start of Block: FABRIC 1
Fab1Defects The fabric is free from defects.
o Strongly agree (1)
o Somewhat agree (2)
o Neither agree nor disagree (3)
o Somewhat disagree (4)
o Strongly disagree (5)
26
Fab1Resiliency The fabric has good resiliency.
o Strongly agree (1)
o Somewhat agree (2)
o Neither agree nor disagree (3)
o Somewhat disagree (4)
o Strongly disagree (5)
Fab1Soft The fabric is soft.
o Strongly agree (1)
o Somewhat agree (2)
o Neither agree nor disagree (3)
o Somewhat disagree (4)
o Strongly disagree (5)
Fab1Stretchy The fabric is stretchy.
o Strongly agree (1)
o Somewhat agree (2)
o Neither agree nor disagree (3)
o Somewhat disagree (4)
o Strongly disagree (5)

27
Fab1Smooth The fabric has a smooth surface.
o Strongly agree (1)
o Somewhat agree (2)
o Neither agree nor disagree (3)
o Somewhat disagree (4)
o Strongly disagree (5)
Fab1Desirable The fiber content is desirable.
o Strongly agree (1)
o Somewhat agree (2)
o Neither agree nor disagree (3)
o Somewhat disagree (4)
o Strongly disagree (5) End of Block: FABRIC 1
Start of Block: CONSTRUCTION 1

28
Fab1Hems The hems and facings are appropriate.
o Strongly agree (1)
o Somewhat agree (2)
o Neither agree nor disagree (3)
o Somewhat disagree (4)
o Strongly disagree (5)
Fab1Pucker The seams are well stitched and pucker free.
o Strongly agree (1)
o Somewhat agree (2)
o Neither agree nor disagree (3)
o Somewhat disagree (4)
o Strongly disagree (5)
Fab1Good The stitch length is good.
o Strongly agree (1)
o Somewhat agree (2)
o Neither agree nor disagree (3)
o Somewhat disagree (4)
o Strongly disagree (5)

29
Fab1ThreadClr The thread color is appropriate.
o Strongly agree (1)
o Somewhat agree (2)
o Neither agree nor disagree (3)
o Somewhat disagree (4)
o Strongly disagree (5) End of Block: CONSTRUCTION 1
Start of Block: AESTHETICS 1
Fab1Fashionable The style is fashionable.
o Strongly agree (1)
o Somewhat agree (2)
o Neither agree nor disagree (3)
o Somewhat disagree (4)
o Strongly disagree (5)
Fab1Features The style has interesting features.
o Strongly agree (1)
o Somewhat agree (2)
o Neither agree nor disagree (3)
o Somewhat disagree (4)
o Strongly disagree (5)

30
Fab1Unique The style is unique.
o Strongly agree (1)
o Somewhat agree (2)
o Neither agree nor disagree (3)
o Somewhat disagree (4)
o Strongly disagree (5) End of Block: AESTHETICS 1
Start of Block: OVERALL 1
Fab1Overall Please rate your overall perception of quality on a scale of 1-7 with 7 being high quality and 1 being low quality.
o 1 (1)
o 2 (2)
o 3 (3)
o 4 (4)
o 5 (5)
o 6 (6)
o 7 (7)
Q22 PLEASE WAIT UNTIL YOU GET THE NEXT GARMENT. End of Block: OVERALL 1
Start of Block: Garment 2 ID

31
Fab2ID Please choose the number on the garment you are evaluating.
o 1 (1)
o 2 (2)
o 3 (3) End of Block: Garment 2 ID
Start of Block: FABRIC 2
Fab2Defects The fabric is free from defects
o Strongly agree (1)
o Somewhat agree (2)
o Neither agree nor disagree (3)
o Somewhat disagree (4)
o Strongly disagree (5)
Fab2Resiliency The fabric has good resiliency
o Strongly Agree (1)
o Somewhat Agree (2)
o Neither agree nor disagree (3)
o Somewhat disagree (4)
o Strongly disagree (5)

32
Fab2Soft The fabric is soft.
o Strongly agree (1)
o Somewhat agree (2)
o Neither agree nor disagree (3)
o Somewhat disagree (4)
o Strongly disagree (5)
Fab2Stretch The fabric is stretchy.
o Strongly agree (1)
o Somewhat agree (2)
o Neither agree nor disagree (3)
o somewhat disagree (4)
o Strongly disagree (5)
Fab2Smooth The fabric has a smooth surface.
o Strongly agree (1)
o Somewhat agree (2)
o Neither agree nor disagree (3)
o Somewhat disagree (4)
o Strongly disagree (5)

33
Fab2Desirable The fiber content is desirable.
o Strongly agree (1)
o Somewhat agree (2)
o Neither agree nor disagree (3)
o Somewhat disagree (4)
o Strongly disagree (5) End of Block: FABRIC 2
Start of Block: CONSTRUCTION 2
Fab2Facings The hems and facings are appropriate
o Strongly agree (1)
o Somewhat agree (2)
o Neither agree nor disagree (3)
o Somewhat disagree (4)
o Strongly disagree (5)
Fab2Pucker The seams are well stitched and pucker free.
o Strongly agree (1)
o Somewhat agree (2)
o Neither agree nor disagree (3)
o Somewhat disagree (4)
o Strongly disagree (5)

34
Fab2Good The stitch length is good.
o Strongly agree (1)
o Somewhat agree (2)
o Neither agree nor disagree (3)
o Somewhat disagree (4)
o Strongly disagree (5)
Fab2Appropriatae The thread color is appropriate.
o Strongly agree (1)
o Somewhat agree (2)
o Neither agree nor disagree (3)
o Somewhat disagree (4)
o Strongly disagree (5) End of Block: CONSTRUCTION 2
Start of Block: AESTHETICS 2

35
Fab2Fashionable The style is fashionable.
o Strongly agree (1)
o Somewhat agree (2)
o Neither agree nor disagree (3)
o Somewhat disagree (4)
o Strongly disagree (5)
Fab2Interesting The style has interesting features
o Strongly agree (1)
o Somewhat agree (2)
o Neither agree nor disagree (3)
o Somewhat disagree (4)
o Strongly disagree (5)
Fab2Unique The style is unique
o Strongly agree (1)
o Somewhat agree (2)
o Neither agree nor disagree (3)
o Somewhat disagree (4)
o Strongly disagree (5) End of Block: AESTHETICS 2

36
Start of Block: OVERALL 2
Fab2Overall Please rate your overall perception of quality on a scale of 1-7 with 7 being high quality and 1 being low quality.
o 1 (1)
o 2 (2)
o 3 (3)
o 4 (4)
o 5 (5)
o 6 (6)
o 7 (7)
NextGarment PLEASE WAIT UNTIL YOU GET THE NEXT GARMENT. End of Block: OVERALL 2
Start of Block: Garment 3 ID
Fab3ID Please choose the number of garment you evaluating
o 1 (1)
o 2 (2)
o 3 (3) End of Block: Garment 3 ID
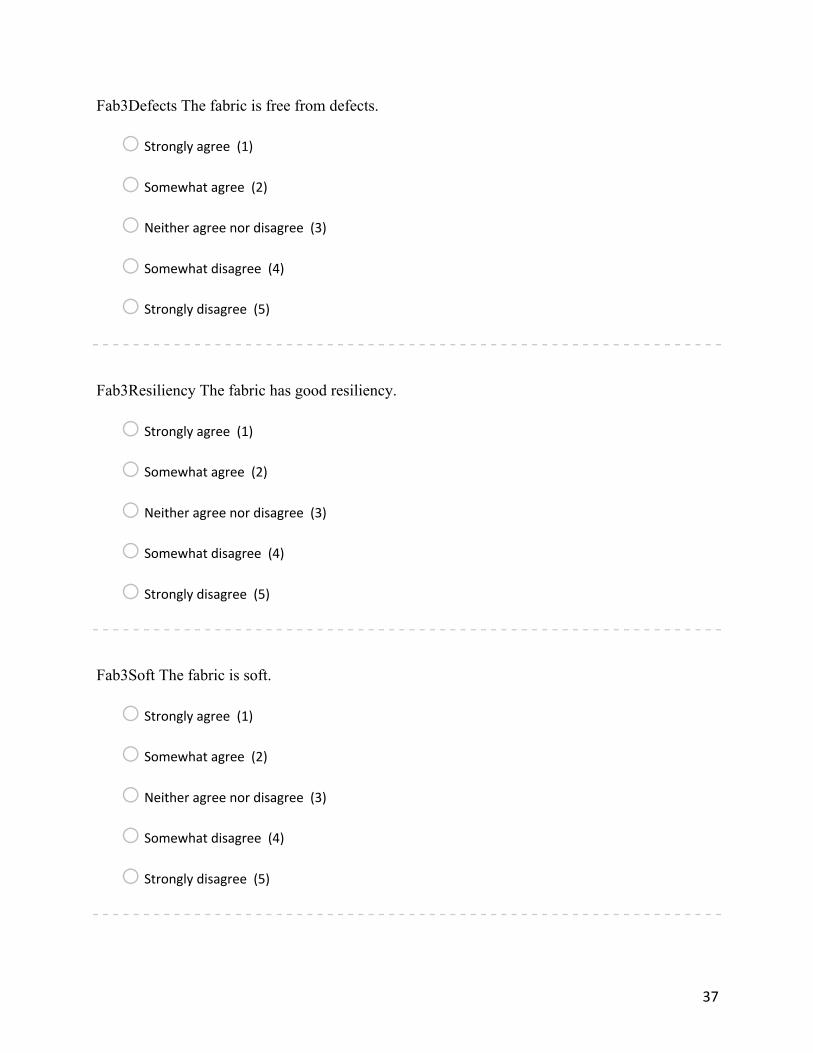
Start of Block: FABRIC 3
37
Fab3Defects The fabric is free from defects.
o Strongly agree (1)
o Somewhat agree (2)
o Neither agree nor disagree (3)
o Somewhat disagree (4)
o Strongly disagree (5)
Fab3Resiliency The fabric has good resiliency.
o Strongly agree (1)
o Somewhat agree (2)
o Neither agree nor disagree (3)
o Somewhat disagree (4)
o Strongly disagree (5)
Fab3Soft The fabric is soft.
o Strongly agree (1)
o Somewhat agree (2)
o Neither agree nor disagree (3)
o Somewhat disagree (4)
o Strongly disagree (5)

38
Fab4Stretchy The fabric is stretchy.
o Strongly agree (1)
o Somewhat agree (2)
o Neither agree nor disagree (3)
o Somewhat disagree (4)
o Strongly disagree (5)
Fab3Smooth The fabric has a smooth surface.
o Strongly agree (1)
o Somewhat agree (2)
o Neither agree nor disagree (3)
o Somewhat disagree (4)
o Strongly disagree (5)
Fab3Desirable The fiber content is desirable.
o Strongly agree (1)
o Somewhat agree (2)
o Neither agree nor disagree (3)
o Somewhat disagree (4)
o Strongly disagree (5) End of Block: FABRIC 3

39
Start of Block: CONSTRUCTION 3
Fab3Facings The hems and facings are appropriate.
o Strongly agree (1)
o Somewhat agree (2)
o Neither agree nor disagree (3)
o Somewhat disagree (4)
o Strongly disagree (5)
Fab3Pucker The seams are well stitched and pucker free.
o Strongly agree (1)
o Somewhat agree (2)
o Neither agree nor disagree (3)
o Somewhat disagree (4)
o Strongly disagree (5)
Fab3Good The stitch length is good.
o Strongly agree (1)
o Somewhat agree (2)
o Neither agree nor disagree (3)
o Somewhat disagree (4)
o Strongly disagree (5)

40
Fab3Appropriate The thread color is appropriate.
o Strongly agree (1)
o Somewhat agree (2)
o Neither agree nor disagree (3)
o Somewhat disagree (4)
o Strongly disagree (5) End of Block: CONSTRUCTION 3
Start of Block: AESTHETICS 3
Fab3Fashionable The style is fashionable.
o Strongly agree (1)
o Somewhat agree (2)
o Neither agree nor disagree (3)
o Somewhat disagree (4)
o Strongly disagree (5)

41
Fab3Features The style has interesting features.
o Strongly agree (1)
o Somewhat agree (2)
o Neither agree nor disagree (3)
o Somewhat disagree (4)
o Strongly disagree (5)
Fab3Unique The style is unique.
o Strongly agree (1)
o Somewhat agree (2)
o Neither agree nor disagree (3)
o Somewhat disagree (4)
o Strongly disagree (5) End of Block: AESTHETICS 3
Start of Block: OVERALL 3

42
Fab3Overall Please rate your overall perception of quality on a scale of 1-7 with 7 being high quality and 1 being low quality.
o 1 (1)
o 2 (2)
o 3 (3)
o 4 (4)
o 5 (5)
o 6 (6)
o 7 (7) End of Block: OVERALL 3