
Household's perception of water quality and hygiene practices
33
Perception of health risk and averting behavior: An analysis of household water consumption in Southwest Sri Lanka Céline Nauges Toulouse School of Economics (LERNA-INRA) Caroline van den Berg The World Bank 1 brought to you by CORE View metadata, citation and similar papers at core.ac.uk provided by Research Papers in Economics
-
Upload
khangminh22 -
Category
Documents
-
view
1 -
download
0
Transcript of Household's perception of water quality and hygiene practices

Perception of health risk and averting behavior:
An analysis of household water consumption in Southwest Sri Lanka
Céline Nauges
Toulouse School of Economics (LERNA-INRA)
Caroline van den Berg
The World Bank
1
brought to you by COREView metadata, citation and similar papers at core.ac.uk
provided by Research Papers in Economics

Abstract
Using household data from surveys made in Sri Lanka, we provide original results regarding i)
factors driving the perception of risk related to water consumption and ii) the role of perceived
risk on household’s decision to treat water before drinking it. First, we find evidence that water
aesthetic attributes (taste, smell, and color), household’s education and information about hygiene
practices drive household’s assessment of safety risk. Second, we show that a higher perceived
risk increases the probability that households boil or filter water before drinking it.
Key words: water consumption, risk perception, averting behavior, Sri Lanka
2

1. Introduction
Lack of safe water, inadequate sanitation facilities, and poor hygiene practices are amongst the
major causes of ill health in many developing countries. In 2004, the World Health Organization
(WHO) estimated that hygiene interventions including hygiene education and promotion of hand
washing can reduce the incidence of diarrheal cases by up to 45%. They also calculated that
improvements in drinking water quality through household water treatment, such as chlorination
at point of use, can lead to a reduction of diarrhea episodes by up to 39% (WHO 2004). The issue
of access to safe water supplies has recently gained a lot more attention as it has become one of
the Millennium Development Goals targets.
The study of household’s health behavior is quite complex since not only socioeconomic but also
psychological factors should be taken into account. Theories of health behavior change, and in
particular the so-called Health Belief Model, emphasize the role of individual’s perceptions in
influencing the probability of performing protective behavior to prevent illness (Redding et al.
2000). In the applied economics literature however, perception of risk related to water
consumption by households in developing countries has not been studied yet, as far as we know.
The present article aims to fill this gap by i) identifying empirically factors driving risk
perception and ii) testing the hypothesis that a higher perceived risk induces a higher probability
of treating water before drinking it. The empirical application is made on households from
Southwest Sri Lanka. We focus our analysis on households without any connection to the
municipal piped network.
3

Section 2 proposes a literature review. Section 3 provides background information and describes
the main features of the data. In section 4 we present the empirical analysis and discuss the
estimation results. Section 5 concludes.
2. Literature review
In the economics literature, several studies have tried to identify factors driving hygiene behavior
in developing countries.i Information (about water quality and available methods of improving it
or/and hygiene behavior) provided through home visits, health education classes, awareness
campaigns or hygiene promotion programs has been shown to be an effective instrument.
Cairncross et al. (2005) found evidence that health education classes were more effective than
home visits and awareness campaigns in inducing a change in hygiene behavior in Kerala, India.
Madajewicz et al. (2007) studied the impact of informing Bangladeshi households about the
arsenic levels in their well water. They found that 60% of households with unsafe wells changed
their water source while only 14% of those with safe wells did so. Jalan and Somanathan (2008)
devised a randomized experiment in Gurgaon, a suburb of Delhi, and found that households who
had not been purifying their water and who were told that their water was “dirty” (indicating the
likelihood, but not certainty, of fecal contamination) were 11 percentage points more likely to
have made changes in water purification, handling and/or storage behavior than households who
had not been informed of the test result.
It has also been shown that socioeconomic factors such as educational status and income could
explain households’ hygiene behavior. Educational status, along with the variables measuring
4

information access, are usually considered as proxies for household’s awareness or knowledge
about water safety issues and health practices (Jalan and Ravallion 2003). Income captures the
opportunity cost of being ill. Curtis et al. (1995), using data from Burkina Faso, found evidence
that factors such as the husband’s occupation, zone of residence and family ownership of
valuable objects (radio, television) help differentiating mothers who reported using safer stool
disposal practices from those who did not. Hygiene behavior was also found to vary depending
on the source of water supply mothers rely on. Mothers with access to a tap in the yard reported
safer practices than mothers collecting water from public standpipes or wells within the yard. The
validity of the latter effect is however doubtful since the authors did not take into account the
potential selection bias due to the characteristics of households using tap versus non-tap sources.
If households using tap water are wealthier, better educated, and more conscious of hygiene than
others using non-tap sources, then the hygienic behavior of the former group could be attributable
not to access to a tap in the yard but to the characteristics of the households which led them to get
access to such tap sources in the first place (see also Strina et al. 2003, and Cairncross and
Valdmanis 2006, for related discussions). Using household data from Jakarta (Indonesia),
Alberini et al. (1996) confirmed the role of economic/behavioral and engineering/infrastructure
factors in explaining hygiene behavior. These authors modeled jointly respondents’ hygiene
behavior (here washing hands after using the toilets) and occurrence of diarrhea or other gastro-
intestinal disruption (as reported by the household). They found evidence that the likelihood of
washing hands rises with income, education, and problems with waste in the neighborhood, and
decreases with house rental value, interruptions in the water supply and connection to the piped
supply network. Jalan and Ravallion (2003) emphasized the need for a combination of
infrastructure investment and improving hygiene knowledge and behaviors to ensure health
gains. These authors measured the impact of piped water access on diarrhea prevalence and
5

duration for children less than five years old, applying propensity score matching to a cross-
sectional survey for rural India. While they found significant health gains overall from access to
piped water, they did not find evidence of significant health gains for the poorest 40 percent of
the population. Also, health gains from piped water supply tended to be lower for children with
less well-educated women in the household.
The role of perceived risk and opinions about water quality in influencing households’ hygiene
behavior in developing countries has not been investigated, as far as we know. Perceived risk is
however recognized as one of the most important factors by health psychologists.ii A whole set of
theories and models (including among others the Health Belief Model, Theory of Reasoned
Action/Planned Behavior, Social Cognitive Theory and The Transtheoretical Model) has been
built to understand change in health behavior and cover topics such as community organization,
communication, diffusion of innovations, social marketing, information processing, and stress
and coping (Redding et al. 2000). The Health Belief Model (HBM) is probably the theory that is
the most related to the purpose of this article since it focuses on the role of individual’s
perceptions in influencing the probability of performing protective behavior to prevent illness. As
described in Redding et al. (2000), four factors corresponding to the perceived threat of the
illness and expectations about outcome are discussed: perceived susceptibility refers to how much
individuals believe they are vulnerable to or at risk for some illnesses; perceived severity refers to
how serious the individual believes the consequences of being ill are; perceived effectiveness
refers to the expected benefits of engaging in the protective behavior and perceived cost refers to
the barriers or losses that interfere with health behavior change. As in the economics literature, it
is assumed that the preventive action will be taken only if the expected benefits outweigh the
expected costs. The role of demographic and social variables (called mediating factors) in
6

indirectly affecting behavior by influencing an individual’s perceptions of susceptibility, severity,
benefits and costs, has also been explored.
If risk perception in a broad sense has been extensively studied (see Camerer 1995, or Slovic
2000, for comprehensive surveys), studies trying to identify factors influencing risk perception
related to water consumption are still scarce and their findings not really conclusive. Several
studies have been made in Canada, see Dupont (2005) for a review. In this country, Jardine,
Gibson, and Hrudey (1999) found evidence that an aesthetic problem (an unpleasant odor or
taste, for example) is usually translated into a potential health risk. Levallois, Grondin, and
Gingras (1999) showed that the taste of water and its source (lake, rivers, groundwater) influence
perception of water quality. Other factors influencing perception of water quality were age,
income, and distance to the water treatment facility (Turgeon et al. 2004). Finally, Danielson et
al. (1995) found that, for the most part, demographic factors did not play a major role in
determining risk perceptions of water quality in Gaston County, North Carolina (US).
3. Background and data
The data used in this article come from a household survey that was conducted in 2003-2004 in
17 municipalities from the districts of Negombo, Kalutara and Galle in Southwest Sri Lanka.
This survey mainly covered urban areas. For greater details on the survey instrument design, see
Pattanayak et al. (2004).
7

Among the surveyed households, 692 have a connection to a piped network at home and 1,125 do
not have any house connection. In this article, we will focus on the latter sub-group of
households. Among the 1,125 households without a house connection, 98 collect water from
public taps, 102 from public wells, 313 from their neighbors, 967 from private wells, 11 from
vendors, 29 from surface water (rivers, lakes, streams), 8 collect rainwater, and 8 buy bottled
water. Some of these households use several water supply sources but usually rely on a unique
source for drinking.
Households were asked to give their opinion about taste, color, smell, and safety of water in the
rainy season and in the dry season. The number of missing information in the dry season is
significant; therefore, we will focus on the perception of water quality and safety during the rainy
season (which is the period when there is a higher risk of contracting a water-related disease).
More precisely, households were asked to rank aesthetic characteristics and perceived risk of the
water from each source (before the household does any treatment) on a four-level scale. Taste,
color and smell were classified respectively from “excellent” to “bad”, from “very clean” to
“very dirty”, and from “no smell” to “serious smell”. As for safety of water from each source,
each household had to choose between (1) no risk, (2) little risk, (3) some risk, (4) serious risk, or
(9) do not know. Detailed questions regarding household’s perception of water quality and safety
are provided in the Appendix. Household’s opinions on aesthetic characteristics and safety of
water from each source are shown on Figures 1 to 4.
[Figures 1 to 4 around here]
8

It is important to note that, for each source, we may have a significant number of missing
information since not all households were always able to give their opinion about each source,
which includes house piped connection, public tap, public well, water provided by neighbors,
private well, vendors, surface water and rainwater. Finally, we were not able to compare
perceived risk related to water consumption from the various sources with objective risk since the
latter information is not available in our data.
Overall, water is considered safe by most households (see Figure 1). Piped network supplies
(through house connections), public taps, neighbors, and private wells are considered the safest
sources. Interestingly, 72% [resp. 69%] of households without a house connection consider
public taps [resp. private wells] to be safe, which is higher than the percentage of those
considering private connections to be safe (60%). Yet, households feel less confident about safety
when water comes from public wells (only 39% of the surveyed households consider that there is
no risk), and above all rivers, lakes, or streams (9% of “no risk” answers). As for the taste of
water, the level of satisfaction is pretty high for private connections (76% of the households
judge the taste of water from the piped network as excellent or good), public taps (87%),
neighbors (86%), private wells (81%), and vendors (73%). The percentage of households
considering the taste as excellent or good is lower for public wells (52%), surface water (25%)
and rainwater (12%). Smell does not seem to be a problem for most of the sources, except for
surface water and rainwater. Less than 30% of households consider the water as very clean
whatever the source (except for bottled water). Water from house connections, public tap,
neighbors, private wells, vendors, are considered clean or very clean. Yet, 13% (10%) think that
water from private well (public well) is dirty or very dirty. The highest level of dissatisfaction is
observed for surface water, which 50% of the respondents considers dirty or very dirty.
9

The survey includes several questions on households’ averting behavior. In our sample, 40% of
the surveyed households without a house connection declare boiling or filtering water before
drinking it.iii Among these households, 80% only boil water, 10% only filter water and 10%
jointly boil and filter. In the forthcoming empirical application, we will not distinguish between
boiling and filtering.
[Table 1 around here]
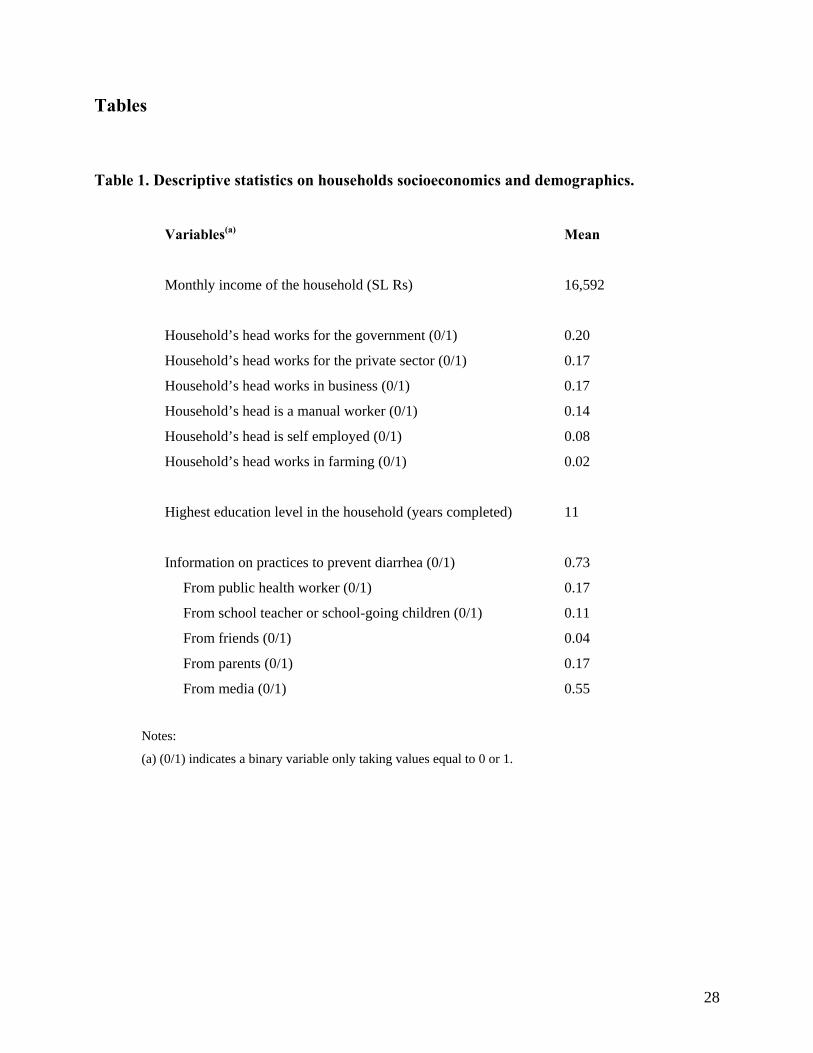
Descriptive statistics on household socioeconomics and demographics are shown in Table 1. The
highest education level in the household is 11 years on average. 73% of surveyed households
have heard (in the last year) about practices such as hand washing, storing and treating water, and
other ways of preventing diarrhea. 55% of households have heard about these practices by the
media, 17% by their parents, 17% by public health workers, 11% by school (or pre-school)
teachers or school-going children, and 4% by friends (see the detailed question and possible
answers in Appendix). Average monthly income (which comprises estimated total monthly
income of all wage earners in the household, plus any other source of income, plus any money
that is remitted to the household by a family member working outside the country) is about LKR
16,500 [which corresponds to about US$ 470, PPP adjusted, at the time of surveying]. Median
income is LKR 12,000 [or PPP adjusted US$ 340].
Wealthier households are, on average, more educated, and better informed. Correlation between
income, education level, access to information, and standard of living, may create
10

multicollinearity problems at the estimation stage, and hence, we may have to exclude some of
these variables from the econometric models.
4. Empirical analysis
4.1. Analysis of perceived risk
Respondents were asked to give their opinion about safety of water from different sources (see
Appendix). For each of the sources, they had to state whether consumption of water incurred no
risk (answer 1), little risk (answer 2), some risk (answer 3), or serious risk (answer 4). Since the
number of respondents perceiving some risk (i.e., answer 3) or a serious risk (answer 4) is quite
small, the variable RISK is recoded such that it takes three values : no risk (1), little risk (2), some
risk or serious risk (3).
In general households give their opinion on safety and quality of water coming from several
sources (4.7 on average). When this is the case, we consider as distinct observations their opinion
about each source. We exclude from the analysis the sources for which the household does not
give any opinion (“do not know” answer). Overall, we have 2,990 observations corresponding to
the opinions of 1,117 households.
Previous studies made in Canada (see the literature review in Section 2) indicated that both
aesthetic characteristics of the water (smell, taste, color) and awareness variables (education,
information) were influencing risk perception. These findings guided our choice of explanatory
11

variables. Several models have been estimated and we present below the one with the best fit to
our data. It includes the following set of explanatory variables:
Water quality attributes which can take four values each: TASTE (excellent, good, poor, bad);
COLOR (very clean, clean, dirty, very dirty); SMELL (no smell, little smell, some smell,
serious smell), see Appendix for greater details on these questions. Water quality attributes
are assumed to be exogenous. We expect a bad taste, a dirty water and a bad smell to induce a
higher perceived risk.
EDUC: the highest education level in the household (measured by years of education
completed). Better educated households are expected to be more aware of water quality and
related health risk. Since we do not observe the “true” quality of water, we will not be able to
test whether better educated households have better judgments than less educated households.
I_INFO: a binary variable which takes the value of 1 if the household has heard about
practices for preventing diarrhea in the last year, and 0 if otherwise. Information is another
typical awareness variable, which is usually found to have an impact on hygiene behavior.
Thus, we expect these variables to influence risk perception as well.
I_HW, I_SCHO, I_PAR, I_MED: binary variables which take the value of 1 if the household
has heard about practices for preventing diarrhea in the last year from health workers, school-
going children or teachers, parents, or media, respectively, and 0 if otherwise. These binary
variables are useful to control for different impacts of information depending on its origin.
12

I_MUNIl (l = 1,…,17), 17 indicator variables which are equal to 1 if the municipality of
residence of the household is municipality l. These variables are included in our model to
control for heterogeneity between the 17 municipalities.
Perceived risk is also likely to depend on the source of water used by the household. In the group
of households without a house connection, the choice has to be made among a variety of sources
such as public tap, public well, vendors or water provided by neighbors. Because the choice of
the source may not be exogenous, we decided not to include source dummies in the model.
The underlying model of risk perception is specified as follows: we assume that household’s true
risk perception, RISK*, depends on a set of observable factors z = (TASTE, COLOR, SMELL,
EDUC, I_INFO, I_HW, I_SCHO, I_PAR, I_MED, I_MUNIl (l = 1,…,17)) and a set of
unobservable factors : ε
RISK* ε′= +z γ . (1)
True risk perception, RISK*, is not observed since households had to choose among a set of four
possible answers only (no risk, little risk, some risk, or serious risk). We thus face a common
problem of censoring. We only observe which answer each household chose (variable RISK), and
we assume that this is the answer that best reflects their own opinion. We have:
RISK = 1 if RISK* 0≤ (no risk)
= 2 if 0 < RISK* 1μ≤ (little risk)
13

= 3 if 1μ < RISK* 2μ≤ (some or serious risk) (2)
where 1μ and 2μ are unknown parameters to be estimated with the set of parameters γ . The
mean and variance of are normalized to zero and one, respectively, and is assumed normally
distributed across observations. We can then derive the set of corresponding probabilities and
write the corresponding likelihood function. This ordered probit model is estimated by Maximum
Likelihood (see Greene 2003, for greater details on the estimation procedure).
ε ε
[Table 2 around here]
Maximum likelihood estimates of the risk perception model are shown in Table 2. The likelihood
ratio test indicates overall significance of the model. The Pseudo R2 is satisfactory since it
reaches 0.36. The aesthetic characteristics of water (taste, smell, and color) are found to be
important factors in explaining perceived risk. Dirty water, bad smelling water or water with a
bad taste induces households to believe that drinking water is more risky. Better educated
households perceive water as more risky, all other things equal, but this effect is not found
significant in our sample. We also find evidence that access to information about practices to
prevent diarrhea drives households’ risk perception. Better informed households usually perceive
water as more risky. We find significant different impacts of information depending on its origin:
households that have been informed by teachers or school-going children perceive water as more
risky than households that have been informed by health workers or by the media.
4.2. Decision to treat water before drinking it
14

At this stage, we only consider the source of the water households use for drinking. In general
households give their opinion on safety and quality of water coming from several sources but the
vast majority of households drink water from a unique source. The dependent variable takes the
value 1 if the household treats (either boiling or filtering) water before drinking it, and 0
otherwise. There exists an extensive literature on averting behavior and households hygiene
practices. Socio-demographic characteristics and awareness variables are common drivers. The
set of explanatory factors that was finally selected includes the following variables that have been
already defined: EDUC, I_INFO, I_HW, I_SCHO, I_PAR, I_MUNIl (l = 1,…,17). In addition,
two other households’ characteristics were proved to be significant in explaining households’
decision to treat water, namely: the number of children less than 3 years old (NBCHILD) and a
binary variable to indicate whether household’s head works for the government (I_GOVT).
One originality of this article is to measure the effect of perceived risk (related to the water
households use for drinking) on households’ decision to treat water before drinking it. However,
as pointed by Whitehead (2006), perceived risk is likely to be endogenous in averting behavior
models. If some unobserved variables (such as health history) determine both perceived risk and
households’ hygiene behavior, then we may face the traditional omitted variables problem. In
Whitehead (2006), the demographic variables were used as identifying instruments. However, we
believe that the assumption that demographic variables “are strongly related to perceived quality
and unrelated to hygiene behavior” is too strong in the present case. We were not able to find
suitable instruments for perceived risk in our database, i.e. variables that would drive risk
perception but would be uncorrelated with hygiene behavior. For this reason, we decided to build
a variable which measures how risk is perceived on average in the municipality where the
15

household lives. For example, if household i living in municipality l is drinking water from
source j, we consider the average perceived risk at source j in municipality l as an independent
variable (called MRISK) in the model describing the decision of household i to treat water before
drinking it. We assume that the average opinion in the municipality will be a good proxy for the
opinion of the household and will not be endogenous in the model explaining household’
decision to treat water.
There is another issue to address: households in our sample very often have to choose among a
set of sources which one to use for drinking purposes. The choice of the drinking water source is
likely not to be independent of the decision to treat or not water before drinking it. We should
thus model simultaneously the choice of the drinking water source and the decision to treat water
before drinking. This calls for the estimation of multivariate probits. Because some of the sources
are marginally chosen in our sample, we consider only four main types of water sources: public
sources (which includes public taps and public wells), private wells, water vended by neighbors,
and other sources (including vendors, surface water, rainwater, and bottled water). In order to
control for simultaneity of choices, we estimate four separate bivariate probit models. In these
four models, we consider the joint probability that i) households drink water from a public source
[resp. a private well, water vended by neighbors, other sources] and ii) households treat water
before drinking it.
Household’ decisions can be modeled as follows:
16

*
1 if 0 and 0 if 0
1 if 0 and 0 if 0
* *j j jSOURCE SOURCE SOURCE SOURCE
TREAT TREAT TREAT TREAT
⎧ = > =⎪⎨⎪ = > = ≤⎩
*j ≤
(3)
for each j = 1 to 4 (j = 1 for public sources, j = 2 for private wells, j = 3 for water vended by
neighbors, and j= 4 for other sources). For each type of source j, the two latent models are
assumed to be specified as follows:
*1
*2
jSOURCE
TREAT
⎧ = +⎪⎨⎪ = +⎩
'1 1
'2 2
x β
x β
ε
ε. (4)
The two latent variables ( and ) are not observed, only the decision to drink
water from source j (SOURCEj variable) and the decision to treat water before drinking it
(TREAT variable) are observed. We also assume that the error terms
*jSOURCE *TREAT
1ε and 2ε are normally and
jointly distributed with:
1 2
1 2
1 2
E 0
Var Var 1
Cov , .
Eε ε
ε ε
ε ε ρ
⎡ ⎤ = ⎡ ⎤ =⎣ ⎦ ⎣ ⎦⎡ ⎤ = ⎡ ⎤⎣ ⎦ ⎣ ⎦⎡ ⎤ =⎣ ⎦
1 2 1 2
1 2 1 2
1 2
x ,x x ,x
x ,x x ,x
x ,x
=
2
(5)
We assume that the explanatory factors are the same in both equations, i.e. = (EDUC,
I_INFO, I_HW, I_SCHO, I_PAR, I_MUNIl (l = 1,…,17), MRISK, NBCHILD, I_GOVT).
Maximum-likelihood provides consistent estimates of the parameters , and
1x = x
2β1β ρ , a parameter
measuring the correlation between the disturbances of the two equations. (for greater details on
17

the estimation procedure, see Greene 2003). We estimate four separate bivariate probit models,
one for each type of source j.
The Likelihood-Ratio test is used to test the null hypothesis that ρ equals 0. In the four bivariate
probit models, we cannot reject the null hypothesis that ρ equals zero, which indicates that the
four models consists of independent probit equations which can be estimated separately.iv We
thus pool the data from all four types of sources and we estimate a single Probit equation to
explain the decision of households to treat or not water before drinking it. The probability that
household i from municipality l treats water from source j before drinking it is written as a
function of the set of variables where MRISK is the average perceived risk of water from
source j in municipality l.
1x = x2
[Table 3 around here]
The final sample contains 1,103 observations. Maximum Likelihood estimation results are shown
in Table 3. First, we find evidence that perceiving water as more risky increases the probability
that households treat water before drinking it. This finding indicates that households are aware
that treating water lowers the risk related to consumption of (unclean) water. Second and as
expected, we find that better educated and better informed households have a higher probability
to treat water. Third, contrary to what we find in the model of perceived risk, the channel through
which information came does not seem to play a role. Also, we find that households who work
for the government, and households with children less than three years old (known as being more
vulnerable to waterborne diseases) have a higher probability to treat water, all other things equal.
18

5. Conclusions
Using household data from surveys conducted in Sri Lanka, we provide original results regarding
household's perception of risk related to water consumption in developing countries, and its
impact on household’s averting behavior. We find evidence that water aesthetic attributes (taste,
smell, and color) drive household’s assessment of safety risk. Risk perceptions are also
influenced by household education level and the channel by which information to prevent
diarrhea was communicated to the household.
Secondly, a higher perceived risk induces households with and without a house connection to
treat water more before drinking it, which indicates that households in our sample are aware that
the action of boiling/filtering water is one type of preventing behavior against the risk of illness.
This latter result confirms the important role of perceptions in inducing change in health
behavior, as described in the psychosocial literature on health behavior change.
Thirdly, our study confirms the impact of socioeconomic characteristics on household’s decision
to undertake averting actions. We find that educational status and access to information about
diarrhea prevention has a direct impact on the household’s decision to treat water.
Overall, our results indicate that the relationship between awareness factors (household’s
education and access to information) and decision to undertake averting behavior involves
complex phenomena. We confirm the findings of previous studies that education and access to
19

20
information have a direct impact on averting behavior, but we also find that they have indirect
effects through their impact on household’s perceived risk. This is an important result that should
be taken into account when assessing costs and benefits of any awareness program. We call for
further research in this area in order to confirm the above findings.
We also believe that it would be important to study perceived risk in greater details. In particular,
surveys should be designed in order to be able to compare perceived risk and actual risk
(contamination level), both at the source (before treatment) and in the house (after possible
treatment).
Perceived risk has been defined here in a very simple manner, compared to what is done in the
field of health psychology. One could imagine developing household surveys that would try to
distinguish between perceived susceptibility (i.e., perceived vulnerability), perceived severity (the
consequences of being ill), perceived effectiveness (of the averting behavior) and perceived cost.
All in all, this calls for more interdisciplinary studies on this topic.
References
Alberini, A., G.S. Eskeland, A. Krupnick, and G. McGranahan. 1996. “Determinants of Diarrheal
Disease in Jakarta.” Water Resources Research 32(7):2259-2269.
Cairncross, S., and V. Valdmanis. 2006. Water supply, sanitation, and hygiene promotion, in
Disease Control Priorities in Developing Countries, second edition. Editors D. T. Jamison, J. G.
Breman, A. R. Measham, G. Alleyne, M. Claeson, D. B. Evans, P. Jha, A. Mills, P. Musgrove.
Oxford University Press and The World Bank.
Cairncross, S., K. Shordt, S. Zacharia, and B.K. Govindan. 2005. “What causes sustainable
changes in hygiene behaviour? A cross-sectional study from Kerala, India.” Social Science &
Medicine 61(10):2212-2220.
Camerer, C. 1995. Individual decision-making, in Handbook of Experimental Economics, J.H.
Kagel and A.E. Roth eds, NJ: Princeton University Press.
Courant, P.N., and R.C. Porter. 1981. “Averting expenditure and the cost of pollution.” Journal
of Environmental Economics and Management 8:321-329.
Curtis, V., and S. Cairncross. 2003. “Effect of washing hands with soap on diarrhoea risk in the
community: A systematic review.” The Lancet Infectious Diseases 3:275-281.
21

Curtis, V., B. Kanki, T. Mertens, E. Traoré, I. Diallo, F. Tall, and S. Cousens. 1995. “Potties, Pits
and Pipes: Explaining hygiene behaviour in Burkina Faso.” Social Science & Medicine
41(3):383-393.
Danielson, L., T.J. Hoban, G. van Houtven, and J.C. Whitehead. 1995. “Measuring the benefits
of local public goods: Environmental quality in Gaston County, North Carolina.” Applied
Economics 27:1253-1260.
Dupont, D. P. 2005. “Tapping into consumers’ perceptions of drinking water quality in Canada:
capturing consumer demand to assist in better management of water resources.” Canadian Water
Resources Journal 30(1):11-20.
Fewtrell, L., R.B. Kaufmann, D. Kay, W. Enanoria, L. Haller, and J.M. Colford Jr. 2005. “Water,
sanitation, and hygiene interventions to reduce diarrhoea in less developed countries: a systematic
review and meta-analysis.” The Lancet Infectious Diseases 5:42-52.
Greene, W. 2003. Econometric Analysis, Prentice Hall, 5th edition.
Jalan, J., and M. Ravallion. 2003. “Does piped water reduce diarrhea for children in rural India?”
Journal of Econometrics 112:153-173.
Jalan, J., and E. Somanathan. 2008. “The importance of being informed: Experimental evidence
on demand for environmental quality.” Journal of Development Economics 87:14-28.
22

Jardine, C.G., N. Gibson, and S. Hrudey. 1999. “Detection of odour and health risk perception of
drinking water.” Water Science and Technology 40(6):91-98.
Kolstad, C.D. 2000. Environmental economics, Oxford University Press.
Levallois, P., J. Grondin, and S. Gingras. 1999. “Evaluation of consumer attitudes on taste and
tap water alternatives in Québec.” Water Science and Technology 40(6):135-39.
Madajewicz, M., A. Pfaff, A. van Geen, J. Graziano, I. Hussein, H. Momotaj, R. Sylvi, and H.
Ahsan. 2007. “Can Information Alone Both Improve Awareness and Change Behavior? Arsenic
contamination of groundwater in Bangladesh.” Journal of Development Economics 84(2):731-
754.
Pattanayak, S.K., J.-C. Yang, C. Agarwal, H.M. Gunatilake, H. Bandara, and T. Ranasinghe.
2004. Water, Sanitation and Poverty in Southwest Sri Lanka, submitted to the World Bank,
Water and Sanitation Program, March.
Redding, C.A., J.S. Rossi, S.R. Rossi, W.F. Velicer, and J.O. Prochaska. 2000. “Health Behavior
Models.” The International Electronic Journal of Health Education, 3 (Special Issue):180-193.
Slovic, P. 2000. The Perception of Risk, Earthscan Publisher.
23
24
Strina, A., S. Cairncross, M.L. Barreto, C. Larrea, C., and M.S. Prado. 2003. “Childhood diarrhea
and observed hygiene behaviour in Salvador, Brazil.” American Journal of Epidemiology
157(11):1032-1038.
Turgeon, S., M.J. Rodriguez, M. Thériault, and P. Levallois. 2004. “Perception of drinking water
in the Quebec City region (Canada): the influence of water quality and consumer location in the
distribution system.” Journal of Environmental Management 70:363-73.
Whitehead, J.C. 2006. “Improving Willingness to Pay Estimates for Quality Improvements
through Joint Estimation with Quality Perceptions.” Southern Economic Journal 73(1):100-111.
World Health Organization (WHO). 2004. “Water, Sanitation and Hygiene Links to Health.”
Facts and Figures.
Zwane, A.P., and M. Kremer. 2007. “What works in fighting diarrheal diseases in developing
countries? A critical review.” World Bank Research Observer 22(1):1-24.

Appendix
Survey questions asking household’s opinion about taste, color, smell and safety of water from each
source (house piped connection, public tap, public well, water provided by neighbors, private well,
vendors, surface water and rainwater) are listed below:
In the rainy season, how would you judge the taste of the water from … SOURCE… ? (before the
household does any treatment)
(1) excellent
(2) good
(3) poor
(4) bad
(9) do not know.
In the rainy season, how would you judge the color of the water from … SOURCE… ? (before the
household does any treatment)
(1) very clean
(2) clean
(3) dirty
(4) very dirty
(9) do not know.
In the rainy season, how would you judge the smell of the water from … SOURCE… ? (before the
household does any treatment)
25

(1) no smell
(2) little smell
(3) some smell
(4) serious smell
(9) do not know.
In the rainy season, how would you judge the safety of the water from … SOURCE… ? (before the
household does any treatment)
(1) no risk
(2) little risk
(3) some risk
(4) serious risk
(9) do not know.
As far as information on hygiene practices is concerned, the question was the following:
In the last year, have you heard about practices such as hand washing, storing and treating
water, and other ways of preventing diarrhea, from any one ? (check all that apply)
1 No
2 From my school-going children
3 From Midwife/public health worker
4 From pre school teacher
5 From school teacher
6 From friends
26

27
7 From parents
8 Media
9 Others.
Tables Table 1. Descriptive statistics on households socioeconomics and demographics.
Variables(a) Mean
Monthly income of the household (SL Rs) 16,592
Household’s head works for the government (0/1) 0.20
Household’s head works for the private sector (0/1) 0.17
Household’s head works in business (0/1) 0.17
Household’s head is a manual worker (0/1) 0.14
Household’s head is self employed (0/1) 0.08
Household’s head works in farming (0/1) 0.02
Highest education level in the household (years completed) 11
Information on practices to prevent diarrhea (0/1) 0.73
From public health worker (0/1) 0.17
From school teacher or school-going children (0/1) 0.11
From friends (0/1) 0.04
From parents (0/1) 0.17
From media (0/1) 0.55
Notes:
(a) (0/1) indicates a binary variable only taking values equal to 0 or 1.
28

Table 2. Perceived risk equation (1: no risk, 2: little risk, 3: some or serious risk). Ordered Probit model. Maximum Likelihood estimation results.
List of variables(a) Coef.(b) Std. Err. P>z Opinion about water taste 0.671*** 0.062 0.000 Opinion about water smell 0.848*** 0.075 0.000 Opinion about water color 0.917*** 0.072 0.000 Highest educational attainment 0.007 0.014 0.597 Household/respondent has been informed (0/1) 0.424*** 0.107 0.000 Information came from health workers (0/1) -0.215** 0.093 0.021 Information came from school-going children or teachers (0/1) 0.164 0.107 0.124 Information came from parents (0/1) -0.117 0.097 0.228 Information came from media (0/1) -0.340*** 0.090 0.000 Akmeemana (0/1) - reference - - - Ambalangoda (0/1) 0.342 0.257 0.183 Baddagama (0/1) 0.734*** 0.229 0.001 Balapitiya (0/1) 0.137 0.216 0.526 Bentota (0/1) 0.127 0.222 0.569 Beruwala (0/1) 0.325* 0.172 0.059 Bope Poddala (0/1) 0.052 0.202 0.796 Dodangoda (0/1) 0.242 0.259 0.351 Elpitiya (0/1) 0.115 0.264 0.662 Galle Four Gravets (0/1) 0.175 0.230 0.445 Habaraduwa (0/1) 0.442* 0.259 0.088 Hikkaduwa (0/1) 0.513*** 0.189 0.007 Kalutara (0/1) 0.216 0.180 0.231 Katana (0/1) 0.196 0.153 0.200 Matugama (0/1) -0.265 0.411 0.519 Negombo (0/1) 0.268 0.164 0.101 Panadura (0/1) 0.066 0.266 0.804
1μ 5.088 0.254
2μ 6.512 0.270 Number of observations 2,990 Pseudo R2 0.3573
Notes:
(a) (0/1) indicates a binary variable only taking values equal to 0 or 1.
(b) * ,**, *** indicate significance at the 10%, 5%, and 1% level respectively.
29

Table 3. Decision to treat water. Probit model, Maximum Likelihood estimation results. List of variables(a) Coef.(b) Std. Err. P>z Constant -1.735*** 0.468 0.000 Average perceived risk in the municipality 0.634** 0.314 0.043 Highest educational attainment 0.056*** 0.020 0.005 Household/respondent has been informed (0/1) 0.201** 0.099 0.043 Information came from health workers (0/1) -0.042 0.112 0.709 Information came from school-going children or teachers (0/1) -0.078 0.133 0.557 Information came from parents (0/1) -0.104 0.115 0.367 Number of children less than 3 0.230** 0.098 0.019 Household’s head works for the government 0.239** 0.102 0.019 Akmeemana (0/1) - reference - - - Ambalangoda (0/1) -0.613 0.382 0.108 Baddagama (0/1) -0.306 0.329 0.351 Balapitiya (0/1) -0.304 0.316 0.337 Bentota (0/1) -0.512 0.338 0.129 Beruwala (0/1) -0.298 0.233 0.200 Bope Poddala (0/1) -0.293 0.289 0.311 Dodangoda (0/1) -0.076 0.353 0.828 Elpitiya (0/1) 0.579 0.366 0.114 Galle Four Gravets (0/1) 0.128 0.321 0.689 Habaraduwa (0/1) -0.112 0.396 0.778 Hikkaduwa (0/1) -0.490* 0.257 0.057 Kalutara (0/1) -0.381 0.244 0.117 Katana (0/1) -0.146 0.202 0.469 Matugama (0/1) -0.214 0.418 0.608 Negombo (0/1) -0.062 0.233 0.791 Panadura (0/1) 0.584 0.395 0.139 Number of observations 1,103 LR chi2(24) 61.28 Prob > chi2 0.0000
Notes:
(a) (0/1) indicates a binary variable only taking values equal to 0 or 1.
(b) * ,**, *** indicate significance at the 10%, 5%, and 1% level respectively.
30

Figures
0%
20%
40%
60%
80%
100%
Private water c
onnection
Public taps
Public well
Neighbours that g
ive water a
way
Private well
Bowsers/
Vendors/Tanke
r
Surface
water source
s
Rainwater
Bottled water
No risk Little risk Some risk Serious risk Do not know
Figure 1: Household’s opinion about water safety, by source
0%
20%
40%
60%
80%
100%
Private
wate
r con
necti
on
Public
taps
Public
well
Neighb
ours
that g
ive w
ater a
way
Private
well
Bowse
rs/Ven
dors/
Tanke
r
Surfac
e wate
r sou
rces
Rainwate
r
Bottled
wate
r
Excellent Good Poor Bad Do not know
Figure 2: Household’s opinion about water taste, by source
31

0%
20%
40%
60%
80%
100%
Private
wate
r con
necti
on
Public
taps
Public
well
Neighb
ours
that g
ive w
ater a
way
Private
well
Bowse
rs/Ven
dors/
Tanke
r
Surfac
e wate
r sou
rces
Rainwate
r
Bottled
wate
r
No smell Little smell Some smell Serious smell Do not know
Figure 3: Household’s opinion about water smell, by source
0%
20%
40%
60%
80%
100%
Private
wate
r con
necti
on
Public
taps
Public
well
Neighb
ours
that g
ive w
ater a
way
Private
well
Bowse
rs/Ven
dors/
Tanke
r
Surfac
e wate
r sou
rces
Rainwate
r
Bottled
wate
r
Very clean Clean Dirty Very dirty Do not know
Figure 4: Household’s opinion about water color, by source
32

Endnotes
i Numerous studies showed evidence of a relationship between hygiene behavior and incidence of
diarrhea (see Curtis et al. 1995, Fewtrell et al. 2005, and Zwane and Kremer 2007, for literature
overviews). For example, it is now well established that safe stool disposal (i.e., not leaving stool
on the ground) and maternal hand washing reduce the incidence of childhood diarrhea. Curtis and
Cairncross (2003), in a review of studies linking hand washing with the incidence of diarrheal
diseases, found that interventions to promote washing hands with soap were associated with a
decrease in the risk of diarrheal disease of 47%.
ii Perceived risk is commonly used in averting/defensive behavior models in the environmental
economics literature using data from industrialized countries (Courant and Porter 1981). These
approaches, which rely on the so-called household production model, derive the valuation of an
environmental “bad” (water contamination for example) through the money spent to defend
against this “bad” (purchase of water filters for example); for greater details on these models, see
Kolstad (2000).
iii Note that it is not possible, from these data, to study the relationship between hygiene practices
and diseases as there are very few households in our sample who experienced diarrhea in the past
month, or malaria, typhoid, or hepatitis in the past year.
iv Estimation results of the four bivariate probit models are not shown here but are available from
authors upon request.
33