Unsteady aeroelastic behaviors of rigid airfoils with preset angles of attack
Upload
khangminh22Category
view
0download
0
A Comparative Study for Different Shapes of Airfoils
MOHAMED ADEL Mechanical Power Engineering Department, Zagazig
University, Zagazig, 44519, [email protected] EGYPT
Abstract: Lift and drag forces are extensively depending on the airfoil geometry. So, in this paper a comparative study for different geometries of airfoils are carried out. Three different geometries NACA0012, NACA2412, and SG6043 has been investigated. A 2-D numerical analysis has been performed using ANSYS 16. The k-ω shear stress transport (SST) model is used to simulate the turbulence effect through the flow. The numerical simulation of flow field around the three different geometries was studied at different angle of attacks (-10, -5, 0, 5, 10, 15, 20, 25o). Pressure distribution, lift and drag coefficients are obtained for the different angle of attacks. The numerical results have been validated by comparing the predicated numerical results with the previous studies. The comparison shows good agreement. The comparison between the three different airfoils recommended the use of SG6043 airfoil for wind turbine application due to the high value for lift to drag ratio. Keywords: NACA airfoil, Lift coefficient, Drag coefficient, CFD, Simulation, and Pressure distribution.
1. Introduction The aerodynamic characteristics of an airfoil is highly affected by the airfoil geometry and the operating conditions. The airfoil geometry is such as the profile and the shape of the airfoil, the airfoil span, the twist angle. The operating conditions are such as the Mach number, the ambient pressure, the ambient temperature, and angle of attack (AOA). Lift and drag forces are generated due to the airfoil geometry and the operating conditions. Lift force is the perpendicular force to the chord generated due to the pressure difference between the lower and upper surface of the airfoil. The other component of the force which is parallel to the chord is called drag force. For aircraft applications it is mandatory to increase the lift forces and decrease the drag forces. In other words, the efficiency and performance of aircraft are depending on the aerodynamic characteristics (lift, drag, lift to drag ratio. etc.) of the wing (airfoil shape).
2. Previous Workds Different researches had been conducted on the flow field around an airfoil with different geometries and several operating conditions. Theses researches investigated the flow field experimentally and numerically. Mineck et al. (1993) examined three planar, untwisted wings with the same elliptical chord but with different curvatures of the quarter-chord line. It was found that the elliptical wing with the unswept quarter-chord line has the minimum lifting performance, the elliptical wing with the unswept trailing edge has the high lifting performance and the crescent-shaped wing has moderate performance in between. Rajakumar (2010) examined numerically the lift and drag forces in a wind turbine blade (NACA 4420 airfoil) at different sections and the effect of angle of attack. The analysis showed that angle of attack of 5o had high Lift/Drag ratio. Kandwal et al. (2012) studied the fluid flow and aerodynamic forces over a two-dimensional NACA 4412 Airfoil. Robert studied the variation of pressure
Mohamed AdelInternational Journal of Mechanical Engineering
http://www.iaras.org/iaras/journals/ijme
ISSN: 2367-8968 27 Volume 4, 2019

distribution over NACA 4412 airfoil with different Reynold’s Number. Sharma (2012) analyzed the flow behavior around an airfoil body. The aerodynamic characteristics (CL, CD and L/D) can be calculated from the surface pressure distribution of the wing, Anderson. Hossain et al. (2012) investigated experimentally the aerodynamic characteristics of rectangular wing equipped with and without bird feather such winglets for several flow velocities. The results showed that the drag coefficient decreased by 25 – 30 % and the lift coefficient increased by 10-20 % when utilizing bird feather at 8-degree angle of attack. Yemenici (2013) made an experimental investigation of the flow field around NACA0012 airfoil. The research studied the effects of variation Reynolds number and the angle of attack. The results showed that the pressure and lift coefficients displayed a strong dependence on Reynolds number and attack angle. Haque et al. (2015) analyzed experimentally the performance of NACA 4412 airfoil. Two models were tested. The first model was with straight leading and trailing edge i.e. rectangular planform and the other model with curved leading edge and straight trailing edge. The obtained results showed the curved leading-edge planform had higher lift to drag ratio than the rectangular planform. Mahmud analyzed the effectiveness of an airfoil with bi-camber surface. Mehdi (2016) investigated the influence of aerodynamic performance on two dimensional NACA 4412 airfoil. Different Reynolds number and angle of attack were simulated. it was found that the higher lift coefficient was obtain at Re=4x10⁶ at angle of attack 9o whereas low drag coefficient was obtained at Re=1x10⁶ at angle of attack 0o. Venkatesan et al. Sogukpinar (2015, 2017) investigated the aerodynamic performances of S-series wind turbine airfoil of S 825 to find optimum angle of attack. RANS and SST turbulence models were used in CFD analysis. The comparison indicated that SST turbulence model used in this study could predict aerodynamics properties of wind blade. (2018) enhanced the lift and drag for
NACA 2412 airfoil by introducing dimples. Dimples with various geometrical shapes like square, rectangle and triangle were simulated using ANSYS CFX. It was found that dimples with square shape had the best results. Sogukpinar (2018) studied the effects of NACA 0012 airfoil modification on aerodynamic performance. Numerical analysis was conducted by varying thickness of NACA 0012 from lower surface and different relative thicknesses asymmetrical airfoils were modified. The main objective of this paper is to simulate the flow field around a 2-D airfoil with different geometries NACA0012, NACA2412, and SG6043. Different angle of attacks is simulated for each shape. CFD results are validated by comparisons with previous works. Pressure, temperature, and velocity distributions are presented. Finally, comparisons between the studied different shapes are discussed and presented.
3. Theoretical background The governing equations of the flow system considered are the basic equations (conservation of mass, conservation of momentum, and conservation of energy). In addition to these basic equations, there are some other auxiliary equations (the turbulence model adopted in the numerical solution). The set of five coupled partial differential equations PDEs for the conservation of mass, momentum and energy in fluid flows is known as the Navier-Stoke’s equations. These equations can be presented in both differential and integral forms. Some terms of the full Navier-Stoke’s equations may be simplified or ignored if certain assumptions are made, El-Sayed (2008). Continuity equation The mass conservation equation for steady flow is given by:
0 (1)
Where;
iV : The absolute velocity in the thi
direction
ix : The coordinate in the thi direction
Mohamed AdelInternational Journal of Mechanical Engineering
http://www.iaras.org/iaras/journals/ijme
ISSN: 2367-8968 28 Volume 4, 2019

: Fluid density. i : A tensor indicating 1, 2, 3. Momentum conservation equations The conservation of momentum equation
in the thi direction for steady flow can be
written as:
(2)
Where p is the static pressure, and ijis
the viscous stress tensor given by 23
(3)
Where; : The absolute viscosity.
lji ,, : are tensor indices indicating 1, 2, 3.
Energy conservation equation The steady equation of conservation of energy is given by
(4)
Where; E : The total energy of the water. K : The fluid thermal conductivity.
iJ :
is the diffusion flux of thj
species in the thi direction.
The first three terms in the right-hand side of equation (4) represent the energy transfer due to conduction, species diffusion, and thermal energy created by viscous shear in the flow, respectively. The air total energy E is given by
2 (5)
and jh is the specific enthalpy, given by
,
where refT= 283.24 K
(6)
4. Computational Analysis The numerical simulation was done using ANSYS Fluent 16. The airfoil with different profiles is generated using the Design Modeler. The mesh element density is increased in regions where high computational accuracy is needed, such as the near wall region of the airfoil. The numerical simulation used the standard K-
ω shear stress transport (SST) model to account for the turbulence effect, Menter (1994). In order to validate the present simulation a comparison with NACA0012 results documented by Harris will be showed. The operating conditions for the simulation are Reynolds number Re=3.0x10⁶, the free stream temperature 283.24 K, the density of the air ρ=1.225 kg/m3, the viscosity µ=1.7894x10⁻⁵ kg/m.s. and angle of attack (AOA) α=1.86o. After validation process various angle of attack are investigated and simulated for the three different airfoils NACA0012, NACA2412, and SG6043.
5. Boundary Conditions In order to simulate the flow around the 2-D airfoil the domain height and length was set to approximately 15-time chord length. The mesh size is concentrated around the airfoil to obtain accurate solution as shown in Fig. 1. The structured grid is consisted of about 95,000 nodes. The influence of mesh size is examined as seen in Fig. 2. There is no variation for the lift coefficient value for further increase in the mesh size after 95,000 cells. The structured grid geometry of the airfoil is constructed for three different airfoils NACA0012, NACA2412, and SG6043.
Fig. 1 Details of the Geometry for
NACA0012 Airfoil.
Mohamed AdelInternational Journal of Mechanical Engineering
http://www.iaras.org/iaras/journals/ijme
ISSN: 2367-8968 29 Volume 4, 2019

Fig. 2 Variation of Lift coefficient with
the no. of grid cells
6. Results Validation To validate the computational results, the numerical results for the 2-D NACA0012 airfoil at AOA=1.86o and 5.86o are compared with the experimental results of Harris. The pressure coefficient distribution around the airfoil for the present study and previous results obtained by Harris (1981) is shown in Fig. 3 for AOA=1.85o and 5.86o respectively. There is an acceptable agreement between the numerical results and the experimental results obtained from Harris.
(a)
(b) Fig. 3 Numerical results validation with
previous experimental work.
7. Results and Discussion After validating the computational results, different angle of attacks (AOA= -10, -5, 0, 5, 10, 15, 20, and 25o) are simulated and presented. Lift coefficient (CL) versus angle of attack (AOA) for the three different airfoils are presented in Fig. 4. Lift coefficient increases with increasing AOA until AOA=15o a further increase in AOA leads to decrease in lift coefficient. This due to the flow separation point propagates to the leading edge as the AOA increases. Consequently, the weak region area increases and the pressure distribution values decrease over the upper surface of the airfoil. Also, it is noticed that SG6043 airfoil has the highest values for lift coefficient over the range of AOA. The effect of angle of attack (AOA) on the drag coefficient is shown in Fig. 5 for various airfoils. As the angle of attack increases the drag coefficient decreases up to AOA=0o a further increase in AOA leads to increase in drag coefficient. That is due to the increase in pressure distribution values over the lower surface of the airfoil. Lift to drag ratio is illustrated in Fig. 5. Lift to drag ratio increases with increasing AOA until AOA=5o for SG6043 and AOA=10o for NACA0012 and NACA2412 a further increase in AOA leads to decrease in lift to drag ratio. Its observed that SG6043 has the highest value for lift to drag ratio which is applicable for wind turbine applications.
Mohamed AdelInternational Journal of Mechanical Engineering
http://www.iaras.org/iaras/journals/ijme
ISSN: 2367-8968 30 Volume 4, 2019

Fig. 4 Lift coefficient (CL) versus angle of
attack (AOA)
Fig. 5 Drag coefficient (CD) versus angle
of attack (AOA)
Fig. 6 Lift to Drag (CL/CD) versus angle of
attack (AOA) The pressure coefficient (Cp) distribution on NACA0012, NACA2412, and SG6043 airfoils for different angles of attacks (AOA) are shown in Fig. 7 thr' Fig. 9. The negative pressure was created on the upper surface of the airfoil and simultaneously positive pressure at the lower surface thus generating lift. Pressure distribution on the
upper section of the airfoil decreases as the AOA increases. In other words, the flow separates from the airfoil surface early as the angle of attack increases. Consequently, the pressure decreases early along the airfoil. So, the flow separation point occurs early and weak region area increases as the AOA increases. Also, it can be concluded that the AOA=20o has the lowest pressure distribution values over the upper section for the airfoil. Which interpret the highest value for the lift coefficient at this value as seen in Fig. 4.
Fig. 7 Pressure coefficient (Cp)
distribution on NACA0012 Airfoil for different angle of attack (AOA)
Fig. 8 Pressure coefficient (Cp)
distribution on NACA2412 Airfoil for different angle of attack (AOA)
Mohamed AdelInternational Journal of Mechanical Engineering
http://www.iaras.org/iaras/journals/ijme
ISSN: 2367-8968 31 Volume 4, 2019

Fig. 9 Pressure coefficient (Cp) distribution on SG6043 Airfoil for different angle of attack (AOA) Turbulent kinetic energy and velocity contours on NACA0012, NACA2412, and SG6043 airfoils are shown in Fig. 10 thr’ Fig. 15. Its observed that for AOA=-10o the low turbulent kinetic energy and velocity region occur at the lower surface. This is due to the occurrence of flow separation at the lower surface due to the high decrease in AOA value. Also, it is noticed as the angle of attack increases the low region of turbulent kinetic energy transfer from the lower surface to the upper surface due to the change in separation point occurrence. So, the AOA=20o has the largest turbulent kinetic energy region due to the low velocity distribution occurred at this weak area. For SG6043 airfoil, the turbulent kinetic energy and velocity distribution are generated extensively compared to NACA0012 and NACA2412 for the different angles. Also, the turbulent kinetic energy and velocity distribution are asymmetric around the airfoil in contrast to NACA0012 and NACA2412. This due to the asymmetric shape of the airfoil. This is may interpret the high values for lift coefficient over the various angle of attack (AOA).
(a) α=-10o
(b) α=0o
(c) α=5o
(d) α=20o
Fig. 9 Turbulent Kinetic Energy contours around the NACA0012 Airfoil
(a) α=-10o
(b) α=0o
Mohamed AdelInternational Journal of Mechanical Engineering
http://www.iaras.org/iaras/journals/ijme
ISSN: 2367-8968 32 Volume 4, 2019

(c) α=5o
(d) α=20o
Fig. 10 Velocity contours around the NACA0012 Airfoil
(a) α=-10o
(b) α=0o
(c) α=5o
(d) α=20o
Fig. 11 Turbulent Kinetic Energy contours around the NACA2412 Airfoil.
(a) α=-10o
(b) α=0o
(c) α=5o
(d) α=20o
Fig. 12 Velocity contours around the NACA2412 Airfoil.
(a) α=-10o
Mohamed AdelInternational Journal of Mechanical Engineering
http://www.iaras.org/iaras/journals/ijme
ISSN: 2367-8968 33 Volume 4, 2019

(b) α=0o
(c) α=5o
(d) α=20o
Fig. 13 Turbulent Kinetic Energy contours around the SG6043 Airfoil.
(a) α=-10o
(b) α=0o
(c) α=5o
(d) α=20o
Fig. 14 Velocity contours around the SG6043 Airfoil.
8. Summary and Conclusion A numerical analysis was performed to simulate the flow around three different shapes of airfoils NACA0012, NACA2412, and SG6043. The numerical simulation was done using ANSYS Fluent 16.0 which solve Navier stokes and energy equations to predict the flow behavior around the different airfoils. The numerical results were validated by comparing the results with the previous obtained experimental results. Comparison showed a good agreement. Different angle of attacks was simulated and studied. From the current comprehensive study, the following conclusions are drawn: 1- The airfoil SG6043 has the highest
value for the lift coefficient and lift to drag ratio.
2- NACA0012 airfoil has the lowest value for the lift coefficient and lift to drag ratio.
3- The Angle of attack has a direct impact on the lift, and drag coefficients.
4- For the lift coefficient, the maximum value occurred at angle of attack 15o.
5- For the drag coefficient, the maximum value occurred at angle of attack 0o.
6- For the lift to drag ratio, the maximum value occurred at angle of attack 5o
Mohamed AdelInternational Journal of Mechanical Engineering
http://www.iaras.org/iaras/journals/ijme
ISSN: 2367-8968 34 Volume 4, 2019
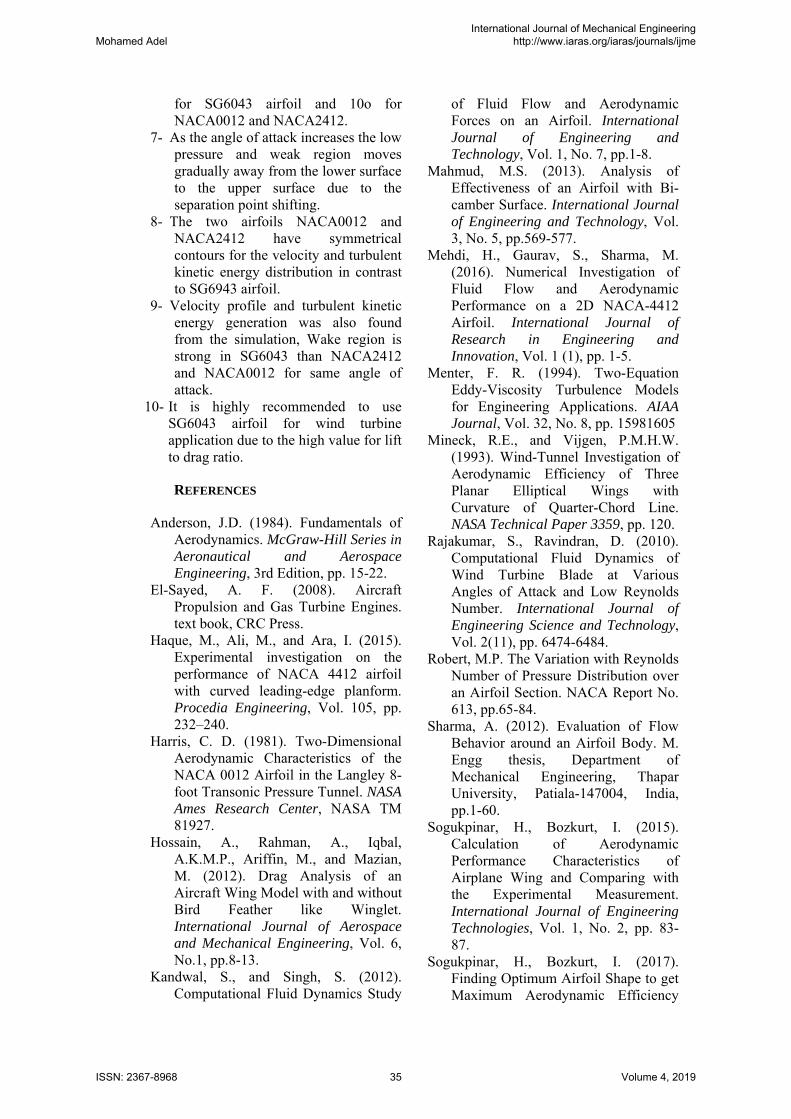
for SG6043 airfoil and 10o for NACA0012 and NACA2412.
7- As the angle of attack increases the low pressure and weak region moves gradually away from the lower surface to the upper surface due to the separation point shifting.
8- The two airfoils NACA0012 and NACA2412 have symmetrical contours for the velocity and turbulent kinetic energy distribution in contrast to SG6943 airfoil.
9- Velocity profile and turbulent kinetic energy generation was also found from the simulation, Wake region is strong in SG6043 than NACA2412 and NACA0012 for same angle of attack.
10- It is highly recommended to use SG6043 airfoil for wind turbine application due to the high value for lift to drag ratio.
REFERENCES
Anderson, J.D. (1984). Fundamentals of Aerodynamics. McGraw-Hill Series in Aeronautical and Aerospace Engineering, 3rd Edition, pp. 15-22.
El-Sayed, A. F. (2008). Aircraft Propulsion and Gas Turbine Engines. text book, CRC Press.
Haque, M., Ali, M., and Ara, I. (2015). Experimental investigation on the performance of NACA 4412 airfoil with curved leading-edge planform. Procedia Engineering, Vol. 105, pp. 232–240.
Harris, C. D. (1981). Two-Dimensional Aerodynamic Characteristics of the NACA 0012 Airfoil in the Langley 8-foot Transonic Pressure Tunnel. NASA Ames Research Center, NASA TM 81927.
Hossain, A., Rahman, A., Iqbal, A.K.M.P., Ariffin, M., and Mazian, M. (2012). Drag Analysis of an Aircraft Wing Model with and without Bird Feather like Winglet. International Journal of Aerospace and Mechanical Engineering, Vol. 6, No.1, pp.8-13.
Kandwal, S., and Singh, S. (2012). Computational Fluid Dynamics Study
of Fluid Flow and Aerodynamic Forces on an Airfoil. International Journal of Engineering and Technology, Vol. 1, No. 7, pp.1-8.
Mahmud, M.S. (2013). Analysis of Effectiveness of an Airfoil with Bi-camber Surface. International Journal of Engineering and Technology, Vol. 3, No. 5, pp.569-577.
Mehdi, H., Gaurav, S., Sharma, M. (2016). Numerical Investigation of Fluid Flow and Aerodynamic Performance on a 2D NACA-4412 Airfoil. International Journal of Research in Engineering and Innovation, Vol. 1 (1), pp. 1-5.
Menter, F. R. (1994). Two-Equation Eddy-Viscosity Turbulence Models for Engineering Applications. AIAA Journal, Vol. 32, No. 8, pp. 15981605
Mineck, R.E., and Vijgen, P.M.H.W. (1993). Wind-Tunnel Investigation of Aerodynamic Efficiency of Three Planar Elliptical Wings with Curvature of Quarter-Chord Line. NASA Technical Paper 3359, pp. 120.
Rajakumar, S., Ravindran, D. (2010). Computational Fluid Dynamics of Wind Turbine Blade at Various Angles of Attack and Low Reynolds Number. International Journal of Engineering Science and Technology, Vol. 2(11), pp. 6474-6484.
Robert, M.P. The Variation with Reynolds Number of Pressure Distribution over an Airfoil Section. NACA Report No. 613, pp.65-84.
Sharma, A. (2012). Evaluation of Flow Behavior around an Airfoil Body. M. Engg thesis, Department of Mechanical Engineering, Thapar University, Patiala-147004, India, pp.1-60.
Sogukpinar, H., Bozkurt, I. (2015). Calculation of Aerodynamic Performance Characteristics of Airplane Wing and Comparing with the Experimental Measurement. International Journal of Engineering Technologies, Vol. 1, No. 2, pp. 83-87.
Sogukpinar, H., Bozkurt, I. (2017). Finding Optimum Airfoil Shape to get Maximum Aerodynamic Efficiency
Mohamed AdelInternational Journal of Mechanical Engineering
http://www.iaras.org/iaras/journals/ijme
ISSN: 2367-8968 35 Volume 4, 2019

for a Wind Turbine. AIP Conference Proceedings 1815, 040007.
Sogukpinar, H. (2018). The Effects of NACA 0012 Airfoil Modification on Aerodynamic Performance Improvement and Obtaining High Lift Coefficient and Post-Stall Airfoil. AIP Conference Proceedings 1935, 020001, 2018.
Venkatesan, S. P., Kumar, V. P., Kumar, M. S., Kumar, S. (2018). Computational Analysis of
Aerodynamic Characteristics of Dimple Airfoil NACA 2412 At Various Angles of Attack. International Journal of Mechanical Engineering and Technology, Vol. 9, No. 9, pp. 41-49.
Yemenici, O. (2013). Experimental Investigation of the Flow Field around NACA0012 Airfoil. International Journal of Sciences, Vol. 2, pp. 98-101.
Mohamed AdelInternational Journal of Mechanical Engineering
http://www.iaras.org/iaras/journals/ijme
ISSN: 2367-8968 36 Volume 4, 2019
Copyright © 2022 FDOKUMEN