a comparative analysis of financial performance of non-bank ...
13
American Finance & Banking Review Vol. 6, No. 1; 2021 ISSN 2576-1226 E-ISSN 2576-1234 Published by CRIBFB, USA 1 A COMPARATIVE ANALYSIS OF FINANCIAL PERFORMANCE OF NON-BANK FINANCIAL INSTITUTIONS IN BANGLADESH S. M. Akber Lecturer Department of Business Administration Ranada Prasad Shaha University, Bangladesh M.Phil Researcher Department of Finance, Jagannath University, Bangladesh E-mail: [email protected] https://orcid.org/0000-0002-0267-3626 Dhiman Barua Assistant Professor Faculty of Business Administration BGC Trust University Bangladesh, Bangladesh M.Phil Researcher Department of Finance, Jagannath University, Bangladesh E-mail: [email protected] Received: October 01, 2021 Accepted: October 30, 2021 Online Published: November 26, 2021 DOI: 10.46281/amfbr.v6i1.1455 URL: https://doi.org/10.46281/amfbr.v6i1.1455 ABSTRACT NBFIs play an important role in economic development through ensuring proper mobilization of funds in Bangladesh. This study represents a comparison of nine NBFIs operating their business in Bangladesh within the period from 2016 to 2019 through using financial ratios and other measures. To analyze the financial performance this study has used ratio analysis, such as ROA, ROE, ROCE, Institutional size/ Total assets and total equity etc. The outcome of this study says that for generating return the NBFIs performance based on efficiency ratio is different from the performance based on liquidity ratio, capital ratio and other financial measures. This study suggests to NBFIs to be more conscious about loan selection and establish a brand image through providing more efficient services. It also suggests the NBFIs to finds more income generating areas to be more competitive. In the coming years NBFIs will have more prospects that will ensure the economic development of our country. Keywords: NBFIs, Financial Performance, Efficiency, Liquidity, Profitability, ROA, ROE, ROCE. JEL Classification Codes: F36, L25, G23.
-
Upload
khangminh22 -
Category
Documents
-
view
1 -
download
0
Transcript of a comparative analysis of financial performance of non-bank ...
American Finance & Banking Review
Vol. 6, No. 1; 2021
ISSN 2576-1226 E-ISSN 2576-1234
Published by CRIBFB, USA
1
A COMPARATIVE ANALYSIS OF FINANCIAL
PERFORMANCE OF NON-BANK FINANCIAL INSTITUTIONS
IN BANGLADESH
S. M. Akber
Lecturer Department of Business Administration
Ranada Prasad Shaha University, Bangladesh
M.Phil Researcher
Department of Finance, Jagannath University, Bangladesh
E-mail: [email protected]
https://orcid.org/0000-0002-0267-3626
Dhiman Barua
Assistant Professor
Faculty of Business Administration
BGC Trust University Bangladesh, Bangladesh
M.Phil Researcher
Department of Finance, Jagannath University, Bangladesh
E-mail: [email protected]
Received: October 01, 2021 Accepted: October 30, 2021 Online Published: November 26, 2021
DOI: 10.46281/amfbr.v6i1.1455 URL: https://doi.org/10.46281/amfbr.v6i1.1455
ABSTRACT
NBFIs play an important role in economic development through ensuring proper mobilization of
funds in Bangladesh. This study represents a comparison of nine NBFIs operating their business
in Bangladesh within the period from 2016 to 2019 through using financial ratios and other
measures. To analyze the financial performance this study has used ratio analysis, such as ROA,
ROE, ROCE, Institutional size/ Total assets and total equity etc. The outcome of this study says
that for generating return the NBFIs performance based on efficiency ratio is different from the
performance based on liquidity ratio, capital ratio and other financial measures. This study
suggests to NBFIs to be more conscious about loan selection and establish a brand image
through providing more efficient services. It also suggests the NBFIs to finds more income
generating areas to be more competitive. In the coming years NBFIs will have more prospects
that will ensure the economic development of our country.
Keywords: NBFIs, Financial Performance, Efficiency, Liquidity, Profitability, ROA, ROE,
ROCE.
JEL Classification Codes: F36, L25, G23.
https://www.cribfb.com/journal/index.php/amfbr American Finance & Banking Review Vol. 6, No. 1; 2021
2
INTRODUCTION
An efficient financial system is essential to ensure economic development for any nation because
it ensures a smooth transfer of fund from the surplus to deficit unit. To ensure an interruption
free production, keeping the market competitive and assist the economic transaction properly a
well-functioning financial system has no substitute. An efficient financial system means
allocating the resources efficiently. It is the foundation of enhancing the performance of the
organizations. Non-bank financial institutions are a part of the financial system. Through serving
the economy, it ensures the economic development of a country. NBFI supports the economy
through investment in the capital market, entrepreneurs’ by giving short term or long term loans
and through providing many other activities. Asset management (AM), institution size (IS), and
operating efficiency three principal factors are important for enhancing the financial performance
(Miskhin, 2019).
Non-bank financial institutions (NBFI) plays an important role in the financial sector of a
country. There could be various institutions that act a NBFI but this paper works with finance
companies. Finance companies are a part of NBFI. They don’t collect a deposit like banks. They
raised funds through selling their shares and invest the funds through providing direct and
indirect loans. They also invest a portion of the funds in the capital market. That’s why finance
companies play a significant role in the performance of capital markets. Most of the finance
companies are vertically integrated organizations. They are incorporated with various services
such as merger and acquisition, advisory services, capital raising services, securities trading
services, and research coverage (Madura, 2018).
The purpose of this study is to analyze the financial performance of the selected NBFI in
Bangladesh within the period of 2016-2019.
To measure the performance, financial ratios and financial measures that have an impact
over the performance of NBFI are used as a basis. So evaluating the financial performance of
NBFI and comparing the relative market position of the selected NBFI in Bangladesh is the
prime objective of this study. To measure the financial performance several ratios such as return
on equity (ROE), return on assets (ROA), institution size/ total assets & total equity, earnings per
share (EPS), current ratio, capital ratio, return on capital employed (ROCE), and Interest
Coverage Ratio are used. This study will analyze the financial performance of selected finance
companies (NBFI) in Bangladesh. Then, based on the result it will identify their competitive
position in Bangladesh. It also involves the managers and investors with important information
about operating efficiency of finance companies so that it would be helpful for them to take
decision for future development and investment.
LITERATURE REVIEW
Usually financial ratios, measuring performance against budget, benchmarking are used to
measure the financial performance of any financial institutions (Avkiran, 1995). Through
published financial statement one can get different types of ratios and it helps to determine the
financial performance of that company. In Pakistan to classify financial institutions based on
their performance different types of financial ratios such as return on equity (ROE), return on
assets (ROA), total assets, total equity, earnings per share (EPS), current ratio, capital ratio,
return on capital employed (ROCE), and administration expenses to profit before tax ratio are
used (Ali Reza, 2011). Several studies have been conducted that are relevant to analyzing the
company’s performance that focus the operational effectiveness and efficiency to ensure the
development of the company.
https://www.cribfb.com/journal/index.php/amfbr American Finance & Banking Review Vol. 6, No. 1; 2021
3
Tarawneh (2006) conduct a research and came with an outcome that having better
efficiency a company may not have a better effectiveness always. Elizabeth. D (2004) suggested
through his study that the financial measures of performance, such as return on equity (ROE),
capital adequacy ratio (CAR) and net interest margins (NIM) should be calculated positively
with scores of customer service quality. Alsamaree (2013) worked in the same area within the
period from 2007- 2010 based on the commercial banks of Kuwait. In his study he showed that
because of distributing the profits properly banks in Kuwait were able to overcome the crisis and
was able to draw the attention of National Bank of Kuwait.
Almumani (2014) made a research to analyze and compare the performance of Saudi
banks listed in their stock market for the period 2007-2011. He measured the financial
performance by two approaches such as trend analysis and inter-firm analysis. He came up with
an outcome that Saudi Banks’ profitability increase, due to increase of their operating income
and their profitability decrease due to increase their assets, operating expense and cost of income.
He also came up with an outcome that Saudi joint venture banks are more efficient to generate
profits, absorb loan losses and to dominate in ROE. But the Saudi established banks are more
capable to absorb asset losses and to dominate in ROA.
Akber (2019) conducted a research on the relationship between profitability and non-
performing loan on sharia based banks of Bangladesh. He used a sample of five sharia based
banks in Bangladesh where return on equity was used as a proxy for profitability. He came up
with an outcome that a consciousness of the authority on loan disbursement will lead to reduce
the non-performing loan and increase the bank’s profitability. Akber (2020) conducted another
research on comparing the performance of traditional private commercial banks and Islamic
banks in Bangladesh. He used a sample of five traditional commercial private banks and five
Islamic banks and the performance were measured based on camels. He came with an outcome
that in term of management quality private commercial banks perform better while in term of
capital adequacy and liquidity position Islamic banks perform better.
Fukuyama (1995) researched among countries in Asia, to employ DEA and to analyze
banking efficiency. In his research, he considered the efficiency of 143 Japanese banks as a
sample. He came up with an outcome that the pure technical efficiency to average around 86%
and scale efficiency around 98%. It means that the major source of overall technical inefficiency
is pure technical inefficiency. He said that the scale inefficiency is because of increasing returns
to scale. He also said that banks with different organizational status perform differently and the
scale efficiency is positively but weakly associated with bank size.
Tandon et al. (2019) conducted a research in the same field. In his research he showed
non-performing loans and their impact on bank profitability. He focused on banks' specific
macroeconomic determinants. Finally, he came with an outcome that to increase the profitability
more attention is required for NPL management.
An efficient financial system reduces liquidity risk and it is done through a proper
combination of different types of illiquid assets and proper securitization. Usually the presence
of financial intermediary reduces information asymmetries and transaction cost. Through
investment banks convert their liquid short-term assets to long-term illiquid investments
(Diamond, 1983). Here the financial comparison of NBFIs in Bangladesh is based on return on
equity (ROE), return on asset (ROA), institution size (IS) and many other activities.
Based on the above discussion, it can be said that most of the research worked with the
banks or investment banks. A very few works have done with NBFIs which contributes a
significant portion to the economic development of our country. So a research gap has created.
https://www.cribfb.com/journal/index.php/amfbr American Finance & Banking Review Vol. 6, No. 1; 2021
4
That’s why this study deals with the NBFIs and tries to analyze a comparative financial position
of NBFIs in Bangladesh.
OBJECTIVES OF THE STUDY
The prime objective of this study is to analyze the financial performance of the finance
companies (NBFI) in Bangladesh to ensure growth and prosperity of this sector. So the specific
objectives of this study are to provide the insights of performance of the selected finance
companies (NBFI) in Bangladesh. Based on the performance their competitive position will be
analyzed. So that it will be helpful for the investor as well the management for taking the right
decisions.
RATIONALE OF THE STUDY
This study is important because it will improve the NBFIs financial performance in Bangladesh.
So it will contribute to the economic growth of Bangladesh. The worldwide growth of NBFIs
and its impact over the economy gives is a clear indication how much it is important in
Bangladesh economy. The reasons inspires to analyze this issue in Bangladesh.
METHODOLOGY
This study followed a quantitative research method to bring the best outcome. Most of the data
used to analyze the performances are secondary data. It also used a comparative study of the
NBFIs based on their individual financial performances.
Sample Size & Sources of Data: The data used in this study consists of nine finance companies
(NBFI) that are listed on the Dhaka Stock Exchange. So the sample size is nine. The duration for
analyzing the data is the period from 2016-2019. These data are collected from the company’s
annual report as well from their websites.
Indicators for Performance Measurement: To measure the financial performance the
following ratios are used:
Profitability ratios: Return on equity (ROE), Return on Assets (ROA), Admin Expenses
to Profit before Tax Ratio, Earnings per Share (EPS), and Return on Capital Employed
(ROCE).
Liquidity Ratio: Current Ratio
Leverage ratio: Capital Ratio
Institution Size: Total Assets, Total Equity
RESULTS AND DISCUSSIONS
To get a sound outcome of the financial performance analysis this study used time series data
analysis for different types of ratios such as ROA, ROE, ROCE, Interest Coverage Ratio, Current
Ratio, and Capital Ratio and measures their result. The results with discussion are as follows.
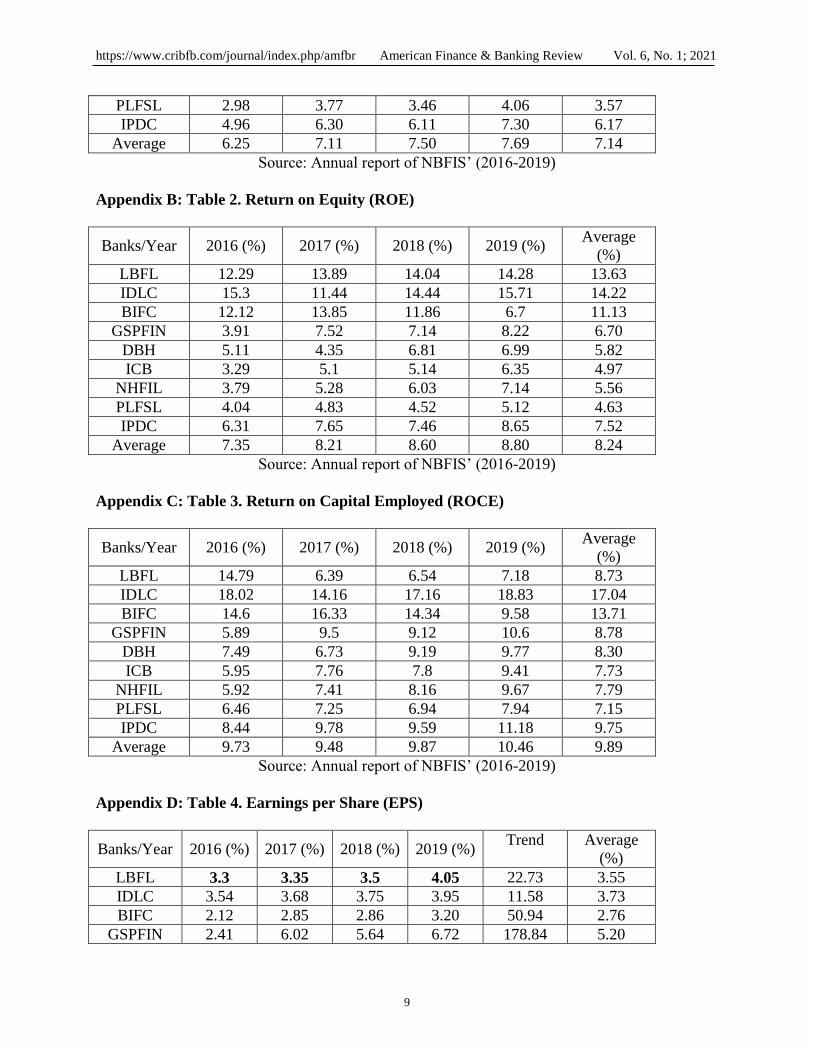
Return on Asset (ROA): The term return on asset means how much return is generated from
using one unit of assets. It denotes the earning capacity of the NBFI by using its assets (Rose,
2016). It is calculated dividing net income by total assets. The calculated results for ROA shows
IDLC generates the highest ROA (13.46) and PLFSL generates the lowest ROA (3.57) for their
https://www.cribfb.com/journal/index.php/amfbr American Finance & Banking Review Vol. 6, No. 1; 2021
5
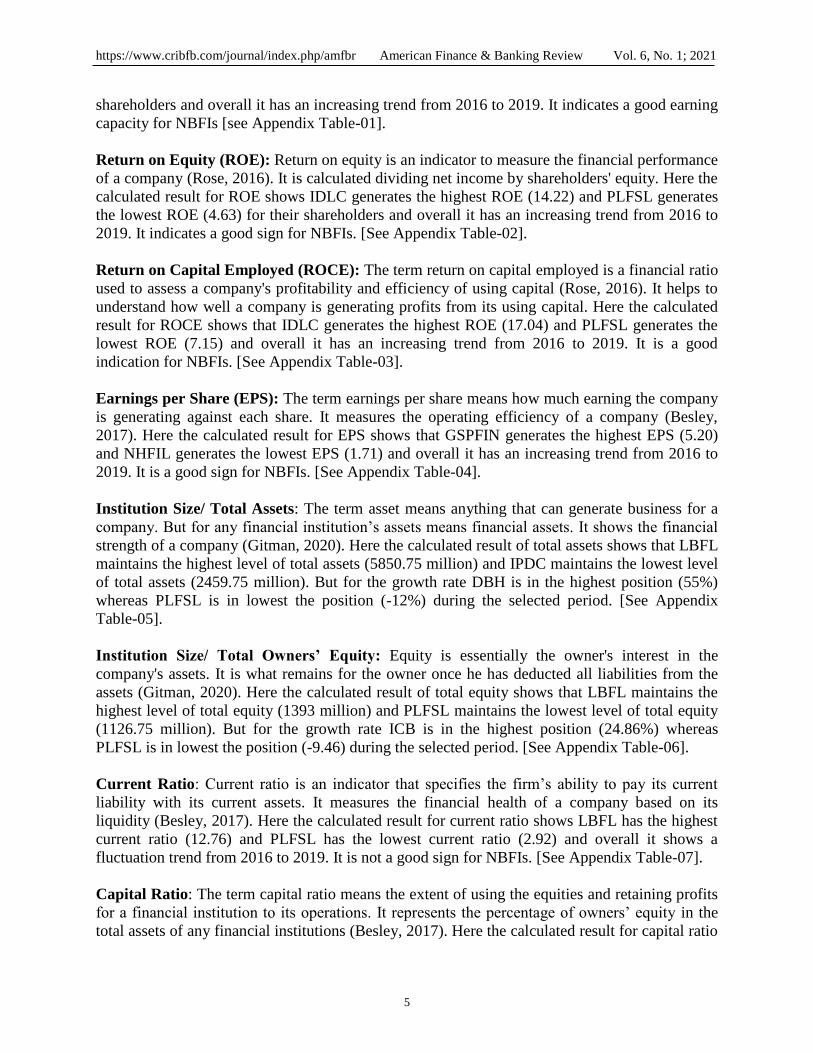
shareholders and overall it has an increasing trend from 2016 to 2019. It indicates a good earning
capacity for NBFIs [see Appendix Table-01].
Return on Equity (ROE): Return on equity is an indicator to measure the financial performance
of a company (Rose, 2016). It is calculated dividing net income by shareholders' equity. Here the
calculated result for ROE shows IDLC generates the highest ROE (14.22) and PLFSL generates
the lowest ROE (4.63) for their shareholders and overall it has an increasing trend from 2016 to
2019. It indicates a good sign for NBFIs. [See Appendix Table-02].
Return on Capital Employed (ROCE): The term return on capital employed is a financial ratio
used to assess a company's profitability and efficiency of using capital (Rose, 2016). It helps to
understand how well a company is generating profits from its using capital. Here the calculated
result for ROCE shows that IDLC generates the highest ROE (17.04) and PLFSL generates the
lowest ROE (7.15) and overall it has an increasing trend from 2016 to 2019. It is a good
indication for NBFIs. [See Appendix Table-03].
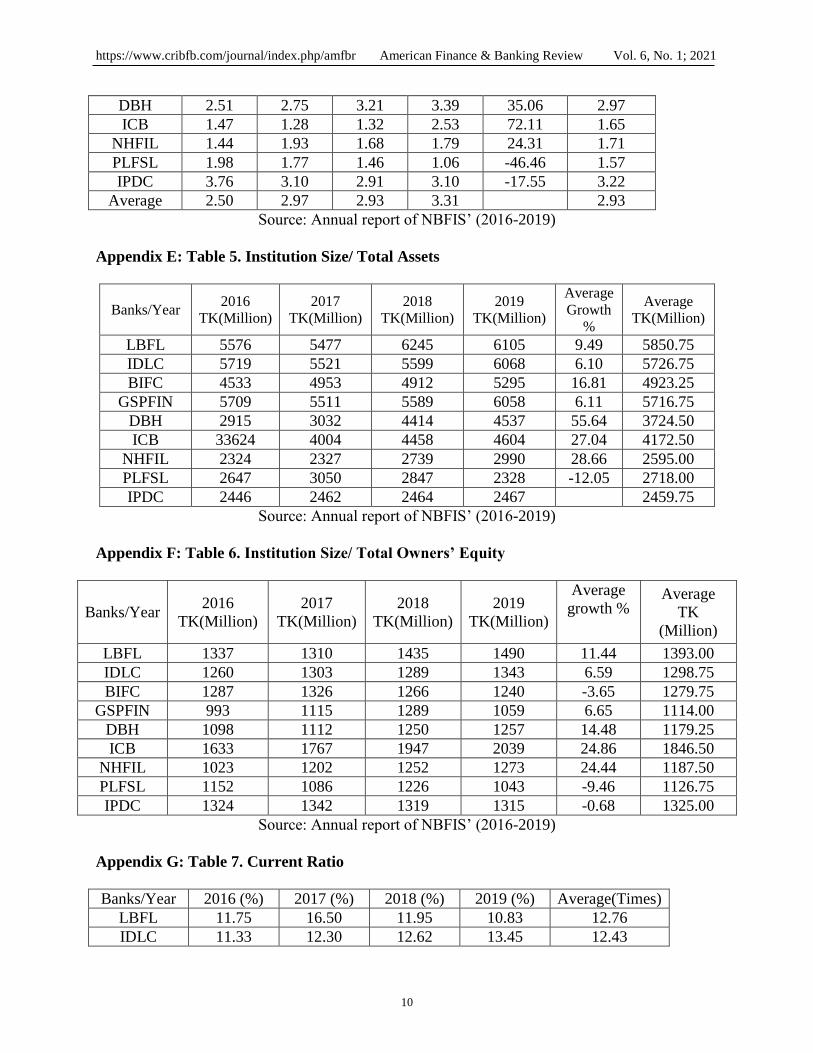
Earnings per Share (EPS): The term earnings per share means how much earning the company
is generating against each share. It measures the operating efficiency of a company (Besley,
2017). Here the calculated result for EPS shows that GSPFIN generates the highest EPS (5.20)
and NHFIL generates the lowest EPS (1.71) and overall it has an increasing trend from 2016 to
2019. It is a good sign for NBFIs. [See Appendix Table-04].
Institution Size/ Total Assets: The term asset means anything that can generate business for a
company. But for any financial institution’s assets means financial assets. It shows the financial
strength of a company (Gitman, 2020). Here the calculated result of total assets shows that LBFL
maintains the highest level of total assets (5850.75 million) and IPDC maintains the lowest level
of total assets (2459.75 million). But for the growth rate DBH is in the highest position (55%)
whereas PLFSL is in lowest the position (-12%) during the selected period. [See Appendix
Table-05].
Institution Size/ Total Owners’ Equity: Equity is essentially the owner's interest in the
company's assets. It is what remains for the owner once he has deducted all liabilities from the
assets (Gitman, 2020). Here the calculated result of total equity shows that LBFL maintains the
highest level of total equity (1393 million) and PLFSL maintains the lowest level of total equity
(1126.75 million). But for the growth rate ICB is in the highest position (24.86%) whereas
PLFSL is in lowest the position (-9.46) during the selected period. [See Appendix Table-06].
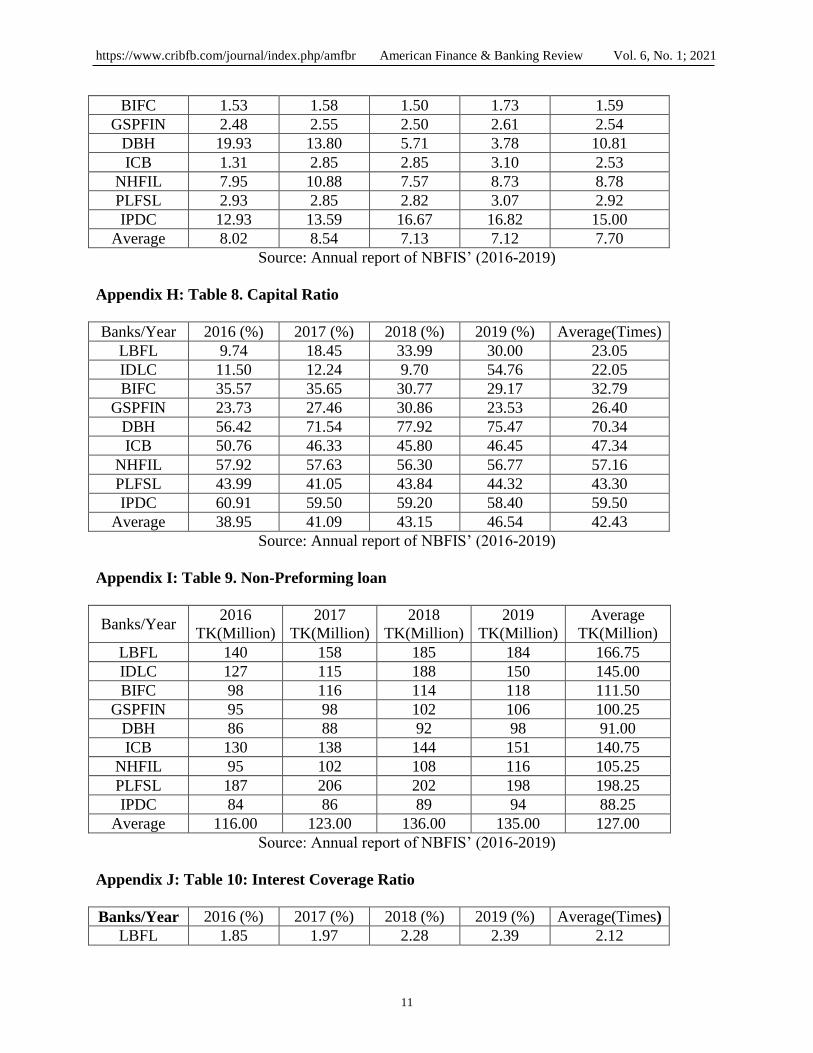
Current Ratio: Current ratio is an indicator that specifies the firm’s ability to pay its current
liability with its current assets. It measures the financial health of a company based on its
liquidity (Besley, 2017). Here the calculated result for current ratio shows LBFL has the highest
current ratio (12.76) and PLFSL has the lowest current ratio (2.92) and overall it shows a
fluctuation trend from 2016 to 2019. It is not a good sign for NBFIs. [See Appendix Table-07].
Capital Ratio: The term capital ratio means the extent of using the equities and retaining profits
for a financial institution to its operations. It represents the percentage of owners’ equity in the
total assets of any financial institutions (Besley, 2017). Here the calculated result for capital ratio
https://www.cribfb.com/journal/index.php/amfbr American Finance & Banking Review Vol. 6, No. 1; 2021
6
shows DBH has the highest capital ratio (70.34) and IDLC has the lowest capital ratio (22.05)
and overall it shows a fluctuation trend from 2016 to 2019 which is not a good sign for NBFIs
[See Appendix Table-08].
Non-Preforming Loan (NPL): A non-performing loan (NPL) is a loan where the borrower is in
default and has not paid the monthly payment of principal and interest for a certain amount. Non-
performing loans arise when borrowers lack the money to make repayments or are in situations
that make it difficult for them to continue to make repayments (Rose, 2016). Here the calculated
result for non-performing loan shows LBFL has the highest NPL (166.75 million) and IPDC has
the lowest NPL (88.25 million) and overall it shows an increasing trend from 2016 to 2019
which is an alarming sign for NBFIs [See Appendix Table-09].
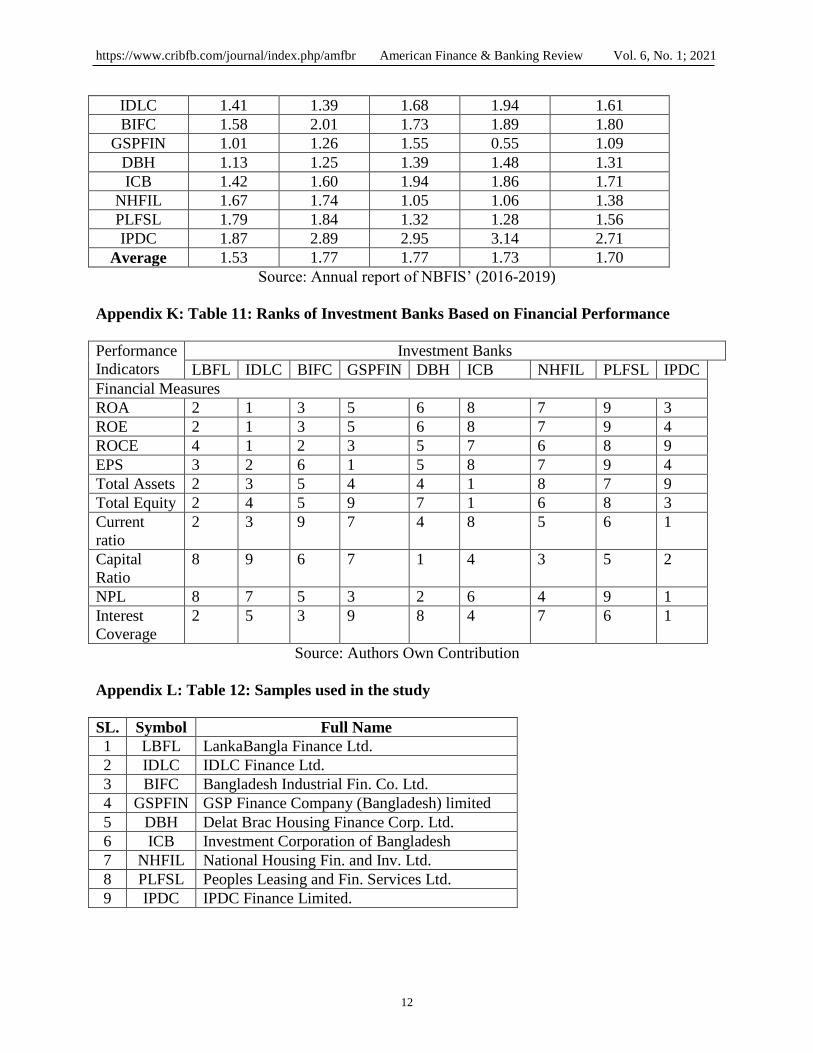
Interest Coverage Ratio (ICR): The term interest coverage ratio is a debt and the profitability
ratio. It is used to determine the capacity of a company to pay interest on its outstanding debt.
Interest coverage ratio is calculated by dividing a company's EBIT by its interest expense during
a given period (Besley, 2017). Here the calculated result of interest coverage ratio shows that
most of the companies are financially capable to pay their financial obligation. Here LBFL has
the highest interest coverage ratio (2.12) and GSPFIN has the lowest interest coverage ratio
(1.09) [See Appendix Table-10].
COMPARISON OF FINANCIAL PERFORMANCE OF INVESTMENT BANK
To evaluate the market position of NBFIs scores is assigned on the basis of financial ratio of
different NBFIs in Bangladesh. The scoring system is based on the performance of different
ratios. The best performer will scored from 1 and the worst performer will be scored with 9. Here
the score is given by
1 = Best Performer
2
.
.
9 = Worst Performer
If any value not available, in that case it will be scored by 9 for undesirable performance.
The comparison table is available in the appendix section. [See Appendix Table-11].
RECOMMENDATIONS
As NBFIs are one of the major sources of funds for the corporations so it contributes a lot to the
economic development of the country. In Bangladesh the operation of sector is developing
gradually. Based on the calculated result, it can be said that the performance for most of NBFIs
in Bangladesh in continuously improving and they are playing a significant role in the market.
Based on ROA, ROE and ROCE the financial performance of the NBFIs shows an
increasing trend which is a good sign for this industry. Based on EPS the financial performance
of NBFIs also shows an increasing trend but for current ratio, capital ratio it shows a fluctuating
trend which means that at any time it can go downward. So to overcome this situation they have
to be more efficient to utilize their funds.
One of the major findings of this study is the non-performing (NPL) shows an
increasing trend of NBFIs. NPL creates obstacle for the development both for the company and
also for the economy. Selecting the adverse loan was the main reason to increase the non-
https://www.cribfb.com/journal/index.php/amfbr American Finance & Banking Review Vol. 6, No. 1; 2021
7
performing loan. So to reduce the amount they have to be careful in loan distribution and take
proper initiative to collect the existing loans.
In Bangladesh the main sources of generating earning for NBFIs is to provide loans
and investing in capital market. Although in recent time performance of capital market is good
but still it follows a huge fluctuations. So to be more competitive and to compete with banks they
have to identify others options to invest funds and generate more secured income.
CONCLUSION
This study focuses to analyze the efficiency of NBFIs in Bangladesh within the period from 2019
to 2019. For this it has applied different types of performance measurement tools and techniques.
Different types of ratios are used to analyze the performance of NBFIs in Bangladesh. Finally,
based on their performances a rank has been created. This study says that NBFIs in Bangladesh
are doing well for some ratios while for others it has to improve their performance. The main
area where they have to improve is the loan selection. They have to reduce the number of
adverse loan selection. At the same time they have to identify other income generating areas to
be more competitive.
Although there are a lot of obstacle NBFIs has a huge scope to develop themselves.
Bangladesh is moving to a developing country from under developed country and it has become
possible for the economic revolution. So NBFIs can take the advantage of this revolution. For
this they need to build a strong brand image by providing efficient services to their customers. So
in the coming years they have a huge potential to perform. Due to the unavailability of data this
study compiles the results of using only nine NBFIs which is a major limitation of this study. In
future, by incorporating other NBFIs and other financial measure more accurate results can be
created and that is the scope for future research of this study. This study will help the managers
to take more accurate decisions related to their operations and the investors to take their
investment decision in the capital market.
REFERENCES Akber, S. M. (2019). Relationship between profitability and non-performing loan and a
comparative financial performance analysis of shari’ah based banks of Bangladesh.
Indian Journal of Finance and Banking, 3(2), 32-42.
Akber, S. M. & Dey, A. (2020). Evaluation of the financial performance between traditional
private commercial banks and Islamic banks in Bangladesh. International Journal of
Islamic Banking and Finance Research, 4(2), 1-10.
Almumani, M. A. (2014). A comparison of financial performance of Saudi banks. Asian Journal
of Research in Banking and Finance, 4(2), 20-29.
Alsamaree, A. H. (2013). Financial ratios and performance of banks. Journal of Research on
International Business and Management, 3(1), 17-19.
Avkiran, N. (1995). Developing an instrument to measure customer service quality in branch
banking. International Journal of Bank’s marketing, 12(6), 10-18.
https://www.cribfb.com/journal/index.php/amfbr American Finance & Banking Review Vol. 6, No. 1; 2021
8
Besley, S. & Bringham, E.F. (2017). Essentials of managerial finance.14th Edition, South-
Western: Thomson Higher Education.
Diamond, D. D. P. (1983). Bank runs, deposit insurance and liquidity. Journal of political
Economy, 91(3), 41-49.
Elizabeth, D. E. G. (2004). Efficiency customer service and financial performance among
Australian financial institutions. International Journal of Bank Marketing, 22(5), 31-42.
Fukuyama, H. (1995). Measuring efficiency and productivity growth in Japanese Banking: A
nonparametric Approach. Journal of Applied Financial Economics, 3(2), 95-107.
Gitman,L.J., Zutter, C.H., & Smart, S.B. (2020). Principles of managerial finance. 15th Edition,
New York: Pearson PLC.
Madura, J. (2018). Financial institutions and markets, 11th Edition, New York: Pearson PLC.
Miskhin, F. (2019). The economics of money, banking and financial markets. 11th Edition, New
York: Pearson PLC.
Raza, A., & Farhan, M. (2011). A comparison of financial performance in investment banking
sector in Pakistan. International Journal of Business and Social Science, 2(9), 35-45.
Rose, P. (2016). Commercial bank management. 4th Edition. New York: McGraw-Hill.
Tarawneh, M. (2006). A comparison of financial performance in the banking sector: Some
Evidence from Omani Commercial banks. International Research Journal of Finance
and Economics, 3(1), 21-31.
Tandon, D., Chaturvedi, A., & Vidyarthi, H. (2019). Non-performing assets and profitability of
Indian banks: an econometric study. International Journal of Business Competition and
Growth, 6(1), 60-76.
APPENDICES
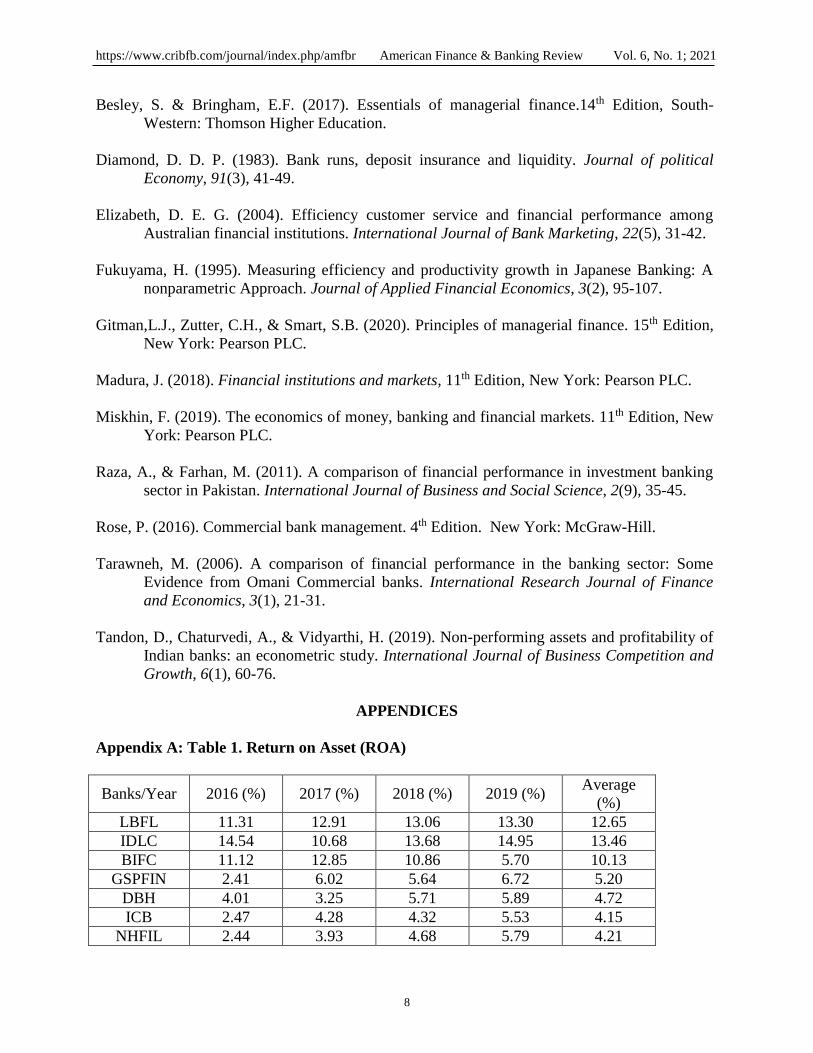
Appendix A: Table 1. Return on Asset (ROA)
Banks/Year 2016 (%) 2017 (%) 2018 (%) 2019 (%) Average
(%)
LBFL 11.31 12.91 13.06 13.30 12.65
IDLC 14.54 10.68 13.68 14.95 13.46
BIFC 11.12 12.85 10.86 5.70 10.13
GSPFIN 2.41 6.02 5.64 6.72 5.20
DBH 4.01 3.25 5.71 5.89 4.72
ICB 2.47 4.28 4.32 5.53 4.15
NHFIL 2.44 3.93 4.68 5.79 4.21
https://www.cribfb.com/journal/index.php/amfbr American Finance & Banking Review Vol. 6, No. 1; 2021
9
PLFSL 2.98 3.77 3.46 4.06 3.57
IPDC 4.96 6.30 6.11 7.30 6.17
Average 6.25 7.11 7.50 7.69 7.14
Source: Annual report of NBFIS’ (2016-2019)
Appendix B: Table 2. Return on Equity (ROE)
Banks/Year 2016 (%) 2017 (%) 2018 (%) 2019 (%) Average
(%)
LBFL 12.29 13.89 14.04 14.28 13.63
IDLC 15.3 11.44 14.44 15.71 14.22
BIFC 12.12 13.85 11.86 6.7 11.13
GSPFIN 3.91 7.52 7.14 8.22 6.70
DBH 5.11 4.35 6.81 6.99 5.82
ICB 3.29 5.1 5.14 6.35 4.97
NHFIL 3.79 5.28 6.03 7.14 5.56
PLFSL 4.04 4.83 4.52 5.12 4.63
IPDC 6.31 7.65 7.46 8.65 7.52
Average 7.35 8.21 8.60 8.80 8.24
Source: Annual report of NBFIS’ (2016-2019)
Appendix C: Table 3. Return on Capital Employed (ROCE)
Banks/Year 2016 (%) 2017 (%) 2018 (%) 2019 (%) Average
(%)
LBFL 14.79 6.39 6.54 7.18 8.73
IDLC 18.02 14.16 17.16 18.83 17.04
BIFC 14.6 16.33 14.34 9.58 13.71
GSPFIN 5.89 9.5 9.12 10.6 8.78
DBH 7.49 6.73 9.19 9.77 8.30
ICB 5.95 7.76 7.8 9.41 7.73
NHFIL 5.92 7.41 8.16 9.67 7.79
PLFSL 6.46 7.25 6.94 7.94 7.15
IPDC 8.44 9.78 9.59 11.18 9.75
Average 9.73 9.48 9.87 10.46 9.89
Source: Annual report of NBFIS’ (2016-2019)
Appendix D: Table 4. Earnings per Share (EPS)
Banks/Year 2016 (%) 2017 (%) 2018 (%) 2019 (%) Trend Average
(%)
LBFL 3.3 3.35 3.5 4.05 22.73 3.55
IDLC 3.54 3.68 3.75 3.95 11.58 3.73
BIFC 2.12 2.85 2.86 3.20 50.94 2.76
GSPFIN 2.41 6.02 5.64 6.72 178.84 5.20
https://www.cribfb.com/journal/index.php/amfbr American Finance & Banking Review Vol. 6, No. 1; 2021
10
DBH 2.51 2.75 3.21 3.39 35.06 2.97
ICB 1.47 1.28 1.32 2.53 72.11 1.65
NHFIL 1.44 1.93 1.68 1.79 24.31 1.71
PLFSL 1.98 1.77 1.46 1.06 -46.46 1.57
IPDC 3.76 3.10 2.91 3.10 -17.55 3.22
Average 2.50 2.97 2.93 3.31 2.93
Source: Annual report of NBFIS’ (2016-2019)
Appendix E: Table 5. Institution Size/ Total Assets
Banks/Year 2016
TK(Million)
2017
TK(Million)
2018
TK(Million)
2019
TK(Million)
Average
Growth
%
Average
TK(Million)
LBFL 5576 5477 6245 6105 9.49 5850.75
IDLC 5719 5521 5599 6068 6.10 5726.75
BIFC 4533 4953 4912 5295 16.81 4923.25
GSPFIN 5709 5511 5589 6058 6.11 5716.75
DBH 2915 3032 4414 4537 55.64 3724.50
ICB 33624 4004 4458 4604 27.04 4172.50
NHFIL 2324 2327 2739 2990 28.66 2595.00
PLFSL 2647 3050 2847 2328 -12.05 2718.00
IPDC 2446 2462 2464 2467 2459.75
Source: Annual report of NBFIS’ (2016-2019)
Appendix F: Table 6. Institution Size/ Total Owners’ Equity
Banks/Year 2016
TK(Million)
2017
TK(Million)
2018
TK(Million)
2019
TK(Million)
Average
growth % Average
TK
(Million)
LBFL 1337 1310 1435 1490 11.44 1393.00
IDLC 1260 1303 1289 1343 6.59 1298.75
BIFC 1287 1326 1266 1240 -3.65 1279.75
GSPFIN 993 1115 1289 1059 6.65 1114.00
DBH 1098 1112 1250 1257 14.48 1179.25
ICB 1633 1767 1947 2039 24.86 1846.50
NHFIL 1023 1202 1252 1273 24.44 1187.50
PLFSL 1152 1086 1226 1043 -9.46 1126.75
IPDC 1324 1342 1319 1315 -0.68 1325.00
Source: Annual report of NBFIS’ (2016-2019)
Appendix G: Table 7. Current Ratio
Banks/Year 2016 (%) 2017 (%) 2018 (%) 2019 (%) Average(Times)
LBFL 11.75 16.50 11.95 10.83 12.76
IDLC 11.33 12.30 12.62 13.45 12.43
https://www.cribfb.com/journal/index.php/amfbr American Finance & Banking Review Vol. 6, No. 1; 2021
11
BIFC 1.53 1.58 1.50 1.73 1.59
GSPFIN 2.48 2.55 2.50 2.61 2.54
DBH 19.93 13.80 5.71 3.78 10.81
ICB 1.31 2.85 2.85 3.10 2.53
NHFIL 7.95 10.88 7.57 8.73 8.78
PLFSL 2.93 2.85 2.82 3.07 2.92
IPDC 12.93 13.59 16.67 16.82 15.00
Average 8.02 8.54 7.13 7.12 7.70
Source: Annual report of NBFIS’ (2016-2019)
Appendix H: Table 8. Capital Ratio
Banks/Year 2016 (%) 2017 (%) 2018 (%) 2019 (%) Average(Times)
LBFL 9.74 18.45 33.99 30.00 23.05
IDLC 11.50 12.24 9.70 54.76 22.05
BIFC 35.57 35.65 30.77 29.17 32.79
GSPFIN 23.73 27.46 30.86 23.53 26.40
DBH 56.42 71.54 77.92 75.47 70.34
ICB 50.76 46.33 45.80 46.45 47.34
NHFIL 57.92 57.63 56.30 56.77 57.16
PLFSL 43.99 41.05 43.84 44.32 43.30
IPDC 60.91 59.50 59.20 58.40 59.50
Average 38.95 41.09 43.15 46.54 42.43
Source: Annual report of NBFIS’ (2016-2019)
Appendix I: Table 9. Non-Preforming loan
Banks/Year 2016
TK(Million)
2017
TK(Million)
2018
TK(Million)
2019
TK(Million)
Average
TK(Million)
LBFL 140 158 185 184 166.75
IDLC 127 115 188 150 145.00
BIFC 98 116 114 118 111.50
GSPFIN 95 98 102 106 100.25
DBH 86 88 92 98 91.00
ICB 130 138 144 151 140.75
NHFIL 95 102 108 116 105.25
PLFSL 187 206 202 198 198.25
IPDC 84 86 89 94 88.25
Average 116.00 123.00 136.00 135.00 127.00
Source: Annual report of NBFIS’ (2016-2019)
Appendix J: Table 10: Interest Coverage Ratio
Banks/Year 2016 (%) 2017 (%) 2018 (%) 2019 (%) Average(Times)
LBFL 1.85 1.97 2.28 2.39 2.12
https://www.cribfb.com/journal/index.php/amfbr American Finance & Banking Review Vol. 6, No. 1; 2021
12
IDLC 1.41 1.39 1.68 1.94 1.61
BIFC 1.58 2.01 1.73 1.89 1.80
GSPFIN 1.01 1.26 1.55 0.55 1.09
DBH 1.13 1.25 1.39 1.48 1.31
ICB 1.42 1.60 1.94 1.86 1.71
NHFIL 1.67 1.74 1.05 1.06 1.38
PLFSL 1.79 1.84 1.32 1.28 1.56
IPDC 1.87 2.89 2.95 3.14 2.71
Average 1.53 1.77 1.77 1.73 1.70
Source: Annual report of NBFIS’ (2016-2019)
Appendix K: Table 11: Ranks of Investment Banks Based on Financial Performance
Performance
Indicators
Investment Banks
LBFL IDLC BIFC GSPFIN DBH ICB NHFIL PLFSL IPDC
Financial Measures
ROA 2 1 3 5 6 8 7 9 3
ROE 2 1 3 5 6 8 7 9 4
ROCE 4 1 2 3 5 7 6 8 9
EPS 3 2 6 1 5 8 7 9 4
Total Assets 2 3 5 4 4 1 8 7 9
Total Equity 2 4 5 9 7 1 6 8 3
Current
ratio
2 3 9 7 4 8 5 6 1
Capital
Ratio
8 9 6 7 1 4 3 5 2
NPL 8 7 5 3 2 6 4 9 1
Interest
Coverage
2 5 3 9 8 4 7 6 1
Source: Authors Own Contribution
Appendix L: Table 12: Samples used in the study
SL. Symbol Full Name
1 LBFL LankaBangla Finance Ltd.
2 IDLC IDLC Finance Ltd.
3 BIFC Bangladesh Industrial Fin. Co. Ltd.
4 GSPFIN GSP Finance Company (Bangladesh) limited
5 DBH Delat Brac Housing Finance Corp. Ltd.
6 ICB Investment Corporation of Bangladesh
7 NHFIL National Housing Fin. and Inv. Ltd.
8 PLFSL Peoples Leasing and Fin. Services Ltd.
9 IPDC IPDC Finance Limited.
https://www.cribfb.com/journal/index.php/amfbr American Finance & Banking Review Vol. 6, No. 1; 2021
13
AUTHOR CONTRIBUTIONS
Conceptualization: S. M. Akber, Dhiman Barua
Data curation: S. M. Akber, Dhiman Barua
Formal analysis: S. M. Akber
Funding Acquisition: S. M. Akber, Dhiman Barua
Project Administration: S. M. Akber
Software: S. M. Akber
Validation: S. M. Akber, Dhiman Barua
Writing – Original Draft: S. M. Akber, Dhiman Barua
Writing – Review & Editing: S. M. Akber, Dhiman Barua
CONFLICT OF INTEREST STATEMENT
The authors declare that they have no competing interests.
COPYRIGHTS
Copyright for this article is retained by the author(s), with first publication rights granted to the
journal. This is an open-access article distributed under the terms and conditions of the Creative
Commons Attribution license (https://creativecommons.org/licenses/by/4.0).