
A Comparative Financial Performance of Selected Public And ...
11
Parikalpana - KIIT Journal of Management 154 155 Thomas, R. J. (2001). Cultural Diversity at Work: The Effects of Diversity Perspectives on Work Group Processes and Outcomes. Administrative science Cornell university, 229-273. Torsten Biemann, 1. a. (2010). Size Does Matter: How Varying Group Sizes in a Sample Affect the Most Common Measures of Group Diversity. Organizational Research Methods 13(3), 582-599. A Comparative Financial Performance of Selected Public And Private Sector Banks in India Sagarika Mohanty [email protected] Ph.D. Scholar, KIIT School of Management KIIT University, Bhubaneswar, India DoI: 10.23862/kiit-parikalpana/2021/v17/i2/210548 Valentine, s. H. (1999). Team innovation and perceptions of consideration what difference does diversity make? Small group research, vol. 30 no. 6, December 1999, 730-750. Van Knippenberg, D. &. (2007). Work group diversity. Annual Review of Psychology, 515–41. Vegt, G. S. (2001). Journal of Management 2003 29 729–751, 729. Abstract: Banks are played significant role in the development of economic condition of the country. The main of the research is to analyze the financial health of selected public and private sector banks in India. The financial performance of banks is analyzed by taking 5years data from 2016-17 to 2020-21. The study is based on using key financial parameters, selected profitability ratios, Liquidity ratios and Asset’s quality ratios of banks. For comparative analysis the T-test, mean value and Graphs are used. The descriptive statistics (T-Test) indicates that there is significance difference between overall performance of selected banks in India by analyzing key performance parameters from 2016- 17 to 2020-21. Hence, from the study it is cleared that IOB has good liquidity position over the last 5 years as compare to liquidity ratio except CD% and CAR%. Thus, from the overall comparative analysis of performances of both the selected bank, it observed that ICICI Bank has better performance as compare to IOB over the research period. Keywords: Financial performance, public bank, Private Bank, Financial parameters, Profitability ratios, Liquidity ratios, Asset Quality ratios. 1. INTRODUCTION: Banking industry is one of the key financial players of the country. Banks are played significant role in the development of economic condition of the country. It generally performs various financial related roles. But the prime one is encourage saving habits of the people by deposited their surplus money into bank and it also provide good return in the form of interest to their customers. Banks generally uses their deposits into different investment and gets handsome return on their investment. Or we can say that it channelizes the saving funds into investment. The second prime role is it also rendering facility to their customer to withdrawn their money when they required. Besides, these roles banks also provide numerous facilities to their customers for their growth and development. Thus, in this Parikalpana - KIIT Journal of Management [Vol. 17 (II), Dec. 2021]
-
Upload
khangminh22 -
Category
Documents
-
view
0 -
download
0
Transcript of A Comparative Financial Performance of Selected Public And ...

Parikalpana - KIIT Journal of Management154 155
Thomas, R. J. (2001). Cultural Diversity at Work: The Effects of Diversity Perspectives on Work Group Processes and Outcomes. Administrative science Cornell university, 229-273.
Torsten Biemann, 1. a. (2010). Size Does Matter: How Varying Group Sizes in a Sample Affect the Most Common Measures of Group Diversity. Organizational Research Methods 13(3), 582-599.
A Comparative Financial Performance of Selected Public And Private Sector Banks in India
Sagarika [email protected]
Ph.D. Scholar, KIIT School of ManagementKIIT University, Bhubaneswar, India
DoI: 10.23862/kiit-parikalpana/2021/v17/i2/210548
Valentine, s. H. (1999). Team innovation and perceptions of consideration what difference does diversity make? Small group research, vol. 30 no. 6, December 1999, 730-750.
Van Knippenberg, D. &. (2007). Work group diversity. Annual Review of Psychology, 515–41. Vegt, G. S. (2001). Journal of Management 2003 29 729–751, 729. Abstract:
Banks are played significant role in the development of economic condition of the country. The main of the research is to analyze the financial health of selected public and private sector banks in India. The financial performance of banks is analyzed by taking 5years data from 2016-17 to 2020-21. The study is based on using key financial parameters, selected profitability ratios, Liquidity ratios and Asset’s quality ratios of banks. For comparative analysis the T-test, mean value and Graphs are used. The descriptive statistics (T-Test) indicates that there is significance difference between overall performance of selected banks in India by analyzing key performance parameters from 2016-17 to 2020-21. Hence, from the study it is cleared that IOB has good liquidity position over the last 5 years as compare to liquidity ratio except CD% and CAR%. Thus, from the overall comparative analysis of performances of both the selected bank, it observed that ICICI Bank has better performance as compare to IOB over the research period.
Keywords: Financial performance, public bank, Private Bank, Financial parameters, Profitability ratios, Liquidity ratios, Asset Quality ratios.
1. INTRODUCTION:
Banking industry is one of the key financial players of the country. Banks are played significant role in the development of economic condition of the country. It generally performs various financial related roles. But the prime one is encourage saving habits of the people by deposited their surplus money into bank and it also provide good return in the form of interest
to their customers. Banks generally uses their deposits into different investment and gets handsome return on their investment. Or we can say that it channelizes the saving funds into investment. The second prime role is it also rendering facility to their customer to withdrawn their money when they required. Besides, these roles banks also provide numerous facilities to their customers for their growth and development. Thus, in this
Parikalpana - KIIT Journal of Management [Vol. 17 (II), Dec. 2021]

Parikalpana - KIIT Journal of Management156 157
sense, we can consider that BANK as the backbone of the country.
In India, both public sector banks and private sectors banks are key parameters for the economic development of the country. Here I am going to discuss two banks’ performances by taking selected ratios. The two banks are ICICI Bank (Industrial and Credit Investment Corporation of India) and Indian Overseas Bank (IOB).
ICICI Banks: The second leading Private Sector Bank in India is ICICI Bank. It is a chief private sector bank in India. It was established in the year 1955.It offers no. of financial facilities
compare to HDFC Bank. Hence, the study concluded that according to the financial performance, HDFC Bank is first one followed by ICICI Bank.
Kapil K Dave (2016) the comparative study of NPA of public and private sector banks have concluded that each bank has its own independence credit rating agency which should evaluate the financial capacity of the borrower before given them credit facilities. NPA can be considered as a crucial rating factor for any bank; it should regularly evaluate the financial condition of their clients.
Jyothirmoy Koley (2019) has done the analysis of financial position and performance of public and private sector banks in India: A comparative study on SBI and HDFC Bank. She has used CAMEL Model with T-test. According to her study it found that HDFC Bank is quite better than SBI on the basis of profitability position, liquidity condition and management efficiency.
Al-Kaseasbah, (2018) Analyzed and compared SBI and ICICI bank’s financial Performance. He took data from the year 2012 to 2016. Financial ratios analyzed and hypothesis testing were also conducted, and it was concluded that the SBI registered good financial results as compare to ICICI Bank in India.
Ch. Balaji and Dr.G. Praveen Kumar (2017) discussed about the financial performances of 5 selected public banks and 5 selected private banks in India. They analyzed the data from the period
2011-12 to 2015-16. They used T-test, mean as tools of analysis and compare the financial performance of selected commercial banks. After analysis the study demonstrated that the selected private banks’ financial growth is more as compare to selected public sector banks.
Vijayalakshmi, Janani J.P. (2021)used CAMELS Model to assess the Profitability and Liquidity positions of BOB and HDFC Bank from 2015 to 2020.The comparative analysis of financial performance of both the selected banks shown that HDFC have better financial status as compare to BOB .
Puja Agarwal (2019) analyzed the public and private banks profitability condition. She has taken 4 major profitability ratios such as ROE, ROA, NIM, Operating Profits and also compare CGR of public and private sector banks. She used independent t-test for her study. According to her study, it concluded that Private banks has better profitability condition as compare to public banks.
Nimalathasan (2008) has done a comparative study of financial performance of banking sector in Bangladesh. He used CAMELS model for his study. He took data from 1999-2006.According to his study it found that 3 banks were 01 rated Strong, 31 banks rated Satisfactory, Fair rated by 7 banks, 5 banks were rated Marginal and 2 banks got Unsatisfactory rating.
Anurag. B. Singh, Priyanka Tondon (2012,) discussed a Study of Financial Performance: A Comparative Analysis
to their customers. The main objective of this bank is to create development financial institutions for rendering both long term and medium-term project financing to their customers. The customers are both corporate and retail customers.
Indian Overseas Bank (IOB): It is the second most- valued listed Public Sector Bank in India. It is also a Nationalized bank of India. It has created numerous milestones in Indian Banking Sector. It was founded in 1937 with twin objectives of facilitating overseas banking and specializing in foreign exchange business.
A brief Information about ICICI bank and IOB in India:
Sl No. Basis ICICI Bank Indian Overseas Bank (IOB)
1. Nature Private Bank in India Nationalized Public Bank in India2. Products Banking, commodities,
credit card, equities trading, insurance, investment banking, wealth management, assets management, risk management.
Banking, Loans, credit cards, sav-ing, investment banking etc.
3. No. of location 5,888 35574. No. of employees 97,354 (2020) 23579 (2021)
5. Subsidiaries ICICI PrudentialICICI LombardICICI SecuritiesICICI Direct
IOB, Singapore BranchIOB, Hong Kong BranchIOB, Asset Management ArmIOB, Bangkok Branch
2. REVIEW OF LITERATURE:
Srinivas and Sarojia (2013) have done the study of Comparative financial performance of HDFC Bank and ICICI Bank. They used CAMEL Model with
t-test for comparative study. As per the study they concluded that there is no significance difference between the ICICI Bank and HDFC Bank’s financial performance. But ICICI Bank has slightly less performance as
A Comparative Financial Performance of Selected Public And Private Sector Banks in India
Parikalpana - KIIT Journal of Management158 159
Of SBI and ICICI Bank. They applied Ratio Analysis and CGR method for analyzed banking profitability. According to the comparison it deployed that SBI present sound financial performance but context of Deposits and Expenditures, ICICI banks has better managing efficiency than SBI.
3. RESEARCH DESIGN OF THE STUDY:
3.1. SCOPE OF THE STUDY:
The scope of the study is comparative performance analysis of selected 1 Public Sector Bank and Private Sector Bank in India only from the duration of 2016-17 to 2020-21.
3.2. OBJECTIVES OF THE STUDY:
• To generate idea on financial performance of selected banks in India.
• To study the selected financial ratios of banks.
• To study the comparative financial performance of selected banks.
• To study the significance financial performance of selected banks in the context of profitability, Liquidity and Asset Quality.
4. METHODOLOGY OF THE STUDY:
4.1. SOURCES OF DATA:
The present study is based on secondary data. These data have been collected from different sources such as:
• Annual reports of ICICI Bank and Indian Overseas Bank.
• Press release report of ICICI Bank and Indian Overseas Bank.
• And related subject matter and related website of selected public and private sector bank in India.
4.2. PERIOD OF STUDY:
The study covers the period of 5 years from 2016-17 to 2020-21.
4.3. SAMPLE DESIGN:
The public and private sector bank for the study were selected based on convenience sampling method. 1 Public Sector and 1 Private Sector Banks in India were taken for the study on the basis of their performance. The following are the selected sample banks:
A. Public sector bank: Indian Overseas Bank (IOB)
B. Private sector bank: ICICI Bank (Industrial and Credit Investment Corporation of India)
4.4. HYPOTHESIS:
From the above objectives, following hypothesis are formulated to test the financial performance of selected banks in India.
Ho-There is no significance difference between financial performance of ICICI Bank and IOB Bank
H1- There is significance difference between financial performance of ICICI Bank and IOB Bank.
4.5. STATISTICAL TOOLS USED:
• Mean has been calculated to know the average financial performance and to know the stability in the performance of the selected banks.
• Comparison also done by Graphical presentation of all the selected key parameters of selected banks.
• T-test also used for analysis the significance performance of the selected banks in the basis of Profitability, Liquidity and Asset Quality Ratio.
• T-test used with the help of SPSS-26.
5. DATA ANALYSIS AND INTERPRETATION:
The following data is analyzed on the basis of:
Table-1- Contents Total deposits, Total Investment, Total Advances
Table-2- Contents Total Income, Total Expenses, Net Profit
Table-3- Contents Profitability Ratios. Such as Net Interest Margin%, Net Profit Margin %, ROE%, ROA%.
Table-4- Contents Liquidity Ratios. Such as CAR %, CASA%, Current Ratio%, Credit to Deposits Ratio%
Table-5- Contents Asset Quality Ratios. Such as Gross NPA% and Net NPA %
Table-6-Contents Descriptive Statistics of Profitability Ratios.
Table-7- Contents Descriptive Statistics of Liquidity Ratios.
Table-8- Contents Descriptive Statistics of Asset Quality Ratios.
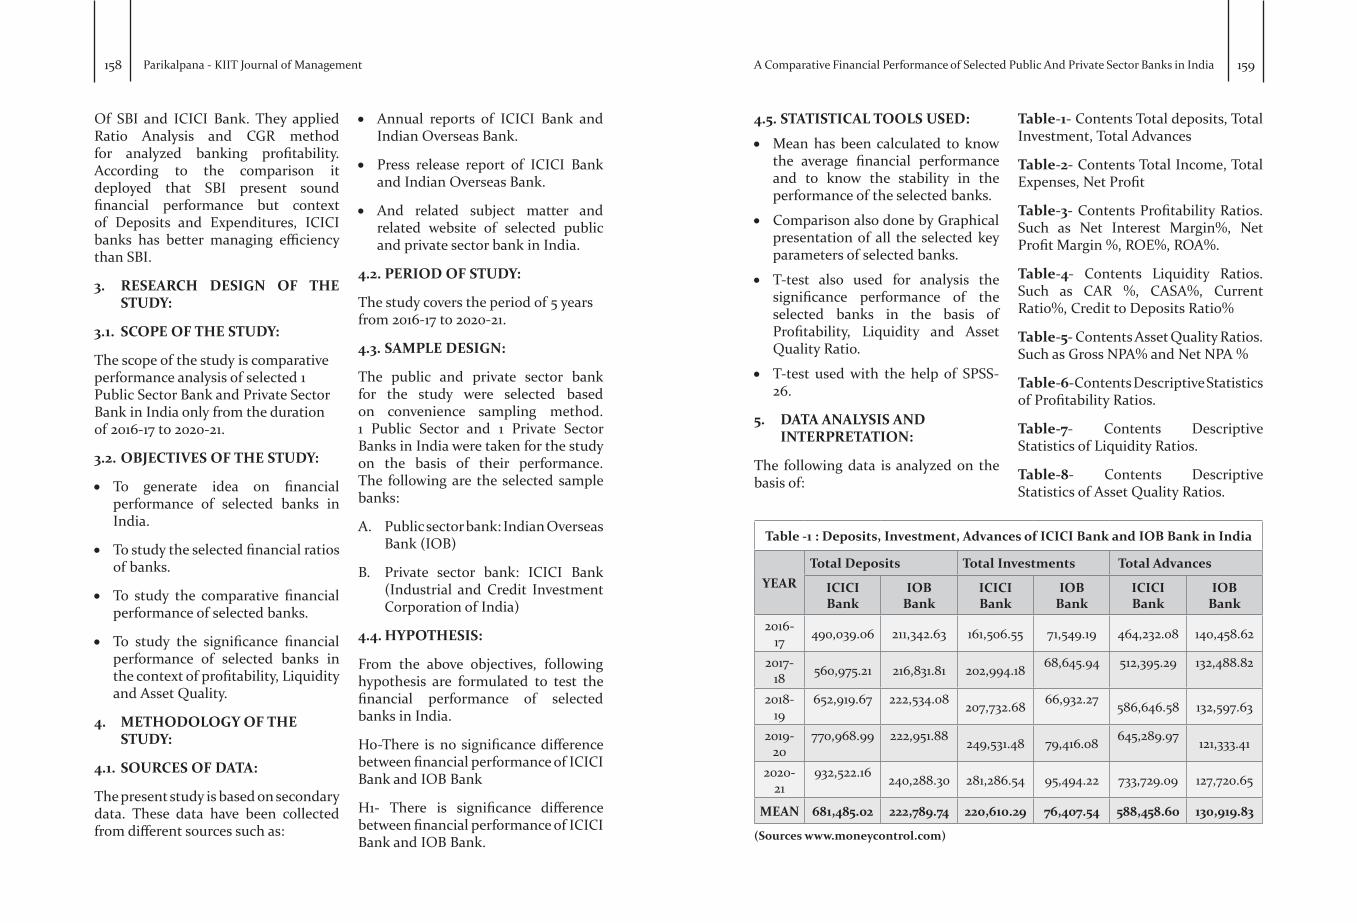
Table -1 : Deposits, Investment, Advances of ICICI Bank and IOB Bank in India
YEARTotal Deposits Total Investments Total Advances
ICICI Bank
IOB Bank
ICICI Bank
IOB Bank
ICICI Bank
IOB Bank
2016-17 490,039.06 211,342.63 161,506.55 71,549.19 464,232.08 140,458.62
2017-18 560,975.21 216,831.81 202,994.18 68,645.94 512,395.29 132,488.82
2018-19
652,919.67 222,534.08 207,732.68 66,932.27 586,646.58 132,597.63
2019-20
770,968.99 222,951.88 249,531.48 79,416.08 645,289.97 121,333.41
2020-21
932,522.16 240,288.30 281,286.54 95,494.22 733,729.09 127,720.65
MEAN 681,485.02 222,789.74 220,610.29 76,407.54 588,458.60 130,919.83
(Sources www.moneycontrol.com)
A Comparative Financial Performance of Selected Public And Private Sector Banks in India

Parikalpana - KIIT Journal of Management160 161
INTERPRETATION:
The above Table and Diagram showing the data related to Total Deposits, Total Investments and Total Advances of ICICI Bank and IOB Bank in India from the year 2016-17 to 2020 2021. The Total Deposit of Mean value of ICICI
Bank is Rs. 681,485.02 Cr. and Mean value of IOB Bank is Rs. 222,789.74 Cr. The Total Investment of Mean value of ICICI Bank is Rs. 220,610.29 Cr. and IOB Bank is Rs. 76,407.54 Cr. The Total Advances of Mean value of ICICI Bank is Rs. 588,458.60 Cr. And IOB Bank is Rs. 130,919.83 Cr.
Table -2 : Total Income, Total Expenses, Net Profit
YEARTotal Income Total Expenses Net Profit
ICICI Bank
IOB Bank
ICICI Bank
IOB Bank
ICICI Bank
IOB Bank
2016-17 73,660.76 23,091.23 63,859.67 26,507.97 9,801.09 -3,416.742017-18 72,385.52 21,661.65 65,608.10 27,961.15 6,777.42 -6,299.502018-19 77,913.36 21,837.58 74,550.05 25,575.46 3,363.30 -3,737.88
2019-20 91,246.94 20,765.79 83,316.13 29,293.19 7,930.81 -8,527.40
2020-21 98,086.80 22,524.55 81,894.11 21,693.08 16,192.68 831.47MEAN 82658.68 21976.16 73845.61 26206.17 8813.06 -4230.01
(Sources www.moneycontrol.com)
DIAGRAM 1:
INTERPRETATION:
• From the above diagram, it states that the Total Deposits of ICICI Bank have increased over the year at increasing rate. But the Deposits of IOB have increased initially, then decreased in the year 2019-20 with the amount of Rs. 417.80 Cr. as compare to previous year. After that it has increased again in the year 2021 with the amount of Rs. 240,288.30 Cr. According to the study it found that Mean value is high in ICICI Bank with Rs. 681,485.02 Cr. followed by IOB Bank i.e., Rs. 222,789.74 Cr.
• As compare to the Total Investment of both the ICICI Bank and IOB Bank, the data pointed that the Total Investments of both the bank have
increased gradually over the 5 years. The total investment of ICICI Bank is high in the year 2019-20 with the amount Rs. 281286.54 Cr. The IOB has highest investment in the year 2020-21 i.e., Rs. 95494.22 Cr. The average investment is high in case of ICICI Bank as compare to IOB bank.
• According to the analysis, it also found that ICICI Bank increased their Advances every year around Rs. 1 Cr. But IBO have shown different scenario here. Firstly, IOB Advances have increased then decreased from the year 2017 to 2020. During the COVID period it again started rising with the amount of Rs.6387.24 Cr. The mean value showing more i.e., Rs. 457,538.77 Cr. in ICICI Bank as compare to IOB.
INTERPRETATION:
The above schedule showing the data of Total Income, Total Expenses and Net Profit of ICICI Bank and IOB bank in India from the year 2016 to 2021. According to the study Mean Income of ICICI is Rs. 82658.68 Cr. And IOB
having Rs. 21976.16 Cr. The Mean value of Total Expenses ad Net profit of ICICI Bank over the 5 years are Rs. 73845.61 Cr. And Rs. 8813.06 Cr. respectively. IOB having Mean value of Total Expenses Rs. 26206.17 Cr. and the Net Loss is Rs. 4230.01 Cr.
DIAGRAM 2:
INTERPRETATION:
• The above chat showing the Total income of ICICI Bank and IOB Bank in India. As we can see that initially Total Income of ICICI Bank have increased, then decreased in the year 2017-18. From the year 2018 to 2021 it showing increasing figures in
Cr. IOB also showing same scenario over the period. According to the data IOB has showing less mean value i.e., Rs.21976.16 Cr.as compare to ICICI Bank over the last 5 years.
• In ICICI Bank Total expenses was less in the year 2016-17 i.e., Rs. 63859.67 Cr. and more in the year
A Comparative Financial Performance of Selected Public And Private Sector Banks in India

Parikalpana - KIIT Journal of Management162 163
2019-20 during the 5 years period. As per the data total expenses increased during first 4 years and then decreased again in the year 2020-21 by Rs. 81894.11 Cr. But in case of IOB, total expenses have fluctuated during the last 5 years. Here IBO having less expenses in the year 2020-21 with the amount Rs.21693.08 Cr. and more expenses in the year 2019-20 with the amount of Rs.2929319. According to the data it found that the total expenses have lowest figures in IOB Bank followed by ICICI Bank.
• From the above diagram it specified that The Net Profit of both the private and public sector banks have fluctuated during the research
period.Net profit of ICICI Bank during the research period showing positive figures. In ICICI Bank highest net profit is showing in the year 2020-21 with Rs. 16192.68 Cr. and lowest one is in the year 2018-19 with the amount Rs. 3363.30 Cr. Whereas IOB is showing negative figures of Net Profit during the research period except previous financial year. During the year 2019-20, IOB having Net loss of Rs. 8527.40 Cr. and in the year 2020-21, it is showing Net profit with Rs.831.47 Cr. According to the study it found that ICICI Bank having positive Mean of Net profit with Rs. 8813.06 Cr. and IOB having Negative Mean of Net profit with Rs. 4230.04 Cr. (Sources www.moneycontrol.com)
2. NET PROFIT MARGIN %:It is another profitability ratio of banking sector. The Net margin indicates how much Net Income a bank makes with Total Sales achieved. It can be calculated by following Formula:
NET PROFIT MARGIN % =
3. RETURN ON EQUITY (ROE) %:
It is another important measure of profitability of banking sectors. It is measured for creating profits for the banks by using its assets. Stakeholders generally used this ratio for taking their investing decisions i.e., whether to invest or not in Banks. It can be calculated by following Formula:
ROE %=
4. RETURN ON ASSETS %:
It is another important ratio for banking sector which determines how profitable the bank is relative to its Total assets. It can be calculated by following Formula:
Return on Assets = Table -3 : Profitability ratio
YEAR
1.Net Interest Margin%
Net profit margin %
Return On Equity (ROE)/Net Worth %
Return On Assets (ROA)
%ICICI Bank
IOB Bank
ICICI Bank
IOB Bank
ICICI Bank
IOB Bank
ICICI Bank
IOB Bank
2016-17 2.81 2.09 18.09 -17.32 10.11 -29.50 1.26 -1.382017-18 2.61 2.20 12.33 -35.16 6.63 -47.45 0.77 -2.542018-19 2.08 2.11 5.30 -21.20 3.19 -22.84 0.34 -1.492019-20 3.02 2.03 10.60 -48.99 6.99 -52.78 0.72 -3.272020-21 3.16 2.15 20.46 4.90 11.21 4.90 1.31 0.30MEAN 2.7360 2.1160 13.356 -23.554 7.626 -29.534 0.88 -1.676
1. Net Interest Margin%:It is a profitability Indicator which calculates the rate of net interest income on a Bank’s interest earning assets.
NIM=
DIAGRAM 3:
INTERPRETATION:
• From the above diagram, it is observed that both the banks i.e., ICICI Bank and IOB bank is showing positive Net Interest margin %
during the research period. Whereas IOB’S NIM have fluctuated during the study period. But in ICICI Bank, initially NIM has decreased from 2016-17 to 2018-19. After the period
A Comparative Financial Performance of Selected Public And Private Sector Banks in India

Parikalpana - KIIT Journal of Management164 165
2019-20 it started increasing. As per the study the Mean value of Net Interest Margin is high in case of ICICI Bank as compare to IOB.
• As per the study it found that in ICICI Bank Net Profit Margin initially decreased. From the period 2018-19, it started increasing with positive %. But in IOB, Net Profit Margin have fluctuated with negative figures except in the year 2020-21, it is showing positive figures with 4.9 % during the research period. According to the study it also observed that in Mean value comparison, ICICI Bank is showing highest % i.e., 13.356 % as compare to IOB, which is showing -23.554.
• The above diagram denoting the Return on Equity % of both the selected public and private sector bank in India. From the diagram it is observed that The ROE % of ICICI Bank initially decreased. From the period 2018-19, it started increasing
with positive %. But in IOB, ROE% have fluctuated with negative figures except in the year 2020-21, it is showing positive figures with 4.9 % during the research period. According to the study it observed that in Mean value comparison, ICICI Bank is showing highest positive % i.e., 7.626 % as compare to IOB, which is showing -29.534% of ROE.
• From the above diagram it also is observed that The ROA % of ICICI Bank initially decreased. From the period 2018-19, it started increasing with positive %. But in IOB, ROA% have fluctuated with negative figures except in the year 2020-21, it is showing positive figures with 0.3 % during the research period. According to the study it also observed that in Mean value comparison, ICICI Bank is showing highest positive % i.e., 0.88 % as compare to IOB, which is showing -1.676 of ROA.
1. CAR RATIO:
This ratio is used by banks to determine how much adequate capital maintained by each bank against its Risk Weighted Assets. It can be calculated by following formula:
CAR Ratio =
2. CASA RATIO:
Current Account and Saving Account (CASA) Ratio is determined the liquidity position of the banking sector. It is used to determined how much deposit is kept by the bank in the form of current account and saving account. It can be calculated by following Formula:
CASA Ratio % =
3. CURRENT RATIO:
In banking sector, another liquidity ratio is Current Ratio. It measures the ability of banks to meet its short-term dues or obligation with respect to its current assets. It can be computed by the following Formula:
Current Ratio=
4. CREDIT TO DEPOSIT RATIO (CD) %:
It is an indicator of banks that helpful to know how much a bank has borrowed with relation to its deposits. Higher CD Ratio is showing better earning capacities of bank and vice-versa. It can be calculated by following Formula:
CD %=Table -4 : Liquidity ratio in %
YEAR CAR % Current Ratio
(CR) % CASA % Credit to Deposit Ratio %
ICICI Bank
IOB Bank
ICICI Bank
IOB Bank
ICICI Bank
IOB Bank
ICICI Bank
IOB Bank
2016-17 17.39 11.00 1.83 1.48 36.08 50.36 94.73 63.5
2017-18 18.42 9.00 2.38 2.01 36.74 51.68 91.34 61.1
2018-19 16.89 10.00 2.16 3.27 38.29 49.61 89.85 59.59
2019-20 16.11 11.00 1.58 2.02 40.25 45.11 83.7 54.42
2020-21 19.12 15.32 1.25 1.30 42.51 46.28 78.68 53.15
MEAN 17.5860 11.2640 1.84 2.016 38.774 48.608 87.66 58.352
(Sources www.moneycontrol.com)
DIAGRAM 4:
A Comparative Financial Performance of Selected Public And Private Sector Banks in India

Parikalpana - KIIT Journal of Management166 167
INTERPRETATION:
• From the above diagram, it found that CAR% of ICICI Bank initially decreased at decreasing rate from the period 2016-17 to 2019-20. Whereas IOB Bank have fluctuated over the last 5 years. Mean Value is showing high in ICICI Bank with 17.5860% as compare to IOB bank which showing 11.2640%.
• From the above diagram, it is found that CASA % of IOB Bank have fluctuated over the last 5 years. Whereas ICICI Bank have increased CASA% over the study period. According to the comparison of CASA% both the banks, it is found that IOB has highest Mean of CASA% with 48.608%, which is 9.834% more than Mean CASA% of ICICI Bank.
• The above diagram also presenting Current Ratio of both the banks. i.e., ICICI Bank and IOB Bank. From the chat it is observed that the CR % of IOB is varying but in case of ICICI Bank it was fluctuated initially from the period 2016-17 to 2018-19. From the period 2018-19, ICICI Bank started decreasing. According to the comparison, mean value is higher in IOB Bank with 2.016 % as compare to ICICI bank which is showing 1.84%.
• From the above diagram, it found that the CD% OF ICICI Bank have decreased over the study period. In the year 2016-17, the CD% is showing highest % in IOB bank. After this year in IOB, the CD% is also started declining. According to the Average comparison, it observed that ICICI bank having highest CD% i.e., 86.66% as compare to IOB i.e., 58.352% over the study period.
I. Gross Non-Performing Assets (NPA) %:
Gross NPAs are the sum total of all loan assets that are classified as NPAs as per RBI guidelines as on balance sheet date. It consists of all Non-Standard assets like as sub-standard, doubtful and loss assets. It can be calculated with the help of following Formula:
Gross NPAs Ratio % =
II. Net Non-Performing Assets (NPA) %:
Net NPAs are those type of NPAs in which the bank has deducted the provision for uncertain and unpaid debts.Net NPA is obtained by reducing the provision from gross NPAs and show the actual burden of banks. It can be calculated by following Formula:
Net NPAs % = Gross NPAs-Provision on Gross Advances
IV. ASSET QUALITY RATIO:
Table -5 : Asset Quality Ratio%
YEAR Gross NPA % Net NPA %
ICICI Bank IOB Bank ICICI Bank IOB Bank
2016-17 7.89 11.69 4.89 13.99
2017-18 8.84 14.78 4.77 15.33
2018-19 6.70 21.97 2.06 10.81
2019-20 5.53 25.28 1.41 5.44
2020-21 4.96 22.39 1.14 3.58
MEAN 6.784 19.222 2.854 9.83
(Sources www.moneycontrol.com)
DIAGRAM 5:
• The above diagram showing Gross NPAs% of both the banks. i.e., ICICI Bank and IOB Bank. From the chat it is observed that the Gross NPAs% of IOB Bank have f luctuated. But in case of ICICI Bank, it was f luctuated initially from the period 2016-17 to 2018-19. After this period, ICICI Bank started decreasing. According to the comparison, mean value is higher in IOB Bank which is 12.438% more as compare to ICICI bank
• The above diagram also presenting the Net NPA% of both the banks i.e., ICICI Bank and IOB Bank. From the chat it found that the Net NPA% of ICICI Bank have decreased over the study period. In the year 2017-18, the Net NPA% is showing highest % in IOB bank i.e., 15.33%. After this year in IOB, the Net NPA% is also started declining. According to the Average comparison of Net NPA%, it observed that IOB bank having highest % i.e., 9.83% as compare to ICICI Bank i.e., 2.845% over the study period.
A Comparative Financial Performance of Selected Public And Private Sector Banks in India

Parikalpana - KIIT Journal of Management168 169
SIGNIFICANCE TEST OF FINANCIAL PERFORMANCE OF ICICI AND IOB BANK:
TABLE-6 : Descriptive Statistics of Profitability Ratios:
• H0-There is no significant difference between profitability ratios of ICICI Bank and IOB Bank.
• H1- There is significant difference between profitability ratios of ICICI Bank and IOB Bank
Profitability Ratios Banks Mean SD Sig.
Value df t-value
1. Net Interest Margin%
ICICI 2.7360 0.421940.029 4.183 3.249
IOB 2.1160 0.06387
2. Net Profit Margin%
ICICI 13.356 6.050310.013 4.1710 3.910
IOB -23.554 20.22204
3. ROE%ICICI 7.626 3.16583
0.021 4.153 3.599IOB -29.534 22.86849
4. ROA%ICICI 0.88 O.40577
0.004 8 4.048IOB -1.676 1.35223
INTERPRETATION:
• Net Interest Margin%: From the table, it is evident that the t (4.183) =3.249, p=0.029 (<0.05) which reject the H0 and accept H1. Thus, there is a significant difference between Net Interest Margin of ICICI Bank and IOB Bank.
• NET PROFIT MARGIN %: From the table, it is evident that the t (4.1710) =3.910, p=0.013(<0.05) which reject the H0 and accept H1. Thus, there is a significant difference between Net Profit Margin of ICICI Bank and IOB Bank.
• ROE%: From the table, it is evident that the t (4.153) =3.599, p=0.021(<0.05) which reject the H0 and accept H1. Thus, there is a significant difference between ROE% of ICICI Bank and IOB Bank.
• ROA%: From the table, it is evident that the t (8) =4.048, p=0.004(<0.05) which reject the H0 and accept H1. Thus, there is a significant difference between ROA% of ICICI Bank and IOB Bank.
TABLE-7: Descriptive Statistics of Liquidity Ratios:
• H0-There is no significant difference between Liquidity ratios of ICICI Bank and IOB Bank.
• H1- There is significant difference between Liquidity ratios of ICICI Bank and IOB Bank.
Liquidity Ratios Banks Mean SD Sig. Value df t-value
1. CAR RatioICICI 17.5860 1.19897
0.002 8 5.244IOB 11.2640 2.41422
2. CASA RatioICICI 38.7740 2.63464
0.000 8 -5.729IOB 48.6080 2.79134
3. Current RatioICICI 1.8400 0.44994
0.673 8 -0.441IOB 2.0160 0.77015
4. Credit to Deposit Ratio
ICICI 87.6600 6.415710.000 8 8.412
IOB 58.3520 4.41892
INTERPRETATION:
• CAR Ratio: From the table, it is evident that the t (8) =5.244, p=0.002(<0.05) which reject the H0 and accept H1. Thus, there is a significant difference between CAR% of ICICI Bank and IOB Bank.
• CASA RATIO: From the table, it is evident that the t (8) =-5.729, p=0.000(<0.05) which reject the H0 and accept H1. Thus, there is a significant difference between CASA% of ICICI Bank and IOB Bank.
• Current Ratio: From the table, it is evident that the t (8) =-0.441, p=0.673(>0.05) which accept the H0. Hence there is no significance difference between the selected two bank’s Current Ratio %.
• Credit to Deposit Ratio: From the table, it is evident that the t (8) =8.412, p=0.000(<0.05) which reject the H0 and accept H1. Hence there is significance difference between the selected two bank’s Credit to Deposits Ratio (CD)%.
A Comparative Financial Performance of Selected Public And Private Sector Banks in India

Parikalpana - KIIT Journal of Management170 171
TABLE-8: Descriptive Statistics of Asset Quality Ratios:• H0-There is no significant difference between Asset Quality ratios of ICICI
Bank and IOB Bank.• H1- There is significant difference between Asset Quality ratios of ICICI Bank
and IOB Bank.
Asset Quality Ratios Banks Mean SD Sig.
Value df t-value
1. Gross NPA%ICICI 6.7840 1.60911
0.006 8 -4.683IOB 19.2220 5.71729
2. Net NPA % ICICI 2.8540 1.83506
0.021 8 -2.844IOB 9.8300 5.16843
INTERPRETATION:
• Gross NPA%: From the table, it is evident that the t (8) =-4.683, p=0.006(<0.05) which reject the H0 and accept H1. Hence there is significance difference between the selected two bank’s Gross NPA%.
• Net NPA %: From the table, it is evident that the t (8) =-2.844, p=0.021(<0.05) which reject the H0 and accept H1. Hence there is significance difference between the selected two bank’s Gross NPA%.
positive Margin. As per the comparison IOB having slightly less NIM Margin as compare to ICICI Bank during the study period. It indicates that IOB has slightly investment inefficiency.
• Net Profit Margin Ratio %:The analysis showing that there is a opposite direction of Margin of selected bank during the research period. ICICI Bank showing positive Margin which demonstrates that it has more Revenue as compare to its overall expenses over the study period. But IOB showing negative Margin which indicates that there are more overall expenses which couldn’t covered by insufficient revenue over the period.
• Return on Equity (ROE) %:As per the comparison, it found that ICICI bank showing fluctuated positive % of ROE. But in IOB it has negative ROE% over the period due to negative Net profits.
• Return on Assets (ROA) %:In ICICI Bank, ROA% showing Fluctuated % over the period. While compare to IOB, it found that it has negative ROA% over the study, which demonstrates that IOB is inefficient to utilize their assets over the period.
• CAR Ratio%: As per the comparison of CAR% of the banks, it found that IOB has less capabilities to maintain their capital over risk weighted assets.
• CASA Ratio %:According to the Mean comparison of CASA% both the selected banks,
it is found that IOB has highest Mean of CASA% with 48.608%, which is 9.834% more than Mean CASA% of ICICI Bank. It demonstrates that IOB has maintain their CASA deposits efficiently as compare to ICICI bank.
• Current Ratio (CR)%:As per the Mean comparison of both the selected banks, it found that the CR% is also high in IOB. As compare to ICICI Bank, IOB has good capacity to meets its short-term obligations by using their current assets over the research period.
• Credit to deposit Ratio (CD)%:According to the Average comparison, it observed that ICICI bank having highest CD% i.e., 86.66% as compare to IOB i.e., 58.352% over the study period. It indicates that IOB has less ability to create credits on their deposits as compare to ICICI Bank.
• Gross Non-Performing Assets (NPA) %:According to the analysis it observed that Gross NPA% is high in ICICI Bank as compare to IOB bank over the study period.
• Net Non-Performing Assets (NPA) %:According to the analysis it observed that Net NPA% is also high in ICICI Bank as compare to IOB Bank. It demonstrates that ICICI bank couldn’t manage their bad loan effectively as compare to IOB Bank over the research period.
6. FINDINGS:
• Total Deposits:While comparing the total deposits of selected banks, it found that ICICI Bank has highest deposit as compare to IOB Bank.
• Total Investment:According to the analysis, it found that total investment of ICICI Bank during the research period is high, which is around 3 times investment of IOB bank.
• Total Advances:The total advances are also high in ICICI Bank during the study period.
• Total Expenses:The analysis showing that ICICI Bank incurred more Expenses as compare to IOB Bank.
• Total Income:The Total income is also high in ICICI Bank as compare to IOB Bank
• Net Profit:According to Net profit, it observed that ICICI Bank showing high Net Profit. But IOB Bank showing Net Losses over the research period.
• Net Interest Margin Ratio %:According to the analysis, it observed that both the selected banks showing
A Comparative Financial Performance of Selected Public And Private Sector Banks in India

Parikalpana - KIIT Journal of Management172 173
7. CONCLUSION:
• As per the comparison with ICICI Bank it concluded that the Total Deposits are less in IOB Bank. So IOB Bank has to increase their deposits for gaining long term benefits.
• The Total Investment is also high in ICICI Bank as compare to IOB Bank. So IOB should invest more in profitable projects and will get handsome return on it.
• The above study concluded that IOB has a smaller number of Total Advances as compare to ICICI Bank. Thus, IOB should give more advances to those customers which having good credit worthiness. It also simplifies the loans structures and facilitates good loan schemes at a reasonable interest rate.
• The above study says that ICICI Bank has incurred more expenses during the research period. Thus, it should reduce their overall operating expenses by using more green products and provide green services to their customers.
• As per the comparison with ICICI Bank it concluded that the Total Income are less in IOB Bank. So IOB Bank should focus more on those banking product and services and investment where it can generate more revenue. Hence, it is cleared that ICICI has good Income structure with respect to IOB.
• The above study concluded that IOB has negative Net profits
during the period. Thus, IOB have to concentrate on their Net Profits. It should increase their overall revenue and reduce their overall expenses. So that it can change their negative Net Profit to positive Net Profit. Hence, it concluded that ICICI has quite better overall profits as compare to IOB Bank.
• As per the comparison of both the Margin i.e., Net interest and Net Profit Margin, it concludes that both the banks have positive margin, but it also f luctuated over the period. Thus, it improves its revenue structure by reducing their overall expenses. Hence the margin of both the selected banks indicates that ICICI Bank has good Profitable position as compare to IOB bank.
• The both selected bank’s ROE % and ROA % showing similar directions i.e., ICICI Bank showing positive % where IOB showing negative %. Hence, it concluded that ICICI have good financial position as compare to IOB Bank.
• On the basis of comparison of Capital Adequacy Ratio (CAR) % of selected banks, it concluded that ICICI has good Capital management as compare to IOB bank. Hence, IOB Bank should also focus on capital management for maintaining their risk weighted assets.
• On the basis of comparison of CASA % and Current Ratio % of selected banks, it concluded that IOB has
good liquidity position as compare to ICICI bank. Hence, ICICI Bank should more focus on their liquidity policy for better earnings.
• On the basis of comparison of Credit Deposit Ratio % of selected banks, it concluded that ICICI has good Credit Deposit systems as compare to IOB bank. Hence, IOB Bank should also focus on credit deposits norms for better liquidity.
• The above study concluded that the NPA % are high in IOB Bank as compare to ICICI Bank over the research period. ICICI Bank’s NPA management is quite better than IOB bank. Hence, IOB Bank should more concentrate on bad loan and improved its management system for better assets quality.
• Thus, the overall descriptive statistics (T-Test) reject the null hypothesis and accept the alternative hypothesis. It indicates that there is significance difference between overall performance of selected banks in India by analyzing key performance parameters from 2016-21. Hence, from the study it is cleared that ICICI Bank have good profitability status, good liquidity position and better asset quality management. Thus, from the overall comparative analysis of performances of both the selected bank, it observed that ICICI Bank has better financial performance as compare to IOB over the research period.
LIMITATION AND FUTURE SCOPE OF STUDY:
The present research is fully based on secondary data. I just made the conclusion on the basis of analyzing data collected from last 5 years from the period 2016-17 to 2020-21. The statistical concept used is limited. The researcher can further do the research on this topic by taking 10 years or more data and using different statistical tools and different parameters which measures banking performances like, market capitalization rate, CAR%, Interest coverage ratios and others.
REFERENCES:
Agarwal, Puja (2019),’’Profitability of Indian Public and Private Sector Bank:A Comparative Study’’. IJRAR Journal. Volume 6. Issue1.
Anurag. B. Singh, Ms. Priyanka Tondon (2012,) A Study Of Financial Performance: A Comparative Analysis Of SBI and ICICI Bank. International Journal of Marketing, Financial services and Management Research.Vol.no.1. Issue 11.
B. Nimalathasan, ‘’A comparative study of financial performance of banking sector in Bangladesh’’-An application of CAMELS rating /Annel of University of Bucharest, Economics and administrative series, Nr. 2 (2008)
Ch. Balaji and Dr. G. Praveen Kumar (2016) ,’’A Comparative Study on Financial Performance of Selected
A Comparative Financial Performance of Selected Public And Private Sector Banks in India

Parikalpana - KIIT Journal of Management174 175
Public and Private Sector Banks in India’’. Journal of Commerce and Trade. Vol. No. 02.
Dave K Kapil. (2016).’’ A Comparative study of NPA in public and private sector banks in India’’. IJSR Journal. Volume No. 5. Issue No. 8.
Koley Jyotirmoy. (2019),’’Analysis of Financial Position And Performance of Public and Private Sector Banks in India: A comparative study on SBI and HDFC Bank’’. NSOU-open Journal. Vol. 2.
Srinivas and L. Sarojia (2013),’’ Comparative financial performance of HDFC Bank and ICICI Bank’’. Vol.1. Issue.2.
Annual Report of ICICI Bank and IOB bank, and Press Release of ICICI Bank and IOB bank.
h t t p s : / / w w w. g o o d r e t u r n s . i n /company/indian-overseas-bank/ratios.html
h t t p s : / / w w w. g o o d r e t u r n s . i n /company/icici-bank/ratios.html
https://www.moneycontrol.com/f inancials/ ic ic ibank/balance-sheetVI/ICI02
https://www.moneycontrol.com/financials/icicibank/profit-lossVI/ICI02
https://www.moneycontrol.com/financials/indianoverseasbank/profit-lossVI/IOB
https://www.moneycontrol.com/financials/indianoverseasbank/balance-sheetVI/iob
Exploring the aspects of Social Entrepreneurship during Covid 19 pandemic in India
Monalisha ChakrabortyPhD scholar at School of Rural Management,
KIIT University [email protected]
Prasanta ParidaAssociate Professor at KIIT School of Rural Management,
KIIT University [email protected]
DoI: 10.23862/kiit-parikalpana/2021/v17/i2/210549
Abstract
Social entrepreneurship has social, cultural, educational and environmental goals. The primary objective of social entrepreneurship is not to earn profits but to provide innovative solutions to solve a variety of urgent social problems for welfare of the society. Efforts are made to provide information about the challenges and opportunities of social entrepreneurship in India. This paper also attempts to shed light on different successful social entrepreneurs along with their initiatives and contribution towards society during Covid 19. A literature review of secondary data resources is undertaken to get a clear idea about the different exploratory aspects of three prominent social enterprises during pandemic such as SELCO, Goonj and Narayana Health. Social entrepreneurs experienced some critical issues during Covid 19 such as dearth of a viable business plan, Lack of funds, qualified manpower, limited to definite geographies etc. are few challenges before social entrepreneurs. There are opportunities of social entrepreneurship in terms of providing employment to rural people. So, they can explore, exploit and provide the products and services at affordable prices. Thus, generating employment opportunity which is significant for the overall development of the country.
Keywords: Entrepreneurship, Social entrepreneurs, Covid 19 pandemic
1. Introduction
In recent decades entrepreneurial activities are on the rise with exclusive social missions leading to the emergence of the term “social entrepreneurship”. The term social
entrepreneurship was first quoted by Bill Drayton in 1980. Poverty alleviation and eradication of socio-economic disparities are the two important aims of social entrepreneurship. Social
Parikalpana - KIIT Journal of Management [Vol. 17 (II), Dec. 2021]