financial fitness of selected pharmaceuticals companies of ...
15
American Economic & Social Review Vol. 7, No. 1; 2021 ISSN 2576-1269 E-ISSN 2576-1277 Published by CRIBFB, USA 10 FINANCIAL FITNESS OF SELECTED PHARMACEUTICALS COMPANIES OF BANGLADESH: A COMPARATIVE ASSESSMENT Sultana Akter Assistant Professor Department of Business Administration Int'l Islamic University Chittagong, Bangladesh E-mail: [email protected] ABSTRACT To understand the financial condition of a firm, it is mandated to evaluate the financial fitness of a firm, whether manufacturing, trading and service rendering etc. The main purpose of this research is to measure the financial fitness of leading pharmaceutical industries and listed on the stock exchange in Bangladesh. This study employs a sample of seven companies from pharmaceutical industries in Bangladesh where Altman’s Z-score model is used to assess the financial fitness of those companies by the prediction of whether they will go into bankruptcy within the next two years. By applying the model, it is revealed that SQUARE Pharmaceuticals Ltd, Renata Limited and IBN SINA Pharmaceutical Limited are in a very good position with higher Z-Score. Beacon Pharmaceuticals Limited and Ambee Pharmaceuticals Limited are heading toward good scores. But ACI Limited and Beximco Pharmaceuticals Limited are financially unhealthy and there is a possibility of going into bankruptcy in the near future. The finding of the study suggested the main reason for such a situation is that the performance of companies is differed by declining market value of shares, falling total asset turnover, inadequate proportion of EBIT to total assets and insufficient liquid assets etc. Keywords: Financial Fitness, Altman Z-Score, Bankruptcy, Pharmaceutical Company. JEL Classification Codes: G33, G53, M10. INTRODUCTION Bangladesh is one of the least developed countries which meets about 98% of its demand for pharmaceutical products. It has a market size of nearly BDT 200 billion. Bangladeshi pharmaceutical products are exported to 147 countries. This industry contributes about 1.85% of total GDP. The industry has undergone remarkable transformations in recent years, and it is now the most successful manufacturing industry in the country (Faisal, 2019). The industry is growing due to the increase in per capita income of the people, their hectic daily activities, an aging population, changing lifestyles and economic status, unhealthy eating habits, increasing incidence of chronic diseases etc. which provide industry players an opportunity to grow. Bangladesh’s pharmaceuticals market size will reach more than BDT 400 billion by 2023 (Niti, 2019). SQUARE Pharmaceuticals Ltd (2020) started its business in 1958 and after 33 years of establishment it was changed into a public limited company in 1991. In 1995, it was listed on stock exchanges. It has a market share of 16.95% and a turnover of BDT 50.87 billion. Square Pharmaceuticals Limited exports medicines from Bangladesh to 42 countries. The objective of the company is to conduct transparent business operations within a legal and social framework. It has exported pharmaceutical products since 1995 and provides quality products. It also offers service for
-
Upload
khangminh22 -
Category
Documents
-
view
3 -
download
0
Transcript of financial fitness of selected pharmaceuticals companies of ...

American Economic & Social Review
Vol. 7, No. 1; 2021
ISSN 2576-1269 E-ISSN 2576-1277
Published by CRIBFB, USA
10
FINANCIAL FITNESS OF SELECTED PHARMACEUTICALS
COMPANIES OF BANGLADESH: A COMPARATIVE
ASSESSMENT
Sultana Akter
Assistant Professor
Department of Business Administration
Int'l Islamic University Chittagong, Bangladesh
E-mail: [email protected]
ABSTRACT
To understand the financial condition of a firm, it is mandated to evaluate the financial fitness of a
firm, whether manufacturing, trading and service rendering etc. The main purpose of this research is
to measure the financial fitness of leading pharmaceutical industries and listed on the stock exchange
in Bangladesh. This study employs a sample of seven companies from pharmaceutical industries in
Bangladesh where Altman’s Z-score model is used to assess the financial fitness of those companies
by the prediction of whether they will go into bankruptcy within the next two years. By applying the
model, it is revealed that SQUARE Pharmaceuticals Ltd, Renata Limited and IBN SINA
Pharmaceutical Limited are in a very good position with higher Z-Score. Beacon Pharmaceuticals
Limited and Ambee Pharmaceuticals Limited are heading toward good scores. But ACI Limited and
Beximco Pharmaceuticals Limited are financially unhealthy and there is a possibility of going into
bankruptcy in the near future. The finding of the study suggested the main reason for such a situation
is that the performance of companies is differed by declining market value of shares, falling total asset
turnover, inadequate proportion of EBIT to total assets and insufficient liquid assets etc.
Keywords: Financial Fitness, Altman Z-Score, Bankruptcy, Pharmaceutical Company.
JEL Classification Codes: G33, G53, M10.
INTRODUCTION
Bangladesh is one of the least developed countries which meets about 98% of its demand for
pharmaceutical products. It has a market size of nearly BDT 200 billion. Bangladeshi pharmaceutical
products are exported to 147 countries. This industry contributes about 1.85% of total GDP. The
industry has undergone remarkable transformations in recent years, and it is now the most successful
manufacturing industry in the country (Faisal, 2019). The industry is growing due to the increase in
per capita income of the people, their hectic daily activities, an aging population, changing lifestyles
and economic status, unhealthy eating habits, increasing incidence of chronic diseases etc. which
provide industry players an opportunity to grow. Bangladesh’s pharmaceuticals market size will reach
more than BDT 400 billion by 2023 (Niti, 2019).
SQUARE Pharmaceuticals Ltd (2020) started its business in 1958 and after 33 years of
establishment it was changed into a public limited company in 1991. In 1995, it was listed on stock
exchanges. It has a market share of 16.95% and a turnover of BDT 50.87 billion. Square
Pharmaceuticals Limited exports medicines from Bangladesh to 42 countries. The objective of the
company is to conduct transparent business operations within a legal and social framework. It has
exported pharmaceutical products since 1995 and provides quality products. It also offers service for

https://www.cribfb.com/journal/index.php/aesr American Economic & Social Review Vol. 7, No. 1; 2021
11
product development and provides assistance in product promotion. Renata Limited (2020), one of
the fastest growing and foremost pharmaceutical companies in Bangladesh, was established in 1972
as Pfizer (Bangladesh) Limited. It was listed on the Dhaka Stock Exchange. It has a market
capitalization of approximately Taka 87 billion. The company exports its products to many countries
around the globe. The company focuses on long-term growth and goes the extra mile for employees.
Caring for employees, assisting disadvantaged members and building a sustainable environment is
the main corporate social responsibility of the company. Beacon Pharmaceuticals Limited (2020)
opened its business in 2006 with the aim of delivering and developing innovative and life-saving
medicines to fight various life-threatening diseases. It was listed on the Dhaka and Chittagong stock
exchanges. It has a premium infrastructure & framework designed by European engineers. The IBN
SINA Pharmaceutical industry Ltd (2020) was established with modern art and technology in 1983 in
Gazipur. The company is outfitted with high-quality machinery and has established itself as a leader
in the pharmaceutical industry in Bangladesh. It has two manufacturing segments like Pharmaceutical
and organic or herbal Medicine Manufacturing Plant. Highest quality medicines at an affordable price
are the primary objective of IBN SINA. The Advanced Chemical Industries Ltd (ACI) is one of
Bangladesh's largest companies, having been founded on January 24, 1973.It has four business
segments such as ACI Agribusiness, ACI Retail Chain, ACI Consumers brands, and ACI
pharmaceuticals. ACI Pharmaceuticals is excited about combining knowledge, expertise, and modern
technology to lead a quality health care system in Bangladesh (ACI Ltd., 2020). Ambee
Pharmaceuticals Limited (2020) was established in 1976. It was incorporated on 4th February 1976.
It is registered under the companies Act 1913 as a public limited company. It has got its own
distribution network throughout the country and a Quality Management System is followed to ensure
consistent quality. They meet all National Regulatory Requirements and follow Good Manufacturing
Practices (GMP) in their business as recommended by the World Health Organization. Beximco
Pharmaceuticals Ltd (Beximco Pharma) was established in 1976 and commenced its operations in
1980. It is a public limited company listed on the Dhaka Stock Exchange. It is headquartered in
Dhanmondi. The mission of the company is to enhance human health and well-being by providing
affordable and contemporary medicine. The core values of the company are commitment to quality,
customer satisfaction, people focus, accountability and corporate social responsibility (Beximco
Pharma, 2020).
Based on the foregoing, it is high time to assess and scrutinize the performance of
pharmaceutical companies. But performance evaluation is a dynamic matter rather than static as
performance has changes yearly, monthly, daily, even within a moment (Majumder & Rahman, 2011).
This study is undertaken to evaluate the performance of some selected listed pharmaceutical
companies in Bangladesh. This will provide insight into the company's financial situation and position
in comparison. The use of a model to assess the financial condition of the company will assist
management in taking corrective measures in the future, potentially reducing bankruptcy. It will even
help creditors, shareholders and regulatory agencies to a great extent. Many studies have been
undertaken in the past and among them, Edward Altman’s Z-Score is the most popular Z-Score is a
multi-discriminate analysis. While doing the review of literature on this area, it was found that a few
studies have been done using Z-Score in Bangladesh. That’s why this study emphases on analyzing
the financial fitness of selected pharmaceutical companies which are listed on the Dhaka Stock
Exchange in Bangladesh (Ray, 2011).
LITERATURE REVIEW
A lot of research has gone into studying and scrutinizing the financial fitness of companies by
researchers in different parts of the world. The literature in this study mostly involves research
depending on the published work existing in Bangladesh as well as abroad. A study used the Z-score
model to analyze the financial health of five Indian pharmaceutical companies over the course of 11
years. This model revealed that Ranbaxy Lab Ltd. and GlaxoSmithKline Pharmaceuticals Ltd. were
https://www.cribfb.com/journal/index.php/aesr American Economic & Social Review Vol. 7, No. 1; 2021
12
in good financial health, while the other three companies needed to focus on improving financial
performance, particularly in terms of sales revenue generation and asset utilization in the future (Panda
& Behera, 2015). Akbar conducted a study to predict financial health conditions on stock returns using
the panel data regression method for seven Indonesian stock exchange companies. The results showed
that there is a decrease in financial ratios in each company and this has implications for the decline in
the financial distress model (Akbar et al., 2019). Another study used Edward I Altman’s Z-Score
model on selected Indian Pharmaceutical companies for the period of 10 years. Statistical tools and
financial techniques are used to analyze a company’s financial health performance and decide that
there are no chances of any bankruptcy in the near future as all are in a safe or healthy zone
(Geethalakshmi & Jothi,2017). Nsiah conducted a study to compare two pharmaceutical companies
listed on the Ghana stock exchange based on the profitability, liquidity, solvency and probability of
that company. It was found that the efficiency of Aryton is declining in the case of management in
utilizing the assets, but Starwin is improving in this case. By using Altman’s Z-score, it was also
shown that Aryton was not in financial distress but Starwin was in financial distress and likely to be
bankrupt in the near future (Nsiah & Aidoo, 2015). A study on an industrial firm and used Altman Z-
scores and ratio analysis approaches to predict the firm’s insolvency for the period of 2002-2004. The
z-score from the analysis was less than 1.81 (z-score < 1.81 which means the firm has increased its
debt and will be facing bankruptcy in the near future (Al-Rawi et al., 2018). Mizan et al. (2011) has
selected six leading pharmaceutical companies of Bangladesh listed on the DSE. They have used
Altman Z-Score to predict, analyze and compare the financial soundness. The values of Z-Score and
other financial trend analysis of the rest of the companies are found to be unsatisfactory and they have
a significant likelihood of facing financial distress in the near future. Ahmed and Hasan (2019) used
ratio analysis of three pharmaceutical companies in Bangladesh. Data has been collected from the
annual financial reports of Beximco, Renata and SQUARE pharmaceutical companies from 2006 to
2010 and found that the financial position and operational performance of the selected
pharmaceuticals are not satisfactory. Jannatunnesa (2016) attempted to analyze the financial
consistency and the profitability determinants of pharmaceutical companies in Bangladesh. Altman's
Z-score model was used for measuring the financial soundness of the pharmaceutical industry. It also
examined the profitability determinants by testing a number of hypotheses. The results show that the
insolvency possibility of almost every company is very high. The industry also has a high possibility
of bankruptcy within the next two years. Dakhwani and Nayak (2017) focused on the financial
position of selected companies of Pharmaceutical Industry in India on the basis of 10 years of data
collected from financial statements of respective companies using Altman’s Z-Score model.
According to their analysis, some companies are found to be in the bankruptcy zone, whereas some
are in a healthy zone and some have become bankrupt. Al Ali (2018) examined the financial soundness
of the two healthcare companies listed on the Kuwait stock exchange. The results showed that both
companies are positioned in the gray area, which means that they are facing bankruptcy risk. Mizan
and Hossain (2014) found on a sample of five cement companies, found that two firms, Heidelberg
cement and Confidence Cement of Bangladesh, are financially sound whereas the other three are not
in a good position.
RESEARCH QUESTIONS & OBJECTIVES OF THE STUDY
Based on the foregoing discussion, two research questions for this study have been identified:
▪ What is the financial position of the pharmaceutical industry in Bangladesh?
▪ How financial distress among the selected companies is measured using Altman Z-score
ratios?
The ultimate objectives of the study are to get the answer to research questions as follows:
▪ To assess the financial situation of sample pharmaceuticals companies of Bangladesh
▪ To measure financial fitness by means of Altman’s Z-score formula and compare the financial
distress among selected pharmaceutical companies.
https://www.cribfb.com/journal/index.php/aesr American Economic & Social Review Vol. 7, No. 1; 2021
13
▪ To highlight some findings and to recommend some measures regarding the financial position
of selected companies.
RATIONAL OF THE STUDY
Determining the financial health of a firm is a very important corporate skill. It is important to know
how the company is performing its business for a number of reasons. It is important to have a clear
picture of the financial health of a company to make more effective strategic decisions about the
organization’s resource allocation and its direction. It also plays a significant role in attracting
investors or for seeking finance.
The study can provide assistance to companies in evaluating their financial efficiency. It can
also help investors in analyzing their investment decisions. Management can find out the financial
problems and take steps for more effective and efficient utilization of resources. It will be helpful to
investors in taking the decision to invest in specified companies.
METHODOLOGY
Data Collection
To conduct the study, secondary data has been gathered from the yearly reports of selected
pharmaceutical companies from the year 2015-2019. The position of the company is analyzed based
on various elements of ratio analysis. To predict the financial distress of the companies using ratio
analysis, the Altman’s Z-score model is used (Altman’s Z-Score Model, 2020).
Population & Sample
Bangladesh's own-grown pharmaceutical industry has met approximately 98% of the demand for
pharmaceutical products. The industry is growing due to the increase in per capita income of the
people, their hectic daily activities, aged population, change in lives and economic status, unconscious
eating behaviors, growing rate of chronic diseases etc. which provides industry players an opportunity
to grow There are a number of pharmaceutical businesses, about 50 plus operating in Bangladesh.
Among them, around 32 companies are listed on the Dhaka Stock Exchange under the pharmaceutical
and chemicals industry. Among all the listed pharmaceutical companies on the stock exchange,
samples of seven companies were selected to conduct this study.
The sample pharmaceutical companies of this study are given below:
▪ SQUARE Pharmaceuticals Ltd
▪ Reneta Limited
▪ Beacon Pharmaceuticals Limited
▪ The IBN SINA Pharmaceutical Industry Ltd
▪ ACI Limited
▪ Ambee Pharmaceuticals Ltd
▪ Beximco Pharmaceuticals Ltd
Method of Data Processing
Altman’s Z-score model was published by Edward I. Altman in 1968 to predict the bankruptcy of a
business. The formula may be used to forecast the possibility of a company going into bankruptcy
within the next two years. This model quantifies a company's financial fitness by using multiple
corporate income and balance sheet values. The model was originally used by publicly held
manufacturers and later it was used in private manufacturing, non-manufacturing and service
companies. The model proved to be accurate for predicting bankruptcy on various occasions. The
model has improved and has become a reliable predictor of bankruptcy.
The study is undertaken by using the Altman’s Z-Score formula. The formula consists of five
key financial ratios: X1, X2, X3, X4 and X5. These are independent variables which are computed and
substituted in the formula to derive the Z-Score of each company. After the derivation of the Z-score,

https://www.cribfb.com/journal/index.php/aesr American Economic & Social Review Vol. 7, No. 1; 2021
14
the values are compared to the benchmark set by the model to determine whether a company is in a
safe, grey or distress zone. On the basis of analysis, it is found whether a company will be bankrupt
in the near future. Lastly, the values of the Z-Score of each company are compared with the average
Z-Score of each company to give a comparative analysis of the company’s performance.
The formula is used as follows:
Z = 1.2 X1 + 1.4 X2 +3.3 X3+ 0.6 X4 + 1.0 X5
Where:
X1= Working capital/ total assets.
X2= Retained Earnings /Total Assets.
X3=Earnings before interest and taxes/total assets.
X4= Market Value of equity/ book value of total liabilities.
X5= Sales/ total assets.
The results obtained from the model are then compared to a benchmark that is set to determine the
financial soundness of the company. The criteria used to interpret the Z-score model are:
Zones of discrimination
Score Zone Description
Z > 2.99 Safety Do not go for bankruptcy within next two years
1.80 < Z < 2.99 Grey Reasonable chance to go for bankruptcy within next two
years
Z < 1.80 Distress/bankruptcy Certainty goes for bankruptcy within two years.
ANALYSIS & FINDINGS
Altman Z-Score for SQUARE Pharmaceuticals Ltd.
Table 1. Computation of Z-Score for SQUARE Pharmaceuticals Ltd.
Variable/year 2015 2016 2017 2018 2019 Mean
X1=Net Working Capital/Total Assets 0.2325 0.3694 0.4100 0.4063 0.5430 0.3922
X2=Retained Earnings/Total Assets 0.6405 0.6880 0.6912 0.6925 0.7442 0.6913
X3=EBIT/Total Assets 0.2579 0.2273 0.1785 0.1448 0.1725 0.1962
X4=Market Value of Equity/ Total Liabilities 43.1798 46.3080 43.6190 32.4179 49.0082 42.9066
X5=Sales/Total Assets 1.1543 0.8580 0.7277 0.6483 0.6854 0.8147
Z-Score 29.16 30.79 28.95 22.03 32.35 28.6560
Table 1. shows the average of X1, X2, X3, X4 and X5 are 0.3922, 0.6913, 0.1962, 42.9066 and 0.8147
respectively. Now, the average Z-score for SQUARE Pharmaceuticals Ltd. can be calculated as
Z = 1.2 X1 + 1.4 X2 +3.3 X3+ 0.6 X4 + 1.0 X5
The Z-score for SQUARE Pharmaceuticals Ltd. will be 28.6560
https://www.cribfb.com/journal/index.php/aesr American Economic & Social Review Vol. 7, No. 1; 2021
15
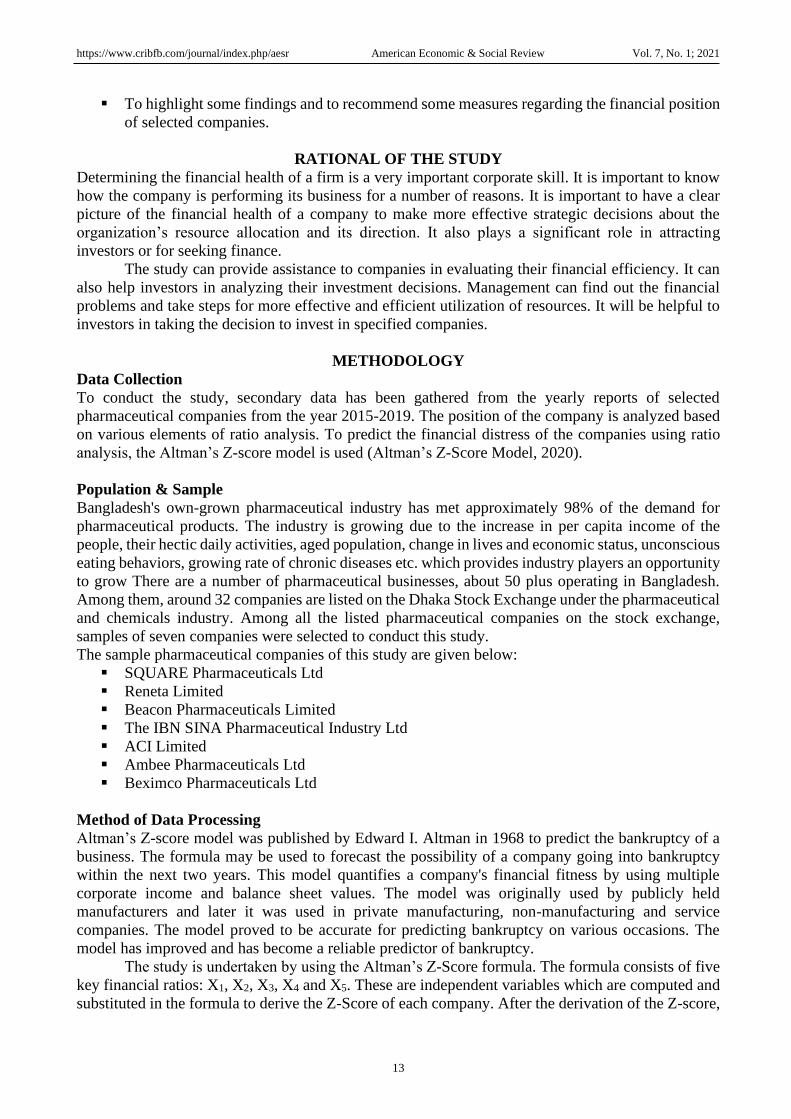
Figure 1. Graphical view of Z-Score of SQUARE Pharmaceuticals Ltd
The above graph shows that the Z-Score of SQUARE Pharmaceuticals Ltd has increased in
2016 and decreased during 2017 and 2018. Then it has increased to the highest in 2019. The results
of Z Score in each study period is above 2.99, which means the company is in a safe zone and the
financial performance of the company is very good, which indicates that the firm is not likely to go
into bankruptcy in the future.
Altman Z-Score for Renata Limited
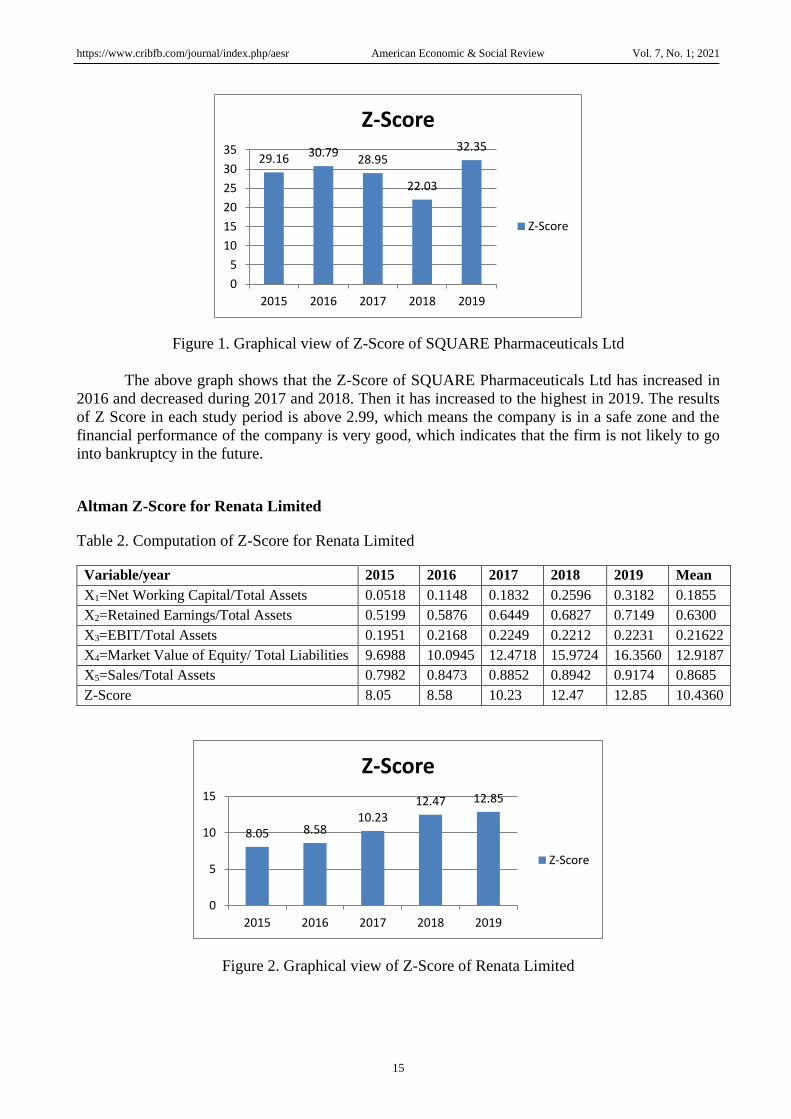
Table 2. Computation of Z-Score for Renata Limited
Variable/year 2015 2016 2017 2018 2019 Mean
X1=Net Working Capital/Total Assets 0.0518 0.1148 0.1832 0.2596 0.3182 0.1855
X2=Retained Earnings/Total Assets 0.5199 0.5876 0.6449 0.6827 0.7149 0.6300
X3=EBIT/Total Assets 0.1951 0.2168 0.2249 0.2212 0.2231 0.21622
X4=Market Value of Equity/ Total Liabilities 9.6988 10.0945 12.4718 15.9724 16.3560 12.9187
X5=Sales/Total Assets 0.7982 0.8473 0.8852 0.8942 0.9174 0.8685
Z-Score 8.05 8.58 10.23 12.47 12.85 10.4360
Figure 2. Graphical view of Z-Score of Renata Limited
29.16 30.7928.95
22.03
32.35
0
5
10
15
20
25
30
35
2015 2016 2017 2018 2019
Z-Score
Z-Score
8.05 8.5810.23
12.47 12.85
0
5
10
15
2015 2016 2017 2018 2019
Z-Score
Z-Score

https://www.cribfb.com/journal/index.php/aesr American Economic & Social Review Vol. 7, No. 1; 2021
16
The above graph shows that the Z-Score has been increased throughout the study period. The
result of Z-Score in each study period is above 2.99. The company is in a safe zone, which means the
financial performance of the company is very good, which indicates that there is no possibility for the
firm to go into bankruptcy in the near future.
Altman Z-Score for Beacon Pharmaceuticals Limited
Table 3. Computation of Z-Score for Beacon Pharmaceuticals Limited
Variable/year 2015 2016 2017 2018 2019 Mean
X1=Net Working Capital/Total Assets 0.3006 0.2817 0.2520 0.2175 0.2774 0.2658
X2=Retained Earnings/Total Assets 0.0618 0.0737 0.0738 0.0828 0.0830 0.0750
X3=EBIT/Total Assets 0.0602 0.0527 0.0523 0.0549 0.0622 0.05646
X4=Market Value of Equity/ Total Liabilities 1.8530 1.9857 2.6514 2.1554 2.4543 2.2110
X5=Sales/Total Assets 0.4332 0,4970 0.5775 0.7662 0.9540 0.6827
Z-Score 2.19 2.30 2.75 2.62 3.09 2.59
Figure 3. Graphical presentation of Z-Score of Beacon Pharmaceuticals Limited
According to the figure 3, the results of Beacon Pharmaceuticals Limited's Z Score value from
2015 to 2018 accounting years are between 1.8 and 2.99, indicating that it is in the grey zone of 1.8
to 2.99. But from the next financial year it has increased, which indicates that the firm is not likely to
go into bankruptcy in the future. Measures should be taken to increase the ratios of X1, X2, X3, X4
and X5 in 2019.
Altman Z-Score The IBN SINA Pharmaceutical Industry Ltd
Table 4. Computation of Z-Score The IBN SINA Pharmaceutical Industry Ltd
Variable/year 2015 2016 2017 2018 2019 Mean
X1=Net Working Capital/Total Assets -0.0619 -0.0770 -0.0385 -0.0830 -0.0637 -0.06482
X2=Retained Earnings/Total Assets 0.2216 0.2200 0.2566 0.3845 0.4107 0.29868
X3=EBIT/Total Assets 0.1432 0.1613 0.1548 0.1662 0.1728 0.15966
X4=Market Value of Equity/ Total Liabilities 2.8823 6.0595 6.0971 6.0196 6.1114 5.43398
X5=Sales/Total Assets 1.9573 2.0167 1.8605 1.9074 1.8612 1.92062
Z-Score 4.40 6.40 6.34 6.71 6.60 6.09
2.19 2.3
2.75 2.62
3.09
0
0.5
1
1.5
2
2.5
3
3.5
2015 2016 2017 2018 2019
Z-Score
Z-Score

https://www.cribfb.com/journal/index.php/aesr American Economic & Social Review Vol. 7, No. 1; 2021
17
Figure 4. Graphical view of Z-Score of The IBN SINA Pharmaceutical Industry Ltd
The above graph shows that the results of Z Score in each study period is above 2.99, which
means the financial performance of the company is good, which indicates that the firm is not likely to
go into bankruptcy in the future.
Altman Z-Score for ACI Limited
Table 5. Computation of Z-Score for ACI Limited
Variable/year 2015 2016 2017 2018 2019 Mean
X1=Net Working Capital/Total Assets 0.2279 0.2161 0.1385 0.0701 0.0791 0.14634
X2=Retained Earnings/Total Assets 0.3950 0.3728 0.3243 0.2766 0.2367 0.3211
X3=EBIT/Total Assets 0.0832 0.0342 0.0588 0.0470 0.0399 0.0526
X4=Market Value of Equity/ Total Liabilities 3.2166 2.1778 1.7701 0.8112 0.5035 1.6958
X5=Sales/Total Assets 0.7525 0.3762 0.6766 0.5993 0.5238 0.5857
Z-Score 3.78 2.58 2.55 1.71 1.38 2.4
Figure 5. Graphical presentation of Z-Score of ACI Limited
From figures, it is found that analysis reveals that z scores have been declining from 3.78
(2015) to 1.38 (2019) for ACI limited. Although the z score value was greater than 2.99 in 2015, it
indicated that ACI Limited was in a safe zone with a good financial position, but the company entered
the grey zone (Z 2.99) in 2016 and 2017 by decreasing the z score values from 3.78 to 2.58 and
2.55.The company has reached the bankruptcy zone (Z 1.8) with z scores of 1.71 and 1.38 respectively
4.4
6.4 6.34 6.7 6.6
0
2
4
6
8
2015 2016 2017 2018 2019
Z-Score
Z-Score
3.78
2.58 2.55
1.711.38
0
1
2
3
4
2015 2016 2017 2018 2019
Z-Score
Z-Score
https://www.cribfb.com/journal/index.php/aesr American Economic & Social Review Vol. 7, No. 1; 2021
18
in the next two years, 2018 and 2019.The more poor z score indicates that the firm’s performance
became poorer due to the decline of total assets, market value of shares, EBIT and liquid assets in
terms of total assets and total liabilities during the period of study. It can be predicted from the
declining z scores that the company is going to be bankrupt in the near future.
Altman Z-Score for Ambee Pharmaceuticals Ltd
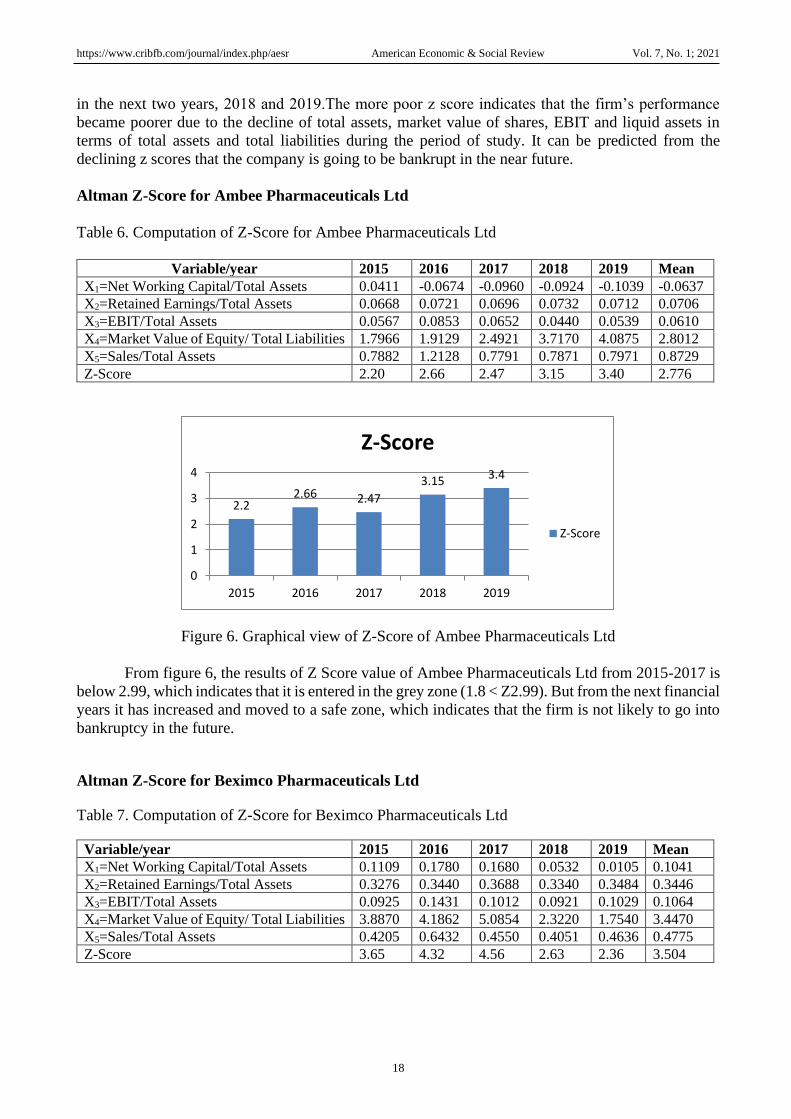
Table 6. Computation of Z-Score for Ambee Pharmaceuticals Ltd
Variable/year 2015 2016 2017 2018 2019 Mean
X1=Net Working Capital/Total Assets 0.0411 -0.0674 -0.0960 -0.0924 -0.1039 -0.0637
X2=Retained Earnings/Total Assets 0.0668 0.0721 0.0696 0.0732 0.0712 0.0706
X3=EBIT/Total Assets 0.0567 0.0853 0.0652 0.0440 0.0539 0.0610
X4=Market Value of Equity/ Total Liabilities 1.7966 1.9129 2.4921 3.7170 4.0875 2.8012
X5=Sales/Total Assets 0.7882 1.2128 0.7791 0.7871 0.7971 0.8729
Z-Score 2.20 2.66 2.47 3.15 3.40 2.776
Figure 6. Graphical view of Z-Score of Ambee Pharmaceuticals Ltd
From figure 6, the results of Z Score value of Ambee Pharmaceuticals Ltd from 2015-2017 is
below 2.99, which indicates that it is entered in the grey zone (1.8 < Z2.99). But from the next financial
years it has increased and moved to a safe zone, which indicates that the firm is not likely to go into
bankruptcy in the future.
Altman Z-Score for Beximco Pharmaceuticals Ltd
Table 7. Computation of Z-Score for Beximco Pharmaceuticals Ltd
Variable/year 2015 2016 2017 2018 2019 Mean
X1=Net Working Capital/Total Assets 0.1109 0.1780 0.1680 0.0532 0.0105 0.1041
X2=Retained Earnings/Total Assets 0.3276 0.3440 0.3688 0.3340 0.3484 0.3446
X3=EBIT/Total Assets 0.0925 0.1431 0.1012 0.0921 0.1029 0.1064
X4=Market Value of Equity/ Total Liabilities 3.8870 4.1862 5.0854 2.3220 1.7540 3.4470
X5=Sales/Total Assets 0.4205 0.6432 0.4550 0.4051 0.4636 0.4775
Z-Score 3.65 4.32 4.56 2.63 2.36 3.504
2.22.66 2.47
3.15 3.4
0
1
2
3
4
2015 2016 2017 2018 2019
Z-Score
Z-Score

https://www.cribfb.com/journal/index.php/aesr American Economic & Social Review Vol. 7, No. 1; 2021
19
Figure 7. Graphical presentation of Z-Score of Beximco Pharmaceuticals Ltd
The results of Z-Score value of Beximco Pharmaceuticals Ltd shows that the company is in
the safe zone during 2015, 2016 and 2017 as the score is above 2.99. But from 2018-2019 the score
is below 2.99, which indicates that it is in a grey zone of 1.8 to 2.99, which indicates that the firm is
in a moderate zone of bankruptcy and steps must be taken before it goes to bankruptcy in the future.
Comparative Analysis
Table 8. Summary of Company’s ranking based on activities and ratios
SQUARE Pharmaceuticals Ltd is ranked first on net working capital to total asset ratio,
retained earnings to total asset ratio and market value of equity to total liabilities. It is ranked second
on EBIT to total assets and fourth on sales to asset ratio. The performance of the company is good
and can increase its sales for holding best position. Renata Ltd is ranked first on EBIT to total asset,
second on retained earnings to total assets and market value to total liabilities. It has ranked third on
net working to total assets and sales to total assets ratio. The company is performing well. Beacon
Pharmaceuticals Ltd is ranked second on net working capital to total asset, fifth on sales to total assets
ratio. It has ranked sixth on retained earnings to total asset ratio EBIT to total asset and market value
of equity to total liabilities. The company is not performing well. The IBN SINA Pharmaceuticals Ltd
is ranked first on sales to total assets ratio, third on EBIT to total asset and market value of equity to
total liabilities. It is ranked fifth on retained earnings to total asset ratio and seventh on net working
capital to total asset ratio. The company has to work on its retained earnings and net working capital
policy. ACI Ltd is ranked fourth on net working capital to total asset ratio and retained earnings to
total asset ratio SQUARE Pharmaceuticals Ltd is ranked first on net working capital to total asset
ratio, retained earnings to total asset ratio and market value of equity to total liabilities. It is ranked
second on EBIT to total assets and fourth on sales to asset ratio. The performance of the company is
good and can increase its sales to hold the best position. Renata Ltd is ranked first on EBIT to total
assets, second on retained earnings to total assets and market value to total liabilities. It has ranked
third on net working to total assets and sales to total assets ratio. The company is performing well.
Company’s
Indicators
SQUARE
Pharmaceuticals
Ltd
Reneta
Ltd
Beacon
Pharmaceuticals
Ltd
The IBN SINA
Pharmaceutical
Industry Ltd
ACI
Ltd
Ambee
Pharmace
uticals Ltd
Beximco
Pharmace
uticals Ltd
Avg. of X1 1 3 2 7 4 6 5
Avg. of X2 1 2 6 5 4 7 3
Avg. of X3 2 1 6 3 7 5 4
Avg. of X4 1 2 6 3 7 5 4
Avg. of X5 4 3 5 1 6 2 7
3.654.32 4.56
2.63 2.36
0
1
2
3
4
5
2015 2016 2017 2018 2019
Z-Score
Z-Score
https://www.cribfb.com/journal/index.php/aesr American Economic & Social Review Vol. 7, No. 1; 2021
20
Beacon Pharmaceuticals Ltd is ranked second on net working capital to total assets, fifth on sales
to total assets ratio. It has ranked sixth on retained earnings to total asset ratio EBIT to total assets and
market value of equity to total liabilities. The company is not performing well. IBN SINA
Pharmaceuticals Ltd is ranked first on sales to total assets ratio, third on EBIT to total assets and
market value of equity to total liabilities. It is ranked fifth on retained earnings to total asset ratio and
seventh on net working capital to total asset ratio. The company has to work on its retained earnings
and net working capital policy. ACI Ltd is ranked fourth on net working capital to total asset ratio
and retained earnings to total asset ratio. It is ranked sixth on sales to total assets ratio, seventh on
EBIT to total assets and market value of equity to total liabilities. The performance of the company is
poor. Ambee Pharmaceuticals Ltd is ranked second on sales to total assets ratio, fifth on EBIT to
total asset and market value of equity to total liabilities, sixth on net working capital to total asset ratio
and seventh on retained earnings to total asset ratio. The performance has to be improved. Beximco
Pharmaceuticals Ltd is ranked third on retained earnings to total asset ratio. It is ranked fourth on
EBIT to total assets and market value of equity to total liabilities, fifth on net working capital to total
asset ratio and seventh on sales to total assets ratio.
From Table 8, it is clear that SQUARE Pharmaceuticals Ltd tops the list among all other
companies. Renata Ltd is performing well but unable to perform at the same pace.
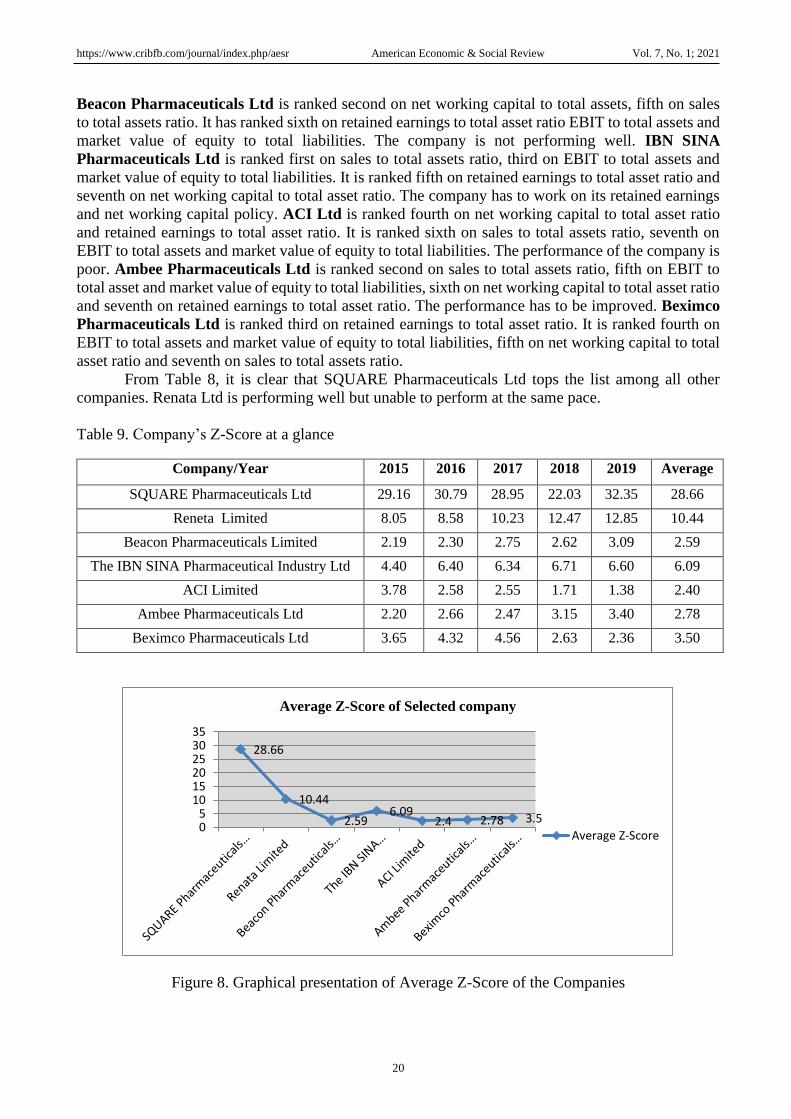
Table 9. Company’s Z-Score at a glance
Company/Year 2015 2016 2017 2018 2019 Average
SQUARE Pharmaceuticals Ltd 29.16 30.79 28.95 22.03 32.35 28.66
Reneta Limited 8.05 8.58 10.23 12.47 12.85 10.44
Beacon Pharmaceuticals Limited 2.19 2.30 2.75 2.62 3.09 2.59
The IBN SINA Pharmaceutical Industry Ltd 4.40 6.40 6.34 6.71 6.60 6.09
ACI Limited 3.78 2.58 2.55 1.71 1.38 2.40
Ambee Pharmaceuticals Ltd 2.20 2.66 2.47 3.15 3.40 2.78
Beximco Pharmaceuticals Ltd 3.65 4.32 4.56 2.63 2.36 3.50
Figure 8. Graphical presentation of Average Z-Score of the Companies
28.66
10.44
2.596.09
2.4 2.78 3.505
101520253035
Average Z-Score of Selected company
Average Z-Score
https://www.cribfb.com/journal/index.php/aesr American Economic & Social Review Vol. 7, No. 1; 2021
21
The above graph shows that the Z-Score value of SQUARE Pharmaceuticals Ltd is above
average in all the years except in 2018, which is 22.03. Renata Limited and Ambee Pharmaceuticals
Ltd’s Z-Score values were low from 2015-2017 and then they have increased above average for the
next two years. The Z-Score value of Beacon Pharmaceuticals Limited is low from 2015-2018 and it
has increased above average in 2019, which is 3.09. The IBN SINA Pharmaceutical Industry Ltd had
a low value of 4.40 in 2015 and it stood above average for the last four years. ACI Limited and
Beximco Pharmaceuticals Ltd’s Z-Score value stood above the average for the first three years and
then it started declining.
Overall, SQUARE pharmaceutical Limited has higher Z-Score values than other companies,
which indicates that the company is in a very good position. Renata Limited and The IBN SINA
Pharmaceutical Industry Ltd also have higher scores than other companies, which indicate a good
position for investment.
RESULT & CONCLUSION
Summary of Findings
▪ Z-Score of SQUARE Pharmaceuticals Ltd has increased in 2016 and decreased during 2017
and 2018. Then it has increased to the highest in 2019. The results of Z-Score in each study
period are above 2.99.
▪ Z-Score of Renata Limited has increased throughout the study period. The result of Z-Score
in each study period is above 2.99
▪ The results of Z-Score value of Beacon Pharmaceuticals Limited from 2015-2018 is below
2.99, which indicates that it is in the grey zone of 1.8 to 2.99. But from the next financial year
it has increased.
▪ The results of Z-Score of The IBN SINA Pharmaceutical Industry Ltd in each study period
are above 2.99.
▪ The analysis of ACI reveals that z scores varied between 3.78 (2015) to 1.38 (2019). In 2015,
the company was in the safety zone (Z > 2.99) and from 2017 onwards the company is in the
grey zone (Z < 2.99) except in 2018 and 2019.
▪ The results of Z-Score value of Ambee Pharmaceuticals Ltd from 2015-2017 is below 2.99,
which indicates that it is in the grey zone of 1.8 to 2.99. But from the next financial years it
has increased.
▪ The results of Z-Score value of Beximco Pharmaceuticals Ltd shows that the company is in
the safe zone during 2015, 2016 and 2017 as the score is above 2.99. But from 2018-2019 the
score is below 2.99, which indicates that it is in the grey zone of 1.8 to 2.99.
▪ The Z-Score value of SQUARE Pharmaceuticals Ltd is above average in all the years except
in 2018, which is 22.03. Renata Limited and Ambee Pharmaceuticals Ltd’s Z-Score values
were low from 2015-2017 and then they have increased above average for the next two years.
The Z-Score value of Beacon Pharmaceuticals Limited is low from 2015-2018 and it has
increased above average in 2019, which is 3.09. The IBN SINA Pharmaceuticals Industry Ltd
had a low value of 4.40 in 2015 and it stood above average for the last four years.
▪ Overall, SQUARE Pharmaceuticals Limited has higher Z-Score values than other companies
and tops the lists in all aspects, which indicates that the company is in a very good position.
Renata Limited and The IBN SINA Pharmaceuticals Industry Ltd also have higher scores than
other companies, which indicate a good position for investment.
RECOMMENDATIONS & CONCLUSION
From the above study, it has been seen that SQUARE Pharmaceuticals Ltd, Renata Limited and The
IBN SINA Pharmaceuticals Limited hold a very good position with the highest score, which is above
2.99. Beacon Pharmaceuticals Limited was in the grey zone from 2015 to 2018 and only moved to
the safe zone in 2019, indicating that the firm expects to be risky. Ambee Pharmaceuticals Limited
https://www.cribfb.com/journal/index.php/aesr American Economic & Social Review Vol. 7, No. 1; 2021
22
shows improvement year by year. BEXIMCO Pharmaceuticals Limited remains a grey zone that
increases the chance of bankruptcy, so measures must be taken to increase its overall performance.
ACI Limited has a very poor Z-Score and headed the company to the bankruptcy zone. The company
has a higher chance of going bankrupt in the future. Proper measures must be taken to improve the
condition of the distressed companies. Management must give a close look at the various indicators
used in the test in order to bring succession to the company. For each selected company, some
suggestions are provided below.
▪ Beacon Pharmaceuticals Limited has been in the grey zone for the majority of the years,
so it must improve sales revenue, which will improve EBIT in the future, and thus the
company's Z-Score. The company should also take care of its market price of shares to
increase the Z-Score and must look at its working capital and try to increase its current
assets.
▪ The IBN SINA Pharmaceuticals must focus on its sales to hold the position.
▪ ACI Limited has a very poor score, so it must increase the market value of its share. There
must be an adequate proportion of EBIT to total assets. The company must increase its
liquid assets in order to increase net working capital and retained earnings must be
increased in order to increase its Z-Score.
▪ Ambee Pharmaceuticals Limited was in the grey zone for the first three years, so it must
work on its working capital policy. It must make more contribution to its retained earnings.
▪ Beximco Pharmaceuticals Ltd must increase its liquid assets and increase its sales through
new drug development.
▪ All companies must utilize their assets properly and must have realistic goals and efficient
management. There must be sufficient research and development on the products. The
companies must hire skilled manpower.
▪ Measures must be taken to overcome power disruption and trouble with machinery. There
must be sufficient availability of raw materials and the number of shares must also be
increased.
Bangladesh is one of the least developed countries which meets up to 98% of its demand for
pharmaceutical products. It has a market size of nearly BDT 200 billion. Bangladeshi pharmaceutical
products are exported to 147 countries. This industry contributes about 1.85% of total GDP. The
industry has undergone remarkable transformations in recent years, and it is now the most successful
manufacturing industry in the country.
REFERENCES
ACI Limited. (August 10, 2020). Company profile. Retrieve from https://www.aci-bd.com/about-
us/company-profile.html
Ahmmed, M., & Hassan, R. (2019). Performance Evaluation of Some Selected Pharmaceutical
Companies in Bangladesh - A Comparative Analysis. Retrieve from
https://www.researchgate.net/publication/335826987_Performance_Evaluation_of_Some_Sele
cted_Pharmaceutical_Companies_in_Bangladesh_-_A_Comparative_Analysis
Akbar, B. M. B., Achsani, N. A., & Maulana, T. N. A. (2019). Financial Distress of Pharmaceutical
Companies in Indonesia. International Journal of Finance and Banking Research, 5(6), 174-179.
Al Ali, M. S. (2018). The Application of Altman’s Z-Score Model in Determining the Financial
Soundness of Healthcare Companies Listed in Kuwait Stock Exchange. International Journal
of Economic Papers, 3(1), 1–5.
https://www.cribfb.com/journal/index.php/aesr American Economic & Social Review Vol. 7, No. 1; 2021
23
Al-Rawi, K., Kiani, R., & Vedd, R. R., (2018). The Use Of Altman Equation For Bankruptcy
Prediction In An Industrial Firm (Case Study). International Business & Economics Research
Journal, 7(7), 2018.
Altman’s Z-Score Model. (August 3, 2020). CFI. Retrieve from
https://corporatefinanceinstitute.com/about-cfi/
Ambee Pharmaceuticals Ltd. (August 5, 2020). Company profile. Retrieve from
https://www.ambeepharma.com/company_profile
Beacon Pharmaceuticals Limited. (August 5, 2020). About us. Retrieve from
https://www.beaconpharma.com.bd/about-us/
Beximco Pharma. (August 10, 2020). About us. Retrieve from https://beximcopharma.com/about.html
Dakhwani, M. J. P., & Nayak, D. K. (2017) Financial Distress Analysis of Selected Indian
Pharmaceutical Companies . IJEMR, 7(10), 2017.
Faisal, M. A. (2019). Pharmaceutical Industry of Bangladesh: A Multi-Billion Dollar Industry.
Eastern Bank Limited Securities Ltd, Dhaka, 2019. Retrieve from
https://www.arx.cfa/~/media/2A85F9B2CEAB43CFAF325AB54F3EF404
Geethalakshmi, A., & Jothi, K. (2017). Financial Health of Select Indian Pharmaceutical Companies
through Z-Score Model. International Journal of Pure and Applied Mathematics, 117(15),
69-78.
Jannatunnesa, M. (2016). Performance Analysis of Financial Soundness and Determinants of
Profitability of Pharmaceutical Industry in Bangladesh. Journal of Business Studies, 37(1),
2016.
Majumder, M. T. H., & Rahman, M. M. (2011). Financial Analysis of Selected Pharmaceutical
Companies in Bangladesh. Journal of Biology, Agriculture and Healthcare, 1(1).
Mizan, A.N.K., & Hossain, M. M. (2014). Financial Soundness of Cement Industry of Bangladesh:
An Empirical Investigation Using Z-score. American Journal of Trade and Policy, 1(1), 16-22.
Mizan, A.N.K., Amin, M. R., & Rahman, T. (2011). Bankruptcy Prediction by Using the Altman Z-
score Model: An Investigation of the Pharmaceutical Industry in Bangladesh. Bank Parikrama,
36(2-4), 33 – 56.
Niti, N. S. (2019). Potentials of Bangladesh Pharmaceutical Industry: A Comparative Study. Global
Journal of Human-Social Science: H Interdisciplinary, 19(1).
Nsiah, F., & Aidoo, P. (2015). Financial Performance of Listed Pharmaceutical Companies on Ghana
Stock Exchange. Research Journal of Finance and Accounting, 6(2), 2015.
Panda, J. K. & Behera, P. (2015). Financial Distress Prediction of Pharmaceutical Industry through Z-
Score Model. International Journal of Research in Commerce and Management, 6(2), 2015.
Ray, S. (2011). Assessing Corporate Financial Distress in Automobile Industry of India: An

https://www.cribfb.com/journal/index.php/aesr American Economic & Social Review Vol. 7, No. 1; 2021
24
Application of Altman’s Model. Research Journal of Finance and Accounting, 2(3).
Renata Limited. (August 5, 2020). About us. Retrieve from https://renata-ltd.com/about-us/
Square Pharmaceuticals Ltd. Bangladesh. (August 3, 2020). About us. Retrieve from
http://www.squarepharma.com.bd/about-us.php
The IBN SINA Pharmaceutical Industry Ltd. (August 6, 2020). Company overview. Retrieve from
http://www.ibnsinapharma.com/about/company-overview/
Copyrights
Copyright for this article is retained by the author(s), with first publication rights granted to the
journal. This is an open-access article distributed under the terms and conditions of the Creative
Commons Attribution license (http://creativecommons.org/licenses/by/4.0/)