A comparative analysis of ensemble classifiers: case studies in genomics
10
A Comparative Analysis of Ensemble Classifiers: Case Studies in Genomics Sean Whalen and Gaurav Pandey Department of Genetics and Genomic Sciences Icahn Institute for Genomics and Multiscale Biology Icahn School of Medicine at Mount Sinai, New York, USA {sean.whalen,gaurav.pandey}@mssm.edu Abstract—The combination of multiple classifiers using ensem- ble methods is increasingly important for making progress in a variety of difficult prediction problems. We present a comparative analysis of several ensemble methods through two case studies in genomics, namely the prediction of genetic interactions and protein functions, to demonstrate their efficacy on real-world datasets and draw useful conclusions about their behavior. These methods include simple aggregation, meta-learning, cluster-based meta-learning, and ensemble selection using heterogeneous clas- sifiers trained on resampled data to improve the diversity of their predictions. We present a detailed analysis of these methods across 4 genomics datasets and find the best of these methods offer statistically significant improvements over the state of the art in their respective domains. In addition, we establish a novel connection between ensemble selection and meta-learning, demonstrating how both of these disparate methods establish a balance between ensemble diversity and performance. Index Terms—Bioinformatics; Genomics; Supervised learning; Ensemble methods; Stacking; Ensemble selection I. I NTRODUCTION Ensemble methods combining the output of individual clas- sifiers [1], [2] have been immensely successful in producing accurate predictions for many complex classification tasks [3]– [9]. The success of these methods is attributed to their ability to both consolidate accurate predictions and correct errors across many diverse base classifiers [10]. Diversity is key to ensemble performance: If there is complete consensus the ensemble cannot outperform the best base classifier, yet an ensemble lacking any consensus is unlikely to perform well due to weak base classifiers. Successful ensemble methods establish a balance between the diversity and accuracy of the ensemble [11], [12]. However, it remains largely unknown how different ensemble methods achieve this balance to extract the maximum information from the available pool of base classifiers [11], [13]. A better understanding of how different ensemble methods utilize diversity to increase accuracy using complex datasets is needed, which we attempt to address with this paper. Popular methods like bagging [14] and boosting [15] gener- ate diversity by sampling from or assigning weights to training examples but generally utilize a single type of base classifier to build the ensemble. However, such homogeneous ensembles may not be the best choice for problems where the ideal base classifier is unclear. One may instead build an ensemble from the predictions of a wide variety of heterogeneous base clas- sifiers such as support vector machines, neural networks, and decision trees. Two popular heterogeneous ensemble methods include a form of meta-learning called stacking [16], [17] as well as ensemble selection [18], [19]. Stacking constructs a higher-level predictive model over the predictions of base clas- sifiers, while ensemble selection uses an incremental strategy to select base predictors for the ensemble while balancing diversity and performance. Due to their ability to utilize heterogeneous base classifiers, these approaches have superior performance across several application domains [6], [20]. Computational genomics is one such domain where classi- fication problems are especially difficult. This is due in part to incomplete knowledge of how the cellular phenomenon of interest is influenced by the variables and measurements used for prediction, as well as a lack of consensus regarding the best classifier for specific problems. Even from a data perspective, the frequent presence of extreme class imbalance, missing values, heterogeneous data sources of different scale, overlapping feature distributions, and measurement noise fur- ther complicate classification. These difficulties suggest that heterogeneous ensembles constructed from a large and diverse set of base classifiers, each contributing to the final predictions, are ideally suited for this domain. Thus, in this paper we use real-world genomic datasets (detailed in Section II-A) to analyze and compare the performance of ensemble methods for two important problems in this area: 1) prediction of pro- tein functions [21], and 2) predicting genetic interactions [9], both using high-throughput genomic datasets. Constructing accurate predictive models for these problems is notoriously difficult for the above reasons, and even small improvements in predictive accuracy have the potential for large contributions to biomedical knowledge. Indeed, such improvements uncovered the functions of mitochondrial proteins [22] and several other critical protein families. Similarly, the computational discovery of genetic interactions between the human genes EGFR-IFIH1 and FKBP9L-MOSC2 potentially enables novel therapies for glioblastoma [23], the most aggressive type of brain tumor in humans. Working with important problems in computational ge- nomics, we present a comparative analysis of several methods used to construct ensembles from large and diverse sets of base classifiers. Several aspects of heterogeneous ensemble arXiv:1309.5047v1 [cs.LG] 19 Sep 2013
-
Upload
independent -
Category
Documents
-
view
0 -
download
0
Transcript of A comparative analysis of ensemble classifiers: case studies in genomics

A Comparative Analysis of Ensemble Classifiers:Case Studies in Genomics
Sean Whalen and Gaurav PandeyDepartment of Genetics and Genomic Sciences
Icahn Institute for Genomics and Multiscale BiologyIcahn School of Medicine at Mount Sinai, New York, USA
{sean.whalen,gaurav.pandey}@mssm.edu
Abstract—The combination of multiple classifiers using ensem-ble methods is increasingly important for making progress in avariety of difficult prediction problems. We present a comparativeanalysis of several ensemble methods through two case studiesin genomics, namely the prediction of genetic interactions andprotein functions, to demonstrate their efficacy on real-worlddatasets and draw useful conclusions about their behavior. Thesemethods include simple aggregation, meta-learning, cluster-basedmeta-learning, and ensemble selection using heterogeneous clas-sifiers trained on resampled data to improve the diversity oftheir predictions. We present a detailed analysis of these methodsacross 4 genomics datasets and find the best of these methodsoffer statistically significant improvements over the state of theart in their respective domains. In addition, we establish anovel connection between ensemble selection and meta-learning,demonstrating how both of these disparate methods establish abalance between ensemble diversity and performance.
Index Terms—Bioinformatics; Genomics; Supervised learning;Ensemble methods; Stacking; Ensemble selection
I. INTRODUCTION
Ensemble methods combining the output of individual clas-sifiers [1], [2] have been immensely successful in producingaccurate predictions for many complex classification tasks [3]–[9]. The success of these methods is attributed to their abilityto both consolidate accurate predictions and correct errorsacross many diverse base classifiers [10]. Diversity is keyto ensemble performance: If there is complete consensus theensemble cannot outperform the best base classifier, yet anensemble lacking any consensus is unlikely to perform welldue to weak base classifiers. Successful ensemble methodsestablish a balance between the diversity and accuracy of theensemble [11], [12]. However, it remains largely unknown howdifferent ensemble methods achieve this balance to extractthe maximum information from the available pool of baseclassifiers [11], [13]. A better understanding of how differentensemble methods utilize diversity to increase accuracy usingcomplex datasets is needed, which we attempt to address withthis paper.
Popular methods like bagging [14] and boosting [15] gener-ate diversity by sampling from or assigning weights to trainingexamples but generally utilize a single type of base classifierto build the ensemble. However, such homogeneous ensemblesmay not be the best choice for problems where the ideal baseclassifier is unclear. One may instead build an ensemble from
the predictions of a wide variety of heterogeneous base clas-sifiers such as support vector machines, neural networks, anddecision trees. Two popular heterogeneous ensemble methodsinclude a form of meta-learning called stacking [16], [17] aswell as ensemble selection [18], [19]. Stacking constructs ahigher-level predictive model over the predictions of base clas-sifiers, while ensemble selection uses an incremental strategyto select base predictors for the ensemble while balancingdiversity and performance. Due to their ability to utilizeheterogeneous base classifiers, these approaches have superiorperformance across several application domains [6], [20].
Computational genomics is one such domain where classi-fication problems are especially difficult. This is due in partto incomplete knowledge of how the cellular phenomenonof interest is influenced by the variables and measurementsused for prediction, as well as a lack of consensus regardingthe best classifier for specific problems. Even from a dataperspective, the frequent presence of extreme class imbalance,missing values, heterogeneous data sources of different scale,overlapping feature distributions, and measurement noise fur-ther complicate classification. These difficulties suggest thatheterogeneous ensembles constructed from a large and diverseset of base classifiers, each contributing to the final predictions,are ideally suited for this domain. Thus, in this paper weuse real-world genomic datasets (detailed in Section II-A) toanalyze and compare the performance of ensemble methodsfor two important problems in this area: 1) prediction of pro-tein functions [21], and 2) predicting genetic interactions [9],both using high-throughput genomic datasets. Constructingaccurate predictive models for these problems is notoriouslydifficult for the above reasons, and even small improvements inpredictive accuracy have the potential for large contributions tobiomedical knowledge. Indeed, such improvements uncoveredthe functions of mitochondrial proteins [22] and several othercritical protein families. Similarly, the computational discoveryof genetic interactions between the human genes EGFR-IFIH1and FKBP9L-MOSC2 potentially enables novel therapies forglioblastoma [23], the most aggressive type of brain tumor inhumans.
Working with important problems in computational ge-nomics, we present a comparative analysis of several methodsused to construct ensembles from large and diverse sets ofbase classifiers. Several aspects of heterogeneous ensemble
arX
iv:1
309.
5047
v1 [
cs.L
G]
19
Sep
2013
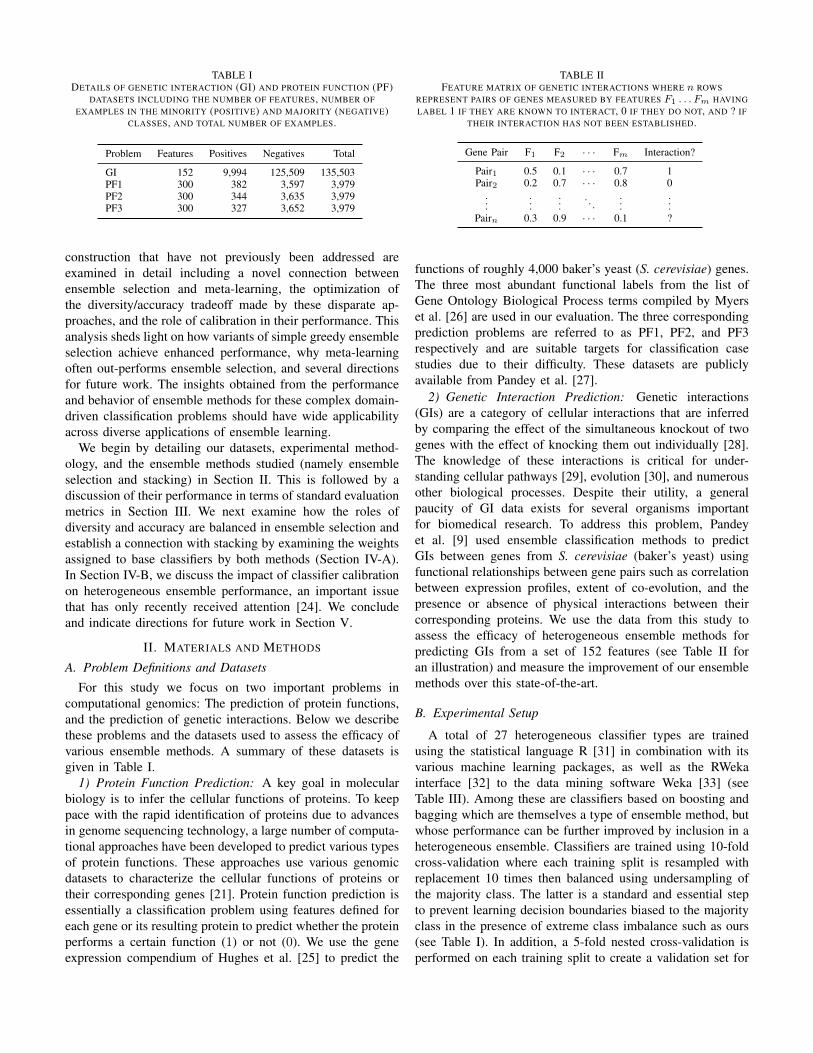
TABLE IDETAILS OF GENETIC INTERACTION (GI) AND PROTEIN FUNCTION (PF)
DATASETS INCLUDING THE NUMBER OF FEATURES, NUMBER OFEXAMPLES IN THE MINORITY (POSITIVE) AND MAJORITY (NEGATIVE)
CLASSES, AND TOTAL NUMBER OF EXAMPLES.
Problem Features Positives Negatives Total
GI 152 9,994 125,509 135,503PF1 300 382 3,597 3,979PF2 300 344 3,635 3,979PF3 300 327 3,652 3,979
construction that have not previously been addressed areexamined in detail including a novel connection betweenensemble selection and meta-learning, the optimization ofthe diversity/accuracy tradeoff made by these disparate ap-proaches, and the role of calibration in their performance. Thisanalysis sheds light on how variants of simple greedy ensembleselection achieve enhanced performance, why meta-learningoften out-performs ensemble selection, and several directionsfor future work. The insights obtained from the performanceand behavior of ensemble methods for these complex domain-driven classification problems should have wide applicabilityacross diverse applications of ensemble learning.
We begin by detailing our datasets, experimental method-ology, and the ensemble methods studied (namely ensembleselection and stacking) in Section II. This is followed by adiscussion of their performance in terms of standard evaluationmetrics in Section III. We next examine how the roles ofdiversity and accuracy are balanced in ensemble selection andestablish a connection with stacking by examining the weightsassigned to base classifiers by both methods (Section IV-A).In Section IV-B, we discuss the impact of classifier calibrationon heterogeneous ensemble performance, an important issuethat has only recently received attention [24]. We concludeand indicate directions for future work in Section V.
II. MATERIALS AND METHODS
A. Problem Definitions and Datasets
For this study we focus on two important problems incomputational genomics: The prediction of protein functions,and the prediction of genetic interactions. Below we describethese problems and the datasets used to assess the efficacy ofvarious ensemble methods. A summary of these datasets isgiven in Table I.
1) Protein Function Prediction: A key goal in molecularbiology is to infer the cellular functions of proteins. To keeppace with the rapid identification of proteins due to advancesin genome sequencing technology, a large number of computa-tional approaches have been developed to predict various typesof protein functions. These approaches use various genomicdatasets to characterize the cellular functions of proteins ortheir corresponding genes [21]. Protein function prediction isessentially a classification problem using features defined foreach gene or its resulting protein to predict whether the proteinperforms a certain function (1) or not (0). We use the geneexpression compendium of Hughes et al. [25] to predict the
TABLE IIFEATURE MATRIX OF GENETIC INTERACTIONS WHERE n ROWS
REPRESENT PAIRS OF GENES MEASURED BY FEATURES F1 . . . Fm HAVINGLABEL 1 IF THEY ARE KNOWN TO INTERACT, 0 IF THEY DO NOT, AND ? IF
THEIR INTERACTION HAS NOT BEEN ESTABLISHED.
Gene Pair F1 F2 · · · Fm Interaction?
Pair1 0.5 0.1 · · · 0.7 1Pair2 0.2 0.7 · · · 0.8 0
......
.... . .
......
Pairn 0.3 0.9 · · · 0.1 ?
functions of roughly 4,000 baker’s yeast (S. cerevisiae) genes.The three most abundant functional labels from the list ofGene Ontology Biological Process terms compiled by Myerset al. [26] are used in our evaluation. The three correspondingprediction problems are referred to as PF1, PF2, and PF3respectively and are suitable targets for classification casestudies due to their difficulty. These datasets are publiclyavailable from Pandey et al. [27].
2) Genetic Interaction Prediction: Genetic interactions(GIs) are a category of cellular interactions that are inferredby comparing the effect of the simultaneous knockout of twogenes with the effect of knocking them out individually [28].The knowledge of these interactions is critical for under-standing cellular pathways [29], evolution [30], and numerousother biological processes. Despite their utility, a generalpaucity of GI data exists for several organisms importantfor biomedical research. To address this problem, Pandeyet al. [9] used ensemble classification methods to predictGIs between genes from S. cerevisiae (baker’s yeast) usingfunctional relationships between gene pairs such as correlationbetween expression profiles, extent of co-evolution, and thepresence or absence of physical interactions between theircorresponding proteins. We use the data from this study toassess the efficacy of heterogeneous ensemble methods forpredicting GIs from a set of 152 features (see Table II foran illustration) and measure the improvement of our ensemblemethods over this state-of-the-art.
B. Experimental Setup
A total of 27 heterogeneous classifier types are trainedusing the statistical language R [31] in combination with itsvarious machine learning packages, as well as the RWekainterface [32] to the data mining software Weka [33] (seeTable III). Among these are classifiers based on boosting andbagging which are themselves a type of ensemble method, butwhose performance can be further improved by inclusion in aheterogeneous ensemble. Classifiers are trained using 10-foldcross-validation where each training split is resampled withreplacement 10 times then balanced using undersampling ofthe majority class. The latter is a standard and essential stepto prevent learning decision boundaries biased to the majorityclass in the presence of extreme class imbalance such as ours(see Table I). In addition, a 5-fold nested cross-validation isperformed on each training split to create a validation set for

TABLE IIIINDIVIDUAL PERFORMANCE OF 27 BASE CLASSIFIERS ON GENETIC
INTERACTION AND PROTEIN FUNCTION DATASETS EVALUATED USING ACOMBINATION OF R [31], CARET [34], AND THE RWEKA INTERFACE [32]
TO WEKA [33]. DETAILS OF EACH CLASSIFIER ARE OMITTED FORBREVITY. R PACKAGES INCLUDE A CITATION DESCRIBING THE METHOD.
FOR ALL OTHERS, SEE THE WEKA DOCUMENTATION. FOR BOOSTINGMETHODS WITH SELECTABLE BASE LEARNERS, THE DEFAULT (NORMALLY
A DECISION STUMP) IS USED.
Performance
Classifier GI PF1 PF2 PF3
Functionsglmboost [35] 0.72 0.65 0.71 0.72glmnet [36] 0.73 0.63 0.71 0.73Logistic 0.73 0.61 0.66 0.71MultilayerPerceptron 0.74 0.64 0.71 0.74multinom [37] 0.73 0.61 0.67 0.71RBFClassifier 0.73 0.62 0.69 0.74RBFNetwork 0.56 0.51 0.52 0.58SGD 0.73 0.63 0.70 0.73SimpleLogistic 0.73 0.65 0.72 0.73SMO 0.73 0.64 0.70 0.73SPegasos 0.66 0.52 0.56 0.56VotedPerceptron 0.65 0.62 0.70 0.71
TreesAdaBoostM1 0.71 0.65 0.67 0.73ADTree 0.73 0.64 0.67 0.75gbm [38] 0.77 0.68 0.72 0.78J48 0.75 0.60 0.65 0.71LADTree 0.74 0.64 0.69 0.75LMT 0.76 0.62 0.71 0.75LogitBoost 0.73 0.65 0.69 0.75MultiBoostAB 0.70 0.63 0.66 0.70RandomTree 0.71 0.57 0.60 0.63rf [39] 0.79 0.67 0.72 0.76
Rule-BasedJRip 0.76 0.63 0.67 0.70PART 0.76 0.59 0.65 0.73
OtherIBk 0.70 0.61 0.66 0.70pam [40] 0.71 0.62 0.66 0.64VFI 0.64 0.55 0.56 0.63
the corresponding test split. This validation set is used for themeta-learning and ensemble selection techniques described inSection II-C. The final result is a pool of 270 classifiers.
Performance is measured by combining the predictionsmade on each test split resulting from cross-validation intoa single set and calculating the area under the Receiver Oper-ating Characteristic curve (AUC). The performance of the 27base classifiers for each dataset is given in Table III, wherethe bagged predictions for each base classifier are averagedbefore calculating the AUC. These numbers become importantin later discussions since ensemble methods involve a tradeoffbetween the diversity of predictions and the performance ofbase classifiers constituting the ensemble.
C. Ensemble Methods
1) Simple Aggregation: The predictions of each base clas-sifier become columns in a matrix where rows are instancesand the entry at row i, column j is the probability of instance ibelonging to the positive class as as predicted by classifier j.We evaluate ensembles using AUC by applying the mean
across rows to produce an aggregate prediction for eachinstance.
2) Meta-Learning: Meta-learning is a general technique forimproving the performance of multiple classifiers by using themeta information they provide. A common approach to meta-learning is stacked generalization (stacking) [17] that trains ahigher-level (level 1) classifier on the outputs of base (level 0)classifiers.
Using the standard formulation of Ting and Witten [41],we perform meta-learning using stacking with a level 1 lo-gistic regression classifier trained on the probabilistic outputsof multiple heterogeneous level 0 classifiers. Though otherclassifiers may be used, a simple logistic regression meta-classifier helps avoid overfitting which typically results insuperior performance [41]. In addition, its coefficients havean intuitive interpretation as the weighted importance of eachlevel 0 classifier [6].
The layer 1 classifier is trained on a validation set createdby the nested cross-validation of a particular training split andevaluated against the corresponding test split to prevent theleaking of label information. Overall performance is evaluatedas described in Section II-B.
In addition to stacking across all classifier outputs, wealso evaluate stacking using only the aggregate output ofeach resampled (bagged) base classifier. For example, theoutputs of all 10 SVM classifiers are averaged and used asa single level 0 input to the meta learner. Intuitively thiscombines classifier outputs that have similar performance andcalibration, which allows stacking to focus on weights between(instead of within) classifier types.
3) Cluster-Based Meta-Learning: A variant on traditionalstacking is to first cluster classifiers with similar predictions,then learn a separate level 1 classifier for each cluster [6].Alternately, classifiers within a cluster can first be combinedby taking their mean (for example) and then learning alevel 1 classifier on these per-cluster averaged outputs. Thisis a generalization of the aggregation approach describedin Section II-C2 but using a distance measure instead ofrestricting each cluster to bagged homogeneous classifiers. Weuse hierarchical clustering with 1− |ρ| (where ρ is Pearson’scorrelation) as a distance measure. We found little differencebetween alternate distance measures based on Pearson andSpearman correlation and so present results using only thisformulation.
For simplicity, we refer to the method of stacking withinclusters and taking the mean of level 1 outputs as intra-clusterstacking. Its complement, inter-cluster stacking, averages theoutputs of classifiers within a cluster then performs stacking onthe averaged level 0 outputs. The intuition for both approachesis to group classifiers with similar (but ideally non-identical)predictions together and learn how to best resolve their dis-agreements via weighting. Thus the diversity of classifierpredictions within a cluster is important, and the effectivenessof this method is tied to a distance measure that can utilizeboth accuracy and diversity.
4) Ensemble Selection: Ensemble selection is the pro-cess of choosing a subset of all available classifiers thatperform well together, since including every classifier maydecrease performance. Testing all possible classifier com-binations quickly becomes infeasible for ensembles of anypractical size and so heuristics are used to approximate theoptimal subset. The performance of the ensemble can onlyimprove upon that of the best base classifier if the ensem-ble has a sufficient pool of accurate and diverse classifiers,and so successful selection methods must balance these tworequirements.
We establish a baseline for this approach by performingsimple greedy ensemble selection, sorting base classifiers bytheir individual performance and iteratively adding the bestunselected classifier to the ensemble. This approach disregardshow well the classifier actually complements the performanceof the ensemble.
Improving on this approach, Caruana et al.’s ensembleselection (CES) [18], [19] begins with an empty ensemble anditeratively adds new predictors that maximize its performanceaccording to a chosen metric (here, AUC). At each iteration, anumber of candidate classifiers are randomly selected and theperformance of the current ensemble including the candidateis evaluated. The candidate resulting in the best ensembleperformance is selected and the process repeats until a maxi-mum ensemble size is reached. The evaluation of candidatesaccording to their performance with the ensemble, instead ofin isolation, improves the performance of CES over simplegreedy selection.
Additional improvements over simple greedy selection in-clude 1) initializing the ensemble with the top n base clas-sifiers, and 2) allowing classifiers to be added multiple times.The latter is particularly important as without replacement,the best classifiers are added early and ensemble performancethen decreases as poor predictors are forced into the ensem-ble. Replacement gives more weight to the best performingpredictors while still allowing for diversity. We use an initialensemble size of n = 2 to reduce the effect of multiple baggedversions of a single high performance classifier dominating theselection process, and (for completeness) evaluate all candidateclassifiers instead of sampling.
Ensemble predictions are combined using a cumulativemoving average to speed the evaluation of ensemble perfor-mance for each candidate predictor. Selection is performed onthe validation set produced by nested cross-validation and theresulting ensemble evaluated as described in Section II-B.
D. Diversity Measures
The diversity of predictions made by members of an en-semble determines the ensemble’s ability to outperform thebest individual, a long-accepted property which we explore inthe following sections. We measure diversity using Yule’s Q-statistic [42] by first creating predicted labels from thresholdedclassifier probabilities, yielding a 1 for values greater than 0.5and 0 otherwise. Given the predicted labels produced by eachpair of classifiers Di and Dk, we generate a contingency table
counting how often each classifier produces the correct labelin relation to the other:
Dk correct (1) Dk incorrect (0)
Di correct (1) N11 N10
Di wrong (0) N01 N00
The pairwise Q statistic is then defined as:
Qi,k =N11N00 −N01N10
N11N00 +N01N10. (1)
This produces values tending towards 1 when Di and Dk
correctly classify the same instances, 0 when they do not,and −1 when they are negatively correlated. We evaluatedadditional diversity measures such as Cohen’s κ-statistic [43]but found little practical difference between the measures (inagreement with Kuncheva et al. [11]) and focus on Q forits simplicity. Multicore performance and diversity measuresare implemented in C++ using the Rcpp package [44]. Thisproves essential for their practical use with large ensemblesand nested cross validation.
We adjust raw Q values using the transformation 1− |Q|so that 0 represents no diversity and 1 represents maximumdiversity for graphical clarity.
III. ENSEMBLE PERFORMANCE
Performance of the methods described in Section II-C issummarized in Table IV. Overall, aggregated stacking is thebest performer and edges out CES for all our datasets. Theuse of clustering in combination with stacking also performswell for certain cluster sizes k. Intra-cluster stacking performsbest with cluster sizes 2, 14, 20, and 15 for GI, PF1, PF2,and PF3, respectively. Inter-cluster stacking is optimal forsizes 24, 33, 33, and 36 on the same datasets. Due to thesize of the GI dataset, only 10% of the validation set isused for non-aggregate stacking and cluster stacking methods.Performance levels off beyond 10% and so this approach doesnot significantly penalize these methods. This step was notnecessary for the other methods and datasets.
Ensemble selection also performs well, though we anticipateissues of calibration (detailed in Section IV-B) could have anegative impact since the mean is used to aggregate ensemblepredictions. Greedy selection achieves best performance forensemble sizes of 10, 14, 45, and 38 for GI, PF1, PF2, andPF3, respectively. CES is optimal for sizes 70, 43, 34, and 56for the same datasets. Though the best performing ensemblesfor both selection methods are close in performance, simplegreedy selection is much worse for non-optimal ensemble sizesthan CES and its performance typically degrades after the bestfew base classifiers are selected (see Section IV-A). Thus, onaverage CES is the superior selection method.
In agreement with Altman et al. [6], we find the meanis the highest performing simple aggregation method forcombining ensemble predictions. However, because we areusing heterogeneous classifiers that may have uncalibratedoutputs, the mean combines predictions made with different

TABLE IVAUC OF ENSEMBLE LEARNING METHODS FOR PROTEIN FUNCTION AND
GENETIC INTERACTION DATASETS. METHODS INCLUDE MEANAGGREGATION, GREEDY ENSEMBLE SELECTION, SELECTION WITH
REPLACEMENT (CES), STACKING WITH LOGISTIC REGRESSION,AGGREGATED STACKING (AVERAGING RESAMPLED HOMOGENEOUS BASE
CLASSIFIERS BEFORE STACKING), STACKING WITHIN CLUSTERS THENAVERAGING (INTRA), AND AVERAGING WITHIN CLUSTERS THEN
STACKING (INTRA). THE BEST PERFORMING BASE CLASSIFIER (RANDOMFOREST FOR THE GI DATASET AND GBM FOR PFS) IS GIVEN FOR
REFERENCE. STARRED VALUES ARE GENERATED FROM A SUBSAMPLE OFTHE VALIDATION SET DUE TO ITS SIZE; SEE TEXT FOR DETAIL.
Performance
Method GI PF1 PF2 PF3
Best Base Classifier 0.79 0.68 0.72 0.78Mean Aggregation 0.763 0.669 0.732 0.773Greedy Selection 0.792 0.684 0.734 0.779CES 0.802 0.686 0.741 0.785Stacking (Aggregated) 0.812 0.687 0.742 0.788Stacking (All) 0.809∗ 0.684 0.726 0.773Intra-Cluster Stacking 0.799∗ 0.684 0.725 0.775Inter-Cluster Stacking 0.786∗ 0.683 0.735 0.783
TABLE VPAIRWISE PERFORMANCE COMPARISON OF MULTIPLE NON-ENSEMBLE
AND ENSEMBLE METHODS ACROSS DATASETS. ONLY PAIRS WITHSTATISTICALLY SIGNIFICANT DIFFERENCES, DETERMINED BY
FRIEDMAN/NEMENYI TESTS AT α = 0.05, ARE SHOWN.
Method A Method B p-value
Best Base Classifier CES 0.001902Best Base Classifier Stacking (Aggregated) 0.000136CES Inter-Cluster Stacking 0.037740CES Intra-Cluster Stacking 0.014612CES Mean Aggregation 0.000300CES Stacking (All) 0.029952Greedy Selection Mean Aggregation 0.029952Greedy Selection Stacking (Aggregated) 0.005364Inter-Cluster Stacking Mean Aggregation 0.047336Inter-Cluster Stacking Stacking (Aggregated) 0.003206Intra-Cluster Stacking Stacking (Aggregated) 0.001124Mean Aggregation Stacking (Aggregated) 0.000022Stacking (Aggregated) Stacking (All) 0.002472
TABLE VIGROUPED PERFORMANCE COMPARISON OF MULTIPLE NON-ENSEMBLEAND ENSEMBLE METHODS ACROSS DATASETS. METHODS SHARING A
GROUP LETTER HAVE STATISTICALLY SIMILAR PERFORMANCE,DETERMINED BY FRIEDMAN/NEMENYI TESTS AT α = 0.05. AGGREGATED
STACKING AND CES DEMONSTRATE THE BEST PERFORMANCE, WHILEGREEDY SELECTION IS SIMILAR TO CES (BUT NOT STACKING).
Group Method Rank Sum
a Stacking (Aggregated) 32ab CES 27bc Greedy Selection 18c Inter-Cluster Stacking 17cd Stacking (All) 16.5cd Intra-Cluster Stacking 15cd Best Base Classifier 11d Mean Aggregation 7.5
scales or notions of probability. This explains its poor perfor-mance compared to the best base classifier in a heterogeneousensemble and emphasizes the need for ensemble selection orweighting via stacking to take full advantage of the ensemble.We discuss the issue of calibration in Section IV-B.
Thus, we observe consistent performance trends across thesemethods. However, to draw meaningful conclusions it is criti-cal to determine if the performance differences are statisticallysignificant. For this we employ the standard methodologygiven by Demsar [45] to test for statistically significant perfor-mance differences between multiple methods across multipledatasets. The Friedman test [46] first determines if thereare statistically significant differences between any pair ofmethods over all datasets, followed by a post-hoc Nemenyitest [47] to calculate a p-value for each pair of methods. Thisis the non-parametric equivalent of ANOVA combined with aTukey HSD post-hoc test where the assumption of normallydistributed values is removed by using rank transformations.As many of the assumptions of parametric tests are violatedby machine learning algorithms, the Friedman/Nemenyi test ispreferred despite reduced statistical power [45].
Using the Freidman/Nemeyi approach with a cutoffof α = 0.05, the pairwise comparison between our ensembleand non-ensemble methods is shown in Table V. For brevity,only methods with statistically significant performance differ-ences are shown. The ranked performance of each methodacross all datasets is shown in Table VI. Methods sharing alabel in the group column have statistically indistinguishableperformance based on their summed rankings. This tableshows that aggregated stacking and CES have the best perfor-mance, while CES and pure greedy selection have similar per-formance. However, aggregated stacking and greedy selectiondo not share a group as their summed ranks are too distant andthus have a significant performance difference. The remainingapproaches including non-aggregated stacking are statisticallysimilar to mean aggregation and motivates our inclusion ofcluster-based stacking, whose performance may improve givena more suitable distance metric. These rankings statisticallyreinforce the general trends presented earlier in Table IV.
We note that nested cross-validation, relative to a singlevalidation set, improves the performance of both stacking andCES by increasing the amount of meta data available as wellas the bagging that occurs as a result. Both effects reduceoverfitting but performance is still typically better with smallerensembles. More nested folds increase the quality of the metadata and thus affects the performance of these methods as well,though computation time increases substantially and motivatesour selection of k = 5 nested folds.
Finally, we emphasize that each method we evaluate out-performs the previous state of the art AUC of 0.741 forGI prediction [9]. In particular, stacked aggregation resultsin the prediction of 988 additional genetic interactions ata 10% false discovery rate. In addition, these heterogeneousensemble methods out-perform random forests and gradientboosted regression models which are themselves homogeneousensembles. This demonstrates the value of heterogeneous

0.60
0.65
0.70
0.75
0.00 0.25 0.50 0.75 1.00Pairwise Diversity (1 − |Q|)
Pai
rwis
e P
erfo
rman
ce (
AU
C)
0.55
0.60
0.65
0.70
0.75
0.00 0.25 0.50 0.75Pairwise Diversity (1 − |Q|)
Pai
rwis
e P
erfo
rman
ce (
AU
C)
Fig. 1. Performance as a function of diversity for all pairwise combinationsof 27 base classifiers on the GI (top figure) and PF3 (bottom figure) datasets.More diverse combinations typically result in less performance except forhigh-performance classifiers such as random forests and generalized boostedregression models, whose points are shown in red if they are part of a pair.Raw Q values are adjusted so that larger values imply more diversity.
ensembles for improving predictive performance.
IV. ENSEMBLE CHARACTERISTICS
A. The Role of Diversity
The relationship between ensemble diversity and perfor-mance has immediate impact on practitioners of ensemblemethods, yet has not formally been proven despite extensivestudy [11], [13]. For brevity we analyze this tradeoff using GIand PF3 as representative datasets, though the trends observedgeneralize to PF1 and PF2.
Figure 1 presents a high-level view of the relationshipbetween performance and diversity, plotting the diversity ofpairwise classifiers against their performance as an ensembleby taking the mean of their predictions. This figure shows the
0.1
0.2
0.3
0 20 40 60Iteration
Ens
embl
e D
iver
sity
(1
− |Q
|)
.76 .77 .78 .79
Ensemble Performance (AUC)
0.1
0.2
0.3
0.4
0.5
0 20 40 60Iteration
Ens
embl
e D
iver
sity
(1
− |Q
|)
.76 .77 .78
Ensemble Performance (AUC)
Fig. 2. Ensemble diversity and performance as a function of iterationnumber for both greedy selection (bottom curve) and CES (top curve) onthe GI and PF3 datasets. For GI (top figure), greedy selection fails toimprove diversity and performance decreases with ensemble size, while CESsuccessfully balances diversity and performance (shown by a shift in colorfrom red to yellow as height increases) and reaches an equilibrium over time.For PF3 (bottom figure), greedy selection manages to improve diversity arounditeration 30 but accuracy decreases, demonstrating that diverse predictionsalone are not enough for accurate ensembles.
complicated relationship between diversity and performancethat holds for each of our datasets: Two highly diverseclassifiers are more likely to perform poorly due to lowerprediction consensus. There are exceptions, and these tendto include well-performing base classifiers such as randomforests and gradient boosted regression models (shown in redin Figure 1) which achieve high AUC on their own and stand togain from a diverse partner. Diversity works in tension withperformance, and while improving performance depends ondiversity, the wrong kind of diversity limits performance ofthe ensemble [48].
Figure 2 demonstrates this tradeoff by plotting ensemblediversity and performance as a function of the iteration numberof the simple greedy selection and CES methods detailed in

TABLE VIITHE MOST-WEIGHTED CLASSIFIERS PRODUCED BY STACKING WITH
LOGISTIC REGRESSION (WEIGHTm) AND CES (WEIGHTc) FOR THE PF3DATASET, ALONG WITH THEIR AVERAGE PAIRWISE DIVERSITY AND
PERFORMANCE.
Classifier Weightm Weightc Div. AUC
rf 0.25 0.21 0.39 0.71gbm 0.20 0.27 0.42 0.72RBFClassifier - 0.05 0.45 0.71MultilayerPerceptron 0.09 - 0.46 0.70SGD 0.09 0.04 0.47 0.69VFI 0.11 0.11 0.71 0.66IBk 0.09 0.13 0.72 0.68
Section II for the GI (top figure) and PF3 (bottom figure)datasets. These figures reveal how CES (top curve) success-fully exploits the tradeoff between diversity and performancewhile a purely greedy approach (bottom curve) actually de-creases in performance over iterations after the best individualbase classifiers are added. This is shown via coloring, whereCES shifts from red to yellow (better performance) as itsdiversity increases while greedy selection grows darker red(worse performance) as its diversity only slightly increases.Note that while greedy selection increases ensemble diversityaround iteration 30 for PF3, overall performance continues todecrease. This demonstrates that diversity must be balancedwith accuracy to create well-performing ensembles.
To illustrate using the PF3 panel of Figure 2, the first classi-fiers chosen by CES (in order) are rf.1, rf.7, gbm.2, RBFClas-sifier.0, MultilayerPerceptron.9, and gbm.3 where numbersindicate bagged versions of a base classifier. RBFClassifier.0 isa low performance, high diversity classifier while the others arethe opposite (see Table III for a summary of base classifiers).This ensemble shows how CES tends to repeatedly selectbase classifiers that improve performance, then selects a morediverse and typically worse performing classifier. Here theformer are different bagged versions of a random forest whilethe latter is RBFClassifier.0. This manifests in the left partof the upper curve where diversity is low and then jumps toits first peak. After this, a random forest is added again tobalance performance and diversity drops until the next peak.This process is repeated while the algorithm approaches aweighted equilibrium of high performing, low diversity andlow performing, high diversity classifiers.
This agrees with recent observations that diversity enforcesa kind of regularization for ensembles [13], [49]: Performancestops increasing when there is no more diversity to extractfrom the pool of possible classifiers. We see this in the PF3panel of Figure 2 as performance reaches its peak, where smalloscillations in diversity represent re-balancing the weights tomaintain performance past the optimal ensemble size.
Since ensemble selection and stacking are top performersand can both be interpreted as learning to weight differentbase classifiers, we next compare the most heavily weightedclassifiers selected by CES (Weightc) with the coefficients ofa level 1 logistic regression meta-learner (Weightm). We com-
TABLE VIIICANDIDATE CLASSIFIERS SORTED BY MEAN PAIRWISE DIVERSITY AND
PERFORMANCE. THE MOST HEAVILY WEIGHTED CLASSIFIERS FOR BOTHCES AND STACKING ARE SHOWN IN BOLD. THIS TREND, WHICH HOLDS
ACROSS DATASETS, SHOWS THE PAIRING OF HIGH-PERFORMANCELOW-DIVERSITY CLASSIFIERS WITH THEIR COMPLEMENTS,
DEMONSTRATING HOW SEEMINGLY DISPARATE APPROACHES CREATE ABALANCE OF DIVERSITY AND PERFORMANCE.
Classifier Diversity AUC
rf 0.386 0.712gbm 0.419 0.720glmnet 0.450 0.694glmboost 0.452 0.680RBFClassifier 0.453 0.713SimpleLogistic 0.459 0.689MultilayerPerceptron 0.459 0.706SMO 0.462 0.695SGD 0.470 0.693LMT 0.472 0.692pam 0.525 0.673LogitBoost 0.528 0.691ADTree 0.539 0.682VotedPerceptron 0.540 0.694multinom 0.553 0.677LADTree 0.568 0.678Logistic 0.574 0.669AdaBoostM1 0.584 0.684PART 0.615 0.652MultiBoostAB 0.615 0.679J48 0.632 0.645JRip 0.687 0.627VFI 0.713 0.662IBk 0.720 0.682RBFNetwork 0.778 0.653RandomTree 0.863 0.602SPegasos 0.980 0.634
pute Weightc as the normalized counts of classifiers includedin the ensemble, resulting in greater weight for classifiersselected multiple times. These weights for PF3 are shown inTable VII.
Nearly the same classifiers receive the most weight underboth approaches (though logistic regression coefficients werenot restricted to positive values so we cannot directly compareweights between methods). However, the general trend ofthe relative weights is clear and explains the oscillationsseen in Figure 2: High performance, low diversity classifiersare repeatedly paired with higher diversity, lower performingclassifiers. A more complete picture of selection emerges byexamining the full list of candidate base classifiers (Table VIII)with the most weighted ensemble classifiers shown in bold.The highest performing, lowest diversity GBM and RF classi-fiers appear at the top of the list while VFI and IBk are near thebottom. Though there are more diverse classifiers than VFI andIBk, they were not selected due to their lower performance.
This example illustrates how diversity and performance arebalanced during selection, and also gives new insight intothe nature of stacking due to the convergent weights of theseseemingly different approaches. A metric incorporating bothmeasures should increase the performance of hybrid methodssuch as cluster-based stacking, which we plan to investigatein future work.
Base Classifiers Ensembles (CES) Ensembles (Greedy)
0.6
0.7
0.7875
0.7900
0.7925
0.7950
0.76
0.77
0.78
0.1 0.2 0.3 0.140 0.145 0.150 0.155 0.15 0.16 0.17 0.18Brier Score
Per
form
ance
(A
UC
)
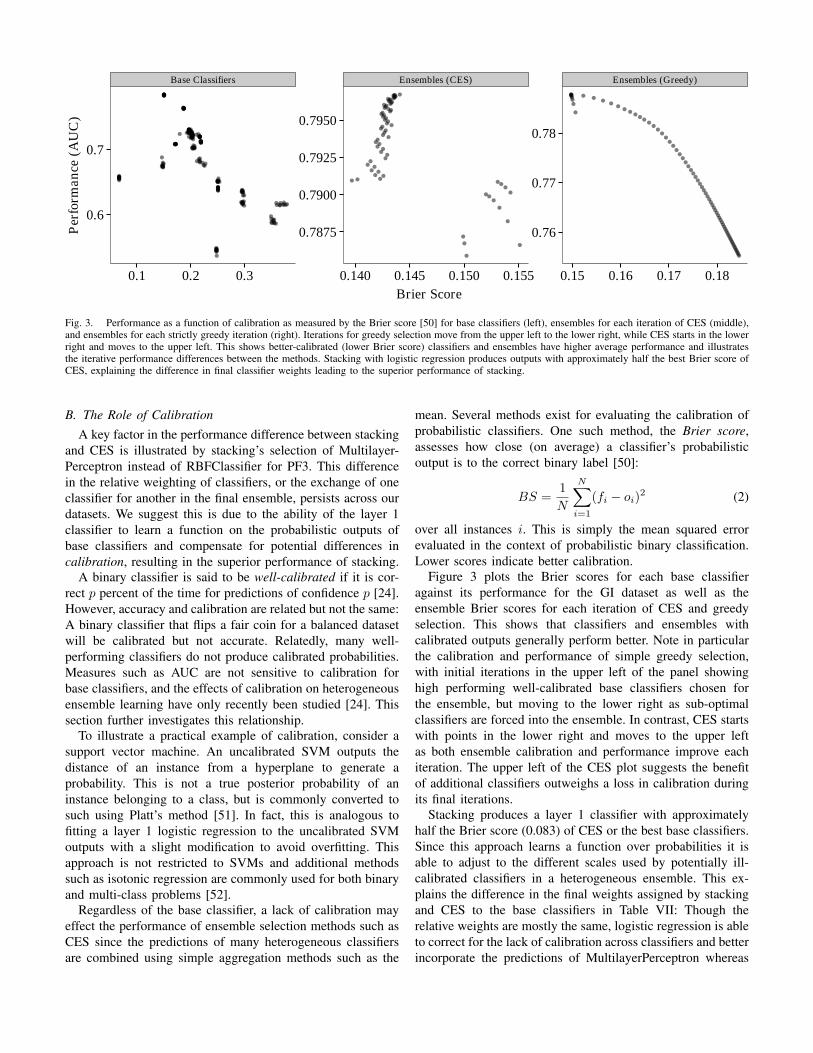
Fig. 3. Performance as a function of calibration as measured by the Brier score [50] for base classifiers (left), ensembles for each iteration of CES (middle),and ensembles for each strictly greedy iteration (right). Iterations for greedy selection move from the upper left to the lower right, while CES starts in the lowerright and moves to the upper left. This shows better-calibrated (lower Brier score) classifiers and ensembles have higher average performance and illustratesthe iterative performance differences between the methods. Stacking with logistic regression produces outputs with approximately half the best Brier score ofCES, explaining the difference in final classifier weights leading to the superior performance of stacking.
B. The Role of CalibrationA key factor in the performance difference between stacking
and CES is illustrated by stacking’s selection of Multilayer-Perceptron instead of RBFClassifier for PF3. This differencein the relative weighting of classifiers, or the exchange of oneclassifier for another in the final ensemble, persists across ourdatasets. We suggest this is due to the ability of the layer 1classifier to learn a function on the probabilistic outputs ofbase classifiers and compensate for potential differences incalibration, resulting in the superior performance of stacking.
A binary classifier is said to be well-calibrated if it is cor-rect p percent of the time for predictions of confidence p [24].However, accuracy and calibration are related but not the same:A binary classifier that flips a fair coin for a balanced datasetwill be calibrated but not accurate. Relatedly, many well-performing classifiers do not produce calibrated probabilities.Measures such as AUC are not sensitive to calibration forbase classifiers, and the effects of calibration on heterogeneousensemble learning have only recently been studied [24]. Thissection further investigates this relationship.
To illustrate a practical example of calibration, consider asupport vector machine. An uncalibrated SVM outputs thedistance of an instance from a hyperplane to generate aprobability. This is not a true posterior probability of aninstance belonging to a class, but is commonly converted tosuch using Platt’s method [51]. In fact, this is analogous tofitting a layer 1 logistic regression to the uncalibrated SVMoutputs with a slight modification to avoid overfitting. Thisapproach is not restricted to SVMs and additional methodssuch as isotonic regression are commonly used for both binaryand multi-class problems [52].
Regardless of the base classifier, a lack of calibration mayeffect the performance of ensemble selection methods such asCES since the predictions of many heterogeneous classifiersare combined using simple aggregation methods such as the
mean. Several methods exist for evaluating the calibration ofprobabilistic classifiers. One such method, the Brier score,assesses how close (on average) a classifier’s probabilisticoutput is to the correct binary label [50]:
BS =1
N
N∑i=1
(fi − oi)2 (2)
over all instances i. This is simply the mean squared errorevaluated in the context of probabilistic binary classification.Lower scores indicate better calibration.
Figure 3 plots the Brier scores for each base classifieragainst its performance for the GI dataset as well as theensemble Brier scores for each iteration of CES and greedyselection. This shows that classifiers and ensembles withcalibrated outputs generally perform better. Note in particularthe calibration and performance of simple greedy selection,with initial iterations in the upper left of the panel showinghigh performing well-calibrated base classifiers chosen forthe ensemble, but moving to the lower right as sub-optimalclassifiers are forced into the ensemble. In contrast, CES startswith points in the lower right and moves to the upper leftas both ensemble calibration and performance improve eachiteration. The upper left of the CES plot suggests the benefitof additional classifiers outweighs a loss in calibration duringits final iterations.
Stacking produces a layer 1 classifier with approximatelyhalf the Brier score (0.083) of CES or the best base classifiers.Since this approach learns a function over probabilities it isable to adjust to the different scales used by potentially ill-calibrated classifiers in a heterogeneous ensemble. This ex-plains the difference in the final weights assigned by stackingand CES to the base classifiers in Table VII: Though therelative weights are mostly the same, logistic regression is ableto correct for the lack of calibration across classifiers and betterincorporate the predictions of MultilayerPerceptron whereas

CES cannot. In this case, a calibrated MultilayerPerceptronserves to improve performance of the ensemble and thusstacking outperforms CES.
In summary, this section demonstrates the tradeoff betweenperformance and diversity made by CES and examines itsconnection with stacking. There is significant overlap in therelative weights of the most important base classifiers selectedby both methods. From this set of classifiers, stacking oftenassigns more weight to a particular classifier as compared toCES and this result holds across our datasets. We attribute thesuperior performance of stacking to this difference, originat-ing from its ability to accommodate differences in classifiercalibration that are likely to occur in large heterogeneousensembles. This claim is substantiated by its significantlylower Brier score compared to CES as well as the correlationbetween ensemble calibration and performance. This suggeststhe potential for improving ensemble methods by accommo-dating differences in calibration.
V. CONCLUSIONS AND FUTURE WORK
The aim of ensemble techniques is to combine diverse clas-sifiers in an intelligent way such that the predictive accuracyof the ensemble is greater than that of the best base classifier.Since enumerating the space of all classifier combinationsquickly becomes infeasible for even relatively small ensemblesizes, other methods for finding well performing ensembleshave been widely studied and applied in the last decade.
In this paper we apply a variety of ensemble approachesto two difficult problems in computational genomics: Theprediction of genetic interactions and the prediction of pro-tein functions. These problems are notoriously difficult fortheir extreme class imbalance, prevalence of missing values,integration of heterogeneous data sources of different scale,and overlap between feature distributions of the majority andminority classes. These issues are amplified by the inherentcomplexity of the underlying biological mechanisms and in-complete domain knowledge.
We find that stacking and ensemble selection approachesoffer statistically significant improvements over the previousstate-of-the-art for GI prediction [9] and moderate improve-ments over tuned random forest classifiers which are par-ticularly effective in this domain [5]. Here, even small im-provements in accuracy can contribute directly to biomedicalknowledge after wet-lab verification: These include 988 addi-tional genetic interactions predicted by aggregated stacking ata 10% false discovery rate. We also uncover a novel connectionbetween stacking and Caruana et al.’s ensemble selectionmethod (CES) [18], [19], demonstrating how these two dis-parate methods converge to nearly the same final base classifierweights by balancing diversity and performance in differentways. We explain how variations in these weights are related tothe calibration of base classifiers in the ensemble, and finallydescribe how stacking improves accuracy by accounting fordifferences in calibration. This connection also shows how theutilization of diversity is an emergent, not explicit, propertyof how CES maximizes ensemble performance and suggests
directions for future work including formalizing the effects ofcalibration on heterogeneous ensemble performance, modifica-tions to CES which explicitly incorporate diversity [49], and anoptimization-based formulation of the diversity/performancetradeoff for improving cluster-based stacking methods.
VI. ACKNOWLEDGEMENTS
We thank the Genomics Institute at Mount Sinai for theirgenerous financial and technical support.
REFERENCES
[1] L. Rokach, “Ensemble-Based Classifiers,” Artificial Intelligence Review,vol. 33, no. 1-2, pp. 1–39, 2009.
[2] G. Seni and J. Elder, Ensemble Methods in Data Mining: ImprovingAccuracy Through Combining Predictions. Morgan & Claypool, 2010.
[3] J. Shotton, A. Fitzgibbon, M. Cook, T. Sharp, M. Finocchio, R. Moore,A. Kipman, and A. Blake, “Real-Time Human Pose Recognition inParts from Single Depth Images,” in Proceedings of the 2011 IEEEConference on Computer Vision and Pattern Recognition, 2011, pp.1297–1304.
[4] D. Kim, “Forecasting Time Series with Genetic Fuzzy Predictor Ensem-ble,” IEEE Transactions on Fuzzy Systems, vol. 5, no. 4, pp. 523–535,1997.
[5] P. Yang, Y. H. Yang, B. B. Zhou, and A. Y. Zomaya, “A Review ofEnsemble Methods in Bioinformatics,” Current Bioinformatics, vol. 5,no. 4, pp. 296–308, 2010.
[6] A. Altmann, M. Rosen-Zvi, M. Prosperi, E. Aharoni, H. Neuvirth,E. Schulter, J. Buch, D. Struck, Y. Peres, F. Incardona, A. Sonnerborg,R. Kaiser, M. Zazzi, and T. Lengauer, “Comparison of Classifier FusionMethods for Predicting Response to Anti HIV-1 Therapy,” PLoS ONE,vol. 3, no. 10, p. e3470, 2008.
[7] M. Liu, D. Zhang, and D. Shen, “Ensemble Sparse Classification ofAlzheimer’s Disease,” Neuroimage, vol. 60, no. 2, pp. 1106–1116, 2012.
[8] A. Khan, A. Majid, and T.-S. Choi, “Predicting Protein SubcellularLocation: Exploiting Amino Acid Based Sequence of Feature Spacesand Fusion of Diverse Classifiers,” Amino Acids, vol. 38, no. 1, pp.347–350, 2010.
[9] G. Pandey, B. Zhang, A. N. Chang, C. L. Myers, J. Zhu, V. Kumar,and E. E. Schadt, “An Integrative Multi-Network and Multi-ClassifierApproach to Predict Genetic Interactions,” PLoS Computational Biology,vol. 6, no. 9, p. e1000928, 2010.
[10] K. Tumer and J. Ghosh, “Error Correlation and Error Reduction inEnsemble Classifiers,” Connection Science, vol. 8, no. 3-4, pp. 385–404, 1996.
[11] L. I. Kuncheva and C. J. Whitaker, “Measures of Diversity in Classi-fier Ensembles and Their Relationship with the Ensemble Accuracy,”Machine Learning, vol. 51, no. 2, pp. 181–207, 2003.
[12] T. G. Dietterich, “An Experimental Comparison of Three Methods forConstructing Ensembles of Decision Trees: Bagging, Boosting, andRandomization,” Machine Learning, vol. 40, no. 2, pp. 139–157, 2000.
[13] E. K. Tang, P. N. Suganthan, and X. Yao, “An Analysis of DiversityMeasures,” Machine Learning, vol. 65, no. 1, pp. 247–271, 2006.
[14] L. Breiman, “Bagging Predictors,” Machine Learning, vol. 24, no. 2,pp. 123–140, 1996.
[15] R. E. Schapire and Y. Freund, Boosting: Foundations and Algorithms.MIT Press, 2012.
[16] C. J. Merz, “Using Correspondence Analysis to Combine Classifiers,”Machine Learning, vol. 36, no. 1-2, pp. 33–58, 1999.
[17] D. H. Wolpert, “Stacked Generalization,” Neural Networks, vol. 5, no. 2,pp. 241–259, 1992.
[18] R. Caruana, A. Niculescu-Mizil, G. Crew, and A. Ksikes, “EnsembleSelection from Libraries of Models,” in Proceedings of the 21st Inter-national Conference on Machine Learning, 2004, pp. 18–26.
[19] R. Caruana, A. Munson, and A. Niculescu-Mizil, “Getting the MostOut of Ensemble Selection,” in Proceedings of the 6th InternationalConference on Data Mining, 2006, pp. 828–833.
[20] A. Niculescu-Mizil, C. Perlich, G. Swirszcz, V. Sindhwani, and Y. Liu,“Winning the KDD Cup Orange Challenge with Ensemble Selection,”Journal of Machine Learning Research Proceedings Track, vol. 7, pp.23–24, 2009.

[21] G. Pandey, V. Kumar, and M. Steinbach, “Computational Approachesfor Protein Function Prediction: A Survey,” University of Minnesota,Tech. Rep., 2006.
[22] D. C. Hess, C. L. Myers, C. Huttenhower, M. A. Hibbs, A. P. Hayes,J. Paw, J. J. Clore, R. M. Mendoza, B. S. Luis, C. Nislow, G. Giaever,M. Costanzo, O. G. Troyanskaya, and A. A. Caudy, “ComputationallyDriven, Quantitative Experiments Discover Genes Required for Mito-chondrial Biogenesis,” PLoS Genetics, vol. 5, no. 3, p. e1000407, 2009.
[23] E. Szczurek, N. Misra, and M. Vingron, “Synthetic Sickness or LethalityPoints at Candidate Combination Therapy Targets in Glioblastoma,”International Journal of Cancer, 2013.
[24] A. Bella, C. Ferri, J. Hernandez-Orallo, and M. J. Ramırez-Quintana,“On the Effect of Calibration in Classifier Combination,” AppliedIntelligence, pp. 1–20, 2012.
[25] T. R. Hughes, M. J. Marton, A. R. Jones, C. J. Roberts, R. Stoughton,C. D. Armour, H. A. Bennett, E. Coffey, H. Dai, Y. D. He, M. J. Kidd,A. M. King, M. R. Meyer, D. Slade, P. Y. Lum, S. B. Stepaniants,D. D. Shoemaker, D. Gachotte, K. Chakraburtty, J. Simon, M. Bard, andS. H. Friend, “Functional Discovery via a Compendium of ExpressionProfiles,” Cell, vol. 102, no. 1, pp. 109–126, 2000.
[26] C. L. Myers, D. R. Barrett, M. A. Hibbs, C. Huttenhower, and O. G.Troyanskaya, “Finding Function: Evaluation Methods for FunctionalGenomic Data,” BMC Genomics, vol. 7, no. 187, 2006.
[27] G. Pandey, C. L. Myers, and V. Kumar, “Incorporating FunctionalInter-Relationships Into Protein Function Prediction Algorithms,” BMCBioinformatics, vol. 10, no. 142, 2009.
[28] J. L. Hartman, B. Garvik, and L. Hartwell, “Principles for the Bufferingof Genetic Variation,” Science, vol. 291, no. 5506, pp. 1001–1004, 2001.
[29] T. Horn, T. Sandmann, B. Fischer, E. Axelsson, W. Huber, andM. Boutros, “Mapping of Signaling Networks Through Synthetic Ge-netic Interaction Analysis by RNAi,” Nature Methods, vol. 8, no. 4, pp.341–346, 2011.
[30] B. VanderSluis, J. Bellay, G. Musso, M. Costanzo, B. Papp, F. J.Vizeacoumar, A. Baryshnikova, B. J. Andrews, C. Boone, and C. L.Myers, “Genetic Interactions Reveal the Evolutionary Trajectories ofDuplicate Genes,” Molecular Systems Biology, vol. 6, no. 1, 2010.
[31] R Core Team, “R: A Language and Environment for Statistical Com-puting,” 2012.
[32] K. Hornik, C. Buchta, and A. Zeileis, “Open-Source Machine Learning:R Meets Weka,” Computational Statistics, vol. 24, no. 2, pp. 225–232,2009.
[33] M. Hall, E. Frank, G. Holmes, B. Pfahringer, P. Reutemann, and I. H.Witten, “The WEKA Data Mining Software: An Update,” SIGKDDExplorations, vol. 11, no. 1, pp. 10–18, 2009.
[34] M. Kuhn, “Building Predictive Models in R Using the caret Package,”Journal of Statistical Software, vol. 28, no. 5, pp. 1–26, 2008.
[35] T. Hothorn, P. Buhlmann, T. Kneib, M. Schmid, and B. Hofner, “Model-Based Boosting 2.0,” Journal of Machine Learning Research, vol. 11,no. Aug, pp. 2109–2113, 2010.
[36] J. H. Friedman, T. Hastie, and R. J. Tibshirani, “Regularization Pathsfor Generalized Linear Models via Coordinate Descent,” Journal ofStatistical Software, vol. 33, no. 1, pp. 1–22, 2010.
[37] W. N. Venables and B. D. Ripley, Modern Applied Statistics with S,4th ed. Springer, 2002.
[38] G. Ridgeway, “gbm: Generalized Boosted Regression Models,” 2013.[39] A. Liaw and M. Wiener, “Classification and Regression by randomFor-
est,” R News, vol. 2, no. 3, pp. 18–22, 2002.[40] T. Hastie, R. J. Tibshirani, B. Narasimhan, and G. Chu, “Diagnosis of
Multiple Cancer Types by Shrunken Centroids of Gene Expression,”Proceedings of the National Academy of Sciences of the United Statesof America, vol. 99, no. 10, pp. 6567–6572, 2002.
[41] K. M. Ting and I. H. Witten, “Issues in Stacked Generalization,” Journalof Artificial Intelligence Research, vol. 10, no. 1, pp. 271–289, 1999.
[42] G. U. Yule, “On the Association of Attributes in Statistics: WithIllustrations from the Material of the Childhood Society,” PhilosophicalTransactions of the Royal Society of London, Series A, vol. 194, pp.257–319, 1900.
[43] J. Cohen, “A Coefficient of Agreement for Nominal Scales,” Educationaland Psychological Measurement, vol. 20, no. 1, pp. 37–46, 1960.
[44] D. Eddelbuettel and R. Francois, “Rcpp: Seamless R and C++ Integra-tion,” Journal of Statistical Software, vol. 40, no. 8, pp. 1–18, 2011.
[45] J. Demsar, “Statistical Comparisons of Classifiers over Multiple DataSets,” Journal of Machine Learning Research, vol. 7, no. Jan, pp. 1–30,2006.
[46] M. Friedman, “The Use of Ranks to Avoid the Assumption of NormalityImplicit in the Analysis of Variance,” Journal of the American StatisticalAssociation, vol. 32, no. 200, pp. 675–701, 1937.
[47] P. B. Nemenyi, “Distribution-Free Multiple Comparisons,” Ph.D. disser-tation, Princeton University, 1963.
[48] G. Brown and L. I. Kuncheva, ““Good” and “Bad” Diversity in MajorityVote Ensembles,” in Proceedings of the 9th International Conference onMultiple Classifier Systems, 2010, pp. 124–133.
[49] N. Li, Y. Yu, and Z.-H. Zhou, “Diversity Regularized Ensemble Prun-ing,” in Proceedings of the 2012 European Conference on MachineLearning and Knowledge Discovery in Databases, 2012, pp. 330–345.
[50] G. W. Brier, “Verification of Forecasts Expressed in Terms of Probabil-ity,” Monthly Weather Review, vol. 78, no. 1, pp. 1–3, 1950.
[51] J. C. Platt, “Probabilistic Outputs for Support Vector Machines andComparisons to Regularized Likelihood Methods,” Advances in LargeMargin Classifiers, vol. 10, no. 3, pp. 61–74, 1999.
[52] B. Zadrozny and C. Elkan, “Transforming Classifier Scores Into Accu-rate Multiclass Probability Estimates,” in Proceedings of the 8th ACMInternational Conference on Knowledge Discovery and Data Mining,2002, pp. 694–699.