A CASE OF COCA-COLA WONGELAWIT MESFIN Addis ...
93
MEASURING CONSUMER-BASED BRAND EQUITY IN THE CARBONATED SOFT DRINK SECTOR: A CASE OF COCA-COLA WONGELAWIT MESFIN Addis Ababa University School of Graduate Studies Department of Marketing Management May 2014 Addis Ababa, Ethiopia
-
Upload
khangminh22 -
Category
Documents
-
view
0 -
download
0
Transcript of A CASE OF COCA-COLA WONGELAWIT MESFIN Addis ...

MEASURING CONSUMER-BASED BRAND EQUITY IN
THE CARBONATED SOFT DRINK SECTOR: A CASE OF COCA-COLA
WONGELAWIT MESFIN
Addis Ababa University School of Graduate Studies Department of Marketing Management
May 2014 Addis Ababa, Ethiopia

Measuring consumer-based brand equity in the carbonated soft drink sector:
A case of Coca-cola
Wongelawit Mesfin
Advisor: Dr. Bizuneh Asfaw
A Research Project Submitted to School of Commerce in partial fulfillment of the requirements for the degree of
Master of Arts in Marketing Management
Addis Ababa University School of Commerce Graduate Program Department of Marketing Management
May 2014 Addis Ababa, Ethiopia

Addis Ababa University
School of Commerce Graduate program Department of Marketing Management
Measuring consumer-based brand equity in the carbonated soft drink sector:
A case of Coca-cola
By: Wongelawit Mesfin
Approved by board of examiners
External examiner Name: ____________________
Signature: ____________________
Date: ____________________
Thesis Advisor Name: ____________________
Signature: ____________________
Date: ____________________
Internal examiner Name: ____________________
Signature: ____________________
Date: ____________________

Declaration page
I, Wongelawit Mesfin, hereby declare that this research paper entitled “Measuring consumer-
based brand equity in the carbonated soft drink sector: - A case of Coca-cola” is my original
work and has not been used by others for any other requirements in any other university and all
sources of information in the study have been appropriately acknowledged.
Wongelawit Mesfin ___________________ May 2014
Student Signature Date

Statement of Certification
This is to certify that Wongelawit Mesfin has carried out her research work on the topic entitled
"Measuring consumer-based brand equity in the carbonated soft drink sector: A case of Coca-
cola" and it is her original work and is suitable for submission of the award of Masters Degree in
Marketing Management.
_______________________________
Advisor: Dr. Bizuneh Asfaw
May 2014

i
Table of contents Acknowledgement...............................................................................................................................i Acronyms............................................................................................................................................ii List of tables........................................................................................................................................iii List of figures.......................................................................................................................................iv Abstract ................................................................................................................................................v Definition of terms..............................................................................................................................vi Chapter one: Introduction 1.1 Background of the problem............................................................................................ 11.2 Statement of the problem............................................................................................... 31.3 Objective of the study..................................................................................................... 4 • General objective • Specific objective 1.4 Hypothesis....................................................................................................................... 51.5 Significance of the study................................................................................................. 51.6 Scope of the study........................................................................................................... 51.7 Limitations of the study................................................................................................... 6Chapter two: Literature review 2.1 A glance at branding....................................................................................................... 72.2 Strategic brand management process.............................................................................. 10 2.2.1 Identifying and establishing brand positioning..................................................... 10 2.2.2 Planning and maintaining brand marketing programs…………………………... 10 2.2.3 Measuring and interpreting brand performance………………………………… 11 2.2.4 Growing and sustaining brand equity…………………………………………… 112.3 Relationship of customer equity to brand equity……………………………………..... 122.4 Brand equity…………………………………………………………………………… 142.5 School of thoughts on brand equity…………………………………………………… 16 2.5.1 Customer based brand equity…………………………………………………… 16 2.5.2 Financial brand equity………………………………………………………… 162.6 Consumer based brand equity………………………………………………………… 172.7 Dimensions of CBBE………………………………………………………………… 18 2.7.1 Perceived quality……………………………………………………………… 18 2.7.2 Brand awareness ……………………………………………………………… 19 2.7.2.1 Breadth & depth of brand awareness………………………………… 20 2.7.2.2 Brand recognition…………………………………………………… 20 2.7.2.3 Brand recall…………………………………………………………… 20 2.7.3 Brand association…………………………………………………………….... 21 2.7.4 Brand loyalty…………………………………………………………………... 242.8 Relationship among brand equity dimensions………………………………………… 262.9 Brand equity and consumer behavior…………………………………………………. 282.10 History of the Coca-cola company……………………………………………………. 28 2.10.1 Coca-cola's adaptation…………………………………………………… 29 2.10.2 Coca-cola & corporate social responsibility (CSR)…………………… .. 302.11 Coca-cola in Ethiopia………………………………………………………………… 31

ii
2.12 Global branding……………………………………………………………………....... 332.13 Building global CBBE…………………………………………………………………. 342.14 Conceptual framework of brand equity………………………………………………... 35Chapter Three: Research design & methodology3.1 Research design............................................................................................................. 373.2 Sample & sampling technique………………………………………………………... 373.3 Sampling size…………………………………………………………………………. 383.4 Data collection instrument……………………………………………………………. 383.5 Procedure of data collection………………………………………………………….. 393.6 Method of data analysis……………………………………………………………..... 40Chapter Four: Results and discussion4.1 Reliability test…………………………………………………………………………. 414.2 Socio-demographic data analysis……………………………………………………… 424.3 Cross tabulation………………………………………………………………………... 464.4 Descriptive statistics of brand equity dimensions……………………………………... 484.5 Structural equation modeling………………………………………………………….. 52 4.5.1 Measurement model……………………………………………………….. 53 4.5.2 Path model………………………………………………………………… 57Chapter Five: Conclusion & recommendation5.1 Summary…………………………………………………………………………….....
Conclusions …………………………………………………………………………… Recommendation............................................................................................................. References.......................................................................................................................
625.2 635.3 64 66 Appendix
i
ACKNOWLEDGEMENTS
The journey to completing this course study was one filled with twists and turns. There were
times of excitement and there times when I was on the brink of giving up. I have finally reached
this point due to the incredible support of some amazing people to whom I am indebted to.
First and foremost, I exalt Almighty God for giving me a second chance to live and praise him
for his grace and unconditional love.
No words can truly describe my gratitude for my beloved father for his encouragement and
support throughout my life. Thank you for my kids for being patient with me. Even if I am guilty
of not spending as much time as I would love to, I am sure one day you will be proud of what
mama has done.
Many thanks go to Fasika, Meron and Mickael who have proved themselves to be the best
individuals anyone could have ever known. All of you have stood by me through one of the
difficult times of my life. I want to thank Tensae, Selome and Mekdes for taking of my new born
while I was taking my exams a week after my delivery.
I am also grateful to my classmates Wasihun and Meselework for being willing to share ideas as
well as being supportive.
To the group of people who made this possible, the respondents who took their time in filling out
the questionnaire, all my friends who helped me in distributing the questionnaires and Ato
Miskir from Coca-cola for providing me with the necessary information.

ii
Acronyms/abbreviations AGFI Adjusted goodness of fit index
AHL Active healthy living
AMOS Analysis of moment structure
CBBE Consumer based brand equity
CFA Confirmatory factor analysis
CFI Comparative Fit Index
COO Country of origin
CR Critical ratio
CSR Corporate social responsibility
EABC East African bottling company
GFI Goodness-of-fit index
IFI Incremental Fit Index
NFI Normed Fit Index
PET Polyethylene Terephthalate
PGFI Parsimony Goodness-of-Fit Index
PNFI Parsimonious Normed Fit Index
RAIN Replenish Africa Initiative
RFI Relative Fit Index
RMR Root mean square residual
RMSEA Root Mean Square Error of Approximation
SABCO South African Beverage Company
SEM Structural equation modeling
SPSS Statistical packages for social science
TLI Tucker-Lewis Index

iii
List of tables
Table 1 Functions of a brand ........................................................................................ 9 Table 2 Generic description of Coca-cola by market ................................................... 30 Table 3 Reliability test ................................................................................................. 41 Table 4 Gender of respondents ..................................................................................... 42 Table 5 Ager of respondents ........................................................................................ 42 Table 6 Religion of respondents ................................................................................... 43 Table 7 Employment status of respondents .................................................................. 43 Table 8 Marital status of respondents ........................................................................... 44 Table 9 Educational status of respondents ................................................................... 44 Table 10 Monthly income of respondents ..................................................................... 45 Table 11 Consumption frequency of respondents .......................................................... 45 Table 12 Gender Vs consumption frequency ................................................................. 46 Table 13 Age Vs consumption frequency ..................................................................... 46 Table 14 Monthly income Vs consumption frequency................................................... 47 Table 15 Descriptive statistics of perceived quality........................................................ 48 Table 16 Descriptive statistics of brand awareness…………………………………… 49 Table 17 Descriptive statistics of brand association………………………………… 50 Table 18 Descriptive statistics of brand loyalty……………………………………. 51 Table 19 Descriptive statistics of overall brand equity……………………………… 52 Table 20 Chi-square ...................................................................................................... 54 Table 21 Goodness-of-fit index ..................................................................................... 55 Table 22 Root mean square error of approximation ...................................................... 55 Table 23 Baseline comparison ..................................................................................... 56 Table 24 Parsimony adjusted measures .......................................................................... 56 Table 25 Regression weight........................................................................................... 57 Table 26 Covariance ...................................................................................................... 58 Table 27 Correlation ..................................................................................................... 59 Table 28 Squared multiple correlation............................................................................ 59 Table 29 Standardized regression weight ...................................................................... 60

iv
List of figures Figure 1 Brand equity versus customer equity........................................... 13Figure 2 A simple representation of tricomponent attitude model............. 27Figure 3 Conceptual framework of brand equity........................................ 35Figure 4 Path diagram of the confirmed relationship of the dimension..... 61
v
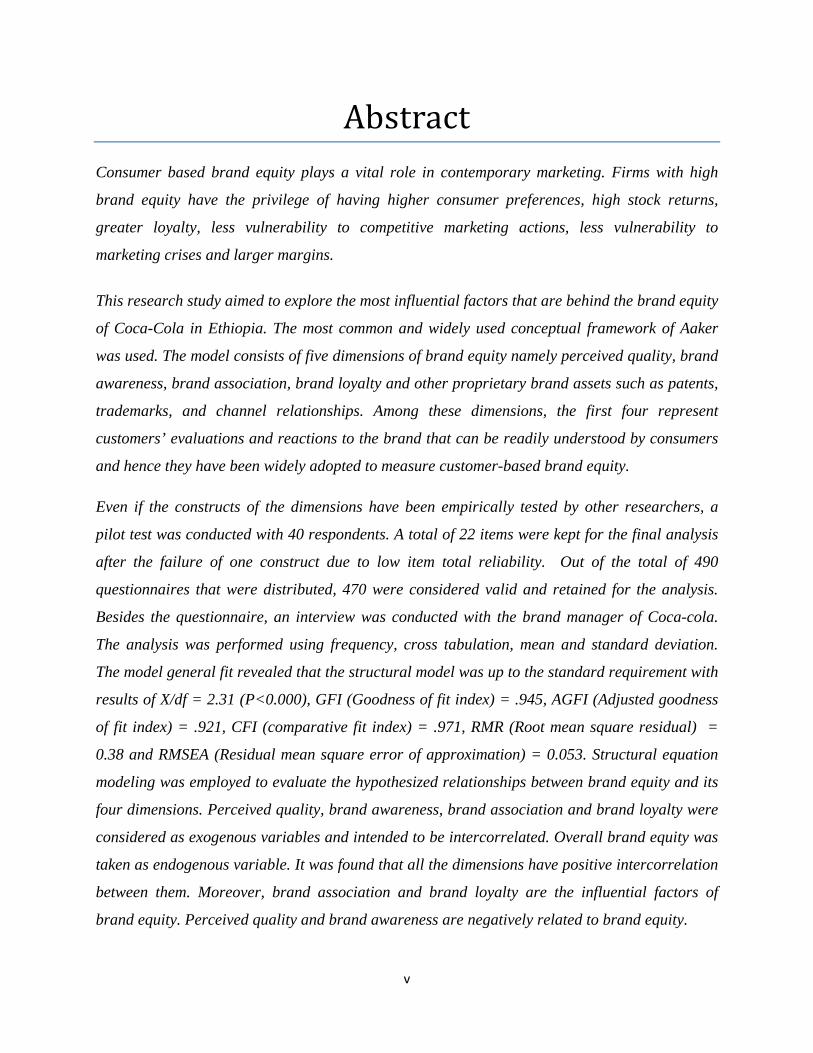
Abstract Consumer based brand equity plays a vital role in contemporary marketing. Firms with high
brand equity have the privilege of having higher consumer preferences, high stock returns,
greater loyalty, less vulnerability to competitive marketing actions, less vulnerability to
marketing crises and larger margins.
This research study aimed to explore the most influential factors that are behind the brand equity
of Coca-Cola in Ethiopia. The most common and widely used conceptual framework of Aaker
was used. The model consists of five dimensions of brand equity namely perceived quality, brand
awareness, brand association, brand loyalty and other proprietary brand assets such as patents,
trademarks, and channel relationships. Among these dimensions, the first four represent
customers’ evaluations and reactions to the brand that can be readily understood by consumers
and hence they have been widely adopted to measure customer-based brand equity.
Even if the constructs of the dimensions have been empirically tested by other researchers, a
pilot test was conducted with 40 respondents. A total of 22 items were kept for the final analysis
after the failure of one construct due to low item total reliability. Out of the total of 490
questionnaires that were distributed, 470 were considered valid and retained for the analysis.
Besides the questionnaire, an interview was conducted with the brand manager of Coca-cola.
The analysis was performed using frequency, cross tabulation, mean and standard deviation.
The model general fit revealed that the structural model was up to the standard requirement with
results of X/df = 2.31 (P<0.000), GFI (Goodness of fit index) = .945, AGFI (Adjusted goodness
of fit index) = .921, CFI (comparative fit index) = .971, RMR (Root mean square residual) =
0.38 and RMSEA (Residual mean square error of approximation) = 0.053. Structural equation
modeling was employed to evaluate the hypothesized relationships between brand equity and its
four dimensions. Perceived quality, brand awareness, brand association and brand loyalty were
considered as exogenous variables and intended to be intercorrelated. Overall brand equity was
taken as endogenous variable. It was found that all the dimensions have positive intercorrelation
between them. Moreover, brand association and brand loyalty are the influential factors of
brand equity. Perceived quality and brand awareness are negatively related to brand equity.
vi
Definition of terms Brand gender - is the set of human personality traits associated with masculinity and femininity applicable and relevant to brands
Brand mantra - is the core brand promise
Brand romance - reflects an emotional attachment to a brand Point of difference (POD) - are attributes of benefits that consumers strongly associate with a brand, positively evaluate, and believe that they could not find to the same extent with a competitive brand.
Point of parity (POP) - are not necessarily unique to the brand but may in fact be shared with other brands.
Usage imagery - where and in what types of situations the product or service is used
User imagery - what type of person uses the product or service

1
CHAPTER ONE
INTRODUCTION
This chapter presents the background of the study, statement of the study, objective of the study,
hypotheses, significance of the study, scope of study and limitations of the study.
1.1 Background of the study
The environment is so volatile that marketers are on a constant watch to track these changes
which would enable them to predict the market trend and strive to satisfy the needs of their
customers. Those firms which satisfy the unmet needs of their consumers in a timely and better
manner than their competitors will not only survive this turbulent market environment but also
gain a profit and grow to become market leaders. Due to this environmental instability, the recent
days emphasis is shifting from selling to marketing. Today marketers strive to come up with a
fine segmented target groups having a well defined position which would allow them to meet the
specific needs of their consumers.. In order to get loyal customers, firms seek exhaustively to
find out what motivates consumers purchase their products other than their competitors.
Different researchers define brand equity in many ways. As per Alagon & Samuel (2011) brand
equity is the ability of brand associations to predispose people to choose it over others or pay
more for it, both now and in the future. Farquhar, Han and Ijiri (1991) described brand equity as
the added value endowed by the brand name. According to Aaker (1991) it is a set of assets (and
liabilities) linked to a brand’s name and symbol that add to (or subtract from) the value provided
by a product or service to a firm and/or that firm’s customers.
Consumer based brand equity model takes into account the perceptions of consumer. The
consumer can be an individual or an organization. Acquiring the information regarding the
perception of consumers towards a certain brand can be a sign of the performance of the brand.
Aaker divided the dimensions of consumer based brand equity into five: perceived quality, brand
loyalty, brand awareness, brand association, and other proprietary brand assets such as patents,
trademarks, and channel relationships. Barwise (1993) and Yoo & Donthu (2001) asserted that
among these five brand equity dimensions, the first four represent customers’ evaluations and
reactions to the brand that can be readily understood by consumers and hence they have been
widely adopted to measure customer-based brand equity in prior researches. Despite the

2
existence of a number of models on brand equity in the literature, this research applies the most
commonly cited model of Aaker. The model has been empirically tested in a number of earlier
studies like Atilgan, Aksoy & Akinci (2005), Kim & Kim (2004) and Yoo, Donth & Lee (2000).
In 1983, Jacob Schweppes, a young watchmaker and amateur scientist perfected an efficient
system for manufacturing carbonated mineral water and founded the Schweppes Company in
Geneva. He relocated to London, England in 1790. Since then the addition of flavorings to
aerated water has seen the development of major soft drinks brands throughout the world. To
meet the need for carbonated soft drinks, the soda fountain was developed by Samuel Fahnestock
in the United States in 1819. The patenting of the Crown cork by William Painter in 1892 and
the automatic production of glass bottles using a glass blowing machine by Michael J. Owens in
1899 were notable achievement that at last allowed carbonated soft drinks to be successful
bottled without significant loss of carbonation." (Beverage history, 2008).
"The most recognized brand name in the world got its start in an Atlanta pharmacy, where it sold
for five cents a glass. The name Coca-Cola was registered as a trademark on January 31, 1893.
The drink soon became a national phenomenon; by 1895, the company has established syrup
plants in Chicago, Dallas and Los Angeles" (Keller, Parameswaran and Jacob, 2011, p.604).
"Coca-cola is produced by East Africa Bottling which was established in 1959 in Addis Abeba
and was operating as Ethiopian Bottling Share Company. It later opened a second branch in Dire
Dawa in 1965. The two plants were nationalized in 1975 and ran as public companies until 1996
when they were bought by Ethiopian entrepreneurs. Just prior to this, in 1995, Coca-Cola
SABCO (South African Beverage Company) bought shares in the business and, in 1999, signed a
joint venture agreement with the plants. With its leadership and working hand in hand, the
business has seen significant growth over the years. Processes and functions have been
improved, resulting in considerable sales increases. In 2001, Coca-Cola SABCO increased its
shares to 61% and the company changed its name to the East African Bottling Share Company
(EABSC). Other than Coca-cola, it produces Coke Light, Fanta Orange, Fanta Pineapple, Fanta
strawberry, Sprite, and Schweppes Tonic. The EABSC continues to run the two plants and
replaced the line in Dire Dawa in 2011. The two plants have 1375 employees in total." (Coca-
cola SABCO, 2014)

3
1.2 Statement of the problem
Firms use marketing activities to get in touch with the public. Marketing is about clearly defining
your unique identity and strengthening it with authentic integrity to build a strong image (Kotler,
Kartajaya & Setiawan, 2010). The marketing mix activities of organizations attempt to
communicate the benefits of their products and services to potential consumers. In addition to
these external influences, consumers use socio-cultural influences as sources of information
about a particular product. Socio-cultural factors influence consumers' product-related values,
attitudes and behaviour and when internalized affect the consumer's purchase decisions. These
include the comment of a friend, an editorial in the newspaper, usage by a family member, an
article in consumer reports, or the views of experienced consumers participating in a special-
interest discussion group on the internet (Schiffman et al 2010). Consumers turn to word of
mouth as a new and credible form of advertising they can trust. Around 90 percent of consumers
surveyed trust recommendations from people they know. Moreover, 70 percent of consumers
believe in customer opinions posted online (Kotler, Kartajaya & Setiawan (2010).
According to Russell (2010), if you are like over 99% of brands on the market today and perform
at parity with your competitors, or your superiority isn’t abundantly clear to the majority of the
population or you believe your state of superiority is probably a temporary status, you are going
to need to build a bond with your consumers that goes beyond the rational into the emotional
level.
Coca-cola is a low involvement good. These are the ones which we don’t think much about, we
don’t search for additional information, we generally buy on autopilot and we rarely feel buyer’s
remorse. They are generally regular repeat purchases and often are inexpensive( Moore & Pareek
2006). Coca-Cola and Pepsi have the major market share in the soft drink industry in Ethiopia.
Their indirect competitors and possible substitutes are bottled mineral water and other soft drinks
which are in their infancy stage when compared to the two giants.
Good customer relationship management creates customer delight. In turn, delighted customers
remain loyal and talk favorably to others about the company and its products. The ultimate aim
of customer relationship management is to produce high customer equity. Customer equity is the

4
total combined customer lifetime values of all of the company’s current and potential customers.
As such, it’s a measure of the future value of the company’s customer base. Clearly, the more
loyal the firm’s profitable customers, the higher its customer equity. Customer equity may be a
better measure of a firm’s performance than current sales or market share. Whereas sales and
market share reflect the past, customer equity suggests the future (Kotler & Armstrong 2012).
There hasn't been much research carried out on consumer based brand equity in the context of
Ethiopia. Findings of a research carried out in the beer industry in the context of our country
revealed that "there is no positive and direct relationship between the four dimensions and brand
equity, however the inter correlations between perceived quality and the inter correlation
between brand awareness and brand loyalty were significant and all positive. Thus perceived
quality and brand awareness might affect brand equity by affecting brand loyalty first" (Million
2013). This research will explore the most influential factors that are behind the brand equity of
Coca-Cola.
1.3 Objective of the study
This research has the following general and specific objectives.
• General objective
This research tries to examine the causal relationships among the four dimensions of brand
equity and overall brand equity in the context of consumers of Coca-Cola.
• Specific objective
The research has these specific objectives
• To determine the highly influential dimensions of consumer based brand equity of Coca-
cola
• To determine the type of relationship that exists between the four dimensions of
consumer based brand equity of Coca-Cola
• To identify which brand equity dimension is weak in contributing towards the brand
equity of Coca-cola and suggest ways of improvement

5
1.4 Hypotheses
The following hypotheses were formulated in line with the above objectives and the literature
review made.
H0. Perceived quality has no significant positive direct effect on brand equity
H1. Perceived quality has significant positive direct effect on brand equity
H0. Brand association has no significant positive direct effect on brand equity
H1. Brand association has a significant positive direct effect on brand equity
H0. Brand awareness has no significant positive direct effect on brand equity
H1. Brand awareness has a significant positive direct effect on brand equity
H0. Brand loyalty has no significant positive direct effect on brand equity
H1. Brand loyalty has a significant positive direct effect on brand equity
1.5 Significance of the study
The research will contribute by being used as a reference by other researchers who want to
conduct further study on the concept of consumer based brand equity in the context of our
county. Furthermore, it will sparkle some high lights about the most prominent contributors of
consumer based brand equity and the challenges it faces, if any. Hence, brand
managers/marketers of Coca-Cola may make use of the findings to know what consumers of
Coca-cola in Addis Abeba think of the brand. Moreover, the company may refocus its attention
towards the challenges the brand currently faces.
1.6 Scope of the study
The research is restricted to some selected areas in Addis Abeba only. This is due to time and
financial constraints. The researcher has no intentions of including the sub brands of Coca-Cola
as Coca-Cola is the parent brand and it is what consumers think of when hearing the name Coca-
Cola. Likewise, soft drinks of other brands are also left out.

6
1.7 Limitations of the study
This research has the following limitations:
The inherent bias in convenience sampling means that the sample is unlikely to be representative
of the population being studied. This undermines to make generalizations from the sample to the
population being studied. As a questionnaire was used, phrases used in the questionnaire can
often skew answers in a particular direction without given an unbiased picture of what the
respondent actually thinks. In addition, when owners of the chosen cafe, restaurant and
recreational centers were requested to use their facilities as means of contacting respondents,
they had skepticism and misperceived the researcher as an inspector from the Ethiopian Revenue
& Tax Authority. Hence a lot of valuable time was wasted awaiting the owners' permission
which at last ended up in decline.

7
CHAPTER TWO
REVIEW OF RELATED LITERATURE
This chapter exhibits the review of related literatures. It consists of a glance at branding, strategic brand management process, relationship of customer equity to brand equity, brand
equity, school of thought on brand equity, consumer based brand equity, dimensions of consumer
based brand equity, relationship among brand equity dimensions, brand equity and consumer
behavior, history of Coca-cola company, Coca-cola in Ethiopia, global branding, building
global consumer based brand equity and the conceptual framework of the research.
2.1 A glance at branding
Kotler & Armstrong (2012) defined a product as anything that can be offered to a market for
attention, acquisition, use, or consumption that might satisfy a want or need. Apart from its
tangible feature, a product might also contain services, events, persons, places, organizations,
ideas, or a mixture of these. A consumer is any individual who is frequently engaged in the
process of analyzing, selecting, using and disposing a product. Consumers buy products for
different reasons. Some buy simply to acquire the functional benefits which would satisfy
unfulfilled needs of consumption. Others try to get self expressive/symbolic benefits which
would help them to see their self image through the brand image of the product. And some others
still buy products to get the intangible benefits of satisfying their sense organs.
In an effort to discriminate a product from that of its competitors, the need for branding was
needed. The word brand comes from the old Norse word" brandr" which means "to burn" as
brands were and still are the means by which owners of livestock mark their animals to identify
them (Keller, Parameswaran & Jacob, 2011, p.2). Historically, brands were created to defend
producers from theft. A cattle brand, a sign burned into the animal’s hide, identified the owner
and made it apparent if the animal had been stolen. ‘Brands’ or trademarks also identified the
source of the olive oil or wine contained in ancient Greek amphoras, and created value in the
eyes of the buyers by building a reputation for the producer or distributor of the oil or wine
(Kapferer, 2008, p.10). According to the definition of brand by the American Marketing
Association in the 1960's , "A name, term, sign, symbol, or design, or a combination of them

8
which is intended to identify the goods or services of one seller or a group of sellers and to
differentiate them from those of competitors" (Hedging, Knudtzen & Bjerre 2009, p.9). The
Merriam Webster dictionary describes brand as "a class of goods identified by name as the
product of a single firm or manufacturer". A product is something created by labor that can be
marketed or sold as a commodity. A brand is created when you take that product and give it
special meaning through names, logos or any form of identification that separates one seller's
goods or services from their competition (Russell, 2010, p.72). According to Kotler and Keller
(2005) as cited by Cerjak, Haas and Kovaĉić (2010) if a company treats a brand only as a name,
it misses the point of branding. Branding is used to develop a deep set of meanings for the brand.
Moreover, branding requires resources, high dedication, and skill to create the unique bond in the
minds of consumers. What makes a certain brand recognizable from a number of other brands?
According to Kapferer, "But what really makes a name become a brand are the saliency,
differentiability, intensity and trust attached to these associations (Kapferer, 2008, p.11). In the
words of Kotler, a brand is described as “The ideas and impressions we might hope the consumer
to have about our brands are subject to the competing ideas, which are available for consumer
perception (Kotler & Pfoertsch, 2006, p.5). Brands assist us in every day of our lives to make
our decisions easy; be the decisions of low involvement products to high involvement products.
They facilitate the choice we make when buying a bread to the schools we enrolled in to the
residential areas we live and the cars we chose to drive. Brands consist of different brand
elements as name, logo, symbol, character, packaging and slogan. These brand elements have to
incorporate characteristics such as memorable, meaningfulness, likable, transferability,
adaptability and protectable which would make possible for consumers to identify a given
product of a firm easily and create unique positioning in their minds and add value to a product.
Creating a unique place in minds of consumers would allow the brand to have a competitive
advantage over its competitors. As elaborated by White (2004) competitive advantage is then the
ability to better satisfy customers than competitors can.
According to Porter (1990) as cited by Pappu, Quester & Cooksey (2005) brand is a powerful
means of differentiation. In the absence of branding, all products would be taken as a
commodity. A brand can be viewed as a kind of translation cipher, which, with the help of a
unique brand name or symbol, reflects the performance characteristics and the quality of a
product (Kotler & Pfoertsch, 2010, p.74). In today's market, there is minimal existence of

9
unbranded products. This is due to each marketer’s intention towards creating a specific identity
for their firms' products. Firms making branded products not only strive to understand the
motivations and wants of their consumers but come up with appropriate and appealing products
in accordance with the demands of consumers. To consumers, brands depict something about a
product; be it product quality or consistency (Ellwood, 2002).
Keller, Parameswaran & Jacob (2011) mentioned that brand benefits are the personal value and
meaning that consumers attach to the product or service attributes. Brands have advantages to
both the consumer and the firm. As per Keller, Parameswaran & Jacob (2011) brands help
consumers in identifying source of product, assigning of responsibility to product maker,
searching cost reducer, promising and bonding with maker of a product, being symbolic device
and signaling of quality. Brands also minimize the risks that consumers are faced with when
buying and consuming a product. These risks include function risks, physical risk, financial risk,
social risk, psychological risk and time risk. On the other hand for the firms, brands are the
means of identification to simplify handling, means of legally protecting unique features, signal
of quality level to satisfied customers, means of endowing products with unique associations,
source of competitive advantage and source of financial returns.
Table 1 Functions of a brand Function Description
Distinguishing function A brand differentiates one company's goods and services from those of other companies
Guarantee and confidence function
A brand guarantees the quality of a product, associated with progress in terms of technology and research
Quality function A brand guarantees that a given product possesses identical or superior properties to another comparable product from a different company
Identification, promotional and origin function
A brand enables a product to be identified and recognized
Orientation function A brand makes it easier to sort offers and to reach a purchase decision
Transparency and insurance function
Since a brand can be monitored carefully, it can also act as an instrument for consumer protection
Source: Kotler & Pfoertsch 2010
Apart from cost leadership strategy, differentiation strategy is another means of positioning a
company to win the battle in this competitive environment. As per Elkin (2007), the benefit of

10
differentiating an offering from that of the competitor is that it encourages initial customer
purchase and ongoing customer loyalty.
In the presence of savvy customers and increasingly complicated marketing techniques, de
Chernatony and McDonald (1992) have classified the functions of brands into eight categories.
They include brand as 1) a sign of ownership; 2) a differentiating device; 3) a communicator of
functional capability; 4) a device which enables buyers to express something about themselves;
5) a risk reducing device; 6) a shorthand communication device; 7) a legal device and 8) a
strategic device.
2.2 Strategic brand management process
Once brands come into existence, they should be carefully managed to increase their longevity in
today's competitive market. Strategic brand management process attempts to build, measure and
maintain brand equity through designing and implementing marketing activities and programs. It
comprises of these steps.
2.2.1 Identifying and establishing brand positioning
It is on this step that the very foundation for the brand is laid. In the identifying process, the
company tries to create a unique brand image with a clear meaning of the brand in the minds of
the targeted consumers. This will enable it to be positioned with an apparent point of difference
when compared with its competitors and guard against its rival from taking the benefit of point
of parity. This also allows consumers to make a solid association with the brand. "Core brand
association, points of difference, and a brand mantra are thus an articulation of the heart and soul
of the brand" (Keller, Parameswaran & Jacob, 2011, p.39).
2.2.2 Planning and maintaining brand marketing programs
The main focus in this process is building brand knowledge. Marketers try to decide on the brand
elements like brand name, logo, slogan, packaging, symbols, and characters. The appropriate
brand element for each product is directed by the guidelines listed in the branding strategy.
Choosing the brand elements alone would not be of great value unless supported by a well
selected marketing program. The marketing programs convey the brand's messages to the
11
targeted consumers so that a favorable, unique and strong association would be created. The last
thing to do in this process is to leverage secondary association with other brand, geographic
region, country of origin, spokespeople, channel of distribution and the like.
2.2.3 Measuring and interpreting brand performance
After the implementation of the marketing program, the performance of the brand has to be
measured and interpreted by carrying out a marketing research. A means for this task is the brand
value chain. The brand value chain is a structured approach to assessing the sources and
outcomes of brand equity and the manner by which marketing activities create brand value
(Keller, Parameswaran & Jacob, 2011, p.317). Another way of measuring brand performance is
through brand audit, brand tracking and brand equity management system. Brand audit is a more
externally, consumer -focused exercise to assess the health of the brand, uncover its sources of
brand equity, and suggest ways to improve and leverage its equity (Keller, Parameswaran &
Jacob, 2011, p.126). Brand audit consists of the steps of brand inventory and brand exploratory.
As per Keller, Parameswaran & Jacob (2011), the former one provides a current, comprehensive
profile of how all the products and services sold by a company are marketed and branded. The
latter one is research directed to understanding what consumers think and feel about the brand
and its corresponding product category in order to identify sources of brand equity. According to
Keller, Parameswaran & Jacob (2011) brand tracking is gathering less detailed brand-related
information from consumers on a routine basis through quantitative measures of brand
performance for short-term tactical decision. A brand equity management system is a set of
research procedures designed to provide timely, accurate, and actionable information for
marketers so that they can make the best possible tactical decisions in the short run and the best
strategic decisions in the long run (Keller, Parameswaran & Jacob, 2011, p.41).
2.2.4 Growing and sustaining brand equity
To maintain and increase the longevity of brand equity, firms need to do the following;
Set a well defined branding strategy: The two main tools in defining branding strategy are the
brand-product matrix and the brand hierarchy. The former one represents graphically all the
brands and products sold by the firm. The latter one shows the number and nature of common
and distinctive brand components across the products of the firm.

12
Handle brand equity over time: Firms need to assess what the responses of their consumers
were towards the past marketing activity of the firm and the brand knowledge consumers had
about the brand. Checking the responses of consumers towards the current marketing activity of
the firm and their brand knowledge are also vital. Obtaining this information would enable the
firm to come up with a consistent marketing activity which reinforces the brand. Brand
consistency is essential in maintaining the strength and favorability of brand association. But
being consistent doesn't mean not making changes to marketing program. Some key elements of
the marketing communication program will be kept. Keller, Parameswaran & Jacob (2011)
explained how reinforcing brand meaning depends on the nature of the brand association. For
brands whose core associations are primarily product-related attributes and functional benefits,
innovation in product design, manufacturing and merchandising is especially critical to
maintaining or enhancing brand equity. For brands whose core associations are primarily non-
product-related attributes and symbolic or experiential benefits, relevance in user and usage
imagery is especially critical to maintaining or enhancing brand equity.
Manage brand equity over geographic boundaries, cultures and market segments: When
firms have market segments that are geographically dispersed as well as comprising different
cultures, they need to collect data regarding the experience and behavior of these segments. This
would facilitate in developing branding and marketing programs for each market segment. Apart
from the above steps, other researchers articulate that "a crisis management plan should be a part
of the overall strategic management plan" (Johnson & Peppas, 2003, p.20).
2.3 Relationship of customer equity to brand equity
According to Blattberg and Deighton, as cited by Keller, Parameswaran & Jacob (2011)
customer equity is defined as the optimal balance between what marketers spend on customer
acquisition and what they spend on customer retention. In the views of Rust, Zeithaml and
Lemon, as cited by Keller Parameswaran & Jacob (2011) customer equity is made of three
components and key drivers:
Value equity: customers' objective assessment of the utility of a brand based on perceptions of
what is given up for what is received. Three drivers of value equity are quality, price, and
convenience.

13
Brand equity: customers' subjective and intangible assessment of the brand, above and beyond
its objectively perceived value. Three key drivers of brand equity are customer brand awareness,
customer brand attitudes, and customer perception of brand ethics.
Relationship equity: customers' tendency to stick with the brand above and beyond objective and
subjective assessments of the brand. Four key drivers of relationship equity are loyalty programs,
special recognition and treatment programs, community-building programs, and knowledge-
building programs.
Brand equity, on the other hand, tends to put more emphasis on strategic issues in managing
brands and how marketing programs can be designed to create and leverage brand awareness and
image with customers. Keller, Parameswaran & Jacob (2011) claimed customer equity and brand
equity are related; in fact the two concepts go hand in hand. Many of the actions that will
increase brand equity will increase customer equity. Brand equity tends to put more emphasis on
"front end" of marketing programs and intangible value potentially created by marketing
programs; customer equity tends to put more emphasis on the "back end" of marketing programs
and the realized value of marketing activities in terms of revenue.
Figure 1 Brand equity versus customer equity
Missing: Segmentation analysis; Quantifiable Financial Effects Emphasis: Prescriptive Marketing Guidelines, Growth opportunities Brand Equity Customer Equity Emphasis: Bottom-line Financial value, Customer Relationship Management Missing: Network Effects; competition
Source: Keller et al 2011
14
2.4 Brand equity
The concept of brand equity began to be used widely in the 1980s by advertising practitioners. In
the old days, real estate, then tangible assets, plants and equipments were the ones which were
taken into consideration when measuring the value of a firm. Since then, brand equity has come
into sight in the marketing literature to make an enhanced comprehension regarding the tangible
and intangible values of brands. Its emergence, however, has meant both good news and bad
news to marketers. The good news is that brand equity has elevated the importance of the brand
in marketing strategy and provided focus for managerial interest and research activity. The bad
news is that, confusingly, the concept has been defined a number of different ways for a number
of different purposes.
A lot of definitions exist in the literature. As noted by Keller, Parameswaran and Jacob (2011)
despite the many different views, most observers agree that brand equity consists of the
marketing effects uniquely attributable to a brand. Some include the financial aspect while others
include the customer aspect. According to Leone et al., (2006) those from a consumer
perspective, are based on the premise that the power of brands lies in the minds of consumers. In
the views of Simon and Sullivan (1993) as cited by Buil, Martı´nez and de Chernatony (2013)
some firms from a financial perspective consider brand equity as the monetary value of a brand
to the firm and Christodoulides & de Chernatony (2010) noted that the financial value of a brand
is, however, the final outcome of consumer responses to brands.
As cited by Tuominen (1999), the following are some of the definitions of brand equity found in
the literature.
– A set of brand assets and liabilities linked to a brand, its name and symbol that add to or
subtract from the value provided by a product or service to a firm and/or to that firm’s customer
(Aaker 1991)
– A utility not explained by measured attributes (Barwise 1993)
– A differentiated, clear image that goes beyond simple product preference (Barwise 1993)
– The value a brand name adds to a product (Broniarczyk & Alba 1994)
– The added value that a brand endows a product with (Farquhar 1990, RC7; Farquhar et al
1990)
– The differential effect that brand knowledge has on consumer response to the marketing

15
of that brand (Keller 1993 ; Keller 1998)
– The combination of brand awareness, liking and perceptions (Moore 1993)
– The added value endowed by the brand to the product as perceived by a consumer (Park &
Srinivasan 1994)
– The value attached to a brand because of the powerful relationship that has been developed
between the brand and customers and other stakeholders over time (Keegan et al 1995)
– The incremental price that a customer will pay for a brand versus the price for a comparable
product or service without a brand name on it (Keegan at al 1995)
– A long-term relationship with those people who loyally buy the brand over and over
again (Keegan at al 1995)
– The accumulated brand support by all stakeholders, not only by customers (Duncan &
Moriarty 1997)
– A product of the total net brand support of customers and other stakeholders that is
determined by all communication interactions of the company (Duncan & Moriarty 1998)
– Off-balance sheet intangible brand properties embedded in a company’s brand (Kerin &
Sethuraman 1998)
"In spite of numerous different ways of defining brand equity, most authors agree that brand
equity represents some form of added value which brands add to products" Rajh, Vranesevic &
Tolic, 2003, p.264). According to Kapferer (1998), brand equity is a result of brand assets which
include brand awareness, brand image, the perceived quality of the brand, evocations and the
familiarity or appeal of the brand. These elements of brand assests bring added value to the
product. The financial value of the brand (brand equity)is equal to the brand value minus the
costs of branding and the costs of invested capital. According to Rajh, Vranesevic & Tolic
(2003) it is the difference between subjective and objective preferences, and this difference is
attributed to the influence of the brand. Srivastava and Shocker (1991) suggested that brand
equity signifies both financial and consumers apects. According to them, brand equity consists of
brand strength and brand value. Brand strength is the set of associations and behaviours on the
part of the brands's customers, channel members, and parent corporations that permts the brand
to enjoy sustainable and differentiated competitive advantages. Brand value is the financial
outcome of the management's ability to leverage brand strength via tactical and strategic actions
16
in providing superior current and future profits and lower risks. It can be concluded that brand
strength refers to the consumer aspect of brand equity, and brand value refers to the financial
aspect of the same concept.
Important academic contributors towards the concept of brand equity throughout the 1990s were
Aaker (1991), Srivastava and Shocker (1991), Kapferer (1992), Keller (1993, 1998) and Y.L &
Lee (2011).
2.5 School of thoughts on brand equity
2.5.1 Consumer based brand equity
This school of thought approaches the question of brand value by taking the customer’s point of
view. This in turn leads to several different theories. Some believe that brand value exists
wherever the preferences expressed for a brand are greater than a simple assessment of the utility
of the product or service’s attributes would have suggested (Kapferer, 2008, p.508).
Rajh, Vranesevic & Tolic (2003) proposed that two different customer based approaches are
distinguished - on that is based on customer behavior (behavioral approach) and another that is
based on customer perception (cognitive approach). Silverman et al (1999) represents the
cognitive approach. Keller's conceptualization of brand equity also represents an example of
cognitive approach. He defines market brand equity as a differential effect of brand knowledge
on customer response to the marketing of the brand. Yoo et al (200) approach represents an
example of behavioral approach. According to them, brand equity is the difference in consumer
choice between the focal branded product and an unbranded product given the same level of
product features.
2.5.2 Financial brand equity
This school of thought is populated by financial analysts whose role is to evaluate assets (which
can sometimes include intangible assets, and thus brands). From their economic perspective,
brand equity is the value today of profits imputable to the brand in the future. (Kapferer, 2008,
p.508).

17
2.6 Consumer based brand equity
Aaker (1991) and Keller (1993) developed the foundation for consumer-based brand equity
research. From a cognitive psychology approach, Aaker defined brand equity as “a set of brand
assets and liabilities linked to a brand, its name and symbol that add to or subtract from the value
provided by a product or service to a firm and/or to that firm’s customers”. These assets are
brand awareness, perceived quality, brand associations, brand loyalty and other proprietary
assets. Keller developed a different view and described the concept of consumer-based brand
equity as the differential effect of brand knowledge on consumer response to the marketing of
the brand. Keller views brand equity in terms of brand awareness and the strength, favourability
and uniqueness of brand associations that consumers hold in memory. The advantages of
consumer based brand equity include high number of loyal customers, command larger price
premiums, receive greater trade cooperation & support, possible licensing opportunities,
additional brand extension opportunities and increase marketing communication effectiveness.
As cited by Lassar, Mittal, B. and Sharma (1995), Farquhar also supports this by recommending
that the competitive advantage of firms that have brands with high equity includes the
opportunity for successful extensions, resilience against competitors’ promotional pressures, and
creation of barriers to competitive entry. With certain brand knowledge in mind and acting
positively towards the marketing efforts of that brand, consumers are said to have positive brand
equity towards the brand. The opposite goes true if consumers have negative brand equity
towards the brand. Johnson & Peppas (2003) elaborated it with the crisis that took place in
Belgium in 1999 which has affected the brand equity of Coca-cola not only in Belgium but also
the whole Europe costing the company more than $200 million. To gain its former brand image,
the company was engaged in aggressive marketing campaign in Europe. In Belgium alone, the
"Belgium's annual Coca-cola Summer Tour" was organized where Coca-cola brand products
were presented at over 90 locations throughout the country and over 72,000 consumers won
premiums on the "Originals Promotion Campaign". As per Kish, Riskey & Kerin (2001) brand
management recognized that the manner by which brand equity is built and nurtured often differs
from country to country. In fact, the actual sources of brand equity may vary across countries in
terms of specific attribute importance.

18
2.7 Dimensions of consumer based brand equity
A number of researchers have proposed different dimensions of consumer based brand equity
over the years. Aaker's consumer based brand equity model consists of the dimensions
perceived quality, brand loyalty, brand awareness, brand association, and other proprietary brand
assets such as patents, trademarks, and channel relationships.
2.7.1 Perceived quality
According to Keller, Parameswaran and Jacob (2011), perceived quality is customers' perception
of the overall quality or superiority of a product or service compared to alternatives and with
respect to its intended purpose. Zeithaml (1988) described it as being not the real quality of the
product but the customer's perception of the overall quality or superiority of the product/service
with respect to its intended purpose, relative to alternatives. Consumers' perceived quality of a
product (or service) is based on a variety of informational cues that they associate with the
product. Some of these cues are intrinsic to the product or service; others are extrinsic. Cues that
are intrinsic concern physical characteristics of the product itself, such as size, color, flavor, or
aroma. Consumers also use extrinsic cues such as price, brand image, manufacturer's image,
retail store image, or even the perceived country of origin to evaluate quality of a product
(Schiffman, Kanuk & Kumar, 2012, p.185). "Similar to brand association, perceived quality also
provides value to consumers by providing them with a reason to buy and by differentiating the
brand from competing brands" (Pappu, Quester & Cooksey, 2005, p.145). According to Ha¨ubl
(1996), Leonidou et al (1999) and Kaynak et al. (2000) as cited by Khmel’nyts’ka & Swift
(2010), the most widely studied aspect of the COO concept is that based on the consumer belief
that particular product categories are superior when they come from countries that have a good
reputation for the manufacture of those products.
Theoretically, the COO informs the ignorant as to the particular level of quality/reliability
associated with a particular product. However, the COO is an extrinsic product characteristic,
which is generally not as important as intrinsic product cues – such as design, quality and taste
(Khmel’nyts’ka & Swift, 2010, p.83). As cited by these authors, many studies have found that
products from developed countries are more favorably evaluated than are similar products

19
manufactured in developing countries: Bilkey and Nes (1982), Ha¨ubl (1996), Manrai et al.
(1998), d’Astous and Ahmed (1999), Kaynak et al. (2000) and Ozretic-Dosen et al. (2007).
According to Petersen and Jolibert (1995) as cited by Khmel’nyts’ka & Swift (2010),
nationalism is referred to as “Domestic Country Bias”, or “Home Country Bias”, and by others
as ethnocentrism (Papadopoulos, 1993, p. 33). As claimed by Baughn and Yaprak, (1993), as
cited by Khmel’nyts’ka & Swift (2010), nationalism is a sub-segment of the wider COO concept,
and is based on the assumption that the patriotic feelings of the consumer have a significant
positive effect on their attitudes and purchase intentions.
However, the contrary view is expressed by Samiee (1994) who claimed that brands such as
Sony, Coca-Cola and Revlon are so global that they no longer tend to be associated by
consumers with their original COO.
2.7.2 Brand awareness
Aaker (1991) asserted that brand awareness is the ability of a potential buyer to recognize or
recall that a brand is a member of a certain product category. A link between product class and
brand is involved. Aaker (1996) added that brand awareness reflects the salience of the brand in
the customers mind. Aaker mentioned several levels of brand awareness, ranging from mere
recognition of the brand to dominance, which refers to the condition where the brand involved is
the only brand recalled by a consumer. As per Aaker brand awareness has these levels;
Brand recognition
Brand recall
Top-of-Mind (the first-named brand in a recall task).
Brand Dominance (the only brand recalled)
Brand Knowledge (I know what the brand stands for)
Brand Opinion (I have an opinion about the brand)
Aaker (1992) added that brand awareness is an asset that can be remarkably durable and thus
sustainable. It can be very difficult to dislodge a brand that has achieved a dominant awareness
level.

20
Keller also described brand awareness as the strength of the brand node or trace in memory and
it consists of brand recognition and brand recall performance (Keller, Parameswaran and Jacob,
2011, p.51).
2.7.2.1 Breadth and depth of awareness
As noted by Keller, Parameswaran and Jacob (2011), the depth of brand awareness measures
how likely it is for a brand element to come to mind, and the ease with which it does so. It is
determined by the ease of brand recognition and recall. The breadth of brand awareness
measures the range of purchase and usage situations in which the brand element comes to mind
and depends to a large extent on the organization of brand and product knowledge in memory.
This is simply saying that this breadth is determined by the number of purchase and consumption
situations for which the brand comes to mind.
2.7.2.2 Brand recognition
Keller (2004) clarified that it is consumer's ability to confirm prior exposure to the brand when
given the brand as a cue. In other words, brand recognition requires that consumers correctly
discriminate the brand as having been seen or heard previously.
2.7.2.3 Brand recall
Keller (2004) elucidated that it is consumer's ability to retrieve the brand from memory when
given the product category, the needs fulfilled by the category, or some other type of probe as a
cue. In other words, brand recall requires that consumers correctly generate the brand from
memory. "Different measures of brand recall are possible depending on the type of cues to help
consumers. Unaided recall on the basis of "all brands" provided as a cue is likely to identify only
the very strongest brands. Aided recall uses various types of cues to help consumers recall. One
possible sequence of aided recall might use progressively narrower cues- such as product class,
product category, and product type labels - to provide insight into the organization of consumers'
brand knowledge structure" (Keller, Parameswaran and Jacob, 2011, p.377).
As per Keller, brand awareness plays an important role in consumer decision making for the
following main reasons.

21
Learning advantage: The first way that brand awareness affects consumer decision
making is by influencing the formation and strength of the brand associations that make
up the brand image. A necessary condition for the creation of a brand image is that a
brand node has been established in memory.
Consideration advantage: It is important that consumers think of and consider the brand
whenever they are making a purchase for which the brand could potentially be
acceptable, or whenever they are consuming a product whose needs the brand could
potentially satisfy. In particular, raising brand awareness increases the likelihood that the
brand will be a member of the consideration set, the handful of brands that receive
serious consideration for purchase.
Choice advantage: Brand awareness can affect choices among brands in the
consideration set, even if there are essentially no other associations to those brands
(Keller, Parameswaran and Jacob, 2011, p.54).
2.7.3 Brand association
"Brand associations are informational nodes linked to the brand node in memory and contain the
meaning of the brand for consumers" (Keller, 1993, p.3). According to Keller (2001), a company
uses brand associations to evoke strong feelings in the consumer and in this way tries to
differentiate itself and create a strong position in relation to the competition. The consumer uses
brand association as a help to organize and control information in the memory. In this way, the
associations form the starting point for the consumer's impressions and opinions of a brand and
for the choices s/he makes about buying and using different brands. On the contrary Aaker
(1991) claimed that consumers must first be aware of a brand to later have a set of brand
associations. As per Keller et al 2011, consumers can form brand association in a variety of ways
other than marketing activities: from direct experience; through information from other
commercial or nonpartisan sources such as consumer reports or other media vehicles; from word
of mouth; and by assumptions or inferences consumers make about the brand itself, its name,
logo, or identification with a company, country, channel of distribution, or person, place, or
event.

22
Dimensions of brand associations
Strength of brand association: The more deeply a person thinks about product information and
relates it to existing brand knowledge, the stronger the resulting brand associations will be. Two
factors that strength associations to any piece of information are its personal relevance and the
consistency with which it is presented over time (Keller, Parameswaran & Jacob, 2011, p.56).
Favorability of brand association: To choose which favorable and unique associations to link to
the brand, marketers carefully analyze the consumer and the competition to determine the best
positioning for the brand. Marketers create favorable brand association by convincing consumers
that the brand possesses relevant attributes and benefits that satisfy their needs and wants.
Favorable associations for a brand are those associations that are desirable to consumers-
convenient, reliable, effective, efficient, colorful- successfully delivered by the product, and
conveyed by the supporting marketing program (Keller, Parameswaran & Jacob, 2011, p.58).
Uniqueness of brand association: These are distinct associations not shared with competing
brands. It is important to associate unique, meaningful point of difference to the brand to provide
a competitive advantage and "reason why" consumers should buy it (Keller, Parameswaran &
Jacob, 2011, p.58)
Keller classified brand associations into three major categories of increasing scope: attributes,
benefits, and attitudes.
Attributes are those descriptive features that characterize a product or service-what a consumer
thinks the product or service is or has and what is involved with its purchase or consumption.
Attributes are distinguished according to how directly they relate to product or service
performance. Product-related attributes are defined as the ingredients necessary for performing
the product or service function sought by consumers. Non-product-related attributes are defined
as external aspects of the product or service that relate to its purchase or consumption. These
include price, packaging, user imagery and usage imagery.
Benefits are the personal value consumers attach to the product or service attributes-that is, what
consumers think the product or service can do for them. According to Park, Jaworski, and
Maclnnis (1986) as cited by Keller (1993) benefits can be further distinguished into three
categories according to the underlying motivations to which they relate: (1) functional benefits,

23
(2) experiential benefits, and (3) symbolic benefits. Functional benefits are the more intrinsic
advantages of product or service consumption and usually correspond to the product-related
attributes. Functional benefits satisfy functional needs. Functional needs are defined as those that
motivate the search for products that solve consumption related problems (e.g. solve a current
problem, resolve conflict, and restructure a frustrating situation) . Experiential benefits relate to
what it feels like to use the product or service and also usually correspond to the product-related
attributes. As per Keller (2004), these benefits satisfy experiential needs such as sensory
pleasure, variety, and cognitive stimulation. Keller also described symbolic benefits as the more
extrinsic advantages of product or service consumption. Symbolic benefits please symbolic
needs. Ghodeswar (2008) claimed that symbolic needs are desires for products that fulfill
internally generated needs for self-enhancement, role position, group membership, or ego
identification.
According to Keller as cited by Wilkie 1986, brand attitudes are defined as consumers' overall
evaluations of a brand. Brand attitudes are important because they often form the basis for
consumer behavior (e.g., brand choice). Brand attitudes can be related to beliefs about product-
related attributes and the functional and experiential benefits, consistent with work on perceived
quality (Zeithaml 1988). Brand attitudes can also be related to beliefs about non-product-related
attributes and symbolic benefits consistent with the functional theory of attitudes which
maintains that attitudes can serve a "value-expressive" function by allowing individuals to
express their self-concepts (Keller, 1993).
Aaker (1996) on the other hand, claimed that associations can be structured around three
perspectives on the brand: the brand-as-product (value), the brand-as person (brand personality)
and the brand-as-organization (organizational associations).
The brand-as-product perspective focuses on the brands value proposition (functional benefit). A
second element of associations/differentiation, brand personality, is based on the brand-as-person
perspective. For some brands, the brand personality can provide a link to the brands emotional
and self-expressive benefits as well as a basis for customer/brand relationships and
differentiation. This is especially the case for brands that have only minor physical differences
and that are consumed in a social setting where the brand can make a visible statement about the

24
consumer. Heckler & Till (2008) asserted that brand personality can add a differentiating
dimension to consumers' understanding of your brand- a dimension not so easily duplicated; a
dimension that can serve as your brand's important point of distinction.
As noted by Aaker (1996), the brand-as-organization perspective considers the organization
(people, values, and programs) that lies behind the brand. This perspective can be particularly
helpful when brands are similar with respect to attributes, when the organization is visible (as in
a durable goods or service business), or when a corporate brand is involved. It can play an
important role by showing that a brand represents more than products and services.
Organizational associations that are often important bases of differentiation and choice include
having a concern for customers, being innovative, striving for high quality, being successful,
having visibility, being oriented toward the community, and being a global player.
Chen (2001) asserted that brand association can be seen in all forms and reflects features of the
product or aspects independent of the product itself.
Aaker (1991)categorized brand association into 11 types:
Product attributes
Intangibles
Customer benefits
Relative price
Use/application
User/customer
Celebrity/person
Life-style/personality
Product class
Competitors and
Country/geographic area
2.7.4 Brand loyalty
As cited by Aaker (1996), the brand strategist Scott Talgo stated that “a brand that captures your
mind gains behavior; a brand that captures your heart gains commitment". Brand loyalty
according to Aaker (1991) was described as a measure of the attachment that a customer has to a

25
brand and it reflects how likely a customer will be to switch to another brand, especially when
that brand makes a change, either in price or in product features.
As per Aaker (1996), when consumers acquire a more positive perception of a brand, loyalty
results. A loyal customer base represents a barrier to entry, a basis for a price premium, time to
respond to competitor's innovations, and a bulwark against deleterious price competition.
It is a deeply held commitment to rebuy or repatronise a preferred product or service consistently
in the future, despite situational influences and marketing efforts having potential to a cause
switching behavior (Oliver 1997). According to Giddens and Hofmann (2002) as cited by Ulas
and Arslan (2006), brand loyalists have three mindsets: commitment to the brand, willingness to
pay a higher price for the brand over other brands and recommending the brand to others.
Leclercq et al (2003) claimed that brand loyalty may be higher for brands, which have a larger
market share. According to Keller, Parameswaran & Jacob (2011), brands with large market
share are more likely to have more loyal customers than brands with small market shares, a
phenomenon called double jeopardy.
Types of brand loyalty
There are two types of brand loyalty namely behavioral loyalty and attitudinal loyalty. Behavioral loyalty is simply repeatedly buying a brand- regardless of the reasons behind that
purchasing behavior (Till & Heckler, 2008, p.107)
Attitudinal loyalty is an affection, a good emotional feeling and a sense of commitment to a
brand (Till & Heckler, 2008, p.107)
Brand communities - As per Keller, Parameswaran & Jacob (2011), a brand may take on broader
meaning to the customer by conveying a sense of community. Identification with a brand
community may reflect an important social phenomenon in which customers feel a kinship or
affiliation with other people associated with the brand, whether fellow brand users or customers,
or employees or representatives of the company. A brand community can exist online or off-line.
Fioroni & Titterton (2009) claimed that brand and religion have many things in common.
Religion represents the relationship which is established between a person and an indeterminate

26
superior being. Every religion bases its appeal on man’s need to believe in something which
gives him a purpose in life and shows him the path he should take. Consumers consider less and
less the functional aspects of a brand, while giving more and more importance to the emotional
and spiritual aspects. Every religion in fact defines among its followers a sense of belonging, of
community and of sharing. It is through this sense of belonging that the creed is created and
strengthened. The same could be said for brands, whose resonance can allow access to a
community and develop feelings of belonging to it. We are talking about communities which are
almost tribal in nature, made up of people who share the same interest in a particular brand
which creates a sort of parallel universe made up of its own values, languages and hierarchy. Its
members are joined by the same subjectivity, passions and experiences and by means of a series
of rituals they are bearers of collective actions which are lived intensely, even if they are in
reality ephemeral. When Apple Computer presents one of its new products ready to be launched
on the market, masses of Apple faithful crowd the place where the presentation is to be held,
even sleeping there the night before, waiting to hear the new parable which the prophet Jobs is
ready to tell them. According to Brown (1998) as cited by Patwardhan & Balasubramanian
(2011) suggested that consumers do fall truly, madly, deeply in love with products and services.
These researchers found out that brand romance is a reliable, valid, and a more proximal
construct that explains loyalty significantly better than attitudes. Different perspective by Azar
(2013) proposed that brands may develop communities based on the sexual symbols (brand
gender) attributed to their brands.
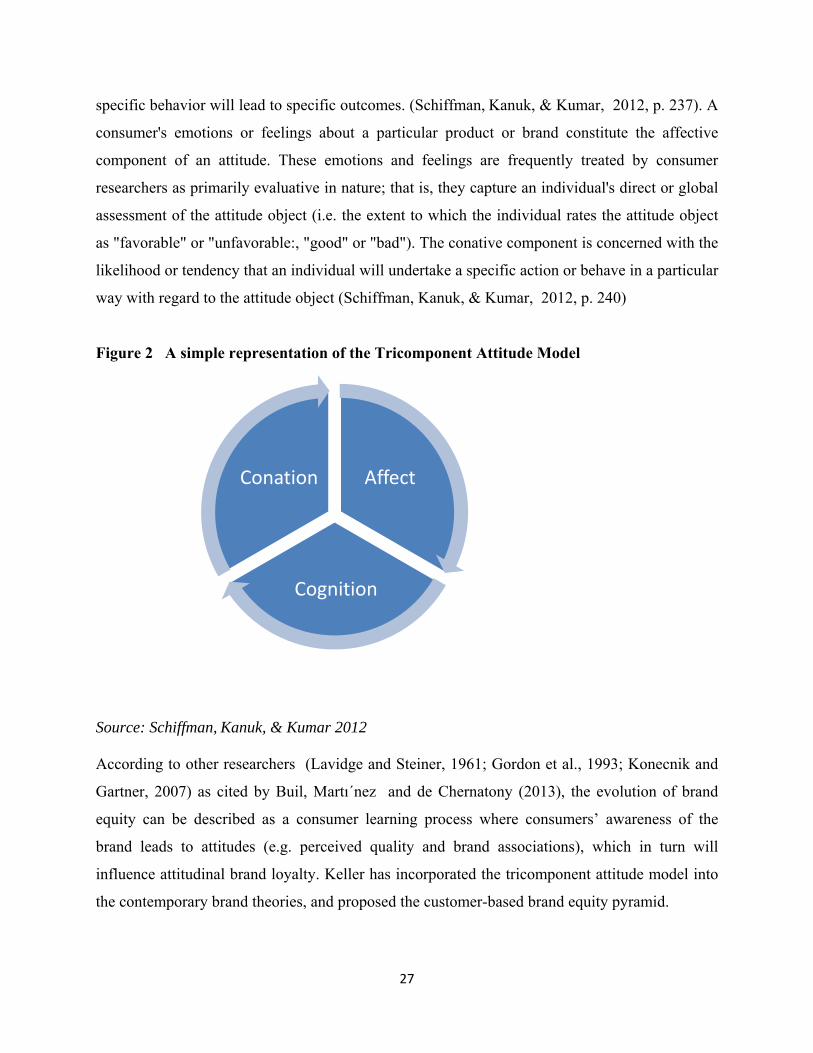
2.8 Relationships among brand equity dimensions As advocated by different researchers (Cobb-Walgren et al ( 1995), Agarwal and Rao (1996),
Yoo and Donthu (2001), Keller and Lehmann (2003/06)) as cited by Buil, Martı´nez and de
Chernatony (2013) the traditional hierarchy of effects model also known as the tricomponent
attitude model is a useful framework for studying the causal order among the dimensions of
brand equity. This sequential process consists of cognitive, affective and conative stages. The
cognitive component is a person's cognitions, that is, the knowledge and perceptions that are
acquired by a combination of direct experience with the attitude object and related information
from various sources. This knowledge and resulting perceptions commonly take the form of
beliefs; that is, the consumer believes that the attitude object possesses various attributes and that
27
specific behavior will lead to specific outcomes. (Schiffman, Kanuk, & Kumar, 2012, p. 237). A
consumer's emotions or feelings about a particular product or brand constitute the affective
component of an attitude. These emotions and feelings are frequently treated by consumer
researchers as primarily evaluative in nature; that is, they capture an individual's direct or global
assessment of the attitude object (i.e. the extent to which the individual rates the attitude object
as "favorable" or "unfavorable:, "good" or "bad"). The conative component is concerned with the
likelihood or tendency that an individual will undertake a specific action or behave in a particular
way with regard to the attitude object (Schiffman, Kanuk, & Kumar, 2012, p. 240)
Figure 2 A simple representation of the Tricomponent Attitude Model
Source: Schiffman, Kanuk, & Kumar 2012 According to other researchers (Lavidge and Steiner, 1961; Gordon et al., 1993; Konecnik and
Gartner, 2007) as cited by Buil, Martı´nez and de Chernatony (2013), the evolution of brand
equity can be described as a consumer learning process where consumers’ awareness of the
brand leads to attitudes (e.g. perceived quality and brand associations), which in turn will
influence attitudinal brand loyalty. Keller has incorporated the tricomponent attitude model into
the contemporary brand theories, and proposed the customer-based brand equity pyramid.
Affect
Cognition
Conation

28
2.9 Brand equity and consumer behavior
As noted by Gbadamosi, Iwaloye and Bamber (2009) it is widely acknowledged that beverages
constitute a type of food and a major source of energy in most countries. According to Wright et
al. (2001) as cited by Gbadamosi, Iwaloye and Bamber (2009), among the variety of functions
that food performs include; acting as a source of nourishment, as a pastime for personal
indulgence or as a focus for socializing with family, friends, and others and in contributing to a
general sense of individual and national well-being. According to Jas (1998), with regard to
eating behavior, adolescents are representatives of the society in that their food choice is
determined by an interaction of various divergent factors. These factors are categorised to be
socioeconomic, biological, and psychological. Examples of socio-cultural factors are culture,
availability, and price, while biological factors will include such factors as energy and nutrient
requirements. Psychological factors include the mood and attitude towards eating. Others
purported more factors from different perspectives which could drive consumers in the choice of
their non-alcoholic beverages and food in general. Shine et al. (1997) as cited by Gbadamosi,
Iwaloye and Bamber (2009), claimed that these factors are listed to be government or food
regulatory bodies, peer pressure, family, health professionals, advertising and media, and another
group of factors termed organoleptic factors which covers issues like the flavor, appearance,
texture, and odor. Others are vintage and place of production (Liu and Murphy, 2007), and
nutritional label (Shine et al., 1997; Baltas, 2001). According to (Vartanian et al., 2007) as cited
by Gbadamosi, Iwaloye and Bamber (2009), consumers sometimes worry about the safety of
some food and beverage items, when there is information or rumor that questions their safety.
Relevant examples include that of sugar-sweetened soft-drinks which are considered by many to
be major contributors to obesity, and the prospective evidence which suggests that their
consumption result in diabetes.
2.10 History of the Coca- Cola Company Dr John Styth Pemberton, a pharmacist, launched his new product at Jacobs Pharmacy in
Atlanta, Georgia, first marketing Coca-Cola in May 1886. The name Coca Cola was coined by
Frank M. Robinson, Dr Pemberton's partner and bookkeeper; it was felt that a name containing
thrice the letter ``C'' in Spencerian script, would look well in advertising. Joseph A. Biedenharn
was a candy merchant in Vicksburg, Mississippi. At a time when Coca-Cola was only available

29
from a soda fountain, Mr. Biedenharn was looking for a method to serve beverages at a picnic.
He obtained syrup from Atlanta, and in 1894 he became the first to bottle Coca-Cola. A quarter
of a century later, there were over 750 bottlers of Coca-Cola in 135 countries overseas. (Dana &
Oldfield, 1999, p.291)
2.10.1 Coca-Cola's adaptation
According to Dana & Oldfield (1999), consumers in different countries drink Coca-Cola for
different reasons. In China, it was a luxury item, served on silver trays at government functions.
In Spain, it is used as a mixer with wine, for example. In California, it is kept in coolers to be
used as refreshment; in Tromso, Norway, it is kept in warmers, rather than coolers. Even the
generic description, the listing of ingredients and format of Coca-Cola varies from country to
country as shown on Table 2. In Zimbabwe, Coca-Cola is almost exclusively limited to 200ml
and 300ml glass bottles. In nearby Botswana, 340ml cans are common while Coca-Cola bottles
are unheard of. In Australia and in the USA, Coca-Cola is available in both bottles and cans. In
the USA, a standard can size is 12 US ounces, which is 355ml. In the UK, the 150ml can is
popular. Product line is also adapted from place to place. In some markets, such as Argentina,
Australia, Canada, Israel, Norway, South Africa, and the US, a sugarless cola was made
available, targeted to upscale, style-conscious, weight-concerned urbanites. In Canada and the
USA, the name ``Diet Coke'' is used; in Israel, the name ``Diet Coca-Cola'' has been selected. In
countries where the word ``diet'' implies weight-reducing (as opposed to minimal weight-
gaining), the product is known as Coca-Cola Light.

30
Table 2 Generic description of Coca-Cola by market Market Description
Belgium Vegetable extract soft drink
Canada Cola
Fiji Compound beverage
France Vegetable extract soda
Greece Refreshment
Holland Soft drink with vegetable extract
Latin America Refreshing extract drink
Portugal Gasified vegetable extract refreshment
United Arab Emirates Carbonated beverage
UK Soft drink with vegetable extracts
USA Cola
Yugoslavia Refreshing non-alcoholic drink with vegetable extract
Source: Dana & Oldfield 1999
2.10.2 Coca-cola and corporate social responsibility (CSR)
During the 1990s the industry trend was such that promotion was gaining importance. At camel
races in Australia, at sheep-shearing contests in New Zealand and at bullfights in Spain, the
Coca-Cola logo was present.
Coca-Cola initiated a ‘‘sustainability scheme’’ which is designed to promote its commitment to
health and physical wellbeing issues worldwide. One element of this scheme consists of adopting
a beyond compliance policy of transparency in respect to nutritional information on product
labels (exceeding federal requisites). Another element of the sustainability scheme is to adhere to
codes of responsible advertising and marketing that target children. A third crucial element is to
encourage, sponsor and initiate grassroots programs around the world and to promote physical
activity and reduce the hazardous effects of inertia associated with modern lifestyles. In order to
meet the above objectives the company developed the Active Healthy Living (AHL) project.
AHL activities include the broadening of Coca-Cola’s line of products and to include more
dietary beverages, juices, energy drinks and water, and the initiation and support of hundreds of

31
projects worldwide aimed at promoting nutritional education and physical activity. In this regard,
the AHL strategy draws a direct link between the company’s core business and practices of
social responsibility (Barkay, 2012, p.50)
2.11 Coca-cola in Ethiopia
“Ethiopia is Coca-Cola’s fourth-most-important market in Africa after South Africa, Kenya and
Uganda. Currently, the company operates two plants in Addis Ababa and Dire Dawa, in the
eastern part of the country. Coca-Cola is set to embark on the construction of a $60-million plant
in Ethiopia as it seeks to quadruple its production capacity to enable it to battle for a bigger share
of the fast-growing market.
Through its local subsidiary, East African Bottling Company (EABC), Coca-Cola has secured a
30 ha piece of land in Bahir Dar, some 578 km north-north-west of the capital, Addis Ababa. The
plant will be Coca-Cola’s third factory in the Horn of Africa nation, where consumption of soft
drinks has been growing at an average rate of 8% year-on-year. Coca-Cola is also mulling
investments in two more plants in Ethiopia. The company’s future plan includes constructing a
further plant in Hawassa. www.engineeringnews.co.za
Few months ago, the company had inaugurated an expansion project at its factory in Dire Dawa.
It enabled the factory, 515km east of Addis Abeba, to increase its production five-fold, at an
outlay of 20 million dollars. The factory has the capacity to fill 36,000 bottles of the company’s
well known beverages, such as – Coca Cola, Fanta, Coca-Light, Sprite and Fanta – every hour.
As part of its plan – the 2020 Coca Cola Initiative, in which the Company is investing 500
million dollars – Coca Cola has invested 50 million dollars to introduce a recyclable packaging
line. This enabled the company to produce plastic packaging for its products at the firm’s branch
in Addis Abeba. This project is expected to produce 750,000 plastic bottles a day. Its recyclable
plastic PET (Polyethylene Terephthalate) bottles are available in two sizes – 500ml and 1.5 liters.
www.addisfortune.net/.../east-african-bottling-sc

32
Coca-cola and CSR in Ethiopia
As per the Brand manager of Coca-cola, apart from the Great Run the company is engaged in
different CSR activities. One is the Replenish Africa Initiative (RAIN) and the other is 5x20
Initiative.
Replenish Africa Initiative (RAIN)
The lack of safe drinking water in Africa is a serious challenge to the health and vitality
of communities. Every year, preventable waterborne illnesses claim the lives of millions
of Africans. No single organization can solve Africa’s water crisis. But together, with a
combination of civil society, non-governmental organizations and government, we can
make a positive difference to Africa’s water challenges. In 2009, Coca-cola launched the
Replenish Africa Initiative (RAIN). RAIN aims to provide over two million people
across Africa with safe water by 2015, and to fund water projects in every African
country.
Here is how the entire Coca-Cola system is working to do its part to replenish 100
percent of the water it uses in the production of its beverages:
Reduce
It continues to reduce its water use ratio (the amount of water we use per
liter of product) to drive efficiency while growing our business and
expanding its portfolio. Between 2008 and 2012, it has improved water
efficiency system wide by 20 percent based on the 2004 baseline.
Recycle
It recycles the water used in its manufacturing processes by treating and
returning it to the environment at a level that supports aquatic life. Its goal
is to recycle 100 percent of the water used in our manufacturing processes.
Replenish
It replenishes water in communities and nature through local sustainable
water projects that include watershed protection and community and
sanitation access programs.

33
5X20 initiative
The Coca-Cola company believes that women are powerful global economic
force – but one that is consistently undervalued. 5by20 is its global
commitment to enable the economic empowerment of 5 million women
entrepreneurs by 2020. Specifically, it will focus on the small businesses the
company works with in over 200 countries around the world.
From fruit farmers to artisans, the 5by20 initiative aims to help women
overcome the barriers they face to business success. To accomplish this, it is
providing access to training, financial resources and mentors.
2.12 Global branding
Keller, Parameswaran & Jacob (2011) stated that global branding does not mean having the same
brand everywhere. It means having an overarching strategy that optimizes brand effectiveness in
local, regional and international markets.
Advantages of global marketing program
Economies of scale in production and distribution
Lower marketing costs
Power and scope
Consistency in brand image
Ability to leverage good ideas quickly and efficiently
Uniformity of marketing practices
Disadvantages of global marketing program
Differences in consumer needs, wants, and usage patterns for products
Differences in consumer response to marketing mix elements
Differences in brand and product development and the competitive environment
Differences in the legal environment
Differences in marketing institutions
Differences in administrative procedures

34
2.13 Building global customer based brand equity
Keller, Parameswaran & Jacob (2011) proposed what they called "Ten commandments of global
branding" which would enable to best build strong global brands.
1. Understand similarities and differences in the global branding landscape
2. Don't take shortcuts in brand building
3. Establish marketing infrastructure
4. Embrace integrated marketing communications
5. Cultivate brand partnerships
6. Balance standardization and customization
7. Balance global and local control
8. Establish operable guidelines
9. Implement a global brand equity measurement system
10. Leverage brand elements
The Coca-cola brand, the second most recognized phrase world-wide next to "ok", has become a
symbol of globalization. Coca-Cola has spent a lot of money in brand building, brand
maintenance and achieving top-of-mind awareness.
Two models in international public relations can be used to explain the strategies in corporate
communications in cyberspace: one is the ethnocentric model, and the other is the polycentric
model. According to Sharpe (1992) and Anderson (1989) as cited by Tian (2006), the
ethnocentric model in international public relations is similar to the global strategy in marketing.
It is more focused on the homogenous aspect of international public relations, and it suggests that
principles for public relations remain same across the world or public relations programs are
more similar than they are different across countries. As per Botan (1992) and Taylor (2000) as
cited by Tian (2006) the polycentric model in international public relations is similar to the
localized strategy in marketing. It is more concerned with the heterogeneous aspect of
international public relations, and it argues that public relations strategies could be different
based on the different situations of each country.
Tian (2006) affirmed that a study reveals that a glocal strategy approach is being practiced by
Coca-Cola in public relations in cyberspace. Coca-Cola is still ‘‘king of the castle’’ and has

35
retained top ranking through thinking globally while acting locally, that is by adapting to local
customs while retaining a globally recognized brand image. According to Robertson (1995),
Maynard (2003) and Svensson (2001) as cited by Tian (2006), a glocal strategy approach, on the
contrary, is a combination of different levels, from local to global, of strategic approaches, with
the awareness of the significance of adaptation to local markets, and it attempts to maintain a
balance between global homogenization and local customization.
2.14 Conceptual framework The researcher has used the most common and widely used conceptual framework of Aaker for
the measurement of consumer-based brand equity. The conceptual framework is illustrated in the
figure below.
Figure 3 Conceptual framework of brand equity
Source: Aaker (1991)
Perceived quality can be defined as the customer’s perception of the overall quality or superiority
of a product or service relative to alternatives. Perceived quality cannot necessarily be
objectively determined, because perceived quality itself is a summary construct (Aaker, 1991,
p.85). Brand associations can affect the processing and recall of information, provide a point of
differentiation, provide a reason to buy, create positive attitudes and feelings and serve as the
Brand Awareness
Brand Association
Brand loyalty Other Propriety Brand Assets
Brand equity Perceived quality

36
basis of brand extensions (Aaker, 1992, p.32). Brand associations may include, e.g., product
attributes, customer benefits, uses, life-styles, product classes, competitors and countries of
origins. Brand awareness is the ability of a potential buyer to recognize or recall that a brand is a
member of a certain product category. Brand awareness involves a continuum ranging from an
uncertain feeling that the brand is recognized to a belief that it is the only one in the product
category (Aaker, 1991, p.61). Brand loyalty represents a favourable attitude toward a brand
resulting in consistent purchase of the brand over time. It is the result of consumers’ learning that
only the particular brand can satisfy their needs (Tuominen, 1999, p.79).
In summary, strong brand equity means that customers have high brand-name awareness,
maintain a favorable brand image, perceive that the brand is of high quality, and are loyal to the
brand.

37
CHAPTER THREE
RESEARCH DESIGN AND METHODOLOGY
In this chapter, the researcher made discussions about the research design, sample and sampling
technique, sample size, data collection instrument, procedure of data collection and method of
data analysis.
3.1 Research design
The research is a quantitative research as it used data that are numeric in nature. Moreover, it is a
correlational research type as it tests hypothesized relationships between variables. The research
seeks to examine the relationship between brand equity and its four dimensions. Even though
there are several brand equity models, this research applied the most commonly cited model of
Aaker. As cited by Tong & Hawley (2009), other researchers (Barwise, Yoo & Donthu) use the
first four brand equity dimensions out of the five as they represent customers' evaluations and
reactions to the brand and therefore they have been widely adopted to measure consumer-based
brand equity. In addition, these brand equity dimensions are widely accepted and used by
numerous researchers (e.g. Yoo et al., 2000; Kim et al., 2003; Pappu et al., 2005; Lee and Back,
2010; Pike et al., 2010; Kim and Hyun, 2011).
3.2 Sample and sampling technique
The target population for this study was female/male and who is a consumer of Coca-cola. As
there are usually a highly populated number of consumers available at cafes, restaurants and
recreational centers, they were chosen as a place of contact with the respondents.
The researcher selected the respondents out of the total population of consumers of Coca-Cola
through convenience sampling. Convenience sampling which also called accidental or
opportunity is sampling is a non-probability sampling technique in which a sample is drawn from
that part of the population that is close to hand, readily available, or convenient (Bhattacherjeend
2012).

38
3.3 Sample size
According to Israel (2013), there are different strategies to calculate sample size. These include
using census for small population, using a sample size of similar study, using published tables
and using formula to calculate sample size.
The target population for this research has a vast number of consumers. A similar study
conducted by Tong & Hawley (2009) used a sample size of 330. As per the on-line published
table of sample size, the sample size taken for a population of more than 500,000 with a 95%
confidence interval and a 5% margin of error is 385.
According to Cochran (1963) as cited by Israel (2009), a large population's sample size can be
calculated by using the formula n0 = Z2 pq
e2
where n0 is the sample size, Z2 is the abscissa of the normal curve that cuts off an area α at the
tails (1 - α equals the desired confidence level) , e is the desired level of precision, p is the
estimated proportion of an attribute that is present in the population, and q is 1-p. The value for Z
is found in statistical tables which contain the area under the normal curve.
With a maximum variability of p=.5 , confidence level of 95% and ±5% precision, the resulting
sample size is n0 = Z2 pq = (1.96)2 (.5) (.5) = 384
e2 (.05)2
Many researchers commonly add 10% to the sample size to compensate for persons that the
researcher is unable to contact (Israel, 2013). The sample size also is often increased by 30% to
compensate for nonresponse (Israel, 2013, p.5). Sampling error is inversely related to the size of
the sample i.e., sampling error decreases as the sample size increases and vice-versa (Kothari,
2004, p.154). Taking all into consideration, the researcher was able to distribute a total number
of 490 questionnaires.
3.4 Data collection instrument
The researcher used primary data as a source of data. The means to collect the primary data was
through self administered questionnaire. The questionnaire has two parts. The first part is
regarding the socio-demographic data of respondents and the second part encompasses the items

39
to measure the four dimensions of brand equity and the overall brand equity aspect which is
based on work of Yoo and Donthu (2001). Apart from the first part, the rest was measured by
using 5 point Likert scale ranging from "strongly agree" to "strongly disagree". A measure for
perceived quality has four items. The first three were adopted from Aaker (1991), Pappu et al.
(2005) and the last one was adopted from Yoo & Donthu (2000). Perceived quality assesses
consumers’ subjective judgments about a brand’s overall excellence or superiority. Brand
awareness has five measures which were adopted from Aaker (1991) and Yoo & Donthu (2000).
It measures the strength of the brand in a consumer’s memory as reflected by the consumer’s
ability to identify various elements of it. Having five items, brand association tries to measure
the brand's uniqueness and favorableness and organizational associations. All the items were
adopted from Aaker (1996), Keller (1993), Pappu et al. (2005) and Yoo & Donthu (2000). Brand
loyalty tries to attain consumer’s overall commitment to being loyal to a brand. All the five items
were adopted from Yoo & Donthu (2000) and Pappu et al. (2005). The customer-based overall
brand equity tries to look at consumers’ overall attitudes toward the focal brand and their
intention to select the brand against its competitor. The four items were adopted form Yoo &
Donthu (2000). The model used in this research has been empirically tested by other researchers.
One item from the brand association dimension was excluded from the final scale due to low
item-total correlation and the rest twenty two items were kept for the study.
Out of the total number of 490 distributed questionnaires, 470 were used for the analysis. Eleven
questionnaires were unreturned and nine discarded as they were not filled properly. The duration
of data collection was four weeks.
3.5 Procedures of data collection
As the researcher believed that legally operating translation offices have the experience and
proficiency in translation, the questionnaire was transformed into the local language of Amharic
by one of these offices. The Amharic version of the questionnaire was intended for those
respondents who have low command of the English language. After the translation was done, the
researcher observed some gap in the translation and tried to modify it.

40
At the time of approaching the voluntary respondents, they were first asked whether they drink
Coca-cola or not. And then they would be asked with which version of the questionnaire they
would be at ease to fill; the English or the Amharic version and then given accordingly.
3.6 Method of data analysis
Firstly descriptive statistical tools were used in the analysis. Descriptive analysis refers to
statistically describing, aggregating, and presenting the constructs of interest or associations
between these constructs. Inferential analysis refers to the statistical testing of hypotheses (theory
testing) (Bhattacherjee, 2012). Descriptive statistical tools like frequency and cross tabulation
were used. In addition SPSS, AMOS version 21 was used to test the proposed hypothesis.
Structural equation modeling with SPSS, AMOS version 21 was also used for the analysis of the
470 valid data. Structural equation modeling is used to study the relationships among latent
constructs that are indicated by multiple measures. SEM takes a confirmatory (hypothesis
testing) approach to the multivariate analysis of a structural theory, one that stipulates causal
relations among multiple variables (Lei & Wu, 2007, p.34). SEM consists of two parts: the
measurement model and the structural equation model.

41
CHAPTER FOUR
RESULTS AND DISCUSSIONS
This chapter presents the reliability test carried out for the 470 valid data that were used for the
analysis. It also includes the different analyses of the data from the questionnaires along with
their interpretation are presented.
4.1 Reliability test Reliability is the degree to which the measure of a construct is consistent or dependable
(Bhattacherjeend, 2012, p.57). The reliability test was executed by Cronbach's alpha coefficient
and items which scored above the acceptable value were retained. As per Tavakol & Dennick
(2011) if a test has more than one concept or construct, it may not make sense to report alpha for
the test as a whole as the larger number of questions will inevitable inflate the value of alpha. In
principle therefore, alpha should be calculated for each of the concepts rather than for the entire
test or scale. The implication for a summative examination containing heterogeneous, case based
questions is that alpha should be calculated for each case. The table below shows the value of
alpha for each dimension as a whole. The value of alpha for each item is presented in the
appendix.
Table 3 Reliability test of the sample
Measurement Number of items Cronbach's alpha
Perceived quality 4 .907
Brand awareness 5 .788
Brand association 4 .738
Brand loyalty 5 .897
Overall brand equity 4 .897
Result of all independent variables 22 .937
Source: Researcher's survey 2014
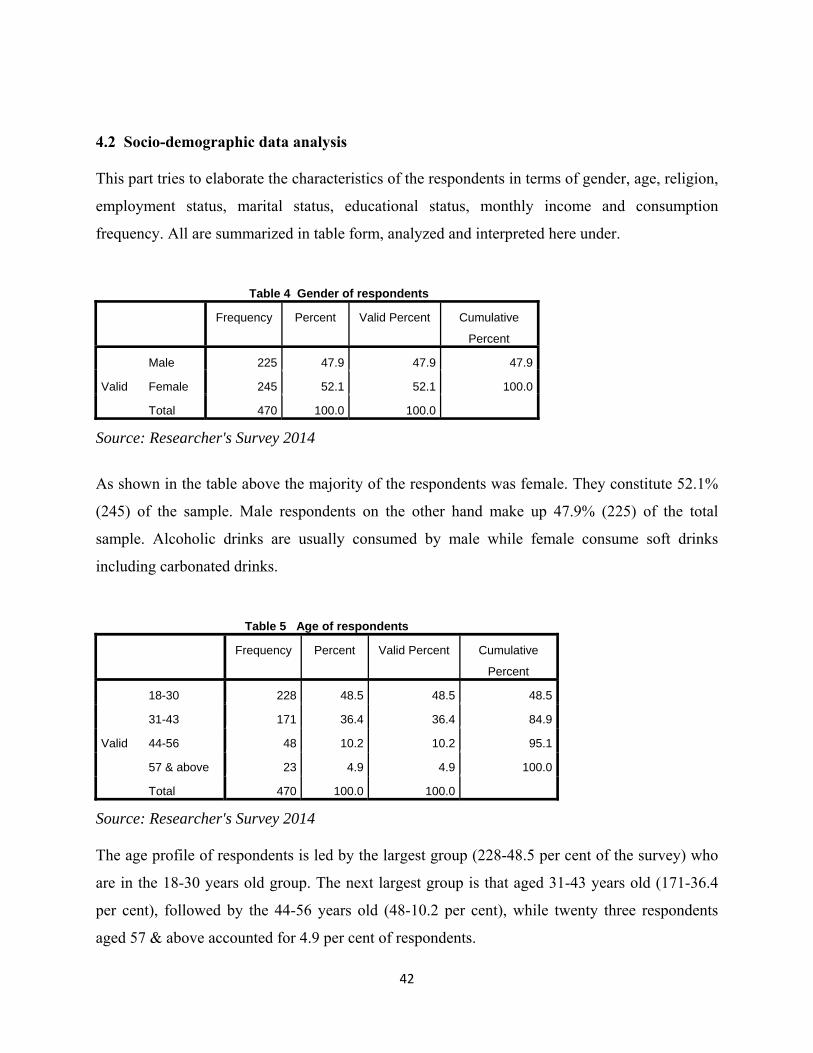
42
4.2 Socio-demographic data analysis This part tries to elaborate the characteristics of the respondents in terms of gender, age, religion,
employment status, marital status, educational status, monthly income and consumption
frequency. All are summarized in table form, analyzed and interpreted here under.
Table 4 Gender of respondents
Frequency Percent Valid Percent Cumulative
Percent
Valid
Male 225 47.9 47.9 47.9
Female 245 52.1 52.1 100.0
Total 470 100.0 100.0
Source: Researcher's Survey 2014
As shown in the table above the majority of the respondents was female. They constitute 52.1%
(245) of the sample. Male respondents on the other hand make up 47.9% (225) of the total
sample. Alcoholic drinks are usually consumed by male while female consume soft drinks
including carbonated drinks.
Table 5 Age of respondents
Frequency Percent Valid Percent Cumulative
Percent
Valid
18-30 228 48.5 48.5 48.5
31-43 171 36.4 36.4 84.9
44-56 48 10.2 10.2 95.1
57 & above 23 4.9 4.9 100.0
Total 470 100.0 100.0
Source: Researcher's Survey 2014 The age profile of respondents is led by the largest group (228-48.5 per cent of the survey) who
are in the 18-30 years old group. The next largest group is that aged 31-43 years old (171-36.4
per cent), followed by the 44-56 years old (48-10.2 per cent), while twenty three respondents
aged 57 & above accounted for 4.9 per cent of respondents.

43
As the age of respondents increase, their consumption of Coca-cola decreases. This might be
related to health issue concerns.
Table 6 Religion of respondents
Frequency Percent Valid Percent Cumulative
Percent
Valid
Christian 380 80.9 81.5 81.5
Muslim 52 11.1 11.2 92.7
Other 34 7.2 7.3 100.0
Total 466 99.1 100.0 Missing 777 4 .9 Total 470 100.0
Source: Researcher's Survey 2014 As can be seen in Table 6, Christian respondents make up 80.9% of the total sample which is
followed by 11.1% of Muslims. Respondents claiming being from other religion added up to
7.2%.
It is known that Muslims don't drink alcohol and therefore have high tendency of drinking
carbonated drinks. Different Christian religions exist like Orthodox, Catholic, Protestant, Baha'i,
Adventist etc. Some of these religions prohibit the consumption of alcohol which some permit.
Even though it is not known to which Christian institutions these respondents belong to, the
majority might be from those who forbid the consumption of alcoholic drinks.
Table 7 Employment status of respondents
Frequency Percent Valid Percent Cumulative
Percent
Valid
Self-employed 133 28.3 29.2 29.2
Employed by others 243 51.7 53.3 82.5
Unemployed 72 15.3 15.8 98.2
Retired 8 1.7 1.8 100.0
Total 456 97.0 100.0 Missing 767 14 3.0 Total 470 100.0
Source: Researcher's Survey 2014

44
Out of the 470 respondents, 243 are employed by elsewhere whereas 133of them are self-
employed. Those who are unemployed composed of 72 respondents. Retired respondents form
1.7% (8) of the respondents.
Table 8 Marital status of respondents
Frequency Percent Valid Percent Cumulative
Percent
Valid
Married 191 40.6 40.9 40.9
Single 258 54.9 55.2 96.1
Divorced 13 2.8 2.8 98.9
Widowed 5 1.1 1.1 100.0
Total 467 99.4 100.0 Missing 757 3 .6 Total 470 100.0
Source: Researcher's Survey 2014
Single respondents amount to 54.9% of the total respondents which is followed by 40.6% of
married respondents. Divorced respondents make up 2.8% while widowed respondents are 1.1
% of the total sample.
The researcher has made educational status into four categories for the respondents to choose
from. Table 9 Educational status of respondents
Frequency Percent Valid Percent Cumulative
Percent
Valid
High school 70 14.9 15.0 15.0
Diploma 116 24.7 24.8 39.7
First degree 231 49.1 49.4 89.1
Masters degree & above 51 10.9 10.9 100.0
Total 468 99.6 100.0 Missing 747 2 .4 Total 470 100.0
Source: Researcher's Survey 2014

45
The highest number of for this category is achieved by 231 respondents (49.1 per cent of the
total) who have undergraduate degree: The next largest group was those with a diploma (116 or
24.7 per cent), then the 70 (14.9 per cent) who were only educated up to high school level.
Finally, there were 51 (10.9 per cent), who have a postgraduate degree and above.
Table 10 Monthly income of respondents
Frequency Percent Valid Percent Cumulative
Percent
Valid
Below 1000 128 27.2 27.4 27.4
1001-3000 88 18.7 18.8 46.2
3001-5000 64 13.6 13.7 59.8
5001-10000 79 16.8 16.9 76.7
Above 10000 109 23.2 23.3 100.0
Total 468 99.6 100.0 Missing 737 2 .4 Total 470 100.0
Source: Researcher's Survey 2014
As shown in Table 10, the majority of the respondents (128; 27.2%); earn a monthly income of
less than 1000Birr. One hundred nine respondents (23.2%) earn the second biggest income
which is above 10000Birr. Those earning between 1001-3000Birr monthly amount to 18.7%
(88) followed by 16.8% (79) of respondents. Respondents with a monthly income of 3001-
5000Birr make up 13.6% (64). The majority of consumers are those earning below 1000 which
might be due the price of Coca-cola being affordable by the majority.
Table 11 Consumption frequency of respondents
Frequency Percent Valid Percent Cumulative
Percent
Valid
Daily 48 10.2 10.2 10.2
Weekly 123 26.2 26.2 36.4
Monthly 54 11.5 11.5 47.9
Occasionally 245 52.1 52.1 100.0
Total 470 100.0 100.0
Source: Researcher's Survey 2014

46
In terms of respondent consumption frequency, the majority of the respondents which make up
52.1% consume Coca-cola occasionally. Those who consume Coca-cola on a weekly basis add
up to 26.2%. Others who are 11.5% of all the respondents consume Coca-cola monthly. Daily
consumers of Coca-cola are represented by10.2% out of the total respondents. This might be due
to the health issues like obesity, diabetes, etc that are presumably caused by carbonated drinks.
4.3 Cross tabulation
The cross tabulation consisting of tables from 12 to 14 summarizes, analyzes and interprets the
consumption frequency of respondents with gender, age and monthly income.
Table 12 Gender Vs consumption frequency Count
Consumption frequency of respondents Total
Daily Weekly Monthly Occasionally
Gender of respondents Male 21 60 23 121 225
Female 27 63 31 124 245
Total 48 123 54 245 470
Source: Researcher's Survey 2014
Female respondents seem to show higher consumption frequency than male respondents.
Empirical study has shown that consumption of caffeine-containing beverages was strongly
related to the prevalence of premenstrual syndrome (Rossignol & Bonnlander, 1990).
Table 13 Age Vs consumption frequency Count
Consumption frequency of respondents Total
Daily Weekly Monthly Occasionally
Age of respondents
18-30 29 75 21 103 228
31-43 16 32 20 103 171
44-56 3 12 10 23 48
57 & above 0 4 3 16 23
Total 48 123 54 245 470
Source: Researcher's Survey 2014
Occasional drinkers amount to 103 in number out of the total of 228 drinkers aged 18-30.
Seventy five of respondents aged 18-30 drink Coca-cola weekly. Within the same age group,

47
twenty nine and twenty one of them drink daily and monthly respectively. For the age group of
31-43 which has 171 drinkers in total, the highest consumption frequency scored is 103 for
occasional drinkers followed by 32 weekly drinkers. Monthly drinkers add up to 20 whereas
daily drinkers amount 16 in number. Those aged 44-56 are 48 in total with 23 occasional
drinkers, 12 weekly drinkers, 10 monthly drinkers and 3 daily drinkers. The last age group which
is 57 & above has 23 drinkers of Coca-cola in total with the 16 occasional drinkers followed by 4
weekly drinkers and 3 monthly drinkers. It can be observed that as the age of respondents
increases, their consumption frequency on the four listed basis decreases. It is known that as
people age, they try to cut their salt, sugar etc intake as to avoid or minimize age related
illnesses. As the young ones spend a lot of time on the internet especially the social medias, their
consumption frequency might be affected by any despicable information about the brand.
Table 14 Monthly income Vs consumption frequency Count
Consumption frequency of respondents Total
Daily Weekly Monthly Occasionally
Monthly income of
respondents
Below 1000 15 42 11 60 128
1001-3000 14 19 15 40 88
3001-5000 6 17 5 36 64
5001-10000 6 25 10 38 79
Above 10000 6 20 13 70 109
Total 47 123 54 244 468
Source: Researcher's Survey 2014
Out of 128 respondents earning below 1000Birr monthly, occasional drinkers add up to 60
respondents. This number is followed by 42 weekly drinkers. Fifteen respondents drink daily
while 11 of them drink monthly. Respondents earning 1001-3000Birr monthly are 88 in number.
Out of this, 40 of them drink occasionally, 19 of them drink weekly, 15 of them drink monthly
and 14 of them drink daily. From the total of 64 respondents earning 3001-5000Birr monthly,
thirty six of them are occasional drinkers, 17 weekly drinkers, 6 daily drinkers and 5 monthly
drinkers. Seventy nine respondents are within the group earning 5001-10000Birr monthly. Out of
this, 38 are occasional drinkers, 25 weekly drinkers, 10monthly drinkers and 6 daily drinkers.
One hundred nine respondents are the top earners out of all with a monthly income above

48
10000Birr. Seventy of them drink occasionally followed by 20 weekly drinkers. The monthly
drinkers amount to 13 respondents while six respondents are daily drinkers.
4.4 Descriptive statistics of brand equity dimensions
As a measurement of brand equity dimension, Table 15 to Table 19 present the items from
perceived quality, brand awareness, brand association, brand loyalty and overall brand equity.
All parts of the dimensions are processed, analyzed and interpreted in order to achieve the
desired result. Finally the relationship among the dimensions is plotted in visual expression in
Figure 4 on page 61.
Table 15 Descriptive statistics of perceived quality
1. I trust the quality of products from Coca-cola
2. Products from Coca-cola would be of very good quality
3. Products from Coca-cola offer excellent features
4. The likelihood that Coca-cola is reliable is very high
Frequency(percent) Frequency(percent) Frequency(percent) Frequency(percent)Strongly disagree
18 (3.8%) 10 (2.1%) 19 (4.0%) 6 (1.3%)
Disagree 34 (7.2%) 32 (6.8%) 35 (7.4%) 17 (3.6%) Neither agree nor disagree
81 (17.2%) 87 (18.5%) 105 (22.3%) 125 (26.6%)
Agree 221 (47.0%) 246 (52.3%) 222 (47.2%) 236 (50.2%) Strongly agree
116 (24.7%) 95 (20.2%) 89(18.9%) 86 (18.3%)
Total 470 (100%) 470 (100%) 470 (100%) 470 (100%) Source: Researcher's Survey 2004
For the first item of perceived quality, 47% and 24.7% of the respondents agree and strongly
agree with the statement respectively. 17.2% of the respondents are neutral. 7.2% and 3.8% of
the respondents disagree and strongly disagree with the statement respectively. For the second
item, 52.3% and 20.2% agree and strongly agree with the statement. Respondents claiming to be
neutral amount to 18.5%. Those stating "disagree" and "strongly disagree" add up to 6.8% and
2.1% respectively. With regards to the third item, those saying "agree" and "strongly agree"
amount to 47.2% and 18.9% respectively. 22.3% of the respondents are neutral. Respondents
who replied "disagree" and "strongly disagree" sum up to be 7.4% and 4.0% correspondingly.
For the last item, half of the respondents and 18.3% of the respondents asserted to be agreed and

49
strongly agree with the statement. Neutral respondents make up 26.6%. 3.6% and 1.3% of the
respondents disagree and strongly disagree with the statement correspondingly. It can be said
that respondents in general tend to like the quality, features and reliability of Coca-cola. The
respondents who have negative feeling towards the quality of Coca-cola might be affected by the
widely spreading word of mouth as well as the information that can be obtained on the internet
regarding the consequences of drinking Coca-cola.
Table 16 Descriptive statistics of brand awareness
1. Some characteristics of Coca-cola come to my mind quickly
2. I can recognize Coca-cola quickly among other competing brands
3. I am familiar with Coca-cola brand
4. I know what Coca-cola looks like
5. I can quickly recall the symbol or logo of Coca-cola
Frequency (percent)
Frequency (percent)
Frequency (percent)
Frequency (percent)
Frequency (percent)
Strongly disagree
21 (4.5%)
13 (2.8%)
18 (3.8%)
0 (0%)
0 (0%)
Disagree 70 (14.9%) 21 (4.5%) 25 (5.3%) 5 (1.1%) 0 (0%) Neither agree nor disagree
99 (21.1%)
58 (12.3%)
76 (16.2%)
141 (30.0%)
79(16.8%) Agree 185 (39.4%) 219 (46.6%) 196 (41.7%) 229 (48.7%) 258 (54.9%) Strongly agree
95 (20.2%)
159 (33.8%)
155 (33.0%)
95 (20.2%)
133(28.3%)
Total 470 (100%) 470 (100%) 470 (100%) 470 (100%) 470 (100%)
Source: Researcher's survey 2014
According to the above table, the respondents who agree with the first item amount to 59.6%
while those who are neutral make up 21.1%. The rest which is 19.4% goes to those who disagree
with statement. For the second item, those who agree with the statement sum up to 80.4% and
those stating neutral with the statement make up 12.3%. Those who disagree add up to 7.3%. In
the case of the third item, 74.7% goes to those who agree with the statement. Those who disagree
make up 9.1% while those claiming to be neutral add up to 16.2%. For the fourth item, 68.9%
are those who agree and 1.1% is those who disagree. Neutral responses make up 30%. For the
last item, 83.2% agree with the statement whereas 16.8% are neutral responses. Despite the

50
majority of the respondents are familiar with the brand and its logo, the brand knowledge in
memory as well as the depth of brand awareness seem to be low.
Table 17 Descriptive statistics of brand association
1. Coca-cola has very unique brand image, compared to competing brands
2. I respect and admire people who drink Coca-cola
3. I like the brand image of Coca-cola
4. I like and trust the company, which makes Coca-cola products
Frequency(percent) Frequency(percent) Frequency(percent) Frequency(percent)Strongly disagree
13 (2.8%) 46 (9.8%) 11 (2.3%) 29 (6.2%)
Disagree 27 (5.7%) 81 (17.2%) 31 (6.6%) 45 (9.6%) Neither agree nor disagree
68(14.5%) 161 (34.3%) 96 (20.4%) 163 (34.7%)
Agree 222 (47.2%) 122 (26.0%) 233 (49.6%) 175 (37.2%) Strongly agree
140 (29.8%) 60 (12.8%) 99 (21.1%) 58 (12.3%)
Total 470 (100%) 470 (100%) 470 (100%) 470 (100%)
Source: Researcher's survey 2014
As shown in Table 17, respondents who agree with the first item make up 77% while 14.5% are
those who replied neutral. The rest (8.5%) goes to those who disagree with the statement. For the
second item, 38.8% agree with the statement, 34.3% are neutral in their replies and the rest
(27%) disagree with the statement. For the third item, 70.7% agree and 8.9% disagree with the
statement. 20.4% are those who replied "neutral". For the last item, those who agree make up
49.5% and those who disagree amount to 15.8%. Those who replied "neutral" make 34.7%.
Based on this, it can be said that the brand doesn't have a strong and favorable association which
might be a result of negative word of mouth or low trust that consumers have on the company.
Moreover, the respondents tend to have low user imagery.

51
Table 18 Descriptive statistics of brand loyalty
1. I consider myself to be loyal to Coca-cola
2. When buying soft drinks, Coca-cola would be my first choice
3. I will keep on buying Coca-cola as long as it provides me satisfying products
4. I am still willing to buy Coca-cola even if its price is a little higher than that of its competitors
5. I would love to recommend Coca-cola to my friends
Frequency (percent)
Frequency (percent)
Frequency (percent)
Frequency (percent)
Frequency (percent)
Strongly disagree
51 (12.1%)
36 (7.7%)
27(5.7%)
44 (9.4%)
49 (10.4%)
Disagree 83 (17.7%) 78 (16.6%) 57 (12.1%) 83 (17.7%) 65 (13.8%) Neither agree nor disagree
139 (29.6%)
73(15.5%)
88 (18.7%)
95 (20.2%)
125(26.6%) Agree 130 (27.7%) 159 (33.8%) 205 (43.6%) 166 (35.3%) 167 (35.5%) Strongly agree
61 (13.0%)
124 (26.4%)
93 (19.8%)
82 (17.4%)
64(13.6%)
Total 470 (100%) 470 (100%) 470 (100%) 470 (100%) 470 (100%)
Source: Researcher's survey 2014
As illustrated in the above table, 40.7% of the respondents agree with the first item, 29.8%
disagree and 29.6% are neutral in their replies. For the second item, 60.2% agree and 24.3%
disagree with the statement. The rest (15.5%) replied "neutral". For the third item, those who
agree amount to 63.4% while those who disagree make up 17.8%. The remaining number
(18.7%) goes to those who replied "neutral". For the fourth item, those who agree make up
52.7% followed by 27.1% of those who disagree and 20.2% who replied "neutral". For the fifth
item, 49.1% are those who agree while 24.2% are those who disagree. Those who replied
"neutral" add up to 26.6%. Most respondents don't consider themselves as being loyal to Coca-
cola and don't have the level of confidence to recommend it to others. They will buy Coca-cola
as long as it is satisfying to them and no price increment is observed.

52
Table 19 Descriptive statistics of overall brand equity
1. Even if another brand has the same features as Coca-cola, I would prefer to buy Coca-cola
2. If another brand is not different from Coca-cola in any way, it seems smarter to purchase
3. Coca-cola is more than a product to me
4. If there is another brand as good as Coca-cola, I prefer to buy Coca-cola
Frequency(percent) Frequency(percent) Frequency(percent) Frequency(percent)Strongly disagree
29 (6.2%) 36 (7.7%) 61 (13.0%) 26 (5.5%)
Disagree 62 (13.2%) 79 (16.8%) 81 (17.2%) 57 (12.1%) Neither agree nor disagree
108 (23.0%) 144 (30.6%) 118 (25.1%) 165 (35.1%)
Agree 185 (39.4%) 144 (30.6%) 135 (28.7%) 158 (33.6%) Strongly agree
185 (39.4%) 67 (14.3%) 75 (16.0%) 64 (13.6%)
Total 470 (100%) 470 (100%) 470 (100%) 470 (100%) Source: Researcher's survey 2014
As shown in Table 19, respondents who agree with the first item amount to 78.8% and those who
disagree add up to 19.4%. Those who replied "neutral" make 23%. For the second item, 44.9%
agree, 24.5% disagree and 30.6% are neutral in their responses. For the third item, those who
agree make up 44.7% while those who disagree add up to 30.2%. The rest (25.1%) goes to those
who are neutral in their responses. For the last item, 47.2% agree with the statement, 17.6%
disagree with the statement, 35.1% replied "neutral". Most consumers of Coca-cola buy the
product mainly for the functional benefit they got and others buy it for the symbolic benefit as
they claimed to have agreed with Coca-cola being more a product to them. As per Ghodeswar
(2008) symbolic benefit can fulfill needs for self-enhancement, role position, group membership
or ego identification.
4.5 Structural equation modeling
SEM takes a confirmatory (hypothesis testing) approach to the multivariate analysis of a
structural theory. The hypothesized theoretical model was evaluated for consistency with the
data collected through model-data fit, which indicates the extent to which the postulated network
of relations among variables is plausible. Afterwards, the hypotheses were evaluated and the

53
significance test was the basis for accepting or rejecting the suggested relationships between the
exogenous variables and the endogenous variable.
In the study, perceived quality, brand awareness, brand association and brand loyalty were
treated as exogenous factors. Exogenous factors are independent variables that are not influenced
by other variables in the model. They use linear combination of measures to represent the
construct, which acts as an independent variable in the model. Perceived quality, brand
awareness, brand association and brand loyalty were taken as exogenous variables. The scale of
customer-based brand equity was considered as an endogenous factor. Endogenous factor is
latent, multi-item equivalent to dependent variables – they are affected by other variables in the
theoretical model.
4.5.1 Measurement Model
The measurement model specifies the rules governing how the latent variables are measured in
terms of the observed variables, and it describes the measurement properties of the observed
variables (Ho, 2006, p.283). The measurement model in SEM is evaluated through confirmatory
factor analysis (CFA). Two approaches can be employed to assess the confirmatory factor
analysis:
1. Examine the Goodness of Fit (GOF) indices.
2. Evaluate the construct validity and reliability of the specified measurement model.
Goodness-of-fit criteria
Goodness-of-fit measures the extent to which the actual or observed covariance input matrix
corresponds with (or departs from) that predicted from the proposed model. Goodness-of-fit
measures can be classified into three types: (1) absolute fit measures, (2) incremental fit
measures, and (3) parsimonious fit measures (Ho, 2006, p.284)
Absolute fit measures
These measures determine the degree to which the proposed model predicts (fits) the observed
covariance matrix. Some commonly used measures of absolute fit include the chi-square statistic,
the goodness-of-fit statistic, and the root mean square error of approximation (Ho, 2006, p.285).

54
The hypothesized model was trimmed and modified using modification indices until the
researcher is satisfied with the fit of the revised model. In doing so, two constructs from
perceived quality (P1 & P3), one brand awareness dimension (BW2), three constructs from
brand associations (BS2, BS4, BS5) and one construct from brand loyalty (BL1) were
eliminated. Hence, the following fit measures were obtained.
Chi-square statistic:
The most fundamental measure of overall fit is the likelihood ratio chi-square (χ2)
statistic. The normed chi square is obtained by dividing the minimum value discrepancy
(CMIN) by the degree of freedom (DF). In this case it is 2.311 which is acceptable. The
general rule of thumb is a value below 2 is preferred but a value between 2 and 5 is
considered acceptable.
Table 20 Chi-square
Model NPAR CMIN DF P CMIN/DF Default model 42 217.198 94 .000 2.311 Saturated model 136 .000 0 Independence model 16 4427.504 120 .000 36.896 Source: Researcher's Survey 2014
A model may fit the data reasonably well but the chi-square test may reject the model because of
large sample size. In reaction to this sample size sensitivity problem, a variety of alternative
goodness-of-fit indices have been developed to supplement the chi-square statistic (Lei & Wu,
2007, p.36).
Goodness-of-fit index (GFI)
According to Jöreskog & Sörbom (1989) as cited by Ho (2006), the GFI measures how much
better the model fits compared with no model at all. It is a non statistical measure ranging from 0
(poor fit) to 1(perfect fit).

55
Table 21 Goodness-of-fit index
Model RMR GFI AGFI PGFI Default model .038 .945 .921 .653 Saturated model .000 1.000 Independence model .471 .269 .171 .237 Source: Researcher's Survey 2014
As shown in Table 21, the GFI is .945 which shows that the model is nearly a perfect fit. The
AGFI (adjusted goodness of fit index) takes into account the degrees of freedom available for
testing the model. The adjusted goodness of fit is .921 which is within the recommended value of
greater or equal to 0.8. The RMR (root mean square residual) is the square root of the average
squared amount by which the sample variances and covariances differ from their estimates
obtained under the assumption that your model is correct. The smaller the RMR is, the better. An
RMR which is less than or equal to 0.1 is the required value; zero being a perfect fit. The RMR
in this case is .038 which is on the lower boundary.
Root Mean Square Error of Approximation (RMSEA)
Ho (2006) defined RMSEA (also called the badness of fit index) as a measure of discrepancy per
degree of freedom which takes into account the error of approximation in the population.
Table 22 RMSEA
Model RMSEA LO 90 HI 90 PCLOSE Default model .053 .044 .062 .293 Independence model .277 .270 .284 .000 Source: Researcher's Survey 2014
RMSEA value which is less than or equal to 1.0 is generally acceptable. The RMSEA value
obtained in Table 22 leans towards the lowest range. The 90 percent confidence interval for the
RMSEA is between a LO of .044 and a HI of 0.062. All the absolute fit measures indicated an
acceptable level fit for the modified model.
Incremental Fit measures Ho (2006) stated that these measures compare the proposed model to some baseline model, most
often referred to as the null or independence model. In the independence model, the observed
variables are assumed to be uncorrelated with each other. The independence model is so severely
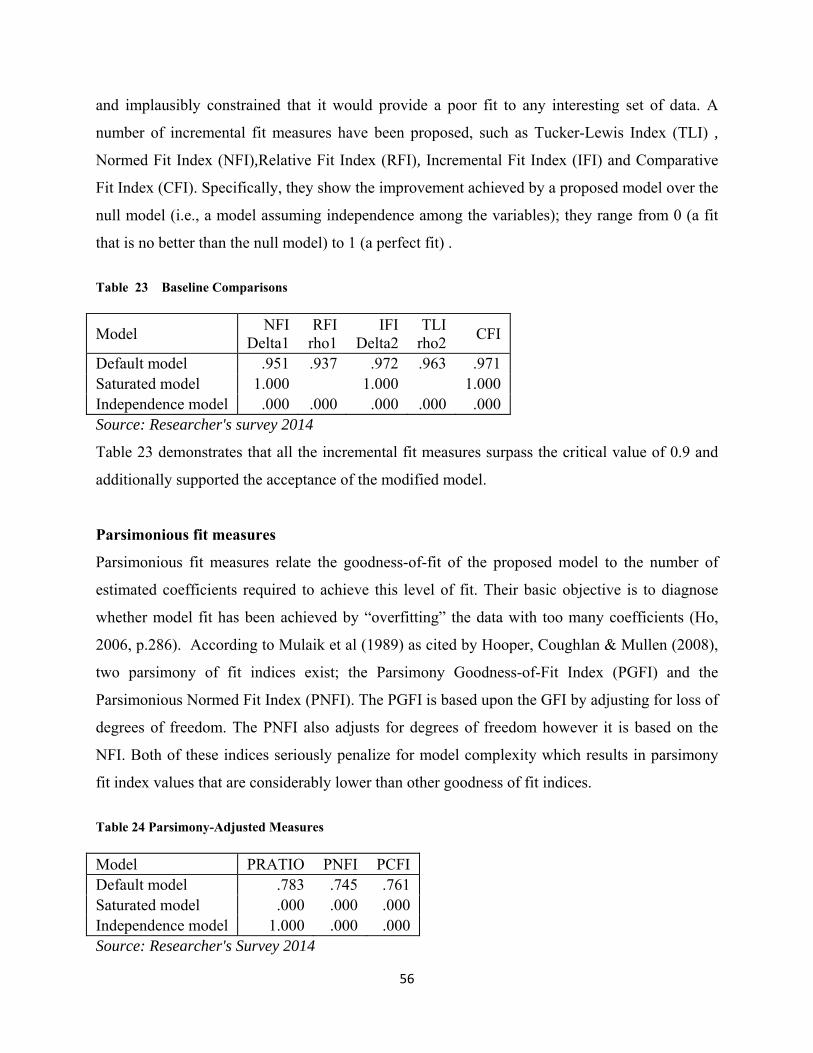
56
and implausibly constrained that it would provide a poor fit to any interesting set of data. A
number of incremental fit measures have been proposed, such as Tucker-Lewis Index (TLI) ,
Normed Fit Index (NFI),Relative Fit Index (RFI), Incremental Fit Index (IFI) and Comparative
Fit Index (CFI). Specifically, they show the improvement achieved by a proposed model over the
null model (i.e., a model assuming independence among the variables); they range from 0 (a fit
that is no better than the null model) to 1 (a perfect fit) .
Table 23 Baseline Comparisons
Model NFI Delta1
RFIrho1
IFIDelta2
TLIrho2 CFI
Default model .951 .937 .972 .963 .971 Saturated model 1.000 1.000 1.000 Independence model .000 .000 .000 .000 .000 Source: Researcher's survey 2014
Table 23 demonstrates that all the incremental fit measures surpass the critical value of 0.9 and
additionally supported the acceptance of the modified model.
Parsimonious fit measures
Parsimonious fit measures relate the goodness-of-fit of the proposed model to the number of
estimated coefficients required to achieve this level of fit. Their basic objective is to diagnose
whether model fit has been achieved by “overfitting” the data with too many coefficients (Ho,
2006, p.286). According to Mulaik et al (1989) as cited by Hooper, Coughlan & Mullen (2008),
two parsimony of fit indices exist; the Parsimony Goodness-of-Fit Index (PGFI) and the
Parsimonious Normed Fit Index (PNFI). The PGFI is based upon the GFI by adjusting for loss of
degrees of freedom. The PNFI also adjusts for degrees of freedom however it is based on the
NFI. Both of these indices seriously penalize for model complexity which results in parsimony
fit index values that are considerably lower than other goodness of fit indices.
Table 24 Parsimony-Adjusted Measures
Model PRATIO PNFI PCFI Default model .783 .745 .761 Saturated model .000 .000 .000 Independence model 1.000 .000 .000 Source: Researcher's Survey 2014

57
While no threshold levels have been recommended for these indices, it is possible to obtain
parsimony fit indices within the .50 region while other goodness of fit indices achieve values
over .90
4.5.2 Path model
The model general fit revealed that the structural model was up to the standard requirement with
results of X/df = 2.31 (P<0.000), GFI = .945, AGFI = .921, CFI = .971, RMR = 0.38 and
RMSEA = 0.053. Structural equation modeling was employed to evaluate the hypothesized
relationships between brand equity and its four dimensions. Perceived quality, brand awareness,
brand association and brand loyalty were considered as exogenous variables and intended to be
intercorrelated. Overall brand equity was taken as endogenous variable.
Regression weight
According to Ho (2006), the standard error of the coefficients represents the expected variation
of the estimated coefficients, and is an index of the “efficiency” of the predictor variables in
predicting the endogenous variable; the smaller the S.E. the more efficient the predictor variable
is. The critical ratio is a test of the significance of the path coefficients. Each C.R. value is
obtained by dividing that parameter estimate by its respective standard error. As such, a critical
ratio that is more extreme than ±1.96 indicates a significant path (p < .05).
Maximum Likelihood Estimates
Table 25 Regression Weights: (Group number 1 - Default model)
Estimate S.E. C.R. P Label OABE <--- Perceived quality -.093 .073 -1.277 .201 par_18OABE <--- Brand awareness -.107 .120 -.888 .375 par_19OABE <--- Brand association .276 .097 2.853 .004 par_20OABE <--- Brand loyalty .760 .055 13.729 *** par_21
Source: Researcher's Survey 2014 As illustrated in Table 25, when perceived quality goes up by 1, overall brand equity goes down
by 0.093. The regression weight estimate, -.093, has a standard error of about .073. The
regression weight for perceived quality in the prediction of overall brand equity is not
significantly different from zero at the 0.05 level (two-tailed). When brand awareness goes up by
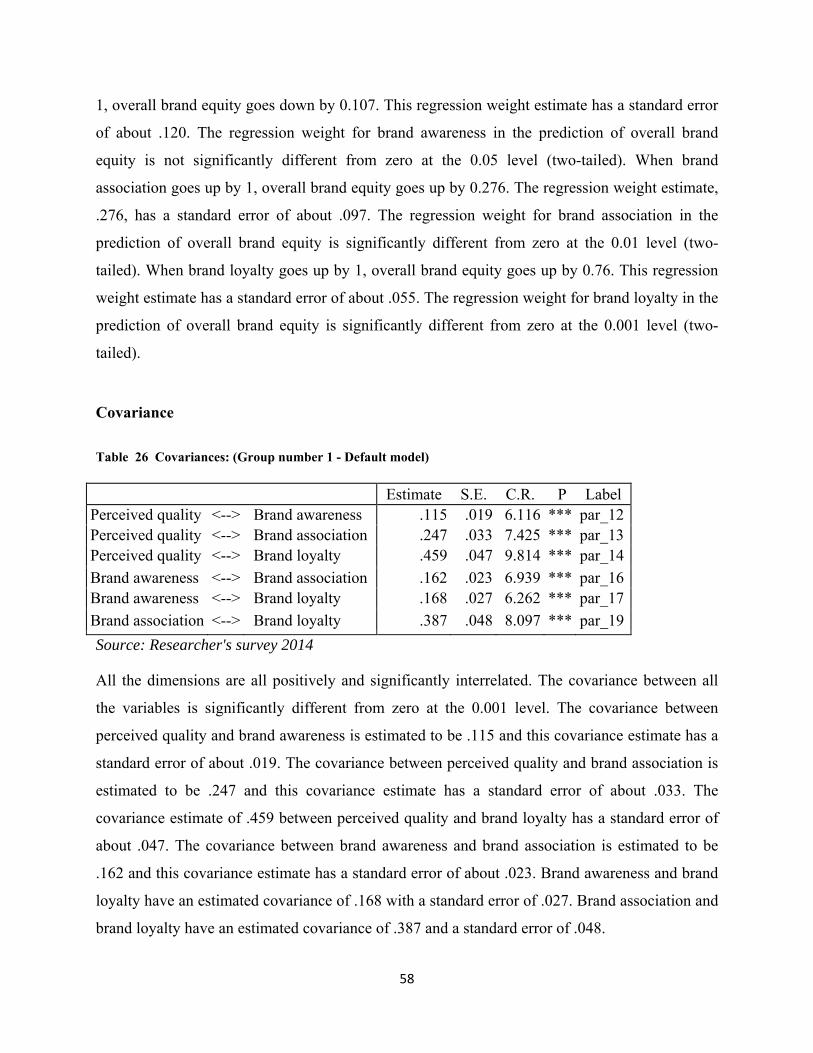
58
1, overall brand equity goes down by 0.107. This regression weight estimate has a standard error
of about .120. The regression weight for brand awareness in the prediction of overall brand
equity is not significantly different from zero at the 0.05 level (two-tailed). When brand
association goes up by 1, overall brand equity goes up by 0.276. The regression weight estimate,
.276, has a standard error of about .097. The regression weight for brand association in the
prediction of overall brand equity is significantly different from zero at the 0.01 level (two-
tailed). When brand loyalty goes up by 1, overall brand equity goes up by 0.76. This regression
weight estimate has a standard error of about .055. The regression weight for brand loyalty in the
prediction of overall brand equity is significantly different from zero at the 0.001 level (two-
tailed).
Covariance
Table 26 Covariances: (Group number 1 - Default model)
Estimate S.E. C.R. P Label Perceived quality <--> Brand awareness .115 .019 6.116 *** par_12 Perceived quality <--> Brand association .247 .033 7.425 *** par_13 Perceived quality <--> Brand loyalty .459 .047 9.814 *** par_14 Brand awareness <--> Brand association .162 .023 6.939 *** par_16 Brand awareness <--> Brand loyalty .168 .027 6.262 *** par_17 Brand association <--> Brand loyalty .387 .048 8.097 *** par_19 Source: Researcher's survey 2014
All the dimensions are all positively and significantly interrelated. The covariance between all
the variables is significantly different from zero at the 0.001 level. The covariance between
perceived quality and brand awareness is estimated to be .115 and this covariance estimate has a
standard error of about .019. The covariance between perceived quality and brand association is
estimated to be .247 and this covariance estimate has a standard error of about .033. The
covariance estimate of .459 between perceived quality and brand loyalty has a standard error of
about .047. The covariance between brand awareness and brand association is estimated to be
.162 and this covariance estimate has a standard error of about .023. Brand awareness and brand
loyalty have an estimated covariance of .168 with a standard error of .027. Brand association and
brand loyalty have an estimated covariance of .387 and a standard error of .048.

59
Correlation Table 27 Correlations: (Group number 1 - Default model)
Estimate Perceived quality <--> Brand awareness .415Perceived quality <--> Brand association .557Perceived quality <--> Brand loyalty .665Brand awareness <--> Brand association .608Brand awareness <--> Brand loyalty .405Brand association <--> Brand loyalty .585Source: Researcher's Survey 2014
As shown in Table 27 all the variables are positively correlated. The estimated correlation
between perceived quality and brand awareness is .415 whereas it is .557 between perceived
quality and brand association. The estimated correlation between perceived quality and brand
loyalty is .665. The estimated correlations between brand awareness and brand association &
brand awareness and brand loyalty are .608 and .405 respectively. The estimated correlation
between brand association and brand loyalty is .585.
Squared multiple correlation
Table 28 Squared Multiple Correlations: (Group number 1 - Default model)
Estimate OABE BW1
.727
.349 BS1 .461 BL5 .567 OB1 .787 OB2 .473 OB3 .650 OB4 .871 BL2 .703 BL3 .716 BL4 .693 BS3 .613 BW3 .509 BW4 .585 BW5 .382 P2 .836 P4 .690 Source: Researcher's survey 2014

60
It can be assumed that the higher the value of the squared multiple correlation, the greater the
explanatory power of the regression model, and therefore the better the prediction of the
dependent variable. The predictor variables of P2 with a value .836 has a better prediction of
brand equity than P4. In regards to brand awareness dimension, BW4 having a value of .585 has
a better prediction of overall brand equity than the other brand awareness constructs. Overall
brand equity is better predicted by brand association construct of BS3 with a value of .613. BL3
with a value of .716 better predicts overall brand equity when compared with other constructs of
brand association.
Table 29 Standardized Regression Weights: (Group number 1 - Default model)
Estimate OABE <--- Perceived quality -.065OABE <--- Brand awareness -.045OABE <--- Brand association .185OABE <--- Brand loyalty .795
Source: Researcher's survey 2014
As shown in Table 29, when perceived quality goes up by 1 standard deviation, overall brand
equity goes down by 0.065 standard deviations. When brand awareness goes up by 1 standard
deviation, overall brand equity goes down by 0.045 standard deviations. When brand association
goes up by 1 standard deviation, overall brand equity goes up by 0.185 standard deviations.
When brand loyalty goes up by 1 standard deviation, overall brand equity goes up by 0.795
standard deviations.
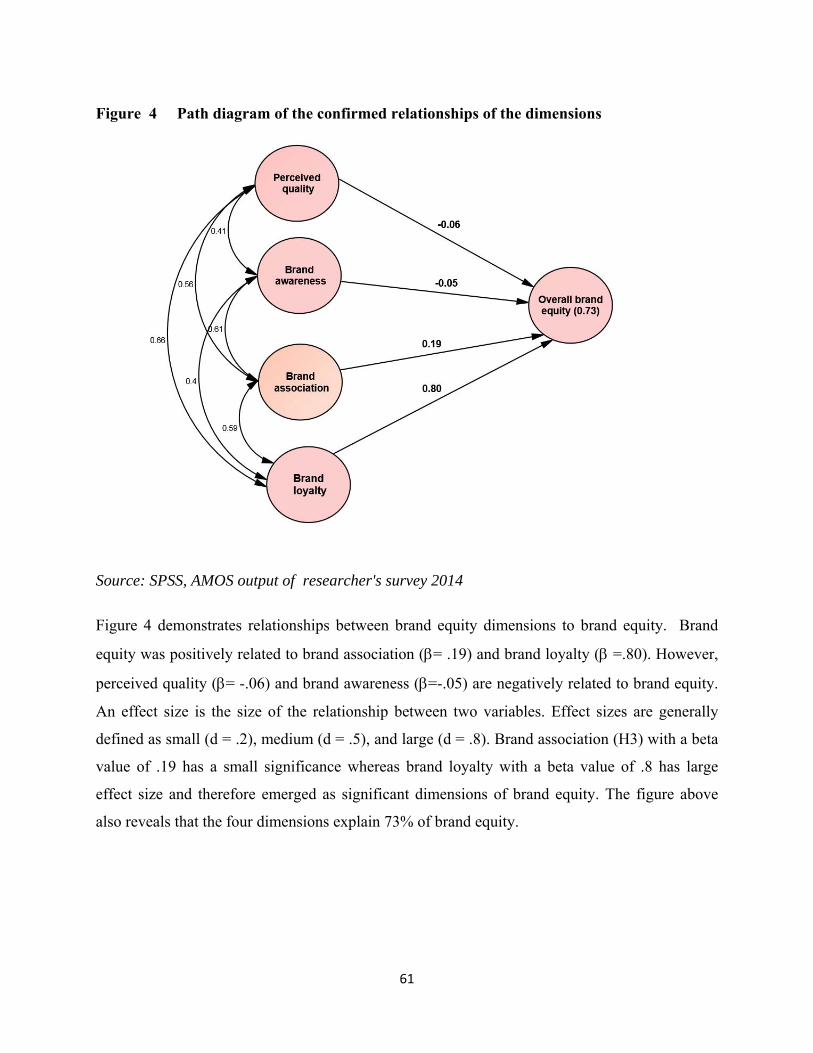
61
Figure 4 Path diagram of the confirmed relationships of the dimensions
Source: SPSS, AMOS output of researcher's survey 2014
Figure 4 demonstrates relationships between brand equity dimensions to brand equity. Brand
equity was positively related to brand association (β= .19) and brand loyalty (β =.80). However,
perceived quality (β= -.06) and brand awareness (β=-.05) are negatively related to brand equity.
An effect size is the size of the relationship between two variables. Effect sizes are generally
defined as small (d = .2), medium (d = .5), and large (d = .8). Brand association (H3) with a beta
value of .19 has a small significance whereas brand loyalty with a beta value of .8 has large
effect size and therefore emerged as significant dimensions of brand equity. The figure above
also reveals that the four dimensions explain 73% of brand equity.

62
CHAPTER FIVE
CONCLUSION AND RECOMMENDATION
This chapter wraps up the research report by presenting the summary of the research findings,
conclusions drawn from the findings followed by the necessary recommendations.
5.1 Summary
The world has changed dramatically and science has taught us far more about how the human
brain works and how people make decisions. As a result, the rules of marketing have changed
and marketers have continued to learn and to develop and improve frameworks to measure and
understand brand value. In today's volatile environment and in the presence savvy consumers,
firms do whatever it takes to keep their brand equity positive and consistent in their consumers'
mind.
Even though different management gurus have proposed different models of consumer based
brand equity, this study used the most-widely and commonly used model of Aaker. The model
has five dimensions called perceived quality, brand awareness, brand association, brand loyalty
and other proprietary brand assets such as patents, trademarks, and channel relationships. As the
first four dimensions represent consumer's expectation and reaction, this study excluded the fifth
dimension. These four dimensions were composed of twenty two items.
The study tried to find out the relationship between the four dimensions of brand equity
(perceived quality, brand awareness, brand association and brand loyalty) and brand equity.
Moreover, it tried to explore the most influential factors that are behind the brand equity of
Coca-Cola in the context of Ethiopia.
The total number of respondents amount to 470. Out of this, 52.1% are female and 47.9% are
male. In regards to the age group, 48.5% are between 18-30 years, 36.4% are between 31-43
years, 10.2% are between 44-56 and 4.9% are 57& above. Respondents who are Christians
constitute 80.9% followed by 11.1% of Muslims and 7.2% which are from other religions.
Married respondents make up 40.6% following 54.9% of single respondents. The divorced are
2.8% while the widowed are 1.1%. Those respondents having undergraduate degree amount to
49.1%. The diploma holders are 24.7% followed by 14.9% of high school graduates and 10.9%

63
of postgraduate degree and above holders. Respondents earning a monthly income below
1000Birr make up 27.2%. Those earning between 1001-3000Birr make up 18.7% while those
earning between 3001-5000Birr add up to 13.6%. A monthly income of 5001-10000Birr is
earned by 16.8% of the respondents. Those earning above 10000Birr are 23.2%. In regards to the
consumption frequency, 10.2% drink Coca-cola daily, 26.2% drink weekly, 11.5% drink
monthly and 52.1% drink occasionally.
The model general fit revealed that the structural model was up to the standard requirement with
results of X/df = 2.31 (P<0.000), GFI= .945, AGFI= .921, CFI= .971, RMR = 0.38 and RMSEA
= 0.053.
In addition, brand association and brand loyalty have positively related to brand equity.
Furthermore, perceived quality and brand awareness negatively related to brand equity.
All the exogenous variables have high positive correlation between themselves. Perceived
quality has a high correlation with brand loyalty than with brand awareness, brand association
and overall brand equity. Brand awareness has a high correlation with brand association than
with the others. Brand loyalty has a high correlation with overall brand equity.
5.2 Conclusions
Building and maintaining positive consumer based brand equity is crucial for global brands such
as Coca-cola. Based on the study conducted and the analysis made, the following conclusions are
drawn:
Age is indirectly related to the consumption of Coca-cola. As age increases, the
consumption of Coca-cola decreases. This relation might be influenced by another
variable and needs further study.
Female consumers drink more Coca-cola than male consumers. Even though a study has
shown that the consumption of caffeine-containing beverages was strongly related to the
prevalence of premenstrual syndrome, further study should be conducted to assure no
other influencing variable exists.

64
Consumers of Coca-cola also have an awareness about the brand and perceive that the
brand has a unique brand image.
Even though the company seems successful to have created a brand image, this brand
image doesn't seem to transmit a clear meaning of the brand in the minds of the targeted
consumers.
Some consumers have low trust on the company and which therefore will affect the
perception of consumers regarding the quality of Coca-cola, their awareness and
association and to their loyalty.
Most consumers of Coca-cola inclined to show more of a behavioral loyalty as they don't
consider themselves as being loyal, they are price sensitive and lack the courage to
recommend the brand to others.
Despite the majority of the respondents are familiar with the brand and its logo, the brand
knowledge in memory as well as the depth of brand awareness seem to be low.
While perceived quality and brand awareness negatively affect overall brand equity, they
might indirectly affect brand equity by affecting brand loyalty and brand association.
5.3 Recommendation
Based upon the study, the following recommendations are suggested.
• Though brand association and brand loyalty seemed to have an impact on brand equity,
the effects of perceived quality and brand awareness should not be undervalue.
• The company should focus more on the assets of its brand equity which are brand loyalty
and brand association. The liabilities of its brand equity which are perceived quality and
brand awareness need further market research.
65
• The company has to be able to convey the essence of the brand through its marketing
activities.
• The company should develop a website which would enable its consumers to retrieve
relevant information regarding its product. This will aid also in tackling the negative
word of mouth that is spreading about Coca-cola.
• The majority of the respondents are Millennials. One thing that all the Millennials have in
common is their utter fluency and comfort with digital technology. As social media
spread a word faster and wider, the company should make use of it as a way of getting in
touch with this target group.
• Only items related to attribute-based, attitude-based and benefit-based associations were
used in this study. Future researchers should incorporate items relating to brand
personality. Personality attributes help the brand to achieve sustainable differentiation as
they are more difficult to copy than functional features of the product and service by the
competition. Another advantage of the personality association is that it establishes direct
relationship with the customers.

66
REFERENCES
• Aaker, D. (1991) Managing Brand Equity. New York. The Free Press.
• Aaker, D. (1992) Strategic Market Management. 3rd edition, United States of America
• Aaker, D. (1996) Building Strong Brands. 3rd edition. New York. Free Press.
• Aaker, D. (1996) Measuring Brand Equity Across Products and Markets. California
Management Review. 38 (3).
• Academic skills tutors/librarians, information service (2013) Harvard quick referencing
guide.
• Atilgan, E., Aksoy, S. and Akinci, S. (2005) Determinants of the brand equity: a
verification approach in the beverage industry in Turkey. Marketing Intelligence &
Planning. 23 (3). p.237-248.
• Azar, S.L. (2013). Exploring brand masculine patterns: moving beyond monolithic
masculinity. Journal of Product & Brand Management. 22 (7). p.502–512.
• Barkay, T. (2012) Employee volunteering: soul, body and CSR. Social Responsibility
Journal. 8 (1). p.48-62.
• Barwise, P. (1993) Brand equity: snark or boojum? International Journal of Research in
Marketing. 10 (1). p.93-104.
• Bhattacherjeend, A. ( 2012) Social science research: principles, methods, and practices.
2nd edition. Switzerland
• Buil, I., Martı´nez E., and de Chernatony L. (2013) The influence of brand equity on
consumer responses. Journal of Consumer Marketing. 30 (1). p.62–74.
• Cerjak, M., Haas, R., and Kovaĉić, D. (2010) Brand familiarity and tasting in conjoint
analysis An experimental study with Croatian beer consumers. British Food Journal.112
(6). p.561-579.
• Chen, A. C. (2001) Using free association to examine the relationship between the
characteristics of brand associations and brand equity. Journal of product & brand
management.10 (7). p.439-451.
• Dana, L. & Oldfield, B.(1999) Lublin Coca-Cola Bottlers Ltd, Journal of International
Marketing Review.16 (4/5). p.291-298.

67
• De Chernatony, L., & Mcdonald, M. (1992) Creating Powerful Brands. The Strategic
Route to Success in Consumer, Industrial and Service Markets. 2nd Ed. Butterworth-
Heinemann: Oxford.
• Elkin, P. (2007) Mastering business planning and strategic management. 2nd Ed.
Replika Press: India
• Ellwood, I. (2002) The Essential Brand Book; Over 100 techniques to increase brand
value. 2nd Ed. Kogan Page Limited: London
• Farquhar, P.H., Han, J.Y. and Ijiri, Y. (1991) Recognizing and measuring brand assets.
Marketing Science Institute Working Paper. 91-119.
• Fayrene, C. & Chai, G. (2011) Customer-based brand equity: A literature review. Journal
of Arts Science & Commerce. 2 (1). p.33-42.
• Fioroni, M. & Titterton, G.(2009) Brand Storming; Managing brands in the era of
complexity. Palgrave Macmillan: Great Britain.
• Gbadamosi, A., Iwaloye, O. and Bamber, D. (2009) An exploratory study of students'
consumption of non-alcoholic beverages in Nigeria, A qualitative perspective. Nutrition
& Food Science. 39 (6). p.609-618.
• Ghodeswar, B. M. (2008) Building brand identity in competitive markets: a conceptual
model, Journal of Product & Brand Management. 17(1). p.4–12.
• Gregory, J.R. (2001) Branding across borders. McGraw-Hill: New York.
• Heding, T., Knudtzen , C.F., & Bjerre, M. (2009) Brand Management (Research, theory
and practice). 2nd Ed. Routledge: Oxford.
• Ho, R. (2006). Handbook of univariate and multivariate data analysis and interpretation
with SPSS. Chapman & Hall CRC: Florida.
• Hooper, D., Coughlan , J. & Mullen. M.R (2008). Structural Equation Modeling:
Guidelines for Determining Model Fit; Journal of Business Research Methods. 6(1).
p.53-60
• Ind., N. (1997) The Corporate Brand. Macmillan: Basingstoke.
• Israel, D.G. (2013) Determining sample size, University of Florida, p.1-5
• Jas, P. (1998) Aspects of food choice behavior in adolescents. Nutrition & Food Science.
3. p. 163-5

68
• Johnson, V. & Peppas, S.(2013) Crisis management in Belgium: a case of Coca-cola.
International Marketing Review. 8 (1). p.18-22.
• Kapferer, J.N.(1998) Strategic Brand Management: Creating and sustaining brand equity
long term. 2nd Ed. Kogan Page: London.
• Kapferer, J.N.(2008) The new strategic brand management. 4th Ed. Kogan Page Limited:
London.
• Keller, K. L.(1993) Conceptualizing, Measuring, and Managing Customer-Based Brand
Equity. Journal of Marketing. 57 (1). p.1-22
• Keller, K.L. (2001) Building customer-based brand equity: A blueprint for creating
strong brands. Marketing Science Institute (MSI). Report no. 01-107.
• Keller, L.K. (2004) Strategic brand management: Building, Measuring and managing
brand equity. 2nd Ed. Prentice-hall of India: New Delhi
• Keller, L.K., Parameswaran, M.G. & Jacob, I. (2011) Strategic brand management. 3rd
Ed. Dorling Kindersely: India
• Khmel’nyts’ka, O. and Swift, J.S. (2010) Beer in the Ukraine: consumer choice criteria.
International Journal of Emerging Markets.5 (1). p.78-101.
• Kim, H., Kim, W.G. and An, J.A. (2003) The effect of consumer-based brand equity on
firms’ financial performance. Journal of Consumer Marketing. 20 (4). p.335-51.
• Kim, J.H. and Hyun,Y.J. (2011) A model to investigate the influence of marketing-mix
efforts and corporate image on brand equity in the IT software sector. Journal of
Industrial Marketing Management. 40(3). p.424-438.
• Kim, W.G. and Kim, H. (2004). Measuring customer-based restaurant brand equity:
Investigating the relationship between brand equity and firms’ performance. Cornell
Hotel & Restaurant Administration Quarterly. 45(2). p.115-131.
• Kish, P., Riskey, D. & Kerin, R.(2001) Measurement and tracking of brand equity in the
global marketplace: The PepsiCo experience International Marketing Review.18 (1).
p.91-96.
• Kothari, C.R. (2004). Research Methodology: Methods & Techniques. 2nd Ed. New Age
International Publishers: New Delhi
• Kotler, P & Armstrong, G.(2012). Principles of Marketing. 14Ed. Prentice Hall: New
Jersey

69
• Kotler, P. & Pfoertsch, W.(2006) B2B brand management. Springer Heildelberg: New
York.
• Kotler, P. & Pfoertsch, W.(2010) Ingredient Branding; making the invisible visible.
Springer Heildelberg: New York.
• Kotler, P. Kartajaya H. & Setiawan I. (2010) Marketing 3.0: From products to
customers to human spirit. John Wiley & sons Ltd: New Jersey
• Lassar, W., Mittal, B. and Sharma A. (1995) Measuring customer-based brand equity.
Journal of Consumer Marketing.12 (4). p.11-19.
• Leclercq, C.et al (2003) Stochastic modeling of human exposure to food chemicals and
nutrients within the Montecarlo project: an exploration of the influence of brand loyalty
and market share on intake estimates of intense sweeteners from sugar-free soft drinks.
Toxicology Letters. No. 140-141. p. 443-57.
• Lee, J.S. and Back, K.J. (2010) Reexamination of attendee-based brand equity. Tourism
Management. 31. p.395-401.
• Lei, P.W. and Wu, Q. (2007). Introduction to Structural Equation Modeling: Issues and
Practical Considerations. Pennsylvania State University. p.33-43.
• Leone, R.P. et al. (2006) Linking brand equity to customer equity. Journal of Service
Research. 9 (2). p.125-38.
• Million,T. (2013) Determinants of Consumer based brand equity: The case of Ethiopian
beer industry. Unpublished Master's thesis. Addis Abeba University School of
Commerce.
• Moore, K.. & Pareek, N. (2006). Marketing: The basics. Taylor and Francis group:
United Kingdom
• Pappu, R., Quester, P.G. & Cooksey, R.W. (2005) Consumer- based brand equity:
Improving the measurement - empirical evidence. Journal of Product and Brand
Management. 14 (3). p. 143-154.
• Patwardhan, H. & Balasubramanian, K.S. (2011). Brand romance: a complementary
approach to explain emotional attachment toward brands. Journal of Product & Brand
Management. 20 (4). p.297-308.
• Pearson, S. (1996) Building Brands Directly. Creating Business Value from Customer
Relationships. Journal Brand Management. 4. Macmillan. Basingstoke.

70
• Pike, S. et al. (2010) Consumer-based brand equity for Australia as a longhaul tourism
destination in an emerging market. International Marketing Review. 27 (4). p. 434-49.
• Rajh, E., Vranesevic, T., & Tolic, D. (2003). Croatian food industry: brand equity in
selected product categories. British Food Journal. 105 (4/5). p.263-273.
• Rossigno, M.A. & Bonnlander, H. (1990). Caffeine-Containing Beverages, Total Fluid
Consumption, and Premenstrual Syndrome; American Journal of Public Health. 80(9).
p.1106-1110
• Russell, E. (2010). The fundamentals of marketing. AVA Publishing: Switzerland.
• Samiee, S. (1994). Customer evaluation of products in a global market. Journal of
International Business Studies. 25 (3). p.579-604.
• Schiffman, L. G., Kanuk, L. L. & Kumar, S.R. (2012). Consumer Behavior. 10th Ed.
Dorling Kindersley: India
• Srivastava, R. & Shocker, A.D. (1991) Brand equity; A perspective on its meaning and
measurement. Report No. 91-124. Marketing Science Institute, Cambridge, MA.
• Tavakol, M. & Dennick, R. (2011) Making sense of Cronbach’s alpha. International
Journal of Medical Education. 2. p.53-55
• Tian, Y. (2006). Communicating with local publics: a case study of Coca-Cola’s Chinese
web site. An International Journal. 11 (1). p.13-22.
• Till, D.B. & Heckler, D. (2008). The truth about brands: Marketing is courtship, not
combat.., Pearson Education Limited. Great Britain
• Tong, X. & Hawley, J. (2009). Measuring customer-based brand equity: empirical
evidence from the sportswear market in China. Journal of Product and Brand
Management. 18 (4). p.262-271.
• Tuominen, P. (1999). Managing Brand Equity. Turku School of Economics and Business
Administration. LTA 1/99. p. 65-100.
• Ulas, D. & Arslan, H.B. (2006). An empirical investigation of Turkish cola market.
British Food Journal. 108 (3). p.156-168.
• White, C. (2004). Strategic management. 2nd Ed. Palgrave Macmillan: New York.
• Worku, D. (2006). English-Amharic Dictionary. 4th Ed. Mega Distribution: Addis Abeba

71
• Yoo, B. & Donthu, N. (2001). Developing and validating a multidimensional consumer-
based brand equity scale. Journal of business research. 52. p.1-14.
• Yoo, B., Donthu, N. & Lee, S. (2000) An examination of selected marketing mix
elements and brand equity. Journal of Academy of Marketing Science. 28 (2). p. 195-
212.
• Zeithaml, V. (1988). Consumer perceptions of price, quality, and value: a means-end
model and synthesis of the evidence. Journal of Marketing. 52 (3). p.2-22.
Websites
Addis Fortune (2013) East African Bottling SC inaugurates expansion. [online] Available
from: www.addisfortune.net/.../east-african-bottling-sc Accessed on March 20, 2014
Beverage history (2008) History of carbonated drinks. [online] Available from:
www.beveragehistory.com/2008/09/history-of-carbonated-drinks.htm Accessed on March
25, 2014
Coca-cola SABCO (2014) Territory Ethiopia. [online] Available from:
www.cocacolasabco.com/Territory.aspx/Show/Ethiopia Accessed on March 22, 2014
Engineering News (2012) Coca-Cola's $60m Ethiopian Plant. [online] Available from:
www.engineeringnews.co.za Accessed on March 10, 2014
The Research Advisor. (2006) Sample size table. [online] Available from:
www.research-advisors.com/tools/SampleSize Accessed on March 02,2014

72

73
Addis Ababa University School of Commerce Measuring consumer based brand equity:
A case of Coca‐cola
Dear respondent My name is Wongelawit Mesfin. I am currently conducting a research as part of a partial fulfillment of the requirements for the degree of Masters of Art in Marketing Management. The purpose of the research is to find out the factors contributing to the brand equity of Coca-cola. All information obtained will be used for academic purpose only. Hence be assured that your responses will not be revealed to anyone. Please answer All the questions as they are vital for the success of this research. Thank you in advance for your utmost cooperation. Part I Socio-demographic data
Gender: Male □ Female □
Age: 18-30 □ 31-43 □ 44-56 □ 57 & above □
Religion: Christian □ Muslim □ Others □
Employment status: Self employed □ Employed by other □ Unemployed □ Retired □
Marital status: Married □ Single □ Divorced □ Widowed □
Educational status: High school □ Diploma □ First degree □ Masters degree and above □
Monthly Income (Birr): Below 1000 □ 1001-3000 □ 3001-5000 □ 50001 -10,000 □
Above 10,000 □
How often do you drink Coca-cola? Daily □ Weekly □ Monthly □ Occasional □

74
Part II Brand equity dimensions Please reply to the following questions by putting a " √" mark on the scale of 1 to 5
Dimensions
Rating Scale
Strongly disagree
1
Disagree 2
Neither agree nor
disagree 3
Agree 4
Strongly agree
5 Perceived quality
I trust the quality of products from Coca-cola Products from Coca-cola would be of very good quality
Products from Coca-cola offer excellent features
The likelihood that Coca-cola is reliable is very high
Brand awareness Some characteristics of Coca-cola come to my mind quickly
I can recognize Coca-cola quickly among other competing brands
I am familiar with Coca-cola brand I know what Coca-cola looks like I can quickly recall the symbol or logo of Coca-cola
Brand AssociationCoca-cola has very unique brand image, compared to competing brands
I respect and admire people who drink Coca-cola
I like the brand image of Coca-cola I like and trust the company, which makes Coca-cola products
I have difficulty in imagining Coca-cola in my mind
Brand LoyaltyI consider myself to be loyal to Coca-cola When buying soft drinks, Coca-cola would be my first choice

75
I will keep on buying Coca-cola as long as it provides me satisfying products
I am still willing to buy Coca-cola even if its price is a little higher than that of its competitors
I would love to recommend Coca-cola to my friends
Overall brand equityEven if another brand has the same features as Coca-cola, I would prefer to buy Coca-cola
If another brand is not different from Coca-cola in any way, it seems smarter to purchase
Coca-cola is more than a product to me If there is another brand as good as Coca-cola, I prefer to buy Coca-cola

76
Perceived quality Case Processing Summary
N %
Cases
Valid 448 95.3
Excludeda 22 4.7
Total 470 100.0
a. Listwise deletion based on all variables in the
procedure.
Reliability Statistics
Cronbach's
Alpha
N of Items
.907 4
Item-Total Statistics
Scale Mean if
Item Deleted
Scale Variance
if Item Deleted
Corrected Item-
Total
Correlation
Cronbach's
Alpha if Item
Deleted
I trust the quality of products
from Coca-cola
11.32 6.132 .724 .894
Products from Coca-cola
would be of very good
quality
11.32 6.319 .800 .864
Products from Coca-cola
offer excellent features
11.44 6.110 .751 .883
The likelihood that Coca-
cola is reliable is very high
11.33 6.489 .865 .847
Brand awareness Case Processing Summary
N %
Cases
Valid 447 95.1
Excludeda 23 4.9
Total 470 100.0
a. Listwise deletion based on all variables in the
procedure.

77
Reliability Statistics
Cronbach's
Alpha
N of Items
.788 5
Item-Total Statistics
Scale Mean if
Item Deleted
Scale Variance
if Item Deleted
Corrected Item-
Total
Correlation
Cronbach's
Alpha if Item
Deleted
Some characteristics of
Coca-cola come to my mind
quickly
15.99 6.833 .525 .766
I can recognize Coca-cola
quickly among other
competing brands
15.50 7.253 .579 .738
I am familiar with Coca-cola
brand
15.60 6.710 .627 .721
I know what Coca-cola looks
like
15.66 7.887 .651 .725
I can quickly recall the
symbol or logo of Coca-cola
15.43 8.698 .499 .768
Brand association
Case Processing Summary
N %
Cases
Valid 458 97.4
Excludeda 12 2.6
Total 470 100.0
a. Listwise deletion based on all variables in the
procedure.
Reliability Statistics
Cronbach's
Alpha
N of Items
.738 4

78
Item-Total Statistics
Scale Mean if
Item Deleted
Scale Variance
if Item Deleted
Corrected Item-
Total
Correlation
Cronbach's
Alpha if Item
Deleted
Coca-cola has very unique
brand image, compared to
competing brands
10.35 6.331 .409 .737
I respect and admire people
who drink Coca-cola
11.16 5.269 .502 .696
I like the brand image of
Coca-cola
10.50 5.654 .620 .628
I like and trust the company,
which makes Coca-cola
products
10.91 5.343 .598 .633
Brand loyalty Case Processing Summary
N %
Cases
Valid 457 97.2
Excludeda 13 2.8
Total 470 100.0
a. Listwise deletion based on all variables in the
procedure.
Reliability Statistics
Cronbach's
Alpha
N of Items
.897 5

79
Item-Total Statistics
Scale Mean if
Item Deleted
Scale Variance
if Item Deleted
Corrected Item-
Total
Correlation
Cronbach's
Alpha if Item
Deleted
I consider myself to be loyal
to Coca-cola
13.76 16.988 .685 .889
When buying soft drinks,
Coca-cola would be my first
choice
13.33 15.830 .785 .866
I will keep on buying Coca-
cola as long as it provides
me satisfying products
13.28 16.839 .788 .867
I am still willing to buy Coca-
cola even if its price is a little
higher than that of its
competitors
13.54 16.206 .766 .871
I would love to recommend
Coca-cola to my friends
13.60 16.936 .715 .882
Overall brand equity Case Processing Summary
N %
Cases
Valid 453 96.4
Excludeda 17 3.6
Total 470 100.0
a. Listwise deletion based on all variables in the
procedure.
Reliability Statistics
Cronbach's
Alpha
N of Items
.897 4
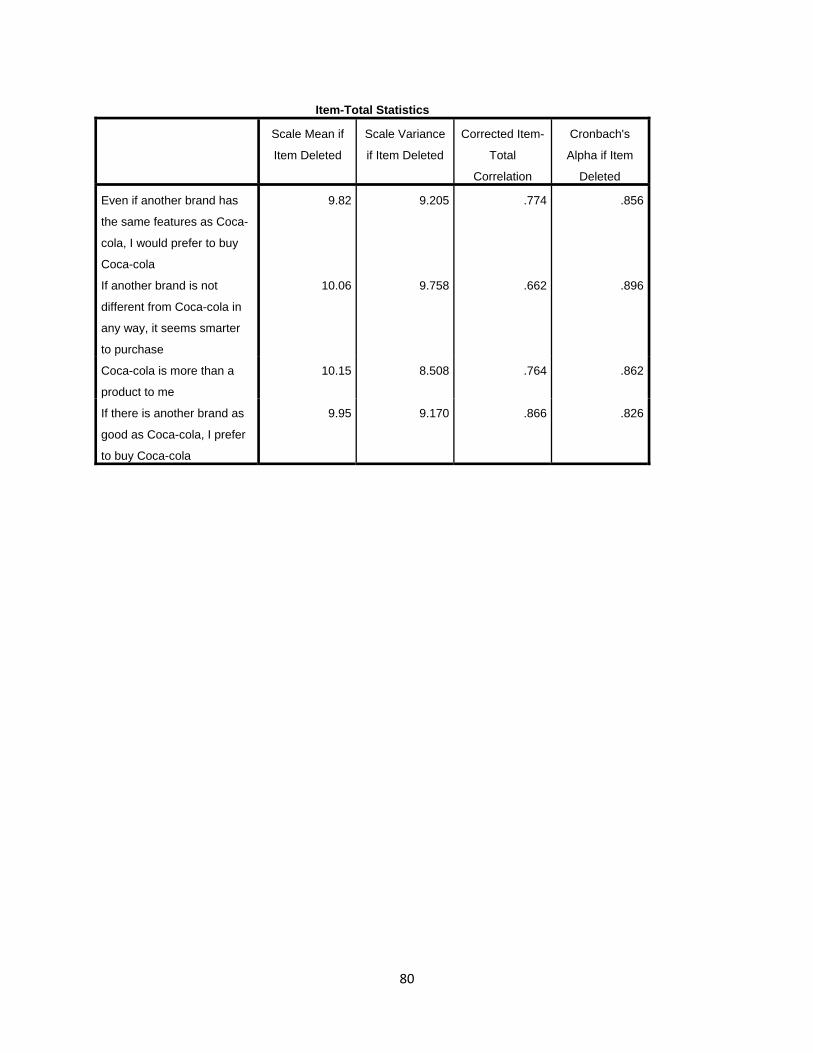
80
Item-Total Statistics
Scale Mean if
Item Deleted
Scale Variance
if Item Deleted
Corrected Item-
Total
Correlation
Cronbach's
Alpha if Item
Deleted
Even if another brand has
the same features as Coca-
cola, I would prefer to buy
Coca-cola
9.82 9.205 .774 .856
If another brand is not
different from Coca-cola in
any way, it seems smarter
to purchase
10.06 9.758 .662 .896
Coca-cola is more than a
product to me
10.15 8.508 .764 .862
If there is another brand as
good as Coca-cola, I prefer
to buy Coca-cola
9.95 9.170 .866 .826