A burning issue: Fire overrides grazing as a disturbance driver for South African grassland bird and...
14
(This is a sample cover image for this issue. The actual cover is not yet available at this time.) This article appeared in a journal published by Elsevier. The attached copy is furnished to the author for internal non-commercial research and education use, including for instruction at the authors institution and sharing with colleagues. Other uses, including reproduction and distribution, or selling or licensing copies, or posting to personal, institutional or third party websites are prohibited. In most cases authors are permitted to post their version of the article (e.g. in Word or Tex form) to their personal website or institutional repository. Authors requiring further information regarding Elsevier’s archiving and manuscript policies are encouraged to visit: http://www.elsevier.com/copyright
Transcript of A burning issue: Fire overrides grazing as a disturbance driver for South African grassland bird and...

(This is a sample cover image for this issue. The actual cover is not yet available at this time.)
This article appeared in a journal published by Elsevier. The attachedcopy is furnished to the author for internal non-commercial researchand education use, including for instruction at the authors institution
and sharing with colleagues.
Other uses, including reproduction and distribution, or selling orlicensing copies, or posting to personal, institutional or third party
websites are prohibited.
In most cases authors are permitted to post their version of thearticle (e.g. in Word or Tex form) to their personal website orinstitutional repository. Authors requiring further information
regarding Elsevier’s archiving and manuscript policies areencouraged to visit:
http://www.elsevier.com/copyright
Author's personal copy
A burning issue: Fire overrides grazing as a disturbance driver for SouthAfrican grassland bird and arthropod assemblage structure and diversity
Ian T. Little a,⇑,1, Philip A.R. Hockey a, Raymond Jansen b
a Percy FitzPatrick Institute of African Ornithology, DST/NRF Centre of Excellence, University of Cape Town, Rondebosch, Cape Town 7701, South Africab Department of Environmental, Water and Earth Sciences, Tshwane University of Technology, Private Bag X680, Pretoria, South Africa
a r t i c l e i n f o
Article history:Received 9 July 2012Received in revised form 17 September 2012Accepted 23 September 2012
Keywords:GrasslandsArthropodsBirdsDisturbanceFireGrazing
a b s t r a c t
In this study, we investigated the responses of two faunal groups, birds and arthropods, to varyingdegrees of disturbance caused by fire and grazing in South Africa, eight study sites of varying fire fre-quency and stocking density were studied over two summer seasons (October–March). Bird assemblagesreflected habitat disturbance in a diversity of ways, driven by factors ranging from direct disturbance tochanges in habitat structure and functioning, and shifts in food availability. Similarly, arthropod diversityand abundance changed seasonally in response to management practices. Fire frequency drives faunalassemblage structure and abundance and, in most cases, overrides the effects of grazing at all taxonomiclevels. In particular, fire frequency strongly influenced grassland-breeding birds because farms are burntin the territory-forming stage of the breeding cycle. Insectivores and nectarivores were disproportion-ately impacted by intensive commercial management. Of particular concern in this system is theyellow-breasted pipit (Anthus chloris), which is regionally and globally Vulnerable because of habitat loss.This species is sensitive to any form of habitat disturbance, highlighting the need for conservation atten-tion in these grasslands. Of the ten arthropod orders present in the study area, only Orthoptera respondedpositively to burning. However, orthopterans made up on average 78% of arthropod biomass in moisthighland grasslands, resulting in high grasshopper biomass on annually burnt farms: this high biomassin turn supports an abundance of insectivores. This reinforces the importance of process-oriented datawhere a measure of performance, such as reproductive success, is considered in assessing ecosystemcondition.
� 2012 Elsevier Ltd. All rights reserved.
1. Introduction
Human land-use practices cause large-scale degradation of thestructure and functioning of natural ecosystems (Furness et al.,1993; Jansen et al., 1999; Darkoh, 2003; Jeanneret et al., 2003; Daleet al., 2005; Driver et al., 2005), with concomitant implications forbiodiversity conservation (Bibby, 1999; Hilty and Merenlender,2000). Of these ecosystems, grasslands are the most utilized andleast protected of any terrestrial vegetation type in the world withonly about 1.4% under formal protection (Driver et al., 2005). InSouth Africa, the grassland biome covers approximately 7750 km2
yet only 2.2% of its total area is formally conserved (Tarboton,1997) and 60% has been irreversibly degraded (Driver et al.,2005). There are several different grassland types within the greatergrassland biome of South Africa, one of which is the highland
grassland of which only 1.5% is formally conserved (Mucina andRutherford, 2006). Grasslands are generally very sensitive to distur-bance (Smit et al., 1997; Little et al., 2005) and the cumulative im-pacts of over-grazing (Tainton, 1981; Hockey et al., 1988; Neke andDu Plessis, 2004), extensive burning (Uys et al., 2004), plantationforestry (Allan et al., 1997; Lipsey and Hockey, 2010) and invasionby alien plants (Le Maitre et al., 1996) has led to grasslands beingconsidered a conservation priority. As of 2004, only about 53% ofthe highland grassland biome remained in a ‘‘semi-pristine’’ state,contained mostly in livestock farms and rangelands (Neke and DuPlessis, 2004).
Loss of natural habitat is considered to be the greatest singlecause of biodiversity loss in terrestrial ecosystems in South Africa(Driver et al., 2005). Therefore, determining the factors leading tocurrent patterns of biodiversity loss in human-degraded land-scapes is a necessary prerequisite to designing future conservationstrategies (Jeanneret et al., 2003). Anthropogenic land use leads toa disjointed mosaic of fragmented, intact and disturbed habitats,testing the adaptability of its component species to persist(Morrison, 1986; Hockey et al., 1988; Harrison et al., 1994; Allanet al., 1997). The relative success with which different species do
0006-3207/$ - see front matter � 2012 Elsevier Ltd. All rights reserved.http://dx.doi.org/10.1016/j.biocon.2012.09.017
⇑ Corresponding author. Address: 3 Sangster Rd., Howick 3290, South Africa. Tel.:+27 84 240 7341; fax: +27 33 330 6982.
E-mail address: [email protected] (I.T. Little).1 Present address: Endangered Wildlife Trust, building K2, Ardeer Rd., Pinelands
Office Park Modderfontein, Johannesburg 1645, South Africa.
Biological Conservation 158 (2013) 258–270
Contents lists available at SciVerse ScienceDirect
Biological Conservation
journal homepage: www.elsevier .com/locate /b iocon
Author's personal copy
so will depend on their ability to utilize both intact patches of nat-ural habitat and the surrounding degraded matrix (Wiens, 1994;Ricketts, 2001). The land making up the ‘matrix’ between con-served habitats will be crucial in both the future conservation ofmany species and in the context of broader ecosystem functioning(Wiens, 1994; Norton, 2000; Ricketts, 2001; Donald et al., 2002;Hilty and Merenlender, 2003). Changes in habitat structure outsideof pristine habitats thus play a critical role in determining speciescomposition, which is influenced both by losses of indigenous spe-cies and gains of species not naturally representative of the originalsystem (Liversidge, 1962; Wiens, 1974; Folse, 1982; Erdelen, 1984;Knopf et al., 1988; Martin and Possingham, 2005).
Bird populations are no exception and it is evident that a num-ber of populations have decreased in many parts of the world asso-ciated with agricultural practices (Pain and Pienkowski, 1997;Donald et al., 2002; Laiolo, 2005; Azpiroz et al., 2012). As agricul-ture is the dominant land-use type in many parts of the world,there is mounting concern over the status of biodiversity associ-ated with farmland environments (Zanette et al., 2000; Jobinet al., 2001; Söderström et al., 2001; Vickery et al., 2001; Bentonet al., 2002; Lepczyk, 2005; Marshall et al., 2005; Martin et al.,2005; Martin and Possingham, 2005; Haslem and Bennett, 2008;Herzon et al., 2008).
In most cases, extensive transformation of natural landscapes tomonoculture, such as exotic plantations or cereal crop systems,may pose more obvious changes to ecosystem structure and func-tion, however, more subtle but as severe changes may not be asobvious in rangeland agriculture where grazing pressures andburning frequency are generally the driving forces. Worldwide,there have been demonstrations that unnaturally high grazingpressure is detrimental to bird species assemblages (Wiens,1973; Martin and Possingham, 2005; Batáry et al., 2006). In high-land grassland ecosystems, livestock grazing often does not simu-late the natural herbivory that would have occurred in an area(McNaughton, 1986) but are often compounded with all-year live-stock camp management where natural seasonal migration is nolonger evident and indigenous grazers have been replaced by com-mercial agricultural breeds. Furthermore, the potential impacts ofcommercial livestock grazing are confounded by the presence offire as a disturbance agent and a farm management tool in thegrassland system. These responses to stocking density have notpreviously been compared in combination with the effects of burn-ing frequency and the resultant impacts on birds and arthropods.Although grassland systems are naturally maintained by winterand spring fires, there is concern over the possible detrimental im-pacts of unnaturally frequent fires (coupled with increasinganthropogenic fragmentation) on floral and faunal communitystructures (Baker, 1992; Swengel, 2001; Giliomee, 2003; Valentineet al., 2007).
Communities within ecosystems are often represented by par-ticular and often specialized species, however, single-taxon ap-proaches to the assessment of disturbance effects on ecologicalassemblages have been shown to be inadequate, supporting theuse of multi-taxon approaches (Milchunas et al., 1998; Söderströmet al., 2001). Indeed, the link between the change in a floral commu-nity and its influence on invertebrates and higher vertebrates is of-ten lacking in ecological studies where assemblages or groups ofassemblages have changed as a result of management practicessuch as fire frequency and stocking density within grassland eco-systems (Joern and Laws, 2012). Few studies have explored the re-sponses of arthropod communities to fire and grazing in grasslands(Joern and Laws, 2012), but it has been shown that many arthropodgroups decrease rapidly in abundance directly after fire, dependingon both the intensity and extent of the burn and the mobility of thetaxa concerned (Dunwiddie, 1991). Arthropods respond similarly inareas which are heavily grazed because of structural simplification
of the habitat and the loss of protective cover (analogous to theeffects of fire – Swengel, 2001). These changes in arthropod com-munity structure are likely to have knock-on effects on insectivo-rous grassland birds (Benton et al., 2002) and even granivorousbirds where the floral community has changed substantially.
Various studies have shown that higher taxonomic level rich-ness acts as an adequate surrogate for arthropod biodiversity,decreasing the need for exhaustive expert identification(Prendergast and Eversham, 1997; Duelli and Obrist, 1998;Biaggini et al., 2007; Öster et al., 2008). Most birds, by contrast, areeasy to identify to species level and this allows more in depth inter-pretation of assemblage effects caused by disturbance pressures.
When assessing bird assemblages species richness alone is apoor biodiversity measure, because changes in habitat structureinfluence species assemblages through losses and gains of differentspecies (Liversidge, 1962; Wiens, 1974; Folse, 1982; Erdelen, 1984;Knopf et al., 1988; Martin and Possingham, 2005). In other words,species richness can remain constant while assemblage composi-tion changes. This suggests that the responses of individual speciesand assemblage shifts are important when assessing the impacts ofdisturbance (Batáry et al., 2006).
In some cases the presence of a particular species in a systemreflects some measure of the character of the habitat and the spe-cies is considered as bio-indicator (McGeoch and Chown, 1998).Such indicator species have the potential to signal the effects ofdisturbances on other species with similar habitat requirements(Noss, 1989) and can thus potentially be utilized as an early warn-ing system for habitat degradation. These species, once identified,can also be useful for future monitoring of the system. While theuse of indicator species is contentious (McGeoch and Chown,1998; Duelli and Obrist, 2003; Sauberer et al., 2004), the impor-tance of single species and habitat specialists’ responses to distur-bance should be taken into consideration. The functional responsesof faunal assemblages or the mere presence/absence of birds andarthropods can be used as indicators of changes in the structureand functioning of the environment (Morrison, 1986; Martin andPossingham, 2005; Child et al., 2009; Vassiliki et al., 2009). Amongbirds, functional richness (the diversity of functional guilds withina community) has been shown to be closely correlated with speciesrichness at large spatial scales (Child et al., 2009), but at finer scalesspecies’ responses are expected to be more indicative of ecosystemfunctioning. Birds respond rapidly to habitat change and move inresponse to anthropogenic habitat alteration (Liversidge, 1962;Folse, 1982; Knopf et al., 1988). These responses, along with shiftsin functional guilds, allow ecologists to infer disturbance processes(Moretti and Legg, 2009).
There has yet to be a broad-scale assessment of both the bene-ficial and detrimental effects of these habitat changes at a multi-taxon and landscape level in South Africa.
This study focuses on the responses of arthropod and birdassemblages to fire and grazing pressure in the moist highlandgrasslands (MHGs) of South Africa. The study aims to assess theshifts in assemblage structures through the summer growing sea-son and between management types in order to infer the conserva-tion implications of current land-management practices in bothconserved areas and the surrounding farmland. We assess the rel-ative disturbance effects of fire and grazing on functional guild andspecies responses within arthropod and bird taxonomic groups.
2. Study site and methods
The study area falls within the Mesic Highveld Grassland Biore-gion and is specifically identified as Lydenberg Montane Grassland(Mucina and Rutherford, 2006). The study sites were all on the pla-teau around the town of Dullstroom (centered at 25� 2500S, 30�
I.T. Little et al. / Biological Conservation 158 (2013) 258–270 259
Author's personal copy
1000E), and were between 1900 and 2200 m.a.s.l. The soils aremostly derived from shale and quartzite as well as lavas and dol-omites of the Transvaal Supergroup (Mucina and Rutherford,2006): areas dominated by lava and dolomitic soils were avoidedas most of the area falls on shale and quartzite soils. The Dullst-room Plateau Grasslands (encompassing this entire study) havebeen classified as Endangered on the basis of very high irreplace-ability of species (National List of threatened Ecosystems, Depart-ment of Environmental Affairs, notice 1477 of 2009). Thetopography includes high-altitude plateaus, undulating plains,mountain peaks and slopes, and hills and deep valleys. The pre-dominant vegetation is short grass in the high-lying areas becom-ing taller on the lower slopes. Grass species diversity is fairly low,but the diversity of forbs is high (Mucina and Rutherford, 2006).Orographic precipitation (660–1180 mm per year – Mucina andRutherford, 2006) and heavy mists throughout most months ofthe year have promoted a unique flora, including a rich diversityof mesophytic plants such as the Orchidaceae. Indeed, forb diver-sity is so high, with over 2260 plant taxa and 51 endemic plant spe-cies, that this grassland type has been proposed as a ‘center ofplant endemism’ (Mucina and Rutherford, 2006).
The study sites all comprised undulating hills ranging from ca1900–2200 m.a.s.l. Eight study sites subject to differing manage-ment regimes were sampled over two summer seasons. These in-cluded an annually burnt farm (AF); communally grazed lands(Com); a biennially burnt farm that was burnt (BF) or was notburnt (BFu) in the study year; a nature reserve site (Verloren ValeiNature Reserve) with a high density of indigenous grazing ungu-lates that was burnt (NRH) or was not burnt (NRHu) in the studyyear; and a nature reserve site with a low density of indigenousgrazing ungulates that was burnt (NRL) or was not burnt (NRLu)in the study year, the high stocking density part of the reservewas fenced off from the rest of the reserve. The nature reserve siteswere both burnt biennially while the communal grazed lands werenot burnt in planned burns due to low fuel loads as a result ofintensive mixed grazing. Burning season is governed by provincialregulations and occurs after the first rains, usually in September.
Within each site, four replicates were chosen such that one wasorientated in each of the four cardinal compass directions. Each ofthe four 25 ha replicates were marked out with at least 500 m be-tween replicates, the largest territory of any of the grassland pas-serine species in this study is no more than 100 m in diameter(Hockey et al., 2005). Sampling sites were selected with sufficientdistance between sites to avoid pseudo-replication (Hurlbert,1984), but were sufficiently close together to standardize as faras possible for extrinsic factors including soil type, rainfall, aspect,slope and temperature.
Field work was conducted during the birds’ breeding season(October–March) in 2007–2008 and 2008–2009. Based on datafrom the local weather station neither temperature, rainfall norwind speed showed significant differences between years, monthsor days between the field seasons, these also showed no significantdifference to 50 year averages (Students t-test for dependent sam-ples). Grazing stocking densities were collected by interviewingfarmers or managers of the study sites and were augmented/vali-dated with animal counts (Table 1).
Relative stocking density was recorded as the number of hect-ares of grazing land available per large animal unit (ha LAU�1).One LAU was defined as being equivalent to one cow or five sheep,and represented the metabolic equivalent of a 454 kg cow(Meissner et al., 1983; Tainton, 1999).
2.1. Vegetation structural sampling
Vegetation structure was sampled monthly throughout thesampling season using two techniques. The first sampling method
was modified from Wiens and Rotenberry (1981). Three 500 mtransects were established within each of the four replicates perstudy site. Along each of these, at 50 m intervals, a 10 m tapewas laid out perpendicular to the transect line. Vegetation wassampled at 1 m intervals along the tape yielding 100 point samplesper transect (in total, 1200 samples per site per month). At eachsampling point a 6 mm diameter rod was positioned verticallythrough the vegetation to the ground. This rod was marked atheight intervals 0–49 mm, 50–99 mm, 100–199 mm, 200–299 mm, 300–399 mm, 400–499 mm, 500–599 mm and 600–1000 mm. At each sampling point two variables were recorded(a) the number of vegetation contacts with the rod per heightinterval, and (b) whether the contact was a grass or a forb. Openground (in the case of no contact with vegetation) and overall max-imum height of vegetation were also recorded. From these datathree sets of vegetation structural indices were recorded.
Cover – Percent grass cover (%grass), percent forb cover (%forb)and percent total plant cover in the form of grass and forb com-bined (%veg), calculated as the percent of points recording eachof these parameters.Structural measures – Average maximum height of vegetation(AveMaxHt) and horizontal density (AvHorDen), derived fromthe mean number of contacts with the rod in the 0–100 mminterval, and vertical density (AvVerDen) derived from themean number of contacts over the entire length of the rod.Heterogeneity measures – canopy heterogeneity (HorHetHt)given by the coefficient of variation of the maximum heightcontacts, and overall heterogeneity (HorHetTo) given by thecoefficient of variation of the mean total number of contactsover the entire rod and a patchiness index (Patchine) whichgroups the 10 samples per 50 m and then calculates landscapepatchiness according to the equation of Wiens and Rotenberry(1981).
Patchiness ¼ RðMax�MinÞ=Rx
where Max = maximum number of contacts recorded in eachsample group, Min = minimum number of contacts recorded ineach sample group, and x = the mean number of contacts re-corded in each sample group.The second technique quantifies vegetation biomass. The quan-
tity of herbage available to herbivores is a function of phytomass(O’Reagain and Turner, 1992; Smith, 2006). Measurement of stand-ing crop is essential for determining herbage production and stock-ing rates in the management of herbivores (Ganguli et al., 2000).
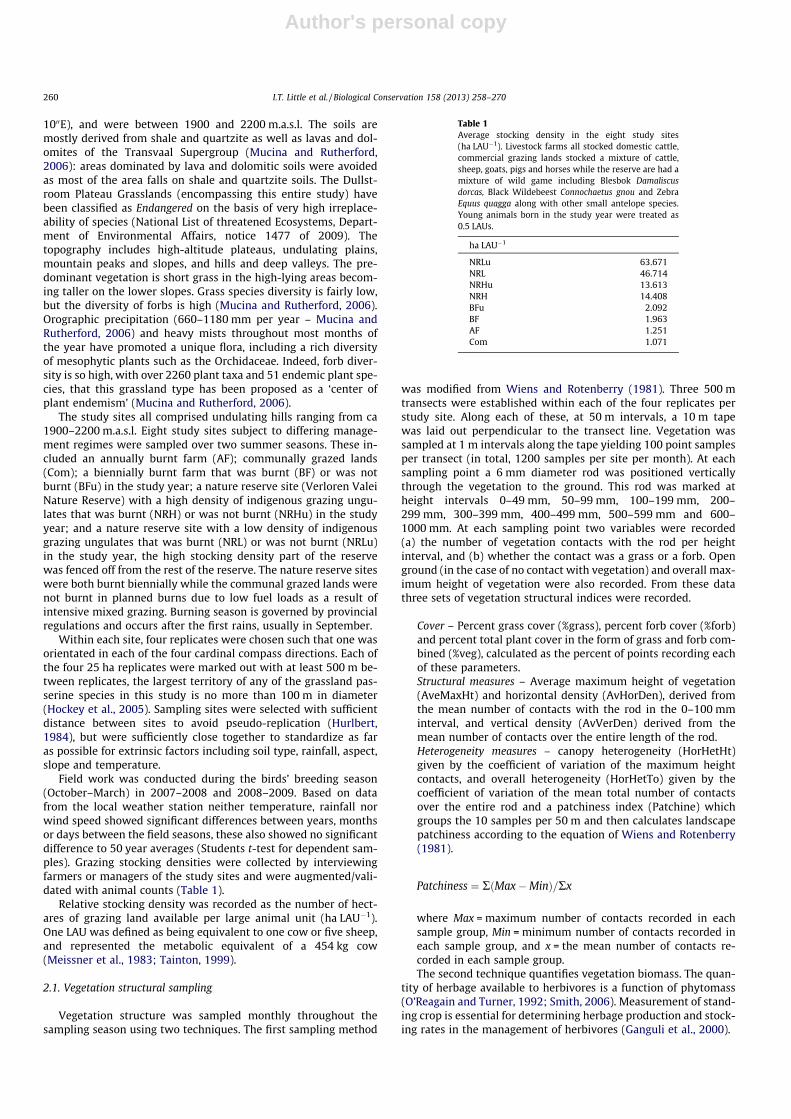
Table 1Average stocking density in the eight study sites(ha LAU�1). Livestock farms all stocked domestic cattle,commercial grazing lands stocked a mixture of cattle,sheep, goats, pigs and horses while the reserve are had amixture of wild game including Blesbok Damaliscusdorcas, Black Wildebeest Connochaetus gnou and ZebraEquus quagga along with other small antelope species.Young animals born in the study year were treated as0.5 LAUs.
ha LAU�1
NRLu 63.671NRL 46.714NRHu 13.613NRH 14.408BFu 2.092BF 1.963AF 1.251Com 1.071
260 I.T. Little et al. / Biological Conservation 158 (2013) 258–270

Author's personal copy
Phytomass was sampled using a Disc Pasture Meter (DPM –Bransby and Tainton, 1977; Danckwerts and Trollope, 1980;Trollope and Potgieter, 1986). The DPM is made up of a 1.5 kg,457 mm diameter disk mounted onto a central rod with a measur-ing scale in 5 mm increments. The disk was dropped verticallyfrom 0.6 m above ground onto the grass sward; the settling heightof the disk was then recorded. Vegetation was sampled every 5 malong the three 500 m transects, yielding 100 DPM samples pertransect and a total of 1200 samples per site per month.
The DPM is calibrated for a specific vegetation type to convertthe DPM reading into biomass estimates (kg ha�1). AlthoughDPM calibrations were available for a number of vegetation typesin South Africa and some outside of South Africa (Bransby andTainton, 1977; Danckwerts and Trollope, 1980; Trollope, 1983;Trollope and Potgieter, 1986), MHG had not been calibrated. Datacollected by Colin Everson in the late 1970s were used to calibratethe DPM. The best fit calibration was the linear regression,y = 358.768�–746.352 (r = 0.95, r2 = 0.91, p < 0.0001).
2.2. Arthropod sampling
Arthropod abundance was sampled monthly along the sametransects where birds were censused (see below), using a circularsweep net with a diameter of 450 mm. Samples were collected inthe beginning of each month on a selected warm, windless day.These samples consisted of 200 sweeps (a sweep is made with eachlong stride) per transect (600 sweeps per treatment) per month.Sweep nets are effective in catching most of the prey groups eatenby the Motacillidae (insectivorous wagtails – Brodmann and Reyer,1999). Arthropods samples were immediately placed in a sealedcontainer with ethyl acetate. The arthropods were separated fromvegetation matter and preserved in ethanol for later identificationto order level, this being sufficient resolution to detect taxonomicresponses to land use at local scales (Prendergast and Eversham,1997; Duelli and Obrist, 1998; Zanette et al., 2000; Vickery et al.,2001; Biaggini et al., 2007; Dennis et al., 2008; Öster et al., 2008;Champlin et al., 2009). Samples were then dried and weighed forbiomass assessment (Cressa, 1999; Zanette et al., 2000; Boultonet al., 2008). Pitfall trapping was attempted, but controlling forcatch success between sites was not possible (even with raisedcovers) because of erratic rainfall patterns and the need for trapsto stay out for at least 3 days, this results in some of the replicatesamples being destroyed due to flooding and hence no comparablesamples.
2.3. Bird sampling
In order to quantify presence/absence and abundance of birdspecies, censuses were undertaken that encompassed all taxapresent.
A 50 m weighted rope was dragged along 500 m long line tran-sects. This is a modification of the fixed-strip or belt transect meth-od (Kendeigh, 1944) and is the most appropriate census method inlarge, open areas (where it is more accurate than point counts –Bibby et al., 1992). Rope drags also obviate problems of having tocorrect for effective transect width and prevent birds from hidingin taller grass clumps and swards (Krook et al., 2007). Birds not uti-lizing the habitat directly, i.e. flying over, were not included in theanalyses.
For each of the four replicates per management type, three500 m parallel transects were walked perpendicular to a plotboundary: each 500 m transect covered an area of 7.5 ha. Census-ing began when breeding territories were established in earlyOctober and were conducted monthly throughout the breedingseason. These were divided into sampling periods in the morning(06h00–10h00) and in the afternoon (14h00–18h00). Census
sessions were spread between the two observation periods in rota-tion according to a randomly selected schedule (MacNally and Hor-ricks, 2002).
2.4. Statistical analysis
The Software packages PC-ORD 5.10 (McCune and Mefford,2006) and STATISTICA 9.0 (StatSoft Inc., 2009) were used to analysethese data.
To assess differences in bird assemblages based on managementtype, as a function of early to late summer season and in responseto burning, we averaged the counts per transect and used theseaveraged values as the monthly count per replicate. We then useda one-way, pairwise, Permutation-based Non-parametric MANOVAor PerManova with a Sørenson (Bray–Curtis) distance measure and5000 iterations (Anderson, 2001) and a pairwise Multi-ResponsePermutation Procedure (MRPP) using a Sørenson distance measureand a natural weighting (Mielke, 1984). MRPP is a non-parametrictest of differences between groups (species assemblages), designedfor multivariate analysis of terrestrial communities. The A-statistic(chance–corrected, within-group agreement) describes effect size:when A = 0, groups are no more or less different than expected bychance; when A = 1, sample units within groups are identical(McCune and Mefford, 2006). Sørenson distance measures were se-lected as these are recommended for abundance data and give ro-bust outputs with zero-dominated data sets (McCune and Grace,2002). Both PerManova and MRPP results are reported as MRPPis considered more robust while PerManova has been more exten-sively published (McCune and Grace, 2002).
To assess the relative influences of grazing type (areas withdomestic stock vs areas with indigenous animals) and burning(burnt vs unburnt), on bird species richness and abundance (calcu-lated as average abundance from the three transects per replicate,sampled monthly for 6 months, October to March), WilcoxonMatched-Pairs tests were performed. To assess the difference inbird species richness and arthropod biomass between manage-ment types as a function of season (from early to late summer)and in response to burning, Analyses of Variance (ANOVA) withpost hoc Tukey Tests were performed. Data were log transformedwhere necessary in order to meet assumptions of normality.
To assess species’ as well as functional guild responses to man-agement type and month, we ran an Indicator Species Analysis(McCune and Mefford, 2006) using a Monte Carlo Test of signifi-cance with 5000 permutations (Dufrêne and Legendre, 1997). Thismethod combines species’ abundances and occurrence: a ‘perfectindicator’ should be present in all replicates within a site and notpresent in any other sites, this would have an indicator value of100.
To determine which vegetation structural indices play the mostimportant role in predicting bird species richness and arthropoddiversity, we used a Backwards Stepwise Multiple Regression witha partial correlation analysis. The beta coefficient compares the rel-ative contribution of each independent variable in the prediction ofthe dependent variable. The tolerance of a variable is defined as1 min the squared multiple correlation of this variable with allother independent variables in the regression equation. Therefore,the closer to zero the tolerance of a variable, the more redundant isits contribution to the regression.
Non-metric Multidimensional Scaling Ordinations (Kruskal,1964; Mather, 1976) were run using a Sørenson distance measurewith 250 runs of the real data and 500 iterations in order to sepa-rate out replicate sites in bird species space and monthly samplesin arthropod biomass space. DPM data were secondarily overlaidover the ordination with vegetation structural indices as a biplot.Orthopteran abundance data were secondarily overlaid onto theordination and illustrated as a biplot.
I.T. Little et al. / Biological Conservation 158 (2013) 258–270 261
Author's personal copy
To assess grassland bird assemblage site preference a Two-wayCluster Dendrogram (McCune and Mefford, 2006) with a Sørensondistance measure and group-average linking method withoutrelativisation was run.
3. Results
3.1. Arthropods
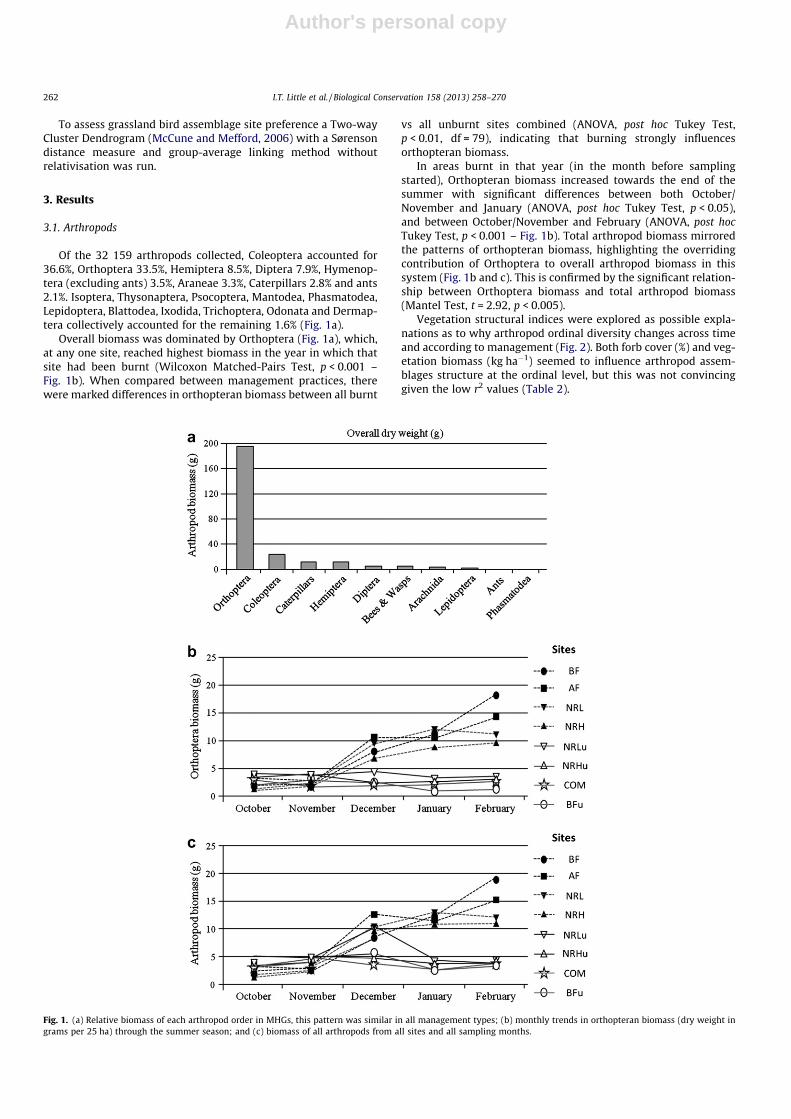
Of the 32 159 arthropods collected, Coleoptera accounted for36.6%, Orthoptera 33.5%, Hemiptera 8.5%, Diptera 7.9%, Hymenop-tera (excluding ants) 3.5%, Araneae 3.3%, Caterpillars 2.8% and ants2.1%. Isoptera, Thysonaptera, Psocoptera, Mantodea, Phasmatodea,Lepidoptera, Blattodea, Ixodida, Trichoptera, Odonata and Dermap-tera collectively accounted for the remaining 1.6% (Fig. 1a).
Overall biomass was dominated by Orthoptera (Fig. 1a), which,at any one site, reached highest biomass in the year in which thatsite had been burnt (Wilcoxon Matched-Pairs Test, p < 0.001 –Fig. 1b). When compared between management practices, therewere marked differences in orthopteran biomass between all burnt
vs all unburnt sites combined (ANOVA, post hoc Tukey Test,p < 0.01, df = 79), indicating that burning strongly influencesorthopteran biomass.
In areas burnt in that year (in the month before samplingstarted), Orthopteran biomass increased towards the end of thesummer with significant differences between both October/November and January (ANOVA, post hoc Tukey Test, p < 0.05),and between October/November and February (ANOVA, post hocTukey Test, p < 0.001 – Fig. 1b). Total arthropod biomass mirroredthe patterns of orthopteran biomass, highlighting the overridingcontribution of Orthoptera to overall arthropod biomass in thissystem (Fig. 1b and c). This is confirmed by the significant relation-ship between Orthoptera biomass and total arthropod biomass(Mantel Test, t = 2.92, p < 0.005).
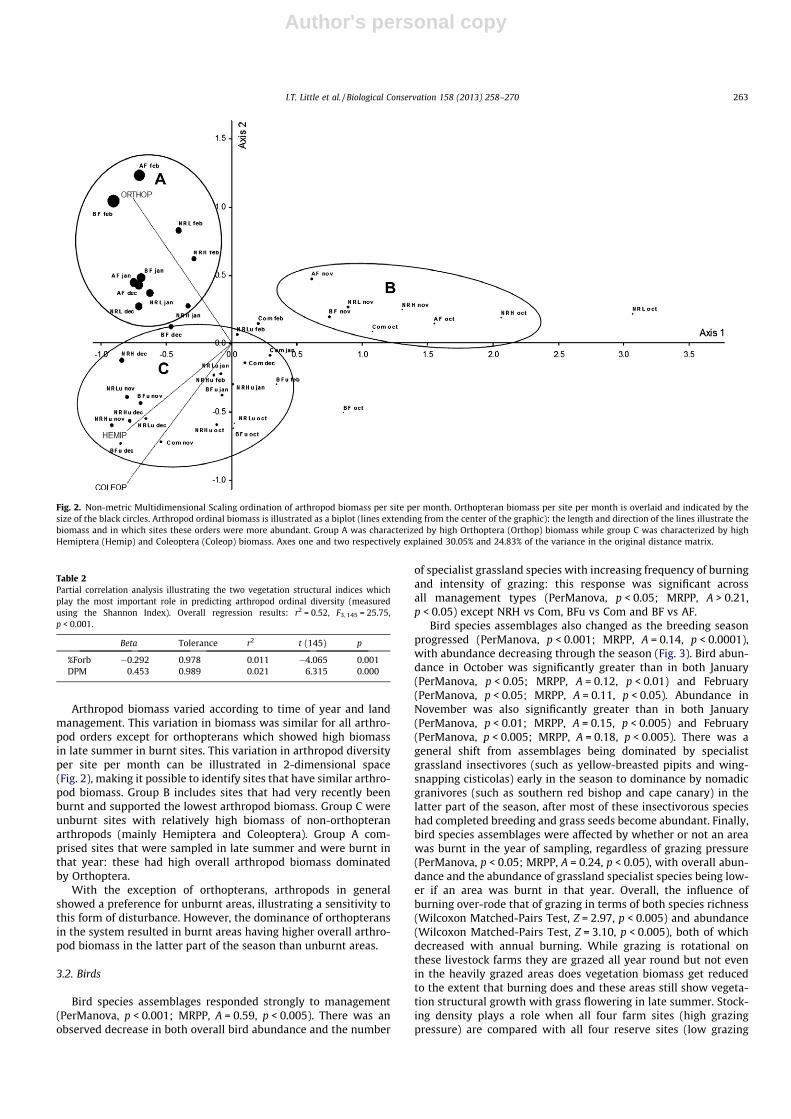
Vegetation structural indices were explored as possible expla-nations as to why arthropod ordinal diversity changes across timeand according to management (Fig. 2). Both forb cover (%) and veg-etation biomass (kg ha�1) seemed to influence arthropod assem-blages structure at the ordinal level, but this was not convincinggiven the low r2 values (Table 2).
Fig. 1. (a) Relative biomass of each arthropod order in MHGs, this pattern was similar in all management types; (b) monthly trends in orthopteran biomass (dry weight ingrams per 25 ha) through the summer season; and (c) biomass of all arthropods from all sites and all sampling months.
262 I.T. Little et al. / Biological Conservation 158 (2013) 258–270
Author's personal copy
Arthropod biomass varied according to time of year and landmanagement. This variation in biomass was similar for all arthro-pod orders except for orthopterans which showed high biomassin late summer in burnt sites. This variation in arthropod diversityper site per month can be illustrated in 2-dimensional space(Fig. 2), making it possible to identify sites that have similar arthro-pod biomass. Group B includes sites that had very recently beenburnt and supported the lowest arthropod biomass. Group C wereunburnt sites with relatively high biomass of non-orthopteranarthropods (mainly Hemiptera and Coleoptera). Group A com-prised sites that were sampled in late summer and were burnt inthat year: these had high overall arthropod biomass dominatedby Orthoptera.
With the exception of orthopterans, arthropods in generalshowed a preference for unburnt areas, illustrating a sensitivity tothis form of disturbance. However, the dominance of orthopteransin the system resulted in burnt areas having higher overall arthro-pod biomass in the latter part of the season than unburnt areas.
3.2. Birds
Bird species assemblages responded strongly to management(PerManova, p < 0.001; MRPP, A = 0.59, p < 0.005). There was anobserved decrease in both overall bird abundance and the number
of specialist grassland species with increasing frequency of burningand intensity of grazing: this response was significant acrossall management types (PerManova, p < 0.05; MRPP, A > 0.21,p < 0.05) except NRH vs Com, BFu vs Com and BF vs AF.
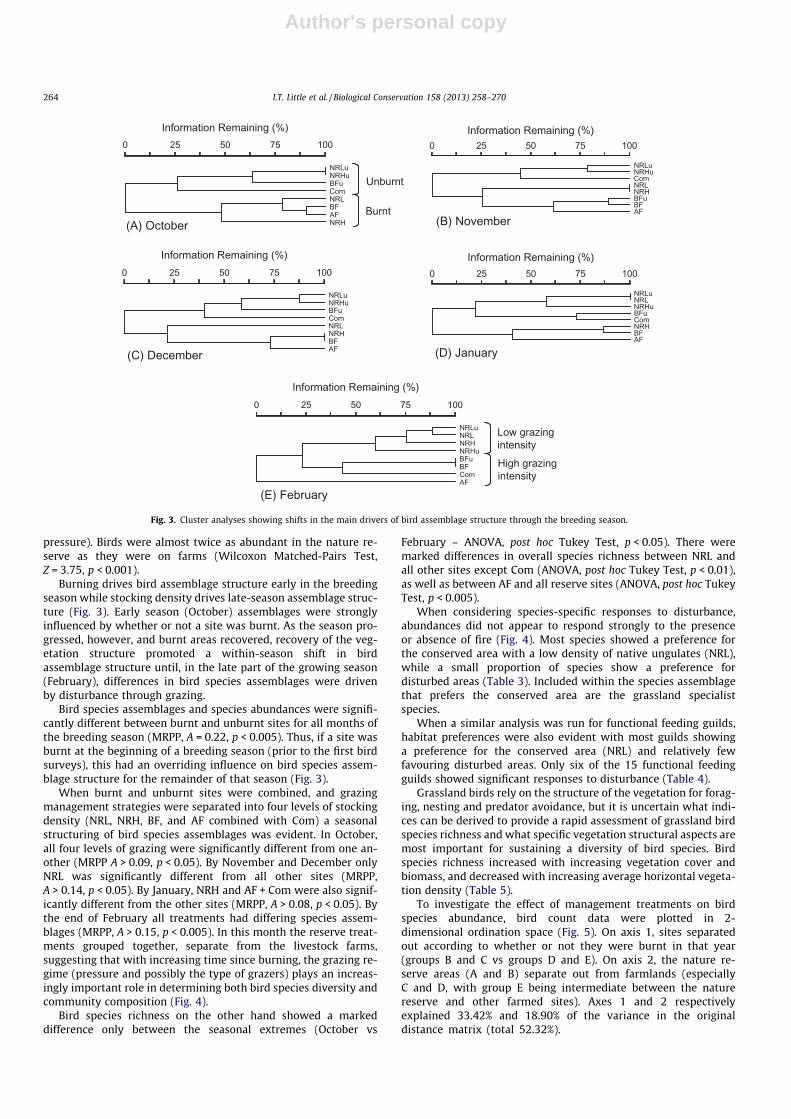
Bird species assemblages also changed as the breeding seasonprogressed (PerManova, p < 0.001; MRPP, A = 0.14, p < 0.0001),with abundance decreasing through the season (Fig. 3). Bird abun-dance in October was significantly greater than in both January(PerManova, p < 0.05; MRPP, A = 0.12, p < 0.01) and February(PerManova, p < 0.05; MRPP, A = 0.11, p < 0.05). Abundance inNovember was also significantly greater than in both January(PerManova, p < 0.01; MRPP, A = 0.15, p < 0.005) and February(PerManova, p < 0.005; MRPP, A = 0.18, p < 0.005). There was ageneral shift from assemblages being dominated by specialistgrassland insectivores (such as yellow-breasted pipits and wing-snapping cisticolas) early in the season to dominance by nomadicgranivores (such as southern red bishop and cape canary) in thelatter part of the season, after most of these insectivorous specieshad completed breeding and grass seeds become abundant. Finally,bird species assemblages were affected by whether or not an areawas burnt in the year of sampling, regardless of grazing pressure(PerManova, p < 0.05; MRPP, A = 0.24, p < 0.05), with overall abun-dance and the abundance of grassland specialist species being low-er if an area was burnt in that year. Overall, the influence ofburning over-rode that of grazing in terms of both species richness(Wilcoxon Matched-Pairs Test, Z = 2.97, p < 0.005) and abundance(Wilcoxon Matched-Pairs Test, Z = 3.10, p < 0.005), both of whichdecreased with annual burning. While grazing is rotational onthese livestock farms they are grazed all year round but not evenin the heavily grazed areas does vegetation biomass get reducedto the extent that burning does and these areas still show vegeta-tion structural growth with grass flowering in late summer. Stock-ing density plays a role when all four farm sites (high grazingpressure) are compared with all four reserve sites (low grazing
Fig. 2. Non-metric Multidimensional Scaling ordination of arthropod biomass per site per month. Orthopteran biomass per site per month is overlaid and indicated by thesize of the black circles. Arthropod ordinal biomass is illustrated as a biplot (lines extending from the center of the graphic): the length and direction of the lines illustrate thebiomass and in which sites these orders were more abundant. Group A was characterized by high Orthoptera (Orthop) biomass while group C was characterized by highHemiptera (Hemip) and Coleoptera (Coleop) biomass. Axes one and two respectively explained 30.05% and 24.83% of the variance in the original distance matrix.
Table 2Partial correlation analysis illustrating the two vegetation structural indices whichplay the most important role in predicting arthropod ordinal diversity (measuredusing the Shannon Index). Overall regression results: r2 = 0.52, F3, 145 = 25.75,p < 0.001.
Beta Tolerance r2 t (145) p
%Forb �0.292 0.978 0.011 �4.065 0.001DPM 0.453 0.989 0.021 6.315 0.000
I.T. Little et al. / Biological Conservation 158 (2013) 258–270 263
Author's personal copy
pressure). Birds were almost twice as abundant in the nature re-serve as they were on farms (Wilcoxon Matched-Pairs Test,Z = 3.75, p < 0.001).
Burning drives bird assemblage structure early in the breedingseason while stocking density drives late-season assemblage struc-ture (Fig. 3). Early season (October) assemblages were stronglyinfluenced by whether or not a site was burnt. As the season pro-gressed, however, and burnt areas recovered, recovery of the veg-etation structure promoted a within-season shift in birdassemblage structure until, in the late part of the growing season(February), differences in bird species assemblages were drivenby disturbance through grazing.
Bird species assemblages and species abundances were signifi-cantly different between burnt and unburnt sites for all months ofthe breeding season (MRPP, A = 0.22, p < 0.005). Thus, if a site wasburnt at the beginning of a breeding season (prior to the first birdsurveys), this had an overriding influence on bird species assem-blage structure for the remainder of that season (Fig. 3).
When burnt and unburnt sites were combined, and grazingmanagement strategies were separated into four levels of stockingdensity (NRL, NRH, BF, and AF combined with Com) a seasonalstructuring of bird species assemblages was evident. In October,all four levels of grazing were significantly different from one an-other (MRPP A > 0.09, p < 0.05). By November and December onlyNRL was significantly different from all other sites (MRPP,A > 0.14, p < 0.05). By January, NRH and AF + Com were also signif-icantly different from the other sites (MRPP, A > 0.08, p < 0.05). Bythe end of February all treatments had differing species assem-blages (MRPP, A > 0.15, p < 0.005). In this month the reserve treat-ments grouped together, separate from the livestock farms,suggesting that with increasing time since burning, the grazing re-gime (pressure and possibly the type of grazers) plays an increas-ingly important role in determining both bird species diversity andcommunity composition (Fig. 4).
Bird species richness on the other hand showed a markeddifference only between the seasonal extremes (October vs
February – ANOVA, post hoc Tukey Test, p < 0.05). There weremarked differences in overall species richness between NRL andall other sites except Com (ANOVA, post hoc Tukey Test, p < 0.01),as well as between AF and all reserve sites (ANOVA, post hoc TukeyTest, p < 0.005).
When considering species-specific responses to disturbance,abundances did not appear to respond strongly to the presenceor absence of fire (Fig. 4). Most species showed a preference forthe conserved area with a low density of native ungulates (NRL),while a small proportion of species show a preference fordisturbed areas (Table 3). Included within the species assemblagethat prefers the conserved area are the grassland specialistspecies.
When a similar analysis was run for functional feeding guilds,habitat preferences were also evident with most guilds showinga preference for the conserved area (NRL) and relatively fewfavouring disturbed areas. Only six of the 15 functional feedingguilds showed significant responses to disturbance (Table 4).
Grassland birds rely on the structure of the vegetation for forag-ing, nesting and predator avoidance, but it is uncertain what indi-ces can be derived to provide a rapid assessment of grassland birdspecies richness and what specific vegetation structural aspects aremost important for sustaining a diversity of bird species. Birdspecies richness increased with increasing vegetation cover andbiomass, and decreased with increasing average horizontal vegeta-tion density (Table 5).
To investigate the effect of management treatments on birdspecies abundance, bird count data were plotted in 2-dimensional ordination space (Fig. 5). On axis 1, sites separatedout according to whether or not they were burnt in that year(groups B and C vs groups D and E). On axis 2, the nature re-serve areas (A and B) separate out from farmlands (especiallyC and D, with group E being intermediate between the naturereserve and other farmed sites). Axes 1 and 2 respectivelyexplained 33.42% and 18.90% of the variance in the originaldistance matrix (total 52.32%).
Information Remaining (%)0 25 50 75 100
NRLuNRLNRHuBFuComNRHBFAF
Unburnt
Low grazingintensity
Burnt
High grazingintensity
Information Remaining (%)0 25 50 75 100
NRLuNRHuBFuComNRLBFAFNRH
Information Remaining (%)0 25 50 75 100
NRLuNRHuComNRLNRHBFuBFAF
Information Remaining (%)0 25 50 75 100
NRLuNRHuBFuComNRLNRHBFAF
Information Remaining (%)0 25 50 75 100
NRLuNRLNRHNRHuBFuBFComAF
(A) October (B) November
(C) December (D) January
(E) February
Fig. 3. Cluster analyses showing shifts in the main drivers of bird assemblage structure through the breeding season.
264 I.T. Little et al. / Biological Conservation 158 (2013) 258–270

Author's personal copy
4. Discussion
Multiple factors influence the composition of bird assemblages,including disturbance, changes in habitat structure and variation in
food availability (Morrison, 1986; Nkwabi et al., 2011). These re-sponses can vary from losses or gains of individual species to entireassemblage shifts (Liversidge, 1962; Wiens, 1974; Folse, 1982;Erdelen, 1984; Knopf et al., 1988; Martin and Possingham, 2005).
Gre
y-w
inge
d F
ranc
olin
Com
mon
Qua
ilEa
ster
n Lo
ng-b
illed
Lar
kZi
tting
Cis
ticol
aW
ing-
snap
ping
Cis
ticol
aC
ape
Can
ary
Afr i
can
Qua
ilfin
chC
ape
Long
claw
Afric
an P
ipit
Long
-taile
d W
idow
bird
Blac
k-w
inge
d La
pwin
gSm
all B
utto
nqui
alAn
t-eat
ing
Cha
tPa
le-c
row
ned
Cis
ticol
aYe
llow
-cro
wne
d Bi
shop
Cro
wne
d La
pwin
gR
ed-c
olla
red
Wid
owbi
rdBl
acks
mith
Lap
win
gC
loud
Cis
ticol
aAf
rican
Wat
tled
Lapw
ing
Sout
hern
Red
bis
hop
Pin-
taile
d W
ydha
yR
ufou
s-na
pped
Lar
kM
ount
ain
Whe
atea
rR
ed- w
inge
d Fr
anco
linG
roun
d W
oodp
ecke
rFa
milia
r Cha
tSe
ntin
el R
ock-
thru
shW
ailin
g C
istic
ola
Yello
w-b
reas
ted
Pipt
Mal
achi
te S
unbi
rdC
omm
on W
axbi
llAf
rican
Sto
nech
atYe
llow
Bis
hop
Pied
Sta
rling
Buff-
stre
aked
Cha
t
100
7550
250
Information Remaining (%)0 25 50 75 100
NRLNRHBFComAF
Matrix Coding
MaxMin
Group AGroup BGroup C
a
Information Remaining (%)0 25 50 75 100
100
7550
250
NRLu
NRHuBFuCom
AF
Gre
y-w
inge
d Fr
anco
linC
omm
on Q
uail
East
ern
Long
-bill
ed L
ark
Com
mon
Wax
bill
Mou
ntai
n W
heat
ear
Cap
e C
anar
yR
ed-w
inge
d Fr
anco
linC
loud
Cis
ticol
aSe
ntin
el R
ock-
thru
shM
alac
hite
Sun
bird
Afric
an S
tone
chat
Red
-col
lare
d W
idow
bird
Yello
w B
isho
pG
roun
d W
oodp
ecke
rFa
milia
r Cha
tW
ailin
g C
istic
ola
Zitti
ng C
istic
ola
Pin -
taile
d W
hyda
hPi
ed S
tarli
ngLo
ng-ta
iled
Wid
owbi
rdW
ing-
snap
ping
Cis
ticol
aAf
rican
Qua
ilfin
chC
ape
Long
claw
Afric
an P
ipit
Smal
l But
tonq
uial
Yello
w-b
reas
ted
Pipi
tBu
ff-st
reak
ed C
hat
Cro
wne
d La
pwin
gBl
ack-
win
ged
Lapw
ing
Afric
an W
attle
d La
pwin
gBl
acks
mith
Lap
win
gSo
uthe
rn R
ed B
isho
pR
ufou
s--
napp
ed L
ark
eatin
g C
hat
Pale
Ant
-cro
wne
d C
istic
ola
Yello
w- c
row
ned
Bish
op
Matrix Coding
MaxMin
Group AGroup BGroup C
b
Fig. 4. Bird species assemblages (based on abundance) as a function of whether or not a site was burnt in the focal year: (a) includes only abundance measures from sites thatwere burnt in that season, while (b) includes only abundance measures from sites that were not burnt in that year. Communal lands and the annually burnt farm wereincluded in both (a) and (b) for comparative purposes (they are both managed in the same way in all years). Groups A, B and C refer to bird species assemblages that showsimilar abundance in a specific site or group of sites.
I.T. Little et al. / Biological Conservation 158 (2013) 258–270 265
Author's personal copy
Some studies of bird assemblage responses to habitat disturbancehave been carried out in South Africa (Mentis and Little, 1992;Little and Crowe, 1994; Cameron, 1999; Jansen et al., 1999;Ratcliffe and Crowe, 2001; Little et al., 2005; Fox and Hockey,
2007). To date, however, none of these studies has focused onthe direct and relative effects of grazing and burning on grasslandfauna and flora.
In terms of the arthropod population on which many grasslandbirds depend, grazing can lead to decreases in some arthropodorders, including spiders, which in turn can lead to concomitantdecreases in the species richness and abundance of grasslandinsectivores (Dennis et al., 2008). Heavy grazing also leads to de-creases in forage palatability, suggesting that high stocking densitycan also reduce the carrying capacity for livestock (Milchunas et al.,2005).
The arthropod biomass of MHGs was dominated by Orthoptera:these accounted for 78% of the total arthropod biomass throughoutthe study period. All arthropod taxa declined markedly immedi-ately following a burn (Swengel, 2001; Nkwabi et al., 2011). In thisstudy, overall arthropod biomass increased from early spring
Table 3Grassland associated bird species with site-specific distributions illustrating habitat preference. Scientific names are provided in Appendix 1.
Species Site Observed indicatorvalue (IV)a
IV from randomized groups p
Mean Std. dev.
Jackal buzzard NRLu 37.5 21.5 8.4 0.042Pallid harrier NRLu 44.4 18.7 8.4 0.017Red-winged francolin NRLu 34.8 22.5 6.0 0.039Sentinel rock-thrush NRLu 48.4 20.0 7.4 0.005Familiar chat NRLu 70.8 21.1 9.5 0.001African stonechat NRLu 39.9 20.7 6.1 0.005Cloud cisticola NRLu 35.6 21.2 7.0 0.044Yellow-breasted pipit NRLu 36.7 22.4 6.5 0.033Cape longclaw NRLu 22.9 17.8 1.9 0.014Malachite sunbird NRLu 35.7 19.7 5.5 0.001Red-collared widowbird NRLu 51.1 19.9 8.1 0.006Common quail NRL 32.4 20.7 4.8 0.015Ground woodpecker NRL 40.6 18.7 9.1 0.044Cinnamon-breasted bunting NRL 45.0 19.0 9.3 0.038Gray-winged francolin NRHu 54.0 23.3 10.2 0.019Eastern long-billed lark NRHu 38.9 22.2 4.9 0.000Mountain wheatear NRHu 34.8 20.6 5.6 0.018Cape canary NRHu 28.4 20.1 2.7 0.006Banded martin BFu 30.6 20.1 2.7 0.002Amur falcon BF 57.4 29.4 11.7 0.024Southern bald ibis AF 51.1 19.0 9.3 0.008Ant-eating chat AF 50.0 20.1 8.5 0.010Bokmakierie AF 50.0 19.6 9.9 0.023Black-headed heron Com 39.5 20.9 8.4 0.036Blacksmith lapwing Com 72.3 18.1 11.4 0.006Cape wagtail Com 44.3 19.9 9.0 0.020African pipit Com 17.6 15.7 1.1 0.040
a Indicator values ranging from 0 to 100. A ‘perfect indicator’ scoring 100 is present in all replicates within a site and not present in any replicates in any other sites.
Table 4Functional guilds (from Hockey et al., 2005) with site-specific distributions illustrating habitat preferences. All the analyzed guilds are represented but only those guilds in boldexhibited significant, habitat-related differences in distribution.
Guild Site Observed indicator value (IV) IV from randomized groups p
Mean S.D.
Water-associated species NRLu 29.7 19.2 2.8 0.001Rocky outcrop insectivores NRLu 32.0 21.6 3.6 0.010Insectivores NRLu 19.7 15.4 1.0 0.000Nectarivores NRLu 35.4 18.1 5.6 0.010Grazers Com 57.1 16.0 7.9 0.002Terrestrial insectivores Com 37.9 20.5 3.7 0.000Generalists NRLu 19.4 18.9 2.6 0.405Snake predators NRLu 40.0 13.0 9.1 0.102Rodent & insect predators NRLu 26.1 19.9 3.6 0.066Bird predators NRLu 25.0 15.7 7.3 0.191Frugivores NRLu 20.0 20.0 0.3 1.000Terrestrial omnivores NRHu 22.7 20.1 3.5 0.224Scavengers NRHu 24.8 17.4 8.1 0.169Granivores NRHu 20.6 18.5 2.8 0.160Aerial insectivores BFu 19.4 18.0 2.0 0.225
Table 5Percentage vegetation cover, phytomass (derived from DPM measures) and averagehorizontal density (out of ten original vegetation structural indices) were extracted byPartial Correlation Analysis as performing best at differentiating between the effectsof management types on bird species richness. Overall regression results:F3, 144 = 11.159, R2 = 0.189, p < 0.001.
Beta Tolerance r2 t (144) p-Level
% Veg. 0.361 0.475 0.525 3.316 0.020DPM 0.335 0.635 0.365 3.561 0.001AvHorDen �0.652 0.407 0.593 �5.535 0.000
266 I.T. Little et al. / Biological Conservation 158 (2013) 258–270

Author's personal copy
through to late summer, with the most rapid and substantial in-creases occurring in sites that were burnt at the start of the currentseason. This response is a result of grasshopper prevalence in thelate summer months in burnt sites, probably explained by theirpreference for grazing new growth (Swengel, 2001). Livestockstocking density does not appear to have a marked effect on anyarthropod order, even though heavy grazing leads to habitat sim-plification (Swengel, 2001). Vegetation structure, largely controlledby burning, seems to have some effect on arthropod biomass, withvegetation density and arthropod biomass being positively, butweakly, correlated (Table 2). Similarly, forb cover is high soon afterburning because large-leaved forbs re-sprout rapidly after fire(Everson et al., 1989). However, as the growing season progresses,grasses become increasingly dominant. The vegetationstructural changes referred to here have been written up forpublication and are in review (Little et al., in preparation). Thenon-grasshopper arthropod biomass is dominated by Coleoptera,Hemiptera and Lepidoptera larvae. These groups respondnegatively to burning in that season and prefer areas that haveremained unburnt for more than a year (Fig. 2).
Bird assemblage structure shifts seasonally. Within sites(regardless of burning or grazing regimes), assemblages at the
end of the season differ significantly from those at the start ofthe season (Fig. 3), but much of this shift may reflect the comple-tion of breeding attempts, with species breeding more successfullybecoming increasingly numerically dominant and some speciesforming flocks. A comparison of time since burning, however,shows very clear differences between sites that were burnt in thecurrent season and those that were not, especially at the start ofthe breeding season. As the summer season progresses, however,the importance of stocking density increases and, by late summer,grazing has a strong influence on bird assemblage structure (Fig. 3).Derner et al. (2009) suggest that domestic livestock can be manip-ulated as ecosystem engineers for the benefit of avian communi-ties. However, if grazing and burning are treated as separateextrinsic forces and compared throughout the season, burning fre-quency overrides stocking density as the main driver of speciesassemblage structure. Contrary to what was found by Nkwabiet al. (2011) in the Serengeti, both bird abundance and speciesrichness were higher in all unburnt sites relative to sites that hadbeen burnt in that season. A distinct cluster of bird species showedsensitivity to both stocking density and burning frequency (GroupA in Fig. 4a and Group B in Fig. 4b). These species have high indi-cator values (Table 3) specific to the NRLu, suggesting that they
Fig. 5. Non-metric Multi-dimensional Scaling Ordination with ordination space based on bird species counts. Symbol sizes are based on overlaid vegetation biomass values,with larger circles indicating higher vegetation biomass. Axis 1: p = 0.036, Axis 2: p = 0.012. The influence of vegetation structure on bird assemblage is illustrated as a biplot(lines extending from the center of the graphic), the direction and length of the lines illustrate the strength of the influence of each vegetation structural index on birdassemblages within sites. The groupings A–E were selected subjectively to illustrate the separation of bird assemblages in ordination space.
I.T. Little et al. / Biological Conservation 158 (2013) 258–270 267
Author's personal copy
are the species most prone to disturbance. Within this assemblageof species, the yellow-breasted pipit (Anthus chloris) is regionallyand globally Vulnerable (Barnes, 2000) and the pallid harrier (Circusmacrourus) is globally Near-threatened (Barnes, 2000).
Another distinct bird assemblage exploits disturbed areas.These species appear in group A of Fig. 5b and include species thatare characteristic of sites AF and Com (Fig. 5). While the majority ofthe species that benefit from disturbance are common and wide-spread, the southern bald ibis (Geronticus calvus) (recorded previ-ously as favouring disturbed areas – Jansen et al., 1999) isregionally and globally Vulnerable (Barnes, 2000). Overall, however,these farming areas support a lower species richness and abun-dance of birds than does the conserved area and lack many threa-tened and specialist species. However, the disproportionate use offarmed areas by even one threatened taxon highlights the need fora large-scale mosaic of habitat management if the focus is to con-serve the maximum number of species (Söderström et al., 2001;Fuhlendorf and Engle, 2004; Coppedge et al., 2008). This mosaiccan be sustained and supplemented with the use of large fire-breaks as these have been shown to have little impact on the floralcomponent as well as the soil integrity (O’Connor et al., 2004).These fire-breaks act as annually burnt patches and in conjunctionwith a paddocks of biennially burnt land create the desired mosaicof habitat management.
Even though not all avian functional guilds were significantlyinfluenced by management practices, it is apparent that the major-ity (71%) of functional groups are concentrated in the reserve sitesand, of these, 75% show preference for the conservatively managed(lower stocking density) part of the reserve. In all managementtypes, rocky outcrops provide refuge habitat for a diversity ofplants, arthropods and reptiles, because they are a) protected fromboth fire and grazing (Jansen et al., 1999) and b) provide nestingand feeding habitat for some birds (Milchunas and Noy-Meir,2004). In the MHGs, nectarivores require intact rocky outcropsfor feeding purposes because flowering plants (such as Leonotisspp.) are confined to these areas. The grassland specialist red-winged francolin (Scleroptila levaillantiiI) is also confined to theserocky outcrop habitats because surrounding grazed grasslandsare ecologically unavailable due to the short sward height anddepletion of food plants. Further work quantifying the effective-ness of these areas as refuges is recommended. Water-associatedspecies are confined to intact wetlands (for which the nature re-serve in this study has been recognized as a Ramsar site by theInternational Convention on Wetlands): these include birds suchas flufftails, aquatic cisticolas and warblers. Grassland-nestinginsectivorous passerines are sensitive to habitat disturbanceresulting in their preference for conserved areas, while terrestrialinsectivores (lapwings and thick-knees) and grazers (anatids) pre-fer open and short-grass areas for foraging, which can lead to dis-turbed areas being artificially species rich.
Shifts in bird species richness and diversity are driven (at leastin part) by vegetation structural change, including phytomass, cov-er and horizontal density (Erdelen, 1984; Martin and Possingham,2005; Wiens, 1974; Wiens and Rotenberry, 1981). Phytomass is in-versely correlated with stocking density, but this is not the onlydisturbance effect that drives bird species assemblages. In grass-lands, where nesting birds require vegetation cover in which toconceal their nests, phytomass is critical for territory selectionand effective reproduction (Batáry et al., 2006). Average horizontaldensity of vegetation is negatively correlated with bird speciesrichness: this is explained by the structure of growing grasses. Inareas that are not heavily grazed, tuft-forming grasses produce acanopy in the later seasonal growth stages. This results in low veg-etation density close to the ground (but cover above), providingsuitable nesting habitat. Intensive grazing results in a morelawn-like structure with little opportunity for nest concealment.
In conclusion, it is apparent that fire and grazing interplay asfactors influencing both bird and arthropod diversity (Fuhlendorfand Engle, 2004; Engle et al., 2008; Fuhlendorf et al., 2008). Inmoist highland grasslands, however, the influence of fire frequencygenerally overrides that of stocking density in influencing botharthropod and bird assemblage structures: this is clearly illustratedby the depauperate faunas that characterize annually burnt areasand conversely fire suppression results in moribund grasslandsalso reducing species diversity (Gregory et al., 2010). Vegetationstructural indices are important for predicting both bird andarthropod species richness, as has been shown previously (Wiens,1974; Wiens and Rotenberry, 1981; Erdelen, 1984; Martin andPossingham, 2005). However, focusing on bird diversity and func-tional guild richness yields more relevant information to guideconservation action. Thus, from the results of this study, it is rec-ommended that bird counts can (as well as vegetation and arthro-pod diversity) be used to assess grassland functional integrity. Ofthe three taxonomic groups, however, birds are the easiest to countand the most responsive to disturbance.
Acknowledgements
The authors would like to thank Balongile Bhengu and her staffat Verloren Valei Nature Reserve for her support and assistancewith historical data. To the farm managers and owners, Thys, theGrobelaars, Bafana and Job of Sakhelwe and Roger Croall, thanksfor allowing the research to be conducted on their land and hope-fully it can assist in your future decision making. To Luciano Mak-aka, Maxwell Boakye, Thabo Mabuza, Thomas Birch, Jessica daSilva, Grant Cannon and the others who assisted in the field, ifnot only for the company, thanks for the help. My gratitude alsogoes to all the others who have helped along the way from Dullst-room weather station (Charl Strydom) to the people of Dullstroom,Colin Everson for the data he provided, Thomas Birch for computerassistance. For financial support we would like to thank the fund-ers SANBI (John Donaldson), the Rufford Small Grant Foundation,the National Research Foundation of South Africa, Tshwane Univer-sity of Technology and the University of Cape Town.
Appendix A. Supplementary material
Supplementary data associated with this article can be found, inthe online version, at http://dx.doi.org/10.1016/j.biocon.2012.09.017.
References
Allan, G.A., Harrison, J.A., Navarro, R.A., Van Wilgen, W., Thompson, M.W., 1997. Theimpact of commercial afforestation on bird populations in MpumalangaProvince, South Africa – insights from bird atlas data. Biol. Conserv. 79, 173–185.
Anderson, M.J., 2001. A new method for non-parametric multivariate analysis ofvariance. Austral. Ecol. 26, 32–46.
Azpiroz, A.B., Isacch, J.P., Dias, R.A., Giacomo, A.S., Fontana, C.S., Palarea, C.M., 2012.Ecology and conservation of grassland birds in southeastern South America: areview. J. Field Orn. 83, 217–246.
Baker, W.L., 1992. The landscape ecology of large disturbances in the design andmanagement of nature reserves. Landscape Ecol. 7, 181–194.
Barnes, K.N., 2000. The Eskom Red Data Book of Birds of South Africa. Lesotho andSwaziland, BirdLife South Africa, Johannesburg.
Batáry, P., Báldi, A., Sarolta, E., 2006. Grassland versus non-grassland birdabundance and diversity in managed grasslands: local, landscape and regionalscale effects. Biodivers. Conserv. 16, 871–881.
Benton, T.G., Bryant, D.M., Cole, L., Crick, H.Q.P., 2002. Linking agricultural practicesto insect and bird populations: a historical study over three decades. J. Appl.Ecol. 39, 673–687.
Biaggini, M., Consorti, R., Dapporto, L., Dellacase, M., Paggetti, E., Corti, C., 2007. Thetaxonomic level order as a possible tool for rapid assessment of Arthropoddiversity in agricultural landscapes. Agr. Ecosyst. Environ. 122, 183–191.
Bibby, C.J., 1999. Making the most of birds as environmental indicators. Ostrich 70,81–87.
268 I.T. Little et al. / Biological Conservation 158 (2013) 258–270
Author's personal copy
Bibby, C.J., Burgess, N.D., Hill, D.A., Mustoe, S.H., 1992. Bird Census Techniques,second ed. Acadamic Press, London.
Boulton, R.L., Richard, Y., Armstrong, D.P., 2008. Influence of food availability,predator density and forest fragmentation on nest survival of New Zealandrobins. Biol. Conserv. 141, 580–589.
Bransby, D.I., Tainton, N.M., 1977. The disc pasture meter: possible applications ingrazing management. Proc. Grassld. Soc. S. Afr. 12, 115–118.
Brodmann, P.A., Reyer, H.U., 1999. Nestling provisioning in water pipits (Anthusspinoletta): do parents go for specific nutrients or profitable prey? Oecologia120, 506–514.
Cameron, A., 1999. The effects of fragmentation of renosterveld vegetation on birdcommunity composition. M.Sc. Thesis, University of Cape Town, Cape Town.
Champlin, T.B., Kilgo, J.C., Moorman, C.E., 2009. Food abundance does not determinebird use of early-successional habitat. Ecology 90, 1586–1594.
Child, M.F., Cumming, G.S., Amano, T., 2009. Assessing the broad-scale impact ofagriculturally transformed and protected area landscapes on avian taxonomicand functional richness. Biol. Conserv. 142, 2593–2601.
Coppedge, B.R., Fuhlendorf, S.D., Harrell, W.C., Engle, D.M., 2008. Avian communityresponse to vegetation structural features in grasslands managed with fire andgrazing. Biol. Conserv. 141, 1196–1203.
Cressa, C., 1999. Dry mass estimation of tropical aquatic insects using differentshort-term preservation methods. Revista de Viologia Tropical 47, 1–7.
Dale, V., Archer, S., Chang, M., Ojima, D., 2005. Ecological impacts and mitigationstrategies for rural land management. Ecol. Appl. 15, 1879–1892.
Danckwerts, J.E., Trollope, W.S.W., 1980. Assessment of the disc pasture meter onnatural veld in the false thornveld of the eastern province. Proc. Grassland Soc.S. Afr. 15, 47–52.
Darkoh, M.B.K., 2003. Regional perspectives on agriculture and biodiversity in thedrylands of Africa. J. Arid Environ. 54, 261–279.
Dennis, P., Skartveit, J., McCracken, I., Pakeman, R.J., Beaton, K., Kunaver, A., Evans,M.D., 2008. The effects of livestock grazing on foliar arthropods associated withbird diet in upland grasslands of Scotland. J. Appl. Ecol. 45, 279–287.
Derner, J.D., Lauenroth, W.K., Stapp, P., Augustine, D.J., 2009. Livestock as ecosystemengineers for grassland bird habitat in the western great plains of NorthAmerica. Rangeland Ecol. Manag. 62, 111–118.
Donald, F., Pisano, G., Rayment, M.D., Pain, D., 2002. The common agriculturalpolicy, EU enlargement and conservation of Europe’s farmland birds. Agr.Ecosyst. Environ. 89, 167–182.
Driver, A., Maze, K., Rouget, M., Lombard, A.T., Nel, J., Turpie, J.K., Cowling, R.M.,Desmet, P., Goodman, P., Harris, J., Jonas, Z., Reyers, B., Sink, K., Strauss, T., 2005.National Spatial Biodiversity Assessment 2004: Priorities for BiodiversityConservation in South Africa. Strelitzia 17. South African National BiodiversityInstitute, Pretoria.
Duelli, P., Obrist, M.K., 1998. In search of the best correlates for local organismalbiodiversity in cultivated areas. Biodivers. Conserv. 7, 297–309.
Duelli, P., Obrist, M.K., 2003. Biodiversity indicators: the choice of values andmeasures. Agr. Ecosyst. Environ. 98, 87–98.
Dufrêne, M., Legendre, P., 1997. Species assemblages and indicator species: the needfor a flexible asymmetrical approach. Ecol. Monogr. 67, 345–366.
Dunwiddie, P.W., 1991. Comparisons of above ground arthropods in burned,mowed and untreated sites in sandplain grasslands of Nantucket Island. Am.Midl. Nat. 125, 206–212.
Engle, D.M., Fuhlendorf, S.D., Roper, A., Leslie Jr., D.M., 2008. Invertebratecommunity response to a shifting mosaic of habitat. Rangeland Ecol. Manage61, 55–62.
Erdelen, M., 1984. Bird communities and vegetation structure: I. Correlations andcomparisons of simple and diversity indices. Oecologia 61, 277–284.
Everson, C.S., George, A., Schulze, R.E., 1989. Fire regime effects on canopy cover andsediment yield in the montane grasslands of Natal. S. Afr. J. Sci. 85,113–116.
Folse, L.J.J., 1982. An analysis of avifauna-resource relationships on the Serengetiplains. Ecol. Monogr. 52, 111–127.
Fox, S.J.C., Hockey, P.A.R., 2007. Impacts of a South African coastal golf estate onshrubland bird communities. S. Afr. J. Sci. 103, 27–34.
Fuhlendorf, S.D., Engle, D.M., 2004. Application of the fire–grazing interaction torestore a shifting mosaic on tallgrass prairie. J. Appl. Ecol. 41, 604–614.
Fuhlendorf, S.D., Engle, D.M., Kerby, J., Hamilton, R., 2008. Pyric Herbivory:rewilding landscapes through the recoupling of fire and grazing. Cons. Biol.23, 588–598.
Furness, R.W., Greenwood, J.J.D., Jarvis, P.J., 1993. Can birds be used to monitor theenvironment? In: Furness, R.W., Greenwood, J.J.D. (Eds.), Birds as Monitors ofEnvironmental Change. Chapman & Hall, London, pp. 1–31.
Ganguli, A.C., Vermeire, L.T., Wallace, M.C., 2000. Comparison of four nondestructivetechniques for estimating standing crop in short grass plains. J. Agronomics 92,1211–1215.
Giliomee, J.H., 2003. Insect diversity in the cape floristic region. Afr. J. Ecol. 41, 237–244.
Gregory, N.C., Sensenig, R.L., Wilcove, D.S., 2010. Effects of controlled fire andlivestock grazing on bird communities in east African savannas. Cons. Biol. 24,1606–1616.
Harrison, J.A., Allan, D.G., Hensbergen, H.J., 1994. Automated habitat annotation ofbird species lists – an aid in environmental consultancy. Ostrich 65, 316–328.
Haslem, A., Bennett, A.F., 2008. Countryside elements and the conservation of birdsin agricultural environments. Agr. Ecosyst. Environ. 125, 191–203.
Herzon, I., Aunins, A., Elts, J., Preiksa, Z., 2008. Intensity of agricultural land-use andfarmland birds in the Baltic States. Agr. Ecosyst. Environ. 125, 93–100.
Hilty, J., Merenlender, A., 2000. Faunal indicator taxa selection for monitoringecosystem health. Biol. Conserv. 92, 185–197.
Hilty, J., Merenlender, A., 2003. Studying biodiversity on private lands. Cons. Biol.17, 132–137.
Hockey, P.A.R., Allan, D.G., Rebelo, A.G., Dean, W.R.J., 1988. The distribution, habitatrequirements and conservation status of Rudd’s Lark Heteromirafra ruddi inSouth Africa. Biol. Conserv. 45, 255–266.
Hockey, P.A.R., Dean, W.R.J., Ryan, P.G. (Eds.), 2005. Roberts – Birds of SouthernAfrica, seventh ed. Trustees of the John Voelcker Bird Book Fund, Cape Town.
Hurlbert, S.H., 1984. Pseudoreplication and the design of ecological fieldexperiments. Ecol. Monogr. 54, 187–211.
Jansen, R., Little, R.M., Crowe, T.M., 1999. Implications of grazing and burning ongrasslands on the sustainable use of francolins (Francolinus spp.) and overallbird conservation in the highlands of Mpumalanga province. S. Afr. Biodivers.Conserv. 8, 587–602.
Jeanneret, P., Schupbach, B., Luka, H., 2003. Quantifying the impact of landscape andhabitat features on biodiversity in cultivated landscapes. Agr. Ecosyst. Environ.98, 311–320.
Jobin, B., Choiniere, L., Belanger, L., 2001. Bird use of three types of field margin inrelation to intensive agriculture in Quebec. Canada. Agr. Ecosyst. Environ. 84,131–143.
Joern, A., Laws, A.N., 2012. Ecological mechanisms underlying arthropod speciesdiversity in grasslands. Annu. Rev. Entomol. 58, 19–36.
Kendeigh, S.C., 1944. Measurements of bird populations. Ecol. Monogr. 14, 106.Knopf, F.L., Sedgwick, J.A., Cannon, R.W., 1988. Guild structure of a riparian avifauna
relative to seasonal cattle grazing. J. Wildl. Manage. 52, 280–290.Krook, K., Bond, W.J., Hockey, P.A.R., 2007. The effects of grassland shifts on the
avifauna of a South African savanna. Ostrich 78, 271–279.Kruskal, J.B., 1964. Nonmetric multidimensional scaling; a numerical method.
Psychometrika 29, 115–129.Laiolo, P., 2005. Spatial and seasonal patterns of bird communities in Italian
agroecosystems. Cons. Biol. 19, 1547–1556.Le Maitre, D.C., Van Wilgen, B.W., Chapman, R.A., McKelly, D.H., 1996. Invasive
plants and water resources in the Western Cape Province, South Africa:modelling the consequences of a lack of management. J. Appl. Ecol. 33,161–172.
Lepczyk, 2005. Integrating published data and citizen science to describe birddiversity across a landscape. J. Appl. Ecol. 42, 672–677.
Lipsey, M.K., Hockey, P.A.R., 2010. Do ecological networks in South Africancommercial forests benefit grassland birds? A case study of a pine plantationin Kwazulu-Natal. Agr. Ecosyst. Environ. 137, 133–142.
Little, I.T., Hockey, P.A.R., Jansen, R.M., in preparation. Fire and grazing: grasslandmanagement for plant conservation, and introducing the ‘fodder capacity’ indexfor setting grazing thresholds.
Little, I.T., Little, R.M., Jansen, R., Crowe, T.M., 2005. Winter bird assemblages, speciesrichness and relative abundance at a re-vegetated coal mine in the Middelburgdistrict, Mpumalanga province, South Africa. S. Afr. J. Wildl. Res. 35, 13–22.
Little, R.M., Crowe, T.M., 1994. Conservation implications of deciduous fruit farmingon birds in the Elgin district, Western Cape Province, South Africa. Trans. Roy.Soc. S. Afr. 49, 185–197.
Liversidge, R., 1962. Distribution of birds in relation to vegetation. Ann. CapeProvince Mus. 1962, 143–151.
MacNally, R., Horricks, G., 2002. Relative influence of patch, landscape and historicalfactors on birds in a fragmented landscape. J. Biogeog. 29, 395–410.
Marshall, E.J.P., West, T.M., Kleijn, D., 2005. Impacts of an agri-environment fieldmargin prescription on the flora and fauna of arable farmland in differentlandscapes. Agr. Ecosyst. Environ. 113, 36–44.
Martin, T.G., Kuhnert, P.M., Mengersen, K., Possingham, H.P., 2005. The power ofexpert opinion in ecological models using Bayesian methods: impact of grazingon birds. Ecol. Appl. 15, 266–280.
Martin, T.G., Possingham, H.P., 2005. Predicting the impact of livestock grazing onbirds using foraging height data. J. Appl. Ecol. 42, 400–408.
Mather, P.M., 1976. Computational Method of Multivariate Analysis in PhysicalGeography. J. Wiley and Sons, London.
McCune, B., Grace, J.B., 2002. Analysis of Ecological Communities. MjM SoftwareDesign, Gleneden Beach, Oregon.
McCune, B., Mefford, M.J., 2006. PC-ORD. Multivariate Analysis of Ecological Data.Version 5.10. MjM Software, Gleneden Beach, Oregon.
McGeoch, M.A., Chown, S.L., 1998. Scaling up the value of bioindicators. TREE 13,46–47.
McNaughton, S.J., 1986. Grazing lawns: on domesticated and wild grazers. Am. Nat.128, 937–939.
Meissner, H.H., Hofmeyr, H.S., Van Rensburg, W.J.J., Pienaar, J.P., 1983. Classificationof livestock for realistic prediction of substitution values in terms of abiologically defined Large Stock Unit. Technical Communication No. 175.Department of Agriculture, Republic of South Africa, Bloemfontein.
Mentis, M.T., Little, R.M., 1992. Distribution and abundance of francolins in theNatal Drakensberg. S. Afr. J. Wildl. Res. 22, 24–37.
Mielke, P.W.J., 1984. Meteorological applications of permutation techniques basedon distance functions. In: Krishnaiah, P.R., Sen, P.K. (Eds.), Handbook ofStatistics. Elsevier Science Publishers, pp. 813–830.
Milchunas, D.G., Lauenroth, W.K., Burke, I.C., 1998. Livestock grazing: animal andplant biodiversity of shortgrass steppe and the relationship to ecosystemfunction. Oikos 83, 65–74.
Milchunas, D.G., Noy-meir, I., 2004. Geologic grazing refuges and grasslanddiversity: a shortgrass steppe study. J. Range Manage. 57, 141–147.
I.T. Little et al. / Biological Conservation 158 (2013) 258–270 269

Author's personal copy
Milchunas, D.G., Varnamkhasti, A.S., Lauenroth, W.K., Goetz, H., 2005. Forage qualityin relation to long-term grazing history, current-year defoliation, and waterresource. Oecologia 101, 366–374.
Moretti, M., Legg, C., 2009. Combining plant and animal traits to assess communityfunctional responses to disturbance. Ecography 32, 299–309.
Morrison, M.L., 1986. Bird populations as indicators of environmental change. In:Johnson, R.F. (Ed.), Current Ornithology. Plenium Press, New York, pp. 429–451.
Mucina, L., Rutherford, M.C., (Eds.), 2006. The vegetation of South Africa, Lesothoand Swaziland. Strelitzia 19. South African National Biodiversity Institute,Pretoria.
Neke, K.S., Du Plessis, M., 2004. The threat of transformation: quantifying thevulnerability of grasslands in South Africa. Cons. Biol. 18, 466–477.
Nkwabi, A.K., Sinclair, A.R.E., Metzger, K.L., Nduma, S.A.R., 2011. Disturbance,species loss and compensation: wildfire and grazing effects on the aviancommunity and its food supply in the Serengeti Ecosystem. Tanzania. AustralEcol. 36, 403–412.
Norton, D.A., 2000. Conservation, biology and private land: shifting the focus(Editorial). Cons. Biol. 14, 1221–1223.
Noss, R.F., 1989. Indicators for monitoring biodiversity: a hierarchical approach.Cons. Biol. 4, 355–364.
O’Connor, T.G., Uys, R.G., Mills, A.J., 2004. Ecological effects of fire-breaks in themontane grasslands of the southern Drakensberg, South Africa. Afr. J. Range andFor. Sci. 21, 1–9.
O’Reagain, P.J., Turner, J.R., 1992. An evaluation of the empirical basis for grazingmanagement recommendations for rangeland in southern Africa. Proc.Grassland Soc. S. Afr. 9, 38–49.
Öster, M., Persson, K., Eriksson, O., 2008. Validation of plant diversity indicators insemi natural grasslands. Agr. Ecosyst. Environ. 125, 65–72.
Pain, D.J., Pienkowski, N.W. (Eds.), 1997. Farming and Birds in Europe. AcademicPress, London.
Prendergast, J.R., Eversham, B.C., 1997. Species richness covariance in higher taxa:empirical tests of the biodiversity indicator concept. Ecography 20, 210–216.
Ratcliffe, C.S., Crowe, T.M., 2001. The effects of agriculture and the availability ofedge habitat on populations of Helmeted Guineafowl Numida meleagris and onthe diversity and composition of associated bird assemblages in KwaZulu-NatalProvince, South Africa. Biodivers. Conserv. 10, 2109–2127.
Ricketts, T.H., 2001. The matrix matters: effective isolation in fragmentedlandscapes. Am. Nat. 158, 87–99.
Sauberer, N., Zulka, K.P., Abensberg-Traun, M., Berg, H., Bieringer, G., Milasowczky,N., Moser, D., Plutzar, C., Pollheimer, M., Storch, C., Trostl, R., Zechmeister, H.,Grabherr, G., 2004. Surrogate taxa for biodiversity in agricultural landscapes ofeastern Austria. Biol. Conserv. 117, 181–190.
Smit, C.M., Bredenkamp, G.J., Van Rooyen, N., Van Wyk, A.E., Combrinck, J.M., 1997.Vegetation of the Witbank nature reserve and its importance for conservation ofthreatened rocky Highveld grassland. Koedoe 40, 85–104.
Smith, B., 2006. The Farming Handbook. Interpak Books, Pietermaritzburg.Söderström, B.O., Svensson, B., Vessby, K., Glimskär, A., 2001. Plants, insects and
birds in semi-natural pastures in relation to local habitat and landscape factors.Biodivers. Conserv. 10, 1839–1863.
StatSoft Inc., 2009. STATISTICA (data analysis software system), version 9.<www.statsoft.com>.
Swengel, A.B., 2001. A literature review of insect responses to fire, compared toother conservation managements at open habitat. Biodivers. Conserv. 10, 1141–1169.
Tainton, N.M., 1981. Veld and Pasture Management in South Africa. University ofNatal Press, Pietermaritzburg.
Tainton, N.M., 1999. Veld Management in South Africa. University of Natal Press,Pietermaritzburg.
Tarboton, W.R., 1997. South Africa’s grasslands: the Cinderella biome, withergrasslands? The way forward. Africa Birds Birding 27, 1–3.
Trollope, W.S.W., 1983. Control of Bush Encroachment with Fire in the AridSavannas of Southeastern Africa. University of Natal, Pietermaritzburg.
Trollope, W.S.W., Potgieter, A.L.F., 1986. Estimating grass fuel loads with a discpasture meter in the Kruger National Park. Proc. Grassld. Soc. Sth. Afr. 3, 148–152.
Uys, R.G., Bond, W.J., Everson, T.M., 2004. The effect of different fire regimeson plant diversity in southern African grasslands. Biol. Conserv. 118,489–499.
Valentine, L.E., Schwarzkopf, L., Johnson, C.N., Grice, A., 2007. Burning seasoninfluences the response on bird assemblages to fire in tropical savannas. Biol.Conserv. 137, 90–101.
Vassiliki, K., Dimopoulos, P., Papaioannou, H., Poirazidis, K., 2009. Ecologicalmanagement of a Mediterranean mountainous reserve (Pindos NationalPark, Greece) using the bird community as an indicator. J. Nature Cons. 17,47–59.
Vickery, J.A., Tallowin, J.R., Feber, R.E., Asteraki, E.J., Atkinson, P.W., Fuller, R.J.,Brown, V.K., 2001. The management of lowland neutral grasslands in Britain:effects of agricultural practices on birds and their resources. J. Appl. Ecol. 38,647–664.
Wiens, J.A., 1973. Pattern and process in grassland bird communities. Ecol. Monogr.43, 237–270.
Wiens, J.A., 1974. Habitat heterogeneity and avian community structure in NorthAmerican grasslands. Am. Midl. Nat. 91, 195–213.
Wiens, J.A., 1994. Habitat fragmentation: island v landscape perspectives on birdconservation. Ibis 137, 97–104.
Wiens, J.A., Rotenberry, J.T., 1981. Habitat associations and community structure ofbirds in shrubsteppe environments. Ecol. Monogr. 51, 21–41.
Zanette, L., Doyle, P., Tremont, S.M., 2000. Food shortage in small fragments:evidence from an area-sensitive passerine. Ecology 81, 1654–1666.
270 I.T. Little et al. / Biological Conservation 158 (2013) 258–270