A biogeochemical study in the Bellingshausen Sea: Overview of the STERNA 1992 expedition
26
Pergamon Deep-Sea Research II. Vol. 42, No. 4-5, pp. 907-932. 1995 0967-0645(95)00056-9 Copyright iQ 1995 Elsevier Science Ltd Printed in Great Britain. All rights reserved 0967+545/95 $9.50+0.00 A biogeochemical study in the Bellingshausen Sea: Overview of the STERNA 1992 expedition D. R. TURNER*? and N. J. P. OWENS*f (Received 20 December 1994; in revised form 2 February 1995; accepted 10 May 1995) Abstract-A general overview and background of a two-ship study to examine biogeochemical fluxes in the marginal ice-zone of the Bellingshausen Sea (65-70‘S; SO-87’W), SE Pacific sector of the Southern Ocean is presented. The major feature studied was an intense band of chlorophyll that was found geographically close to a receding ice-edge. However, the bloom appeared not to be a result of a shallow mixed layer caused by ice-melt stabilisation, but rather associated with an oceanic front that coincided with the ice-edge. Details of the hydrographic conditions existing along the 85”W meridian from the ice-edge to open water to the north, and detailed surveys of surface hydrographic conditions are presented. INTRODUCTION Biogeochemical carbon fluxes in the Southern Ocean are determined by some environ- mental features that are unique or unusual, in addition to those that are shared with other areas of the world ocean. Two features are of particular importance. First, seasonal differences in euphotic zone productivity are considerable. In most parts of the world ocean, primary productivity is limited by the availability of dissolved inorganic nutrients, and in seasonally stratified waters the annual burst of phytoplankton growth results in the depletion of the nutrient pool. This depletion does not take place over most of the Southern Ocean, and primary production is generally lower than might be expected from the high concentrations of inorganic nutrients in the surface waters. Although a lack of trace elements, in particular iron, has been proposed as an explanation for these observations (Martin et al., 1990), the evidence is inconclusive (e.g. Dugdale and Wilkerson, 1990; de Baar et al., 1990). However, despite the general lack of ‘conventional’ nutrient depletion, this does take place in some local environments (e.g. Jennings et al., 1984). Such depletion is located in environments that exhibit a shallowing of the mixed layer, for example through ice-melt induced stability (e.g. Nelson and Smith, 1986) or local hydrographic features (e.g. Owens et al., 1991). The often high biomass and productivity associated with such local features result from a favourable light environment that allows growth in the sense of the classical Sverdrup model. The general absence of marked seasonal shallowing of the mixed layer and concomitant phytoplankton growth *Plymouth Marine Laboratory, Prospect Place, Plymouth PLl 3DH, U.K. tPresent address: Department of Analytical and Marine Chemistry, G(iteborg University and Chalmers University of Technology, S-412 96 G(iteborg, Sweden. fPresent address: Department of Marine Sciences and Coastal Management, The Ridley Building, The University of Newcastle, Newcastle upon Tyne NE1 7RU, U.K. 907
-
Upload
independent -
Category
Documents
-
view
0 -
download
0
Transcript of A biogeochemical study in the Bellingshausen Sea: Overview of the STERNA 1992 expedition

Pergamon Deep-Sea Research II. Vol. 42, No. 4-5, pp. 907-932. 1995
0967-0645(95)00056-9 Copyright iQ 1995 Elsevier Science Ltd
Printed in Great Britain. All rights reserved 0967+545/95 $9.50+0.00
A biogeochemical study in the Bellingshausen Sea: Overview of the STERNA 1992 expedition
D. R. TURNER*? and N. J. P. OWENS*f
(Received 20 December 1994; in revised form 2 February 1995; accepted 10 May 1995)
Abstract-A general overview and background of a two-ship study to examine biogeochemical fluxes in the marginal ice-zone of the Bellingshausen Sea (65-70‘S; SO-87’W), SE Pacific sector of the Southern Ocean is presented. The major feature studied was an intense band of chlorophyll that was found geographically close to a receding ice-edge. However, the bloom appeared not to be a result of a shallow mixed layer caused by ice-melt stabilisation, but rather associated with an oceanic front that coincided with the ice-edge. Details of the hydrographic conditions existing along the 85”W meridian from the ice-edge to open water to the north, and detailed surveys of surface hydrographic conditions are presented.
INTRODUCTION
Biogeochemical carbon fluxes in the Southern Ocean are determined by some environ- mental features that are unique or unusual, in addition to those that are shared with other areas of the world ocean. Two features are of particular importance.
First, seasonal differences in euphotic zone productivity are considerable. In most parts of the world ocean, primary productivity is limited by the availability of dissolved inorganic nutrients, and in seasonally stratified waters the annual burst of phytoplankton growth results in the depletion of the nutrient pool. This depletion does not take place over most of the Southern Ocean, and primary production is generally lower than might be expected from the high concentrations of inorganic nutrients in the surface waters. Although a lack of trace elements, in particular iron, has been proposed as an explanation for these observations (Martin et al., 1990), the evidence is inconclusive (e.g. Dugdale and Wilkerson, 1990; de Baar et al., 1990). However, despite the general lack of ‘conventional’ nutrient depletion, this does take place in some local environments (e.g. Jennings et al., 1984). Such depletion is located in environments that exhibit a shallowing of the mixed layer, for example through ice-melt induced stability (e.g. Nelson and Smith, 1986) or local hydrographic features (e.g. Owens et al., 1991). The often high biomass and productivity associated with such local features result from a favourable light environment that allows growth in the sense of the classical Sverdrup model. The general absence of marked seasonal shallowing of the mixed layer and concomitant phytoplankton growth
*Plymouth Marine Laboratory, Prospect Place, Plymouth PLl 3DH, U.K. tPresent address: Department of Analytical and Marine Chemistry, G(iteborg University and Chalmers
University of Technology, S-412 96 G(iteborg, Sweden. fPresent address: Department of Marine Sciences and Coastal Management, The Ridley Building, The
University of Newcastle, Newcastle upon Tyne NE1 7RU, U.K.
907

908 D. R. Turner and N. J. P. Owens
typical of lower latitudes is prevented by a combination of dynamic oceanographic and meteorological conditions. Thus despite the possible interaction of micro and trace nutrients, it is evident that light availability is a major determinant of productivity in the Southern Ocean.
Secondly, the Southern Ocean is influenced by sea-ice. The maximum extent of sea-ice covers 60% of the area south of the Polar Front. Over 80% of this is annual sea-ice that recedes to cover approximately 10% of the surface area of the Southern Ocean in the Austral summer. The increased albedo and optical attenuation of sea-ice, together with the large latitude-determined variations in incident radiation, combine to accentuate the effects of the hydrographic control of the light environment.
The marginal ice zone
The sea-ice and its associated systems form a complex environment that varies on a wide range of spatial and temporal scales. The gross scale of annual variations has been noted above. To the poleward side of the annual sea-ice is a small amount of perennial ice, whilst to the north it is an open-water area. The interface between the seasonal ice and open water is not a clear-cut boundary but a complex belt with distinct characteristics. This marginal ice-zone (MIZ) may be up to 100-200 km in width. The poleward part of this area comprises broken ice in the early stages of melting. The geographic location of the outer edge also may vary over relatively short time scales as a result of compaction and release caused by variations in wind stress (see below). Distinctive horizontal frontal gradients have been observed in the MIZ (e.g. Zwally et al., 1983; Maykut, 1985; Niebauer and Alexander, 1985). The classical view is that relatively fresh meltwater spreads horizontally from this front, giving rise to strong stratification (e.g. Smith and Nelson, 1986). Here environmental patchiness is extreme. The distribution and topography of the ice floes influence local climate at the sea-surface and impose a high-amplitude patchiness in the incident radiation field at spatial scales of metres (Gosselin et al., 1986; Buckley and Trodahl, 1987).
Primary production in the sea-ice-ocean system is associated with three very different environments and communities.
Microbial communities growing in or on the ice. These are highly specialised and are apparently sensitive to the modifications of the radiation environment as seasons and snow and ice properties change (Rochet et al., 1986; McGrath-Grossi et al., 1987). The biomass of ice-associated algae may be high enough to impart colouration to floes. The community inhabiting the underside of the ice may reach especially high densities, based on dense mats of colonial diatoms (Garrison et aE., 1986). The contribution of this community to biogeochemical fluxes is unknown. The MIZ, where the physical structure has been observed to stimulate dense phyto- plankton blooms in the stratified upper water column (e.g. Smith and Nelson, 1986; Sullivan et al., 1988,199O; Comiso et al., 1990; Cota et al., 1992; Lancelot et al., 1993). The spatial extent and duration of the bloom appear to be determined by the persistence of this density structure. In the Weddell Sea, this frontal system moves at approximately 130 km per month. The bloom extent here is approximately 250 km, suggesting a maximum duration for the bloom at any one location of 1.5 to 2 months. Up to 75% of the total annual primary production in the Weddell Sea has been

A biogeochemical study in the Bellingshausen Sea 909
3.
suggested to be the result of MIZ blooms. The proportion of ‘new production’ (i.e. potentially exportable production: Eppley and Peterson, 1979) has been observed to be high in the MIZ (Smith and Nelson, 1990). Thus the contribution of this community to biogeochemical fluxes is likely to be high. Open water-pelagic areas. Outside the seasonal ice-zone, phytoplankton blooms are also spatially and temporally patchy, apparently responding to patterns of water column stability, possibly associated with oceanic fronts (e.g. Jennings et al., 1984; Sullivan et al., 1993; Comiso et al., 1993). Although highly variable, the rates of ‘new production’ are typically lower in these open water environments (e.g. Olson, 1980; Glibert et al., 1982; Owens et al., 1991) than in MIZ blooms, thus indicating a potentially lower contribution to biogeochemical fluxes on an area1 basis. However, the annual phytoplankton production over the entire open water area is not known.
Objectives of the STERNA expedition
The programme was designed to evaluate the magnitude and variability of biogeochemi- cal fluxes (particularly carbon and nitrogen) during early summer in the SE Pacific sector (Bellingshausen Sea) of the Southern Ocean. Given the evident importance of the sea-ice system, particular emphasis was placed on the MIZ. The programme had four specific components: (i) to determine ocean-atmosphere exchanges of radiatively active gases, and the factors influencing such fluxes, over a wide latitudinal range; (ii) to investigate the interactions between the biological, chemical and physical processes that control carbon fluxes in the euphotic zone; (iii) to assess the impact of sea-ice on biogeochemical fluxes; (iv) to determine the export of biogenic material from the upper ocean.
The purpose of this paper is to provide a general overview of the study, and a summary of the conditions found, and to provide a context for the more detailed studies which can be found elsewhere (see Table 1).
THE CRUISES AND METHODS
The study was a simultaneous, two-ship exercise. R.R.S. Discovery carried out large scale survey mode operations in essentially ice-free open waters to the north of the ice edge, whilst the ice-strengthened R.R.S. James Clark Ross provided a platform for detailed process studies on selected stations within and to the north of the ice. The study was carried out during the period 26 October to 18 December 1992 (James Clark Ross) and 5 November to 8 December 1992 (Discovery).
Details of the methods used for individual studies can be found in the relevant specific contributions, thus only a brief description of the techniques employed will be described here. Where available, Joint Global Ocean Flux Study (JGOFS) protocols were used.
The majority of the work carried out on Discovery was undertaken whilst the ship was underway (see Fig. 1 for the location of the principal surveys). The suite of techniques employed were similar to those used successfully during the U.K. JGOFS study in the North Atlantic (see for example Ducklow and Harris, 1993). Oceanographic variables were primarily determined using a SeaSoar towed CTD package which undulated between the surface and depths of up to 400 m. In addition to CTD instrumentation, the SeaSoar was equipped with a range of underwater light sensors. Standard vertical CTD profiles, including sampling for trace gas analysis, were obtained when the survey approach
910 D. R. Turner and N. J. P. Owens
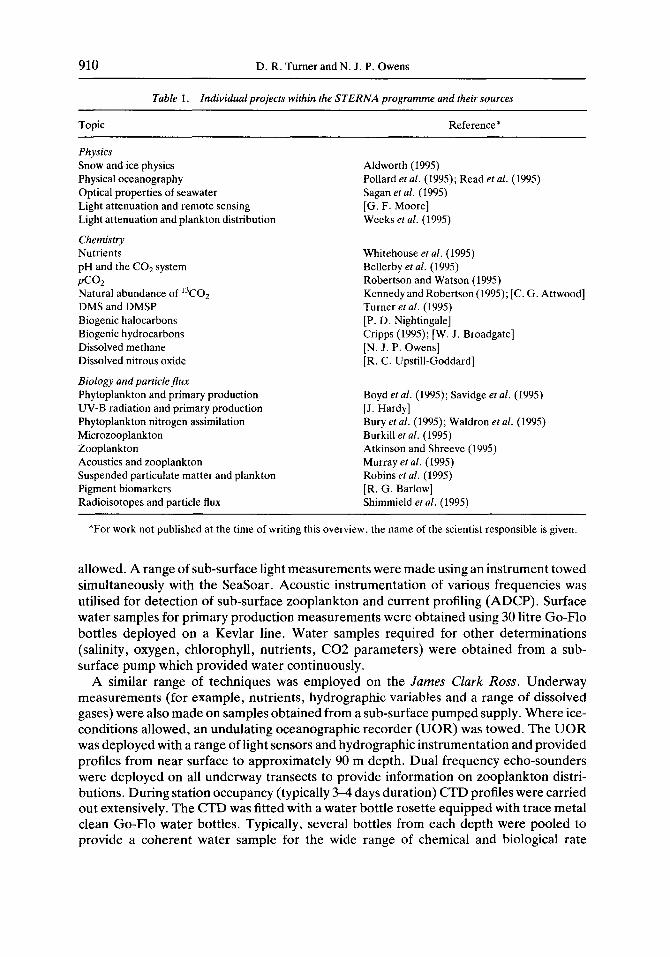
Table 1. Individualprojects within the STERNA programme and their sources
Topic
Physics Snow and ice physics Physical oceanography Optical properties of seawater Light attenuation and remote sensing Light attenuation and plankton distribution
Chemistry Nutrients pH and the CO2 system PC02 Natural abundance of 13C0 2
DMS and DMSP Biogenic halocarbons Biogenic hydrocarbons Dissolved methane Dissolved nitrous oxide
Biology and particle flu Phytoplankton and primary production UV-B radiation and primary production Phytoplankton nitrogen assimilation Microzooplankton Zooplankton Acoustics and zooplankton Suspended particulate matter and plankton Pigment biomarkers Radioisotopes and particle flux
Reference*
Aldworth (1995) Pollard et al. (1995); Read et al. (1995) Sagan et al. (1995) [G. F. Moore] Weeks et al. (1995)
Whitehouse et al. (1995) Bellerby et al. (1995) Robertson and Watson (1995) Kennedy and Robertson (1995); [C. G. Attwood] Turner et al. (1995) [P. D. Nightingale] Cripps (1995); [W. J. Broadgate] [N. J. P. Owens] [R. C. Upstill-Goddard]
Boyd et al. (1995); Savidge et al. (1995) [J. Hardy] Bury et al. (1995); Waldron et al. (1995) Burkill et al. (1995) Atkinson and Shreeve (1995) Murray et al. (1995) Robins et al. (1995) [R. G. Barlow] Shimmield et al. (1995)
*For work not published at the time of writing this overview, the name of the scientist responsible is given
allowed. A range of sub-surface light measurements were made using an instrument towed simultaneously with the SeaSoar. Acoustic instrumentation of various frequencies was utilised for detection of sub-surface zooplankton and current profiling (ADCP). Surface water samples for primary production measurements were obtained using 30 litre Go-F10 bottles deployed on a Kevlar line. Water samples required for other determinations (salinity, oxygen, chlorophyll, nutrients, CO2 parameters) were obtained from a sub- surface pump which provided water continuously.
A similar range of techniques was employed on the James Clark Ross. Underway measurements (for example, nutrients, hydrographic variables and a range of dissolved gases) were also made on samples obtained from a sub-surface pumped supply. Where ice- conditions allowed, an undulating oceanographic recorder (UOR) was towed. The UOR was deployed with a range of light sensors and hydrographic instrumentation and provided profiles from near surface to approximately 90 m depth. Dual frequency echo-sounders were deployed on all underway transects to provide information on zooplankton distri- butions. During station occupancy (typically 3-4 days duration) CTD profiles were carried out extensively. The CTD was fitted with a water bottle rosette equipped with trace metal clean Go-Flo water bottles. Typically, several bottles from each depth were pooled to provide a coherent water sample for the wide range of chemical and biological rate

A biogeochemical study in the Bellingshausen Sea 911
86 05 84
4 .Wx:Y ZAB
: CTD section
86 85 84
Longitude “W
28 December /, j : B
-j 69.0 1
86 85 84
Longitude “W
Fig. 1. Tracks of the Discovery’s two grid surveys centred on 85”W, and station latitudes for Dbcovery’s 85”W CTD section. The dashed portion of the second survey was carried out without the SeaSoar. Letters W-Z and A-D identify the individual north-south legs, and boxed letters
show the latitudes of the final two James Clark Ross stations (both were at longitude 85”W).
measurement requirements. Vertical zooplankton nets and multiple opening rectangular mid-water trawls were used for sampling zooplankton, including krill. Various biological rate measurements were carried out using in situ incubations. A number of stand-alone- pump deployments were made to provide large volume in situ filtrations of particulate matter for particle characterisation. A limited number of sediment traps were deployed, which proved largely unsuccessful. Ocean floor samples were obtained using a box-corer. The water column sampling programme was significantly enhanced by an extensive diving programme when in ice. A total of 36 under-ice dives were made. A range of on-ice activities were also carried out to characterise the physical properties of the ice and its influence on the underwater light climate.
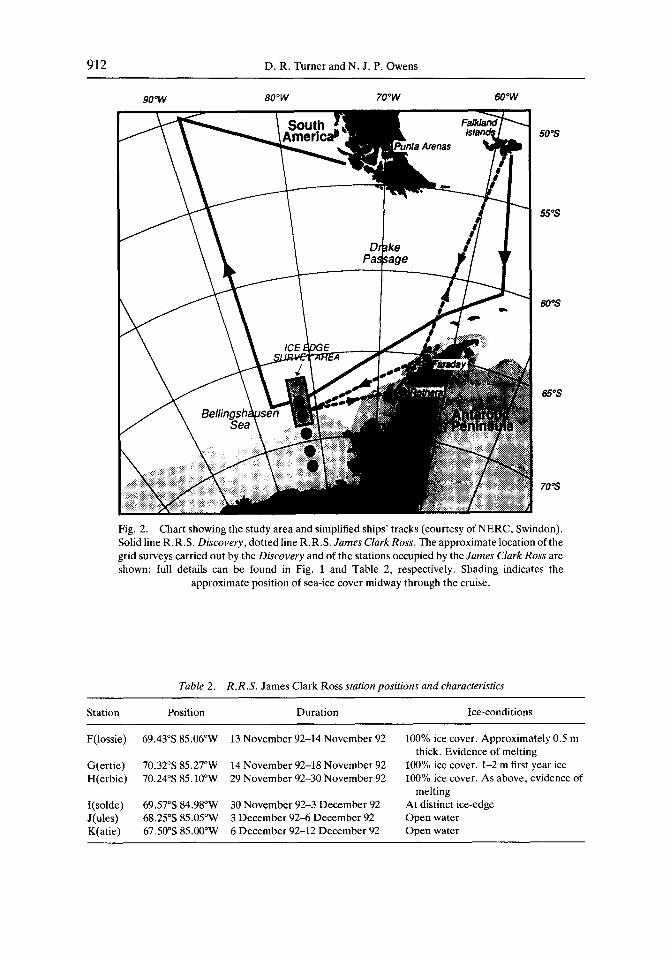
Figure 2 shows the location of the study area and a simplified summary of the cruise tracks of the two ships. It can be seen that in addition to the detailed study carried out in the Bellingshausen Sea a number of long transect legs were also worked. While this overview paper will focus on the intensive study area centred on 85”W, several papers in this volume include results from the transect studies. Table 2 shows the locations and duration of the 85”W stations occupied by James Clark Ross, together with a qualitative assessment of the ice-conditions prevailing at the time of station occupancy. In addition to station work along SYW, a number of short transects were carried out on the James Clark Ross on transit across the ice-edge. These are shown in Fig. 3 and will be discussed below in relation to the location of the ice-front. Figure 1 shows the tracks of the two Discovery grid surveys centred on 85”W. Although the initial intention had been to carry out repeat surveys, with the two survey tracks covering the same area, the second survey was moved southwards in order to map the southern edge of the high chlorophyll area (see Results and Discussion
912 D. R. Turner and N. J. P. Owens
9O”W 8O”W 7oow 6O”W
Fig. 2. Chart showing the study area and simplified ships’ tracks (courtesy of NERC, Swindon). Solid line R.R.S. Discovery, dotted line R.R.S. James Clark Ross. The approximate location of the grid surveys carried out by the Discovery and of the stations occupied by the James Clark Ross are shown: full details can be found in Fig. 1 and Table 2, respectively. Shading indicates the
approximate position of sea-ice cover midway through the cruise.
Table 2. R.R.S. James Clark Ross station positions and characteristics
Station Position
F(lossie) 69.43”s 8.5.06”W
G(ertie) 70.32”s 85.27”W 14 November 92-18 November 92 H(erbie) 70.24”s 85.1O”W 29 November 92-30 November 92
I(solde) J(ules) K(atie)
69.57”s 84.98”W 30 November 92-3 December 92 68.25”s 85.05”W 3 December 92-6 December 92 67.50”s 85.OO”W 6 December 92-12 December 92
Duration Ice-conditions
13 November 92-14 November 92 100% ice cover. Approximately 0.5 m thick. Evidence of melting
100% ice cover. l-2 m first year ice 100% ice cover. As above, evidence of
melting At distinct ice-edge Open water Open water

A biogeochemical study in the Bellingshausen Sea 913
Sep Ott Nov Dee Jan 65 ’ I / I I
F
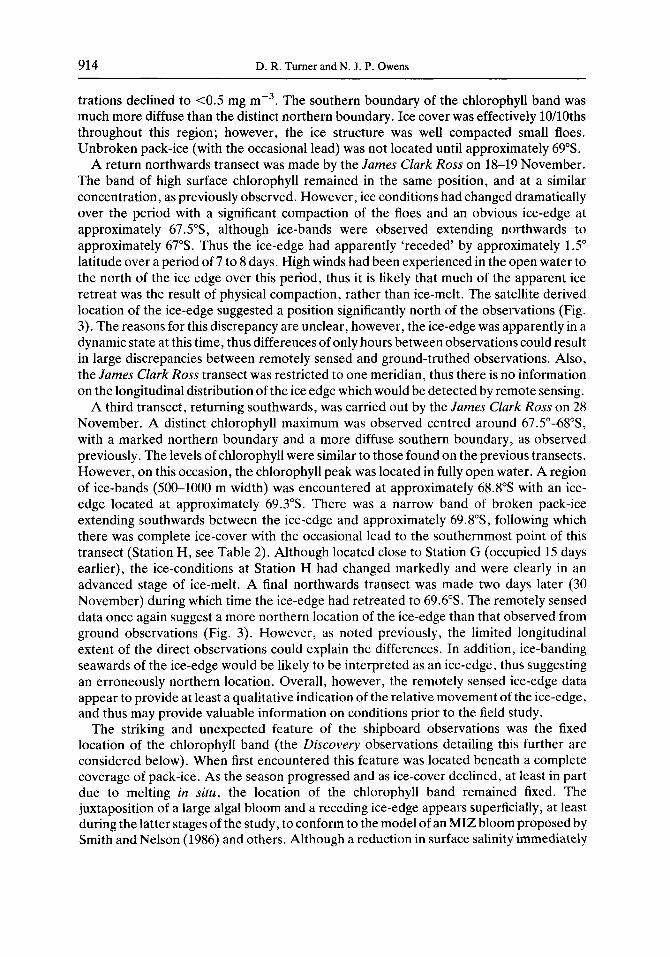
Fig. 3. Approximate position of the ice-edge prior to, during and following the cruises. Data obtained by digitisation of NOAA ice-maps (courtesy of E. Murphy, British Antarctic Survey, Cambridge, U.K.). Letters show the locations of the James Clark Ross 85”W stations (Table 2);
black bars and arrows show visual observations of the ice edge and direction of travel.
below). The north-south extent of the survey was limited to approximately 2.5” of latitude so that the southern ends of each leg could coincide with maximum visibility (midday) for safety reasons: icebergs were common in this area, and the locations of the largest icebergs can be inferred from the deviations from a rectangular survey track. The SeaSoar was lost part way through the second survey, and the dashed portion of this survey consisted of underway surface chemistry supplemented by north-south UOR tows. Figure 1 also shows the CTD section worked by Discovery between the two grid surveys, and the two northernmost James Clark Ross stations, J and K. Station J overlapped spatially and temporally with the second Discovery survey, and Station K was located well within the area of the first Discovery survey, although station occupancy was some 12 days following the survey.
RESULTS AND DISCUSSION
General properties and location of the ice-edge
An initial southwards transect along 85”W was made by the James Clark Ross on 12 November (Fig. 3). A fairly distinct ice-edge was observed with brash ice and l-2 m diameter floes at approximately 66%. The location of the ice-edge determined from NOAA ice-maps is in reasonable agreement with our ground observation (Fig. 3). Ice cover was estimated as approximately 5/lOths and varied little along the transect until approximately 67% where a marked compaction of the floes was observed (8/lOths ice cover). Surface chlorophyll concentrations were low throughout this region. Further south, a distinct boundary between low chlorophyll containing water and a band of high surface chlorophyll (over 4 mg mw3) was observed at approximately 67.5%. High surface chlorophyll concentrations remained to approximately 68.2”S, following which concen-
914 D. R. Turner and N. J. P. Owens
trations declined to <OS mg mP3. The southern boundary of the chlorophyll band was much more diffuse than the distinct northern boundary. Ice cover was effectively lO/lOths throughout this region; however, the ice structure was well compacted small floes. Unbroken pack-ice (with the occasional lead) was not located until approximately 69”s.
A return northwards transect was made by the James Clark Ross on 18-19 November. The band of high surface chlorophyll remained in the same position, and at a similar concentration, as previously observed. However, ice conditions had changed dramatically over the period with a significant compaction of the floes and an obvious ice-edge at approximately 67..S’S, although ice-bands were observed extending northwards to approximately 67”s. Thus the ice-edge had apparently ‘receded’ by approximately 1.5” latitude over a period of 7 to 8 days. High winds had been experienced in the open water to the north of the ice edge over this period, thus it is likely that much of the apparent ice retreat was the result of physical compaction, rather than ice-melt. The satellite derived location of the ice-edge suggested a position significantly north of the observations (Fig. 3). The reasons for this discrepancy are unclear, however, the ice-edge was apparently in a dynamic state at this time, thus differences of only hours between observations could result in large discrepancies between remotely sensed and ground-truthed observations. Also, the James Clark Ross transect was restricted to one meridian, thus there is no information on the longitudinal distribution of the ice edge which would be detected by remote sensing.
A third transect, returning southwards, was carried out by the James Clark Ross on 28 November. A distinct chlorophyll maximum was observed centred around 67.5”-68%, with a marked northern boundary and a more diffuse southern boundary, as observed previously. The levels of chlorophyll were similar to those found on the previous transects. However, on this occasion, the chlorophyll peak was located in fully open water. A region of ice-bands (500-1000 m width) was encountered at approximately 68.8”s with an ice- edge located at approximately 69.3”s. There was a narrow band of broken pack-ice extending southwards between the ice-edge and approximately 69.8”S, following which there was complete ice-cover with the occasional lead to the southernmost point of this transect (Station H, see Table 2). Although located close to Station G (occupied 15 days earlier), the ice-conditions at Station H had changed markedly and were clearly in an advanced stage of ice-melt. A final northwards transect was made two days later (30 November) during which time the ice-edge had retreated to 69.6%. The remotely sensed data once again suggest a more northern location of the ice-edge than that observed from ground observations (Fig. 3). However, as noted previously, the limited longitudinal extent of the direct observations could explain the differences. In addition, ice-banding seawards of the ice-edge would be likely to be interpreted as an ice-edge, thus suggesting an erroneously northern location. Overall, however, the remotely sensed ice-edge data appear to provide at least a qualitative indication of the relative movement of the ice-edge, and thus may provide valuable information on conditions prior to the field study.
The striking and unexpected feature of the shipboard observations was the fixed location of the chlorophyll band (the Discovery observations detailing this further are considered below). When first encountered this feature was located beneath a complete coverage of pack-ice. As the season progressed and as ice-cover declined, at least in part due to melting in situ, the location of the chlorophyll band remained fixed. The juxtaposition of a large algal bloom and a receding ice-edge appears superficially, at least during the latter stages of the study, to conform to the model of an MIZ bloom proposed by Smith and Nelson (1986) and others. Although a reduction in surface salinity immediately

A biogeochemical study in the Bellingshausen Sea 915
-ice cover
ot /kg I
-27.60 --
-27.55 --
-27.50 --
-27.45 --
-27.40 -.
-27.35 --
27.30 -- ‘.-‘:a 27.25 __
27.20 --
27.15 --
27.10 --
T-i3 27.65
27.60
27.55
27.50
27.45
27.40
27.35
27.30
27.25
27.20
27.15
65 66 67 69 70
Latitude 5 Fig. 4. Shallow density (a,) section along the 85”W meridian. Data are a compilation of 21 CTD profiles obtained from both ships over the period 28 November to 6 December. The approximate
ice coverage is shown for the period when the southernmost stations were occupied.
seawards of the ice-edge was observed (presumably caused by ice-melt), this was relatively minor and was clearly not associated with the initiation or maintenance of the bloom (see discussion below). The most likely explanation for the bloom lies with its connection with a frontal feature located between 66 and 67”s. This is dealt with in greater detail below, and in a number of the detailed studies (Boyd et al., 1995; Pollard et al., 1995; Read et al., 1995; Robins et al., 1995).
A further complication is the observation that the high chlorophyll band was initially observed beneath complete ice cover. Measurements of irradiance and primary pro- duction made at the time suggest that the biomass observed could not have been produced in situ (Boyd et al., 1995). However, the remotely sensed ice-edge data suggest that the ice- edge had advanced considerably prior to our measurements on the first into-ice transect (Fig. 3). Thus the region of the bloom could have experienced open water conditions prior to the initial observations and the biomass observed could be a remnant from an earlier period of production. An alternative suggestion, dealt with in greater detail by Pollard et al. (1995) and below, is that the high biomass was advected into the region from the west.
Summary of the hydrography along 85”W
Figures 4 to 8 inclusive provide a summary of the hydrographic conditions in the surface 200 m along the 85”W transect. The sections represent a compilation of data from 21 CID profiles carried out from both ships. The profiles selected were as temporally coherent as possible and were collected over the period 28 November-6 December, and thus represent conditions towards the end of the study.
The density section (Fig. 4) indicates a vertically well mixed surface layer to over 100 m
916 D. R. Turner and N. J. P. Owens
65 66 67 68 69 70 oL,'i,,',,',",;,',',,",',,'
_ice cover
200 6% $6 67 $8 7.0
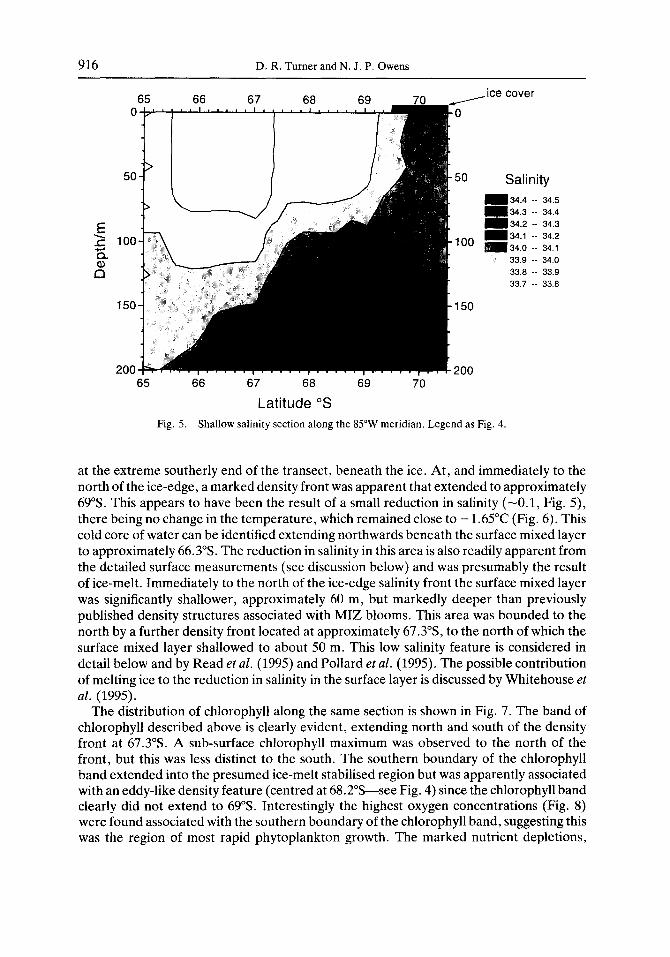
Latitude 5 Fig. 5. Shallow salinity section along the 85”W meridian. Legend as
Salinity
-34.4 -- 34.5 -34.3 _- 34.4 -34.2 -- 34.3 m 34.1 -- 34.2
34.0 -- 34.1 33.9 -- 34.0 33.8 -- 33.9 33.7 -- 33.8
Fig. 4.
at the extreme southerly end of the transect, beneath the ice. At, and immediately to the north of the ice-edge, a marked density front was apparent that extended to approximately 69%. This appears to have been the result of a small reduction in salinity (-0.1, Fig. 5), there being no change in the temperature, which remained close to - 1.65”C (Fig. 6). This cold core of water can be identified extending northwards beneath the surface mixed layer to approximately 66.3”s. The reduction in salinity in this area is also readily apparent from the detailed surface measurements (see discussion below) and was presumably the result of ice-melt. Immediately to the north of the ice-edge salinity front the surface mixed layer was significantly shallower, approximately 60 m, but markedly deeper than previously published density structures associated with MIZ blooms. This area was bounded to the north by a further density front located at approximately 67.3’S, to the north of which the surface mixed layer shallowed to about 50 m. This low salinity feature is considered in detail below and by Read et al. (1995) and Pollard et al. (1995). The possible contribution of melting ice to the reduction in salinity in the surface layer is discussed by Whitehouse et al. (1995).
The distribution of chlorophyll along the same section is shown in Fig. 7. The band of chlorophyll described above is clearly evident, extending north and south of the density front at 67.3”s. A sub-surface chlorophyll maximum was observed to the north of the front, but this was less distinct to the south. The southern boundary of the chlorophyll band extended into the presumed ice-melt stabilised region but was apparently associated with an eddy-like density feature (centred at 68.2”S-see Fig. 4) since the chlorophyll band clearly did not extend to 69”s. Interestingly the highest oxygen concentrations (Fig. 8) were found associated with the southern boundary of the chlorophyll band, suggesting this was the region of most rapid phytoplankton growth. The marked nutrient depletions,

A biogeochemical study in the Bellingshausen Sea 917
67 68 ss i0
Latitude “S Fig. 6. Shallow temperature section along the 85”W meridian. Legend as Fig. 4.
ice cover
Temperatl JrePC
m 1.2 -- m 0.9 _- m 0.6 -- m 0.3 .- m 0.0 --
-0.3 _- -0.6 -- -0.9 -- -1.2 -- -1.5 -- -1.6 --
1.5 1.2 0.9 0.6 0.3 0.0 -0.3 -0.6 -0.9 -1.2 -1.5
50 50 ChlorophylVmg mm3
E 2 100 ‘; s 0.0 -. 0.5 1.0 0.5 --
150
200 65 66 67 68 69 70
Latitude “S Fig. 7. Shallow chlorophyll section along the 85”W meridian. Legend as Fig. 4.

918 D. R. Turner and N. J. P. Owens
65 66 67 68 69 _ 0
50
100
150
200
‘0
,50
.I00
-150
-200
_ice cover
Oxygen/pm01 kg-’
x
400 -- 420
380 -- 400
380 -- 380
340 -- 380
-320 -- 340
-300 -- 320
280 -- 300
‘3 260 -- 280
240 -- 260
220 -- 240
200 -- 220
67 68 69 70
Latitude “S Fig. 8. Shallow dissolved oxygen section along the 85”W meridian. Lc :gend as Fig. 4.
which were also evident in this area, are discussed below, and a more detailed analysis of the nutrient data is presented by Whitehouse et al. (1995).
Surface water properties in the 85”W survey area
Results from the grid surveys. Figure 1 shows the tracks of the two grid surveys carried out by Discovery. The second survey was placed further south than the first to allow detailed mapping of the southern edge of the high chlorophyll area, which the James Clark Ross had previously located between 68 and 683’S At the same time the overlap between the two surveys (68 to 67.53, and to 67‘3 on Legs B, C, and D) was designed to investigate the temporal development of the central part of the high chlorophyll area. Figures 9 to 12 show surface contours of temperature, salinity, chlorophyll andpC0, from these surveys. The key hydrographic feature in the first survey is a band of low salinity in the region of 67”S, which is associated with sharp discontinuities in both chlorophyll and temperature. Read et al. (1995) have shown that this feature is part of a long-lived and extensive front within the Antarctic Circumpolar Current characterised by the low surface salinity seen in Fig. 10, the outcropping of the 27.2 kg m -3 isopycnal, and by a strong eastgoing flow. These authors have proposed the name “Southern Polar Front” (SPF) for this feature. Comparison with Fig. 11 reveals that this front marks the northern edge of the high chlorophyll area, with chlorophyll concentrations <l mg rnp3 in the low salinity band of the front. The pattern of surface water pC02 in the first survey (Fig. 12) follows that of chlorophyll, with the lowest values being found in the high chlorophyll area and the highest in the low chlorophyll, low salinity band. However, even the low chlorophyll area is

A biogeochemical study in the Bellingshausen Sea 919
Temp erature/“C
-0.9 -- -0.8 -1.0 -- -0.9 -1.1 -- -1.0 -1.2 -- -1.1 -1.3 -- -1.2 -1.4 -- -1.3 -1.5 -- -1.4 -1.6 -- -1.5 -1.7 -- -1.6 -1.8 -- -1.7
66.5
67.0
67.5
_WX YZ A B
68.5 - First survey
69.0 - I ” ” I ““I
86 85 84 8’6 8’5 84
66.5
67.0
67.5 G s
& 68.0 <b
ci; 68.5
69.0
Longitude “W Fig. 9. Surface contours of temperature from the two grid surveys. The ship’s track is super-
imposed on the contour plots.
substantially undersaturated with pC02 some 50-60 patm below the atmospheric value of 355 patm.
Turning now to the contour plots from the second survey (also shown in Figs 9 to 12), it is immediately apparent that there has been a significant warming of the surface water, and that there is now no clear relationship between temperature and salinity. The low salinity band is still visible at the northern end of Legs B, C and D (Fig. lo), and the more southerly survey track reveals a second, weaker low salinity band centred around 68.6”s. These two bands enclose a band of higher salinity surface water that is approximately coincident with the high chlorophyll band: the relationship between these bands is explored in more detail along 85”W (Leg A) below. The development of the surface chlorophyll and pC02 fields (Figs 11 and 12) reveals an interesting contrast. Overall, chlorophyll shows a decline between the two surveys, and in particular the high chlorophyll levels on Legs Y and B of the first survey have all but disappeared in the second survey. The pattern is not, however, uniform since small increases in chlorophyll can be seen on Legs A and D. In contrast, pCOz shows a significant decrease in the centre of the high chlorophyll area, indicating substantial net production in the area, which is most clearly seen on Legs Y, Z, A and B. Although we cannot be certain that the two surveys are sampling the same surface waters in the overlap area, the observation of simultaneous reductions in chlorophyll and pCOz suggests that losses, presumably by grazing, are accounting for more than 100% of primary

920 D. R. Turner and N. J. P. Owens
66.5
67.0
Salinity 133.66 -- 33.90
133.66 . . 33.66
133.64 -- 33.66 67.5 - 133.62 -- 33.64
133.60 -- 33.62
133.76 -- 33.60
33.76 -- 33.76 _~__,
’ I “” 33.74 -- 33.76 68.0 .
33.72 -- 33.74
33.70 -- 33.72 JWX ’
33.66 -- 33.70
33.66 -- 33.66
68.5
69.0
86 85 84 86 85 84
66.5
67.0
67.5 r b, s
2. 68.0 (D
68.5
69.0
Longitude “W Fig. 10. Surface contours of salinity from the two grid surveys. The ship’s track is superimposed
on the contour plots.
production in the time interval between the two surveys. This effect is discussed in more detail below.
Temporal developments along 85”W. In order to investigate the temporal development of the surface fields in more detail, we will concentrate on the 85”W meridian where the most comprehensive data set is available. During the period 12 November to 6 December the two ships occupied 10 transects along this meridian with varying latitudinal coverage between 65’S and 70% (Fig. 13). We can use the continuous and quasi-continuous measurements of surface properties along these transects both to give an overview of the latitudinal dependence of surface mixed layer properties, and to investigate the temporal development of key features during the time period covered.
The surface contour plots discussed above have shown that discontinuities in both salinity and chlorophyll lie in an approximately east-west orientation across the survey area giving rise to a banded structure to the surface waters. In discussing the distribution and evolution of surface properties at 85”W, it is convenient to divide the transect from 65% to 70% into five bands, each with distinct hydrographic and biogeochemical proper- ties. Analysis of the surface currents has shown that the strong eastgoing flow associated with the SPF includes both the low salinity band at 67”s and the northern part of the high chlorophyll area (Pollard et al., 1995), with the result that the high chlorophyll area has

A biogeochemical study in the Bellingshausen Sea 921
67.0
ChlorophyWmg mm3
5.5 -- 6.0 67.5 5.0 -_ 5.5 4.5 -- 5.0 4.0 -- 4.5 3.5 -- 4.0 3.0 -- 3.5 2.5 -- 3.0 68.0 _._ _ 2.0 -- 2.5 WX YZ AB 1.5 -- 2.0 1.0 -- 1.5 0.5 -- 1.0 < 0.5 68.5 First survey
69.0],, , , , , , , , , , , r
86 85 84
67.0
,675 c/, 0
2 '68.0 -2
1
krl 69.0
86 85 84
Longitude “W Fig. 11. Surface contours of chlorophyll from the two grid surveys. The ship’s track is super-
imposed on the contour plots.
been divided into two bands. It should be emphasised that this banding refers to properties measured after the retreat of the ice.
Band I (65-66.8”s): This area was not intensively studied, but was characterised by moderate chlorophyll levels (approximately 1 mg mp3). Band ZZ(66.8-67.2”S): Low surface salinity (~33.75) and low chlorophyll (~1 mg mp3). The surface water is Antarctic Surface Water flowing eastwards at a velocity >lO cm SC*. Band ZZZ (67.2-67.4”s): Water of higher salinity and high chlorophyll (up to 5 mg m-“), also moving eastwards at a velocity >lO cm s-l. Band IV (67.4-68.2”S): High but patchy chlorophyll and slow surface water advection; the physical circulation in this region is dominated by eddies (Pollard et al., 1995). Band V (68.2-70.0”s): This region remained low in chlorophyll well after the ice retreat.
Salinity profiles along 85”W are shown in Fig. 14: data obtained during ice cover have been excluded since artefacts associated with localised ice melting and formation are significant on the scale shown here. One of the most striking features of this plot is the stability of the salinity distribution which showed very little change over a two week period when significant rises in surface temperature were recorded (Fig. 9). The low salinity associated with the SPF is clearly visible, as is a weak salinity minimum centred at about

922 D. R. Turner and N. J. P. Owens
PC(
I B
330 320 310 300 290 260 270 260 250
66.5
atm 67.0
-- 340 -- 330 -- 320 -- 310 -_ 300 67.5 -- 290 -- 260 -- 270 -- 260 RR n
"-'" 240 -- 250 230 -- 240 WXY ZAB
68.5
69.0
86 85 84
67.0
67.5
68.5
69.0
Longitude “W Fig. 12. Surface contours of&O, from the two grid surveys. The ship’s track is superimposed on
the contour plots.
-12 No”
I JCR \ 20 Nov
I DI 123 Nov
-26 Nov
&I JCR ‘28 Nov
t-% 30 Nov
I JCR 13 Dee
I DI 14 Dee
-6 Dee
64 I”“I”“I”“I”“1”“““”
65 66 67 68 69 70 71
Latitude “S
Fig. 13. Transects along the 85”W meridian during the ‘STERNA 92’ expedition (JCR: James Clark Ross transects, DI : Discovery transects). Dark shading shows the extent of ice cover during James Clark Ross transects. The letters at the bottom of the diagram show the locations of the three
open-water stations worked by the James Clark Ross.

A biogeochemical study in the Bellingshausen Sea 923
33.90
33.85
x 33.80 C c $ 33.75
F I ---- Nov23-Nov28 c 0 Nov28
33.65 I
65 66 67 68 69 70
Latitude “S
Fig. 14. Surface salinity along 85”W. Roman numerals mark the different bands of surface water, and boxed letters show the locations of the three open-water stations worked by the James Clark Ross. Near-continuous data are plotted as lines, and more widely spaced data as discrete symbols.
6
5
...-.-- 4 Nov 26-26
3 E
m3 E : x z 2 2 52 J= 1 0
0
65 66 67 68 69 70
Latitude “S
Fig. 1.5. Surface chlorophyll along 85”W. Legend as for Fig. 14.
68.6”s (Band V), and another at 67.8% (Band IV). These latter minima are most probably derived from mixing of meltwater. The only sign of variations in surface salinity over the period are within Bands III and IV: it is likely that the Band III differences reflect small variations in the SPF flow while the Band IV differences reflect eddy activity in that region.
Chlorophyll profiles (Fig. 15) are dominated by the high but variable chlorophyll in Bands III and IV. Band IV shows high chlorophyll levels throughout, while chlorophyll is

924 D. R. Turner and N. J. P. Owens
320 0 & 300 t
0 240 a
220 I t : "..
E 280
5 j.
6 260
atmospheric pC0,
‘~~~~~
I I I * * I I I I I I I I I I,
66 67 68 69
Latitude “S
Fig. 16. Surface pC0, along 85”W. pCOz values have been corrected to 0°C assuming a temperature coefficient of 0.0423 K-’ (Takahashi et nl., 1993). Legend as for Fig. 14.
low in Band III in both the first transect (12 November, Band III ice-covered) and the second transect (20 November, Band III in open water). It is not until the third transect on 23 November that high chlorophyll is seen in Band III: this observation is discussed in more detail below. Elsewhere it is interesting to see evidence of an increase in the standing stock of chlorophyll in Bands I and II, suggesting that the relatively low levels of chlorophyll there are nevertheless active, a conclusion supported by the results of Waldron et al. (1995), who obtained nitrogen uptake rates in Bands I and II which were between 30 and 40% of the maximum value measured in Band III. Band V, in contrast, shows no clear evidence of any increases in the standing stock of chlorophyll, which may reflect the close coupling between primary production and microzooplankton grazing seen in this region (Burkill et al., 1995).
pCOZ profiles (Fig. 16) show an interesting relationship to the chlorophyll profiles. Only at the southern end of Band V does surface water pCOZ reach equilibrium with the atmosphere. Elsewhere there is substantial undersaturation, with the lowest $0, values occurring in Band IV, which is also the only area in which we have evidence that pC02 decreased significantly during our measurements. pCOZ is relatively high in the low chlorophyll, low salinity area (Band II), and intermediate in Band III. Band I shows low pCOZ and relatively low chlorophyll. Bakker et al. (1994) recently measured surface water pC02 in the Weddell Sea during spring and found similar relationships to the frontal structure; undersaturation in the Polar Front was associated with a phytoplankton bloom, while&O, remained near equilibrium with the atmosphere between the Polar Front and the ice edge; under the pack ice pC0, was reported to be supersaturated.
Nutrient profiles (Fig. 17) show clear anomalies in nitrate and phosphate in Bands III and IV associated with the high chlorophyll, and both follow pCOZ in showing a further decrease in Band IV during the course of the measurements. However, nitrate also shows a substantial decrease in Band V and an early decrease in Band IV, neither of which is accompanied by any significant change in phosphate. Silicate, in contrast, shows a steady

A biogeochemical study in the Bellingshausen Sea 925
65 66 67 68 69 70
65 66 67 68 69 70 I-
, -
--- Nov26
66 67 68
Latitude “S
69 70
Fig. 17. Surface macronutrients along 85”W. Legend as for Fig. 14
increase towards the ice-edge with some evidence of an anomaly in Band IV reflecting uptake of silicate by the diatoms which dominated the phytoplankton population in this region (Savidge et al., 1995). However, there is no clear indication of a significant reduction in silicate with time as seen for the other macronutrients.
Oxygen and ammonium profiles (Fig. 18) are included as indicators of recent biological activity, since oxygen disequilibria with the atmosphere and elevated ammonium concen- trations are short-lived in comparison with the signals displayed by CO2 and the macronutrients. It can be seen that the highest ammonium levels and oxygen supersatu- ration are largely confined to Band IV, but also that there is significant ammonium at the northern edge of Band V, which is consistent with the close coupling between primary production and microzooplankton grazing noted above. The persistent supersaturation of oxygen in Bands I and II is another indicator that the chlorophyll present is active in photosynthesis.
Primary production rates at 85”W. The high chlorophyll region of the transect was divided into two bands (III and IV) on a physical basis, Band III being subject to rapid advection and Band IV being characterised by eddy activity. From the above summary it is

926 D. R. Turner and N. J. P. Owens
110 - 0
I v 85 ~~~~‘~~~~‘~~~~‘~~~“~~~~’
65 66 67 68 69 70
0.8
E
65 66 67 68 69 70
Latitude “S
Fig. 18. Surface ammonium and dissolved oxygen along 85”W. Legend as for Fig. 14.
Table 3. Production rates estimated from surface water changes at 85”W, 67.8”S
Parameter X Change AX (mm01 mm3)
Time (days)
Rate dXldt
Production rate* (gC m -3 day-‘) (gC m -’ day-‘)
Nitrate -5.0 9.16 -0.55 0.043 2.2 Phosphate -0.4 9.16 -0.04 0.056 2.8 Chlorophyllt 2.5 6.75 0.37 0.013 0.6 TCOzS -32 6.75 -4.74 0.057 2.8
*Conversions to carbon assume C:N:P 106:16:1 and carbon:chlorophyll ratio 34 (Robins et al., 1995); conversion to an area basis assumes production over a 50 m depth.
Khlorophyll concentrations in mg mm3. $Estimated from change in pC0, at 0°C (Fig. 16) and a specific alkalinity of 68.1 (Bellerby et al., 1995).
clear that there is also a strong geochemical distinction between these two bands. There are no clear chemical changes with time in the rapidly advecting Band III, while Band IV in contrast shows chemical changes indicative of substantial primary production between late November and early December. Over this same period there was also a sharp increase in surface chlorophyll in Band IV at 85”W. We can use the changes in chlorophyll, macronutrients and&O2 to obtain approximate estimates of primary production over the period, with the results shown in Table 3. The estimates based on phosphate and carbon

A biogeochemical study in the Bellingshausen Sea 927
Table 4. Production rates measured close to 85”W, 61.5”S
Date Station Method New production
gC m-* day-’ Total production
gC rn-’ day-’ Reference
4 Dee 6 Dee 8 Dee 8 Dee 8 Dee
12,224 , 15N deck incubation 12,225 , 15N deck incubation
K “N, in situ incubation K 13C, in situ incubation K 14C, in situ incubation
1.83 1.13 0.24
3.84 Waldron et al. (1995) 2.70 Waldron et al. (1995) 0.59 Bury et al. (1995) 0.69 Bury et al. (1995) 0.76 Boyd et al. (1995)
Table 5. Maximum total CO, reduction (ATCOJ and associated chlorophyll change (AChl) on each survey leg between the first and second surveys
Leg Latitude “S ATC02(mmol me3)* AChl(mg mm3) AChl-C/ATC02 (%) t
X 67.6 -37 3.0 23 Y 67.5 -27 -2.4 -25 Z 67.85 -23 0.0 0 A 67.8 -32 2.5 22 B 67.9 -14 -1.1 -22
*Estimated from pCOz change as described in Table 3. tAChl-C is the change in chlorophyll carbon calculated using the carbon:chlorophyll
ratio given in Table 3.
are in close agreement, while the nitrate-based estimate is somewhat lower, implying anf- ratio of 0.79, compared withf-ratios of between 0.35 and 0.48 measured at 85”W, 67.5”s (Bury et al., 1995; Waldron et al., 1995). Finally, the chlorophyll increase is much smaller than that implied by nutrient and CO2 uptake, indicating a substantial loss to grazing: both microzooplankton and krill grazing were estimated to be significant in this area (Burkill et al., 1995; Murray et al., 1995). These estimates must, of course, be treated with a degree of caution since we cannot be certain that we measured the same water mass over this period: the changes we observe may be due to eddies moving through the 85”W meridian. It is therefore interesting to compare these measurements with incubation-based productivity measurements in the same area: the closest set of productivity measurements are from 85”W, 67.5”s and are summarised in Table 4. The measurements from 4 and 6 December are in good agreement with the longer term geochemical estimates derived in Table 3, while the 8 December measurements (from a different station) are substantially lower.
While it may be tempting to interpret this difference as a decline in productivity, it may also be an artefact resulting from the patchiness of the phytoplankton distribution. This patchiness is evident in Fig. 11, and our selection of Leg A for detailed analysis, which was determined by the availability of data, fortuitously included one of the few points at which there was a significant increase in surface chlorophyll between the two surveys. Table 5 summarises the relationship between production estimated by COZ removal and the change in surface chlorophyll, taking for each leg the latitude at which the largest CO2 change is seen. In every case the increase in chlorophyll accounts for less than 25% of the carbon fixed, and on two legs there is a substantial reduction in chlorophyll standing stock
928 D. R. Turner and N. J. P. Owens
33.95 r m m * m Novl2 rrn
b, j ---- Nov23-Nov26 1
0 0
33.65 I v
m
65 66 67 66 69 70
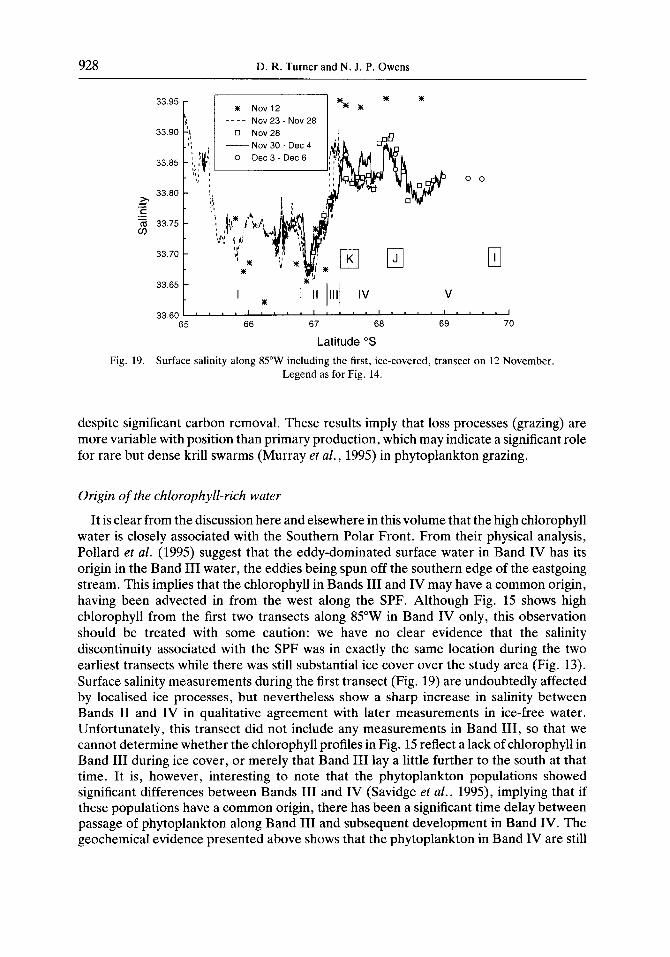
Latitude “S Fig. 19. Surface salinity along 85”W including the first, ice-covered, transect on 12 November.
Legend as for Fig. 14.
despite significant carbon removal. These results imply that loss processes (grazing) are more variable with position than primary production, which may indicate a significant role for rare but dense krill swarms (Murray et al., 1995) in phytoplankton grazing.
Origin of the chlorophyll-rich water
It is clear from the discussion here and elsewhere in this volume that the high chlorophyll water is closely associated with the Southern Polar Front. From their physical analysis, Pollard et al. (1995) suggest that the eddy-dominated surface water in Band IV has its origin in the Band III water, the eddies being spun off the southern edge of the eastgoing stream. This implies that the chlorophyll in Bands III and IV may have a common origin, having been advected in from the west along the SPF. Although Fig. 15 shows high chlorophyll from the first two transects along 85”W in Band IV only, this observation should be treated with some caution: we have no clear evidence that the salinity discontinuity associated with the SPF was in exactly the same location during the two earliest transects while there was still substantial ice cover over the study area (Fig. 13). Surface salinity measurements during the first transect (Fig. 19) are undoubtedly affected by localised ice processes, but nevertheless show a sharp increase in salinity between Bands II and IV in qualitative agreement with later measurements in ice-free water. Unfortunately, this transect did not include any measurements in Band III, so that we cannot determine whether the chlorophyll profiles in Fig. 15 reflect a lack of chlorophyll in Band III during ice cover, or merely that Band III lay a little further to the south at that time. It is, however, interesting to note that the phytoplankton populations showed significant differences between Bands III and IV (Savidge et al., 1995), implying that if these populations have a common origin, there has been a significant time delay between passage of phytoplankton along Band III and subsequent development in Band IV. The geochemical evidence presented above shows that the phytoplankton in Band IV are still

A biogeochemical study in the Bellingshausen Sea 929
33.6 65 66 67 68 69 70
65 66 67 68 69 70
Latitude “S Fig. 20. Surface profiles of salinity, chlorophyll, and eastgoing water velocity at 85”W, 86”W and 88”W. Estimates of eastgoing velocity are derived from ADCP measurements and refer to a depth
of 29 m (Pollard et al., 1995).
active, but may have passed their peak (Table 4, but see also Discussion above). In contrast, Band III chlorophyll appears to be relatively constant (Fig. 11, Legs B, C, D), implying advection from a constant, high-chlorophyll source.
We can gain some insight into the origin of this Band III chlorophyll at 85”W by comparison of the north-south transect with corresponding transects from 86”W and 88”W (Fig. 20). The high chlorophyll area is further to the south at the more westerly longitudes, a trend that is also visible in Fig. 11. A common feature at all three longitudes is that the strong eastgoing flow associated with the SPF straddles the northern edge of the high chlorophyll area, i.e. there is a ‘Band III’ of rapidly advecting chlorophyll at least as far west as 88”W. Again at all longitudes there is a salinity minimum in the northerly part of the eastgoing stream, but the value of the salinity minimum changes between 86”W and 88”W from 33.65 to 33.7, the salinity minimum of 33.65 lying further to the north and out of

930 D. R. Turner and N. J. P. Owens
the SPF flow at 88”W. In other words the lowest salinity water at 85”W appears to have been entrained into the eastgoing stream somewhere between 86”W and 88”W. Although from our data we are unable to trace the Band III high chlorophyll water any further to the west, simple extrapolation of this band westwards leads to Peter I Island at 68.8”S,90.6”W. Following the demonstration that the chlorophyll-rich plume downstream of the Galapa- gos Islands is associated with elevated iron concentrations (Martin et al., 1994), it is interesting to speculate that a similar mechanism may be operating in the Bellingshausen Sea. In this context we note also that de Baar et al. (1995) found enhanced chlorophyll levels in the Polar Front jet in the Weddell Sea to be associated with elevated iron concentrations.
State of the ‘bloom’
While it is clear that the development of the phytoplankton ‘bloom’ observed at 85”W differs substantially from that seen in temperate regions such as the North Atlantic, it is interesting to compare the biogeochemical signatures in the different bands with those seen in temperate blooms.
Band I: Undersaturation in pCOz with only moderate chlorophyll levels. Oxygen supersaturation indicates continuing production. This is equivalent in some ways to the summer post-bloom situation in temperate waters, although the continuing high nutrient concentrations indicate a different mechanism for limiting primary producti- vity. Band III/IV: Strong undersaturation in pCOZ and high chlorophyll levels, strong correlation between pCOz and chlorophyll. This appears equivalent to the temperate spring bloom situation, but with some data from Band IV implying that the ‘bloom’ had passed its peak. Band V: pCOZ at or near saturation, low chlorophyll. This most closely equivalent to the temperate pre-bloom situation, but the close coupling between primary production and microzooplankton grazing will strongly hinder the sharp increase in phytoplankton standing stock that characterises a bloom.
Acknowledgements-The authors acknowledge the magnificent service provided by the Captains, officers and crews of the R.R.S.s Discovery andJames Clark Ross. We also thank all those who contributed to the cruises in many ways, but did not sail, and the scientists on both ships who have provided data for this overview. The work was supported by funds from the Plymouth Marine Laboratory, the British Antarctic Survey, Cambridge and from the U.K. Biogeochemical Flux Study (BOFS). This is BOFS contribution No. 234.
REFERENCES
Aldworth E. (1995). Snow and ice characteristics of the Bellingshausen Sea, during the spring melt. Deep-Sea Research II, 42, 1021-1045.
Atkinson A. and R. Shreeve (1995). Response of the copepod community to a spring bloom in the Bellingshau- sen Sea. Deep-Sea Research II, 42,1291-1311.
Bakker D. C. E., H. J. W. de Baar and U. Bathmann (1994). Surface water CQ changes in a Southern Spring, EOS, 75 Suppl. 177-178.
Bellerby R. G. J., D. R. Turner and J. E. Robertson (1995). Surface pH and pCQ distributions in the Bellingshausen Sea, Southern Ocean during the early Austral summer. Deep-Sea Research II, 42, 1093- 1107.
Boyd P. W., C. Robinson, G. Savidge and P. J. IeB. Williams (1995). Water column and sea-ice primary production during Austral spring in the Bellingshausen Sea. Deep-Sea Research II, 42,1179-1200.

A biogeochemical study in the Bellingshausen Sea 931
Buckley R. G. and H. J. Trodahl (1987). Scattering and absorption of visible light by sea ice. Nature, 326, 867-869.
Burkill P. H., E. S. Edwards and M. A. Sleigh (1995). Microzooplankton and their role in controlling phytoplankton growth in the marginal ice zone of the Bellingshausen Sea. Deep-Sea Research II, 42,1279- 1290.
Bury S. J., N. J. P. Owens and T. Preston (1995). i3C and”N uptake by phytoplankton in the marginal ice zone of the Bellingshausen Sea. Deep-Sea Research II, 42,122.5-1252.
de Baar H. J. W., A. G. J. Buma, R. F. Nolting, G. C. Cadee, G. Jacques and P. J. Treguer (1990). On iron limitation of the Southern Ocean: experimental observations in the Weddell and Scotia Seas. Marine Ecology Progress Series 65, 105-122.
de Baar H. J. W., J. T. M. de Jong, D. C. E. Bakker, B. M. Loscher, C. Veth, U. Bathmann and V. Smetacek (1995). Importance of iron for plankton blooms and carbon dioxide drawdown in the Southern Ocean. Nature, 373,412-415.
Comiso J. C., N. G. Maynard, W. 0. Smith and C. W. Sullivan (1990). Satellite ocean colour studies of Antarctic ice edges in the Summer/Autumn. Journal of Geophysical Research, 95,9481-9496.
Comiso J. C., C. R. McClain, C. W. Sullivan, J. P. Ryan and C. L. Leonard (1993). Coastal Zone Colour Scanner pigment concentrations in the Southern Ocean and relationships to geophysical surface features. Journal of Geophysical Research, 98,2419-2451.
Cota G. F., W. 0. Smith, D. M. Nelson, R. D. Muench and L. I. Gordon (1992). Nutrient and biogenic particulate distributions, primary productivity and nitrogen uptake in the Weddell-Scotia Sea marginal ice zone during winter. Journal of Marine Research, 50,155-181.
Cripps G. C. (1995). Biogenic hydrocarbons in the particulate material of the water column of the Bellingshausen Sea, Antarctica, in the region of the marginal ice zone. Deep-Sea Research II, 42, 1123-1135.
Ducklow H. W. and R. P. Harris (editors) (1993). JGOFS: The North Atlantic Bloom Experiment. Deep-Sea Research II, 40, l-641.
Dugdale R. C. and F. P. Wilkerson (1990). Iron addition experiments in the Antarctic: A reanalysis. Global Biogeochemical Cycles, 4, 13-19.
Eppley R. W. and B. J. Peterson (1979). Particulate organic matter flux and planktonic new production in the deep ocean. Nature, 282,677-680.
Garrison D. L., C. W. Sullivan and S. F. Ackley (1986). Sea ice microbial communities in Antarctic. Bioscience, 36,243-250.
Glibert R. M., D. C. Biggs and J. J. McCarthy (1982). Utilisation of ammonium and nitrate during Austral summer in the Scotia Sea. Deep-Sea Research, 29,837-850.
Gosselin M., L. Legendre, J.-C. Therriault, S. Demers and R. Rochet (1986). Physical control of the horizontal patchiness of sea-ice microalgae. Marine Ecology Progress Series, 29,289-298.
Jennings J. C., L. I. Gordon and D. M. Nelson (1984). Nutrient depletion indicates high primary productivity in the Weddell Sea. Nature, 309,51-54.
Kennedy H. and J. E. Robertson (1995). Variations in the isotopic composition of particulate organic carbon in surface waters along a 88”W transect from 67’S to 54%. Deep-Sea Research II, 42, 1109-l 122.
Lancelot C., S. Mathot, C. Veth and H. de Baar (1993). Factors controlling phytoplankton ice-edge blooms in the marginal ice zone of the Northwestern Weddell Sea during sea-ice retreat 1988 - field observations and mathematical modelling. Polar Biology, 13,377-387.
Martin J. H., S. E. Fitzwater and R. M. Gordon (1990) Iron deficiency limits phytoplankton growth in Antarctic waters. Global Biogeochemical Cycles, 4, 5-12.
Martin J. H. ef al. (1994). Testing the iron hypothesis in ecosystems of the equatorial Pacific Ocean. Nature, 371, 123-129.
Maykut G. A. (1985). The ice environment. In: Sea ice biota, R. A. Horner, editor, CRC, Boca Raton, FL, U.S.A., pp. 21-82.
McGrath-Grossi S., S. T. Kottmeier, R. L. Moe, G. T. Taylor and C. W. Sullivan (1987). Sea ice microbial communities. VI, Growth and primary production in bottom ice under graded snow cover. Marine Ecology Progress Series, 35, 153-164.
Murray A. W. A., J. L. Watkins and D. G. Bone (1995). A biological acoustic survey in the marginal ice-edge zone of the Bellingshausen Sea. Deep-Sea Research II, 42, 1159-1175.
Nelson D. M. and W. 0. Smith (1986). Phytoplankton bloom dynamics of the western Ross Sea ice edge - Il. Mesoscale cycling of nitrogen and silicon. Deep-Sea Research, 33, 1389-1412.
Niebauer H. J. and V. Alexander (1985). Oceanographic frontal structure and biological production at an ice edge. Continental Shelf Research, 4,367-388.

932 D. R. Turner and N. J. P. Owens
Olson R. J. (1980). Nitrate and ammonium uptake in Antarctic waters. Limnology and Oceanography, 2.5, 1064-1074.
Owens N. J. P., J. Priddle and M. J. Whitehouse (1991). Variations in phytoplanktonic nitrogen assimilation around South Georgia and in the Bransfield Strait (Southern Ocean). Marine Chemistry, 35,287-304.
Pollard R. T., J. F. Read, J. T. Allen, G. Griffiths and A. I. Morrison (1995). On the physical structure of a front in the Bellingshausen Sea. Deep-Sea Research II, 42,955-982.
Read J. F., R. T. Pollard, A. I. Morrison and C. Symon (1995). On the southerly extent of the Antarctic Circumpolar Current in the southeast Pacific. Deep-Sea Research II, 42,933-954.
Robertson J. E. and A. J. Watson (1995). A summer-time sink for atmospheric carbon dioxide in the Southern Ocean between 88”W and 80”E. Deep-Sea Research II, 42, 1081-1091.
Robins D. B., R. P. Harris, A. W. Bedo, E. Fernandez, T. W. Fileman, D. S. Harbour and R. N. Head (1995). The relationship between suspended particulate material, phytoplankton and zooplankton during the retreat of the marginal ice zone in the Bellingshausen Sea. Deep-Sea Research II, 42, 1137-1158.
Rochet M., L. Legendre and S. Demers (1986). Photosynthetic and pigment responses of sea-ice microalgae to changes in light intensity and quality. Journal of Experimental Marine Biology and Ecology, 101,211-226.
Sagan S., A. R. Weeks, I. S. Robinson G. F. Moore and J. Aiken (1995). The relationship between beam attenuation and chlorophyll concentration and reflectance in Antarctic waters. Deep-Sea Research II, 42, 983-996.
Savidge G., D. Harbour, L. C. Gilpin and P. W. Boyd (1995). Phytoplankton distributions and production in the Bellingshausen Sea, Austral spring 1992. Deep-Sea Research II, 42, 1201-1224.
Shimmield G. B., G. D. Ritchie and T. W. Fileman (1995). The impact of marginal ice zone processes on the distribution of *l’Pb, 210 PO and 23‘?h and implications for new production in the Bellingshausen Sea, Antarctica. Deep-Sea Research II, 42, 1313-1335.
Smith W. 0. and D. M. Nelson (1986). The importance of ice-edge phytoplankton blooms in the Southern Ocean. Bioscience, 36,251-257.
Smith W. 0. and D. M. Nelson (1990). Phytoplankton growth and new production in the Weddell Sea marginal ice zone in the austral spring and autumn. Limnology and Oceanography, 35,809-821.
Sullivan C. W., C. R. McClain, J. C. Comiso and W. 0. Smith (1988). Phytoplankton standing crops within an Antarctic ice edge assessed by satellite remote sensing. Journal of Geophysical Research, 93, 12,487- 12,498.
Sullivan C. W., G. F. Cota, D. W. Krempin and W. 0. Smith (1990). Distribution and activity of bacterioplank- ton in the marginal ice zone of the Weddell-Scotia Sea during austral spring. Marine Ecology Progress Series, 63,239-252.
Sullivan C. W., K. R. Arrigo, C. R. McClain, J. C. Comiso and J. Firestone (1993). Distributions of phytoplankton blooms in the Southern Ocean. Science, 262, 1832-1837.
Takahashi T., J. Olafson, J. G. Goddard, D. W. Chipman and S. C. Sutherland (1993). Seasonal variation of CO, and nutrients in the high-latitude surface oceans: a comparative study. Global Biogeochemical Cycles, 7, 843-878.
Turner S. M., P. D. Nightingale, W. Broadgate and P. S. Liss (1995). The distribution of dimethyl sulphide and dimethylsulphoniopropionate in Antarctic waters and sea ice. Deep-Sea Research II, 42, 1059-1080.
Waldron H. N., C. G. Attwood, T. A. Probyn and M. 1. Lucas (1995). Nitrogen dynamics in the Bellingshausen Sea during the Austral spring of 1992. Deep-Sea Research II, 42, 1253-1276.
Weeks A. R., G. Griffiths, H. Roe, G. Moore, I. S. Robinson, A. Atkinson and R. Shreeve (1995). The distribution of acoustic backscatter from zooplankton compared with physical structure, phytoplankton and radiance during the spring bloom in the Bellingshausen Sea. Deep-Sea Research II, 42, 997-1019.
Whitehouse M. J., J. Priddle and E. M. S. Woodward (1995). Spatial variability of inorganic nutrients in the marginal ice zone of the Bellingshausen Sea during the Austral spring. Deep-Sea Research II, 42, 1047- 1058.
Zwally H. J., J. C. Comiso, C. L. Parkinson, W. J. Campbell, F. D. Carsey and P. Gloersen (1983). Antarcticsea kc, 1973-1976 from satellite passive microwave observations, NASA Special Publication SP459, NASA, Greenbelt MD, U.S.A.