Uranium Mine Aftermath and Yangiabad Expedition in Uzbekistan
26
Discussion Paper No. 647 “Uranium Mine Aftermath and Yangiabad Expedition in Uzbekistan ” Tsukatani, T., Toderich, K. and Goldstein, R.I. March 2008 KYOTO UNIVERSITY KYOTO, JAPAN http://www.kier.kyoto-u.ac.jp/index.html KYOTO INSTITUTE OF ECONOMIC RESEARCH KIER DISCUSSION PAPER SERIES
-
Upload
independent -
Category
Documents
-
view
0 -
download
0
Transcript of Uranium Mine Aftermath and Yangiabad Expedition in Uzbekistan

Discussion Paper No. 647
“Uranium Mine Aftermath and Yangiabad Expedition in Uzbekistan ”
Tsukatani, T., Toderich, K. and Goldstein, R.I.
March 2008
KYOTO UNIVERSITY
KYOTO, JAPAN
http://www.kier.kyoto-u.ac.jp/index.html
KYOTO INSTITUTE OF
ECONOMIC RESEARCH
KIER DISCUSSION PAPER SERIES

1
Uranium Mine Aftermath and Yangiabad Expedition in Uzbekistan
Tsukatani1, T., Toderich
2, K. and Goldstein
3, R.I.
Abstract
This article describes the first half of a history of uranium mines in the Fergana Valley of
Central Asia, introduces the existing environment of the old mines, and analyzes a part of heavy
metals of water resource in the surrounding. Fergana Valley itself has a long history of
civilization, to which Chinese called Dayuan, going back to the conquest of Alexander the Great
in 329 BCE or the description of a Chinese explorer Zhang Qian in 130 BCE. After the Second
World War, however, Soviet Union polluted the area with heavy metal and radioactivity where
a dense monoculture of cotton was developed. A great number of uranium works are located in
the landslide zone and are currently exposed to destruction, thus causing radioactive pollution of
the surface and underground water. The rehabilitation will cost a huge amount of cost and time.
Uzbek and Japanese team dispatched a joint expedition in October 1998 to Yangiabad, one
of the former uranium mines, and sampled surface water and particles in the sediments.
Japanese side has studied 58 points and Uzbek side has studied 13 random points located in the
Yangiabad sites. ICP-MS analysis showed that the uranium concentration of the river water
around Yangiabad was unbelievably high (10 to 1,000 ppb-U238
).
Outline
For more than 40 years, Uzbekistan was one of the main uranium raw material bases for
the former Soviet Union. It was resulted in a large number of uranium stockpiles and
hydrometallurgical wastes accumulated on the territory. Some of the biggest uranium deposits
(Maili-say, Shekaftar, and Kyzyldzhar) are located in Kyrgyzstan. Water erosion of radioactive
wastes of these deposits causes transborder contamination of the surface and soil water and soil
structure of the Northern Namangan region since all water arteries, which are active bearers of
radioactive materials, have their detrital cones on the territory of Uzbekistan. This is the place
1 Professor Emeritus, Kyoto University : [email protected] (His position is from April 2008)
2 Consultant, ICBA-Central Asia, Tashkent: [email protected]. (She was in Uzbek Acad. Sciences)
3 Head, Complex Geoecological Expedition Kyzyltepageologia at State Committee of Uzbekistan for
Geology and Mineral Resources (He has left for Israel.)

2
where radioactive sedimentation occurs. Soil water uranium is concentrated in stagnant,
swamped area of the central part of the valley forming, together with the associated strontium,
selenium, vanadium, lead, zinc, molybdenum, and other elements.
This article describes the first half of the history of uranium development in Uzbekistan,
introduces the current state of an old uranium mine from the aspect of environmental problems,
and analyzes a part of the distribution of heavy metals of water resource in the surrounding.
Central Asia was one of the large supply bases of uranium that was the nuclear weapon raw
material in the Former Soviet Union in the cold war era, and large-scale mining was conducted
in the Fergana Valley and Kyzylkum Desert. It reflected the abundant deposit of natural
resources on this ground. Uzbekistan is a standing uranium exporting. However, the situation of
disintegration of Soviet Union has left a big, negative inheritance on the uranium mine sites of
Uzbekistan. In the Fergana Valley of an overpopulated zone where irrigation agriculture was
especially developed, and where that has valuable historic culture and ruins of the human race, a
lot of uranium sullage was left and remained in the foot of mountains. It exposes the increasing
tendency in recent years to danger of flowing out of ore sullage by a certain flood and landslide
into the irrigated areas. This is not only a problem of one Uzbekistan country but also is equal to
the present world that obtained energy of nuclear power with the problem that should be thought.
This article provides the basic intelligence.
Introduction
There is a history of in the uranium extraction of in Central Asia for 100 years4. The
mining of the radioactive substance started at the end of the 19th century in the Fergana Valley5.
At first, the ore was mined from uranium-radium deposit in 1899 at Tuyamuyun (40° 21' N, 72°
36' E) near the old town Osh in the southeast basin. Tuyamuyun sent off a large amount of ore
containing uranium to Germany via St. Petersburg in the 1910's. Moreover, it is ascertained that
Taboshar and Kyzyldzhar, etc. at the west edge of the Fergana Valley produced the uranium ore
before the Second World War.
After and in the war, the Soviet Union went forward on the nuclear weapons drive. The
Fergana Valley became the main supply base of the uranium of secret backs in the 1950's and
1940's, and many deposits were developed. The main deposits were Taboshar (40° 35' N, 69°
38' E), Yangiabad (41° 08' N, 70° 06' E), Charkesar (41° 02' N, 70° 52' E), Uygursay (41° 02' N,
4 D. B. Shimkin: Uranium Deposits in the USSR, Science 21 January 1949, 109: 58-60.
5 Russia at that time did not know the radium extraction method, and however, it was extracted to the
first radium from Russia in December 1921.

3
71° 12' E), Shekaftar (41° 18' N, 71° 19' E), Kyzyldzhar (41° 26' 0N, 72° 01' 0E), and Maili-say
(41° 18' N, 72° 27' E). Uranium processing up to yellow cake started at Chkalovsk near
Leninabad (Khujand) in the late 1940s. Taboshar was the first mines to transfer the uranium to
Chkalovsk.
In the late 1950s, uranium extraction shifted to underground leaching in Kyzylkum
desert. Uranium production in Uzbekistan is limited to three in-situ leaching (ISL) sites:
Uchkuduk, Zafarabad, and Nurabad. With underground leaching, no large infrastructure,
transport facilities, and others are required; conditions for highly efficient development of poor
but large deposits are thus provided, reducing investment 2-3 times and tripling the labor
productivity as assessed in terms of the end-product. Basic sources of environment pollution on
the uranium-ore of Kyzylkum are: the dumps of ores below industrial grade that were formed
during the process of deposit development by open and underground ways; underground
leaching mines; and tailing of the hydrometallurgical plant in Navoi that processes uranium ores
and solutions of hydrochloric acid. Uranium ore's extraction on Kyzylkum territory has been
conducted in restricted volumes. Basic volume was fulfilled on Uchkuduk. As a result of 30
years' deposit operation it was piled up 23 dumps of ores below industrial grade. Total surface
of dumps is about 700 th. sq. meters; mountain mass volume in it exceeds 3 mln. tons. Since
1992, all uranium production is exported mainly to the United States.
The uranium ore site left in Fergana Valley was transfigured to the world's largest
polluted area by the radioactive substance without informing the resident in the surrounding on
its pollution. If a radioactive sullage of Charkesar, Uygursay, Shekaftar, Kyzyldzhar and
Maili-say, all of them are located in the northern part of mountainous region of Fergana Valley,
does the collapse and outflow according to the global warming in recent years and other factors,
the affected area would be 1,300 km2 in Fergana only and the population is 1.1 million.
The uranium will elute from the Fergana Valley to the stream water in the situation to
date and the future. If the amount of fissionable uranium 235 is calculated from the density of
the eluted uranium and the river flow rate, it becomes 75 kg a year only in the Yangiabad
deposit. The amount of the fissionable uranium from Yangiabad corresponds to seven
Hiroshima atomic bombs a year if the uranium 235 of 10 kg was used for a Hiroshima type
atomic bomb. It is possible to look for the importance of the uranium waste problem of Fergana
from this figure.
Uzbekistan was one of the main uranium supply regions of the former Soviet Union for
40 years or more. Soviet Union left many uranium ore dregs and other heavy metal wastes in
this country as a result. The uranium ore deposit is located in the landslide zone in the Fergana

4
Valley, and therefore, underground and surface water produces radioactive pollution of drinking
water and irrigation water by underground water and surface water. Some deposits (Shekaftar,
Kyzyldzhar, and Maili-say) are in the Kyrgyzstan Republic, and the transfrontier pollution
exists in the Uzbekistan Namangan area in the result that the sullage enters into the downstream.
The sullage contains metals. Besides uranium, such metals as strontium, selenium, vanadium,
lead, zinc, and molybdenum are contained in the sullage, thereby arises a metallic pollution in
the hydrosphere and the soil.
In general, it is difficult to imagine the situation of the uranium's flowing out to the
Fergana Valley of Uzbekistan, gathering in the Kairakkum Reservoir of Tadzhikistan through
the irrigation canal like net meshes, entering Syrdarya main stream via the Khujand gate, and
flowing into Aral Sea from the Chardara Reservoir through Kazakhstan. However, the water is
given in the this process between the Fergana uranium ore deposit and Aral Sea, to the livestock
drinking,, to the rice and fruits though the soil, and to the living thing of the fishery. It is in such
an environment and the size and the seriousness of the scale have the possibility of becoming
the difficulty of measures. It may exceed our assumption far together when being thinking the
generation's influence in the future.
Uranium ore deposit in the Fergana Valley
The outline of old uranium ore deposits that remain in the Fergana Valley is as follows.
The position of the Fergana Valley is shown in Fig. 1. Figs. 2 and 3 show the location of
deposits on the foot of a mountain. Each deposit surrounds the Fergana Valley, where peculiar
distribution of the uranium mines is shown, and the danger of the sullage collapse by the flood
and the landslide is shown.

5
Fig. 1 Topography and Hydrography of the Fergana Valley Novikov, V. and Rekacewicz, P: UNEP/GRID-ARENDAL, April 2005
6.
6 http://maps.grida.no/go/graphic/topography_and_hydrography_of_the_ferghana_valley

6
Fig. 3 Radioactive Waste Hotspots around Fergana Valley Emmanuelle Bournay: UNEP/GRID-Arendal, 2006
7.
1 Taboshar
Located on the southern slopes of the Kuramin Mountains, the Taboshar uranium mine
is in Tajikistan, in 60 km of Uzbekistan. It is a roofless mine which, in the fifties, stretched over
400 hectares and used more than 10,000 miners. It had an extraction complex (former mine,
processing plant and tailings) that was a huge assembly of facilities spread on over 400 hectares.
It operated between 1949 and 1965. The site consists of open-pit, few underground mines,
dismantled facilities, and a series of seven tailing sites covering 150 hectares. Since its closing
in 1973, the mine is in the state of abandonment. There is a vast hole with a lake. Three huge
radioactive tailing piles heap up 20 million tons of process residue tailings lies unprotected,
vulnerable to the erosion by the wind and the rain. The site requires urgent rehabilitation as it
poses.
7
http://maps.grida.no/go/graphic/radioactive_waste_hotspots_and_transboundary_pollution_in_central
_asia_s_ferghana_valley
7
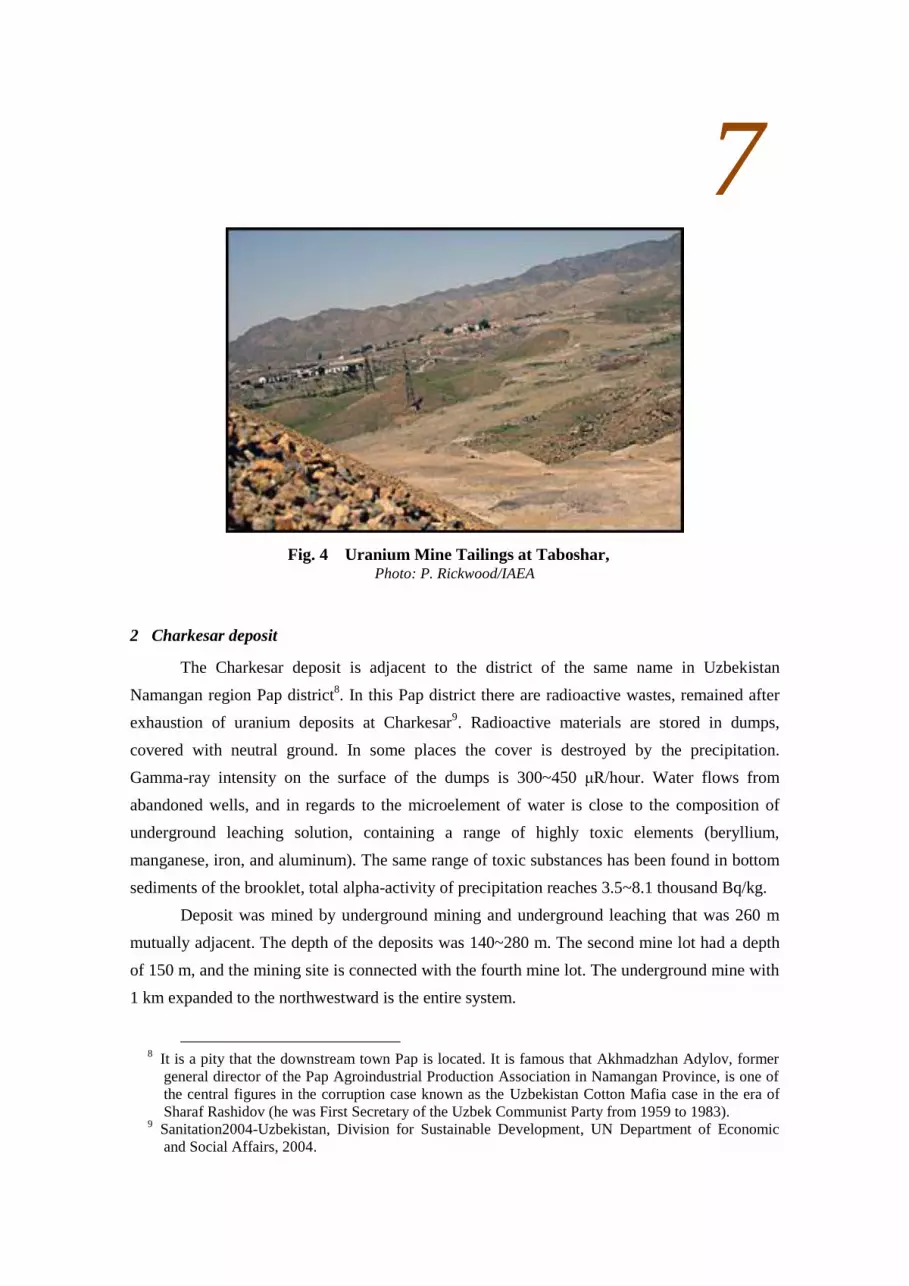
Fig. 4 Uranium Mine Tailings at Taboshar, Photo: P. Rickwood/IAEA
2 Charkesar deposit
The Charkesar deposit is adjacent to the district of the same name in Uzbekistan
Namangan region Pap district8. In this Pap district there are radioactive wastes, remained after
exhaustion of uranium deposits at Charkesar9. Radioactive materials are stored in dumps,
covered with neutral ground. In some places the cover is destroyed by the precipitation.
Gamma-ray intensity on the surface of the dumps is 300~450 μR/hour. Water flows from
abandoned wells, and in regards to the microelement of water is close to the composition of
underground leaching solution, containing a range of highly toxic elements (beryllium,
manganese, iron, and aluminum). The same range of toxic substances has been found in bottom
sediments of the brooklet, total alpha-activity of precipitation reaches 3.5~8.1 thousand Bq/kg.
Deposit was mined by underground mining and underground leaching that was 260 m
mutually adjacent. The depth of the deposits was 140~280 m. The second mine lot had a depth
of 150 m, and the mining site is connected with the fourth mine lot. The underground mine with
1 km expanded to the northwestward is the entire system.
8 It is a pity that the downstream town Pap is located. It is famous that Akhmadzhan Adylov, former
general director of the Pap Agroindustrial Production Association in Namangan Province, is one of
the central figures in the corruption case known as the Uzbekistan Cotton Mafia case in the era of
Sharaf Rashidov (he was First Secretary of the Uzbek Communist Party from 1959 to 1983). 9 Sanitation2004-Uzbekistan, Division for Sustainable Development, UN Department of Economic
and Social Affairs, 2004.

8
The entire tunnel is filled with the water
current at a height of 1,293 m above sea level, and
this water is supplied to the field irrigation and
domestic drinking. In a preliminary survey,
underwater trace element was close to the
underground leaching solution in the tunnel. It
contained sulfate, showed high mineralization
(2.75 g/l), and showed pH 6.4. Metal concentration
was beryllium 42 ppm, manganese 17 ppm, iron 38
ppm and aluminum 7 ppm. The uranium
concentration was 4,000~6,100 ppm. There was
such high density in the bottom sediment as
uranium 18~1,750 g/l, arsenic 15~25 g/l, copper
150 g/l, zinc 400 g/l and beryllium 14 g/l. Gamma
ray intensity of the rock left in brooklet is 150~200
μR/hour. The alpha ray of the sediment was
35,000-81,000 Bq/kg.
The building built in the Charkesar village
uses the material moved from nearby sullage and
Uygursay deposit. In preparatory investigations to
the Charkesar resident (8,900 people), there was a
radioactive gamma ray of 60~150 μR/hour in 50 % of 250 household buildings, and the radon
was 200~3,000 Bq/m3 that exceeded the permissible level. People contracted cancer, especially
lung cancer, circulatory disease, respiratory disease, and urogenital disease.
3 Uygursay deposit
The Uygursay deposit operated from 1947 to 1954. Three mines were worked out and
300 km of boreholes were drilled. The processing plant was in the mine deposit area, and the
radioactive material was disposed to the neighborhood of the mine. The depository site recently
became clear that it is insufficient. A detailed environmental surveillance and conservation
measures are necessary because it is karstic and is adjacent to Syrdarya up to 10km.
4 Sumsar-Shekaftar deposit
Sumsar has several prospects, including Shekaftar, which features carnolite (Potassium
uranium vanadate) mineralization in widths of up to 2.5 meters with assays up to 0.1% across a
Fig. 5 Charkesar and Uygursay Deposits near Pap close to Syrdarya
Width is around 21 km. Google Earth, 2008.

9
series of lenses. Chonkal, which features hydrothermally altered porphyries up to 10 meters in
width, with assays up to 0.09% U3O8; Tengi, which has mineralization associated with intrusive;
and Yangak-Sa, where the mineralization is associated with granites10
.
The Shekaftar deposit is in the Kyrgyzstan territory between Kasansai, Ala-Buka, Tengi,
and Varzik villages in north Fergana. The Shekaftar deposit is limited to Paleocene carbonate.
The ore containing uranium was developed from beginning of 1945 to 1958. 1,000 or more than
1,000 boreholes (141.3 m), 7.6 km underground site was developed and about 1/3 ore resources
were mined at this time. The processing plant is located in the deposit district. There is a piling
up sullage of the size of 100 m×100 m×10 m in the neighborhood. The gamma rays for the
environmental radioactivity of 50~150 μR/hour was detected in a preparatory investigation. The
uranium concentration showed 46~70 g/t and the selenium concentration showed 1.16 g/t. The
deposit is supplied as materials for building construction without permission. The tunnel head
has a heap of waste dump of 250 m×150 m×20 m piles in size, and the radioactivity is 80~250
μR/hour .
Fig. 6 Great Wall of Shekaftar
Николай Петров, 2007: http://nikolay-petrov.mylivepage.ru/image/
The mining tailings are concentrated in village Sumsar, Shekaftar and Terek-Sai of
Chatkal rayon11
. In the 1960s, uranium mining went on in Maili-say. Around the Sumsar
10
Uraniumletter International, December 2006. www.monaromining.com.au.

10
settlement, there are two mine tailings (used for exploration of lead, copper, zinc, silver and
cadmium heavy metal ores), which previously belonged to the Sumsar ore department until
1978. Three tailings ponds near the Sumsar River containing 4.5 million tons of radioactive
uranium rock, lead and toxic heavy metal salts have been partially eroded allowing a constant
inflow of heavy metal pollutants. In the territory of the Shekaftar settlement, eight dumps are
located containing 700,000 m3 of substandard uranium ores; they have not been are not
rehabilitated, and the radiation level is up to 90 μR/hour .
The waste dumps were located close to residential areas; one is located in a mountainous
area. Currently, the sites have no owners; the tailings are not monitored and are washed away
into the drinking water. The owner of the abandoned mining tailings has changed several times.
The tailings are located on the banks of the Sumsar River.
During the rain seasons, the tailing dams erode and are washed away, the tailing slopes
erode and deepen, and no rehabilitation and conservation works have been made over a long
period of time. The Shekaftar settlement drinks water from the Sumsar River and is located
down the steam from the mine tailings. Similar is the situation around Terek-Say mine complex.
5 Kyzyldzhar deposit
The Kyzyldzhar deposit in the Kyrgyzstan territory is 20 km north of Uchkurgan It
belongs to the Paleogene carbonate rock. Underground mining was done in 1957~1960. Only
the northwest part in the deposit was developed due to a difficulty and technical incompleteness
of mining. The ore waste made when developing is not reproduced, a high density radioelement
flows into the intermittent Aksai river through a temporary riverbed, and it pours into the Narin
river at an international border with Uzbekistan.
6 Maili-say deposit
The Maili-say deposit in the Kyrgyzstan territory is located, along the same name river
30 km from Uzbekistan on the northeastern border of the Fergana Valley. The uranium ore is a
carbonate rock layer of the Paleogene Alai and Turkestan range. The first discovery of the
uranium ore in this region was in 1933. The mining started in 1946 and continued for 23 years
until 1968. As for the uranium, whole quantity of uranium was mined by the underground
mining method. The depth of the mining tunnel was more than 220 m at the time of its closing.
11
Olga Pavlova: Presentations by Oblast Committee Representatives, Fourth Regional Meeting of
Local Environmental Authorities from Kyrgyzstan, Tajikistan and Uzbekistan, Dushanbe, Tajikistan,
11-12 July 2006.

11
The fineness of ore is low-grade ore (0.03-0.1 %), and is fineness ordinary ore
(0.1-0.2 %), quality item title ore (0.2-0.5 %), and a usual high-grade ore (0.5% or more). The
main portion of ore was processed at a local hydrometallurgical plant of the Maili-say facilities
to provide raw material of the Soviet nuclear weapon arsenal. These facilities also processed
uranium ores, delivered from Tajikistan (Taboshar), East Germany and Czechoslovakia12
.
Approximately 2.5 million cubic meters of radioactive waste remain in 23 tailings and 13
stockpiles of run-of-mine (ROM) ores down the valley of the river and its tributaries. The total
volume is 2.7 million m3 and the total radioactivity is 1.1x10
15 Bq. Tailings 3, 5 and 7 are
considered potential hot spots due to the danger of landslides, and could easily release a large
amount of waste material into the Maili-say river, which would flow to the Syrdarya, and the
Fergana Valley in Uzbekistan.
Fig. 7 Tailing Dumps at Maili-say13
#3, 9, ••• indicate the numbers of 23 tailings. Arrows show the landslide forces.
Photo: Министерство чрезвычайных ситуаций Кыргызской Республики
The main source of pollution is the radioactive waste that piled up in the sullage and the
slag heap14
. They have abandoned partly according to the plan and the partly because of
12
Torgoev I.A., Aleshin U.G : The history of discovering uranic deposits in Kyrgyzstan. Ecological
Bulletin MUREK, No.4, August 2002. 13
Проблема отходов, Документы и иллюстрации, Экологическое состояние региона
Ферганской долины: http://enrin.grida.no/htmls/ferghana_valley

12
spontaneous abandonment. The main source of pollution is the radioactive waste that piled up in
the sullage and the slag heap. They have abandoned partly according to the plan and the partly
because of spontaneous abandonment.
The amount of the rough estimate of radioactive waste that flowed out from the sullage
is about ten % of the primary quantities. Gamma ray is intensified and reaches to 1,000 μR/hour
on the surface of the sullage or on the rain ditch. Concentrated decay of the radon reaches
30,000~40,000 Bq/m3 or more according to the sullage condition. At present, there exists no
protection of the environment against the majority of the sullage. There is neither protective
fences for the sullage or marker that alarms the danger of the radiation. Cows pasture, children
play, and people love in a cottage on and around the tailings.
The uranium, radium, and those decay products are related to the radioactive waste in
the sullage. There is not quantitatively much uranium. An overwhelming amount of radioactive
waste pours into Maili-say river water. The composition of this river is a carbonate type. The
uranium often migrates under such a condition and forms the carbonate complex. Radium
moves with the bottom sediment.
Radium in the bottom sediment of the Maili-say river decreases to almost one tenth or
less, and the backing ground value (3×10⁻³
% uranium equivalent) is almost maintained in the
distance of 30km from the 7th deposit to Izbaskan (frontier town belonging to Uzbekistan). The
radium concentration of the stream water is about 1×10-12
g/l or less. The uranium
concentration is about 1.5×10⁻⁵
g/l, and it is one digit higher than the background level. The
chemical composition of radioactive waste reflects the initial composition of the uranium ore,
where the content of calcium is intensified, while silicon, nickel, copper, chrome, and other
elements decreases. Additionally, the density of manganese is high, and reaches 500~2,000 g/l
in the lower layer of the waste. This is a vestige of the oxidation extraction processing.
Large-scale pollution (ore splinter) exists over 15 square km2 of the Maili-say city.
Everything was collected, and kept into one of the slag heaps. Radium (10-13
g/l) of the low
concentration and reinforced uranium were seen in the sullage and the water in the city. This
water is used in the irrigation region. The intensity of the radionuclide of the drinking water is
not measured. The radionuclide of the farm products has not been surveyed. A radon
concentration in the dwelling in the city and the adjacent village in the air has not been
measured. The population densities are about 1,500 people per one square km. It is thought that
14
Gerhard Schmidt: Anlagenzustand und radiologische Bewertung der früheren
Urangewinnungsanlagen am Standort Mailii Su (Kirgisstan), im Auftrag der Friedrich Ebert
Stiftung, Büro Bischkek (Kirgisstan), December 1997.

13
the population living from the Maili-say valley to the Uzbekistan Izbaskan village in the
Fergana Valley is the risk group. The adjoining land is a farming region now.
Various accidents occurred in the past 30 years. A part of the sullage was destroyed by
the landslide in 1958, 1984, 1994, and 2002. When all of the sullage collapses, 1.15 million m3
of the sullage with the radionuclide of 10,600 Ci will be thrown to the Izbaskan village. The
area polluted by it will be 300 km2.
They are uranium tailings accumulated in mountain valleys close to the Uzbek border
(Andijan and Fergana oblasts). Most of the tailing dams are unstable due to insufficient storage
capacity, and are not equipped with a base lining to prevent seepage of hazardous substances
into surface and groundwater. The potential risk of accidents due to geological hazards, like
landslides, mudflows, or earthquakes, is high. In April, 1958 after an earthquake and heavy
rains the weak dam of the tailing #7 in Maili-say was destroyed, being constructed only 30 m
away from the Maili-say river. 600,000 m3 of the tailings (about 50 % of the total volume) were
spilled into the river. The radioactive mudflow destroyed a lot of houses in the town, people
were killed and the tailings were spread over 40 km down by the river, contaminating flood
plains. Cleaning up agricultural fields was going on for many years. Since 1958, when a breach
in a tailing dam released 6,000 m3 of radioactive material along 25 km in the Maili-say river,
these processes have been documented in the region. From 1992 to 1996, several landslides
triggered by tectonic events led to the erosion and partial destruction of some tailings, releasing
toxic materials into the environment. The population densities are about 1,500 /km2. The people
living from the Maili-say valley to the Uzbekistan Izbaskan village is the risk group.
7 Yangiabad deposit
The Yangiabad deposit is located in the Dukentsay river valley that flows from the north
side into the town of Angren. Dukentsay river valley is located in the North-Eastern part of
Chatkal mountain ridge of Tien Shan mountains. The river is formed by confluence of two
small mountain streams - Alatanga and Chilten. When coming out from mountains the river is
frill of rapids and then it joins bigger river - Akhangaran which in its turn feeds Tuyabuguz
(alias Tashkent lake) reservoir before flowing into Syrdarya river. Hydrothermal and
sedimentary deposit had been operating for 1950-1980 on this ground.
Radioactive wastes of exhaust deposits of Yangiabad mining field are located on the
area of about 50 km2 in the Akhangaran district of Tashkent region
15. Radioactive waste from
15
Sanitation2004-Uzbekistan, Division for Sustainable Development, UN Department of Economic
and Social Affairs, 2004.

14
the uranium mine (heap of mined ore below an industrial standard) piles up in the Yangiabad
region. The gross volume of stored there contaminated material is about 500 thousand m3. The
uranium of 250-300 tons is contained in the storing soil. Abnormally high radium intensity
(2,500 Bq/m3) is found in an accommodation of Yangiabad and its site. Intensity of
gamma-radiation within the limits of contaminated areas here is around 60~200 μR/hour, and
seldom 1,500 μR/hour. Main radioactive material is referred to low radioactive waste. The basic
data has been collected to execute inactivation and care work by Republican point for
radioactive waste disposal (RPRWD).
Since 1970 RPRWD undertakes disposal of all radioactive waste, produced in all
research institutions, medical institutions and sectors of economy. It has been determined in the
result of survey, which outside the borders of sanitary protection zone RPRWD has no negative
impact on the environment.
There is the Angren open-pit brown coal deposit that is the biggest in Uzbekistan in the
Akhangaran river valley where the Dukentsay river flows in. This valley expands 100 km or
more (10km in width). Part of the coal produced from this deposit contains uranium. Fly ash is
generated if this coal is burnt in the thermal power plant combustion furnace, and the density of
the radionuclide increases by a factor of several. A part of this coal fly ash is discharged from
the chimney and does the diffusion and deposition in the surrounding. This problem of
radioactive coal is serious for Uzbekistan.
Fig. 8 A View of Yangiabad
8 Chkalovsk Uranium Combine
Vostokredmet (Востокредмет: Eastern Plant of Rare Metals, or Khujand Uranium and
Refining Association)16
, known as the Leninabad Mining and Chemical Combine until 1992,
was established at Chkalovsk in May 1945 by Lavrenti Beria, the Soviet secret police chief, to
mine and process uranium from deposits in Tajikistan, Kyrgyzstan, and Uzbekistan. During the
16
Anya Loukianova: Tajikistan Profile, NTI Working for a Safer World, Updated November 2007

15
Cold War years, Vostokredmet produced yellowcake for the Soviet nuclear power and defense
industries, processing up to 1,000,000 metric tons of uranium ore per year. The uranium
produced at Chkalovsk exploded the first Soviet nuclear bomb at Semipalatinsk in August 1949.
Radioactive ore was processed at the western industrial complex of Vostokredmet that is
in the vicinity of reservoir Kairakkum. The waste was piled up in the Dehmai village, located 10
km southwest of Chkalovsk and the Gafurov village. This has the major risk for the pollution of
the Syrdarya river.
The most serious source of danger is a waste dump in the town of Dehmai. This site,
which contains 36 million tons of waste, has not been guarded for more than 10 years. A vast
amount of water accumulates in its pit during the winter period, which then dries up in summer.
Thus, radioactive dust rises from the dump and settles in some parts of the city of Chkalovsk,
not far from Khujand, the center of the province. According to experts, in some parts of
Khujand (primarily residential areas) the background radiation reading is 80 μR/hour and higher.
But in certain parts of the Sogd area, background radiation can be as high as 1,000 μR/hour
(IWPR; nuclear.kz 04.04.05)17
. The maximum permissible concentration in Tajikistan is 57
μR/hour.
Unaware of the terrible dangers posed by
uranium waste, people continue to build houses and
plant gardens next to the dumps.
Fig. 9 A View of Khujand
Uranium ore deposit in Kyzylkum Desert
The facilities are subordinate to the Navoi Mining and Metallurgy Combine (NMMC) in
the Navoi City. In 1999, NMMC produced 2,130 metric tons (t) of uranium, or 6.8% of the
world's total output. Output for 2006 is estimated at 2,270t per year from the Northern, Central
and Southern mining districts18
. The uranium deposits are in the central Kyzylkum area, a
125km wide belt extending 400km from Uchkuduk in the northwest to Nurabad in the southeast.
17
Daler Hamidov: Tajikistan’s Atomic Dustbin, IWPR, Reporting Central Asia 394, 8 July 2005. 18
Uranium production figures, Information Papers, 1998-2006: World Nuclear Association,
http://www.world-nuclear.org/info/uprod.html.

16
It has a uranium waste reservoir from 1961. The area is 23.4 ha and the amount of waste is 3
mln. tons. Waste is composed of sand and clay containing 120-200 g/t of uranium. NMMC
monitors the state of waste.
Uranium extraction had shifted from conventional and underground operations to in-situ
leaching (ISL) operations. Fig. 9 shows the location of the uranium deposit in Kyzylkum Desert.
When the uranium is developed by ISL method, local pollution appears in the ambient
surrounding. The reason of this pollution is that the balance of injection and suction of the
solvent collapses, and the solvent left in the deposit extends to the vein of underground water.
The target of pollution is the atmosphere, soil, and underground water.
Underground ISL by the sulfuric acid injection worsens the ecology of the vein of
underground water that includes the mineral in the surrounding, and the quality of underground
water deteriorates. The contaminant is sulphuric acid ion, hydrogen ion, uranium, iron,
aluminum, and manganese, other heavy metals contained in the solvent, and nitrate at the stage
of processing. Sulfate rises 20 times or more, aluminum and uranium rise 100 times more, and
the pollution level of iron and the beryllium rises to about 1,000 times.
Fig. 10 Location of Uranium Deposit in Kyzylkum Desert

17
When the carbonate is used with the oxidant by underground ISL, the underground
water concentrates not much. Though the ecology of underground water that includes the
mineral deteriorates, yet the degree is lower than it injects sulfuric acid. Other elements do not
change though the carbonate use slightly increases carbonate, calcium, ammonia, chlorine,
sulfate, uranium, and molybdenum.
Local environmental pollution extends only within the range of 100-150 m for
underground leaching. However, there is considerable danger even when underground water is
used as household water and drinking water. The polluted water table area has been extending
little by little for 8-10 years according to the regular observation though the solvent component
of the underground ISL district does not change much. This result doesn't expect a fast
self-reproduction of underground water.
Underground uranium ore deposit is required to be reproduced for the regeneration of
water quality. Especially, the vein of underground water must be reproduced under the
freshwater environment. Almost all underground ISL districts of Uzbekistan are under the vein
of salt water.
Besides the waste repository and the underground leaching district mentioned above,
there is "The first Navoi Hydro–Metallurgical Plant (NHMP)" of NMMC located in the left
bank of Zarafshan to the west of Navoi City. The area of the sullage storing dam is 630 ha. The
height of the dam is 15m. The sullage renunciation began in 1964, and the piled up waste is 59.7
million tons. Waste is a fine schlich that remained after processing uranium mineral at
Uchkuduk, Sugraly and Sabyrsay deposit. The radioactivity is 90 kBq/kg and the radionuclide
gross intensity is 160,000 Ci. The storing dam water is seen to enter into the underground water
vein. It increases the ions of the underground water salinity, the sulphuric acid, the chlorine,
iron, the selenium, and manganese within the range to Zarafshan up to 1.5km. Moreover, a
pulverization has been generated on the surface of dam.
The gamma rays of the sullage storing dam is 300~500 μR/h according to the radiation
monitoring data in 1998, and the extent of the impact is 300~400 m.
Waste by the gold production is piled up on the waste from the uranium production in
the sullage storing dam now. To ease the ecological effect with this sullage storing dam, the
following measures are taken: The ooze solvent is returned to the disposal factory by 24
pumping out well drain systems; regular monitoring observes the change in the chemical
composition of underground water in the sullage region at 108 observation wells.

18
Environmental surveillance around Yangiabad deposit
The Yangiabad deposit is located along Dukentsay river. Dukentsay Valley is located in
the North-Eastern part of Chatkal mountains ridge of Tien Shan mountainous area. The river is
formed by confluence of two small mountain streams - Alatanga and Chilten. Large left
tributary -Kattasay- inflows to Dukentsay near Yangiabad township. When coming out from
mountains the river is frill of rapids and then it joins bigger river - Akhangaran which in its turn
feeds Tuyabuguz reservoir before flowing into Syrdarya. Dukentsay has rapid flow and unstable
hydrogeological regime. Maximum water level appears in spring and early summer. Ecological
state of Dukentsay Valley depends on worked out deposits of uranium which forms
Kattasay-Alatanga ore field of 50 km2 total area. During the exploration and operation 64 mines
were developed. All of these mines have wastes stockpiles with higher content of natural
radionuclide. Besides, several industrial radioactive waste piles are located in the valley. The
Dukentsay Valley is a radon generation region with radioactive waste. Waste consists of the
rock and the abandonment mining equipment put out along with ore and digging in the tunnel
that exists in the nonequilibrium state. The capacity is 500,000 m3, and everything approaches
the Dukentsay.
The National Geological Group Kyzyltepageologia jointly made a site investigation of
Yangiabad in October 1998 with us. The aquatic sample was first gathered from two branches
of Alatanga and Chilten that was the source of the Dukentsay and the outflow water from the
tunnel of an old uranium mine was gathered. Afterwards, the aquatic sample of the Akhangaran
and the Tuyabuguz reservoir was gathered from the Dukentsay mid and downstream.
At each final sampling point, following field data were measured simultaneously: global
position by SONY GPS; pH, electronic conductivity, turbidity, dissolved oxygen, water
temperature, and salinity by Horiba multiple water quality monitoring system U-10. Table 1
shows these field data. Sampled water of 250 or 300 ml was immediately filtered by Millipore
filter of 5 micrometer and 0.45 micrometer respectively and stored in 100, 50 and 20 ml
polypropylene bottles that had been pretreated in Japan by hydrochloric acid after cleaned up by
surface active cleansing agent.
After the expedition, alkalinity was measured in Tashkent by titration of 0.02N H2SO4
down to pH 4.3. After coming back to Japan, following ion concentrations were measured by
Shimadzu ion chromatographic analyzer HIC-6A: Na+, K
+, Mg
2+, Ca
2+, Cl
– and SO4
2–.

19
No. Lat Long alt pH Cond DO w.Temp Salinity
deg min sec deg min sec m mS/cm mg/l ℃ %
1 41° 6' 48.6" 70° 5' 18.4" 1342 8.38 0.211 7.7 14.1 0
2 41° 6' 48.6" 70° 5' 18.4" 1342 8.42 0.61 5.82 18.1 0.02
3 41° 6' 57.3" 70° 5' 28.8" 1261 8.42 0.241 7.4 15.5 0
4 41° 7' 23.4" 70° 6' 21.0" 1342 7.88 0.097 7.3 15.2 0
5 41° 8' 9.9" 70° 7' 11.7" 1338 8.22 0.338 7.12 17.6 0.01
6 41° 8' 48.0" 70° 7' 59.4" 1335 8.06 0.115 6.88 14.1 0
7 41° 7' 31.6" 70° 5' 45.0" 1558 8.58 0.153 7.01 15.1 0
8 41° 8' 11.7" 70° 5' 45.7" 1393 8.71 0.155 6.91 15.9 0
9 41° 8' 11.7" 70° 5' 47.7" 1393 8.65 0.304 6.86 15 0.01
10 41° 8' 37.5" 70° 5' 44.7" 8.58 0.152 6.66 13.4 0
11 8.16 0.147 6.62 14.9 0
12 8 0.325 5.58 15.8 0.01
13 41° 9' 13.2" 70° 5' 35.4" 1261 8.22 0.158 6.76 14.1 0
14 41° 9' 13.2" 70° 5' 35.4" 1231 8.38 0.118 6.66 15 0
15 41° 9' 13.2" 70° 5' 35.4" 1261 7.88 0.134 6.69 14.4 0
16 41° 9' 22.8" 70° 5' 27.3" 1500 8.05 0.147 6.8 13.1 0
17 41° 9' 22.8" 70° 5' 27.3" 1500 8.24 0.374 3.79 14.3 0.01
18 41° 9' 22.8" 70° 5' 27.3" 1300 8.32 0.146 6.83 13.2 0
19 40° 7' 39.3" 70° 6' 38.1" 1371 8.34 0.138 8.34 8.9 0
20 41° 7' 12.3" 70° 5' 55.8" 7.83 0.103 0 11.9 0 14
21 41° 6' 12.3" 70° 5' 16.2" 1150 8.18 0.739 7.85 10.1 0.03
22 41° 6' 12.3" 70° 5' 16.2" 1150 8.28 0.234 7.76 11 0
23 41° 6' 12.3" 70° 5' 16.2" 1150 8.07 0.271 7.75 10.8 0.01
24 41° 5' 25.0" 70° 5' 15.3" 1130 8.57 0.737 7.65 10.1 0.03
25 41° 4' 3.9" 70° 5' 21.3" 1039 8.2 0.422 7.33 13.2 0.01
26 41° 2' 37.5" 70° 5' 33.6" 1010 8.93 0.333 7.76 13.1 0.01
27 41° 2' 14.8" 70° 6' 0.6" 1039 8.87 0.335 7.57 13.1 0.01
28 40° 58' 42.3" 70° 2' 53.7" 922 8.82 0.371 8.38 13.7 0.01
29 40° 58' 6.9" 70° 3' 6.3" 837 8.25 0.299 7.72 14.7 0.01
30 40° 37' 15.0" 70° 2' 53.3" 800 8.36 0.663 8.05 11.6 0.02
31 40° 39' 42.4" 70° 6' 40.3" 760 8.58 0.269 7.41 14.9 0.01
32 41° 0' 42.7" 70° 8' 9.0" 986 8.54 0.174 7.6 14.5 0
33 40° 56' 6.0" 69° 54' 2.1" 657 9.09 0.34 8.51 16 0.01
34 40° 54' 3.9" 69° 36' 1.3" 555 8.55 0.43 8.3 15.3 0.01
35 40° 53' 5.7" 69° 31' 33.0" 442 7.68 0.561 7.52 17.4 0.02
36 40° 57' 46.0" 69° 22' 39.0" 379 8.29 1.01 6.87 13.9 0.04
Table 1 Position of Sampling Sites and Its Field Data
Site without longitude and latitude is the same with the preceding site.

20
Dissolved inorganic nitrogen (DIN), dissolved inorganic phosphorus (DIP) was measured
by Technicon Instruments Corporation Auto Analyzer II. Standard for NH4, NO2 and NO3 were
special grade reagents of (NH4)2SO4, NaNO2 and KNO3 from Wako Pure Chemical Industries,
Ltd. These reagents were first dried for one hour at a temperature of 110 °C, and adjusted to
each concentration after cooled in desiccators. Standard PO4 from Wako Pure Chemical
Industries, Ltd. was also used. Note that the unit of DIN and DIP is the amount of simple
elements of nitrogen and phosphorus, while that of NH4+ and NO3
– is the amount of molecular
weight of each ion.
Metal concentration was analyzed by Hewlett Packard HP 4500 inductively coupled
plasma mass spectrometer (ICP-MS) for U238
, Pb208
, Au197
, Sb121
, Cd111
, Se82
, As75
, Zn66
, Cu63
,
Ni60
, Fe57
, Fe56
, Mn55
, Cr53
, and Al27
. B11
was also measured. Standard solutions were adjusted
to blank, 2.50, 5.00, 10.0, 25.0 and 50.0 ppb for Zn66
, Fe57
, Fe56
, Mn55
, Al27
and B11
. Standards
for U238
and Sb121
were blank, 0.05, 0.10, 0.20, 0.05 and 1.00 ppb. Standards for other elements
were blank, 0.50, 1.00, 2.00, 5.00 and 10.0 ppb. Samples were diluted to one hundredth and
internal standards method was applied. Ga69
, In115
and Bi209
were added to be of 50 ppb for
elements whose mass numbers is less than 82, for Cd111
and Sb121
, and for Pb208
and U238
respectively. Integral time was 3 seconds. For comparison of uranium analyses, integral time of
10 seconds was also tried. Calibration was a logarithmic linear regression curve.
Table 1, Fig. 11 and Table 2 show the result. The uranium concentration is shown and
the one that logarithm circle of each point was displayed in Fig. 12.
Collection point 5 is drain from the uranium ore mountain tunnel before. Collection
point 6 is a drinking water head of a river for Yangiabad. Collection point 12 is ooze water from
the pit where the bore investigation was done before. In collection point 16, there is a headrace
tunnel over a few km of upstream, and the river before is a withering valley.
To confirm the correspondence of the ICP-MS analysis, the uranium concentration of 20
samples was independently analyzed in the Kanazawa University Low-level Radiation Research
Facilities. The correlation coefficient of the analysis value of us and Kanazawa University
indicated a high value, and it was confirmed that it was an analysis value to which the result in
Table 2 was steady.
. We found that the uranium concentration of the river water around Yangiabad was
unbelievably high (10 to 1,000 ppb-U238
). Annual discharge of U238
was estimated to be three
tons per year. U235
from Dukentsay to Akhangaran was estimated to be at least of 22 kilogram
per year. This is equivalent to the amount of two nuclear bombs of Nagasaki type

21

22
(unit:ppb)
B 11 Al 27
Cr 53 Mn
55 Fe 57
Ni 60 Cu 63
Zn 66 As 75
Se 82 Mo 95
Cd 115 Sb
121 Au 197
Pb 208 U 238
Kanazawa
1 78.9 75.3 14.5 9.58 298 5.8 18.5 13.3 2.9 37.2 37.4 2.5 1.1 4.9 5.5 100.2 101.2
2 251.7 47.8 17.0 6.20 301 6.8 22.3 15.7 5.8 37.2 8.7 2.1 0.9 5.1 5.9 8.3
3 81.8 52.2 14.4 7.05 333 8.6 19.2 28.0 3.5 35.3 53.3 1.5 0.9 3.9 7.8 176.9 159.9
4 72.7 67.0 13.2 6.18 319 8.1 15.0 21.4 2.5 33.7 10.3 1.4 0.7 3.6 7.5 13.2
5 70.9 51.4 13.3 6.60 326 14.1 18.9 99.5 4.8 37.1 320.6 1.6 1.5 3.1 7.0 1312.0 1156.6
6 119.2 53.3 12.8 6.65 328 8.7 17.8 25.3 2.4 29.8 13.4 1.4 0.7 4.2 13.3 5.6 4.6
7 82.8 58.2 12.1 6.65 348 8.4 15.9 21.6 3.0 30.7 17.5 1.4 0.7 3.9 5.4 18.1 15.7
8 72.0 55.7 11.8 6.58 329 8.4 16.3 22.5 2.9 29.3 16.5 1.3 0.8 3.6 7.1 17.8
9 74.9 47.5 11.6 6.43 347 9.0 18.7 21.9 4.0 30.6 12.4 1.5 0.9 3.6 8.8 4.3 3.8
10 61.5 58.6 12.0 6.35 326 8.8 17.9 20.1 2.8 30.5 14.6 1.3 0.7 3.7 9.7 15.6
11 55.6 56.4 11.8 6.51 326 9.4 17.4 18.6 2.7 30.7 14.0 1.3 0.6 3.2 16.3 15.4 13.2
12 57.2 55.4 11.5 7.33 394 9.6 24.4 44.7 3.7 32.2 278.1 1.5 1.3 2.6 149.5 121.0
13 46.2 50.8 11.7 7.05 408 9.2 16.1 22.6 1.9 34.1 15.6 1.7 0.7 2.1 6.2 6.5 15.5
14 41.8 51.0 11.6 6.77 416 9.3 15.9 16.1 1.7 34.8 6.8 1.6 0.6 2.1 6.9 2.7
15 104.3 49.0 11.5 6.71 365 8.6 18.0 18.4 2.8 31.3 14.3 1.4 0.7 3.5 7.5 17.9 15.6
16 72.2 75.4 11.6 8.16 359 10.0 316.2 285.4 2.6 29.3 8.0 1.4 0.7 3.9 21.9 8.4 7.4
17 73.9 49.9 11.3 6.59 353 8.9 17.2 22.0 31.6 30.7 87.1 1.4 2.5 4.1 8.1 285.8 246.5
18 36.0 47.1 12.3 7.49 465 9.5 14.0 14.2 1.7 37.9 6.4 1.7 0.7 2.0 8.7 5.5 4.9
19 56.3 54.5 11.4 7.03 344 9.1 17.7 36.2 2.4 30.2 32.2 1.5 0.7 3.0 11.2 103.6 89.8
20 53.1 47.2 11.4 8.46 339 9.3 17.9 43.3 1.8 30.5 9.0 1.4 0.7 3.0 13.5 13.1
21 273.2 50.4 11.6 7.61 346 9.3 26.0 70.1 2.5 31.4 8.3 1.4 0.9 2.9 15.9 7.3 6.4
22 60.9 40.8 11.0 8.10 375 8.4 13.3 14.6 2.5 31.5 14.6 1.5 0.7 2.9 6.5 79.2
23 86.8 40.8 11.2 7.09 351 8.6 14.5 14.9 3.1 32.2 32.9 1.4 0.7 3.0 4.3 94.4 81.6
24 171.1 46.3 11.7 7.14 370 8.9 16.7 13.8 4.9 31.7 40.0 1.5 1.7 2.9 18.4 111.8
25 180.6 48.2 11.3 7.12 343 9.2 20.7 17.7 5.4 31.3 40.1 1.4 1.0 3.9 6.1 101.4 87.1
26 123.2 43.6 11.8 6.96 342 8.5 15.2 14.5 4.1 29.8 35.3 1.4 0.9 3.3 11.9 103.7
27 104.3 63.6 11.8 7.67 339 10.9 18.6 21.2 4.8 31.3 35.2 1.5 0.9 3.8 19.5 105.4 92
28 90.8 39.3 11.7 7.03 353 8.7 14.8 12.9 2.2 34.4 7.0 1.6 0.8 2.9 3.4 6.2 5
29 104.0 57.9 11.9 8.11 435 9.4 14.4 14.8 2.2 35.6 10.9 1.8 0.8 2.9 3.6 9.0
30 145.4 160.9 12.5 298.10 466 11.6 27.8 31.0 1.8 37.8 6.2 2.5 1.0 5.0 13.8 3.6 2.9
31 115.8 86.8 12.3 8.68 482 9.5 15.7 17.7 3.3 38.6 20.9 1.9 1.0 3.1 6.6 36.0
32 51.6 50.7 12.1 8.18 475 9.5 14.2 11.2 2.3 38.7 7.6 1.8 0.8 2.3 3.8 3.9 3.1
33 115.8 61.9 12.7 8.45 491 9.7 17.9 15.7 2.7 39.3 10.4 1.8 0.9 2.6 9.2 9.3
34 107.2 48.1 12.5 7.92 502 9.9 17.0 105.8 2.1 38.5 8.8 1.9 1.0 2.7 15.9 8.0
35 152.6 45.1 12.5 7.99 528 9.8 15.6 13.6 1.7 38.6 6.6 1.8 0.9 2.6 4.6 15.1
36 146.6 41.7 15.1 7.64 475 9.4 19.8 15.0 2.3 39.0 6.1 1.8 0.8 3.0 8.8 5.0
G-1 5,000 200 50 100 200 50 1,000 5,000 50 10 5 50 10
G-2 5,000 5,000 100 50 5,000 200 200 2,000 100 20 10 10
Table 2 Result of Ultimate Analysis by ICP-MS Colored Value shows higher one than other sites. G1 is the Guideline of drinking water of
WHO, EEC, or Canada, while G2 is the Guideline for irrigation water by FAO.
Kanazawa means the analysed value of U238
by Kanazawa University for cross check.

23

24
The following three points are paid to attention if consideration of the water quality around
Yangiabad is added based on the above-mentioned analysis result.
1 It is iron, a selenium, a molybdenum (irrigation rainwater), and a uranium that
exceeds the guideline value. Especially, the uranium is high density in the
Dukentsay, and about 100 ppb is kept in the middle and lower reaches. There is a
mineral water manufacturing factory along the river. This is a remains of the
temporary favor of radioactive mineral spring.
2 The point where higher density is shown compared with other points is near an
old tunnel such as 5, 12, 16, and 17. Moreover, 30 point is a lower part of
Gushsay river that flows from the south into Akhangaran. There are a lot of mines
in the upper part of Gushsay river.
3 Dukentsay should not be used for the drinking water source as an interim measure,
and water transmission from the Kattasay upstream and the Karabau river (river
that goes parallel in the west to Dukentsay) should be promoted. However, the
infestation of Islam guerrilla comes to common in the Yangiabad region, and a
big social problem exists in the background of the river securing.
Up-to-date analysis results (Table 2) and collected bibliography shows exceeded value
of limited specific intensity (370 Bq/kg) for all sediments samples. The highest level occurs in
Kattasay, where river washes rock piles along the river. Bottom sediments are specified with
high value of summary alpha-activeness reaching 4,000-5,000 Bq/kg, expositional doze of 60-
110 μR/h. In total, Dukentsay has lower value of specific alpha-activeness as compared with
Kattasay and Jekindeksay samples.
Problems and Conclusion
There are many urgent problems posed to the present and future generation. First is the
possibility of the spillage of uranium and other toxic metals flowing from the tailings in Fergana
Valley into Syrdarya basin. Recent land sliding process has been intensified in this area. The
development of this process can cause the destruction of the tailing ponds and environmental
pollution.
Second is the constant discharge of uranium and other metals from the tailings and old
mining galleries. We estimated annual amount of U235
discharged from Yangiabad mines, and
got 30 kg/year. This is equivalent to the materials of three nuclear weapons.
Third is the discharge of uranium into atmosphere. Angren is famous for its production of
open pit coal in Uzbekistan. This coal contains not only carbon but uranium also. After the

25
burning of carbon, the ash that is reinforced the content of uranium is discharged into the air and
falls down in the vicinity of power plants.
Fourth is the contamination of food chain in and along the river, canal, drainage, well, etc.
that originate the pollution of water and soil. In the era of USSR, Uzbekistan was, in some sense,
fortunately a cotton producing country. But agriculture itself is the source of industry, intensive
labor, culture preservation and independence of the country.
There is no investigation of the health of people, especially from the epidemiological
viewpoint. Exception is the investigations made in the area of Charkesar settlement (number of
the population is 8,900 people.) It indicated that in 50% of the houses investigated ionizing
radiation and radon exaltation level was higher than it is allowable. People used to make bricks
from tailings and live inside the radon exposing houses. Population of the area is suffering from
cancer deceases, including lung cancer, it is said.
Acknowledgement
This Joint Field Survey Expedition Team would like to express their sincere gratitude to
Academician Pulat Khabibullayev for his heartily and permanent support as a Chairman of the
State Committee for Science and Technology of the Republic of Uzbekistan. He always
encouraged us to promote the international scientific cooperation. This research forms part of
Japan Monbusho International Scientific Research Program: Joint Research (Subject No.
09044028.)