
8 6 -5 5 Tomo 3 MODELACIÓN MATEMÁTICA DE FENÓMENOS DEL MEDIO AMBIENTE Y LA SALUD Capítulo 6...
14
55 8 6 - 5 5 Tomo 3 MODELACIÓN MATEMÁTICA DE FENÓMENOS DEL MEDIO AMBIENTE Y LA SALUD Capítulo 6 STUDIES OF CANCER PROBLEMS USING RANKED SET SAMPLES A. I. Al-Omari*, C. N. Bouza**, A. Santiago *** and J. M. Sautto*** * Al al-Bayt University, Faculty of Science, Department of Mathematics, Jordan **Universidad de La Habana, Cuba. ***Universidad Autónoma de Guerrero ABSTRACT We present some studies on cancer issues where samples are needed. Ranked set sampling (RSS) is considered as a challenging model and it is compared with the behavior of simple random sampling (SRS). The accuracy of RSS methods is larger than SRS. These results suggest that RSS allows increasing the accuracy for a fixed cost or reducing the costs for a fixed error. KEYWORDS: RSS, SRS, tumor size, ratio, quantile, mean variance RESUMEN Presentamos algunos estudios de problemas de cáncer en los que se utilizan muestras. El muestreo por conjuntos ordenados (Ranked set sampling, RSS) es considerado como un modelo competitivo y se compara con el comportamiento del muestreo simple aleatorio (MSA). La precisión de los métodos basados en RSS es mayor que la del MSA. Estos resultados sugieren que el RSS permite incrementar la precisión para un costo fijo o reducir los costos para un error fijo. 1. INTRODUCTION In this chapter, we will present some studies where the well known ranked set sampling (RSS) methods as well as some of its modifications are applied. The RSS was first suggested by McIntyre (1952) for estimating the population mean of pasture and forage yields. He claimed without proof that RSS was more accurate than simple random sample, its efficiency for estimating the higher population moments is better than that of SRS unless if the underlying distribution is rectangular in shape. Takahasi and Wakimoto (1968) have given a mathematical theory of RSS. The usual sampling designs are characterized as follows: Definition A randomly selected sample from a larger sample or population, giving all the individuals in the sample an equal chance to be chosen. (Cochran 1977). RSS may be considered as a “controlled random sampling” design. It can be described as follows: Step 1: Randomly select m 2 units from the target population. Step 2: Allocate the m 2 selected units as randomly as possible into m sets, each of size m. Step 3: Without yet knowing any values for the variable of interest, rank the units within each set with respect to variable of interest. This may be based on personal professional judgment or done with concomitant variable correlated with the variable of interest. Step 4: Choose a sample for actual quantification by including the smallest ranked unit in the first set, the second smallest ranked unit in the second set, the process is continues in this way until the largest ranked unit is selected from the last set. Step 5: Repeat Steps 1 through 4 for n cycles to obtain a sample of size mn for actual quantification. For fixing some ideas, consider a random sample from a distribution F(x), which admits a density function f (x), with a mean and a variance 2 . With compared to SRS, RSS uses one unit, namely, 1(1: ) m X , the lowest unit from this set, then 2(2: ) m X , the second lowest unit from another independent set of m
-
Upload
independent -
Category
Documents
-
view
0 -
download
0
Transcript of 8 6 -5 5 Tomo 3 MODELACIÓN MATEMÁTICA DE FENÓMENOS DEL MEDIO AMBIENTE Y LA SALUD Capítulo 6...

55
86-55 Tomo 3 MODELACIÓN MATEMÁTICA DE FENÓMENOS DEL MEDIO AMBIENTE Y LA SALUD
Capítulo 6 STUDIES OF CANCER PROBLEMS USING RANKED SET SAMPLES
A. I. Al-Omari*, C. N. Bouza**, A. Santiago *** and J. M. Sautto***
* Al al-Bayt University, Faculty of Science, Department of Mathematics, Jordan
**Universidad de La Habana, Cuba.
***Universidad Autónoma de Guerrero
ABSTRACT
We present some studies on cancer issues where samples are needed. Ranked set sampling (RSS) is
considered as a challenging model and it is compared with the behavior of simple random sampling
(SRS). The accuracy of RSS methods is larger than SRS. These results suggest that RSS allows
increasing the accuracy for a fixed cost or reducing the costs for a fixed error.
KEYWORDS: RSS, SRS, tumor size, ratio, quantile, mean variance
RESUMEN
Presentamos algunos estudios de problemas de cáncer en los que se utilizan muestras. El muestreo por
conjuntos ordenados (Ranked set sampling, RSS) es considerado como un modelo competitivo y se
compara con el comportamiento del muestreo simple aleatorio (MSA). La precisión de los métodos
basados en RSS es mayor que la del MSA. Estos resultados sugieren que el RSS permite incrementar
la precisión para un costo fijo o reducir los costos para un error fijo.
1. INTRODUCTION
In this chapter, we will present some studies where the well known ranked set sampling (RSS)
methods as well as some of its modifications are applied. The RSS was first suggested by McIntyre (1952) for
estimating the population mean of pasture and forage yields. He claimed without proof that RSS was more
accurate than simple random sample, its efficiency for estimating the higher population moments is better
than that of SRS unless if the underlying distribution is rectangular in shape. Takahasi and Wakimoto (1968)
have given a mathematical theory of RSS.
The usual sampling designs are characterized as follows:
Definition A randomly selected sample from a larger sample or population, giving all the individuals in the
sample an equal chance to be chosen. (Cochran 1977).
RSS may be considered as a “controlled random sampling” design. It can be described as follows:
Step 1: Randomly select m2 units from the target population.
Step 2: Allocate the m2 selected units as randomly as possible into m sets, each of size m.
Step 3: Without yet knowing any values for the variable of interest, rank the units within each set with respect
to variable of interest. This may be based on personal professional judgment or done with
concomitant variable correlated with the variable of interest.
Step 4: Choose a sample for actual quantification by including the smallest ranked unit in the first set,
the second smallest ranked unit in the second set, the process is continues in this way until the largest
ranked unit is selected from the last set.
Step 5: Repeat Steps 1 through 4 for n cycles to obtain a sample of size mn for actual quantification.
For fixing some ideas, consider a random sample from a distribution F(x), which admits a density
function f (x), with a mean and a variance 2 . With compared to SRS, RSS uses one unit, namely,
1(1: )mX , the lowest unit from this set, then 2(2: )mX , the second lowest unit from another independent set of m
56
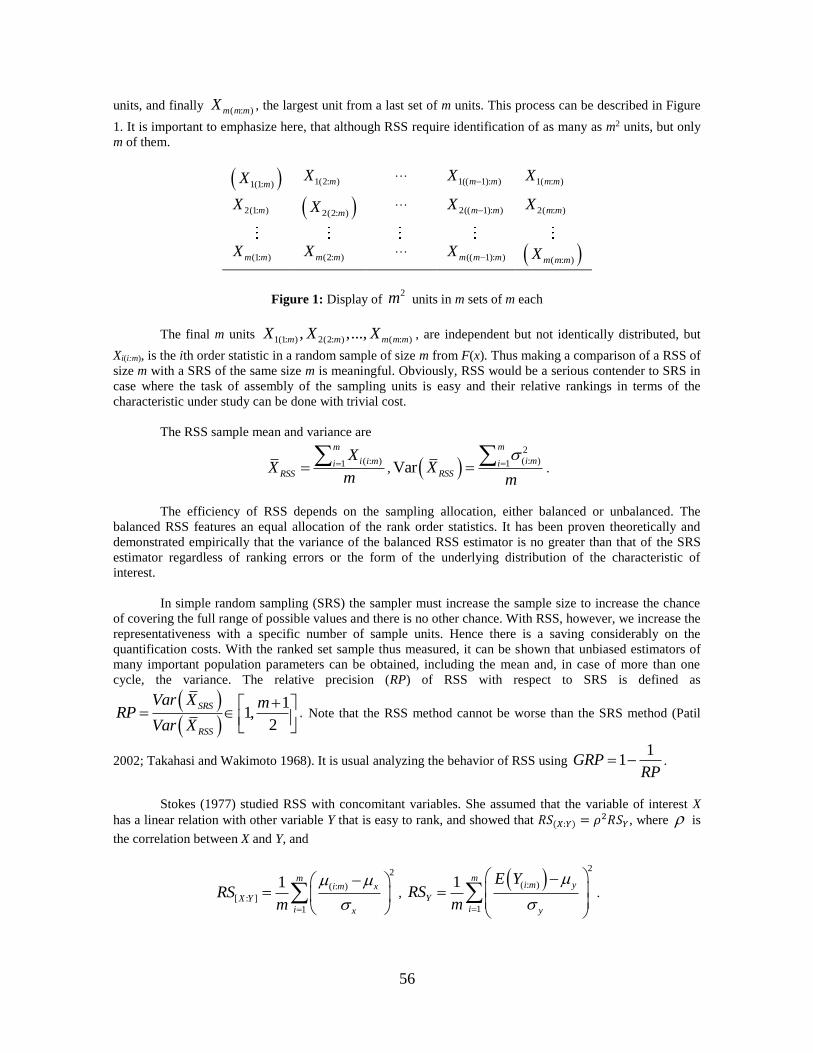
units, and finally ( : )m m mX , the largest unit from a last set of m units. This process can be described in Figure
1. It is important to emphasize here, that although RSS require identification of as many as m2 units, but only
m of them.
1(1: )mX 1(2: )mX … 1(( 1): )m mX 1( : )m mX
2(1: )mX 2(2: )mX …
2(( 1): )m mX 2( : )m mX
(1: )m mX (2: )m mX … (( 1): )m m mX ( : )m m mX
Figure 1: Display of 2m units in m sets of m each
The final m units 1(1: ) 2(2: ) ( : ), ,...,m m m m mX X X , are independent but not identically distributed, but
Xi(i:m), is the ith order statistic in a random sample of size m from F(x). Thus making a comparison of a RSS of
size m with a SRS of the same size m is meaningful. Obviously, RSS would be a serious contender to SRS in
case where the task of assembly of the sampling units is easy and their relative rankings in terms of the
characteristic under study can be done with trivial cost.
The RSS sample mean and variance are
( : )1
m
i i miRSS
XX
m
,
2
( : )1Var
m
i miRSSX
m
.
The efficiency of RSS depends on the sampling allocation, either balanced or unbalanced. The
balanced RSS features an equal allocation of the rank order statistics. It has been proven theoretically and
demonstrated empirically that the variance of the balanced RSS estimator is no greater than that of the SRS
estimator regardless of ranking errors or the form of the underlying distribution of the characteristic of
interest.
In simple random sampling (SRS) the sampler must increase the sample size to increase the chance
of covering the full range of possible values and there is no other chance. With RSS, however, we increase the
representativeness with a specific number of sample units. Hence there is a saving considerably on the
quantification costs. With the ranked set sample thus measured, it can be shown that unbiased estimators of
many important population parameters can be obtained, including the mean and, in case of more than one
cycle, the variance. The relative precision (RP) of RSS with respect to SRS is defined as
11,
2
SRS
RSS
Var X mRP
Var X
. Note that the RSS method cannot be worse than the SRS method (Patil
2002; Takahasi and Wakimoto 1968). It is usual analyzing the behavior of RSS using 1
1GRPRP
.
Stokes (1977) studied RSS with concomitant variables. She assumed that the variable of interest X
has a linear relation with other variable Y that is easy to rank, and showed that 𝑅𝑆(𝑋:𝑌) = 𝜌2𝑅𝑆𝑌, where is
the correlation between X and Y, and
2
( : )
[ : ]
1
1 mi m x
X Y
i x
RSm
,
2
( : )
1
1 mi m y
Y
i y
E YRS
m
.

57
She showed that, X YRS RS if X Y up to a linear transformation, since the relative savings
are unaffected by linear transformations of the variable of interest.
Commonly RSS behaves better if we repeat the procedure n times for obtain g a sample of size nm.
Then, if 1n we deal with
( : )1 1
n m
i i m rr iRSS
XX
nm
,
2
( : )1Var
m
i miRSSX
nm
.
Some related important results are:
Kaur et al. (1996): compared RSS and stratified SRS when using a concomitant variable based on
equal and optimum allocation of units for estimating the population mean.
Patil et al. (1997) investigated the effect of the sample size upon the performance of the balanced
RSS for estimating the population mean.
Hossain (2001) suggested a nonparametric approach for the modified RSS method for estimating the
population mean, namely, nonparametric selected ranked set sampling.
Wang et al. (2004) proposed estimator of the population mean using the general ranked set sampling
in which more than one observation can be chosen from each ranked set.
Al-Saleh and Al-Kadiri (2000) introduced the double RSS procedure (DRSS) for estimating the
population mean. They showed that the ranking at the second stage is easier than ranking at the first
stage, and also the DRSS estimator is more efficient than that using RSS with respect to SRS based
on the same sample size.
2. REVIEW ON SOME PREVIOUS APPLICATIONS OF RSS
Fortunately, in many fields, such as in medicine, environment, biology and agriculture, the variable of interest
is not easily measured, but it can be easily ranked with cheap or free cost. The RSS can be implemented to
yield more efficient estimator of the population parameters as compared to SRS based on the same number of
quantified units. Here, some examples on reported applications of RSS in real situations will be given.
Evans (1967) applied RSS to regeneration surveys in areas direct-seeded to longleaf pine. He noted
that the means based on both of RSS and SRS methods were not significantly different, but the computed
variances of the means were very different. Martin et al. (1980) applied the RSS procedure for estimating
shrub phytomass in Appalachin Oak forests. Cobby et al. (1985) conducted four experiments at Hurley (UK)
during 1983 to investigate the performance of RSS relative to SRS for estimation of herbage mass in pure
grass swards, and of herbage mass and clover content in mixed grass-clover swards. Johnson et al. (1993)
applied RSS method to estimate the mean of forest, grassland and other vegetation resources. Mode et al.
(1999) investigated under which conditions the RSS becomes a cost-effective sampling method for ecological
and environmental field studies where the rough but cheap measurement has a cost. They have introduced
formula for the total cost for both RSS and SRS, and present cost ratios for a real data set consisting of
judgment estimated and physically measured stream. Al-Saleh and Al-Shrafat (2001) studied the performance
of RSS in estimation milk yield based on 402 sheep. Al-Saleh and Al-Omari used the MSRSS to estimate the
average of Olives yields in a field in West of Jordan. Husby et al. (2005) investigated on the use of the RSS in
estimation of the mean and median of a population using the crop production dataset from the United State
Department of Agriculture. They found that the gain in efficiency for mean estimation using RSS is better for
symmetric distribution than asymmetric distribution, and vice versa in the case of median estimation.
Kowalczyk (2005) applied the RSS procedure in market and consumer surveys. Ganeslingam and Ganesh
(2006) applied the RSS method to estimate the population mean and the ratio using a real data set on body
measurement. The authors used the data of the weight and height of 507 individuals. Halls and Dell (1966)
coined McIntyre’s method as RSS and applied it for estimating the weights of browse and herbage in a pine-
hardwood forest of east Texas, USA.

58
3. ESTIMATION USING RSS
Let nm units be selected randomly from the target population and these units be randomly allocated into n
sets, each of size m units. From each set of size m one unit will be selected to get n measured units. We
consider some well know RSS estimators
3.1. Estimation of the population mean
( : )1 1
n m
i i m rr iRSS
XX
nm
,
2
2 2( )( : ) 11
2Var
mm
ii m iiRSSX
nm nm nm
,
where ( : ) ( )i i m iE X .
It is clear that generally it is more efficient than
1
nm
iiSRS
XX
nm
,
2
Var SRSXnm
.
Consider that the units to be quantified were chosen as in the following steps. First, let l1,…,lm be
positive integers such that l1+…+lm =n. After ranking the units within each set with respect to the variable of
interest, the lowest ranked unit is measured from the first l1 sets; the second lowest ranked unit is measured
from the next l2 sets, and so on until the highest ranked unit is quantified from the last lm sets. Let Ti be the
sum of measurements of the ith ranked units for 1,2,...,i m . Therefore, the unbiased RSS estimator of
is 1
1 m iRSS i
i
TX
m l . The Neyman allocations fixes that ( : )i i ml . We have that
2
( : )
1
2
2
( : )1
2
if is balancedVar
if Neyman allocation is used.
m i m
ii
RSS
m
i mi
lRSS
mX
RSSnm
Some alternative estimators for the mean have been developed. We revise some of them.
Al-Saleh and Al-Omari (2002) introduced a multistage ranked set sampling (MSRSS) as a
generalization of the DRSS. The MSRSS procedure can be described as:
Step 1: Randomly select mr+1 units from the target population, where r is the number of stages and m
is the sample size.
Step 2: Allocate the mr+1 selected units as randomly as possible into mr-1 sets, each of size m2.
Step 3: For each set in Step (2), use the procedure of balanced ranked set sampling as described in Section
2.2.2 to obtain a ranked set sample of size m. This step yields mr-1 ranked set samples each of size m.
Step 4: Repeat Step (3) on the mr-1 ranked set samples to obtain mr-2 second stage RSS samples each of size
m. The process continues until we end up with one rth stage RSS of size m.
Suppose that the variable of interest X has mean , and variance 2 with a pdf ( )f x and cdf
( )F x . Let ( ) ( ) ( )
1 2, ,...,r r r
mX X X be a MSRSS of size m at stage r, with mean ( ) ,r
i variance 2( )r
i , pdf
( ) ( )r
if x and cdf ( ) ( )r
iF x 1,2,...,i m .
The authors derived that:

59
( )
1( )
( )
m r
iif x
f xm
,
( )
1( )
m r
iif x
m
,
2
( )2( )
2 11
mm rrii ii
m m
.
The inferences on the population mean are developed using:
( )
( ) 1
m r
ir iMSRSS
XX
m
,
2
( )2( ) 2( ) 11
2 2Var
mm rriir ii
MSRSSXm m m
.
The RP at the rth stage is
2( )
( ) 1
2( )
1
1
m r
ir i
m r
ii
RP
.
The authors defined a steady state efficiency of RSS at stage r to be as ( ) ( )lim r
reff eff
, and derived
( 1)/
( ) ( )
( 1)/ /
/
0,
( ) ( ) ( ) ( 1),
1, ,
i m
r
i i i m i mr
i m
x Q
F x Lim F x m F x i Q x Q
x Q
where Q is the quantity which satisfies ( )
Q
f x dx
, (0,1) .
So that 1( ) ( )
( ) ,( ) ( )
0
i ir
i i m m
mf x if x Q Qf x f x
otherwise
.
Hence if (0, )X U , then ( )
1,
( )
0
i
m iif x i
f x m m
otherwise
and ( ) 2eff m .
Muttlak (1998a) conducted a study of the performance of MRSS to estimate the population mean of
a variable of interest when the ranking is based on a concomitant variable. Also, based on an auxiliary
variable the regression estimator is proposed to estimate the population mean. According to this study,
Muttlak showed that the MRSS estimator is more efficient than RSS and regression estimators.
For mean estimation based on RSS some other modifications have been developed:
Samawi et al. (1996) suggested a variety of extreme RSS.
Muttlak (1997) suggested a median ranked set sampling.
Samawi (2002) suggested double extreme ranked set sampling.
Yu and Lam (2002) proposed the RSS in the presence of concord data.
Al-Saleh and Al-Hadrami (2003) investigated the moving extremes RSS parametrically for
estimating the location parameter of symmetric distributions.
Muttlak et al. (2003) considered the random selection introduced by Li et al. (1999) based on RSS.
Muttlak (2003a,b) suggested percentile and quartile RSS methods.
Rahimov and Muttlak (2003) extended the random selection in RSS suggested by Li et al. (1999) for
estimating the population mean.

60
3.2. Estimation of the variance
The SRS estimator of the population variance 2 is given by
2
2 1ˆ1
mn
i SRSiSRS
X X
mn
.
An earlier work for estimating the population variance is Stokes (1980a). Based on judgment ordered using
balanced RSS she defined
2
( : )1 12ˆ1
n m
i m j RSSj i
RSS
X X
mn
.
( : )i m jX is the quantification of the ith ranked unit in a set of size m in the jth replicate. She showed that it is a
biased estimator because
2
( : )2 2 1ˆ1
m
i mi
RSSEnm
.
Clearly the bias approach to zero as nm becomes large. The performance of this estimator was
investigated and derived that
2
2
ˆVarlim 1
ˆMES
SRS
nRSS
RP
. The author concluded that the gain in efficiency
of RSS over SRS is little when estimating higher moments.
MacEachern et al (2002) proposed to use as estimator 2 2 2
( ) 1 2RSS M M M ,
where
2
( ) ( )1 12
1 2 22
m m
r i s jr s j i
M
X X
m n
;
2
( ) ( )1 1 12
2 2 22 ( 1)
n m m
r i r jr j i
M
X X
m m n
.
It is unbiased.
Perron et al. (2004) developed a nonparametric study for the estimation of the population variance 2 under ranked set sample.
3.3. Estimation of the population ratio
The population ratio of two variables X and Y is defined as Y
X
R
. The SRS estimator of the population
ratio is ˆSRS
YR
X . This estimator. Samawi and Muttlak (1996) suggested an estimator of the population ratio
using ranked set sampling as ˆ RSSRSS
RSS
YR
X , taking
( : )1
m
i i miRSS
ZZ
m
, ,Z X Y . The ranking of X is
considered perfect while the ranking of Y has errors. Its variance is given by
2 2 22 22
( ) [ ] ( )1 1 1
2 2 2 2ˆVar 2 2
m m m
X i Y i XY ii i iX Y X YRSS
X Y X Y X Y X Y
RR
m m m m
,

61
where ( ) ( )X i X i X , [ ] [ ]Y i Y i Y and ( ) ( ) [ ]XY i X i X Y i Y .
Based on the above table it is clear that the RSS is more efficient than SRS in estimating the
population ratio.
Bouza (2001) used RSS for selecting a sample using a third variable Z related with X and Y.
( )ˆ RSS
RSS Z
RSS
YR
X .
The results are basically equal but they are related with a superpopulation model that links Z and Y.
Other approaches are:
Samawi and Muttlak (2001) used the median RSS to estimate the population ratio.
Samawi and Tawalbeh (2002) introduced a double median RSS for estimating the population mean
and ratio.
For more about ratio estimation in RSS see Samawi and Saeid (2004), Al-Omari et al. (2009), Al-
Omari (2012).
3.4. Estimation of the quantiles
Let X be a random variable with cumulative distribution function F(x). The pth quantile is,
inf : ( )p x F x p for 0 1p . When a sample is selected we may estimate F(x) using the
empirical distribution function
1
( )mn
nm iiF x I X x
,
1,
0, .
i
i
if X xI X x
otherwise
This is an estimator when a SRSWR sample of size nm is selected. In the case of RSS sample of size
mn we may use
( : )1 1( )
n m
nmRSS i i kk iF x I X x
, ( : )
( : )
1,
0, .
i i k
i i k
if X xI X x
otherwise
The estimation of a quantile is obtained looking for the values of the sample quantiles. That is
,ˆ inf | ( )mn p nmx F x p , ,
ˆ inf | ( )mnRSS p nmRSSx F x p .
The following authors have done works to estimate the pth quantile by different procedures as given
below.
Chen (2000) considered quantile estimation from balanced RSS data and found that the RSS
method can substantially improve the efficiency of quantile estimators.
Chen (2001) further generalized the results in Chen (2000) from balanced to unbalanced scheme.
Indeed, the quantile estimator considered in both Chen (2000, 2001) is based on the empirical
distribution of the pooled RSS data.
Kaur et al. (2002) proposed RSS sign test for population quantiles and identified the optimal
allocation, based on the quantile obtained, but not based on the underlying distribution.
62
Adatia and Saleh (2004) applied the generalized RSS method in estimating quantiles of the uniform
distribution.
Zhu and Wang (2004) considered quartile estimation using RSS under perfect ranking.
4. CANCER STUDIES USING RSS
In clinical trials is necessary to select a sample of patients and assign to them the new medicaments.
Generally, there is a series of control variables in the files which may be used for designing RSS protocols.
The sequel presents some applications in cancer studies. They have some issues in common:
1. A population of patients has been studied and we have full response on the variables.
2. The further development of studies need establishing how more efficient is RSS
with respect to SRS.
We decided taking the data and implementing RSS strategies. B independent samples were selected
and estimates computed for each one. They were compared with the true value of the parameter using
1
ˆˆ , ,
B
db bA d A RSS SRS
B
.
4.1. Problem 1: Estimation of tumor size
Tumor size is an important predictor of survival in patients with early-stage lung cancer. Currently lung
tumors with a baseline value larger than 3 cm need of accurate assessing and treatment. Physicians use X-
Rays as a first evaluation for predicting the base line. The accuracy of the predictions of young physicians
must be evaluated. They use the X-Rays and predict the base line for calculating the outer mass of the tumor.
Currently the outer dimensions of the tumor are measured. Then for the patients is usually obtained:
X Outer mass of the tumor.
If base line is larger than 3 cm. a more costly process is used to evaluate the size of the tumor cavity. That is if
the case seems to be grave. Hence the patient is reevaluated using Computed tomography (CT) and two
variables are considered:
1Y Outer mass measured using CT
2Y Filling-in of cavitation.
For evaluating both a set of 351 patients was analyzed. 133 patients received doublet chemo with an
antiangiogenic agent. Some of them experienced tumor cavitation during the treatment. Another group of 118
patients were treated with chemo alone on another trial. Samples are selected using SRS and RSS for
evaluating the behavior of estimators of the population mean. The results will support the use of one or other
sampling method for selecting patients to be included in clinical trials with new medicaments. We decided
using 1000B and three values of 2,3,5m and 5,10,20n . The results were evaluated computing
SRS SRS
s
RSS RSS
YR
Y
,
( )
, 2,3SRS SRS
Msr r
RSS MSRSS
YR r
Y
.
Table 1: Efficiency of RSS alternatives for outer mass of the tumor using CT and filling-in of
cavitation
Outer mass of the tumor using CT Filling-in of cavitation
Rs RMS2 RMS3 Rs RMS2 RMS3
2m

63
5n 1.23 1.43 1.49 1.81 2.07 2.83
10n 1.37 1.41 1.46 2.32 2.41 2.56
20n 1.42 1.48 1.51 2.77 2.79 2.94
3m
5n 1.27 1.30 1.44 2.01 2.11 2.49
10n 1.26 1.42 1.58 2.93 2.92 2.97
20n 1.35 1.52 1.69 3.07 3.04 3.10
5m
5n 1.33 1.39 1.47 2.90 2.84 2.99
10n 1.22 1.43 1.56 3.74 3.82 3.90
20n 1.38 1.49 1.61 4.02 3.97 4.04
Note that RSS is more accurate than SRS, for Y1 MRSS improve substantially the efficiency but it is
not important for Y2. These results allow diminishing the sample size fixed by SRS for obtaining a certain
level of accuracy. Hence a diminishing in the Clinical Trial costs can be attained by using RSS.
4.2. Problem 2: Measurement of the ratio of the interface between tumor and neighboring structures to
maximum tumor diameter
Median arch distance-to-maximum tumor diameter ratios for pleural invasion categories are classified as PL1,
PL2 and PL3. The protocol of the Union International Center of Cancer (UICC) established the staging
considering the Table 2
Table 2: UICC protocol of median arch distance-to-maximum tumor
diameter ratios for pleural invasion
Stage Mean (P0.25, P0.75)
PL1 0.206 (0, 0.486)
PL2 0.638 (0.385, 0.830)
PL3 1.092 (1.045, 1.214)
The data on preoperative computed tomography (CT) of 1342 patients’ were studied. They were
obtained form the files on 6 oncologic hospitals in the years 2009-2012. The length of the interface between
the primary tumor and neighboring structures (arch distance) and the maximum tumor diameter were
measured on CT images. The invasion categories were determined using the protocol.
X Maximum tumor diameter,
Y Arch distance.
Was of interest estimating a ratio of the interface between tumor and neighboring structures to
maximum tumor diameter and the mean for the stages. SRS and RSS are compared. Imai et al. (2013)
developed a study on this problem through the use of ROC-curves. We consider estimating using ratio
estimators using SRS and RSS. A third variable was used for ranking in order to evaluate the behavior of
( )ˆ
RSS ZR . The third variable was
Z Prediction of the tumor diameter using X-Ray.
The study was performed for patients in each stage. The results are given in the following table computing the
corresponding ∆𝐴(�̂�𝑑), , , ( )A SRS RSS RSS Z .

64
The analysis of the results suggests that the use of a Z increases the accuracy if its correlating is
higher that the correlation with X. In this case the correlating 0.9763ZY while 0.8862XY . The
existence of a larger stability in the values of the variables for PL3 is clearly the cause of the drastic
diminutions of the values of ∆𝐴(�̂�𝑑).
Another interesting problem is establishing how the intervals behave in the particular conditions of
the sampled hospitals. The quantities were estimated by using SRS and RSS. The objective is comparing the
particular behavior of the results with the suggested by UICC . The estimate of the mean and of the quantiles
were computed and compared with the standards fixed by UICC. The results of the calculated ∆𝐴(�̂�𝑑),
,A SRS RSS ; d mean , 0.25 ,
0.75 given in the next tables.
Table 3: Analysis of the accuracy of the estimations of the ratios in the different stages. SRS vs RSS
PL1 PL2 PL3
ˆSRSR
ˆRSSR
( )ˆ
RSS ZR ˆSRSR
ˆRSSR
( )ˆ
RSS ZR ˆSRSR
ˆRSSR
( )ˆ
RSS ZR
2m
5n 7.31 6.33 6.33 3.63 1.78 1.23 3.04 1.50 1.21
10n 5.43 5.37 5.24 2.13 1.69 1.26 2.05 1.44 1.17
20n 4.66 2.25 2.06 2.13 2.25 1.08 2.02 1.35 1.09
3m
5n 4.37 3.73 3.33 3.16 1.66 1.25 2.86 1.45 1.19
10n 4.64 4.14 4.04 1.93 1.48 1.25 2.74 1.45 1.10
20n 4.29 2.11 2.03 1.61 1.17 1.19 2.53 1.40 1.07
5m
5n 2.26 1.71 1.21 1.69 1.36 1.20 1.19 1.15 1.12
10n 2.23 1.64 1.24 1.64 1.30 1.18 1.13 1.15 1.12
20n 2.18 1.51 1.21 1.51 1.17 1.18 1.11 1.07 1.05
Note that the results on PL1 fix that RSS is more accurate for estimating the mean. For the quantiles
the gain due to the use of RSS is considerably larger.
Analyzing the results obtained in the stage PL2 again RSS is more accurate than SRS and the larger gains are
obtained in the estimating of the quantiles.
Table 4: Analysis of the accuracy of the estimations of the ratios in PL1. SRS vs
RSS
SRS RSS
Mean 0.25 0.75 Mean 0.25 0.75
2m
5n 41.7 14.2 43.0 42.5 44.9 44.9
10n 41.4 14.2 42.1 42.0 44.9 44.1
20n 41.4 15.1 42.0 40.9 44.9 44.0
3m
5n 44.9 44.0 42.2 9.9 40.0 22.2
10n 44.2 40.1 42.2 9.2 40.1 22.2
20n 44.4 40.2 42.2 9.4 29.2 22.0
5m

65
5n 44.1 20.0 24.9 7.5 44.4 44.0
10n 44.1 20.1 24.1 7.4 44.2 40.1
20n 44.4 20.0 24.2 7.4 44.4 40.2
Table 5: Analysis of the accuracy of the estimations of the ratios in PL2.
SRS vs RSS
SRS RSS
Mean 0.25 0.75 Mean 0.25
0.75
2m
5n 41.7 14.2 43.0 42.5 44.9 44.9
10n 41.4 14.2 42.1 42.0 44.9 44.1
20n 41.4 15.1 42.0 40.9 44.9 44.0
3m
5n 44.9 44.0 42.2 9.9 40.0 22.2
10n 44.2 40.1 42.2 9.2 40.1 22.2
20n 44.4 40.2 42.2 9.4 29.2 22.0
5m
5n 44.1 20.0 24.9 7.5 44.4 44.0
10n 44.1 20.1 24.1 7.4 44.2 40.1
20n 44.4 20.0 24.2 7.4 44.4 40.2
The results in stage PL3 are more inaccurate than those derived in stage PL1 and RSS is considerably
more accurate than SRS.
Table 6: Analysis of the accuracy of the estimations of the ratios in
PL3. SRS vs RSS
SRS RSS
Mean 0.25 0.75 Mean 0.25 0.75
2m
5n 49.3 26.7 44.7 42.4 44.4 40.9
10n 49.4 22.5 44.3 42.4 44.0 40.2
20n 49.4 22.5 42.2 42.4 44.0 40.7
3m
5n 49.1 24.5 44.3 47.3 10.7 40.7
10n 49.4 22.9 44.4 47.4 40.5 40.3
20n 42.7 24.3 42.7 47.4 40.5 40.5
5m
5n 42.4 24.7 44.9 43.4 9.5 40.4
10n 47.9 24.5 44.4 45.9 9.5 40.4
20n 47.4 24.5 44.4 45.7 9.5 40.4
4.3. Problem 3: The variability of computed tomography (CT) based tumor measurement.
The variability of CT measurements on repeated occasions has not been comprehensively evaluated.
In this study, we assess the variability of lung tumor measurement using repeat CT scans in 3 occasions
within 20 minutes of each other. This experiment is similar to the experiences of Oxnard et al. (2011). The
involved variables were:

66
X Outer mass of the tumor measured using X-Rays,
jY Outer mass of the tumor measured using CT on occasion 1,2,3j .
We analyze the behavior of different estimators of the variance in each occasion. It is supposed that
the variances of the occasions in the set of measurements be similar. A subset of the data on preoperative
computed tomography (CT) was selected. Each hospital measured repeatedly a 10% of the patients studied.
We obtained 130 sets of 3 measurements of CT images. We used 1000B , 2,3,5m m=2, 3, 5 and
5,10,20n . The efficiency was measured by computing
2 2
12
2
ˆˆ , ( ), ,
B
Ab bA A RSS M RSS SRS
B
.
Table 7: Efficiency of alternative estimators of the variances of median arch distance-to-maximum
tumor diameter ratios for pleural invasion
2ˆSRS 2ˆ
RSS 2
( )ˆ
RSS M
Occasion Occasion Ocassion
1 2 3 1 2 3 1 2 3
2m
5n 4.4 4.3 4.4 5.8 5.7 5.7 6.1 5.8 6.0
10n 3.8 4.1 4.1 5.5 5.6 5.4 6.0 6.0 6.0
20n 3.0 3.6 3.4 5.7 5.5 5.5 5.8 5.8 5.8
3m
5n 3.1 3.3 3.3 6.1 5.8 5.8 5.8 5.8 5.8
10n 3.1 2.8 3.1 6.1 5.3 5.3 5.5 5.5 5.5
20n 2.8 2.5 2.5 6.1 5.7 5.7 5.7 5.7 5.7
5m
5n 2.3 2.2 2.4 5.8 5.7 5.8 5.6 5.6 5.7
10n 2.1 1.8 2.0 5.5 5.2 5.2 5.2 5.4 5.4
20n 1.8 1.8 1.8 5.4 5.2 5.3 5.3 5.4 5.2
These results suggest that CT has a similar variation in the occasions. For estimating the variance,
SRS is better than the RSS alternatives.
5. CONCLUSIONS
We present a study of the behavior of the use of RSS for selecting samples for developing cancer studies. The
results suggest that RSS is to be preferred to SRS. Cancer studies generate a lot of auxiliary information that
is in the files of the patients. The development of different investigations, as the introduction of new
medicaments or treatments, need of samples. The usually samples are selected from a small set of patients.
The existence of different concomitant variables allows the use of RSS at low costs because, as RSS is more
accurate than SRS, is possible using smaller samples sizes for a fixed accepted approximation error or
increasing the accuracy using the same sample size.

67
Further research on which variable is to be used for ranking should be developed in each practical
study. For example, for estimating a ratio it seems reasonable to look for a concomitant variable with a large
correlation with Y than the correlation between X and Y.
Acknowledgments: The authors acknowledge the help of the researchers of the National Group on Advanced
Oncology Research for providing access to the data used in this paper. These results were supported partially
by the project ”Modelos Matemáticos para el Estudio de Medio Ambiente, Salud y Desarrollo Humano”.
REFERENCES
1 ADATIA, A. & SALEH, A.K.MD. (2004): Estimation of quantiles of uniform distribution using
generalized ranked set sampling. Pakistan Journal of Statistics 20, 355-368
2 AHRENS W. & MERLETTI F. (1988): A standard tool for the analysis of occupational lung cancer in
epidemiologic studies. Int J. Occup Environ Health 4, 236–242.
3 AL-OMARI, A.I., JEMAIN, A.A., & IBRAHIM, K. (2009): A new ratio estimators of the mean using
simple random sampling and ranked set sampling methods. Revista Investigación Operacional, 30, 97-108.
4 AL-OMARI, A.I. (2012): Ratio estimation of the population mean using auxiliary information in simple
random sampling and median ranked set sampling. Statistics and Probability Letters, 82.1883–1890.
5 AL-SALEH, M.F. & AL-HADRAMI, S. (2003): Parametric estimation for the location parameter for
symmetric distributions using moving extremes ranked set sampling with application to tree data.
Environmetrics 14, 651-664.
6 AL-SALEH, M.F. & AL-KADIRI, M. (2000): Double ranked set sampling. Statistics & Probability
Letters 48, 205–212.
7 AL-SALEH, M.F. & AL-OMARI, A.I. (2002): Multistage ranked set sampling. Journal of Statistical
Planning and Inference 102, 273-286.
8 AL-SALEH, M.F. & AL-SHRAFAT, K. (2001): Estimation of milk yield using ranked set sampling.
Envirometrics 12: 395-399.
9 BOUZA, C.N. (2001): Model assisted ranked survey sampling. Biometrical J., 43, 248-258.
10 CHEN, Z. (2000): On ranked-set sample quantiles and their applications. Journal of Statistical
Planning and Inference 83, 125-135.
11 CHEN, Z. (2001): The optimal ranked-set sampling scheme for inference on population quantiles.
Statistica Sinica 11, 23-37.
12 CHEN, Z., BAI, Z. & SINHA, B. (2004): Ranked set sampling: Theory and Applications. Springer
Verlag. New York.
13 COBBY, J.M., RIDOUT, M.S., BASSETT, P.J. & LARGE, R.V. (1985): An investigation into the use of
ranked set sampling on grass and grass-clover swards. Grass and Forage Science 40: 257-63.
14 EVANS, M. J. (1967): Application of ranked set sampling to regeneration, Surveys in areas direct-
seeded to long leaf pine. Master Thesis, school for Forestry and Wild-life Management, Louisiana state
University, Baton Rouge, Louisiana.
15 GANESLINGAM, S. & GANESH, S. (2006): Ranked set sampling versus simple random sampling in
the estimation of the mean and the ratio. Journal of Statistics and Management Systems 2, 459-472.
16 IMAI, K., Y. MINAMIYA, K. ISHIYAMA, M. HASHIMOTO, H. SAITO, S. MOTOYAMA,Y. SATO
& J.-I. OGAWA (2013): Measurement of the Ratio of the Interface between Tumor and Neighboring
Structures to Maximum Tumor Diameter. Radiology, doi: 10.1148/radiol.12120864.
17 KAUR, A., PATIL, G.P., TAILLIE, C. & WIT, J. (2002): Ranked set sample sign test for quantiles.
Journal of Statistical Planning and Inference 100, 337-347.
18 KOWALCZYK, B. (2004): Ranked set sampling and its application in finite population studies.
Statistics in Transition 6, 1031-1046.
19 HALL, L.K. and T.R. DELL (1996): “Trials of ranked set sampling for forage yields”, Forest Sc. 121,
22-26.
20 OSSAIN, S.S. (2001): Non-parametric selected ranked set sampling. Biometrical Journal 43, 97-105.
21 HUSBY, C.E., STANSY, E.A. & WOLFE, D.A. (2005): An application of ranked set sampling for mean
and median estimation using USDA crop production data. Journal of Agricultural, Biological, and
Environmental Statistics 10, 354-373.

68
22 JOHNSON, G.D., PAUL, G.P. & SINHA, A.K. (1993): Ranked set sampling for vegetation research.
Abstracta Botanica 17, 87-102.
23 KAUR, A., PATIL, G., SHIRK, S.J. & TAILLIE, C. (1996): Environmental sampling with a
concomitant variable: a comparison between ranked set sampling and stratified simple random sampling.
Journal of Applied Statistics 23, 231-255.
24 MACEACHERN S., Ö. ÖSTURK , D. A. WOLFE & G. V. STARK (2002): A new ranked sample
estimator of variance. J. Royal Stat. Soc. B. 64, 277-88.
25 MODE, N. A., CONQUEST, L. L. & MARKER, D. A. (2002) : Incorporating prior knowledge in
environmental sampling: ranked set sampling and other double sampling procedures. Environmetrics 13:
513-521.
26 MUTTLAK, H.A. (1995): Parameter Estimation in a simple linear regression using rank set sampling.
Biometrical Journal 37, 799-810.
27 MUTTLAK, H.A. (1997): Median Ranked Set Sampling. Journal of Applied Statistical Sciences 6,
245-255.
28 MUTTLAK, H.A. (2003): Investigating the use of quartile ranked set samples for estimating the
population mean. Applied Mathematics and Computation 146, 437-443.
29 ODERWALD, R. & SMITH, D. (1980): Evaluation of ranked set sampling for estimating shrub
phytomass in Appalachian oak forests. Publication Number FWS-4-80, School of Forestry and Wildlife
Resources, Virginia Polytechnic Institute and State University, Blacksburg, Virginia.
30 OXNARD, G.R., C.S. SIMA, M.S. GINSBERG, L.P. JAMES, R.A. LEFKOWITZ, P. GUO, M.G.
KRIS, L.H. SCHWARTZ & G.J. RIELY (2011): Variability of Lung Tumor Measurements on Repeat
Computed Tomography Scans Taken Within 15 Minutes. Journal of Clinical Oncology, 28, 3114.3118.
31 PATIL, G.P. (2002). Ranked set sampling. Encyclopedia of Environmetrics 3, 1684-1690.
32 MARTIN, W., SHARIK, T., PERRON, F. & SINHA, B.K., (2004): Estimation of variance based on a
ranked set sample. Journal of Statistical Planning and Inference 120: 21-28.
33 RAHIMOV, I. & MUTTLAK, H.A. (2003): Estimation of the population mean using random selection
in ranked set samples. Statistics and Probability Letters 62, 203-209.
34 RIDOUT, M.S. & COBBY, J.M. (1987): Ranked set sampling with non-random selection of sets and
errors in ranking. Applied Statistics 36, 145-152.
35 SAMAWI, H.M, AHMED, M.S. & ABU-DAYYEH, W. (1996): Estimating the population mean using
extreme ranked set sampling. Biometrical Journal 38, 577-586.
36 SAMAWI, H.M. & AL-SAGHEER, O.A. (2001): On the estimation of the distribution function using
extreme and median ranked set sampling. Biometrical Journal 43, 357-373.
37 SAMAWI, H.M. & MUTTLAK, H.A. (1996): Estimation of ratio using rank set sampling. Biometrical
Journal 63, 753-764.
38 SAMAWI, H.M. & SAEID, L.J. (2004): Stratified extreme ranked set sample with application to ratio
estimators. Journal of Modern Applied Statistical Methods 3,117-133.
39 SAMAWI, H.M. & TAWALBEH, E.M. (2002): Double median ranked set sampling: Comparison to
other double ranked set samples for mean and ratio estimators. Journal of Modern Applied Statistical
Methods 1, 428-442.
40 STOKES, S.L. (1977): Ranked set sampling with concomitant variables. Communications in Statistics
A6, 1207- 1211.
41 STOKES, S.L. (1980): Estimation of variance using judgment ordered ranked-set samples. Biometrics
36, 35-42.
42 TAKAHASI, K. & WAKIMOTO, K. (1968): On the unbiased estimates of the population mean based on
the sample stratified by means of ordering. Annals of the Institute of Statistical Mathematics 20, 1-31.
43 YU, P.L.H. & TAM, Y.C. (2002): Ranked set sampling in the presence of censored data.
Environmetrics 13, 379-396.
44 WANG, Y.G., CHEN, Z. & LIU, J. (2004): General ranked set sampling with cost consideration.
Biometrics 60: 556-561.
45 ZHU, M. & WANG, Y. (2004): Quantile estimation from ranked set sampling data. Sankhya: The Indian Journal of Statistics 67, 295-304.

![Preparation of [5 + 6]-, [6 + 6]-, and [6 + 7]Bicyclic Guanidines fromC,C'Bis(iminophosphoranes](https://static.fdokumen.com/doc/165x107/631f2da3d10f1687490fada7/preparation-of-5-6-6-6-and-6-7bicyclic-guanidines-fromccbisiminophosphoranes.jpg)