70 REGIONAL INVESTMENT FINANCIAL REPORT ...
11
DiA: Jurnal Administrasi Publik, 2021 December Vol. 19 No. 2, e-ISSN: 2615-7268 70 REGIONAL INVESTMENT FINANCIAL REPORT ANALYSIS IN BADUNG REGENCY I Nyoman Tingkes Corresponding Author: Departement of Management, University of Dhyanapura, Badung, Bali, Indonesia [email protected] Ida Ayu Putu Sri Widnyani Magister of Public Administration, Universitas Ngurah Rai [email protected] ABSTRACT The purpose of this study was to analyze the effect of financial reports through symmetric information on increasing investment in Badung Regency, Bali Province. This study was designed using quantitative research methods on data sourced from reports on budget realization and income, reports on changes in excess budget balances, balance sheets, operational reports, reports on changes in equity, cash flow reports, and notes to financial statements from 2016 to 2020. The results of the study found that the liquidity ratio is 6.09, the solvency ratio is 0.017, the activity ratio is 27.83, the profitability ratio consists of ROI-6.77 and ROE-0.22, and the ratio of direct spending to indirect spending is 0.88. Specifically, for the investment in capital-output ratio-ICOR, it was found that the average economic growth per year was 5.29 percent. Based on the results of this study, it can be suggested to the Badung Regency Government that (a) the collection of tax and levy receivables be more optimized, (b) there needs to be a policy regarding the budget deficit, (c) increase direct spending at least equal to or more than the apparatus expenditure, and (d) further improve operating cost efficiency. In addition, spending on grants and social assistance should be more directed at spending on goods and services that are truly vital and strategic. Keywords: liquidity, solvency, activity, profitability, direct spending, and ICOR A. INTRODUCTION Under Government Regulation Number 58 of 2019 concerning Regional Finance, it mandates that good regional financial management is financial management based on the principles of transparency, accountability, and participation, both at the planning and budgeting stages, implementation, and administration, as well as regional financial accountability. The planning and budgeting stages use the performance approach. A characteristic of this approach is the process of clarifying the budget by activity as well as by the organizational unit. The budget that has been grouped into activities will make it easier for interested parties to measure performance.
-
Upload
khangminh22 -
Category
Documents
-
view
4 -
download
0
Transcript of 70 REGIONAL INVESTMENT FINANCIAL REPORT ...

DiA: Jurnal Administrasi Publik, 2021 December Vol. 19 No. 2, e-ISSN: 2615-7268
70
REGIONAL INVESTMENT
FINANCIAL REPORT ANALYSIS
IN BADUNG REGENCY
I Nyoman Tingkes
Corresponding Author: Departement of Management, University of Dhyanapura,
Badung, Bali, Indonesia
Ida Ayu Putu Sri Widnyani
Magister of Public Administration, Universitas Ngurah Rai
ABSTRACT
The purpose of this study was to analyze the effect of financial reports through
symmetric information on increasing investment in Badung Regency, Bali
Province. This study was designed using quantitative research methods on data
sourced from reports on budget realization and income, reports on changes in
excess budget balances, balance sheets, operational reports, reports on changes in
equity, cash flow reports, and notes to financial statements from 2016 to 2020.
The results of the study found that the liquidity ratio is 6.09, the solvency ratio is
0.017, the activity ratio is 27.83, the profitability ratio consists of ROI-6.77 and
ROE-0.22, and the ratio of direct spending to indirect spending is 0.88.
Specifically, for the investment in capital-output ratio-ICOR, it was found that the
average economic growth per year was 5.29 percent. Based on the results of this
study, it can be suggested to the Badung Regency Government that (a) the
collection of tax and levy receivables be more optimized, (b) there needs to be a
policy regarding the budget deficit, (c) increase direct spending at least equal to or
more than the apparatus expenditure, and (d) further improve operating cost
efficiency. In addition, spending on grants and social assistance should be more
directed at spending on goods and services that are truly vital and strategic.
Keywords: liquidity, solvency, activity, profitability, direct spending, and ICOR
A. INTRODUCTION
Under Government Regulation Number 58 of 2019 concerning Regional
Finance, it mandates that good regional financial management is financial
management based on the principles of transparency, accountability, and
participation, both at the planning and budgeting stages, implementation, and
administration, as well as regional financial accountability.
The planning and budgeting stages use the performance approach. A
characteristic of this approach is the process of clarifying the budget by activity as
well as by the organizational unit. The budget that has been grouped into activities
will make it easier for interested parties to measure performance.

DiA: Jurnal Administrasi Publik, 2021 December Vol. 19 No. 2, e-ISSN: 2615-7268
71
The implementation and administration stage is a process that is bound by
various applicable laws and regulations. The process of implementing and
administering regional finances in practice must also take into account the
performance that has been determined in the APBD. This process must be in line
with the performance indicators that have been agreed upon in the APBD
document. Thus, the planned budget can be in line as it should and must be able to
improve coordination of various parties in the preparation of accrual-based
financial reports, which is a new thing for local governments.
The stage of regional financial accountability is realized in the form of
financial reports. The financial report is a manifestation of strengthening
transparency, accountability, and participation. Regarding financial statements,
there are at least seven financial reports that must be made, namely balance
sheets, budget realization reports, operational reports, and reports of changes in
excess budget balances, reports of changes in equity, cash flow statements, and
notes to financial statements.
From the background description of regional financial reports as a form of
strengthening transparency, accountability, and participation in the
implementation of regional revenue and expenditure budgets for five fiscal years,
the main issues of regional financial reports can be formulated as follows. What is
the quality of the regional financial reports of the Badung Regency Government
on investment from 2016 to 2020?
Based on these issues, the purpose of this study is to analyze the effect of
quality financial reports through symmetric information on the investment of the
Badung Regional Government from 2016 to 2020.
B. THEORETICAL REVIEW
Finance Theory
From an economist's point of view, money is a stock of assets used for
transactions. Money is something that is accepted or trusted by the public as a
means of payment or transaction. Therefore, money can take any form, but that
does not mean everything is money. Economics money has four functions, namely
as a unit of account, a means of transaction, a store of value, and a standard for
future payments. Through these four functions, money has become an important
element of development. So, money needs to be managed properly. Besides that,
it also needs to be directed and controlled through fiscal and monetary policy
instruments towards the desired economic conditions (Prathama and Manurung,
2008).
Fiscal policy is an economic policy used by the government to
manage/direct the economy to a better or desired condition by changing
government revenues and expenditures. Thus, fiscal policy has the same
objectives as monetary policy. The difference lies in the policy instruments. If in
monetary policy, the government controls the money supply; in fiscal policy, the
government controls its revenues and expenditures (Prathama and Manurung).
Regarding the quality of good financial reports, financial reports must be
result-oriented, professional, proportional, open, and follow the principles of free
and independent financial audits. Financial management as far as possible
DiA: Jurnal Administrasi Publik, 2021 December Vol. 19 No. 2, e-ISSN: 2615-7268
72
considers the principle of efficiency, meaning that it does not cause waste that
damages the benefit of the region or the welfare of the people. However, in
practice, it is still often found that there is duplication of operating expenditure
with direct expenditure, especially in non-physical direct expenditure, so that it is
difficult to measure. This happened because the allocation of funds did not reflect
the actual allocation. Subsidy spending should be directed at vital and strategic
expenditures that control the lives of many people, such as subsidies for
fertilizers, gas, fuel, and MSMEs. However, in practice, it does not live up to
expectations. In addition, control is also often only administrative in nature, so
that it is not in accordance with the aims and objectives of the subsidy. The same
thing happened to capital expenditures allocated for the purchase of investment
needs in the form of fixed assets and other assets. In other spending practices, the
majority consists of personnel expenditures, interest expenditures, and official
travel expenses, which are not directly related to investment (Anggara, 2016).
Regarding quality financial reports, Astika (2016) says that financial reports
are said to be of quality if they are relevant to decision making, control interests,
reporting of resources, and the implementation of social functions, can be verified,
free from prejudice, and can be measured. Quality financial reports will provide
benefits to the entity by reducing operational costs, investment costs, increasing
the efficiency and performance of an entity (Yadiati and Abdulolloh, 2017).
Astika, Yadiati, and Abdulolloh's statement is following the findings of research
conducted by Verdi (2006) on 38,062 companies for 23 years (1980-2003). The
findings suggest that quality reports are negatively related to investment costs.
That is, the better the financial statements of an entity, the lower the investment
costs. The same research was also conducted by Biddle and Hilary (2006) on 34
countries using secondary financial and accounting data during 1999--2004.
Biddle and Hilary found that report quality increases investment efficiency
through asymmetric information between management (agent) and shareholders
(principal). On the other hand, manipulated financial statements and not
complying with accounting rules result in non-optimal or high-cost investment
decisions (McNichols and Stubben (2008).
Investment Theory
According to Harrod-Domar (1939-1946), every economy has to save some
of its income to replace capital goods, such as buildings, machinery, equipment,
and raw materials that are shrinking or damaged. However, to spur economic
growth, new investment is needed which is a net addition to the capital stock.
That is, it is assumed that there is a direct relationship between the total capital
stock (K) and the total Gross Domestic Product (GDP=Y). If $3 of capital is
required to generate $1 of GDP, this means that every additional net stock of
capital in the form of new investments will increase GDP. This positive
relationship is called the investment capital-output ratio-ICOR. The ratio of
capital to output is k and the ratio of savings to Y is s. This means the amount of
new investment is determined by s.
The economic growth model according to Harrod-Domar is formulated as
follows. The economic growth model according to Harrod-Domar is formulated
as follows.

DiA: Jurnal Administrasi Publik, 2021 December Vol. 19 No. 2, e-ISSN: 2615-7268
73
1. Savings (S) is part of a certain amount of income (Y). The equation of saving
to come can be written as below.
S = sY (1.1)
2. Net investment (I) is defined as the change in the capital stock (K)
represented by ΔK, so it can be written as follows.
I = ΔK (1.2)
Since the amount of capital stock (K), has a direct relationship with the
amount of income (Y), it can be written as follows.
or
Finally ΔK kΔY
3. Given that net savings (S) must equal net investment (I), the next equation
can be written as follows.
S = I (1.3)
4. From equation: 1.1 it is known that S = sY and from equation: 1.2 and 1.3 it
is also known that it can be written as follows.
I = ΔK kΔY
5. Thus, it can be written that the "identity" of saving is equal to
investment in equation 1.4
S = sY = kΔK ΔK = I (1.4)
or summarized as follows.
sY = kΔY (1.5)
Furthermore, if both sides of the equation: 1.6 are divided by Y then by k,
we get as below.
(1.6)
The left-hand equation represents the rate of change of GDP growth, that is,
the growth rate determined jointly by the savings ratio and the capital ratio. More
specifically, the equation states that without government intervention, the income
growth rate is positively proportional to the savings ratio. This means that the
more a share of income is saved and invested, the greater the GDP growth
generated.
The simple logic of equation 1.6 above is that to grow rapidly, every
economy must save and invest as much of its income as possible. The more that
can be saved and invested, the faster the rate of economic growth will be.
However, the actual rate of growth and investment that can be reached on each
savings and the amount of additional output gained from an additional unit of
investment can be measured by the inverse of the ratio of capital to output k. So,
ICOR = 1/k.

DiA: Jurnal Administrasi Publik, 2021 December Vol. 19 No. 2, e-ISSN: 2615-7268
74
Thinking Framework
Based on the subject matter, research objectives, as well as theoretical
studies, and empirical studies, a framework model can be built as a guide in
solving research problems. In this case, the quality of financial reports can be
measured by the ratio of liquidity, solvency, activity, profitability, and the ratio of
direct spending to indirect spending. These ratios can produce two types of
information, namely symmetric information and asymmetric information.
Symmetrical information can increase investment, while asymmetric information
can decrease investment ability.
Figure 1
Report Flowchart Model Quality
Finance
Kualitas Laporan
Keuangan
Rasio
Profitabilitas
Rasio Aktivitas
Rasio Solvabilitas
Rasio Likuiditas
Informasi
Asimetris
Rasio BL/BTL
Feed Back
Investasi
Daerah
Informasi
Simetris
C. RESEARCH METHOD
This study was designed using quantitative research methods. Quantitative
research methods are carried out by determining and measuring between items in
one or several types of financial statements for five reporting periods (Kasmir,
2016).
Data Source The type of data used is quantitative data. The data is sourced from financial
reports. There are at least seven types of financial reports that can be a source of
data, namely balance sheets, budget realization reports, operational reports,
Source: Analyis Result of Research Model
Penelitian

DiA: Jurnal Administrasi Publik, 2021 December Vol. 19 No. 2, e-ISSN: 2615-7268
75
reports of changes in excess budget balances, reports of changes in equity, cash
flow reports, and notes to financial statements (PP 58/2019).
Data Analysis Technique
1. Ratio analysis technique is an analysis used to determine the relationship
between items in one financial report. The ratio analysis technique consists of
the ratio of liquidity, solvency, activity, profitability, and the ratio of direct
expenditure to indirect expenditure (Gill, 2004).
2. Comparative analysis technique, which is done by comparing the financial
statements of more than one period so that it can be seen the changes that occur
for each item or component.
3. The percentage per component analysis technique is an analytical technique
carried out to determine the percentage composition of costs, the percentage of
capital expenditures to income, and the ratio of investment to income (ICOR =
1/k).
Based on these analytical techniques, management's strengths and
weaknesses can be identified, the position of assets, liabilities, and own capital. In
addition, some steps can be suggested to the Regional Government of Badung
Regency to improve performance in the future.
D. RESEARCH RESULTS AND DISCUSSION
Liquidity Ratio
The liquidity ratio is a ratio that describes an entity's ability to meet short-
term obligations, such as salary payments, income improvement allowances,
allowances, and others. Another function of this ratio is to measure the entity's
ability to meet short-term obligations that are due, both to outside parties, such as
paying bills to suppliers and short-term internal obligations. The liquidity ratio is
often also referred to as the working capital ratio which compares all components
of total current assets with total current liabilities. The liquidity ratio is calculated
by the formula (Fred Welson (2004), below.
Ratio Liquidity = Total Liquid Assets
Total Liquid Liability
Ratio Liquidity 2016 = 1,966,284,484,172.34
= 20.41 96,347,742,246.87
Ratio Liquidity 2017 = 2.007,655,000,774.57
= 23.69 84,744,409,868.56
Ratio Liquidity 2018 = 1,166,731,976,000.60 = 1.59
734,758,735,930.30
Ratio Liquidity 2019 = 963,524,115,734.04 = 8.09
119,049,148,578.80
Ratio Liquidity 2020 = 1,066,778,138,598.16 = 7.48
142,696,617,690.31
The average liquidity ratio per year is 6.09. This means that the short-term
liabilities of one unit are guaranteed by liquid assets of 6.09 times. However,
DiA: Jurnal Administrasi Publik, 2021 December Vol. 19 No. 2, e-ISSN: 2615-7268
76
behind the good liquidity ratio, receivable accounts showed an increase from year
to year, except in 2018. The details of income receivable accounts can be
presented, namely Rp 929,692,984,205.74 in 2016, Rp 941,504,164,456.88 in
2017. Rp 977,651,230,260.53 in 2018, Rp 833,585,471,554.50. Rp
1,018,874,312,968.55 in 2020. This income receivable needs to be considered
because it contains an element of default risk and can affect the liquidity ratio in
the following years.
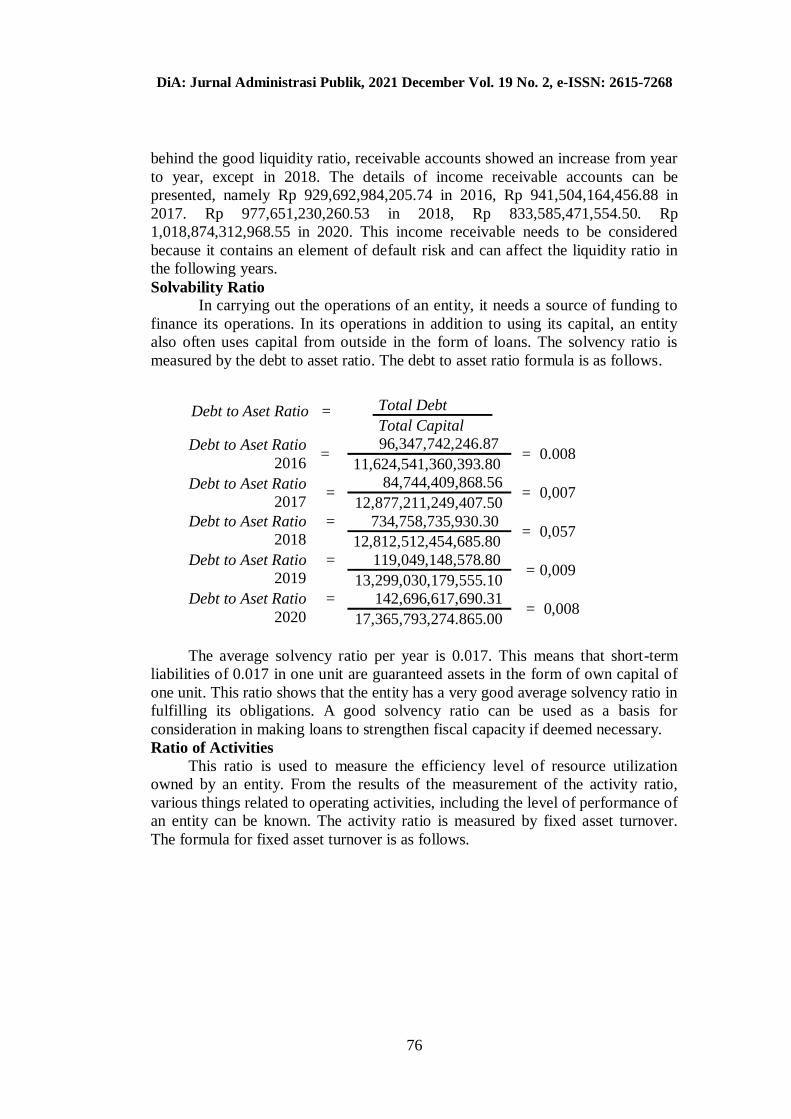
Solvability Ratio
In carrying out the operations of an entity, it needs a source of funding to
finance its operations. In its operations in addition to using its capital, an entity
also often uses capital from outside in the form of loans. The solvency ratio is
measured by the debt to asset ratio. The debt to asset ratio formula is as follows.
Debt to Aset Ratio = Total Debt
Total Capital
Debt to Aset Ratio
2016 =
96,347,742,246.87 = 0.008
11,624,541,360,393.80
Debt to Aset Ratio
2017 =
84,744,409,868.56 = 0,007
12,877,211,249,407.50
Debt to Aset Ratio
2018
= 734,758,735,930.30 = 0,057
12,812,512,454,685.80
Debt to Aset Ratio
2019
= 119,049,148,578.80 = 0,009
13,299,030,179,555.10
Debt to Aset Ratio
2020
= 142,696,617,690.31 = 0,008
17,365,793,274.865.00
The average solvency ratio per year is 0.017. This means that short-term
liabilities of 0.017 in one unit are guaranteed assets in the form of own capital of
one unit. This ratio shows that the entity has a very good average solvency ratio in
fulfilling its obligations. A good solvency ratio can be used as a basis for
consideration in making loans to strengthen fiscal capacity if deemed necessary.
Ratio of Activities
This ratio is used to measure the efficiency level of resource utilization
owned by an entity. From the results of the measurement of the activity ratio,
various things related to operating activities, including the level of performance of
an entity can be known. The activity ratio is measured by fixed asset turnover.
The formula for fixed asset turnover is as follows.

DiA: Jurnal Administrasi Publik, 2021 December Vol. 19 No. 2, e-ISSN: 2615-7268
77
Fixed asset
turnover =
Total Revenew
Total Fixed Asset
Fixed asset
turnover 2016 =
3,563,459,644,191.57 = 30.40%
11,720,889,102,640.70
Fixed asset
turnover 2017 =
4,172,457,395,825.25 = 32.19%
12,961,955,659,276.00
Fixed asset
turnover 2018
= 4,555,716,407,353.28 = 33.16%
13,547,271,190,616.10
Fixed asset
turnover 2019
= 4,835,188,460,096.80 = 36.03%
13,418,079,328,133.90
Fixed asset turnover
2020
= 2,116,974,302,051.93 = 12.09%
17,508,489,892,555.30
The average activity ratio per year is 27.83%. This means that the average
ability of total fixed assets to total local revenue is 27.83% or
Rp3,848,759,241,903.77 or 2.3% per month compared to total assets of
Rp13,831,337,034,644.40 on average. . From the results of the analysis, it was
found that the highest activity ratio occurred in 2019 with total local revenue of
IDR 4,835,188,460,096.80 or 36.03%. On the other hand, the lowest activity ratio
occurred in 2020, which was IDR 2,116,974,302,051.93 or 12.09%. The low
activity ratio in 2020 was caused by the Covid-19 pandemic that hit the world.
Profitability Ratio
The ultimate goal of an entity is to increase the value of the entity
concerned. One way to increase this value is to increase profitability. However,
for the public sector, the terms commonly used are surplus and deficit, not
profitability. A surplus will be able to increase capital, while a deficit will be able
to reduce capital. The surplus/deficit ratio is useful for measuring the ability to
increase revenue and the effectiveness of operations management. The activity
ratio is measured by: (a) return on investment, and (b) return on equity.
(a) Return on Invesment (ROI) calculated by the following formula.
ROI = Total Surplus/Defisit
Total Investment
ROI 2016 = 166,125,687,387.46
= 10.102%% 1.644,518,405,341.07
ROI 2017 = -474,550,289,578.04
= -26.924% 1,762,537,470,553.72
ROI 2018 = -379,575,101,692.51 = -20.782%
1,826,428,324,830.48
ROI 2019 = 59,184,946,824.39 = 3.224%
1,835,604,529,053.40
ROI 2020 = 28,759,334,730.46 = 1.611%
1,784,982,062,58.48

DiA: Jurnal Administrasi Publik, 2021 December Vol. 19 No. 2, e-ISSN: 2615-7268
78
The average surplus/deficit ratio per year is -6.77%. This means that the
average ability to generate a surplus is -6.777%. Based on the results of the
surplus/deficit ratio analysis, it can be explained that the average deficit per year
is -6.777% due to the significant increase in grant and social assistance spending,
which is Rp. 1,018,305,817,154.70 or 18.787% of the total gross income of Rp. 5
.420,009,298,379.53 in 2018.
(b) Return on Equity(ROE) dihitung dengan rumus di bawah ini.
ROE = Total Surplus/Defisit
Total Equity
ROE 2016 = 166,125,687,387.46
= 1.429% 11,624,541,360,393.80
ROE 2017 = -474,550,289,578.04
= -3,685% 12,877,211,249,407.50
ROE 2018 = -379,575,101,692.51 = -2,963%
12,812,512,454,685.80
ROE 2019 = 59,184,946,824.39 = 0.445%
13,299,030,179,555.10
ROE 2020 = 28,759,334,730.46
= 0.166% 17,365,793,274,865.00
The average surplus/deficit ratio per year is calculated based on total equity
-0.922%, while the average surplus/deficit ratio is calculated based on total
investment:-6.777%. This means that the resulting surplus/deficit is significantly
affected by the net investment value, not by total equity. Based on the results of
this analysis, it can be concluded that there are still unproductive equities that do
not affect the increase in the budget surplus.
The relationship between investment and economic growth can be explained
as follows. The average capital expenditure (K) per year is IDR
924,114,249,756.06, while the average income (Y) per year is IDR
4,876,927,264,796.19. Thus, the average investment ratio is K/Y = 0.189, while
the average investment ratio to average income is 1/k = 1/0.189 = 5.29. So, ICOR
= 5.29. The number 5.29 means that the average investment during the period
2016 to the period of 2020, 924 billion is more capable of creating an average
economic growth of 5.29 percent per year. The results of this study are following
the argument put forward by Harrod-Domar that investment has a positive and
significant relationship to economic growth.
The Ratio of Direct Expenditure to Indirect Expenditure (BL/BTL)
BL/BTL is used to measure the extent to which local governments take
sides with the public interest. If BL/TBL = 1, it means that the expenditures
carried out are the same or more oriented to the public interest. If BL/BTL = 1, it
means that the implementation of the budget is the same or less oriented to the
public interest. The calculation of the BL/BTL ratio uses the formula below.

DiA: Jurnal Administrasi Publik, 2021 December Vol. 19 No. 2, e-ISSN: 2615-7268
79
Indeks BL/BTL = Total Belanja Langsung
Total Belanja Tidak Langsung
Indeks BL/BTL
2016 =
2.061,925,907,260.81 = 0.98
2,100,194,081,122.73
Indeks BL/BTL
2017 =
2,671,781,510,035.59 = 0.97
2,742,154,913,454.54
Indeks BL/BTL
2018
= 2,575,218,294,940.07 = 0.79
3,224,366,105,131.97
Indeks BL/BTL
2019
= 2,697,734,876,871.47 = 0.88
3,036,047,767,711.70
Indeks BL/BTL
2020
= 1,729,362,381,720.69 = 0.80
2,147,806,666,422.64
The average BL/BTL ratio per year is 0.88. This means that public policy is
still not optimal for the public interest compared to the interests of the apparatus.
The average BL/BTL ratio: 0.88 will be even smaller if expenditures, such as civil
servant honoraria, non-civil servant honoraria, and overtime pay are removed
from public expenditure accounts.
E. CONCLUSION
Based on the subject matter, research objectives, theoretical studies,
empirical studies, liquidity ratio analysis techniques, solvency, activity,
profitability, direct expenditure index to indirect expenditure, as well as
comparison and percentage analysis techniques, it can be concluded as follows.
1. Financial liquidity shows a good ratio, but in this account there are still
receivables that show an increasing trend and contain a potential risk of
default.
2. The ability to pay for short-term obligations, both for internal and external
obligations, is in the good or safe category.
3. The ability to generate surplus is in the poor category. This is due to the high
cost of operations, grants, and social assistance in the period 2017 to d. 2018 so
the profitability ratio is -6.777 percent.
4. The ability to encourage the rate of economic growth is in the fairly good
category. This is indicated by the ICOR of 5.28 percent.
5. Direct spending for the public interest is still lower when compared to
personnel spending (BL/BTL = 0.88).
Based on the conclusion, so it can be suggest as follows.
1. Efforts should be made to collect receivables from taxpayers by optimizing
online payments, monitoring, and improving tax and levy administration
services.
2. Efficiency measures need to be taken in operating expenditures, grants and
social assistance expenditures so that goods and services expenditures are truly
vital and strategic.

DiA: Jurnal Administrasi Publik, 2021 December Vol. 19 No. 2, e-ISSN: 2615-7268
80
3. There needs to be a policy regarding budget deficit limits so that entities can
consistently set aside a share of income for savings/investment as a prerequisite
for economic growth.
4. Efforts should be made to ensure that public expenditures are at least equal to
or more than those for apparatus.
REFERENCES
Anggara, Sahya, (2016). Administrasi Keuangan Negara. First Edition. Bandung:
Penerbit CV Pustaka Setia.
Astika, Putra, I.B. (2016). Konsep-Konsep Dasar Akuntansi Keuangan. Second
Edition. Denpasar: Penerbit Udayana University Press.
Biddle, G., Hilary, G., dan Verdi, R.S. (2009). How Does Financial Reporting
Quality Relate to Investment Efficiency? Journal of Accounting and
Economics 48(2-3), h. 112--231.
Cooper dan Emory. (1998). Metode Penelitian Bisnis. Volume 2. Fifth Edition.
Jakarta: Penerbit Erlanga.
Cresweel, John W. and Vickil Plano Clark. (2007). Mixed Methods Research.
The University of Nebraska Lincoln.
Dewan Perwakilan Rakyat Republik Indonesia dan Presiden Republik Indonesia
(2003), Undang-Undang Nomor 17 Tahun 2003 tentang Keuangan
Negara. Lembaran Negara Tahun 2003.
Glaninta, S. Chegini, M.G. dan Mohtasham, Esmaeil M. (2013). The Importance
of Financial Reporting and Affecting Factors on It. Arabian Journal of
Business and Management Review. 1(10), h. 70--78.
Harrod-Domar, (1939-1946). Harrod-Domar Model is a Keynesian Model of
Economic Growth. Wikipedia, en.m.wikipedia. org. July 14, 2021.
8.24 pm.
J. Fred Weston, Eugen, (2004). Dasar-Dasar Manajemen Keuangan. Seventh
Edition. Jakarta: Penerbit Erlangga.
Kasmir. (2019). Analisis Laporan Keuangan. Revised Edition, Printing K1 12.
Depok: Penerbit Raja Grafindo Persada.
Pratama, Rahardja and Manurung, Mandala, (2008). Teori Ekonomi Makro suatu
Pengantar. Fourth Edition. Jakarta: Penerbit Fakultas Ekonomi
Universitas Indonesia.
Presiden Republik Indonesia (2019), Peraturan Pemerintah Nomor 58 Tahun 2019
concerning Regional Finance. Lembaran Negara Tahun 2019 Nomor
42.
Putra, Astika Ida Bagus. (2016). Konsep-Konsep Dasar Akuntansi Keuangan.
Second Edition. Denpasar: Penerbit Udayana University Press.
Salvatore, Dominick, (2005). Managerial Economics. Book 2 Fifth Edition.
Penerbit: Salemba Empat. Jakarta.
Yadiati, Wiwin and Mubarok, Abdulah, (2017). Kualitas Pelaporan Kuuangan:
Kajian Teoritis dan Empiris. Jakarta: Penerbit Kencana Rawamangun.
Verdi. (2006). “Financial Reporting Quality and Investment Efficiency”. Working
Paper. Sloan School of Management Massachusetts Institute of
Technology. h.1.