
Instructions for Data Preparation and use of TSW Spreadsheet ...
Upload
khangminh22Category
view
0download
0
Download free books at BookBooN.com
Marketing Research
93
7. Data preparation and preliminary data analysis
7.1 Chapter summary
After developing an appropriate questionnaire and pilot testing the same, researchers need to undertake the field study and collect the data for analysis. In this chapter, we shall focus on the fieldwork and data collection process. Furthermore, once the data is collected it is important to use editing and coding procedures to input the data in the appropriate statistical software. Once the data is entered into the software it is also important to check the data before the final analysis is carried out. This chapter also deals with the how to code the data, input the data and clean the data. It will further discuss the preliminary data analysis such as normality and outlier check. The last section of this chapter will focus on the preliminary data analysis techniques such as frequency distribution and also discuss hypothesis testing using various analysis techniques.
7.2 Survey fieldwork and data collection
As stated earlier, many marketing research problems require collection of primary data and surveys are one of the most employed techniques for collection of primary data. Primary data collection therefore, in the field of marketing research requires fieldwork. In the field of marketing (especially in the case of corporate research) primary data is rarely collected by the person who designed the research. It is generally collected by the either people in the research department or an agency specialising in fieldwork. Issues have been raised with regard to fieldwork and ethics. If a proper recruitment procedure is followed, such concerns rarely get raised. The process of data collection can be defined in four stages: (a) selection of fieldworkers; (b) training of fieldworkers; (c) supervision of fieldworkers and (d) evaluation of fieldwork and fieldworkers.
Prior to selecting any fieldworker the researcher must have clarity as to what kind of fieldworker will be suitable for a particular study. This is critical in case personal and telephone interview because the respondent must feel comfortable interacting with the fieldworker. Many times researchers leave the fieldworkers on their own and this can have a direct impact on overall response rate and quality of data collected. It is very important for the researcher to train the fieldworker with regard to what the questionnaire and the study aim to achieve. Most fieldworkers have little idea of what exactly research process is and if not trained properly, they might not conduct the interviews in the correct manner. Researchers have prepared guidelines for fieldworkers in asking questions. The guidelines72 include:
a. Be thoroughly familiar with the questionnaire. b. Ask the questions in the order in which they appear in the questionnaire. c. Use the exact wording given in the questionnaire.
Data preparation and preliminary data analysis

Download free books at BookBooN.com
Marketing Research
94
d. Read each question slowly. e. Repeat questions that are not understood. f. Ask every applicable question. g. Follow instructions and skip patterns, probing carefully.
The researcher should also train the fieldworkers in probing techniques. Probing helps in motivating the respondent and helps focus on a specific issue. However, if not done properly, it can generate bias in the process. There are several probing techniques73:
a. Repeating the question b. Repeating the respondents’ reply c. Boosting or reassuring the respondent d. Eliciting clarification e. Using a pause (silent probe) f. Using objective/neutral questions or comments
The fieldworkers also should be trained on how to record the responses and how to terminate the interviews politely. A trained fieldworker can become a good asset in the whole of the research process in comparison to a fieldworker who is feeling disengagement with the whole process.
It is important to remember that fieldworkers are generally paid on hourly or daily basis and paid minimum wages in many cases. Therefore, their motivation to conduct the interviews may not be as high as a researcher overlooking the whole process. This brings about the issue of supervision, through which, researchers can keep a control over the fieldworkers by making sure that they are following the procedures and techniques in which they were trained. Supervision provides advantages in terms of facilitating quality and control, keeping a tab on ethical standards employed in the field, and control over cheating.
The fourth issue with regard to fieldwork is the issue of evaluating fieldwork and fieldworkers. Evaluating fieldwork is important from the perspective of authenticity of the interviews conducted. The researcher can call 10-20% of the sample respondents to inquire the fieldworker actually conducted the interviews or not. The supervisor could ask several questions within the questionnaire to reconfirm the data authenticity. The fieldworkers should be evaluated on the total cost incurred, response rates, quality of interviewing and the data.
7.3 Nature and scope of data preparation
Once the data is collected, researchers’ attention turns to data analysis. If the project has been organized and carried out correctly, the analysis planning is already done using the pilot test data. However, once the final data has been captured, researchers cannot start analysing them straightaway. There are several steps which are required to prepare the data ready for analysis. The steps generally involve data editing and coding, data entry, and data cleaning.
Data preparation and preliminary data analysis

Download free books at BookBooN.com
Marketing Research
95
The above stated steps help in creating a data which is ready for analysis. It is important to follow these steps in data preparation because incorrect data can results into incorrect analysis and wrong conclusion hampering the objectives of the research as well as wrong decision making by the manager.
7.3.1 Editing
The usual first step in data preparation is to edit the raw data collected through the questionnaire. Editing detects errors and omissions, corrects them where possible, and certifies that minimum data quality standards have been achieved. The purpose of editing is to generate data which is: accurate; consistent with intent of the question and other information in the survey; uniformly entered; complete; and arranged to simplify coding and tabulation.
Sometimes it becomes obvious that an entry in the questionnaire is incorrect or entered in the wrong place. Such errors could have occurred in interpretation or recording. When responses are inappropriate or missing, the researcher has three choices:
(a) Researcher can sometimes detect the proper answer by reviewing the other information in the schedule. This practice, however, should be limited to those few cases where it is obvious what the correct answer is. (b) Researcher can contact the respondent for correct information, if the identification information has been collected as well as if time and budget allow.
Data preparation and preliminary data analysis
Ple
ase
clic
k th
e ad
vert
Download free books at BookBooN.com
Marketing Research
96
(c) Researcher strike out the answer if it is clearly inappropriate. Here an editing entry of ‘no answer’ or ‘unknown’ is called for. This procedure, however, is not very useful if your sample size is small, as striking out an answer generates a missing value and often means that the observation cannot be used in the analyses that contain this variable.
One of the major editing problem concerns with faking of an interview. Such fake interviews are hard to spot till they come to editing stage and if the interview contains only tick boxes it becomes highly difficult to spot such fraudulent data. One of the best ways to tackle the fraudulent interviews is to add a few open-ended questions within the questionnaire. These are the most difficult to fake. Distinctive response patterns in other questions will often emerge if faking is occurring. To uncover this, the editor must analyse the instruments used by each interviewer.
7.3.2 Coding
Coding involves assigning numbers or other symbols to answers so the responses can be grouped into a limited number of classes or categories. Specifically, coding entails the assignment of numerical values to each individual response for each question within the survey. The classifying of data into limited categories sacrifices some data detail but is necessary for efficient analysis. Instead of requesting the word male or female in response to a question that asks for the identification of one’s gender, we could use the codes ‘M’ or ‘F’. Normally this variable would be coded 1 for male and 2 for female or 0 and 1. Similarly, a Likert scale can be coded as: 1 = strongly disagree; 2 = disagree; 3 = neither agree nor disagree; 4 = agree and 5 = strongly agree. Coding the data in this format helps the overall analysis process as most statistical software understand the numbers easily. Coding helps the researcher to reduce several thousand replies to a few categories containing the critical information needed for analysis. In coding, categories are the partitioning of a set; and categorization is the process of using rules to partition a body of data.
One of the easiest ways to develop coding structure for the questionnaire is to develop a codebook. A codebook, or coding scheme, contains each variable in the study and specifies the application of coding rules to the variable. It is used by the researcher or research staff as a guide to make data entry less prone to error and more efficient. It is also the definitive source for locating the positions of variables in the data file during analysis. Most codebooks – computerized or not – contain the question number, variable name, location of the variable’s code on the input medium, descriptors for the response options, and whether the variable is alpha (containing a – z) or numeric (containing 0 – 9). Table 7.1 below provides an example of a codebook.
Data preparation and preliminary data analysis

Download free books at BookBooN.com
Marketing Research
97
Table 7.1:Sample codebook for a study on DVD rentals
Variableinstructions
SPSS Variable name
Coding
Identification n° ID Number of each respondent
Movie rentals(1) Rent 1= yes 2= no
Movie genre(2) Genre 1= comedy 2= action/adventure 3= thriller 4= drama 5= family 6= horror 7= documentary
DVD rental sources(3)
Source 1= in-store 2= online
Renting for(4) Time 1= less than 6 months 2= 6 months – 1 year 3= 1 –2 years 4= 2-5 years 5= above 5 years
Coding close ended questions is much easier as they are structured questions and the responses obtained are predetermined. As seen in the table 7.1 the coding of close ended question follows a certain order. However, coding open ended questions is tricky. The variety of answer one may encounter is staggering. For example, an open ended question relating to what makes you rent a DVD in the above questionnaire created more than 65 different types of response patterns among 230 responses. In such situations, content analysis is used, which provides an objective, systematic and quantitative description of the response.74 Content analysis guards against selective perception of the content, provides for the rigorous application of reliability and validity criteria, and is amenable to computerization.
7.3.3 Data entry
Once the questionnaire is coded appropriately, researchers input the data into statistical software package. This process is called data entry. There are various methods of data entry. Manual data entry or keyboarding remains a mainstay for researchers who need to create a data file immediately and store it in a minimal space on a variety of media. Manual data entry is highly error prone when complex data is being entered and therefore it becomes necessary to verify the data or at least a portion of it. Many large scale studies now involve optical character recognition or optical mark recognition wherein a questionnaire is scanned using
Data preparation and preliminary data analysis

Download free books at BookBooN.com
Marketing Research
98
optical scanners and computer itself converts the questionnaire into a statistical output. Such methods improve the overall effectiveness and efficiency of data entry. In case of CATI or CAPI data is directly added into the computer memory and therefore there is no need for data entry at a later stage. Many firms now a days use electronic devices such as PDAs, Teblet PCs and so on in fieldwork itself and thereby eliminating the data entry process later on. However, as the data is being manually entered in this process, researchers must look for anomalies and go through the editing process.
7.3.4 Data cleaning
Data cleaning focuses on error detection and consistency checks as well as treatment of missing responses. The first step in the data cleaning process is to check each variable for data that are out of the range or as otherwise called logically inconsistent data. Such data must be corrected as they can hamper the overall analysis process. Most advance statistical packages provide an output relating to such inconsistent data. Inconsistent data must be closely examined as sometimes they might not be inconsistent and be representing legitimate response.
Data preparation and preliminary data analysis
Always aiming for higher ground.Just another day at the office for a Tiger.
©2009 Accenture. All rights reserved.
Visit student.accentureforum.dk
Join the Accenture High Performance Business Forum On Thursday, April 23rd, Accenture invites top students to the High Performance Business Forum where you can learn how leading Danish companies are using the current economic downturn to gain competitive advantages. You will meet two of Accenture’s global senior executives as they present new original research and illustrate how technology can help forward thinking companies cope with the downturn.
Visit student.accentureforum.dk to see the program and register
Ple
ase
clic
k th
e ad
vert
Download free books at BookBooN.com
Marketing Research
99
In most surveys, it happens so that respondent has either provided ambiguous response or the response has been improperly recorded. In such cases, missing value analysis is conducted for cleaning the data. If the proportion of missing values is more than 10%, it poses greater problems. There are four options for treating missing values: (a) substituting missing value with a neutral value (generally mean value for the variable); (b) substituting an imputed response by following a pattern of respondent’s other responses; (c) casewise deletion, in which respondents with any missing responses are discarded from the analysis and (d) pairwise deletion, wherein only the respondents with complete responses for that specific variable are included. The different procedures for data cleaning may yield different results and therefore, researcher should take utmost care when cleaning the data. The data cleaning should be kept at a minimum if possible.
7.4 Preliminary data analysis
In the earlier part of this chapter, we discussed how responses are coded and entered. Creating numerical summaries of this process provides valuable insights into its effectiveness. For example, missing data, information that is missing about a respondent or case for which other information is present, may be detected. Mis-coded, out-of-range data, extreme values and other problems also may be rectified after a preliminary look at the dataset. Once the data is cleaned a researcher can embark on the journey of data analysis. In this section we will focus on the first stage of data analysis which is mostly concerned with descriptive statistics.
Descriptive statistics, as the name suggests, describe the characteristics of the data as well as provide initial analysis of any violations of the assumptions underlying the statistical techniques. It also helps in addressing specific research questions. This analysis is important because many advance statistical tests are sensitive to violations in the data. The descriptive tests provide clarity to the researchers as to where and how violation is occurring within the dataset. Descriptive statistics include the mean, standard deviation, range of scores, skewness and kurtosis. This statistics can be obtained using frequencies, descriptives or explore command in SPSS. To make it clear, SPSS is one of the most used statistical software packages in the world. There are several other such software packages available in the market which include, Minitab, SAS, Stata and many others.75
For analysis purposes, researchers define the primary scales of measurements (nominal, ordinal, interval and ratio) into two categories. They are named as categorical variables (also called as non-metric data) and continuous variables (also called as metric data). Nominal and ordinal scale based variables are called categorical variables (such as gender, marital status and so on) while interval and ratio scale based variables are called continuous variables (such as height, length, distance, temperature and so on).
Programmes such as SPSS can provide descriptive statistics for both categorical and continuous variables. The figure below provides how to get descriptive statistics in SPSS for both kinds of variables.
Data preparation and preliminary data analysis

Download free books at BookBooN.com
Marketing Research
100
Figure 7.1: Descriptive analysis process
The descriptive data statistics for categorical variables provide details regarding frequency (how many times the specific data occurs for that variable such as number of male and number of female respondents) and percentages. The descriptive data statistics for continuous variables provide details regarding mean, standard deviation, skewness and kurtosis.
Categorical variables: SPSS menu Analyse > Descriptive statistics > Frequencies (Choose appropriate variables and transfer them into the variables box using the arrow button. Then choose the required analysis to be carried out using the statistics, charts and format button in the same window. Press OK and then you will see the results appear in another window)
Continuous variables: SPSS menu Analyse > Descriptive statistics > Descriptives (Choose all the continuous variables and transfer them into the variables box using the arrow button. Then clicking the options button, choose the various analyses you wish to perform. Press OK and then you will see the results appear in another window)
Data preparation and preliminary data analysis
it’s an interesting world
Get under the skin of it.Graduate opportunitiesCheltenham | £24,945 + benefits
One of the UK’s intelligence services, GCHQ’s role is two-fold: to gather and analyse intelligence which helps shape Britain’sresponse to global events, and, to provide technical advice for theprotection of Government communication and information systems.In doing so, our specialists – in IT, internet, engineering, languages,information assurance, mathematics and intelligence – get wellbeneath the surface of global affairs. If you thought the world was an interesting place, you really ought to explore our world of work.
www.careersinbritishintelligence.co.ukApplicants must be British citizens. GCHQ values diversity and welcomes applicants fromall sections of the community. We want our workforce to reflect the diversity of our work.
TOPGOVERNMENT
EMPLOYER
Ple
ase
clic
k th
e ad
vert
Download free books at BookBooN.com
Marketing Research
101
7.5 Assessing for normality and outliers
To conduct many advance statistical techniques, researchers have to assume that the data provided is normal (means it is symmetrical on a bell curve) and free of outliers. In simple terms, if the data was plotted on a bell curve, the highest number of data points will be available in the middle and the data points will reduce on either side in a proportional fashion as we move away from the middle. The skewness and kurtosis analysis can provide some idea with regard to the normality. Positive skewness values suggest clustering of data points on the low values (left hand side of the bell curve) and negative skewness values suggest clustering of datapoints on the high values (right hand side of the bell curve). Positive kurtosis values suggest that the datapoints have peaked (gathered in centre) with long thin tails. Kurtosis values below 0 suggest that the distribution of datapoints is relatively flat (i.e. too many cases in the extreme).
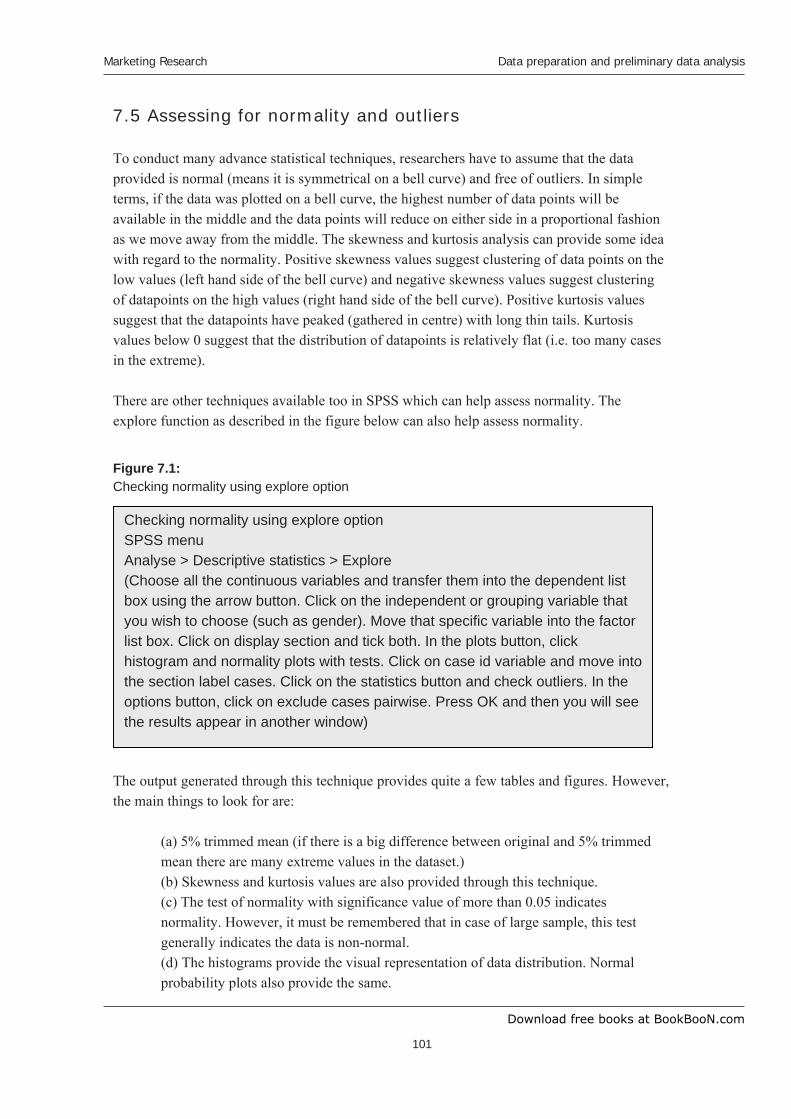
There are other techniques available too in SPSS which can help assess normality. The explore function as described in the figure below can also help assess normality.
Figure 7.1: Checking normality using explore option
The output generated through this technique provides quite a few tables and figures. However, the main things to look for are:
(a) 5% trimmed mean (if there is a big difference between original and 5% trimmed mean there are many extreme values in the dataset.) (b) Skewness and kurtosis values are also provided through this technique. (c) The test of normality with significance value of more than 0.05 indicates normality. However, it must be remembered that in case of large sample, this test generally indicates the data is non-normal. (d) The histograms provide the visual representation of data distribution. Normal probability plots also provide the same.
Checking normality using explore option SPSS menu Analyse > Descriptive statistics > Explore (Choose all the continuous variables and transfer them into the dependent list box using the arrow button. Click on the independent or grouping variable that you wish to choose (such as gender). Move that specific variable into the factor list box. Click on display section and tick both. In the plots button, click histogram and normality plots with tests. Click on case id variable and move into the section label cases. Click on the statistics button and check outliers. In the options button, click on exclude cases pairwise. Press OK and then you will see the results appear in another window)
Data preparation and preliminary data analysis

Download free books at BookBooN.com
Marketing Research
102
(e) Boxplots provided in this output also help identify the outliers. Any cases which are considered outliers by SPSS will be marked as small rounds at the edge of the boxplot lines.
The tests of normality and outliers are important if the researcher wishes to know and rectify any anomalies in the data.
7.7 Hypothesis testing
Once the data is cleaned and ready for analysis, researchers generally undertake hypothesis testing. Hypothesis is an empirically testable though yet unproven statement developed in order to explain a phenomena. Hypothesis is generally based on some preconceived notion of the relationship between the data derived by the manager or the researcher. These preconceived notions generally arrive from existing theory or practices observed in the marketplace. For example, a hypothesis could be that ‘consumption of soft drinks is higher among young adults (pertaining to age group 18-25) in comparison to middle aged consumers (pertaining to age group 35-45)’. In the case of the above stated hypothesis we are comparing two groups of consumers and the two samples are independent of each other. On the other hand, a researcher may wish to compare the consumption pattern relating to hard drinks and soft drinks among the young adults. In this case the sample is related. Various tests are employed to analyse hypothesis relating to independent samples or related samples.
7.7.1 Generic process for hypothesis testing
Testing for statistical significance follows a relatively well-defined pattern, although authors differ in the number and sequence of steps. The generic process is described below.
1. Formulate the hypothesis While developing hypothesis, researchers use two specific terms: null hypothesis and alternative hypothesis. The null hypothesis states that there is no difference between the phenomena. On the other hand, alternative hypothesis states that there is true difference between the phenomena. While developing null hypothesis, researcher assumes that any change from what has been thought to be true is due to random sampling error. In developing alternative hypothesis researcher assumes that the difference exists in reality and is not simply due to random error.76 For example, in the earlier explained hypothesis relating to hard drinks and cola drinks, if after analysis, null hypothesis is accepted, we can conclude that there is no difference between the drinking behaviour among young adults. However, if the null hypothesis is rejected, we accept the alternative hypothesis that there is difference between the drinking of hard and soft drinks among young adults. In research terms null hypothesis is denoted via H0 and alternative hypothesis as H1.
Data preparation and preliminary data analysis

Download free books at BookBooN.com
Marketing Research
103
2. Select an appropriate test Statistical techniques can be classified into two streams namely univariate and multivariate (bivariate techniques have been included as multivariate analysis here). Univariate techniques are appropriate when there is a single measurement of each element in the sample, or there are several measurements of each elements but each variable is analysed in isolation. On the other hand, multivariate techniques are suitable for analysing data when there are two or more measurements of each element and the variables are analysed simultaneously.77 The major difference between univariate and multivariate analysis is the focus of analysis where univariate analysis techniques focus on averages and variances, multivariate analysis techniques focus on degree of relationships (correlations and covariances).78 Univariate techniques are further classified on the basis of the nature of the data (i.e. categorical or continuous). Multivariate techniques are classified on the basis of dependency (i.e. dependence techniques and independence techniques).
The figure below explains the various types of analysis techniques researchers use when analysing data.
Data preparation and preliminary data analysis
By 2020, wind could provide one-tenth of our planet’s electricity needs. Already today, SKF’s innovative know-how is crucial to running a large proportion of the world’s wind turbines.
Up to 25 % of the generating costs relate to mainte-nance. These can be reduced dramatically thanks to our systems for on-line condition monitoring and automatic lubrication. We help make it more economical to create cleaner, cheaper energy out of thin air.
By sharing our experience, expertise, and creativity, industries can boost performance beyond expectations.
Therefore we need the best employees who can meet this challenge!
The Power of Knowledge Engineering
Brain power
Plug into The Power of Knowledge Engineering.
Visit us at www.skf.com/knowledge
Ple
ase
clic
k th
e ad
vert
Download free books at BookBooN.com
Marketing Research
104
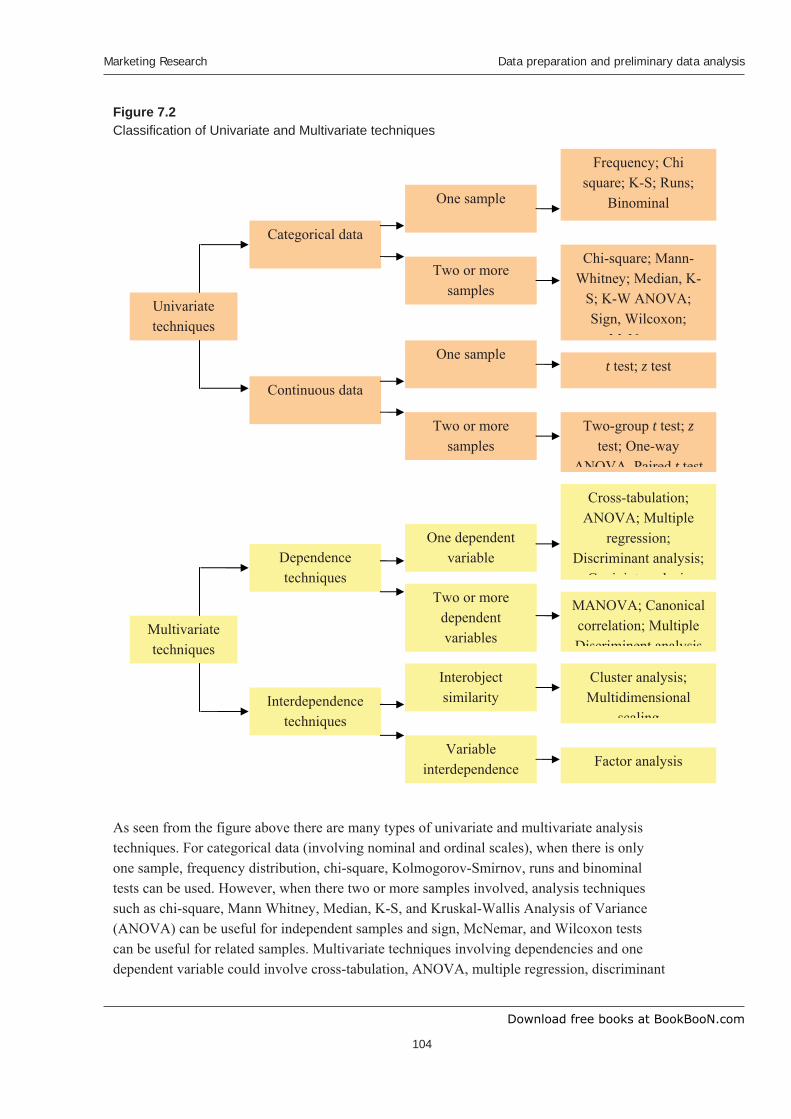
Figure 7.2Classification of Univariate and Multivariate techniques
As seen from the figure above there are many types of univariate and multivariate analysis techniques. For categorical data (involving nominal and ordinal scales), when there is only one sample, frequency distribution, chi-square, Kolmogorov-Smirnov, runs and binominal tests can be used. However, when there two or more samples involved, analysis techniques such as chi-square, Mann Whitney, Median, K-S, and Kruskal-Wallis Analysis of Variance (ANOVA) can be useful for independent samples and sign, McNemar, and Wilcoxon tests can be useful for related samples. Multivariate techniques involving dependencies and one dependent variable could involve cross-tabulation, ANOVA, multiple regression, discriminant
Multivariatetechniques
Univariatetechniques
Categorical data
Continuous data
Dependencetechniques
Interdependencetechniques
One sample
Two or more samples
One sample
Two or more samples
Frequency; Chi square; K-S; Runs;
Binominal
Chi-square; Mann-Whitney; Median, K-
S; K-W ANOVA; Sign, Wilcoxon;
M N
One dependent variable
Two or more dependentvariables
Interobjectsimilarity
Variableinterdependence
t test; z test
Two-group t test; ztest; One-way
ANOVA Paired t test
Cross-tabulation;ANOVA; Multiple
regression;Discriminant analysis;
C j i t l i
MANOVA; Canonical correlation; Multiple Discriminent analysis
Cluster analysis; Multidimensional
scaling
Factor analysis
Data preparation and preliminary data analysis
Download free books at BookBooN.com
Marketing Research
105
analysis and conjoint analysis. However, if there are two or more dependent variables in these dependence techniques, multivariate analysis of variance (MANOVA), canonical correlation, and multiple discriminant analysis can be used. For the interdependence multivariate techniques when a researcher wishes to measure interobject similarity cluster analysis and multidimensional scaling can be used. On the other hand, if a researcher wishes to measure variable interdependence factor analysis can be used. We shall not be covering these techniques in details as they are quite advance in nature and it is beyond the remit of this book.
3. Select desired level of significance In marketing research, we accept or reject a hypothesis on the basis of the information provided by our respondent sample. Since any sample will almost surely vary somewhat from its population, we must judge whether the differences between groups are statistically significant or insignificant. A difference has statistical significance if there is good reason to believe the difference does not represent random sampling fluctuations only. For example, in case of the first hypothesis we developed relating to the young adults and middle aged consumers, we found that the young adults consume 21 soft drinks a week and the middle aged people consumer 16 soft drinks a week. Can we state there is a meaningful difference between the groups? To define this meaningfulness we need to conduct significance testing.
Data preparation and preliminary data analysis
NNE and Pharmaplan have joined forces to create NNE Pharmaplan, the world’s leading engineering and consultancy company focused entirely on the pharma and biotech industries.
Inés Aréizaga Esteva (Spain), 25 years oldEducation: Chemical Engineer
NNE Pharmaplan is the world’s leading engineering and consultancy company focused entirely on the pharma and biotech industries. We employ more than 1500 people worldwide and offer global reach and local knowledge along with our all-encompassing list of services. nnepharmaplan.com
– You have to be proactive and open-minded as a newcomer and make it clear to your colleagues what you are able to cope. The pharmaceutical fi eld is new to me. But busy as they are, most of my colleagues fi nd the time to teach me, and they also trust me. Even though it was a bit hard at fi rst, I can feel over time that I am beginning to be taken seriously and that my contribution is appreciated.
Trust and responsibility
Ple
ase
clic
k th
e ad
vert

Download free books at BookBooN.com
Marketing Research
106
In either accepting or rejecting a null hypothesis, we can make incorrect decisions. A null hypothesis may get accepted when it should have been rejected or rejected when it should have been accepted. These incorrect decisions lead to errors which are termed as Type I error and Type II error. When a Type I error (Also termed as alpha error – ) occurs, a true null hypothesis is rejected. When a Type II error (also termed as beta error – ) one fails to reject a false null hypothesis. Although is unknown as it is a population parameter, it is related to .An extremely low value of (e.g. = 0.0001) will result in intolerably high errors. So it is necessary to balance the two errors. Marketing researchers therefore use value generally as 0.05 or 0.01. Increasing sample size also can help control Type I and II errors.
4. Compute the calculated difference value After the data are collected, researchers use a formula for the appropriate significance test to obtain the calculated value.
5. Obtain the critical valueOnce the test is conducted for t value or chi-square or other measure, researchers must look up the critical value in the appropriate table for that distribution. These tables are generally available in many research books or can be easily obtained from internet.79 The critical value is the criterion that defines the region of rejection from the region of acceptance of the null hypothesis.
6. Compare the calculated and critical values Once the calculated and critical values are obtained the researcher then compares the values. If the calculated value of the test statistics is greater than the critical value of the test statistics, the null hypothesis is rejected. Furthermore, if the probability associated with the calculated value of the test statistics is less than the level of significance ( ) then the null hypothesis is rejected.
7. Marketing research interpretation The conclusion reached by hypothesis testing must be converted into a language which can be understood by managers. In this way, what was stated as a managerial problem gets answered.
7.8 Conclusion
In this chapter, we discussed three aspects of marketing research process: data collection, data preparation and preliminary data analysis. Once the questionnaire is designed, to collect primary data researchers need to involve fieldworkers. It is very important for the researcher to control the selection, training and supervision process of the fieldworkers as it can have a direct impact on the quality of the data collected.
Once the data is collected using fieldwork, the next stage for the researcher is to edit and code the data. The editing and coding process can be tedious at times but are important in the data entry process. The editing and coding processes help identify anomalies within the data which can at times be solved using various data cleaning methods.
Data preparation and preliminary data analysis

Download free books at BookBooN.com
Marketing Research
107
The clean data is then used for analysis purposes by researchers. The first step for analysis is to look for normality and outliers. It is important to do these tests as many advance statistical tests are quite sensitive to extreme values in dataset.
After the preliminary data is analysed for normality, researchers undertake hypothesis testing. Researchers first develop a null hypothesis which stats there is no difference between the phenomena being measured. Once an appropriate hypothesis is formulated, researchers choose between various statistical tests which are classified broadly into two categories: univariate and multivariate techniques. Researchers then select the desired level of significance to avoid Type I ( ) and Type II ( ) errors. After that they compute the critical value and obtain the calculated value. Once both the values are obtained, researchers compare the values and decide on the acceptance or rejection of null hypothesis.
Data preparation and preliminary data analysis
Ple
ase
clic
k th
e ad
vert
Copyright © 2022 FDOKUMEN