Report preparation and presentation
19
Report preparation and presentation 25 CHAPTER Managers should find reports easy to understand, be confident in the findings, and be clear about the action they should take, based on the researcher’s approach, insight and integrity. After reading this chapter, you should be able to: 1 discuss the basic requirements of report preparation, including report format, report writing, graphs and tables; 2 discuss the nature and scope of the oral presentation; 3 describe the approach to the marketing research report from the client’s perspective; 4 explain the reason for follow-up with the client and describe the assistance that should be given to the client and the evaluation of the research project; 5 understand the report preparation and presentation process in international marketing research; 6 identify the ethical issues related to the interpretation and reporting of the research process and findings to the client and the use of these results by the client. Objectives Stage 1 Problem definition Stage 2 Research approach developed Stage 3 Research design developed Stage 4 Fieldwork or data collection Stage 5 Data preparation and analysis Stage 6 Report preparation and presentation
-
Upload
khangminh22 -
Category
Documents
-
view
4 -
download
0
Transcript of Report preparation and presentation

Report preparation andpresentation
25C H A P T E R
Managers should find reports easy to
understand, be confident in the findings, and
be clear about the action they should take,
based on the researcher’s approach, insight
and integrity.
After reading this chapter, you should be able to:
1 discuss the basic requirements of report preparation, including
report format, report writing, graphs and tables;
2 discuss the nature and scope of the oral presentation;
3 describe the approach to the marketing research report from the
client’s perspective;
4 explain the reason for follow-up with the client and describe the
assistance that should be given to the client and the evaluation
of the research project;
5 understand the report preparation and presentation process in
international marketing research;
6 identify the ethical issues related to the interpretation and
reporting of the research process and findings to the client and
the use of these results by the client.
Objectives
Stage 1
Problem definition
Stage 2
Research approach
developed
Stage 3
Research design
developed
Stage 4
Fieldwork or data
collection
Stage 5
Data preparation
and analysis
Stage 6
Report preparation
and presentation

Overview
This chapter describes the importance of report preparation and presentation andoutlines the process of producing written and oral presentations. We provide guide-lines for report preparation, including report writing and preparing tables andgraphs, and we discuss oral presentation of the report. Research follow-up, includingassisting the client and evaluating the research process, is described. The special con-siderations for report preparation and presentation in international marketingresearch are discussed, and relevant ethical issues are identified. We begin with anexample of the potential array of reports that can emerge from a marketing researchproject that is primarily presenting quantitative findings. This is followed with anexample of a very creative means to present findings to a study that is primarily pre-senting qualitative findings. Both examples illustrate the different styles and means topresent marketing research reports.
Report preparation and presentation
In the GlobalCash Project, funding for the research came from 15 pan-European banks and
trade associations throughout Europe, such as the Dutch and the UK Association of Corporate
Treasurers. With different sponsoring organisations, a number of formats of report presenta-
tion were made. As 19 European countries were surveyed, reports were prepared for each
country. There were additional reports for the Nordic/Scandinavia region that combined the
results from Denmark, Finland, Norway and Sweden, plus an aggregated report for the whole
of Europe. Given the importance of the introduction of European Monetary Union, interim
reports (based upon 250 and then 500 responses) were presented as the total dataset was
being compiled.
The aggregated European report, compiled from data from 1994, 1996, 1998 and 2000,
was presented in a written format. As well as the statistical findings, interpretation of the sta-
tistics was presented. For individual countries, statistics and interpretations were presented in
electronic formats, available on the Internet in a password-protected location. As well as
receiving the written and electronic findings, each of the sponsoring banks made an oral pres-
entation. Some of the banks, such as Citibank and the Chase Manhattan Bank, used
video-conferencing to allow executives in the United States to participate in the oral presenta-
tion. Each oral presentation was tailored to the individual sponsoring bank. They wished to
understand the impact of the findings upon their future strategy in the European market.
For the sponsoring trade associations, a written report for their country was presented. This
report was shorter than the bank report in that individual bank ratings and performance were
omitted. Again, an oral presentation was made to an association meeting which could number
up to 300 delegates from a wide array of companies and banks within individual countries.
Finally a much shorter summary of the statistics was written and sent to all questionnaire
respondents. ■
Meet Matthias, Stephanie, Seb, Justine and Stan 1
Allied Domecq Spirits and Wines (ADSW) commissioned an innovative study to understand
the factors of brand adoption of young emergent adult drinkers. The innovative approach to
gathering data continued into communicating the findings. ADSW managers were invited to
spend a day of ‘discovery’. The day started by holding breakout sessions to gauge current
assumptions about young drinkers. They then ‘met’ a set of fictional characters that repre-
sented the adult emergent drinker generation that had been the focus of the study. The idea
behind this was to allow ADSW managers to be able to visualise their consumers when devel-
oping new product development or communications strategies. Personalities were created
and brought to life using actors. In France, for example, the clients were able to meet
Matthias, Stephanie, Seb, Justine and Stan. These five characters symbolised the richness
and the diversity of the generation. Each of the characters engaged with the manager audi-
ence via dialogue, discussing for example their lifestyle, behaviours, what’s ‘in’ or ‘out’, values,
concerns and expectations for the future, as well as their current attitudes towards alcohol. In
Chapter 25 • Report preparation and presentation
644
e x a m p l e
GlobalCash Project
e x a m p l e

addition, the audience was presented with workshop ‘souvenirs’, notebooks with pictures and
biographies of the character types where they could take notes during the presentation. The
effect was immediate; with a bar as a cue, managers were able to step into a new world and
easily meet and interact with their consumers. Moreover, their ‘consumers’ were eager to
explain what was and wasn’t important to them. This multi-media/multi-layered presentation of
findings allowed information to be assimilated both visually, audibly and kinesthetically. ■
Importance of the report and presentation
For the following reasons, the report and its presentation are important parts of themarketing research project:
1 They are the tangible products of the research effort. After the project is completeand management has made the decision, there is little documentary evidenceof the project other than the written report. The report serves as a historicalrecord of the project.
2 Management decisions are guided by the report and the presentation. If the firstfive steps in the project are carefully conducted but inadequate attention is paid tothe sixth step, the value of the project to management will be greatly diminished.
3 The involvement of many marketing managers in the project is limited to the writ-ten report and the oral presentation. These managers evaluate the quality of theentire project on the quality of the report and presentation.
4 Management’s decision to undertake marketing research in the future or to use theparticular research supplier again will be influenced by the perceived usefulness ofthe report and the presentation.
Preparation and presentation process
Figure 25.1 illustrates report preparation and presentation.
Preparation and presentation process
645
Problem definition, approach,
research design and fieldwork
Data analysis
Interpretation, conclusion,
and recommendations
Report preparation
Oral presentation
Reading of the report
by the client
Research follow-up
Figure 25.1
The report preparation
and presentation
process
The process begins by interpreting the results of data analysis in the light of themarketing research problem, approach, research design and fieldwork. Instead ofmerely summarising the quantitative and/or qualitative analyses, the researchershould present the findings in such a way that they can be used directly as input intodecision-making. Wherever appropriate, conclusions should be drawn and recom-mendations made. The researcher should aim to make their recommendationsactionable. Before writing the report, the researcher should discuss the major find-ings, conclusions and recommendations with the key decision-makers. Thesediscussions play a major role in ensuring that the report meets the client’s needs andis ultimately accepted. These discussions should confirm specific dates for the deliveryof the written report and other data.
The entire marketing research project should be summarised in a single writtenreport or in several reports addressed to different readers. Generally, an oral presenta-tion supplements the written documents. The client should be given an opportunityto read the report. After that, the researcher should take necessary follow-up actions.The researcher should assist the client in understanding the report, help in interpreta-tions of the findings that can affect their implementation, offer to undertake furtherresearch and reflect upon the research process to evaluate its overall worth.
Report preparation
Researchers differ in the way they prepare a research report. The personality, back-ground, expertise and responsibility of the researcher, along with the marketingdecision-maker to whom the report is addressed, interact to give each report a uniquecharacter. Yet there are guidelines for formatting and writing reports and designingtables and graphs.2
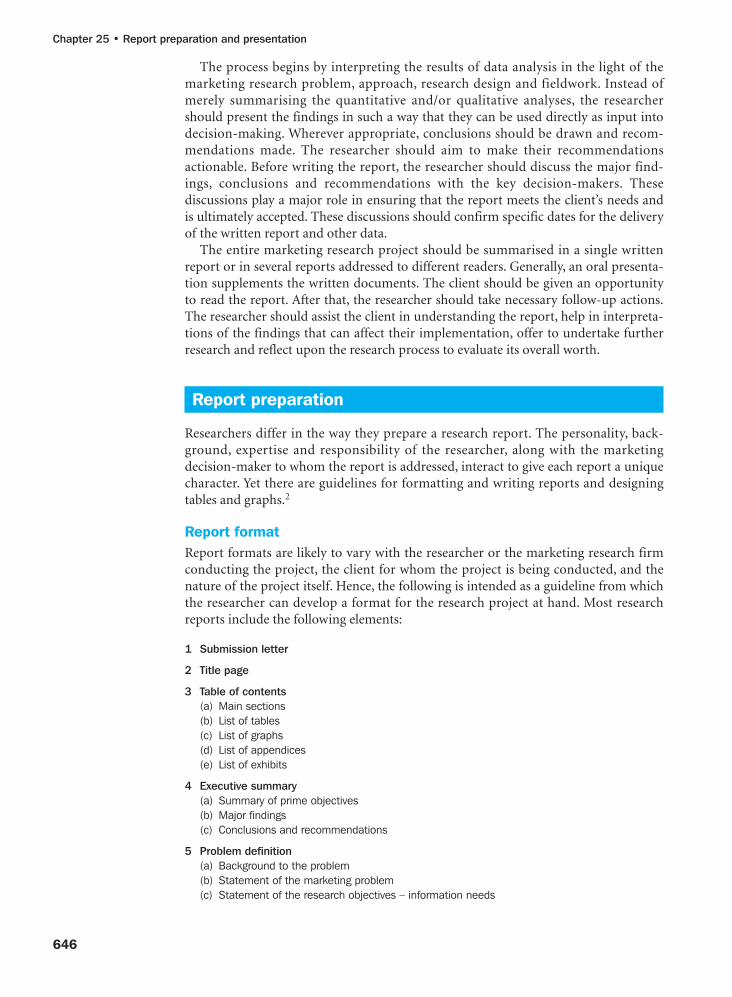
Report format
Report formats are likely to vary with the researcher or the marketing research firmconducting the project, the client for whom the project is being conducted, and thenature of the project itself. Hence, the following is intended as a guideline from whichthe researcher can develop a format for the research project at hand. Most researchreports include the following elements:
1 Submission letter
2 Title page
3 Table of contents
(a) Main sections
(b) List of tables
(c) List of graphs
(d) List of appendices
(e) List of exhibits
4 Executive summary
(a) Summary of prime objectives
(b) Major findings
(c) Conclusions and recommendations
5 Problem definition
(a) Background to the problem
(b) Statement of the marketing problem
(c) Statement of the research objectives – information needs
Chapter 25 • Report preparation and presentation
646

6 Approach to the problem and research design
(a) Type of research design
(b) Data collection from secondary sources
(c) Data collection from primary sources
7 Data analysis
(a) Research design
(b) Plan of data analysis and means of interpreting results
8 Results
9 Conclusions and recommendations
10 Limitations and caveats
11 Appendices
(a) Letter of authorisation
(b) Questionnaire development and pre-testing
(c) Questionnaires, forms, interview guides
(d) Sampling techniques, including error and confidence levels
(e) Fieldwork
(f) Lists including contact individuals and organisations
This format closely follows the earlier steps of the marketing research process. The
results may be presented in several chapters of the report. For example, in a national
survey, data analysis may be conducted for the overall sample and then the data for
each geographic region may be analysed separately. If so, the results from each analy-
sis may be presented in a separate chapter.
Submission letter. A formal report generally contains a letter of submission that
delivers the report to the client and summarises the researcher’s overall experience
with the project, without mentioning the findings. The letter should also identify the
need for further action on the part of the client, such as implementation of the find-
ings or further research that should be undertaken.
Title page. The title page should include the title of the report, information (name,
address and telephone number) about the researcher or organisation conducting the
research, the name of the client for whom the report was prepared, and the date of
release. The title should encapsulate the nature of the project with a tone that is
meaningful to the target managers, not one of technical ‘research-speak’.
Table of contents. The table of contents should list the topics covered and the
appropriate page numbers. In most reports, only the major headings and subheadings
are included. The table of contents is followed by a list of tables, a list of graphs, a list
of appendices and a list of exhibits.
Executive summary. The executive summary is an extremely important part of the
report, because this is often the only portion of the report that executives read. The
summary should concisely describe the problem, approach and research design that
were adopted. A summary section should be devoted to the major results, conclusions
and recommendations. The executive summary should be written after the rest of
the report.
Problem definition. The problem definition section of the report gives the back-
ground to the problem. This part summarises elements of the marketing and research
problem diagnosis. Key elements of any discussions with decision makers, industry
Report preparation
647

experts and initial secondary data analyses are presented. Having set this context for
the whole project, a clear statement of the management decision problem(s) and the
marketing research problem(s) should be presented.
Approach to the problem and research design. The approach to the problem sec-
tion should discuss the broad approach that was adopted in addressing the problem.
This section should summarise the theoretical foundations that guided the research,
any analytical models formulated, research questions, hypotheses, and the factors that
influenced the research design. The research design should specify the details of how
the research was conducted, preferably with a graphical presentation of the stages
undertaken, showing the relationships between stages. This should detail the methods
undertaken in the data collection from secondary and primary sources. These topics
should be presented in a non-technical, easy-to-understand manner. The technical
details should be included in an appendix. This section of the report should justify
the specific methods selected.
Data analysis. The section on data analysis, be it quantitative or qualitative, should
describe the plan of data analysis and justify the data analysis strategy and techniques
used. The techniques used for analysis should be described in simple, non-technical
terms, with examples to guide the reader through the interpretations.
Results. The results section is normally the longest part of the report and may entail
several chapters. It may be presented in any of the following ways.
1 Forms of analysis. For example, in a health care marketing survey of hospitals, the
results were presented in four chapters. One chapter presented the overall results,
another examined the differences between geographical regions, a third presented
the differences between for-profit and non-profit hospitals, and a fourth presented
the differences according to bed capacity. Often, results are presented not only at
the aggregate level but also at the subgroup (market segment, geographical area,
etc.) level.
2 Forms of data collection. For example, a study may contain significant elements of
secondary data collection and analyses, a series of focus group interviews and a
survey. The results in such circumstances may be best presented by drawing con-
clusions from one method before moving on to another method. The conclusions
derived from focus groups, for example, may need to be established to show the
link to a sample design and questions used in a survey.
3 Objectives. There may be a series of research objectives whose fulfilment may incor-
porate a variety of data collection methods and levels of analysis. In these
circumstances the results combine methods and levels of analyses to show connec-
tions and to develop and illustrate emerging issues.
The results should be organised in a coherent and logical way. Choosing whether to
present by forms of analysis, forms of data collection or objectives helps to build that
coherence and logic. The presentation of the results should be geared directly to the
components of the marketing research problem and the information needs that were
identified. The nature of the information needs and characteristics of the recipients of
the report ultimately determine the best way to present results.
Conclusions and recommendations. Presenting a mere summary of the quantita-
tive or qualitative findings is not enough. The researcher should interpret the results
in light of the problem being addressed to arrive at major conclusions. Based on the
Chapter 25 • Report preparation and presentation
648

results and conclusions, the researcher may make recommendations to the decision-
makers. Sometimes, marketing researchers are not asked to make recommendations
because they research only one area and do not understand the bigger picture at the
client firm. The researcher may not have been fully involved in the diagnosis of the
marketing and research problems, in which case their interpretations may not fit into
the context that the marketer understands.
In any research project there are many approaches that can be taken to analyse the
data. This can result in a potential over-abundance of data (quantitative and/or quali-
tative) and distilling the ‘meaning’ from the data and presenting this in a clear report
can result in much of the original meaning or richness being lost.3 To maintain the
meaning or richness, the researcher should strive to understand the nature of the
decision-making process that is being supported. Only then can sound interpretations
of the collected data be made.
Limitations and caveats. All marketing research projects have limitations caused by
time, budget and other organisational constraints. Furthermore, the research design
adopted may be limited in terms of the various types of errors, and some of these may
be serious enough to warrant discussion. This section should be written with great
care and a balanced perspective. On the one hand, the researcher must make sure that
management does not rely too heavily on the results or use them for unintended
purposes, such as projecting them to unintended populations. On the other hand,
this section should not erode their confidence in the research or unduly minimise
its importance.
Appendices. At the end of the report, documents can be compiled that may be used
by different readers to help them to understand characteristics of the research project
in more detail. These should include the letter of authorisation to conduct the
research; this authorisation could include the agreed research proposal. Details that
relate to individual techniques should be included relating to questionnaires, inter-
view guides, sampling and fieldwork activities. The final part of the appendix should
include lists of contacts, references used and further sources of reference.
Report writing
Readers. A report should be written for a specific reader or readers: the marketing
decision-makers who will use the results. The report should take into account the
readers’ technical sophistication and interest in the project as well as the circum-
stances under which they will read the report and how they will use it.4
Technical jargon should be avoided. As expressed by one expert, ‘The readers of
your reports are busy people; and very few of them can balance a research report, a
cup of coffee, and a dictionary at one time.’5 Instead of technical terms such as maxi-
mum likelihood, heteroscedasticity, and non-parametric, use descriptive
explanations. If some technical terms cannot be avoided, briefly define them in an
appendix. When it comes to marketing research, decision-makers would rather live
with a problem they cannot solve than accept a solution they cannot understand.
Often the researcher must cater to the needs of several audiences with different
levels of technical sophistication and interest in the project. Such conflicting needs
may be met by including different sections in the report for different readers or sepa-
rate reports entirely.
Easy to follow. The report should be easy to follow.6 It should be structured logicallyand written clearly. The material, particularly the body of the report, should be struc-
Report preparation
649

tured in a logical manner so that the reader can easily see the inherent connections andlinkages. Headings should be used for different topics and subheadings for subtopics.
A logical organisation also leads to a coherent report. Clarity can be enhanced by
using well-constructed sentences that are short and to the point. The words used should
express precisely what the researcher wants to communicate. Difficult words, slang and
clichés should be avoided. An excellent check on the clarity of a report is to have two or
three people who are unfamiliar with the project read it and offer critical comments.
Several revisions of the report may be needed before the final document emerges.
Presentable and professional appearance. The look of a report is important. The
report should be professionally reproduced with quality paper, typing and binding.
The typography should be varied. Variation in type size and skilful use of white space
can greatly contribute to the appearance and readability of the report. However, a bal-
ance should be sought with styles of variation. Too much variation can lead to
confusion; variation is only useful if it aids understanding.
Objective. Objectivity is a virtue that should guide report writing. Researchers can
become so fascinated with their project that they overlook their ‘scientific’ role. The
report should accurately present the research design, results and conclusions of the
project, without slanting the findings to conform to the expectations of management.
Decision-makers are unlikely to receive with enthusiasm a report that reflects
unfavourably on their judgement or actions. Yet the researcher must have the courage
to present and defend the results objectively.
Reinforce text with tables and graphs. It is important to reinforce key informa-
tion in the text with tables, graphs, pictures, maps and other visual devices. Visual aids
can greatly facilitate communication and add to the clarity and impact of the report.
Guidelines for tabular and graphical presentation are discussed later.
Reinforce tables and graphs with text. Conversely it is important to illustrate
tables and graphs with verbatim quotes from questionnaires and interviews. Quotes
can bring to life the meaning in tables and graphs and, used carefully, can make the
reading of the report far more interesting than a solid body of statistics.
Terse. A report should be terse and concise. Anything unnecessary should be omit-
ted. If too much information is included, important points may be lost. Avoid lengthy
discussions of common procedures. Yet brevity should not be achieved at the expense
of completeness.
Guidelines for tables
Statistical tables are a vital part of the report and deserve special attention. We illus-
trate the guidelines for tables using data from the GlobalCash study. Table 25.1
presents the findings from two questions. The rows in Table 25.1 show how European
companies plan to change their relationships with their existing banks once EMU is
introduced. The columns in Table 25.1 summarise the number of relationships com-
panies have with banks in their home countries. This number of relationships is
termed the ‘sourcing strategy’, i.e. a single strategy means all transactions go through
one bank, a dual strategy means that transactions go through two banks and a multi-
ple strategy means that transactions go through more than two banks, in some
instances up to 70 banks for some Italian companies.
Chapter 25 • Report preparation and presentation
650

The numbers in parentheses in the following paragraphs refer to the numbered
sections of the table.
Title and number. Every table should have a number (1a) and title (1b). The title
should be brief yet clearly descriptive of the information provided. Arabic numbers
are used to identify tables so that they can be referenced in the text.7
Arrangement of data items. The arrangement of data items in a table should
emphasise the most significant aspect of the data. For example, when the data pertain
to time, the items should be arranged by appropriate time period. When order of
magnitude is most important, the data items should be arranged in that order (2a). If
ease of locating items is critical, an alphabetical arrangement is most appropriate.
Basis of measurement. The basis or unit of measurement should be clearly stated
(3a). In Table 25.1, the totals sample size is shown and the sub-sample sizes of the dif-
ferent sourcing strategies. The main body of data is shown in percentages. The %
signs would normally be removed, with a note to tell the reader that the main body is
based upon column percentages or row percentages, or percentages related to the total
sample size.
Leaders, rulings and spaces. The reader’s eye should be guided to be able to read
across the table clearly. This can be achieved with ruled lines (4a), alternate shaded
rows, or white spaces with dotted lines leading from the row headings to the data.
Explanations and comments: headings, stubs and footnotes. Explanations and
comments clarifying the table can be provided in the form of captions, stubs and foot-
notes. Designations placed over the vertical columns are called headings (5a).
Designations placed in the left-hand column are called stubs (5b). Information that
cannot be incorporated in the table should be explained by footnotes (5c). Letters or
symbols should be used for footnotes rather than numbers. The footnotes that are part
of the original source should come after the main table, but before the source note.
Report preparation
651
How EMU will affect Sourcing strategya
cash management
banking relationships Totals Single Dual Multiple
Totals 896 155 179 562
Existing country 46% 41% 45% 48%
relationships maintained
Fewer banks used 33% 31% 30% 35%
across euro zone
One major bank to 33% 43% 39% 29%
co-ordinate
Fewer banks used in 22% 15% 17% 25%
each country
Table 25.1 How the introduction of EMU will affect company relationships with
their banks – analysed by sourcing strategya
a Sourcing strategy relates to the number of banks used for domestic business
Source: GlobalCash-Europe98, Statistical Report for Europe, p. 137
1a
1b 2a 3a
4a
5a
5b
5c
6a
Sources of the data. If the data contained in the table are secondary, the source of
data should be cited (6a).
Guidelines for graphs
As a general rule, graphical aids should be employed whenever practical. Graphical
display of information can effectively complement the text and tables to enhance clar-
ity of communication and impact.8 As the saying goes, a picture is worth a thousand
words. The guidelines for preparing graphs are similar to those for tables. Therefore,
this section focuses on the different types of graphical aids.9 We illustrate several of
these using the GlobalCash data from Table 25.1.
Geographic and other maps. Geographic and other maps, such as product posi-
tioning maps, can communicate relative location and other comparative information.
Geographic maps form the bases of presentations in geodemographic analyses as dis-
cussed in Chapter 5. The maps used in geodemographic analyses can portray
customer locations and types, potential consumers, location of competitors, road net-
works to show consumer flows and other facilities that may attract consumers to
certain locations.
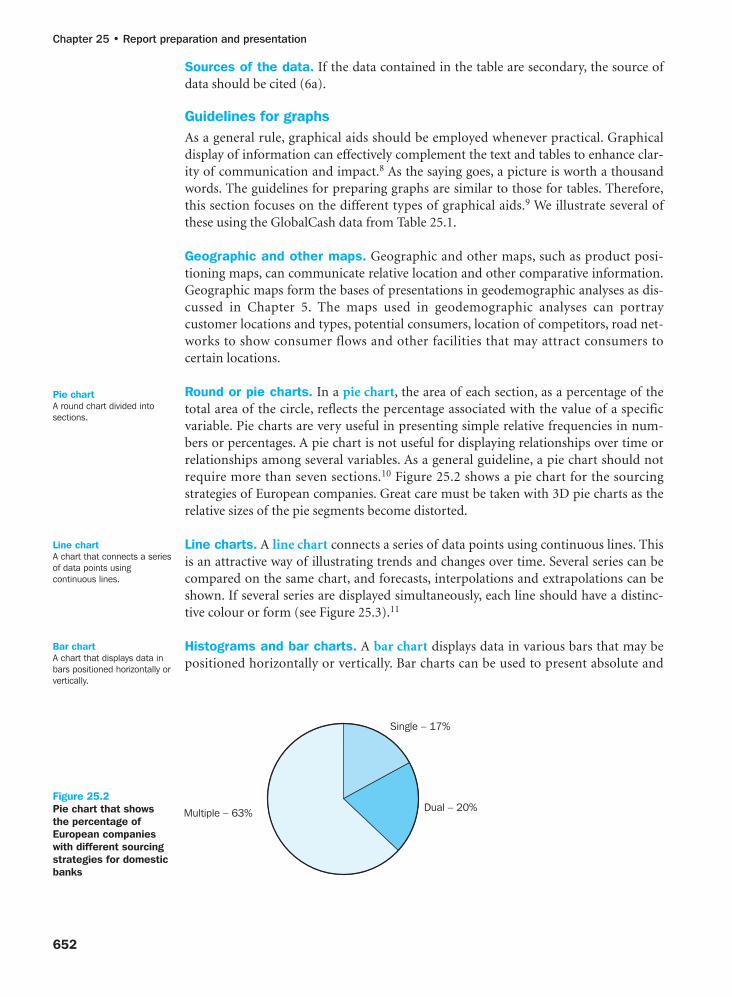
Round or pie charts. In a pie chart, the area of each section, as a percentage of the
total area of the circle, reflects the percentage associated with the value of a specific
variable. Pie charts are very useful in presenting simple relative frequencies in num-
bers or percentages. A pie chart is not useful for displaying relationships over time or
relationships among several variables. As a general guideline, a pie chart should not
require more than seven sections.10 Figure 25.2 shows a pie chart for the sourcing
strategies of European companies. Great care must be taken with 3D pie charts as the
relative sizes of the pie segments become distorted.
Line charts. A line chart connects a series of data points using continuous lines. This
is an attractive way of illustrating trends and changes over time. Several series can be
compared on the same chart, and forecasts, interpolations and extrapolations can be
shown. If several series are displayed simultaneously, each line should have a distinc-
tive colour or form (see Figure 25.3).11
Histograms and bar charts. A bar chart displays data in various bars that may be
positioned horizontally or vertically. Bar charts can be used to present absolute and
Chapter 25 • Report preparation and presentation
652
Line chart
A chart that connects a series
of data points using
continuous lines.
Pie chart
A round chart divided into
sections.
Single – 17%
Dual – 20%Multiple – 63%
Figure 25.2
Pie chart that shows
the percentage of
European companies
with different sourcing
strategies for domestic
banks
Bar chart
A chart that displays data in
bars positioned horizontally or
vertically.

relative magnitudes, differences and change. A histogram is a vertical bar chart in
which the height of the bars represents the relative or cumulative frequency of occur-
rence of a specific variable (see Figure 25.4). Other variations on the basic bar chart
include the stacked bar chart (Figure 25.5) and the cluster bar chart (Figure 25.6).
Stacked and cluster bar charts can work well with a few data items presented, to quali-
tatively represent differences between groups. As noted with pie charts, 3D charts
should be used with great caution as they can distort the message and confuse an audi-
ence. Most graphics packages have a great array of 3D options; however, there are few
circumstances where they can be used to present data in a clear and unbiased manner.
Schematic figures and flowcharts. Schematic figures and flowcharts take on anumber of different forms. They can be used to display the steps or components of aprocess, as in Figure 25.1. They can also be of great value in presenting qualitative
Report preparation
653
Histogram
A vertical bar chart in which
the height of the bars
represents the relative or
cumulative frequency of
occurrence.
0%
10%
20%
30%
40%
50%
60%
SingleDualMultiple
Fewer
banks in
each country
One major
bank to
coordinate
Fewer
banks across
euro zone
Existing
relationship
maintained
Figure 25.3
Line chart of how the
introduction of EMU will
affect cash
management banking
relationships
0%
25%
30%
35%
40%
45%
50%
MultipleDualSingle
20%
15%
10%
5%
29%
39%
43%
One major bank to co-ordinate
Figure 25.4
Bar chart that shows
the percentage of
company types that
planned to use one
major bank to
coordinate cash
transactions throughout
Europe

data analyses by representing the nature and interconnection of ideas that have beenuncovered (see Chapter 9). Another useful form of these charts is classification dia-grams. Examples of classification charts for classifying secondary data were providedin Chapter 4 (Figures 4.1 to 4.4). An example of a flowchart for questionnaire designwas given in Chapter 13 (Figure 13.3).12
Chapter 25 • Report preparation and presentation
654
0%
Single
20% 40% 60% 80% 100% 120% 140% 160%
Dual
Multiple 48% 35% 29% 25%
45% 30% 39% 17%
41% 31% 43% 15%
Fewer banks in
each country
One major bank to
coordinate
Fewer banks across
euro zone
Existing relationship
maintained
Figure 25.5
Stacked bar chart
Multiple
0%
5%
10%
15%
20%
25%
30%
35%
40%
45%
50%
Single
Dual
Fewer banks
in each
country
One major
bank to
coordinate
Fewer banks
across
euro zone
Existing
relationships
maintained
Figure 25.6
3D cluster bar

Oral presentation
The entire marketing research project should be presented to the management of theclient firm. This presentation will help management understand and accept the writ-ten report. Any preliminary questions that the management may have can beaddressed in the presentation. Because many executives form their first and lastingimpressions about the project based on the oral presentation, its importance cannotbe overemphasised.13
The key to an effective presentation is preparation. A written script or detailed out-line should be prepared following the format of the written report. The presentationmust be geared to the audience. For this purpose, the researcher should determine thebackgrounds, interests and involvement of those in the project, as well as the extent towhich they are likely to be affected by it. The presentation should be rehearsed severaltimes before it is made to the management.
Visual aids such as tables and graphs should be displayed with a variety of media.Flip charts of large pads of blank paper mounted on an easel enable the researcher tomanipulate numbers. They are particularly useful in communicating answers to tech-nical questions. Visual aids can also be drawn on the pages in advance, and thespeaker flips through the pages during the presentation. Although not as flexible,magnetic boards and felt boards allow for rapid presentation of previously preparedmaterial. Overhead projectors can present simple charts as well as complex overlaysproduced by the successive additions of new images to the screen. The use of com-puter packages such as Microsoft’s PowerPoint can also be of immense help. They canbe used for making computer-controlled presentations or for presenting technicalinformation such as analytical models. However, the presenter must not lose sight ofthe message, as illustrated in the following two examples.
Bridging the gap14
The following summarises the views of Cristina Stuart, managing director of SpeakEasy
Training, and Khalid Aziz, Chairman of the Aziz Corporation. In essence they argue that the
oral presentation is not about the slick use of technology – the presenter should add some-
thing to the visual presentation.
Actors understand that there is a gap between the speaker and the audience and that you
have to do a certain amount of work to bridge that gap. Actors spend their lives at interviews
and are constantly having to present themselves to new people. Like actors, some speakers
use props to enhance their performance but these need to be handled with care. It is the
person that must be persuasive, not the PC. People often hide behind their visuals but if that
is all that you are presenting, you might as well have sent them in the post. Technology may
be used where it is appropriate, but too often people overdo the visuals to the detriment of
the message. Even at Microsoft, where with its PowerPoint software the medium is the mes-
sage, the presenter presides over the technology, not the other way around. ■
Screen saviours15
Phillip Redding, Deputy Managing Director of The Presentation Company, emphasises that
technology is only part of the presentation picture. For him, it is just as important to get the
content and structure of the argument right, and to create designs that put them over in a
powerful way. ‘If the content and structure are not clear, the presentation is not going to
stand a chance. People think that by adding 3D animation the audience will be impressed.
They will, but they still won’t think the argument is very good.’
Video recorders (VCRs) and large-screen projectors are particularly effective in presenting
focus groups and other aspects of fieldwork that are dynamic in nature. It is important to
maintain eye contact and to interact with the audience during the presentation. Sufficient
Oral presentation
655
e x a m p l e
e x a m p l e

opportunity should be provided for questions, both during and after the presentation. The
presentation should be made interesting and convincing with the use of appropriate stories,
examples, experiences and quotations. Filler words like ‘uh’, ‘y’know’ and ‘all right’ should not
be used.
Body language should be employed. Descriptive gestures are used to clarify or enhance
verbal communication. Emphatic gestures are used to emphasise what is being said.
Suggestive gestures are symbols of ideas and emotions. Prompting gestures are used to elicit
a desired response from the audience. The speaker should vary the volume, pitch, voice qual-
ity, articulation and rate while speaking. The presentation should terminate with a strong
closing. To stress its importance, the presentation should be sponsored by a top-level man-
ager in the client’s organisation. ■
After the presentation, key executives in the client firm should be given time toread the report in detail.
Research follow-up
The researcher’s task does not end with the oral presentation. Two other tasks remain.The researcher should help the client understand and implement the findings andtake follow-up action. Second, while it is still fresh in the researcher’s mind, the entiremarketing research project should be evaluated.
Assisting the client
After the client has read the report in detail, several questions may arise. Parts of thereport, particularly those dealing with technical matters, may not be understood andthe researcher should provide the help needed. Sometimes the researcher helps imple-ment the findings. Often, the client retains the researcher to help with the selection ofa new product or advertising agency, development of a pricing policy, market seg-mentation or other marketing actions. An important reason for client follow-up is todiscuss further research projects. For example, the researcher and management mayagree to repeat the study after two years. Finally, the researcher should help the clientfirm make the information generated in the marketing research project a part of thefirm’s marketing (management) information system (MIS) or decision supportsystem (DSS), as discussed in Chapter 1. A key element in researchers being able toassist marketing decision-makers is the level of trust that exists between the twoparties. The nature of personal interaction between managers and researchers isvery important in creating trust in the researcher and consequently in the results ofthe research. The quality of personal interaction affects managers’ perceptions ofthe overall quality of the report itself.16 Trust between the decision-maker and theresearcher has been found to influence the perceived quality of user–researcher inter-actions, the level of researcher involvement, the level of user commitment to therelationship and the level of market research utilisation.17
Evaluation of the research project
Although marketing research is scientific, which may seem to imply a rigid, systematicprocess, it clearly involves creativity, intuition and personal judgement. Hence, everymarketing research project provides an opportunity for learning, and the researchershould critically evaluate the entire project to obtain new insights and knowledge.The key question to ask is ‘Could this project have been conducted more effectively orefficiently?’ This question, of course, raises several more specific questions. Could theproblem have been defined differently so as to enhance the value of the project to the
Chapter 25 • Report preparation and presentation
656

client or reduce the costs? Could a different approach have yielded better results? Wasthe research design that was used the best? How about the method of data collection?Should street interviews been used instead of telephone interviews? Was the samplingplan employed the most appropriate? Were the sources of possible design error cor-rectly anticipated and kept under control, at least in a qualitative sense? If not, whatchanges could have been made? How could the selection, training and supervision offieldworkers be altered to improve data collection? Was the data analysis strategyeffective in yielding information useful for decision-making? Were the conclusionsand recommendations appropriate and useful to the client? Was the report adequatelywritten and presented? Was the project completed within the time and budget allo-cated? If not, what went wrong? The insights gained from such an evaluation willbenefit the researcher and the subsequent projects conducted.
Ethics in marketing research
657
In ternat ional market ing research
The guidelines presented earlier in this chapter apply to international marketingresearch as well, although report preparation may be complicated by the need toprepare reports for management in different countries and in different languages.In such a case, the researcher should prepare different versions of the report, eachgeared to specific readers. The different reports should be comparable, although theformats may differ. The guidelines for oral presentation are also similar to thosegiven earlier, with the added proviso that the presenter should be sensitive to cul-tural norms. For example, making jokes, which is frequently done in manycountries, is not appropriate in all cultures (which may also include particularorganisational cultures). Most marketing decisions are made from facts and figuresarising out of marketing research. But these figures and how they have been arrivedat have to be credible to decision-makers. The subjective experience and gut feelingof managers could vary widely across countries, necessitating that different recom-mendations be made for implementing the research findings in different countries.This is particularly important when making innovative or creative recommenda-tions such as in advertising campaigns.
Eth ics in market ing research
Many issues pertaining to research integrity arise during report preparation andpresentation. A survey of 254 marketing researchers found that 33% believed thatthe most difficult ethical problems they face pertain to issues of research integrity.These issues included ignoring pertinent data, compromising the research design,deliberately misusing statistics, falsifying figures, altering research results and misin-terpreting the results with the objective of supporting a personal or corporate pointof view, and withholding information.18 It is important that researchers deal withthese issues in a satisfactory manner and prepare a report which accurately and fullydiscloses the details of all the procedures and findings.
Objectivity should be maintained throughout the research process. For example,when data are analysed and no meaningful results are found, researchers aretempted to see findings which are not supported by the analysis. One example ismeaningfully interpreting a regression equation when all the independent variablesturn out to be non-significant (Chapter 20). Ethical dilemmas can arise in these ▲

Chapter 25 • Report preparation and presentation
658
instances. The researchers are being paid for their expert interpretation of data, andcan nothing meaningful be said? ‘To arrive at some rational, logical, and convincingconclusion is so much more satisfying intellectually than to admit that the findingsare inconsistent and inconclusive. No wonder we find ourselves mentally selectingand shaping what might otherwise be shapeless into a coherent, well-definedstory.’19 Such temptations must be resisted to avoid unethical conduct.
Like researchers, clients also have the responsibility for full and accurate disclo-sure of the research findings and are obligated to employ these findings honourably.For example, the public can be negatively affected by a client who distorts theresearch findings to develop a more favourable television advertising campaign.Ethical issues also arise when client firms, such as tobacco companies, use market-ing research findings to formulate questionable marketing programmes.
In ternet and computer app l icat ions
Marketing research reports are being published or posted directly on the Internet or onintranets. Go to the Companion Website and read Professional Perspective 7 by ArnoHummerston, ‘Net reporting comes of age’. Arno describes how the Internet hasallowed the readers of research reports to tailor findings to suit their own unique needs.
Reports on the Internet are not located in publicly accessible areas but in loca-tions protected by passwords or corporate intranets. The various word-processing,spreatsheet and presentation packages have the capability to produce material in aformat that can be posted directly to the Web, thus facilitating the process.
There are a number of advantages to publishing marketing research reports onthe Web. These reports can incorporate all kinds of multimedia presentations,including graphs, pictures, animation, audio and full-motion video. The dissemina-tion is immediate and the reports can be accessed by authorised persons online on aworldwide basis. These reports can be electronically searched to identify materials ofspecific interest. For example, a manager in Kuala Lumpur can electronically locatethe portions of a report that pertain to Malaysia or Southeast Asia. Storage or futureretrieval is efficient and effortless. It is easy to integrate these reports to become partof a decision support system. The main disadvantage is that the readers may nothave permanent access to the reports, as Websites may change periodically.
Given the ability to electronically search and tailor reports on the Internet, infor-mation published on Websites is now becoming more ‘pull’ oriented, as opposed tothe ‘push’ orientation of a printed report. The standard analysis that the researchergenerates can continue to be written, but can now be accessed as a result of a search,instigation of a link, or even just rolling the mouse over an icon. In addition, usingdatabase-driven technology it is possible to have a completely interactive Websitethat allows data interrogation through the specification of questions, filters, cross-tabulations and even applied weighting.
The basic structure of a Website, and the ease with which it is possible to navigatearound a large amount of information, ensures that managers can quickly findexactly what they want. It is also possible to have index areas constantly visible onthe screen to ensure that areas of information contained within a single report, orindeed multiple reports, can be accessed quickly.
➤➤➤
See Professional
Perspective 7.

Summary
Report preparation and presentation is the final step in the marketing research proj-ect. This process begins with interpretation of data analysis results and leads toconclusions and recommendations. Next, the formal report is written and an oralpresentation made. After management has read the report, the researcher should con-duct a follow-up, assisting management and undertaking a thorough evaluation ofthe marketing research project.
In international marketing research, report preparation may be complicated by theneed to prepare reports for management in different countries and in different lan-guages. Several ethical issues are pertinent, particularly those related to theinterpretation and reporting of the research process and findings to the client and theuse of these results by the client.
The final example presents a metaphor of the use of the guitar in supporting pre-sentations. It is a final reminder that the power of computing software can neverreplace the creative skills of conveying the story and impact of a piece of researchupon a decision-making situation.
My paradigm is the guitar21
Developments in modern technology have had a profound impact on the art of business pres-
entation, most notably through PC-driven presentations. There is no doubt that the standard
of visualisation in presentations has improved immeasurably, but has the presentation itself?
Technically good presentations are becoming commonplace, perhaps even predictable.
Predictability precedes boredom.
Presenters spend too much time at the PC creating a slide show and not enough on their
performance. Presenters have forgotten to plan their personal involvement and the involve-
ment of their audience.
Summary
659
Examples of how marketing research reports on the Internet are making deci-sion-makers’ lives easier are as follows: 20
■ Reporting and interrogating real-time data (not just from Web interviews butfrom CATI and CAPI data)
■ Linking different research projects’ reports together to create a more detailedoverview
■ Building charts and tables by adding different elements (such as confidencelimits and explanation of chart movements).
■ Applying rules to the reporting to ensure the robustness of the presented results.■ Applying complex modelling calculations and processes to data as it is made
available.
Viewing marketing research reports using the Internet is effectively the same asconducting a search for secondary data as detailed in Chapter 4. In order to get afeel for the different styles of report presentation, based upon the types of researchtechnique used, the country in which it was conducted and the industry supported,visit the Websites of leading marketing research agencies. Click onwww.tnsofres.com, the Web address of Taylor Nelson Sofres, and www.gfk.de, theWeb address of the German marketing research company GfK. On both sites(which cover the many countries they operate in, with different languages) you willsee case studies, descriptions of special studies related to specific industry sectorsand examples of reports that they produce.
e x a m p l e

My paradigm is the guitar. The guitar represents a tool that supports presentation, rather
like a PC, but that can never do the performance for you. From my own experience as a
guitarist, presentations and gigs have many parallels. You have to prepare diligently, and
have a good plan for the progress of the performance. You should know your material. You
must be able to excite the audience and get them involved. You must be able to improvise
and respond to requests. You should have a good guitar, but the good guitar on its own
won’t carry the day. You will. ■
Chapter 25 • Report preparation and presentation
660
Some presenters
forget to plan their
personal involvement
in a presentation.
1 Describe the process of report preparation.
2 Why is the quality of report presentation vital to the success of a marketing research
project?
3 Describe a commonly used format for writing marketing research reports.
4 Describe the following parts of a report: title page, table of contents, executive sum-
mary, problem definition, research design, data analysis, conclusions and
recommendations.
5 Why is the ‘limitations and caveats’ section included in the report?
6 Discuss the importance of objectivity in writing a marketing research report.
Questions ?????
Notes
661
7 Describe the guidelines for report writing.
8 How should the data items be arranged in a table?
9 What is a pie chart? For what type of information is it suitable? For what type of
information is it not suitable?
10 Describe a line chart. What kind of information is commonly displayed using such
charts?
11 What are the advantages and disadvantages of presenting data using 3D charts?
12 What is the purpose of an oral presentation? What guidelines should be followed in
an oral presentation?
13 To what extent should marketing researchers interpret the information they present
in a report?
14 Describe the evaluation of a marketing research project in retrospect.
15 Graphically represent the consumer decision-making process described in the follow-
ing paragraph:
The consumer first becomes aware of the need. Then the consumer simultaneously
searches for information from several sources: retailers, advertising, word of mouth,
and independent publications. After that a criterion is developed for evaluating the
available brands in the marketplace. Based on this evaluation, the most preferred
brand is selected.
1 Acreman, S. and Pegram, B., ‘Getting to know you’, Research(November 1999), 36–41.
2 Tufte, E.R., Visual Explanations: Images and Quantities, Evidenceand Narrative (Cheshire, CT: Graphic, 1997); Fink, A., How toReport on Surveys (Thousand Oaks, CA: Sage, 1995).
3 Birks, D.F., ‘Market research’, in Baker, M.J. (ed.), TheMarketing Book, 3rd edn (Oxford: Butterworth Heinemann,1994), 262.
4 Keys Jr, T., ‘Report writing’, Internal Auditor 53(4) (August1996), 65–6.
5 Britt, S.H., ‘The writing of readable research reports’, Journal ofMarketing Research (May 1971), 265. See also Mort, S.,Professional Report Writing (Brookfield, IL: Ashgate, 1995); Shair,D.I., ‘Report Writing’, HR Focus 71(2) (February 1994), 20.
6 Boland, A., ‘Got report-o-phobia?: Follow these simple stepsto get those ideas onto paper’, Chemical Engineering 103(3)(March 1996), 131–2.
7 Wilson, L.D., ‘Are appraisal reports logical fallacies’, AppraisalJournal 64(2) (April 1996), 129–33; Leach, J., ‘Seven steps tobetter writing’, Planning 59(6) (June 1993), 26–7; Ehrenberg,A.S.C., ‘The problem of numeracy’, American Statistician 35(May 1981), 67–71.
8 Wallgren, A., Wallgren, B., Persson, R., Jorner, U. and Haaland,J.A., Graphing Statistics and Data (Thousand Oaks, CA: Sage,1996); Tufte, E.R., Visual Display of Quantitative Information(Cheshire, CT: Graphic, 1992).
9 Kauder, N.B., ‘Pictures worth a thousand words’, AmericanDemographics (Tools Supplement) (November/December1996), 64–8.
10 Hinkin, S., ‘Charting your course to effective informationgraphics’, Presentations 9(11) (November 1995), 28–32.
11 Chen, M.T., ‘An innovative project report’, Cost Engineering
38(4) (April 1996), 41–5; Zelazny, G., Say It with Charts, 3rd
edn (Homewood, IL: Business One Irwin, 1996).
12 Johnson, S. and Regan, M., ‘A new use for an old tool’, Quality
Progress 29(11) (November 1996), 144; Parr, G.L., ‘Pretty-
darned-quick flowchart creation’, Quality (August 1996), 62–3.
13 Verluyten, S.P., ‘Business communication and intercultural
communication in Europe: the state of the art’, Business
Communication Quarterly 60(2) (June 1997) 135–43; Hynes,
G.E. and Bhatia, V., ‘Graduate business students’ preferences
for the managerial communication course curriculum’,
Business Communication Quarterly 59(2) (June 1996), 45–55.
14 Miller, R., ‘In the spotlight’, Marketing (1997), 35.
15 Condon, R., ‘Screen saviours’, Marketing (8 January 1998), 24.
16 Deshpande, R. and Zaltman, G., ‘Factors affecting the use of
market research information: a path analysis’, Journal of
Marketing Research 19 (February 1982), 25.
17 Moorman, C., Deshpande, R. and Zaltman, G., ‘Factors affect-
ing trust in market research relationships’, Journal of
Marketing 57 (January 1993), 81–101.
18 Milton-Smith, J., ‘Business ethics in Australia and New
Zealand’, Journal of Business Ethics 16(14) (October 1997),
1485–97; Chonko, L.B., Ethical Decision Making in Marketing
(Thousand Oaks, CA: Sage, 1995).
19 Day, R.L., ‘A comment on “Ethics in marketing research”’,
Journal of Marketing Research 11 (1974), 232–3.
20 Hummerston, A., ‘Net reporting comes of age’, Research (May
2000), 36.
21 Willetts N.J., ‘Going Live’, Marketing Week (13 November
1997), 47–8.
Notes