6 Sound Pressure, Power, and Loudness - Sites do IFGW
22
CHAPTER 6 Sound Pressure, Power, and Loudness In this chapter, we will discuss the quality of loudness and the physical parameters that determine it. The principal such parameter, we learned in Table 5.1, is sound pressure. Related to the sound pressure are the sound power emitted by the source and the sound intensity (the power carried across a unit area by the sound wave). The output signal of a microphone is generally proportional to the sound pressure, so sound pressure can be measured with a microphone and a voltmeter. In this chapter, you should learn: About sound pressure level, sound intensity level, and sound power level; About the decibel scale for comparing sound levels; How to combine sound levels from several sources; What determines the perceived loudness of a sound; How one sound can mask another. 6.1 DECIBELS Decibel scales are widely used to compare two quantities. We may express the power gain of an amplifier in decibels (abbreviated dB), or we may express the relative power of two sound sources. We could even compare our bank balance at the beginning with the balance at the end of the month. (“My bank account decreased 27 decibels last month.”) The decibel difference between two power levels, L , is defined in terms of their power ratio W 2 / W 1 : L = L 2 − L 1 = 10 log W 2 / W 1 . (6.1) Although decibel scales always compare two quantities, one of these can be a fixed reference, in which case we can express another quantity in terms of this reference. For example, we often express the sound power level of a source by using W 0 = 10 −12 W as a reference. Then the sound power level (in decibels) will be L W = 10 log W/ W 0 (6.2) EXAMPLE 6.1 What is the sound power level of a loudspeaker that radiates 0.1 W? Solution L W = 10 log W/ W 0 = 10 log(0.1/10 −12 ) = 10(11) = 110 dB. Although L W is the preferred abbreviation for sound power level, one often sees it abbreviated as PWL. Copyright © 2002 by Pearson Education, Inc. All rights reserved. From Chapter 6 of The Science of Sound, Third Edition. Thomas D. Rossing, Richard F. Moore, Paul A. Wheeler.
-
Upload
khangminh22 -
Category
Documents
-
view
0 -
download
0
Transcript of 6 Sound Pressure, Power, and Loudness - Sites do IFGW

CHAPTER
6 Sound Pressure, Power, and Loudness
In this chapter, we will discuss the quality of loudness and the physical parameters thatdetermine it. The principal such parameter, we learned in Table 5.1, is sound pressure.Related to the sound pressure are the sound power emitted by the source and the soundintensity (the power carried across a unit area by the sound wave). The output signal ofa microphone is generally proportional to the sound pressure, so sound pressure can bemeasured with a microphone and a voltmeter.
In this chapter, you should learn:
About sound pressure level, sound intensity level, and sound power level;About the decibel scale for comparing sound levels;How to combine sound levels from several sources;What determines the perceived loudness of a sound;How one sound can mask another.
6.1 DECIBELS
Decibel scales are widely used to compare two quantities. We may express the power gainof an amplifier in decibels (abbreviated dB), or we may express the relative power of twosound sources. We could even compare our bank balance at the beginning with the balanceat the end of the month. (“My bank account decreased 27 decibels last month.”) The decibeldifference between two power levels, �L , is defined in terms of their power ratio W2/W1:
�L = L2 − L1 = 10 log W2/W1. (6.1)
Although decibel scales always compare two quantities, one of these can be a fixedreference, in which case we can express another quantity in terms of this reference. Forexample, we often express the sound power level of a source by using W0 = 10−12 W as areference. Then the sound power level (in decibels) will be
LW = 10 log W/W0 (6.2)
EXAMPLE 6.1 What is the sound power level of a loudspeaker that radiates 0.1 W?
Solution LW = 10 log W/W0 = 10 log(0.1/10−12) = 10(11) = 110 dB.Although LW is the preferred abbreviation for sound power level, one often sees it
abbreviated as PWL.
Copyright © 2002 by Pearson Education, Inc. All rights reserved.From Chapter 6 of The Science of Sound, Third Edition. Thomas D. Rossing, Richard F. Moore, Paul A. Wheeler.

100 Chapter 6 Sound Pressure, Power, and Loudness
EXAMPLE 6.2 What is the decibel gain of an amplifier if an input of 0.01 W gives anoutput of 10 W?
Solution L2 − L1 = 10 log W2/W1 = 10 log 10/0.01 = 10(3) = 30 dB.
One number fact worth remembering is that the logarithm of 2 is 0.3 (actually 0.3010,but 0.3 will do). Why is this worthwhile? Because 10 log 2 = 3, doubling the powerresults in an increase of 3 dB in the power level. In rating the frequency responseof audio amplifiers and other devices, one often specifies the frequencies of the 3-dB points, the upper and lower frequencies at which the power drops to one-half itsmaximum level.
Actually, remembering that log 2 = 0.3 can be used to estimate other decibellevels. We know that log 10 = 1, so a power gain of 10 represents a power level gainof 10 dB. For a power gain of 5, note that 5 = 10/2, so if we gain 10 dB (multiplyingby 10) and lose 3 dB (dividing by 2), multiplying power by 5 results in a gain of 7 dB.Multiplying by 4 should give 6 dB of gain, because 4 = 2 × 2. If multiplication by 2is equivalent to 3 dB and multiplication by 4 is equivalent to 6 dB, we can probablyguess that multiplying by 3 would give about 5 dB (actually 4.8, but 5 is often closeenough).
Also, 100 = 10 × 10, so a power gain of 100 should represent 20 dB (two 10-dBincreases).
Here, then, is a summary of what we have just figured out.
Power ratio: 2 3 4 5 10 100Decibel gain: 3 5 6 7 10 20
EXAMPLE 6.3 What is the decibel gain when the power gain is 400?
Solution 400 = 2 × 2 × 10 × 10, so the decibel gain is 3 + 3 + 10 + 10 = 26 dB.
6.2 SOUND INTENSITY LEVEL
We have just seen how the strength of a sound source can be expressed in decibels bycomparing its power to a reference power (nearly always W0 = 10−12 W). Similarly, thesound intensity level at a point some distance from the source can be expressed in decibelsby comparing it to a reference intensity, for which we generally use I0 = 10−12 W/m2.Thus the sound intensity level at some location is defined as
LI = 10 log I/I0. (6.3)
6.2 Sound Intensity Level 101
EXAMPLE 6.4 What is the sound intensity level at a point where the sound intensity is10−4 W/m2?
Solution LI = 10 log I/I0 = 10 log 10−4/10−12 = 10(8) = 80 dB.
Even though they are both expressed in decibels, do not confuse sound power level,which describes the sound source, with sound intensity level, which describes the sound atsome point. The relationship between the sound intensity level at a given distance from asound source and the sound power level of the source depends upon the nature of the soundfield. In the following boxes, we consider two cases.
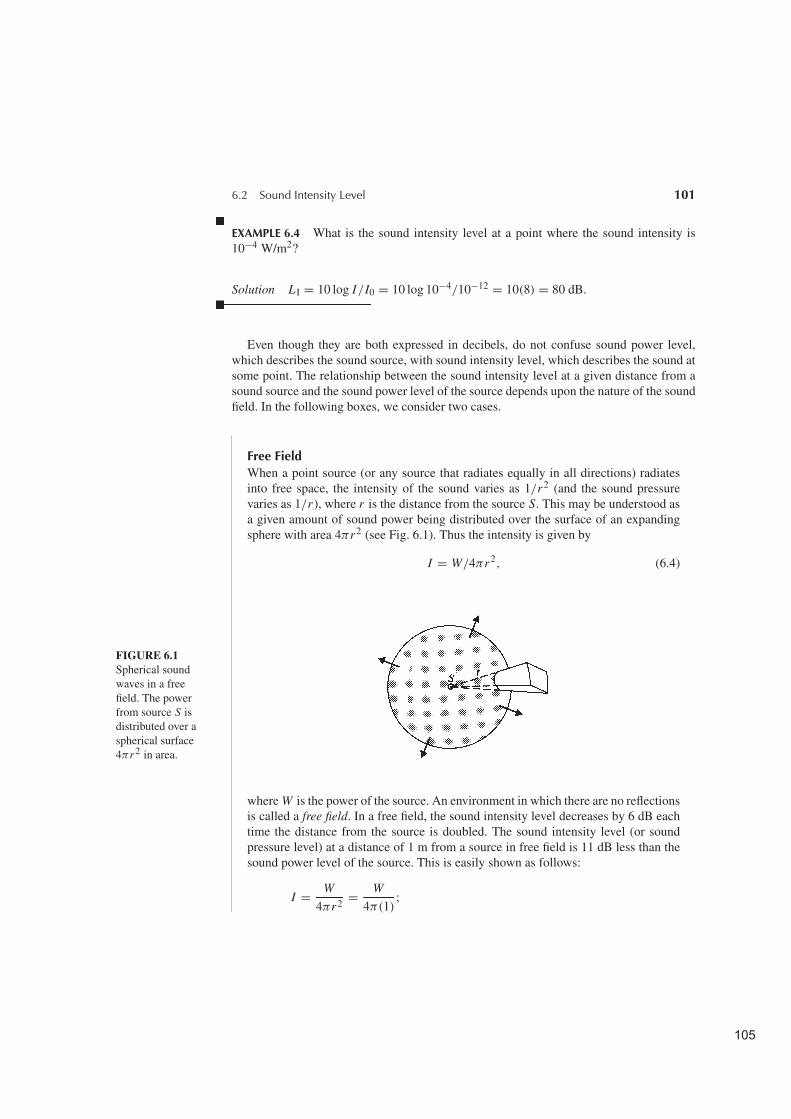
Free FieldWhen a point source (or any source that radiates equally in all directions) radiatesinto free space, the intensity of the sound varies as 1/r2 (and the sound pressurevaries as 1/r), where r is the distance from the source S. This may be understood asa given amount of sound power being distributed over the surface of an expandingsphere with area 4πr2 (see Fig. 6.1). Thus the intensity is given by
I = W/4πr2, (6.4)
FIGURE 6.1Spherical soundwaves in a freefield. The powerfrom source S isdistributed over aspherical surface4πr2 in area.
where W is the power of the source. An environment in which there are no reflectionsis called a free field. In a free field, the sound intensity level decreases by 6 dB eachtime the distance from the source is doubled. The sound intensity level (or soundpressure level) at a distance of 1 m from a source in free field is 11 dB less than thesound power level of the source. This is easily shown as follows:
I = W
4πr2= W
4π(1);
102 Chapter 6 Sound Pressure, Power, and Loudness
L I = 10 logI
10−12= 10 log
W
10−12− 10 log 4π = LW − 11 � L p.
Similarly, it can be shown that at a distance of two meters, L I is 17 dB less than LW .
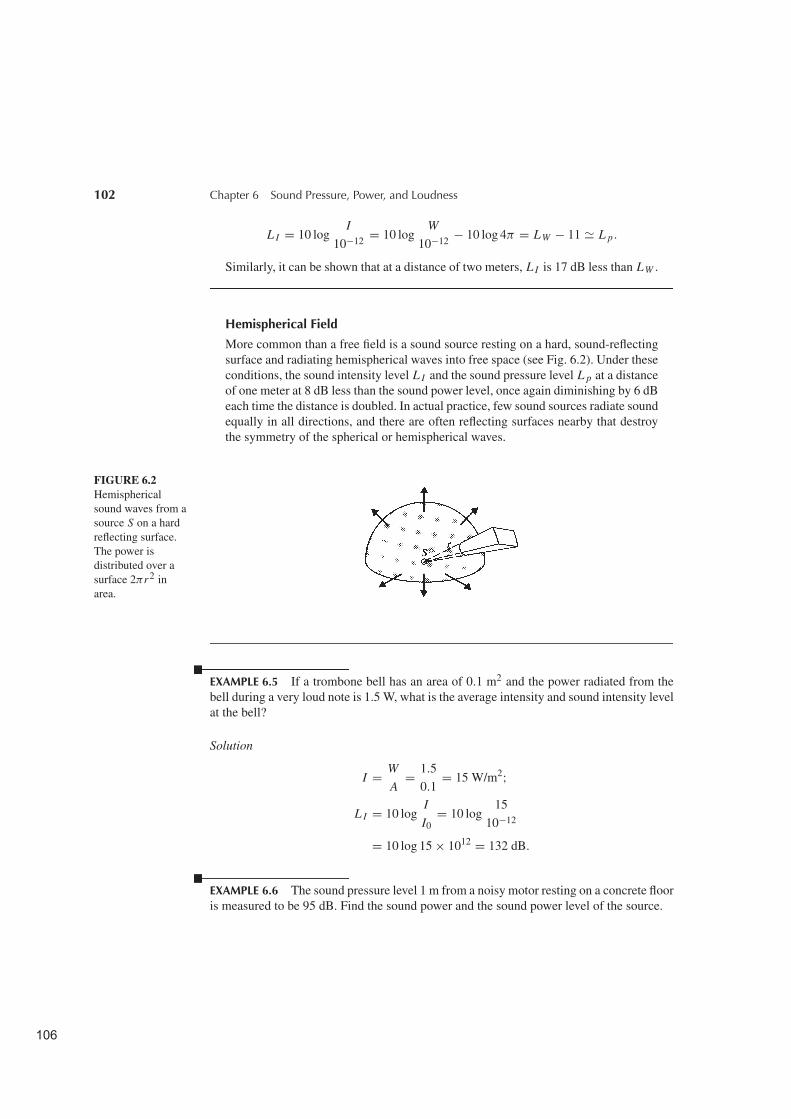
Hemispherical Field
More common than a free field is a sound source resting on a hard, sound-reflectingsurface and radiating hemispherical waves into free space (see Fig. 6.2). Under theseconditions, the sound intensity level L I and the sound pressure level L p at a distanceof one meter at 8 dB less than the sound power level, once again diminishing by 6 dBeach time the distance is doubled. In actual practice, few sound sources radiate soundequally in all directions, and there are often reflecting surfaces nearby that destroythe symmetry of the spherical or hemispherical waves.
FIGURE 6.2Hemisphericalsound waves from asource S on a hardreflecting surface.The power isdistributed over asurface 2πr2 inarea.
EXAMPLE 6.5 If a trombone bell has an area of 0.1 m2 and the power radiated from thebell during a very loud note is 1.5 W, what is the average intensity and sound intensity levelat the bell?
Solution
I = W
A= 1.5
0.1= 15 W/m2;
L I = 10 logI
I0= 10 log
15
10−12
= 10 log 15 × 1012 = 132 dB.
EXAMPLE 6.6 The sound pressure level 1 m from a noisy motor resting on a concrete flooris measured to be 95 dB. Find the sound power and the sound power level of the source.
6.3 Sound Pressure Level 103
Solution 1
L I = 10 logI
I0� L p = 95 dB;
I = Io INV log95
10= 3.16 × 10⁻³ W/m2;
W = 2πr2 I = 2π(1)2(3.16 × 10⁻³) = 1.98 × 10⁻² W.
Solution 2 For a hemispherical field,
LW = L p(1 m) + 8 = 95 + 8 = 103 dB;
W = W0 INV log103
10= 1.98 × 10⁻² W.
Demonstration 4 on the Auditory Demonstrations CD (Houtsma, Rossing, and Wage-naars 1987) provides test tones to “calibrate” your hearing. Broadband noise is reducedin steps of 6 dB, 3 dB, and 1 dB. You probably noticed that the 1-dB steps are about thesmallest steps in which you can notice a difference. The demonstration also records free-field speech at distances of 0.25, 0.5, 1, and 2 m from a microphone. Doubling the distancefrom the source also reduces the sound level in 6-dB steps, as we have just discussed.
6.3 SOUND PRESSURE LEVEL
In a sound wave there are extremely small periodic variations in air pressure to which ourears respond. The minimum pressure fluctuation to which the ear can respond is less than1 billionth (10−9) of atmospheric pressure. This threshold of audibility, which varies fromperson to person, corresponds to a sound pressure amplitude of about 2 × 10⁻⁵ N/m2 at afrequency of 1000 Hz. The threshold of pain corresponds to a pressure amplitude approxi-mately 1 million (106) times greater, but still less than 1/1000 of atmospheric pressure.
The intensity of a sound wave is proportional to the pressure squared. In other words,doubling the sound pressure quadruples the intensity. The actual formula relating soundintensity I and sound pressure p is
I = p2/ρc (6.5)
where ρ is the density of air and c is the speed of sound. The density ρ and the speedof sound c both depend on the temperature (see Section 3.5). At normal temperatures theproduct ρc is around 410 to 420, but for ease of calculation, we often set it equal to 400.
It is useful to substitute for I from Eq. 6.5 setting ρc = 400) in Eq. 6.3: L I =10 log p2/400Io = 10 log p2/4 × 10−10 = 20 log p/2 × 10−5. The latter expression isdefined as the sound pressure level L p (sometimes abbreviated SPL, although L p is pre-ferred).
L p = 20 log p/p0, (6.6)

104 Chapter 6 Sound Pressure, Power, and Loudness
TABLE 6.1 Typical sound levels one might encounter
Jet takeoff (60 m) 120 dBConstruction site 110 dB IntolerableShout (1.5 m) 100 dBHeavy truck (15 m) 90 dB Very noisyUrban street 80 dBAutomobile interior 70 dB NoisyNormal conversation (1 m) 60 dBOffice, classroom 50 dB ModerateLiving room 40 dBBedroom at night 30 dB QuietBroadcast studio 20 dBRustling leaves 10 dB Barely audible
0 dB
where the reference level p0 = 2 × 10⁻⁵ N/m2 = 20μPa (a pascal (Pa) is an alterna-tive name for N/m2). Note that Eq. 6.6 is the definition of sound pressure level, which isequal to sound intensity level only when ρc = 400 (which would happen at 30◦ C and748 mm Hg, for example). However, at ordinary temperatures, the two are so close to eachother that they are often considered to be equal and called merely sound level. For precisemeasurement, a distinction should be made, however.
Sound pressure levels are measured by a sound-level meter, consisting of a microphone,an amplifier, and a meter that reads in decibels. Sound pressure levels of a number ofsounds are given in Table 6.1. If you have access to a sound-level meter, it is recommendedthat you carry it with you to many locations to obtain a feeling for different sound pressurelevels.
EXAMPLE 6.7 What sound pressure level corresponds to a sound pressure of 10−3 N/m2?
Solution L p = 20 log10−3
2 × 10−5= 34.0 dB.
EXAMPLE 6.8 How much force does a sound wave at the pain threshold (L p � 120 dB)exert on an eardrum having a diameter of 7 mm?
Solution
L p = 120 = 20 logp
p0;
p = p0 INV log120
20= 20 N/m2;
F = p A = 20π(3.5 × 10⁻³)2 = 1.54 × 10⁻³ N.

6.4 Multiple Sources 105
6.4 MULTIPLE SOURCES
Very frequently we are concerned with more than one source of sound. The way in whichsound levels add may seem a little surprising at first. For example, two uncorrelatedsources, each of which would produce a sound level of 80 dB at a certain point, willtogether give 83 dB at that point. Figure 6.3 gives the increase in sound level due to ad-ditional equal sources. It is not difficult to see why this is the case, because doubling thesound power raises the sound power level by 3 dB and thus raises the sound pressure level3 dB at our point of interest. Under some conditions, however, there may be interferencebetween waves from the two sources, and this doubling relationship will not hold true.
When two waves of the same frequency reach the same point, they may interfere con-structively or destructively. If their amplitudes are both equal to A, the resultant amplitudemay thus be anything from zero up to 2 A. The resultant intensity, which is proportional tothe amplitude squared, may thus vary from 0 to 4 A2. If the waves have different frequen-cies, however, these well-defined points of constructive and destructive interference do notoccur. In the case of sound waves from two noise sources (as in the case of light from twolight bulbs), the waves include a broad distribution of frequencies (wavelength), and we donot expect interference to occur. In this case, we can add the energy carried by each waveacross a surface or, in other words, the intensities.
In the case of independent (uncorrelated) sound sources, what we really want to addare the mean-square pressures (average values of p2) at a point. Because intensity is pro-portional to p2, however, we can add the intensities. For example, two sources that bythemselves cause LI = 40 dB at a certain location will cause L I = 43 dB at the samelocation when sounded together. (This result is also obtained from the graph in Fig. 6.3.)
FIGURE 6.3Addition of equal(uncorrelated)sound sources.
EXAMPLE 6.9 With one violin playing, the sound pressure level at a certain place is mea-sured to be 50 dB. If three violins play equally loudly, what will the sound pressure levelmost likely be at the same location?
106 Chapter 6 Sound Pressure, Power, and Loudness
Solution
L p = 10 logp2
1 + p22 + p2
3
p20
= 10 logI1 + I2 + I3
I0
= 10 logI1
I0+ 10 log 3
= 50 + 4.8 = 54.8 dB
(This result could also be determined from Fig. 6.3.)
EXAMPLE 6.10 If two sound sources independently cause sound levels of 50 and 53 dBat a certain point, what is L I at that point when both sources contribute at the same time?
Solution
50 = 10 logI1
I0
so I1 = I0 INV log50
10= (10−12)(105) = 10−7 W/m2;
likewise I2 = 2 × 10⁻⁷ W/m2;
L I = 10 logI1 + I2
I0= 10 log
10−7 + 2 × 10⁻⁷
10−12
= 10 log 3 × 105 = 54.8 dB.
(Note that the answer is not 50 + 53 = 103 dB.)
6.5 LOUDNESS LEVEL
Although sounds with a greater L I or L p usually sound louder, this is not always the case.The sensitivity of the ear varies with the frequency and the quality of the sound. Many yearsago Fletcher and Munson (1933) determined curves of equal loudness level (L L ) for puretones (that is, tones of a single frequency). The curves shown in Fig. 6.4, recommended bythe International Standards Organization, are quite similar to those of Fletcher and Munson.These curves demonstrate the relative insensitivity of the ear to sounds of low frequencyat moderate to low intensity levels. Hearing sensitivity reaches a maximum between 3500and 4000 Hz, which is near the first resonance frequency of the outer ear canal, and againpeaks around 13 kHz, the frequency of the second resonance.
The contours of equal loudness level are labeled in units called phons, the level in phonsbeing numerically equal to the sound pressure level in decibels at f = 1000 Hz. Thephon is a rather arbitrary unit, however, and is not widely used in measuring sound. It is

6.5 Loudness Level 107
FIGURE 6.4Equal-loudnesscurves for puretones (frontalincidence). Theloudness levels areexpressed in phons.
important, however, to note the relative insensitivity of the ear to sounds of low frequency,which is one reason why weighting networks are used in sound-measuring equipment.
Sound level meters have one or more weighting networks, which provide the desiredfrequency responses. Generally three weighting networks are used; they are designatedA, B, and C. The C-weighting network has an almost flat frequency response, whereasthe A-weighting network introduces a low-frequency rolloff in gain that bears rather closeresemblance to the frequency response of the ear at low sound pressure level. A sound levelmeter is shown in Fig. 6.5, along with the frequency responses of A-, B-, and C-weightingnetworks.
FIGURE 6.5Sound-level meterwith the frequencyresponse of its A-,B-, andC-weightingnetworks.(Photographycourtesy ofGenRad, Inc.) (a) (b)
108 Chapter 6 Sound Pressure, Power, and Loudness
Measurements of sound level are usually made using the A-weighting network; suchmeasurements are properly designated as L p(A) or S P L(A) in dB, although the unit dBAor dB(A) is often used to denote A-weighted sound level. Inside a building, the C-weightedsound level may be substantially higher than the A-weighted sound level, because of low-frequency machinery noise, to which the ear is quite insensitive. Many sound-level metershave both fast and slow response, the slow response measuring an “average” level.
Although it is difficult to describe a sound environment by a single parameter, for manypurposes the A-weighted sound level will suffice. At low to medium sound levels, it isreasonably close to the true loudness level so that dBA (easily measured with a sound-level meter) may be substituted for phons without too much error.
There are many examples of interesting sound environments to measure. In the class-room, one can ask the entire class to shout loudly, then half the class to do so, one-fourth ofthe class, etc. The sound level should drop about 3 dB in each step. One can also measuretraffic noise, noise near a construction site, sound level at a concert, noise in an automobile,and so on. In each case the A-weighted sound level should be measured, although it maybe interesting to measure the C-weighted level (which places more emphasis on sounds oflow frequency) as well.
6.6 LOUDNESS OF PURE TONES: SONES
In Chapter 5, we mentioned Fechner’s law, relating sensation to stimulus. The logarithmicrelationship in that law was found to provide only a rough approximation to listeners’estimates of their own sensations of loudness. In an effort to obtain a quantity proportionalto the loudness sensation, a loudness scale was developed in which the unit of loudness iscalled the sone. The sone is defined as the loudness of a 1000-Hz tone at a sound level of40 decibels (a loudness level of 40 phons).
For loudness levels of 40 phons or greater, the relationship between loudness S in sonesand loudness level L L in phons recommended by the International Standards Organization(ISO) is
S = 2(L L−40)/10. (6.7)
A graph of Eq. 6.7 is shown in Fig. 6.6. An equivalent expression for loudness S that avoidsthe use of L L is
S = Cp0.6, (6.8)
where p is the sound pressure and C depends on the frequency.Equations 6.7 and 6.8 are based on the work of S. S. Stevens, which indicated a doubling
of loudness for a 10-dB increase in sound pressure level. Some investigators, however, havefound a doubling of loudness for a 6-dB increase in sound pressure level (Warren 1970).This suggests the use of a formula in which loudness is proportional to sound pressure(Howes 1974):
S = K (p − p0), (6.9)
where p is sound pressure and p0 is the pressure at some threshold level.

6.7 Loudness of Complex Tones: Critical Bands 109
FIGURE 6.6The relationshipbetween theloudness (in sones)and the loudnesslevel (in phons)from Eq. 6.7.
EXAMPLE 6.11 Find the loudness level and the loudness of a 500-Hz tone with L p =70 dB.
Solution From Fig. 6.4, the loudness level is L L = 74 phons.The loudness is: S = 2(74−40)/10 = 10.6 sones.
6.7 LOUDNESS OF COMPLEX TONES: CRITICAL BANDS
As pointed out in Table 5.1, loudness depends mainly on sound pressure, but it also varieswith frequency, spectrum, and duration. We have already seen how loudness depends onfrequency; now we will consider its dependence on the spectrum of the sound.
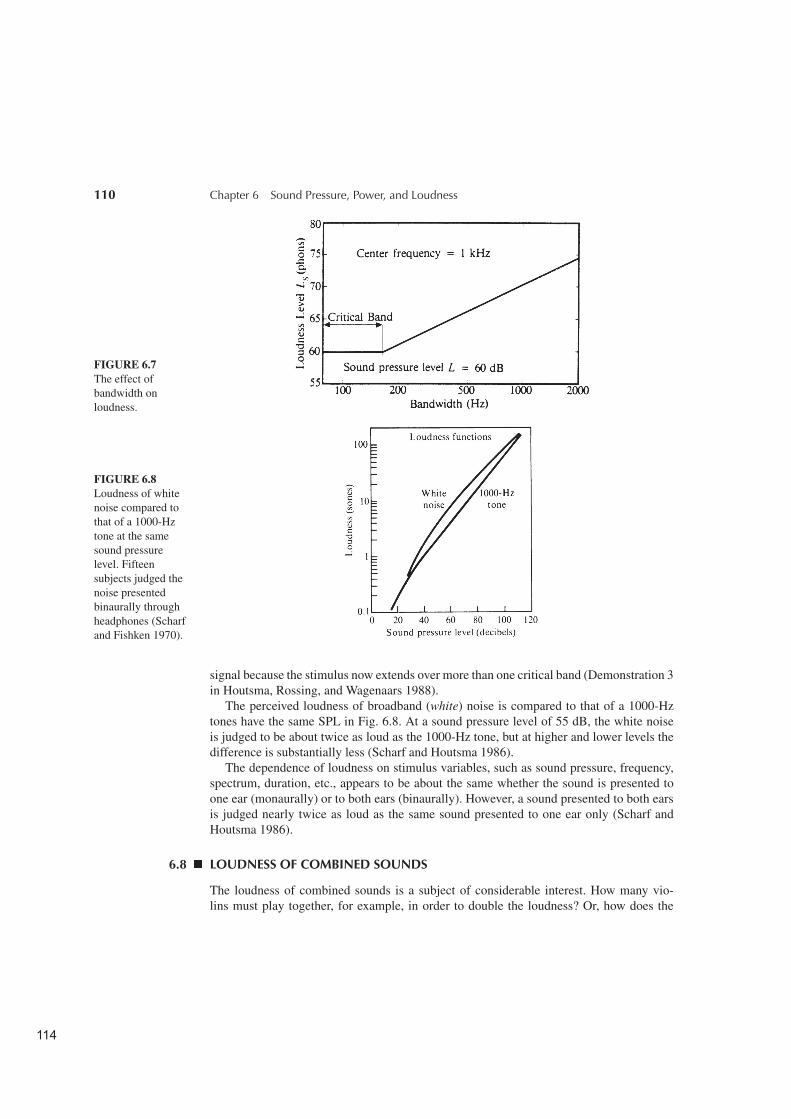
If we were to listen to two pure tones having the same sound pressure level but with in-creasing frequency separation, we would note that when the frequency separation exceedsthe critical bandwidth, the total loudness begins to increase. Broadband sounds, such asthose of jet aircraft, seem louder than pure tones or narrowband noise having the samesound pressure level. Figure 6.7 illustrates the dependence of loudness on bandwidth withfixed sound pressure level and center frequency. Note that loudness is not affected untilthe bandwidth exceeds the critical bandwidth, which is about 160 Hz for the 1-kHz centerfrequency shown.
One way to estimate the critical bandwidth is to increase the bandwidth of a noise signalwhile decreasing the amplitude in order to keep the power constant. When the bandwidth isgreater than a critical band, the subjective loudness increases above that of a reference noise
110 Chapter 6 Sound Pressure, Power, and Loudness
FIGURE 6.7The effect ofbandwidth onloudness.
FIGURE 6.8Loudness of whitenoise compared tothat of a 1000-Hztone at the samesound pressurelevel. Fifteensubjects judged thenoise presentedbinaurally throughheadphones (Scharfand Fishken 1970).
signal because the stimulus now extends over more than one critical band (Demonstration 3in Houtsma, Rossing, and Wagenaars 1988).
The perceived loudness of broadband (white) noise is compared to that of a 1000-Hztones have the same SPL in Fig. 6.8. At a sound pressure level of 55 dB, the white noiseis judged to be about twice as loud as the 1000-Hz tone, but at higher and lower levels thedifference is substantially less (Scharf and Houtsma 1986).
The dependence of loudness on stimulus variables, such as sound pressure, frequency,spectrum, duration, etc., appears to be about the same whether the sound is presented toone ear (monaurally) or to both ears (binaurally). However, a sound presented to both earsis judged nearly twice as loud as the same sound presented to one ear only (Scharf andHoutsma 1986).
6.8 LOUDNESS OF COMBINED SOUNDS
The loudness of combined sounds is a subject of considerable interest. How many vio-lins must play together, for example, in order to double the loudness? Or, how does the

6.8 Loudness of Combined Sounds 111
loudness of traffic noise depend on the number of vehicles? We stated in Section 6.4 thatthe intensities (or mean-square pressures) from two or more uncorrelated sound sourcesadd together to give a total intensity. The loudness is not necessarily additive, however.Accepted methods for combining loudness are given in the following box.
When two or more tones are mixed, the way in which their individual loudnessescombine depends on how close they are to each other in frequency. We can havethree different situations:
1. If the frequencies of the tones are the same or fall within the critical bandwidth,the loudness is calculated from the total intensity I = I1 + I2 + I3 + · · ·. If theintensities I1, I2, I3, etc., are equal, the increase in sound level is as shown inFig. 6.3. The loudness may then be determined from the combined sound level.
2. If the bandwidth exceeds the critical bandwidth, the resulting loudness is greaterthan that obtained from simple summation of intensities. As the bandwidth in-creases, the loudness approaches (but remains less than) a value that is the sum ofthe individual loudnesses:
S = S1 + S2 + S3 + · · · . (6.10)
3. If the frequency difference is very large, the summation becomes complicated.Listeners tend to focus primarily on one component (e.g., the loudest or the oneof highest pitch) and assign a total loudness nearly equal to the loudness of thatcomponent (Roederer 1975).
To determine the loudness of sones of a complex sound with many components,it is advisable to measure the sound level in each of the ten standard octave bands (orin thirty 1
3 -octave bands). Octave bands are frequency bands one octave wide (that is,the maximum frequency is twice the minimum frequency). Octave-band analyzers,available in many acoustic laboratories, usually have a filter that allows convenientmeasurement of the sound level in standard octave bands with center frequencies at31, 63, 125, 250, 500, 1000, 2000, 4000, 8000, and 16,000 Hz. Once these levelshave been measured, a suitable chart (see ISO Recommendations No. 532) can beused to find the loudness in sones.
Is this seemingly complicated procedure necessary? For precise determination of loud-ness, yes. For estimating loudness, no. A pretty fair estimate of loudness can be made byusing an ordinary sound level meter to measure the A-weighted sound level. To estimatethe number of sones, let 30 dBA correspond to 1.5 sones and double the number of sonesfor each 10-dBA increase, as shown in Table 6.2. This procedure works quite well at low tomoderate levels, because the A-weighting is a reasonable approximation to the frequencyresponse of the ear.
Because the previous paragraphs have dealt with numbers, formulas, and graphs, it isappropriate to make a few comments on how they apply to music, environmental noise,

112 Chapter 6 Sound Pressure, Power, and Loudness
TABLE 6.2 Chart for estimating loudness in sones of complex sounds from A-weighted soundlevels
L p(A) 30 40 50 55 60 65 70 75 80 85 90 dBS 1.5 3 6 8 12 16 24 32 48 64 96 sones
and audiometric measurements. It should be emphasized that loudness is subjective, andits assessment varies from individual to individual. On the average, a sound of four sonessounds twice as loud as a sound of two sones, but some listeners may regard it as threetimes louder or one and a half times louder.
Interesting examples illustrating the importance of loudness phenomena in music appearthroughout the literature. Roederer (1975) discusses the selection of combinations of organstops. Benade (1976) describes how a saxophone was made to sound louder at the samesound pressure level by a change in timbre.
6.9 MUSICAL DYNAMICS AND LOUDNESS
Variations in loudness add excitement to music. The range of sound level in musical per-formance, known as the dynamic range, may vary from a few decibels to 40 dB or more,depending on the music (loud peaks and pauses may cause the instantaneous level to ex-ceed this range). The approximate range of sound level and frequency heard by the musiclistener is shown in Fig. 6.9.
Composers use dynamic symbols to indicate the appropriate loudness to the performer.The six standard levels are shown in Table 6.3.
Measurements of sound intensity of a number of instrumentalists have shown that sel-dom do musical performers actually play at as many as six distinguishable dynamic levels,however. In one study, the dynamic ranges of 11 professional bassoonists were found tovary from 6 to 17 decibels with an average of 10 dB (Lehman 1962). A 10-dB increase
FIGURE 6.9Approximate rangeof frequency andsound level ofmusic compared tothe total range ofhearing.
Threshold of audibility

6.10 Masking 113
TABLE 6.3 Standard levels of musical dynamics
Name Symbol Meaning
Fortissimo ff Very loudForte f LoudMezzo forte mf Moderately loudMezzo piano mp Moderately softPiano p SoftPianissimo pp Very soft
TABLE 6.4 Dynamic ranges of musical instruments
Average dynamic range (dB) Maximum dynamic range (dB)Instrument (Clark and Luce 1965) (Patterson 1974)
Violin 14 40Viola 16Cello 14String bass 14 30Recorder 10Flute 7 30Oboe 7English horn 5Clarinet 8 45Bassoon 10 40Trumpet 9Trombone 17 38French horn 18Tuba 13
in sound level, you will recall from Section 6.4, is usually said to double the loudness(expressed in sones). Most listeners would have considerable difficulty identifying six dif-ferent levels within a dynamic range of 10 dB. Dynamic ranges of several instruments aregiven in Table 6.4.
The dynamic ranges in Table 6.4 are for single notes played loudly and softly. Severalinstruments have much more sound power near the top of their playing range than near thebottom. (Fortissimo on a French horn, for example, is found to be nearly 30 dB greater atC5 than at C2, although the difference between ff and pp on any note of the scale may be20 dB or less.)
Measurement of the dynamic ranges of various musical instruments and players is aninstructive and relatively easy experiment for the reader to perform. The dynamic rangesof most players we have measured fall close to those reported by Clark and Luce (1965).
6.10 MASKING
When the ear is exposed to two or more different tones, it is a common experience that onemay mask the others. Masking is probably best explained as an upward shift in the hearing
114 Chapter 6 Sound Pressure, Power, and Loudness
threshold of the weaker tone by the louder tone and depends on the frequencies of the twotones. Pure tones, complex sounds, narrow and broad bands of noise all show differencesin their ability to mask other sounds. Masking of one sound can even be caused by anothersound that occurs a split second after the masked sound.
Some interesting conclusions can be made from the many masking experiments thathave been performed:
1. Pure tones close together in frequency mask each other more than tones widely sepa-rated in frequency.
2. A pure tone masks tones of higher frequency more effectively than tones of lower fre-quency.
3. The greater the intensity of the masking tone, the broader the range of frequencies itcan mask.
4. If the two tones are widely separated in frequency, little or no masking occurs.5. Masking by a narrow band of noise shows many of the same features as masking by a
pure tone; again, tones of higher frequency are masked more effectively than tones oflower frequency than the masking noise.
6. Masking of tones by broadband (“white”) noise shows an approximately linear relation-ship between masking and noise level (that is, increasing the noise level 10 dB raises thehearing threshold by the same amount). Broadband noise masks tones of all frequencies.
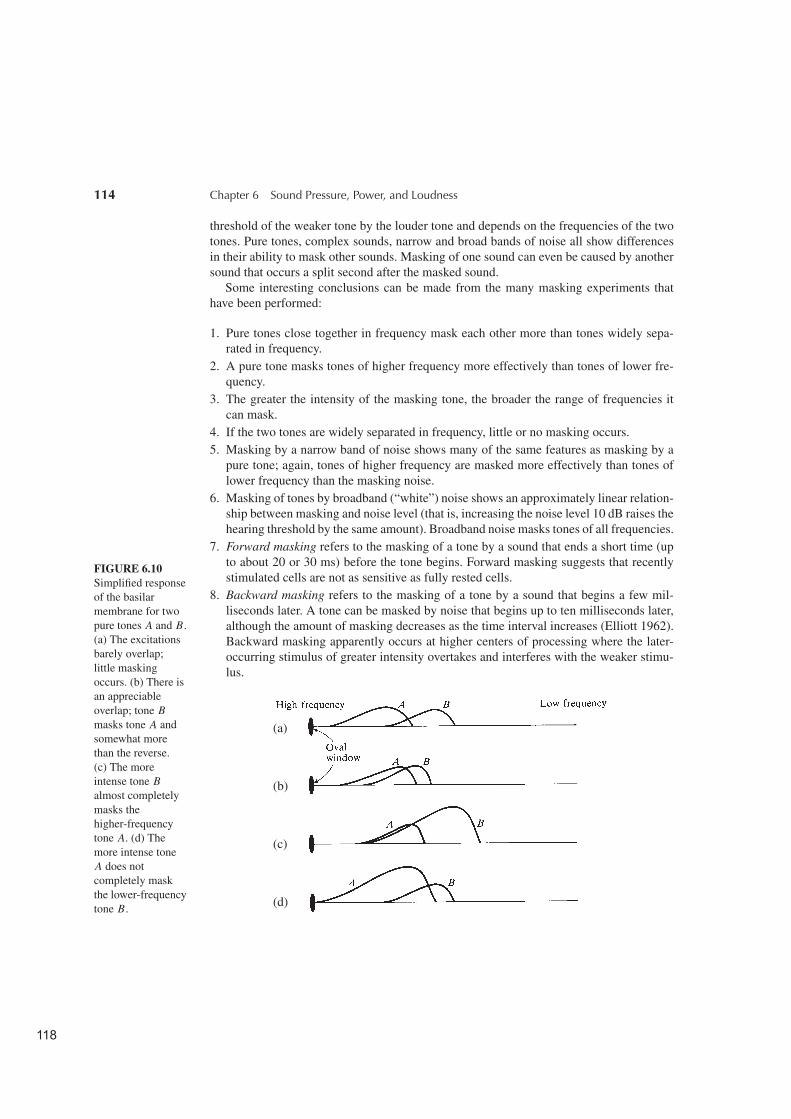
7. Forward masking refers to the masking of a tone by a sound that ends a short time (upto about 20 or 30 ms) before the tone begins. Forward masking suggests that recentlystimulated cells are not as sensitive as fully rested cells.
8. Backward masking refers to the masking of a tone by a sound that begins a few mil-liseconds later. A tone can be masked by noise that begins up to ten milliseconds later,although the amount of masking decreases as the time interval increases (Elliott 1962).Backward masking apparently occurs at higher centers of processing where the later-occurring stimulus of greater intensity overtakes and interferes with the weaker stimu-lus.
FIGURE 6.10Simplified responseof the basilarmembrane for twopure tones A and B.(a) The excitationsbarely overlap;little maskingoccurs. (b) There isan appreciableoverlap; tone Bmasks tone A andsomewhat morethan the reverse.(c) The moreintense tone Balmost completelymasks thehigher-frequencytone A. (d) Themore intense toneA does notcompletely maskthe lower-frequencytone B.
(a)
(b)
(c)
(d)

6.12 Loudness and Duration: Impulsive Sounds and Adaptation 115
9. Masking of a tone in one ear can be caused by noise in the other ear, under certainconditions; this is called central masking.
Some of the conclusions about masking just stated can be understood by considering theway in which pure tones excite the basilar membrane (see Fig. 5.6). High-frequency tonesexcite the basilar membrane near the oval window, whereas low-frequency tones createtheir greatest amplitude at the far end. The excitation due to a pure tone is asymmetrical,however, having a tail that extends toward the high-frequency end as shown in Fig. 6.10.Thus it is easier to mask a tone of higher frequency than one of lower frequency. As theintensity of the masking tone increases, a greater part of its tail has amplitude sufficient tomask tones of higher frequency.
6.11 LOUDNESS REDUCTION BY MASKING
Sounds are seldom heard in isolation. The presence of other sounds not only raises thethreshold for hearing a given sound but generally reduces its loudness as well (this is some-times called partial masking).
Figure 6.11 shows how white noise reduces the apparent loudness of a 1000-Hz tone.Compared to the tone in quiet (see Fig. 6.8), the loudness functions in white noise aresteeper. Rising form an elevated threshold, the partially masked tone eventually comes toits full unmasked loudness when the noise level is less than 80 dB. In more intense noise,the loudness does not reach its full unmasked value, but the function approaches the sameslope as the function without masking noise (Scharf and Houtsma 1986).
6.12 LOUDNESS AND DURATION: IMPULSIVE SOUNDS AND ADAPTATION
How does the loudness of an impulsive sound compare to the loudness of a steady soundat the same sound level? Numerous experiments have pretty well established that the earaverages sound energy over about 0.2 s (200 ms), so loudness grows with duration up to this
FIGURE 6.11Loudness functionsfor a 1000-Hz tonepartially masked bywhite noise atvarious soundpressure levels.Subjects adjustedthe level of the tonein quiet so that itsounded as loud asthe tone with noise.(After Scharf1978.)
116 Chapter 6 Sound Pressure, Power, and Loudness
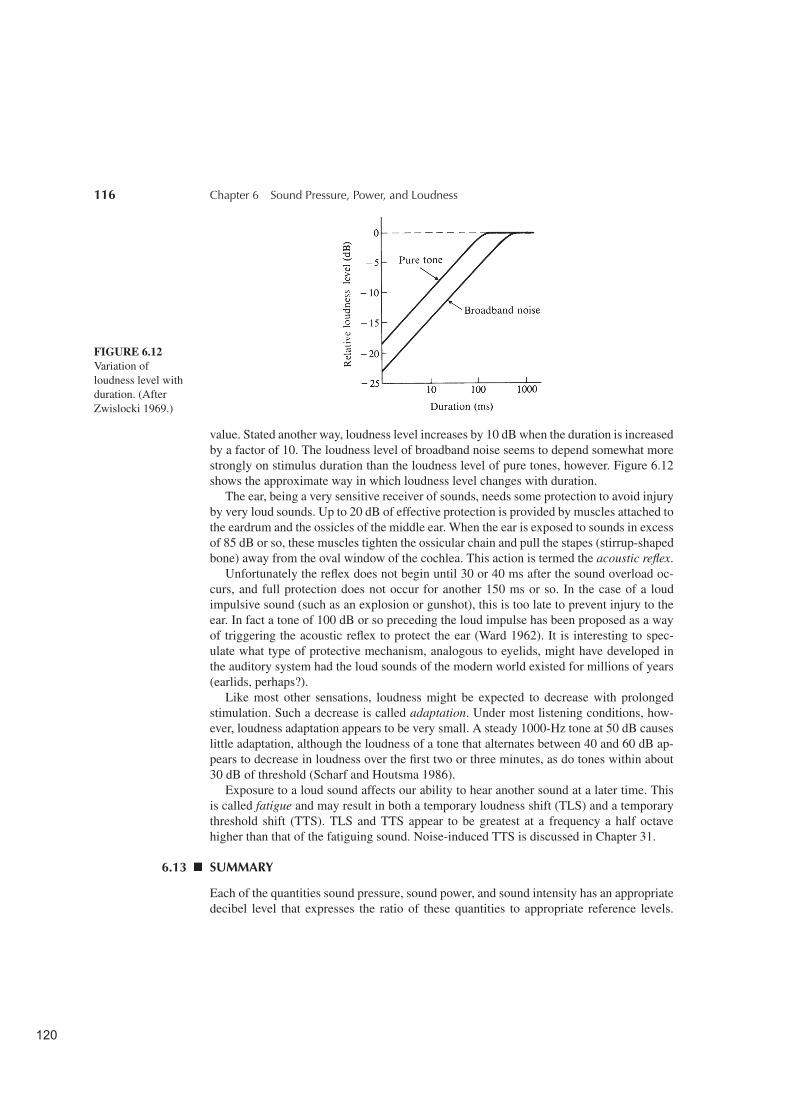
FIGURE 6.12Variation ofloudness level withduration. (AfterZwislocki 1969.)
value. Stated another way, loudness level increases by 10 dB when the duration is increasedby a factor of 10. The loudness level of broadband noise seems to depend somewhat morestrongly on stimulus duration than the loudness level of pure tones, however. Figure 6.12shows the approximate way in which loudness level changes with duration.
The ear, being a very sensitive receiver of sounds, needs some protection to avoid injuryby very loud sounds. Up to 20 dB of effective protection is provided by muscles attached tothe eardrum and the ossicles of the middle ear. When the ear is exposed to sounds in excessof 85 dB or so, these muscles tighten the ossicular chain and pull the stapes (stirrup-shapedbone) away from the oval window of the cochlea. This action is termed the acoustic reflex.
Unfortunately the reflex does not begin until 30 or 40 ms after the sound overload oc-curs, and full protection does not occur for another 150 ms or so. In the case of a loudimpulsive sound (such as an explosion or gunshot), this is too late to prevent injury to theear. In fact a tone of 100 dB or so preceding the loud impulse has been proposed as a wayof triggering the acoustic reflex to protect the ear (Ward 1962). It is interesting to spec-ulate what type of protective mechanism, analogous to eyelids, might have developed inthe auditory system had the loud sounds of the modern world existed for millions of years(earlids, perhaps?).
Like most other sensations, loudness might be expected to decrease with prolongedstimulation. Such a decrease is called adaptation. Under most listening conditions, how-ever, loudness adaptation appears to be very small. A steady 1000-Hz tone at 50 dB causeslittle adaptation, although the loudness of a tone that alternates between 40 and 60 dB ap-pears to decrease in loudness over the first two or three minutes, as do tones within about30 dB of threshold (Scharf and Houtsma 1986).
Exposure to a loud sound affects our ability to hear another sound at a later time. Thisis called fatigue and may result in both a temporary loudness shift (TLS) and a temporarythreshold shift (TTS). TLS and TTS appear to be greatest at a frequency a half octavehigher than that of the fatiguing sound. Noise-induced TTS is discussed in Chapter 31.
6.13 SUMMARY
Each of the quantities sound pressure, sound power, and sound intensity has an appropriatedecibel level that expresses the ratio of these quantities to appropriate reference levels.

References and Suggested Readings 117
Sound pressure can be measured directly by a sound level meter, which may offer oneto three different frequency weightings. Loudness level (in phons) expresses the soundpressure level of an equally loud 1000-Hz tone, whereas the loudness (in sones) expressesa subjective rating of loudness. Expressing the loudness of complex tones is fairly subtle,involving critical bandwidth, masking one tone by another, etc. The loudness of impulsivesounds increases with their duration up to about 0.2 s. The dynamic range of music coversabout 40 dB, although individual instruments have dynamic ranges considerably less thanthis. Composers use six standard levels to indicate loudness. The ear is partially protectedfrom loud sounds by the acoustic reflex.
REFERENCES AND SUGGESTED READINGS
Benade, A. H. (1976). Fundamentals of Musical Acoustics.New York: Oxford.
Clark, M., and D. Luce (1965). “Intensities of Orchestral In-strument Scales Played at Prescribed Dynamic Markings,”J. Audio Eng. Soc. 13: 151.
Egan, J. P., and H. W. Hake (1950). “On the Masking Patternof a Simple Auditory Stimulus,” J. Acoust. Soc. Am. 22:622.
Elliott, L. L. (1962). “Backward and Forward Masking ofProbe Tones of Different Frequencies,” J. Acoust. Soc. Am.34: 1116.
Fletcher, H., and W. A. Munson (1933). “Loudness, Defini-tion, Measurement and Calculation,” J. Acoust. Soc. Am.6: 59.
Hawkins, J. E., Jr., and S. S. Stevens (1950). “Masking ofPure Tones and Speech by Noise,” J. Acoust. Soc. Am. 22:6.
Houtsma, A. J. M., T. D. Rossing, and W. M. Wagenaars(1988). Auditory Demonstrations (Philips Compact Disc#1126-061 and text). Woodbury, N.Y.: Acoustical Societyof America.
Howes, W. L. (1974). “Loudness Function Derived from Dataon Electrical Discharge Rates in Auditory Nerve Fibers,”Acustica 30: 247.
International Standards Organization, Standards R131, 26,R357 and R454 (International Organization for Standard-ization, 1 Rue de Narembe, Geneva, Switzerland).
Lehman, P. R. (1962). “The Harmonic Structure of the Toneof the Bassoon,” Ph.D. thesis, University of Michigan,Ann Arbor.
Littler, T. S. (1965). The Physics of the Ear. New York:Macmillan.
Patterson, B. (1974). “Musical Dynamics,” Sci. Am. 231(5):78.
Plomp, R. (1976). Aspects of Tone Sensation. London: Aca-demic.
Roederer, J. G. (1975). Introduction to the Physics and Psy-chophysics of Music, 2nd ed. New York: Springer-Verlag.
Scharf, B. (1978). “Loudness,” in Handbook of Perception,Vol. 4. Ed., E. C. Carterette and M. P. Friedman. NewYork: Academic Press.
Scharf, B., and D. Fishken (1970). “Binaural Summation ofLoudness,” J. Experimental Psych. 86: 374–79.
Scharf, B. and A. J. M. Houtsma (1986). “Audition II. Loud-ness, Pitch, Localization, Aural Distortion, Pathology,” inHandbook of Perception and Human Performance. Ed., K.R. Boff, L. Kaufman, and J. P. Thomas. New York: J. Wi-ley.
Stevens, S. S., and G. Stevens (1975). Psychophysics Intro-duction to Its Perceptual, Neural and Social Prospects.New York: Wiley.
Ward, W. D. (1962). “Studies on the Aural Reflex III. ReflexLatency as Inferred from Reduction of Temporary Thresh-old Shift from Impulses,” J. Acoust. Soc. Am. 34: 1132.
Warren, R. M. (1970). “Elimination of Biases in LoudnessJudgements for Tones,” J. Acoust. Soc. Am. 48: 1397.
Zwislocki, J. J. (1969). “Temporal Summation of Loudness:An Analysis,” J. Acoust. Soc. Am. 46: 431.
118 Chapter 6 Sound Pressure, Power, and Loudness
GLOSSARY
acoustic reflex Muscular action that reduces the sensitivityof the ear when a loud sound occurs.auditory fatigue Change in loudness of a sound that followsa loud sound.critical bandwidth The frequency bandwidth beyond whichsubjective loudness increases with bandwidth (see also defi-nition in chapter 5).decibel A dimensionless unit used to compare the ratio oftwo quantities (such as sound pressure, power, or intensity),or to express the ratio of one such quantity to an appropriatereference.intensity Power per unit area; rate of energy flow.intensity level L I = 10 log I/I0, where I is intensity andI0 = 10−12 W/m2 (abbreviated SIL or L I ).loudness Subjective assessment of the “strength” of a sound,which depends on its pressure, frequency, and timbre; loud-ness may be expressed in sones.
loudness level Sound pressure of a 1000-Hz tone that soundsequally loud when compared to the tone in question; loudnesslevel is expressed in phons.
masking The obscuring of one sound by another.
phon A dimensionless unit used to measure loudness level;for a tone of 1000 Hz, the loudness level in phons equals thesound pressure in decibels.
sone A unit used to express subjective loudness; doubling thenumber of sones should describe a sound twice as loud.
sound power level LW = 10 log W/W0, where W is soundpower and W0 = 10−12 W (abbreviated PWL or LW ).
sound pressure level L p = 20 log p/p0, where p is soundpressure and p0 = 2 × 10⁻⁵ N/m2 (or 20 micropascals) (ab-breviated SPL or L p).
white noise Noise whose amplitude is constant throughoutthe audible frequency range.
REVIEW QUESTIONS
1. In what units is sound intensity measured?2. What reference level is used to measure sound intensity
level?3. What is meant by a free field?4. How large is the “just noticeable difference” in sound
level?5. How much does the sound level decrease in a free field
when the distance from the source is doubled?6. In air, how does ρ change as the temperature increases?7. In air, how does c change as the temperature increases?8. In air, how does ρc change with temperature?9. What is the approximate sound level in normal conver-
sation?10. If each of two sound sources alone produces a sound
level of 55 dB at a certain point, what will the level mostlikely be at that point if both sources are active?
11. In what units is loudness level expressed?
12. In what units is loudness expressed?
13. What generally happens to loudness as the bandwidth ofa noise source is increased while the sound level staysconstant?
14. By approximately how many decibels must the A-weighted sound level increase in order to double theloudness of a complex tone?
15. What is the average dynamic range of a single noteplayed on a musical instrument?
16. What is backward masking?
17. Is it easier for a tone of lower frequency to mask a toneof a higher frequency, or vice versa?
18. Does a given tone generally sound louder or less loudagainst a background noise as compared to the same tonein a quiet setting?
19. How does loudness depend upon duration at constantsound level?
QUESTIONS FOR THOUGHT AND DISCUSSION
1. Which will sound louder, a pure tone of L p = 40 dB,f = 2000 Hz, or a pure tone of L p = 65 dB, f =50 Hz?
2. If two identical loudspeakers are driven at the samepower level by an amplifier, how will the sound levels

Experiments for Home, Laboratory, and Classroom Demonstration 119
due to each combine? Does it make a difference whetherthe program source is stereophonic or monophonic?
3. How is it possible for one sound to mask a sound that hasalready occurred (backward masking)? Speculate whatmight happen in the human nervous system when such aphenomenon occurs.
4. How low long must a burst of broadband (white) noisebe in order to be half as loud as a continuous noise of thesame type?
5. Why do community noise laws generally specify maxi-mum L p(A) rather than L p(C)?
EXERCISES
1. What sound pressure level is required to produce min-imum audible field at 50, 100, 500, 1000, 5000, and10,000 Hz?
2. What sound pressure level of 100-Hz tone is necessary tomatch the loudness of a 3000-Hz tone with L p = 30 dB?What is the loudness level (in phons) of each of thesetones?
3. With one violin playing, the sound level at a certain placeis measured as 50 dB. If four violins play equally loudly,what will the sound level most likely be at this sameplace?
4. If two sounds differ in level by 46 dB, what is the ratioof their sound pressures? their intensities?
5. A loudspeaker is supplied with 5 W of electrical power,and it has an efficiency of 10% in converting this to
sound power. What is its sound power level? If we as-sume that the sound radiates equally in all directions,what is the sound pressure level at a distance of 1 m?at a distance of 4 m?
6. A 60-Hz tone has a sound pressure level of 60 dB mea-sured with C-weighting on a sound level meter. Whatlevel would be measured with A-weighting?
7. Find the sound pressure and the intensity of a sound withL p = 50 dB.
8. What is the decibel gain when the power gain is 30?when it is 50?
9. According to Fig. 6.6, what is the loudness level that pro-duces a loudness of 10 sones? 100 sones?
EXPERIMENTS FOR HOME, LABORATORY, AND CLASSROOM DEMONSTRATION
Home and Classroom Demonstration1. The decibel scale Demonstration 4 on the AuditoryDemonstrations CD (Houtsma, Rossing, and Wagenaars1988). Broadband is reduced in steps of 6 dB, 3 dB, and 1 dB.This is followed by free-field speech, recorded at distances of0.25, 0.5, 1, and 2 m from a microphone.
2. Frequency response of the ear Demonstration 6 on theAuditory Demonstrations CD. Tones having frequencies of125, 250, 500, 1000, 2000, 4000, and 8000 Hz are decreasedin 10 steps of −5 dB each in order to determine thresholds ofaudibility at each frequency.
3. Loudness scaling Demonstration 7 on the AuditoryDemonstrations CD. Listeners are asked to rate the loudnessof 20 test tones in comparison to a reference tone. These rat-ings are plotted against the sound level of each test tone toestablish an average loudness scale. If done as a class demon-stration, better statistics are obtained by combining all the re-sponses on a single graph.
4. Critical bands by loudness comparison Demonstration 3on the Auditory Demonstrations CD. The bandwidth of a
noise burst is increased while its amplitude is decreased tokeep the power constant. When the bandwidth is greater thana critical band, the subjective loudness increases above thatof a reference noise burst, because the stimulus now extendsover more than one critical band.
5. Critical bands by masking Demonstration 2 on the Audi-tory Demonstrations CD. A 2000-Hz tone is masked by spec-trally flat (white) noise of different bandwidths. You expect tohear more steps in the 2000-Hz tone staircase when the noisebandwidth is reduced below the critical bandwidth.
6. Temporal integration Demonstration 8 on the AuditoryDemonstrations CD. Bursts of broadband noise having dura-tions of 1000, 300, 100, 30, 10, 3, and 1 ms are presented ateight decreasing levels. A graph of a number of steps heard asa function of duration should give an indication of integrationtime (see Fig. 6.12).
7. Asymmetry of masking Demonstration 9 on the AuditoryDemonstrations CD. This demonstration compares the mask-

120 Chapter 6 Sound Pressure, Power, and Loudness
ing of a 2000-Hz tone by a 1200-Hz tone with the masking ofa 1200-Hz tone by a 2000-Hz tone.8. Backward and forward masking Demonstration 10 onthe Auditory Demonstrations CD. This demonstration ofmasking by nonsimultaneous tones compares forward mask-ing (masking tone before the test tone) with backward mask-ing (masking tone after the test tone). Forward masking ismore robust, of course, but the amazing thing is that back-ward masking occurs at all!
9. Familiarity with sound levels Use an inexpensive sound-level meter to determine the sound level of as many differ-ent sounds as possible (music, broadband noise, traffic noise,conversation, etc.).
10. Asymmetry of masking with two oscillators Two audiogenerators can be used to show that a tone of lower frequencymasks a tone of higher frequency more effectively than theother way around.
Laboratory ExperimentsSound level (Experiment 10 in Acoustics Laboratory Experi-
ments)Loudness level and audiometry (Experiment 12 in Acoustics
Laboratory Experiments)