Mastercard Merchant Offers 2022 - Bangladesh Category: Lifestyle
Upload
khangminh22Category
view
2download
0
5757 S. University Ave.
Chicago, IL 60637
Main: 773.702.5599
bfi.uchicago.edu
WORKING PAPER · NO. 2019-65
Impacts of Industrial and Entrepreneurial Jobs on Youth: 5-year Experimental Evidence on Factory Job Offers and Cash Grants in Ethiopia Christopher Blattman, Stefan Dercon, and Simon FranklinAPRIL 2019

IMPACTS OF INDUSTRIAL AND ENTREPRENEURIAL JOBS ON YOUTH:5-YEAR EXPERIMENTAL EVIDENCE ON
FACTORY JOB OFFERS AND CASH GRANTS IN ETHIOPIA
Christopher BlattmanStefan Dercon
Simon Franklin
We thank the participating firms plus the Ethiopian Development Research Institute and Innovations for Poverty Action for field research. For comments we thank Ben Olken and seminar participants. For funding we thank the Private Enterprise Development in Low-Income Countries (PEDL) initiative and the U.K. Department for International Development. Prior rounds were funded by the Aspen ANDE group, the International Growth Center, the Templeton Foundation, and a Vanguard Charitable Trust. Natalie Carlson, Peter Deffebach, Felipe Dizon, Courtney Han, Dawit Kebede, Sana Khan, Benjamin Morse, Richard Peck, Patryk Perkowski, Katherine Rodrigues, Joe St. Clair, Nolawi Taddesse and Nynne Warring provided research assistance. The views expressed herein are those of the authors and do not necessarily reflect the views of the National Bureau of Economic Research.
© 2019 by Christopher Blattman, Stefan Dercon, and Simon Franklin. All rights reserved. Short sections of text, not to exceed two paragraphs, may be quoted without explicit permission provided that full credit, including © notice, is given to the source.
Impacts of Industrial and Entrepreneurial Jobs on Youth: 5-year Experimental Evidence on Factory Job Offers and Cash Grants in EthiopiaChristopher Blattman, Stefan Dercon, and Simon FranklinApril 2019JEL No. F16,J24,J81,O14,O17
ABSTRACT
We study two interventions for underemployed youth across five Ethiopian sites: a $300 grant to spur self-employment, and a job offer to an industrial firm. Despite significant impacts on occupational choice, income, and health in the first year, after five years we see nearly complete convergence across all groups and outcomes. Shortrun increases in productivity and earnings from the grant dissipate as recipients exit their micro-enterprises. Adverse effects of factory work on health found after one year also appear to be temporary. These results suggest that one-time and one-dimensional interventions may struggle to overcome barriers to wage- or self-employment.
Christopher BlattmanHarris School of Public Policy The University of Chicago 1155 E 60th St.Chicago, IL [email protected]
Stefan DerconOxford [email protected]
Simon FranklinCentre for Economic Perfornance London School of Economics United [email protected]
A randomized controlled trials registry entry is available at https://www.socialscienceregistry.org/trials/2198
One-year publication is available at https://www.aeaweb.org/articles?id=10.1257/app.20170173
1 Introduction
In developing countries, such as Ethiopia, low-skilled youth often spend long periods of timeunderemployed or not employed at all. Young women often face steeper challenges than menand exhibit lower rates of labour force participation and higher rates of unemployment.
This paper follows a panel of young, mostly women, low-skilled job-seekers in Ethiopiaover a period of five years. Our aim is to assess whether young people in this context facebarriers to entry into occupations for which they would be well suited. We use two experi-ments to analyze whether one-time interventions can overcome impediments to entering twoof the most common types of work: (i) low-skill wage work, especially in factories; and (ii)self-employment in petty business and other "microenterprises".
Between 2010 and 2013, we identified nearly 1000 people interested in an industrial jobat one of five firms. The firms were in different sectors and regions, each one hiring a largebatch of workers for a line expansion, sometimes multiple cohorts over time. Most of theeligible applicants were healthy but unemployed women in their early 20s, with no formalwork experience and little self-employment. We introduced two experimental interventions:a cash grant intended to stimulate self-employment, and a factory job offer intended toreduce barriers to entry in wage employment. Thus, the job-seekers were assigned to eithera start-up grant, the job offer, or a control group. After a baseline survey, we re-interviewedthe sample after roughly 1 and 5 years, finding 85–90%.
The first intervention was a cash grant worth roughly $300, equal to about one year’sincome at prevailing wages. It was framed as a business start-up grant and came with afew days of training and consulting on microenterprises.1 The grant was designed to helpthese young people overcome one of the most commonly cited barriers to self-employment:a lack of capital or access to credit.2 Unemployed youth in developing countries may haveopportunities in “entrepreneurial” self-employment, in agriculture or petty trades, but lackthe initial capital required to start such small businesses. They may also face uncertaintyabout their own ability to run an enterprise and not be able to take the risk of experimentingwith this kind of work.
In these contexts, cash or in-kind grants could spur investment and increase long-runearnings. A number of recent studies have found that cash or other capital injections reducepoverty over horizons of mostly 1–4 years.3 These results have bolstered a view that a lack of
1We repeatedly stressed to participants, the grant was unconditional.2See Banerjee and Duflo (2011), Blattman and Ralston (2015), Brudevold-Newman, Honorati, Jakiela,
and Ozier (2017), McKenzie (2017).3In northern Uganda, a program giving women $150 grants, basic training and follow-up led to large
income gains after 18 months (Blattman, Annan, Green, Lehmann, and Jamison (2016)). Grants of cashand in-kind capital to less poor, existing entrepreneurs in Sri Lanka, Ghana and India led to sustained
1
capital and imperfect financial markets hold many poor people below their potential. Thereis relatively little long term evidence, however, and we do not know the longevity of thesehigh returns to capital. Moreover, theory suggests that, unless people are hampered byextreme constraints and frictions, over time they should be able to earn and save enough tomake the same microenterprise investments.
In the second experiment, we worked with the industrial firms to randomize offers toentry-level jobs. We observed queues of young people, mostly women, applying for industrialjobs around Ethiopia, most of whom were turned away because of insufficient new openings.4
Following months of qualitative observation and interviews around dozens of factories, wehypothesized that these industrial jobs were widely desired but scarce. There were someindications the firms offered unusually stable employment levels and paid wage premiumscompared to self-employment. Theoretically, there are several reasons why industrial workwould pay a wage premium compared to informal work. Firms may pay efficiency wages orthere may also be institutional and legislative sources, such as minimum wages, labor codes,or union bargaining (Katz, Summers, Hall, Schultze, & Topel, 1989; Akerlof & Yellen, 1986;Card, 1996). If so, the result is a dual or segmented labor market, in which those gainingindustrial jobs earn rents while informal workers queue for those jobs (Lewis, 1954; Harris &Todaro, 1970; Fields, 1975).5 Even in the absence of wage premiums, industrial jobs couldalso set young workers on a job ladder that leads to scarce skills, better jobs, and higherwages over time, especially young women.6 But workers may exhibit considerable hetero-
increases in earnings 1–5 years later (Mel, McKenzie, and Woodruff (2012), Fafchamps, McKenzie, Quinn,and Woodruff (2014), Hussam, Rigol, and Roth (2017)). Cash grants to poor farmers in Mali raised farminputs and incomes after 1 and 2 years (Beaman, Karlan, Thuysbaert, and Udry (2014)). Unconditionalcash transfers in Kenyan villages led to sustained increases in assets between treatment and control villages,but no consumption impacts after 9 months and 3 years (Haushofer and Shapiro (2016, 2018)). There is alsosome evidence from a Mexican national program that cash relieves important financial constraints and leadsto higher income after 1–2 years (Gertler, Martinez, and Rubio (2012), Bianchi and Bobba (2013)). Across7 countries, programs that give grants of livestock with basic training and temporary income support showsustained increases on the incomes and consumption of the poorest rural households four years after grants(Banerjee, Karlan, and Zinman (2015), Bandiera et al. (2013, 2017)). The effects of capital injections are notuniversally positive, however. Fiala (2018) fails to find income effects from cash grants to existing businessesin Uganda. A cash grant programs to young men living on the streets of Monrovia and engaged in pettycrime also had very short-lived impacts (less than one year) on enterprise and earnings, potentially due tothe unusual instability and risk of their existence (Blattman, Jamison, and Sheridan (2017)). Karlan, Osei,Osei-Akoto, and Udry (2014) find that cash grants to Ghanaian farmers had no effect without insurance,also because of the constraints from imperfect insurance.
4Ethiopia has been a growing export hub in horticulture, textiles, and leather. As countries like Ethiopiaenter the early stages of industrialization, the number of low-skill industrial job opportunities have grown.
5Empirically, a large body of observational evidence suggests that formal firms pay premium wages,especially large, foreign-owned, or exporting firms (Bernard, Robertson, & Schott, 2010; Verhoogen, 2008;Söderbom & Teal, 2004; El Badaoui, Strobl, & Walsh, 2008).
6Women are commonly employed in low-skill firms, and there is observational evidence that working intextile factories or other export manufacturers raises women’s status in the household, their quality of life,
2
geneity in their suitability for factory work. And a growing body of literature suggests thathiring among firms in developing countries is prone to considerable frictions and informa-tion assymetries, which may prevent firms from selecting the workers who are most likely toflourish in careers in these occupations (Abebe et al., 2018; Bassi & Nansamba, 2017; Abel,Burger, & Piraino, 2017).
Even absent any scarcity or rents in industrial jobs, a randomized job offer might changeoccupational choice and earnings paths in the long run. Most of our sample was unemployedfor at least a month before they entered our sample, either due to adverse shocks or becausethey are entering the labor market for the first time or after a spell of unemployment. Arange of research in more developed labor markets suggests that market conditions andopportunities for such people matter a great deal for long term labor market prospects(Arulampalam, Gregg, & Gregory, 2001; Kroft, Lange, & Notowidigdo, 2013). Young peopleand women in particular in Ethiopia may also face uncertainty about their own proclivitiesand abilities for industrial work, be unaware of health and other risks, or face other searchand matching frictions. Because so many low-skilled people apply to the still small numberof industrial firms, even well-matched individuals may never get the opportunity to enterinto these occupations.
For the most part, we do not find support for the hypotheses that start-up grants leadto sustained income changes, or that industrial job offers affect long-run well-being. Overfive years, we see that these young and mostly unemployed women found relatively full-timeemployment in a variety of wage work and microenterprises, even without the opportunityfor a grant or an initial job offer. Medium-run equilibrium labor market outcomes seem un-affected by the interventions. After 5 years we see almost complete convergence in earnings,employment, and health.
These medium-run results diverge from some of the short-run results in important ways.For instance, in Blattman and Dercon (2018), we saw evidence that the start-up grantdramatically raised short-run productivity. While those offered the grant weren’t workingmany more hours than the control or job offer groups, their earnings were a third higher.This corresponded to nearly PPP$1 a day greater income—a huge amount considering thatcounterfactual earnings were only about PPP$3 (or about $1 a day at 2010 price levelsand market exchange rates). After 5 years, we find that the new microenterprises andproductivity boost are not sustained and that the control and start-up grant groups convergewithin a few years. At best, the cash acted as like a temporary boost to earnings with short-term consumption impacts rather than a permanent lift out of poverty.
Another example is the effects of industrial work on health. Our 1-year results showed
and the health of children (Kabeer, 2002; Hewett & Amin, 2000; Atkin, 2009; Getahun & Villanger, 2016).
3

that those who took the factory job were more likely to report substantial health problems ayear after the job offer, even though the average employee quit after a few weeks or months.Were these health problems temporary or lasting? We returned with a battery of expandedmeasures, and pre-specified health as our second primary outcome after incomes. After 5years, we see no evidence of long term adverse effects from the industrial work. Those as-signed to the industrial job offer have 3 months more cumulative experience in factories thanthe control group, and neither reduced-form treatment effects or an instrumental variablesapproach suggest that this added factory work reduced health in the long run.
Such longer-term results are useful for a few reasons. First, they allow us to rule outsustained or transformative impacts of the cash grants. There are few studies on the effects ofcash transfers in early industrializing areas, let alone long term follow ups. Our findings areconsistent with a 9-year evaluation of group cash transfers in Uganda, however (Blattman,Fiala, & Martinez, 2018). Second, as more societies industrialize, it is also important toknow whether industrial work can lead to large, chronic, and unanticipated health problems.At least in this instance, the adverse health effects seem to have been temporary.
Finally, we wanted to assess longer run impacts of the industrial job offer on income andemployment. We might not expect earnings gains in industrial work after one year, becauseentry-level wages are so low. Even so, by fostering experimentation with a new sector, newmatches, and allowing ‘good’ types to get a foot in the door, we may see their wages risewith tenure and from climbing up the job ladder (even if this is a minority of those assignedto the job).
Figures 1a and 1b summarize the paths of income and employment in all three armsover the 5 years, with all results deflated to 2010 Birr. The jump in weekly earnings andemployment in all three groups in the first year suggests that people self-selected into thesample of job applicants because they were new labor market entrants or had suffered ashock. Likely this is both a life-cycle effect from youth increasing hours and earnings overtime and perhaps rapid recovery from any adverse shocks to employment that propelledpeople into the sample.
4

Figure 1: Progression of income and hours worked across time by treatment status
(a) Mean income (all profits and wages) in pastweek across time for all cohorts
(b) Mean hours worked across time for all co-horts
Note that the figure makes it seem that job offer and control group incomes are stagnatingfrom years 1 to 4, and that the start-up grant group is converging down to their level. Thisis possible, and indeed we see evidence of microenterprise exit. But this is also a period ofhigh inflation, and nominally earnings and consumption are rising. At the same time, this isa period of high inflation and the national inflation index (the only available measurement)could exaggerate the flatness of poor young people’s incomes. In any case, we see no sustainedeffect of cash on income or consumption.
In the end, only one in six people remain in factory work, even among those randomlyoffered the job. From our data and qualitative work, it seems that people in all three armsused factory jobs as a safety net to smooth income temporarily until other less rigid andless risky work could be found. Altogether, these medium-run results are consistent withthe simple alternative hypothesis that industrial jobs are not higher-quality and "rare" jobs,but rather are average to low quality jobs where labor markets function normally.
In the end, a main takeaway from this experiment is that two of the interventions thatsome schools of thought think should have large lasting effects on poverty simply do not havethese impacts, at least in this setting and with young women. One interpretation is thatone-off interventions and nudges addressing a single or small number of market failures maynot be lasting. Powerful forces may push individuals back towards equilibrium outcomesirrespective of interventions. This is largely speculative, but if more interventions in moreplaces fail to find long run effects of initially-successful poverty or employment interventions,it may challenge the widespread marginalist view of poverty alleviation. This could pushinterventions to be more multifaceted addressing multiple barriers at once, and perhapsaddressing constraints at the local or macro level as well.
5

2 Setting
Ethiopia is the second most populous nation in Africa after Nigeria, and also one of the poor-est. 27 percent live under $2 a day in purchasing power parity (PPP) terms, and agricultureemploys 85 percent of the workforce. Like many African countries, the underdeveloped pri-vate sector has offered few formal sector jobs. Youth unemployment and underemploymentare high. Most young people are engaged in informal wage work or self-employment.
At the same time, Ethiopia is also one of the fastest growing economies in the region,with GDP growth of roughly 10% per year from 2006–16. In particular, Ethiopia has becomea growing export hub in horticulture, textiles, and leather. Although the economy has beenmoving in fits and starts through the early stages of of industrialization, Ethiopia has beentouted as one of China’s successors in light manufacturing (The Economist, 2014). Thecountry has several advantages from a manufacturer’s point of view: low wages, a politicallystable and foreign investment-friendly regime, a domestic market of 94 million people, andproximity to Europe.
Over the last two decades, there has been a transformation in Ethiopia’s urban labormarkets. They have become more flexible, with rising importance of private sector work, noobvious skill premiums between the private and public sector, and lower (but still consider-able) urban unemployment. In all the firms in our study, and in general across the privatesector, employers can set wages without any legal restriction or reference to union deals. Thegoverning labor law makes it also relatively straightforward to fire an employee.
In the years prior to our study, 2000–08, national income and industrial output both grewabout 10 percent per year, with the number of medium and large manufacturers doubling innumber (CSA, 2011). The beginning of the study period was first a boom time followed bya mild slow down. Even so, during this period new foreign firms were entering the marketand starting small plants, and some domestic firms were continuing to invest and expand.Growth picked up later in the study period, and again Ethiopia is now one of the fastestgrowing economies in the region.
3 Experimental sample, procedures, and data
3.1 Experimental sample
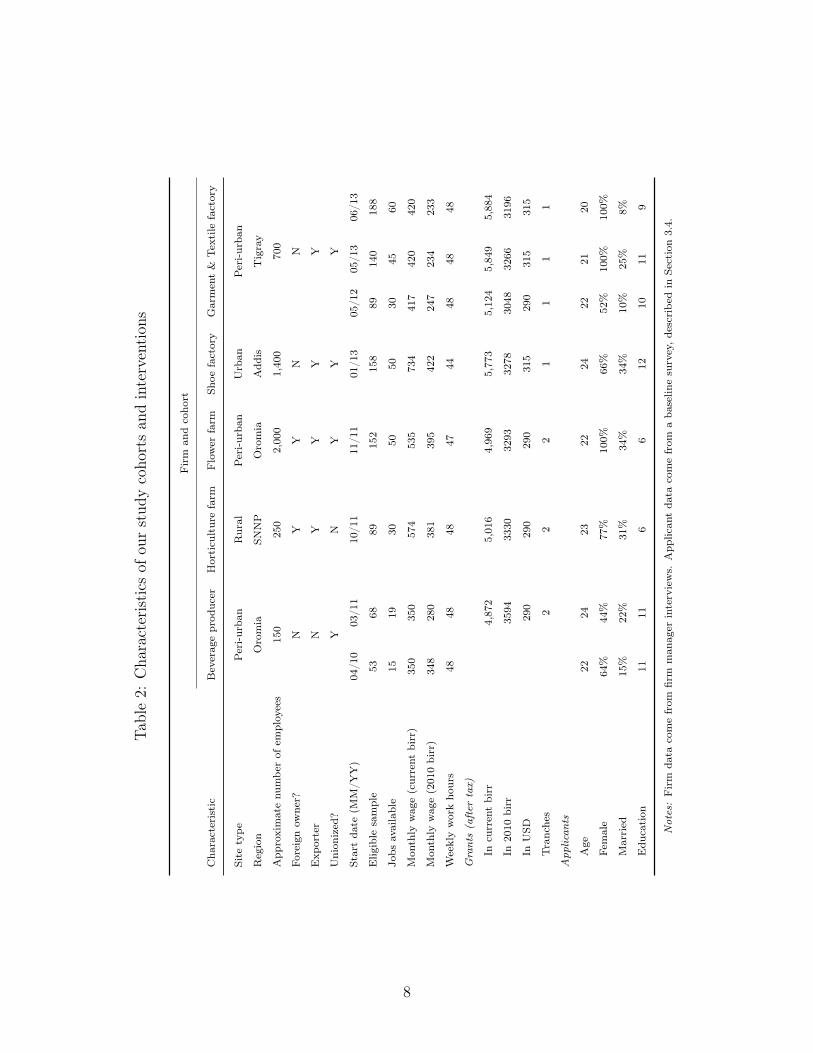
Our sample of young people comes from job applicants to 5 industrial firms, in 5 differentsectors and 4 regions of the country, both urban and rural. Two firms hired more thanone cohort over the study period, 2010–13, for a total of eight cohorts. Table 2 describesthe firms and cohorts. Three firms engaged in light manufacturing (textiles and garments,
6
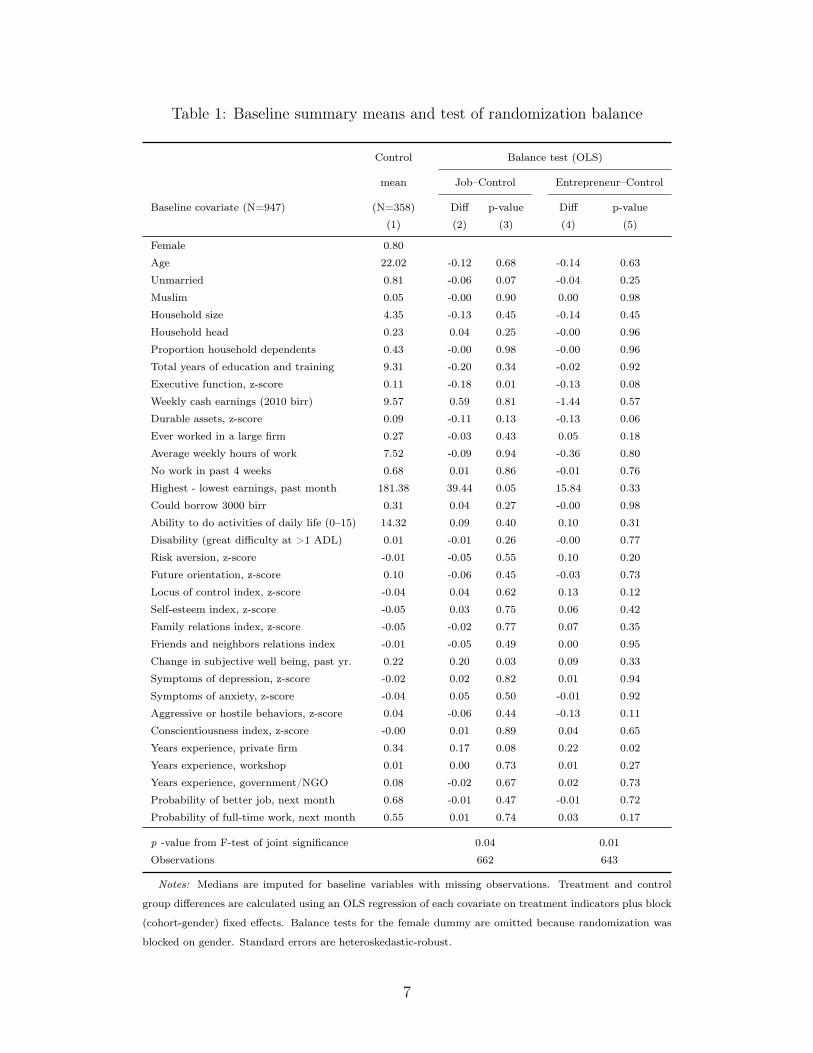
Table 1: Baseline summary means and test of randomization balance
Control Balance test (OLS)
mean Job–Control Entrepreneur–Control
Baseline covariate (N=947) (N=358) Diff p-value Diff p-value
(1) (2) (3) (4) (5)
Female 0.80
Age 22.02 -0.12 0.68 -0.14 0.63
Unmarried 0.81 -0.06 0.07 -0.04 0.25
Muslim 0.05 -0.00 0.90 0.00 0.98
Household size 4.35 -0.13 0.45 -0.14 0.45
Household head 0.23 0.04 0.25 -0.00 0.96
Proportion household dependents 0.43 -0.00 0.98 -0.00 0.96
Total years of education and training 9.31 -0.20 0.34 -0.02 0.92
Executive function, z-score 0.11 -0.18 0.01 -0.13 0.08
Weekly cash earnings (2010 birr) 9.57 0.59 0.81 -1.44 0.57
Durable assets, z-score 0.09 -0.11 0.13 -0.13 0.06
Ever worked in a large firm 0.27 -0.03 0.43 0.05 0.18
Average weekly hours of work 7.52 -0.09 0.94 -0.36 0.80
No work in past 4 weeks 0.68 0.01 0.86 -0.01 0.76
Highest - lowest earnings, past month 181.38 39.44 0.05 15.84 0.33
Could borrow 3000 birr 0.31 0.04 0.27 -0.00 0.98
Ability to do activities of daily life (0–15) 14.32 0.09 0.40 0.10 0.31
Disability (great difficulty at >1 ADL) 0.01 -0.01 0.26 -0.00 0.77
Risk aversion, z-score -0.01 -0.05 0.55 0.10 0.20
Future orientation, z-score 0.10 -0.06 0.45 -0.03 0.73
Locus of control index, z-score -0.04 0.04 0.62 0.13 0.12
Self-esteem index, z-score -0.05 0.03 0.75 0.06 0.42
Family relations index, z-score -0.05 -0.02 0.77 0.07 0.35
Friends and neighbors relations index -0.01 -0.05 0.49 0.00 0.95
Change in subjective well being, past yr. 0.22 0.20 0.03 0.09 0.33
Symptoms of depression, z-score -0.02 0.02 0.82 0.01 0.94
Symptoms of anxiety, z-score -0.04 0.05 0.50 -0.01 0.92
Aggressive or hostile behaviors, z-score 0.04 -0.06 0.44 -0.13 0.11
Conscientiousness index, z-score -0.00 0.01 0.89 0.04 0.65
Years experience, private firm 0.34 0.17 0.08 0.22 0.02
Years experience, workshop 0.01 0.00 0.73 0.01 0.27
Years experience, government/NGO 0.08 -0.02 0.67 0.02 0.73
Probability of better job, next month 0.68 -0.01 0.47 -0.01 0.72
Probability of full-time work, next month 0.55 0.01 0.74 0.03 0.17
p -value from F-test of joint significance 0.04 0.01
Observations 662 643
Notes: Medians are imputed for baseline variables with missing observations. Treatment and control
group differences are calculated using an OLS regression of each covariate on treatment indicators plus block
(cohort-gender) fixed effects. Balance tests for the female dummy are omitted because randomization was
blocked on gender. Standard errors are heteroskedastic-robust.
7
T able2:
Cha
racteristics
ofou
rstud
ycoho
rtsan
dintervention
s
Firm
andcoho
rt
Cha
racteristic
Beverageprod
ucer
Horticulturefarm
Flower
farm
Shoe
factory
Garment&
Textile
factory
Site
type
Peri-urba
nRural
Peri-urba
nUrban
Peri-urba
n
Region
Oromia
SNNP
Oromia
Add
isTigray
App
roximatenu
mbe
rof
employees
150
250
2,000
1,400
700
Foreignow
ner?
NY
YN
N
Exp
orter
NY
YY
Y
Union
ized?
YN
YY
Y
Startda
te(M
M/Y
Y)
04/10
03/1
110/11
11/11
01/13
05/12
05/13
06/13
Elig
ible
sample
5368
89152
158
89140
188
Jobs
available
1519
3050
5030
4560
Mon
thly
wage(current
birr)
350
350
574
535
734
417
420
420
Mon
thly
wage(2010birr)
348
280
381
395
422
247
234
233
Weeklyworkho
urs
4848
4847
4448
4848
Gra
nts
(after
tax)
Incurrentbirr
4,872
5,016
4,969
5,773
5,124
5,849
5,884
In2010
birr
3594
3330
3293
3278
3048
3266
3196
InUSD
290
290
290
315
290
315
315
Tranches
22
21
11
1
App
lican
ts
Age
2224
2322
2422
2120
Female
64%
44%
77%
100%
66%
52%
100%
100%
Married
15%
22%
31%
34%
34%
10%
25%
8%
Edu
cation
1111
66
1210
119
Not
es:Firm
data
comefrom
firm
man
ager
interviews.
App
lican
tda
tacomefrom
aba
selin
esurvey,describe
din
Section3.4.
8

shoes, and beverages) and two in commercial agriculture (flowers and vegetables). Four wereexport-oriented. Only one was foreign-owned.
Eligible job applicants were recruited and screened in the firms’ standard fashion, de-scribed below. Only these screened applicants were eligible for one of the two treatments:an industrial job offer or the start-up grant package.
Table 1 reports baseline characteristics of these screened applicants, from self-reportedsurveys.7 80 percent were women. The average applicant was 22 and had completed grade9. Most were unmarried. They had 7.5 hours of work per week, typically a portfolio ofactivities such as farming, casual labor, or petty business. They had earned little cash inthe previous month. Only 27 percent had worked in a large, formal firm before, and only 19percent in a factory. Based on qualitative interviews, most applicants had only a hazy ideaof the type and difficulty of the work in advance, and often only learned the salary beingoffered at the time of hiring.
3.2 Interventions
3.2.1 "Start-up" grant and training
The core of the start-up treatment was an unconditional cash grant of nearly 5000 Birr, orroughly $300. (see Table 2).8 We chose the $300 amount based on our qualitative assessmentof the costs required to set up a small part-time enterprise. While we framed the cash grant asa business start-up fund, throughout the intervention we made clear that it was nonethelessan unconditional grant and grantees were free to use it as they saw fit—savings, consumption,or investment.
To encourage and enable business start-up, however, grantees initially received five daysof business training and planning.9 Professional skills trainers led classes of about 20, andeach person also received individual mentoring during those five days.10 Subjects had to
7Applicants completed a 90-minute baseline survey plus 45 minutes of interactive games, with real money,to measure time and risk preferences, and cognitive abilities such as executive function. An Ethiopianenumerator delivered surveys and the games verbally in the local language. The games remunerated therespondent with roughly a half days wages.
8The grant amount varied slightly from cohort to cohort because of inflation, currency devaluation, andtax issues. For cohorts 2 to 4, a for-profit firm ran the intervention and was required to withhold tax onthe grants. To minimize the tax burden the cash was disbursed in two tranches several weeks apart. Weused a for-profit firm because we could not find a non-profit organization willing to disburse cash withoutconditions at low cost. For cohorts 5 to 8, we ran the intervention through a parastatal research organizationto avoid the tax burden. The amount of the grant was increased to maintain the rough purchasing powerand disbursed in a single tranche to reduce implementation costs.
9Total implementation cost of training and grant was roughly $450 per person including the grant, train-ing, and local program administration.
10Cohorts 2 and 3 also received a follow-up visit by the trainer after three months for additional advice.
9
complete at least three days of the training to receive the grant.
3.2.2 Industrial job offer
The jobs involved working on production lines where the workers bottled water, picked andpacked produce and flowers, cut fabric, or sewed shoes. They could involve heavy machineryor simple tools.
In terms of eligibility, the positions required no previous work experience. Applicants hadto be healthy and able-bodied. All firms also had a minimum education requirement —grade6 in the two rural horticulture firms, and grade 8 or 10 in the more urban manufacturingones. Most firms had separate jobs for men and women, and depending on the position theywere hiring for, they would specify a gender.
The positions required 45 to 50 hours per week over 5 or 6 days. At the time of thebaseline surveys, the jobs typically paid a wage of $1 to $1.50 per day at 2010 marketexchange rates (where $1 = 13.5 birr in 2010). Some firms offered non-wage benefits suchas on-site health care and bus transport.
The workplaces were professional and well-maintained, and firms never coerced employ-ees. Nonetheless, health risks were common, especially: air quality (dust particles or chemicalfumes); discomfort and fainting from standing or lack of breaks or water; and safety hazardssuch as wet floors, sharp instruments, and so forth. In interviews, workers who used cleaningsolvents, pesticides, dyes and glues sometimes reported fainting from inhalation.
Most firms were unionized, but these were generally worker associations that mediateddisputes but did not engage in collective bargaining. Occasionally, however, we did observeshort strikes or walkouts in response to salary delays.
3.3 Recruitment
3.3.1 Firm recruitment and selection
We approached roughly 300 firms, about half of all private industrial firms in Ethiopia with50 or more employees.11 We contacted them by phone or walk-in. To be eligible for thestudy, a firm had to be in manufacturing or commercial farming, expect to hire a batch ofat least 15 low-skill, full-time workers, and be willing to randomly assign job offers amongscreened applicants.
Grantees did not see this service as helpful, and given the cost it was discontinued after cohort 3.11We identified these firms through applications for investment certificates, public business listings, indus-
try associations, and personal contacts.
10

The limiting factor was whether a firm had imminent large expansion plans. Only ahandful had plans to open a entire new production line and hire a large batch of workersat once.12 Firms with more modest expansion plans were a poor fit for the study, as theyplanned to hire people piecemeal, to accommodate more gradual growth and cope withregular attrition.
Randomization was seldom an issue, and more than three-quarters of the firms we ap-proached were open to the study.13 While one might expect that firms want to select thebest workers, low-skill entry-level positions were often filled without a substantive interviewprocess. In most of the firms we approached, entry-level hiring was ad hoc in the sensefirms filling low-skill positions on a first-come, first-hire manner, with little or no interviewprocess.
What are these five study firms a case of? Our data suggest the jobs are similar toother labor-intensive, low-skill, entry-level positions in the large textile, garment, footwear,beverage, and commercial farming sectors, and thus different from positions in higher-skilland heavier or more capital-intensive manufacturing. Compared to a representative sample ofindustrial firms in 2014 in the capital Addis Ababa, our five firms had higher revenues, lowerprofits, two to three times as many production employees, and lower-skilled employees.14
It is reasonable to worry that firms willing to randomize employment were poorly man-aged or had unusual turnover. While possible, qualitatively we saw little difference betweenour firms and the others we approached. On the contrary, all were expanding employment,suggesting they had more credit and higher returns to investment than others.
12One reason is that sector growth was slowing in this period. 2010 to 2012 in Ethiopia was a periodof moderate government financial repression and pre-election uncertainty. Despite a growing economy anda boom in some sectors, such as construction, many of the existing firms we approached were temporarilyholding off on growth plans. Other common sources of delay included difficulty in obtaining licenses, foreignexchange, importing equipment, and obtaining parts. At least two other firms intended to participate, butsuffered prolonged delays and did not open their new line during the study period. Also, some sector growthwas coming from new firms, often foreign-owned, who were reluctant to participate because their start-upwas already complicated enough.
13They typically expressed interest in participation in the study for several reasons: curiosity in theanswer; the opportunity to bring some structure to relatively unstructured hiring processes; and an interestin learning more about their applicant pool and the other opportunities available to their employees.
14Given the low-skill nature of the work and the entry-level positions, starting salaries were lower than themanufacturing average—at roughly the 25th percentile of manufacturers in the capital. Since most of ourfirms are outside the capital, the purchasing power of their wages is greater, probably putting them betweenthe 25th and 50th percentile in terms of wages. Moreover, comparing wages to the distribution quoted in the2009/10 census of manufacturing firms suggest that they were not at all uncommon for the specific sectorsinvolved. The modal workers in the census earned between 400-600 birr in 2010 prices, with the second mostcommon interval 200-400 birr, jointly making up 40 percent of the workforce in manufacturing in generaland more than 60 percent in textiles or footwear (CSA, 2011). The wages of the workers in our sample fallin these ranges.
11
3.3.2 Sample recruitment and selection
We followed each firms’ normal procedures for hiring batches of new employees to staff newproduction lines. The firms advertised jobs through a posting on the front gate, word ofmouth, and local job boards.15 Applicants were instructed to gather on a specific day. Firmmanagers would then screen written or verbal applications, typically based on job-specificgender, education, and health requirements. Across all 8 cohorts, between 75 and 95 percentof applicants passed these criteria and thus entered the study sample. We do not have dataon ineligible applicants.
A research team from Innovations for Poverty Action (IPA) and the Ethiopian Develop-ment Research Institute (EDRI) then debriefed eligible applicants on the study, the start-upstart-up arm arm, and the survey and randomization procedures. Nearly all agreed to enterthe study, completed a baseline survey, and entered the lottery.
Following randomization, the firm posted the names of people receiving the job offerat the factory site and the IPA/EDRI research team contacted all those assigned to twotreatment arms. Job offers began within a few days and the start-up training and grantswithin a few weeks.
We gave each firm a list of unsuccessful applicants and asked the firm not to hire themfor at least 1–2 months. In practice, however, the firms kept poor records and within a fewdays or weeks of the randomization could have hired control group members.
3.4 Randomization and balance
We randomized by cohort, stratified by gender, using a uniform random variable generator.304 were assigned to the job offer, 285 to the start-up grant arm, and 358 to the control arm.
Table 2 reports tests of randomization balance, where we regress each covariate on treat-ment indicators plus randomization block (cohort-gender) fixed effects. This sample is some-what imbalanced across the treatment arms at baseline. As Table 1 shows, of the 34 covari-ates across two treatments, 8 of the 68 mean differences (12 percent) have p < .1. Thoseassigned to jobs are less likely to be married and have slightly lower executive functions andeducation compared to the control group. Those assigned to the entrepreneurship program
15In order to ensure sufficient applicants, we only made one change to standard procedures: we assistedthe firm in posting more notices within a wider radius than usual (usually no more than a few kilometers).Since the firm typically drew employees from this radius, we expected this to generate an applicant poolvery similar to the usual one. It is possible, however, that the experimental pool of applicants is furtheroutside the family/friend network, and lives slightly further from the factory, than would otherwise havebeen the case. That said, most applicants live within a few miles of the firm, and so are extremely local byany measure. (The firms, who were reluctant to hire people who lived far away, reported that they did notthink the distance would make a material difference, since all live nearby.)
12
have lower assets and more firm experience. A test of joint significance of all covariates hasa p-value of 0.04 for the job offer and 0.01 for the entrepreneurship program. To minimizebias, we control for baseline covariates when estimating treatment effects.
3.5 Outcomes
3.5.1 1- and 5-year endline data
We conducted follow-up surveys roughly 1 and 5 years after assignment to the two treatments.At each of these two endlines, we attempted to reach each respondent twice, roughly 2–3months apart, to measure our main outcomes twice. We did so to improve statistical precisionwith highly-variable outcomes such as earnings or consumption (McKenzie, 2012).16
During site visits to several dozen factories and commercial farms, we conducted informalinterviews with workers and managers. At each study firm we systematically interviewedmanagers at every level from senior management to line managers. Research assistants alsointerviewed 138 workers and microenterprise owners, both in and out of the sample. Theyalso conducted 60 exit interviews by phone with sample members who quit the study firms.
3.5.2 Attrition
Our sample frequently moved between survey rounds. We were able to track down 88% after1 year and 84.3% after five.17 Appendix Table A.1 reports the correlates of attrition after 5years, from a simple regression of an attrition indicator on baseline covariates.
After 1 year, all treatment arms were roughly as likely to be found. After 5 years,those assigned to the job offer were no more likely to be found after five years than thecontrol group. But those assigned to the start-up arm were roughly 5 percentage pointsmore likely to be found and interviewed. Controlling for baseline covariates, this differenceis not statistically significant, but it is potentially substantively important. Thus, below, wewill consider the robustness of our estimates to alternative attrition scenarios and sensitivityanalysis.
Otherwise, attrition is mostly uncorrelated with baseline characteristics. The exceptionis marriage, as unmarried individuals at baseline are 6.5 percentage points less likely to befound after five years. Women commonly move to become married, and this may accountfor their loss.
16For the 1-year survey, we also attempted to interview the household head once, since the sample membermay have been a dependent and unaware of household labor allocations, wealth, and attitudes. At the 5-yearsurvey, given that the sample is considerably older, we did not interview household heads.
17For discussion of the rates and pattern of attrition for the 1-year endline survey, see Blattman andDercon (2018).
13
3.5.3 Primary outcomes and dealing with multiple outcomes
Based on the 1-year findings, our pre-analysis plan for the 5-year endline pre-specified twoprimary outcomes of interest: income and physical health. As secondary outcomes we spec-ified an interest in occupational choice and quality. We designated all other outcomes asexploratory.18
We divided outcomes into primary and secondary to minimize the number of hypothesestested. To further minimize comparisons, we assembled our various measures into a fam-ily index of income and a family index of health. Our tables report treatment effects onthe components of these indexes as well, but those comparisons should be regarded as ex-ploratory. At present we have not adjusted our p-values for multiple comparisons across thetwo primary measures or within these indexes.
3.6 Estimation
To estimate program impacts on outcome Y , we calculate the intent-to-treat (ITT) estimateof the job offer and start-up arms via OLS:
(1) Yirj = αj + γr=13 + θJJobij + θEStartupij + βXij + εij
where Job and Startup are indicators for random assignment to the treatment arms. Toaccount for observed baseline imbalance and endline attrition, we control for the baselinecovariates, X, listed in Table 1, as well as gender-cohort fixed effects, αj. Recall that at eachendline we surveyed respondents in two different rounds r, collecting the same outcome twotimes. Each round enters the regression as a separate observation, and we cluster standarderrors by individual and include a fixed effect, γr=2, forthe second round.
Note that all outcomes are self-reported, and each treatment arm was aware of theirassignment and the existence of other arms. Thus, there is the potential for self-reportedoutcomes to vary with treatment status. As with most low-income countries, there are noadministrative data on earnings. And as with most countries, there are no systematic andavailable administrative data on health or informal earnings.
14
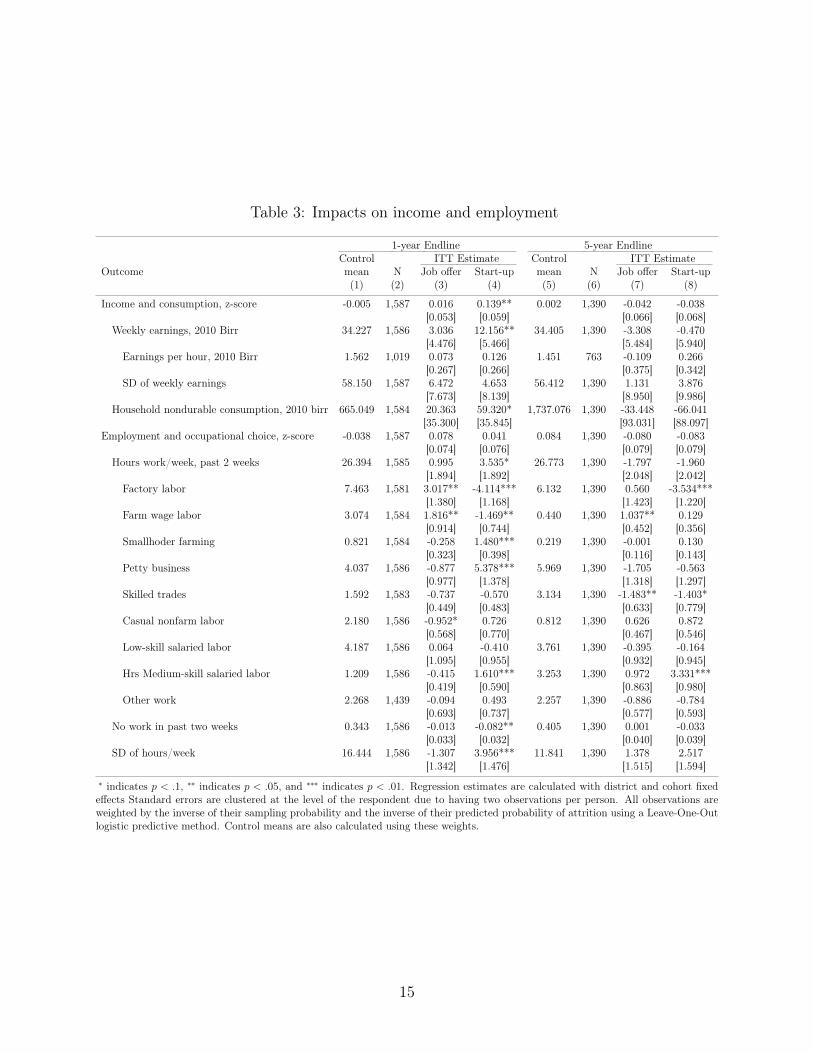
Table 3: Impacts on income and employment
1-year Endline 5-year EndlineControl ITT Estimate Control ITT Estimate
Outcome mean N Job offer Start-up mean N Job offer Start-up(1) (2) (3) (4) (5) (6) (7) (8)
Income and consumption, z-score -0.005 1,587 0.016 0.139** 0.002 1,390 -0.042 -0.038[0.053] [0.059] [0.066] [0.068]
Weekly earnings, 2010 Birr 34.227 1,586 3.036 12.156** 34.405 1,390 -3.308 -0.470[4.476] [5.466] [5.484] [5.940]
Earnings per hour, 2010 Birr 1.562 1,019 0.073 0.126 1.451 763 -0.109 0.266[0.267] [0.266] [0.375] [0.342]
SD of weekly earnings 58.150 1,587 6.472 4.653 56.412 1,390 1.131 3.876[7.673] [8.139] [8.950] [9.986]
Household nondurable consumption, 2010 birr 665.049 1,584 20.363 59.320* 1,737.076 1,390 -33.448 -66.041[35.300] [35.845] [93.031] [88.097]
Employment and occupational choice, z-score -0.038 1,587 0.078 0.041 0.084 1,390 -0.080 -0.083[0.074] [0.076] [0.079] [0.079]
Hours work/week, past 2 weeks 26.394 1,585 0.995 3.535* 26.773 1,390 -1.797 -1.960[1.894] [1.892] [2.048] [2.042]
Factory labor 7.463 1,581 3.017** -4.114*** 6.132 1,390 0.560 -3.534***[1.380] [1.168] [1.423] [1.220]
Farm wage labor 3.074 1,584 1.816** -1.469** 0.440 1,390 1.037** 0.129[0.914] [0.744] [0.452] [0.356]
Smallhoder farming 0.821 1,584 -0.258 1.480*** 0.219 1,390 -0.001 0.130[0.323] [0.398] [0.116] [0.143]
Petty business 4.037 1,586 -0.877 5.378*** 5.969 1,390 -1.705 -0.563[0.977] [1.378] [1.318] [1.297]
Skilled trades 1.592 1,583 -0.737 -0.570 3.134 1,390 -1.483** -1.403*[0.449] [0.483] [0.633] [0.779]
Casual nonfarm labor 2.180 1,586 -0.952* 0.726 0.812 1,390 0.626 0.872[0.568] [0.770] [0.467] [0.546]
Low-skill salaried labor 4.187 1,586 0.064 -0.410 3.761 1,390 -0.395 -0.164[1.095] [0.955] [0.932] [0.945]
Hrs Medium-skill salaried labor 1.209 1,586 -0.415 1.610*** 3.253 1,390 0.972 3.331***[0.419] [0.590] [0.863] [0.980]
Other work 2.268 1,439 -0.094 0.493 2.257 1,390 -0.886 -0.784[0.693] [0.737] [0.577] [0.593]
No work in past two weeks 0.343 1,586 -0.013 -0.082** 0.405 1,390 0.001 -0.033[0.033] [0.032] [0.040] [0.039]
SD of hours/week 16.444 1,586 -1.307 3.956*** 11.841 1,390 1.378 2.517[1.342] [1.476] [1.515] [1.594]
∗ indicates p < .1, ∗∗ indicates p < .05, and ∗∗∗ indicates p < .01. Regression estimates are calculated with district and cohort fixedeffects Standard errors are clustered at the level of the respondent due to having two observations per person. All observations areweighted by the inverse of their sampling probability and the inverse of their predicted probability of attrition using a Leave-One-Outlogistic predictive method. Control means are also calculated using these weights.
15
4 Results
4.1 Economic impacts
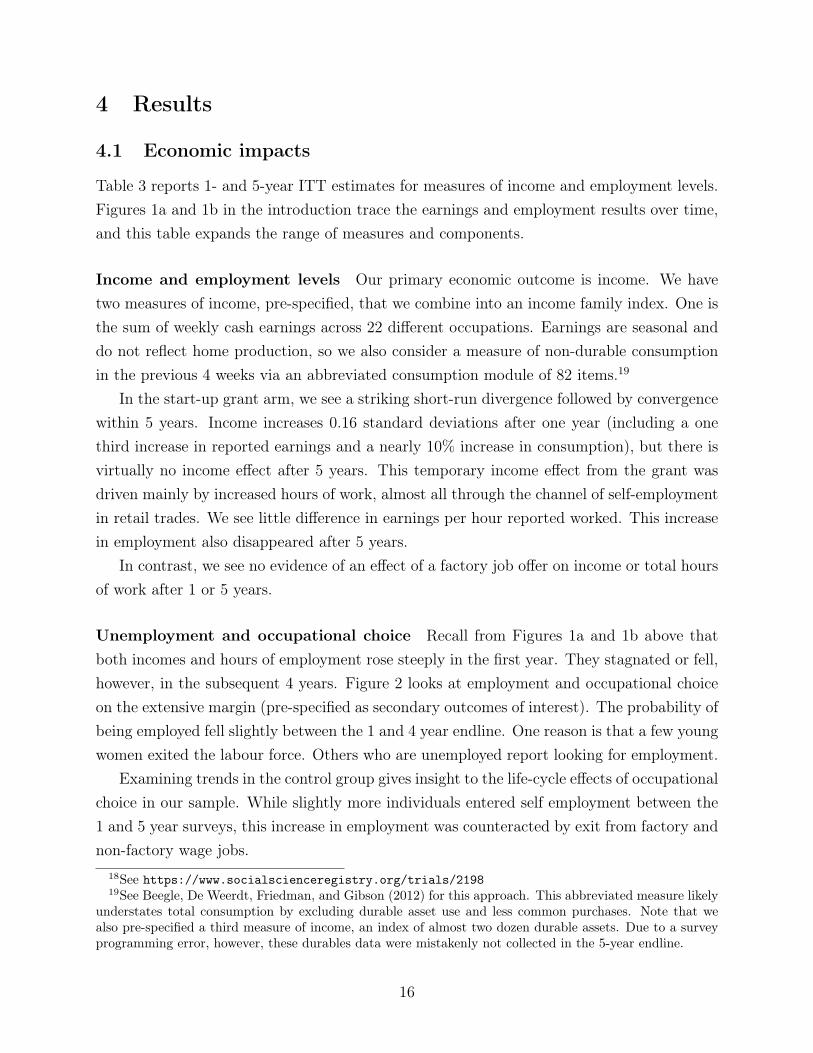
Table 3 reports 1- and 5-year ITT estimates for measures of income and employment levels.Figures 1a and 1b in the introduction trace the earnings and employment results over time,and this table expands the range of measures and components.
Income and employment levels Our primary economic outcome is income. We havetwo measures of income, pre-specified, that we combine into an income family index. One isthe sum of weekly cash earnings across 22 different occupations. Earnings are seasonal anddo not reflect home production, so we also consider a measure of non-durable consumptionin the previous 4 weeks via an abbreviated consumption module of 82 items.19
In the start-up grant arm, we see a striking short-run divergence followed by convergencewithin 5 years. Income increases 0.16 standard deviations after one year (including a onethird increase in reported earnings and a nearly 10% increase in consumption), but there isvirtually no income effect after 5 years. This temporary income effect from the grant wasdriven mainly by increased hours of work, almost all through the channel of self-employmentin retail trades. We see little difference in earnings per hour reported worked. This increasein employment also disappeared after 5 years.
In contrast, we see no evidence of an effect of a factory job offer on income or total hoursof work after 1 or 5 years.
Unemployment and occupational choice Recall from Figures 1a and 1b above thatboth incomes and hours of employment rose steeply in the first year. They stagnated or fell,however, in the subsequent 4 years. Figure 2 looks at employment and occupational choiceon the extensive margin (pre-specified as secondary outcomes of interest). The probability ofbeing employed fell slightly between the 1 and 4 year endline. One reason is that a few youngwomen exited the labour force. Others who are unemployed report looking for employment.
Examining trends in the control group gives insight to the life-cycle effects of occupationalchoice in our sample. While slightly more individuals entered self employment between the1 and 5 year surveys, this increase in employment was counteracted by exit from factory andnon-factory wage jobs.
18See https://www.socialscienceregistry.org/trials/219819See Beegle, De Weerdt, Friedman, and Gibson (2012) for this approach. This abbreviated measure likely
understates total consumption by excluding durable asset use and less common purchases. Note that wealso pre-specified a third measure of income, an index of almost two dozen durable assets. Due to a surveyprogramming error, however, these durables data were mistakenly not collected in the 5-year endline.
16

Figure 2: Employment status and program impacts for work in past 2 weeks after 1 and 5years
The start-up grant initially had a strong effect on self employment. After 1 year, 41% ofthis arm were engaged in self-employment. In fact, 78% of the start-up arm attempted self-employment at any time over five years, and most of this experimentation took place withinthe first year of receiving the treatment (Table 4). There are some lingering effects of thisafter 5 years. The start-up grant arm are still slightly more likely to be self-employed (notstatistically significant). But the fall from 1-year levels of self-employment is precipitous,suggesting that even this occupational choice impact may be converging.
This finding runs counter to the notion that individuals in our sample would be successfulin entrepreneurial work if they could only overcome barriers to starting a small business. Thestart-up arm induces significantly higher levels of experimentation with self-employmentemployment. But the large number of people who were induced to start small enterprises donot appear to have stuck with them five years later.
One of the other patterns we see across the five years of the study is rapid exit fromfactory work. To understand the rapid rate of exit from factory jobs, we begin with evidencefrom Blattman and Dercon (2018), where we analyzed the first year of qualitative data andpatterns in the panel. A few findings stand out:
• We saw no evidence of an industrial wage premium in our five firms. A simple non-experimental wage comparison suggested that industrial jobs seemed to pay almost a
17
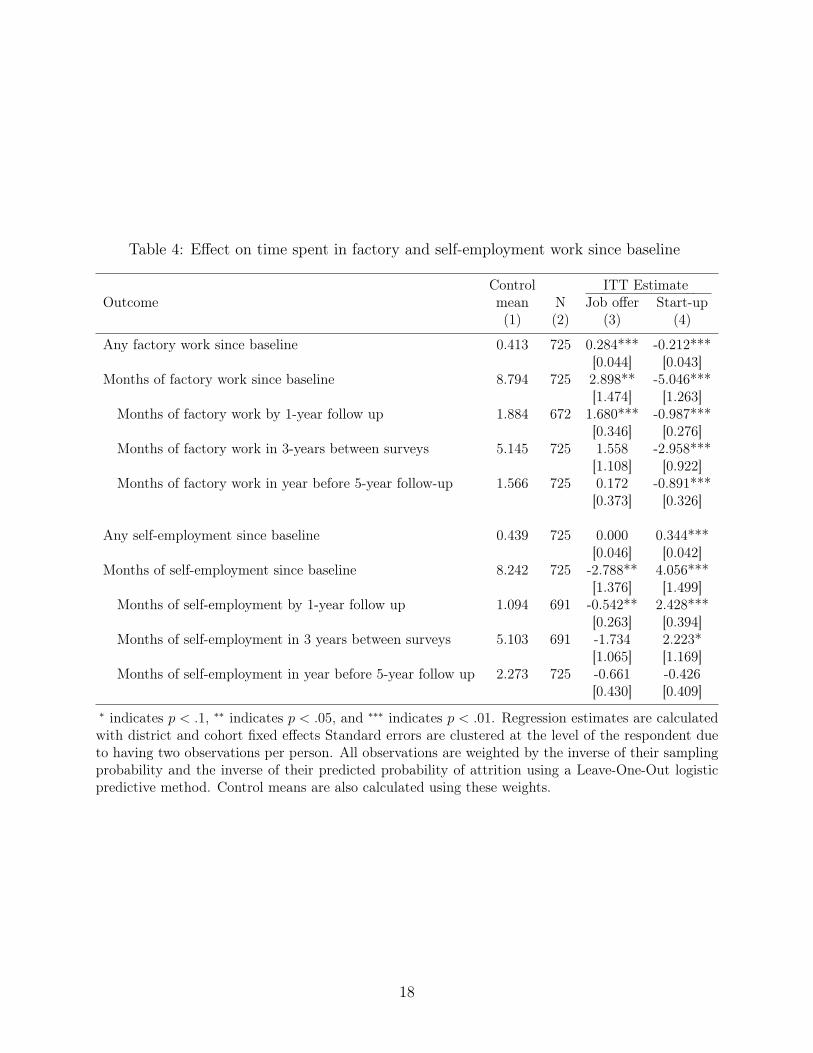
Table 4: Effect on time spent in factory and self-employment work since baseline
Control ITT EstimateOutcome mean N Job offer Start-up
(1) (2) (3) (4)
Any factory work since baseline 0.413 725 0.284*** -0.212***[0.044] [0.043]
Months of factory work since baseline 8.794 725 2.898** -5.046***[1.474] [1.263]
Months of factory work by 1-year follow up 1.884 672 1.680*** -0.987***[0.346] [0.276]
Months of factory work in 3-years between surveys 5.145 725 1.558 -2.958***[1.108] [0.922]
Months of factory work in year before 5-year follow-up 1.566 725 0.172 -0.891***[0.373] [0.326]
Any self-employment since baseline 0.439 725 0.000 0.344***[0.046] [0.042]
Months of self-employment since baseline 8.242 725 -2.788** 4.056***[1.376] [1.499]
Months of self-employment by 1-year follow up 1.094 691 -0.542** 2.428***[0.263] [0.394]
Months of self-employment in 3 years between surveys 5.103 691 -1.734 2.223*[1.065] [1.169]
Months of self-employment in year before 5-year follow up 2.273 725 -0.661 -0.426[0.430] [0.409]
∗ indicates p < .1, ∗∗ indicates p < .05, and ∗∗∗ indicates p < .01. Regression estimates are calculatedwith district and cohort fixed effects Standard errors are clustered at the level of the respondent dueto having two observations per person. All observations are weighted by the inverse of their samplingprobability and the inverse of their predicted probability of attrition using a Leave-One-Out logisticpredictive method. Control means are also calculated using these weights.
18
quarter lower wages than informal opportunities.
• Industrial work came with more stable employment hours, though only modestly so.Most members of the control arm were able to find full-time informal work by thetime of the 1-year endline. Informal work also tended to pay higher wages than theindustrial firms, but it typically came with the risk of short unemployment spells. Overthe horizon of a month or a year, however, earnings in the industrial sector were nomore stable than the alternatives.
• A third of people offered an industrial job quit the study firm in the first month, and77 percent quit within the year. People generally quit the sector altogether, ratherthan simply switch firms. Firm managers said they found the high levels of turnoverinconvenient, but were generally able to fill the positions with other low-skill workers.
• Qualitatively, our interviews suggested that young people used low-skill industrial jobsmore as a safety net than a long-term job, and where self-employment and informalwork were typically preferred to, and more profitable than, industrial jobs.
What do we see in the subsequent four years? First, looking again at Figure 2, partici-pation in factory work has declined in the control group between the 1- and 5-year endlines,falling from 18% to below 12% at the extensive margin. In other words, the high rate ofexit from factory jobs continued after year 1, such that the job-offer individuals are notsignificantly more likely to be in factory jobs five years later.
Even though few are employed in factories at the 5-year endline, the control group con-tinued to experiment with factory work at a similar pace as they did in the first year of thestudy. (As Table 4 shows, the control group had on average 2 months of factory work by theone year follow up, and 5 months by the five-year follow up.)
Even after 5 years, the job offer results in nearly 3 additional months of lifetime experiencein factories – a one third increase over the control group mean. About half of this gaincomes from the first year after the offer. About half comes in the subsequent 3 years (notstatistically significant). The small but steady exposure of the control group to factory workbolsters the earlier interpretation that these are unpleasant jobs that our sample used as alast resort.
We also see that the start-up grant deters people from sampling factory work, to someextent. After 5 years, the start-up arm are significantly less likely to be engaged in factorywork, and have only a third as many months of cumulative factory experience. We can alsointerpret this as consistent with unemployed workers seeking factory work as a last resort in
19
times of need. The start-up grant had higher incomes after 1 year, allowing them to avoidfactory work for a time.
Finally, we see no evidence that these spells of factory employment have effects on longterm incomes or hours of work. Appendix Table A.3 reports the complier average causaleffect of assignment to the job offer or start-up grant, where we use assignment to treatmentas an instrument for length of time in the industrial sector. That is, we use the estimatesin Table 4 as a “first stage”. This instrumental variables (IV) estimate is useful for under-standing whether a longer spell of past employment in the industrial sector has long termeffects on outcomes such as income and employment. For instance, the spell could lead toexperience, social networks, or shocks that improve or hinder future employment prospects.The instrument is weak by the 5-year endline, since the cumulative effect on months of em-ployment has fallen to 3 months (a 33% increase). This contributes to noisy IV estimates.Nonetheless, we see nothing to suggest that employment or income prospects improve withlonger spells of factory employment. If anything there is a small but noisy adverse effect onincomes and employment levels.
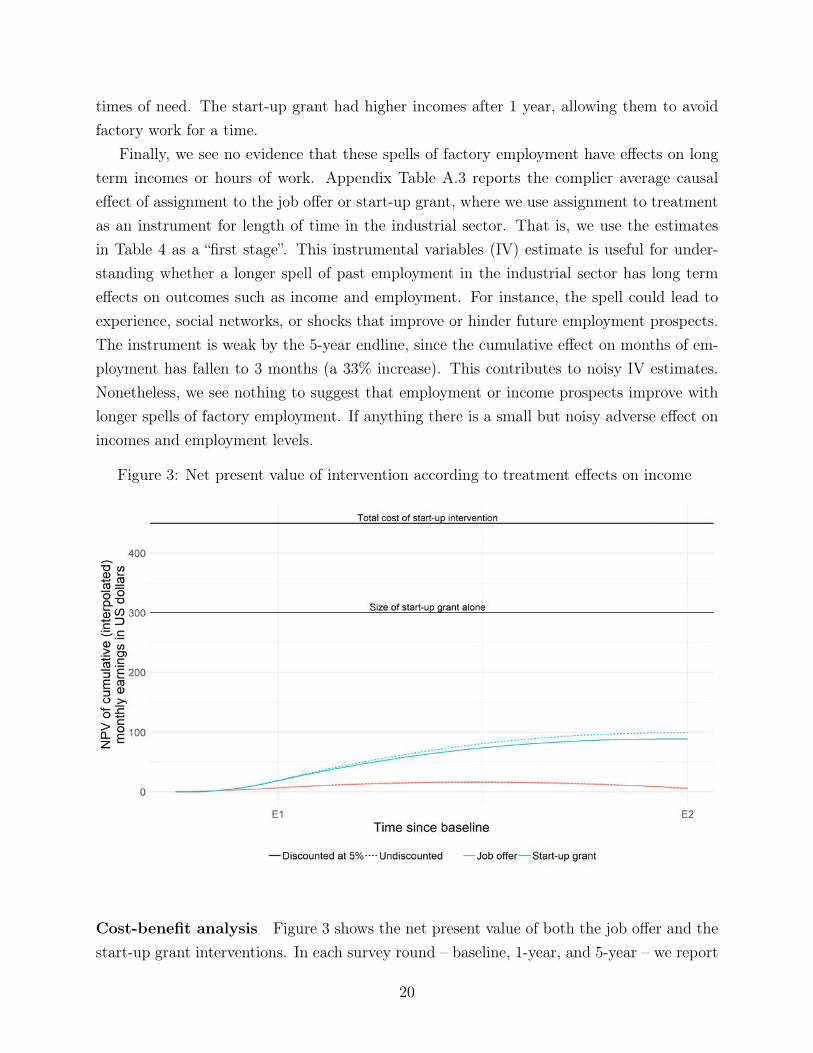
Figure 3: Net present value of intervention according to treatment effects on income
Cost-benefit analysis Figure 3 shows the net present value of both the job offer and thestart-up grant interventions. In each survey round – baseline, 1-year, and 5-year – we report
20
the treatment effects of the interventions on earnings and linearly interpolate between them.We take the cumulative sum of such treatment effects across all 5 years and discount thesum at a 5% annualized rate. This gives us a relatively generous estimate of the net presentvalue.
The figure shows how far the start-up grant intervention is from being a cost-effectiveprogram of poverty reduction, in comparison to its $300 grant amount and $450 total oper-ating cost. As noted in Blattman and Dercon (2018), the effects on earnings of the start-upgrant after 1 year amounted to only 16% of the total $300 grant amount.
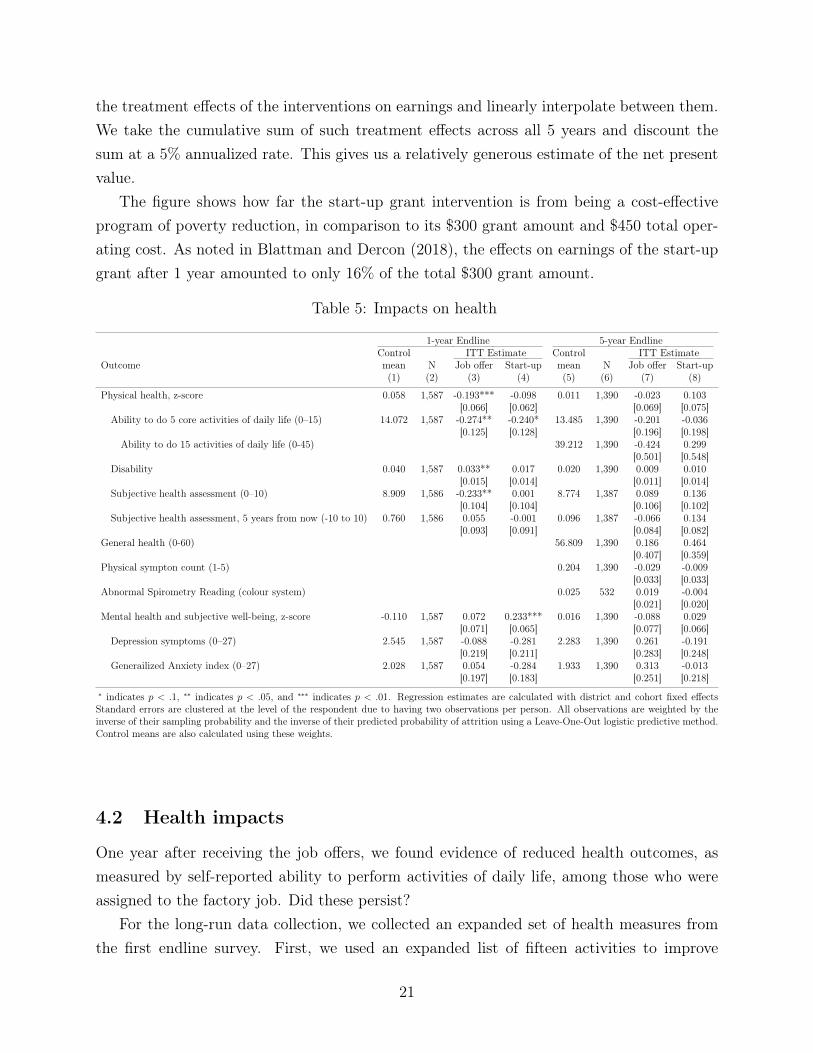
Table 5: Impacts on health
1-year Endline 5-year EndlineControl ITT Estimate Control ITT Estimate
Outcome mean N Job offer Start-up mean N Job offer Start-up(1) (2) (3) (4) (5) (6) (7) (8)
Physical health, z-score 0.058 1,587 -0.193*** -0.098 0.011 1,390 -0.023 0.103[0.066] [0.062] [0.069] [0.075]
Ability to do 5 core activities of daily life (0–15) 14.072 1,587 -0.274** -0.240* 13.485 1,390 -0.201 -0.036[0.125] [0.128] [0.196] [0.198]
Ability to do 15 activities of daily life (0-45) 39.212 1,390 -0.424 0.299[0.501] [0.548]
Disability 0.040 1,587 0.033** 0.017 0.020 1,390 0.009 0.010[0.015] [0.014] [0.011] [0.014]
Subjective health assessment (0–10) 8.909 1,586 -0.233** 0.001 8.774 1,387 0.089 0.136[0.104] [0.104] [0.106] [0.102]
Subjective health assessment, 5 years from now (-10 to 10) 0.760 1,586 0.055 -0.001 0.096 1,387 -0.066 0.134[0.093] [0.091] [0.084] [0.082]
General health (0-60) 56.809 1,390 0.186 0.464[0.407] [0.359]
Physical sympton count (1-5) 0.204 1,390 -0.029 -0.009[0.033] [0.033]
Abnormal Spirometry Reading (colour system) 0.025 532 0.019 -0.004[0.021] [0.020]
Mental health and subjective well-being, z-score -0.110 1,587 0.072 0.233*** 0.016 1,390 -0.088 0.029[0.071] [0.065] [0.077] [0.066]
Depression symptoms (0–27) 2.545 1,587 -0.088 -0.281 2.283 1,390 0.261 -0.191[0.219] [0.211] [0.283] [0.248]
Generailized Anxiety index (0–27) 2.028 1,587 0.054 -0.284 1.933 1,390 0.313 -0.013[0.197] [0.183] [0.251] [0.218]
∗ indicates p < .1, ∗∗ indicates p < .05, and ∗∗∗ indicates p < .01. Regression estimates are calculated with district and cohort fixed effectsStandard errors are clustered at the level of the respondent due to having two observations per person. All observations are weighted by theinverse of their sampling probability and the inverse of their predicted probability of attrition using a Leave-One-Out logistic predictive method.Control means are also calculated using these weights.
4.2 Health impacts
One year after receiving the job offers, we found evidence of reduced health outcomes, asmeasured by self-reported ability to perform activities of daily life, among those who wereassigned to the factory job. Did these persist?
For the long-run data collection, we collected an expanded set of health measures fromthe first endline survey. First, we used an expanded list of fifteen activities to improve
21
our measurement of ability to perform activities of daily activities, ranging from 0 to 45.Second, we conducted a comprehensive questionnaire covering a list of twenty symptoms ofill health. Here respondents could report the regularity with which they experienced thesephysical symptoms from zero (never) to three (often), without having to be diagnosed witha particular condition. Third, we asked about four specific health conditions that are partic-ularly common among individuals working in industrial work, namely: asthma, respiratoryproblems, dermatitis, and carpal tunnel. Fourth, to more accurately measure respiratoryhealth, and verify our self-reported measures, we conducted a spirometry procedure. Herewe followed guidelines from the European Respiratory Society, reported in Moore (2012). Forthe main results we report on indicator for whether the spirometry test shows an abnormalreading, indicating a respiratory problem.
In the pre-analysis plan we committed to report the effect of the two treatments on thesefour aggregate measures. Table 5 shows these results. We find that these negative healtheffects do not persist. Health outcomes are not significantly different for either treatmentgroup across a wide range of measures.
There are two possible interpretation of these findings. The first is that the maladiesexperienced one year after receiving the factory job offer were not chronic. The secondis that the control group was exposed to hazardous factory work in the interim and haveexperienced the same health problems as a result. The evidence favors the first explanation.
First, in absolute terms, the sample is in good health, perhaps even slightly improvedover time. Serious disability rates after 5 years are half of what they were after 1 year,suggesting many of the problems reported in the previous endline were temporary.
Second, we see no evidence that those who stayed longer in factory work have poorerhealth. Appendix Table A.4 reports complier average causal effects using assignment totreatment as an instrument for length of time in the industrial sector (see Table 4). After1-year, these IV estimates showed serious adverse effects on health. After 5 years we seeno such evidence. While it is true that the instrument is considerably weaker after 5 years,the IV estimate for physical health or serious disabilities is close to zero, and the confidenceinterval does not include the 1-year point estimate.
5 Discussion and conclusions
We report on the labor market trajectories of almost 1000 young and mostly unemployedwomen in Ethiopia. We also report on two interventions that many have reasonably proposedcould have had large and lasting effects on long run labor market outcomes: among peopleappearing to queue for industrial employment, offering an entry-level factory job in a country
22
that is just beginning to industrialize; and offering approximately one year of factory wagesas a cash grant plus some business training.
We learn both from the descriptive analysis of the panel and the experiments. We find,after five years, neither intervention has any effect on the likelihood to still work that sectorafter 5 years, compared to the control group (although the start-up grant group were lesslikely to experiment with factory employment). Earnings and consumption are also nodifferent in any of these groups. The labour market choices and outcomes for our populationhave roughly the same structure and earnings that the treated would have had without theintervention.
This is doubly important because of the promising short-term evidence that the start-up grant increased productivity and earnings by a third. Within 5 years, however, theseproductivity gains seem to have dissipated.
There are reasons to believe these (mostly) young women did not have high sustainedreturns to self-employment relative to non-industrial wage work. The businesses may simplyhave failed or faded away gradually over time, as the women failed to reinvest earnings in thebusiness. It is also possible that the business was simply a form of savings and consumptionsmoothing in an economy where the real interest rate from cash savings is as low as -15--20% due to high inflation and the high cost of local savings institutions (which offer negativenominal interest rates). Investing in a small enterprise may simply be the most efficient wayof maximizing consumption of a grant. For instance, at a real interest rate of -15%, a 5000birr grant could be consumed completely in 5 years by spending 54 birr per month. But ata real interest rate of 5% for example (supposing this is what a business or other savingsvehicle could earn), a 5000 birr grant could provide a monthly payment of 94 per month overthe same period, almost double.
Plausibly, the number of constraints on entrepreneurial success in this setting meant thatlifting a single, marginal constraint such as investment capital is not enough to have a lastingreturn for this particular group of young mainly female workers. Given that many of themicroenterprises folded, we suspect that low returns to capital given other barriers is a likelyfactor. Of course, it is also possible that our sample – drawn from a population queuing for afactory job – are per definition not terribly representative, nor full of entrepreneurial talent.Still, evidence points to a large number of them regularly engaging in some self-employmentas a temporary alternative to wage work.
Our results also bolster a view that industrial work is not particularly high-quality, andnot particularly skilled and high-paying (at least at this stage of development in Ethiopia).Wages were no better than in other low-paid sectors, jobs were unpleasant and seemingly haz-ardous, and (most worryingly) those that spent more months in factory work reported more
23

serious health problems after one year. Nevertheless, for some it offered another employmentoption seemingly worth taking, at least for some time during the five years studied.
Naturally there are limits to what we can learn from five sites and five firms. Yet the sameis true of any single program evaluation. Our start-up program is comparable in many re-spects to a suite of anti-poverty programs that give youth start-up capital, and the industrialresults speak to low-skill light industry in contexts where workers are effectively disposableto firms. This is also a reasonable description of early and middle-stage industrialization inthe US, Europe, and Asia.
References
Abebe, Girum Tefera et al. (2018). “Anonymity or Distance? Job Search and Labour MarketExclusion in a Growing African City.” In:
Abel, Martin, Rulof Burger, and Patrizio Piraino (2017). The value of reference letters.Akerlof, George A. and Janet L. Yellen (1986). Efficiency wage models of the labor market.
Cambridge University Press. isbn: 0-521-31284-1.Arulampalam, Wiji, Paul Gregg, and Mary Gregory (2001). “Unemployment scarring.” In:
The Economic Journal 111.475, pp. 577–584.Atkin, David (2009). “Working for the Future: Female Factory Work and Child Health in
Mexico.” In: Working paper.Bandiera, Oriana et al. (2013). “Can entrepreneurship programs transform the economic lives
of the poor?” In: Working paper.— (2017). “Labor markets and poverty in village economies.” In: The Quarterly Journal of
Economics 132.2, pp. 811–870.Banerjee, Abhijit V. and Esther Duflo (2011). Poor economics: A radical rethinking of the
way to fight global poverty. New York: Public Affairs. isbn: 1-58648-798-1.Banerjee, Abhijit, Dean Karlan, and Jonathan Zinman (2015). “Six Randomized Evaluations
of Microcredit: Introduction and Further Steps.” In: American Economic Journal: AppliedEconomics 7.1, pp. 1–21. doi: 10.1257/app.20140287. url: http://www.aeaweb.org/articles.php?doi=10.1257/app.20140287 (visited on 06/02/2015).
Bassi, Vittorio and Aisha Nansamba (2017). “Information Frictions in the Labor Market:Evidence from a Field Experiment in Uganda.” In: Working Paper.
Beaman, Lori et al. (2014). Self-Selection into Credit Markets: Evidence from Agriculturein Mali. Working Paper 20387. National Bureau of Economic Research. doi: 10.3386/w20387. url: http://www.nber.org/papers/w20387.
24

Beegle, Kathleen et al. (2012). “Methods of household consumption measurement throughsurveys: Experimental results from Tanzania.” In: Journal of Development Economics98.1, pp. 3–18. issn: 0304-3878. url: http://www.sciencedirect.com/science/article/pii/S0304387811001039.
Bernard, Andrew B., Raymond Robertson, and Peter K. Schott (2010). “Is Mexico a LumpyCountry?” en. In: Review of International Economics 18.5, pp. 937–950. issn: 1467-9396.doi: 10.1111/j.1467-9396.2010.00918.x. url: http://onlinelibrary.wiley.com/doi/10.1111/j.1467-9396.2010.00918.x/abstract (visited on 07/17/2014).
Bianchi, Milo and Matteo Bobba (2013). “Liquidity, Risk, and Occupational Choices.” In:Review of Economic Studies 80.2, pp. 491–511. url: http://restud.oxfordjournals.org/content/80/2/491.abstract.
Blattman, Christopher and Stefan Dercon (2018). “The impacts of industrial and entrepreneurialwork on income and health: Experimental evidence from Ethiopia.” In: American Eco-nomic Journal: Applied Economics 10.3, pp. 1–38.
Blattman, Christopher, Nathan Fiala, and Sebastian Martinez (2018). “The Long TermImpacts of Grants on Poverty: 9-Year Evidence from Uganda’s Youth OpportunitiesProgram.” In: Working paper.
Blattman, Christopher, Julian Jamison, and Margaret Sheridan (2017). “Reducing crime andviolence: Experimental evidence on cognitive behavioral therapy in Liberia.” In: AmericanEconomic Review 107.4, pp. 1165–1206.
Blattman, Christopher and Laura Ralston (2015). “Generating employment in poor and frag-ile states: A review of the evidence from labor market and entrepreneurship programs.”In: Working paper.
Blattman, Christopher et al. (2016). “The returns to microenterprise support among theultra-poor: A field experiment in postwar Uganda.” In: American Economic Journal:Applied Economics 8.2, pp. 35–64.
Brudevold-Newman, Andrew Peter et al. (2017). “A firm of one’s own: experimental evidenceon credit constraints and occupational choice.” In: Working paper.
Card, David (1996). “The Effect of Unions on the Structure of Wages: A Longitudinal Anal-ysis.” In: Econometrica 64.4, pp. 957–979. issn: 0012-9682. doi: 10.2307/2171852. url:http://www.jstor.org/stable/2171852 (visited on 10/30/2014).
CSA (2011). Report on large and medium manufacturing industries survey 2009-2010. Tech.rep. Addis Abada: Central Statistical Authority.
El Badaoui, E., E. Strobl, and F. Walsh (2008). “Is There an Informal Employment WagePenalty? Evidence from South Africa.” In: Economic Development and Cultural Change56, pp. 683–710.
25
Fafchamps, Marcel et al. (2014). “When is capital enough to get female microenterprisesgrowing? Evidence from a randomized experiment in Ghana.” In: Journal of DevelopmentEconomics 106.1, pp. 211–226.
Fiala, Nathan (2018). “Returns to microcredit, cash grants and training for male and femalemicroentrepreneurs in Uganda.” In: World Development 105, pp. 189–200.
Fields, Gary S. (1975). “Rural-urban migration, urban unemployment and underemployment,and job-search activity in LDCs.” In: Journal of development economics 2.2, pp. 165–187.
Gertler, Paul, Sebastian Martinez, and Marta Rubio (2012). “Investing Cash Transfers toRaise Long Term Living Standards.” In: American Economic Journal: Applied Eco-nomics. 164-192 4.1, pp. 164–192.
Getahun, Tigabu D. and Espen Villanger (2016). “Labor-intensive jobs for women and de-velopment: Intrahousehold welfare effects and its transmission channels.” In: Workingpaper.
Harris, John R. and Michael P. Todaro (1970). “Migration, unemployment and development:a two-sector analysis.” In: The American Economic Review 60.1, pp. 126–142.
Haushofer, Johannes and Jeremy Shapiro (2016). “The short-term impact of unconditionalcash transfers to the poor: Experimental evidence from Kenya.” In: The Quarterly Journalof Economics 131.4, pp. 1973–2042.
— (2018). “The Long-Term Impact of Unconditional Cash Transfers: Experimental Evidencefrom Kenya.” In: Working paper.
Hewett, P. and S. Amin (2000). “Assessing the Impact of Garment Work on Quality of LifeMeasures.” In: Discussion paper, Population Council.
Hussam, Reshmaan, Natalia Rigol, and Benjamin Roth (2017). “Targeting high ability en-trepreneurs using community information: Mechanism design in the field.” In: Workingpaper.
Kabeer, N. (2002). The Power to Choose: Bangladeshi Garment Workers in London andDhaka. London: Verso.
Karlan, Dean et al. (2014). “Agricultural decisions after relaxing credit and risk constraints.”In: The Quarterly Journal of Economics 129.2, pp. 597–652.
Katz, Lawrence F. et al. (1989). “Industry Rents: Evidence and Implications.” In: Brook-ings Papers on Economic Activity. Microeconomics 1989, pp. 209–290. issn: 1057-8641.doi: 10.2307/2534722. url: http://www.jstor.org/stable/2534722 (visited on10/30/2014).
Kroft, Kory, Fabian Lange, and Matthew J Notowidigdo (2013). “Duration dependence andlabor market conditions: Evidence from a field experiment.” In: The Quarterly Journalof Economics 128.3, pp. 1123–1167.
26
Lewis, W. Arthur (1954). “Economic development with unlimited supplies of labor.” In:Manchester School 22.2, pp. 139–191.
McKenzie, David (2012). “Beyond baseline and follow-up: The case for more T in experi-ments.” In: Journal of Development Economics 99.2, pp. 210–221.
— (2017). “How effective are active labor market policies in developing countries? A criticalreview of recent evidence.” In: The World Bank Research Observer 32.2, pp. 127–154.
Mel, Suresh de, David J. McKenzie, and Christopher Woodruff (2012). “One-Time Transfersof Cash or Capital Have Long-Lasting Effects on Microenterprises in Sri Lanka.” In:Science 335.6071, pp. 962–966. url: http://www.sciencemag.org/content/335/6071/962.abstract.
Moore, VC (2012). “Spirometry: step by step.” In: Breathe 8.3, pp. 232–240.Söderbom, Måns and F. Teal (2004). “Size and efficiency in African manufacturing firms: ev-
idence from firm-level panel data.” In: Journal of Development Economics 73.1, pp. 369–394.
The Economist (2014). “An awakening giant.” In: The Economist. issn: 0013-0613. url:http : / / www . economist . com / news / middle - east - and - africa / 21595949 - if -
africas-economies-are-take-africans-will-have-start-making-lot (visitedon 07/15/2014).
Verhoogen, Eric (2008). “Trade, Quality Upgrading and Wage Inequality in the MexicanManufacturing Sector.” In: Quarterly Journal of Economics 123.2, pp. 489–530.
27

Online appendix
i

Table A.1: Attrition
Attrition and Non-ResponseOnly FE All Covariates
Dependent Variable: Never found at 5-year endline Beta Std. error Beta Std. errorFraction of sample not found: .2 (1) (2) (3) (4)
Job offer 0.003 0.032 0.014 0.034Start-up -0.054 0.031* -0.047 0.032Age 0.648 1.347Age squared -0.039 0.079Age cubed 0.001 0.002Age quartic -0.000 0.000Female 0.110 0.096Unmarried 0.044 0.034Muslim 0.231 0.071***Household Size 0.009 0.008Household head 0.055 0.039Proportion of household dependents -0.034 0.026Numeracy score -0.003 0.006Total years of education and training -0.001 0.008Cognitive function score -0.022 0.019Executive function, z-score 0.039 0.018**Completed secondary school 0.003 0.046Weekly cash earnings, 2010 Birr 0.000 0.001Durable assets, z-score -0.017 0.020Wealth index: Production Durables (Z-Score) -0.036 0.015**Total debt 0.000 0.000Total savings 0.000 0.000*Average weekly work hours (over past 2 weeks) : 0.003 0.005Hrs work/wk, cas non-farm labor 0.002 0.003Hrs work/wk, factory -0.002 0.004Hrs work/wk, petty business 0.001 0.002Hrs work/wk, skilled trades -0.002 0.004Hrs work/wk, low skill sal labor -0.002 0.002Hrs work/wk, med skill sal labor 0.000 0.000Hrs work/wk, other work -0.001 0.003Did no work in the past 2 weeks (formal and informal) 0.003 0.060Ever worked in a large firm 0.006 0.040Months experience: Agriculture 0.000 0.000Months experience: Casual work -0.002 0.001Months experience: Factory labor -0.001 0.002Months experience: Petty business -0.000 0.001Months experience: Skilled trade -0.002 0.001**Months experience: Wage labor - low skill 0.000 0.001Months experience: Wage labor - medium skill 0.003 0.006Months experience: Other 0.000 0.002Years experience, private firm -0.015 0.014Years experience, workshop -0.105 0.084Years experience working in state/parastatal org 0.022 0.035Years experience working in NGO -0.023 0.063Self perception of health -0.002 0.006Probability of a better job, next month -0.034 0.064Probability of full-time work, next month 0.064 0.062Predicted income uncertainty in next year 0.000 0.000Predicted income uncertainty in next month -0.000 0.000Highest - lowest earnings, past month -0.000 0.000Could borrow 3000 birr 0.058 0.033*Family relations index, z-score 0.025 0.015*Friends and nieghbors relations index -0.027 0.015*Ability to do activities of daily life (0-15) 0.002 0.012Disability: Great difficulty at more than 1 activities 0.219 0.190Change in subjective well being, past yr. -0.009 0.013Symptoms of depression, z-score -0.008 0.019Symptoms of anxiety, z-score 0.015 0.020Risk aversion from IBM games 0.004 0.015Risk aversion score 0.008 0.011Patience score from IBM games -0.009 0.017Time inonsistency score 0.013 0.022Patience index 0.022 0.009**Locus of control index -0.008 0.015Self esteem index, s-score 0.023 0.016Self control index -0.015 0.014Agressive or hostile behaviors, z-score 0.016 0.014Conscientiousness index, z-score -0.025 0.016P-value of F-test 0.1220 0.0011N 947 947∗ indicates p < .1, ∗∗ indicates p < .05, and ∗∗∗ indicates p < .01Regression estimates use the full sample of baseline respondents with cohort and district fixedeffects.
ii
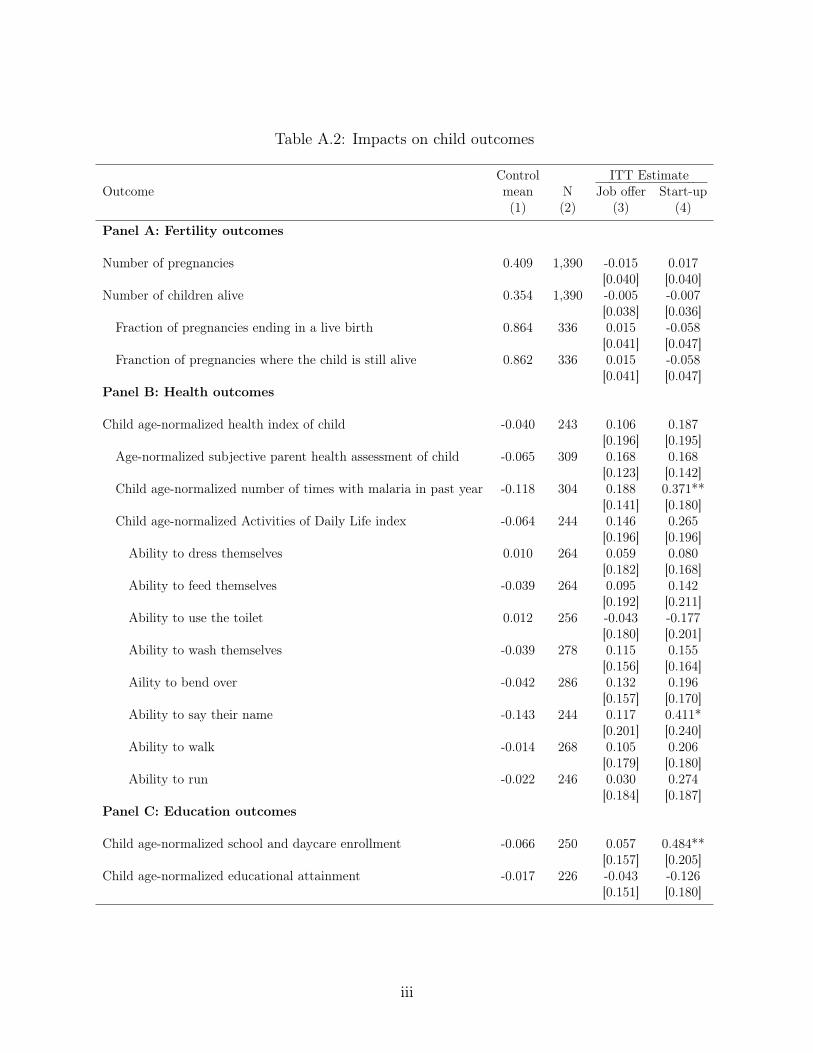
Table A.2: Impacts on child outcomes
Control ITT EstimateOutcome mean N Job offer Start-up
(1) (2) (3) (4)
Panel A: Fertility outcomes
Number of pregnancies 0.409 1,390 -0.015 0.017[0.040] [0.040]
Number of children alive 0.354 1,390 -0.005 -0.007[0.038] [0.036]
Fraction of pregnancies ending in a live birth 0.864 336 0.015 -0.058[0.041] [0.047]
Franction of pregnancies where the child is still alive 0.862 336 0.015 -0.058[0.041] [0.047]
Panel B: Health outcomes
Child age-normalized health index of child -0.040 243 0.106 0.187[0.196] [0.195]
Age-normalized subjective parent health assessment of child -0.065 309 0.168 0.168[0.123] [0.142]
Child age-normalized number of times with malaria in past year -0.118 304 0.188 0.371**[0.141] [0.180]
Child age-normalized Activities of Daily Life index -0.064 244 0.146 0.265[0.196] [0.196]
Ability to dress themselves 0.010 264 0.059 0.080[0.182] [0.168]
Ability to feed themselves -0.039 264 0.095 0.142[0.192] [0.211]
Ability to use the toilet 0.012 256 -0.043 -0.177[0.180] [0.201]
Ability to wash themselves -0.039 278 0.115 0.155[0.156] [0.164]
Aility to bend over -0.042 286 0.132 0.196[0.157] [0.170]
Ability to say their name -0.143 244 0.117 0.411*[0.201] [0.240]
Ability to walk -0.014 268 0.105 0.206[0.179] [0.180]
Ability to run -0.022 246 0.030 0.274[0.184] [0.187]
Panel C: Education outcomes
Child age-normalized school and daycare enrollment -0.066 250 0.057 0.484**[0.157] [0.205]
Child age-normalized educational attainment -0.017 226 -0.043 -0.126[0.151] [0.180]
iii
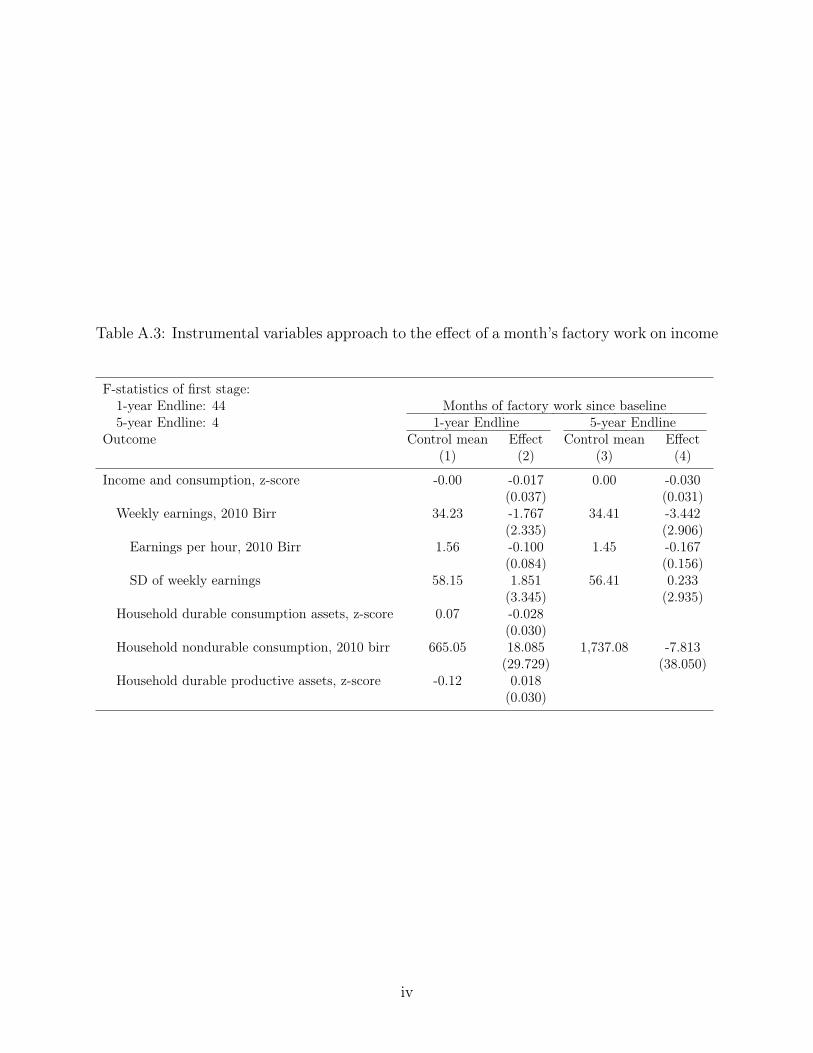
Table A.3: Instrumental variables approach to the effect of a month’s factory work on income
F-statistics of first stage:1-year Endline: 44 Months of factory work since baseline5-year Endline: 4 1-year Endline 5-year Endline
Outcome Control mean Effect Control mean Effect(1) (2) (3) (4)
Income and consumption, z-score -0.00 -0.017 0.00 -0.030(0.037) (0.031)
Weekly earnings, 2010 Birr 34.23 -1.767 34.41 -3.442(2.335) (2.906)
Earnings per hour, 2010 Birr 1.56 -0.100 1.45 -0.167(0.084) (0.156)
SD of weekly earnings 58.15 1.851 56.41 0.233(3.345) (2.935)
Household durable consumption assets, z-score 0.07 -0.028(0.030)
Household nondurable consumption, 2010 birr 665.05 18.085 1,737.08 -7.813(29.729) (38.050)
Household durable productive assets, z-score -0.12 0.018(0.030)
iv

Table A.4: Instrumental variables approach to the effect of a month’s factory work on health
F-statistics of first stage:1-year Endline: 43 Months of factory work since baseline5-year Endline: 4 1-year Endline 5-year Endline
Outcome Control mean Effect Control mean Effect(1) (2) (3) (4)
Physical health, z-score 0.06 -0.082 0.01 -0.008(0.035) (0.029)
Ability to do 5 core activities of daily life (0–15) 14.07 -0.125 13.49 -0.070(0.069) (0.089)
Ability to do 15 activities of daily life (0-45) 39.21 -0.073(0.209)
Disability 0.04 0.012 0.02 0.003(0.008) (0.004)
Subjective health assessment (0–10) 8.91 -0.090 8.77 0.029(0.061) (0.043)
Subjective health assessment, 5 years from now (-10 to 10) 0.76 0.009 0.10 -0.013(0.053) (0.035)
General health (0-60) 56.81 -0.033(0.203)
Physical sympton count (1-5) 0.20 -0.003(0.014)
Abnormal Spirometry Reading (colour system) 0.03 0.008(0.008)
Mental health and subjective well-being, z-score -0.11 0.018 0.02 -0.034(0.043) (0.037)
Depression symptoms (0–27) 2.54 -0.024 2.28 0.143(0.136) (0.146)
Generailized Anxiety index (0–27) 2.03 0.125 1.93 0.085(0.124) (0.114)
v
Copyright © 2022 FDOKUMEN