4649_200dpi.pdf - NIVA Open Access Archive
147
-
Upload
khangminh22 -
Category
Documents
-
view
1 -
download
0
Transcript of 4649_200dpi.pdf - NIVA Open Access Archive


O-80106
JOINT ASSESSMENT AND MONITORING PROGRAMME (JAMP)
BIOLOGICAL EFFECTS METHODS,
NORWEGIAN MONITORING 1997-2001
Oslo, 28. Februar 2003
Submitted by: NORWAY Norman W. Green
Norwegian Institute for Water Research (NIVA) PB 173 Kjelsås N-0411 Oslo
Submitted to: Norwegian Pollution Control Authority (SFT) att. Per Erik Iversen PB 8100 Dep. N-0032 Oslo Oslo and Paris Commissions (OSPAR) att. Dornford Rugg New Court 48 Carey Street London WC2A 2JQ
International Council for the Exploration of the Seas (ICES) att. Janet Pawlak Palægade 2-4 DK-1261 Copenhagen

JAMP Biological Effects Methods 1997-2001 - Norway
NIVA report no. 4649-2003
Foreword This report presents the results from the biological effects monitoring as applied in the Norwegian Joint Assessment and Monitoring Programme (JAMP) 1997-2001. JAMP is administered by the Oslo and Paris Commissions (OSPAR) and their Environmental Assessment and Monitoring Committee (ASMO). JAMP receives guidance from the International Council for the Exploration of the Sea (ICES). ASMO has delegated implementation of part of the programme to the Working Group on Concentrations, Trends and Effects of Substances in the Marine Environment (SIME). The Norwegian 1997-2001 investigations are directed to particular JAMP issues relating to contaminants and implemented by SIME. This contribution to the Norwegian JAMP for 1997-2001 was carried out by the Norwegian Institute for Water Research (NIVA) by contract from the Norwegian Pollution Control Authority (SFT), (NIVA contract O-80106). It was initiated by NIVA in 1997 as part of the national monitoring programme. It now comprises five fjord areas: the Oslofjord, Lista, Sørfjord/Hardangerfjord to the open coast, Lofoten and Varangerfjord. Thanks are due to many colleagues at NIVA, especially: Unni Efraimsen, Åse Kristine Rogne, Sigurd Øxnevad, Tom Tellefsen for field work, sample preparations, data entry; Torgunn Sætre, Alfhild Kringstad, Einar Brevik and colleagues for organic analyses; Norunn Følsvik and Torgunn Sætre for organotin analyses; Bente Hiort Lauritzen and her colleagues for metal analyses; Randi Romstad and her colleagues for biological effects measurements, Gunnar Severinsen for data programme management and operation; and to the authors Ketil Hylland and Anders Ruus (biological effects methods), and Mats Walday (organotin). Thanks go also to the numerous fishermen and their boat crews for which we have had the pleasure of working with. Oslo,28 February 2003. Norman W. Green Project co-ordinator

JAMP Biological Effects Methods 1997-2001 - Norway
NIVA report no. 4649-2003
Contents
1. Executive Summary / Sammendrag 1
2. Introduction 5 2.1 The purpose of this report 5 2.2 Data source and availability 5 2.3 Biological effects methods 5 2.4 Biological effects methods in the Norwegian JAMP 7
3. Materials and methods 8 3.1 Compliance with guidelines/procedures 8 3.2 Locations and species 8 3.3 Analytical methods 9 3.3.1 OH-pyrene metabolites 9 3.3.2 ALA-D 9 3.3.3 EROD 9 3.3.4 Metallothionein 9 3.3.5 Protein 10 3.3.6 Statistical analyses 10
4. Results and discussion 11 4.1 General assumptions and precautions 11 4.2 OH-pyrene metabolites in bile 12 4.2.1 Specific assumptions and background levels 12 4.3 ALA-D in red blood cells 14 4.3.1 Specific assumptions and background levels 14 4.4 Hepatic EROD 16 4.4.1 Specific assumptions and background levels 16 4.5 Hepatic metallothionein 22 4.5.1 Specific assumptions and background levels 22
5. Conclusions and recommendations 24 5.1 General conclusions and recommendations 24 5.2 Conclusions and recommendations for the Norwegian JAMP 24

JAMP Biological Effects Methods 1997-2001 - Norway
NIVA report no. 4649-2003
6. References 26
Appendix A . Analytical methods 31
Appendix B Stations and sample count for fish used for biological effects methods 1997-2001 41
Appendix C Map of stations 45
Appendix D Biomarkers in fish 1997-2001 Raw data 53
Appendix E Biomarkers in fish 1997-2001 Statistical analyses 107
Appendix F Temporal trend analyses of biomarkers in biota 1997-2001 125
Appendix G Geographical distribution of biomarkers in biota 1997-2001 129

JAMP Biological Effects Methods 1997-2001 - Norway
NIVA report no. 4649-2003 1
1. Executive Summary / Sammendrag
Biological effects methods, BEM or biomarkers were introduced in the Norwegian JAMP in 1997. The purpose of these markers is, by investigations on molecular/cell/individual level, to give warning signals if ecosystems are affected by toxic compounds, i.e. contaminants, and to assist in establishing an understanding of the specific mechanisms involved. Biomarkers can, in other words, provide information regarding the effects of xenobiotics, and not simply their concentrations in environmental matrices. This report assesses the use of biological effects methods within the Norwegian JAMP 1997-2001, leading to conclusions and recommendations for future use of such methods. The biological effects methods measured are OH-pyrene (pyrene metabolite; specificity for PAH), δ-aminolevulinic acid dehydrase (ALA-D; specificity for lead), cytochrome P4501A activity (EROD; specificity for planar hydrocarbons) and metallothionein (MT; specificity for Cd, Cu, Zn, [Hg]). Through the five years of monitoring, these BEMs have been determined in cod from eight stations and flatfish from seven stations along the coast from the Oslofjord to the Russian border. Six of the seven flatfish stations were near the cod stations. The results from this investigation indicate that the measurement of PAH metabolites in bile (exemplified by 1-OH-pyrene) is a reliable method to quantify the extent of PAH contamination in marine coastal systems. The results from this programme also provide a putative background level for 1-OH-pyrene for Atlantic cod and plaice. Furthermore, the results show that specific coastal areas in Norway appear to be affected by PAHs. From the data available here it is however not possible to separate inputs from air (long-range transport) and local sources (exhaust, small oil spills, etc.). The results confirmed that red blood cell ALA-D is inhibited by lead and can be expected to be effected in fish from coastal areas near led inputs , such as urban and/or industrial centers. Some results indicate that there may be a threshold concentration of lead above which ALA-D is affected and also that there may be adaptation (although at a depressed level) following chronic exposure. ALA-D does not appear to be strongly affected by other endogenous (or exogenous) factors. It is therefore possible to set reference values for this biomarker. Such reference values can be set for Atlantic cod and plaice using the data from the Norwegian JAMP-programme. Interpretation of the response, however, was made more difficult by the lack of a complementary dataset for tissue lead. More specific, the ALA-D results show clear evidence for effect in the two most contaminated areas, Sørfjord and the inner Oslofjord. Results for more diffusely affected areas are more uncertain and fish in remote areas do not appear to be affected by lead. The interpretation of the results are hampered by the lack of data for the same flatfish species along the entire coast. Despite the large variability both within and between species, the results also show that hepatic EROD activity is affected by organic contaminants and that fish collected in areas with local inputs respond in a reproducible manner. A novel result is the indication that size may affect the EROD response in some species. This effect does not appear to reflect maturation or sex-related differences. There were surprisingly small differences between sexes, indicating that the time of year (September-October) is appropriate for sampling to reduce such differences. More specific, the EROD-results show that fish in the two most contaminated areas, Sørfjord and the inner Oslofjord, are affected by organic contaminants (as is also shown through approximately 20 years of JAMP-monitoring). There were clear relationships with accumulation of contaminants. There was also a reproducible increase in hepatic EROD in fish from these two areas. The range of responses in less contaminated areas also indicate that individual fish are affected by organic contaminants. Hepatic metallothionein generally reflected metal concentrations in the liver of the fish studied. For cod and dab, differences appeared to reflect natural endogenous processes involving the two essential metals zinc and copper. For flounder and plaice, there was some indication that cadmium (and for plaice, mercury) may affect the response, but this relationship was weak. As for EROD, there was a surprising relationship between metallothionein and size, but only minor differences due to sex. In
JAMP Biological Effects Methods 1997-2001 - Norway
2 NIVA report no. 44649-2003
the species investigated here, metallothionein does not appear to provide easily interpretable information about the metal exposure. Of the four methods investigated during the Norwegian JAMP in the period 1997 to 2001, OH-pyrene, ALA-D and EROD provide useful information about how and whether contaminants affect fish. The results for the fourth method, hepatic metallothionein, could not clearly be related to metal effects in the areas investigated. It is recommended to continue the biological effects programme for Atlantic cod at the same stations for three methods: OH-pyrene, ALA-D and EROD. The results for metallothionein did not indicate clear effects and the use of this method should be discontinued. The same three methods should also be continued for flounder, but there is a need for a reference site for this species. Flounder is found in the most contaminated coastal areas and estuaries both in Norway and other European countries. It is therefore important to enhance the database for biological effects in this species.

JAMP Biological Effects Methods 1997-2001 - Norway
NIVA report no. 4649-2003 3
Sammendrag Biologiske effekt-metoder, BEM (eller biomarkører), ble introdusert i norske JAMP i 1997. Hensikten med disse markørene er, ved å gå inn på molekyl/ celle/organisme-nivå, å gi varselsignaler om økosystemer er påvirket av giftige stoffer (miljøgifter), samt å bidra til å øke forståelsen rundt de spesifikke mekanismene som er involvert i de eventuelle forstyrrelsene. Biomarkørene kan med andre ord bidra med informasjon om effekter av fremmedstoffer og ikke bare deres konsentrasjoner i miljøet. Denne rapporten vurderer bruken av biologiske effekt-metoder innenfor norske JAMP 1997-2001, som fører til konklusjoner og anbefalinger for fremtidig bruk av slike metoder. De biologiske effekt-metodene som er målt er OH-pyren (pyren-metabolitt; spesifisitet for PAH), δ-aminolevulinic acid dehydrase (ALA-D; spesifisitet for bly), cytokrom P4501A aktivitet (EROD; spesifisitet for plane hydrokarboner) og metallotionein (MT; spesifisitet for Cd, Cu, Zn). I løpet av 5 år med overvåking har disse metodene vært brukt på torsk fra 8 stasjoner og flyndre-arter fra 7 stasjoner langs kysten, fra Oslofjorden til grensen mot Russland. Seks av flatfiskstasjonene lå i nærheten av torskestasjonene. Resultatene fra denne undersøkelsen indikerer at målinger av PAH-metabolitter (eksemplifisert av 1-OH-pyren) er en pålitelig metode for å kvantifisere utstrektningen av PAH-forurensning i kyst-områder. Resultatene fra dette programmet gir også et antatt bakgrunnsnivå for 1-OH-pyren for torsk og rødspette. Resultatene viser også at spesifikke kystområder i Norge ser ut til å være påvirket av PAH. Fra de data som er tilgjengelig er det imidlertid ikke mulig å skille tilførsel fra luft (lang-transportert) og lokale kilder. Resultatene bekreftet at ALA-D i røde blodlegemer hemmes av bly, og kan forventes å være påvirket i fisk fra kystområder nær blytilførsel, slik som urbane og/eller industrialiserte områder. Noen resultater indikerer at det kan være en terskelverdi for konsentrasjoner av bly, hvilket ALA-D påvirkes ved overskridelse. Det kan også være en adapsjon (dog lavt) ved kronisk eksponering. ALA-D ser ikke ut til å bli særlig påvirket av andre endogene (eller eksogene) faktorer. Det er derfor mulig å sette referanseverdier for denne biomarkøren. Slike referanseverdier kan bli satt for torsk og rødspette vha. data fra det norske JAMP-programmet. Tolkning av responsen var imidlertid vanskelig på grunn av ufullstendige data på vevskonsentrasjoner av bly. Mer spesifikt viste ALA-D-resultatene effekter av miljøgifter i de mest forurensede områdene Sørfjord og indre Oslofjord. Resultater fra mer diffust påvirkede områder er mer usikre og fisk i de mest avsidesliggende områdene ser ikke ut til å være påvirket av bly. Tolkningen av resultatene er hemmet av mangel på data fra flatfiskartene langs resten av kysten. Til tross for stor variablitet både innen og mellom arter, viser resultatene også at EROD-aktivitet påvirkes av organiske miljøgifter. Det er også indikasjoner på at fiskestørrelse påvirker EROD-responsen i enkelte arter. Denne effekten ser ikke ut til å gjenspeile modningsgrad eller kjønnsrelaterte forskjeller. Det var overaskende små forskjeller mellom kjønnene, noe som indikerer at årstiden (september-oktober) er hensiktsmessig for innsamling, for å redusere slike forskjeller. Mer spesifikt viste EROD-resultatene at fisk i de mest forurensede områdene, Sørfjorden og indre Oslofjord, er påvirket av organiske miljøgifter (som man også vet av 20 år med overvåking gjennom JAMP). Det var klare sammenhenger med akkumulering av miljøgifter. Det var også reproduserbare økninger i EROD-aktivitet i fisk fra disse to områdene. Spennvidden av responser i mindre forurensede områder indikerer også at individuelle fisk er påvirket av organiske miljøgifter. Metallotionein i lever gjenspeilet generelt metall-konsentrasjoner i leveren til fiskene som er undersøkt. For torsk og sandflyndre ser forskjellene ut til å gjenspeile endogene prosesser, som involverer de essensielle metallene sink og kobber. For skrubbe og rødspette var det noe indikasjon på at kadmium (og for rødspette, kvikksølv) kan påvirke responsen, men denne sammenhengen er svak. Slik som for EROD, var det en overaskende sammenheng mellom metallotionein og størrelse, men bare små forskjeller på grunn av kjønn. I artene som er undersøkt ser det ut til at metallotionein ikke bidrar med tolkbar informasjon om metall-påvirkning.
JAMP Biological Effects Methods 1997-2001 - Norway
4 NIVA report no. 44649-2003
Av de fire metodene som er undersøkt i norske JAMP i perioden 1997 til 2001, så bidrar OH-pyren, ALA-D, og EROD med nyttig informasjon om hvordan (og om) miljøgifter påvirker fisk. Resultatene fra den fjerde metoden (metallotionein) kunne ikke, uten videre, relateres til metall-påvirkning i områdene som er undersøkt. Det anbefales at biologisk effekt-programmet fortsettes for torsk på de samme stasjonene for tre metoder: OH-pyren, ALA-D og EROD. Resultatene for metallotionein indikerte ingen klare effekter og bruken av denne metoden bør avsluttes. De samme tre metodene bør også fortsette for skrubbe, men det er behov for en referanse-stasjon for denne arten. Skrubbe finnes i de mest forurensede kystområdene og i estuarier i Norge, så vel som i andre europeiske land. Det er derfor viktig å forbedre databasen for biologiske effekter i denne arten.
JAMP Biological Effects Methods 1997-2001 - Norway
NIVA report no. 4649-2003 5
2. Introduction The Norwegian contribution to the “Joint Assessment and Monitoring Programme (JAMP) was initiated by the Norwegian Pollution Control Authority (SFT) and is integrated with SFT’s State Pollution Monitoring Programme. The procedures and practice of JAMP has also provided a basis for other investigations of interest to SFT but not necessarily requested by JAMP (e.g. SFT’s Index Programme (Pollution and Reference Indices). Data are submitted to ICES under three categories: for Purpose A (health assessment) on a voluntary basis, Purpose C (spatial distribution) on a voluntary basis and Purpose D (temporal trend assessment) on a mandatory basis. Where practical, data collection was in accordance to agreed procedures (OSPAR 1990, 1997). Data were screened and submitted to ICES in accordance with procedures outlined by ICES (1996). 2.1 The purpose of this report This report focuses on one JAMP issue (no.1.17): "Where do pollutants cause deleterious biological effects?" (ASMO 1997, Annex 30) and assesses the use of biological effects methods within the Norwegian JAMP 1997-2001, leading to conclusions and recommendations for future use of such methods. 2.2 Data source and availability An overview of JAMP stations in Norway where biological effects methods are employed is shown in Appendix B and in maps in Appendix C. The stations and sample counts relevant to the 2001 investigations are noted in the tables in Appendix B. A brief summary of the use of these methods during the period 1997-2001 has been recently reported in the Norwegian National Comments for JAMP 2001 (Green et al., 2002). 2.3 Biological effects methods Biological effects markers, BEM or biomarkers were introduced in the Norwegian JAMP in 1997. The purpose of these markers is, by investigations on molecular/cell/individual level, to give warning signals if ecosystems are affected by toxic compounds, i.e. contaminants, and to assist in establishing an understanding of the specific mechanisms involved. Biomarkers can, in other words, provide information regarding the effects of xenobiotics, and not simply their concentrations in environmental matrices. Exposure of environmental contaminants to biological systems will first affect molecular and cellular processes. If the adaptation- and repair-mechanisms are overloaded, the effect will be transferred to another level (f. i. tissue, organ, individual, population, or community/ecosystem). Effects at higher hierarchical levels are always preceded by changes in “lower” processes, allowing the development of the mentioned biomarker signals of effects at “higher” response levels (Bayne et al. 1985) (Figure 1).

JAMP Biological Effects Methods 1997-2001 - Norway
6 NIVA report no. 44649-2003
Pollutantexposure
Molecular processes
Cellular processes
Organism
Population
Community
Ecosystem
Figure 1. Sequential order of responses to pollutant exposure within a biological system. There are several definitions for a “biomarker”. According to Peakall (1994) biomarkers are “biological responses that can be related to an exposure to, or toxic effect of, an environmental chemical or chemicals”. This is a very wide definition, since “biological responses” can refer to responses at any hierarchical level, from molecular processes to the ecosystem. Other definitions are more specific, such as that of Mayer (1992) which states that biomarkers are “quantifiable biochemical, physiological, or histological measures that relate in a dose- or time-dependent manner to the degree of dysfunction that contaminants have produced”. This narrows a biomarker down to the lower hierarchical levels illustrated in Figure 1. These measures are quickly evident, but not readily interpreted at the population level. Measures at higher hierarchical levels will, on the other hand, become evident too late to have a diagnostic or preventive value, and thus not function as the wanted “early warning signal”. The definition of Mayer (1992) includes a number of parameters that may serve as a biological effects marker/biomarker. Examples are (Fox, 1993): • induction of the stress response • induction of detoxification systems • inhibition of specific enzymes • metabolic impairments that detrimentally alter synthetic or degradative processes or that deplete
energy, vitamin, or substrate stores • impaired growth or failure to thrive, mass loss • genetic damage, or impaired repair • impairment of immune system function • impaired or altered reproductive function • impaired organ or tissue function based on functional tests or histopathological alterations. For any biological response, there are criteria for it to serve as a biomarker, according to Stegemann et al. (1992): 1 The assay to quantify the biomarker should be sensitive, reliable, and relatively simple; 2 baseline data for the concentration/activity of the biomarker should be known in order to be able
to distinguish between natural variability (noise) and contaminant induced stress (signal);
JAMP Biological Effects Methods 1997-2001 - Norway
NIVA report no. 4649-2003 7
3 the basic biology/physiology of the test organism should be known so that sources of uncontrolled variation (growth and development, reproduction, food sources) can be minimized;
4 all the factors, intrinsic as well as extrinsic, that affect the biomarker should be known; 5 it should be established whether changes in biomarker concentration are due to physiological
acclimation or to genetic adaption; and finally, 6 changed levels of the biomarker should be correlated with the “health” or “fitness” of the
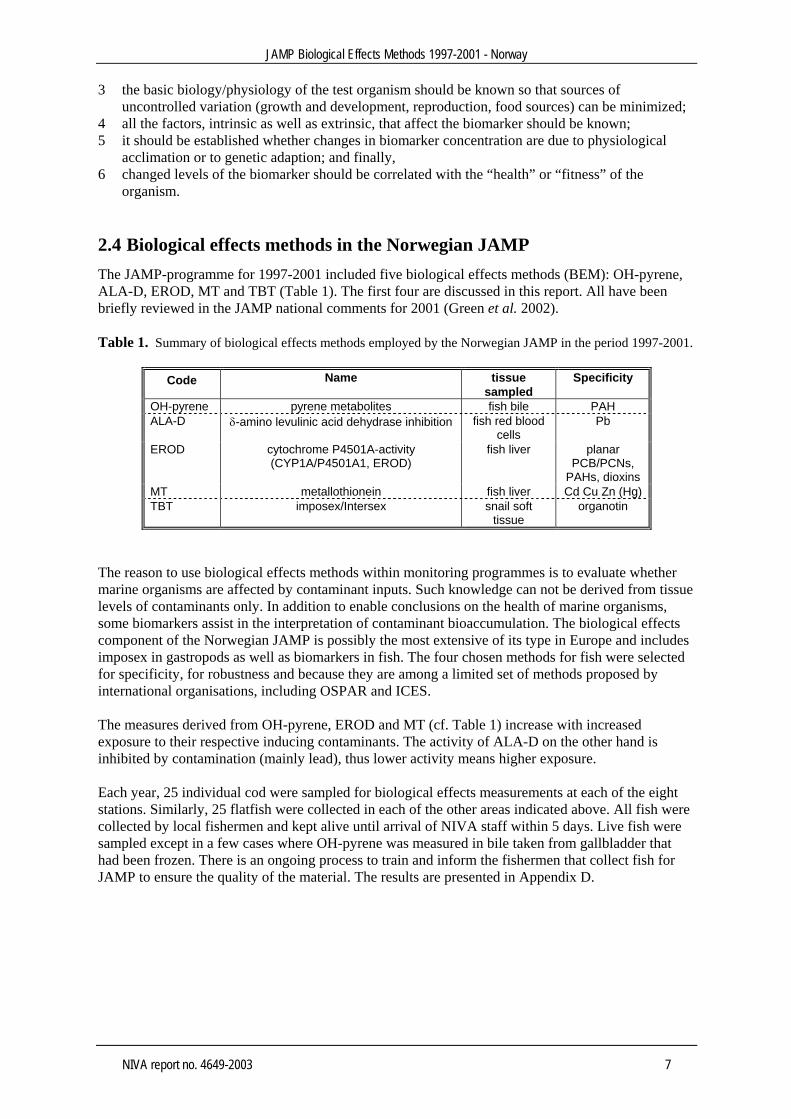
organism. 2.4 Biological effects methods in the Norwegian JAMP The JAMP-programme for 1997-2001 included five biological effects methods (BEM): OH-pyrene, ALA-D, EROD, MT and TBT (Table 1). The first four are discussed in this report. All have been briefly reviewed in the JAMP national comments for 2001 (Green et al. 2002). Table 1. Summary of biological effects methods employed by the Norwegian JAMP in the period 1997-2001.
Code Name tissue sampled
Specificity
OH-pyrene pyrene metabolites fish bile PAH ALA-D δ-amino levulinic acid dehydrase inhibition fish red blood
cells Pb
EROD cytochrome P4501A-activity (CYP1A/P4501A1, EROD)
fish liver planar PCB/PCNs,
PAHs, dioxins MT metallothionein fish liver Cd Cu Zn (Hg) TBT imposex/Intersex snail soft
tissue organotin
The reason to use biological effects methods within monitoring programmes is to evaluate whether marine organisms are affected by contaminant inputs. Such knowledge can not be derived from tissue levels of contaminants only. In addition to enable conclusions on the health of marine organisms, some biomarkers assist in the interpretation of contaminant bioaccumulation. The biological effects component of the Norwegian JAMP is possibly the most extensive of its type in Europe and includes imposex in gastropods as well as biomarkers in fish. The four chosen methods for fish were selected for specificity, for robustness and because they are among a limited set of methods proposed by international organisations, including OSPAR and ICES. The measures derived from OH-pyrene, EROD and MT (cf. Table 1) increase with increased exposure to their respective inducing contaminants. The activity of ALA-D on the other hand is inhibited by contamination (mainly lead), thus lower activity means higher exposure. Each year, 25 individual cod were sampled for biological effects measurements at each of the eight stations. Similarly, 25 flatfish were collected in each of the other areas indicated above. All fish were collected by local fishermen and kept alive until arrival of NIVA staff within 5 days. Live fish were sampled except in a few cases where OH-pyrene was measured in bile taken from gallbladder that had been frozen. There is an ongoing process to train and inform the fishermen that collect fish for JAMP to ensure the quality of the material. The results are presented in Appendix D.

JAMP Biological Effects Methods 1997-2001 - Norway
8 NIVA report no. 44649-2003
3. Materials and methods
3.1 Compliance with guidelines/procedures Samples were collected and analysed, where possible, according to OSPAR guidelines for OH-pyrene and EROD (OSPAR 1998). The data is stored at NIVA in MS ACCESS 1997. The tables have been generated using MS ACCESS 97 and MS EXCEL 97. 3.2 Locations and species OH-pyrene, ALA-D, EROD and MT were measured in Atlantic cod along the coast from the Oslofjord to the Russian border, including the Sørfjord and Hardangerfjord area (23B, 30B, 36B, 53B, 67B, 98B, 10B). The same parameters were also measured in flounder at three locations, Sørfjord and Hardangerfjord area and the nearby reference area in the Åkrafjord (21F, 53F, 67F), dab at one location in outer Oslofjord (st.36F) and in the Lista area (15F) and plaice from Lofoten (st.98F) and Varangerfjord (10F). No data from station 15B/F was obtained in 2000. There is also a limited number of samples from 21F and only from the last three years. Samples from the inner Oslofjord (st.30B), Sørfjord (53B/F) and to some extent Hardangerfjord (67B/F) are considered to be more highly contaminated with metals and organochlorines than the other stations. An overview of the samples collected can be found in Table 2 and Appendix B. Table 2 also indicate which stations are considered as reference locations or areas presumed only diffusely contaminanted. Atlantic cod (Gadus morhua L.) is present and can be collected along the entire Norwegian coast, from south to north and from the inner end of fjords to the open sea. In contrast, Norwegian flatfish species have more limited spatial distribution. The main OSPAR target species, dab (Limanda limanda L.) and European flounder (Platichthys flesus L.) are present along the entire coast, but their availability in different coastal habitats vary. Generally, flounder is most abundant in shallow parts of fjords and inshore areas, whereas dab is mainly found on the open coast. Plaice (Pleuronectes platessa L.) is similarly found along the entire Norwegian coast from south to north, but only in some habitats. Table 2. Sampling years for biological effects analyses. A complete overview can be found at Appendix A. The stations are shown from north to south along the coast. The suffix “B” after the station-number indicates cod and the suffix “F” indicates flatfish * indicate reference locations, i.e. those that are presumed to be only diffusely contaminated (with respect to this investigation/report on BEM).
Area Station code
Atlantic cod
Flounder Dab Plaice
Varangerfjord * 10B/F 2000-2001 2000-2001 Svolvær * 98B/F 2000-2001 2000-2001 Bømlo * 23B 1997-2001 Åkrafjord * 21F 1999-2000 Hardangerfjord 67B/F 1997-2001 1999-2001 Inner Sørfjord 53B/F 1997-2001 1999-2001 Lista 15B/F 1997-2001 1999-2001 Færder 36B/F 1997-2001 1999-2001 Inner Oslofjord 30B 1997-2001

JAMP Biological Effects Methods 1997-2001 - Norway
NIVA report no. 4649-2003 9
3.3 Analytical methods Detailed descriptions of the analytical methods can be found at 6.Appendix A. 3.3.1 OH-pyrene metabolites When fish are exposed to, and take up PAHs, the compounds are biotransformed into polar metabolites, to enable their excretion. One such biotransformation is the coupling of a hydroxyl-group to the molecule (Figure 7 in Appendix A) .The bile is thought to be the dominant excretion route of metabolites of especially larger PAH molecules in fish (Meador et al. 1995). Since PAH metabolites are stored for some time and thereby concentrated in the gall bladder, the bile is shown to be a good matrix for the quantification of PAH metabolites (Creaven et al. 1965; Lech et al. 1973; Statham et al. 1976; Aas et al. 2000a,b). OH-pyrene metabolites were analysed with HPLC and fluorescence detection.The concentration of pyrene metabolites was normalised to the absorbance at 380nm (bile diluted in ethanol), quantified using a spectrophotometer. 3.3.2 ALA-D One of the most important toxic mechanisms of non-essential metals is the interaction with and inhibition of enzymes, especially enzymes with metal co-factors. One such enzyme is δ-aminolevulinic acid dehydratase (ALA-D) which has Zn as a co-factor (Granick et al., 1972). This enzyme is one step in the synthesis pathway for heme. Heme is incorporated in macromolecules such as hemoglobin and cytochromes. In mammals and birds, inhibition of ALA-D may lead to anemia since it is one of the rate-limiting enzymes in heme (and hence hemoglobin) synthesis. This does not appear to be the case for fish (Larsson et al., 1985). The reason for ecotoxicological interest in ALA-D is its inhibition by Pb, even at very low exposure levels (Hodson et al., 1984; Haux and Förlin, 1989). The ALA-D activity was determined in red blood cells, basically as described by Hodson et al., (1984). 3.3.3 EROD EROD (7-Ethoxyresorufin-O-deethylase) is a specific cytochrome P450 reaction where ethoxyresorufin is used as substrate (Burke & Mayer, 1974). Cytochrome P450 1A catalyse the deethylation of 7-ethoxyresorufin to resorufin. Cytochrome P4501A activity in microsome fractions can be quantified from the amount of resorufin produced (Andersson & Förlin, 1985). The resorufin can be quantified by spectrophotometric or fluorimetric methods (Klotz et al., 1984). In addition to being substrates for biotransformation, different planar hydrocarbons can also interact with cytochrome P450 1A as inducers (Boon et al., 1992; Goksøyr and Förlin, 1992). The induction is initiated by the binding of the inducer to the cytosolic Ah (Aryl hydrocarbon)-receptor (Rowlands and Gustafsson, 1997; Van den Berg et al., 1998). Several studies have indicated that P450 induction is the first step in a series of toxic symptoms, such as immunosuppression, vitamin and hormonal imbalance, and reproductive failure (reviewed by Safe, 1994). EROD is a tool used to measure this induction. The induction of cytochrome P450 enzymes in fish liver was first suggested as an indicator of environmental contamination in the 1970s by Payne (1976), and the EROD measurement has now gained widespread use in biomonitoring studies with fish (Goksøyr and Förlin, 1992; Sandvik et al., 1997; Ruus et al. 2002). Ethoxyresorufin-O-deetylase (EROD) activity was assayed fluorimetrically (Burke and Mayer, 1974) using an internal NIVA-method adapted for plate-reader. 3.3.4 Metallothionein The low-molecular-weight protein metallothionein (MT) is present in most vertebrate tissues. A major role of this protein is regulation of the intracellular availability of zinc (Zn) and/or copper (Cu). Other functions, such as metal detoxification and free radical scavenging, have also been suggested (Kägi and Schäffer, 1988). In addition to Cu and Zn, MT binds non-essential metals such as cadmium (Cd), mercury (Hg) and silver (Ag). The synthesis of the protein is induced by elevated intracellular concentrations of the above mentioned metals. Metallothionein induction is a response to elevated intracellular metal concentrations and the protein has been applied as a biomarker for environmental

JAMP Biological Effects Methods 1997-2001 - Norway
10 NIVA report no. 44649-2003
metal contamination (Hogstrand & Haux, 1989; Hylland et al., 1991). Metallothionein was assayed by the use of differential pulse polarography (DPP) as described by Olsson, (1987).
3.3.5 Protein ALA-D and EROD activity, as well as metallothionein concentration, were normalised to protein content in the respective preparations, determined according to the Lowry protein assay (Lowry et al., 1951) adapted to measurement by plate reader. Protein standard was bovine gamma globulin.
3.3.6 Statistical analyses Statistical analysis was performed with the use of Statistica® software (version 6.1; StatSoft). Each of the four biological effect methods (OH-pyrene, ALA-D, EROD, metallothionein) were treated as response (dependent) variables in separate analyses (separate also for each species), and their variability explained by a range of explanatory variables (predictors) (Table 3) in multiple regressions, performed in the GLM (General Linear Models)-module in Statistica®. Due to measurements below detection limits and, in some cases, expected colinearity, specific compounds/congeners were selected to represent specific groups of contaminants (Table 3). Second degree interactions were tested for the categorical factors. Non-significant predictors (with low explanatory value) were manually taken out of the models in a backwards stepwise fashion until the best models were obtained. All continuos predictors were log2-transformed prior to the analysis to reduce skewness of distributions. Table 3. Explanatory variables (predictors) in the full GLM model, before stepwise (manual) elimination. Variable Abbreviation Type of
variable Measured in
(matrix) Notes/Explanations
Year year Categorical 1997-2001 Station station Categorical Sex sex Categorical Maturation maturation Categorical Determined from length 1 Length length Continuous Condition cond Continuous Only for cod Liver Somatic Index log2LSI Continuous OH-pyrene 2 oh-pyr Continuous 2 Bile Represents PAH-
metabolites PCB-153 livcb153 Continuous Liver Represents congeners with
≥ 2 Cl in ortho-position PCB-105 + -118 l105_118 Continuous Liver Represents congeners with
1 Cl in ortho-position p,p’-DDE livddepp Continuous Liver Represents DDT-
compounds/metabolites Cd livcd Continuous Liver Cu livcu Continuous Liver Hg muhg Continuous Muscle Pb livpb Continuous Liver Zn livzn Continuous Liver 1 Gadus morhua: Individuals > 400 mm = mature (others = juvenile). Limanda limanda: Individuals > 130 mm = mature (others = juvenile). Platichthys flesus: Individuals > 204 mm = mature (others = juvenile).
Pleuronectes platessa: Individuals > 265 mm = mature (others = juvenile). 2 Not when OH-pyrene was the response (dependent) variable.

JAMP Biological Effects Methods 1997-2001 - Norway
NIVA report no. 4649-2003 11
4. Results and discussion
4.1 General assumptions and precautions The JAMP sampling programme has some consequences for the assessment of the biological effects sub-programme. Cod is the only species found at all locations, making it difficult to compare species responses. Of the flatfish species, flounder was sampled at both contaminated and less polluted locations, providing different exposure levels against which to test responses. Dab was sampled in two areas (15 and 36) expected to represent the diffuse contamination levels in the Skagerrak. As will be evident from results presented below, the biological effects programme showed that this was not the case. Dab were in fact exposed to PAH at one of the two locations (15F). Plaice was only sampled in areas with no known point sources and low-level exposure to long-range transported contaminants. In conclusion, only cod and flounder were exposed to different levels of environmental contaminants, the two other species (dab, plaice) were each sampled from two areas with similar contamination loads. In the present assessment, biological effects responses have been compared with tissue-levels of contaminants and general physiological characteristics. Biological responses and physiological endpoints have been determined for each individual fish as was contaminant levels in cod. Contaminants in flatfish were however determined in pools of five fish. For the purpose of the analyses presented below, each of the five fish were allocated the value of the analyses of the pooled sample. Biological effects reflect endogenous processes in organisms and will therefore to varying degrees be affected by sex, nutritional status, maturation, general health and the levels of accumulated contaminants. For the analyses presented below it would obviously be desirable to have homogenously distributed samples with regard to size, sex, condition, etc. This is not always possible. Problems associated with skewed distributions have been assessed and will be commented upon in this report. Furthermore, the relative importance of external factors, e.g. contaminant exposure, as compared to internal processes, e.g. maturation or growth, will vary between methods. At one extreme is the concentration of OH-pyrene metabolites in bile, which would not be expected to be strongly affected by endogenous processes (and results actually shows it is not). Metallothionein would be at the other end of the scale – a “householding” protein for the essential metals zinc and copper for which effects of external factors will have to be extracted from factors relating to normal trace metal metabolism (zinc and copper). To assess any influence of maturation on the chosen methods, fish within each species were divided between juvenile and mature. As it turned out, this parameter did not explain much variability in most of analyses. It will be apparent below whenever maturation status is relevant for the interpretation of results. The dataset has been running for too short period to conclude on changes between years. There is an ongoing process to develop and improve the methods themselves and the quality assurance aspect of the methods (through the international programme BEQUALM). "Year" has been included as a factor in the analyses, but is interpreted with caution. With the determination of pyrene metabolites, year has a more definite interpretation. Due to an improvement in methodology between 1999 and 2000 (from single wavelength to HPLC separation), values in 1998-1999 and 2000-2001 are not directly comparable. The pattern between stations is however convincingly similar for the two sets. For other methods, between-year variability could derive from environmental factors not controlled for (e.g. temperature) or year-to-year variability in the analyses themselves. Generally, a set of samples from the previous year was run with every year's samples to identify and minimise such effects. For each of the methods, a “normal” range has been indicated. The range given is simply the quartiles of responses at stations removed from any point source of contaminants. From discussions below it will be evident that it is difficult to provide such absolute limits of what is ”normal” for each response

JAMP Biological Effects Methods 1997-2001 - Norway
12 NIVA report no. 44649-2003
(as they will all be affected by other factors). The values may however be used as a guide to the range that must bee seen as normal for each of the species. It must also be remembered that sampling for this programme has adhered to the general OSPAR guidelines. Hence, the fish has primarily been sampled during September and October, a period in which gender-related differences are at their least. Every effort has also been made to sample 25 fish at each station each year, although this has not been possible for all years, stations and species. 4.2 OH-pyrene metabolites in bile 4.2.1 Specific assumptions and background levels Detection methods for OH-pyrene have been improved two times since the initiation of these analyses in the JAMP programme. In 1998 the support/normalisation parameter biliverdin was changed to measurement of light absorbance at 380 nm. Furthermore, in 2000, the use of single-wavelength fluorescence for quantification of OH-pyrene was discontinued and the use of HPLC separation with fluorescence detection was implemented. Although there is a good correlation between results from the two methods they can not be compared directly. The single wavelength fluorescence method is naturally more unspecific and will include fluorescence from more components than the HPLC method, which has extremely high specificity towards individual metabolites. The interpretation of OH-pyrene data is therefore primarily focused towards stations within each year. Bile metabolites of PAH can be detected within a short period (hours) following exposure, and holding conditions prior to sampling may affect results. However, measures were taken in 1998 and 1999 to minimise or remove such exposure. Given the precautions taken, it is unlikely that the observed levels have been caused by exposure during the storage of fish prior to sampling. The higher levels of pyrene metabolites at stations 53B and 30B compared to the other areas (1998 - 2000) presumably reflect the general contamination of the two areas (inner Sørfjord and inner Oslofjord). There is no reason to expect different fish species to metabolise pyrene with very different rates. The large difference in range observed at reference locations presumably reflects the fact that only Atlantic cod and plaice were collected in areas with low PAH inputs (Table 4). The results indicate that open coastal areas in southern Norway (Færder) and the presumably diffusely contaminated Åkrefjord are to some extent affected by PAHs. Table 4. Biliary concentration of OH-pyrene (µg/kg bile standardised to absorbance at 380 nm) from fish collected at reference locations; the range represents the quartiles of the observations.
Species Stations Count Range OH-pyrene (µg/kg)
Atlantic cod 10, 23, 98 117 0.6-4.4 flounder 21 11 26.4-88.5 dab 36* 37 3.1-34.1 plaice 10, 98 67 0.4-2.5
*) station 15 not included

JAMP Biological Effects Methods 1997-2001 - Norway
NIVA report no. 4649-2003 13
Atlantic cod (Gadus morhua L.) The available data explained nearly 90% of the variability in bile concentration of OH-pyrene in Atlantic cod in the general linear model (Table 9 in Appendix E, see also Appendix A for details of the analysis). As indicated above, year-to-year differences for this parameter should not be given too much weight as there was a change in methods. The model shows that, the ability of cod to metabolise pyrene, cytochrome P4501A activity (EROD), appears to have some effect on the concentration of metabolites in bile. It has generally been thought that the activity of the cytochrome P4501A system would not be limiting to the metabolism of pyrene. The results found here indicates a more intimate relationship. The cytochrome P4501A system will be induced by PAHs, so the result may indicate a parallel increase more than direct interaction. Furthermore, size had an influence as did maturation, indicating that smaller individuals had lower relative accumulation of metabolites in bile. In addition to the included factors, there was a significant additional component linked to station. The results show that station/location affects this parameter. Fish at all but the most remote areas had elevated levels of OH-pyrene. It has also become clear that cod caught in the open coastal area outside Lista are more strongly affected by PAHs than cod at the other stations, despite the large water exchange in that area. Inputs from an aluminium smelter is the probable reason for the elevated concentrations. Station differences were to be expected and fits with the general pattern of contamination (except the Lista station). Dab (Limanda limanda L.) No biological or physiological factors appeared to have a strong effect on the levels of OH-pyrene in bile from dab (Table 10 in Appendix E). Most of the observed variability could be accounted for through differences between the two stations and difference between years (the latter due to change in methodology). Dab at both stations appear to be exposed to PAHs. Dab from the Lista area (station 15F) are probably exposed to higher environmental PAH levels than dab from the outer Oslofjord (station 36F). Flounder (Platichthys flesus L.) As for cod, much of the variability in individual concentrations of OH-pyrene in flounder could be explained by the factors available (Table 11 in Appendix E). In contrast to cod, size did not appear important, whereas males and females appeared to accumulate the pyrene metabolite differently. The model showed that the relative size of the liver, indicating fat content, also had a influence. It is possible that high fat content in the liver results in higher direct accumulation of hydrophobic contaminants, e.g. PAH, thus decreasing the availability of PAHs for the metabolising “machinery” of the liver (which will then lead to accumulation of metabolites in bile). The results found here only indicate a possible relationship and such a relationship will obviously need to be tested experimentally. Any accumulation of contaminants in liver fat is nevertheless a two-edge sword – although immediate exposure is decreased, future use of resources (e.g. prior to spawning) will lead to mobilisation of contaminants. Such a mechanism has been suggested to explain the pattern of EROD seen in dab from the southern North Sea (Cooreman, pers. comm.). Plaice (Pleuronectes platessa L.) In addition to year and station, both sex and length contributed significantly to explain variability in OH-pyrene in plaice (Table 12 in Appendix E). All plaice sampled were presumably mature, so effect of length could not be explained by a difference between juvenile and mature individuals. Dietary or habitat differences between different age groups could however, lead to the observed result. In addition, there is a change with growth in the relative size of gill area to body weight (decreases with increasing size). The results also indicate a difference between the two stations expected to be the least contaminated. Results for plaice from station 10F (Varangerfjord) was used to derive a baseline or background level of 1-OH-pyrene in bile for plaice (Table 4). Such a value (or range) may possibly be relevant also to other flatfish species, but this will need to be verified experimentally.

JAMP Biological Effects Methods 1997-2001 - Norway
14 NIVA report no. 44649-2003
4.3 ALA-D in red blood cells 4.3.1 Specific assumptions and background levels The activity of ALA-D is known to be inhibited by exposure to lead. The results indicated that fish from the Sørfjord (station 53B/F) and inner Oslofjord (station 30B) are affected by the exposure to lead (Figure 13 in Appendix E) (as is also shown through the approximately 20 years of JAMP-monitoring). During the period 1998-2001 slight overconcentrations of lead in cod liver have been found in the Sørfjord (1-1.3 times provisional "high background" concentrations, Green et al. 2002) and for the period 1997-2001 in cod from the inner Oslofjord (1-8.5 times, cf. Appendix F). During the period 1997-2001, no overconcentrations were found for cod from Hardangerfjord (67B) or outer Oslofjord (36B). For flounder from the Sørfjord (53F), overconcentrations of 1-1.9 were found during this period but none for flounder from the Hardangerfjord (67F). The results indicate that ALA-D in red blood cells is probably a more sensitive indicator of lead-exposure than lead concentration measurements in fish liver (Figure 2). Although ALA-D inhibition is lead-specific, it is not possible to rule out interference by other metals or organic contaminants. Previous studies indicate that only zinc may ameliorate the effect of lead to some extent, but the effect is variable and weak. Other studies have also shown ALA-D to be a remarkably robust biomarker and factors such as sex, age or season do not appear to affect the response. As stated above, ALA-D is specifically inhibited by exposure to lead. One problem in the assessment has been the high proportion of liver samples with lead levels below the detection limit. For three of the species, more than half the cases are excluded if lead is included in the analysis (due to lack of data). A close relationship is to be expected between concentrations of lead in liver and lead in red blood cells. It is of course the latter that will affect ALA-D activity in that tissue, but Pb in blood is rarely measured in monitoring programmes. The background or baseline activity of ALA-D in red blood cells are within a similar range for the four fish species (Table 5). Such ranges must be used with caution, although ALA-D appears to be less affected by non-contaminant factors than other biological effects methods. Table 5. Red blood cell ALA-D activity in the indicated species from reference locations; the range represents the quartiles of the observations.
Species Stations Count Range ALA-D (ng PBG/min/mg protein)
Atlantic cod 10, 23, 98 129 15-21 flounder 21 36 13-21 dab 15, 36 99 10-20 plaice 10, 98 67 13-21
Atlantic cod (Gadus morhua L.) ALA-D in Atlantic cod appears to be primarily affected by metals, presumably as substitutes for lead (in a statistical sense), but there is also residual variance being explained by both year, station and an interaction between the two (Table 13 in Appendix E). This general linear model explained about 40% of the variability in the dataset. In a reduced model with lead included (would skew the selection of fish towards the two contaminated areas 53 and 30), the metal came out as significant. More surprisingly, maturation also contributed significantly in this second model in addition to station and year (Table 13). Even including lead as an explanatory factor, station came out as significant. This could mean that there are other factors at stations (e.g. other contaminants) that affect the response, but it is more probable that there is either an adaptation (decreasing the response over time) or that the effect of environmental
JAMP Biological Effects Methods 1997-2001 - Norway
NIVA report no. 4649-2003 15
lead levels on ALA-D has one or more threshold levels. One should also be aware that the statistical model used not necessarily will reflect the true relationship between variables. Non-linearity will e.g. not be included. As expected, sex or size did not appear to have any relevance to ALA-D activity in cod blood. Similarly, the fat-content of the liver, LSI or condition of the cod did not appear to have any consequences for ALA-D activity. Tissue residues of organic contaminants also did not appear to affect ALA-D activity. Dab (Limanda limanda L.) Dab was collected in two areas on the open coast with a presumably diffuse contaminant load. Differences in ALA-D activity between years and the two stations contributed in the model (Table 14 in Appendix E). For both years where both station were sampled the results for Lista were slightly higher (Figure 12). Hepatic lead concentrations were above the detection limit in more than two thirds of the material, but liver lead did not enter significantly in the general linear model. Lead concentrations in the liver of dab were lower than that found in cod and flounder, but at the same level as for plaice. There is some variability in ALA-D in dab between years and stations, but it does not appear to be strongly associated with accumulated lead. It may simply be that the lead levels are too low to affect ALA-D or that exchange between liver and blood is slow. Lead is known to accumulate in insoluble forms in some tissues, although it is not known if such is the case for fish (dab) liver. Flounder (Platichthys flesus L.) In contrast to cod, there was no evidence that hepatic metal accumulation has affected ALA-D in flounder. In comparing ALA-D directly with hepatic lead, it was clear that flounder from Sørfjord all had similar ALA-D activity even with varying lead levels (Figure 2). The activity of ALA-D was lower in flounder from the inner Sørfjord (station 53F) than in flounder from cleaner areas (Hardangerfjord 67F and Åkrefjord 21F). Flounder from Sørfjord may have reached a threshold of depressed ALA-D that is not further decreased with increasing hepatic lead accumulation. Approximately 80% of Sørfjord flounder have blood ALA-D levels below the lower baseline level indicated (Table 5; Figure 2).

JAMP Biological Effects Methods 1997-2001 - Norway
16 NIVA report no. 44649-2003
0,0 0,1 0,2 0,3 0,4 0,5 0,6 0,7 0,8 0,9
hepatic lead
0
5
10
15
20
25
30A
LA-D
Figure 2. Relationship between hepatic lead (µg/g w.w.) and red blood cell ALA-D (ng PBG/min/mg protein) in flounder from Sørfjord (circles), Hardangerfjord (squares), Åkrafjord (triangles). As for cod, there were no indications that other factors such as sex, size, condition or accumulation of organic contaminants affected the response of ALA-D in flounder (Table 15 in Appendix E). Plaice (Pleuronectes platessa L.) In contrast to the other species, there were no obvious relationships between any of the factors and ALA-D in red blood cells from plaice (Table 16 in Appendix E). As mentioned above, plaice was collected from two areas with low contaminant exposure. Hepatic lead levels in the plaice collected during JAMP are presumably too low to cause inhibition of ALA-D in this species. 4.4 Hepatic EROD 4.4.1 Specific assumptions and background levels High activity of hepatic cytochrome P4501A activity (EROD) indicates a response to planar organic contaminants. It was expected that higher activity would be found at the stations that were presumed to be most perturbed by planar PCBs, PCNs, PAHs or dioxins, which were station 30B (inner Oslofjord) and 53B/F (inner Sørfjord). EROD activity at these stations were not consistently higher than activity at other stations when other factors were not included in the analysis. The median EROD activity in cod from Lofoten (98B) for both 2000 and 2001 was between 2-3 pmol/min/mg-protein (Figure 15) and the lowest recorded in this investigation and may represent "background". As shown in Table 6 the upper quartile at the reference locations was higher.

JAMP Biological Effects Methods 1997-2001 - Norway
NIVA report no. 4649-2003 17
Table 6. Hepatic EROD in fish collected at reference locations; the range represents upper and lower quartiles of the observations.
Species Stations Count Range EROD (pmol/min/mg protein)
Atlantic cod 10, 23, 98 139 9-95 flounder 21* 16 10-43 dab 36 98 123-529 plaice 10, 98 81 33-146
*) supplemented with values from other reference locations not included in JAMP Fish are sampled at the same time of year (September-November) when differences between the sexes should be at a minimum. Statistical analyses indicated no clear difference in activity between the sexes (Appendix E). Generally, higher activity was found at more contaminated stations, but the response was inconsistent (Appendix G). This inconsistency might indicate that populations with variable exposure history are sampled. Besides, there is evidence from other fish species that continuous exposure to e.g. PCBs may cause adaptation, i.e. decreased EROD response. Atlantic cod (Gadus morhua L.) The general linear model (explaining about 40% of the variability in the data) shows that EROD in Gadus morhua change between years and stations, but there is also a significant interaction between these two categorical factors (Table 17 in Appendix E). This indicated that the differences between stations do not follow the same pattern all years. This can also be seen in Figure 3, which shows that in 1997, the EROD activities at the various stations are not as different as the other years (which seem to display approximately the same pattern between stations). Furthermore, both muscle concentrations of Hg, and especially liver concentrations of HCB are shown to be significant contributors to the model. The median concentration of HCB in cod liver was the lowest at station 98 for the years 2000 and 2001 (Green et al. 2002). Likewise, EROD was also the lowest at station 98 for these two years (Appendix G). Figure 4 shows the relationship between HCB and EROD in cod (when all stations and years are included). It is possible that HCB induces EROD through interaction with the cytosolic Ah-receptor, although this is not known. Another possibility is that HCB co-vary with other known inducers of CYP1A, that are not measured through the JAMP-programme, such as dioxins or non-ortho-PCBs. The Liver-Somatic Index (LSI) reflects the size and lipid content of the liver. These may be important factors for the induction of hepatic biotransformation enzymes such as CYP1A (and thus EROD) since lipophilic contaminants may be “trapped” in these lipids and kept from interacting with receptors in the hepatocytes (Ruus et al. 2001). It is known that lipids of aquatic organisms can serve (among other functions) as a protective storage site against toxic effects of contaminants that accumulate in body lipids (Geyer et al. 1993). In organisms with higher lipid content, a smaller fraction of a lipophilic chemical will reach target organs to cause adverse effects. It is known that EROD activity can be influenced by sex (at least at certain times of the year). However, no clear differences was seen between sexes in cod for any years at any stations (Table 17 in Appendix E).

JAMP Biological Effects Methods 1997-2001 - Norway
18 NIVA report no. 44649-2003
1997 1998 1999 2000 2001
15B 10B 23B 30B 36B 67B 53B 98B
station
0
1
2
3
4
5
6
7
ERO
D
Figure 3. EROD activity (log2-transformed; Least Squares Means) in cod at the various stations, the different years. (See Table 17 in Appendix E for model effects).

JAMP Biological Effects Methods 1997-2001 - Norway
NIVA report no. 4649-2003 19
-2 -1 0 1 2 3 4
log (liver HCB)
-4
-2
0
2
4
6
8lo
g(ER
OD
)
Figure 4. Relationship between concentrations of hepatic HCB concentration and EROD activity in Gadus morhua (all stations and years included). Both variables were log-2 transformed. Dab (Limanda limanda L.) The general linear model (explaining about 35% of the variability in the data) shows (as for cod) that EROD in Limanda limanda change between years (Table 18 in Appendix E), but a significant interaction between year and station also exists, indicating that the differences between stations do not follow the same pattern all years. There are, however only three years (1999-2001) and two stations (15 and 36) where this species has been caught within the JAMP-programme. Furthermore, liver concentrations of both PCB-153 and PCB-105/-118 are shown to be significant contributors to the model (Table 18). This indicates that diffuse perturbation by PCBs affects EROD activity. This was also noted in JAMP National comments regarding the Norwegian data for 2000 (Green et al. 2002), where induction of EROD was indicated in both cod and plaice from the diffusely contaminated area Varangerfjord (10B/F). PCB-data from 1995 have shown great variations in liver concentrations in cod, indicating variable exposure, or a point source near the 10B/F station. Planar hydrocarbons, such as certain PCBs (these are primarily non-ortho) are known to be inducers of CYP1A/EROD. Mono-ortho substituted PCBs (such as PCB-105 and –118) are partly coplanar, but congeners with two or more Cl-atoms in ortho-positions are sterically prevented from having this conformation. The liver-somatic index (LSI) was (as for cod) a significant contributor to the model. The LSI reflects the size and lipid content of the liver. These may be important factors for the induction of hepatic biotransformation enzymes such as CYP1A (and thus EROD) since lipophilic contaminants may be “trapped” in these lipids and kept from interacting with receptors in the hepatocytes (Ruus et al. 2001). It is known that lipids of aquatic organisms can serve (among other functions) as a protective storage site against toxic effects of contaminants that accumulate in body lipids (Geyer et al. 1993).

JAMP Biological Effects Methods 1997-2001 - Norway
20 NIVA report no. 44649-2003
In organisms with higher lipid content, a smaller fraction of a lipophilic chemical will reach target organs to cause adverse effects. Flounder (Platichthys flesus L.) Despite the large range of EROD responses in flounder from the three locations, only about a third of the total variability could be explained from the factors available (Table 19 in Appendix E). Both length and relative liver size (LSI) had significant influence. It was not possible to single out maturation as the main size-associated process affecting EROD, mainly due to the lack of juveniles. Hepatic p,p-DDE was the organic contaminant that provided the best fit in the model, but it may well be a substitute for other contaminants. Including tissue contaminants had to be done with some care as there are only results for pools of five individuals (as indicated above). OH-pyrene also contributed to the model, but weakly. Plaice (Pleuronectes platessa L.) The general linear model (explaining about 50% of the variability in the data) shows that EROD in Pleuronectes platessa change between years (see Table 20 in Appendix E). Note that there are only two years (2000 and 2001) and two stations (10 and 98) where this species has been caught within the JAMP-programme. Liver concentration of PCB-153 is shown to be a significant contributor to the model, as for Limanda limanda, which again indicates that diffuse perturbation by PCBs affects EROD activity (see above). Both EROD activity (Appendix G) and liver concentrations of PCB-153 (cf. Green et al. 2002) in P. platessa are also shown to be higher in 2000 than 2001. PCB-data since 1995 have indicated large variations in PCB exposure at station 10 (see above; Green et al. 2002). Length was also shown to be a significant predictor for EROD activity in P. platessa (Table 20). Figure 5 shows the relationship between fish length and EROD activity (when both years and both stations are included), and may indicate that the EROD activity decreases with length. According to the estimate used for mature individuals (those of > 265 mm of length), only mature individuals were found. This criterion may, however, not apply to plaice in northern, cold areas such as stations 10 and 98. Maturity may, in other words, be an important factor, and indicates that gonado-somatic index (GSI) should be included in future studies/monitoring.

JAMP Biological Effects Methods 1997-2001 - Norway
NIVA report no. 4649-2003 21
300 350 400 450 500 550 600 650 700
length (mm)
2
3
4
5
6
7lo
g(E
RO
D)
Figure 5. Relationship between length and EROD activity (pmol/min/mg protein) for Pleuronectes platessa (both years, 2000 and 2001, and both stations, 10 and 98, included). EROD has been log-2 transformed. The Liver-Somatic Index (LSI) was again a significant predictor for EROD activity (Table 20). As already mentioned, the LSI reflects the size and lipid content of the liver. These may be important factors for the induction of hepatic biotransformation enzymes such as CYP1A (and thus EROD) since lipophilic contaminants may be “trapped” in these lipids and kept from interacting with receptors in the hepatocytes (Ruus et al. 2001). Figure 6 indicates that EROD activity decrease with increasing LSI. It is known that lipids of aquatic organisms can serve (among other functions) as a protective storage site against toxic effects of contaminants that accumulate in body lipids (Geyer et al. 1993). In organisms with higher lipid content, a smaller fraction of a lipophilic chemical will reach target organs to cause adverse effects.

JAMP Biological Effects Methods 1997-2001 - Norway
22 NIVA report no. 44649-2003
-0,8 -0,6 -0,4 -0,2 0,0 0,2 0,4 0,6 0,8 1,0 1,2 1,4 1,6
log(LSI)
2
3
4
5
6
7lo
g(ER
OD
)
Figure 6. Relationship between liver-somatic index (LSI) and hepatic EROD activity (pmol/min/mg protein) in Pleuronectes platessa (both years, 2000 and 2001, and both stations, 10 and 98, included). Both variables were log-2 transformed. 4.5 Hepatic metallothionein 4.5.1 Specific assumptions and background levels As indicated earlier (Green et al. 2002e), 1997-1999 samples have been reanalysed for metallothionein using differential pulse polarography (DPP). Thus, the same method has been used for all samples from all years and temporal comparisons can be made. There were no clear trends in the hepatic concentrations of the metal-binding protein metallothionein (MT) in cod from the eight stations for the period 1997-2001 and in flounder from three stations 1999-2001. Metallothionein is a protein that is induced by and binds the metals cadmium, zinc, copper and mercury, and differences in median metal concentration should indicate differences in exposure. However, presumed gradients in metal exposures, such as that decreasing from the inner Oslofjord to the outer Oslofjord and likewise from the Sørfjord to the Hardangerfjord (cf. Appendix G), did not correspond directly with metallothionein levels. More often than not the opposite was observed in cod and flounder for the period 1999 to 2001. The response in metallothionein largely appear to reflect hepatic metal levels (see more detailed analyses below). There are surprisingly small differences in the putative baseline levels of hepatic metallothionein in the four main species used in the Norwegian JAMP (Table 7). In all four species, baseline values (as used herein) lie between 6.5 and 15-16 µg/mg protein. For metallothionein there is however a need to investigate other factors to clarify whether a fish population is under metal stress or not.

JAMP Biological Effects Methods 1997-2001 - Norway
NIVA report no. 4649-2003 23
Table 7. Hepatic metallothionein (MT) activity in the indicated species from reference locations; the range represents the quartiles of the observations.
Species Stations Count Range MT (µg/mg protein)
Atlantic cod 10, 23, 98 131 6.5-15.8 flounder 21* 6 8.4-15.3 dab 15, 36 95 7.2-13.3 plaice 10, 98 76 6.5-14.3
*) Supplemented with values from other reference locations not included in JAMP Atlantic cod (Gadus morhua L.) The results for hepatic metallotionein in Atlantic cod suggests several previously unknown relationships in a general linear model that explained three-quarters of the total variability (Table 21 in Appendix E). As expected, hepatic copper and zinc explain a large part of the variability observed in hepatic metallothionein. In addition, there are differences between years and stations. More surprising is the relationship between length and metallothionein. This has not been observed earlier. An apparent relationship between metallothionein and relative liver size is presumably only an inverse correlation between metallothionein (associated with water-soluble components) with fatty tissue in the liver (which increases with increasing relative liver size). In addition to copper and zinc, there were unknown differences between stations (showing up as highly significant), presumably due to other factors that modulate metallothionein. Dab (Limanda limanda L.) In contrast to the other three species, the best model for hepatic metallothionein in dab did not explain much variability (only about 25%, Table 22 in Appendix E). Copper and zinc in the liver were significant components, as expected (in this analysis summed to give one parameter). In dab there also appear to be an effect of size on hepatic metallothionein levels. Flounder (Platichthys flesus L.) The model for flounder explained about 60% of the total variability in metallothionein (Table 23 in Appendix E). In addition to including year and station, sex and hepatic cadmium concentration explained variability in this biomarker. Flounder differ from the above species in that a non-essential metal, cadmium, appear to explain variability in the statistical model. Surprisingly, neither of the essential metals copper or zinc contributed in this model. Plaice (Pleuronectes platessa L.) Hepatic metallothionein in plaice related to tissue levels of several metals, both essential (zinc) and non-essential (mercury). In addition, there were gender-related differences, although not found as extensively as expected (Table 24 in Appendix E).

JAMP Biological Effects Methods 1997-2001 - Norway
24 NIVA report no. 44649-2003
5. Conclusions and recommendations
5.1 General conclusions and recommendations The results from the Norwegian JAMP indicate that the measurement of PAH metabolites in bile (exemplified by 1-OH-pyrene) is a reliable method to quantify the extent of PAH contamination in marine coastal systems. The results also provide a putative background level for 1-OH-pyrene for Atlantic cod and plaice. Other species probably have similar baseline levels, but this cannot be verified from the results from this programme. The Norwegian JAMP confirms that red blood cell ALA-D is inhibited by lead and can be expected to be effected in fish from coastal areas near lead inputs, such as urban and/or industrial centers. Some results indicate that there may be a threshold concentration of lead above which ALA-D is affected and also that there may be adaptation (although at a depressed level) following chronic exposure. ALA-D does not appear to be strongly affected by other endogenous (or exogenous) factors. It is therefore possible to set reference values for this biomarker. Such reference values can be set for Atlantic cod and plaice (found at stations 10 and 98) using the data from this programme. Interpretation of the response was made more difficult by the lack of a complementary dataset for tissue lead. Despite the large variability both within and between species, the results from five years of Norwegian JAMP shows that EROD is affected by organic contaminants and that fish collected in areas with local inputs respond in a reproducible manner. A novel result is the indication that size may affect the EROD response in some species. This effect does not appear to reflect maturation or sex-related differences. There were surprisingly small differences between sexes, indicating that the time of year (September-October) is appropriate for sampling to reduce such differences. Hepatic metallothionein generally reflected metal concentrations in the liver of the fish studied. For cod and dab, differences appeared to reflect natural endogenous processes involving the two essential metals zinc and copper. For flounder and plaice, there was some indication that cadmium (and for plaice, mercury) may affect the response, but this relationship was weak. As for EROD, there was a surprising relationship between metallothionein and size, but only minor differences due to sex. In the species investigated here, metallothionein does not appear to provide easily interpretable information about the metal exposure. Of the four methods investigated during the Norwegian JAMP in the period 1997 to 2001, OH-pyrene, ALA-D and EROD, provide useful information about how and whether contaminants affect fish. The results for the fourth method, hepatic metallothionein, could not be related to metal contamination in the areas investigated. 5.2 Conclusions and recommendations for the Norwegian JAMP The results for pyrene metabolites in bile indicate that specific stations in coastal areas in Norway (not the most remote) are affected by PAHs. From the data available here it is not possible to distinguish between inputs from air (long-range transport) and local sources (exhaust, small oil spills, etc.). The results for ALA-D inhibition shows that there is clear evidence for effects in the two most contaminated areas, Sørfjord and the inner Oslofjord. Results for more diffusely affected areas are more uncertain and fish in remote areas do not appear to be affected by lead. The interpretation of the results were hampered by the lack of data for the same flatfish species along the entire coast. EROD results show that fish in the two most contaminated areas, Sørfjord and the inner Oslofjord, are indeed affected by organic contaminants (as is also shown through the approximately 20 years of

JAMP Biological Effects Methods 1997-2001 - Norway
NIVA report no. 4649-2003 25
JAMP-monitoring). There were clear relationships with accumulation of contaminants. There was also a reproducible increase in hepatic EROD in fish from these two areas. The range of responses in less contaminated areas also indicate that individual fish are affected by organic contaminants. Results for hepatic metallothionein indicate that fish are not strongly exposed by zinc, copper, cadmium or mercury in the areas investigated during this 5-year programme. It is recommended to continue the biological effects programme for Atlantic cod at the same stations for three methods: OH-pyrene, ALA-D and EROD. The results for metallothionein did not indicate clear effects and the use of this method should be discontinued. The same three methods should also be continued for flounder, but there is a need for a reference site for this species. Flounder is found in the most contaminated coastal areas and estuaries both in Norway and other European countries. It is therefore important to enhance the database for biological effects in this species.

JAMP Biological Effects Methods 1997-2001 - Norway
26 NIVA report no. 44649-2003
6. References Titles translated to English in square brackets [ ] are not official. Addison, R.F., Fitzpatrick, D., Renton, K.W. 1990. Distribution of delta -aminolevulinic acid synthetase and δ -
aminolevulinic acid dehydratase in liver and kidney of rainbow trout (Salmo gairdneri). Comp. Biochem. Physiol. 95B:317-319.
Ahlborg, U.G., 1989. Nordic risk assessment of PCDDs and PCDFs. Chemosphere 19:603-608. Ahlborg, U.G., Becking G.B., Birnbaum, L.S., Brouwer, A, Derks, H.J.G.M., Feely, M., Golor, G., Hanberg, A., Larsen,
J.C., J.C., Liem, A.K.G., Safe, S.H., Schlatter, C., Wärn, F., Younes, M., Yrjänheikki, E., 1994. Toxic equivalency factors for dioxin-like PCBs. Report on a WHO-ECEH and IPSC consultation , December 1993. Chemosphere 28:1049-1067.
Andersson, T., Förlin, L. 1985. Spectral properties of substrate-cytochrome P-450 interaction and catalytic activity of xenobiotic metabolizing enzymes in isolated rainbow trout liver cells. Biochem. Pharmacol. 34:1407-1413.
ASMO, 1994. Draft assessment of temporal trends monitoring data for 1983-91: Trace metals and organic contaminants in biota. Environmental Assessment and Monitoring Committee (ASMO). Document ASMO(2) 94/6/1.
ASMO, 1997. Summary Record. Environmental Assessment and Monitoring Committee (ASMO). Document ASMO 97/9/1.
Bayne, B.L., Brown, D.A., Burns, K., Dixon, D.R., Ivanovici, A., Livingstone, D.A. Lowe, D. M., Moore, M. N., Stebbing, A.R.D. Widdows, J. 1985. The effects of stress and pollution on marine animals. Praeger, New York, USA.
Bogovski, S., Sergeyev, B., Muzyka, V., Karlova, S. 1998. Cytochrome P450 System and Heme Synthase Enzymes Activity in Flounder Liver as Biomarkers of Marine Environments Pollution. Mar. Environ. Res. 46:13-16.
Boon, J.P., Van Arnhem, E., Jansen, S., Kannan, N., Petrick, G., Schulz, D., Duinker, J.C. Reijnders, P.H.J., Goksøyr, A., 1992. The toxicokinetics of PCBs in marine mammals with special reference to possible interactions of individual congeners with the cytochrome P450-dependent monooxygenase system: an overview. In: Walker C.H., Livingstone, D.R. (eds.), Persistent pollutants in marine ecosystems, 1st ed, Pergamon Press, Oxford, pp. 119-159.
Burden, V.M., Sandheinrich, M.B., Caldwell, C.A. 1998. Effects of lead on the growth and delta -aminolevulinic acid dehydratase activity of juvenile rainbow trout, Oncorhynchus mykiss. Environ. Pollut. 107:285-289.
Burke, M.D., Mayer, R.T. 1974. Ethoxyresorufin: Direct fluorimetric assay of a microsomal O-dealkylation which is preferentially inducible by 3-methylchoalanthrene. Drug metabolism and Disposition. 2:583-588.
Collier, T.K., Varanasi, U. 1991. Hepatic activities of xenobiotic metabolising enzymes and bilary levels of xenobiotics in English sole (Parophrys vetulus) exposed to environmental contaminants. Arch. Environ. Contam. Toxicol. 20:463-473.
Creaven, P.J., Parke, D.V., Williams, R.T: 1965. A fluorimetric study of the hydroxylation of biphenyl in vitro by liver preparations of various species. Biochemistry Journal. 96:879-885.
Følsvik N., Berge J.A., Brevik E. M. & M. Walday. 1999. Quantification of organotin compounds and determination of imposex in populations of dogwhelks (Nucella lapillus) from Norway. Chemosphere. 38 (3): 681-691.
Geyer, H.J., Steinberg, C.E., Scheunert, I., Brüggemann, R., Schütz, W., Kettrup, A., Rozman, K. 1993. A review of the relationship between acute toxicity (LC50) of γ-hexachlorocyclohexane (γ-HCH, lindane) and total lipid content of different fish species. Toxicology. 83:169-179.
Goksøyr, A. 1995. Cytochrome P450 in marine mammals: isozyme forms, catalytic functions, and physiological regulations. In Blix A.S., Walløe L., Ulltang Ø. (eds), Whales, seals, fish and man Developments in marine biology 4, Elsevier, Amsterdam, The Netherlands, pp 629-639.
Goksøyr, A., Förlin, L. 1992. The cytochrome P-450 system in fish, aquatic toxicology and environmental monitoring. Aquat. Toxicol. 22:287-312.
Granick, S., Sassa, S., Granick, J.L., Levere, R.D., Kappas, A. 1972. Assays for porphyrins, δ-amino levulinic-acid dehydratase, and porphyrinogen synthetase in microliter samples of whole blood: Applications to metabolic defects involving the heme pathway. Procedures, the National Academy of Science, USA, 69:2381-2385.
Green, N.W., 1987. "Joint Monitoring Group" (JMG). Felles monitoring program i Norge: Oslofjord-området, Sørfjorden og Hardangerfjorden, og Orkdalsfjorden. Programforslag for 1988. 4.Dec.1987. NIVA-project 80106, 12 pp..
Green, N.W., 1989. The effect of depuration on mussels analyses. Report of the 1989 meeting of the working group on statistical aspects of trend monitoring. The Hague, 24-27 April 1989. ICES-report C.M.1989/E:13 Annex 6:52-58.
Green, N.W., 1991. Joint Monitoring Programme. National Comments to the Norwegian Data for 1989. Norwegian Institute for Water Research (NIVA) memo 27pp.. JMG 16/info 13-E.
Green, N.W., 1997. Joint Assessment and Monitoring Programme (JAMP) National Comments to the Norwegian Data for 1995. Norwegian Pollution Control Authority, Monitoring report no. 685/97 TA no. 1405/1997. Norwegian Institute for Water Research project 80106, report number 3597-97, 124 pp.. ISBN number 82-577-3152-8. (Also as document SIME 97/5/5).
Green, N.W., 2001 Joint Assessment and Monitoring Programme in Norway 2001 Contaminants - Oslofjord area, Lista, Sørfjorden, Hardangerfjorden, Bømlo, Lofoten area and Varangerfjord. Programme for 2001 NIVA project 80106, 8.3.2001. 54 sider.

JAMP Biological Effects Methods 1997-2001 - Norway
NIVA report no. 4649-2003 27
Green, N.W., Bjerkeng B., Berge J.A., 1996. Depuration (12h) of metals, PCB and PAH concentrations by blue mussels (Mytilus edulis). Report of the Working Group on the Statistical Aspects of Environmental Monitoring. Stockholm 18-22 March 1996. ICES C.M.1996/D:1 Annex 13:108-117.
Green, N.W., Bjerkeng, B, Helland, A., Hylland, K., Knutzen, J., Walday, M., 2000. Joint Assessment and Monitoring Programme (JAMP) National Comments regarding the Norwegian Data for 1998 and supplementary investigations on cod (1996) and sediment (1996-1997). Norwegian Pollution Control Authority, Monitoring report no. 788/00 TA no. 1702/2000. Norwegian Institute for Water Research project 80106, report number 4171-2000, 206 pp.. ISBN number 82-577-3787-9. (Also presented as SIME 2000 document 00/3/6).
Green, N.W., Følsvik, N., Oredalen, T.J., Prestbakmo, G., 2001b. Joint Assessment and Monitoring Programme (JAMP). Overview of analytical methods 1981-2000. SFT Statlig overvåkingsprogram rapport nr. 822/01, TA nr. 1800/2001. NIVA, rapport nr. 4353-2001, 68 s. ISBN nr. 82-577-3989-8.
Green, N.W., Helland, A., Hylland, K., Knutzen, J., Walday, M., 2001c. Joint Assessment and Monitoring Programme (JAMP). Overvåking av miljøgifter i marine sedimenter og organismer 1981-1999. SFT Statlig overvåkingsprogram rapport nr. 819/01, TA nr. 1797/2001. NIVA, rapport nr. 4358-2001, 191 s. ISBN nr. 82-577-3995-2.
Green, N.W., Hylland, K., Ruus, A., Walday, M., 2002e. Joint Assessment and Monitoring Programme (JAMP). National Comments regarding the Norwegian Data for 2000. Norwegian Pollution Control Authority, Monitoring report no. 842/02 TA no. 1854/2002. Norwegian Institute for Water Research project 80106, report number 4468-2002, 197 pp.. ISBN number 82-577-4115-9. (Also presentert som SIME 2002 document 02/2/info. 2).
Green, N.W., Hylland, K., Walday, M., 2001a. Joint Assessment and Monitoring Programme (JAMP). National Comments regarding the Norwegian Data for 1999. SFT Statlig overvåkingsprogram 812/01 TA no. 1780/2001. NIVA, rapport nr. 4335-2001, 181 s. ISBN nr. 82-577-3969-3.
Green, N.W., Knutzen, J., 2001. Joint Assessment and Monitoring Programme (JAMP). Forurensnings- og referanseindeks basert på observasjoner av miljøgifter i blåskjell fra utvalgte områder 1995-1999.[Joint Assessment and Monitoring Programme (JAMP). Pollution and reference indicies based on contaminants in blue mussels 1995-1999]. Norwegian Pollution Control Authority, Monitoring report no. 821/01 TA no. 1799/2001. NIVA project O-80106, (report number 4342-2001) 35 pp.. ISBN number 82-577-3977-4.
Green, N.W., Knutzen, J., Helland, A., Brevik, E.M., 1995. Overvåking av miljøgifter i sedimenter og organismer 1981-92. "Joint Monitoring Programme (JMP)". [Monitoring av contamiants in sediment and organisms 1981-92 "Joint Assessment and Monitoring Programme (JMP)".] Norwegian Pollution Control Authority, Monitoring report no. 593/95. Norwegian Institute for Water Research project 80106, report number 3184, 195 pp.. ISBN-82-577-2676-1.
Green, N.W., Severinsen G., Rogne, Å.K., 2002a. Joint Assessment and Monitoring Programme (JAMP). Contaminant data for sediments 1986-1997. Norwegian Pollution Control Authority, Monitoring report no. 861/02 TA no. 1918/2002. Norwegian Institute for Water Research project 80106, report number 4599-2002, 230 pp.. ISBN number 82-577-4259-7.
Green, N.W., Severinsen G., Rogne, Å.K., 2002b. Joint Assessment and Monitoring Programme (JAMP). Contaminant data for shellfish 1998-2001. Norwegian Pollution Control Authority, Monitoring report no. 862/02 TA no. 1919/2002. Norwegian Institute for Water Research project 80106, report number 4600-2002, 269 pp.. ISBN number 82-577-4260-0.
Green, N.W., Severinsen G., Rogne, Å.K., 2002c. Joint Assessment and Monitoring Programme (JAMP). Contaminant data for fish 1998-2001. Norwegian Pollution Control Authority, Monitoring report no. 863/02 TA no. 1920/2002. Norwegian Institute for Water Research project 80106, report number 4601-2002, 336 pp.. ISBN number 82-577-4261-9.
Green, N.W., Severinsen G., Rogne, Å.K., 2002d. Joint Assessment and Monitoring Programme (JAMP). Summary statistics for contaminants in shellfish and fish 1981-2001. Norwegian Pollution Control Authority, Monitoring report no. 864/02 TA no. 1921/2002. Norwegian Institute for Water Research project 80106, report number 4602-2002, 422 pp.. ISBN number 82-577-4262-7.
Harding M.J.C., Bailey S.K. & I..M. Davies. 1992. TBT imposex survey of the North Sea. Annex 7:Norway. Scottish Fisheries working paper No 10/92 (1992).
Haux, C., Förlin, L. 1989. Selected assays for health status in natural fish populations. In: Landner L. (Ed.), Chemicals in the aquatic environment. Berlin: Springer Verlag. pp. 197-215.
Hodson, P.V. 1976. δ-amino levulinic acid dehydratase activity of fish blood as an indicator of a harmful exposure to lead. J. Fish. Res. Board Canada. 33:268-271.
Hodson, P.V., Blunt, B.R., Spry, D.J. 1978. Chronic toxicity of water-borne and dietary lead to rainbow trout (Salmo gairdneri) in Lake Ontario water. Water Res. 12:869-878.
Hodson, P.V., Blunt, B.R., Spry, D.J., Austen, K. 1977. Evaluation of erythrocyte δ-amino levulinic acid dehydratase activity as a short-term indicator in fish of a harmful exposure to lead. J. Fish. Res. Board Canada 34:501-508.
Hodson, P.V., Blunt, B.R., Whittle, D.M. 1984. Monitoring lead exposure of fish. In: Cairns V.W., Hodson P.V. Nriagu J.O. (Eds.), Contaminant effects on fisheries. New York: John Wiley & Sons. pp. 87-98.
Hogstrand, C., Haux, C. 1990. A radioimmunoassay for perch (Perca fluviatilis) metallothionein. Toxicol. appl. Pharmacol. 103:56-65.
Hylland, K., Haux, C., Hogstrand, C. 1992. Hepatic metallothionein and metals in dab (Limanda limanda L.) from the German Bight. Mar Ecol Prog Ser 91: 89-96.

JAMP Biological Effects Methods 1997-2001 - Norway
28 NIVA report no. 44649-2003
IARC, 1987. IARC [International Agency for Research on Cancer] monographs on the evaluation of the carcinogenic risk of chemicals to humans. Overall evaluations of carcinogenicity: an updating of IARC monographs. Vol., 1-42. Suppl. 7. Lyon.
ICES, 1996. ICES Environmental Data Reporting Formats. Version 2.2, revision 2 - July 1996. Klotz, A.V., Stegeman, J. J., Walsh, C. 1984. An alternative 7-Ethoxyresorufin O-Deethylase activity assay: A continous
visible spectrophotometric method for measurement of cytochrome P-450 monooxygenase activity. Anal. Biochem. 140:138-145.
Knutzen, J., Bjerkeng, B., Green, N.W., Kringstad, M., Schlaback, M., Skåre J.U., 2001. Overvåking av miljøgifter i fisk og skalldyr fra Grenlandsfjordene 2000. [Monitoring of micorpollutants in fish and shellfish from the Grenland fjords (S. Norway) 2000] Norwegian Pollution Control Authority, Monitoring report no. 835/01. TA no. 1832/2001. NIVA project O-800309, (report number 4452-2001) 230 pp.. ISBN number 82-577-4098-5.
Knutzen, J., Green, N.W., 1995. Bakgrunnsnivåer av en del miljøgifter i fisk, blåskjell og reker. Data fra utvalgte norske prøvesteder innen den felles overvåking under Oslo-/Paris-kommisjonene 1990-1993. [Background levels of some micropollutants in fish, the blue mussel and shrimps. Data from selected Norwegian sampling sites within the joint monitoring of the Oslo-/Paris Commissions 1990-1993]. Norwegian Pollution Control Authority, Monitoring report no. 594/94 TA no. 1173/1994. NIVA project O-80106/E-91412, (report number 3302) 105 pp.. ISBN number 82-577-2678-8.
Knutzen, J., Green, N.W., 2001a. Tiltaksorienterte miljøundersøkelser i Sørfjorden og Hardangerfjord 2000. Delrapport 2. Miljøgifter i organismer. [Investigation of micropollutants in the Sørfjord and Hardangerfjord 2000. Report 2. Contaminants in organisms.] Norwegian Pollution Control Authority, Monitoring report no. 836/01. TA no. 1833/2001. NIVA project O-800309, (report number 4445-2001) 51 pp.. ISBN number 82-577-4091-8.
Knutzen, J., Green, N.W., 2001b. Joint Assessment and Monitoring Programme (JAMP). "Bakgrunnsnivåer" av miljøgifter i fisk og blåskjell basert på datamateriale fra 1990-1998.[Joint Assessment and Monitoring Programme (JAMP). Background levels of some contaminants in fish and blue mussel based on data from 1990-1998]. Norwegian Pollution Control Authority, Monitoring report no. 820/01 TA no. 1798/2001. NIVA project O-80106, (report number 4339) 145 pp.. ISBN number 82-577-3973-1.
Knutzen, J., Skei, J., 1990. Kvalitetskriterier for miljøgifter i vann, sedimenter og organismer samt foreløpige forslag til klassifikasjon av miljøkvalitet. [Quality criteria for water, sediments and organisms and preliminary proposals for classification of environmental quality]. NIVA-prosjekt O-8000309 (NIVA report no. 2540), 139 sider. ISBN.82-577-1855-6.
Krahn, M.M., Rhodes, L.D., Myers, M.S., Moore, L.K., MacLeod, W.D., Malins, D.C: 1986. Associations between metabolites of aromatic compounds in bile and the occurence of hepatic lesions in English sole (Parophrys vetulus) from Puget Sound, Washington. Arch. Environ. Contam. Toxicol. 15:61-67.
Kägi, J.H.R., Schäffer, A. 1988. Biochemistry of metallothionein. Biochem. 27:8509-8515. Larsson, Å., Haux, C., Sjöbeck, M.-L. 1985. Fish Physiology and Metal Pollution: Results and Experiences from
Laboratory and Field Studies. Ecotoxicol. Environ. Saf. 9:250-281. Lech, J.J., Pepple, S.K., Statham, C.N. 1973. Fish bile analysis: a possible aid in monitoring water quality. Toxicol Appl
Pharmacol. 25:430-434. Letcher, R.J., Klasson-Wehler, E., Bergman, Å. 2000. Methyl sulfone and hydroxylated metabolites of polychlorinated
biphenyls. In: Paasivirta J. (ed), The handbook of environmental chemistry Vol. 3 Part K. New types of persistent halogenated compounds, Springer-Verlag, Berlin Heidelberg, Germany, pp 315-359.
Lowry, O.H., Rosebrough, N.J., Farr, A.L., Randall, R.J. 1951. Protein measurement with the folin phenol reagent. J. biol. Chem. 193:265-275.
Matthews, H.B., Dedrick, R.L. 1984. Pharmacokinetics of PCBs. Annu. Rev. Pharmacol. 24:85-103. Mayer, F. L., Versteeg, D. J., McKee, M. J., Folmar, L. C., Graney, R. L., McCume, D. C., Rattner, B. A. 1992.
Physiological and nonspecific biomarkers. In Biomarkers. Biochemical, physiological, and histological markers of anthropogenic stress. Eds: Huggett, R. J., Kimerle, R. A., Mehrle Jr., P. M. & Bergman, H. L., pp. 5-85, Lewis Publishers.
Meador, J.P., Stein, J.E., Reichert, W.L. Varanasi, U. 1995. Bioaccumulation of polycyclic aromatic hydrocarbons by marine organisms. Rev. Environ. Contam. Toxicol. 143:79-166.
Molvær, J., Knutzen, J., Magnusson, J., Rygg, B., Skei J., Sørensen, J., 1997. Klassifisering av miljøkvalitet i fjorder og kystfarvann. Veiledning. Classification of environmental quality in fjords and coastal waters. A guide. Norwegian Pollution Control Authority. TA no. TA-1467/1997. 36 pp.
MON, 1993. Draft Summary record. Eleventh meeting of the Ad Hoc Working Group on Monitoring, Copenhagen: 8-12 November 1993. MON 11/1/7-E.
MON, 1998. Summary record. Ad Hoc Working Group on Monitoring, Copenhagen: 23-27 February 1998. MON 98/6/1-E. MON, 2001. The first draft of a new OSPAR Strategy for a Joint Assessment and Monitoring Programme (JAMP).
Working Group on Monitoring (MON), Belfast: 4-7 December 2001. MON 01/7/1-E. Nelson, D.R., Koymans, L., Kamataki, T., Stegeman, J.J., Feyreisen, R., Waxman, D.J., Waterman, M.R., Gotoh, O., Coon,
M.J., Estabrook, R.W., Gunsalus, I.C., Nebert, D.W. 1996. P450 superfamily: update on new sequences, gene mapping, accession numbers and nomenclature. Pharmacogenetics. 6:1-42.
Nicholson, M., Fryer, R.J., Green, N.W., 1994. Focusing on key aspects of contaminant trend assessments. Nineteenth meeting of the Joint Monitoring Group 24-29 . January, 1994. Document JMG 19/3/3.
JAMP Biological Effects Methods 1997-2001 - Norway
NIVA report no. 4649-2003 29
Nicholson, M., Fryer, R.J., Larsen, J.R., 1998. Temporal trend monitoring: A robust method for analysing trend monitoring data, ICES Techniques in Marine Envrionmental Sciences, No.20 September 1998.
Nicholson, M., Fryer, R.J., Maxwell, D.M., 1997. A study of the power of various methods for detecting trends. ICES CM 1997/Env.11.
Olsson, P.E. 1987. Metallothionein in fish: Aspects of biochemistry and function. PhD thesis. Gøteborgs Universitet. pp. 1-41.
OSPAR, 1990. Oslo and Paris Conventions. Principles and methodology of the Joint Monitoring Programme. [Monitoring manual for participants of the Joint Monitoring Programme (JMP) and North Sea Monitoring Master Plan (NSMMP)]. March 1990.
OSPAR, 1997. JAMP Guidelines. Oslo and Paris Commissions, Joint Assessment and Monitoring Programme (including chapter updates 1998-1999).
Payne, J.F. 1976. Field evaluation of benzopyrene hydroxylase induction as a monitor for marine petroleum pollution. Science 191:945-946.
Peakall, D. B. 1994. The role of biomarker in environmental assessment. 1. Introduction. Ecotoxicology. 3:157-160. Rowlands, J.C., Gustafsson, J.Å., 1997. Aryl hydrocarbon receptor-mediated signal transduction. Crit. Rev. Toxicol.
27:109-134. Ruus A., Sandvik M., Ugland K.I., Skaare J.U. 2002. Factors influencing activities of biotransformation enzymes,
concentrations and compositional patterns of organochlorine contaminants in members of a marine food web. Aquat. Toxicol. 61:73-87.
Ruus, A., Green, N.W., 2002. Tiltaksorienterte miljøundersøkelser i Sørfjorden og Hardangerfjorden 2001. Delrapport 2. Miljøgifter i organismer. Measure oriented environmental monitoring of Sørfjord and Hardangerfjord 2002. Report component 2. Contaminants in organisms. Norwegian Pollution Control Authority, Monitoring report no. 865/02 TA no. 1922/2002. NIVA project 800309 (report number 4612-2002), 41 pp.. ISBN number 82-577-4273-2.
Ruus, A., Skaare, J.U., Ingebrigtsen, K. 2001. Disposition and depuration of lindane (γ-HCH) and polychlorinated biphenyl-110 (2,3,3′,4′,6-pentachlorobiphenyl) in cod (Gadus morhua) and bullrout (Myoxocephalus scorpius) after single oral exposures. Environ. Toxicol. Chem. 20:2377-2382.
Safe, SH. 1994. Polychlorinated biphenyls (PCBs): environmental impact, biochemical and toxic responses, and implications for risk assessment. Crit. Rev. Toxicol. 24:87-149.
Sandvik, M., Beyer, J., Goksøyr, A., Hylland, K., Egaas, E., Skaare, J.U. 1997. Interaction of benzo[a]pyrene, 2,3,3′,4,4′,5-hexachlorobiphenyl (PCB-156) and cadmium on biomarker responses in flounder (Platichthys flesus L.). Biomarkers. 2:153-160.
SIME, 1997. Summary Record. Oslo and Paris Conventions for the Prevention of Marine Pollution. Working Group on Concentrations, Trends and Effects of Substances in the Marine Environment (SIME), Bonn: 17-21 November 1997. SIME (2) 97/12/1-E, 29 pp. + Annexes.
SIME, 2002, OSPAR Coordinated Environmental Monitoring Programme (CEMP). Working Group on Concentrations, Trends and Effects of Substances in the Marine Environment (SIME), Oudenburg: 29-31 January 2002. Summary Record, Annex 5 SIME 02/10/1-E, 8 pp.
Skei, J., 2000. Tiltaksorienterte miljøundersøkelser i Sørfjorden og Harangerjforden 1999. Delrapport 1 Vannkjemi. [Investigation of Sørfjord and Hardangerfjord 1999. Report 1. Water Chemistry] Norwegian Pollution Control Authority, Monitoring report no. 796/00 TA no. 1724/2000. NIVA project O-800309, (report number 4236-2000) 23 pp.. ISBN number 82-577-3858-1.
Skei, J., 2001. Tiltaksorienterte miljøundersøkelser i Sørfjorden og Harangerjforden 2000. Delrapport 1 Vannkjemi. [Investigation of Sørfjord and Hardangerfjord 2000. Report 1. Water Chemistry] Norwegian Pollution Control Authority, Monitoring report no. 830/01 TA no. 1818/2001. NIVA project O-800309, (report number 4406-2001) 22 pp.. ISBN number 82-577-4048-9.
Skei, J., Knutzen, J., 2000. Utslipp av kvikksølv til Sørfjorden som følge av uhell ved Norzink AS vinteren 1999-2000. Miljømessige konsekvenser. [Accidental mercury discharge by Norzink AS to the Sørfjord, winter 1999-2000. Environmental consequences.] NIVA project O-89083 (report number 4234-2000) 12pp.. ISBN number 82-577-3856-5.
Skei, J., Rygg, B., Moy, F., Molvær, J., Knutzen, J., Hylland, K., Næs, K., Green, N. Johansen, T., 1998. Forurensningsutviklingen i Sørfjorden og Hardangerfjorden i perioden 1980-1997. Sammenstilling av resultater fra overvåking av vann, sedimenter og organismer. [The development of pollution in the Sørfjord and Hardangerfjord during the period 1980-1997. Summary of results from monitoring of water, sediment and organisms.] Norwegian Pollution Control Authority, Monitoring report no. 742/98 TA no. 1581/1998. NIVA project O-800310, (report number 3922-98) 95 pp.. ISBN number 82-577-3507-8.
Stegeman, J. J., Brouwer, M., Di Giulio, R. T., Förlin, L., Fowler, B. A., Sanders, B. M., Van Veld, P. A. 1992. Molecular responses to Environmental contamination: Enzyme and protein systems as indicators of chemical exposure and effect. In Biomarkers. Biochemical, physiological, and histological markers of anthropogenic stress. Eds: Huggett, R. J., Kimerle, R. A., Mehrle Jr., P. M. & Bergman H. L., pp. 235-335, Lewis Publishers.
Van den Berg, Birnbaum, L, Bosveld, A. T. C. and co-workers, 1998. Toxic equivalency factors (TEFs) for PCBs, PCDDs, PCDFs for humans and wildlife. Environ Hlth. Perspect. 106:775-792.
Van den Berg, M., Birnbaum, L., Bosveld, A.T.C., Brunström, B., Cook, P., Feeley, M., Giesy, J.P., Hanberg, A., Hasegawa, R., Kennedy, S.W., Kubiak, T., Larsen, J.C., van Leeuwen, F.X.R., Liem, A.K.D., Nolt, C., Peterson, R.E., Poellinger, L., Safe, S., Schrenk, D., Tillitt, D., Tysklind, M., Younes, M., Wærn, F., Zacharewski, T., 1998.

JAMP Biological Effects Methods 1997-2001 - Norway
30 NIVA report no. 44649-2003
Toxic Equivalency Factors (TEFs) for PCBs, PCDDs, PCDFs for humans and wildlife. Environ. Health Perspect. 106:775-792.
Walday M., Berge J.A. & N. Følsvik. 1997. Imposex and levels of organotin in populations of Nucella lapillus in Norway (English summary). Norwegian Institute for Water Research, report no. 3665-97. 28pp.
Walday, M., Green, N., Hylland, K., 1995. Kostholds- og tilstandsindikatorer for miljøgifter i marine områder. Norwegian Institute for Water Research project 93254, report number 3280, 39 pp.. ISBN number 82-577-2691-5.
WGSAEM, 1993. The length effect on contaminant concentrations in mussels. Section 13.2. in the Report of the Working Group on Statistical Aspects of Environmental Monitoring, Copenhagen 27-30, April 1993. International Council for the Exploration of the Sea. C-M- 1993/ENV:6 Ref.: D and E, 61 pp.
Williams, R.T. 1974. Inter-species variations in the metabolism of xenobiotics. Biochem. Soc. T. 2:359-377. Aas, E., Baussant, T., Balk, L., Liewenborg, B., Andersen, O.K. 2000b. PAH metabolites in bile, cytochrome P4501A and
DNA adducts as environmental risk parameters for chronic oil exposure: a laboratory experiment with Atlantic cod. Aquat. Toxicol. 51:241-258.
Aas, E., Beyer, J., Goksøyr, A. 2000a. Fixed wavelength fluorescence (FF) of bile as a monitoring tool for polyaromatic hydrocarbon exposure in fish: an evaluation of compound specificity, inner filter effect and signal interpretation. Biomarkers. 5:9-23.

JAMP Biological Effects Methods 1997-2001 - Norway
NIVA report no. 4649-2003 31
Appendix A. Analytical methods


JAMP Biological Effects Methods 1997-2001 - Norway
NIVA report no. 4649-2003 33
ANALYTICAL METHODS OH-pyrene metabolites When fish are exposed to, and take up PAHs, the compounds are biotransformed into polar metabolites, which enhances the efficiency of excretion. One such biotransformation is the coupling of a hydroxyl-group to the molecule (Figure 7) .The bile is thought to be the dominant excretion route of metabolites of especially larger PAH molecules in fish (Meador et al. 1995). Since PAH metabolites are stored for some time and thereby concentrated in the gall bladder, the bile is shown to be a suited matrix for measures of PAH metabolites (Creaven et al. 1965; Lech et al. 1973; Aas et al. 2000a,b).
OH
Figure 7. 1-OH-pyrene. Example of a PAH-metabolite. A hydroxyl-group has been added to the molecule, through biotransformation, to increase the polarity of the molecule, and thus the efficiency of excretion. All PAH compounds fluoresce (FAC: Fluorescent Aromatic Compounds). PAH molecules absorb ultraviolet light followed by emission of light of a longer wavelength. These compounds can therefore be detected by using their fluorescence. The use of high performance liquid chromatography (HPLC) provides a compound specific characterisation of the PAH composition in the bile (Krahn et al. 1986). By this method, the PAH metabolites are separated in a chromatographic column prior to detection. The detection can be performed by either as fluorescence (as mentioned above; HPLC/F) or with mass spectrometer (HPLC/MS). A factor influencing the absolute levels of PAH metabolites in bile is differences in bile density between individuals. Filling and emptying of the gall bladder is dependent on the feeding status of the fish, and this is influencing the bile density and therby also the concentration of eventual PAH metabolites in the bile (Collier and Varnasi 1991). One can normalise for this bile density by measuring the absorbance in the bile at 380 nm. It is the bile pigment biliverdin that has one of its two major peaks at this wavelength, thus the relative concentration of biliverdin can be deduced from the measured absorbance. Twenty microlitres of the bile sampled from the fishes were added triphenylamine (internal standard), diluted with demineralised water (50µl) and hydrolysed with β-glucuronidase/arylsulfatase (20µl; 1 hour at 37°C). Methanol (200µl) was added and each sample was centrifuged to precipitate any dissoluted proteins. The superanatant was subsequently analysed with HPLC and fluorescence detection with the following conditions: Column: Vydac C18 3 µm particles, 4,6 mm*15cm Temperature: 40°C Mobile phase: Gradient from 40%:60% acetonitrile:water to 100 % acetonitrile Flow: 1ml/min

JAMP Biological Effects Methods 1997-2001 - Norway
34 NIVA report no. 4649-2003
Dector: The fluorescence was measured at the optimum for each analyte The bile-concentrations of the PAH metabolites were normalised (see above) according to the bile-absorbance at 380nm (bile diluted in ethanol), detected in a spectrophotometer. ALA-D Many metals are essential to all organisms, e.g. copper (Cu), zinc (Zn), iron (Fe), manganese (Mn) and molybdenum (Mo), but there are also metals for which no biological function is known, such as mercury (Hg), cadmium (Cd), gold (Au), silver (Ag) and lead (Pb). Such non-essential metals generally have much higher toxicity than the essential metals. Uptake, storage and excretion are also less well controlled for the non-essential than for essential metals. One of the most important toxic mechanisms of non-essential metals is the interaction with and inhibition of enzymes, especially enzymes with metal co-factors. One such enzyme is δ-aminolevulinic acid dehydratase (ALA-D) which has Zn as a co-factor (Granick et al., 1972). This enzyme is one step in the synthesis pathway for heme and is found in bacteria, plants and invertebrates as well as in vertebrates. Heme is incorporated in macromolecules such as hemoglobin and cytochromes. In mammals and birds, inhibition of ALA-D may lead to anemia since it is one of the rate-limiting enzymes in heme (and hence hemoglobin) synthesis. This does not appear to be the case for fish (Larsson et al., 1985). The reason for ecotoxicological interest in ALA-D is its inhibition by Pb, even at very low exposure levels (Hodson et al., 1984; Haux and Förlin, 1989). ALA-D has been used to investigate Pb effects in several species (e.g. Hodson, 1976; Hodson et al., 1977; 1978; Addison et al., 1990; Burden et al.,. 1998; Bogovski et al., 1998). The sensitivity, timing and specificity of ALA-D inhibition in response to lead exposure has been reviewed by Hodson et al. (1984). The ALA-D activity was determined in red blood cells (Hodson et al., 1984) as follows: Red blood cells were separated from plasma by centrifugation at 5000 g for 5 min (4°C). The blood cell-samples were homogenised in 3 volumes (v/v) of dillution buffer (0.1 M potassium phosphate buffer with 0.2% Triton X-100, pH optimised for the fish species in question at 7.0) using a Potter-Elvehjem glass-teflon homogeniser before centrifugation for 30 min at 10 000 g (4°C). The resulting supernatant was then used for measurement of ALA-D activity and blood-protein. The analysis of ALA-D activity was performed in three steps (i) sample dilution and initiation of reaction, (ii) stopping the reaction and separation of product from reagents, (iii) quantifying the product: Step (i): The supernatant was diluted in dilution buffer (see above). 50 µL of this solution were added to six eppendorf tubes. 200 µL of dilution buffer (see above) were then added to three tubes, and 200 µL ALA-reagent (33.5 mg δ-aminolevulinic acid dilluted in 50 mL dilution buffer [see above]) to the remaining three. The solutions were mixed well and incubated for 2 h at room temperature. Step (ii): Standards were prepared (from the standard solution; porphobilinogen dissolved in dilution buffer to a final concentration of 40µL/mL) in dilution buffer to a total volume of 400 µL; 20, 40, 80, 160 µL of the standard solution are generally appropriate. Then 300 µL precipitation reagent (4.0 g trichloroacetic acid and 2.7 g mercury chloride dissolved in distilled water to a volume of 100 mL) were added to all tubes (samples and standards); mixed immediately and left for 5 min, before centrifugation at 2500 g for 5 min (room temperature). The supernatants were transferred to clean, labelled tubes. Step (iii): 150 µL of each supernatant were transferred to wells in a 96-wells plate (in triplicate), before 150 µL modified Erlich reagent (0.35 g mercury chloride dissolved in 6 mL of distilled water and 20 mL of 70% perchloric acid. Acetic acid added to a total volume of 110 mL and 2.0 g p-amino benzoic acid dissolved in the final volume) were added to all the wells and mixed well. The solutions

JAMP Biological Effects Methods 1997-2001 - Norway
NIVA report no. 4649-2003 35
were incubated for 15 min (room temperature), and the absorbance at 553 nm was read, using a plate reader. The assay is linear for values exceeding those found in the temperate fish species studied. The ALA-D activity was normalised to blood protein content, determined according to the Lowry protein assay (Lowry et al., 1951) adapted to measurement by plate reader. Protein standard was bovine gamma globulin. EROD EROD (7-Ethoxyresorufin-O-deethylase) is a specific cytochrome P450 reaction where ethoxyresorufin is used as substrate (Burke & Mayer, 1974). Cytochrome P450 1A (see below) catalyse the deethylation of 7-ethoxyresorufin to resorufin (Figure 8). P-450 activity in microsome fractions can be quantified from the amount of resorufin produced (Andersson & Förlin, 1985). The resorufin can be quantified by spectrophotometric or fluorimetric methods (Klotz et al., 1984).
O
N
OCH3CH2O O
N
OHO
+ CH3OHP450
7-ethoxyresorufin resorufin Figure 8. The deethylation of 2-ethoxyresorufin to resorufin, catalysed by cytochrome P450. The cytochrome P450 system is a large superfamily of enzymes with several hundred forms comprising 265 different families (of which animals have 69), further divided into subfamilies (see Nelson et al. [1996] and http://drnelson.utmem.edu/ CytochromeP450.html for overview). The system is a highly diversified set of proteins and is found in bacteria, plants and lower eukaryotes, as well as in animals. Members of the P450 subfamily CYP1A are particularly important in the metabolism of many pollutants. In the case of planar molecules, such as certain PCBs, PCNs, dioxins and PAHs iso-enzymes of CYP1A are responsible for the insertion of oxygen into the molecular structure of the compound (Matthews and Dedrick, 1984; Letcher et al., 2000). This first oxidative step in the biotransformation process is called ‘phase I’ (Williams, 1974). The introduced oxygen creates a functional group for attachment of larger polar molecules of endogenous origin in a ‘phase II’ reaction (e.g. glucoronidation and sulphate- or glutathione conjugation) (Williams, 1974; Goksøyr, 1995). In this way, a lipophilic xenobiotic is transformed into a polar and water-soluble end product that can be excreted through bile or urine. These metabolites can also serve as a biomarker for contaminant exposure, as described above (quantification of OH-pyrene metabolites in fish bile). In addition to being substrates for biotransformation, the above mentioned planar compounds can also interact with cytochrome P450 1A as inducers (Boon et al., 1992; Goksøyr and Förlin, 1992). The induction is initiated by the binding of the inducer to the cytosolic Ah (Aryl hydrocarbon)-receptor (Rowlands and Gustafsson, 1997; Van den Berg et al., 1998). Several studies have indicated that P450 induction is the first step in a series of toxic symptoms, such as immunosuppression, vitamin and hormonal imbalance, and reproductive failure (Reviewed by Safe, 1994). EROD is a tool used to measure this induction. The induction of cytochrome P450 enzymes in fish liver was first suggested as an indicator of environmental contamination in the 1970s by Payne (1976), and the EROD measurement has now gained widespread use in biomonitoring studies with fish (Goksøyr and Förlin, 1992; Sandvik et al., 1997; Ruus et al. 2002). Ethoxyresorufin-O-deetylase (EROD) activity was assayed fluorimetrically (Burke and Mayer, 1974) in 8 steps, as follows:

JAMP Biological Effects Methods 1997-2001 - Norway
36 NIVA report no. 4649-2003
i. The reaction mixture was prepared from 50 mL buffer (0.1 M potassium-phosphate; pH 8.0) and 0.75 mL 7-ethoxyresorufin (0.2 mM in dimethylsulfoxide [DMSO]).
ii. Samples of microsomes, prepared from the fish livers, were then diluted to 2 mg/mL in buffer (see above).
iii. resorufin-standards (duplicates) were pipetted onto a (plate-reader) plate: 0, 0.01, 0.02, 0.04, 0.08, 0.16, 0.32 µM in buffer (300 µL; see above).
iv. 200 µL reaction mixture (see pt. i) were pipetted into subsequent wells (see pt. iii) on the plate.
v. 50 µL buffer were pipetted into the same wells as in pt. iv, above.
vi. 10 µL 0.32 µM resorufin-standard (see pt. iii) were added to subsequent wells on the plate.
vii. 25 µL NADPH-solution (2.4 mM in buffer [see above]) were added to the same wells as in pts. iv and v above.
viii. transformation of 7-ethoxyresorufin to resorufin was read in 8 steps on the plate reader. Excitation was at 530 nm and flourescence emmission was measured at 590 nm.
The EROD activity was normalised to protein content in the microsome fraction, determined according to the Lowry protein assay (Lowry et al., 1951) adapted to measurement by plate reader. Protein standard was bovine gamma globulin. Metallothionein The low-molecular-weight protein metallothionein (MT) is present in most vertebrate tissues. A major role of this protein is regulation of the intracellular availability of zinc (Zn) and/or copper (Cu). Other functions, such as metal detoxification and free radical scavenging, have also been suggested (Kägi and Schäffer, 1988). In addition to Cu and Zn, MT binds non-essential metals such as cadmium (Cd), mercury (Hg) and silver (Ag). The synthesis of the protein is induced by elevated intracellular concentrations of the above mentioned metals. Metallothionein induction is a response to elevated intracellular metal concentrations and the protein has been applied as a biomarker for environmental metal contamination (Hogstrand & Haux, 1989; Hylland et al., 1991). A widely used method to quantify MT is the quantification of sulfhydryl groups, which in most cases is done with an electrochemical quantification of MT by differential pulse polarography, DPP. This method involves an initial removal of high-molecular-weight proteins, either by heat denaturation or organic precipitation, followed by quantificaton of sulfhydryl groups. Sulfhydryl groups are quantified by either DPP or spectrophotometrically, using DTNB (5,5'-dithiobis 2-nitrobenzoic acid) as a chromophore. Metallothionein was assayed by the use of differential pulse polarography (DPP) as follows. Sample preparation: i. Samples of cytosol, prepared from the fish livers, were diluted approximately 1:10 in 0.9% NaCl.
ii. The diluted samples (pt. i) were heat-denatured at 95°C (5 min) before they were cooled on ice.
iii. The samples were sentrifuged at 10 000 g (10-15 min), and the supernatant was removed.
Analysis: i. 100 µL triton X-100 solution (125 µL triton X-100 to 1 L ddH2O [0.0125%]) was added to 10 mL electrolyte (0.6 mM hexamine cobalt chloride [0.321 g], 1.0 M NH4Cl [53.4 g], 1.0 M NH4OH (NH3) [75 mL], ddH2O to 1L).

JAMP Biological Effects Methods 1997-2001 - Norway
NIVA report no. 4649-2003 37
ii. Sample or standard is added to the electrolyte.
iii. After deoxygenation for 2 min the scan is initiated.
The amount of metallothionein is proportional to peak height (and area) (in the scan) and can be calculated from a prepared standard curve. An exaple of a scan is presented in Figure 9.
Figure 9. A typical scan. One baseline and one with 55 pmol rainbow trout (Onchorynchus mykiss) MT (from Olsson, 1987). Data preparation and statistical analyses Statistical analysis was performed with the use of Statistica® software (version 6.1; StatSoft, Tulsa, OK, USA). Each of the four Biological Effect Markers (above) were treated as response (dependent) variables in separate analyses (separate also for each species), and tried explained by a battery of explanatory variables (predictors) (Table 8) in multiple regressions, performed in the GLM (General Linear Models)-module in Statistica®. All contaminants that are analysed in the fish through the JAMP-programme can be found in Green et al. 2002. Due to measurements below detection limits and, in some cases, expected colinearity, specific compounds/congeners were selected to represent specific groups of contaminants (Table 3). Second degree interactions were tested for the categorical factors. Non-significant predictors (with low explanatory value) were stepwise taken out of the models (manually) until the best models were obtained. All continuos predictors were loge-transformed prior to the analysis to reduce skewness of distributions.

JAMP Biological Effects Methods 1997-2001 - Norway
38 NIVA report no. 4649-2003
Table 8. Explanatory variables (predictors) in full GLM model, before stepwise (manual) elimination. Variable Abbreviation Type of
variable Measured in (matrix)
Notes/Explanations
Year year Categorical 1997-2001 Station station Categorical Sex sex Categorical Maturation maturation Categorical Determined from length 1 Length length Continuous Condition cond Continuous Only for cod Liver Somatic Index log2LSI Continuous OH-pyrene 2 oh-pyr Continuous 2 Bile Represents PAH-
metabolites PCB-153 livcb153 Continuous Liver Represents congeners with
≥ 2 Cl in ortho-position PCB-105 + -118 l105_118 Continuous Liver Represents congeners with
1 Cl in ortho-position p,p’-DDE livddepp Continuous Liver Represents DDT-
compounds/metabolites Cd livcd Continuous Liver Cu livcu Continuous Liver Hg muhg Continuous Muscle Pb livpb Continuous Liver Zn livzn Continuous Liver 1 Gadus morhua: Individuals > 400 mm = mature (others = juvenile). Limanda limanda: Individuals > 130 mm = mature (others = juvenile). Platichthys flesus: Individuals > 204 mm = mature (others = juvenile).
Pleuronectes platessa: Individuals > 265 mm = mature (others = juvenile). 2 Not when OH-pyrene is the response (dependent) variable. Trend analyses The same simple 3-model approach used to study time trends for contaminants in biota based on median concentrations (ASMO 1994) was also applied to results from all four biological effects methods: OH-pyrene, ALA-D, EROD and metallothionein. The method was first used on a large-scale basis by the Ad Hoc Working Group on Monitoring that met in Copenhagen 8-12. November 1993 (MON 1993). The method of calculating the smoother is in accordance to the methods employed at Ad Hoc Working Group on Monitoring that met in Copenhagen 23-27. February 1998 (MON 1998). A Loess smoother is based on a running seven-year interval, a non-parametric curve fitted to median log-values (Nicholson et al.1997). For statistical tests based on a fitted smoother to be valid the contaminants indices should be independent to a constant level of variance and the residuals for the fitted model should be lognormally distributed (cf. Nicholson et al. 1998). The National Comments since 1994 have included two additional analyses. The first is that the smoothed median for the last three sampling years is linearly projected for the next three years. This deviates from previous reports where the upper 95 confidence interval was used to assess the likelihood of overconcentrations (Nicholson, et al. 1994). The projected estimate is based on the results for the temporal trend analyses of at least 6 years of data. The second is an estimate of the power of the temporal trend series expressed as the number of years to detect a 10% change per year with a 90% power (cf. Nicholson et al. 1997). The fewer the years the easier it is to detect a trend. The power is based on the percentage relative standard deviation (RLSD) estimated using the robust method described by ASMO (1994) and Nicholson et al. (1998).

JAMP Biological Effects Methods 1997-2001 - Norway
NIVA report no. 4649-2003 39
The estimate was made for series with at least 3 years of data and covers the entire period monitored. This fixed means of treating all the datasets may give misleading results especially where non-linear temporal changes are known to occur.


JAMP Biological Effects Methods 1997-2001 - Norway
NIVA report no. 4649-2003 41
Appendix B Stations and sample count for fish used for
biological effects methods 1997-2001
Station positions are shown on maps in Appendix C
jmpco: JAMP area code (J99 = unclassified) jmpst: station code stnam: station code Lon: Longitude Lat: Latitude icear: ICES area speci: species code (English, Norwegian (Latin))
GADU MOR - Atlantic cod, torsk (Gadus morhua) LIMA LIM - dab, sandflyndre (Limanda limanda) PLAT FLE - flounder, skrubbe (Platichthys flesus) PLEU PLA - plaice, rødspette (Pleuronectes platessa)
tissu: tissue: BI - bile BL - blood LI - liver MU - muscle
param: parameter
PYR1O - OH-pyrene ALAD - ALA-D (δ-amino levulinic acid dehydrase inhibition) EROD - EROD (Cytochrome P4501A-activity) MT - Metallothionein OC - Organochlorines HS - Hazardous substances, including cadmium, lead, mercury,
copper, zinc and PCBs (see Green et al. 2002).


JAMP Biological Effects Methods 1997-2001 - Norway
NIVA report no. 4649-2003 43
STATIONS AND SAMPLE COUNT FOR FISH USED FOR BIOLOGICAL EFFECTS METHODS
jmpco jmpst stnam lat lon icear speci tissu param 97 98 99 00 01 J26 30B Oslo City area 59° 49.0 10° 33.0 48G05 GADU MOR BI PYR1O 27 23 21 25J26 30B Oslo City area 59° 49.0 10° 33.0 48G05 GADU MOR BL ALAD 20 27 25 25 25J26 30B Oslo City area 59° 49.0 10° 33.0 48G05 GADU MOR LI EROD 11 30 25 25 25J26 30B Oslo City area 59° 49.0 10° 33.0 48G05 GADU MOR LI MT 16 22 25 25 25J26 36B Færder 59° 2.0 10° 32.0 47G06 GADU MOR BI PYR1O 25 25 23 25J26 36B Færder 59° 2.0 10° 32.0 47G06 GADU MOR BL ALAD 20 25 25 23 25J26 36B Færder 59° 2.0 10° 32.0 47G06 GADU MOR LI EROD 18 23 25 23 24J26 36B Færder 59° 2.0 10° 32.0 47G06 GADU MOR LI MT 20 22 25 23 24J26 36F Færder area 59° 4.0 10° 23.0 47G06 LIMA LIM BI PYR1O 11 8 18J26 36F Færder area 59° 4.0 10° 23.0 47G06 LIMA LIM BL ALAD 20 9 20J26 36F Færder area 59° 4.0 10° 23.0 47G06 LIMA LIM LI EROD 20 10 19J26 36F Færder area 59° 4.0 10° 23.0 47G06 LIMA LIM LI MT 19 9 19J99 15B Ullerø area 58° 3.0 6° 43.0 45F69 GADU MOR BI PYR1O 25 25 24J99 15B Ullerø area 58° 3.0 6° 43.0 45F69 GADU MOR BL ALAD 24 22 25 23J99 15B Ullerø area 58° 3.0 6° 43.0 45F69 GADU MOR LI EROD 23 25 24 24J99 15B Ullerø area 58° 3.0 6° 43.0 45F69 GADU MOR LI MT 24 19 24 24J99 15F Ullerø area 58° 3.0 6° 43.0 45F69 LIMA LIM BI PYR1O 20 20J99 15F Ullerø area 58° 3.0 6° 43.0 45F69 LIMA LIM BL ALAD 25 25J99 15F Ullerø area 58° 3.0 6° 43.0 45F69 LIMA LIM LI EROD 25 25J99 15F Ullerø area 58° 3.0 6° 43.0 45F69 LIMA LIM LI MT 23 25J63 53B Inner Sørfjord 60° 10.0 6° 34.0 49F65 GADU MOR BI PYR1O 28 24 25 25J63 53B Inner Sørfjord 60° 10.0 6° 34.0 49F65 GADU MOR BL ALAD 15 29 25 25 25J63 53B Inner Sørfjord 60° 10.0 6° 34.0 49F65 GADU MOR LI EROD 10 30 25 25 25J63 53B Inner Sørfjord 60° 10.0 6° 34.0 49F65 GADU MOR LI MT 14 24 25 25 25J63 53B Inner Sørfjord 60° 10.0 6° 34.0 49F65 PLAT FLE BI PYR1O 25 11 11J63 53B Inner Sørfjord 60° 10.0 6° 34.0 49F65 PLAT FLE BL ALAD 23 11 12J63 53B Inner Sørfjord 60° 10.0 6° 34.0 49F65 PLAT FLE LI EROD 25 11 12J63 53B Inner Sørfjord 60° 10.0 6° 34.0 49F65 PLAT FLE LI MT 24 11 12J62 67B Strandebarm 60° 16.0 6° 2.0 49F62 GADU MOR BI PYR1O 24 25 14 25J62 67B Strandebarm 60° 16.0 6° 2.0 49F62 GADU MOR BL ALAD 25 25 25 13 24J62 67B Strandebarm 60° 16.0 6° 2.0 49F62 GADU MOR LI EROD 25 25 25 14 25J62 67B Strandebarm 60° 16.0 6° 2.0 49F62 GADU MOR LI MT 25 23 25 15 25J62 67B Strandebarm 60° 16.0 6° 2.0 49F62 PLAT FLE BI PYR1O 25 22 24J62 67B Strandebarm 60° 16.0 6° 2.0 49F62 PLAT FLE BL ALAD 25 23 23J62 67B Strandebarm 60° 16.0 6° 2.0 49F62 PLAT FLE LI EROD 25 24 25J62 67B Strandebarm 60° 16.0 6° 2.0 49F62 PLAT FLE LI MT 23 23 25J99 21F Åkrefjord 59° 45.0 6° 7.0 48F62 PLAT FLE BI PYR1O 11J99 21F Åkrefjord 59° 45.0 6° 7.0 48F62 PLAT FLE BL ALAD 11 25J99 21F Åkrefjord 59° 45.0 6° 7.0 48F62 PLAT FLE LI EROD 11 6J99 21F Åkrefjord 59° 45.0 6° 7.0 48F62 PLAT FLE LI MT 6J99 23B Karihavet area 59° 54.0 5° 8.0 48F51 GADU MOR BI PYR1O 23 24 23 25J99 23B Karihavet area 59° 54.0 5° 8.0 48F51 GADU MOR BL ALAD 25 24 25 24 25J99 23B Karihavet area 59° 54.0 5° 8.0 48F51 GADU MOR LI EROD 21 25 25 25 25J99 23B Karihavet area 59° 54.0 5° 8.0 48F51 GADU MOR LI MT 22 18 25 25 25J99 98B Lille Molla 68° 12.0 14° 48.0 65G48 GADU MOR BI PYR1O 14 21J99 98B Lille Molla 68° 12.0 14° 48.0 65G48 GADU MOR BL ALAD 5 25J99 98B Lille Molla 68° 12.0 14° 48.0 65G48 GADU MOR LI EROD 15 25J99 98B Lille Molla 68° 12.0 14° 48.0 65G48 GADU MOR LI MT 15 25J99 98F Lille Molla 68° 12.0 14° 48.0 65G48 PLEU PLA BI PYR1O 18 22J99 98F Lille Molla 68° 12.0 14° 48.0 65G48 PLEU PLA BL ALAD 13 19J99 98F Lille Molla 68° 12.0 14° 48.0 65G48 PLEU PLA LI EROD 18 25J99 98F Lille Molla 68° 12.0 14° 48.0 65G48 PLEU PLA LI MT 18 25J99 10B Varangerfjorden 69° 56.0 29° 40.0 68H97 GADU MOR BI PYR1O 19 18J99 10B Varangerfjorden 69° 56.0 29° 40.0 68H97 GADU MOR BL ALAD 25 25J99 10B Varangerfjorden 69° 56.0 29° 40.0 68H97 GADU MOR LI EROD 25 24
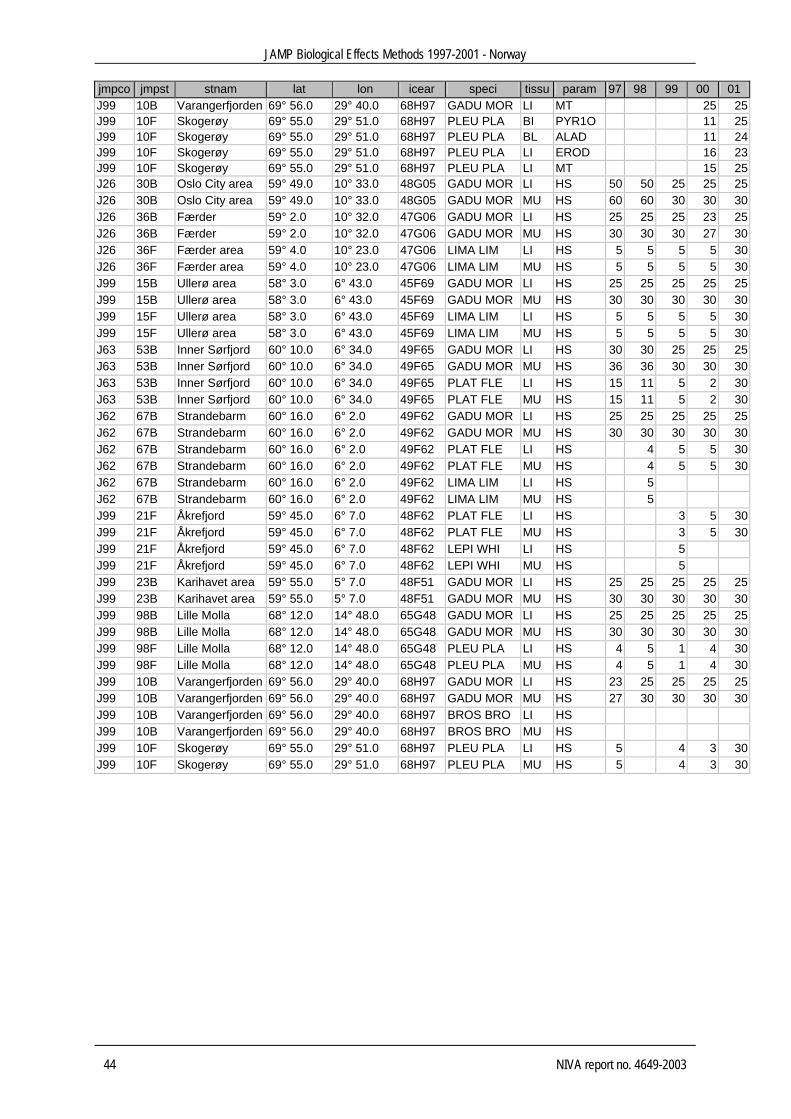
JAMP Biological Effects Methods 1997-2001 - Norway
44 NIVA report no. 4649-2003
jmpco jmpst stnam lat lon icear speci tissu param 97 98 99 00 01 J99 10B Varangerfjorden 69° 56.0 29° 40.0 68H97 GADU MOR LI MT 25 25J99 10F Skogerøy 69° 55.0 29° 51.0 68H97 PLEU PLA BI PYR1O 11 25J99 10F Skogerøy 69° 55.0 29° 51.0 68H97 PLEU PLA BL ALAD 11 24J99 10F Skogerøy 69° 55.0 29° 51.0 68H97 PLEU PLA LI EROD 16 23J99 10F Skogerøy 69° 55.0 29° 51.0 68H97 PLEU PLA LI MT 15 25J26 30B Oslo City area 59° 49.0 10° 33.0 48G05 GADU MOR LI HS 50 50 25 25 25J26 30B Oslo City area 59° 49.0 10° 33.0 48G05 GADU MOR MU HS 60 60 30 30 30J26 36B Færder 59° 2.0 10° 32.0 47G06 GADU MOR LI HS 25 25 25 23 25J26 36B Færder 59° 2.0 10° 32.0 47G06 GADU MOR MU HS 30 30 30 27 30J26 36F Færder area 59° 4.0 10° 23.0 47G06 LIMA LIM LI HS 5 5 5 5 30J26 36F Færder area 59° 4.0 10° 23.0 47G06 LIMA LIM MU HS 5 5 5 5 30J99 15B Ullerø area 58° 3.0 6° 43.0 45F69 GADU MOR LI HS 25 25 25 25 25J99 15B Ullerø area 58° 3.0 6° 43.0 45F69 GADU MOR MU HS 30 30 30 30 30J99 15F Ullerø area 58° 3.0 6° 43.0 45F69 LIMA LIM LI HS 5 5 5 5 30J99 15F Ullerø area 58° 3.0 6° 43.0 45F69 LIMA LIM MU HS 5 5 5 5 30J63 53B Inner Sørfjord 60° 10.0 6° 34.0 49F65 GADU MOR LI HS 30 30 25 25 25J63 53B Inner Sørfjord 60° 10.0 6° 34.0 49F65 GADU MOR MU HS 36 36 30 30 30J63 53B Inner Sørfjord 60° 10.0 6° 34.0 49F65 PLAT FLE LI HS 15 11 5 2 30J63 53B Inner Sørfjord 60° 10.0 6° 34.0 49F65 PLAT FLE MU HS 15 11 5 2 30J62 67B Strandebarm 60° 16.0 6° 2.0 49F62 GADU MOR LI HS 25 25 25 25 25J62 67B Strandebarm 60° 16.0 6° 2.0 49F62 GADU MOR MU HS 30 30 30 30 30J62 67B Strandebarm 60° 16.0 6° 2.0 49F62 PLAT FLE LI HS 4 5 5 30J62 67B Strandebarm 60° 16.0 6° 2.0 49F62 PLAT FLE MU HS 4 5 5 30J62 67B Strandebarm 60° 16.0 6° 2.0 49F62 LIMA LIM LI HS 5J62 67B Strandebarm 60° 16.0 6° 2.0 49F62 LIMA LIM MU HS 5J99 21F Åkrefjord 59° 45.0 6° 7.0 48F62 PLAT FLE LI HS 3 5 30J99 21F Åkrefjord 59° 45.0 6° 7.0 48F62 PLAT FLE MU HS 3 5 30J99 21F Åkrefjord 59° 45.0 6° 7.0 48F62 LEPI WHI LI HS 5J99 21F Åkrefjord 59° 45.0 6° 7.0 48F62 LEPI WHI MU HS 5J99 23B Karihavet area 59° 55.0 5° 7.0 48F51 GADU MOR LI HS 25 25 25 25 25J99 23B Karihavet area 59° 55.0 5° 7.0 48F51 GADU MOR MU HS 30 30 30 30 30J99 98B Lille Molla 68° 12.0 14° 48.0 65G48 GADU MOR LI HS 25 25 25 25 25J99 98B Lille Molla 68° 12.0 14° 48.0 65G48 GADU MOR MU HS 30 30 30 30 30J99 98F Lille Molla 68° 12.0 14° 48.0 65G48 PLEU PLA LI HS 4 5 1 4 30J99 98F Lille Molla 68° 12.0 14° 48.0 65G48 PLEU PLA MU HS 4 5 1 4 30J99 10B Varangerfjorden 69° 56.0 29° 40.0 68H97 GADU MOR LI HS 23 25 25 25 25J99 10B Varangerfjorden 69° 56.0 29° 40.0 68H97 GADU MOR MU HS 27 30 30 30 30J99 10B Varangerfjorden 69° 56.0 29° 40.0 68H97 BROS BRO LI HS J99 10B Varangerfjorden 69° 56.0 29° 40.0 68H97 BROS BRO MU HS J99 10F Skogerøy 69° 55.0 29° 51.0 68H97 PLEU PLA LI HS 5 4 3 30J99 10F Skogerøy 69° 55.0 29° 51.0 68H97 PLEU PLA MU HS 5 4 3 30

JAMP Biological Effects Methods 1997-2001 - Norway
NIVA report no. 4649-2003 45
Appendix C Map of stations
Station positions 1981-2001
(cf. Appendix B)

JAMP Biological Effects Methods 1997-2001 - Norway
NIVA report no. 4649-2003 47
Appendix C (cont.) Map of stations
NOTES For a few stations the geolocation has varied somewhat in order to collect sufficient material (e.g., st. 36B and 98A) or investigate local geographical variations (e.g., in the inner Oslofjord and Sørfjord). Hence, the same station name may appear more than once on a map. The letter A following the station identification number indicates that blue mussels were sampled. The letter B indicates sampling for cod and the letter F indicates sampling for flatfish (selected stations, marked B and/or F are used in this BEM-investigation, see Table 2). This system for fish is not consistent for some older stations (30, 33, 52 and 67) where only the letter B is used indicating that either cod or flatfish or both were sampled. An encircled dot indicates a mussel, shrimp or fish station. The letter G indicates sampling for dog whelks and S indicates sampling for sediment. An encircled dot indicates the position for sampling mussels, shrimp or fish. A square and pentagon symbol indicates the position for sampling dog whelks or sediment, respectively. A triangle indicates the position of a town or city. The letter "I" preceding the station identification number indicates an INDEX station for determining a "pollution" index. The letter R indicates a station for evaluating a "reference" index. Only blue mussels are used for these indices. The indices are based on a selection of JAMP and INDEX stations (cf. Green et al. 2001). The maps are generated using ArcView GIS version 3.3.

JAMP Biological Effects Methods 1997-2001 - Norway
48 NIVA report no. 4649-2003
#Y#Y#Y#Y#Y#Y
#Y#Y#Y#Y#Y#Y#Y#Y#Y
#Y#Y#Y#Y#Y#Y#Y#Y#Y#Y#Y#Y#Y#Y#Y
#Y#Y#Y#Y#Y#Y#Y#Y#Y#Y#Y#Y#Y#Y#Y#Y#Y#Y#Y#Y#Y#Y#Y#Y#Y#Y#Y#Y
#Y#Y#Y#Y#Y#Y#Y#Y#Y#Y#Y#Y#Y#Y#Y#Y#Y#Y#Y#Y#Y#Y#Y#Y#Y#Y#Y#Y#Y#Y#Y#Y#Y
#Y#Y#Y#Y#Y#Y#Y
#Y#Y#Y#Y#Y#Y#Y#Y#Y#Y#Y#Y#Y#Y#Y#Y#Y#Y#Y#Y#Y#Y#Y#Y#Y#Y#Y#Y#Y#Y#Y#Y#Y#Y#Y#Y#Y#Y#Y#Y#Y#Y#Y#Y#Y#Y#Y#Y#Y#Y#Y#Y#Y#Y#Y#Y#Y#Y#Y#Y#Y#Y#Y#Y#Y#Y#Y#Y#Y#Y#Y#Y#Y#Y#Y#Y#Y#Y#Y#Y#Y#Y#Y#Y#Y#Y#Y#Y#Y#Y#Y#Y#Y#Y#Y#Y#Y#Y#Y#Y#Y#Y#Y#Y#Y#Y#Y#Y#Y#Y#Y#Y#Y#Y#Y#Y#Y#Y#Y#Y#Y#Y#Y#Y#Y#Y#Y#Y#Y#Y#Y#Y#Y#Y#Y#Y#Y#Y#Y#Y#Y#Y#Y#Y#Y#Y#Y#Y
#Y#Y
#Y#Y#Y#Y#Y#Y
#Y#Y#Y#Y#Y#Y#Y#Y#Y#Y#Y#Y
#Y#Y#Y#Y#Y#Y#Y
#Y#Y #Y#Y#Y #Y#Y
#Y#Y#Y#Y#Y#Y#Y#Y#Y#Y#Y#Y#Y#Y#Y#Y#Y#Y#Y#Y#Y#Y#Y#Y#Y#Y#Y#Y#Y#Y#Y#Y#Y#Y#Y#Y#Y#Y#Y#Y#Y#Y#Y#Y#Y#Y#Y#Y#Y#Y#Y#Y#Y#Y#Y#Y#Y#Y#Y#Y#Y#Y#Y#Y#Y#Y#Y#Y#Y#Y#Y#Y#Y#Y#Y#Y#Y#Y#Y#Y#Y#Y#Y#Y#Y#Y#Y#Y#Y#Y#Y#Y#Y#Y#Y#Y#Y#Y#Y#Y#Y#Y#Y#Y#Y#Y#Y#Y#Y#Y#Y#Y#Y#Y#Y#Y#Y#Y#Y#Y#Y#Y#Y
#Y#Y#Y#Y#Y#Y#Y#Y#Y#Y#Y#Y#Y#Y#Y#Y#Y#Y#Y#Y#Y#Y#Y#Y#Y#Y#Y#Y#Y#Y#Y#Y#Y
#Y#Y#Y#Y#Y#Y#Y#Y#Y#Y#Y#Y#Y#Y#Y#Y#Y#Y#Y#Y#Y#Y#Y#Y#Y#Y#Y#Y#Y#Y#Y#Y#Y#Y#Y#Y#Y#Y#Y#Y#Y#Y#Y#Y#Y#Y#Y#Y#Y#Y#Y#Y#Y#Y#Y#Y#Y#Y#Y
#Y#Y#Y#Y#Y#Y#Y#Y#Y#Y#Y#Y#Y#Y
#Y#Y
#Y#Y#Y#Y
#Y#Y#Y#Y#Y#Y#Y#Y#Y#Y#Y#Y#Y#Y#Y#Y#Y#Y#Y#Y#Y#Y#Y#Y#Y#Y
#Y#Y#Y#Y#Y#Y#Y#Y#Y#Y#Y#Y#Y#Y#Y#Y
#Y#Y
#Y#Y#Y#Y#Y#Y#Y#Y#Y
#Y#Y#Y#Y#Y
#Y#Y#Y#Y#Y#Y#Y#Y#Y
#Y#Y#Y#Y#Y#Y#Y#Y#Y#Y#Y#Y
#Y#Y#Y#Y#Y#Y
#Y#Y#Y#Y#Y
#Y#Y#Y#Y#Y#Y#Y#Y
#Y#Y#Y#Y#Y#Y#Y#Y%U%U%U%U%U
%U%U
%U %U
%U%U %U%U
#Y#Y#Y#Y#Y#Y
#Y
#Y#Y#Y#Y#Y#Y#Y
#Y
&V
&V&V
&V&V
&V
&V
&V&V&V&V&V&V&V&V&V
&V&V
&V&V
&V&V&V &V &V
&V&V&V&V&V&V&V&V&V&V&V&V
&V&V
&V&V&V&V&V&V&V
&V
&V
&V&V
#Y
30G S p ro
306 /I3 06 H åø ya
15A G å søy
33C S an de
82A Fla kk
302 O rm øy a
25A H in nø y
26A H am n en
3 6A Fæ rd er
3 6B Fæ rd er�
305 L ys ak er
14A A av ig en
23A A us tv ik
27A G ri nde n
56A K va ln es
86A G e itne s
88A R ø dbe rg
I13 1 L as ta d
I91 1 H o rvi ka
13A L an gø su nd
28A E ik su nde t
51A B yr kje ne s
63A R an as kj ær
02A Fu gle sk jæ r
30H S to reg ru nn
74A O d dne sk jæ r
77B B or øy ar ea
77C B or øy ar ea
8 0A /I8 0A Øs tm ark ne s
84A T ro ss avi ka
85A G e itst ran d
1 5B /F Ull erø a rea
36F F æ rde r a re a
65A V ik ing ne se t67B S tra nd eb ar m
69A L ille T erø y
77A F lo sta fjo rd
87A I ng da lsb uk t
98B /F L ille M oll a
22F B or øy fjo rde n
I01 1 Krå ke ne bb et
22A E sp ev æ r,w es t
I13 3 O d de rø, w es t
I24 2 Va lhe im ne se t
I71 2 G je m es ho lme n
23B K ar iha ve t a re a
30B O sl o C ity a rea
30B O sl o C ity a rea
30B O sl o C ity a rea
52A /E E itr hei ms ne se t53B I nn er Sø rfjo rd
53B I nn er Sø rfjo rd
53B /E In ne r Sø rfjo rd
I0 22 W es t Da mh ol me n
30X We st of Ne so dd en
33X S an de (w e st sid e)
96A /R 09 6 Br eiv ike n, To m ma
I02 4 K ir kø y, n or th we st
43A L yn gn es et, Lan gf jor d
79 A Gje rd sv old sø ye n
ea st
43B /F K væ na ng en , O ld er fjo rd
30G S p ro
33C S an de
35A M ø len
76A R is øy
304 /I 30 4 G å sø ya
03A T is ler
24A V ar dø y
303 M al mø ya
305 L ys ak er
92A S to kk en
99A B ru nv ær
01A Sp on vik a
10F S ko ge rø y
11 XBra sh av n
40C S te ile ne
91A N er dv ika
93A S æ ter vik
94A Lan df as t
I2 41 No rdn es
10A S ka go dd en
32A R ø dta ng en
57A K ro ss an es
22C B ø mlo fjo rd
30H S to reg ru nn
7 3A Lyn gh ol me n
97A K la kh olm en
67B /E S tra nd eb ar m
83A Frø se ts kjæ r
I24 3 He gre ne se t
47A /G K ifj ord ne se t
92B S to kk en ar ea
I 13 2 Fis kå tan ge n
I71 1 S te inh ol me n
31A /B /C So lbe rg str an d
I02 1 Kjø kø , s ou th
I20 5 B ø lsn es (G 5)
I30 7 R a mt on ho lme n
44A E le nh eim su nd et
53B I nn er Sø rfjo rd
10B V ar an ge rfjo rd en
46B H am m er fes t a re a
98A S vo lv ær om rå de t
30X We st of Ne so dd en
I20 1 E k kje gru nn (G 1 )
33B S an de (e as t s ide )33X S an de (w e st sid e)
35C H o mlm e str an d-M ø len
41A F en sn es et, G ryt øy a
11A S ild kr on ese t, Bø kf j
46A S m ine s ved A lte su la
I96 2 K o ksv er kto m ta (B 2)
I96 9 B jø rn bæ rv ike n (B9 )
49A N or df jord en
98X S kr ov a
42A T en ns kjæ r
48A T ro llfj ord en
I0 23 Sin gle ka lv en ,
so uth
301 /I3 01Ak ers hu sk aia
30AGre ss ho lm en
30B O sl o C ity a rea
30B O sl o C ity a rea
71A B jø rkø ya (R is øy od d.)
81A Bio log is k s ta sjo n
91A N er dv ika
VE GA
$TBR ØN Ø YS U ND
FO SN AHA RS V IK$T92A S to kk en
TR ON D HE IM
HIT R A
SM Ø LA
KR IS TIA N SU ND
$TMO LD E
$T$T
ST AD LA N DE T
MÅ LØ Y
UL ST EI NV IK
$T$TFL OR Ø
FØ RD E
$TGL OM F JO RD
MO I RA N A
95A F la tsk jæ r
$TSV OL VÆR
97A K la kh olm en
98A S vo lv ær om rå de t
$THA RS T AD
$TTR OM S Ø
SØ RØ Y
HA SV IK$T 70° 30 '
70°3
0'
70°
45'
70°4
5'
71°
71°
22° 45 '
22°
45'
23°
23°
23° 15 '
23° 15 '
23° 30 '
23° 30 '
23° 45 '
23° 45 '
24°
24°
24° 15 '
24° 15 '
24° 30 '
24° 30 '
24° 45 '
24° 45 '
25°
25°
25°1
5'
25° 15 '
SØ RØ Y
HA MM E RF E ST$T$THØ NN IN G SV ÅG
PO
RSA N
GEN
L A
K
S F
J O
R D
70°
45'
70°4
5'
71°
71°
25° 30 '
25°
30'
25° 45 '
25° 45 '
26°
26°
26° 15 '
26° 15 '
26° 30 '
26° 30 '
26° 45 '
26° 45 '
27°
27°
27° 15 '
27° 15 '
27° 30 '
27° 30 '
27°4
5'
27° 45 '
28°
28° $TBE RL EV Å G
V A R A N G E R P E N I N S U L A
70°
30'
70°3
0'
70°
45'
70°4
5'
71°
71°
28° 15 '
28°
15'
28° 30 '
28° 30 '
28° 45 '
28° 45 '
29°
29°
29° 15 '
29° 15 '
29° 30 '
29° 30 '
29° 45 '
29° 45 '
30°
30°
30°1
5'
30° 15 '
30°3
0'
30° 30 '
$TBÅ TS FJ OR D
$TKIR K EN ES
$TVA DS Ø
$TBE RG E N
$TOD DA
$TØY ST ES E
HAR
D AN G
ERFJ
O RD
SØ
RFJO
RD
$THA UG E SU N D$TSA UD A
$TLE IRV IK
$T$T $T$TFL EK KE FJ O RD
FA RS U ND
MA ND A L
KR IS TIA N SA ND
$T$T$T
AR EN D AL
RIS Ø R
LA NG E SU ND
LIN D ES NE S
LIS TA
$T$T$TSA ND E FJ OR D
FR ED R IKS T AD
HA LD EN
S K A G E R R A K
O S
L O
F
J O
R D
SWE DE N
NO RW A Y
36B F æ rde r
$TOS LO
O
S L
O
F J
O
R D
$THO RT E N$TMO S S
FIN LA N D RU SS IANO RW A Y
69° 30 '
69°3
0'
69°
45'
69°4
5'
70°
70°
28° 45 '
28°
45'
29°
29°
29° 15 '
29° 15 '
29° 30 '
29° 30 '
29° 45 '
29° 45 '
30°
30°
30° 15 '
30° 15 '
30° 30 '
30° 30 '
30°4
5'
30° 45 '
31°
31°
1
2
34
5
67
89
1012
11
13
14
15
16
1718
1921
22 23
24
RUSSIA
FINLAND
SWEDENNORWAY
F R
O H
A V
E T
VE
FSN F
JORD
$TR A N
A F J O
R D
V Å
G S F
J O
R D
AN DØ Y A
M A L A N G E N
KV AL ØY
L O P P H A V E TSØ R ØY
SU N DET
FU
GLØY
SUN
DET
$TSK JE RV Ø Y
SØ
RØYS
UNDE
T
RE VS B OT N
T
A N
A F
J O
R D
SY L
T EFJOR
D
TR O ND HE
IM SL E IA
$TI91 2 H o nn ha mm e r
$TSU NN D AL SØ R A
SU NN D AL S-FJO R D
HO M ME LV IK
TR ON D HE IM SF JO R D
OR KD A LS FJ OR D
TIN G VO LL S-FJO R D
VA RT
D ALS FJ O
R D
VA NY LV S -FJO R D
ST AV FJ OR D
DA LS FJ OR D
SE LB JØ R NS F
J OR D
SA
UDAF
J OR
D
BØ M
LOF JO
RD
$TDR AM M EN
FE DA F
J O RD
224 G H eg gje len
220 G S mø rs tak k
221 A /G St an ge lan d
227 A /G Me la nd ho lm en
226 A /G Ka rm su nd b rid ge (e ast )
KO R SF JO RD
V E
S T
F J O
R D
KV Æ AN GE N
70°
70°
70°
15'
70°1
5'
70°
30'
70°3
0'
20° 15 '
20°
15'
20° 30 '
20° 30 '
20° 45 '
20° 45 '
21°
21°
21° 15 '
21° 15 '
21° 30 '
21° 30 '
21° 45 '
21° 45 '
22°
22°
22° 15 '
22° 15 '
22°3
0'
22° 30 '
68°
45'
68°4
5'
69°
69°
15° 45 '
15° 45 '
16°
16°
16° 15 '
16° 15 '
16° 30 '
16° 30 '
16° 45 '
16° 45 '
17°
17°
17° 15 '
17° 15 '
17° 30 '
17° 30 '
17°4
5'17° 45 '
67°
45' 6
7°45'
68°
68°
68° 15 ' 68° 15 '
13° 45 '
13° 45 '
14°
14°
14° 15 '
14° 15 '
14° 30 '
14° 30 '
14° 45 '
14° 45 '
15°
15°
15° 15 '
15° 15 '
15° 30 '
15° 30 '
66°
15'
66°1
5'
66°
30'
66°3
0'
66°
45'
66°4
5'
12° 30 '
12° 30 '
12° 45 '
12° 45 '
13°
13°
13° 15 '
13° 15 '
13° 30 '
13° 30 '
13° 45 '
13° 45 '
14°
14°
14° 15 '
14° 15 '
65°
30'
65°3
0'
65°
45'
65°4
5'
11°11°
11° 15 '
11° 15 '
11° 30 '
11° 30 '
11° 45 '
11° 45 '
12°
12°
12° 15 '
12° 15 '
12° 30 '
12° 30 '
12° 45 '
12° 45 '
64°
64°
64°
15'
64°1
5'
64°
30'
64°3
0'
9°1 5'
9°1 5'
9°3 0'
9°3 0'
9°4 5'
9°4 5'
10°
10°
10° 15 '
10° 15 '
10° 30 '
10° 30 '
10° 45 '
10° 45 '
63°
15'
63°1
5'
63°
30'
63°3
0'
7°1
5'
7°1 5'
7°3 0'
7°3 0'
7°4 5'
7°4 5'
8°
8°
8°1 5'
8°1 5'
8°3 0'
8°3 0'
8°4 5'
8°4 5'
9°
9°
62°
45'
62°4
5'
63°
63°
7°
7°
7°1 5'
7°1 5'
7°3 0'
7°3 0'
7°4 5'
7°4 5'
8°
8°
8°1 5'
8°1 5'
8°3 0'
8°30'
63°
15'
63°1
5'
63°
30'
63°3
0'
9°3 0'
9°3 0'
9°4 5'
9°4 5'
10°
10°
10° 15 '
10° 15 '
10° 30 '
10° 30 '
10° 45 '
10° 45 '
11°
11°
62°
62°
62°
15'
62°1
5'
4°4
5'
4°4 5'
5°
5°
5°1 5'
5°1 5'
5°3 0'
5°3 0'
5°4 5'
5°4 5'
6°
6°
6°1 5'
6°15'
61°
15'
61°1
5'
61°
30'
61°3
0'
4°3 0'
4°3 0'
4°4 5'
4°4 5'
5°
5°
5°1 5'
5°1 5'
5°3 0'
5°3 0'
5°4 5'
5°4 5'
6°
6°
60°
60°
60°
15'
60°1
5'
4°1
5'
4°1 5'
4°3 0'
4°3 0'
4°4 5'
4°4 5'
5°
5°
5°1 5'
5°1 5'
5°3 0'
5°3 0'
5°4 5'
5°45'
60°
60°
60°
15'
60°1
5'
60° 30 '
60°3
0'
5°1
5'
5°1 5'
5°3 0'
5°3 0'
5°4 5'
5°4 5'
6°
6°
6°1 5'
6°1 5'
6°3 0'
6°3 0'
6°4 5'
6°45'
57°
45'
57° 45 '
58°
58°
58°
15'
58°1
5'
6°4 5'
6°4 5'
7°
7°
7°1 5'
7°1 5'
7°3 0'
7°3 0'
7°4 5'
7°4 5'
8°
8°
58°
30'
58°3
0'
58°
45'
58°4
5'
59°
59°
8°3
0'
8°3 0'
8°4 5'
8°4 5'
9°
9°
9°1 5'
9°1 5'
9°3 0'
9°3 0'
9°4 5'
9°4 5'
58°
45'
58° 45 '
59°
59°
59°
15'
59°1
5'
10° 15 '
10° 15 '
10° 30 '
10° 30 '
10° 45 '
10° 45 '
11°
11°
11° 15 '
11° 15 '
11° 30 '
11° 30 '
59°
30'
59°3
0'
59°
45'
59°4
5'
60°
60°
9°4
5'
9°4 5'
10°
10°
10° 15 '
10° 15 '
10° 30 '
10° 30 '
10° 45 '
10° 45 '
11°
11°
11° 15 '
11°1
5'
I91 3 F jø se id
561 0 Kv aln es , nor th
562 0 Kj eke n, nea r He lla nd
571 0 Ur dh em , s. o f K ro ss an es
21F K yr pin g
24S S ot ra
82S Fla kk
56S K va ln es
30S S te ile ne
42S Ma lan ge n
45S R ev sb ot n
52S T ys se da l
43S K væ n an ge n
44S S ør øy su nd
47S L ak sfj ord
48S T an af jor d
63S R an as kj ær
89S T ha m sh avn
15 SLis ta are a
22S B øm lo a rea
84S T ro ss avi ka
41S V åg sf jor de n
67S S tra nd eb ar m
77S A re nd al are a
10S V ar an gfj ord en
46S P or sa ng erf jor de n
35S H ol me st ran d- Mø le n
98S S kr ov a ( so uth o f) 99S L un dø y (no rth o f)
69 SKv inn he rad sf jor de n
90S O u ter Or kd als fjo rd
27S S ta ttla nd et (e as t o f)
93S R au dø ya nor te ast of )
57S K ro ss an es
36S F æ rde r
36S F æ rde r
59°
15'
59°1
5'
59°
30'
59°3
0'
59°
45'
59°4
5'
4°4
5'
4°4 5'
5°
5°
5°1 5'
5°1 5'
5°3 0'
5°3 0'
5°4 5'
5°4 5'
6°
6°
6°1 5'
6°1 5'
6°3 0'
6°30'
$T
44G A lta
36G F æ rd er
49G H a rst ad
42G F in ns ne s
43G S kj erv øy
226 A Ka rm øy br ua
46G H o nn ing sv åg
227 G M ela nd sh lm .226 G K arm su nd ø st
45A /G O ut er Sa ug ha m nes et
224 G H eg gje len K ar ms un d
69°
15'
69°1
5'
69°
30'
69°3
0'
69°
45'
69°4
5'
17° 15 '
17° 15 '
17° 30 '
17° 30 '
17° 45 '
17° 45 '
18°
18°
18° 15 '
18° 15 '
18° 30 '
18° 30 '
18° 45 '
18° 45 '
19°
19°
19°1
5'
19° 15 '
#Y#Y
48G M e ha mn
AL TA$TAL
TAFJ
ORDE
N
70°
70°
70°
15'
70°1
5'
70°
30'
70°3
0'
21° 30 '
21° 30 '
21° 45 '
21° 45 '
22°
22°
22° 15 '
22° 15 '
22° 30 '
22° 30 '
22° 45 '
22° 45 '
23°
23°
23° 15 '
23° 15 '
23°3
0'
23° 30 '
20
JAMP stations Norway. Numbers indicate map reference

JAMP Biological Effects Methods 1997-2001 - Norway
NIVA report no. 4649-2003 49
#Y#Y#Y#Y
#Y
#Y
#Y#Y#Y#Y#Y#Y#Y#Y#Y#Y#Y#Y#Y#Y#Y#Y
#Y#Y#Y
#Y
#Y#Y
#Y#Y#Y#Y
#Y
#Y#Y#Y#Y
#Y
#Y#Y#Y#Y
#Y#Y#Y#Y
#Y #Y
#Y#Y#Y#Y#Y#Y#Y#Y#Y#Y#Y#Y#Y#Y#Y#Y#Y#Y#Y#Y#Y
#Y#Y#Y#Y#Y#Y#Y#Y#Y#Y#Y#Y#Y#Y#Y#Y#Y#Y#Y#Y#Y#Y#Y
#Y#Y#Y#Y#Y#Y#Y#Y#Y#Y#Y#Y#Y#Y#Y#Y#Y#Y#Y#Y
#Y#Y
#Y#Y#Y
#Y#Y#Y
#Y#Y#Y
#Y#Y#Y
&V&V&V
&V
&V&V
#Y30G Spro
306/I306 Håøya
33C Sande
302 Ormøya
305 Lysaker
30H Storegrunn
30B Oslo City area
30B Oslo City area
30B/F Oslo City area 30X West of Nesodden
33X Sande (west side)
30G Spro
33C Sande
35A Mølen
304 /I304 Gåsøya 303 Malmøya
305 Lysaker
40C Steilene
32A Rødtangen
30H Storegrunn
31A/B/C Solbergstrand
I307 Ramtonholmen
30X West of Nesodden
33B Sande (east side)
33X Sande (west side)
35C Holmestrand-Mølen
301/I301Akershuskaia
30AGressholmen
30B Oslo City area
30B Oslo City area
$TOSLO
O
S L
O
F
J
O
R
D
$THORTEN$T MOSS
$TDRAMMEN
59°3
0'
59°30'
59°4
5'
59°45'
60° 60°
9°45
'9°45'
10°
10°
10°15'
10°15'
10°30'
10°30'
10°45'
10°45'
11°
11°
11°15'
11°15'
30S Steilene
35S Holmestrand-Mølen#
MAP 1
#Y#Y#Y
#Y#Y#Y
#Y#Y#Y
#Y#Y#Y#Y#Y#Y#Y#Y#Y#Y#Y#Y#Y#Y#Y#Y#Y#Y#Y#Y#Y#Y#Y#Y#Y#Y#Y#Y#Y#Y#Y#Y#Y #Y
#Y#Y#Y#Y#Y#Y#Y#Y#Y
#Y#Y #Y#Y
#Y#Y#Y#Y#Y#Y
#Y#Y#Y#Y#Y#Y
%U&V &V
&V36A/G Færder
36B Færder�
02A Fugleskjær
36F Færder areaI011 Kråkenebbet
I022 West Damholmen
I024 Kirkøy, north west
03A Tisler
01A/I001Sponvika
73A Lyngholmen
I021 Kjøkø, south
I023 Singlekalven,
south
$T
$T
$T
SANDEFJORD
FREDRIKSTAD
HALDEN
S K A G E R R A K
O S L O
F J O R
D
SWEDEN
NORWAY
36B Færder
58°4
5'
58°45'
59°
59°
59°1
5'
59°15'
10°15'
10°15'
10°30'
10°30'
10°45'
10°45'
11°
11°
11°15'
11°15'
11°30'
11°30'
36S Færder
36S Færder
MAP 2

JAMP Biological Effects Methods 1997-2001 - Norway
50 NIVA report no. 4649-2003
#Y#Y
#Y#Y#Y#Y#Y#Y#Y#Y#Y#Y#Y#Y#Y#Y#Y#Y#Y#Y#Y#Y#Y#Y#Y#Y#Y#Y
#Y#Y#Y
#Y#Y#Y #Y#Y#Y&V&V
15A Gåsøy14A Aavigen
I131 Lastad
13A Langøsund
15B/F Ullerø area
I133 Odderø, west
I132 Fiskåtangen
$T
$T
$T
$T
FLEKKEFJORD
FARSUND
MANDAL
KRISTIANSAND
LINDESNES
LISTA
FEDAFJORD57
°45'
57°45'
58°
58°58
°15'
58°15'
6°45'
6°45'
7°
7°
7°15'
7°15'
7°30'
7°30'
7°45'
7°45'
8°
8°
15SLista area
MAP 4
#Y#Y#Y#Y#Y#Y#Y#Y#Y
#Y#Y#Y#Y#Y#Y#Y#Y
#Y#Y#Y
#Y#Y
%U
%U
%U%U
%U
&V&V
#Y
#Y#Y
#Y#Y
#Y#Y#Y
#Y
#Y
22F Borøyfjorden
22C Bømlofjord
I205 Bølsnes (G5)
I201 Ekkjegrunn (G1)
$THAUGESUND
$TSAUDA
$TLEIRVIK
SAU
DAFJ
ORD
BØMLOFJ
ORD
224G Heggjelen
220G Smørstakk
221A/G Stangeland
227A/G Melandholmen
226A/G Karmsund bridge (east)
21F Kyrping
22S Bømlo area
59°1
5'
59°15'
59°3
0'
59°30'
59°4
5'
59°45'
4°45
'
4°45'
5°
5°
5°15'
5°15'
5°30'
5°30'
5°45'
5°45'
6°
6°
6°15'
6°15'
6°30'
6°30'
#Y
#Y
#Y
22A/G Espevær,West
21D Åkrafjord
MAP 5

JAMP Biological Effects Methods 1997-2001 - Norway
NIVA report no. 4649-2003 51
#Y#Y#Y#Y#Y#Y#Y#Y#Y#Y#Y#Y#Y#Y
#Y#Y#Y#Y#Y#Y#Y#Y#Y#Y#Y#Y#Y#Y#Y#Y#Y#Y#Y#Y
#Y
#Y#Y#Y#Y#Y#Y
#Y
#Y#Y#Y#Y
#Y#Y#Y#Y#Y#Y#Y#Y#Y#Y#Y#Y
#Y#Y#Y#Y#Y#Y#Y#Y#Y#Y#Y
#Y#Y#Y#Y#Y#Y#Y#Y#Y#Y#Y
#Y#Y#Y#Y#Y#Y#Y#Y#Y#Y#Y#Y
#Y#Y#Y#Y#Y#Y#Y#Y#Y#Y#Y#Y#Y#Y#Y#Y#Y#Y#Y
#Y
#Y#Y#Y#Y#Y
#Y#Y#Y#Y#Y#Y
#Y#Y#Y#Y#Y#Y#Y#Y#Y
&V&V
&V&V
&V&V&V&V
&V&V
&V&V
#Y
#Y
#Y
#Y#Y
#Y
#Y
#Y
56A Kvalnes
51A Byrkjenes
63A Ranaskjær
65A Vikingneset67B Strandebarm
69A Lille Terøy
I242 Valheimneset
52A/E Eitrheimsneset53B Inner Sørfjord
53B Inner Sørfjor
53B/E Inner Sørfjord
I241 Nordnes
57A Krossanes
67B/E Strandebarm
I243 Hegreneset
53B Inner Sørfjord
$TBERGEN
$TODDA
$TØYSTESE
HARDA
NGER
FJORD
SØR
FJO
RD
60°
60°
60°1
5'
60°15'
60°30'
60°30'
5°15
'5°15'
5°30'
5°30'
5°45'
5°45'
6°
6°
6°15'
6°15'
6°30'
6°30'
6°45'
6°45'
56S Kvalnes
52S Tyssedal
63S Ranaskjær
67S Strandebarm
69SKvinnheradsfjorden
57S Krossanes
53D Digraneset
56D Kvalnes
5710 Urdhems. of Krossanes5620 Kjekennear Helland
MAP 6
#Y#Y
#Y#Y#Y#Y#Y#Y#Y#Y#Y#Y#Y#Y
#Y#Y
#Y#Y#Y#Y#Y#Y
#Y#Y#Y#Y#Y#Y#Y#Y#Y
&V
23A Austvik
69A Lille Terøy
I242 Valheimneset
23B Karihavet area
24A Vardøy
I241 Nordnes
I243 Hegreneset
$TBERGEN
SELBJØRNSFJORD
KORSFJORD
60°
60°
60°1
5'
60°15'
4°15
'
4°15'
4°30'
4°30'
4°45'
4°45'
5°
5°
5°15'
5°15'
5°30'
5°30'
5°45'
5°45'
24S Sotra
MAP 7

JAMP Biological Effects Methods 1997-2001 - Norway
52 NIVA report no. 4649-2003
#Y#Y
#Y#Y
#Y
#Y#Y#Y#Y#Y#Y#Y#Y#Y#Y#Y#Y#Y#Y#Y#Y#Y#Y#Y
#Y#Y
&V&V
98B/F Lille Molla
99A Brunvær
97A Klakholmen
98A Svolvær området
98X Skrova
$TSVOLVÆR
97A Klakholmen
98A Svolvær området
V E S
T F
J O
R D
67°4
5' 67°45'
68° 68°
68°15' 68°15'
13°45'
13°45'
14°
14°
14°15'
14°15'
14°30'
14°30'
14°45'
14°45'
15°
15°
15°15'
15°15'
15°30'
15°30'
98S Skrova (south of) 99S Lundøy (north of)
MAP 16
#Y#Y#Y#Y
#Y#Y#Y#Y#Y #Y
#Y#Y#Y#Y
#Y
&V
#Y
10F Skogerøy
11XBrashavn
10A Skagodden
10B Varangerfjorden
11A Sildkroneset, Bøkfj
$T
KIRKENES
$TVADSØ
FINLAND RUSSIANORWAY
10S Varangfjorden
10A Skalneset
30°
30°
69°30'
69°30'
69°4
5'
69°45'
70°
70°
28°45'
28°4
5'
29°
29°
29°15'
29°15'
29°30'
29°30'
29°45'
29°45'
30°
30°
30°15'
30°15'
30°30'
30°30'
30°45'
30°45'
31°
31°
MAP 24

JAMP Biological Effects Methods 1997-2001 - Norway
NIVA report no. 4649-2003 53
Appendix D
Biomarkers in fish 1997-2001 Raw data
NOTES
This appendix presents results from biological effects methods applied to fish. All data are on a original basis; that is, the basis on which the sample was analysed.Three units of measure are used: ppm (parts per million, mg/kg), ppb (parts per billion, µg/kg) and ppp (parts per trillion, ng/kg). The numeric values shown have been printed with a fixed number of digits and do not necessarily indicate analytical precision. Refer also to the comments preceding the table. The data is sorted in the order of::
Species Alphabetically by ICES code; Latin, English and Norwegian name follow. Tissue Softbody, tail muscle Sample area Geographically beginning with those stations near the Swedish border and
continuing around the coast to the Russian border (cf., maps, Appendix E). The sample area code refers to the official JAMP designation and for some areas this may be undefined (J99).


JAMP Biological effects methods 1997-2001 - Norway
Limit check file: No limit checkWeight basis "ORGINAL"Table sorted by Specie, Tissue, Locality (Predefined sequence), Catchment date, Sample type (Individual, Bulked, Homegenate)NOTES:
The detection limit given here are approximations based on 3 times the standard deviation og the "blank" or near zero concentration of a solutionDay to day variations in the analytical instrument may lead to different detection limitsMethod codes are explained in: Green, N.W., 2001. Joint Assessment and Monitoring Programme (JAMP).Overview of Analythical Methods 1981-2000. NIVA report 4353-2001, project 80106.NB! The numeric values showν have been prιnted with a FIXED number of digit, and do not necessarily indicate analytical precisionIf a numeric value is suspect (ie. prefixed with "s"), the value is ignored in parameter statistics unless all observations are suspect.If a value can not be converted to basis for the table, the value is printed in the orginal basis but not included in any parameter statisticunless all values are in the orginal basis.
If replicates are analyzed, the mean value of the replicates is counted in parameter statisticsA value prefixed with "<<" indicates that the number of "<" values is greater or equal to 25% of computed observations.The corresponding standard deviation is prefixed with the character "~" if any "<" value is included
NIVA report no. 4649 - 55

JAMP Biological effects methods 1997-2001 - Norway
Species : GADU MOR Gadus morhua GB: Cod, N: TorskSample area: J26 Oslofjorden Tissue: AllLocality : 30B Oslo City area Latitude: 59°48.50N Longitude: 10°32.50ECatch,date : 19980115 Count: 10 Sample type: Individual
Analytical lab. => NIVA NIVA NIVA NIVA NIVA NIVAAnalysis code =>Detection limit => Mean
Samp/ Sex Age Wght Lngt weight Dry Fat BLOPR(BL) CYTPR(LI) MICPR(LI) ALAD(BL) EROD(LI) MT(LI)repl. F/M year g mm g % % mg/mL mg/mL mg/mLPBG/min/mg protmin/min/mg prot µg/mg protno. w.wt w.wt w.wt w.wt w.wt w.wt1/1 F 6 1124 500 46,3 64,7 57,1 48.28 3.936 4.01 4.35 79.16 26.962/1 F 7 2548 640 100,3 76,5 69,8 47.28 12.87 2.502 5.813 18.75 11.123/1 M 6 1542 525 34,5 64,5 56,7 46.04 17.89 3.701 6.817 49.64 15.384/1 M 4 488 375 41.96 14.845/1 F 7 1295 525 53,5 72,0 68,2 50.44 6.966 9.1996/1 M 9 2991 655 47,6 56,0 43,7 48 16.7 11.05 4.2767/1 F 5 603 405 108,5 57,8 47,8 39.96 15.12 3.841 0.8271 78.37 12.748/1 F 6 662 420 36,6 62,1 51,1 42.48 2.89 3.448 15.54 25.18 30.289/1 F 8 2564 655 9,3 46,1 26,2 40.52 10.71 6.23 6.075 134.5 26.7110/1 M 7 1585 555 19,3 52,9 37,2 29.64 8.363 0.1234 129.6Mean 7 1540 526 50,7 61,4 50,9 43,460 10,885 4,585 7,463 73,600 18,209Minimum 4 488 375 9,3 46,1 26,2 29,640 2,890 2,502 0,123 18,750 4,276Maximum 9 2991 655 108,5 76,5 69,8 50,440 17,890 8,363 15,540 134,500 30,280St.Dev 1 892 104 33,5 9,4 14,1 6,045 5,761 2,011 5,251 46,234 9,805Count 10 10 10 9 9 9 10 8 7 10 7 7
Comments Station: Oslo City area Slemmestad-Måsene, 100m, trawlSpecies : GADU MOR Gadus morhua GB: Cod, N: TorskSample area: J26 Oslofjorden Tissue: AllLocality : 30B Oslo City area Latitude: 59°47.0N Longitude: 10°35.50ECatch,date : 19980117 Count: 10 Sample type: Individual
Analytical lab. => NIVA NIVA NIVA NIVA NIVA NIVAAnalysis code =>Detection limit => Mean
Samp/ Sex Age Wght Lngt weight Dry Fat BLOPR(BL) CYTPR(LI) MICPR(LI) ALAD(BL) EROD(LI) MT(LI)repl. F/M year g mm g % % mg/mL mg/mL mg/mLPBG/min/mg protmin/min/mg prot µg/mg protno. w.wt w.wt w.wt w.wt w.wt w.wt1/1 M 6 1144 500 35,8 71,2 64,8 45.08 3.832 1.177 10.55 14.832/1 M 5 1149 515 22,5 57,4 44,5 43.4 8.463 3.939 17.41 13.53/1 F 5 1155 520 29,0 58,9 46,0 43.72 7.896 3.973 8.208 68.83 10.924/1 F 6 1426 520 57,2 64,4 54,7 54.88 5.81 2.324 4.613 15.445/1 M 7 1450 530 34,8 61,3 50,0 34.41 5.958 2.884 27.65 12.256/1 F 7 1391 540 37,7 58,8 45,2 40.68 9.54 4.367 11.25 65.22 11.477/1 F 6 1655 565 37.7 12.188/1 F 7 1682 565 53,2 56,6 44,3 36.91 5.03 2.535 12.6 12.849/1 M 7 2004 575 112,8 82,0 77,8 39.74 10.74 5.175 5.855 110.3 21.9210/1 M 8 1918 575 88,6 80,2 76,1 39.67 12.03 9.5 8.764 46.04 17.49Mean 6 1497 541 52,4 65,6 55,9 41,619 7,700 3,986 11,908 72,598 14,518Minimum 5 1144 500 22,5 56,6 44,3 34,410 3,832 1,177 4,613 46,040 10,920Maximum 8 2004 575 112,8 82,0 77,8 54,880 12,030 9,500 27,650 110,300 21,920St.Dev 1 312 28 30,1 9,8 13,6 5,707 2,754 2,396 6,619 27,052 3,461Count 10 10 10 9 9 9 10 9 9 10 4 9
Comments Station: Oslo City area Svestad, 60-90m Correct sampling date 980116. Changed due to IT problem; collision with same date at another "30B" site (ng-990209).
NIVA report no. 4649 - 56

JAMP Biological effects methods 1997-2001 - Norway
Species : GADU MOR Gadus morhua GB: Cod, N: TorskSample area: J26 Oslofjorden Tissue: AllLocality : 30B Oslo City area Latitude: 59°48.50N Longitude: 10°32.50ECatch,date : 19990114 Count: 10 Sample type: Individual
Analytical lab. => NIVA NIVA NIVA NIVA NIVA NIVA NIVA NIVAAnalysis code =>Detection limit => Mean
Samp/ Sex Age Wght Lngt weight Dry Fat AY(BI) BLOPR(BL) CYTPR(LI) MICPR(LI) ALAD(BL) EROD(LI) MT(LI) PYR1O(BI)repl. F/M year g mm g % % ABS 380 nm mg/mL mg/mL mg/mLPBG/min/mg protmin/min/mg prot µg/mg protg/kg/ABS 380 nmno. w.wt w.wt w.wt w.wt w.wt w.wt w.wt w.wt1/1 F 6 900 450 13,8 50,6 37,8 12.98 37.42 9.423 2.553 10.88 249.3 14.28 141.52/1 F 5 814 460 10,7 40,4 22,3 11.72 27.32 11.74 3.632 15.57 210.6 9.091 219.63/1 F 6 1386 510 20,9 57,0 32,5 9.954 25.29 10.16 3.158 28.41 192.4 13.71 1124/1 M 7 1425 510 22,6 53,0 42,0 11.21 20.49 9.012 3.969 22.49 160.7 17.78 126.65/1 M 7 1450 525 36,0 60,3 50,8 32.51 29.86 7.533 3.058 14.4 99.09 19.33 86.856/1 F 6 1539 550 23,4 36,9 20,0 33.08 10.68 3.669 4.412 97.847/1 F 7 1600 575 13,7 30,2 13,9 18.77 35.55 11.41 4.069 11.58 74.03 23.2 88.358/1 F 8 1628 575 19,5 33,9 18,4 12.1 25.65 12.28 5.774 12.88 60.87 151.39/1 F 7 2090 630 18,6 29,7 12,9 7.56 21.66 11.37 3.652 25.48 206.7 20.22 161.310/1 9 2487 665 39,0 33,9 12,0 7.182 miss 10.22 3.457 91.06 13.86 137.8Mean 7 1532 545 21,8 42,6 26,3 13,776 28,480 10,383 3,699 16,234 144,259 16,434 136,144Minimum 5 814 450 10,7 29,7 12,0 7,182 20,490 7,533 2,553 4,412 60,870 9,091 86,850Maximum 9 2487 665 39,0 60,3 50,8 32,510 37,420 12,280 5,774 28,410 249,300 23,200 219,600St.Dev 1 493 69 9,2 11,6 13,6 7,801 5,946 1,436 0,856 7,730 67,357 4,518 40,693Count 10 10 10 10 10 10 9 9 10 10 9 10 8 9
miss(1) ! Missing value Comments Station: Oslo City area Slemmestad-Måsane, 100m, trawlSpecies : GADU MOR Gadus morhua GB: Cod, N: TorskSample area: J26 Oslofjorden Tissue: AllLocality : 30B Oslo City area Latitude: 59°48.50N Longitude: 10°32.50ECatch,date : 19990121 Count: 10 Sample type: Individual
Analytical lab. => NIVA NIVA NIVA NIVA NIVA NIVA NIVA NIVAAnalysis code =>Detection limit => Mean
Samp/ Sex Age Wght Lngt weight Dry Fat AY(BI) BLOPR(BL) CYTPR(LI) MICPR(LI) ALAD(BL) EROD(LI) MT(LI) PYR1O(BI)repl. F/M year g mm g % % ABS 380 nm mg/mL mg/mL mg/mLPBG/min/mg protmin/min/mg prot µg/mg protg/kg/ABS 380 nmno. w.wt w.wt w.wt w.wt w.wt w.wt w.wt w.wt1/1 M 5 503 390 6,1 29,8 10,7 9.828 27.82 12.57 4.482 20.14 156.6 9.841 76.692/1 F 5 574 400 7,5 41,8 23,8 15.75 26.89 9.82 3.023 10.29 272.6 11.92 112.83/1 M 5 789 455 11,5 44,1 26,2 9.198 29.59 11.8 6.765 21.51 98.79 165.44/1 F 6 970 480 23,5 46,8 32,7 12.73 37.64 9.153 3.903 19.39 70.54 1435/1 M 6 1144 495 16,5 50,8 39,0 35.91 32.27 9.825 3.25 14.89 98.91 16.21 87.366/1 M 6 1386 545 20,6 48,9 35,6 22.18 34.29 9.534 3.249 22.54 335.7 115.47/1 M 8 1766 590 23,6 45,2 32,4 37.93 29.99 7.491 3.462 21.62 2.291 24.68 89.578/1 M 8 2030 590 39,9 58,4 48,7 51.99 10.95 4.172 154.2 16.669/1 F 8 1660 655 58,7 65,0 51,1 22.43 35.66 6.303 2.502 25.49 65.17 20.83 122.310/1 M 8 3148 680 90,8 69,0 61,2 32.26 27.47 6.864 1.934 33.09 47.34 18.64 100.4Mean 7 1397 528 29,9 50,0 36,1 22,024 33,361 9,431 3,674 20,996 130,214 16,969 112,547Minimum 5 503 390 6,1 29,8 10,7 9,198 26,890 6,303 1,934 10,290 2,291 9,841 76,690Maximum 8 3148 680 90,8 69,0 61,2 37,930 51,990 12,570 6,765 33,090 335,700 24,680 165,400St.Dev 1 800 101 26,6 11,6 14,7 11,123 7,495 2,063 1,322 6,371 103,688 5,068 28,328Count 10 10 10 10 10 10 9 10 10 10 9 10 7 9
Comments Station: Oslo City area Slemmestad-Måsane, 100m, trawl
NIVA report no. 4649 - 57

JAMP Biological effects methods 1997-2001 - Norway
Species : GADU MOR Gadus morhua GB: Cod, N: TorskSample area: J26 Oslofjorden Tissue: AllLocality : 30B Oslo City area Latitude: 59°48.50N Longitude: 10°32.50ECatch,date : 19990128 Count: 10 Sample type: Individual
Analytical lab. => NIVA NIVA NIVA NIVA NIVA NIVA NIVA NIVAAnalysis code =>Detection limit => Mean
Samp/ Sex Age Wght Lngt weight Dry Fat AY(BI) BLOPR(BL) CYTPR(LI) MICPR(LI) ALAD(BL) EROD(LI) MT(LI) PYR1O(BI)repl. F/M year g mm g % % ABS 380 nm mg/mL mg/mL mg/mLPBG/min/mg protmin/min/mg prot µg/mg protg/kg/ABS 380 nmno. w.wt w.wt w.wt w.wt w.wt w.wt w.wt w.wt1/1 F 5 700 420 7,8 30,8 66,8 23.81 30.2 17.58 7.068 17.69 120.1 17.55 124.72/1 F 6 840 445 14,9 41,7 19,2 35.28 38.59 14.89 5.325 13.8 27.27 12.97 71.123/1 M 5 966 450 17,0 59,6 51,4 27.47 28.84 7.299 3.085 15.12 171.5 121.84/1 F 6 880 450 12,3 28,1 51,0 miss 12.4 6.396 84.095/1 F 6 912 450 8,9 31,1 27,4 15.25 34.04 13.45 4.043 12 190.3 14.93 145.26/1 F 6 1096 480 21,1 41,9 58,6 13.48 24.68 16.15 3.826 10.78 128.5 116.57/1 M 7 1332 535 19,1 30,3 63,7 19.91 31.18 15.4 8.612 14.72 29.78 13.18 68.348/1 M 8 1566 535 39,4 65,1 61,9 26.96 35.8 6.288 1.815 11.13 93.41 15.48 93.729/1 F 8 2117 615 44,4 66,6 57,4 11.72 37.1 7.404 2.994 16.72 203.3 16.27 107.410/1 F 9 3691 750 55,9 51,4 75,5 14.49 30.6 9.804 2.582 18.15 365.1 30.76 99.76Mean 7 1410 513 24,1 44,7 53,3 20,930 32,337 12,067 4,575 14,457 141,335 17,306 105,393Minimum 5 700 420 7,8 28,1 19,2 11,720 24,680 6,288 1,815 10,780 27,270 12,970 68,340Maximum 9 3691 750 55,9 66,6 75,5 35,280 38,590 17,580 8,612 18,150 365,100 30,760 145,200St.Dev 1 906 102 16,6 15,1 17,5 7,972 4,422 4,098 2,200 2,756 99,366 6,150 25,173Count 10 10 10 10 10 10 9 9 10 10 9 10 7 9
miss(1) ! Missing value
Comments Station: Oslo City area Slemmestad-Måsane, 100m, trawl
NIVA report no. 4649 - 58

JAMP Biological effects methods 1997-2001 - Norway
Species : GADU MOR Gadus morhua GB: Cod, N: TorskSample area: J26 Oslofjorden Tissue: AllLocality : 30B Oslo City area Latitude: 59°49.0N Longitude: 10°33.0ECatch,date : 19991106 Count: 25 Sample type: Individual
Analytical lab. => NIVA NIVA NIVA NIVA NIVA NIVA NIVA NIVAAnalysis code =>Detection limit => Mean
Samp/ Sex Age Wght Lngt weight Dry Fat AY(BI) BLOPR(BL) CYTPR(LI) MICPR(LI) ALAD(BL) EROD(LI) MT(LI) PYR1O(BI)repl. F/M year g mm g % % ABS 380 nm mg/mL mg/mL mg/mLPBG/min/mg protmin/min/mg prot µg/mg protg/kg/ABS 380 nmno. w.wt w.wt w.wt w.wt w.wt w.wt w.wt w.wt1/1 F 5 1969 560 55,0 47,8 33,4 28.05 7.407 2.289 18.26 31.56 17.422/1 F 4 2269 650 23,0 36,9 18,8 57.17 33.09 7.956 2.973 13.96 4.19 15.52 67.863/1 F 2 980 470 7,0 35,2 12,2 14.95 32.01 13.52 5.383 12.07 12.28 17.64 80.814/1 M 4 1601 565 24,0 54,0 41,0 26.99 35.46 9.117 3.393 20.66 125.6 24.2 135.65/1 F 5 1970 595 52,0 48,8 33,2 22.22 30.81 9.264 4.766 18.22 4.611 13.8 81.866/1 F 3 1000 410 5,0 30,2 6,5 11.21 29.91 10.64 5.231 12.41 74.65 16.1 95.627/1 M 4 1346 545 14,0 24,8 5,1 22.62 32.28 12.22 4.407 16.55 2.34 24.45 129.78/1 F 5 812 470 15,0 43,6 28,3 16.06 28.09 11.26 3.819 12.57 35.05 10.98 185.79/1 F 5 2657 650 55,0 63,7 55,6 53.32 26.28 4.725 2.477 15.46 71.88 23.59 139.310/1 F 5 1155 510 18,0 40,3 21,8 12.42 28.86 8.589 5.685 14.62 23.9 29.32 134.811/1 F 4 1009 475 17,0 40,6 24,0 8.484 27.64 8.067 2.772 15.32 99.18 18.33 144.712/1 M 3 577 385 6,0 25,3 9,3 28.73 11.7 6.123 15.31 10.87 15.0713/1 F 3 1003 465 29,0 57,7 44,5 36.76 29.36 6.963 4.148 11.71 11.46 30.98 114.914/1 M 3 486 375 8,0 54,7 41,8 14.54 27.91 8.472 2.854 14.34 86.2 21.93 101.915/1 M 6 373 380 13,0 44,1 26,8 33.33 30.81 10.4 4.676 12.99 4.32 29.23 52.9116/1 M 2 602 415 7,0 48,0 30,5 9.393 26 9.084 3.306 13.12 107.3 17.33 240.817/1 M 2 584 405 8,0 31,0 11,7 7.272 24.73 10.32 3.81 10.82 140.7 19.28 160.918/1 F 2 450 370 4,0 31,4 9,0 28.48 25.55 13.09 5.744 12.98 69.99 12.43 105.819/1 F 2 931 475 12,0 28,2 8,5 11.31 28.73 11.29 2.627 11.48 82.7 24.39 151.220/1 F 4 1297 525 29,0 45,9 24,2 49.46 34.08 9.252 3.783 12.29 15.44 16.9 93.6921/1 F 6 668 415 11,0 42,7 21,8 10.61 26 9.612 3.225 10.97 71.48 10.11 118.622/1 M 2 463 370 6,0 43,0 28,4 12.63 27.73 12 5.242 12.6 104.8 7.813 152.723/1 M 6 1236 510 14,0 45,5 27,3 34.14 28.82 9.405 4.013 15.29 77.92 21.6 77.3624/1 F 4 849 455 8,0 22,5 2,8 21.51 26.73 8.904 3.557 12.64 141.4 24.99 149.125/1 F 6 893 465 8,0 37,4 15,5 23.94 31.44 11.56 5.874 9.887 17.64 22.19 208.5Mean 4 1087 476 17,9 40,9 23,3 23,427 29,164 9,793 4,087 13,861 57,098 19,424 127,144Minimum 2 373 370 4,0 22,5 2,8 7,272 24,730 4,725 2,289 9,887 2,340 7,813 52,910Maximum 6 2657 650 55,0 63,7 55,6 57,170 35,460 13,520 6,123 20,660 141,400 30,980 240,800St.Dev 1 600 83 15,3 10,7 13,7 14,662 2,770 2,036 1,167 2,580 46,229 6,141 45,498Count 25 25 25 25 25 25 23 25 25 25 25 25 25 23
NIVA report no. 4649 - 59

JAMP Biological effects methods 1997-2001 - Norway
Species : GADU MOR Gadus morhua GB: Cod, N: TorskSample area: J26 Oslofjorden Tissue: AllLocality : 30B Oslo City area Latitude: 59°49.0N Longitude: 10°33.0ECatch,date : 20001106 Count: 25 Sample type: Individual
Analytical lab. => NIVA NIVA NIVA NIVA NIVA NIVA NIVA NIVA NIVA NIVA NIVAAnalysis code =>Detection limit => Mean
Samp/ Sex Age Wght Lngt weight Dry Fat AY(BI) BLOPR(BL) CYTPR(LI) MICPR(LI) ALAD(BL) EROD(LI) MT(LI) BAP3O(BI) NAP2O(BI) PA1O(BI) PYR1O(BI)repl. F/M year g mm g % % ABS 380 nm mg/mL mg/mL mg/mLPBG/min/mg protmin/min/mg prot µg/mg protg/kg/ABS 380 nmg/kg/ABS 380 nm µg/kg/ABS 38µg/kg/ABS 38no. w.wt w.wt w.wt w.wt w.wt w.wt w.wt w.wt w.wt w.wt w.wt1/1 X 4 765 450 17,0 50,5 36,0 8.989 34.97 6.654 3.587 9.789 268.1 8.686 <nd <nd <nd 41.832/1 X 5 845 460 32,0 72,4 62,0 36.7 32.99 6.66 2.591 10.56 239 9.29 <nd <nd <nd 7.5213/1 X 4 856 470 9,0 21,0 13.03 19.56 8.566 3.539 9.113 225.3 6.954 <nd <nd <nd 8.9034/1 X 3 805 440 23,0 60,5 47,0 14.04 39.56 10.24 2.99 13.74 18.49 5.845 <nd <nd <nd 17.245/1 X 3 800 430 31,0 71,0 62,0 17.37 25.62 4.744 1.978 14.77 315.3 10.04 <nd <nd <nd 13.356/1 X 6 1295 560 14,0 33,7 15,0 15.96 36.59 13.61 4.699 13.6 214.4 5.085 <nd <nd <nd 11.537/1 X 4 670 420 23,0 72,3 64,0 14.08 31.51 6.982 3.981 15.35 133.5 8.294 <nd <nd <nd 10.728/1 X 5 908 460 9,0 55,4 43,0 17.17 40.01 6.498 1.964 14.6 207.4 6.882 <nd <nd <nd 16.029/1 X 5 945 480 29,0 63,6 53,0 10.61 40.52 7.664 2.83 9.865 284 8.015 <nd <nd <nd 9.4310/1 X 3 500 400 9,0 63,6 54,0 16.36 43.07 11.08 2.708 3.299 336.2 5.42 <nd <nd <nd 8.49511/1 X 4 885 470 39,0 61,7 50,0 14.24 35.17 6.75 1.556 18.83 163.4 8.514 <nd <nd <nd 8.98812/1 X 5 1450 540 52,0 40,0 16.16 39.56 7.716 2.511 15.72 248.2 11.62 <nd <nd <nd 12.2513/1 X 3 742 430 15,0 57,4 46,0 42.3 9.364 3.14 11.7 239 7.36614/1 X 4 640 430 13,0 57,5 42,0 25.35 38.57 7.968 2.906 13.91 159.4 10.97 <nd <nd <nd 11.8715/1 X 2 860 470 15,0 51,0 38,0 10.81 38.03 9.436 3.485 12.15 202.9 5.71 <nd <nd <nd 14.6216/1 X 4 1140 505 29,0 59,4 49,0 17.17 36.68 7.752 3.027 17.35 309.9 5.338 <nd <nd <nd 13.9817/1 X 5 1625 570 17,0 40,4 24,0 19.09 38.75 11.3 3.285 16.86 259.5 8.165 <nd <nd <nd 7.12518/1 X 5 845 450 27,0 62,7 54,0 11.11 41.9 7.842 2.381 21.66 349.2 8.454 <nd <nd <nd 13.7719/1 X 6 1235 540 29,0 54,2 43,0 10.5 38.8 9.902 3.064 15.75 394 10.85 <nd <nd <nd 13.1420/1 X 5 835 490 42,0 74,2 66,0 41.45 4.644 1.425 18.44 315.2 6.723 <nd <nd <nd21/1 X 4 1160 490 37,0 58,9 49,0 17.7 31.02 7.448 2.994 13.1 231.4 8.553 <nd <nd <nd 15.0322/1 X 3 900 485 33,0 64,6 55,0 38.3 6.05 1.823 18.64 331.2 6.735 <nd <nd <nd23/1 X 4 815 460 36,0 64,9 57,0 12.85 42.62 7.968 2.293 13.57 312.7 5.984 <nd <nd <nd 10.0424/1 X 3 775 435 18,0 59,6 48,0 39.83 9.024 2.902 15.64 262.5 9.58825/1 X 2 575 390 9,0 42,1 28,0 12.04 33.94 11.26 3.098 14.86 632.1 3.854 <nd <nd <nd 13.79Mean 4 915 469 24,3 58,8 45,8 15,778 36,853 8,285 2,830 14,115 266,092 7,717 <<0.000 <<0.000 <<0.000 13,316Minimum 2 500 390 9,0 33,7 15,0 8,989 19,560 4,644 1,425 3,299 18,490 3,854 <0.000 <0.000 <0.000 7,125Maximum 6 1625 570 52,0 74,2 66,0 36,700 43,070 13,610 4,699 21,660 632,100 11,620 0,000 0,000 0,000 41,830St.Dev 1 266 47 11,8 10,2 13,4 6,068 5,502 2,132 0,753 3,816 110,165 2,012 ~0.000 ~0.000 ~0.000 7,119Count 25 25 25 25 23 25 21 25 25 25 25 25 25 23 23 23 21
NIVA report no. 4649 - 60

JAMP Biological effects methods 1997-2001 - Norway
Species : GADU MOR Gadus morhua GB: Cod, N: TorskSample area: J26 Oslofjorden Tissue: AllLocality : 30B Oslo City area Latitude: 59°49.0N Longitude: 10°33.0ECatch,date : 20011002 Count: 25 Sample type: Individual
Analytical lab. => NIVA NIVA NIVA NIVA NIVA NIVA NIVA NIVA NIVA NIVAAnalysis code =>Detection limit => Mean
Samp/ Sex Age Wght Lngt weight Dry Fat AY(BI) BLOPR(BL) CYTPR(LI) MICPR(LI) ALAD(BL) EROD(LI) MT(LI) BAP3O(BI) PA1O(BI) PYR1O(BI)repl. F/M year g mm g % % ABS 380 nm mg/mL mg/mL mg/mLPBG/min/mg protmin/min/mg prot µg/mg protg/kg/ABS 380 nmg/kg/ABS 380 nm µg/kg/ABS 380 nmno. w.wt w.wt w.wt w.wt w.wt w.wt w.wt w.wt w.wt w.wt1/1 F 6 1531 540 57,7 60,4 49,0 14.99 47.49 10.42 3.115 12.42 61.52 13.3 <nd <nd 10.62/1 F 6 778 456 17,9 42,8 28,0 13.74 39.46 13.27 4.366 12.75 52.3 16.07 <nd <nd 21.43/1 M 5 1086 485 16,9 45,7 29,0 11.21 43.33 13.25 3.694 15.03 25.49 17.01 <nd <nd 24.444/1 F 4 1452 501 36,2 58,9 48,0 14.14 46.92 9.244 3.234 11.09 49.37 15.72 <nd <nd 17.045/1 M 5 1192 535 19,5 48,1 31,0 31.21 41.31 18.26 3.849 13.31 78.1 11.63 <nd <nd 7.4666/1 M 4 1237 430 41,5 65,7 54,0 14.34 46.67 7.2 2.104 11.53 177.8 14.41 <nd <nd 11.997/1 F 3 460 375 6,5 39,7 23,0 11.62 48.28 13.45 3.487 9.744 120.8 9.546 <nd <nd 18.778/1 F 3 822 460 9,4 39,5 20,0 30.18 53.44 12.6 5.01 12.72 54.14 17.72 <nd <nd 15.019/1 M 3 779 428 32,4 66,5 57,0 7.575 37.1 8.462 1.94 11.24 133.7 8.718 <nd <nd 32.2110/1 M 5 865 445 23,7 63,7 53,0 15.96 40.67 11.26 3.107 10.3 87.02 10.73 <nd <nd 16.111/1 M 4 911 432 23,4 63,5 47,0 17.88 50.33 8.712 2.459 11.74 206.8 11.81 <nd <nd 19.9712/1 F 4 1076 500 12,6 38,6 21,0 9.494 45.75 14.38 3.999 14.95 47.88 10.83 <nd <nd 19.5913/1 M 4 813 440 24,0 64,8 54,0 8.787 43.83 8.528 2.546 8.746 118 11.09 <nd <nd 17.5314/1 M 2 433 355 16,0 61,9 51,0 8.383 41.22 9.442 2.396 17.41 128.9 13.91 <nd <nd 19.2115/1 F 4 1509 545 12,2 23,8 3,7 20.1 47.91 16.52 3.463 12.49 61.95 12.96 <nd <nd 9.95116/1 M 4 1046 485 20,5 52,2 35,0 13.23 54.1 10.97 3.626 9.693 80.32 10.42 <nd <nd 23.0517/1 F 5 3233 690 72,6 58,1 46,0 21.41 44.1 10.76 2.432 16.22 73.13 18.8 <nd <nd 4.62418/1 M 4 709 410 10,8 43,6 27,0 11.31 43.42 15.27 4.312 10.79 117.3 8.14 <nd <nd 12.1119/1 F 4 2137 500 100,8 76,8 70,0 9.191 50.79 5.506 1.713 15.77 81.15 7.89 <nd <nd 16.7620/1 M 3 731 405 13,3 49,9 35,0 14.14 47.36 14.96 3.881 17.37 74.15 8.39 <nd <nd 21.521/1 M 3 681 420 9,5 39,8 21,0 12.73 53.54 16.67 4.933 17.28 157.8 8.905 <nd <nd 24.1222/1 M 3 698 415 17,2 57,9 44,0 30.3 52.17 11.84 3.55 8.063 129 9.022 <nd <nd 12.5723/1 F 5 1197 500 11,8 28,0 9,1 18.28 50.7 15.43 4.372 13.9 37.67 13.18 <nd <nd 12.224/1 F 5 888 440 25,2 57,8 45,0 8.585 47.86 9.642 2.869 16.1 92.22 15.96 <nd <nd 15.8425/1 F 4 956 455 17,4 46,9 31,0 15.05 59.5 12.36 3.466 12.7 130.1 8.477 <nd <nd 27.58Mean 4 1089 466 26,0 51,8 37,3 15,353 47,090 11,936 3,357 12,934 95,064 12,186 <<0.000 <<0.000 17,265Minimum 2 433 355 6,5 23,8 3,7 7,575 37,100 5,506 1,713 8,063 25,490 7,890 <0.000 <0.000 4,624Maximum 6 3233 690 100,9 76,8 70,0 31,210 59,500 18,260 5,010 17,410 206,800 18,800 <0.000 <0.000 32,210St.Dev 1 582 68 21,9 12,9 16,2 6,786 5,273 3,227 0,896 2,744 45,566 3,302 ~0.000 ~0.000 6,391Count 25 25 25 25 25 25 25 25 25 25 25 25 25 25 25 25
NIVA report no. 4649 - 61

JAMP Biological effects methods 1997-2001 - Norway
Species : GADU MOR Gadus morhua GB: Cod, N: TorskSample area: J26 Oslofjorden Tissue: AllLocality : 36B Færder Latitude: 59°2.0N Longitude: 10°32.0ECatch,date : 19971012 Count: 25 Sample type: Individual
Analytical lab. => NIVA NIVA NIVA NIVA NIVA NIVA NIVA NIVAAnalysis code =>Detection limit => Mean
Samp/ Sex Age Wght Lngt weight Dry Fat BILIV(BI) BLOPR(BL) CYTPR(LI) MICPR(LI) OHBIL(BI) ALAD(BL) EROD(LI) MT(LI)repl. F/M year g mm g % % mg/L mg/mL mg/mL mg/mL µg/kgPBG/min/mg protmin/min/mg prot µg/mg protno. w.wt w.wt w.wt w.wt w.wt w.wt w.wt w.wt1/1 M 4 518 400 668.6 38.48 10.88 17.942/1 F 4 676 425 9,0 42,0 25,1 369.9 27.34 14.3 11.39 60.96 11.98 186.1 12.394/1 M 6 1288 530 15,3 21,5 3,9 558 44.32 14.99 8.419 34.9 13.3 11.266/1 M 7 1333 555 11,1 21,7 3,4 1732 49.92 14.51 5.909 32.12 9.265 114.6 28.947/1 F 6 1325 555 15,6 22,1 4,8 1242 14.99 8.304 37.14 6.455 21.288/1 F 7 1518 560 13,8 21,6 4,4 3562 39.82 13.08 8.525 11.44 15.71 74.69 35.749/1 F 6 2172 570 102,8 57,6 44,5 661.8 42.76 24.66 7.655 18.15 16.84 111.3 11.6910/1 F 6 997 570 10,5 19,9 4,0 966.7 43.48 16.66 3.726 41.48 15.2 1.86 16.3112/1 F 7 1031 580 9,3 24,2 4,9 890.2 51.56 21.44 6.256 16.06 10.96 12.3813/1 F 6 1856 580 33,4 51,0 36,9 2476 28.56 19.39 4.889 22.36 12.76 120.2 18.7814/1 M 6 1993 595 16,8 20,8 5,0 1065 22.56 14.55 10.15 33.61 6.635 154.5 27.9115/1 F 6 1941 600 28,4 51,4 38,3 1063 37.52 13.65 10.06 48.42 5.975 74.28 15.3616/1 M 6 1091 600 15,1 37,5 20,2 954.8 39.11 25.66 11.72 30.19 14.86 71.02 17.0317/1 F 7 1916 610 22,0 22,8 5,8 679.6 42.92 16.85 9.96 28.36 10.02 132.8 16.418/1 M 7 2091 620 40,3 56,3 45,1 2355 54.56 15.52 9.464 16.38 15.08 75.7 16.2219/1 M 6 2301 630 49,1 46,1 28,8 725.4 52.96 26.5 10.03 22.47 9.419 108.7 11.7321/1 F 7 2237 640 18,2 22,2 5,0 1727 30.35 11.76 8.554 24.8 13.95 114.7 30.4622/1 M 8 2863 705 57,1 44,8 30,4 1346 50.8 22.34 4.725 6.922 12.61 83.22 25.1623/1 M 7 3132 730 37,5 37,6 22,6 2272 48.04 24.28 11.75 16.12 13.7 41.53 26.3624/1 M 10 3695 760 73,1 44,8 31,2 611.2 38.78 31.95 13.09 13.13 20.98 13.43 30.2525/1 M 10 3412 760 81,0 33,5 18,5 909.3 44.68 17.95 6.034 7.067 11.29 139.1 31.46Mean 7 1875 599 33,0 35,0 19,1 1278 41,426 18,752 8,531 25,379 12,924 90,233 20,856Minimum 4 518 400 9,0 19,9 3,4 369,900 22,560 11,760 3,726 6,922 5,975 1,860 11,260Maximum 10 3695 760 102,8 57,6 45,1 3562 54,560 31,950 13,090 60,960 20,980 186,100 35,740St.Dev 1 870 91 26,9 13,4 15,1 806,069 8,946 5,515 2,611 14,115 3,685 51,232 7,923Count 21 21 21 20 20 20 21 20 20 20 21 20 18 20
NIVA report no. 4649 - 62
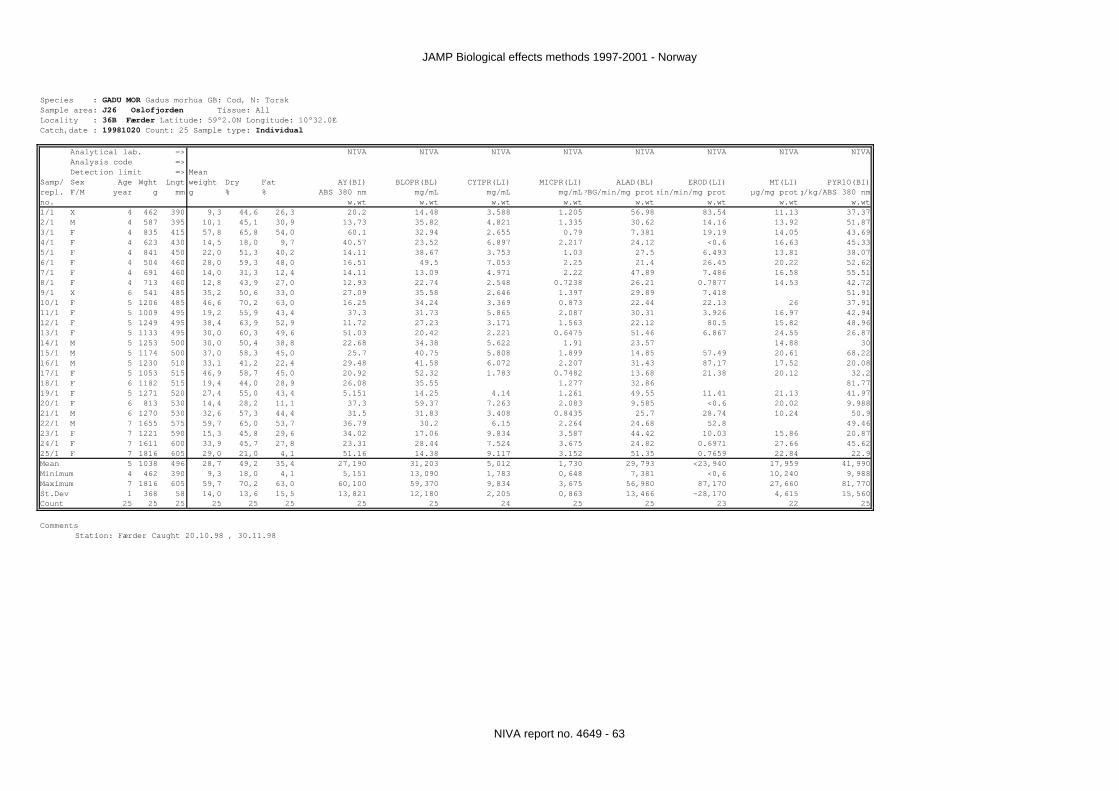
JAMP Biological effects methods 1997-2001 - Norway
Species : GADU MOR Gadus morhua GB: Cod, N: TorskSample area: J26 Oslofjorden Tissue: AllLocality : 36B Færder Latitude: 59°2.0N Longitude: 10°32.0ECatch,date : 19981020 Count: 25 Sample type: Individual
Analytical lab. => NIVA NIVA NIVA NIVA NIVA NIVA NIVA NIVAAnalysis code =>Detection limit => Mean
Samp/ Sex Age Wght Lngt weight Dry Fat AY(BI) BLOPR(BL) CYTPR(LI) MICPR(LI) ALAD(BL) EROD(LI) MT(LI) PYR1O(BI)repl. F/M year g mm g % % ABS 380 nm mg/mL mg/mL mg/mLPBG/min/mg protmin/min/mg prot µg/mg protg/kg/ABS 380 nmno. w.wt w.wt w.wt w.wt w.wt w.wt w.wt w.wt1/1 X 4 462 390 9,3 44,6 26,3 20.2 14.48 3.588 1.205 56.98 83.54 11.13 37.372/1 M 4 587 395 10,1 45,1 30,9 13.73 35.82 4.821 1.335 30.62 14.16 13.92 51.873/1 F 4 835 415 57,8 65,8 54,0 60.1 32.94 2.655 0.79 7.381 19.19 14.05 43.694/1 F 4 623 430 14,5 18,0 9,7 40.57 23.52 6.897 2.217 24.12 <0.6 16.63 45.335/1 F 4 841 450 22,0 51,3 40,2 14.11 38.67 3.753 1.03 27.5 6.493 13.81 38.076/1 F 4 504 460 28,0 59,3 48,0 16.51 49.5 7.053 2.25 21.4 26.45 20.22 52.627/1 F 4 691 460 14,0 31,3 12,4 14.11 13.09 4.971 2.22 47.89 7.486 16.58 55.518/1 F 4 713 460 12,8 43,9 27,0 12.93 22.74 2.548 0.7238 26.21 0.7877 14.53 42.729/1 X 6 541 485 35,2 50,6 33,0 27.09 35.58 2.646 1.397 29.89 7.418 51.9110/1 F 5 1206 485 46,6 70,2 63,0 16.25 34.24 3.369 0.873 22.44 22.13 26 37.9111/1 F 5 1009 495 19,2 55,9 43,4 37.3 31.73 5.865 2.087 30.31 3.926 16.97 42.9412/1 F 5 1249 495 38,4 63,9 52,9 11.72 27.23 3.171 1.563 22.12 80.5 15.82 48.9613/1 F 5 1133 495 30,0 60,3 49,6 51.03 20.42 2.221 0.6475 51.46 6.867 24.55 26.8714/1 M 5 1253 500 30,0 50,4 38,8 22.68 34.38 5.622 1.91 23.57 14.88 3015/1 M 5 1174 500 37,0 58,3 45,0 25.7 40.75 5.808 1.899 14.85 57.49 20.61 68.2216/1 M 5 1230 510 33,1 41,2 22,4 29.48 41.58 6.072 2.207 31.43 87.17 17.52 20.0817/1 F 5 1053 515 46,9 58,7 45,0 20.92 52.32 1.783 0.7482 13.68 21.38 20.12 32.218/1 F 6 1182 515 19,4 44,0 28,9 26.08 35.55 1.277 32.86 81.7719/1 F 5 1271 520 27,4 55,0 43,4 5.151 14.25 4.14 1.261 49.55 11.41 21.13 41.9720/1 F 6 813 530 14,4 28,2 11,1 37.3 59.37 7.263 2.083 9.585 <0.6 20.02 9.98821/1 M 6 1270 530 32,6 57,3 44,4 31.5 31.83 3.408 0.8435 25.7 28.74 10.24 50.922/1 M 7 1655 575 59,7 65,0 53,7 36.79 30.2 6.15 2.264 24.68 52.8 49.4623/1 F 7 1221 590 15,3 45,8 29,6 34.02 17.06 9.834 3.587 44.42 10.03 15.86 20.8724/1 F 7 1611 600 33,9 45,7 27,8 23.31 28.44 7.524 3.675 24.82 0.6971 27.66 45.6225/1 F 7 1816 605 29,0 21,0 4,1 51.16 14.38 9.117 3.152 51.35 0.7659 22.84 22.9Mean 5 1038 496 28,7 49,2 35,4 27,190 31,203 5,012 1,730 29,793 <23,940 17,959 41,990Minimum 4 462 390 9,3 18,0 4,1 5,151 13,090 1,783 0,648 7,381 <0,6 10,240 9,988Maximum 7 1816 605 59,7 70,2 63,0 60,100 59,370 9,834 3,675 56,980 87,170 27,660 81,770St.Dev 1 368 58 14,0 13,6 15,5 13,821 12,180 2,205 0,863 13,466 ~28,170 4,615 15,560Count 25 25 25 25 25 25 25 25 24 25 25 23 22 25
Comments Station: Færder Caught 20.10.98 , 30.11.98
NIVA report no. 4649 - 63

JAMP Biological effects methods 1997-2001 - Norway
Species : GADU MOR Gadus morhua GB: Cod, N: TorskSample area: J26 Oslofjorden Tissue: AllLocality : 36B Færder Latitude: 59°2.0N Longitude: 10°32.0ECatch,date : 19991028 Count: 25 Sample type: Individual
Analytical lab. => NIVA NIVA NIVA NIVA NIVA NIVA NIVA NIVAAnalysis code =>Detection limit => Mean
Samp/ Sex Age Wght Lngt weight Dry Fat AY(BI) BLOPR(BL) CYTPR(LI) MICPR(LI) ALAD(BL) EROD(LI) MT(LI) PYR1O(BI)repl. F/M year g mm g % % ABS 380 nm mg/mL mg/mL mg/mLPBG/min/mg protmin/min/mg prot µg/mg protg/kg/ABS 380 nmno. w.wt w.wt w.wt w.wt w.wt w.wt w.wt w.wt1/1 F 2 925 480 9,3 25,3 5,6 23.03 48.66 9.543 4.577 11.08 2.62 32.85 31.622/1 M 3 1028 490 22,8 65,0 53,9 65.04 56.07 6.516 2.184 7.974 73.47 27.09 12.183/1 F 4 1027 470 14,6 45,6 31,8 16.46 23.34 7.932 2.579 37.24 1.03 32.07 28.924/1 F 5 2145 630 31,1 52,5 42,3 32.32 49.35 6.723 1.748 8.09 <0.6 40.89 115/1 F 2 842 440 24,0 57,2 48,7 34.04 45.72 5.793 1.811 7.005 52.02 11.8 28.546/1 F 2 994 470 24,6 65,4 57,5 12.83 39.36 6.264 2.154 18.86 33.7 17.63 36.787/1 M 3 1196 540 19,2 49,8 37,1 29.9 56.67 6.273 2.68 9.341 53.27 26.78 25.568/1 F 1 327 330 11,8 70,2 62,0 20.2 51.72 4.932 1.845 9.131 82.46 22.13 60.139/1 M 1 495 360 9,8 50,4 34,0 35.25 34.02 7.701 3.189 20.05 77.86 13.07 29.6910/1 F 1 411 360 14,1 62,9 54,4 16.06 40.83 6.378 2.36 13.46 70.71 14.05 60.9211/1 X 1 403 340 14,8 63,0 52,7 25.96 42 4.623 1.965 7.054 285.4 14.26 46.1912/1 F 1 332 320 13,4 68,6 63,5 66.96 38.79 4.416 1.799 9.931 44.38 13.23 19.813/1 F 3 1815 580 27,1 54,8 40,0 52.02 34.14 6.129 2.357 24.97 97.41 28.47 10.8414/1 F 2 2552 630 44,9 34,8 18,1 41.01 41.31 6.513 2.529 9.421 153.5 35.44 10.4615/1 F 2 1331 530 19,0 35,2 17,7 12.12 45.3 9.84 4.585 11.84 137.9 30.16 34.7416/1 M 4 1388 520 29,9 39,0 24,0 10.2 34.53 8.631 2.85 2.864 2.317 22.48 58.3417/1 F 2 1064 470 28,1 65,7 57,3 32.42 45.39 4.923 1.68 10.75 127.7 31.17 24.0818/1 M 2 449 380 6,2 42,7 28,0 27.67 43.74 6.624 2.744 10.73 49.2 18.64 61.9819/1 F 5 2988 690 37,5 48,1 34,1 27.67 35.79 8.328 2.704 12.89 55.15 26.33 22.0420/1 X 1 343 320 10,8 62,1 47,1 17.57 27.33 6.273 1.922 4.33 58.99 12.45 62.9421/1 F 3 1775 570 33,3 49,1 35,2 68.78 50.13 6.744 2.019 6.368 60.17 16.35 9.56822/1 F 5 3423 680 48,4 53,0 39,9 30.5 47.37 7.872 2.962 2.755 72.29 34.04 19.0823/1 F 3 2392 580 88,4 67,0 59,0 24.64 33.69 5.115 1.944 14.98 48.12 42.46 28.0924/1 M 3 653 420 7,5 27,8 9,4 7.575 37.05 8.685 3.873 5.702 64.14 26.95 58.725/1 M 1 526 380 19,3 68,8 58,9 16.77 30.57 5.979 1.809 17.04 81.5 19.21 50.63Mean 2 1233 479 24,4 53,0 40,5 29,880 41,315 6,750 2,515 11,754 <71,436 24,400 33,713Minimum 1 327 320 6,2 25,3 5,6 7,575 23,340 4,416 1,680 2,755 <0,6 11,800 9,568Maximum 5 3423 690 88,4 70,2 63,5 68,780 56,670 9,840 4,585 37,240 285,400 42,460 62,940St.Dev 1 882 114 17,5 13,2 16,7 17,292 8,551 1,484 0,817 7,537 ~59,523 9,143 18,491Count 25 25 25 25 25 25 25 25 25 25 25 25 25 25
NIVA report no. 4649 - 64

JAMP Biological effects methods 1997-2001 - Norway
Species : GADU MOR Gadus morhua GB: Cod, N: TorskSample area: J26 Oslofjorden Tissue: AllLocality : 36B Færder Latitude: 59°2.0N Longitude: 10°32.0ECatch,date : 20001027 Count: 23 Sample type: Individual
Analytical lab. => NIVA NIVA NIVA NIVA NIVA NIVA NIVA NIVA NIVA NIVA NIVAAnalysis code =>Detection limit => Mean
Samp/ Sex Age Wght Lngt weight Dry Fat AY(BI) BLOPR(BL) CYTPR(LI) MICPR(LI) ALAD(BL) EROD(LI) MT(LI) BAP3O(BI) NAP2O(BI) PA1O(BI) PYR1O(BI)repl. F/M year g mm g % % ABS 380 nm mg/mL mg/mL mg/mLPBG/min/mg protmin/min/mg prot µg/mg protg/kg/ABS 380 nmg/kg/ABS 380 nm µg/kg/ABS 38µg/kg/ABS 38no. w.wt w.wt w.wt w.wt w.wt w.wt w.wt w.wt w.wt w.wt w.wt1/1 F 6 2136 640 17,4 21,8 3,1 79.47 42.38 14.63 3.673 1.335 14.37 <nd <nd <nd 1.5232/1 F 3 1452 560 16,2 26,1 9,5 68.74 30.93 11.07 3.471 22.98 43.86 20.52 <nd <nd <nd 3.3463/1 F 3 2188 620 44,2 53,0 40,4 22.8 50.02 10.75 2.584 18.83 1.855 19.61 <nd <nd <nd 7.6314/1 M 2 1062 490 26,8 55,2 43,2 37.05 53.04 9.65 6.168 20.99 2.469 12.75 <nd <nd <nd 6.2885/1 M 2 882 460 21,2 56,0 45,1 64.89 44.24 10.25 2.772 17.07 71.98 5.238 <nd <nd <nd 6.0886/1 F 2 694 420 14,6 54,8 37,9 51.98 52.73 12.14 3.731 17.89 96.75 8.16 <nd <nd <nd 5.1377/1 F 2 624 405 5,8 10,8 34.2 50.2 13.26 4.303 22.64 17.72 13.61 <nd <nd <nd 7.288/1 M 2 664 410 12,6 49,1 32,2 7.878 47.05 10.66 4.13 21.59 98.05 10.86 <nd <nd <nd 9.2669/1 F 2 1528 540 64,6 64,4 56,5 41.11 52.34 7.836 2.125 17.42 77.88 18.43 <nd <nd <nd 5.2310/1 F 2 840 460 16,2 54,4 43,2 40.6 43.09 10.42 3.382 21.49 6.086 10.58 <nd <nd <nd 5.46811/1 F 2 1579 570 54,8 63,2 55,7 20.6 42.79 7.38 1.952 22.03 64.93 13.11 <nd <nd <nd 6.79512/1 M 2 1468 550 37,8 64,0 53,9 31.52 42.51 7.992 2.977 18.13 1354 32.95 <nd <nd <nd 7.99513/1 M 2 868 450 25,4 64,1 55,9 68.58 45.16 8.282 2.356 17.74 104.6 13.67 <nd <nd <nd 4.21414/1 F 2 816 455 20,8 55,8 44,5 53.15 48.18 9.6 2.751 21.93 134.1 10.85 <nd <nd <nd 2.33315/1 F 2 739 430 20,6 64,7 55,3 25.32 32.07 7.48 2.61 25.03 79.82 14.75 <nd <nd <nd 6.39916/1 M 2 934 450 22,2 65,7 58,5 64.72 41.73 7.564 2.064 24 14.74 11.89 <nd <nd <nd 4.92917/1 M 2 901 460 15,2 50,6 37,9 77.8 51.59 7.596 2.45 22.1 43.88 11.63 <nd <nd <nd 2.98218/1 F 2 702 420 20,2 61,3 47,5 23.14 37.53 8.576 2.745 22.96 66.68 9.215 <nd <nd <nd 8.21219/1 M 2 843 470 9,6 30,3 14,0 22.3 48.09 11.42 3.446 23.95 1.525 9.506 <nd <nd <nd 4.97820/1 F 2 591 390 14,2 57,4 43,5 42.92 43.07 8.348 2.66 25.91 49.13 10.16 <nd <nd <nd 4.5221/1 M 2 627 415 11,4 44,1 26,8 59.52 43.79 10.07 2.49 23.69 1.611 7.086 <nd <nd <nd 3.32722/1 F 2 1293 510 48,6 67,6 60,5 38.56 32.87 7.358 2.292 18.41 80.5 9.033 <nd <nd <nd 2.43823/1 F 2 910 490 9,2 25,3 8,1 47.95 41.36 10.94 2.969 24.06 156.1 11.32 <nd <nd <nd 4.067Mean 2 1058 481 23,9 52,2 38,4 44,556 44,207 9,707 3,048 21,402 111,722 13,013 <<0.000 <<0.000 <<0.000 5,237Minimum 2 591 390 5,8 21,8 3,1 7,878 30,930 7,358 1,952 17,070 1,335 5,238 <0.000 <0.000 <0.000 1,523Maximum 6 2188 640 64,6 67,6 60,5 79,470 53,040 14,630 6,168 25,910 1354 32,950 <0.000 <0.000 <0.000 9,266St.Dev 1 462 69 15,6 14,1 18,0 19,985 6,406 2,007 0,938 2,704 274,533 5,735 ~0.000 ~0.000 ~0.000 2,064Count 23 23 23 23 22 23 23 23 23 23 22 23 23 23 23 23 23
NIVA report no. 4649 - 65
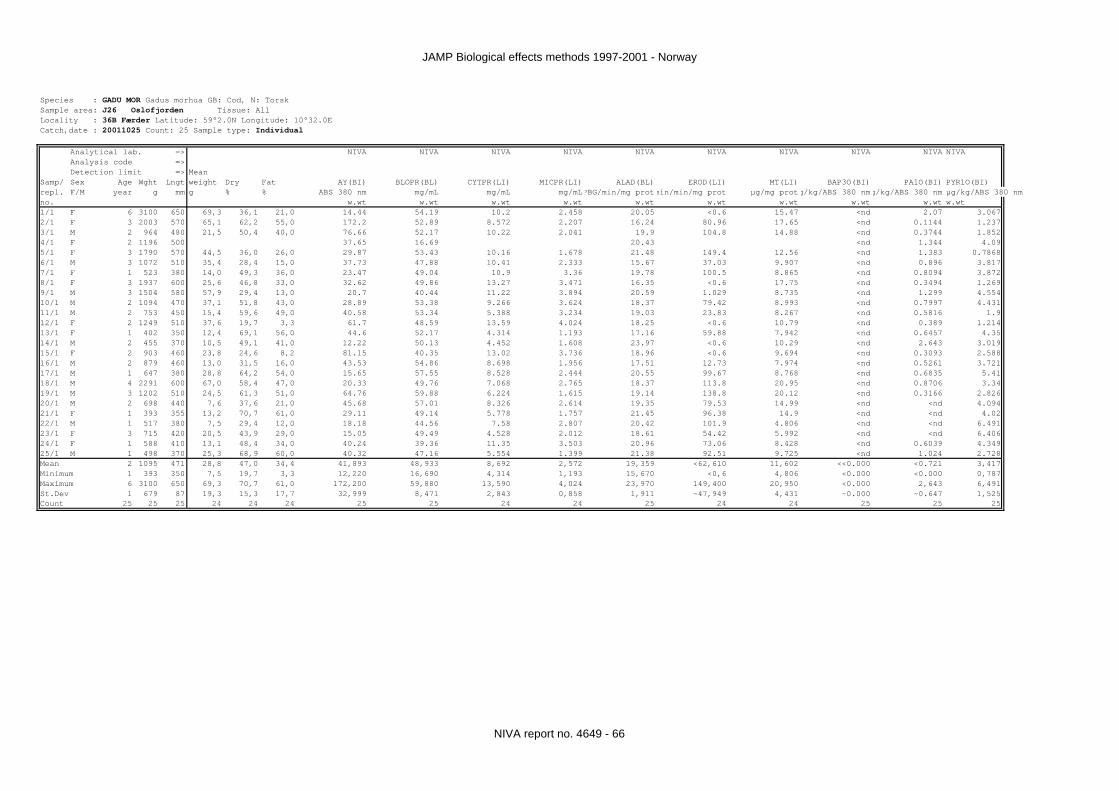
JAMP Biological effects methods 1997-2001 - Norway
Species : GADU MOR Gadus morhua GB: Cod, N: TorskSample area: J26 Oslofjorden Tissue: AllLocality : 36B Færder Latitude: 59°2.0N Longitude: 10°32.0ECatch,date : 20011025 Count: 25 Sample type: Individual
Analytical lab. => NIVA NIVA NIVA NIVA NIVA NIVA NIVA NIVA NIVA NIVAAnalysis code =>Detection limit => Mean
Samp/ Sex Age Wght Lngt weight Dry Fat AY(BI) BLOPR(BL) CYTPR(LI) MICPR(LI) ALAD(BL) EROD(LI) MT(LI) BAP3O(BI) PA1O(BI) PYR1O(BI)repl. F/M year g mm g % % ABS 380 nm mg/mL mg/mL mg/mLPBG/min/mg protmin/min/mg prot µg/mg protg/kg/ABS 380 nmg/kg/ABS 380 nm µg/kg/ABS 380 nmno. w.wt w.wt w.wt w.wt w.wt w.wt w.wt w.wt w.wt w.wt1/1 F 6 3100 650 69,3 36,1 21,0 14.44 54.19 10.2 2.458 20.05 <0.6 15.47 <nd 2.07 3.0672/1 F 3 2003 570 65,1 62,2 55,0 172.2 52.89 8.572 2.207 16.24 80.96 17.65 <nd 0.1144 1.2373/1 M 2 964 480 21,5 50,4 40,0 76.66 52.17 10.22 2.041 19.9 104.8 14.88 <nd 0.3744 1.8524/1 F 2 1196 500 37.65 16.69 20.43 <nd 1.344 4.095/1 F 3 1790 570 44,5 36,0 26,0 29.87 53.43 10.16 1.678 21.48 149.4 12.56 <nd 1.383 0.78686/1 M 3 1072 510 35,4 28,4 15,0 37.73 47.88 10.41 2.333 15.67 37.03 9.907 <nd 0.896 3.8177/1 F 1 523 380 14,0 49,3 36,0 23.47 49.04 10.9 3.36 19.78 100.5 8.865 <nd 0.8094 3.8728/1 F 3 1937 600 25,6 46,8 33,0 32.62 49.86 13.27 3.471 16.35 <0.6 17.75 <nd 0.3494 1.2699/1 M 3 1504 580 57,9 29,4 13,0 20.7 40.44 11.22 3.894 20.59 1.029 8.735 <nd 1.299 4.55410/1 M 2 1094 470 37,1 51,8 43,0 28.89 53.38 9.266 3.624 18.37 79.42 8.993 <nd 0.7997 4.43111/1 M 2 753 450 15,4 59,6 49,0 40.58 53.34 5.388 3.234 19.03 23.83 8.267 <nd 0.5816 1.912/1 F 2 1249 510 37,6 19,7 3,3 61.7 48.59 13.59 4.024 18.25 <0.6 10.79 <nd 0.389 1.21413/1 F 1 402 350 12,4 69,1 56,0 44.6 52.17 4.314 1.193 17.16 59.88 7.942 <nd 0.6457 4.3514/1 M 2 455 370 10,5 49,1 41,0 12.22 50.13 4.452 1.608 23.97 <0.6 10.29 <nd 2.643 3.01915/1 F 2 903 460 23,8 24,6 8,2 81.15 40.35 13.02 3.736 18.96 <0.6 9.694 <nd 0.3093 2.58816/1 M 2 879 460 13,0 31,5 16,0 43.53 54.86 8.698 1.956 17.51 12.73 7.974 <nd 0.5261 3.72117/1 M 1 647 380 28,8 64,2 54,0 15.65 57.55 8.528 2.444 20.55 99.67 8.768 <nd 0.6835 5.4118/1 M 4 2291 600 67,0 58,4 47,0 20.33 49.76 7.068 2.765 18.37 113.8 20.95 <nd 0.8706 3.3419/1 M 3 1202 510 24,5 61,3 51,0 64.76 59.88 6.224 1.615 19.14 138.8 20.12 <nd 0.3166 2.82620/1 M 2 698 440 7,6 37,6 21,0 45.68 57.01 8.326 2.614 19.35 79.53 14.99 <nd <nd 4.09421/1 F 1 393 355 13,2 70,7 61,0 29.11 49.14 5.778 1.757 21.45 96.38 14.9 <nd <nd 4.0222/1 M 1 517 380 7,5 29,4 12,0 18.18 44.56 7.58 2.807 20.42 101.9 4.806 <nd <nd 6.49123/1 F 3 715 420 20,5 43,9 29,0 15.05 49.49 4.528 2.012 18.61 54.42 5.992 <nd <nd 6.40624/1 F 1 588 410 13,1 48,4 34,0 40.24 39.36 11.35 3.503 20.96 73.06 8.428 <nd 0.6039 4.34925/1 M 1 498 370 25,3 68,9 60,0 40.32 47.16 5.554 1.399 21.38 92.51 9.725 <nd 1.024 2.728Mean 2 1095 471 28,8 47,0 34,4 41,893 48,933 8,692 2,572 19,359 <62,610 11,602 <<0.000 <0.721 3,417Minimum 1 393 350 7,5 19,7 3,3 12,220 16,690 4,314 1,193 15,670 <0,6 4,806 <0.000 <0.000 0,787Maximum 6 3100 650 69,3 70,7 61,0 172,200 59,880 13,590 4,024 23,970 149,400 20,950 <0.000 2,643 6,491St.Dev 1 679 87 19,3 15,3 17,7 32,999 8,471 2,843 0,858 1,911 ~47,949 4,431 ~0.000 ~0.647 1,525Count 25 25 25 24 24 24 25 25 24 24 25 24 24 25 25 25
NIVA report no. 4649 - 66

JAMP Biological effects methods 1997-2001 - Norway
Species : GADU MOR Gadus morhua GB: Cod, N: TorskSample area: J99 Undefined Tissue: AllLocality : 15B Ullerø area Latitude: 58°3.0N Longitude: 6°43.0ECatch,date : 19971006 Count: 25 Sample type: Individual
Analytical lab. => NIVA NIVA NIVA NIVA NIVA NIVA NIVA NIVAAnalysis code =>Detection limit => Mean
Samp/ Sex Age Wght Lngt weight Dry Fat BILIV(BI) BLOPR(BL) CYTPR(LI) MICPR(LI) OHBIL(BI) ALAD(BL) EROD(LI) MT(LI)repl. F/M year g mm g % % mg/L mg/mL mg/mL mg/mL µg/kgPBG/min/mg protmin/min/mg prot µg/mg protno. w.wt w.wt w.wt w.wt w.wt w.wt w.wt w.wt1/1 F 4 1028 479 9,7 23,9 3,3 54.88 15.32 6.608 16.99 35.55 13.092/1 M 5 962 488 7,3 25,7 3,7 38.32 11.58 4.628 12.38 3.114 10.93/1 M 4 1160 488 26,9 58,7 40,0 12.82 5.324 10.464/1 M 5 752 490 8,4 34,6 13,2 39.27 17.54 6.269 26.33 2.397 9.665/1 M 5 1267 524 33,9 61,8 52,0 631.4 46.8 12.22 3.094 265.1 18.22 111.9 10.156/1 M 5 1452 533 24,9 58,1 44,5 40.24 17.71 6.776 14.5 49.85 7.5647/1 M 5 1427 541 12,9 32,2 13,3 27.62 11.71 6.039 22.09 31.8 13.918/1 F 5 1685 551 77,7 75,1 68,5 45.24 5.102 2.143 21.44 51.47 13.139/1 F 5 1623 555 59,8 72,3 64,8 1017 41.92 11.39 3.984 1150 21.7 264.8 14.8710/1 F 5 1813 580 36,6 55,9 42,4 384.8 21.49 19.02 6.14 426.8 26.46 40.7 12.8711/1 F 5 1922 595 36,7 53,5 41,2 510.1 47.96 18.44 8.536 3024 15.94 434.4 18.7912/1 F 6 1176 600 26,9 63,8 50,4 478.3 46.44 22.44 13.11 200.1 17.49 122.1 11.7613/1 F 6 2259 605 51,0 53,5 37,8 42.04 27.96 8.262 17.5 26.53 17.6614/1 M 5 2111 610 91,7 75,8 70,8 546.1 50.36 5.162 2.94 130.7 18.1 40.25 17.5315/1 M 5 2147 620 107,5 72,4 64,4 47.16 8.438 4.363 12.92 94.35 13.816/1 F 5 2762 655 136,2 66,9 63,7 628 45.44 11.61 5.365 719.3 15.45 38.16 13.5617/1 F 6 2563 670 139,8 72,4 68,3 46.64 7.208 2.888 9.037 70.14 16.4218/1 F 6 2817 675 167,1 73,7 66,1 435.5 41.48 7.208 1.838 2631 13.84 173.8 14.2919/1 F 6 3096 679 150,9 73,2 64,5 47 11.91 3.035 15.05 128.5 12.1820/1 M 7 3371 688 148,8 74,3 67,8 728.4 41.24 20.42 3.628 6.885 8.758 15.09 9.35721/1 M 6 3180 693 65,8 58,2 45,1 23.41 18.49 5.611 28.6 84.08 16.5222/1 M 6 3294 700 106,6 60,3 42,7 680.7 45.12 30.84 9.44 14.23 8.163 25.86 6.62223/1 F 7 3206 700 42.96 7.2924/1 F 7 3790 710 177,0 72,8 66,0 24.71 13.86 4.435 23.6 48.22 21.3925/1 M 8 3780 725 132,3 68,7 62,4 22.8 13.25 3.378 30.27 99.57 15.54Mean 6 2186 606 76,5 59,9 48,2 604,030 40,439 14,652 5,326 856,812 17,588 86,636 13,418Minimum 4 752 479 7,3 23,9 3,3 384,800 21,490 5,102 1,838 6,885 7,290 2,397 6,622Maximum 8 3790 725 177,0 75,8 70,8 1017 54,880 30,840 13,110 3024 30,270 434,400 21,390St.Dev 1 940 80 56,5 15,9 21,2 181,862 9,388 6,552 2,614 1099 6,456 97,053 3,583Count 25 25 25 24 24 24 10 24 24 24 10 24 23 24
Comments Station: Ullerø area Caught 6.10.97 15.11.97 2.12.97
NIVA report no. 4649 - 67

JAMP Biological effects methods 1997-2001 - Norway
Species : GADU MOR Gadus morhua GB: Cod, N: TorskSample area: J99 Undefined Tissue: AllLocality : 15B Ullerø area Latitude: 58°3.0N Longitude: 6°43.0ECatch,date : 19981007 Count: 25 Sample type: Individual
Analytical lab. => NIVA NIVA NIVA NIVA NIVA NIVA NIVA NIVAAnalysis code =>Detection limit => Mean
Samp/ Sex Age Wght Lngt weight Dry Fat AY(BI) BLOPR(BL) CYTPR(LI) MICPR(LI) ALAD(BL) EROD(LI) MT(LI) PYR1O(BI)repl. F/M year g mm g % % ABS 380 nm mg/mL mg/mL mg/mLPBG/min/mg protmin/min/mg prot µg/mg protg/kg/ABS 380 nmno. w.wt w.wt w.wt w.wt w.wt w.wt w.wt w.wt1/1 F 3 329 330 3,4 38,3 24.24 24.75 8.396 2.954 25.17 72.96 41852/1 F 4 733 430 12,7 53,7 38,5 26.46 48.67 8.607 3.136 20.6 74.16 15.94 153103/1 F 4 902 450 25,5 70,4 62,5 20.03 37.59 2.497 0.8779 30.26 63.63 15.86 18944/1 F 5 845 452 9,0 26,0 5,2 19.9 31.41 11.51 6.348 20.76 93.67 11.23 125205/1 M 5 834 455 18,0 58,5 48,2 20.66 27.07 7.785 3.23 34.27 42.81 7.378 73636/1 M 4 848 464 14,0 40,0 23,2 10.33 26.8 16.42 3.807 31.02 26.22 39607/1 X 5 977 480 17,1 61,5 47,9 32.22 50.04 4.98 1.788 9.251 130.4 11.52 48538/1 M 5 1251 496 25,0 54,3 40,1 53.42 28.22 10.36 3.882 23.37 119.3 20.47 37709/1 F 5 1239 500 16,0 39,2 20,7 33.73 26 15.44 6.204 29.04 0.7738 17.27 823.210/1 F 5 1423 526 30,0 52,0 40,8 23.69 33.9 11.21 3.31 21.34 53.3 18.76 368611/1 M 5 1373 529 26,0 46,7 31,3 15.75 24.85 12.92 4.044 22.81 30.68 19.52 1016012/1 F 5 1582 530 41,0 57,9 42,8 56.76 25.94 12.37 4.204 26.5 6.462 28.48 182213/1 F 5 1381 550 38,0 65,6 51,0 22.43 62.58 7.917 2.446 21.2 203.2 22.19 601714/1 M 5 1581 559 18,0 30,1 10,6 20.66 27.69 12.3 8.064 23.88 1.183 489315/1 M 5 1691 563 13,0 34,3 14,1 16.16 35.91 17.07 3.983 18.79 38.69 515016/1 F 6 1651 566 23,0 37,5 18,0 23.44 31.53 11.53 3.987 23.34 3.096 30.74 561017/1 M 5 1574 570 13,0 24,6 6,3 15.75 39.12 8.286 2.905 121.3 19.6 279218/1 M 6 1967 581 43,0 58,9 47,1 37.42 25.97 16.89 3.288 15.26 20.66 535219/1 M 5 1895 583 36,0 55,1 43,0 20.7 44.73 7.281 2.796 99.13 337020/1 M 6 1872 585 13,0 60,2 51,3 19.66 28.48 11.19 3.135 28.81 7.815 15.38 142521/1 F 6 2866 670 116,0 66,5 57,9 23.43 16.54 13.63 6.216 42.9 85.25 22.72 265722/1 M 7 3217 690 175,7 74,3 67,7 32.76 53.43 3.18 1.513 21.27 52.27 19.35 351.523/1 F 7 3393 725 245,0 83,2 77,5 7.308 20.87 2.411 0.74 38.28 12.93 28 213424/1 F 7 3921 775 328,0 66,4 60,9 27.72 41.19 5.424 1.666 21.4 <0.6 23.24 170.925/1 F 4 772 945 12,4 56,6 42,8 29.74 35.76 8.814 3.172 22.3 202.9 3266Mean 5 1605 560 52,5 52,5 39,6 25,375 33,962 9,937 3,508 25,298 <62,320 19,385 4541Minimum 3 329 330 3,4 24,6 5,2 7,308 16,540 2,411 0,740 9,251 <0,6 7,378 170,900Maximum 7 3921 945 328,0 83,2 77,5 56,760 62,580 17,070 8,064 42,900 203,200 30,740 15310St.Dev 1 894 126 80,4 15,4 19,8 11,391 11,060 4,284 1,740 7,155 ~58,844 5,964 3626Count 25 25 25 25 25 24 25 25 25 25 22 25 19 25
Comments Station: Ullerø area Caught 7.10.98 14.10.98 5.12.98
NIVA report no. 4649 - 68

JAMP Biological effects methods 1997-2001 - Norway
Species : GADU MOR Gadus morhua GB: Cod, N: TorskSample area: J99 Undefined Tissue: AllLocality : 15B Ullerø area Latitude: 58°3.0N Longitude: 6°43.0ECatch,date : 19991021 Count: 25 Sample type: Individual
Analytical lab. => NIVA NIVA NIVA NIVA NIVA NIVA NIVA NIVAAnalysis code =>Detection limit => Mean
Samp/ Sex Age Wght Lngt weight Dry Fat AY(BI) BLOPR(BL) CYTPR(LI) MICPR(LI) ALAD(BL) EROD(LI) MT(LI) PYR1O(BI)repl. F/M year g mm g % % ABS 380 nm mg/mL mg/mL mg/mLPBG/min/mg protmin/min/mg prot µg/mg protg/kg/ABS 380 nmno. w.wt w.wt w.wt w.wt w.wt w.wt w.wt w.wt1/1 M 2 1628 560 55,0 73,4 64,0 27.57 38.37 4.581 1.611 2.989 193.2 22.99 77242/1 F 2 1735 570 56,8 61,5 54,1 28.79 45.51 6.345 2.256 9.608 196.4 14.46 156303/1 M 2 974 470 19,7 51,7 42,0 24.54 50.04 5.997 1.813 7.194 453.5 17.76 72534/1 M 1 399 350 3,4 13,6 46.56 43.23 9.588 3.981 8.446 136.5 16.22 343105/1 F 3 2850 690 115,2 70,4 62,8 27.16 41.4 4.008 1.563 14.29 35.37 24.156/1 M 2 855 450 50,6 76,1 69,0 34.04 32.88 2.674 0.942 6.269 75.9 15.46 148.47/1 F 1 432 370 5,4 13,2 16.87 41.46 11.48 3.865 16.57 106.3 12.27 103.98/1 F 1 434 360 5,5 13,2 17.47 38.91 7.242 4.189 4.934 420.5 13.05 71.659/1 M 2 1310 500 48,6 68,7 62,0 21.61 31.8 4.71 1.757 3.072 251.6 19.53 96.4410/1 F 2 2722 640 122,5 72,6 55,0 23.43 46.05 3.021 1.059 8.252 81.43 26.12 82.3711/1 F 2 1187 510 27,0 61,6 49,6 29.09 36.57 6.441 3.816 23.14 102.1 27.08 47.6512/1 F 2 1003 450 24,6 64,4 52,4 22.22 33.63 5.301 2.523 20.75 140.5 16.43 56.9813/1 M 3 2548 600 158,1 75,3 65,3 9.494 27.63 2.427 1.193 2.676 58.79 23.53 56.4614/1 M 2 1303 520 31,1 62,4 46,3 17.68 35.67 5.337 2.059 17.96 14.15 119.515/1 F 1 470 370 8,1 60,9 48,7 14.65 35.73 4.758 2.307 16.37 209.7 15.21 156.116/1 M 1 357 320 3,3 10,7 15.25 34.5 8.694 3.693 3.333 53.46 17.76 252.917/1 M 1 299 320 3,5 20,8 11.72 37.71 7.845 3.909 6.421 148.6 7.704 432.118/1 F 1 358 350 3,6 20,0 33.84 36.96 9.342 3.619 21.3 312.6 14.9 178.719/1 F 2 1500 540 34,4 65,1 49,0 33.33 41.46 5.106 2.163 27.2 156 27 195220/1 F 2 1102 500 35,7 66,5 55,0 27.37 39.63 4.614 1.988 8.261 332.9 26.36 2162021/1 F 2 873 460 17,7 56,5 35,0 40.4 43.26 5.328 2.204 3.522 212.4 27.36 7232022/1 F 2 765 450 7,6 37,9 18,0 12.32 45.72 10.81 4.221 6.048 349.2 14.58 658823/1 F 1 792 440 23,1 69,6 55,0 64.03 52.29 5.097 1.692 13.16 666.2 19.63 1053024/1 M 1 712 420 16,2 62,8 48,0 10.71 41.52 5.358 2.732 20.37 174.5 19.68 1140025/1 M 3 637 420 14,3 54,5 39,0 53.23 57.96 6.951 2.277 10.1 302.5 23.82 10920Mean 2 1090 465 35,6 63,8 42,5 26,535 40,396 6,122 2,537 11,289 215,423 18,877 8083Minimum 1 299 320 3,3 37,9 10,7 9,494 27,630 2,427 0,942 2,676 35,370 7,704 24,150Maximum 3 2850 690 158,1 76,1 69,0 64,030 57,960 11,480 4,221 27,200 666,200 27,360 72320St.Dev 1 735 99 40,5 9,3 18,9 13,575 6,797 2,393 1,054 7,289 150,324 5,507 15819Count 25 25 25 25 19 25 25 25 25 25 25 24 24 25
Comments Station: Ullerø area Caught 20-21okt. 1999
NIVA report no. 4649 - 69

JAMP Biological effects methods 1997-2001 - Norway
Species : GADU MOR Gadus morhua GB: Cod, N: TorskSample area: J99 Undefined Tissue: AllLocality : 15B Ullerø area Latitude: 58°3.0N Longitude: 6°43.0ECatch,date : 20011016 Count: 25 Sample type: Individual
Analytical lab. => NIVA NIVA NIVA NIVA NIVA NIVA NIVA NIVA NIVA NIVAAnalysis code =>Detection limit => Mean
Samp/ Sex Age Wght Lngt weight Dry Fat AY(BI) BLOPR(BL) CYTPR(LI) MICPR(LI) ALAD(BL) EROD(LI) MT(LI) BAP3O(BI) PA1O(BI) PYR1O(BI)repl. F/M year g mm g % % ABS 380 nm mg/mL mg/mL mg/mLPBG/min/mg protmin/min/mg prot µg/mg protg/kg/ABS 380 nmg/kg/ABS 380 nm µg/kg/ABS 380 nmno. w.wt w.wt w.wt w.wt w.wt w.wt w.wt w.wt w.wt w.wt1/1 F 3 1698 569 41,2 53,4 42,0 38.78 42.39 10.58 1.851 17.97 54.58 10.44 <nd 0.7477 32.412/1 F 3 1846 590 37,4 35,5 24,0 30.2 50.39 11.98 2.911 18.94 31.8 18.45 <nd 0.9272 11.193/1 M 3 1065 489 25,4 57,0 47,0 89.86 56.68 6.194 0.9515 14.03 25.48 15.25 <nd 2.326 22.024/1 F 2 801 442 18,1 46,5 31,0 34.04 57.45 10.71 1.607 27.2 38.44 12.6 <nd 5.377 50.185/1 F 3 1193 494 41,1 63,4 56,0 26.56 54.75 8.91 1.778 21.16 89.28 16.66 <nd 2.183 25.076/1 M 3 1466 560 48,4 54,7 42,0 28.48 56.66 9.28 2.539 28.11 <0.6 18.74 <nd 3.793 28.947/1 M 3 1174 500 28,9 48,7 34,0 37.88 13.48 2.324 102.8 12.92 <nd 3.036 26.678/1 M 3 1333 523 29,7 46,5 33,0 39.82 13.86 1.656 10.39 14.63 <nd 3.516 26.079/1 F 2 1391 537 33,8 60,0 44,0 58.59 61.47 10.92 1.827 22.41 69 21.71 <nd 1.929 20.2310/1 F 2 1021 475 11,4 37,8 20,0 28.98 46.89 13.91 2.896 17.11 137.7 15.99 <nd 2.312 18.1811/1 F 2 1071 480 21,3 53,8 41,0 46.37 50.58 11.63 1.988 17.86 47.99 13.17 <nd 1.855 17.7112/1 M 3 1880 590 38,7 54,7 41,0 58.47 8.63 1.87 18.39 64.44 29.0513/1 M 2 1208 521 27,8 53,4 39,0 99.99 59.29 13.13 2.312 15.81 57.67 13.26 <nd 2.48 24.4314/1 F 2 1035 481 21,6 60,2 48,0 26.46 47.51 10.52 1.778 17.84 45.01 14.04 <nd 3.741 39.4215/1 M 2 844 440 15,2 48,0 33,0 13.53 54.8 13.59 3.271 19.43 83.6 10.03 <nd 5.985 57.1216/1 M 2 723 434 11,8 44,7 29,0 74.8 57.81 13.63 2.801 23.04 13.09 13.42 <nd 1.618 13.0117/1 M 2 784 422 30.87 60.25 21.83 <nd 4.082 45.7118/1 M 2 781 447 14,8 40,3 27,0 30.74 62.94 12.45 2.65 37.36 64.55 17.09 <nd 4.228 28.8219/1 M 2 817 445 20,8 59,6 43,0 33.01 60.29 8.928 1.984 19.39 75.83 10.89 <nd 5.15 42.1120/1 M 2 960 459 40,0 72,5 67,0 22.81 58.38 9.938 1.287 14.49 113.1 14.37 <nd 4.341 43.6321/1 M 3 1562 558 52,6 60,6 49,0 33.52 47.74 9.466 1.851 18.9 55.25 24.31 <nd 7.071 53.5622/1 M 2 1183 496 15,8 36,4 20,0 28.6 53.02 16.01 3.994 20.09 184.4 17.12 <nd 3.321 30.4923/1 M 3 1129 500 40,4 62,7 52,0 57.71 49.79 9.082 1.424 19.68 12.48 14.8 <nd 3.483 36.5524/1 M 2 810 456 18,9 38,5 20,0 28.85 51.93 13.42 3.974 17.68 84.3 17.6 <nd 4.713 54.5225/1 M 3 1450 539 55,4 66,4 54,0 47.88 45.98 7.034 1.831 15.79 113.2 15.64 <nd 6.704 65.6Mean 2 1169 498 29,6 52,3 39,0 41,180 54,150 11,137 2,223 20,196 <65,624 15,924 <<0.000 3,538 33,902Minimum 2 723 422 11,4 35,5 20,0 13,530 42,390 6,194 0,952 14,030 <0,6 10,030 <0.000 0,748 11,190Maximum 3 1880 590 55,4 72,5 67,0 99,990 62,940 16,010 3,994 37,360 184,400 29,050 0,000 7,071 65,600St.Dev 1 338 50 13,1 10,1 12,3 21,152 5,647 2,455 0,778 5,099 ~43,708 4,360 ~0.000 1,711 14,883Count 25 25 25 24 24 24 24 23 24 24 23 24 24 24 24 24
NIVA report no. 4649 - 70

JAMP Biological effects methods 1997-2001 - Norway
Species : GADU MOR Gadus morhua GB: Cod, N: TorskSample area: J63 Sørfjorden Tissue: AllLocality : 53B Inner Sørfjord Latitude: 60°7.30N Longitude: 6°33.50ECatch,date : 19970930 Count: 15 Sample type: Individual
Analytical lab. => NIVA NIVA NIVA NIVA NIVA NIVA NIVA NIVAAnalysis code =>Detection limit => Mean
Samp/ Sex Age Wght Lngt weight Dry Fat BILIV(BI) BLOPR(BL) CYTPR(LI) MICPR(LI) OHBIL(BI) ALAD(BL) EROD(LI) MT(LI)repl. F/M year g mm g % % mg/L mg/mL mg/mL mg/mL µg/kgPBG/min/mg protmin/min/mg prot µg/mg protno. w.wt w.wt w.wt w.wt w.wt w.wt w.wt w.wt1/1 M 4 391 360 2,8 49,4 727.1 36.41 21.98 7.322 113.3 1.172 22.83 11.92/1 F 5 418 360 1,3 26,0 320.5 35.94 18.69 6.859 152.5 2.72 109.2 9.983/1 M 5 517 370 19,5 71,7 57,0 449 34.84 20.16 8.179 49.83 6.854 503.3 15.844/1 F 5 361 370 1,1 1926 37.1 17.59 5.259 17.5 12.71 24.095/1 F 4 429 370 2,8 22,4 167.9 32.22 19.44 7.119 139.3 9.987 88.02 18.186/1 M 5 313 370 11,5 58,1 51,5 1209 25.56 18.48 9.784 73.07 12.08 83.817/1 M 4 465 410 1,9 23,1 269.8 38.25 16.72 6.225 45.14 5.913 32.068/1 M 5 655 420 5,7 31,5 25,8 1146 37.52 21.48 8.341 43.17 8.053 16.749/1 M 5 472 420 6,8 30,2 22,6 679 39.63 17.87 6.612 84.35 9.283 14.9910/1 M 5 777 420 19,2 56,2 51,2 354.4 40.36 16.72 4.883 203 6.496 146 14.5511/1 M 4 776 425 24,2 69,4 57,1 449.7 33.75 13.7 6.443 77.71 2.13 32.56 8.42212/1 F 5 568 440 2,2 24,7 264.8 44.68 18.13 6.49 111.9 2.768 21.6313/1 F 6 674 465 2,6 22,5 585.3 45.16 27.3 8.47 39.96 17.8 84.91 22.5314/1 F 5 963 480 7,2 37,7 20,9 221.5 40.68 16.75 6.979 344.1 8.042 179.4 17.3915/1 M 6 1649 530 85,9 74,0 401.9 48.52 7.05 6.464 76.37 7.636 14.63 17.52Mean 5 629 414 13,0 42,6 40,9 611,460 38,041 18,137 7,029 104,747 7,576 126,466 17,559Minimum 4 313 360 1,1 22,4 20,9 167,900 25,560 7,050 4,883 17,500 1,172 14,630 8,422Maximum 6 1649 530 85,9 74,0 57,1 1926 48,520 27,300 9,784 344,100 17,800 503,300 32,060St.Dev 1 336 50 21,5 19,8 16,8 479,758 5,644 4,351 1,263 82,664 4,489 142,430 6,120Count 15 15 15 15 14 7 15 15 15 15 15 15 10 14
Comments Station: Inner Sørfjord Tyssedal, 5-10m, fish traps
NIVA report no. 4649 - 71

JAMP Biological effects methods 1997-2001 - Norway
Species : GADU MOR Gadus morhua GB: Cod, N: TorskSample area: J63 Sørfjorden Tissue: AllLocality : 53B Inner Sørfjord Latitude: 60°10.0N Longitude: 6°34.0ECatch,date : 19981024 Count: 15 Sample type: Individual
Analytical lab. => NIVA NIVA NIVA NIVA NIVA NIVA NIVA NIVAAnalysis code =>Detection limit => Mean
Samp/ Sex Age Wght Lngt weight Dry Fat AY(BI) BLOPR(BL) CYTPR(LI) MICPR(LI) ALAD(BL) EROD(LI) MT(LI) PYR1O(BI)repl. F/M year g mm g % % ABS 380 nm mg/mL mg/mL mg/mLPBG/min/mg protmin/min/mg prot µg/mg protg/kg/ABS 380 nmno. w.wt w.wt w.wt w.wt w.wt w.wt w.wt w.wt1/1 F 4 482 360 8,6 54,0 39,2 4.557 7.437 2.737 245.4 143.7 19.142/1 F 4 437 370 7,4 54,0 38,3 15.37 29.7 8.502 2.998 15.44 118.8 15.66 185.93/1 M 4 555 390 12,0 42,5 27,7 13.03 29.06 21.06 7.206 10.09 6.807 17.23 266.94/1 M 4 580 410 5,7 29,2 10,6 22.12 41.25 11.32 4.582 2.006 119.8 14.98 83.435/1 M 5 649 410 15,1 57,4 47,8 16.88 50.13 8.421 2.565 16.31 204.7 19.57 564.26/1 F 5 855 450 22,0 61,6 62,5 30.24 28.57 8.664 2.649 11.3 70.39 202.77/1 M 4 927 460 12,0 49,2 59,6 22.05 35.94 11.23 3.427 21.94 290.6 22.01 49.618/1 F 5 1215 500 41,3 66,7 59,5 30.24 37.01 7.077 2.788 14.18 110.9 3.0589/1 M 5 1172 510 25,1 60,3 18,5 12.73 42.57 7.917 2.634 3.86 125 26.77 240.510/1 M 6 1100 520 16,3 36,8 52,4 29.49 38.7 10.59 3.266 8.133 41.84 20.87 70.9311/1 F 6 1328 520 29,2 51,2 37,0 13.36 38.68 11.23 0.997 4.602 22.26 37.12 235.712/1 F 5 1436 540 40,8 64,1 55,5 19.19 42.34 6.108 1.604 13.15 164.4 33.07 5713/1 F 6 1954 550 61,6 62,3 53,6 9.292 62.71 7.212 2.61 7.794 96.83 32.31 685.714/1 F 6 1115 590 42,8 66,0 46,2 18.28 15.03 6.117 2.292 9.655 153.4 40.4815/1 M 6 1182 590 41,7 73,3 61,4 15.35 65.16 4.346 1.006 8.431 64.17 35.16 181.2Mean 5 999 478 25,4 55,2 44,7 19,116 37,427 9,149 2,891 26,153 115,573 24,491 204,808Minimum 4 437 360 5,7 29,2 10,6 9,292 4,557 4,346 0,997 2,006 6,807 14,980 3,058Maximum 6 1954 590 61,6 73,3 62,5 30,240 65,160 21,060 7,206 245,400 290,600 37,120 685,700St.Dev 1 418 77 16,8 12,0 16,0 6,873 15,654 3,896 1,498 60,876 72,866 8,014 198,788Count 15 15 15 15 15 15 14 15 15 15 15 15 12 14
NIVA report no. 4649 - 72

JAMP Biological effects methods 1997-2001 - Norway
Species : GADU MOR Gadus morhua GB: Cod, N: TorskSample area: J63 Sørfjorden Tissue: AllLocality : 53B Inner Sørfjord Latitude: 60°10.0N Longitude: 6°34.0ECatch,date : 19981025 Count: 15 Sample type: Individual
Analytical lab. => NIVA NIVA NIVA NIVA NIVA NIVA NIVA NIVAAnalysis code =>Detection limit => Mean
Samp/ Sex Age Wght Lngt weight Dry Fat AY(BI) BLOPR(BL) CYTPR(LI) MICPR(LI) ALAD(BL) EROD(LI) MT(LI) PYR1O(BI)repl. F/M year g mm g % % ABS 380 nm mg/mL mg/mL mg/mLPBG/min/mg protmin/min/mg prot µg/mg protg/kg/ABS 380 nmno. w.wt w.wt w.wt w.wt w.wt w.wt w.wt w.wt1/1 F 4 313 310 2,3 30.24 25.61 4.756 2.131 11.56 4.593 45.842/1 F 4 427 350 7,7 57,1 43,5 13.03 39.08 9.984 2.716 17.27 230.5 53.33/1 M 4 406 360 3,0 24.54 44.59 9.387 3.976 19.94 188.3 14.86 46.964/1 M 4 442 360 6,8 50,4 32,3 16.88 32.11 10.99 3.518 19.25 133.7 16.04 47.955/1 F 4 459 360 7,6 48,0 30,5 3.455 34.38 8.88 6.418 11.21 105.8 13.59 249.66/1 M 4 476 370 5,1 36,5 17,4 11.82 42.39 11.76 3.745 371.4 112.97/1 M 4 821 420 12,4 36,2 20,2 25.25 8.672 2.87 10.55 75.94 15.478/1 M 5 1206 510 32,2 67,2 59,6 34.54 41.31 16.25 5.031 11.62 221.4 25.9 82.589/1 M 5 1300 510 17,4 36,6 19,5 16.38 42.41 19.57 3.226 7.818 150.7 15.9 300.610/1 F 6 1414 520 41,4 57,9 44,5 9.797 29.23 15.38 3.265 7.133 60.28 21.48 489.811/1 F 5 1395 530 31,7 66,7 58,0 25.2 49.73 8.286 2.33 4.676 266.4 33.58 90.5612/1 F 7 2460 600 86,4 63,3 52,1 10.61 43.08 19.73 2.292 6.79 22.36 39.96 43.3513/1 M 7 2528 620 77,0 60,0 48,7 15.05 32.49 7.29 1.841 3.255 150.3 35.78 26.714/1 F 6 2337 630 29,4 33,3 17,3 18.52 43.76 9.843 4.812 6.149 95.22 21.36 45.1215/1 M 9 2199 650 19,8 23,1 4,4 38.3 29.06 9.921 4.021 2.276 4.429 35.78 39.63Mean 5 1212 473 25,3 49,0 34,5 19,169 36,965 11,380 3,479 9,964 138,755 24,142 119,635Minimum 4 313 310 2,3 23,2 4,4 3,455 25,250 4,756 1,841 2,276 4,429 13,590 26,700Maximum 9 2528 650 86,4 67,2 59,6 38,300 49,730 19,730 6,418 19,940 371,400 39,960 489,800St.Dev 2 825 118 26,0 14,5 17,8 10,077 7,680 4,400 1,246 5,654 103,888 9,697 134,622Count 15 15 15 15 13 13 14 15 15 15 14 15 12 14
Comments Station: Inner Sørfjord Edna Correct sampling date 981024. Changed due to IT problem; collision with same date at another "53B" site (ng-991202).
NIVA report no. 4649 - 73

JAMP Biological effects methods 1997-2001 - Norway
Species : GADU MOR Gadus morhua GB: Cod, N: TorskSample area: J63 Sørfjorden Tissue: AllLocality : 53B Inner Sørfjord Latitude: 60°10.0N Longitude: 6°34.0ECatch,date : 19991002 Count: 25 Sample type: Individual
Analytical lab. => NIVA NIVA NIVA NIVA NIVA NIVA NIVA NIVAAnalysis code =>Detection limit => Mean
Samp/ Sex Age Wght Lngt weight Dry Fat AY(BI) BLOPR(BL) CYTPR(LI) MICPR(LI) ALAD(BL) EROD(LI) MT(LI) PYR1O(BI)repl. F/M year g mm g % % ABS 380 nm mg/mL mg/mL mg/mLPBG/min/mg protmin/min/mg prot µg/mg protg/kg/ABS 380 nmno. w.wt w.wt w.wt w.wt w.wt w.wt w.wt w.wt1/1 F 5 1408 520 43,7 62,2 49,1 67.91 37.68 5.823 2.615 12.94 61.07 29.15 46.742/1 F 5 943 480 9,2 30,8 12,1 26.49 40.5 9.84 3.329 11 104 33.16 55.793/1 F 5 1155 520 22,6 49,6 36,0 66.56 38.16 7.197 3.105 11.51 90.11 35.21 42.134/1 M 4 465 380 5,0 24,1 2,2 213.4 42.69 11.5 3.65 13 16.43 26.39 11.855/1 F 4 405 390 8,3 55,4 43,2 33.2 37.68 7.536 2.986 4.827 120.6 16.99 83.566/1 M 5 744 460 6,2 30,2 5,3 161.6 40.86 8.07 2.912 8.027 110.7 19.22 20.287/1 F 5 1145 500 25,4 64,2 49,0 49.13 43.83 5.709 1.887 4.027 109.7 27.35 47.638/1 F 3 299 330 3,7 28,0 42,1 27.17 31.71 10.36 3.241 13.27 6.48 18.67 73.919/1 M 4 415 350 12,2 54,9 42,1 42.12 34.65 6.684 2.942 11.77 67.05 11.94 73.5110/1 M 5 615 420 5,3 25,5 6,5 23.73 43.23 10.39 5.492 5.763 49.06 23.21 45.511/1 M 4 468 370 9,6 58,7 43,8 37.05 6.582 2.061 99.67 13.08 60.0212/1 M 5 1044 480 26,7 65,5 55,8 40.74 32.1 5.661 2.01 11.15 125.2 38.64 30.4813/1 M 4 462 370 12,9 66,7 52,3 50.97 37.8 5.643 2.529 13.3 168 20.56 68.1214/1 M 4 378 350 4,6 42,9 26,1 27.83 30.42 8.25 3.152 12.16 35.21 19.96 65.1415/1 M 4 739 460 4,8 25,4 3,3 28.48 45.51 8.886 3.909 9.714 59.78 29.26 55.416/1 F 5 682 430 7,3 37,0 16,6 72.6 39.18 7.422 3.088 2.592 34.99 18.98 65.1217/1 M 4 411 370 4,0 30,4 7,0 32.62 36.96 7.161 3.68 11.05 98.43 21.65 46.5318/1 M 4 342 340 4,3 29,6 10,1 18.18 36.75 8.283 3.478 5.299 81.77 12.05 80.4219/1 M 4 415 350 6,1 41,7 27,5 43.26 35.01 9.159 2.46 14.11 204.3 12.75 87.1120/1 M 4 432 360 10,6 50,0 33,8 34.84 34.62 6.159 2.706 1.421 46.92 18.91 75.8821/1 M 4 461 350 16,5 64,6 50,2 53.43 36.3 6.57 2.24 15.01 10.64 15.91 45.1422/1 M 4 636 400 5,4 35,2 17,1 41.49 9.969 3.662 15.12 32.57 20.2623/1 M 4 437 380 5,6 39,1 41,9 23.33 50.52 8.238 3.27 8.293 112.4 27.87 79.8124/1 M 5 709 430 5,4 25,5 5,7 20.7 36.99 9.975 4.123 13.64 94.75 23.75 133.325/1 F 5 617 410 8,3 40,7 20,8 43.93 36.39 7.728 3.122 12.03 136.5 15.92 57.27Mean 4 633 408 10,9 43,1 28,0 51,636 38,376 7,952 3,106 10,043 83,053 22,034 60,443Minimum 3 299 330 3,7 24,1 2,2 18,180 30,420 5,643 1,887 1,421 6,480 11,940 11,850Maximum 5 1408 520 43,7 66,7 55,8 213,400 50,520 11,500 5,492 15,120 204,300 38,640 133,300St.Dev 1 295 59 9,5 14,8 18,2 45,071 4,634 1,697 0,772 4,044 49,105 7,297 24,925Count 25 25 25 25 25 25 24 24 25 25 24 25 25 24
NIVA report no. 4649 - 74

JAMP Biological effects methods 1997-2001 - Norway
Species : GADU MOR Gadus morhua GB: Cod, N: TorskSample area: J63 Sørfjorden Tissue: AllLocality : 53B Inner Sørfjord Latitude: 60°10.0N Longitude: 6°34.0ECatch,date : 20001010 Count: 25 Sample type: Individual
Analytical lab. => NIVA NIVA NIVA NIVA NIVA NIVA NIVA NIVA NIVA NIVA NIVAAnalysis code =>Detection limit => Mean
Samp/ Sex Age Wght Lngt weight Dry Fat AY(BI) BLOPR(BL) CYTPR(LI) MICPR(LI) ALAD(BL) EROD(LI) MT(LI) BAP3O(BI) NAP2O(BI) PA1O(BI) PYR1O(BI)repl. F/M year g mm g % % ABS 380 nm mg/mL mg/mL mg/mLPBG/min/mg protmin/min/mg prot µg/mg protg/kg/ABS 380 nmg/kg/ABS 380 nm µg/kg/ABS 38µg/kg/ABS 38no. w.wt w.wt w.wt w.wt w.wt w.wt w.wt w.wt w.wt w.wt w.wt1/1 M 4 1375 580 12,4 22,7 5,4 15.81 30.2 12.33 3.698 9.214 10.17 17.06 <nd <nd <nd 4.6812/1 F 3 1047 510 10,4 21,9 3,8 62.54 37.19 9.45 1.254 7.652 <0.6 12.13 0.3198 <nd <nd 8.0433/1 M 3 1107 490 22,4 58,5 48,6 62.88 38.63 9.492 2.716 9.349 43.32 18.33 0.3817 <nd <nd 12.54/1 M 1 237 310 2,6 21.83 35.34 8.588 2.258 7.411 <0.6 10.22 <nd <nd <nd 12.195/1 F 2 255 320 2,4 46.86 34.41 8.072 0.9672 11.03 15.89 9.938 <nd <nd <nd 2.3056/1 F 2 696 450 7,2 9,3 25.05 36.69 14.19 4.09 12.46 17.35 6.418 0.3593 <nd <nd 14.857/1 M 2 554 390 6,8 17,6 11.98 31.78 12.38 2.65 16.8 171.9 8.826 0.9178 <nd <nd 28.548/1 M 2 335 350 2,8 9.945 39.4 10.59 3.898 13.79 65.19 13.12 1.709 <nd <nd 18.49/1 M 2 431 380 4,0 30.4 39.09 8.412 2.248 19.02 114.7 15.56 <nd <nd <nd 11.9410/1 M 2 578 400 17,0 55,6 47,6 54.14 21.54 9.324 2.182 19.09 134.7 10.64 <nd <nd <nd 7.27811/1 F 1 245 310 4,2 61.91 43.38 7.752 2.053 14.32 133.3 13.99 0.2261 <nd <nd 13.8712/1 M 2 757 430 17,2 53,5 44,1 18.48 32.4 9.662 3.27 18.41 124.9 9.277 0.9198 <nd <nd 14.3913/1 M 3 885 470 19,4 43,6 32,6 69.49 24.56 9.028 3.005 11.88 76.25 8.146 <nd <nd <nd 5.35314/1 F 4 930 460 28,0 69,4 62,8 33.37 37.45 5.654 1.055 18.85 232.9 17.28 <nd <nd <nd 9.20115/1 F 3 1286 550 22,6 42,7 28,4 56.17 24.31 9.934 1.968 5.396 142.7 17.2 <nd <nd <nd 7.37116/1 M 2 865 460 37,2 63,1 53,6 88.86 29.74 5.796 0.9852 9.317 120.9 10.34 <nd <nd <nd 5.62717/1 M 2 847 490 7,4 4,0 29.8 36.13 12.79 4.149 11.79 218.4 11.71 <nd <nd <nd 9.2318/1 F 2 838 450 24,6 61,9 54,4 54.44 45.15 8.914 2.139 20.8 169.1 13.97 <nd <nd <nd 8.68919/1 M 2 459 380 7,6 11,9 34.04 25.04 11.05 3.499 17.93 190.3 8.779 0.235 <nd <nd 12.920/1 M 1 294 310 7,4 28.08 42.76 9.152 1.963 14.21 155.4 8.625 0.1781 <nd <nd 12.0721/1 M 4 1593 570 67,2 63,4 60,6 79.47 24.99 4.904 1.701 14.52 156 12.39 <nd <nd <nd 6.90822/1 F 4 1535 550 37,6 59,7 54,0 136.3 20.64 9.208 2.912 7.284 74.27 15.57 <nd <nd <nd 6.04723/1 F 2 705 440 14,2 44,2 36,4 37.17 39.06 9.61 2.861 12.94 142.5 13.31 <nd <nd <nd 9.87424/1 M 2 716 440 39,2 71,6 68,5 53.13 30.16 4.776 1.185 10.7 128.1 8.595 <nd <nd <nd 8.52725/1 F 3 707 420 13,4 42,0 31,0 12.42 39.41 11.02 2.966 12.72 214.2 9.132 <nd <nd <nd 16.26Mean 2 771 436 17,4 51,6 35,5 45,383 33,578 9,283 2,467 13,075 <114,146 12,022 <<0.210 <<0.000 <<0.000 10,682Minimum 1 237 310 2,4 21,9 3,8 9,945 20,640 4,776 0,967 5,396 <0,6 6,418 <0.000 <0.000 <0.000 2,305Maximum 4 1593 580 67,2 71,6 68,5 136,300 45,150 14,190 4,149 20,800 232,900 18,330 1,709 <0.000 <0.000 28,540St.Dev 1 392 81 15,3 15,2 21,6 29,042 7,026 2,362 0,975 4,312 ~70,538 3,380 ~0.409 ~0.000 ~0.000 5,415Count 25 25 25 25 15 19 25 25 25 25 25 25 25 25 25 25 25
NIVA report no. 4649 - 75

JAMP Biological effects methods 1997-2001 - Norway
Species : GADU MOR Gadus morhua GB: Cod, N: TorskSample area: J63 Sørfjorden Tissue: AllLocality : 53B Inner Sørfjord Latitude: 60°10.0N Longitude: 6°34.0ECatch,date : 20011009 Count: 25 Sample type: Individual
Analytical lab. => NIVA NIVA NIVA NIVA NIVA NIVA NIVA NIVA NIVA NIVAAnalysis code =>Detection limit => Mean
Samp/ Sex Age Wght Lngt weight Dry Fat AY(BI) BLOPR(BL) CYTPR(LI) MICPR(LI) ALAD(BL) EROD(LI) MT(LI) BAP3O(BI) PA1O(BI) PYR1O(BI)repl. F/M year g mm g % % ABS 380 nm mg/mL mg/mL mg/mLPBG/min/mg protmin/min/mg prot µg/mg protg/kg/ABS 380 nmg/kg/ABS 380 nm µg/kg/ABS 380 nmno. w.wt w.wt w.wt w.wt w.wt w.wt w.wt w.wt w.wt w.wt1/1 F 11 2466 680 21,5 19,3 2,0 43.73 47.75 11.63 2.531 9.651 <0.6 23.96 <nd 0.3247 9.4212/1 F 5 3791 790 68,4 32,9 17,0 30.81 45.29 13.38 3.453 11.07 67.11 20.18 <nd 0.1363 1.2243/1 M 3 202 280 2,8 4,5 3.57 15.85 8.076 1.866 8.454 7.487 5.932 <nd <nd 12.164/1 F 2 159 260 6,7 67,0 58,0 17.68 30.53 8.344 1.64 16.34 16.93 9.648 <nd <nd 3.8135/1 F 2 183 280 2,5 20,0 10.1 47.3 6.35 1.577 9.057 34.74 8.537 <nd 2.782 63.476/1 F 4 972 470 21,2 44,5 28,0 18.48 51.59 12.35 2.796 10.98 74.26 13.4 <nd <nd 3.0357/1 M 3 598 390 19,4 71,5 63,0 17.68 49.69 7.53 1.682 16.28 94.14 20.76 <nd 0.2376 2.9258/1 F 3 1397 540 11,7 21,3 2,3 18.18 45.69 15.5 3.378 9.431 29.56 20.71 <nd 0.6711 6.1069/1 M 3 1170 520 10,0 20,3 3,2 32.12 50.66 14.06 2.92 5.252 25.46 21.63 <nd 0.1744 4.07910/1 F 2 439 360 9,4 49,6 37,0 25.45 45.39 12.78 2.4 11.63 63.47 11.52 <nd 0.3929 2.3511/1 F 2 199 280 20,3 9,9 16.16 50.66 14.17 2.381 15.9 2.608 9.301 <nd 0.4146 3.29812/1 M 3 525 400 4,5 25,9 4,2 9.696 46.64 12.9 2.607 5.36 5.753 25.94 <nd 6.663 12.3813/1 F 1 227 290 3,2 31,5 13,0 12.73 61.56 7.494 2.191 12.07 24.84 7.091 <nd <nd 2.67214/1 F 1 193 280 3,0 42,3 22,0 4.386 43.78 5.786 1.192 18.28 3.601 6.576 <nd <nd 5.03915/1 M 3 789 450 7,0 29,7 11,0 2.346 50.11 16.78 3.994 8.239 <0.6 20.8 <nd <nd 19.6916/1 M 3 1812 570 44,2 60,2 51,0 25.25 53.93 9.822 2.24 22.75 63.79 16.89 <nd 0.6653 3.9617/1 F 2 1172 490 30,6 57,8 47,0 23.23 53.89 11.51 2.844 12.3 53.01 21.44 <nd 2.609 1.24818/1 F 3 982 520 15,1 21,3 3,1 11.31 46.03 14.29 5.291 10.86 40.29 10.27 <nd <nd 6.76319/1 M 3 668 410 9,5 33,3 17,0 23.53 54.11 15.99 3.753 10.02 100.3 8.879 <nd <nd 2.43520/1 M 2 639 390 25,2 57,8 47,0 59.29 42.12 9.44 1.823 6.478 51.99 11.15 <nd <nd 0.870321/1 M 3 1539 570 16,2 29,8 13,0 18.52 54.16 14.74 4.021 5.642 58.07 20.09 <nd <nd 5.42122/1 M 3 820 450 21,5 62,2 53,0 44.48 55.48 8.136 1.943 9.039 21.22 18.94 <nd 0.4609 0.753223/1 M 5 1653 580 26,1 35,0 19,0 13.23 38.85 13.3 3.711 7.625 75.08 11.05 <nd 1.565 4.84524/1 M 5 1811 560 62,2 55,5 41,0 24.14 44.05 8.572 2.692 19.92 112.3 15.68 <nd <nd 2.06325/1 M 3 963 480 34,0 16,0 19.29 49.55 13.96 3.382 7.481 13.78 17.95 <nd <nd 3.064Mean 3 1015 452 19,3 41,0 24,1 21,016 46,986 11,476 2,732 11,204 <41,640 15,133 <<0.000 <<0.684 7,323Minimum 1 159 260 2,5 19,3 2,0 2,346 15,850 5,786 1,192 5,252 <0,6 5,932 <0.000 <0.000 0,753Maximum 11 3791 790 68,4 71,5 63,0 59,290 61,560 16,780 5,291 22,750 112,300 25,940 <0.000 6,663 63,470St.Dev 2 844 136 17,5 16,5 19,6 13,353 8,926 3,245 0,963 4,646 ~33,436 6,086 ~0.000 ~1.463 12,481Count 25 25 25 24 22 25 25 25 25 25 25 25 25 25 25 25
NIVA report no. 4649 - 76
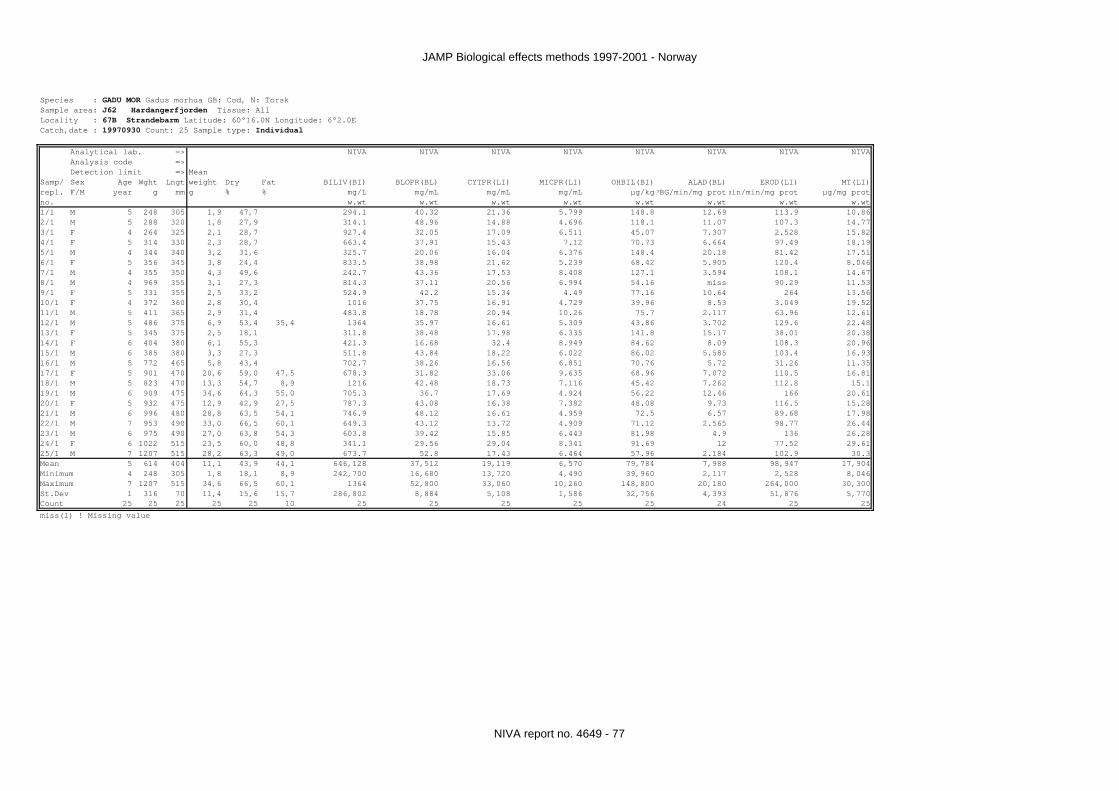
JAMP Biological effects methods 1997-2001 - Norway
Species : GADU MOR Gadus morhua GB: Cod, N: TorskSample area: J62 Hardangerfjorden Tissue: AllLocality : 67B Strandebarm Latitude: 60°16.0N Longitude: 6°2.0ECatch,date : 19970930 Count: 25 Sample type: Individual
Analytical lab. => NIVA NIVA NIVA NIVA NIVA NIVA NIVA NIVAAnalysis code =>Detection limit => Mean
Samp/ Sex Age Wght Lngt weight Dry Fat BILIV(BI) BLOPR(BL) CYTPR(LI) MICPR(LI) OHBIL(BI) ALAD(BL) EROD(LI) MT(LI)repl. F/M year g mm g % % mg/L mg/mL mg/mL mg/mL µg/kgPBG/min/mg protmin/min/mg prot µg/mg protno. w.wt w.wt w.wt w.wt w.wt w.wt w.wt w.wt1/1 M 5 248 305 1,9 47,7 294.1 40.32 21.36 5.799 148.8 12.69 113.9 10.862/1 M 5 288 320 1,8 27,9 314.1 48.96 14.88 4.696 118.1 11.07 107.3 14.773/1 F 4 264 325 2,1 28,7 927.4 32.05 17.09 6.511 45.07 7.307 2.528 15.824/1 F 5 314 330 2,3 28,7 663.4 37.91 15.43 7.12 70.73 6.664 97.49 18.195/1 M 4 344 340 3,2 31,6 325.7 20.06 16.04 6.376 148.4 20.18 81.42 17.516/1 F 5 356 345 3,8 24,4 833.5 38.98 21.62 5.239 68.42 5.905 120.4 8.0467/1 M 4 355 350 4,3 49,6 242.7 43.36 17.53 8.408 127.1 3.594 108.1 14.678/1 M 4 969 355 3,1 27,3 814.3 37.11 20.56 6.994 54.16 miss 90.29 11.539/1 F 5 331 355 2,5 33,2 524.9 42.2 15.34 4.49 77.16 10.64 264 13.5610/1 F 4 372 360 2,8 30,4 1016 37.75 16.91 4.729 39.96 8.53 3.049 19.5211/1 M 5 411 365 2,9 31,4 483.8 18.78 20.94 10.26 75.7 2.117 63.96 12.6112/1 M 5 486 375 6,9 53,4 35,4 1364 35.97 16.61 5.309 43.86 3.702 129.6 22.4813/1 F 5 345 375 2,5 18,1 311.8 38.48 17.98 6.335 141.8 15.17 38.01 20.3814/1 F 6 404 380 6,1 55,3 421.3 16.68 32.4 8.949 84.62 8.09 108.3 20.9615/1 M 6 385 380 3,3 27,3 511.8 43.84 18.22 6.022 86.02 5.585 103.4 16.9316/1 M 5 772 465 5,8 43,4 702.7 38.26 16.56 6.851 70.76 5.72 31.26 11.3517/1 F 5 901 470 20,6 59,0 47,5 678.3 31.82 33.06 9.635 68.96 7.072 110.5 16.8118/1 M 5 823 470 13,3 54,7 8,9 1216 42.48 18.73 7.116 45.42 7.262 112.8 15.119/1 M 6 909 475 34,6 64,3 55,0 705.3 36.7 17.69 4.924 56.22 12.46 166 20.6120/1 F 5 932 475 12,9 42,9 27,5 787.3 43.08 16.38 7.382 48.08 9.73 116.5 15.2821/1 M 6 996 480 28,8 63,5 54,1 746.9 48.12 16.61 4.959 72.5 6.57 89.68 17.9822/1 M 7 953 490 33,0 66,5 60,1 649.3 43.12 13.72 4.909 71.12 2.565 98.77 26.4423/1 M 6 975 490 27,0 63,8 54,3 603.8 39.42 15.85 6.443 81.98 4.9 136 26.2824/1 F 6 1022 515 23,5 60,0 48,8 341.1 29.56 29.04 8.341 91.69 12 77.52 29.6125/1 M 7 1207 515 28,2 63,3 49,0 673.7 52.8 17.43 6.464 57.96 2.184 102.9 30.3Mean 5 614 404 11,1 43,9 44,1 646,128 37,512 19,119 6,570 79,784 7,988 98,947 17,904Minimum 4 248 305 1,8 18,1 8,9 242,700 16,680 13,720 4,490 39,960 2,117 2,528 8,046Maximum 7 1207 515 34,6 66,5 60,1 1364 52,800 33,060 10,260 148,800 20,180 264,000 30,300St.Dev 1 316 70 11,4 15,6 15,7 286,802 8,884 5,108 1,586 32,756 4,393 51,876 5,770Count 25 25 25 25 25 10 25 25 25 25 25 24 25 25
miss(1) ! Missing value
NIVA report no. 4649 - 77

JAMP Biological effects methods 1997-2001 - Norway
Species : GADU MOR Gadus morhua GB: Cod, N: TorskSample area: J62 Hardangerfjorden Tissue: AllLocality : 67B Strandebarm Latitude: 60°16.0N Longitude: 6°2.0ECatch,date : 19981028 Count: 25 Sample type: Individual
Analytical lab. => NIVA NIVA NIVA NIVA NIVA NIVA NIVA NIVAAnalysis code =>Detection limit => Mean
Samp/ Sex Age Wght Lngt weight Dry Fat AY(BI) BLOPR(BL) CYTPR(LI) MICPR(LI) ALAD(BL) EROD(LI) MT(LI) PYR1O(BI)repl. F/M year g mm g % % ABS 380 nm mg/mL mg/mL mg/mLPBG/min/mg protmin/min/mg prot µg/mg protg/kg/ABS 380 nmno. w.wt w.wt w.wt w.wt w.wt w.wt w.wt w.wt1/1 M 4 565 390 14,0 64,3 49,7 31.5 15.83 8.244 2.382 42 161.1 14.77 24.432/1 M 5 578 405 57,1 49,1 14.49 29.63 2.535 1.123 24.32 58.38 13.75 35.823/1 F 4 658 430 7,2 31,5 12,1 45.15 46.4 11.29 3.659 18.73 165.2 17.63 10.94/1 F 4 796 430 10,1 50,7 32,2 41.83 26.68 9.105 3.136 47.42 160 25.61 17.435/1 F 5 811 440 20,1 59,8 49,8 9.45 28.28 2.869 1.122 34.65 162.6 12.04 42.096/1 M 5 859 450 19,9 57,5 48,2 18.14 31.32 1.448 0.7048 28.18 34.24 16.49 16.917/1 M 4 926 470 11,3 48,6 35,6 33.14 34.11 10.88 2.501 22.75 94.28 22.99 23.328/1 F 5 1095 470 34,0 63,6 52,7 7.303 28.02 4.104 1.41 34.7 90.45 17.93 56.869/1 F 4 921 470 24,8 66,4 56,6 35.03 26.8 2.28 0.987 22.44 76.23 15.36 18.710/1 M 5 1076 470 66,7 79,1 71,4 30.49 17.5 0.915 0.4528 46.91 30.05 21.54 17.8911/1 F 5 1150 490 39,5 63,6 56,1 15.37 28.37 1.168 0.5755 28.26 42.21 30.61 23.412/1 M 5 1161 490 30,9 61,2 49,9 5.144 27.5 1.283 0.6484 32.67 26.35 21.83 22.6413/1 F 4 1213 500 44,5 72,2 62,6 16.16 25.16 7.508 2.199 27.56 109.7 33.8714/1 M 5 1143 500 31,3 57,1 46,1 23.94 32.52 1.683 0.7555 22.08 30.64 15.87 17.715/1 F 4 1219 510 39,5 72,2 62,5 44.86 42.16 6.462 1.948 19 166.3 21.78 18.8316/1 M 5 1231 510 40,0 65,3 53,2 12.98 34.52 2.753 1.21 21.53 99.97 20.56 26.6117/1 F 5 1507 520 42,1 55,3 41,1 41.16 6.258 1.556 14.93 153.8 21.718/1 M 5 1143 500 50,3 68,9 58,1 24.32 31.65 2.264 0.949 31.17 54.41 25.57 15.1519/1 M 6 1249 560 12,6 28,8 10,3 33.89 27.72 3.414 1.204 20.86 2.118 13.86 13.8120/1 F 6 1653 570 56,4 72,5 63,2 21.92 32.97 4.02 1.469 31.57 108 30.2 20.4821/1 M 6 1707 570 63,2 77,0 60,9 13.61 37.26 1.924 0.639 32.7 57.8 27.51 43.6922/1 M 5 1991 580 73,7 72,4 56,5 15.62 38.56 2.319 0.959 20.08 125.8 26.74 23.1323/1 M 6 1885 590 55,3 67,2 56,3 21.8 31.83 2.405 1.003 28.51 41.22 20.71 19.1624/1 F 7 2516 620 71,3 55,4 43,0 16.76 28.66 20.3 6.822 19.68 73.47 15.3625/1 F 7 3446 680 169,4 63,4 52,7 10.84 29.75 5.072 1.617 39.1 34.4 27.38 15.35Mean 5 1300 505 42,8 61,2 49,2 22,656 30,974 4,900 1,641 28,472 86,349 20,975 23,897Minimum 4 565 390 7,2 28,8 10,3 5,144 15,830 0,915 0,453 14,930 2,118 12,040 10,900Maximum 7 3446 680 169,4 79,1 71,4 45,150 46,400 20,300 6,822 47,420 166,300 30,610 56,860St.Dev 1 642 69 33,6 12,2 14,4 11,795 6,858 4,437 1,351 8,837 52,470 5,491 11,046Count 25 25 25 24 25 25 24 25 25 25 25 25 23 24
Comments Station: Strandebarm Caught 28.10.98 5.11.98
NIVA report no. 4649 - 78

JAMP Biological effects methods 1997-2001 - Norway
Species : GADU MOR Gadus morhua GB: Cod, N: TorskSample area: J62 Hardangerfjorden Tissue: AllLocality : 67B Strandebarm Latitude: 60°16.0N Longitude: 6°2.0ECatch,date : 19990927 Count: 25 Sample type: Individual
Analytical lab. => NIVA NIVA NIVA NIVA NIVA NIVA NIVA NIVAAnalysis code =>Detection limit => Mean
Samp/ Sex Age Wght Lngt weight Dry Fat AY(BI) BLOPR(BL) CYTPR(LI) MICPR(LI) ALAD(BL) EROD(LI) MT(LI) PYR1O(BI)repl. F/M year g mm g % % ABS 380 nm mg/mL mg/mL mg/mLPBG/min/mg protmin/min/mg prot µg/mg protg/kg/ABS 380 nmno. w.wt w.wt w.wt w.wt w.wt w.wt w.wt w.wt1/1 F 6 2849 660 58,4 65,2 54,9 32.38 44.4 4.851 1.333 17.2 19.06 39.34 14.782/1 F 4 567 400 7,9 44,9 31,8 62.92 36.42 8.502 3.485 19.12 121.4 19.38 14.813/1 M 4 395 340 10,4 52,7 41,2 19.7 35.55 6.516 3.896 20.09 151.4 11.94 16.484/1 F 4 381 360 4,8 36,3 38.48 45.39 7.686 3.069 6.039 103.8 23.32 13.795/1 M 4 354 350 3,3 4,4 37.37 47.19 7.248 2.271 16 135.3 12.13 20.26/1 M 6 1755 580 23,2 40,7 24,4 30.81 35.4 10.52 3.528 16.64 156.1 21.31 15.537/1 F 5 1118 500 15,5 39,7 22,2 31.71 41.94 10.26 4.56 16.89 101.2 27.51 9.6338/1 M 4 343 330 3,1 30.4 42 8.091 3.191 19 75.99 20.88 28.869/1 F 4 325 330 3,1 17.27 41.34 8.52 2.463 16.19 115.4 16.38 14.2910/1 M 4 654 420 14,3 60,9 47,6 35.35 44.19 7.251 2.586 17.09 79.13 16.84 14.8711/1 F 4 279 320 8,4 65,9 57,0 48.08 24.37 5.01 1.47 10.86 132.2 14.82 14.712/1 M 4 475 370 5,7 16,1 16.56 38.82 10.12 3.915 20.68 77.96 15.85 14.1113/1 M 4 307 330 2,5 4,5 9.696 38.55 7.944 2.781 12.31 50.8 14.05 48.7614/1 M 7 2983 710 42,1 31,5 11,7 22.62 34.05 9.747 4.399 20.86 122.4 22.82 17.4215/1 M 5 1440 530 25,7 54,1 42,9 25.96 49.38 5.592 2.547 15.31 51.68 32.64 11.2816/1 F 5 1141 510 20,1 46,8 30,5 46.97 38.67 9.627 2.507 20.66 84.55 18.38 11.8117/1 F 4 497 370 20,7 69,4 59,1 21.21 31.29 5.274 3.333 3.276 141.3 7.298 16.5718/1 F 5 1528 560 21,3 49,4 39,0 33.33 43.53 7.233 3.096 15.71 71.29 18.08 16.7619/1 F 4 488 370 13,7 51,6 35,1 23.63 37.62 5.469 4.718 16.4 60.58 12.01 28.7320/1 F 4 559 390 8,6 49,0 34,0 31.31 34.71 6.918 2.301 19.99 32.68 10.24 18.0921/1 F 4 412 350 9,6 49,0 35,5 18.68 27.4 7.2 3.033 11.81 106.2 12.5 22.9922/1 F 4 668 410 15,5 51,5 39,3 30.68 47.85 6.093 2.184 19.62 62.43 16.58 17.6523/1 F 4 492 370 4,8 7,0 12.73 49.05 10.16 4.54 17.23 29.54 18.39 26.3824/1 M 4 521 370 18,6 70,2 61,4 66.56 42.69 5.73 1.818 19.46 141.9 18.06 13.9525/1 M 4 457 360 4,7 13,2 33.13 36.09 11.52 5.42 3.251 68.33 12.31 51.2Mean 4 840 424 14,6 52,5 32,6 31,101 39,516 7,723 3,138 15,667 91,705 18,122 19,746Minimum 4 279 320 2,5 31,5 4,5 9,696 24,370 4,851 1,333 3,251 19,060 7,298 9,633Maximum 7 2983 710 58,4 70,2 61,4 66,560 49,380 11,520 5,420 20,860 156,100 39,340 51,200St.Dev 1 746 109 13,0 10,8 17,4 13,947 6,438 1,941 1,052 5,116 39,998 7,111 10,359Count 25 25 25 25 17 23 25 25 25 25 25 25 25 25
Comments
NIVA report no. 4649 - 79

JAMP Biological effects methods 1997-2001 - Norway
Species : GADU MOR Gadus morhua GB: Cod, N: TorskSample area: J62 Hardangerfjorden Tissue: AllLocality : 67B Strandebarm Latitude: 60°16.0N Longitude: 6°2.0ECatch,date : 20001014 Count: 25 Sample type: Individual
Analytical lab. => NIVA NIVA NIVA NIVA NIVA NIVA NIVA NIVA NIVA NIVA NIVAAnalysis code =>Detection limit => Mean
Samp/ Sex Age Wght Lngt weight Dry Fat AY(BI) BLOPR(BL) CYTPR(LI) MICPR(LI) ALAD(BL) EROD(LI) MT(LI) BAP3O(BI) NAP2O(BI) PA1O(BI) PYR1O(BI)repl. F/M year g mm g % % ABS 380 nm mg/mL mg/mL mg/mLPBG/min/mg protmin/min/mg prot µg/mg protg/kg/ABS 380 nmg/kg/ABS 380 nm µg/kg/ABS 38µg/kg/ABS 38no. w.wt w.wt w.wt w.wt w.wt w.wt w.wt w.wt w.wt w.wt w.wt1/1 M 6 3517 770 57,4 39,6 24,3 43.33 29.12 11.12 2.8 11.66 0.9504 8.764 <nd <nd <nd 0.46162/1 F 2 1207 510 46,0 76,4 66,5 43.13 43.95 6.082 16.88 19.89 <nd <nd <nd 1.4843/1 F 2 1056 490 38,6 68,8 61,7 28.68 36.34 7.42 1.737 29.47 50.72 20.48 <nd <nd <nd 1.7084/1 F 2 539 400 9,8 46,0 33.84 40.01 10.07 3.266 21.43 258.6 13.44 <nd <nd <nd 2.1585/1 F 4 6400 860 183,8 57,8 51,6 40.3 43.03 6.588 1.604 22.37 95.05 16.34 <nd <nd <nd 1.2166/1 F 7 4285 760 91,2 49,1 36,6 19.19 36.56 9.832 2.786 22.51 56.14 21.21 <nd <nd <nd 1.6157/1 M 2 1923 580 90,4 76,6 70,2 20.3 37.17 2.394 0.7226 22.67 69.55 33.42 <nd <nd <nd 1.6268/1 M 2 950 470 14,8 51,8 40,2 50.5 44.98 10.77 2.099 23.12 119.3 18.34 <nd <nd <nd 1.4859/1 M 2 1813 560 66,2 67,9 59,1 18.18 47.87 8.626 1.748 21.81 104.7 11.74 <nd <nd <nd 1.7610/1 F 2 1564 530 54,2 72,2 60,2 36.56 6.03 0.7782 24.09 150 17.43 <nd <nd <nd11/1 M 2 1388 520 38,0 68,6 60,2 26.56 7.508 2.414 82.74 23.06 <nd <nd <nd 1.9212/1 F 2 839 460 17,4 56,0 44,3 32.52 8.322 2.634 100.4 14.16 <nd <nd <nd 1.44513/1 F 2 449 370 5,6 37.98 42.59 11.74 2.93 23.6 220.2 8.474 <nd <nd <nd 1.5814/1 M 2 934 470 13,0 39,9 26,3 23.94 51.97 10.53 2.953 12.14 201.5 11.95 <nd <nd <nd 1.71315/1 F 2 593 390 9,8 43,2 29,9 6.363 51.89 10.34 2.87 22.39 364.7 6.382 <nd <nd <nd 2.515Mean 3 1830 543 49,1 59,1 48,4 30,344 41,695 8,491 2,239 21,088 133,896 16,339 <<0.000 <<0.000 <<0.000 1,620Minimum 2 449 370 5,6 39,6 24,3 6,363 29,120 2,394 0,723 11,660 0,950 6,382 <0.000 <0.000 <0.000 0,462Maximum 7 6400 860 183,8 76,6 70,2 50,500 51,970 11,740 3,266 29,470 364,700 33,420 <0.000 <0.000 <0.000 2,515St.Dev 2 1662 146 46,8 13,6 15,3 12,150 6,639 2,526 0,813 4,872 96,950 6,905 ~0.000 ~0.000 ~0.000 0,463Count 15 15 15 15 13 14 14 13 15 14 13 14 15 15 15 15 14
NIVA report no. 4649 - 80

JAMP Biological effects methods 1997-2001 - Norway
Species : GADU MOR Gadus morhua GB: Cod, N: TorskSample area: J62 Hardangerfjorden Tissue: AllLocality : 67B Strandebarm Latitude: 60°16.0N Longitude: 6°2.0ECatch,date : 20011212 Count: 25 Sample type: Individual
Analytical lab. => NIVA NIVA NIVA NIVA NIVA NIVA NIVA NIVA NIVA NIVAAnalysis code =>Detection limit => Mean
Samp/ Sex Age Wght Lngt weight Dry Fat AY(BI) BLOPR(BL) CYTPR(LI) MICPR(LI) ALAD(BL) EROD(LI) MT(LI) BAP3O(BI) PA1O(BI) PYR1O(BI)repl. F/M year g mm g % % ABS 380 nm mg/mL mg/mL mg/mLPBG/min/mg protmin/min/mg prot µg/mg protg/kg/ABS 380 nmg/kg/ABS 380 nm µg/kg/ABS 380 nmno. w.wt w.wt w.wt w.wt w.wt w.wt w.wt w.wt w.wt w.wt1/1 M 3 1378 530 26,1 49,6 35,8 10.3 51.77 9.95 1.843 18.46 19.9 22.04 <nd 1.068 4.3782/1 F 3 961 480 20,2 57,5 43,8 22.52 53.58 11.13 2.692 14.43 65.14 14.11 <nd 0.666 2.7443/1 M 3 1237 500 23,1 52,4 40,7 24.75 60.56 11.65 3.064 28.24 76.79 13.75 <nd 0.5254 2.0374/1 F 3 1516 540 63,1 60,5 53,3 32.02 42.03 8.208 2.075 18.61 79.18 35.59 <nd 0.3123 1.4995/1 F 1 628 410 14,5 52,9 37,4 50.2 61.84 10.65 3.011 18.1 125.4 11.91 <nd 0.3785 1.3716/1 F 3 1354 520 38,0 60,7 49,1 33.13 47.66 10.19 2.825 22.63 65.23 11.79 <nd <nd 1.1297/1 M 3 1556 550 33,7 48,4 34,4 7.777 51.05 10.21 3.513 17.06 75.94 10.3 <nd <nd 2.0578/1 F 3 1780 580 35,2 58,7 46,9 40.6 67.56 11.04 1.751 18.26 49.51 25.1 <nd <nd 1.59/1 F 3 2056 620 29,6 35,9 19,0 25.75 57.79 12.3 3.083 21.83 27.47 16.89 <nd <nd 1.36310/1 F 2 1455 540 14,3 33,0 15,9 63.04 48.02 16.38 3.829 11.81 72.22 26.7 <nd 0.2697 1.21811/1 F 1 612 410 10,1 54,0 36,9 68.24 53.01 13.15 2.693 25.42 1.241 10.66 <nd 0.1905 1.712/1 F 1 421 350 11,7 68,2 62,6 40.41 8.116 1.946 113.3 12.32 <nd 0.3465 1.7513/1 F 1 637 400 7,5 27,3 4,0 29.34 40.21 15.3 3.684 19.32 3.595 8.904 <nd 0.7839 1.82714/1 F 3 1302 520 32,4 55,1 42,0 59.86 56.45 10.33 2.469 18.57 37.78 19.45 <nd <nd 0.564715/1 F 1 648 400 9,8 39,6 23,0 56.5 53.87 14.3 3.049 22.54 9.919 9.846 <nd 0.2832 0.865416/1 F 1 552 380 18,4 70,3 62,0 11.31 58.94 7.326 1.92 20.77 147.9 11.77 <nd <nd 1.66217/1 F 1 428 360 4,9 41,5 16,0 14.85 50.25 12.48 3.822 11.46 35.87 12.67 <nd 0.6062 1.81218/1 F 3 1928 580 52,8 59,3 48,0 27.17 62.48 9.544 2.35 21.11 74.88 16.94 <nd 0.1104 1.46519/1 F 3 1959 600 44,4 57,1 42,0 36.55 48.12 10.73 2.719 16.97 72.92 15.75 <nd 0.4651 1.99720/1 M 1 583 390 15,0 51,3 36,0 12.93 40.53 9.95 2.168 20.38 44.15 7.01 <nd 1.006 3.00121/1 M 1 682 410 18,3 57,0 47,0 54.66 53.3 8.656 2.2 17.42 128.7 7.134 <nd 0.3476 0.828822/1 F 1 589 380 22,6 70,3 61,0 99.9 29.63 6.528 1.702 27.84 86.37 14.95 <nd 0.1101 1.06123/1 M 1 544 380 18,7 69,9 60,0 28 46.4 8.362 1.649 27.46 192.9 12.76 <nd 0.5357 1.82524/1 M 1 636 400 13,4 48,6 34,0 25.49 59.41 10.24 3.229 23.58 130.3 9.634 <nd <nd 2.15425/1 F 3 1255 520 30,6 58,0 45,0 51.81 48.79 12.61 2.548 17.27 208.9 13.86 <nd <nd 1.031Mean 2 1068 470 24,3 53,5 39,8 37,084 51,802 10,773 2,633 19,981 77,820 14,874 <<0.000 <<0.320 1,714Minimum 1 421 350 4,9 27,3 4,0 7,777 29,630 6,528 1,649 11,460 1,241 7,010 <0.000 <0.000 0,565Maximum 3 2056 620 63,1 70,3 62,6 99,900 67,560 16,380 3,829 28,240 208,900 35,590 <0.000 1,068 4,378St.Dev 1 534 85 14,4 11,4 15,3 21,828 8,475 2,393 0,673 4,483 54,710 6,616 ~0.000 ~0.322 0,792Count 25 25 25 25 25 25 25 24 25 25 24 25 25 25 25 25
NIVA report no. 4649 - 81
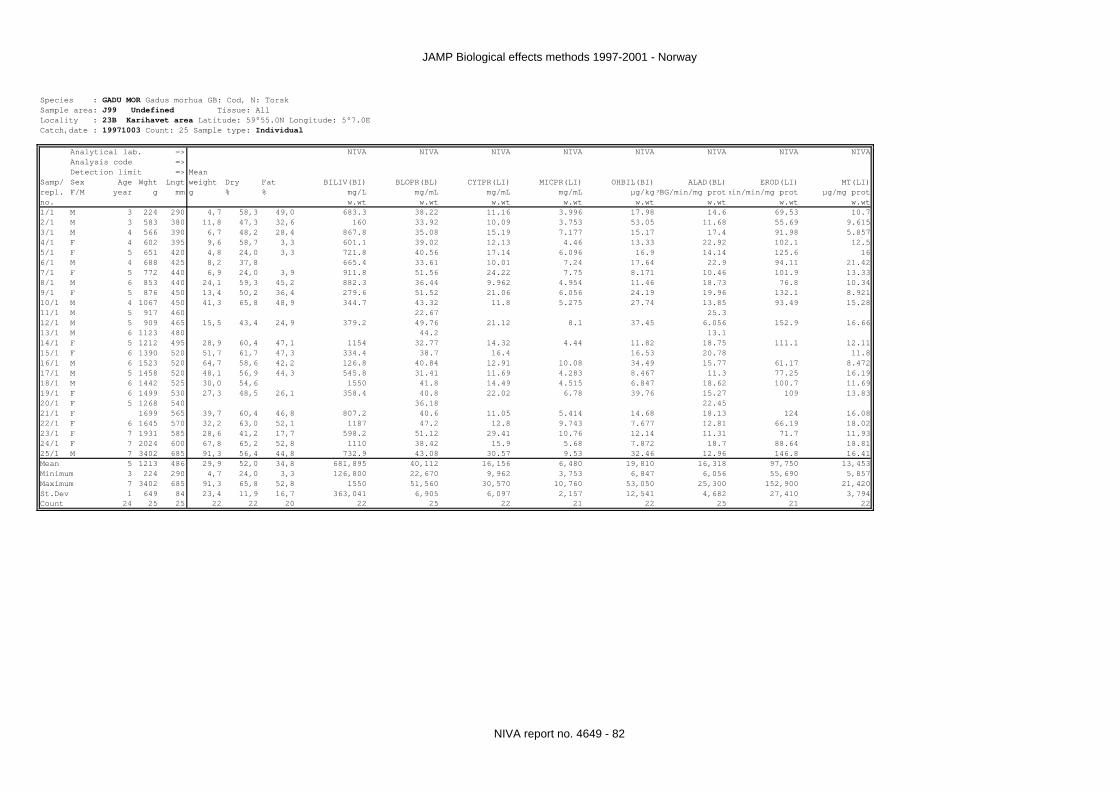
JAMP Biological effects methods 1997-2001 - Norway
Species : GADU MOR Gadus morhua GB: Cod, N: TorskSample area: J99 Undefined Tissue: AllLocality : 23B Karihavet area Latitude: 59°55.0N Longitude: 5°7.0ECatch,date : 19971003 Count: 25 Sample type: Individual
Analytical lab. => NIVA NIVA NIVA NIVA NIVA NIVA NIVA NIVAAnalysis code =>Detection limit => Mean
Samp/ Sex Age Wght Lngt weight Dry Fat BILIV(BI) BLOPR(BL) CYTPR(LI) MICPR(LI) OHBIL(BI) ALAD(BL) EROD(LI) MT(LI)repl. F/M year g mm g % % mg/L mg/mL mg/mL mg/mL µg/kgPBG/min/mg protmin/min/mg prot µg/mg protno. w.wt w.wt w.wt w.wt w.wt w.wt w.wt w.wt1/1 M 3 224 290 4,7 58,3 49,0 683.3 38.22 11.16 3.996 17.98 14.6 69.53 10.72/1 M 3 583 380 11,8 47,3 32,6 160 33.92 10.09 3.753 53.05 11.68 55.69 9.6153/1 M 4 566 390 6,7 48,2 28,4 867.8 35.08 15.19 7.177 15.17 17.4 91.98 5.8574/1 F 4 602 395 9,6 58,7 3,3 601.1 39.02 12.13 4.46 13.33 22.92 102.1 12.55/1 F 5 651 420 4,8 24,0 3,3 721.8 40.56 17.14 6.096 16.9 14.14 125.6 166/1 M 4 688 425 8,2 37,8 665.4 33.61 10.01 7.24 17.64 22.9 94.11 21.427/1 F 5 772 440 6,9 24,0 3,9 911.8 51.56 24.22 7.75 8.171 10.46 101.9 13.338/1 M 6 853 440 24,1 59,3 45,2 882.3 36.44 9.962 4.954 11.46 18.73 76.8 10.349/1 F 5 876 450 13,4 50,2 36,4 279.6 51.52 21.06 6.056 24.19 19.96 132.1 8.92110/1 M 4 1067 450 41,3 65,8 48,9 344.7 43.32 11.8 5.275 27.74 13.85 93.49 15.2811/1 M 5 917 460 22.67 25.312/1 M 5 909 465 15,5 43,4 24,9 379.2 49.76 21.12 8.1 37.45 6.056 152.9 16.6613/1 M 6 1123 480 44.2 13.114/1 F 5 1212 495 28,9 60,4 47,1 1154 32.77 14.32 4.44 11.82 18.75 111.1 12.1115/1 F 6 1390 520 51,7 61,7 47,3 334.4 38.7 16.4 16.53 20.78 11.816/1 M 6 1523 520 64,7 58,6 42,2 126.8 40.84 12.91 10.08 34.49 15.77 61.17 8.47217/1 M 5 1458 520 48,1 56,9 44,3 545.8 31.41 11.69 4.283 8.467 11.3 77.25 16.1918/1 M 6 1442 525 30,0 54,6 1550 41.8 14.49 4.515 6.847 18.62 100.7 11.6919/1 F 6 1499 530 27,3 48,5 26,1 358.4 40.8 22.02 6.78 39.76 15.27 109 13.8320/1 F 5 1268 540 36.18 22.4521/1 F 1699 565 39,7 60,4 46,8 807.2 40.6 11.05 5.414 14.68 18.13 124 16.0822/1 F 6 1645 570 32,2 63,0 52,1 1187 47.2 12.8 9.743 7.677 12.81 66.19 18.0223/1 F 7 1931 585 28,6 41,2 17,7 598.2 51.12 29.41 10.76 12.14 11.31 71.7 11.9324/1 F 7 2024 600 67,8 65,2 52,8 1110 38.42 15.9 5.68 7.872 18.7 88.64 18.8125/1 M 7 3402 685 91,3 56,4 44,8 732.9 43.08 30.57 9.53 32.46 12.96 146.8 16.41Mean 5 1213 486 29,9 52,0 34,8 681,895 40,112 16,156 6,480 19,810 16,318 97,750 13,453Minimum 3 224 290 4,7 24,0 3,3 126,800 22,670 9,962 3,753 6,847 6,056 55,690 5,857Maximum 7 3402 685 91,3 65,8 52,8 1550 51,560 30,570 10,760 53,050 25,300 152,900 21,420St.Dev 1 649 84 23,4 11,9 16,7 363,041 6,905 6,097 2,157 12,541 4,682 27,410 3,794Count 24 25 25 22 22 20 22 25 22 21 22 25 21 22
NIVA report no. 4649 - 82

JAMP Biological effects methods 1997-2001 - Norway
Species : GADU MOR Gadus morhua GB: Cod, N: TorskSample area: J99 Undefined Tissue: AllLocality : 23B Karihavet area Latitude: 59°55.0N Longitude: 5°7.0ECatch,date : 19981021 Count: 25 Sample type: Individual
Analytical lab. => NIVA NIVA NIVA NIVA NIVA NIVA NIVA NIVAAnalysis code =>Detection limit => Mean
Samp/ Sex Age Wght Lngt weight Dry Fat AY(BI) BLOPR(BL) CYTPR(LI) MICPR(LI) ALAD(BL) EROD(LI) MT(LI) PYR1O(BI)repl. F/M year g mm g % % ABS 380 nm mg/mL mg/mL mg/mLPBG/min/mg protmin/min/mg prot µg/mg protg/kg/ABS 380 nmno. w.wt w.wt w.wt w.wt w.wt w.wt w.wt w.wt1/1 F 4 386 360 3,8 21,7 2,2 41.96 36.45 5.007 1.525 21.42 7.489 17.01 12.412/1 F 4 661 400 12,8 54,5 38,3 74.47 31.68 18.31 6.627 28.78 7.414 17.09 8.5523/1 M 4 732 440 6,2 28,5 10,9 37.17 38.5 19.11 6.042 17.7 27.41 18.01 26.194/1 X 4 798 440 7,1 25,0 3,8 110.9 34.98 15.18 3.979 23.32 1.707 22.47 4.8895/1 M 5 758 450 11,0 39,2 19,8 41.45 32.19 10.4 4.029 41.85 28.56 9.1236/1 F 5 915 450 13,6 43,7 24,7 49.38 7.422 2.61 16.85 143 17.117/1 M 4 856 460 18,4 58,8 46,0 33.43 55.62 6.756 2.051 17.33 9.908 23.7 23.028/1 M 5 1076 480 15,6 38,6 21,8 36.85 11.12 3.08 25.39 202.2 17.969/1 M 5 1050 500 13,5 44,1 25,5 26.08 29.9 12.34 2.889 19.7 83.1 20.7410/1 M 5 1028 510 12,2 37,9 17,7 23.03 51.78 11.44 3.089 25.4 60.94 15.7 27.7911/1 M 4 1298 520 36,2 64,1 50,8 54.74 32.34 7.974 2.166 21.44 69.82 17 9.36412/1 F 5 1284 520 27,1 56,2 41,2 28.1 38.34 9.867 3.259 25.58 85.58 28.82 13.8513/1 F 5 1370 530 34,8 57,6 44,8 62.62 58.32 7.9 2.451 18.8 18.45 18.87 7.81614/1 M 6 1265 540 21,9 70,4 62,1 4.064 42.27 10.13 2.712 23.95 118.2 33.18 62.2515/1 F 5 2081 540 57,0 45,3 29,5 98.14 34.14 26.49 7.719 29.07 30.01 4.616/1 F 5 1422 550 27,0 63,3 50,4 68.52 41.31 5.283 2.028 24.15 81.57 12.7417/1 F 6 1494 550 45,7 71,0 62,0 28.98 32.46 6.123 1.232 36.73 24.92 21.26 17.9718/1 M 6 1567 570 34,3 57,7 40,4 27.97 31.71 7.815 2.778 47.67 76.77 21.8 15.7819/1 M 5 1873 580 23,1 33,5 16,7 44.95 15.96 16.39 5.373 55.56 27.84 14.3920/1 F 6 2378 580 168,0 78,2 72,6 39.82 42.46 3.441 0.9783 25.55 74.31 6.52921/1 M 6 2191 590 79,8 70,3 60,8 70.53 52.17 6.996 2.368 57.66 38.98 8.68622/1 M 6 2965 640 348,0 82,0 78,7 50.9 59.94 2.097 0.574 20.49 14.99 28.16 10.9323/1 F 6 3664 680 331,0 83,1 77,1 60.09 15.38 5.014 1.804 54.28 6.157 130.824/1 M 6 3579 710 177,7 74,2 67,4 44.43 29.1 13.77 3.479 34.27 23.49 38.11 10.3325/1 M 7 5551 770 567,0 86,4 79,8 20.29 41.63 2.446 0.6995 16.4 17.49 29.44 14.15Mean 5 1690 534 83,7 55,4 41,8 47,506 38,594 9,953 3,022 27,987 51,959 23,593 20,561Minimum 4 386 360 3,8 21,7 2,2 4,064 15,380 2,097 0,574 16,400 1,707 15,700 4,600Maximum 7 5551 770 567,0 86,4 79,8 110,900 59,940 26,490 7,719 55,560 202,200 38,980 130,800St.Dev 1 1181 96 137,9 19,0 24,0 25,196 11,410 5,787 1,805 11,420 48,972 7,477 26,850Count 25 25 25 25 25 25 23 25 25 25 24 25 18 23
NIVA report no. 4649 - 83

JAMP Biological effects methods 1997-2001 - Norway
Species : GADU MOR Gadus morhua GB: Cod, N: TorskSample area: J99 Undefined Tissue: AllLocality : 23B Karihavet area Latitude: 59°55.0N Longitude: 5°7.0ECatch,date : 19990922 Count: 25 Sample type: Individual
Analytical lab. => NIVA NIVA NIVA NIVA NIVA NIVA NIVA NIVAAnalysis code =>Detection limit => Mean
Samp/ Sex Age Wght Lngt weight Dry Fat AY(BI) BLOPR(BL) CYTPR(LI) MICPR(LI) ALAD(BL) EROD(LI) MT(LI) PYR1O(BI)repl. F/M year g mm g % % ABS 380 nm mg/mL mg/mL mg/mLPBG/min/mg protmin/min/mg prot µg/mg protg/kg/ABS 380 nmno. w.wt w.wt w.wt w.wt w.wt w.wt w.wt w.wt1/1 F 5 1493 540 26,3 47,0 31,0 38.18 35.64 9.036 2.643 23.32 113.6 27.53 3.2482/1 M 5 1208 490 48,1 68,5 61,0 42.12 48.15 4.131 0.9841 12.92 52.05 30.05 16.173/1 M 4 697 400 13,8 60,6 47,0 15.25 39.87 5.505 2.054 20.66 139.7 17.28 24.784/1 F 6 2318 600 94,5 71,7 65,0 45.15 48.81 4.191 2.224 2.581 70.05 25.14 19.095/1 F 5 1135 500 20,4 53,5 37,0 24.06 8.712 3.611 22.35 66.75 24.56/1 M 5 1125 490 19,5 51,6 33,0 63.04 39.09 9.333 2.869 15.59 125.6 12.99 6.3857/1 M 5 698 410 10,1 55,6 45,0 9.999 52.26 8.313 3.305 6.989 65.87 14.71 22.658/1 F 6 1262 490 36,9 64,0 52,0 48.68 40.83 6.249 2.046 19.71 46.74 25.79 7.6729/1 M 6 2649 650 82,1 68,7 62,0 77.97 38.1 5.346 1.371 18.56 99.62 36.5 17.8310/1 F 7 4938 720 61,6 37,7 22,7 29.68 39.27 10.48 3.639 21.2 <0.6 37.29 33.1611/1 M 5 991 480 29,5 62,3 52,1 56.46 46.26 7.356 2.841 5.631 42.65 18.06 5.06912/1 F 6 1852 590 80,4 75,8 67,7 47.87 52.38 5.844 1.461 15.98 40.84 27.04 14.7413/1 F 5 804 450 17,0 60,2 42,4 57.37 39.48 7.176 2.535 20.93 52.78 30.26 11.0414/1 M 4 641 410 6,5 7,6 51.81 57.87 10.52 2.906 14.4 106.3 23.81 37.8315/1 F 6 1602 550 45,3 62,9 51,3 43.63 40.8 8.256 2.355 19.79 51.44 10.48 5.04716/1 F 5 657 410 10,9 52,1 33,4 70.25 40.05 7.716 2.862 21.66 132.1 17.4 7.90717/1 M 6 1463 540 21,7 52,4 36,2 40.91 35.61 9.288 3.167 20.25 0.69 18.96 11.4218/1 M 5 994 460 18,2 51,7 35,2 67.77 48 7.296 2.586 16.57 92.1 18.31 7.88719/1 M 5 1639 570 72,5 74,7 65,6 39.09 37.41 3.486 1.258 20.29 145.8 49.72 9.83720/1 F 7 4408 730 255,3 78,7 72,7 55.55 53.91 4.497 1.424 8.911 26.01 22.27 10.4721/1 F 4 679 410 11,3 52,2 28,9 35.15 40.95 8.706 3.456 18.07 71.94 20.86 6.322/1 M 4 1081 480 16,4 48,1 26,9 8.181 50.16 8.271 2.51 17.1 93.6 30.08 30.7323/1 F 5 968 470 20,0 53,6 38,6 50.5 40.8 6.966 2.235 14.31 40.34 20.12 6.84224/1 M 4 531 390 8,3 38,0 51.41 43.74 8.025 3.683 17.38 107.9 14.63 14.2325/1 X 5 971 470 11,0 48,5 30,9 44.54 44.7 9.972 3.744 18.57 125.5 23.53 11.28Mean 5 1472 508 41,5 58,8 43,3 45,440 43,128 7,387 2,551 16,549 <76,423 23,892 14,234Minimum 4 531 390 6,5 37,7 7,6 8,181 24,060 3,486 0,984 2,581 <0,6 10,480 3,248Maximum 7 4938 730 255,3 78,7 72,7 77,970 57,870 10,520 3,744 23,320 145,800 49,720 37,830St.Dev 1 1097 94 51,6 10,6 16,1 17,452 7,262 2,027 0,815 5,443 ~41,707 8,712 9,468Count 25 25 25 25 23 25 24 25 25 25 25 25 25 24
NIVA report no. 4649 - 84

JAMP Biological effects methods 1997-2001 - Norway
Species : GADU MOR Gadus morhua GB: Cod, N: TorskSample area: J99 Undefined Tissue: AllLocality : 23B Karihavet area Latitude: 59°55.0N Longitude: 5°7.0ECatch,date : 20001020 Count: 25 Sample type: Individual
Analytical lab. => NIVA NIVA NIVA NIVA NIVA NIVA NIVA NIVA NIVA NIVA NIVAAnalysis code =>Detection limit => Mean
Samp/ Sex Age Wght Lngt weight Dry Fat AY(BI) BLOPR(BL) CYTPR(LI) MICPR(LI) ALAD(BL) EROD(LI) MT(LI) BAP3O(BI) NAP2O(BI) PA1O(BI) PYR1O(BI)repl. F/M year g mm g % % ABS 380 nm mg/mL mg/mL mg/mLPBG/min/mg protmin/min/mg prot µg/mg protg/kg/ABS 380 nmg/kg/ABS 380 nm µg/kg/ABS 38µg/kg/ABS 38no. w.wt w.wt w.wt w.wt w.wt w.wt w.wt w.wt w.wt w.wt w.wt1/1 F 4 3960 730 141,4 63,1 53,1 23.33 45.93 8.528 1.765 12.92 88.17 20.91 <nd <nd <nd 1.5862/1 M 4 2943 670 63,6 52,0 38,9 39.34 8.502 4.1 19.85 97.55 11.583/1 F 4 3749 750 150,0 72,7 65,6 45.35 45.54 4.508 0.7164 19.67 18.67 12 <nd <nd <nd 2.3824/1 F 4 3276 690 75,8 53,8 40,5 10.5 48.99 9.144 2.668 20.21 68.34 17.69 <nd <nd <nd 3.7135/1 F 3 4241 740 149,8 69,0 59,3 18.18 55.45 6.822 1.569 16.23 96.56 20.51 <nd <nd <nd 4.956/1 M 4 1805 570 45,8 60,7 51,6 6.962 1.576 49.21 17.947/1 M 3 1483 630 61,4 68,3 60,0 23.94 48.22 6.544 1.874 20.48 67.23 11.52 <nd <nd <nd 3.8858/1 F 3 2089 570 104,8 68,4 62,1 12.52 45.98 5.282 1.705 25.54 105.6 13.63 <nd <nd <nd 4.1529/1 F 3 2054 550 98,6 74,1 66,3 10.91 49.33 5.05 1.337 22.16 73.47 18.44 <nd <nd <nd 4.49210/1 M 3 1697 580 34,8 54,6 39,8 12.12 46.89 8.586 3.002 19.46 1023 12.74 <nd <nd <nd 4.9511/1 M 4 2443 580 96,0 66,2 59,4 25.75 47.62 4.972 1.61 26.9 79.51 18.89 <nd <nd <nd 3.33912/1 M 5 2596 650 98,4 66,4 59,9 36.26 39.48 4.848 0.858 18.48 122 25.71 <nd <nd <nd 4.66113/1 M 3 1760 600 30,0 27,9 12,3 15.35 46.07 10.87 2.758 22.85 4.416 15.85 <nd <nd <nd 2.60614/1 F 2 1897 550 104,0 73,2 66,0 13.43 55.11 5.182 1.274 16.56 71.77 16.82 <nd <nd <nd 6.10415/1 F 2 1278 530 43,2 69,4 61,5 21.21 50.34 7.068 2.051 20.3 42.96 18.52 <nd <nd <nd 2.9716/1 F 2 2922 590 34,0 58,8 51,5 32.12 42.69 7.974 2.83 20.07 41.69 16.86 <nd <nd <nd 5.97817/1 M 4 1985 580 85,6 70,6 62,9 56.56 48.01 5.532 1.662 22.29 336.7 16.33 <nd <nd <nd 4.72118/1 F 2 887 450 20,4 61,7 51,6 46.86 44.15 7.068 2.029 17.71 74.02 12.21 <nd <nd <nd 3.13719/1 F 3 1199 510 17,8 55,4 44,0 31.01 46.49 8.332 2.624 15.77 1081 14.34 <nd <nd <nd 5.93420/1 M 2 1196 500 29,2 54,9 41,5 7.171 52.61 7.94 2.565 16.27 87.83 14.17 <nd <nd <nd 11.0221/1 M 1 838 440 13,0 45,3 25,8 16.97 43.95 10 2.732 27.44 73.25 14.15 <nd <nd <nd 5.59922/1 M 1 425 350 9,4 59,3 44,9 9.999 48.69 7.014 2.61 15.11 44.92 8.283 <nd <nd <nd 7.80123/1 F 2 1197 520 23,4 59,5 51,0 23.53 47.8 8.594 2.442 17.42 59.6 12.4 <nd <nd <nd 3.31424/1 F 2 692 420 14,6 55,7 39,0 30.3 41.57 10.82 2.581 21.67 66.09 9.14 <nd <nd <nd 3.86125/1 F 2 993 470 13,8 40,6 16,8 55.25 39.56 9.968 2.692 16.88 96.21 12.23 <nd <nd <nd 3.276Mean 3 1984 569 62,4 60,1 49,0 25,157 46,659 7,444 2,145 19,677 158,791 15,315 <<0.000 <<0.000 <<0.000 4,540Minimum 1 425 350 9,4 27,9 12,3 7,171 39,340 4,508 0,716 12,920 4,416 8,283 <0.000 <0.000 <0.000 1,586Maximum 5 4241 750 150,0 74,1 66,3 56,560 55,450 10,870 4,100 27,440 1081 25,710 0,000 0,000 0,000 11,020St.Dev 1 1052 102 45,2 10,9 14,8 14,580 4,345 1,912 0,762 3,663 275,449 4,007 ~0.000 ~0.000 ~0.000 2,005Count 25 25 25 25 25 25 23 24 25 25 24 25 25 23 23 23 23
NIVA report no. 4649 - 85

JAMP Biological effects methods 1997-2001 - Norway
Species : GADU MOR Gadus morhua GB: Cod, N: TorskSample area: J99 Undefined Tissue: AllLocality : 23B Karihavet area Latitude: 59°55.0N Longitude: 5°7.0ECatch,date : 20011015 Count: 25 Sample type: Individual
Analytical lab. => NIVA NIVA NIVA NIVA NIVA NIVA NIVA NIVA NIVA NIVAAnalysis code =>Detection limit => Mean
Samp/ Sex Age Wght Lngt weight Dry Fat AY(BI) BLOPR(BL) CYTPR(LI) MICPR(LI) ALAD(BL) EROD(LI) MT(LI) BAP3O(BI) PA1O(BI) PYR1O(BI)repl. F/M year g mm g % % ABS 380 nm mg/mL mg/mL mg/mLPBG/min/mg protmin/min/mg prot µg/mg protg/kg/ABS 380 nmg/kg/ABS 380 nm µg/kg/ABS 380 nmno. w.wt w.wt w.wt w.wt w.wt w.wt w.wt w.wt w.wt w.wt1/1 M 3 2261 600 137,1 72,1 63,0 34.02 59.38 5.658 1.506 34.45 49.86 15.61 <nd <nd 2.6282/1 M 2 1782 560 57,4 66,0 54,0 27.72 55.49 8.154 1.575 28.14 90.58 16.96 <nd <nd 1.4433/1 F 2 2111 600 52,3 61,1 51,0 28.6 64.48 9.384 2.849 22.54 115.5 15.09 <nd <nd 2.6014/1 F 4 2473 650 58,8 57,4 37,0 24.7 55.3 10.8 2.23 25.71 65.38 21.94 <nd <nd 2.2645/1 F 4 3136 620 199,3 74,7 68,0 16.25 48.61 5.922 1.881 26.57 62.99 12.78 <nd <nd 3.156/1 M 2 1269 510 28,5 65,4 54,0 21.82 49.75 9.45 2.197 17.86 57.33 15.55 <nd <nd 2.5497/1 M 3 3127 670 177,7 74,1 67,0 25.55 60.48 4.094 1.351 26.84 48.15 19.85 <nd <nd 3.0378/1 F 3 2548 590 160,9 73,2 67,0 30.81 57.3 5.78 1.707 24.72 46.88 12.06 <nd <nd 2.4419/1 M 3 3189 640 327,0 82,8 76,0 27.67 61.32 2.621 0.7927 25.02 <0.6 18.81 <nd <nd 2.73210/1 F 3 2490 610 147,5 74,2 66,0 10.2 60.75 5.072 1.414 20.15 65.13 16.02 <nd <nd 3.15711/1 F 3 2442 620 73,8 57,0 43,0 22.73 44.67 10.61 2.668 24.59 78.36 20.46 <nd <nd 2.3112/1 F 2 1772 520 26,7 67,2 55,0 23.94 51.66 9.866 2.135 20.2 77.81 23.83 <nd <nd 3.18813/1 M 2 875 430 15,9 43,4 25,0 3.468 24.31 14.53 2.168 74.52 110.6 19.52 <nd <nd 4.98814/1 F 3 2877 640 103,9 68,7 59,0 11.41 48.33 7.568 1.656 25.4 32.03 24.78 <nd <nd 2.15515/1 F 2 1455 540 19,6 37,2 22,0 21.11 49.84 11.97 2.688 21.85 96.21 24.82 <nd <nd 3.38216/1 F 2 2682 550 51,5 66,8 59,0 62.2 49.75 6.728 1.791 24.19 50.93 19.34 <nd <nd 1.80517/1 F 3 1692 560 46,2 52,0 36,0 59.69 53.77 9.31 3.494 17.31 67.73 11.52 <nd <nd 1.6318/1 F 2 893 460 22,1 60,2 44,0 23.56 47.3 10.1 1.95 17.99 106.8 14.94 <nd <nd 2.04619/1 M 3 1931 570 46,9 68,0 56,0 14.85 55.21 8.968 2.405 20.12 167.2 17.16 <nd <nd 2.47220/1 M 2 391 350 4,7 48,9 13.53 40.97 10.65 2.499 26.1 88.73 10.04 <nd <nd 4.67721/1 F 2 1335 530 22,5 53,5 34,0 30.85 58.85 11.14 2.898 20.53 140.7 10.58 <nd <nd 2.20722/1 M 2 936 460 9,2 25,0 63.38 46.59 17.71 3.526 24.02 1.23 16.46 <nd <nd 1.79223/1 M 3 2444 610 28,3 31,5 11,0 3.366 49.75 13.67 4.651 16.69 76.46 19.18 <nd <nd 2.82224/1 M 3 3358 700 86,7 63,2 50,0 4.794 41.3 6.872 2.207 18.29 142.2 24.55 <nd <nd 2.00325/1 F 2 616 390 6,6 33,6 15.65 37.03 10.15 2.916 19.65 79.91 9.897 <nd <nd 5.251Mean 3 2003 559 76,4 59,1 49,9 24,875 50,888 9,071 2,286 24,938 <76,772 17,270 <<0.000 <<0.000 2,749Minimum 2 391 350 4,7 25,0 11,0 3,366 24,310 2,621 0,793 16,690 <0,6 9,897 <0.000 <0.000 1,443Maximum 4 3358 700 327,0 82,8 76,0 63,380 64,480 17,710 4,651 74,520 167,200 24,820 <0.000 <0.000 5,251St.Dev 1 863 88 77,2 15,2 16,8 16,346 8,905 3,400 0,825 11,123 ~39,972 4,625 ~0.000 ~0.000 0,982Count 25 25 25 25 25 22 25 25 25 25 25 25 25 25 25 25
fished 5-10m depht
NIVA report no. 4649 - 86

JAMP Biological effects methods 1997-2001 - Norway
Species : GADU MOR Gadus morhua GB: Cod, N: TorskSample area: J99 Undefined Tissue: AllLocality : 98B Lille Molla Latitude: 68°12.0N Longitude: 14°48.0ECatch,date : 20000921 Count: 25 Sample type: Individual
Analytical lab. => NIVA NIVA NIVA NIVA NIVA NIVA NIVA NIVA NIVA NIVA NIVAAnalysis code =>Detection limit => Mean
Samp/ Sex Age Wght Lngt weight Dry Fat AY(BI) BLOPR(BL) CYTPR(LI) MICPR(LI) ALAD(BL) EROD(LI) MT(LI) BAP3O(BI) NAP2O(BI) PA1O(BI) PYR1O(BI)repl. F/M year g mm g % % ABS 380 nm mg/mL mg/mL mg/mLPBG/min/mg protmin/min/mg prot µg/mg protg/kg/ABS 380 nmg/kg/ABS 380 nm µg/kg/ABS 38µg/kg/ABS 38no. w.wt w.wt w.wt w.wt w.wt w.wt w.wt w.wt w.wt w.wt w.wt1/1 F 6 295 330 2,5 23,3 5,0 5.978 2.235 2.153 miss2/1 M 4 758 445 6,7 24,1 4,0 25.05 5.254 1.94 1.923 miss <nd <nd <nd 0.75853/1 M 3 143 310 2,3 27,5 3,7 8.08 7.804 2.74 <0.6 10.15 <nd <nd <nd 2.4754/1 F 4 312 330 3,1 22,0 5,5 11.51 7.75 3.125 2.303 11.26 <nd <nd <nd 2.5195/1 F 5 671 430 4,7 22,2 2,4 12.63 10.12 3.667 8.946 miss <nd <nd <nd 1.5056/1 F 5 865 460 7,8 21,6 2,4 17.57 57.25 12.67 3.664 19.39 2.278 8.959 <nd <nd <nd 0.96737/1 M 5 549 390 3,8 24,6 2,4 21.01 7.218 2.689 4.553 miss <nd <nd <nd 0.9528/1 F 5 458 370 4,4 29,3 8,2 5.559 9.748 4.335 9.151 miss <nd <nd <nd 3.4189/1 M 4 305 310 2,3 27,3 2,4 26.46 30.47 7.944 2.413 21.44 <0.6 miss <nd <nd <nd 0.90710/1 F 4 1840 575 19,7 35,7 20,0 14.95 9.372 2.577 38.54 9.513 <nd <nd <nd 1.67211/1 F 4 2346 590 78,1 66,9 60,0 5.304 3.59 1.835 61.18 miss <nd <nd <nd <nd12/1 M 4 510 390 4,1 24,8 2,1 23.73 31.84 16.55 6.431 15.77 0.77 miss <nd <nd <nd 0.800513/1 F 5 1309 470 17,2 35,9 22,0 11.41 39.7 11.61 3.677 15.34 25.82 10.17 <nd <nd <nd 1.75214/1 M 3 463 370 4,4 28,0 9,9 12.25 4.717 1.961 9.396 <nd <nd <nd <nd15/1 M 3 238 300 1,9 28,6 5,2 10.56 15.21 6.402 3.158 18.99 2.439 miss <nd <nd <nd 2.177Mean 4 737 405 10,9 29,5 10,3 14,909 34,894 8,951 3,280 18,186 <10,881 9,908 <<0.000 <<0.000 <<0.000 <1.422Minimum 3 143 300 1,9 21,6 2,1 5,304 15,210 3,590 1,835 15,340 <0,6 8,959 <0.000 <0.000 <0.000 <0.000Maximum 6 2346 590 78,1 66,9 60,0 26,460 57,250 16,550 6,431 21,440 61,180 11,260 0,000 0,000 0,000 3,418St.Dev 1 630 91 19,3 11,3 15,1 7,261 15,324 3,341 1,209 2,580 ~17,594 0,809 ~0.000 ~0.000 ~0.000 ~0.985Count 15 15 15 15 15 15 13 5 15 15 5 15 6 14 14 14 14
miss(9) ! Missing value
NIVA report no. 4649 - 87

JAMP Biological effects methods 1997-2001 - Norway
Species : GADU MOR Gadus morhua GB: Cod, N: TorskSample area: J99 Undefined Tissue: AllLocality : 98B Lille Molla Latitude: 68°12.0N Longitude: 14°48.0ECatch,date : 20010918 Count: 25 Sample type: Individual
Analytical lab. => NIVA NIVA NIVA NIVA NIVA NIVA NIVA NIVA NIVA NIVAAnalysis code =>Detection limit => Mean
Samp/ Sex Age Wght Lngt weight Dry Fat AY(BI) BLOPR(BL) CYTPR(LI) MICPR(LI) ALAD(BL) EROD(LI) MT(LI) BAP3O(BI) PA1O(BI) PYR1O(BI)repl. F/M year g mm g % % ABS 380 nm mg/mL mg/mL mg/mLPBG/min/mg protmin/min/mg prot µg/mg protg/kg/ABS 380 nmg/kg/ABS 380 nm µg/kg/ABS 380 nmno. w.wt w.wt w.wt w.wt w.wt w.wt w.wt w.wt w.wt w.wt1/1 F 5 491 377 5,8 25,5 5,0 49.33 15.25 4.397 13.06 5.949 13.352/1 M 6 898 500 6,9 35,2 24.7 50.99 18.76 6.457 13.37 6.799 15.88 <nd 1.348 3.1383/1 F 6 1388 555 33,9 46,8 32,0 16.88 50.99 12.51 3.056 15.21 10.51 11.92 <nd <nd 4.754/1 M 5 640 427 8,8 21,2 8,4 14.34 48.1 14.66 3.951 11.96 <0.6 12.53 <nd 2.559 5.6135/1 M 4 1182 540 13,5 19,8 3,5 17.37 43.93 14.27 4.168 13.26 <0.6 12.01 <nd 2.141 4.6346/1 X 5 1652 572 23,9 49,8 28,0 18.08 26.01 12.8 2.738 10.2 39.34 19.21 <nd 1.897 4.6527/1 F 5 449 360 4,6 23,9 11.82 41.96 14.94 3.499 15.44 7.943 10.14 <nd <nd 6.7878/1 F 4 205 291 1,9 27,9 15.96 38.93 10.4 2.285 11.45 1.909 11.28 <nd <nd 4.8389/1 F 5 332 316 4,5 35,6 16.66 45.53 13.98 3.692 12.58 <0.6 9.508 <nd <nd 4.97410/1 M 5 691 404 9,1 35,1 19,0 9.494 29.67 12.57 3.753 12.14 1.242 12.74 <nd 3.939 8.46911/1 M 4 447 367 4,5 31,9 8,0 14.95 48.87 13.17 3.956 12.67 9.445 15.2 <nd 2.382 5.39212/1 F 4 518 399 5,1 25,9 5,4 42.05 17.33 5.015 12.24 0.7555 11.113/1 M 4 420 348 11,3 51,6 32,0 14.85 42.25 9.09 2.874 15.4 48.81 14.34 <nd 2.324 5.76514/1 F 5 698 436 8,8 32,6 16,0 18.48 38.14 13.62 4.199 13.43 7.865 9.733 <nd <nd 4.38815/1 M 2 137 260 1,4 36,3 14.75 44.52 16.84 4.309 16.14 1.049 8.159 <nd 2.496 5.67616/1 M 3 155 255 2,4 29,6 29.89 9.832 2.686 9.691 <0.6 7.825 <nd <nd17/1 F 2 113 235 1,0 8.989 31.28 15.93 5.065 12.56 1.763 9.981 <nd 4.138 8.88918/1 F 4 975 519 5,7 23,5 3,4 43.59 48.74 16.04 2.999 19.37 <0.6 15.29 <nd <nd 1.82819/1 M 6 2003 630 47,7 58,5 49,0 35.21 50.98 9.216 2.319 16.26 34.86 16.62 <nd <nd 2.24120/1 F 5 2148 595 35,3 49,3 35,0 9.09 44.1 12.62 3.151 13.7 9.921 21.5 <nd <nd 8.87821/1 F 4 1012 468 23,1 56,9 46,0 40.4 37.96 11.03 2.86 19.53 6.128 15.81 <nd <nd 2.0322/1 F 3 291 285 3,4 31,6 4,2 12.73 37.92 13.71 3.523 12.77 0.7105 10.51 <nd <nd 6.47523/1 M 4 532 378 8,8 45,0 27,0 13.33 48.78 13.42 4.527 16.73 3.224 13.03 <nd <nd 6.05324/1 M 3 197 290 2,7 19,7 44.33 11.28 3.767 19.36 2.739 6.07925/1 F 4 476 381 4,9 25,5 3,4 19.39 47.29 13.02 3.329 11.77 8.662 14.55 <nd <nd 4.162Mean 4 722 408 11,2 34,9 19,1 18,622 42,502 13,452 3,703 14,012 <8,505 12,732 <<0.000 <<1.056 5,221Minimum 2 113 235 1,0 19,7 3,4 8,989 26,010 9,090 2,285 9,691 <0,6 6,079 <0.000 <0.000 1,828Maximum 6 2148 630 47,7 58,5 49,0 43,590 50,990 18,760 6,457 19,530 48,810 21,500 0,000 4,138 8,889St.Dev 1 568 114 12,2 11,9 15,7 9,652 7,224 2,487 0,958 2,705 ~12,885 3,572 ~0.000 ~1.414 2,008Count 25 25 25 25 24 17 21 25 25 25 25 25 25 22 22 21
NIVA report no. 4649 - 88

JAMP Biological effects methods 1997-2001 - Norway
Species : GADU MOR Gadus morhua GB: Cod, N: TorskSample area: J99 Undefined Tissue: AllLocality : 10B Varangerfjorden Latitude: 69°56.0N Longitude: 29°40.0ECatch,date : 20000918 Count: 25 Sample type: Individual
Analytical lab. => NIVA NIVA NIVA NIVA NIVA NIVA NIVA NIVA NIVA NIVA NIVAAnalysis code =>Detection limit => Mean
Samp/ Sex Age Wght Lngt weight Dry Fat AY(BI) BLOPR(BL) CYTPR(LI) MICPR(LI) ALAD(BL) EROD(LI) MT(LI) BAP3O(BI) NAP2O(BI) PA1O(BI) PYR1O(BI)repl. F/M year g mm g % % ABS 380 nm mg/mL mg/mL mg/mLPBG/min/mg protmin/min/mg prot µg/mg protg/kg/ABS 380 nmg/kg/ABS 380 nm µg/kg/ABS 38µg/kg/ABS 38no. w.wt w.wt w.wt w.wt w.wt w.wt w.wt w.wt w.wt w.wt w.wt1/1 M 2 270 320 8,9 68,7 58,0 24.81 40.52 3.652 1.308 19.76 27.92 4.036 <nd <nd <nd 0.16122/1 M 3 427 375 14,3 66,1 57,0 20.12 30.68 4.84 1.377 21.3 10.1 4.525 <nd <nd <nd 0.34793/1 F 3 382 370 15,8 61,6 53,0 18.11 22.99 6.858 1.642 18.75 118.2 5.719 <nd <nd <nd 0.4974/1 F 3 237 310 5,0 44,4 31,0 17.92 5.596 1.46 18.92 61.37 4.3395/1 F 2 275 335 4,2 19,0 13.08 19.42 4.312 1.308 19.45 27.79 6.482 <nd <nd <nd 0.53536/1 M 4 806 440 41,6 73,6 69,0 113.8 29.68 1.593 0.5404 20.87 85.93 9.495 <nd <nd <nd 3.5147/1 M 3 265 320 9,0 53,0 29.51 34.4 3.758 1.117 21.59 64.29 4.234 <nd <nd <nd 0.13568/1 M 2 251 315 8,3 54,0 12.07 23.62 6.688 2.382 18.32 76.34 6.422 <nd <nd <nd 0.82849/1 F 3 207 310 2,4 4,3 27.83 27.98 8.146 2.313 20.05 20.02 8.129 <nd <nd <nd 0.215610/1 F 3 301 325 3,7 17,0 37.44 5.372 1.997 19.67 194.1 6.042 <nd <nd <nd11/1 F 2 228 310 4,8 24,0 7.373 44.88 5.48 2.289 16.58 64.8 5.208 <nd <nd <nd <nd12/1 F 2 358 350 5,7 31,0 7.979 50.2 4.98 1.867 20.35 113.9 9.165 <nd <nd <nd 0.626613/1 M 3 416 360 13,3 68,4 57,0 47.66 5.526 1.629 25.77 200.6 6.334 <nd <nd <nd14/1 F 3 425 370 10,1 57,3 42,0 11.31 50.12 8.918 2.366 3.836 102.6 6.527 <nd <nd <nd 0.353615/1 F 3 346 340 11,1 68,5 56,0 22.32 41.67 6.406 1.626 20.48 165.6 6.709 <nd <nd <nd 0.268816/1 F 3 322 340 4,5 26,0 7.88 42.34 6.23 2.017 18.68 110.3 4.308 <nd <nd <nd 0.507617/1 M 2 239 300 14,3 74,2 66,0 15.93 26.12 3.389 0.989 22.42 77.74 5.928 <nd <nd <nd 0.313918/1 F 3 376 350 10,1 56,0 26.49 22.23 6.75 2.369 20.5 124.6 7.161 <nd <nd <nd 0.188719/1 M 2 207 300 5,9 42,0 31.52 35.75 6.476 1.594 21.83 118.7 6.901 <nd <nd <nd 0.222120/1 M 2 138 260 2,2 24,0 33.58 5.14 1.837 14.6 118.7 3.31321/1 M 3 533 310 13,0 60,3 50,0 11.74 22.49 7.108 1.46 15.94 131.7 6.093 <nd <nd <nd 0.255622/1 F 3 346 350 6,6 37,0 45.89 8.38 2.688 18.11 81.53 4.631 <nd <nd <nd23/1 M 3 407 375 12,5 51,6 39,0 15.59 38.61 7.002 2.314 16.57 205.2 5.897 <nd <nd <nd 0.641324/1 M 3 281 330 6,5 54,0 39.25 5.824 1.561 13.94 151.3 4.63925/1 M 2 247 320 4,8 37,0 29.01 28 7.116 2.301 18.87 94.86 4.279 <nd <nd <nd 0.2069Mean 3 332 335 9,5 63,2 42,3 23,499 34,138 5,822 1,774 18,686 101,928 5,861 <<0.000 <<0.000 <<0.000 <0.517Minimum 2 138 260 2,2 44,4 4,3 7,373 17,920 1,593 0,540 3,836 10,100 3,313 <0.000 <0.000 <0.000 <0.000Maximum 4 806 440 41,6 74,2 69,0 113,800 50,200 8,918 2,688 25,770 205,200 9,495 0,000 0,000 0,000 3,514St.Dev 1 133 35 7,8 9,3 16,8 23,270 9,871 1,677 0,527 4,003 54,140 1,570 ~0.000 ~0.000 ~0.000 ~0.755Count 25 25 25 25 11 25 19 25 25 25 25 25 25 22 22 22 19
NIVA report no. 4649 - 89

JAMP Biological effects methods 1997-2001 - Norway
Species : GADU MOR Gadus morhua GB: Cod, N: TorskSample area: J99 Undefined Tissue: AllLocality : 10B Varangerfjorden Latitude: 69°56.0N Longitude: 29°40.0ECatch,date : 20010915 Count: 25 Sample type: Individual
Analytical lab. => NIVA NIVA NIVA NIVA NIVA NIVA NIVA NIVA NIVA NIVAAnalysis code =>Detection limit => Mean
Samp/ Sex Age Wght Lngt weight Dry Fat AY(BI) BLOPR(BL) CYTPR(LI) MICPR(LI) ALAD(BL) EROD(LI) MT(LI) BAP3O(BI) PA1O(BI) PYR1O(BI)repl. F/M year g mm g % % ABS 380 nm mg/mL mg/mL mg/mLPBG/min/mg protmin/min/mg prot µg/mg protg/kg/ABS 380 nmg/kg/ABS 380 nm µg/kg/ABS 380 nmno. w.wt w.wt w.wt w.wt w.wt w.wt w.wt w.wt w.wt w.wt1/1 F 3 318 338 6,1 60,7 40,0 56.51 11.18 2.432 16 80.59 7.348 <nd <nd2/1 F 2 251 313 6,4 65,4 49,0 24.64 41.72 7.908 1.489 16.81 60.54 6.344 <nd <nd 0.23943/1 F 2 423 368 6,6 36,7 21,0 11.21 32.59 13.97 3.185 27.01 22.53 8.287 <nd <nd 0.40144/1 F 2 308 335 6,5 55,9 39,0 18.78 43.52 11.18 2.938 19.53 84.24 7.072 <nd <nd 0.28225/1 F 3 459 374 20,0 75,3 66,0 30.87 35.67 6.852 1.623 17.99 79.56 3.98 <nd <nd 0.1496/1 M 4 1056 486 49,8 58,4 43,0 14.85 42.91 11.5 3.011 19.16 19.01 11.64 <nd <nd 0.24257/1 F 2 181 279 7,3 67,0 56,0 9.99 7.58 1.802 13.78 55.09 5.1918/1 F 2 253 320 5,7 50,8 34,0 38.11 13.13 3.178 18.14 77.2 8.7079/1 M 2 214 300 3,7 37.45 9.226 2.375 21.54 83.7 5.4410/1 F 2 212 300 5,6 64,8 50,0 23.03 52.19 9.324 2.46 15.74 102.3 5.313 <nd <nd 0.147611/1 F 2 309 329 9,2 62,1 50,0 11.31 53.22 9.46 2.247 19.09 91.42 6.756 <nd <nd 0.265212/1 F 2 256 316 3,4 23.84 38.83 11.97 2.931 10.22 1.39 8.647 <nd <nd 0.306313/1 F 2 263 330 4,5 19.21 12.6 3.332 40.2 78.42 5.427 <nd <nd14/1 F 3 311 344 8,5 66,3 55,0 58.18 30.92 8.306 1.853 16.46 109.5 5.963 <nd <nd 0.140915/1 M 3 457 372 16,6 69,0 59,0 11.31 42.75 4.595 1.554 13.81 145.4 7.306 <nd <nd 0.477416/1 M 2 309 330 3,4 8.888 51.12 14.05 3.724 12.69 63.12 6.079 <nd <nd 0.573817/1 F 3 390 376 14,9 65,6 59,0 13.55 39.51 5.564 2.064 14.76 16.09 <nd <nd 0.39118/1 M 2 221 303 6,4 65,3 59,0 15.45 35.24 11.35 2.482 15.18 19.14 6.402 <nd <nd 0.284719/1 M 2 366 359 7,2 51,2 30,0 45.65 13.1 3.21 19.06 69.69 5.787 <nd <nd20/1 M 2 266 321 10,8 65,0 60,0 14.03 40.48 8.406 2.455 22.62 180.7 8.053 <nd <nd 0.584521/1 M 4 342 356 3,7 57,3 19.29 35.08 11.48 2.973 14.5 136.2 9.909 <nd <nd 0.404322/1 M 2 293 331 8,2 52,0 40.33 7.316 1.559 25.83 93.77 6.18623/1 F 2 320 308 5,3 64,2 55,0 12.42 10.71 10.44 2.011 14.26 71.61 5.242 <nd <nd 0.410524/1 F 2 238 311 5,9 54,4 44,0 31.01 49.21 10.02 2.265 14.32 76.75 8.252 <nd <nd 0.280625/1 M 3 288 324 7,1 55,0 43,0 5.757 52.96 11.4 2.529 12.68 108.8 5.209 <nd <nd 0.799Mean 2 332 337 9,3 60,5 48,2 19,356 39,035 10,076 2,467 18,055 79,611 7,225 <<0.000 <<0.000 0,354Minimum 2 181 279 3,4 36,7 21,0 5,757 9,990 4,595 1,489 10,220 1,390 3,980 <0.000 <0.000 0,141Maximum 4 1056 486 49,8 75,3 66,0 58,180 56,510 14,050 3,724 40,200 180,700 16,090 0,000 0,000 0,799St.Dev 1 168 40 9,4 8,4 11,4 12,063 11,934 2,552 0,629 6,119 40,919 2,524 ~0.000 ~0.000 0,172Count 25 25 25 25 20 20 18 25 25 25 25 24 25 21 21 18
NIVA report no. 4649 - 90

JAMP Biological effects methods 1997-2001 - Norway
Species : PLAT FLE Platichtys flesus GB: Flounder, N: SkrubbeSample area: J63 Sørfjorden Tissue: AllLocality : 53B Inner Sørfjord Latitude: 60°10.0N Longitude: 6°34.0ECatch,date : 19990930 Count: 25 Sample type: Individual
Analytical lab. => NIVA NIVA NIVA NIVA NIVA NIVA NIVA NIVAAnalysis code =>Detection limit => Mean
Samp/ Sex Age Wght Lngt weight Dry Fat AY(BI) BLOPR(BL) CYTPR(LI) MICPR(LI) ALAD(BL) EROD(LI) MT(LI) PYR1O(BI)repl. F/M year g mm g % % ABS 380 nm mg/mL mg/mL mg/mLPBG/min/mg protmin/min/mg prot µg/mg protg/kg/ABS 380 nmno. w.wt w.wt w.wt w.wt w.wt w.wt w.wt w.wt6/1 F 452 360 7,4 32.83 53.82 8.049 4.797 12.43 20.03 16.03 667/1 M 382 340 6,0 108.2 43.08 8.139 4.089 4.341 12.9 12.64 10.728/1 F 386 340 8,3 39.39 52.77 9.393 5.122 10.4 27.76 16.28 101.39/1 F 627 360 18,5 34.44 8.481 4.12 10.13 6.839 52.110/1 M 485 350 11,8 32.52 53.7 9.003 4.743 11.06 24.57 11.39 59.811/1 F 857 420 18,4 86.85 33.96 8.868 3.203 14.17 13.02 15.38 25.8112/1 F 487 380 4,1 27.88 40.8 7.587 3.373 8.354 136.4 31.6 46.1113/1 F 516 370 6,4 81.15 45.3 9.276 5.271 7.089 45.67 6.468 39.8314/1 F 523 350 9,5 18.68 38.85 7.365 4.864 12.27 94.95 19.16 74.6315/1 M 320 320 3,9 85.68 44.88 8.298 4.375 10.45 68.11 7.472 17.4316/1 F 576 350 16,0 13.33 23.29 10.65 5.675 0.1119 18.25 13.3 134.517/1 F 980 420 19,2 6.666 25.28 9.411 5.013 15.08 6.22 22.08 71.3418/1 F 626 380 10,6 3.535 38.19 8.772 5.399 10.2 12.68 3.15 89.2319/1 F 498 370 9,3 42.42 46.83 6.801 6.024 10.78 28.49 23.31 29.820/1 F 570 360 12,0 13.74 50.76 6.72 3.595 14.53 15.95 14.7 166.421/1 M 332 320 5,6 87.86 31.71 11.35 5.124 12.6 16.14 20.77 27.6422/1 F 615 360 14,3 12.02 60.06 9.288 4.212 9.699 29.26 20.63 141.323/1 F 261 280 3,2 25.45 56.22 6.258 3.494 17.43 30.9 9.36 80.8324/1 F 305 300 5,4 19.08 35.85 10.54 6.894 12.53 25.01 13.71 168.925/1 M 452 330 16,1 28.5 7.638 2.997 7.87 6.808 59.8526/1 M 280 310 5,6 54.16 43.71 8.199 3.855 3.697 41.54 6.504 90.8927/1 F 603 370 20,4 16.56 45.6 8.301 3.076 8.143 6.27 15.76 132.628/1 F 368 330 5,2 6.161 54.3 8.466 4.894 8.087 53.82 127.329/1 M 407 350 6,4 6.464 35.25 9.333 7.227 15.42 2.952 16.39 16030/1 M 348 320 5,3 29.17 58.23 8.76 3.539 9.47 42.89 21.16 176.1Mean 490 350 10,0 36,509 44,019 8,598 4,599 10,363 31,671 14,620 86,016Minimum 261 280 3,2 3,535 23,290 6,258 2,997 0,112 2,952 3,150 10,720Maximum 980 420 20,4 108,200 60,060 11,350 7,227 17,430 136,400 31,600 176,100St.Dev 172 33 5,4 30,208 10,197 1,211 1,124 4,044 30,516 6,749 51,662Count 25 25 25 25 23 25 25 23 25 24 25
NIVA report no. 4649 - 91

JAMP Biological effects methods 1997-2001 - Norway
Species : PLAT FLE Platichtys flesus GB: Flounder, N: SkrubbeSample area: J63 Sørfjorden Tissue: AllLocality : 53B Inner Sørfjord Latitude: 60°10.0N Longitude: 6°34.0ECatch,date : 20001011 Count: 10 Sample type: Individual
Analytical lab. => NIVA NIVA NIVA NIVA NIVA NIVA NIVA NIVA NIVA NIVA NIVAAnalysis code =>Detection limit => Mean
Samp/ Sex Age Wght Lngt weight Dry Fat AY(BI) BLOPR(BL) CYTPR(LI) MICPR(LI) ALAD(BL) EROD(LI) MT(LI) BAP3O(BI) NAP2O(BI) PA1O(BI) PYR1O(BI)repl. F/M year g mm g % % ABS 380 nm mg/mL mg/mL mg/mLPBG/min/mg protmin/min/mg prot µg/mg protg/kg/ABS 380 nmg/kg/ABS 380 nm µg/kg/ABS 38µg/kg/ABS 38no. w.wt w.wt w.wt w.wt w.wt w.wt w.wt w.wt w.wt w.wt w.wt3/1 M 316 290 11,2 0.832 16.89 8.322 3.705 24.33 1.092 4.773 <nd <nd <nd 12.024/1 M 272 300 5,2 21.11 41.81 8.606 3.012 8.824 6.215 8.337 <nd <nd <nd 21.455/1 M 488 340 13,6 0.78 40.65 8.8 4.112 0.2003 3.855 5.901 <nd <nd <nd 14.16/1 M 424 330 9,0 3.042 25.78 8.352 3.65 6.656 2.913 6.806 <nd <nd <nd 19.727/1 F 412 350 5,6 63.21 33.56 10.34 3.187 7.939 12.24 12.82 <nd <nd <nd 6.478/1 M 387 330 5,8 116.7 30.8 10.76 6.319 11.14 2.297 6.943 0.1028 <nd <nd 3.6159/1 M 277 320 6,6 216.9 17.13 6.926 3.255 18.85 0.6634 7.4 <nd <nd <nd 2.59510/1 M 263 300 3,0 58.28 53.53 8.43 2.599 6.954 87.33 10.15 <nd <nd <nd 9.74711/1 M 148 240 1,8 39.79 34.04 11.07 5.043 9.888 9.581 8.327 0.2262 <nd <nd 9.29812/1 M 323 300 6,6 2.054 56.51 10.88 3.026 8.476 104.5 17.16 <nd <nd <nd 51.1213/1 F 300 300 4,4 31.86 42.41 11.67 4.313 10.33 15.45 23.25 <nd <nd <nd 7.126Mean 328 309 6,6 50,414 35,737 9,469 3,838 10,326 22,376 10,170 <<0.030 <<0.000 <<0.000 14,296Minimum 148 240 1,8 0,780 16,890 6,926 2,599 0,200 0,663 4,773 <0.000 <0.000 <0.000 2,595Maximum 488 350 13,6 216,900 56,510 11,670 6,319 24,330 104,500 23,250 0,226 <0.000 <0.000 51,120St.Dev 94 30 3,5 65,694 12,985 1,521 1,077 6,390 36,862 5,572 ~0.072 ~0.000 ~0.000 13,606Count 11 11 11 11 11 11 11 11 11 11 11 11 11 11
Species : PLAT FLE Platichtys flesus GB: Flounder, N: SkrubbeSample area: J63 Sørfjorden Tissue: AllLocality : 53B Inner Sørfjord Latitude: 60°10.0N Longitude: 6°34.0ECatch,date : 20011201 Count: 25 Sample type: Individual
Analytical lab. => NIVA NIVA NIVA NIVA NIVA NIVA NIVA NIVA NIVA NIVAAnalysis code =>Detection limit => Mean
Samp/ Sex Age Wght Lngt weight Dry Fat AY(BI) BLOPR(BL) CYTPR(LI) MICPR(LI) ALAD(BL) EROD(LI) MT(LI) BAP3O(BI) PA1O(BI) PYR1O(BI)repl. F/M year g mm g % % ABS 380 nm mg/mL mg/mL mg/mLPBG/min/mg protmin/min/mg prot µg/mg protg/kg/ABS 380 nmg/kg/ABS 380 nm µg/kg/ABS 380 nmno. w.wt w.wt w.wt w.wt w.wt w.wt w.wt w.wt w.wt w.wt6/1 F 4 676 370 15,9 25.45 64.9 15.18 4.151 5.678 22.1 28.67 <nd <nd 1.9457/1 F 5 672 420 8,5 14.74 65.91 12.71 4.276 5.339 8.671 22.78 <nd <nd 3.4058/1 F 4 372 290 9,2 13.23 69.68 12.53 2.719 2.375 44.39 13.31 <nd <nd 4.869/1 M 5 278 320 3,0 19.19 48.37 9.45 2.632 9.736 16.34 9.331 <nd <nd 3.64310/1 M 4 514 360 10,6 21.41 70.31 11.63 1.987 7.135 83.53 14.92 <nd <nd 2.37311/1 F 1 145 230 1,4 14.24 76.94 9.676 2.559 12.4 15.11 18.96 <nd <nd 4.86612/1 M 6 431 360 5,1 45.93 36.28 13.58 3.892 8.402 8.569 17.74 <nd <nd 1.313/1 F 2 389 310 5,5 22.18 79.38 15.52 4.388 14.17 64.65 17.05 <nd <nd 6.05614/1 M 5 390 330 7,5 62.5 62.75 13.13 4.762 8.228 28.73 8.955 <nd <nd 2.43815/1 M 5 425 340 7,8 25.6 74.8 13.73 4.633 3.222 120.8 18.78 <nd <nd 18.1816/1 F 7 579 370 12,8 11.01 63.42 12.93 3.708 8.107 39.68 25.21 <nd <nd 6.79417/1 M 4 432 330 10,9 80.34 10.44 2.732 4.674 75.94 23.62 <nd <ndMean 4 442 336 8,2 25,044 66,090 12,542 3,537 7,456 44,043 18,277 <<0.000 <<0.000 5,078Minimum 1 145 230 1,4 11,010 36,280 9,450 1,987 2,375 8,569 8,955 <0.000 <0.000 1,300Maximum 7 676 420 15,9 62,500 80,340 15,520 4,762 14,170 120,800 28,670 <0.000 <0.000 18,180St.Dev 2 153 48 4,1 15,668 12,885 1,951 0,953 3,514 35,345 6,107 ~0.000 ~0.000 4,679Count 12 12 12 12 11 12 12 12 12 12 12 12 12 11
Comments Station: Inner Sørfjord Fish 1-13 fished 6.oct-10.oct Fish14-25 fished 1.dec 2001 Fished at 5-20m depth
NIVA report no. 4649 - 92

JAMP Biological effects methods 1997-2001 - Norway
Species : PLAT FLE Platichtys flesus GB: Flounder, N: SkrubbeSample area: J62 Hardangerfjorden Tissue: AllLocality : 67B Strandebarm Latitude: 60°16.0N Longitude: 6°2.0ECatch,date : 19990927 Count: 25 Sample type: Individual
Analytical lab. => NIVA NIVA NIVA NIVA NIVA NIVA NIVA NIVAAnalysis code =>Detection limit => Mean
Samp/ Sex Age Wght Lngt weight Dry Fat AY(BI) BLOPR(BL) CYTPR(LI) MICPR(LI) ALAD(BL) EROD(LI) MT(LI) PYR1O(BI)repl. F/M year g mm g % % ABS 380 nm mg/mL mg/mL mg/mLPBG/min/mg protmin/min/mg prot µg/mg protg/kg/ABS 380 nmno. w.wt w.wt w.wt w.wt w.wt w.wt w.wt w.wt6/1 F 1731 460 71,5 26.97 51.48 6.642 3.189 16.92 2.064 25.67 23.277/1 F 548 380 7,9 26.46 45.57 8.508 3.769 13.44 39.69 26.34 21.428/1 F 877 380 25,2 4.242 48.15 6.444 4.024 15.42 12.55 77.97 53.269/1 F 2032 490 102,0 8.888 51.57 6.219 2.4 13.91 121.9 31.37 41.1210/1 M 1215 440 50,5 35.45 59.76 5.556 3.504 17.24 34.4 20.6 14.811/1 F 1519 450 47,8 6.06 44.19 6.726 3.243 10.8 5.35 34.14 66.6312/1 F 1998 510 62,9 5.252 52.29 7.194 4.227 22.21 8.35 52.73 69.9713/1 F 1015 390 35,2 7.878 56.97 9.384 4.797 13.47 7.86 32.66 47.6614/1 F 2144 490 101,1 14.24 70.56 6.504 3.824 25.89 <0.6 44.84 29.2515/1 F 1136 390 44,6 18.99 46.98 6.996 2.841 15.89 28.46 36.15 61.0616/1 F 1111 420 33,9 15.96 63.18 7.032 2.964 21.2 42.44 21.917/1 F 986 390 34,6 8.686 51.48 6.72 2.261 12.71 14.02 16.78 42.1918/1 F 706 370 21,0 68.58 55.17 6.165 1.889 19.95 8.792 35.69 54.1919/1 F 1752 460 70,8 15.76 47.52 6.219 5.01 13.21 8.49 40.68 41.0520/1 M 535 320 13,4 33.73 47.4 7.266 2.752 28.26 36.58 38.14 24.1921/1 F 457 350 4,9 27.98 49.89 8.754 3.982 15.87 28.88 23.43 10.9922/1 F 2519 520 83,3 34.44 56.73 7.047 5.769 16.8 0.9 69.86 22.2723/1 F 2458 510 77,3 21.21 39.51 6.852 2.906 1.668 6.39 44.72 29.5924/1 F 1124 410 44,1 14.65 58.71 7.83 3.059 19.39 16.09 40.06 26.1925/1 F 268 290 2,6 47.27 59.49 11.62 6.136 26.43 23.75 16.1526/1 M 1623 480 66,2 16.46 29.78 7.071 3.458 12.5 53.54 17.71 56.9927/1 F 1217 410 31,0 3.535 53.52 8.817 4.503 17.98 62.33 23.13 100.628/1 F 1673 460 58,4 8.484 45.96 8.904 2.298 16.77 19 40.03 98.1129/1 M 926 400 27,2 4.949 53.49 7.443 4.412 15.15 16.54 20.85 47.3730/1 F 1147 410 41,8 9.393 57.69 7.008 3.822 13.31 12.65 33.24 39.02Mean 1309 423 46,4 19,421 51,882 7,397 3,642 16,656 <24,465 35,947 42,370Minimum 268 290 2,6 3,535 29,780 5,556 1,889 1,668 <0,6 16,780 10,990Maximum 2519 520 102,0 68,580 70,560 11,620 6,136 28,260 121,900 77,970 100,600St.Dev 617 60 28,0 15,542 8,164 1,311 1,070 5,535 ~26,234 15,284 23,913Count 25 25 25 25 25 25 25 25 25 23 25
NIVA report no. 4649 - 93
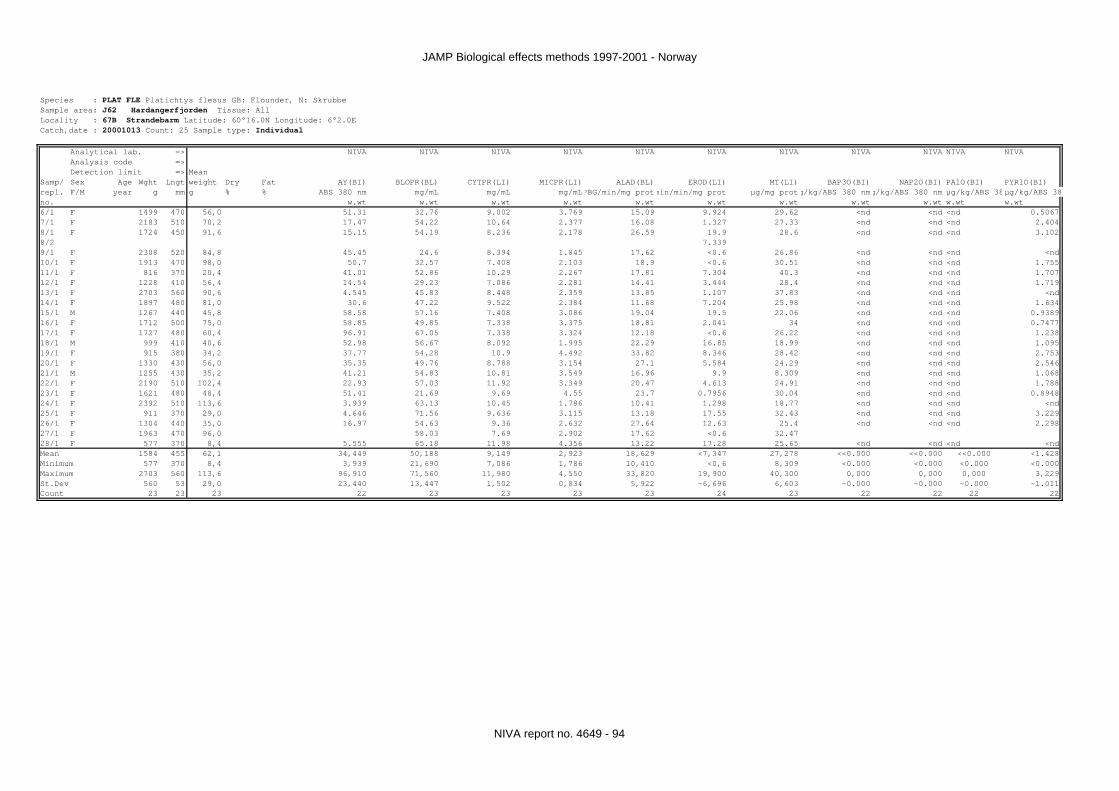
JAMP Biological effects methods 1997-2001 - Norway
Species : PLAT FLE Platichtys flesus GB: Flounder, N: SkrubbeSample area: J62 Hardangerfjorden Tissue: AllLocality : 67B Strandebarm Latitude: 60°16.0N Longitude: 6°2.0ECatch,date : 20001013 Count: 25 Sample type: Individual
Analytical lab. => NIVA NIVA NIVA NIVA NIVA NIVA NIVA NIVA NIVA NIVA NIVAAnalysis code =>Detection limit => Mean
Samp/ Sex Age Wght Lngt weight Dry Fat AY(BI) BLOPR(BL) CYTPR(LI) MICPR(LI) ALAD(BL) EROD(LI) MT(LI) BAP3O(BI) NAP2O(BI) PA1O(BI) PYR1O(BI)repl. F/M year g mm g % % ABS 380 nm mg/mL mg/mL mg/mLPBG/min/mg protmin/min/mg prot µg/mg protg/kg/ABS 380 nmg/kg/ABS 380 nm µg/kg/ABS 38µg/kg/ABS 38no. w.wt w.wt w.wt w.wt w.wt w.wt w.wt w.wt w.wt w.wt w.wt6/1 F 1499 470 56,0 51.31 32.76 9.002 3.769 15.09 9.924 29.62 <nd <nd <nd 0.50677/1 F 2183 510 70,2 17.47 54.22 10.64 2.377 16.08 1.327 27.33 <nd <nd <nd 2.4048/1 F 1724 450 91,6 15.15 54.19 8.236 2.178 26.59 19.9 28.6 <nd <nd <nd 3.1028/2 7.3399/1 F 2308 520 84,8 45.45 24.6 8.394 1.845 17.62 <0.6 26.86 <nd <nd <nd <nd10/1 F 1913 470 98,0 50.7 32.57 7.408 2.103 18.9 <0.6 30.51 <nd <nd <nd 1.75511/1 F 816 370 20,4 41.01 52.86 10.29 2.267 17.81 7.304 40.3 <nd <nd <nd 1.70712/1 F 1228 410 56,4 14.54 29.23 7.086 2.281 14.41 3.444 28.4 <nd <nd <nd 1.71913/1 F 2703 560 90,6 4.545 45.83 8.448 2.359 13.85 1.107 37.83 <nd <nd <nd <nd14/1 F 1897 480 81,0 30.6 47.22 9.522 2.384 11.68 7.204 25.98 <nd <nd <nd 1.63415/1 M 1267 440 45,8 58.58 57.16 7.408 3.086 19.04 19.5 22.06 <nd <nd <nd 0.938916/1 F 1712 500 75,0 58.85 49.85 7.338 3.375 18.81 2.041 34 <nd <nd <nd 0.747717/1 F 1727 480 60,4 96.91 67.05 7.338 3.324 12.18 <0.6 26.22 <nd <nd <nd 1.23818/1 M 999 410 40,6 52.98 56.67 8.092 1.995 22.29 16.85 18.99 <nd <nd <nd 1.09519/1 F 915 380 34,2 37.77 54.28 10.9 4.492 33.82 8.346 28.42 <nd <nd <nd 2.75320/1 F 1330 430 56,0 35.35 49.76 8.788 3.154 27.1 5.584 24.29 <nd <nd <nd 2.54621/1 M 1255 430 35,2 41.21 54.83 10.81 3.549 16.96 9.9 8.309 <nd <nd <nd 1.06822/1 F 2190 510 102,4 22.93 57.03 11.92 3.349 20.47 4.613 24.91 <nd <nd <nd 1.78823/1 F 1621 480 48,4 51.41 21.69 9.69 4.55 23.7 0.7956 30.04 <nd <nd <nd 0.894824/1 F 2392 510 113,6 3.939 63.13 10.45 1.786 10.41 1.298 18.77 <nd <nd <nd <nd25/1 F 911 370 29,0 4.646 71.56 9.636 3.115 13.18 17.55 32.43 <nd <nd <nd 3.22926/1 F 1304 440 35,0 16.97 54.63 9.36 2.632 27.64 12.63 25.4 <nd <nd <nd 2.29827/1 F 1963 470 96,0 58.03 7.69 2.902 17.62 <0.6 32.4728/1 F 577 370 8,4 5.555 65.18 11.98 4.356 13.22 17.28 25.65 <nd <nd <nd <ndMean 1584 455 62,1 34,449 50,188 9,149 2,923 18,629 <7,347 27,278 <<0.000 <<0.000 <<0.000 <1.428Minimum 577 370 8,4 3,939 21,690 7,086 1,786 10,410 <0,6 8,309 <0.000 <0.000 <0.000 <0.000Maximum 2703 560 113,6 96,910 71,560 11,980 4,550 33,820 19,900 40,300 0,000 0,000 0,000 3,229St.Dev 560 53 29,0 23,440 13,447 1,502 0,834 5,922 ~6,696 6,603 ~0.000 ~0.000 ~0.000 ~1.011Count 23 23 23 22 23 23 23 23 24 23 22 22 22 22
NIVA report no. 4649 - 94

JAMP Biological effects methods 1997-2001 - Norway
Species : PLAT FLE Platichtys flesus GB: Flounder, N: SkrubbeSample area: J62 Hardangerfjorden Tissue: AllLocality : 67B Strandebarm Latitude: 60°16.0N Longitude: 6°2.0ECatch,date : 20011012 Count: 25 Sample type: Individual
Analytical lab. => NIVA NIVA NIVA NIVA NIVA NIVA NIVA NIVA NIVA NIVAAnalysis code =>Detection limit => Mean
Samp/ Sex Age Wght Lngt weight Dry Fat AY(BI) BLOPR(BL) CYTPR(LI) MICPR(LI) ALAD(BL) EROD(LI) MT(LI) BAP3O(BI) PA1O(BI) PYR1O(BI)repl. F/M year g mm g % % ABS 380 nm mg/mL mg/mL mg/mLPBG/min/mg protmin/min/mg prot µg/mg protg/kg/ABS 380 nmg/kg/ABS 380 nm µg/kg/ABS 380 nmno. w.wt w.wt w.wt w.wt w.wt w.wt w.wt w.wt w.wt w.wt6/1 F 5 2086 470 124,3 4.131 19.48 7.982 3.684 25.84 <0.6 36.94 <nd <nd 19.97/1 F 7 2282 500 92,6 2.652 57.81 9.918 3.309 17.53 3.286 36.56 <nd <nd 31.458/1 F 5 1780 430 67,8 6.477 38.9 9.27 2.728 31.75 <0.6 49.98 <nd 2.795 12.349/1 M 5 1023 430 51,2 37.55 63.21 9.752 2.832 20.04 9.525 17.9 <nd 3.862 1.52310/1 F 4 809 370 21,7 34.27 52.05 11.71 3.412 25.63 1.594 27.58 <nd 4.202 1.73311/1 F 5 842 380 31,6 19.03 54.25 8.476 4.021 26.77 3.42 22.9 <nd 0.7411 3.93112/1 F 5 1538 460 89,7 7.373 62.12 7.954 2.538 17.41 13.04 29 <nd 2.238 10.7113/1 F 4 1391 430 44,3 24.64 59.22 11.88 3.776 24.22 <0.6 39.2 <nd 1.493 2.73514/1 F 3 1045 400 40,7 11.11 71.25 10.58 4.297 23.02 6.375 21.12 <nd 1.215 7.01215/1 M 5 835 400 22,3 68.74 64.17 11.24 2.955 25.53 3.419 18.57 <nd 0.7535 0.824816/1 F 5 1226 420 43,7 12.42 37.62 11.03 4.314 28.77 <0,6 29.05 <nd 4.21 5.60317/1 F 5 1791 470 71,9 27.47 44.12 10.11 4.526 23.61 5.494 53.99 <nd 0.6735 3.05418/1 F 5 895 370 26,6 73.1 52.74 12.18 4.41 35.05 <0.6 42.05 <nd 7.893 1.30419/1 F 6 1564 430 63,5 8.888 40.66 12.65 3.358 33.98 1.191 30.25 <nd 1.665 9.2620/1 M 4 1060 410 51,3 5.959 9.14 2.913 37.08 19.49 <nd <nd 14.2521/1 F 7 2465 530 108,6 5.252 8.002 3.398 <0.6 22 <nd 4.513 16.322/1 F 6 2583 510 116,8 16.16 61.75 12.03 4.301 17.6 7.304 41 <nd <nd 5.41523/1 F 4 1027 390 48,9 9.494 42.03 10.7 3.944 22.94 2.498 27.23 <nd 2.001 8.15324/1 F 4 1251 440 47,3 20.03 38.99 10.15 3.518 34.71 13.27 35.55 <nd <nd 3.48425/1 F 4 1021 390 40,8 9.898 46.66 9.38 3.73 26.59 <0.6 35.92 <nd 3.728 7.95126/1 F 7 2208 460 101,2 14.34 62.85 12.13 3.547 20.25 <0.6 42.18 <nd <nd 5.42527/1 M 4 897 400 32,8 43.93 77.62 10.35 2.75 17.02 20.85 26.15 <nd 3.369 1.30228/1 F 4 167 250 2,0 35.04 61.57 8.212 2.353 15.23 8.149 20.52 <nd <nd 1.90129/1 F 4 990 380 43,9 16.46 67.48 8.59 3.715 18.67 <0.6 21.83 <nd 1.512 4.50730/1 F 4 373 310 3,5 75.39 13.02 4.205 22.6 17.16 26.57 <nd <ndMean 5 1326 417 55,6 21,434 54,432 10,257 3,541 24,120 <<6,362 30,941 <<0.000 <<1.875 7,503Minimum 3 167 250 2,0 2,652 19,480 7,954 2,353 15,230 <0,6 17,900 <0.000 <0.000 0,825Maximum 7 2583 530 124,3 73,100 77,620 13,020 4,526 35,050 37,080 53,990 <0.000 7,893 31,450St.Dev 1 632 60 33,6 19,083 14,099 1,573 0,630 5,862 ~8,581 9,976 ~0.000 ~2.016 7,230Count 25 25 25 25 24 23 25 25 23 25 25 25 25 24
NIVA report no. 4649 - 95

JAMP Biological effects methods 1997-2001 - Norway
Species : PLAT FLE Platichtys flesus GB: Flounder, N: SkrubbeSample area: J99 Undefined Tissue: AllLocality : 21F Åkrefjord Latitude: 59°45.0N Longitude: 6°7.0ECatch,date : 19991122 Count: 11 Sample type: Individual
Analytical lab. => NIVA NIVA NIVA NIVA NIVA NIVA NIVAAnalysis code =>Detection limit => Mean
Samp/ Sex Age Wght Lngt weight Dry Fat AY(BI) BLOPR(BL) CYTPR(LI) MICPR(LI) ALAD(BL) EROD(LI) PYR1O(BI)repl. F/M year g mm g % % ABS 380 nm mg/mL mg/mL mg/mLPBG/min/mg protmin/min/mg protg/kg/ABS 380 nmno. w.wt w.wt w.wt w.wt w.wt w.wt w.wt4/1 M 505 340 5,4 22.02 69.24 8.574 4.657 11.52 28.77 505/1 M 514 330 9,8 66.9 56.94 8.49 3.554 11.04 5.21 53.996/1 F 634 350 18,5 47.17 56.7 7.389 5.511 18.5 <0.6 26.387/1 M 454 320 12,5 84.08 57.12 7.416 3.482 13.04 23.21 9.3778/1 M 496 340 11,3 26.77 58.17 6.822 2.563 11.45 61.99 48.799/1 F 619 360 23,4 63.73 51.87 7.062 miss 14.66 miss 15.4510/1 F 789 370 19,9 20.3 81.75 8.376 miss 12.25 4.62 112.811/1 F 282 310 4,3 1.785 60.96 7.962 2.503 21.21 10.66 88.4912/1 F 127 230 1,2 36.76 57.42 7.491 2.67 15.49 53.46 49.4813/1 F 83 200 0,6 17.17 53.07 7.365 4.251 14.02 74.87 11214/1 F 199 230 2,9 17.37 63.99 6.39 3.158 16.62 32.47 52.24Mean 427 307 10,0 36,732 60,657 7,576 3,594 14,527 <29,586 56,272Minimum 83 200 0,7 1,785 51,870 6,390 2,503 11,040 <0,6 9,377Maximum 789 370 23,4 84,080 81,750 8,574 5,511 21,210 74,870 112,800St.Dev 226 59 7,9 25,601 8,504 0,705 1,034 3,226 ~26,111 35,016Count 11 11 11 11 11 11 9 11 10 11
miss(3) ! Missing value
NIVA report no. 4649 - 96

JAMP Biological effects methods 1997-2001 - Norway
Species : PLAT FLE Platichtys flesus GB: Flounder, N: SkrubbeSample area: J99 Undefined Tissue: AllLocality : 21F Åkrefjord Latitude: 59°45.0N Longitude: 6°7.0ECatch,date : 20001016 Count: 25 Sample type: Individual
Analytical lab. => NIVA NIVA NIVA NIVA NIVA NIVAAnalysis code =>Detection limit => Mean
Samp/ Sex Age Wght Lngt weight Dry Fat BLOPR(BL) CYTPR(LI) MICPR(LI) ALAD(BL) EROD(LI) MT(LI)repl. F/M year g mm g % % mg/mL mg/mL mg/mLPBG/min/mg protmin/min/mg prot µg/mg protno. w.wt w.wt w.wt w.wt w.wt w.wt6/1 M 372 310 8,6 49.47 9.458 3.27 7.961 10.14 13.927/1 F 329 300 8,6 77.34 8.672 3.049 12.95 13.49 16.758/1 F 261 290 2,2 57.94 7.07 2.623 17.36 25.64 11.969/1 M 24 270 1,6 67.82 8.918 2.984 26.66 83.09 15.2910/1 M 234 280 3,4 62.74 8.464 3.204 26.55 30.68 6.1611/1 F 55 180 49.72 1712/1 M 115 220 36.05 21.4813/1 F 88 200 54.2 19.3114/1 F 122 220 53.59 28.4115/1 M 94 210 52.75 13.5816/1 M 248 270 4,4 31.05 8.638 3.674 10.37 14.15 8.38317/1 M 102 210 64.11 28.6718/1 M 92 200 63.6 18.1619/1 M 101 220 48.3420/1 M 92 210 63 18.6421/1 F 105 210 64.45 28.8222/1 M 79 200 62.23 19.9823/1 F 98 200 53.27 13.3524/1 F 90 200 62.66 13.3725/1 M 80 200 65.12 10.426/1 F 73 200 56.15 30.9627/1 F 78 190 39.68 23.2728/1 F 69 190 38.47 19.7229/1 M 68 190 44.81 24.0330/1 F 71 190 57.55 19.82Mean 126 222 4,8 55,044 8,537 3,134 19,618 29,532 12,077Minimum 24 180 1,6 31,050 7,070 2,623 7,961 10,140 6,160Maximum 372 310 8,6 77,340 9,458 3,674 30,960 83,090 16,750St.Dev 89 39 3,1 11,033 0,797 0,348 6,552 27,404 4,104Count 25 25 6 25 6 6 24 6 6
NIVA report no. 4649 - 97
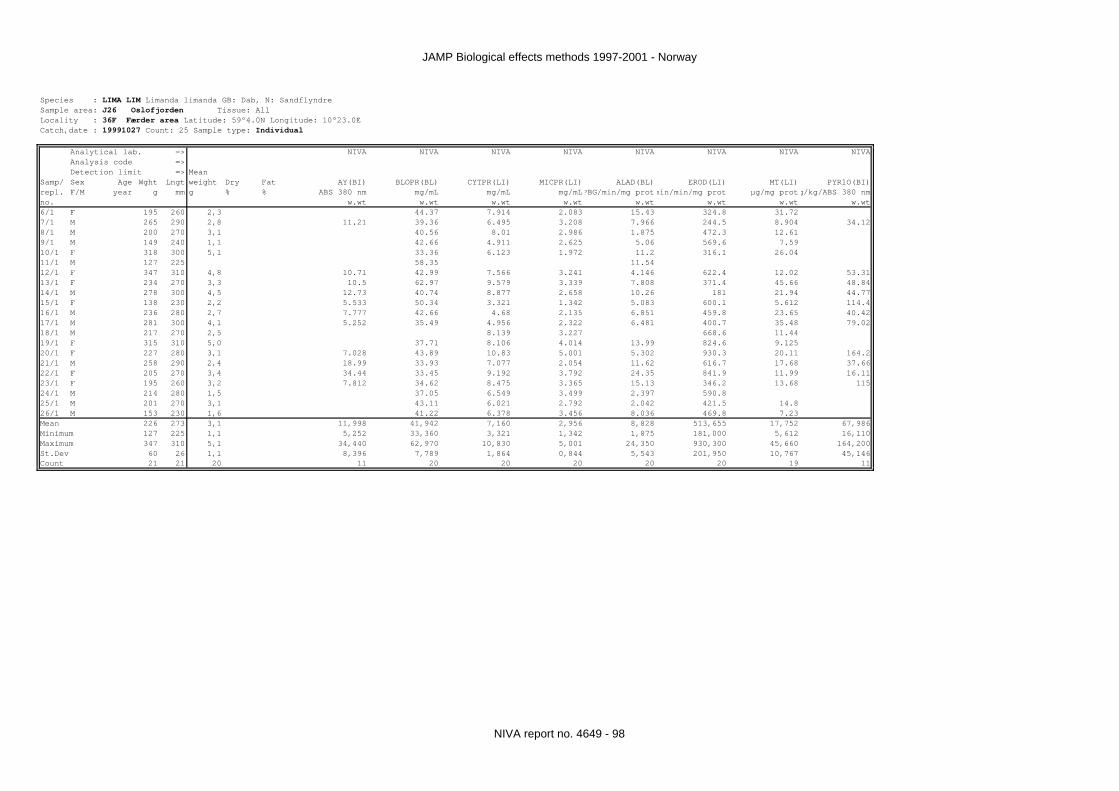
JAMP Biological effects methods 1997-2001 - Norway
Species : LIMA LIM Limanda limanda GB: Dab, N: SandflyndreSample area: J26 Oslofjorden Tissue: AllLocality : 36F Færder area Latitude: 59°4.0N Longitude: 10°23.0ECatch,date : 19991027 Count: 25 Sample type: Individual
Analytical lab. => NIVA NIVA NIVA NIVA NIVA NIVA NIVA NIVAAnalysis code =>Detection limit => Mean
Samp/ Sex Age Wght Lngt weight Dry Fat AY(BI) BLOPR(BL) CYTPR(LI) MICPR(LI) ALAD(BL) EROD(LI) MT(LI) PYR1O(BI)repl. F/M year g mm g % % ABS 380 nm mg/mL mg/mL mg/mLPBG/min/mg protmin/min/mg prot µg/mg protg/kg/ABS 380 nmno. w.wt w.wt w.wt w.wt w.wt w.wt w.wt w.wt6/1 F 195 260 2,3 44.37 7.914 2.083 15.43 324.8 31.727/1 M 265 290 2,8 11.21 39.36 6.495 3.208 7.966 244.5 8.904 34.128/1 M 200 270 3,1 40.56 8.01 2.986 1.875 472.3 12.619/1 M 149 240 1,1 42.66 4.911 2.625 5.06 569.6 7.5910/1 F 318 300 5,1 33.36 6.123 1.972 11.2 316.1 26.0411/1 M 127 225 58.35 11.5412/1 F 347 310 4,8 10.71 42.99 7.566 3.241 4.146 622.4 12.02 53.3113/1 F 234 270 3,3 10.5 62.97 9.579 3.339 7.808 371.4 45.66 48.8414/1 M 278 300 4,5 12.73 40.74 8.877 2.658 10.26 181 21.94 44.7715/1 F 138 230 2,2 5.533 50.34 3.321 1.342 5.083 600.1 5.612 114.416/1 M 236 280 2,7 7.777 42.66 4.68 2.135 6.851 459.8 23.65 40.4217/1 M 281 300 4,1 5.252 35.49 4.956 2.322 6.481 400.7 35.48 79.0218/1 M 217 270 2,5 8.139 3.227 668.6 11.4419/1 F 315 310 5,0 37.71 8.106 4.014 13.99 824.6 9.12520/1 F 227 280 3,1 7.028 43.89 10.83 5.001 5.302 930.3 20.11 164.221/1 M 258 290 2,4 18.99 33.93 7.077 2.054 11.62 616.7 17.68 37.6622/1 F 205 270 3,4 34.44 33.45 9.192 3.792 24.35 841.9 11.99 16.1123/1 F 195 260 3,2 7.812 34.62 8.475 3.365 15.13 346.2 13.68 11524/1 M 214 280 1,5 37.05 6.549 3.499 2.397 590.825/1 M 201 270 3,1 43.11 6.021 2.792 2.042 421.5 14.826/1 M 153 230 1,6 41.22 6.378 3.456 8.036 469.8 7.23Mean 226 273 3,1 11,998 41,942 7,160 2,956 8,828 513,655 17,752 67,986Minimum 127 225 1,1 5,252 33,360 3,321 1,342 1,875 181,000 5,612 16,110Maximum 347 310 5,1 34,440 62,970 10,830 5,001 24,350 930,300 45,660 164,200St.Dev 60 26 1,1 8,396 7,789 1,864 0,844 5,543 201,950 10,767 45,146Count 21 21 20 11 20 20 20 20 20 19 11
NIVA report no. 4649 - 98

JAMP Biological effects methods 1997-2001 - Norway
Species : LIMA LIM Limanda limanda GB: Dab, N: SandflyndreSample area: J26 Oslofjorden Tissue: AllLocality : 36F Færder area Latitude: 59°4.0N Longitude: 10°23.0ECatch,date : 20001026 Count: 25 Sample type: Individual
Analytical lab. => NIVA NIVA NIVA NIVA NIVA NIVA NIVA NIVA NIVA NIVA NIVAAnalysis code =>Detection limit => Mean
Samp/ Sex Age Wght Lngt weight Dry Fat AY(BI) BLOPR(BL) CYTPR(LI) MICPR(LI) ALAD(BL) EROD(LI) MT(LI) BAP3O(BI) NAP2O(BI) PA1O(BI) PYR1O(BI)repl. F/M year g mm g % % ABS 380 nm mg/mL mg/mL mg/mLPBG/min/mg protmin/min/mg prot µg/mg protg/kg/ABS 380 nmg/kg/ABS 380 nm µg/kg/ABS 38µg/kg/ABS 38no. w.wt w.wt w.wt w.wt w.wt w.wt w.wt w.wt w.wt w.wt w.wt6/1 M 248 280 4,4 72.26 36.67 5.526 2.084 16.46 9.73 5.56 <nd <nd <nd 9.1887/1 F 29 295 5,2 64.22 23.88 9 4.166 19.44 60.44 4.586 <nd <nd <nd 7.6938/1 M 189 250 3,4 22.47 34.11 5.576 2.495 25.95 322.7 10.93 <nd <nd <nd 5.1199/1 M 253 285 2,8 25.82 13.13 5.234 2.382 20.63 687.5 9.833 <nd <nd <nd 2.0919/2 291910/1 F 259 295 4,4 13.84 47.28 8.9 2.475 15.73 349.2 13.28 <nd <nd <nd 15.7511/1 F 157 245 2,2 7.495 5.81 2.301 17.32 462.2 7.969 <nd <nd <nd12/1 F 165 255 2,0 53.49 17.33 4.858 2.149 17.58 283.6 3.733 <nd <nd <nd 3.42113/1 F 278 275 1,4 26.83 6.259 4.208 1.155 11.34 98.53 12.74 <nd <nd <nd 2.75814/1 F 291 290 5,8 8.383 20.32 8.656 2.866 17.99 2192 12.11 <nd <nd <nd 3.101Mean 208 274 3,5 35,914 22,942 6,419 2,453 18,049 738,490 8,971 <<0.000 <<0.000 <<0.000 6,140Minimum 29 245 1,4 8,383 6,259 4,208 1,155 11,340 9,730 3,733 <0.000 <0.000 <0.000 2,091Maximum 291 295 5,8 72,260 47,280 9,000 4,166 25,950 2919 13,280 0,000 0,000 0,000 15,750St.Dev 83 20 1,5 24,028 13,955 1,885 0,794 3,948 993,199 3,649 ~0.000 ~0.000 ~0.000 4,622Count 9 9 9 8 9 9 9 9 10 9 9 9 9 8
Species : LIMA LIM Limanda limanda GB: Dab, N: SandflyndreSample area: J26 Oslofjorden Tissue: AllLocality : 36F Færder area Latitude: 59°4.0N Longitude: 10°23.0ECatch,date : 20011025 Count: 25 Sample type: Individual
Analytical lab. => NIVA NIVA NIVA NIVA NIVA NIVA NIVA NIVA NIVA NIVAAnalysis code =>Detection limit => Mean
Samp/ Sex Age Wght Lngt weight Dry Fat AY(BI) BLOPR(BL) CYTPR(LI) MICPR(LI) ALAD(BL) EROD(LI) MT(LI) BAP3O(BI) PA1O(BI) PYR1O(BI)repl. F/M year g mm g % % ABS 380 nm mg/mL mg/mL mg/mLPBG/min/mg protmin/min/mg prot µg/mg protg/kg/ABS 380 nmg/kg/ABS 380 nm µg/kg/ABS 380 nmno. w.wt w.wt w.wt w.wt w.wt w.wt w.wt w.wt w.wt w.wt6/1 F 6 436 330 96.89 51.03 14.92 <nd <nd 0.66887/1 M 7 316 310 3,2 106.4 67.86 6.006 2.9 17.23 123.3 14.97 <nd <nd 1.9078/1 M 4 217 290 3,7 426.6 39.34 7.41 3.685 26.05 317.3 3.457 <nd <nd 0.48999/1 F 4 269 300 3,4 32.12 51.21 10.5 4.702 16.84 577.8 11.9 <nd <nd 3.11410/1 F 4 307 310 4,6 78.13 54.5 9.514 2.955 30.52 34.78 11.1 <nd <nd 2.12511/1 F 2 151 240 4,2 34.39 13.99 6.592 2.467 11.87 21.33 4.68 <nd <nd 1.22712/1 F 4 233 280 3,1 17.68 46.98 5.74 2.474 19.14 123.4 4.775 <nd <nd 3.71713/1 F 4 162 260 2,0 18.68 52.71 2.583 1.357 18.05 572 9.317 <nd <nd 3.61814/1 M 4 234 290 3,8 7.575 23.62 6.566 2.918 18 17.18 4.472 <nd <nd 25.3515/1 F 5 307 300 4,5 43.26 11.63 13.99 3.337 13.01 155.5 9.706 <nd <nd 4.11516/1 M 4 272 310 3,1 37.73 35.82 7.598 2.263 12.95 3.59 4.327 <nd <nd 1.76817/1 F 4 242 285 3,2 24.95 32.8 8.724 2.775 10.87 396.8 8.129 <nd <nd 3.31118/1 M 3 139 230 1,3 29.86 51.28 5.022 1.866 13.89 163.8 8.447 <nd <nd 7.33419/1 M 3 184 260 2,8 49.52 65.79 9.366 2.622 14.35 240.7 5.19 <nd <nd 3.35220/1 M 3 143 245 1,8 55.94 32.28 2.142 1.306 11.17 172.7 6.36 <nd <nd 3.87921/1 F 2 191 270 2,0 41.2 54.59 5.332 2.123 18.07 32.18 2.305 <nd <nd 4.68422/1 F 4 267 310 2,8 31.37 38.74 5.59 1.992 15.03 102.8 10.91 <nd <nd 5.57823/1 F 3 181 250 2,7 55.8 4.758 1.393 12.07 137.7 10.6424/1 F 5 174 260 2,2 40.82 47.16 11.96 2.158 10.79 297 9.035 <nd <nd 3.8725/1 F 2 144 240 1,5 15.07 6.812 2.251 17.07 149.1 5.142 <nd <nd30/1 F 5 309 305 14.24Mean 4 232 280 2,9 62,492 42,110 7,169 2,502 16,095 191,524 7,624 <<0.000 <<0.000 4,450Minimum 2 139 230 1,3 7,575 11,630 2,142 1,306 10,790 3,590 2,305 <0.000 <0.000 0,490Maximum 7 436 330 4,6 426,600 67,860 13,990 4,702 30,520 577,800 14,970 0,000 0,000 25,350St.Dev 1 76 29 1,0 92,037 16,485 2,985 0,836 4,996 172,304 3,426 ~0.000 ~0.000 5,489
NIVA report no. 4649 - 99

JAMP Biological effects methods 1997-2001 - Norway
Count 21 21 21 19 19 20 19 19 20 19 19 19 19 18
NIVA report no. 4649 - 100

JAMP Biological effects methods 1997-2001 - Norway
Species : LIMA LIM Limanda limanda GB: Dab, N: SandflyndreSample area: J99 Undefined Tissue: AllLocality : 15F Ullerø area Latitude: 58°3.0N Longitude: 6°43.0ECatch,date : 19991020 Count: 25 Sample type: Individual
Analytical lab. => NIVA NIVA NIVA NIVA NIVA NIVA NIVA NIVAAnalysis code =>Detection limit => Mean
Samp/ Sex Age Wght Lngt weight Dry Fat AY(BI) BLOPR(BL) CYTPR(LI) MICPR(LI) ALAD(BL) EROD(LI) MT(LI) PYR1O(BI)repl. F/M year g mm g % % ABS 380 nm mg/mL mg/mL mg/mLPBG/min/mg protmin/min/mg prot µg/mg protg/kg/ABS 380 nmno. w.wt w.wt w.wt w.wt w.wt w.wt w.wt w.wt6/1 546 370 10,9 12.42 39.33 7.494 5.527 23.85 250.2 24.02 56.277/1 F 479 350 10,6 25.45 47.97 6.123 2.728 3.427 73.39 31.11 26.878/1 F 446 370 3,6 3.468 46.05 8.25 3.59 7.199 1243 7.995 284.39/1 M 289 310 2,2 3.737 45.21 7.074 3.074 8.664 475.5 2.12 980.610/1 F 482 350 4,4 6.767 42.78 8.109 3.903 6.384 545.2 15.71 97.9811/1 F 413 360 4,6 7.07 45.45 4.737 2.47 16.08 567.6 14.24 32412/1 F 348 310 3,5 7.373 35.7 8.37 3.599 6.751 528.5 8.3 32813/1 F 339 320 3,1 5.959 37.23 7.29 4.296 10.05 333.5 2.058 216.614/1 F 412 330 7,2 5.454 47.16 6.483 2.907 22.22 239.6 15.37 339.615/1 M 282 310 3,0 31.31 40.02 6.108 3.987 3.255 275.7 9.666 129.916/1 F 331 320 4,0 19.49 42.78 8.556 3.115 9.988 353.1 23.4 30517/1 M 275 300 2,7 2.828 36.96 8.196 3.064 4.667 398 10.97 103418/1 F 222 280 1,8 34.59 5.703 3.89 16.64 117119/1 F 177 260 1,4 32.97 3.486 2.147 14.48 652.5 6.45220/1 F 172 260 1,3 30.99 6.309 3.026 17.81 884.2 14.521/1 F 413 340 3,6 4.646 43.95 5.319 4.062 11.47 16.14 14.86 1103022/1 M 397 330 3,8 13.43 55.65 5.925 3.039 11.82 243.4 7.227 325323/1 F 413 350 5,1 7.272 52.23 9.171 5.707 9.267 213.7 20.48 238124/1 F 426 350 4,0 4.284 35.1 10.59 8.448 12.9 214.1 9.646 809925/1 F 333 320 4,5 44.04 6.153 3.018 3.534 365.3 12.0726/1 M 255 280 2,1 7.878 42.87 6.039 4.674 3.837 572.4 28.99 460527/1 F 278 300 3,4 26.87 41.79 7.764 3.711 20.36 472.9 8.724 476.728/1 F 246 300 1,8 48.48 7.17 3.063 17.31 332.1 5.5729/1 F 227 280 2,9 3.535 35.82 7.143 3.336 3.198 565 625.730/1 X 259 290 2,9 5.365 28.44 3.657 2.009 23.07 625 8.283 213.2Mean 338 318 3,9 10,230 41,342 6,849 3,696 11,529 464,441 13,120 1740Minimum 172 260 1,3 2,828 28,440 3,486 2,009 3,198 16,140 2,058 26,870Maximum 546 370 10,9 31,310 55,650 10,590 8,448 23,850 1243 31,110 11030St.Dev 101 32 2,4 8,635 6,643 1,643 1,337 6,669 296,340 7,902 2968Count 25 25 25 20 25 25 25 25 25 23 20
NIVA report no. 4649 - 101

JAMP Biological effects methods 1997-2001 - Norway
Species : LIMA LIM Limanda limanda GB: Dab, N: SandflyndreSample area: J99 Undefined Tissue: AllLocality : 15F Ullerø area Latitude: 58°3.0N Longitude: 6°43.0ECatch,date : 20010927 Count: 25 Sample type: Individual
Analytical lab. => NIVA NIVA NIVA NIVA NIVA NIVA NIVA NIVA NIVA NIVAAnalysis code =>Detection limit => Mean
Samp/ Sex Age Wght Lngt weight Dry Fat AY(BI) BLOPR(BL) CYTPR(LI) MICPR(LI) ALAD(BL) EROD(LI) MT(LI) BAP3O(BI) PA1O(BI) PYR1O(BI)repl. F/M year g mm g % % ABS 380 nm mg/mL mg/mL mg/mLPBG/min/mg protmin/min/mg prot µg/mg protg/kg/ABS 380 nmg/kg/ABS 380 nm µg/kg/ABS 380 nmno. w.wt w.wt w.wt w.wt w.wt w.wt w.wt w.wt w.wt w.wt6/1 F 4 396 339 4,9 23.13 15.29 9.838 2.107 20.33 187 13.29 <nd 3.027 199.57/1 F 5 411 335 8,0 16.16 17.02 6.478 2.174 55.07 78.5 9.22 <nd 1.423 1648/1 M 4 357 334 4,6 23.43 20.47 6.9 1.812 27.36 170.2 5.18 <nd <nd 10.169/1 F 3 285 297 4,1 10.1 15.52 11.07 2.224 14.85 124.7 9.348 <nd 1.98 208.910/1 M 5 391 358 3,4 34.09 11.55 3.08 16.23 466.4 8.896 <nd <nd11/1 F 4 364 331 4,7 18.18 26.06 13.73 2.154 42.95 165.5 10.72 <nd <nd 12.8212/1 F 3 328 320 4,9 24.24 30.94 6.896 1.829 20 84.74 9.627 miss13/1 F 4 324 305 6,3 14.75 29.64 9.5 1.08 17.46 87.99 14.85 <nd 0.6782 49.0314/1 F 4 364 335 3,8 20.2 14.11 10.45 2.979 70.42 96.63 13.07 <nd 1.238 133.815/1 F 2 235 287 2,5 7.171 38.92 9.83 2.375 29.76 298.6 11.95 <nd <nd 48.6716/1 F 3 296 309 2,6 6.161 43.88 12.1 3.402 26.61 404.9 10.05 <nd <nd 139.117/1 F 5 405 330 9,5 38.4 30 10.97 2.493 18.89 61.24 6.483 <nd <nd 59.0818/1 F 3 312 310 1,9 10.1 32.35 6.27 2.071 8.224 555.5 8.18 <nd <nd 104.819/1 M 5 401 336 5,9 48.08 35.83 7.552 2.125 20.65 129.8 7.042 <nd <nd 25.1920/1 F 4 493 357 7,4 8.686 23.59 7.97 1.312 11.18 103.4 11.23 <nd <nd 121.621/1 F 4 419 350 5,2 7.878 30.07 7.624 2.051 24.17 104.7 5.026 <nd <nd 28122/1 F 5 516 392 6,6 28.84 9.434 2.241 21.74 34.13 5.00323/1 F 4 368 331 7,8 14.95 47.09 13.02 2.712 16.17 21.25 9.802 <nd <nd 100.824/1 F 3 389 361 6,2 54.81 17.48 9.966 2.425 47.49 140.5 7.297 <nd <nd 24.7825/1 F 4 307 314 4,8 11.92 22.68 11.69 3.312 31.27 211.2 12.67 <nd 1.51 77.5326/1 F 4 422 344 7,6 32.91 9.898 2.251 35.53 44.65 11.6327/1 F 2 219 277 2,2 27.39 11.34 2.954 27.15 32.08 5.528/1 F 6 413 341 7,3 22.83 25.33 12.8 2.845 51.98 47.83 15.66 <nd 1.008 90.9529/1 F 4 465 359 4,1 11.41 47.93 12.53 3.47 23.63 553.3 8.718 <nd 2.19 76.9330/1 F 3 289 315 4,5 13.64 54.48 9.878 2.403 24.17 126.9 12.41 <nd 3.3 136.4Mean 4 367 331 5,2 19,344 29,676 9,971 2,395 28,131 173,266 9,714 <<0.000 <<0.779 103,252Minimum 2 219 277 1,9 6,161 14,110 6,270 1,080 8,224 21,250 5,003 <0.000 <0.000 10,160Maximum 6 516 392 9,5 54,810 54,480 13,730 3,470 70,420 555,500 15,660 0,000 3,300 281,000St.Dev 1 73 26 2,0 13,144 10,768 2,170 0,598 14,955 158,346 3,056 ~0.000 ~1.080 71,761Count 25 25 25 25 21 25 25 25 25 25 25 21 21 20
miss(1) ! Missing value
NIVA report no. 4649 - 102

JAMP Biological effects methods 1997-2001 - Norway
Species : PLEU PLA Pleuronectes platessa GB: Plaice, N: RødspetteSample area: J99 Undefined Tissue: AllLocality : 98F Lille Molla Latitude: 68°12.0N Longitude: 14°48.0ECatch,date : 20000921 Count: 20 Sample type: Individual
Analytical lab. => NIVA NIVA NIVA NIVA NIVA NIVA NIVA NIVA NIVA NIVA NIVAAnalysis code =>Detection limit => Mean
Samp/ Sex Age Wght Lngt weight Dry Fat AY(BI) BLOPR(BL) CYTPR(LI) MICPR(LI) ALAD(BL) EROD(LI) MT(LI) BAP3O(BI) NAP2O(BI) PA1O(BI) PYR1O(BI)repl. F/M year g mm g % % ABS 380 nm mg/mL mg/mL mg/mLPBG/min/mg protmin/min/mg prot µg/mg protg/kg/ABS 380 nmg/kg/ABS 380 nm µg/kg/ABS 38µg/kg/ABS 38no. w.wt w.wt w.wt w.wt w.wt w.wt w.wt w.wt w.wt w.wt w.wt5/1 F 636 390 5,0 2.856 46.56 9.788 4.444 10.89 325.3 miss <nd <nd <nd <nd6/1 F 1075 410 19,0 0.91 62.28 11.68 3.926 12.99 185.4 14.99 <nd <nd <nd 23.087/1 F 1333 465 24,0 13.82 41.53 10.76 4.396 20.43 112.7 17.37 <nd <nd <nd 1.4478/1 M 715 420 5,0 13.64 44.55 5.706 2.935 11.37 312.8 miss <nd <nd <nd 1.4679/1 M 721 400 9,0 16.77 12.84 3.458 184.9 miss <nd <nd <nd 1.25310/1 F 2101 550 31,0 15.86 48.66 9.768 3.999 16.22 56.92 miss <nd <nd <nd <nd11/1 F 1808 530 28,8 44.64 7.994 3.708 32.15 miss <nd <nd <nd 0.492812/1 F 2141 550 35,0 12.12 31.48 9.808 2.422 34.2 129.9 miss <nd <nd <nd 1.6513/1 F 2033 545 50,0 13.74 47.7 10.04 2.22 11.76 90.16 19.93 <nd <nd <nd 1.45614/1 F 1869 520 27,0 8.925 42.77 11.67 3.877 15.14 132.1 10.66 <nd <nd <nd 2.57715/1 M 1298 470 17,9 16.56 42.17 10.4 2.916 23 165 8.233 <nd <nd <nd 1.14716/1 M 1062 440 19,0 5.916 9.264 2.721 399.2 7.857 <nd <nd <nd <nd17/1 F 1529 490 26,0 15.81 38.06 10.75 3.298 16.33 211.5 16 <nd <nd <nd <nd18/1 F 1054 450 14,0 18.79 12.22 3.784 101.4 12.08 <nd <nd <nd 1.01119/1 M 1021 430 13,0 21.31 46.1 10.88 0.857 12.84 21.61 7.143 <nd <nd <nd 0.985420/1 F 3303 650 64,0 31.01 45.1 10.72 2.712 12.15 100.8 13.73 <nd <nd <nd 0.64521/1 2310 550 51,0 30.85 11.64 3.272 98.03 13.89 <nd <nd <nd 0.615922/1 F 2413 550 53,0 16.97 48.52 10.33 4.099 24.41 98.67 miss <nd <nd <nd 1.473Mean 1579 489 27,3 16,694 45,037 10,348 3,280 17,056 153,252 12,898 <<0.000 <<0.000 <<0.000 <2.183Minimum 636 390 5,0 0,910 31,480 5,706 0,857 10,890 21,610 7,143 <0.000 <0.000 <0.000 <0.000Maximum 3303 650 64,0 44,640 62,280 12,840 4,444 34,200 399,200 19,930 <0.000 <0.000 <0.000 23,080St.Dev 718 70 17,3 10,510 7,021 1,626 0,896 6,809 103,035 4,136 ~0.000 ~0.000 ~0.000 ~5.262Count 18 18 18 18 13 18 18 13 18 11 18 18 18 18
miss(7) ! Missing value Station: Lille Molla Fish from 1-16 and 21,22 are fished 20.09.2000 Fish 23,24,25 are fished in januar 2001
NIVA report no. 4649 - 103

JAMP Biological effects methods 1997-2001 - Norway
Species : PLEU PLA Pleuronectes platessa GB: Plaice, N: RødspetteSample area: J99 Undefined Tissue: AllLocality : 98F Lille Molla Latitude: 68°12.0N Longitude: 14°48.0ECatch,date : 20010919 Count: 25 Sample type: Individual
Analytical lab. => NIVA NIVA NIVA NIVA NIVA NIVA NIVA NIVA NIVA NIVAAnalysis code =>Detection limit => Mean
Samp/ Sex Age Wght Lngt weight Dry Fat AY(BI) BLOPR(BL) CYTPR(LI) MICPR(LI) ALAD(BL) EROD(LI) MT(LI) BAP3O(BI) PA1O(BI) PYR1O(BI)repl. F/M year g mm g % % ABS 380 nm mg/mL mg/mL mg/mLPBG/min/mg protmin/min/mg prot µg/mg protg/kg/ABS 380 nmg/kg/ABS 380 nm µg/kg/ABS 380 nmno. w.wt w.wt w.wt w.wt w.wt w.wt w.wt w.wt w.wt w.wt6/1 M 8 1067 448 14,4 91.22 11.51 2.791 14.08 33.02 4.7527/1 M 8 1036 451 11,4 58.35 52.35 11.35 3.333 22.13 68.5 4.618 <nd <nd 1.2848/1 F 8 1161 471 12,7 35.21 69.68 12.55 3.167 24.33 22.61 6.433 <nd <nd 2.2249/1 F 15 2892 590 52,5 61.03 61.93 12.82 4.15 14.53 16.98 19.8 <nd <nd 1.3310/1 F 15 2551 585 45,0 53.49 54.64 10.88 4.939 21.9 59.66 19.55 <nd <nd 1.44311/1 F 13 2182 569 39,8 51.47 65.15 14.11 3.283 21.96 38.49 20.59 <nd <nd 1.54112/1 F 12 2179 558 36,6 95.13 40.81 10.63 3.708 13.57 18.5 12.73 <nd <nd 0.844113/1 F 12 2278 571 29,7 28.17 64.69 13.14 4.109 14.32 34.84 13.78 <nd <nd 2.69514/1 F 7 997 432 17,0 21.55 65.88 12.64 3.753 21.52 20.53 25.24 <nd <nd 3.62515/1 F 9 1344 500 14,7 39.9 61.11 10.64 4.93 19.75 19.05 9.677 <nd <nd 1.96516/1 F 12 1940 532 24,8 53.99 62.24 13.08 4.519 16.82 31.84 18.83 <nd <nd 1.43917/1 M 6 1089 449 19,6 18.4 49.24 10.78 2.909 11.64 145.7 5.829 <nd <nd 4.46818/1 F 6 887 426 12,0 7.07 52.01 14.61 4.001 22.1 63.98 18.3 <nd <nd 11.4319/1 F 14 3098 630 47,4 10.91 57.36 14 3.537 20.51 32.34 16.23 <nd 3.264 7.45320/1 F 6 467 365 5,1 18.38 49.11 14.38 4.451 16.24 785.9 6.434 <nd 2.133 4.55321/1 F 11 1186 458 18,2 25.45 59.88 11.8 3.094 13.41 23.42 12.9 <nd <nd 3.17922/1 M 7 791 419 7,9 58.97 59.65 12.35 4.339 10.46 64.16 6.703 <nd <nd 1.27423/1 F 6 420 331 4,1 10.71 36.12 10.22 3.158 15.45 379.7 15.23 <nd 3.4 4.86624/1 M 8 1046 471 6,8 11.31 41.86 16.7 6.503 17.11 347.4 6.56 <nd 3.324 7.3925/1 F 10 1291 478 19,1 14.04 10.41 5.085 <0.6 13.19 <nd <nd 5.77726/1 F 7 961 428 5,9 8.364 8.504 2.69 <0.6 21.07 <nd 4.495 9.19427/1 F 7 930 430 11,9 11.09 2.553 <0.6 7.065 <nd28/1 M 6 760 399 6,1 15.96 9.814 2.015 <0.6 6.721 <nd 2.394 4.93229/1 M 5 503 361 2,0 24.24 6.88 1.848 <0.6 5.913 <nd 1.687 3.46530/1 M 5 511 341 1,4 15.65 8.26 1.48 <0.6 7.961Mean 9 1343 468 18,6 32,076 57,628 11,726 3,614 17,465 <88,409 12,244 <<0.000 <<0.900 3,926Minimum 5 420 331 1,4 7,070 36,120 6,880 1,480 10,460 <0,6 4,618 <0.000 <0.000 0,844Maximum 15 3098 630 52,5 95,130 91,220 16,700 6,503 24,330 785,900 25,240 0,000 4,495 11,430St.Dev 3 771 82 14,9 22,960 12,281 2,199 1,137 4,162 ~174,774 6,272 ~0.000 ~1.477 2,861Count 25 25 25 25 23 19 25 25 19 25 25 22 23 22
Station: Lille Molla Fished from16.-19.sept.2001(no1-19) Fished 22.sept.2001(20-25)
NIVA report no. 4649 - 104

JAMP Biological effects methods 1997-2001 - Norway
Species : PLEU PLA Pleuronectes platessa GB: Plaice, N: RødspetteSample area: J99 Undefined Tissue: AllLocality : 10F Skogerøy Latitude: 69°55.0N Longitude: 29°51.0ECatch,date : 20000919 Count: 15 Sample type: Individual
Analytical lab. => NIVA NIVA NIVA NIVA NIVA NIVA NIVA NIVA NIVA NIVA NIVAAnalysis code =>Detection limit => Mean
Samp/ Sex Age Wght Lngt weight Dry Fat AY(BI) BLOPR(BL) CYTPR(LI) MICPR(LI) ALAD(BL) EROD(LI) MT(LI) BAP3O(BI) NAP2O(BI) PA1O(BI) PYR1O(BI)repl. F/M year g mm g % % ABS 380 nm mg/mL mg/mL mg/mLPBG/min/mg protmin/min/mg prot µg/mg protg/kg/ABS 380 nmg/kg/ABS 380 nm µg/kg/ABS 38µg/kg/ABS 38no. w.wt w.wt w.wt w.wt w.wt w.wt w.wt w.wt w.wt w.wt w.wt4/1 F 634 390 7,0 7.171 47.66 9.464 3.646 21.09 409.6 5.387 <nd <nd <nd 0.27895/1 F 649 400 8,1 10.81 48.1 9.898 3.376 23.6 295.5 9.326 <nd <nd <nd 0.27766/1 F 552 390 5,4 19.39 32.12 9.588 3.487 13.77 277 7.084 <nd <nd <nd 0.20637/1 F 666 400 7,1 5.304 49.44 13.23 3.882 16.8 353.5 5.503 <nd <nd <nd <nd8/1 F 757 390 13,2 14.14 41.71 7.278 2.829 19.21 294.3 5.427 <nd <nd <nd 0.28299/1 F 982 460 14,8 19.04 66.51 9.604 3.735 14.11 39.92 7.628 <nd <nd <nd <nd10/1 F 930 420 18,7 27.98 45.38 8.708 2.864 16.91 58.85 6.944 <nd <nd <nd 0.107211/1 F 942 430 13,7 14.54 45.83 7.354 2.871 15.64 214 5.73 <nd <nd <nd 0.343812/1 M 1013 465 15,6 14.95 9.802 3.018 44.53 8.27213/1 F 1004 445 18,3 23.43 9.042 3.716 59.6 9.52914/1 F 655 410 4,3 6.812 41.24 10.54 3.558 18.33 615.8 4.73 <nd <nd <nd 0.587214/2 256.615/1 F 1081 375 14,3 37.88 40.8 8.672 3.389 26.59 178.7 6.402 <nd <nd <nd 0.26416/1 F 732 400 7,1 8.585 6.062 2.409 195.2 4.5217/1 F 757 410 9,7 21.72 11.89 3.627 215 4.75118/1 F 1149 490 20,6 9.292 40.82 11.06 4.508 28.7 50.64 9.297 <nd <nd <nd <ndMean 834 418 11,9 16,070 45,419 9,479 3,394 19,523 222,421 6,702 <<0.000 <<0.000 <<0.000 <<0.213Minimum 552 375 4,3 5,304 32,120 6,062 2,409 13,770 39,920 4,520 <0.000 <0.000 <0.000 <0.000Maximum 1149 490 20,6 37,880 66,510 13,230 4,508 28,700 615,800 9,529 0,000 0,000 0,000 0,587St.Dev 189 33 5,2 9,029 8,509 1,818 0,524 4,965 157,506 1,761 ~0.000 ~0.000 ~0.000 ~0.179Count 15 15 15 15 11 15 15 11 16 15 11 11 11 11
NIVA report no. 4649 - 105

JAMP Biological effects methods 1997-2001 - Norway
Species : PLEU PLA Pleuronectes platessa GB: Plaice, N: RødspetteSample area: J99 Undefined Tissue: AllLocality : 10F Skogerøy Latitude: 69°55.0N Longitude: 29°51.0ECatch,date : 20010916 Count: 25 Sample type: Individual
Analytical lab. => NIVA NIVA NIVA NIVA NIVA NIVA NIVA NIVA NIVA NIVAAnalysis code =>Detection limit => Mean
Samp/ Sex Age Wght Lngt weight Dry Fat AY(BI) BLOPR(BL) CYTPR(LI) MICPR(LI) ALAD(BL) EROD(LI) MT(LI) BAP3O(BI) PA1O(BI) PYR1O(BI)repl. F/M year g mm g % % ABS 380 nm mg/mL mg/mL mg/mLPBG/min/mg protmin/min/mg prot µg/mg protg/kg/ABS 380 nmg/kg/ABS 380 nm µg/kg/ABS 380 nmno. w.wt w.wt w.wt w.wt w.wt w.wt w.wt w.wt w.wt w.wt6/1 F 10 1210 468 27,9 4.343 48.5 14.56 3.227 13.47 58.38 11.6 <nd <nd <nd7/1 F 9 1354 480 25,4 10.2 43.7 12.99 4.226 13.18 64.31 9.241 <nd <nd 0.52948/1 F 9 1603 515 34,6 9.999 49.68 17.02 4.542 9.727 28.97 8.66 <nd <nd 0.299/1 F 8 1098 458 17,7 20.2 50.9 13.87 4.043 18.19 65.48 14.98 <nd <nd 0.133710/1 F 8 945 417 21,4 10.3 46.08 12.28 3.123 10.81 35.97 18.67 <nd <nd 0.184411/1 F 13 1287 462 31,5 4.646 46 13.94 4.454 12.42 16.85 <nd <nd 0.90412/1 F 8 1359 464 36,8 31.61 51.68 12.16 4.313 12.43 37.04 13.03 <nd <nd 0.132913/1 F 12 1319 475 30,3 13.53 14.98 7.369 35.28 14.73 <nd <nd 0.583714/1 M 4 466 334 6,4 7.373 66.79 9.088 2.871 21.6 94.63 4.082 <nd <nd 0.542515/1 F 6 899 423 13,7 4.04 61.05 12.37 3.139 19.74 31.92 9.859 <nd <nd 2.47516/1 F 10 735 415 13,7 2.397 64.94 13.38 4.174 18.59 62.57 7.853 <nd <nd <nd17/1 F 10 1044 434 20,5 4.242 48.56 13.67 3.974 20.3 84.97 10.51 <nd <nd 1.83918/1 F 8 750 390 15,7 3.621 53.12 15.18 3.426 16.8 46.55 14.73 <nd <nd 1.7419/1 F 8 824 411 18,3 8.686 45.85 14.46 2.508 10.94 104.6 3.241 <nd <nd 2.23320/1 F 8 620 371 13,1 14.54 53.31 12.83 3.201 23.92 98.75 5.75 <nd <nd 0.3321/1 F 8 1030 438 18,7 6.161 61.42 12.13 1.674 11.34 41.74 5.767 <nd <nd 2.14322/1 F 8 1004 418 21,1 6.666 45.45 14.39 3.865 25.16 35.96 13.83 <nd <nd 0.780123/1 F 7 664 476 12,9 21.82 68.04 11.99 3.535 14.6 77 8.764 <nd <nd 0.325424/1 M 7 813 421 11,6 31.31 72.89 14.71 3.023 18.59 64.53 6.241 <nd <nd 0.137325/1 F 7 683 393 12,4 28.58 50 9.682 2.751 11.05 92.67 13.06 <nd <nd 0.216926/1 F 8 955 451 15,9 12.22 71.28 14.36 4.326 18.11 140.2 9.639 <nd <nd 0.392827/1 F 7 783 390 8,4 17.57 73.38 8.726 3.618 16.8 16.31 <nd <nd 0.278828/1 F 7 704 389 15,3 27.47 57.63 13.18 3.656 11.79 32.06 12.6 <nd <nd 0.45529/1 F 10 892 430 18,2 9.494 50.62 12.62 3.856 16.06 31.8 9.33 <nd <nd 0.410830/1 F 9 830 425 17,1 5.656 57.13 12.63 3.961 11.43 42.66 9.364 <nd <nd 2.988Mean 8 955 430 19,1 12,667 55,750 13,088 3,714 15,710 61,219 10,748 <<0.000 <<0.000 <0.802Minimum 4 466 334 6,4 2,397 43,700 8,726 1,674 9,727 28,970 3,241 <0.000 <0.000 <0.000Maximum 13 1603 515 36,8 31,610 73,380 17,020 7,369 25,160 140,200 18,670 <0.000 <0.000 2,988St.Dev 2 277 40 7,9 9,161 9,464 1,898 1,023 4,428 29,834 4,086 ~0.000 ~0.000 ~0.874Count 25 25 25 25 25 24 25 25 24 23 25 25 25 25
NIVA report no. 4649 - 106

JAMP Biological Effects Methods 1997-2001 - Norway
NIVA report no. 4649-2003 107
Appendix E
Biomarkers in fish 1997-2001 Statistical analyses
EROD in:
GADU MOR - Atlantic cod (Gadus morhua) LIMA LIM - Dab (Limanda limanda) PLAT FLE - Flounder (Platichthys flesus) PLEU PLA - Plaice (Pleuronectes platessa)


JAMP Biological Effects Methods 1997-2001 - Norway
NIVA report no. 4649-2003 109
Table 9. Test of significance for OH-pyrene in Gadus morhua (and test of SS Whole model vs. SS Residual).
Effect SS Degr. of Freedom
MS F p
Intercept 32,8243 1 32,8243 59,6133 0,000000 year 758,2135 3 252,7378 459,0063 0,000000 station 90,9352 7 12,9907 23,5930 0,000000 maturation 6,5825 1 6,5825 11,9548 0,000586 year*station 110,3620 16 6,8976 12,5270 0,000000 station* maturation
14,9221 7 2,1317 3,8715 0,000396
length 12,4025 1 12,4025 22,5246 0,000003 log2lsi 1,9663 1 1,9663 3,5710 0,059310 erod 6,1138 1 6,1138 11,1035 0,000918 Error 309,4482 562 0,5506 dep. var. Multiple
R Multiple
R2 Adjusted
R2 SS
Model df
Model MS
Model oh-pyr 0,944844 0,892729 0,885667 2575,292 37 69,60249 SS
Residual df
Residual MS
Residual F p
309,4482 562 0,550620 126,4076 0,00
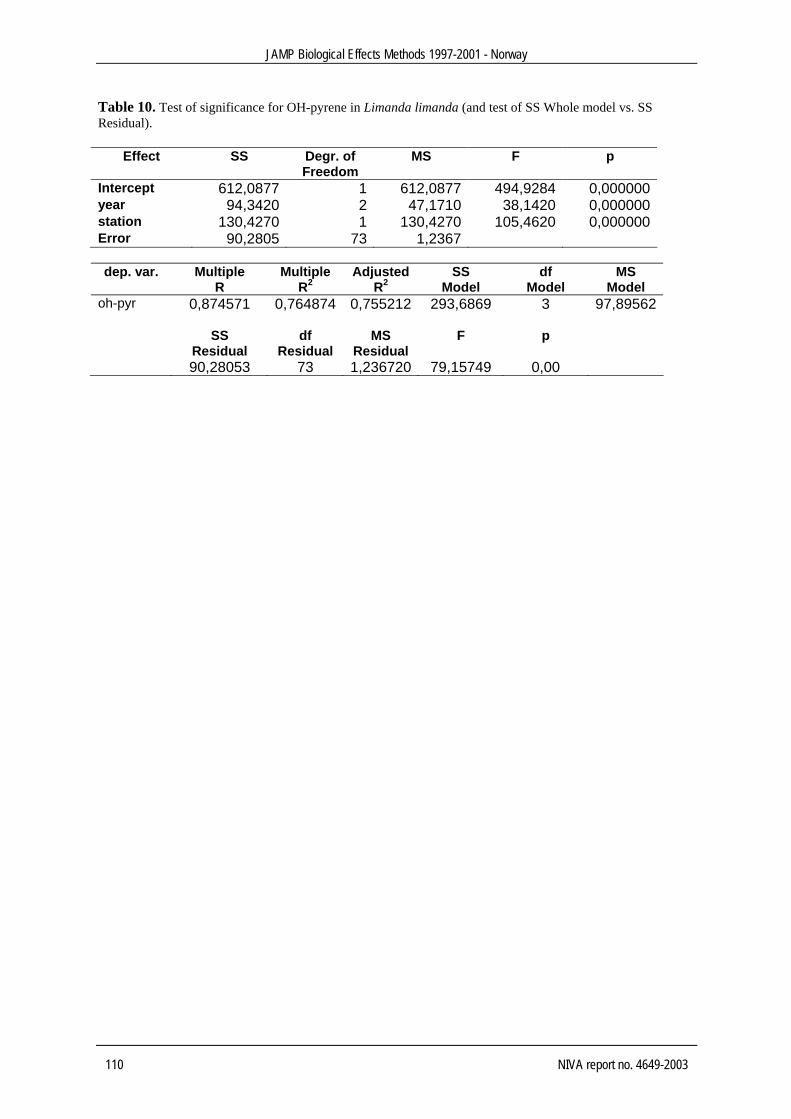
JAMP Biological Effects Methods 1997-2001 - Norway
110 NIVA report no. 4649-2003
Table 10. Test of significance for OH-pyrene in Limanda limanda (and test of SS Whole model vs. SS Residual).
Effect SS Degr. of Freedom
MS F p
Intercept 612,0877 1 612,0877 494,9284 0,000000 year 94,3420 2 47,1710 38,1420 0,000000 station 130,4270 1 130,4270 105,4620 0,000000 Error 90,2805 73 1,2367 dep. var. Multiple
R Multiple
R2 Adjusted
R2 SS
Model df
Model MS
Model oh-pyr 0,874571 0,764874 0,755212 293,6869 3 97,89562 SS
Residual df
Residual MS
Residual F p
90,28053 73 1,236720 79,15749 0,00

JAMP Biological Effects Methods 1997-2001 - Norway
NIVA report no. 4649-2003 111
Table 11. Test of significance for OH-pyrene in Platichthys flesus (and test of SS Whole model vs. SS Residual).
Effect SS Degr. of Freedom
MS F p
Intercept 61,7877 1 61,78772 125,1048 0,000000 year 132,6583 2 66,32915 134,3001 0,000000 station 21,0279 2 10,51397 21,2882 0,000000 sex 4,0777 1 4,07771 8,2564 0,004838 year*station 18,1457 2 9,07283 18,3702 0,000000 log2lsi 4,2955 1 4,29547 8,6973 0,003861 Error 56,7971 115 0,49389 dep. var. Multiple
R Multiple
R2 Adjusted
R2 SS
Model df
Model MS
Model oh-pyr 0,899805 0,809650 0,796408 241,5851 8 30,19814 SS
Residual df
Residual MS
Residual F p
56,79707 115 0,493888 61,14376 0,00

JAMP Biological Effects Methods 1997-2001 - Norway
112 NIVA report no. 4649-2003
Table 12. Test of significance for OH-pyrene in Pleuronectes platessa (and test of SS Whole model vs. SS Residual).
Effect SS Degr. of Freedom
MS F p
Intercept 4,63711 1 4,63711 7,28467 0,008985 year 7,58946 1 7,58946 11,92267 0,001014 station 49,67124 1 49,67124 78,03108 0,000000 sex 2,74068 1 2,74068 4,30548 0,042215 length 5,65842 1 5,65842 8,88910 0,004118 Error 38,82998 61 0,63656 dep. var. Multiple
R Multiple
R2 Adjusted
R2 SS
Model df
Model MS
Model oh-pyr 0,773259 0,597930 0,571565 57,74519 4 14,43630 SS
Residual df
Residual MS
Residual F p
38,82998 61 0,636557 22,67872 0,000000

JAMP Biological Effects Methods 1997-2001 - Norway
NIVA report no. 4649-2003 113
Table 13. Test of significance for ALA-D in Gadus morhua (and test of SS Whole model vs. SS Residual). Lead not included in the model:
Effect SS Degr. of Freedom
MS F p
Intercept 5,1035 1 5,10349 23,53239 0,000002 year 42,0471 4 10,51178 48,47023 0,000000 station 5,3406 7 0,76295 3,51797 0,001013 year*station 26,9148 20 1,34574 6,20526 0,000000 livcd 4,8006 1 4,80060 22,13574 0,000003 muhg 1,8307 1 1,83067 8,44128 0,003784 livzn 1,7555 1 1,75553 8,09484 0,004569 Error 152,0264 701 0,21687 dep. var. Multiple
R Multiple
R2 Adjusted
R2 SS
Model df
Model MS
Model alad 0,654304 0,428113 0,400376 113,8068 34 3,347258 SS
Residual df
Residual MS
Residual F p
152,0264 701 0,216871 15,43434 0,00 Lead included in the model
Effect SS Degr. of Freedom
MS F p
Intercept 122,5785 1 122,5785 390,7963 0,000000 year 23,3339 4 5,8335 18,5979 0,000000 station 17,1979 7 2,4568 7,8327 0,000000 maturation 2,2373 1 2,2373 7,1327 0,008066 livpb 3,0380 1 3,0380 9,6855 0,002073 Error 78,4158 250 0,3137 dep. var. Multiple
R Multiple
R2 Adjusted
R2 SS
Model df
Model MS
Model alad 0,562819 0,316765 0,281237 36,35563 13 2,796587 SS
Residual df
Residual MS
Residual F p
78,41583 250 0,313663 8,915889 0,000000

JAMP Biological Effects Methods 1997-2001 - Norway
114 NIVA report no. 4649-2003
Table 14. Test of significance for ALA-D in Limanda limanda (and test of SS Whole model vs. SS Residual).
Effect SS Degr. of Freedom
MS F p
Intercept 0,50505 1 0,505049 2,08127 0,153845 year 5,35414 2 2,677071 11,03203 0,000074 station 3,12534 1 3,125341 12,87932 0,000632 livpb 0,83995 1 0,839953 3,46139 0,067273 Error 16,01579 66 0,242664 dep. var. Multiple
R Multiple
R2 Adjusted
R2 SS
Model df
Model MS
Model alad 0,728362 0,530511 0,502057 18,09744 4 4,524360 SS
Residual df
Residual MS
Residual F p
16,01579 66 0,242664 18,64458 0,000000

JAMP Biological Effects Methods 1997-2001 - Norway
NIVA report no. 4649-2003 115
Table 15. Test of significance for ALA-D in Platichthys flesus (and test of SS Whole model vs. SS Residual).
Effect SS Degr. of Freedom
MS F p
Intercept 39,64045 1 39,64045 104,1583 0,000000 length 1,66319 1 1,66319 4,3702 0,038283 station 25,27509 2 12,63755 33,2061 0,000000 Error 56,32570 148 0,38058 dep. var. Multiple
R Multiple
R2 Adjusted
R2 SS
Model df
Model MS
Model alad 0,557570 0,310885 0,296916 25,41056 3 8,470185 SS
Residual df
Residual MS
Residual F p
56,32570 148 0,380579 22,25605 0,000000

JAMP Biological Effects Methods 1997-2001 - Norway
116 NIVA report no. 4649-2003
Table 16. Test of significance for ALA-D in Pleuronectes platessa (and test of SS Whole model vs. SS Residual).
[There were no significant model explaining ALA-D for this species]
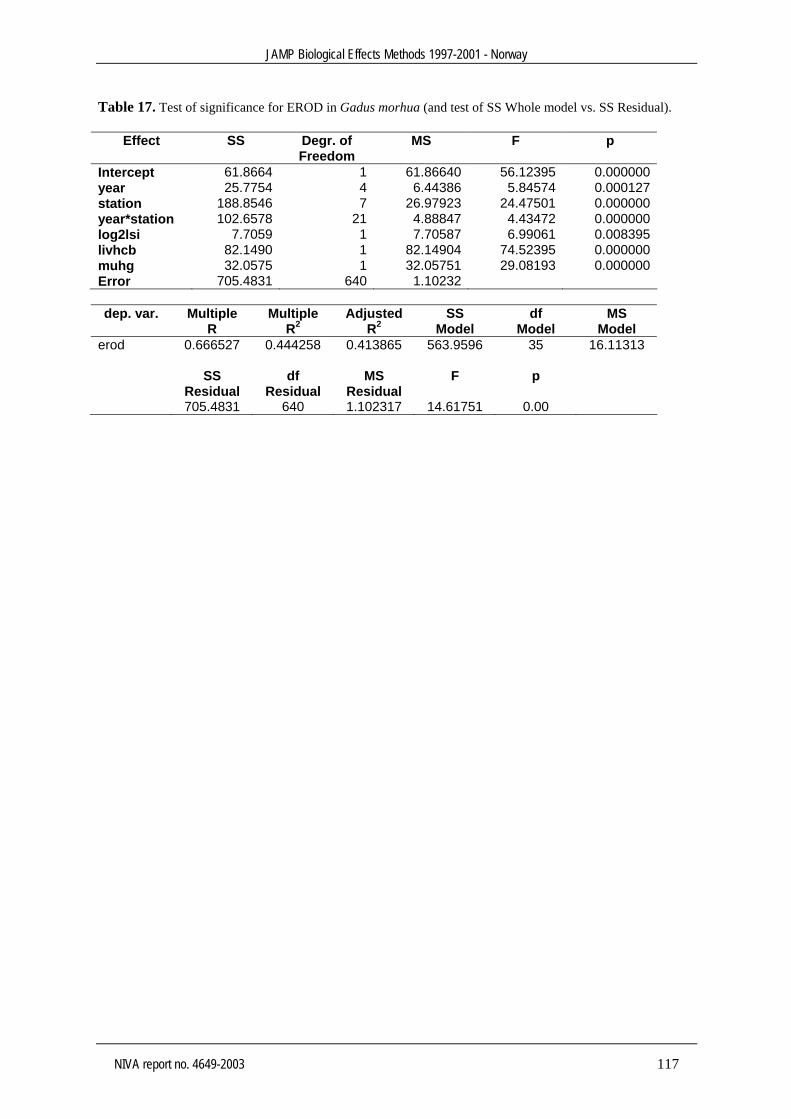
JAMP Biological Effects Methods 1997-2001 - Norway
NIVA report no. 4649-2003 117
Table 17. Test of significance for EROD in Gadus morhua (and test of SS Whole model vs. SS Residual).
Effect SS Degr. of Freedom
MS F p
Intercept 61.8664 1 61.86640 56.12395 0.000000 year 25.7754 4 6.44386 5.84574 0.000127 station 188.8546 7 26.97923 24.47501 0.000000 year*station 102.6578 21 4.88847 4.43472 0.000000 log2lsi 7.7059 1 7.70587 6.99061 0.008395 livhcb 82.1490 1 82.14904 74.52395 0.000000 muhg 32.0575 1 32.05751 29.08193 0.000000 Error 705.4831 640 1.10232 dep. var. Multiple
R Multiple
R2 Adjusted
R2 SS
Model df
Model MS
Model erod 0.666527 0.444258 0.413865 563.9596 35 16.11313 SS
Residual df
Residual MS
Residual F p
705.4831 640 1.102317 14.61751 0.00

JAMP Biological Effects Methods 1997-2001 - Norway
118 NIVA report no. 4649-2003
Table 18. Test of significance for EROD in Limanda limanda (and test of SS Whole model vs. SS Residual).
Effect SS Degr. of Freedom
MS F p
Intercept 20.97716 1 20.97716 23.93532 0.000004 year 32.74844 2 16.37422 18.68328 0.000000 station 1.54203 1 1.54203 1.75949 0.188045 year*station 5.48687 1 5.48687 6.26061 0.014152 log2lsi 6.09835 1 6.09835 6.95833 0.009829 livcb153 4.80084 1 4.80084 5.47785 0.021469 l105_118 4.88828 1 4.88828 5.57762 0.020348 Error 78.87695 90 0.87641 dep. var. Multiple
R Multiple
R2 Adjusted
R2 SS
Model df
Model MS
Model erod 0.618024 0.381954 0.333884 48.74619 7 6.963742 SS
Residual df
Residual MS
Residual F p
78.87695 90 0.876411 7.945753 0.000000

JAMP Biological Effects Methods 1997-2001 - Norway
NIVA report no. 4649-2003 119
Table 19. Test of significance for EROD in Platichthys flesus (and test of SS Whole model vs. SS Residual).
Effect SS Degr. of Freedom
MS F p
Intercept 7,2567 1 7,256657 6,240097 0,014071 length 7,0907 1 7,090727 6,097412 0,015182 log2lsi 6,6126 1 6,612634 5,686293 0,018928 oh-pyr 4,5208 1 4,520821 3,887515 0,051328 livddepp 8,0317 1 8,031661 6,906533 0,009901 station 7,5950 2 3,797488 3,265511 0,042165 sex 3,1675 1 3,167506 2,723781 0,101910 station*sex 9,4637 2 4,731873 4,069001 0,019916 Error 119,7795 103 1,162908 dep. var. Multiple
R Multiple
R2 Adjusted
R2 SS
Model df
Model MS
Model erod 0,616435 0,379993 0,325817 73,41095 9 8,156772 SS
Residual df
Residual MS
Residual F p
119,7795 103 1,162908 7,014117 0,000000

JAMP Biological Effects Methods 1997-2001 - Norway
120 NIVA report no. 4649-2003
Table 20. Test of significance for EROD in Pleuronectes platessa (and test of SS Whole model vs. SS Residual).
Effect SS Degr. of Freedom
MS F p
Intercept 34.13887 1 34.13887 78.09186 0.000000 year 5.79521 1 5.79521 13.25640 0.000525 length 9.57215 1 9.57215 21.89608 0.000014 log2lsi 5.35424 1 5.35424 12.24769 0.000827 livcb153 1.99831 1 1.99831 4.57108 0.036113 livddepp 1.54511 1 1.54511 3.53441 0.064392 Error 29.72708 68 0.43716 dep. var. Multiple
R Multiple
R2 Adjusted
R2 SS
Model df
Model MS
Model erod 0.736036 0.541749 0.508054 35.14367 5 7.028734 SS
Residual df
Residual MS
Residual F p
29.72708 68 0.437163 16.07807 0.000000

JAMP Biological Effects Methods 1997-2001 - Norway
NIVA report no. 4649-2003 121
Table 21. Test of significance for metallothionein in Gadus morhua (and test of SS Whole model vs. SS Residual).
Effect SS Degr. of Freedom
MS F p
Intercept 0,42434 1 0,424341 7,28633 0,007173 year 1,42120 4 0,355301 6,10085 0,000084 station 3,25688 7 0,465268 7,98909 0,000000 maturation 0,38217 1 0,382170 6,56222 0,010695 year*station 4,40791 20 0,220396 3,78440 0,000000 year* maturation
0,65376 4 0,163441 2,80643 0,025159
length 2,11264 1 2,112642 36,27604 0,000000 log2lsi 2,48422 1 2,484222 42,65641 0,000000 livhchg 0,33582 1 0,335815 5,76626 0,016684 livcu 5,01423 1 5,014235 86,09908 0,000000 livzn 1,02394 1 1,023938 17,58197 0,000032 Error 30,51669 524 0,058238 dep. var. Multiple
R Multiple
R2 Adjusted
R2 SS
Model df
Model MS
Model mt 0,871909 0,760225 0,741464 96,75549 41 2,359890 SS
Residual df
Residual MS
Residual F p
30,51669 524 0,058238 40,52151 0,00

JAMP Biological Effects Methods 1997-2001 - Norway
122 NIVA report no. 4649-2003
Table 22. Test of significance for metallothionein in Limanda limanda (and test of SS Whole model vs. SS Residual).
Effect SS Degr. of Freedom
MS F p
Intercept 1,15662 1 1,156618 4,460086 0,037563 length 1,04034 1 1,040341 4,011703 0,048298 livcd 0,89780 1 0,897798 3,462040 0,066171 cu_zn 2,20945 1 2,209453 8,519969 0,004471 year 1,89240 2 0,946198 3,648676 0,030086 station 0,16139 1 0,161385 0,622325 0,432329 year*station 2,32205 1 2,322052 8,954169 0,003602 Error 22,56140 87 0,259326 dep. var. Multiple
R Multiple
R2 Adjusted
R2 SS
Model df
Model MS
Model mt 0,551351 0,303988 0,247987 9,853857 7 1,407694 SS
Residual df
Residual MS
Residual F p
22,56140 87 0,259326 5,428271 0,000034

JAMP Biological Effects Methods 1997-2001 - Norway
NIVA report no. 4649-2003 123
Table 23. Test of significance for metallothionein in Platichthys flesus (and test of SS Whole model vs. SS Residual).
Effect SS Degr. of Freedom
MS F p
Intercept 75,39965 1 75,39965 562,4129 0,000000 year 2,42889 2 1,21445 9,0587 0,000221 station 6,51766 2 3,25883 24,3079 0,000000 sex 2,53141 1 2,53141 18,8820 0,000030 livcd 1,62411 1 1,62411 12,1144 0,000706 Error 15,55149 116 0,13406 dep. var. Multiple
R Multiple
R2 Adjusted
R2 SS
Model df
Model MS
Model mt 0,800187 0,640300 0,621695 27,68310 6 4,613849 SS
Residual df
Residual MS
Residual F p
15,55149 116 0,134065 34,41513 0,00

JAMP Biological Effects Methods 1997-2001 - Norway
124 NIVA report no. 4649-2003
Table 24. Test of significance for metallothionein in Pleuronectes platessa (and test of SS Whole model vs. SS Residual).
Effect SS Degr. of Freedom
MS F p
Intercept 0,000373 1 0,000373 0,00309 0,955847 sex 3,240956 1 3,240956 26,82878 0,000002 muhg 2,536341 1 2,536341 20,99594 0,000020 livzn 2,416526 1 2,416526 20,00411 0,000029 Error 8,456103 70 0,120801 dep. var. Multiple
R Multiple
R2 Adjusted
R2 SS
Model df
Model MS
Model mt 0,704827 0,496781 0,475214 8,347911 3 2,782637 SS
Residual df
Residual MS
Residual F p
8,456103 70 0,120801 23,03479 0,000000

JAMP Biological Effects Methods 1997-2001 - Norway
NIVA report no. 4649-2003 125
Appendix F Temporal trend analyses of biomarkers in biota
1997-2001
Sorted by contaminant, species and area/station:
OH-pyrene ALA-D (δ-amino levulinic acid dehydrase inhibition)
EROD (Cytochrome P4501A-activity) MT (Metallothionein)
GADU MOR - Atlantic cod (Gadus morhua)
LIMA LIM - Dab (Limanda limanda) PLAT FLE - Flounder (Platichthys flesus)
Tsu tissue
LI - Liver tissue BL - Blood
BI - Bile
OC Overconcentration expressed as quotient of median of last year and “high background” ("?" missing background value)
TRND trend D- Significant linear trend, downward U- Significant linear trend, upward -- No significant trend -? No significant linear trend, systematic non-linear trend can not
be tested because of insufficient data (<6 years) -Y No significant linear trend, but a systematic non-linear trend DY or UY Significant linear trend (downward or upward) and a significant
non-linear trend. This is considered the same as "-Y" SIZE length effect (mercury in fillet) L Significant difference in concentration levels but pattern of
variation same D As "L" but pattern of variation significantly different - No significant difference between “small” and “large” fish
SM+3 Projected smoothed median for three years expressed as quotient of value and “high background” ("?" if missing background or if number of years is less than seven)
PWR POWER; estimated number of years to detect a hypothetical situation of 10% trend a year with a 90% power


JAMP Biological Effects Methods 1997-2001 - Norway
NIVA report no. 4649-2003 127
Annual median concentration of OH-PYRENE (ug/kg/ABS 380nm)
ANALYSIS St Species Tiss
ue Base 1981 1982 1983 1984 1985 1986 1987 1988 1989 1990 1991 1992 1993 1994 1995 1996 1997 1998 1999 2000 2001 OC TRND SM+3 PWR
30B GADU MOR BI w.wt 115 130 12.3 17 m -? m 22 36B GADU MOR BI w.wt 42.9 28.9 5.14 3.72 m D? m 15 15B GADU MOR BI w.wt 3770 253 29.7 m -? m 23 53B GADU MOR BI w.wt 83 58.6 9.23 3.81 m D? m 15 67B GADU MOR BI w.wt 19.8 16.5 1.62 1.66 m -? m 20 23B GADU MOR BI w.wt 12.7 11.2 4.15 2.55 m D? m 11 53B PLAT FLE BI w.wt 74.6 9.75 3.64 m -? m 15 67B PLAT FLE BI w.wt 41 1.71 5.42 m -? m >25 36F LIMA LIM BI w.wt 48.8 4.18 3.48 m -? m 23
Annual median concentration of ALAD (ng PBG/min/mg prot.)
ANALYSIS St Species Tiss
ue Base 1981 1982 1983 1984 1985 1986 1987 1988 1989 1990 1991 1992 1993 1994 1995 1996 1997 1998 1999 2000 2001 OC TRND SM+3 PWR
30B GADU MOR BL w.wt 8.98 15.6 13 14.6 12.7 m -? m 10 36B GADU MOR BL w.wt 13 26.2 9.93 22 19.4 m -? m 15 15B GADU MOR BL w.wt 17.2 23.4 8.45 18.9 m -? m 17 53B GADU MOR BL w.wt 7.64 10.1 11.1 12.7 10 m -? m 8 67B GADU MOR BL w.wt 7.17 28.2 16.9 22.4 19 m -? m 16 23B GADU MOR BL w.wt 15.8 24.8 18.1 19.8 24 m -? m 9 53B PLAT FLE BL w.wt 10.4 8.82 7.61 m D? m <=5 67B PLAT FLE BL w.wt 15.9 17.6 23.6 m -? m 6 36F LIMA LIM BL w.wt 7.89 17.6 15 m -? m 14

JAMP Biological Effects Methods 1997-2001 - Norway
128 NIVA report no. 4649-2003
Annual median concentration of EROD (pmol/min/mg prot.)
ANALYSIS St Species Tiss
ue Base 1981 1982 1983 1984 1985 1986 1987 1988 1989 1990 1991 1992 1993 1994 1995 1996 1997 1998 1999 2000 2001 OC TRND SM+3 PWR
30B GADU MOR LI w.wt 68.8 109 70 260 81.2 m -? m 18 36B GADU MOR LI w.wt 95.1 14.2 62.1 64.9 79.5 m -? m 22 15B GADU MOR LI w.wt 49.9 52.3 184 64.4 m -? m 20 53B GADU MOR LI w.wt 86.5 119 90.1 133 37.4 m -? m 16 67B GADU MOR LI w.wt 103 76.2 84.5 103 72.9 m -? m 9 23B GADU MOR LI w.wt 94.1 28.6 71 73.5 77.1 m -? m 16 53B PLAT FLE LI w.wt 24.6 6.22 33.8 m -? m >25 67B PLAT FLE LI w.wt 16.1 7.3 6.38 m -? m 11 36F LIMA LIM LI w.wt 471 336 149 m -? m 9
Annual median concentration of MT (ug/mg prot.)
ANALYSIS St Species Tiss
ue Base 1981 1982 1983 1984 1985 1986 1987 1988 1989 1990 1991 1992 1993 1994 1995 1996 1997 1998 1999 2000 2001 OC TRND SM+3 PWR
30B GADU MOR LI w.wt 14.2 16.2 18.3 8.02 11.6 m -? m 12 36B GADU MOR LI w.wt 17.9 16.8 26.3 11.6 9.82 m -? m 13 15B GADU MOR LI w.wt 13.3 19.5 17.8 15 m -? m 10 53B GADU MOR LI w.wt 17.1 21.4 20.3 11.7 15.7 m -? m 10 67B GADU MOR LI w.wt 16.9 21.5 16.8 16.3 12.8 m -? m 8 23B GADU MOR LI w.wt 12.9 21.5 23.5 14.3 17 m -? m 12 53B PLAT FLE LI w.wt 15 8.33 18.3 m -? m 17 67B PLAT FLE LI w.wt 34.1 27.3 29 m -? m 7 36F LIMA LIM LI w.wt 13.7 9.83 8.13 m -? m <=5
JAMP Biological Effects Methods 1997-2001 - Norway
NIVA report no. 4649-2003 129
Appendix G Geographical distribution of biomarkers in biota
1997-2001
Sorted by contaminant and species:
OH-pyrene
ALA-D (δ-amino levulinic acid dehydrase inhibition) EROD (Cytochrome P4501A-activity)
MT (Metallothionein)
GADU MOR - Atlantic cod (Gadus morhua) PLAT FLE - Flounder (Platichthys flesus)
LIMA LIM - Dab (Limanda limanda) PLEU PLA - Plaice (Pleuronectes platessa)
Station positions are shown on maps in Appendix C


JAMP Biological Effects Methods 1997-2001 - Norway
NIVA report no. 4649-2003 131
Appendix G Geographical distribution of biomarkers in biota 1997-2001
(cont.)

JAMP Biological Effects Methods 1997-2001 - Norway
132 NIVA report no. 4649-2003
A 1-OH-Pyrene in fish bile
0.01
0.10
1.00
10.00
100.00
1000.00
30B
Cod
36B
Cod
15B
Cod
53B
Cod
67B
Cod
23B
Cod
98B
Cod
10B
Cod
53B
Flou
nder
67B
Flou
nder
21F
Flou
nder
36F
Dab
15F
Dab
98F
Plai
ce
10F
Plai
ce
ug/k
g/A
BS
380n
m
median (x)x + 1 st.devbackground
B 1-OH-Pyrene in fish bile
0.01
0.10
1.00
10.00
100.00
1000.00
30B
Cod
36B
Cod
15B
Cod
53B
Cod
67B
Cod
23B
Cod
98B
Cod
10B
Cod
53B
Flo
unde
r
67B
Flo
unde
r
21F
Flou
nder
36F
Dab
15F
Dab
98F
Pla
ice
10F
Pla
ice
ug/k
g/A
BS
380n
m
median (x)x + 1 st.devbackground
C 1-OH-Pyrene in fish bile
0.01
0.10
1.00
10.00
100.00
1000.00
30B
Cod
36B
Cod
15B
Cod
53B
Cod
67B
Cod
23B
Cod
98B
Cod
10B
Cod
53B
Flo
unde
r
67B
Flo
unde
r
21F
Flou
nder
36F
Dab
15F
Dab
98F
Pla
ice
10F
Pla
ice
ug/k
g/A
BS
380n
m
median (x)x + 1 st.devbackground
Figure 10. Median and standard deviation concentration for OH-pyrene (Pyrene metabolite) in fish bile 1997 (A), 1998 (no analyses) (B) and 1999 (C), µg/kg/ABS (absorbance) 380 nm (see maps in Appendix C).

JAMP Biological Effects Methods 1997-2001 - Norway
NIVA report no. 4649-2003 133
A OH-pyrene in fish bile
0.01
0.10
1.00
10.00
100.00
1000.00
30B
Cod
36B
Cod
15B
Cod
53B
Cod
67B
Cod
23B
Cod
98B
Cod
10B
Cod
53B
Flo
unde
r
67B
Flo
unde
r
21F
Flou
nder
36F
Dab
15F
Dab
98F
Pla
ice
10F
Pla
ice
ug/k
g/A
BS
380
nm
median (x)x + 1 st.dev
B OH-pyrene in fish bile
0.01
0.10
1.00
10.00
100.00
1000.00
30B
Cod
36B
Cod
15B
Cod
53B
Cod
67B
Cod
23B
Cod
98B
Cod
10B
Cod
53B
Flo
unde
r
67B
Flo
unde
r
21F
Flou
nder
36F
Dab
15F
Dab
98F
Pla
ice
10F
Pla
ice
ug/k
g/A
BS
380
nm
median (x)x + 1 st.dev
Figure 11. Median and standard deviation concentration for OH-pyrene (Pyrene metabolite) in fish bile 2000 (A) and 2001 (B), µg/kg/ABS (absorbance) 380 nm (see maps in Appendix C).

JAMP Biological Effects Methods 1997-2001 - Norway
134 NIVA report no. 4649-2003
A ALAD in fish blood
0
10
20
30
40
50
60
30B
Cod
36B
Cod
15B
Cod
53B
Cod
67B
Cod
23B
Cod
98B
Cod
10B
Cod
53B
Flo
unde
r
67B
Flo
unde
r
21F
Flou
nder
36F
Dab
15F
Dab
98F
Pla
ice
10F
Pla
ice
ng
PBG
/min
/mg
prot
.
median (x)x + 1 st.devbackground
B ALAD in fish blood
0
10
20
30
40
50
60
30B
Cod
36B
Cod
15B
Cod
53B
Cod
67B
Cod
23B
Cod
98B
Cod
10B
Cod
53B
Flo
unde
r
67B
Flo
unde
r
21F
Flou
nder
36F
Dab
15F
Dab
98F
Pla
ice
10F
Pla
ice
ng
PBG
/min
/mg
prot
.
median (x)x + 1 st.devbackground
C ALAD in fish blood
0
10
20
30
40
50
60
30B
Cod
36B
Cod
15B
Cod
53B
Cod
67B
Cod
23B
Cod
98B
Cod
10B
Cod
53B
Flo
unde
r
67B
Flo
unde
r
21F
Flou
nder
36F
Dab
15F
Dab
98F
Pla
ice
10F
Pla
ice
ng
PBG
/min
/mg
prot
.
median (x)x + 1 st.devbackground
Figure 12. Median and standard deviation concentration for ALA-D (δ-amino levulinic acid dehydrase inhibition) in fish liver 1997 (A), 1998 (B) and 1999 (C), ng PBG (porphobilinogen)/min/mg protein (see maps in Appendix C).

JAMP Biological Effects Methods 1997-2001 - Norway
NIVA report no. 4649-2003 135
A ALA-D in fish blood
0
10
20
30
40
50
60
30B
Cod
36B
Cod
15B
Cod
53B
Cod
67B
Cod
23B
Cod
98B
Cod
10B
Cod
53B
Flo
unde
r
67B
Flo
unde
r
21F
Flou
nder
36F
Dab
15F
Dab
98F
Pla
ice
10F
Pla
ice
ng
PB
G/m
in/m
g pr
ot.
median (x)x + 1 st.dev
B ALA-D in fish blood
0
10
20
30
40
50
60
30B
Cod
36B
Cod
15B
Cod
53B
Cod
67B
Cod
23B
Cod
98B
Cod
10B
Cod
53B
Flo
unde
r
67B
Flo
unde
r
21F
Flou
nder
36F
Dab
15F
Dab
98F
Pla
ice
10F
Pla
ice
ng
PB
G/m
in/m
g pr
ot.
median (x)x + 1 st.dev
Figure 13. Median and standard deviation concentration for ALA-D (δ-amino levulinic acid dehydrase inhibition) in fish liver 2000 (A) and 2001 (B), ng PBG (porphobilinogen)/min/mg protein (see maps in Appendix C).

JAMP Biological Effects Methods 1997-2001 - Norway
136 NIVA report no. 4649-2003
A EROD in fish liver
1
10
100
1000
30B
Cod
36B
Cod
15B
Cod
53B
Cod
67B
Cod
23B
Cod
98B
Cod
10B
Cod
53B
Flo
unde
r
67B
Flo
unde
r
21F
Flou
nder
36F
Dab
15F
Dab
98F
Pla
ice
10F
Pla
ice
pmol
/min
/mg
prot
.
median (x)x + 1 st.devbackground
B EROD in fish liver
1
10
100
1000
30B
Cod
36B
Cod
15B
Cod
53B
Cod
67B
Cod
23B
Cod
98B
Cod
10B
Cod
53B
Flou
nder
67B
Flou
nder
21F
Flou
nder
36F
Dab
15F
Dab
98F
Plai
ce
10F
Plai
ce
pmol
/min
/mg
prot
.
median (x)x + 1 st.devbackground
C EROD in fish liver
1
10
100
1000
30B
Cod
36B
Cod
15B
Cod
53B
Cod
67B
Cod
23B
Cod
98B
Cod
10B
Cod
53B
Flou
nder
67B
Flou
nder
21F
Flou
nder
36F
Dab
15F
Dab
98F
Plai
ce
10F
Plai
ce
pmol
/min
/mg
prot
.
median (x)x + 1 st.devbackground
Figure 14. Median and standard deviation concentration for EROD (Cytochrome P4501A-activity) in fish liver 1997 (A), 1998 (B) and 1999 (C), pmol/min/mg protein (see maps in Appendix C).
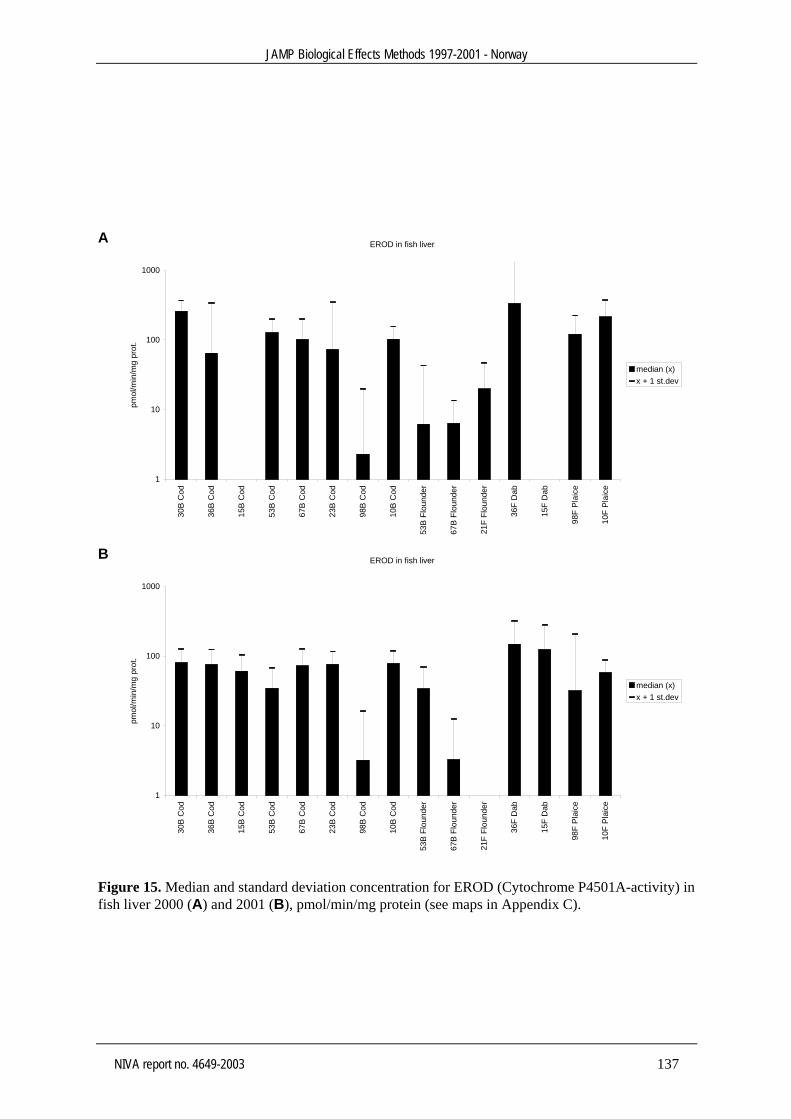
JAMP Biological Effects Methods 1997-2001 - Norway
NIVA report no. 4649-2003 137
A EROD in fish liver
1
10
100
1000
30B
Cod
36B
Cod
15B
Cod
53B
Cod
67B
Cod
23B
Cod
98B
Cod
10B
Cod
53B
Flo
unde
r
67B
Flo
unde
r
21F
Flou
nder
36F
Dab
15F
Dab
98F
Pla
ice
10F
Pla
ice
pmol
/min
/mg
prot
.
median (x)x + 1 st.dev
B EROD in fish liver
1
10
100
1000
30B
Cod
36B
Cod
15B
Cod
53B
Cod
67B
Cod
23B
Cod
98B
Cod
10B
Cod
53B
Flo
unde
r
67B
Flo
unde
r
21F
Flou
nder
36F
Dab
15F
Dab
98F
Pla
ice
10F
Pla
ice
pmol
/min
/mg
prot
.
median (x)x + 1 st.dev
Figure 15. Median and standard deviation concentration for EROD (Cytochrome P4501A-activity) in fish liver 2000 (A) and 2001 (B), pmol/min/mg protein (see maps in Appendix C).

JAMP Biological Effects Methods 1997-2001 - Norway
138 NIVA report no. 4649-2003
A Metalthionine in fish liver
0
5
10
15
20
25
30
35
40
45
50
30B
Cod
36B
Cod
15B
Cod
53B
Cod
67B
Cod
23B
Cod
98B
Cod
10B
Cod
53B
Flo
unde
r
67B
Flo
unde
r
21F
Flou
nder
36F
Dab
15F
Dab
98F
Pla
ice
10F
Pla
ice
ug/
mg
prot
.
median (x)x + 1 st.devbackground
B Metalthionine in fish liver
0
5
10
15
20
25
30
35
40
45
50
30B
Cod
36B
Cod
15B
Cod
53B
Cod
67B
Cod
23B
Cod
98B
Cod
10B
Cod
53B
Flou
nder
67B
Flou
nder
21F
Flou
nder
36F
Dab
15F
Dab
98F
Plai
ce
10F
Plai
ce
ug/
mg
prot
.
median (x)x + 1 st.devbackground
C Metalthionine in fish liver
0
5
10
15
20
25
30
35
40
45
50
30B
Cod
36B
Cod
15B
Cod
53B
Cod
67B
Cod
23B
Cod
98B
Cod
10B
Cod
53B
Flou
nder
67B
Flou
nder
21F
Flou
nder
36F
Dab
15F
Dab
98F
Plai
ce
10F
Plai
ce
ug/
mg
prot
.
median (x)x + 1 st.devbackground
Figure 16. Median and standard deviation concentration for MT (Metallothionein) in fish blood 1997 (A), 1998 (B) and 1999 (C), µg/mg prot. (see maps in Appendix C).

JAMP Biological Effects Methods 1997-2001 - Norway
NIVA report no. 4649-2003 139
A Metallothionein in fish liver
0
5
10
15
20
25
30
35
40
45
50
30B
Cod
36B
Cod
15B
Cod
53B
Cod
67B
Cod
23B
Cod
98B
Cod
10B
Cod
53B
Flo
unde
r
67B
Flo
unde
r
21F
Flou
nder
36F
Dab
15F
Dab
98F
Pla
ice
10F
Pla
ice
ug/
mg
prot
.
median (x)x + 1 st.dev
B Metallothionein in fish liver
0
5
10
15
20
25
30
35
40
45
50
30B
Cod
36B
Cod
15B
Cod
53B
Cod
67B
Cod
23B
Cod
98B
Cod
10B
Cod
53B
Flo
unde
r
67B
Flo
unde
r
21F
Flou
nder
36F
Dab
15F
Dab
98F
Pla
ice
10F
Pla
ice
ug/
mg
prot
.
median (x)x + 1 st.dev
Figure 17. Median and standard deviation concentration for MT (Metallothionein) in fish blood 2000 (A) and 2001 (B), µg/mg prot. (see maps in Appendix C).