4.4 Exercises
20
Section 4.4 Absolute Value Inequalities 405 Version: Fall 2007 4.4 Exercises For each of the inequalities in Exercises 1- 10, perform each of the following tasks. i. Set up a coordinate system on a sheet of graph paper. Label and scale each axis. ii. Sketch the graph of each side of the inequality without the aid of a cal- culator. Label each graph with its equation. iii. Shade the solution of the inequality on the x-axis (if any) in the manner shown in Figures 4 and 8 in the narra- tive. That is, drop dashed lines from the points of intersection to the axis, then shade and label the solution set on the x-axis. Use set-builder and interval notation (when possible) to describe your solution set. 1. |x| > −2 2. |x| > 0 3. |x| < 3 4. |x| > 2 5. |x| > 1 6. |x| < 4 7. |x|≤ 0 8. |x|≤−2 9. |x|≤ 2 10. |x|≥ 1 Copyrighted material. See: http://msenux.redwoods.edu/IntAlgText/ 1 For each of the inequalities in Exercises 11- 22, perform each of the following tasks. i. Load each side of the inequality into the Y= menu of your calculator. Ad- just the viewing window so that all points of intersection of the two graphs are visible in the viewing window. ii. Copy the image in your viewing screen onto your homework paper. Label each axis and scale each axis with xmin, xmax, ymin, and ymax. La- bel each graph with its equation. iii. Use the intersect utility in the CALC menu to determine the points of in- tersection. Shade the solution of the inequality on the x-axis (if any) in the manner shown in Figures 4 and 8 in the narrative. That is, drop dashed lines from the points of intersection to the axis, then shade and label the solution set on the x-axis. Use set- builder and interval notation (when appropriate) to describe your solution set. 11. |3 − 2x| > 5 12. |2x +7| < 4 13. |4x +5| < 7 14. |5x − 7| > 8 15. |4x +5| > −2 16. |3x − 5| < −3 17. |2x − 9|≥ 6 18. |3x + 25|≥ 8
-
Upload
khangminh22 -
Category
Documents
-
view
0 -
download
0
Transcript of 4.4 Exercises

Section 4.4 Absolute Value Inequalities 405
Version: Fall 2007
4.4 Exercises
For each of the inequalities in Exercises 1-10, perform each of the following tasks.
i. Set up a coordinate system on a sheetof graph paper. Label and scale eachaxis.
ii. Sketch the graph of each side of theinequality without the aid of a cal-culator. Label each graph with itsequation.
iii. Shade the solution of the inequalityon the x-axis (if any) in the mannershown in Figures 4 and 8 in the narra-tive. That is, drop dashed lines fromthe points of intersection to the axis,then shade and label the solution seton the x-axis. Use set-builder andinterval notation (when possible) todescribe your solution set.
1. |x| > −2
2. |x| > 0
3. |x| < 3
4. |x| > 2
5. |x| > 1
6. |x| < 4
7. |x| ≤ 0
8. |x| ≤ −2
9. |x| ≤ 2
10. |x| ≥ 1
Copyrighted material. See: http://msenux.redwoods.edu/IntAlgText/1
For each of the inequalities in Exercises 11-22, perform each of the following tasks.
i. Load each side of the inequality intothe Y= menu of your calculator. Ad-just the viewing window so that allpoints of intersection of the two graphsare visible in the viewing window.
ii. Copy the image in your viewing screenonto your homework paper. Labeleach axis and scale each axis withxmin, xmax, ymin, and ymax. La-bel each graph with its equation.
iii. Use the intersect utility in the CALCmenu to determine the points of in-tersection. Shade the solution of theinequality on the x-axis (if any) in themanner shown in Figures 4 and 8 inthe narrative. That is, drop dashedlines from the points of intersectionto the axis, then shade and label thesolution set on the x-axis. Use set-builder and interval notation (whenappropriate) to describe your solutionset.
11. |3− 2x| > 5
12. |2x+ 7| < 4
13. |4x+ 5| < 7
14. |5x− 7| > 8
15. |4x+ 5| > −2
16. |3x− 5| < −3
17. |2x− 9| ≥ 6
18. |3x+ 25| ≥ 8

406 Chapter 4 Absolute Value Functions
Version: Fall 2007
19. |13− 2x| ≤ 7
20. |2x+ 15| ≤ 7
21. |3x− 11| > 0
22. |4x+ 19| ≤ 0
For each of the inequalities in Exercises 23-32, provide a purely algebraic solutionwithout the use of a calculator. Showall of your work that leads to the solu-tion, shade your solution set on a num-ber line, then use set-builder and intervalnotation (if possible) to describe your so-lution set.
23. |4x+ 3| < 8
24. |3x− 5| > 11
25. |2x− 3| ≤ 10
26. |3− 5x| ≥ 15
27. |3x− 4| < 7
28. |5− 2x| > 10
29. |3− 7x| ≥ 5
30. |2− 11x| ≤ 6
31. |x+ 2| ≥ −3
32. |x+ 5| < −4
For each of the inequalities in Exercises 33-38, perform each of the following tasks.
i. Arrange each of the following partson your homework paper in the samelocation. Do not do place the alge-braic work on one page and the graph-ical work on another.
ii. Follow each of the directions given forExercises 11-22 to find and record
a solution with your graphing calcu-lator.
iii. Provide a purely algebraic solution,showing all the steps of your work.Sketch your solution on a number line,then use set-builder and interval no-tation to describe your solution set.Do these solutions compare favorablywith those found using your graphingcalculator in part (ii)? If not, look fora mistake in your work.
33. |x− 8| < 7
34. |2x− 15| > 5
35. |2x+ 11| ≥ 6
36. |5x− 21| ≤ 7
37. |x− 12| > 6
38. |x+ 11| < 5
Use a strictly algebraic technique to solveeach of the equations in Exercises 39-46. Do not use a calculator. Shade thesolution set on a number line and de-scribe the solution set using both set-builder and interval notation.
39. |x+ 2| − 3 > 4
40. 3|x+ 5| < 6
41. −2|3− 2x| ≤ −6
42. |4− x|+ 5 ≥ 12
43. 3|x+ 2| − 5 > |x+ 2|+ 7
44. 4− 3|4− x| > 2|4− x| − 1
45.∣∣∣∣x3 − 1
4
∣∣∣∣ ≤ 112
46.∣∣∣∣x4 − 1
2
∣∣∣∣ ≥ 23

Section 4.4 Absolute Value Inequalities 407
Version: Fall 2007
Use the technique of distance on the num-ber line demonstrated in Examples 21and 22 to solve each of the inequalities inExercises 47-50. Provide number linesketches as in Example 17 in the narra-tive. Describe the solution set using bothset-builder and interval notation.
47. |x− 5| < 8
48. |x− 2| > 4
49. |x+ 4| ≥ 3
50. |x+ 2| ≤ 11
Use the instructions provided in Exercises 11-22 to solve the inequalities in Exercises 51-52. Describe the solution set using bothset-builder and interval notation.
51. |x+ 2| < 13x+ 5
52. |x− 3| > 5− 12x
In Exercises 53-54, perform each of thefollowing tasks.
i. Set up a coordinate system on graphpaper. Label and scale each axis.
ii. Without the use of a calculator, sketchthe graphs of the left- and right-handsides of the given inequality. Labeleach graph with its equation.
iii. Shade the solution of the inequalityon the x-axis (if any) in the man-ner shown in Figures 4 and 8 in thenarrative. That is, drop dashed linesfrom the points of intersection to theaxis, then shade and label the solu-tion set on the x-axis (you will haveto approximate). Describe the solu-tion set using both set-builder and in-terval notation.
53. |x− 2| > 13x+ 2
54. |x+ 4| < 13x+ 4

Chapter 4 Absolute Value Functions
Version: Fall 2007
4.4 Solutions
1. Sketch the graph of y = |x| on graph paper. Plotting points such as (−5, 5), (0, 0),and (5, 5) will help provide accuracy. Sketch the graph of y = −2.
x5
y5 y=|x|
y=−2
The question asks us to solve the inequality |x| > −2. Hence, we need to locate wherethe graph of y = |x| lies above the graph of y = −2. This is true for all values of x.Thus, the solution is R = (−∞,∞). Note that this solution is shaded on the x-axis.
3. Sketch the graph of y = |x| on graph paper. Plotting points such as (−5, 5), (0, 0),and (5, 5) will help provide accuracy. Sketch the graph of y = 3. Drop dashed linesfrom the points of intersection to the x-axis and label these points with their x-values.
x5
y5 y=|x|
y=3
−3 3
To find the solution of |x| < 3, note where the graph of y = |x| lies below the graphof y = 3. This occurs for all values of x between −3 and 3. This set is shaded on thex-axis and described with the following notation: (−3, 3) = {x : −3 < x < 3}.
5. Sketch the graph of y = |x| on graph paper. Plotting points such as (−5, 5), (0, 0),and (5, 5) will help provide accuracy. Sketch the graph of y = 1. Drop dashed linesfrom the points of intersection to the x-axis and label these points with their x-values.

Section 4.4 Absolute Value Inequalities
Version: Fall 2007
x5
y5 y=|x|
y=1
−1 1
To find the solution of |x| > 1, note where the graph of y = |x| lies above the graph ofy = 1. This occurs for values of x that lie to the left of −1 or to the right of 1. This setis shaded on the x-axis and described with the following notation: (−∞,−1) ∪ (1,∞)or {x : x < −1 or x > 1}.
7. Sketch the graph of y = |x| on graph paper. Plotting points such as (−5, 5), (0, 0),and (5, 5) will help provide accuracy. Sketch the graph of y = 0. This is a somewhatunusual case as the two graphs intersect at only one point, namely x = 0.
x5
y5 y=|x|
y=00
To find the solution of |x| ≤ 0, we need to find where the graph of y = |x| lies belowthe line y = 0 (this never happens) or where the graph of y = |x| intersects the graphof y = 0 (this happens at only one place, x = 0). Thus, the solution of |x| ≤ 0 isx = 0. That is why you only see x = 0 shaded on the x-axis. In set-builder notation,the solution is {x : x = 0}.
9. Sketch the graph of y = |x| on graph paper. Plotting points such as (−5, 5), (0, 0),and (5, 5) will help provide accuracy. Sketch the graph of y = 2. Drop dashed linesfrom the points of intersection to the x-axis and label these points with their x-values.

Chapter 4 Absolute Value Functions
Version: Fall 2007
x5
y5 y=|x|
y=2
−2 2
To find the solution of |x| ≤ 2, we need to find where the graph of y = |x| lies belowthe graph of y = 2 (this happens for all values of x between −2 and 2) or where thegraph of y = |x| intersects the graph of y = 2 (this happens at x = −2 and x = 2).Hence, we shade on the x-axis all points that lie between −2 and 2, then we shade thepoints −2 and 2 as well. This solution set is described with the following notation:[−2, 2] = {x : −2 ≤ x ≤ 2}.
11. Load y = |3− 2x| into Y1 and y = 5 into Y2, as shown in (a). Use the intersectutility from the CALC menu to determine the points of intersection shown in (b) and(c).
(a) (b) (c)
Copy the image onto your homework paper. Drop dashed lines from the points ofintersection to the x-axis and label the x-values.
x
y
−10 10
−10
10 y=|3−2x|
y=5
−1 4

Section 4.4 Absolute Value Inequalities
Version: Fall 2007
We’re asked to solve |3− 2x| > 5, so we must find where the graph of y = |3− 2x| liesabove the graph of y = 5. This happens for all values of x that lie to the left of −1 orto the right of 4, which we’ve shaded on the x-axis. This solution set is described withthe following notation: (−∞,−1) ∪ (4,∞) or {x : x < −1 or x > 4}.
13. Load y = |4x+ 5| into Y1 and y = 7 into Y2, as shown in (a). Use the intersectutility from the CALC menu to determine the points of intersection shown in (b) and(c).
(a) (b) (c)
Copy the image onto your homework paper. Drop dashed lines from the points ofintersection to the x-axis and label the x-values.
x
y
−10 10
−10
10 y=|4x+5|y=7
−3 0.5
We’re asked to solve |4x+ 5| < 7, so we must find where the graph of y = |4x+ 5| liesbelow the graph of y = 7. This happens for all values of x that lie between −3 and0.5, which we’ve shaded on the x-axis. This solution set is described with the followingnotation: (−3, 0.5) = {x : −3 < x < 0.5}.

Chapter 4 Absolute Value Functions
Version: Fall 2007
15. Load y = |4x + 5| into Y1 and y = −2 into Y2, as shown in (a). Note that thegraph of y = |4x+ 5| does not intersect the graph of y = −2, as shown in (b).
(a) (b)
Copy the image onto your homework paper.
x
y
−10 10
−10
10 y=|4x+5|
y=−2
We’re asked to solve |4x + 5| > −2, so we must find where the graph of y = |4x + 5|lies above the graph of y = −2. This is true for all values of x, which we’ve shaded onthe x-axis. This solution set is best described with R = (−∞,∞).
17. Load y = |2x − 9| into Y1 and y = 6 into Y2, as shown in (a). Adjust theWINDOW parameters as shown in (b). Use the intersect utility from the CALC menu todetermine the points of intersection shown in (c) and (d).
(a) (b) (c) (d)
Copy the image onto your homework paper. Drop dashed lines from the points ofintersection to the x-axis and label the x-values.
Section 4.4 Absolute Value Inequalities
Version: Fall 2007
x
y
−5 15
−10
10 y=|2x−9|
y=6
1.5 7.5
We’re asked to solve |2x− 9| ≥ 6, so we must find where the graph of y = |2x− 9| liesabove the graph of y = 6 (this happens for all values of x that lie to the left of 1.5 or tothe right of 7.5), or where the graph of y = |2x−9| intersects the graph of y = 6 (thishappens at x = 1.5 and x = 7.5). We’ve shaded these on the x-axis. This solution set isdescribed with the following notation: (−∞, 1.5]∪ [7.5,∞) or {x : x ≤ 1.5 or x ≥ 7.5}.
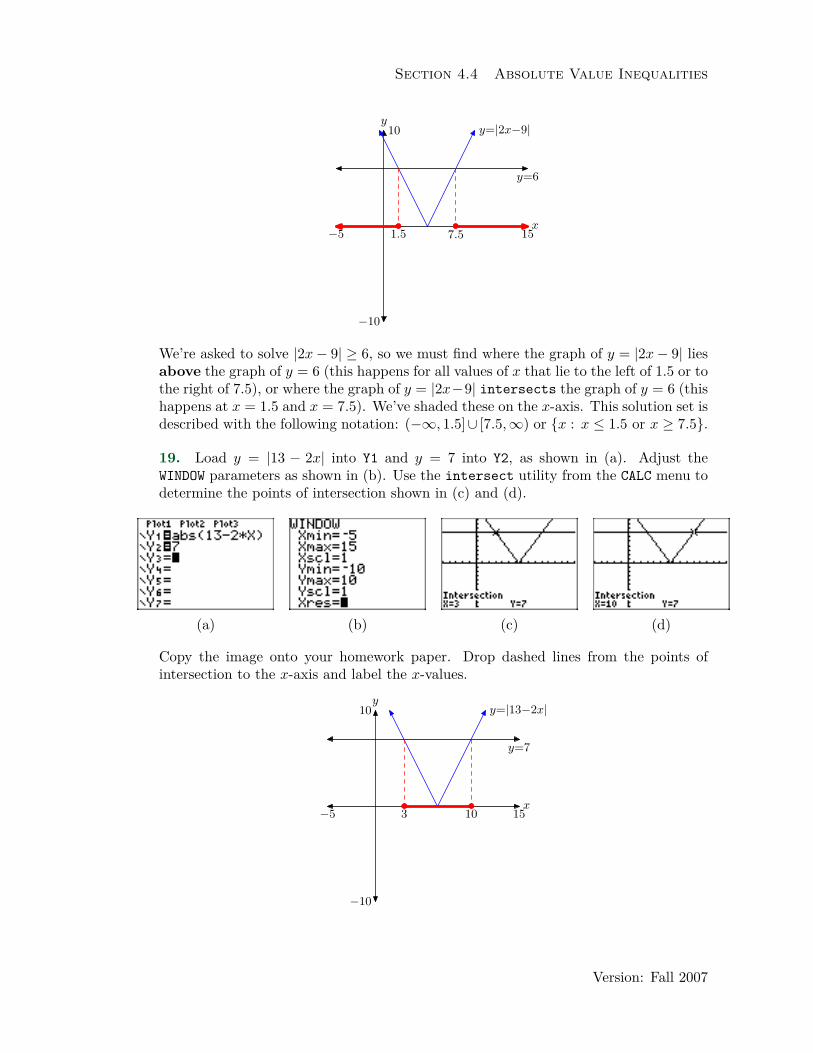
19. Load y = |13 − 2x| into Y1 and y = 7 into Y2, as shown in (a). Adjust theWINDOW parameters as shown in (b). Use the intersect utility from the CALC menu todetermine the points of intersection shown in (c) and (d).
(a) (b) (c) (d)
Copy the image onto your homework paper. Drop dashed lines from the points ofintersection to the x-axis and label the x-values.
x
y
−5 15
−10
10 y=|13−2x|
y=7
3 10

Chapter 4 Absolute Value Functions
Version: Fall 2007
We’re asked to solve |13 − 2x| ≤ 7, so we must find where the graph of y = |13 − 2x|lies below the graph of y = 7 (this happens for all values of x that lie between 3 and10), or where the graph of y = |13− 2x| intersects the graph of y = 7 (this happensat x = 3 and x = 10). We’ve shaded these on the x-axis. This solution set is describedwith the following notation: [3, 10] = {x : 3 ≤ x ≤ 10}.
21. Load y = |3x−11| into Y1, then select 6:ZStandard on the ZOOM menu to producethe image shown in (b).
(a) (b)
Copy the image onto your homework paper.
x
y
−10 10
−10
10 y=|3x−11|
y=0 11/3
We’re asked to solve |3x − 11| > 0, so we must find where the graph of y = |3x − 11|lies above the x-axis. This is true for all values of x except where the vertex touchesthe x-axis. This point is easily found with this calculation.
3x− 11 = 03x = 11x = 11/3
Thus, the graph of y = |3x − 11| lies above the x-axis for all values of x except 11/3.This solution set is described with the following notation: {x : x 6= 11/3}.
23. To solve |4x+ 3| < 8, set
−8 < 4x+ 3 < 8,
subtract 3 from all three members, then divide all three members of the resultinginequality by 4.

Section 4.4 Absolute Value Inequalities
Version: Fall 2007
−11 < 4x < 5
−114< x <
54
Sketch the solution on a number line.
−11/4 5/4
The solution set is described with the following notation: (−11/4, 5/4) = {x : −11/4 <x < 5/4}.
25. To solve |2x− 3| ≤ 10, set
−10 ≤ 2x− 3 ≤ 10,
add 3 to all three members, then divide all three members of the resulting inequalityby 2.
−7 ≤ 2x ≤ 13
−72≤ x ≤ 13
2Sketch the solution on a number line.
−7/2 13/2
The solution set is described with the following notation: [−7/2, 13/2] = {x : −7/2 ≤x ≤ 13/2}.
27. To solve |3x− 4| < 7, set
−7 < 3x− 4 < 7,
add 4 to all three members, then divide all three members of the resulting inequalityby 3.
−3 < 3x < 11
−1 < x < 113
Sketch the solution on a number line.
−1 11/3
The solution set is described with the following notation: (−1, 11/3) = {x : −1 < x <11/3}.

Chapter 4 Absolute Value Functions
Version: Fall 2007
29. To solve |3− 7x| ≥ 5, set
3− 7x ≤ −5 or 3− 7x ≥ 5.
Solve each inequality independently by first subtracting 3 from each side of each in-equality, then dividing both sides of each inequality by −7, reversing the inequalitysymbols as we do so.
− 7x ≤ −8 or − 7x ≥ 2
x ≥ 87
x ≤ −27
We write the last inequality in the more natural order x ≤ −2/7 or x ≥ 8/7 and sketchthe solution on a number line.
−2/7 8/7
We describe the solution with the following notation: (−∞,−2/7] ∪ [8/7,∞) or {x :x ≤ −2/7 or x ≥ 8/7}
31. To solve the inequality |x+2| ≥ −3, it is easiest to reason that the absolute valuewill be greater than or equal to −3 for all values of x. Sketch the solution on a numberline.
Hence, the following notation is used to describe the solution set: R = (−∞,∞).
33. Load y = |x−8| in Y1 and y = 7 in Y2, as shown in (a). Set the WINDOW parametersas shown in (b). Use the intersect utility from the CALC menu to find the points ofintersection shown in (c) and (d).
(a) (b) (c) (d)
Copy the image onto your homework paper. Drop dashed lines from the points ofintersection to the x-axis and label the x-values.

Section 4.4 Absolute Value Inequalities
Version: Fall 2007
x
y
−5 20
−10
10 y=|x−8|
y=7
1 15
To find the solution of |x − 8| < 7 note that the graph of y = |x − 8| falls below thegraph of y = 7 for all values of x between 1 and 15. We’ve shaded these solutions onthe x-axis.To solve |x− 8| < 7 algebraically, set
−7 < x− 8 < 7,
then add 8 to all three members of the inequality.
1 < x < 15
Note that this solution matches the graphical solution found above. We describe thesolution using the following notation: (1, 15) = {x : 1 < x < 15}
35. Load y = |2x + 11| in Y1 and y = 6 in Y2, as shown in (a). Set the WINDOWparameters as shown in (b). Use the intersect utility from the CALC menu to find thepoints of intersection shown in (c) and (d).
(a) (b) (c) (d)
Copy the image onto your homework paper. Drop dashed lines from the points ofintersection to the x-axis and label the x-values.

Chapter 4 Absolute Value Functions
Version: Fall 2007
x
y
−15 5
−10
10y=|2x+11|
y=6
−8.5 −2.5
To find the solution of |2x+ 11| ≥ 6, note where the graph of y = |2x+ 11| falls abovethe graph of y = 6 (this happens for values of x that lie to the left of −8.5 or to theright of −2.5), then note where the graph of y = |2x+ 11| intersects the graph of y = 6(this happens at x = −8.5 and x = −2.5). We’ve shaded these solutions on the x-axis.To solve |2x+ 11| ≥ 6 algebraically, set
2x+ 11 ≤ −6 or 2x+ 11 ≥ 6.
Solve each inequality independently by first subtracting 11 from each side of eachinequality, then dividing both sides of each inequality by 2.
2x ≤ −17 or 2x ≥ −5
x ≤ −172
x ≥ −52
Note that this solution matches the graphical solution found above. We describe the so-lution using the following notation: (−∞,−17/2]∪[−5/2,∞) or {x : x ≤ −17/2 or x ≥−5/2}.
37. Load y = |x − 12| in Y1 and y = 6 in Y2, as shown in (a). Set the WINDOWparameters as shown in (b). Use the intersect utility from the CALC menu to find thepoints of intersection shown in (c) and (d).
(a) (b) (c) (d)
Copy the image onto your homework paper. Drop dashed lines from the points ofintersection to the x-axis and label the x-values.

Section 4.4 Absolute Value Inequalities
Version: Fall 2007
x
y
−5 25
−10
10 y=|x−12|
y=6
6 18
To find the solution of |x − 12| > 6, note where the graph of y = |x − 12| lies abovethe graph of y = 6 (this happens for values of x that lie to the left of 6 or to the rightof 18). We’ve shaded these solutions on the x-axis.To solve |x− 12| > 6 algebraically, set
x− 12 < −6 or x− 12 > 6.
Solve each inequality independently by adding 12 to each side of each inequality.
x < 6 or x > 18
Note that this solution matches the graphical solution found above. We describe thesolution using the following notation: (−∞, 6) ∪ (18,∞) or {x : x < 6 or x > 18}.
39. To solve |x + 2| − 3 > 4, start by adding 3 to both sides of the inequality toproduce the equivalent inequality
|x+ 2| > 7.
Next, set
x+ 2 < −7 or x+ 2 > 7.
Solve each inequality independently by subtracting 2 from each side of each inequality.
x < −9 or x > 5
Sketch the solution on a number line.
−9 5
We describe the solution set with the following notation: (−∞,−9) ∪ (5,∞) or {x :x < −9 or x > 5}.
41. To solve the inequality −2|3 − 2x| ≤ −6, start by dividing both sides of theinequality by −2, reversing the inequality symbol.
|3− 2x| ≥ 3
Set

Chapter 4 Absolute Value Functions
Version: Fall 2007
3− 2x ≤ −3 or 3− 2x ≥ 3.
Solve each inequality independently by first subtracting 3 from each side of each in-equality, then dividing both sides of each inequality by −2, reversing the inequalitysymbols as we do so.
− 2x ≤ −6 or − 2x ≥ 0
x ≥ 3 x ≤ 0
We write this solution in a more natural order using the following notation: (−∞, 0]∪[3,∞) or {x : x ≤ 0 or x ≥ 3}.Sketch this solution on a number line.
0 3
43. To solve the inequality 3|x+ 2| − 5 > |x+ 2|+ 7, first add 5 to both sides of theinequality, then subtract |x+ 2| from both sides of the inequality.
3|x+ 2| − |x+ 2| > 7 + 52|x+ 2| > 12
Divide both sides of the last inequality by 2.
|x+ 2| > 6
Set
x+ 2 < −6 or x+ 2 > 6.
Solve each inequality independently by subtracting 2 from each side of each inequality.
x < −8 or x > 4
Sketch the solution on a number line.
−8 4
We describe the solution set using the following notation: (−∞,−8) ∪ (4,∞) or {x :x < −8 or x > 4}
45. To solve the inequality |x/3 − 1/4| ≤ 1/12, first multiply both sides of the in-equality by 12.

Section 4.4 Absolute Value Inequalities
Version: Fall 2007
12∣∣∣∣x3 − 1
4
∣∣∣∣ ≤ 12(
112
)|12|∣∣∣∣x3 − 1
4
∣∣∣∣ ≤ 1∣∣∣∣12(x
3− 1
4
)∣∣∣∣ ≤ 1
|4x− 3| ≤ 1
Set
−1 ≤ 4x− 3 ≤ 1,
add 3 to all three members, then divide all three members of the resulting inequalityby 4.
2 ≤ 4x ≤ 412≤ x ≤ 1
Sketch the solution on a number line.
1/2 1
We describe this solution set using the notation: [1/2, 1] = {x : 1/2 ≤ x ≤ 1}.
47. The inequality |x − 5| < 8 is pronounced “the distance between x and 5 is lessthan 8.” Draw a number line and mark 5 on the line. Next, mark −3 and 13, both ofwhich are 8 units away from 5.
5−3 13
8 8
We want the numbers that are less than 8 units away from 5. These are the numbersthat lie between −3 and 13, which are shaded on the number line above. This solutionset is described with the following notation: (−3, 13) = {x : −3 < x < 13}
49. First, the inequality |x + 4| ≥ 3 is equivalent to the inequality |x − (−4)| ≥ 3.This latter inequality is pronounced “the distance between x and −4 is greater thanor equal to 3.” Draw a number line and mark −4 on the line. Next, mark −7 and −1,both of which are 3 units away from −4.
−4−7 −1
3 3

Chapter 4 Absolute Value Functions
Version: Fall 2007
We want the numbers that are more than 3 units away from −1. These are thenumbers that lie to the left of −7 or to the right of −1. We also need the numbersthat are exactly 3 units away from −4, namely −7 and −1, which are shaded onthe number line above. This solution set is described with the following notation:(−∞,−7] ∪ [−1,∞) or {x : x ≤ −7 or x ≥ −1}.
51. Load the equations y = |x + 2| into Y1 and y = (1/3)x + 5 into Y2, as shown in(a), then select 6:ZStandard from the ZOOM menu. Use the intersect utility from theCALC menu to determine the points of intersection, as shown in (b) and (c).Copy the image onto your homework. Drop dashed vertical lines from the points ofintersection to the x-axis and label the x-values.
x
y
−10 10
−10
10y=|x+2|
y=x/3+5
−5.25 4.5
Note that the graph of y = |x+ 2| lies below the graph of y = (1/3)x+ 5 for all valuesof x that lie between −5.25 and 4.5. These solutions are shaded on the x-axis aboveand are described with the following notation: (−5.25, 4.5) = {x : −5.25 < x < 4.5}
53. There are a number of ways that you can draw an accurate graph of y = |x− 2|.One, you can do a number line analysis.
|x−2| −(x−2) x−2
x−2 − 2 +
This leads to the piecewise definition
y ={−x+ 2, if x < 2,x− 2, if x ≥ 2.
This can be used to draw the graph of y = |x−2| in the figure that follows. Alternatively,we know that y = |x− 2| is a “V” that is shifted 2 units to the right. Plotting a pointon each side of the vertex point should lead to the graph shown below.The graph of y = (1/3)x+ 2 is a line having slope m = 1/3 and y-intercept (0, 2). Plotthe y-intercept at (0, 2), then move 3 units to the right and 1 unit up to draw the lineshown below.

Section 4.4 Absolute Value Inequalities
Version: Fall 2007
The graphs intersect in two locations. Drop dashed lines from these points of intersec-tion to the x-axis and label the x-values as shown in the figure that follows.
x
y
−10 10
−10
10y=|x−2|
y=x/3+2
0 6
Finally, we need to state where the graph of y = |x − 2| lies above the graph ofy = (1/3)x + 2 (this happens for values of x that lie to the left of 0 or to the right of6). These solutions are shaded on the x-axis in the figure above and can be describedusing the following notation: (−∞, 0) ∪ (6,∞) or {x : x < 0 or x > 6}.