429.pdf - Rockefeller University Press
16
EXPERIMENTAL STUDY OF OSMOSIS THROUGH A COLLODION MEMBRANE* BY GIACOMO MESCHIA Am} IVO SETNIKAR$ (From the Department of Physiology, Yale University, School of Medicine, New Haven) (Received for publication, April 15, 1958) ABSTRACT Experiments were carried out on a collodion membrane in order to study the fac- tors that determine direction and magnitude of net flow of water across a membrane permeable to the solvent and to some of the solutes present. The solutes used were all non-ionic. When only one solute was present and there was no difference of hydro- static pressure across the membrane, water flowed toward the side where its vapor pressure was lower, but the rate of transfer depended upon the nature of the solute: for a given difference in osmolality across the membrane, the rate increased with the molecular volume of the solute and reached its maximum with the solute to which the membrane was impermeable. These results led to the experimental demonstration that in the presence of two or more solutes of different molecular volumes, of which one at least can diffuse through the barrier, the net transfer of water can take place against its vapor pressure gradient. Some of the physicochemical and physiological implications of the data are discussed. INTRODUCTION Osmosis is often defined as the flow of solvent across a membrane from the compartment where the vapor pressure of the solvent is higher to the com- partment where it is lower. Analogous definitions of osmosis state that the os- motic flow takes place according to the difference in chemical potential, or "escaping tendency" or "activity" of the solvent across the membrane. The above definitions of osmosis and the theory that the difference in vapor pressure of the solvent determines the direction and the rate of the osmotic transfer of water have been largely accepted and used by physiologists in their studies of the phenomenon of osmosis in biological systems. Whenever a trans- fer of water is known to occur across a biological membrane, it is customary to sample the two fluids that the membrane separates and determine their vapor pressures or their freezing points and to measure the difference of pres- sure across the membrane (little attention has been paid, until recently, to * Aided by grants from the Division of Research Grants and Fellowships, National Institute of Health, United States Public Health Service, and the Josiah Macy, Jr. Foundation. Toscanini Fellow. 429 J. GI~. PHYsIoy~., 1958, Vol. 42, No. 2 The Journal of General Physiology Downloaded from http://rupress.org/jgp/article-pdf/42/2/429/1241960/429.pdf by guest on 13 January 2022
-
Upload
khangminh22 -
Category
Documents
-
view
0 -
download
0
Transcript of 429.pdf - Rockefeller University Press

E X P E R I M E N T A L STUDY OF OSMOSIS THROUGH A COLLODION MEMBRANE*
BY GIACOMO MESCHIA Am} IVO SETNIKAR$
(From the Department of Physiology, Yale University, School of Medicine, New Haven)
(Received for publication, April 15, 1958)
ABSTRACT
Experiments were carried out on a collodion membrane in order to study the fac- tors that determine direction and magnitude of net flow of water across a membrane permeable to the solvent and to some of the solutes present. The solutes used were all non-ionic. When only one solute was present and there was no difference of hydro- static pressure across the membrane, water flowed toward the side where its vapor pressure was lower, but the rate of transfer depended upon the nature of the solute: for a given difference in osmolality across the membrane, the rate increased with the molecular volume of the solute and reached its maximum with the solute to which the membrane was impermeable. These results led to the experimental demonstration that in the presence of two or more solutes of different molecular volumes, of which one at least can diffuse through the barrier, the net transfer of water can take place against its vapor pressure gradient. Some of the physicochemical and physiological implications of the data are discussed.
INTRODUCTION
Osmosis is often defined as the flow of solvent across a membrane from the compartment where the vapor pressure of the solvent is higher to the com- partment where it is lower. Analogous definitions of osmosis state that the os- motic flow takes place according to the difference in chemical potential, or "escaping tendency" or "activity" of the solvent across the membrane.
The above definitions of osmosis and the theory that the difference in vapor pressure of the solvent determines the direction and the rate of the osmotic transfer of water have been largely accepted and used by physiologists in their studies of the phenomenon of osmosis in biological systems. Whenever a trans- fer of water is known to occur across a biological membrane, it is customary to sample the two fluids that the membrane separates and determine their vapor pressures or their freezing points and to measure the difference of pres- sure across the membrane (little attention has been paid, until recently, to
* Aided by grants from the Division of Research Grants and Fellowships, National Institute of Health, United States Public Health Service, and the Josiah Macy, Jr. Foundation.
Toscanini Fellow. 429
J. GI~. PHYsIoy~., 1958, Vol. 42, No. 2
The Journal of General Physiology
Dow
nloaded from http://rupress.org/jgp/article-pdf/42/2/429/1241960/429.pdf by guest on 13 January 2022

430 OSMOSIS THROUGH COLLODION MEMBRANE
gradients of temperature (1)). If the direction of transfer of water happens to be in accord with the difference in vapor pressure, and therefore also with the difference in chemical potential of water, then the hypothesis that water is os- motically transferred appears plausible. On the contrary, if the net movement of water happens to be in the opposite direction, i.e. against its difference in chemical potential, "ordinary osmosis" is ruled out as the possible mechanism of transfer.
An apparent exception to this way of looking at the phenomenon of osmosis is represented by Starling's hypothesis concerning the factors that determine direction and rate of water transfer across the capillary wall. According to Starling (2), these factors are the differences in hydrostatic pressure and in colloidal osmotic pressure of the proteins across the membrane. Starling him- self pointed out that his hypothesis referred to the case in which the diffusible solutes had the same concentrations they would have at equilibrium. In that case the differences in hydrostatic pressure and colloidal osmotic pressure of the proteins are the only two factors upon which the difference in vapor pres- sure of water across the membrane depends. Accordingly, Starling's hypothesis would not contradict the principle that the osmotic transfer of water depends upon the difference in vapor pressure, but it would simply represent an appli- cation of that principle to a particular situation.
I t is important to realize that ff we accept the statement that the osmotic transfer of water is determined only by the difference in vapor pressure of water across the barrier, we limit the validity of Starling's hypothesis to the case in which the diffusible solutes have come to an equilibrium on the two sides of the barrier or are quite near to it. The severe limitation imposed by this condition is shown by the following example. In the anesthetized dog the osmotic pressure of the venous plasma is about 1.5 milliosmols per kg. of water higher than that of the arterial plasma (3). The difference is due to the exchange of the respira- tory gases. Since it would be necessary to double the concentration of the plasma proteins to obtain the same effect on the osmotic pressure of plasma, it is ob- vious that the diffusible components of plasma and interstitial fluids cannot be considered at equilibrium, as far as their influence on the difference in chem- ical potential of water across the capillary membrane is concerned, even when the animal is under basal conditions. Thus, it would seem that either (1) Starling's hypothesis is not valid because the difference in chemical potential of water across the membrane does not depend solely upon the differences of hydrostatic pressure and colloidal osmotic pressure of the proteins on the two sides of the capillary membrane; or (2) the assumption that the osmotic trans- fer of water depends upon the difference in chemical potential of water across the semipermeable membrane is incorrect and therefore from the measurement of the freezing points or vapor pressures of two solutions separated by a bio- logical membrane and of their pressure difference across it we cannot infer the direction of the osmotic transfer of water.
Dow
nloaded from http://rupress.org/jgp/article-pdf/42/2/429/1241960/429.pdf by guest on 13 January 2022
GIACOMO MESCHIA AND IVO SETNIKAR 431
The definition of osmosis given at the beginning of this paper refers to ideal semipermeable membranes, permeable to the solvent, completely impermeable to all the solutes present, and we may accept its validity for such systems. But since no biological membrane is an ideal, semipermeable membrane, it is very important to determine whether such a definition is valid also for leaky membranes; i.e., membranes permeable to some or all of the solutes present. If not, it appears equally important to define the circumstances under which osmosis takes place across a leaky barrier and what the factors are that deter- mine the direction and magnitude of osmotic flow.
I I
' 2 R 1 [ Z ............... ,
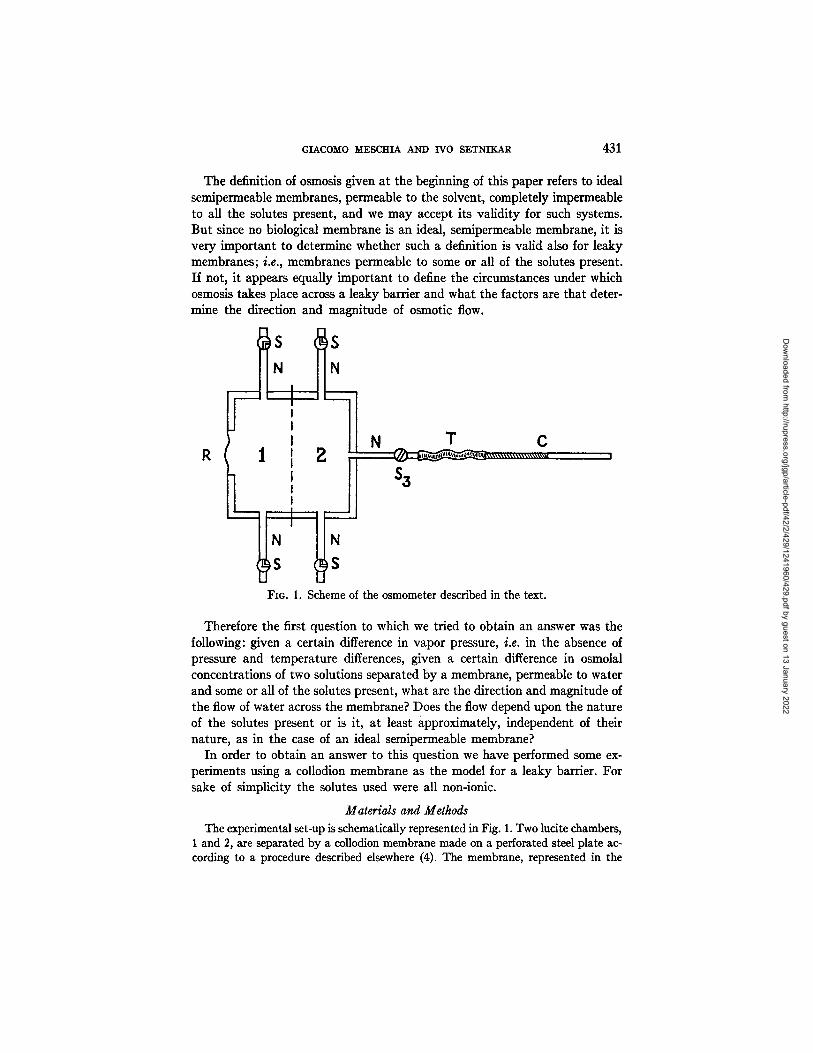
FIG. 1. Scheme of the osmometer described in the text.
Therefore the first question to which we tried to obtain an answer was the following: given a certain difference in vapor pressure, i.e. in the absence of pressure and temperature differences, given a certain difference in osmolal concentrations of two solutions separated by a membrane, permeable to water and some or all of the solutes present, what are the direction and magnitude of the flow of water across the membrane? Does the flow depend upon the nature of the solutes present or is it, at least approximately, independent of their nature, as in the case of an ideal semipermeable membrane?
In order to obtain an answer to this question we have performed some ex- periments using a collodion membrane as the model for a leaky barrier. For sake of simplicity the solutes used were all non-ionic.
Materials and Methods
The experimental set-up is schematically represented in Fig. 1. Two lucite chambers, 1 and 2, are separated by a collodion membrane made on a perforated steel plate ac- cording to a procedure described elsewhere (4). The membrane, represented in the
Dow
nloaded from http://rupress.org/jgp/article-pdf/42/2/429/1241960/429.pdf by guest on 13 January 2022

432 OSMOSIS T H R O U G H COLLODION M E M B R A N E
scheme by the dotted line, is quite rigid and does not give under the pressure differ- ences applied during some of the experiments. The volume of chamber 2 is 7.4 ml. and remains constant during the course of an experiment because all its walls are rigid. Chamber 1 has an opening covered with a thin rubber membrane, R, so that its volume can expand from 7.4 ml. to about 8.2 ml. without the development of any appreciable pressure inside the chamber. The chambers can be filled through the hypodermic needles, N, equipped with stop-cocks, S. A polyethylene tube, T, inside diameter 0.5 mm., about 50 cm. long, connects chamber 2 with capillary C, inside diameter 2 mm., which lies horizontally on a graduated scale.
In order to mix the fluids contained in chambers 1 and 2, the two chambers were rocked at a constant rate around an axis perpendicular to the surface of the mem- brane. The level of capillary C was so adjusted that there was not any appreciable movement of fluid due to hydrostatic and capillary forces. At the beginning of each experiment, tube T and about half of the capillary were filled with distilled water. Each experiment was so arranged that, ff any movement of water took place, it was from the tube into the chambers and not vice versa. This arrangement simplified the mathematical treatment of the data because the quantity of solute that during an experiment leaked from chamber 2 into capillary C was negligible and therefore the quantity of solute present in the two chambers could be taken as constant.
Hydraulic Conductivity of the Membrane:
To measure the flux of water across the membrane per unit of pressure difference, the free end of capillary C was connected to a bottle of air whose pressure with re- spect to the atmospheric could be set and changed at will. The pressure difference across the membrane was measured by means of a water manometer connected with the bottle. The flux of water through the membrane was determined by measuring the movement of the meniscus in capillary C for a given interval of time.
Experiments at Zero Pressure Difference across the Membrane: (a) Experiments with But One Solute.--At time zero, chamber 1 was filled by means
of a syringe with the solution to be tested. The quantity of solution put in chamber 1 was equal to the quantity of water contained in chamber 2. As quickly as possible, the stop-cocks of chamber 1 were closed, the apparatus set rocking, and the stop-cock S, opened. For the following 100 minutes the movement of the meniscus in capillary C was recorded. At the end of this period the rocking of the chambers was stopped, stop-cock $3 closed, and samples of the fluids contained in chambers 1 and 2 taken for analysis.
(b) Experiment with Two Solutes, Urea and Dextran.--Chamber 1 was filled with a solution of dextran, previously dialyzed against distilled water. At time zero, chamber 2 was filled with a solution of urea, the apparatus set rocking, and stop-cock $3 opened. The movement of the meniscus in capillary C was recorded for the following 60 minutes. At the end of this period samples for analysis were taken from both cham- bers.
Experiments at Constant Volume: Capillary C was replaced by a capillary of smaller inside diameter, about 0.5 ram.
The free end of this capillary was connected with the bottle of air already mentioned.
Dow
nloaded from http://rupress.org/jgp/article-pdf/42/2/429/1241960/429.pdf by guest on 13 January 2022
GIACOM0 MESCHIA AND IV0 SETNIKAR 433
At time zero, chamber 2 was filled with the solution to be tested, the two chambers set rocking, stop-cock S, opened, and the pressure in the bottle of air adjusted to prevent any movement of fluid in or out of the capillaries. For the next 100 minutes, the pressure in the bottle of air that was necessary to prevent any volume displace- ment across the collodion membrane was recorded. At the end of the 100 minute period samples were taken from the two chambers.
The solutes used were H20 is, urea, glucose, sucrose, raffinose, and dextran. Con- centrations of the solutions of urea, glucose, sucrose, and raflfinose were estimated by freezing point determinations on a 2 ml. sample with a Fiske osmometer. 1 The appa- ratus was standardized with solutions of known concentration. The osmolal concen- tration of each standard was calculated from its cryoscopic point, as given by the International Critical Tables. A solution that has a concentration of 1 osmol per kg. of water has a cryoscopic point of -1.858°C. H20 Js concentration was measured with a mass spectrograph. 2 The osmolal concentration of the dextran solution was measured directly by determining the osmotic pressure of the solution against dis- tilled water across the collodion membrane. The apparent molecular volumes of the solutes were calculated from the densities and molar concentrations of the solutions used. The over-aU change of volume that takes place in mixing two different solutions was disregarded as too small to be significant. All experiments were done at room temperature (range of variability throughout the work, +2°C.).
RESULTS
All the following results were obtained on the same membrane.
Hydraulic Conductivity of the Membrane:
The water transferred per unit time across the membrane was directly pro- portional to the applied difference of pressure: 6.9 X 10 -7 ml. sec.-~(cm.H20) -1.
Experiments at Zero Pressure Di.fferenee across the Membrane
(a) Experiments with But One Solute:
H~O18.--The solution of H20 is placed in chamber 1 at time zero was a 1.4 volumes per cent solution. Some H2018 was contained as impuri ty in the dis- tilled water of chamber 2 at the concentration of 0.2 per cent. At the end of 30 minutes the concentrations of H20 ~s in chambers 1 and 2 were, respectively, 1.075 and 0.52 per cent. No detectable movement of the meniscus in capillary C was observed during the experiment; i.e., the volume of chamber 1 remained constant. Thus, since the volume of each chamber was 7.4 ml., about 2.5 X 10 --2 ml. of H2015 were transferred from chamber 1 to chamber 2 in the 30 minute period and an exactly equal amount of water was transferred in the opposite
1 Built by the Fiske Associates, Inc., Boston. The mass spectrometric analyses were made under the guidance and with the
assistance of Dr. A. Mauro, whose generous help we gladly acknowledge.
Dow
nloaded from http://rupress.org/jgp/article-pdf/42/2/429/1241960/429.pdf by guest on 13 January 2022

434 O S M O S I S T H R O U G H C O L L O D I O N M E M B R A N E
direction. Applying Fick's equation of diffusion to the movement of the solute, J :
- d - -7 - - g ( 1 )
in which -- d]l/dt represents the flux (ml./sec.) of H20 is across the mem- brane from compartment 1 to 2, J1/V1 and J~/V2 represent the concentra- tions of H20 TM in chambers f and 2, and g is a proportionality coefficient. Since V1 = V2 == 7.4 ml., Equation 1 can be integrated:
7.4 3~ -- ]0 In (2)
g- - 2-; J2
in which J~ and J~ represent the quantities of H20 TM present in compartments 1 and 2, respectively, at the beginning of the experiment (t = 0), and J1 and J~ the quantities present at time t. Therefore g is equal to 1.58 X 10 -8 ml./sec. One mole of H,O TM per kg. of water represents a concentration of 18/1018 = 1.77 X 10- 2 ml. per ml. of solution. According to Equation 1, when the dif- ference in concentration across the membrane is 0.0177, the quantity of H20 is transferred is 2.8 X 10- s ml./sec. Because the volume of chamber 1 remained constant, 2.8 X 10- 5 ml./sec, is also the flux of water due to a difference in the concentration of H20 ~s across the membrane of 1 mole per kg. of water.
Urea.--At time zero a solution of urea, having a concentration of 543 m.osm. per kg. of water, was placed in chamber 1. Since the apparent molar volume of urea is 45 ml., the concentration of urea in the solution was, in volumes, 24.4 ml. per kg. of water or approximately 0.024 ml. per ml. of solution. After 100 minutes the concentrations of the solutions in chambers 1 and 2 were 335.4 and 207.1 m.osm, respectively; i.e., the concentration of urea had decreased to 0.015 ml./ml, in chamber 1 and increased to 0.009 ml./ml, in chamber 2. During the course of the experiment the volume of chamber 1 appeared to remain constant. Since the volume of each chamber was 7.4 ml., 0.067 ml. of urea crossed the membrane from chamber 1 to chamber 2 in the 100 minutes. As the volume of the solution in chamber 1 remained constant, we must also conclude that an equal volume of water went from chamber 2 to chamber 1 in the same period of time. Therefore the situation is analogous to that repre- sented by the experiment with H20 TM and the same mathematical treatment can be used to calculate the value of g, the proportionality coefficient in Fick's equation. On the basis of the data given above the value of g for urea is 8.5 X 10-*. An osmolal solution of urea has a concentration of about 0.043 ml./ml. Thus the quantity of urea, and therefore of water, transferred across the membrane when the difference in concentration of urea across the membrane is 1 osmol per kg. of water, is about 3.7 X 10 -5 ml./sec.
Glucose.--At time zero, a solution of glucose, millosmolality 571.5, was placed
Dow
nloaded from http://rupress.org/jgp/article-pdf/42/2/429/1241960/429.pdf by guest on 13 January 2022

GIACOM0 MESCHIA AND IVO SETNIKAR 435
in chamber 1. Since the apparent molar volume of glucose is approximately 113 m]., the concentration of glucose in the solution was circa 0.0505 ml./ml. After 100 minutes the concentrations of the solutions in chambers 1 and 2 were 393.4 and 120.6 m.osm, per kg. of water respectively or, in volumes, 0.0425 and 0.0134 ml./ml. During the course of the experiment, a considerable expansion of the volume of chamber 1 took place: from 7.4 to 7.751 ml. Therefore during the experiment about 0.1 ml. of glucose went from chamber 1 to chamber 2 and about 0.45 ml. of water went in the opposite direction.
If we assume that the rates of transfer of solute and water through the barrier are proportional to their concentration differences, we obtain the following two equations:
.Ol - e-T = e - = ~ (3 )
and
- d--T = w (4 )
in which G1 and G2, W1 and W~ are the quantities in volumes of solute and water respectively in chambers 1 and 2. Since:
WI + Gt = V1 (5)
dWl
dt
From Equations 3, 5, and 7:
dVt dt
and from Equations 3 and 8:
and W, + G, = V2 (6)
- w - ( 7 )
G1 Gt ) - ( ~ - g ) ~ - ~
dVt w -- g E
dC~ g
(8)
(9)
w - - g V~ G
V2 In g (11) g------~ w - - g
v~ G + v l - v l g
and
Since at time zero V1 = V2 and V~ is constant, on the assumption that w and g remain constant, Equations 9 and 8 can be integrated to give the following two equations:
w -- g V1 -- V2 (tO)
g G~
Dow
nloaded from http://rupress.org/jgp/article-pdf/42/2/429/1241960/429.pdf by guest on 13 January 2022

436 OSMOSIS THROUGH COLLODION MEMBRANE
in which G = C-n + Gv The value of G is approximately constant because the quantity of solute that during the experiment leaks out of chamber 2 into the tube T is negligible. Substituting in Equations 10 and 11 the experimental data:
~v - - g = 3.54 and g = 3.96 x 10 - ~ g
If V~ is plotted against time, the points represented in Fig. 2 are obtained. The same figure shows that the curve calculated according to Equation 11 is in good agreement with the experimental values. Therefore the assumption that
7 . 8 -
7.7- tU
• J 7 . 6 - . J
& 7.5-
J/ /,/ /
o doo zo'oo 45'oo t (ssco.Ds)
s~oo
FIG. 2. The volume of chamber 1 is plotted against time. At time zero 7.4 ml. of a solution of glucose (mflliosmolality 571.5) was placed in chamber 1. The curve is drawn according to Equation 11:
7.4 7.4 X 3.54 X 0.428 = 2 X 3.96 X 104 In 7.4 X 3.54 X 0.428 + 7.42 - V~
w and g remain fairly constant appears to be correct. (The proportionality con- stants ~v and g are purely empirical: the fact that Fick's equation of diffusion and Equations 3 and 4 are similar does not necessarily imply that diffusion is the only mechanism by which solvent and solute cross the membrane.) An osmolal solution of glucose contains 113 ml. of glucose per kg. of water or, approximately, 0.1 ml. of glucose per ml. of solution. According to Equation 4, when the difference in concentration of glucose across the membrane is 0.1 ml./ml, and w is 1.8 X 10 -a, the flux of water is 1.8 X 10 ~ ml./sec.: this is therefore the flux of water across the membrane when the difference in osmolal- ity on the two sides of it is 1.
Sucrose and Raffinose.--The experiments carried out with sucrose and raf- finose as solutes gave results completely analogous to those obtained with
Dow
nloaded from http://rupress.org/jgp/article-pdf/42/2/429/1241960/429.pdf by guest on 13 January 2022

GIACOMO MESCHIA AND IVO SETNIKAR 437
glucose; in these experiments also a conspicuous expansion of the volume of the solution contained in chamber 1 took place. The coefficients g and w calculated by means of Equations I0 and 11 for sucrose and raffinose are given in Table I, rows 4 and 5. In row 6 of the same table is given the flux of water across the membrane when the difference in concentration of the solute on the two sides of the membrane is 1 osmol per kg. of water.
D e x t r a n . - - C h a m b e r 1 was filled with a 10.8 gin. per 100 ml. dextran solu- tion, capable of exerting an osmotic pressure of 58.6 cm. of water. One m.osm. per kg. of water is the equivalent of an osmotic pressure of 25.2 cm. H~O at 25°C. Thus the concentration of the dextran solution, calculated from its os- motic pressure, was 2.32 m.osm, per kg. of water. The freezing point of the solu- tion was the equivalent of 2.3 m.osm, per kg. of water, showing that no appre- ciable quantity of diffusible molecules was mixed with the dextran. The flux
TABLE I
1. Solute . . . . . . . . . . . . . . . . . 2. Molecular weight . . . . . . . 3. Approximate molar vol-
ume, ml . . . . . . . . . . . . . . . .
4. gX 10 z . . . . . . . . . . . . . . . . 5. wX I0 ~ . . . . . . . . . . . . . . .
X 10 ~ 6. Os-m-ola-~-lty' ml . / s ec . . . . .
7. g' experimental X 10 ~. • • 8. cr experimental . . . . . . . . . . 9. ~ calculated . . . . . . . . . . . .
H~O t' Urea 20 60
18 45 1.58 0.85 1.58 0.85
2.8 3.7
0.0000 0.0000
0.0000 0.0000
}lucose 180
113 0.40 1.80
18.0
0.44 0.0090 0.010~
Sucrose
I 342
[ 211 0.27 1.22
24.8
0.34 0.0131
! 0.0126
Ra~nose 504
308 0.24 1.22
35.6
0.28 0.0185 0.0190
Dextran 5 2 , 0 0 0
0.54
1740
1.00 1.00
of water determined by this solution was 4.04 X 10 -5 ml./sec. The flux of water due to a difference in concentration of dextran of 1 osmol per kg. of water is therefore 1.74 X 10- 2 ml./sec.
The values presented in Table I, row 6, show quite clearly that for a given difference in osmolality across the membrane, the flux of water can vary from a minimal value, as given by a solute very similar to water, H~O xs in our case, to a maximal value as given by a solute that cannot pass through the mem- brane. The minimal and maximal values are wide apart: the maximal is 620 times greater than the minimal. Fluxes determined by molecules that can pass through the membrane and whose molecular size is bigger than that of water, lie in between these two extreme values. As far as the experimental evidence goes, there is a definite correlation between the molecular size and the flux of water determined by a given difference in osmolal concentration of the solute. These data suggest that if on one side of the collodion membrane we put the solution of a macromolecule, let us say dextran, and on the other side the solu- tion of a diffusible substance, such as urea, we should be able to demonstrate
Dow
nloaded from http://rupress.org/jgp/article-pdf/42/2/429/1241960/429.pdf by guest on 13 January 2022

438 OSMOSIS THROUGt t COLLODION ~$E~'BRANE
by properly choosing the concentrations of the two molecules, that water can move, by osmosis, from the compartment having the higher osmolality to the compartment at lower osmolality. This was the purpose of the following ex- periment.
(b ) Experiment with Two Solutes, Dextran and Urea:
Chamber 1 was filled with 7.4 ml. of the dextran solution (2.3 m.osm, per kg. of water). At time zero, a solution of urea having the concentration of 201.3 m.osm, was put in chamber 2. Thus the solution of urea had an osmolality 87 times greater than the dextran solution. Without any detectable delay, the volume of the dextran solution began to expand and kept expanding at the constant rate of 3.8 × 10 -~ ml./sec. At the end of 1 hour the experiment was interrupted and samples for analysis were taken from chambers 1 and 2. The osmolality of the solution of urea was found to be 144.2 m.osm, and that of the solution containing dextran 63.5 m.osm, per kg. of water. Thus, during the course of the whole experiment the so called "osmotic pressure" of the solution of urea was higher than that of the solution containing dextran. In the course of 1 hour the volume of the solution containing dextran increased 0.136 ml. I t is easy to calculate from the experimental data that of the 0.136 ml. that was driven into the dextran solution, 0.0185 ml. was urea and 0.1175 was water. Therefore we must conclude that in this case water was driven from the chamber in which the "osmotic pressure" was higher to the chamber in which the "osmotic pres- sure" was lower. Since both chambers were at the same temperature and pres- sure, we can conclude also that water went against its chemical potential dif- ference.
Experiments at Constant Volume
(a) Apparent Osmotic Pressure of a Solution Ora):
We have seen in the preceding experiments that when a solution is put on one side of a collodion membrane, having distilled water on the other side, the volume of the solution may remain constant or increase. Theoretically (5), it could also decrease if the membrane is more permeable to the solute than to the solvent. In order to prevent any change of volume, a pressure must be ap- plied to the solution. Accordingly, the pressure will be zero, positive, or even negative. The pressure that must be applied in order to keep the volume of the solution constant is called the apparent osmotic pressure of the solution, ~ra. For a solution made up exclusively of substances that cannot diffuse through the membrane, this pressure is the true osmotic pressure and can be calculated if the freezing point or vapor pressure of the solution is known. With the collodion membrane that we have used, the apparent osmotic pressure of the H~O TM
and urea solutions is zero, since the displacement of volume is zero. For the solutions of glucose, sucrose, and raffinose 7ro is positive. As the difference in
Dow
nloaded from http://rupress.org/jgp/article-pdf/42/2/429/1241960/429.pdf by guest on 13 January 2022

GIACOM0 MESCHIA AND IVO S E T N I K A R 439
apparent osmotic pressure across the membrane, ATr~, depends upon the differ- ence in concentration of the solute on the two sides of the membrane, the pres- sure necessary to hold constant the volume of the solution decreases with time and tends to zero, owing to diffusion of solute through the membrane. If the logarithm of A~r, is plotted against time, a straight line is obtained. Therefore it is possible to know with a fair degree of accuracy, by extrapola- tion, what the A~r~ is at time zero and at the time of sampling of the two solu- tions and to compare the A~r~ values with the ATr values, calculated from the freezing points of the solutions. As an example we give in Table I I the data obtained with a solution of sucrose that was introduced in chamber 2 at time zero at the concentration of 310.8 m.osm, per kg. of water (room temperature 28°C.). One m.osm, per kg. of water at 28°C. is the equivalent of 25.4 cm. H20 pressure. The ratios ATrJATr obtained for glucose, sucrose, and raflinose are given in Table I, row 8.
T A B L E I I
Time
m/n,
o 10o
Chamber !
~r, on. H~O
7,900 5,960
Chamber 2
~r, cm. H20
o 1,560
ATr
7,900 4,400
100.5 0.0127 59.5 0.0135
(b) Changes of tke Fluxes of Water and Solute Wken a Pressure Difference is Applied Across the Membrane
A~ra could also be defined, with reference to Equation 8, as the pressure that makes the value of w equal to g; i.e., the flux of water in one direction equal to the flux of solute in the opposite direction. Under the condition of constant volume, values of g, and therefore of w, have been measured: the values ob- tained, indicated as g', are given in Table I, row 7, where they can be compared with the values found under the condition of volume displacement and no dif- ference of pressure across the membrane (see rows 4 and 5). I t is evident from this comparison that the pressure applied to keep the volume constant changed the rate of water transfer remarkably (g' about ~ of w), but affected the trans- fer of solute very little (g' approximately equal to g).
DISCUSSION
The experimental results presented in this paper contradict the assumption that the direction and rate of transfer of water across a collodion membrane depend solely upon the difference in vapor pressure of the solvent on the two sides of the barrier. They appear to be explicable on the basis of the following two assumptions: (1) the collodion membrane has pores large enough to allow a bulk flow of matter through them; (2) a bulk flow of matter through the mem-
Dow
nloaded from http://rupress.org/jgp/article-pdf/42/2/429/1241960/429.pdf by guest on 13 January 2022

440 OSMOSIS THROUGH COLLODION MEM~BRANE
brahe is caused by differences of pressure across it and also by differences of con- centration of solutes to which the membrane is, at least to some extent, less per- meable than water.
With a membrane of very coarse porosity we would observe that differences of concentration across the membrane cause interdiffusional flows of solutes and solvent through it and that a difference of pressure causes the solution to flow through the barrier v/a the pores, but the mutual interference of the two processes of interdiffusion and bulk flow would be negligible. The flow of the solution would not create any appreciable concentration gradients (the com- position of the solution would be equal before and after passing through the membrane) and conversely concentration gradients would not create any appreciable flow of the solution. Our experimental results lead us to assume that a semipermeable membrane, such as a collodion membrane with respect to a solution of dextran, has the peculiar property of coupling the two processes of hydraulic flow and interdiffusion so that they become mutually dependent: forcing a solution through a membrane that is semipermeable with respect to that solution, by applying a difference of pressure, creates differences of con- centration and conversely differences of concentration create a flow of the solu- tion. Accordingly we shall call osmotic flow the bulk flow of matter across the semipermeable membrane that depends upon differences of pressure and con- centration at the same time. For instance, if the collodion membrane separates a solution of dextran from a solution of urea, the osmotic flow is represented by the flow of the solution of urea through the membrane.
Some experimental evidence which points to the conclusion that the osmotic flow through a collodion membrane is a bulk flow of matter has been already presented by Mauro (6). We shall attempt now to define the circumstances under which an osmotic flow occurs and what determines its direction and mag- nitude. Since in our experiments the mixing of two solutions did not alter appre- ciably their total volume, the observed change of volume of either one of the two solutions that the membrane separates is equal to the presumed bulk flow through the membrane. If a solution of relative viscosity ~/is placed on the two sides of a collodion membrane and there is no separation of solute from solvent when, by applying a difference of pressure Ap, the solution is forced through the membrane, the volume transferred per unit of time is given by the equation:
- ~- = kZ~LPI~ (~2)
in which k is a proportionality coefficient that expresses the hydraulic conduc- tivity of the membrane to water. Equation 12 is valid also in the case in which the solutes to which the membrane is as permeable as it is to water are at dif- ferent concentrations on the two sides of the membrane.
If we start from a condition of equilibrium and add on one side of the mem-
Dow
nloaded from http://rupress.org/jgp/article-pdf/42/2/429/1241960/429.pdf by guest on 13 January 2022
GIACOMO MESCHIA AND IVO S]ETNIKAR 441
brane a solute that cannot pass through it and in such concentration that the difference in osmotic pressure between the two solutions separated by the barrier is A~r, the equation for the transfer of volume becomes:
- f ~ = k (AP - ATr)/~l (13)
in which ~ represents the relative viscosity of the solution inside the membrane; i.e., the viscosity of the ultrafiltrate, For 12 = 0, Ap = A~r.
If we start with water on both sides of the membrane and add a solute like glucose, sucrose, or raffinose to one compartment, for l) -- 0, Ap > 0 but < A~r, or
Z~P = ~A~r ---- Alto (14)
in which ~ is a coefficient whose value is never greater than 1 and ira is the apparent osmotic pressure of the solution, always less than 7r. Tentatively, by analogy with Equation 13, the equation that describes the transfer of vol- ume through leaky membranes becomes:
- P = k ( ~ P - ~ T r ) / ~ ( i5)
Thus, for AP = 0,
, = l~*I/kA, r (16)
If the concentrations of the diffusible solute on the two sides of the membrane are cl and ct respectively, we have assumed that the mean concentration inside the membrane is approximately (ci + ct)/2 = g and ~ is the viscosity of the solution having the concentration g. Therefore from the values of 12 obtained in the experiments with AP = 0, ,r can be calculated by means of Equation 16 and should be equal to the value of ~ obtained when 12 = 0, as defined by Equa- tion 14. The values of ~ obtained in these two different situations are presented in Table I, rows 8 and 9. Their agreement, which appears to be within the limits of the experimental error, supports the validity of Equation 15. Staverman (7, 8) calls the ~ "reflection coefficient." T h e , coefficient is an index of the capacity of the membrane to discriminate between solutes and solvent. For g -- 0 (no discrimination), Equation 15 becomes equal to Equation 12 and for $ = 1 (perfect discrimination), Equation 15 becomes equal to Equation 13. In connection with these considerations there is an interesting analogy with another osmotic phenomenon, the so called thermal osmosis. If two com- partments, separated by a membrane, are filled with water and kept at two different temperatures, there is theoretically possible a net transfer of water from the hot to the cold compartment. Actually, according to Spanner (1), a net transfer takes place if the intervening membrane lets through "hot" more easily than "cold" molecules of water. The magnitude of the pressure difference that must be applied in order to prevent a net transfer of water depends upon the extent to which the membrane is able to discriminate.
Dow
nloaded from http://rupress.org/jgp/article-pdf/42/2/429/1241960/429.pdf by guest on 13 January 2022

442 OSMOSIS THROUGH COLLODION MEMBRANE
In a system with more than two components, represented in our data by the experiments with water, dextran, and urea, it is necessary to take into con- sideration the Gr coefficient of each solute in order to be able to predict direction and magnitude of osmotic flow. We know, for example, on the basis of the ex- periments the results of which are given in Table I, that the ~ coefficient of urea is zero (4-0.001) 3, whereas that of dextran is 1. Therefore when we put on one side of the collodion membrane the solution of dextran and on the other side the solution of urea, the osmotic flow will be toward the solution of dex- tran, as if water and not a solution of urea were on the other side of the mem- brane. The presence of urea will modify the magnitude of the osmotic flow only in so far as a solution of urea has a different viscosity from tha t,of water, but it does not matter whether urea is or is not at the same concentration on the two sides of the membrane. If we put the dextran solution, which has an osmotic pressure of 58.6 cm. H20, against water across the collodion membrane, the volume displacement l) is 4.04 X 10 -s ml./sec. (k = 6.88 X 10⁻⁷). The rela- five viscosity of a 0.1 molal solution of urea is approximately 1.005. Thus when we put the solution of dextran against the solution of urea, we expect the volume displacement to be:
1) ---- 6.88 X 10 -7 X 58.6/1.005 -- 4.0 X 10 -4.
The experimental value, 3.8 X 10 -5, is close to that calculated. During the whole experiment the solution of dextran behaved like a solution having an osmotic pressure of 58.6 cm. H20, despite the fact that its freezing point was continuously increasing, owing to the addition of urea. Thus it would appear that the osmotic flow depends upon the partial osmotic pressure difference of each component (ATr') multiplied by its coefficient of discrimination ~r. Conse- quently, for a solution with n solutes, the equation for the transfer of volume becomes:
For the case in which the membrane is perfectly impermeable to some solutes (~ = 1) and as permeable as it is to water to all the others (a = 0), Equation 17 becomes:
- • = k ( A P - a ~ r ' ) / ~ ( i s )
in which 7r' is in this instance the partial osmotic pressure of the non-diffusible components. The experiment with dextran and urea represents such a case. Equation 18 is interesting from the biological point of view because it is valid also when the solutes to which the membrane is as permeable as to water are not at equilibrium on the two sides of the membrane. We could not obtain such
* We have estimated that a a coefficient as low as 0.001 would have been detected.
Dow
nloaded from http://rupress.org/jgp/article-pdf/42/2/429/1241960/429.pdf by guest on 13 January 2022

GIACOMO MESCHIA AND IVO SETNIKAR 443
a simple equation if we considered the transfer of water instead of the transfer of volume. Fortunately, in many physiological situations we are more concerned with displacements of volumes across membranes than with the transfer of water per se.
Whatever the physicochemical interpretation of the results may be, some conclusions can be drawn that are of physiological interest : --
1. For a given difference of osmolal concentration of a solute across a mem- brane (Air'), the rate of water transfer depends upon the nature of the solute (whereas that across an ideal semipermeable membrane is independent of the nature of the solute). In the case of a collodion membrane, varying the molecu- lar dimension of the solute from small to big molecules increases the flow of water. The maximal value of flow of water is attained when the molecular di- mension of the solute is such that it cannot pass through the barrier. In this case the flow is of equal magnitude to that determined by applying a pressure difference Ap _- A~r'. When the molecular size of the solute and its physico- chemical characteristics are approximately equal to those of the solvent, as when H20 ~8 is used, the flow is almost identical with the so called self-diffusion of water across the membrane. The difference between the self-diffusion flow and the maximal osmotic flow can be enormous; with the membrane we have used, the maximal osmotic flow was about 620 times greater than the self- diffusion flow. I t follows from the preceding statements and it has been proved experimentally that water can be osmotically transferred from the compart- ment at higher "osmotic pressure" to the compartment at lower "osmotic pressure"; i.e., against its difference in chemical potential. Therefore, just from the measurement of the freezing points or vapor pressures of two solutions separated by a membrane we cannot infer the direction of the osmotic transfer of water.
2. The apparent osmotic pressure of a solution across a non-ideal semiper- meable membrane is always less than the maximal theoretical value. For ex- ample, with the membrane we have used the apparent osmotic pressure of urea is zero and the pressures of glucose, sucrose, and raflinose are 1, 1.3, and 1.9 per cent resp~fively of the maximal. Shuler, Dames, and Laidler (9) and Grim (10) have shown already, by experimenting with a collodion membrane, that the apparent osmotic pressure of a solution across a leaky membrane is less than the maximal, but we cannot agree with their interpretation of the phenomenon. They assume that the transfer of water (I/v') will obey an equation of the type
- I V = constant (AP - A~r) (19)
even for non-ideal semipermeable membranes. One of the conditions imposed by Equation 19 is that water will flow from the compartment with the higher "osmotic pressure" to the compartment with the lower "osmotic pressure"
Dow
nloaded from http://rupress.org/jgp/article-pdf/42/2/429/1241960/429.pdf by guest on 13 January 2022

AAA OSMOSIS THROUGH COLLODION MEMBRANE
only when AP is higher than ATr. To the contrary, a transfer of water across the collodion membrane against the "osmotic gradient" occurs when AP is less and even very much less than ATr, if the membrane is permeable to both solvent and solute.
Turning our attention to Starling's hypothesis with these conclusions in mind we see at once that a solution does not need to be isotonic with the plasma in order to be reabsorbed by the blood vessels. On the assumption that the mem- brane of the capillaries is perfectly impermeable to the proteins but does not discriminate between water and the other solutes, the transfer of a given volume of solution across the capillary membrane will depend upon the AP -- ATr' difference, in which ~r' represents the colloidal osmotic pressure of the pro- teins, irrespective of what might be the Ap -- Air difference.
However, it is quite probable that a certain degree of discrimination between water and some of the other plasma constituents that pass through the" mem- brane exists, and that the capillaries are not perfectly impermeable to the plasma and interstitial proteins. Most likely, across the capillary membrane the ¢ coefficient for the proteins is near to 1 and that of other components is near to zero. Therefore in many physiological conditions any volume displace- ment across the capillary membrane can be considered to be determined by dif- ferences of colloidal osmotic pressure and hydrostatic pressure, and the existence of concentration gradients of other components can be neglected. Nevertheless if the ¢ coefficient for a given substance is greater than zero, a concentration grad/ent of unusual magnitude (as can occur, for instance, after the injection of a solution of that substance) can produce a displacement of volume of con- siderable size.
We wish to express our gratitude to Dr. D. H. Barron, Dr. D. I. Hitchcock, and Dr. A. Mauro for their interest and help.
REFERENCES
1. Spanner, D. C., Syrup. Soc. Exp. Biol., Active Transport and Secretion, No. 8, New York, Academic Press, Inc., 1954, 76.
2. Starling, E. H., J. Physiol., 1896, 19, 312. 3. Meschia, G., and Barron, D. H., Yale J. Biol. and Me.d, 1956, 29, 54. 4. Meschia, G., Yale J. Biol. and Med., 1954, 9.7, 205. 5. Laidler, K. J., and Shuler, K. E., J. Chem. Physics, 1949, 17, 851. 6. Mauro, A., Science, 1957, 126, 252. 7. Staverman, A. J., Rec. tray. ckim. Pays-bas, 1951, 70, 344. 8. Staverman, A. J., Rec. tray. chim. Pays-bas, 1952, 71, 623. 9. Shuler, K. E., Dames, C. A., and Laidler, K. J., J. Chem. Physics, 1949, 17, 850.
10. Grim, E., Proc. Soc. Exp. Biol. and Med. 1953, 83, 195.
Dow
nloaded from http://rupress.org/jgp/article-pdf/42/2/429/1241960/429.pdf by guest on 13 January 2022