4.1_EIA RPT FOR KPA DREDGING.pdf - Kenya Ports Authority
217
i KENYA PORTS AUTHORITY REPUBLIC OF KENYA ENVIRONMENTAL IMPACT ASSESSMENT REPORT Consultancy for Proposed Dredging Works at the Port of Mombasa March 2009 Studied & Prepared by: Consultants: Client: HEZTECH ENGINEERING SERVICES CANNON TOWERS, 3 RD FLOOR, MOMBASA P.O BOX 42269 MOMBASA JAPAN PORT CONSULTANTS IN ASSOCIATION WITH BAC ENGINEERING & ARCHITECTURE. P.O BOX 61231, NRB KENYA PORTS AITHORITY P.O BOX 95009 TEL: 2312211/2221211 MOMBASA
-
Upload
khangminh22 -
Category
Documents
-
view
1 -
download
0
Transcript of 4.1_EIA RPT FOR KPA DREDGING.pdf - Kenya Ports Authority

i
KENYA PORTS AUTHORITY
REPUBLIC OF KENYA
ENVIRONMENTAL IMPACT ASSESSMENT REPORT
Consultancy for Proposed Dredging Works
at the Port of Mombasa
March 2009
Studied & Prepared by:
Consultants: Client:
HEZTECH ENGINEERING
SERVICES
CANNON TOWERS, 3RD
FLOOR,
MOMBASA
P.O BOX 42269 MOMBASA
JAPAN PORT CONSULTANTS
IN ASSOCIATION WITH BAC
ENGINEERING &
ARCHITECTURE.
P.O BOX 61231, NRB
KENYA PORTS AITHORITY
P.O BOX 95009
TEL: 2312211/2221211
MOMBASA

ii
ACCRONYMS
AIDS Acquired Immune Deficiency Syndrome
BAC BAC Engineering & Architecture Ltd
BOD Biological Oxygen Demand
COD Chemical Oxygen Demand
DRC Democratic Republic of Congo
EACC East African Coastal Currents
EAM East African Environmental Management Company Ltd
ECD Empty Container Deport
EIA Environmental Impact Assessment
EMCA Environmental Management and Coordination Act
GBHL Grain Bulk Handlers Limited
GDP Gross Domestic Product
GOK Government of Kenya
IMSR Inter Monsoon Short Rains
IMLR Inter Monsoon Long Rains
ITCZ Inter Tropical Convergence Zone
JBIC Japan Bank for International Cooperation
JPC Japan Port Consultants Ltd
KESCOM Kenya Sea Turtle Conservation Committee
KEFRI Kenya Forestry Research Institute
KARI Kenya Agricultural Research institute
KMA Kenya Maritime Authority
KMFRI Kenya Marine & Fisheries Research Institute
KWS Kenya Wildlife Service
KPA Kenya Ports Authority
NEC National Environmental Council
NEM North Eastern Monsoon

iii
NEMA National Environment Management Authority
NGOs Non Governmental Organisations
NMK National Museums of Kenya
NWCPC National Water Conservation & Pipeline Corporation
OSMAG Oil Spill Mutual Aid Group
OSRAT Oil Spill Response Action Team
RMG Rail Mounted Gantry
RTG Rubber Tyred Gantry
SEC South Equatorial Current
SLP Sea Level Pressure
SH Stakeholders
SSG Ship to Shore Gantry
TDS Total Dissolved Solids
TSS Total Suspended Solids
TOR Terms of Reference
TEU Twenty-foot Equivalent Unit
TGS Total Ground Slot
UNEP United Nations Environment Programme
WWF World Wildlife Fund
MARPOL International Convention for Prevention of Marine Pollution
iv
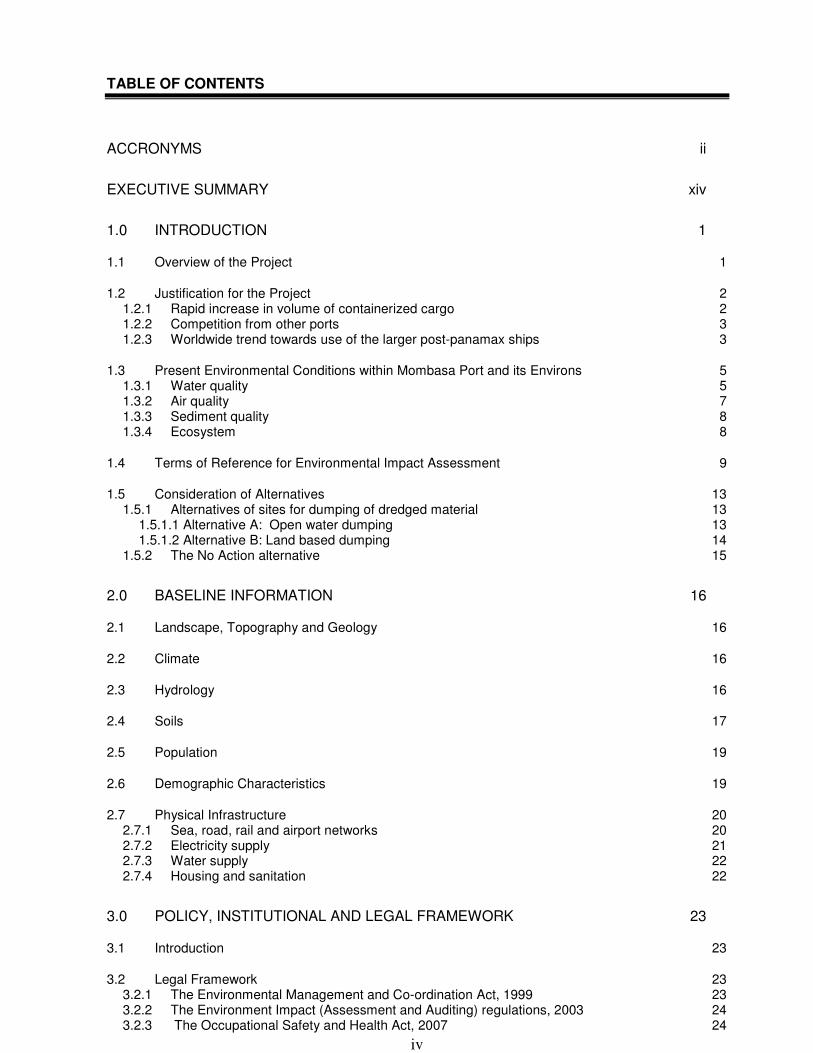
TABLE OF CONTENTS
ACCRONYMS ii
EXECUTIVE SUMMARY xiv
1.0 INTRODUCTION 1
1.1 Overview of the Project 1
1.2 Justification for the Project 2 1.2.1 Rapid increase in volume of containerized cargo 2 1.2.2 Competition from other ports 3 1.2.3 Worldwide trend towards use of the larger post-panamax ships 3
1.3 Present Environmental Conditions within Mombasa Port and its Environs 5 1.3.1 Water quality 5 1.3.2 Air quality 7 1.3.3 Sediment quality 8 1.3.4 Ecosystem 8
1.4 Terms of Reference for Environmental Impact Assessment 9
1.5 Consideration of Alternatives 13 1.5.1 Alternatives of sites for dumping of dredged material 13
1.5.1.1 Alternative A: Open water dumping 13 1.5.1.2 Alternative B: Land based dumping 14
1.5.2 The No Action alternative 15
2.0 BASELINE INFORMATION 16
2.1 Landscape, Topography and Geology 16
2.2 Climate 16
2.3 Hydrology 16
2.4 Soils 17
2.5 Population 19
2.6 Demographic Characteristics 19
2.7 Physical Infrastructure 20 2.7.1 Sea, road, rail and airport networks 20 2.7.2 Electricity supply 21 2.7.3 Water supply 22 2.7.4 Housing and sanitation 22
3.0 POLICY, INSTITUTIONAL AND LEGAL FRAMEWORK 23
3.1 Introduction 23
3.2 Legal Framework 23 3.2.1 The Environmental Management and Co-ordination Act, 1999 23 3.2.2 The Environment Impact (Assessment and Auditing) regulations, 2003 24 3.2.3 The Occupational Safety and Health Act, 2007 24
v
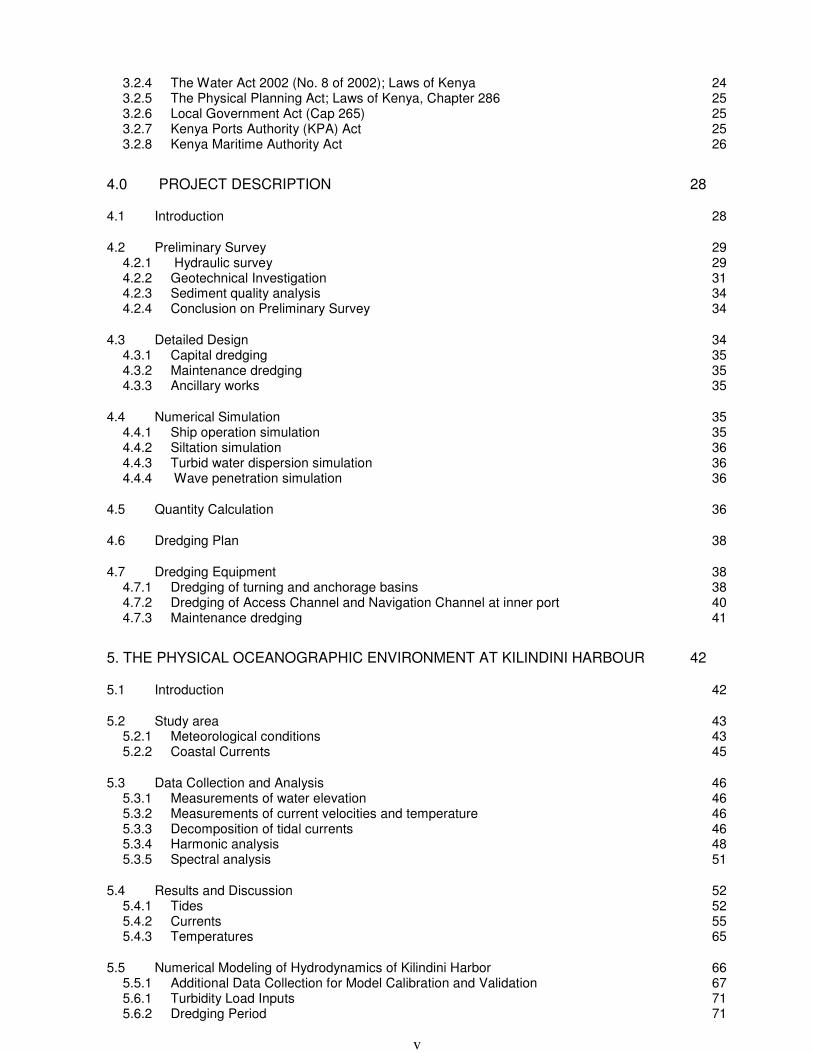
3.2.4 The Water Act 2002 (No. 8 of 2002); Laws of Kenya 24 3.2.5 The Physical Planning Act; Laws of Kenya, Chapter 286 25 3.2.6 Local Government Act (Cap 265) 25 3.2.7 Kenya Ports Authority (KPA) Act 25 3.2.8 Kenya Maritime Authority Act 26
4.0 PROJECT DESCRIPTION 28
4.1 Introduction 28
4.2 Preliminary Survey 29 4.2.1 Hydraulic survey 29 4.2.2 Geotechnical Investigation 31 4.2.3 Sediment quality analysis 34 4.2.4 Conclusion on Preliminary Survey 34
4.3 Detailed Design 34 4.3.1 Capital dredging 35 4.3.2 Maintenance dredging 35 4.3.3 Ancillary works 35
4.4 Numerical Simulation 35 4.4.1 Ship operation simulation 35 4.4.2 Siltation simulation 36 4.4.3 Turbid water dispersion simulation 36 4.4.4 Wave penetration simulation 36
4.5 Quantity Calculation 36
4.6 Dredging Plan 38
4.7 Dredging Equipment 38 4.7.1 Dredging of turning and anchorage basins 38 4.7.2 Dredging of Access Channel and Navigation Channel at inner port 40 4.7.3 Maintenance dredging 41
5. THE PHYSICAL OCEANOGRAPHIC ENVIRONMENT AT KILINDINI HARBOUR 42
5.1 Introduction 42
5.2 Study area 43 5.2.1 Meteorological conditions 43 5.2.2 Coastal Currents 45
5.3 Data Collection and Analysis 46 5.3.1 Measurements of water elevation 46 5.3.2 Measurements of current velocities and temperature 46 5.3.3 Decomposition of tidal currents 46 5.3.4 Harmonic analysis 48 5.3.5 Spectral analysis 51
5.4 Results and Discussion 52 5.4.1 Tides 52 5.4.2 Currents 55 5.4.3 Temperatures 65
5.5 Numerical Modeling of Hydrodynamics of Kilindini Harbor 66 5.5.1 Additional Data Collection for Model Calibration and Validation 67 5.6.1 Turbidity Load Inputs 71 5.6.2 Dredging Period 71
vi
5.6.3 Interpretation of simulation results 71 5.6.4 The potential for sediment resuspension. 75 5.6.5 Hydrodynamic modeling of water quality impacts 77
5.7 Concluding Remarks 78 5.7.1 Hydrodynamic Characteristics 78 5.7.2 Numerical Modeling 79
6. THE BIOLOGICAL ENVIRONMENT 80
6.1 Introduction 80
6.2 Methodologies for Biological Studies 82 6.2.1 Scoping: 82 6.2.2 Fieldwork: 83
6.2.2.1 Water column assemblages 83 6.2.2.2 Sediment (benthic) assemblages 89 6.2.2.3 Critical habitats 90 6.2.2.4 Environmental data 92 6.2.2.5 MPA survey and analysis 93 6.2.2.6 Impact analysis, Mitigations and Monitoring plan 93
6.3 Baseline Characterizations 93 6.3.1 Water Column Assemblages – Planktons 93 6.3.2 Water Column Assemblages – Fisheries 95
6.3.2.1 Distribution of fishing effort 95 6.3.2.2 The ecological resources information 97 6.3.2.3 Fish production 98 6.3.2.4 Seasonality of the fishery by species 99 6.3.2.5 Economic value of the fishery 101 6.3.2.6 The potential and existing Aquaculture/ Mariculture 101
6.3.3 Sediment (benthic) assemblages 101 6.3.3.1 The soft sediments benthos 101 6.3.3.2 The epifaunal and infauna benthos 103 6.3.3.3 Hard substrata benthos and slow invertebrates 103
6.3.4 Critical Habitats: 104 6.3.4.1 Coral reefs and rocky platform communities (Andromache and Leven reefs) 104 6.3.4.2 Seagrass Beds 105 6.3.4.3 Seaweeds 106 6.3.4.4 Epiphytic seaweed community 106
6.3.5 Mangrove forest 107 6.3.6 Deep sea benthos 110 6.3.7 The Mombasa Marine Park and Reserve (MNPR). 110 6.3.8 Avifauna (Birds) 114 6.3.9 Marine turtles 116
7. WATER AND SEDIMENT QUALITY 119
7.1 Introduction 119
7.2 Methodology 119 7.2.1 Description of sampling area 119 7.2.2 Results and Discussion 120
7.2.2.1 Water quality 120 7.2.2.2 Sediment Quality 123
8. PUBLIC CONSULTATION AND PARTICIPATION 127
9. POTENTIAL IMPACTS AND MITIGATION MEASURES 128

vii
9.1 Impacts of Dredging 128 9.1.1 Loss of bottom habitat, shellfisheries, fisheries, fishery food sources 128 9.1.2 Water-column turbidity 128 9.1.3 Water contamination 128 9.1.4 Impacts on Port Operations 128
9.1.4.1 Discharge of garbage and litter 129 9.1.4.4 Sanitary wastes 129 9.1.4.5 Noise from Port traffic and Terminal operations 130
9.2 Oceanographic Environmental Impacts and Mitigation Measures 130 9.2.1 Oceanographic impacts of offshore disposal 130 9.2.2 Hydrodynamics 131 9.2.3 Waves 131 9.2.4 Predicted effect of the dredging project on water levels and tidal currents 132
9.3 Biological Impacts 134 9.3.2 Suspended sediment effects on sessile and slow-moving invertebrates 135 9.3.3 Suspended sediment effects on fish 135 9.3.4 Suspended sediment effects on ichthyoplanktic stages 136 9.3.5 Suspended sediment effects on phytoplankton productivity and other aquatic plants 136 9.3.6 Depletion of water column oxygen concentration 137 9.3.7 Noise during dredging / dumping activities 137 9.3.8 Sedimentation on subtidal muddy and sandy habitats 138 9.3.9 Oil spill effects on mangroves and seabirds due to coating 138 9.3.10 Oil spill affects on marine life and habitats 139 9.3.11 Other spills from containers and their effects on marine life 139 9.3.12 Spills from operational machinery and their affect on marine life 140 9.3.13 Ship wastes effect on marine life 140 9.3.14 Discharge of ballast water introduces alien species 140 9.3.15 Synergistic (cumulative) impacts 141
9.3.15 Potential negative impacts specific to coral gardens and Mombasa Marine Reserve 141
9.4 Chemical Impacts 142
10. ENVIRONMENTAL MANAGEMENT PLAN 143
10.1 Mitigation Measures 143 10.1.1 Mitigation measures for dredging impacts 143
10.1.1.1 Dredging work - General 143 10.1.1.3 Effluent discharge from calling ships 144 10.1.1.4 Accidental oil spill 144
10.1.2 Mitigation measures for biological impacts 145 10.1.2.1 Mitigation for fisheries impacts 145 10.1.1.2 Hindrance of Sea Turtle migration 146 10.1.1.3 Re-location of rare species before dredging if found 146 10.1.2.4 Monitoring of state of the environment of the key critical habitats 146 Suspended sediment effects on fish, sessile and slow-moving invertebrates 147 Suspended sediment effects on phytoplankton productivity and other aquatic plants 147 Depletion of water column oxygen concentration 147 Noise during dredging / dumping activities 147 Sedimentation on sub-tidal muddy and sandy habitats 147 Oil spill effects on mangroves and seabirds due to coating 147 Oil spill affects on marine life and habitats 147 Potential accidental spills from containers containing hazardous substances reach the sea and may affect marine organisms 147 Discharge of ballast water introduces alien species 147 Potential negative impacts specific to coral gardens and Mombasa Marine Reserve 147
10.1.3 Mitigation measures for chemical impacts 148
10.1.4 Mitigation measures for oceanographic impacts 148

viii
10.2 Monitoring Plan 149
10.3 Environmental Management Plan for the Construction Stage 151
10.4 Environmental Monitoring Survey 152
10.5 Contractors Pollution Control Measures 154
11. RECOMMENDATIONS AND CONCLUSION 155
REFERENCES 156
APPENDICES 162
ix
LIST OF FIGURES
Figure 1. 1: Locations and Dimensions of Dredging Works ..........................................................................2
Figure 1. 2 Container traffic at the Port of Mombasa between 1997 – 2004 ................................................3
Figure 1. 3: Spill of soda ash from Magadi Soda conveyor belt ...................................................................5
Figure 1. 4: Untreated effluent from Municipal treatment plant discharges to sea .......................................6
Figure 1. 5: A grab discharging clinker into a truck .......................................................................................7
Figure 1. 6: Alternative locations for proposed dumping sites ................................................................... 14
Figure 4. 1: : Location of the dredging and dumping areas ....................................................................... 28
Figure 4. 2.: Hydraulic survey .................................................................................................................... 30
Figure 4. 5: Area of Investigation ............................................................................................................... 32
Figure 4. 6: Results of seabed boring ........................................................................................................ 33
Figure 4. 7: Results of seabed material sampling ...................................................................................... 33
Figure 4. 8: Trailing Suction Hopper Dredger ............................................................................................ 39
Figure 4. 9: Grab Dredger .......................................................................................................................... 40
Figure 5.1: Seasonal variations of the average wind speed during the northeast and southeast monsoons
................................................................................................................................................................... 44
Figure 5.2: KMFRI GLOSS Tide Gauge at Liwatoni jetty in Kilindini harbour, Mombasa .......................... 48
Figure 5.3: Time series water level variations at Mombasa tide gauge station for year 2007, observed
(blue), computed (red) and residual (magenta) values from harmonic analysis. ....................................... 55
Figure 5.4: Time series of current velocities at Liwatoni station ................................................................ 57
Figure 5.5: Time series of (a) observed (b) computed and (c) residual for u-velocity components at
Liwatoni station from harmonic analysis results......................................................................................... 58
Figure 5.6: Time series of (a) observed (b) computed) and (c) residual for v-velocity components at
Liwatoni station from harmonic analysis results......................................................................................... 59
Figure 5.7: Observed current directions versus speeds at Liwatoni station .............................................. 60
Figure 5.8: Scatter plot of north-south (u) and east-west (v) current velocity components ....................... 61
Figure 5.9: Comparison of water levels (solid line) and current velocities (doted line) at Liwatoni station
during spring tide. ....................................................................................................................................... 62
Figure 5.10: Relative energy density spectrum for water levels Liwatoni station based on spectral
analysis. ..................................................................................................................................................... 63
Figure 5.11 Relative energy density spectrum for current velocities at Liwatoni station based on spectral
analysis. ..................................................................................................................................................... 64
Figure 5.12: Time series of water temperatures at Liwatoni station .......................................................... 65
Figure 5.13: Comparison of water levels and temperatures at Liwatoni on (a) December 15, 2007 from
midnight and (b) December 20, 2007 from midnight ................................................................................. 66
Figure 5.14: Stations at Kilindini harbor for monitoring tides, currents and suspended sediment
concentrations as well as salinity in February to March 2008 ................................................................... 67
Figure 5.15: Result of two-dimensional bathymetric survey of Kilindini harbour ....................................... 70
x
Figure 5.16: Turbid water dispersion simulation (surface and bottom layers) at offshore dumping during
NE Monsoon season (Jan – Apr). .............................................................................................................. 72
Figure 5.17: Turbid water dispersion simulation (surface and bottom layers) at offshore dumping during
SE Monsoon season (Jul – Oct). ............................................................................................................... 73
Figure 5.18: Turbidity water dispersion due to dredging works at Turning Basin and temporary dumping at
New Container Terminal during NE Monsoon. .......................................................................................... 74
Figure 5.19: Turbidity water dispersion due to dredging works at Turning Basin and temporary dumping at
New Container Terminal during SE Monsoon. ........................................................................................... 75
Figure 5.20: Results of numerical simulations of siltation before and after dredging during the South East
Monsoon season and the siltation difference before and after dredging. .................................................. 76
Figure 5.21: Results of numerical simulations of siltation before and after dredging during the North East
Monsoon season and the siltation difference before and after dredging. .................................................. 77
Figure 6.1 Coastal type, biological resource, and human use features of the port entrance area, Kilindini
harbour and Tudor Creek (after Environmental Sensitivity Map, KenSea; Tychsen 2006) ....................... 82
Figure 6.2: Coastal type, biological resource, and human use features at the western end of Port Reitz
Creek (after Environmental Sensitivity Map, KenSea; Tychsen 2006) ...................................................... 82
Figure 6.5: Landsat image (bands arrangement 3-2-1) showing the port entrance and the study sites
studied for coral cover ................................................................................................................................ 91
Figure 6.6: Proportions of major phytoplankton groups in the samples analyzed. See appendix- for details
on specific categories ................................................................................................................................. 94
Figure 6. 7: Occurrence of zooplankton taxa in water samples from Port Reitz ....................................... 95
Figure 6.8: No of foot fishers and boats per landing sites Likoni ............................................................... 96
Figure 6.9: No of boats and fishers per landing sites / Changamwe ........................................................ 96
Figure 6.10: Fish landings (kg) at Likoni landing sites for five years ......................................................... 98
Figure 6.11: Seasonality in landings of pelagic fish species in Port Reitz creek ....................................... 99
Figure 6. 12: Seasonality of landings of key demersal fish species in Port Reitz creek .......................... 100
Figure 6.13: Seasonality of landings of sharks and crustacea in Port Reitz creek .................................. 100
Figure 6.14: Seasonality in landings of octopus, squids, crustacean Likoni ............................................ 101
Figure 6.15: Macrobenthos from Port Reitz ............................................................................................. 102
Figure 6.16: Macrobenthos from Shelly Beach ........................................................................................ 102
Figure 6.17: Occurrence of common taxa in benthic samples from Globallast survey (Source - KMFRI
2006) ........................................................................................................................................................ 103
Figure 6.18: Map of the Kenya coast highlighting KESCOM study sites which included Shelly and Nyali
beach (near the entrance to the port). South Coast (SC), Mombasa (MSA), Kilifi (KFI), Watamu (WTM),
Malindi (MAL), Kipini (KIP) Lamu (LAM), and Kiunga (KIU). (Source: Marine Turtle Newsletter 105:1-6, ©
2004). ....................................................................................................................................................... 117
Figure 9.1: Results of wave penetration simulation showing that change of wave heights
(increase/decrease) due to dredging is negligible (less than 10%). ........................................................ 132
Figure 9. 2: Numerical simulation results of created current velocities vector field in Kilindini harbour
including the offshore dumping site and the adjacent Tudor creek ......................................................... 133

xi
Figure 10.2: Monitoring scheme .............................................................................................................. 149

xii
LIST OF TABLES
Table 2. 1. Population distribution in the Mombasa District ....................................................................... 19
Table 4. 1 Item and Purpose of Hydraulic Survey 29
Table 4. 2: Key Survey Results .................................................................................................................. 30
Table 4. 3: Item and Purpose of Geotechnical Investigation ..................................................................... 31
Table 4. 4: Primary Investigation Results .................................................................................................. 32
Table 4. 5: Item and Purpose of Sediment Quality Analysis ...................................................................... 34
Table 4. 6: Capital Dredging ...................................................................................................................... 37
Table 4. 7: Maintenance Dredging ............................................................................................................. 37
Table 4. 8: Ancillary Works ........................................................................................................................ 38
Table 5.1: Major tidal constituents ............................................................................................................. 50
Table 5.2: The classification of the tides based on F-ratio scale ............................................................... 53
Table 5.3: Results of harmonic analysis of water levels in Liwatoni .......................................................... 54
Table 5.4: Results of harmonic analysis of current velocities in Kilindini harbour ..................................... 57
Table 5.5: Tidal statistics, amplitudes and phases based on harmonic analysis ...................................... 62
Table 6.1: Water column biota (phytoplankton) in three divisions of Port Reitz, Kilindini and the Entrance
Harbour ...................................................................................................................................................... 93
Table 6.2: Species composition of landed fish/crustacean (including target species for the area- frame
survey data 2006) ...................................................................................................................................... 97
Table 6.3: Total fish production and value for the last 4 years in Port Reitz and Likoni ............................ 99
Table 6.4: Benthic invertebrate assemblages at the Port Reitz, Shelly and Nyali Beach waters based on
10 transect observations (September – November 2006) ....................................................................... 104
Table 6.5: Summary of percentage cover of the major substrate categories in the four studied sites ........... 105
Table 6.6: Summary of the number of hard coral genera observed in the studied sites. ........................ 105
Table 6.7: Sea grass species at some sites of the Port of Mombasa ...................................................... 106
Table 6.8: Main seaweed genera at two sites of the Port of Mombasa ................................................... 108
Table 6. 9: Mangrove community structure at the study plots in Port Reitz basin ................................... 109
Table 6. 10: Average densities of fish and standard deviations for the four marine parks. 12 transects of
250 m2 in each park in two seasons ........................................................................................................ 112
Table 6.11: Average densities of invertebrates and standard deviations for the four marine parks. The
data was collected in 12 transects of 250 m2 in each park in two different seasons ............................... 113
Table 6.12: Percentage benthic cover per 10 m transect and the standard deviation ............................ 113
Table 6.13: Avian species at the Port Reitz based on 12 repeated observations (2 x low tides, 2 x high
tides, 2 x mornings, 2 x evenings, and twice at two fish-landing sites (Kwa Kanji and Kwa Skembo) during
fish landings (flooding tides) between September – November 2006. .................................................... 115
Table 6.14: Timing for recovery of seabed habitats after dredging (after Ellis 1996) .............................. 134
Table 10.1: Parameters for monitoring 150
Table 10.2: Monitoring of mitigation measures ........................................................................................ 150

xiii
LIST OF PLATES
Plate 6.1: Photo A - C: Part of the ecological team, including divers, and some sampling equipment
aboard hired boats used in survey ............................................................................................................. 83
Plate 6.2: Photo D – F: Plankton sampling, microscopic survey and computer-aided taxonomic analysis.
................................................................................................................................................................... 84
Plate 6.3: Photo G – O: Field survey of rare / critical ecological fish types and ID (top) socio-economic
(gear - mid and catch - bottom) for fish, shell-fish and prawn collections. ................................................. 88
Plate 6.4: Photo P - R: Bird survey on mangrove tress and tidal flats ....................................................... 88
Plate 6.5: Photo S – U: Sediment field survey and processing for benthic collections and laboratory ID
using microscopy and technical guides. .................................................................................................... 89
Plate 6.6: Photo V – X: Hard substrata survey and collections for laboratory ID from 25m2 quadrants .... 90
Plate 6. 7: Photo Y – AA: Coral field survey and some coral genera and associated invertebrates
encountered ............................................................................................................................................... 91
Plate 6.8: Photo AB – AD: Mangrove field survey for plant structure and associate macro-invertebrates 92
Plate 8.1: An elderly fisherman gives his contribution during the consultation stage .............................. 127

xiv
CERTIFICATION
Certification by Lead Expert (I): I hereby certify that the environmental impact assessment report has been done under my
supervision and that the audit criteria, methodology and content reporting conform to the
requirements of the Environmental Management and Coordination Act, 1999.
Signature_________________________ Date _______________________ Name___________________________________________________________ Address_________________________________________________________ Certificate of Registration No________________________________________ Certification by Lead Expert (II): I hereby certify that the environmental impact assessment report has been done under my
supervision and that the audit criteria, methodology and content reporting conform to the
requirements of the Environmental Management and Coordination Act, 1999.
Signature_________________________ Date _______________________ Name___________________________________________________________ Address_________________________________________________________ Certificate of Registration No________________________________________
Certification by Proponent We, Kenya Ports Authority hereby confirm that the contents of this report are true and will
implement practicable mitigation measures proposed in the report.
Signed for and on behalf of Kenya Ports Authority: Name_____________________________________________________________ Signature___________________________ Date ________________________ Official Rubberstamp ________________________________________________

xv
EXECUTIVE SUMMARY
This Environmental Impact Assessment Study report relates to the proposed Dredging of the
Access Channel and the Turning Basin at the Port of Mombasa. Over the last few years there
has been rapid increase in national and international container volumes. This requires KPA to
improve existing waterside facilities and undertake port expansion and modernization projects.
The proposed project involves dredging of the access channel comprising of the navigation
channel at port entrance, the navigation channel at inner port and the turning and anchorage
basins at the proposed Kipevu West Container Terminal. Also incorporated into this project is
maintenance dredging at the existing berths 1-19 as well as installation of associated navigation
aids. In addition this project has been made necessary as a result of the world wide trend
towards use of post-panamax vessels which are bigger than the ones the port is currently
receiving. Further there has been increasing competition from other ports such as Dar Es
Salaam and Durban and these calls for better efficiency in service delivery reflected by vessel
turn-around time and time taken to haul the cargo to the end users.
The projected dredge volumes are as follows: Access Channel (C1 – C6) - 0.6 million m3
Turning basin (C7 – C9) - 4.5 million m3
Anchorage Basin (C 10) - 2.9 million m3
Maintenance dredging (M1 – M4) -0.2 million m3
The study has taken into account the following: Background information on the project area as well as any adjacent or remote areas likely to
be affected by the project;
A description of the physical, biological and socio-economic environment of the project area;
A description of legislation, regulations and standards, and environmental policies
applicable to the proposed project, and identification of the applicable authority jurisdictions;
Identification of impacts (both positive and negative) related to dredging and disposal of
dredged materials;
An outline of mitigation measures to prevent or reduce significant negative impacts to
acceptable levels as well as measures to minimise disruption to existing port operations;
An environmental monitoring plan to ensure that the proposed mitigation measures are
implemented, and the measures are effective addressing the adverse impacts;
A proposal for review of the environmental management plan in tandem with project
progress so that it addresses issues arising from periodical monitoring.

xvi
This study has established that the water quality around the Port of Mombasa is poor as a result
of contamination from waterfront activities. It is however acceptable for recreation purposes.
The study encountered high levels of Cd and As in sediments from the Turning Basin
attributable to anthropogenic sources, especially, the wastewater discharge from the municipal
sewage treatment facility at Kipevu. It is therefore recommended that the contaminated dredged
material from this area should not be disposed at sea. The contaminated sediments would
therefore be disposed in a containment facility to be constructed at the site of the proposed
container terminal project in Port Reitz. With this arrangement the contained material would also
act as landfill for the reclamation site.
This study established that the project area has two types of sediments: The hard substrate material at the access channel and at the navigation channel at inner
port. This material, totaling approximately 0.6 million m3 would be dredged by a grab
dredger and be deposited at the site of the proposed container terminal in Kipevu where it
would act as landfill in the reclamation exercise;
Soft, silty material at the turning and anchorage basins totaling 7.4 million m3 to be dredged
by trailing suction dredger. The uncontaminated material from the anchorage basin would
be deposited offshore while the contaminated material would be deposited at the reclaimed
area in the proposed Kipevu Container terminal with containment.
Key adverse negative impacts identified in this study include:
Temporary disruption of fishing activities as a result of increased vessel traffic during the
dredging period;
Turbidity of water column as a result of release of sediments (particulate) during dredging
and offshore dumping. This would obstruct visibility thereby temporarily impairing activities
of fishers;
Possible interference with normal port operations such as ships docking and ferries plying
passengers across the Likoni Channel.
Mitigation measures proposed include:
Use of appropriate dredging methods to minimize physical impacts. Sediment quality
analysis undertaken as part of the EIA identified Grab Dredger method for hard material and
Trailing Suction Dredger for the soft material.
The project would be undertaken in consideration of seasonal variations and wind patterns
to limit the extent of propagation of sediments during dredging and dumping
The proponent shall arrange a compensation package for fishermen who lose their
livelihood during the course of the project. Such compensation includes provision of

xvii
motorized boats to enable fishers venture further offshore and/or monetary support for the
affected fishers.
A detailed monitoring programme has been prepared to assist in tracking the progress of
implementation of the environmental management programme. The programme is to be
implemented by the contractor, the proponent and a consortium of stake holders comprising of
Lead Agencies and Non-Governmental Organizations (NGOs). This study therefore
recommends that the proposed project be approved subject to implementation of the proposed
environmental management and monitoring plan.
1
1.0 INTRODUCTION
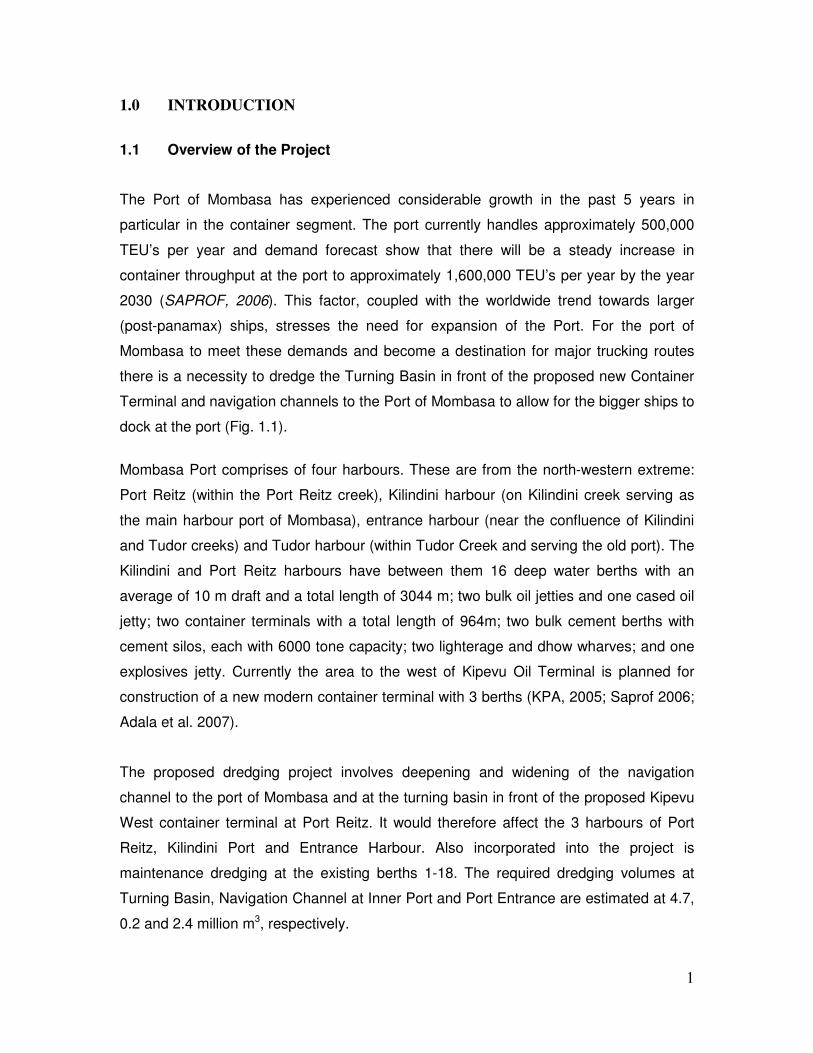
1.1 Overview of the Project
The Port of Mombasa has experienced considerable growth in the past 5 years in
particular in the container segment. The port currently handles approximately 500,000
TEU’s per year and demand forecast show that there will be a steady increase in
container throughput at the port to approximately 1,600,000 TEU’s per year by the year
2030 (SAPROF, 2006). This factor, coupled with the worldwide trend towards larger
(post-panamax) ships, stresses the need for expansion of the Port. For the port of
Mombasa to meet these demands and become a destination for major trucking routes
there is a necessity to dredge the Turning Basin in front of the proposed new Container
Terminal and navigation channels to the Port of Mombasa to allow for the bigger ships to
dock at the port (Fig. 1.1).
Mombasa Port comprises of four harbours. These are from the north-western extreme:
Port Reitz (within the Port Reitz creek), Kilindini harbour (on Kilindini creek serving as
the main harbour port of Mombasa), entrance harbour (near the confluence of Kilindini
and Tudor creeks) and Tudor harbour (within Tudor Creek and serving the old port). The
Kilindini and Port Reitz harbours have between them 16 deep water berths with an
average of 10 m draft and a total length of 3044 m; two bulk oil jetties and one cased oil
jetty; two container terminals with a total length of 964m; two bulk cement berths with
cement silos, each with 6000 tone capacity; two lighterage and dhow wharves; and one
explosives jetty. Currently the area to the west of Kipevu Oil Terminal is planned for
construction of a new modern container terminal with 3 berths (KPA, 2005; Saprof 2006;
Adala et al. 2007).
The proposed dredging project involves deepening and widening of the navigation
channel to the port of Mombasa and at the turning basin in front of the proposed Kipevu
West container terminal at Port Reitz. It would therefore affect the 3 harbours of Port
Reitz, Kilindini Port and Entrance Harbour. Also incorporated into the project is
maintenance dredging at the existing berths 1-18. The required dredging volumes at
Turning Basin, Navigation Channel at Inner Port and Port Entrance are estimated at 4.7,
0.2 and 2.4 million m3, respectively.

2
Figure 1.1: Locations of Capital Dredging Works
Most of the dredged materials will be disposed at a planned offshore dumping site
located about 6km offshore from the port entrance. Sandy or hard materials extracted
from the access channel and from the navigation channel at inner port will be utilized as
filling materials for reclamation of the site for the proposed new Container Terminal.
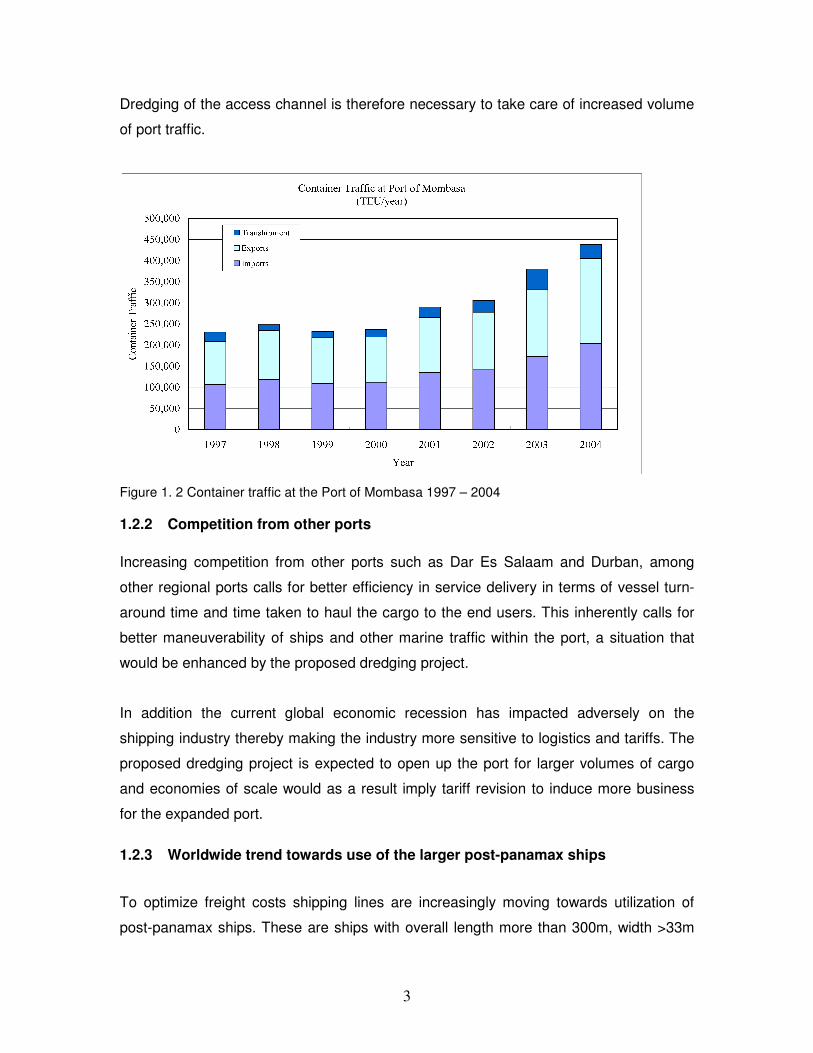
1.2 Justification for the Project 1.2.1 Rapid increase in volume of containerized cargo The port currently handles various cargoes including dry bulk, liquid bulk, conventional
cargo and containers. Most of the cargoes are increasing and, among them, the growth
of the container cargo is very high recording 380,000 TEU in 2003 and 439,000 TEU in
2004 (Figure 1.2)
This volume of the container cargo already exceeds the estimated capacity of the
existing container terminal and neighboring berths of Mombasa Port that is
approximately 400,000 TEU/year. It is forecasted that the growth of the container cargo
will continue and within ten years, the containerized cargo volume will be doubled.
3
Dredging of the access channel is therefore necessary to take care of increased volume
of port traffic.
Figure 1. 2 Container traffic at the Port of Mombasa 1997 – 2004
1.2.2 Competition from other ports
Increasing competition from other ports such as Dar Es Salaam and Durban, among
other regional ports calls for better efficiency in service delivery in terms of vessel turn-
around time and time taken to haul the cargo to the end users. This inherently calls for
better maneuverability of ships and other marine traffic within the port, a situation that
would be enhanced by the proposed dredging project.
In addition the current global economic recession has impacted adversely on the
shipping industry thereby making the industry more sensitive to logistics and tariffs. The
proposed dredging project is expected to open up the port for larger volumes of cargo
and economies of scale would as a result imply tariff revision to induce more business
for the expanded port.
1.2.3 Worldwide trend towards use of the larger post-panamax ships
To optimize freight costs shipping lines are increasingly moving towards utilization of
post-panamax ships. These are ships with overall length more than 300m, width >33m

4
and air draft more than 60m measured from the water line to the vessel’s highest point.
These ships typically have a displacement of approximately 65,000 tonnes, meaning that
they are designed to transport the maximum amount of cargo in a single vessel.
Because of the large sizes of these ships they require deeper berths for docking and
deeper and wider channels for navigation. The current depths of the berths and access
channel at Mombasa Port renders it unsuitable for use by post panamax ships, and the
dredging project needs to be undertaken to avoid risk of Mombasa port being relegated
to a feeder port.
1.2.4 Vision 2030
This is the government of Kenya’s development blueprint prepared in mid 2007, which
charters the countries development strategy in all sectors and aims to make the country
a newly industrialized, middle income nation, providing high quality of life to it’s citizens
by 2030. This vision came into play after the successful implementation of the Kenya
Economic Recovery Strategy for Wealth and Employment Creation 2003 – 2007, which
witnessed a rise in the countries GDP from 0.6% to 6.1% in 2006 (World Bank)
The economic pillar of Vision 2030 aims at providing prosperity to all Kenyans through
and economic development programme aimed at achieving an average GDP growth rate
of 10% per annum in the next 25 years. The social pillar sees to build a cohesive
society with social equity in a clean and secure environment.
In order to achieve a GDP of 10%, the whole sale/ retail trade sector, the Mombasa port
into a free Trade Zone similar to Dubai has been proposed as a flagship project. For this
to be achieved, it is imperative for the port to undergo modernization and expansion to
match worldwide trends

5
1.3 Present Environmental Conditions within Mombasa Port and its Environs
1.3.1 Water quality
Water quality within the port has deteriorated due to both onshore and offshore activities.
Main sources of pollution include:
Marine Vessels: Both cargo vessels and the port’s marine craft pose risk of water
pollution discharges (accidental release of fuels or lubricants). This may come as a
result of vessel collisions, vessels running aground or vessels colliding with stationary
structures.
Operations: Cargo operations especially liquid bulk from port users (oil marketing
companies, importers and exporters of edible oils). Spillage may occur during truck
loading, pumping or faulty tankers. In most cases the spill finds its way into surface
water drain and eventually into the sea.
Figure 1.3: Spill of soda ash from Magadi Soda conveyor belt
Dry Cargo releases: There have been complaints of excessive dust releases during
offloading of coal or clinker (for Bamburi Cement), soda ash (for Magadi Soda, Figure
1.3) and occasionally during discharge of bulk grain (Grain Bulk Handlers Ltd). Some of

6
the material finds its way into the ocean raising the Chemical Oxygen Demand (COD) to
levels that may not be conducive for the survival of marine life.
Water front industry discharges: Industries in the neighbourhood of the port discharge
untreated sanitary and industrial wastes into the sea. There is also effluent from the
Municipal sewage treatment plant (Figure 1.4) that is currently not functioning
consequently discharging raw sewage into the sea. Unfortunately this situation still
prevails.
Studies have indicated that the water quality in the area is already poor, rich in nutrients
and contaminated with high concentrations 0of heavy metals. Pollution by faecal matter
has also been reported by Kamau (2001), while that for oil has been reported by
Norconsult (1975) and Munga et. al (1993).
Figure 1.4: Untreated effluent from Municipal treatment plant discharges to sea
Part of the pollution was for a long time attributed to the Municipal Dumpsite at Kibarani
near Makupa Creek. The dumpsite was decommissioned in 2002 and is now only used
as a holding site for transshipment of waste to the current dumpsite located at
Mwakirunge in the mainland north.
High nutrients 0.2-36 mg/l subset nitrates, 0.1-7.7 mg/l subset reactive phosphate and
indicator bacteria 13-90,000 coliforms/100ml, 13-17,000 E-coli/100ml, have been

7
reported in the adjacent Makupa Creek, (Mwangi et.al). This water of low quality finds its
way into the Kilindini creek, which also receives its own share of untreated sewage.
Despite this, the area has shown resilience with an abundance of copepods. It can be
predicted with a fairly good degree of certainty that the status quo can be maintained
even with the proposed dredging project and subsequent marine operations in the area.
This prediction should be understood in the light that the project will not introduce any
nutrient rich materials, nor will it generate large volumes of human waste.
1.3.2 Air quality Presently sources of air pollution within the port include: Dry Cargo Releases: As described above there is release of significant quantity of dust
into the environment during offloading of dry cargo. Some of this is released as fine
airborne dust, thereby lowering the ambient air quality standards (Figure 1.5)
Figure 1.5: A grab discharging clinker into a truck
Road Traffic: Traffic within the port generates fugitive dust from unpaved roads and road
shoulders. A considerable number of local delivery trucks are poorly maintained and
emit thick black smoke with considerable quantities of carbon monoxide.

8
Port Equipment: Equipment such as forklifts, tug-masters, trailers also emits pollutants
into the environment. Although most port equipment are well maintained they are quite
many in number and this combined with the frequency of use (most container handling
equipment are used continuously for 24 hours) makes the emission from equipment
significant.
As part of the EIA process SGS Kenya Limited were contracted to carry out air quality
measurements at 5 points along the Kenyan coast at Mombasa on various dates
between 3rd November 2007 and 7th November 2007. The measurements were to
identify the concentration of pollutant releases in the land based receptor areas. The
pollutants targeted in the air quality measurements were Carbon Monoxide (CO),
Nitrogen Dioxide (NO2), Sulphur Dioxide (SO2), Hydrogen Sulphide (H2S) and Particulate
Matter (PM). SGS Kenya Limited is accredited by NEMA for environmental sample
collection and analysis. The results are as shown in the appendix.
On the basis of the measurement results, the survey results were found to be within the
World Health Organization Air Quality Guideline Values. The prescribed WHO values for
the key pollutants Nitrogen Dioxide and Sulphur Dioxide are 200µg/m3 per 1hr mean and
500µg/m3 per 10 minute mean respectively. It was concluded therefore that other than
occasional incidents of fugitive releases the current air quality within the port does not
present risk to human health. During project implementation continuous monitoring
would be undertaken to establish whether there would be further degradation attributable
to project activities.
1.3.3 Sediment quality
Previous studies have indicated certain areas of the port are contaminated with heavy
metals. However approximately 95% of the samples extracted during the study
indicated levels that fall within the acceptable concentration levels for open water
disposal (Testing Values) presented in World Bank Technical Paper No 126, 1990. All
dredged material that is classified as contaminated will be placed in contained land
based receptacles within the proposed container terminal reclamation area.
1.3.4 Ecosystem
Notable conservation areas in the neighbourhood of the Port include:

9
♦ The Mombasa Marine Park: Located about 15 km from the proposed site;
♦ Shimba Hills National Park: This is located in Kwale District, approximately 50 km
from the site.
The Ecosystem around Mombasa Port and the project area is covered in greater detail
in Chapter 6 of this report.
1.4 Terms of Reference for Environmental Impact Assessment The following Terms of Reference for the Environmental Impact Assessment (EIA) of the
proposed Dredging Works at Mombasa Port were adapted in accordance with the World
Bank and NEMA environmental impact assessment guidelines.
1. Introduction – The consultants would identify the development project to be
assessed and explain the executing arrangements for the environmental
assessment. This chapter of the report would detail the rationale for the
development and its objectives. Also to be covered is the context of the proposed
project in relation to future plans for development of Mombasa Port.
Deliverable: A detailed project outline would be given to familiarize stakeholders on the project objectives and scope.
2. Background Information – The experts would highlight the major components of
the proposed project, the implementing agents, a brief history of the project and
its current status including a justification as to whether the project is indeed
necessary.
Deliverable: Major project components will be documented, including
current and projected container volumes and project justification made.
3. Study Area – Specification would be made of the boundaries of the study area as
well as any adjacent or remote areas considered to be affected by the project
such as dredged material disposal sites.
Deliverable: Study areas to be clearly identified so that all social and
environmental issues are catalogued and analysed.
4. The following tasks will be performed:
Task 1. Description of the Proposed Project - a full description of the relevant
parts of the project, using maps at appropriate scales where necessary. This is

10
to include: quality and volume of sediments to be excavated in each area to be
dredged; type of dredging equipment to be used and the manner of deployment
including handling, transportation, and disposal of dredged material, sediment
containment settling and turbidity control measures; alternative dredging
methods considered; project schedule; and life span.
Deliverable: This would include a detailed project description and scope,
and the options available for achieving the project objectives.
Task 2. Description of the Environment - Assemble, evaluate and present
baseline data on the relevant environmental characteristics of the study area
(and disposal sites), including the following:
a) Physical environment: geomorphology, meteorology (rainfall, wind, waves
and tides), sea currents and bathymetry, surface hydrology,
estuarine/marine receiving water quality, and ambient noise.
b) Biological environment: terrestrial and marine vegetation and fauna, rare
or endangered species, wetlands, coral reefs, and other sensitive habitats,
species of commercial importance, and species with the potential to
become nuisances or vectors.
c) Socio-cultural environment: shipping and fishing activities and use of the
port, population, land use, planned development activities, employment,
recreation and public health, community perception of the development,
vulnerable occupants. Field survey would also e conducted on the
number of households to be displaced and areas of resettlement and land
acquired for the project.
d) Hazard vulnerability; vulnerability of area to flooding, hurricanes, storm
surge, and earthquakes. Also to be included here is maritime accident
data including ship collision, oil spill from ships and from land based
industrial activities.
The consultants would characterize the extent and quality of the available data,
indicating significant information deficiencies and any uncertainties associated with
the prediction of impacts.
11
Deliverable: Baseline environmental information, comprising physical,
biological and socio-economic conditions associated with the site will be
assembled and evaluated, including assumptions and limitations.
Task 3. Legislative and Regulatory Considerations – A description of the
pertinent legislation, regulations and standards, and environmental policies that
are relevant and applicable to the proposed project, and identification of the
appropriate authority jurisdictions that will specifically apply to the project.
Deliverable; All relevant legislative, regulatory and institutional
arrangements applicable to project will be summarized and presented.
Task 4. Determine the Potential Impacts of the Proposed Project –
Identification of impacts related to dredging, spoil disposal and possible land
filling. Also to be identified are impacts related to road construction, land
reclamation and construction of office buildings and associated facilities. A
distinction will be made between significant impacts that are positive and
negative, direct and indirect (= triggering), and short and long term. Identify
impacts that are cumulative, unavoidable or irreversible. Identify any information
gaps and evaluate their importance for decision-making. Special attention will be
paid to:
• Effects of the project (dredging and spoil disposal) on water quality and
existing coastal ecosystems and resources,
• Effects of dredging on the coastal stability of adjacent shorelines,
• Effects of dredging works on the existing operations of the port, fishermen,
and on the rights/operations of any other stakeholders,
• Effects of the project on future port development and the tourism sector,
• Effects of the project on maritime, boating and road traffic,
• Effects of the project on ambient noise levels, and
• Effects of the project on any historical resources.
Deliverable: All potential impacts (both positive and negative) likely to
result from the development will be identified and ranked in an
environmental impact matrix.

12
Task 5. Analysis of Alternatives to the Proposed Project. – A Description of the
alternatives examined for the proposed project that would achieve the same
objective including the “no action” alternative. This includes dredging vessel
types and disposal sites, alternative traffic routes and alternative resettlement
plans. Distinguish the most environmentally friendly alternatives.
Deliverable: Project alternatives would be identified and analysed and a
justification made as to why the chosen sites, methods and plans
constitute the best practicable environmental option.
Task 6. Mitigation and Management of Negative Impacts – The consultants will
identify possible measures to prevent or reduce significant negative impacts to
acceptable levels with particular attention paid to dredge spoil disposal and
dispersal/sedimentation control, as well as measures to minimise disruption to
existing port operations. Costing will be made of the mitigation measures and
equipment and resources required to implement those measures. Proposals will
be made for investigating claims for compensation put forward by affected
stakeholders.
Deliverable: A detailed environmental management programme will be developed to reduce the effects of the negative environmental impacts and enhance the impacts considered beneficial to the proponent and the community.
Task 7. Development of a Monitoring Plan – Identify the critical issues requiring
monitoring to ensure compliance to mitigation measures and present impact
management and monitoring plan for such issues.
Deliverable: An environmental monitoring plan will be prescribed to ensure
that the proposed mitigation measures are effected and the desired
remediation effects achieved.
Task 8. Assist in Public Participation and Consultation
The consultants would identify appropriate mechanisms for providing information
on project activities and progress of project to stakeholders, assist in co-
coordinating the environmental assessment with the relevant government
agencies and in obtaining the views of local stakeholders and affected groups. (It
is anticipated that there will be considerable public interest concerning issues of

13
sediment disposal and turbidity with respect to fishing activities, and the
economic benefits to be derived from the project.)
Deliverable: Public consultation will be conducted and stakeholder views
documented. Where necessary the consultants would conduct stakeholder
workshops to collect and collate stakeholder views.
Report - The environmental impact assessment report, to be presented in electronic
and hard copies, will be concise and focus on significant environmental issues. It will
contain the findings, conclusions and recommended actions supported by
summaries of the data collected and citations for any references used in interpreting
those data. The environmental assessment report will be prepared in the format
prescribed by NEMA, the outline of which is as follows:
• Executive Summary
• Description of Proposed Project
• Policy, Legal and Administrative Framework
• Identification of Environmental Impacts
• Impact Mitigation Measures
• Impact Monitoring Plan
• Public Consultation and Participation Process
• Appendices/List of References
1.5 Consideration of Alternatives
1.5.1 Alternatives of sites for dumping of dredged material
The following sites were considered for dumping of the dredged material:
1.5.1.1 Alternative A: Open water dumping
One of the areas considered is a site offshore with a depth of 100m and a distance of
about 3 km from entrance of the Port as indicated in Figure 1.6. The advantage of this
site is that it is strongly influenced by the East African Coastal Current that flows
northward all the year round. The topography is such that the bottom drops steeply from

14
40 m to 200 m depth within a distance of less than 3km away from the fringing coral reef
found in this area.
Figure 1. 6: Alternative locations for proposed dumping sites
This means materials disposed at Alternative site A beyond the reef front are placed in
the path of the main coastal current and have limited chance of drifting back to the
shallow areas and impacting on the ecosystems such as corals reefs and seagrass beds.
The area considered for disposal is within the limits of the Port and has been used
before for dumping of dredged material from the harbor channel. The seabed material at
100 m is likely to be fine mud similar to the disposal material and hence would not
introduce significant impact.
1.5.1.2 Alternative B: Land based dumping
PROPOSED CONTAINER TERMINALPROPOSED CONTAINER TERMINALPROPOSED CONTAINER TERMINALPROPOSED CONTAINER TERMINAL
BASIN/ACCESS CHANNEL DREDGINGBASIN/ACCESS CHANNEL DREDGINGBASIN/ACCESS CHANNEL DREDGINGBASIN/ACCESS CHANNEL DREDGING (RELEVANT PROJECT)(RELEVANT PROJECT)(RELEVANT PROJECT)(RELEVANT PROJECT) Shelly Beach
Nyali Beach
Limit of Port Mombasa
Mombasa Marine
National Reserve
AlternativeAlternativeAlternativeAlternative---- AAAA AlternativeAlternativeAlternativeAlternative---- BBBB

15
Another alternative is to dump the dredged material at the land based disposal site on
Mombasa West mainland at the site of the proposed container terminal in Port Reitz.
The material would then act as backfill in the area where 100 hectares is proposed for
reclamation from the sea. This site is also proposed for dumping of contaminated
sediments. In such case KPA shall equip the site with containment facilities such as
installation of enclosing concrete or steel wall or use of thick plastic sheets such that the
dumped material does not contaminate soil or groundwater.
1.5.2 The No Action alternative
The selection of the “No Action” alternative would mean the sea being retained in its
existing form. As mentioned in sec. 1.2 the trend worldwide is that the shipping industry
is moving towards use of post-panamax ships. The current depths of the berths and
access channel at Mombasa Port renders it unsuitable for use by post panamax ships,
and the dredging project needs to be undertaken to avoid risk of Mombasa port being
relegated to a feeder port.
The “No Action” Alternative is likely to have the greatest negative implications on the
socio-economic environment of the area and surrounding communities. It is anticipated
that the proposed development would provide opportunities for employment both at the
construction and operation stages and potentially significant business opportunities
would spring up as a result of its implementation. All these benefits would be foregone if
the project is not undertaken.
16
2.0 BASELINE INFORMATION
2.1 Landscape, Topography and Geology The Mombasa District is situated in coastal lowland with extensive flat areas rising gently
from 8 meters above sea level to 100 meters above sea level in the west. It can be
divided into three main physiographic belts, namely, the flat coastal plain, which is 6
kilometres wide, and includes the Island division, Kisauni on the north mainland and
Mtongwe to the south. Next, are found the broken, severely dissected and eroded belt
that consists of Jurassic shale overlain in places by residual sandy plateau found in
Changamwe division. Finally, there is the undulating plateau of sandstone that is divided
from the Jurassic belt by a scarp fault. Nearer the sea, the land is composed of coral
reef of Pleistocene Age that offers excellent drainage. The coral limestone and lagoon
deposit reach a thickness of 100 meters.
2.2 Climate
The Port of Mombasa lies in the hot tropical region where the weather is influenced by
the great monsoon winds of the Indian Ocean, which also influences the climate and
weather systems that are dominated by the large scale pressure system of the western
Indian Ocean and the two distinct monsoon periods. Comparatively dry weather
conditions are experienced in the area from November/December to early March, when
the North-East Monsoon predominates. Detailed climatic description will be found in the
section under description of the physical environment.
2.3 Hydrology There are no permanent rivers in Mombasa. However, due to favourable geology,
groundwater sourced from shallow wells and boreholes is available to supplement the
needs of the residents. Otherwise, water to serve the needs of the area is sourced from
Kwale through Marere Springs and the Tiwi Boreholes; Malindi through the River Sabaki;
and from the Mzima springs in Taita Taveta District.
It is however of note to state that there are number of semi-perennial and seasonal
rivers such as the Mwache, Kombeni, Tsalu, Hodi-hodi and Nzovuni, which drain into
coastal region from arid and semi-arid catchments.

17
Mombasa has some potential in terms of groundwater resources. This is because of its
geological structure that promotes rapid infiltration and percolation of surface run-off to
recharge groundwater aquifers. Areas covered with the Kilindini sands have a high
groundwater potential so are the areas with Triassic sandstone geology, which have
shown high groundwater yields.
Four main types of groundwater have been identified in the Kenya coast according to
their anionic content: carbonate, bicarbonate, chloride and sulphate. Mixed types of
groundwater composed of the above have also been found in the Kenya coast.
The main factors controlling the quality of groundwater are the permeability of the rock,
the rock type and degree of recharge from surface run-off and rainfall. Water of the
poorest quality (high TDS) is associated with the Jurassic shale; intermediate water
quality is associated with the Triassic sandstones and Pleistocene coral limestone; while
the best quality is associated with the unconsolidated sands that receive efficient
recharge due to their high infiltration capacities.
Groundwater quality also varies depending on the depth of the borehole/well, nearness
to the ocean and proximity to human settlements. Boreholes located near the coast have
a problem with salt water intrusion and this problem is exacerbated by over-extraction.
Boreholes and wells located in urban areas suffer from the threat of pollution originating
from pit latrines and septic tank-soakage pit systems, which are often the source of
contamination to otherwise good quality water chemically rendering it unsuitable for
drinking purposes.
The exploitation of groundwater in Mombasa has been haphazard with no strict
government control on borehole drilling or well development. With the current problem of
water supply shortages and increased urban-rural population, people in urban areas,
especially Mombasa, are increasingly dependent on groundwater for potable needs.
2.4 Soils
The soil types in the Port of Mombasa area are broadly associated with the geological
formations along the physiographic zones in Mombasa district as detailed by the Ministry
of Agriculture, Government of Kenya (1988). Along the coastal lowlands, four soil types
predominate:
18
♦ On the raised reefs along the shore, well-drained, shallow (< 10 cm) to moderately
deep, loamy to sandy soils predominate;
♦ On unconsolidated deposits in the quaternary sands zone (also referred to as
Kilindini sands) are well drained moderately deep, to deep, sandy clay loam, to
sandy clay, underlying 20 to 40 cm loamy medium sand;
♦ In the Kilindini sands zone are also to be found areas with very deep soils of varying
drainage conditions and colour, variable consistency, texture and salinity;
♦ Also found on the Kilindini sands are well-drained very deep, dark red to strong
brown, firm, sandy clay loam to sandy clay, underlying 30 to 60 cm medium sand to
loamy sand soils;
In the coastal plain, the soils are developed on coral limestone merging to Kilindini sands
inland. The coral soils are generally well drained and of sandy clay loam to sandy clay
texture. They range from very deep and non rocky to very shallow and extremely rocky.
The soils developed on Kilindini sands vary from excessively drained, very deep, very
sandy soils to poorly drained, very deep, heavy clay soils. Extensive areas of imperfectly
drained, clayey soils occur in the southern part of the coastal plain.
Most of the agricultural activities in the district occur in the mainland areas, i.e. Kisauni
(north mainland), Likoni (south mainland) and Changamwe (west mainland). The low-
lying areas are dominated by the coconut-cassava and cashew nut-cassava agro
ecological zones (GOK Ministry of Agriculture 1988).
Most of the Mombasa island area and parts of Kisauni and Likoni fall under the coconut-
cassava zone. This zone is characterised by a medium to long cropping season and
intermediate rains. The rest of the low lying areas in Kisauni and Likoni fall under the
cashew nut-cassava zone, which is characterised by medium cropping season, followed
by intermediate rains.
Most of the raised Changamwe area falls under the cashew nut-cassava zone. The
raised areas in Kisauni and parts of Changamwe, that mainly include the shale areas,
fall under the lowland livestock-millet zone. This zone is characterised by a short to
medium cropping season and a second season with intermediate cropping.

19
2.5 Population According to the 1999 Population and Housing Census (GOK, 1999) the population of
Mombasa District stood at 665,000 persons distributed in the four divisions’ of the
District as indicated in Table 2.1. The projected population for the district in 2005 is also
given.
Table 2. 1. Population distribution in the Mombasa District
Administrative
Division
Size:
Area km2
Population Population density/ km2
2005 1989 1999 2005*
Island 14.1 127,720 146,334 170,699 12,106
Kisauni 109.7 153,324 249,861 291,463 2,657
Likoni 51.3 67,240 94,883 110,681 2,158
Changamwe 54.5 113,469 173,930 202,889 3,723
TOTAL 229.6 461,753 665,018 775,743 3,379*
Source: GOK (1989, 1999). * Projected
Mombasa district experienced a 44% increase in population between the census years
of 1989 and 1999. Changamwe Division has the second highest number of people in the
District. Kisauni Divisions’ population grew by 63% in 10 years’ period. The high
increase in population was attributed to natural growth and in-migration, mostly of the
labour force from other parts of the country. Generally, the high population in Mombasa
has proved to be a serious challenge in the provision of housing and essential services
such as water, sanitation and health care.
2.6 Demographic Characteristics The Island division of Mombasa district is the Central Business District (CBD). It is the
most built up area and has the highest population density. High cost low-density
settlements within the Island are found in Kizingo and Tudor, while middle cost, high-
density settlements are found around the Buxton-Stadium area, Makupa and Saba Saba.
Then we have the low cost high-density settlements found around Buxton, Tononoka,
and Old Town. Informal and slum settlements found on the Island include Muoroto
20
California, Muoroto Paradise, Muoroto Kafoka, Kiziwi, Kaloleni, Spaki, Sarigoi/Mwembe
Tayari, Mwembe Taganyika and Kibarani.
A land use classification study (Agil Saleh, 1999) indicates that only 31.2% of the total
land area in Mombasa district is under residential settlements. The direction of growth in
human settlements is found concentrated northwards in Kisauni Division where other
socio-economic activities occupy large parcels of land. This has entailed the crowding of
many people in small land areas with many implications. For example in the Kisauni
division, large beef and dairy farms, the tourist hotels, Shimo La Tewa School and
Prison and Bamburi Cement, occupy large tracts of land. The result of this is population
concentrations in the sprawling low cost high density settlements of Kisauni Estate,
Mlaleo, Barsheba, Mwandoni, Bakarani, Magogoni, Mishomoroni, Mtopanga, Shanzu;
and the squatter areas of Ziwa la Ngombe, Kisimani and the Bombolulu slums.
A similar situation exists in Likoni and Changamwe divisions, where large pieces of land
having been reserved for productive economic activities, people have been left to
concentrate on small areas in several informal settlements. Such of the areas include
Maweni, Timbwani, Kidunguni, Ujamaa/Shika-Adabu, and Mtongwe (Shonda) all in
Likoni division. In Changamwe division, concentrations of human settlements are found
at the Chaani conglomerate areas of California, Dunga Unuse, Tausa, Kwarasi, and
Migadini. Other informal settlements and slums are found at Kasarani, Fuata Nyayo,
Kalahari, Birikani, Kwa Punda, Bangladesh, Gana Ola, Mikanjuni, Miritini Madukani,
Vikobani, Mwamlali, Cha Munyu, Magongo-Wayani, and Jomvu Kuu. These are areas
where the sanitation status is poorest: crowded human settlements and generally poor
infrastructure facilities resulting in a myriad of environmental problems as a
consequence (Gatabaki-Kamau et al., (2000).
2.7 Physical Infrastructure 2.7.1 Sea, road, rail and airport networks Sea transport in Mombasa is provided by the Port of Mombasa. The major exports from
the port of Mombasa are coffee, petroleum products, meat and meat products, hides and
skins, cement, pineapple, and tea. Main imports include industrial and electrical
machinery, crude petroleum, assembled motor vehicles and chassis, iron and steel,

21
agricultural machinery and tractors, pharmaceuticals, fertilizers, textiles, mineral fuels,
chemicals, food and live animals.
Most of the roads in the Mombasa District converge on the city due to its importance as
an industrial and commercial centre. The district is well served by both classified and
unclassified roads, although the network is not equally distributed with many of the roads
being concentrated on the Mombasa/West Mainland axis. This has left the north/south
mainland areas with few vehicular roads and this is a contributing factor in the relative
underdevelopment of these parts.
It has been estimated that nearly 75 % of all goods imported and exported through the
Port of Mombasa are conveyed by road, underlying the importance of this means of
transport. The main exception to this is oil products, which are conveyed by a pipeline
into Kenya’s interior.
Rail transport between Mombasa, though important has relatively declined over the
years. The main railway line between Mombasa and Nairobi, branches off at Voi to
connect with the Taveta Town-ship. Kenya railways has large marshalling yards and
depots at Mombasa and lines extend from this into the industrial area and the port
Warehouses
Moi Airport Mombasa, is the main airport for the coast region. It is served by the
national airline as well as other flights bringing in passengers and cargo. There are
frequent flights to Nairobi as well as other less frequent ones to other areas like Malindi
and Lamu.
2.7.2 Electricity supply
Electricity is adequately provided in and around the port of Mombasa. However, the
frequent and irritating power failures, which go, unexplained are common. This hurts
many sectors of the economy. This has prompted many Mombasa business people and
enterprises to install standby generators in order to minimize business losses.

22
2.7.3 Water supply Mombasa district heavily depends on water sources from outside the district for its
needs. It supplements this water need from groundwater sources in the district. The
district has a daily water demand of 200,000 cubic meters of water against the available
130,000 cubic meters that come from the traditional supply sources of Kwale, Malindi
and Taita-Taveta. There is therefore a water shortfall of 70, 000 cubic meters, (NWCPC,
2000). This 35% shortfall is met by tapping the groundwater sources, which are potential
in the district. Also, as the reticulated supplies experience constant breakdowns,
groundwater sources, not only supplement the supply, but they sometimes become the
major source of water available in the district. In fact, 13,286 out of the 183,540
households in the district are almost permanently dependant on groundwater. These are
distributed as follows: - wells- 6,245 households, boreholes- 6,941 households (GOK,
Kenya Population Census 1999).
A significant number of the population therefore relies on groundwater for their potable
needs. As groundwater is an important source of potable water, it must be protected
from sewage pollution.
2.7.4 Housing and sanitation The study found that the main systems available for sewage management in Mombasa
district include the following: -
♦ Centralized sewers and treatment plants
♦ Septic tanks and soakage pits, and
♦ Pit latrines.
The centralized sewer system serves only a small proportion of the population in the
district. The use of septic tanks and soakage pits is largely limited to the planned areas
of development. The majority of the population is served by the use of pit latrines. About
one third of the Island is on a centralized sewer system, this serves about 12 percent of
the households.

23
3.0 POLICY, INSTITUTIONAL AND LEGAL FRAMEWORK
3.1 Introduction Among environmental challenges being experienced today include land degradation,
loss of biodiversity, solid waste management air pollution, and water management. This
situation is aggravated by lack of awareness and inadequate information amongst the
public on the consequences of their interaction with the environment. In addition, there is
limited involvement of the local communities in participatory planning and management
of environment and natural resources. Recognizing the importance of natural resources
and environment in general, the Government has put in place a wide range of policy,
institutional and legislative measures to address the underlying causes of environmental
degradation in the country.
3.2 Legal Framework The following pieces of legislations and regulations are applicable to the proposed
project:
3.2.1 The Environmental Management and Co-ordination Act, 1999
This Act enacted in 1999 brought into force the National Environmental Management
Authority (NEMA). NEMA is a corporate body responsible for the administration of the
above legislation. The Director General appointed by the President heads NEMA. NEMA
functions include the co-ordination of various environmental management activities,
initiation of legislative proposals and submission of such proposals to Attorney General
through the Minister for Environment & Natural Resources. NEMA also conducts
research, investigations and surveys in the field of environment and undertakes
environmental education and awareness. In addition, NEMA advises the Government on
regional and international agreements to which Kenya should be a party and issues of
an annual report on the state of environment in Kenya. NEMA is charged with the
responsibility of the execution of the Environmental Impact Assessment (EIA).
According to section 58 of the Act projects specified in the second schedule that are
likely to have significant impact on the environment have to be subjected to an EIA study.
Being a construction project, this project is considered to fall under the said schedule.

24
Part VII, section 68 of the same Act requires operators of projects or undertakings to
carry out annual environmental audits to determine the level of compliance with
statements made during EIA study and submit the audit report to NEMA.
Part VIII, section 72 of the Act prohibits discharging or applying poisonous, toxic,
noxious or obstructing matter, or any other pollutant into aquatic environment. Section
73 requires that operators of projects which discharge effluent or other pollutants submit
to NEMA accurate information about quantities and qualities of effluent discharged, and
that effluent generated from point sources are discharged into existing sewers only after
issuance of prescribed permit from the local authorities.
3.2.2 The Environment Impact (Assessment and Auditing) regulations, 2003
This Legal Notice stipulates ways in which environmental experts should conduct the
Environment Impact Assessment and Audits in conformity with the requirements stated.
It is concise in its report content requirements, processes of public participation,
licensing procedures, inspections and any possible offences under the Act.
3.2.3 The Occupational Safety and Health Act, 2007
This Act commenced in 2007 and replaces The Factories and Other Places of Work Act,
Cap 514. It makes provisions for the health, safety and welfare to be observed by
employers and persons employed in places of work. Part IV of the act covers health
issues such as the state of cleanliness, refuse management, employee space
requirement, ventilation and sanitary conveniences. Part V covers fire safety, operation
and maintenance of machinery, fencing requirements, storage of dangerous substances,
training and supervision of workers. Part VI deals with welfare issues; drinking water
supply, washing facilities, sitting areas and first aid provision.
3.2.4 The Water Act 2002 (No. 8 of 2002); Laws of Kenya
The Water Resource Management Authority was established under this Act to:
♦ Develop principles and guidelines for allocation of water resources
♦ Monitor and re-assess water resource management strategy
♦ Monitor and enforce permissions attached to water use
♦ Regulate and protect resources quality from adverse impacts
♦ Manage and protect water catchments

25
♦ To liaise with other bodies for better regulation and protection of water
resources
The Water Act provides for the conservation and controlled use of water resources in
Kenya. Under the Ministry of Water the Act prohibits pollution of water resources and
controls the discharge of industrial and municipal effluents into the ocean and other
water bodies.
The proposed project would impact on sea water due to dredging and disposal of
dredged material and hence is subject to the provisions of the Water Act.
3.2.5 The Physical Planning Act; Laws of Kenya, Chapter 286
This Act provides for the preparation and implementation of physical development plans.
They formulate national, regional and local development policies, guidelines and
strategies. The Act empowers the Director of Physical Planning to advise the
Commissioner of Lands on appropriate uses of land and land management. The Act
ensures that use and development of land and buildings is carried out in accordance
with the projected development plans of the area.
3.2.6 Local Government Act (Cap 265)
The Local Government Act (Cap 265) provides for local councils to establish and
maintain sewage and drainage systems. It has also provisions for the construction of
water supply systems and measures for the prevention of pollution in urban areas. The
project site falls within Mombasa Municipality and would hence be governed by the
provisions of this act.
3.2.7 Kenya Ports Authority (KPA) Act
Through the Kenya Ports Authority (KPA) Act, KPA has the responsibility for controlling
oil pollution in the Kenyan territorial waters, which include all inshore waters and those
extending up to 160km offshore. In fulfillment of this obligation, the KPA together with
the Oil Spill Mutual Aid Group OSMAG has developed a National Oil Spill Response
Contingency Plan.

26
3.2.8 Kenya Maritime Authority Act
Kenya Maritime Authority is charged with the responsibility of regulating, coordinating
and overseeing maritime affairs in the country. In fulfilling this mandate KMA is expected
to:
• Advise the government on the development of international maritime conventions,
treaties and agreements as well as their codification into the laws of Kenya;
• Conduct and liaise with other stakeholders in doing research, investigations and
surveys relating to maritime affairs;
• Develop and maintain the national oil spill response plan in coastal and inland
waterways in liaison with players in the oil industry;
• Serve as coordinators of search and rescue operations in liaison with KPA, Kenya
Navy and other relevant bodies;
• Ensure sustainable exploitation of marine resources and rapid response to marine
calamities;
KMA therefore provides a forum for which the various players involved in maritime affairs
develop maritime policies and integrate these policies into the national development
plan.
Further, KPA policy on environmental issues is governed by the provisions of The
International Convention for the Prevention of Pollution from Ships, 1973 (MARPOL
73/78) to which Kenya ascribes. This is the most important instrument for preventing
pollution from arising from marine transportation. It was adopted in 1973 and modified by
the Protocol of 1978 relating thereto, hence MARPOL 73/78. It consists of five Annexes
as follows:
Annex I: Oil - Ships are prohibited to discharge oil or oily water, such as dirty ballast
water and oily bilge water containing more than 15 ppm of oil, within 12 miles of land.
Other conditions apply to discharges outside 12 mile limits.
Annex II: Noxious Liquid Substances in Bulk - Chemicals are evaluated for the
environmental hazard they may cause if discharged into the sea (Categories A,B,C and
D). Discharge into the sea of the most harmful chemicals (Category A) is prohibited and
tank washings and other residues of less harmful substances (Categories B, C and D)

27
may only be discharged under certain conditions, e.g., total quantity, distance from the
shore, depth of water, prescribed depending on the hazards. There are substances, e.g.,
water, wine, acetone, ethyl alcohol, for which no restrictions apply.
Annex III: Harmful substances in packaged form - this is principally oriented towards
prevention of pollution by regulating packaging, marking and labeling and stowage.
Annex IV: Sewage - It is prohibited to discharge ship-generated sewage unless it is
treated with an approved sewage treatment plant or at a certain distance from land.
Annex V Garbage: - Garbage produced on board a ship, food waste, packaging, etc.
must be kept on board and discharged either ashore or into the sea under certain
conditions, such as the distance from land. Discharge of all plastics is prohibited.
Maritime operations are also regulated by London Convention, 1972 which prohibits
dumping of garbage at sea.
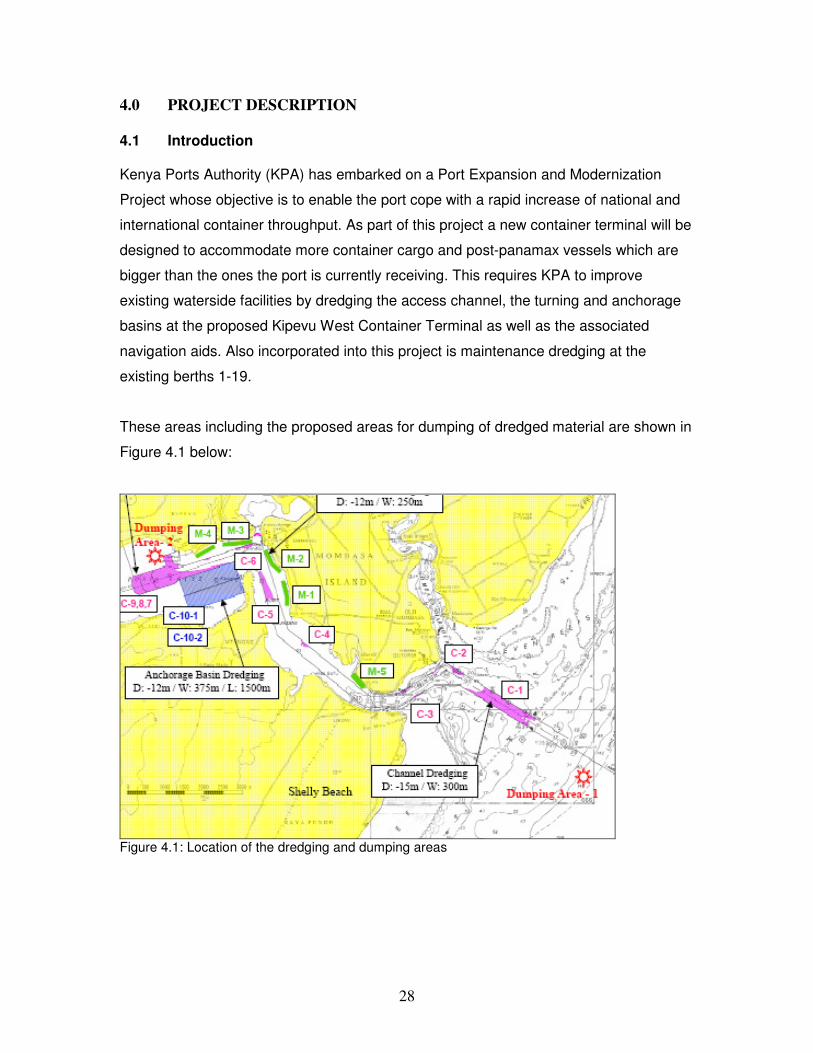
28
4.0 PROJECT DESCRIPTION
4.1 Introduction Kenya Ports Authority (KPA) has embarked on a Port Expansion and Modernization
Project whose objective is to enable the port cope with a rapid increase of national and
international container throughput. As part of this project a new container terminal will be
designed to accommodate more container cargo and post-panamax vessels which are
bigger than the ones the port is currently receiving. This requires KPA to improve
existing waterside facilities by dredging the access channel, the turning and anchorage
basins at the proposed Kipevu West Container Terminal as well as the associated
navigation aids. Also incorporated into this project is maintenance dredging at the
existing berths 1-19.
These areas including the proposed areas for dumping of dredged material are shown in
Figure 4.1 below:
Figure 4.1: Location of the dredging and dumping areas

29
4.2 Preliminary Survey In order to obtain necessary information on natural conditions for detailed design and
simulation works, Hydraulic Survey, Geotechnical Investigation and Sediment Quality
Analysis were carried out in and around the planned dredging and dumping areas.
Scope and results of the surveys are briefly described in the following sections. Full
results are available in the separate Survey Reports.
4.2.1 Hydraulic survey
This survey was carried out by Southern Engineering Co Ltd from January 2008 to
March 2008. It consisted of three (3) items and their purposes are shown in Table 4.1
Table 4.1 Item and Purpose of Hydraulic Survey
Survey Item Purpose 1. Bathymetric Survey To set up seabed elevation in simulation works.
To set up dredging dimensions. To calculate required dredging volumes
2. Seismic Survey To verify existence of hard material (rock) layer in dredging area
4. Tide, Current and Suspended Solid (SS) Measurement
To set up hydraulic conditions in simulation works To decide dredging dimensions To assess construction effieciency
The above surveys were carried out in the areas shown in Figure 4.2.

30
Figure 4.2: Hydraulic survey
Key results of the survey are shown in Table 4.2 and Figures 4.3 and 4.4.
Table 4. 2: Key Survey Results
Survey Item Primary Results
1. Bathymetric Survey - Seabed level in entire survey area was obtained. See Figure 4.3 - Very deep areas (CDL-40 to 60m) at port entrance and narrow bend section were surveyed. - Two small wrecks were found outside dredging area. - No fluid mud was found by means of dual frequency echo sounding.
2. Seismic Survey - Hard material was found in dredging area outside port entrance but not found inside port entrance.
3. Tide, Current and Suspended Solid (SS) Measurement
- Observed high and low tides in spring tide were about CDL+3.6 and +0.3, respectively. - Current max speed ranges about from 40 to 120 m/sec. Highest current speed was observed at port entrance station at 110 m/sec. See Figure 4.4. - SS concentrations in surface and middle layers range from 5 to 30 mg/l. SS concentrations in bottom layer inside port entrance reach about 120 mg/l caused by re-suspension of fine particles on seabed.

31
4.2.2 Geotechnical Investigation
This Investigation was carried out by Foundation Pilling Limited from February 2008 to
March 2008. The Geotechnical Investigation consists of three (3) items and their
purposes are shown in Table 4.3
Table 4. 3: Item and Purpose of Geotechnical Investigation
Investigation Item Purpose
1. Boring and Laboratory Analysis
To verify results of seismic survey. To obtain characteristics of seabed materials to be dredged.
2. Jet Boring
To complement results of boring survey.
3. Seabed Material Sampling
To set up particle size distribution of seabed material in simulation works.
The above investigations were carried out in the areas shown in Figure 4.5
Figure 4. 3: Results of Bathymetric Survey
Figure 4. 4: Results of Current Measurement

32
Figure 4. 5: Area of Investigation
Key investigation results are shown in Table 4.4 below:
Table 4. 4: Primary Investigation Results
Investigation Item Primary Results 1. Boring & Laboratory Analysis
- Hard materials (coble and gravel) were found in the dredging area at Boring No. 1- 6 and 7. See Figure 4.6 and Attachment 1. - Soft materials (silt) were found in the dredging area at Boring No. 8, 9 and 10.
2. Jet Boring
- Seabed materials inside port entrance are very soft and cohesive.
3. Seabed Material Sampling
- Seabed materials outside port entrance are composed of hard coral, gravel and sand, while seabed materials inside port entrance are composed of very soft fine silt.
See Figure 4.7

33
Figure 4. 6: Results of seabed boring
Figure 4. 7: Results of seabed material sampling

34
4.2.3 Sediment quality analysis
This exercise was carried out by NEMA certified SGS Kenya Limited and the
Department of Mines and Geology. The item and purpose of Sediment Quality Analysis
are shown in Table 4.5.
Table 4. 5: Item and Purpose of Sediment Quality Analysis
Analysis Item Purpose Sampling and concentration analysis of heavy metals (Hg, As, Cd)
To verify sediment quality to accept disposal of dredged materials at the designated offshore dumping area, comparing with the permissible Concentration levels presented in World Bank technical paper no 126, 1990. The permissible levels of Hg, As, Cd are 1.6, 85, 7.5 mg/kg, respectively.
As a result of laboratory analysis, no sample exceeded the permissible concentration
levels presented. However, as a common practice, a dredging contractor shall carry out
re-sampling and analysis in their Pre-dredging Survey and Environmental Monitoring
Survey.
4.2.4 Conclusion on Preliminary Survey In summary the preliminary survey came out with the following key findings
♦ Maximum and average current speeds at bending areas along the existing channel
reaches at about 110 and 65 cm/sec, respectively.
♦ Seabed materials to be dredged can be categorized into two (2) types, i.e. soft
materials (silt, N value=1) and hard materials (cobble and gravel, N value=refused)
♦ No significant contamination of seabed materials by heavy metals, such as cadmium,
arsenic, mercury, has been detected in the planned dredging areas.
4.3 Detailed Design Detailed design of the capital dredging, maintenance dredging and ancillary works
(navigation aids and tide gage installation) were carried out. Primary results of the
detailed design are as follows.

35
4.3.1 Capital dredging
As for the access channel, original alignment of center line, depth of CDL-15m and width
of 300m were confirmed to be acceptable in terms of safe channel operation by ship
operation simulation. The turning basin and anchorage were designed to be dredged
down to CDL-15 and CDL-12m having width of 500m and 375m, respectively.
4.3.2 Maintenance dredging
Maintenance dredging of the basins in front of the existing berths No. 1 to No. 19 and
Mbaraki wharf were designed to be dredged down to the depths which keep existing
berth structures stable, i.e. CDL-10m to CDL-11m.
4.3.3 Ancillary works Lighting buoys, leading lights and a tide gage station were designed. As a result of the
ship operation simulation, no installation and relocation of the lighting buoys in the
access channel was proposed. Eight (8) lighting buoys are designed to be installed at
corners of the planned anchorage and turning basin. Improvement of all existing leading
lights, i.e. raising height and light intensity, were also designed. A tide gauge station,
which continuously measures tide level in an observation well by a float, was designed
as a permanent facility.
4.4 Numerical Simulation In order to verify the technical and environmental conditions which form the basis of this
detailed design works, numerical simulations on four (4) subjects were carried out as
described below.
4.4.1 Ship operation simulation Critical conditions which make handling of the post-panamax vessels difficult were
revealed in this simulation. They are caused by tide, current, wind and other marine
traffic. Analyzing the results of simulation together with the comments given by KPA
pilots, a ship operation manual was prepared.

36
4.4.2 Siltation simulation As a result of simulation, possible siltation thickness and volume in the turning basin
area were estimated. They are 15.7 cm per year and 115,000 m3 per year, respectively.
These figures imply that capital dredging of the turning basin with over dredging of 0.5 m
will be followed by maintenance dredging after three (3) years. It is noted that in some
location, such as corner and edge of the dredging area where stagnant water likely
occur, the siltation thickness per year may be greater than the above figure, i.e. two fold.
Since seabed materials in the port entrance area consist mainly of coral cobble and
gravel, no significant siltation was estimated at the access channel dredging area.
4.4.3 Turbid water dispersion simulation In consideration of most possible dredging and dumping methods, potential area and
concentration level of turbid water dispersion at dredging and dumping areas were
predicted. In the anchorage and turning basin dredging area, turbidity of vicinal waters
will be increased during the dredging operation. However, no turbid water will reach
coral reef beyond the port entrance. In and around the offshore dumping area, which is
located about four (4) km away from the coral reef; dense turbid water will disperse in
the bottom layer along the coral reef. However, no area indicating more than 10 mg/L
increase in turbidity reaches -50 m isobar which is known as the deepest outer fringe of
the existing coral reef. Since dumping is done from the bottom door of transport vessels
at the area having -150 m in depth, no significant increase in water turbidity is expected
in the surface layer.
4.4.4 Wave penetration simulation This simulation was carried out to determine the impact of access channel dredging on
the wave conditions in and around the port entrance. The simulation results revealed
that change of wave height before and after the dredging is small, less 10%. Therefore,
impact of the dredging on local wave climate will be negligible.
4.5 Quantity Calculation Quantity of capital dredging, maintenance dredging and ancillary works was calculated
as shown in the Tables 4.6 and 4.7. It is noted that all quantities in the tables are
minimum quantities; no extra and over dredging volume is included.

37
Table 4. 6: Capital Dredging
Dredge Area Quantity
(m3)
Hardness of
Materials
Dredging Dimensions
Depth (m) Width (m) Slope
1. Access Channel 612,325
C-1 367,995 Hard -15 300 1:1
C-2 72,370 Hard -15 300 1:1
C-3 10,450 Hard -15 300 1:1
C-4 1,660 Soft -15 300 1:4
C-5 143,095 Soft -15 300 1:4
C-6 16,755 Soft -15 300 1:4
2. Turning Basin 4,534,405
C-7 2,657,155 Soft -15 500 1:4
C-8 1,291,950 Soft -15 500 1:4
C-9 585,300 Soft -15 500 1:4
3. Anchorage
Basin 7,403,841
C-101-1 2.903,592 Soft -12 375 1:4
C-101-2 4,500279 Soft -12 375 1:4
Total 12,550,571
Table 4. 7: Maintenance Dredging
Dredge Area Quantity
(m3)
Hardness of
Materials
Dredging Dimensions
Depth (m) Width (m) Slope
1. Basins in front
of existing berths
272,704
M-1 141,655 Soft -10 150 1:4
M-2 41,285 Soft -10 150 1:4
M-3 60,063 Soft -10 150 1:4
M-4 21,793 Soft -10/ -10.36 150 1:4
M-5 7,908 Soft -11 150 1:4
The projected total dredge volumes were therefore found to be as follows:
Access Channel (C1 – C6) - 0.6 million m3
Turning basin (C7 – C9) - 4.5 million m3
Anchorage Basin (C 10) - 2.9 million m3
Maintenance dredging (M1 – M4) -0.2 million m3
A list of the ancillary works to be accomplished is presented in Table 4.8.
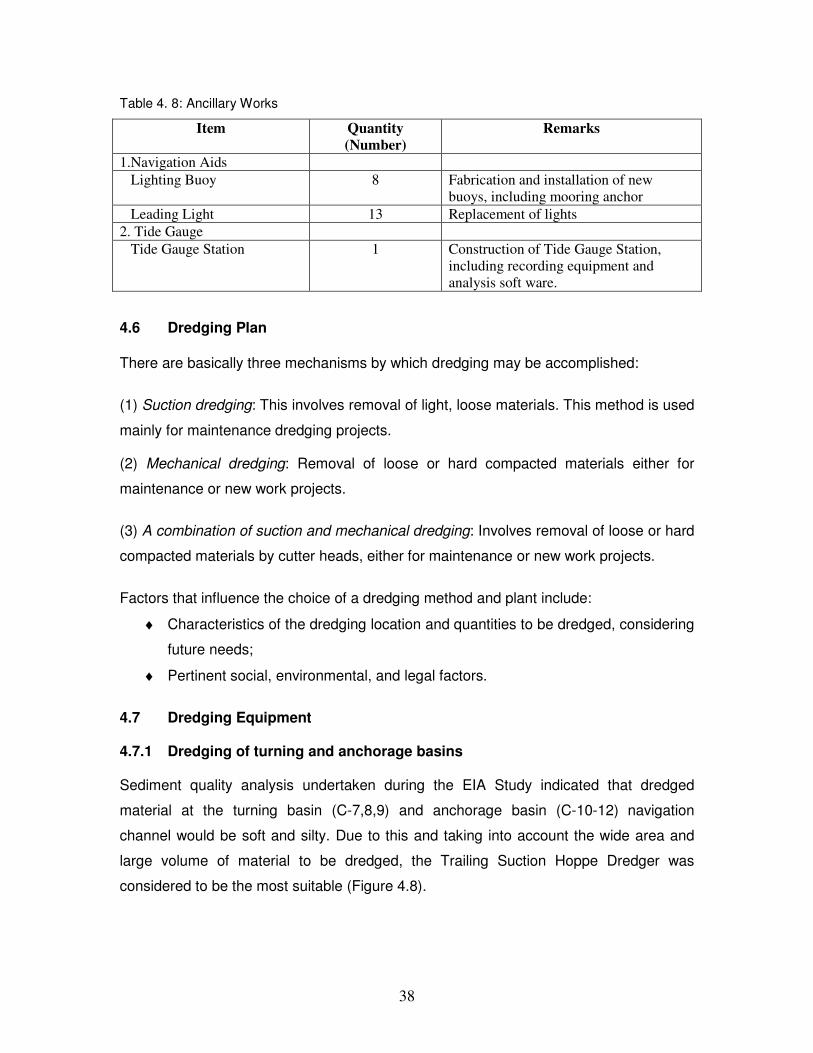
38
Table 4. 8: Ancillary Works
Item Quantity
(Number)
Remarks
1.Navigation Aids
Lighting Buoy 8 Fabrication and installation of new
buoys, including mooring anchor
Leading Light 13 Replacement of lights
2. Tide Gauge
Tide Gauge Station 1 Construction of Tide Gauge Station,
including recording equipment and
analysis soft ware.
4.6 Dredging Plan
There are basically three mechanisms by which dredging may be accomplished:
(1) Suction dredging: This involves removal of light, loose materials. This method is used
mainly for maintenance dredging projects.
(2) Mechanical dredging: Removal of loose or hard compacted materials either for
maintenance or new work projects.
(3) A combination of suction and mechanical dredging: Involves removal of loose or hard
compacted materials by cutter heads, either for maintenance or new work projects.
Factors that influence the choice of a dredging method and plant include:
♦ Characteristics of the dredging location and quantities to be dredged, considering
future needs;
♦ Pertinent social, environmental, and legal factors.
4.7 Dredging Equipment
4.7.1 Dredging of turning and anchorage basins Sediment quality analysis undertaken during the EIA Study indicated that dredged
material at the turning basin (C-7,8,9) and anchorage basin (C-10-12) navigation
channel would be soft and silty. Due to this and taking into account the wide area and
large volume of material to be dredged, the Trailing Suction Hoppe Dredger was
considered to be the most suitable (Figure 4.8).

39
Figure 8: Trailing Suction Hopper Dredger
Hopper dredges are self-propelled seagoing ships of 180 to 550 ft in length, equipped
with propulsion machinery, sediment containers (hoppers), dredge pumps, and other
special equipment required to perform their essential function of removing material from
a channel bottom or ocean bed. Dredged material is raised by dredge pumps through
drag arms connected to drags in contact with the channel bottom and discharged into
hoppers built in the vessel.
Dredging is accomplished by progressive traverses over the area to be dredged. Suction
pipes (drag-arms) are hinged on each side of the vessel with the intake (drag) extending
downward toward the stern of the vessel. The drag is moved along the channel bottom
as the vessel moves forward. The dredged material is sucked up the pipe and deposited
and stored in the hoppers of the vessel. Once fully loaded, hopper dredges move to the
disposal site to unload before resuming dredging.
Advantages of Hopper Dredges Because of the hopper dredge’s design and method of operation, it has the following
advantages over other types of dredgers for many types of projects:
♦ It can work effectively, safely, and economically in rough, open water under its own power.
♦ Its operation has minimal interfere on port traffic.
♦ Its method of operation produces usable channel improvement almost as soon
as work begins. A hopper dredge usually traverses the entire length of the
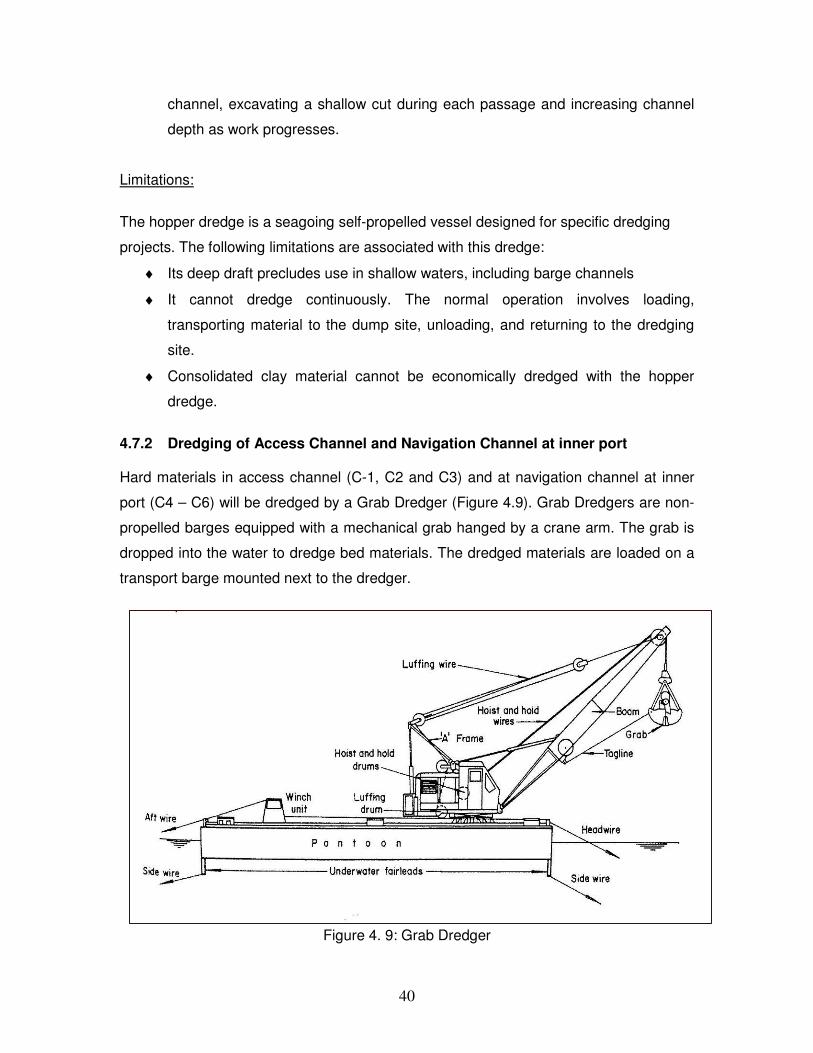
40
channel, excavating a shallow cut during each passage and increasing channel
depth as work progresses.
Limitations:
The hopper dredge is a seagoing self-propelled vessel designed for specific dredging
projects. The following limitations are associated with this dredge:
♦ Its deep draft precludes use in shallow waters, including barge channels
♦ It cannot dredge continuously. The normal operation involves loading,
transporting material to the dump site, unloading, and returning to the dredging
site.
♦ Consolidated clay material cannot be economically dredged with the hopper
dredge.
4.7.2 Dredging of Access Channel and Navigation Channel at inner port Hard materials in access channel (C-1, C2 and C3) and at navigation channel at inner
port (C4 – C6) will be dredged by a Grab Dredger (Figure 4.9). Grab Dredgers are non-
propelled barges equipped with a mechanical grab hanged by a crane arm. The grab is
dropped into the water to dredge bed materials. The dredged materials are loaded on a
transport barge mounted next to the dredger.
Figure 4. 9: Grab Dredger
41
The transport barges with full load are transported by a tugboat to designated dumping
location to discharge the loaded materials. Empty barges go back to the dredging site to
load next dredged materials.
Advantages: The grab dredger has the following advantages:
• Replacing the grab, any materials (silt, sand, rock) can be dredged.
• Accurate dredging work is possible.
• Dredging work in shallow area is possible.
• Using a special grab and surrounding frame with protection curtain, contaminated
materials can be dredged and transported to the designated dumping location with
minimum environmental impacts.
Limitations: The limitations on grab dredgers are as follows:
• Hindrance to existing operations due to stretched wires to keep the positions of the
dredger.
• Dredging of wide area is not efficient in general.
4.7.3 Maintenance dredging
Soft materials in front of the existing berths (M-1,2,3,4,5) will be dredged by a Grab
Dredger.

42
5. THE PHYSICAL OCEANOGRAPHIC ENVIRONMENT AT KILINDINI
HARBOUR
5.1 Introduction Estuaries contain important harbors, ports and navigational channels. Many of the
world’s seaports are located on estuaries and ready access requires maintenance of
navigation channels. Estuaries are effective traps for sediments. A significant feature of
most estuaries is a zone of high-suspended sediment concentration near the head of the
estuary, turbidity maximum zone. This zone often contains high concentrations of
contaminants to which are added pollutants from effluent discharges (Martin, 1999). The
accumulation of sediments in harbors and navigational channels makes it necessary to
carry out dredging works to ensure safe navigation for large ships.
Estuaries often have complex coastline and bathymetric variations that give rise to
strong spatial variations in the tidal currents and marked asymmetry between ebb and
flood flows (Shetye, 1992). This in turn leads to effective tidal dispersion and exchange.
Understanding these mixing processes is of critical importance for effective
environmental management of these regions. Due to geometrical complexity of most
estuaries and embayment, both field observations and numerical models are needed to
understand the hydrodynamics.
Research on water circulation in estuarine systems is important because hydrodynamic
processes influence the sustainability of marine ecological systems. Knowledge on water
circulation is necessary for a better understanding of the biological, chemical and
physical processes taking place. Information on water circulation also determines the
interaction and therefore the linkage between coastal and marine ecosystems through
nutrients and material exchanges (e.g. Wolanski et al. 1980; Kjerfve et al. 1991). The
study of water circulation is also significant to environmentalists and land-use planners
interested in determining the impact of coastal development projects on marine
ecosystems. Thus, the description of coastal water circulation and exchange patterns in
estuaries is crucial to understanding the ecosystem dynamics.
Some previous studies have shown that most estuarine systems are characterized by
the occurrence of time velocity asymmetry in which the ebb tidal flow is much stronger
than the flood tidal flow (Furukawa, Wolanski, & Mueller, 1997; Kitheka et. al., 2003;

43
Wolanski, Jones, & Bunt, 1980). This situation results in a net seaward-directed residual
flow that is crucial in determining the net flux of materials (including sediments) out of the
system.
Knowledge of the hydrodynamics of estuaries is necessary for a better understanding of
how sediments are transported and dispersed within the system and how the channel is
flushed through exchange with offshore waters. The fate and transport of materials in the
system are strongly related to the hydrodynamic conditions.
Among a wide range of factors influencing sediment transport in estuaries, tidal range
and current speed are the most important (Althausen and Kjerfve, 1992; Lindsay et al.,
1996). It is often argued that in estuarine systems with tidal asymmetry, the net sediment
flux follows pattern of the dominant tidal current. If the system is ebb dominant, there will
possibly be ebb dominance in the fluxes of suspended sediment (Linsay et al., 1996).
Wolanski et al., (1998), Mazda et al., (1995) found that the net sediment transport to be
principally controlled by the asymmetry between flood and ebb tides.
This report presents the hydrodynamic characteristics of Kilindini harbor, Mombasa.
Water levels are available for one year period. Time series of current velocity and water
temperature data was observed for a period of 30 days. We investigate the factor(s)
responsible for water movements, circulation patterns and establish if there is tidal
asymmetry in the harbor.
5.2 Study area 5.2.1 Meteorological conditions The area experiences a tropical climate characterised by the monsoon seasons. In
general the climate is hot and humid throughout the year. The shifting monsoons result
in two distinct dry seasons and two rainy seasons. The South-East monsoon (SEM)
related to the long rains, occurs from April to October and the North-East Monsoon
(NEM), which causes the short rains, occurs from November to March. The monsoon
transitional stages occur in late October and mid April respectively. The maximum
rainfall during the long rains experienced in May while that due to short-rains is
experienced in November. The total annual rainfall in Mombasa ranges from 1000 to
1500 mm.
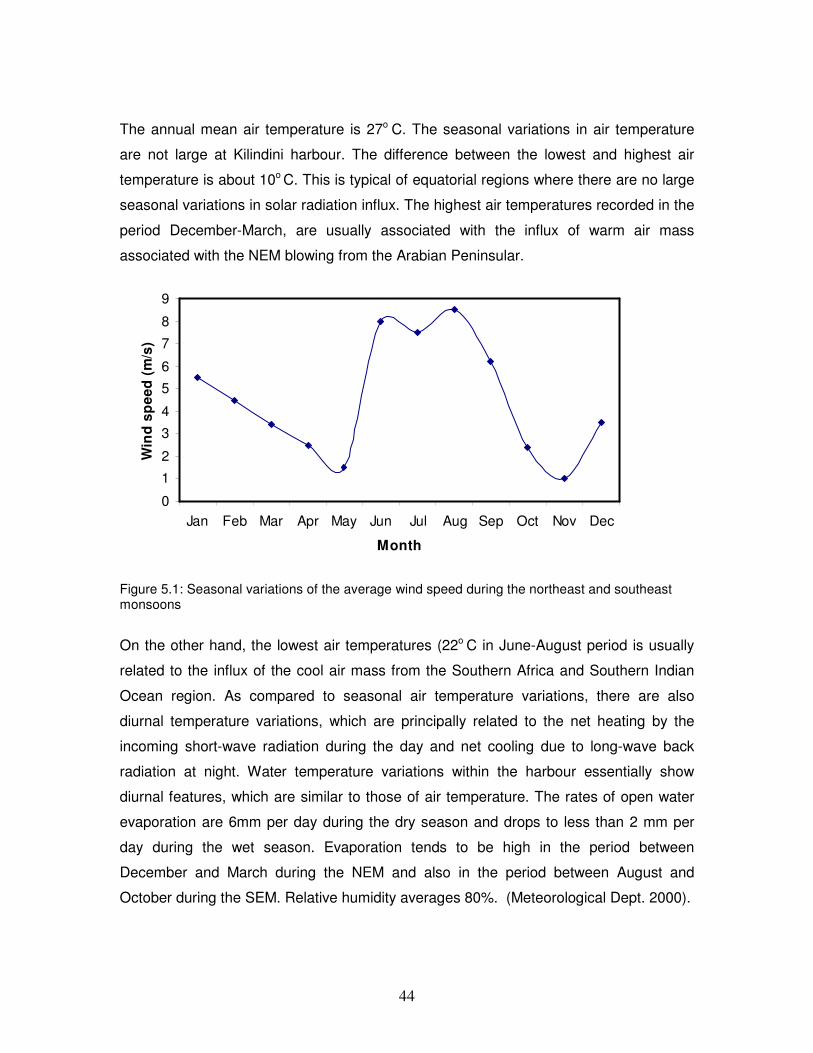
44
The annual mean air temperature is 27o C. The seasonal variations in air temperature
are not large at Kilindini harbour. The difference between the lowest and highest air
temperature is about 10o C. This is typical of equatorial regions where there are no large
seasonal variations in solar radiation influx. The highest air temperatures recorded in the
period December-March, are usually associated with the influx of warm air mass
associated with the NEM blowing from the Arabian Peninsular.
0
1
2
3
4
5
6
7
8
9
Jan Feb Mar Apr May Jun Jul Aug Sep Oct Nov Dec
Month
Win
d s
pe
ed
(m
/s)
Figure 5.1: Seasonal variations of the average wind speed during the northeast and southeast monsoons
On the other hand, the lowest air temperatures (22o C in June-August period is usually
related to the influx of the cool air mass from the Southern Africa and Southern Indian
Ocean region. As compared to seasonal air temperature variations, there are also
diurnal temperature variations, which are principally related to the net heating by the
incoming short-wave radiation during the day and net cooling due to long-wave back
radiation at night. Water temperature variations within the harbour essentially show
diurnal features, which are similar to those of air temperature. The rates of open water
evaporation are 6mm per day during the dry season and drops to less than 2 mm per
day during the wet season. Evaporation tends to be high in the period between
December and March during the NEM and also in the period between August and
October during the SEM. Relative humidity averages 80%. (Meteorological Dept. 2000).
45
The surface winds in the coastal region of Kenya are dominated by the two distinct
monsoons. From April to November, the winds blow from the southwest direction,
reaching peak velocities in July and August. They then gradually reduce in strength to a
minimum in November when they reverse to north-easterly direction. The next reversal
occurs in March/April at the onset of the southwest monsoons and November/December
at the onset of the northeast monsoon. The winds of the NEM are markedly influenced
by a land-sea breeze. They blow at an average wind velocity of about 6 ms-1. The winds
of the SEM are stronger and to a lesser degree influenced by the land-sea breeze. They
blow mostly to the North with an average velocity of 7.5 ms-1.
5.2.2 Coastal Currents The most important current along the Kenyan coastline is the EACC, which has a net
northward flow. The speed of this current varies between 0.25 and 1 ms-1, being fastest
during the SEM, and lowest during the NEM. During the NEM, along Kenya, the EACC
converges with a weaker southward flowing Somali current. The convergence zone of
these currents constitutes the root of the Equatorial Counter Current. During the SEM, a
large portion of the Equatorial Current is moved northward via the powerful Somali
Current along Kenya and Somalia and is absorbed eastward by the southwest monsoon
current (Duing and Schott, 1978).
The Equatorial Counter Current is present south of the equator between 2 and 5 so and
is quite strong in the NEM period. The northward flowing Somali Current is well
developed in June and is stronger in July. The Somali current is still strong in August but
its southern extent is reduced. In September, the current is prominent only beyond 5 on.
Intense up welling occurs during the SEM season along the northern part of Kenyan
coastline and Somali area. As a result of this up welling, cold surface water is brought to
the nearshore surface layers, which spreads over extensive areas of the Arabian sea.
Thus the local climate and biological productivity are much controlled by oceanic
processes (Benny, 2002).
Thus, the Western Indian Ocean currents show spatial and temporal variations. Among
the currents, the Somali Currents exhibits more dramatic seasonal variation than any
other current in the region. The Somali Current is notable for its high speed of up to 200
cms-1.

46
5.3 Data Collection and Analysis 5.3.1 Measurements of water elevation We have utilized one year time series of sea level observations from a tide gauge
installed at Liwatoni jetty in Kilindini harbor, Mombasa (Figure 5.2). The Mombasa tide
gauge being managed by Kenya Marine & Fisheries Research Institute (KMFRI) is a
principal station on the Global Sea Level Observing System (GLOSS) network. It
measures sea level every 15 minutes interval and transmits a signal every hour to
University of Hawaii Sea Level Centre for inclusion in the global sea level database.
Data from this station is for monitoring climate change induced sea level rise and also for
detecting extreme oceanic events such as storm surges and tsunamis.
The station is equipped with 3 sensors consisting of a Float, Radar and Pressure sensor.
The float sensor is not operational at the moment. The additional sensors are for
redundancy checks in the system. Figure 2 below is a photo of the Mombasa tide station.
5.3.2 Measurements of current velocities and temperature During the period, one Aanderaa Recording Current Meters (RCM) was moored near
Liwatoni Jetty in Kilindini harbour in the middle of the channel about 5m below the water
surface during LWS. The instrument was programmed to measure and record current
speed and directions at 10 minutes interval. The current velocity sensor has a velocity
range of 0 to 3 ms-1 and a precision of ±2 cms-1. The magnetic compass Hall Effect type
of the current direction sensor has a precision of ±1.5o. Table shows the record span of
available field data at each of the sampling sites.
The RCM is also equipped with an additional sensor for measuring and recording water
temperature. The temperature sensor has a precision of ±0.1o C.
5.3.3 Decomposition of tidal currents Tidal current velocities measured by the Aanderaa Recording Current Meter (RCM-9)
were decomposed in order to determine the horizontal velocity components within the
main channel. The main direction of flow was determined by plotting current velocities
against their respective directions. This was also used to determine the dominant current

47
velocities during the period of measurements. The along channel velocity component (u)
was determined from the current velocity record as
=
180cos
απUu (1)
The cross channel velocity component (v) was determined by using the equation
=
180sin
απUv (2)
Where U is the current speed record and α is the direction angle measured in degrees.

48
Figure 5.2: KMFRI GLOSS Tide Gauge at Liwatoni jetty in Kilindini harbour, Mombasa
5.3.4 Harmonic analysis Harmonic analysis is a mathematical method of extracting sinusoidal components of
specific frequencies from e.g. a water level record. In this case, it is based on the
“method of least squares”. Instead of fitting a straight line to the data by varying its slope
and intercept, a set of cosine (or sine) curves with given frequencies ω are fitted by
varying amplitudes and phases, minimizing the sum of deviations from the original curve.
Given a time series Z (t) of data points, its tidal part can be expressed as a combination
of sine and cosine functions (cf. Shureman, 1941; Dronkers, 1964).

49
∑ ∑+=k k
kkkk tbtatZ )cos()sin()( ωω (3)
The value of ak and bk can be calculated for the given frequencies, ωk by minimizing the
sum of squares of the differences between the assumed function and the given time
series Zn.
Least square fit requires that the following function is minimized
2
1
)cos()sin(),( ∑ ∑ ∑=
+−=
N
n k k
nkknkknkk tbtazbaf ωω (4)
This requirement is satisfied by
0=∂
∂
ia
f i = 1,…,k (5)
and
0=∂
∂
ib
f i = 1,…,k (6)
Where
0)cos()sin()cos(21
=
−−−=
∂
∂∑ ∑ ∑
=
N
n k k
nkknkknni
i
tbtazta
fωωω (7)
and
0)cos()sin()sin(21
=
−−−=
∂
∂∑ ∑ ∑
=
N
n k k
nkknkknni
i
tbtaztb
fωωω (8)
The above equations can be rewritten as
∑ ∑ ∑∑ ∑= ==
=+k
N
n
N
n
ninnkniknk
k
N
n
nkk tZttbtta1 11
)sin()sin()sin()cos()sin( ωωωωω (9)

50
∑ ∑ ∑∑ ∑= ==
=+k
N
n
N
n
ninnkniknk
k
N
n
nkk tZttbtta1 11
)cos()sin()cos()cos()cos( ωωωωω (10)
This can be simplified by introducing the notation
)cos( niin tC ω= , )sin( nkkn tS ω= (11)
∑ ∑ ∑=+k k n
innkninkknknk SZSSbCSa (12)
∑ ∑ ∑=+k k n
innkninkknknk SZSCbCCa (13)
Which gives a system of 2k equations with 2k unknowns; ai through ak and bi through bk.
Table 5.1: Major tidal constituents
Tidal Constituent
Symbol Period (hours)
Diurnal Components: Principal lunar diurnal Principal solar diurnal Luni solar diurnal
O1 P1 K1
25.82 24.07 23.93
Semi-diurnal Components: Principal lunar Principal solar Luni-solar Larger lunar elliptic
M2 S2 K2 N2
12.42 12.00 11.97 12.66
Shallow water Components:
M4 M6 S4 2MS2 MS4 2MS6
6.21 4.14 6.00 11.61 6.10 4.09
Long Period Component: Lunar fortnightly
Mf
327.86
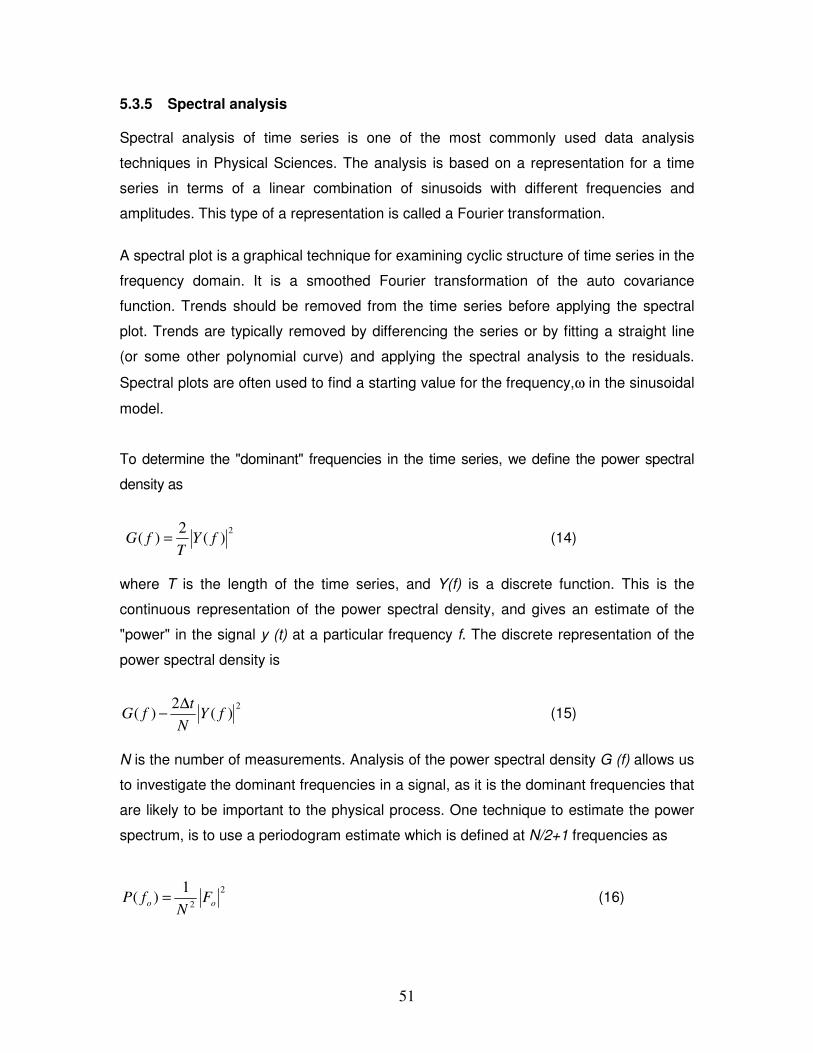
51
5.3.5 Spectral analysis Spectral analysis of time series is one of the most commonly used data analysis
techniques in Physical Sciences. The analysis is based on a representation for a time
series in terms of a linear combination of sinusoids with different frequencies and
amplitudes. This type of a representation is called a Fourier transformation.
A spectral plot is a graphical technique for examining cyclic structure of time series in the
frequency domain. It is a smoothed Fourier transformation of the auto covariance
function. Trends should be removed from the time series before applying the spectral
plot. Trends are typically removed by differencing the series or by fitting a straight line
(or some other polynomial curve) and applying the spectral analysis to the residuals.
Spectral plots are often used to find a starting value for the frequency,ω in the sinusoidal
model.
To determine the "dominant" frequencies in the time series, we define the power spectral
density as
2
)(2
)( fYT
fG = (14)
where T is the length of the time series, and Y(f) is a discrete function. This is the
continuous representation of the power spectral density, and gives an estimate of the
"power" in the signal y (t) at a particular frequency f. The discrete representation of the
power spectral density is
2)(
2)( fY
N
tfG
∆− (15)
N is the number of measurements. Analysis of the power spectral density G (f) allows us
to investigate the dominant frequencies in a signal, as it is the dominant frequencies that
are likely to be important to the physical process. One technique to estimate the power
spectrum, is to use a periodogram estimate which is defined at N/2+1 frequencies as
2
2
1)( oo F
NfP = (16)

52
( )22
2
1)( kNkk FF
NfP −+= 1)2/(,...,2,1 −= Nk (17)
2
22
1)( Nc F
NfP = (18)
It is sometimes of interest to investigate the joint structure of two series. That is the
dependence of either series on the other. We are only able to observe relationships at
the same frequency in both series. We define the cross-spectrum as
[ ])()(2
)( * wYwYT
wG yxxy = (19)
The "*" refers to the complex conjugate of the function.
Unlike the power spectrum, the cross-spectrum is complex valued as it contains
amplitude and phase information. The real part of the cross-spectrum is known as the
coincident spectrum (or co-spectrum), and the complex part of the cross-spectrum is
known as the quadrature spectrum (or quad-spectrum). From the cross-spectrum, we
are able to estimate the amplitude and phase relationship between the signals. The
amplitude relationship is quantified through the coherency squared, calculated as
)()(
)()(
2
2
wGwG
wGwS
yx
xy
xy = (20)
A coherency squared value of unity indicates complete dependence of one signal on
another, whereas a coherency squared value of zero refers to no dependence of one
signal on another. Two signals can only be coherent at the same frequency.
5.4 Results and Discussion 5.4.1 Tides Time series data of water levels and current velocities was subjected to harmonic and
spectral analysis using T_Tide software (Pawlowicz et. al., 2002). The water level
variations at Liwatoni are sinusoidal with two unequal peaks daily. The results from
harmonic analysis are shown in Table 5.3 and Figure 5.3.
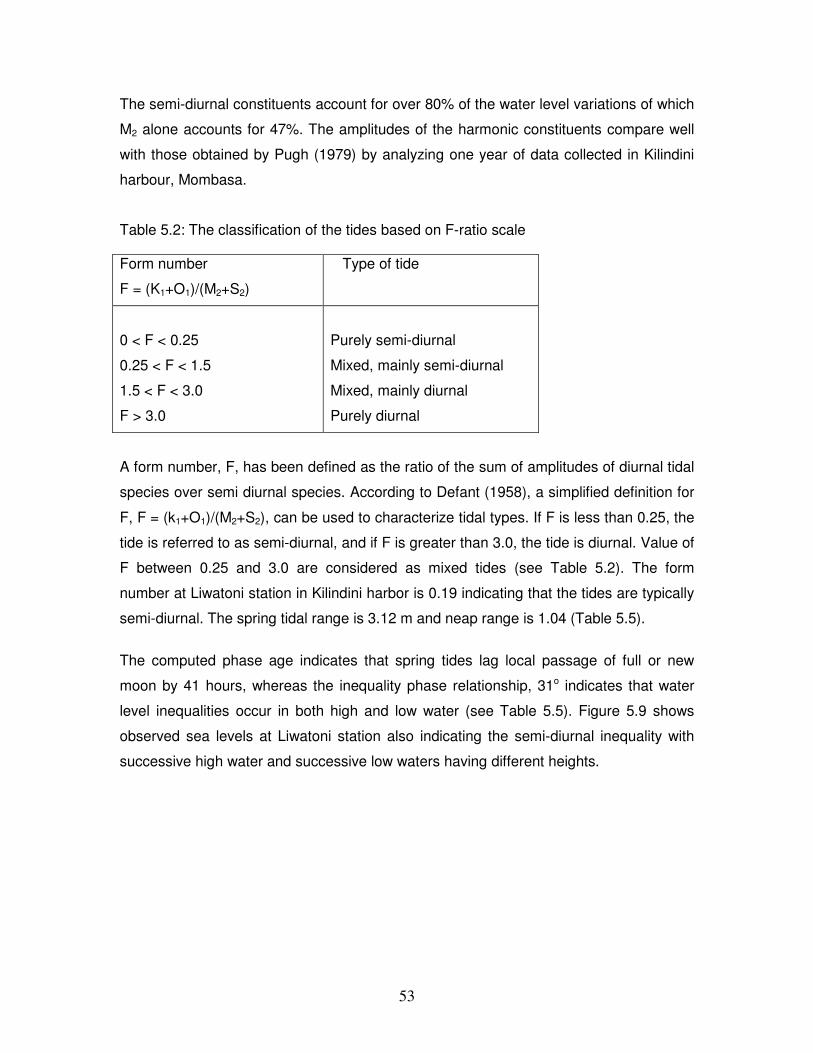
53
The semi-diurnal constituents account for over 80% of the water level variations of which
M2 alone accounts for 47%. The amplitudes of the harmonic constituents compare well
with those obtained by Pugh (1979) by analyzing one year of data collected in Kilindini
harbour, Mombasa.
Table 5.2: The classification of the tides based on F-ratio scale
Form number
F = (K1+O1)/(M2+S2)
Type of tide
0 < F < 0.25
0.25 < F < 1.5
1.5 < F < 3.0
F > 3.0
Purely semi-diurnal
Mixed, mainly semi-diurnal
Mixed, mainly diurnal
Purely diurnal
A form number, F, has been defined as the ratio of the sum of amplitudes of diurnal tidal
species over semi diurnal species. According to Defant (1958), a simplified definition for
F, F = (k1+O1)/(M2+S2), can be used to characterize tidal types. If F is less than 0.25, the
tide is referred to as semi-diurnal, and if F is greater than 3.0, the tide is diurnal. Value of
F between 0.25 and 3.0 are considered as mixed tides (see Table 5.2). The form
number at Liwatoni station in Kilindini harbor is 0.19 indicating that the tides are typically
semi-diurnal. The spring tidal range is 3.12 m and neap range is 1.04 (Table 5.5).
The computed phase age indicates that spring tides lag local passage of full or new
moon by 41 hours, whereas the inequality phase relationship, 31o indicates that water
level inequalities occur in both high and low water (see Table 5.5). Figure 5.9 shows
observed sea levels at Liwatoni station also indicating the semi-diurnal inequality with
successive high water and successive low waters having different heights.
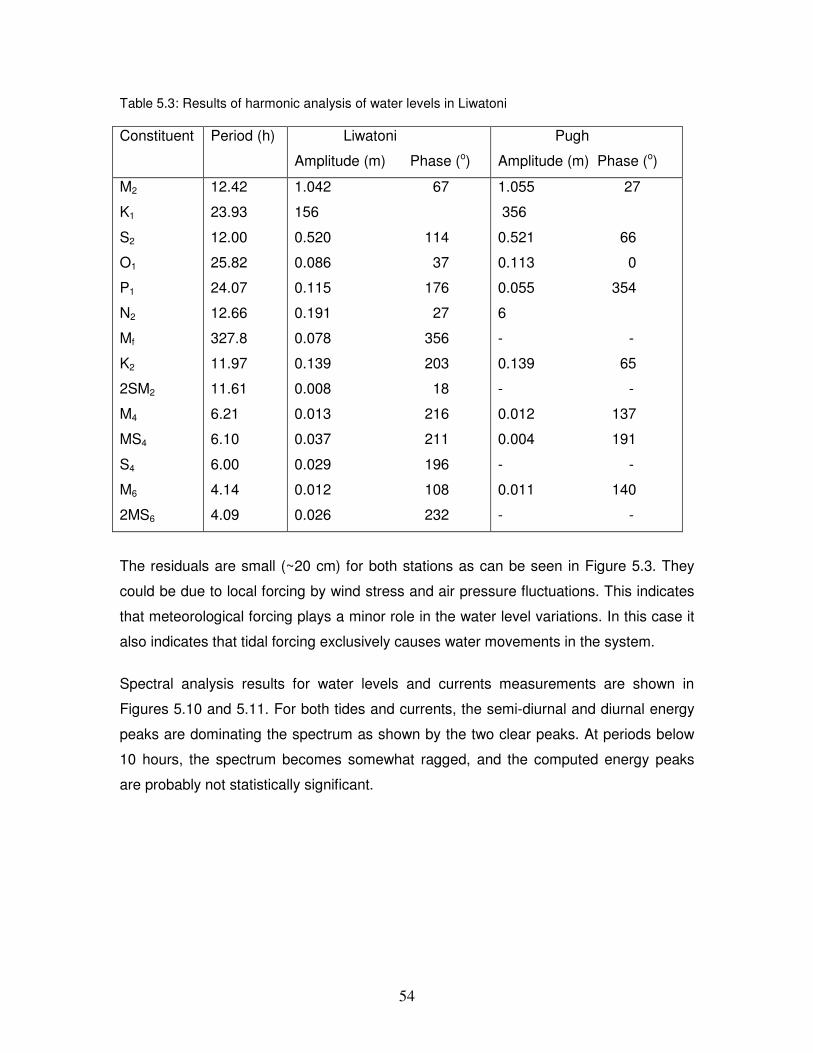
54
Table 5.3: Results of harmonic analysis of water levels in Liwatoni
Constituent Period (h) Liwatoni
Amplitude (m) Phase (o)
Pugh
Amplitude (m) Phase (o)
M2
K1
S2
O1
P1
N2
Mf
K2
2SM2
M4
MS4
S4
M6
2MS6
12.42
23.93
12.00
25.82
24.07
12.66
327.8
11.97
11.61
6.21
6.10
6.00
4.14
4.09
1.042 67
156
0.520 114
0.086 37
0.115 176
0.191 27
0.078 356
0.139 203
0.008 18
0.013 216
0.037 211
0.029 196
0.012 108
0.026 232
1.055 27
356
0.521 66
0.113 0
0.055 354
6
- -
0.139 65
- -
0.012 137
0.004 191
- -
0.011 140
- -
The residuals are small (~20 cm) for both stations as can be seen in Figure 5.3. They
could be due to local forcing by wind stress and air pressure fluctuations. This indicates
that meteorological forcing plays a minor role in the water level variations. In this case it
also indicates that tidal forcing exclusively causes water movements in the system.
Spectral analysis results for water levels and currents measurements are shown in
Figures 5.10 and 5.11. For both tides and currents, the semi-diurnal and diurnal energy
peaks are dominating the spectrum as shown by the two clear peaks. At periods below
10 hours, the spectrum becomes somewhat ragged, and the computed energy peaks
are probably not statistically significant.

55
01/01/07 04/01/07 07/01/07 10/01/07 01/01/08-2
-1
0
1
2
Wate
r Lev
el (m
)
01/01/07 04/01/07 07/01/07 10/01/07 01/01/08-2
-1
0
1
2
Wate
r Lev
el (m
)
01/01/07 04/01/07 07/01/07 10/01/07 01/01/08-2
-1
0
1
2
Wate
r Lev
el (m
)
Year
Figure 5.3: Time series water level variations at Mombasa tide gauge station for year 2007,
observed (blue), computed (red) and residual (magenta) values from harmonic analysis.
5.4.2 Currents Current measurements (Figure 5.4) showed that velocities in spring tides were generally
higher than in neap tides. Current meter data was analyzed in a manner similar to that
described above for tides. Harmonic analysis procedure was applied to the east-west (v)
and north-south (u) components of velocity. The results are presented in Table 5.4. and
Figures 5.5 and 5.6. The average flood and ebb flow directions at Liwatoni station are
separated by about 170° (280°) during flood and 110o during ebb (Figure 5.7). Maximum
spring velocities of 0.80 ms-1 and 0.50 ms-1 were observed during flood and ebb
respectively. A scatter plot of u (along channel) and v (cross channel) components of
velocities at Liwatoni station indicates that the flow is confined along the axis of the
channel during both spring and neap tides (Figure 5.8).
The currents in the channel indicate a relatively strong asymmetry with ebb currents being
stronger than flood currents. The ebb period is roughly 5.5 hours compared to a flood period
56
of about 7 hours, thus a slightly larger difference than that obtained from the tides at the
Liwatoni station (6.58 h Vs 6.04 h). This can be readily seen in Figure 5.9 where a
comparison is made between along channel components and water levels. The asymmetry
is not pronounced during neap, however. Higher velocities during ebb (0.8 ms-1) as
compared to flood (0.5 ms-1) are because of the different flow dynamics during filling of the
inter tidal area compared to during emptying (Wolanski, 1990). The asymmetric velocity is a
key parameter that reflects the topography of the harbor.
Although there is very little asymmetry in the tide, the current measurements in the
channel reveal an asymmetry of ebb-dominance, i.e. high ebb velocities and shorter ebb
periods. This asymmetry of ebb-dominance fits well with the conclusions concerning
topography by Shetye and Gouveia (1992). This features are similar to those in
Hinchinbrook channel (Wolanski et al., 1980) and in the North inlet which is a channel
surrounded by salt marshes (Kjerfve et al., 1991). Ebb-dominance has also been
observed in deep sub-tidal channels with mudflats e.g. the Wachapreague inlet (Boon
and Byrne, 1981). Non-linear friction effects in the mangrove swamps in the upper parts
of the harbor (Port Reitz creek area) could result in an asymmetry between the filling and
emptying of the mangrove swamps (e.g. Wolanski et al., 1980, Kitheka et al., 2003).
Comparison of water levels and current velocities indicate that water levels lead the
currents by an average of 3.45 hours (104o). Slack waters coincide with the times of high
and low water. The two variables are almost out of phase. Zero velocities in the channel
lag the occurrence of high water and low water by 0.6 hours and 0.2 hours respectively.

57
0 5 10 15 20 25 30-100
-80
-60
-40
-20
0
20
40
60
80
100
Velo
citie
s (
cm
s-1
)
Time (days)
Figure 5.4: Time series of current velocities at Liwatoni station
Table 5.4: Results of harmonic analysis of current velocities in Kilindini harbour
Constitue
nt
Period
(h)
U-Component
Amplitude (cm) Phase (o)
V-Component
Amplitude (cm) Phase
(o)
M2
K1
S2
O1
P1
N2
Mf
K2
2SM2
12.42
23.93
12.00
25.82
24.07
12.66
327.8
11.97
11.61
30.01 341
14
16.15 44
4.73 58
3.34 27
2.44 133
5.10 81
1.23 173
0.74 172
8.43 117
1.61 167
5.04 119
0.50 6
1.36 141
0.81 96
2.42 81
2.63 149
0.09 15
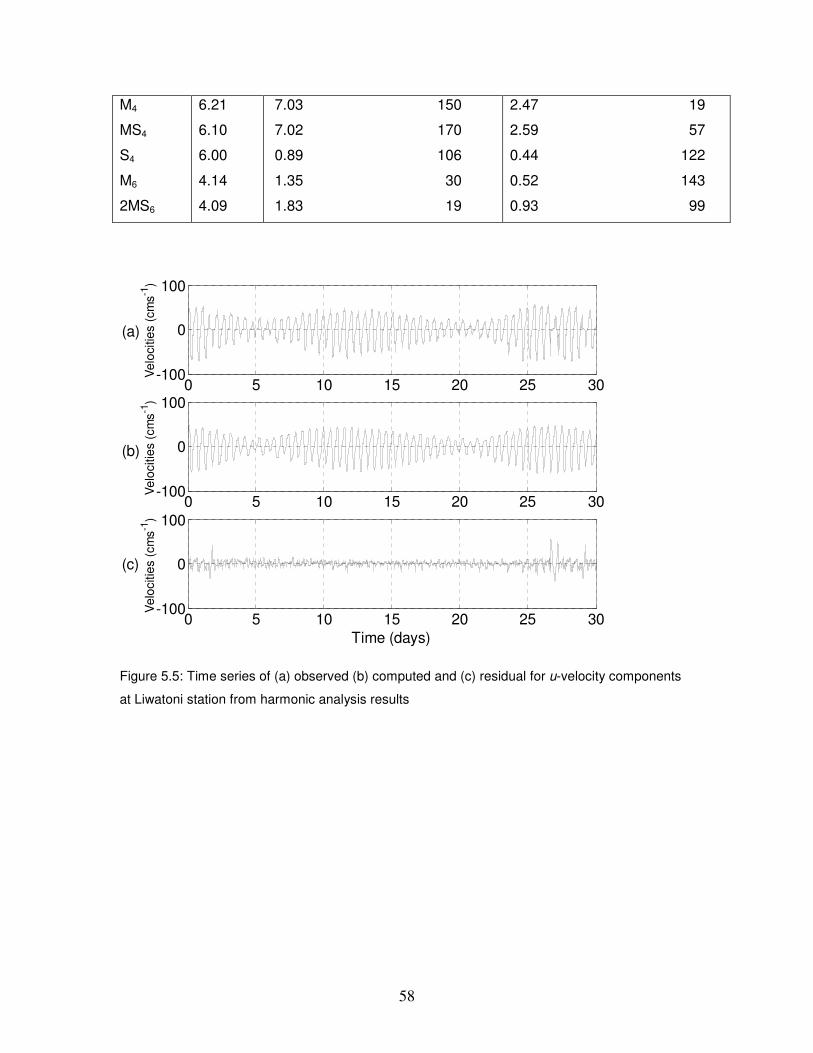
58
M4
MS4
S4
M6
2MS6
6.21
6.10
6.00
4.14
4.09
7.03 150
7.02 170
0.89 106
1.35 30
1.83 19
2.47 19
2.59 57
0.44 122
0.52 143
0.93 99
0 5 10 15 20 25 30-100
0
100
Velo
citie
s (
cm
s-1
)
0 5 10 15 20 25 30-100
0
100
Velo
citie
s (
cm
s-1
)
0 5 10 15 20 25 30-100
0
100
Velo
citie
s (
cm
s-1
)
Time (days)
(a)
(b)
(c)
Figure 5.5: Time series of (a) observed (b) computed and (c) residual for u-velocity components
at Liwatoni station from harmonic analysis results

59
0 5 10 15 20 25 30-100
0
100
Ve
locitie
s (
cm
s-1
)
0 5 10 15 20 25 30-100
0
100
Ve
locitie
s (
cm
s-1
)
0 5 10 15 20 25 30-100
0
100
Ve
locitie
s (
cm
s-1
)
Time (days)
(a)
(b)
(c)
Figure 5.6: Time series of (a) observed (b) computed) and (c) residual for v-velocity components
at Liwatoni station from harmonic analysis results

60
0 50 100 150 200 250 300 350 4000
10
20
30
40
50
60
70
80
Directions (degree)
Sp
ee
d (
cm
s-1
)
Figure 5.7: Observed current directions versus speeds at Liwatoni station

61
-80 -60 -40 -20 0 20 40 60-40
-30
-20
-10
0
10
20
u (cms-1)
v (
cm
s-1
)
Figure 5.8: Scatter plot of north-south (u) and east-west (v) current velocity components

62
0 10 20 30 40 50 60 70-2
-1.5
-1
-0.5
0
0.5
1
1.5
2
Time (hours)
Wa
ter
leve
l (m
) / V
elo
citie
s (
ms
-1)
Figure 5.9: Comparison of water levels (solid line) and current velocities (dotted line) at Liwatoni
station during spring tide.
Table 5.5: Tidal statistics, amplitudes and phases based on harmonic analysis
Parameter Formula Water Levels
Current
Velocitie
s
Form number (K1+O1)/(M2+S2) 0.19 0.21
Inequality Phase
Relationship
M2o-(K1
o+O1o)
-126o
268o
Phase age 0.98(S2o-M2
o) 46 25
Mean Range 2.2(M2) 2.29 0.66
Spring Range 2.0(M2+S2) 3.12 0.92
Neap Range 2.0(M2-S2) 1.04 0.28
Tropic Range 2.0(K1+O1) 0.58 0.20
Equatorial Range 2.0(K1-O1) 0.24 0.01
Diurnal Age 0.91(K1o-O1
o) 108o -40o

63
10-1
100
101
102
10-2
100
102
104
106
Period (hours)
Energ
y (
cm
2s
-2cph
-1)
(a)
Figure 5.10: Relative energy density spectrum for water levels Liwatoni station based on spectral
analysis.

64
10-1
100
101
102
102
103
104
105
106
107
108
Period (hours)
Energ
y (
cm
2s
-2cph
-1)
(b)
Figure 5.11 Relative energy density spectrum for current velocities at Liwatoni station based on
spectral analysis.
Harmonic analysis results of along channel (u) and cross channel (v) velocities using 14
tidal constituents are presented in Table 5.4. The results reveal that tidal currents
dominate the flow. Like the water levels, the semi-diurnal constituents account for 80%
of the total variability. M2 tidal constituent alone accounts for over 40%.
As in the case of tides, a form number can be defined to characterize tidal current types
where F is the ratio of the sum of the semi-major axes of tidal current ellipses for diurnal
over semidiurnal constituents. The computed F value is 0.21 thus indicating that the
currents in Kilindini harbor can be characterized as semi-diurnal (Table 5). The
maximum current speed at spring tide is estimated by (M2+S2) + (k1+O1), where the four
major harmonics are assumed to be in phase. The maximum current speed at neap
tides is estimated to be not less than (M2-S2) + (O1-K1) where M2 and S2, O1 and K1 are
assumed to be out of phase at the same time.
Comparison of the relative phase differences between the tides and tidal currents
reinforces the conclusion that the tides in Kilindini harbor are primarily standing waves.
The phase difference of M2 and K1 tidal currents at Liwatoni is 86o with the tides leading
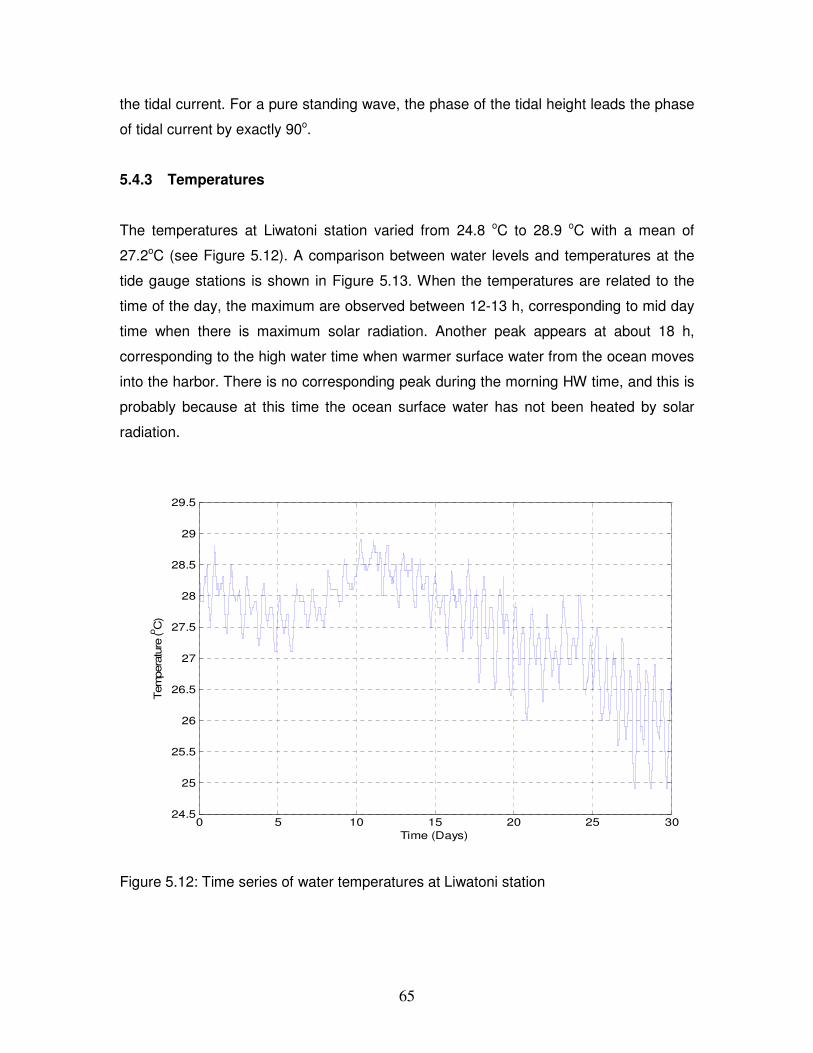
65
the tidal current. For a pure standing wave, the phase of the tidal height leads the phase
of tidal current by exactly 90o.
5.4.3 Temperatures
The temperatures at Liwatoni station varied from 24.8 oC to 28.9 oC with a mean of
27.2oC (see Figure 5.12). A comparison between water levels and temperatures at the
tide gauge stations is shown in Figure 5.13. When the temperatures are related to the
time of the day, the maximum are observed between 12-13 h, corresponding to mid day
time when there is maximum solar radiation. Another peak appears at about 18 h,
corresponding to the high water time when warmer surface water from the ocean moves
into the harbor. There is no corresponding peak during the morning HW time, and this is
probably because at this time the ocean surface water has not been heated by solar
radiation.
0 5 10 15 20 25 3024.5
25
25.5
26
26.5
27
27.5
28
28.5
29
29.5
Time (Days)
Tem
pera
ture
(oC
)
Figure 5.12: Time series of water temperatures at Liwatoni station

66
0 10 20 30 40 5027
27.5
28
28.5
29
Time (Hours)
Tem
pera
ture
(oC
)
0 10 20 30 40 5027
27.5
28
28.5
29
Time (Hours)
Tem
pera
ture
(oC
)
0 10 20 30 40 50-2
-1
0
1
2
Time (Hours)
Wate
r Level (m
)
0 10 20 30 40 50-2
-1
0
1
2
Time (Hours)
Wate
r Level (m
)
(a) (b)
Figure 5.13: Comparison of water levels and temperatures at Liwatoni on (a) December 15, 2007
from midnight and (b) December 20, 2007 from midnight
At Liwatoni station, water temperature decreases during flood. The semi-diurnal
variability is clear during flood when more cool water enters into the harbor from the
deep Indian Ocean. Similar patterns of temperature variations have been observed in
the adjacent Tudor Creek (Odido, 1994). Lower water temperatures could also be
attributed to rapid tidal flushing and the effect of wind.
In general, the temperature variations in the harbor are dominated by the diurnal solar
heating and night cooling due to a combination of evaporation and long wave back
radiation. Temperature rise and fall patterns were asymmetric with rapid rises during the
day and gradual decreases in the evening and night.
5.5 Numerical Modeling of Hydrodynamics of Kilindini Harbor Due to the large spatial and temporal variability in water levels, current velocities and
salinity that exist, a large number of field observations must be carried out in order to
determine the hydrodynamic characteristics of estuaries. The costs associated with data

67
collection are usually quite high. A plausible solution out of this situation is the use of
numerical models as sophisticated techniques for interpolation of field data in both
special and temporal domains. These models however, must be compared against
available field data (i.e. calibration) and be shown to satisfactorily reproduce
independently the observed data sets (validation). Only then can the model be used as a
research tool for describing estuarine hydrodynamic characteristics. Rapid development
in computing hardware and software in recent years has provided researchers with
unprecedented opportunities to conduct estuarine hydrodynamic studies by use of
numerical models.
5.5.1 Additional Data Collection for Model Calibration and Validation In this study, we applied numerical simulations by means of a model that couples
hydrodynamics and diffusion of Suspended Sediment (SS) and sedimentation of
dumped soils. The model is a three-dimensional model, or “two-dimensional multi-layer
unsteady level model”
Figure 5.14: Stations at Kilindini harbor for monitoring tides, currents and suspended sediment concentrations as well as salinity in February to March 2008
Legend
Tide (4 points)
Current / Suspended Solid / Salinity (9 points)
No. 1No. 2No. 4No. 3No.5No.6No7No.9 No.8No.10

68
which has three layers vertically, employing Navier-Stokes’ equation of motion and the
equation of continuity of fluid water. See Appendix 1 for methodology of the dispersal
and settlement simulation model. The aim of the numerical modeling studies was to
provide detailed information on the hydrodynamic and sedimentological effects of the
proposed channel deepening and widening in support of studies relating to the
Environmental impact assessment (EIA). The key was developing a model which
accurately represented natural tidal conditions and hence sediment movement within the
study area. The model provided a means to assess the following:
• Prediction of the currents and hence how a sediment plume may behave;
• Prediction of sediment deposition during dredging and disposal.
In order to generate a better spatial resolution data for model calibration and validation,
additional stations were established at selected locations within Kilindini harbor to
monitor tides, currents and suspended solids as well as salinity (See Figure 5.14). These
observations were conducted in the period of February-March 2008.
5.6 Hydrodynamic and Sedimentary Implications of the Proposed Project After extensive validation against available observations, the model was used to predict
the effects of the proposed scheme on tidal flows, waves and sediment transport. Four
scenarios were examined during the numerical simulations:
Scenario 1: Offshore dumping in NE Monsoon season at designated Point in New
Container Terminal
Scenario 2: Offshore Dumping in SE Monsoon Season at Designated Point in New
Container Terminal
Scenario 3: Basin Dredging Operation in Turning Basin in front of New Container
Terminal + Temporally Dumping at New Container Terminal in NE Monsoon Season
Scenario 4: Basin Dredging Operation in Turning Basin in front of New Container
Terminal + Temporally Dumping at New Container Terminal in SE Monsoon Season
During the simulation field setting, the following cases were considered:
- Latest bathymetry measured in this study (see Figure 5.15)
- Current measured in this study

69
- Waterbed material characteristics Particle Size Distribution (PSD) obtained in this
study
- Wind described in Container Terminal EIA, and
- Water discharge from 2 rivers in Port Reitz described in Container Terminal EIA
The simulation period of the model continued for 10 days during spring tide duration, in
which turbidity levels had increased and reached constant values. The results of the
modeling exercise for the above scenarios are presented in Figures 5.16 – 5.22.

70
Figure 5.15: Result of two-dimensional bathymetric survey of Kilindini harbour
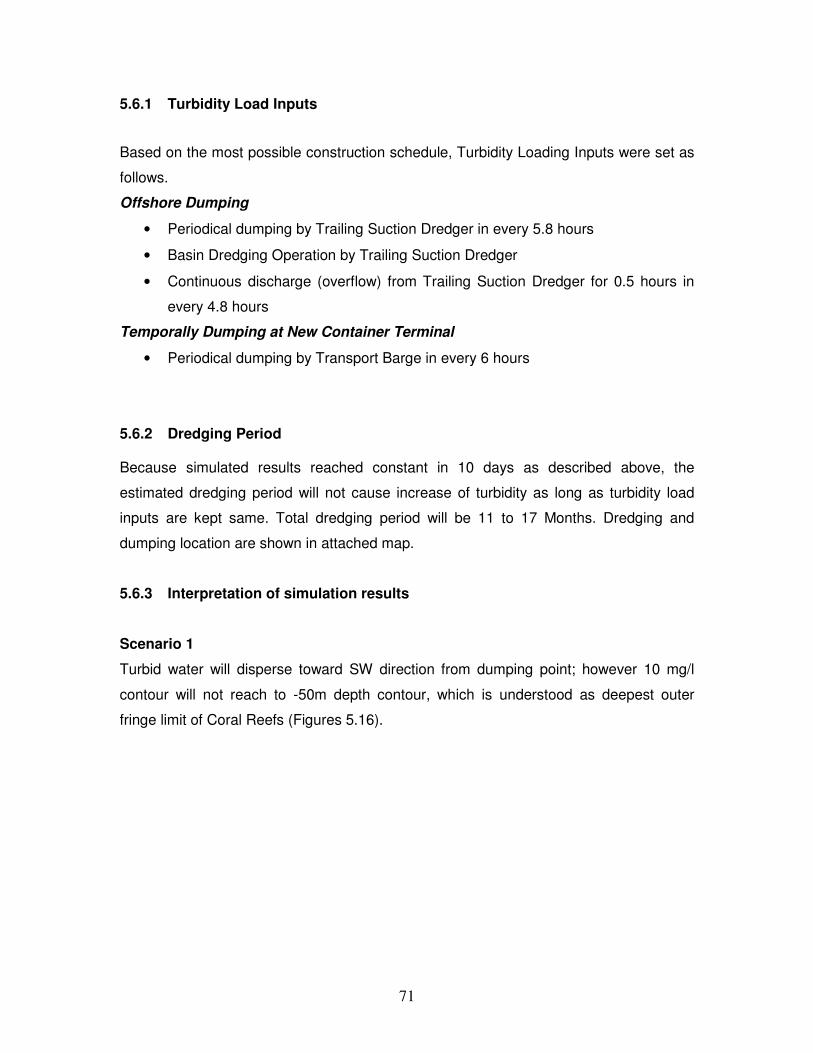
71
5.6.1 Turbidity Load Inputs
Based on the most possible construction schedule, Turbidity Loading Inputs were set as
follows.
Offshore Dumping
• Periodical dumping by Trailing Suction Dredger in every 5.8 hours
• Basin Dredging Operation by Trailing Suction Dredger
• Continuous discharge (overflow) from Trailing Suction Dredger for 0.5 hours in
every 4.8 hours
Temporally Dumping at New Container Terminal
• Periodical dumping by Transport Barge in every 6 hours
5.6.2 Dredging Period Because simulated results reached constant in 10 days as described above, the
estimated dredging period will not cause increase of turbidity as long as turbidity load
inputs are kept same. Total dredging period will be 11 to 17 Months. Dredging and
dumping location are shown in attached map.
5.6.3 Interpretation of simulation results
Scenario 1
Turbid water will disperse toward SW direction from dumping point; however 10 mg/l
contour will not reach to -50m depth contour, which is understood as deepest outer
fringe limit of Coral Reefs (Figures 5.16).

72
Figure 5.16: Turbid water dispersion simulation (surface and bottom layers) at offshore
dumping during NE Monsoon season (Jan – Apr).
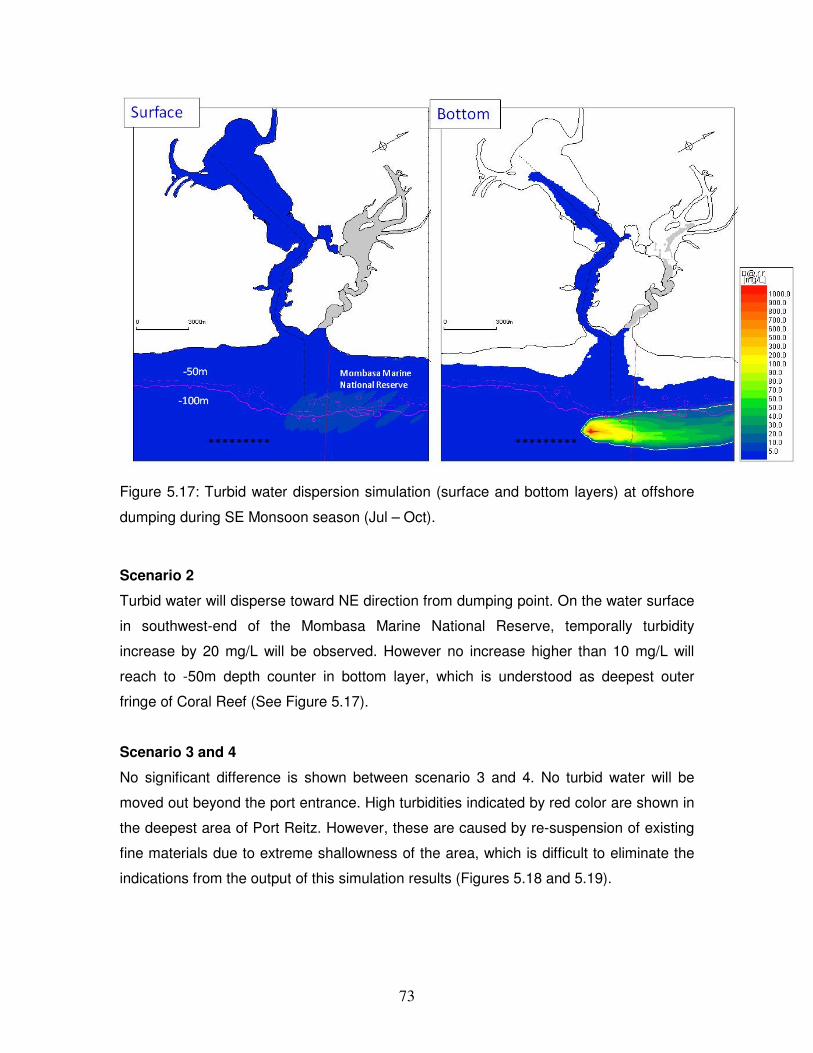
73
Figure 5.17: Turbid water dispersion simulation (surface and bottom layers) at offshore
dumping during SE Monsoon season (Jul – Oct).
Scenario 2
Turbid water will disperse toward NE direction from dumping point. On the water surface
in southwest-end of the Mombasa Marine National Reserve, temporally turbidity
increase by 20 mg/L will be observed. However no increase higher than 10 mg/L will
reach to -50m depth counter in bottom layer, which is understood as deepest outer
fringe of Coral Reef (See Figure 5.17).
Scenario 3 and 4
No significant difference is shown between scenario 3 and 4. No turbid water will be
moved out beyond the port entrance. High turbidities indicated by red color are shown in
the deepest area of Port Reitz. However, these are caused by re-suspension of existing
fine materials due to extreme shallowness of the area, which is difficult to eliminate the
indications from the output of this simulation results (Figures 5.18 and 5.19).
74
Figure 5.18: Turbidity water dispersion due to dredging works at Turning Basin and
temporary dumping at New Container Terminal during NE Monsoon.

75
Figure 5.19: Turbidity water dispersion due to dredging works at Turning Basin and
temporary dumping at New Container Terminal during SE Monsoon.
5.6.4 The potential for sediment resuspension.
The results of the hydrodynamic model were then used to assess, amongst other things,
the sedimentation and turbidity as a result of dredging activities and consequently
potential impacts on marine flora, fauna and biological processes within the study area.
Figures 5.20 and 5.21 show the predicted extent and level of concentrations of
suspended sediment expected at the Turning Basin and Offshore site following 10 days
of constant dredging.
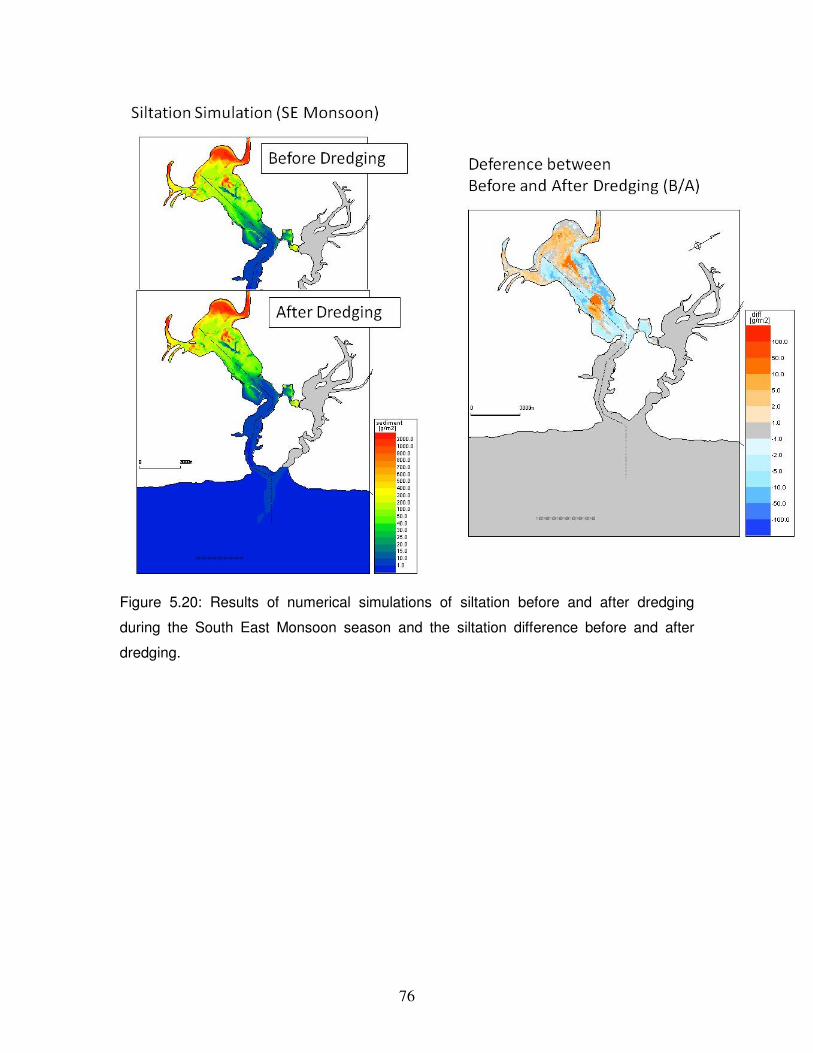
76
Figure 5.20: Results of numerical simulations of siltation before and after dredging
during the South East Monsoon season and the siltation difference before and after
dredging.

77
Figure 5.21: Results of numerical simulations of siltation before and after dredging
during the North East Monsoon season and the siltation difference before and after
dredging.
5.6.5 Hydrodynamic modeling of water quality impacts
Dredging increases water turbidity and relocation of dredged material to an offshore site
can spread the plume over a greater area. The approach to developing the
hydrodynamic model for the project was to predict the spatial extent of impact from
turbid plumes as well as the concentrations of suspended sediments that would be
experienced by biota through the reduction in available photosynthetic light and through
physical smothering of deposited dredge sediments. This approach enabled the project
team to predict turbidity related impacts and develop management and mitigation
strategies prior to the commencement of the dredging project and occurrence of impacts.

78
The focus was on the dredging process to enable a responsive approach to
management. As part of the predictive monitoring approach, mitigation measures based
on tolerance values were developed for sensitive habitats and then used to develop
management responses.
5.7 Concluding Remarks 5.7.1 Hydrodynamic Characteristics This study provides baseline data and information on the hydrodynamic characteristics
of Kilindini harbor, in Mombasa, Kenya.
Water level variations in Kilindini harbor are typically semi-diurnal with spring tide range
of 3.12 m and neap tide range of 1.04 m at the entrance. The mean tide range is 2.3m.
Reasonable predictions of water levels can be obtained by using only fourteen tidal
constituents. Astronomical tides account for more than 90% of water level variations in
the harbour.
Water movements follow closely the tidal rhythm. There is a phase difference of about
3.45 hours between current velocities and water levels. During both spring and neap
tides, the currents are confined along the axis of the main channel.
There is an asymmetry of ebb-dominance with ebb currents being stronger than flood
currents. Maximum ebb and flood velocities are 0.8 ms-1 and 0.5 ms-1 respectively. This
situation tends to favour a net export of materials (including sediments) out of the
system. Typically, flood tide last for 6.58 hours while ebb tide extends for 6.04 hours
within the harbor.
Temperature variations are diurnal with maximum values occurring at about midday and
during the afternoon within the harbor. These variations are slightly sensitive to the semi
diurnal variations caused by the tides.
Meteorological forcing due to wind stress or fluctuations in air pressure play a minor role
in the harbour-ocean exchange processes. This indicates that water movements in
Kilindini harbor are exclusively caused by the tides.

79
Harmonic and spectral analysis methods are useful tools for characterization of
estuarine flows. Both methods describe fairly well the hydrodynamic characteristics of
Kilindini harbor.
5.7.2 Numerical Modeling Three-Dimensional hydrodynamic models coupled with advection-diffusion term can be
used to simulate the hydrodynamics of Kilindini harbor including the transport of
suspended sediments.
The model applied in this study was used to predict the effects of the proposed dredging
scheme on tidal flows, waves and sediment transport using four scenarios examined
during both the NE and SE monsoon seasons. The results of the hydrodynamic model
were then used to assess, amongst other things, the sedimentation and turbidity as a
result of dredging activities and consequently potential impact on sensitive habitats in
the harbor and nearby areas.
The development and application of the hydrodynamic model for the project was to
predict the spatial extent of impact from turbid plumes as well as the concentrations of
suspended sediments. This approach enabled the project team to predict turbidity
related impacts and develop management and mitigation strategies prior to the
commencement of the dredging project and occurrence of associated impacts.
Modelling results indicates that sea levels will not be impacted by the dredging and that
the tidal water levels will be reduced very slightly by about 20 mm in the harbor. The
results also indicate that there will be no change in the current speeds in the harbor or
the dredged channel after the dredging. However, there will be a small decrease in
current speeds through the entrance of the Harbour associated with the increase in the
cross sectional area. There shall be a slight decrease of current in the Turning Basin
because of the deepening. Model results also indicate reduced ebb-dominance in tidal
asymmetry in the harbor.
Results of the model further indicated that changes to wave heights (increase or
decrease) were negligible (less than 10% change) implying that the proposed dredging
works is not likely to alter alongshore erosion and sediment transport processes.

80
6. THE BIOLOGICAL ENVIRONMENT 6.1 Introduction The present project proposes to dredge the shipping route leading to the Port of
Mombasa to deepen and widen the channel at specific locations (Figure 1.1, 4.1). Due to
the potential impacts to the marine environment and human use features associated with
it, background ecological checks were requested and surveys were carried out to
address key environmental concerns and issues, identify potential impacts and
recommend workable mitigation strategies. Consultative meetings were done with the
proponent (KPA) and it’s engineering and port development consultants (Japan Port
Consultants, BAC Engineering & Architecture Ltd.) to gain insight into project design and
scope, and preliminary joint site visits made to gauge the extent of the project area
(proposed dredge areas along shipping route and the nature of the environment existing
thereon).
The Port of Mombasa is surrounded by areas of high natural resource value. Figure 6.1
shows the main coastal type, biological resource, and human use features associated
with the entrance channel (and part of Kilindini harbour). They include a rocky coast at
Shelly Beach, a sheltered sandy beach at Mkomani (Tudor), an exposed sandy beach at
Shelly and Nyali Beach which are also potential turtle nestling sites, contiguous or
isolated patches of fringing coral reefs and reef flats, back-reef lagoons, several hotel
areas, and a marine protected area (Mombasa Marine Park and Nature Reserve). In
Figure 6.2, the main coastal type, biological resource, and human use features
associated with the western end of Port Reitz creek are shown. These include tidal flats
and mud banks, river mouth or creeks, mangroves, relics of coastal forests, small scale
fishing areas, fish landing sites, and harbour areas.
Three perennial rivers – Mwache, Mambone, and Chasimba (Pembe) – feed into the
western end of Port Reitz creek, while three seasonal rivers (Kombeni, Tsatu, Mtsapuni)
flow into Tudor Creek. The mangroves around the port areas and the intertidal mudflats
are a bird sanctuary, and provide other ecological services for fish and shrimp breeding
grounds (Little et al. 1988, Wakwabi and Jaccarini 1993, Seys et al. 1995, Zimmerman
et al. 1995, Wakwabi and Mees 1999, Fulanda 2002, Fisheries Dept 2006, Adala et al,
1997). The waters of the port areas are widely used for various maritime and shipping
activities (KPA, 2004. 2005). In Tudor creek, water sports activities (boating, water skiing,

81
swimming, etc) take place and there are two facilities (Tudor water sports and Mombasa
water sports) for deep sea water fishing and sport activities.
To assess and address issues and concerns of the impacts of the proposed dredging
and dumping activities, a biological baseline study was conducted with careful selection
of study site locations focusing on flora and fauna in 3 communities: water column, soft
sediment and hard substrata habitats, critical habitats (corals, seagrass beds,
mangroves, nearby beach and tidal flat areas used by avifauna, turtles, and humans)
and the MPA. The biological study also benefited from parallel assessments of
hydrodynamic conditions and forcing (physical environmental data) and physio-chemical
conditions of the biotic environment, as well as air quality and noise levels. An
assessment of the nearby marine conservation area (Mombasa MPA) was also done.
Mombasa Marine National Reserve
Shelly Beach
Nyali
Beach
Entrance Harbour
Kilindini Creek
Tudor Creek

82
Figure 6.1 Coastal type, biological resource, and human use features of the port entrance area, Kilindini harbour and Tudor Creek (after Environmental Sensitivity Map, KenSea; Tychsen 2006)
Port Reitz Bay
Mangrove Is-1 Port Reitz Harbour
R. Mwache MIA R. Mambone
R. Chasimba
Figure 6.2: Coastal type, biological resource, and human use features at the western end of Port Reitz Creek (after Environmental Sensitivity Map, KenSea; Tychsen 2006)
6.2 Methodologies for Biological Studies 6.2.1 Scoping: An environmental review (scoping) was undertaken to identify issues and concerns for
the marine biological environment from lead agencies, NGO’s, private sector investors
and the general public stakeholders (Adala et al, 2007).

83
The ecological survey team and study tools were assembled and comprised scientific
divers, marine ecologists, fish and bird specialists and GIS experts, amongst other
technical specialists, and boats, samplers, measurement equipment and tools (Plate 6.1).
The staff were briefed and de-briefed before and after each field expedition. At all times,
marine safety was affected in accordance with existing KMFRI safety guidelines for
research operations at sea. Quality assurance for field sampling and work protocols was
ensured by adopting the scientific operating procedures in standard use at KMFRI and
working with experienced staff.
Plate 6.1: Part of the ecological team, including divers, and some sampling equipment aboard hired boats used in survey
6.2.2 Fieldwork:
Fieldwork focused on flora and fauna in 3 communities: water column, soft sediment and
hard substrata, critical habitats (corals, seagrass beds, mangroves, beach and tidal flats),
and an assessment of the Mombasa MPA conservation area.
6.2.2.1 Water column assemblages
a) Planktons Water samples were collected from 32 water sampling sites (Figure 6.3). For
microscopic life-forms, planktons samples were collected using plankton nets (Photo D).
Vertical and horizontal tows –plankton nets (100 µm for zooplankton and 200 µm
phytoplankton) – were undertaken. Vertical tows were done from 1m above sea surface,
while horizontal tows were towed for 25 m at about 0.3m/sec. The samples were
washed into a receptacle and fixed in 8% buffered formalin and sent to KMFRI Mombasa
laboratories. In the laboratories, the retained materials were washed into a glass dish
and the biota sorted out under a microscope.

84
Microscopy and computer-aided taxonomic analyses (Plate 6.2) followed standard
methods; e.g. for phytoplankton – the Utermorhl method was used to identify the
phytoplankton. Diatom species were ordered according to Hasle and Syvertsen (1997);
Dinoflagellates according to Steidinger and Tangen (1997); and Flagellates according to
Throndsen (1997), all cited in Carmulo (1997). Zooplankton systematic categories were
counted under a Wild Heerbrugg Stereomicroscope, and all samples were equally
treated according to standard national and international laboratory procedures in use at
KMFRI. Bacterial samples were collected by and analyzed at the Society General
Surveillance (SGS) Mombasa offices using the ISO 9308 PT2 methods.
Plate 6.2: Plankton sampling, microscopic survey and computer-aided taxonomic analysis.
b) Nektons
(i) Fisheries
15 fish landing sites (Figure 6.4) were surveyed for primary catch data (gill-net, trap-
fisheries, and prawn-fisheries Plate 6.3), interviews with fishermen, and aquaculture
potential. Comprehensive data was collected from 5 years fish landing data (2003 –
2007) from the 15 landing sites (Frame survey data 2007) that included all the gazette
landing sites listed in Figure 6.4. Data collected and analyzed (5 year data sets) paid
particular attention to catch effort, crafts used, ecological groups/fish categories
(species/taxa and dominant groups represented, including sightings for charismatic
fauna – dugongs, turtles, dolphins, sharks, etc), fish production (fish landings, catch
trend), and other potential and existing aquaculture/mariculture sites and initiatives.

85

86
Offshore Dumping
Temporally Dumping
Water column/ Soft substrata/ sed benthos /: 32 points Soft substrata/sediment transects 4 sites
Hard substrate/sessile inverts/sponge/seaweeds/ slow mobile fauna: 12 points
Fisheries/turtle nests/birds survey: 15 points
Mangrove/tidal flats survey: 10 sites
Coral quality survey: 4 sites
Seagrass study transects 4 sites
15
5
ϒϒϒϒ
3 ♠
♠
♠
♠ ♠
♠
♠
♠
♠
♠
♠
ϒϒϒϒ10-13
ϒϒϒϒ5-9
ϒϒϒϒ3
ϒϒϒϒ1
ϒϒϒϒ15 ϒϒϒϒ14 ϒϒϒϒ4
π
π π
π
π
π
π
ΩΩΩΩ
ΩΩΩΩ ΩΩΩΩ
ΩΩΩΩ
ΩΩΩΩ
♠
♠
♠
π
π
π
S1
S2
S3
ϒϒϒϒ2
S1
Figure 6.3: Sampling site locations and transects for baseline studies (Fisheries landing sites are shown in Fig 6.4).
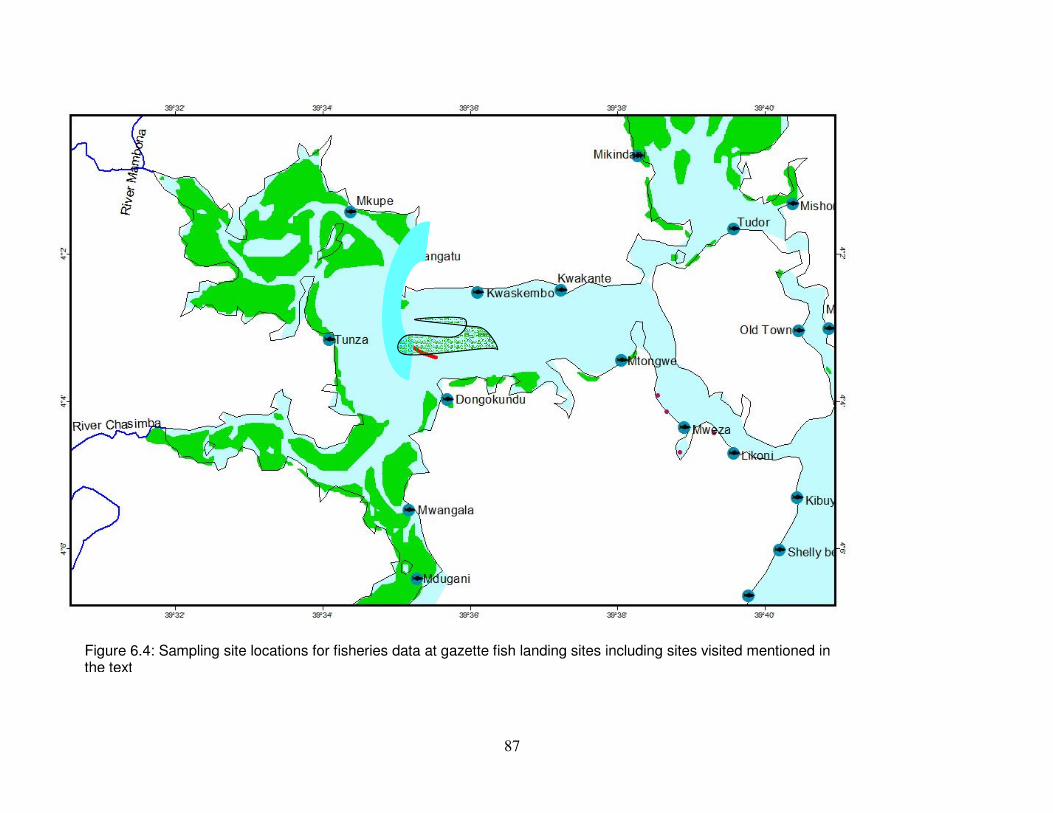
87
Figure 6.4: Sampling site locations for fisheries data at gazette fish landing sites including sites visited mentioned in the text

Plate 6.3: Field survey of rare / critical ecological fish types and ID (top) socio-economic (gear - mid and catch - bottom) for fish, shell-fish and prawn collections.
(ii) Mega-fauna /migratory fauna (reptiles, birds and mammals)
15 sites (same sites as fisheries sites, Figure 6, 4 & Plate 6.4) were surveyed for large faunal incidences
and usage. These sites encompassed beach and tidal flat areas used by avifauna, turtles, and humans.
Bird records were made by an experienced observer hired for that purpose and using standard guides
(Brown et al, 1986; Urban et al, 1988; Fry et al, 1988; Keith et al, 1992; Zimmerman et al., 1996). In
addition, information and data on turtles, avifauna, dugongs, and related charismatic fauna were sourced
from responsible government departments (fisheries department, Kenya wildlife service – Mombasa,
KESCOM, IUCN and WWF conservation agencies, local universities and KMFRI contacts). Additional
information was collated from published reports and papers.
Plate 6.4: Bird survey on mangrove tress and tidal flats

6.2.2.2 Sediment (benthic) assemblages
a) Benthic surveys:
i. Soft sediment infauna
32 sediment cores were taken by divers from specified locations (see Figure 6.3). Coring was
carried out by divers using 50cm long clear perspex tubes with a 6.4 cm internal diameter and
enclosed with rubber bungs at each end (Plate 6.5). Coring procedures were as specified in
Hewitt and Martin (1996, 2000). Sub-sample core samples were taken for grain size and
organic matter analysis.
Plate 6.5: Sediment field survey and processing for benthic collections and laboratory ID using microscopy and technical guides.
The fauna samples were sieved in field through a 0.5mm mesh tray, care being taken not to
introduce sea water into the sample to avoid water-column ichthyoplankton contamination. The
samples retained were preserved in 10% buffered formalin and sent to KMFRI Mombasa
laboratories. In the laboratories, the retained materials were washed into a glass dish and the
infauna sorted out under a microscope and later identified according to standard identification
kits.
ii. Hard substrata invertebrates
12 sites for sessile and cryptic invertebrates were sampled at specified locations (see Figure
6.3 & Plate 6.6). Sampling protocol was to scrape the fauna and flora from replicate 25 X 25 cm
quadrates and concomitantly carry out visual diver searches at the same sites, as specified in
Hewitt and Martin (1996, 2000). Additional collections were made of the larger sessile
invertebrates such as sponges, hydrozoans and bryozoans (which also provide habitat for
smaller animals).

Plate 6.6: Hard substrata survey and collections for laboratory ID from 25m2 quadrants
The retrieved samples were identified in-situ where possible using water-proof identification
sheets / manuals. Unfamiliar species were stuffed into plastic bags and preserved in 10%
buffered formalin and sent to KMFRI Mombasa laboratories for analysis using standard
identification kits.
b) Slow mobile fauna
12 underwater visual census (UVC) and snapshots were conducted at specified locations (see
Figure 6.3) as specified in Hewitt and Martin (1996, 2000) by divers (deep sites), snorkeling
(shallow sites) or beach walk (shallow or exposed sites).
The observed organisms were identified in-situ where possible using identification sheets.
Unfamiliar species will be collected and stuffed into plastic bags and preserved in 10% buffered
formalin and sent to KMFRI Mombasa laboratories for analysis using standard identification kits.
6.2.2.3 Critical habitats a) Coral reef beds and associated substrata communities (seagrass, seaweeds,
algae, sponge)
LandSat Imagery was used to select sites, on the basis of the depth limit of coral and availability
of hard substrate and the proximity to the proposed dredging and dumping activities. The
average depth for the selected sites was approximately eight meters. Landsat TM image for
2005 was downloaded from USGS website (Figure 6.5). Among the pre-processing steps
carried out were: subset to the study area and the dark pixel subtraction to remove the effect of
atmosphere. Benthic substrate were sampled using a 10 line transect method where the
substrate > 3cm beneath the transect line was measured and recorded (McClanahan and Shafir,
1990).
Nine 10m transects (Plate 6.7) were laid in each site where major substrate categories were
recorded: hard coral, soft coral, sea grass, sponge, sand and algae. Four sites were selected
where benthic surveys were carried out to identify the major substrate types in the selected
sites. 3 sites selected were on the southern tip of the Mombasa marine reserve, extending to

the shallow end of the Tudor channel, and one site at Shelly beach in the south close to port
entrance. Site 4 is a heavily fished site with beach seine being the major gear used. Sites 1, 2,
and 3 are protected under ‘Reserve’ category. However no form of management has been
initiated and as a consequence heavy fishing takes place in these areas.
Figure 6.3: Landsat image (bands arrangement 3-2-1) showing the port entrance and the study sites studied for coral cover
Plate 6. 7: Coral field survey and some coral genera and associated invertebrates encountered
b) Seagrass beds and associated communities (seaweeds, algae, sponge)
Sampling for seagrass community structure and associated communities (seaweeds, algae,
sponge) was carried at 4 sites (Figure 6.3). The structural features of seagrass and other
substrata conditions were assessed from 10 quadrats (50 x 50 cm) at each site. Species
composition, canopy height and percentage cover (seagrass research methods – Phillips and
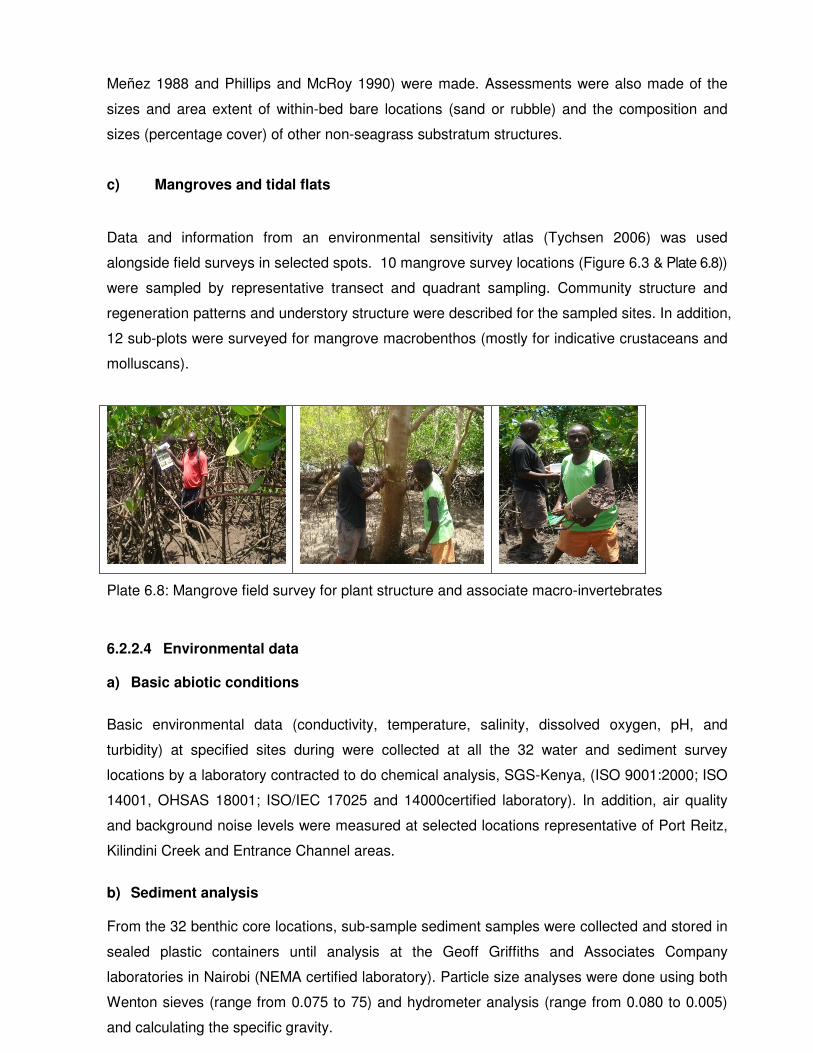
Meñez 1988 and Phillips and McRoy 1990) were made. Assessments were also made of the
sizes and area extent of within-bed bare locations (sand or rubble) and the composition and
sizes (percentage cover) of other non-seagrass substratum structures.
c) Mangroves and tidal flats
Data and information from an environmental sensitivity atlas (Tychsen 2006) was used
alongside field surveys in selected spots. 10 mangrove survey locations (Figure 6.3 & Plate 6.8))
were sampled by representative transect and quadrant sampling. Community structure and
regeneration patterns and understory structure were described for the sampled sites. In addition,
12 sub-plots were surveyed for mangrove macrobenthos (mostly for indicative crustaceans and
molluscans).
Plate 6.8: Mangrove field survey for plant structure and associate macro-invertebrates
6.2.2.4 Environmental data a) Basic abiotic conditions
Basic environmental data (conductivity, temperature, salinity, dissolved oxygen, pH, and
turbidity) at specified sites during were collected at all the 32 water and sediment survey
locations by a laboratory contracted to do chemical analysis, SGS-Kenya, (ISO 9001:2000; ISO
14001, OHSAS 18001; ISO/IEC 17025 and 14000certified laboratory). In addition, air quality
and background noise levels were measured at selected locations representative of Port Reitz,
Kilindini Creek and Entrance Channel areas.
b) Sediment analysis From the 32 benthic core locations, sub-sample sediment samples were collected and stored in
sealed plastic containers until analysis at the Geoff Griffiths and Associates Company
laboratories in Nairobi (NEMA certified laboratory). Particle size analyses were done using both
Wenton sieves (range from 0.075 to 75) and hydrometer analysis (range from 0.080 to 0.005)
and calculating the specific gravity.

6.2.2.5 MPA survey and analysis The existing documented biodiversity at Mombasa Marine Park and Reserve (Mombasa MNPR)
was reviewed from lead agencies and re-compiled. The information obtained was compared
with information from other national marine parks and reserves.
6.2.2.6 Impact analysis, Mitigations and Monitoring plan
Impact characterization and analysis, and mitigations measures and monitoring plans were
developed across broad categories covering the holistic nature of marine dynamics and
integrating physical, chemical and biological aspects. Monitoring plans proposed involved an
integrated approach, and included parameters, locations, frequencies, duration, target values,
required cost, human resource and effective institutional arrangements.
6.3 Baseline Characterizations 6.3.1 Water Column Assemblages – Planktons a) Phytoplankton
About 40 species were represented out of which a few potentially toxic forms (dinoflagellates –
Alexandrium and Dinophysis) responsible for algal blooms, fish kills and human intoxication
were present. Table 6.1 summarizes the phytoplankton distributions in the 3 study divisions.
The diatoms were the majority followed by dinoflagellates. The flagellates were rare (Figure 6.6)
Other phytoplankton features at the three sites included the following observations:
1. Relatively high diversity at Port Reitz – suggestive of differences in oceanographic
conditions between this and other sites (maybe relative high nutrient areas in P. Reitz
areas as suggested in literature)
2. Some populations are common at three sites – suggestive of their wide distributions
either due to water driven mixing/transport or plastic adaptive strategies;
3. Few are exclusive to inner or outer sites – oceanic vs estuarine indicative mutual
exclusivity either due to abiotic and/or abiotic conditions or interactive effects
b) Zooplankton The following statements can be made of zooplankton assemblages (Appendix-3):
1. About 120 species were represented out of which several potentially from breeders
(eggs) and nursery forms (juveniles; e.g., copepod nauplii were present.
2. More zooplankton types and numbers, and the young stages of many fauna were
obtained in Port Reitz waters than from Shelly beach.

3. Relatively high forms of eggs and juveniles at Port Reitz – suggestive of significant
areas important for life stage cycles of fauna represented.
4. At Port Reitz, cyclopoida and calanoida were the most abundant, followed by mollusca,
appendicularia and copepod nauplii. Pisces, cirripied nauplii, and polychaeta were
present in intermediate numbers.
5. Main taxa represented in Port Reitz samples were distributed as shown in Figure 6.7.
Table 6.1: Water column biota (phytoplankton) in three divisions of Port Reitz, Kilindini and the Entrance Harbour
Port Reitz Kilindini Entrance Harbour
Main Spp Counts Main Spp Counts Main Spp Counts
Ceratium furca 97 Ceratium furca 74 Ceratium furca 18
Pleurosigma normanii 30 Protoperidinium spp 48 Pleurosigma normanii 17
Navicula spp 22 Coscinodiscus spp 26 Coscinodiscus spp 14
Thalassiosira eccentrica 21 Thalassionema nitzschioides 23 Navicula spp 12
Alexandrium catenella 20 Pleurosigma capense 18 Skeletonema costatum 11
Nitzschia spp 18 Dictyocha fibula 11 Thalassionema nitzschioides 11
Thalassionema nitzschioides 17 Chaetoceros spp 9 Chaetoceros spp 10
Protoperidinium spp 15 Nitzschia closterium 8 Dictyocha fibula 8
Ditylum brightwelli 12 Pleurosigma normanii 8 Thalassiosira anguste-lineata 8
Dictyocha fibula 11 Thalassiosira spp 8 Nitzschia spp 7
Pleurosigma capense 10 Skeletonema costatum 7 Pleurosigma directum 7
diatom dinoflagellate flagellate
Figure 6.4: Proportions of major phytoplankton groups in the samples analyzed. See appendix- for details on specific categories
57.6% 41.1%

0
200
400
600
800
1000
1200
1400
1600
Cyc
lopo
ida
Mol
lusc
a
cope
pod
naup
lii
cirri
pied
nau
plii
Eupha
uceac
ea
fora
min
ifera
mon
stril
loid
a
copilia
Amph
ipod
a
Brach
yura
e
Isop
oda
taxonomic grouping
ab
un
dan
ce (
un
it p
lan
kto
n)
Figure 6. 5: Occurrence of zooplankton taxa in water samples from Port Reitz
c) Coliform bacteria
For coliforms types and composition, there were no differences between the various forms
enumerated. All fecal coliforms present were comprised by E. coli. The mpn values in 100ml
were similar at 23mpn/100mls or undetected at all sites in Port Reitz, Kilindini and Shelly
beach.
6.3.2 Water Column Assemblages – Fisheries
6.3.2.1 Distribution of fishing effort
A total of 1349 fishers are recorded to fish and land at 28 landing sites of Mombasa District
(Marine Fisheries Frame Survey 2006). However, 324 of these fishers fish within the Port Reitz
creek with majority fishers landing in Tsunza (~55 %). In Likoni division the fishers are
distributed as follows; Tsunza (227) Old ferry (48), Mtongwe (35) and Mwangala (14) as shown
in Figure 6.8. In Changamwe division there is a total of 313 fishers from the following landing
sites; Mkupe- Maweni (147), Kwa Skembo ( 78 ), Kitanga Juu (66) and Kwa Kanji (22) (Figure
6.9). There are two landing sites in the Old port area namely; Mlango wa papa and Old port
town. A total of 58 fishers are recorded to land in the two sites. According to frame survey report
only 14 fishers use sails, paddles or walk to the fishing ground, the rest have Mashua boats
fitted with outboard or inboard engines.

Fishing within the Port Reizt creek is largely artisanal and dug-out canoes propelled by either
sail or paddles are the main fishing boats. There are three boats that are propelled by out-
board engines (15 Hp). A total of 230 boats fish within the creek with two or three crew
members per boat depended on the fishing area and target species/fishing method. There are
also fishers who walk to the fishing ground especially those that use traps. A total of 18 fishers
are recorded as foot fishers 12 of them landing at the Old ferry and 6 in Mtongwe (Figure 6.8),
while 17 foot fishers are recorded to land at landing sites of Shelly beach area (Kibuyuni, Shelly
beach and Mavovoni). Fishers in Shelly beach area are estimated at 65 with a total of 18 boats
(Frame Survey 2006).
Figure 6.6: No of foot fishers and boats per landing sites Likoni
Figure 6.7: No of boats and fishers per landing sites / Changamwe
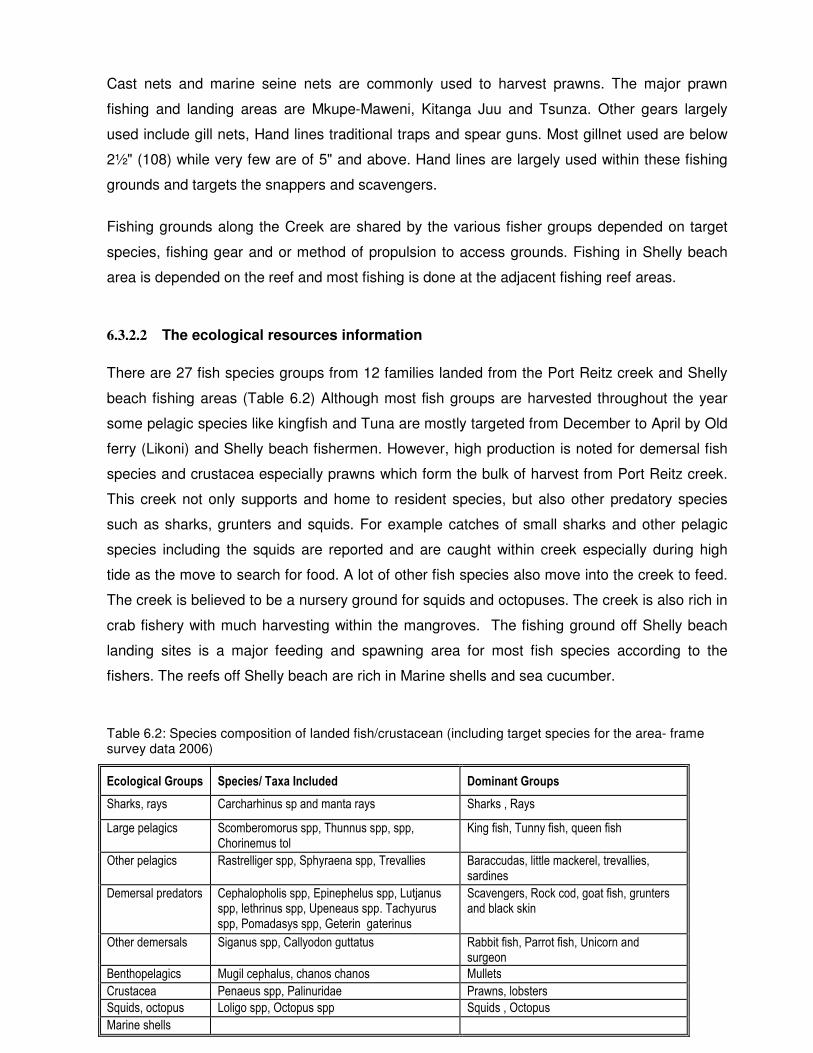
Cast nets and marine seine nets are commonly used to harvest prawns. The major prawn
fishing and landing areas are Mkupe-Maweni, Kitanga Juu and Tsunza. Other gears largely
used include gill nets, Hand lines traditional traps and spear guns. Most gillnet used are below
2½" (108) while very few are of 5" and above. Hand lines are largely used within these fishing
grounds and targets the snappers and scavengers.
Fishing grounds along the Creek are shared by the various fisher groups depended on target
species, fishing gear and or method of propulsion to access grounds. Fishing in Shelly beach
area is depended on the reef and most fishing is done at the adjacent fishing reef areas.
6.3.2.2 The ecological resources information
There are 27 fish species groups from 12 families landed from the Port Reitz creek and Shelly
beach fishing areas (Table 6.2) Although most fish groups are harvested throughout the year
some pelagic species like kingfish and Tuna are mostly targeted from December to April by Old
ferry (Likoni) and Shelly beach fishermen. However, high production is noted for demersal fish
species and crustacea especially prawns which form the bulk of harvest from Port Reitz creek.
This creek not only supports and home to resident species, but also other predatory species
such as sharks, grunters and squids. For example catches of small sharks and other pelagic
species including the squids are reported and are caught within creek especially during high
tide as the move to search for food. A lot of other fish species also move into the creek to feed.
The creek is believed to be a nursery ground for squids and octopuses. The creek is also rich in
crab fishery with much harvesting within the mangroves. The fishing ground off Shelly beach
landing sites is a major feeding and spawning area for most fish species according to the
fishers. The reefs off Shelly beach are rich in Marine shells and sea cucumber.
Table 6.2: Species composition of landed fish/crustacean (including target species for the area- frame survey data 2006)
Ecological Groups Species/ Taxa Included Dominant Groups
Sharks, rays Carcharhinus sp and manta rays Sharks , Rays
Large pelagics Scomberomorus spp, Thunnus spp, spp, Chorinemus tol
King fish, Tunny fish, queen fish
Other pelagics Rastrelliger spp, Sphyraena spp, Trevallies Baraccudas, little mackerel, trevallies, sardines
Demersal predators Cephalopholis spp, Epinephelus spp, Lutjanus spp, lethrinus spp, Upeneaus spp. Tachyurus spp, Pomadasys spp, Geterin gaterinus
Scavengers, Rock cod, goat fish, grunters and black skin
Other demersals Siganus spp, Callyodon guttatus Rabbit fish, Parrot fish, Unicorn and surgeon
Benthopelagics Mugil cephalus, chanos chanos Mullets Crustacea Penaeus spp, Palinuridae Prawns, lobsters Squids, octopus Loligo spp, Octopus spp Squids , Octopus Marine shells

Sea turtles have been reported (Wamukoya et al 1997) to nest in this area an indication of a
major feeding ground for turtle species. Sharks and Rays harvested in this area are not
reported to species level and there a need to monitor the species as some shark and ray
species are listed as threatened in the IUCN red list.
6.3.2.3 Fish production
Fish species exploited within the dredging and dumping sites are shown Table 6.2. Rabbit fish,
scavengers, Sardines, Sharks/rays, octopus and prawns have contributed to a greater extend to
the Likoni fish landings (Figure 6.10). On average landings from the key species range from 8 to
11 tons according to landing statistics from Likoni fish landing sites (Fisheries statistics). Other
species contribute 2 and 3 tons annually. From the statistical data high catches of 113 and 124
MT are recorded in 2004 and 2005 respectively and dropped to 83 MT tons in 2006 and 2007
(Table 6.3). The landings in Likoni area are highest in 2007 (144). Most of the other species are
recorded as mixed species and contribute to 40 to 50% of the total landings. The highest
catches are for sharks/rays, rabbit fish, and scavengers. The Old Port fish landing statistics
show a total of 71MT valued at 6.7 million Kshs. for 2004 and 63MT valued at 6.0 million Ksh.
for 2005. High catch records are from the month of November to April and most common fish
are sharks/rays, sardines, barracuda, Rabbit fish, king fish, snappers, parrot fish scavengers
and lobsters.
Figure 6.8: Fish landings (kg) at Likoni landing sites for five years

Table 6.3: Total fish production and value for the last 4 years in Port Reitz and Likoni
Year Port Reitz Likoni
Wt (Mt) Value(000’sh) WT (Mt) Value(000’sh) 2004 113 8175 83 7333
2005 124 7247 76 7198
2006 83 6374 79 8463
2007 83 6513 144 17099
6.3.2.4 Seasonality of the fishery by species Figures 8.11 - 8.13 show seasonality in the fish species landed from Port Reitz and Likoni areas.
From these data there is an indication that the fishers heavily depend on the sea during the
North east monsoons and that some species do occur in large quantities in the South East
season. High prawn catches are after the rains. However it is important to note that most of
these species are landed throughout the year with varying quantities depended upon the
prevailing season and the fishing grounds. It should further be noted that due to inaccessibility
of some landing sites some data may not be reported and hence the exact value of the fishery
not adequately quantified.
Figure 6.9: Seasonality in landings of pelagic fish species in Port Reitz creek
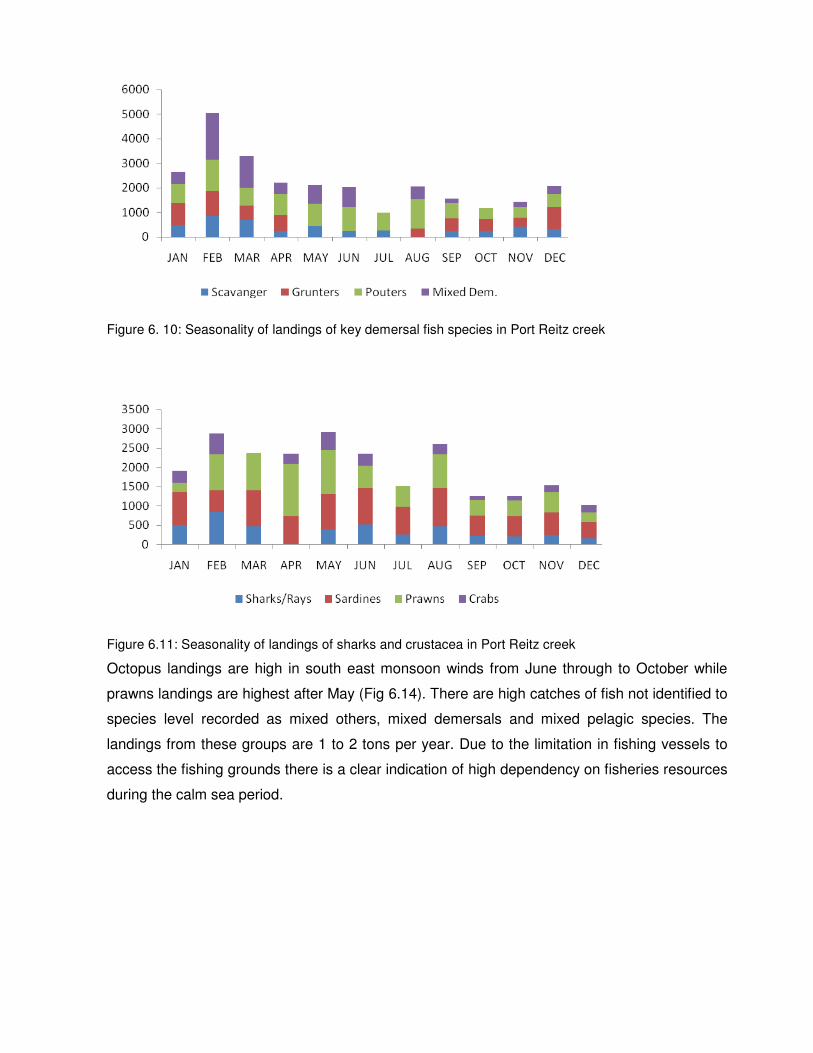
Figure 6. 10: Seasonality of landings of key demersal fish species in Port Reitz creek
Figure 6.11: Seasonality of landings of sharks and crustacea in Port Reitz creek
Octopus landings are high in south east monsoon winds from June through to October while
prawns landings are highest after May (Fig 6.14). There are high catches of fish not identified to
species level recorded as mixed others, mixed demersals and mixed pelagic species. The
landings from these groups are 1 to 2 tons per year. Due to the limitation in fishing vessels to
access the fishing grounds there is a clear indication of high dependency on fisheries resources
during the calm sea period.

Figure 6.12: Seasonality in landings of octopus, squids, crustacean Likoni
6.3.2.5 Economic value of the fishery There is a high dependency on the fishery. For example prawns earn the fisher between 1.1 –
1.2 million Kenya shillings, an indication of high productivity in terms of crustacea and a major
source of food protein to residents of Mombasa. Most fish species cost Ksh. 70 to 80 per kg or
even up to 150/- per kg depended on season and fish types. The fish catches earn fishers over
7 million shillings Table 6.3. In this analysis the dependency on the fishery in terms household
and other livelihoods has not been quantified. It is also important to understand economic value
of the ecosystem to be quantified as the loss.
6.3.2.6 The potential and existing Aquaculture/ Mariculture The Port Reitz creek which surrounds the Island town of Mombasa in the south west has a total
coastline area estimated at 2250 ha (Fulanda 2002) and recent survey by Fisheries Department.
Suitable mariculture sites have been estimated to cover over 60% in the swamp areas in the mangroves
(Fulanda and Muturi 2002, other later surveys). Two community crab farming projects exist in Tsunza
and Kwa Skembo area Fresh water fish ponds rearing exists too. Therefore there is a high aquaculture
potential along this creek and any development may lead to loss of potential aquaculture opportunity an
alternative to capture fisheries and hence enhancement of food security in this area.
6.3.3 Sediment (benthic) assemblages 6.3.3.1 The soft sediments benthos The macrobenthic community had about 20 different species identities from Port Reitz (15
samples) and about 16 from Shelly Beach (15 samples) (Figure 6.15 and 6.16). In terms of
dominance, Port Reitz area was dominated by Nassarius coronatus and Oliva bulbosa, though
several unidentified Nereidae and Epitoniidae sp were also dominant as were oligochaetes
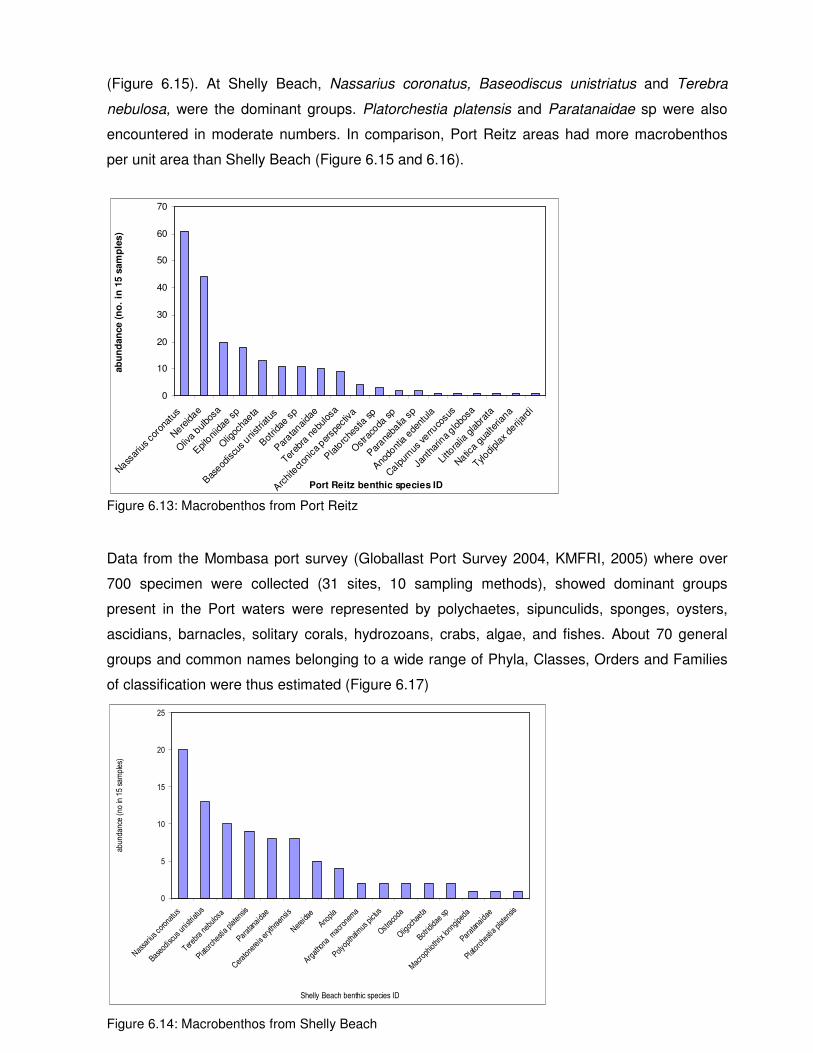
(Figure 6.15). At Shelly Beach, Nassarius coronatus, Baseodiscus unistriatus and Terebra
nebulosa, were the dominant groups. Platorchestia platensis and Paratanaidae sp were also
encountered in moderate numbers. In comparison, Port Reitz areas had more macrobenthos
per unit area than Shelly Beach (Figure 6.15 and 6.16).
0
10
20
30
40
50
60
70
Nass
arius co
rona
tus
Nere
idae
Oliv
a bulbo
sa
Epito
niidae
sp
Olig
ocha
eta
Bas
eodiscu
s uni
stria
tus
Bot
ridae
sp
Par
atanai
dae
Tereb
ra nebu
losa
Arc
hite
cton
ica per
spec
tiva
Plato
rche
stia sp
Ostra
coda
sp
Par
aneba
lia sp
Ano
dont
ia e
dent
ula
Calp
urnus
verru
cosu
s
Jant
harin
a glo
bosa
Litto
ralia
glabr
ata
Natic
a gu
alte
riana
Tylodi
plax
derij
ardi
Port Reitz benthic species ID
ab
un
dan
ce (
no
. in
15 s
am
ple
s)
Figure 6.13: Macrobenthos from Port Reitz
Data from the Mombasa port survey (Globallast Port Survey 2004, KMFRI, 2005) where over
700 specimen were collected (31 sites, 10 sampling methods), showed dominant groups
present in the Port waters were represented by polychaetes, sipunculids, sponges, oysters,
ascidians, barnacles, solitary corals, hydrozoans, crabs, algae, and fishes. About 70 general
groups and common names belonging to a wide range of Phyla, Classes, Orders and Families
of classification were thus estimated (Figure 6.17)
0
5
10
15
20
25
Nassa
rius coronatus
Baseodiscus unistriatus
Tereb
ra nebulosa
Platorchestia platensis
Paratanaidae
Ceratonereis erythraensis
Nereidae
Anopla
Argathona macron
ema
Polyopthalm
us pictus
Ostracoda
Oligochaeta
Botrididae sp
Macrophiothrix lo
nngipeda
Paratanaidae
Platorchestia platensis
Shelly Beach benthic species ID
abun
dance (no in 15 sa
mples
)
Figure 6.14: Macrobenthos from Shelly Beach

Occurence of common taxa
0
10
20
30
40
50
60
70
80
zo
oa
nth
ids
po
ych
ate
s
sip
un
cu
lid
s
spo
ng
es
oy
ster s
hell
s
asc
idia
ns
ba
rn
acle
s
soli
tary
co
ra
ls
bris
tle s
tars
cra
bs
hy
dro
zo
an
s
alg
ae
fish
spacimen taxa
Nu
mb
ers
Figure 6.15: Occurrence of common taxa in benthic samples from Globallast survey (Source - KMFRI 2006)
6.3.3.2 The epifaunal and infauna benthos
Assortments of epiphytic faunal communities were encountered. At Shelly beach they were
either sessile on the substratum or on seagrass and seaweeds – hydroids, sponges, and
ascidians. At Port Reitz, mangrove epiphytes (e.g., Balanus, Amphitrite and Ostrea sp on
Rhozophora trunks and prop roots) were observed. Some of these were seaweeds and are
listed under seaweeds section.
6.3.3.3 Hard substrata benthos and slow invertebrates
Hard substrata benthos and slow invertebrates from underwater visual census, scrapes or
observed in transect observations or still photo-imagery included the following groups (Table
6.4).

Table 6.4: Benthic invertebrate assemblages at the Port Reitz, Shelly and Nyali Beach waters based on 10 transect observations (September – November 2006)
Site Benthos Comments
Port Reitz Oysters Crabs (mostly mangrove types and few sandy types – see Table details) Barnacles
Oysters and barnacles growing mostly on hard substrata off the seawall at berth-19 (Kilindini Oil Terminal)
Shelly Beach Corals – hard and soft see Table details) Sponges Acanthanster Sea urchins – Diadema, Echinometra, Tripenestus
Corals and sponges species sedentary; Acanthanster (rare) and sea urchins (common) are predatory species indicating some ecological imbalances
Nyali Beach
Corals – hard and soft see Table details) Sponges Acanthanster Sea urchins – Diadema, Echinometra, Tripenestus
Corals and sponges species sedentary; Acanthanster (rare) and sea urchins (common) are predatory species indicating some ecological imbalances
Beach-walk observations revealed fauna on rocks in the upper part of intertidal zone had a
sparse biological activity, with mostly unicellular algae and fleshy alga, and a fauna of chitons
and limpets and some amphibian crustaceans.
6.3.4 Critical Habitats:
6.3.4.1 Coral reefs and rocky platform communities (Andromache and Leven reefs) Results from the four study sites show that algae and sea grass are the dominant cover in all
the studied sites. All the algal types and sea grass were summed into one substrate category.
Coral cover varied among the studied sites. Site2 had the highest coral cover with 32% while
the lowest coral cover observed was 11.9% in site4. Despite this being a fished site, corals in
site 2 is comparable to that observed in some of the Kenya’s Marine Protected Areas. This
indicates that this area (site-2) is important for hard corals. These corals grow in relatively high
water flow, and could be a source of coral larvae for locations further north of the Marine
National Reserve. Factors which affect these coral habitats among others include trampling by
fishermen. 21 coral genera were counted in all the three sites with site 1 having the highest
number of coral genera (Table 6.5). Site 4 was less diverse with only 7 taxa.
Site 4 had the highest algal cover, dominated by turf algae and the Sargassum macro algae.
The latter do well in high energy areas such as in site 4. The removal of herbivorous fish and

trophy collections or scavenging have also led to the low coral cover that was observed here as
these activities hamper coral recruitment and contribute to low herbivory which leads to
increase in macro algal cover.
Table 6.5: Summary of percentage cover of the major substrate categories in the four studied sites
Site 1 Site 2 Site 3 Site 4
Mean Mean Error Mean Mean Error Mean Mean Error Mean Mean Error
Hard Coral 26.5 2.9 32.4 1.8 13.9 1.8 11.9 2.8
Algae and sea grass 64.9 9.2 59.9 4.6 80.8 10.3 79.2 3.3
Soft coral 2.1 0.6 2.1 0.5 1.2 0.5 0.1 0.1
Sponge 0.1 0.1 0.0 0.0 0.7 0.4 0.2 0.2
Bare substrate 6.3 1.3 5.6 1.1 3.4 1.3 8.7 3.5
Table 6.6: Summary of the number of hard coral genera observed in the studied sites.
Site
Acropora
Alveopora
Astreo
Astreopora
Cyphastrea
Echinophyllia
Echinphora
Favia
Favites
Galaxea
Goniastrea
Goniopora
Hydnophora
Leptoria
Millepora
Montipora
Pavona
Platygyra
Pocillopora
Porites bran
ching
Porites mas
sive
Total tax
a
1 1 1 1 1 1 1 1 1 1 1 1 1 1 1 1 152 1 1 1 1 1 1 1 1 1 1 1 1 1 133 1 1 1 1 1 1 1 1 1 1 1 1 124 1 1 1 1 1 1 1 7
Following the major 1998 El Nino, most corals at Shelly beach areas must have been killed as
seen from dead tops of most hard corals there. The few hard corals encountered (Table 6.6)
comprised less than 15% of the total benthic cover, and are not yet in a state of good recovery
as seen in evidence of breakages, erosion of newly dead corals and increased dominance by
fleshy/tuft algae. Some scleractina corals, in particular Horastrea indica, which is listed as
endemic to the western Indian Ocean was not seen in this survey even though it has an
occurance potential.
6.3.4.2 Seagrass Beds
There were no seagrass beds on study sites at Port Reitz area, except for a small patch of bed
in an areas between Ras Kikangoni and the Kenya Navy jetty (Table 6.7). All seagrass species
reported in this study were found at the Shelly Beach and Nyali beach areas, where a total of
eight species were recorded, in particularly high densities were encountered at the entrance
areas of the Port (Shelly and Nyali beach), and these are listed in Table 6.7

Table 6.7: Sea grass species at some sites of the Port of Mombasa
S. no Species ID
Shelly Beach (relative species % cover* of
species encountered)1 Port Reitz (KN jetty/quay)2
Transect-S1 Transect-S2 Transect-S3 presence
180-m 220-m 210-m
1 Cymodocea serrulata 15 35 20
2 Cymodocea rotundata 20
3 Halodule uninervis 20
4 Syringodium isoetifolium 15 5 30 √
5 Thalassia hemprichii 10 30 5
6 Thalassodendron ciliutum 30 25 15
7 Halophila ovalis 5 5 5 √
8 Halodule spp 5 5 √
Species % cover* relative only for seagrass on defined transect distance.
6.3.4.3 Seaweeds
The seaweeds structure of Port Reitz comprised mostly blue-greens loosely attached on silty
sediments. Patches of Enteromorpha crassa on sediment surfaces, with occasional
occurrences of Padina, Ulva and floating Sargassum were encountered. Some species were
found epiphytic on mangrove roots (e.g., Enteromorpha, Bostrychia and Murrayella spp. on
Avicennia).
At Shelly and Nyali Beach, several species were found that grow attached on reef front, reef
crest, reef flat, and on dead coral debris and sandy pools: Padina, Cystoseira, Dictyosphaeria,
Digenia, Avanthophora, Pseudovalonia, Laurencia, Hypnea, and Dictyota and some forms of
Calcerous algae were some common genera encountered. For a full list of occurrence by
transect points, see Table 6.8.
6.3.4.4 Epiphytic seaweed community
Epiphytic seaweed communities (on seagrass) were encountered. These include the species
Ulva, Caulerpa, Colpomenia, Hydroclathrus, Pocockiella, Jania, Amphiroa, Codium, Gracilaria,
Padina, Stypopodium, Enteromorpha, Galidiella, Sphacelaria, Psedovalonia, and Calcerous algae

6.3.5 Mangrove forest
Table 6.9 summarizes the general characteristics of the main mangrove sites surveyed (existing
forest area > 0.5 acres). In Port Reitz were found the most extensive mangrove forests in the
typical estuarine environment (along 2 major river channels). At the confluence where the two
main rivers (Mwache and Cha Shimba) met on the Port Reitz Channel –an island of Sonneratia
alba mangrove has formed.
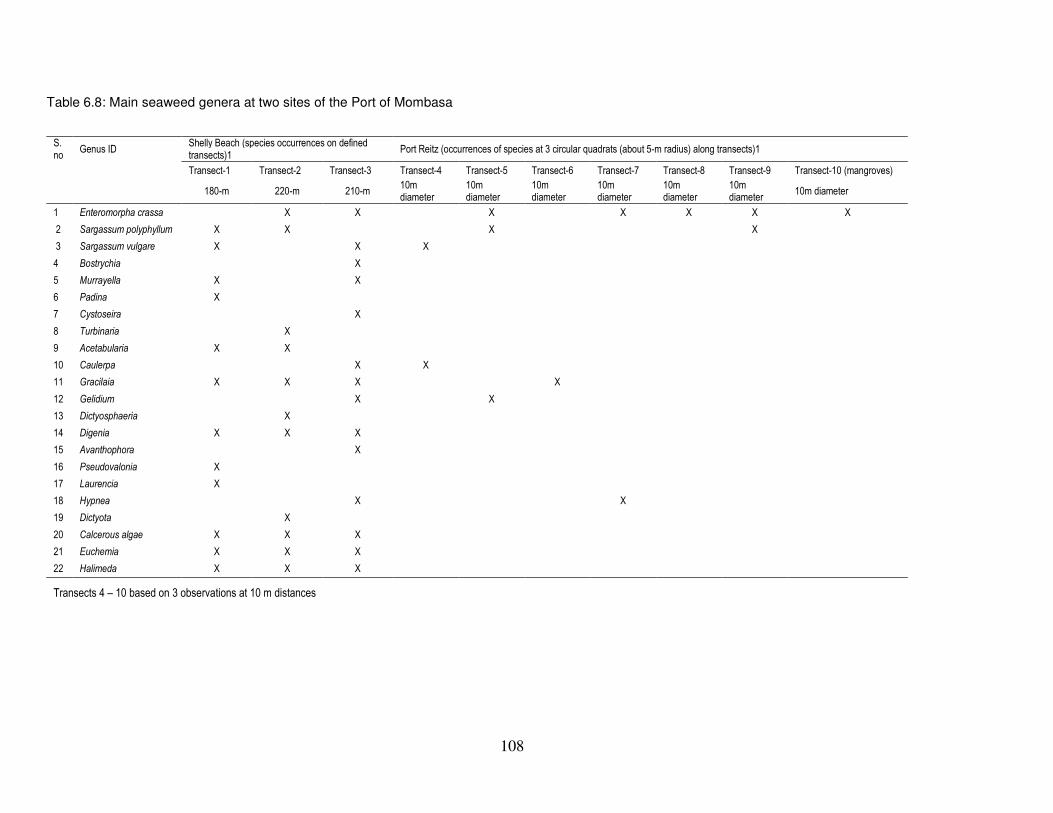
108
Table 6.8: Main seaweed genera at two sites of the Port of Mombasa
S. no
Genus ID Shelly Beach (species occurrences on defined transects)1
Port Reitz (occurrences of species at 3 circular quadrats (about 5-m radius) along transects)1
Transect-1 Transect-2 Transect-3 Transect-4 Transect-5 Transect-6 Transect-7 Transect-8 Transect-9 Transect-10 (mangroves)
180-m 220-m 210-m 10m diameter
10m diameter
10m diameter
10m diameter
10m diameter
10m diameter
10m diameter
1 Enteromorpha crassa X X X X X X X
2 Sargassum polyphyllum X X X X
3 Sargassum vulgare X X X
4 Bostrychia X
5 Murrayella X X
6 Padina X
7 Cystoseira X
8 Turbinaria X
9 Acetabularia X X
10 Caulerpa X X
11 Gracilaia X X X X
12 Gelidium X X
13 Dictyosphaeria X
14 Digenia X X X
15 Avanthophora X
16 Pseudovalonia X
17 Laurencia X
18 Hypnea X X
19 Dictyota X
20 Calcerous algae X X X
21 Euchemia X X X
22 Halimeda X X X
Transects 4 – 10 based on 3 observations at 10 m distances

109
Table 6. 9: Mangrove community structure at the study plots in Port Reitz basin
Parameter
Site Kilindini Channel Port Reitz Channel
Tudor Channel
Site-1 Site-1 Site-2 Site-3 Site-4 Site-5 Site-6 Site-7 Site-8 Site-9 Site-10 Site-11 Site-10
Mweza Creek
Mangrove Is-1
Mangrove Is-2
Mangrove Is-3 Mwagonde
Dongo Kundu,
R. Chasimba Creek Tsunza Mwache
Mkupe- Maweni
Kwa Skembo
Kitanga Juu Mkomani
Avg area studied (Ha) 1.5 0.5 1.2 0.5 1.5 2 2 1.5 3 1.5 1.5 0.5 0.25
Spp comp
Rm, Ct, Bg, Am, Lr, Sa Sa Sa Sa
Rm, Ct, Am, Sa
Sa, Rm, Ct, Bg, Am
Sa, Rm, Ct, Bg, Am, Lr
Sa, Xg, Rm, Ct, Bg, Am,
Lr
Sa, Xg, Rm, Ct, Bg, Am,
Lr
Sa, Xg, Rm, Ct, Am
Xg, Rm, Ct, Bg, Am, Lr
Rm, Am, Lr Sa
Dominant adult species Rm - Ct Sa Sa Sa Am Sa - Rm Sa - Rm Sa Sa - Am Am Am Am Sa
Dominant young species Ct - Rm Sa Sa Sa Am Rm - Sa Rm - Am Rm - Ct Rm - Sa - Am Rm - - Sa
Avg ht (m) - adults 2.4 1.7 1,3 0.9 3.8 3.1 3.4 2.2 3.5 2.1 3.1 2.7 2.3 Avg density (no/10m2 pots) - adults 11 ± 3.6 4 ± 2.2 3 ± 1.2 3 ± 1.6 7 ± 4.2 18 ± 8.1 19 ± 17.6 13 ± 6.9
15 ± 5.6 8 ± 5.1 3 ± 2.8
0.2 ± 1.6 4 ± 2.7
Dominant regeneration status (class I, II, III) III III III III I II III III II - - - -
Understory cover
Halophytes (% substratum cover) 10 0 0 0 6 3 5 0 2 5 5 2 0
Associated substratum (feel) sandy to
silty sandy sandy sandy to
silty silty sandy to
silty silty sandy to
silty sandy sandy rocky Adults1 description based on UNESCO 1984; regeneration2 status based on UNESCO 1984 and Kairo 1995.
Key: Am Avicennia marina Ct Ceriops tagal Xg Xylocarpus granatum
Rm Rhizophora mucronata Lr Lumnitzera racemosa Hl Heritiera littoralis
Bg Bruguierra gymnorhiza Sa Sonneratia alba
6.3.6 Deep sea benthos Information and data for potential deep-sea benthos was inferred (predicted) from a synthesis of
secondary information sources, in particular data from the Netherlands Indian Ocean Program
(NIOP) 1990-1995 (NIOP, 1992, 1995) for the Kenyan coast that was based on four transect
points at Kiwayu, Tana, Sabaki and Gazi, at depths: 20m, 50m, 500m, 1000m, and 2000m.
Nematode groups are chosen in this report an indicator species (based on analysis by
Muthumbi, 1998).
Based on depths and genus composition (200 genera described (Muthumbi, 1998)), abundance
and species composition were predicted at specific depths. The general trend in Tyro transects
was high nematode density at shallow depth which decreased up to 1000m, then increased
slightly or decreased slightly up to 2000m. The trend was similar in oxygen concentration, and
therefore oxygen was thought to be influencing nematode density. The most dominant genera
common in all the five depths were Monhystera, Sabatieria, Halalaimus and Daptonema spp.
Acantholaimus spp was also dominant but was absent in the shallowest stations. About 55
species were represented in these main 4 -5 families.
Also based on depths and genus composition, ecological groups were categorized for deep sea
benthos. Using the nematode indicator index, four ecological groups were categorized, with
nematode similarities coinciding with the depths of (i) 20, 50 and 200m; (ii) 20 and 50m; (iii) 500
and 1000m; (iv) 1000 and 2000m). This showed the significance of depth in structuring
ecological groups, and the same trends can be implied for the deep waters off Mombasa port
entrance where dumping will be done.
6.3.7 The Mombasa Marine Park and Reserve (MNPR). The Mombasa Marine National Park and Reserve (MNPR) was gazetted in 1986 under the
Wildlife Conservation and Management Act Cap 3726 of 1977 (revised in 1985). This marine
protected area (MPA) is managed by the Kenya Wildlife Service and lies between Tudor Creek
to the south and Mtwapa creek to the north, of Mombasa District (latitudes 40o 43’ and 40o 15’
and longitudes 30o 55’ and 4o 12’ N.E). The MNPR is zoned into two main management areas,
the Mombasa Marine National Park which is 10 km2 and is encompassed within the larger
Mombasa Marine National Reserve with an area of 200 km2 (Chebures 1989; Nyawira 2001,
Weru et al. 2001). The MNPR lies within 20km of Mombasa Island, and Kilindini Harbour.
In the park area, no activity other than observations is allowed. In the reserve area, line fishing
and trap fishing are allowed but shell collection and beach seining are prohibited.

The Mombasa Marine Protected Area (Park and Reserve) consists of the following main
ecosystems and habitats:-
a. A sand dune and sandy beach extending 20 — 50m from shore. In some areas, sand
dune vegetation including sedges, grasses and palms can be found. These areas are
important nesting grounds for sea turtles (KESCOM 1996).
b. In some areas sand flat extends approximately 100-150m from the beach that is usually
exposed during low tide (4m tidal range). This tidal sand flat is rich with benthic
organisms including tube worms, molluscs, crabs and other benthic crustaceans making
this an important feeding area for shore birds including great herons, egrets, terns, and
various species of seagulls (Seys et al 1995).
c. A lagoon separates the sand flat from an extensive fringing reef. The lagoon is mainly
covered by seagrass beds composed mainly of the species Thalassodendron ciliatum,
Thalassia hemprichii, Syringodium isoetifolium, Halodule wrightii and Halophile ovalis
(GROFLOW 1998, Muthama and Uku, Uku, Gwada). These species are also common
throughout the Kenyan coast (Ochieng and erft……., heminga………. The seagrass
beds within the marine reserve serve as the primary site for artisanal fishing by the local
communities
d. Beyond the lagoon lies the coral reef composed of an inner shallow reef, a reef flat that
is commonly exposed during low tide and a fore reef facing the open sea. The inner reef
is dominated by massive and branching forms of the hard coral Porites (Hamilton and
Brakel 1984) and interspersed by areas of the fleshy algae Sargassum, Turbinaria,
Padina and calcareous algae Halimeda. Many species of coral reef fishes, echinoderms
and shells occur within this lagoon (McClanahan 1990, 1994; Muthiga and Ndirangu
2000). The fore reef has a high percent cover of hard and soft coral species and large
schools of coral reef and pelagic fishes (KWS-CORDIO; 2005). Sea turtles are often
seen foraging in these waters.
e. Beyond the reef in the open ocean, large schools of pelagic fishes, whale sharks,
dolphins and sea turtles are common, while humpback whales are occasionally sighted
on their southward migrations.
f. Shoreward from the high tide mark, a riparian area occurs that has a varied community
of plants and tree species. Although this area is not part of the MPA, it is the home to a
wide range of terrestrial fauna including mammals, birds, reptiles and insects.
g. Two mangrove fringed creeks (Mtwapa and Tudor) border the northern and southern
boundaries of the Mombasa MPA and the seasonal Mtopanga creek drains into the
MPA during the long rains that occur from April through June. Theses creek are
important fisheries areas but are also a major source of sediments and solid waste
pollution into the MPA (Mwangi et al 2001).

h. Data from monitoring programs indicate that the Mombasa MPA has a fairly low
fisheries diversity and abundance relative to other MPA’s, but a fairly high invertebrate
cover (Table 6.10 -6.11). Mombasa MPA also has on average lower hard coral cover;
the algal turf being the dominant benthic cover (Table 6.12).
Table 6. 10: Average densities of fish and standard deviations for the four marine parks. 12 transects of 250 m
2 in each park in two seasons
NE Monsoon
Common name Kisite Malindi Mombasa Watamu
Angelfish 9.00 ± 6.26 1.5 ± 1.87 1.00 ± 1.41 1.58 ± 1.61 Barracuda 0.58 ± 1.93 - - - Butterfly fish 12.83 ± 6.52 7.13 ± 4.2 2.50 ± 3.84 2.75 ± 1.74 Emperors 17.5 ± 26.36 4.63 ± 9.68 2.50 ± 5.48 0.67 ± 0.94 Fusiliers 26.66 ± 44.22 13.3 ± 29.8 - - Goatfish 3.92 ± 2.43 1.00 ± 1.32 1.00 ± 2.00 0.92 ± 1.32 Groupers 5.50 ± 7.91 0.63 ± 0.86 0.25 ± 0.83 1.25 ± 2.35 Grunt/Sweetlips 20.75 ± 26.20 5.13 ± 5.90 2.83 ± 4.84 9.25 ± 8.83 Jacks 1.83 ± 2.37 0.75 ± 1.3 - - Parrotfish 17.42 ± 8.85 13.5 ± 6.54 4.83 ± 4.45 6.83 ± 5.62 Rabbitfish 5.25 ± 5.60 1.50 ± 2.35 1.25 ± 2.42 0.58 ± 1.19 Sharks - - - - Snappers 64.0 ± 108.14 14.38 ± 15.6 3.00 ± 2.68 2.08 ± 2.18 Surgeon fish 24.58 ± 21.39 54.38 ± 15.1 5.00 ± 5.89 28.83 ± 47.79 Triggerfish 2.58 ± 2.25 6.75 ± 4.24 0.58 ± 0.86 2.00 ± 2.58 Wrasses 19.00 ± 8.84 11.75 ± 6.9 3.25 ± 2.13 4.00 ± 3.11
SE Monsoon
Angelfish 5.08 ± 5.77 0.08 ± 0.28 1.08 ± 2.06 0.42 ± 0.49 Barracuda 2.25 ± 5.51 - - - Butterfly fish 5.25 ± 3.06 2.83 ± 2.51 4.75 ± 3.59 2.92 ± 1.32 Emperors 8.33 ± 12.19 - 0.83 ± 1.28 0.92 ± 2.06 Fusiliers 78.57 ± 192.46 3.67 ± 8.20 - 75.33 ± 89.86 Goatfish 7.92 ± 15.48 5.00 ± 6.61 1.25 ± 1.59 2.33 ± 3.25 Groupers 19.75 ± 58.93 1.25 ± 2.24 0.58 ± 0.95 1.08 ± 1.32 Grunt/Sweetlips 14.25 ± 14.01 2.42 ± 3.43 5.83 ± 8.15 19.33 ± 17.61 Jacks 7.75 ± 14.83 0.08 ± 0.28 - - Parrotfish 13.17 ± 7.77 5.58 ± 4.66 4.75 ± 5.28 11.08 ± 8.33 Rabbitfish 19.00 ± 46.01 4.67 ± 4.46 0.42 ± 0.76 5.92 ± 6.73 Sharks 1.42 ± 4.70 - - - Snappers 12.58 ± 17.09 0.67 ± 1.18 2.92 ± 3.77 1.92 ± 2.33 Surgeon fish 22.00 ± 26.10 30.67 ± 33.34 11.67 ± 7.54 24.75 ± 16.32 Triggerfish 5.58 ± 9.35 5.83 ± 4.63 1.33 ± 1.37 0.92 ± 2.02 Wrasses 18.25 ± 23.68 10.67 ± 3.82 22.50 ± 17.22 9.00 ± 8.52
Source: Kenya Wildlife Service and CORDIO Ecological Monitoring Report; 2005.

Table 6.11: Average densities of invertebrates and standard deviations for the four marine parks. The data was collected in 12 transects of 250 m
2 in each park in two different seasons
NE MONSOON
Common name Kisite 0 Malindi 0 Mombasa 0 Watamu
Clams 28 ± 3.08 1 12 ± 1.35 1 30 ± 3.34 1 16 ± 0.98 Crown of thorns 1 ± 0.29 2 - 2 5 ± 0.67 2 - Lobsters - 3 - 3 1 ± 0.30 3 7 ± 1.73 Octopus 3 ± 0.62 4 5 ± 0.51 4 1 ± 0.29 4 - Sea anemone - 5 - 5 - 5 - Sea cucumber 45 ± 3.14 6 11 ± 1.24 6 83 ± 3.40 6 5 ± 0.51 Sea stars 37 ± 3.70 7 15 ± 1.54 7 15 ± 1.66 7 2 ± 0.39 Sea urchins 712 ± 49.71 8 100 ± 10.65 8 1031 ± 56.59 8 305 ± 42.76 Shells 23 ± 1.16 9 10 ± 0.72 9 18 ± 1.73 9 11 ± 1.08
SE MONSOON
Clams 017 ± 1.24 10 8 ± 1.07 10 19 ± 1.74 10 19 ± 2.19 Crown of thorns 1- 11 - 11 12 ± 1.51 11 - Lobsters 2- 12 - 12 4 ± 0.83 12 1 ± 0.29 Octopus 39 ± 2.05 13 - 13 - 13 1 ± 0.29 Sea anemone 45 ± 2.04 14 - 14 - 14 - Sea cucumber 551 ± 4.39 15 9 ± 1.25 15 85 ± 3.43 15 3 ± 0.62 Sea stars 618 ± 2.11 16 2 ± 0.76 16 13 ± 0.83 16 - Sea urchins 71389 ± 173.95 17 27 ± 4.02 17 461 ± 19.14 17 97 ± 19.19 Shells 823 ± 1.73 18 16 ± 2.75 18 18 ± 1.98 18 5 ± 0.67
Source: Kenya Wildlife Service and CORDIO Ecological Monitoring Report; 2005.
Table 6.12: Percentage benthic cover per 10 m transect and the standard deviation
Kisite Mombasa Malindi Watamu Chi-Sq. p
Coralline algae 0.21 ± 1.44 5.00 ± 6.15 56.70 ± 16.44 28.83 ± 49.92 26.86 0.00*
Halimeda 0.00 ± 0.00 0.58 ± 0.90 5.70 ± 4.62 2.00 ± 2.70 10.63 0.01*
Dead Coral 3.42 ± 4.85 2.50 ± 4.01 6.40 ± 4.30 2.75 ± 1.82 23.29 0.00*
Soft Coral 1.75 ± 3.41 0.00 ± 0.00 8.00 ± 25.30 0.00 ± 0.00 3.81 0.28
Fleshy algae 0.50 ± 1.24 2.83 ± 5.06 4.10 ± 5.97 9.25 ± 9.23 7.08 0.07
Sand 1.48 ± 4.83 3.25 ± 2.22 10.50 ± 7.53 4.00 ± 3.25 22.53 0.00*
Hard Coral 48.62 ± 16.62 2.50 ± 5.73 3.80 ± 9.30 0.67 ± 0.98 12.07 0.01*
Rubble 15.80 ± 15.74 3.00 ± 2.80 11.80 ± 15.71 2.08 ± 2.27 17.51 0.00*
Algal Turf 28.19 ± 14.58 1.00 ± 1.48 1.60 ± 2.01 1.58 ± 1.68 20.58 0.00*
Source: Kenya Wildlife Service and CORDIO Ecological Monitoring Report; 2005.

6.3.8 Avifauna (Birds)
Majority of bird species encountered belonged to brackish species as shown in Table 6.13. All
data are based on repeated observations between September and November 2006. From
about 115 bird observations made, about 18 species were noted to use/visit /reside in this area.
A comparison was made in this data with those of the east African coastal and marine
environment resources database and atlas (UNEP 1998) and KMFRI database (Okemwa and
On’ganda personal communication). It was noted that the current field-work observations
yielded fairly good representative information for birdlife in the area. KMFRI records have 26
species counts for Tudor and Port Reitz area.

115
Table 6.13: Avian species at the Port Reitz based on 12 repeated observations (2 x low tides, 2 x high tides, 2 x mornings, 2 x evenings, and twice at two fish-landing sites (Kwa Kanji and Kwa Skembo) during fish landings (flooding tides) between September – November 2006.
Bird abundance (cumulative numbers observed in)
Bird type Species ID Low-tide High-tide Morning Evening Kwa Kanji Kwa
Skembo
Pelican – pink-billed Pelecanus rufescens 1 1 1 2
Egret - big Bubulcus ibis 1 2 1 1 1 1
Egret - small 2 2 1
Egret - yellow-billed 2 2 1 2
Egret - great Egretta alba 2 1 1
Heron - green Butorides striatus 2
Heron - black Egretta ardesiaca 2
Heron cormorant 2 2
Stork - yellow-billed Myctaria ibis 2 2 2
Stork - woolly necked Ciconia episcopus 3 2
Sacred ibis Threskiornis aethiopica 4 2 2 1
Kites - black Milvus migrans 3 4 2 5 5 6
Fish-eagle Haliaetus vocifera 1
Sand-plover Charadrium leschanaultii 2 2 2
Grey-plover Pluvialis squatorola 1 1 2 2 2 2
Sand-piper Xenus cinereus 5 2 2
Gull-billed tern 2 3 1
Kingfisher 1 1
Data for Port Reitz sandy beaches, mudflats, mangrove areas (especially Mangrove Island at the centre of Port Reitz bay) and northern banks. Only at Port Reitz area was a detailed bird watch commissioned.

116
6.3.9 Marine turtles
Five species of sea turtles have been documented as occurring within Kenyan waters
(Frazier 1975): the green turtle (Chelonia mydas), hawksbill turtle (Eretmochelys imbricata),
loggerhead turtle (Caretta caretta), olive ridley turtle (Lepidochelys olivacea) and the
leatherback turtle (Dermochelys coriacea). Of these, green, hawksbill and olive ridley turtles
are known to nest in Kenya.
An aerial survey conducted in 1994 found that sea turtles are widely distributed along the
coastline within the 20m isobath in areas mainly associated with seagrasses and coral reefs,
implicating the presence of a significant foraging turtle population (Wamukoya et al. 1996).
Notable concentrations were observed at certain areas particularly Mpunguti/Wasini,
Takaungu, Watamu, Ungwana Bay, and Lamu and the adjacent offshore islands.
The Kenya government has put in place legislation to protect sea turtles i.e., the Wildlife Act
(Cap 376) and the Fisheries Industry Act (Cap 378). The laws prohibit hunting, removing,
holding, moving and trafficking sea turtles and their products whether dead or alive. However,
there is no legislation protecting key nesting and foraging habitats utilized by sea turtles
except for those falling within Marine Protected Areas (MPAs). As a result, turtle fishing,
turtle by-catch in fishing operations, and poaching of sea turtles and turtle eggs continues
unabated compounded by poor enforcement due to a lack of personnel and facilities
To address the plight of marine turtles, KESCOM was established in 1993 under the
patronage of various government institutions: Kenya Wildlife Services (KWS), Fisheries
Department (FD), Kenya Marine and Fisheries Research Institute (KMFRI), Coast
Development Authority (CDA) and National Museums of Kenya (NMK) and Wildlife Clubs of
Kenya. Various non-governmental organizations, WWF-Kiunga, Baobab Trust, Watamu
Turtle Watch (WTW) and Colobus Trust, have given extensive on-ground support towards
the KESCOM cause. KESCOM therefore represents a national integrated approach to sea
turtle conservation promoting community participation in various conservation activities that
include research and monitoring, public awareness and advocacy.
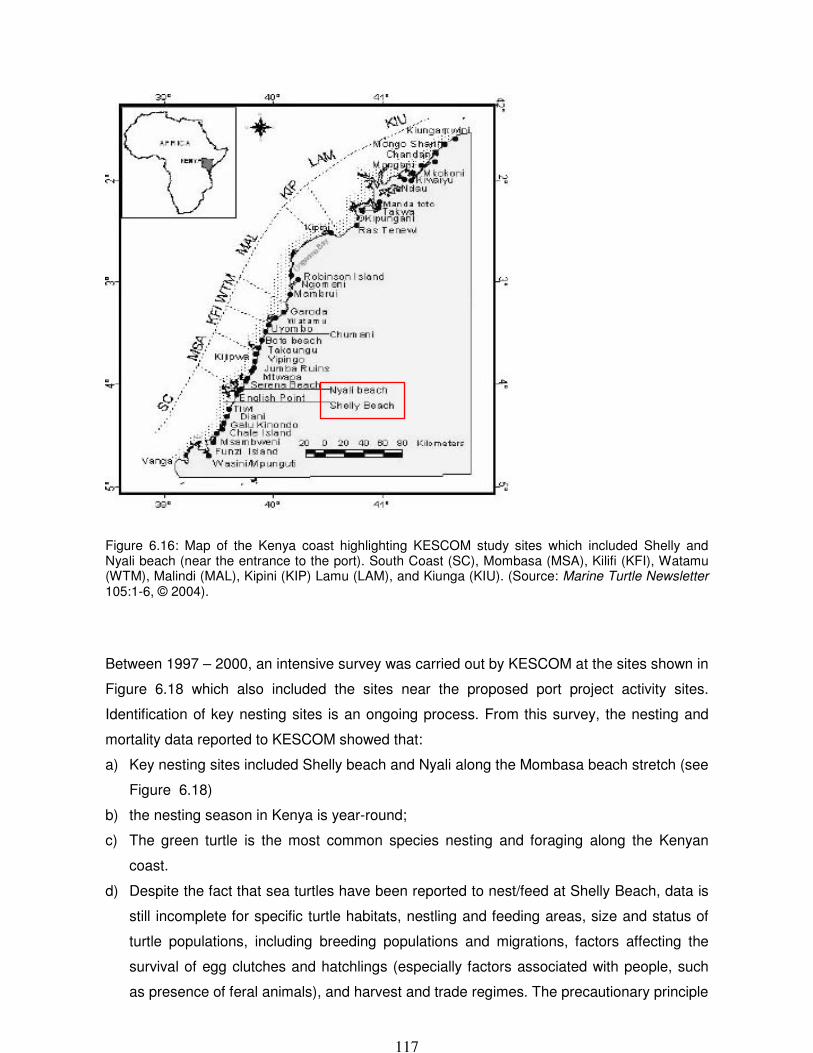
117
Figure 6.16: Map of the Kenya coast highlighting KESCOM study sites which included Shelly and Nyali beach (near the entrance to the port). South Coast (SC), Mombasa (MSA), Kilifi (KFI), Watamu (WTM), Malindi (MAL), Kipini (KIP) Lamu (LAM), and Kiunga (KIU). (Source: Marine Turtle Newsletter 105:1-6, © 2004).
Between 1997 – 2000, an intensive survey was carried out by KESCOM at the sites shown in
Figure 6.18 which also included the sites near the proposed port project activity sites.
Identification of key nesting sites is an ongoing process. From this survey, the nesting and
mortality data reported to KESCOM showed that:
a) Key nesting sites included Shelly beach and Nyali along the Mombasa beach stretch (see
Figure 6.18)
b) the nesting season in Kenya is year-round;
c) The green turtle is the most common species nesting and foraging along the Kenyan
coast.
d) Despite the fact that sea turtles have been reported to nest/feed at Shelly Beach, data is
still incomplete for specific turtle habitats, nestling and feeding areas, size and status of
turtle populations, including breeding populations and migrations, factors affecting the
survival of egg clutches and hatchlings (especially factors associated with people, such
as presence of feral animals), and harvest and trade regimes. The precautionary principle
118
in management control applies (e.g., code of conduct in responsible fishing). The data
shortcomings are being addressed through an integrated management of marine turtle
population, of which KESCOM is playing a pivotal role.
Data gaps
a. Lack of good data on the ecological processes (scale-related processes on
productivity, trophic dynamics, fluxes and connectivity, interactions, larval dispersal
patterns, etc.,) for the Port area environments
b. Lack of good resource maps data on the submerged resources (habitats, condition,
etc.,) for the Port area environments
c. Lack of good data on the strengths of ecological relationships and linkages between
and within Port habitats /communities /biounits
d. Up till now, hydrodynamic model results for water movements and larval dispersal
patterns did not exist and verifications and validations of current model predictions
will be necessary.

119
7. WATER AND SEDIMENT QUALITY
7.1 Introduction
The drastic increase in water turbidity as a result of dredging for port development and
maintenance is about the most visible and significant impact on the water quality. Planned
dredging activities in the Mombasa port are expected to introduce such high loads of
suspended sediments in the water column that will make fishing in the harbour creek
daunting. This is likely to impact negatively on the livelihood of the artisanal fishers operating
in the Kilindini and Port Reitz creeks. The enhanced levels of suspended sediments will have
the potential of increasing the concentration and of associated contaminants such as heavy
metals and hydrocarbons in the water column. Indeed exposing contaminated sediments
from reducing bottom conditions to oxidising conditions in the water column may increase the
bioavailability of certain toxic heavy metals. Ocean disposal of dredged material is a
preferred option, but is subject to an acceptable quality of the sediments that will ensure no
adverse impacts on the environment and animal life.
In this study the prevailing water and sediment quality from the Kilindini and Port Reitz
creeks including the planned Turning Basin were investigated with the aim of assessing the
levels of contamination with toxic heavy metals. The findings form the basis of
recommendations on environmentally safe disposal of the sediments.
7.2 Methodology 7.2.1 Description of sampling area The study area comprised the entire Port Reitz and Kilindini creeks, with sampling points
located along the Navigation Channel in Kilindini and the Turning Basin in Port Reitz (Fig.
7.1). The sampling stations are denoted A to G in the figure, with several sampling points
within station G.
Water samples were collected from the sub-surface layer (about 1 m depth) and bottom layer
in duplicate. In deeper stations (depth exceeding 10 m) water samples at approximately mid-
depth were collected. Sediment samples were obtained by diving and using 30 cm plastic
hand-held corers. Sediment cores were sectioned into 10 cm top and 10 cm bottom sub-
samples. All samples were stored appropriately for analysis at the SGS Laboratories,
Mombasa and the Department of Mines and Geology Laboratories in Nairobi.
Physico-chemical parameters that were measured in situ included water temperature, pH
and salinity. In the laboratory water samples were analysed for ammonia, nitrate/nitrite and

120
phosphate. Dissolved heavy metals analysed included Cd, Hg, Pb, Cr and As. Sediment
samples were analysed for the heavy metals Cd, Hg, Pb, Cr and As. Other parameters
determined organic carbon content (loss on ignition).
Figure 7.1: Map of study area showing sampling sites
7.2.2 Results and Discussion
7.2.2.1 Water quality
Temperatures in the water column along the Kilindini and Port Reitz Channel varied from a
maximum of 31.0 to 28.7 °C. The vertical distribution of water temperatures was largely
uniform indicating a well mixed column. Variations along the channel indicated an increase in
temperatures towards the open sea (Station A) (Figure 7.2). Water pH varied from 7.5 to 6.8.
Water salinity expressed as NaCl % wt varied narrowly from 2.6 – 2.4.
Area - A
Area - B Area - C
Area - D
Area - E
Area - F
Area - G

121
26
27
28
29
30
31
32
A B C D E F G H I J K
Sampling Points
Te
mp
era
ture
(oC
)
2
3
4
5
6
7
8
pH
, S
alin
ity
Temp
pH
Sal
Figure 7.2: Variations of water pH, Salinity and Temperature measured along the Kilindini and Port Reitz Channel
2
3
4
5
6
7
8
1 2 3 4 5 6 7 8 9 10 11 12 13 14 15 16 17 18 19 20 21 22 23
Sampling Stations
pH
& S
alin
ity
25
26
27
28
29
30
31
Te
mp
era
ture
(oC
)
pH
Sal
Temp
Figure 7.3: Mean Water Temperature, pH and Salinity within the Turning Basin
An intensive sampling of the water column in the vicinity of the turning basin revealed
comparable magnitudes of pH, Salinity and Temperature (Figure 7.3). On comparing the
measurements of the parameters from the two study sites; the water temperature and salinity
were significantly different. The distribution of phosphates in the Channel and Turning Basin
is presented in Figures 7.4 and 7.5. Measurements of pH, phosphate and cadmium from the
2 sites were not significantly deferent (Table 7.1). The concentration levels of ammonia were
low (< 0.03 µmol l-1), whereas levels of nitrate/nitrite were very high (> 500 µmol l-1).

122
Dissolved levels of Hg, As and Cr were below detection limits. The results of the water
quality parameters investigated were within the range of previous studies (Adala et al., 2007).
0.00
0.05
0.10
0.15
0.20
0.25
A B C D E F G H I J K
Sampling Stations
Co
nce
ntr
atio
n (
mg
l-1)
Figure 7.4: Distribution of Phosphates along the Kilindini / Port Reitz Channel
0.00
0.05
0.10
0.15
0.20
0.25
0.30
1 3 5 7 9 11 13 15 17 19 21 23
Sampling Points
Ph
osp
ha
te &
Ca
dm
ium
(ug
l-1)
Phos Cd
Figure 7.5: Mean Concentrations of Phosphates and Cadmium in the Turning Basin
Table 7.1. Comparison of water quality parameters between the Channel and Turning Basin

123
Site Parameters
Temperature pH Salinity Phosphate Pb Cd
Channel Mean 29.43 7.26 2.45 0.19 0.08 0.16
Max 31.00 7.53 2.55 0.22 0.10 0.21
Min 28.70 6.77 2.40 0.12 0.06 0.11
SD 1.08 0.23 0.05 0.04 0.01 0.03
Turning Bay Mean 28.65 7.26 2.50 0.18
0.05 0.17
Max 30.10 7.76 2.60 0.24 0.09 0.28
Min 25.40 6.85 2.40 0.15 0.02 0.10
SD 1.11 0.23 0.06 0.03 0.04 0.04
t Test (p<0.05) different
Not different different
Not different
Not different
A number of samples were tested for contamination with microbial indicator organisms. The
results showed that 91 % of the samples analysed had coliform counts. It was realised that
the water quality with respect to coliform was acceptable for recreation purposes.
91%
9%
<10 Counts
>10 counts
Figure 7.6: Levels of coliform counts in water samples
7.2.2.2 Sediment Quality
A total of 42 sediment samples from the Navigation Channel in Kilindini creek and the
Turning Basin in Port Reitz creek were collected and analysed for Cadmium (Cd), Lead (Pb),
Mercury (Hg), Chromium (Cr) and Arsenic (As). The analytical results are summarized in
Table 7.2 and Figure 7.6.
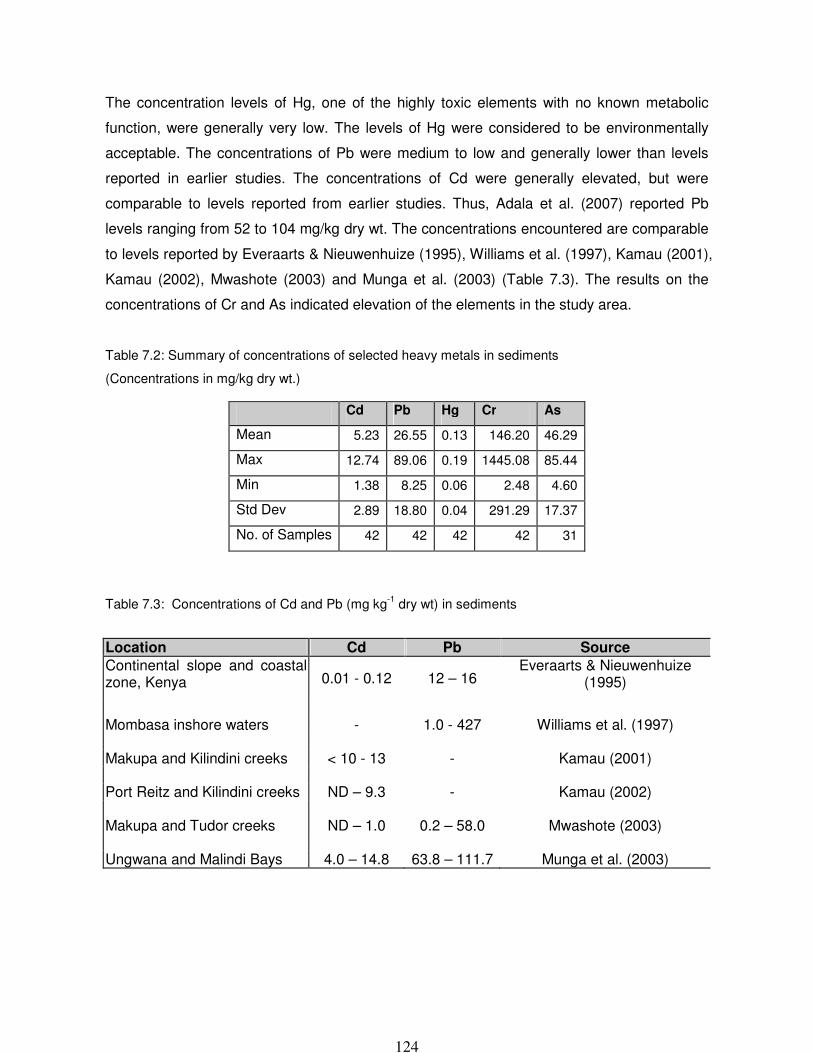
124
The concentration levels of Hg, one of the highly toxic elements with no known metabolic
function, were generally very low. The levels of Hg were considered to be environmentally
acceptable. The concentrations of Pb were medium to low and generally lower than levels
reported in earlier studies. The concentrations of Cd were generally elevated, but were
comparable to levels reported from earlier studies. Thus, Adala et al. (2007) reported Pb
levels ranging from 52 to 104 mg/kg dry wt. The concentrations encountered are comparable
to levels reported by Everaarts & Nieuwenhuize (1995), Williams et al. (1997), Kamau (2001),
Kamau (2002), Mwashote (2003) and Munga et al. (2003) (Table 7.3). The results on the
concentrations of Cr and As indicated elevation of the elements in the study area.
Table 7.2: Summary of concentrations of selected heavy metals in sediments
(Concentrations in mg/kg dry wt.)
Cd Pb Hg Cr As
Mean 5.23 26.55 0.13 146.20 46.29
Max 12.74 89.06 0.19 1445.08 85.44
Min 1.38 8.25 0.06 2.48 4.60
Std Dev 2.89 18.80 0.04 291.29 17.37
No. of Samples 42 42 42 42 31
Table 7.3: Concentrations of Cd and Pb (mg kg-1
dry wt) in sediments
Location Cd Pb Source
Continental slope and coastal zone, Kenya 0.01 - 0.12 12 – 16
Everaarts & Nieuwenhuize (1995)
Mombasa inshore waters - 1.0 - 427 Williams et al. (1997) Makupa and Kilindini creeks < 10 - 13 - Kamau (2001) Port Reitz and Kilindini creeks ND – 9.3 - Kamau (2002) Makupa and Tudor creeks ND – 1.0 0.2 – 58.0 Mwashote (2003) Ungwana and Malindi Bays 4.0 – 14.8 63.8 – 111.7 Munga et al. (2003)

125
Median
25%-75%
Non-Outlier Range
Outliers
ExtremesCd Pb Cr As
Heavy metals
0
20
40
60
80
100C
oncentr
ations (
mg/k
g)
Figure 7.7: Heavy metals in sediments from the Channel and Turning Basin
As the development of marine sediment quality guidelines (SQGs) in Kenya is yet to be
finalized, SQGs from the Centre for Environment, Fisheries and Aquaculture Science,
CEFAS, and compared with other typical guidelines from other countries were used to
evaluate the levels of particularly Cd, Pb, Cr and As (Table 7.4). The CEFAS SQGs
categorize metal concentration into 2 Action Levels. Concentrations below Action Level 1;
the sediment is considered safe for disposal at sea. Concentrations exceeding Action Level
2; the sediment is not safe for disposal at sea. Alternative disposal methods have to be
adopted. For concentration levels occurring between the 2 categories, precautionary measures
have to be taken. With reference to the CEFAS SQGs therefore the following inferences are
made (Table 7.5).
Table 7.4: CEFAS sediment quality guidelines
Metal Action Level 1 (mg/kg)
Action Level 2 (mg/kg)
Arsenic 10 25 - 50
Cadmium 0.2 2.5
Chromium 20 200
Lead 25 250
Mercury 0.15 1.5
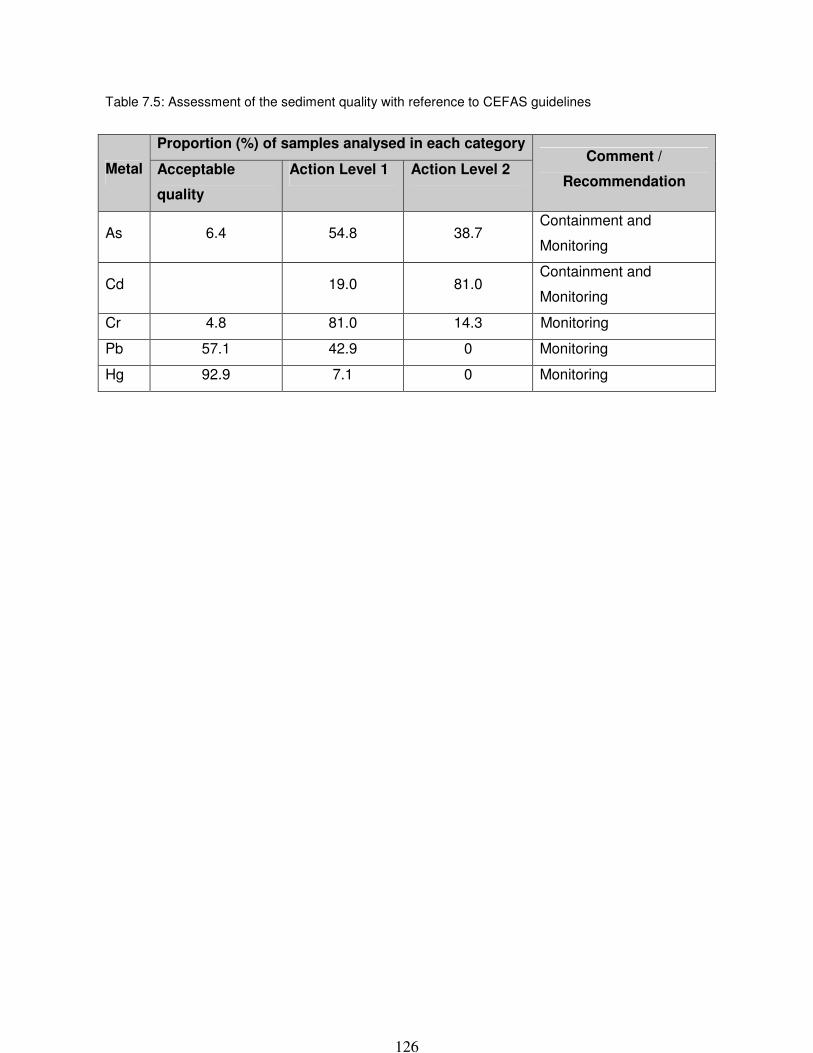
126
Table 7.5: Assessment of the sediment quality with reference to CEFAS guidelines
Metal
Proportion (%) of samples analysed in each category Comment /
Recommendation Acceptable
quality
Action Level 1 Action Level 2
As 6.4 54.8 38.7 Containment and
Monitoring
Cd 19.0 81.0 Containment and
Monitoring
Cr 4.8 81.0 14.3 Monitoring
Pb 57.1 42.9 0 Monitoring
Hg 92.9 7.1 0 Monitoring

127
8. PUBLIC CONSULTATION AND PARTICIPATION
During the EIA process consultations were conducted with Lead Agencies and members of
the public. Key stakeholders consulted include fishermen, Non-Governmental Organisations
(NGOs) such as CORDIO, KESCOM, WCS and Lead Agencies such as Kenya Wildlife
Service (KWS), Kenya Marine & Fisheries Research Institute (KEMFRI) and the Department
of Fisheries. The lead environmental regulator, National Environment Management Authority
was also briefed on the preliminary findings of the EIA Study.
Plate 8.1: An elderly fisherman gives his contribution during the consultation stage
Key issues raised by the stakeholders include:
♦ The need to adequately compensate fishermen for loss of livelihood as a result of
interruption of fishing activities during the dredging period;
♦ The proponent was advised to develop a comprehensive monitoring procedure that
would address the adverse impacts predicted in this study report as well as impacts
that may arise during dredging but are not anticipated in the study
In addition a number of memoranda were submitted to KPA by the fishermen detailing their
proposal of how the compensation mechanism should be implemented. Details of
stakeholders meetings are as attached in the appendices.

128
9. POTENTIAL IMPACTS AND MITIGATION MEASURES 9.1 Impacts of Dredging 9.1.1 Loss of bottom habitat, shellfisheries, fisheries, fishery food sources Dredging of soft bottom can remove important bottom-living aquatic life. However this bottom
will readily be recolonized by replacement benthic organisms within a few seasons. As the
original habitat will probably have changed due to the dredging operations the new
population might differ from the original one. Simulations undertaken during the EIA study
indicate there would be no significant change in current patterns hence this impact is
expected to be minimal.
9.1.2 Water-column turbidity Fine-grained dredged material slurry discharged during open-water disposal would be
dispersed in the water column as a turbidity plume; however, the vast majority rapidly
descends to the bottom of the disposal area where it accumulates under the discharge point
in the form of a low-gradient fluid mud mound overlying the existing bottom sediment.
Under normal conditions, more than 98 percent of the sediment in the mudflow remains in
the fluid mud layer at concentrations greater than 1%, while the remaining 2 percent may be
re-suspended by mixing with the overlying water at the fluid mud surface. These conditions
may persist for the duration of the disposal operation at the site and for varying times
thereafter as the material consolidates to typical sediment density.
9.1.3 Water contamination Although the vast majority of heavy metals, nutrients, and petroleum and chlorinated
hydrocarbons are usually associated with the fine-grained and organic components of the
sediment there is no biologically significant release of these chemical constituents from
typical dredged material to the water column during or after dredging or disposal operations.
However there would be no persistently higher levels of dissolved metals or nutrients greater
than background concentrations.
9.1.4 Impacts on Port Operations
A number of these impacts already exist as a result of current port operations. However it is
expected that with completion of the dredging project more the volume of maritime traffic
would increase thereby increasing the magnitude of these impacts. Such impacts include:

129
9.1.4.1 Discharge of garbage and litter
Discharge of garbage into the waters, if not controlled will result in unsightly conditions on the
shoreline owing to accumulation of non-biodegradable materials such as plastics, glass and
metal containers. Plastic bags and sheets can block cooling water intakes or foul propellers
of vessels and small craft using the port.
9.1.4.2 Accidental Spills
Accidental spills can and do occur owing to marine casualties (collisions, groundings, fires,
etc.), failure of equipment (pipelines, hoses, flanges, etc.) or improper operating procedures
during cargo transfer or bunkering. Such spills can involve crude oils, refined products or
residual fuels, noxious liquid substances and harmful substances in packaged form.
The more volatile oils are generally less harmful to the environment because they rapidly
evaporate but they can present the hazard of fire or explosion. The more viscous oils remain
on the water surface where they will move under the influence of wind and current. Chemical
spills can also result in the introduction of water-soluble toxic substances into the marine
environment, which can have a damaging effect upon marine organisms.
9.1.4.3 Dry cargo releases
Most such releases are likely to be wind-blown particulates from vessels loading or offloading
or from waterfront deliveries. Engineering/planning should be done prior to project
implementation to determine the feasibility of requiring enclosed storage or loading/offloading
facilities. At the moment dry cargo within the port are handled by a private company, Grain
Bulk Handlers Limited who have leased berth no. 3 for this purpose. This is a state-of-the-art
bulk terminal with enclosed conveyor systems complete with dust extractors. Further, it is
expected that the effect of dry cargo releases will be minimal as the proposed berths will be
used only for container handling.
9.1.4.4 Sanitary wastes Treated and untreated sanitary wastes may be discharged to sea water from vessels and
waterfront installations. This will increase organic matter concentration in vicinal water area
which can be a main source of eutrophication processes in the adjacent waters.
130
9.1.4.5 Noise from Port traffic and Terminal operations
Port activities such as clamping and loading/offloading of containers and movement of cargo
handling equipment may generate noise above levels of comfort to the operators. Noise
would also be generated by trucks hauling containers to and from port terminals. Noise level
is expected to increase with increased port cargo.
9.1.4.6 Effects of dust and other airborne emissions
Dust sources include various port operations such as construction activities, outdoor storage
of raw materials and other particulates (ranging from coal and limestone to grain and wheat
storage, for example). Smoke is expected from increased port traffic. If vehicles and
equipment are not well maintained exhaust fumes can be a safety hazard as the fumes
obstruct vision, increasing the potential for accidents. Smoke and airborne combustion
products can present problems primarily because of the potential for distributing toxic or
hazardous substances and for the greater capacity for dispersal.
9.1.4.7 Traffic burden projections
As a result of the dredging project there is expected to be an increase in containerized cargo
offloaded from the port of Mombasa, mainly from post-panamax ships expected to call at the
port. This would result into increased number of trucks at the container terminals, causing
congestion.
Additional problems include lack of sufficient parking for trucks and drivers, trucks waiting for
port access, damage by trucks to roadways, and spillages from trucks. Further there would be
secondary traffic impacts - traffic increases not directly attributable to the project but expansion
of residential, market and commercial areas due to the enlarged industrial employment base.
9.2 Oceanographic Environmental Impacts and Mitigation Measures
9.2.1 Oceanographic impacts of offshore disposal All dredged materials have a significant physical impact at the point of disposal. This includes
local covering of the seabed and local increase in suspended solids. Physical impacts may
result from subsequent transport, particularly of the finer fractions, by wave and tidal action
and residual current movements. Biological consequences of these physical impacts include
smothering of benthic organisms in the dumping area. The significance of the physical and
biological impacts largely depends on the physical conditions and natural values locally met.

131
The seabed at Mombasa, including the ocean floor near the entrance of Kilindini harbor, is
characterized by a slope that gradually becomes steeper. From the proposed offshore
dumping site, the seafloor slope reaches 200 m of depth over a distance of 500 m. A depth
of over 2000 m is already reached at 10 km from Mombasa.
Disposal of the dredged material (from capital dredging) will be carried out in this area, where
the sediments will move into deep waters, and prevent a significant increase in the sediment
load in the plume. Considering the available alternatives and their possible environmental
impacts, offshore disposal of the dredged material is considered to be the most favorable
option.
Numerical modeling results from the applied dispersal models suggest that any sediment
plumes resulting from dredging operations will either be dispersed Northwards during the
south east monsoon (SEM) season and Southwards during the north east monsoon (NEM)
season. The model further predicts the magnitude and extent of turbidity. The sediment
plume dispersion is higher during the SEM as compared to the NEM period (Figures 15 and
16). The maximum values of TSS concentrations were 50 mg/l during SEM as compared to
20 mg/L during the NEM.
9.2.2 Hydrodynamics
Currents: Impacts of changes to bathymetry and the increase of the cross-sectional area of
the entrance to Kilindini harbour associated with dredging were modeled. Modeling results
indicates that sea levels will not be impacted by the dredging and that the tidal water levels
will remain almost exactly the same in the harbor. The results also indicate that there will be
no change in the current speeds in the harbor or the dredged channel after the dredging.
However, there will be a small decrease in current speeds through the entrance of the
harbour associated with the increase in the cross sectional area.
9.2.3 Waves Wave Climate: Potential impacts to tides and shoreline wave action from changes in the
bathymetry of Kilindini harbor through dredging and widening of the shipping channel were
also modeled. Results showed that changes to wave heights (increase or decrease) were
negligible (less than 10% change) as shown in Figure 9.1.

132
Figure 9.1: Results of wave penetration simulation showing that change of wave heights (increase/decrease) due to dredging is negligible (less than 10%).
Modelling of wave current directions before and after the construction of the land reclamation
area at the deepening and widening of the navigation channel indicates only minor variations
in current directions. This indicates that the proposed dredging works is not likely to alter
alongshore erosion and sediment transport processes.
9.2.4 Predicted effect of the dredging project on water levels and tidal currents
It is predicted that spring tide low water levels in Kilindini harbor would be lowered by up to
20mm as a result of the effect of the channel deepening and widening on tidal propagation,
resulting in the increased exposure of intertidal areas at low water on spring tides. Figure 9.2
shows an instantaneous snap short of depth-averaged current velocity vectors generated by
numerical simulations during spring tide conditions.

133
Figure 9. 2: Numerical simulation results of created current velocities vector field in Kilindini harbour including the offshore dumping site and the adjacent Tudor creek
Regarding the impact of the capital dredging works on tidal currents within Kilindini Harbor,
the following conclusions were drawn:
• The spring tide current directions are little altered, although there are corresponding
small changes to the current speed;
• Although more water is drawn into the channel during flood tide and flushed out
during ebb tide as a result of the deepening and widening, this does not necessarily
imply faster currents in the channel, given the additional cross section of the channel;
and,
• Current speeds in the deepened Turning Basin are generally reduced.
9.2.5 Predicted effect of the proposed project on ebb-dominance of the Harbour
Modeling results indicate that after the dredging works, Kilindini harbor shall still have tidal
asymmetry that remains ebb-dominant (i.e. stronger ebb currents as compared to flood
currents). This situation shall continue to favor a net export of materials (including coarse
sediments from upstream rivers) out of the harbor (see Wolanski, Jones, & Bunt, 1980;
Shetye, 1992; Mazda et al., 1995; Kitheka et. al., 2003). However, the ebb-dominance of the
harbor will not be as pronounced as during the period before the dredging. This is attributed
to more attenuation of ebb currents as compared to flood currents after dredging.

134
This implies a tendency for slightly more retention of materials in the system as compared to
the present situation. In mangrove-fringed estuarine systems (such as Kilindini harbor), ebb
dominance is believed to help scour the channel (see Wolanski et al., 1992). This situation
(of reduced ebb-dominance) may require Kilindini harbor to undergo relatively more regular
maintenance dredging due to slightly faster rate of siltation.
9.3 Biological Impacts 9.3.1 Removal of sub-marine sediment and associated attached sessile organisms Nature of impact –Submarine sediments and their associated attached sessile organisms will
be physically removed from the seabed with consequential destruction of the infaunal and
epifaunal biota;
Duration – Short, recolonization is predicted to take about one year on silty clays (see Table
6.14);
Intensity – Medium, the majority of the benthic organisms are likely to die, but quite a number
will relocate by migration (Hall 1994, Kenny and Rees 1994, 1996, Newell et al. 1998,
Herrmann et al. 1999, Ellis 1996, 2000); Long-lived species, like molluscs and echinoderms
need longer to re-establish the natural age and size structure of the population (Kenny and
Rees 1994, 1996). Large burrowing species may, however, be able to persist by retreating
into their burrows.
Probability – Definite;
Status of impact – Negative;
Degree of confidence – High;
Significance – Medium, due to the short duration and medium intensity of the impact;
Mitigation – Leave some undisturbed patches (reservoirs) between the dredging areas, to
speed up recolonization and recovery. This is already implied in the works structure as
dredge areas are clearly marked and some areas will remain undisturbed.
Table 6.14: Timing for recovery of seabed habitats after dredging (after Ellis 1996)
Sediment type Recovery time
Fine-grained deposits: muds, silts, clays, which can contain some rocks and boulders
1 year
Medium-grained deposits: sand, which can contain some silts, clay and gravel
1-3 years
Coarse-grained deposits: gravels, which can contain some finer fraction and some rock and boulders
5 years
Coarse-grained deposits: gravels with many rocks and boulders
>5 years

135
9.3.2 Suspended sediment effects on sessile and slow-moving invertebrates Nature of impact – Generation of suspended sediment plumes during the dredging and off-
shore dumping periods may have sublethal or lethal impacts on sessile and slow-moving
invertebrates
Duration – Medium, potential effects extend over the duration of the dredging activity
(expected to last few months)
Intensity – Low, area already under high turbidity regimes and existing organisms are
adapted to those local high turbidity levels (see Adala et al., 2008)
Probability – Definite, elevated suspended sediment concentrations are a typical by-product
of soft bottom marine sediment dredging / dumping activities
Status of impact – Negative
Degree of confidence – High
Significance – Low, due to the medium duration and low intensity of the impact
Mitigation – Not necessary in itself but reductions in the amount of suspended sediment
through use of appropriate civil technology will further reduce risks
9.3.3 Suspended sediment effects on fish Nature of impact – Generation of suspended sediment plumes in the dredging / dumping
areas may have sublethal or lethal impacts on fish and/or may result in avoidance behaviour
Duration – Medium, potential effects extend over the duration of the dredging / dumping
activites
Intensity – Low, fish are mobile and will move out of the affected area. Effects on fish vary
greatly and critical exposure levels can range from ~500 mg/l for 24 hours to no effects at
concentrations of >10 000 mg/l over 7 days (Clarke and Wilber 2000). However, direct long-
term impacts are unlikely to occur for fish as they are mobile and therefore will avoid any
area affected by increased sediment loadings and are able to return once construction
activity has ceased. Short-term impacts may occur by reducing the ability to find prey by
visual feeders (Hecht and van der Lingen 1992). On the other hand, fish may be attracted by
the ‘odour stream’ of crushed benthic organisms (Herrmann et al. 1999).
Probability – Definite, elevated suspended sediment concentrations are a typical by-product
of soft bottom marine sediment dredging / dumping activities
Status of impact - Negative
Degree of confidence – High
Significance – Low, due to short duration and low intensity of the impact
Mitigation – Not necessary in itself but reductions in the amount of suspended sediment
through use of appropriate civil technology will further reduce risks

136
9.3.4 Suspended sediment effects on ichthyoplanktic stages Nature of impact – Generation of suspended sediment plumes in the dredging / dumping
areas may have an impact on ichthyoplanktic stages
Duration – Medium, potential effects extend over the duration of the dredging / dumping
activity
Intensity – Medium, some ichthyoplankton may die. Fish eggs and larvae are generally more
susceptible to elevated concentrations of suspended sediments; hatching can be delayed
and feeding of larvae may be impaired. The adhesion of particles to eggs may cause loss of
buoyancy resulting in the eggs sinking to the bottom (ICES ACME 1997).
Probability – Definite, elevated suspended sediment concentrations are a typical by-product
soft bottom marine sediment dredging / dumping activities
Status of impact - Negative
Degree of confidence – High
Significance – Low, due to the medium duration of the impact
Mitigation – Not necessary in itself but reductions in the amount of suspended sediment
through use of appropriate civil technology will further reduce risks
9.3.5 Suspended sediment effects on phytoplankton productivity and other aquatic plants Nature of impact – Generation of suspended sediment plumes in the dredging / dumping
areas may reduce the productivity of phytoplankton and other aquatic plants.
Duration – Low, potential effects extend over the duration of the dredging / dumping activity
Intensity – High, the proportion of very fine sediment is very high (over 90%) and the settling
of the material out of the photic zone will be slow. Results from a geophysical survey by
Japan Port Consultants (Chapter 5) show that organic matter in the vicinity of the turning
basin is high. This suggests that the relative concentrations of contaminants are likely to be
high. More so, due to high concentration of organic matter in the sediments nutrient
concentrations in pore waters are likely to be moderate to high and therefore risks of
eutrophication due to introductions of nutrients to the water column are considered to be
moderate, but this effect is likely to be offset by high uptake rates in the otherwise
oligotrophioc Indian ocean waters.
Probability – Definite, elevated suspended sediment concentrations are a typical by-product
soft bottom marine sediment dredging / dumping activities
Status of impact – Negative
Degree of confidence – High
Significance – low, due to the low duration and high intensity of the impact

137
Mitigation – Not necessary in itself but reductions in the amount of suspended sediment
through use of appropriate civil technology will further reduce risks.
9.3.6 Depletion of water column oxygen concentration Nature of impact – Potential depletion of water column oxygen concentration through
bacterial decomposition of remobilised organic matter in the works area over the dredging /
dumping period.
Duration – Medium, potential effects extend over the duration of the dredging / dumping
activity
Intensity – Medium, organic matter concentration in the sediments are moderately high, but
tidal movements helps in aiding water mixing. Moreover, the bottom waters in Port Reitz bay
are usually well oxygenated (Chapter 7), and the organic matter suspended in the plume is
likely to be medium due to the moderate POC concentration in the sediments (Chapter 7).
Similarly, due to moderate amounts of POC in the sediments nutrient concentrations in pore
waters are likely to be moderate, but risks of eutrophication due to introductions of nutrients
to the water column are considered to be low because of effective mop up by primary
producers.
Probability – Improbable, medium organic matter concentration in the sediments
overshadowed by tidally-driven water column mixing and biological mop-ups
Status of impact - Negative
Degree of confidence – High
Significance – Low, due to low likelihood
Mitigation – Not necessary in itself but reductions in the amount of suspended sediment
through use of appropriate dredging technology will further reduce risks
9.3.7 Noise during dredging / dumping activities Nature of impact – Noise from the dredging / dumping activity may disturb some marine
mammals. But in the worst-case scenario the noise impact has a potential radius of few
hundred metres from the source
Duration – Medium, potential effects extend over the duration of the dredging / dumping
activity
Intensity – Low, sensitive mammals do not use these shallow areas; in the worst-case
scenario, marine mammals have a wide distribution range and should move away from
source of noise;

138
Probability – Probable, depends whether any marine mammals may migrate towards the
source of noise
Status of impact – Negative
Degree of confidence – High
Significance – Low, due to low intensity
Mitigation – Not necessary due to low significance
9.3.8 Sedimentation on subtidal muddy and sandy habitats Nature of impact – Settling of material from construction works may smother benthos on
subtidal muddy and sandy habitats adjacent to the dredging / dumping sites
Duration – Medium or long, recovery can take from <1 year (muddy habitats) up to 3 years
(sandy habitats)
Intensity – Medium, depending on the sediment layer thickness many organisms may burrow
to the surface through the deposited sediment and many filter-feeders are highly adaptable
to increased sediment loads
Probability – Definite
Status of impact - Negative
Degree of confidence – High
Significance – Low, due to the small extent of the impact
Mitigation – Not necessary due to low significance
9.3.9 Oil spill effects on mangroves and seabirds due to coating Nature of impact – Accidental and/or operational oil spills form vessels during dredging /
dumping periods or during the operational phase may affect mangroves and seabirds due to
oiling
Duration – Very long term, due to (1) potential damage to mangroves which takes several
decade-years to clean, and (2), potentially reduced breeding success of seabirds
Intensity – High, (1) oil-smoothed mangroves die and so do their ecosystem services, and (2)
seabirds die or their breeding success is reduced and this may have international
implications
Probability – Unknown, no predictions are made for the likelihood of increases in oil spill with
increased ship traffic or for possible accidents during dredging
Status of impact – Negative
Degree of confidence – High
Significance – High, mangroves and birdlife thereon are protected in Kenya (mangroves –
Kenya Forest Service; Birds – Kenya Wildlife Service and National Museums of Kenya), and

139
impacts on them have international implications through the Biodiversity Convention,
Important Birdlife Areas, and IUCN conservation classification
Mitigation – Through KMA’s and KPA’s port and shipping regulations, and best practice
procedures in place, seek to reduce probabilities of accidental and/or operational spills
through enforcement of vessel traffic and oil spill management systems. However, due to
devastating effects of even one large spill significance would remain high but mitigation can
help reduce probabilities of accidents
9.3.10 Oil spill affects on marine life and habitats Nature of impact – Accidental and/or operational oil spills from vessels during dredging /
dumping and the operational phase may affect marine life due to direct toxic effects and/or
habitat alteration.
Duration – Medium (but chronic)
Intensity – Low
Probability – Probable
Status of impact – Negative
Degree of confidence – Medium
Significance – Low, most of the potentially affected organisms are widely distributed in the
region
Mitigation – Through KMA’s and KPA’s port and shipping regulations, and best practice
procedures in place, seek to reduce probabilities of accidental and/or operational spills
through enforcement of vessel traffic and oil spill management systems. However, due to
devastating effects of even one large spill significance would remain high but mitigation can
help reduce probabilities of accidents.
9.3.11 Other spills from containers and their effects on marine life Nature of impact – Potential accidental spills from containers containing hazardous
substances reach the sea and may affect marine organisms
Duration – Unknown, depends on the substance
Intensity – Unknown, depends on the substance
Probability – Probable
Status of impact – Negative
Degree of confidence – Low, due to the unknown extent, duration and intensity
Significance – Unknown, depends on the substance
Mitigation – A management plan on how to deal with containers with hazardous substances,
which also incorporates plans for emergencies, should be in place

140
9.3.12 Spills from operational machinery and their affect on marine life Nature of impact – Potential accidental spills from operational machinery, which could
include hydrocarbons such as hydraulic fluids, may affect marine organisms
Duration – Unknown, depends on the substances and the amount
Intensity – Unknown, depends on the substances and the amount
Probability – Probable
Status of impact – Negative
Degree of confidence – Low, due to the unknown extent, duration and intensity
Significance – Low, when good management plan in place
Mitigation – Detailed management plan should be in place
9.3.13 Ship wastes effect on marine life Nature of impact – Potential waste from ships berthed at the container terminal may affect
marine organisms
Duration – Unknown, depends on the waste
Intensity – Unknown, depends on the waste
Probability – Improbable, when regulations of no discharge are followed
Status of impact – Negative
Degree of confidence – Low, due to unknown duration and intensity
Significance – Low, when regulations of no discharge are followed
Mitigation – Not necessary when regulations are policed
9.3.14 Discharge of ballast water introduces alien species Nature of impact – A rise in discharge of ballast water in the harbour due to increased
shipping as a response to the berthing of ships may increase the risk of introduction of
marine exotic species
Duration – Unknown, depends on the introduced organisms but likely to be very long term or
permanent when an introduced alien becomes invasive
Intensity – Unknown, depends on the introduced organisms
Probability – probable, given that there is no policy of management of ballast water in Kenya
(plans are under way to establish some through KMA and IMO’s initiatives)
Status of impact – Negative
Degree of confidence – Low, due to unknown duration and intensity
Significance – Medium, no policy of management of ballast water in Kenya
Mitigation – Abide by the interim provisions of the Management of Ballast Waters in Port
states currently under development by IMO

141
9.3.15 Synergistic (cumulative) impacts Since the construction of the Mombasa harbour, the shoreline of the Port of Mombasa and its
natural resources has already been significantly modified by many dynamic forces acting on
sediment and water interfaces. Any further, even slight changes in the sediment distribution
may therefore have a cumulative impact, resulting in a complete change of the
morphodynamics and consequently the associated biota. At present, the pollution status of
Port of Mombasa do indicate high build-ups of some contaminants in some places (see
Everaarts & Nieuwenhuize 1995, Williams et al., 1997, Kamau 2002, 2005, this study chapter
7), suggesting that most communities in the Port Reitz area are not impacted by pollution.
The increase in the number of containers handled at the KPA terminals with associated
increased risk of spills during operation could result in higher pollution input into Port waters,
which, in addition to the existing input from storm water, river and municipal waste
discharges may eventually lead to the contaminants reaching levels of concern.
9.3.15 Potential negative impacts specific to coral gardens and Mombasa Marine Reserve
A plume modeling from the hydrodynamic exercise indicates that during the south east
monsoon, the plume direction moves northwards and into parts of the marine protected area.
However, the deleterious plume of over 50mg/l is not expected to move into the coral reef
areas. The model predicts the plume with total suspended solids of 50mb/l will be limited to
depths beyond 50m contour for most of the time. However, other deep sea communities may
still be temporarily affected. These include:
a) 16 taxa grouping of fisheries listed in the KWS-CORDIO monitoring schedule (Table
6.10)
b) 10 taxa grouping of invertebrates listed in the KWS-CORDIO monitoring schedule
(Table 6.11)
c) Potential IUCN listings of endangered species including sharks, turtles, dugongs, that
may be using these areas (Table 6.10 – 6.12)
Baseline surveys of these key habitats have been undertaken (this EIA study, other
monitoring programs). In addition we suggest that in situ turbidity loggers be employed at
reef slope stations so as to monitor the levels of turbidity throughout the dredging / dumping
process. This information will also used to derive key habitat tolerances.
Routine biological monitoring and a Coral Condition Monitoring Program that includes pre-
dredging / dumping condition of benthic habitats and communities should be undertaken and
supported. Coral colonies should be routinely assessed for changes in % bleaching and %
partial mortality to ensure warning or shutdown habitat trigger values are not exceeded.

142
9.4 Chemical Impacts The results of the analysis of surficial sediments from the Navigation Channel in Kilindini
creek and the Turning Basin in Port Reitz indicate significant contamination with
environmentally toxic heavy metals Cd and As. Contamination by the 2 metals is more
pronounced in the Turning Basin which has sediments composed of relatively high levels of
silt and mud associated with high organic matter. The high levels of Cd and As in sediments
from the Turning Basin is attributed to anthropogenic sources, especially, the wastewater
discharge from the municipal sewage treatment facility at Kipevu. It is therefore
recommended that the contaminated dredged material should not be disposed at sea.

143
10. ENVIRONMENTAL MANAGEMENT PLAN
Environmental Management Plan proposed in this study consists of:
Mitigation
Monitoring
10.1 Mitigation Measures
Mitigation refers to formulation and implementation of measures to ensure that adverse
environmental impacts are eliminated or minimised to acceptable levels
Mitigation Measures may be:
Engineering – Incorporated into project design
Management – Monitoring, Evaluation, Review
10.1.1 Mitigation measures for dredging impacts Dredging and disposal of dredged materials are primary sources of water quality degradation
during construction stage.
10.1.1.1 Dredging work - General Taking account of proposed dredging methods/equipment, hopper dredger for access
channel and grab dredger for turning basin, no significant increase of surrounding water
turbidity is expected. However, if unacceptable level of suspended solid (SS) concentration is
monitored around the dredging site, following measures will be taken immediately:
• Restrict overflow operation during dredged material loading
• Reduce dredging volume per day
• Installation of silt protection curtain surrounding grab dredger
• Use special dredging equipment to minimize agitation of bed material if the material is
significantly contaminated.

144
10.1.1.2 Disposal of dredged materials Dredged materials will be disposed at designated open water dumping site keeping a
distance more than 3km from biological sensitive areas, such as existing coral reef, sea
grass bed and Mombasa Marine National Reserve. Disposal period will be mainly during SE
Monsoon Season (from April to September) considering preferable local current system
which could avoid significant impacts on the biological sensitive areas due to turbid water
dispersion from the dumping site.
According to the simulation exercise we carried out of turbid dispersion conducted in the EIA,
turbid water column will not reach beyond 3 km from the dumping location. However, if
unacceptable level of SS concentration is measured at the monitoring points which are
placed at said biological sensitive areas, following measures will be taken immediately:
• Reduce disposal volume per day
• Relocate dumping site further offshore
In case at any time the monitoring exercise indicates that the dredged material is
unacceptably contaminated, thus can not be disposed at the offshore dumping site, the
material will be disposed at a land based dumping site in Port Reitz area (at the site of the
proposed container terminal) with proper care and containment facilities.
10.1.1.3 Effluent discharge from calling ships On commissioning of the dredging project increased number of ships will call at the port.
Prior to permitting the ships to offload cargo, KPA will inspect the ships and/or liaise with the
ship administration to establish weather there is any waste on board. Any waste found will be
received at the designated facilities such as East Africa Environment Company (EAM).
10.1.1.4 Accidental oil spill The most potential occasion involving the oil spill is ship collision and landing. This risk will
be raised by increased number of water traffic due to operation of new container terminal. In
order to decrease the risk, following measures will be taken:
• Evaluate future traffic volume for design of sufficient port facilities
• Ensure operation in line with the ship handling manual. The manual has been designed
specific to the Port of Mombasa by Japan Marine Science Inc on behalf of KPA. KPA
pilots were part of the design and will be trained after the proposed dredging works
• KPA will install new navigation buoys and leading lights to allow for safer navigation of

145
the channe
• Special short-based radar and/or reflectors will be installed for safe navigation and
collision avoidance
• Updated pilot qualification or additional training will be undertaken
• Additional tugs, lighters and mooring and pilots requiring special skills will be made
available.
In order to respond to possible accidental oil spill, the Port of Mombasa already has an
emergency response program. This emergency contingency plan will be enhanced to the
proposed dredging project, clearly indicating authority and responsibility for dealing with such
incidents. Reporting and altering mechanism will established to ensure that any spillage is
promptly reported to the Port Authority.
In addition, specialized oil spill response equipment will be available to deal with small to
medium spillages. This equipment will include containment booms, recovery devices, oil
recovery or dispersant application vessels. The equipment operators will be trained in
deployment of the equipment, and the contingency plan regularly exercised to test reporting
and altering procedures.
During dumping the material will be released at sea bottom to minimise plume
generation;
Fishers to be provided with motorised boats to enable them fish further offshore
during the dredging period
Monetary compensation for fishers to assist in restoration of livelihood lost during
dredging
Continuous monitoring during dredging to ensure contaminated sediments are
captured and dumped at appropriate sites.
10.1.2 Mitigation measures for biological impacts
10.1.2.1 Mitigation for fisheries impacts The fishery in terms of biomass, abundance and diversity and sizes is inadequate and for
this study catch data was used to quantify the fishery loss in the short term and long term
effects. Indirect effects (food web) during dredging and dumping period could not be
estimated and therefore monitoring of the fishery is suggested.

146
The fishers will not be able to fish during this dredging period hence compensation is relation
to loss of commercial fish catch loss should be considered. Access to the fishing grounds
after dredging should be allowed and a fishing plan to be developed. Fishers should be
empowered to access other fishing grounds. Fishermen within the creek should be supported
to explore alternative sources of livelihoods such as aquaculture.
Biodiversity monitoring should continue during dredging and dumping and should include the
threatened species. Mitigations relating to water column turbity and contamination that may
affect resident slow motile or benthic flora and fauna arising from dredge works, reclamation
and disposal of dredged materials and other operational activities have already been
addresses in sections above.
During public consultation an array of issues were raised by fishermen that go beyond the
TOR for this study. To adequately address all fisheries issues KPA would develop a
compensation action plan (CAP) that would come up with timelines and amounts due to all
the fishers affected. KPA intends to complete this study by end of second quarter of this year.
10.1.1.2 Hindrance of Sea Turtle migration The dredging operation will not affect directly beaches but may hinder sea turtle migration
route to those beaches. However, according to Kenya Sea Turtle Conservation Committees
(KESCOM), their migration routes and periodicity here are rare events. But nevertheless, in
such circumstance a Turtle Exclusion Device (TED) may be a possible mitigation measure.
10.1.1.3 Re-location of rare species before dredging if found During the entire phase of the project, a number of species which are known to be rare,
threatened, or endangered will be given particular attention. Whenever encountered these
species will be carefully relocated to other similar biotopes if on the path, or the project phase
will need to be temporarily halted (time-out) to allow the rare / endangered / threatened
species time for migration/reproduction/ completion of their natural life cycle.
10.1.2.4 Monitoring of state of the environment of the key critical habitats Environmental assessments of critical habitats (corals, seagrass beds, and mangrove areas,
and including mudflats) will be undertaken for purposes of monitoring changes in biological
communities which may be impacted by the project works.

147
Summary of Mitigation measures for biological impacts
Impact Mitigation
Removal of sub-marine sediment and associated attached sessile organisms
Leave some undisturbed patches (reservoirs) between the dredging areas, to speed up recolonization and recovery. This is already implied in the works structure as dredge areas are clearly marked and some areas will remain undisturbed. Use of appropriate engineering technology reductions in the amount of suspended sediment
Suspended sediment effects on fish, sessile and slow-moving invertebrates
Reductions in the amount of suspended sediment through use of appropriate engineering technology will further reduce risks
Suspended sediment effects on phytoplankton productivity and other aquatic plants
Reductions in the amount of suspended sediment through use of appropriate engineering technology will further reduce risks
Depletion of water column oxygen concentration
Reductions in the amount of suspended
sediment through use of appropriate
dredging methods will further reduce risks
Noise during dredging / dumping activities
Not necessary due to low significance
Sedimentation on sub-tidal muddy and sandy habitats
Not necessary due to low significance
• Oil spill effects on mangroves and seabirds due to coating
• Oil spill affects on marine life and habitats
Through KMA’s and KPA’s port and shipping regulations, and best practice procedures in place, seek to reduce probabilities of accidental and/or operational spills through enforcement of vessel traffic control and oil spill management systems. Oil Spill Mutual Aid Group (OSMAG), an initiative of KPA and stakeholders in the oil industry is expected to play a major role in emergency preparedness.
Potential accidental spills from containers containing hazardous substances reach the sea and may affect marine organisms
A management plan on how to deal with containers with hazardous substances, which also incorporates plans for emergencies, should be in place.
Discharge of ballast water introduces alien species
Abide by the interim provisions of the Management of Ballast Waters in Port states currently under development by IMO
Potential negative impacts specific to coral gardens and Mombasa Marine Reserve
Routine biological monitoring and a Coral Condition Monitoring Program that includes pre-dredging / dumping condition of benthic habitats and communities should be undertaken and supported.
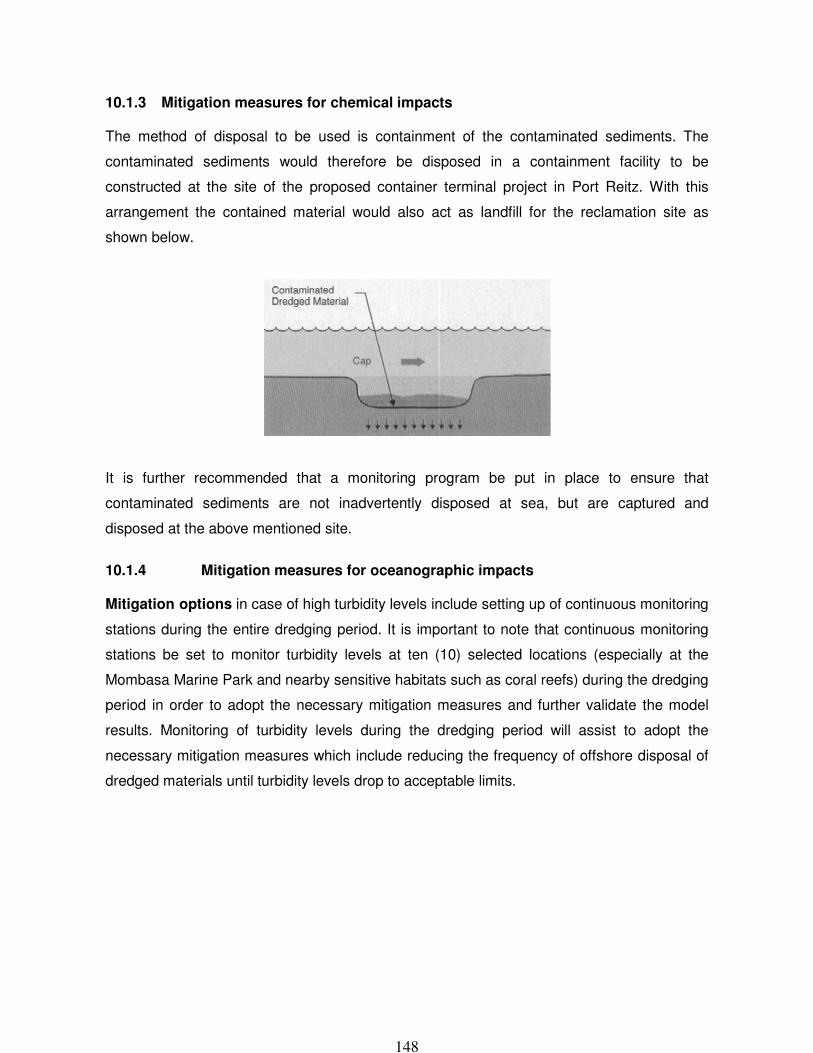
148
10.1.3 Mitigation measures for chemical impacts The method of disposal to be used is containment of the contaminated sediments. The
contaminated sediments would therefore be disposed in a containment facility to be
constructed at the site of the proposed container terminal project in Port Reitz. With this
arrangement the contained material would also act as landfill for the reclamation site as
shown below.
It is further recommended that a monitoring program be put in place to ensure that
contaminated sediments are not inadvertently disposed at sea, but are captured and
disposed at the above mentioned site.
10.1.4 Mitigation measures for oceanographic impacts Mitigation options in case of high turbidity levels include setting up of continuous monitoring
stations during the entire dredging period. It is important to note that continuous monitoring
stations be set to monitor turbidity levels at ten (10) selected locations (especially at the
Mombasa Marine Park and nearby sensitive habitats such as coral reefs) during the dredging
period in order to adopt the necessary mitigation measures and further validate the model
results. Monitoring of turbidity levels during the dredging period will assist to adopt the
necessary mitigation measures which include reducing the frequency of offshore disposal of
dredged materials until turbidity levels drop to acceptable limits.

149
10.2 Monitoring Plan Monitoring in an EIA Study refers to continuous assessment of environmental or socio-
economic variables by the systematic collection of specific data in time and space and
evaluating the data to confirm whether the proposed mitigation measures effectively address
the project impacts.
Monitoring in this study includes:
Baseline Monitoring – This has been undertaken prior to implementation;
Compliance Monitoring – To be undertaken during construction and operation and
comprises of:
Impact and Mitigation Monitoring
Work In Progress - Expense Tracking, Implementation Timelines
Monitoring in this project would follow the following characteristic loop:
Figure 10.1: Monitoring scheme
The key parameters proposed for monitoring are in Table as follows:

150
Table 10.1: Parameters for monitoring
IMPACT ResponsibilityFrequency Parameter Target
Water Quality
KPA Contractor
2 x a day during dredging works
Turbidity, Temp, Salinity, pH
+10 mg/L – Offshore +50 mg/L – Port
Water Quality
KPA Contractor
Monthly COD, DO, Nutrients
Ditto
Sediment Quality
KPA Contractor
Before Dredging
Hg, Cd, Pb, PSD World Bank Levels
Air Quality KPA Contractor
Biannually CO2, O2, H20, NO2, CO, SO2
Ambient
Fishing Constraints
KPA Contractor Fisheries
Department
Before Works
Compensation & Recovery
Completed
Abundance of Eco-systems
KPA Biannually Presence & Abundance
Maintained or Improved
In addition the following specific mitigation measures require keen monitoring:
Table 10.2: Monitoring of mitigation measures
Mitigation Measure Responsibility Stage
Provision of Fishing Boats
KPA During Construction & Operation & after
Beach Management Unit (facilitation & creation)
KPA/ Fisheries During Operation of New Container Terminal
Provision of Landing Site
KPA During Operation of New Container Terminal
Measurement of Bio-diversity Richness (fish, coral and other species)
KPA/ Contractor Before, during and after construction
151
10.3 Environmental Management Plan for the Construction Stage The Contractor shall prepare and submit the Environmental Management Plan (EMP) as a
method statement to the Engineer for his approval within 30 days of the Contractor receiving
the Letter of Acceptance.
The EMP shall address potential environmental impacts, mitigation measures, and
monitoring activities associated with dredging and dumping, and any other activities identified
by the Engineer.
The EMP will be designed to protect the following:
1) Water quality - this includes nearby beaches, fisheries/aquaculture resources, and
ambient water quality immediately outside the construction area, and
2) Coral reefs near the outer dredging area and offshore dumping area, and
3) Any other sensitive environmental areas identified by the Engineer
The EMP shall follow the mitigation and monitoring guidance for activities identified in the
EIA Report.
As the EMP is a management tool for the Contractor’s use, it shall present in detail how
these measures should be operated, the resources required, and the schedule of
implementation. The general format of the EMP shall be:
a. Objective
b. Work Plan
c. Implementation Schedule
d. Human Resources (organization chart, skill/experience of environmental staff)
e. Monitoring Schedule
f. Monitoring Location and Items
g. Monitoring Frequency
h. Others
The Contractor shall not commence any construction activities that may impact the
environment (e.g. dredging, blasting, and dumping) until the Engineer issues approval for the
EMP Method Statement.

152
The Engineer reserves the right to levy fines, restrict payment, or stop construction activities
at any time during the Contract period should the Contractor: 1) commence dredging,
blasting, reclamation or dumping activities prior to receiving an approved EMP Method
Statement; or 2) fail to adequately implement any part of the EMP Method Statement during
the course of construction activities.
10.4 Environmental Monitoring Survey The Project’s environmental monitoring program shall be detailed and approved. Monitoring
surveys shall be carried out in accordance with the proposed and approved EMP during
construction Period.
The monitoring parameters shall include, but not be limited to: Water Quality
Turbidity (NTU)
Temperature
Salinity
Conductivity
Current speed/direction
Wind speed/direction
Rain/Sun
Fecal Coliform (CFU/MPN)
Total suspended solids
Sediment settling rate
Cadmium
Lead
Iron
Zinc
Dredging Qualities
Cadmium
Lead
Iron
Zinc
Copper
Oil

153
Biological Quality
Sediment settling rate on nearby coral reefs
Changing in living coral covers on nearby coral reefs
The Monitoring surveys shall be carried out by the experienced and qualified monitoring
team. The experience and qualification of the team members will be submitted to the
Engineer in writing for approval prior to commencement of the monitoring program.
Monitoring Locations shall be indicated on a map include, but not be limited to:
1) The offshore dumping area;
2) Coral reefs nearby the dumping area;
3) Outer access channel dredging area;
4) The inner access channel, turning basin, mooring basin and berthing basins
dredging areas.
Result of the turbidity surveys during dredging operation shall be submitted daily to the
Engineer
The Monitoring Reports shall be submitted to the Engineer within 21 days of completion of
each survey. The reports shall contain:
a. Title page
b. Table of contents
c. Introduction
d. Update of priority issues identified in last month’s report
e. Results of this month report/graphs to compare results with previous months.
Results should be analysed and graphed using statistical tools (such as mean, one and two-
tailed t-tests) from Microsoft Excel or another suitable statistical package.
Summary of priority issues in this monitoring period. Priority issues should be determined in
part by: 1) comparing data with national (TCVN) standards or standards accepted by other
countries or international organizations and/or 2) significant trends identified by the
aforementioned statistical analyses.

154
10.5 Contractors Pollution Control Measures The Contractor shall provide the necessary pollution control measures in case the following
adverse environmental concerns are encountered with:
(1) When the silt content (fine materials passing #200 sieve) being disposed into the offing
reaches 2,000 PPM
(2) When the dispersion of silt content in the vicinity of dumping areas averages 1,000 PPM
over any six consecutive hour measurement; and
(3) When the dispersion of silt content reaches a maximum of 500 PPM within a radius of
250 meters from the point of dumping of dredged material into the dumping areas.
(4) The Contractor shall undertake the necessary measurements to determine the
occurrence of any of the foregoing adverse environmental consequences and should
any of the above be encountered, anti-pollution control measures including the provision
of net to contain the dispersion shall be provided by the Contractor at his own cost as
part of and incidental to the dredging activities.

155
11. RECOMMENDATIONS AND CONCLUSION
This study report has established that the proposed project would bring a number of positive
benefits to the proponent, the country and indeed the entire region including the landlocked
countries such as Rwanda, Burundi, Southern Sudan and the Democratic Republic of Congo
that depend on the Port of Mombasa for sea-bound trade. Such benefits include boost in
trade and employment creation for the region suffering from large percentages of
underemployment.
However adverse negative impacts have also been identified in the study including
temporary disruption of fishing activities during the dredging period, turbidity of water column
as a result of release of sediments (particulate) during dredging and offshore dumping and
interference with normal port operations such as docking of ships and ferries plying
passengers across the Likoni channel.
Mitigation measures have been proposed such as such as use of appropriate dredging
methods to minimize physical impacts. To mitigate against loss of fishers’ livelihood the
proponent shall arrange a compensation package for fishermen who lose their livelihood
during the course of the project. Such compensation includes provision of motorized boats to
enable fishers venture further offshore and/or monetary support for the affected fishers.
A detailed monitoring programme has been prepared to assist in tracking the progress of
implementation of the environmental management programme. This study therefore
recommends that the proposed project be approved subject to implementation of the
proposed environmental management and monitoring plan.

156
REFERENCES
Aanderaa (1998): S/T-C/T-S/T/D and C/T/D Sensors. Data Sheet D310. Aanderaa
Instruments, Bergen, Norway. Adala, H.O. 2007. Environmental Impact Assessment Report of the Proposed Container
Terminal Modernisation Project for Kenya Ports Authority. BAC Engineering & Architecture, Japan Port Consultants, Heztech Engineering Services.
Dredging of the Access Channel at the Port of Mombasa: An Inception Report Baillie, J. and Groombridge, B. (1996) 1996 IUCN Red List of Threatened Animals. J Baillie
and B. Groombridge (ends). IUCN, Glands. Benny P. N. (2002): Variability of Western Indian Ocean Currents: Western Indian Ocean
Journal of Marine Science. Vol. 1, 81-90. Bergman, M.J.N., Daan, R., Murk, A.J., Vethaak, A.D. (2003). Environmental impact and
recovery at two dumping sites for dredged material in the North Sea Environmental Pollution 124, 17–31
Best practice environmental management: guidelines for dredging 2001 Environment
Protection Authority 40 City Road, Southbank Victoria 3006 AUSTRALIA Publication 691 ISBN 0 7306 7578 5
Boon J. D. and Byrne R. J. (1981): On Basin Hypsometry and the Morphodynamic Response
of Coastal Inlet Systems. Marine Geology 40, 27-48. Brown, B. E., Howard, L. S. (1985). Assessing the effects of 'stress' on reef corals. Advanced
marine biology 22: 1-63 Buchheim, J. (1998). Coral Reef Bleaching. Odyssey Expeditions – Marine Biology Learning
Centre Publications. URL: http://www.marinebiology.org/coralbleaching.htm. Access date:10/10/2006
Coral Reef Degradation of the Indian Ocean (CORDIO) 2000: status reports and project
presentations. Stockholm, Sweden 205pp. Davidson, O. G. (1998) The Enchanted Braid: Coming to Terms with Nature on the Coral
Reef, John Wiley and Sons, Inc. Defant A. (1958), Ebb and Flow. Ann Arbor Science Paperbacks, Ann Arbor, 121 pp Dodge, R. E., Vaisnys, J. R. (1977). Coral populations and growth patterns: responses to
sedimentation and turbidity associated with dredging. Journal of marine research 35: 715-730
Dronkers J. J. (1964): Tidal Computations in Rivers and Coastal Waters. John Wiley and Son,
Inc. New York, 518 pp. Duing W. and Schott F. (1978): Measurements in the Source Current of the Somali Current
During Monsoon Reversal. Journal of Physical Oceanography. Vol. 8, 278-289.

157
Everaarts & Nieuwenhuize (1995), Williams et al. (1997), Kamau (2001), Kamau (2002), Mwashote (2003) and Munga et al. (2003) (Table 3.4.) Mwashote, B.M. 2003. Levels of cadmium and lead in water, sediments and selected fish species in Mombasa, Kenya. Western Indian Ocean J. Mar. Sci., 2(1), 25 – 34.
Fang, L.S., Liao, C.W. and Liu, M.C. (1995). Pigment composition in different-colored
scleractinian corals before and during the bleaching process. Zool Studies, 34, 10-17. Finelli, C. M., Helmuth, B. S. T., Pentcheff, N. D. and Wethey, D. S. (2006) Water flow
influences oxygen transport and photosynthetic efficiency in corals. Coral Reefs, 25, 47-57
Fisheries Act Cap 378 (1989) Fisheries Department, 2006: Marine Frame Survey report 2006. Fisheries Statistics report 2004: Fisheries Department Mombasa District Fulanda B.M (2002). A re-evaluation of potential of mariculture sites identified in March 2002. Gray S and Tanner J 2002: Review of proposed dredge site at outer Harbor. SARDI Aquatic
Science Australia (Report) Grigg, D. I., Crean, R. F., van Eepoel, R. P. (1972). Marine environment of Brewer's Bay, St.
Thomas, V.I. with a summary of recent changes. Caribbean Research Institute Water GROFLOW 1998. Influence of groundwater discharge on community structure in Kenyan
coastal lagoons. GROFLO Final Report Part 2, Individual partner reports pp 47 — 68. Harvey, M., Gauthier, D., Munro, J., 1998. Temporal changes in the composition and
abundance of the macro-benthos invertebrate communities at dredged material disposal sites in the Anse-a-Beaufils, Baie des Chaleurs, eastern Canada. Mar. Poll. Bull. 36, 41–55.
Hubbard, J. A. E. B., Pocock, Y. B. (1972). Sediment rejection by recent scleractinian corals:
a key to palaeo-environmental reconstruction. Geol. Rdsch. 61. 598-626 IUCN Red List of Endangered species 2006 www.iucnredlist.org IUCN. (2004). Red List of Threatened Species. Japan Society of Civil Engineers: “Formula of Hydraulics,” 1999. Port & Harbour Research
Institute: “Technical Manual for Environmental Assessment in Ports and Harbors,” Report of P&HRI No.3, Vol. 22, 1983
Jarman, P.J (1966). The status of dugong (Dugong dugon) in Kenya.1961. E. A.fr. Wildlife J.
4: 82-88. Kamau, J.N. 2001. Heavy metals distribution in sediments along the Kilindini and Makupa
creeks, Kenya. Hydrobiologia 458, 235 – 240. Kamau, J.N. Heavy metal distribution and enrichment at Port-Reitz creek, Mombasa.
Western Indian Ocean J. Mar. Sci., 1(1), 65 – 70. KESCOM 2004 Marine Turtle Newsletter 105:1-6, © 2004

158
Kitheka J. U., Ongwenyi G. S., and Mavuti K. M. (2003): Fluxes and Exchanges of Suspended Sediments in Tidal Inlets Draining a Degraded Mangrove Forest in Kenya. Estuarine, Coastal and Shelf Science 56, 655-667.
Kitheka, J. U. 2002. Suspended sediment transport and exchange in Port Reitz Creek with
special focus on the mangrove fringed Mwache Wetland, Kenya. M.Sc thesis, Gothenburg University
Kjerfve B., L. B. Mirando, and E. Wolanski (1991), Modeling Water Circulation in an Estuary
and Intertidal Salt Marsh System. Netherlands Journal of Sea Research 28(3), 141 - 147.
KMFRI 2005. Globallast Port of Mombasa survey. Preliminary data reports. 200pp Koskela, R. W., Ringeltaube, P., Small1, A. R., Koskela, T. V., Fraser, A. R., Lee, J. D. and
Marshall, P. (2002). Using predictive monitoring to mitigate construction impacts in sensitive marine environments Recent Advances in Marine Science and Technology 1-15
KPA (2004): KPA Annual Review and Bulletin of Statistics 2004 Lindsay P., Balls P. W., and West J. R. (1996): Influence of Tidal Range and River Discharge
on Suspended Particulate Matter Fluxes in North Estuary, Scotland. Estuarine, Coastal and Shelf Science 42: 63-82.
Marshall, P. (2002). Using predictive monitoring to mitigate construction impacts in sensitive
marine environments. Recent Advances in Marine Science and Technology 1-15 Marszalek, D. S. (1981). Impact of dredging on a subtropical reef community, Southeast
Flonda, Martin J. L. and McCutcheon S. C. (1999): Hydrodynamics and Transport for Water Quality
Modeling. Lewis Publishers, Boca Raton, London, New York, Washington D. C. 781 pp. Mazda, Y., Kanazawa N. and Wolanski E. (1995): Tidal Asymmetry in Mangrove Creeks,
Hydrobiologia 295: 51-58. McArthur, C, Ferry, R., Proni, J. (2002) Development of guidelines for dredged material
disposal based on abiotic determinants of coral reef community structure. Dredging ?02 Proceedings of the Third Specialty Conference on Dredging and Dredged Material Disposal Coasts, Oceans, Ports, and Rivers Institute (COPRI) of ASCE May 5, 2002, Orlando, FL USA
McClanahan, T. R. and Obura, D. O. (1997). Sedimentation effects on shallow coral
communities in Kenya. Journal of Experimental Marine Biology and Ecology, 209, 103-122.
McClanahan, T. R., Maina, J., Moothien-Pillay, R. and Baker, A. C. (2005). Effects of
geography, taxa, water flow, and temperature variation on coral bleaching intensity in Mauritius. Marine Ecological Progress Series, 298, 131-142.
McClanahan, T.R. (1988) Seasonality in the Eastern Africa's coastal water. Mar. Ecol. Progr.
Ser. 44: 191-199.

159
McClanahan, T.R. and Shaffir, S.R. (1990) Causes and consequences of sea urchin abundance and diversity in Kenyan coral reef lagoons. Oecologia. 83: 368-370
Meesters, E. H., Bak, R. P. M., Westmacott, S., Ridgley, M. and Dollar, S. (1998). A Fuzzy
Model to Predict Coral Reef Development under Nutrient and Sediment Stress. Conservation Biology, 12, 957-965.
Munga D., Kamau, J.N., Abuodha, P. & Ikubi, J.G. 2003. Concentrations of heavy metals in
sediments and biota and implications of pollution of the Ungwana and Malindi Bays in Kenya. Proceedings of the Third WIOMSA Scientific Symposium, Maputo, Mozambique, 15-18 October 2003.
Muthumbi, AWN (1998). Biodiversity of Nematodes in the Western Indian Ocean (WIO):
Taxonomy and Assemblages. Faculty of Science, University of Ghent, Belgium. 406pp. Navigation Chart No. 666. Port Mombasa including Port Kilindini and Port Reitz(666).
Sounding in fathoms. Scale 1:12,500, 1966 updated up to 1972. Netherlands Indian Ocean programme (NIOP) – Shipboard Data Report. Project A.
Monsoons and Coastal Systems in Kenya. Carlo Heip and Michael Nguli (Chief Scientists). KMFRI Data Reports 1992.
Netherlands Indian Ocean programme (NIOP) 1990/1995. – Scientific Programme Plan.
Netherlands Marine Research Foundation, The Hague, the Netherlands (1991). (118pp).
Nyawira Muthiga (2001). The effectiveness of management and the ICAM experience in
marine protected areas: the Mombasa Marine Park and reserve Obura, D. O. (1995). Environmental Stress and Life History Strategies, a Case Study of
Corals and River Sediment from Malindi, Kenya. PhD. Miami, USA, University of Miami. Odido M. (1994): Tidal Dynamics of Tudor Creek, Kenya. MSc. Thesis, University of
Gothenburg, 35 pp. Pawlowisz R., Beardsley B. and Lentz S. (2002): Classical Tidal Harmonic Analysis Including
Error Estimates in MATLAB using T_TIDE. Computers and Geosciences, Vol. 28, pp 921-937.
Pianc, 1998. Management of Aquatic Disposal of Dredged Material (Report). Permanent
Pollution Pugh D. (1979): Sea Level at Aldabra Atoll, Mombasa and Mahe, Western Equatorial Indian
Ocean, Related to Tides, Meteorology and Ocean Circulation. Journal of Deep Sea Research, Vol. 26 A, pp 237-258.
Pugh D. (1987): Tides, surges and Mean Sea-Level. A handbook for Engineers and
Scientists. John Wiley and Sons, New York. Roberts, R.D., Forrest, B.M. (1999). Minimal impact from long-term dredge spoil disposal at a
dispersive site in Tasman Bay, New Zealand. New Zealand Journal of Marine and Freshwater Research 33, 623-633.
Ruwa, R. K., G. Habib, M. Mukira, G. Okoth and G. Mwatha. (2003): Profile of Kenya Marine
and Fisheries – Country Working Resource Document. GEF-South-West Indian Ocean Fisheries Project (SWIOFP) in Kenya. Publication No. 1 (2003), 71p.

160
Ruwa, R.K (1993). Zonation and distribution of creek and fringe mangroves in the semi-arid
Kenyan coast. In: “Towards rational use of high salinity tolerance plants. Vol. 1. Deliberations about the high salinity tolerant plants and ecosystems”. H Leath and A. Almassoum (Eds). Kluwer Acad. Publ. Dordretch TVS: 97-105.
Schureman P. (1940): Manual of Harmonic Analysis and Prediction of Tides (Reprinted With
Corrections, 1976), U. S. Coast and Geodetic Survey, Special Publication No. 98, 377 pp.
S eys, J., Moragwa, G., Boera P., and Ngoa M. 1995. The distribution and abundance of
birds in tidal creeks and estuaries of the Kenyan Coast. Scopus 19:47 —60. Shetye S. R. and Gouveia A. D. (1992): On The Role of Geometry of Cross-Section in
Generating Flood-Dominance in Shallow Estuaries. Estuarine Coastal and Shelf Science 35, 113-126.
Souter, D. W. and Linden, O. (2000). The health and future of coral reef systems. Ocean and Coastal Management, 43, 657-688.
Tychsen, J. 2006 (Ed): KenSea. Environment Sensitivity Atlas for the Coastal Area of Kenya,
76pp. UNEP (1998a). Eastern Africa Atlas of Coastal Resources 1: Kenya. UNEP, Nairobi, Kenya. UNEP/FAO/PAP/CDA 2000: Progress in Integrated coastal management for sustainable
development of Kenya’s coast: The case of Nyali-Bamburi-Shanzu Area. East African Regional Seas Technical Reports Series No. 6. Split Croatia.
UNESCO (1984) Methods for studying mangrove structure. In: Snedaker SC, Snedaker JG,
(eds) The mangrove ecosystem: research methods. UNESCO, Paris, France 213pp van Duin, E. H. S., Blom., G. (2001). Modeling underwater light climate in relation to
sedimentation, resuspension, water quality and autotrophic growth. Hydrobiologia 444: 25-42.
Wakwabi, E. O. and Mees J. 1999. The epibenthos of the backwaters of a tropical mangrove
creek (Tudor Creek, Mombasa, Kenya) Wamukoya, G. M., J. M. Mirangi and W. K. Ottichillo. 1996. Report on the marine aerial
survey of the marine mammals, sea turtles, sharks and rays. KWS Technical Series Report No. 1. 22 pp.
Wamukoya, G.M., Kaloki, F.P. and Mbendo, J.R.1997. Sea Turtle Recovery Action Plan for
Kenya (STRAP). KESCOM Technical Report Series, 69 pp. Weru, S., G. Amboga., E. Verheij, A. Koyo., N. Muthiga., B. Kavu., J. Kareko and M. Litoro.
Management plan for the Mombasa marine Park and Reserve. (T. van’t Hof ed). Kenya Wildlife Service, Mombasa, pp 124
Wildlife and conservation Act Cap 376

161
Williams, T.M., Rees, J.G., Ferguson, A., Herd, R.A., Kairu, K.K. and Yobe, A.C. 1997.
Metals, petroleum hydrocarbons, and organochlorines in inshore sediments and waters
of Mombasa, Kenya. Marine Pollution Bulletin, 34(7): 570-577.
Wolanski E., Jones M., and Bunt J. S. (1980): Hydrodynamics of a Tidal Creek Mangrove
Swamp Systems. Australian Journal of Marine and Freshwater Research 13: 431-450.
Wolanski E., Mazda Y., and Ridd P. V. (1992): Mangrove Hydrodynamics. In A. I. Robertson & D. M. Alongi (eds.), Tropical Mangrove Ecosystems. American Geophysical Union, Washington, DC: 43-62. Zimmerman, D.A., Turner, D.A. and Pearson, D.l (1996) Birds of Kenya and northern
Tanzania

162
APPENDICES

163
APPENDIX I
Simulation Model of Diffusion of SS and Sedimentation of Dumped Soils.
The simulation model is a three-dimensional model, or “two-dimensional multi-layer
unsteady level model,” which has three layers vertically, employing Navier-Stokes’ equation
of motion and the equation of continuity of fluid water.
(1) Equations of Continuity
( )
−
−=−−=
⋅⋅⋅⋅⋅⋅⋅⋅=−−=
=
∑∑
−
k
k
k
k
kkkk
K
Ny
Mxt
ory
N
x
MW
t
Kky
N
x
MWW
W
∂
∂
∂
∂
∂
ζ∂
∂
∂
∂
∂
∂
ζ∂
∂
∂
∂
∂
111
1 4,3,2
0
(2) Equations of Motion
“x-direction”
( ) ( )
[ ]
1,,1
01
11
2
1~
+−
−=−−=
−+
+
+
−+
++−−−=
kkx
kkx
ky
kx
kkkx
k
k
kHkzHkz
kkkkk
y
M
yx
M
x
xghP
h
NfUWUWy
VM
x
UM
t
M
τρ
τρ∂
∂ν
∂
∂
∂
∂ν
∂
∂
∂
ρ∂
ρ
∂
∂
∂
∂
∂
∂
“y-direction”
( ) ( )
[ ]
1,,1
01
11
2
1~
+−
−=−−=
−+
+
+
−+
−+−−−=
kky
kky
ky
kx
kkky
k
k
kHkzHkz
kkkkk
y
N
yx
N
x
yghP
h
MfVWVWy
VN
x
UN
t
N
τρ
τρ∂
∂ν
∂
∂
∂
∂ν
∂
∂
∂
ρ∂
ρ
∂
∂
∂
∂
∂
∂
where mass transport at each level, M,N, are expressed by the following equations:
∫∫ ==hk
khk
k VdzNUdzM ,
Expression of Pressure Term
Pressure term can be expressed as follow:
“x-direction”
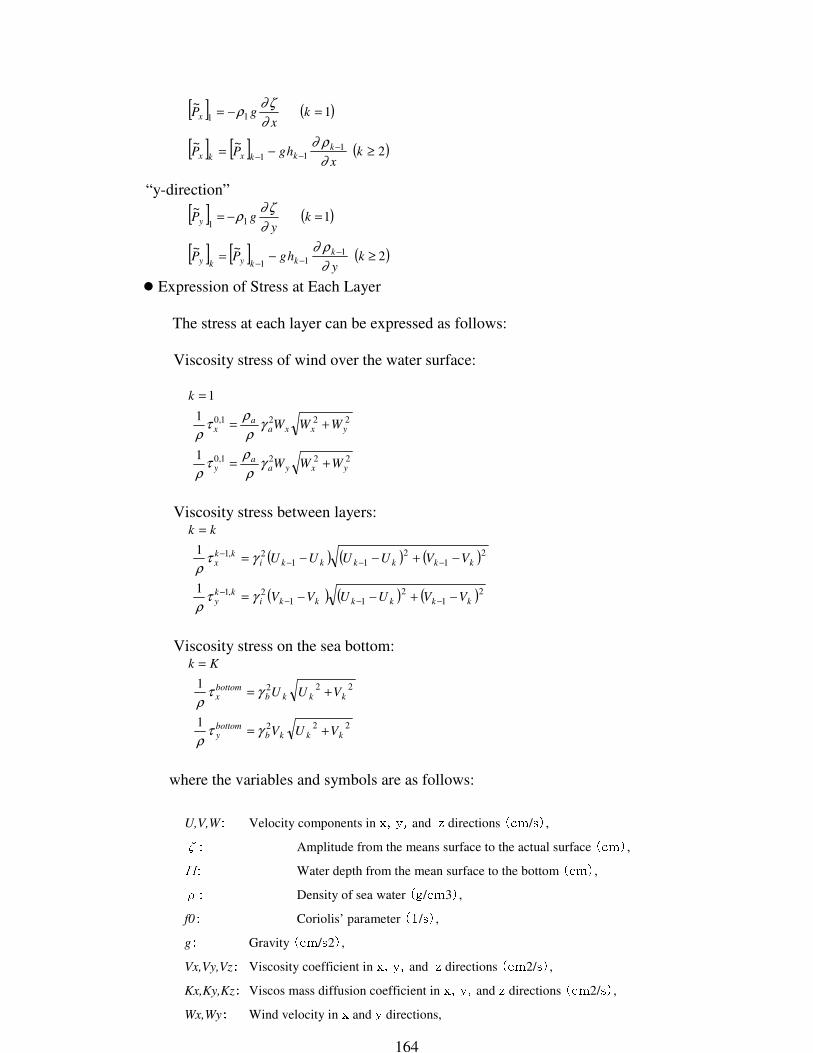
164
[ ] ( )
[ ] [ ] ( )2~~
1~
111
11
≥−=
=−=
−−− k
xhgPP
kx
gP
kkkxkx
x
∂
ρ∂
∂
ζ∂ρ
“y-direction”
[ ] ( )
[ ] [ ] ( )2~~
1~
111
11
≥−=
=−=
−−−
ky
hgPP
ky
gP
kkkyky
y
∂
ρ∂
∂
ζ∂ρ
Expression of Stress at Each Layer
The stress at each layer can be expressed as follows:
Viscosity stress of wind over the water surface:
2221,0
2221,0
1
1
1
yxyaa
y
yxxaa
x
WWW
WWW
k
+=
+=
=
γρ
ρτ
ρ
γρ
ρτ
ρ
Viscosity stress between layers:
( ) ( ) ( )
( ) ( ) ( )21
211
2,1
21
211
2,1
1
1
kkkkkkikk
y
kkkkkkikk
x
VVUUVV
VVUUUU
kk
−+−−=
−+−−=
=
−−−−
−−−−
γτρ
γτρ
Viscosity stress on the sea bottom:
222
222
1
1
kkkbbottomy
kkkbbottomx
VUV
VUU
Kk
+=
+=
=
γτρ
γτρ
where the variables and symbols are as follows:
U,V,W: Velocity components in x,y,and z directions (cm/s), ζ: Amplitude from the means surface to the actual surface (cm), H: Water depth from the mean surface to the bottom (cm), ρ: Density of sea water (g/cm3),
f0: Coriolis’ parameter (1/s),
g: Gravity (cm/s2),
Vx,Vy,Vz: Viscosity coefficient in x,y,and z directions (cm2/s),
Kx,Ky,Kz: Viscos mass diffusion coefficient in x,y,and z directions (cm2/s),
Wx,Wy: Wind velocity in x and y directions,

165
ρa: Density of air, γa2: Friction coefficient on the sea surface, γi2: Friction coefficient between layers, and γb2: Friction coefficient on the sea-bottom.
References:
Japan Society of Civil Engineers: “Formula of Hydraulics,” 1999
Port & Harbour Research Institute: “Technical Manual for Environmental Assessment in
Ports and Harbors,” Report of P&HRI No.3, Vol. 22, 1983
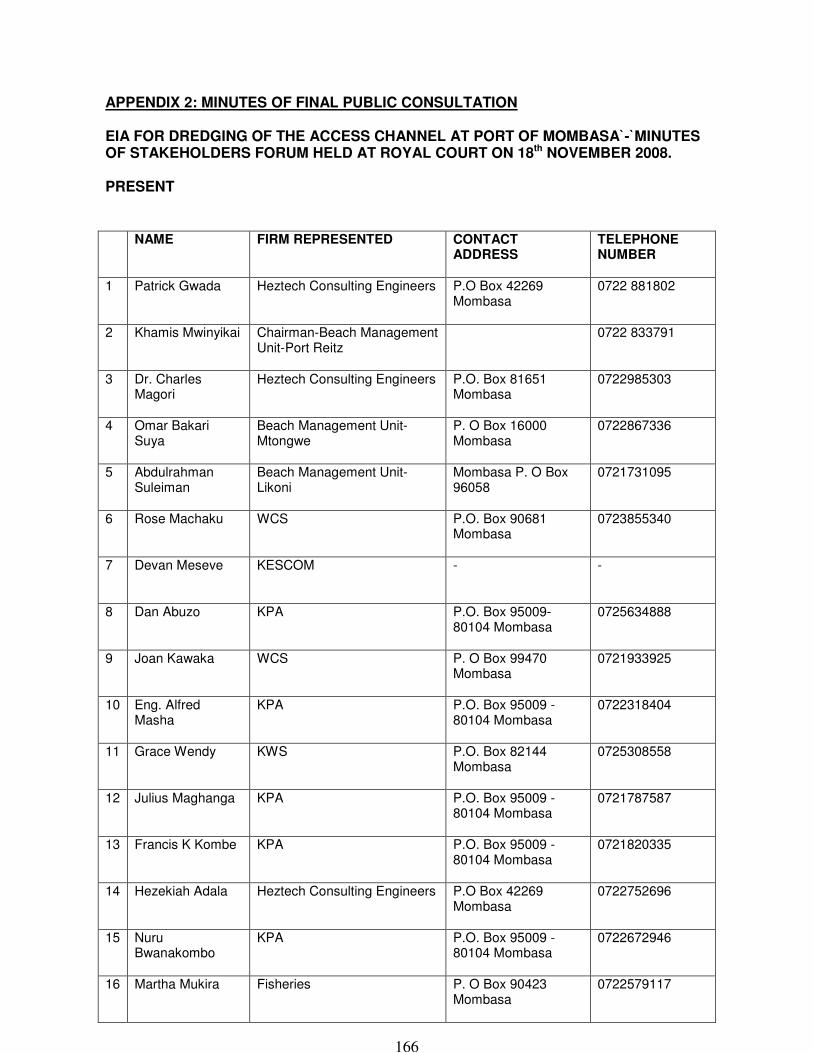
166
APPENDIX 2: MINUTES OF FINAL PUBLIC CONSULTATION EIA FOR DREDGING OF THE ACCESS CHANNEL AT PORT OF MOMBASA`-`MINUTES OF STAKEHOLDERS FORUM HELD AT ROYAL COURT ON 18th NOVEMBER 2008. PRESENT
NAME FIRM REPRESENTED CONTACT ADDRESS
TELEPHONE NUMBER
1 Patrick Gwada
Heztech Consulting Engineers P.O Box 42269 Mombasa
0722 881802
2 Khamis Mwinyikai Chairman-Beach Management Unit-Port Reitz
0722 833791
3 Dr. Charles Magori
Heztech Consulting Engineers P.O. Box 81651 Mombasa
0722985303
4 Omar Bakari Suya
Beach Management Unit- Mtongwe
P. O Box 16000 Mombasa
0722867336
5 Abdulrahman Suleiman
Beach Management Unit- Likoni
Mombasa P. O Box 96058
0721731095
6 Rose Machaku WCS P.O. Box 90681 Mombasa
0723855340
7 Devan Meseve KESCOM - -
8 Dan Abuzo KPA P.O. Box 95009-80104 Mombasa
0725634888
9 Joan Kawaka WCS P. O Box 99470 Mombasa
0721933925
10 Eng. Alfred Masha
KPA P.O. Box 95009 -80104 Mombasa
0722318404
11 Grace Wendy KWS P.O. Box 82144 Mombasa
0725308558
12 Julius Maghanga KPA P.O. Box 95009 -80104 Mombasa
0721787587
13 Francis K Kombe KPA P.O. Box 95009 -80104 Mombasa
0721820335
14 Hezekiah Adala Heztech Consulting Engineers P.O Box 42269 Mombasa
0722752696
15 Nuru Bwanakombo
KPA P.O. Box 95009 -80104 Mombasa
0722672946
16 Martha Mukira Fisheries P. O Box 90423 Mombasa
0722579117
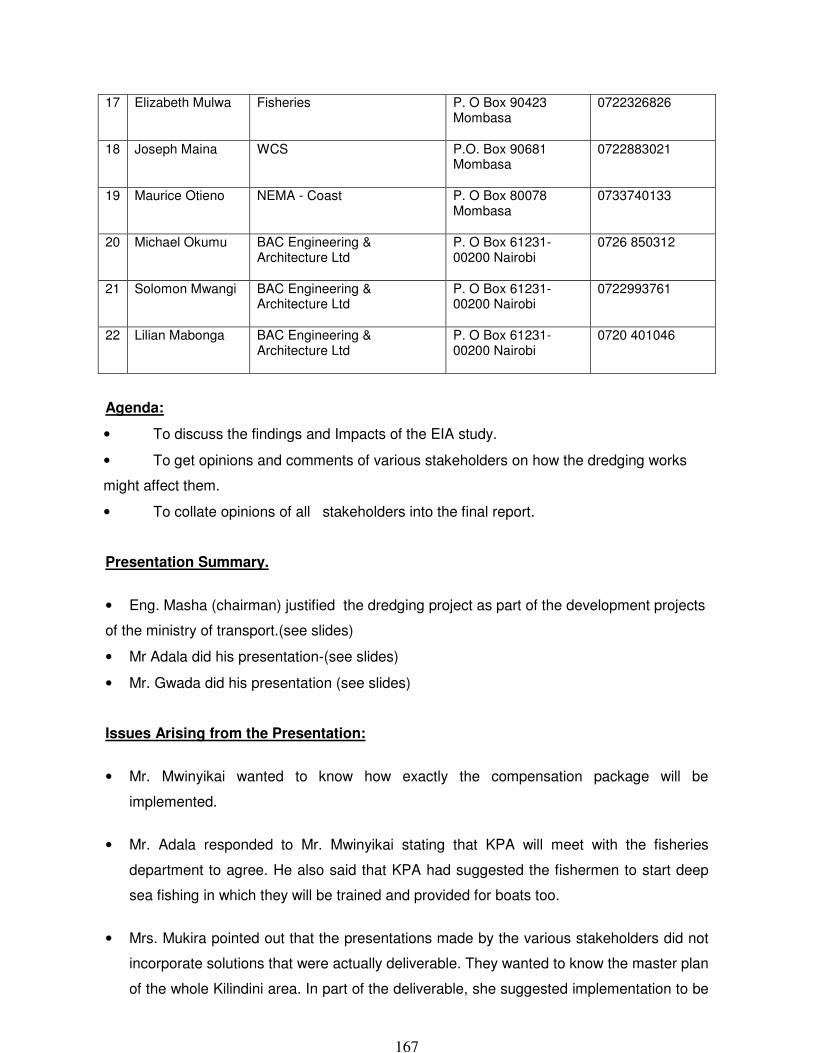
167
17 Elizabeth Mulwa Fisheries P. O Box 90423 Mombasa
0722326826
18 Joseph Maina WCS P.O. Box 90681 Mombasa
0722883021
19 Maurice Otieno NEMA - Coast P. O Box 80078 Mombasa
0733740133
20 Michael Okumu BAC Engineering & Architecture Ltd
P. O Box 61231-00200 Nairobi
0726 850312
21 Solomon Mwangi BAC Engineering & Architecture Ltd
P. O Box 61231-00200 Nairobi
0722993761
22 Lilian Mabonga BAC Engineering & Architecture Ltd
P. O Box 61231-00200 Nairobi
0720 401046
Agenda:
• To discuss the findings and Impacts of the EIA study.
• To get opinions and comments of various stakeholders on how the dredging works
might affect them.
• To collate opinions of all stakeholders into the final report.
Presentation Summary.
• Eng. Masha (chairman) justified the dredging project as part of the development projects
of the ministry of transport.(see slides)
• Mr Adala did his presentation-(see slides)
• Mr. Gwada did his presentation (see slides)
Issues Arising from the Presentation:
• Mr. Mwinyikai wanted to know how exactly the compensation package will be
implemented.
• Mr. Adala responded to Mr. Mwinyikai stating that KPA will meet with the fisheries
department to agree. He also said that KPA had suggested the fishermen to start deep
sea fishing in which they will be trained and provided for boats too.
• Mrs. Mukira pointed out that the presentations made by the various stakeholders did not
incorporate solutions that were actually deliverable. They wanted to know the master plan
of the whole Kilindini area. In part of the deliverable, she suggested implementation to be
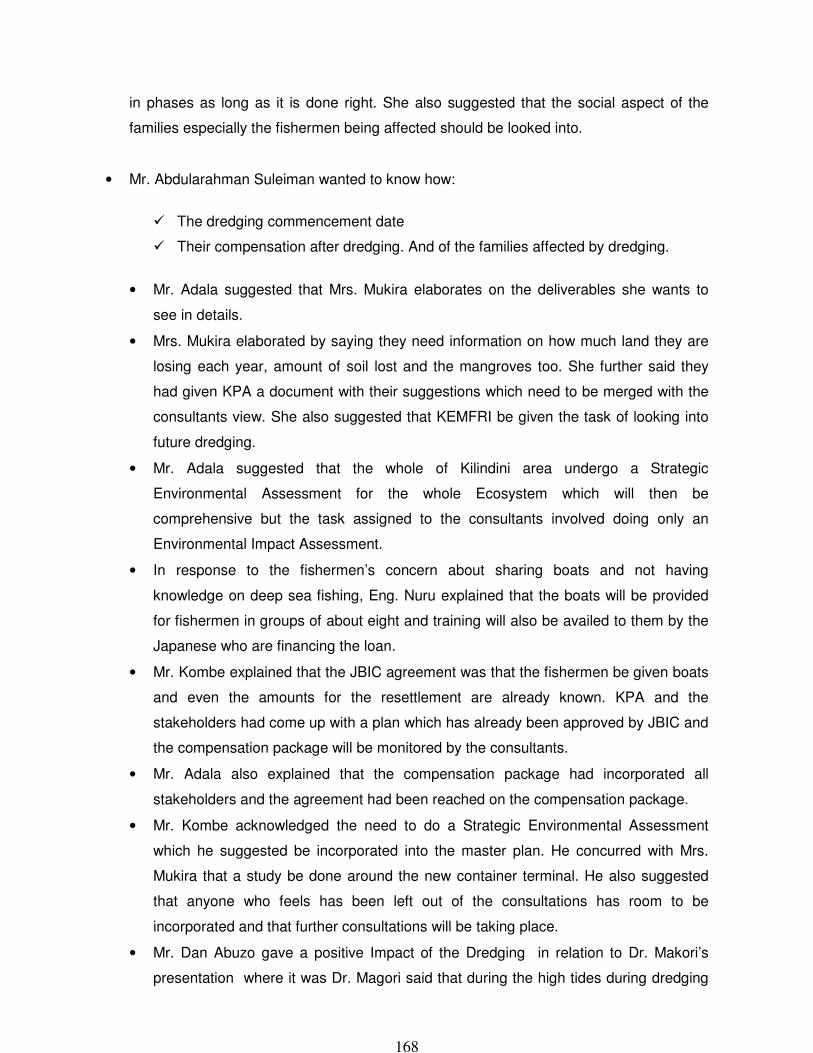
168
in phases as long as it is done right. She also suggested that the social aspect of the
families especially the fishermen being affected should be looked into.
• Mr. Abdularahman Suleiman wanted to know how:
The dredging commencement date
Their compensation after dredging. And of the families affected by dredging.
• Mr. Adala suggested that Mrs. Mukira elaborates on the deliverables she wants to
see in details.
• Mrs. Mukira elaborated by saying they need information on how much land they are
losing each year, amount of soil lost and the mangroves too. She further said they
had given KPA a document with their suggestions which need to be merged with the
consultants view. She also suggested that KEMFRI be given the task of looking into
future dredging.
• Mr. Adala suggested that the whole of Kilindini area undergo a Strategic
Environmental Assessment for the whole Ecosystem which will then be
comprehensive but the task assigned to the consultants involved doing only an
Environmental Impact Assessment.
• In response to the fishermen’s concern about sharing boats and not having
knowledge on deep sea fishing, Eng. Nuru explained that the boats will be provided
for fishermen in groups of about eight and training will also be availed to them by the
Japanese who are financing the loan.
• Mr. Kombe explained that the JBIC agreement was that the fishermen be given boats
and even the amounts for the resettlement are already known. KPA and the
stakeholders had come up with a plan which has already been approved by JBIC and
the compensation package will be monitored by the consultants.
• Mr. Adala also explained that the compensation package had incorporated all
stakeholders and the agreement had been reached on the compensation package.
• Mr. Kombe acknowledged the need to do a Strategic Environmental Assessment
which he suggested be incorporated into the master plan. He concurred with Mrs.
Mukira that a study be done around the new container terminal. He also suggested
that anyone who feels has been left out of the consultations has room to be
incorporated and that further consultations will be taking place.
• Mr. Dan Abuzo gave a positive Impact of the Dredging in relation to Dr. Makori’s
presentation where it was Dr. Magori said that during the high tides during dredging

169
the water will be deeper by about 2.3 M which is a good depth for more fish which
can be a god thing for the fishermen-more fish.
• Dr. Magori explained that water and sea materials come in during dredging and go
out during ebbing therefore there is a net effect on the sea level and the dirt too.
• Mr. Kombe suggested that the vessels used during dredging should be in a way that
they are careful not to dump the dredged material in areas that are not deep enough.
• In response, Mr. Adala explained that the dredgers will be environmental compliant.
He explained that the consultants will make sure the NEMA requirements are being
followed.
• Mr. Okumu explained that the consultants had already put into considerations the
types of dredgers, and the dumping method which will be environmental compliant
and by NEMA standards.
• Mr. Kombe suggested that all material whether contaminated or not should be
subjected to treatment.
• Mr. Adala in response to Mr. Kombe’s suggestion explained that hard materials had
no evidence of contamination. The contamination was with the silty materials.
• Mr. Okumu also explained that the material if contaminated will not be dumped.
• Mr. Gwada explained that there are legislative frameworks to be followed especially
where Kenya is a signatory and has therefore to comply.
• Mr. Kombe expressed his concern about the consultant’s preparedness in the event
of pollution or other environmental disasters. He suggested that consultants come up
with a report to show their preparedness in the event of an emergency.
• Mr. Mwinyikai wanted to know the dredging areas, Mr. Adala explained.
• Mr. Mwinyikai also wanted to know what will happen to the fishermen after the
dredging as the fishermen will have been displaced and there will be a lot of
congestion.
• Eng. Nuru explained that aside from JBIC giving the fishermen the boats, it will also
give them training to ensure sustainability and maintenance.
• Mr. Mwinyikai further said that there are different types of fishermen who do different
types of fishing therefore cannot be accommodated in a single boat in a single area.
• Eng. Nuru explained that there will be monitoring to ensure the fishermen’s needs are
met.
• Mr. Adala explained that consultations are still ongoing and that the fishermen should
air their concerns which will be looked into and that the compensation decision was
not final and still up for further negotiations.

170
• Mrs. Martha Mukira suggested a fisheries stakeholder be part of the team in the
training of the deep sea venture. She also suggested a conflict management team
between KPA, fishermen and the fisheries.
• Eng. Nuru suggested that all fishermen have a valid license to enable KPA to know
who are to be rightfully compensated.
• Mr. Adala suggested there be further consultations concerning fishermen’s security
issues where Beach Management Unit, KWS and all stakeholders be involved where
all conflicts should be resolved .
• Mr Omari Bakari wanted clarification as to whether:
Fishermen will be able to fish in the dredged areas after the project
The sort of boat that will be given to the fishermen
• Mr. Adala explained that there is a provision for mobilisation and training and if not
there will be monetary compensation to be added. He also suggested that the
chairman of the BMU meet with Mrs Mueni who will then forward their concerns.
• Mr. Kombe also explained that in case the fishermen had any problems, the
consultants are available to forward their concerns.
• Grace Wendy explained that in regards to Mr. Gwada’s presentation, unlike what Mr.
Gwada explained that during the survey there were no turtles found around shelly
beach, there were actually turtles around shelly beach. She also suggested use of
standard vessels to avoid oil spillage.
• Mr Gwada explained that during the study, the turtles were not found as the study
was short but the dredging will not affect the nestling site for turtles but their migratory
route might be affected.
• Mrs. Mukira suggested that dredging not be done during the migration times of the
turtles and suggested all areas nurturing the animals like the turtles be protected.
• Ms. Joan wanted to know how the sea grass will be affected during dredging.
• Mr. Maina said that sedimentation during dredging should not be allowed to go
beyond the required levels.
• Mr. Otieno explained that the port area is not suitable for fishing because there was
some evidence of traces of heavy metals found in the port area which was being
consumed by the fish and therefore the human population which is highly detrimental
to the human health.
• He also said that KPA’s master plan has to have an environmental strategy. He also
said that the EMP is generic and therefore the need for an action plan. This needs to
be emphasised to the prospective contractor. He insisted the contractors and

171
consultants seek consultative process to the end which should be all inclusive and
transparent to avoid conflict as any conflict by parties could lead to the project being
stalled.
• Mr. Kombe closed with a word of prayer.

172
Coastal Oceans Research and Develpoment Indian Ocean (CORDIO), EAST AFRICA OFFICE
Date: 29.10.2008
Representatives: Dr Shakil Visram Associate Post Doctrate Fellow, Corals
Innocent Wanyonyi Associate, Regional Coordinator, SocMon WIO
Particular Area of Interest:
Coral Reef/ Species
Issues Discussed
1 Dr Visram requested that the consultants/client consider moving the off-shore
dumping ground further out. The feeling if cordio is that the dispersal plume, although simulating a scenario whereby the plume will outside the 50m contour (coral existence), the margin for error is slim.
2 Dr Visram inquired about the accuracy of the simulation model. If there was a an
in-accuracy in the the simulation model, the plume will definatley breach the 50m contour line.
3 Consider a further dumping ground. Perhaps 4 or 5km off-shore 4 Mr Wanyonyi inquired about the possible handling of contaminated material. The
consultants explained that there are mitigation measures in place that will ensure that un-acceptable material are identified early and disposed on land based, and contained receptors
Notes:
1 In stakeholder meet, expand on accuracy of Simulation Model - DR MAGORI 2 In stakeholder meet, explain contaminated material handling in detail - Eng
ADALA & DR MUNGA

173
Department of Coastal and Marine Fisheries, Ministry of Fisheries Devlopment, MOMBASA.
Date: 30.10.2008
Representatives: Mrs Martha Mukira Assistant Director, Fisheries.
Simon M. Komu District Ficheries Officer, Lamu
Elizabeth Mulwa Senior Fisheries Officer
Collins K. Ndoro Senior Fisheries Officer
Geoffrey Kamakya Senior Fisheries Officer
Stanley M. Nuguti District Ficheries Officer
Ephraim Wairangu Senior Fisheries Officer
Ndegwa Stephen Senior Fisheries Officer
Particular Area of Interest: Fishing and related
Issues Discussed
1 Mrs Mukira questioned the credibility of KPA to implement any mitigation
measures that were suggested in the study. She pointed out that since a recent oil spill, KPA have yet to fullfill their compensation pledged/ resposilibilities
2 The fisheries officers felt that this tudy should bring out the socio-economic
aspects very cleary.
3 Fisheries suggested that in future, KPA should look into adopting early mitigation measures against siltation e.g. farming in highlands and intergrated catchment management.
4 Mrs Mukira also suggested that KPA should also expand their Cooperate Social
Responsility to reach the communities from which the Fishers & PAP come from e.g. Drill BH, wells, markets
5 Fisheries requested that the EIA study include data on the effects of the 2005 Oil
Spill an it's effects on the fish stock at the port.
6 Fisheries queried if the local people were questioned during the study, especially the sea-turtle study
7 Mrs Mukira suggested that the study make recommendations to the formation of
a Turtle Nesting Ground Protection Act
8 Fisheries requested that The EIA study make recommendations to KPA to provide Fishing Gear and training as part of their compensation package.
9 Fisheries requested that the presentation be clearer on; data being current,
mitigation measures - containment, economic effects, effects on fish stocks,
10 Fisheries suggested that they work with KPA in the implemementation of mitigation measures
Notes:
1 KPA should prove commitment in stakeholder meet.
2 KPA to make stand on; oil spill, compensation (funds available),

174
National Environmental Management Authority, MOMBASA.
Date: 31.10.08
Representatives: Maurice Otieno Provincial Director of Environment
Particular Area of Interest: Regulatory
Issues Discussed
1 Mr Otieno feels that NEMA-HQ should have been thoroughly consulted on the
TOR of the study at the Genisis stage
2 Mr otieno suggested that we also consult with Kenya Maritime Authority. 3 Traffic control is an aspect that should be clear. 4 NEMA would like to know were previouse disposal sites are for dredging works.
Notes:
1 Contractor is required to submit a detialed port traffic control plan - Dredging Programme = Traffic Maintainance & Control (clause 8.1.4(3))
2 KMA to be invited to stakeholder consultation.

175
Kenya Wildlife Services, Mombasa
Date: 10.11.2008
Representatives: Mr Gitau Assistant Director, KWS
Alice Bett Research Scientist
Silas Murithi OC Intelligence
Grace Wendot Assistant Warden
Elijah Chege OC Investigation
Arthur Tuda Warden
Josphine Mituso Research Assistant
Immaculate Muthui Research Scientist
Rose Abae Research Assistant
Stephen Okoth OC Intelligence
Particular Area of Interest: Marine Protection
Issues Discussed
1 KWS pointed out that they will be in a better position to mak comments when
they read the final report.
2 Particular interest was drawn to th handling of contaminated material. 3 KWS noted that there might be a conflict between port boundary and Marine
Protected Area (MPA)
4 KWS would like some of the data to be more current e.g. details on shark species, details on sting ray species. This will be key in determining whether species are on the IUCN protection list
5 KWS suggested to ensure transect data are consistent which is good for
comparison
6 Study should consider Conservation of Migratoy Patterns - Sea Turtles 7 It was suggested that the possibility of invasion of some species as a result of
dredging works be addressed
8 KWS would like to see particular attention paid to port traffic control 9 KWS raised concern about the recovery of natural conditions at the dumping
grounds 10 KWS requested that an additional monitoring point be inculded within the MPA 11 KWS suggested that structures are put into place to ensure that the
implemementation and management of the compensation package for fishermen.
12 Effects of Noise, Vibration and Visual impacts on the environment should be highlighted.
Notes:
1 Provide information on containment of contaminated material
2 Add monitring point in MPA

176
Kenya Marine and Fisheries Research Institute, MOMBASA
Date: 12.11.2008
Representatives: Jared Bosire Assistant Director
EstherFondo Research Officer
Dr Michael Nguli Head of Research, Oceanography
Dr Charles Magori Research Officer
Dr Daniel Munga Centre Director
Julius Okondo Research Officer
Jaqueline Uku Research Officer
Veronica Wanjeri Laboratory Technician
Particular Area of Interest: Marine & Fisheries
Issues Discussed
1 KMFRI suggested that KPA should monitor siltation closely after the dredging
works. It was suggeste that they recommendations should be made for KPA to purchase an echo-sounder
2 KMFRI suggested as part of CSR, KPA should consider purchasing a small scale
dredger and assist the community by dredging siltation areas.
3 It was recommended that the EIA should also consider the use of siltation screens to minimise the dispersal plumes.
4 KMFRI requested an expansion on the contaminated material handling
technique. 5 KMFRI also requested that an extra monitoring position be included in the MPA. 6 KMFRI asked about the loss of habitat and wether the recovery potential and
period had been considered.
7 KMFRI requested that KPA be more involved in conservation of mangroves as (1) CSR and (2) siltation control
8 It was also queired whether the study has recommended "compenation
restoration" i.e. for every loss of habitat, similar habitat is created elsewhere.
Notes: 1 Look into implementation of siltation screens if monitoring levels show elevated
turbidity levels outside simulation prediction. 2 KMFRI to suggest CSR recommendations to KPA in the stakeholder forum
18.11.08 3 Add monitring point in MPA
4 Attain details of containment receptor for possible contaminated materials.

177
APPENDIX 3: Fishermen’s Memorandum of Understanding

178

179
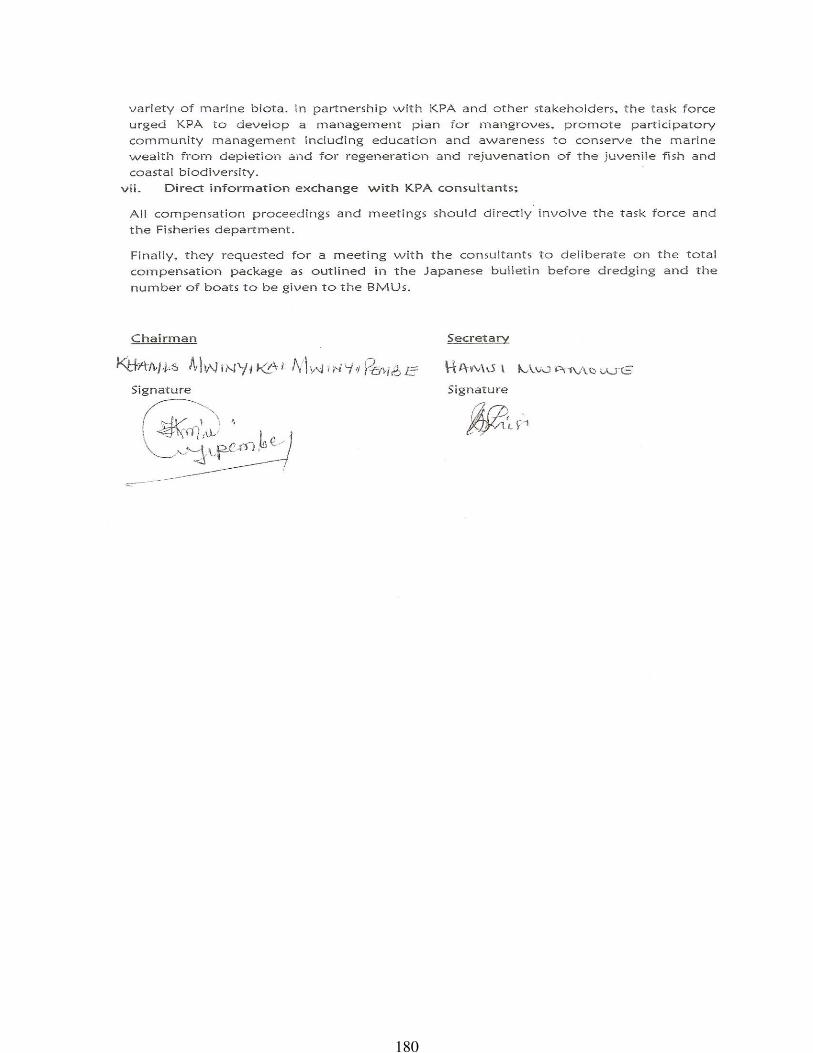
180
181
APPENDIX 4: Inception Report
Kenya Ports Authority
Republic of Kenya
INCEPTION REPORT
Consultancy for Environmental Impact Assessment for
Dredging Works
at Port of Mombasa
August 2007
Prepared by HEZTECH ENGINEERING SERVICES for
Japan Port Consultants, Ltd.
in Association with
BAC Engineers & Architects

182
TABLE OF CONTENTS
Item Page
1.0 INTRODUCTION…………………………………………………………. 1
2.0 COMPOSITION OF TEAM……………………………………………… 2
3.0 SCOPE OF STUDY……………..………………………………………. 3
3.1 Scoping……………………………………………………………. 4
3.2 Baseline Studies…………………………………………………… 4
3.3 Impact Prediction…………………………………………………. 6
3.4 Mitigation…………………………………………………………. 7
3.5 Monitoring………………………………………………………… 7
4.0 EIA LEGISLATION IN KENYA…………………………………………. 8
5.0 TIME SCHEDULE OF EIA STUDY……………………………………… 8
6.0 ENVRONMENTAL ISSUES TO BE STUDIED……………….…………. 9
6.1 Methodology………………………………………………………. 12

183
1.0 INTRODUCTION
The port of Mombasa is considered as a major gateway for the importation and exportation of
goods to Kenya and neighboring countries. The port currently handles approximately 500,000
TEU’s per year and demand forecast show that there will be a steady increase in container
throughput at the port to approximately 1,600,000 TEU’s per year by the year 2030 (SAPROF,
2006). This factor, coupled with the worldwide trend towards larger (post-panamax) ships,
stresses the need for expansion of the Port.
For the port of Mombasa to meet these demands and become a destination for major trunking
routes there is a necessity to:
1. Construct a New Container terminal to accommodate larger capacity container ships
and increased container storage capacity.
2. Deepen and widen, i.e. dredge Turning Basin in front of the New Container Terminal
and Navigation Channels to the Port of Mombasa to allow for the bigger ships to dock
at the port.
Under these circumstances, in April 2007, the Kenya government through Kenya Ports
Authority commissioned Japan Port Consultants in association with BAC Engineering &
Architects (Consultant) to carry out the consultancy services, Dredging and Hydrographic
Works at the Port of Mombasa (Tender number KPA/041/2006CE), for implementation of the
above Turning Basin and Navigation Channel dredging project (Project).
As part of the consultancy services, the Consultant is required to carry out a successful
Environmental Impact Assessment (EIA) study and attain a license for the Project from
National Environment Management Authority (NEMA). The aim of the EIA study is to
greatly reduce or prevent environmental damage caused by the dredging and its associated
works of the Project. To achieve this, the Consultant has subcontracted the EIA study to a
team of environmental experts led by HEZTECH ENGINEERING SERVICES (Study Team).
Precise locations and dimensions of planned dredging works will be decided based on the
results of detailed design during the consultancy services, however, possible figures can be
presented as Figure 1.
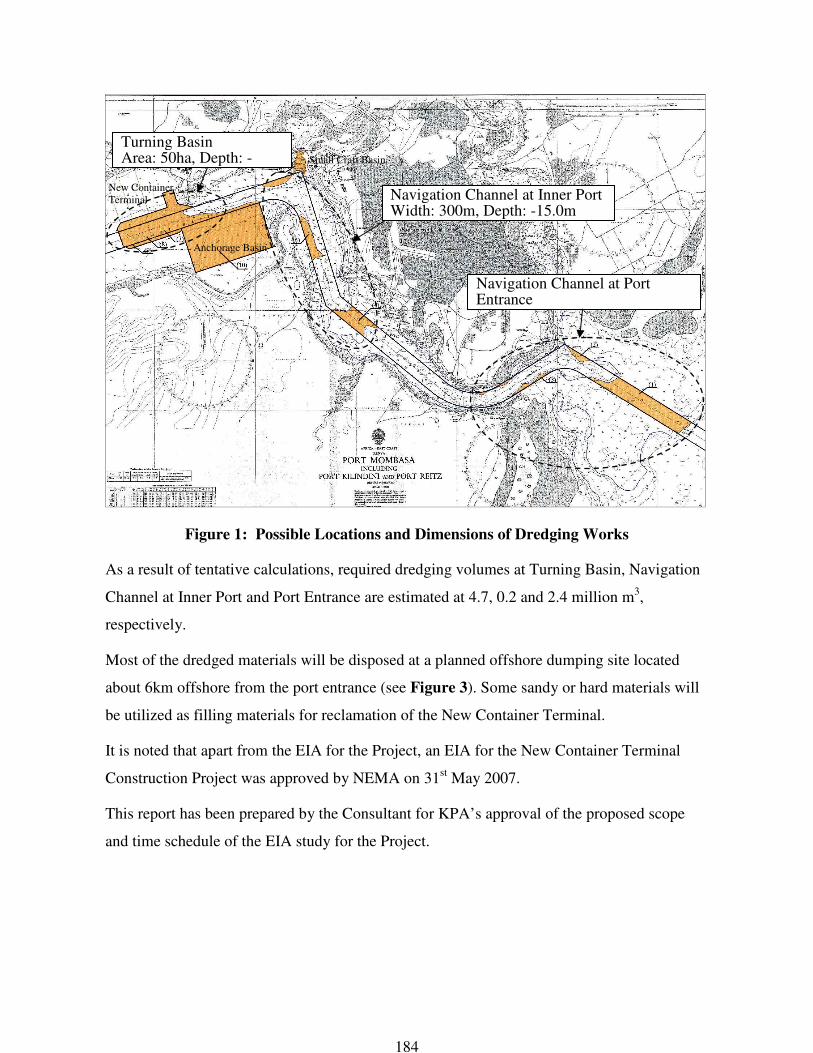
184
Figure 1: Possible Locations and Dimensions of Dredging Works
As a result of tentative calculations, required dredging volumes at Turning Basin, Navigation
Channel at Inner Port and Port Entrance are estimated at 4.7, 0.2 and 2.4 million m3,
respectively.
Most of the dredged materials will be disposed at a planned offshore dumping site located
about 6km offshore from the port entrance (see Figure 3). Some sandy or hard materials will
be utilized as filling materials for reclamation of the New Container Terminal.
It is noted that apart from the EIA for the Project, an EIA for the New Container Terminal
Construction Project was approved by NEMA on 31st May 2007.
This report has been prepared by the Consultant for KPA’s approval of the proposed scope
and time schedule of the EIA study for the Project.
Navigation Channel at Port Entrance Width: 300m, Depth: -17.5m
Navigation Channel at Inner Port Width: 300m, Depth: -15.0m
Turning Basin Area: 50ha, Depth: -15.0m
Anchorage Basin
Small Craft Basin
New Container
Terminal

185
2.0 COMPOSITION OF STUDY TEAM
The Study Team has been formed comprising of eight (8) specialists listed in Table 1, each
with responsibility for specific part of the EIA study.
The EIA study shall be supervised by M Okumu, Environmental Specialist of the Consultant.
Table 1 Composition of Study Team
Name Specialty
H Adalla (Heztech Eng. Services) Environmental Engineer / Team Leader
D Munga Pollution Expert
P Gwada Marine Ecologist
C Magori Oceanographer
E Mweni Fisheries Expert
J Ochiewo Socio – Economist
C Odhiambo Health & Safety Coordinator
F Owiti Environmental Scientist

186
3.0 SCOPE OF EIA STUDY
Figure 2 shows the stepwise nature of the EIA study and the requirement for continuous
reappraisal and adjustment (as indicated by the feedback loops)
Scope of the EIA study will involve the following components:
3.1 Scoping
Scoping is an essential first step in the assessment. The main aims are:
• To identify at an early stage (when the project design is relatively amenable to
modification) what the key receptors, impacts and project alternatives to consider, what
methodologies to use, and who to consult
• To ensure that resources and time are focused in important impacts and receptors;
SCOPING AND PREPARATION OF TOR
BASELINE STUDIES
DESCRIPTION & EVALUATION OF BASELINE CONDITIONS
IMPACT PREDICTION
FORMULATION OF ENVIRONMENTAL MANAGEMENT
PLAN
(MITIGATION & MONITORING)
MONITORING (during Construction and Operation)
Primary pathway Feedback loops
Figure 2: Procedures on Environmental Components of EIA Study
PRESENTATIONS OF FINDINGS (REPORT)
EIA APPROVAL BY
NEMA
Scope of EIA Study

187
• To establish early communication between the client (KPA), consultants, NEMA and
other major stakeholders who can provide advice and information.
• To alert KPA of any possible constraints that may pose problems if not discovered
until later in the EIA process.
The scoping exercise will provide an implementation plan for subsequent steps by making
a preliminary assessment of:
• potential impacts of dredging on component receptors, estimated from the project
description;
• the impact area/zone within which impacts are likely to be effective, estimated from
the impact types and the nature of the surrounding area;
• possible mitigation measures;
• the methods and levels study needed to obtain reliable baseline information to
evaluate baseline conditions
3.2 Baseline Studies
This component will form the backbone of component assessments. It is only when they
provide sound information on the environmental systems around the port that valid impact
predictions can be made and effective mitigation and monitoring programs formulated.
Baseline studies will provide:
• a clear presentation of methods and results;
• indications of limitations and uncertainties, e.g. in relation to data accuracy;
• an assessment of the value of key receptors and their sensitivity to impacts;
• a very comprehensive sediment and water quality analysis for contamination levels
(see Figure 3 and Table 2), carrying out concentration analysis of key parameters
selected by the Consultant at a laboratory accredited by NEMA.
• Existence of coral reef in areas close to dumping site (see Figure 3).
• Environmental effects of different dredging methods to be used in this project.
Alternatives.

188
Figure 3 Locations of Baseline Studies
Table 2 Description of Sediment and Water Quality Analysis
Item Parameter Sampling
Sediment Quality Organics, Heavy metals (Cd, Hg,
Pb, As, Cr), Grain size
Samples will be taken by divers from
50cm below waterbed surface.
Water Quality
Temp, pH, Salinity, Organics,
Nutrients, Heavy metals (Cd, Hg,
Pb, As, Cr), Coliforms, Turbidity
(SS)
Samples will be taken from 3 layers (1m
below surface, middle and 1m above
waterbed surface), but from 2 layers (1m
below surface and 1m above water be
surface) in case water depth is less 10m.
Sampling will be done during ebb tide.
Mombasa Marine National Reserve
New Container Terminal
New Container Terminal
Dumping SiteDumping SiteDumping SiteDumping Site Water Quality : 12 points
Sediment and Water Quality : 8
points
Sediment and Water Quality : 15
points
Turning Turning Turning Turning
Area of Coral
Survey

189
3.3 Impact Prediction
Impact prediction of dredging will include:
• Direct/ primary impacts – that are direct result of dredging
• Indirect/ secondary impacts – that may be “knock-on” effects of (and in the same
location as) direct impacts, but as often produced in other locations and/or as a result
of a complex pathway.
• Cumulative impacts – that accrue over time and space from a number of
developments or activities.
The Consultant and Study Team, in order to predict impacts will;
• have a good understanding of dredging, channel design, construction activities and
timing;
• have knowledge of the outcomes of similar projects and EIAs, including the
effectiveness of mitigation measures;
• have knowledge of past, existing and approved nearby projects that may have
cumulative impacts with the proposed dredging works.
• Attain adequate information on relevant receptors, and knowledge of how these may
respond to environmental changes.
There are several techniques that can aid in impacts prediction and assessment of
environmental components. Checklists are useful in identifying key impacts and ensuring
that they are not overlooked, especially in scoping. They will include information such as
data requirements, study options, questionnaires and statutory thresholds. Matrices will
be used for impact identification and also to show cause link effects between impact
sources and impacts. They can also indicate features of impacts such as their predicted
magnitudes and whether they are likely to be localized or extensive, short or long term etc.
Flowcharts and networks will be used to identify cause-effect
relationships/links/pathways: between impact sources; between sources and impacts; and
between primary and secondary impacts. Computer Simulation will be applied to
calculate deterministic or probabilistic quantitative values from numerical input data.
Maps will also be used as an indicative tool.

190
3.4 Mitigation
Mitigation measures will aim to avoid, minimize, remedy or compensate for the predicted
adverse impacts of the project. Much of the environmental damage from dredging
activities occurs during the actual works stage when material is harvested/ dredged and
subsequently dumped. There would be need for an adequate dredging phase
management plan to deal with any changes and to closely monitor the work which will
be carried out by a contractor.
The mitigation measures to be proposed in the EIA study shall be realistic and
sustainable.
3.5 Monitoring
Monitoring can be defined as the continuous assessment of environmental or socio-
economic variables by the systematic collection of data in space and time. It can be
continuous but in this case will involve periodic repeat data collection. Monitoring in this
project will include baseline monitoring, impacts and mitigation monitoring during
dredging and compliance monitoring during maintenance dredging activities.
Monitoring will be used to verify whether the conditions of the EIA license from NEMA
are met – compliance monitoring – and that the assumptions made during the EIA review
and site selection process were correct and sufficient to protect the environmental and
human health – field monitoring.
The monitoring plan to be proposed in the EIA study shall include parameters, locations,
frequencies, duration, target values, required cost, human resource and institutional
arrangement of the monitoring activities.
4.0 EIA LEGISLATION IN KENYA
The Environmental Management and Coordination Act (EMCA), 1999, largely governs
environmental legislations in Kenya. The National Environmental Action Plan initialized this
Act.
Under Part III of the EMCA, 1999, the country has a council known as the National
Environmental Council, which is chaired by the Minister for Environment and Natural
Resources. The council is responsible for formulation and prioritization of the policies within
the Act. The council has appointed an authority whose objective and purpose is to exercise

191
general supervision and coordination over all matters relating to the environment and to be the
principle instrument of government in implementation of policies at all levels. This authority
is known as the National Environment Management Authority (NEMA), which is based in
Nairobi.
The Council appoints a Provincial Environment Committee. The Provincial Environment
Committee is responsible for the matters specified in the first schedule of the provincial level
and whose area for jurisdiction falls wholly or partly within the province. The Committee is
responsible for the proper management of the environment within the province.
The Council appoints a District Environment Committee. The District Environment
Committee is responsible for the matters specified in the first schedule of the provincial level
and whose area for jurisdiction falls wholly or partly within the district. The Committee is
responsible for the proper management of the environment within the district.
5.0 TIME SCHEDULE OF EIA STUDY
The EIA study will be conducted following the time schedule shown in Table 3.
Table 3 Time Schedule of EIA Study
Component 2007
July Aug. Sep. Oct. Nov. Dec. Jan. Feb. Mar. Apr.
Preparation
Baseline Survey
Impact Prediction
EMP Formulation
Assistance for EIA
Approval
Reporting
Inception Interim Draft Final EIA
Final EIA Submission for Approval
(Computer Simulation)
192
6.0 ENVIRONMENTAL ISSUES TO BE STUDIED
Dredging, like most maritime development activities, throughout history has been known to
have serious implications on many aspects of the environment and some of them could be
permanent if inadequate mitigation techniques are not implemented. The port and its
surrounding can be very rich and sensitive in natural and renewable resources that need to be
studied when implementing a project.
The consultants will compare different dredging and disposal options to determine whether
the proposed dredging methodology is the most environmentally suitable. The consultants
will take into account the following aspects:
1. Types of Dredgers and their associated impacts.
2. Dumping alternatives; open water, land and beneficial (reclamation) options,
considering implementation schedule of the New Container Terminal Construction
Project.
3. Necessity of channel dimensions (depths & widths)
4. Dredging time schedules and suitability with regard to seasonal environmental
conditions and water dynamics.
Proper selection of a dump site at sea for the reception of dredging waste will be assessed.
The information the consultants will collate will include:
1. Physical, chemical and biological characteristics of the water column and the sea bed.
2. Location of amenities, values and other uses of the sea in the area under consideration.
Recreational, scientific interest, historical, fishing/economical, shipping, military
exclusion.
3. Assessment of the constituent fluxes associated with dumping in relation to existing
fluxes of substances in the marine environment.
4. Economic and operational feasibility.
A common problem in dredging in tropical countries such as Kenya is the dispersal and
resettlement of suspended particles on sensitive aquatic ecosystems e.g. coral reefs. This
issue is more prominent when carrying out capital dredging than in comparison with
maintenance dredging mainly because of the dredging volumes. Similarly, deepening can

193
result in increased shoreline wave action with consequent accelerated erosion and other
problems. The preferential use of a trailer suction dredger will allow for minimal allowance of
sea bed material during the works. Suction dredgers operate by sucking through a long tube,
like some vacuum cleaners. The tube can have a cutter to disturb stubborn material though on
this project the material is expected to be soft hence no need for a cutting tool. The study team
will apply simulation numerical model of diffusion of SS and sedimentation of dumped soils.
See Appendix 1 for methodology of the dispersal and settlement simulation model.
In order to ascertain appropriate dumping locations, it is important to carry out dredged
material characterization. Previous studies in the area have shown that there is a possibility
for heavy metal contamination in the upper layer of the sea bed around the port. If this is
confirmed, the dredging material will be classified as hazardous material and would require
specialized dumping techniques which will be explored in this study. If the material is
confirmed clean it can be dumped or beneficially used for engineering purposes (such as
reclamation), or for environmental enhancement (beach replenishment). Figure 4 shows the
framework to be used for assessment of dredged material. Characterization should be done for
chemical, physical and biological properties.
NB: All analytical work will be carried out in a NEMA accredited laboratory and all results
will be accompanied by Quality Control Data.
In the case where contamination is identified, the consultants will provide a solution taking
into account the criteria and standards to be used, the economic considerations i.e. cost
effectiveness and the most suitable technological clean up technique to be used.

194
NEED FOR DREDGING
Dredged material
Characterization
Is material
acceptable?
Beneficial Use Possible? Beneficia
l Use
YES
No
Identify and Characterize
Disposal Site
Determine Potential Impacts
and Prepare Impact Prediction
Can Material
Be Made
Acceptable
YES
No
No
Other
PERMIT?
YES
YES
DREDGE/DUMP &
MONITOR
Figure 4: Dredged Material Assessment Framework.

195
6.1 METHOLOGY PROPOSED DREDGING OF THE ACCESS CHANNEL AT KPA, MOMBASA
Item Details Deliverable
Project
Description
The consultants would identify the development
project to be assessed and explain the
executing arrangements for the environmental
assessment. This section of the report will
detail the rationale for the development and
its objectives. Also to be covered is the
context of the proposed project in relation to
future plans for development of Mombasa Port.
A detailed project outline will be given
to familiarize stakeholders on the project
objectives and scope. This is to include: quality and volume of sediments to be
excavated in each area to be dredged; type
of dredging equipment to be used and the
manner of deployment including handling,
transportation, and disposal of dredged
material, sediment containment settling
and turbidity control measures;
alternative dredging methods considered;
project schedule; and project life span.
Legal &
Regulatory
Reference.
Conventions
and Codes.
The consultants will identify relevant and
appropriate legal and regulatory references to
be used in the study and in decision/ action
making. Standards.
E.g. London Convention 1972, World Bank,
EMCA 1999, International Association of
Dredging Companies (IADC), Central
Dredging Association (CEDA), UNEP.
Baseline
environmental
data
Consultants will document the current state of
the study area in relation to current and
future state.
Brief description of physical environment,
biological environment, socio-economic
state and hazard vulnerability.
Materials
Classification
Study needs to determine the characteristics
of the material in the areas to be dredged.
This will mitigate impacts caused.
Materials testing to determine chemical,
biological and physical characteristics.
This information is critical to

196
determining disposal or treatment of
dredged techniques. Refer to chapter 4
Dispersal of
Suspended
Sediments
Sediments become re-suspended during initial
excavation and during deposition at designated
dumping sites. The consultants will determine
dispersal and settlement of re-suspended
sediments:
Dependant on dredging methods. Simulation
model of diffusion of SS and sedimentation
of dumped soils to be used. See Appendix 1
Effects on
tidal patterns
Influence on tidal and river flows. Altered salt wedge intrusion. Accelerated natural sediment deposition. Attraction of desirable or undesirable fisheries. Altered bottom biota.
Bathymetric survey data to be analysed

197
Shoreline
configuration
Change in current patterns can lead to
subsequent shore and coastal erosion.
Identify possible affected areas.
Effects on
ecological
component
Dredging and dumping activities can lead to
Loss of bottom habitat (sea turtles), shell fisheries, fishery food resources: Exposed subsurface materials unconductive to recolonization. Lost attachment potential for aquatic biota. Current pattern changes.
Sea bed investigation for faunal and
floral species and cross reference with
protected species list etc. Record of
designated sites e.g. Marine Park
Noise from
dredging
activities
Ascertain the background noise levels
generated currently and compare with predicted
noise levels generated by the proposed
dredging equipment.
Noise survey to be carried out by the
consultants to get relevant noise levels
at source and at impact zones
Handling of
Contaminated
Material
Determine toxicity levels of the dredged
material possible remediation and containment
techniques. Important to determine the bio-
availability of heavy metals.
Sediment and water sampling from numerous
points in areas to be dredge with
subsequent testing in accredited
laboratory. If contaminated, suggest
possible remediation and containment
techniques of material. Action list, see
chapter 4.
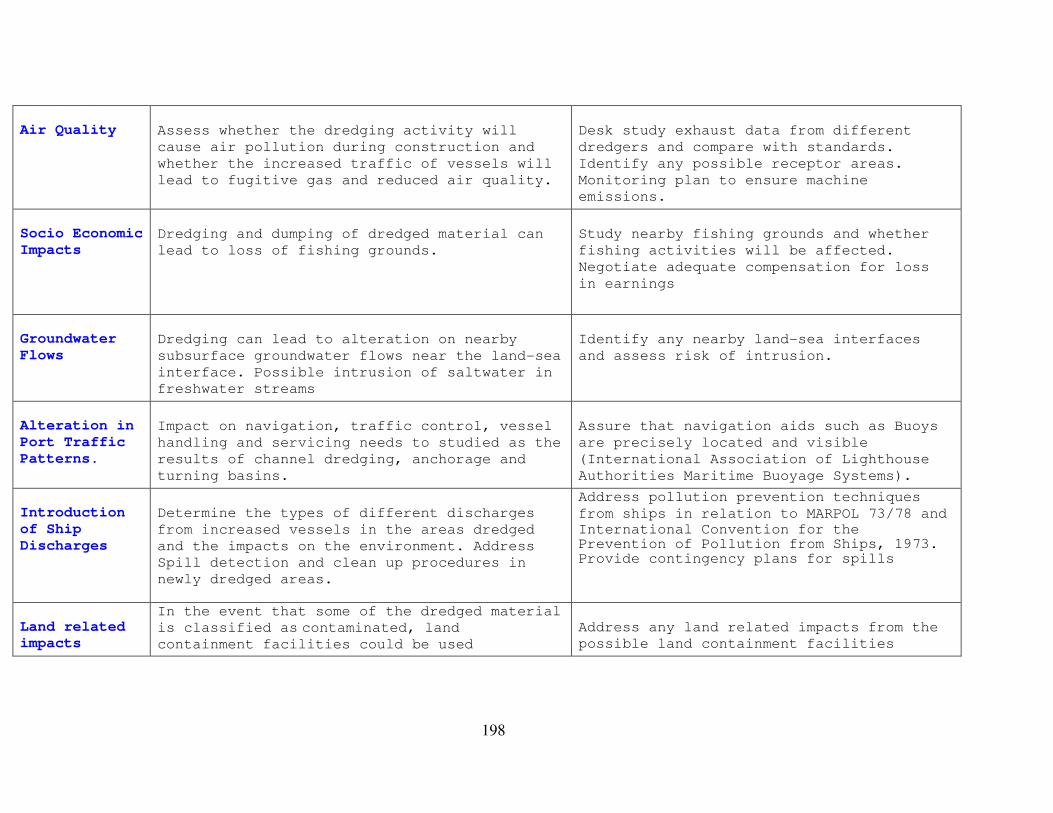
198
Air Quality Assess whether the dredging activity will
cause air pollution during construction and
whether the increased traffic of vessels will
lead to fugitive gas and reduced air quality.
Desk study exhaust data from different
dredgers and compare with standards.
Identify any possible receptor areas.
Monitoring plan to ensure machine
emissions.
Socio Economic
Impacts
Dredging and dumping of dredged material can
lead to loss of fishing grounds.
Study nearby fishing grounds and whether
fishing activities will be affected.
Negotiate adequate compensation for loss
in earnings
Groundwater
Flows
Dredging can lead to alteration on nearby
subsurface groundwater flows near the land-sea
interface. Possible intrusion of saltwater in
freshwater streams
Identify any nearby land-sea interfaces
and assess risk of intrusion.
Alteration in
Port Traffic
Patterns.
Impact on navigation, traffic control, vessel
handling and servicing needs to studied as the
results of channel dredging, anchorage and
turning basins.
Assure that navigation aids such as Buoys
are precisely located and visible
(International Association of Lighthouse
Authorities Maritime Buoyage Systems).
Introduction
of Ship
Discharges
Determine the types of different discharges
from increased vessels in the areas dredged
and the impacts on the environment. Address
Spill detection and clean up procedures in
newly dredged areas.
Address pollution prevention techniques
from ships in relation to MARPOL 73/78 and
International Convention for the Prevention of Pollution from Ships, 1973. Provide contingency plans for spills
Land related
impacts
In the event that some of the dredged material
is classified as contaminated, land containment facilities could be used
Address any land related impacts from the
possible land containment facilities
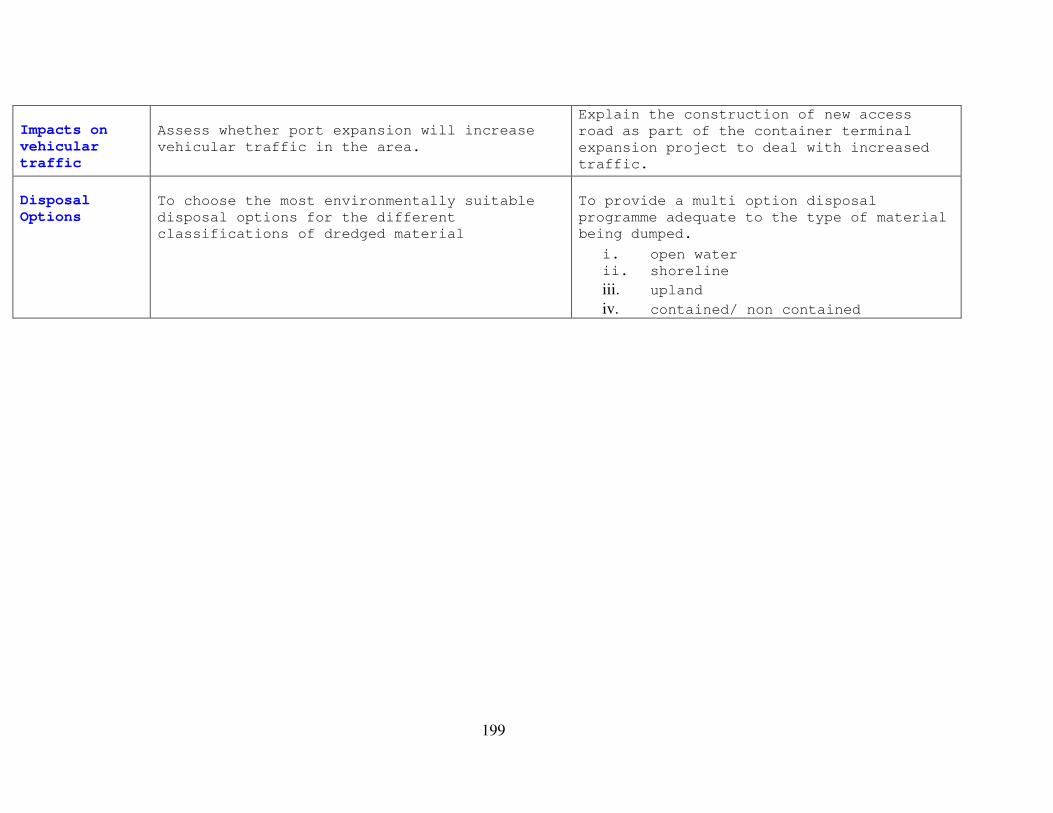
199
Impacts on
vehicular
traffic
Assess whether port expansion will increase
vehicular traffic in the area.
Explain the construction of new access
road as part of the container terminal
expansion project to deal with increased
traffic.
Disposal
Options
To choose the most environmentally suitable
disposal options for the different
classifications of dredged material
To provide a multi option disposal
programme adequate to the type of material
being dumped.
i. open water
ii. shoreline
iii. upland
iv. contained/ non contained

200