401.4ki **V'
14
40 1 . 4 ki ASATE) >. **V' EA-4 119 MILITARY TECHNICAL COLLEGE CAIRO - EGYPT EXPERIMENTAL AND NUMERICAL INVESTIGATION OF THE FLOW THROUGH CASCADES ** Ghazy M. R. Assassa and Mamdouh E. Abdel Ghany ABSTRACT Investigation of the flow through two-dimensional cascade is considered in the present work, the relation between cascade geometric and aerodynamic parameters is handled both experimentally and theoretically. Experiments have been performed on an isolated airfoil and a cascade of airfoils. The pressure distribution along the airfoil contour was measured at different incidence angles, for the isolated airfoil, and different stagger and inlet flow angles, for the cascade; NACA 0015 blade section is employed in the measurements. The theoretical approach to calculate the frictionless flow through two-dimensional cascades was conducted using the singularity method of Schlichting, the airfoil is replaced by distributions of vortices, and sources and sinks. The direct problem is considered i.e. determination of the vortex and source distributions related to a prescribed profile geometry. A computer program, in Basic language, is developed for that purpose. The measured pressure distributions along the blade suction and pressure sides were compared with the computed results. Moreover, the present prediction is compared with other experimental data that covers a variety of geometrical configurations and flow conditions. The comparison shows that the present computer code is stable and efficient; it is economical and yields good engineering results. * Associate Professor, ** Graduate Student Dept. Of Mechanical Eng., Shoubra Faculty of Engineering, 108 Shoubra Str., Cairo.
-
Upload
khangminh22 -
Category
Documents
-
view
0 -
download
0
Transcript of 401.4ki **V'

401.4ki ASATE)•■•>.
**V' EA-4 119
MILITARY TECHNICAL COLLEGE
CAIRO - EGYPT
EXPERIMENTAL AND NUMERICAL INVESTIGATION OF THE FLOW THROUGH CASCADES
**
Ghazy M. R. Assassa and Mamdouh E. Abdel Ghany
ABSTRACT
Investigation of the flow through two-dimensional cascade is
considered in the present work, the relation between cascade geometric and aerodynamic parameters is handled both experimentally and theoretically. Experiments have been performed on an isolated airfoil and a cascade of airfoils. The pressure distribution along the airfoil contour was measured at different incidence angles, for the isolated airfoil, and different stagger and inlet flow angles, for the cascade; NACA 0015 blade section
is employed in the measurements. The theoretical approach to calculate the frictionless flow through two-dimensional cascades was conducted using the singularity method of Schlichting, the airfoil is replaced by distributions of vortices, and sources and sinks. The direct problem is considered i.e. determination of the vortex and source distributions related to a prescribed profile geometry. A computer program, in Basic language, is developed for
that purpose.
The measured pressure distributions along the blade suction and pressure sides were compared with the computed results. Moreover, the present prediction is compared with other experimental data that covers a variety of geometrical configurations and flow conditions. The comparison shows that the present computer code is stable and efficient; it is economical
and yields good engineering results.
* Associate Professor, ** Graduate Student Dept. Of Mechanical Eng., Shoubra Faculty of Engineering,
108 Shoubra Str., Cairo.

Sot for stagger arcs space variation
Yi z
Disc for het angle variation
(b)
Ftov
I Cgm, in cm
Test section details
SECOND A.S.A.T. CONFERENCE
EA-4 1 120 21 - 23 April 1987 , CAIRO
INTRODUCTION
The quasi three-dimensional flow through the blading of a turbomachine is usually considered as a combination of two basic two-dimensional flows (1,2], the first is the mean merdional flow on stream surfaces assumed of revolution about the axis of rotation, and the second is the cascade, or the blade-to-blade, flow on these stream surfaces. The present investigation considers the flow through two-dimensional cascades. The main problem in the investigation of two-dimensional cascades is to find the relation between the geometric and aerodynamic parameters.
m, [31 axial direction
c blade chord s cascade space (pitch) W1 inlet flow velocity W2 outlet flow velocity Al inlet flow angle Al outlet flow angle A stagger angle
Fig. 1. (a) Cascade representation (b) Schematic of the wind tunnel and test section.
The geometric parameters could be obtained from airfoil shape and airfoils arrangement in the cascade as shown in Fig. 1(a). The aerodynamic parameters of a cascade are the inlet and outlet flow angles, the pressure distribution along the blade contour, and the resultant aerodynamic force. The relation between the geometric and aerodynamic parameters could be handled experimentally and/or theoretically. Experimental investigations had been carried out for a wide range of two-dimensional compressor cascade configurations at low speed, C3,4,5,6], e.g. NACA 65-series laminar airfoils. These experimental results are

SECOND A.S.A.T. CONFERENCE
21 - 23 April 1987 , CAIRO
EA-4 121
used as a design basis for engineering applications in the field of axial turbomachinary. Two-dimensional cascade test data at low speed are essential for design purposes, corrections for high speed (compressibility effect) could be introduced 11,7,87; moreover, they pi-divide a means for testing and evaluating the existing computational methods.
The present work follows the above methodology. An experimental investigation is conducted and a computational method for the inviscid flow is adopted. Comparisons between the computed results against the present measurements and some other measurements available in the literature are also presented.
2- EXPERIMENTAL WORK
2.1- Wind Tunnel Discription and Instrumentations
Experiments were conducted using a modified version of a low speed open circuit wind tunnel laboratory facility, originally dedicated to isolated airfoils. The modification was necessary to convert the circular test section into a rectangular one, thus allowing measurements to be carried out for cascade configurations. Figure 1(b) shows the actual wind tunnel facility used in the present measurements. Air is drawing into the test section by an axial flow type fan driven by a D.C. motor (1.5 kw), the air velocity can be continuously raised up by adjusting the fan speed via a control unit. The contraction is of rectangular cross-section of length 0.61 m and contraction ratio 1 to 2.6. The test section dimensions are 0.43 m width, 0.46 m length, and 0.20 m height. In order to vary the inlet flow angle, the bottom side of the test section was manufactured such that it has a circular disc on which a cascade of airfoils could be mounted and rotated as a block, i.e. at constant stagger angle. Changing the pitch between airfoils is achieved by a slot in the disc.
Regarding airfoil selection, the following points were considered. Extensive experimental data are available for laminar airfoils, e.g. the NACA 65-series [4]: this is not the situation as far as the classical 4-digits NACA series is considered. This last series is used in wind turbines and in the blades of the main rotor of helicopters. The present experimental investigation was carried out using NACA 0*15 blade section. Selection of this type of symmetrical airfoil, rather than cambered one, is related to three reasons : (1) ease of manufacturing of the outer surface and of fitting the blade contour pressure holes with the necessary tubes; (2) decreasing, for small inlet and stagger

SECOND A.S.A.T. CONFERENCE
EA-4 122 21 - 23 April 1987 , CAIRO
angles, the test section upper and lower walls effect (walls facing airfoil upper and lower sides i.e. walls limiting the maximum number of airfoils in the test section) that would be significant if cambered airfoils were employed; (3) use of a relatively simple theoretical flow model that could be worked out on the available Z-100 Zenith Data System microcomputer; this is
achieved by employing a chord-wise singularity distribution that in the case of symmetrical airfoils is equivalent to the more accurate approach of camber-wise singularity distribution.
Six airfoils of NACA 0015 form were manufactured using wood as material, the coordinates of this airfoil are given in Ref. [93. The chord and span lengths are taken as 0.1 m and 0.2 m, respectively. A seventh airfoil was manufactured of aluminium and was fitted with seven pressure holes on both of its sides, thus allowing static pressure determination on the blade contour. The pressure holes, drilled normal to the blade surface, are of 1 mm diameter and are located at the following positions: for the upper side x/c = 0.05, 0.15, 0.25, 0.36, 0.5, 0.6, 0.7, and for the lower side x/c =0.05,0.15, 0.25, 0.36, 0.4B, 0.56, 0.7. A standard calibrated pitot tube of outer diameter 4 mm is employed to measure the upstream velocity and static pressure.
2.2- Test Procedure
Due to the expected test section upper and lower walls effect, the experimental work was limited to cascade configurations at low incidence angles. This limitation was imposed by the fact that for high incidence angles, the flow hits the wind tunnel wall, thus yielding a non periodic flow in the pitch direction. This limitation could be overcome by reducing the blade-chord dimension; however, this would yield a thin blade impractical for manufacturing with 14 pressure tubes connected to the holes on its contour. In addition, this would reduce the operating Reynolds number which is already limited by the maximum upstream velocity available in the wind tunnel.
The present experimental study was conducted at Reynolds number based on the chord of 160500 using NACA 0015 blade section. For the isolated airfoil, the incidence angle was varied as 0,5,10 deg. For the cascade, the following parameter were systematically used:
1) Space-chord ratio: s/c= 0.5,0.75 2) Inlet flow angle (deg.): -10,-5,0,5,10,15 3) Stagger angle (deg.):0,5,10,15
An additional value of unit space-chord ratio is used for the cascade at zero inlet flow and stagger angles; for the employed
test section and in absence of turning, icreasing cascade space had no detrimental effect as it would be the case in presence of turning. The static pressure distribution along the blade contour

SECOND A.S.A.T. CONFERENCE
21 - 23 April 1987 , CAIRO EA-4 123
was measured through the static pressure holes located along the blade suction and preasure sides. The upstream velocity and static pressure were measured using pitot tube. Reliability of the experimental data was checked by repeating the measurements under the same operating conditions. The pressure coefficient Cp is calculated as follows;
Cp = (P - P1 )/ ( 0.5 W1-2)
where P and P1 are the local and inlet static pressures ,respectively, WI is the inlet velocity, and / is the density.
3- THEORETICAL ANALYSIS
Incompressible potential flow through two-dimensional cascades is considered as the design basis for axial turbomachines at low speeds. Compressibilty effects could be, however, taken into account either directly or through corrections (1,7,8], and viscosity effects could also be handled by applying boundary layer theory, thus giving theoretical estimation for the loss coefficient. Theoretical investigations for the two-dimensional incompressible frictionless flow through cascades were reported, (10], for the case of direct, known geometric parameters, and indirect, known aerodynamic parameter, problems. Many numerical techniques could be used to solve the direct problem; e.g. finite differences (11,12], finite elements (7,13], conformal transformation [7,14], and the singularities methods C7,15,16,171 The field techniques, finite differences and finite elements, yield accurate results; however, their use require an experienced user to manipulate input data and control parameters, the corresponding codes may also limit the designer in the types of blade geometries, cascade configurations, and flow conditions (177. In order to accelerate the blade design procedure and give the designer more freedom in developing blade shapes, a simple blade-to-blade flow code has to be used. The singularity method seems simple and adequate for this purpose, (7,17]. In the
singularities method, the singularities may be distributed on the chord (7), on the camber (7,18], or on the blade contour
E16,177. A survey of the range of applicability of these methods showed that the chord-wise distribution approach yields results useful in engineering practice for airfoils with maximum thickness-to-chord ratio of the order 15 % [7]. The chord-wise
distribution of singularities, Schlichting method (7,14], is
adopted in the present analysis, a computer code in Basic is
developed using Z-100 Zenith Data System microcomputer. The code was tested and proved to be Simple, stable and efficient. Such a code provides a means of rapidly screening blade designs for analysis by more complex codes which have better accuracy.

SECOND A.S.A.T. CONFERENCE
21 - 23 April 1987 , CAIRO EA-4 124
3.1- Schlichting Method
According to the singularities method of Schlichting for the inviscid incompressible flow through two-dimensional cascades, each airfoil of the cascade is replaced by a continuous distribution of vortices, and sources and sinks; these singularities are situated on the chord [7,143. The flow around an airfoil of finite thickness with camber and incidence could be found by superposition of two basic flows. The first flow, around the uncambered airfoil of finite thickness, is represented by a source and sink distributions; whereas, the second flow, around the infinitly thin camber line with incidence, is represented by a vortex distribution. The singularities could be represented by suitable series expansion with free coefficients. The basic procedure for solving the direct problem consists in the determination of the vortex and source distributions, related to a prescribed profile geometry, with the aid of the condition of tangential flow. For NACA 65-series and NACA 4-digits blades, analytical expressions are available for airfoil coordinates C77; for other blades, curve fitting procedure is adopted to fit airfoil coordinates of both pressure and suction sides. The slopes of the camber-line and of the symmetric airfoil are estimated at different stations on the chord line. In the method of Schilchting, vortex and source distributions are expressed using the first three terms of Glaurt series; this leads to six unknown coefficients. Each of these terms induces velocity contribution at pivotal points selected along the profile contour. With the help of the tangential flow conditions at the selected three pivotal points, and expressing the isolated profile and remaining cascade induced velocities as functions of the six coefficients, a system of six simultaneous linear equations is obtained. Upon solution, the unknown six coefficients, of Glaurt source and vortex expressions, are known; consequently, the singularity distribution is available. The velocity distribution along the blade contour could then be determined. The angle of attack effect could be introduced in the equations to get the corresponding six coefficients.
3.2- Compressibility Effect
High speed cascade characteristics are similar to those at low speed until the critical Mach number is reached, after which the performance declines. For subsonic flows at high Mach number where compressibility effects cannot be ignored, the pressure distribution along an airfoil could be obtained from measurement, or calculation, conducted at low speed conditions, (1,7,8,]. The computer code of Schlichting method was extended to include compressibility effect. Once the incompressible velocity

SECOND A.S.A.T. CONFERENCE
21 - 23 April 1987 , CAIRO EA-4 125
distribution is calculated by the program, the equivalent compressible velocity distribution is computed according to equation (7.44) in Ref. (77.
3.3- Computer Program Description
Program input data:- Table 1 : Cascade independent universal functions D(I,J) : Values of cot(0/2), sin(9), sin(20), sin(30), cos(8),
cos(29) and cos(3e) for x/c= 0.0, 0.05, 0.1,.., 1.0 and
x/c = 0.58 and 0.91 where x = c/2 (1 - cos(E1))
A(I,J) : values of cot(6/2), sin(E:), sin(2H) and sin(30) for x/c = .25, .58 and .91
Table 2 : Airfoil geometry
Np : Number of points defining the profile
c : Chord length XE(I), YE(I): Coordinates of profile upper surface XI(I), YI(I): Coordinates of profile lower surface
Table 3 : Cascade specification Inlet flow and stagger angles, and space-chord ratio
3.4- Numerical Algorithm
The numerical algorithm includes the following main steps. Step 1- Curve fitting of airfoil coordinates of both suction and
pressure sides or use of analytical expressions (73. Step 2- calculation of the slopes of the camber line and the
symmetric airfoil Step 3- calculation of universal-non-dimensional-cascade downwash
functions Step 4- calculation of the six singularity coefficients Step 5- calculation of cascade outlet flow angle, contour
velocity, and pressure distribution.
4- COMPARISON BETWEEN MEASUREMENTS AND COMPUTATION -DISCUSSION
The present cascade and isolated airfoil measurements, were compared with the numerical resuls of Schlichting method. In addition, to test the validity and accuracy of the computer program, other examples of cascade flows are considered. These examples include different airfoil geometries and different flow conditions; also examples with different Mach numbers were
considered.

0.2- Exp w° o v tho Upper Side • • ♦ ■ Lower Side 0.4
0.2 0.4 0.6 0.8 w010 X/C Fig. 2.
Comparison between measured and calculated pressure distributions for NACA 0015.
EA-41126 SECOND A.S.A.T. CONFERENCE
21 - 23 April 1987 , CAIRO
4.1- Comparison between the Present Measurements and Computations
The comparison between Schlichting method and the present measuremets, for the employed NACA 0015 blade section, are displayed in Figs. 2 to 4. Figure 2 shows the results for four values of space-chord ratio (s/c= 0.5, 0.75, 1 and c•). The static pressure coefficient distribution on both sides of the blade is shown for zero inlet flow and stagger angles. Generally, good agreement between the present measured pressure distribution and the prediction of schlichting method is observed. Also, the figure indicates that the difference between the pressure distribution of the blade in cascade and the single airfoil increases with closer spacing, vise versa, cascade calculations with increasing values of space-chord ratio tends to yield results closer to the results of a single airfoil.
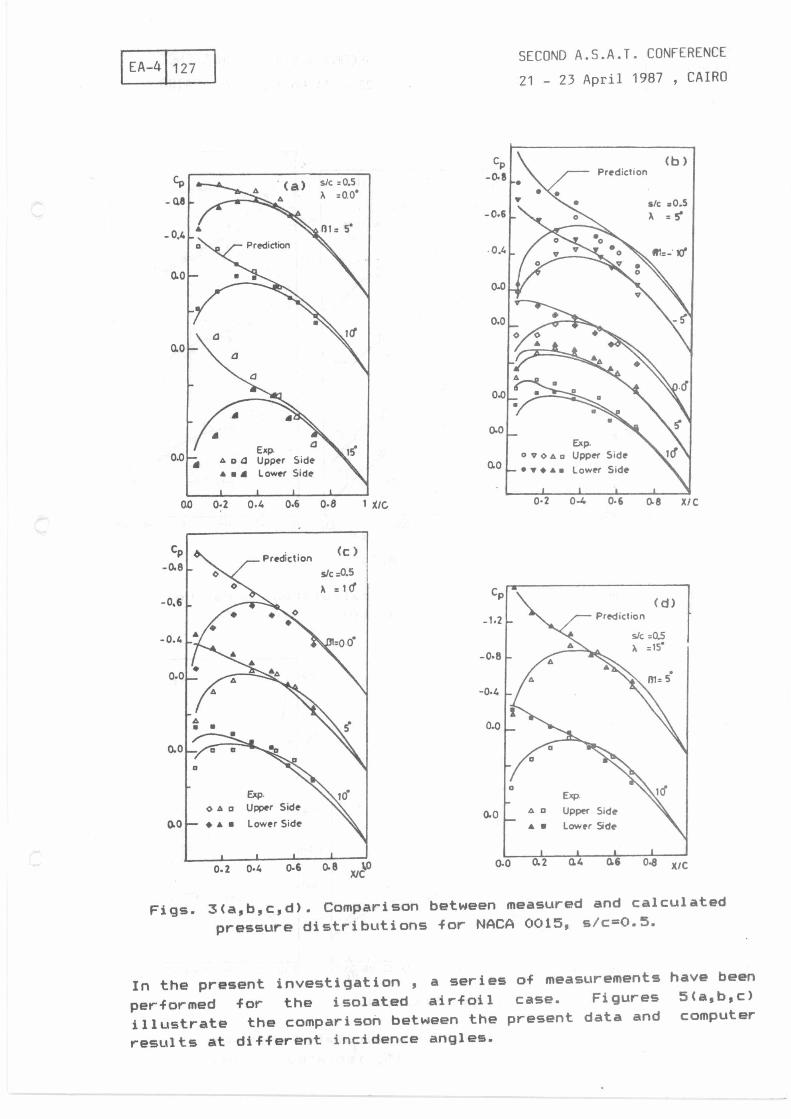
Figures 3(a,b,c,d) illustrate the results corresponding to stagger angles of 0, 5, 10, 15, deg. respectively, for constant space-chord ratio of 0.5 and different inlet flow angles. The inlet flow angle varies as follows (in deg.) : Fig. 3(a): (5,10,15 ), Fig. 3(b): (-10,-5,0,5,10), Fig. 3(c): (0,5,10), Fig. 3(d): (5,10). In general, good agreement is observed between the experimental data and the computed results; the agreement is less pronounced for high angles of incidence of the order of 15 deg. This is due to the expected effect of the test section walls facing the blade upper and lower sides. For this reason, the other experiments were limited to incidence angle of 10 deg. From Fig. 3 it could be observed that the difference between the upper and lower surface pressure coefficient increases with the increase in incidence angle. Presented in Figs. 4(a,b,c) are the results, for space-chord ratio of 0.75, corresponding to stagger angle of 0,5,10 deg., respectively, at different inlet flow angles. The inlet flow angle varies as follows (in deg.): Fig. 4(a): (5,10), Fig. 4(b): (-5,0,5,10), Fig. 4(c): (0,5,10). The discussion given for Fig. 3 applies for Fig. 4 too; moreover, the figures suggest that, at the same incidence, the area included between the upper and lower surface pressure distributions, proportional to the lift, increases as the space-chord ratio increases.
Exp. o e o Upper Side • • ■ Lower Side
EA-4 127
81= 5"
0.0
1 X/C 0.2 0.4 0.6 0.8
( a) sic =0.5 A =0.0'
a
Exp. a a Upper Side
• • • Lower Side 0.0 — •
CP - 0.8
-0.4
0.0
Prediction (c) s/c =0.5 A =1d
0.0
Exp. 0 eoeo Upper Side Lower Side
SECOND A.S.A.T. CONFERENCE
21 — 23 April 1987 , CAIRO
(b) Prediction
cp -0.8
-0.6
0.4
0.0
0.0
0.0
0.12 0-4 0.6 0.'11 X C
Exp. Upper Side Lower Side
00 0.2 44 0.6 0.8 X/C
Prediction
s/c =0.5 A .15'
Figs. 3(a,b,c,d). Comparison between measured and calculated pressure distributions for NACA 0015, s/c=0.5.
In the present investigation , a series of measurements have been performed for the isolated airfoil case. Figures 5(a,b,c) illustrate the comparison between the present data and computer
results at different incidence angles.

Exp. 45 e a Upper Side
— • • ■ Lower Side Exp. Upper Side Lower Side
I I I
0.4 06 045 x/C
I I I I
0.2 a6 1.0 X /C
Figs. 4(a,b,c).
1
/--Predidion
• sk .0.75 • A =10'
0.2 0 0
cp
- 0.2
0.0
0.2
0.4
cp
Exp. predection -20 • upper side • loser side
42
-0.8
-44
0.0
44
EA-4 1128 SECOND A.S.A.T. CONFERENCE
21 - 23 April 1987 , CAIRO
Comparison of measured and calculated pressure distributions for NACA 0015, s/c=0.75.
0.1 0.2 03 0.4 06 0.6 07 Q. 0.9 xk 0 01 07 43 0.4 05 Ob 47' WI J,42 1. 0 (11 (12 03 0.4 (15 0.6 07 08 IR 1.0
Figs. 5(a,b,c).
Comparison of measured and calculated pressure distributions for NACA 0015, isolated airfoil.

12 .0 • -0.2_
0.0 _ 0.2 _ _.2
W.,:contour velocity
- f‘reCicirri ►resent Precicbm} EN) o • Exp.
NACA 4412 A = sk =0.968
angle of ;ttaidi = 9.7°
CP 4.8
cp A .1D %\
NACA 65-12 (A 10)10
-0.6
Exp. 197 As A upper side m.3o•
lower side A ,...15• sic= 1.0
0 Exp NACA 6 5 -12 (A10)10 .2 o Suction side1.(20] Pressure side-, (b) .6
0.2 04 0.6 0,8 0 X/ C
Prediction present --- Prediction CI93
(a) 0
00 0.2 OF 0.6 0.8 xic 1.( 0
(c)
I I I
.2 .4 .6 .8 xic
SECOND A.S.A.T. CONFERENCE
21 - 23 April 1987 , CAIRO EA-4 129
The comparison between the present messurements and the present calculation, Figs. 2,3,4,5, shows in general good agreement; however, some deviation could be observed. This difference may be attributed to the following reasons: (1) viscosity effect that is not taken into account in the computation, (2) inherent computational errors due to curve fitting procedure for the blade coordinates, (3) inherent experimental errors, (4) inherent manufacturing errors of the blade section, and (5) test section side walls boundary layer effect.
Figs. 6(a,b,c). Comparison between the present calculations against other predictions and experiments.
4.2- Comparison between the Present Computation against other Predictions and Experiments.
In order to test the present prediction, comparisons with experimental data, other than the present, and prediction methods were conducted; the comparison covers a variety of geometrical configurations and flow conditions. Figure 6(a) illustrates the comparison for NACA 65-12(A10)10 compressor blade section for the following conditions: unit space-chord ratio, -0.15 deg. stagger angle, 30 deg. inlet flow angle. The figure exhibits the pressure distribution along both sides of the blade as predicted by the present method and compares it with NACA data and with another prediction method (19]. Figure 6(b) compares the same blade section but for the following conditions: 0.8 space-chord ratio, 43.9 deg. stagger angle, 60 deg. inlet flow angle (20]. Another comparison is held for NACA 4412 blade section under the following coditions: 9.7 deg. angle of attack, zero stagger angle, 0.968 space-chord ratio. Figure 6(c) illustrates the pressure distribution along both sides of the blade as predicted by the present method and compares it with measurement and with another prediction method [16]. The comparison given in Figs.

EA-4 130 SECOND A.S.A.T. CONFERENCE
21 - 23 April 1987 , CAIRO
6(a,b,c) shows that the present computer code yields good results. Furthermore, a comparison is held in Figs. 7(a,b) between the present computed results and the experimental data of [9,20], respectively, for the case of isolated airfoil.
Cp -2 0 -2.0 Cp
o upper side pesent
• lower side -12 -11
-0.8
-0.4
0.0
0.4
0.8
-0.8
- 0.4
0.0
0.4
0.8
0.1 02 0.3 0.4 05 0.6 0.7 0.8 Q9 1.0 0.1 02 0.3 0/. 0.5 0.6 47 Q8 09 1.0 xk xic
Fig. 7(a,b). Comparison of the present prediction and other experimental data for the isolated airfoil.
In general, the comparison given in Figs. 6,7 shows that the present prediction code yields good results when compared against the above mentioned experimental data. However, some discrepancy is obsereved between the computed and measured results. This discrepancy may be mainly attributed to viscosity effect that is not accounted for in the computer program.
The presnt computer code has been extended to include compressibility effects. This is achieved by first calculating the incompressible velocity distribution along the blade contour, the corrected comperssible velocity distribution could then be
obtained (7). Figures 8(a,b,c,d) display the comparison between
measurements [7] and prediction fora cascade based on NACA 0010 airfoil section at two inlet flow angles of 0 and 10 deg. and two
different Mach numbers 0.25 and 0.55. The Figures show that better results are obtained when applying the compressibility
correction However, the figures indicate that the compressibiliy effect on the excess velocities is underestimated . This may be due to some extent to a greater effect of the boundary layer
displacement on the local velocity at high Mach numbers, which
increases it.

W 13
+12 11
1.0
0.9
08
07
0.6
W= : contour velocity
w 1.2
1.1
1.0
0.9
08 0.7
46
0.1 0.2 0.3 0.4 0.5 0.6 07 0.8 0.9 1.0 O./ 0.2 0.3 OF 45 0.6 0.7 0.8 0,9 LC x/c x/c
0J 0.2 03 0.4 0.5 0.6 47 08 09 1.0 x /c
wf w 1,4
1.3
12
1.1
1.0
49
0.8 0.7
0.6
Ma =0.25 ni rad
( a )
w 14
1.3
12
1.1
to
0.9
as
0.7 0.6
Exp C73 • upper side • lower side
= sic=1.4
0.1 0.2 030.4 450.6 07 0.8 Stv if
SECOND A.S.A.T. CONFERENCE EA-4 131 21 - 23 April 1987 , CAIRO
NACA MO Prediction (comp) Preck bon ( incomp )
Fig. S(a,b,c,d). Corrected compressible velocity distribution for NACA 0010.
CONCLUSION
Experiments have been carried out to measure blade contour pressure distribution for the cases of isolated airfoil and cascade of airfoils. Different flow and cascade geometry conditions were considered (stagger and inlet flow angles, space-chord ratio). In addition, a computer program was developed based on the singularities method of Schlichting. A comparison is held between the present prediction method against : (1) the present measurements, (2) other experimental data, (3) other prediction methods. The comparison shows that the computer code is stable and efficient. The code is economical and yields good engineering results for a variety of flow conditions and cascade configurations. Better prediction could be expected if the viscosity effect (boundary layer displacement effect) has been
taken into account.
REFERENCES
1- Vavra, M.H.,"Aero-Thermodynamics and Flow in Turbomachines",
Robert E. Krieger Pub. Comp., New York, 1974.
2- Chung-Hua, Wu., A General Theory of Three-Dimensional Flow in Subsonic and Supersonic Turbomachines of Axial, Radial
and Mixed-Flow Types ", NACA TN 2604, 1952.

3-
4-
SECOND A.S.A.T. CONFERENCE
21 - 23 April 1987 , CAIRO
!CD.," Turbomachines ", C.N., Ecole Centerale de
J.L., Emery, J.C.and Erivin,J.R.," Systematic Two- Cascade Tests of NACA 65-Series Compressor
LEA-4 132
Papailiou, Lyon, 1978. Herring, Dimensional Blades at Low Speeds", NACA TN 3916, 1957.
5- Lieblein, S. " Incidence and Deviation Angle Correction for Compressor Cascades ", ASME, Journal of Basic Eng., Series D, vol. 82, p. 575, 1960.
6- Pollard, D. and Gostelow, J.P. " Some Experiments at Low Speed on Compressor Cascades ", ASME , Journal of Engineering for Power , pp. 427-435, 1967.
7- Scholz, N., " Aero-Dynamics of Cascades ", AGARDograph No. 220, NATO, 1977.
8- Tsien, H.S., " Two-Dimensional Subsonic Flow of Compressible Fluids ", Journal Aeronaut. Sciences, vol. 6, No. 10, pp. 390-407, 1939.
9- Abbot, I.H. and Von Doenhoff, A.E.," Theory of Wing Sections", Dover Pub. Inc., New York, 1955.
10- Schlichting, h.,"Problems and Results of Investigations on Cascade Flow", Journal Aeronaut. Sciences, pp. 163-177, 1954.
11- Khalifa, M. M.," Computation of Incompressible Cascade Flows by Means of Finite-Differences ", M.Sc., Faculty of Eng., Cairo University, 1981
12- Dodge, P. R.," The Use of Finite Difference Technique to Predict Cascade Stator and Rotor Deviation Angles and Optimum Angles of Attack", ASME, Journal of Engineering for Power, pp. 185-190. July 1973.
13- Argyris,J. H., Mareczek, G., and Scharpf, D. W.," Two- and Three-Dimensional Flow Using Finite Elements", Aeronaut. Journal, 73,11,pp. 961-964,1969.
14- Horlock,J.H.,"Axial Flow Compressors", Robert, E. krieger Pub. Comp., New York, 1973.
15- Scholz, N.," On an Extention of Glauert's Theory of Thin Airfoils to Profiles in Cascade", Journal Aeronaut. Sciences, pp. 637-638, 1951.
16- Minassian,L.M.,"A Study on Multielement Cascades and Airfoils", ASME J. of Fluids Eng., pp. 208-215, June 1976.
17- Mcfarland, E. R.," Solution of Plane Cascade Flow Using Improved Surface Singularity Methods", ASME, Journal of Eng. for Power, vol. 104, p. 668, 1982.,
18- Strscheletzky, M.," Ein Beitrag Zur Berechnung der Umstromung von festen Leitflachen", Voith Forschung and Konstruktion 4,16.1- 16.6, 1958.
19- Assassa, G.M.," Measurements in Cascade", M.Sc., Ecole Central de Lyon, 1972.
20- Lieblein, S.," Analytical Relation for Wake Momentum Thickness and Diffusion Ratio for Low-Speed Compressor Cascade Blades", NACA TN 4318, August 1958.
21- Private communication, Prof. M.-Essawy, M.T.C., Cairo, 1987.

![Semester V (Third year] Branch/Course Civil Engineering V ...](https://static.fdokumen.com/doc/165x107/6321a517ae0f5e8191058b94/semester-v-third-year-branchcourse-civil-engineering-v-.jpg)