3d modeling of roman bridge by the integration of terrestrial ...
7
3D MODELING OF ROMAN BRIDGE BY THE INTEGRATION OF TERRESTRIAL AND UAV PHOTOGRAMMETRIC SURVEY FOR STRUCTURAL ANALYSIS PURPOSE Pepe M. 1,* , Costantino D 1 ., Crocetto N. 2 , Restuccia Garofalo A. 3 1 DICATECh, Polytechnic of Bari, Italy 2 Università degli Studi della Campania Luigi Vanvitelli, Italy 3 AESEI spin-off, Polytechnic of Bari, Italy Commission II KEY WORDS: photogrammetry, UAV, masonry bridges, FEM, structural analysis ABSTRACT: The 3D survey of the masonry bridges is rather complex and may require the integration of terrestrial and aerial surveys. In fact, in order to perform the survey of the superstructure of a bridge, the photogrammetric survey may be realized by the use UAV (Unmanned Aerial Vehicle) since it allows acquiring all the details of the upper part of the bridge. Indeed, especially the extreme lateral parts of the bridge cannot be performed through a traditional terrestrial survey. In addition, the UAV photogrammetry allows speeding up and optimizing work. As regards the terrestrial survey, instead, it has the advantage of being able to use highly performing optics and cameras (high resolution of the sensor, stabilized optics, etc.). However, these types of sensors are quite heavy and, in general, could not be mounted on an aerial platform on commercial and low-cost drones. In any case, beyond the payload of common commercial drones at low cost, there is also the problem that the digital cameras mounted on the UAV platforms cannot observe the arches of the bridge from the bottom upwards by low-cost tools. Therefore, a simple way to build a unique 3D model consists in the integration of terrestrial and aerial surveys; in this way, using a suitable procedure, sensor and software based on the Structure from Motion (SfM) and Multi View Stereo (MVS) approaches, it was possible to build detailed, precise and textured three-dimensional models of structures, such as the buildings, historical artefact, bridges etc. In this paper, a case study concerning the construction of a three-dimensional model according a photogrammetric method of a Roman bridge is discussed. In particular, the bridge taken under investigation, belong to the Cultural Heritage, is called "San Cono" and is located in south of Italy. After built the 3D model of masonry bridge (3D point cloud and 3D mesh), it was identified a special procedure that allowed to obtain the model of the bridge suitable for a structural analysis within of dedicate software. 1. INTRODUCTION The development of algorithms based on the SFM (Structure from Motion) approach made it possible to orientate numerous images of the object to be investigated with high level of automation, without the need to know "a priori" information and, at the same time, to use rigorous geometric and stochastic models developed through traditional photogrammetry. Once obtained the camera poses, it is possible to apply MVS (Multi-View- Stereo) algorithm. This latter algorithm allows to increase the density of points starting from the point cloud generated in SfM process. Therefore, Image-based modelling (IBM) allows to obtain measurements and 3D models from images (Luhmann et al., 2007). For this reason, the IBM approach were applied with success in building 3D models in diverse fields and using several sensors. Generally, the workflow that allows to produce 3D reconstructions/3D models in most common photogrammetry software may be synthesized as (Rahaman & Champion, 2019): (i) Image acquisition (or adding photos), (ii) Feature detection, matching, triangulation (or align photos) (iii) Sparse reconstruction, bundle adjustment (or point cloud generation) (iv) Dense correspondence matching (or dense cloud generation) (v) Mesh/surface generation, and (vi) Texture generation. Recently, the combination of SfM algorithms (Remondino, 2013; Angelini et al., 2017; Murtiyoso et al., 2018) and aerial images obtained by UAV (Unmanned Aerial Vehicle) platform has revolutionized photogrammetric surveying, allowing obtaining 3D models through low-cost, fast and high quality data acquisition and processing (Cucchiaro et al., 2018). In addition, the use of UAV is really useful in critical scenarios, where the easy transportability and low cost of the necessary equipment for aerial survey compared to laser scanning techniques represent a great advantage. Actually, there are on the market many commercial UAV aerial platform solutions for the photogrammetric survey. Some examples of UAV aerial platforms are the Xiaomi Mi Drone 4K UHD WiFi FPV (Figure 1.a), 3D Robotics Aero-M Drone (fixed wings) supplied with Canon PowerShot S100 (Figure 1.b), SwissDrones Dragon 50 V2 equipped with Leica RCD30 (Figure 1.c), DJI’s M600 and M600-Pro (hexacopter) drones integrated with Phase One aerial cameras (Figure 1.d), SenseFly UAV (fixed wings) (Figure 1.e). (a) (b) (c) (d) (e) Figure 1. Examples of UAV aerial platforms. * Corresponding author: [email protected] The International Archives of the Photogrammetry, Remote Sensing and Spatial Information Sciences, Volume XLII-2/W17, 2019 6th International Workshop LowCost 3D – Sensors, Algorithms, Applications, 2–3 December 2019, Strasbourg, France This contribution has been peer-reviewed. https://doi.org/10.5194/isprs-archives-XLII-2-W17-249-2019 | © Authors 2019. CC BY 4.0 License. 249
-
Upload
khangminh22 -
Category
Documents
-
view
2 -
download
0
Transcript of 3d modeling of roman bridge by the integration of terrestrial ...

3D MODELING OF ROMAN BRIDGE BY THE INTEGRATION OF TERRESTRIAL AND
UAV PHOTOGRAMMETRIC SURVEY FOR STRUCTURAL ANALYSIS PURPOSE
Pepe M.1,*, Costantino D1., Crocetto N.2, Restuccia Garofalo A.3
1DICATECh, Polytechnic of Bari, Italy
2Università degli Studi della Campania Luigi Vanvitelli, Italy 3AESEI spin-off, Polytechnic of Bari, Italy
Commission II
KEY WORDS: photogrammetry, UAV, masonry bridges, FEM, structural analysis
ABSTRACT:
The 3D survey of the masonry bridges is rather complex and may require the integration of terrestrial and aerial surveys. In fact, in
order to perform the survey of the superstructure of a bridge, the photogrammetric survey may be realized by the use UAV (Unmanned
Aerial Vehicle) since it allows acquiring all the details of the upper part of the bridge. Indeed, especially the extreme lateral parts of
the bridge cannot be performed through a traditional terrestrial survey. In addition, the UAV photogrammetry allows speeding up and
optimizing work. As regards the terrestrial survey, instead, it has the advantage of being able to use highly performing optics and
cameras (high resolution of the sensor, stabilized optics, etc.). However, these types of sensors are quite heavy and, in general, could
not be mounted on an aerial platform on commercial and low-cost drones. In any case, beyond the payload of common commercial
drones at low cost, there is also the problem that the digital cameras mounted on the UAV platforms cannot observe the arches of the
bridge from the bottom upwards by low-cost tools. Therefore, a simple way to build a unique 3D model consists in the integration of
terrestrial and aerial surveys; in this way, using a suitable procedure, sensor and software based on the Structure from Motion (SfM)
and Multi View Stereo (MVS) approaches, it was possible to build detailed, precise and textured three-dimensional models of
structures, such as the buildings, historical artefact, bridges etc.
In this paper, a case study concerning the construction of a three-dimensional model according a photogrammetric method of a Roman
bridge is discussed. In particular, the bridge taken under investigation, belong to the Cultural Heritage, is called "San Cono" and is
located in south of Italy. After built the 3D model of masonry bridge (3D point cloud and 3D mesh), it was identified a special procedure
that allowed to obtain the model of the bridge suitable for a structural analysis within of dedicate software.
1. INTRODUCTION
The development of algorithms based on the SFM (Structure
from Motion) approach made it possible to orientate numerous
images of the object to be investigated with high level of
automation, without the need to know "a priori" information and,
at the same time, to use rigorous geometric and stochastic models
developed through traditional photogrammetry. Once obtained
the camera poses, it is possible to apply MVS (Multi-View-
Stereo) algorithm. This latter algorithm allows to increase the
density of points starting from the point cloud generated in SfM
process. Therefore, Image-based modelling (IBM) allows to
obtain measurements and 3D models from images (Luhmann et
al., 2007). For this reason, the IBM approach were applied with
success in building 3D models in diverse fields and using several
sensors. Generally, the workflow that allows to produce 3D
reconstructions/3D models in most common photogrammetry
software may be synthesized as (Rahaman & Champion, 2019):
(i) Image acquisition (or adding photos), (ii) Feature detection,
matching, triangulation (or align photos) (iii) Sparse
reconstruction, bundle adjustment (or point cloud generation)
(iv) Dense correspondence matching (or dense cloud generation)
(v) Mesh/surface generation, and (vi) Texture generation.
Recently, the combination of SfM algorithms (Remondino, 2013;
Angelini et al., 2017; Murtiyoso et al., 2018) and aerial images
obtained by UAV (Unmanned Aerial Vehicle) platform has
revolutionized photogrammetric surveying, allowing obtaining
3D models through low-cost, fast and high quality data
acquisition and processing (Cucchiaro et al., 2018).
In addition, the use of UAV is really useful in critical scenarios,
where the easy transportability and low cost of the necessary
equipment for aerial survey compared to laser scanning
techniques represent a great advantage. Actually, there are on the
market many commercial UAV aerial platform solutions for the
photogrammetric survey.
Some examples of UAV aerial platforms are the Xiaomi Mi
Drone 4K UHD WiFi FPV (Figure 1.a), 3D Robotics Aero-M
Drone (fixed wings) supplied with Canon PowerShot S100
(Figure 1.b), SwissDrones Dragon 50 V2 equipped with Leica
RCD30 (Figure 1.c), DJI’s M600 and M600-Pro (hexacopter)
drones integrated with Phase One aerial cameras (Figure 1.d),
SenseFly UAV (fixed wings) (Figure 1.e).
(a)
(b)
(c)
(d)
(e)
Figure 1. Examples of UAV aerial platforms.
* Corresponding author: [email protected]
The International Archives of the Photogrammetry, Remote Sensing and Spatial Information Sciences, Volume XLII-2/W17, 2019 6th International Workshop LowCost 3D – Sensors, Algorithms, Applications, 2–3 December 2019, Strasbourg, France
This contribution has been peer-reviewed. https://doi.org/10.5194/isprs-archives-XLII-2-W17-249-2019 | © Authors 2019. CC BY 4.0 License.
249
1.1 Related works
The use of IBM approach in order to construction 3D models of
bridges for the representation or structural analysis is becoming
increasingly widespread over the years.
Şeker et al., 2006 have developed a terrestrial photogrammetry
method to obtain virtual model of Kapuağas bridge. In this case
study, a Samsung Digimax 430 digital camera featuring 4.3 mega
pixels and Pictran-D digital photogrammetric software were used
in building of 3D model of the masonry bridge.
Jáuregui et al. 2006 proposed a special procedure for bridge
inspections and Historic Bridge documentation. The historic
bridge digital documentation study was carried out by the use of
Kodak DCS660 camera, which has a solid-state CCD (charged
coupled device) image sensor with a 6.1 megapixel (3048 x 2008
pixels) resolution. The photogrammetric p was carried out using
PhotoModeler commercial software.
Lorenzo et al., 2006 discussed a multidisciplinary approach to
heritage documentation involving Close Range Photogrammetry
(CRP) and, in particular, the usefulness of CRP in the accurate
3D modelling and crack detection. In this case study, the 3D
model of the Fillaboa Bridge was created using a Canon EOS
10D DSLR camera. The 3D model was generated in
PhotoModeler software.
Jiang et al., 2008 wrote a review about the major aspects of
photogrammetry bridge measurement. As consequence, the paper
describes the measurement types, cameras, targets, network
control and software in the bridge environment.
Altuntas et al., 2017 wrote a method for 3D reconstruction of the
Meran bridge (Turkey). The survey was carried out with a Canon
PowerShot A2200 digital camera and a total amount of 189
images were acquired. The post-processing of the image was
performed with Photomodeler software.
Kouimtzoglou et al., 2017 discussed the reconstruction of the
Plake bridge, in Greece. In this case study, using terrestrial
images, the 3D model of the bridge was realized using Agisoft
Photoscan Pro software. Starting from the model obtained in this
way, the masonry arches structure was analysed using the FEM
(Finite Element Method) approach.
Calì et al., 2018 wrote about the survey of the “Saracens”
masonry bridge located in Adrano (Italy). The contribute of UAV
photogrammetry was crucial in order to survey the upper and
lateral part of the bridge.
2. METHOD AND SENSORS
2.1 Method
The first step in building 3D model is the choice of the Scale of
Representation (SR) of the masonry bridge. In addition, taking
into account the graphical error drawing (generally established in
0.2mm), it is possible to calculate the Graphical Error (EGR) as
the product between the SR and the graphic drawing error.
Therefore, once established the tolerable error, the next step
consisted in the determination of the Ground Sample Distance
(GSD). As it is known, the GSD of the image can be calculated
by the following equation:
𝐺𝑆𝐷 =𝐻
𝑐𝐶𝐶𝐷 𝑝𝑖𝑥𝑒𝑙 𝑠𝑖𝑧𝑒 (1)
where:
H flight height (or distance from the target to sensor);
CCD pixel size dimension of the sensor.
In order to obtain a final GSD value lower than the tolerance
provided for by the project, in general two times the Graphical
Error, a value of half of the originally planned GSD was chosen
(Pepe, 2018a). In this way, it was possible to design the flight
planning on the masonry bridge. Indeed, especially in the aerial
survey, the relation (1) is particularly useful to calculate the flight
height of the UAV. However, even in the terrestrial survey, it is
necessary to pay attention in order to acquire images with a GSD
not higher than the project one.
The images were imported into photogrammetric software to
build 3D model of masonry bridge. Subsequently, to scale the
model of the bridge to real dimensions, it was necessary to
perform a topographic survey. This last aim was reached using
total station instruments featuring the precision required by the
project.
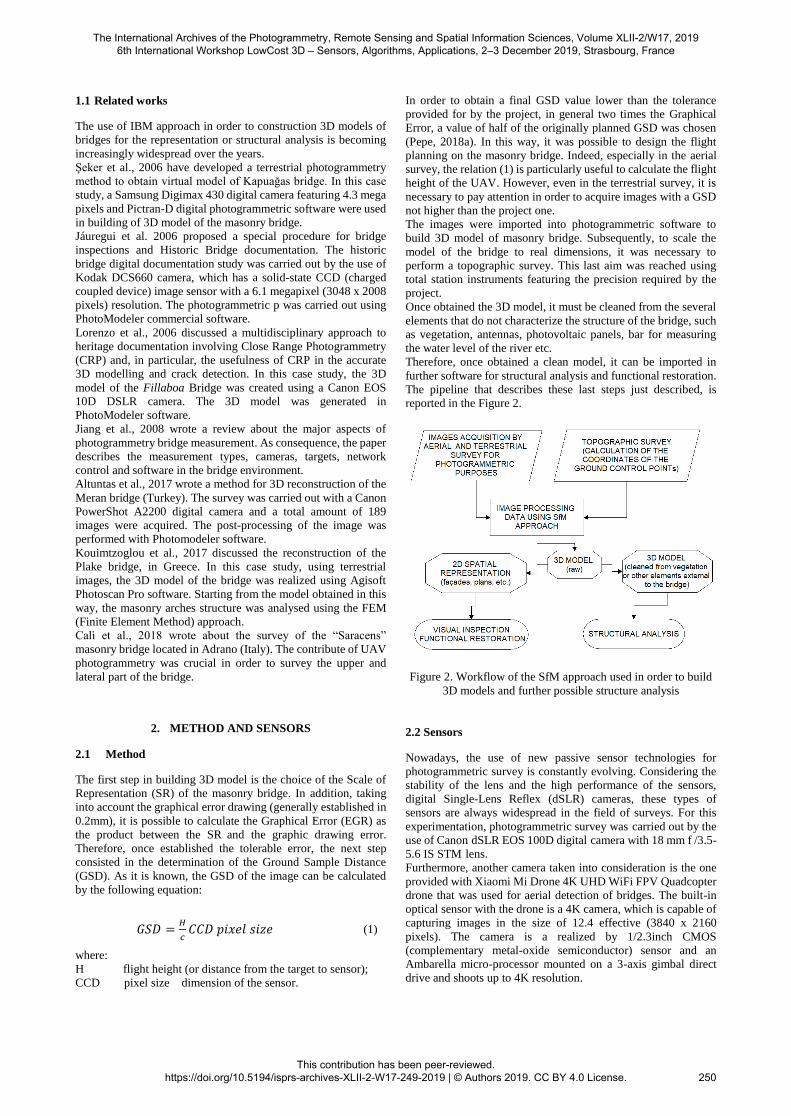
Once obtained the 3D model, it must be cleaned from the several
elements that do not characterize the structure of the bridge, such
as vegetation, antennas, photovoltaic panels, bar for measuring
the water level of the river etc.
Therefore, once obtained a clean model, it can be imported in
further software for structural analysis and functional restoration.
The pipeline that describes these last steps just described, is
reported in the Figure 2.
Figure 2. Workflow of the SfM approach used in order to build
3D models and further possible structure analysis
2.2 Sensors
Nowadays, the use of new passive sensor technologies for
photogrammetric survey is constantly evolving. Considering the
stability of the lens and the high performance of the sensors,
digital Single-Lens Reflex (dSLR) cameras, these types of
sensors are always widespread in the field of surveys. For this
experimentation, photogrammetric survey was carried out by the
use of Canon dSLR EOS 100D digital camera with 18 mm f /3.5-
5.6 IS STM lens.
Furthermore, another camera taken into consideration is the one
provided with Xiaomi Mi Drone 4K UHD WiFi FPV Quadcopter
drone that was used for aerial detection of bridges. The built-in
optical sensor with the drone is a 4K camera, which is capable of
capturing images in the size of 12.4 effective (3840 x 2160
pixels). The camera is a realized by 1/2.3inch CMOS
(complementary metal-oxide semiconductor) sensor and an
Ambarella micro-processor mounted on a 3-axis gimbal direct
drive and shoots up to 4K resolution.
The International Archives of the Photogrammetry, Remote Sensing and Spatial Information Sciences, Volume XLII-2/W17, 2019 6th International Workshop LowCost 3D – Sensors, Algorithms, Applications, 2–3 December 2019, Strasbourg, France
This contribution has been peer-reviewed. https://doi.org/10.5194/isprs-archives-XLII-2-W17-249-2019 | © Authors 2019. CC BY 4.0 License.
250

3. CASE STUDY OF SAN CONO’S BRIDGE
3.1 Location and brief history of the San Cono’s bridge
The SfM-MVS approach was applied in the relief of masonry
road bridges built at the end of the 1800s. San Cono’s bridge, over
the Bianco river located in the municipality of Buccino (in
southern Italy), was considered for the experimentation (Figure
3).
Figure 3. Orthophoto of the area of interest on the Bianco river
(latitude 40 ° 36'27.84 "N; longitude 15 ° 23'25.81" E)
San Cono’s bridge, as reported by the inscription on the bridge,
can be dated to the Augustan age. The “Volceiani, Municipes et
Incolae” collected the money needed to build the bridge in order
to reach the city from neighboring countries. The route separated
from the "Rhegio - Capuam" road to the "Taverna Cerreta" and
headed north. The work is remembered since the sixteenth
century for the ancient inscription repeatedly repeated on it,
which celebrated its construction: it was engraved on tables
surmounting the top of an arch where the erection and testing are
remembered (figure 4.a). Originally, the bridge had a pronounced
donkey-back profile with two shoulders and a steep slope at the
ends and a pylon with a triangular rostrum, as shown in an
eighteenth-century print (figure 4.b).
(a)
(b)
Figure 4. Historical information on the bridge. a) table on the
bridge; b) image of the original structure of the bridge taken
from the book “Strade romane, ponti e viadotti”, Quilici, L., &
Gigli, S. Q.,1996
The current shape of the bridge is incorporated into a new bridge,
which in 1872 levelled the road and widened the site (taking it
from 3.20 m to 6.45 m), covering it, so as to leave only the
original arches visible, below the new ones. In this way, the
intervention represented an exceptional example of respect for the
ancient monument.
From the architectural point of view, the bridge has two spans of
unequal light, for a total length of 40 m. Part of the ancient arches
can still be seen below the nineteenth-century one, which changes
its profile.
The central round arch has a light of 17.3 m and at the base there
are five projecting brackets with three others at a higher altitude
to complete the support of the rib; the minor arc has a light of 5.9
m with three shelves.
The central pile, about 9.20 m long, still presents the triangular-
shaped rostrum, on which the nineteenth-century brick arches are
set.
The original vestments of the tympani, as can be seen in the
eighteenth-century print, were in square work; today they are
inserted in the new 19th century vestments, with an upper parapet
that modifies the original donkey back profile.
A plaque was placed on the key of the central arch that recalls the
construction of the ancient bridge and its reconstruction.
3.2 3D survey of the masonry bridge
In order to construct the 3D model, in this case study, the
photogrammetric survey was divided into the aerial and the
terrestrial one.
Taking into account the Scale of Representation (SR) and the
graphical error drawing (generally established in 0.2 mm) it is
possible to calculate the Graphical Error (EGR) as their product.
Once established the tolerable error, the next step concerns the
determination of the Ground Sample Distance (GSD) using the
equation 1.
Therefore, taking into account a planning 𝐺𝑆𝐷 = 1 𝑐𝑚 and the
features of the sensors follows that to realize this geometric
resolution, the maximum distance between object and sensor is
42 m for the dSLR camera and 8m for the camera supplied with
Xiaomi Mi drone, as show in the following Table 1.
Canon EOS
100D
(f=18mm)
Xiaomi Mi 4K
camera
𝐶𝐶𝐷𝑝𝑖𝑥𝑒𝑙 𝑠𝑖𝑧𝑒 (μm) 4.29 4.54
Focal length (mm) 18 3.5
𝐻𝑚𝑎𝑥 (m) 42 8
Table 1. Flight height (or distance from the target to sensor)
values for 𝐺𝑆𝐷 = 1𝑐𝑚
The aerial survey was carried out with the UAS Xiaomi Mi Drone
system whose weigh less than 1 kg and a half and the declared
maximum speed is 18 meters per second (about 65 km/h) and was
developed and produced by Flymi, a company of the Mi
Ecosystem. The Xiaomi Mi Drone is equipped with a 5.100 mAh
battery and 17.4 V. The estimated flight time in 27 minutes (25
minutes in hovering) is the flagship of a model that manages to
guarantee fun and stable shooting.
In particular, the aerial survey was designed with the open source
software "Mission Planner", developed by Oborne for the open-
source APM autopilot project. Mission Planner is an application
for the Ground Station with full functionality for the open source
autopilot project called ArduPilot. The flight plan was realized
with a longitudinal overlap (end-lap) of 80% and a transversal
(sidelap) of 60% (Pepe et al., 2018). In addition, flight lines (FL)
inclined at 30° and 45° were designed in a longitudinal direction
to the bridge in order to increase the rigidity of the aerial
photogrammetric block in the bridge part and, at the same time,
The International Archives of the Photogrammetry, Remote Sensing and Spatial Information Sciences, Volume XLII-2/W17, 2019 6th International Workshop LowCost 3D – Sensors, Algorithms, Applications, 2–3 December 2019, Strasbourg, France
This contribution has been peer-reviewed. https://doi.org/10.5194/isprs-archives-XLII-2-W17-249-2019 | © Authors 2019. CC BY 4.0 License.
251
to increase the redundancy of information with the data obtained
from the terrestrial survey. In total, 285 aerial photos were taken.
It should be noted that while the flight plan was designed and
planned in the laboratory, the flight was carried out thanks to a
company specialized in the use of SAPRs (drones) in operations
in critical and non-critical areas. In fact, according to art. 8
"General provisions for operating RPAS" of Regulation of
Remotely Piloted Aerial Vehicles issued by ENAC (Ente
Nazionale per l'Aviazione Civile - Italian Civil Aviation
Authority) the following conditions must be met (ENAC, 2018):
1. The RPAS shall be identified by a plate installed on the RPA
showing the identification of the system and of the operator.
An identical plate shall be installed also on the remote
ground pilot station.
2. As of the 1st of July 2016, in addition to plates required by
the Art 8.1, any RPAS shall be equipped with an Electronic
Identification Device, that allows the transmission of RPA
real time data, its owner/operator and basic flight
parameters, as well as the recording of these data. Electronic
Identification Device performances and characteristics are
defined by ENAC.
3. RPAS shall be supplied with a Flight Manual or equivalent
manual.
4. Specialized Operations shall comply with the provisions
regarding procedures in air navigation and airspace use, laid
down in Section V.
5. RPAS shall be equipped with systems/equipment necessary
to carry out intended operations in compliance with the
applicable rules of the air and according to the airspace class
engagement. They shall be equipped with
systems/equipment intended to indicate the RPA height
above ground so to enable a positive check during flight.
6. For VLOS operations within un-controlled airspace, ENAC
reserves the right to require the installation of lights or other
means to augment the RPA conspicuity by the remote pilot
or by other airspace users.
7. RPAS shall be piloted by a pilot with recognized
competences and skills as per Section IV.
8. During VLOS operations, pilot shall be clearly visible and
immediately identifiable by proper means. Pursuant to this
Regulation, the pilot shall wear a high visibility vest with the
sign RPA pilot.
9. RPAS in the scope of this section are operated for
specialized operations either “non-critical” or “critical”,
pursuant to articles 9 and 10.
10. RPAS operations with purpose “research and development”
are subject to ENAC authorization.
The UAV used for the experimentation is the Xiaomi Mi 4K, a
multi-copter rotary wing type that allows achieving a max flight
speed of 18 m/s with a max climbing speed of 6 m/s and lowering
speed of 1.5 m/s. The weight of the vehicle is 1250 gr.
As usual, before using an aerial platform in the airspace, it was
necessary to check if it was possible to fly on the area of interest.
For this reason, it was necessary to plan, from an aeronautical
point of view, the flight operations in relation to the airspace. The
Italian Airspace Structure is divided in 3 FIRs (Flight Information
Regions): Milano, Roma and Brindisi. The area of interest is
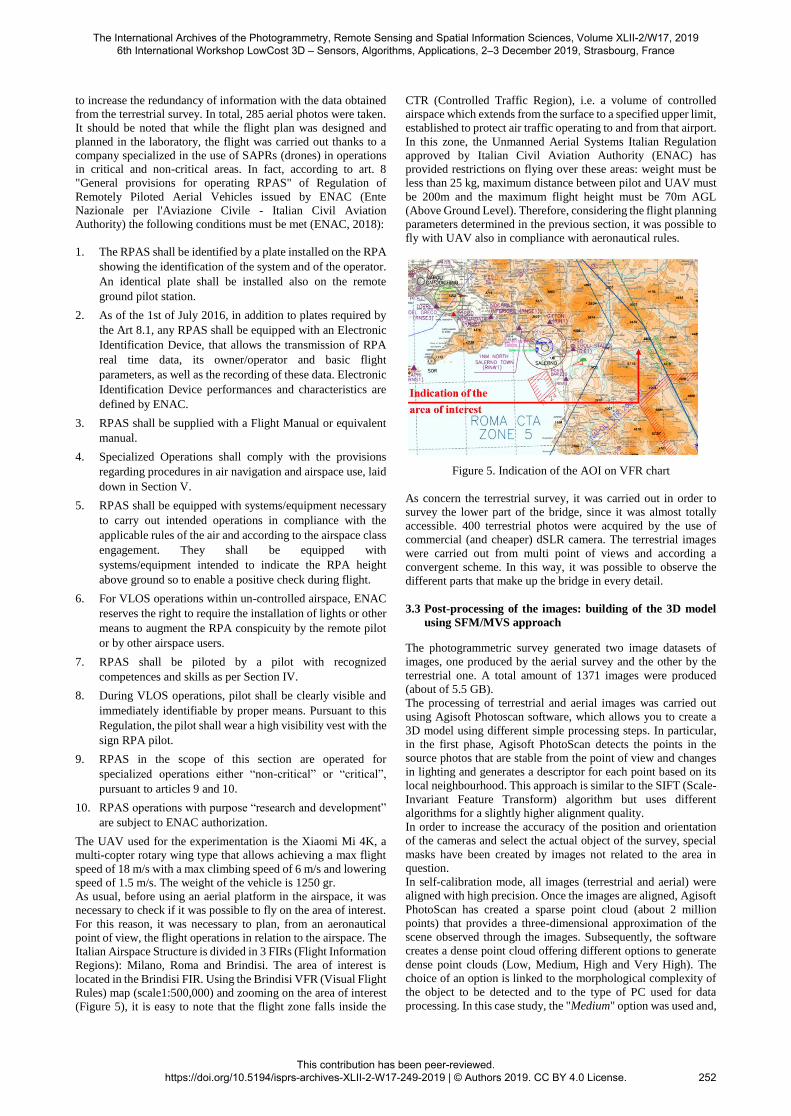
located in the Brindisi FIR. Using the Brindisi VFR (Visual Flight
Rules) map (scale1:500,000) and zooming on the area of interest
(Figure 5), it is easy to note that the flight zone falls inside the
CTR (Controlled Traffic Region), i.e. a volume of controlled
airspace which extends from the surface to a specified upper limit,
established to protect air traffic operating to and from that airport.
In this zone, the Unmanned Aerial Systems Italian Regulation
approved by Italian Civil Aviation Authority (ENAC) has
provided restrictions on flying over these areas: weight must be
less than 25 kg, maximum distance between pilot and UAV must
be 200m and the maximum flight height must be 70m AGL
(Above Ground Level). Therefore, considering the flight planning
parameters determined in the previous section, it was possible to
fly with UAV also in compliance with aeronautical rules.
Figure 5. Indication of the AOI on VFR chart
As concern the terrestrial survey, it was carried out in order to
survey the lower part of the bridge, since it was almost totally
accessible. 400 terrestrial photos were acquired by the use of
commercial (and cheaper) dSLR camera. The terrestrial images
were carried out from multi point of views and according a
convergent scheme. In this way, it was possible to observe the
different parts that make up the bridge in every detail.
3.3 Post-processing of the images: building of the 3D model
using SFM/MVS approach
The photogrammetric survey generated two image datasets of
images, one produced by the aerial survey and the other by the
terrestrial one. A total amount of 1371 images were produced
(about of 5.5 GB).
The processing of terrestrial and aerial images was carried out
using Agisoft Photoscan software, which allows you to create a
3D model using different simple processing steps. In particular,
in the first phase, Agisoft PhotoScan detects the points in the
source photos that are stable from the point of view and changes
in lighting and generates a descriptor for each point based on its
local neighbourhood. This approach is similar to the SIFT (Scale-
Invariant Feature Transform) algorithm but uses different
algorithms for a slightly higher alignment quality.
In order to increase the accuracy of the position and orientation
of the cameras and select the actual object of the survey, special
masks have been created by images not related to the area in
question.
In self-calibration mode, all images (terrestrial and aerial) were
aligned with high precision. Once the images are aligned, Agisoft
PhotoScan has created a sparse point cloud (about 2 million
points) that provides a three-dimensional approximation of the
scene observed through the images. Subsequently, the software
creates a dense point cloud offering different options to generate
dense point clouds (Low, Medium, High and Very High). The
choice of an option is linked to the morphological complexity of
the object to be detected and to the type of PC used for data
processing. In this case study, the "Medium" option was used and,
The International Archives of the Photogrammetry, Remote Sensing and Spatial Information Sciences, Volume XLII-2/W17, 2019 6th International Workshop LowCost 3D – Sensors, Algorithms, Applications, 2–3 December 2019, Strasbourg, France
This contribution has been peer-reviewed. https://doi.org/10.5194/isprs-archives-XLII-2-W17-249-2019 | © Authors 2019. CC BY 4.0 License.
252

at the end of the processing, about 53 million points were
generated.
In order to effectively reduce the calculation times of the mesh
construction, starting from the dense point clouds obtained in the
project, the network processing available in Agisoft Photoscan
was exploited.
In this case study, two separate chunks were built. In the Table 2
the number of the projections and the error of the single chunk are
reported.
Dataset Projections Error
(pixel)
min max min max
Aerial 1831 2426 0.524 0.8427
Terrestrial 4031 5114 0.622 0.247
Table 2. Report on image matching for the two datasets
Therefore, in order to carry out the photogrammetric survey of
this bridge, it was necessary to integrate the datasets of the photos
obtained with the drone and those generated by the reflex camera.
From an operational point of view, it means creating two point
clouds in the project, one for the dataset produced by the drone,
and the other for the reflex camera (survey performed with images
acquired through a terrestrial survey).
Subsequently, through an algorithm "Iterative Closest Point"
(ICP), i.e. an algorithm used to minimize the difference between
two point clouds; the aerial and terrestrial point clouds were
aligned in a single one able to represent the entire survey. In total,
the final 3D model consists of approximately 1 million points.
Figure 6. 3D dense point cloud representation in Photoscan
environment
3.4 Model scaling by topographic survey
The model is scaled using Ground Control Points (GCPs). This
GCPs may be determined by traditional topographic survey or
GNSS (Global Navigation Satellite Systems) techniques (Lingua
et al., 2017; Pepe, 2018b). In this case study, the scale model was
obtained by recognizing on the images of 4 markers positioned
on the superstructure of the bridge.
The coordinates of these markers were obtained by means of a
special topographic survey performed with a total station.
The coordinates of each target were measured by the Pentax R-
325 (N) total station equipped with a laser sensor for readings
without prism whose characteristics are shown in the following
Table 3.
Features Parameters
Telescope
Magnification 30 x
Optical aperture
45mm (EDM45mm)
Resolving
power 3”
EDM
Laser class Class 3R/ Class 2 (Switchable)
Measurement
range
Reflectorless 1.5m~270m (Long range
mode)
Mini prism 1.5M~1100m (1600m) *(1)
Single element
prism
1.5m~3000m
(4000m) *(2)
Reflector sheet 1.5m~600m
(800m) *(3)
Accuracy
Prism, Reflector sheet
±(2+2ppm x D) mm
Reflectorless ±(5+3ppm x D)
mm *
Angle
Measurement
Accuracy (ISO
17123-3) 5”
Compensator Dual Axis
Table 3. Technical and performance characteristics of the total
station used for the survey
The report of the polar coordinates is shown in the following table
4, where the reflector height was set to value 0 (the GCPs were
determined without the use of prism).
ID
Horizontal
Angle
(gon)
Zenith
angle
(gon)
Real
distance
(m)
Horizontal
distance
(m)
101 57.9508 106.0786 10.968 11.018
102 91.7626 106.8010 9.808 9.864
103 87.6390 101.1188 51.487 51.495
104 80.9230 101.1814 51.596 51.605
Table 4. Polar coordinates of the markers
Defining the average altitude zero on the station point named 100,
it was possible to obtain the altimetry of the points. The
processing was performed using a special tool developed in the
Matlab environment. The coordinates of the GCPs, referred into
a local reference system, are reported in the following table
(Table 5)
ID X
(m)
Y
(m)
Z
(m)
101 6.729 8.661 -1.050
102 1.266 9.726 -1.052
103 9.934 50.519 -0.905
104 15.231 49.297 -0.957
Table 5. Target coordinates in a local reference system
Finally, by recognizing the points chosen as markers on the
photos, Photoscan software performs a roto-translation scaling
the 3D model. The root mean square value calculated on the
model on GCPs was 0.011 m.
3.5 Qualitative and quantitative analysis of the masonry
bridge
Once realized the model, a qualitative and quantitative analysis is
carried out. As regards the qualitative analysis, the visual
inspection can be used in order to check the state of preservation
of the upper part. Therefore, using the photogrammetric
The International Archives of the Photogrammetry, Remote Sensing and Spatial Information Sciences, Volume XLII-2/W17, 2019 6th International Workshop LowCost 3D – Sensors, Algorithms, Applications, 2–3 December 2019, Strasbourg, France
This contribution has been peer-reviewed. https://doi.org/10.5194/isprs-archives-XLII-2-W17-249-2019 | © Authors 2019. CC BY 4.0 License.
253

approach, it is possible to faithfully reconstruct the arches of the
bridge according coloured mesh (Figure 7.a). In addition,
reducing the number of mesh (decimated mesh), it was possible
to emphasize the view of the several arches of the bridge, Indeed,
according wireframe model, the arch of the I century A.D. was
red-coloured while the external one built in the nineteenth century
(Figure 7.b).
(a)
(b)
Figure 7. 3D representation of the arches of the bridge a) 3D of
the San Cono’s bridge arches; b) Plan view in wireframe mode
of the (decimalized) mesh of the arches
A detail that characterizes the structure is, unfortunately, a rather
abundant vegetation present in several parts of the structure. This
vegetation, beyond to hide the beauty of the bridge, could also
compromise the integrity of the structure.
The stacks located in the bed of a watercourse, generally arranged
in the direction of the stream, have both appendages, upstream
and downstream, called appendages with the function of
gradually modifying the section of the riverbed, of diverting the
material transported by the river and, of consequence, by reducing
the turbulence of the current. In this way it is possible to reduce
the risk of erosion of the bottom.
As regards the quantitative analysis, the creation of suitable
surfaces for the structural modelling of the bridge, starting from
a 3D model according to "dense point cloud", may take place
along different ways.
In general, the first obstacle is represented by the presence of
thick vegetation on the structure to be investigated. In fact, the
elimination of vegetation has created holes within the structure.
Therefore, the further difficulty in modelling was the
reconstruction of the geometry of the bridge covered by
vegetation.
Several pipelines have been examined. The most efficient of the
several possible pipelines can thus be outlined:
- import of point cloud in Rhinoceros software;
- creation of objects in Rhino;
- creation of structural objects in structural analysis
software.
As indicated in the previous pipeline, the first step was to import
the point cloud into the Rhinoceros software through the use of
special plug-in called “Arena”. This plug-in allowed an optimal
management of the point cloud; indeed, it was possible to create
detailed profiles in the specific sections (Figure 8).
Figure 8. Extraction of sections from point cloud
In this (software) environment, the complex and irregular shapes
of the bridge were created according to nurb geometries. In this
way, it was also possible to differentiate the different elements of
the bridge and define, at the same time, the different geometries
of the pylons, double vaults and retaining walls. The
characterization of each structural element allows each of them to
be assigned a specific material. In order to dissect the vault, a
geometric construction with projecting beams has been created
which is able to define the precise spatial position of the sections.
Once the sections were defined, nurbs connecting surfaces were
built. Due to the irregular geometries, it was necessary to use an
additional plug-in developed within Rhino, called "Evolut",
which was able to generate highly complex and sophisticated
nurbs surfaces. Therefore, using this method, the single and
double vaulted bridge pylons, the retaining walls and the road
were built through the sections and surfaces, as shown in the
Figure 9.
Figure 9. Construction of the structural parts of the bridge:
containment walls, vaults and pillars.
Subsequently, the surfaces were imported into the GTS NX
structural software. GTS NX is a comprehensive finite element
analysis software package that is equipped to handle the entire
range of structural design applications. In this type of software,
nurbs surfaces cannot be imported but solids must be built
(through the aforementioned surfaces). As a result, each nurbs
surface was transformed into a solid through modelling in Rhino.
Once the solid geometric objects were exported in GTS-NX
software, it was possible to create structural meshes. For example,
is shown in the Figure 10, a view of the vault of the bridge in GTS
NX software (import from Rhino as a solid in parasolid format).
The International Archives of the Photogrammetry, Remote Sensing and Spatial Information Sciences, Volume XLII-2/W17, 2019 6th International Workshop LowCost 3D – Sensors, Algorithms, Applications, 2–3 December 2019, Strasbourg, France
This contribution has been peer-reviewed. https://doi.org/10.5194/isprs-archives-XLII-2-W17-249-2019 | © Authors 2019. CC BY 4.0 License.
254

Figure 10. View of the vault of the bridge in GTS NX software
In order to perform the structural calculation, these objects were
constrained and subjected to loads. Since that the several objects
already distinct from one another during the mesh creation
operation, it was possible to assign them specific materials. In this
way, the single geometric object was parameterized, and
consequently, each of them had appropriate values of the elastic
modulus. Since the geometric objects are made of masonry, the
structural analysis was performed using the constitutive model of
Mohr Coulomb.
4. CONCLUSIONS
The integration of terrestrial and aerial photogrammetric
techniques allowed to obtain an accurate 3D model of masonry
bridge. In the data acquisition step, the use of UAV aerial
platform was applied with success to survey a lot of detail of the
superstructure of the bridge which could not be obtained by
terrestrial survey. As regards the post-processing of the image,
the elevated automation and high accuracy achievable by
commercial software based on SfM-MVS approach allowed to
build a 3D point cloud and 3D mesh with texture. So, starting
from a geomatics surveys, it was identified and applied a novel
and efficient procedure able to obtain a 3D model suitable for
structural analysis. Indeed, despite the 3D model of masonry
bridge showed the presence of dense vegetation in some parts of
the structure, this criticality was overcome reconstructing the
geometry in Rhino environment which specializes in 3D surface
management and modelling.
REFERENCES
Altuntas, C., Pehlivanlı, M. E., Kurban, S., 2017. Low-Cost 3D
Imaging and Measurement Techniques for Documentation of
Meram Masonry Arch Bridge in Turkey. International Journal of
Sensors and Sensor Networks, 5(5), p.63.
Angelini, M. G., Baiocchi, V., Costantino, D., Garzia, F. 2017.
Scan to BIM for 3D reconstruction of the papal basilica of Saint
Francis in Assisi in Italy. International Archives of the
Photogrammetry, Remote Sensing & Spatial Information
Sciences, 42.
Calì, M., Ambu, R., 2018. Advanced 3D Photogrammetric
Surface Reconstruction of Extensive Objects by UAV Camera
Image Acquisition. Sensors, 18(9), p. 2815.
Cucchiaro, S., Maset, E., Fusiello, A., Cazorzi, F., 2018. 4d-sfm
photogrammetry for monitoring sediment dynamics in a debris-
flow catchment: software testing and results
comparison. International Archives of the Photogrammetry,
Remote Sensing & Spatial Information Sciences, 42(2).
Enac, 2018. Regulation RPAS_Issue_2_Rev_4.
(https://www.enac.gov.it/sites/default/files/allegati/2018-
Lug/Regulation_RPAS_Issue_2_Rev_4_eng.pdf)
Jiang, R., Jáuregui, D. V., White, K. R., 2008. Close-range
photogrammetry applications in bridge measurement: Literature
review. Measurement, 41(8), 823-834.
Jáuregui, D., Tian, Y., Jiang, R., 2006. Photogrammetry
applications in routine bridge inspection and historic bridge
documentation. Transportation Research Record: Journal of the
Transportation Research Board, (1958), 24-32.
Kouimtzoglou, T., Stathopoulou, E. K., Georgopoulos, A., 2017.
Image-Based 3D Reconstruction Data as AN Analysis and
Documentation Tool for Architects: the case of Plaka Bridge in
Greece, The International Archives of the Photogrammetry,
Remote Sensing and Spatial Information Sciences.
Lingua, A., Noardo, F., Spanò, A., Sanna, S., & Matrone, F. 2017.
3D model generation using oblique images acquired by UAV.
International Archives of the Photogrammetry, Remote Sensing
& Spatial Information Sciences, 42.
Lorenzo, H., Arias, P., Armesto, J., Rial, F. I., Pereira, M., Novo,
A., Solla, M., 2007. Documentation and evaluation of historic
masonry arch bridges by means of geomatic techniques.
In Proceedings of 5th International Conference on Arch Bridges
(ARCH’07), 373-380.
Luhmann, T., Robson, S., Kyle, S., Harley, I., 2007. Close range
photogrammetry, Wiley.
Murtiyoso, A., Grussenmeyer, P., Börlin, N., Vandermeerschen,
J., Freville, T. 2018. Open source and independent methods for
bundle adjustment assessment in close-range UAV
photogrammetry. Drones, 2(1), 3.
Pepe, M., Fregonese, L., Scaioni, M., 2018. Planning airborne
photogrammetry and remote-sensing missions with modern
platforms and sensors. European Journal of Remote
Sensing, 51(1), 412-436.
Pepe, M., 2018a. Image-based methods for metric surveys of
buildings using modern optical sensors and tools: from 2D
approach to 3D and vice versa, International Journal of Civil
Engineering and Technology.
Pepe, M. 2018b. CORS architecture and evaluation of positioning
by low-cost GNSS receiver. Geodesy and Cartography, 44(2),
36-44.
Rahaman, H., Champion, E., 2019. To 3D or Not 3D: Choosing a
Photogrammetry Workflow for Cultural Heritage
Groups. Heritage, 2(3), 1835-1851.
Remondino, F., Worth a thousand words – photogrammetry for
archaeological 3D surveying, in: Opitz, R.S., Cowley, D.C.
(Eds.), Interpreting archaeological topography: airborne laser
scanning, 3D data, and ground observation, occasional
publication of the aerial archaeology research group no. 5, Oxbow
Books, Oakville, CT, 2013, 115–122.
Şeker, D. Z., Avşar, E. Ö., Aydar, U., 2006. Modeling of
Historical Bridges Using Photogrammetry and Virtual Realty. In:
XXIII FIG Congress and XXIX General Assembly - Shaping the
Change, Munich, Germany, p.12.
The International Archives of the Photogrammetry, Remote Sensing and Spatial Information Sciences, Volume XLII-2/W17, 2019 6th International Workshop LowCost 3D – Sensors, Algorithms, Applications, 2–3 December 2019, Strasbourg, France
This contribution has been peer-reviewed. https://doi.org/10.5194/isprs-archives-XLII-2-W17-249-2019 | © Authors 2019. CC BY 4.0 License.
255