30862 Rostron Adam Final e-Thesis (Master Copy).pdf
312
The Role of Dynamins in the Fusion of Synaptic Vesicles and their Subsequent Recycling by Adam Rostron (B.Sc.) A thesis submitted in partial fulfilment for the requirements for the degree of Doctor of Philosophy at the University of Central Lancashire. October, 2019
-
Upload
khangminh22 -
Category
Documents
-
view
3 -
download
0
Transcript of 30862 Rostron Adam Final e-Thesis (Master Copy).pdf
i
The Role of Dynamins in the Fusion of Synaptic Vesicles and their Subsequent Recycling
by
Adam Rostron (B.Sc.)
A thesis submitted in partial fulfilment for the requirements for the degree of Doctor of Philosophy at the University of Central Lancashire.
October, 2019

i
This thesis is dedicated to my mum and dad, before day one you were there for me.

ii
STUDENT DECLARATION FORM Concurrent registration for two or more academic awards
I declare that while registered as a candidate for the research degree, I have
not been a registered candidate or enrolled student for another award of the University or other academic or professional institution.
Material submitted for another award
I declare that no material contained in the thesis has been used in any other submission for an academic award and is solely my own work.
Signature of Candidate
Adam Paul Rostron (B.Sc.) Type of award Doctorate of Philosophy, PhD
School School of Pharmacy and Biomedical Sciences, University of Central Lancashire

iii
Abstract
Kiss and run (KR) is a highly debated mode of synaptic vesicle (SV) recycling in neurons,
and limited research has investigated the protein pathways that regulate it. This thesis
demonstrates that protein kinase A (PKA) activation can specifically switch the reserve
pool (RP) of SVs to KR, whilst PKA inhibition switches the readily releasable pool (RRP)
of SVs to full fusion (FF) for some stimuli. This thesis also demonstrated that cytosolic
Dynamin-I (Dyn-I) is not required to mediate the basal KR observed during exocytosis,
but a membrane bound sub-pool of Dyn-I is. KR can only occur when actin filaments
are polymerised or able to polymerise, and actin polymerisation is also required to
mobilise the RP to fuse at the active zone (AZ). Activation of adenylyl cyclase (AC) can
block release of the RP by lowering intracellular Ca2+ ([Ca2+]i) levels via activation of
exchange-proteins activated by cyclic-AMP (EPACs), but activation of AC can also
switch the RRP to a KR mode of exocytosis by increasing [Ca2+]i during certain
stimulation paradigms. This thesis also validates that Serine (Ser-795) is an in vivo
phosphorylation site, and a confirmed target of protein kinase C (PKCs) and protein
phosphatase 1 or 2A (PP1 or PP2A). Activation of PKA significantly decreases the basal
phosphorylated state of Ser-795, A conditions which increases the prevalence of KR.
These results reveal significant new roles for PKA and AC in regulation of SV exocytosis,
for distinct pools, and highlight the sub-pool of membrane bound Dyn-I and the vital
role of actin during exocytosis. Certainly future research may reveal the overall
importance of dysfunction in these processes and the roles they could play in
understanding neuronal disorders and disease states as dysfunctional communication
has been associated with many of these. The understanding of how distinct modes of
recycling are regulated by protein pathways is vital to this research.

iv
Contents
Dedication .......................................................................................................................... i
Declaration ....................................................................................................................... ii
Abstract ............................................................................................................................ iii
Contents ........................................................................................................................... iv
List of Tables ..................................................................................................................... x
List of Figures ................................................................................................................... xi
List of Abbreviations and Acronyms .............................................................................. xv
Acknowledgements ...................................................................................................... xvii
Chapter 1: Introduction .................................................................................................... 1
1.1 Synaptic Transmission ......................................................................................................... 2
1.2 Synaptic Vesicles ................................................................................................................. 3
1.3 SV Pools ............................................................................................................................... 6
1.4 SV Recycling ....................................................................................................................... 11
1.5 KR ....................................................................................................................................... 15
1.6 Dyn-I in KR ......................................................................................................................... 17
1.7 Dyns ................................................................................................................................... 19
1.8 Phosphorylation of Dyns ................................................................................................... 24
1.9 Review of Previous Research ............................................................................................ 31
1.9.1 Maximal Glu Release ................................................................................................... 31
1.9.2 A Single Round of Exocytosis ...................................................................................... 35
1.9.3 Maximal Labelling of SVs with FM 2-10 Dye .............................................................. 37

v
1.9.4 The Mode of Exocytosis is Stimulation Dependent .................................................... 38
1.9.5 Presynaptic Proteins Regulating Exocytosis ............................................................... 42
1.9.6 Phosphorylation of Dyn-I Ser-795 in vivo ................................................................... 48
1.9.7 Conclusion ................................................................................................................... 52
1.10 Research Aims ................................................................................................................ 53
1.10.1 Specific Aims ............................................................................................................. 53
Chapter 2: Materials and Methods ................................................................................ 54
2.1 Materials ............................................................................................................................ 55
2.1.1 Buffering Reagents ..................................................................................................... 55
2.1.2 Stimulation Solutions ................................................................................................. 55
2.1.3 Drugs and Final Concentrations (Dissolved in DMSO) .............................................. 58
2.1.4 Various Chemicals Employed ..................................................................................... 59
2.1.5 Equipment ................................................................................................................... 60
2.1.6 Specific Antibodies Employed .................................................................................... 61
2.2 Preparing Synaptosomes .................................................................................................. 62
2.3 Glutamate Release Assay .................................................................................................. 63
2.4 FM 2-10 Styryl Dye Release Assay .................................................................................... 69
2.4.1 Background/Rationale ................................................................................................ 69
2.4.2 Method ........................................................................................................................ 70
2.5 Intracellular Ca2+ Assay ..................................................................................................... 72
2.5.1 Background/Rationale ................................................................................................ 72
2.5.2 Method ....................................................................................................................... 74
2.6 Western Blotting .............................................................................................................. 77
vi
2.6.1 Introduction ................................................................................................................ 77
2.6.2 Sample Preparation .................................................................................................... 77
2.6.3 Electrophoresis and Transfer ...................................................................................... 78
2.6.4 Probing and Chemiluminescence ................................................................................ 79
2.6.5 Quantification of Bands from PVDF Membranes ....................................................... 79
2.7 Bioenergetics Assay .......................................................................................................... 81
2.7.1 Background/Rationale ................................................................................................ 81
2.7.2 Method ........................................................................................................................ 83
Chapter 3: The Role of PKA, Dyn-I and the Actin Cytoskeleton in Regulating
the Mode of exocytosis for SV Pools .......................................................................... 86
3.1 The Effect of Protein Kinase A Regulation on Evoked Glu Release ................................ 87
3.1.1 The Effect of PKA Inhibition on Evoked Glu Release ................................................. 88
3.1.2 The Effect of PKA Activation on Evoked Glu Release ................................................ 90
3.2 The Effect of Dyn-I Inhibition on Evoked Glu Release ..................................................... 92
3.3 The Effect of Actin Disruption on Evoked Glu Release .................................................... 95
3.4 The Effect of PKA Regulation on Evoked FM 2-10 Dye Release ....................................... 97
3.4.1 The Effect of PKA Inhibition on Evoked FM 2-10 Dye Release .................................. 97
3.4.2 The Effect of PKA Activation on Evoked FM 2-10 Dye Release ............................... 100
3.4.3 The Specificity of cBIMPS Action on Evoked FM 2-10 Dye Release ........................ 103
3.5 The Effect of Dyn-I Inhibition on Evoked FM 2-10 Dye Release .................................... 105
3.6 The Effect of Actin Disruption on Evoked FM 2-10 Dye Release ................................... 107
3.7 Intracellular Ca2+ Levels ................................................................................................... 113
3.7.1 The Effect of PKA Inhibition on Evoked Changes in [Ca2+]i ....................................... 113

vii
3.7.2 The Effect of PKA Activation on Evoked Changes in [Ca2+]i ...................................... 115
3.8 Nerve Terminal Bioenergetics ......................................................................................... 117
3.8.1 The Effect of PKA Inhibition on Nerve Terminal Bioenergetics ............................... 118
3.8.2 The Effect of PKA Activation on Nerve Terminal Bioenergetics .............................. 121
3.8.3 The Effect of Dyn-I Inhibition on Nerve Terminal Bioenergetics ............................. 124
3.8.4 The Effect of Actin Disruption on Nerve Terminal Bioenergetics ............................ 127
3.9 Discussion ........................................................................................................................ 130
3.9.1 Evoked Glu Release ................................................................................................... 131
3.9.2 Evoked FM 2-10 Dye Release .................................................................................... 133
3.9.3 Dual Treatments ........................................................................................................ 136
3.9.4 Effect of Dyn-I and Actin Modulation on Evoked FM 2-10 Dye Release.................. 137
3.9.5 Evoked [Ca2+]i Levels .................................................................................................. 139
3.9.6 Bioenergetics of Synaptosomes ................................................................................ 140
3.10 Conclusion ..................................................................................................................... 143
Chapter 4: The Role of AC in Modulating the Mode of Exocytosis and SV Pool
Release via PKA and EPAC Regulation ..................................................................... 144
4.1 Introduction ..................................................................................................................... 145
4.2 The Effect of Adenylyl Cyclase Regulation on Evoked Glu Release ............................... 145
4.2.1 The Effect of AC Inhibition on Evoked Glu Release .................................................. 146
4.2.2 The Effect of AC Activation on Evoked Glu Release ................................................. 148
4.2.3 The Effect of EPAC Inhibition on Evoked Glu Release .............................................. 152
4.3 The Effect of AC Regulation on Evoked FM 2-10 Dye Release ....................................... 155
4.3.1 The Effect of AC Inhibition on Evoked FM 2-10 Dye Release ................................... 155

viii
4.3.2 The Effect of AC Activation on Evoked FM 2-10 Dye Release .................................. 157
4.4 The Effect of AC Regulation on Evoked Changes in [Ca2+]i ............................................. 163
4.4.1 The Effect of AC Inhibition on Evoked Changes in [Ca2+]i ......................................... 163
4.4.2 The Effect of AC Activation on Evoked Changes in [Ca2+]i ........................................ 165
4.4.3 The Effect of EPAC Inhibition on Evoked Changes in [Ca2+]i ..................................... 168
4.5 The Effect of the Regulation of AC on Nerve Terminal Bioenergetics ........................... 172
4.5.1 The Effect of AC Inhibition on Nerve Terminal Bioenergetics ................................. 172
4.5.2 The Effect of AC Activation on Nerve Terminal Bioenergetics ................................. 174
4.5.3 The Effect of EPAC Inhibition on Nerve Terminal Bioenergetics ............................. 177
4.6 Discussion ........................................................................................................................ 181
4.6.1 Evoked Glu Release ................................................................................................... 182
4.6.2 Evoked FM 2-10 Dye Release .................................................................................... 184
4.6.3 Evoked [Ca2+]i Levels ......................................................................................... 186
4.6.4 Bioenergetics of Synaptosomes ................................................................................ 189
4.7 Conclusion ....................................................................................................................... 190
Chapter 5: Studies of Dyn-I Phosphorylation during Exocytosis ................................ 191
5.1 Introduction ..................................................................................................................... 192
5.2 Results .............................................................................................................................. 196
5.2.1 Phosphorylation of Dyn-I Ser-795 in vivo ................................................................. 197
5.2.2 The Effect of 0.8 µM OA upon Dyn-I Phosphorylation in the RRP ........................... 200
5.2.3 The Effect of 2 µM KT5720 upon Dyn-I Phosphorylation in the RRP ....................... 209
5.2.4 The Effect of 50 µM cBIMPS upon Dyn-I Phosphorylation ...................................... 213
5.3 Discussion ........................................................................................................................ 220

ix
5.3.1 Phosphorylation of Dyn-I Ser-795 in vivo ................................................................. 221
5.3.2 The Effect of 0.8 µM OA upon Dyn-I during 4AP5C Stimulation .............................. 222
5.3.3 The Effect of PKA Inhibition upon Dyn-I during 4AP5C Stimulation ........................ 223
5.3.4 The Effect of PKA Activation upon Dyn-I Phosphorylation ...................................... 225
5.4 Conclusion ....................................................................................................................... 225
Chapter 6: General Discussion ..................................................................................... 227
6.1 Results .............................................................................................................................. 228
6.1.1 The Role of PKA, Dyn-I and Actin in Neurotransmission.......................................... 229
6.1.2 The Role of cAMP and EPACs in Neurotransmission ................................................ 231
6.1.3 The Role of Dyn-I Ser-795 in Mode Regulation ........................................................ 233
6.2 Future Studies .................................................................................................................. 236
Chapter 7: References and Appendix .......................................................................... 239
7.1 Appendix A ...................................................................................................................... 290
7.2 Appendix B ....................................................................................................................... 294

x
List of Tables
Table 1.1: Overview of the Four Major Recycling Modes……………………………………………16 Table 1.2: Known Dyn-I Phosphorylation Sites................……………………...........……………29
Table 2.1: Antibodies for Western Blotting………………………………………………………………..61

xi
List of Figures
Figure 1.1: Vesicle Pools and Sizes.......…………………………………...…………………………………10
Figure 1.2: Overview of CME and ADBE ………………………………...………………………………….11
Figure 1.3: Overview of CME, UE and KR ………...……………..………………………………………..12
Figure 1.4: The Crystal Structure of Dyn.........................................................................22
Figure 1.5: Dyn Tetramers form a Helix..........................................................................23
Figure 1.6: Domains and Established Phosphorylation Sites Present on Dyn-I.............25
Figure 1.7: Effect of a Range of [Ca2+]e upon Evoked Glu Release.................................32
Figure 1.8: Effect of Stimuli upon Cytosolic free Calcium [Ca2+]i...................................34
Figure 1.9: Effect of 1 μM Bafilomycin A1 upon Evoked Glu release............................36
Figure 1.10: Difference between SVs Loaded with 1 mM or 100 μM FM 2-10 Dye.....38
Figure 1.11: Mode of RRP Release during Control and 0.8 μM OA Treatment............40
Figure 1.12: Mode of RRP Release................................................................................41
Figure 1.13: Effect of 160 μM Dynasore vs Control upon Evoked Glu and..................42
FM 2-10 Dye Release
Figure 1.14: Effect of 50 μM Blebb upon Evoked Glu Release......................................44
Figure 1.15: Effect of 50 μM Blebb upon Evoked FM 2-10 Dye Release.......................45
Figure 1.16: Effect of 1 μM Cys A upon Evoked Glu and FM 2-10 Dye Release...........47
Figure 1.17: Phosphorylation of Dyn-I Ser-795 across a range of Treatments.............49
Figure 1.18: Phosphorylation of Dyn-I Ser-778.............................................................50
Figure 1.19: Phosphorylation of Dyn-I Ser-774.............................................................51
Figure 2.1: Glu Assay Time Course................................................................................63
Figure 2.2: Average Size of Maximum Glu Release with HK5C and ION5C ....................67
Stimulation

xii
Figure 2.3: Evoked Glu Release Equivalency of Approach..............................................68
Figure 2.4: FM 2-10 Assay Time Course.........................................................................70
Figure 2.5: Fura-2 Assay Time Course.............................................................................74
Figure 3.1: Effect of 2 µM KT5720 vs Control upon Evoked Glu Release.......................89
Figure 3.2: Effect of 50 µM cBIMPS vs Control upon Evoked Glu Release.....................91
Figure 3.3: Effect of 30 µM MITMAB vs Control upon Evoked Glu Release...................94
Figure 3.4: Effect of 15 µM Latrunculin vs Control upon Evoked Glu Release...............96
Figure 3.5: Effect of 2 µM KT5720 vs Control upon Evoked FM 2-10 Dye Release........99
Figure 3.6: Effect of 50 µM cBIMPS vs Control upon Evoked FM 2-10 Dye Release....101
Figure 3.7: Effect of 2 µM KT5720 plus 50 µM cBIMPS Treatment upon.....................104
Evoked FM 2-10 Dye Release
Figure 3.8: Effect of 30 µM MITMAB vs Control upon Evoked FM 2-10 Dye...............106
Release
Figure 3.9: Effect of 15 µM Latrunculin vs Control upon Evoked FM...........................109
2-10 Dye Release
Figure 3.10: Comparison of Latrunculin plus Control upon Evoked FM 2-10..............112
Dye Release
Figure 3.11: Effect of 2 µM KT5720 vs Control upon Evoked [Ca2+]i Levels.................114
Figure 3.12: Effect of 50 µM cBIMPS vs Control upon Evoked [Ca2+]i Levels...............116
Figure 3.13: Effect of 2 µM KT5720 upon Synaptosomal Bioenergetics......................119
Figure 3.14: Effect of 2 µM KT5720 upon Mitochondrial Function..............................120
Figure 3.15: Effect of 50 µM cBIMPS upon Synaptosomal Bioenergetics....................121
Figure 3.16: Effect of 50 µM cBIMPS upon Mitochondrial Function.............................122
Figure 3.17: Effect of 30 µM MITMAB upon Synaptosomal Bioenergetics..................125
Figure 3.18: Effect of 30 µM MITMAB upon Mitochondrial Function..........................126
xiii
Figure 3.19: Effect of 15 µM Latrunculin upon Synaptosomal Bioenergetics............. 128
Figure 3.20: Effect of 15 µM Latrunculin upon Mitochondrial Function......................129
Figure 4.1: Effect of 100 µM 9-cp-ade vs Control upon Evoked Glu Release...............147
Figure 4.2: Effect of 100 µM Forskolin vs Control upon Evoked Glu Release...............150
Figure 4.3: Effect of 100 µM 1,9-dideoxyforskolin and 100 µM 9-cp-ade plus............151
100 µM Forskolin Treatment upon Evoked Glu Release
Figure 4.4: Effect of 100 µM ESI-09 and 100 µM ESI-09 plus 100 µM..........................154
Forskolin upon Evoked Glu Release
Figure 4.5: Effect of 100 µM 9-cp-ade vs Control upon Evoked FM 2-10.....................156
Dye Release
Figure 4.6: Effect of 100 µM Forskolin; 100 µM 9-cp-ade plus 100 µM.......................159
Forskolin upon 4AP5C Evoked FM 2-10 Dye Release
Figure 4.7: Effect of 2 µM KT5720 Pre-treatment and 100 µM Forskolin....................160
upon 4AP5C Evoked FM 2-10 Dye Release
Figure 4.8: Effect of 0.8 µM OA; 0.8 µM OA plus 100 µM Forskolin upon...................162
4AP5C Evoked FM 2-10 Dye Release
Figure 4.9: Effect of 100 µM 9-cp-ade vs Control upon Evoked [Ca2+]i Levels..............164
Figure 4.10: Effect of 100 µM Forskolin vs Control upon Evoked [Ca2+]i Levels...........167
Figure 4.11: Effect of 100 µM ESI-09 vs Control upon Evoked [Ca2+]i Levels...............169
Figure 4.12: Effect of 100 µM ESI-09 plus 100 µM Forskolin upon...............................171
Evoked [Ca2+]i Levels
Figure 4.13: Effect of 100 µM 9-cp-ade upon Synaptosomal Bioenergetics................173
Figure 4.14: Effect of 100 µM 9-cp-ade upon Mitochondrial Function........................174
Figure 4.15: Effect of 100 µM Forskolin upon Synaptosomal Bioenergetics................175
xiv
Figure 4.16: Effect of 100 µM Forskolin upon Mitochondrial Function.......................176
Figure 4.17: Effect of 100 µM ESI-09 upon Synaptosomal Bioenergetics....................178
Figure 4.18: Effect of 100 µM ESI-09 upon Mitochondrial Function............................179
Figure 5.1: Effect of 40 nM or 1 μM PMA upon Dyn-I Ser-795 over 120 sec...............199
Figure 5.2: Effect of OA or KT5720 upon Dyn-I Ser Sites 2-15 sec...............................202
Figure 5.3: Effect of OA or KT5720 upon Dyn-I Ser Sites 30-120 sec...........................203
Figure 5.4: Effect of 0.8 μM OA upon Dyn-I Ser-795 over 120 sec..............................205
Figure 5.5: Effect of 0.8 μM OA upon Dyn-I Ser-774 over 120 sec..............................206
Figure 5.6: Effect of 0.8 μM OA upon Dyn-I Ser-778 over 120 sec..............................208
Figure 5.7: Effect of 2 μM KT5720 upon Dyn-I Ser-795 over 120 sec..........................210
Figure 5.8: Effect of 2 μM KT5720 upon Dyn-I Ser-774 over 120 sec..........................211
Figure 5.9: Effect of 2 μM KT5720 upon Dyn-I Ser-778 over 120 sec..........................212
Figure 5.10: Effect of 50 μM cBIMPS upon Dyn-I Ser sites 2-15 sec............................214
Figure 5.11: Effect of 50 μM cBIMPS upon Dyn-I Ser-795 over 15 sec........................216
Figure 5.12: Effect of 50 μM cBIMPS upon Dyn-I Ser-774 over 15 sec........................218
Figure 5.13: Effect of 50 μM cBIMPS upon Dyn-I Ser-778 over 15 sec........................219

xv
List of Abbreviations and Acronyms
[Ca2+]e – Extracellular Ca2+ [Ca2+]i – Intracellular Ca2+ 9-cp-ade – 9-cyclopentyladenine mesylate AC – Adenylyl cyclase ADBE – Activity dependent bulk endocytosis AP – Action potential ATP – Adenosine triphosphate
AZ – Active zone BSE – Bundle signalling element cAMP – Cyclic adenosine monophosphate CAZ – Cytomatrix at the active zone CBD – cAMP binding domain cBIMPS – Sp-5,6-dichloro-cBIMPS CDK5 – Cyclin-dependent kinase 5
CME – Clathrin mediated endocytosis
CNS – Central nervous system Cys A – Cyclosporine A DAG – Diacylglycerol DTT – Dithiothreitol Dyn – Dynamin
EM – Electron microscopy EPAC – Exchange protein activated by cAMP ETC – Electron transport chain F-actin – Filamentous actin
FF – Full fusion
FP – Fusion pore Fura-2-AM – Fura-2-acetoxymethly ester GDH – Glutamate dehydrogenase type-II GED – GTPase effector domain GEF – Guanine-nucleotide exchange factor Glu – Glutamate Gsα – G-protein α-subunit GSK3 – Glycogen synthase kinase 3 GTP – Guanosine triphosphate HCN – Hyperpolarisation-activated cyclic nucleotide-modulated KO – Knockout KR – Kiss and run LDS – Lithium dodecyl sulphate LTD – Long-term depression LTP – Long-term potentiation
MD – Middle domain MITMAB – Myristyl trimethyl ammonium bromide Mito-Stress – Mitochondrial stress mUnits – Milli-Units NM-II – Non-muscle myosin-II

xvi
NMJ – Neuromuscular junction
NT – Neurotransmitter OA – Okadaic acid OCR – Oxygen consumption rate
PAA – Phosphoamino acid analysis PAZ – Peri-active zone PEA – Polethlyeneamine
PH – Pleckstrin-homology PIP2 – Phosphatidylinositol 4, 5-bisphosphate
PKA – Protein kinase A
PKC – Protein kinase C
PM – Plasma membrane
PMA – Phorbol 12-myristate 13-acetate PP1 – Protein phosphatase 1 PP2A – Protein phosphatase 2A PP2B – Protein phosphatase 2B PRD – Proline rich domain PVDF – Polyvinylidene fluoride RP – Reserve pool RRP – Readily releasable pool RT – Room temperature
S.E.M. – Standard error of mean
Ser – Serine
SP – Silent pool SVs – Synaptic vesicles TBS – Tris buffered saline
UE – Ultrafast endocytosis

xvii
Acknowledgements
Without the commitment, love and support from a myriad of individuals this thesis
would never have been a possibility. Special thanks go to my supervisor and mentor,
Dr. Anthony Ashton for his tireless guidance and many hours of tutoring, support and
training. Without his support and good practice at scientific accuracy, this thesis would
have never seen the light of day. Many thanks go to Deeba Singh who trained me well,
and wasn’t afraid to correct my laziness and bad practices. A special mention goes to
Stephen Gilbody, who made the long car journeys into Preston so much more
bearable, and who constantly challenges me with his in-depth knowledge of chemistry
and biology. I would also like to thank Tae Guan Kuan and Dan, who brought levity to
sometimes dull working days, and joy to my life through friendship over the years.
I am thankful to all the staff at UCLan who have put up with me, advised me and asked
me questions which have enriched my time here. Many thanks should also go to the
unsung heroes of UCLan who work to help, guide and support students to realise their
full potential.
A very special mention is also due to mum and dad, who put up with me at home for
all these long uni years, and who have also provided me with everything I could ever
need to establish myself in the world. No better parents could exist. Thanks also to
Nannan and Grandad who have believed in me before I knew what I was capable of,
who have prayed for me and looked after me since before I was born. I must also say a
special thanks to Naomi, my incredible wife, who joined me partway through this
thesis, but who has given up evenings and weekends to look over chapters, offer
support and guidance when my determination was fading.
It has been a long road, but I like to think this is still the start of my journey, I have no
idea what the future holds, but I know my future is in God’s hands, and I know what a
good and gracious God he is. I leave you with a few stats from my time as a PhD
student: serious headaches – 4, sleepless nights – 0, litres of tea drank – 2,741, and still
counting...

1
Chapter 1:
Introduction
2
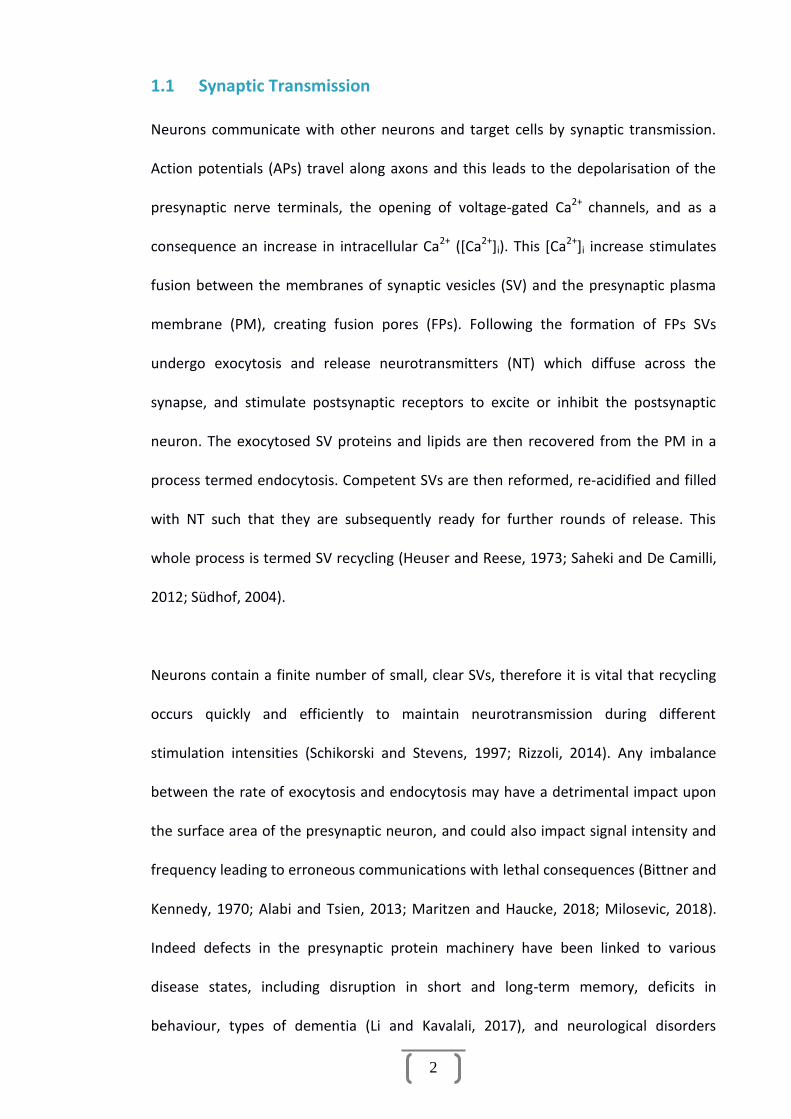
1.1 Synaptic Transmission
Neurons communicate with other neurons and target cells by synaptic transmission.
Action potentials (APs) travel along axons and this leads to the depolarisation of the
presynaptic nerve terminals, the opening of voltage-gated Ca2+ channels, and as a
consequence an increase in intracellular Ca2+ ([Ca2+]i). This [Ca2+]i increase stimulates
fusion between the membranes of synaptic vesicles (SV) and the presynaptic plasma
membrane (PM), creating fusion pores (FPs). Following the formation of FPs SVs
undergo exocytosis and release neurotransmitters (NT) which diffuse across the
synapse, and stimulate postsynaptic receptors to excite or inhibit the postsynaptic
neuron. The exocytosed SV proteins and lipids are then recovered from the PM in a
process termed endocytosis. Competent SVs are then reformed, re-acidified and filled
with NT such that they are subsequently ready for further rounds of release. This
whole process is termed SV recycling (Heuser and Reese, 1973; Saheki and De Camilli,
2012; Südhof, 2004).
Neurons contain a finite number of small, clear SVs, therefore it is vital that recycling
occurs quickly and efficiently to maintain neurotransmission during different
stimulation intensities (Schikorski and Stevens, 1997; Rizzoli, 2014). Any imbalance
between the rate of exocytosis and endocytosis may have a detrimental impact upon
the surface area of the presynaptic neuron, and could also impact signal intensity and
frequency leading to erroneous communications with lethal consequences (Bittner and
Kennedy, 1970; Alabi and Tsien, 2013; Maritzen and Haucke, 2018; Milosevic, 2018).
Indeed defects in the presynaptic protein machinery have been linked to various
disease states, including disruption in short and long-term memory, deficits in
behaviour, types of dementia (Li and Kavalali, 2017), and neurological disorders

3
(Cortès-Saladelafont, et al., 2018). In order to maintain healthy neurotransmission
during different stimulation intensities, neurons have developed multiple modes of SV
recycling, regulated by many complex protein pathways (Soykan, et al., 2016), to
elegantly match release of NT with demand (Kavalali, 2007).
It is imperative to understand the molecular, morphological and functional features of
SV recycling in healthy models, in order to understand what detrimental changes may
have occurred in various disease states and chronic conditions, e.g. diabetes,
Alzheimer’s and so forth (Waites and Garner, 2011; Esposito, et al., 2012).
1.2 Synaptic Vesicles
In the early 1950’s Bernard Katz performing research with Paul Fatt and José del
Castillo, discovered that the release of acetylcholine at frog neuromuscular junctions
(NMJs) occurs in discrete parcels of uniform volume (Fatt and Katz, 1952; Del Castillo
and Katz, 1954). From this research, Katz developed his quantal theory which
suggested that distinct uniform packets of NT ‘quanta’ were released from the
presynaptic terminal. It was not clear at this time if the NT was released from a single
pool within the cytoplasm, or if it was stored in discrete organelles.
Following this theory, electron microscopy (EM) studies noted granular components
present in presynaptic terminals from a range of synapses (De Robertis and Bennett,
1955; Palade and Palay, 1954; Palay, 1956). These granules ranged between 40-60 nm
in diameter, had a uniform appearance, limited spatial organisation and were named
small, clear-cored synaptic vesicles by De Robertis and Bennett (De Robertis and
Bennett, 1955). The number of vesicles present in a terminal could vary from dozens to

4
hundreds, leading Palay to theorise that the SVs may play a direct role in
neurotransmission, either containing small units of NT or a precursor molecule (Palay,
1956).
Further evidence for NTs being stored in SVs came in 1962 when Gray and Whittaker
performed EM studies on a particulate fraction which Whittaker had obtained through
the differential centrifugation and density gradient separation from sucrose
homogenates of the fore-brains of rabbit, guinea-pig and other species (Whittaker,
1959; Gray and Whittaker, 1962). This fraction was distinct from nuclei, mitochondria
and microsomes and contained the highest fraction of bound acetylcholine. It was
discovered that this fraction (fraction B) was composed mainly of particles derived
from nerve endings, which had been created by being pinched or torn-off from axons.
Interestingly, the nerve endings retaining their structural integrity and even resealed at
the point of rupture to form a continuous structure surrounding the nerve terminal
contents. These pinched-off terminals were found to be packed with SVs and were
named ‘synaptosomes’ the following year and have since become a vital tool in
studying synapses and neurotransmission (Whittaker, et al., 1964; Evans, 2015).
The final evidence proving that SVs contained and released NTs at the PM, instead of
simply a pool of NT in the cytoplasm, came when Heuser and colleagues correlated
quantal release of NTs with SVs undergoing exocytosis (Heuser, et al., 1979). Heuser
and colleagues performed quick-freezing of frog NMJs milliseconds after they were
stimulated for release. They found a strong correlation between SVs undergoing
exocytosis, and the release time of NTs. Through statistical analysis they also noted

5
that each vesicle released a similar volume of transmitter (a quanta), proving Katz’s
quantal theory.
Within the central nervous system (CNS), co-secretion of NTs and neuropeptides has
been shown to occur at a variety of synapses (Van Den Pol, 2012). These molecules are
stored and released from two different types of secretory vesicle. Classical NTs are
stored in small synaptic vesicles (SVs) which have an average diameter of 40-60 nm
(Südhof, 2004), whilst neuropeptides are stored in larger organelles, 80-120 nm in
diameter, and feature a dense core, termed large dense-core vesicles (LDCVs)
(Matteoli, et al., 1988). Though exocytosis of both SSVs and LDCVs occurs at the AZ of
CNS terminals (Jung, et al., 2018), and is mediated following Ca2+ entry, both
organelles have distinct release and molecular properties (Laurent, et al., 2018). After
exocytosis SVs can be locally rescued from the PM, but LDCVs can only be replenished
via de novo synthesis at the endoplasmic reticulum (ER) (Zupanc, 1996; Moghadam
and Jackson, 2013).
Secretory vesicles are composed entirely of phospholipids and proteins, with the latter
being in greater proportion. This is contrary to many other membrane bound
organelles and the PM, where proteins are described as ‘icebergs floating in a sea of
lipids’. In a landmark study, Takamori and colleagues found over 400 proteins present
in purified SVs, and while a great majority were loosely associated or interaction
partners, more than 80 were integral proteins vital to trafficking and transport, with
their number being bolstered by multiple copies (Takamori, et al., 2006). This
highlights the complexity of the molecular mechanisms in vesicular trafficking and
recycling, to ensure synaptic transmission is not perturbed.
6
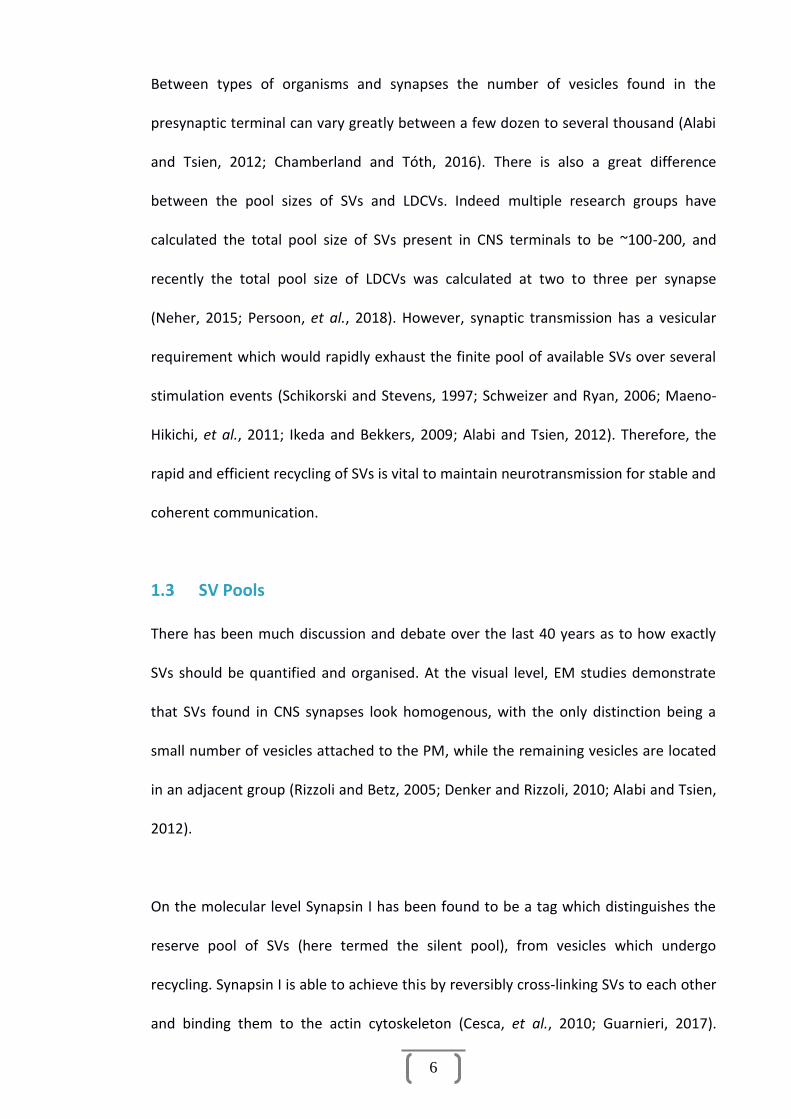
Between types of organisms and synapses the number of vesicles found in the
presynaptic terminal can vary greatly between a few dozen to several thousand (Alabi
and Tsien, 2012; Chamberland and Tóth, 2016). There is also a great difference
between the pool sizes of SVs and LDCVs. Indeed multiple research groups have
calculated the total pool size of SVs present in CNS terminals to be ~100-200, and
recently the total pool size of LDCVs was calculated at two to three per synapse
(Neher, 2015; Persoon, et al., 2018). However, synaptic transmission has a vesicular
requirement which would rapidly exhaust the finite pool of available SVs over several
stimulation events (Schikorski and Stevens, 1997; Schweizer and Ryan, 2006; Maeno-
Hikichi, et al., 2011; Ikeda and Bekkers, 2009; Alabi and Tsien, 2012). Therefore, the
rapid and efficient recycling of SVs is vital to maintain neurotransmission for stable and
coherent communication.
1.3 SV Pools
There has been much discussion and debate over the last 40 years as to how exactly
SVs should be quantified and organised. At the visual level, EM studies demonstrate
that SVs found in CNS synapses look homogenous, with the only distinction being a
small number of vesicles attached to the PM, while the remaining vesicles are located
in an adjacent group (Rizzoli and Betz, 2005; Denker and Rizzoli, 2010; Alabi and Tsien,
2012).
On the molecular level Synapsin I has been found to be a tag which distinguishes the
reserve pool of SVs (here termed the silent pool), from vesicles which undergo
recycling. Synapsin I is able to achieve this by reversibly cross-linking SVs to each other
and binding them to the actin cytoskeleton (Cesca, et al., 2010; Guarnieri, 2017).
7
Numerous studies have demonstrated this role for Synapsin I, as a decrease in pool
size was observed during Synapsin I knockout (KO) or inhibition (Rizzoli and Betz, 2005;
Guarnieri, 2017). Research has also indicated that Synapsin I may work as part of a
ternary complex with Tomosyn I and Rab3A to secure vesicles, as Synapsin I deletions
still displayed filaments tethering SVs together (Siksou, et al., 2007; Cazares, et al.,
2016).
As the majority of vesicles do not arrange into distinct groups, SVs have tended to be
pooled in accordance to their physiological responses to stimulation. Currently SVs are
arranged into three pools based on speed and ease of release, though more recent
advances in research may divide these into a number of sub-pools (Doussau, et al.,
2017). The three pools in the pre-synaptic terminal are:
(i) The readily releasable pool (RRP) which undergoes release at the active zone
(AZ) immediately upon depolarisation.
(ii) The reserve pool (RP), also termed the recycling pool, which begins to mobilise
toward the AZ upon terminal depolarisation and only releases once the RRP is
exhausted.
(iii) The silent pool (SP), which has also been termed the resting pool or the
reluctant pool, which does not release under normal physiological stimulation
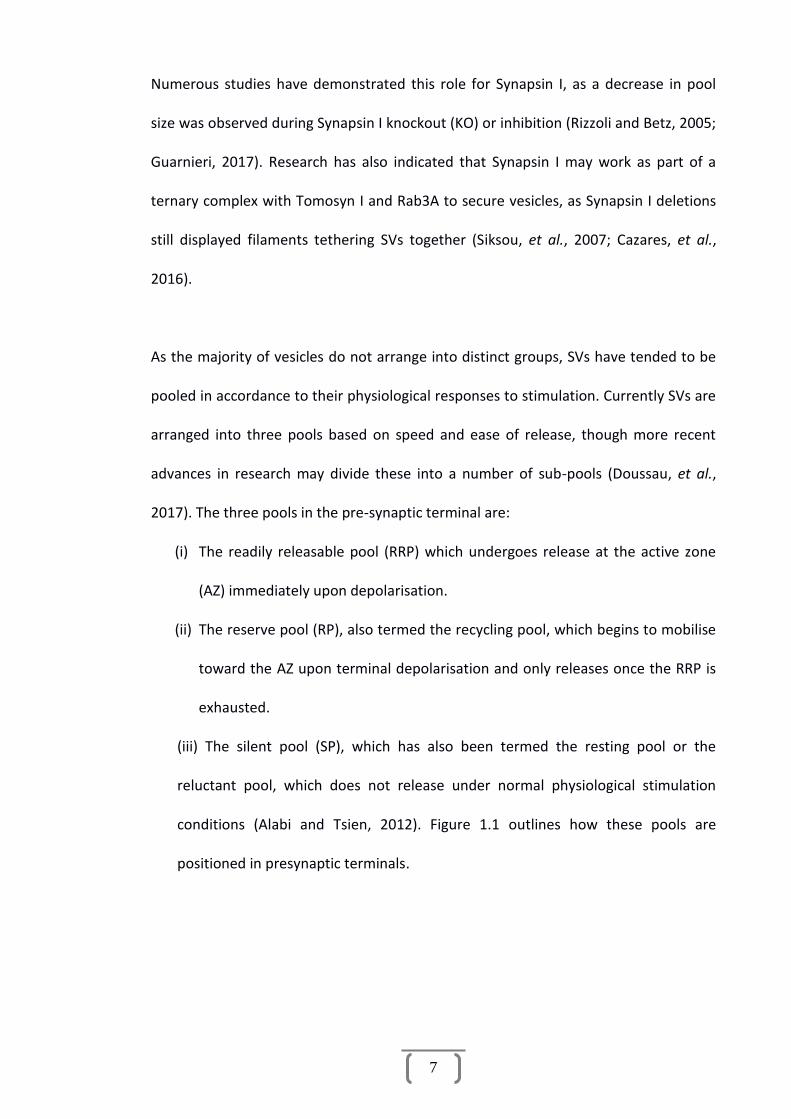
conditions (Alabi and Tsien, 2012). Figure 1.1 outlines how these pools are
positioned in presynaptic terminals.
8
Under physiological conditions, all exocytosis in the neuron occurs at the AZ. Indeed
the AZ is the only place that SVs can undergo exocytosis due to the protein-rich
cytomatrix at the AZ (CAZ), making SV targeting to this area vital (Michel, et al., 2015).
AZs contain enrichments of complexes containing RIM, Munc13, RIM-BP, α-liprin, and
ELKS proteins, which work to ‘dock’ and prime the SV at the PM ready for release
(Südhof, 2013). During exocytosis the AZ can potentially undergo much structural
change with the addition of protein and lipids into the PM. In order to maintain release
an AZ must have several mechanisms in place to maintain stability (Byczkowicz, et al.,
2017). The mechanism of release at the AZ is mediated by vesicular SNAREs and PM
SNAREs which interact and are vital to open and maintain FPs for NT release during
exocytosis (Rizo and Rosenmund, 2008; Shi, et al., 2012; Zhou, et al., 2015). A FP is a
direct channel between the SV lumen and the extracellular space. In neurons FPs are
≤20 nm in diameter and allow rapid (≤100 µs) conduct of small neurotransmitters from
the SVs (Lindau and Alvarez de Toledo, 2003; Jackson and Chapman, 2006; Chang, et
al., 2017).
In a resting neuron under physiological conditions, the RRP is already docked at the AZ
awaiting an increase in local Ca2+ concentration to exocytose. During terminal
depolarisation and Ca2+ influx, the RRP rapidly forms FPs with the PM and releases NTs
into the synaptic cleft (Katz, 1969; Barclay, et al., 2005; Rizzo and Rosenmund, 2008;
Hosoi, et al., 2009; Kaeser and Regehr, 2017). Research indicates that the RRP can be
recycled independently of the RP under certain stimulation conditions, increasing
efficiency through placing a low demand on the terminal to recycle (Rizzoli and Betz,
2004; Ashton and Ushkaryov, 2005; Schikorski, 2014). The RP begins to migrate toward
the AZ and undergoes docking and fusion once the RRP is exhausted. This occurs when
9
the stimulation intensity is higher, or more frequent, leading to a greater demand for
neurotransmission. Finally, the SP is release incompetent under physiological
conditions, but can be released under intense non-physiological stimulation, or
pharmacological treatment.
Considering there are ~100-200 SVs in every nerve terminal, it would make sense to
assume that the majority of these are found in either the RRP or RP. However, this is
not the case. In most terminals studied, the SP contains the largest number of vesicles
≤80%, while the RRP may contain ≤5% of vesicles present (Figure 1.1) (Rizzoli and Betz,
2005; Denker, et al., 2011; Fowler and Staras, 2015). It is debated if this large variation
in SP size is due to individual neuronal activity or plasticity, specific function tied to the
location of the neuron, or methodology of measurement (Harata, et al., 2001; Rizzoli
and Betz, 2005; Ikeda and Bekkers, 2009; Denker and Rizzoli, 2010; Guarnieri, 2017).
Recently Kavalali has suggested that the size of the SP may have a specific role in
neurotransmission, and this could be linked to spontaneous release (Kavalali, 2015;
Cousin, 2017).

10
Figure 1.1: Vesicle Pools and Sizes
The RRP is docked at the AZ ready to release upon Ca2+ influx. The RP docks upon RRP
exhaustion and is roughly the same size as the RRP. The SP contains the majority of
vesicles in the terminal, which cannot be released during physiological stimulation.
Though these percentages may vary between species and neurons, they are a good
representation of the average size of each pool. Note the presence of a mitochondrion
and two LDCVs, which is a typical representation of a synaptosome.

11
1.4 SV Recycling
As previously mentioned, recycling has two major stages: exocytosis and endocytosis,
both of which have a number of alternate forms. There are four prevalent theories as
to the modes of SV recycling; clathrin-mediated endocytosis (CME), activity dependent
bulk endocytosis (ADBE), ultrafast endocytosis (UE) and kiss and run (KR), evidence for
which has been found in a range of model systems including neurons (Gan and
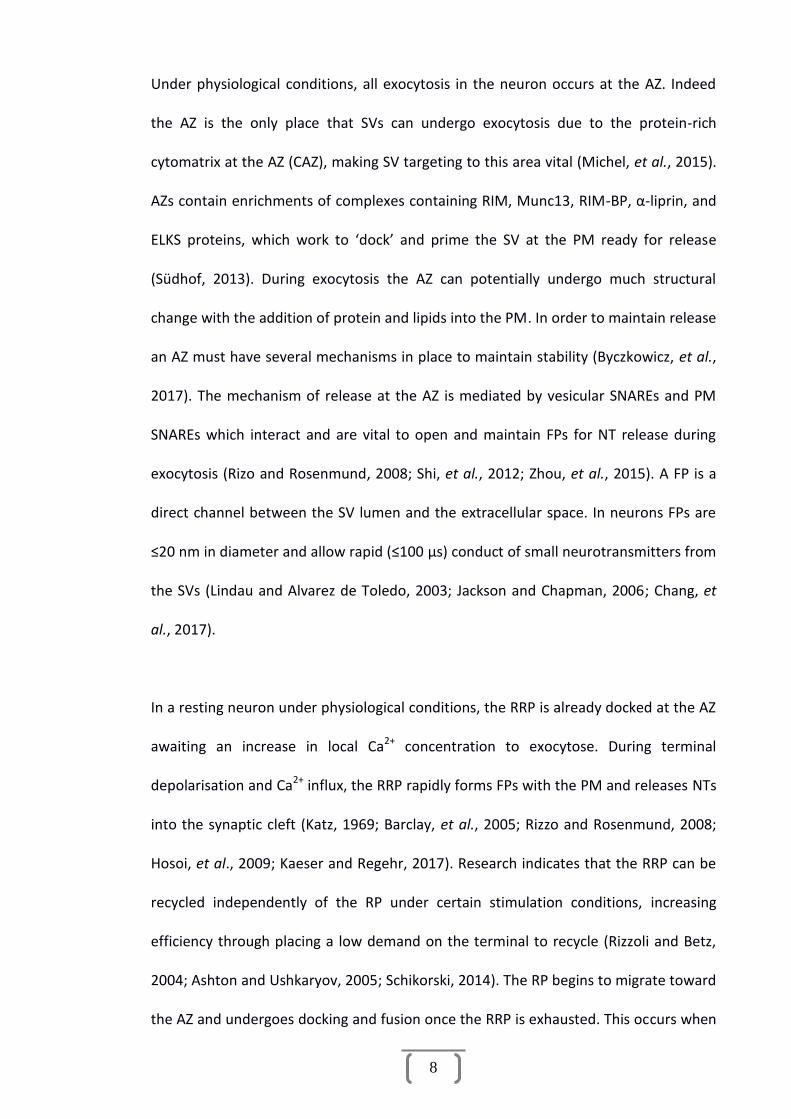
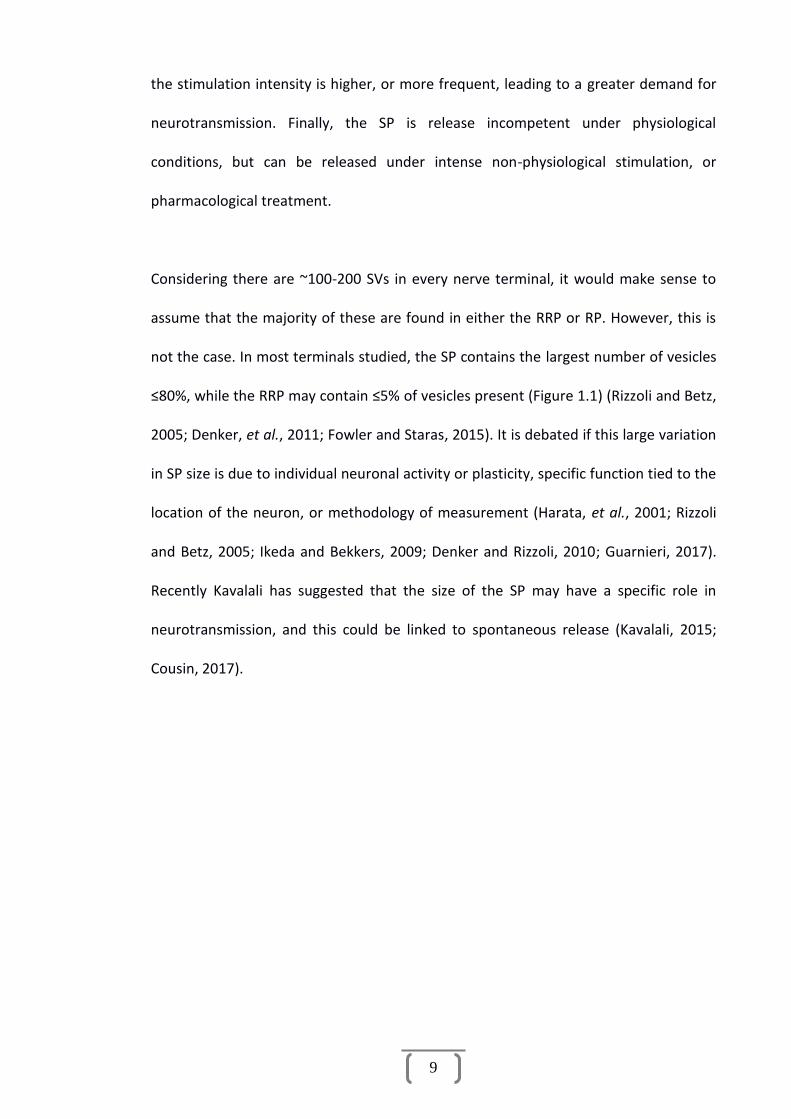
Watanabe, 2018). Figures 1.2 & 1.3 provide a basic overview of these recycling modes
and the molecular mechanisms involved.
Figure 1.2: Overview of CME and ADBE
(A) CME – SVs fully collapse into the PM (left) and clathrin is recruited to rescue SVs
from the PM (right). (B) ADBE – Large invaginations of the PM are recaptured during
intense neuronal activity to reform large numbers of SVs (from Clayton and Cousin,
2009).

12
Figure 1.3: Overview of CME, UE and KR
(A) CME has a long recycling duration and SVs are recovered at a distance by clathrin
and dynamin-dependent mechanisms. (B) UE invaginates a large area of the PM
rapidly, which is then transferred to a large endosome, from which SVs are later
generated. Here the time to occur is described as ≤0.1 sec, but when taking endosomal
sorting and clathrin-dependent SV generation into account takes ~5-10 sec. (C) In KR a
FP is created and restricted from expansion, which would collapse the SVs into the PM.
Instead, protein mechanisms rapidly work to close the FP so the SVs can recycle rapidly
within local proximity to the AZ (from Kononenko, et al., 2013).
Each form of recycling utilises a different method to retrieve SVs from the PM, and
each has its own benefits and disadvantages (He, et al., 2006; Granseth, et al., 2007;
Watanabe, et al., 2013; Watanabe, et al., 2014). It is debated which mode of recycling
is most prevalent in neuronal signalling, though this is dependent upon many factors
such as stimulation intensity and duration, neuronal plasticity and depression of signal
(Granseth, et al., 2006; Harata, et al., 2006; Wu and Wu, 2007; Mellander, et al., 2012;
Nicholson-Fish, et al., 2015; Morton, et al., 2015).
13
Of these, CME, ADBE and UE all employ classical exocytosis, where during fusion, the
FP expands and the SV, unable to retain its shape, fully collapses into the PM, here
termed full fusion (FF) (Rizzoli and Jahn, 2007; Rizo and Rosenmund, 2008). Upon
collapse the SV protein complex and lipid arrangement migrate from the AZ to the
peri-active zone (PAZ) (immediate area surrounding the AZ) where endocytosis can
occur via clathrin and/or dynamin-dependent means (Sone, et al., 2000; Cano and
Tabares, 2016). Either individual SVs are retrieved from the PM, as in CME; or a large
portion of the PM is retrieved to form an endosome, from which SVs are later
generated as in ADBE. UE utilises a combination of the two as it retrieves sections of
the PM roughly equal in surface area to four SVs, which then proceed to join with a
large endosome from which SVs are later generated, via a clathrin-dependent pathway
(Watanabe, et al., 2014).
The mechanism of generating SVs from either the PM or an endosome requires
clathrin, a triskeletal scaffold protein. Through interactions with adaptor proteins,
clathrin invaginates the membrane into clathrin-coated pits (Von Kleist, et al., 2011;
Rizzoli, 2014). For a short duration 1-2 sec these coated pits are attached to the plasma
or endosomal membrane via a narrow neck consisting of lipids and/or proteins. In
order for a coated pit to detach from membrane and become a vesicle, the neck must
be severed.
Scission is performed by the protein dynamin (Dyn), which is a 100-KDa lipid-binding
GTPase which is recruited and oligomerises into a spiral around the neck of budding
pits (Urrutia, et al., 1997; Ferguson and De Camilli, 2012; Cocucci, et al., 2014). Dyn is a
mechanoenzyme and through guanosine triphosphate (GTP) hydrolysis it undergoes a
14
structural change, which may place tension and or torsion on the vesicle neck, leading
to destabilisation of the structure and eventually scission (Stowell, et al., 1999;
Hinshaw, 2000; Yamashita, et al., 2005; Heymann and Hinshaw, 2009). The vesicle is
then able to migrate away from the PM, dissociate from clathrin and other scaffold
proteins and re-acidify ready for NT filling.
Dyn inhibition and knockout (KO) models highlight the dependence of classical
endocytic modes upon Dyn, especially during high or prolonged stimulation where
presynaptic terminals are depleted of SVs (Harata, et al., 2006; Chang, et al., 2010;
Chung, et al., 2010; Douthitt, et al., 2011). Research has also demonstrated that
blockade of Dyn using anti-dynamin IgGs, and a non-hydrolysable form of GTP (GTPγS)
describe a role regulating the FP during exocytosis, including fast recycling and KR
(Graham, et al., 2002; Holroyd, et al., 2002; Harata, et al., 2006; Chan, et al., 2010;
Chanaday and Kavalali, 2017). This indicates that Dyn has a distinct role separate from
endocytosis to regulate synaptic transmission through the exocytotic pathway.
CME, UE and ADBE all have dependencies upon clathrin and Dyn in order to
endocytose SV for further rounds of release, especially in ADBE where clathrin-
dependent endocytosis buds SVs from bulk endosomes (Clayton, et al., 2007). This
Dyn-dependence can be observed in the shibire gene mutant, found in Drosophila.
Here an increase in environmental temperature to 30˚C causes the flies to exhibit
complete muscular paralysis, caused by a blockade in the ability of the mutated Dyns
to cut the neck of endocytosing vesicles. EM studies have highlighted electron dense
collars which surround the endocytosing pits and large membrane in-folds, and these
collars have been identified as Dyns unable to perform scission (Hinshaw, 2000).

15
1.5 KR
SVs which release via KR have a unique and more distinct recycling mode. Ca2+ influx
activates synaptotagmins which modulate SNAREs complexes to form a FP (Jackman,
et al., 2016; Bao, et al., 2018; Sharma and Lindau, 2018). The FP then can be stabilised,
restricted from expanding and rapidly closed through the actions of Dyn-I or Non-
muscle myosin-II (NM-II), though this may depend upon the stimulation utilised (see
Section 1.9), and interactions with the actin cytoskeleton (Fesce, et al., 1994; Harata,
et al., 2006; Chan, et al., 2010; Chang, et al., 2017; Lasič, et al., 2017; Soykan, et al.,
2017). This allows the full content of NT to be released from the SV in ≤1sec, creating
an empty SV which requires no vesicular processing steps or endocytosis and is
immediately ready for re-acidification and refilling with NT (Zhang, et al., 2007; Zhang,
et al., 2009; Alabi and Tsien, 2013).
As a KR SV does not collapse into the PM and does not require rescuing, it has no
clathrin dependency and can migrate directly into the terminal from the AZ upon FP
closure and scission. This leads to a much shorter ‘recycling’ duration of ≤1sec for KR
making it a much more efficient method of vesicular replenishing. This mode of
recycling allows conservation of scarce resource within nerve terminals and rapid
turnover of NT release during moderate stimulation. Table 1.1 compares the major
aspects of each of the four recycling pathways.
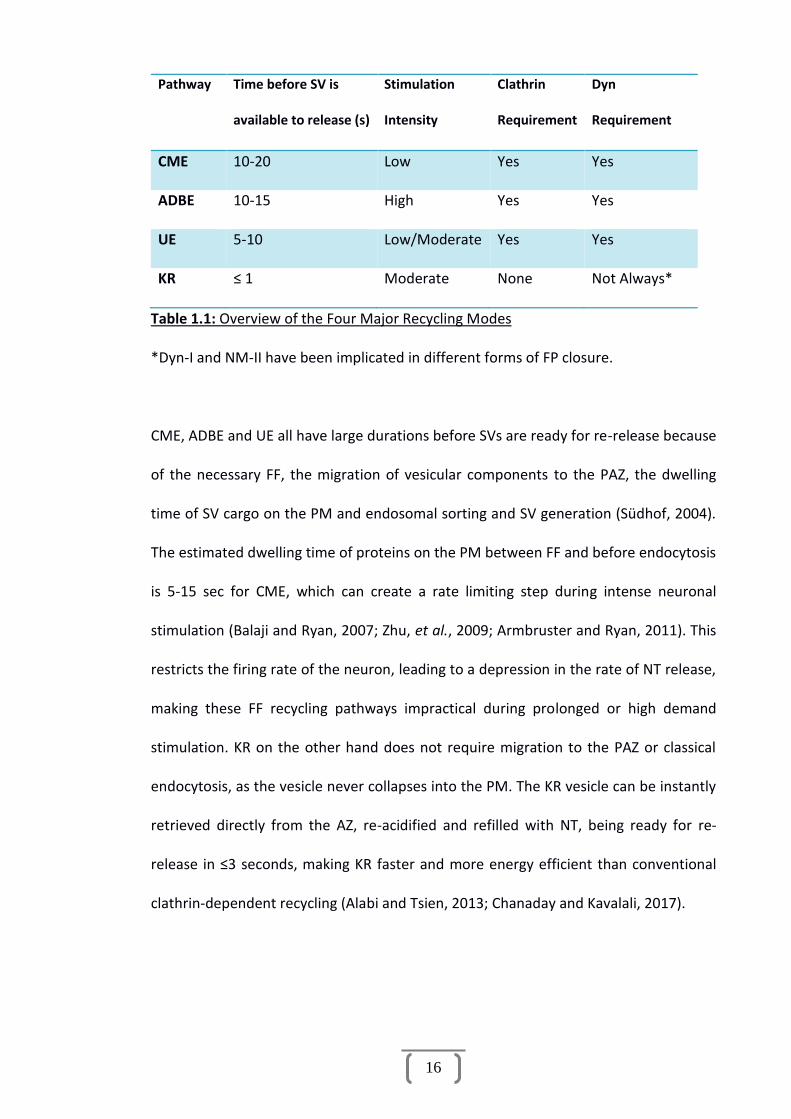
16
Pathway Time before SV is
available to release (s)
Stimulation
Intensity
Clathrin
Requirement
Dyn
Requirement
CME 10-20 Low Yes Yes
ADBE 10-15 High Yes Yes
UE 5-10 Low/Moderate Yes Yes
KR ≤ 1 Moderate None Not Always*
Table 1.1: Overview of the Four Major Recycling Modes
*Dyn-I and NM-II have been implicated in different forms of FP closure.
CME, ADBE and UE all have large durations before SVs are ready for re-release because
of the necessary FF, the migration of vesicular components to the PAZ, the dwelling
time of SV cargo on the PM and endosomal sorting and SV generation (Südhof, 2004).
The estimated dwelling time of proteins on the PM between FF and before endocytosis
is 5-15 sec for CME, which can create a rate limiting step during intense neuronal
stimulation (Balaji and Ryan, 2007; Zhu, et al., 2009; Armbruster and Ryan, 2011). This
restricts the firing rate of the neuron, leading to a depression in the rate of NT release,
making these FF recycling pathways impractical during prolonged or high demand
stimulation. KR on the other hand does not require migration to the PAZ or classical
endocytosis, as the vesicle never collapses into the PM. The KR vesicle can be instantly
retrieved directly from the AZ, re-acidified and refilled with NT, being ready for re-
release in ≤3 seconds, making KR faster and more energy efficient than conventional
clathrin-dependent recycling (Alabi and Tsien, 2013; Chanaday and Kavalali, 2017).
17
1.6 Dyn-I in KR
As well as having a role in membrane fission during endocytosis (Herskovits, 1993; van
der Bliek, 1993; Artalejo, 1995), Dyn-I has also been implicated in exocytosis and the
regulation of the FP (Min, et al., 2007; Fulop, et al., 2008; Chan, et al., 2010; Chang, et
al., 2017; Chanaday and Kavalali, 2017). It is theorised that under certain stimulation
conditions the regulation of the FP during KR can be mediated by Dyn-I which is
recruited to the FP (Artalejo, et al., 2002; Graham, et al., 2002; Chan, et al., 2010;
Anantharam, et al., 2012; Zhao, et al., 2016), and indeed a population of Dyn-I has
been found highly enriched around the AZ in some models (Wahl, et al., 2013).
Just as Dyns have been proved to have a vital role in endocytic neck scission, evidence
suggests they are recruited during exocytosis to close the newly formed FP, mediating
the KR mode of recycling (Chan, et al., 2010; Anatharam, et al., 2011; Zhao, et al.,
2016). In this role Dyn-I may interact and work with the actin cytoskeleton in order to
regulate neurotransmitter exocytosis, by mediating pore constriction (Gu, et al., 2010;
Trouillon and Ewing, 2013). Filamentous actin (F-actin) is enriched at AZs and sites of
endocytosis (Dunaevsky and Connor, 2000; Lou, 2018), and F-actin disruption inhibits
several forms of endocytosis, SV replenishment and SV fusion in nerve terminals,
highlighting a dual-role during exocytosis and endocytosis (Cingolani and Goda, 2008;
Wu, et al., 2016; Lou, 2018).
NM-II in conjunction with F-actin, has also been implicated in regulating FP kinetics and
facilitation of transmitter release during KR, mainly in chromaffin cells (Doreian, et al.,
2008; Berberian, et al., 2009; Gutiérrez and Villanueva, 2018). NM-II is able to expand
the KR fusion pore in chromaffin cells by remodelling the nanoscale, cortical F-actin

18
network during high frequency stimulation conditions, while NM-II inhibition prevents
FP dilation and retains an extended KR mode (Doreian, et al., 2008). Though the exact
mechanisms of NM-II and F-actin on SV regulation in KR are not well established, the
presence of NM-II in the neuronal presynaptic terminal, and a role during ADBE may
indicate a place for NM-II during KR (Papadopulos, et al., 2013; Kokotos and Low, 2015;
Miki, et al., 2016).
It has been theorised that Dyn dephosphorylation can recruit NM-II to work with actin,
mediating FP closure during exocytosis (Chan, et al., 2010), and a similar mechanism
has recently been described during SV endocytosis (Soykan, et al., 2017); however this
may conflict with recent studies performed by Ashton and colleagues (Ashton,
unpublished).
KR has been well established in many non-neuronal tissues such as adrenal chromaffin
cells (Albillos, et al., 1997; Elhamdani, et al., 2006; Doreian, et al., 2008), and evidence
from FM dye studies has suggested KR occurs in hippocampal neurons (Stevens and
Williams, 2000; Zhang, et al., 2007), but the existence of KR in synaptic communication
is controversial partially due to the speed at which KR occurs (Henkel, et al., 2001; He
and Wu, 2007; Aravanis, et al., 2003; Chanaday and Kavalali, 2017). This makes the
study of the role of Dyn-I in nerve terminals vital to the research of the KR mechanism.

19
1.7 Dyns
Mammals have three Dyn genes, which code for three isoforms of Dyn (Dyn I, II & III)
(Cao, Garcia and McNiven, 1998). Dyn-I is expressed at high levels specifically in the
brain, Dyn-II is expressed at a low level ubiquitously in all tissues, and Dyn-III is
expressed at a high level in testis with lower levels of expression in the brain, heart and
lung (Sontag, et al., 1994; Cook, Urrutia and McNiven, 1994; Cook, Mesa and Urruita,
1996; Cao, Garcia and McNiven, 1998). Though all three proteins are present in the
presynaptic terminal, the expression rate of Dyn-I is 100-fold that of both Dyn II and
Dyn III, demonstrating the importance of Dyn I in the terminal (Anggono and Robinson,
2009). To date 25 splice variants of Dyns have been identified; Dyn I, II and III having 8,
4 and 13 splice variants respectively (Cao, Garcia and McNiven, 1998). Though
individual functions for each splice variant have yet to be discovered, their specific
tissue expression and concentration gives each Dyn variant specific functions with
some redundancy, which can be seen especially well in single KO studies.
Mice generated with Dyn I KO were able to form synapses, but such animals die within
two weeks of birth suggesting a Dyn I requirement for healthy postnatal development,
and a Dyn II and Dyn III role for embryonic development and synaptic formation
(Ferguson, et al., 2007). Though Dyn I is not essential for neurotransmission, as Dyn II
and Dyn III can mediate slow endocytosis (Liu, et al., 2011), it is vital for efficient and
sustained recycling, with synaptic fatigue occurring much faster and a depression in
both long-term potentiation (LTP) and neurotransmission seen with repeated
stimulation (Fà, et al., 2014). This is due to the deficit in CME leading to the
accumulation of clathrin-coated pits on the PM, and a depletion of SVs in the nerve
terminal as Dyn is unable to perform fission during endocytosis (Ferguson, et al., 2007;

20
Ritter, et al., 2013). The KO of Dyn II led to early embryonic lethality, describing a vital
role for perinatal development, due to the ubiquitous expression of Dyn II and its role
in all cell types (Liu, et al., 2008; Ferguson, et al., 2009). Double KO of Dyn I and Dyn II
enhanced the Dyn I KO phenotype, with severe defects in CMS, and also described a
relationship between Dyns and actin to regulation the fission pore (Ferguson, et al.,
2009).
The KO of Dyn III displayed no overt phenotype, but also enhanced the phenotype of
Dyn I KO in double KO studies, leading to perinatal lethality and greater deficits in
endocytosis (Raimondi, et al., 2011). However in cultured cells from this model, Dyn II
was able to mediate much reduced synaptic transmission in cells, highlighting the
redundancies of these proteins. The generation of a triple Dyn KO fibroblast cell line
(where Dyn II is reducing using anti-sense RNA) did not reveal any new information
beyond what was observed in double KO studies (Park, et al., 2013).
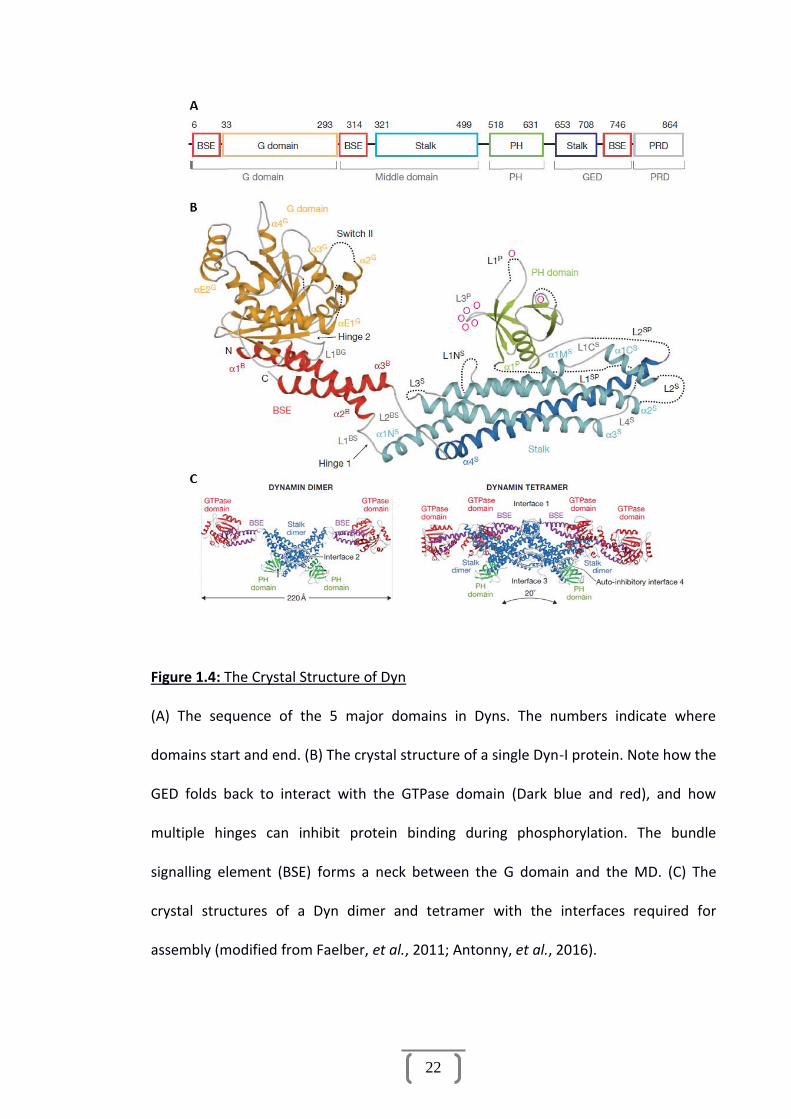
Dyns have 5 well-characterised domains (Figure 1.4 A) providing a range of functions,
vital to their roles as enzymes, protein recruiters and mechanoproteins. These domains
consist of:
(i) A GTPase head (G domain) which undergoes structural change when GTP is
bound and hydrolysed.
(ii) A middle domain (MD) which contains the majority of the stalk of the Dyn
and contains multiple sites important for cross liking to form dimers and
further oligomerisation.
(iii) A pleckstrin-homology (PH) domain which binds to phospholipids present in
the PM most notably Phosphatidylinositol 4, 5-bisphosphate (PIP2).

21
(iv) A GTPase effector domain (GED) which is also important for self-assembly
and when phosphorylated inhibits GTPase activity of the G domain through
direct association.
(v) A proline rich domain (PRD) which contains multiple binding sites for SH3
domain proteins, but is also the region of Dyn with the highest variation in
sequence homology, which is theorised to play a role in tissue specificity
and selective protein binding (Niemann, et al., 2001; Ford, et al., 2011;
Faelber, et al., 2011; Reubold, et al., 2015).
Figure 1.4 B demonstrates the overall crystal structure of a single Dyn molecule,
lacking the PRD which has not yet been resolved. Dyn dimerization is mediated by
interface 2 upon the stalk in the MD to form an X shape; interactions between
interfaces 1 and 3 facilitate assembly into tetramers followed by helical polymers
where the PH domains face inward toward the membrane (Figure 1.4 C) (Antonny, et
al., 2016). Figure 1.5 outlines how multiple Dyn dimers interact to form a helix.
22
Figure 1.4: The Crystal Structure of Dyn
(A) The sequence of the 5 major domains in Dyns. The numbers indicate where
domains start and end. (B) The crystal structure of a single Dyn-I protein. Note how the
GED folds back to interact with the GTPase domain (Dark blue and red), and how
multiple hinges can inhibit protein binding during phosphorylation. The bundle
signalling element (BSE) forms a neck between the G domain and the MD. (C) The
crystal structures of a Dyn dimer and tetramer with the interfaces required for
assembly (modified from Faelber, et al., 2011; Antonny, et al., 2016).
23
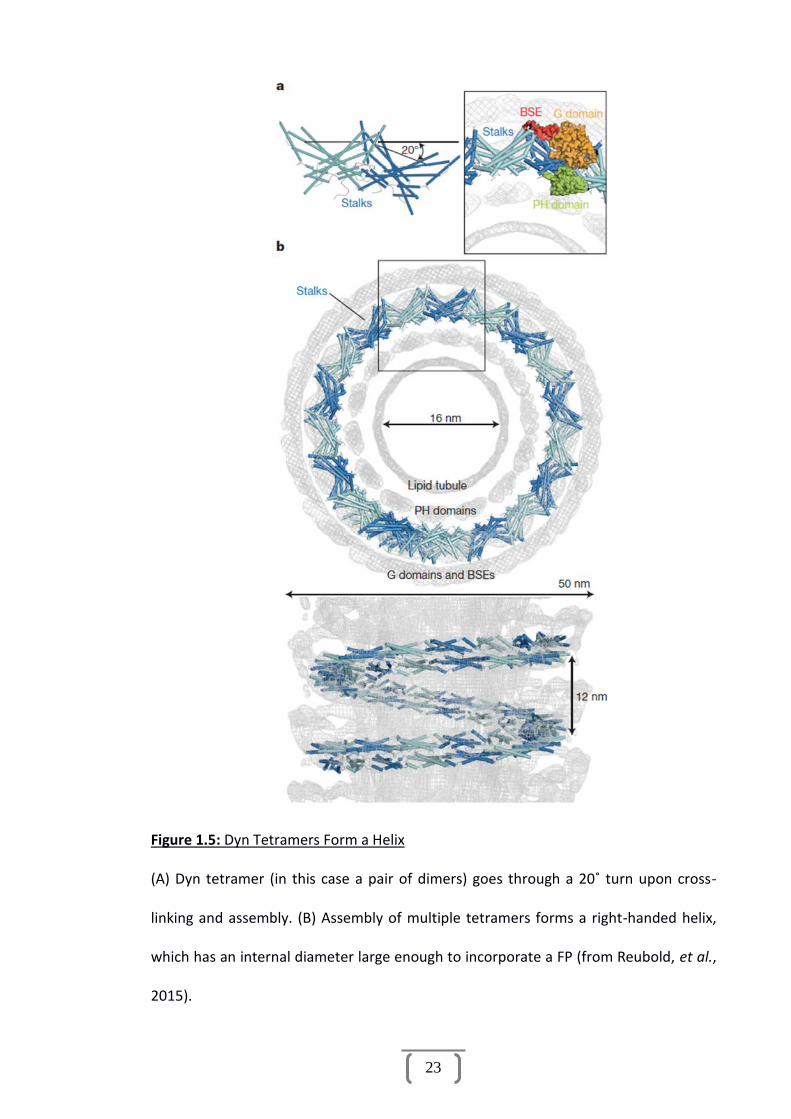
Figure 1.5: Dyn Tetramers Form a Helix
(A) Dyn tetramer (in this case a pair of dimers) goes through a 20˚ turn upon cross-
linking and assembly. (B) Assembly of multiple tetramers forms a right-handed helix,
which has an internal diameter large enough to incorporate a FP (from Reubold, et al.,
2015).

24
1.8 Phosphorylation of Dyns
As in any cell, phosphorylation plays a vital role in regulating the activity, subcellular
location and stability of proteins. In neurons however, the phosphorylated state of
proteins can be regulated by neuronal activity as well as physiological pathways,
creating unique phosphorylation expression. During nerve terminal depolarisation the
large influx of Ca2+ activates the phosphatase calcineurin, which dephosphorylates, and
activates, a group of proteins termed the dephosphins, these proteins play vital roles
in triggering synaptic vesicle recycling (Robinson, et al., 1994; Cousin and Robinson,
2001).
Dyn is one of these dephosphins and regulation of Dyn activity through
phosphorylation and dephosphorylation is essential for endocytosis and exocytosis of
vesicles (Robinson, et al., 1994; Smillie and Cousin, 2005). After terminal
depolarisation, Dyn remains dephosphorylated during endocytosis and is
rephosphorylated while endocytosis is completing (Robinson, 1991).
Following classical endocytosis the specific phosphorylation of Dyn-I works to reverse
oligomerisation, protein binding, phospholipid binding on membranes and GTP
hydrolysis, stopping any Dyn-I activity within the neuron and leaving a majority of the
Dyns residing in the cytosol, waiting for dephosphorylation (Robinson, 1991; Smillie
and Cousin, 2005). This is the situation observed in resting nerve terminals, where a
fraction of Dyns reside in the cytosol in a heavily phosphorylated state, while a portion
reside on membrane sites that become saturated, with almost no phosphorylation
(Robinson, 1991; Liu, et al., 1994).

25
Since Dyn-I was first discovered as a ‘dephosphin’, research focused upon which
kinases and phosphatases regulate its phosphorylated state, and at which sites this
phosphorylation occurs. Early on it was established that Dyns were specifically
dephosphorylated both in vitro and in vivo by the Ca2+/calmodulin-dependent
phosphatase calcineurin in a Ca2+-dependent manner. The use of pharmacological
calcineurin antagonists abolishes Dyn-I dephosphorylation in nerve terminals (Liu, et
al., 1994; Bauerfeind, et al., 1997; Marks and McMahon, 1998; Smillie and Cousin,
2005). To date no other phosphatases specific to Dyn-I have been discovered,
suggesting this exclusive interaction is in part due to the role of Dyn-I as a dephosphin.
Regarding sites of phosphorylation, Dyn-I phosphorylation occurs exclusively on serine
(Ser) sites in intact models (Robinson, 1991; Liu, et al., 1994; Graham, et al., 2007), and
8 major Ser sites have been established to date (Powell, et al., 2000; Graham, et al.,
2007) (Figure 1.6). Of these sites only four have currently been studied to determine
the effect upon Dyn-I regulation (see Table 1.2).
Figure 1.6: Domains and Established Phosphorylation Sites Present on Dyn-I
All known Ser sites present on Dyn-I. Note both a/b splice variants of the PRD tail and
how these modulate expression of Ser-851 and Ser-857 (modified from Chan, et al.,
2010).

26
The roles of Ser-774 and Ser-778 have been well established. Upon terminal
depolarisation and Ca2+ influx, calcineurin is activated which rapidly dephosphorylates
Dyn-I (Liu, et al., 1994; Smillie and Cousin, 2005), mainly at these sites. This mobilises
Dyn-I to mediate SV endocytosis, bringing about scission at the fission pore via GTP
hydrolysis, and completing SV recycling. After vesicular scission has occurred, Dyn-I
Ser-778 is phosphorylated by CDK5 (Graham, et al., 2007), and Ser-774 is
phosphorylated by glycogen synthase kinase 3 (GSK3) (Clayton, et al., 2010; Srinivasan,
et al., 2018), which in tandem with GTP hydrolysis causes Dyn-I to dissociate from the
endocytotic machinery, disassemble into monomers and migrate back to the cytosol
(Graham, et al., 2007; Saheki and De Camilli, 2012). Ser-774 and Ser-778 were
highlighted as the main sites that underwent changes in phosphorylation during
terminal depolarisation with ~69% of the total sample phosphorylation associated with
these sites (Graham, et al., 2007).
Initially it was suggested that these two sites mediated CME, but Cousin and colleagues
provided data which suggested that Ser-774 and Ser-778 mediate ADBE but not CME
(Clayton, et al., 2010), however this is controversial. Cousin originally discussed
phosphorylation changes at these two sites to be the main regulator of CME (Cousin
and Robinson, 2001; Tan, et al., 2003; Clayton, et al., 2007; Mettlen, et al., 2009), but
later they suggested perturbation of these two sites arrests ADBE but this had no
effect upon CME (Clayton, et al., 2009). However, primary neuron cultures with Dyn-I
and Dyn-II double KO’s did not see perturbation of ADBE (Wu, et al., 2014); and
recently Dyn phosphomimetic 774 and 778 knock-in models have not been found to
affect ADBE (Armbruster, et al., 2013) . Clearly the roles of Ser-774 and Ser-778 are not

27
yet clear-cut and further research needs to be undertaken before they are fully
understood.
Ser-857 also undergoes Ca2+-dependent dephosphorylation during terminal
depolarisation, and rephosphorylation is mediated by dual-specificity tyrosine
phosphorylation-regulated kinase 1A (DYRK1A) (Xie, et al., 2012). This dissociates Dyn-I
from amphiphysins, which induce membrane curvature and are thought to recruit
Dyns to the neck region of endocytosing vesicles, especially during CME (Huang, et al.,
2004; Meinecke, et al., 2013).
Intriguingly another site Ser-795 – which was not reported by Graham et al., 2007 –
was found in non-stimulated tissues on Dyn-I, though there is some confusion if it is an
in vitro artefact or an in vivo site (Powell, et al., 2000). Purified Dyn-I was found to have
the highest affinity for protein kinase C (PKC) of any known substrate, and in vivo PKC
was found to regulate Dyn-I phosphorylation and endocytosis (Robinson, et al., 1993;
Robinson, et al., 1994). This PKC phosphorylation site was theorised to reside in the
PRD where protein fragment studies had found increases in phosphorylation,
suggesting a role for PKC in intact terminals (Robinson, 1992; Liu, et al., 1994;
Robinson, et al., 1994).
Ser-795, in the PRD, was then discovered as a strong phosphorylation target of PKC in
vitro, and was thought to be the most likely candidate to be phosphorylated by PKC in
vivo (Powell, et al., 2000). This study found that Dyn-I Ser-795 underwent
phosphorylation by PKC in vitro and this prevented phospholipid association, localising
Dyn-I to the cytosol, which may regulate the recruitment of Dyn-I to the fission or

28
fusion pores in vivo (Powell, et al., 2000). However this was later dismissed and Ser-
795 was described as an in vitro site only – even though some authors had apparently
observed it in vivo previously – explaining why it was not responsible for regulating
endocytosis and the lack of Ser-795 observed in isolated Dyn-I studies (Smillie and
Cousin, 2005; Graham, et al., 2007).
Recent evidence has shown that Dyn-I Ser-795 is actually an in vivo site that has a
distinct role from what originally thought as phosphorylation levels can be dramatically
increased through the inhibition of PP2A with OA or PMA (Bhuva, 2015, p. 149), and
Ser-795 could regulate NT release during Ca2+-dependent exocytosis (Singh, 2017, p.
234).
Though the phospho-regulation of Dyn-I activity has been well established during
endocytosis, little research has been done investigating the phosphorylated state of
Dyn-I during exocytosis, and in particular KR. As Dyn-I must be dephosphorylated to
become active, it is theorised that during exocytosis, where Dyn-I undergoes
dephosphorylation, it can regulate FP closure, switching the mode of exocytosis to KR.
Ser-774 and Ser-778 are both well known to regulate the scission activity of Dyn-I
during endocytosis, but no correlation has been discovered between these sites and
KR (Bhuva, 2015). Furthermore, Ser-795 has been shown to block the association of
Dyn-I with phospholipids in vitro (Powell, et al., 2000), and the recent discovery that
Ser-795 may be an in vivo site (Bhuva, 2015) highlight this site, and the kinases that
regulate it as a potential regulator of KR during exocytosis.

29
Not much Ser-795 phosphorylation is observed during basal conditions, and this site
can clearly be dephosphorylated very easily. Therefore it is possible that due to
methodological differences, no in vivo Ser-795 could be detected (Graham, et al.,
2007). Further if the normal physiologically relevant Ser-795 only occurs on a sub-pool
of Dyn-I already membrane bound (Wahl, et al., 2013), then this may not have been
purified, or may have undergone dephosphorylation due to stimulation in the method
used by Graham, et al., (2007) (Table 1.2).
Serine Kinase Effect on Dyn Phosphatase
347 Unknown -
Calcineurin
dephosphorylates
all sites
(Liu, et al., 1994;
Xie, 2012).
512 Unknown -
774 GSK3 Phosphorylation mediates ADBE, but not
CME (Clayton, et al., 2010).
778 CDK5 Phosphorylation primes Ser-774 for
phosphorylation (Graham, et al., 2007)
795 PKC (in
vitro)
Phosphorylation prevents phospholipid
binding in vitro (Powell, et al., 2000).
Unknown in vivo effects (Bhuva, 2015).
822 Unknown -
851 Unknown -
857 DYRK1A Phosphorylation prevents amphiphysin
binding in vitro (Xie, et al., 2012).
Table 1.2: Known Dyn-I Phosphorylation Sites
Established phosphorylation sites on Dyn-I, their kinases and the effects of phospho-
regulation during recycling.

30
Recently PKC has been shown to regulate the mode of exocytosis in neurons (Sun and
Alkon, 2012; Petrov, et al., 2015), although no direct correlation between PKC
mediated Dyn-I phosphorylation and the mode of release could be established (Singh,
2017). Alternatively protein kinase A (PKA) could be a strong candidate for regulating
nerve terminal exocytosis (Seino and Shibasaki, 2005). PKA is expressed in presynaptic
nerve terminals (Leenders and Sheng, 2005), becomes active when cyclic-AMP (cAMP)
levels increase and phosphorylates serine and threonine residues (Nguyen and Woo,
2003; Park, et al., 2014). Activation of PKA has been implicated in LTP and memory
(Chavez-Noriega and Stevens, 1994; Hilfiker, et al., 2001; Leenders and Sheng, 2005;
Zhang, et al., 2018), and has been shown to increase the instance of fast exocytosis,
potentially by enhancing presynaptic Ca2+ influx, and modulating synaptic plasticity and
memory through regulation of the RRP (Yoshihara, et al., 2000; Seino and Shibasaki,
2005; Park, et al., 2014).
PKA is a vital kinase to presynaptic function, phosphorylation of RIM1 has been shown
to control exocytosis (Gao, et al., 2016), while phosphorylation of synapsin I enhances
exocytosis (Menegon, et al., 2006), and phospho-regulation of syntaphilin regulates
the availability of Dyn-I in terminals (Boczan, et al., 2004) which may affect the ability
of Dyn-I to regulate the mode of exocytosis, making it a viable candidate to study
during release.

31
1.9 Review of Previous Research
Results in this section reflect previous research carried out by Ashton group. These
results were created whilst establishing optimal experimental conditions for use with
the synaptosomes model, and are displayed here to aid understanding of new and
original data presented and discussed later in this thesis.
1.9.1 Maximal Glu Release
For a direct comparison between FM 2-10 dye and glutamate (Glu) release assays it
was necessary that the stimuli employed in this thesis produced a maximal level of Glu
release. In order to determine this, synaptosomes were treated with the three stimuli
(HK, ION and 4AP) – see material and methods for further details – in the presence of a
range of extracellular Ca2+ concentrations ([Ca2+]e) (Figure 1.7). It can be observed that
5 mM [Ca2+]e produced maximal Glu release for all stimuli, and a further increase in
[Ca2+]e to 10 mM had no effect on HK evoked Glu release (Figure 1.7 A), and possibly
decreased Glu release with ION and 4AP (Figure 1.7 B-C). For all experiments in this
study a concentration of 5 mM [Ca2+]e was therefore used with each of the three
stimuli to maximally release Glu from synaptosomes.

32
Figure 1.7: Effect of a Range of [Ca2+]e upon Evoked Glu Release
Stimulation in the presence of 5 mM [Ca2+]e induces maximal Glu release for HK (A),
ION (B) and 4AP (C). Values represented are the mean plus S.E.M. from 4 independent
experiments.

33
Stimulation with 4AP5C produced a lower maximal Glu release (4.5 moles/mg of
protein) (Figure 1.7 C) compared to HK5C (10.8 moles/mg of protein) (p<0.05) (Figure
1.7 A) or ION5C (11 moles/mg of protein) (p<0.05) (Figure 1.7 B) with 5 mM [Ca2+]e. An
explanation for this can be found when looking at the different changes in [Ca2+]i
produced by each stimuli (Figure 1.8). 4AP5C produces a lower, more gradual change
in [Ca2+]i (180±20 nM Ca2+) than either HK5C or ION5C (370 ±25 nM Ca2+) (p<0.05),
which is interpreted as 4AP5C only being able to release the RRP of SVs whilst HK5C
and ION5C can release both the RRP and the RP of SVs.
Though HK5C and ION5C achieved an equivalent level of [Ca2+]i, this is mediated by
different kinetics (Figure 1.8). HK5C produced much of the [Ca2+]i increase upon the
application of stimulation, plateauing rapidly (<10 sec), potentially due to VGCC
desensitisation (Bähring & Covarrubias, 2011); whilst ION5C produced a more gradual
increase in [Ca2+]i which plateaus later (~40 sec) (Figure 1.8). This speed of achieving
maximum increase in [Ca2+]i occurred in every experiment performed in this thesis and
over 10 years of research. However, it would appear that distinct batches of ionomycin
may achieve higher maximum [ca2+]i although maximum release is not altered (Ashton,
manuscript in preparation).

34
Figure 1.8: Effect of Stimuli upon Cytosolic free Calcium [Ca2+]i
All three stimuli employed in this study produce a change in [Ca2+]i via different
kinetics. 4AP5C evokes a significantly lower [Ca2+]i change than HK5C or ION5C
(p<0.05). No significant difference was observed between HK5C and ION5C (p>0.05) in
this set of experiments. Values represented are the mean plus S.E.M. from 3
independent experiments.

35
1.9.2 A Single Round of Exocytosis
Due to the kinetics of the FM 2-10 dye and Glu release assays, synaptosomes in this
study are subject to long stimulation periods (between 60-300 sec). Due to this long
duration of stimulation there is a possibility that SVs could undergo multiple rounds of
recycling, refilling with and re-release Glu, leading to an erroneous interpretation of
Glu release. Further, it is possible that a SV releasing via KR could retain its FM 2-10
dye label while undergoing several round of KR recycling, or SV could lose its FM 2-10
dye and release additional Glu without a link to dye fluorescence. In order to
accurately compare Glu and FM 2-10 dye release, it is essential to establish that SVs
are only undergoing one round of release during the stimulation and measurement
period.
In order to ensure recycling was not occurring during stimulation and measurement,
synaptosomes were acutely treated with 1 µM of the selective vacuolar H+ ATPase (V-
ATPase) inhibitor Bafilomycin A1. The V-ATPase pump is a complex found on SVs that is
responsible for re-acidification of the vesicular lumen after endocytosis, which is vital
in order for SVs to be re-filled with Glu (Cotter, et al., 2015). Such acute bafilomycin A1
treatment has no effect upon the Glu content of non-exocytosed SVs, and does not
impede their release upon stimulation (Ikeda and Bekkers, 2008). An acute treatment
of 1 µM Bafilomycin A1 did not significantly affect Glu release compared with
untreated controls, regardless of stimulation (Figure 1.9) (p>0.05). If SVs were
undergoing multiple rounds of recycling, the level of Glu release would be expected to
decrease with the Bafilomycin A1 treatment.

36
Figure 1.9: Effect of 1 µM Bafilomycin A1 upon Evoked Glu release
Treatment with 1 µM Bafilomycin A1 does not significantly affect Glu release when
stimulated with HK5C (A), ION5C (B) or 4AP5C (C) compared to untreated controls
(p>0.05 for all). Values represented are the mean plus S.E.M. from 4 independent
experiments.

37
1.9.3 Maximal Labelling of SVs with FM 2-10 Dye
Styryl dyes, such as FM 2-10, have been used extensively to label lipid membranes and
in particular vesicular trafficking and recycling (see Chapter 4.1). In all experiments a
concentration of 100 μM FM 2-10 dye was utilised, as many researchers have
employed the same concentration (Baldwin, et al., 2003; Cheung, et al., 2010). Clayton
and Cousin (2008) however, have previously suggested that the labelling of SVs,
especially via bulk endocytosis, is dependent upon the concentration of FM 2-10 dye,
and 1 mM but not 100 μM will fully label all SVs (Clayton and Cousin, 2008).
In order to ensure that all SVs are fully labelled with FM 2-10 dye, synaptosomes were
incubated with 1 mM or 100 μM and evoke to release during a drug treatment (160
µM dynasore (DYN)) which has been observed to increase exocytosis via FF (Figure
1.10). In this model system there was no significant difference in FM 2-10 dye release
seen between synaptosomes loaded with 1 mM or 100 μM (p>0.05), and drug
treatment had no significant impact upon labelling or release of SVs (p>0.05). If 100
μM FM 2-10 dye had been failing to label all releasable SVs, then a reduced amount of
dye would be released.

38
Figure 1.10: Difference between SVs Loaded with 1 mM or 100 µM FM 2-10 Dye
SVs loaded with 1 mM (Blue) or 100 µM (Red) release equivalent levels of FM 2-10 dye
following stimulation (p>0.05). Drug treatment, 160 µM dynasore, increases FM 2-10
dye release by a corresponding amount, regardless of amount of FM 2-10 dye loaded,
following stimulation (Green vs Yellow) (p>0.05). Values represented are the mean
minus S.E.M from 4 independent experiments.
1.9.4 The Mode of Exocytosis is Stimulation Dependent
Each of the stimuli used in this thesis have been shown to evoke release through
distinct [Ca2+]i kinetics (Figure 1.8), and changes in [Ca2+]i have been linked to
regulating the mode of exocytosis of distinct pools (Alés, et al., 1999), therefore each
stimuli could evoke release of SVs pools via unique modes. As the RRP is suggested to
be released within 2 sec of stimulation (Rizzoli and Betz, 2005), this time period was
studied during FM 2-10 dye release for all stimuli (Figure 1.11 A).

39
Interestingly HK5C and ION5C did not cause any significantly release of FM 2-10 dye in
this period (p>0.05), unlike 4AP5C (Figure 1.11 A) (p<0.05). It could be argued that this
indicates no SVs are being release during this time period, however when the
experiment was repeated with a pre-treatment of 0.8 µM OA (Figure 1.11 B), an
inhibitor of protein phosphatase 1 and 2A which is known to convert all RRP SVs to FF
(Ashton, et al., 2011), an increase in FM 2-10 dye release was noted for all stimuli, that
was not significantly different between stimuli at 2 sec (p>0.05). Comparison of these
results are interpreted as HK5C and ION5C releasing the RRP via KR under control
conditions, while 4AP5C releases roughly half the RRP via KR and half by FF. All three
stimuli release an equivalent amount of FM 2-10 dye during this period (2 sec),
suggesting it is the RRP being released.
In order to determine the exocytic mode of the RRP and RP, the fluorescence value of
FM 2-10 dye release during control conditions was subtracted from the fluorescence
value achieved during OA treatment (Figure 1.12). HK5C stimulation caused all RRP SVs
to undergo KR in the first 2 sec (Figure 1.12 A), and all RP SVs to release via FF (after 2
sec; Figure 1.12 B). Stimulation with 4AP5C releases all RRP SVs some via KR and some
by FF, with fluorescence subtraction demonstrating that both modes contribute
equally (Figure 1.12 C). RP SVs do not release when synaptosomes are stimulated with
4AP5C, as this stimuli induced a lower average [Ca2+]i compared to HK5C and ION5C,
and this is unable to drive RP fusion (see Figure 1.7 C and Figure 1.8).
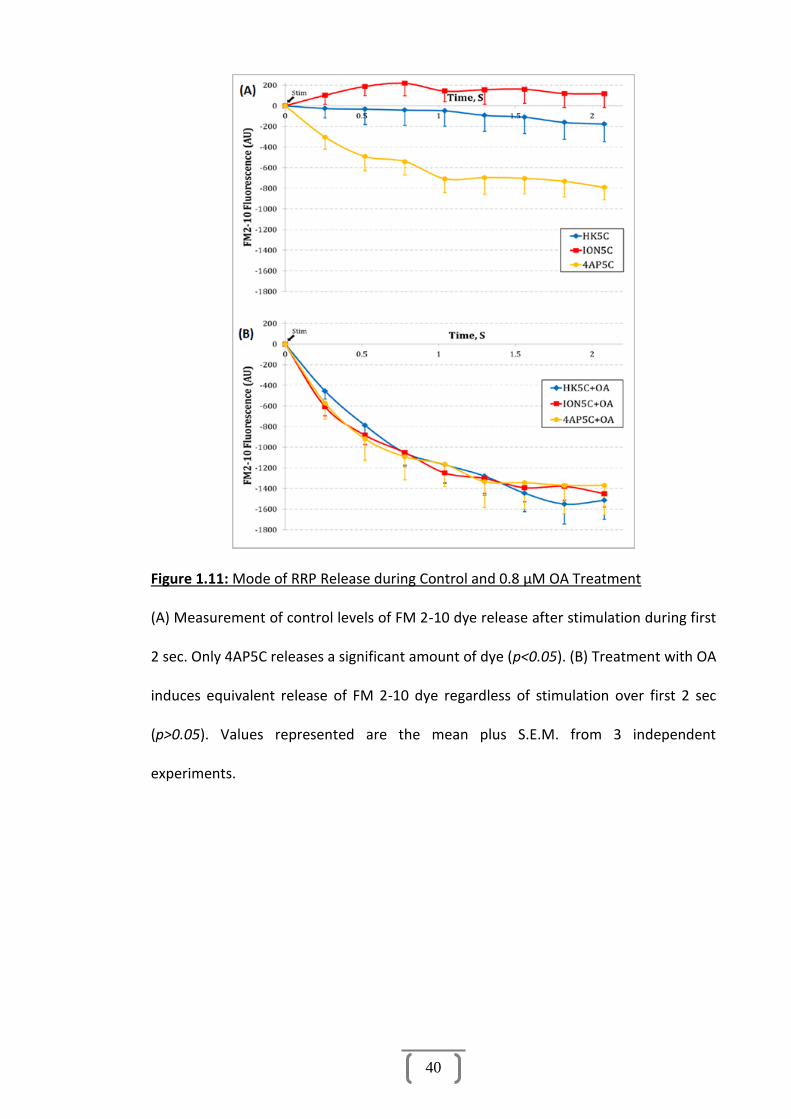
40
Figure 1.11: Mode of RRP Release during Control and 0.8 µM OA Treatment
(A) Measurement of control levels of FM 2-10 dye release after stimulation during first
2 sec. Only 4AP5C releases a significant amount of dye (p<0.05). (B) Treatment with OA
induces equivalent release of FM 2-10 dye regardless of stimulation over first 2 sec
(p>0.05). Values represented are the mean plus S.E.M. from 3 independent
experiments.
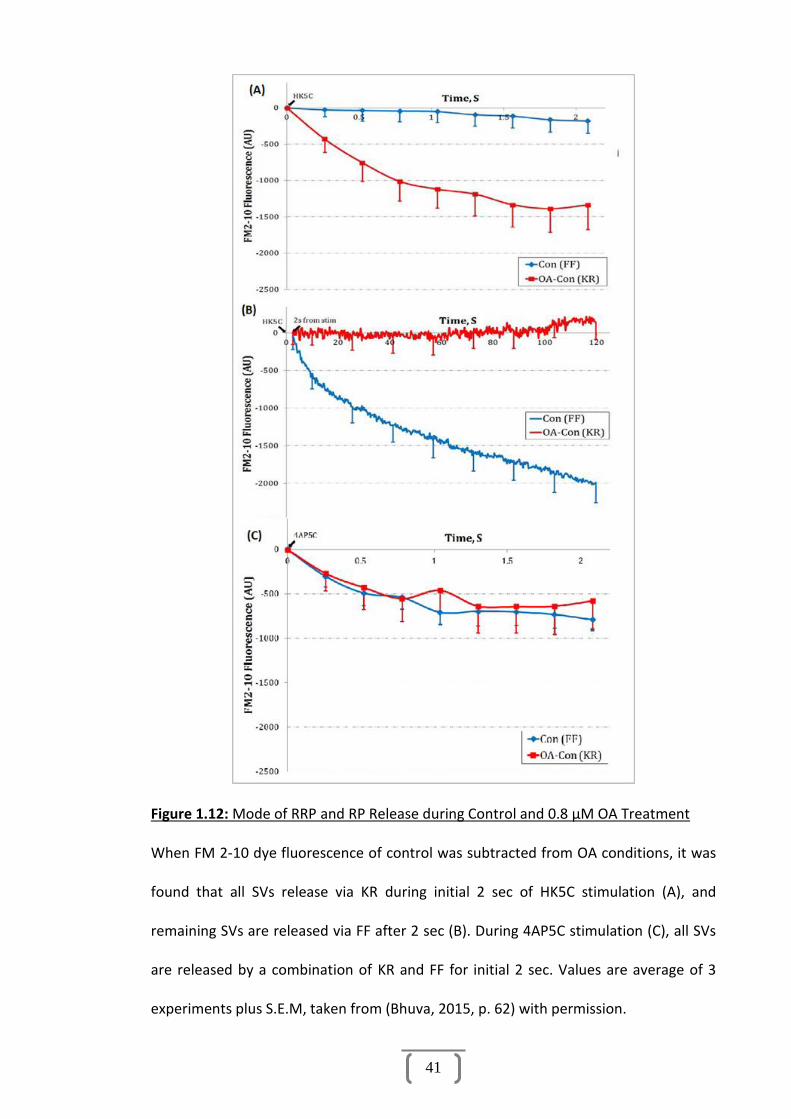
41
Figure 1.12: Mode of RRP and RP Release during Control and 0.8 µM OA Treatment
When FM 2-10 dye fluorescence of control was subtracted from OA conditions, it was
found that all SVs release via KR during initial 2 sec of HK5C stimulation (A), and
remaining SVs are released via FF after 2 sec (B). During 4AP5C stimulation (C), all SVs
are released by a combination of KR and FF for initial 2 sec. Values are average of 3
experiments plus S.E.M, taken from (Bhuva, 2015, p. 62) with permission.
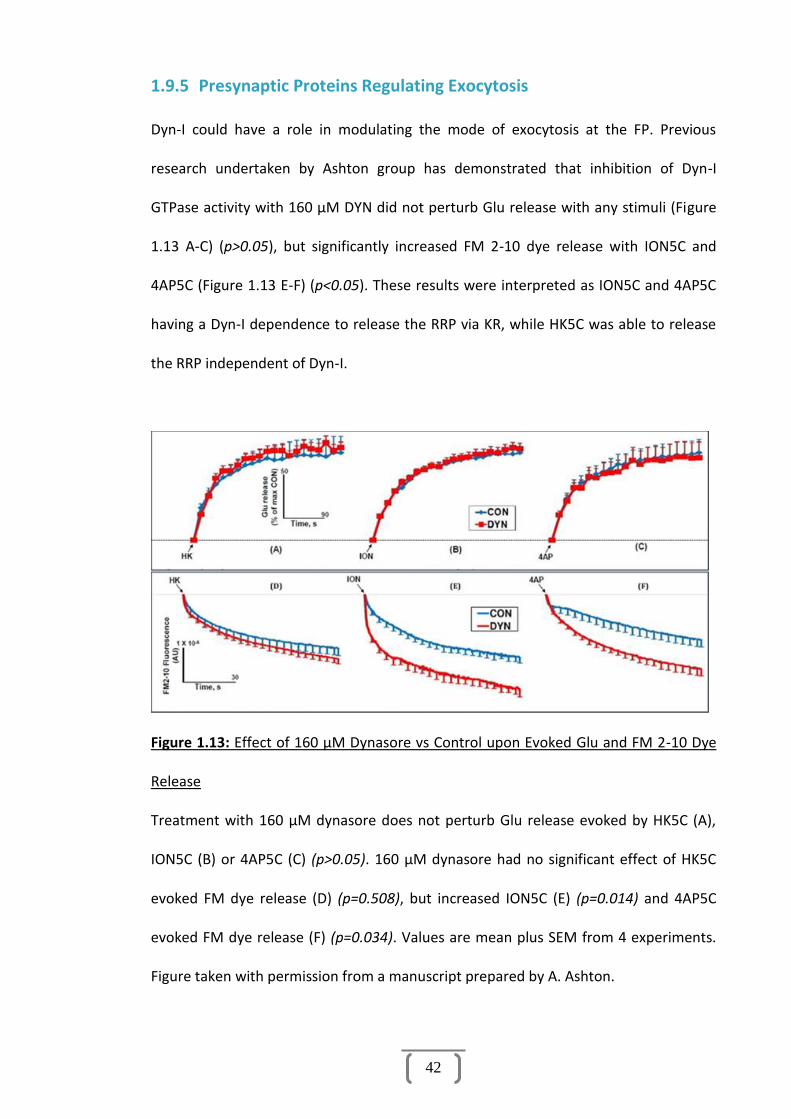
42
1.9.5 Presynaptic Proteins Regulating Exocytosis
Dyn-I could have a role in modulating the mode of exocytosis at the FP. Previous
research undertaken by Ashton group has demonstrated that inhibition of Dyn-I
GTPase activity with 160 µM DYN did not perturb Glu release with any stimuli (Figure
1.13 A-C) (p>0.05), but significantly increased FM 2-10 dye release with ION5C and
4AP5C (Figure 1.13 E-F) (p<0.05). These results were interpreted as ION5C and 4AP5C
having a Dyn-I dependence to release the RRP via KR, while HK5C was able to release
the RRP independent of Dyn-I.
Figure 1.13: Effect of 160 µM Dynasore vs Control upon Evoked Glu and FM 2-10 Dye
Release
Treatment with 160 µM dynasore does not perturb Glu release evoked by HK5C (A),
ION5C (B) or 4AP5C (C) (p>0.05). 160 µM dynasore had no significant effect of HK5C
evoked FM dye release (D) (p=0.508), but increased ION5C (E) (p=0.014) and 4AP5C
evoked FM dye release (F) (p=0.034). Values are mean plus SEM from 4 experiments.
Figure taken with permission from a manuscript prepared by A. Ashton.

43
NM-II has also been implicated in regulating the mode of exocytosis at the FP (Chan, et
al., 2010; Berberian, et al., 2009; Neco, et al., 2008). Since no change in FM 2-10 dye
release was observed when Dyn-I was inhibited with DYN during HK5C stimulation
(Figure 1.13 D), it was theorised NM-II could be responsible for regulating the FP
during this mode of exocytosis. Thus NM-II was blocked with 50 µM blebbistatin
(Blebb), a selective, high affinity small molecule which blocks NM-II by inhibiting
ATPase activity (Shu, et al., 2005; Kovacs, et al., 2004).
A treatment of 50 µM Blebb did not perturb Glu release with any stimuli (p>0.05)
(Figure 1.14), but did significantly increase FM 2-10 dye release with HK5C stimulation
only (p<0.05) (Figure 1.15 A). These data may suggest that NM-II is able to close the FP
during HK5C stimulation, when the [Ca2+]i level at the AZ is high (Figure 1.8), as Ca2+ is
required to regulate NM-II phosphorylation and activation (Martinsen, et al., 2014).
These data may also suggest that the [Ca2+]i level achieved at the AZ during ION5C and
4AP5C stimulation may not be high enough to activate NM-II, but satisfactory to
activate Dyn-I to regulate the exocytosing FP (Figure 1.13 E-F).

44
Figure 1.14: Effect of 50 µM Blebb upon Evoked Glu Release
Treatment with 50 µM Blebb did not significantly affect Glu release when stimulated
with HK5C (A), ION5C (B) or 4AP5C (C) (p>0.05). Values represented are the mean plus
S.E.M. from 4 independent experiments.

45
Figure 1.15: Effect of 50 µM Blebb upon Evoked FM 2-10 Dye Release
Treatment with 50 µM Blebb significantly increased FM 2-10 dye release when
stimulated with HK5C (A) (p<0.05), but had no effect when stimulated with ION5C (B)
(p=0.716) or 4AP5C (C) (p=0.642). Values represented are the mean plus S.E.M. from 3
independent experiments.
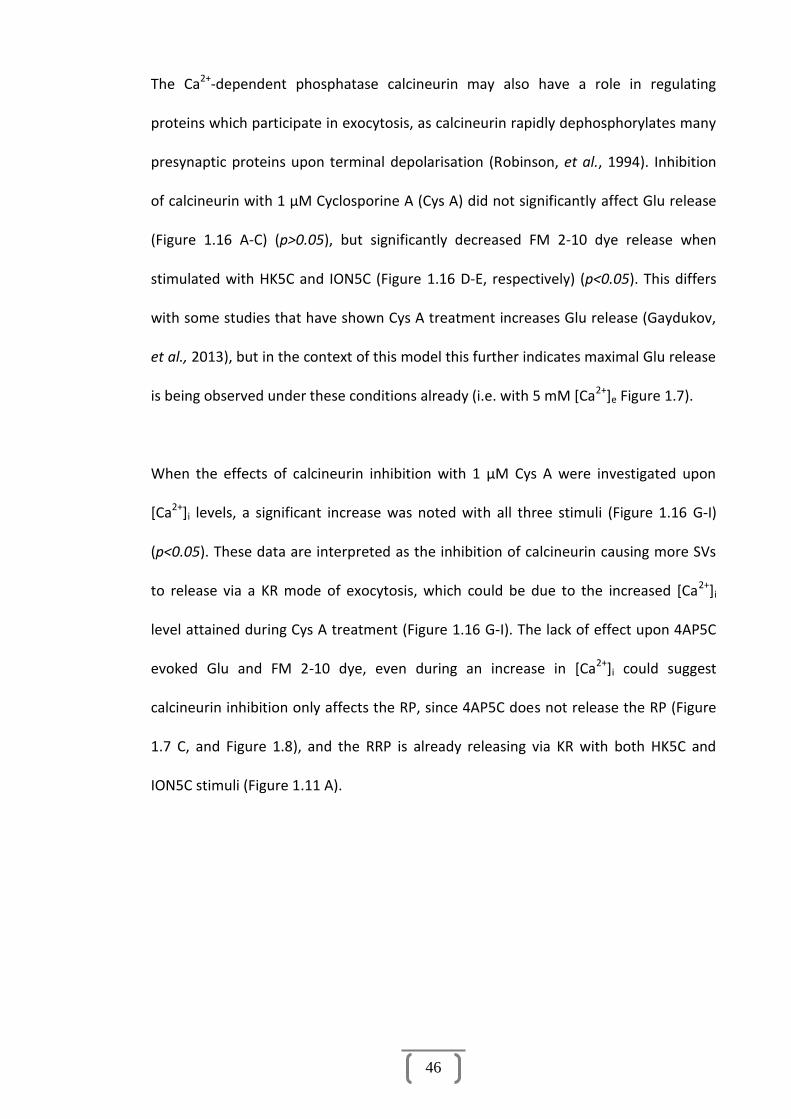
46
The Ca2+-dependent phosphatase calcineurin may also have a role in regulating
proteins which participate in exocytosis, as calcineurin rapidly dephosphorylates many
presynaptic proteins upon terminal depolarisation (Robinson, et al., 1994). Inhibition
of calcineurin with 1 µM Cyclosporine A (Cys A) did not significantly affect Glu release
(Figure 1.16 A-C) (p>0.05), but significantly decreased FM 2-10 dye release when
stimulated with HK5C and ION5C (Figure 1.16 D-E, respectively) (p<0.05). This differs
with some studies that have shown Cys A treatment increases Glu release (Gaydukov,
et al., 2013), but in the context of this model this further indicates maximal Glu release
is being observed under these conditions already (i.e. with 5 mM [Ca2+]e Figure 1.7).
When the effects of calcineurin inhibition with 1 µM Cys A were investigated upon
[Ca2+]i levels, a significant increase was noted with all three stimuli (Figure 1.16 G-I)
(p<0.05). These data are interpreted as the inhibition of calcineurin causing more SVs
to release via a KR mode of exocytosis, which could be due to the increased [Ca2+]i
level attained during Cys A treatment (Figure 1.16 G-I). The lack of effect upon 4AP5C
evoked Glu and FM 2-10 dye, even during an increase in [Ca2+]i could suggest
calcineurin inhibition only affects the RP, since 4AP5C does not release the RP (Figure
1.7 C, and Figure 1.8), and the RRP is already releasing via KR with both HK5C and
ION5C stimuli (Figure 1.11 A).

47
Figure 1.16: Effect of 1 µM Cys A upon Evoked Glu and FM 2-10 Dye Release
1 µM Cys A did not perturb Glu release evoked by HK5C (A), ION5C (B) or 4AP5C (C)
(p>0.05 for all). 1 µM Cys A significantly decreased HK5C (D) (p<0.025) and ION5C (E)
(p<0.023) evoked FM 2-10 dye release, but had no effect upon 4AP5C (F) (p=0.985)
evoked FM 2-10 dye release. 1 µM Cys A significantly increased [Ca2+]i levels with HK5C
(G) (p<0.001), ION5C (H) (p<0.044) and 4AP5C (I) (p<0.049) stimulation, compared to
controls. Values represented are the mean plus S.E.M. from 4 experiments. Figure
taken from a manuscript prepared by A. Ashton.

48
1.9.6 Phosphorylation of Dyn-I Ser-795 in vivo
Previous research by Bhuva has proved that synaptosomes treated with 0.8 μM OA
(Figure 1.17 B) or 80 nM of the PKC activator phorbol 12-myristate 13-acetate (PMA)
(Figure 1.17 C) exhibit detectable levels of in vivo Dyn-I Ser-795 phosphorylation over
2-120 seconds, compared to control synaptosomes where Ser-795 was undetectable
(Figure 1.17 A) (Bhuva, 2015, p. 151). The lack of Ser-795 phosphorylation in control
samples was explained as Ser-795 either remaining dephosphorylated during this
treatment or being dephosphorylated almost immediately after phosphorylation, as
pan-Dyn-I (4E67) revealed uniform protein levels in all samples (Figure 1.17 D) (Bhuva,
2015, p. 160). More recent studies have been able to reproducibly demonstrate a basal
level of phospho-Ser-795 in drug free terminals (see Chapter 5).
Previous research has also demonstrated that samples stimulated with HK5C or ION5C
over 120 sec, show a time-dependent decrease in phosphorylation levels at Ser-774
and Ser-778 during control conditions (Figures 1.18 and 1.19 A), with ION5C
stimulation induced a greater decrease in phosphorylation than HK5C (Lanes 11 vs 12).
Interestingly, drug treatments can block this dephosphorylation effect, potentially
describing roles for these sites in exocytosis (Figures 1.18 and 1.19 B). This decrease in
phosphorylation was interpreted as the Ser sites undergoing dephosphorylation after
stimulation, as levels of Dyn-I protein did not change in a relative manner (Figures 1.18
and 1.19 C).
49
Figure 1.17: Phosphorylation of Dyn-I Ser-795 across a range of Treatments
(A) Ser-795 is not detectable in control conditions. Treatment with 0.8 µM OA (B) and
80 nM PMA (C) reveal phospho-Ser-795. (D) A representative blot displaying total Dyn-I
protein in each sample.

50
Figure 1.18: Phosphorylation of Dyn-I Ser-778
(A) A time dependent decrease in phosphorylation is noted over 120 sec, with a
greater decrease observed with ION5C stimulation. (B) This decrease can be reversed
by drug treatments. (C) Uniform levels of protein are present in samples.
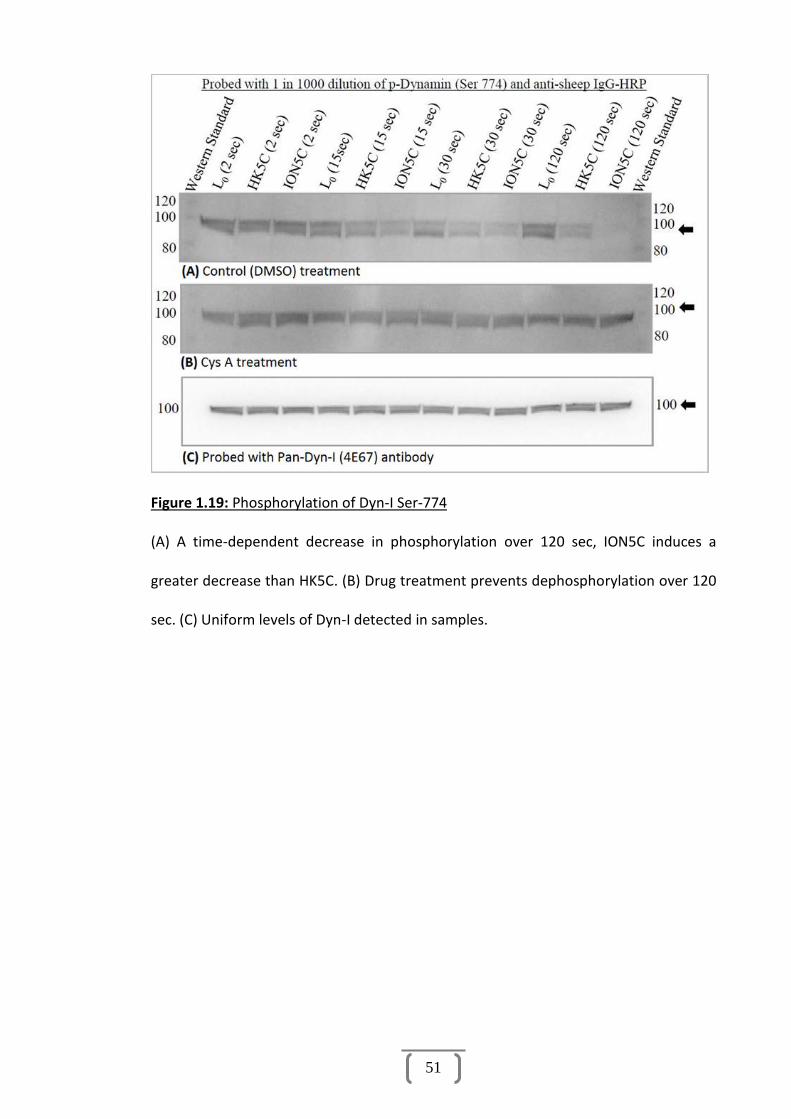
51
Figure 1.19: Phosphorylation of Dyn-I Ser-774
(A) A time-dependent decrease in phosphorylation over 120 sec, ION5C induces a
greater decrease than HK5C. (B) Drug treatment prevents dephosphorylation over 120
sec. (C) Uniform levels of Dyn-I detected in samples.

52
1.9.7 Conclusion
Collectively these data suggest that stimulation with HK and ION, in the presence of 5
mM [Ca2+]e, can maximally release Glu from the RRP via KR and from the RP by FF in
one round of exocytosis. 4AP5C stimulation on the other hand, can only stimulate
maximal Glu release of the RRP (half by KR, half via FF) in one round of exocytosis, and
the lack of RP release is probably due to the lower average [Ca2+]i level seen in the
terminals with this stimulus, compared to HK5C and ION5C.
Inhibition of Dyn-I increases the FF mode of exocytosis (by blocking FP regulation), but
only with stimuli where the increase in [Ca2+]i is more gradual (ION5C and 4AP5C). It is
theorised that the slower increase in [Ca2+]i activates kinases to drive Dyn-I action
(Singh, 2017, p. 99), and when the increase in [Ca2+]i is more rapid, as with HK5C, Dyn-I
may be inactivated by distinct kinases. Interestingly, when the [Ca2+]i level increases
rapidly with HK5C, NM-II can be inhibited with Blebb, suggesting that the high Ca2+
may prevent Dyn-I activation, but certain kinases can activate NM-II to be able to
regulate the FP (Singh, 2017, p. 98).

53
1.10 Research Aims
Previous research has indicated that PKC can regulate the mode of exocytosis, but
while PKC may induce Dyn-I phosphorylation and switching of the mode of exocytosis,
it would appear that other kinases may contribute to the phosphorylation of Ser-795
and the regulation of the FP (Barclay, et al., 2003; Bhuva, 2015; Singh, 2017). Therefore
the aim of this thesis is to establish whether regulating PKA or cAMP levels can control
the mode of exocytosis and if such effects could be related to changes in the
phosphorylation of Dyn-I Ser-795.
1.10.1 Specific Aims
(i) Investigate how the activation and inhibition of PKA regulate the release mode
of SV pools and what effect Dyn-I inhibition and actin disruption also have on
release.
(ii) Determine how the activation and inhibition of AC affect cAMP levels to
regulate the activity of PKA and EPACs, and the impact of such regulation upon
the mode of exocytosis.
(iii) Throughout – Investigate how such pharmacological treatments affect [Ca2+]i
levels during synaptosomal stimulation.
(iv) Study the phosphorylated profile of Dyn-I during pharmacological treatments
to determine any correlation with the mode of exocytosis.

54
Chapter 2:
Materials and Methods

55
2.1 Materials
2.1.1 Buffering Reagents
Basal Physiological buffer (L0): 125 mM NaCl, 5 mM KCl, 1 mM MgCl2, 20 mM
Hepes and 10 mM glucose (pH adjusted to 7.4 with NaOH).
Isotonic sucrose solution (Homogenisation buffer): 320 mM sucrose and 10 mM
Hepes (pH adjusted to 7.4 with NaOH).
Stock high potassium (HK0) buffer: 130 mM KCl, 20 mM Hepes, 1 mM MgCl2
and 10 mM glucose (pH adjusted to 7.4 with NaOH).
Bioenergetics buffer*: (3.5 mM KCl, 120 mM NaCl, 1.3 mM CaCl2, 0.4 mM
KH2PO4, 1.2 mM Na2SO4, 2 mM MgSO4, 15 mM glucose, 10 mM pyruvate).
*Note – Bioenergetics buffer has no actual buffering component as this would
interfere with the assay measuring proton production.
2.1.2 Stimulation Solutions
Three Ca2+ requiring stimuli are used to investigate the mechanisms of NT release; 30
mM K+ (high potassium), 5 μM ionomycin or 1 mM 4-aminopyridine, each in the
presence of 5 mM [Ca2+]e (HK5C, ION5C and 4AP5C respectively).
High potassium is a clamping stimulus which depolarises the nerve terminal, activating
voltage-gated Ca2+ channels at the AZ. This creates a large influx of Ca2+ immediately at
the release site which then diffuses through the terminal, producing a lower Ca2+
concentration, allowing release of both the RRP and RP (see Figures 1.7 and 1.8).

56
Ionomycin is an ionophore which raises [Ca2+]i levels by transporting Ca2+ across the
PM. Ionomycin is also able to cross lipid bilayers and due to this can also transport Ca2+
out of intracellular stores (Yoshida and Plant, 1992; Kao, Li and Auston, 2010). This
creates a uniform increase in [Ca2+]i across the terminal, releasing both the RRP and
RP.
4-aminopyridine is a selective blocker of voltage-gated K+ channels which induces Ca2+-
dependent Glu release through repetitive Na+ channel firing, leading to random Ca2+
channel opening and generation of spontaneous APs (Tibbs, et al., 1989). However 4-
aminopyradine may also mobilise Ca2+ from intracellular stores to mediate release
(Grimaldi, et al., 2001). 4-aminopyridine causes a slower increase in [Ca2+]i than high
potassium or ionomycin, which may be the reason it only releases the RRP of SVs
(Tibbs, et al., 1989; Figure 1.8).
These stimuli work through separate mechanisms, and their use highlights similarities
and differences in Ca2+-dependent exocytosis (McMahon and Nicholls, 1991; Tibbs, et
al., 1989). Previous research by A. Ashton has demonstrated that 5 mM extracellular
Ca2+ ([Ca2+]e) when utilised with HK and ION produces maximal Glu release from both
the RRP and RP, and use with 4AP produces maximal Glu release from just the RRP.
This allows study of the Glu released by the RRP and its mode separately from the RP
using the assays listed below (see Figure 1.7).
For stimulation with HK5C and 4AP5C, Ca2+ free stimulation solutions termed HK0 and
4AP0 were employed for basal conditions in Glu assays. Due to the nature of
ionomycin to transport Ca2+ across the PM and out of intracellular stores (Yoshida and

57
Plant, 1992), L0 was used as a basal stimulation solution instead. Through comparison
studies (Ashton, et al., unpublished), it was determined that L0 produced
indistinguishable results from HK0 and 4AP0 during the FM 2-10 dye release assay, and
so L0 was used as the control condition for these experiments.

58
2.1.3 Drugs and Final Concentrations (Dissolved in DMSO)
1-9-dideoxyforskolin (100 µM); Tocris Bioscience; #5034
4-Aminopyridine; Sigma-Aldrich; #A78403
9-cyclopentyladenine mesylate (9-cp-ade) (100 µM); Sigma-Aldrich; #C4479
Advasep-7; Sigma-Aldrich; #A3723
β-Nicotinamide adenine dinucleotide phosphate hydrate (NADP+); Sigma-
Aldrich; #N5775
Cyclosporine A (Cys A) (10 µM); Tocris Bioscience; #1101
Dynasore (80-160 µM); Sigma-Aldrich; #D7693
ESI-09 (10, 33 and 100 µM); Sigma-Aldrich; #SML0814
FM 2-10 dye; Thermo fisher Scientific; #T7508
Forskolin (100 µM); Tocris Bioscience; #1099
Fura-2-AM; Thermo Fisher Scientific; #F1221
Ionomycin; Tocris Bioscience; #1704
KT5720 (2 µM); Tocris Bioscience; #1288
Latrunculin (15 µM); Tocris Bioscience; #3973
36 milli-Units (mUnits) of L-Glutamate Dehydrogenase type-II (GDH); Sigma-
Aldrich; #MAK099-1KT
Myristyl trimethyl ammonium bromide (MITMAB) (30 µM); Tocris Bioscience;
#4224
Okadaic acid (OA) (0.8 µM); Tocris Bioscience; #1136
Pitstop 2TM (15 µM); Abcam Biochemicals; #ab120687
Sp-5,6-dichloro-cBIMPS (cBIMPS) (50 µM); Santa Cruz Biotechnology; #sc-
201566

59
For the bioenergetics Mito-Stress test:
Carbonyl cyanide 4-(trifluoromethoxy)phenylhydrazone (FCCP); Sigma-Aldrich;
#C2920 (18 µM) (2 µM Final)
Oligomycin A; Sigma-Aldrich; #75351 (32 µM) (4 µM Final)
Rotenone; Sigma-Aldrich; #R8875 (5 or 50 µM) (0.5 or 5 µM Final)
Antimycin A; Sigma-Aldrich; #A8674 (5 or 50 µM) (0.5 or 5 µM Final)
2.1.4 Various Chemicals Employed
NuPAGE LDS sample buffer (4x Stock); Thermo Fisher Scientific; #NP0008
NuPAGE MES SDS Running buffer; Thermo Fisher Scientific; #NP000202
NuPAGE Sample Reducing Agent (10x Stock); Thermo Fisher Scientific; #NP0009
15 ml Restore™ PLUS Western Blot Stripping Buffer; Thermo Fisher Scientific;
#46430
StartingBlock T20 Blocking Buffer (TBS); Thermo Fisher Scientific; #37543
3 ml SuperSignal™ West Dura Extended Duration Substrate; Thermo Fisher
Scientific; #34076
3-5 µl Unstained MagicMark™ XP Western Protein Standard; Thermo Fisher
Scientific; #LC5602

60
2.1.5 Equipment
Avanti® J-25 series centrifuge – Beckman-Coulter
iBlot Transfer Stack, PVDF, Regular size’ Thermo Fisher Scientific; #IB401031
JA-17 Fixed-Angle Aluminium Rotor – Beckman-Coulter; #369691
Motor driven, Teflon (pestle)-based homogeniser (Similar to a Potter-Elvehjem
tissue homogenizer)
GENios Pro Infinite 200 multimode microplate reader – Tecan
NuPAGE 4-12% Bis-Tris Protein Gels, 12-Well; Thermo Fisher Scientific;
#NP0322BOX
NuPAGE Gel Electrophoresis Tanks and pre-cast gel system – Thermo Fisher
Scientific
PowerEase 500 power packs – Thermo Fisher Scientific; #EI8600
ChemiDoc XRS+ Imaging System – Bio-Rad Laboratories, Inc., with Image Lab
software version 3.0.1
Seahorse Xfp extracellular flux analyser – Seahorse Bioscience, USA

61
2.1.6 Specific Antibodies Employed
During Western blot analysis, specific commercially available antibodies outlined in
Table 2.1 were used to investigated the phosphorylation profile of Dyn-I. All antibodies
were sourced from Santa Cruz Biotechnology, Inc., USA.
Primary Antibody Dilution Secondary Antibody Dilution
p-Dyn-I Ser-774
Sheep Polyclonal
(sc-135689)
1:1000 Donkey anti-sheep HRP conjugated
(sc-2473) 1:3000
Dyn Ser-778
Sheep Polyclonal
(sc-135690)
1:1000 Donkey anti-sheep HRP conjugated
(sc-2473) 1:2000
Dyn Ser-795
Goat Polyclonal
(sc-12937)
1:500 Donkey anti-goat HRP conjugated
(sc-2020)
1:2000
Pan-Dyn-I (4E67)
Mouse Monoclonal
(sc-58260)
1:1000 Goat anti-mouse HRP conjugated
(sc-2005) 1:5000
Table 2.1: Antibodies for Western Blotting
Catalogue numbers are found beneath each antibody.

62
2.2 Preparing Synaptosomes
In this study, synaptosomes (pinched-off nerve terminals) prepared from the cerebral
cortex of adult male Wistar rat brains were used as the research model. Synaptosomes
were prepared according to a method developed by Hebb and Whittaker and modified
by Dodd and colleagues (Hebb and Whittaker, 1958; Gray and Whittaker, 1962; Dodd,
et al., 1981), with minor alterations. Briefly, one rat was sacrificed by cervical
dislocation and the cerebral cortex swiftly removed and put into homogenisation
buffer (320 mM sucrose plus 10 mM Hepes pH 7.4) at 4˚C. Tissue was then
homogenised using a motor driven Teflon homogenizer that was specially designed for
preparing synaptosomes. The shearing force provided by the rotating pestle (900 rpm)
and the clearance of 150 μm ensured the production of intact and functional
synaptosomes. This homogenate was then centrifuged at 1941 × g for 10 min to
separate the neuronal cell bodies from the nerve terminals. The resulting pellet (P1)
was discarded and the supernatant (S1) was then centrifuged at 21,075 × g for 20 min.
The subsequent pellet (P2), which contained synaptosomes, was then suspended in
basal physiological buffer (125 mM NaCl, 5 mM KCl, 1 mM MgCl2, 20 mM Hepes and 10
mM glucose. pH 7.4) termed ‘L0’ at 4˚C. This suspension was again centrifuged at
21,075 × g for 20 min and the final pellet (P3) was re-suspended in 8 ml of L0, kept at
4˚C and gassed with O2 until required. Synaptosomes prepared by this method
represent a good semi-in-vitro model due to the presence of functioning ion channels,
receptors, proteins and pathways. They exhibit physiological properties expected of
pre-synaptic neurons (Erecińska, Nelson and Silver, 1996). All synaptosomes were used
within four hours of preparation, after which viability begins to decrease.

63
2.3 Glutamate Release Assay
The Glu release assay follows a method developed by Nicholls and colleagues (Nicholls,
et al., 1987), and was adapted by Sim and colleagues for use on a fluorescence
microtiter plate and plate reader (Sim, et al., 2006). This assay converts the Ca2+-
dependent exocytotic release of Glu into a fluorescent signal, which can then be used
to calculate which pools of SVs are undergoing release. Minor alterations were made
by A. Ashton establishing the measurement parameters and durations set forth here.
Figure 2.1 outlines the time course of the Glu assay, the incubation temperatures and
relative treatments.
Figure 2.1: Glu Assay Time Course
The time course demonstrates each treatment the synaptosomes underwent during
the assay, the duration and the temperature of each treatment. For dual drug
treatments a second incubation period of 5-10 min at 37˚C follows the first drug
treatment. Inc – incubation.
A 2 ml aliquot of synaptosomes, prepared as described, was washed (with L0) and re-
suspended in 1 ml of fresh L0. The suspension was stimulated for 90 sec with HK5C,
causing all the releasable vesicles in the synaptosomes to undergo exocytosis. The
synaptosomes were then spun down at 9589 x g for 45 sec, washed once in L0 spun
down again and re-suspended in L0. The suspension was then incubated at room

64
temperature (RT) for 10 min to allow all the exocytosed SVs to recycle. This stimulation
step, though not necessary for the Glu assay directly, allows comparison with the FM
2-10 dye release assay, by treating all samples in a similar manner as the latter assay
requires this pre-stimulation.
After this, synaptosomes were incubated with the desired drug or equivalent volume
of drug solvent (DMSO for control samples unless otherwise stated) for 5-10 min at
37˚C. The samples were washed with L0 then re-suspended in 1.6 ml of fresh L0, plus
the corresponding amount of drug or DMSO volume (to prevent the reversibility of the
drug action). For dual drug treatments, synaptosomes were again incubated for 5-10
min at 37 ˚C in a solution containing the second desired drug or drug solvent for control
samples.
Aliquots of 121 μl from this preparation were added to wells 1-12 of a row in a Greiner
96 well microtiter plate (black with flat, transparent bottom). In addition 20 μl of L0
was added to each well for a volume of 141 µl. After this 10 µl of 20 mM NADP+ and 9
µl of GDH were added to each well (for a final volume of 160 µl and a final
concentration of 1 mM NADP+ and 36 mUnits GDH) and the resulting mixture was
incubated at RT for 10 min.
At this stage, any Glu present outside the synaptosomes is converted to α-
ketoglutarate by GDH in the presence of NADP+ which itself is converted to NADPH
producing background fluorescence, demonstrated in the equation below.
GLDH2 + H2O + NADP+ = α-ketoglutarate + NH3 + NADPH + H+

65
Any increase in fluorescence measured after this point is a result of evoked Glu release
from within the synaptosomes, which allows indirect quantification.
After incubation, wells 1-5 were treated with 40 µl of the desired stimulus (HK5C,
4AP5C or ION5C) and the corresponding stimulus without Ca2+ was added to wells 6-12
(e.g. HK0). For samples stimulated with ION5C, LO was added to the basal samples as
ionomycin would disrupt the Ca2+ gradient and its hydrophobic nature means
membrane binding is irreversible (Kao, Li and Auston, 2010).
Fluorescence was then measured from wells 1-9 with the Tecan GENIOS Pro infinite
200 plate reader (at excitation wavelength: 340 nm; emission wavelength: 465 nm;
gain: 100; read mode: bottom; and for 21 cycles). This number of cycles reflects an
assay time of ~5 min to ensure all Glu exocytosed is hydrolysed by GDH. After the
measurement, 10 μl of L0 was added to wells 7-9, and 10 μl of freshly prepared 1 mM
stock glutamate (final amount added 10 nmol) was added to wells 10-12. Fluorescence
was measured from wells 7-12 using the same setting but at 15 cycles ~4 min. These
latter settings, allow an internal control to be ran on each drug or control condition
and allows for normalisation of all the rows for equivalent sensitivity. Subtracting the
background values from the stimulation values provides a true representation of Ca2+
dependent vesicular Glu release. Significance values were calculated using two way
Student’s t-test, with a significance threshold of 0.05.
In some cases, there are large differences in the amount of Glu release observed
between ION5C and HK5C and this is because these sets of experiments were done at
different times. It could be that there are differences in the total protein between the

66
different sets of experiments or it could be that the different ages of the rats may have
made a difference. This effect has not really been investigated fully and in using rats
ranging in size from 250g to 650g, all have displayed the regulation of the modes of
exocytosis but it was not observed whether they produced slightly different amounts
of release. It should be noted that the comparison between control and drug
treatment were always done with the same synaptosomes so that the observed
differences and trends are valid. However, it should also be considered that overall in
more than 10 years or research, the average ION5C or HK5C evoked control release for
Glu and FM dye are comparable (Ashton, unpublished observation). Herein, a
comparison has been made for the average maximum release evoked by HK5C and
ION5C from 20 independent experiments performed over a period of a year. It can be
seen that statistically there is no significant difference between the evoked release of
the two stimuli (Figure 2.2).
Throughout this thesis Glu release data is expressed in AU of fluorescence and in order
to show equivalence of approach Figure 2.3 demonstrates the conversion of AU to
nmol of Glu release per mg of protein. This conversion is done using the average signal
for a 10 nmol Glu standard added at the end of each assay, and the average amount of
protein (from P2 synaptosomes) calculated per well. This data can also be represented
as a percentage of maximum HK5C evoked release (Figure 2.3 C). Figure 2.3 A-C
highlights that ION5C and HK5C stimuli evoked similar amounts of Glu release with the
different graphs looking similar, so one is able to use AU of fluorescence rather than
nmol of Glu per mg of protein.

67
Figure 2.2: Average Size of Maximum Glu Release with HK5C and ION5C Stimulation
Maximum Glu release evoked by HK5C and ION5C from 20 independent experiments,
adjusted with 10 nmol Glu standard (p=0.755). Values represented are the mean plus
S.E.M. from 20 independent experiments. NS, not significant.

68
Figure 2.3: Evoked Glu Release Equivalency of Approach
(A) AU of fluorescence of Glu release evoked by ION5C or HK5C, (B) nmol of Glu
released per mg of protein evoked by ION5C or HK5C. (C) Glu release represented as a
percentage of maximum HK5C evoked Glu release (all p>0.05). Values represented are
the mean plus S.E.M. from 5 independent experiments.

69
2.4 FM 2-10 Styryl Dye Release Assay
2.4.1 Background/Rationale
In order to determine the mode of exocytosis for distinct SV pools, the Styryl dye FM 2-
10 was utilised. Styryl dyes are water soluble, non-toxic, lipophilic molecules that can
reversibly insert into cell membranes without completely permeating. This is due to a
lipophilic hydrocarbon tail that readily dissolves into lipid leaflets and a hydrophilic
ammonium head which prevents penetration (Betz, et al., 1992; Iwabuchi, et al.,
2014). FM dyes are non-fluorescent in an aqueous environment, but undergo a 100-
fold increase in quantum yield (fluorescence) when they associate with lipid
membranes (Hoopmann, et al., 2012). Styryl dyes have been used extensively to label
lipid membranes in a range of tissue samples and can be internalised by recycling SVs
to study the different vesicle pools (Pyle, et al., 2000; Gaffield and Betz, 2006;
Iwabuchi, et al., 2014).
Use of FM dyes in CNS nerve terminals demonstrate dye retention during exocytosis,
which could be evidence for a fast mode of endocytosis, such as KR (Pyle, et al., 2000;
Aravanis, et al., 2003; Richards, et al., 2005). FM 2-10 dye is a good candidate to study
KR as it has a faster membrane association time than any other Styryl dye, meaning
SVs can be labelled rapidly, and one of the fastest dissociation times due to its shorter
lipophilic tail (Wu, et al., 2009; Iwabuchi, et al., 2014). If exocytosis occurs but no FM 2-
10 dye is released, this could be good evidence for KR, as the duration of the FP is too
short to allow the dye to departition, but fast enough that all NT is released (Stevens
and Williams, 2000).
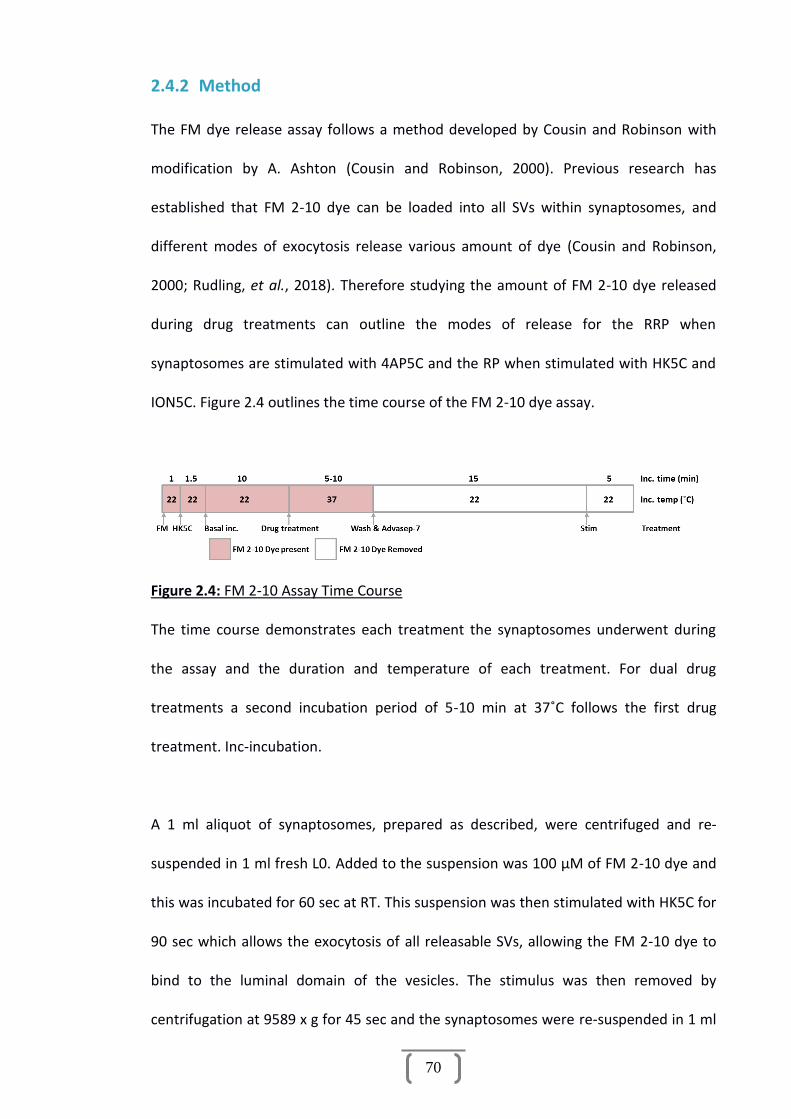
70
2.4.2 Method
The FM dye release assay follows a method developed by Cousin and Robinson with
modification by A. Ashton (Cousin and Robinson, 2000). Previous research has
established that FM 2-10 dye can be loaded into all SVs within synaptosomes, and
different modes of exocytosis release various amount of dye (Cousin and Robinson,
2000; Rudling, et al., 2018). Therefore studying the amount of FM 2-10 dye released
during drug treatments can outline the modes of release for the RRP when
synaptosomes are stimulated with 4AP5C and the RP when stimulated with HK5C and
ION5C. Figure 2.4 outlines the time course of the FM 2-10 dye assay.
Figure 2.4: FM 2-10 Assay Time Course
The time course demonstrates each treatment the synaptosomes underwent during
the assay and the duration and temperature of each treatment. For dual drug
treatments a second incubation period of 5-10 min at 37˚C follows the first drug
treatment. Inc-incubation.
A 1 ml aliquot of synaptosomes, prepared as described, were centrifuged and re-
suspended in 1 ml fresh L0. Added to the suspension was 100 μM of FM 2-10 dye and
this was incubated for 60 sec at RT. This suspension was then stimulated with HK5C for
90 sec which allows the exocytosis of all releasable SVs, allowing the FM 2-10 dye to
bind to the luminal domain of the vesicles. The stimulus was then removed by
centrifugation at 9589 x g for 45 sec and the synaptosomes were re-suspended in 1 ml

71
fresh L0 with 100 μM of FM 2-10 dye, spun down at 9589 x g for 45 sec and re-
suspended in FM dye incubated for 10 min at RT. This wash with FM 2-10 dye was to
ensure the entire HK5C stimulus had been removed. This allowed all FM-dye labelled
SVs to recycle so that they were fluorescently tagged.
Synaptosomes were incubated with the desired drug or equivalent volume of drug
solvent (DMSO for control samples) and incubated at 37°C for 5-10 min. A 1 mM
aliquot of ADVASEP-7 (final concentration) was then added to the suspension at RT,
which removes the FM 2-10 dye from the synaptosomal plasma membrane without
removing internalised dye. ADVASEP-7 has a higher affinity for FM dyes than the PM
which allows it to remove all non-specifically bound dye from the outer leaflet of the
PM, reducing background fluorescence (Kay, et al., 1999). The seven negative charges
on ADVASEP-7 make it membrane impermeable, preventing dye removal from the
endocytosed SVs (Kay, 2007). Synaptosomes were washed twice (with L0), to help
remove all excess FM dye, and re-suspended in 1.5 ml of fresh L0, along with the
corresponding concentration of the drug or volume of DMSO (to prevent the
reversibility of the drug action).
Aliquots of 160 μL from this preparation were then added to wells 1-8 in one row of a
Greiner 96 well microtiter plate (black with opaque, flat bottom). Fluorescence
measurements were performed using Tecan GENIOS Pro infinite 200 plate reader
(excitation wavelength: 465 nm; emission wavelength: 555 nm; gain: 40; read mode:
top; and for 461 cycles). This number of cycles represents an assay time of ~ 2 min.
Just prior to measuring fluorescence, each well was injected with either 40 µl of the
chosen stimulus (HK5C, ION5C or 4AP5C) or 40 µl of L0 for control. For each row 4

72
wells were stimulated and 4 wells underwent basal (L0) conditions. This procedure was
repeated for all the eight rows of the plate, where each row could represent a
different drug treatment. Upon subsequent experimental repeats, row order was
switched to ensure the age of the synaptosomes did not introduce artefacts with each
drug or control condition.
After the experiment, basal data was subtracted from stimulation data for each drug
and control condition. This gave a true representation of the Ca2+ dependent SV
release, expressed in terms of a decrease in fluorescence. All rows were normalised to
a constant starting fluorescence. The absolute starting fluorescence measured enabled
one to ensure that drug treatments did not perturb loading of FM 2-10 dye into SVs.
Significance values were calculated using a two-way Student’s t-test with a significance
threshold of 0.05.
2.5 Intracellular Ca2+ Assay
2.5.1 Background/Rationale
In order to calculate the evoked change in the level of [Ca2+]i, the Fura-2-
acetoxymethyl ester (Fura-2-AM) assay was utilised. Fura-2-AM is a Ca2+ insensitive,
cell-permeable ester, which when taken up by a cell has its acetoxymethyl (AM) group
cleaved off by esterases (Grynkiewicz, et al., 1985; Gulaboski, et al., 2008). This process
converts the ester into a Ca2+ sensitive, negatively charged acid (Fura-2) which is no
longer able to cross lipid membranes, including the PM. When bound to Ca2+ Fura-2
fluoresces maximally when excited at a wavelength of 340 nm, but when present in a
Ca2+ free environment, Fura-2 fluoresces maximally when excited at 380 nm. The
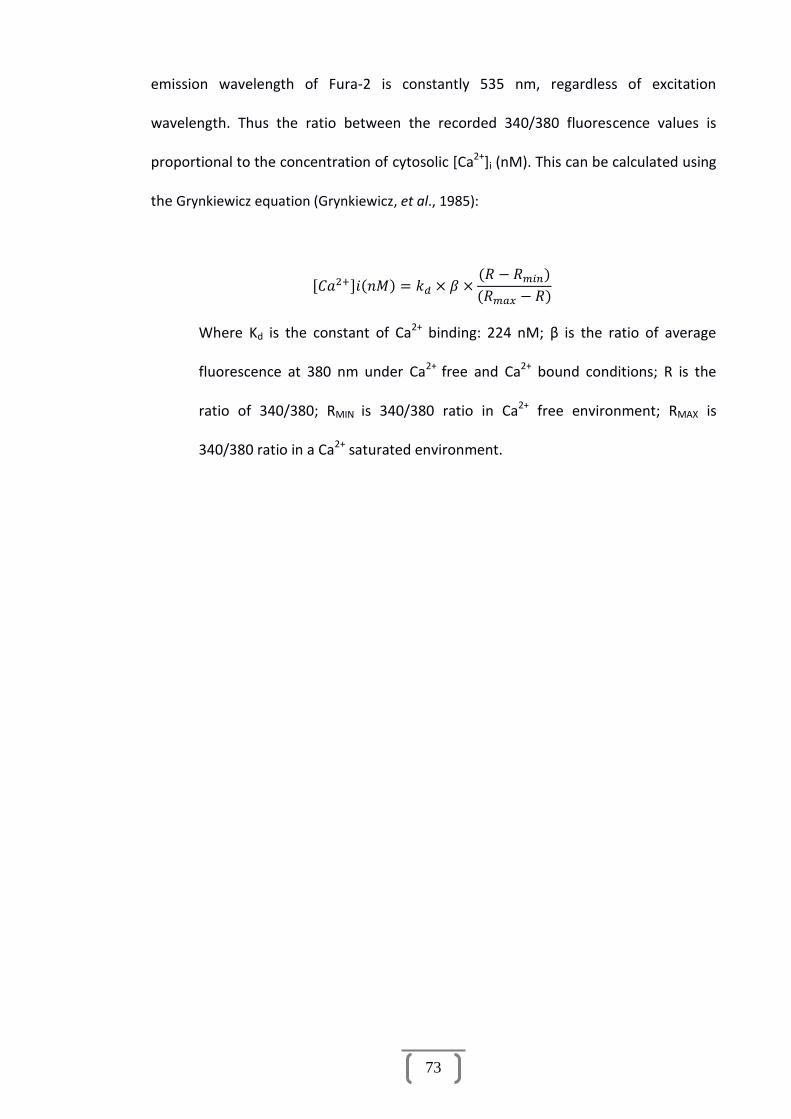
73
emission wavelength of Fura-2 is constantly 535 nm, regardless of excitation
wavelength. Thus the ratio between the recorded 340/380 fluorescence values is
proportional to the concentration of cytosolic [Ca2+]i (nM). This can be calculated using
the Grynkiewicz equation (Grynkiewicz, et al., 1985):
[𝐶𝑎2+]𝑖(𝑛𝑀) = 𝑘𝑑 × 𝛽 ×(𝑅 − 𝑅𝑚𝑖𝑛)
(𝑅𝑚𝑎𝑥 − 𝑅)
Where Kd is the constant of Ca2+ binding: 224 nM; β is the ratio of average
fluorescence at 380 nm under Ca2+ free and Ca2+ bound conditions; R is the
ratio of 340/380; RMIN is 340/380 ratio in Ca2+ free environment; RMAX is
340/380 ratio in a Ca2+ saturated environment.

74
2.5.2 Method
The Fura-2 assay follows a method developed by Brent and colleagues (Brent, et al.,
1997), with minor modifications (Baldwin, et al., 2003). Briefly, An 8 ml aliquot of
synaptosomes, prepared as described, was incubated with 5 µM Fura-2-acetoxymethyl
ester (Fura-2-AM) for 30 min at 37˚C, whilst being constantly oxygenated. During this
incubation the Fura-2-AM enters the synaptosomes where esterases cleave off the AM
group, trapping the dye inside. After this incubation period, synaptosomes were
centrifuged using a bench top centrifuge (9589 x g for 45 sec) and re-suspended in
fresh, ice cold L0 buffer to remove any remaining extracellular Fura-2-AM. This wash
was performed twice, after which synaptosomes were kept oxygenated at 4˚C until
required. Figure 2.5 outlines the experimental design of the Fura-2 assay.
Figure 2.5: Fura-2 Assay Time Course
The time course demonstrates each treatment the synaptosomes underwent during
the course of the assay. Fura-2 was loaded into synaptosomes before being
oxygenated on ice until required. Inc – Incubation.
For each test condition, a 1 ml aliquot of synaptosomes was stimulated with 0.25 ml of
HK5C (final) for 90 sec. The stimulus was then removed by centrifugation at 9589 x g
for 45 sec and the resulting pellet was re-suspended in 1 ml of L0, spun down at 9589 x
g for 45 sec and re-suspended in 1 ml L0 and left to incubate for 10 min at RT. These
last two steps, though not necessary for the Ca2+ assay directly, allow comparison with
the Glu and FM 2-10 dye release assays.
75
After the incubation, synaptosomes had the relevant concentration of drug or an
equivalent volume of DMSO (for control conditions) added and were incubated for 5
min at 37˚C, or longer depending on the relevant drug treatment. Synaptosomes were
then centrifuged at 9589 x g for 45 sec, re-suspended in 1 ml of L0 and centrifuged at
9589 x g for 45 sec again. The final pellet was re-suspended in 1.6 ml of oxygenated L0
which contained the same concentration of drug, or volume of DMSO as used above
(to prevent reversibility of drug action). 120 µl aliquots of this final suspension were
added to each of the 12 wells in a row of a Greiner 96 well microtiter plate (black, flat
bottom). In addition, 40 µl of L0 was added to each well to make a total volume of 160
µl.
Fluorescence was measured from each well individually. The first well was measured
for 40 cycles at the excitation wavelength of 340 nm and emission wavelength 535 nm,
which is equivalent to ~10 sec, providing an average, baseline-fluorescence value. 40 µl
of either a specific stimuli or L0 was injected into the well and the well was read for
160 cycles, ~40 sec, at the same excitation and emission wavelengths. For the second
well, a similar procedure is used, with the only change being excitation at 390 nm (this
was the nearest filter available to 380 nm, but it had a bandwidth which includes 380
nm).
Use of two excitation wavelengths allows calculation of the 340/390 ratio metric value
for these wells. On each row, six wells were injected with 40 µl of a specific stimulus
(due to the nature of ionomycin, it could not be injected and thus ionomycin was
added to the relevant well just before it was injected with L0 containing 25 mM Ca2+
(final concentration 5 mM)), and six wells were injected with 40 µl of L0. The 340/390

76
ratio calculated for L0 treated wells were subtracted from the 340/390 ratio from
stimulated wells in order to estimate the change in [Ca2+]i evoked by the stimulation
alone. Thus each row produces three 340/390 ratio sets for stimulation and control
conditions of the drug treatment.
After all 12 wells in a row had been read, aliquots of 2.25 mM Ca2+ and 0.3% Triton X-
100 (final concentrations) were added to each of the six wells that had been injected
with a stimuli, making the final volume 240 µl. For the six wells which were injected
with L0, aliquots of 15 mM EGTA and 0.3% Triton X-100 (final concentrations) were
added, making the final volume 240 µl. After this treatment all 12 wells were
measured for 40 cycles, first at the excitation wavelength 340 nm then at excitation
wavelength 390 nm. These values were then used to calculate RMAX and RMIN from
samples treated with 2.25 mM Ca2+ and 15 mM EGTA respectively. A spreadsheet was
designed which utilised the Grynkiewicz equation to calculate the concentration of
intracellular [Ca2+]i. Significance values were calculated using two way Student’s t-test,
with a significance threshold of 0.05.
77
2.6 Western Blotting
2.6.1 Introduction
In order to study the phosphorylated profile of Dyn-I, LDS-PAGE and Western blotting
techniques were employed. In Western blotting protein samples are denatured by the
addition of anionic detergents such as sodium dodecyl sulfate (SDS) or lithium dodecyl
sulfate (LDS). The denatured proteins bind an amount of detergent relative to the
molecular mass of the protein, which negatively charges the protein allowing for
separation by electrophoresis. In this study LDS was used as the detergent as it
required a lower temperature to fully denature the sample compared to SDS. NuPAGE
Bis-Tris gels were also utilised due to their more neutral running pH and the
preservation of protein integrity for study of post-translational modification
(phosphorylation).
2.6.2 Sample Preparation
Synaptosomes prepared as described, were washed in L0, re-suspended in fresh L0
then stimulated for 90 sec with HK5C at RT. The stimulus was then removed by
centrifugation as previously described and synaptosomes were re-suspended in fresh
L0. Samples were treated with the relevant drug, dissolved in DMSO, or equivalent
volume of DMSO for each test condition for 5-10 min at 37˚C. Following this treatment
and the relevant washes, the appropriate stimulus or basal condition (HK5C, ION5C,
4AP5C or L0) was applied for a range of specific time points (2, 15, 30, 120 sec) before
the reaction was terminated by the addition of sample buffer, containing lithium
dodecyl sulfate (LDS) and the reducing agent dithiothreitol (DTT) (1x final
78
concentration). Samples were then vortexed for 5-10 sec, heated at 70˚C for 10 min
and stored at -20°C until required.
An aliquot of each samples was taken in order to determine the protein concentration
of each sample (not containing gel sample buffer), using the Bradford assay. The final
protein concentration of samples for blotting was adjusted to 1.5 mg/ml. The Bradford
assay measurements were made using the Tecan GENIOS Pro infinite 200 plate reader
at an absorbance wavelength of 595 nm.
2.6.3 Electrophoresis and Transfer
Prior to gel electrophoresis, samples were heated for 10 min at 70˚C, then into each of
the 12 sample wells 45 µl of sample was loaded. Electrophoresis was performed using
the NuPAGE gel system with midi protein gels of 4-12% Bis-Tris from Life Technologies
and 1x (final concentration) NuPAGE MES running buffer. Western blotting transfer
was performed (at 20 V for 7 min) on iBlot or iBlot 2 systems from Thermo Fisher,
which transferred the proteins from the protein gel onto a polyvinylidene fluoride
(PVDF) membrane. The membrane was then blocked with either 30 ml of blocking
buffer (3% dried milk powder, 1% Tween-20 in tris buffered saline (TBS); pH 7.4) or 15
ml of StartingBlock buffer (proprietary protein formulation in Tris-buffered saline at pH
7.5 with 0.05% Tween-20), for 60 min. The blocking buffer was removed and the blots
were washed for 10 sec with 1% Tween-20 in TBS.
79
2.6.4 Probing and Chemiluminescence
The PVDF membrane was then probed for specific phosphorylation sites on proteins of
interest with specific primary antibodies suspended in 10-15 ml antibody buffer (1%
dried milk powder, 1% Tween-20 in TBS; pH 7.4) for 60-90 min at RT. Antibody solution
was then removed from the membrane which was then washed for 6 x 5 min with 25
ml wash buffer (0.5% Tween-20 in TBS; pH 7.4). Wash buffer was then removed and a
HRP conjugated secondary antibody, raised against the primary, was then added. The
secondary antibody was also suspended in 10-15 ml antibody buffer (1% dried milk
powder, 1% Tween-20 in TBS; pH 7.4) and incubated for 60-90 min at RT.
Antibody buffer was again removed, followed by the same washing procedure. Wash
buffer was then removed and PVDF membranes were incubated with 3 ml
SuperSignal™ West Dura Extended Duration Substrate chemiluminescence agent for
300 sec. Visualisation of the bands was then carried out on the BioRad ChemiDoc XRS+
with Image lab software obtained from Bio-Rad. For re-probing of membranes, the
membrane was stripped using 15 ml Restore™ PLUS Western Blot Stripping Buffer for
20 min at RT and re-blocked ready for further antibody probing.
2.6.5 Quantification of Bands from PVDF Membranes
The ChemiDoc XRS+ system in conjunction with Image Lab software detects the
chemiluminescence of proteins bands on the membrane, where signal intensity is
directly proportional to the amount of protein in the band. Signal intensity is also
directly linked to duration of exposure, whereby a longer exposure time could
introduce error in band quantification. In order to ensure measured band intensity was
in the linear signal range of the sample and antibody, multiple exposures times were

80
taken for each Western blot and plotted against band intensity. A linear range of band
intensity was plotted for each unique antibody used in this thesis (Appendix B), only
exposure times which corresponded to a linear range of detection relative to the time
point were used to determine sample intensity, minimising overexposure or
underexposure of bands which could lead to erroneous and unrepeatable results.
The semi-quantification analysis carried out in this thesis was designed to eliminate
such variations, by quantifying bands relative to each other. Bands of interest were
quantified using the volume calculation tool within the Image Lab software. This tool
allows boxes to be drawn around bands of interest after which the software calculates
average signal intensity within the box; where more intense bands would give a higher
reading in arbitrary units. Furthermore localised errors are reduced as the software
accounts for changes in background signal intensity between bands, reducing artefacts
potentially introduced by uneven background signal (Bio-Rad). Once all the bands
present on a blot were quantified in this manner, they were expressed as a percentage
of the unstimulated control sample (in order to get the relative quantities of protein
present in the given set of bands). The same blots were also probed with pan-Dyn-I to
reveal the total amount of Dyn-I protein in the samples. This allowed the values to be
normalised for the phosphorylated bands relative to the amount of protein, reducing
errors associated with poor sample loading.
81
2.7 Bioenergetics Assay
2.7.1 Background/Rationale
Mitochondrial respiration can be measured via oxygen consumption rate (OCR) to
assess viability and activity of synaptosomes across both basal and drug treatment
conditions (Wallace, 2013; Agilent Technologies, 2019). It is important to ensure
incubation periods with pharmacological agents do not perturb the biological integrity
of synaptosomes. If this were the case, results observed in other assays may reflect the
toxicity of the drug rather than the specific pharmacological treatment. The Xfp
analyser from Seahorse (Agilent Technologies) utilises a mitochondrial stress (Mito-
Stress) test to measure the OCR of mitochondria in the sample (Agilent Technologies,
2019). Specifically the Mito-Stress test looks at 6 aspects of mitochondrial function to
determine the viability of the sample:
(i) Basal respiration – is calculated over the first 0-15 min while synaptosomes
acclimatise to the microtiter plate and represents the amount of oxygen
synaptosomes require during baseline conditions.
(ii) Adenosine triphosphate (ATP) production – represents the portion of basal
respiration mitochondria use to produce ATP, meeting the energy demands
of the synaptosomes. This is assessed over the next 20 min upon injection
of oligomycin, the ATP synthase inhibitor (Agilent Technologies, 2019).
(iii) Proton leakage – is also calculated over this time period and represents the
remaining basal respiration not linked to ATP production.
(iv) Maximal respiration – is measured over the next 20 min with the addition
of the mitochondrial uncoupler FCCP. This treatment collapses the H+

82
gradient across the mitochondrial membrane, stimulating the maximal
oxygen consumption synaptosomal mitochondrial can achieve.
(v) Spare respiratory capacity – represents the difference observed between
basal and maximal respiration (see above), indicating how well the sample
(synaptosomes) can respond to energetic demand. It is calculated at the
same time as maximal respiration.
(vi) Non-mitochondrial respiration – is measured over the final 20 min, where
addition of rotenone and antimycin A stop all mitochondrial respiration.
Any remaining respiration detected represents oxygen consumption driven
by processes outside of mitochondria (Agilent Technologies, 2019).
Specifically designed 8 well (A-H) utility plates along with a sensory cartridge are used
by the Xfp analyser. The sensory cartridge fits on the utility plate like a lid, placing 4
channels (known as drug ports; A-D) and a sensory probe into each of the 8 wells in the
utility plate. The design of the well bottoms in the utility plate creates a micro-
chamber when the sensory cartridge is lowered (by the Xfp analyser). While the micro-
chamber is formed, measurements are taken by the probes in close proximity to the
synaptosomes. The drug ports hold a small volume of suspended drug which is then
added at specific time points during the assay; after which measurements from the
wells are taken.

83
2.7.2 Method
The Mito-Stress assay utilises a kit and procedure developed and supplied by Agilent
technologies for the Seahorse bioenergetics analyser. 24 hours before a bioenergetics
assay was to take place, the wells of a fresh utility plate were pre-treated with 1:1500
of 50% solution polyethyleneamine (PEA) and incubated at RT. This solutions aids cells
(in this case synaptosomes) adhering to the base of the well plate (Vancha, et al.,
2004). When performing the assay the PEA solution was removed from the utility
plate, and the plate was allowed to dry.
A fresh sensory cartridge was hydrated overnight by filling each well of a fresh utility
plate with 200 µl of calibration buffer (PBS, pH 7.4, supplied by Seahorse Biosciences)
and attaching the cartridge so the sensor probes are submerged. This assembly was
then incubated at 37˚C in a sealed container to prevent buffer evaporation. The utility
plate has 4 moat chambers next to the wells which were filled with 400 µl of
calibration buffer, also aiding in evaporation prevention during incubation.
After hydrating for 24 hours, the sensory cartridge was primed with drugs which had
been prepared in the basal buffer, and had been carefully adjusted to pH 7.4. 3 of the
4 drug ports (A-C) were loaded with; 25 µl of 32 µM oligomycin (port A), 25 µl of 18 µM
FCCP (port B) and 25 µl of 0.5 or 5 µM antimycin A with 0.5 or 5 µM rotenone (port C).
In the Mito-Stress test these drugs work to modulate components of the mitochondrial
electron transport chain (ETC). The primed cartridge was then inserted into the
Seahorse XFp machine and equilibrated at 37˚C for 12 min. This time also serves for
the analyser to check the cartridge sensors are working optimally.

84
0.04 ml aliquot of synaptosomes, prepared as previously described suspended in L0,
were centrifuged at 9589 x g for 45 sec. The resulting pellet was suspended in 1.2 ml
bioenergetics buffer at 4˚C with 4 mg/ml of bovine serum albumin added (adjusted to
pH 7.4). 0.175 ml aliquots of the synaptosomal preparation were added to wells B-G of
the Seahorse XFp utility plate. While background wells A and H were filled with
bioenergetics buffer and BSA only. The plate was then centrifuged in an Eppendorf A-2
MTP swing out rotor at 2000 X g for 20 min at 4˚C, to adhere the synaptosomes to the
well bottoms, in a uniform layer.
The supernatant from each well was removed and wells B-D were treated with 0.2 ml
of bioenergetics buffer with the relevant testing drug concentration at 37˚C. Wells E-G
were treated with 0.2 ml bioenergetics with an equivalent DMSO volume at 37˚C. 0.2
ml of bioenergetics buffer was added to wells A and H, and these represent
background conditions which would later be subtracted from the conditions data set.
The utility plate was then incubated at 37˚C for 5-10 min. After incubation the utility
plate was washed two times following drug removal and was inserted into the Xfp
analyser and the Mito-Stress test programme was then used to measure:
(i) 3x3 min measurements of basal OCR and proton production.
(ii) Injection of 25 µl of 32 µM oligomycin from port A to all wells followed by
3x3 min measurements of OCR and proton production (final concentration
of 4 µM).
(iii) Injection of 25 µl of 18 µM FCCP from port B to all wells followed by 3x3
min measurements of OCR and proton production (final concentration of
2 µM).

85
(iv) Injection of 25 µl of 5 or 50 µM of rotenone/actimycin A from port C to all
wells followed by 3x3 min measurements of OCR and proton production
(final concentration of 0.5 or 5 µM).
Note, earlier experiments conducted in the Mito-Stress test were performed at 37 °C.
However, a hardware update allowed the Mito-Stress test to be performed at RT, the
temperature at which all release was measured, allowing later experiments to be
performed at RT. The machine converts all the data from changes in oxygen
consumption or proton production into plots and rates. This resulting data was then
analysed with Wave 2 software from Seahorse Bioscience. A later upgrade to the
software allowed the data to be directly inserted into Excel. The raw data for each well
could then be analysed and such data was amalgamated with repeat experiments to
obtain average values amenable to statistical analysis by two-way Student’s t-test,
with a significance threshold of 0.05.

86
Chapter 3:
The Role of PKA, Dyn-I and the Actin
Cytoskeleton in Regulating the Mode of
Exocytosis for SV Pools

87
3.1 The Effect of Protein Kinase A Regulation on Evoked Glu Release
Dyn-I is a substrate of PKC in both intact synaptosomes and in vitro studies (Robinson,
1991; Robinson, 1992). Robinson did not investigate the specific phosphorylation site
of Dyn-I however, Powell and colleagues demonstrated that PKC phosphorylation of
Dyn-I occurred at Ser-795 in vitro, and this prevented Dyn-I interacting with
phospholipid membranes (Powell, et al., 2000). Research by Bhuva has demonstrated
Dyn-I Ser-795 can also be phosphorylated in vivo (Bhuva, 2015), however Singh has
outlined this may not directly be through PKC action, suggesting another kinase may
be responsible (Singh, 2017). Thus, the phosphorylated state of Dyn-I Ser-795 in vivo
may regulate the ability of Dyn-I to modulate the mode of SV exocytosis.
It is possible that other kinases activated by secondary messengers could be
responsible, either directly or indirectly, for phosphorylating Dyn-I Ser-795 during
terminal depolarisation. PKA is a viable candidate as it is present in nerve terminals, it
phosphorylates serine and threonine residues (Dyn-I is exclusively phosphorylated on
serine sites (Graham, et al., 2007)) and it becomes active when cAMP levels increase
(Nguyen and Woo, 2003; Seino and Shibasaki, 2005; Park, et al., 2014). PKA has a great
number of substrates in the presynaptic terminal, which it can regulate in order to
modulate aspects of SV recycling, including exocytosis (Neuberger, et al., 2007; Park, et
al., 2014). Therefore, regulation of PKA activity is relevant to a large range of proteins
and their pathways. One such PKA substrate is syntaphilin, which regulates the
availability of Dyn-I in terminals (Boczan, et al., 2004), and therefore synaptaphilin’s
action by being modulated by PKA activity could subsequently affect the ability of Dyn-
I to be phospho-regulated, which would then regulate the mode of exocytosis (Lou,
2018).

88
PKA activity can enhance presynaptic Ca2+ influx (Yoshihara, et al., 2000), and has been
implicated in long-term potentiation (LTP) affecting synaptic strength through
phosphorylation and modulation of the secretory machinery (Leenders and Sheng,
2005). PKA has also been shown to enhance the release probability of NTs at many
types of synapse (Menegon, et al., 2006; Huang, et al., 2010; Wang and Sieburth,
2013). Thus, PKA is a vital kinase to study in synaptic communication, and a viable
candidate to modify the mode of exocytosis through the phospho-regulation of Dyn-I.
This section investigates the role of PKA activation and inhibition upon regulating the
mode of Glu release from the RRP and RP of SVs.
3.1.1 The Effect of PKA Inhibition on Evoked Glu Release
To inhibit PKA enzymatic activity, KT5720 – which blocks PKA action through
competitive inhibition of the ATP binding site – was utilised (Kase, et al., 1987).
Synaptosomes treated with 2 µM of the PKA inhibitor KT5720 exhibited no significant
change in evoked Glu release from the RRP when stimulated with 4AP5C (Figure 3.1 A;
Glu release: CON 632.80 ± 129.63 (AU), KT5720 626.35 ± 118.14; p>0.05 at 300 sec –
bar chart), or from the RRP and RP, when stimulated with HK5C (Figure 3.1 B; CON
1286.40 ± 108.39 (AU), KT5720 1196.81 ± 129.23; p>0.05 at 300 sec) or ION5C (Figure
3.1 C; CON 1307.59 ± 296.04 (AU), KT5720 1315.63 ± 390.72; p>0.05 at 300 sec),
compared to drug free controls. Previous research has already established that 5 mM
[Ca2+]e evokes maximal release of Glu from the RRP when used with 4AP, and maximal
release of Glu from both the RRP and RP when used with HK and ION (Bhuva, 2015)
(Figure 1.7). Figure 3.1 demonstrates maximal Glu release from the RRP and RP is still
occurring when PKA is inhibited.

89
Figure 3.1: Effect of 2 µM KT5720 vs Control upon Evoked Glu Release
2 µM KT5720 had no effect upon 4AP5C (A) (p=0.750), HK5C (B) (p=0.934) or ION5C (C)
(p=0.840) evoked Glu release, compared to controls. Inserts demonstrate final
fluorescence at 300 sec. Values represented are the mean plus S.E.M. from 3
independent experiments. NS, not significant.

90
3.1.2 The Effect of PKA Activation on Evoked Glu Release
As the inhibition of PKA did not perturb evoked Glu release, the effect of PKA
activation upon evoked Glu release was investigated. cBIMPS is a cAMP analogue
which potently and specifically activates PKA by binding to the A and B sites on the
regulatory subunits, exposing the catalytic sites of PKA allowing substrate binding for
phosphorylation (Sandberg, et al., 1991). Under basal conditions, PKA has a specific
constitutive level of activity and treatment with 50 μM cBIMPS works to increase this
activity to maximal.
A treatment of 50 µM cBIMPS had no significant effect upon the release of Glu from
the RRP evoked by 4AP5C (Figure 3.2 A; Glu release: CON 735.36 ± 141.62 (AU),
cBIMPS 679.01 ± 115.23, p>0.05 at 300 sec – bar chart), or from the RRP and RP
evoked by HK5C (Figure 3.2 B; Glu release: CON 1353.70 ± 114.06 (AU), cBIMPS
1289.20 ± 135.11, p>0.05 at 300 sec) or ION5C (Figure 3.2 C; Glu release: CON 1317.38
± 124.46 (AU), cBIMPS 1353.73 ± 126.46, p>0.5 at 300 sec), compared to drug free
controls.
Figures 3.1 and 3.2 demonstrate that modulation of PKA activity does not perturb the
maximal release of Glu from either the RRP or RP of SVs. Therefore the modes of
exocytosis for the SV pools, with KT5720 and cBIMPS treatments, could be investigated
using evoked FM 2-10 dye release. As there is no significant change in Glu release, any
measured difference in FM 2-10 dye release must be due to changes in the mode of
exocytosis and not Glu release.

91
Figure 3.2: Effect of 50 µM cBIMPS vs Control upon Evoked Glu Release
50 µM cBIMPS had no effect upon 4AP5C (A) (p=0.960), HK5C (B) (p=0.841) or ION5C
(C) (p=0.548) evoked Glu release, when compared to controls. Inserts demonstrate
final fluorescence at 300 sec. Values represented are the mean plus S.E.M. from 3
independent experiments. NS, not significant.

92
3.2 The Effect of Dyn-I Inhibition on Evoked Glu Release
Within intact nerve terminals Dyn-I has been shown to reside either in the cytosol
(whilst heavily phosphorylated), or upon membranes (whilst dephosphorylated) (Liu,
et al., 1994), and can cycle between the two during terminal activity (Damke, et al.,
1994; Wu, et al., 2010), in response to phospho-regulation (Robinson, 1994). Dyn-I has
been shown to preferentially bind to areas of high membrane curvature, such as
clathrin-coated pits and FP necks, and disruption to proteins that generate such
membrane curvature prevents Dyn-I recruitment (Sundborger and Hinshaw, 2014).
This previous research supports the theory that some Dyn-I is recruited from the
cytosol in order to mediate different forms of endocytosis during terminal
depolarisation (Lin and Gilman, 1996; Ferguson and De Camilli, 2012), and a sub-pool
of Dyn-I, which has been found enriched at the AZ (Wahl, et al., 2013), could be
recruited to mediate KR during SV exocytosis, as has been implicated (Fulop, et al.,
2008; Chan, et al., 2010; Chang, et al., 2017; Chanaday and Kavalali, 2017).
In order to establish if this was the case synaptosomes were treated with 30 µM
MITMAB, a surface-active small-molecule inhibitor which competitively binds the PH-
domain of Dyn-I, preventing it binding to phospholipids present in the PM (Hill, et al.,
2004; Quan, et al., 2007). Treatment with 30 μM MITMAB has previously been shown
to inhibit SV endocytosis in synaptosomes, indicating that it prevents cytosolic Dyn-I
from being recruited to the PM during multiple forms of endocytosis (Quan, et al.,
2007). If cytosolic Dyn-I is being recruited to mediate KR during exocytosis, treatment
with MITMAB may affect the mode of release.
93
To ensure that MITMAB causes changes to the mode of exocytosis without perturbing
the release of Glu from either the RRP or RP, the Glu release assay was performed
(Figure 3.3). Synaptosomes treated with 30 µM MITMAB exhibited no significant
change in Glu released from the RRP when stimulated with 4AP5C (Figure 3.3 A; Glu
release: CON 506.92 ± 141.94 (AU), MITMAB 573.03 ± 70.75, p>0.5 at 300 sec – bar
chart) and from the RRP and RP when stimulated with either HK5C (Figure 3.3 B; Glu
release: CON 689.28 ± 142.51 (AU), MITMAB 588.67 ± 76.09, p>0.5 at 300 sec) or
ION5C (Figure 3.3 C; Glu release: CON 914.56 ± 141.76 (AU), MITMAB 890.76 ± 192.29,
p>0.5 at 300 sec). Figure 3.3 demonstrates that inhibition of cytosolic Dyn-I
recruitment does not affect Glu release from either the RRP or RP during stimulation.
This corresponds well with previous data showing that Dyn-I inhibition with Dynasore
does not perturb Glu release (see section 1.9.5; Figure 1.13).
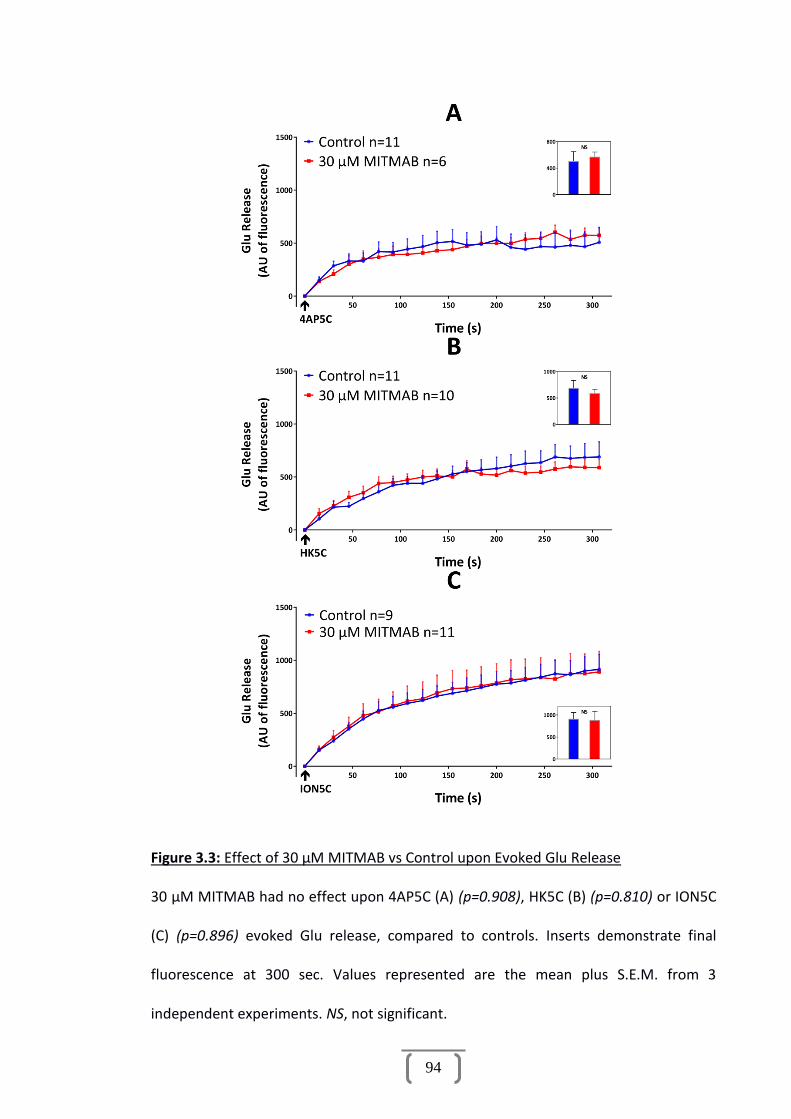
94
Figure 3.3: Effect of 30 µM MITMAB vs Control upon Evoked Glu Release
30 µM MITMAB had no effect upon 4AP5C (A) (p=0.908), HK5C (B) (p=0.810) or ION5C
(C) (p=0.896) evoked Glu release, compared to controls. Inserts demonstrate final
fluorescence at 300 sec. Values represented are the mean plus S.E.M. from 3
independent experiments. NS, not significant.
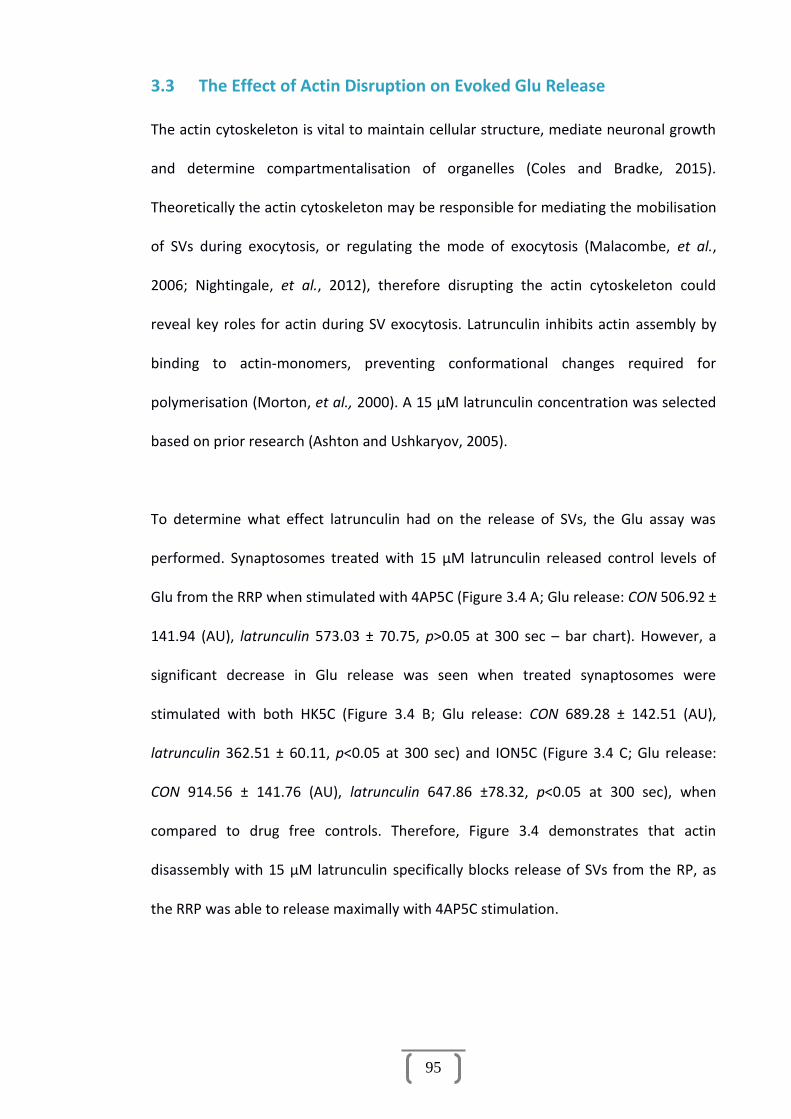
95
3.3 The Effect of Actin Disruption on Evoked Glu Release
The actin cytoskeleton is vital to maintain cellular structure, mediate neuronal growth
and determine compartmentalisation of organelles (Coles and Bradke, 2015).
Theoretically the actin cytoskeleton may be responsible for mediating the mobilisation
of SVs during exocytosis, or regulating the mode of exocytosis (Malacombe, et al.,
2006; Nightingale, et al., 2012), therefore disrupting the actin cytoskeleton could
reveal key roles for actin during SV exocytosis. Latrunculin inhibits actin assembly by
binding to actin-monomers, preventing conformational changes required for
polymerisation (Morton, et al., 2000). A 15 µM latrunculin concentration was selected
based on prior research (Ashton and Ushkaryov, 2005).
To determine what effect latrunculin had on the release of SVs, the Glu assay was
performed. Synaptosomes treated with 15 µM latrunculin released control levels of
Glu from the RRP when stimulated with 4AP5C (Figure 3.4 A; Glu release: CON 506.92 ±
141.94 (AU), latrunculin 573.03 ± 70.75, p>0.05 at 300 sec – bar chart). However, a
significant decrease in Glu release was seen when treated synaptosomes were
stimulated with both HK5C (Figure 3.4 B; Glu release: CON 689.28 ± 142.51 (AU),
latrunculin 362.51 ± 60.11, p<0.05 at 300 sec) and ION5C (Figure 3.4 C; Glu release:
CON 914.56 ± 141.76 (AU), latrunculin 647.86 ±78.32, p<0.05 at 300 sec), when
compared to drug free controls. Therefore, Figure 3.4 demonstrates that actin
disassembly with 15 µM latrunculin specifically blocks release of SVs from the RP, as
the RRP was able to release maximally with 4AP5C stimulation.

96
Figure 3.4: Effect of 15 µM Latrunculin vs Control upon Evoked Glu Release
(A) 15 µM latrunculin had no effect upon 4AP5C evoked Glu release (p=0.641), but did
significantly reduce Glu release when stimulated with (B) HK5C (p=0.002), and (C)
ION5C (p=0.008), when compared to controls. Inserts demonstrate final fluorescence
at 300 sec. Values represented are the mean plus S.E.M. from 3 independent
experiments. *, p < 0.01; NS, not significant.

97
3.4 The Effect of PKA Regulation on Evoked FM 2-10 Dye Release
3.4.1 The Effect of PKA Inhibition on Evoked FM 2-10 Dye Release
Synaptosomes treated with 2 µM KT5720 released significantly more FM 2-10 dye
compared to control conditions, when stimulated with 4AP5C (Figure 3.5 A; FM dye
release: CON -552.76 ± 329.32 (AU), KT5720 -1310.21 ± 190.07, p<0.05 at 120 sec – bar
chart) or with ION5C (Figure 3.5 B; FM dye release: CON -2526.45 ± 174.74 (AU),
KT5720 -3155.33 ± 198.27, p<0.05 at 120 sec), whereas stimulation with HK5C
produced no significant change in release (Figure 3.5 C; FM dye release: CON -1482.03
± 224.80 (AU), KT5720 -1342.78 ± 206.45, p>0.05 at 120 sec).
These results may indicate that SVs from the RRP, which all undergo KR in control
conditions with ION5C (Figure 1.11 A), have switched to a FF mode of exocytosis during
PKA inhibition when released with this stimuli; whereas with 4AP5C only some RRP SVs
undergo KR in control conditions (Figure 1.11 A) but these are switched to FF by
KT5720 treatment. Stimulation with HK5C did not switch the mode of exocytosis of any
SVs in KT5720 treated terminals and so the RRP SVs were still undergoing KR and the
RP SVs were still undergoing FF as seen in control conditions discussed in Section 1.9.4
(Figure 1.11 A).
These data are remarkably similar to previous data collected when Glu and FM 2-10
dye release was studied with the Dyn-I and Dyn-II inhibitor dynasore (Bhuva, 2015), a
reversible, non-competitive GTPase activity inhibitor of Dyns (Macia, et al., 2006).
Synaptosomes treated with 160 µM dynasore maximally released Glu from the RP and
RRP when stimulated with HK5C (Figure 1.13 A) or ION5C (Figure 1.13 B), and from the
RRP when stimulated with 4AP5C (Figure 1.13 C) (see section 1.9.5).

98
This demonstrates inhibition of Dyns does not perturb the vesicular release of Glu.
Furthermore, there was no significant increase in FM 2-10 dye release observed with
160 µM dynasore treatment when stimulated with HK5C (Figure 1.13 D). However a
substantial increase in FM 2-10 dye release was observed when dynasore treated
synaptosomes were stimulated with ION5C (Figure 1.13 E) and 4AP5C (Figure 1.13 F).
From these observations of the action of dynasore upon FM 2-10 dye release, it was
determined that the ION5C and 4AP5C stimuli have a Dyn-I requirement for closing the
FP during exocytosis (Bhuva, 2015, p. 84). These stimuli induce a lower Ca2+
concentration at the AZ, which activates local Dyn-I creating a Dyn-dependent KR
mode of exocytosis, while HK5C induces a higher Ca2+ change at the AZ, inhibiting local
Dyn-I creating a Dyn-independent mode of exocytosis. When the GTPase activity of
Dyn-I is blocked with dynasore a mode switch to FF is observed, and when PKA is
blocked with 2 µM KT5720, the same mode switch to FF is seen with the same stimuli
(4AP5C and ION5C). This could demonstrate that PKA activity plays a role in regulating
properties of Dyn-I, allowing it to induce a KR mode of exocytosis at the FP and this
could be through changes in the evoked [Ca2+]i levels or changes in Dyn-I via protein
partners or phosphorylation.
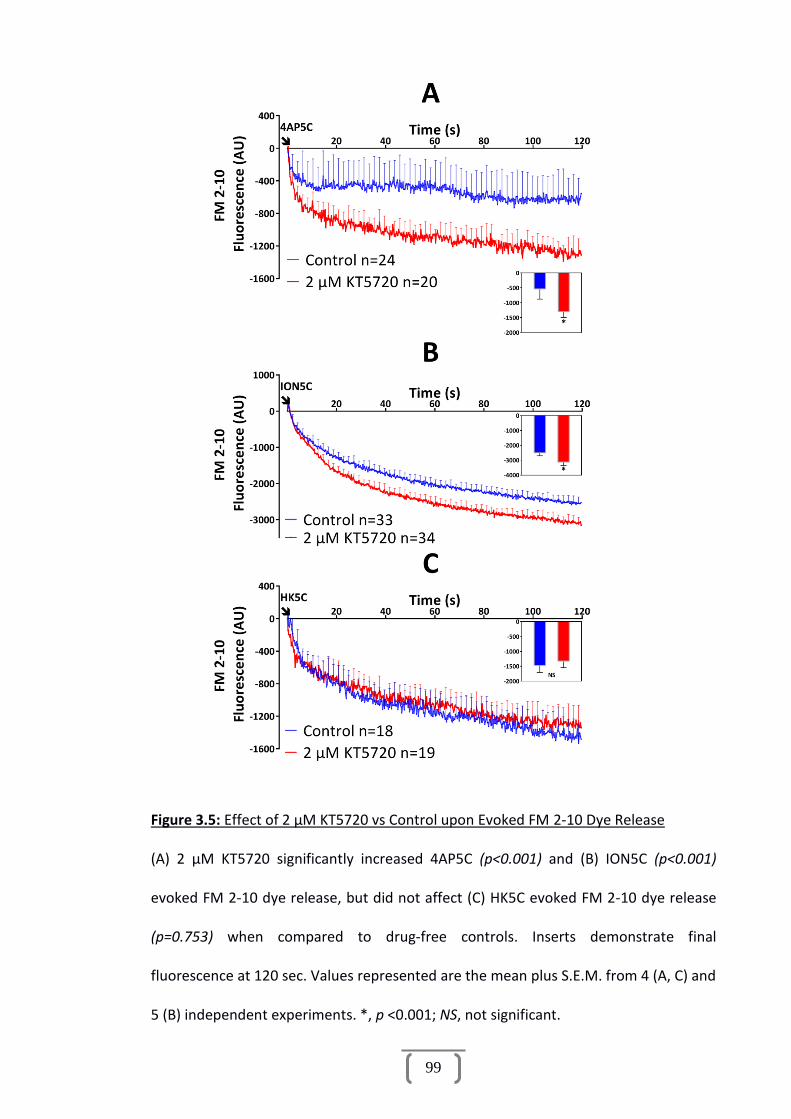
99
Figure 3.5: Effect of 2 µM KT5720 vs Control upon Evoked FM 2-10 Dye Release
(A) 2 µM KT5720 significantly increased 4AP5C (p<0.001) and (B) ION5C (p<0.001)
evoked FM 2-10 dye release, but did not affect (C) HK5C evoked FM 2-10 dye release
(p=0.753) when compared to drug-free controls. Inserts demonstrate final
fluorescence at 120 sec. Values represented are the mean plus S.E.M. from 4 (A, C) and
5 (B) independent experiments. *, p <0.001; NS, not significant.

100
3.4.2 The Effect of PKA Activation on Evoked FM 2-10 Dye Release
Activation of PKA with 50 µM cBIMPS made no significant change to the amount of FM
2-10 dye released, compared to controls, when synaptosomes were stimulated with
4AP5C (Figure 3.6 A; FM dye release: CON -1108.19 ± 196.61 (AU), cBIMPS -1172.19 ±
238.35, p>0.05 at 120 sec – bar chart). However a significant decrease in FM 2-10 dye
release was seen when synaptosomes were stimulated with either HK5C (Figure 3.6 B;
FM dye release: CON -1482.03 ± 208.56 (AU), cBIMPS -942.64, p<0.05 at 120 sec) or
ION5C (Figure 3.6 C; FM dye release: CON -2639.23 ± 146.72 (AU), cBIMPS -2050.67 ±
184.50, p<0.05 at 120 sec), compared to non-drug treated controls. This indicates that
some SVs in the RP, all of which normally undergo release by FF, have switched to a KR
mode of exocytosis. It would appear that with 4AP5C, activation of PKA does not
regulate the mode of exocytosis of the RRP, because SVs which normally undergo FF
have not been switched (Figure 3.6 A). This highlights that PKA activation has a specific
role in regulating the mode of the RP of SVs independently of the RRP.

101
Figure 3.6: Effect of 50 µM cBIMPS vs Control upon Evoked FM 2-10 Dye Release
(A) 50 µM cBIMPS had no effect upon 4AP5C evoked FM 2-10 dye release (p=0.302),
but significantly decreased dye release with (B) HK5C (p<0.001) and (C) ION5C
(p<0.001) stimuli. Inserts demonstrate final fluorescence at 120 sec. Values
represented are the mean plus S.E.M. from 3 (A, B) and 6 (C) independent
experiments. *, p <0.001; NS, not significant.

102
This phenotype is similar to previous research results when Glu and FM 2-10 dye
release assays were performed in synaptosomes treated with the protein phosphatase
2B (PP2B) inhibitor cyclosporine A (Cys A). A treatment of 1 µM Cys A did not perturb
Glu release from the RP and RRP when stimulated with HK5C (Figure 1.16 A) or ION5C
(Figure 1.16 B), or Glu release from the RRP when stimulated with 4AP5C (Figure 1.16
C) (Bhuva, 2015, p. 127). This is different from some studies which show Cys A
treatment can increase Glu release (Gaydukov, et al., 2013), but as discussed in section
1.9.5, this indicated maximal Glu release is being observed with this model system
under these conditions already (i.e. with 5mM [Ca2+]e) (see Bhuva, 2015, p. 127).
A significant decrease in FM 2-10 dye release was seen when synaptosomes treated
with 1 µM Cys A were stimulated with HK5C (Figure 1.16 D) and ION5C (Figure 1.16 E),
while no significant difference was observed when stimulated with 4AP5C (Figure 1.16
F), compared to controls. It is noteworthy that this data may indicate that the PKA
substrate that regulates the mode of the RP may be the same substrate that Cys A acts
on, PP2B. Moreover, there was no additivity of FM 2-10 dye release when both Cys A
and cBIMPS were employed together (data not shown). Treatment with 1 µM Cys A
was accompanied by an increase in [Ca2+]i levels for HK5C and ION5C stimuli (Figure
1.16 G and H respectively), which is distinct from the effect of cBIMPS (see later).

103
3.4.3 The Specificity of cBIMPS Action on Evoked FM 2-10 Dye Release
In order to ensure the effect of cBIMPS was specifically due to the activation of PKA,
synaptosomes were pre-treated with 2 µM KT5720 before treatment with 50 µM
cBIMPS. If the action of cBIMPS upon FM dye release were working through PKA, this
pre-treatment with KT5720 would block or significantly reduce the number of SVs
switching to a KR mode of exocytosis.
Release of FM 2-10 dye from synaptosomes treated with 2 µM KT5720 and
subsequently 50 µM cBIMPS, was not significantly different to control synaptosomes
when stimulated with HK5C (Figure 3.7 A; FM dye release: CON -1185.07 ± 208.56
(AU), KT5720 plus cBIMPS -1084.62 ± 223.10, p>0.05 at 120 sec – bar chart) or ION5C
(Figure 3.7 B; FM dye release: CON -2511.80 (AU), KT5720 plus cBIMPS -2717.67 ±
274.45, p>0.05 at 120 sec). These data highlight the specificity of both cBIMPS and
KT5720 for PKA, and reveal pool dependent mode switching for distinct stimuli.

104
Figure 3.7: Effect of 2 µM KT5720 plus 50 µM cBIMPS Treatment upon Evoked FM 2-10
Dye Release
(A) 2 µM KT5720 plus 50 µM cBIMPS treatment did not perturb FM 2-10 dye release
with HK5C (p=0.461) or (B) ION5C (p=0.804) stimuli. Inserts demonstrate final
fluorescence at 120 sec. Values represented are the mean plus S.E.M. from 5 (A) and 3
(B) independent experiments respectively. NS, not significant.

105
3.5 The Effect of Dyn-I Inhibition on Evoked FM 2-10 Dye Release
Though blocking Dyn-I from binding to phospholipids with 30 µM MITMAB did not
perturb the release of Glu (Figure 3.3), it could have an impact upon the mode of
exocytosis. Synaptosomes treated with 30 µM MITMAB did not release significantly
more FM 2-10 dye than control synaptosomes when stimulated with HK5C (Figure 3.8
A; FM dye release: CON -1743.47 ± 173.16 (AU), MITMAB -1601.59 ± 275.92, p>0.05 at
120 sec – bar chart) or ION5C (Figure 3.8 B; FM dye release: CON -1703.83 ± 228.11
(AU), MITMAB -1640.11 ± 350.30, p>0.05 at 120 sec). 30 µM MITMAB was not tested
with 4AP5C as this stimulus only evokes release of the RRP which is mediated by Dyn-I
already membrane bound and enriched at the AZ (Wahl, et al., 2013), revealing
nothing related to any action of Dyn-I that could be recruited from the cytoplasm
(Ferguson and De Camilli, 2012). Figure 3.8 demonstrates that the Dyn-I-dependent KR
mode of exocytosis seen for the RRP when stimulated with ION5C is mediated by a
sub-pool of Dyn-I which is already bound to the phospholipid membrane, or to SVs
directly, and therefore is not able to be inhibited by MITMAB.

106
Figure 3.8: Effect of 30 µM MITMAB vs Control upon Evoked FM 2-10 Dye Release
(A) 30 µM MITMAB does not significantly affect HK5C evoked (p=0.342), (B) or ION5C
evoked FM 2-10 dye release (p=0.114), when compared to controls. Inserts
demonstrate final fluorescence at 120 sec. Values represented are the mean plus
S.E.M. from 4 independent experiments. NS, not significant.

107
3.6 The Effect of Actin Disruption on Evoked FM 2-10 Dye Release
Actin may also have a role in regulation of the FP during exocytosis (Nightingale, et al.,
2012). Actin may work to either stabilise the releasing SVs in conjunction with Dyn-I
during ION5C stimulation, or to work in tandem with NM-II (which actin does
frequently in other cell types (Murrell, et al., 2015)) to regulate the FP opening during
HK5C stimulation, thus disruption of actin could also affect the mode of release.
No significant change in FM 2-10 dye release was observed from synaptosomes
treated with 15 µM latrunculin and stimulated with either HK5C (Figure 3.9 A; FM dye
release: CON -1454.28 ± 291.33 (AU), latrunculin -1225.63 ± 237.68, p>0.05 at 120 sec
– bar chart) or ION5C (Figure 3.9 B; FM dye release: CON -1703.83 ± 228.11 (AU),
latrunculin -1624.01 ± 221.53, p>0.05 at 120 sec) when compared to drug free
synaptosomes. However, this data is misleading as results in Figure 3.4 already
established that Glu released from the RP had been blocked during 15 µM latrunculin
treatment. Therefore, a drop in the amount of FM 2-10 dye released would be
expected if the RP was not releasing. One possibility is that the FM dye release is
actually from the RP and that the reduction in Glu release is actually due to inhibition
of the RRP by latrunculin. However, this is unlikely as the release of the RRP by 4AP5C
is not perturbed by this drug and normally it is envisaged that the RP is released only
after the RRP is released.
A more feasible explanation is that the FM 2-10 dye seen to be released is coming from
the RRP SVs which have switched from a KR mode of exocytosis (which releases no FM
2-10 dye under control conditions) to a FF mode of release, due to the 15 µM
latrunculin treatment.

108
Thus the KR mode of RRP SVs does appear to have a requirement for intact actin
microfilaments, regardless if there is a Dyn-I-dependency as with ION5C, or a NM-II-
dependency as with HK5C. It is serendipitous that the FM 2-10 dye curve for RP SVs
releasing by FF is similar to the FM 2-10 dye curve for the RRP SVs undergoing FF, but
this is expected as in our studies the RRP and RP contain roughly similar numbers of
SVs (see Chapter 1).

109
Figure 3.9: Effect of 15 µM Latrunculin vs Control upon Evoked FM 2-10 Dye Release
(A) 15 µM latrunculin had no significant effect upon FM 2-10 dye release evoked by
either HK5C (p=0.538), (B) or ION5C (p=0.684), when compared to controls. Inserts
demonstrate final fluorescence at 120 sec. Values represented are the mean plus
S.E.M. from 4 independent experiments. NS, not significant.

110
In order to determine if treatment with latrunculin was blocking release of all RP SVs,
the sum of FM 2-10 dye release data from control synaptosomes and dye release from
latrunculin treated synaptosomes was determined and plotted (Figure 3.10). When
stimulated with HK5C and ION5C, without drug treatment, SVs in the RRP were
releasing via KR and SVs in the RP via FF (see Section 1.9.4) and this is demonstrated by
the Control in Figure 3.10 A for HK5C. However latrunculin treatment is suggested to
release the RRP only by FF (Figure 3.9), thus an addition of control and latrunculin
treatments should present a release curve identical to a condition where all SVs are
undergoing FF, e.g. treatment with 0.8 µM OA. Such OA treatment has been well
established to switch the RRP to FF (Figure 1.11; Ashton, et al., 2011), so that all SVs in
the terminal are now releasing via FF as exemplified herein for HK5C stimulation
(Figure 3.10 A; FM dye release: CON -1412.61 ± 152.19 (AU), OA -2343.39 ± 255.28,
p<0.05 at 120 sec – bar chart).
Assuming that the FM 2-10 dye released during control treatment (Figure 3.10 A)
represents the RP of SVs only (as they undergo FF while the RRP undergoes KR,
releasing no dye), then an addition of this data with 15 µM latrunculin release data
(which only releases the RRP by FF) should give a more pronounced FM 2-10 dye
release when compared to control conditions, as observed (Figure 3.10 B; FM dye
release: CON -14554.28 ± 377.72 (AU), CON release plus release in presence of
latrunculin -2679.91 ± 395.03, p<0.05 at 120 sec). If this treatment (control +
latrunculin) represents all RRP and RP SVs now undergoing FF, it should be comparable
(not significantly different) to FM 2-10 dye release seen with 0.8 µM OA (Figure 3.10 C;
FM dye release: OA -2343.39 ± 255.28 (AU), CON release plus release in presence of
latrunculin -2679.91 ± 395.03, p>0.05 at 120 sec). These data suggest that treatment

111
with 15 µM latrunculin only releases the RRP of SVs, as any RP SVs releasing would
enhance the release of FM 2-10 dye beyond that observed here.

112
Figure 3.10: Comparison of Latrunculin plus Control upon Evoked FM 2-10 Dye Release
(A) 0.8 µM OA significantly increased FM 2-10 dye release compared to controls
(p<0.001), as did Control plus 15 µM Latrunculin (B) (p<0.001). (C) There was no
significant difference in FM 2-10 dye release when comparing 0.8 µM OA and Control
plus 15 µM latrunculin (p=0.456). Inserts demonstrate final fluorescence at 120 sec.
Values represented are the mean plus S.E.M. from 3 independent experiments.
*, p <0.001; NS, not significant.

113
3.7 Intracellular Ca2+ Levels
High extracellular Ca2+ levels have been shown to switch vesicles to a KR mode of
exocytosis in chromaffin cells (Alés, et al., 1999), and Richards has demonstrated that
changes to [Ca2+]i levels can regulate the mode of exocytosis in neurons (Richards,
2010); furthermore Ashton has recently demonstrated that large increases in [Ca2+]i
can switch some RP SVs to KR (Section 1.9.4). Any perceived changes in mode of
exocytosis may then be the result of drug induced changes to [Ca2+]i levels upon pools
of SVs. Therefore, PKA inhibition with KT5720 and stimulation with 4AP5C and ION5C
may be switching the mode of RRP SVs to FF by lowering the level of [Ca2+]i, whilst PKA
activation with cBIMPS and stimulation with HK5C or ION5C may be switching RP SVs
to a KR mode of exocytosis through the increase of [Ca2+]i levels.
3.7.1 The Effect of PKA Inhibition on Evoked Changes in [Ca2+]i
Treatment of synaptosomes with 2 µM KT5720 had no significant effect upon [Ca2+]i
levels evoked by 4AP5C (Figure 3.11 A; [Ca2+]i: CON 295.82 ± 23.02 (nM), KT5720
337.38 ± 28.22, p>0.05, final time point), HK5C (Figure 3.11 B; [Ca2+]i: CON 369.21 ±
26.59 (nM), KT5720 402.43 ± 24.22, p>0.05, final time point) or ION5C (Figure 3.11 C;
[Ca2+]i: CON 1711.59 ± 147.26 (nM), KT5720 1720.81 ± 119.86, p>0.05, final time point)
compared to non-drug treated controls. This suggests that inhibition of PKA regulates
the mode of RRP SVs for 4AP5C and ION5C independently of drug induced changes in
the level of [Ca2+]i.

114
Figure 3.11: Effect of 2 µM KT5720 vs Control upon Evoked [Ca2+]i Levels
(A) 2 µM KT5720 did not significantly affect intracellular [Ca2+]i levels when stimulated
with 4AP5C (p=0.397), (B) HK5C (p=0.425) or (C) ION5C (p=0.455), compared with
controls. Values represented are the mean plus S.E.M. from 3 independent
experiments.
115
3.7.2 The Effect of PKA Activation on Evoked Changes in [Ca2+]i
Previous research with Cys A has suggested that an increase in [Ca2+]i can switch RP
SVs to a KR mode of release when stimulated with HK5C (compare Figure 1.16 D and
G) or ION5C (compare Figure 1.16 E and H) (Section 1.9.4). Thus, it was possible that a
treatment with 50 µM cBIMPS could also cause an increase in [Ca2+]i levels when
stimulated with HK5C and ION5C, and this may explain why cBIMPS induced more RP
SVs to undergo a KR mode of exocytosis.
Treatment with 50 µM cBIMPS had no significant effect upon [Ca2+]i levels evoked by
4AP5C (Figure 3.12 A; [Ca2+]i: CON 285.13 ± 37.11 (nM), cBIMPS 283.76 ± 31.38,
p>0.05, final time point) , HK5C (Figure 3.12 B; [Ca2+]i: CON 373.05 ± 25.88 (nM),
cBIMPS 403.88 ± 21.76, p>0.05, final time point) or ION5C (Figure 3.12 C; [Ca2+]i: CON
1711.58 ± 147.26 (nM), cBIMPS 1780.44 ± 101.42, p>0.05, final time point) stimulation.
Activation of PKA therefore, may be acting to switch the mode of RP SVs to KR when
stimulated with HK5C or ION5C (Figure 3.6 B and C) without drug induced changes in
evoked [Ca2+]i levels (Figure 3.12). Figures 3.11 and 3.12 show that PKA can switch the
mode of exocytosis of distinct SV pools (Figure 3.5 and Figure 3.6) independently of
changes to evoked [Ca2+]i levels, which has previously been shown to affect the mode
of release (Chapter 1.9.4; Figure 1.16).

116
Figure 3.12: Effect of 50 µM cBIMPS vs Control upon Evoked [Ca2+]i Levels
(A) 50 µM cBIMPS did not significantly affect [Ca2+]i levels evoked by 4AP5C (p=0.759)
(B) HK5C (p=0.223) or (C) ION5C (p=0.301) stimuli, compared to controls. Values
represented are the mean plus S.E.M. from 3 independent experiments.

117
3.8 Nerve Terminal Bioenergetics
As discussed previously (Chapter 2.7), perceived changes to the mode of release during
FM 2-10 dye assays with drug treatments could be the result of respiratory stress in
the synaptosomes due to drug treatments perturbing the bioenergetic integrity of the
synaptosomes. The results from drug treatments could be due to a decrease in
available energy (ATP) stores, or mitochondrial function and not due to a direct effect
on Glu release, or on the mode of exocytosis.
In order to account for this, drug treated synaptosomes were subjected to the
bioenergetics Mito-Stress test to determine metabolic viability. Drug treatments were
investigated without stimulation treatment as the specific action of the drug on their
targets are independent of any action due to stimulation (e.g. KT5720 inhibits PKA
independent of stimulation action; cBIMPS maximally activates PKA independent of
stimulation action, etc.). The Mito-Stress test has a ~90 min duration, therefore
treatment with stimuli present would mean synaptosomes are chronically stimulated
for a timescale much longer than the maximal 5 min utilised in all assays of this thesis,
such a treatment would not correlate with the normal release measurement.
Prolonged stimulation might reveal a long-term effect of depolarisation, but this would
be done without drug treatment and this cannot be achieved with ionomycin as 20
min treatment has been shown to perturb bioenergetics (Sanchez-Prieto, et al., 1987).

118
3.8.1 The Effect of PKA Inhibition on Nerve Terminal Bioenergetics
There was no significant difference in the oxygen consumption rate (OCR) of
synaptosomes when treated with 2 µM KT5720, compared to non-drug treated control
synaptosomes (Figure 3.13; p>0.05). Figure 3.14 outlines the effect of 2 µM KT5720
upon the 6 aspects of mitochondrial function measured during a Mito-Stress test, as
discussed in section 2.7. The values represented in the bar graphs are the average
values measured over three time points for each section of the Mito-Stress test; basal
(0-15 min), oligomycin treatment (20-35 min), FCCP treatment (40-55 min) and
rotenone with antimycin A treatment (60-75 min) (Section 2.7.1). A significant increase
in basal mitochondrial respiration over the first 15 min was observed (Figure 3.14 A;
p<0.05 at 0-15 min), however this change was minimal and had no effect on the other
parameters measured.

119
Figure 3.13: Effect of 2 µM KT5720 upon Synaptosomal Bioenergetics
A treatment of 2 µM KT5720 did not significantly affect the bioenergetics of
synaptosomes during a Mito-Stress test (p=0.891). Values represented are the mean
plus S.E.M. from 3 independent experiments. Experiment performed at 37˚C in the
Seahorse Xfp flux analyser.

120
Figure 3.14: Effect of 2 µM KT5720 upon Mitochondrial Function
(A) There was a significant increase in basal respiration over the first 15 min (p<0.05)
when synaptosomes were treated with 2 µM KT5720, compared to controls. (B)
Synaptosomes treated with 2 µM KT5720 exhibited no significant changes in ATP
production at 20-35 min, (C) maximal respiration at 40-55 min, (D) spare capacity at
40-55 min, (E) proton leakage at 20-35 min, (F) or non-mitochondrial respiration at 60-
75 min, compared to controls (p>0.05) for all conditions. Values represented are the
mean plus S.E.M. from 3 independent experiments. *, p < 0.05; NS, not significant.

121
3.8.2 The Effect of PKA Activation on Nerve Terminal Bioenergetics
Synaptosomes treated with 50 µM cBIMPS were subjected to the bioenergetics Mito-
Stress test; no significant difference in OCR was seen when compared to control
synaptosomes (Figure 3.15; p>0.05). Figure 3.16 outlines the effect of 50 µM cBIMPS
upon the 6 aspects of mitochondrial function, an increase in basal respiration was
noted (Figure 3.16 A; p < 0.05 at 0-15 min), but again this was minimal and did not
affect the other parameters measured.
Figure 3.15: Effect of 50 µM cBIMPS upon Synaptosomal Bioenergetics
A treatment of 50 µM cBIMPS did not significantly affect the bioenergetics of
synaptosomes during a Mito-Stress test (p=0.547). Values represented are the mean
plus S.E.M. from 3 independent experiments. Experiment performed at 37˚C in the
Seahorse Xfp flux analyser.

122
Figure 3.16: Effect of 50 µM cBIMPS upon Mitochondrial Function
(A) Treatment with 50 µM cBIMPS led to a significant increase in basal respiration
(p<0.05) at 0-15 min, but no significant changes in (B) ATP production at 20-35 min, (C)
maximal respiration at 40-55 min, (D) spare capacity at 40-55 min, (E) proton leakage
at 20-35 min, (F) or non-mitochondrial respiration compared to controls (p>0.05) for
all conditions. Values represented are the mean plus S.E.M. from 3 independent
experiments. *, p < 0.05; NS, not significant.
123
These data highlight that exposure to either 2 µM KT5720 (Figure 3.13) or 50 µM
cBIMPS (Figure 3.15) for 90-min at 37°C did not perturb the viability of synaptosomes.
An acute drug treatment as used in the other assays (≤5-min) would therefore not
disrupt the integrity of the synaptosomes and would not be likely to produce non-
specific effects upon the measurements taken. Figures 3.14 and 3.16 outline these
drug treatments do not have a detrimental impact upon mitochondrial and
synaptosomal function, despite an increase in basal respiration (see discussion).

124
3.8.3 The Effect of Dyn-I Inhibition on Nerve Terminal Bioenergetics
Potentially 30 µM MITMAB could be perturbing the synaptosomes, so treated nerve
terminals were subjected to the bioenergetics Mito-Stress test. No significant
difference in OCR was observed between control and 30 µM MITMAB treated
synaptosomes (Figure 3.17; p>0.05). Figure 3.18 outlines the effect of 30 µM MITMAB
upon the 6 aspects of mitochondrial function. A significant decrease in non-
mitochondrial oxygen consumption was noted (Figure 3.18 F; p<0.05 at 60-75 min).
Figures 3.17 and 3.18 show that 30 µM MITMAB does not significantly perturb the
bioenergetics of synaptosomes and thus the membrane bound fraction of Dyn-I is
sufficient to regulate the release of the RRP via KR and the RP via FF. This one change
to non-mitochondrial oxygen consumption seems irrelevant relative to the fact that
there was no change in mitochondrial function.

125
Figure 3.17: Effect of 30 µM MITMAB upon Synaptosomal Bioenergetics
A treatment of 30 µM MITMAB did not significantly affect the OCR of synaptosomes
during a Mito-Stress test (p=0.730). Values represented are the mean plus S.E.M. from
3 independent experiments. Experiment performed at RT in the Seahorse Xfp flux
analyser. Note, the synaptosomes were incubated with the drug or control at 37°C for
the normal incubation duration and then washed. The Mito-Stress test was performed
at RT.

126
Figure 3.18: Effect of 30 µM MITMAB upon Mitochondrial Function
(A) Treatment with 30 µM MITMAB did not significantly affect basal respiration at 0-15
min, (B) ATP production at 20-35 min, (C) maximal respiration at 40-55 min, (D)spare
capacity at 40-55 min, (E) or proton leakage at 20-35 min (p>0.05), (F) but did
significantly decrease non-mitochondrial oxygen consumption at 60-75 min compared
to drug-free controls (p=0.0154). Values represented are the mean plus S.E.M. from 3
independent experiments. *, p < 0.05; NS, not significant.

127
3.8.4 The Effect of Actin Disruption on Nerve Terminal Bioenergetics
The perturbation of Glu release seen with 15 µM latrunculin may be the result of the
drug disrupting the bioenergetics or perturbing the integrity of some of the
synaptosomes. In order to determine if this was the case synaptosomes treated with
15 µM latrunculin were subjected to the Mito-Stress test (Figure 3.19; p>0.05), no
significant difference was observed between control and treated terminals. Figure 3.20
outlines the effect of 15 µM latrunculin upon the 6 aspects of mitochondrial
bioenergetics. The disruption of actin with 15 µM latrunculin did not perturb the
bioenergetics of the synaptosomes, meaning that the loss of Glu release observed
from the RP and the mode switch to FF are specific molecular effects and not simply
the nerve terminals being disrupted.

128
Figure 3.19: Effect of 15 µM Latrunculin upon Synaptosomal Bioenergetics
A treatment of 15 µM latrunculin did not significantly affect the OCR of synaptosomes
during a Mito-Stress test (p=0.934). Values represented are the mean plus S.E.M. from
3 independent experiments. Experiment performed at RT in the Seahorse Xfp flux
analyser. Note, the synaptosomes were incubated with the drug or control at 37°C for
the normal incubation duration and then washed. The Mito-Stress test was performed
at RT.
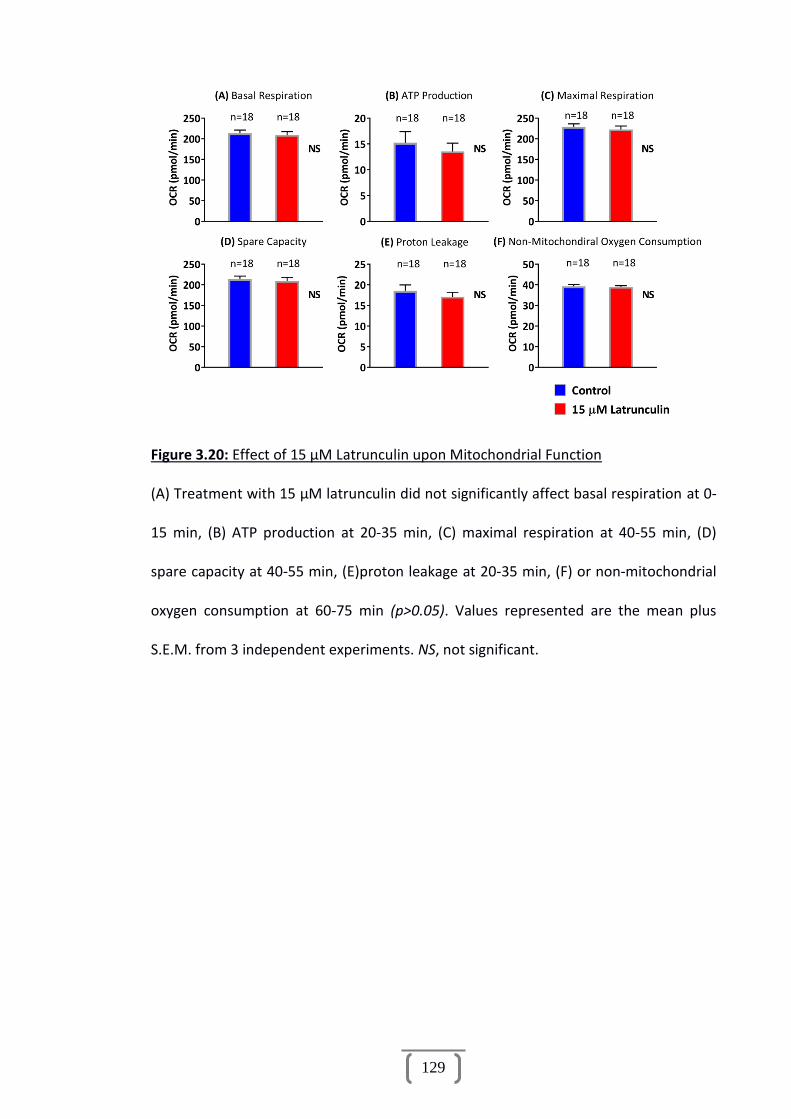
129
Figure 3.20: Effect of 15 µM Latrunculin upon Mitochondrial Function
(A) Treatment with 15 µM latrunculin did not significantly affect basal respiration at 0-
15 min, (B) ATP production at 20-35 min, (C) maximal respiration at 40-55 min, (D)
spare capacity at 40-55 min, (E)proton leakage at 20-35 min, (F) or non-mitochondrial
oxygen consumption at 60-75 min (p>0.05). Values represented are the mean plus
S.E.M. from 3 independent experiments. NS, not significant.

130
3.9 Discussion
This chapter examined the roles that PKA, Dyn-I and actin might play in the regulation
of the mode of NT exocytosis. The effects of PKA inhibition and activation upon Glu
release, FM 2-10 dye release, [Ca2+]i levels and terminal bioenergetics were studied. It
was demonstrated that PKA modulation can switch the mode of Glu release in distinct
SV pools during stimulation, without affecting the amount of Glu released, the [Ca2+]i
levels and such treatments did not perturb the bioenergetics of nerve terminals. The
effects of either inhibiting cytosolic Dyn-I from binding to phospho-lipid membrane, or
disassembling the actin cytoskeleton were also investigated upon Glu release, FM 2-10
dye release and terminal bioenergetics. It was shown that blocking cytosolic Dyn-I
from binding to lipid membranes does not affect the amount of Glu release,the
amount of evoked FM 2-10 dye release and does not perturb the bioenergetics of
nerve terminals. Disassembly of actin on the other hand, blocks RP release and
switches the RRP mode to FF, but without affecting the bioenergetics of nerve
terminals.
Previous research has shown that PKA can enhance NT release probability (Trudeau, et
al., 1996), modify synaptic transmission by acting on neurotransmission machinery
(Boczan, et al., 2004), and regulate synaptic plasticity and SV priming through
phosphorylation of multiple downstream proteins (Nguyen and Woo, 2003; Leenders
and Sheng, 2005; Wang and Sieburth, 2013). Considering this, PKA may be able to
regulate the phosphorylation, or availability of Dyn-I to regulate the mode of NT
release, creating changes in the plasticity of the synapse.

131
3.9.1 Evoked Glu Release
PKA does not regulate the evoked release of Glu from synaptosomes. Figures 3.1 and
3.2 demonstrate that pre-treatment with 2 µM KT5720 and 50 µM cBIMPS
respectively, had no effect upon evoked Glu release. As HK5C or ION5C can induce the
maximum amount of Glu release from the RRP and RP SVs (as ascertained by [Ca2+]e
dose response curves: Section 1.9.1; Figure 1.7), these data indicate that neither
inhibition nor activation of PKA affect the total number of SVs undergoing exocytosis
during application of distinct stimuli. This data also concurs with other research groups
who find no reduction in Glu release, or the availability of SVs to undergo release,
when PKA activity was modulated (Trudeau, et al., 1996; Menegon, et al., 2006).
Any previously observed effects of regulation of release by modifying PKA activity
(Chavez-Noriega and Stevens, 1994; Weisskopf, et al., 1994; Tzounopoulos, et al.,
1998), may be related to control release being sub-maximal, where these studies do
not demonstrate maximal release of NT. Under such conditions PKA may be able to
mobilise more SVs to exocytose, enhancing release, but it cannot induce a greater
release that the maximum possible, and this has already been achieved with the
stimuli used in this study, when in the presence of 5 mM [Ca2+]e, as discussed.
Previous research by A. Ashton’s group established that 4AP5C, HK5C and ION5C all
evoke SVs to undergo one round of release (Section 1.9.2; Figure 1.9). If SV recycling
were occurring, the observed level of evoked Glu would continue to rise over the
duration of the assay and not plateau as demonstrated in Figures 3.1 and 3.2; this
would be especially true with 4AP5C (which only release the RRP). Similarly, as
discussed earlier in Chapter 3, Ashton has shown that 4AP5C maximally releases the

132
RRP, whilst HK5C and ION5C both maximally release the RRP and the RP; therefore
Figures 3.1 and 3.2 cannot reflect PKA activity sub-maximal releasing or recycling any
vesicular pool. Note, inhibition of any Dyn or clathrin dependent recycling does not
induce any more release, which is further proof that just one round of SV release is
occurring (Section 1.9.5).
Blocking cytosolic Dyn-I from binding to membranes does not perturb Glu release for
either the RRP or the RP. This agrees well with previous research which indicates a
portion of Dyn-I is membrane bound, and this is sufficient to aid exocytosis during
evoked release (Robinson, 1991; Wahl, et al., 2013). It could be argued that this result
indicates Dyn-I is not present at the AZ, however inhibition of the GTPase activity of
Dyn-I has been shown to modulate the mode of exocytosis from glutamatergic
synaptosomes, therefore Dyn-I has a role during exocytosis (Figure 1.13; Ashton,
manuscript in preparation).
Inhibition of cytoskeletal actin assembly, blocks release of the RP of SVs. Figure 3.4
outlines that treatment with 15 µM latrunculin has no effect upon RRP SVs released
during 4AP5C stimulation, but directly blocks RP release when evoked to release with
either HK5C or ION5C. Actin has been well established to play a role in the
maintenance of RP SVs in neurons (Doussau and Augustine, 2000; Dillon and Goda,
2005). Furthermore, other research groups have established that high concentrations
of latrunculin can reduce release of catecholamines from chromaffin cells (Gasman, et
al., 2004) and indeed these results support the theory that actin aids exocytosis during
evoked release, rather than being a barrier against vesicular mobilisation (Malacombe,
et al., 2006; Lee, et al., 2012; Nightingale, et al., 2012; Glebov, et al., 2017).

133
3.9.2 Evoked FM 2-10 Dye Release Though PKA activity does not regulate the release of SV pools, it does have a direct
role in regulating the mode of SV exocytosis for distinct pools. Figure 3.5 shows that
inhibition of PKA caused synaptosomes to release significantly more FM 2-10 dye than
controls, when stimulated with 4AP5C (Figure 3.5 A) and ION5C (Figure 3.5 B).
Stimulation with 4AP5C releases only the RRP of SVs, with roughly half being via a KR
mechanism and half being through FF during controls (Section 1.9.4).
Stimulation with ION5C and HK5C on the other hand, is theorised to release the RRP
exclusively by KR, and the RP exclusively by FF during drug-free conditions (Ashton and
Ushkaryov, 2005; Ashton, unpublished observations (see Figure 1.12)). Considering
this, Figure 3.5 may indicate that inhibition of PKA causes SVs in the RRP to switch their
mode of exocytosis from KR to FF. Interestingly HK5C stimulation does not increase FM
2-10 dye release in a similar manner when PKA was inhibited (Figure 3.5 C),
demonstrating that the RRP SVs are still all undergoing KR and not switching to FF,
when stimulated with HK5C.
Previously this phenotype was seen when Bhuva inhibited Dyn-I with 160 µM dynasore
(Figure 1.13) (Bhuva, 2015). It was concluded that Dyn-I, which has been shown to
have a role at the site of exocytosis, was required to close the FP during KR of the RRP
when synaptosomes were stimulated with 4AP5C and ION5C. Ashton previously
demonstrated that the 4AP5C and ION5C stimuli induce [Ca2+]i changes through
different kinetics at the AZ, while HK5C in known to induce a higher and faster initial
[Ca2+]i level at the AZ (Figure 1.8). As Dyn-I has been shown to be inhibited by high
concentrations of Ca2+ (Liu, et al., 1994; Ashton, manuscript in preparation), Dyn-I is

134
able to mediate KR during 4AP5C and ION5C stimulation, where the [Ca2+]i level at the
AZ is not high enough to inhibit Dyn-I activity; unlike during HK5C stimulation where
Dyns are inhibited by this high [Ca2+]i at the AZ. Even though Dyns are inhibited during
HK5C stimulation, RRP SVs are theorised to still be able to release via a KR mode as the
higher [Ca2+]i activates NM-II which is able to close the FP, creating a Dyn-independent
KR mode (Figure 1.15).
PKA has not been shown to directly phosphorylate Dyn-I, but it does have a number of
phosphorylation targets in the pre-synaptic terminal, such as syntaphilin which
regulates the availability of Dyn-I, and such regulation can inhibit Dyn-mediated
endocytosis (Das, et al., 2003; Boczan, et al., 2004). Potentially the activity of PKA
could regulate syntaphilin to affect the availability of Dyn-I, preventing it from
mediating KR during 4AP5C and ION5C stimulation. As non-muscle NM-II is not being
inhibited by syntaphilin, NM-II is still free to mediate KR during HK5C stimulation,
when Dyn-I is inactive anyway, and this is worth investigating further by assessing the
phosphorylated state of syntaphilin following PKA inhibition. Alternatively, PKA could
phospho-regulate an unknown phosphatase to dephosphorylate Dyn-I, thus allowing it
to mediate KR. Clearly, inhibition of PKA prevents such interactions leading to FF at the
AZ, since KR cannot occur.
Results presented in Figure 3.6 demonstrate that PKA activation can also specifically
regulate the release mode of RP SVs. Activation of PKA with 50 µM cBIMPS caused a
significant decrease in FM 2-10 dye released from synaptosomes when stimulated with
HK5C and ION5C (Figure 3.6 B and C), but not 4AP5C (Figure 3.6 A). As mentioned
above both HK5C and ION5C release the RP of SVs via a FF mode of exocytosis during
135
control conditions (Figure 1.12). When PKA is activated however, at least some SVs in
the RP are switched from a FF mode of exocytosis to a KR mode and so less FM 2-10
dye is released. Interestingly, this effect was specific to the RP SVs as no mode switch
was seen for the sub-pool of SVs in the RRP, which undergo FF when stimulated with
4AP5C (Figure 3.6 A). Thus, increasing the ability of PKA to phosphorylate substrates
leads to a marked increase of RP SVs undergoing KR exocytosis.
This particular phenotype resembles previous research when PP2B (also termed
calcineurin) was inhibited with Cys A (Figure 1.16). Calcineurin has been shown to
dephosphorylate Dyn-I both in vitro and in vivo, during terminal depolarisation (Liu, et
al., 1994; Marks and McMahon, 1998; Bauerfeind, et al., 1997). As Dyns are
dephosphorylated by calcineurin, it was theorised that Dyn-I localised to the RP may
require calcineurin mediated dephosphorylation in order to drive FP expansion during
FF (Bhuva, 2015). Thus, inhibiting Dyn-I dephosphorylation could prevent some RP SVs
switching to a FF mode of exocytosis. However, blocking Dyn-I directly with dynasore
does not give the same result (compare Figure 3.6 with Figure 1.13). This demonstrates
that though inhibition of calcineurin led to an increase in SVs undergoing KR, it was not
directly through regulating Dyn-I activity. Ashton has recently demonstrated that with
HK5C stimulation release of the RRP is mediated by NM-II whilst Dyn-I regulates RP
release; with ION5C however, both the RRP and RP are released via Dyn-I mechanisms
(compare Figures 1.13 and 1.14).
Similarly, some FM 2-10 dye was still lost from the RP SVs when PKA was activated
(Figure 3.6 B and C), indicating that not all of this pool of SVs are being switched to KR
by PKA activation. This might suggest that there is a sub-pool of SVs within the RP

136
which are available to switch to a KR mode of exocytosis under the right conditions,
however further investigation is needed. Some unpublished results from Ashton
suggest that if all the RRP are undergoing KR, it is not possible for all the RP to also
undergo KR. This suggests that the site for KR exocytosis may get saturated. If one
converts the RRP to FF, it would appear that all RP SVs can undergo KR (Ashton, et al.,
unpublished).
These data may indicate that PKA and protein phosphatase 2B (calcineurin) share a
substrate which regulates the release dynamics of the RP, without regulating the RRP.
It is currently unclear what this substrate is, or what role it may play in mode
regulation.
3.9.3 Dual Treatments
Recent papers have questioned the specificity of KT5720 for PKA in a range of models,
stating KT5720 may potentially inhibit other kinases and alter receptor-binding
affinities through non-specific effects when used at lower concentrations than in this
study (Olsen, et al., 1998; Davies, et al., 2000; Lazareno, et al., 2000). Though this may
seem the case at face value, a few differences in methodology must be highlighted:
(i) In many models, in vitro cells were chronically incubated with KT5720 for
longer than 10-min, in some cases hours (Davies, et al., 2000; Lazareno, et al.,
2000). In this thesis, all drugs were washed away after a maximum time of 10-
min, before being re-added for the duration of the assays <5-min.
(ii) In some studies cultured cells were kept at 30°C for the duration of the
experiments (Davies, et al., 2000), while measurements in this thesis took place
at room temperature.

137
(iii) All models used reflected in vitro studies taking place in tissues cultures,
bacterial cultures or disrupted cellular membranes (Olsen, et al., 1998;
Lazareno, et al., 2000), while synaptosomes used in this study are an in vivo
model, representing viable nerve terminals.
These differences can lead to fallacious assumptions about the specificity of drugs and
their long-term actions during chronic treatments.
To highlight the specificity of both KT5720 and cBIMPS for PKA, a dual treatment was
conducted for FM 2-10 dye release. Synaptosomes pre-treated with 2 µM KT5720
followed by 50 µM cBIMPS treatment released levels of FM 2-10 dye equivalent to
controls when stimulated with HK5C (Figure 3.7 A) and ION5C (Figure 3.7 B). If KT5720
was not inhibiting PKA during such an acute treatment, an increase of evoked FM 2-10
dye would have been seen with ION5C; furthermore, if cBIMPS had not been
specifically working on PKA a decrease in evoked FM 2-10 dye would have been noted
for this dual treatments with ION5C stimulation.
3.9.4 Effect of Dyn-I and Actin Modulation on Evoked FM Dye Release
MITMAB prevents Dyn-I binding to membranes, but does not disrupt or inhibit Dyn-I
that is already associated with the membrane, and synaptosomes treated with 30 µM
MITMAB do not significantly change the amount of Glu released (Figure 3.3) or the
amount of FM 2-10 dye released (Figure 3.8). With ION5C stimulation the KR mode of
the RRP is Dyn-dependent (as demonstrated with dynasore: Figure 1.13), and this
suggests that the sub-pool of Dyn-I that regulates the mode of release is already
associated with the membrane. This is a very important discovery, as it suggests that
though cytosolic Dyn-I must undergo dephosphorylation in order to become active,

138
membrane bound Dyn-I is already active, and located at the AZ (Wahl, et al., 2013),
and thus can instantly polymerise around forming FPs, without a rate limiting time
step. As MITMAB does not perturb the GTPase activity of this membrane bound Dyn-I
sub-pool it is still able to regulate the FP during exocytosis, and this may indicate that a
sub-pool of Dyn-I is localised to the AZ, or the RRP SVs ready to facilitate KR exocytosis.
Latrunculin disrupts the actin cytoskeleton by preventing polymerisation, and this
blocks release of SVs from the RP only (Figure 3.4 B and C). However, when FM 2-10
dye release is investigated there appears to be no switch in the mode of release
(Figure 3.9 A and B), as the amount of FM 2-10 dye released is quite similar with or
without latrunculin treatment. Interestingly, if the RP (which undergoes FF) is not able
to release then no decrease in FM 2-10 dye release should be observed at all (as the
RRP releases via KR for both HK5C and ION5C). However, control levels of FM 2-10 dye
appear to be released and this indicates that SVs in the RRP are switching to a FF mode
of release, as both pools are similar in size (Figure 1.1).
In order to determine if latrunculin was releasing only the RRP, the maximal FM 2-10
dye release of latrunculin was added to control levels of FM 2-10 dye release (Figure
3.10). This presented a result identical to FM 2-10 dye release observed with OA
(where all SVs are undergoing FF) (Figure 1.11), suggesting that latrunculin is only
releasing the RRP of SVs, and Control FM 2-10 dye traces are showing only the release
of RP SVs. Recent studies by Ashton and colleagues (Ashton, unpublished) indicate a
dual-treatment of latrunculin and OA gives no extra FM dye release, indicating
latrunculin switches all RRP SVs to FF. These data indicate that not only does actin have
a direct role in the release of the RP, but it also has a role in the regulation of the FP

139
during RRP exocytosis. Previous studies have highlighted that actin can coat different
types of secretory cells during exocytosis (Miklavc, et al., 2009), and this may work
with either Dyn-I or NM-II to stabilise the FP and regulate release (Malacombe, et al.,
2006; Nightingale, et al., 2012). Indeed the inhibition of actin prevents any KR taking
place which suggests that actin must work to regulate the FP during some stimulation
paradigms.
3.9.5 Evoked [Ca2+]i Levels
Previously changes to [Ca2+]i levels have been linked to changes in the mode of
exocytosis, where an increase leads to a high prevalence of KR (Alés, et al., 1999;
Ashton, manuscript in preparation – Figure 1.8).
When PKA was inhibited or activated, distinct changes in the mode of exocytosis were
observed for each stimuli, however no significant change in [Ca2+]i levels occurred. This
is good evidence to suggest that PKA activity regulates the mode of exocytosis,
independently of [Ca2+]i, through phosphorylation of protein partners, which the
neuron could utilise to regulate signalling.
Prevention of PKA from phosphorylating a target protein may inhibit the action of Dyn-
I during exocytosis, as this phenotype is similar to Dyn-I inhibition with dynasore
(Bhuva, 2015; Figure 1.13), however further studies must be conducted to determine if
there is a link between these proteins, and the extent of the protein pathway. During
control conditions PKA could be phosphorylating -and thus activating- a phosphatase
which dephosphorylates Dyn-I allowing it to mediate KR; the inhibition of PKA may
140
then prevent the activation of the phosphatase and of Dyn-I, leading to the same
phenotype as direct Dyn-I inhibition.
Previously when calcineurin inhibition was shown to give the same phenotype as PKA
activation it was assumed to be through changes to protein pathways; however, Bhuva
demonstrated that the inhibition of calcineurin with Cys A significantly raised the
[Ca2+]i level and this is able to switch the mode of RP SVs (Bhuva, 2015). PKA activation
however, had no significant effect upon the [Ca2+]i level, demonstrating the activation
of PKA was able to change the mode of RP exocytosis through protein pathways rather
than changes to [Ca2+]i. These data concur with other researchers who suggest that
PKA activation is able to modulate vesicular exocytosis downstream of changes to
[Ca2+]i levels, potentially describing a regulatory role for PKA in signalling.
3.9.6 Bioenergetics of Synaptosomes
In order to ensure that distinct changes to mode of release were due to targeted drug
action and not non-specific perturbation of the synaptosomes by the drugs utilised,
drug treated samples were subjected to the bioenergetics Mito-Stress test. The Mito-
Stress test measured mitochondrial function and terminal viability by recording the
OCR of synaptosomes to determine respiratory stress. If a treatment or condition
negatively affects either the energetic demands or the molecular nature of the nerve
terminals, this would become apparent through this assay.
Inhibition and activation of PKA did not compromise the viability of synaptosomes over
chronic, but more importantly during acute treatments (≤ 5-min), as used with the Glu,
FM 2-10 dye and Fura-2 assays. Drug treatments led to perceived switches in the mode

141
of exocytosis as discussed above, without non-specific drug action or perturbation of
the synaptosomes as the presence of either drug had no effect upon mitochondrial
ATP production, maximal respiration, spare capacity, proton leakage, or non-
mitochondrial respiration (Figures 3.14 and 3.16 B-F).
However, both drug treatments caused an increase in basal respiration (Figures 3.14
and 3.16 A). Basal respiration reflects the OCR required by the mitochondria of the
sample to meet cellular ATP demand during resting conditions. Such an increase in
mitochondrial oxygen consumption reflects the cells facing an increased energy
demand on the mitochondria (Agilent Technologies, 2019). Potentially some activation
or inhibition of PKA pathways may cause some slight increase in respiration, or
perhaps synaptosomes were still acclimatising to the microtiter plate. However this
effect would need to be studied in more detail in order to determine the significance.
MITMAB prevented cytosolic Dyn-I from binding to the membrane without
compromising the viability of the synaptosomes (Figure 3.17). MITMAB does not affect
mitochondrial basal respiration, ATP production, maximal respiration, spare capacity
or proton leakage (Figure 3.18 A-E), but did decrease non-mitochondrial respiration
(Figure 3.218 F). Non-mitochondrial respiration is defined as any oxygen consumption
that persists due to a subset of cellular enzymes outside of the mitochondria, which is
used to calculate the overall mitochondrial respiration rate; however, as no significant
change in any other aspect was noted (Figure 3.18), the implication of this data is not
yet fully understood. If MITMAB caused other cellular enzymes to decrease their OCR
this could indicate a non-specific effect of the drug during prolonged treatments,
however this has not been observed previously.

142
Synaptosomes treated with latrunculin blocked release of the RP (Figure 3.4 B and C),
and potentially switched the mode of release for the RRP from KR to FF (Figure 3.9).
However latrunculin did not affect the OCR or the viability of the synaptosomes as no
significant change was seen in basal respiration, ATP production, maximal respiration,
spare capacity, proton leakage and non-mitochondrial respiration (Figure 3.20 A-F).

143
3.10 Conclusion
This chapter demonstrates that PKA inhibition potentially reduces the number of SVs
undergoing exocytosis via KR by switching these to FF, and this is probably through
blocking the action of Dyn-I. Furthermore, PKA activation increases the number of SVs
undergoing KR and this could be through Dyn-I or NM-II. KT5720 and cBIMPS
specifically work to inhibit and activate PKA respectively, without perturbing the Glu
release, the viability of synaptosomes or affecting the [Ca2+]i level within the terminals.
Significantly, the Dyn-I which is already bound to membranes is sufficient to facilitate
KR during SV release, because prevention of further Dyn-I binding to membranes with
MITMAB does not impact Glu release, the mode of exocytosis or nerve terminals
bioenergetics. Actin is potentially required to mobilise release of the RP, and could also
regulate the mode of RRP SVs exocytosis, regardless of which stimuli is used. The role
of actin needs to be studies in more detail, since it appears to be important for both
Dyn-dependent and NM-II-dependent KR of the RRP.
If PKA is switching the mode of exocytosis through Dyn-I phospho-regulation, this will
be revealed using these drug treatments in phosphorylation studies. However, if such a
small pool of membrane bound Dyn-I appears to be able to regulate the mode of
release, the changes in phosphorylation of this sub-pool of Dyn-I may be very small
and beyond the sensitivities of detection of such phosphorylation by Western blotting.

144
Chapter 4:
The Role of AC in Modulating the Mode of
Exocytosis and SV Pool Release via PKA
and EPAC Regulation

145
4.1 Introduction
Chapter 3 of this thesis established that PKA activation can inhibit Dyn-I-dependent
RRP KR, PKA inhibition can enhance RP KR without modulating the RRP, cytosolic Dyn-I
is not required to regulate the RRP mode of exocytosis, and actin has a role in both the
RRP mode, and the mobilisation of the RP. The aim of this chapter is to discover how
modulating levels of the secondary messenger cAMP (which activates PKA) affects the
mode of release for the RRP and RP. Furthermore, this chapter aims to investigate if
cAMP is working through PKA alone to mediate specific changes in mode.
4.2 The Effect of Adenylyl Cyclase Regulation on Evoked Glu Release
PKA is activated by the secondary messenger cAMP (Walsh, et al., 1968; Knighton, et
al., 1991). cAMP is synthesised from ATP by the transmembrane enzyme adenylyl
cyclase (AC), which has 9 isoforms and is activated by the GTP-bound α-subunit of the
stimulatory G-protein (Gsα) (Sunahara, et al., 1996; Hanoune and Defer, 2001;
Sandana and Dessauer, 2009). Changes to intracellular levels of cAMP have been
shown to enhance NT release by modifying secretory machinery (Zhong and Wu, 1991;
Chen and Regehr, 1997), influence synaptic plasticity including memory and learning
(Huang, et al., 1995; Grandoch, et al., 2010), and has been linked to changes in Ca2+
sensitivity for fast-releasing SVs during low intensity stimulation (Ster, et al., 2007;
Petrov, et al., 2008; Yao and Sakaba, 2010).
For many years these effects were attributed to the action of cAMP upon PKA and
certain hyperpolarisation-activated cyclic nucleotide-modulated (HCN) channels
(Zambon, et al., 2005; Biel, 2008), but since the discovery of a second family of cAMP
activated proteins, exchange proteins directly activated by cAMP (EPACs) (de Rooij, et

146
al., 1998; Kawasaki, et al., 1998), the PKA-independent effects of cAMP have been
better explained (Beaumont, et al., 2002; Grandoch, et al., 2010).
As cAMP directly activates PKA, modulation of cAMP levels within the terminals may
create similar mode switching conditions to when PKA activity was directly modulated
with KT5720 and cBIMPS treatments (see Chapter 3). However, the additional
activation of EPACs may also have a direct impact upon release dynamics (Almahariq,
et al., 2013; Schmidt, et al., 2013).
Forskolin has long been used to activate AC (Seamon and Daly, 1981; Tang and Hurley,
1998) which raises the level of intracellular cAMP, while 9-cp-ade has been used
extensively to inhibit AC (Johnson, et al., 1997). These drugs were utilised in this
chapter in order to ascertain what effects the activation and inhibition of AC had upon
evoked Glu release, FM 2-10 dye release and the level of [Ca2+]i.
4.2.1 The Effect of AC Inhibition on Evoked Glu Release
AC can be specifically inhibited by 9-cp-ade, a non-competitive inhibitor which targets
the P-site of AC to prevent ATP binding and thus cAMP production (Johnson, et al.,
1997). No significant change in Glu release was observed from the RRP when
synaptosomes were treated with 100 µM of 9-cp-ade and stimulated with 4AP5C
(Figure 4.1 A; Glu release: CON 632.80 ± 129.63 (AU), 9-cp-ade 561.61 ± 110.18, p>0.05
at 300 sec – bar chart), or from the RRP and RP when stimulated with HK5C (Figure 4.1
B; Glu release: CON 1073.96 ± 105.56 (AU), 9-cp-ade 1093.56 ± 116.78, p>0.05 at 300
sec) or ION5C (Figure 4.1 C; Glu release: CON 1307.59 ± 85.46 (AU), 9-cp-ade 1356.33 ±
87.78, p>0.05 at 300 sec).

147
Figure 4.1: Effect of 100 µM 9-cp-ade vs Control upon Evoked Glu Release
(A) 100 µM 9-cp-ade had no effect upon 4AP5C (p=0.655), (B) HK5C (p>0.05) or (C)
ION5C (p=0.872) evoked Glu release, compared to controls. Inserts demonstrate final
fluorescence at 300 sec. Value represented are the mean plus S.E.M. from 3
independent experiments. NS, not significant.

148
4.2.2 The Effect of AC Activation on Evoked Glu Release
As the inhibition of AC with 9-cp-ade did not perturb Glu release, the effect of the
selective, reversible AC activator forskolin was investigated upon evoked Glu release.
Forskolin increases the binding affinity of two cytoplasmic domains C1 and C2 on AC, C1
is located between two sets of six transmembrane spans, while C2 is located on the C-
terminus. Binding of these two domains promotes a more efficient catalyst to produce
cAMP, and significantly increases intracellular cAMP levels (Seamon and Daly, 1981;
Dessauer, et al., 1997). Forskolin treatment has been shown to enhance 4AP
stimulated Glu release from synaptosomes (but see discussion), and increase [Ca2+]i
levels (Herrero and Sánchez-Prieto, 1996), through the activation of PKA and EPACs
(Ferrero, et al., 2013).
Synaptosomes treated with 100 µM of forskolin exhibited no significant change in Glu
released from the RRP when stimulated with 4AP5C compared to drug free controls
(Figure 4.2 A; Glu release, CON 500.73 ± 148.19 (AU), forskolin 490.88 ± 54.78, p>0.05
at 300 sec – bar chart). Glu released from the RRP and RP was significantly lower in
terminals treated with 100 µM forskolin when evoked by HK5C (Figure 4.2 B; Glu
release, CON 843.04 ± 73.30 (AU), forskolin 492.96 ± 113.39, p<0.05 at 300 sec) and
ION5C (Figure 4.2 C; Glu release: CON 1307.59 ± 85.46 (AU), forskolin 768.87 ± 70.73,
p<0.05 at 300 sec), compared to untreated controls. Treatment with forskolin
perturbed evoked release of SVs from the RP, as release from the RRP (measured using
4AP5C) was not disrupted (Figure 4.2 A).
In order to prove this loss of RP SVs was a specific effect of forskolin, synaptosomes
were treated with 100 µM of the forskolin inactive homologue 1,9-dideoxyforskolin

149
(Pinto, et al., 2009), and stimulated with HK5C (Figure 4.3 A). This did not change the
amount of evoked Glu release compared to controls (Glu release: CON 1073.96 ±
105.56 (AU), 1,9-dideoxyforskolin 914.67 ± 133.35, p>0.05 at 300 sec – bar chart), as
maximal Glu release was observed from both RRP and RP and this also outlined the
specificity of forskolin upon AC.
The specific effect of forskolin upon AC was further confirmed when synaptosomes
were pre-treated with 100 µM 9-cp-ade (to inhibit AC) and then subsequently treated
with 100 µM forskolin. In these terminals the HK5C evoked Glu release was identical to
non-drug treated controls (Figure 4.3 B; Glu release: CON 1073.96 ± 105.56 (AU), 9-cp-
ade plus forskolin 901.82 ± 127.44, p>0.05 at 300 sec). This pre-treatment condition
also had no effect upon Glu release from the RRP evoked by 4AP5C (Figure 4.3 C; Glu
release: CON 632.80 ± 129.63 (AU), 9-cp-ade plus forskolin 577.78 ± 82.08, p>0.5 at
300 sec). These results indicate that forskolin specifically inhibits release of the RP of
SVs evoked by HK5C by activating AC, but if AC is first inhibited forskolin is no longer
able to block RP release. This data also demonstrates that 9-cp-ade is actively
inhibiting AC.
These are intriguing data, as forskolin raises cAMP levels and cAMP activates PKA, it
may be expected that activation of AC by forskolin should share a similar phenotype as
when PKA is activated with cBIMPS; however as previously seen cBIMPS had no such
effect upon HK5C (Figure 3.2 B) and ION5C (Figure 3.2 C) evoked Glu release from
synaptosomes.

150
Figure 4.2: Effect of 100 µM Forskolin vs Control upon Evoked Glu Release
(A) 100 µM forskolin had no effect upon 4AP5C (p=0.861), (B) but perturbed HK5C
(p<0.001) and (C) ION5C (p<0.001) evoked Glu release. Inserts demonstrate final
fluorescence at 300 sec. Values represented are the mean plus S.E.M. from 3 (A) and 5
(B, C) independent experiments. *, p < 0.05; NS, not significant.

151
Figure 4.3: Effect of 100 µM 1,9-dideoxyforskolin and 100 µM 9-cp-ade plus 100 µM
Forskolin Treatment upon Evoked Glu Release
(A) 100 µM 1,9-dideoxyforskolin had no effect upon HK5C evoked Glu release
(p=0.991). (B) Glu release from synaptosomes pre-treated with 100 µM 9-cp-ade prior
to 100 µM forskolin treatment was equivalent to controls when stimulated with HK5C
(p=0.197), (C) and when stimulated with 4AP5C (p=0.587). Values represented are the
mean plus S.E.M. from 3 independent experiments. NS, not significant.

152
4.2.3 The Effect of EPAC Inhibition on Evoked Glu Release
cAMP has two major cellular targets PKA and EPACs. EPAC1 and EPAC2 are proteins
which have guanine-nucleotide exchange factor (GEF) activity which is utilised to
switch GDP for GTP in the small GTPases Rap1 and Rap2 (de Rooij, et al., 1998;
Kawasaki, et al., 1998). EPAC1 has limited expression in the CNS, being enriched in the
kidneys and gonads, while EPAC2 is highly expressed in the brain and pancreas
(Kawasaki, et al., 1998).
The increase in cAMP within synaptosomes has been shown to activate both EPACs as
well as PKA (Dao, et al., 2006). Interestingly the activation of EPACs has been shown to
enhance neurotransmitter release from glutamatergic synapses (Grandoch, et al.,
2010; Ferrero, et al., 2013) (but see discussion), and has a role in regulation of
exocytosis (Fernandes, et al., 2015). If elevation of cAMP levels via treatment with
forskolin blocks release of the RP, this could be through the activation of EPACs, as PKA
regulation does not affect pool release (Chapter 3). Inhibition of EPACs with the
specific inhibitor ESI-09, and a dual treatment with forskolin should reveal if EPACs are
regulating RP release.
ESI-09 competitively binds to the cAMP binding domain (CBD) B-site present on the
regulatory-domain of both EPAC1 and EPAC2 (Almahariq, et al., 2013). This prevents
EPACs undergoing a structural change which exposes the binding site for Rap1 and
Rap2 on the catalytic-domain (de Rooij, et al., 2000; Bos, 2006). Treatment with 100
µM ESI-09 had no effect upon HK5C evoked release of Glu from synaptosomes
compared to controls (Figure 4.4 A; Glu release: CON 745.01 ± 91.02 (AU), ESI-09
770.86 ± 87.99, p>0.05 at 300 sec – bar chart). A pre-treatment of 100 µM ESI-09 prior

153
to the 100 µM forskolin treatment led to no significant decrease in Glu being released
from the RP and RRP, compared to controls (Figure 4.4 B; Glu release: CON 715.96 ±
98.03 (AU), ESI-09 plus forskolin 653.24 ± 170.14, p>0.05 at 300 sec). This indicates that
perturbation of Glu release from the RP could be caused by the activation of EPACs
due to an increase in cAMP levels, which was mediated by forskolin activating AC. The
phenotype induced by forskolin was reversed by blocking EPACs before activating AC.

154
Figure 4.4: Effect of 100 µM ESI-09 and 100 µM ESI-09 plus 100 µM Forskolin upon
Evoked Glu Release
(A) 100 µM ESI-09 had no significant effect upon HK5C evoked Glu release (p=0.964).
(B) 100 µM ESI-09 plus 100 µM forskolin was not significantly different to control with
HK5C stimulation (p=0.823). Inserts demonstrate final fluorescence at 300 sec. Values
represented are the mean plus S.E.M. from 4 independent experiments. NS, not
significant.

155
4.3 The Effect of AC Regulation on Evoked FM 2-10 Dye Release
4.3.1 The Effect of AC Inhibition on Evoked FM 2-10 Dye Release
The effect of 100 µM 9-cp-ade on FM 2-10 dye release was investigated. Inhibition of
AC had no effect upon FM 2-10 dye released from the RRP when stimulated with
4AP5C (Figure 4.5 A; FM dye release: CON -626.04 ± 418.25 (AU), 9-cp-ade -924.86 ±
292.98, p>0.05 at 120 sec – bar chart), nor did this drug perturb the properties of the
dye release from the RP and RRP when stimulated with HK5C (Figure 4.5 B; FM dye
release: CON -1482.03 ± 224.80 (AU), 9-cp-ade -1386.21 ± 206.10, p>0.05 at 120 sec)
or ION5C (Figure 4.5 C; FM dye release: CON -2750.52 ± 173.69 (AU), 9-cp-ade -
2726.38 ± 211.62, p>0.05 at 120 sec). Inhibition of AC does not regulate the mode of
exocytosis from either the RRP or RP evoked by these stimuli.

156
Figure 4.5: Effect of 100 µM 9-cp-ade vs Control upon Evoked FM 2-10 Dye Release
(A) 100 µM 9-cp-ade had no significant effect upon 4AP5C (p=0.572), (B) HK5C
(p=0.8064) or (C) ION5C (p=0.6343) evoked FM 2-10 dye release, compared to drug-
free controls. Inserts demonstrate final fluorescence at 120 sec. Values represented
are the mean plus S.E.M. from 3 independent experiments. NS, not significant.

157
4.3.2 The Effect of AC Activation on Evoked FM 2-10 Dye Release
As forskolin disrupted release of Glu from the RP, only the RRP mode of exocytosis
could be studied. Synaptosomes treated with 100 µM forskolin released significantly
less FM 2-10 dye from the RRP with 4AP5C stimulation, compared to non-drug controls
(Figure 4.6 A; FM dye release: CON -981.65 ± 341.02 (AU), forskolin -437.41 ± 278.89,
p<0.05 at 120 sec – bar chart). As about half of the SVs in the RRP undergo 4AP5C
evoked exocytosis via FF and half by KR, the results indicate that those SVs which
normally undergo a FF mode of exocytosis have been switched to a KR mode.
In order to assess if this forskolin action was specifically working through AC, a pre-
treatment with 100 µM 9-cp-ade was again employed. The amount of 4AP5C evoked
FM 2-10 dye release was similar to control levels following 100 µM 9-cp-ade pre-
treatment and subsequent addition of 100 µM forskolin (Figure 4.6 B; FM dye release:
CON -1108.19 ± 196.61 (AU), 9-cp-ade plus forskolin -829.59 ± 193.72, p>0.05 at 120
sec), indicating that the activation of AC does induce the RRP SVs undergoing FF to
switch to KR. It should be noted that forskolin treatment did appear to cause a
statistically non-significant reduction in FM dye release following the 9-cp-ade pre-
treatment; but this slight decrease may be because a 5-min pre-treatment period with
9-cp-ade may not have completely inhibited all AC in the synaptosomes, so forskolin
could still have a minor effect on the AC that were still active.
Though the release of RP SVs is regulated by the activity of EPACs during AC activation,
the RRP mode of release may be regulated by the activity of PKA. As shown earlier
(Chapter 3), inhibition of PKA with 2 µM KT5720 causes all 4AP5C evoked SVs to
undergo a FF mode of exocytosis, without perturbing Glu release (Figures 3.5 A and 3.1
158
A respectively). However, no change in 4AP5C evoked FM 2-10 dye is observed when
PKA is activated with 50 µM cBIMPS (Figure 3.6 A), but when PKA is inhibited with 2
µM KT5720 before being treated with 100 µM forskolin, control levels of FM 2-10 dye
release are observed, with 4AP5C stimulation (Figure 4.7 A; FM dye release: CON -
1355.24 ± 258.52 (AU), KT5720 plus forskolin -1656.05 ± 437.07, p>0.05 at 120 sec –
bar chart); which is a significant increase in release when directly compared to FM 2-10
dye release with 100 µm forskolin (Figure 4.7 B; FM dye release: forskolin -437.41 ±
278.89 (A), KT5720 plus forskolin -1656.05 ± 437.07, p<0.05 at 120 sec). This may be
complicated and whilst the amount of FM 2-10 dye released is similar to control when
PKA is activated (Figure 3.6), it could be that this is due to actual switching of those SVs
undergoing KR to FF, and those undergoing FF to KR, so that there appears to be no
change.
Figure 4.7 indicates that forskolin no longer switches the RRP SVs which undergo FF to
KR but the SVs which normally undergo KR, have been switched to FF. This result is
consistent with forskolin working on the RRP via activation of PKA, where PKA is
inhibited. However, forskolin no longer acts, as KT5720 produces the same phenotype
as KT5720 plus forskolin, it could be that the target for KT5720 is downstream of the
target for forskolin such that the forskolin action may not involve PKA.

159
Figure 4.6: Effect of 100 µM Forskolin; 100 µM 9-cp-ade plus 100 µM Forskolin upon
4AP5C Evoked FM 2-10 Dye Release
(A) 100 µM forskolin significantly reduced the release of FM 2-10 dye from
synaptosomes stimulated with 4AP5C (p<0.001). (B) No significant difference in FM 2-
10 dye release was observed with 100 µM 9-cp-ade pre-treatment followed by 100 µM
forskolin, when stimulated with 4AP5C stimulation (p>0.145). Inserts demonstrate final
fluorescence at 120 sec. Values represented are the mean plus S.E.M. from 6 (A) and 4
(B) independent experiments. *, p<0.001; NS; not significant.

160
Figure 4.7: Effect of 2 µM KT5720 Pre-treatment and 100 µM Forskolin upon 4AP5C
Evoked FM 2-10 Dye Release
(A) Joint pre-treatment with 2 µM KT5720 and 100 µM forskolin is not significantly
different to control values when stimulated with 4AP5C (p>0.05) (B) but is a
significantly increase in release compared to 100 µM forskolin (p<0.001). Inserts
demonstrate final fluorescence at 120 sec. Values represented are the mean plus
S.E.M. from 4 independent experiments. *, p <0.05; NS, not significant.

161
The data with KT5720 plus forskolin, where the RRP switches to a predominantly FF
mode of exocytosis resemble previous research results in which FM dye release assays
were performed in synaptosomes treated with the protein phosphatase 2A (PP2A) and
protein phosphatase 1 (PP1) inhibitor OA. We repeated these experiments herein. 0.8
µM OA significantly increased FM 2-10 dye release, switching the mode of 4AP5C
stimulated RRP SVs so that all undergo FF (Figure 4.8 A; FM dye release: CON -1207.59
± 260.78 (AU), OA -1676.45 ± 163.20, p<0.05 at 120 sec – bar chart) compared to drug-
free controls.
Potentially OA may stop the action of forskolin switching the majority of the RRP SVs to
a KR mode of exocytosis, just as was found above with KT5720. However,
synaptosomes treated with 0.8 µM OA plus 100 µM forskolin still released significantly
less dye than controls (Figure 4.8 B; FM dye release: CON -1207.59 ± 260.78 (AU), OA
plus forskolin -428.76 ± 234.42, p<0.05 at 120 sec), and this was similar to forskolin
action alone (see Figure 4.6 A). This is clearly different to the KT5720 action, which
prevented the effects of forskolin, and this suggests that OA might act on a different
substrate to the one that forskolin works on or that forskolin acts downstream of OA.

162
Figure 4.8: Effect of 0.8 µM OA; 0.8 µM OA plus 100 µM Forskolin upon 4AP5C Evoked
FM 2-10 Dye Release
(A) 0.8 µM OA treatment significantly increased 4AP5C evoked FM 2-10 dye release
(p<0.001). (B) 0.8 µM OA pre-treatment with 100 µM forskolin treatment significantly
decreased FM 2-10 dye release when compared to control (p<0.001). Inserts
demonstrate final fluorescence at 120 sec. Values represented are the mean plus
S.E.M. from 4 independent experiments. *, p <0.001.

163
4.4 The Effect of AC Regulation on Evoked Changes in [Ca2+]i
4.4.1 The Effect of AC Inhibition on Evoked Changes in [Ca2+]i
Although inhibition of AC with 9-cp-ade did not lead to any significant changes to the
maximal release of Glu, or to the mode of exocytosis for either the RRP or RP, it is still
possible that such treatments may induce changes to evoked [Ca2+]i levels within the
synaptosomes (as discussed in Chapter 3). This was tested by using Fura-2 to measure
evoked changes in [Ca2+]i following such drug treatment.
Synaptosomes treated with 100 µM 9-cp-ade exhibited no significant change to [Ca2+]i
levels compared to non-drug treated controls, when stimulated with 4AP5C (Figure 4.9
A; [Ca2+]i: CON 285.13 ± 37.11 (nM), 9-cp-ade 287.96 ± 38.29, p>0.05, final time point),
HK5C (Figure 4.9 B; [Ca2+]i: CON 378.26 ± 28.09 (nM), 9-cp-ade 357.40 ± 24.54, p>0.05,
final time point) or ION5C (Figure 4.9 C; [Ca2+]i: CON 1711.58 ± 147.26 (nM), 9-cp-ade
1780.90 ± 121.30, p>0.05, final time point). Thus, whilst 9-cp-ade does have an effect
upon the terminals as it reversed the action of forskolin (Figures 4.3 B and 4.6 B) and
must therefore block AC, it does not cause any changes to the evoked level of [Ca2+]i.
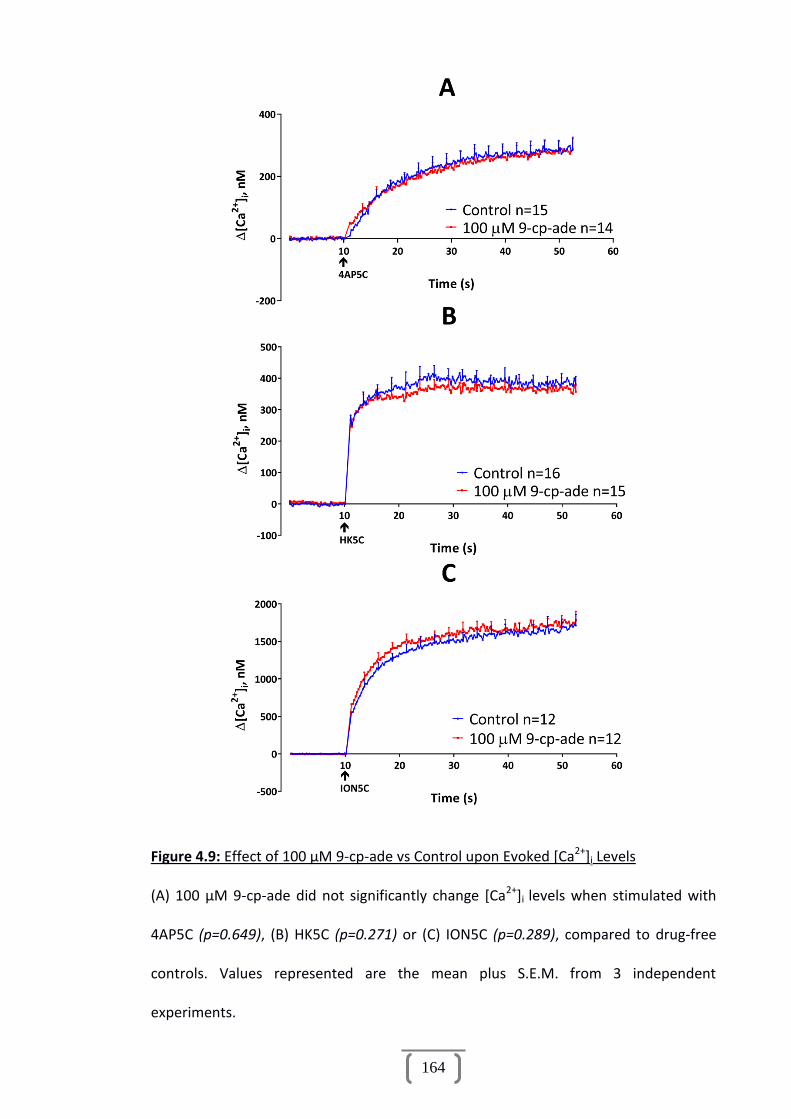
164
Figure 4.9: Effect of 100 µM 9-cp-ade vs Control upon Evoked [Ca2+]i Levels
(A) 100 µM 9-cp-ade did not significantly change [Ca2+]i levels when stimulated with
4AP5C (p=0.649), (B) HK5C (p=0.271) or (C) ION5C (p=0.289), compared to drug-free
controls. Values represented are the mean plus S.E.M. from 3 independent
experiments.
165
4.4.2 The Effect of AC Activation on Evoked Changes in [Ca2+]i
As the inhibition of AC caused no significant change to [Ca2+]i, the activation of AC with
forskolin was investigated. The activation of AC increased the intracellular cAMP level,
which blocked release of the RP via activation of EPACs, when stimulated with HK5C or
ION5C (Figure 4.2 B and C). Furthermore, the activation of AC caused most RRP SVs
stimulated by 4AP5C to exocytosis by a KR mode (Figure 4.6 A). Previous research by A.
Ashton’s group (Ashton, manuscript in preparation), and others (Alés, et al., 1999),
have demonstrated that increases in levels of [Ca2+]i can switch more SVs to undergo
exocytosis via KR (see Section 1.9.4; Figure 1.11). Thus, an investigation was carried
out to determine whether the action of forskolin may be due to changes in evoked
[Ca2+]i.
Synaptosomes treated with 100 µM forskolin exhibited a significant increase in 4AP5C
evoked [Ca2+]i levels (Figure 4.10 A; [Ca2+]i: CON 160.07 ± 14.58 (nM), forskolin 222.96 ±
21.56, p>0.05, final time point), whilst HK5C evoked [Ca2+]i levels decreased
significantly (Figure 4.10 B; [Ca2+]i: CON 465.36 ± 34.20 (nM), forskolin 368.38 ± 19.83,
p>0.05, final time point). The 4AP5C data would suggest that AC activation and rising
cAMP levels increased the level of [Ca2+]i, causing RRP SVs to switch to a KR mode of
exocytosis. Research by Ashton and colleges, has determined that the release of the RP
requires a sufficient increase in the average [Ca2+]i throughout the terminal, and this
explains why in control conditions 4AP5C fails to stimulate release of the RP; as it does
not produce as significant a [Ca2+]i increase as HK5C or ION5C (Figure 1.8). The slight
increase in the 4AP5C evoked [Ca2+]i is still not sufficient to induce RP SVs to exocytose;
however, forskolin inhibiting release of the RP (Figure 4.6), could be explained by the

166
average amount of HK5C evoked [Ca2+]i change within the terminals being insufficient
to induce the mobilisation and fusion of the RP, with this drug (Figure 4.10 B).

167
Figure 4.10: Effect of 100 µM Forskolin vs Control upon Evoked [Ca2+]i Levels
(A) 100 µM forskolin significantly increased [Ca2+]i levels when stimulated with 4AP5C
(p<0.001), (B) but significantly decreased [Ca2+]i levels when stimulated with HK5C
(P<0.001). Values represented are the mean plus S.E.M. from 4 independent
experiments.
168
4.4.3 The Effect of EPAC Inhibition upon Evoked Changes in [Ca2+]i
AC activation with forskolin decreased the HK5C evoked level of [Ca2+]i within the
terminals (Figure 4.10 B), and blocked release of SVs from the RP (Figure 4.2 B). When
EPACs were inhibited with ESI-09 and AC was activated with forskolin, RP SV release
was restored for HK5C stimulation (Figure 4.4 B). The inhibition of EPACs may restore
RP release by increasing the level of [Ca2+]i, thus it is important to establish what
effects inhibition of EPACs had upon evoked changes in [Ca2+]i levels.
Synaptosomes treated with 100 µM ESI-09 exhibited a significant increase in evoked
[Ca2+]i levels when stimulated with 4AP5C (Figure 4.11 A; [Ca2+]i: CON 209.72 ± 24.84
(nM), ESI-09 307.70 ± 31.73, p<0.05, final time point) and HK5C (Figure 4.11 B; [Ca2+]i:
CON 378.26 ± 28.09 (nM), ESI-09 643.52 ± 47.22, p<0.001, final time point), compared
to non-drug treated controls. As the inhibition of EPACs is able to increase in [Ca2+]i
level significantly, this may explain how ESI-09 pre-treatment followed by forskolin is
able to restore RP release.
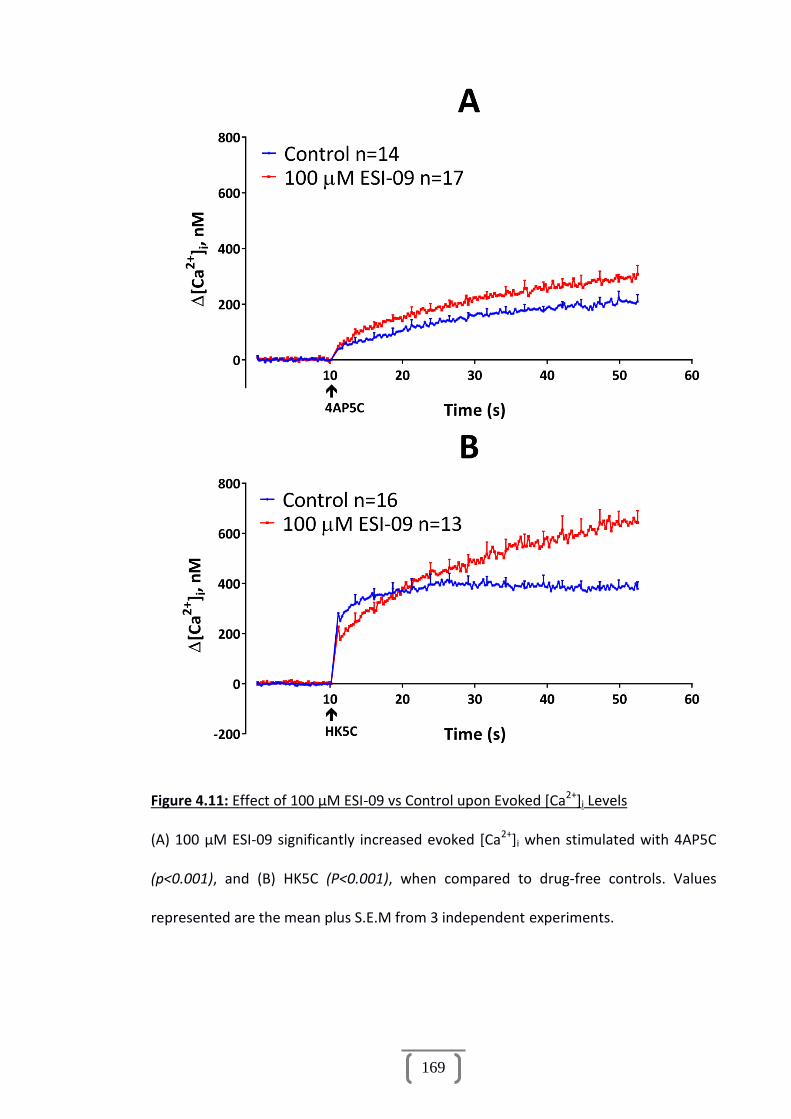
169
Figure 4.11: Effect of 100 µM ESI-09 vs Control upon Evoked [Ca2+]i Levels
(A) 100 µM ESI-09 significantly increased evoked [Ca2+]i when stimulated with 4AP5C
(p<0.001), and (B) HK5C (P<0.001), when compared to drug-free controls. Values
represented are the mean plus S.E.M from 3 independent experiments.

170
To determine if forskolin was working to decrease HK5C evoked [Ca2+]i levels through
EPACs activation, synaptosomes were pre-treated with 100 µM ESI-09 (to inhibit
EPACs) then 100 µM forskolin. These treated synaptosomes exhibited a significant
increase in the level of 4AP5C evoked [Ca2+]i (Figure 4.12 A; [Ca2+]i: CON 206.02 ± 22.34
(nM), ESI-09 plus forskolin 543.58 ± 37.18, p<0.001, final time point), and HK5C evoked
[Ca2+]i (Figure 4.12 B; [Ca2+]i: CON 384.97 ± 20.15 (nM), ESI-09 plus forskolin 704.22 ±
42.07, p<0.001, final time point). This demonstrates that inhibition of EPACs reverses
the action of forskolin to inhibit the release of the RP by raising the evoked changes in
[Ca2+]i levels within the terminals.

171
Figure 4.12: Effect of 100 µM ESI-09 plus 100 µM Forskolin upon Evoked [Ca2+]i Levels
(A) 100 µM ESI-09 plus 100 µM forskolin significantly increased evoked [Ca2+]i when
stimulated with 4AP5C (p<0.001), (B) and HK5C (p<0.001), compared to controls.
Values represented are the mean plus S.E.M from 3 independent experiments.

172
4.5 The Effect of the Regulation of AC on Nerve Terminal Bioenergetics
4.5.1 The Effect of AC Inhibition on Nerve Terminal Bioenergetics
Potentially changes in Glu release, mode of exocytosis and [Ca2+]i levels (or the lack of),
may be mediated by the synaptosomes being non-specifically perturbed by the drug
treatments. Synaptosomes treated with 100 µM 9-cp-ade were subjected to the
bioenergetics Mito-Stress test to determine if they were still metabolically viable after
90-min at 37˚C. No significant difference in bioenergetics was observed between
terminals treated with 100 µM 9-cp-ade or controls (Figure 4.13) and furthermore, this
treatment did not have any significant effects upon the 6 aspects of mitochondrial
function (Figure 4.14 A-F).

173
Figure 4.13: Effect of 100 µM 9-cp-ade upon Synaptosomal Bioenergetics
A treatment of 100 µM 9-cp-ade did not significantly affect the bioenergetics of
synaptosomes during a Mito-Stress test (p=0.920). Values represented are the means
plus S.E.M. from 3 independent experiments. Experiment performed at 37˚C in the
Seahorse Xfp flux analyser.

174
Figure 4.14: Effect of 100 µM 9-cp-ade upon Mitochondrial Function
(A) Synaptosomes treated with 100 µM 9-cp-ade exhibited no significant change in
basal respiration over the first 15 min, (B) ATP production at 20-35 min, (C) maximal
respiration at 40-55 min, (D) spare capacity at 40-55 min, (E) proton leakage at 20-35
min, (F) or non-mitochondrial oxygen consumption compared to control synaptosomes
(all conditions, p>0.05). Values represented are the mean plus S.E.M. from 3
independent experiments. NS, not significant.
4.5.2 The Effect of AC Activation on Nerve Terminal Bioenergetics
Synaptosomes treated with 100 µM forskolin were subjected to the bioenergetics
Mito-Stress test, and displayed no significant changes in metabolic viability, when
compared with untreated controls (Figure 4.15). Such treatment also did not affect the
6 aspects of mitochondrial function measured during a Mito-Stress test (Figure 4.16 A-
F).
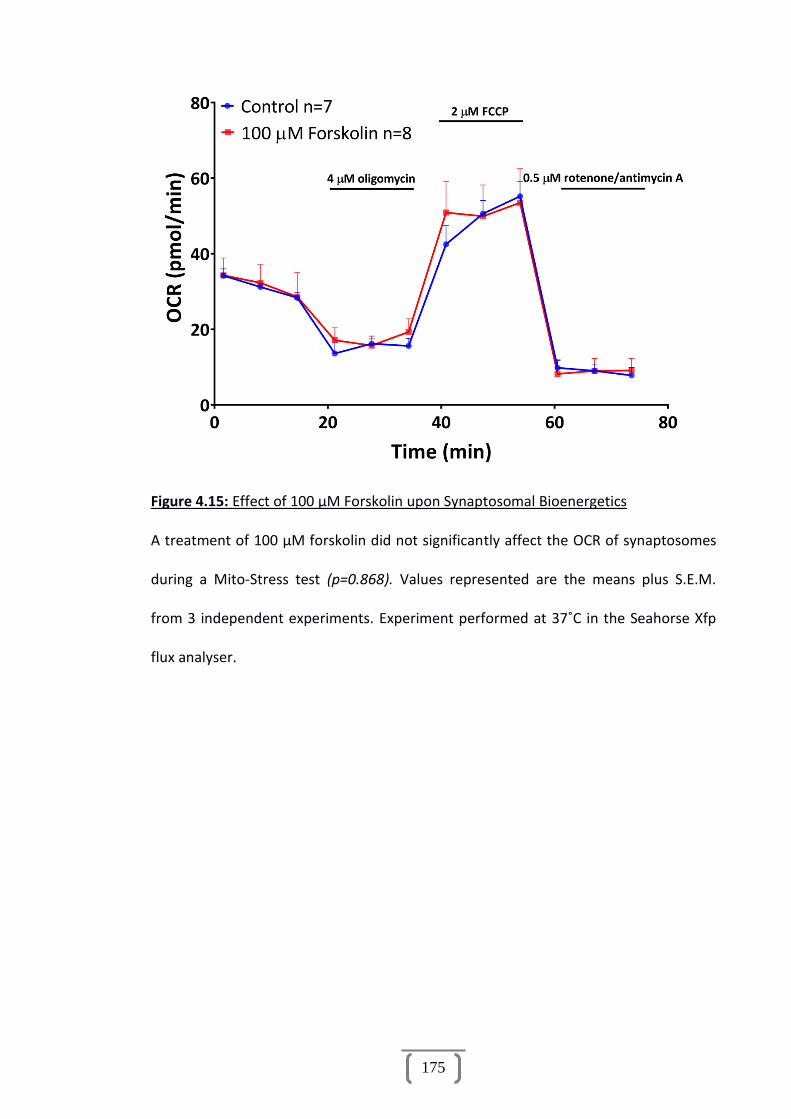
175
Figure 4.15: Effect of 100 µM Forskolin upon Synaptosomal Bioenergetics
A treatment of 100 µM forskolin did not significantly affect the OCR of synaptosomes
during a Mito-Stress test (p=0.868). Values represented are the means plus S.E.M.
from 3 independent experiments. Experiment performed at 37˚C in the Seahorse Xfp
flux analyser.

176
Figure 4.16: Effect of 100 µM Forskolin upon Mitochondrial Function
(A)Synaptosomes treated with 100 µM forskolin exhibited no significant change in
basal respiration at 0-15 min, (B) ATP production at 20-35 min, (C) maximal respiration
at 40-55 min, (D) spare capacity at 40-55 min, (E) proton leakage at 20-35 min, (F) or
non-mitochondrial oxygen consumption at 60-75 min, compared to controls (all
conditions, p>0.05). Values represented are the mean plus S.E.M. from 3 independent
experiments. NS, not significant.

177
Figure 4.13 and Figure 4.15 demonstrate that the OCR of synaptosomes was not
affected by treatment with either 9-cp-ade or forskolin respectively, over 80 min at
37˚C. This suggests that the integrity of the synaptosomes would not be perturbed
during the acute treatments used in the other assays (≤ 5-min); any changes to Glu
release, FM 2-10 dye release or [Ca2+]i reflect specific action of the drugs upon their
targets and not non-specific action within the synaptosomes. Both Figure 4.14 and
Figure 4.16 determine that 9-cp-ade and forskolin respectively have no significant
effect upon any aspect of mitochondrial function or responses that were measured
and do not impact synaptosomal activity.
4.5.3 The Effect of EPACs Inhibition on Nerve Terminal Bioenergetics
Blocking EPACs with ESI-09 does not perturb Glu release (Figure 4.4 A), but is able to
prevent forskolin from blocking the release of RP SVs by increasing the level of [Ca2+]i
(Figure 4.11 B). Treatment with ESI-09 could raise the [Ca2+]i level through the
perturbation of the synaptosomes, thus terminals treated with 100 µM ESI-09 were
subjected to the bioenergetics Mito-Stress test. No significant difference in the viability
of synaptosomes was observed when compared to controls (Figure 4.17). Treatment
with 100 µM ESI-09 did not significantly affect several aspect of mitochondrial function
(Figure 4.18 A-D and F), but did significantly increase proton leakage (Figure 4.18 E),
when compared to controls.

178
Figure 4.17: Effect of 100 µM ESI-09 upon Synaptosomal Bioenergetics
A treatment of 100 µM ESI-09 had no significant effect upon the OCR of synaptosomes
during a Mito-stress test (p=0.672). Values represented are the mean plus S.E.M. from
3 independent experiments. Experiment performed at 37˚C in the Seahorse Xfp flux
analyser.

179
Figure 4.18: Effect of 100 µM ESI-09 upon Mitochondrial Function
(A)100 µM ESI-09 had no significant affect upon basal respiration over the first 15 min,
(B) ATP production at 20-35 min, (C) maximal respiration at 40-55 min, (D) spare
capacity at 40-55 min, (F) and non-mitochondrial oxygen consumption at 60-75 min,
compared to controls (p<0.05), (E) but did increase proton leakage at 20-35 min
(p>0.05). Values represented are the mean plus S.E.M. from 3 independent
experiments. *, p < 0.05; NS, not significant.
180
Figure 4.17 demonstrates that EPACs inhibition via 100 µM ESI-09 had no significant
effect upon the bioenergetics of synaptosomes during a Mito-Stress test at 37˚C for
90-min, suggesting that an acute drug treatment (≤ 5-min), as used in the other assays,
would not disrupt the synaptosomes integrity by producing non-specific affects upon
the measurements taken. Figure 4.18 shows the ESI-09 did not perturb any of the 6
aspects of mitochondrial function, over the 90-min assay apart from the proton
leakage. The relevance of this is not understood, however, part of the apparent larger
proton leakage is due to the higher basal respiration (Figure 4.17), which although is
statistically not significant means that following treatment with oligomycin there is
higher oxygen consumption in ESI-09 treated terminals. Whilst following
rotenone/antimycin A treatment there is similar oxygen consumption, so the
difference between these parameters – which is the measure of proton leakage – can
explain this.

181
4.6 Discussion
As discussed in Chapter 3, PKA is able to switch the mode of exocytosis differently for
each SV pool, and this could be through the phospho-regulation of Dyn-I activity. PKA
is specifically activated by the binding of cAMP which is synthesised by AC (Walsh, et
al., 1968). This chapter investigated the role AC and cAMP play in the regulation of the
modes of Glu release in synaptosomes.
cAMP is well known to regulate Ca2+-triggered exocytosis, by modifying the molecular
machinery (Chen and Regehr, 1997), and in neurons cAMP has been shown to increase
NT release and has been implicated in LTP (Huang, et al., 1995; Weisskopf, et al.,
1994), which is important for synaptic plasticity. However, this may simply be through
the activation of PKA. As discussed in Chapter 3, increases to PKA can enhance NT
release, unless NT release is at maximal. Other research on increasing cAMP levels
however, has demonstrated a disruption to vesicular mobility (Petrov, et al., 2008),
and this could be through the activation of both PKA and EPACs (Dao, et al., 2006;
Grandoch, et al., 2010). Since the discovery of EPACs (de Rooij, et al., 1998), many PKA-
independent cAMP effects have been shown to be the result of EPACs activation
(Beaumont, et al., 2002).
AC was inhibited with 9-cp-ade and activated with forskolin and EPACs were inhibited
with ESI-09 to determine how these treatments would affect the release of Glu, the
modes of exocytosis for distinct SV pools, and the levels of [Ca2+]i.

182
4.6.1 Evoked Glu Release
Inhibition of AC does not regulate the release of Glu from synaptosomes. Glu was
released at control levels from the RRP when treated with 9-cp-ade and stimulated
with 4AP5C (Figure 4.1 A). Treatment with 9-cp-ade did not disrupt Glu release from
the RP when stimulated with HK5C (Figure 4.1 B) or ION5C (Figure 4.1 C). These data
demonstrate that the same number of SVs were undergoing release in both drug and
non-drug treated synaptosomes during stimulation, as discussed in Chapter 3. As no
SVs are recycling and only one round of release is being studied (Section 1.9.2), the
inhibition of AC and the decrease in cAMP concentration does not have a role
regulating the release of SV pools from synaptosomes, when these are stimulated to
evoked maximal release of either pool.
Activation of AC blocks the exocytosis of RP SVs. Glu was released at control levels
from the RRP in synaptosomes treated with forskolin and stimulated with 4AP5C
(Figure 4.2 A), indicating all RRP SVs were released. However, synaptosomes treated
with forskolin exhibited a loss of Glu release when stimulated with HK5C (Figure 4.2 B),
or ION5C (Figure 4.2 C). Intriguingly this loss was specifically from the RP as RRP
release was not perturbed with 4AP5C stimulation (Figure 4.2 A).
If Forskolin treatment were blocking the release of all SVs when stimulating with HK5C
or ION5C no observed Glu release would be seen for these stimuli, which is not the
case (Figure 4.2 B and C). As the RRP is not perturbed by forskolin, its action specifically
blocks RP SV release by increasing intracellular levels of cAMP.

183
Petrov and colleagues who utilised cAMP analogues to activate cAMP-dependent
proteins reported a similar disruption to SV mobility and NT release (Petrov, et al.,
2008). They theorised that activation of cAMP-dependent proteins disrupted the
transport of vesicles from a pool termed ‘the mobilisation pool’ (which is equivalent to
the RP discussed in this thesis). Thus, the increase in intracellular cAMP levels activates
cAMP-dependent proteins which prevent the release of RP SVs.
Forskolin was specifically working on AC as both 100 µM of the inactive homologue
1,9-did-forsk, and 100 µM 9-cp-ade pre-treatment before 100 µM forskolin,
demonstrated Glu release at levels identical to untreated controls (Figure 4.3 A-C). As
no loss in Glu release was seen for PKA activation with cBIMPS in Chapter 3 (Figure
3.2), the loss of Glu release from the RP seen when cAMP are raised by AC activation,
could be mediated by the activation of EPACs, or a change in [Ca2+]i.
The specific inhibitor of EPACs, ESI-09, did not significantly perturb HK5C evoked Glu
release (Figure 4.4 A), and 100 µM ESI-09 pre-treatment plus 100 µM forskolin
restored Glu release to control levels (Figure 4.4 B). Thus the activation of EPACs,
specifically by increasing cAMP levels, is able to block release of the RP of SVs.
Though the inhibition of AC and the presumed lowering of intracellular cAMP levels
does not regulate the release dynamics of SV pools, the activation of AC, and the
increase in cAMP can block the release of RP SVs specifically through the activation of
EPACs. As EPACs have been shown to activate Rap1 and Rap2 (de Rooij, et al., 1998;
Kawasaki, et al., 1998), it could be downstream targets of Rap1 and Rap2 play a direct
role in the mobilisation of SVs from the RP during stimulation. Indeed Rap proteins

184
have been implicated in synaptic long-term depression (LTD) (Zhu, et al., 2002), the
inhibition of transmission at glutamatergic synapses (Imamura, et al., 2003), at the frog
neuromuscular junction (Petrov, et al., 2008), and the indirect disruption of the actin
cytoskeleton (Taira, et al., 2004).
Considering cAMP is a vital secondary messenger, the activation of AC may produce a
high enough cAMP concentration to saturate PKA (which binds cAMP in the range of
5.0-24.6 nM) and activate EPACs, this may suggest that EPACs have a lower cAMP
sensitivity than PKA, allowing for activation either individually or cooperatively (Seino
and Shibasaki, 2005; Dao, et al., 2006).
4.6.2 Evoked FM 2-10 Dye Release
AC inhibition does not regulate the mode of SV exocytosis in synaptosomes. FM 2-10
was released at control levels from the RRP when stimulated with 4AP5C (Figure 4.5
A), and from the RRP and RP when stimulated with HK5C (Figure 4.5 B) and ION5C
(Figure 4.5 C). These data highlight that lowering the intracellular cAMP level does not
play a role in switching the mode of release for SVs from either the RRP or the RP.
AC activation does regulate the mode of SV exocytosis, for the RRP. As the RP did not
undergo exocytosis during forskolin treatment (Figure 4.2), only the mode of the RRP
could be determined. Treatment with 100 µM forskolin led to a significant decrease in
FM 2-10 dye release when stimulated with 4AP5C (Figure 4.6 A), indicating SVs which
release via FF in control conditions had been switched to a KR mode of exocytosis. This
mode switch was significantly reduced when synaptosomes were pre-treated with 100
µM 9-cp-ade (to inhibit AC) before 100 µM forskolin, which restored FM 2-10 dye

185
release to control levels (Figure 4.6 B). Thus, forskolin is activating AC and increasing
cAMP levels to switch the mode of RRP SVs to KR, and blocking AC can reverse this
effect.
However it was not clear if the RRP mode of release was being regulated by EPACs or
PKA. As inhibition of PKA with KT5720 produces a majority FF mode of exocytosis when
stimulated with 4AP5C (Figure 3.5 A), it was theorised that forskolin may work to
switch the RRP mode by activating PKA via increased cAMP levels. Thus, synaptosomes
were pre-treated with 2 µM KT5720 (to inhibit PKA) plus 100 µM forskolin and FM 2-10
dye release was studied with 4AP5C stimulation (Figure 4.7). A significant increase in
FM 2-10 dye release was seen, indicating a switch to a FF mode of exocytosis (Figure
4.7). This highlights that the mode of the RRP is regulated specifically by PKA activity.
Interestingly, the activation of PKA with cBIMPS had no effect upon the RRP mode of
exocytosis (Figure 3.6). This may reveal that a combination of both PKA and EPACs
activation is required in order for the mode of the RRP to be switched to a KR majority.
The activation of EPACs was beyond the scope of this research, so how this impacts the
modes of release for both SV pools would be an interesting experiment to study in the
future.
Treatment with OA is also able to switch RRP SVs to undergo a predominantly FF mode
of exocytosis (Figure 4.8 A). OA inhibits PP2A and PP1 to a lesser extent, dramatically
increasing the phosphorylated state of numerous proteins (Bialojan and Takai, 1988;
Fernández, et al., 2002), which prevents KR mediated exocytosis (Ashton, 2009). In
order to see if OA stops the action of forskolin on the RRP, synaptosomes were treated
with 0.8 µM OA plus 100 µM forskolin. Significantly less FM 2-10 dye release was seen

186
for this treatment when stimulated with 4AP5C (Figure 4.8 B), which was similar to the
action of forskolin alone (Figure 4.6 A), indicating the action of forskolin is still able to
switch RRP to KR despite treatment with OA. As KT5720 blocked the effects of
forskolin, but OA didn’t, this may mean that either forskolin and OA work on different
substrates, or forskolin is able to act downstream of the action of OA.
4.6.3 Evoked [Ca2+]i Levels
It was possible that treatment with 9-cp-ade could be affecting evoked [Ca2+]i levels,
without reaching levels sufficient enough to affect Glu or FM 2-10 dye release;
however, treating synaptosomes with 100 µM 9-cp-ade had no significant effect upon
[Ca2+]i levels evoked by any stimuli (Figure 4.9). This could indicate that the inhibition
of AC and the drop in cAMP levels do not play a direct role in regulating evoked [Ca2+]i
levels.
Considering that 9-cp-ade has not had any significant effect upon Glu release, FM 2-10
dye release or evoked [Ca2+]i levels, it was possible that the drug is not actually
inhibiting AC at all (perhaps the drug employed was defective). However, 9-cp-ade
treatment is able to restore Glu release to control levels when used as a dual
treatment with forskolin (Figure 4.3 B and C), indicating it does indeed inhibit AC.
Activation of AC had a significant impact upon evoked [Ca2+]i levels. Synaptosomes
treated with 100 µM forskolin and stimulated with 4AP5C released Glu at controls
levels from the RRP (Figure 4.2 A), but there was a switch in the mode of exocytosis to
KR (Figure 4.6 A) (p<0.05). As previously mentioned a switch to the KR mode of release
can be mediated by an increase in evoked [Ca2+]i levels (Alés, et al., 1999; Ashton,
187
2009); and in fact there was a significant increase in evoked [Ca2+]i levels when
synaptosomes were treated with 100 µM forskolin and stimulated with 4AP5C (Figure
4.10). This is good evidence that forskolin may be able to switch the mode of
exocytosis of some RRP SVs from FF to KR by inducing an increase in evoked [Ca2+]i.
This explains why no similar switch in mode was seen when PKA was activated directly
with cBIMPS (Figure 3.6 A), as cBIMPS did not affect [Ca2+]i levels.
However, activation of AC with forskolin and stimulation with HK5C prevented RP SVs
from undergoing exocytosis (Figure 4.2 B). Ashton has previously demonstrated that
4AP5C evokes a lower average [Ca2+]i level than HK5C in nerve terminals and that is
why 4AP5C cannot stimulate the RP to release (Section 1.9.1; Figure 1.8). Therefore it
was possible that forskolin may be blocking release of the RP by reducing the [Ca2+]i
level during HK5C stimulation. Synaptosomes treated with 100 µM forskolin exhibited
significantly less evoked [Ca2+]i when stimulated with HK5C, compared to untreated
synaptosomes (Figure 4.10 B). Therefore forskolin may block the release of the RP
through the reduction in average [Ca2+]i levels, note that with HK5C there is an initial
large increase in [Ca2+]i at the AZ which drives the fusion of RRP SVs; but as this Ca2+
diffuses within the terminal there is a sufficient build-up of Ca2+ away from the AZ to
drive fusion and release of RP SVs. If this level of [Ca2+]i is lowered then RP SVs will not
exocytose. Forskolin increases cAMP levels within the terminal which works to reduce
the evoked [Ca2+]i level below a minimum threshold which the RP needs to release. As
cAMP has two targets, PKA and cBIMPS, and the stimulation of PKA did not perturb Glu
release (Figure 3.2) then cAMP must be activating EPACs to block the release of the RP.
188
Inhibition of EPACs with 100 µM ESI-09 did not affect Glu release when stimulated with
HK5C (Figure 4.4 A), but did block the action of forskolin (which blocked RP release)
when used in a dual treatment, restoring Glu release to controls levels (Figure 4.4 B).
As discussed in the last paragraph forskolin blocks RP release by reducing evoked
[Ca2+]i levels through the activation of EPACs. Thus, it is possible that blocking EPACs
would lead to an increase in evoked [Ca2+]i levels, especially if ESI-09 treatment can
restore RP Glu release. Synaptosomes treated with 100 µM ESI-09 exhibited a
significant increase in evoked [Ca2+]i levels when stimulated with both 4AP5C (Figure
4.11 A) and HK5C (Figure 4.11 B). Blocking EPACs does lead to a substantial increase in
HK5C evoked [Ca2+]i which is also observed when synaptosomes are treated with ESI-
09 plus forskolin (Figure 4.12). Inhibition of EPACs can prevent forskolin blocking RP
release, through an increase in evoked [Ca2+]i, which reaches the sensitivity threshold
for the RP SVs.
Together these data highlight how changes in evoked [Ca2+]i levels can discretely
regulate both the mode of SVs release for individual pools, and the availability of
whole pools to release.

189
4.6.4 Bioenergetics of Synaptosomes
To ensure distinct changes to mode of release and regulation of SV pools undergoing
exocytosis were due to targeted drug action and not the perturbation of
synaptosomes, treated samples were subjected to the bioenergetics Mito-Stress test.
As discussed in Chapter 3, the test measures 6 aspects of mitochondrial respiration to
determine if drug treatments are causing respiratory or functional stress to
mitochondria.
Synaptosomes treated with 100 µM 9-cp-ade, 100 µM forskolin or 100 µM ESI-09 for
90-min at 37˚C displayed the same OCR, viability and mitochondrial function as
untreated synaptosomes. 9-cp-ade and forskolin were able to regulate AC without
significantly affect basal respiration, ATP production, maximal respiration, spare
capacity, proton leakage, or non-mitochondrial respiration (Figures 4.14 and 4.16 A-F).
Treatment with ESI-09 also did not affect the majority of mitochondrial functions, but
did significantly increase proton leakage. Proton leakage is basal respiration that is not
linked to ATP production, and excessive amounts could be a sign of mitochondrial
damage (Agilent Technologies, 2019). As no other effect was observed with this
treatment, the significance of this is not understood and it may be because of some of
the measurement values (see results section). Further repeats with this treatment
could aid understanding if this is a result of long-term treatment and what is occurring.
These data demonstrate the specific actions observed with these drugs are not non-
specific effects or the perturbation of the synaptosomes.

190
4.7 Conclusion
All this data highlight that increased cAMP levels inhibits the release of the RP of SVs
through the activation of EPACs, which reduces the evoked [Ca2+]i level, without
perturbing the bioenergetics of the terminals. Elevation of cAMP levels can also switch
the RRP mode of exocytosis to a KR majority through raising [Ca2+]i via EPACs.
Therefore, AC can regulate the RRP and RP independently of one another by
modulating Ca2+ levels within the terminals. This allows a great deal of plasticity in the
synapse.
The inhibition of AC did not have any significant effect upon Glu or FM 2-10 dye
release, and neither did it perturb the viability of the synaptosomes or affect the [Ca2+]i
levels. However, inhibition of AC was able to prevent the action of forskolin when used
in dual treatments. However, it may be that an incubation time of 5-10-min was not
sufficient to inhibit all AC present in the synaptosomes or is unable to block all AC
subtypes, allowing a small amount of cAMP to be produced and regulate PKA and
EPACs in a reduced way. In concurrence with this, it has been demonstrated that 9-cp-
ade does not inhibit AC type II when purified from rat and bovine brains and tested in
vitro (Johnson, et al., 1997). However, this did not create a significant effect upon FM
2-10 dye release, or play a role in the modulation of mode of exocytosis.

191
Chapter 5:
Studies of Dyn-I Phosphorylation during
Exocytosis

192
5.1 Introduction
Chapters 3 of this thesis established conditions where PKA inhibition increased SVs
undergoing FF (Figure 3.5), and PKA activation enhanced the KR mode of exocytosis
(Figure 3.6). These changes in mode were independent from changes to evoked [Ca2+]i
levels, which have previously been shown to regulate the mode of exocytosis (Alés,
1999; Ashton, 2009; Section 1.9.1). Such mode changes could be mediated by a
membrane bound fraction of Dyn-I, which the inhibition of has previously been shown
to regulate exocytosis (Figure 1.13). Chapter 4 established how cAMP levels regulated
PKA activity and mediated blocking of RP release probably via activation of EPACs,
whilst a mode switch to KR for the RRP was mediated by an increase in [Ca2+]i.
As discussed in Chapter 1, Dyn-I is well established to mediate certain forms of
endocytosis via membrane fission (Herskovits, 1993; van der Bliek, 1993; Artalejo,
1995; Urrutia, 1997), but has also been implicated in FP regulation during vesicular
exocytosis (Min, et al., 2007; Fulop, et al., 2008; Chan, et al., 2010), which fits well with
an enrichment of Dyn-I found at the AZ (Wahl, et al., 2013). This role in exocytosis has
been proven in chromaffin cells where dense-core vesicles are able to undergo KR by
rapidly shutting the FP after fusion (Albillos, et al., 1997; Alés, et al., 1999); and active
Dyn-I has been found to facilitate the closure of the FP during this form of KR (Chan, et
al., 2010; Anantharam, et al., 2011; Samaslip, et al., 2012; Trouillon and Ewing, 2013).
Evidence from FM dye studies has also suggested KR occurs in neurons (Stevens and
Williams, 2000). Studies have shown the involvement of Dyn-I in neuronal exocytosis
(Zhang, et al., 2007; Alabi and Tsien, 2013; Roman-Vendrell, et al., 2014) and recently
Bhuva demonstrated that Dyn-I can regulate the exocytosing FP in order to mediate KR
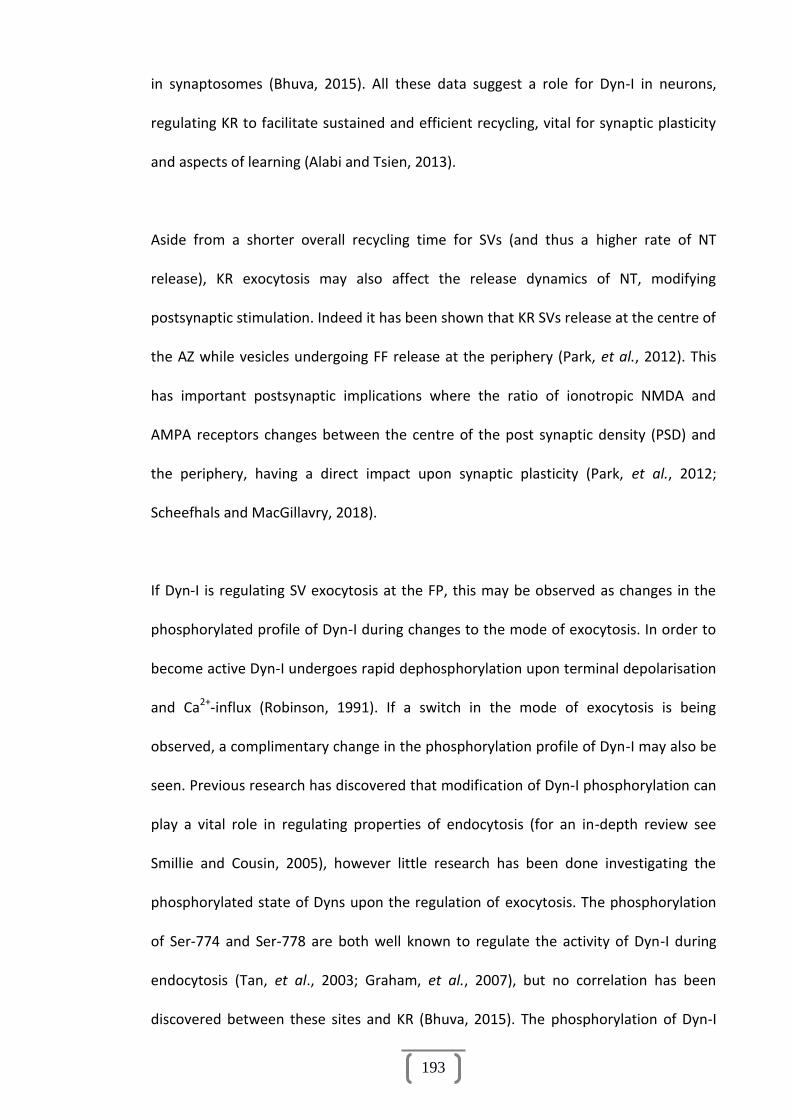
193
in synaptosomes (Bhuva, 2015). All these data suggest a role for Dyn-I in neurons,
regulating KR to facilitate sustained and efficient recycling, vital for synaptic plasticity
and aspects of learning (Alabi and Tsien, 2013).
Aside from a shorter overall recycling time for SVs (and thus a higher rate of NT
release), KR exocytosis may also affect the release dynamics of NT, modifying
postsynaptic stimulation. Indeed it has been shown that KR SVs release at the centre of
the AZ while vesicles undergoing FF release at the periphery (Park, et al., 2012). This
has important postsynaptic implications where the ratio of ionotropic NMDA and
AMPA receptors changes between the centre of the post synaptic density (PSD) and
the periphery, having a direct impact upon synaptic plasticity (Park, et al., 2012;
Scheefhals and MacGillavry, 2018).
If Dyn-I is regulating SV exocytosis at the FP, this may be observed as changes in the
phosphorylated profile of Dyn-I during changes to the mode of exocytosis. In order to
become active Dyn-I undergoes rapid dephosphorylation upon terminal depolarisation
and Ca2+-influx (Robinson, 1991). If a switch in the mode of exocytosis is being
observed, a complimentary change in the phosphorylation profile of Dyn-I may also be
seen. Previous research has discovered that modification of Dyn-I phosphorylation can
play a vital role in regulating properties of endocytosis (for an in-depth review see
Smillie and Cousin, 2005), however little research has been done investigating the
phosphorylated state of Dyns upon the regulation of exocytosis. The phosphorylation
of Ser-774 and Ser-778 are both well known to regulate the activity of Dyn-I during
endocytosis (Tan, et al., 2003; Graham, et al., 2007), but no correlation has been
discovered between these sites and KR (Bhuva, 2015). The phosphorylation of Dyn-I

194
Ser-795 has been shown to block the association between Dyn-I and phospholipids in
vitro (Powell, et al., 2000), and recently Ser-795 has been shown as a genuine in vivo
site highly phosphorylated during FF (Bhuva, 2015; Singh 2017), making it a prime
candidate to study during exocytosis.
It is theorised that in order for Dyn-I to be active at the FP during KR exocytosis, it must
be dephosphorylated at Ser-795, while being phosphorylated during a FF mode of
exocytosis. Research presented in Chapter 1 has shown that Dyn-I inhibition leads to
the mode of exocytosis being switched to FF, for specific stimulation conditions (Figure
1.13 E and F), while PKA inhibition also leads to a FF mode of exocytosis for the same
conditions (Figure 3.5).
To determine if PKA and AC are switching the mode of exocytosis through the
phospho-regulation of Dyn-I activity, phosphorylation studies were performed for a
range of drug treatment conditions used in Chapters 3, while specifically investigating
the phosphorylated state of three Dyn-I Ser sites: 774, 778 and 795. Ser-774 and Ser-
778 are two well established in vivo sites in Dyn-I which have been shown to be
dephosphorylated by Ca2+-dependent Calcineurin which activated Dyn-I for particular
reactions. Whilst such sites are rephosphorylated by cyclin-dependent kinase 5 (Cdk5)
and glycogen synthase kinase 3 (GsK3) and this inactivates these actions of Dyn-I. Ser-
795 is a disputed in vivo site (Graham, et al., 2007), and this is because under basal
conditions this site could not be detected in intact animal tissue. However, as such
tissues were not prepared under various stimuli (as in this thesis), and Ser-795 may
only normally occur on a sub-pool of Dyn-I (as demonstrated in Chapter 3), the results
presented by Graham and colleagues could be explained.

195
It was established in vitro that phospho-Ser-795 prevents Dyn-I binding to
phospholipids when phosphorylated by PKC (Powell, et al., 2000), but this has only
been studied in a few papers, and PKC has recently appeared not to be the only
kinases that may act at this site since OA treatment revealed Ser-795 even when PKCs
were inhibited (Bhuva, 2015; Singh, 2017). Herein, it is argued that any significant
change in Ser-795 phosphorylation, for conditions where the mode switches, that is
not matched by equivalent changes to Ser-774 or Ser-778 are indicative of Ser-795
regulating the activity of Dyn-I on the FP.

196
5.2 Results
It was not possible to perform Western blots for all drug treatments studied in this
thesis. Therefore, results presented in this chapter should be treated as building blocks
for future phosphorylation studies. Samples were prepared for Western blotting in
three or more experiments, as described in Chapter 2, and PVDF membranes were
probed with antibodies specific to Dyn-I Ser-774, Ser-778, Ser-795 or pan-Dyn-I (4E67)
which detects all isoforms of Dyn-I present in the sample regardless of phosphorylated
state.
All Western blots were subjected to densitometric analysis as described in Chapter 2,
and S.E.M. depicting the average changes in phosphorylation relative to the respective
L0 condition, based on the number of experiments carried out. The effect of 4AP5C
stimulation upon Dyn-I phosphorylation was studied for the first time in this thesis.
4AP5C stimulation evokes release of the RRP only, via a mixture of KR and FF (Figure
1.11). As results from Chapter 3 have already demonstrated, Dyn-I is already
associated with docked SVs at the AZ, and could have a role in regulating the mode of
release. Therefore, it is important to establish how the phosphorylated profile of Dyn-I
may change under conditions where the mode of exocytosis is being switched.

197
5.2.1 Phosphorylation of Dyn-I Ser-795 in vivo
Previous research by Bhuva has shown that in control synaptosomes Dyn-I Ser-795
levels are consistently low regardless of stimulation or duration (Section 1.9.6; Figure
1.17 A), but synaptosomes treated with 0.8 μM OA (Figure 1.17 B) or 80 nM of the PKC
activator phorbol 12-myristate 13-acetate (PMA) (Figure 1.17 C) exhibit strong bands
of in vivo Ser-795 phosphorylation over 2-120 seconds (Bhuva, 2015, p. 151). The lack
of Ser-795 phosphorylation in control samples was explained as Ser-795 either
remaining dephosphorylated during this treatment or being dephosphorylated almost
immediately after phosphorylation, as pan-Dyn-I (4E67) revealed uniform levels in all
samples (Figure 1.17 D).
It has been speculated that the action of PMA to produce Ser-795 could be due to
broken terminals, where PKC and Dyn-I are present in the buffer ready to be
phosphorylated (Graham, et al., 2007). To ensure the synaptosomal model utlised in
this thesis used intact and functional nerve terminals, 40 nM or 1 µM of PMA was
added to synaptosomes in basal buffer (without stimulation) for four time periods
equal to the stimulation times studied in Western blot experiments; 2, 15, 30 and 120
sec at RT. Under such conditions PMA would not be able to activate PKC to
phosphorylated Ser-795 in intact nerve terminals (as it would need to cross the PM),
whilst strong bands of Ser-795 would be observed if the synaptosomes were broken
terminals.
When PMA is added to the basal buffer no Dyn-I Ser-795 phosphorylation is visualised
at any time point, or any concentration of PMA in 3 different experiments (Figure 5.1
A), but a uniform level of pan Dyn-I protein is detectable within the nerve terminals

198
(Figure 5.1 B). This gives good reason to assume previous studies revealing Dyn-I Ser-
795 (Bhuva, 2015; Singh, 2017), represent in vivo phospho-regulation of Dyn-I and not
a spurious result produced by PMA acting upon broken synaptosomes.
This data also validates the results obtained from assays in the previous chapters of
this thesis. The synaptosomes used with [Ca2+]i levels, Glu and FM dye release are
intact and studying the effect of acute drug treatments in this model represents real
effects on synaptosomes.
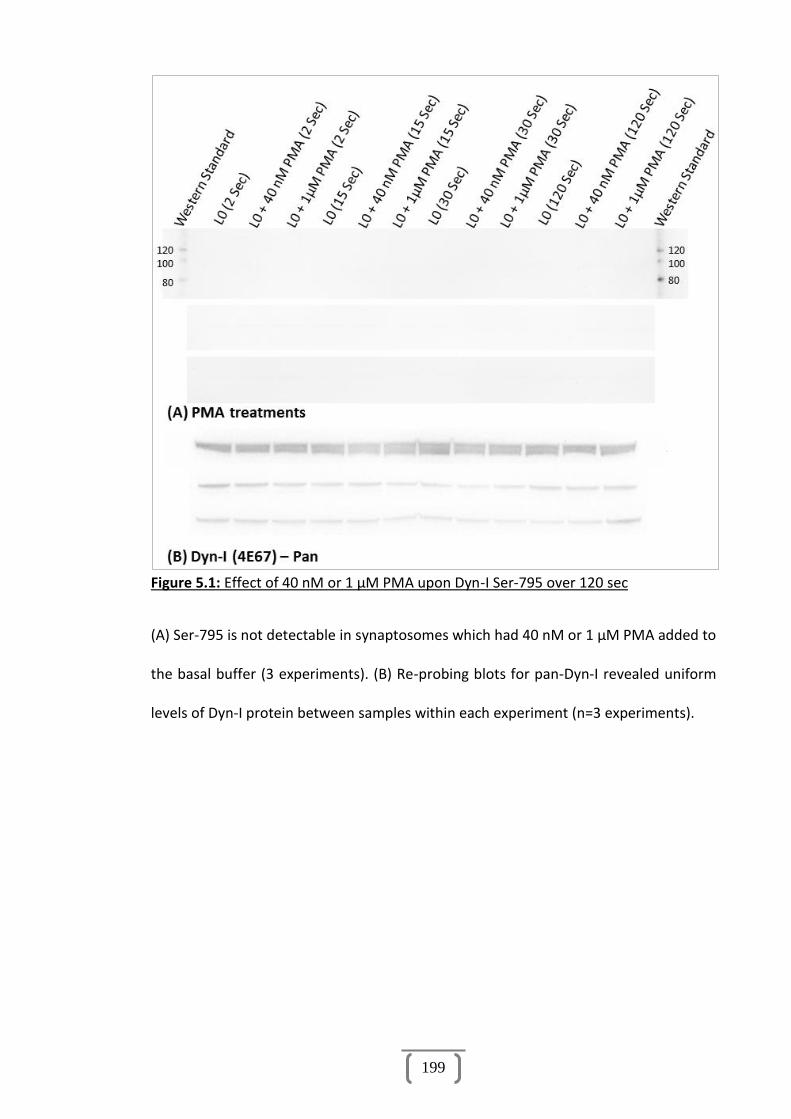
199
Figure 5.1: Effect of 40 nM or 1 µM PMA upon Dyn-I Ser-795 over 120 sec
(A) Ser-795 is not detectable in synaptosomes which had 40 nM or 1 µM PMA added to
the basal buffer (3 experiments). (B) Re-probing blots for pan-Dyn-I revealed uniform
levels of Dyn-I protein between samples within each experiment (n=3 experiments).

200
5.2.2 The Effect of 0.8 µM OA upon Dyn-I Phosphorylation in the RRP
The RRP of SVs is able to recycle independently of the RP (Ashton and Ushkaryov,
2005) and can release via FF or KR depending upon the stimulation paradigm (see
Section 1.9.4). The stimulation 4AP5C used in this thesis is able to reproducibly release
only the RRP of SVs from synaptosomes (Figure 1.7 C), and studying how the
phosphorylated profiles of proteins changes when subjected to this stimulation may
reveal if the RRP has unique regulatory mechanisms separate to those which govern
the RP.
The inhibition of protein phosphatase 1 and 2A (PP1 and PP2A) with 0.8 μM OA has
been shown to switch RRP SVs to a FF mode of exocytosis for all stimuli (Section 1.9,
Figure 1.11), and as demonstrated in Figure 1.17 OA treatment can increase the level
of Ser-795 phosphorylation relative to non-drug treated controls. This may suggest a
link between the phosphorylated state of Ser-795 and the mode of exocytosis, where
inhibition of PP1 or PP2A is able to regulate the mode of exocytosis by preventing the
dephosphorylation of Dyn-I Ser-795.
To investigate the effect of 0.8 μM OA upon the phosphorylated state of Dyn-I in more
detail, samples were treated with 0.8 µM OA and stimulated with 4AP5C for 2, 15, 30
and 120 seconds. Western blots were probed for all Ser sites of interest (Figure 5.2 and
Figure 5.3); all blots are representative of three experiments.
Detectable levels of Ser-795 are visible during control conditions for all time points
(Figures 5.2 and 5.3 A, lanes 1-2, 7-8), treatment with 0.8 µM OA appears to increase
Ser-795 levels for all time points (lanes 5-6, 11-12), but slight changes in pan-Dyn-I

201
levels (Figure 5.2 B) may explain some variation seen with Ser-795. No visible
difference is noted in Ser-774 or Ser-778 levels with 0.8 µM OA treatment (Figures 5.2
and 5.3, C and E), and levels of Dyn-I protein are uniform for these blots (Figures 5.2
and 5.3, D and F).
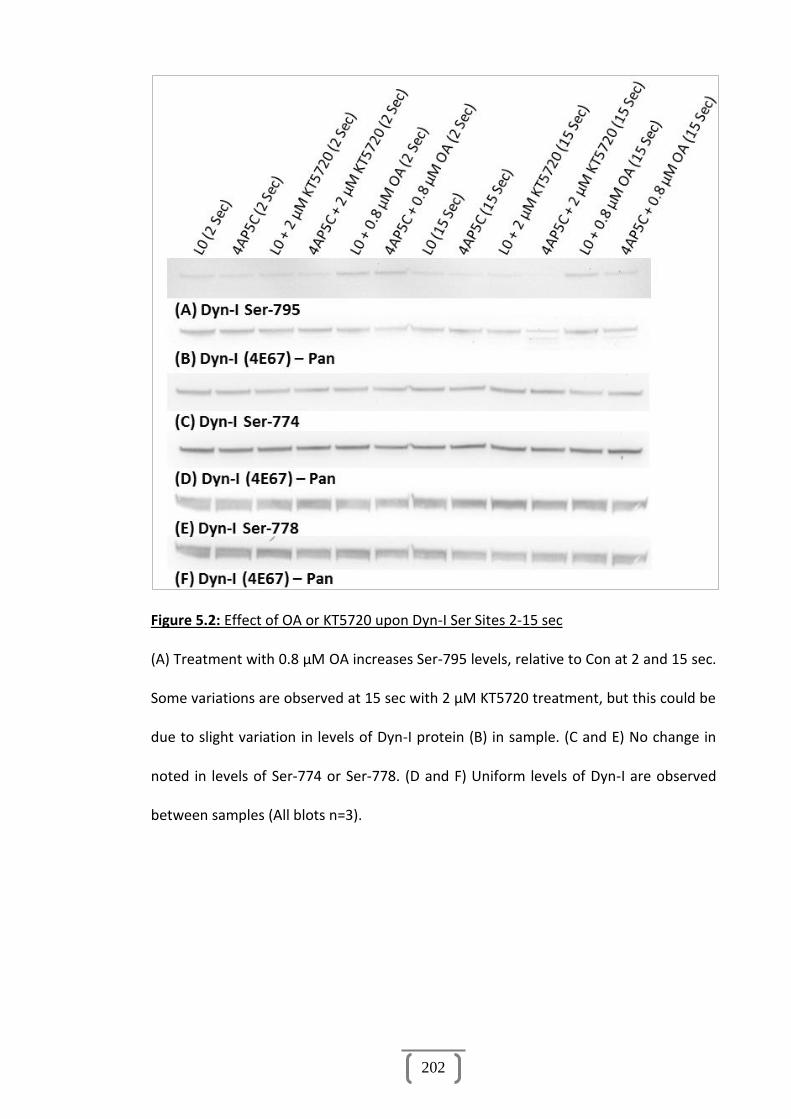
202
Figure 5.2: Effect of OA or KT5720 upon Dyn-I Ser Sites 2-15 sec
(A) Treatment with 0.8 µM OA increases Ser-795 levels, relative to Con at 2 and 15 sec.
Some variations are observed at 15 sec with 2 µM KT5720 treatment, but this could be
due to slight variation in levels of Dyn-I protein (B) in sample. (C and E) No change in
noted in levels of Ser-774 or Ser-778. (D and F) Uniform levels of Dyn-I are observed
between samples (All blots n=3).

203
Figure 5.3: Effect of OA or KT5720 upon Dyn-I Ser Sites 30-120 sec
(A) Treatment with 0.8 µM OA increase Ser-795 levels relative to control at 30 and 120
sec. (C) 4AP5C samples see a slight time-dependent decrease in Ser-774
phosphorylation not seen with basal samples. (B and D) Uniform levels of Dyn-I protein
are seen in samples. (E) Slight variations in Ser-778 levels may be accounted for by
variations in Dyn-I protein levels (F) (All blots n=3).

204
The Western blots in Figures 5.2 and 5.3 were subjected to densitometric analysis and
values were normalised based upon the level of pan-Dyn-I present in each sample, as
described in Chapter 2.6.4. Figures 5.4-5.6 represent the phosphorylation levels of
each Ser site presented as time graphs with S.E.M. error bars.
Stimulation with 4AP5C, without drug, does not affect the phosphorylated state of Ser-
795, relative to unstimulated conditions (Figure 5.4, Red and Blue). Treatment with 0.8
µM OA increased Ser-795 levels significantly, relative to Con L0, regardless if samples
were stimulated or not (Green and Purple), suggesting the effect of inhibition of PP1 or
PP2A is not stimulation dependent, and phospho-regulation of Dyn-I could occur
during this treatment regardless of stimulation.
Samples stimulated with 4AP5C, regardless of drug treatment, saw a decrease in Ser-
774 phosphorylation over time (Figure 5.5, Red and Purple), which is a well-established
effect (see discussion). Treatment with 0.8 µM OA did not significantly affect Ser-774
levels relative to their stimulated or unstimulated counterparts, suggesting OA
treatment does not regulate Ser-774 with this stimuli.

205
Figure 5.4: Effect of 0.8 µM OA upon Dyn-I Ser-795 over 120 sec
Application of 4AP5C stimulation, without OA treatment (Red), does not significantly
increase the phosphorylated state of Ser-795 relative to basal Con (Blue) (All time
points p>0.05). OA treatment significantly increases Ser-795 phosphorylation of
unstimulated samples (Green) at 2-15 sec relative to Con L0 (Blue) (2 sec p=0.025; 15
sec p=0.040), but not 30-120 (p>0.05); and of stimulated samples (Purple) at 2-30 sec
relative to CON L0 (2 sec p=0.018; 15 sec p=0.035; 30 sec p=0.045). Samples treated
with OA and stimulated with 4AP5C (Purple) see no significant increase in
phosphorylation relative to samples treated with OA and not stimulated (Green) (All
time points p>0.05).

206
Figure 5.5: Effect of 0.8 µM OA upon Dyn-I Ser-774 over 120 sec
Application of 4AP5C stimulation, without OA treatment (Red), does not significantly
affect Ser-774 levels relative to Con L0 (Blue) at 2-15 sec (2 sec-p=0.524; 15 sec-
p=0824), but sees a significant time-dep decrease in Ser-774 at 30-120 (30 sec-
p=0.016; 120 sec-p=0.036). OA treatment does not affect the Ser-774 level of
unstimulated samples (Green) relative to Con L0 (Blue) (all time points p>0.05), or
relative to CON 4AP (Red) (all time points p>0.05). OA treatment does not sig affect
Ser-774 levels of 4AP5C stimulated samples (Purple) relative to Con L0 (Blue) at 2-15
sec (time points p>0.05), but a significant time-dep decrease is noted at 30-120 sec (30
sec-p=0.048; 120 sec-p=0.049). No significant difference is seen between 4AP5C
stimulated OA treatment (Purple) and Con 4AP5C (RED) (all time points p>0.05).
Samples treated with OA and stimulated with 4AP5C (Purple) see no significant change
in Ser-774, relative to unstimulated OA treatment (Green) (all time points p>0.05).

207
Samples stimulated with 4AP5C display a time-dependent decrease in Ser-778
phosphorylation, regardless of drug treatment (Figure 5.6, Purple and Red). Treatment with
0.8 µM OA does not significantly affect unstimulated samples compared to controls (Green vs
Blue), but OA treatment sees a slight increase in Ser-778 levels at 15 sec when stimulated with
4AP5C, compared to drug free controls (Purple vs Red), however further repeats may reveal
this is not a significant effect.
208
Figure 5.6: Effect of 0.8 µM OA upon Dyn-I Ser-778 over 120 sec
Application of 4AP5C stimulation, without OA treatment (Red), does not significantly
affect Ser-778 levels at 2-15 sec relative to Con L0 (Blue) (p>0.05), however a
significant time-dep decrease was observed at 30-120 sec (30 sec p=0.028; 120 sec
p=0.047). OA treatment of unstimulated samples (Green) does not significantly affect
Ser-778 levels relative to Con L0 (Blue) at all time points (p>0.05). OA treatment of
4AP5C stimulated samples (Purple) does not significantly affect Ser-778 relative to Con
L0 (Blue) at 2-30 sec (p>0.05), however a significant difference was observed at 120 sec
(p>0.0481). No significant difference was observed between OA 4AP5C samples
(Purple) and control 4AP5C (Red) at 2, 30 and 120 sec (p>0.05), however a significant
difference was observed at 15 sec (p=0.0274).

209
5.2.3 The Effect of 2 µM KT5720 upon Dyn-I Phosphorylation in the RRP
Western blots presented in Figure 5.2 and 5.3 also contain samples treated with the
PKA inhibitor KT5720. Treatment with 2 µM KT5720 switched the mode of exocytosis
to FF during stimulation with 4AP5C (Figure 3.5 A), indicating RRP SVs have changed
mode from KR to FF (Chapter 3.4.1). Western blots may indicate that samples treated
with 2 µM KT5720 see a change in Ser-795 levels at all time points (Figure 5.2 and 5.3
A, lanes 3-4 and 9-10), with no noticeable changes in Ser-774 or Ser-778 levels (Figure
5.2 and 5.3, C and E). Figures 5.7-5.9 represent the normalised and corrected
phosphorylation levels of each Ser site presented as time graphs with S.E.M. error
bars.
Treatment with KT5720 did not significantly affect the phosphorylated state of Ser-795
at any time point, regardless of stimulation condition (p>0.05) (Figure 5.7). Stimulation
with 4AP5C had no significant effect upon Ser-795 levels either (P>0.05). These data
suggest that inhibition of PKA does not phospho-regulate Ser-795.

210
Figure 5.7: Effect of 2 µM KT5720 upon Dyn-I Ser-795 over 120 sec
No significant difference in Ser-795 phosphorylation levels was observed between any
condition at any time point (p>0.05).
Treatment with 2 µM KT5720 does not significantly affect the phosphorylated state of
Dyn-I Ser-774, regardless of stimulation condition (p>0.05) (Figure 5.8). Samples
stimulated with 4AP5C again see a time dependent decrease in phosphorylation,
independent of drug treatment.
Treatment with 2 µM KT5720 does not statistically affect the level of Ser-778
phosphorylation, regardless of stimulation condition (p>0.05) (Figure 5.9). A time
dependent decrease in Ser-778 is noted over 15-120 sec as described previously.

211
Figure 5.8: Effect of 2 µM KT5720 upon Dyn-I Ser-774 over 120 sec
Application of 4AP5C, without drug (Red), does not significantly affect Ser-774 levels
relative to Con L0 (Blue) at 2-15 sec (2 sec p=0.998; 15 sec p=0.870), but a significant
time dependent decrease is noted at 30-120 (30 sec-p=0.0001; 120 sec-p=0.0007).
Treatment with KT5720 does not significantly affect Ser-774 levels of unstimulated
samples (Green), relative to Con L0 (Blue) (p>0.05). Treatment with KT5720 of 4AP5C
stimulated samples (Purple) does not significantly affect Ser-774 levels relative to
control 4AP5C (Red) (p>0.05), but does significantly decrease Ser-774 relative to Con
L0 (Blue) at 30 and 120 sec (30 sec p=0.001; 120 sec p=0.039).

212
Figure 5.9: Effect of 2 µM KT5720 upon Dyn-I Ser-778 over 120 sec
Application of 4AP5C, without drug (Red), significantly decrease Ser-778 levels at 15-
120 sec relative to Con L0 (Blue) (15 sec p=0.0027; 30 sec p=0.0033; 120 sec p=0.0007),
but not at 2 sec (p>0.05). Treatment with KT5720 does not significantly affect Ser-778
levels of unstimulated samples (Green), relative to Con L0 (Blue) (all time points
p>0.05). KT5720 treatment does not significantly affect Ser-778 levels of stimulated
samples (Purple) relative to Con 4AP5C (Red) (all time points p>0.05).
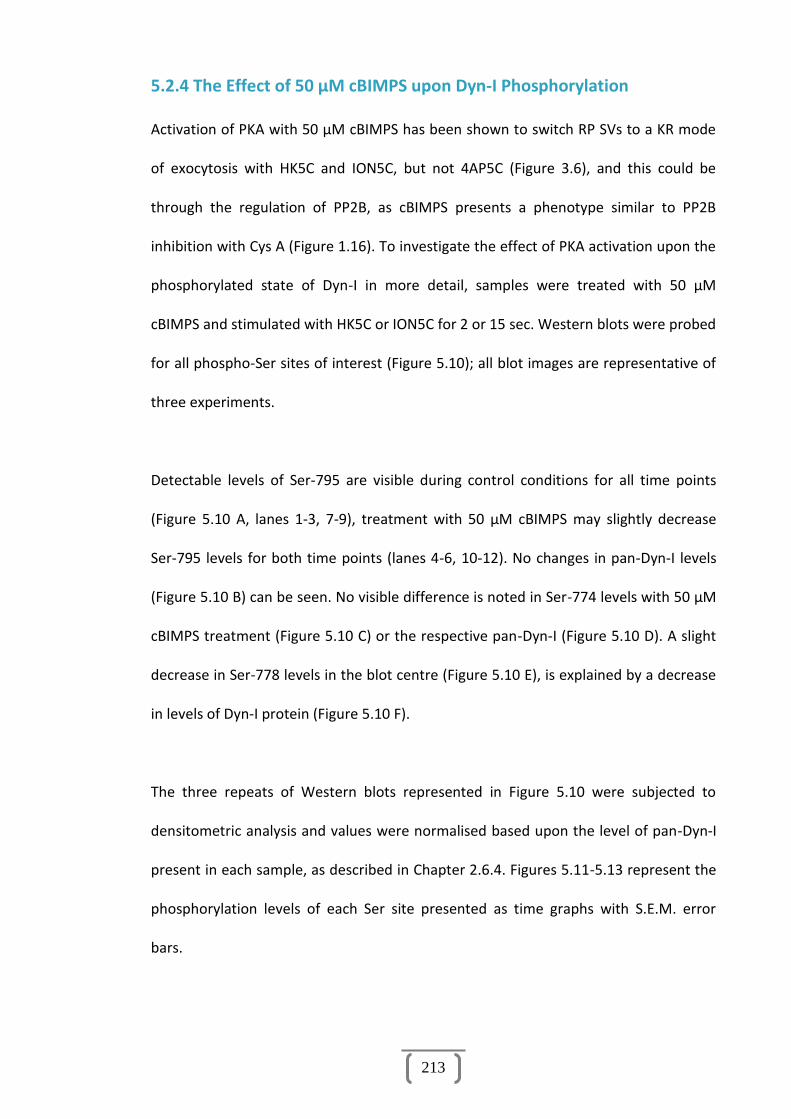
213
5.2.4 The Effect of 50 µM cBIMPS upon Dyn-I Phosphorylation
Activation of PKA with 50 µM cBIMPS has been shown to switch RP SVs to a KR mode
of exocytosis with HK5C and ION5C, but not 4AP5C (Figure 3.6), and this could be
through the regulation of PP2B, as cBIMPS presents a phenotype similar to PP2B
inhibition with Cys A (Figure 1.16). To investigate the effect of PKA activation upon the
phosphorylated state of Dyn-I in more detail, samples were treated with 50 µM
cBIMPS and stimulated with HK5C or ION5C for 2 or 15 sec. Western blots were probed
for all phospho-Ser sites of interest (Figure 5.10); all blot images are representative of
three experiments.
Detectable levels of Ser-795 are visible during control conditions for all time points
(Figure 5.10 A, lanes 1-3, 7-9), treatment with 50 µM cBIMPS may slightly decrease
Ser-795 levels for both time points (lanes 4-6, 10-12). No changes in pan-Dyn-I levels
(Figure 5.10 B) can be seen. No visible difference is noted in Ser-774 levels with 50 µM
cBIMPS treatment (Figure 5.10 C) or the respective pan-Dyn-I (Figure 5.10 D). A slight
decrease in Ser-778 levels in the blot centre (Figure 5.10 E), is explained by a decrease
in levels of Dyn-I protein (Figure 5.10 F).
The three repeats of Western blots represented in Figure 5.10 were subjected to
densitometric analysis and values were normalised based upon the level of pan-Dyn-I
present in each sample, as described in Chapter 2.6.4. Figures 5.11-5.13 represent the
phosphorylation levels of each Ser site presented as time graphs with S.E.M. error
bars.

214
Figure 5.10: Effect of 50 µM cBIMPS upon Dyn-I Ser sites 2-15 sec
(A) Treatment with cBIMPS may decrease Ser-795 levels at both time points, but does
not affect Ser-774 levels (C). A slight decrease in Ser-778 levels are observed, but also
in the level of Dyn-I protein (F). Uniform levels of Dyn-I protein are seen for Ser-795
and Ser-774 samples (B and D respectively).

215
Stimulation of drug free samples with HK5C or ION5C did not significantly affect the
phosphorylated state of Ser-795 at 2 or 15 sec relative to unstimulated controls (Figure
5.11,Red and Green). Treatment with 50 µM cBIMPS did not affect the Ser-795 level of
unstimulated samples at 2 or 15 sec (Figure 5.11, Purple), but significantly decreased
the detectable level of Ser-795 at 2 sec when stimulated with HK5C and ION5C (Figure
5.11, Orange and Light Blue), relative to all control conditions and cBIMPS L0 (Blue).
Treatment with 50 µM cBIMPS significantly decreased the level of Ser-795 at 15 sec
when stimulated with HK5C, relative to all control conditions, and stimulation with
ION5C was significantly decreased relative to Con L0, Con HK5C and cBIMPS L0, but not
Con ION5C.

216
Figure 5.11: Effect of 50 µM cBIMPS upon Dyn-I Ser-795 over 15 sec
Stimulation with HK5C in the presence of 50 µM cBIMPS (Light Blue) significantly
decreased levels of Ser-795 at 2 and 15 sec, relative to Con L0, Con HK5C, Con ION5C
and cBIMPS L0 (all p<0.05). Similarly stimulation with ION5C with 50 µM cBIMPS
treatment (Orange), significantly decreased Ser-795 levels at 2 sec, relative to Con L0,
Con HK5C, Con ION5C and cBIMPS L0 (all p<0.05), and at 15 sec, relative to Con L0, Con
HK5C and cBIMPS L0 (all p<0.05); but was not significantly different to Con ION5C
(Green) at 15 sec (p=0.517). No difference was noted between cBIMPS HK5C (Light
Blue) and cBIMPS ION5C (Orange) at 2 sec (p=0.5660), or 15 sec (p=0.7704).
Stimulation with HK5C, without drug treatment (Red) or ION5C, without drug (Green)
were not significantly different from unstimulated controls (Blue) or each other at 2 or
15 sec (all p>0.05). No significant difference in Ser-795 was observed when samples
were treated with 50 µM cBIMPS but not stimulated (L0 – Purple) relative to Con L0
(Blue), Con HK5C (Red) or Con ION5C (Green), (all conditions p>0.05).
217
Treatment with 50 µM cBIMPS did not significantly affect the phosphorylation level of
Ser-774 at 2 or 15 sec (p>0.05) (Figure 5.12), indicating this site has no specific role in
the regulation of exocytosis during this drug treatment.
A time dependent decrease in Ser-778 phosphorylation is observed with HK5C and
ION5C stimulation, without drug (Figure 5.13), but no significant effect is observed
with 50 µM cBIMPS treatment.

218
Figure 5.12: Effect of 50 µM cBIMPS upon Dyn-I Ser-774 over 15 sec
Treatment with 50 µM cBIMPS does not significantly affect the phosphorylated state of
Ser-774 at 2 or 15 sec. No significant difference was measured between any conditions
across either time point (all p>0.05).

219
Figure 5.13: Effect of 50 µM cBIMPS upon Dyn-I Ser-778 over 15 sec
Application of either HK5C or ION5C stimuli, without drug treatment (Red or Green
respectively), does not significantly affect 778 phosphorylation at 2 sec, relative to Con
L0 (Blue) (p>0.05), but a significant time dependent decrease is observed at 15 sec
(HK5C vs L0-p=0.038; ION5C vs L0-p=0.025). Treatment with 50 µM cBIMPS does not
significantly affect the phosphorylated state of Ser-778 at either time point, relative to
any condition (p>0.05).

220
5.3 Discussion
This chapter aimed to investigate if perceived changes to the mode of exocytosis
induced by certain drug treatments were due to modification of the phosphorylated
profile of Dyn-I, in particular Ser-795. As discussed earlier a multitude of evidence
points to a regulatory role at the FP for Dyn-I during exocytosis (Fulop, et al., 2008;
Chan, et al., 2010). Though as of yet no correlation has been established between the
mode of SV exocytosis and the phosphorylated profile of Dyn-I (Singh, 2017).
Dyn-I has a range of in vivo phosphorylation sites (Graham, 2007), and these have been
shown to be exclusively Ser sites (Robinson, 1991). Ser-778 and Ser-774 are well
established as the major phosphorylation sites of Dyn-I in vivo, and are responsible for
regulating forms of endocytosis (Chapter 1.8) (Tan, et al., 2003; Graham, 2007).
However, though Ser-795 is demonstrated as a potent in vitro site (Powell, et al.,
2000), there is only little evidence to identify it as a truly in vivo phosphorylation site
(Bhuva, 2015). In order for Dyn-I to be active at the FP during KR, Ser-795 is expected
to be dephosphorylated, while during FF it is expected to become more
phosphorylated. In this thesis, it is argued that a change seen in the phosphorylated
state of Ser-795 without an equivalent change in either Ser-778 or Ser-774, during a
mode switch is indicative of Ser-795 regulating the mode of exocytosis.
This thesis describes a correlation between the phosphorylated state of Ser-795 and a
distinct switch in mode, for two stimuli which could be how the synaptosomes regulate
exocytosis.

221
5.3.1 Phosphorylation of Dyn-I Ser-795 in vivo
The inhibition of PP1 and PP2A with 0.8 μM OA, and the activation of PKCs with 80 nM
PMA have previously been shown to increase the level of phosphorylation at Ser-795,
relative to controls (Figure 1.17). It was possible however, that such an increase in
phosphorylation at Ser-795 could be a result of PMA acting upon broken terminals. In
such a situation Dyn-I Ser-795 would be immediately available for phosphorylation
much as seen in vitro (Powell, et al., 2000); unlike with intact terminals, where the
PMA must first cross the PM in order to access Dyn-I.
In order to establish if the changes to Ser-795 were strictly in vivo, 40 nM PMA was
added to the basal buffer around the synaptosomes without any stimulation (Figure
5.1). Even after 120 seconds no detectable level of Ser-795 was present (Lanes 10-12),
unlike Figure 1.17 where 40 nM PMA (pre-incubation) increases the phosphorylation
of Ser-795 at 15 seconds, before darkening at 120 seconds (Figure 1.17; lanes 10-11).
Therefore, the synaptosomes contain very few lysed terminals as no PMA induced
phosphorylation of Ser-795 was observed, and a pre-stimulation is required for the
PMA to be taken up by the intact terminals to interact with the intracellular PKCs.
PMA is able to specifically increase the phosphorylated profile of Dyn-I Ser-795 in vivo
through the activation of PKCs only when it has entered the terminals. This
demonstrates that Ser-795 is a viable in vivo phosphorylation target for PKCs, and
requires specific conditions for it to be detectable (Bhuva, 2015). However, PKCs may
not regulate the mode of exocytosis via Ser-795 as high level of Ser-795 has still been
observed even when PKCs were first inhibited before treatment (Singh, 2017).

222
5.3.2 The Effect of 0.8 μM OA upon Dyn-I during 4AP5C Stimulation
The phosphorylated profile of Dyn-I has never before been investigated during
terminal stimulation with 4AP5C, so these data present completely novel results where
only the RRP on SVs are undergoing release (see Section 1.9.1). During 4AP5C
stimulation a lower, more gradual increase in [Ca2+]i is observed (Figure 1.8) which is
theorised to activate Dyn-I at the FP to mediate the mode of release (see Section
1.9.5).
Inhibition of PP1 and PP2A with 0.8 μM OA during basal or 4AP5C stimulation
increases in vivo Ser-795 phosphorylation relative to untreated synaptosomes, and no
similar phenotype is observed for either Ser-774 or Ser-778. Data presented earlier in
this thesis also demonstrates OA treatment increases the number of RRP SVs
undergoing FF with all stimuli (Figure 1.11), and this could indicate OA mediates a
switch in the mode of exocytosis from KR to FF by preventing the dephosphorylation of
Dyn-I.
Potentially the inhibition of PP1, PP2A or both, prevents the dephosphorylation of
Dyn-I Ser-795, suggesting one (if not both) could be specific phosphatases for Ser-
795. However, due to the well-established, long reaching effects of PP1 and PP2A
(Zolnierowicz, 2000; Cohen, 2002), it is difficult to accurately say through what means
their inhibition increases Ser-795 phosphorylation, potentially several proteins and
their interaction partners could be mediating this change, but it is important to note
no changes are seen at Ser-774/778 demonstrating some specificity at Ser-795.
223
During control conditions a time-dependent decrease in Ser-774 and Ser-778
phosphorylation is observed with 4AP5C stimulation, which is not seen with
unstimulated samples (L0) (Figure 5.5 and 5.6). This occurs during a prolonged
stimulation process, but one after 15 sec, indicating a Ca2+-dependent mechanism.
Such an observation has previously been described for both HK5C and ION5C
stimulated samples (Bhuva, 2015, p. 155), however this is the first time 4AP5C
stimulation has been investigated in this paradigm, and the similarity could indicate
how a relative increase in [Ca2+]i is able to mediate dephosphorylation of a portion of
Dyn-I Ser sites. Further research should be conducted into the effect of prolonged
stimulation (≤ 5 min) upon dephosphorylation of specific sites.
As treatment with OA does not significantly affect this trend seen between stimulated
and unstimulated samples for Ser-774 and Ser-778 (Figure 5.5 and 5.6), this suggests
that PP1 and PP2A are probably not phosphatases for these two sites. Further, these
sites have no correlation between OA treatment and changes to levels of
phosphorylation, unlike what is seen with Ser-795, again suggesting these sites have
no regulatory effect upon the mode.
5.3.3 The Effect of PKA Inhibition upon Dyn-I during 4AP5C Stimulation
The inhibition of PKA with 2 µM KT5720 significantly increased the number of RRP SVs
undergoing FF with 4AP5C (Figure 3.5), presenting a similar phenotype to OA
treatment. From this it was expected a similar increase in Ser-795 phosphorylation
could be observed during KT5720 treatment, however the inhibition of PKA does not

224
significantly affect the in vivo phosphorylation of Ser-795 when releasing the RRP with
4AP5C.
The inhibition of PKA also does not affect the phosphorylated state of Dyn-I Ser-774 or
Ser-778 over 120 sec (Figure 5.8 and 5.9). Again a time-dependent decrease in
phosphorylation is noted for both these Ser sites when stimulated with 4AP5C,
compared to L0, and this is not measurably altered by KT5720 treatment. This could
indicate that the time-dependent decrease in phosphorylation is a trend in response to
the stimulation and represents the effect of prolonged elevated [Ca2+]i.
As inhibition of PKA does regulate the mode of exocytosis, specifically switching KR SVs
to FF with 4AP5C stimulation, this may suggest PKA inhibition is able to mediate this
RRP mode switch independently of changes to Ser-795, Ser-774 or Ser-778. This could
indicate that Dyn-I does not have a role in regulating the RRP FP during this paradigm
and another protein recruited at the FP is involved, or that another Ser site on Dyn-I is
being regulated to mediate this form of KR. Investigation of the Dyn-I phosphorylation
profile via mass-spectrometry could reveal more information with this drug treatment.
Inhibition of PKA also caused an increase in FF with ION5C stimulation, but not HK5C
stimulation. Preliminary Western blots revealed no significant changes in Ser-795, Ser-
774 or Ser-778 phosphorylation between these stimuli during PKA inhibition,
suggesting PKA activity regulates the mode of exocytosis in other ways.

225
5.3.4 The Effect of PKA Activation upon Dyn-I Phosphorylation
The activation of PKA with 50 µM cBIMPS has been shown to switch RP SVs to KR with
both HK5C and ION5C (Figure 3.6), without affecting RRP SVs. Potentially cBIMPS may
increase the occurrence of KR by decreasing the phosphorylated state of Ser-795.
Treatment with cBIMPS did significantly decrease Ser-795 phosphorylation during
HK5C stimulation at 2 and 15 sec, and during ION5C stimulation at 2 sec (Figure 5.11).
Samples treated with cBIMPS and unstimulated (L0), saw no significant change in Ser-
795 phosphorylation levels across either time point, suggesting an effect linked to
stimulation.
The activation of PKA with cBIMPS had no significant effect upon the phosphorylated
state of Dyn-I Ser-774 and Ser-778 over the same time points (Figures 5.12 and 5.13).
These data may suggest that the action of cBIMPS to increase KR of the RP is working
through Dyn-I Ser-795, partly due to the specificity, though sites not studied here
should be investigated further. As treatment with OA and PMA have been shown to
increase Ser-795 (Figure 1.17) and switch RRP SVs to FF (Figure 1.11 B), it could be the
Dyn-I associated with these vesicles has become phosphorylated thus the RP
undergoes FF too. However, when cBIMPS activates PKA the RP Dyn-I Ser-795 becomes
dephosphorylated allowing the RP to undergo KR exocytosis.
5.4 Conclusion
Dyn-I Ser-795 is an in vivo phosphorylation site that may undergo changes in
phosphorylation during stimulation. Ser-795 becomes dephosphorylated when RP SVs
release via KR during PKA activation, and an increase in Ser-795 phosphorylation is
observed when PP1 and PP2A are inhibited, increasing the number of SVs undergoing
226
FF. Both of these results suggest the mechanism to switch the mode of exocytosis can
sometimes be linked to the phosphorylated state of Ser-795. Both Dyn-I Ser-774 and
Ser-778 display a time-dependent dephosphorylation when stimulated with 4AP5C,
independent of drug treatments, and this could be a general effect of prolonged
increased [Ca2+]i levels, as it is similar to what has been observed with HK5C and
ION5C.

227
Chapter 6:
General Discussion

228
6.1 Results
The KR mode of exocytosis has been a controversial topic in neuronal communication
since its inception over 40 years ago (Heuser and Reese, 1973; Ceccarelli, et al., 1973).
Since these seemingly opposing discoveries FF has been well established as a
predominant mode of exocytosis in neurons, and while there is consensus that
multiple modes of recycling exist (CME, ADBE, UE) with new modes being theorised
(Soykan, et al., 2017), there is still conflict surrounding KR in neurons (Chanaday and
Kavalali, 2017).
KR has been well studied in non-neuronal secretory cells, such as chromaffin cells
where exocytosis is both larger and slower (Elhamdani, et al., 2006; Chan, et al., 2010;
Guček, et al., 2016), but such a presence in neurons is more debatable due to the
difficulty of visualising KR, in part owed to the speed at which it occurs and the small
FP size (for in-depth reviews see: Rizzoli and Jahn, 2007; He and Wu, 2007; Chanaday
and Kavalali, 2017).
Recently work by Ashton and colleagues has determined that SVs in rat cerebral
cortical synaptosomes can release via KR during certain stimulation paradigms (Figure
1.11), and that the mode of release can be determined using a combination of maximal
Glu release (determined using Ca2+ dose response curves – Figure 1.7) and FM 2-10 dye
release assays. Ashton and colleagues have also outlined a major role for [Ca2+]i in the
regulation of the mode of exocytosis, specifically, increases in [Ca2+]i can switch SVs
which undergo FF to KR (Ashton, manuscript in preparation; Figures 1.8 and 1.16).

229
The aim of this thesis was to establish whether regulating the activity of PKA, or the
level of cAMP in nerve terminals, via AC activity, could affect the mode of exocytosis,
and if such effects could be related to changes in the phosphorylated state of Dyn-I.
The results presented here further support the existence of KR as a common mode of
exocytosis in neurons and have identified PKA and cAMP levels as regulators of the
mode of release, and EPACs as regulators of the release of the RP of SVs. Results
presented in Chapter 5 also demonstrate that Dyn-I Ser-795 is an in vivo
phosphorylation site that retains a low level of phosphorylation during rest, seeing an
increase in phosphorylation upon terminal stimulation. Ser-795 has also been shown
to undergo specific changes in phosphorylation which correlate with expected changes
in the mode of exocytosis.
6.1.1 The Roles of PKA, Dyn-I and Actin in Neurotransmission
This thesis has established that changes to the activity of PKA can switch the mode of
exocytosis for both SV pools, independently of changes to [Ca2+]i, and without
compromising the bioenergetics of nerve terminals. Inhibition of PKA can specifically
switch RRP SVs to release via FF in a similar manner to the inhibition of Dyn-I with
Dynasore can switch the mode. This could implicate Dyn-I in the regulation of RRP
release, however, further research needs to be conducted to determine if PKA
regulates a phosphatase that dephosphorylates Dyn-I or perhaps a binding partner
(e.g. syntaphilin) which can bind and inhibit Dyn-I directly.
Activation of PKA can increase the number of RP SVs releasing via KR, and this could be
through the activation of Dyn-I, though as Dyn-I requires dephosphorylation to
become active PKA cannot be working directly upon Dyn-I. Clearly an intermediate

230
phosphatase (such as calcineurin) which is activated by PKA is a viable option to
dephosphorylate Dyn-I. These data reveal a major role for Dyn-I in regulating release
dynamics, though potentially not all Dyn-I within the terminal is required to regulate
the mode of release.
Preventing cytosolic Dyn-I from binding to phospholipid membranes (SVs, PM, etc.),
did not perturb Glu release or FM 2-10 dye release with either HK5C or ION5C stimuli.
Therefore, only a sub-pool of Dyn-I is required to regulate the mode of release during
exocytosis, but further research needs to be performed to determine if this Dyn-I is
bound to the PM or to SVs as this may have an important implication in the
characterisation of specific SV pools, or the structure of the AZ. Though if both the RRP
and RP are capable of releasing via either KR of FF, this may indicate that distinct SV
pools do not have different proteins present for regulating their mode, but rather non-
vesicular components can do this.
Actin plays a vital role in the mobilisation of RP SVs, as destabilising the actin
cytoskeleton with latrunculin specifically prevented release of all RP SVs without
affecting the RRP. Though actin has previously been described as creating a barrier
that SVs cannot cross until terminal depolarisation (Papadopulos, 2017), this is good
evidence to prove actin may also have a role in the transport of SVs to the PM for
release (Meunier and Gutiérrez, 2016). Actin may also have a role in regulating the
mode of the RRP SVs, as perturbation of actin microfilaments affected FM dye release
in a way that suggests more SVs releasing via FF.

231
Actin has been shown to be regulated by, and bind directly to Dyns, and this
interaction is enhanced when Dyns can also bind lipids (e.g. at the AZ) (Gu, et al.,
2010), which may suggest a role during KR. It has also been suggested that Dyn-I may
regulate actin nucleation during endocytosis to aid membrane scission (Lee and De
Camilli, 2002), and this could also happen at the FP. Furthermore, actin interacts with
intracellular membranes, and research groups have demonstrates that actin can form
rings around releasing secretory granules to regulate exocytosis (Nightingale, et al.,
2012). As inhibition of actin switches the RRP to FF, it is suggested that actin in
conjunction with Dyn-I could regulate the FP of RRP SVs with ION5C stimulation, and
that NM-II and actin are regulating the FP of RRP SVs with HK5C stimulation (as HK5C
inhibits Dyn-I via PKCs and activates NM-II, while with ION5C Dyn-I is active).
Clearly more research in this area is required to establish what effects actin
stabilisation such as with Jasplakinolide (Holzinger, 2009), has upon the release of
distinct SV pools and their modes of exocytosis, and utilisation of other research
models could aid in this.
6.1.2 The Roles of cAMP and EPACs in Neurotransmission
PKA is regulated by cAMP which is produced by AC, and investigations into the activity
of AC determined it can regulate the RRP and RP independently most probably through
the regulation of the [Ca2+]i level via EPACs and PKA activity. The activation of AC
blocks release of RP SVs through the activation of EPACs which works to lower the
average [Ca2+]i level within the terminals. Though Ca2+-dependent exocytosis is well
established, this is the first evidence to demonstrate that specific changes to [Ca2+]i
levels can regulate the release of distinct SV pools when protein phosphorylation

232
pathways are modulated. However the link between a decrease in [Ca2+]i and the loss
of RP exocytosis does correlate well with previous work by Ashton and colleagues
which demonstrate stimulation with 4AP5C releases only the RRP (Figure 1.7), and
induces a lower and more gradual average [Ca2+]i level (Figure 1.8). Further work to
investigate this link between [Ca2+]i and pools undergoing release could identify a role
for Ca2+ to regulate aspects of release.
When stimulating with 4AP5C and releasing only the RRP, the activation of AC (with
forskolin) appears to switch RRP SVs to a KR mode of exocytosis through the activation
of PKA and EPACs. Again this could be due to increases in [Ca2+]i levels and should also
be investigated further.
Interestingly the direct activation of PKA, did not show change, when release was
stimulated with 4AP5C, but when PKA is inhibited (with KT5720) before AC is activated,
the RRP switches to a FF mode of exocytosis. This may imply that both PKA and EPACs
are required to regulate the RRP mode, but clearly further research must be
performed with the EPACs inhibitor ESI-09. Alternatively, the lack of a change in the
RRP mode when PKA is activated (with cBIMPS) may be due to the RRP SVs that are
undergoing FF switching to KR, and the SVs that are undergoing KR switching to FF
showing no overall mode switch. Investigating the specific activation of EPACs may
reveal more details surrounding the regulation of RP release and the role of Rap1 and
Rap2.
Collectively these results demonstrate that PKA can regulate the mode of release
distinctly for each SV pool and AC can regulate the release of the RP through activation

233
of EPACs which reduce the level of [Ca2+]i and the mode of the RRP potentially through
the activation of PKA and EPACs, where the [Ca2+]i level decreases. These data present
many situations where the change in mode could be mediated by a change in the
phosphorylated profile of Dyn-I.
6.1.3 The Role of Dyn-I Ser-795 in Mode Regulation
As only a sub-pool of Dyn-I has been shown to be required to regulate the mode of
release, changes to the phosphorylated profile of Dyn-I were less easy to determine as
the antibodies, though Ser-specific, show all Dyn-I in the terminal not just that which is
actually regulating the mode of release. This thesis confirms that Dyn-I Ser-795 is an in
vivo phosphorylation site, as the presence of PMA only during the final stimulation
period (when PMA would be expected to activate PKCs in lysed samples and
phosphorylate substrates that may not be available for phosphorylation in the intact
tissues) displayed no phospho-Ser-795, but when synaptosomes were pre-treated with
PMA before stimulation, intense bands were observed for phosphorylated Ser-795,
indicating the PMA was able to cross the PM to activate PKCs to phosphorylate Dyn-I.
This demonstrates that the nerve terminals are intact, and that PMA acts by crossing
the PM to activate PKCs within the terminal. Research with OA also demonstrates that
Ser-795 is a target of either PP1 or PP2A, as an increase in phosphorylation is observed
with this treatment, and these changes are independent of changes to other Dyn-I
phospho-Ser-sites of interest.
PKA inhibition does not modulate the phosphorylated state of any Dyn-I Ser-site over 5
min when stimulated with 4AP5C, though this treatment has been shown to switch the
RRP to FF. A time-dependent decrease in phosphorylation was observed for Ser-778

234
and Ser-774 with control samples, but PKA inhibition did not disrupt this. Furthermore,
no difference in the phosphorylated state of Ser-795 was observed with either HK5C or
ION5C stimuli during preliminary research, even though a difference in
phosphorylation phenotype was expected, as ION5C switches the mode to FF with PKA
inhibition, but HK5C does not. This potentially means that PKA inhibition may not
regulate the mode of exocytosis through Dyn-I. Collectively these data suggest that
though PKA inhibition is able to switch the specific mode of the RRP, it is not through
Ser-795, Ser-778 or Ser-774.
This is the first time a time-dependent decrease in phosphorylation has been observed
during 4AP5C stimulation; however a similar observation has been made with HK5C
and ION5C stimulation previously (Bhuva, 2015). This is probably the effect of
prolonged increased [Ca2+]i levels as described previously, however further studies
could establish the extent of this effect.
The activation of PKA decreased the detectable level of Ser-795 during stimulation
with both HK5C and ION5C. As the activation of PKA has been shown to switch only the
RP to KR, these data could suggest that Dyn-I Ser-795 must be dephosphorylated in
order for RP SVs to release by KR, and a certain threshold of phosphorylation is
required for this pool to release via FF. Though this could just be a correlation, it is the
first time a significant decrease in Ser-795 phosphorylation has been report during KR
(where Dyn-I is theorised to undergo dephosphorylation in order to mediate this
mode). As the inhibition of PP1 and PP2A with OA treatment has been shown to
increase both the number of SVs undergoing FF, and the phosphorylated state of Ser-
795, these data could indicate a reduction of Ser-795 is required to mediate KR.

235
In order to establish if there is a causal relationship between the level of Ser-795
phosphorylation and the mode of exocytosis, further Western blotting studies of
conditions which induce KR should be investigated. The AC activator, forskolin, used in
this thesis, did display an increase in KR with 4AP5C stimulation, however this was
attributed to a noticeable increase in [Ca2+]i during the same period, which may
indicate Ser-795 is not involved. Similarly inhibition of calcineurin with Cys A has
displayed an increase in KR with HK5C and ION5C (Figure 1.16 D-E) which could be
studied, however [Ca2+]i levels also increased with these stimulations (Figure 1.16 G-H).
Previous Western blot research has not established any change in the phosphorylated
state of Ser-795 during Cys A treatment (Bhuva, 2015; Singh, 2017), over a range of
stimulation conditions.
Future studies should look at alternative means to analyse the phosphorylated profile
of Dyn-I under mode switching conditions, such as using phosphoproteomics in mass
spectrometry. This could reveal if there is a causal link between Dyn-I Ser-795 and the
mode of exocytosis, or if other Dyn-I Ser sites are involved.

236
6.2 Future Studies
This thesis contributes new knowledge to the understanding of how the distinct pools
of SVs are released, how the activity of PKA and AC (via cAMP) pathways can regulate
the mode of exocytosis, and how the phosphorylated profile of Dyn-I can regulate the
modes of exocytosis. However, further research must be undertaken in order to
establish what other factors can regulate the mode of SV exocytosis, what the specific
differences between the SVs pools are during release, and to further reveal the
relationship between the mode of release and the phosphorylated state of Dyn-I.
Some of the experiments suggested in this section may aid current knowledge and
expand the understanding surrounding SV exocytosis in neurons.
Chapter 3 of this thesis presents the investigation of the activity of PKA through
the use of cBIMPS and KT5720. A dual-treatment to study FM 2-10 dye release
was performed with both these drugs, but a Glu release assay was not. For
completeness it would be useful to perform the Glu release assay for the dual-
drug treatment of KT5720 and cBIMPS, even though individually these drugs do
not perturb Glu release.
MITMAB and latrunculin have shown very interesting specific effects and it is
important to perform the Fura-2 [Ca2+]i assay with both MITMAB and
latrunculin to determine if they affect the level of [Ca2+]i, as this could help
explain the phenotype produced by latrunculin.
Though the mode of release during inhibition of EPACs with ESI-09 was not
studied in this thesis, this is clearly an important experiment to determine how
EPACs may affect the mode of exocytosis, particularly for the action of forskolin
upon 4AP5C evoked exocytosis.

237
Though 9-cp-ade had no effect on any assays utilised in this thesis (though the
drug itself was working by preventing the action of forskolin), it is important to
perform further research with 9-cp-ade focusing on longer drug incubation
times (e.g. 20 min at 37°C), to determine any specifics that may be time-
dependent.
Western blotting may not provide the whole story of the phosphorylated
profile of Dyn-I, as there are many other Ser sites that could be undergoing
changes during exocytosis. Therefore, preparing synaptosomal samples treated
with various drug conditions to induce specific modes of exocytosis, then
immunopurifying the Dyn-I for analysis by mass spectrometry may reveal more
details surrounding the phosphorylation sites which could aid in finding a link
between the mode of release and the phosphorylated profile of Dyn-I.
In order to determine if the modes of exocytosis are detectable in other
experimental models primary cultures of rat cerebrocortical neurons could be
prepared and the FM 2-10 dye assay could be modified to be used with a
fluorescent microscope to be able to visualise KR and FF events. This will be
important in order to do the transfection experiments, highlighted below.
If analysis by mass spectrometry highlights a number of key Ser-sites
developing phosphomimetic Dyn-I constructs where Ser sites of interest (Ser-
795, Ser-778 and Ser-774) are either continually phosphorylated or
dephosphorylated and transfecting them into neurons could permanently
switch the mode of exocytosis, establishing these sites are mode regulators. A
longer term aim of this project would be to make transgenic animals by
CRISPR/Cas9 technology (Cong, et al., 2013), to replace the Ser-795 residue
with either alanine to prevent phosphorylation, or replace the Ser with aspartic
238
acid to mimic constant phosphorylation. This could be used with our assays to
confirm this site and how it can have a role in the regulation of the mode.
Further, such animals may present a specific phenotype which may reveal the
importance of phospho-Ser-795 on Dyn-I in higher order processes involving
synaptic plasticity such as memory and behaviour.
As the disassembly of actin perturbs release of the RP, it is important to
investigate how the stabilisation of actin with jasplakinolide affects the release
of SV pools and influences the mode of exocytosis. This would create a better
picture for the role of actin in neurons, beyond that of a simple cytoskeletal
element.
Over the long-term it would be important to utilise super-resolution
fluorescence microscopy alongside fluorescent monoclonal antibodies to
detect the phospho-Ser-795 site, during stimulation. As we believe this site only
occurs in a sub-pool of Dyn-I, specific changes in sub-cellular compartments
may be observed (e.g. on the SVs or at the AZ).

239
Chapter 7:
References and Appendix
240
Agilent Technologies, Inc. (2019). Agilent Seahorse XF Cell Mito Stress Test Kit:
User Guide: 103016-400. Wilmington, DE: Author.
Alabi, A. A. and Tsien, R. W. (2012). Synaptic Vesicle Pools and Dynamics. Cold
Spring Harb. Perspect. Biol., 4:a013680.
Alabi, A. A. and Tsien, R. W. (2013). Perspectives on kiss-and-run: role in
exocytosis, endocytosis, and neurotransmission. Annu. Rev. Physiol., 75, 393-
422.
Albillos, A., Dernick, G., Horstmann, H., Almers, W., Alvarez de Toledo, G. and
Lindau, M. (1997). The exocytotic event in chromaffin cells revealed by patch
amperometry. Nature., 389, 509-512.
Alés, E., Tabares, L., Poyato, J. M., Valero, V., Lindau, M. and Alvarez de Toledo,
G. (1999). High calcium concentrations shift the mode of exocytosis to the kiss-
and-run mechanism. Nat. Cell. Biol., 1, 40-44.
Almahariq, M., Tsalkova, T., Mei, F. C., Chen, H., Zhou, J., sastry, S. K., schwede,
F. and Cheng, X. (2013). A novel EPAC-specific inhibitor suppresses pancreatic
cancer cell migration and invasion. Mol. Pharmacol., 83, 122-128.
Anantharam, A., Bittner, M. A., Aikman, R. L., Stuenkel, E. L., Schmid, S. L.,
Axelrod, D. and Holz, R. W. (2011). A new role for the dynamin GTPase in the
regulation of fusion pore expansion. Mol. Biol. Cell., 22, 1907-1918.

241
Anantharam, A., Axelrod, D. and Holz, R. W. (2012). Real-time imaging of
plasma membrane deformations reveals pre-fusion membrane curvature
changes and a role for dynamin in the regulation of fusion pore expansion. J.
Neurochem., 122, 661-671.
Anggono, V. and Robinson, P. J. (2009). Dynamin. Encyclopedia of Neuroscience.
Edited by Larry R. Squire. Amsterdam , The Netherlands: Elseiver.725-735.
Antonny, B., Burd, C., De Camilli, P., Chen, E., Daumke, O., Faelber, K., Ford, M.,
Frolov, V. A., Frost, A., Hinshaw, J. E., Kirchhausen, T., Kozlov, M. M., Lenz, M.,
Low, H. H., McMahon, H., Merrifield, C., Pollard, D., Robinson, P. J., Roux, A.
and Schmid, S. (2016). Membrane fission by dynamin: what we know and what
we need to know. EMBO. J., 35, 2270–2284.
Aravanis, A. M., Pyle, J. L., Harata, N. C. and Tsien, R. W. (2003). Imaging single
synaptic vesicles undergoing repeated fusion events: kissing, running, and
kissing again. Neuropharmacol., 45, 797-813.
Armbruster, M. and Ryan, T. A. (2011). Synaptic vesicle retrieval time is a cell-
wide not an individual synapse property. Nat. Neurosci., 14, 824-826.

242
Armbruster, M., Messa, M., Ferguson, S. M., De Camilli, P. and Ryan, T. A.
(2013). Dynamin phosphorylation controls optimization of endocytosis for brief
action potential bursts. eLife., 2, e00845. doi:10.7554/eLife.00845.
Artalejo, C. R., Henley, J.R., McNiven, M. A. and Palfrey, H. C. (1995). Rapid
endocytosis coupled to exocytosis in adrenal chromaffin cells involves Ca2+,
GTP, and dynamin but not clathrin. PNAS., 92, 8328-8332.
Artalejo, C. R., Elhamdani, A. and Palfrey, H. C. (2002). Sustained stimulation
shifts the mechanism of endocytosis from dynamin-1-dependent rapid
endocytosis to clathrin- and dynamin-2-mediated slow endocytosis in
chromaffin cells. PNAS. 99, 6358-6363.
Ashton, A. C. and Ushkaryov, Y. A. (2005). Properties of Synaptic Vesicle Pools
in Mature Central Nerve Terminals. J. Biol. Chem., 280, 37278-37288.
Ashton, A. C., Patel, M. H. and Sihra, T. S. (2009). Changes in protein
phosphorylation and calcium regulate switching between distinct modes of
synaptic vesicle exocytosis. Soc. Neurosci.
Ashton, A. C., Sihra, T. S., Babar, P., Patel, M. H., Bhuva, D. A., Singh, D. and
Green, J. (Manuscript in preparation for submission). Switching between
distinct modes of synaptic vesicle exocytosis depends upon changes in protein
phosphorylation and calcium: the contribution of dynamins and myosin 2.

243
Bähring, R. and Covarrubias, M. (2011). Mechanisms of closed-state
inactivation in voltage-gated ion channels. J. Physiol., 589, 461-479.
Balaji, J. and Ryan, T. A. (2007). Single-vesicle imaging reveals that synaptic
vesicle exocytosis and endocytosis are coupled by a single stochastic mode.
PNAS., 104, 20576-20581.
Baldwin, M. L., Rostas, J. A. P. and Sim, A. T. R. (2003). Two modes of exocytosis
from synaptosomes are differentially regulated by protein phosphatase types
2A and 2B. J. Neurochem., 85, 1190-1199.
Bao, H., Das, D., Courtney, N. A., Jiang, Y., Briguglio, J. S., Lou, X., Roston, D.,
Cui, Q., Chanda, B. and Chapman, E. R. (2018). Trans-SNARE complex dynamics
and number determine nascent fusion pore properties. Nature., 554, 260-263.
Barclay, J. W., Craig, T. J., Fisher, R. J., Ciufo, L. F., Evans, G. J., Morgan, A. and
Burgoyne, R. D. (2003). Phosphorylation of Munc18 by protein kinase C
regulates the kinetics of exocytosis. J. Biol. Chem., 278, 10538-10545.
Barclay, J. W., Morgan, A. and Burgoyne, R. D. (2005). Calcium-dependent
regulation of exocytosis. Cell Calcium., 38, 343-353.
244
Bauerfeind, R., Takei, K. and De Camilli, P. (1997). Amphiphysin I is associated
with coated endocytic intermediates and undergoes stimulation-dependent
dephosphorylation in nerve terminals. J. Biol. Chem., 272, 30984-30992.
Beaumont, V., Zhong, N., Fromke, R. C., Ball, R. W. and Zucker, R. S. (2002).
Temporal synaptic tagging by I(h) activation and actin: involvement in long-
term facilitation and cAMP-induced synaptic enhancement. Neuron., 33, 601-
613.
Berberian, K., Torres, A. J., Fang, Q., Kisler, K. and Lindau, M. (2009). F-actin and
myosin II accelerate catecholamine release from chromaffin granules. J.
Neurosci., 29, 863-870.
Betz, W. J., Mao, F. and Bewick, G. S. (1992). Activity-dependent Fluorescent
Staining and Destaining of Living Vertebrate Motor Nerve Terminals. J.
Neurosci., 12, 363-375.
Bhuva, D. (2015). Dynamins and myosin-II regulate the distinct modes of
synaptic vesicle exocytosis in mature cerebrocortical nerve terminals and this
involves calcium dependent phosphorylations. Doctoral thesis, UCLan, Preston.
Bialojan, C. and Takai, A. (1988). Inhibitory effect of a marine-sponge toxin,
okadaic acid, on protein phosphatases. Specificity and kinetics. Biochem. J.,
256, 283-290.

245
Biel, M. (2008). Cyclic Nucleotide-regulated Cation Channels. J. Biol. Chem.,
284, 9017-9021.
Bittner, G. D. and Kennedy, D. (1970). Quantitative aspects of transmitter
release. J. Cell. Biol., 47, 585-592.
Boczan, J., Leenders, A. G. M. and Sheng, Z. H. (2004). Phosphorylation of
Syntaphilin by cAMP-dependent Protein Kinase Modulates Its Interaction with
Syntaxin-1 and Annuls Its Inhibitory Effect on Vesicle Exocytosis. J. Biol. Chem.,
279, 18911-18919.
Bos, J. L. (2006). Epac proteins: multi-purpose cAMP targets. Trends. Biochem.
Sci., 31, 680-686.
Brent, P. J., Herd, L., Saunders, H., Sim, A. T. R. and Dunkley, P. R. (1997).
Protein Phosphorylation and Calcium Uptake into Rat Forebrain Synaptosomes:
Modulation by the ơ Ligand, 1,3-Ditolylguanidine. J. Neurochem., 68, 2201-
2211.
Byczkowicz, N., Ritzau-Jost, A., Delvendahl, I. And Hallermann, S. (2017). How to
maintain active zone integrity during high-frequency transmission. Neurosci.
Res. 127, 61-69.
246
Cano, R. and Tabares, L. (2016). The Active and Periactive Zone Organization
and the Functional Properties of Small and Large Synapses. Front. Synaptic
Neurosci., 8, doi: 10.3389/fnsyn.2016.00012.
Cao, H., Garcia, F. and McNiven, M. A. (1998). Differential distribution of
dynamin isoforms in mammalian cells. Mol. Biol. Cell. 9, 2595-2609.
Del Castillo, J. and Katz, B. (1954). Quantal components of the end-plate
potential. J. Physiol., 124, 560-573.
Cazares, V. A., Njus, M. M., Manly, A. Saldate, J. J., Subramani, A., Ben-Simon,
Y., Sutton, M. A., Ashery, U. and Stuenkel, E. L. (2016). Dynamic Partitioning of
Synaptic Vesicle Pools by the SNARE-Binding Protein Tomosyn. J. Neurosci., 36,
11208 –11222.
Cesca, F., Baldelli, P., Valtorta, F. and Benfenati, F. (2010). The synapsins: Key
actors of synapse function and plasticity. Prog. Neurobiol., 91, 312-348.
Chamberland, S. and Tóth, K. (2016). Functionally heterogeneous synaptic
vesicle pools support diverse synaptic signalling. J. Physiol., 594, 825–835.
Chan, S., Doreian, B. and Smith, C. (2010). Dynamin and Myosin Regulate
Differential Exocytosis from Mouse Adrenal Chromaffin Cells. Cell Mol.
Neurbiol., 30, 1351-1357.

247
Chanaday, N. L. and Kavalali, E. T. (2017). How do you recognize and
reconstitute a synaptic vesicle after fusion? F1000Research., 6,
doi:10.12688/f1000research.12072.1
Chang, C. Y., Jiang, X., Moulder, K. L. and Mennerick, S. (2010). Rapid Activation
of Dormant Presynaptic Terminals by Phorbol Esters. J. Neurosci., 30, 10048-
10060.
Chang, C. W., Chiang, C. W. and Jackson, M. B. (2017). Fusion pores and their
control of neurotransmitter and hormone release. J. Gen. Physiol., 149, 301-
322.
Chavez-Noriega, L. E. and Stevens, C. F. (1994). Increased transmitter release at
excitatory synapses produced by direct activation of adenylate cyclase in rat
hippocampal slices. J. Neurochem., 14, 310-317.
Chen, C. and Regehr, W. G. (1997). The mechanism of cAMP-mediated
enhancement at a cerebellar synapse. J. Neurosci., 17, 8687-8694.
Cheung, G., Jupp, O. J. and Cousin, M. A. (2010). Activity-dependent bulk
endocytosis and clathrin-dependent endocytosis replenish specific synaptic
vesicle pools in central nerve terminals. J. Neurosci., 30, 8151-8161.

248
Chung, C., Barlyko, B., Leitz, J., Liu, X. and Kavalali, E. T. (2010). Acute dynamin
inhibition dissects synaptic vesicle recycling pathways that drive spontaneous
and evoked neurotransmission. J. Neurosci., 30, 1363-1376.
Cingolani, L. A. and Goda, Y. (2008). Actin in action: the interplay between the
actin cytoskeleton and synaptic efficacy. Nat. Rev. Neurosci., 9, 344-356.
Clayton, E. L., Evans, G. J. O. and Cousin, M. A. (2007). Activity-dependent
control of bulk endocytosis by protein dephosphorylation in central nerve
terminals. J. Physiol., 585, 687-691.
Clayton, E. L., and Cousin, M. A. (2008). Differential labelling of bulk
endocytosis in nerve terminals by FM dyes. Neurochem. Int., 53, 51-55.
Clayton, E. L. and Cousin, M. A. (2009). The molecular physiology of activity-
dependent bulk endocytosis of synaptic vesicles. J. Neurochem., 111, 901-914.#
Clayton, E. L., Anggono, V., Smillie, K. J., Chau, N., Robinson, P. J. and Cousin, M.
A. (2009). The Phospho-Dependent Dynamin-Syndapin Interaction Triggers
Activity-Dependent Bulk Endocytosis of Synaptic Vesicles. J. Neurosci., 29, 7706-
7717.
Clayton, E. L., Sue, N., Smillie, K. J., O’Leary, T., Bache, N., Cheung, G., Cole, A.
R., Wyllie, D. J., Sutherland, C., Robinson, P. J. and Cousin, M. A. (2010).

249
Dynamin I phosphorylation by GSK3 controls activity-dependent bulk
endocytosis of synaptic vesicles. Nat. Neurosci., 13, 845-851.
Cocucci, E., Gaudin, R. and Kirchhausen, T. (2014). Dynamin recruitment and
membrane scission at the neck of a clathrin-coated pit. Mol. Biol. Cell., 25,
3595-3609.
Cohen, P. T. W. (2002). Protein phosphatase 1 – targeted in many directions. J.
Cell. Sci., 115, 241-256.
Coles, C. H. and Bradke, F. (2015). Coordinating neuronal actin-microtubule
dynamics. Curr. Biol., 25, 677-691.
Cong, L., Ran, F. A., Cox, D., Lin, S., Barretto, R., Habib, N., Hsu, P. D., Wu, X.,
Jiang, W., Marraffini, L. A. and Zhang, F. (2013). Multiplex genome engineering
using CRISPR/Cas systems. Sci., 339, 819-823.
Cook, T. A., Urrutia, R. and McNiven, M. A. (1994). Identification of dynamin 2,
an isoform ubiquitously expressed in rat tissues. PNAS., 91, 644-648.
Cook, T. A., Messa, K. and Urrutia, R. (1996). Three dynamin-encoding genes
are differentially expressed in developing rat brain. J. Neurochem., 67, 927-931.

250
Cortès-Saladelafont, E., Lipstein, N. and garcía-cazorla. (2018). Presynaptic
disorders: a clinical and pathophysiological approach focused on the synaptic
vesicle. J. Inherit. Metab. Dis., 41, 1131-1145.
Cotter, K., Stransky, L., McGuire, C. and Forgac, M. (2015). Recent Insights into
the Structure, Regulation and Function of the V-ATPases. Trends. Biochem. Sci.,
40, 611-622.
Cousin, M. A. and Robinson, P. J. (2000). Two Mechanisms of Synaptic Vesicle
Recycling in Rat Brain Nerve Terminals. J. Neurochem., 75, 1645–1653.
Cousin, M. A. and Robinson, P. J. (2001). The dephosphins: dephosphorylation
by calcineurin triggers synaptic vesicle endocytosis. Trends Neurosci., 24, 659-
665.
Cousin, M. A. (2017). A (free) radical approach reveals the physiological
function of different synaptic vesicle pools. J. Physiol., 595, 1005-1006.
Damke, H., Baba, T., Warnock, D. E. and Schmid, S. L. (1994). Induction of
mutant dynamin specifically blocks endocytic coated vesicle formation. J. Cell.
Biol., 127, 915-934.
Dao, K. K., Teigen, K., Kopperud, R., Hodneland, E., schwede, F., Christine, A. E.,
Martinez, A. and Døskeland, S. O. (2006). Epac1 and cAMP-dependent protein
kinase holoenzyme have similar cAMP affinity, but their cAMP domains have
251
distinct structural features and cyclic nucleotide recognition. J. Biol. Chem., 281,
21500-21511.
Das, S., Gerwin, C. and Sheng, Z. H. (2003). Syntaphilin binds to dynamin-1 and
inhibits dynamin-dependent endocytosis. J. Biol. Chem., 278, 41221-41226.
Davies, S. P., Reddy, H., Caivano, M. and Cohen, P. (2000). Specificity and
mechanism of action of some commonly used protein kinase inhibitors.
Biochem. J., 351, 95-105.
Denker, A. and Rizzoli, S. O. (2010). Synaptic vesicle pools: an update. Front
Synaptic Neurosci., 2, doi: 10.3389/fnsyn.2010.00135.
Denker, A., Kröhnert, K., Bückers, J., Neher, E. and Rizzoli, S. O. (2011). The
reserve pool of synaptic vesicles acts as a buffer for proteins involved in
synaptic vesicle recycling. Proc. Natl. Acad. Sci. USA., 108, 17183-17188.
Dessauer, C. W., Scully, T. T. and Gilman, A. G. (1997). Interactions of Forskolin
and ATP with the Cytosolic Domains of Mammalian Adenylyl Cyclase. J. Biol.
Chem., 272, 22272–22277.
Dillon, C. and Goda, Y. (2005). The actin cytoskeleton: integrating form and
function at the synapse. Annu. Rev. Neurosci., 28, 25-55.
252
Dodd, P. R., Hardy, J. A., Oakley, A. E., Edwardson, J. A., Perry, E. K. and
Delaunoy, J. P. (1981). A rapid method for preparing synaptosomes:
comparison, with alternative procedures. Brain. Res., 226, 107-118.
Doreian, B. W., Fulop, T. G. and Smith, C. B. (2008). Myosin II activation and
actin reorganization regulate the mode of quantal exocytosis in mouse adrenal
chromaffin cells. J. Neurosci., 28, 4470-4478.
Doussau, F. and Augustine, G. J. (2000). The actin cytoskeleton and
neurotransmitter release: an overview. Biochimie., 82, 353-363.
Doussau, F., Schmidt, H., Dorgans, K., Valera, A. M., Poulain, B. and Isope, P.
(2017). Frequency-dependent mobilization of heterogeneous pools of synaptic
vesicles shapes presynaptic plasticity. eLife 2017;6:e28935.
Douthitt, H. L., Luo, F., McCann, S. D. and meriney, S. D. (2011). Dynasore, an
inhibitor of dynamin, increases the probability of transmitter release.
Neuroscience., 172, 187-195.
Dunaevsky, A. and Connor, E. A. (2000). F-Actin Is Concentrated in Nonrelease
Domains at Frog Neuromuscular Junctions. J. Neurosci., 20, 6007-6012.
Elhamdani, A., Azizi, F. and Artalejo, C. R. (2006). Double patch clamp reveals
that transient fusion (kiss-and-run) is a major mechanism of secretion in calf
253
adrenal chromaffin cells: high calcium shifts the mechanism from kiss-and-run
to complete fusion. J. Neurosci., 26, 3030-3036.
Erecińska, M., Nelson, D. and Silver, I. A. (1996). Metabolic and energetic
properties of isolated nerve ending particles (synaptosomes). Biochim. Biophys.
Acta., 1277, 13-34.
Esposito, G., Ana Clara, F. and Verstreken, P. (2012). Synaptic vesicle trafficking
and Parkinson's disease. Dev. Neurobiol., 72, 134-144.
Evans, G. J. O. (2015). The Synaptosome as a Model System for Studying
Synaptic Physiology. Cold. Spring. Harb. Protoc., 5, 421-424.
Fà, M., Staniszewski, A., Saeed, F., Francis, Y. I. and Arancio, O. (2014). Dynamin
1 Is Required for Memory Formation. PLoS ONE., 9(3),
doi:10.1371/journal.pone.0091954.
Faelber, K., Posor, Y., Gao, S., Held, M., Roske, Y., Schulze, D., Haucke, V., Noé,
F. and Daumke, O. (2011). Crystal structure of nucleotide-free dynamin.
Nature., 477, 556-560.
Fatt, P. and Katz, B. (1952). Spontaneous subthreshold activity at motor nerve
endings. J. Physiol., 117, 109-128.

254
Ferguson, S. M., Brasnjo, G., hayashi, M., Wölfel, M., Collesi, C., Giovedi, S.,
Raimondi, A., Gong, L. W., Ariel, P., Paradise, S., O’Toole, E., Flavell, R.,
Cremona, O., Miesenböck, G., Ryan T. A. and De Camilli, P. (2007). A selective
activity-dependent requirement for dynamin 1 in synaptic vesicle endocytosis.
Science., 316, 570-574.
Ferguson, S. M., Raimondi, A., Paradise, S., Shen, H., Mesaki, K., Ferguson, A.,
Destaing, O., Ko, G., Takasaki, J., Cremona, O., O’ Toole, E. and De Camilli, P.
(2009). Coordinated Actions of Actin and BAR Proteins Upstream of Dynamin at
Endocytic Clathrin-Coated Pits. Dev. Cell., 17, 811-822.
Ferguson, S. M. and De Camilli, P. (2012). Dynamin, a membrane-remodelling
GTPase. Nat. Rev. Mol. Cell Biol., 13, 75-88.
Fernandes, H. B., Riordan, S., Nomura, T., Remmers, C. L., Kraniotis, S.,
Marshall, J. J., Kukreja, L., Vassar, R. and Contractor, A. (2015). Epac2 Mediates
cAMP-Dependent Potentiation of Neurotransmission in the Hippocampus. J.
Neurosci., 35, 6544-6553.
Fernández, J. J., Candenas, M. L., Souto, M. L., Trujillo, M. M. and Norte, M.
(2002). Okadaic acid, useful tool for studying cellular processes. Curr. Med.
Chem., 9, 229-262.
Ferrero, J. J., Alvarez, A. M., Ramirez-Franco, J., Godino, M. C., Bartolome-
Martin, D., Aguado, C., Torres, M., Lujan, R., Ciruela, F. and Sanchez-Prieto, J.
255
(2013). β-adrenergic receptors activate Epac, translocate Munc13-1 and
enhance the Rab3A-Rim1α interaction to potentiate glutamate release at
cerebrocortical nerve terminals. J. Biol. Chem., 288, 31370-31385.
Fesce, R., Grohovaz, F., Valtorta, F. and Meldolesi, J. (1994). Neurotransmitter
release: fusion or ‘kiss-and-run’? Trends Cell Biol., 4, 1-4.
Ford, M. G. J., Jenni, S. and Nunnari, J. (2011). The crystal structure of dynamin.
Nature., 477, 561-566.
Fowler, M, W. and Staras, K. (2015). Synaptic vesicle pools: Principles,
properties and limitations. Exp. Cell. Res., 335, 150-156.
Fulop, T., Doreian, B. and Smith C. (2008). Dynamin I plays dual roles in the
activity-dependent shift in exocytic mode in mouse adrenal chromaffin cells.
Arch. Biochem. Biophys., 477, 146-154.
Gaffield, M. A., and Betz, W. J. (2006). Imaging synaptic vesicle exocytosis and
endocytosis with FM dyes. Nat. Protoc., 1, 2916–2921.
Gan, Q. and Watanabe, S. (2018). Synaptic Vesicle Endocytosis in Different
Model Systems. Front. Cell. Neurosci., 28, 171, doi:10.3389/fncel.2018.00171.
Gao, J., Hirata, M., Mizokami, A., Zhao, J., Takahashi, I., Takeuchi, H. and Hirata,
M. (2016). Differential role of SNAP-25 phosphorylation by protein kinases A

256
and C in the regulation of SNARE complex formation and exocytosis in PC12
cells. Cell. Sig., 28, 425-437.
Gasman, S., Chasserot-Golaz. S., Malacombe, M., Way, M. and Bader, M. F.
(2004). Regulated Exocytosis in Neuroendocrine Cells: A Role for
Subplasmalemmal Cdc42/N-WASP-induced Actin Filaments. Mol. Biol. Cell., 15,
520-531.
Gaydukov, A. E., Tarasova, E. O. and Balezina, O. P. (2013). Calcium-dependent
phosphatase calcineurin downregulates evoked neurotransmitter release in
neuromuscular junctions of mice. Neurochem. J., 7:29, 29-33.
Glebov, O. O., Jackson, R. E., Winterflood, C. M., Doherty, P., Ewers, H. and
Burrone, J. (2017). Nanoscale Structural Plasticity of the Active Zone Matrix
Modulates Presynaptic Function. Cell. Rep., 18, 2715-2728.
Graham, M. E., O’Callaghan, D. W., McMahon, H. T. and Burgoyne, R. D. (2002).
Dynamin-dependent and dynamin-independent processes contribute to the
regulation of single vesicle release kinetics and quantal size. PNAS., 99, 7124-
7129.
Graham, M. E., Anggono, V., bache, N., Larsen, M. R., Craft, G. E. and Robinson,
P.J. (2007). The in vivo phosphorylation sites of rat brain dynamin I. J. Biol.
Chem., 282, 14695-14707.

257
Grandoch, M., Roscioni, S. S. and Schmidt, M. (2010). The role of Epac proteins,
novel cAMP mediators, in the regulation of immune, lung and neuronal
function. Br. J. Pharmacol., 159, 265-284.
Granseth, B., Odermatt, B., Royle, S. J. and Lagnado, L. (2006). Clathrin-
mediated endocytosis is the dominant mechanism of vesicle retrieval at
hippocampal synapses. Neuron., 51, 773-786.
Granseth, B., Odermatt, B., Royle, S. J. and Lagnado, L. (2007). Clathrin-
mediated endocytosis: the physiological mechanism of vesicle retrieval at
hippocampal synapses. J. Physiol., 585, 681-686.
Gray, E. G. and Whittaker V. P. (1962). The isolation of nerve endings from
brain: an electron-microscopic study of cell fragments derived by
homogenization and centrifugation. J. Anat., 96, 79-88.
Grimaldi, M., Atzori, M., Ray, P. and Alkon, D. L. (2001). Mobilization of Calcium
from Intracellular Stores, Potentiation of Neurotransmitter-Induced Calcium
Transients, and Capacitative Calcium Entry by 4-Aminopyridine. J. Neurosci., 21,
3135-3143.
Grynkiewicz, G., Poenie, M. and Tsien, R. Y. (1985). A new generation of Ca2+
indicators with greatly improved fluorescence properties. J. Biol. Chem. 260,
3440-3450.

258
Gu, C., Yaddanapudi, S., Weins, A., Osborn, T., Reiser, J., Pollak, M., Hartwig, J.
and Sever, S. (2010). Direct dynamin-actin interactions regulate the actin
cytoskeleton. EMBO. J., 29, 3593-3606.
Guarnieri, F. C. (2017). How Do Synaptic Vesicles “Know” Which Pool They
Belong to? J. Neurosci., 37, 2276-2278.
Guček, A., Jorgačevski, J., Singh, P., Geisler, C., Lisjak, M., Vardjan, N., Kreft, M.,
Egner, A. and Zorec, R. (2016). Dominant negative SNARE peptides stabilize the
fusion pore in a narrow, release-unproductive state. Cell. Mol. Life. Sci., 73,
3719-3731.
Gulaboski, R., Pereira, C. M., Cordeiro, M. N., Silva, A. F., Hoth, M. and Bogeski,
I. (2008). Redox properties of the calcium chelator Fura-2 in mimetic
biomembranes. Cell. Calcium., 43, 615-621.
Gutiérrez, L. M. and Villanueva, J. (2018). The role of F-actin in the transport
and secretion of chromaffin granules: an historic perspective. Pflugers Arch.,
470, 181-186.
Hanoune, J. and Defer, N. (2001). Regulation and role of adenylyl cyclase
isoforms. Annu. Rev. Pharmacol. Toxicol., 41, 145-174.
Harata, N., Pyle, J. L., Aravanis, A. M., Mozhayeva, M., Kavalali, E. T. and Tsien,
R. W. (2001). Limited numbers of recycling vesicles in small CNS nerve
259
terminals: implications for neural signaling and vesicular cycling. Trends.
Neurosci., 24, 637-643.
Harata, N. C., Aravanis, A. M. and Tsien, R. W. (2006). Kiss-and-run and full-
collapse fusion as modes of exo-endocytosis in neurosecretion. J. Neurochem.,
97, 1546-1570.
He, L., Wu, X. S., Mohan R. and Wu, L. G. (2006). Two modes of fusion pore
opening revealed by cell-attached recordings at a synapse. Nature., 444, 102-
105.
He, L. and Wu, L. G. (2007). The debate on the kiss-and-run fusion at synapses.
Trends Neurosci., 30, 447-455.
Hebb, C. O. and Whittaker, V. P. (1958). Intracellular distributions of
acetylcholine and choline acetylase. J. Physiol., 142, 187-196.
Henkel, A. W., Kang, G. and Kornhuber, J. (2001). A common molecular
machinery for exocytosis and the 'kiss-and-run' mechanism in chromaffin cells
is controlled by phosphorylation. J. Cell. Sci., 114, 4613-4620.
Herrero, I. and Sánchez-Prieto, J. (1996). cAMP-dependent Facilitation of
Glutamate Release by β-Adrenergic Receptors in Cerebrocortical Nerve
Terminals. J. Biol. Chem., 271, 30554–30560.

260
Herskovits, J. S., Burgess, C. C., Obar, R. A. and Vallee, R. B. (1993). Effect of
mutant rat dynamin on endocytosis. J. Cell. Biol., 122, 565-578.
Heuser, J. E. and Reese, T. S. (1973). Evidence for recycling of synaptic vesicle
membrane during transmitter release at the frog neuromuscular junction. J.
Cell. Biol., 57, 315-344.
Heuser, J. E., Reese, T. S., Dennis, M. J., Jan, Y., Jan, L. and Evans, L. (1979).
Synaptic vesicle exocytosis captured by quick freezing and correlated with
quantal transmitter release. J. Cell. Biol., 81, 275-300.
Heymann, J. A. and Hinshaw, J. (2009). Dynamins at a glance. J. Cell. Sci., 122,
3427-3431.
Hilfiker, S., Czernik, A. J., Greengard, P. and Augustine, G. J. (2001). Tonically
active protein kinase A regulates neurotransmitter release at the squid giant
synapse. J. Physiol., 531, 141-146.
Hill, T. A., Odell, L. R., Quan, A., Abagyan, R., Ferguson, G., Robinson, P. J. and
McCluskey, A. (2004). Long chain amines and long chain ammonium salts as
novel inhibitors of dynamin GTPase activity. Bioorg. Med. Chem. Lett., 14, 3275-
3278.
Hinshaw, J. E. (2000). Dynamin and its role in membrane fission. Annu. Rev.
Cell. Dev. Biol., 16, 483-519.

261
Holroyd, P., Lang, T., Wenzel, D., De Camilli, P. and Jahn, P. (2002). Imaging
direct, dynamin-dependent recapture of fusing secretory granules on plasma
membrane lawns from PC12 cells. PNAS, 99, 16806-16811.
Hosoi, N., Holt, M. and Sakaba, T. (2009). Calcium dependence of exo- and
endocytotic coupling at a glutamatergic synapse. Neuron., 63, 216-229.
Huang, K. P. (1989). The mechanism of protein kinase C activation. Trends.
Neurosci., 12, 425-432.
Huang, Y. Y., Kandel, E. R., Varshavsky, L., brandon, E. P., Qi, M., Idzerda, R. L.,
McKnight, G. S. and Bourtchouladze, R. (1995). A genetic test of the effects of
mutations in PKA on mossy fiber LTP and its relation to spatial and contextual
learning. Cell., 83, 1211-1222.
Huang, Y., Chen-Hwang, M. C., Dolios, G., Murakami, N., Padovan, J. C., Wang,
R. and Hwang, Y. W. (2004). Mnb/Dyrk1A phosphorylation regulates the
interaction of dynamin 1 with SH3 domain-containing proteins. Biochemistry.,
43, 10173-10185.
Huang, T. N., Chang, H. P. and Hsueh, Y. P. (2010). CASK phosphorylation by
PKA regulates the protein–protein interactions of CASK and expression of the
NMDAR2b gene. J. Neurochem., 112, 1562-1573.

262
Ikeda, K. and Bekkers, J. M. (2009). Counting the number of releasable synaptic
vesicles in a presynaptic terminal. PNAS., 106, 2945-2950.
Imamura, Y., Matsumoto, N., Kondo, S., Kitayama, H. and Noda, M. (2003).
Possible involvement of Rap1 and Ras in glutamatergic synaptic transmission.
Neuroreport., 14, 1203-1207.
Iwabuchi, S., Kakazu, Y., Koh, J. Y., Goodman, K. M., Harata, N. C. (2014).
Examination of Synaptic Vesicle Recycling Using FM Dyes During Evoked,
Spontaneous, and Miniature Synaptic Activities. J. Vis. Exp., 85, 50557. doi:
10.3791/50557.
Jackman, S. L., Turecek, J., Belinsky, J. E. and Regehr, W. G. (2016). The calcium
sensor synaptotagmin 7 is required for synaptic facilitation. Nature., 529, 88-
91.
Jackson, M. B. and Chapman, E. R. (2006). Fusion pores and fusion machines in
Ca2+-triggered exocytosis. Annu. Rev. Biophys. Biomol. Struct., 35, 135-160.
Johnson, R. A., Desaubry, L., Bianchi, G., Shoshani, I., Lyons, E., Taussig, R.,
Watson, P. A., Cali, J. J., Krupinski, J., Pieroni, J. P. and Iyengar, R. (1997).
Isozyme-dependent Sensitivity of Adenylyl Cyclases to P-site-mediated
Inhibition by Adenine Nucleosides and Nucleoside 3′-Polyphosphates. J. Biol.
Chem., 272, 8962-8966.

263
Jung, J. H., Szule, J. A., Stouder, K., Marshall, R. M. and McMahan, U. J. (2018).
Active Zone Material-Directed Orientation, Docking, and Fusion of Dense Core
Vesicles Alongside Synaptic Vesicles at Neuromuscular Junctions. Front.
Neuroanat., 12:72. doi: 10.3389/fnana.2018.00072.
Kaeser, P. S. and Regehr, W. G. (2017). The readily releasable pool of synaptic
vesicles. Curr. Opin. Neurobiol., 43, 63-70.
Kao, J., Li, G. and Auston, D. (2010). Calcium in Living Cells. Method Cell Biol. 99,
113-152.
Kase, H., Iwahashi, K., Nakanishi, S., Matsuda, Y., Yamada, K., Takkahashi, M.,
Murakata, C., Sato, A. and Kaneko, M. (1987). K-252 compounds, novel and
potent inhibitors of protein kinase C and cyclic nucleotide-dependent protein
kinases. Biochem. Biophys. Res. Commun., 142, 436-440.
Katz, B. (1969). The release of neural transmitter substances. Charles C.
Thomas. Springfield, IL, USA.
Kavalali, E. T. (2007). Multiple vesicle recycling pathways in central synapses
and their impact on neurotransmission. J. Physiol., 585, 669-679.
Kavalali, E. T. (2015). The mechanisms and functions of spontaneous
neurotransmitter release. Nat. Rev. Neurosci., 16, 5–16.

264
Kawasaki, H., Springett, G. M., Mochizuki, N., Toki, S., Nakaya, M., Matsuda, M.,
Housman, D. E. and Graybiel, A. M. (1998). A family of cAMP-binding proteins
that directly activate Rap1. Science., 282, 2275-2279.
Kay, A. R., Alfonso, A., Alford, S., Cline, H. T., Holgado, A. M., Sakmann, B.,
Snitsarev, V. A., Stricker, T. P., Takahashi, M. and Wu, L. (1999). Imaging
Synaptic Activity in Intact Brain Slices with FM1-43 in C. elegens, Lamprey, and
Rat. Neuron., 24, 809-817.
Kay, A. R. (2007). Imaging FM Dyes in Brain Slices. CHS Protoc., 1,
doi:10.1101/pdb.prot4853.
Von Kleist, L., Stahlschmidt, W., Bulut, H., Gromova, K., Puchkov, D., Robertson,
M. J., MacGregor, K. A., Tomilin, N., Pechstein, A., Chau, N., Chircop, M., Sakoff,
J., von Kries, J. P., Saenger, W., Kräusslich, H. G., Shupliakov, O., Robinson, P. J.,
McCluskey, A. and Haucke, V. (2011). Role of the clathrin terminal domain in
regulating coated pit dynamics revealed by small molecule inhibition. Cell., 146,
471-484.
Knighton, D. R., Zheng, J. H., Ten Eyck, L. F., Xuong, N. H., Taylor, S. S. and
Sowadski, J. M. (1991). Structure of a peptide inhibitor bound to the catalytic
subunit of cyclic adenosine monophosphate-dependent protein kinase.
Science., 253, 414-420.

265
Kokotos, A. C. and Low, D. W. (2015). Myosin II and Dynamin Control Actin
Rings to Mediate Fission during Activity-Dependent Bulk Endocytosis. J.
Neurosci., 35, 8687-8688.
Köles, L., Kató, E., Hanuska, A., Zádori, Z. S., Al-Khrasani, M., Zelles, T., Rubini, P.
and Illes, P. (2016). Modulation of excitatory neurotransmission by
neuronal/glial signalling molecules: interplay between purinergic and
glutamatergic systems. Purinergic signalling, 12, 1–24.
Kononenko, N. L., Pechstein, A. and Haucke, V. (2013). The tortoise and the
hare revisited. elife 2013;2:e01233.
Kovacs, M., Tóth, J., Hetényi, C., Málnási-Csizmadia, A. and Sellers, J. R. (2004).
Mechanism of blebbistatin inhibition of myosin II. J. Biol. Chem., 279, 35557-
35563.
Larsen, M. R., Graham, M. E., Robinson, P. J. and Roepstorff, P. (2004).
Improved detection of hydrophilic phosphopeptides using graphite powder
microcolumns and mass spectrometry: evidence for in vivo doubly
phosphorylated dynamin I and dynamin III. Mol. Cell. Proteomics., 3, 456-465.
Lasič, E., Stenovec, M., Kreft, M., Robinson, P. J. and Zorec, R. (2017). Dynamin
regulates the fusion pore of endo- and exocytotic vesicles as revealed by
membrane capacitance measurements. BBA – Gen. Subj., 1861, 2293-2303.
266
Laurent, P., Ch’ng, Q. L., Jospin, M., Chen, C., Lorenzo, R. and de Bono, M.
(2018). Genetic dissection of neuropeptide cell biology at high and low activity
in a defined sensory neuron. PNAS., 115, E6890–E6899.
Lazareno, S., Popham, A. and Birdsall, N. J. (2000). Allosteric interactions of
staurosporine and other indolocarbazoles with N-[methyl-(3)H]scopolamine
and acetylcholine at muscarinic receptor subtypes: identification of a second
allosteric site. Mol. Pharmacol., 58, 194-207.
Lee, E. and De Camilli, P. (2002). Dynamin at actin tails. PNAS., 99, 161-166.
Lee, J. S., Ho, W. K. and Lee, S. H. (2012). Actin-dependent rapid recruitment of
reluctant synaptic vesicles into a fast-releasing vesicle pool. PNAS, 109, E765-
774.
Leenders, A. G. M. and Sheng, Z. H. (2005). Modulation of neurotransmitter
release by the second messenger-activated protein kinases: Implications for
presynaptic plasticity. Pharmacol. Ther., 105, 69-84.
Li, Y. C. and Kavalali, E. T. (2017). Synaptic Vesicle-Recycling Machinery
Components as Potential Therapeutic Targets. Pharmacol. Rev., 69, 141-160.
Lin, H. C. and Gilman, A. G. (1996). Regulation of Dynamin I GTPase Activity by
G Protein βγ Subunits and Phosphatidylinositol 4,5-Bisphosphate. J. Biol. Chem.,
271, 27979-27982.
267
Lindau, M. and Alvarez de Toledo, G. (2003). The fusion pore. Biochem. Biophys.
Acta. 1641, 167-173.
Liu, J. P., Sim, A. T. and Robinson, P. J. (1994). Calcineurin inhibition of dynamin
I GTPase activity coupled to nerve terminal depolarization. Science., 265, 970-
973.
Liu, Y. W., Surka, M. C., Schroeter, T., Lukiyanchuk, V. and Schmid, S. L. (2008).
Isoform and splice-variant specific functions of dynamin-2 revealed by analysis
of conditional knock-out cells. Mol. Biol. Cell., 19(12), 5347-5359.
Liu, Y. W., Neumann, S., Ramachandran, R., Ferguson, S. M., Pucadyil, T. J. and
Schmid, S. L. (2011). Differential curvature sensing and generating activities of
dynamin isoforms provide opportunities for tissue-specific regulation. PNAS,
108, 234-242.
Lou, X. (2018). Sensing Endocytosis and Triggering Endocytosis at the Synapses:
Synaptic Vesicle Exocytosis-Endocytosis Coupling. Front. Cell. Neurosci., 12(66),
doi: 10.3389/fncel.2018.00066.
Macia, E., Ehrlich, M., Massol, R., Boucrot, E., Brunner, C. and Kirchhausen, T.
(2006). Dynasore, a cell-permeable inhibitor of dynamin. Dev. Cell., 10, 839-
850.

268
Maeno-Hikichi, Y., Polo-Parada, L., Kastanenka, K. and Landmesser, L. T. (2011).
Frequency dependent modes of synaptic vesicle endocytosis and exocytosis at
adult mouse neuromuscular junctions. J. Neurosci., 31, 1093-1105.
Malacombe, M., Bader, M. F. and Gasman, S. (2006). Exocytosis in
neuroendocrine cells: new tasks for actin. Biochim. Biophys. Acta., 1763, 1175-
1183.
Maritzen, T. and Haucke, V. (2018). Coupling of exocytosis and endocytosis at
the presynaptic active zone. Neurosci. Res., 127, 45-52.
Marks, B. and McMahon, H.T. (1998). Calcium triggers calcineurin-dependent
synaptic vesicle recycling in mammalian nerve terminals. Curr. Biol. 8, 740-749.
Martinsen, A., Schakman, O., Yerna, X., Dessy, C. and Morel, N. (2014). Myosin
light chain kinase controls voltage-dependent calcium channels in vascular
smooth muscle. Pflugers Arch., 466(7), 1377-1389.
Matteoli, M., Haimann, C., Torri-Tarelli, F., Polak, J. M., Ceccarelli, B. and De
Camilli, P. (1988). Differential effect of ci-latrotoxin on exocytosis from small
synaptic vesicles and from large dense-core vesicles containing calcitonin gene-
related peptide at the frog neuromuscular junction. PNAS., 85, 7366-7370.
McMahon, H. T. and Nicholls, D. G. (1991). The bioenergetics of
neurotransmitter release. Biochim, Biophys, Acta., 1059, 243-264.

269
Meinecke, M., Boucrot, E., Camdere, G., Hon, W. C., Mittal, R. and McMahon,
H. T. (2013). Cooperative Recruitment of Dynamin and BIN/Amphiphysin/Rvs
(BAR) Domain-containing Proteins Leads to GTP-dependent Membrane
Scission. J. Biol. Chem., 288, 6651-6661.
Mellander, L. J., Trouillon, R., Svensson, M. I. and Ewing, A. G. (2012).
Amperometric post spike feet reveal most exocytosis is via extended kiss-and-
run fusion. Sci. Rep., 2, doi: 10.1038/srep00907.
Menegon, A., Bonanomi, D., Albertinazzi, C., Lotti, F., Ferrari, G., Kao, H. T.,
Benfenati, F., Baldelli, P. and Valtorta, F. (2006). Protein kinase A-mediated
synapsin I phosphorylation is a central modulator of Ca2+-dependent synaptic
activity. J. Neurosci., 26, 11670-11681.
Mettlen, M., Pucadyil, T., Ramachandran, R. and Schmid, S. L. (2009). Dissecting
dynamin’s role in clathrin-mediated endocytosis. Biochem. Soc. Trends., 37,
1022-1026.
Michel, K., Müller, J. A., Oprişoreanu, A. and Schoch, S. (2015). The presynaptic
active zone: A dynamic scaffold that regulates synaptic efficacy. Exp. Cell Res.,
335, 157-164.
Miki, T., Malagon, G., Pulido, C., Llano, I., Neher, E. and Marty, A. (2016). Actin-
and Myosin-Dependent Vesicle Loading of Presynaptic Docking Sites Prior to
Exocytosis. Neuron., 91, 808-823.

270
Miklavc, P., Wittekindt, O. H., Felder, E. and Dietl, P. (2009). Ca2+-Dependent
Actin Coating of Lamellar Bodies after Exocytotic Fusion: A Prerequisite for
Content Release or Kiss-and-Run. Annals. New. York. Accad. Sci., 1152, 43-52.
Milosevic, I. (2018). Revisiting the Role of Clathrin-Mediated Endocytosis in
Synaptic Vesicle Recycling. Front. Cell. Neurosci., 12, 27. doi:
10.3389/fncel.2018.00027.
Min, L., Leungm Y. M., Tomas, A., Watson, R. T., Gaisano, H. Y., Halban, P. A.,
Pessin, J. E. and Hou, J. C. (2007). Dynamin is functionally coupled to insulin
granule exocytosis. J. Biol. Chem., 282, 33530-33536.
Moghadam, P. K. and Jackson, M. B. (2013). The functional significance of
synaptotagmin diversity in neuroendocrine secretion. Front. Endocrinol., 4,
doi:10.3389/fendo.2013.00124.
Morton, A., Marland, J. R. and Cousin, M. A. (2015). Synaptic vesicle exocytosis
and increased cytosolic calcium are both necessary but not sufficient for
activity-dependent bulk endocytosis. J. Neurochem., 134, 405-415.
Morton, W. M., Ayscough, K. R. and McLaughlin, P. J. (2000). Latrunculin alters
the actin-monomer subunit interface to prevent polymerization. Nat. Cell. Biol.,
2, 376-378.

271
Murrell, M., Oakes, P. W., Lenz, M. and Gardel, M. L. (2015). Forcing cells into
shape: the mechanics of actomyosin contractility. Nat. Rev. Mol. Cell. Biol. 16,
486-498.
Neco, P., Fernández-Peruchena, C., Navas, S., Gutiérrez, L. M., Alvarez de
Toledo, G. and Alés, E. (2008). Myosin II Contributes to Fusion Pore Expansion
during Exocytosis. J. Biol. Chem., 283, 10949-10957.
Neher, E. (2015). Merits and Limitations of Vesicle Pool Models in View of
Heterogeneous Populations of Synaptic Vesicles. Neuron., 87, 1131-1142.
Neuberger, G., Schneider, G. and Eisenhaber, F. (2007). pkaPS: prediction of
protein kinase A phosphorylation sites with the simplified kinase-substrate
binding model. Biol. Direct., 2, 1. doi:10.1186/1745-6150-2-1.
Nguyen, P. V. and Woo, N. H. (2003). Regulation of hippocampal synaptic
plasticity by cyclic AMP-dependent protein kinases. Prog. Neurobiol. 71, 401-
437.
Nicholls, D. G., Sihra, T. S. and Sanchez-Prieto, J. (1987). Calcium-Dependent
and-Independent Release of Glutamate from Synaptosomes Monitored by
Continuous Fluorometry. J. Neurochem., 49, 50-57.
272
Nicholson-Fish, J. C., Kokotos, A. C., Gillingwater, T. H., Smillie, K. J. and Cousin,
M. A. (2015). VAMP4 Is an Essential Cargo Molecule for Activity-Dependent
Bulk Endocytosis. Neuron., 88, 973-984.
Niemann, H. H., Knetsch, M. L. W., Scherer, A., Manstein, D. J. and Kull, F. J.
(2001). Crystal structure of a dynamin GTPase domain in both nucleotide-free
and GDP-bound forms. EMBO. J., 20, 5813-5821.
Nightingale, T. D., Cutler, D. F. and Cramer, L. P. (2012). Actin coats and rings
promote regulated exocytosis. Trends. Cell. Biol., 22, 329-337.
Olsen, M. K., Reszka, A. A. and Abraham, I. (1998). KT5720 and U-98017 inhibit
MAPK and alter the cytoskeleton and cell morphology. J. Cell. Physiol., 176,
525-536.
Papadopulos, A., Tomatis, V. M., Kasula, R. and Meunier, F. A. (2013). The
Cortical Acto-Myosin Network: From Diffusion Barrier to Functional Gateway in
the Transport of Neurosecretory Vesicles to the Plasma Membrane. Front.
Endocrinol., 4, 153. doi:10.3389/fendo.2013.00153.
Papadopulos, A. (2017). Membrane shaping by actin and myosin during
regulated exocytosis. Mol. Cell. Neurosci., 84, 93-99.

273
Park, H., Li, Y. and Tsien, R. W. (2012). Influence of Synaptic Vesicle Position on
Release Probability and Exocytotic Fusion Mode. Science., 335, 1362-1366.
Park, R. J., Shen, H., Liu, L., Liu, X., Ferguson, S. M. and De Camilli, P. (2013).
Dynamin triple knockout cells reveal off target effects of commonly used
dynamin inhibitors. J. Cell. Sci., 126, 5305-5312.
Park, A. J., Havekes, R., Choi, J. H., Luczak, V., Nie, T., Huang, T. and Abel, T.
(2014). A presynaptic role for PKA in synaptic tagging and memory. Neurobiol.
Learn. Mem., 114, 101-112.
Palade, G. E. and Palay, S. L. (1954). Electron microscope observations of
interneuronal and neuromuscular synapses. Anat. Rec., 118, 335-336.
Palay, S. L. (1956). Synapses in the central nervous system. J Biophys. Biochem.
Cytol. 2, 193-202.
Persoon, C. M., Moro, A., Nassal, J. P., Farina, M., Broeke, J. H., Arora, S.,
Dominguez, N., van Weering, J. R. T., Toonen, R. F. and Verhage, M. (2018).
Pool size estimations for dense-core vesicles in mammalian CNS neurons.
EMBO. J., 37, e99672. doi:10.15252/embj.201899672.
Petrov, A. M., Giniatullin, A. R. and Zefirov, A. L. (2008). Role of the cAMP
cascade in the turnover of synaptic vesicles of the frog motor nerve terminal.
Neurochem. J., 2, 175-182.

274
Petrov, A. M., Zakyrjanova, G. F., Yakovleva, A. A. and Zefirov, A. L. (2015).
Inhibition of protein kinase C affects on mode of synaptic vesicle exocytosis due
to cholesterol depletion. Biochem. Biophys. Res. Commun., 456, 145-150.
Pinto, C., Hübner, M., Gille, A., Richter, M., Mou, T. C., Sprang, S. R., Seifert, R.
(2010). Differential Interactions of the Catalytic Subunits of Adenylyl Cyclase
with Forskolin Analogs. Biochem. Pharmacol., 78, 62-69.
Powell, K. A., Valova, V. A., Malladi, C. S., Jensen, O. N., Larsen, M. R. and
Robinson, P. J. (2000). Phosphorylation of dynamin I on Ser-795 by protein
kinase C blocks its association with phospholipids. J. Biol. Chem., 275, 11610–
11617.
Pyle, J. L., Kavalali, E. T., Piedras-Rentería, E. S. and Tsien, R. W. (2000). Rapid
Reuse of Readily Releasable Pool Vesicles at Hippocampal Synapses. Neuron.,
28, 221-231.
Quan, A., McGeachie, A. B., Keating, D. J., van Dam, E. M., Rusak, J., Chau, N.,
Malladi, C. S., Chen, C., McCluskey, A., Cousin, M. A. and Robinson, P. J. (2007).
Myristyl trimethyl ammonium bromide and octadecyl trimethyl ammonium
bromide are surface-active small molecule dynamin inhibitors that block
endocytosis mediated by dynamin I or dynamin II. Mol. Pharmacol., 72, 1425-
1439.

275
Raimondi, A., Ferguson, S. M., Lou, X., Armbruster, M., Paradise, S., Giovedi, S.,
Messa, M., Kono, N., Takaski, J., Cappello, V., O’Toole, E., Ryan, T. A. and De
Camilli, P. (2011). Overlapping role of dynamin isoforms in synaptic vesicle
endocytosis. Neuron., 70, 1100-1114.
Reubold, T. F., Faelber, K., Plattner, N., Posor, Y., Ketel, K., Curth, U., Schlegel, J.,
Anand, R., Manstein, D. J., Noé, V., Haucke, V., Daumke, O. and Eschenburg, S.
(2015). Crystal structure of the dynamin tetramer. Nature., 525, 404-408.
Richards, D. A., Bai, J. and Chapman, E. R. (2005). Two modes of exocytosis at
hippocampal synapses revealed by rate of FM1-43 efflux from individual
vesicles. J. Cell. Biol., 168, 929-939.
Richards, D. A. (2010). Regulation of exocytic mode in hippocampal neurons by
intra-bouton calcium concentration. J. Physiol., 588, 4927-4936.
Ritter, B., Murphy, S., Dokainish, H., Girard, M., Gudheti, M. V., Kozlov, G.,
Halin, M., Philie, J., Jorgensen, E. M., Gehring, K. and McPherson, P. S. (2013).
NECAP 1 Regulates AP-2 Interactions to Control Vesicle Size, Number, and
Cargo During Clathrin-Mediated Endocytosis. PLoS. Biol., 11, e1001670.
doi:10.1371/journal.pbio.1001670.

276
Rizo, J. and Rosenmund, C. (2008). Synaptic vesicle fusion. Nat. Struct. Mol.
Biol. 15, 665-674.
Rizzoli, S. O. and Betz, W. J. (2003). Neurobiology: All change at the synapse.
Nature., 423, 591-592.
Rizzoli, S. O. and Betz, W. J. (2004). The structural organization of the readily
releasable pool of synaptic vesicles. Science., 303, 2037-2039.
Rizzoli, S. O. and Betz, W. J. (2005). Synaptic vesicle pools. Nat. Rev. Neurosci.,
6, 57-69.
Rizzoli, S. O. and Jahn, R. (2007). Kiss-and-run, collapse and 'readily retrievable'
vesicles. Traffic., 8, 1137-1144.
Rizzoli, S. O. (2014). Synaptic vesicle recycling: steps and principles. EMBO J.,
33, 788-822.
De Robertis, E. D. P. and Bennett, H. S. (1955). Submicroscopic vesicular
component in the synapse. Fed. Proc. 13, 35.
Robinson, P. J. (1991). Dephosphin, a 96,000 Da substrate of protein kinase C in
synaptosomal cytosol, is phosphorylated in intact synaptosomes. FEBS Lett.,
282, 388-392.

277
Robinson, P. J. (1992). Differential Stimulation of Protein Kinase C Activity by
Phorbol Ester or Calcium/Phosphatidylserine in Vitro and in Intact
Synaptosomes. J. Biol. Chem. 267, 21637-21644.
Robinson, P. J., Liu, K.A., Powell, K. A., Fyske, E. M. and Südhof, T.C. (1994).
Phosphorylation of dynamin I and synaptic-vesicle recycling. Trends Neurosci.,
17, 348-353.
Roman-Vendrell, C., Chevalier, M., Acevedo-Canabal, A. M., Delgado-Peraza, F.,
Flores-Otero, J. and Yudowski, G. A. (2014). Imaging of kiss-and-run exocytosis
of surface receptors in neuronal cultures. Front. Cell. Neurosci., 8, 363.
doi:10.3389/fncel.2014.00363.
de Rooij, J., Zwartkruis, F. J., Verheijen, M. H., Col, R. H., Nijman, S. M.,
Wittinghofre, A. and Bos, J. L. (1998). Epac is a Rap1 guanine-nucleotide-
exchange factor directly activated by cyclic AMP. Nature., 396, 474-477.
de Rooij, J., Rehmann, H., van Triest, M., Cool, R. H., Wittinghofer, A. and Bos, J.
L. (2000). Mechanism of regulation of the Epac family of cAMP-dependent
RapGEFs. J. Biol. Chem., 275, 20829-20836.
Rudling, J. E., Drever, B. D., Reid, B. and Bewick, G. S. (2018). Importance of Full-
Collapse Vesicle Exocytosis for Synaptic Fatigue-Resistance at Rat Fast and Slow
Muscle Neuromuscular Junctions. Int. J. Mol. Sci., 19,
doi:10.3390/ijms19071936.

278
Saheki, Y. and De Camilli, P. (2012). Synaptic Vesicle Endocytosis. Cold Spring
Harb Perspect Biol., 4:a005645.
Samaslip, P., Chan, S. A. and Smith, C. (2012). Activity-Dependent Fusion Pore
Expansion Regulated by Calcineurin-Dependent Dynamin-Syndapin Pathway in
Mouse Adrenal Chromaffin cells. J. Neurosci., 32, 10438-10447.
Sanchez-Prieto, J., Sihra, T. S., Evans, D., Ashton, A., Dolly, J. O. and Nichols, D.
G. (1987). Botulinum toxin A blocks glutamate exocytosis from guinea-pig
cerebral cortical synaptosomes. Eur. J. Biochem., 165, 675-681.
Sandberg, M., Butt, E., Nolte, C., Fischer, L., Halbrügge, M., Beltman, J.,
Jahnsen, T., Genieser, H. G., Jastorff, B. and Walter, U. (1991). Characterization
of Sp-5,6-dichloro-1-beta-D-ribofuranosylbenzimidazole-3',5'-
monophosphorothioate (Sp-5,6-DCl-cBiMPS) as a potent and specific activator
of cyclic-AMP-dependent protein kinase in cell extracts and intact cells.
Biochem. J., 279, 521-527.
Sandana, R. and Dessauer, C. W. (2009). Physiological roles for G protein-
regulated adenylyl cyclase isoforms: insights from knockout and overexpression
studies. Neurosignals., 17, 5-22.
Scheefhals, N. and MacGillavry, H. D. (2018). Functional organization of
postsynaptic glutamate receptors. Mol. Cell. Neurosci., 91, 82-94.

279
Schikorski, T. and Stevens C. F. (1997). Quantitative Ultrastructural Analysis of
Hippocampal Excitatory Synapses. J. Neurosci., 17, 5858-5867.
Schikorski, T. (2014). Readily releasable vesicles recycle at the active zone of
hippocampal synapses. PNAS., 111, 5415-5420.
Schmidt, M., Dekker, F. J. and Maarsingh, H. (2013). Exchange Protein Directly
Activated by cAMP (epac): A Multidomain cAMP Mediator in the Regulation of
Diverse Biological Functions. Pharmacol. Rev., 65, 670-709.
Schweizer, F. E. and Ryan, T. A. (2006). The synaptic vesicle: cycle of exocytosis
and endocytosis. Curr. Opin. Neurobiol., 16, 298-304.
Seamon, K. B. and Daly, J. W. (1981). Forskolin: a unique diterpene activator of
cyclic AMP-generating systems. J. Cyclic. Nucleotides. Res., 7, 201-224.
Seino, S. and Shibasaki, T. (2005). PKA-dependent and PKA-independent
pathways for cAMP-regulated exocytosis. Physiol. Rev. 85, 1303-1342.
Sharma, S. and Lindau, M. (2018). Molecular mechanism of fusion pore
formation driven by the neuronal SNARE complex. PNAS., 115, 12751-12756.
Shi, L., Shen, Q. T., Kiel, A., Wang, J., Wang, H. W., Melia, T. J., Rothman, J. E.
and Pincet, F. (2012). SNARE proteins: one to fuse and three to keep the
nascent fusion pore open. Science., 335, 1355-1359.

280
Shu, S., Liu, X. and Korn, E. D. (2005). Blebbistatin and blebbistatin-inactivated
myosin II inhibit myosin II-independent processes in Dictyostelium. PNAS., 102,
1472-1477.
Siksou, L., Rostaing, P., Lechaire, J. P., Boudier, T., Ohtsuka, T., Fejtová, A., Kao,
H. T., Greengard, P., Gundelfinger, E. D., Triller, A. and Marty, S. (2007). Three-
Dimensional Architecture of Presynaptic Terminal Cytomatrix. J. Neurosci., 27,
6868-6877.
Sim, A. T. R., Herd, L., Proctor, D. T., Baldwin, M. L., Meunier, F. A. and Rostas, J.
A. P. (2006). High throughput analysis of endogenous glutamate release using a
fluorescence plate reader. J. Neurosci. Methods. 153, 43-47.
Singh, D. (2017). Phosphorylation sites on specific neuronal protein can control
the mode of synaptic vesicle exocytosis and thereby regulate synaptic
transmission. Doctoral thesis, UCLan, Preston.
Smillie, K. J. and Cousin, M. A. (2005). Dynamin I Phosphorylation and the
Control of Synaptic Vesicle Endocytosis. Biochem Soc Symp., 72, 87-97.
Sone, M., Suzuki, E., Hoshino, M., Hou, D., Kuromi, H., Fukata, M., Kuroda, S.,
Kaibuchi, K., Nabeshima, Y. and Hama, C. (2000). Synaptic development is
controlled in the periactive zones of Drosophila synapses. Development., 127,
4157-4168.

281
Sontag, J., Fyske, E. M., Ushkaryov, Y., Liu, J., Robinson, P. J. and Südhof, T. C.
(1994). Differential Expression and Regulation of Multiple Dynamins. J. Biol.
Chem., 269, 4547-4554.
Soykan, T., Maritzen, T. and Haucke, V. (2016). Modes and mechanisms of
synaptic vesicle recycling. Curr. Opin. Neurobiol., 39, 17-23.
Soykan, T., Kaempf, N., Sakaba, T., Vollweiter, D., Goerdeler, F., Puchkov, D.,
Kononenko, N. L. and Haucke, V. (2017). Synaptic Vesicle Endocytosis Occurs on
Multiple Timescales and Is Mediated by Formin-Dependent Actin Assembly.
Neuron., 93, 854-866.
Srinivasan, S., Burckhardt, C. J., Bhave, M., Chen, Z., Chen, P. H., Wang, X.,
Danuser, G. and Schmid, S. L. (2018). A noncanonical role for dynamin-1 in
regulating early stages of clathrin-mediated endocytosis in non-neuronal cells.
PLoS. Biol., 16(4). e2005377. doi: 10.1371/journal.pbio.2005377.
Ster, J., Bock, F. D., Guerineau, N. C., Janossy, A., Barrere-Lemaire, S., Bos, J. L.,
Bockaert, J. and Fagni, L. (2007). Exchange protein activated by cAMP (Epac)
mediates cAMP activation of p38 MAPK and modulation of Ca2+-dependent K+
channels in cerebellar neurons. PNAS., 104, 2519-2524.
Stevens, C. F. and Williams, J. H. (2000). "Kiss and run" exocytosis at
hippocampal synapses. PNAS., 97, 12828-12833.
282
Stowell, M. H., Marks, B., Wigge, P. and McMahon, H.T. (1999). Nucleotide-
dependent conformational changes in dynamin: evidence for a
mechanochemical molecular spring. Nat. Cell. Biol., 1, 27-32.
Südhof, T. C. (2004). The Synaptic Vesicle Cycle. Annu. Rev. Neurosci., 27, 509–
47.
Südhof, T. C. (2013). Neurotransmitter release: the last millisecond in the life of
a synaptic vesicle. Neuron., 80, 675-690.
Sun, M. K. and Alkon, D. L. (2012). Activation of protein kinase C isozymes for
the treatment of dementias. Adv. Pharmacol., 64, 273-302.
Sunahara, R. K., Dessauer, C. W. and Gilman, A. G. (1996). Complexity and
diversity of mammalian adenylyl cyclases. Annu. Rev. Pharmacol. Toxicol., 36,
461-480.
Sundborger, A. C. and Hinshaw, J. E. (2014). Regulating dynamin dynamics
during endocytosis. F1000prime reports, 6, 85. doi:10.12703/P6-85.
Taira, K., Umikawa, M., Takei, K., Myagmar, B. E., Shinzato, M., Machida, N.,
Uezato, H., Nonaka, S. and Kariya, K. (2004). The Traf2- and Nck-interacting
kinase as a putative effector of Rap2 to regulate actin cytoskeleton. J. Biol.
Chem., 279, 49488-49496.

283
Takamori, S., Holt, M., Stenius, K., Lemke, E. A., Grønborg, M., Riedel, D.,
Urlaub, H., Schenck, S., Brügger, B., Ringler, P., et al., (2006). Molecular
anatomy of a trafficking organelle. Cell., 127, 831–846.
Tan, T. C., Valova, V. A., Malladi, C. S., Graham, M. E., Berven L. A., Jupp O. J.,
Hansra G., McClure S. J., Sarcevic B., Boadle R. A., et al., (2003). Cdk5 is
essential for synaptic vesicle endocytosis. Nat. Cell Biol. 5, 701-710.
Tang, W. J. and Hurley, J. H. (1998). Catalytic mechanism and regulation of
mammalian adenylyl cyclases. Mol. Pharmacol., 54, 231-240.
Tibbs, G. R., Barrie, A. P., Mieghem, F. J. E., McMahon, H. T. and Nicholls, D. G.
(1989). Repetitive Action Potentials in Isolated Nerve Terminals in the Presence
of 4-Aminopyridine: Effects on Cytosolic Free Ca2+ and Glutamate Release. J.
Neurochem., 53, 1693-1699.
Trouillon, R. and Ewing, A. G. (2013). Amperometric measurements at cells
support a role for dynamin in the dilation of the fusion pore during exocytosis.
Chemphyschem., 14, 2295-2301.
Trudeau, L. E., Emery, D. G., Haydon, P. G. (1996). Direct Modulation of the
Secretory Machinery Underlies PKA-Dependent Synaptic Facilitation in
Hippocampal Neurons. Neuron., 17, 789-797.
284
Tzounopoulos, T., Janz, R., Südhof, T. C., Nicoll, R. A. and Malenka, R. C. (1998).
A role for cAMP in long-term depression at hippocampal mossy fiber synapses.
Neuron., 21, 837-845.
Urrutia, R., Henley, J. R., Cook, T. and McNiven, M. A. (1997). The dynamins:
Redundant or distinct function for an expanding family of related GTPases?
PNAS., 94, 377-384.
van der Bliek, A. M., Redelmeier, T. E., Damke, H., Tisdale, E. J., Meyerowitz, E.
M. and Schmid, S. L. (1993). Mutations in human dynamin block an
intermediate stage in coated vesicle formation. J. Cell. Biol., 122, 553-563.
van den Pol A. N. (2012). Neuropeptide transmission in brain circuits. Neuron.,
76, 98–115.
Vancha, A. R., Govindaraju, S., Parsa, K. V. L., Jasti, M., González-García, M. and
Ballestero, R. P. (2004). Use of polyethyleneimine polymer in cell culture as
attachment factor and lipofection enhancer. BMC. biotechnol., 4, (23).
doi:10.1186/1472-6750-4-23.
Wahl, S., Katiyar, R. and Schmitz, F. (2013). A Local, Periactive Zone Endocytic
Machinery at Photoreceptor Synapses in Close Vicinity to Synaptic Ribbons. J.
Neurosci., 33, 10278-10300.

285
Waites, C. L. and Garner, C. C. (2011). Presynaptic function in health and
disease. Trends. Neurosci., 34, 326-337.
Wallace, D. C. (2013). A mitochondrial bioenergetic etiology of disease. J. Clin.
Invest., 123, 1405-1412.
Walsh, D. A., Perkins, J. P. and Krebs, E. G. (1968). An adenosine 3',5'-
monophosphate-dependant protein kinase from rabbit skeletal muscle. J. Biol.
Chem., 243, 3763-3765.
Wang, H. and Sieburth, D. (2013). PKA Controls Calcium Influx into Motor
Neurons during a Rhythmic Behavior. PloS. Genet., 9(9):e1003831.
Watanabe, S., Rost, B. R., Camacho-Pérez, M., Davis, M. W., Söhl-Kielczynski, B.,
Rosenmund, C. and Jorgenson, E. M. (2013). Ultrafast endocytosis at mouse
hippocampal synapses. Nature., 504, 242-247.
Watanabe, S., Trimbuch, T., Camacho-Pérez, M., Rost, B. R., Brokowski, B., Söhl-
Kielczynski, B., Felies, A., Davis, M. W., Rosenmund, C. and Jorgenson, E. M.
(2014). Clathrin regenerates synaptic vesicles from endosomes. Nature., 515,
228-233.
Weisskopf, M. G., Castillo, P. E., Zalutsky, R. A. and Nicoll, R. A. (1994).
Mediation of hippocampal mossy fiber long-term potentiation by cyclic AMP.
Science., 265, 1878-1882.

286
Whittaker, V. P. (1959). The isolation and characterization of acetylcholine
containing particles from brain. Biochem. J., 72, 694-706.
Whittaker, V. P., Michaelson, I. A. and Kirkland, R. J. A. (1964). The separation
of synaptic vesicles from nerve-ending particles ('Synaptosomes’). Biochem. J.,
90, 293-303.
Wu, W. and Wu, L. G. (2007). Rapid bulk endocytosis and its kinetics of fission
pore closure at a central synapse. PNAS., 104, 10234–10239.
Wu, Y., Yeh, F. L., Mao, F. and Chapman, E. R. (2009). Biophysical
Characterization of Styryl Dye-Membrane Interactions. Biophys. J., 97, 101-109.
Wu, M., Huang, B., Graham, M., Raimondi, A., Heuser, J. E., Zhuang, X. and
Camilli, P. (2010). Coupling between clathrin-dependent endocytic budding and
F-BAR-dependent tubulation in a cell-free system. Nat. Cell. Biol., 12, 902-908.
Wu, Y., O’Toole, E. T., Girard, M., Ritter, B., Messa, M., Liu, X., McPherson, P. S.,
Ferguson, S. M. and De Camilli, P. (2014). A dynamin 1-, dynamin 3- and
clathrin-independent pathway of synaptic vesicle recycling mediated by bulk
endocytosis. ELife.,3, e01621. doi:10.7554/eLife.01621.
Wu, X. S., Lee, S., Sheng, J., Zhang, Z., Zhao, W., Wang, D., Jin, Y., Charnay, P.,
Ervasti, J. M. and Wu, L. G. (2016). Actin is crucial for all kinetically
distinguishable forms of endocytosis at synapses. Neuron., 92, 1020-1035.

287
Xie, W., Adayev, T., Zhu, H., Wegiel, J., Wieraszko, A. and Hwang, Y. W. (2012).
Activity-dependent phosphorylation of dynamin 1 at serine 857. Biochemistry.,
51, 6786-6796.
Xue, J., Graham, M. E., Novelle, A. E., Sue, N., Gray, N., McNiven, M. A., Smillie,
K. J., Cousin, M. A. and Robinson, P. J. (2011). Calcineurin Selectively Docks with
the Dynamin Ixb Splice Variant to Regulate Activity-dependent Bulk
Endocytosis. J. Biol. Chem., 286, 30295-30303.
Yamashita, T., Hige, T. and Takahashi, T. (2005). Vesicle endocytosis requires
dynamin-dependent GTP hydrolysis at a fast CNS synapse. Science., 307, 124-
127.
Yao, L. and Sakaba, T. (2012). Activity-dependent modulation of endocytosis by
calmodulin at a large central synapse. PNAS., 109, 291-296.
Yoshida, S. and Plant, S. (1992). Mechanism of release of ca2+ from intracellular
stores in response to ionomycin in oocytes of the frog xenopus laevis. J.
Physiol., 458, 307-318.
Yoshihara, M., Suzuki, K. and Kidokoro, Y. (2000). Two Independent Pathways
Mediated by cAMP and Protein Kinase A Enhance Spontaneous Transmitter
Release at Drosophila Neuromuscular Junctions. J. Neurosci., 20, 8315-8322.

288
Zambon, A. C., Zhang, L., Minovitsky, S., Kanter, J. R., Prabhakar, S., Salomonis,
N., Vranizan, K., Dubchak, I., Conklin, B. R. and Insel, P. A. (2005). Gene
expression patterns define key transcriptional events in cell-cycle regulation by
cAMP and protein kinase A. PNAS., 102, 8561-8566.
Zhang, Q., Cao, Y. and Tsien, R. W. (2007). Quantum dots provide an optical
signal specific to full collapse fusion of synaptic vesicles. PNAS, 104, 17843-
17848.
Zhang, Q., Li, Y. and Tsien, R. W. (2009). The dynamic control of kiss-and-run
and vesicular reuse probed with single nanoparticles. Science., 323, 1448-1453.
Zhang, Q., Huang, H., Zhang, L., Wu, R., Chung, C. L., Zhang, S. Q., Torra, J.,
Schepis, A., Coughlin, S. R., Kornberg, T. B. and Shu, X. (2018). Visualizing
Dynamics of Cell Signaling In Vivo with a Phase Separation-Based Kinase
Reporter. Mol. Cell., 69, 334-346.
Zhao, W. D., Hamid, E., Shin, W., Wen, P. J., Krystofiak, E. S., Villarreal, S. A.,
Chiang, H. C., Kachar, B. and Wu, L. G. (2016). Hemi-fused structure mediates
and controls fusion and fission in live cells. Nature., 23, 548-552.
Zhong, Y. and Wu, C. F. (1991). Altered synaptic plasticity in Drosophila memory
mutants with a defective cyclic AMP cascade. Science., 251, 198-201.

289
Zhou, Q., Lai, Y., Bacaj, T., Zhao, M., Lyubimov, A. Y., Uervirojnangkoorn, M.,
Zeldin, O. B., Brewster, A. S., Sauter, N. K., Cohen, A. E., et al., (2015).
Architecture of the synaptotagmin–SNARE machinery for neuronal exocytosis.
Nature., 525, 62-67.
Zhu, J. J., Qin, Y., Zhao, M., Van Aelst, L. and Malinow, R. (2002). Ras and Rap
control AMPA receptor trafficking during synaptic plasticity. Cell., 110, 443-455.
Zhu, Y., Xu, J. and Heinemann, S. F. (2009). Synaptic vesicle exocytosis-
endocytosis at central synapses: Fine-tuning at differential patterns of neuronal
activity. Commun. Integr. Biol., 2, 418-419.
Zolnierowicz, S. (2000). Type 2A Protein Phosphatase, the Complex Regulator of
Numerous Signaling Pathways. Biochem. Pharmacol., 60, 1225-1235.
Zupanc, G. K. (1996). Peptidergic transmission: from morphological correlates
to functional implications. Micron., 27, 35-91.

290
Appendix A
Total FM 2-10 Dye Content at the beginning of Measurements
It is vital to establish if any of the drug treatments perturb the amount of FM 2-10 dye
being loaded into the nerve terminals in order for key interpretations drawn in this
thesis to be accurate. Otherwise, comparisons between the FM 2-10 dye release and
Glu assays would lead to fallacious assumptions. The fluorescence of the FM 2-10 dye
was measured prior to stimulation (time zero) and compared with the control used in
each assay. None of the drugs utilised in this thesis have had a significant impact upon
the total FM 2-10 dye uptake (p>0.05).
Below are bar charts displaying the average nerve terminal fluorescence before
stimulation began, error bars are plus S.E.M.

291
Appendix A (Continued)
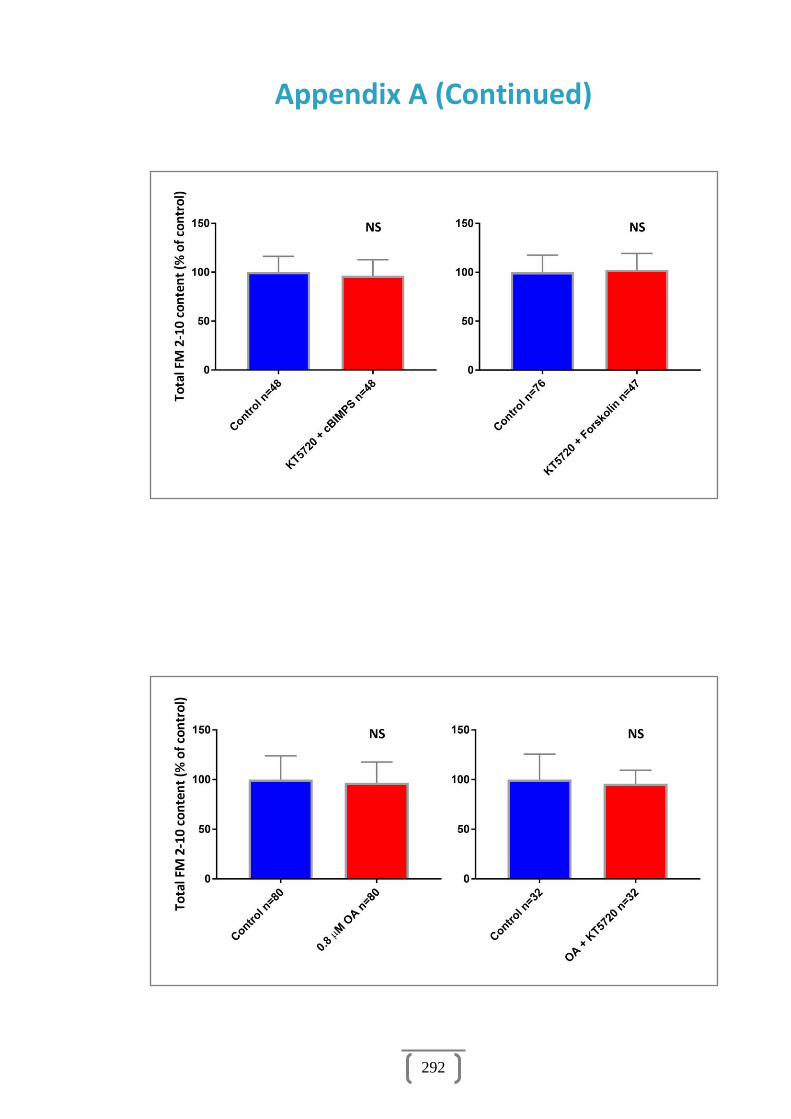
292
Appendix A (Continued)

293
Appendix A (Continued)

294
Appendix B