3_-_CV_physiology_and_Carlmonary_Interactions.pdf - Great ...
20
Disclaimer: The Great Ormond Street Paediatric Intensive Care Training Programme was developed in 2004 by the clinicians of that Institution, primarily for use within Great Ormond Street Hospital and the Children’s Acute Transport Service (CATS). The written information (known as Modules) only forms a part of the training programme. The modules are provided for teaching purposes only and are not designed to be any form of standard reference or textbook. The views expressed in the modules do not necessarily represent the views of all the clinicians at Great Ormond Street Hospital and CATS. The authors have made considerable efforts to ensure the information contained in the modules is accurate and up to date. The modules are updated annually. Users of these modules are strongly recommended to confirm that the information contained within them, especially drug doses, is correct by way of independent sources. The authors accept no responsibility for any inaccuracies, information perceived as misleading, or the success of any treatment regimen detailed in the modules. The text, pictures, images, graphics and other items provided in the modules are copyrighted by “Great Ormond Street Hospital” or as appropriate, by the other owners of the items. Copyright 2004-2005 Great Ormond Street Hospital. All rights reserved. CARDIOVASCULAR PHYSIOLOGY AND CARDIOPULMONARY INTERACTIONS Kate Brown 2005, KB & Lara Jackman: Revised November 2006, KB Revised May 2009 1. Prior Knowledge Anatomy: Heart, conducting system, pericardium Circulation of the myocardium, Great vessels, main peripheral arteries and veins Physiology: Myocyte contraction: role of Ca flux in excitation coupling. Cardiac cycle and impulse generation with Na, K, Ca fluxes. Role of actin, myosin, troponin Clinical examination of the cardiovascular system Embryology: General concepts Module Content Physiology Determinants of output: Preload, afterload, contractility and rate, including measurement of each – basic level. Regional circulations: regulation and modulation of flow: cerebral, splanchnic, renal, pulmonary, coronary circulations Investigations Echocardiography: understand the assessment of normal and depressed function on echocardiography. Cardiac Output measurements: Doppler flowmetry, invasive monitoring using thermodilution or Fick technique. Physiology Systemic oxygen supply & demand Understand the major forms of interactions between lungs and heart in the non-ventilated and the positive pressure ventilated patient. Determinants of myocardial oxygen consumption, effects of hypoxia/ischaemia, pH, Microcirculation: Regulation of vascular tone, effects of pH, hypoxia, inflammatory mediators. Role of the endothelium in vascular tone and inflammation. Transcapillary fluid flux. Copyright 2009-10 Great Ormond Street Hospital. All rights reserved. 1
-
Upload
khangminh22 -
Category
Documents
-
view
1 -
download
0
Transcript of 3_-_CV_physiology_and_Carlmonary_Interactions.pdf - Great ...
Great Ormond Street Hospital Modular ITU Training Programme 2009-2010
Disclaimer: The Great Ormond Street Paediatric Intensive Care Training Programme was developed in 2004 by the clinicians of that Institution, primarily for use within Great Ormond Street Hospital and the Children’s Acute Transport Service (CATS). The written information (known as Modules) only forms a part of the training programme.
The modules are provided for teaching purposes only and are not designed to be any form of standard reference or textbook. The views expressed in the modules do not necessarily represent the views of all the clinicians at Great Ormond Street Hospital and CATS. The authors have made considerable efforts to ensure the information contained in the modules is accurate and up to date. The modules are updated annually. Users of these modules are strongly recommended to confirm that the information contained within them, especially drug doses, is correct by way of independent sources.
The authors accept no responsibility for any inaccuracies, information perceived as misleading, or the success of any treatment regimen detailed in the modules. The text, pictures, images, graphics and other items provided in the modules are copyrighted by “Great Ormond Street Hospital” or as appropriate, by the other owners of the items. Copyright 2004-2005 Great Ormond Street Hospital. All rights reserved.
CARDIOVASCULAR PHYSIOLOGY AND CARDIOPULMONARY INTERACTIONS
Kate Brown 2005, KB & Lara Jackman: Revised November 2006, KB Revised May 2009 1. Prior Knowledge Anatomy:
Heart, conducting system, pericardium Circulation of the myocardium, Great vessels, main peripheral arteries and veins
Physiology: Myocyte contraction: role of Ca flux in excitation coupling. Cardiac cycle and impulse generation with Na, K, Ca fluxes. Role of actin, myosin, troponin Clinical examination of the cardiovascular system
Embryology: General concepts
Module Content Physiology
Determinants of output: Preload, afterload, contractility and rate, including measurement of each – basic level.
Regional circulations: regulation and modulation of flow: cerebral, splanchnic, renal, pulmonary, coronary circulations
Investigations Echocardiography: understand the assessment of normal and depressed
function on echocardiography. Cardiac Output measurements: Doppler flowmetry, invasive monitoring
using thermodilution or Fick technique. Physiology
Systemic oxygen supply & demand Understand the major forms of interactions between lungs and heart in the
non-ventilated and the positive pressure ventilated patient. Determinants of myocardial oxygen consumption, effects of
hypoxia/ischaemia, pH, Microcirculation: Regulation of vascular tone, effects of pH, hypoxia,
inflammatory mediators. Role of the endothelium in vascular tone and inflammation. Transcapillary fluid flux.
Copyright 2009-10 Great Ormond Street Hospital. All rights reserved. 1
Great Ormond Street Hospital Modular ITU Training Programme 2009-2010
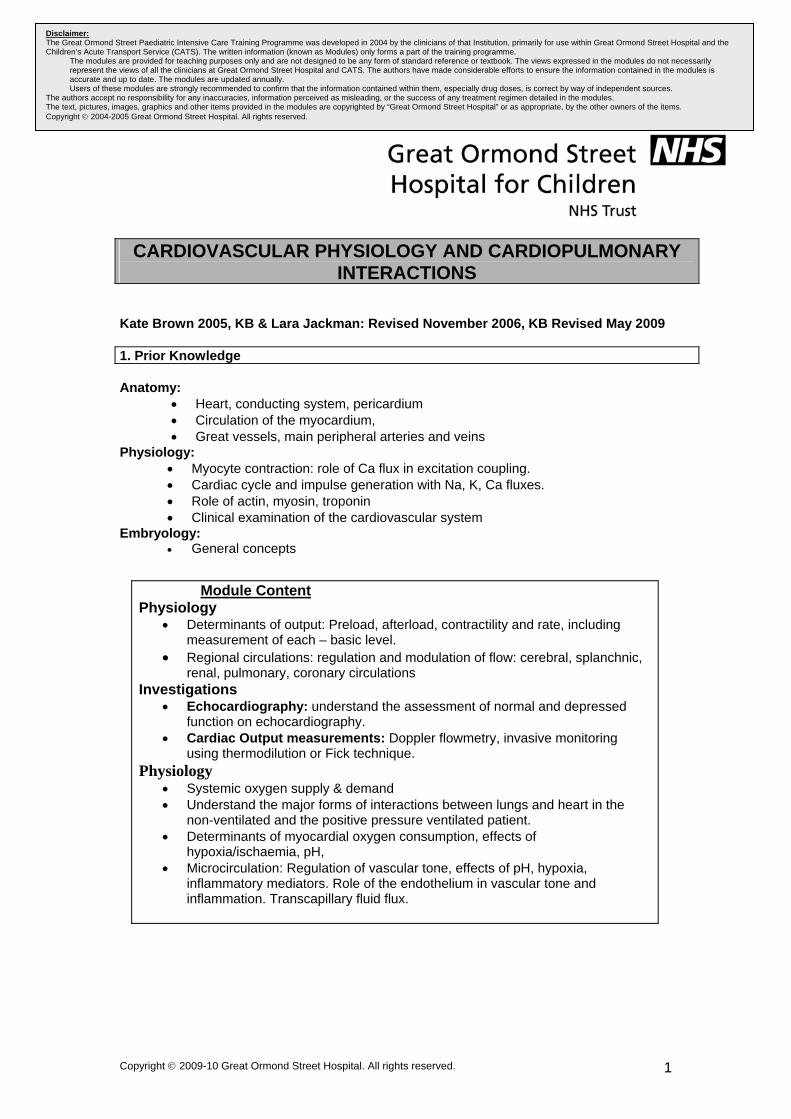
The Normal Heart and Circulation: The diagram shows the normal intra-cardiac oxygen saturations (%) and pressures (mmHg) in red font. These pressures are applicable to a healthy teenager or adult who is standing up.
100% 90/50
75% 25/8
100%2-7
100%1-5 75%
0-6
72% -3 to 0
100%90/6
72 % 25/3 70%
10-14
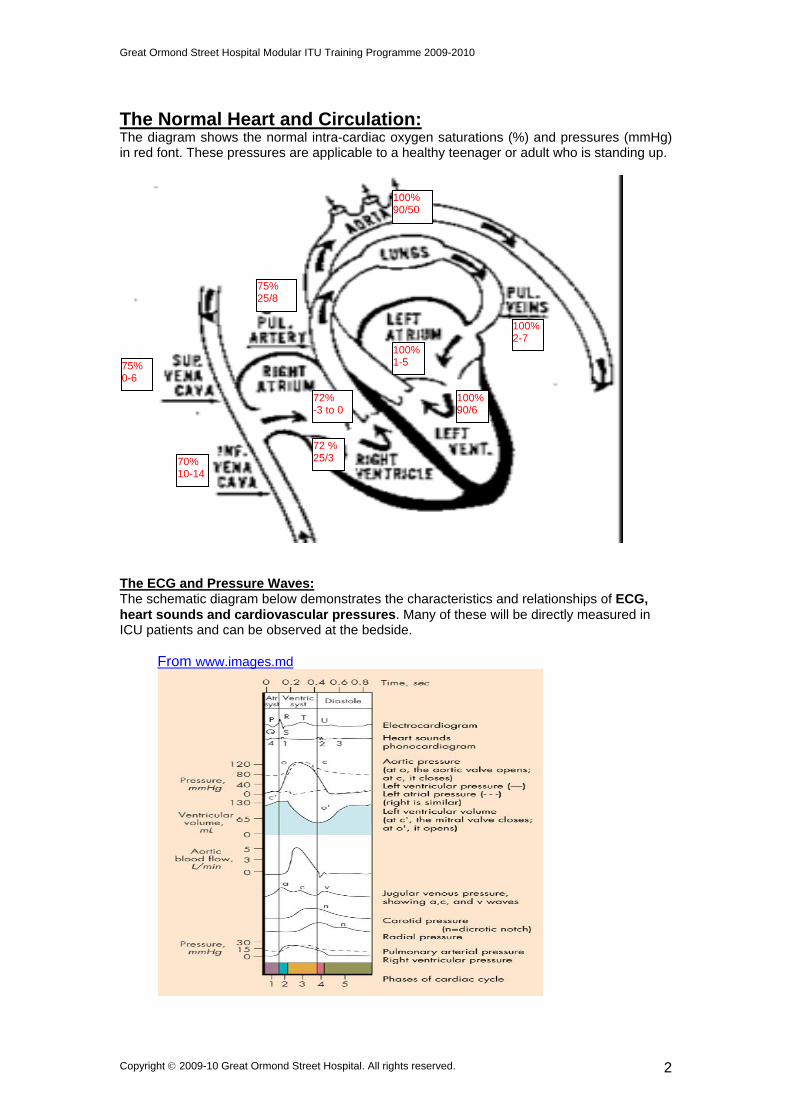
The ECG and Pressure Waves: The schematic diagram below demonstrates the characteristics and relationships of ECG, heart sounds and cardiovascular pressures. Many of these will be directly measured in ICU patients and can be observed at the bedside.
From www.images.md
Copyright 2009-10 Great Ormond Street Hospital. All rights reserved. 2

Great Ormond Street Hospital Modular ITU Training Programme 2009-2010
ECG P Wave: Depolarisation of the atria PQ Interval: AV conduction QRS Complex: Conduction through the Bundle of His, the Purkinje system and depolarisation of the ventricles T Wave: Repolarisation of the ventricles Arterial Pressure Pulse Pressure: The difference between the systolic (peak) and diastolic (trough) pressures. Pulse pressure is influence by stroke volume (amount of blood ejected by the heart with each beat) and the compliance of the arterial system. When the stroke volume increases and more blood is ejected, the pulse pressure widens. When the arterial tree accomodates more blood because it is compliant, the pulse pressure will remain unaffected by increased stroke volume. Therefore pulse pressure is the ratio of stroke volume output to compliance of the arterial tree. Dicrotic Notch: The arterial wave form has a notch or incisura at the end of ventricular ejection. Physiologic Variations in the Arterial Pulse Increased Heart Rate: This results in reduced stroke volume and therefore narrowed pulse pressure (assumes cardiac output remains constant). Decreased Peripheral Resistance: If the resistance of the peripheral circulation falls, more blood will flow into the venous system with each beat, therefore more blood will return to the right atrium and the stroke volume will increase. Respiration: During normal cycles of respiration, the blood pressure will increase by 4 to 6 mmHg. This is discussed in the section on cardiopulmonary interactions. Abdominal Compression: Increased tone in the abdominal muscles such as occurs during exercise or active compression of the abdomen in a supine patient will lead to increased ejection of blood from the venous system into the right atrium. This will result in increased stroke volume and higher blood and pulse pressure. Central Venous Pressure From www.images.md
Copyright 2009-10 Great Ormond Street Hospital. All rights reserved. 3
Great Ormond Street Hospital Modular ITU Training Programme 2009-2010
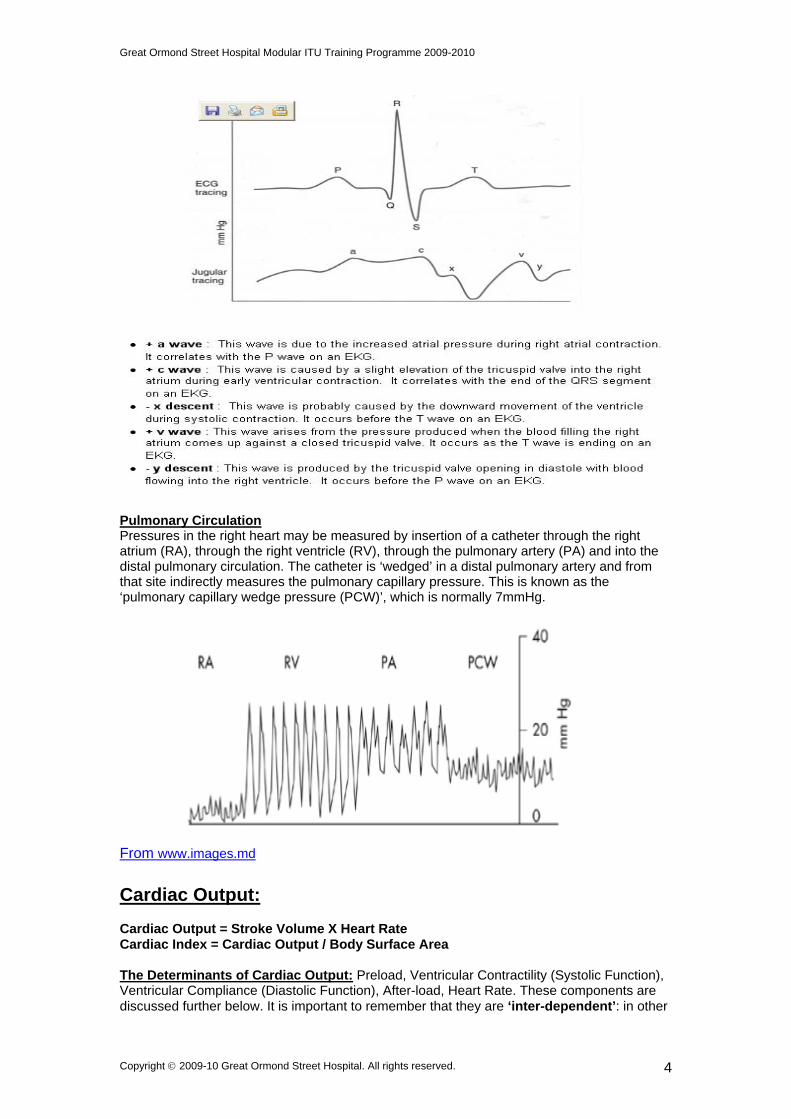
Pulmonary Circulation Pressures in the right heart may be measured by insertion of a catheter through the right atrium (RA), through the right ventricle (RV), through the pulmonary artery (PA) and into the distal pulmonary circulation. The catheter is ‘wedged’ in a distal pulmonary artery and from that site indirectly measures the pulmonary capillary pressure. This is known as the ‘pulmonary capillary wedge pressure (PCW)’, which is normally 7mmHg.
From www.images.md
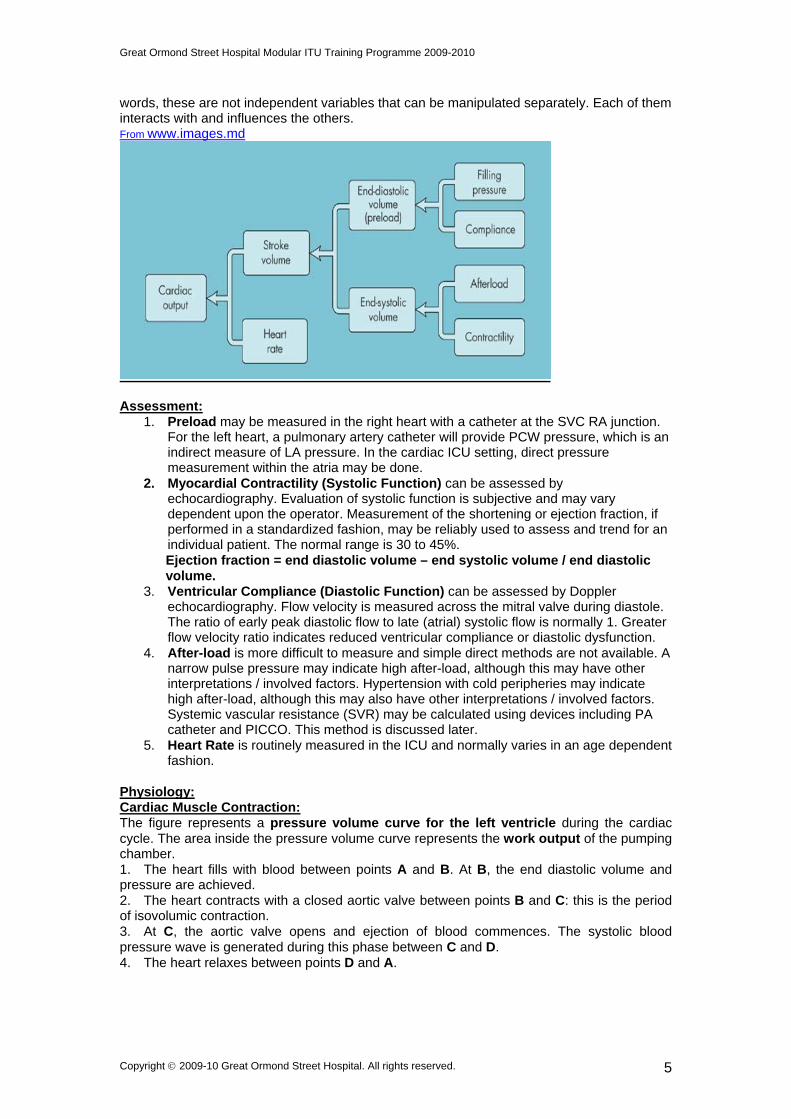
Cardiac Output: Cardiac Output = Stroke Volume X Heart Rate Cardiac Index = Cardiac Output / Body Surface Area The Determinants of Cardiac Output: Preload, Ventricular Contractility (Systolic Function), Ventricular Compliance (Diastolic Function), After-load, Heart Rate. These components are discussed further below. It is important to remember that they are ‘inter-dependent’: in other
Copyright 2009-10 Great Ormond Street Hospital. All rights reserved. 4
Great Ormond Street Hospital Modular ITU Training Programme 2009-2010
words, these are not independent variables that can be manipulated separately. Each of them interacts with and influences the others. From www.images.md
Assessment:
1. Preload may be measured in the right heart with a catheter at the SVC RA junction. For the left heart, a pulmonary artery catheter will provide PCW pressure, which is an indirect measure of LA pressure. In the cardiac ICU setting, direct pressure measurement within the atria may be done.
2. Myocardial Contractility (Systolic Function) can be assessed by echocardiography. Evaluation of systolic function is subjective and may vary dependent upon the operator. Measurement of the shortening or ejection fraction, if performed in a standardized fashion, may be reliably used to assess and trend for an individual patient. The normal range is 30 to 45%.
Ejection fraction = end diastolic volume – end systolic volume / end diastolic volume. 3. Ventricular Compliance (Diastolic Function) can be assessed by Doppler
echocardiography. Flow velocity is measured across the mitral valve during diastole. The ratio of early peak diastolic flow to late (atrial) systolic flow is normally 1. Greater flow velocity ratio indicates reduced ventricular compliance or diastolic dysfunction.
4. After-load is more difficult to measure and simple direct methods are not available. A narrow pulse pressure may indicate high after-load, although this may have other interpretations / involved factors. Hypertension with cold peripheries may indicate high after-load, although this may also have other interpretations / involved factors. Systemic vascular resistance (SVR) may be calculated using devices including PA catheter and PICCO. This method is discussed later.
5. Heart Rate is routinely measured in the ICU and normally varies in an age dependent fashion.
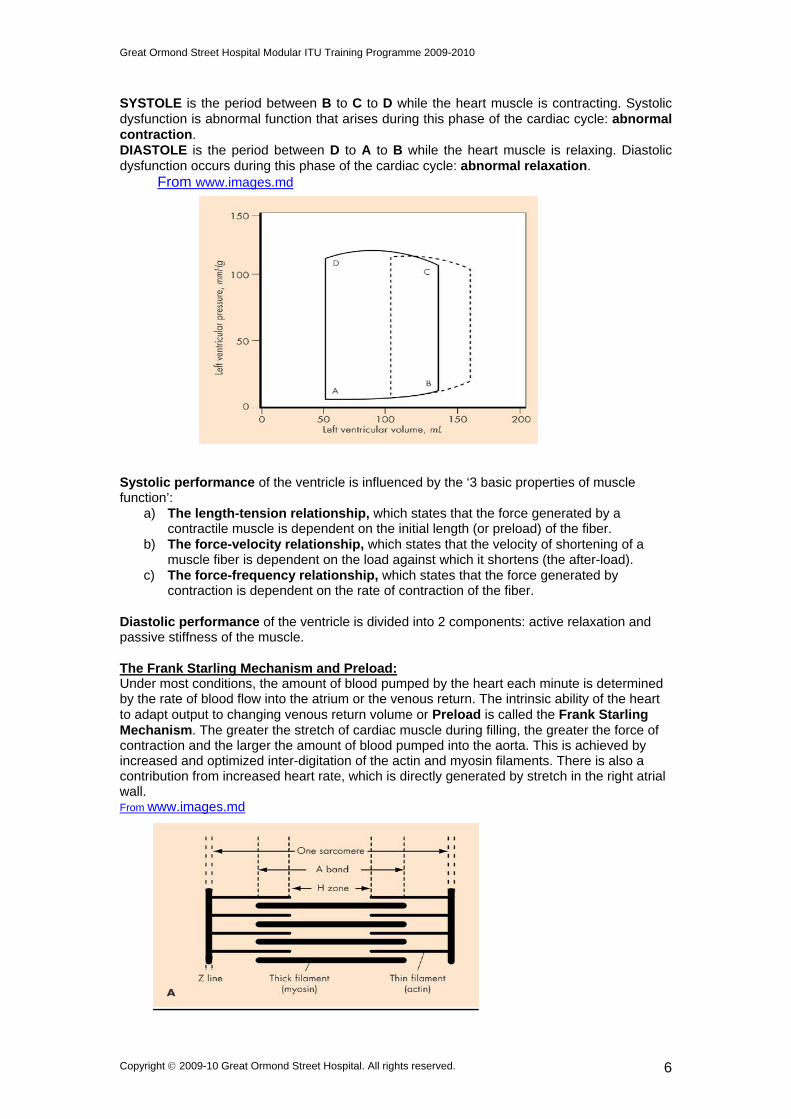
Physiology: Cardiac Muscle Contraction: The figure represents a pressure volume curve for the left ventricle during the cardiac cycle. The area inside the pressure volume curve represents the work output of the pumping chamber. 1. The heart fills with blood between points A and B. At B, the end diastolic volume and pressure are achieved. 2. The heart contracts with a closed aortic valve between points B and C: this is the period of isovolumic contraction. 3. At C, the aortic valve opens and ejection of blood commences. The systolic blood pressure wave is generated during this phase between C and D. 4. The heart relaxes between points D and A.
Copyright 2009-10 Great Ormond Street Hospital. All rights reserved. 5
Great Ormond Street Hospital Modular ITU Training Programme 2009-2010
SYSTOLE is the period between B to C to D while the heart muscle is contracting. Systolic dysfunction is abnormal function that arises during this phase of the cardiac cycle: abnormal contraction. DIASTOLE is the period between D to A to B while the heart muscle is relaxing. Diastolic dysfunction occurs during this phase of the cardiac cycle: abnormal relaxation.
From www.images.md
Systolic performance of the ventricle is influenced by the ‘3 basic properties of muscle function’:
a) The length-tension relationship, which states that the force generated by a contractile muscle is dependent on the initial length (or preload) of the fiber.
b) The force-velocity relationship, which states that the velocity of shortening of a muscle fiber is dependent on the load against which it shortens (the after-load).
c) The force-frequency relationship, which states that the force generated by contraction is dependent on the rate of contraction of the fiber.
Diastolic performance of the ventricle is divided into 2 components: active relaxation and passive stiffness of the muscle. The Frank Starling Mechanism and Preload: Under most conditions, the amount of blood pumped by the heart each minute is determined by the rate of blood flow into the atrium or the venous return. The intrinsic ability of the heart to adapt output to changing venous return volume or Preload is called the Frank Starling Mechanism. The greater the stretch of cardiac muscle during filling, the greater the force of contraction and the larger the amount of blood pumped into the aorta. This is achieved by increased and optimized inter-digitation of the actin and myosin filaments. There is also a contribution from increased heart rate, which is directly generated by stretch in the right atrial wall. From www.images.md
Copyright 2009-10 Great Ormond Street Hospital. All rights reserved. 6
Great Ormond Street Hospital Modular ITU Training Programme 2009-2010
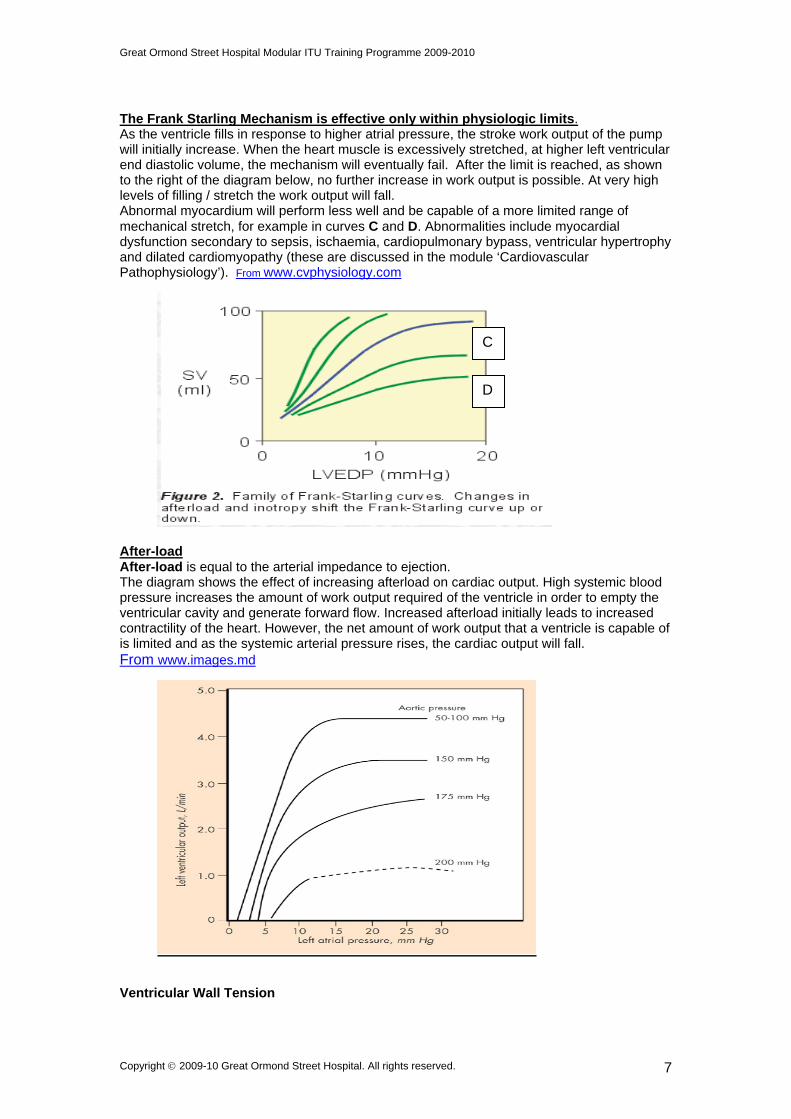
The Frank Starling Mechanism is effective only within physiologic limits. As the ventricle fills in response to higher atrial pressure, the stroke work output of the pump will initially increase. When the heart muscle is excessively stretched, at higher left ventricular end diastolic volume, the mechanism will eventually fail. After the limit is reached, as shown to the right of the diagram below, no further increase in work output is possible. At very high levels of filling / stretch the work output will fall. Abnormal myocardium will perform less well and be capable of a more limited range of mechanical stretch, for example in curves C and D. Abnormalities include myocardial dysfunction secondary to sepsis, ischaemia, cardiopulmonary bypass, ventricular hypertrophy and dilated cardiomyopathy (these are discussed in the module ‘Cardiovascular Pathophysiology’). From www.cvphysiology.com
C
D
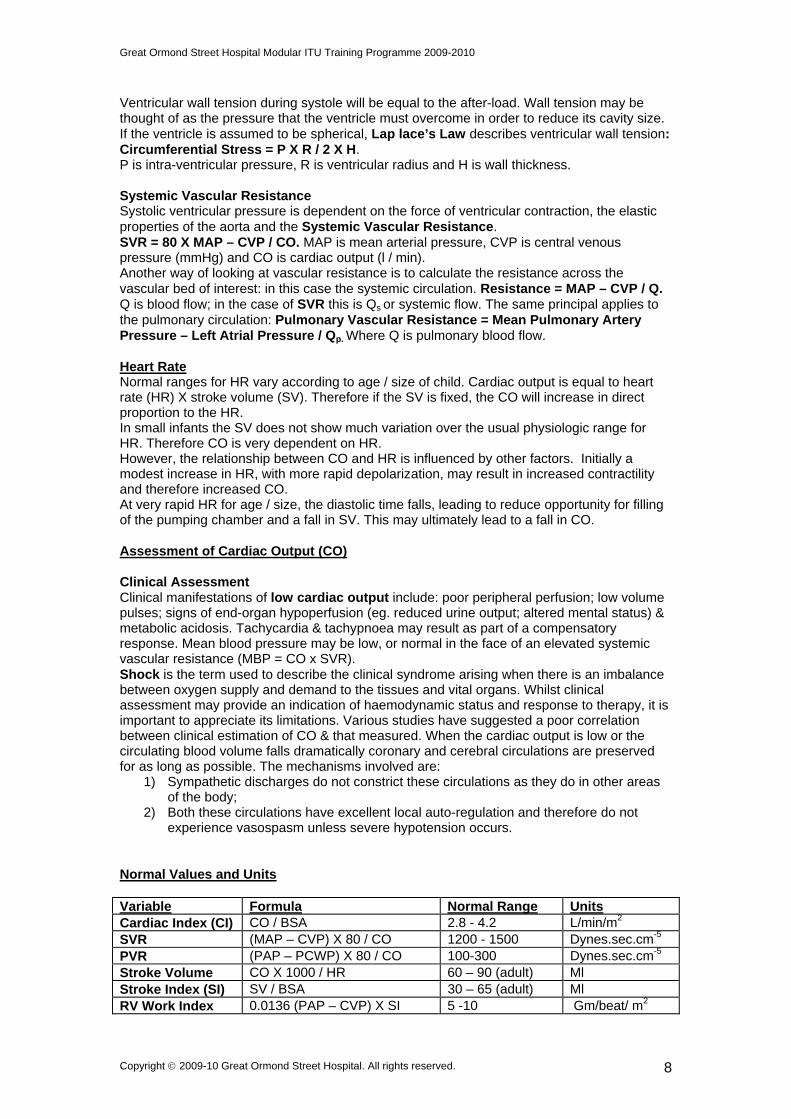
After-load After-load is equal to the arterial impedance to ejection. The diagram shows the effect of increasing afterload on cardiac output. High systemic blood pressure increases the amount of work output required of the ventricle in order to empty the ventricular cavity and generate forward flow. Increased afterload initially leads to increased contractility of the heart. However, the net amount of work output that a ventricle is capable of is limited and as the systemic arterial pressure rises, the cardiac output will fall. From www.images.md
Ventricular Wall Tension
Copyright 2009-10 Great Ormond Street Hospital. All rights reserved. 7
Great Ormond Street Hospital Modular ITU Training Programme 2009-2010
Ventricular wall tension during systole will be equal to the after-load. Wall tension may be thought of as the pressure that the ventricle must overcome in order to reduce its cavity size. If the ventricle is assumed to be spherical, Lap lace’s Law describes ventricular wall tension: Circumferential Stress = P X R / 2 X H. P is intra-ventricular pressure, R is ventricular radius and H is wall thickness. Systemic Vascular Resistance Systolic ventricular pressure is dependent on the force of ventricular contraction, the elastic properties of the aorta and the Systemic Vascular Resistance. SVR = 80 X MAP – CVP / CO. MAP is mean arterial pressure, CVP is central venous pressure (mmHg) and CO is cardiac output (l / min). Another way of looking at vascular resistance is to calculate the resistance across the vascular bed of interest: in this case the systemic circulation. Resistance = MAP – CVP / Q. Q is blood flow; in the case of SVR this is Qs or systemic flow. The same principal applies to the pulmonary circulation: Pulmonary Vascular Resistance = Mean Pulmonary Artery Pressure – Left Atrial Pressure / Qp. Where Q is pulmonary blood flow. Heart Rate Normal ranges for HR vary according to age / size of child. Cardiac output is equal to heart rate (HR) X stroke volume (SV). Therefore if the SV is fixed, the CO will increase in direct proportion to the HR. In small infants the SV does not show much variation over the usual physiologic range for HR. Therefore CO is very dependent on HR. However, the relationship between CO and HR is influenced by other factors. Initially a modest increase in HR, with more rapid depolarization, may result in increased contractility and therefore increased CO. At very rapid HR for age / size, the diastolic time falls, leading to reduce opportunity for filling of the pumping chamber and a fall in SV. This may ultimately lead to a fall in CO. Assessment of Cardiac Output (CO) Clinical Assessment Clinical manifestations of low cardiac output include: poor peripheral perfusion; low volume pulses; signs of end-organ hypoperfusion (eg. reduced urine output; altered mental status) & metabolic acidosis. Tachycardia & tachypnoea may result as part of a compensatory response. Mean blood pressure may be low, or normal in the face of an elevated systemic vascular resistance (MBP = CO x SVR). Shock is the term used to describe the clinical syndrome arising when there is an imbalance between oxygen supply and demand to the tissues and vital organs. Whilst clinical assessment may provide an indication of haemodynamic status and response to therapy, it is important to appreciate its limitations. Various studies have suggested a poor correlation between clinical estimation of CO & that measured. When the cardiac output is low or the circulating blood volume falls dramatically coronary and cerebral circulations are preserved for as long as possible. The mechanisms involved are:
1) Sympathetic discharges do not constrict these circulations as they do in other areas of the body;
2) Both these circulations have excellent local auto-regulation and therefore do not experience vasospasm unless severe hypotension occurs.
Normal Values and Units Variable Formula Normal Range Units Cardiac Index (CI) CO / BSA 2.8 - 4.2 L/min/m2
SVR (MAP – CVP) X 80 / CO 1200 - 1500 Dynes.sec.cm-5
PVR (PAP – PCWP) X 80 / CO 100-300 Dynes.sec.cm-5 Stroke Volume CO X 1000 / HR 60 – 90 (adult) Ml Stroke Index (SI) SV / BSA 30 – 65 (adult) Ml RV Work Index 0.0136 (PAP – CVP) X SI 5 -10 Gm/beat/ m2
Copyright 2009-10 Great Ormond Street Hospital. All rights reserved. 8
Great Ormond Street Hospital Modular ITU Training Programme 2009-2010
LV Work Index 0.0136 (MAP – PCWP) X SI 45 - 60 Gm/beat/ m2 Oxygen Supply and Demand Measuring the mixed venous oxygen content of the blood may assess adequacy of O2 delivery to the tissues: MVO2. The mixed venous oxygen saturation is a useful guide to the adequacy or otherwise of ICU treatments in children with shock and low cardiac output syndrome. Oxygen content = (0.003 X PO2) + SaO2 X Hb X 1.31 Hb is the haemoglobin concentration, SaO2 is the aortic O2 saturation, units are mL / dL blood. Mixed (Systemic) Venous Oxygen Tension Normal MVO2 or SVO2 is 40 mmHg or 75%. MVO2 should classically be measured from the pulmonary artery via a Swan Ganz catheter. In reality this is rarely available and MVO2 drawn from the SVC correlates well with the true PA measurement. MVO2 samples drawn from the atrium and the IVC may be misleading as desaturated blood from the coronary sinus or lower body may influence the results significantly. Causes of low MVO2 are: Increased O2 consumption: fever, exercise or infection. Decreased O2 delivery: pulmonary venous desaturation, low cardiac output, decreased haemoglobin concentration and abnormal haemoglobin.
Shunt and Flow Calculations These are usually performed in the Catheterization Laboratory. An estimate of the ratio Qp to Qs may be made by using assumed pulmonary venous saturation of 100%. Systemic and pulmonary flow can be calculated using the Fick principal by measuring haemoglobin concentration, saturations and oxygen consumption. Blood flow is calculated by knowing the amount of oxygen on each side of the vascular bed. Pulmonary Blood Flow (Qp) = oxygen consumption (VO2) / oxygen content pulmonary vein – oxygen content pulmonary artery Systemic Blood Flow (Qs) = VO2 / aortic blood oxygen content - mixed venous oxygen content It is assumed that oxygen consumption (VO2) equals oxygen delivery (DO2). VO2 can be calculated using nomo-grams based on age or surface area. VO2 can also be measured in the catheterization laboratory in a spontaneously breathing patient. Oxygen content is calculated by the equation above using PO2 and saturations from the relevant sites. The ratio of Qp to Qs is calculated by comparing: Pulmonary vein saturation –pulmonary artery saturation to aortic saturation - mixed venous saturation Or Qp / Qs = PV sat – PA sat / AO sat – MV sat The ratio of pulmonary to systemic blood flow is used to assess the significance of intra cardiac shunts, such as ASD and VSD.
Copyright 2009-10 Great Ormond Street Hospital. All rights reserved. 9
Great Ormond Street Hospital Modular ITU Training Programme 2009-2010
Techniques for Monitoring Cardiac Output There are various techniques available for determining CO in the ICU setting. Interpretation of the data requires an awareness of the limitations of the modality used & the dynamic nature of the patient’s physiology. Furthermore, many of these techniques are rarely used in the ICU or their application in the ICU remains research based at the present time. Indicator Dilution Method Principle: Indicator is injected into the central venous system & blood flow calculated by
measuring the change in indicator concentration over time at a defined point distal to the site of injection.
CO = Amount of indicator/ Average concentration of indicator for duration of curve x duration of the curve.
A computer program is used that integrates the area under the curve & performs calculations of the values listed in the table below (CI, SVR etc).
Relies on complete mixing of blood & indicator & no loss of indicator between the point of injection & measurement.
Intracardiac shunts & significant valvar regurgitation may invalidate results. Indicators:
o Dye: Superseded by newer techniques. Issues with accumulation of dye. o Thermodilution: Pulmonary
Advantages: Well-established; semi-continuous; provides additional information including PAP; PAWP;MV02. Disadvantages: Invasive: low but significant morbidity from knots in catheter; haemorrhage; infection. Difficult access in smaller patients. CO varies with respiratory cycle. Confounded by shunts. Transpulmonary Advantages: Ease of access in smaller patients; provides additional data eg. intrathoracic blood volume (preload) & cardiac function index (contractility).
Disadvantages: Requires dedicated arterial line. Confounded by shunts LiDCO: Minimally invasive/ safe; accurate; provides continuous data.
The Fick Method Principle: Relies on the principle of mass conservation. CO = O2 consumption/ arterial O2 content – venous O2 content. Uptake of oxygen by the body is determined by the product of blood flow across lungs
(Qs) & the arterial-venous oxygen gradient. Oxygen consumption = Inhaled – exhaled gas. ‘Gold-standard’ in controlled conditions but difficult to achieve in the clinical setting. Limitations:
o Assumes constant oxygen consumption & CO during gas analysis. o Difficult/ time-consuming gas collection. o Requires ‘leak free’ ventilator circuit. Inaccurate in the presence of
pneumothoraces. o Inaccurate in context of high CO due to small differences in Ca02-Cv02. o Discontinuous data. o Invasive: requires ‘Swan-Ganz’ pulmonary artery catheter for mixed venous
blood sampling.
Transthoracic Echocardiography Advantages: Non-invasive; provides other structural/ functional information relating to
diastolic function, regional wall motion (abnormalities of which may indicate ischaemia/ infarction), valvar competence, chamber size/ interdependence & the presence of pericardial effusions.
Disadvantages: Requires expertise; intra/ inter-operator variability. Transoesophageal Doppler Principles:
o Blood velocity is calculated from frequency shift of reflected ultrasound waves at the aorta.
Copyright 2009-10 Great Ormond Street Hospital. All rights reserved. 10
Great Ormond Street Hospital Modular ITU Training Programme 2009-2010
o Velocity-time integral is equivalent to stroke distance ie. the distance travelled along aorta by a column of blood during 1 cardiac cycle.
o Stroke volume can be calculated from this utilising LV outflow tract dimensions & from this CO derived.
Advantages: Minimal training required; repeatable; rapid insertion; low morbidity; provides continuous data.
Disadvantages: Error varies between patients; probe fixation difficult; not evaluated for single ventricle physiology.
Bioimpedence Thoracic
o Voltage sensing, current transmitting electrodes placed on the chest wall act as a conductor.
o Impedence is altered by changes in blood flow/ velocity during the cardiac cycle. o Stroke volume is derived from an equation using baseline & maximum rate of change
of impedence, ventricular ejection time, thoracic segment length. Advantages: Non-invasive. Disadvantages: Accuracy in critical illness uncertain; affected by lead position, posture,
temperature and respiratory pattern. Intracardiac
Conductance catheter placed directly in LV resulting in greater accuracy but at the expense of being much more invasive.
Measurement of regional oxygen delivery Near Infrared Spectroscopy (NIRS) Assesses adequacy of oxygen delivery at a regional level. Sensitive indicator of perfusion-metabolism coupling. Addresses some of the limitations of SvO2 monitoring. Principle:
o Relies on change in differential light signal determined by changing absorption spectrum of Hb in response to different levels of O2 saturations.
o Utilises whole light signal versus non-pulsatile signal used in oximetry. This is advantageous as venous-weighted capillary blood makes the greatest contribution to the absorption spectrum of Hb.
Mixed Sv02 is flow-weighted average of regional Sv02. Hence, multiple regional rS02
measures can be used to approximate mixed Sv02. Advantages:
o Non-invasive; continuous. o Early warning of changes in whole body oxygen delivery. o Identifies critical regional ischaemia.
Disdvantages: o Relative vs absolute numbers. o Inter-patient variability high. o Confounded by path length and tissue signal.
Cardiopulmonary Interactions
Just as the factors influencing cardiac output are ‘inter-dependent’, so are the heart, lungs and circulation.
Furthermore, each of the 2 sides of the heart (left and right) influences the other, since they are adjacent and connected by the septum.
Any change to the output of one side of the heart must lead to readjustment and balance with the opposite side.
Normal Respiration:
Copyright 2009-10 Great Ormond Street Hospital. All rights reserved. 11
Great Ormond Street Hospital Modular ITU Training Programme 2009-2010
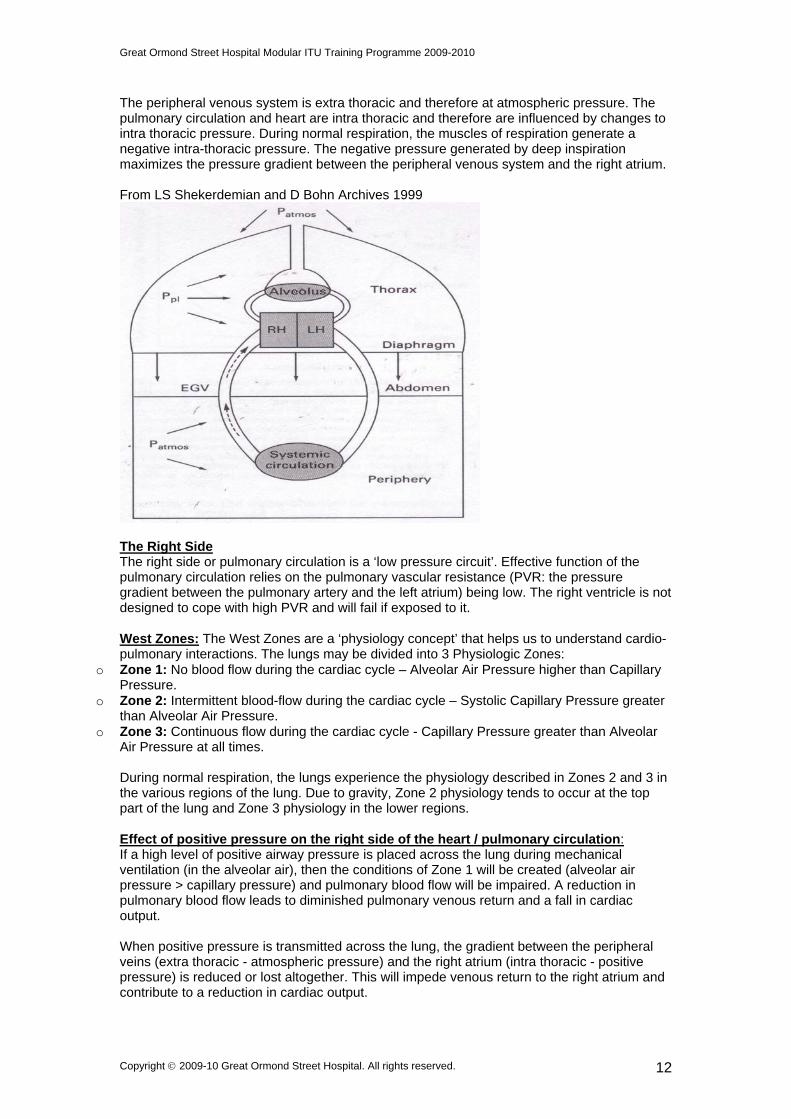
The peripheral venous system is extra thoracic and therefore at atmospheric pressure. The pulmonary circulation and heart are intra thoracic and therefore are influenced by changes to intra thoracic pressure. During normal respiration, the muscles of respiration generate a negative intra-thoracic pressure. The negative pressure generated by deep inspiration maximizes the pressure gradient between the peripheral venous system and the right atrium. From LS Shekerdemian and D Bohn Archives 1999
The Right Side The right side or pulmonary circulation is a ‘low pressure circuit’. Effective function of the pulmonary circulation relies on the pulmonary vascular resistance (PVR: the pressure gradient between the pulmonary artery and the left atrium) being low. The right ventricle is not designed to cope with high PVR and will fail if exposed to it. West Zones: The West Zones are a ‘physiology concept’ that helps us to understand cardio-pulmonary interactions. The lungs may be divided into 3 Physiologic Zones:
o Zone 1: No blood flow during the cardiac cycle – Alveolar Air Pressure higher than Capillary Pressure.
o Zone 2: Intermittent blood-flow during the cardiac cycle – Systolic Capillary Pressure greater than Alveolar Air Pressure.
o Zone 3: Continuous flow during the cardiac cycle - Capillary Pressure greater than Alveolar Air Pressure at all times. During normal respiration, the lungs experience the physiology described in Zones 2 and 3 in the various regions of the lung. Due to gravity, Zone 2 physiology tends to occur at the top part of the lung and Zone 3 physiology in the lower regions. Effect of positive pressure on the right side of the heart / pulmonary circulation: If a high level of positive airway pressure is placed across the lung during mechanical ventilation (in the alveolar air), then the conditions of Zone 1 will be created (alveolar air pressure > capillary pressure) and pulmonary blood flow will be impaired. A reduction in pulmonary blood flow leads to diminished pulmonary venous return and a fall in cardiac output. When positive pressure is transmitted across the lung, the gradient between the peripheral veins (extra thoracic - atmospheric pressure) and the right atrium (intra thoracic - positive pressure) is reduced or lost altogether. This will impede venous return to the right atrium and contribute to a reduction in cardiac output.
Copyright 2009-10 Great Ormond Street Hospital. All rights reserved. 12
Great Ormond Street Hospital Modular ITU Training Programme 2009-2010
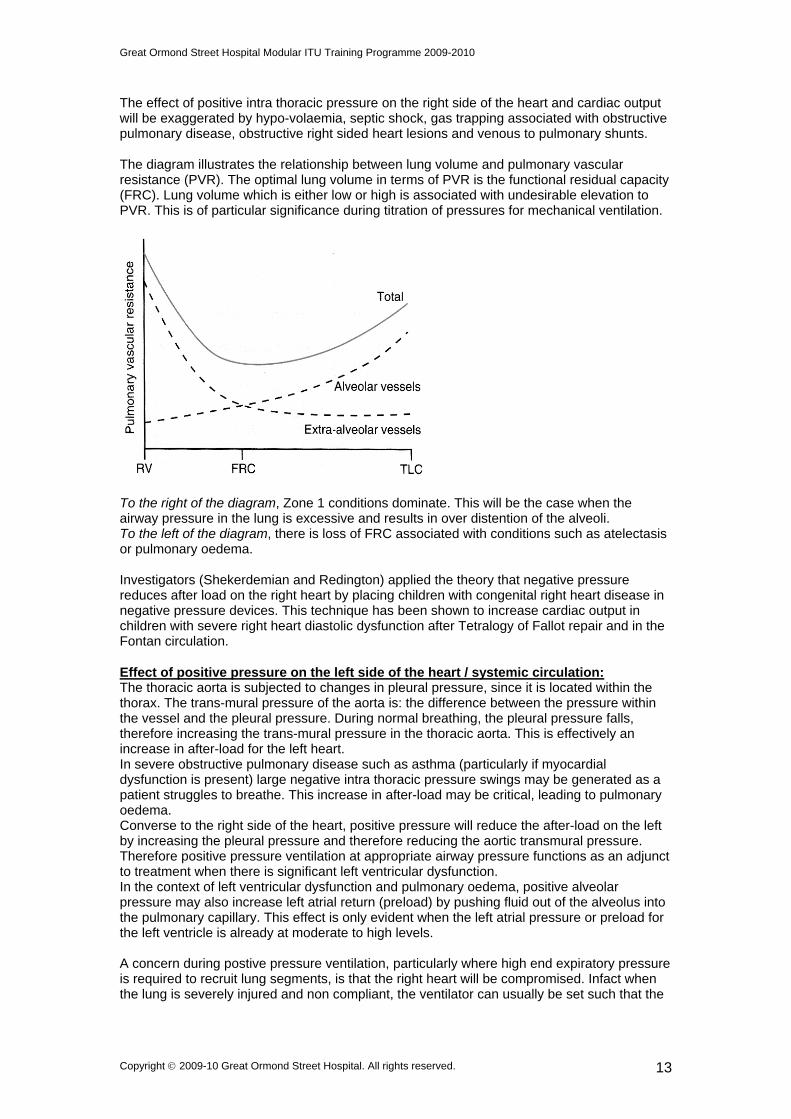
The effect of positive intra thoracic pressure on the right side of the heart and cardiac output will be exaggerated by hypo-volaemia, septic shock, gas trapping associated with obstructive pulmonary disease, obstructive right sided heart lesions and venous to pulmonary shunts. The diagram illustrates the relationship between lung volume and pulmonary vascular resistance (PVR). The optimal lung volume in terms of PVR is the functional residual capacity (FRC). Lung volume which is either low or high is associated with undesirable elevation to PVR. This is of particular significance during titration of pressures for mechanical ventilation.
To the right of the diagram, Zone 1 conditions dominate. This will be the case when the airway pressure in the lung is excessive and results in over distention of the alveoli. To the left of the diagram, there is loss of FRC associated with conditions such as atelectasis or pulmonary oedema. Investigators (Shekerdemian and Redington) applied the theory that negative pressure reduces after load on the right heart by placing children with congenital right heart disease in negative pressure devices. This technique has been shown to increase cardiac output in children with severe right heart diastolic dysfunction after Tetralogy of Fallot repair and in the Fontan circulation. Effect of positive pressure on the left side of the heart / systemic circulation: The thoracic aorta is subjected to changes in pleural pressure, since it is located within the thorax. The trans-mural pressure of the aorta is: the difference between the pressure within the vessel and the pleural pressure. During normal breathing, the pleural pressure falls, therefore increasing the trans-mural pressure in the thoracic aorta. This is effectively an increase in after-load for the left heart. In severe obstructive pulmonary disease such as asthma (particularly if myocardial dysfunction is present) large negative intra thoracic pressure swings may be generated as a patient struggles to breathe. This increase in after-load may be critical, leading to pulmonary oedema. Converse to the right side of the heart, positive pressure will reduce the after-load on the left by increasing the pleural pressure and therefore reducing the aortic transmural pressure. Therefore positive pressure ventilation at appropriate airway pressure functions as an adjunct to treatment when there is significant left ventricular dysfunction. In the context of left ventricular dysfunction and pulmonary oedema, positive alveolar pressure may also increase left atrial return (preload) by pushing fluid out of the alveolus into the pulmonary capillary. This effect is only evident when the left atrial pressure or preload for the left ventricle is already at moderate to high levels. A concern during postive pressure ventilation, particularly where high end expiratory pressure is required to recruit lung segments, is that the right heart will be compromised. Infact when the lung is severely injured and non compliant, the ventilator can usually be set such that the
Copyright 2009-10 Great Ormond Street Hospital. All rights reserved. 13
Great Ormond Street Hospital Modular ITU Training Programme 2009-2010
positive pressure is felt where it is needed – inside the alveoli – rather than transmitted throughout the thorax. The Pericardium The pericardium can limit acute changes in chamber size and limit cardiac output both directly and indirectly. Intra pericardial pressure may increase when a heart dilates or when fluid accumulates, such as during tamponade. The intra pericardial pressure increases, affecting diastolic function more than systolic. Diastolic filling is impaired and coronary perfusion reduced. This is because coronary filling occurs during diastole and becomes limited by acute rise in intra pericardial pressure. Pulmonary Vascular Resistance The pulmonary vascular resistance (PVR) is crucial to the performance of the right heart and therefore if abnormally elevated has a ‘knock on’ effect on the performance of the whole circulation as shown in the diagram. Abnormal pulmonary vasculature is discussed further in later modules. PVR in a person with normal lungs is reduced by inspired fraction of oxygen > 21%, alkalosis (high PH), maintenance of lung volume at FRC. PVR in a person with normal lungs is increased by increased lung volume (as shown in the PVR – FRC diagram above), reduced lung volume, Inspired fraction of oxygen < 21%, acidosis (low PH).
Copyright 2009-10 Great Ormond Street Hospital. All rights reserved. 14
Great Ormond Street Hospital Modular ITU Training Programme 2009-2010
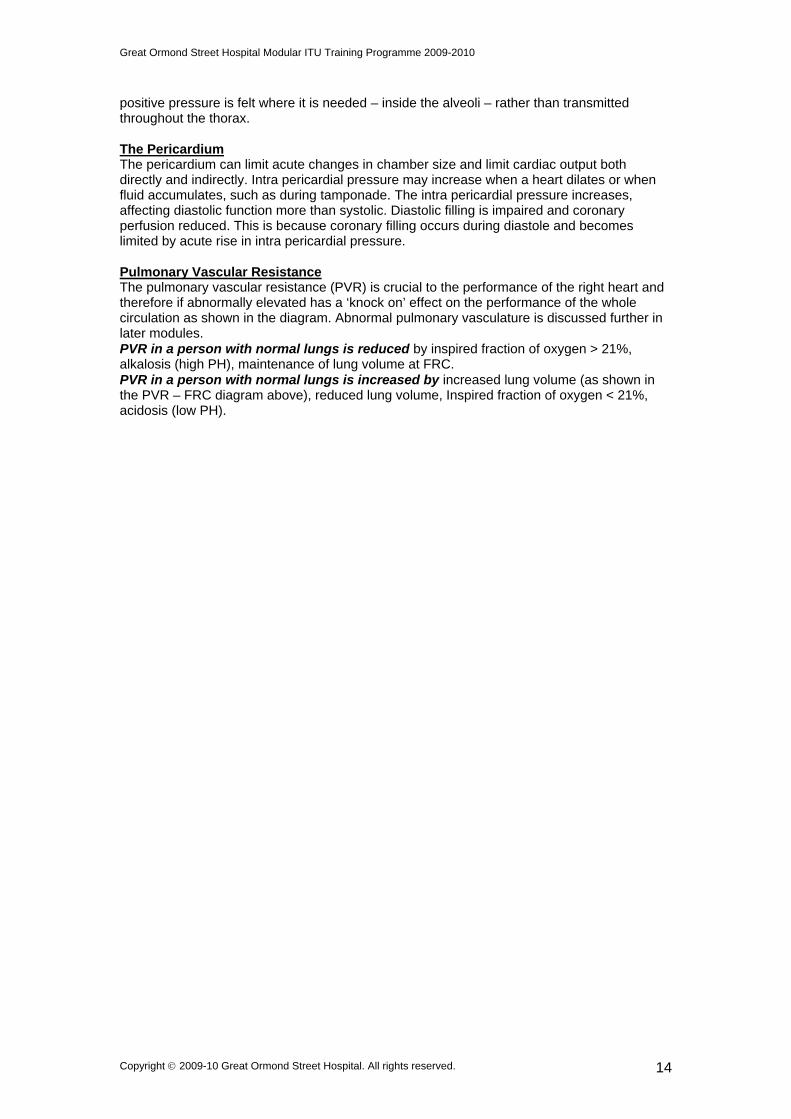
From DJ Penny, Melbourne
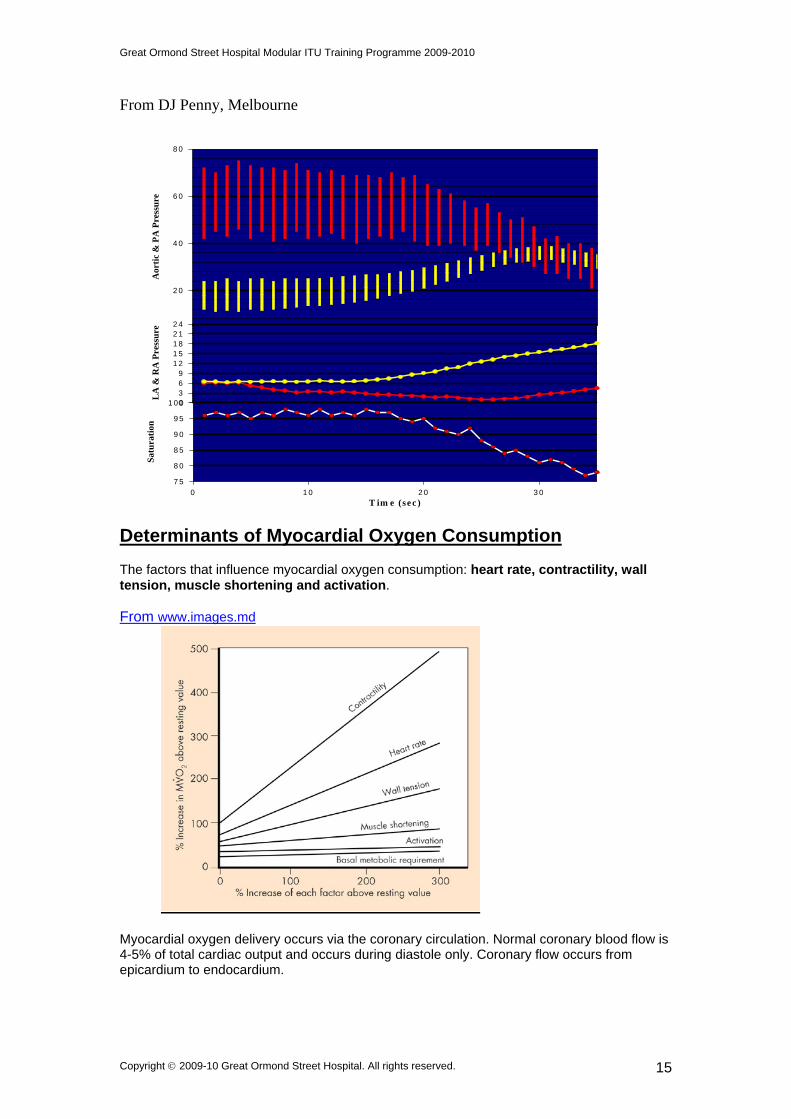
Determinants of Myocardial Oxygen Consumption The factors that influence myocardial oxygen consumption: heart rate, contractility, wall tension, muscle shortening and activation.
2 0
4 0
6 0
8 0A
orti
c &
PA
Pre
ssu
re
0369
1 21 51 82 12 4
LA
& R
A P
ress
ure
7 5
8 0
8 5
9 0
9 5
1 0 0
From www.images.md
Myocardial oxygen delivery occurs via the coronary circulation. Normal coronary blood flow is 4-5% of total cardiac output and occurs during diastole only. Coronary flow occurs from epicardium to endocardium.
T im e (se c )
Sat
ura
tion
0 1 0 2 0 3 0
Copyright 2009-10 Great Ormond Street Hospital. All rights reserved. 15
Great Ormond Street Hospital Modular ITU Training Programme 2009-2010
Coronary perfusion pressure = Arterial diastolic pressure – Left ventricular end diastolic pressure During exercise or severe physical stress the normal heart may increase cardiac output 4-7X. If the arterial pressure (and SVR) is high, the required myocardial work may increase 6-9X. The coronary circulation has capacity for a 4X increase in blood flow. It also works more efficiently during periods of increased O2 demand by local ‘micro’ alternations in flow. Vasodilatation occurs in areas of myocardium where the O2 levels are low. Blood flow in the coronary system is therefore regulated by local arterial and vasodilatation in response to O2 demand by the myocardium. The myocardium extracts 65% of O2 in arterial blood compared with 25% in most other tissues. Coronary sinus blood is normally 30% saturated. Causes of compromise to myocardial oxygenation in children:
A drop in aortic diastolic pressure to sub normal levels and / or an increase in left ventricular end diastolic pressure may compromise coronary perfusion pressure. High heart rate may also compromise coronary flow by reducing diastolic time. When all 3 occur together (low diastolic blood pressure, high end diastolic pressure and tachycardia) there is significant cumulative risk of compromise to myocardial blood flow. This may lead to an irreversible cycle and a terminal situation with myocardial ischaemia and cell death.
During systole, the pressure within the left ventricular sub-endocardium will be nearly equivalent to intra- ventricular pressure. The lack of a pressure gradient to encourage coronary flow may compromise perfusion and therefore O2 delivery during extreme conditions. This is more likely if the coronary circulation is abnormal or the myocardium is hypertrophied.
High doses of inotrope lead to an increase in myocardial oxygen consumption. In a situation where supply and demand of oxygen is at a critical level, this may compromise the myocardium. This is particularly noted in the neonatal heart, where studies have demonstrated myocardial cell death after administration of high dose inotropes.
Neural and Humoral Control of the Circulation The Heart The effectiveness of heart pumping is controlled by the autonomic nervous system. Vascular tone and autonomic influences on the heart are controlled by vasomotor centers in the reticular formation of the lower Pons and the Medulla. Sympathetic stimulation occurs during times of circulatory stress or demand. This mechanism increases both heart rate and contractility and therefore cardiac output. This increase is additional to the Frank Starling Mechanism. Reduced or absent sympathetic tone, such as in the de-enervated heart, may reduce the cardiac output by as much as 30%. Strong vagal stimulation will slow the heart rate until it reaches it’s ‘escape rate’, this may be as low as 30 - 50 beats per minute. Circulation Mean Arterial Pressure – CVP = SVR X CO Rapid control mechanisms:
Sympathetic mechanisms in both the heart and circulatory system will be elicited if there is a sudden drop in circulating volume (hypo-volaemia). Sympathetic discharges will elevate the blood pressure via both arterial and venous constriction. The cardiac output will be increased by direct effect on HR and SV.
Aortic chemoreceptors respond to low O2 levels in the circulating blood, by stimulation of the central vasomotor centre. This elicits very potent sympathetic discharge.
Peripheral low-pressure sensors operate via feedback mechanisms to elevate blood pressure.
Copyright 2009-10 Great Ormond Street Hospital. All rights reserved. 16
Great Ormond Street Hospital Modular ITU Training Programme 2009-2010
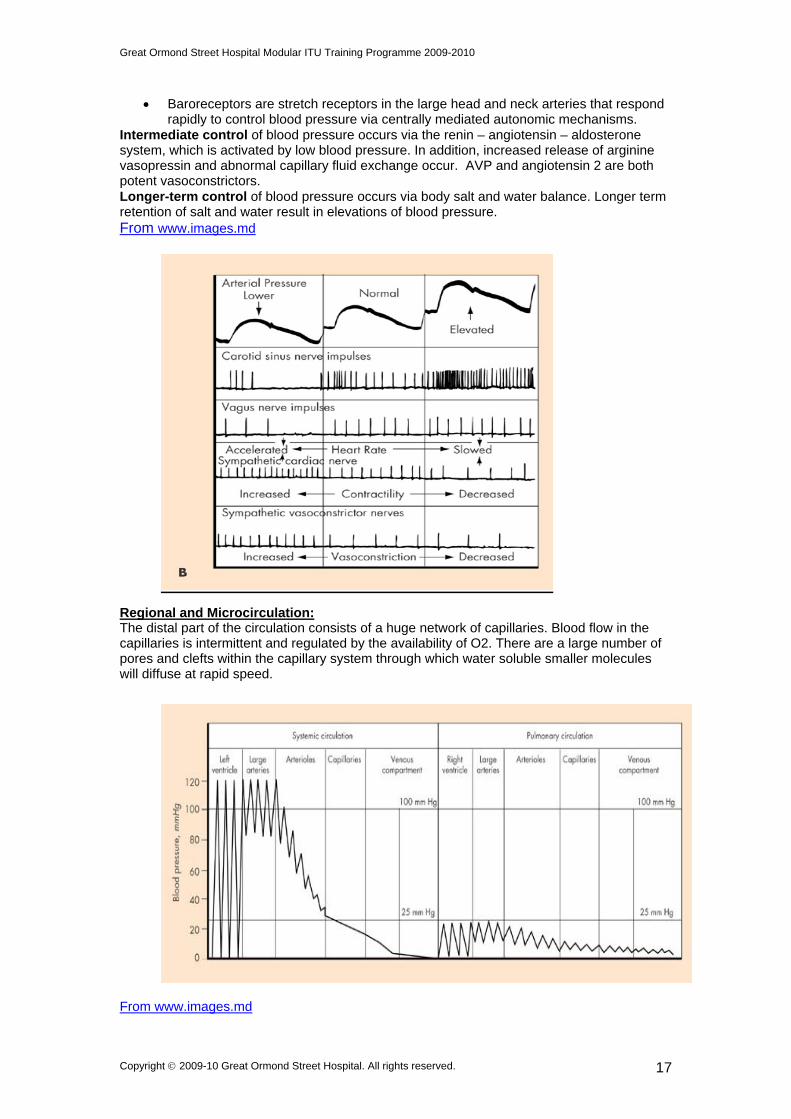
Baroreceptors are stretch receptors in the large head and neck arteries that respond rapidly to control blood pressure via centrally mediated autonomic mechanisms.
Intermediate control of blood pressure occurs via the renin – angiotensin – aldosterone system, which is activated by low blood pressure. In addition, increased release of arginine vasopressin and abnormal capillary fluid exchange occur. AVP and angiotensin 2 are both potent vasoconstrictors. Longer-term control of blood pressure occurs via body salt and water balance. Longer term retention of salt and water result in elevations of blood pressure. From www.images.md
Regional and Microcirculation: The distal part of the circulation consists of a huge network of capillaries. Blood flow in the capillaries is intermittent and regulated by the availability of O2. There are a large number of pores and clefts within the capillary system through which water soluble smaller molecules will diffuse at rapid speed.
From www.images.md
Copyright 2009-10 Great Ormond Street Hospital. All rights reserved. 17
Great Ormond Street Hospital Modular ITU Training Programme 2009-2010
Four forces determine movement of fluid through the capillary membrane:
Capillary pressure, which tends to force fluid outward. Interstitial fluid pressure, which tends to force fluid inward. Plasma colloid osmotic pressure, which tends to cause osmosis of fluid inward. Interstitial fluid colloid osmotic pressure, which tends to cause osmosis of fluid outward.
Thus, an increase in capillary pressure (above 17 mmHg), an increase in permeability of the capillary membrane and reduced plasma oncotic pressure all lead to flow of fluid from the intra capillary space to the interstitium. Acute local control of blood flow: There are 2 theories concerning acute local regulation of blood flow to the tissues:
Vasodilator theory. Decreased supply of O2 leads to release of vasodilator substances such as adenosine and lactic acid. These in turn increase local blood flow and hence O2 delivery.
Oxygen Lack Theory. Local blood vessel sphincter control is mediated proportional to the lack of tissue nutrients in the area of tissue supplied. Long term control of blood flow: Long term regulation of blood flow relies on changes in tissue vascularity. Lack of O2 availability is a stimulus for vascular growth. The maximum level of blood flow need rather than the average amount determines long-term vascularity. Humoral Control of Blood Flow: Vasoconstrictor agents include: adrenaline, noradrenaline, angiotensin, vasopressin and endothelin. Vasodilator agents include: bradykinin and histamine. 4. Suggested reading Key Textbooks: Guyton and Hall Textbook of Medical Physiology. Tenth Edition. W.B. Saunders Company 2000. Chang, Hanley, Wessel, Wernovsky. Pediatric Cardiac Intensive care. Williams and Wilkins 1999. GE Morgan and MS Mikhail. Clinical Anesthesiology. Appleton and Lang. 1999. Key Articles: West JB, Dollery CT Distribution of blood flow and the pressure flow relations of the whole lung. J Appl Physiology 1965;20:175 Robotham JL, Scharf S Effects of positive and negative pressure ventilation on cardiac performance. Clin Chest Medicine 1983;4:161 (For the very keen: multiple other articles by Robotham 1980-2000 available via PubMed) Shekerdemian LS, Bohn D. Cardiovascular effects of mechanical ventilation. Archives Dis Child 1999;80:475-480 Tibby SM et al. Monitoring cardiac function in intensive care. Arch Dis Child 2003; 88: 46-52 Brierley J et al. Clinical practice parameters for haemodynamic support of pediatric and neonatal septic shock. CCM 2009 Feb;37(2):785-6 Martin J, Shekerdemian L. The monitoring of venous saturations of oxygen in children with congenitally malformed hearts. Cardiol Young 2009 Feb:19(1):34-9
Useful References for Cardiac Output Monitoring: Linton RA et al. Cardiac output measured by lithium dilution and transpulmonary thermodilution in a paediatric intensive care unit. Int Care Med 2000 (10) 1507-11 Tibby SM et al. Use of transoesophageal doppler ultrasound in ventilated paediatric patients. Crit Care Med 2000 28(6) 2168-9 Hoffman GM et al. Noninvasive Assessment of Cardiac Output. Semin Thorac Cardiovasc Surg Pediatr Card Surg Ann 2005; 8: 12-21
Copyright 2009-10 Great Ormond Street Hospital. All rights reserved. 18

Great Ormond Street Hospital Modular ITU Training Programme 2009-2010
Tibby SM et al. Clinicians’ abilities to estimate cardiac index in ventilated children and infants. Arch Dis Child 1997; 77: 516-518 Egan JR et al. Intensive Care Med. 2005; 940: 568-73 Shephard JN et al. Intensive Care Med 1994; 20: 513-21 5. Additional Useful Information & Internet sites www.images.md cardiac anaesthesia section. website is accessible with NHS Athens password. 6. Available guidelines The Cardiac Intensive Care Guidelines, GOSH. MCQs for the Module. The correct answers are available from K Brown upon completion of the Module.
A normal heart has a maximum capacity to increase output
A) 2 times B) 4 times C) 7 times D) 10 times E) 15 times
Normal right atrial pressure in a teen-ager standing up is
A) –3 to 0 mm Hg B) 0 to 3 mm Hg C) 3 to 6 mm Hg D) 6 to 9 mm Hg E) 9 to 12 mm Hg
Which of the following is NOT a direct determinant of cardiac output A) Pre load B) Heart rate C) Oxygen saturation D) Ventricular compliance E) After load
All of the following are signs of low cardiac output EXCEPT A) Low volume pulses B) Poor skin perfusion C) Altered mental state D) Hypoxemia E) Low urine output
All of the following may compromise myocardial oxygen levels in children EXCEPT A) Low diastolic blood pressure B) High dose inotropes C) Slow heart rate D) Increased left ventricular end diastolic pressure E) Severe left ventricular hypertrophy
Which of the following is TRUE with respect to cardiopulmonary interactions A) West’s Zone 1 conditions enhance pulmonary blood flow B) During mechanical ventilation the pressure gradient between peripheral veins
and right atrium is increased C) During normal respiration West’s Zone 1 conditions apply D) Mechanical ventilation reduces after load on the right heart
Copyright 2009-10 Great Ormond Street Hospital. All rights reserved. 19
Great Ormond Street Hospital Modular ITU Training Programme 2009-2010
Copyright 2009-10 Great Ormond Street Hospital. All rights reserved. 20
E) The optimal pulmonary vascular resistance is achieved at FRC
In a child with NORMAL lungs, which of the following INCREASES pulmonary vascular resistance
A) Inspired oxygen B) Inspired nitric oxide C) Positive pressure ventilation D) Negative pressure ventilation E) Bicarbonate infusion
RAPID control of blood pressure includes all the following mechanisms EXCEPT
A) Sympathetic nervous system B) Renin – Angiotensin - Aldosterone system C) Baroreceptors D) Central nervous system ischaemic response E) Peripheral low pressure sensors
Which of the following CVP waves represents contraction of the right atrium
A) a wave B) c wave C) v wave D) x descent E) y descent
Which of the following is FALSE with respect to SYSTOLIC performance of the ventricle A) Can be assessed by echocardiography B) Is influenced by the length – tension relationship C) Is influenced by the force – velocity relationship D) Is represented by the ejection fraction E) Is divided into active relaxation and passive stiffness