29787 v.2 - World Bank Documents & Reports
310
050-2792vietnam vol2.qxd 8/24/04 9:37 AM Page 1 Public Disclosure Authorized Public Disclosure Authorized Public Disclosure Authorized Public Disclosure Authorized Public Disclosure Authorized Public Disclosure Authorized Public Disclosure Authorized Public Disclosure Authorized
-
Upload
khangminh22 -
Category
Documents
-
view
4 -
download
0
Transcript of 29787 v.2 - World Bank Documents & Reports
050-2792vietnam vol2.qxd 8/24/04 9:37 AM Page 1P
ublic
Dis
clos
ure
Aut
horiz
edP
ublic
Dis
clos
ure
Aut
horiz
edP
ublic
Dis
clos
ure
Aut
horiz
edP
ublic
Dis
clos
ure
Aut
horiz
edP
ublic
Dis
clos
ure
Aut
horiz
edP
ublic
Dis
clos
ure
Aut
horiz
edP
ublic
Dis
clos
ure
Aut
horiz
edP
ublic
Dis
clos
ure
Aut
horiz
ed
Administrator
29787 v.2
Preface and acknowledgement
In 2000, the Vietnam Ministry of Education and Training (MoET) launcheda large scale monitoring study of primary education. The study tested pupilsand their teachers in the last grade of primary education (Grade 5), using asample cross-sectoral survey in two key subject areas, readingcomprehension in Vietnamese and mathematics.
This volume is the second of three. Each volume contains different aspectsof the study carried out in Vietnam in 2001. Volume 1 presents the study,summarizes the main issues and proposes policy recommendations.
Volume 2 presents detailed findings of the study structured around tenchapters:
Chapter 1 Setting for the StudyChapter 2 What were the levels of achievement of Grade 5 pupils in
Reading and Mathematics?Chapter 3 What were the baseline data on Grade 5 pupils?Chapter 4 What were the characteristics of Grade 5 teachers and their
classrooms?Chapter 5 What were the characteristics of School Heads and schools?Chapter 6 How do the conditions of schooling in Vietnam compare
with the Ministry's own benchmark standards?Chapter 7 How equitably allocated were educational inputs to primary
schools?How equitably distributed was pupil achievement betweenschools?
Chapter 8 Effective primary schools in VietnamChapter 9 Initial explorations of relationships among independent
variablesChapter 10 Summary and Conclusions
Volume 3 provides full technical details of the design and conduct of thestudy.
The study was conducted by the MoET in Vietnam. Many people wereinvolved in the study. We would like to acknowledge our sincere thanks tothe following people: the late Vice-Minister Le Vu Hung, who provided theoversight and guidance for the study; Vice-Minister Dang Huynh Mairesponsible for primary education; senior directors and heads of departmentsof MoET, National Education Institutes, which provided specialists andresearchers to conduct this study; provincial and district education offices,whose staff collected the data from over 3600 schools throughout Vietnam inan exemplary fashion; Dr. Nguyen Quoc Chi, National Manager of thePrimary Education Project, who was instrumental in conducting the studyand who provided special insights into the problems of primary education;Professor Dang Ba Lam, Director of the National Institute of Educational
Vietnam Reading and Mathematics Assessment Study
1
Development (NIED), who provided a member of the data team; ProfessorTran Kieu, Director of the National Institute of Educational Science (NIES),who furnished researchers for the questionnaire committee, and alsoProfessor Do Dinh Hoan and Dr. Do Cong Vinh who worked on the study.Professor Hoan and his team were responsible for test development. Dr. Vinhorganized the data editing, entry, cleaning and analysis.
Members of the international support team included Dr. Kenneth Ross, Dr.Mioko Saito and Stephanie Dolata from IIEP/UNESCO; Professor PatrickGriffin of the Assessment Research Center of Melbourne University; MiyakoIkeda who guided the data entry, cleaning and merging of files for nearly75,000 records and who conducted many of the subsequent statisticalanalyses, and finally the principal architect of the study who guided andhelped the international advisory and the national researchers, EmeritusProfessor Neville Postlewaite of Hamburg University.
The report writing team would like to acknowledge detailed and thoughtfulcomments by Vincent Greaney (Lead Education Specialist), MarlaineLockheed (Lead Education Specialist) and Luis Benveniste (SeniorEducation Specialist) from the World Bank and Richard Wolf (Professor andChairman, Department of Measurement, Evaluation and Statistics, TeachersCollege, Columbia University, USA) and Al Beaton (Professor in Education,Boston College, MA, USA).
Finally, we would like to thank the British Department for InternationalDevelopment and the Canadian Agency for International Development fortheir strong and generous support to the undertaking of this study.
Christopher Shaw and Mai Thi ThanhWorld Bank in VietnamAugust 2004
Vietnam Reading and Mathematics Assessment Study
2
Chapter 1
THE SETTING FOR THE STUDY
Introduction
By the beginning of the 21st century, Vietnam was richly endowedwith human and natural resources but had been constrained in itsdevelopment by almost a century of colonialism and thirty years ofdevastating war. The population numbered about 76 million and
the population growth rate was 1.7 percent in the period 1989 to 1999. Of the76 million persons, about 34 percent was under the age of 16. Seventy-sixpercent of the population lived in rural areas. Most people lived in the deltaareas of the Mekong and Red rivers and along the long coastline. There weremore than fifty ethnic groups (comprising about 9 million people) but mostlived in the mountainous areas of the central plateau and in the northern partof the country.
Vietnam is one of the world’s top rice exporters. There are large reserves ofcoal, bauxite, and gemstones. Petroleum and natural gas have been found offthe coast. Upon re-unification in 1975, Vietnam’s initial development modelwas based upon a command economy and a highly centralisedadministration. By the year 2000, there was a great deal of decentralisation,and a state-managed market economy with a socialist orientation had beenestablished. The primary political goal of the government is economic growthand development through transition to a market economy. Education and theeconomy are viewed as linked in Vietnam and consequently a high priority isplaced on education. The literacy rate at the last count was said to be 91percent for all persons over the age of ten-years. Only 9.8 percent of thoseover five years of age had never attended school.
There are five years of primary school which are compulsory and childrenbegin school in September in the calendar year in which they become six.After primary school, there are four years of lower secondary school, threeyears of upper secondary school, and two to eight years of tertiary orprofessional education. The survival rate in primary school was 68 percent atthe end of the1990s and the transition rate from Grade 5 primary to lowersecondary school was 98 percent.
Vietnam's population in1999 was 76 million ofwhich 9 million weremembers of ethnicminorities.
Education viewed aslink to economicdevelopment.
School system 5-4-3.
Vietnam Reading and Mathematics Assessment Study
3
Vietnam Reading and Mathematics Assessment Study
4
This report is concerned with primary education and more particularly withthe last grade of primary education, namely Grade 5. This is the last grade ofmass education and it was important to have information on the conditions ofschooling as well as the achievement of pupils in the two key subjects ofreading comprehension in Vietnamese and mathematics. The rest of thischapter therefore concentrates on the primary school.
Primary education
There are nearly 15,000 primary schools enrolling over 10 million pupilswith about 1.9 million in Grade5. In 1999, the net enrolment ratio for primaryschool was 88.5 percent but this average masked the fact that in the largecities there was a 95.2 percent enrolment and in some mountainous areas itwas only 56.5 percent. An effort is underway to achieve 100 percentenrolment at the primary school level in accordance with ‘Education for All’(EFA). The allotment of the government’s budget to education was 17.4percent in 1998. This was the equivalent of 3.5 percent of GDP. Of theMOET (Ministry of Education and Training) budget 36.4 percent went toprimary education. About 90 percent of the total primary education is paid forfrom the local budget. There are 61 provinces and it is money levied at theprovincial and school levels that finances much of education.
Although the central Ministry sets the overall policy for primary education,including the development of a new curriculum, it is the provincial offices(and sometimes district offices) that control the allocation of teachers andfacilities to schools. There was thought to be considerable variation in schooland classroom resources not only among schools but also among provinces.One objective of the Grade 5 sample survey was to identify the extent of theinequity among schools and provinces in the conditions of schooling.
Primary school teachers were paid about 50 US dollars a month but in someschools, given extra allowances, this can be as much as USD130. This is lowcompared with the teacher salaries in several other Asian countries. Manyteachers teach extra classes or second shifts or have other forms ofemployment in order to supplement their incomes. In 1999, some 41 percentof primary teachers had not received the full pre-service teacher training oftwo years after graduation from secondary school. Forty-seven percent of allprimary teachers had received the ‘standard’ teacher training consisting of 12years of general education and two years of pre-service teacher training. Theremaining 12 percent of teachers had 12 years of general education and threeor more years of pre-service teacher training. Again, as will be seen later,some of these figures had changed by 2001.
Three kinds of curriculum have been in operation for 25 years. The firstconsists of a 165 weeks full curriculum across the five years of primaryschool and this requires 165 days in school per year. The second was a 120
70-80% governmentbudget allocated to
education, of which 36%to primary education.
But, 90% paid fromlocal budget.
Teachers poorly paid.Teachers receiveddifferent forms of
teacher training indifferent eras.
Average pupil receives660 instruction hours
per year.
Vietnam Reading and Mathematics Assessment Study
5
weeks curriculum for ethnic minorities but this has now been discontinued.The third lasts 100 weeks and this is aimed at out-of-school youth wishingto attend primary school. The National Institute for Educational Sciences(NIES – an institute within the Ministry of Education) has been developing anew curriculum and as from 2001 it has begun to be gradually introduced intothe schools. In 2000, the average number of hours of instruction per day formost pupils was four hours. With 33 weeks per year this only allowed 660hours of instruction per year. This means that there is no place for anoverloaded curriculum. And yet, at the same time, there is more and moredemand to increase the content of the curriculum. Exactly how the newcurriculum will turn out remains to be seen. Currently there are the followingcompulsory subjects in the Grade 5 primary school curriculum: Vietnameselanguage, mathematics, moral education, nature and society,technology/crafts, health education, physical education, music, and art. Insome schools, pupils have an option to study informatics and English as aforeign language.
The major objectives for primary education in the year 2000 includedachieving education for all, having all teachers receive thorough in-servicetraining programs, improving the classroom and school resources, extendingthe school day so as to have more time to cover the curriculum, and ensuringa quality education for all.
Major research questions posed by theMinistry of Education
Since this study was the first national survey of educational achievementever undertaken in Vietnam, the focus was on the questions that were of mostinterest to the senior officials of the Ministry of Education and Training(MOET). A group of 36 senior members of the Ministry held discussions –both plenary and group – and decided on the research questions to be usedfor the survey. Selected general and specific questions have been listed in‘Appendix 1.1: Policy research questions’. The research study was concernedonly with the policy questions posed by the ministry. All dummy tables andinstruments were based on the research questions. The policy questions weredeveloped at the end of 1999. The data for the study were collected in April,2001. It is clear that several developments took place subsequently withinthe ministry and the system of education. The current study has dealt with theoriginally posed policy questions.
As a summary the major questions have been listed below.
1. What was the level of achievement of Grade 5 pupils overall and in thevarious domains of reading and mathematics? What was the level of Grade 5teachers in reading and mathematics?
Ministry officialsdecided on policyresearch questions forstudy.
9 compulsory subjects atGrade 5

Vietnam Reading and Mathematics Assessment Study
6
a) What percentages of pupils reached the different skill levels in readingand mathematics?
b) What percentages of pupils reached benchmark levels in reading andmathematics?
c) What were the total scores by region and province?d) What were the differences in achievement between: i) pupils on
isolated, rural, and urban schools; ii) boys and girls; and iii) differentsocio-economic groups?
e) Were the pupils ‘elite’ (upper 5%) performances similar in differentregions and socio-economic groups? To What extent did theperformance ‘tails’ (bottom 5%) differ across regions and socio-economic groups?
f) What were the relationships between teachers and pupils performanceon the tests of reading and mathematics?
2. Policy questions related to educational inputs
a) What were the characteristics of Grade 5 pupils?b) What were the characteristics of Grade 5 teachers?c) What were the teaching conditions in Grade 5 classrooms and in
primary schools?d) What aspects of the teaching function designed to improve the quality
of education were in place?e) What was the general condition of school buildings?f) What level of access did pupils have to textbooks and library books?
3. Specific questions relating to a comparison of reality in the schools and thebenchmarks set by the MOET and the Fundamental School Quality Levels
Were the following benchmarks met? (total school enrolment, class size,classroom space, staffing ratio, sitting places, writing places, chalkboard,classroom furniture, classroom supplies, academic qualification of schoolheads, professional qualification of school heads, etc.)
4. Have the educational inputs to schools been allocated in an equitablefashion?
a) What was the equity of material resource inputs among regions,among provinces and among schools within provinces?
b) What was the equity of human resource inputs among provinces andamong schools within provinces?
c) How different was pupil achievement among regions, among provinces,and among schools within provinces?
5. Which were the variables most associated with the difference betweenthe most effective and least effective schools?
6. What variables were most associated with achievement?
The main focus of the study is, however, on the achievement of the pupils and
Vietnam Reading and Mathematics Assessment Study
7
in all ensuing chapters in this book relationships will be made toachievement. Furthermore, it is the achievement chapter that has beenpresented first in this report and the other chapters follow in sequence.
The design of the study
A decision was taken to conduct a cross-sectional survey of all pupils inGrade 5 in April 2001 in the whole country. At the same time it wasconsidered that since this was the first survey, the Ministry of Education andTraining might well wish to conduct repeat surveys and that this survey mightwell be the benchmark data against which future comparisons will be made.The perceived future did have an influence on the design of this studybecause, for example, when the tests were developed account was also takenof the new curriculum to have sufficient anchor items between the twocurricula so that comparisons will be able to be made at a future time.
A second decision was taken that the survey would be a sample survey butthat the sample should be drawn in such a way that the standard errors ofsampling would be very small for national estimates and small for provincialestimates.
A third decision was taken to select two aspects of learning for the study:reading comprehension and mathematics.
In general, the design of the study followed from the questions posed by theMinistry. There were pupil tests and a questionnaire as well as a teacher testand questionnaire and then a school head questionnaire. The samplingtherefore was a sample of pupils and two Grade 5 teachers were selectedfrom all grade 5 teachers in the school. For the most part the analyses wereundertaken using the pupil as the unit of analysis.
Sampling
The size of a sample is a function of the amount of differences among schoolsand the accuracy of estimates that one wishes to have. The more there aredifferences among schools the more schools that have to be included in thesample to be sure to cover all of the variation. The more accuracy that onewishes to have the greater the number of schools and pupils that one needs inthe sample. For the country as a whole it was decided to aim for greataccuracy and certainly not more than 2.5 percent for one standard error ofsampling for a percentage (or 0.1 of a standard deviation for a mean). For aprovince it was decided to have as good accuracy as one could with themoney and resources available.
Sampling needed to bevery good.
Reading andMathematics selected asachievement focus.
Tests covered both theold and new curricula.
Vietnam Reading and Mathematics Assessment Study
8
It was assumed that the intraclass correlation (a measure of the extent towhich pupils within schools were like each other) at the province level wouldbe not less than 0.30. To achieve standard errors of sampling of not more than7.5 percent for a percentage (at the 95 percent confidence limit), this meanthaving 60 schools per province. With 61 provinces this meant 3660 schools.With a random sample of 20 pupils per school this meant 73,200 pupils.Clearly this was to be a very large survey. If an intraclass correlation of 0.50was assumed, this would mean having 77 schools per province and therefore1880 pupils per province and 114,680 pupils altogether. There was somesmall amount of evidence available from a previous study undertaken in fiveprovinces that for those provinces the intraclass correlation was about 0.4.But since there had only been 14 schools in each province in the study, thenthe estimate was unstable. It was therefore agreed to ‘go with’ 60 schools perprovince and hope that a province error would not exceed 10 percent. With3660 schools in the sample it could be safely assumed that the national errorwould be very small.
A school was defined as a school on the school census form. This was usuallya school building consisting of a main school. In some cases however, therewere main schools plus up to ten satellite campuses. But in this latter case theschool plus campuses was regarded as one school.
The sampling frame for all primary schools was taken from the 1999special school census conducted by the Australian Council for EducationalResearch (ACER). The way in which the sample was drawn and theensuing calculations and post-stratification have been reported in Volume 3of this series and will not be given here. It should be noted that without theACER census it would have been impossible to have a sampling frame. TheMOET’s annual school census only contains aggregated data to theprovince level.
Using the latest (March, 2001) figures available for the enrolment in eachprovince, the weighting of the sample was undertaken by Dr. Kenneth N.Ross of the International Institute for Educational Planning (IIEP, UNESCO).Thus, sampling weights were available and all estimates produced in thisbook for pupils, teachers and schools are:
For each estimate in the book there is an associated standard error ofsampling. This will be further explained at the beginning of later chapters.These standard errors are needed to enable readers to construct confidencelimits for sample estimates of population characteristics, and to make
Unit Percentage Mean
Pupil % pupils Mean of pupils
Teacher % pupils having teachers withthe referred to characteristics
Average pupils in Vietnam has ateacher with reported characteristics
School % pupils are in school withthe referred to characteristics
Average pupil is in a school withthe referred to characteristics
Sample to have 60schools per province and
20 Grade 5 pupils perschool.
Vietnam Reading and Mathematics Assessment Study
9
appropriate comparisons among different sample estimates. Suffice it to sayhere that the sampling errors for the national Vietnamese estimates were verysmall (less than one percentage point for percentage estimates) but forprovinces they were higher. The intraclass correlations between schoolswithin provinces varied from 0.20 to 0.81 and most were around 0.60. Thismeans that in future that if generalisations are to be made from provincialsamples to provincial populations a large sample of schools will be requiredfor most provinces.
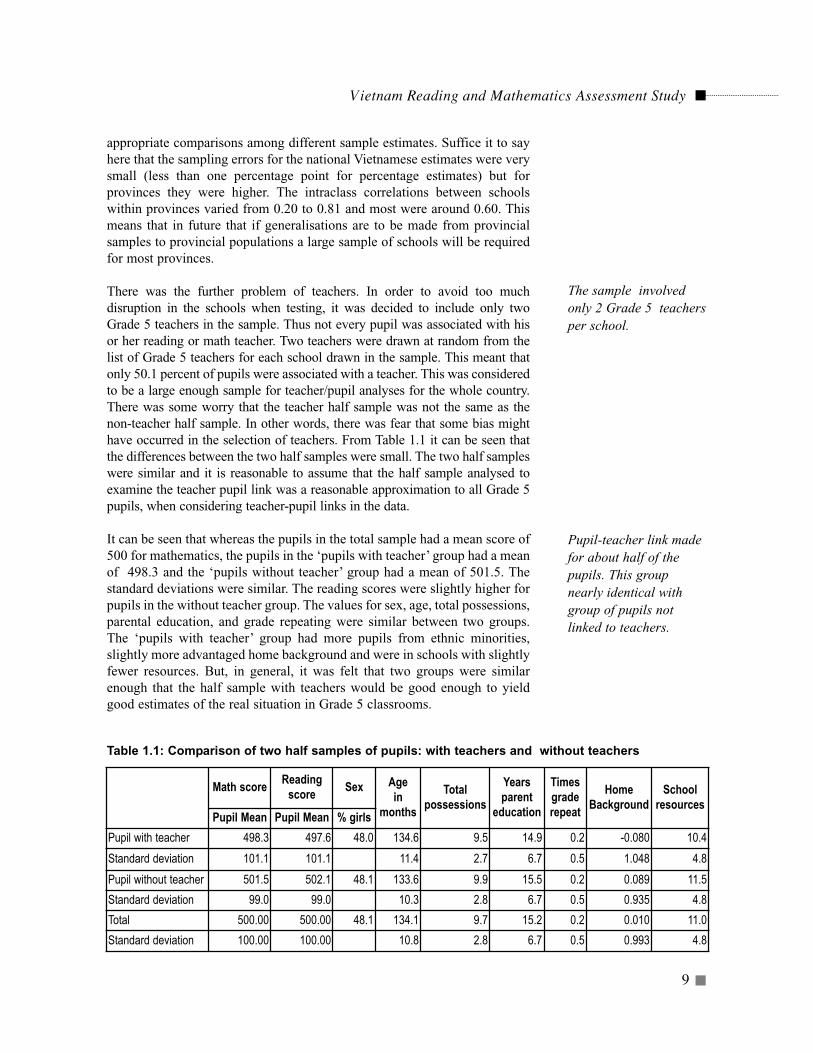
There was the further problem of teachers. In order to avoid too muchdisruption in the schools when testing, it was decided to include only twoGrade 5 teachers in the sample. Thus not every pupil was associated with hisor her reading or math teacher. Two teachers were drawn at random from thelist of Grade 5 teachers for each school drawn in the sample. This meant thatonly 50.1 percent of pupils were associated with a teacher. This was consideredto be a large enough sample for teacher/pupil analyses for the whole country.There was some worry that the teacher half sample was not the same as thenon-teacher half sample. In other words, there was fear that some bias mighthave occurred in the selection of teachers. From Table 1.1 it can be seen thatthe differences between the two half samples were small. The two half sampleswere similar and it is reasonable to assume that the half sample analysed toexamine the teacher pupil link was a reasonable approximation to all Grade 5pupils, when considering teacher-pupil links in the data.
It can be seen that whereas the pupils in the total sample had a mean score of500 for mathematics, the pupils in the ‘pupils with teacher’ group had a meanof 498.3 and the ‘pupils without teacher’ group had a mean of 501.5. Thestandard deviations were similar. The reading scores were slightly higher forpupils in the without teacher group. The values for sex, age, total possessions,parental education, and grade repeating were similar between two groups.The ‘pupils with teacher’ group had more pupils from ethnic minorities,slightly more advantaged home background and were in schools with slightlyfewer resources. But, in general, it was felt that two groups were similarenough that the half sample with teachers would be good enough to yieldgood estimates of the real situation in Grade 5 classrooms.
Math score Readingscore Sex Age
inmonths
Total possessions
Years parent
education
Timesgraderepeat
HomeBackground
Schoolresources
Pupil Mean Pupil Mean % girlsPupil with teacher 498.3 497.6 48.0 134.6 9.5 14.9 0.2 -0.080 10.4Standard deviation 101.1 101.1 11.4 2.7 6.7 0.5 1.048 4.8Pupil without teacher 501.5 502.1 48.1 133.6 9.9 15.5 0.2 0.089 11.5Standard deviation 99.0 99.0 10.3 2.8 6.7 0.5 0.935 4.8Total 500.00 500.00 48.1 134.1 9.7 15.2 0.2 0.010 11.0Standard deviation 100.00 100.00 10.8 2.8 6.7 0.5 0.993 4.8
Table 1.1: Comparison of two half samples of pupils: with teachers and without teachers
Pupil-teacher link madefor about half of thepupils. This groupnearly identical withgroup of pupils notlinked to teachers.
The sample involvedonly 2 Grade 5 teachersper school.
Vietnam Reading and Mathematics Assessment Study
10
It must be recalled however when dealing with the linkages between pupilsand teachers that they are based on the half sample above. But for the generaldescriptive statistics for all teacher variables are based on the whole sampleof two Grade 5 teachers per school.
Instrument development
Both tests and questionnaires were developed The tests were developed bymembers of the National Institute for Educational Science (NIES) with theguidance and assistance of Professor Patrick Griffin from the University ofMelbourne. There were two pupil tests and two teacher tests to be developed.Full details of the test development have been given in Chapter 2 of Volume3. The questionnaires were developed by a team from NIES.
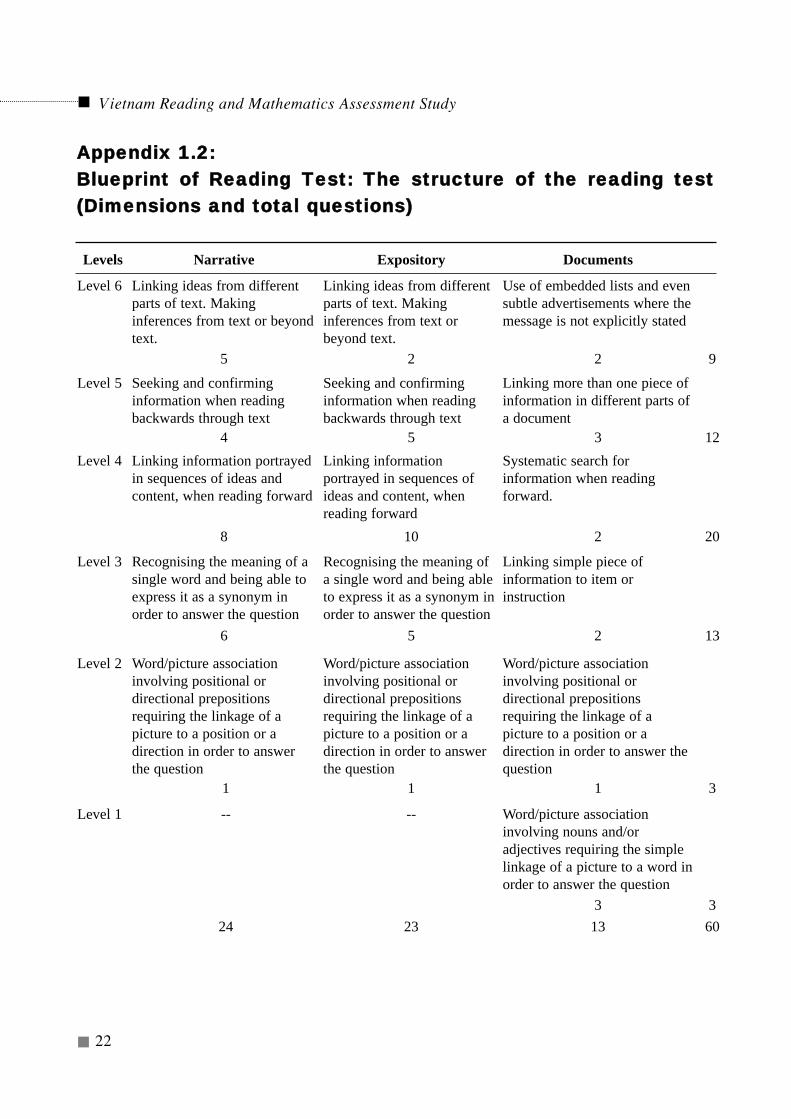
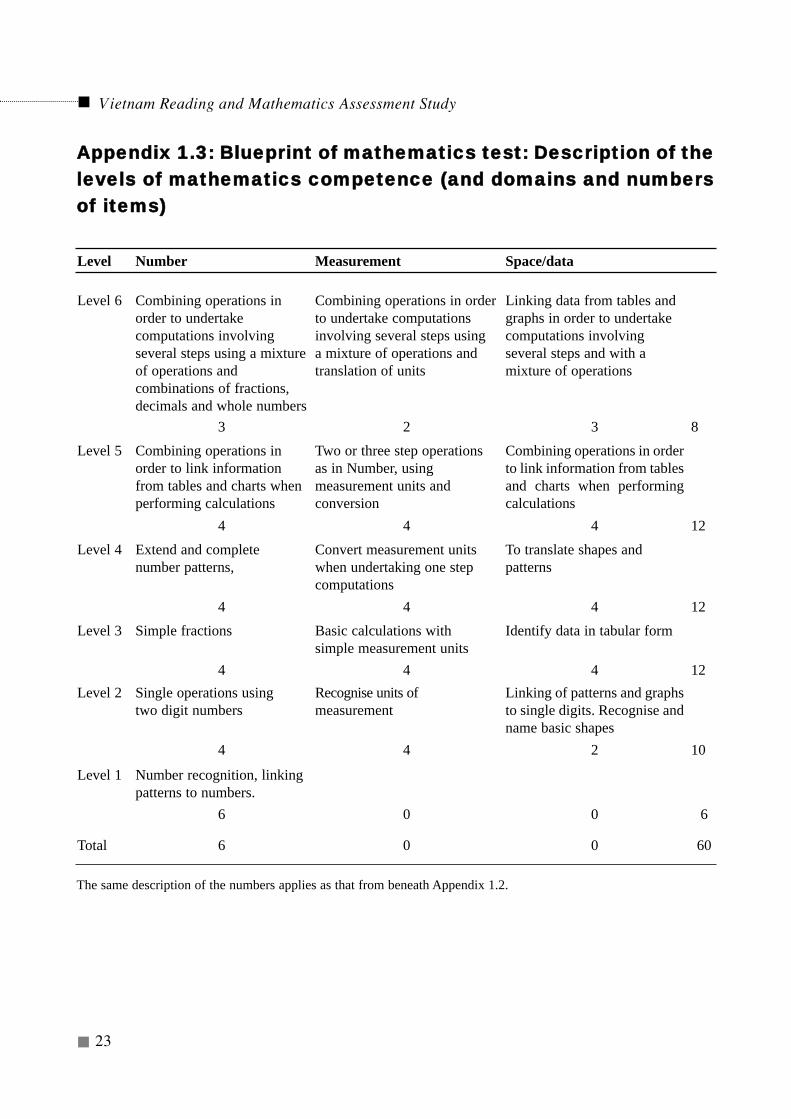
Pupil tests: A blueprint was drawn up for the pupil reading test and aseparate one for the pupil math test. (see Appendices 1.2 and 1.3). Theseblueprints were based on the existing curricula and the changes foreseenover the next few years – on the pre- and post-2000 curricula (commonlyknown in Vietnam as the old and new curricula). The reason for includingthose changes made between the pre and post 2000 curricula was toensure that the test would be valid for 2001 and also later years. It wasagreed that the test should have about 60 questions. This was a functionof the amount of time that could be made available for testing in theschools. The items were written in terms of the skills required and readingand math for the two tests. In reading the domains of narrative, expositorytexts and document reading and in mathematics the domains werenumber, measurement and space. About three times more items werewritten than were required for the final test.
A specific decision was taken to use multiple choice items. Although multiplechoice items had not been used widely in Vietnamese primary schools, therewere various reasons for the decision. These included;¶ with multiple choice format, more items could be included in the tests,¶ they allowed objectivity of marking,¶ they had been used with success in the five province study,¶ there was sufficient evidence from other countries having used multiple
choice for the first time that, with the careful administration of practiceitems before the test, all pupils quickly adapted to responding to multiplechoice items.
Most of the items had four options consisting of one right answer and threewrong ones. The disadvantage of this was that a pupil who did not know theanswer still had a 25 percent chance of guessing the right answer. Theadvantage was that the only three good wrong answers had to be created.
These items were trialled in the province of Thanh Hoa, an averageprovince, and after the item statistics were reviewed a selection of 60 items
Pupil tests: 60 multiplechoice items for each
test.
Vietnam Reading and Mathematics Assessment Study
11
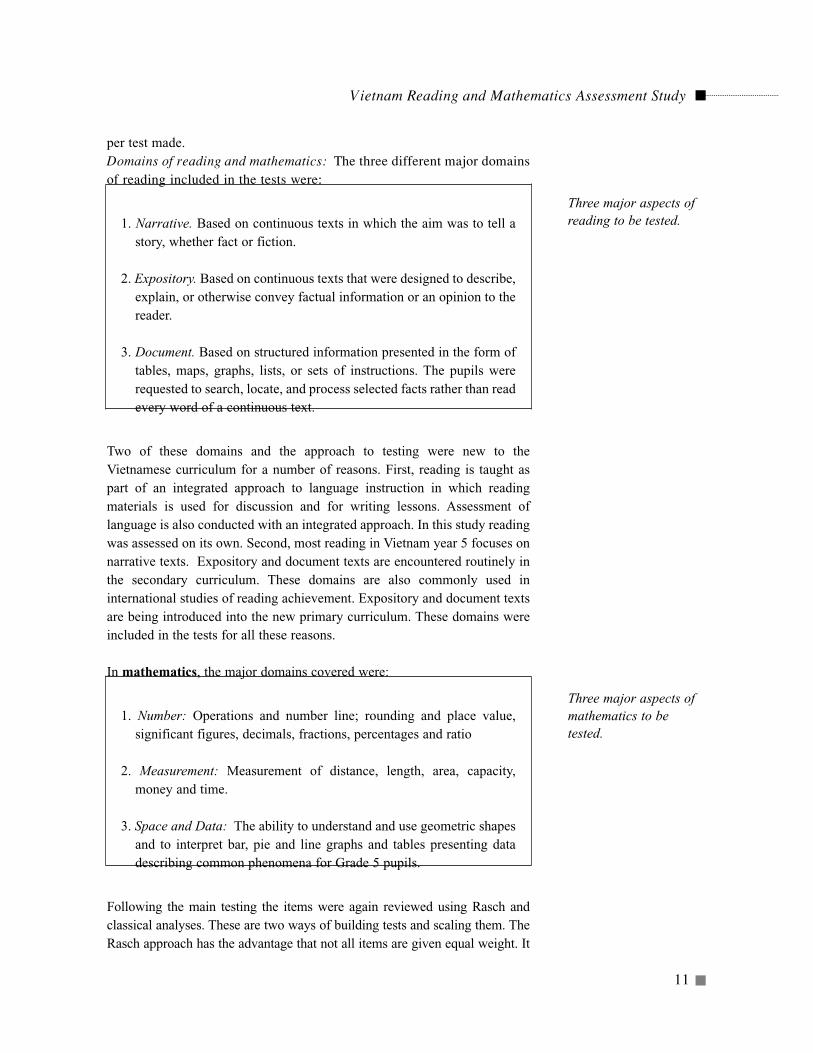
per test made.Domains of reading and mathematics: The three different major domainsof reading included in the tests were:
1. Narrative. Based on continuous texts in which the aim was to tell astory, whether fact or fiction.
2. Expository. Based on continuous texts that were designed to describe,explain, or otherwise convey factual information or an opinion to thereader.
3. Document. Based on structured information presented in the form oftables, maps, graphs, lists, or sets of instructions. The pupils wererequested to search, locate, and process selected facts rather than readevery word of a continuous text.
Two of these domains and the approach to testing were new to theVietnamese curriculum for a number of reasons. First, reading is taught aspart of an integrated approach to language instruction in which readingmaterials is used for discussion and for writing lessons. Assessment oflanguage is also conducted with an integrated approach. In this study readingwas assessed on its own. Second, most reading in Vietnam year 5 focuses onnarrative texts. Expository and document texts are encountered routinely inthe secondary curriculum. These domains are also commonly used ininternational studies of reading achievement. Expository and document textsare being introduced into the new primary curriculum. These domains wereincluded in the tests for all these reasons.
In mathematics, the major domains covered were:
1. Number: Operations and number line; rounding and place value,significant figures, decimals, fractions, percentages and ratio
2. Measurement: Measurement of distance, length, area, capacity,money and time.
3. Space and Data: The ability to understand and use geometric shapesand to interpret bar, pie and line graphs and tables presenting datadescribing common phenomena for Grade 5 pupils.
Following the main testing the items were again reviewed using Rasch andclassical analyses. These are two ways of building tests and scaling them. TheRasch approach has the advantage that not all items are given equal weight. It
Three major aspects ofreading to be tested.
Three major aspects ofmathematics to betested.
Vietnam Reading and Mathematics Assessment Study
12
is also possible to scale all items onto one scale and in this case it was alsopossible to scale the teacher items and the pupil items onto one scale thusallowing the teachers and pupils to be compared on the same scale. Four itemswere dropped from the pupil reading test but all 60 were retained for the mathtest. The four items were dropped from the reading test because they werefound not to be measuring the same construct as the other fifty six items.
Test scores: Three types of scores were produced for each test. The first wasa skill levels categorisation. This allows teachers and curriculum developersto know what the pupils in specific classes or in the country as a whole cando. The skills of individuals or groups can be analysed and decisions takenon further work for them. In this sense, it is a developmental framework. Thesecond is a functional categorisation. It provides benchmarks about how theprimary school system is functioning for primary children to enter societyand to prepare pupils for studying independently in secondary school. Thethird is a scale score that is used for the comparison of achievement amonggroups and for other explanatory type analyses.
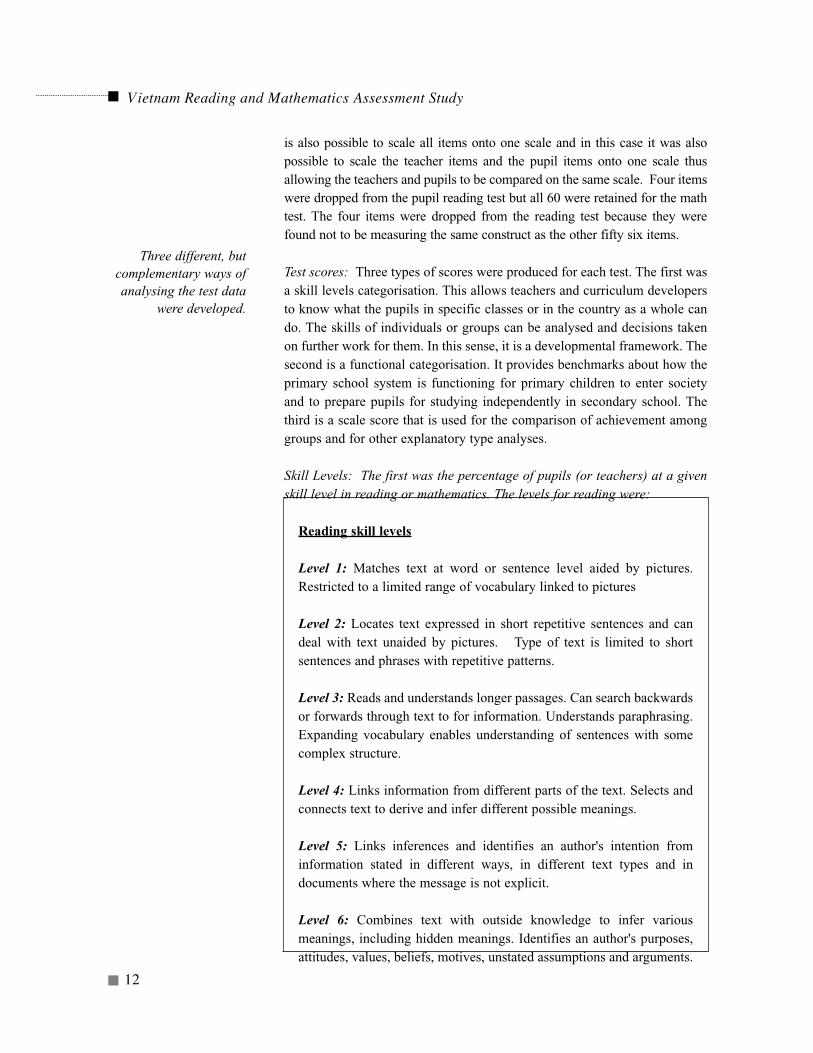
Skill Levels: The first was the percentage of pupils (or teachers) at a givenskill level in reading or mathematics. The levels for reading were:
Reading skill levels
Level 1: Matches text at word or sentence level aided by pictures.Restricted to a limited range of vocabulary linked to pictures
Level 2: Locates text expressed in short repetitive sentences and candeal with text unaided by pictures. Type of text is limited to shortsentences and phrases with repetitive patterns.
Level 3: Reads and understands longer passages. Can search backwardsor forwards through text to for information. Understands paraphrasing.Expanding vocabulary enables understanding of sentences with somecomplex structure.
Level 4: Links information from different parts of the text. Selects andconnects text to derive and infer different possible meanings.
Level 5: Links inferences and identifies an author's intention frominformation stated in different ways, in different text types and indocuments where the message is not explicit.
Level 6: Combines text with outside knowledge to infer variousmeanings, including hidden meanings. Identifies an author's purposes,attitudes, values, beliefs, motives, unstated assumptions and arguments.
Three different, butcomplementary ways ofanalysing the test data
were developed.
Vietnam Reading and Mathematics Assessment Study
13
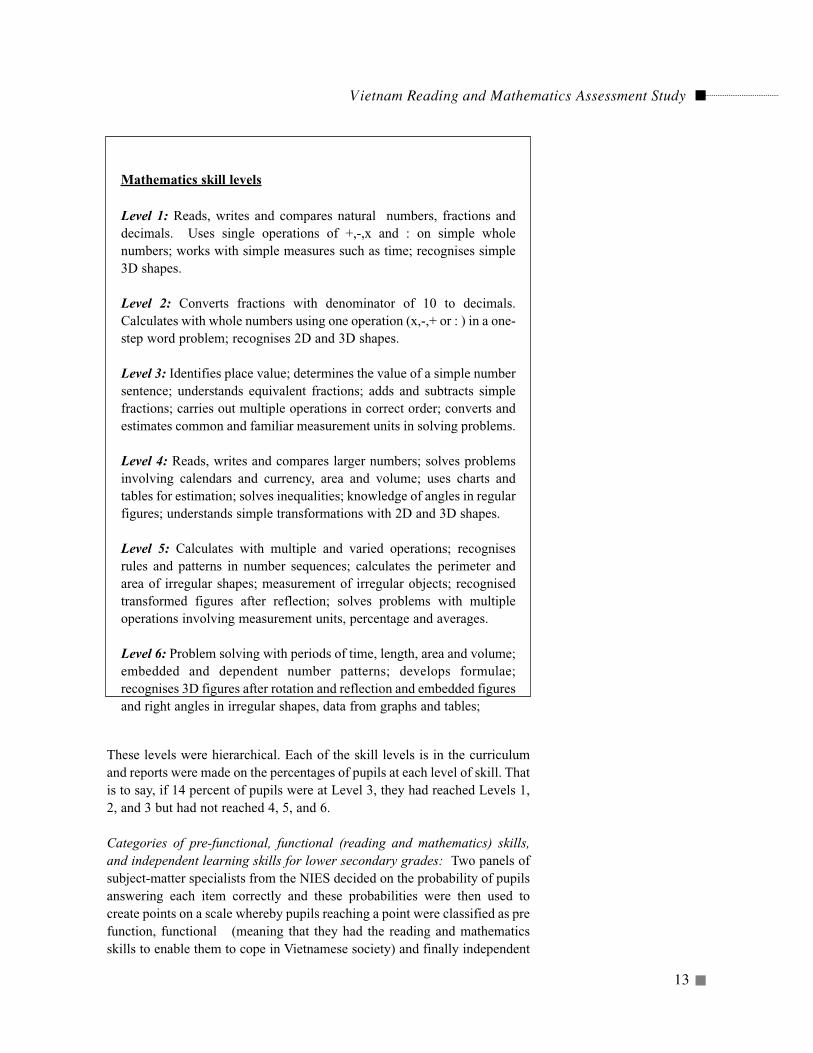
Mathematics skill levels
Level 1: Reads, writes and compares natural numbers, fractions anddecimals. Uses single operations of +,-,x and : on simple wholenumbers; works with simple measures such as time; recognises simple3D shapes.
Level 2: Converts fractions with denominator of 10 to decimals.Calculates with whole numbers using one operation (x,-,+ or : ) in a one-step word problem; recognises 2D and 3D shapes.
Level 3: Identifies place value; determines the value of a simple numbersentence; understands equivalent fractions; adds and subtracts simplefractions; carries out multiple operations in correct order; converts andestimates common and familiar measurement units in solving problems.
Level 4: Reads, writes and compares larger numbers; solves problemsinvolving calendars and currency, area and volume; uses charts andtables for estimation; solves inequalities; knowledge of angles in regularfigures; understands simple transformations with 2D and 3D shapes.
Level 5: Calculates with multiple and varied operations; recognisesrules and patterns in number sequences; calculates the perimeter andarea of irregular shapes; measurement of irregular objects; recognisedtransformed figures after reflection; solves problems with multipleoperations involving measurement units, percentage and averages.
Level 6: Problem solving with periods of time, length, area and volume;embedded and dependent number patterns; develops formulae;recognises 3D figures after rotation and reflection and embedded figuresand right angles in irregular shapes, data from graphs and tables;
These levels were hierarchical. Each of the skill levels is in the curriculumand reports were made on the percentages of pupils at each level of skill. Thatis to say, if 14 percent of pupils were at Level 3, they had reached Levels 1,2, and 3 but had not reached 4, 5, and 6.
Categories of pre-functional, functional (reading and mathematics) skills,and independent learning skills for lower secondary grades: Two panels ofsubject-matter specialists from the NIES decided on the probability of pupilsanswering each item correctly and these probabilities were then used tocreate points on a scale whereby pupils reaching a point were classified as prefunction, functional (meaning that they had the reading and mathematicsskills to enable them to cope in Vietnamese society) and finally independent
Vietnam Reading and Mathematics Assessment Study
14
(meaning a standard at which they were deemed to have the reading and mathskills needed for independent learning in Grade 6). These points have beendescribed as bench marks in this report.
Reading and mathematics 500 scores and sub-scores: A scale of achievementwas used where a score of 500 was the mean for the country and the standarddeviation was 100. These scores were produced for the overall scores inreading and mathematics and then for each sub-score: narrative, expository,documents, number, measurement, and space.
Other measures
Teacher tests: There were two aims for the teacher tests. First they shouldprovide a good spread of teacher achievement in reading and mathematics.Second, they should have enough items in common with the pupil tests sothat teacher and pupil scores and reading and mathematics skills could bebrought onto one scale. Items were written and trialled. The resultant teachertests had 45 items each.
Questionnaires: There were three questionnaires: pupil, teacher, and schoolhead. The policy questions developed by the Ministry of Education weretaken and a list made of the information required for them. This list wasthen developed into questionnaire items by a questionnaire committee offourteen persons, most of whom came from NIES. The questionnaires werefinalised in English and the English version was translated intoVietnamese. It is normal to have a forward translation (in this case fromEnglish into Vietnamese) and also a back translation by another group oftranslators (in this case from Vietnamese into English) in order to be surethat the meaning of the translated version is the same as in English and thatthe difficulty of words used was about the same. Only the forwardtranslation was made. Despite trialling the questionnaires in Thanh Hoa atthe same time as the test items were trialled, a later back translation showedthat there were some deviations in one or two questionnaire items from theoriginal intention. The data emanating from some questions had to bedropped from the anticipated analyses. But, the data from all of the otherquestions could be used.
The Conduct of the Study
Data collection
The number of schools in the sample was 3639 (of the 3660 schools some
Teacher tests in readingand mathematics were
developed.
Questionnaires weredeveloped by special
committee.
All measures werepiloted.
Vietnam Reading and Mathematics Assessment Study
15
had two groups of 20 pupils because they were very large and hence thereduction to 3639 schools) and it was estimated that each school should bevisited for two days. The time allowed for the total data collection was fourweek(s) (from the first day of the training sessions for data collectors onMarch 19, 2001 to the last day of the arrival of the instruments by mail at theMOET on April 21).
A data collection team headed by Dr. Do Cong Vinh of NIES was created.The preparation work was enormous. The pupil names in Grade 5 werecollected by means of a Pupil Name Form from each of the schools selectedin the sample. The sub-sample of 20 pupils per school was drawn at randomby the local data collector following the instruction provided by the centralteam. Pupil booklets were prepared for each of the sampled pupils with therelevant ID information being written into the front page of the booklet. Thebooklet consisted of a Pupil Questionnaire followed by a mathematics testand then a reading test. In a similar fashion the names of the mathematics andreading teachers of Grade 5 pupils were known from the School Form and asub-sample of two mathematics and reading teachers was drawn for eachschool. Again, Teacher booklets were prepared for each of the sampledteachers. A Data Collection Manual was prepared including information onevery step to be taken by the data collectors.
In all there were 4,405 persons involved in the data collection. Each sampleschool needed one data collector. This person was selected from the localdistrict educational officers; each district having a school in the sampleselected a coordinator. Each province formed a small committee of threepersons to organize the data collection within a province. The sampledschools were known about three months before the data had to be collected.The district and province in which the sampled schools were located werealso known. Contact was made with the Provincial Directors of Educationand discussions were held to arrange for the DEOs (District EducationOfficers) in which the schools were located to be available for the datacollection.
The packages were sent to the Provincial Education offices two weeksbefore the date of the data collection. Three training courses were held,the first for those central officers (14-15/3/2001), who were to train theprovincial officers in the second training course (27-29/3 for thenorthern provinces and 2-4/4 for the southern provinces). The thirdtraining course consisted of sixty-one different provincial trainingcourses to train the data collect within each province. In all of thetraining courses the participants completed all instruments themselvesand were also trained in what they had to do from the moment theyarrived at schools for the testing to the point when they departed the
4405 persons involved indata collection.
Data collectors weretrained at national andprovincial levels.
Vietnam Reading and Mathematics Assessment Study
16
schools with the completed instruments. The data collector for aparticular school was given the package for that school where he or shehad to collect data. If a pupil or teacher was absent on the day of testingthen no replacements were allowed, but a red line had to be drawnthrough the name. If a pupil or teacher was not present for any onetesting session, then a comment to this effect had to be made on the Pupiland Teacher Name forms.
On the first day, the data collector selected a random sample of 20 pupils per
school and, at the same time, selected a random sample of two Grade 5
teachers. The data collector also prepared the ‘Pupil Name Form’, ‘School
Form’, and ‘Teacher Name Form’. Arrangements were made for rooms to be
available for the testing of both pupils and teachers. The data collector filled
in the ID numbers on each of the booklets at the end of the first day. On the
second day in the morning the pupil questionnaire, pupil reading test, pupil
math test, and school head questionnaire were completed. In the afternoon
the teacher questionnaire, teacher reading test, and teacher math test were
completed. In three schools there were two pupils in each of them who were
present for the questionnaire and math test but not for the reading test. In one
school only a teacher was absent.
The data collectors handed in the completed packages for their schools to the
District Education Office, that in turn sent them to the National Centre. The
informal feedback from the data collectors was that the pupils and teachers
all enjoyed taking the tests. Two teachers complained that the Teacher
questionnaire was too long but they had completed it.
Data editing, entry, and cleaning
Part of a Hanoi Educational Management College was used as the central
place to which all completed instruments had to be returned. There had to be
a lot of storage space so that the instruments from each school could be stored
by province in such a way that they could be accessed very quickly when
required.
As soon as the data collection finished three teams (editing, entering, and
cleaning) of fourteen persons were formed for the data-entry. They were
trained in the use of the Windows version of the Data Entry Manager
(WINDEM) computer software developed by the IEA Data-Processing
Center in Hamburg, Germany (IEA, 2000). This software was adapted
specifically for the entry of the Vietnam Grade 5 data and no problems were
Data editing and entrywas completed in 12
weeks.
First day in schooldevoted to organising
the testing. The secondday was devoted to the
actual testing.
All test instruments werereturned to the district
offices and then toHanoi.
Vietnam Reading and Mathematics Assessment Study
17
encountered in the installation and use of this software.
Once the data-collection instruments were returned to the National Centre,
they were checked (edited) to ensure that the instruments for each pupil, each
teacher, and each school head were there and that there were no missing data
for the factual questions on the questionnaires. There were some missing
instruments and data and several school heads had to be contacted for the
missing instruments and data to be provided.
The data entry took 12 weeks. Just over three percent of the data were entered
twice, the second time for verification purposes. No major problems were
encountered and at the end of 14 weeks all data had been entered. However,
near the beginning of the data entry phase a ‘virtual’ workshop was held for
three days where the satellite classroom in the World Bank was connected to
the satellite classroom in the World Bank building in Paris. At the Hanoi end
was the Vietnam team of data enterers and at the Paris end there was the IIEP
team that was training the Vietnam data enterers. This type of
teaching/learning proved to be very effective.
At the same time as the data were entered, a further data cleaning team of six
persons checked the data for accuracy and reasonableness. They conducted a
series of consistency checks in order to correct some data and in other cases
to contact schools in order to check some of the information that had been
filled in on questionnaires and where the information looked suspect.
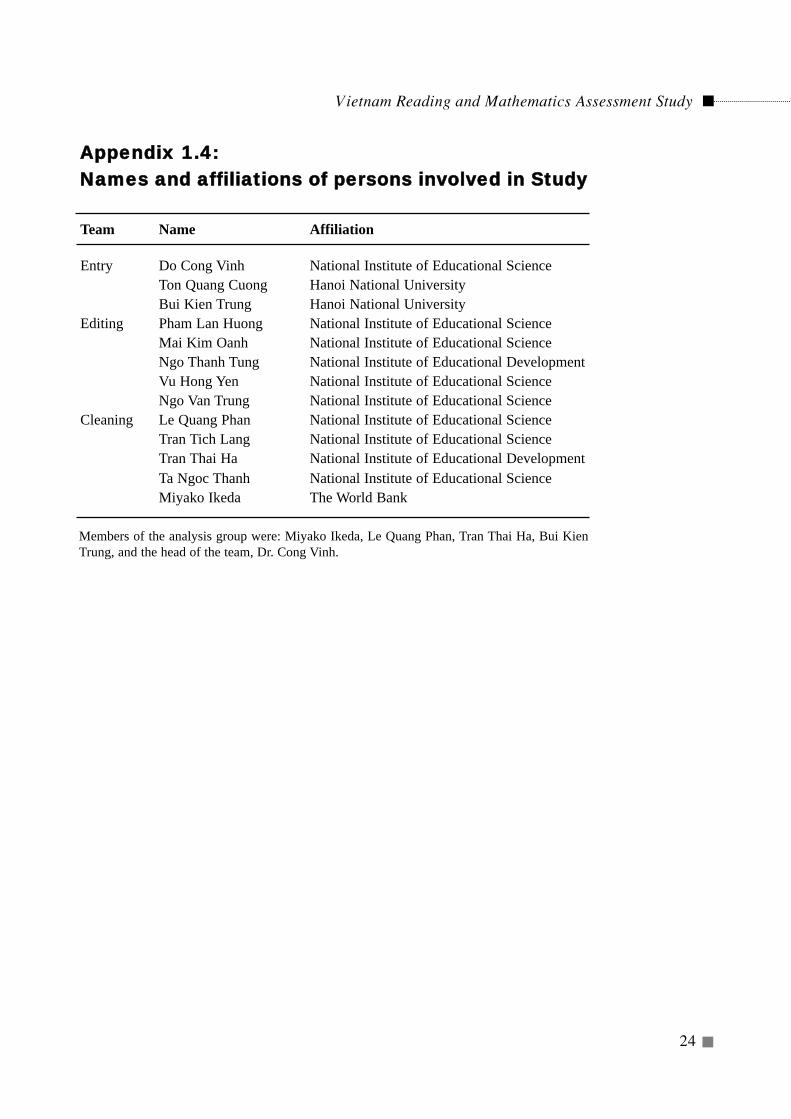
The names of the peoples working on data editing, entry, and cleaning have
been presented in Appendix 1.4.
Further cleaning, file merging and weighting
The data were sent to the IIEP team in Paris (Ken Ross, Mioko Saito, and
Stephanie Leite) by Miyako Ikeda who had been working with the Vietnam
data entry and checking team. Further consistency checks were undertaken
and problems resolved as a result of continuous e-mailing between Paris and
Ha Noi. The data files were merged to the pupil level and the sampling
weighting undertaken to correct for disproportionality between strata.
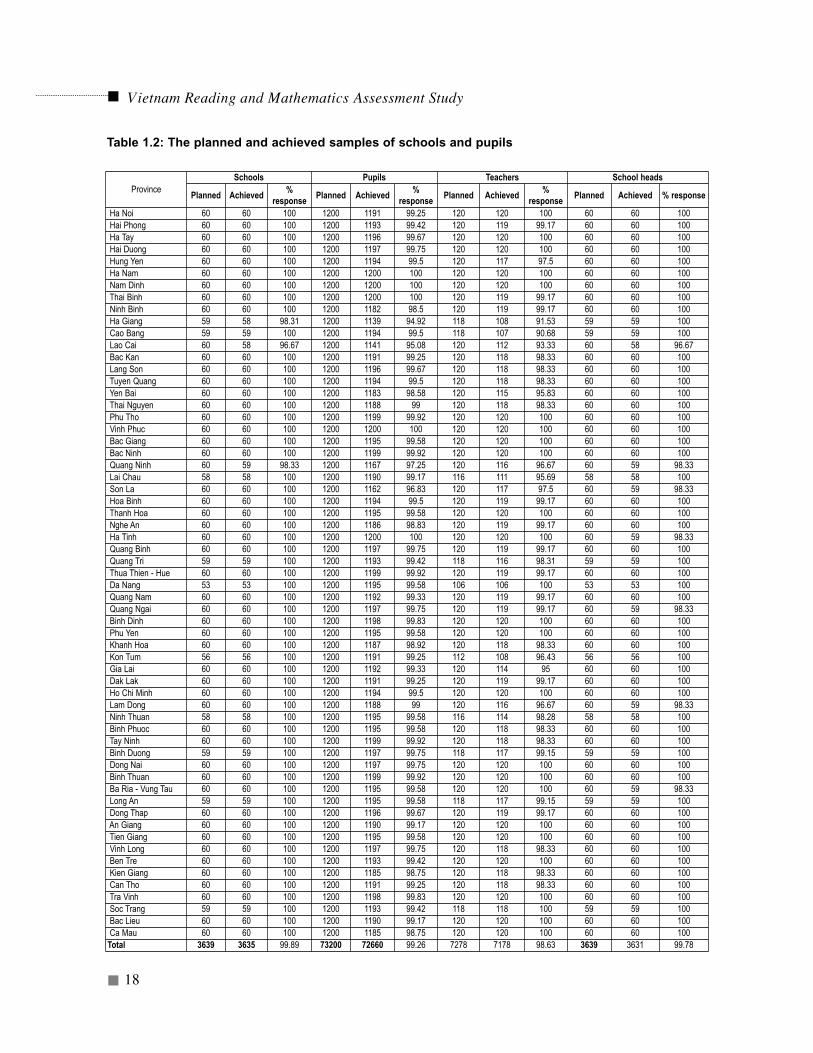
The numbers of pupils teachers and schools in the data file have been
presented in Table 1.2 together with the response rates. It is to be noted that
final response rates were 99.78 percent for school heads, 98.63 percent for
Cleaning of datacompleted in 3 months.
The overall finalresponse rate was99.15%.
Vietnam Reading and Mathematics Assessment Study
18
ProvinceSchools Pupils Teachers School heads
Planned Achieved %response Planned Achieved %
response Planned Achieved %response Planned Achieved % response
Ha Noi 60 60 100 1200 1191 99.25 120 120 100 60 60 100Hai Phong 60 60 100 1200 1193 99.42 120 119 99.17 60 60 100Ha Tay 60 60 100 1200 1196 99.67 120 120 100 60 60 100Hai Duong 60 60 100 1200 1197 99.75 120 120 100 60 60 100Hung Yen 60 60 100 1200 1194 99.5 120 117 97.5 60 60 100Ha Nam 60 60 100 1200 1200 100 120 120 100 60 60 100Nam Dinh 60 60 100 1200 1200 100 120 120 100 60 60 100Thai Binh 60 60 100 1200 1200 100 120 119 99.17 60 60 100Ninh Binh 60 60 100 1200 1182 98.5 120 119 99.17 60 60 100Ha Giang 59 58 98.31 1200 1139 94.92 118 108 91.53 59 59 100Cao Bang 59 59 100 1200 1194 99.5 118 107 90.68 59 59 100Lao Cai 60 58 96.67 1200 1141 95.08 120 112 93.33 60 58 96.67Bac Kan 60 60 100 1200 1191 99.25 120 118 98.33 60 60 100Lang Son 60 60 100 1200 1196 99.67 120 118 98.33 60 60 100Tuyen Quang 60 60 100 1200 1194 99.5 120 118 98.33 60 60 100Yen Bai 60 60 100 1200 1183 98.58 120 115 95.83 60 60 100Thai Nguyen 60 60 100 1200 1188 99 120 118 98.33 60 60 100Phu Tho 60 60 100 1200 1199 99.92 120 120 100 60 60 100Vinh Phuc 60 60 100 1200 1200 100 120 120 100 60 60 100Bac Giang 60 60 100 1200 1195 99.58 120 120 100 60 60 100Bac Ninh 60 60 100 1200 1199 99.92 120 120 100 60 60 100Quang Ninh 60 59 98.33 1200 1167 97.25 120 116 96.67 60 59 98.33Lai Chau 58 58 100 1200 1190 99.17 116 111 95.69 58 58 100Son La 60 60 100 1200 1162 96.83 120 117 97.5 60 59 98.33Hoa Binh 60 60 100 1200 1194 99.5 120 119 99.17 60 60 100Thanh Hoa 60 60 100 1200 1195 99.58 120 120 100 60 60 100Nghe An 60 60 100 1200 1186 98.83 120 119 99.17 60 60 100Ha Tinh 60 60 100 1200 1200 100 120 120 100 60 59 98.33Quang Binh 60 60 100 1200 1197 99.75 120 119 99.17 60 60 100Quang Tri 59 59 100 1200 1193 99.42 118 116 98.31 59 59 100Thua Thien - Hue 60 60 100 1200 1199 99.92 120 119 99.17 60 60 100Da Nang 53 53 100 1200 1195 99.58 106 106 100 53 53 100Quang Nam 60 60 100 1200 1192 99.33 120 119 99.17 60 60 100Quang Ngai 60 60 100 1200 1197 99.75 120 119 99.17 60 59 98.33Binh Dinh 60 60 100 1200 1198 99.83 120 120 100 60 60 100Phu Yen 60 60 100 1200 1195 99.58 120 120 100 60 60 100Khanh Hoa 60 60 100 1200 1187 98.92 120 118 98.33 60 60 100Kon Tum 56 56 100 1200 1191 99.25 112 108 96.43 56 56 100Gia Lai 60 60 100 1200 1192 99.33 120 114 95 60 60 100Dak Lak 60 60 100 1200 1191 99.25 120 119 99.17 60 60 100Ho Chi Minh 60 60 100 1200 1194 99.5 120 120 100 60 60 100Lam Dong 60 60 100 1200 1188 99 120 116 96.67 60 59 98.33Ninh Thuan 58 58 100 1200 1195 99.58 116 114 98.28 58 58 100Binh Phuoc 60 60 100 1200 1195 99.58 120 118 98.33 60 60 100Tay Ninh 60 60 100 1200 1199 99.92 120 118 98.33 60 60 100Binh Duong 59 59 100 1200 1197 99.75 118 117 99.15 59 59 100Dong Nai 60 60 100 1200 1197 99.75 120 120 100 60 60 100Binh Thuan 60 60 100 1200 1199 99.92 120 120 100 60 60 100Ba Ria - Vung Tau 60 60 100 1200 1195 99.58 120 120 100 60 59 98.33Long An 59 59 100 1200 1195 99.58 118 117 99.15 59 59 100Dong Thap 60 60 100 1200 1196 99.67 120 119 99.17 60 60 100An Giang 60 60 100 1200 1190 99.17 120 120 100 60 60 100Tien Giang 60 60 100 1200 1195 99.58 120 120 100 60 60 100Vinh Long 60 60 100 1200 1197 99.75 120 118 98.33 60 60 100Ben Tre 60 60 100 1200 1193 99.42 120 120 100 60 60 100Kien Giang 60 60 100 1200 1185 98.75 120 118 98.33 60 60 100Can Tho 60 60 100 1200 1191 99.25 120 118 98.33 60 60 100Tra Vinh 60 60 100 1200 1198 99.83 120 120 100 60 60 100Soc Trang 59 59 100 1200 1193 99.42 118 118 100 59 59 100Bac Lieu 60 60 100 1200 1190 99.17 120 120 100 60 60 100Ca Mau 60 60 100 1200 1185 98.75 120 120 100 60 60 100
Total 3639 3635 99.89 73200 72660 99.26 7278 7178 98.63 3639 3631 99.78
Table 1.2: The planned and achieved samples of schools and pupils
teachers, and 99.26 percent for pupils from 99.89 percent of schools.
Derived variables
A series of derived variables were constructed and added to the file. Thesewill become obvious as the reader progresses through the following chapters.
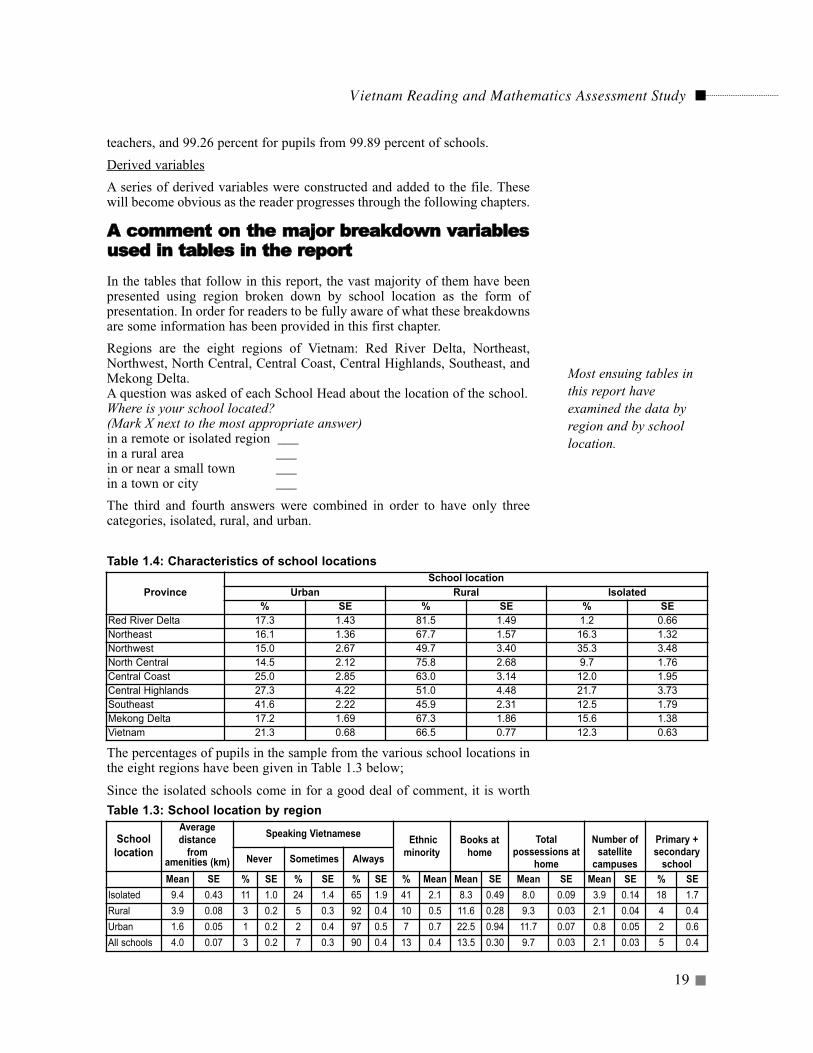
A comment on the major breakdown variablesused in tables in the reportIn the tables that follow in this report, the vast majority of them have beenpresented using region broken down by school location as the form ofpresentation. In order for readers to be fully aware of what these breakdownsare some information has been provided in this first chapter.
Regions are the eight regions of Vietnam: Red River Delta, Northeast,Northwest, North Central, Central Coast, Central Highlands, Southeast, andMekong Delta. A question was asked of each School Head about the location of the school. Where is your school located?(Mark X next to the most appropriate answer)in a remote or isolated region ___in a rural area ___in or near a small town ___in a town or city ___
The third and fourth answers were combined in order to have only threecategories, isolated, rural, and urban.
The percentages of pupils in the sample from the various school locations inthe eight regions have been given in Table 1.3 below;
Since the isolated schools come in for a good deal of comment, it is worth
Vietnam Reading and Mathematics Assessment Study
19
Most ensuing tables inthis report haveexamined the data byregion and by schoollocation.
ProvinceSchool location
Urban Rural Isolated% SE % SE % SE
Red River Delta 17.3 1.43 81.5 1.49 1.2 0.66Northeast 16.1 1.36 67.7 1.57 16.3 1.32Northwest 15.0 2.67 49.7 3.40 35.3 3.48North Central 14.5 2.12 75.8 2.68 9.7 1.76Central Coast 25.0 2.85 63.0 3.14 12.0 1.95Central Highlands 27.3 4.22 51.0 4.48 21.7 3.73Southeast 41.6 2.22 45.9 2.31 12.5 1.79Mekong Delta 17.2 1.69 67.3 1.86 15.6 1.38Vietnam 21.3 0.68 66.5 0.77 12.3 0.63
Table 1.4: Characteristics of school locations
Table 1.3: School location by region
Schoollocation
Average distance
fromamenities (km)
Speaking Vietnamese Ethnicminority
Books athome
Total possessions at
home
Number ofsatellite
campuses
Primary +secondary
schoolNever Sometimes Always
Mean SE % SE % SE % SE % Mean Mean SE Mean SE Mean SE % SEIsolated 9.4 0.43 11 1.0 24 1.4 65 1.9 41 2.1 8.3 0.49 8.0 0.09 3.9 0.14 18 1.7Rural 3.9 0.08 3 0.2 5 0.3 92 0.4 10 0.5 11.6 0.28 9.3 0.03 2.1 0.04 4 0.4Urban 1.6 0.05 1 0.2 2 0.4 97 0.5 7 0.7 22.5 0.94 11.7 0.07 0.8 0.05 2 0.6All schools 4.0 0.07 3 0.2 7 0.3 90 0.4 13 0.4 13.5 0.30 9.7 0.03 2.1 0.03 5 0.4
describing more what kinds of schools these are. Various characteristics ofthese schools have been presented in Table 1.4 below. The average distance from amenities is the average number of kilometers tothe nearest health clinic, the nearest road accessible by car, the nearest publiclibrary, the nearest bookstore, the nearest junior secondary school, and thenearest market. It can be seen that the average distance to these amenitiesfrom isolated schools was more than from rural schools which in turn wassomewhat more than from urban schools. The standard deviation ofkilometers was greater for isolated schools than for other schools. It shouldalso be noted that there were many missing data for this first variable andhence the distances for the isolated areas was probably underestimated.
The pupils were asked to what extent they spoke Vietnamese outside ofschool The replies were never, sometimes, and always. It can be seen thatpupils in isolated areas tended to speak less Vietnamese.
There were many more ethnic minority pupils in the isolated areas. Thepupils in the isolated areas had the least number of books in the home, hadthe least number of possessions in the home, and were in schools with moresatellite campuses (1= main school only, 2 = 1-2 campuses, 3 = 3-4campuses, 4 = 5-6 campuses, 5 = 7-8 campuses, 6 = 9-10 campuses and 7 =more than ten campuses). Finally 18 percent of pupils in isolated areas werein schools designated as primary school plus secondary school whereas inthen other areas the pupils tended to be more in primary only schools.
ConclusionIn this chapter a very brief description has been presented of the setting forthe study and the procedures undertaken in order to construct theinstruments and then conduct the sample survey in Vietnam. A much moredetailed description of the procedures for the study has been given inVolume 3 of this series.
In the following six chapters of this report emphasis has been placed on theeducational policy implications of the results arising from the data analyses.In each of these chapters one of the main policy questions described in thisfirst chapter has been addressed. In Chapter 2 the achievement levels of bothpupils and teachers have been described. The reason for having theachievement results first is that in the ensuing chapters reference has oftenbeen made to the achievement levels and scores. In Chapter 3 the personalcharacteristics and the home backgrounds of the Grade 5 pupils have beendescribed. The characteristics of Grade 5 teachers have been presented inChapter 4 and in Chapter 5 the characteristics of school heads and schoolshave been described. How the schools met with the Ministry’s ownbenchmark standards has been taken up in Chapter 6 while in Chapter 7analyses of the extent to which inputs (human and material resources) toschools have been allocated in an equitable fashion among and withinprovinces have been presented. An effective schools’ analysis has beendescribed in Chapter 8. Various attempts analysing the relative ‘effects’ ofselected variables on achievement have been described in Chapter 9. Finally,in Chapter 10 an ‘Agenda for action’ has been presented. This summarises
Vietnam Reading and Mathematics Assessment Study
20
Isolated schools had pupilsfrom poor ethnic minority
families, coming fromfurther distances,
sometimes not speakingVietnamese out side of
schools. These schools hadmore satellite campuses.
Vietnam Reading and Mathematics Assessment Study
21
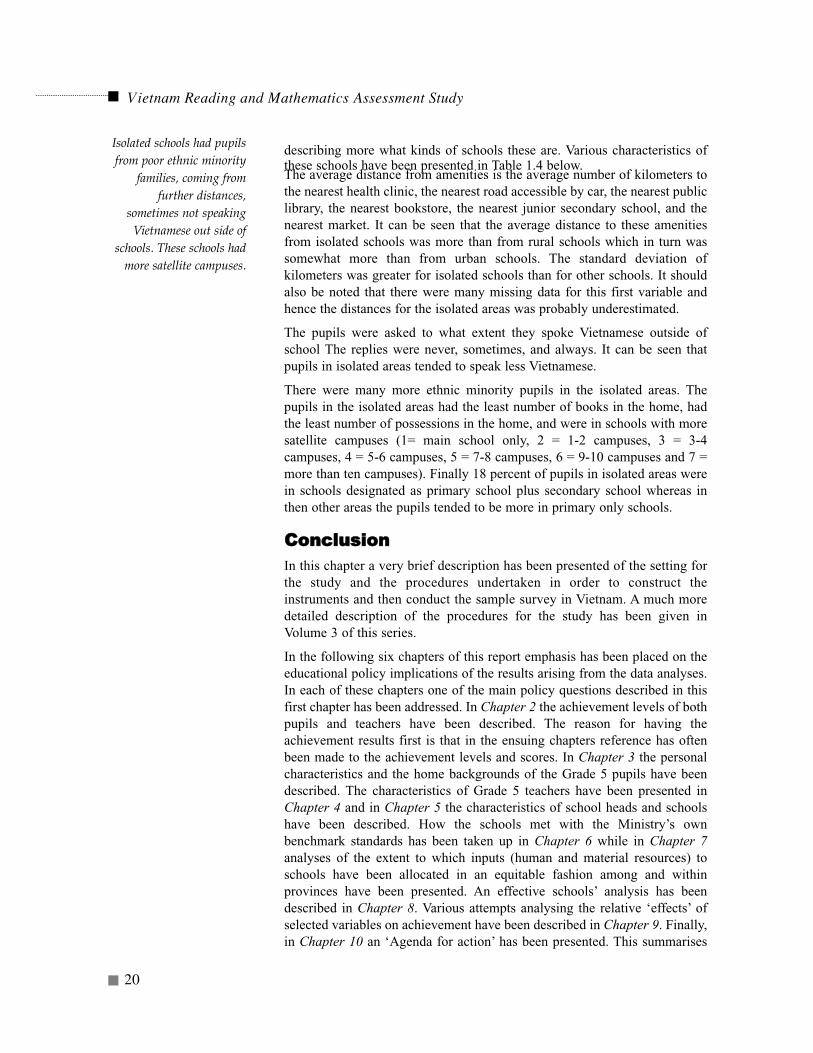
Appendix 1.1:Examples of policy questions (Page 1 out of 20 pages)
Group Questionnumber
Policy question Tablereference
Questionnairereference
Pupils
1 What are the characteristics, including homebackground, of the Grade 5 pupils? What actions dothese characteristics require the Ministry to take? Dothese characteristics and the home background have aninfluence on achievement?
1.01 What is the age distribution of Grade 5 pupils? Are theredistribution patterns requiring corrective action and/orhaving an influence on teaching methods and/or thecurriculum?
3.1 P02 D
1.02 What is the sex distribution of Grade 5 pupils? Are thereimbalances in the enrolment of male and female pupilsrequiring corrective action?
3.1 P03 D
1.03 What is the ethnic group of the children? 3.1 P05 D
1.04 How regularly do Grade 5 pupils eat meals? 3.1 P10
1.05 What percentage of Grade 5 pupils speaks the language ofthe test at home?
3.2 P04 D
1.06 What is the level of the parents' education of Grade 5pupils? (Add)
3.1 P11 DP12 D
1.07 How many books are there in pupils' homes? 3.1 P06 D
P = Pupil questionnaire D = Derived variable to be computed (see Vietnam: recoding of variables)TQ = Teacher questionnaire R = Rasch score to be computedS = School Head questionnaire
In some cases the implication of the question is spelled out but in other cases this has not been done because it is felt tobe self-evident.
Vietnam Reading and Mathematics Assessment Study
21
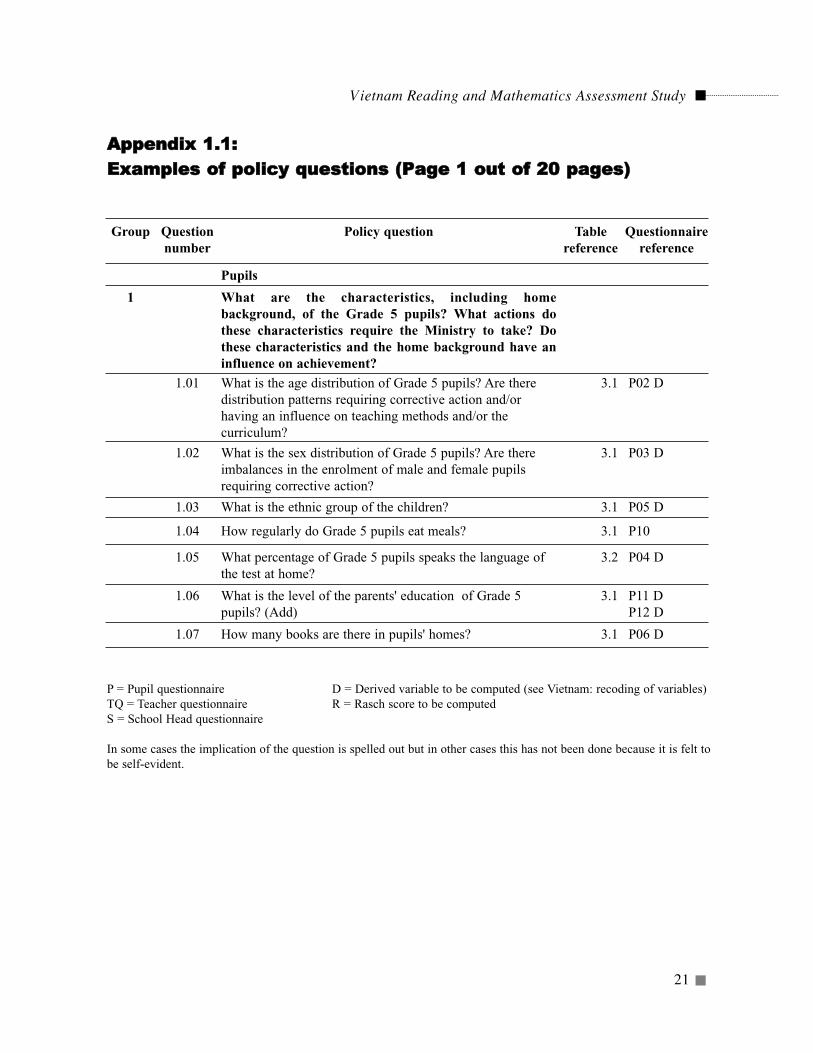
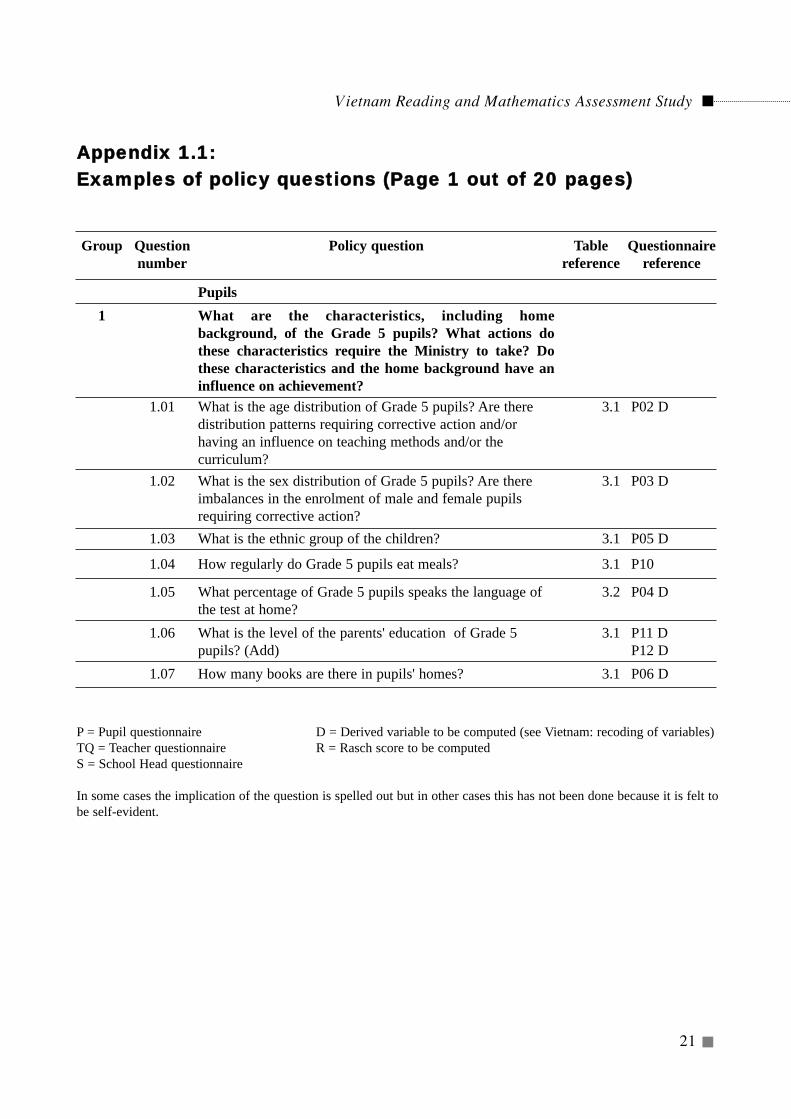
AAppppeennddiixx 11..11:: EExxaammpplleess ooff ppoolliiccyy qquueessttiioonnss ((PPaaggee 11 oouutt ooff 2200 ppaaggeess))
Group Questionnumber
Policy question Tablereference
Questionnairereference
Pupils1 What are the characteristics, including home
background, of the Grade 5 pupils? What actions dothese characteristics require the Ministry to take? Dothese characteristics and the home background have aninfluence on achievement?
1.01 What is the age distribution of Grade 5 pupils? Are theredistribution patterns requiring corrective action and/orhaving an influence on teaching methods and/or thecurriculum?
3.1 P02 D
1.02 What is the sex distribution of Grade 5 pupils? Are thereimbalances in the enrolment of male and female pupilsrequiring corrective action?
3.1 P03 D
1.03 What is the ethnic group of the children? 3.1 P05 D
1.04 How regularly do Grade 5 pupils eat meals? 3.1 P10
1.05 What percentage of Grade 5 pupils speaks the language ofthe test at home?
3.2 P04 D
1.06 What is the level of the parents' education of Grade 5pupils? (Add)
3.1 P11 DP12 D
1.07 How many books are there in pupils' homes? 3.1 P06 D
P = Pupil questionnaire D = Derived variable to be computed (see Vietnam: recoding of variables)TQ = Teacher questionnaire R = Rasch score to be computedS = School Head questionnaire
In some cases the implication of the question is spelled out but in other cases this has not been done because it is felt tobe self-evident.
Vietnam Reading and Mathematics Assessment Study
22
Levels Narrative Expository Documents
Level 6 Linking ideas from differentparts of text. Makinginferences from text or beyondtext.
Linking ideas from differentparts of text. Makinginferences from text orbeyond text.
Use of embedded lists and evensubtle advertisements where themessage is not explicitly stated
5 2 2 9
Level 5 Seeking and confirminginformation when readingbackwards through text
Seeking and confirminginformation when readingbackwards through text
Linking more than one piece ofinformation in different parts ofa document
4 5 3 12Level 4 Linking information portrayed
in sequences of ideas andcontent, when reading forward
Linking informationportrayed in sequences ofideas and content, whenreading forward
Systematic search forinformation when readingforward.
8 10 2 20
Level 3 Recognising the meaning of asingle word and being able toexpress it as a synonym inorder to answer the question
Recognising the meaning ofa single word and being ableto express it as a synonym inorder to answer the question
Linking simple piece ofinformation to item orinstruction
6 5 2 13
Level 2 Word/picture associationinvolving positional ordirectional prepositionsrequiring the linkage of apicture to a position or adirection in order to answerthe question
Word/picture associationinvolving positional ordirectional prepositionsrequiring the linkage of apicture to a position or adirection in order to answerthe question
Word/picture associationinvolving positional ordirectional prepositionsrequiring the linkage of apicture to a position or adirection in order to answer thequestion
1 1 1 3
Level 1 -- -- Word/picture associationinvolving nouns and/oradjectives requiring the simplelinkage of a picture to a word inorder to answer the question
3 324 23 13 60
AAppppeennddiixx 11..22:: BBlluueepprriinntt ooff RReeaaddiinngg TTeesstt:: TThhee ssttrruuccttuurree ooff tthhee rreeaaddiinngg tteesstt((DDiimmeennssiioonnss aanndd ttoottaall qquueessttiioonnss))
Vietnam Reading and Mathematics Assessment Study
23
AAppppeennddiixx 11..33:: BBlluueepprriinntt ooff mmaatthheemmaattiiccss tteesstt:: DDeessccrriippttiioonn ooff tthheelleevveellss ooff mmaatthheemmaattiiccss ccoommppeetteennccee ((aanndd ddoommaaiinnss aanndd nnuummbbeerrssooff iitteemmss))
Level Number Measurement Space/data
Level 6 Combining operations inorder to undertakecomputations involvingseveral steps using a mixtureof operations andcombinations of fractions,decimals and whole numbers
Combining operations in orderto undertake computationsinvolving several steps using a mixture of operations andtranslation of units
Linking data from tables andgraphs in order to undertakecomputations involvingseveral steps and with amixture of operations
3 2 3 8Level 5 Combining operations in
order to link informationfrom tables and charts whenperforming calculations
Two or three step operations as in Number, usingmeasurement units andconversion
Combining operations in orderto link information from tablesand charts when performingcalculations
4 4 4 12Level 4 Extend and complete
number patterns,Convert measurement units when undertaking one step computations
To translate shapes andpatterns
4 4 4 12Level 3 Simple fractions Basic calculations with
simple measurement unitsIdentify data in tabular form
4 4 4 12Level 2 Single operations using
two digit numbersRecognise units of measurement
Linking of patterns and graphsto single digits. Recognise andname basic shapes
4 4 2 10
Level 1 Number recognition, linkingpatterns to numbers.
6 0 0 6
Total 6 0 0 60
The same description of the numbers applies as that from beneath Appendix 1.2.
Vietnam Reading and Mathematics Assessment Study
24
Team Name Affiliation
Entry Do Cong Vinh National Institute of Educational ScienceTon Quang Cuong Hanoi National UniversityBui Kien Trung Hanoi National University
Editing Pham Lan Huong National Institute of Educational ScienceMai Kim Oanh National Institute of Educational ScienceNgo Thanh Tung National Institute of Educational DevelopmentVu Hong Yen National Institute of Educational ScienceNgo Van Trung National Institute of Educational Science
Cleaning Le Quang Phan National Institute of Educational ScienceTran Tich Lang National Institute of Educational ScienceTran Thai Ha National Institute of Educational DevelopmentTa Ngoc Thanh National Institute of Educational ScienceMiyako Ikeda The World Bank
AAppppeennddiixx 11..44:: NNaammeess aanndd aaffffiilliiaattiioonnss ooff ppeerrssoonnss iinnvvoollvveedd iinn SSttuuddyy
Members of the analysis group were: Miyako Ikeda, Le Quang Phan, Tran Thai Ha, Bui KienTrung, and the head of the team, Dr. Cong Vinh.
Vietnam Reading and Mathematics Assessment Study
25
Chapter 21
WHAT WERE THE LEVELS OFACHIEVEMENT OF GRADE 5 PUPILS INREADING AND MATHEMATICS
Introduction
In any system of education, probably the most important aspect is"whether or not the pupils are learning", or stated in a slightly morenuanced way "to what extent the pupils have learned what they weremeant to learn". In later chapters of this report, an examination has been
made of the home backgrounds of pupils, the classrooms in which they were,the teachers they had, and finally of the conditions of the schools theyattended. But, in the end, the important question is "how well did the pupilslearn?". In this chapter, a proxy measure for learning has been examined - thepupils' achievement measured towards the end of their time in Grade 5. It is,in a way, the culmination of learning that has taken place up to the end ofGrade 5 and is an indication of the state of learning at the end of primaryeducation in Vietnam. In order to structure the chapter the following majorquestions have been posed and answered.
1. What did the tests measure and how is this reported?
2. What percentages of pupil reached the different levels of skills in readingand mathematics?
3. What percentages of pupil reached different benchmarks in reading andmathematics?
4. What were the test scores in reading and mathematics?
5. What were the differences in test scores in both reading and mathematicsbetween boys and girls and between the different socio-economic groups?
1 This chapter was written by Professor Patrick Griffin of Melbourne University
Tests were used as ameasure of learning atthe end of primaryschool
Vietnam Reading and Mathematics Assessment Study
26
6. Were the pupils 'elite' (upper 5 %) performances similar in differentregions and economically advantaged areas? To what extent did theperformance 'tails' (bottom 5%) differ across regions and economicallyadvantaged areas?
7. What were the relationships between teacher and pupil performance on thetests of reading and mathematics?
What did the tests measure?
The tests were developed by teams of specialists from the National Instituteof Educational Science (NIES) following the specifications set out in Chapter1. They ensured that the test items measured both the old and newcurriculum. They were designed to measure achievement in two subjectareas: reading comprehension and mathematics. There were three differentapproaches that were used in the measurement of achievement. These havebeen explained to some extent in the test development section in Chapter 1and in detail in Volume 3. The Vietnamese mathematics curriculum is similarto curriculum that is common to many countries. This, however, is not thecase with the reading curriculum. In language education the emphasis in ona local curriculum which conveys the culture as well as the skills in reading,writing, listening and speaking. In Vietnam, the language curriculum isintegrated in its approach and in its role of cultural development. This projecthas assessed reading on its own and in a manner unfamiliar to the pupils andteachers. The usual integrated approach to reading, discussion and writing inlanguage classes, was not included in the test used. It could not be done withsuch a large sample and the performance testing techniques that theassessment of speaking and writing would require.. Despite this the level ofreading achievement was generally high. This is not the case with themathematics curriculum, which is linked to international mathematicsapproaches to mathematics teaching and learning. International curriculumtrends and assessment methods influence it. The mathematics curriculum hasmuch that is common with most other countries.
Other aspects of testing and of changes in curriculum were also taken intoaccount. The objectives of the language and reading curriculum emphasisereading for details and not processing or inference development. This ischanging in the curriculum currently being introduced to primary schools.The test also contained two areas possibly not familiar to all students-expository and document texts. Document literacy in particular could beexpected to be associated with lower performance, as it does not involvecontinuous prose. However both expository and document styles of text canbe expected to be routinely encountered in secondary texts and weretherefore legitimately included in the tests. The three different measures wereused because they provided different uses and interpretation of the data. Thefirst describes the skill development of the pupil. The second indicates howthe pupil has been prepared to cope with the reading demands of two contexts
Levels of achievementin a criterion
referenced frameworkprovided a competency
basis for describinglearning outcomes. The
tests were constructedby NIES
Changes in curriculumtaking place in
primary educationwere taken into
account in the tests.
into which the pupil will progress- the Vietnamese community and lowersecondary education. The third is a scaled score used to analyse and interpretdifferences in performances between groups. Each of the measures and theiruses are described in more details and the details of how they were developedare provided in Volume 3.
a) Skill levels. Six skill levels were identified in each of the subject areas underconsideration. The levels are hierarchical. It was possible to calculate thepercentages of pupils who had or had not reached each of the skill levels. Theseskill levels enable a direct interpretation of the pupils' performances in each ofthe tests and to link the skills to possible intervention through curriculumdevelopment and teaching strategies. They provide a criterion referenced anddevelopmental framework for interpreting how pupils are progressing andwhat whey can and cannot do in terms of increasing levels of competence.Details of how these levels were defined have been included in Volume 3.
b) Benchmarks: Two benchmark levels2 were also established. They werebased on the pupil's ability to cope with reading and mathematics tasksencountered in specific circumstances. The first benchmark was based on apupil's ability to use a set of reading and mathematics skills needed tofunction in Vietnamese society. Those below this benchmark were describedas 'pre-functional'. A second benchmark was based on an estimation of apupil's ability to cope with the reading and mathematics tasks in the nextgrade of education, Grade 6, which is the first year of secondary education.The two benchmarks helped to identify three groups of pupils. Those belowthe first benchmark would need considerable help to enable them to functionand participate fully in Vietnamese society. Those above this benchmark butbelow the second would need assistance to help them cope with the readingand mathematics involved in secondary education. Pupils above the secondbenchmark were expected to be able to cope with the reading andmathematics involved in secondary education.
i) Benchmark 1: A group of pupils were described as pre functional becausethey had not yet reached a benchmark demonstrating reading ormathematics required for everyday activities in Vietnamese society. Thelabel used in the tables is 'Pre functional'; It does not mean that a pupil isilliterate or non-numerate. There are basic skills that these pupils candemonstrate, but the skill level is not yet deemed by experts to be at asufficient level to enable the person to be an effective member ofVietnamese society.
ii) A second group of pupils was identified as those who could demonstratethe kinds of skills needed to cope with life in Vietnam. They were found
Vietnam Reading and Mathematics Assessment Study
27
Benchmarking at twolevels of competence-minimum forparticipation in society -and desired forindependent learning inlower secondary weredeveloped
Minimum benchmarkdefined for societalinvolvement
2 A detailed technical explanation of how and why this was done has been given in Volume 3of this series. The experts made two ratings for each item in the tests. The first was theprobability that a person who could adequately function in Vietnamese society could obtain thecorrect answer to each item. The second was the probability that a pupil who had adequate skillsto cope with Grade 6 learning, could obtain the correct answer to each item. In each case theprobabilities were summed using an Angoff approach to establish the cut-off points.
A desired benchmark ofindependent learningskills was developed
Vietnam Reading and Mathematics Assessment Study
28
to be above this lower benchmark but had not yet reached the secondbenchmark. These pupils were designated as "functional" in terms of theircapacity to participate in Vietnamese society. However it was deemedthat this group would need some remedial assistance to be able to copewith the reading and mathematics required at Grade 6 level.
iii) Benchmark 2: These pupils, whose performances above the secondbenchmark, were described as demonstrating the kinds of skills that weredesirable in order to learn independently at the next level of schooling,without needing remedial assistance. The label used in the tables was'independent'.
c) Total scores and sub-scores. Pupils' scores on each test and sub domain ofitems were converted to a new, neutral common scale allowing estimates ofrelative educational importance of differences between groups. scale with amean of 500 and a standard deviation of 100. This is a frequently usedconversion of scores. The scaled score is used to examine differencesbetween sub groups in the sample. In education differences of 0.2 standarddeviations are often considered to be large and educationally important. Withvery large samples such as we have in this study, very small differences canbe statistically significant and this is often mistaken for educationalimportance. Using the scale with a mean of 500 and a standard deviation of100, gives a simple way of interpreting differences. Scores below 500 arebelow the national average and scores over 500 are above the nationalaverage. Differences between groups of more than 20 points deserve to beexamined in detail for possible explanation as they may be of someeducational importance. Details of how these scores were derived have beenpresented in Volume 3.
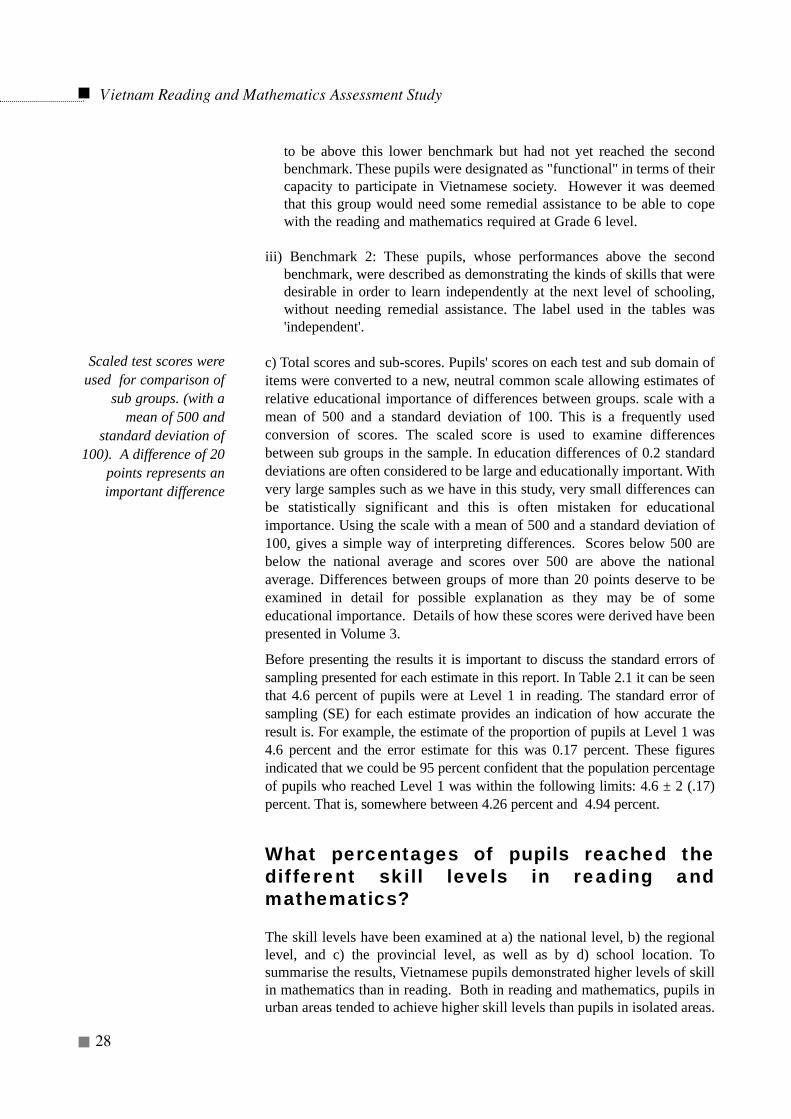
Before presenting the results it is important to discuss the standard errors ofsampling presented for each estimate in this report. In Table 2.1 it can be seenthat 4.6 percent of pupils were at Level 1 in reading. The standard error ofsampling (SE) for each estimate provides an indication of how accurate theresult is. For example, the estimate of the proportion of pupils at Level 1 was4.6 percent and the error estimate for this was 0.17 percent. These figuresindicated that we could be 95 percent confident that the population percentageof pupils who reached Level 1 was within the following limits: 4.6 ± 2 (.17)percent. That is, somewhere between 4.26 percent and 4.94 percent.
What percentages of pupils reached thedifferent skill levels in reading andmathematics?
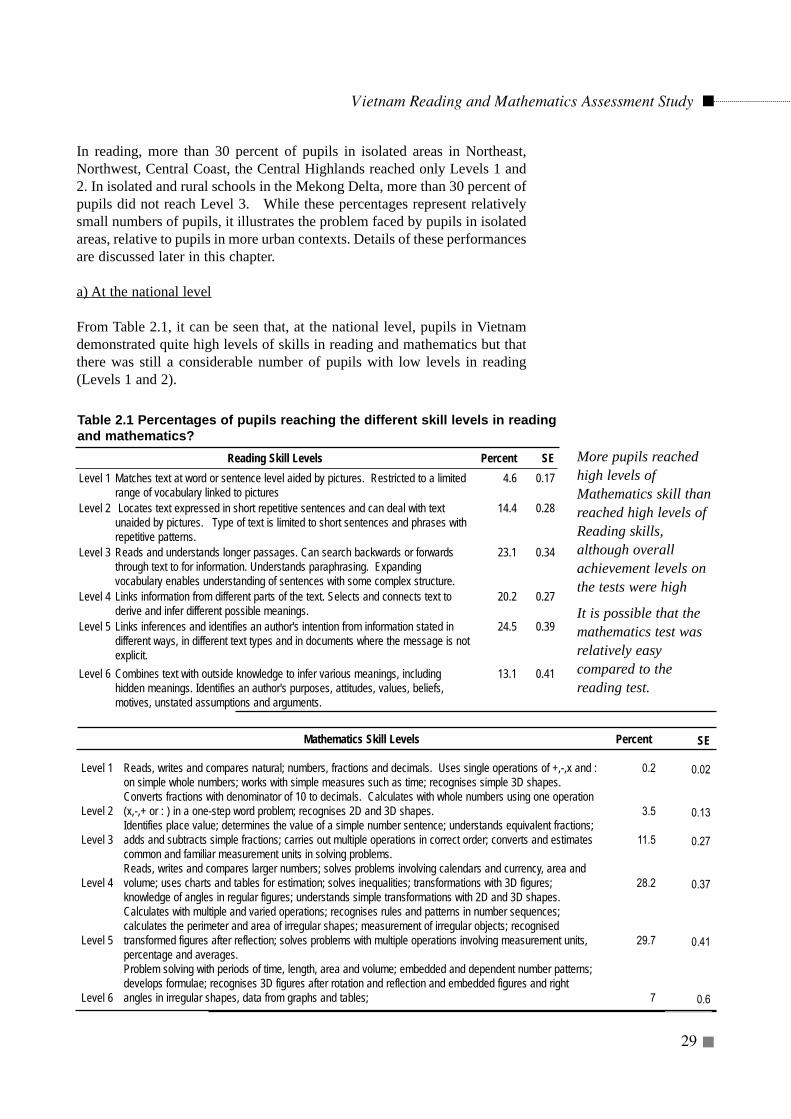
The skill levels have been examined at a) the national level, b) the regionallevel, and c) the provincial level, as well as by d) school location. Tosummarise the results, Vietnamese pupils demonstrated higher levels of skillin mathematics than in reading. Both in reading and mathematics, pupils inurban areas tended to achieve higher skill levels than pupils in isolated areas.
Scaled test scores wereused for comparison of
sub groups. (with amean of 500 and
standard deviation of100). A difference of 20
points represents animportant difference
In reading, more than 30 percent of pupils in isolated areas in Northeast,Northwest, Central Coast, the Central Highlands reached only Levels 1 and2. In isolated and rural schools in the Mekong Delta, more than 30 percent ofpupils did not reach Level 3. While these percentages represent relativelysmall numbers of pupils, it illustrates the problem faced by pupils in isolatedareas, relative to pupils in more urban contexts. Details of these performancesare discussed later in this chapter.
a) At the national level
From Table 2.1, it can be seen that, at the national level, pupils in Vietnamdemonstrated quite high levels of skills in reading and mathematics but thatthere was still a considerable number of pupils with low levels in reading(Levels 1 and 2).
Vietnam Reading and Mathematics Assessment Study
29
Reading Skill Levels Percent SELevel 1 Matches text at word or sentence level aided by pictures. Restricted to a limited
range of vocabulary linked to pictures 4.6 0.17
Level 2 Locates text expressed in short repetitive sentences and can deal with textunaided by pictures. Type of text is limited to short sentences and phrases withrepetitive patterns.
14.4 0.28
Level 3 Reads and understands longer passages. Can search backwards or forwardsthrough text to for information. Understands paraphrasing. Expandingvocabulary enables understanding of sentences with some complex structure.
23.1 0.34
Level 4 Links information from different parts of the text. Selects and connects text toderive and infer different possible meanings.
20.2 0.27
Level 5 Links inferences and identifies an author's intention from information stated indifferent ways, in different text types and in documents where the message is notexplicit.
24.5 0.39
Level 6 Combines text with outside knowledge to infer various meanings, includinghidden meanings. Identifies an author's purposes, attitudes, values, beliefs,motives, unstated assumptions and arguments.
13.1 0.41
More pupils reachedhigh levels ofMathematics skill thanreached high levels ofReading skills,although overallachievement levels onthe tests were high
It is possible that themathematics test wasrelatively easycompared to thereading test.
Table 2.1 Percentages of pupils reaching the different skill levels in readingand mathematics?
Percent
0.2
3.5
11.5
28.2
29.7
7
SE
0.02
0.13
0.27
0.37
0.41
0.6
Level 1
Level 2
Level 3
Level 4
Level 5
Level 6
Mathematics Skill Levels
Reads, writes and compares natural; numbers, fractions and decimals. Uses single operations of +,-,x and :on simple whole numbers; works with simple measures such as time; recognises simple 3D shapes.Converts fractions with denominator of 10 to decimals. Calculates with whole numbers using one operation(x,-,+ or : ) in a one-step word problem; recognises 2D and 3D shapes.Identifies place value; determines the value of a simple number sentence; understands equivalent fractions;adds and subtracts simple fractions; carries out multiple operations in correct order; converts and estimatescommon and familiar measurement units in solving problems.Reads, writes and compares larger numbers; solves problems involving calendars and currency, area andvolume; uses charts and tables for estimation; solves inequalities; transformations with 3D figures;knowledge of angles in regular figures; understands simple transformations with 2D and 3D shapes.Calculates with multiple and varied operations; recognises rules and patterns in number sequences;calculates the perimeter and area of irregular shapes; measurement of irregular objects; recognisedtransformed figures after reflection; solves problems with multiple operations involving measurement units,percentage and averages.Problem solving with periods of time, length, area and volume; embedded and dependent number patterns;develops formulae; recognises 3D figures after rotation and reflection and embedded figures and rightangles in irregular shapes, data from graphs and tables;
The percentage of pupils reaching the top three levels in reading was lowerthan in mathematics. There are a number of reasons for this. The reading testincluded items from old and new curriculum and text genre that were relatedto the secondary school, but not currently included in the primary schoolcurriculum. The gap between the upper primary and lower secondary schoolreading demands placed on pupils is larger than the gap between the upperprimary and lower secondary mathematics demands. For instance, theobjectives of the reading curriculum emphasise reading for detail and not onprocessing and inference development. While this is changing in the newcurriculum, the development of teachers and pupils has not yet reached thelevels that appear to have been achieved in mathematics where the transitionto secondary curriculum is not as abrupt. There are many issues that need tobe dealt with in the Vietnamese language curriculum in the transition to thenew curriculum, including the tradition of emphasising detail in reading.Accordingly the test performance was analysed using items related to the oldcurriculum and items related to the new curriculum. Results of these analyseshave also been presented in this chapter.
The test results have been reported in developmental or criterion referencedterms. This is because criterion-referenced interpretations of performanceshave meaning for the kind of assistance needed by pupils, teachers andcurriculum developers as the new curriculum is ushered into the system andthe schools. This developmental assessment strategy illustrated in thischapter provides powerful diagnostic and substantive information aboutpupil performance and related curriculum.
Policy suggestion 2.1: The MOET might wish to consider theintroduction of curriculum and assessment frameworks and benchmarkswritten in criterion referenced (profile) format. This can be done as thenew curriculum is introduced. This will encourage a competency-baseddevelopmental interpretation of pupil performances.
Policy suggestion 2.2: The MOET might wish to use developmentalassessment procedures to plan intervention programs for specific groupsof pupils and teachers.
b) At the regional level
The percentages of pupils who reached the various levels of skills in readingand mathematics have been presented in Table 2.2. It can be seen that therewere large differences between regions in terms of achievement of levels ofskills. At Level 6, for instance, the highest level measured by the tests, theMekong Delta had 7.5 percent of pupils at this level in mathematics and 13.0percent in reading. In contrast to this, the Red River Delta had 18.8 percentand 37.8 percent respectively. At the lower levels of reading skills, especiallyLevels 1 and 2 the Mekong Delta had a total of 6 percent compared with theRed River Delta's 2.1 percent. A similar ratio of skill level was evident inmathematics where the percentages were 30.4 and 10.5 respectively. It is
Vietnam Reading and Mathematics Assessment Study
30
Changes in thecurriculum are taking
place in primaryeducation.
High levels in the RedRiver region and low
achievement in theMekong Delta were
observed in both readingand mathematics
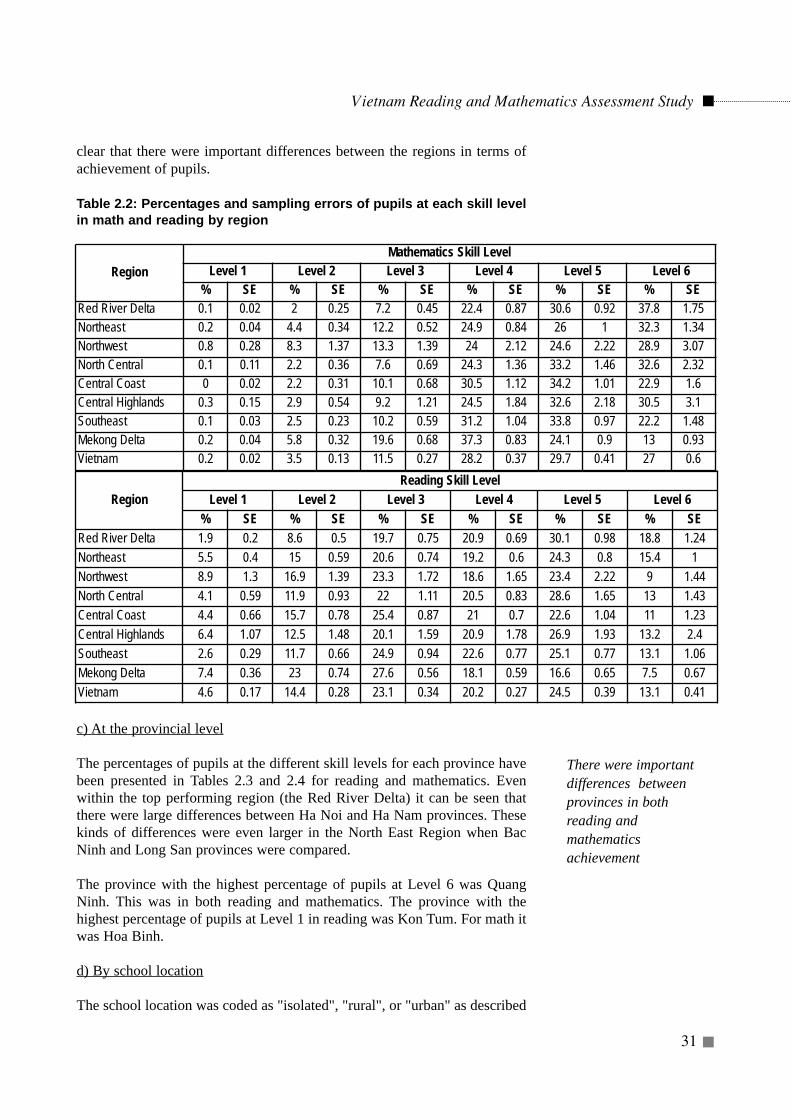
Vietnam Reading and Mathematics Assessment Study
31
clear that there were important differences between the regions in terms ofachievement of pupils.
Table 2.2: Percentages and sampling errors of pupils at each skill levelin math and reading by region
c) At the provincial level
The percentages of pupils at the different skill levels for each province havebeen presented in Tables 2.3 and 2.4 for reading and mathematics. Evenwithin the top performing region (the Red River Delta) it can be seen thatthere were large differences between Ha Noi and Ha Nam provinces. Thesekinds of differences were even larger in the North East Region when BacNinh and Long San provinces were compared.
The province with the highest percentage of pupils at Level 6 was QuangNinh. This was in both reading and mathematics. The province with thehighest percentage of pupils at Level 1 in reading was Kon Tum. For math itwas Hoa Binh.
d) By school location
The school location was coded as "isolated", "rural", or "urban" as described
RegionMathematics Skill Level
Level 1 Level 2 Level 3 Level 4 Level 5 Level 6% SE % SE % SE % SE % SE % SE
Red River Delta 0.1 0.02 2 0.25 7.2 0.45 22.4 0.87 30.6 0.92 37.8 1.75Northeast 0.2 0.04 4.4 0.34 12.2 0.52 24.9 0.84 26 1 32.3 1.34Northwest 0.8 0.28 8.3 1.37 13.3 1.39 24 2.12 24.6 2.22 28.9 3.07North Central 0.1 0.11 2.2 0.36 7.6 0.69 24.3 1.36 33.2 1.46 32.6 2.32Central Coast 0 0.02 2.2 0.31 10.1 0.68 30.5 1.12 34.2 1.01 22.9 1.6Central Highlands 0.3 0.15 2.9 0.54 9.2 1.21 24.5 1.84 32.6 2.18 30.5 3.1Southeast 0.1 0.03 2.5 0.23 10.2 0.59 31.2 1.04 33.8 0.97 22.2 1.48Mekong Delta 0.2 0.04 5.8 0.32 19.6 0.68 37.3 0.83 24.1 0.9 13 0.93Vietnam 0.2 0.02 3.5 0.13 11.5 0.27 28.2 0.37 29.7 0.41 27 0.6
RegionReading Skill Level
Level 1 Level 2 Level 3 Level 4 Level 5 Level 6% SE % SE % SE % SE % SE % SE
Red River Delta 1.9 0.2 8.6 0.5 19.7 0.75 20.9 0.69 30.1 0.98 18.8 1.24Northeast 5.5 0.4 15 0.59 20.6 0.74 19.2 0.6 24.3 0.8 15.4 1Northwest 8.9 1.3 16.9 1.39 23.3 1.72 18.6 1.65 23.4 2.22 9 1.44North Central 4.1 0.59 11.9 0.93 22 1.11 20.5 0.83 28.6 1.65 13 1.43Central Coast 4.4 0.66 15.7 0.78 25.4 0.87 21 0.7 22.6 1.04 11 1.23Central Highlands 6.4 1.07 12.5 1.48 20.1 1.59 20.9 1.78 26.9 1.93 13.2 2.4Southeast 2.6 0.29 11.7 0.66 24.9 0.94 22.6 0.77 25.1 0.77 13.1 1.06Mekong Delta 7.4 0.36 23 0.74 27.6 0.56 18.1 0.59 16.6 0.65 7.5 0.67Vietnam 4.6 0.17 14.4 0.28 23.1 0.34 20.2 0.27 24.5 0.39 13.1 0.41
There were importantdifferences betweenprovinces in bothreading andmathematicsachievement
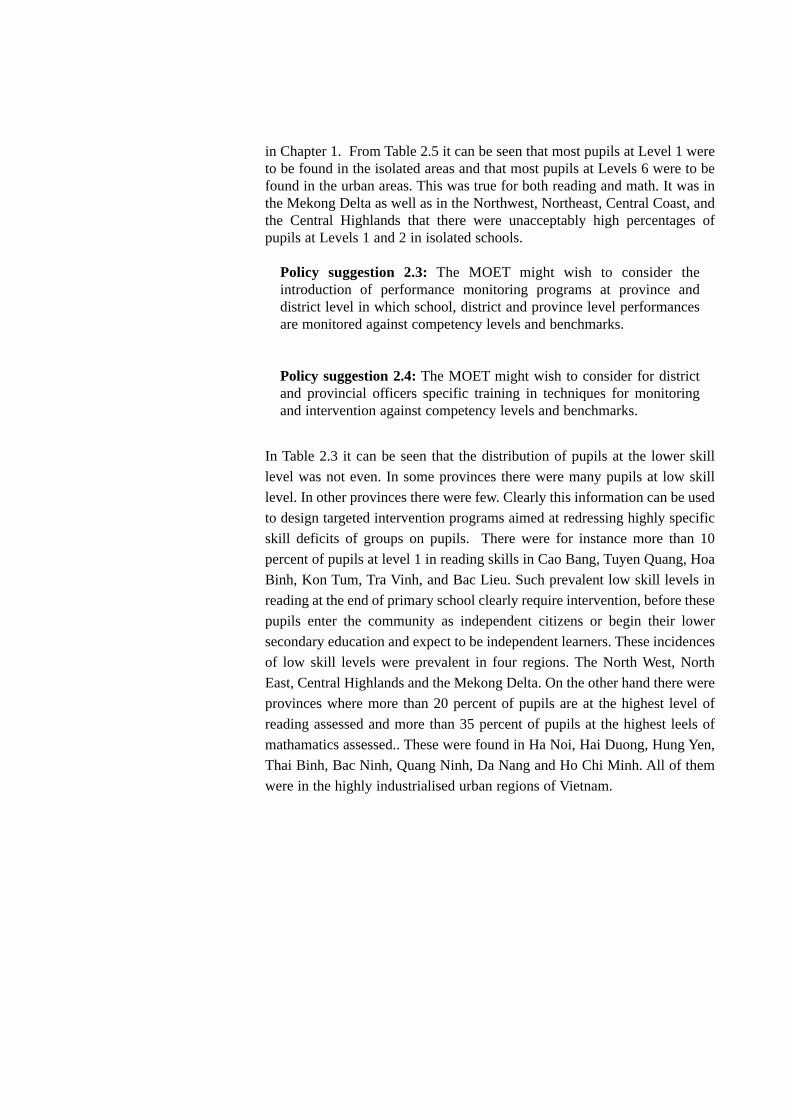
in Chapter 1. From Table 2.5 it can be seen that most pupils at Level 1 wereto be found in the isolated areas and that most pupils at Levels 6 were to befound in the urban areas. This was true for both reading and math. It was inthe Mekong Delta as well as in the Northwest, Northeast, Central Coast, andthe Central Highlands that there were unacceptably high percentages ofpupils at Levels 1 and 2 in isolated schools.
Policy suggestion 2.3: The MOET might wish to consider theintroduction of performance monitoring programs at province anddistrict level in which school, district and province level performancesare monitored against competency levels and benchmarks.
Policy suggestion 2.4: The MOET might wish to consider for districtand provincial officers specific training in techniques for monitoringand intervention against competency levels and benchmarks.
In Table 2.3 it can be seen that the distribution of pupils at the lower skilllevel was not even. In some provinces there were many pupils at low skilllevel. In other provinces there were few. Clearly this information can be usedto design targeted intervention programs aimed at redressing highly specificskill deficits of groups on pupils. There were for instance more than 10percent of pupils at level 1 in reading skills in Cao Bang, Tuyen Quang, HoaBinh, Kon Tum, Tra Vinh, and Bac Lieu. Such prevalent low skill levels inreading at the end of primary school clearly require intervention, before thesepupils enter the community as independent citizens or begin their lowersecondary education and expect to be independent learners. These incidencesof low skill levels were prevalent in four regions. The North West, NorthEast, Central Highlands and the Mekong Delta. On the other hand there wereprovinces where more than 20 percent of pupils are at the highest level ofreading assessed and more than 35 percent of pupils at the highest leels ofmathamatics assessed.. These were found in Ha Noi, Hai Duong, Hung Yen,Thai Binh, Bac Ninh, Quang Ninh, Da Nang and Ho Chi Minh. All of themwere in the highly industrialised urban regions of Vietnam.
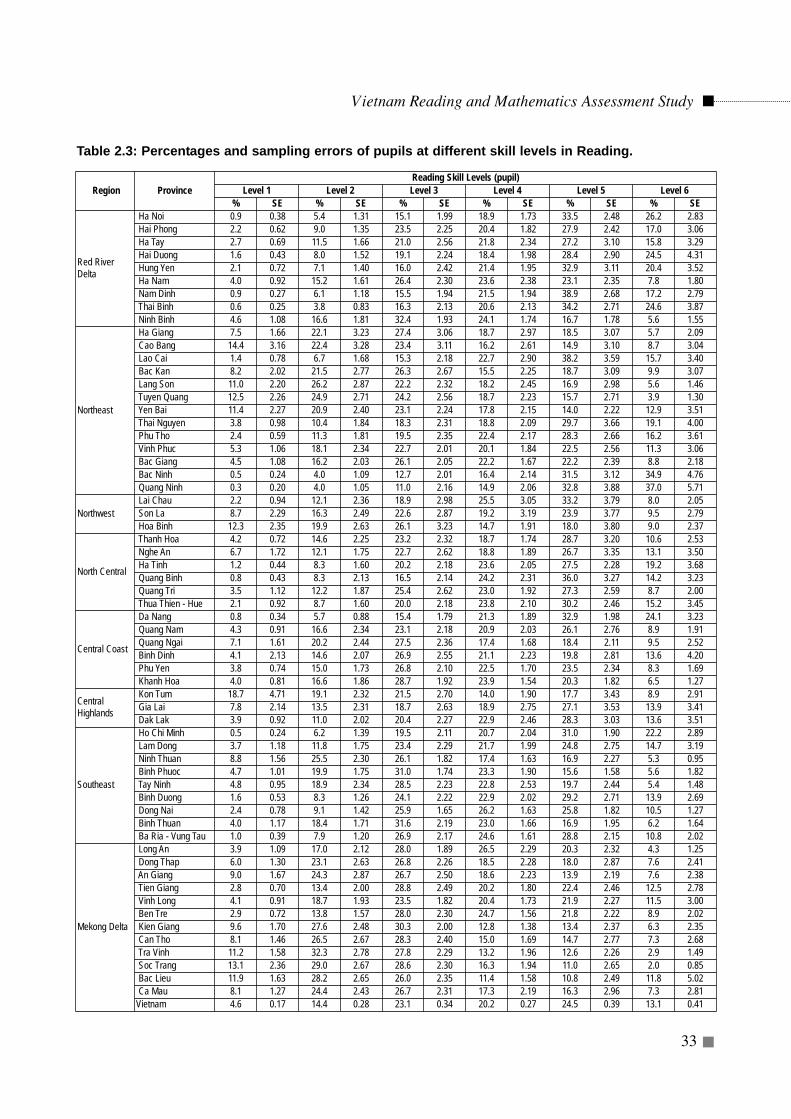
Vietnam Reading and Mathematics Assessment Study
33
Region ProvinceReading Skill Levels (pupil)
Level 1 Level 2 Level 3 Level 4 Level 5 Level 6 % SE % SE % SE % SE % SE % SE
Red RiverDelta
Ha Noi 0.9 0.38 5.4 1.31 15.1 1.99 18.9 1.73 33.5 2.48 26.2 2.83Hai Phong 2.2 0.62 9.0 1.35 23.5 2.25 20.4 1.82 27.9 2.42 17.0 3.06Ha Tay 2.7 0.69 11.5 1.66 21.0 2.56 21.8 2.34 27.2 3.10 15.8 3.29Hai Duong 1.6 0.43 8.0 1.52 19.1 2.24 18.4 1.98 28.4 2.90 24.5 4.31Hung Yen 2.1 0.72 7.1 1.40 16.0 2.42 21.4 1.95 32.9 3.11 20.4 3.52Ha Nam 4.0 0.92 15.2 1.61 26.4 2.30 23.6 2.38 23.1 2.35 7.8 1.80Nam Dinh 0.9 0.27 6.1 1.18 15.5 1.94 21.5 1.94 38.9 2.68 17.2 2.79Thai Binh 0.6 0.25 3.8 0.83 16.3 2.13 20.6 2.13 34.2 2.71 24.6 3.87Ninh Binh 4.6 1.08 16.6 1.81 32.4 1.93 24.1 1.74 16.7 1.78 5.6 1.55
Northeast
Ha Giang 7.5 1.66 22.1 3.23 27.4 3.06 18.7 2.97 18.5 3.07 5.7 2.09Cao Bang 14.4 3.16 22.4 3.28 23.4 3.11 16.2 2.61 14.9 3.10 8.7 3.04Lao Cai 1.4 0.78 6.7 1.68 15.3 2.18 22.7 2.90 38.2 3.59 15.7 3.40Bac Kan 8.2 2.02 21.5 2.77 26.3 2.67 15.5 2.25 18.7 3.09 9.9 3.07Lang Son 11.0 2.20 26.2 2.87 22.2 2.32 18.2 2.45 16.9 2.98 5.6 1.46Tuyen Quang 12.5 2.26 24.9 2.71 24.2 2.56 18.7 2.23 15.7 2.71 3.9 1.30Yen Bai 11.4 2.27 20.9 2.40 23.1 2.24 17.8 2.15 14.0 2.22 12.9 3.51Thai Nguyen 3.8 0.98 10.4 1.84 18.3 2.31 18.8 2.09 29.7 3.66 19.1 4.00Phu Tho 2.4 0.59 11.3 1.81 19.5 2.35 22.4 2.17 28.3 2.66 16.2 3.61Vinh Phuc 5.3 1.06 18.1 2.34 22.7 2.01 20.1 1.84 22.5 2.56 11.3 3.06Bac Giang 4.5 1.08 16.2 2.03 26.1 2.05 22.2 1.67 22.2 2.39 8.8 2.18Bac Ninh 0.5 0.24 4.0 1.09 12.7 2.01 16.4 2.14 31.5 3.12 34.9 4.76Quang Ninh 0.3 0.20 4.0 1.05 11.0 2.16 14.9 2.06 32.8 3.88 37.0 5.71
NorthwestLai Chau 2.2 0.94 12.1 2.36 18.9 2.98 25.5 3.05 33.2 3.79 8.0 2.05Son La 8.7 2.29 16.3 2.49 22.6 2.87 19.2 3.19 23.9 3.77 9.5 2.79Hoa Binh 12.3 2.35 19.9 2.63 26.1 3.23 14.7 1.91 18.0 3.80 9.0 2.37
North Central
Thanh Hoa 4.2 0.72 14.6 2.25 23.2 2.32 18.7 1.74 28.7 3.20 10.6 2.53Nghe An 6.7 1.72 12.1 1.75 22.7 2.62 18.8 1.89 26.7 3.35 13.1 3.50Ha Tinh 1.2 0.44 8.3 1.60 20.2 2.18 23.6 2.05 27.5 2.28 19.2 3.68Quang Binh 0.8 0.43 8.3 2.13 16.5 2.14 24.2 2.31 36.0 3.27 14.2 3.23Quang Tri 3.5 1.12 12.2 1.87 25.4 2.62 23.0 1.92 27.3 2.59 8.7 2.00Thua Thien - Hue 2.1 0.92 8.7 1.60 20.0 2.18 23.8 2.10 30.2 2.46 15.2 3.45
Central Coast
Da Nang 0.8 0.34 5.7 0.88 15.4 1.79 21.3 1.89 32.9 1.98 24.1 3.23Quang Nam 4.3 0.91 16.6 2.34 23.1 2.18 20.9 2.03 26.1 2.76 8.9 1.91Quang Ngai 7.1 1.61 20.2 2.44 27.5 2.36 17.4 1.68 18.4 2.11 9.5 2.52Binh Dinh 4.1 2.13 14.6 2.07 26.9 2.55 21.1 2.23 19.8 2.81 13.6 4.20Phu Yen 3.8 0.74 15.0 1.73 26.8 2.10 22.5 1.70 23.5 2.34 8.3 1.69Khanh Hoa 4.0 0.81 16.6 1.86 28.7 1.92 23.9 1.54 20.3 1.82 6.5 1.27
CentralHighlands
Kon Tum 18.7 4.71 19.1 2.32 21.5 2.70 14.0 1.90 17.7 3.43 8.9 2.91Gia Lai 7.8 2.14 13.5 2.31 18.7 2.63 18.9 2.75 27.1 3.53 13.9 3.41Dak Lak 3.9 0.92 11.0 2.02 20.4 2.27 22.9 2.46 28.3 3.03 13.6 3.51
Southeast
Ho Chi Minh 0.5 0.24 6.2 1.39 19.5 2.11 20.7 2.04 31.0 1.90 22.2 2.89Lam Dong 3.7 1.18 11.8 1.75 23.4 2.29 21.7 1.99 24.8 2.75 14.7 3.19Ninh Thuan 8.8 1.56 25.5 2.30 26.1 1.82 17.4 1.63 16.9 2.27 5.3 0.95Binh Phuoc 4.7 1.01 19.9 1.75 31.0 1.74 23.3 1.90 15.6 1.58 5.6 1.82Tay Ninh 4.8 0.95 18.9 2.34 28.5 2.23 22.8 2.53 19.7 2.44 5.4 1.48Binh Duong 1.6 0.53 8.3 1.26 24.1 2.22 22.9 2.02 29.2 2.71 13.9 2.69Dong Nai 2.4 0.78 9.1 1.42 25.9 1.65 26.2 1.63 25.8 1.82 10.5 1.27Binh Thuan 4.0 1.17 18.4 1.71 31.6 2.19 23.0 1.66 16.9 1.95 6.2 1.64Ba Ria - Vung Tau 1.0 0.39 7.9 1.20 26.9 2.17 24.6 1.61 28.8 2.15 10.8 2.02
Mekong Delta
Long An 3.9 1.09 17.0 2.12 28.0 1.89 26.5 2.29 20.3 2.32 4.3 1.25Dong Thap 6.0 1.30 23.1 2.63 26.8 2.26 18.5 2.28 18.0 2.87 7.6 2.41An Giang 9.0 1.67 24.3 2.87 26.7 2.50 18.6 2.23 13.9 2.19 7.6 2.38Tien Giang 2.8 0.70 13.4 2.00 28.8 2.49 20.2 1.80 22.4 2.46 12.5 2.78Vinh Long 4.1 0.91 18.7 1.93 23.5 1.82 20.4 1.73 21.9 2.27 11.5 3.00Ben Tre 2.9 0.72 13.8 1.57 28.0 2.30 24.7 1.56 21.8 2.22 8.9 2.02Kien Giang 9.6 1.70 27.6 2.48 30.3 2.00 12.8 1.38 13.4 2.37 6.3 2.35Can Tho 8.1 1.46 26.5 2.67 28.3 2.40 15.0 1.69 14.7 2.77 7.3 2.68Tra Vinh 11.2 1.58 32.3 2.78 27.8 2.29 13.2 1.96 12.6 2.26 2.9 1.49Soc Trang 13.1 2.36 29.0 2.67 28.6 2.30 16.3 1.94 11.0 2.65 2.0 0.85Bac Lieu 11.9 1.63 28.2 2.65 26.0 2.35 11.4 1.58 10.8 2.49 11.8 5.02Ca Mau 8.1 1.27 24.4 2.43 26.7 2.31 17.3 2.19 16.3 2.96 7.3 2.81
Vietnam 4.6 0.17 14.4 0.28 23.1 0.34 20.2 0.27 24.5 0.39 13.1 0.41
Table 2.3: Percentages and sampling errors of pupils at different skill levels in Reading.
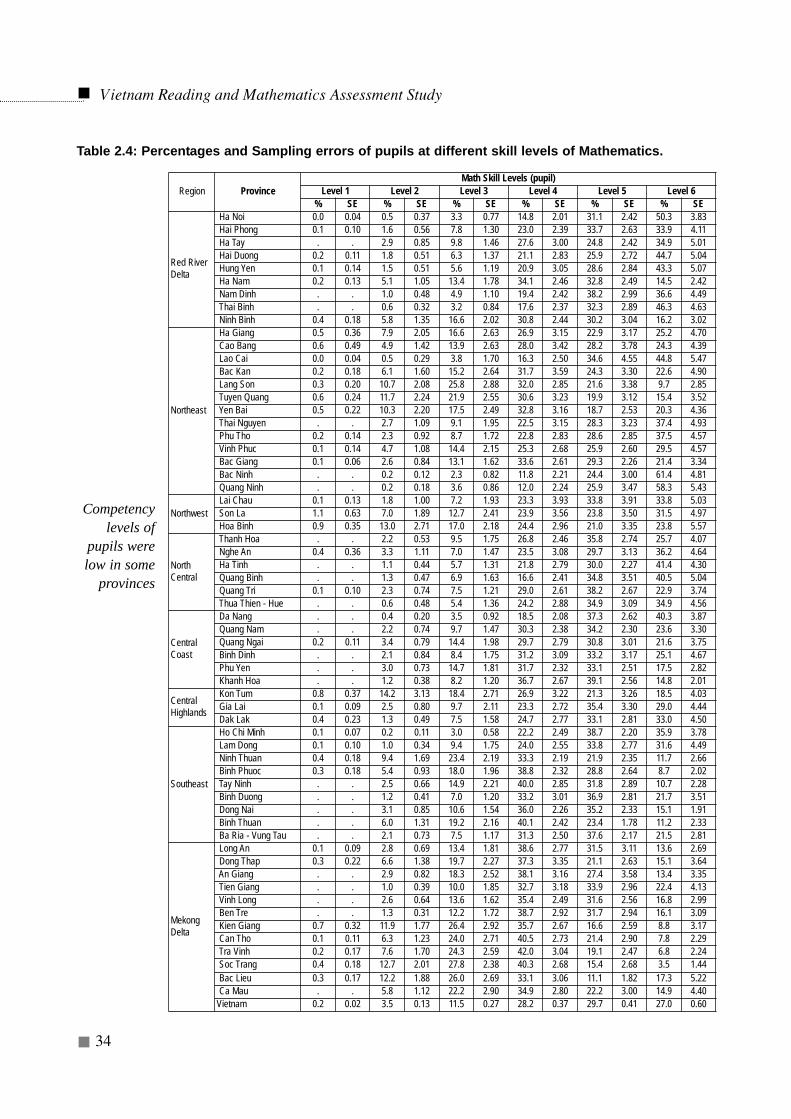
Vietnam Reading and Mathematics Assessment Study
34
Region ProvinceMath Skill Levels (pupil)
Level 1 Level 2 Level 3 Level 4 Level 5 Level 6 % SE % SE % SE % SE % SE % SE
Red RiverDelta
Ha Noi 0.0 0.04 0.5 0.37 3.3 0.77 14.8 2.01 31.1 2.42 50.3 3.83Hai Phong 0.1 0.10 1.6 0.56 7.8 1.30 23.0 2.39 33.7 2.63 33.9 4.11Ha Tay . . 2.9 0.85 9.8 1.46 27.6 3.00 24.8 2.42 34.9 5.01Hai Duong 0.2 0.11 1.8 0.51 6.3 1.37 21.1 2.83 25.9 2.72 44.7 5.04Hung Yen 0.1 0.14 1.5 0.51 5.6 1.19 20.9 3.05 28.6 2.84 43.3 5.07Ha Nam 0.2 0.13 5.1 1.05 13.4 1.78 34.1 2.46 32.8 2.49 14.5 2.42Nam Dinh . . 1.0 0.48 4.9 1.10 19.4 2.42 38.2 2.99 36.6 4.49Thai Binh . . 0.6 0.32 3.2 0.84 17.6 2.37 32.3 2.89 46.3 4.63Ninh Binh 0.4 0.18 5.8 1.35 16.6 2.02 30.8 2.44 30.2 3.04 16.2 3.02
Northeast
Ha Giang 0.5 0.36 7.9 2.05 16.6 2.63 26.9 3.15 22.9 3.17 25.2 4.70Cao Bang 0.6 0.49 4.9 1.42 13.9 2.63 28.0 3.42 28.2 3.78 24.3 4.39Lao Cai 0.0 0.04 0.5 0.29 3.8 1.70 16.3 2.50 34.6 4.55 44.8 5.47Bac Kan 0.2 0.18 6.1 1.60 15.2 2.64 31.7 3.59 24.3 3.30 22.6 4.90Lang Son 0.3 0.20 10.7 2.08 25.8 2.88 32.0 2.85 21.6 3.38 9.7 2.85Tuyen Quang 0.6 0.24 11.7 2.24 21.9 2.55 30.6 3.23 19.9 3.12 15.4 3.52Yen Bai 0.5 0.22 10.3 2.20 17.5 2.49 32.8 3.16 18.7 2.53 20.3 4.36Thai Nguyen . . 2.7 1.09 9.1 1.95 22.5 3.15 28.3 3.23 37.4 4.93Phu Tho 0.2 0.14 2.3 0.92 8.7 1.72 22.8 2.83 28.6 2.85 37.5 4.57Vinh Phuc 0.1 0.14 4.7 1.08 14.4 2.15 25.3 2.68 25.9 2.60 29.5 4.57Bac Giang 0.1 0.06 2.6 0.84 13.1 1.62 33.6 2.61 29.3 2.26 21.4 3.34Bac Ninh . . 0.2 0.12 2.3 0.82 11.8 2.21 24.4 3.00 61.4 4.81Quang Ninh . . 0.2 0.18 3.6 0.86 12.0 2.24 25.9 3.47 58.3 5.43
NorthwestLai Chau 0.1 0.13 1.8 1.00 7.2 1.93 23.3 3.93 33.8 3.91 33.8 5.03Son La 1.1 0.63 7.0 1.89 12.7 2.41 23.9 3.56 23.8 3.50 31.5 4.97Hoa Binh 0.9 0.35 13.0 2.71 17.0 2.18 24.4 2.96 21.0 3.35 23.8 5.57
NorthCentral
Thanh Hoa . . 2.2 0.53 9.5 1.75 26.8 2.46 35.8 2.74 25.7 4.07Nghe An 0.4 0.36 3.3 1.11 7.0 1.47 23.5 3.08 29.7 3.13 36.2 4.64Ha Tinh . . 1.1 0.44 5.7 1.31 21.8 2.79 30.0 2.27 41.4 4.30Quang Binh . . 1.3 0.47 6.9 1.63 16.6 2.41 34.8 3.51 40.5 5.04Quang Tri 0.1 0.10 2.3 0.74 7.5 1.21 29.0 2.61 38.2 2.67 22.9 3.74Thua Thien - Hue . . 0.6 0.48 5.4 1.36 24.2 2.88 34.9 3.09 34.9 4.56
CentralCoast
Da Nang . . 0.4 0.20 3.5 0.92 18.5 2.08 37.3 2.62 40.3 3.87Quang Nam . . 2.2 0.74 9.7 1.47 30.3 2.38 34.2 2.30 23.6 3.30Quang Ngai 0.2 0.11 3.4 0.79 14.4 1.98 29.7 2.79 30.8 3.01 21.6 3.75Binh Dinh . . 2.1 0.84 8.4 1.75 31.2 3.09 33.2 3.17 25.1 4.67Phu Yen . . 3.0 0.73 14.7 1.81 31.7 2.32 33.1 2.51 17.5 2.82Khanh Hoa . . 1.2 0.38 8.2 1.20 36.7 2.67 39.1 2.56 14.8 2.01
CentralHighlands
Kon Tum 0.8 0.37 14.2 3.13 18.4 2.71 26.9 3.22 21.3 3.26 18.5 4.03Gia Lai 0.1 0.09 2.5 0.80 9.7 2.11 23.3 2.72 35.4 3.30 29.0 4.44Dak Lak 0.4 0.23 1.3 0.49 7.5 1.58 24.7 2.77 33.1 2.81 33.0 4.50
Southeast
Ho Chi Minh 0.1 0.07 0.2 0.11 3.0 0.58 22.2 2.49 38.7 2.20 35.9 3.78Lam Dong 0.1 0.10 1.0 0.34 9.4 1.75 24.0 2.55 33.8 2.77 31.6 4.49Ninh Thuan 0.4 0.18 9.4 1.69 23.4 2.19 33.3 2.19 21.9 2.35 11.7 2.66Binh Phuoc 0.3 0.18 5.4 0.93 18.0 1.96 38.8 2.32 28.8 2.64 8.7 2.02Tay Ninh . . 2.5 0.66 14.9 2.21 40.0 2.85 31.8 2.89 10.7 2.28Binh Duong . . 1.2 0.41 7.0 1.20 33.2 3.01 36.9 2.81 21.7 3.51Dong Nai . . 3.1 0.85 10.6 1.54 36.0 2.26 35.2 2.33 15.1 1.91Binh Thuan . . 6.0 1.31 19.2 2.16 40.1 2.42 23.4 1.78 11.2 2.33Ba Ria - Vung Tau . . 2.1 0.73 7.5 1.17 31.3 2.50 37.6 2.17 21.5 2.81
MekongDelta
Long An 0.1 0.09 2.8 0.69 13.4 1.81 38.6 2.77 31.5 3.11 13.6 2.69Dong Thap 0.3 0.22 6.6 1.38 19.7 2.27 37.3 3.35 21.1 2.63 15.1 3.64An Giang . . 2.9 0.82 18.3 2.52 38.1 3.16 27.4 3.58 13.4 3.35Tien Giang . . 1.0 0.39 10.0 1.85 32.7 3.18 33.9 2.96 22.4 4.13Vinh Long . . 2.6 0.64 13.6 1.62 35.4 2.49 31.6 2.56 16.8 2.99Ben Tre . . 1.3 0.31 12.2 1.72 38.7 2.92 31.7 2.94 16.1 3.09Kien Giang 0.7 0.32 11.9 1.77 26.4 2.92 35.7 2.67 16.6 2.59 8.8 3.17Can Tho 0.1 0.11 6.3 1.23 24.0 2.71 40.5 2.73 21.4 2.90 7.8 2.29Tra Vinh 0.2 0.17 7.6 1.70 24.3 2.59 42.0 3.04 19.1 2.47 6.8 2.24Soc Trang 0.4 0.18 12.7 2.01 27.8 2.38 40.3 2.68 15.4 2.68 3.5 1.44Bac Lieu 0.3 0.17 12.2 1.88 26.0 2.69 33.1 3.06 11.1 1.82 17.3 5.22Ca Mau . . 5.8 1.12 22.2 2.90 34.9 2.80 22.2 3.00 14.9 4.40
Vietnam 0.2 0.02 3.5 0.13 11.5 0.27 28.2 0.37 29.7 0.41 27.0 0.60
Competencylevels of
pupils werelow in some
provinces
Table 2.4: Percentages and Sampling errors of pupils at different skill levels of Mathematics.
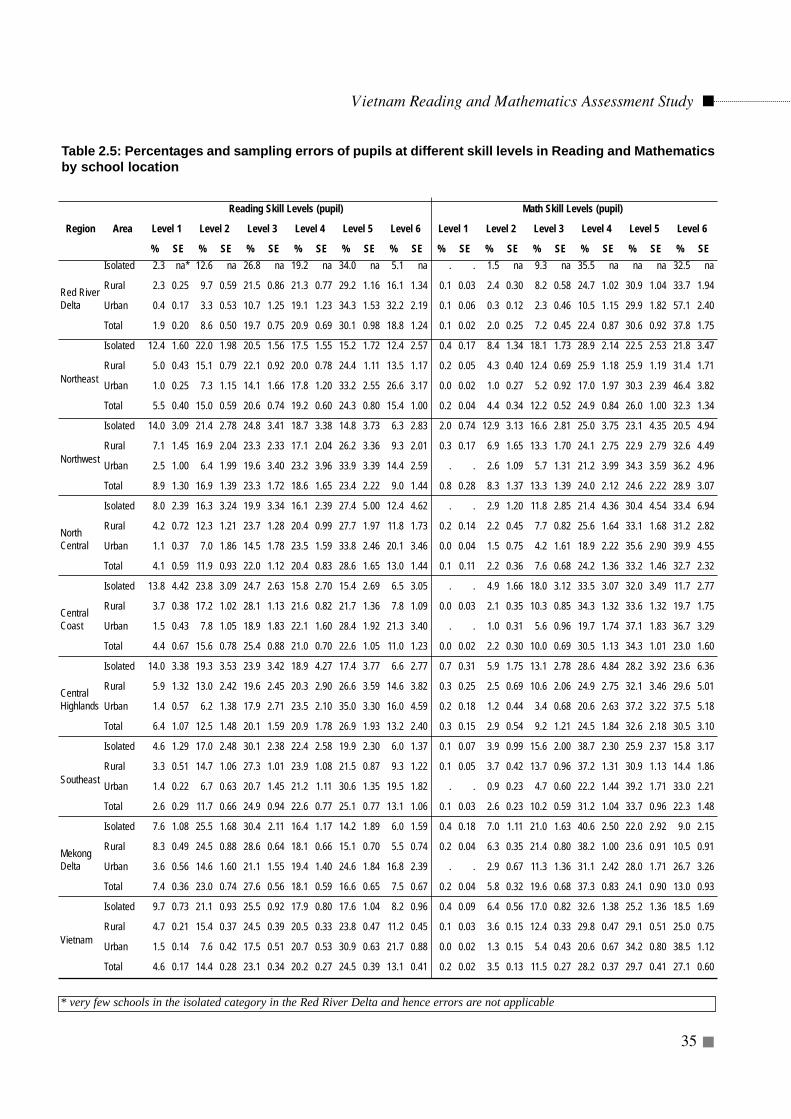
Vietnam Reading and Mathematics Assessment Study
35
Region Area
Reading Skill Levels (pupil) Math Skill Levels (pupil)
Level 1 Level 2 Level 3 Level 4 Level 5 Level 6 Level 1 Level 2 Level 3 Level 4 Level 5 Level 6
% SE % SE % SE % SE % SE % SE % SE % SE % SE % SE % SE % SE
Red RiverDelta
Isolated 2.3 na* 12.6 na 26.8 na 19.2 na 34.0 na 5.1 na . . 1.5 na 9.3 na 35.5 na na na 32.5 na
Rural 2.3 0.25 9.7 0.59 21.5 0.86 21.3 0.77 29.2 1.16 16.1 1.34 0.1 0.03 2.4 0.30 8.2 0.58 24.7 1.02 30.9 1.04 33.7 1.94
Urban 0.4 0.17 3.3 0.53 10.7 1.25 19.1 1.23 34.3 1.53 32.2 2.19 0.1 0.06 0.3 0.12 2.3 0.46 10.5 1.15 29.9 1.82 57.1 2.40
Total 1.9 0.20 8.6 0.50 19.7 0.75 20.9 0.69 30.1 0.98 18.8 1.24 0.1 0.02 2.0 0.25 7.2 0.45 22.4 0.87 30.6 0.92 37.8 1.75
Northeast
Isolated 12.4 1.60 22.0 1.98 20.5 1.56 17.5 1.55 15.2 1.72 12.4 2.57 0.4 0.17 8.4 1.34 18.1 1.73 28.9 2.14 22.5 2.53 21.8 3.47
Rural 5.0 0.43 15.1 0.79 22.1 0.92 20.0 0.78 24.4 1.11 13.5 1.17 0.2 0.05 4.3 0.40 12.4 0.69 25.9 1.18 25.9 1.19 31.4 1.71
Urban 1.0 0.25 7.3 1.15 14.1 1.66 17.8 1.20 33.2 2.55 26.6 3.17 0.0 0.02 1.0 0.27 5.2 0.92 17.0 1.97 30.3 2.39 46.4 3.82
Total 5.5 0.40 15.0 0.59 20.6 0.74 19.2 0.60 24.3 0.80 15.4 1.00 0.2 0.04 4.4 0.34 12.2 0.52 24.9 0.84 26.0 1.00 32.3 1.34
Northwest
Isolated 14.0 3.09 21.4 2.78 24.8 3.41 18.7 3.38 14.8 3.73 6.3 2.83 2.0 0.74 12.9 3.13 16.6 2.81 25.0 3.75 23.1 4.35 20.5 4.94
Rural 7.1 1.45 16.9 2.04 23.3 2.33 17.1 2.04 26.2 3.36 9.3 2.01 0.3 0.17 6.9 1.65 13.3 1.70 24.1 2.75 22.9 2.79 32.6 4.49
Urban 2.5 1.00 6.4 1.99 19.6 3.40 23.2 3.96 33.9 3.39 14.4 2.59 . . 2.6 1.09 5.7 1.31 21.2 3.99 34.3 3.59 36.2 4.96
Total 8.9 1.30 16.9 1.39 23.3 1.72 18.6 1.65 23.4 2.22 9.0 1.44 0.8 0.28 8.3 1.37 13.3 1.39 24.0 2.12 24.6 2.22 28.9 3.07
NorthCentral
Isolated 8.0 2.39 16.3 3.24 19.9 3.34 16.1 2.39 27.4 5.00 12.4 4.62 . . 2.9 1.20 11.8 2.85 21.4 4.36 30.4 4.54 33.4 6.94
Rural 4.2 0.72 12.3 1.21 23.7 1.28 20.4 0.99 27.7 1.97 11.8 1.73 0.2 0.14 2.2 0.45 7.7 0.82 25.6 1.64 33.1 1.68 31.2 2.82
Urban 1.1 0.37 7.0 1.86 14.5 1.78 23.5 1.59 33.8 2.46 20.1 3.46 0.0 0.04 1.5 0.75 4.2 1.61 18.9 2.22 35.6 2.90 39.9 4.55
Total 4.1 0.59 11.9 0.93 22.0 1.12 20.4 0.83 28.6 1.65 13.0 1.44 0.1 0.11 2.2 0.36 7.6 0.68 24.2 1.36 33.2 1.46 32.7 2.32
CentralCoast
Isolated 13.8 4.42 23.8 3.09 24.7 2.63 15.8 2.70 15.4 2.69 6.5 3.05 . . 4.9 1.66 18.0 3.12 33.5 3.07 32.0 3.49 11.7 2.77
Rural 3.7 0.38 17.2 1.02 28.1 1.13 21.6 0.82 21.7 1.36 7.8 1.09 0.0 0.03 2.1 0.35 10.3 0.85 34.3 1.32 33.6 1.32 19.7 1.75
Urban 1.5 0.43 7.8 1.05 18.9 1.83 22.1 1.60 28.4 1.92 21.3 3.40 . . 1.0 0.31 5.6 0.96 19.7 1.74 37.1 1.83 36.7 3.29
Total 4.4 0.67 15.6 0.78 25.4 0.88 21.0 0.70 22.6 1.05 11.0 1.23 0.0 0.02 2.2 0.30 10.0 0.69 30.5 1.13 34.3 1.01 23.0 1.60
CentralHighlands
Isolated 14.0 3.38 19.3 3.53 23.9 3.42 18.9 4.27 17.4 3.77 6.6 2.77 0.7 0.31 5.9 1.75 13.1 2.78 28.6 4.84 28.2 3.92 23.6 6.36
Rural 5.9 1.32 13.0 2.42 19.6 2.45 20.3 2.90 26.6 3.59 14.6 3.82 0.3 0.25 2.5 0.69 10.6 2.06 24.9 2.75 32.1 3.46 29.6 5.01
Urban 1.4 0.57 6.2 1.38 17.9 2.71 23.5 2.10 35.0 3.30 16.0 4.59 0.2 0.18 1.2 0.44 3.4 0.68 20.6 2.63 37.2 3.22 37.5 5.18
Total 6.4 1.07 12.5 1.48 20.1 1.59 20.9 1.78 26.9 1.93 13.2 2.40 0.3 0.15 2.9 0.54 9.2 1.21 24.5 1.84 32.6 2.18 30.5 3.10
Southeast
Isolated 4.6 1.29 17.0 2.48 30.1 2.38 22.4 2.58 19.9 2.30 6.0 1.37 0.1 0.07 3.9 0.99 15.6 2.00 38.7 2.30 25.9 2.37 15.8 3.17
Rural 3.3 0.51 14.7 1.06 27.3 1.01 23.9 1.08 21.5 0.87 9.3 1.22 0.1 0.05 3.7 0.42 13.7 0.96 37.2 1.31 30.9 1.13 14.4 1.86
Urban 1.4 0.22 6.7 0.63 20.7 1.45 21.2 1.11 30.6 1.35 19.5 1.82 . . 0.9 0.23 4.7 0.60 22.2 1.44 39.2 1.71 33.0 2.21
Total 2.6 0.29 11.7 0.66 24.9 0.94 22.6 0.77 25.1 0.77 13.1 1.06 0.1 0.03 2.6 0.23 10.2 0.59 31.2 1.04 33.7 0.96 22.3 1.48
MekongDelta
Isolated 7.6 1.08 25.5 1.68 30.4 2.11 16.4 1.17 14.2 1.89 6.0 1.59 0.4 0.18 7.0 1.11 21.0 1.63 40.6 2.50 22.0 2.92 9.0 2.15
Rural 8.3 0.49 24.5 0.88 28.6 0.64 18.1 0.66 15.1 0.70 5.5 0.74 0.2 0.04 6.3 0.35 21.4 0.80 38.2 1.00 23.6 0.91 10.5 0.91
Urban 3.6 0.56 14.6 1.60 21.1 1.55 19.4 1.40 24.6 1.84 16.8 2.39 . . 2.9 0.67 11.3 1.36 31.1 2.42 28.0 1.71 26.7 3.26
Total 7.4 0.36 23.0 0.74 27.6 0.56 18.1 0.59 16.6 0.65 7.5 0.67 0.2 0.04 5.8 0.32 19.6 0.68 37.3 0.83 24.1 0.90 13.0 0.93
Vietnam
Isolated 9.7 0.73 21.1 0.93 25.5 0.92 17.9 0.80 17.6 1.04 8.2 0.96 0.4 0.09 6.4 0.56 17.0 0.82 32.6 1.38 25.2 1.36 18.5 1.69
Rural 4.7 0.21 15.4 0.37 24.5 0.39 20.5 0.33 23.8 0.47 11.2 0.45 0.1 0.03 3.6 0.15 12.4 0.33 29.8 0.47 29.1 0.51 25.0 0.75
Urban 1.5 0.14 7.6 0.42 17.5 0.51 20.7 0.53 30.9 0.63 21.7 0.88 0.0 0.02 1.3 0.15 5.4 0.43 20.6 0.67 34.2 0.80 38.5 1.12
Total 4.6 0.17 14.4 0.28 23.1 0.34 20.2 0.27 24.5 0.39 13.1 0.41 0.2 0.02 3.5 0.13 11.5 0.27 28.2 0.37 29.7 0.41 27.1 0.60
* very few schools in the isolated category in the Red River Delta and hence errors are not applicable
Table 2.5: Percentages and sampling errors of pupils at different skill levels in Reading and Mathematicsby school location
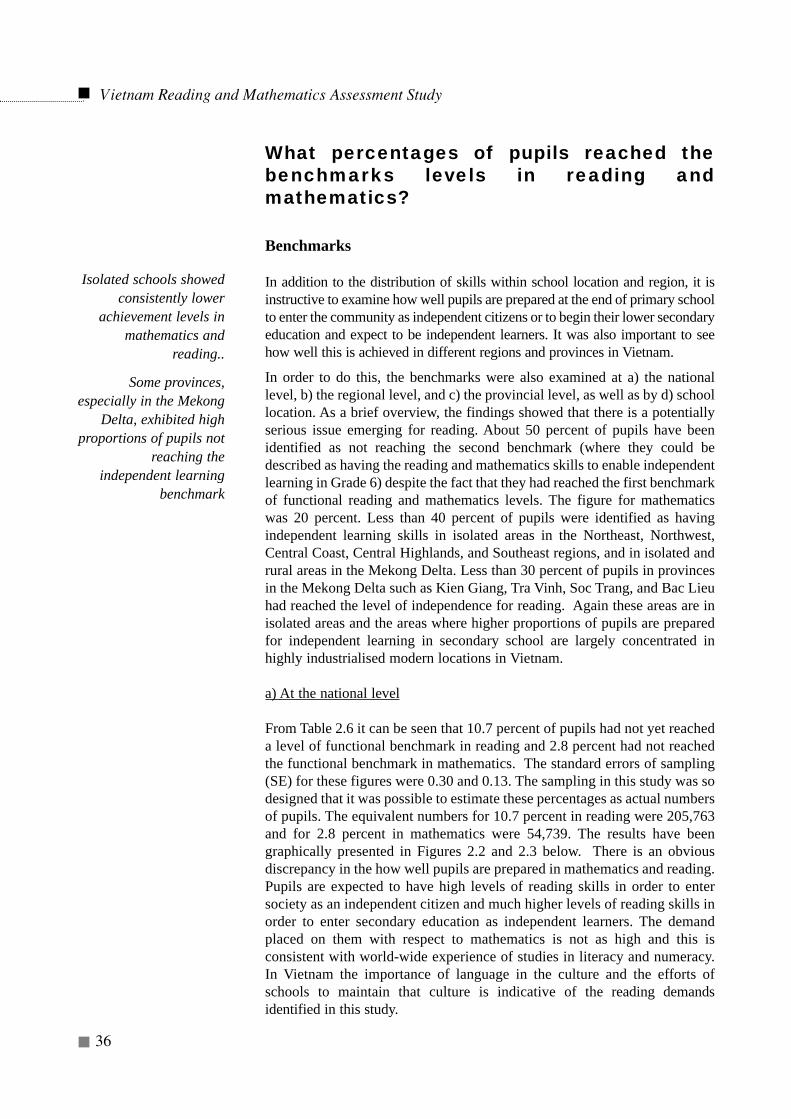
Vietnam Reading and Mathematics Assessment Study
36
What percentages of pupils reached thebenchmarks levels in reading andmathematics?
Benchmarks
In addition to the distribution of skills within school location and region, it isinstructive to examine how well pupils are prepared at the end of primary schoolto enter the community as independent citizens or to begin their lower secondaryeducation and expect to be independent learners. It was also important to seehow well this is achieved in different regions and provinces in Vietnam.
In order to do this, the benchmarks were also examined at a) the nationallevel, b) the regional level, and c) the provincial level, as well as by d) schoollocation. As a brief overview, the findings showed that there is a potentiallyserious issue emerging for reading. About 50 percent of pupils have beenidentified as not reaching the second benchmark (where they could bedescribed as having the reading and mathematics skills to enable independentlearning in Grade 6) despite the fact that they had reached the first benchmarkof functional reading and mathematics levels. The figure for mathematicswas 20 percent. Less than 40 percent of pupils were identified as havingindependent learning skills in isolated areas in the Northeast, Northwest,Central Coast, Central Highlands, and Southeast regions, and in isolated andrural areas in the Mekong Delta. Less than 30 percent of pupils in provincesin the Mekong Delta such as Kien Giang, Tra Vinh, Soc Trang, and Bac Lieuhad reached the level of independence for reading. Again these areas are inisolated areas and the areas where higher proportions of pupils are preparedfor independent learning in secondary school are largely concentrated inhighly industrialised modern locations in Vietnam.
a) At the national level
From Table 2.6 it can be seen that 10.7 percent of pupils had not yet reacheda level of functional benchmark in reading and 2.8 percent had not reachedthe functional benchmark in mathematics. The standard errors of sampling(SE) for these figures were 0.30 and 0.13. The sampling in this study was sodesigned that it was possible to estimate these percentages as actual numbersof pupils. The equivalent numbers for 10.7 percent in reading were 205,763and for 2.8 percent in mathematics were 54,739. The results have beengraphically presented in Figures 2.2 and 2.3 below. There is an obviousdiscrepancy in the how well pupils are prepared in mathematics and reading.Pupils are expected to have high levels of reading skills in order to entersociety as an independent citizen and much higher levels of reading skills inorder to enter secondary education as independent learners. The demandplaced on them with respect to mathematics is not as high and this isconsistent with world-wide experience of studies in literacy and numeracy.In Vietnam the importance of language in the culture and the efforts ofschools to maintain that culture is indicative of the reading demandsidentified in this study.
Isolated schools showedconsistently lower
achievement levels inmathematics and
reading..
Some provinces,especially in the Mekong
Delta, exhibited highproportions of pupils not
reaching theindependent learning
benchmark
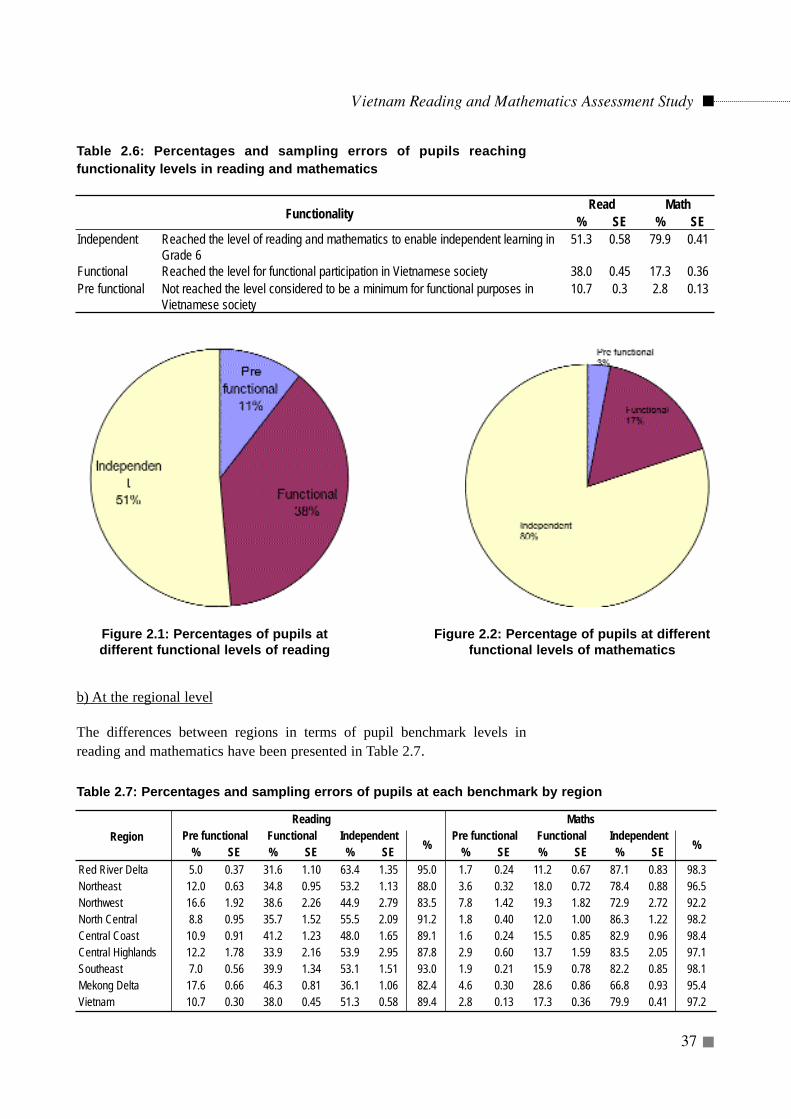
Table 2.6: Percentages and sampling errors of pupils reachingfunctionality levels in reading and mathematics
b) At the regional level
The differences between regions in terms of pupil benchmark levels inreading and mathematics have been presented in Table 2.7.
Vietnam Reading and Mathematics Assessment Study
37
Functionality Read Math
% SE % SEIndependent Reached the level of reading and mathematics to enable independent learning in
Grade 651.3 0.58 79.9 0.41
Functional Reached the level for functional participation in Vietnamese society 38.0 0.45 17.3 0.36Pre functional Not reached the level considered to be a minimum for functional purposes in
Vietnamese society10.7 0.3 2.8 0.13
Figure 2.1: Percentages of pupils atdifferent functional levels of reading
Figure 2.2: Percentage of pupils at differentfunctional levels of mathematics
RegionReading Maths
Pre functional Functional Independent%
Pre functional Functional Independent%% SE % SE % SE % SE % SE % SE
Red River Delta 5.0 0.37 31.6 1.10 63.4 1.35 95.0 1.7 0.24 11.2 0.67 87.1 0.83 98.3Northeast 12.0 0.63 34.8 0.95 53.2 1.13 88.0 3.6 0.32 18.0 0.72 78.4 0.88 96.5Northwest 16.6 1.92 38.6 2.26 44.9 2.79 83.5 7.8 1.42 19.3 1.82 72.9 2.72 92.2North Central 8.8 0.95 35.7 1.52 55.5 2.09 91.2 1.8 0.40 12.0 1.00 86.3 1.22 98.2Central Coast 10.9 0.91 41.2 1.23 48.0 1.65 89.1 1.6 0.24 15.5 0.85 82.9 0.96 98.4Central Highlands 12.2 1.78 33.9 2.16 53.9 2.95 87.8 2.9 0.60 13.7 1.59 83.5 2.05 97.1Southeast 7.0 0.56 39.9 1.34 53.1 1.51 93.0 1.9 0.21 15.9 0.78 82.2 0.85 98.1Mekong Delta 17.6 0.66 46.3 0.81 36.1 1.06 82.4 4.6 0.30 28.6 0.86 66.8 0.93 95.4Vietnam 10.7 0.30 38.0 0.45 51.3 0.58 89.4 2.8 0.13 17.3 0.36 79.9 0.41 97.2
Table 2.7: Percentages and sampling errors of pupils at each benchmark by region
It can be seen that the national benchmark levels were generally high. Inreading the percentage judged to be functional was 89.3 (38.0 + 51.3) and inmathematics the percentage was 97.2 (17.3 + 79.9). Eighty percent weredeemed to have the reading and mathematics skills needed to enter secondaryschool and expect to be independent learners in mathematics. The figure forreading was 51 percent identified as having the reading skills needed forindependent learning in secondary school. The difference is not because theskills in reading are weaker, but perhaps because the change from primary tosecondary curriculum is more abrupt in reading than it is in mathematics.Hence the preparation for secondary learning in mathematics is more alignedwith the secondary curriculum than is the case with reading. It is also truethat reading demands in society are more extensive than are mathematicsdemands and this is also reflected in the lower benchmark figures. Only 10.7percent and 2.8 percent of pupils in reading and math respectively were foundnot to be able to function at a minimal level in Vietnamese society. Thedefinition of functional used in this study was "the level of reading (ormathematics) comprehension needed to function in Vietnamese societyeffectively ". This did not mean that they were illiterate or non-numerate! Theexpert panels that worked on these definitions took into account the schoolcurriculum, the performances on the test and the types of mathematics andreading that were assessed in the Grade 5 tests. These were compared to thekinds of reading that a citizen would need to be able to do in Vietnam tofunction in the community. A score was then set, using the Angoff procedure,which separated those considered to be functional from those who were prefunctional level and who would struggle in literacy and numeracy tasksrequired on a day to day basis. A similar procedure was followed formathematics in identifying the level of numeracy needed in Vietnamesesociety.
The point was made above that the test was assessing the old and newcurricula and that expository and document texts were not emphasised in theprimary reading curriculum. From Table 2.8 it can be seen how the Angoffprocedure applied to the items representing the two parts of the test yieldedpercentage scores for the two benchmarks. As can be observed theexpectations in terms of the benchmarks did not change. Accordingly in theremainder of this report the full test result has been used for reportingpurposes.
Table 2.8: Comparison of Benchmark Scores after Allowing for Old and New
Vietnam Reading and Mathematics Assessment Study
38
Fewer pupils preparedfor reading demands of
secondary school wheretext types is varied and
demanding.Mathematics
expectations are not asdemanding.
The benchmark levelswere the same for the old
and the new curriculumitems in the test.
CurriculumItem set all all old new old new old new
Benchmark Functional Independent Functional Independent raw score 36.70 20.90 25.00 32.00 15.90 20.80 9.30 12.70Proportion 0.64 0.37 0.64 0.65 0.37 0.40
Vietnam Reading and Mathematics Assessment Study
39
In the Mekong Delta region and in the Northeast, Northwest, CentralCoast, and the Central Highlands more than 10 percent of pupils werestill classified as being below this functional benchmark in reading. Inreading, the situation for promotion to lower secondary school wasserious. In the Mekong Delta only 36 percent of pupils were categorisedas reaching the independent learning benchmark. In mathematics thefigure was 67 percent.
By the end of primary school it could be reasonably expected that allpupils would have sufficient reading skills to engage in everydayactivities of the Vietnamese community. It should also be expected thatat least 95 percent of pupils would have reached the level of competenceat which they could be expected to learn independently in lowersecondary school. Indeed, it was this figure that was set as the target forschool principals. Hence is it reasonable to expect that the pupilachievement level would also be at that level for them to learn withoutremedial assistance in Grade 6, the first year of lower secondary. Inseveral regions and provinces (see Table 2.9 and the Grade 5 Study ofReading and Mathematics: Provincial Tables, 2002) there was adiscrepancy between the reported number of pupils transferring fromGrade 5 to Grade 6 (i.e., starting lower secondary education) and thenumber of Grade 5 pupils reaching an "independent" learning level. TheMOET and provincial educational authorities may wish to re-examinethe design and conduct of the examination at the end of Grade 5 if thisdiscrepancy is linked to the amount and type of assistance needed bypupils not reaching the second benchmark. This might be resolved bymoving more to a competency based interpretation of test information sothat teachers, pupils and parents would have better information on whichto base the progression from primary to secondary education and providetargeted assistance to those pupils who need assistance in reading andmathematics. Moving to a competency based interpretation ofassessments at the end of secondary school would assist all peopleinvolved in helping the pupil learn.
Policy suggestion 2.5: The MOET might wish to consider acceleratingthe shift in the primary school reading curriculum to ensure that morepupils are adequately prepared for the wider range of genre encounteredin secondary school learning materials.
c) At the provincial level
Vietnam Reading and Mathematics Assessment Study
40
The percentages of pupils reaching specific levels for each of thebenchmarks within provinces have been shown in Table 2.9. Where pre-functional rates exceeded 20 percent, the figures have been presented inbold. Where the percentages deemed to be at a sufficient level toprogress to Grade 6 were less than 30 percent, then the figures have alsobeen presented in bold.
There were differences among regions in achievement and there werealso large differences among provinces. Even within the highestperforming region, there was considerable variation among provinces.Ha Nam and Ninh Binh provinces within the Red River Delta region hadabout 10 percent of pupils in reading who were pre functional and some50 to 60 percent of pupils had not yet reached the independentbenchmark. The provinces of Ha Noi and Thai Binh had about twopercent of pupils who were pre functional and only about 25 percent ofpupils not yet independent.
The situation was worse, again in reading, in the Mekong Delta regionwhere overall performance levels tended to be low. In this region pre-functional rates rose to more than 20 percent in a number of provincesand the proportion of pupils with independent reading and mathematicslearning skills for lower secondary school was low across all provincesin the region. The situation in mathematics was much better and it wasonly in the provinces of Hoa Binh, Kon Tum, Soc Trang, and Bac Lieuthat there were over 10 percent of pupils categorised as pre-functional.In Vietnam 80 percent of pupils were categorised as possessing readingand mathematics skills for independent learning in Grade 6 but thepercentages were somewhat low in several provinces in the MekongDelta.
There is clearly a very wide range of variation in the extent to whichpupils are prepared to enter the community or to enter secondaryeducation. Just as was the case with the competency levels, thebenchmark data illustrates that there are several provinces where pupilshave not attained a level that can assist them to enter society withreading and math skills needed by independent citizens. Once againthese are concentrated in the same regions in the Northwest, North East,Central Highlands and in the Mekong Delta. It is evident that in theseregions the capacity of people to participate in he community and tomake informed decisions must be limited if the level of reading skillsremains so low at the end of primary school.
There were largeproportions of low
achieving pupils andsmall proportions of
high performing pupilsconcentrated in specific
provinces
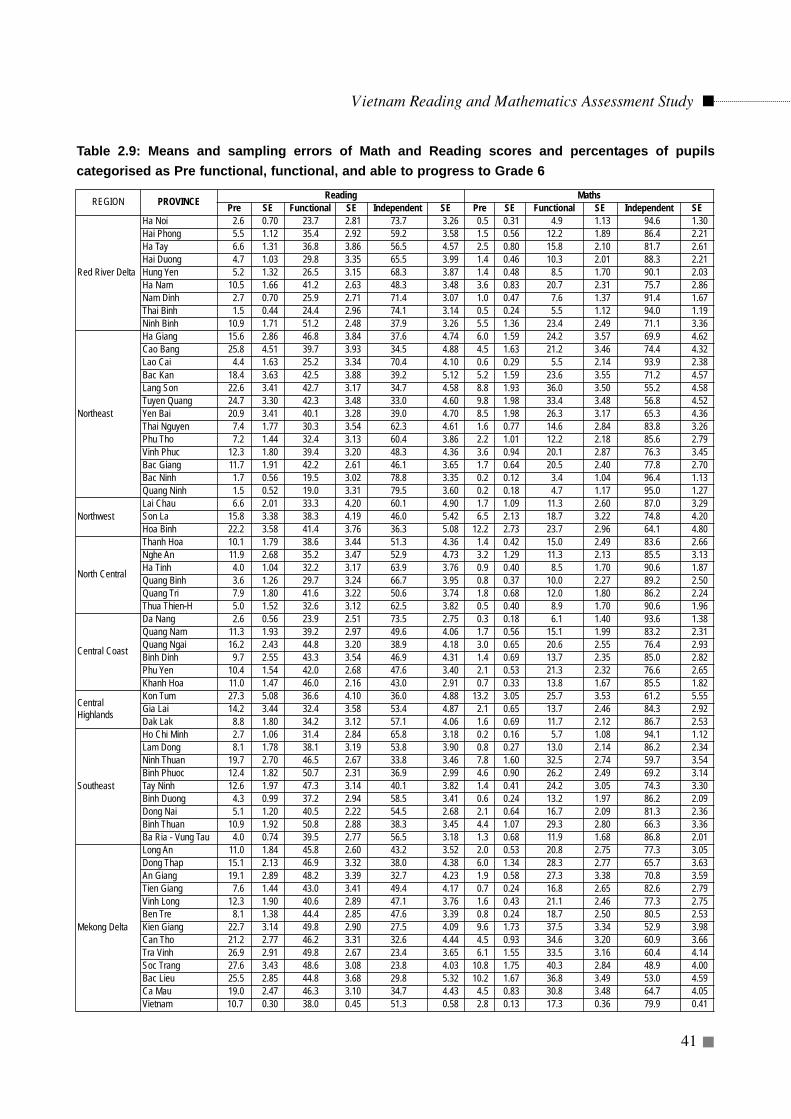
Vietnam Reading and Mathematics Assessment Study
41
Table 2.9: Means and sampling errors of Math and Reading scores and percentages of pupilscategorised as Pre functional, functional, and able to progress to Grade 6
REGION PROVINCE Reading Maths Pre SE Functional SE Independent SE Pre SE Functional SE Independent SE
Red River Delta
Ha Noi 2.6 0.70 23.7 2.81 73.7 3.26 0.5 0.31 4.9 1.13 94.6 1.30Hai Phong 5.5 1.12 35.4 2.92 59.2 3.58 1.5 0.56 12.2 1.89 86.4 2.21Ha Tay 6.6 1.31 36.8 3.86 56.5 4.57 2.5 0.80 15.8 2.10 81.7 2.61Hai Duong 4.7 1.03 29.8 3.35 65.5 3.99 1.4 0.46 10.3 2.01 88.3 2.21Hung Yen 5.2 1.32 26.5 3.15 68.3 3.87 1.4 0.48 8.5 1.70 90.1 2.03Ha Nam 10.5 1.66 41.2 2.63 48.3 3.48 3.6 0.83 20.7 2.31 75.7 2.86Nam Dinh 2.7 0.70 25.9 2.71 71.4 3.07 1.0 0.47 7.6 1.37 91.4 1.67Thai Binh 1.5 0.44 24.4 2.96 74.1 3.14 0.5 0.24 5.5 1.12 94.0 1.19Ninh Binh 10.9 1.71 51.2 2.48 37.9 3.26 5.5 1.36 23.4 2.49 71.1 3.36
Northeast
Ha Giang 15.6 2.86 46.8 3.84 37.6 4.74 6.0 1.59 24.2 3.57 69.9 4.62Cao Bang 25.8 4.51 39.7 3.93 34.5 4.88 4.5 1.63 21.2 3.46 74.4 4.32Lao Cai 4.4 1.63 25.2 3.34 70.4 4.10 0.6 0.29 5.5 2.14 93.9 2.38Bac Kan 18.4 3.63 42.5 3.88 39.2 5.12 5.2 1.59 23.6 3.55 71.2 4.57Lang Son 22.6 3.41 42.7 3.17 34.7 4.58 8.8 1.93 36.0 3.50 55.2 4.58Tuyen Quang 24.7 3.30 42.3 3.48 33.0 4.60 9.8 1.98 33.4 3.48 56.8 4.52Yen Bai 20.9 3.41 40.1 3.28 39.0 4.70 8.5 1.98 26.3 3.17 65.3 4.36Thai Nguyen 7.4 1.77 30.3 3.54 62.3 4.61 1.6 0.77 14.6 2.84 83.8 3.26Phu Tho 7.2 1.44 32.4 3.13 60.4 3.86 2.2 1.01 12.2 2.18 85.6 2.79Vinh Phuc 12.3 1.80 39.4 3.20 48.3 4.36 3.6 0.94 20.1 2.87 76.3 3.45Bac Giang 11.7 1.91 42.2 2.61 46.1 3.65 1.7 0.64 20.5 2.40 77.8 2.70Bac Ninh 1.7 0.56 19.5 3.02 78.8 3.35 0.2 0.12 3.4 1.04 96.4 1.13Quang Ninh 1.5 0.52 19.0 3.31 79.5 3.60 0.2 0.18 4.7 1.17 95.0 1.27
NorthwestLai Chau 6.6 2.01 33.3 4.20 60.1 4.90 1.7 1.09 11.3 2.60 87.0 3.29Son La 15.8 3.38 38.3 4.19 46.0 5.42 6.5 2.13 18.7 3.22 74.8 4.20Hoa Binh 22.2 3.58 41.4 3.76 36.3 5.08 12.2 2.73 23.7 2.96 64.1 4.80
North Central
Thanh Hoa 10.1 1.79 38.6 3.44 51.3 4.36 1.4 0.42 15.0 2.49 83.6 2.66Nghe An 11.9 2.68 35.2 3.47 52.9 4.73 3.2 1.29 11.3 2.13 85.5 3.13Ha Tinh 4.0 1.04 32.2 3.17 63.9 3.76 0.9 0.40 8.5 1.70 90.6 1.87Quang Binh 3.6 1.26 29.7 3.24 66.7 3.95 0.8 0.37 10.0 2.27 89.2 2.50Quang Tri 7.9 1.80 41.6 3.22 50.6 3.74 1.8 0.68 12.0 1.80 86.2 2.24Thua Thien-H 5.0 1.52 32.6 3.12 62.5 3.82 0.5 0.40 8.9 1.70 90.6 1.96
Central Coast
Da Nang 2.6 0.56 23.9 2.51 73.5 2.75 0.3 0.18 6.1 1.40 93.6 1.38Quang Nam 11.3 1.93 39.2 2.97 49.6 4.06 1.7 0.56 15.1 1.99 83.2 2.31Quang Ngai 16.2 2.43 44.8 3.20 38.9 4.18 3.0 0.65 20.6 2.55 76.4 2.93Binh Dinh 9.7 2.55 43.3 3.54 46.9 4.31 1.4 0.69 13.7 2.35 85.0 2.82Phu Yen 10.4 1.54 42.0 2.68 47.6 3.40 2.1 0.53 21.3 2.32 76.6 2.65Khanh Hoa 11.0 1.47 46.0 2.16 43.0 2.91 0.7 0.33 13.8 1.67 85.5 1.82
CentralHighlands
Kon Tum 27.3 5.08 36.6 4.10 36.0 4.88 13.2 3.05 25.7 3.53 61.2 5.55Gia Lai 14.2 3.44 32.4 3.58 53.4 4.87 2.1 0.65 13.7 2.46 84.3 2.92Dak Lak 8.8 1.80 34.2 3.12 57.1 4.06 1.6 0.69 11.7 2.12 86.7 2.53
Southeast
Ho Chi Minh 2.7 1.06 31.4 2.84 65.8 3.18 0.2 0.16 5.7 1.08 94.1 1.12Lam Dong 8.1 1.78 38.1 3.19 53.8 3.90 0.8 0.27 13.0 2.14 86.2 2.34Ninh Thuan 19.7 2.70 46.5 2.67 33.8 3.46 7.8 1.60 32.5 2.74 59.7 3.54Binh Phuoc 12.4 1.82 50.7 2.31 36.9 2.99 4.6 0.90 26.2 2.49 69.2 3.14Tay Ninh 12.6 1.97 47.3 3.14 40.1 3.82 1.4 0.41 24.2 3.05 74.3 3.30Binh Duong 4.3 0.99 37.2 2.94 58.5 3.41 0.6 0.24 13.2 1.97 86.2 2.09Dong Nai 5.1 1.20 40.5 2.22 54.5 2.68 2.1 0.64 16.7 2.09 81.3 2.36Binh Thuan 10.9 1.92 50.8 2.88 38.3 3.45 4.4 1.07 29.3 2.80 66.3 3.36Ba Ria - Vung Tau 4.0 0.74 39.5 2.77 56.5 3.18 1.3 0.68 11.9 1.68 86.8 2.01
Mekong Delta
Long An 11.0 1.84 45.8 2.60 43.2 3.52 2.0 0.53 20.8 2.75 77.3 3.05Dong Thap 15.1 2.13 46.9 3.32 38.0 4.38 6.0 1.34 28.3 2.77 65.7 3.63An Giang 19.1 2.89 48.2 3.39 32.7 4.23 1.9 0.58 27.3 3.38 70.8 3.59Tien Giang 7.6 1.44 43.0 3.41 49.4 4.17 0.7 0.24 16.8 2.65 82.6 2.79Vinh Long 12.3 1.90 40.6 2.89 47.1 3.76 1.6 0.43 21.1 2.46 77.3 2.75Ben Tre 8.1 1.38 44.4 2.85 47.6 3.39 0.8 0.24 18.7 2.50 80.5 2.53Kien Giang 22.7 3.14 49.8 2.90 27.5 4.09 9.6 1.73 37.5 3.34 52.9 3.98Can Tho 21.2 2.77 46.2 3.31 32.6 4.44 4.5 0.93 34.6 3.20 60.9 3.66Tra Vinh 26.9 2.91 49.8 2.67 23.4 3.65 6.1 1.55 33.5 3.16 60.4 4.14Soc Trang 27.6 3.43 48.6 3.08 23.8 4.03 10.8 1.75 40.3 2.84 48.9 4.00Bac Lieu 25.5 2.85 44.8 3.68 29.8 5.32 10.2 1.67 36.8 3.49 53.0 4.59Ca Mau 19.0 2.47 46.3 3.10 34.7 4.43 4.5 0.83 30.8 3.48 64.7 4.05Vietnam 10.7 0.30 38.0 0.45 51.3 0.58 2.8 0.13 17.3 0.36 79.9 0.41

It can be seen in the data that there is a potentially serious issue emerging.About 50 percent of pupils have been categorised as not being of such a levelin reading as to be able to cope independently in Grade 6 despite the fact thatthey had attained functional reading levels. The figure for mathematics was20 percent. In the Mekong Delta, more than 70 percent of pupils fell into thiscategory for reading and just over 60 percent for mathematics. Using thebenchmark performances set by the experts panels in mathematics andreading all regions may need to examine the progress of pupils. In terms offunctional reading and mathematics the situation was somewhat moreoptimistic.
d) By school location
From the foot of Table 2.10, it can be seen that 19.5 percent of pupils inisolated areas were pre- functional in reading but this figure was only 5.7percent for mathematics. The equivalent figures for rural areas and urbanareas were respectively 11.0 and 4.4 percent for reading and 2.9 and 1.0percent for mathematics. It is clear that isolation is related to achievement -and an examination of other factors that arise from isolation and are, in turn,related to achievement have been examined in later chapters. In every region,the pupils in isolated schools had the lowest performance levels in readingand mathematics. Isolated schools also had low percentages of pupils withthe reading and mathematics skills for independent learning in secondaryschool. In the isolated locations of some regions (notably the North West,Central Highlands and Mekong Delta regions) little more than a quarter ofthe pupils were deemed to have those skills.
Vietnam Reading and Mathematics Assessment Study
42
Figure 2.4: Relationship between school location and functionality level of achievement
Closer scrutiny ofprogress in reading andmathematics is needed
using a system ofnational benchmark and
competency levels.
There was a clearrelationship betweenschool isolation and
achievement in readingand mathematics
especially in North West,Central Highlands and
Mekong regions
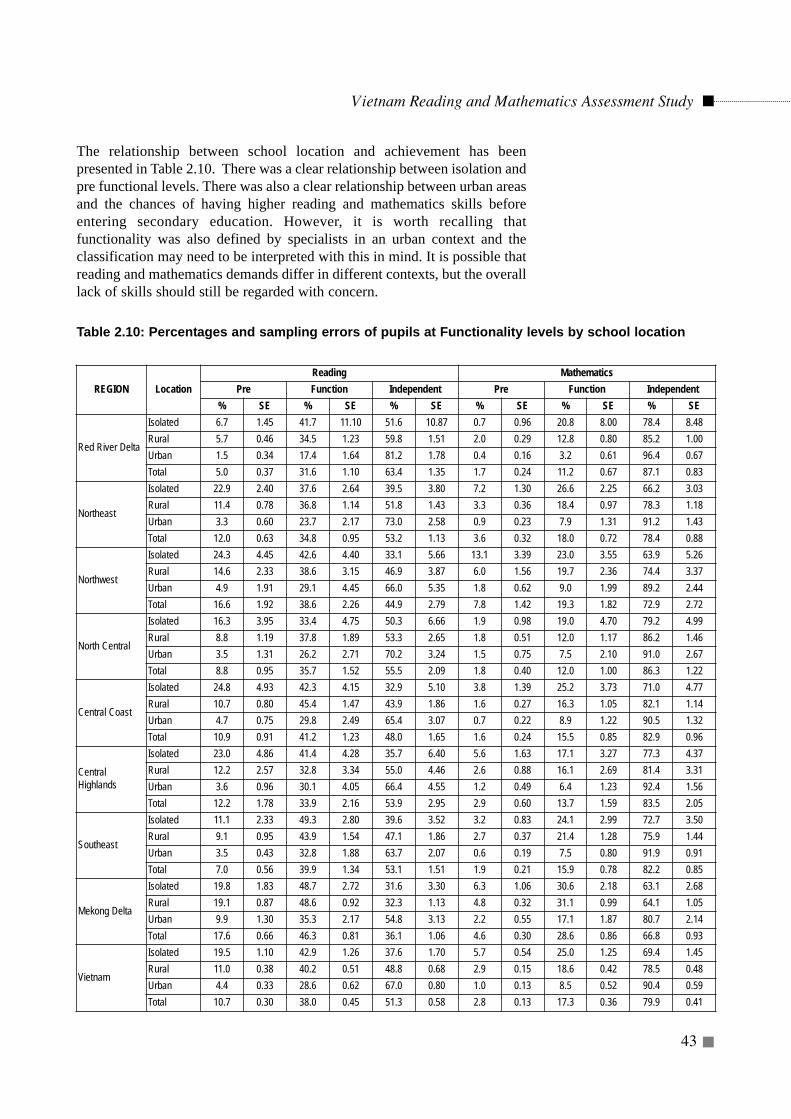
The relationship between school location and achievement has beenpresented in Table 2.10. There was a clear relationship between isolation andpre functional levels. There was also a clear relationship between urban areasand the chances of having higher reading and mathematics skills beforeentering secondary education. However, it is worth recalling thatfunctionality was also defined by specialists in an urban context and theclassification may need to be interpreted with this in mind. It is possible thatreading and mathematics demands differ in different contexts, but the overalllack of skills should still be regarded with concern.
Vietnam Reading and Mathematics Assessment Study
43
REGION LocationReading Mathematics
Pre Function Independent Pre Function Independent% SE % SE % SE % SE % SE % SE
Red River Delta
Isolated 6.7 1.45 41.7 11.10 51.6 10.87 0.7 0.96 20.8 8.00 78.4 8.48Rural 5.7 0.46 34.5 1.23 59.8 1.51 2.0 0.29 12.8 0.80 85.2 1.00Urban 1.5 0.34 17.4 1.64 81.2 1.78 0.4 0.16 3.2 0.61 96.4 0.67Total 5.0 0.37 31.6 1.10 63.4 1.35 1.7 0.24 11.2 0.67 87.1 0.83
Northeast
Isolated 22.9 2.40 37.6 2.64 39.5 3.80 7.2 1.30 26.6 2.25 66.2 3.03Rural 11.4 0.78 36.8 1.14 51.8 1.43 3.3 0.36 18.4 0.97 78.3 1.18Urban 3.3 0.60 23.7 2.17 73.0 2.58 0.9 0.23 7.9 1.31 91.2 1.43Total 12.0 0.63 34.8 0.95 53.2 1.13 3.6 0.32 18.0 0.72 78.4 0.88
Northwest
Isolated 24.3 4.45 42.6 4.40 33.1 5.66 13.1 3.39 23.0 3.55 63.9 5.26Rural 14.6 2.33 38.6 3.15 46.9 3.87 6.0 1.56 19.7 2.36 74.4 3.37Urban 4.9 1.91 29.1 4.45 66.0 5.35 1.8 0.62 9.0 1.99 89.2 2.44Total 16.6 1.92 38.6 2.26 44.9 2.79 7.8 1.42 19.3 1.82 72.9 2.72
North Central
Isolated 16.3 3.95 33.4 4.75 50.3 6.66 1.9 0.98 19.0 4.70 79.2 4.99Rural 8.8 1.19 37.8 1.89 53.3 2.65 1.8 0.51 12.0 1.17 86.2 1.46Urban 3.5 1.31 26.2 2.71 70.2 3.24 1.5 0.75 7.5 2.10 91.0 2.67Total 8.8 0.95 35.7 1.52 55.5 2.09 1.8 0.40 12.0 1.00 86.3 1.22
Central Coast
Isolated 24.8 4.93 42.3 4.15 32.9 5.10 3.8 1.39 25.2 3.73 71.0 4.77Rural 10.7 0.80 45.4 1.47 43.9 1.86 1.6 0.27 16.3 1.05 82.1 1.14Urban 4.7 0.75 29.8 2.49 65.4 3.07 0.7 0.22 8.9 1.22 90.5 1.32Total 10.9 0.91 41.2 1.23 48.0 1.65 1.6 0.24 15.5 0.85 82.9 0.96
CentralHighlands
Isolated 23.0 4.86 41.4 4.28 35.7 6.40 5.6 1.63 17.1 3.27 77.3 4.37Rural 12.2 2.57 32.8 3.34 55.0 4.46 2.6 0.88 16.1 2.69 81.4 3.31Urban 3.6 0.96 30.1 4.05 66.4 4.55 1.2 0.49 6.4 1.23 92.4 1.56Total 12.2 1.78 33.9 2.16 53.9 2.95 2.9 0.60 13.7 1.59 83.5 2.05
Southeast
Isolated 11.1 2.33 49.3 2.80 39.6 3.52 3.2 0.83 24.1 2.99 72.7 3.50Rural 9.1 0.95 43.9 1.54 47.1 1.86 2.7 0.37 21.4 1.28 75.9 1.44Urban 3.5 0.43 32.8 1.88 63.7 2.07 0.6 0.19 7.5 0.80 91.9 0.91Total 7.0 0.56 39.9 1.34 53.1 1.51 1.9 0.21 15.9 0.78 82.2 0.85
Mekong Delta
Isolated 19.8 1.83 48.7 2.72 31.6 3.30 6.3 1.06 30.6 2.18 63.1 2.68Rural 19.1 0.87 48.6 0.92 32.3 1.13 4.8 0.32 31.1 0.99 64.1 1.05Urban 9.9 1.30 35.3 2.17 54.8 3.13 2.2 0.55 17.1 1.87 80.7 2.14Total 17.6 0.66 46.3 0.81 36.1 1.06 4.6 0.30 28.6 0.86 66.8 0.93
Vietnam
Isolated 19.5 1.10 42.9 1.26 37.6 1.70 5.7 0.54 25.0 1.25 69.4 1.45Rural 11.0 0.38 40.2 0.51 48.8 0.68 2.9 0.15 18.6 0.42 78.5 0.48Urban 4.4 0.33 28.6 0.62 67.0 0.80 1.0 0.13 8.5 0.52 90.4 0.59Total 10.7 0.30 38.0 0.45 51.3 0.58 2.8 0.13 17.3 0.36 79.9 0.41
Table 2.10: Percentages and sampling errors of pupils at Functionality levels by school location
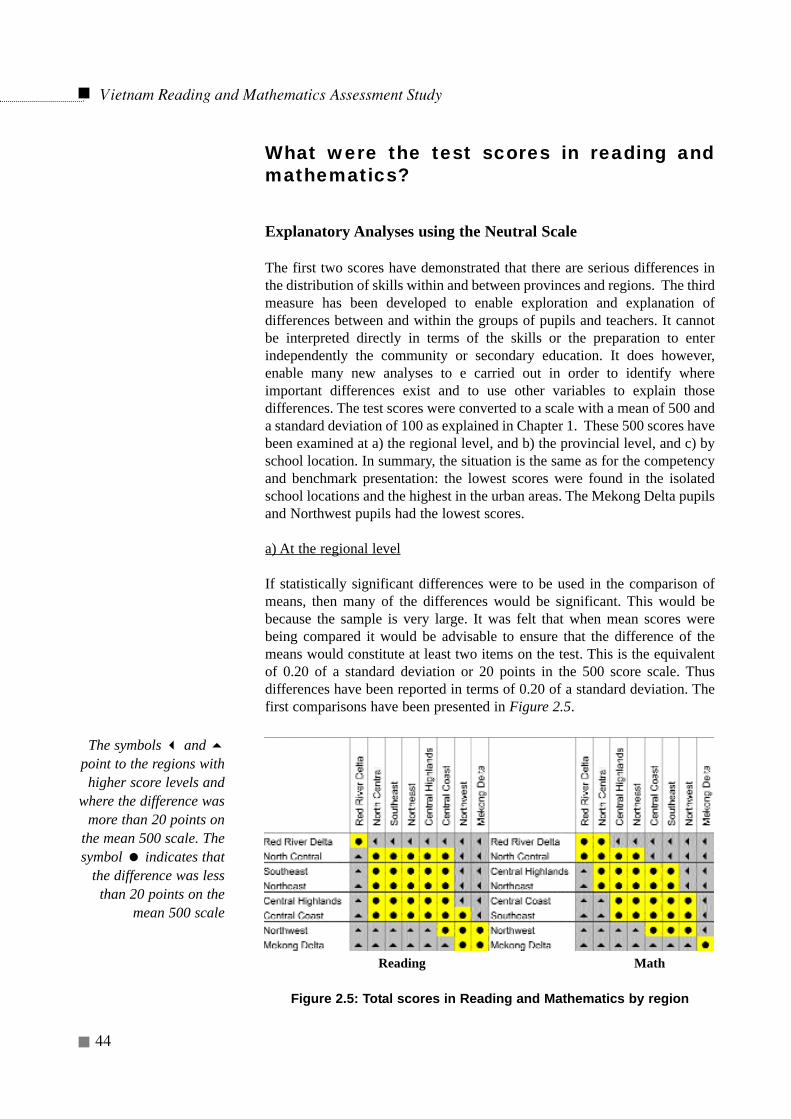
What were the test scores in reading andmathematics?
Explanatory Analyses using the Neutral Scale
The first two scores have demonstrated that there are serious differences inthe distribution of skills within and between provinces and regions. The thirdmeasure has been developed to enable exploration and explanation ofdifferences between and within the groups of pupils and teachers. It cannotbe interpreted directly in terms of the skills or the preparation to enterindependently the community or secondary education. It does however,enable many new analyses to e carried out in order to identify whereimportant differences exist and to use other variables to explain thosedifferences. The test scores were converted to a scale with a mean of 500 anda standard deviation of 100 as explained in Chapter 1. These 500 scores havebeen examined at a) the regional level, and b) the provincial level, and c) byschool location. In summary, the situation is the same as for the competencyand benchmark presentation: the lowest scores were found in the isolatedschool locations and the highest in the urban areas. The Mekong Delta pupilsand Northwest pupils had the lowest scores.
a) At the regional level
If statistically significant differences were to be used in the comparison ofmeans, then many of the differences would be significant. This would bebecause the sample is very large. It was felt that when mean scores werebeing compared it would be advisable to ensure that the difference of themeans would constitute at least two items on the test. This is the equivalentof 0.20 of a standard deviation or 20 points in the 500 score scale. Thusdifferences have been reported in terms of 0.20 of a standard deviation. Thefirst comparisons have been presented in Figure 2.5.
Figure 2.5: Total scores in Reading and Mathematics by region
Vietnam Reading and Mathematics Assessment Study
44
Reading Math
The symbols and point to the regions withhigher score levels and
where the difference wasmore than 20 points on
the mean 500 scale. Thesymbol indicates that
the difference was lessthan 20 points on the
mean 500 scale
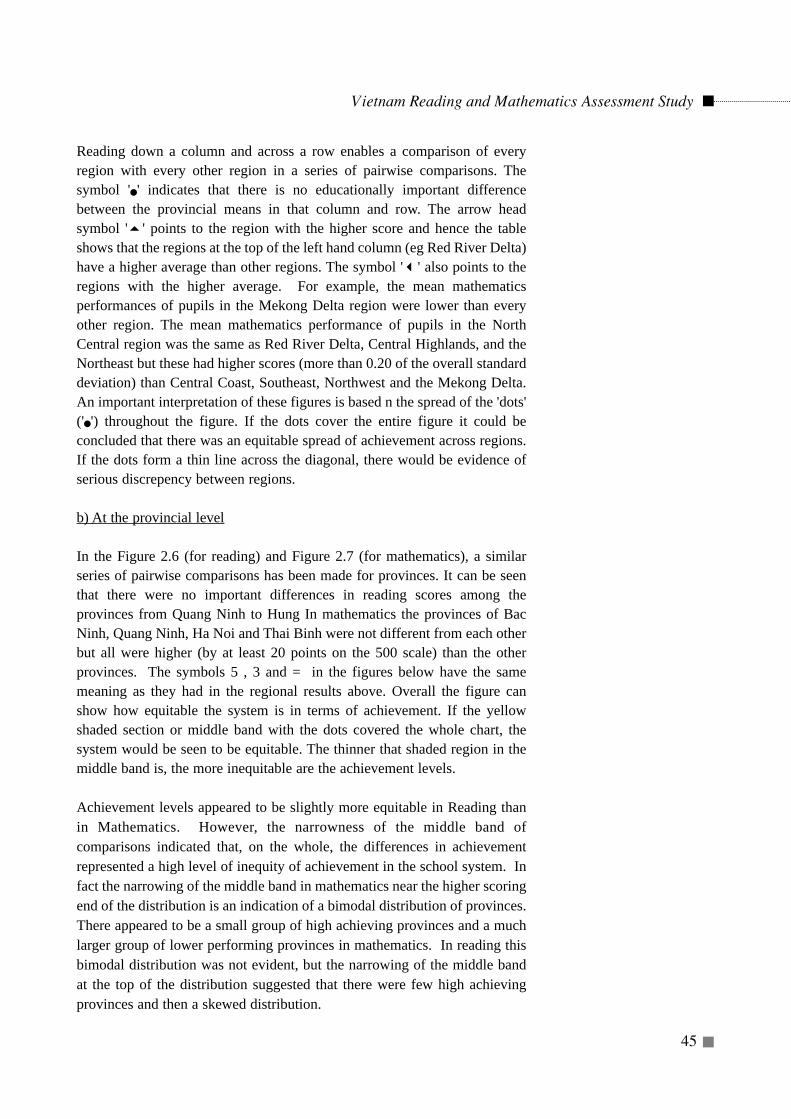
Vietnam Reading and Mathematics Assessment Study
45
Reading down a column and across a row enables a comparison of everyregion with every other region in a series of pairwise comparisons. Thesymbol ' ' indicates that there is no educationally important differencebetween the provincial means in that column and row. The arrow headsymbol ' ' points to the region with the higher score and hence the tableshows that the regions at the top of the left hand column (eg Red River Delta)have a higher average than other regions. The symbol ' ' also points to theregions with the higher average. For example, the mean mathematicsperformances of pupils in the Mekong Delta region were lower than everyother region. The mean mathematics performance of pupils in the NorthCentral region was the same as Red River Delta, Central Highlands, and theNortheast but these had higher scores (more than 0.20 of the overall standarddeviation) than Central Coast, Southeast, Northwest and the Mekong Delta.An important interpretation of these figures is based n the spread of the 'dots'(' ') throughout the figure. If the dots cover the entire figure it could beconcluded that there was an equitable spread of achievement across regions.If the dots form a thin line across the diagonal, there would be evidence ofserious discrepency between regions.
b) At the provincial level
In the Figure 2.6 (for reading) and Figure 2.7 (for mathematics), a similarseries of pairwise comparisons has been made for provinces. It can be seenthat there were no important differences in reading scores among theprovinces from Quang Ninh to Hung In mathematics the provinces of BacNinh, Quang Ninh, Ha Noi and Thai Binh were not different from each otherbut all were higher (by at least 20 points on the 500 scale) than the otherprovinces. The symbols 5 , 3 and = in the figures below have the samemeaning as they had in the regional results above. Overall the figure canshow how equitable the system is in terms of achievement. If the yellowshaded section or middle band with the dots covered the whole chart, thesystem would be seen to be equitable. The thinner that shaded region in themiddle band is, the more inequitable are the achievement levels.
Achievement levels appeared to be slightly more equitable in Reading thanin Mathematics. However, the narrowness of the middle band ofcomparisons indicated that, on the whole, the differences in achievementrepresented a high level of inequity of achievement in the school system. Infact the narrowing of the middle band in mathematics near the higher scoringend of the distribution is an indication of a bimodal distribution of provinces.There appeared to be a small group of high achieving provinces and a muchlarger group of lower performing provinces in mathematics. In reading thisbimodal distribution was not evident, but the narrowing of the middle bandat the top of the distribution suggested that there were few high achievingprovinces and then a skewed distribution.
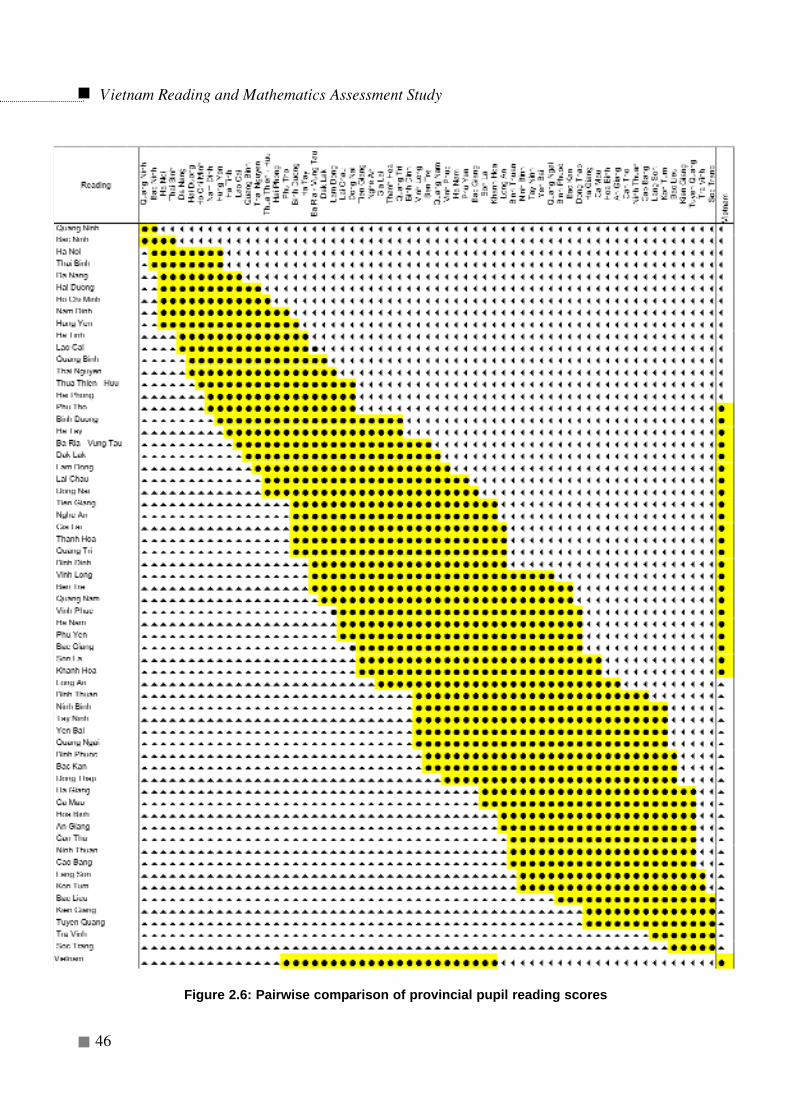
Vietnam Reading and Mathematics Assessment Study
46
Figure 2.6: Pairwise comparison of provincial pupil reading scores
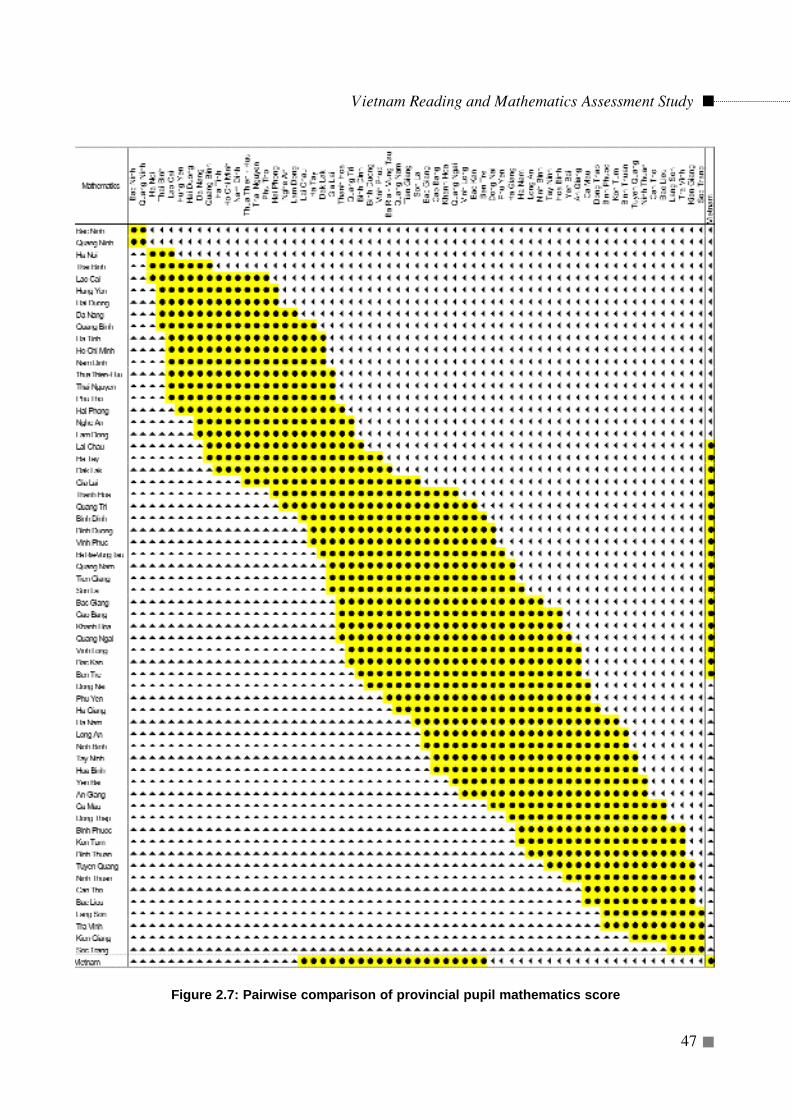
Vietnam Reading and Mathematics Assessment Study
47
Figure 2.7: Pairwise comparison of provincial pupil mathematics score
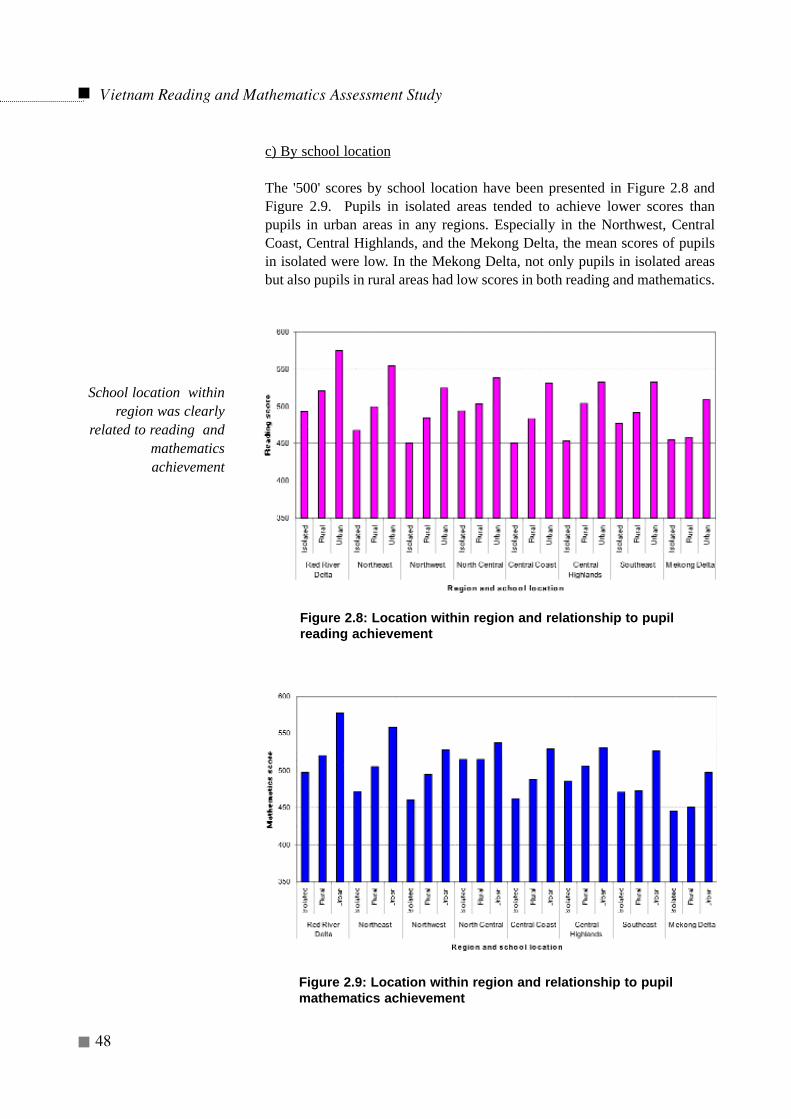
c) By school location
The '500' scores by school location have been presented in Figure 2.8 andFigure 2.9. Pupils in isolated areas tended to achieve lower scores thanpupils in urban areas in any regions. Especially in the Northwest, CentralCoast, Central Highlands, and the Mekong Delta, the mean scores of pupilsin isolated were low. In the Mekong Delta, not only pupils in isolated areasbut also pupils in rural areas had low scores in both reading and mathematics.
Vietnam Reading and Mathematics Assessment Study
48
Figure 2.8: Location within region and relationship to pupilreading achievement
School location withinregion was clearly
related to reading andmathematicsachievement
Figure 2.9: Location within region and relationship to pupilmathematics achievement
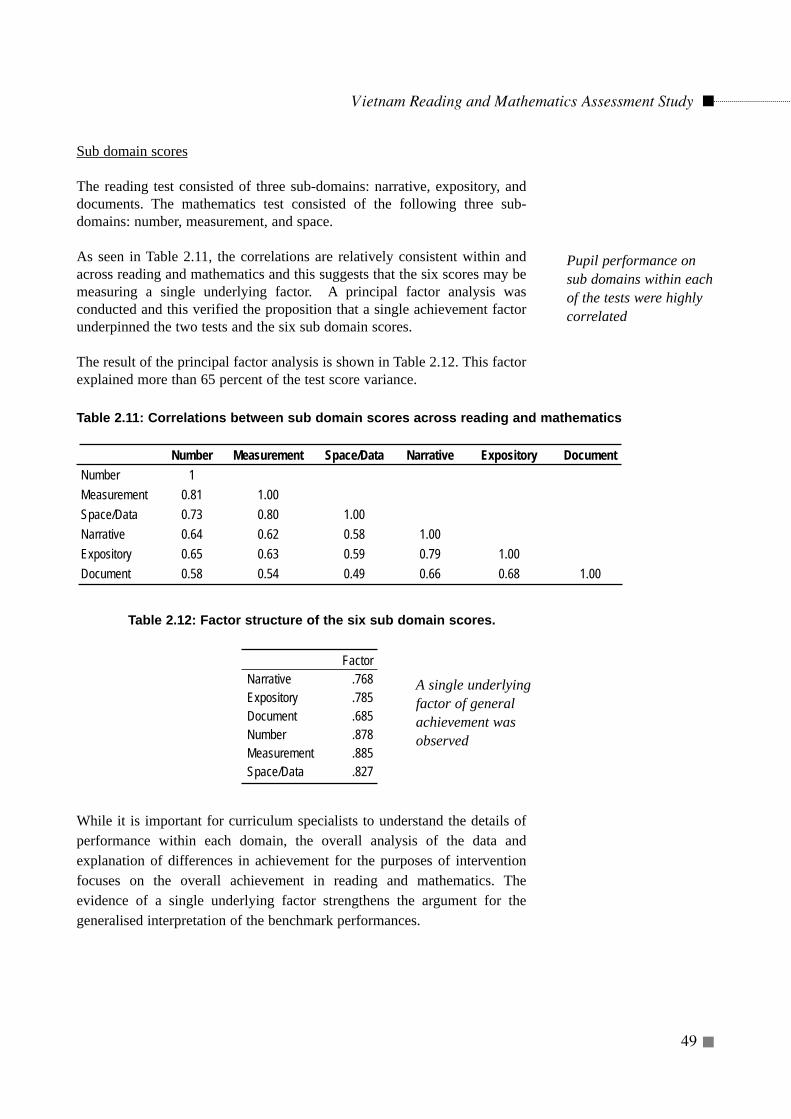
Sub domain scores
The reading test consisted of three sub-domains: narrative, expository, anddocuments. The mathematics test consisted of the following three sub-domains: number, measurement, and space.
As seen in Table 2.11, the correlations are relatively consistent within andacross reading and mathematics and this suggests that the six scores may bemeasuring a single underlying factor. A principal factor analysis wasconducted and this verified the proposition that a single achievement factorunderpinned the two tests and the six sub domain scores.
The result of the principal factor analysis is shown in Table 2.12. This factorexplained more than 65 percent of the test score variance.
While it is important for curriculum specialists to understand the details ofperformance within each domain, the overall analysis of the data andexplanation of differences in achievement for the purposes of interventionfocuses on the overall achievement in reading and mathematics. Theevidence of a single underlying factor strengthens the argument for thegeneralised interpretation of the benchmark performances.
Vietnam Reading and Mathematics Assessment Study
49
Number Measurement Space/Data Narrative Expository DocumentNumber 1Measurement 0.81 1.00Space/Data 0.73 0.80 1.00Narrative 0.64 0.62 0.58 1.00Expository 0.65 0.63 0.59 0.79 1.00Document 0.58 0.54 0.49 0.66 0.68 1.00
Table 2.11: Correlations between sub domain scores across reading and mathematics
Table 2.12: Factor structure of the six sub domain scores.
FactorNarrative .768Expository .785Document .685Number .878Measurement .885Space/Data .827
Pupil performance onsub domains within eachof the tests were highlycorrelated
A single underlyingfactor of generalachievement wasobserved
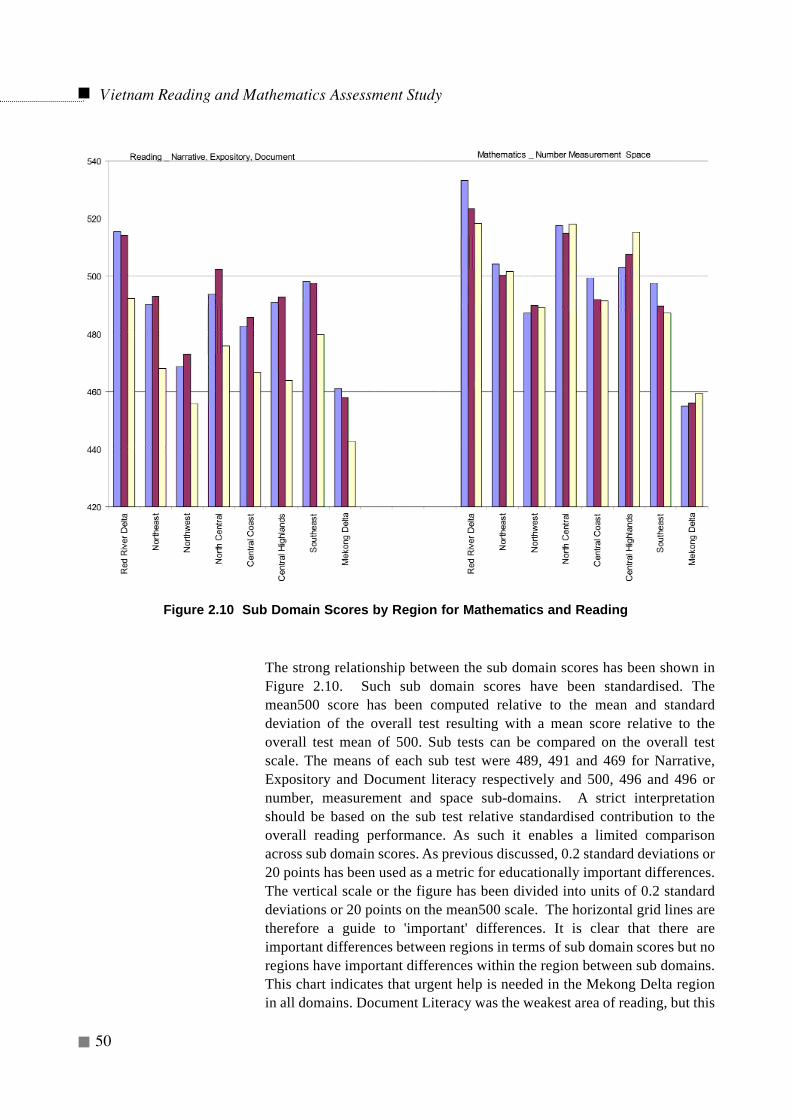
Vietnam Reading and Mathematics Assessment Study
50
The strong relationship between the sub domain scores has been shown inFigure 2.10. Such sub domain scores have been standardised. Themean500 score has been computed relative to the mean and standarddeviation of the overall test resulting with a mean score relative to theoverall test mean of 500. Sub tests can be compared on the overall testscale. The means of each sub test were 489, 491 and 469 for Narrative,Expository and Document literacy respectively and 500, 496 and 496 ornumber, measurement and space sub-domains. A strict interpretationshould be based on the sub test relative standardised contribution to theoverall reading performance. As such it enables a limited comparisonacross sub domain scores. As previous discussed, 0.2 standard deviations or20 points has been used as a metric for educationally important differences.The vertical scale or the figure has been divided into units of 0.2 standarddeviations or 20 points on the mean500 scale. The horizontal grid lines aretherefore a guide to 'important' differences. It is clear that there areimportant differences between regions in terms of sub domain scores but noregions have important differences within the region between sub domains.This chart indicates that urgent help is needed in the Mekong Delta regionin all domains. Document Literacy was the weakest area of reading, but this
Figure 2.10 Sub Domain Scores by Region for Mathematics and Reading
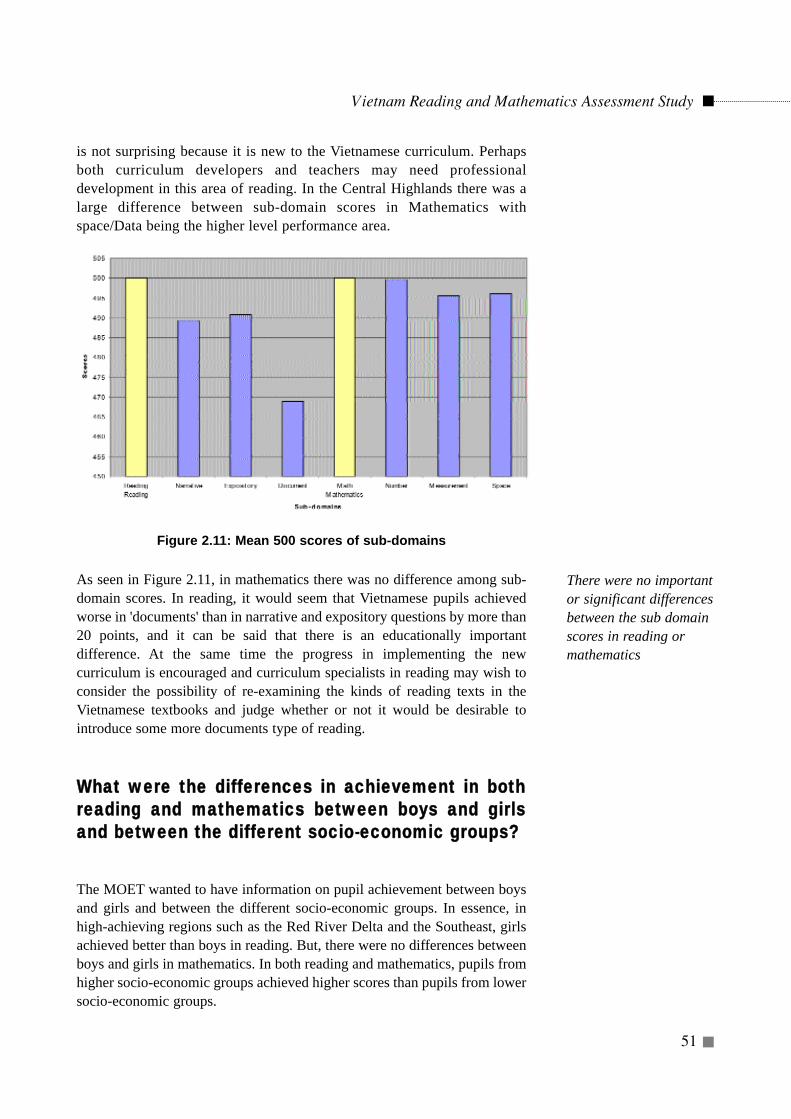
is not surprising because it is new to the Vietnamese curriculum. Perhapsboth curriculum developers and teachers may need professionaldevelopment in this area of reading. In the Central Highlands there was alarge difference between sub-domain scores in Mathematics withspace/Data being the higher level performance area.
As seen in Figure 2.11, in mathematics there was no difference among sub-domain scores. In reading, it would seem that Vietnamese pupils achievedworse in 'documents' than in narrative and expository questions by more than20 points, and it can be said that there is an educationally importantdifference. At the same time the progress in implementing the newcurriculum is encouraged and curriculum specialists in reading may wish toconsider the possibility of re-examining the kinds of reading texts in theVietnamese textbooks and judge whether or not it would be desirable tointroduce some more documents type of reading.
WWhhaatt wweerree tthhee ddiiffffeerreenncceess iinn aacchhiieevveemmeenntt iinn bbootthhrreeaaddiinngg aanndd mmaatthheemmaattiiccss bbeettwweeeenn bbooyyss aanndd ggiirrllssaanndd bbeettwweeeenn tthhee ddiiffffeerreenntt ssoocciioo-eeccoonnoommiicc ggrroouuppss??
The MOET wanted to have information on pupil achievement between boysand girls and between the different socio-economic groups. In essence, inhigh-achieving regions such as the Red River Delta and the Southeast, girlsachieved better than boys in reading. But, there were no differences betweenboys and girls in mathematics. In both reading and mathematics, pupils fromhigher socio-economic groups achieved higher scores than pupils from lowersocio-economic groups.
Vietnam Reading and Mathematics Assessment Study
51
Figure 2.11: Mean 500 scores of sub-domains
There were no importantor significant differencesbetween the sub domainscores in reading ormathematics
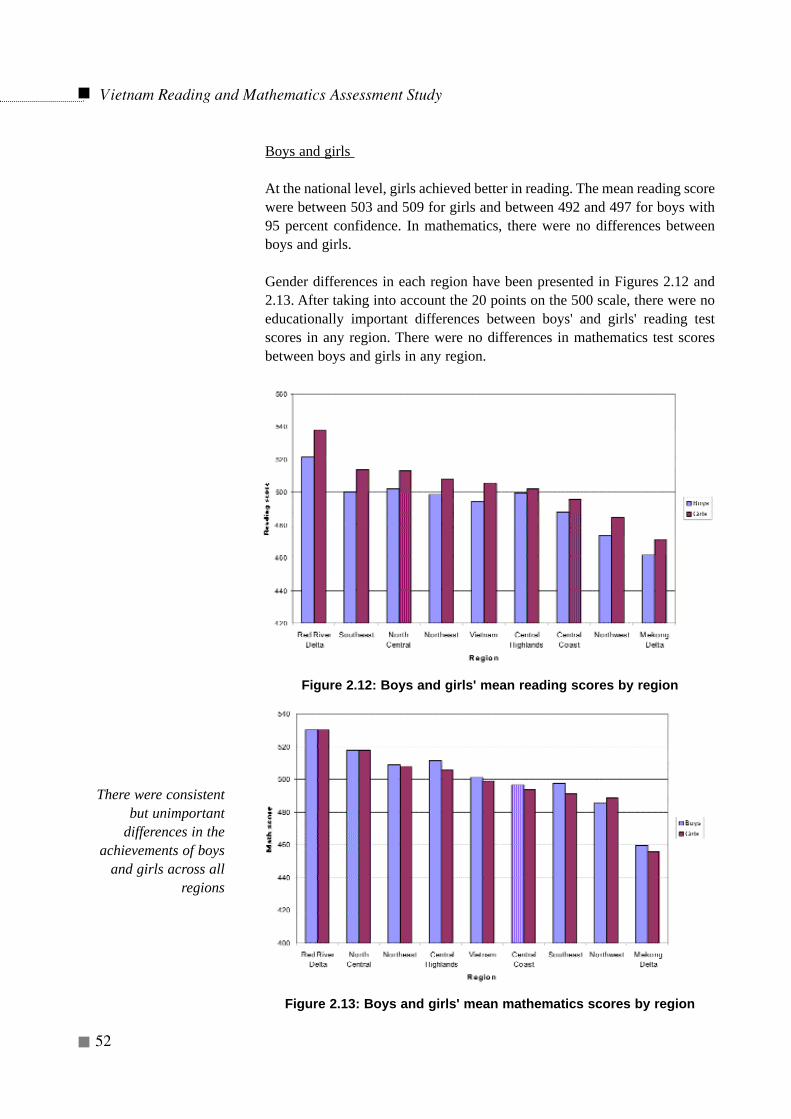
Boys and girls
At the national level, girls achieved better in reading. The mean reading scorewere between 503 and 509 for girls and between 492 and 497 for boys with95 percent confidence. In mathematics, there were no differences betweenboys and girls.
Gender differences in each region have been presented in Figures 2.12 and2.13. After taking into account the 20 points on the 500 scale, there were noeducationally important differences between boys' and girls' reading testscores in any region. There were no differences in mathematics test scoresbetween boys and girls in any region.
Vietnam Reading and Mathematics Assessment Study
52
Figure 2.12: Boys and girls' mean reading scores by region
Figure 2.13: Boys and girls' mean mathematics scores by region
There were consistentbut unimportant
differences in theachievements of boys
and girls across allregions
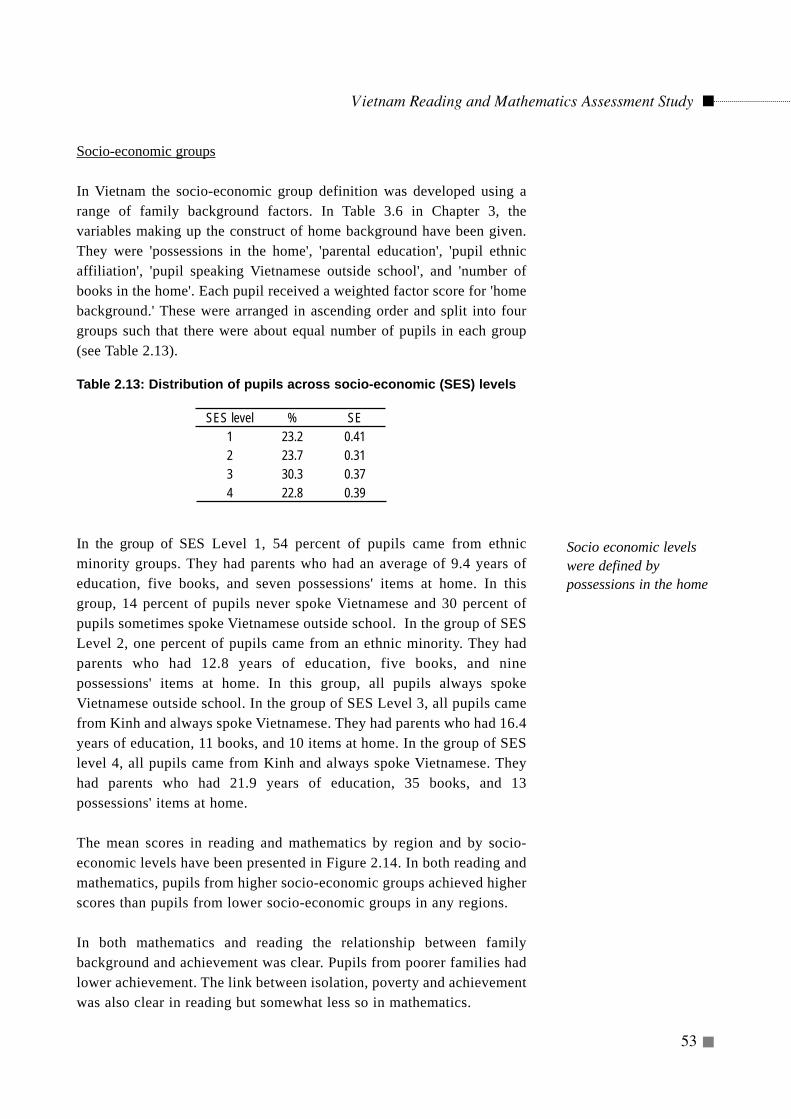
Socio-economic groups
In Vietnam the socio-economic group definition was developed using arange of family background factors. In Table 3.6 in Chapter 3, thevariables making up the construct of home background have been given.They were 'possessions in the home', 'parental education', 'pupil ethnicaffiliation', 'pupil speaking Vietnamese outside school', and 'number ofbooks in the home'. Each pupil received a weighted factor score for 'homebackground.' These were arranged in ascending order and split into fourgroups such that there were about equal number of pupils in each group(see Table 2.13).
Table 2.13: Distribution of pupils across socio-economic (SES) levels
In the group of SES Level 1, 54 percent of pupils came from ethnicminority groups. They had parents who had an average of 9.4 years ofeducation, five books, and seven possessions' items at home. In thisgroup, 14 percent of pupils never spoke Vietnamese and 30 percent ofpupils sometimes spoke Vietnamese outside school. In the group of SESLevel 2, one percent of pupils came from an ethnic minority. They hadparents who had 12.8 years of education, five books, and ninepossessions' items at home. In this group, all pupils always spokeVietnamese outside school. In the group of SES Level 3, all pupils camefrom Kinh and always spoke Vietnamese. They had parents who had 16.4years of education, 11 books, and 10 items at home. In the group of SESlevel 4, all pupils came from Kinh and always spoke Vietnamese. Theyhad parents who had 21.9 years of education, 35 books, and 13possessions' items at home.
The mean scores in reading and mathematics by region and by socio-economic levels have been presented in Figure 2.14. In both reading andmathematics, pupils from higher socio-economic groups achieved higherscores than pupils from lower socio-economic groups in any regions.
In both mathematics and reading the relationship between familybackground and achievement was clear. Pupils from poorer families hadlower achievement. The link between isolation, poverty and achievementwas also clear in reading but somewhat less so in mathematics.
Vietnam Reading and Mathematics Assessment Study
53
SES level % SE1 23.2 0.412 23.7 0.313 30.3 0.374 22.8 0.39
Socio economic levelswere defined bypossessions in the home

Vietnam Reading and Mathematics Assessment Study
54
There were clear differences between socio-economic groups and thedifferences are educationally important within and between regions. It wasnoticeable that the pupils in the lowest socio-economic group on averagenever reached the achievement levels of the pupils in the higher socio-economic group regardless of region. In other words poverty is not overcomein educational terms, no mater where the pupils live.
Policy suggestion 2.6: The MOET might wish to consider urgent actionfor schools in low performing regions where isolation and povertycombine to align with low competency levels.
Were the pupils 'elite' (upper 5 %) performancessimilar in different regions and economicallyadvantaged areas? To what extent did theperformance 'tails' (bottom 5%) differ acrossregions and economically advantaged strata?
The upper five percent of pupils were identified by separating all pupilsabove the 95th percentile. Then the percentages of pupils who had scoredhigh enough to be in the national top five percent of pupils in each regionby school location and in each region by socio-economic levels wastabulated. The results of this analysis have been presented in Table 2.14.What does the value of 1.2 percent for the isolated schools in the Red RiverDelta mean? It means that of all of the pupils in isolated schools in the Red
Low socio-economic
groups showpersistent
lowerachievement
levels,regardless of
region.
The distribution of theupper and lower 5% ofpupil performances waslinked to geographiclocation.
Socio-economic levelwas also related to
distribution of upper andlower performing groups
of pupils
Figure 2.14: Pupil mean scores and sampling errors for regions by socio-economic levels
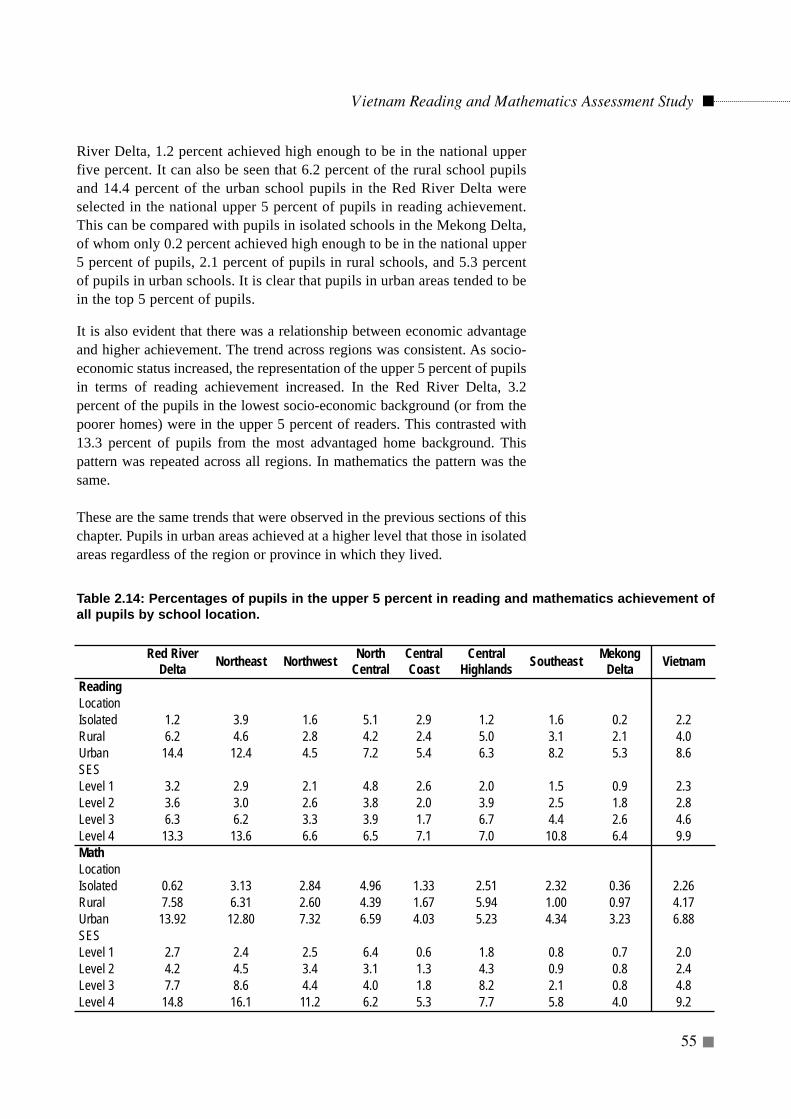
River Delta, 1.2 percent achieved high enough to be in the national upperfive percent. It can also be seen that 6.2 percent of the rural school pupilsand 14.4 percent of the urban school pupils in the Red River Delta wereselected in the national upper 5 percent of pupils in reading achievement.This can be compared with pupils in isolated schools in the Mekong Delta,of whom only 0.2 percent achieved high enough to be in the national upper5 percent of pupils, 2.1 percent of pupils in rural schools, and 5.3 percentof pupils in urban schools. It is clear that pupils in urban areas tended to bein the top 5 percent of pupils.
It is also evident that there was a relationship between economic advantageand higher achievement. The trend across regions was consistent. As socio-economic status increased, the representation of the upper 5 percent of pupilsin terms of reading achievement increased. In the Red River Delta, 3.2percent of the pupils in the lowest socio-economic background (or from thepoorer homes) were in the upper 5 percent of readers. This contrasted with13.3 percent of pupils from the most advantaged home background. Thispattern was repeated across all regions. In mathematics the pattern was thesame.
These are the same trends that were observed in the previous sections of thischapter. Pupils in urban areas achieved at a higher level that those in isolatedareas regardless of the region or province in which they lived.
Vietnam Reading and Mathematics Assessment Study
55
Red RiverDelta Northeast Northwest North
CentralCentralCoast
CentralHighlands Southeast Mekong
Delta Vietnam
Reading LocationIsolated 1.2 3.9 1.6 5.1 2.9 1.2 1.6 0.2 2.2Rural 6.2 4.6 2.8 4.2 2.4 5.0 3.1 2.1 4.0Urban 14.4 12.4 4.5 7.2 5.4 6.3 8.2 5.3 8.6SESLevel 1 3.2 2.9 2.1 4.8 2.6 2.0 1.5 0.9 2.3Level 2 3.6 3.0 2.6 3.8 2.0 3.9 2.5 1.8 2.8Level 3 6.3 6.2 3.3 3.9 1.7 6.7 4.4 2.6 4.6Level 4 13.3 13.6 6.6 6.5 7.1 7.0 10.8 6.4 9.9Math LocationIsolated 0.62 3.13 2.84 4.96 1.33 2.51 2.32 0.36 2.26Rural 7.58 6.31 2.60 4.39 1.67 5.94 1.00 0.97 4.17Urban 13.92 12.80 7.32 6.59 4.03 5.23 4.34 3.23 6.88SESLevel 1 2.7 2.4 2.5 6.4 0.6 1.8 0.8 0.7 2.0Level 2 4.2 4.5 3.4 3.1 1.3 4.3 0.9 0.8 2.4Level 3 7.7 8.6 4.4 4.0 1.8 8.2 2.1 0.8 4.8Level 4 14.8 16.1 11.2 6.2 5.3 7.7 5.8 4.0 9.2
Table 2.14: Percentages of pupils in the upper 5 percent in reading and mathematics achievement ofall pupils by school location.
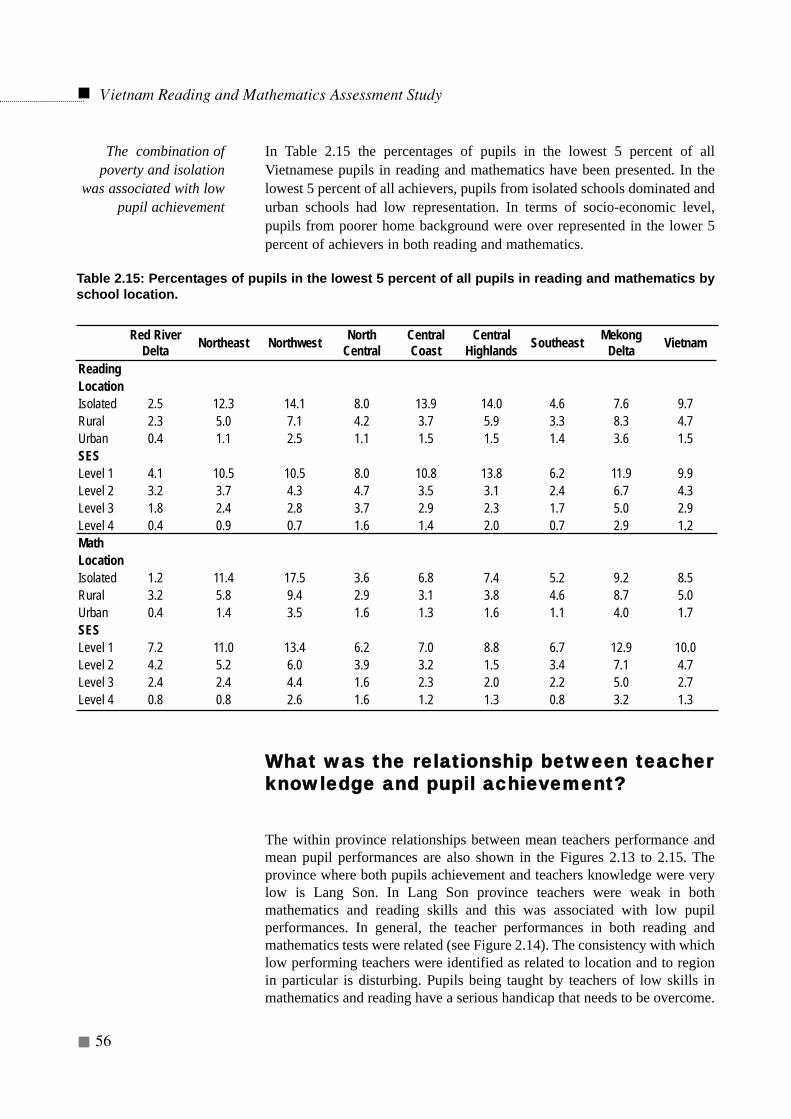
Vietnam Reading and Mathematics Assessment Study
56
In Table 2.15 the percentages of pupils in the lowest 5 percent of allVietnamese pupils in reading and mathematics have been presented. In thelowest 5 percent of all achievers, pupils from isolated schools dominated andurban schools had low representation. In terms of socio-economic level,pupils from poorer home background were over represented in the lower 5percent of achievers in both reading and mathematics.
WWhhaatt wwaass tthhee rreellaattiioonnsshhiipp bbeettwweeeenn tteeaacchheerrkknnoowwlleeddggee aanndd ppuuppiill aacchhiieevveemmeenntt??
The within province relationships between mean teachers performance andmean pupil performances are also shown in the Figures 2.13 to 2.15. Theprovince where both pupils achievement and teachers knowledge were verylow is Lang Son. In Lang Son province teachers were weak in bothmathematics and reading skills and this was associated with low pupilperformances. In general, the teacher performances in both reading andmathematics tests were related (see Figure 2.14). The consistency with whichlow performing teachers were identified as related to location and to regionin particular is disturbing. Pupils being taught by teachers of low skills inmathematics and reading have a serious handicap that needs to be overcome.
Red RiverDelta Northeast Northwest North
CentralCentralCoast
CentralHighlands Southeast Mekong
Delta Vietnam
Reading LocationIsolated 2.5 12.3 14.1 8.0 13.9 14.0 4.6 7.6 9.7Rural 2.3 5.0 7.1 4.2 3.7 5.9 3.3 8.3 4.7Urban 0.4 1.1 2.5 1.1 1.5 1.5 1.4 3.6 1.5SESLevel 1 4.1 10.5 10.5 8.0 10.8 13.8 6.2 11.9 9.9Level 2 3.2 3.7 4.3 4.7 3.5 3.1 2.4 6.7 4.3Level 3 1.8 2.4 2.8 3.7 2.9 2.3 1.7 5.0 2.9Level 4 0.4 0.9 0.7 1.6 1.4 2.0 0.7 2.9 1.2Math LocationIsolated 1.2 11.4 17.5 3.6 6.8 7.4 5.2 9.2 8.5Rural 3.2 5.8 9.4 2.9 3.1 3.8 4.6 8.7 5.0Urban 0.4 1.4 3.5 1.6 1.3 1.6 1.1 4.0 1.7SESLevel 1 7.2 11.0 13.4 6.2 7.0 8.8 6.7 12.9 10.0Level 2 4.2 5.2 6.0 3.9 3.2 1.5 3.4 7.1 4.7Level 3 2.4 2.4 4.4 1.6 2.3 2.0 2.2 5.0 2.7Level 4 0.8 0.8 2.6 1.6 1.2 1.3 0.8 3.2 1.3
Table 2.15: Percentages of pupils in the lowest 5 percent of all pupils in reading and mathematics byschool location.
The combination ofpoverty and isolation
was associated with lowpupil achievement
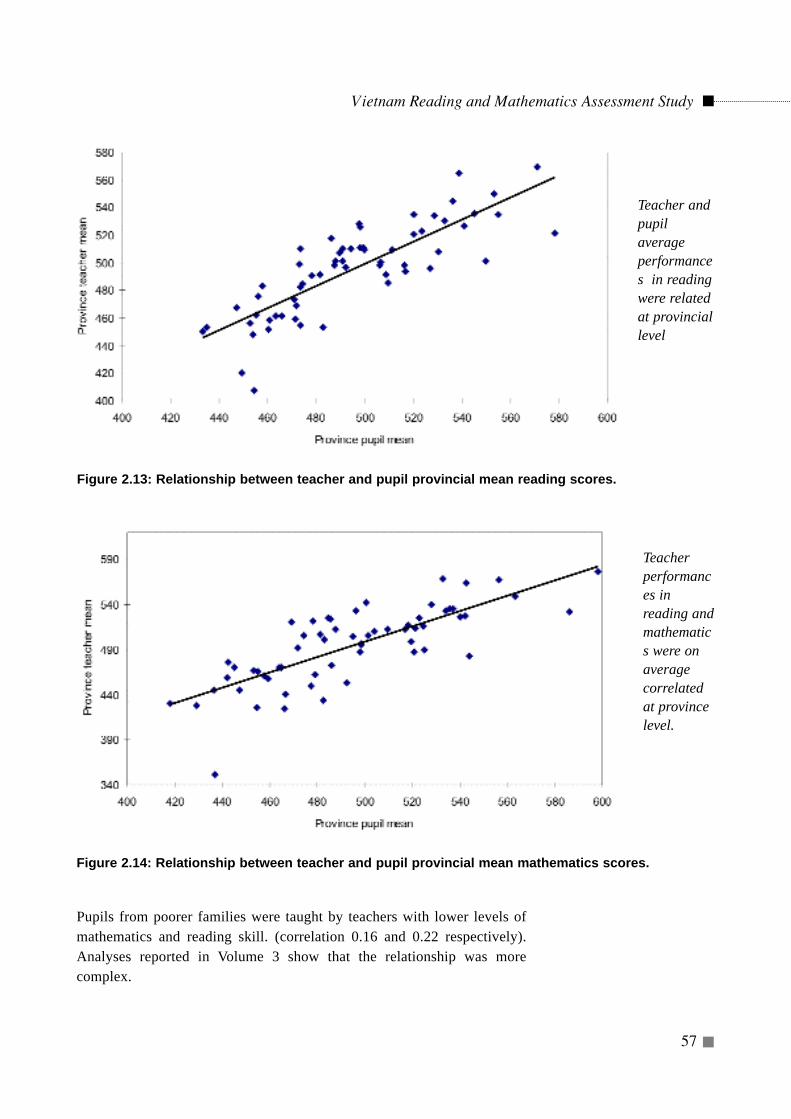
Pupils from poorer families were taught by teachers with lower levels ofmathematics and reading skill. (correlation 0.16 and 0.22 respectively).Analyses reported in Volume 3 show that the relationship was morecomplex.
Vietnam Reading and Mathematics Assessment Study
57
Teacher andpupilaverageperformances in readingwere relatedat provinciallevel
Teacherperformances inreading andmathematics were onaveragecorrelatedat provincelevel.
Figure 2.13: Relationship between teacher and pupil provincial mean reading scores.
Figure 2.14: Relationship between teacher and pupil provincial mean mathematics scores.
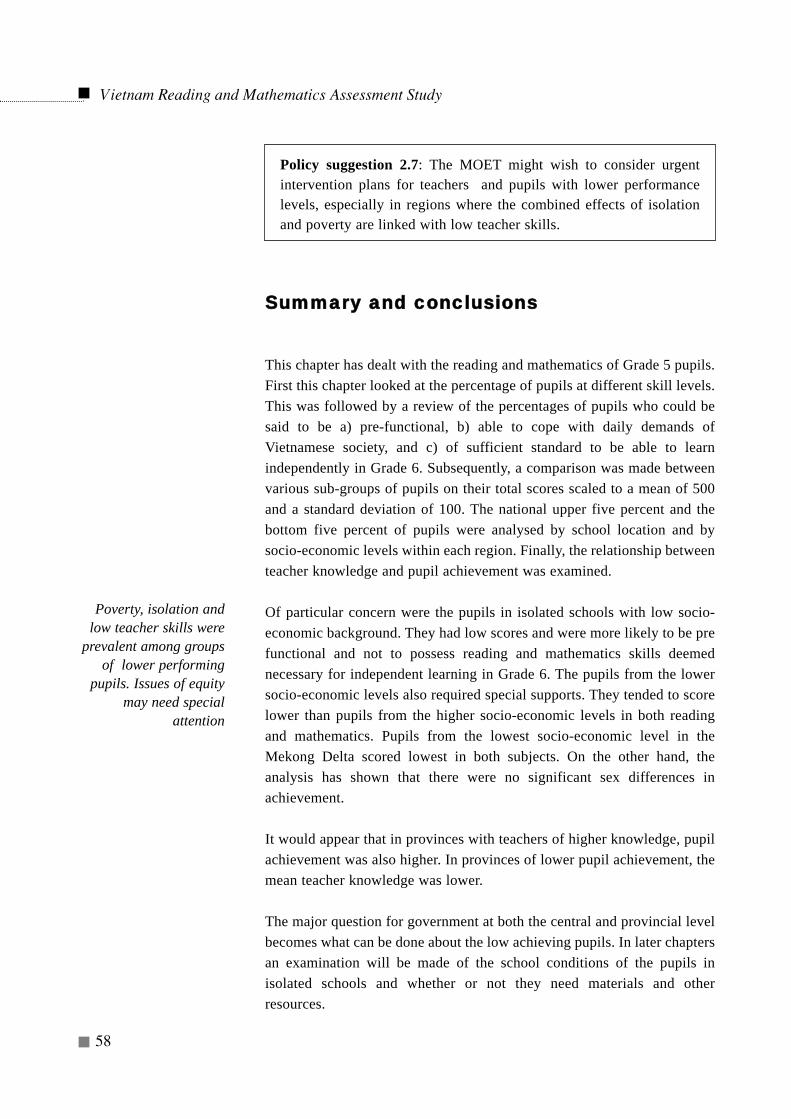
Vietnam Reading and Mathematics Assessment Study
58
Policy suggestion 2.7: The MOET might wish to consider urgentintervention plans for teachers and pupils with lower performancelevels, especially in regions where the combined effects of isolationand poverty are linked with low teacher skills.
SSuummmmaarryy aanndd ccoonncclluussiioonnss
This chapter has dealt with the reading and mathematics of Grade 5 pupils.First this chapter looked at the percentage of pupils at different skill levels.This was followed by a review of the percentages of pupils who could besaid to be a) pre-functional, b) able to cope with daily demands ofVietnamese society, and c) of sufficient standard to be able to learnindependently in Grade 6. Subsequently, a comparison was made betweenvarious sub-groups of pupils on their total scores scaled to a mean of 500and a standard deviation of 100. The national upper five percent and thebottom five percent of pupils were analysed by school location and bysocio-economic levels within each region. Finally, the relationship betweenteacher knowledge and pupil achievement was examined.
Of particular concern were the pupils in isolated schools with low socio-economic background. They had low scores and were more likely to be prefunctional and not to possess reading and mathematics skills deemednecessary for independent learning in Grade 6. The pupils from the lowersocio-economic levels also required special supports. They tended to scorelower than pupils from the higher socio-economic levels in both readingand mathematics. Pupils from the lowest socio-economic level in theMekong Delta scored lowest in both subjects. On the other hand, theanalysis has shown that there were no significant sex differences inachievement.
It would appear that in provinces with teachers of higher knowledge, pupilachievement was also higher. In provinces of lower pupil achievement, themean teacher knowledge was lower.
The major question for government at both the central and provincial levelbecomes what can be done about the low achieving pupils. In later chaptersan examination will be made of the school conditions of the pupils inisolated schools and whether or not they need materials and otherresources.
Poverty, isolation andlow teacher skills were
prevalent among groupsof lower performing
pupils. Issues of equitymay need special
attention
Vietnam Reading and Mathematics Assessment Study
59
Chapter 3
WHAT WERE THE BASELINE DATA FORSELECTED INPUT DATA ABOUT PUPILS INGRADE 5 IN VIETNAM?
Introduction
The aim of this chapter as well as of Chapters 4 and 5 is to presentsome examples of baseline data for inputs to primary schools inorder to establish a descriptive account of the pupils, theirteachers and their schools. This chapter is concerned with the
pupils. The data are important for two reasons. The first is that they providea 'context' for the analyses presented later in this report. For example whenthe differences in the number of resources among provinces and amongschool within provinces are presented later (see Chapter 7) it is importantto link the differences to the actual levels of provision. It is in chapters 3, 4and 5 that the levels have been presented. The second reason is that, overtime, the levels and differences of some variables may well change. Thuswhen Vietnam, in the future, undertakes another survey of Grade 5conditions of schooling and pupil achievement, it will be possible toexamine the extent to which the 'context' variables have changed. Highquality data about 'context' and the 'levels and distribution' provideeducational planners and policy-makers with a sound means of mapping thegeneral evolution of the school system and also offer tools for theidentification of existing or emerging problems.
Policy suggestion 3.1: The MOET might wish to undertake follow-upsurveys of Grade 5 at five year intervals in order to establish, interalia, changes in important educational indicators over time.
Vietnam Reading and Mathematics Assessment Study
60
A note on the interpretation of the dataanalyses
Three points should be stressed before the results are presented. The first isthat the variables/indicators in chapters 3, 4 and 5 are but a small subset ofthe many indicators that could have been collected. The MOET willprovide a separate publication containing descriptive statistics of allvariables in the study.
The second point, dealt with to some extent in chapters 1 and 2, is that eachstatistic has been presented together with its standard error of sampling. Itwill be recalled from Chapter 1 that the sample was drawn in order to yieldstandard errors of sampling such that a sample estimate of a populationpercentage would have a very small standard error. The samplingprocedures have been presented in detail in Chapter 3 of Volume 3 of thisseries. However, although the standard errors for Vietnam as a whole aresmall the standard errors of sampling for sub-groups of pupils and schoolswill be larger. For many of the tables appearing in this report it is theschools in isolated areas, rural areas, and urban areas that have beenpresented within each region.
Where a percentage or a mean has been presented for a sub-group of pupils(such as for pupils in schools in isolated areas within regions) then thestandard error will be greater than for the whole sample. The general reasonwhy sub-group estimates have larger standard errors is because the samplesizes for sub-groups are smaller than for the total sample. To illustrate,consider the first column of entries in Table 3.1. The average age of pupilsin months at the time the data were collected has been presented separatelyfor each school location in each region and for Vietnam overall. Thestandard error (SE) of each average has also been presented. For the firstentry in Table 3.1, namely isolated schools in the Red River Delta, theaverage pupil age was 132.0 months and the standard error was 0.67months. That is, there 19 chances in 20 that the average age of thepopulation of Grade 5 pupils in isolated schools in the Red River Delta was132.0 months ± 2(0.67). In other words it can be said that we can be 95percent confident that the population value was between 130.66 and 133.34months. For all of the Grade 5 pupils in Vietnam we can be 95 percentconfident that the population value was between 133.9 and 134.3 months
The third point to note is that the values in all tables have been presentedin terms of pupils. Pupils were the unit of analysis even though some of thevariables described in Chapters 4 and 5 refer to teachers and schools.Where a percentage refers to a pupil characteristic then this means that it isthe percentage of pupils having this characteristic. Where a percentage fora variable refers to teachers then the percentage should be interpreted as'the stated percentages of pupils were in schools with teachers having theparticular characteristic'. Similarly, a percentage for a variable thatdescribes schools should be interpreted as 'the stated percentages of pupils
Data in this report havebeen presented by region
and by school location.The same data for eachprovince separately can
be obtained from theMOET.
Sampling errors for eachestimate in this reporthave been calculated
and presented.
The unit of analysisthroughout this report
has been the pupil.
Vietnam Reading and Mathematics Assessment Study
61
were in schools with the particular characteristic'. Where the mean of avariable has been presented for a teacher or school this means that theaverage pupil in the region or in Vietnam has a teacher or is in a school withthe stated characteristic.
This concept is important for planning decisions. Take an example oflibraries in schools. There are schools of different sizes and it may well bethat 50 percent of schools (the small schools) do not have school librarieswhereas the large schools have school libraries. But the large schools have 80percent of Grade 5 pupils in them. Thus the figure presented in the tablewould be that 80 percent of pupils are in schools with libraries. Since aMinistry of Education is responsible for all pupils then it has been deemed tobe more important to know what the pupils as a group are exposed to ratherthan the actual number of schools.
Finally, it should be pointed out that most of the tables, as already mentioned,have been presented in terms of in terms of pupils in schools in differentlocations in each region of Vietnam. However, many other tables wereproduced and sometimes use is made of the results from these other tables.They are all to be found in an MOET publication entitled 'Grade 5Achievement Study: Provincial data' and available from the MOET in Hanoi.
Specific policy questions related to pupil inputs
This chapter has been divided into four sections as follows:
(a) What were the home backgrounds from which the pupils came?
(b) To what extent did the pupils receive homework and have help at home?
(c) To what extent did pupils receive extra tuition?
(d) What were the relationships of pupil background indicators toachievement in mathematics and reading?
What were the home backgrounds fromwhich the pupils came?
The selected data about home backgrounds have been summarised in twotables - Tables 3.1 and 3.2.
(a) Age of Grade 5 pupils
Pupils enter school at the beginning of the year in which they become six
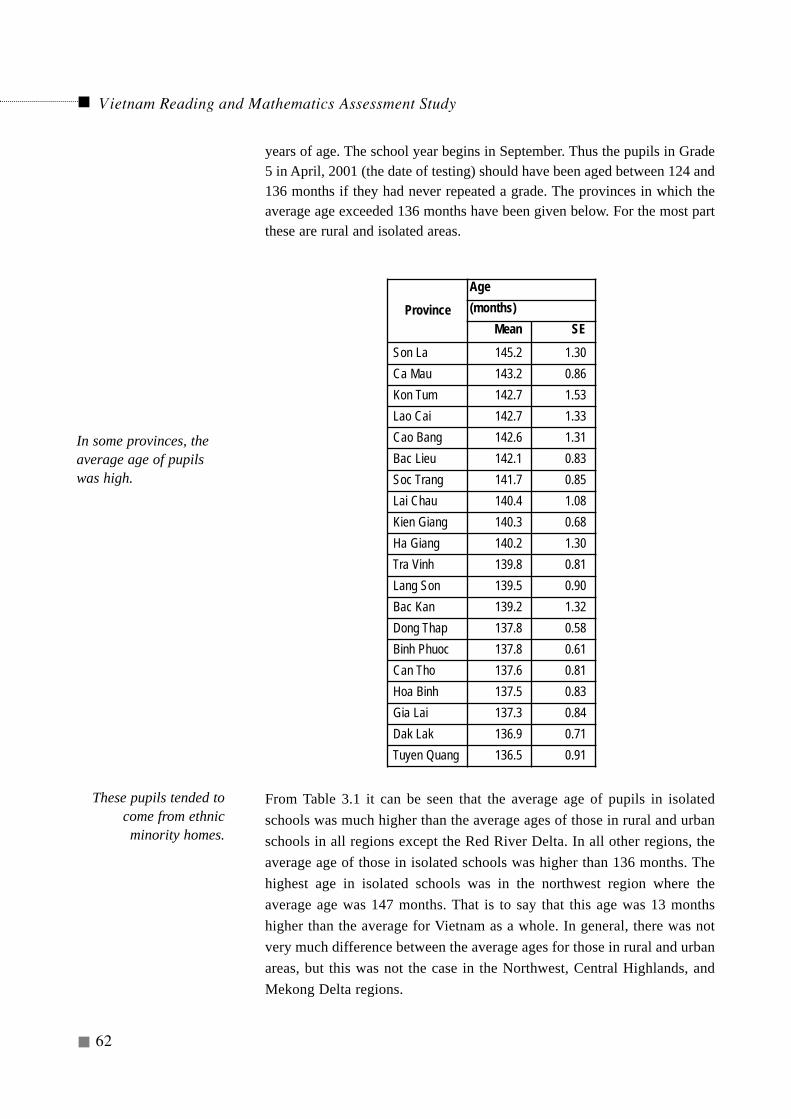
Vietnam Reading and Mathematics Assessment Study
62
years of age. The school year begins in September. Thus the pupils in Grade5 in April, 2001 (the date of testing) should have been aged between 124 and136 months if they had never repeated a grade. The provinces in which theaverage age exceeded 136 months have been given below. For the most partthese are rural and isolated areas.
From Table 3.1 it can be seen that the average age of pupils in isolatedschools was much higher than the average ages of those in rural and urbanschools in all regions except the Red River Delta. In all other regions, theaverage age of those in isolated schools was higher than 136 months. Thehighest age in isolated schools was in the northwest region where theaverage age was 147 months. That is to say that this age was 13 monthshigher than the average for Vietnam as a whole. In general, there was notvery much difference between the average ages for those in rural and urbanareas, but this was not the case in the Northwest, Central Highlands, andMekong Delta regions.
ProvinceAge(months)
Mean SESon La 145.2 1.30Ca Mau 143.2 0.86Kon Tum 142.7 1.53Lao Cai 142.7 1.33Cao Bang 142.6 1.31Bac Lieu 142.1 0.83Soc Trang 141.7 0.85Lai Chau 140.4 1.08Kien Giang 140.3 0.68Ha Giang 140.2 1.30Tra Vinh 139.8 0.81Lang Son 139.5 0.90Bac Kan 139.2 1.32Dong Thap 137.8 0.58Binh Phuoc 137.8 0.61Can Tho 137.6 0.81Hoa Binh 137.5 0.83Gia Lai 137.3 0.84Dak Lak 136.9 0.71Tuyen Quang 136.5 0.91
In some provinces, theaverage age of pupilswas high.
These pupils tended tocome from ethnicminority homes.
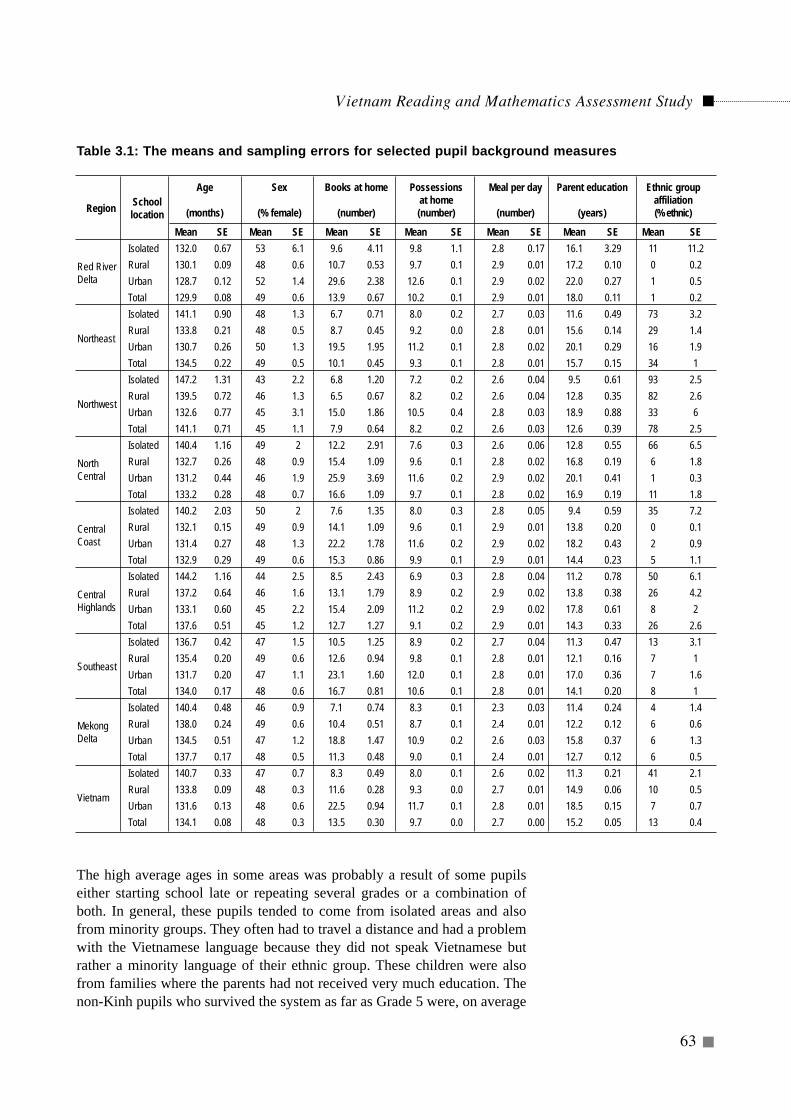
Vietnam Reading and Mathematics Assessment Study
63
The high average ages in some areas was probably a result of some pupilseither starting school late or repeating several grades or a combination ofboth. In general, these pupils tended to come from isolated areas and alsofrom minority groups. They often had to travel a distance and had a problemwith the Vietnamese language because they did not speak Vietnamese butrather a minority language of their ethnic group. These children were alsofrom families where the parents had not received very much education. Thenon-Kinh pupils who survived the system as far as Grade 5 were, on average
Region Schoollocation
Age
(months)
Sex
(% female)
Books at home
(number)
Possessions at home (number)
Meal per day
(number)
Parent education
(years)
Ethnic groupaffiliation (% ethnic)
Mean SE Mean SE Mean SE Mean SE Mean SE Mean SE Mean SE
Red RiverDelta
Isolated 132.0 0.67 53 6.1 9.6 4.11 9.8 1.1 2.8 0.17 16.1 3.29 11 11.2Rural 130.1 0.09 48 0.6 10.7 0.53 9.7 0.1 2.9 0.01 17.2 0.10 0 0.2Urban 128.7 0.12 52 1.4 29.6 2.38 12.6 0.1 2.9 0.02 22.0 0.27 1 0.5Total 129.9 0.08 49 0.6 13.9 0.67 10.2 0.1 2.9 0.01 18.0 0.11 1 0.2
Northeast
Isolated 141.1 0.90 48 1.3 6.7 0.71 8.0 0.2 2.7 0.03 11.6 0.49 73 3.2Rural 133.8 0.21 48 0.5 8.7 0.45 9.2 0.0 2.8 0.01 15.6 0.14 29 1.4Urban 130.7 0.26 50 1.3 19.5 1.95 11.2 0.1 2.8 0.02 20.1 0.29 16 1.9Total 134.5 0.22 49 0.5 10.1 0.45 9.3 0.1 2.8 0.01 15.7 0.15 34 1
Northwest
Isolated 147.2 1.31 43 2.2 6.8 1.20 7.2 0.2 2.6 0.04 9.5 0.61 93 2.5Rural 139.5 0.72 46 1.3 6.5 0.67 8.2 0.2 2.6 0.04 12.8 0.35 82 2.6Urban 132.6 0.77 45 3.1 15.0 1.86 10.5 0.4 2.8 0.03 18.9 0.88 33 6Total 141.1 0.71 45 1.1 7.9 0.64 8.2 0.2 2.6 0.03 12.6 0.39 78 2.5
NorthCentral
Isolated 140.4 1.16 49 2 12.2 2.91 7.6 0.3 2.6 0.06 12.8 0.55 66 6.5Rural 132.7 0.26 48 0.9 15.4 1.09 9.6 0.1 2.8 0.02 16.8 0.19 6 1.8Urban 131.2 0.44 46 1.9 25.9 3.69 11.6 0.2 2.9 0.02 20.1 0.41 1 0.3Total 133.2 0.28 48 0.7 16.6 1.09 9.7 0.1 2.8 0.02 16.9 0.19 11 1.8
CentralCoast
Isolated 140.2 2.03 50 2 7.6 1.35 8.0 0.3 2.8 0.05 9.4 0.59 35 7.2Rural 132.1 0.15 49 0.9 14.1 1.09 9.6 0.1 2.9 0.01 13.8 0.20 0 0.1Urban 131.4 0.27 48 1.3 22.2 1.78 11.6 0.2 2.9 0.02 18.2 0.43 2 0.9Total 132.9 0.29 49 0.6 15.3 0.86 9.9 0.1 2.9 0.01 14.4 0.23 5 1.1
CentralHighlands
Isolated 144.2 1.16 44 2.5 8.5 2.43 6.9 0.3 2.8 0.04 11.2 0.78 50 6.1Rural 137.2 0.64 46 1.6 13.1 1.79 8.9 0.2 2.9 0.02 13.8 0.38 26 4.2Urban 133.1 0.60 45 2.2 15.4 2.09 11.2 0.2 2.9 0.02 17.8 0.61 8 2Total 137.6 0.51 45 1.2 12.7 1.27 9.1 0.2 2.9 0.01 14.3 0.33 26 2.6
Southeast
Isolated 136.7 0.42 47 1.5 10.5 1.25 8.9 0.2 2.7 0.04 11.3 0.47 13 3.1Rural 135.4 0.20 49 0.6 12.6 0.94 9.8 0.1 2.8 0.01 12.1 0.16 7 1Urban 131.7 0.20 47 1.1 23.1 1.60 12.0 0.1 2.8 0.01 17.0 0.36 7 1.6Total 134.0 0.17 48 0.6 16.7 0.81 10.6 0.1 2.8 0.01 14.1 0.20 8 1
MekongDelta
Isolated 140.4 0.48 46 0.9 7.1 0.74 8.3 0.1 2.3 0.03 11.4 0.24 4 1.4Rural 138.0 0.24 49 0.6 10.4 0.51 8.7 0.1 2.4 0.01 12.2 0.12 6 0.6Urban 134.5 0.51 47 1.2 18.8 1.47 10.9 0.2 2.6 0.03 15.8 0.37 6 1.3Total 137.7 0.17 48 0.5 11.3 0.48 9.0 0.1 2.4 0.01 12.7 0.12 6 0.5
Vietnam
Isolated 140.7 0.33 47 0.7 8.3 0.49 8.0 0.1 2.6 0.02 11.3 0.21 41 2.1Rural 133.8 0.09 48 0.3 11.6 0.28 9.3 0.0 2.7 0.01 14.9 0.06 10 0.5Urban 131.6 0.13 48 0.6 22.5 0.94 11.7 0.1 2.8 0.01 18.5 0.15 7 0.7Total 134.1 0.08 48 0.3 13.5 0.30 9.7 0.0 2.7 0.00 15.2 0.05 13 0.4
Table 3.1: The means and sampling errors for selected pupil background measures
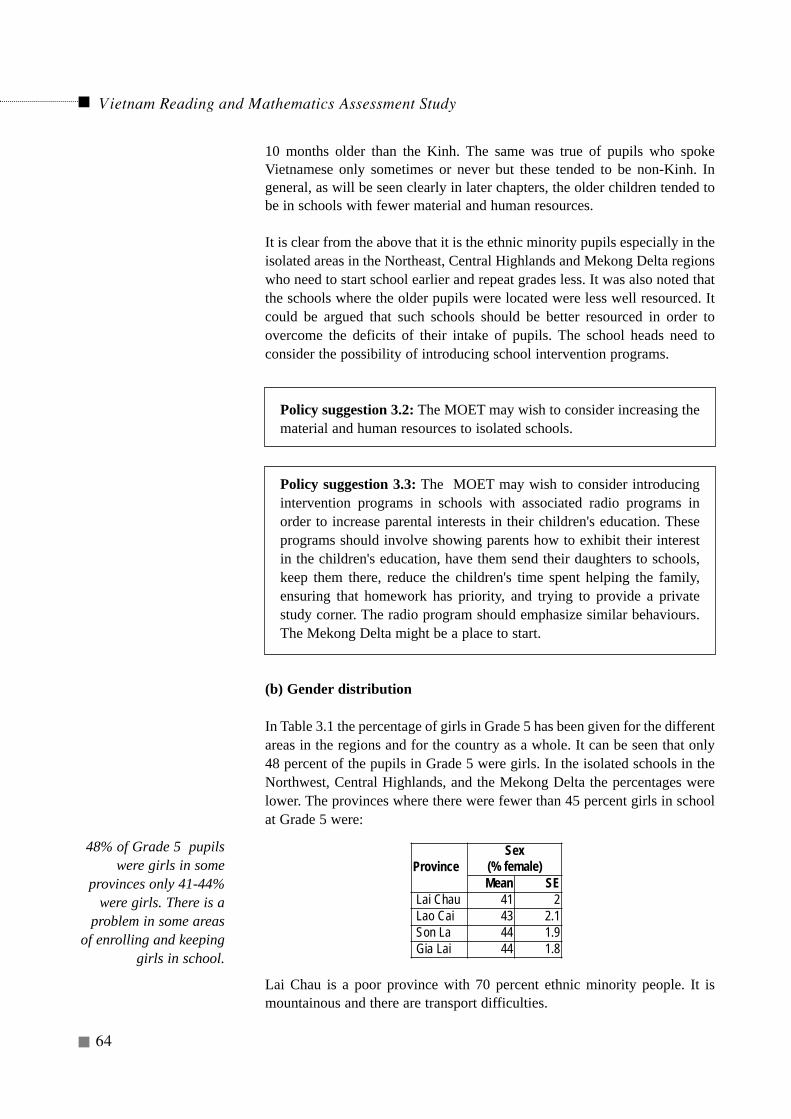
Vietnam Reading and Mathematics Assessment Study
64
10 months older than the Kinh. The same was true of pupils who spokeVietnamese only sometimes or never but these tended to be non-Kinh. Ingeneral, as will be seen clearly in later chapters, the older children tended tobe in schools with fewer material and human resources.
It is clear from the above that it is the ethnic minority pupils especially in theisolated areas in the Northeast, Central Highlands and Mekong Delta regionswho need to start school earlier and repeat grades less. It was also noted thatthe schools where the older pupils were located were less well resourced. Itcould be argued that such schools should be better resourced in order toovercome the deficits of their intake of pupils. The school heads need toconsider the possibility of introducing school intervention programs.
Policy suggestion 3.2: The MOET may wish to consider increasing thematerial and human resources to isolated schools.
Policy suggestion 3.3: The MOET may wish to consider introducingintervention programs in schools with associated radio programs inorder to increase parental interests in their children's education. Theseprograms should involve showing parents how to exhibit their interestin the children's education, have them send their daughters to schools,keep them there, reduce the children's time spent helping the family,ensuring that homework has priority, and trying to provide a privatestudy corner. The radio program should emphasize similar behaviours.The Mekong Delta might be a place to start.
(b) Gender distribution
In Table 3.1 the percentage of girls in Grade 5 has been given for the differentareas in the regions and for the country as a whole. It can be seen that only48 percent of the pupils in Grade 5 were girls. In the isolated schools in theNorthwest, Central Highlands, and the Mekong Delta the percentages werelower. The provinces where there were fewer than 45 percent girls in schoolat Grade 5 were:
Lai Chau is a poor province with 70 percent ethnic minority people. It ismountainous and there are transport difficulties.
ProvinceSex
(% female)Mean SE
Lai Chau 41 2Lao Cai 43 2.1Son La 44 1.9Gia Lai 44 1.8
48% of Grade 5 pupilswere girls in some
provinces only 41-44%were girls. There is a
problem in some areasof enrolling and keeping
girls in school.
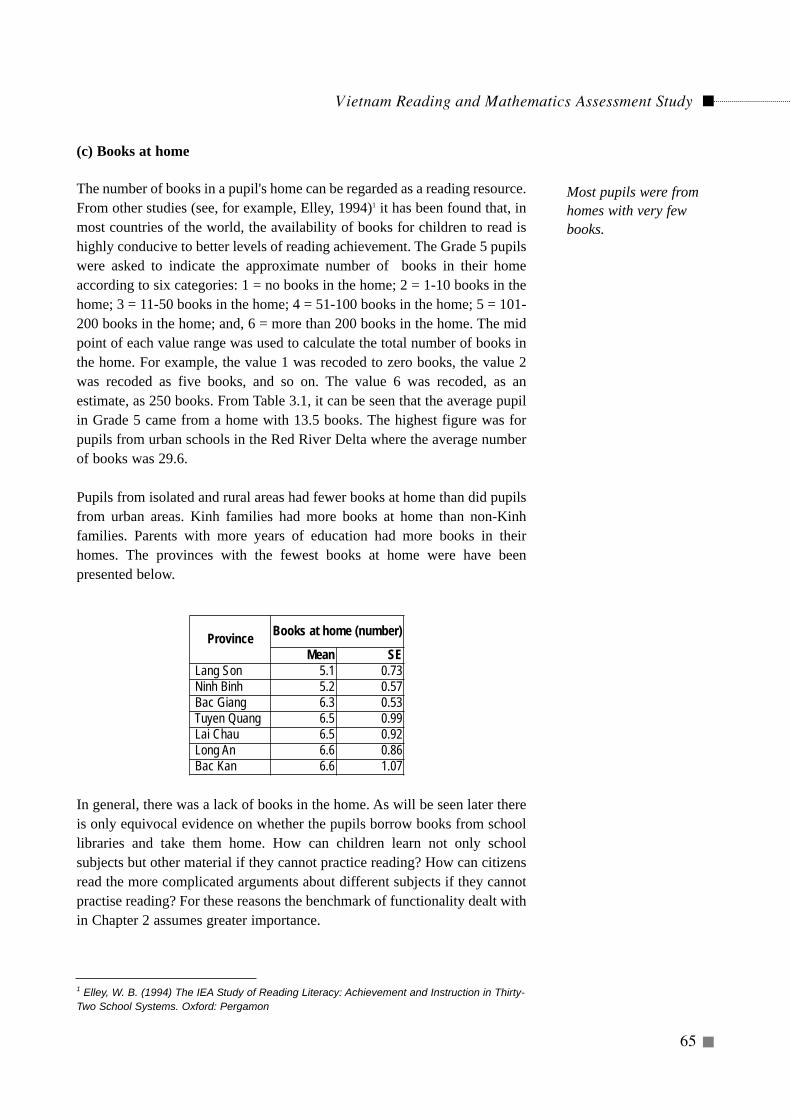
(c) Books at home
The number of books in a pupil's home can be regarded as a reading resource.From other studies (see, for example, Elley, 1994)1 it has been found that, inmost countries of the world, the availability of books for children to read ishighly conducive to better levels of reading achievement. The Grade 5 pupilswere asked to indicate the approximate number of books in their homeaccording to six categories: 1 = no books in the home; 2 = 1-10 books in thehome; 3 = 11-50 books in the home; 4 = 51-100 books in the home; 5 = 101-200 books in the home; and, 6 = more than 200 books in the home. The midpoint of each value range was used to calculate the total number of books inthe home. For example, the value 1 was recoded to zero books, the value 2was recoded as five books, and so on. The value 6 was recoded, as anestimate, as 250 books. From Table 3.1, it can be seen that the average pupilin Grade 5 came from a home with 13.5 books. The highest figure was forpupils from urban schools in the Red River Delta where the average numberof books was 29.6.
Pupils from isolated and rural areas had fewer books at home than did pupilsfrom urban areas. Kinh families had more books at home than non-Kinhfamilies. Parents with more years of education had more books in theirhomes. The provinces with the fewest books at home were have beenpresented below.
In general, there was a lack of books in the home. As will be seen later thereis only equivocal evidence on whether the pupils borrow books from schoollibraries and take them home. How can children learn not only schoolsubjects but other material if they cannot practice reading? How can citizensread the more complicated arguments about different subjects if they cannotpractise reading? For these reasons the benchmark of functionality dealt within Chapter 2 assumes greater importance.
Vietnam Reading and Mathematics Assessment Study
65
1 Elley, W. B. (1994) The IEA Study of Reading Literacy: Achievement and Instruction in Thirty-Two School Systems. Oxford: Pergamon
Most pupils were fromhomes with very fewbooks.
Province Books at home (number)
Mean SELang Son 5.1 0.73Ninh Binh 5.2 0.57Bac Giang 6.3 0.53Tuyen Quang 6.5 0.99Lai Chau 6.5 0.92Long An 6.6 0.86Bac Kan 6.6 1.07

(d) Possessions in the home
Pupils were asked about the existence of 18 different possessions in theirhomes. These possessions were bicycle, motorcycle, clock, study desk, studychair, study lamp, newspaper/magazine, books, bookcase, radio, TV set,wardrobe, electric fan, electric or gas cooker, washing machine, telephone,air conditioner, and computer. The number of possessions that a pupil saidwas in his/her home were summed to make a total possessions score. Thistotal was seen as a proxy variable for the wealth of the home The averagenumbers of possessions of pupils in different locations in each region werepresented in Table 3.1 above.
The average pupil was from a home with 9.7 possessions. In all regions exceptfor the Red River Delta pupils in isolated areas were from homes with fewerpossessions than pupils from rural areas and in turn those in rural areas hadfewer possessions than pupils from urban areas. Pupils from schools inisolated areas in the Northwest and Central Highlands regions were from thepoorest homes. It is in these areas that there are many pupils from ethnicminority homes. There were also pockets of areas in the Central Highlandsand Northwest regions where there was no electricity and some of thepossessions in the list in the questionnaire concerned items where electricityis needed. A program is underway to supply electricity to all areas of Vietnam.When this program has succeeded it will be possible to have a computer ortwo in community centres, if required, to allow the children and adults(including teachers) to access the Internet for much of their information.
(e) Number of meals per day
Pollitt (Pollitt, E. (1990) Malnutrition and infection in the classroom Paris:UNESCO) has shown that poor nutrition results in a lack of concentrationand reduced perseverance in school. Regularity of meals was therefore seenas a factor likely to influence achievement. It had been hoped to use aquestion about the number of breakfasts, lunches and evening meals eaten ina week as has been used successfully in many countries at this age level.However, the Vietnamese questionnaire constructors were of the opinion thatVietnamese Grade 5 pupils would not be able to remember how many mealsthey had eaten last week. Rather a question was asked about how many mealsthey ate each day (1 = one meal per day, 2 = two meals per day, and 3 = threeor more meals per day). This resulted in a scale from 1 to 3 only. From Table3.1 it can be seen that the average Grade 5 pupil ate 2.7 meals per day. In
Vietnam Reading and Mathematics Assessment Study
66
The average pupils camefrom a home with 10
possessions out of 18.Urban homes had more
possessions.
Most pupils had 2.7meals per day. In some
rural provinces, theyhad fewer meals.
Policy suggestion 3.4: The MOET might wish to consider: a) getting up-to-date information on the availability of supplementary reading materialsand library books; b) strengthening the current availability of the threedifferent types of books in school libraries; c) the possibility of having bookflood programs in selected schools; and d) encouraging the PTAs toorganize the donation of the books to the libraries.
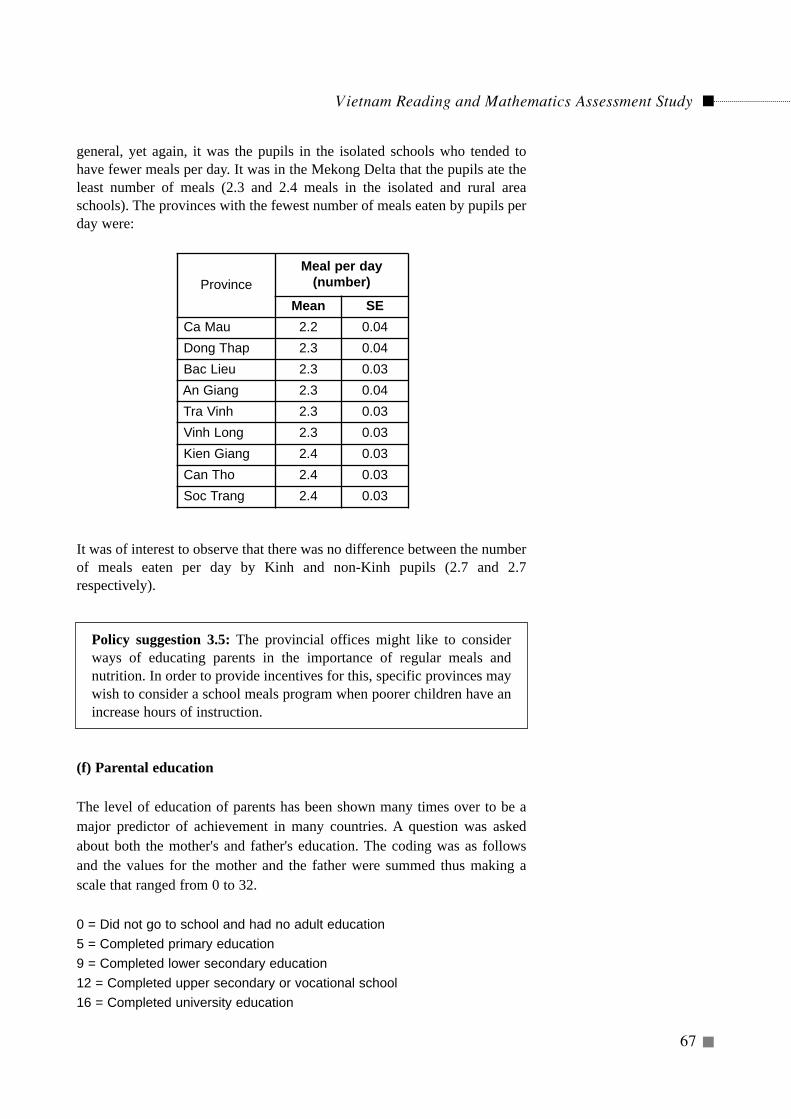
general, yet again, it was the pupils in the isolated schools who tended tohave fewer meals per day. It was in the Mekong Delta that the pupils ate theleast number of meals (2.3 and 2.4 meals in the isolated and rural areaschools). The provinces with the fewest number of meals eaten by pupils perday were:
It was of interest to observe that there was no difference between the numberof meals eaten per day by Kinh and non-Kinh pupils (2.7 and 2.7respectively).
Policy suggestion 3.5: The provincial offices might like to considerways of educating parents in the importance of regular meals andnutrition. In order to provide incentives for this, specific provinces maywish to consider a school meals program when poorer children have anincrease hours of instruction.
(f) Parental education
The level of education of parents has been shown many times over to be amajor predictor of achievement in many countries. A question was askedabout both the mother's and father's education. The coding was as followsand the values for the mother and the father were summed thus making ascale that ranged from 0 to 32.
0 = Did not go to school and had no adult education5 = Completed primary education9 = Completed lower secondary education12 = Completed upper secondary or vocational school16 = Completed university education
Vietnam Reading and Mathematics Assessment Study
67
ProvinceMeal per day
(number)
Mean SECa Mau 2.2 0.04Dong Thap 2.3 0.04Bac Lieu 2.3 0.03An Giang 2.3 0.04Tra Vinh 2.3 0.03Vinh Long 2.3 0.03Kien Giang 2.4 0.03Can Tho 2.4 0.03Soc Trang 2.4 0.03
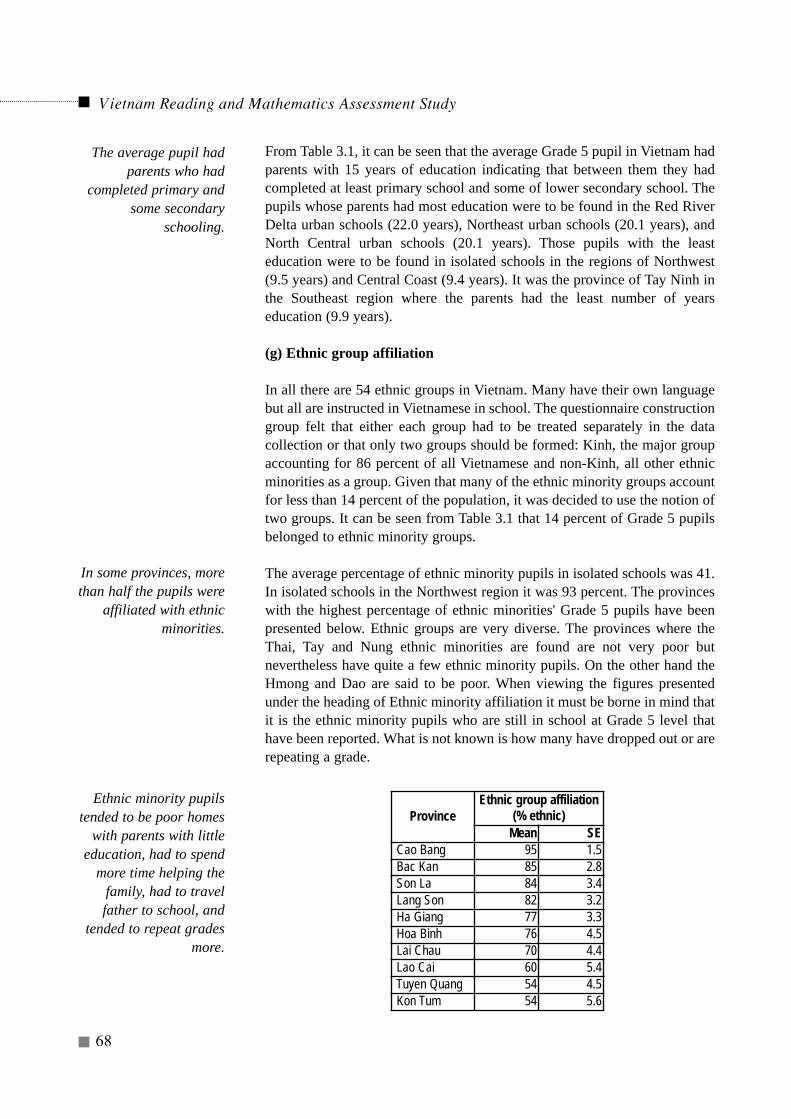
Vietnam Reading and Mathematics Assessment Study
68
From Table 3.1, it can be seen that the average Grade 5 pupil in Vietnam hadparents with 15 years of education indicating that between them they hadcompleted at least primary school and some of lower secondary school. Thepupils whose parents had most education were to be found in the Red RiverDelta urban schools (22.0 years), Northeast urban schools (20.1 years), andNorth Central urban schools (20.1 years). Those pupils with the leasteducation were to be found in isolated schools in the regions of Northwest(9.5 years) and Central Coast (9.4 years). It was the province of Tay Ninh inthe Southeast region where the parents had the least number of yearseducation (9.9 years).
(g) Ethnic group affiliation
In all there are 54 ethnic groups in Vietnam. Many have their own languagebut all are instructed in Vietnamese in school. The questionnaire constructiongroup felt that either each group had to be treated separately in the datacollection or that only two groups should be formed: Kinh, the major groupaccounting for 86 percent of all Vietnamese and non-Kinh, all other ethnicminorities as a group. Given that many of the ethnic minority groups accountfor less than 14 percent of the population, it was decided to use the notion oftwo groups. It can be seen from Table 3.1 that 14 percent of Grade 5 pupilsbelonged to ethnic minority groups.
The average percentage of ethnic minority pupils in isolated schools was 41.In isolated schools in the Northwest region it was 93 percent. The provinceswith the highest percentage of ethnic minorities' Grade 5 pupils have beenpresented below. Ethnic groups are very diverse. The provinces where theThai, Tay and Nung ethnic minorities are found are not very poor butnevertheless have quite a few ethnic minority pupils. On the other hand theHmong and Dao are said to be poor. When viewing the figures presentedunder the heading of Ethnic minority affiliation it must be borne in mind thatit is the ethnic minority pupils who are still in school at Grade 5 level thathave been reported. What is not known is how many have dropped out or arerepeating a grade.
The average pupil hadparents who had
completed primary andsome secondary
schooling.
In some provinces, morethan half the pupils were
affiliated with ethnicminorities.
Ethnic minority pupilstended to be poor homes
with parents with littleeducation, had to spend
more time helping thefamily, had to travelfather to school, and
tended to repeat gradesmore.
ProvinceEthnic group affiliation
(% ethnic)Mean SE
Cao Bang 95 1.5Bac Kan 85 2.8Son La 84 3.4Lang Son 82 3.2Ha Giang 77 3.3Hoa Binh 76 4.5Lai Chau 70 4.4Lao Cai 60 5.4Tuyen Quang 54 4.5Kon Tum 54 5.6
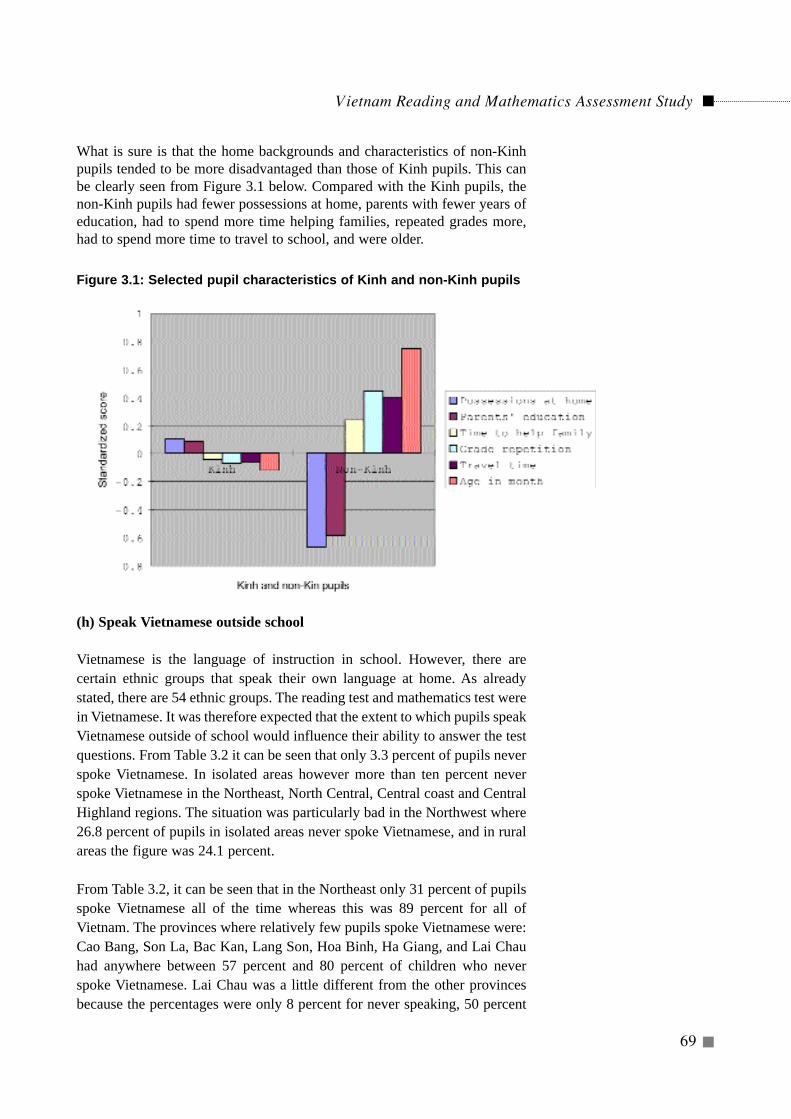
Vietnam Reading and Mathematics Assessment Study
69
What is sure is that the home backgrounds and characteristics of non-Kinhpupils tended to be more disadvantaged than those of Kinh pupils. This canbe clearly seen from Figure 3.1 below. Compared with the Kinh pupils, thenon-Kinh pupils had fewer possessions at home, parents with fewer years ofeducation, had to spend more time helping families, repeated grades more,had to spend more time to travel to school, and were older.
(h) Speak Vietnamese outside school
Vietnamese is the language of instruction in school. However, there arecertain ethnic groups that speak their own language at home. As alreadystated, there are 54 ethnic groups. The reading test and mathematics test werein Vietnamese. It was therefore expected that the extent to which pupils speakVietnamese outside of school would influence their ability to answer the testquestions. From Table 3.2 it can be seen that only 3.3 percent of pupils neverspoke Vietnamese. In isolated areas however more than ten percent neverspoke Vietnamese in the Northeast, North Central, Central coast and CentralHighland regions. The situation was particularly bad in the Northwest where26.8 percent of pupils in isolated areas never spoke Vietnamese, and in ruralareas the figure was 24.1 percent.
From Table 3.2, it can be seen that in the Northeast only 31 percent of pupilsspoke Vietnamese all of the time whereas this was 89 percent for all ofVietnam. The provinces where relatively few pupils spoke Vietnamese were:Cao Bang, Son La, Bac Kan, Lang Son, Hoa Binh, Ha Giang, and Lai Chauhad anywhere between 57 percent and 80 percent of children who neverspoke Vietnamese. Lai Chau was a little different from the other provincesbecause the percentages were only 8 percent for never speaking, 50 percent
Figure 3.1: Selected pupil characteristics of Kinh and non-Kinh pupils
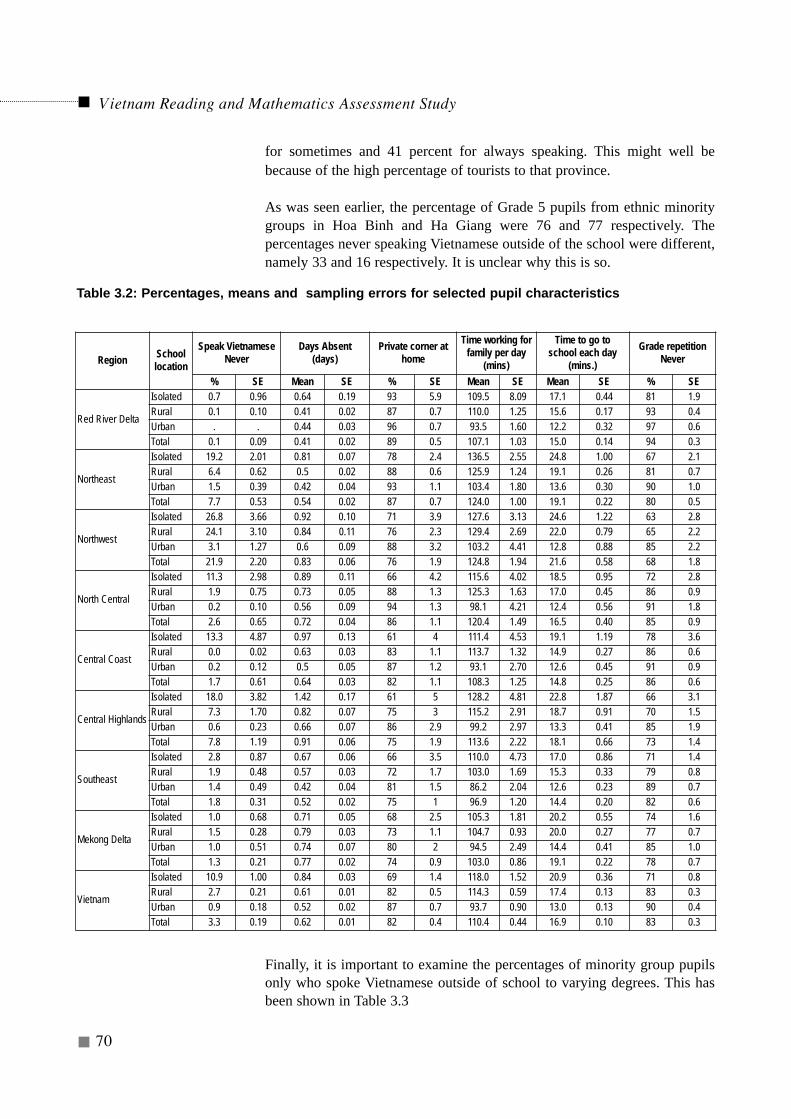
Vietnam Reading and Mathematics Assessment Study
70
for sometimes and 41 percent for always speaking. This might well bebecause of the high percentage of tourists to that province.
As was seen earlier, the percentage of Grade 5 pupils from ethnic minoritygroups in Hoa Binh and Ha Giang were 76 and 77 respectively. Thepercentages never speaking Vietnamese outside of the school were different,namely 33 and 16 respectively. It is unclear why this is so.
Finally, it is important to examine the percentages of minority group pupilsonly who spoke Vietnamese outside of school to varying degrees. This hasbeen shown in Table 3.3
Region Schoollocation
Speak VietnameseNever
Days Absent(days)
Private corner athome
Time working forfamily per day
(mins)
Time to go to school each day
(mins.)
Grade repetitionNever
% SE Mean SE % SE Mean SE Mean SE % SE
Red River Delta
Isolated 0.7 0.96 0.64 0.19 93 5.9 109.5 8.09 17.1 0.44 81 1.9Rural 0.1 0.10 0.41 0.02 87 0.7 110.0 1.25 15.6 0.17 93 0.4Urban . . 0.44 0.03 96 0.7 93.5 1.60 12.2 0.32 97 0.6Total 0.1 0.09 0.41 0.02 89 0.5 107.1 1.03 15.0 0.14 94 0.3
Northeast
Isolated 19.2 2.01 0.81 0.07 78 2.4 136.5 2.55 24.8 1.00 67 2.1Rural 6.4 0.62 0.5 0.02 88 0.6 125.9 1.24 19.1 0.26 81 0.7Urban 1.5 0.39 0.42 0.04 93 1.1 103.4 1.80 13.6 0.30 90 1.0Total 7.7 0.53 0.54 0.02 87 0.7 124.0 1.00 19.1 0.22 80 0.5
Northwest
Isolated 26.8 3.66 0.92 0.10 71 3.9 127.6 3.13 24.6 1.22 63 2.8Rural 24.1 3.10 0.84 0.11 76 2.3 129.4 2.69 22.0 0.79 65 2.2Urban 3.1 1.27 0.6 0.09 88 3.2 103.2 4.41 12.8 0.88 85 2.2Total 21.9 2.20 0.83 0.06 76 1.9 124.8 1.94 21.6 0.58 68 1.8
North Central
Isolated 11.3 2.98 0.89 0.11 66 4.2 115.6 4.02 18.5 0.95 72 2.8Rural 1.9 0.75 0.73 0.05 88 1.3 125.3 1.63 17.0 0.45 86 0.9Urban 0.2 0.10 0.56 0.09 94 1.3 98.1 4.21 12.4 0.56 91 1.8Total 2.6 0.65 0.72 0.04 86 1.1 120.4 1.49 16.5 0.40 85 0.9
Central Coast
Isolated 13.3 4.87 0.97 0.13 61 4 111.4 4.53 19.1 1.19 78 3.6Rural 0.0 0.02 0.63 0.03 83 1.1 113.7 1.32 14.9 0.27 86 0.6Urban 0.2 0.12 0.5 0.05 87 1.2 93.1 2.70 12.6 0.45 91 0.9Total 1.7 0.61 0.64 0.03 82 1.1 108.3 1.25 14.8 0.25 86 0.6
Central Highlands
Isolated 18.0 3.82 1.42 0.17 61 5 128.2 4.81 22.8 1.87 66 3.1Rural 7.3 1.70 0.82 0.07 75 3 115.2 2.91 18.7 0.91 70 1.5Urban 0.6 0.23 0.66 0.07 86 2.9 99.2 2.97 13.3 0.41 85 1.9Total 7.8 1.19 0.91 0.06 75 1.9 113.6 2.22 18.1 0.66 73 1.4
Southeast
Isolated 2.8 0.87 0.67 0.06 66 3.5 110.0 4.73 17.0 0.86 71 1.4Rural 1.9 0.48 0.57 0.03 72 1.7 103.0 1.69 15.3 0.33 79 0.8Urban 1.4 0.49 0.42 0.04 81 1.5 86.2 2.04 12.6 0.23 89 0.7Total 1.8 0.31 0.52 0.02 75 1 96.9 1.20 14.4 0.20 82 0.6
Mekong Delta
Isolated 1.0 0.68 0.71 0.05 68 2.5 105.3 1.81 20.2 0.55 74 1.6Rural 1.5 0.28 0.79 0.03 73 1.1 104.7 0.93 20.0 0.27 77 0.7Urban 1.0 0.51 0.74 0.07 80 2 94.5 2.49 14.4 0.41 85 1.0Total 1.3 0.21 0.77 0.02 74 0.9 103.0 0.86 19.1 0.22 78 0.7
Vietnam
Isolated 10.9 1.00 0.84 0.03 69 1.4 118.0 1.52 20.9 0.36 71 0.8Rural 2.7 0.21 0.61 0.01 82 0.5 114.3 0.59 17.4 0.13 83 0.3Urban 0.9 0.18 0.52 0.02 87 0.7 93.7 0.90 13.0 0.13 90 0.4Total 3.3 0.19 0.62 0.01 82 0.4 110.4 0.44 16.9 0.10 83 0.3
Table 3.2: Percentages, means and sampling errors for selected pupil characteristics
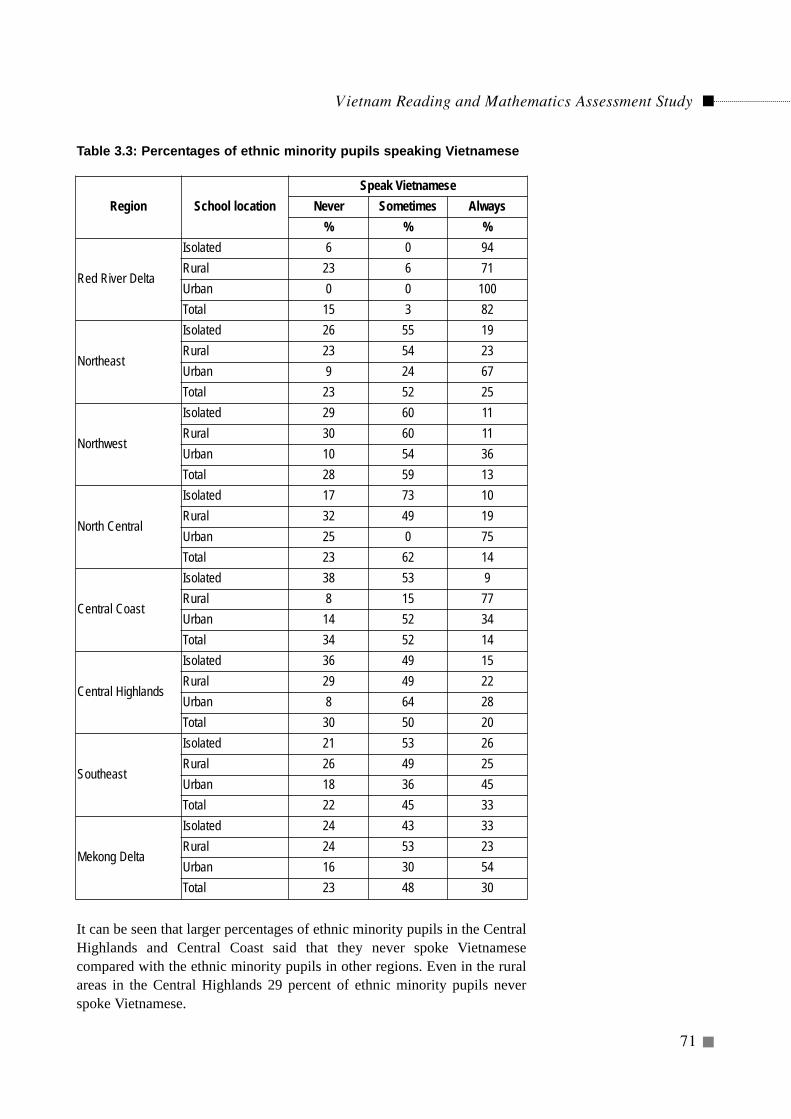
Vietnam Reading and Mathematics Assessment Study
71
Table 3.3: Percentages of ethnic minority pupils speaking Vietnamese
It can be seen that larger percentages of ethnic minority pupils in the CentralHighlands and Central Coast said that they never spoke Vietnamesecompared with the ethnic minority pupils in other regions. Even in the ruralareas in the Central Highlands 29 percent of ethnic minority pupils neverspoke Vietnamese.
Region School locationSpeak Vietnamese
Never Sometimes Always% % %
Red River Delta
Isolated 6 0 94Rural 23 6 71Urban 0 0 100Total 15 3 82
Northeast
Isolated 26 55 19Rural 23 54 23Urban 9 24 67Total 23 52 25
Northwest
Isolated 29 60 11Rural 30 60 11Urban 10 54 36Total 28 59 13
North Central
Isolated 17 73 10Rural 32 49 19Urban 25 0 75Total 23 62 14
Central Coast
Isolated 38 53 9Rural 8 15 77Urban 14 52 34Total 34 52 14
Central Highlands
Isolated 36 49 15Rural 29 49 22Urban 8 64 28Total 30 50 20
Southeast
Isolated 21 53 26Rural 26 49 25Urban 18 36 45Total 22 45 33
Mekong Delta
Isolated 24 43 33Rural 24 53 23Urban 16 30 54Total 23 48 30
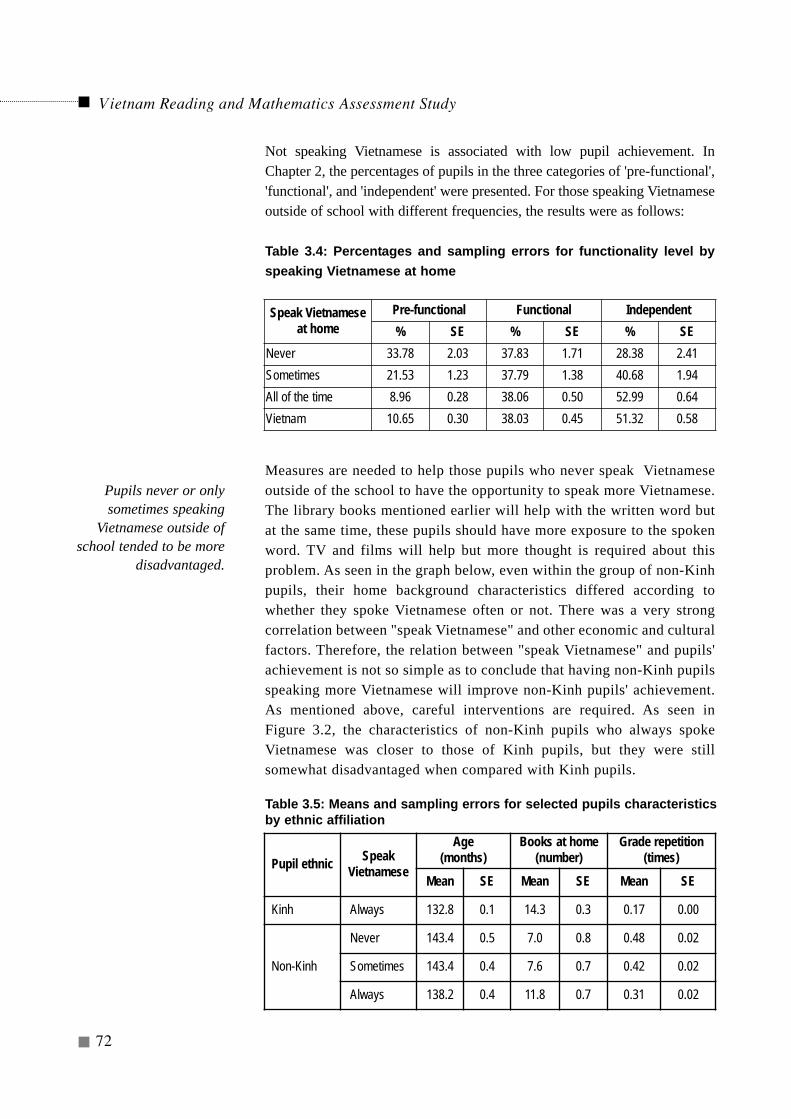
Not speaking Vietnamese is associated with low pupil achievement. InChapter 2, the percentages of pupils in the three categories of 'pre-functional','functional', and 'independent' were presented. For those speaking Vietnameseoutside of school with different frequencies, the results were as follows:
Table 3.4: Percentages and sampling errors for functionality level byspeaking Vietnamese at home
Measures are needed to help those pupils who never speak Vietnameseoutside of the school to have the opportunity to speak more Vietnamese.The library books mentioned earlier will help with the written word butat the same time, these pupils should have more exposure to the spokenword. TV and films will help but more thought is required about thisproblem. As seen in the graph below, even within the group of non-Kinhpupils, their home background characteristics differed according towhether they spoke Vietnamese often or not. There was a very strongcorrelation between "speak Vietnamese" and other economic and culturalfactors. Therefore, the relation between "speak Vietnamese" and pupils'achievement is not so simple as to conclude that having non-Kinh pupilsspeaking more Vietnamese will improve non-Kinh pupils' achievement.As mentioned above, careful interventions are required. As seen inFigure 3.2, the characteristics of non-Kinh pupils who always spokeVietnamese was closer to those of Kinh pupils, but they were stillsomewhat disadvantaged when compared with Kinh pupils.
Vietnam Reading and Mathematics Assessment Study
72
Speak Vietnameseat home
Pre-functional Functional Independent% SE % SE % SE
Never 33.78 2.03 37.83 1.71 28.38 2.41 Sometimes 21.53 1.23 37.79 1.38 40.68 1.94 All of the time 8.96 0.28 38.06 0.50 52.99 0.64 Vietnam 10.65 0.30 38.03 0.45 51.32 0.58
Pupils never or onlysometimes speaking
Vietnamese outside ofschool tended to be more
disadvantaged.
Pupil ethnic SpeakVietnamese
Age (months)
Books at home(number)
Grade repetition(times)
Mean SE Mean SE Mean SE
Kinh Always 132.8 0.1 14.3 0.3 0.17 0.00
Non-Kinh
Never 143.4 0.5 7.0 0.8 0.48 0.02
Sometimes 143.4 0.4 7.6 0.7 0.42 0.02
Always 138.2 0.4 11.8 0.7 0.31 0.02
Table 3.5: Means and sampling errors for selected pupils characteristicsby ethnic affiliation
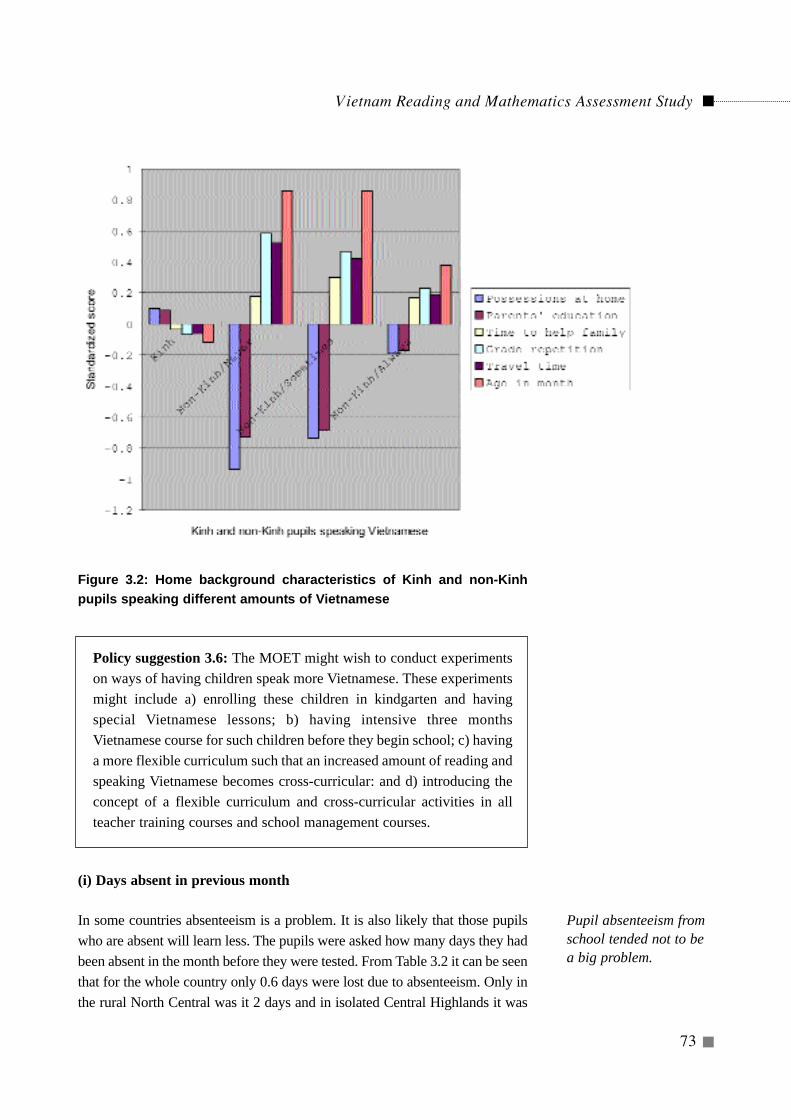
Vietnam Reading and Mathematics Assessment Study
73
Figure 3.2: Home background characteristics of Kinh and non-Kinhpupils speaking different amounts of Vietnamese
Policy suggestion 3.6: The MOET might wish to conduct experimentson ways of having children speak more Vietnamese. These experimentsmight include a) enrolling these children in kindgarten and havingspecial Vietnamese lessons; b) having intensive three monthsVietnamese course for such children before they begin school; c) havinga more flexible curriculum such that an increased amount of reading andspeaking Vietnamese becomes cross-curricular: and d) introducing theconcept of a flexible curriculum and cross-curricular activities in allteacher training courses and school management courses.
(i) Days absent in previous month
In some countries absenteeism is a problem. It is also likely that those pupilswho are absent will learn less. The pupils were asked how many days they hadbeen absent in the month before they were tested. From Table 3.2 it can be seenthat for the whole country only 0.6 days were lost due to absenteeism. Only inthe rural North Central was it 2 days and in isolated Central Highlands it was
Pupil absenteeism fromschool tended not to bea big problem.
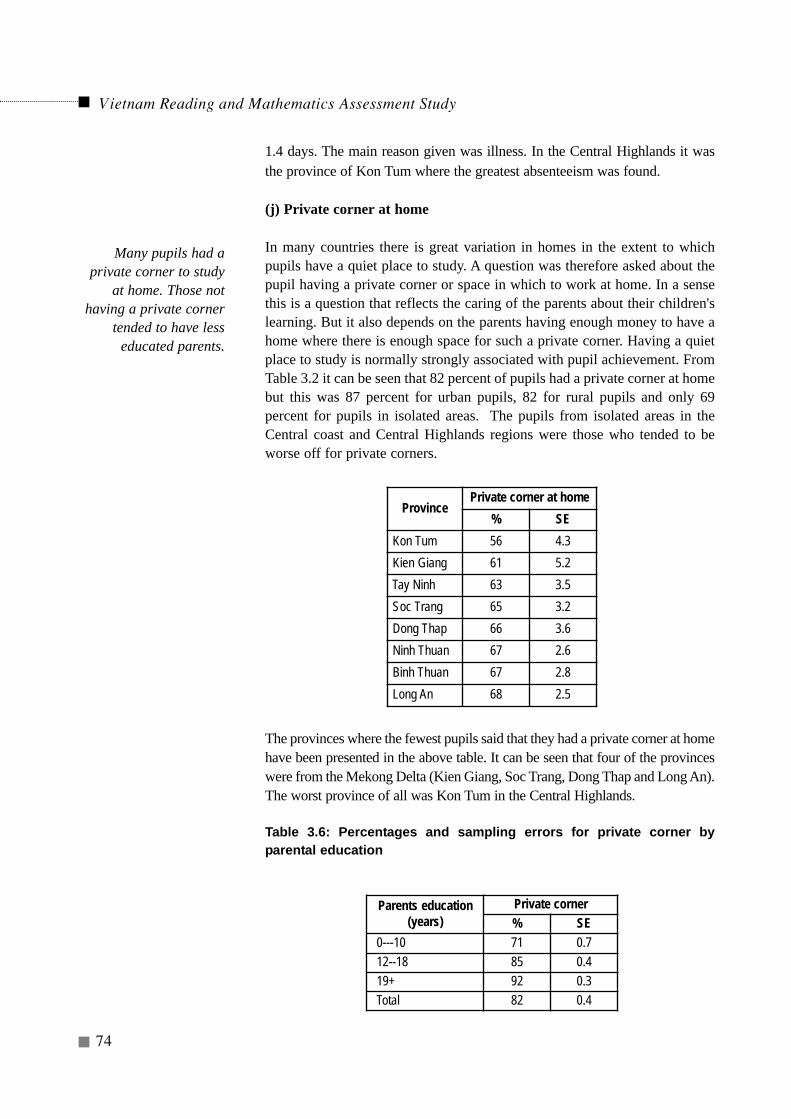
Vietnam Reading and Mathematics Assessment Study
74
1.4 days. The main reason given was illness. In the Central Highlands it wasthe province of Kon Tum where the greatest absenteeism was found.
(j) Private corner at home
In many countries there is great variation in homes in the extent to whichpupils have a quiet place to study. A question was therefore asked about thepupil having a private corner or space in which to work at home. In a sensethis is a question that reflects the caring of the parents about their children'slearning. But it also depends on the parents having enough money to have ahome where there is enough space for such a private corner. Having a quietplace to study is normally strongly associated with pupil achievement. FromTable 3.2 it can be seen that 82 percent of pupils had a private corner at homebut this was 87 percent for urban pupils, 82 for rural pupils and only 69percent for pupils in isolated areas. The pupils from isolated areas in theCentral coast and Central Highlands regions were those who tended to beworse off for private corners.
The provinces where the fewest pupils said that they had a private corner at homehave been presented in the above table. It can be seen that four of the provinceswere from the Mekong Delta (Kien Giang, Soc Trang, Dong Thap and Long An).The worst province of all was Kon Tum in the Central Highlands.
Table 3.6: Percentages and sampling errors for private corner byparental education
Many pupils had aprivate corner to study
at home. Those nothaving a private corner
tended to have lesseducated parents.
ProvincePrivate corner at home
% SEKon Tum 56 4.3Kien Giang 61 5.2Tay Ninh 63 3.5Soc Trang 65 3.2Dong Thap 66 3.6Ninh Thuan 67 2.6Binh Thuan 67 2.8Long An 68 2.5
Parents education(years)
Private corner% SE
0---10 71 0.712--18 85 0.419+ 92 0.3Total 82 0.4
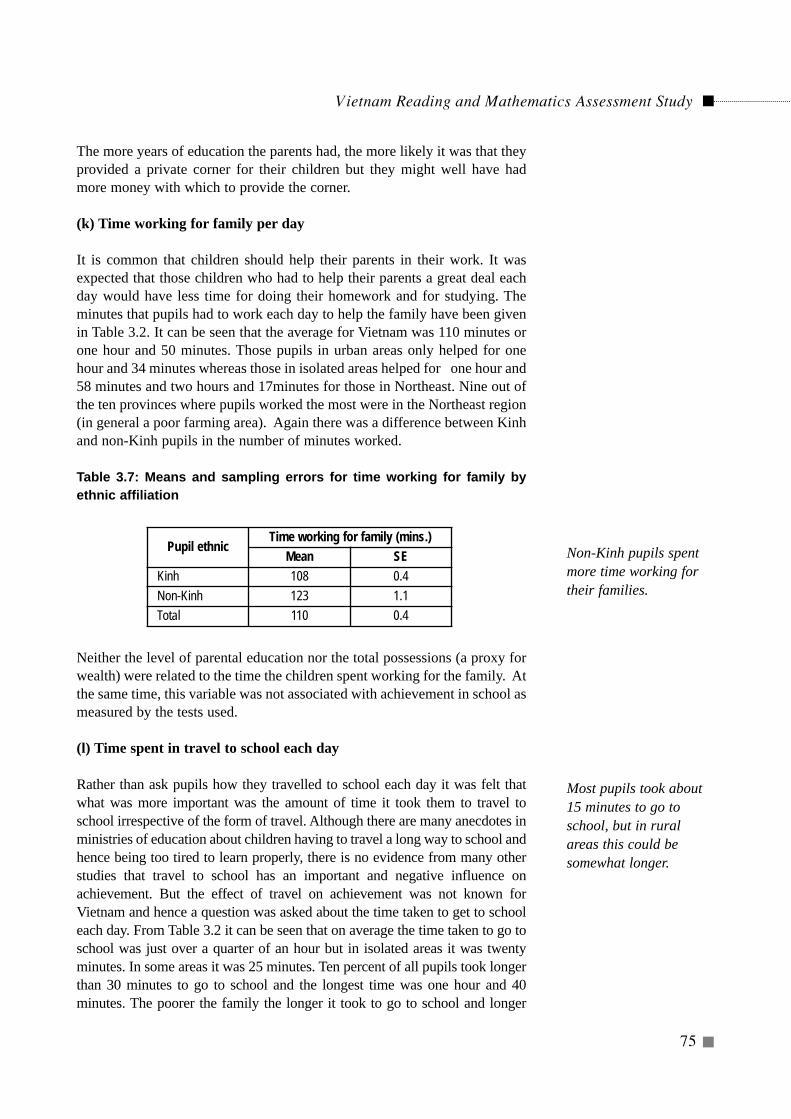
Vietnam Reading and Mathematics Assessment Study
75
The more years of education the parents had, the more likely it was that theyprovided a private corner for their children but they might well have hadmore money with which to provide the corner.
(k) Time working for family per day
It is common that children should help their parents in their work. It wasexpected that those children who had to help their parents a great deal eachday would have less time for doing their homework and for studying. Theminutes that pupils had to work each day to help the family have been givenin Table 3.2. It can be seen that the average for Vietnam was 110 minutes orone hour and 50 minutes. Those pupils in urban areas only helped for onehour and 34 minutes whereas those in isolated areas helped for one hour and58 minutes and two hours and 17minutes for those in Northeast. Nine out ofthe ten provinces where pupils worked the most were in the Northeast region(in general a poor farming area). Again there was a difference between Kinhand non-Kinh pupils in the number of minutes worked.
Table 3.7: Means and sampling errors for time working for family byethnic affiliation
Neither the level of parental education nor the total possessions (a proxy forwealth) were related to the time the children spent working for the family. Atthe same time, this variable was not associated with achievement in school asmeasured by the tests used.
(l) Time spent in travel to school each day
Rather than ask pupils how they travelled to school each day it was felt thatwhat was more important was the amount of time it took them to travel toschool irrespective of the form of travel. Although there are many anecdotes inministries of education about children having to travel a long way to school andhence being too tired to learn properly, there is no evidence from many otherstudies that travel to school has an important and negative influence onachievement. But the effect of travel on achievement was not known forVietnam and hence a question was asked about the time taken to get to schooleach day. From Table 3.2 it can be seen that on average the time taken to go toschool was just over a quarter of an hour but in isolated areas it was twentyminutes. In some areas it was 25 minutes. Ten percent of all pupils took longerthan 30 minutes to go to school and the longest time was one hour and 40minutes. The poorer the family the longer it took to go to school and longer
Pupil ethnicTime working for family (mins.)
Mean SEKinh 108 0.4Non-Kinh 123 1.1Total 110 0.4
Non-Kinh pupils spentmore time working fortheir families.
Most pupils took about15 minutes to go toschool, but in ruralareas this could besomewhat longer.
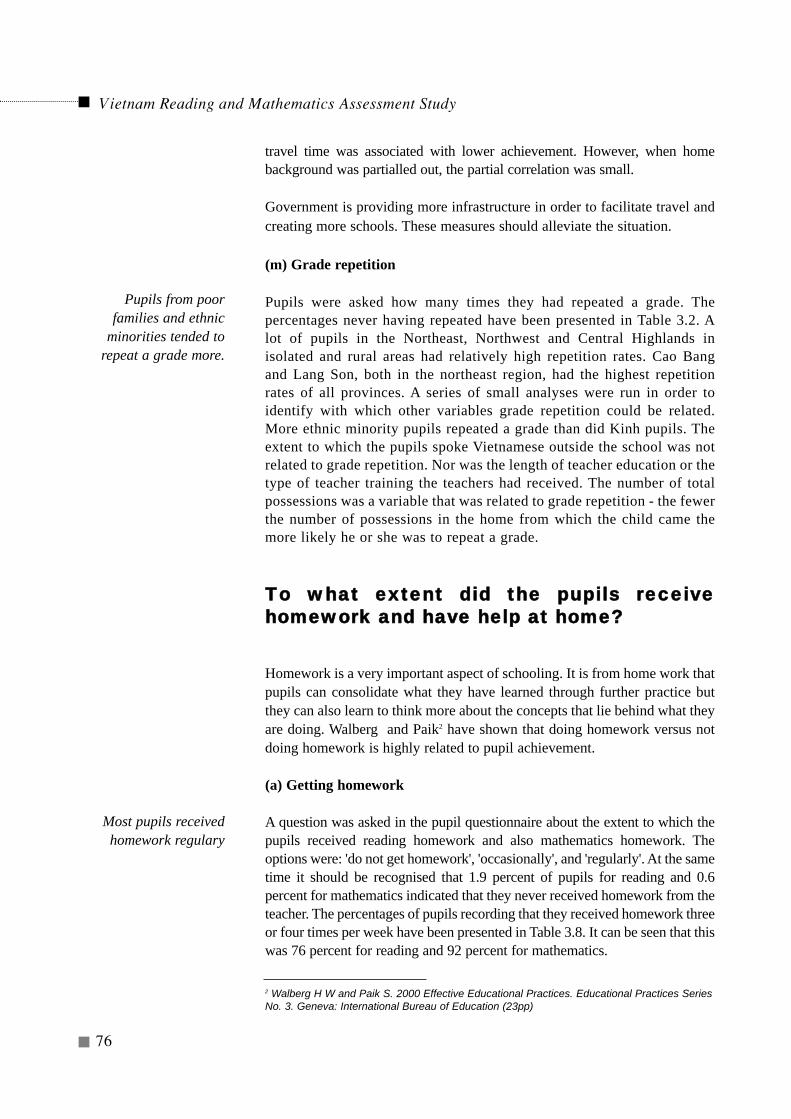
Vietnam Reading and Mathematics Assessment Study
76
travel time was associated with lower achievement. However, when homebackground was partialled out, the partial correlation was small.
Government is providing more infrastructure in order to facilitate travel andcreating more schools. These measures should alleviate the situation.
(m) Grade repetition
Pupils were asked how many times they had repeated a grade. Thepercentages never having repeated have been presented in Table 3.2. Alot of pupils in the Northeast, Northwest and Central Highlands inisolated and rural areas had relatively high repetition rates. Cao Bangand Lang Son, both in the northeast region, had the highest repetitionrates of all provinces. A series of small analyses were run in order toidentify with which other variables grade repetition could be related.More ethnic minority pupils repeated a grade than did Kinh pupils. Theextent to which the pupils spoke Vietnamese outside the school was notrelated to grade repetition. Nor was the length of teacher education or thetype of teacher training the teachers had received. The number of totalpossessions was a variable that was related to grade repetition - the fewerthe number of possessions in the home from which the child came themore likely he or she was to repeat a grade.
TToo wwhhaatt eexxtteenntt ddiidd tthhee ppuuppiillss rreecceeiivveehhoommeewwoorrkk aanndd hhaavvee hheellpp aatt hhoommee??
Homework is a very important aspect of schooling. It is from home work thatpupils can consolidate what they have learned through further practice butthey can also learn to think more about the concepts that lie behind what theyare doing. Walberg and Paik2 have shown that doing homework versus notdoing homework is highly related to pupil achievement.
(a) Getting homework
A question was asked in the pupil questionnaire about the extent to which thepupils received reading homework and also mathematics homework. Theoptions were: 'do not get homework', 'occasionally', and 'regularly'. At the sametime it should be recognised that 1.9 percent of pupils for reading and 0.6percent for mathematics indicated that they never received homework from theteacher. The percentages of pupils recording that they received homework threeor four times per week have been presented in Table 3.8. It can be seen that thiswas 76 percent for reading and 92 percent for mathematics.
Most pupils receivedhomework regulary
Pupils from poorfamilies and ethnic
minorities tended torepeat a grade more.
2 Walberg H W and Paik S. 2000 Effective Educational Practices. Educational Practices SeriesNo. 3. Geneva: International Bureau of Education (23pp)
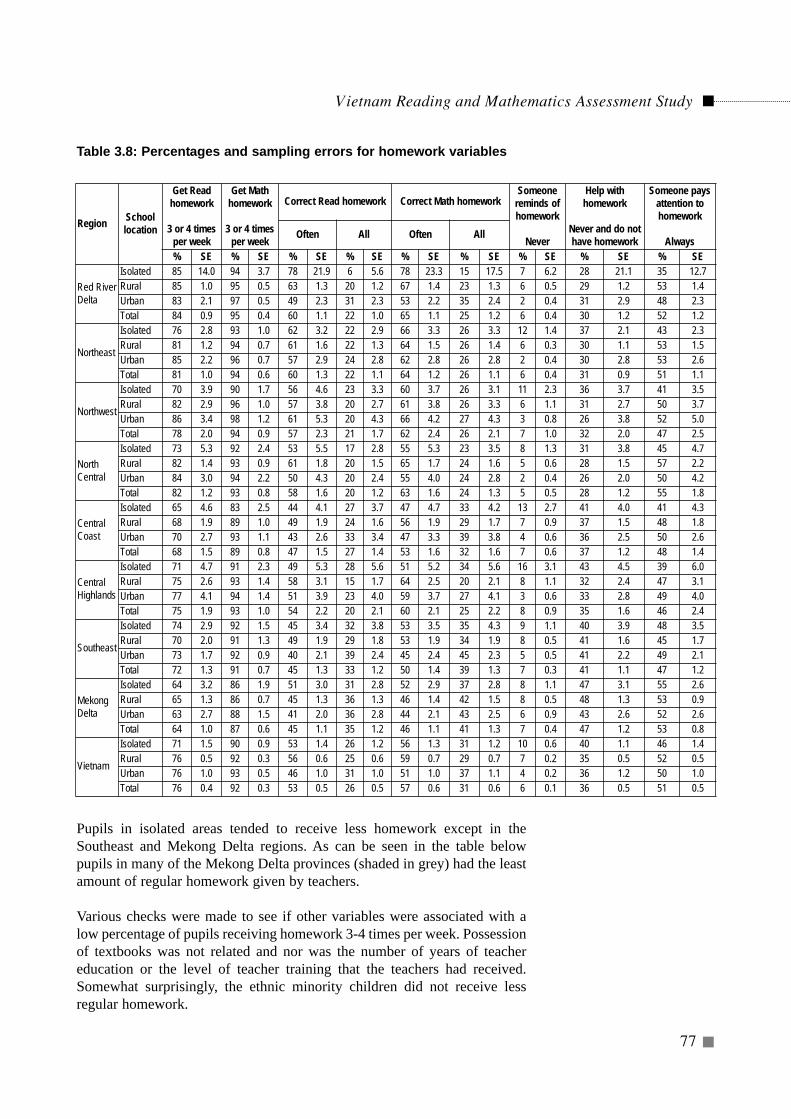
Vietnam Reading and Mathematics Assessment Study
77
Pupils in isolated areas tended to receive less homework except in theSoutheast and Mekong Delta regions. As can be seen in the table belowpupils in many of the Mekong Delta provinces (shaded in grey) had the leastamount of regular homework given by teachers.
Various checks were made to see if other variables were associated with alow percentage of pupils receiving homework 3-4 times per week. Possessionof textbooks was not related and nor was the number of years of teachereducation or the level of teacher training that the teachers had received.Somewhat surprisingly, the ethnic minority children did not receive lessregular homework.
Region Schoollocation
Get Read homework
3 or 4 times per week
Get Math homework
3 or 4 times per week
Correct Read homework Correct Math homeworkSomeone
reminds of homework
Never
Help with homework
Never and do nothave homework
Someone paysattention tohomework
AlwaysOften All Often All
% SE % SE % SE % SE % SE % SE % SE % SE % SE
Red RiverDelta
Isolated 85 14.0 94 3.7 78 21.9 6 5.6 78 23.3 15 17.5 7 6.2 28 21.1 35 12.7Rural 85 1.0 95 0.5 63 1.3 20 1.2 67 1.4 23 1.3 6 0.5 29 1.2 53 1.4Urban 83 2.1 97 0.5 49 2.3 31 2.3 53 2.2 35 2.4 2 0.4 31 2.9 48 2.3Total 84 0.9 95 0.4 60 1.1 22 1.0 65 1.1 25 1.2 6 0.4 30 1.2 52 1.2
Northeast
Isolated 76 2.8 93 1.0 62 3.2 22 2.9 66 3.3 26 3.3 12 1.4 37 2.1 43 2.3Rural 81 1.2 94 0.7 61 1.6 22 1.3 64 1.5 26 1.4 6 0.3 30 1.1 53 1.5Urban 85 2.2 96 0.7 57 2.9 24 2.8 62 2.8 26 2.8 2 0.4 30 2.8 53 2.6Total 81 1.0 94 0.6 60 1.3 22 1.1 64 1.2 26 1.1 6 0.4 31 0.9 51 1.1
Northwest
Isolated 70 3.9 90 1.7 56 4.6 23 3.3 60 3.7 26 3.1 11 2.3 36 3.7 41 3.5Rural 82 2.9 96 1.0 57 3.8 20 2.7 61 3.8 26 3.3 6 1.1 31 2.7 50 3.7Urban 86 3.4 98 1.2 61 5.3 20 4.3 66 4.2 27 4.3 3 0.8 26 3.8 52 5.0Total 78 2.0 94 0.9 57 2.3 21 1.7 62 2.4 26 2.1 7 1.0 32 2.0 47 2.5
NorthCentral
Isolated 73 5.3 92 2.4 53 5.5 17 2.8 55 5.3 23 3.5 8 1.3 31 3.8 45 4.7Rural 82 1.4 93 0.9 61 1.8 20 1.5 65 1.7 24 1.6 5 0.6 28 1.5 57 2.2Urban 84 3.0 94 2.2 50 4.3 20 2.4 55 4.0 24 2.8 2 0.4 26 2.0 50 4.2Total 82 1.2 93 0.8 58 1.6 20 1.2 63 1.6 24 1.3 5 0.5 28 1.2 55 1.8
CentralCoast
Isolated 65 4.6 83 2.5 44 4.1 27 3.7 47 4.7 33 4.2 13 2.7 41 4.0 41 4.3Rural 68 1.9 89 1.0 49 1.9 24 1.6 56 1.9 29 1.7 7 0.9 37 1.5 48 1.8Urban 70 2.7 93 1.1 43 2.6 33 3.4 47 3.3 39 3.8 4 0.6 36 2.5 50 2.6Total 68 1.5 89 0.8 47 1.5 27 1.4 53 1.6 32 1.6 7 0.6 37 1.2 48 1.4
CentralHighlands
Isolated 71 4.7 91 2.3 49 5.3 28 5.6 51 5.2 34 5.6 16 3.1 43 4.5 39 6.0Rural 75 2.6 93 1.4 58 3.1 15 1.7 64 2.5 20 2.1 8 1.1 32 2.4 47 3.1Urban 77 4.1 94 1.4 51 3.9 23 4.0 59 3.7 27 4.1 3 0.6 33 2.8 49 4.0Total 75 1.9 93 1.0 54 2.2 20 2.1 60 2.1 25 2.2 8 0.9 35 1.6 46 2.4
Southeast
Isolated 74 2.9 92 1.5 45 3.4 32 3.8 53 3.5 35 4.3 9 1.1 40 3.9 48 3.5Rural 70 2.0 91 1.3 49 1.9 29 1.8 53 1.9 34 1.9 8 0.5 41 1.6 45 1.7Urban 73 1.7 92 0.9 40 2.1 39 2.4 45 2.4 45 2.3 5 0.5 41 2.2 49 2.1Total 72 1.3 91 0.7 45 1.3 33 1.2 50 1.4 39 1.3 7 0.3 41 1.1 47 1.2
MekongDelta
Isolated 64 3.2 86 1.9 51 3.0 31 2.8 52 2.9 37 2.8 8 1.1 47 3.1 55 2.6Rural 65 1.3 86 0.7 45 1.3 36 1.3 46 1.4 42 1.5 8 0.5 48 1.3 53 0.9Urban 63 2.7 88 1.5 41 2.0 36 2.8 44 2.1 43 2.5 6 0.9 43 2.6 52 2.6Total 64 1.0 87 0.6 45 1.1 35 1.2 46 1.1 41 1.3 7 0.4 47 1.2 53 0.8
Vietnam
Isolated 71 1.5 90 0.9 53 1.4 26 1.2 56 1.3 31 1.2 10 0.6 40 1.1 46 1.4Rural 76 0.5 92 0.3 56 0.6 25 0.6 59 0.7 29 0.7 7 0.2 35 0.5 52 0.5Urban 76 1.0 93 0.5 46 1.0 31 1.0 51 1.0 37 1.1 4 0.2 36 1.2 50 1.0Total 76 0.4 92 0.3 53 0.5 26 0.5 57 0.6 31 0.6 6 0.1 36 0.5 51 0.5
Table 3.8: Percentages and sampling errors for homework variables
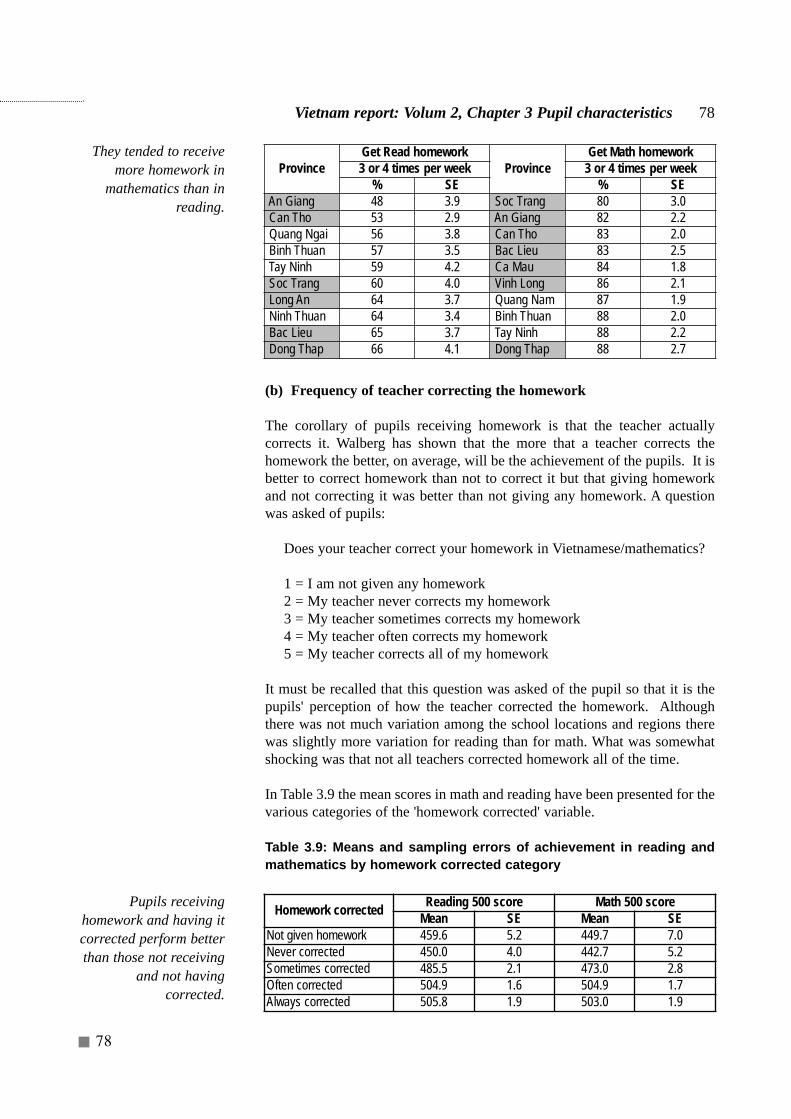
78
(b) Frequency of teacher correcting the homework
The corollary of pupils receiving homework is that the teacher actuallycorrects it. Walberg has shown that the more that a teacher corrects thehomework the better, on average, will be the achievement of the pupils. It isbetter to correct homework than not to correct it but that giving homeworkand not correcting it was better than not giving any homework. A questionwas asked of pupils:
Does your teacher correct your homework in Vietnamese/mathematics?
1 = I am not given any homework2 = My teacher never corrects my homework3 = My teacher sometimes corrects my homework4 = My teacher often corrects my homework5 = My teacher corrects all of my homework
It must be recalled that this question was asked of the pupil so that it is thepupils' perception of how the teacher corrected the homework. Althoughthere was not much variation among the school locations and regions therewas slightly more variation for reading than for math. What was somewhatshocking was that not all teachers corrected homework all of the time.
In Table 3.9 the mean scores in math and reading have been presented for thevarious categories of the 'homework corrected' variable.
Table 3.9: Means and sampling errors of achievement in reading andmathematics by homework corrected category
Vietnam report: Volum 2, Chapter 3 Pupil characteristics 78
ProvinceGet Read homework
ProvinceGet Math homework
3 or 4 times per week 3 or 4 times per week% SE % SE
An Giang 48 3.9 Soc Trang 80 3.0Can Tho 53 2.9 An Giang 82 2.2Quang Ngai 56 3.8 Can Tho 83 2.0Binh Thuan 57 3.5 Bac Lieu 83 2.5Tay Ninh 59 4.2 Ca Mau 84 1.8Soc Trang 60 4.0 Vinh Long 86 2.1Long An 64 3.7 Quang Nam 87 1.9Ninh Thuan 64 3.4 Binh Thuan 88 2.0Bac Lieu 65 3.7 Tay Ninh 88 2.2Dong Thap 66 4.1 Dong Thap 88 2.7
Homework corrected Reading 500 score Math 500 scoreMean SE Mean SE
Not given homework 459.6 5.2 449.7 7.0Never corrected 450.0 4.0 442.7 5.2Sometimes corrected 485.5 2.1 473.0 2.8Often corrected 504.9 1.6 504.9 1.7Always corrected 505.8 1.9 503.0 1.9
Pupils receivinghomework and having itcorrected perform betterthan those not receiving
and not havingcorrected.
They tended to receivemore homework in
mathematics than inreading.

Vietnam Reading and Mathematics Assessment Study
79
79 Vietnam report: Volum 2, Chapter 3 Pupil characteristics
For both subjects there was no difference in score between never being givenhomework and being given it but it never being corrected. There was adramatic increase in score if the pupils were given homework and it wassometimes corrected. There was a further increase in score if the pupils weregiven homework and it was corrected often. There was no difference in pupilscore between homework being corrected often and always.
This is an important finding and shows the great importance of homeworkbeing given and corrected often. But, it has already been shown that it is thepupils in the isolated areas who received less homework.
Policy suggestion 3.7: The MOET and the provincial authorities shouldre-stress in their guidelines the importance of giving and correctinghomework. In the monitoring (inspection) system special checks shouldbe made in the schools to ensure that this is happening.
(c) Someone pays attention to school work
It is commonplace in Vietnam that someone at home will look at theschoolwork to follow how the children are progressing. This behaviour isknown as 'paying attention'. The options in the question in the questionnairewere: 'never', 'sometimes', and 'most of the time'. From Table 3.8, it can beseen that only seven percent said that no one paid attention. However, inisolated areas in the Northeast, Northwest and Central Highlands this figurewas 10 percent or more. Pupils responding that they had less attention paidat home tended to have parents with fewer years of education and who metthe teachers less frequently and also to come from poorer homes as measuredby total possessions.
(d) Help with homework outside school
A further question was asked about the extent to which the pupils receivedhelp with their homework from a person outside of school. The options were:'I do not get homework', 'never', 'sometimes', and 'most of the time'. FromTable 3.8, it can be seen that 36 percent of pupils said that either they did notreceive homework or never received help at home. This percentage washigher in isolated areas than in rural and urban areas. The percentages areparticularly high in the isolated areas in the Central Coast, Central Highlands,Southeast and Mekong Delta regions.
The percentage of pupils responding 'never had homework' or 'never receivedhelp with homework' was related to the level of parental education and to thewealth of the home. Pupils whose parents had lower levels of education andwho had fewer possessions at home tended to receive less help at home. But,those pupils whose parents have had very little education cannot be expectedto give direct help to their children.
Most pupils hadsomeone at home who"paid attention" to theirschool work.
36% of pupils said thatthey did not receivehomework and did notreceive help at home.And they tended to comefrom poor homes andparents had littleeducation.
From experiences in other countries it might be assumed that parentsshowing interest in their children's homework might help increaseachievement even though the parents cannot be of direct help to theirchildren. This was suggested earlier in the chapter when it was suggested thatthere be a series of school intervention programs.
(e) Someone checks that the homework has been done
The pupils were asked to what extent there was someone that made sure thatthey had done their homework. The options were the same as for the previousquestion. It can be seen that about half of the pupils in Vietnam's Grade 5 didhave someone at home who ensured that their homework had been done.Pupils in urban areas had someone who reminded them more than pupils inrural and isolated areas. The Southeast and Central Highlands had parentswho reminded them less often than pupils in other regions. Again thisvariable was related to parents with fewer years of education, poorer familiesand meeting teachers less often.
It is clear that pupils from poorer homes and where parents had less educationwere those who did not have the family support required for doinghomework.
To what extent did pupils receive extra tuition?
In most countries, many children take extra tuition. And in Asia thesenumbers are quite high (Bray, 19993). It was therefore of interest to discoverthe extent of this phenomenon in Vietnam. However, it is important toproceed carefully in Vietnam since the question of extra tuition is politicallysensitive. This is because the government's position is to discourage thepractice of extra tuition. At the same time, it is recognised that teachersalaries are low and hence many teachers wish to supplement their incomeand one way to do this is to give extra tuition.
It is also important to be careful about the pupils' responses since they mayhave misunderstood the question. Those pupils in full-day schooling have onesession in the morning which is free, one on the afternoon for which the parentsmust pay for and sometimes they have extra tuition in the evening. But thesepupils may have thought that they were having extra tuition in the afternoonsession because their parents pay for it. The percentages of pupils not havingextra tuition have been compared with the percentages of pupils in full dayschooling. Nearly all pupils in full-day schools answered that they did not haveany extra tuition. It can be assumed that most pupils understood the questionwell and that there was not a misunderstanding as had been feared.
Vietnam Reading and Mathematics Assessment Study
80
Extra tuition isdiscouraged by the
government.
Only hafl of the pupilshad someone at home
who check theirhomework have been
done.
But, nearly 30% ofpupils said that they
took extra tuition..Nearly all came from
half-day schooling.
3 Bray, Mark (1999) The Shadow Education System: private tutoring and it implications forplanners. Fundamentals of Educational Planning Series No. 61. IIEP: Paris

Table 3.10: Percentage and sampling errors for extra tuition by school shift
Table 3.11a: Percentages, means and sampling errors of extratuition variables (all pupils)
Vietnam Reading and Mathematics Assessment Study
81
Pupil shift No extra tuition% SE
Full-day school 80 1.3First shift only 55 0.9Second shift only 67 1.6Vietnam 62 0.6
Region Schoollocation
Time spent on extra tuition (all pupils)None Viet Math Viet + Math
% SE Mean SE Mean SE Mean SE
Red RiverDelta
Isolated 86 9.4 0.21 0.20 0.42 0.27 0.63 0.46Rural 76 1.7 0.68 0.05 0.71 0.06 1.39 0.11Urban 63 3.6 0.9 0.12 1.13 0.13 2.03 0.24Total 73 1.6 0.72 0.05 0.78 0.05 1.49 0.10
Northeast
Isolated 79 3.2 0.61 0.11 0.56 0.10 1.17 0.21Rural 68 2.0 0.89 0.06 0.93 0.06 1.82 0.12Urban 65 3.3 1.11 0.13 1.19 0.13 2.3 0.26Total 69 1.6 0.88 0.05 0.91 0.05 1.79 0.10
Northwest
Isolated 77 5.4 0.56 0.15 0.54 0.15 1.11 0.30Rural 81 3.5 0.51 0.12 0.54 0.13 1.05 0.24Urban 58 6.5 0.93 0.17 0.95 0.16 1.89 0.33Total 76 2.7 0.59 0.08 0.6 0.08 1.2 0.16
NorthCentral
Isolated 63 6.9 1.12 0.23 1.1 0.23 2.21 0.46Rural 57 3.2 1.21 0.10 1.31 0.11 2.52 0.21Urban 55 5.3 1.43 0.21 1.52 0.20 2.95 0.41Total 58 2.6 1.23 0.08 1.32 0.08 2.55 0.17
CentralCoast
Isolated 45 6.5 1.66 0.23 1.75 0.24 3.41 0.47Rural 51 3.3 1.5 0.12 1.59 0.13 3.09 0.24Urban 43 3.9 1.69 0.19 1.83 0.17 3.52 0.35Total 49 2.3 1.57 0.09 1.67 0.09 3.24 0.18
CentralHighlands
Isolated 64 6.9 1.38 0.29 1.23 0.28 2.61 0.55Rural 49 5.3 1.76 0.23 1.75 0.22 3.51 0.44Urban 44 6.2 2.2 0.33 2.27 0.31 4.47 0.64Total 51 3.3 1.8 0.15 1.78 0.15 3.58 0.29
Southeast
Isolated 51 5.4 1.5 0.18 1.6 0.19 3.1 0.38Rural 46 2.4 1.72 0.11 1.92 0.12 3.64 0.21Urban 42 3.3 1.99 0.14 2.33 0.16 4.32 0.30Total 45 2.0 1.8 0.09 2.05 0.10 3.86 0.18
MekongDelta
Isolated 81 2.8 0.48 0.08 0.55 0.09 1.02 0.17Rural 67 1.3 0.92 0.06 1.06 0.06 1.98 0.12Urban 53 3.5 1.39 0.14 1.55 0.14 2.93 0.28Total 67 1.2 0.93 0.05 1.07 0.05 1.99 0.09
Vietnam
Isolated 69 1.9 0.92 0.06 0.93 0.07 1.85 0.13Rural 63 1.0 1.06 0.04 1.15 0.04 2.21 0.07Urban 51 1.6 1.53 0.06 1.73 0.07 3.26 0.13Total 62 0.6 1.15 0.03 1.25 0.03 2.39 0.05
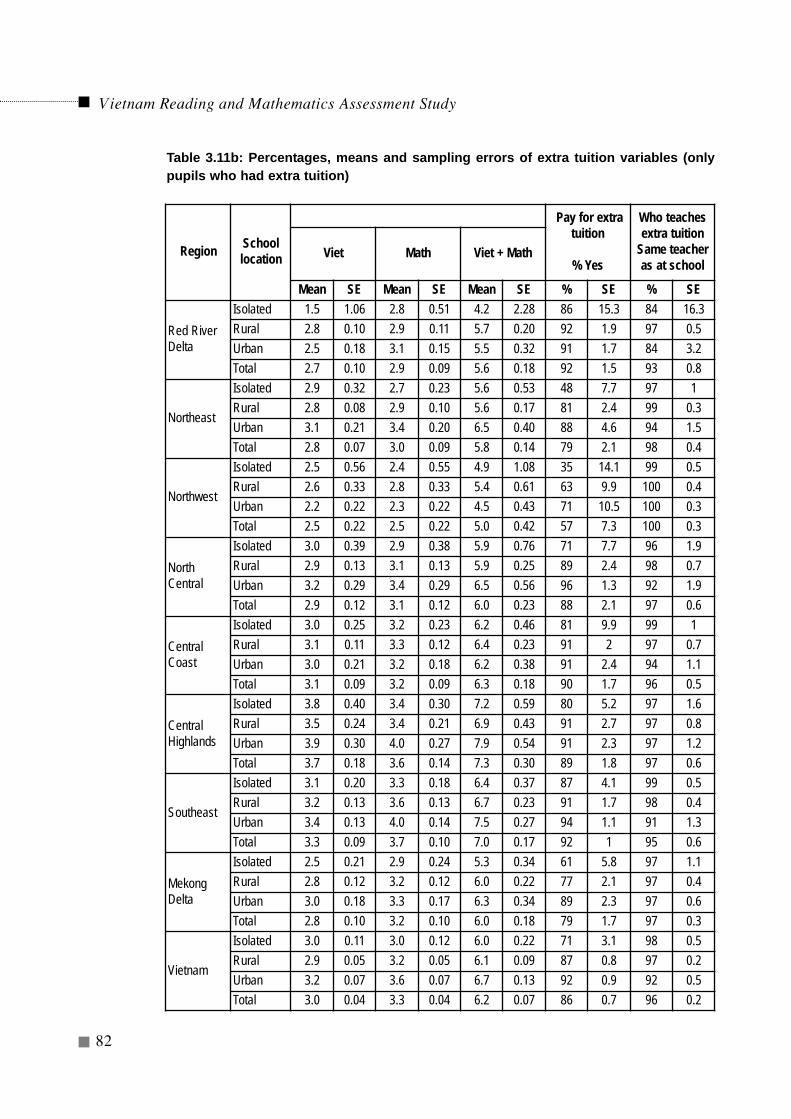
Vietnam Reading and Mathematics Assessment Study
82
Region Schoollocation
Pay for extratuition
% Yes
Who teachesextra tuition
Same teacheras at school
Viet Math Viet + Math
Mean SE Mean SE Mean SE % SE % SE
Red RiverDelta
Isolated 1.5 1.06 2.8 0.51 4.2 2.28 86 15.3 84 16.3Rural 2.8 0.10 2.9 0.11 5.7 0.20 92 1.9 97 0.5Urban 2.5 0.18 3.1 0.15 5.5 0.32 91 1.7 84 3.2Total 2.7 0.10 2.9 0.09 5.6 0.18 92 1.5 93 0.8
Northeast
Isolated 2.9 0.32 2.7 0.23 5.6 0.53 48 7.7 97 1Rural 2.8 0.08 2.9 0.10 5.6 0.17 81 2.4 99 0.3Urban 3.1 0.21 3.4 0.20 6.5 0.40 88 4.6 94 1.5Total 2.8 0.07 3.0 0.09 5.8 0.14 79 2.1 98 0.4
Northwest
Isolated 2.5 0.56 2.4 0.55 4.9 1.08 35 14.1 99 0.5Rural 2.6 0.33 2.8 0.33 5.4 0.61 63 9.9 100 0.4Urban 2.2 0.22 2.3 0.22 4.5 0.43 71 10.5 100 0.3Total 2.5 0.22 2.5 0.22 5.0 0.42 57 7.3 100 0.3
NorthCentral
Isolated 3.0 0.39 2.9 0.38 5.9 0.76 71 7.7 96 1.9Rural 2.9 0.13 3.1 0.13 5.9 0.25 89 2.4 98 0.7Urban 3.2 0.29 3.4 0.29 6.5 0.56 96 1.3 92 1.9Total 2.9 0.12 3.1 0.12 6.0 0.23 88 2.1 97 0.6
CentralCoast
Isolated 3.0 0.25 3.2 0.23 6.2 0.46 81 9.9 99 1Rural 3.1 0.11 3.3 0.12 6.4 0.23 91 2 97 0.7Urban 3.0 0.21 3.2 0.18 6.2 0.38 91 2.4 94 1.1Total 3.1 0.09 3.2 0.09 6.3 0.18 90 1.7 96 0.5
CentralHighlands
Isolated 3.8 0.40 3.4 0.30 7.2 0.59 80 5.2 97 1.6Rural 3.5 0.24 3.4 0.21 6.9 0.43 91 2.7 97 0.8Urban 3.9 0.30 4.0 0.27 7.9 0.54 91 2.3 97 1.2Total 3.7 0.18 3.6 0.14 7.3 0.30 89 1.8 97 0.6
Southeast
Isolated 3.1 0.20 3.3 0.18 6.4 0.37 87 4.1 99 0.5Rural 3.2 0.13 3.6 0.13 6.7 0.23 91 1.7 98 0.4Urban 3.4 0.13 4.0 0.14 7.5 0.27 94 1.1 91 1.3Total 3.3 0.09 3.7 0.10 7.0 0.17 92 1 95 0.6
MekongDelta
Isolated 2.5 0.21 2.9 0.24 5.3 0.34 61 5.8 97 1.1Rural 2.8 0.12 3.2 0.12 6.0 0.22 77 2.1 97 0.4Urban 3.0 0.18 3.3 0.17 6.3 0.34 89 2.3 97 0.6Total 2.8 0.10 3.2 0.10 6.0 0.18 79 1.7 97 0.3
Vietnam
Isolated 3.0 0.11 3.0 0.12 6.0 0.22 71 3.1 98 0.5Rural 2.9 0.05 3.2 0.05 6.1 0.09 87 0.8 97 0.2Urban 3.2 0.07 3.6 0.07 6.7 0.13 92 0.9 92 0.5Total 3.0 0.04 3.3 0.04 6.2 0.07 86 0.7 96 0.2
Table 3.11b: Percentages, means and sampling errors of extra tuition variables (onlypupils who had extra tuition)
Vietnam Reading and Mathematics Assessment Study
83
(a) Number of hours of extra tuition per school week
Since this study is focussed on reading in Vietnamese and also mathematics,it was thought important to find out about extra tuition in these two subjectareas. The results have been presented in Table 3.11a and Table 3.11b. Allpupils, both pupils who had extra tuition and who did not have extra tuitionhave been taken into account in Table 3.11a. In Table 3.11b, the calculationshave been based on only those pupils who said that they had extra tuition. Itcan be seen that 62 percent of pupils stated that they had had no extra tuition.However, this means that 38 percent of pupils did have some extra tuition.More pupils in urban areas had extra tuition than in the other areas. Theaverage number of hours per week spent on extra tuition in each subject areafor all pupils (including those not taking extra tuition, was about 1.2 hours.The average number of extra tuition hours for only those who had extratuitions was about 3 hours for Vietnamese and 3.3 hours for mathematics.Pupils in isolated schools tended to have fewer hours of extra tuition perweek compared with pupils in rural and urban schools.
The number of hours of extra tuition was not related to achievement scores.Presumably this is because it was the parents of the weaker pupils who sentthem to extra tuition in order to catch up.
(b) Do parents pay for extra tuition?
Those pupils who attended extra tuition were asked if they paid for it. In otherwords had their parents given them money to give to the teacher? Thepercentage of pupils responding 'yes' was 86. It must be remembered that thisis 86 percent of those saying that they took extra tuition. Pupils in isolatedareas were less likely to have to pay. A higher percentage of pupils fromricher homes went to extra tuition than from poorer homes. It was noted thatin Hai Duong province the pupils had fewer hours of extra tuition but it wasthere that 99 percent paid for extra tuition.
(c) Who teaches the pupils for extra tuition?
The only options offered to the pupils were: 'I have the same teacher as atschool' and 'I have a teacher from different school'. The responses have beenpresented in Table 3.11b. It can be seen that in general the pupils had thesame teachers as at school for the extra tuition.
Given that the issue of extra tuition is a sensitive one, it is suggested that theMOET select one or two provinces and carry out a much more detailedexamination of who is doing extra tuition, why, for how long, how, and if ithas an effect. Who pays how much for the extra tuition and whether extratuition can be seen as a positive and needed supplement to ordinary school.
Policy suggestion 3.8: The MOET might wish to consider mounting aseparate detailed study of extra tuition in selected provinces in order toobtain a much more detailed account of what is happening, why, how,and if it can used to improve pupil attainment.
Most of those taking extratuition took one hour inmathematics or one hourin Vietnamese.
And, most pupils hadtheir own teachers astheir tutors.
Most extra tuition waspaid for.
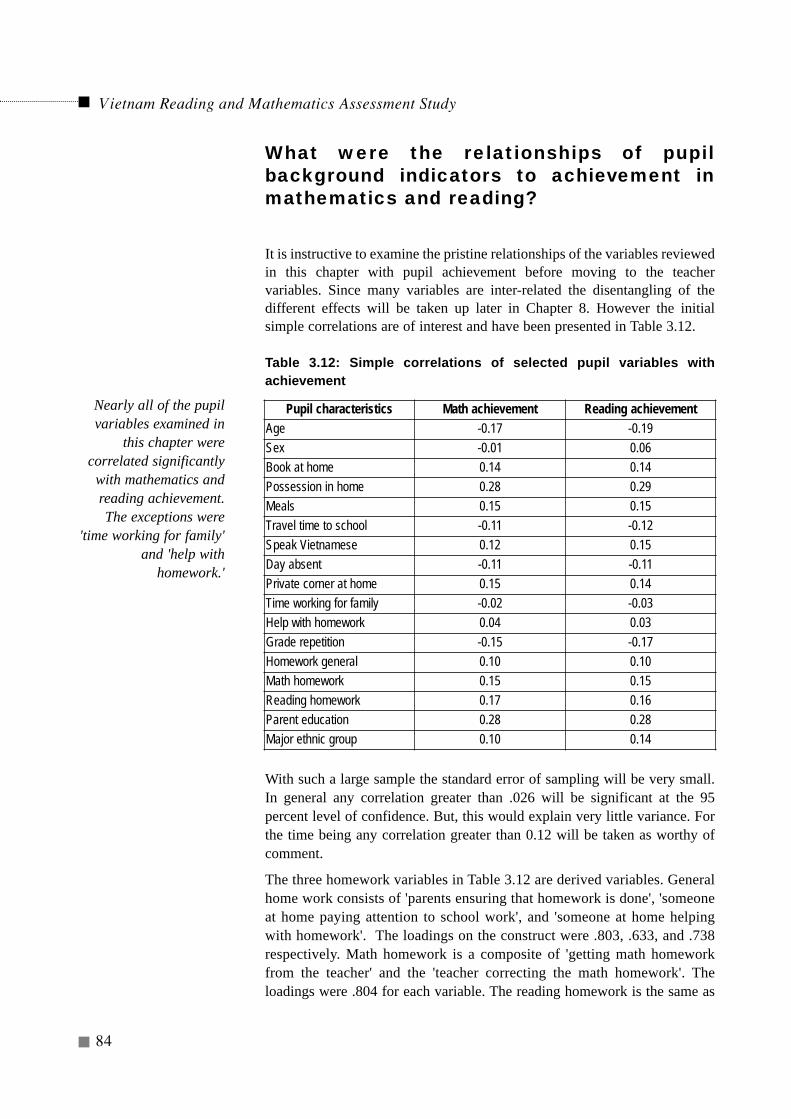
Vietnam Reading and Mathematics Assessment Study
84
What were the relationships of pupilbackground indicators to achievement inmathematics and reading?
It is instructive to examine the pristine relationships of the variables reviewedin this chapter with pupil achievement before moving to the teachervariables. Since many variables are inter-related the disentangling of thedifferent effects will be taken up later in Chapter 8. However the initialsimple correlations are of interest and have been presented in Table 3.12.
Table 3.12: Simple correlations of selected pupil variables withachievement
With such a large sample the standard error of sampling will be very small.In general any correlation greater than .026 will be significant at the 95percent level of confidence. But, this would explain very little variance. Forthe time being any correlation greater than 0.12 will be taken as worthy ofcomment.
The three homework variables in Table 3.12 are derived variables. Generalhome work consists of 'parents ensuring that homework is done', 'someoneat home paying attention to school work', and 'someone at home helpingwith homework'. The loadings on the construct were .803, .633, and .738respectively. Math homework is a composite of 'getting math homeworkfrom the teacher' and the 'teacher correcting the math homework'. Theloadings were .804 for each variable. The reading homework is the same as
Nearly all of the pupilvariables examined in
this chapter werecorrelated significantly
with mathematics andreading achievement.The exceptions were
'time working for family'and 'help with
homework.'
Pupil characteristics Math achievement Reading achievementAge -0.17 -0.19Sex -0.01 0.06Book at home 0.14 0.14Possession in home 0.28 0.29Meals 0.15 0.15Travel time to school -0.11 -0.12Speak Vietnamese 0.12 0.15Day absent -0.11 -0.11Private corner at home 0.15 0.14Time working for family -0.02 -0.03Help with homework 0.04 0.03Grade repetition -0.15 -0.17Homework general 0.10 0.10Math homework 0.15 0.15Reading homework 0.17 0.16Parent education 0.28 0.28Major ethnic group 0.10 0.14
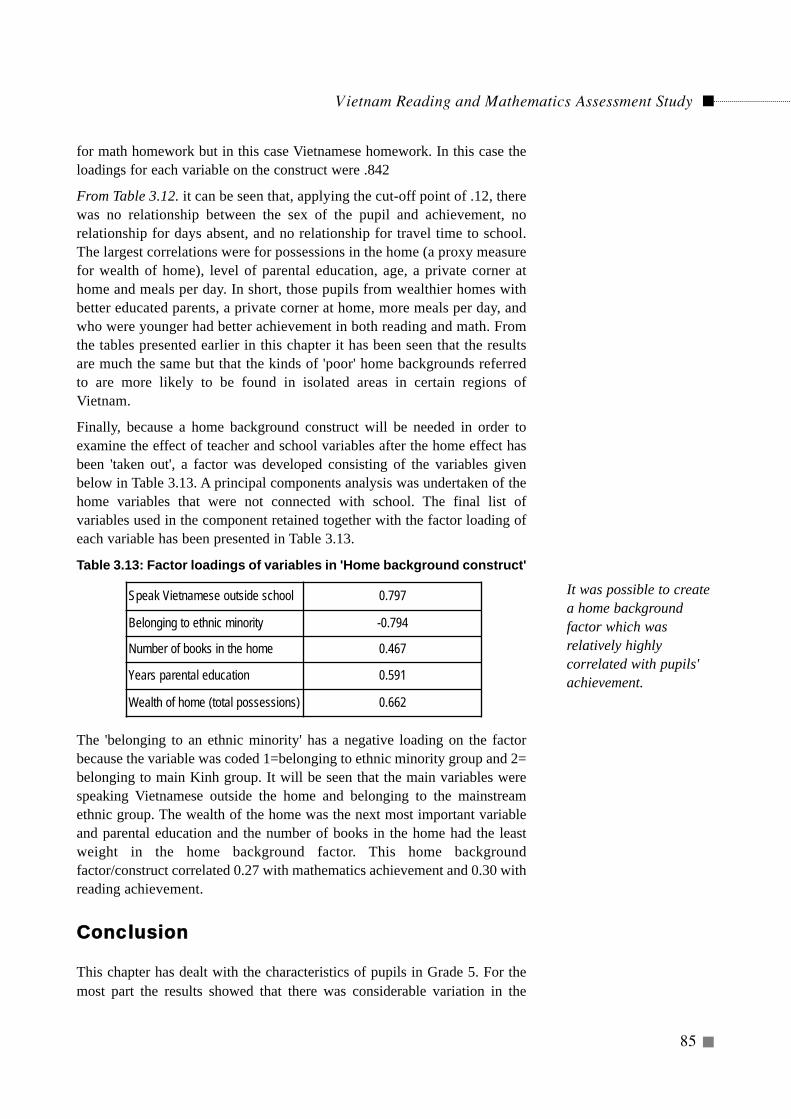
for math homework but in this case Vietnamese homework. In this case theloadings for each variable on the construct were .842
From Table 3.12. it can be seen that, applying the cut-off point of .12, therewas no relationship between the sex of the pupil and achievement, norelationship for days absent, and no relationship for travel time to school.The largest correlations were for possessions in the home (a proxy measurefor wealth of home), level of parental education, age, a private corner athome and meals per day. In short, those pupils from wealthier homes withbetter educated parents, a private corner at home, more meals per day, andwho were younger had better achievement in both reading and math. Fromthe tables presented earlier in this chapter it has been seen that the resultsare much the same but that the kinds of 'poor' home backgrounds referredto are more likely to be found in isolated areas in certain regions ofVietnam.
Finally, because a home background construct will be needed in order toexamine the effect of teacher and school variables after the home effect hasbeen 'taken out', a factor was developed consisting of the variables givenbelow in Table 3.13. A principal components analysis was undertaken of thehome variables that were not connected with school. The final list ofvariables used in the component retained together with the factor loading ofeach variable has been presented in Table 3.13.
Table 3.13: Factor loadings of variables in 'Home background construct'
The 'belonging to an ethnic minority' has a negative loading on the factorbecause the variable was coded 1=belonging to ethnic minority group and 2=belonging to main Kinh group. It will be seen that the main variables werespeaking Vietnamese outside the home and belonging to the mainstreamethnic group. The wealth of the home was the next most important variableand parental education and the number of books in the home had the leastweight in the home background factor. This home backgroundfactor/construct correlated 0.27 with mathematics achievement and 0.30 withreading achievement.
CCoonncclluussiioonn
This chapter has dealt with the characteristics of pupils in Grade 5. For themost part the results showed that there was considerable variation in the
Vietnam Reading and Mathematics Assessment Study
85
Speak Vietnamese outside school 0.797
Belonging to ethnic minority -0.794
Number of books in the home 0.467
Years parental education 0.591
Wealth of home (total possessions) 0.662
It was possible to createa home backgroundfactor which wasrelatively highlycorrelated with pupils'achievement.
Vietnam Reading and Mathematics Assessment Study
86
characteristics of pupils among the isolated, rural and urban areas of thecountry. Those regions with more provinces having isolated areas tended tobe those where the pupils were somewhat disadvantaged compared with theirpeers in other parts of the country. The isolated areas had Grade 5 pupils whowere older, sometimes a year older than the average for Vietnam, had fewergirls in school, had more ethnic minority children, and had pupils frompoorer families where the parents had fewer years of education than parentsin other areas. Such children were also from homes with fewer books. Indeedthe average number of books at home for all of Vietnam was very low. Thesechildren also spoke less Vietnamese outside of school, tended to repeat agrade more than those from other areas. The parents of these children tendedto pay less attention to their school work and homework.
To compound matters, these disadvantaged pupils did not receive extra helpfrom school to help overcome their disdvantagedness. Rather they were alsothe pupils who received less homework from school and had their homeworkcorrected less frequently.
A number of policy suggestions were made throughout the chapter. In manycases they were specific about what to do in which provinces. These mostlyconcerned the authorities instituting so-called school intervention programsin order that the school can influence the behaviour of parents in taking aninterest in their children's education and homework as well as having thepupils come to school on time (not a year late) and not dropping out. It wassuggested that the Vietnam authorities should study what other South-EastAsian countries have done in way of school intervention programs and thendevelop and assess, before full implementation, the best kinds of interventionprograms for Vietnam.
Suggestions were made for school meal programs in selected areas as thesystem moves to full-day schooling. Book flood programs should beconsidered for schools in isolated areas.
Other suggestions concerned strengthening the current school and classroomlibrary program in order to for children to have sufficient leisure time readingmaterials, ensuring that teachers give and correct homework.
Extra tuition was a form of extra schooling that was taken by more than thirtypercent of pupils. Although teachers are discouraged from extra teaching bythe State it nevertheless happens to a great extent. It was suggested that theMOET undertake a detailed study of this phenomenon in order to improve itand make it beneficial for as many pupils as possible.
Finally, it was seen that teachers giving homework and then correcting itoften or always was beneficial for pupil achievement. It was worrisome thatsome teachers were not perceived by pupils to be giving homework orcorrecting it. Steps should be taken by the MOET to emphasise homeworkeven more in their teacher pre- and in-service training courses. Thoseresponsible for monitoring what happens in schools should have the task ofensuring that homework is given and corrected on a very regular basis.
Vietnam Reading and Mathematics Assessment Study
87
Chapter 4
WHAT WERE THE CHARACTERISTICS OFGRADE5 TEACHERS AND THEIR CLASSROOMS?
Introduction
Teachers are viewed as a key part of the educational process. Theyalso account for nearly 90 percent of the educational budget inmany countries. They are selected for teacher training, undergothe teacher training, are allocated to schools where they gain
experience and undergo in-service training. What then were thecharacteristics of Grade 5 teachers in Vietnam and how were the teachersdistributed across schools? The same reasons apply for measuring thecharacteristics of teachers and their classrooms as for measuring thepupils' backgrounds and characteristics as were reported in Chapter 3.
It will be recalled from Chapter 1 that only two teachers per school weredrawn at random. However, only just over half the pupils were linked toteachers on the data file. But, when the differences were examined betweenpupils who were linked to teachers and those who were not linked toteachers there were no differences between the mean values andpercentages for the two groups. In this chapter it must be recalled thatwhere teacher characteristics have been related to pupil achievement it wasonly 51 percent of pupils that were used in the calculations.
Finally, all teacher data have been disaggregated to the pupil level. Thismeans that in tables in this chapter when a percentage is used it means thatx percent of pupils had teachers with the particular characteristic. A"mean" value means that the average pupil had a teacher with thatcharacteristic.
What were the background characteristicsof teachers of Grade 5 pupils?
The first teacher background data to be examined have been presented in Table 4.1.
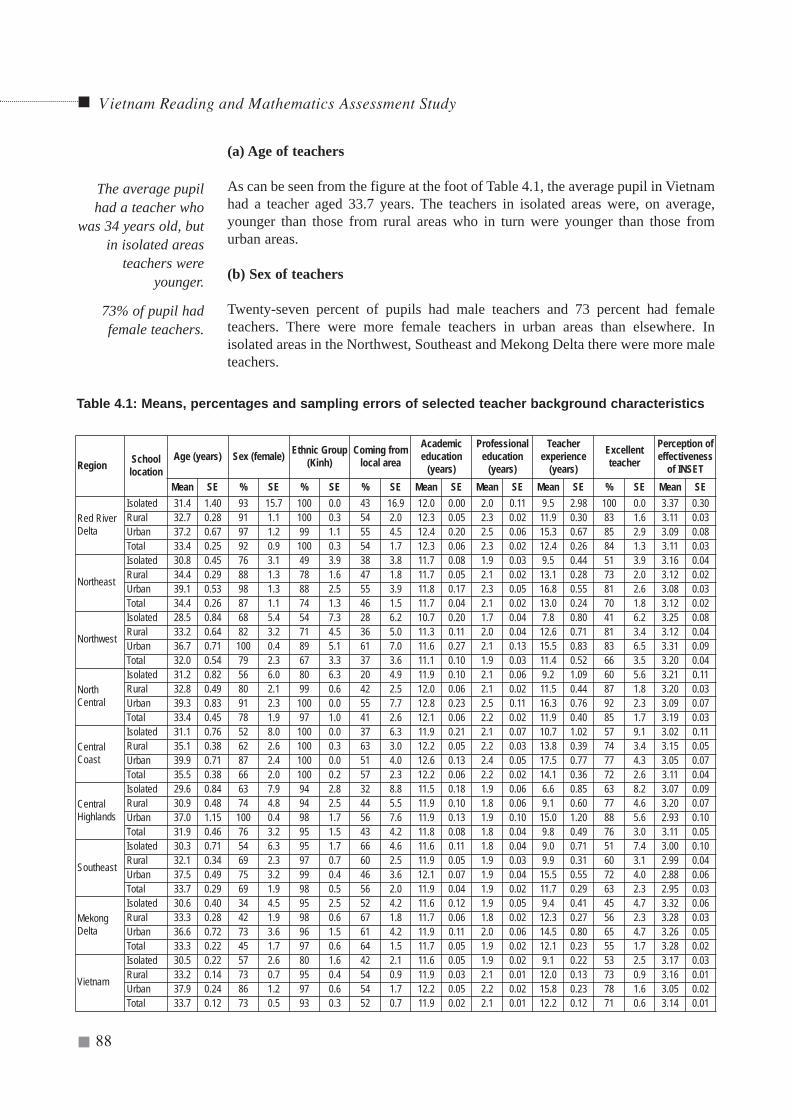
Vietnam Reading and Mathematics Assessment Study
88
(a) Age of teachers
As can be seen from the figure at the foot of Table 4.1, the average pupil in Vietnamhad a teacher aged 33.7 years. The teachers in isolated areas were, on average,younger than those from rural areas who in turn were younger than those fromurban areas.
(b) Sex of teachers
Twenty-seven percent of pupils had male teachers and 73 percent had femaleteachers. There were more female teachers in urban areas than elsewhere. Inisolated areas in the Northwest, Southeast and Mekong Delta there were more maleteachers.
Region Schoollocation
Age (years) Sex (female) Ethnic Group(Kinh)
Coming fromlocal area
Academiceducation
(years)
Professionaleducation
(years)
Teacherexperience
(years)
Excellentteacher
Perception ofeffectiveness
of INSETMean SE % SE % SE % SE Mean SE Mean SE Mean SE % SE Mean SE
Red RiverDelta
Isolated 31.4 1.40 93 15.7 100 0.0 43 16.9 12.0 0.00 2.0 0.11 9.5 2.98 100 0.0 3.37 0.30Rural 32.7 0.28 91 1.1 100 0.3 54 2.0 12.3 0.05 2.3 0.02 11.9 0.30 83 1.6 3.11 0.03Urban 37.2 0.67 97 1.2 99 1.1 55 4.5 12.4 0.20 2.5 0.06 15.3 0.67 85 2.9 3.09 0.08Total 33.4 0.25 92 0.9 100 0.3 54 1.7 12.3 0.06 2.3 0.02 12.4 0.26 84 1.3 3.11 0.03
Northeast
Isolated 30.8 0.45 76 3.1 49 3.9 38 3.8 11.7 0.08 1.9 0.03 9.5 0.44 51 3.9 3.16 0.04Rural 34.4 0.29 88 1.3 78 1.6 47 1.8 11.7 0.05 2.1 0.02 13.1 0.28 73 2.0 3.12 0.02Urban 39.1 0.53 98 1.3 88 2.5 55 3.9 11.8 0.17 2.3 0.05 16.8 0.55 81 2.6 3.08 0.03Total 34.4 0.26 87 1.1 74 1.3 46 1.5 11.7 0.04 2.1 0.02 13.0 0.24 70 1.8 3.12 0.02
Northwest
Isolated 28.5 0.84 68 5.4 54 7.3 28 6.2 10.7 0.20 1.7 0.04 7.8 0.80 41 6.2 3.25 0.08Rural 33.2 0.64 82 3.2 71 4.5 36 5.0 11.3 0.11 2.0 0.04 12.6 0.71 81 3.4 3.12 0.04Urban 36.7 0.71 100 0.4 89 5.1 61 7.0 11.6 0.27 2.1 0.13 15.5 0.83 83 6.5 3.31 0.09Total 32.0 0.54 79 2.3 67 3.3 37 3.6 11.1 0.10 1.9 0.03 11.4 0.52 66 3.5 3.20 0.04
NorthCentral
Isolated 31.2 0.82 56 6.0 80 6.3 20 4.9 11.9 0.10 2.1 0.06 9.2 1.09 60 5.6 3.21 0.11Rural 32.8 0.49 80 2.1 99 0.6 42 2.5 12.0 0.06 2.1 0.02 11.5 0.44 87 1.8 3.20 0.03Urban 39.3 0.83 91 2.3 100 0.0 55 7.7 12.8 0.23 2.5 0.11 16.3 0.76 92 2.3 3.09 0.07Total 33.4 0.45 78 1.9 97 1.0 41 2.6 12.1 0.06 2.2 0.02 11.9 0.40 85 1.7 3.19 0.03
CentralCoast
Isolated 31.1 0.76 52 8.0 100 0.0 37 6.3 11.9 0.21 2.1 0.07 10.7 1.02 57 9.1 3.02 0.11Rural 35.1 0.38 62 2.6 100 0.3 63 3.0 12.2 0.05 2.2 0.03 13.8 0.39 74 3.4 3.15 0.05Urban 39.9 0.71 87 2.4 100 0.0 51 4.0 12.6 0.13 2.4 0.05 17.5 0.77 77 4.3 3.05 0.07Total 35.5 0.38 66 2.0 100 0.2 57 2.3 12.2 0.06 2.2 0.02 14.1 0.36 72 2.6 3.11 0.04
CentralHighlands
Isolated 29.6 0.84 63 7.9 94 2.8 32 8.8 11.5 0.18 1.9 0.06 6.6 0.85 63 8.2 3.07 0.09Rural 30.9 0.48 74 4.8 94 2.5 44 5.5 11.9 0.10 1.8 0.06 9.1 0.60 77 4.6 3.20 0.07Urban 37.0 1.15 100 0.4 98 1.7 56 7.6 11.9 0.13 1.9 0.10 15.0 1.20 88 5.6 2.93 0.10Total 31.9 0.46 76 3.2 95 1.5 43 4.2 11.8 0.08 1.8 0.04 9.8 0.49 76 3.0 3.11 0.05
Southeast
Isolated 30.3 0.71 54 6.3 95 1.7 66 4.6 11.6 0.11 1.8 0.04 9.0 0.71 51 7.4 3.00 0.10Rural 32.1 0.34 69 2.3 97 0.7 60 2.5 11.9 0.05 1.9 0.03 9.9 0.31 60 3.1 2.99 0.04Urban 37.5 0.49 75 3.2 99 0.4 46 3.6 12.1 0.07 1.9 0.04 15.5 0.55 72 4.0 2.88 0.06Total 33.7 0.29 69 1.9 98 0.5 56 2.0 11.9 0.04 1.9 0.02 11.7 0.29 63 2.3 2.95 0.03
MekongDelta
Isolated 30.6 0.40 34 4.5 95 2.5 52 4.2 11.6 0.12 1.9 0.05 9.4 0.41 45 4.7 3.32 0.06Rural 33.3 0.28 42 1.9 98 0.6 67 1.8 11.7 0.06 1.8 0.02 12.3 0.27 56 2.3 3.28 0.03Urban 36.6 0.72 73 3.6 96 1.5 61 4.2 11.9 0.11 2.0 0.06 14.5 0.80 65 4.7 3.26 0.05Total 33.3 0.22 45 1.7 97 0.6 64 1.5 11.7 0.05 1.9 0.02 12.1 0.23 55 1.7 3.28 0.02
Vietnam
Isolated 30.5 0.22 57 2.6 80 1.6 42 2.1 11.6 0.05 1.9 0.02 9.1 0.22 53 2.5 3.17 0.03Rural 33.2 0.14 73 0.7 95 0.4 54 0.9 11.9 0.03 2.1 0.01 12.0 0.13 73 0.9 3.16 0.01Urban 37.9 0.24 86 1.2 97 0.6 54 1.7 12.2 0.05 2.2 0.02 15.8 0.23 78 1.6 3.05 0.02Total 33.7 0.12 73 0.5 93 0.3 52 0.7 11.9 0.02 2.1 0.01 12.2 0.12 71 0.6 3.14 0.01
The average pupilhad a teacher who
was 34 years old, butin isolated areas
teachers wereyounger.
73% of pupil hadfemale teachers.
Table 4.1: Means, percentages and sampling errors of selected teacher background characteristics
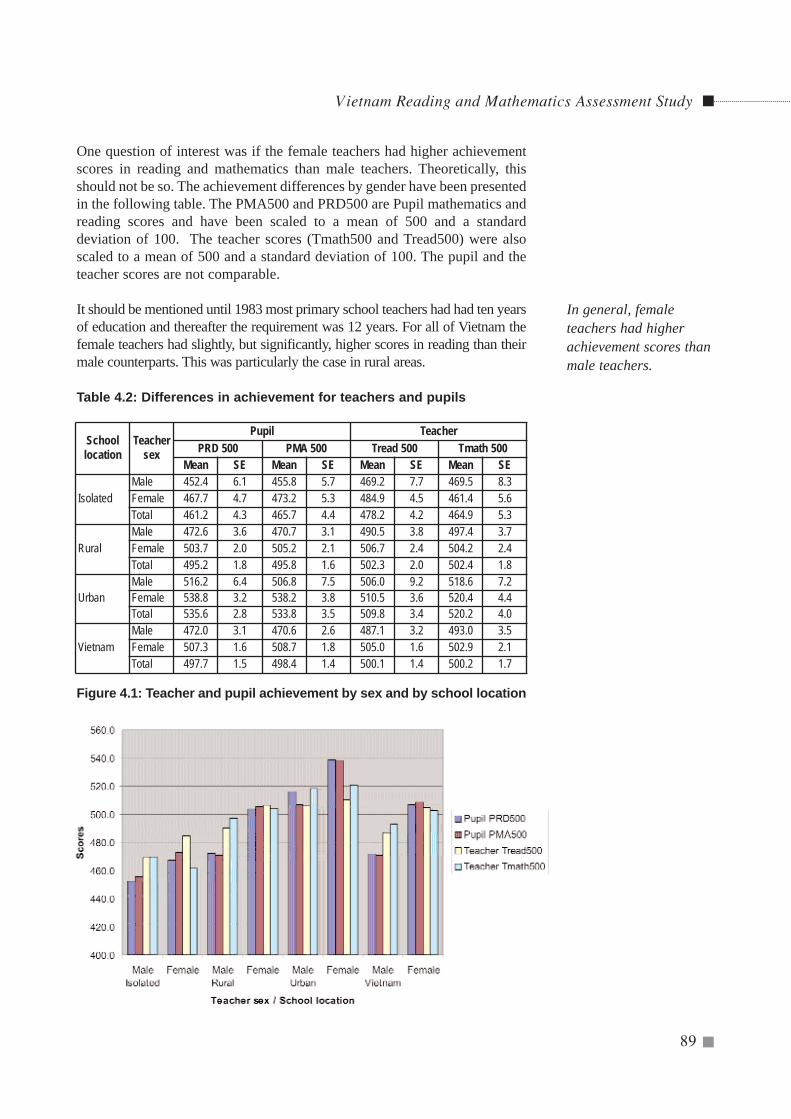
Vietnam Reading and Mathematics Assessment Study
89
One question of interest was if the female teachers had higher achievementscores in reading and mathematics than male teachers. Theoretically, thisshould not be so. The achievement differences by gender have been presentedin the following table. The PMA500 and PRD500 are Pupil mathematics andreading scores and have been scaled to a mean of 500 and a standarddeviation of 100. The teacher scores (Tmath500 and Tread500) were alsoscaled to a mean of 500 and a standard deviation of 100. The pupil and theteacher scores are not comparable.
It should be mentioned until 1983 most primary school teachers had had ten yearsof education and thereafter the requirement was 12 years. For all of Vietnam thefemale teachers had slightly, but significantly, higher scores in reading than theirmale counterparts. This was particularly the case in rural areas.
Table 4.2: Differences in achievement for teachers and pupils
Figure 4.1: Teacher and pupil achievement by sex and by school location
In general, femaleteachers had higherachievement scores thanmale teachers.
Schoollocation
Teachersex
Pupil TeacherPRD 500 PMA 500 Tread 500 Tmath 500
Mean SE Mean SE Mean SE Mean SE
IsolatedMale 452.4 6.1 455.8 5.7 469.2 7.7 469.5 8.3Female 467.7 4.7 473.2 5.3 484.9 4.5 461.4 5.6Total 461.2 4.3 465.7 4.4 478.2 4.2 464.9 5.3
RuralMale 472.6 3.6 470.7 3.1 490.5 3.8 497.4 3.7Female 503.7 2.0 505.2 2.1 506.7 2.4 504.2 2.4Total 495.2 1.8 495.8 1.6 502.3 2.0 502.4 1.8
UrbanMale 516.2 6.4 506.8 7.5 506.0 9.2 518.6 7.2Female 538.8 3.2 538.2 3.8 510.5 3.6 520.4 4.4Total 535.6 2.8 533.8 3.5 509.8 3.4 520.2 4.0
VietnamMale 472.0 3.1 470.6 2.6 487.1 3.2 493.0 3.5Female 507.3 1.6 508.7 1.8 505.0 1.6 502.9 2.1Total 497.7 1.5 498.4 1.4 500.1 1.4 500.2 1.7
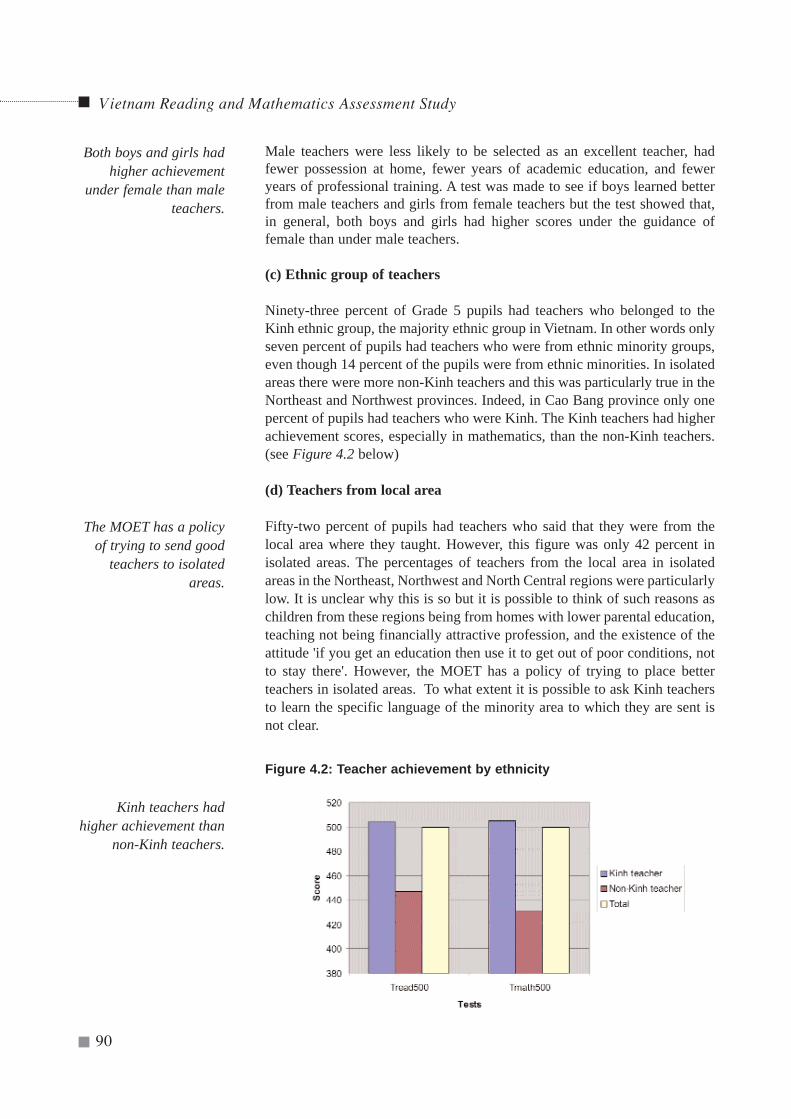
Vietnam Reading and Mathematics Assessment Study
90
The MOET has a policyof trying to send good
teachers to isolatedareas.
Male teachers were less likely to be selected as an excellent teacher, hadfewer possession at home, fewer years of academic education, and feweryears of professional training. A test was made to see if boys learned betterfrom male teachers and girls from female teachers but the test showed that,in general, both boys and girls had higher scores under the guidance offemale than under male teachers.
(c) Ethnic group of teachers
Ninety-three percent of Grade 5 pupils had teachers who belonged to theKinh ethnic group, the majority ethnic group in Vietnam. In other words onlyseven percent of pupils had teachers who were from ethnic minority groups,even though 14 percent of the pupils were from ethnic minorities. In isolatedareas there were more non-Kinh teachers and this was particularly true in theNortheast and Northwest provinces. Indeed, in Cao Bang province only onepercent of pupils had teachers who were Kinh. The Kinh teachers had higherachievement scores, especially in mathematics, than the non-Kinh teachers.(see Figure 4.2 below)
(d) Teachers from local area
Fifty-two percent of pupils had teachers who said that they were from thelocal area where they taught. However, this figure was only 42 percent inisolated areas. The percentages of teachers from the local area in isolatedareas in the Northeast, Northwest and North Central regions were particularlylow. It is unclear why this is so but it is possible to think of such reasons aschildren from these regions being from homes with lower parental education,teaching not being financially attractive profession, and the existence of theattitude 'if you get an education then use it to get out of poor conditions, notto stay there'. However, the MOET has a policy of trying to place betterteachers in isolated areas. To what extent it is possible to ask Kinh teachersto learn the specific language of the minority area to which they are sent isnot clear.
Figure 4.2: Teacher achievement by ethnicity
Both boys and girls hadhigher achievement
under female than maleteachers.
Kinh teachers hadhigher achievement than
non-Kinh teachers.
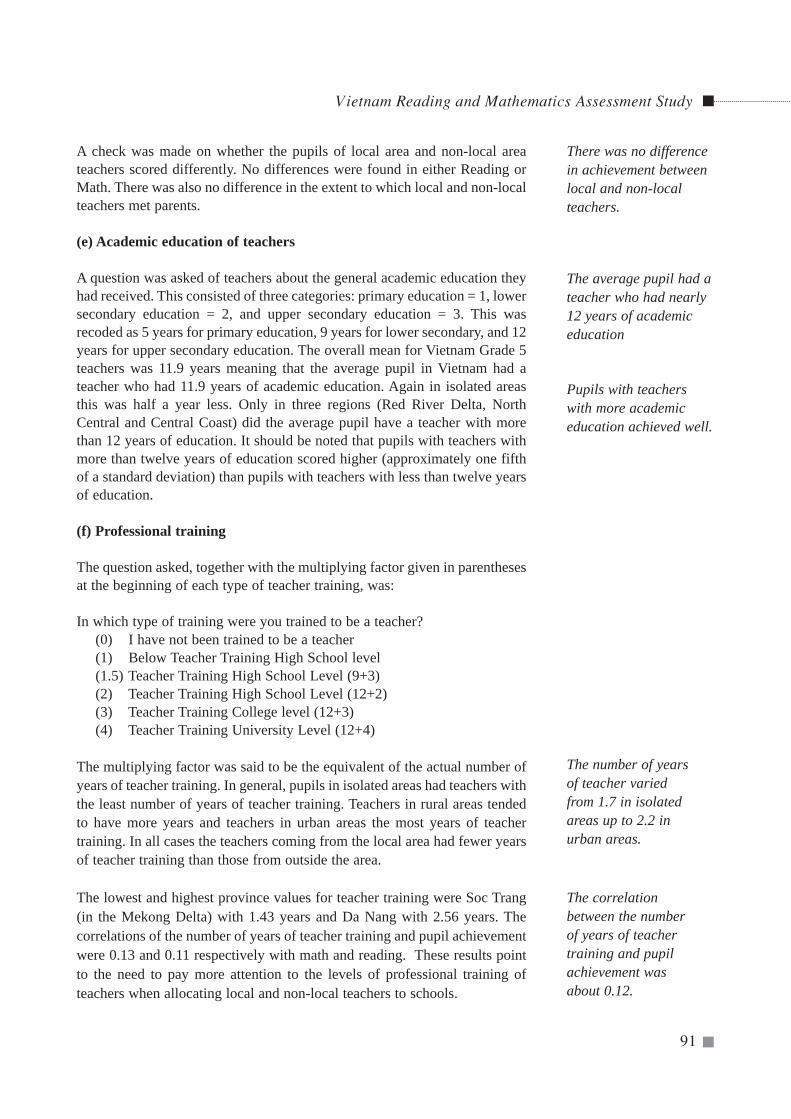
Vietnam Reading and Mathematics Assessment Study
91
A check was made on whether the pupils of local area and non-local areateachers scored differently. No differences were found in either Reading orMath. There was also no difference in the extent to which local and non-localteachers met parents.
(e) Academic education of teachers
A question was asked of teachers about the general academic education theyhad received. This consisted of three categories: primary education = 1, lowersecondary education = 2, and upper secondary education = 3. This wasrecoded as 5 years for primary education, 9 years for lower secondary, and 12years for upper secondary education. The overall mean for Vietnam Grade 5teachers was 11.9 years meaning that the average pupil in Vietnam had ateacher who had 11.9 years of academic education. Again in isolated areasthis was half a year less. Only in three regions (Red River Delta, NorthCentral and Central Coast) did the average pupil have a teacher with morethan 12 years of education. It should be noted that pupils with teachers withmore than twelve years of education scored higher (approximately one fifthof a standard deviation) than pupils with teachers with less than twelve yearsof education.
(f) Professional training
The question asked, together with the multiplying factor given in parenthesesat the beginning of each type of teacher training, was:
In which type of training were you trained to be a teacher?(0) I have not been trained to be a teacher(1) Below Teacher Training High School level(1.5) Teacher Training High School Level (9+3)(2) Teacher Training High School Level (12+2)(3) Teacher Training College level (12+3)(4) Teacher Training University Level (12+4)
The multiplying factor was said to be the equivalent of the actual number ofyears of teacher training. In general, pupils in isolated areas had teachers withthe least number of years of teacher training. Teachers in rural areas tendedto have more years and teachers in urban areas the most years of teachertraining. In all cases the teachers coming from the local area had fewer yearsof teacher training than those from outside the area.
The lowest and highest province values for teacher training were Soc Trang(in the Mekong Delta) with 1.43 years and Da Nang with 2.56 years. Thecorrelations of the number of years of teacher training and pupil achievementwere 0.13 and 0.11 respectively with math and reading. These results pointto the need to pay more attention to the levels of professional training ofteachers when allocating local and non-local teachers to schools.
There was no differencein achievement betweenlocal and non-localteachers.
The average pupil had ateacher who had nearly12 years of academiceducation
Pupils with teacherswith more academiceducation achieved well.
The number of yearsof teacher variedfrom 1.7 in isolatedareas up to 2.2 inurban areas.
The correlationbetween the numberof years of teachertraining and pupilachievement wasabout 0.12.
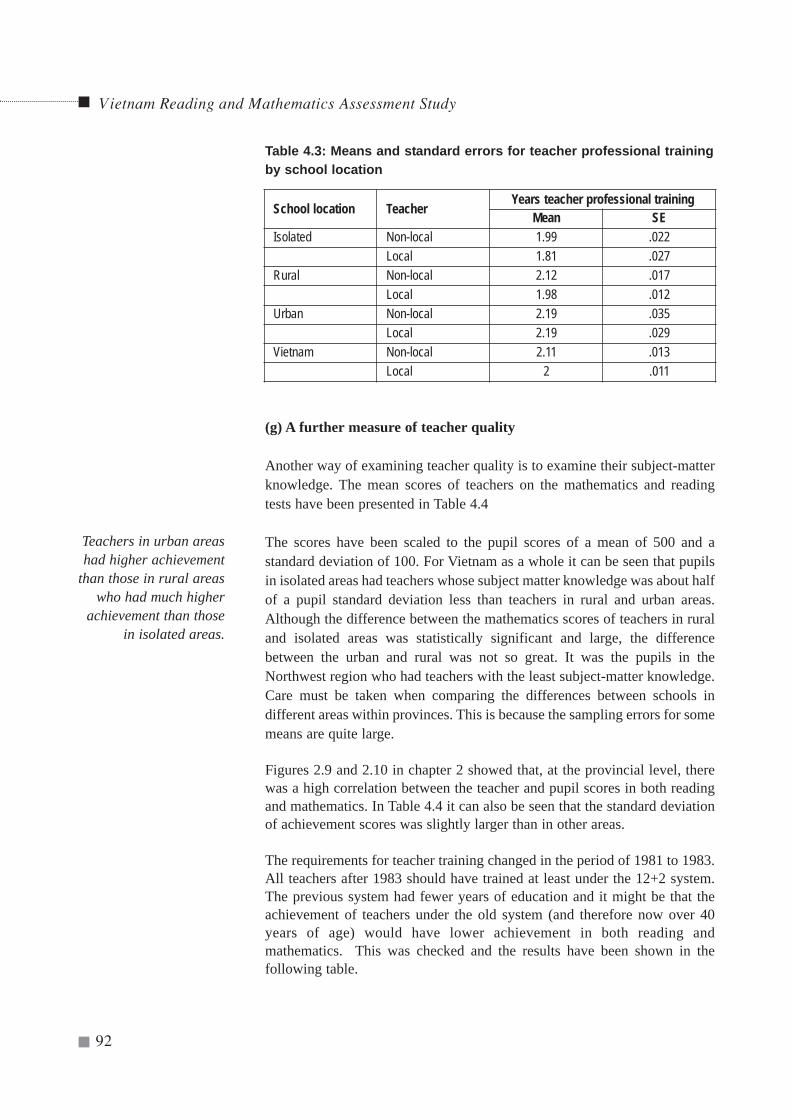
Vietnam Reading and Mathematics Assessment Study
92
(g) A further measure of teacher quality
Another way of examining teacher quality is to examine their subject-matterknowledge. The mean scores of teachers on the mathematics and readingtests have been presented in Table 4.4
The scores have been scaled to the pupil scores of a mean of 500 and astandard deviation of 100. For Vietnam as a whole it can be seen that pupilsin isolated areas had teachers whose subject matter knowledge was about halfof a pupil standard deviation less than teachers in rural and urban areas.Although the difference between the mathematics scores of teachers in ruraland isolated areas was statistically significant and large, the differencebetween the urban and rural was not so great. It was the pupils in theNorthwest region who had teachers with the least subject-matter knowledge.Care must be taken when comparing the differences between schools indifferent areas within provinces. This is because the sampling errors for somemeans are quite large.
Figures 2.9 and 2.10 in chapter 2 showed that, at the provincial level, therewas a high correlation between the teacher and pupil scores in both readingand mathematics. In Table 4.4 it can also be seen that the standard deviationof achievement scores was slightly larger than in other areas.
The requirements for teacher training changed in the period of 1981 to 1983.All teachers after 1983 should have trained at least under the 12+2 system.The previous system had fewer years of education and it might be that theachievement of teachers under the old system (and therefore now over 40years of age) would have lower achievement in both reading andmathematics. This was checked and the results have been shown in thefollowing table.
School location TeacherYears teacher professional training
Mean SEIsolated Non-local 1.99 .022
Local 1.81 .027Rural Non-local 2.12 .017
Local 1.98 .012Urban Non-local 2.19 .035
Local 2.19 .029Vietnam Non-local 2.11 .013
Local 2 .011
Teachers in urban areashad higher achievement
than those in rural areaswho had much higher
achievement than thosein isolated areas.
Table 4.3: Means and standard errors for teacher professional trainingby school location
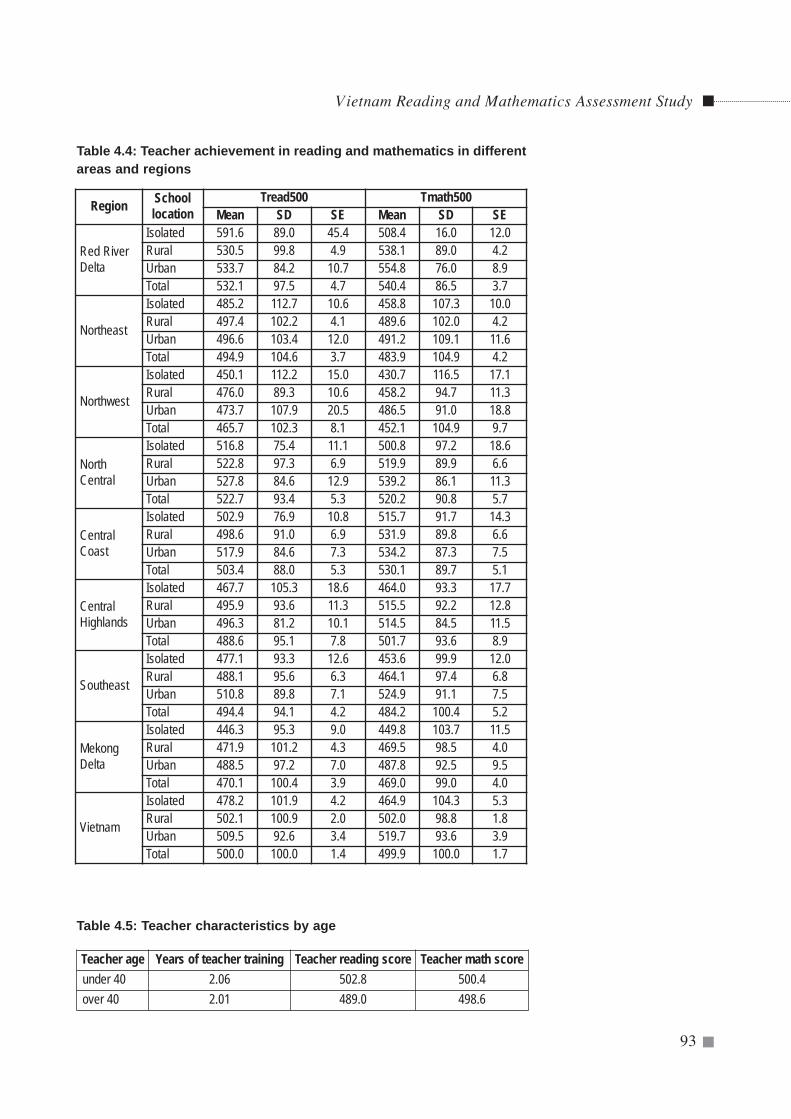
Table 4.5: Teacher characteristics by age
Vietnam Reading and Mathematics Assessment Study
93
Region Schoollocation
Tread500 Tmath500Mean SD SE Mean SD SE
Red RiverDelta
Isolated 591.6 89.0 45.4 508.4 16.0 12.0Rural 530.5 99.8 4.9 538.1 89.0 4.2Urban 533.7 84.2 10.7 554.8 76.0 8.9Total 532.1 97.5 4.7 540.4 86.5 3.7
Northeast
Isolated 485.2 112.7 10.6 458.8 107.3 10.0Rural 497.4 102.2 4.1 489.6 102.0 4.2Urban 496.6 103.4 12.0 491.2 109.1 11.6Total 494.9 104.6 3.7 483.9 104.9 4.2
Northwest
Isolated 450.1 112.2 15.0 430.7 116.5 17.1Rural 476.0 89.3 10.6 458.2 94.7 11.3Urban 473.7 107.9 20.5 486.5 91.0 18.8Total 465.7 102.3 8.1 452.1 104.9 9.7
NorthCentral
Isolated 516.8 75.4 11.1 500.8 97.2 18.6Rural 522.8 97.3 6.9 519.9 89.9 6.6Urban 527.8 84.6 12.9 539.2 86.1 11.3Total 522.7 93.4 5.3 520.2 90.8 5.7
CentralCoast
Isolated 502.9 76.9 10.8 515.7 91.7 14.3Rural 498.6 91.0 6.9 531.9 89.8 6.6Urban 517.9 84.6 7.3 534.2 87.3 7.5Total 503.4 88.0 5.3 530.1 89.7 5.1
CentralHighlands
Isolated 467.7 105.3 18.6 464.0 93.3 17.7Rural 495.9 93.6 11.3 515.5 92.2 12.8Urban 496.3 81.2 10.1 514.5 84.5 11.5Total 488.6 95.1 7.8 501.7 93.6 8.9
Southeast
Isolated 477.1 93.3 12.6 453.6 99.9 12.0Rural 488.1 95.6 6.3 464.1 97.4 6.8Urban 510.8 89.8 7.1 524.9 91.1 7.5Total 494.4 94.1 4.2 484.2 100.4 5.2
MekongDelta
Isolated 446.3 95.3 9.0 449.8 103.7 11.5Rural 471.9 101.2 4.3 469.5 98.5 4.0Urban 488.5 97.2 7.0 487.8 92.5 9.5Total 470.1 100.4 3.9 469.0 99.0 4.0
Vietnam
Isolated 478.2 101.9 4.2 464.9 104.3 5.3Rural 502.1 100.9 2.0 502.0 98.8 1.8Urban 509.5 92.6 3.4 519.7 93.6 3.9Total 500.0 100.0 1.4 499.9 100.0 1.7
Table 4.4: Teacher achievement in reading and mathematics in differentareas and regions
Teacher age Years of teacher training Teacher reading score Teacher math scoreunder 40 2.06 502.8 500.4over 40 2.01 489.0 498.6
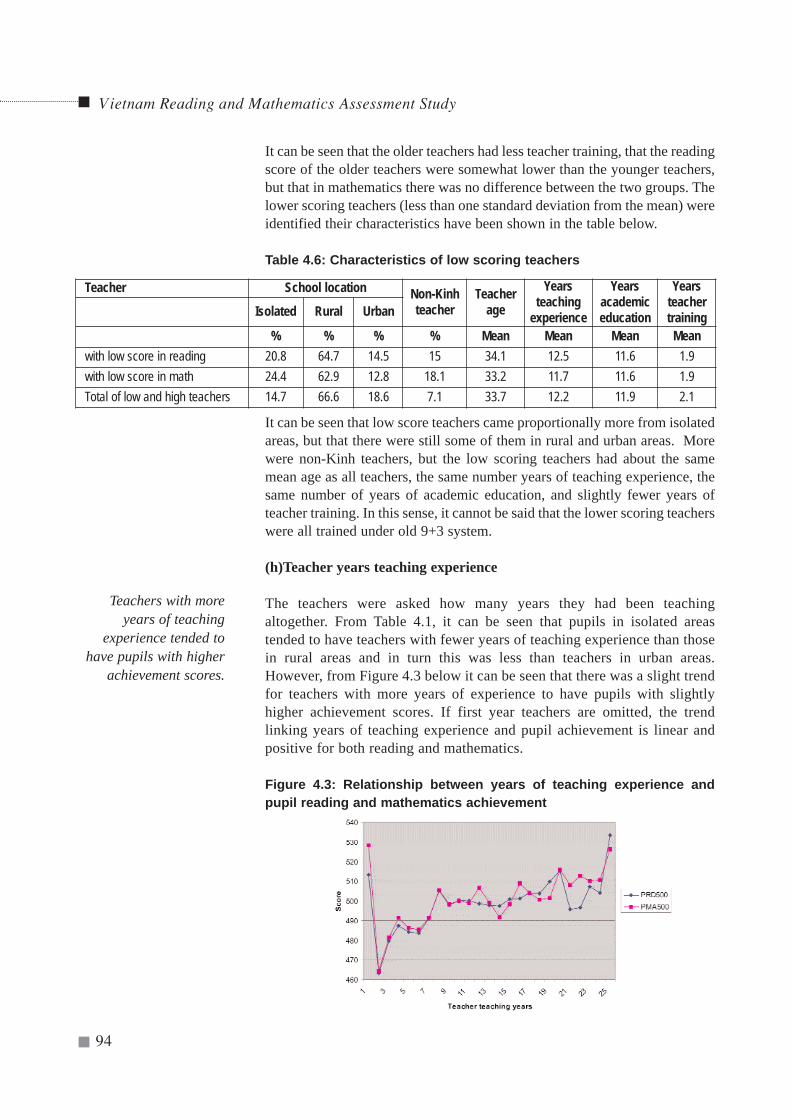
Vietnam Reading and Mathematics Assessment Study
94
It can be seen that the older teachers had less teacher training, that the readingscore of the older teachers were somewhat lower than the younger teachers,but that in mathematics there was no difference between the two groups. Thelower scoring teachers (less than one standard deviation from the mean) wereidentified their characteristics have been shown in the table below.
Table 4.6: Characteristics of low scoring teachers
It can be seen that low score teachers came proportionally more from isolatedareas, but that there were still some of them in rural and urban areas. Morewere non-Kinh teachers, but the low scoring teachers had about the samemean age as all teachers, the same number years of teaching experience, thesame number of years of academic education, and slightly fewer years ofteacher training. In this sense, it cannot be said that the lower scoring teacherswere all trained under old 9+3 system.
(h)Teacher years teaching experience
The teachers were asked how many years they had been teachingaltogether. From Table 4.1, it can be seen that pupils in isolated areastended to have teachers with fewer years of teaching experience than thosein rural areas and in turn this was less than teachers in urban areas.However, from Figure 4.3 below it can be seen that there was a slight trendfor teachers with more years of experience to have pupils with slightlyhigher achievement scores. If first year teachers are omitted, the trendlinking years of teaching experience and pupil achievement is linear andpositive for both reading and mathematics.
Figure 4.3: Relationship between years of teaching experience andpupil reading and mathematics achievement
Teacher School location Non-Kinhteacher
Teacherage
Yearsteaching
experience
Yearsacademiceducation
YearsteachertrainingIsolated Rural Urban
% % % % Mean Mean Mean Meanwith low score in reading 20.8 64.7 14.5 15 34.1 12.5 11.6 1.9with low score in math 24.4 62.9 12.8 18.1 33.2 11.7 11.6 1.9Total of low and high teachers 14.7 66.6 18.6 7.1 33.7 12.2 11.9 2.1
Teachers with moreyears of teaching
experience tended tohave pupils with higher
achievement scores.
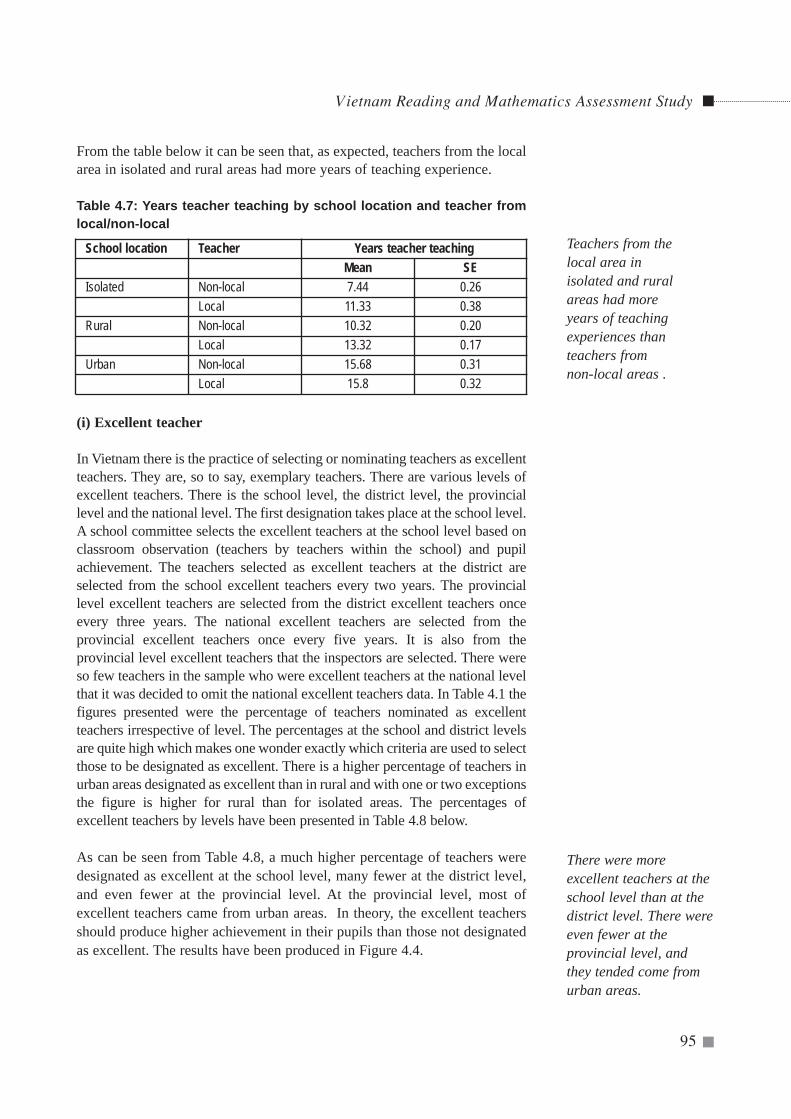
From the table below it can be seen that, as expected, teachers from the localarea in isolated and rural areas had more years of teaching experience.
Table 4.7: Years teacher teaching by school location and teacher fromlocal/non-local
(i) Excellent teacher
In Vietnam there is the practice of selecting or nominating teachers as excellentteachers. They are, so to say, exemplary teachers. There are various levels ofexcellent teachers. There is the school level, the district level, the provinciallevel and the national level. The first designation takes place at the school level.A school committee selects the excellent teachers at the school level based onclassroom observation (teachers by teachers within the school) and pupilachievement. The teachers selected as excellent teachers at the district areselected from the school excellent teachers every two years. The provinciallevel excellent teachers are selected from the district excellent teachers onceevery three years. The national excellent teachers are selected from theprovincial excellent teachers once every five years. It is also from theprovincial level excellent teachers that the inspectors are selected. There wereso few teachers in the sample who were excellent teachers at the national levelthat it was decided to omit the national excellent teachers data. In Table 4.1 thefigures presented were the percentage of teachers nominated as excellentteachers irrespective of level. The percentages at the school and district levelsare quite high which makes one wonder exactly which criteria are used to selectthose to be designated as excellent. There is a higher percentage of teachers inurban areas designated as excellent than in rural and with one or two exceptionsthe figure is higher for rural than for isolated areas. The percentages ofexcellent teachers by levels have been presented in Table 4.8 below.
As can be seen from Table 4.8, a much higher percentage of teachers weredesignated as excellent at the school level, many fewer at the district level,and even fewer at the provincial level. At the provincial level, most ofexcellent teachers came from urban areas. In theory, the excellent teachersshould produce higher achievement in their pupils than those not designatedas excellent. The results have been produced in Figure 4.4.
Vietnam Reading and Mathematics Assessment Study
95
Teachers from thelocal area inisolated and ruralareas had moreyears of teachingexperiences thanteachers fromnon-local areas .
School location Teacher Years teacher teachingMean SE
Isolated Non-local 7.44 0.26Local 11.33 0.38
Rural Non-local 10.32 0.20Local 13.32 0.17
Urban Non-local 15.68 0.31Local 15.8 0.32
There were moreexcellent teachers at theschool level than at thedistrict level. There wereeven fewer at theprovincial level, andthey tended come fromurban areas.
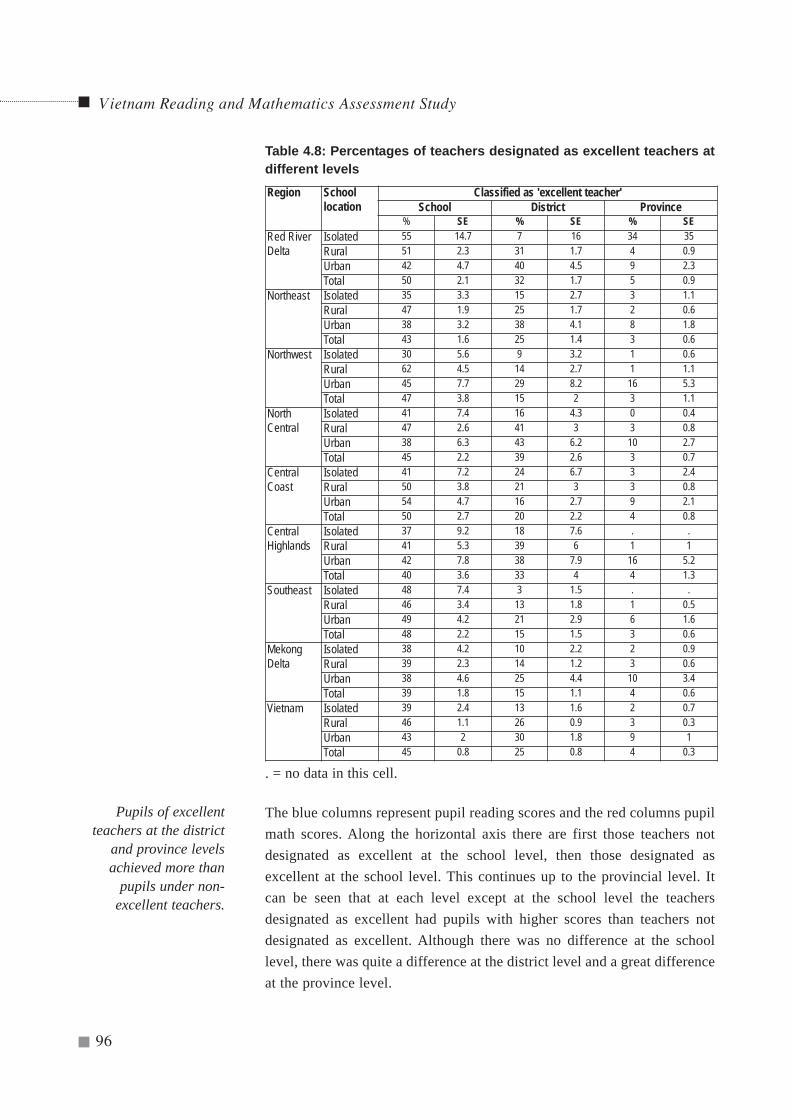
Vietnam Reading and Mathematics Assessment Study
96
The blue columns represent pupil reading scores and the red columns pupilmath scores. Along the horizontal axis there are first those teachers notdesignated as excellent at the school level, then those designated asexcellent at the school level. This continues up to the provincial level. Itcan be seen that at each level except at the school level the teachersdesignated as excellent had pupils with higher scores than teachers notdesignated as excellent. Although there was no difference at the schoollevel, there was quite a difference at the district level and a great differenceat the province level.
Region Schoollocation
Classified as 'excellent teacher'School District Province
% SE % SE % SERed RiverDelta
Isolated 55 14.7 7 16 34 35Rural 51 2.3 31 1.7 4 0.9Urban 42 4.7 40 4.5 9 2.3Total 50 2.1 32 1.7 5 0.9
Northeast Isolated 35 3.3 15 2.7 3 1.1Rural 47 1.9 25 1.7 2 0.6Urban 38 3.2 38 4.1 8 1.8Total 43 1.6 25 1.4 3 0.6
Northwest Isolated 30 5.6 9 3.2 1 0.6Rural 62 4.5 14 2.7 1 1.1Urban 45 7.7 29 8.2 16 5.3Total 47 3.8 15 2 3 1.1
NorthCentral
Isolated 41 7.4 16 4.3 0 0.4Rural 47 2.6 41 3 3 0.8Urban 38 6.3 43 6.2 10 2.7Total 45 2.2 39 2.6 3 0.7
CentralCoast
Isolated 41 7.2 24 6.7 3 2.4Rural 50 3.8 21 3 3 0.8Urban 54 4.7 16 2.7 9 2.1Total 50 2.7 20 2.2 4 0.8
CentralHighlands
Isolated 37 9.2 18 7.6 . .Rural 41 5.3 39 6 1 1Urban 42 7.8 38 7.9 16 5.2Total 40 3.6 33 4 4 1.3
Southeast Isolated 48 7.4 3 1.5 . .Rural 46 3.4 13 1.8 1 0.5Urban 49 4.2 21 2.9 6 1.6Total 48 2.2 15 1.5 3 0.6
MekongDelta
Isolated 38 4.2 10 2.2 2 0.9Rural 39 2.3 14 1.2 3 0.6Urban 38 4.6 25 4.4 10 3.4Total 39 1.8 15 1.1 4 0.6
Vietnam Isolated 39 2.4 13 1.6 2 0.7Rural 46 1.1 26 0.9 3 0.3Urban 43 2 30 1.8 9 1Total 45 0.8 25 0.8 4 0.3
Table 4.8: Percentages of teachers designated as excellent teachers atdifferent levels
. = no data in this cell.
Pupils of excellentteachers at the district
and province levelsachieved more than
pupils under non-excellent teachers.
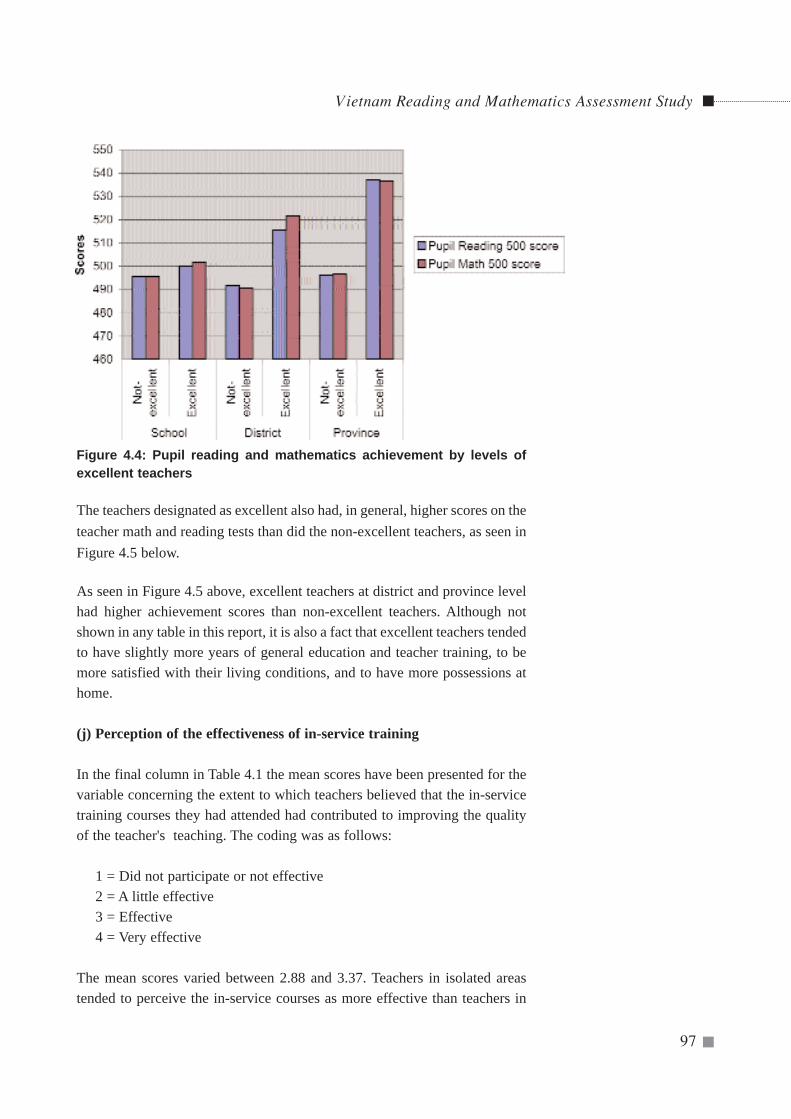
Vietnam Reading and Mathematics Assessment Study
97
The teachers designated as excellent also had, in general, higher scores on theteacher math and reading tests than did the non-excellent teachers, as seen inFigure 4.5 below.
As seen in Figure 4.5 above, excellent teachers at district and province levelhad higher achievement scores than non-excellent teachers. Although notshown in any table in this report, it is also a fact that excellent teachers tendedto have slightly more years of general education and teacher training, to bemore satisfied with their living conditions, and to have more possessions athome.
(j) Perception of the effectiveness of in-service training
In the final column in Table 4.1 the mean scores have been presented for thevariable concerning the extent to which teachers believed that the in-servicetraining courses they had attended had contributed to improving the qualityof the teacher's teaching. The coding was as follows:
1 = Did not participate or not effective2 = A little effective3 = Effective4 = Very effective
The mean scores varied between 2.88 and 3.37. Teachers in isolated areastended to perceive the in-service courses as more effective than teachers in
Figure 4.4: Pupil reading and mathematics achievement by levels ofexcellent teachers
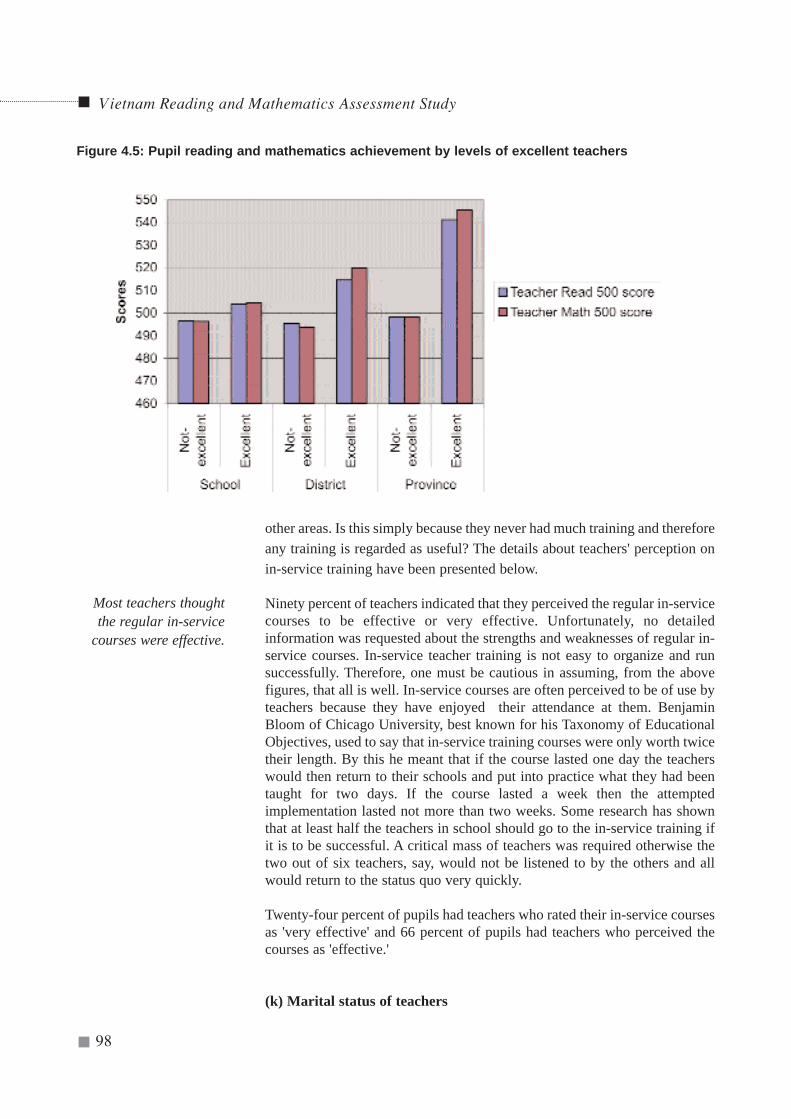
Vietnam Reading and Mathematics Assessment Study
98
Most teachers thoughtthe regular in-service
courses were effective.
other areas. Is this simply because they never had much training and thereforeany training is regarded as useful? The details about teachers' perception onin-service training have been presented below.
Ninety percent of teachers indicated that they perceived the regular in-servicecourses to be effective or very effective. Unfortunately, no detailedinformation was requested about the strengths and weaknesses of regular in-service courses. In-service teacher training is not easy to organize and runsuccessfully. Therefore, one must be cautious in assuming, from the abovefigures, that all is well. In-service courses are often perceived to be of use byteachers because they have enjoyed their attendance at them. BenjaminBloom of Chicago University, best known for his Taxonomy of EducationalObjectives, used to say that in-service training courses were only worth twicetheir length. By this he meant that if the course lasted one day the teacherswould then return to their schools and put into practice what they had beentaught for two days. If the course lasted a week then the attemptedimplementation lasted not more than two weeks. Some research has shownthat at least half the teachers in school should go to the in-service training ifit is to be successful. A critical mass of teachers was required otherwise thetwo out of six teachers, say, would not be listened to by the others and allwould return to the status quo very quickly.
Twenty-four percent of pupils had teachers who rated their in-service coursesas 'very effective' and 66 percent of pupils had teachers who perceived thecourses as 'effective.'
(k) Marital status of teachers
Figure 4.5: Pupil reading and mathematics achievement by levels of excellent teachers
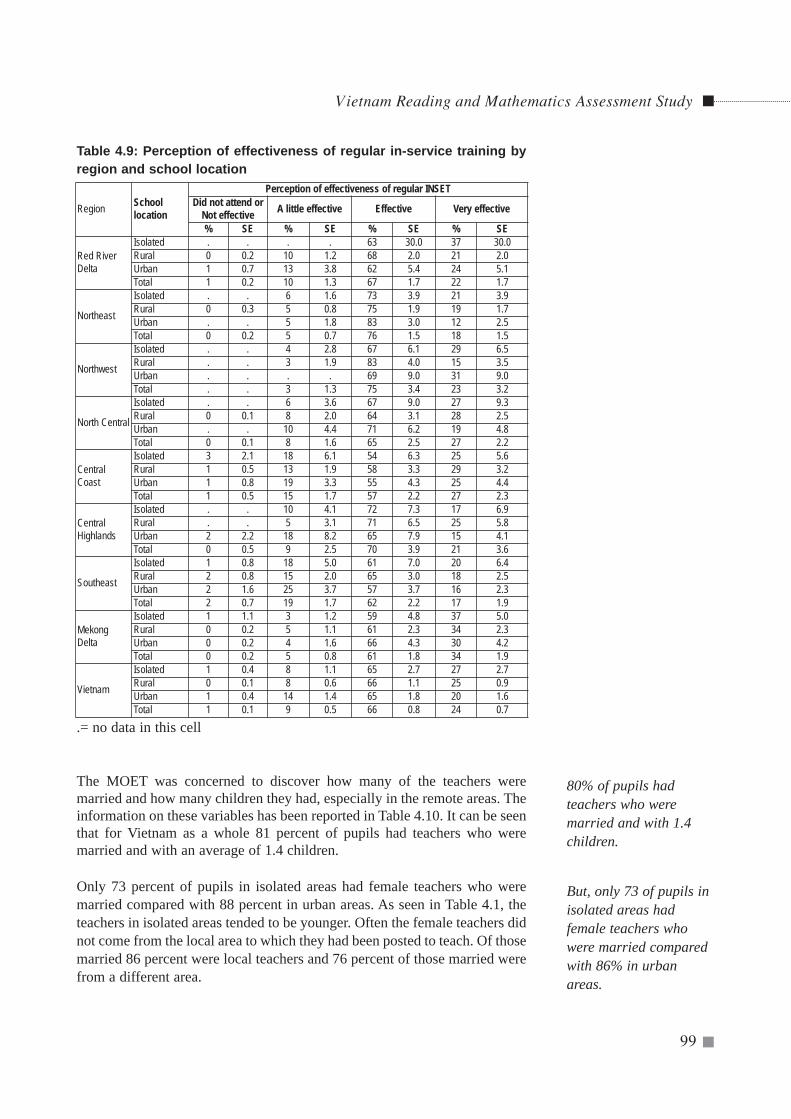
Vietnam Reading and Mathematics Assessment Study
99
The MOET was concerned to discover how many of the teachers weremarried and how many children they had, especially in the remote areas. Theinformation on these variables has been reported in Table 4.10. It can be seenthat for Vietnam as a whole 81 percent of pupils had teachers who weremarried and with an average of 1.4 children.
Only 73 percent of pupils in isolated areas had female teachers who weremarried compared with 88 percent in urban areas. As seen in Table 4.1, theteachers in isolated areas tended to be younger. Often the female teachers didnot come from the local area to which they had been posted to teach. Of thosemarried 86 percent were local teachers and 76 percent of those married werefrom a different area.
Region Schoollocation
Perception of effectiveness of regular INSETDid not attend or
Not effective A little effective Effective Very effective
% SE % SE % SE % SE
Red RiverDelta
Isolated . . . . 63 30.0 37 30.0Rural 0 0.2 10 1.2 68 2.0 21 2.0Urban 1 0.7 13 3.8 62 5.4 24 5.1Total 1 0.2 10 1.3 67 1.7 22 1.7
Northeast
Isolated . . 6 1.6 73 3.9 21 3.9Rural 0 0.3 5 0.8 75 1.9 19 1.7Urban . . 5 1.8 83 3.0 12 2.5Total 0 0.2 5 0.7 76 1.5 18 1.5
Northwest
Isolated . . 4 2.8 67 6.1 29 6.5Rural . . 3 1.9 83 4.0 15 3.5Urban . . . . 69 9.0 31 9.0Total . . 3 1.3 75 3.4 23 3.2
North Central
Isolated . . 6 3.6 67 9.0 27 9.3Rural 0 0.1 8 2.0 64 3.1 28 2.5Urban . . 10 4.4 71 6.2 19 4.8Total 0 0.1 8 1.6 65 2.5 27 2.2
CentralCoast
Isolated 3 2.1 18 6.1 54 6.3 25 5.6Rural 1 0.5 13 1.9 58 3.3 29 3.2Urban 1 0.8 19 3.3 55 4.3 25 4.4Total 1 0.5 15 1.7 57 2.2 27 2.3
CentralHighlands
Isolated . . 10 4.1 72 7.3 17 6.9Rural . . 5 3.1 71 6.5 25 5.8Urban 2 2.2 18 8.2 65 7.9 15 4.1Total 0 0.5 9 2.5 70 3.9 21 3.6
Southeast
Isolated 1 0.8 18 5.0 61 7.0 20 6.4Rural 2 0.8 15 2.0 65 3.0 18 2.5Urban 2 1.6 25 3.7 57 3.7 16 2.3Total 2 0.7 19 1.7 62 2.2 17 1.9
MekongDelta
Isolated 1 1.1 3 1.2 59 4.8 37 5.0Rural 0 0.2 5 1.1 61 2.3 34 2.3Urban 0 0.2 4 1.6 66 4.3 30 4.2Total 0 0.2 5 0.8 61 1.8 34 1.9
Vietnam
Isolated 1 0.4 8 1.1 65 2.7 27 2.7Rural 0 0.1 8 0.6 66 1.1 25 0.9Urban 1 0.4 14 1.4 65 1.8 20 1.6Total 1 0.1 9 0.5 66 0.8 24 0.7
Table 4.9: Perception of effectiveness of regular in-service training byregion and school location
.= no data in this cell
80% of pupils hadteachers who weremarried and with 1.4children.
But, only 73 of pupils inisolated areas hadfemale teachers whowere married comparedwith 86% in urbanareas.
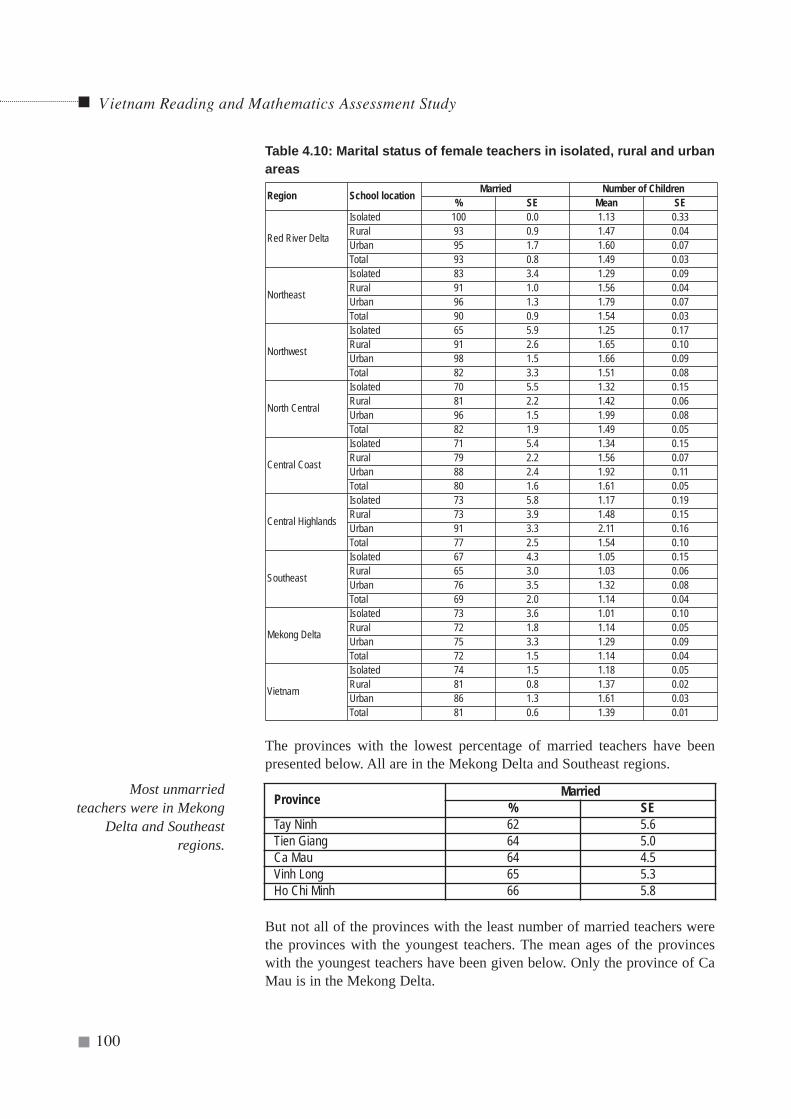
The provinces with the lowest percentage of married teachers have beenpresented below. All are in the Mekong Delta and Southeast regions.
But not all of the provinces with the least number of married teachers werethe provinces with the youngest teachers. The mean ages of the provinceswith the youngest teachers have been given below. Only the province of CaMau is in the Mekong Delta.
Vietnam Reading and Mathematics Assessment Study
100
Province Married% SE
Tay Ninh 62 5.6Tien Giang 64 5.0Ca Mau 64 4.5Vinh Long 65 5.3Ho Chi Minh 66 5.8
Region School location Married Number of Children% SE Mean SE
Red River Delta
Isolated 100 0.0 1.13 0.33Rural 93 0.9 1.47 0.04Urban 95 1.7 1.60 0.07Total 93 0.8 1.49 0.03
Northeast
Isolated 83 3.4 1.29 0.09Rural 91 1.0 1.56 0.04Urban 96 1.3 1.79 0.07Total 90 0.9 1.54 0.03
Northwest
Isolated 65 5.9 1.25 0.17Rural 91 2.6 1.65 0.10Urban 98 1.5 1.66 0.09Total 82 3.3 1.51 0.08
North Central
Isolated 70 5.5 1.32 0.15Rural 81 2.2 1.42 0.06Urban 96 1.5 1.99 0.08Total 82 1.9 1.49 0.05
Central Coast
Isolated 71 5.4 1.34 0.15Rural 79 2.2 1.56 0.07Urban 88 2.4 1.92 0.11Total 80 1.6 1.61 0.05
Central Highlands
Isolated 73 5.8 1.17 0.19Rural 73 3.9 1.48 0.15Urban 91 3.3 2.11 0.16Total 77 2.5 1.54 0.10
Southeast
Isolated 67 4.3 1.05 0.15Rural 65 3.0 1.03 0.06Urban 76 3.5 1.32 0.08Total 69 2.0 1.14 0.04
Mekong Delta
Isolated 73 3.6 1.01 0.10Rural 72 1.8 1.14 0.05Urban 75 3.3 1.29 0.09Total 72 1.5 1.14 0.04
Vietnam
Isolated 74 1.5 1.18 0.05Rural 81 0.8 1.37 0.02Urban 86 1.3 1.61 0.03Total 81 0.6 1.39 0.01
Table 4.10: Marital status of female teachers in isolated, rural and urbanareas
Most unmarriedteachers were in Mekong
Delta and Southeastregions.
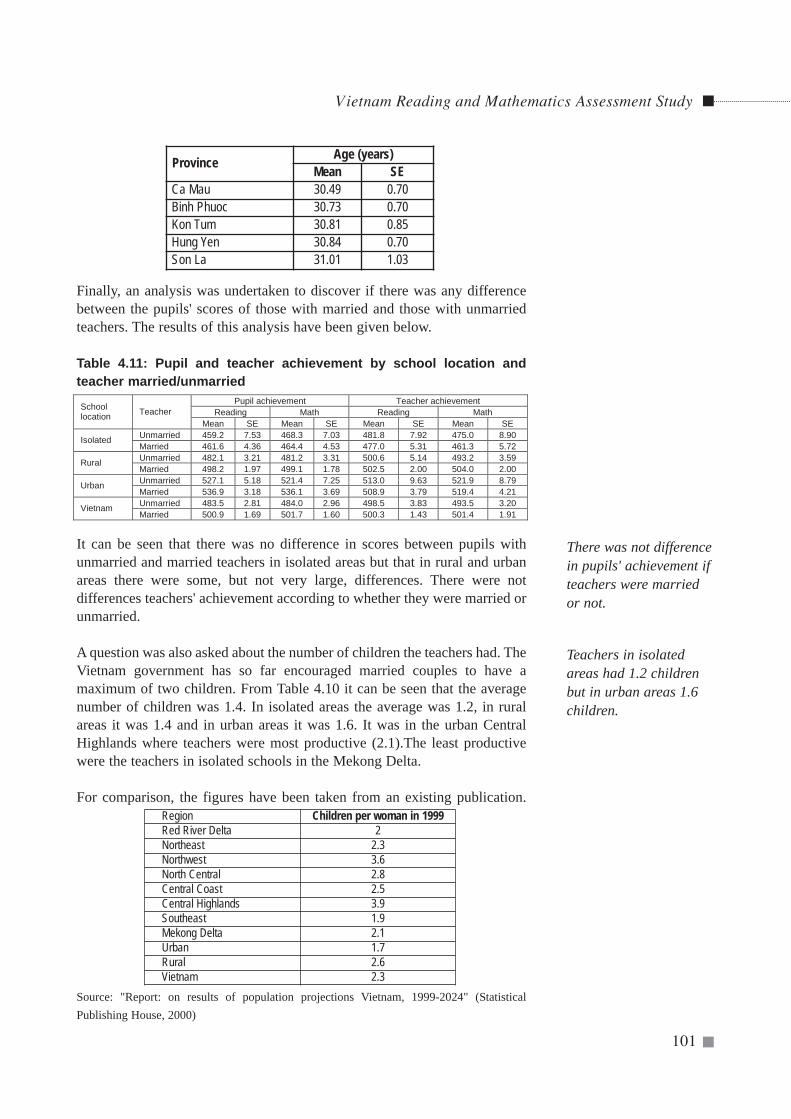
Finally, an analysis was undertaken to discover if there was any differencebetween the pupils' scores of those with married and those with unmarriedteachers. The results of this analysis have been given below.
Table 4.11: Pupil and teacher achievement by school location andteacher married/unmarried
It can be seen that there was no difference in scores between pupils withunmarried and married teachers in isolated areas but that in rural and urbanareas there were some, but not very large, differences. There were notdifferences teachers' achievement according to whether they were married orunmarried.
A question was also asked about the number of children the teachers had. TheVietnam government has so far encouraged married couples to have amaximum of two children. From Table 4.10 it can be seen that the averagenumber of children was 1.4. In isolated areas the average was 1.2, in ruralareas it was 1.4 and in urban areas it was 1.6. It was in the urban CentralHighlands where teachers were most productive (2.1).The least productivewere the teachers in isolated schools in the Mekong Delta.
For comparison, the figures have been taken from an existing publication.
Source: "Report: on results of population projections Vietnam, 1999-2024" (StatisticalPublishing House, 2000)
Vietnam Reading and Mathematics Assessment Study
101
Province Age (years)Mean SE
Ca Mau 30.49 0.70Binh Phuoc 30.73 0.70Kon Tum 30.81 0.85Hung Yen 30.84 0.70Son La 31.01 1.03
Teachers in isolatedareas had 1.2 childrenbut in urban areas 1.6children.
Pupil achievement Teacher achievement Reading Math Reading Math School
location Teacher Mean SE Mean SE Mean SE Mean SE
Unmarried 459.2 7.53 468.3 7.03 481.8 7.92 475.0 8.90 Isolated Married 461.6 4.36 464.4 4.53 477.0 5.31 461.3 5.72 Unmarried 482.1 3.21 481.2 3.31 500.6 5.14 493.2 3.59 Rural Married 498.2 1.97 499.1 1.78 502.5 2.00 504.0 2.00 Unmarried 527.1 5.18 521.4 7.25 513.0 9.63 521.9 8.79 Urban Married 536.9 3.18 536.1 3.69 508.9 3.79 519.4 4.21 Unmarried 483.5 2.81 484.0 2.96 498.5 3.83 493.5 3.20 Vietnam Married 500.9 1.69 501.7 1.60 500.3 1.43 501.4 1.91
There was not differencein pupils' achievement ifteachers were marriedor not.
Region Children per woman in 1999Red River Delta 2Northeast 2.3Northwest 3.6North Central 2.8Central Coast 2.5Central Highlands 3.9Southeast 1.9Mekong Delta 2.1Urban 1.7Rural 2.6Vietnam 2.3
Thus far, descriptions of the characteristics of teachers have been presented.In particular differences among regions and also between schools in isolated,rural and urban areas have been examined. As in most countries in the world,it was the urban areas where there were the 'better' teachers. In isolated areasof Vietnam, there were more male teachers, more younger and moreinexperienced teachers, teachers with fewer years of general education andalso teacher training (as well as having lower scores on the teacher math andreading tests), and fewer teachers designated as an excellent teacher. Thisimplies that when allocating teachers to schools the relevant authorities didnot take into account having equity in the quality of teachers across schools.
At present, the way in which a teacher obtains a post in a school is that upongraduating from a provincial teacher training college, he or she applies to adistrict office (or sometimes a provincial office) for a job. After an interviewand an examination, if the candidate is successful, he or she is allocated to aschool in that district (or province). As found in the data, this can lead toinequity in distribution of teachers across schools within a province. Therewould also appear to be inequity between provinces. This process should bereviewed with the aim of improving equity in teacher resources at school.One practice to consider is a point-gaining system used in several countries.If a teacher wishes to teach in an urban area or in a town or city, then he orshe must gain points to be able to do so. The more that they teache in isolatedand rural areas the more points they will gain in order to be able to be postedto an urban area.
There were two other aspects of schooling in Vietnam that stood out in whathas just been presented. The first concerned the non-difference betweenschool level excellent teachers and those who were not excellent teachers atthe school level. But, on the other hand the excellent teachers at the districtand provincial levels had much better results from their pupils than the non-excellent teachers at these two levels. The question must be asked about whatis going wrong at the designation stage at the school and national levels. TheMOET should look into this matter in some detail and suggest revisions tothe excellent teacher system. The primary teacher assessment criteria need tobe reviewed.
Finally, it was felt that the data on the teachers' perception of theeffectiveness of the current in-service training programs were inadequate andthat a special study should be conducted on the quality of in-service trainingprograms.
Vietnam Reading and Mathematics Assessment Study
102
There was inequity indistribution of teachers
to school. Urban schoolshad the "best" teachers
in terms of education,teacher training, and
subject matterknowledge. Isolatedschools had "worst"
teachers.
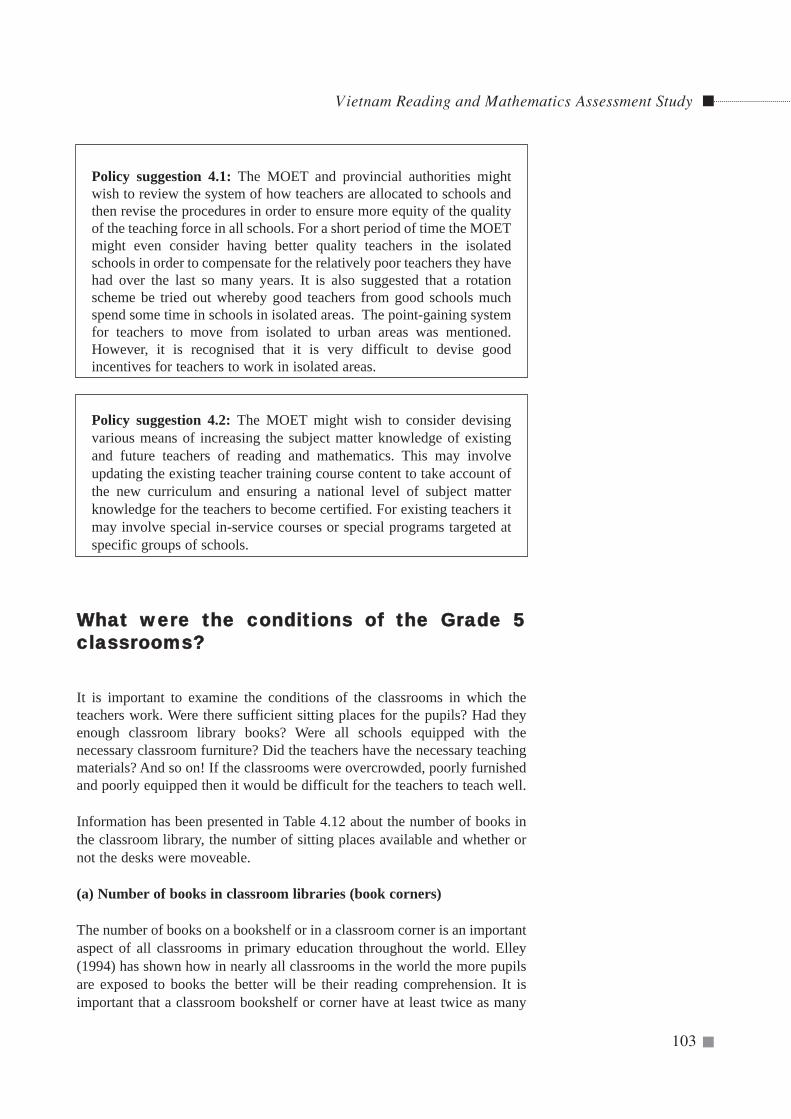
Vietnam Reading and Mathematics Assessment Study
103
Policy suggestion 4.1: The MOET and provincial authorities mightwish to review the system of how teachers are allocated to schools andthen revise the procedures in order to ensure more equity of the qualityof the teaching force in all schools. For a short period of time the MOETmight even consider having better quality teachers in the isolatedschools in order to compensate for the relatively poor teachers they havehad over the last so many years. It is also suggested that a rotationscheme be tried out whereby good teachers from good schools muchspend some time in schools in isolated areas. The point-gaining systemfor teachers to move from isolated to urban areas was mentioned.However, it is recognised that it is very difficult to devise goodincentives for teachers to work in isolated areas.
Policy suggestion 4.2: The MOET might wish to consider devisingvarious means of increasing the subject matter knowledge of existingand future teachers of reading and mathematics. This may involveupdating the existing teacher training course content to take account ofthe new curriculum and ensuring a national level of subject matterknowledge for the teachers to become certified. For existing teachers itmay involve special in-service courses or special programs targeted atspecific groups of schools.
WWhhaatt wweerree tthhee ccoonnddiittiioonnss ooff tthhee GGrraaddee 55ccllaassssrroooommss??
It is important to examine the conditions of the classrooms in which theteachers work. Were there sufficient sitting places for the pupils? Had theyenough classroom library books? Were all schools equipped with thenecessary classroom furniture? Did the teachers have the necessary teachingmaterials? And so on! If the classrooms were overcrowded, poorly furnishedand poorly equipped then it would be difficult for the teachers to teach well.
Information has been presented in Table 4.12 about the number of books inthe classroom library, the number of sitting places available and whether ornot the desks were moveable.
(a) Number of books in classroom libraries (book corners)
The number of books on a bookshelf or in a classroom corner is an importantaspect of all classrooms in primary education throughout the world. Elley(1994) has shown how in nearly all classrooms in the world the more pupilsare exposed to books the better will be their reading comprehension. It isimportant that a classroom bookshelf or corner have at least twice as many
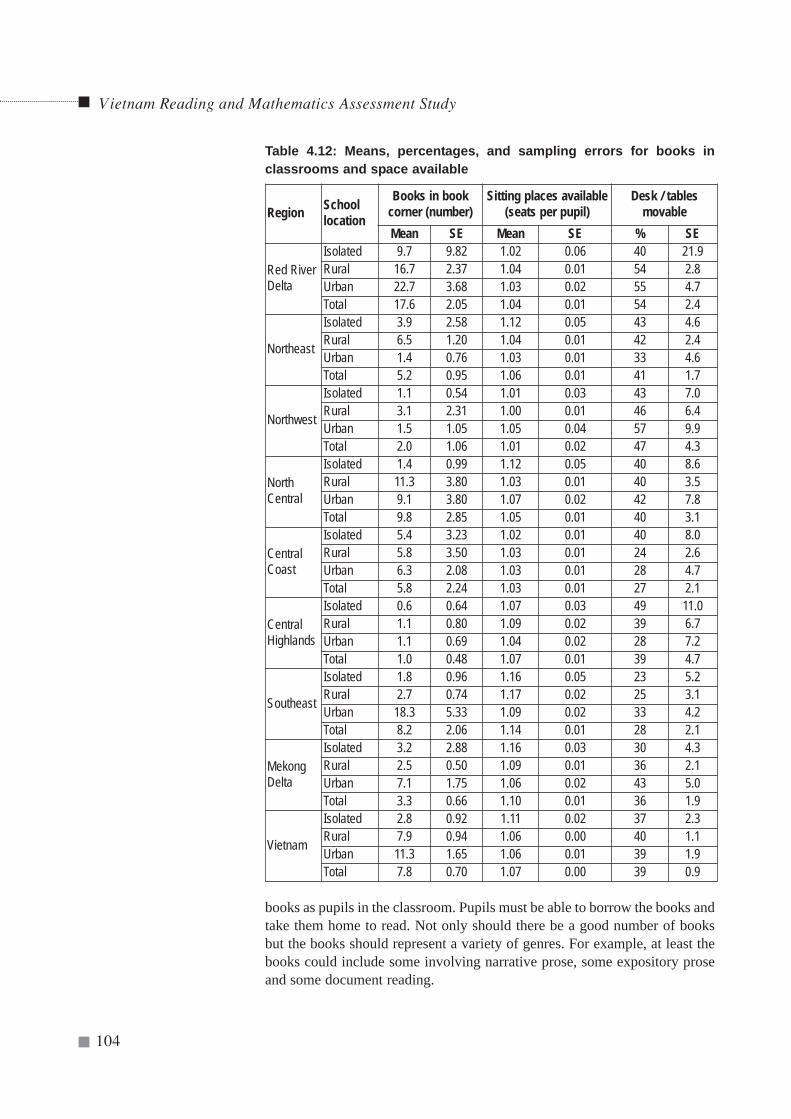
books as pupils in the classroom. Pupils must be able to borrow the books andtake them home to read. Not only should there be a good number of booksbut the books should represent a variety of genres. For example, at least thebooks could include some involving narrative prose, some expository proseand some document reading.
Vietnam Reading and Mathematics Assessment Study
104
Region Schoollocation
Books in bookcorner (number)
Sitting places available(seats per pupil)
Desk / tablesmovable
Mean SE Mean SE % SE
Red RiverDelta
Isolated 9.7 9.82 1.02 0.06 40 21.9Rural 16.7 2.37 1.04 0.01 54 2.8Urban 22.7 3.68 1.03 0.02 55 4.7Total 17.6 2.05 1.04 0.01 54 2.4
Northeast
Isolated 3.9 2.58 1.12 0.05 43 4.6Rural 6.5 1.20 1.04 0.01 42 2.4Urban 1.4 0.76 1.03 0.01 33 4.6Total 5.2 0.95 1.06 0.01 41 1.7
Northwest
Isolated 1.1 0.54 1.01 0.03 43 7.0Rural 3.1 2.31 1.00 0.01 46 6.4Urban 1.5 1.05 1.05 0.04 57 9.9Total 2.0 1.06 1.01 0.02 47 4.3
NorthCentral
Isolated 1.4 0.99 1.12 0.05 40 8.6Rural 11.3 3.80 1.03 0.01 40 3.5Urban 9.1 3.80 1.07 0.02 42 7.8Total 9.8 2.85 1.05 0.01 40 3.1
CentralCoast
Isolated 5.4 3.23 1.02 0.01 40 8.0Rural 5.8 3.50 1.03 0.01 24 2.6Urban 6.3 2.08 1.03 0.01 28 4.7Total 5.8 2.24 1.03 0.01 27 2.1
CentralHighlands
Isolated 0.6 0.64 1.07 0.03 49 11.0Rural 1.1 0.80 1.09 0.02 39 6.7Urban 1.1 0.69 1.04 0.02 28 7.2Total 1.0 0.48 1.07 0.01 39 4.7
Southeast
Isolated 1.8 0.96 1.16 0.05 23 5.2Rural 2.7 0.74 1.17 0.02 25 3.1Urban 18.3 5.33 1.09 0.02 33 4.2Total 8.2 2.06 1.14 0.01 28 2.1
MekongDelta
Isolated 3.2 2.88 1.16 0.03 30 4.3Rural 2.5 0.50 1.09 0.01 36 2.1Urban 7.1 1.75 1.06 0.02 43 5.0Total 3.3 0.66 1.10 0.01 36 1.9
Vietnam
Isolated 2.8 0.92 1.11 0.02 37 2.3Rural 7.9 0.94 1.06 0.00 40 1.1Urban 11.3 1.65 1.06 0.01 39 1.9Total 7.8 0.70 1.07 0.00 39 0.9
Table 4.12: Means, percentages, and sampling errors for books inclassrooms and space available
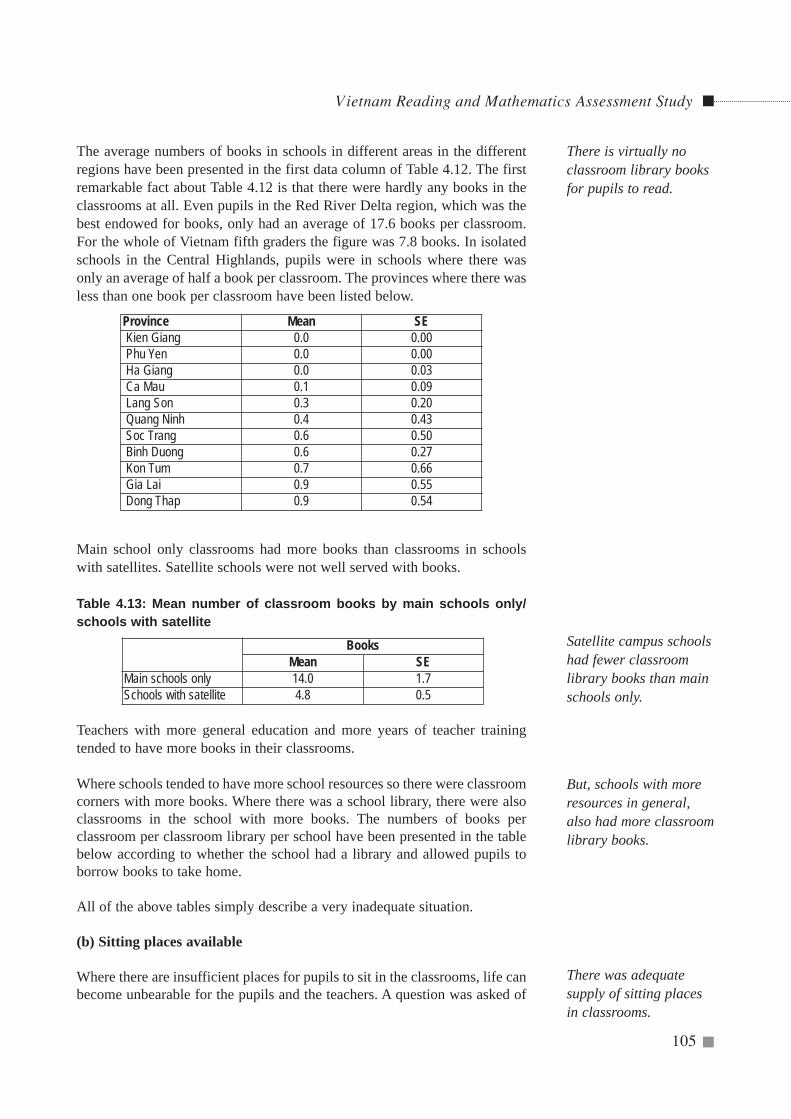
The average numbers of books in schools in different areas in the differentregions have been presented in the first data column of Table 4.12. The firstremarkable fact about Table 4.12 is that there were hardly any books in theclassrooms at all. Even pupils in the Red River Delta region, which was thebest endowed for books, only had an average of 17.6 books per classroom.For the whole of Vietnam fifth graders the figure was 7.8 books. In isolatedschools in the Central Highlands, pupils were in schools where there wasonly an average of half a book per classroom. The provinces where there wasless than one book per classroom have been listed below.
Main school only classrooms had more books than classrooms in schoolswith satellites. Satellite schools were not well served with books.
Table 4.13: Mean number of classroom books by main schools only/schools with satellite
Teachers with more general education and more years of teacher trainingtended to have more books in their classrooms.
Where schools tended to have more school resources so there were classroomcorners with more books. Where there was a school library, there were alsoclassrooms in the school with more books. The numbers of books perclassroom per classroom library per school have been presented in the tablebelow according to whether the school had a library and allowed pupils toborrow books to take home.
All of the above tables simply describe a very inadequate situation.
(b) Sitting places available
Where there are insufficient places for pupils to sit in the classrooms, life canbecome unbearable for the pupils and the teachers. A question was asked of
Vietnam Reading and Mathematics Assessment Study
105
There is virtually noclassroom library booksfor pupils to read.
Province Mean SEKien Giang 0.0 0.00Phu Yen 0.0 0.00Ha Giang 0.0 0.03Ca Mau 0.1 0.09Lang Son 0.3 0.20Quang Ninh 0.4 0.43Soc Trang 0.6 0.50Binh Duong 0.6 0.27Kon Tum 0.7 0.66Gia Lai 0.9 0.55Dong Thap 0.9 0.54
BooksMean SE
Main schools only 14.0 1.7Schools with satellite 4.8 0.5
Satellite campus schoolshad fewer classroomlibrary books than mainschools only.
But, schools with moreresources in general,also had more classroomlibrary books.
There was adequatesupply of sitting placesin classrooms.
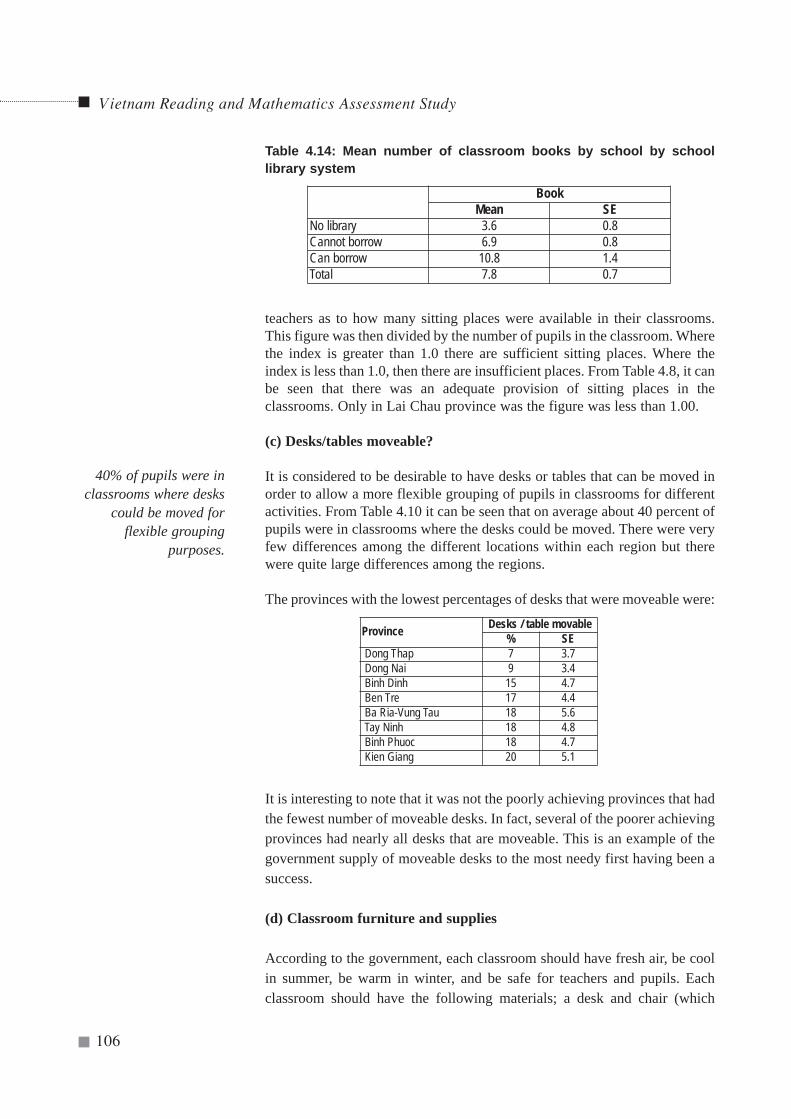
teachers as to how many sitting places were available in their classrooms.This figure was then divided by the number of pupils in the classroom. Wherethe index is greater than 1.0 there are sufficient sitting places. Where theindex is less than 1.0, then there are insufficient places. From Table 4.8, it canbe seen that there was an adequate provision of sitting places in theclassrooms. Only in Lai Chau province was the figure was less than 1.00.
(c) Desks/tables moveable?
It is considered to be desirable to have desks or tables that can be moved inorder to allow a more flexible grouping of pupils in classrooms for differentactivities. From Table 4.10 it can be seen that on average about 40 percent ofpupils were in classrooms where the desks could be moved. There were veryfew differences among the different locations within each region but therewere quite large differences among the regions.
The provinces with the lowest percentages of desks that were moveable were:
It is interesting to note that it was not the poorly achieving provinces that hadthe fewest number of moveable desks. In fact, several of the poorer achievingprovinces had nearly all desks that are moveable. This is an example of thegovernment supply of moveable desks to the most needy first having been asuccess.
(d) Classroom furniture and supplies
According to the government, each classroom should have fresh air, be coolin summer, be warm in winter, and be safe for teachers and pupils. Eachclassroom should have the following materials; a desk and chair (which
Vietnam Reading and Mathematics Assessment Study
106
BookMean SE
No library 3.6 0.8Cannot borrow 6.9 0.8Can borrow 10.8 1.4Total 7.8 0.7
40% of pupils were inclassrooms where desks
could be moved forflexible grouping
purposes.
Province Desks / table movable% SE
Dong Thap 7 3.7Dong Nai 9 3.4Binh Dinh 15 4.7Ben Tre 17 4.4Ba Ria-Vung Tau 18 5.6Tay Ninh 18 4.8Binh Phuoc 18 4.7Kien Giang 20 5.1
Table 4.14: Mean number of classroom books by school by schoollibrary system
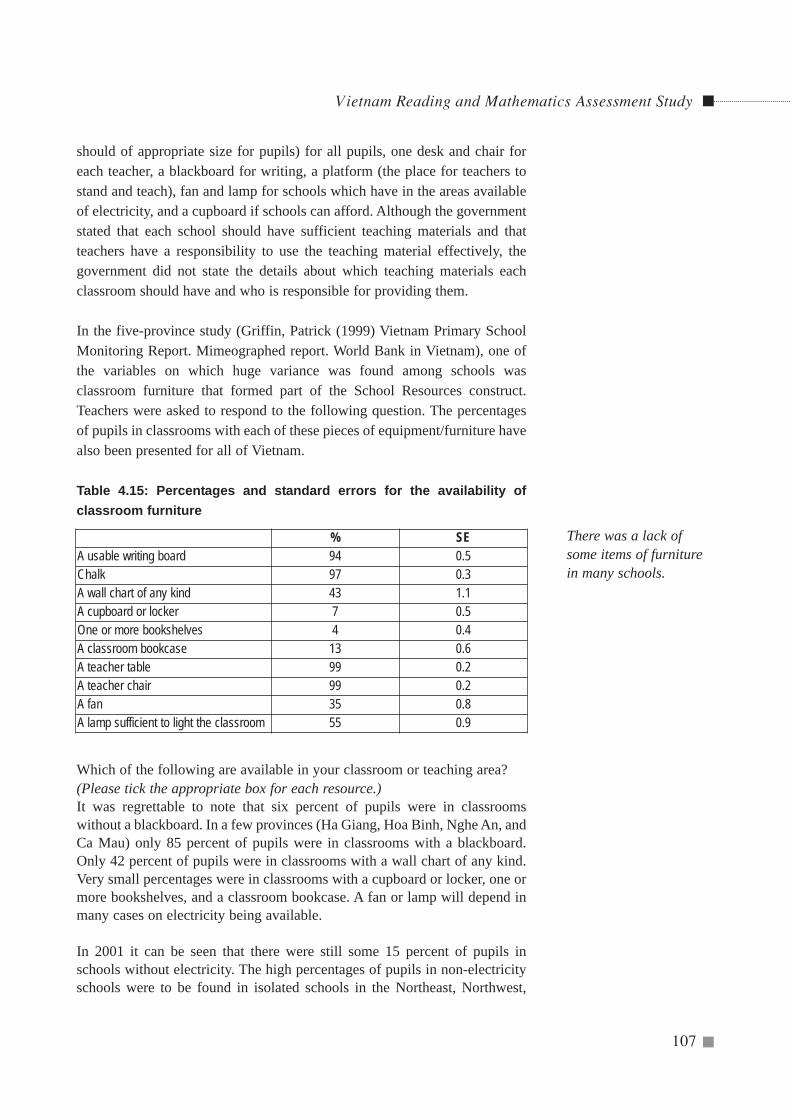
should of appropriate size for pupils) for all pupils, one desk and chair foreach teacher, a blackboard for writing, a platform (the place for teachers tostand and teach), fan and lamp for schools which have in the areas availableof electricity, and a cupboard if schools can afford. Although the governmentstated that each school should have sufficient teaching materials and thatteachers have a responsibility to use the teaching material effectively, thegovernment did not state the details about which teaching materials eachclassroom should have and who is responsible for providing them.
In the five-province study (Griffin, Patrick (1999) Vietnam Primary SchoolMonitoring Report. Mimeographed report. World Bank in Vietnam), one ofthe variables on which huge variance was found among schools wasclassroom furniture that formed part of the School Resources construct.Teachers were asked to respond to the following question. The percentagesof pupils in classrooms with each of these pieces of equipment/furniture havealso been presented for all of Vietnam.
Table 4.15: Percentages and standard errors for the availability ofclassroom furniture
Which of the following are available in your classroom or teaching area?(Please tick the appropriate box for each resource.)It was regrettable to note that six percent of pupils were in classroomswithout a blackboard. In a few provinces (Ha Giang, Hoa Binh, Nghe An, andCa Mau) only 85 percent of pupils were in classrooms with a blackboard.Only 42 percent of pupils were in classrooms with a wall chart of any kind.Very small percentages were in classrooms with a cupboard or locker, one ormore bookshelves, and a classroom bookcase. A fan or lamp will depend inmany cases on electricity being available.
In 2001 it can be seen that there were still some 15 percent of pupils inschools without electricity. The high percentages of pupils in non-electricityschools were to be found in isolated schools in the Northeast, Northwest,
Vietnam Reading and Mathematics Assessment Study
107
% SEA usable writing board 94 0.5Chalk 97 0.3A wall chart of any kind 43 1.1A cupboard or locker 7 0.5One or more bookshelves 4 0.4A classroom bookcase 13 0.6A teacher table 99 0.2A teacher chair 99 0.2A fan 35 0.8A lamp sufficient to light the classroom 55 0.9
There was a lack ofsome items of furniturein many schools.
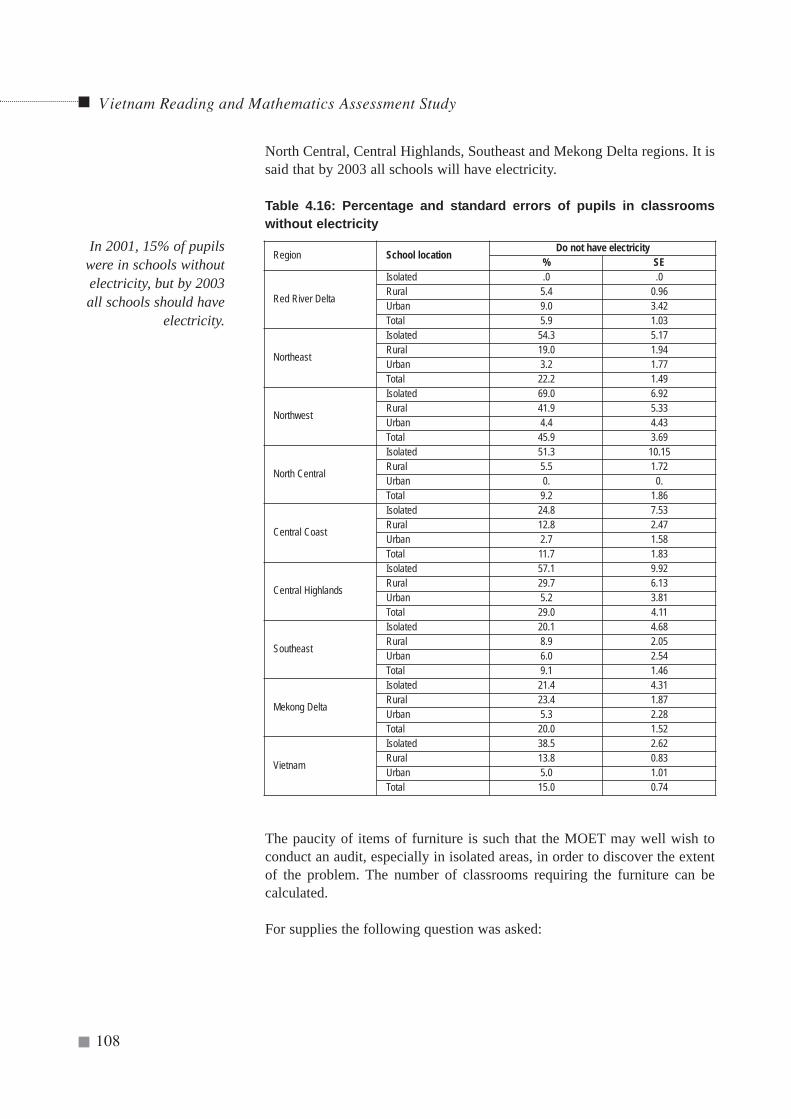
North Central, Central Highlands, Southeast and Mekong Delta regions. It issaid that by 2003 all schools will have electricity.
Table 4.16: Percentage and standard errors of pupils in classroomswithout electricity
The paucity of items of furniture is such that the MOET may well wish toconduct an audit, especially in isolated areas, in order to discover the extentof the problem. The number of classrooms requiring the furniture can becalculated.
For supplies the following question was asked:
Vietnam Reading and Mathematics Assessment Study
108
Region School location Do not have electricity% SE
Red River Delta
Isolated .0 .0Rural 5.4 0.96Urban 9.0 3.42Total 5.9 1.03
Northeast
Isolated 54.3 5.17Rural 19.0 1.94Urban 3.2 1.77Total 22.2 1.49
Northwest
Isolated 69.0 6.92Rural 41.9 5.33Urban 4.4 4.43Total 45.9 3.69
North Central
Isolated 51.3 10.15Rural 5.5 1.72Urban 0. 0.Total 9.2 1.86
Central Coast
Isolated 24.8 7.53Rural 12.8 2.47Urban 2.7 1.58Total 11.7 1.83
Central Highlands
Isolated 57.1 9.92Rural 29.7 6.13Urban 5.2 3.81Total 29.0 4.11
Southeast
Isolated 20.1 4.68Rural 8.9 2.05Urban 6.0 2.54Total 9.1 1.46
Mekong Delta
Isolated 21.4 4.31Rural 23.4 1.87Urban 5.3 2.28Total 20.0 1.52
Vietnam
Isolated 38.5 2.62Rural 13.8 0.83Urban 5.0 1.01Total 15.0 0.74
In 2001, 15% of pupilswere in schools withoutelectricity, but by 2003all schools should have
electricity.
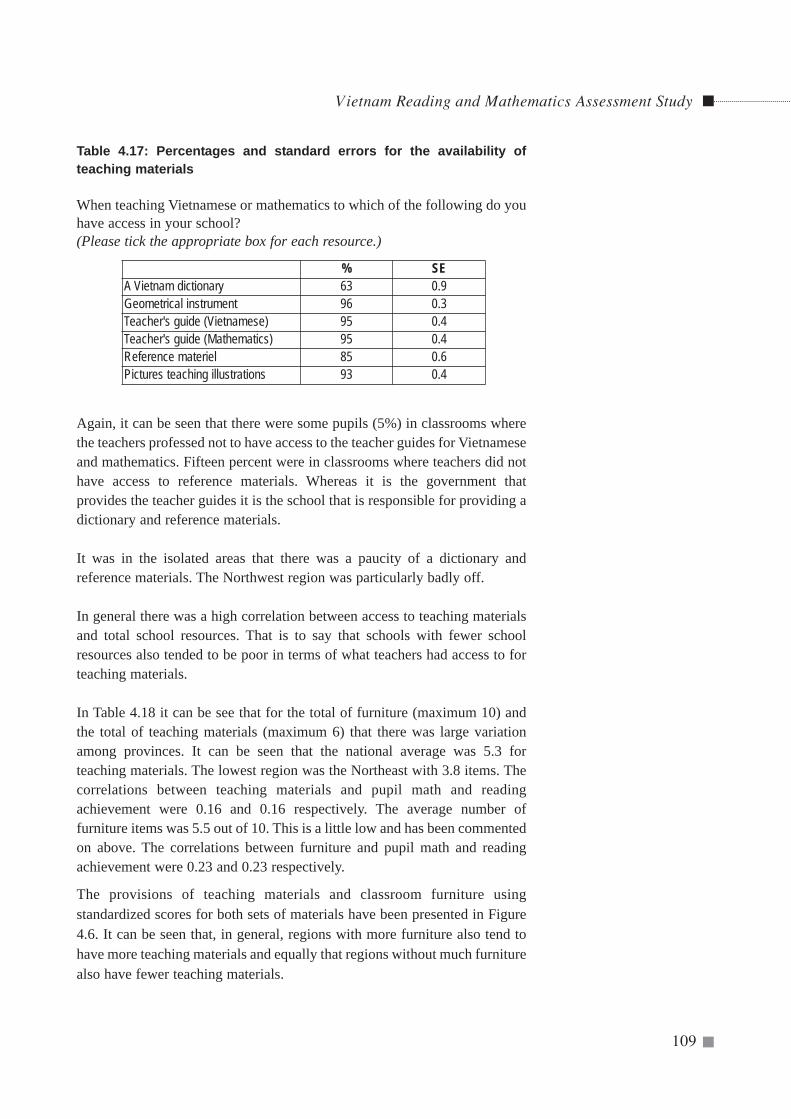
Vietnam Reading and Mathematics Assessment Study
109
Table 4.17: Percentages and standard errors for the availability ofteaching materials
When teaching Vietnamese or mathematics to which of the following do youhave access in your school?(Please tick the appropriate box for each resource.)
Again, it can be seen that there were some pupils (5%) in classrooms wherethe teachers professed not to have access to the teacher guides for Vietnameseand mathematics. Fifteen percent were in classrooms where teachers did nothave access to reference materials. Whereas it is the government thatprovides the teacher guides it is the school that is responsible for providing adictionary and reference materials.
It was in the isolated areas that there was a paucity of a dictionary andreference materials. The Northwest region was particularly badly off.
In general there was a high correlation between access to teaching materialsand total school resources. That is to say that schools with fewer schoolresources also tended to be poor in terms of what teachers had access to forteaching materials.
In Table 4.18 it can be see that for the total of furniture (maximum 10) andthe total of teaching materials (maximum 6) that there was large variationamong provinces. It can be seen that the national average was 5.3 forteaching materials. The lowest region was the Northeast with 3.8 items. Thecorrelations between teaching materials and pupil math and readingachievement were 0.16 and 0.16 respectively. The average number offurniture items was 5.5 out of 10. This is a little low and has been commentedon above. The correlations between furniture and pupil math and readingachievement were 0.23 and 0.23 respectively.
The provisions of teaching materials and classroom furniture usingstandardized scores for both sets of materials have been presented in Figure4.6. It can be seen that, in general, regions with more furniture also tend tohave more teaching materials and equally that regions without much furniturealso have fewer teaching materials.
% SEA Vietnam dictionary 63 0.9Geometrical instrument 96 0.3Teacher's guide (Vietnamese) 95 0.4Teacher's guide (Mathematics) 95 0.4Reference materiel 85 0.6Pictures teaching illustrations 93 0.4
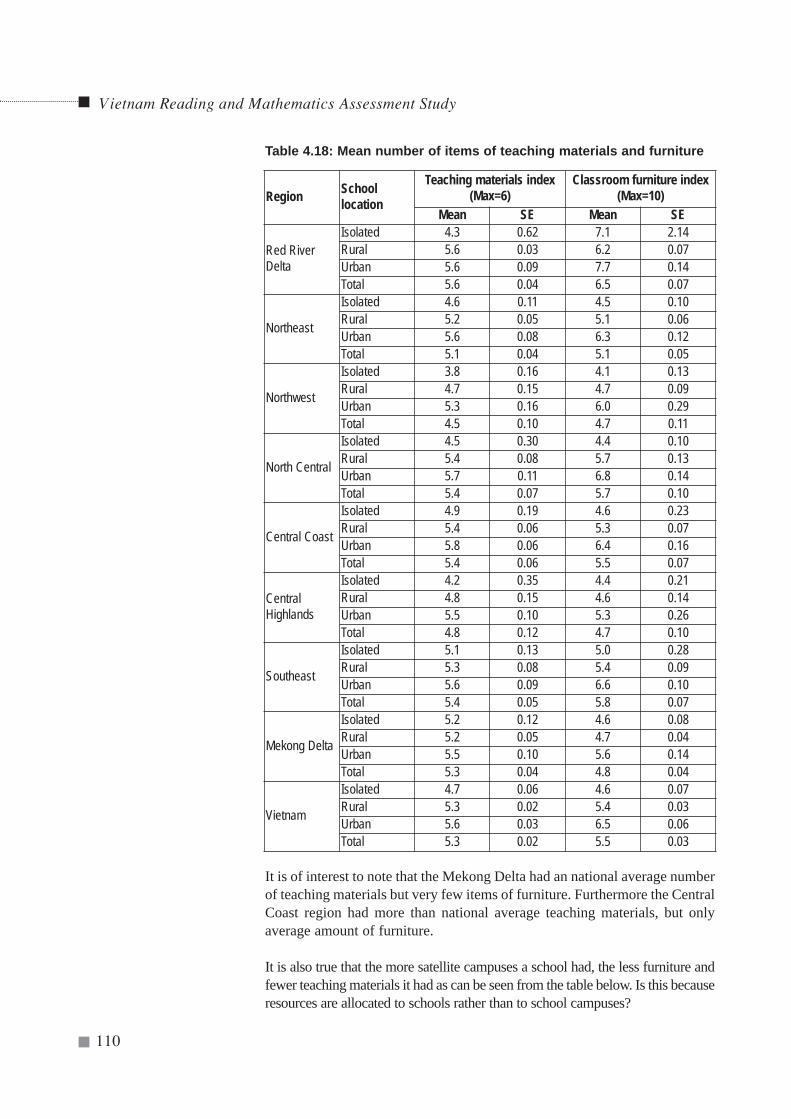
It is of interest to note that the Mekong Delta had an national average numberof teaching materials but very few items of furniture. Furthermore the CentralCoast region had more than national average teaching materials, but onlyaverage amount of furniture.
It is also true that the more satellite campuses a school had, the less furniture andfewer teaching materials it had as can be seen from the table below. Is this becauseresources are allocated to schools rather than to school campuses?
Vietnam Reading and Mathematics Assessment Study
110
Region Schoollocation
Teaching materials index(Max=6)
Classroom furniture index(Max=10)
Mean SE Mean SE
Red RiverDelta
Isolated 4.3 0.62 7.1 2.14Rural 5.6 0.03 6.2 0.07Urban 5.6 0.09 7.7 0.14Total 5.6 0.04 6.5 0.07
Northeast
Isolated 4.6 0.11 4.5 0.10Rural 5.2 0.05 5.1 0.06Urban 5.6 0.08 6.3 0.12Total 5.1 0.04 5.1 0.05
Northwest
Isolated 3.8 0.16 4.1 0.13Rural 4.7 0.15 4.7 0.09Urban 5.3 0.16 6.0 0.29Total 4.5 0.10 4.7 0.11
North Central
Isolated 4.5 0.30 4.4 0.10Rural 5.4 0.08 5.7 0.13Urban 5.7 0.11 6.8 0.14Total 5.4 0.07 5.7 0.10
Central Coast
Isolated 4.9 0.19 4.6 0.23Rural 5.4 0.06 5.3 0.07Urban 5.8 0.06 6.4 0.16Total 5.4 0.06 5.5 0.07
CentralHighlands
Isolated 4.2 0.35 4.4 0.21Rural 4.8 0.15 4.6 0.14Urban 5.5 0.10 5.3 0.26Total 4.8 0.12 4.7 0.10
Southeast
Isolated 5.1 0.13 5.0 0.28Rural 5.3 0.08 5.4 0.09Urban 5.6 0.09 6.6 0.10Total 5.4 0.05 5.8 0.07
Mekong Delta
Isolated 5.2 0.12 4.6 0.08Rural 5.2 0.05 4.7 0.04Urban 5.5 0.10 5.6 0.14Total 5.3 0.04 4.8 0.04
Vietnam
Isolated 4.7 0.06 4.6 0.07Rural 5.3 0.02 5.4 0.03Urban 5.6 0.03 6.5 0.06Total 5.3 0.02 5.5 0.03
Table 4.18: Mean number of items of teaching materials and furniture
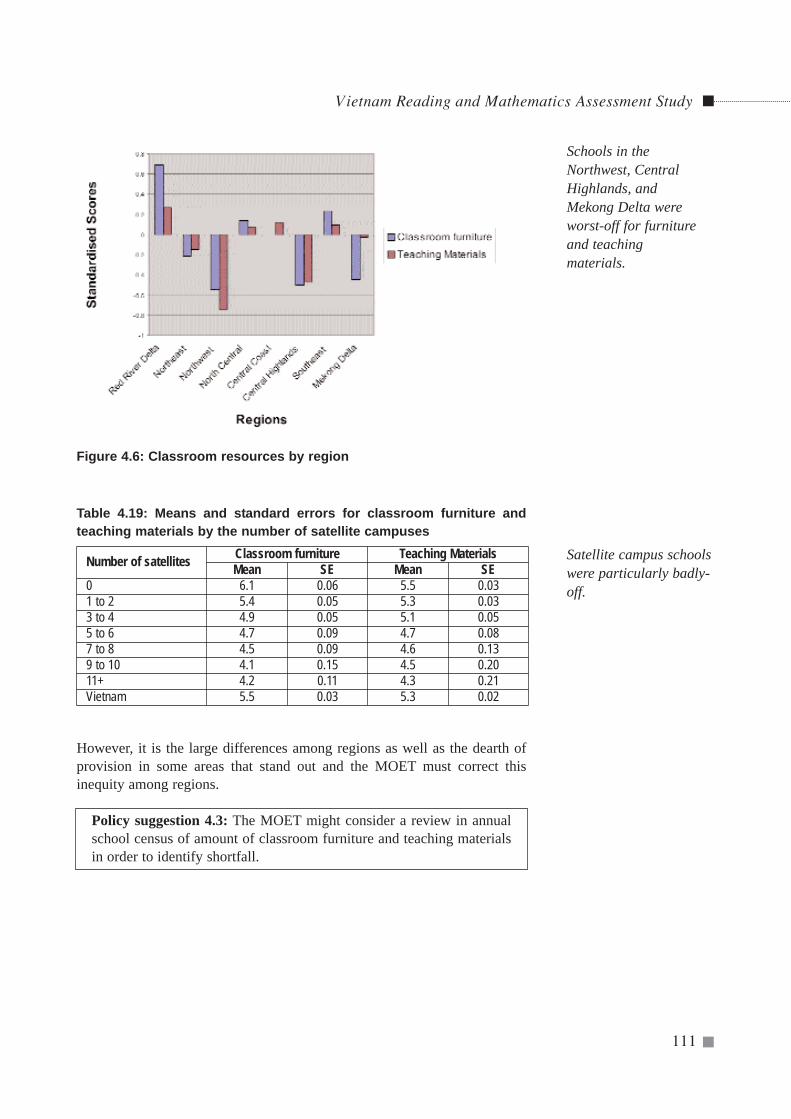
Vietnam Reading and Mathematics Assessment Study
111
Table 4.19: Means and standard errors for classroom furniture andteaching materials by the number of satellite campuses
However, it is the large differences among regions as well as the dearth ofprovision in some areas that stand out and the MOET must correct thisinequity among regions.
Policy suggestion 4.3: The MOET might consider a review in annualschool census of amount of classroom furniture and teaching materialsin order to identify shortfall.
Schools in theNorthwest, CentralHighlands, andMekong Delta wereworst-off for furnitureand teachingmaterials.
Number of satellites Classroom furniture Teaching MaterialsMean SE Mean SE
0 6.1 0.06 5.5 0.031 to 2 5.4 0.05 5.3 0.033 to 4 4.9 0.05 5.1 0.055 to 6 4.7 0.09 4.7 0.087 to 8 4.5 0.09 4.6 0.139 to 10 4.1 0.15 4.5 0.2011+ 4.2 0.11 4.3 0.21Vietnam 5.5 0.03 5.3 0.02
Figure 4.6: Classroom resources by region
Satellite campus schoolswere particularly badly-off.
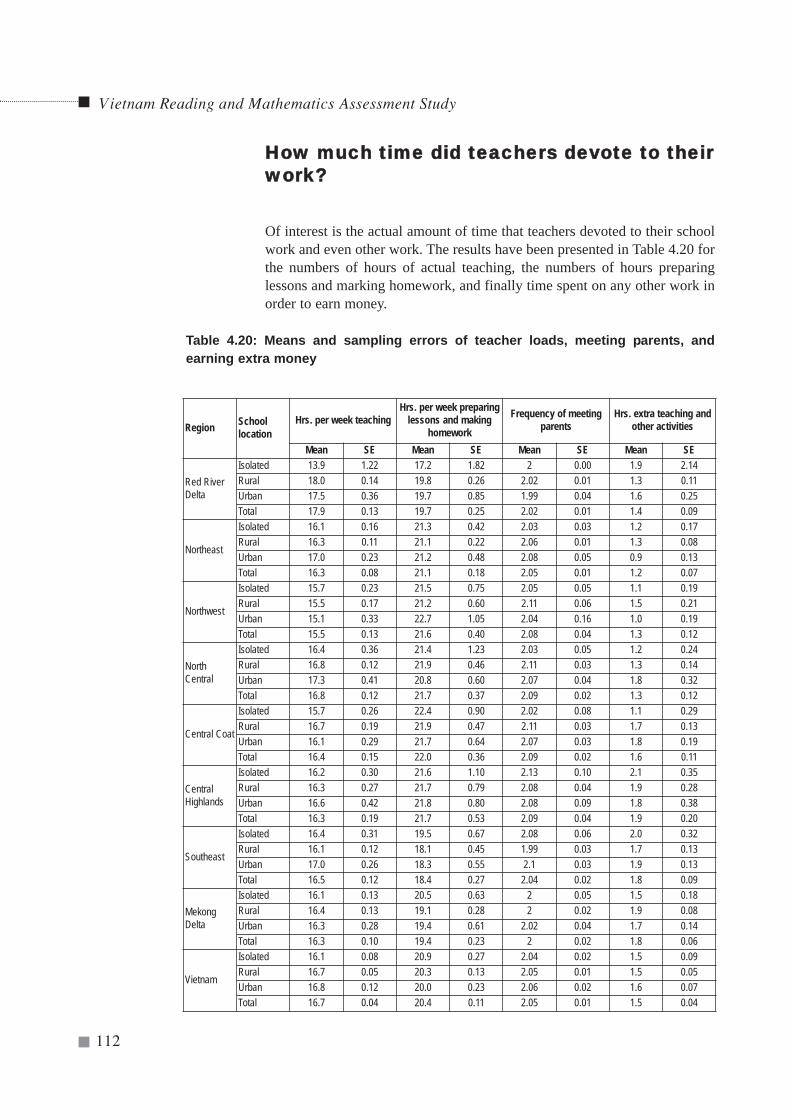
HHooww mmuucchh ttiimmee ddiidd tteeaacchheerrss ddeevvoottee ttoo tthheeiirrwwoorrkk??
Of interest is the actual amount of time that teachers devoted to their schoolwork and even other work. The results have been presented in Table 4.20 forthe numbers of hours of actual teaching, the numbers of hours preparinglessons and marking homework, and finally time spent on any other work inorder to earn money.
Vietnam Reading and Mathematics Assessment Study
112
Region Schoollocation
Hrs. per week teachingHrs. per week preparing
lessons and makinghomework
Frequency of meetingparents
Hrs. extra teaching andother activities
Mean SE Mean SE Mean SE Mean SE
Red RiverDelta
Isolated 13.9 1.22 17.2 1.82 2 0.00 1.9 2.14Rural 18.0 0.14 19.8 0.26 2.02 0.01 1.3 0.11Urban 17.5 0.36 19.7 0.85 1.99 0.04 1.6 0.25Total 17.9 0.13 19.7 0.25 2.02 0.01 1.4 0.09
Northeast
Isolated 16.1 0.16 21.3 0.42 2.03 0.03 1.2 0.17Rural 16.3 0.11 21.1 0.22 2.06 0.01 1.3 0.08Urban 17.0 0.23 21.2 0.48 2.08 0.05 0.9 0.13Total 16.3 0.08 21.1 0.18 2.05 0.01 1.2 0.07
Northwest
Isolated 15.7 0.23 21.5 0.75 2.05 0.05 1.1 0.19Rural 15.5 0.17 21.2 0.60 2.11 0.06 1.5 0.21Urban 15.1 0.33 22.7 1.05 2.04 0.16 1.0 0.19Total 15.5 0.13 21.6 0.40 2.08 0.04 1.3 0.12
NorthCentral
Isolated 16.4 0.36 21.4 1.23 2.03 0.05 1.2 0.24Rural 16.8 0.12 21.9 0.46 2.11 0.03 1.3 0.14Urban 17.3 0.41 20.8 0.60 2.07 0.04 1.8 0.32Total 16.8 0.12 21.7 0.37 2.09 0.02 1.3 0.12
Central Coat
Isolated 15.7 0.26 22.4 0.90 2.02 0.08 1.1 0.29Rural 16.7 0.19 21.9 0.47 2.11 0.03 1.7 0.13Urban 16.1 0.29 21.7 0.64 2.07 0.03 1.8 0.19Total 16.4 0.15 22.0 0.36 2.09 0.02 1.6 0.11
CentralHighlands
Isolated 16.2 0.30 21.6 1.10 2.13 0.10 2.1 0.35Rural 16.3 0.27 21.7 0.79 2.08 0.04 1.9 0.28Urban 16.6 0.42 21.8 0.80 2.08 0.09 1.8 0.38Total 16.3 0.19 21.7 0.53 2.09 0.04 1.9 0.20
Southeast
Isolated 16.4 0.31 19.5 0.67 2.08 0.06 2.0 0.32Rural 16.1 0.12 18.1 0.45 1.99 0.03 1.7 0.13Urban 17.0 0.26 18.3 0.55 2.1 0.03 1.9 0.13Total 16.5 0.12 18.4 0.27 2.04 0.02 1.8 0.09
MekongDelta
Isolated 16.1 0.13 20.5 0.63 2 0.05 1.5 0.18Rural 16.4 0.13 19.1 0.28 2 0.02 1.9 0.08Urban 16.3 0.28 19.4 0.61 2.02 0.04 1.7 0.14Total 16.3 0.10 19.4 0.23 2 0.02 1.8 0.06
Vietnam
Isolated 16.1 0.08 20.9 0.27 2.04 0.02 1.5 0.09Rural 16.7 0.05 20.3 0.13 2.05 0.01 1.5 0.05Urban 16.8 0.12 20.0 0.23 2.06 0.02 1.6 0.07Total 16.7 0.04 20.4 0.11 2.05 0.01 1.5 0.04
Table 4.20: Means and sampling errors of teacher loads, meeting parents, andearning extra money
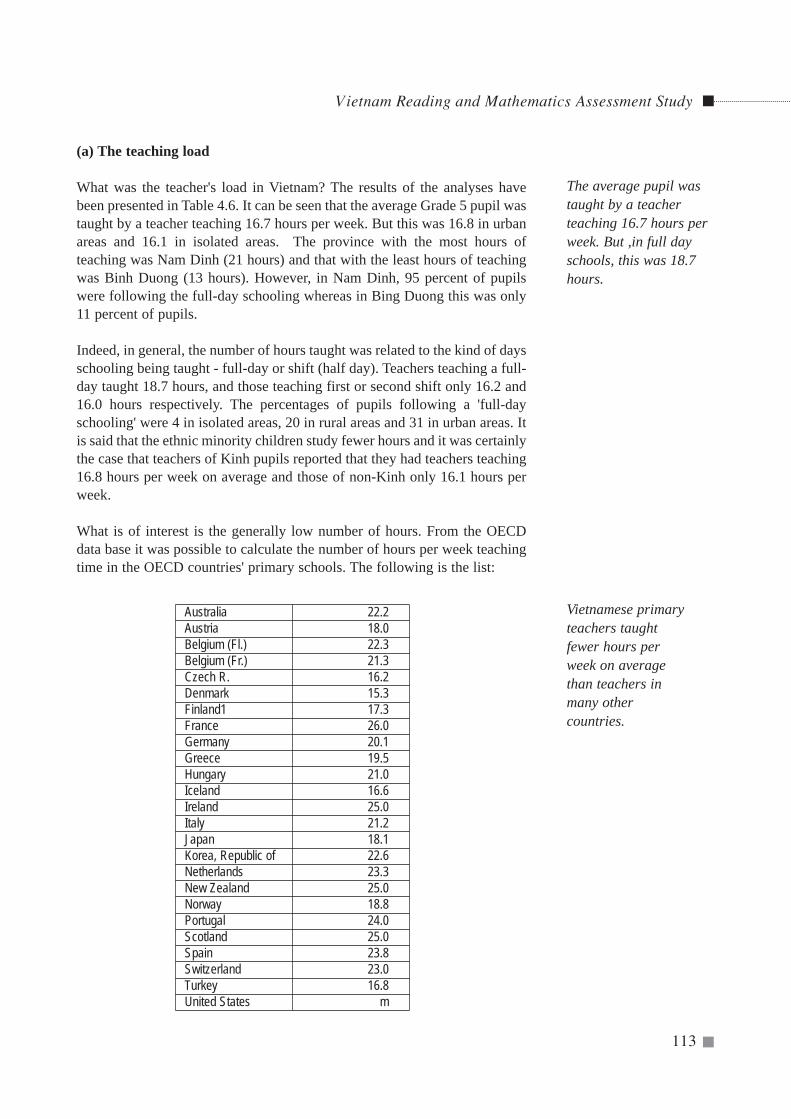
(a) The teaching load
What was the teacher's load in Vietnam? The results of the analyses havebeen presented in Table 4.6. It can be seen that the average Grade 5 pupil wastaught by a teacher teaching 16.7 hours per week. But this was 16.8 in urbanareas and 16.1 in isolated areas. The province with the most hours ofteaching was Nam Dinh (21 hours) and that with the least hours of teachingwas Binh Duong (13 hours). However, in Nam Dinh, 95 percent of pupilswere following the full-day schooling whereas in Bing Duong this was only11 percent of pupils.
Indeed, in general, the number of hours taught was related to the kind of daysschooling being taught - full-day or shift (half day). Teachers teaching a full-day taught 18.7 hours, and those teaching first or second shift only 16.2 and16.0 hours respectively. The percentages of pupils following a 'full-dayschooling' were 4 in isolated areas, 20 in rural areas and 31 in urban areas. Itis said that the ethnic minority children study fewer hours and it was certainlythe case that teachers of Kinh pupils reported that they had teachers teaching16.8 hours per week on average and those of non-Kinh only 16.1 hours perweek.
What is of interest is the generally low number of hours. From the OECDdata base it was possible to calculate the number of hours per week teachingtime in the OECD countries' primary schools. The following is the list:
Vietnam Reading and Mathematics Assessment Study
113
Australia 22.2Austria 18.0Belgium (Fl.) 22.3Belgium (Fr.) 21.3Czech R. 16.2Denmark 15.3Finland1 17.3France 26.0Germany 20.1Greece 19.5Hungary 21.0Iceland 16.6Ireland 25.0Italy 21.2Japan 18.1Korea, Republic of 22.6Netherlands 23.3New Zealand 25.0Norway 18.8Portugal 24.0Scotland 25.0Spain 23.8Switzerland 23.0Turkey 16.8United States m
Vietnamese primaryteachers taughtfewer hours perweek on averagethan teachers inmany othercountries.
The average pupil wastaught by a teacherteaching 16.7 hours perweek. But ,in full dayschools, this was 18.7hours.
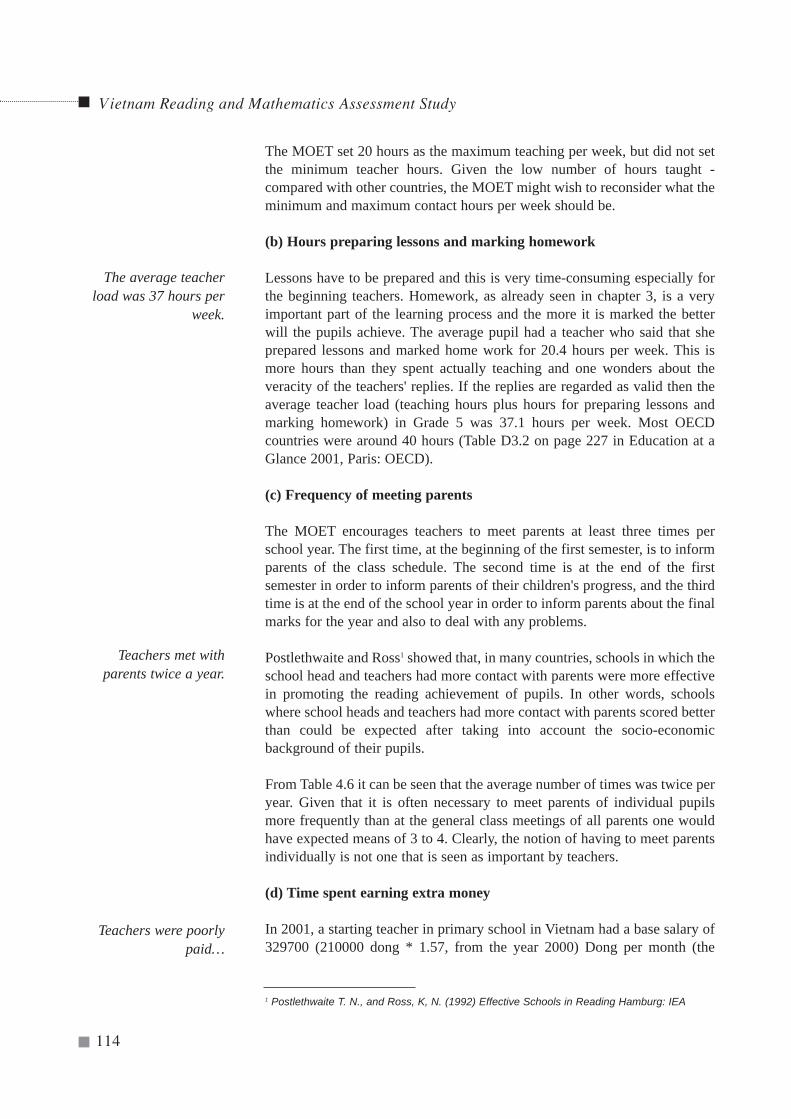
The MOET set 20 hours as the maximum teaching per week, but did not setthe minimum teacher hours. Given the low number of hours taught -compared with other countries, the MOET might wish to reconsider what theminimum and maximum contact hours per week should be.
(b) Hours preparing lessons and marking homework
Lessons have to be prepared and this is very time-consuming especially forthe beginning teachers. Homework, as already seen in chapter 3, is a veryimportant part of the learning process and the more it is marked the betterwill the pupils achieve. The average pupil had a teacher who said that sheprepared lessons and marked home work for 20.4 hours per week. This ismore hours than they spent actually teaching and one wonders about theveracity of the teachers' replies. If the replies are regarded as valid then theaverage teacher load (teaching hours plus hours for preparing lessons andmarking homework) in Grade 5 was 37.1 hours per week. Most OECDcountries were around 40 hours (Table D3.2 on page 227 in Education at aGlance 2001, Paris: OECD).
(c) Frequency of meeting parents
The MOET encourages teachers to meet parents at least three times perschool year. The first time, at the beginning of the first semester, is to informparents of the class schedule. The second time is at the end of the firstsemester in order to inform parents of their children's progress, and the thirdtime is at the end of the school year in order to inform parents about the finalmarks for the year and also to deal with any problems.
Postlethwaite and Ross1 showed that, in many countries, schools in which theschool head and teachers had more contact with parents were more effectivein promoting the reading achievement of pupils. In other words, schoolswhere school heads and teachers had more contact with parents scored betterthan could be expected after taking into account the socio-economicbackground of their pupils.
From Table 4.6 it can be seen that the average number of times was twice peryear. Given that it is often necessary to meet parents of individual pupilsmore frequently than at the general class meetings of all parents one wouldhave expected means of 3 to 4. Clearly, the notion of having to meet parentsindividually is not one that is seen as important by teachers.
(d) Time spent earning extra money
In 2001, a starting teacher in primary school in Vietnam had a base salary of329700 (210000 dong * 1.57, from the year 2000) Dong per month (the
Vietnam Reading and Mathematics Assessment Study
114
The average teacherload was 37 hours per
week.
Teachers met withparents twice a year.
Teachers were poorlypaid…
1 Postlethwaite T. N., and Ross, K, N. (1992) Effective Schools in Reading Hamburg: IEA
multiplier number 1.57 is for the beginning teachers. This multiplier numberincreases according to the years of teacher teaching). The equivalent in USdollars is 22 (US$1=15000dong in June 2002). The average per capitaincome in 2001 when the testing was carried out was 390 dollars per year. Itcan easily be seen that the teachers were hardly paid a living wage, especiallyin the larger cities. When this occurs, people tend to take on second, third andeven fourth jobs. Another secondary side-effect that frequently occurs is thatcorruption sets in and it has even been known in some countries for teachersto find all sorts of ways of extracting more money from parents. It is clearthat with other competing jobs, those working more hours on other tasks willbe more tired for their ordinary teaching task.
The mean number of hours spent earning extra money for the whole ofVietnam was 1.5 hours per day. At the same time, the standard deviation was1.9 hours per day. The minimum number of extra hours worked was zero andthe maximum was 10 hours per day. There is some doubt about the veracityof these replies and MOET may wish to consider undertaking a separatestudy of this matter.
Policy suggestion 4.4: a) the MOET might wish to reconsider theminimum and maximum contact hours per week for teachers, given theexisting low number of hours compared with other countries; b) theMOET may wish to undertake a special study of teachers meetingparents and then improve the teacher training programs for improvingschool, family, and community interactions.
Which materials and books did pupils have?
No matter how well the classrooms may be equipped, it is clear that thepupils must have their pens, pencils, paper, and above all the textbooks theyneed. At the time of testing the government policy was that parents shouldbuy these books for their children. Thus, a child possessing the materials isdependent on the parents being able to pay for them. In needy cases, theprovincial authorities may provide the major textbooks free of charge. Themajor textbooks are Vietnamese 5, Vols. 1 & 2, Math 5, Moral Education 5,and Nature and Society (History, Geography, and Science). The number ofbooks possessed can thus, in one way, be seen as an index of parental wealth.On the other hand, it can also be seen as the extent to which the pupils wereable to cover the curriculum content.
The data collected on the above have been summarized in Tables 4.21, Table4.22, Table 4.23, and Table 4.25. The percentages have been presented as thepercentages of pupils NOT possessing the items. In Table 4.21 there are tenitems of materials that each pupil should have. These are: notebook for
Vietnam Reading and Mathematics Assessment Study
115
Having the wherewithalto learn in school isimportant…
and said that theyworked extra 1.5 hoursper day for more money.
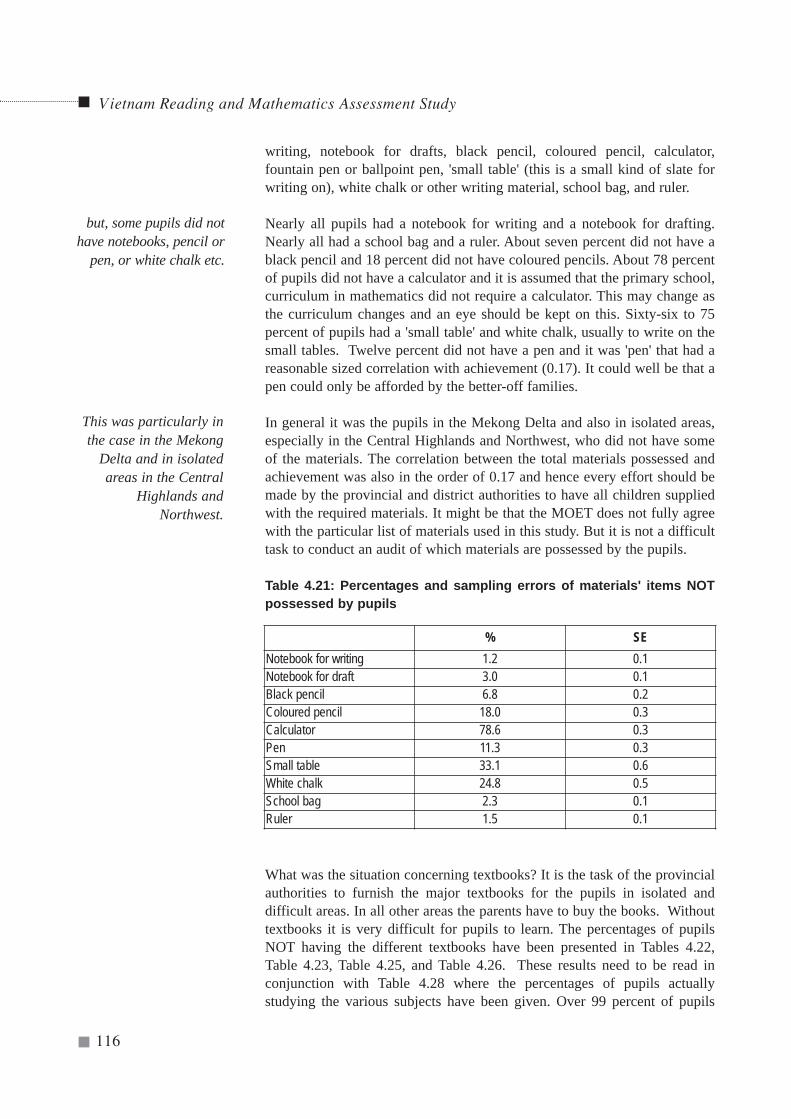
writing, notebook for drafts, black pencil, coloured pencil, calculator,fountain pen or ballpoint pen, 'small table' (this is a small kind of slate forwriting on), white chalk or other writing material, school bag, and ruler.
Nearly all pupils had a notebook for writing and a notebook for drafting.Nearly all had a school bag and a ruler. About seven percent did not have ablack pencil and 18 percent did not have coloured pencils. About 78 percentof pupils did not have a calculator and it is assumed that the primary school,curriculum in mathematics did not require a calculator. This may change asthe curriculum changes and an eye should be kept on this. Sixty-six to 75percent of pupils had a 'small table' and white chalk, usually to write on thesmall tables. Twelve percent did not have a pen and it was 'pen' that had areasonable sized correlation with achievement (0.17). It could well be that apen could only be afforded by the better-off families.
In general it was the pupils in the Mekong Delta and also in isolated areas,especially in the Central Highlands and Northwest, who did not have someof the materials. The correlation between the total materials possessed andachievement was also in the order of 0.17 and hence every effort should bemade by the provincial and district authorities to have all children suppliedwith the required materials. It might be that the MOET does not fully agreewith the particular list of materials used in this study. But it is not a difficulttask to conduct an audit of which materials are possessed by the pupils.
Table 4.21: Percentages and sampling errors of materials' items NOTpossessed by pupils
What was the situation concerning textbooks? It is the task of the provincialauthorities to furnish the major textbooks for the pupils in isolated anddifficult areas. In all other areas the parents have to buy the books. Withouttextbooks it is very difficult for pupils to learn. The percentages of pupilsNOT having the different textbooks have been presented in Tables 4.22,Table 4.23, Table 4.25, and Table 4.26. These results need to be read inconjunction with Table 4.28 where the percentages of pupils actuallystudying the various subjects have been given. Over 99 percent of pupils
Vietnam Reading and Mathematics Assessment Study
116
but, some pupils did nothave notebooks, pencil or
pen, or white chalk etc.
This was particularly inthe case in the Mekong
Delta and in isolatedareas in the Central
Highlands andNorthwest.
% SENotebook for writing 1.2 0.1Notebook for draft 3.0 0.1Black pencil 6.8 0.2Coloured pencil 18.0 0.3Calculator 78.6 0.3Pen 11.3 0.3Small table 33.1 0.6White chalk 24.8 0.5School bag 2.3 0.1Ruler 1.5 0.1
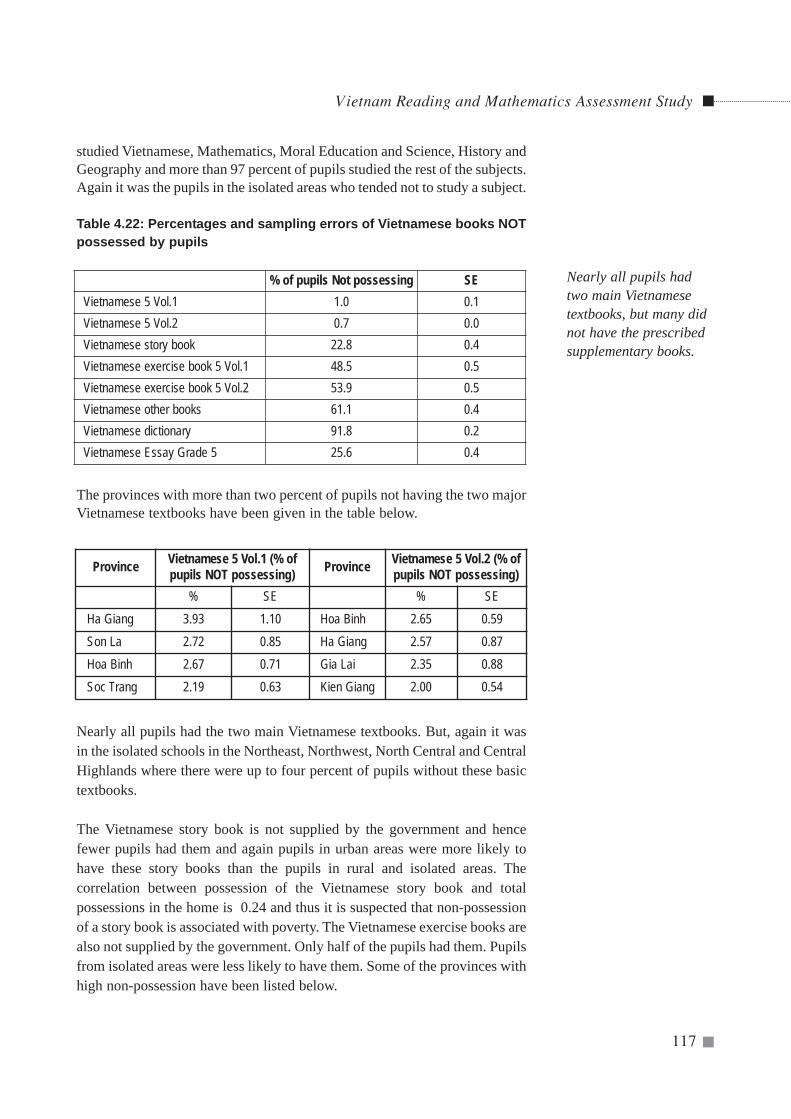
Vietnam Reading and Mathematics Assessment Study
117
studied Vietnamese, Mathematics, Moral Education and Science, History andGeography and more than 97 percent of pupils studied the rest of the subjects.Again it was the pupils in the isolated areas who tended not to study a subject.
Table 4.22: Percentages and sampling errors of Vietnamese books NOTpossessed by pupils
The provinces with more than two percent of pupils not having the two majorVietnamese textbooks have been given in the table below.
Nearly all pupils had the two main Vietnamese textbooks. But, again it wasin the isolated schools in the Northeast, Northwest, North Central and CentralHighlands where there were up to four percent of pupils without these basictextbooks.
The Vietnamese story book is not supplied by the government and hencefewer pupils had them and again pupils in urban areas were more likely tohave these story books than the pupils in rural and isolated areas. Thecorrelation between possession of the Vietnamese story book and totalpossessions in the home is 0.24 and thus it is suspected that non-possessionof a story book is associated with poverty. The Vietnamese exercise books arealso not supplied by the government. Only half of the pupils had them. Pupilsfrom isolated areas were less likely to have them. Some of the provinces withhigh non-possession have been listed below.
% of pupils Not possessing SEVietnamese 5 Vol.1 1.0 0.1Vietnamese 5 Vol.2 0.7 0.0Vietnamese story book 22.8 0.4Vietnamese exercise book 5 Vol.1 48.5 0.5Vietnamese exercise book 5 Vol.2 53.9 0.5Vietnamese other books 61.1 0.4Vietnamese dictionary 91.8 0.2Vietnamese Essay Grade 5 25.6 0.4
Province Vietnamese 5 Vol.1 (% ofpupils NOT possessing) Province Vietnamese 5 Vol.2 (% of
pupils NOT possessing)% SE % SE
Ha Giang 3.93 1.10 Hoa Binh 2.65 0.59Son La 2.72 0.85 Ha Giang 2.57 0.87Hoa Binh 2.67 0.71 Gia Lai 2.35 0.88Soc Trang 2.19 0.63 Kien Giang 2.00 0.54
Nearly all pupils hadtwo main Vietnamesetextbooks, but many didnot have the prescribedsupplementary books.
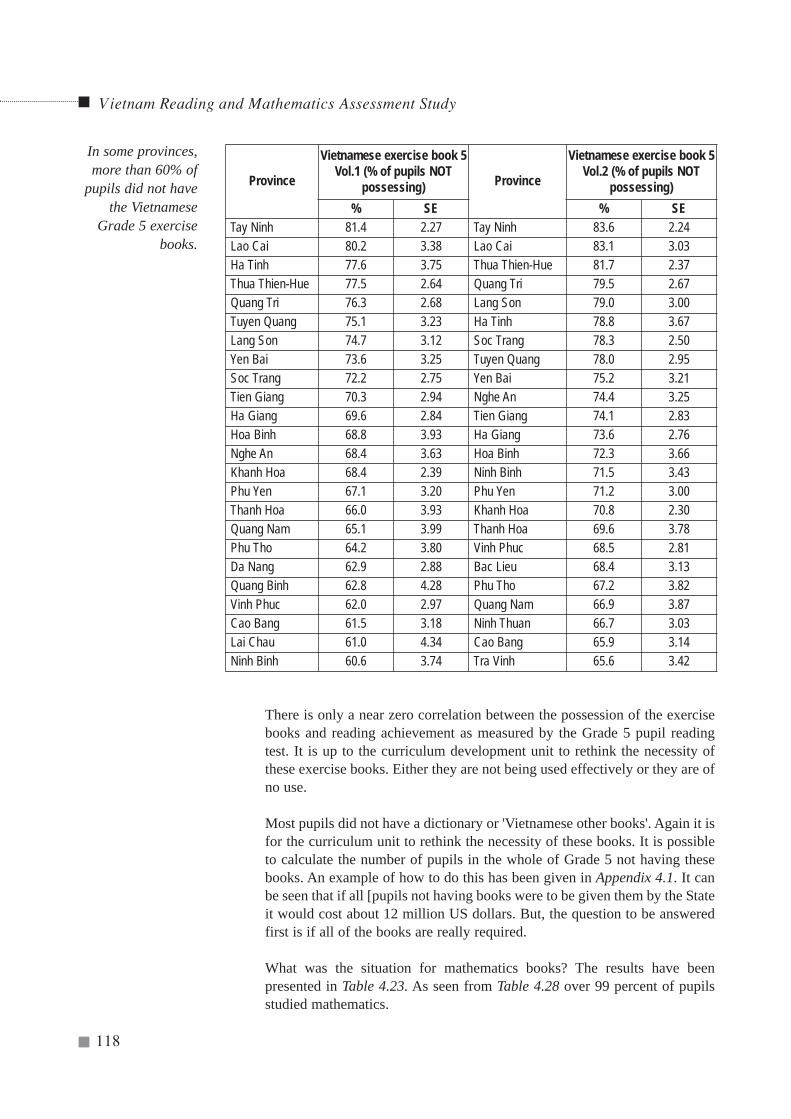
Vietnam Reading and Mathematics Assessment Study
118
There is only a near zero correlation between the possession of the exercisebooks and reading achievement as measured by the Grade 5 pupil readingtest. It is up to the curriculum development unit to rethink the necessity ofthese exercise books. Either they are not being used effectively or they are ofno use.
Most pupils did not have a dictionary or 'Vietnamese other books'. Again it isfor the curriculum unit to rethink the necessity of these books. It is possibleto calculate the number of pupils in the whole of Grade 5 not having thesebooks. An example of how to do this has been given in Appendix 4.1. It canbe seen that if all [pupils not having books were to be given them by the Stateit would cost about 12 million US dollars. But, the question to be answeredfirst is if all of the books are really required.
What was the situation for mathematics books? The results have beenpresented in Table 4.23. As seen from Table 4.28 over 99 percent of pupilsstudied mathematics.
Province
Vietnamese exercise book 5Vol.1 (% of pupils NOT
possessing) Province
Vietnamese exercise book 5Vol.2 (% of pupils NOT
possessing)% SE % SE
Tay Ninh 81.4 2.27 Tay Ninh 83.6 2.24Lao Cai 80.2 3.38 Lao Cai 83.1 3.03Ha Tinh 77.6 3.75 Thua Thien-Hue 81.7 2.37Thua Thien-Hue 77.5 2.64 Quang Tri 79.5 2.67Quang Tri 76.3 2.68 Lang Son 79.0 3.00Tuyen Quang 75.1 3.23 Ha Tinh 78.8 3.67Lang Son 74.7 3.12 Soc Trang 78.3 2.50Yen Bai 73.6 3.25 Tuyen Quang 78.0 2.95Soc Trang 72.2 2.75 Yen Bai 75.2 3.21Tien Giang 70.3 2.94 Nghe An 74.4 3.25Ha Giang 69.6 2.84 Tien Giang 74.1 2.83Hoa Binh 68.8 3.93 Ha Giang 73.6 2.76Nghe An 68.4 3.63 Hoa Binh 72.3 3.66Khanh Hoa 68.4 2.39 Ninh Binh 71.5 3.43Phu Yen 67.1 3.20 Phu Yen 71.2 3.00Thanh Hoa 66.0 3.93 Khanh Hoa 70.8 2.30Quang Nam 65.1 3.99 Thanh Hoa 69.6 3.78Phu Tho 64.2 3.80 Vinh Phuc 68.5 2.81Da Nang 62.9 2.88 Bac Lieu 68.4 3.13Quang Binh 62.8 4.28 Phu Tho 67.2 3.82Vinh Phuc 62.0 2.97 Quang Nam 66.9 3.87Cao Bang 61.5 3.18 Ninh Thuan 66.7 3.03Lai Chau 61.0 4.34 Cao Bang 65.9 3.14Ninh Binh 60.6 3.74 Tra Vinh 65.6 3.42
In some provinces,more than 60% of
pupils did not havethe Vietnamese
Grade 5 exercisebooks.
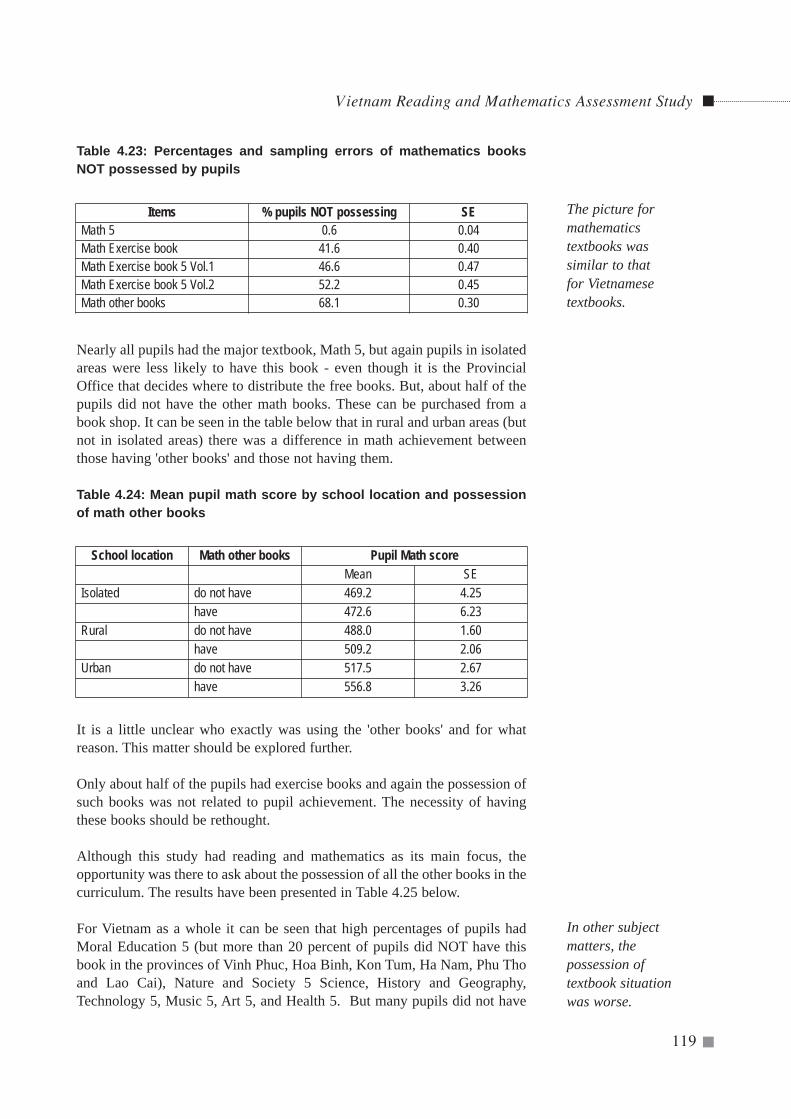
Table 4.23: Percentages and sampling errors of mathematics booksNOT possessed by pupils
Nearly all pupils had the major textbook, Math 5, but again pupils in isolatedareas were less likely to have this book - even though it is the ProvincialOffice that decides where to distribute the free books. But, about half of thepupils did not have the other math books. These can be purchased from abook shop. It can be seen in the table below that in rural and urban areas (butnot in isolated areas) there was a difference in math achievement betweenthose having 'other books' and those not having them.
Table 4.24: Mean pupil math score by school location and possessionof math other books
It is a little unclear who exactly was using the 'other books' and for whatreason. This matter should be explored further.
Only about half of the pupils had exercise books and again the possession ofsuch books was not related to pupil achievement. The necessity of havingthese books should be rethought.
Although this study had reading and mathematics as its main focus, theopportunity was there to ask about the possession of all the other books in thecurriculum. The results have been presented in Table 4.25 below.
For Vietnam as a whole it can be seen that high percentages of pupils hadMoral Education 5 (but more than 20 percent of pupils did NOT have thisbook in the provinces of Vinh Phuc, Hoa Binh, Kon Tum, Ha Nam, Phu Thoand Lao Cai), Nature and Society 5 Science, History and Geography,Technology 5, Music 5, Art 5, and Health 5. But many pupils did not have
Vietnam Reading and Mathematics Assessment Study
119
The picture formathematicstextbooks wassimilar to thatfor Vietnamesetextbooks.
In other subjectmatters, thepossession oftextbook situationwas worse.
Items % pupils NOT possessing SEMath 5 0.6 0.04Math Exercise book 41.6 0.40Math Exercise book 5 Vol.1 46.6 0.47Math Exercise book 5 Vol.2 52.2 0.45Math other books 68.1 0.30
School location Math other books Pupil Math scoreMean SE
Isolated do not have 469.2 4.25have 472.6 6.23
Rural do not have 488.0 1.60have 509.2 2.06
Urban do not have 517.5 2.67have 556.8 3.26
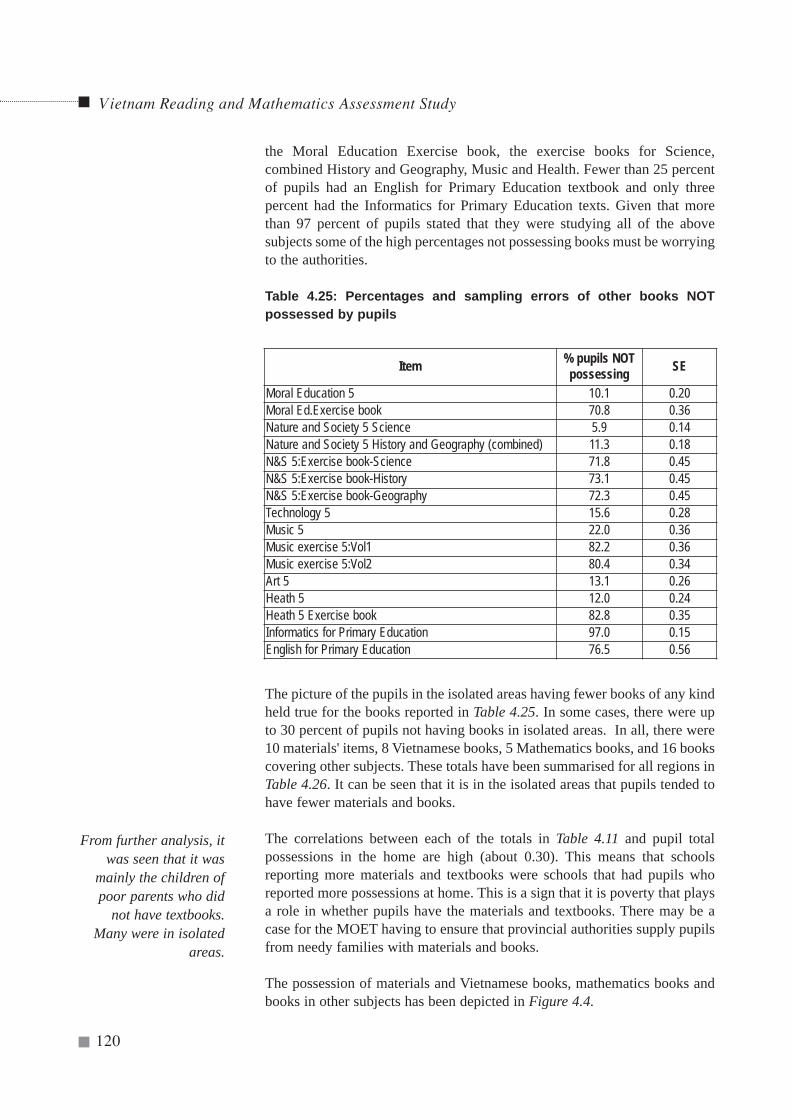
the Moral Education Exercise book, the exercise books for Science,combined History and Geography, Music and Health. Fewer than 25 percentof pupils had an English for Primary Education textbook and only threepercent had the Informatics for Primary Education texts. Given that morethan 97 percent of pupils stated that they were studying all of the abovesubjects some of the high percentages not possessing books must be worryingto the authorities.
Table 4.25: Percentages and sampling errors of other books NOTpossessed by pupils
The picture of the pupils in the isolated areas having fewer books of any kindheld true for the books reported in Table 4.25. In some cases, there were upto 30 percent of pupils not having books in isolated areas. In all, there were10 materials' items, 8 Vietnamese books, 5 Mathematics books, and 16 bookscovering other subjects. These totals have been summarised for all regions inTable 4.26. It can be seen that it is in the isolated areas that pupils tended tohave fewer materials and books.
The correlations between each of the totals in Table 4.11 and pupil totalpossessions in the home are high (about 0.30). This means that schoolsreporting more materials and textbooks were schools that had pupils whoreported more possessions at home. This is a sign that it is poverty that playsa role in whether pupils have the materials and textbooks. There may be acase for the MOET having to ensure that provincial authorities supply pupilsfrom needy families with materials and books.
The possession of materials and Vietnamese books, mathematics books andbooks in other subjects has been depicted in Figure 4.4.
Vietnam Reading and Mathematics Assessment Study
120
Item % pupils NOTpossessing SE
Moral Education 5 10.1 0.20Moral Ed.Exercise book 70.8 0.36Nature and Society 5 Science 5.9 0.14Nature and Society 5 History and Geography (combined) 11.3 0.18N&S 5:Exercise book-Science 71.8 0.45N&S 5:Exercise book-History 73.1 0.45N&S 5:Exercise book-Geography 72.3 0.45Technology 5 15.6 0.28Music 5 22.0 0.36Music exercise 5:Vol1 82.2 0.36Music exercise 5:Vol2 80.4 0.34Art 5 13.1 0.26Heath 5 12.0 0.24Heath 5 Exercise book 82.8 0.35Informatics for Primary Education 97.0 0.15English for Primary Education 76.5 0.56
From further analysis, itwas seen that it was
mainly the children ofpoor parents who did
not have textbooks.Many were in isolated
areas.
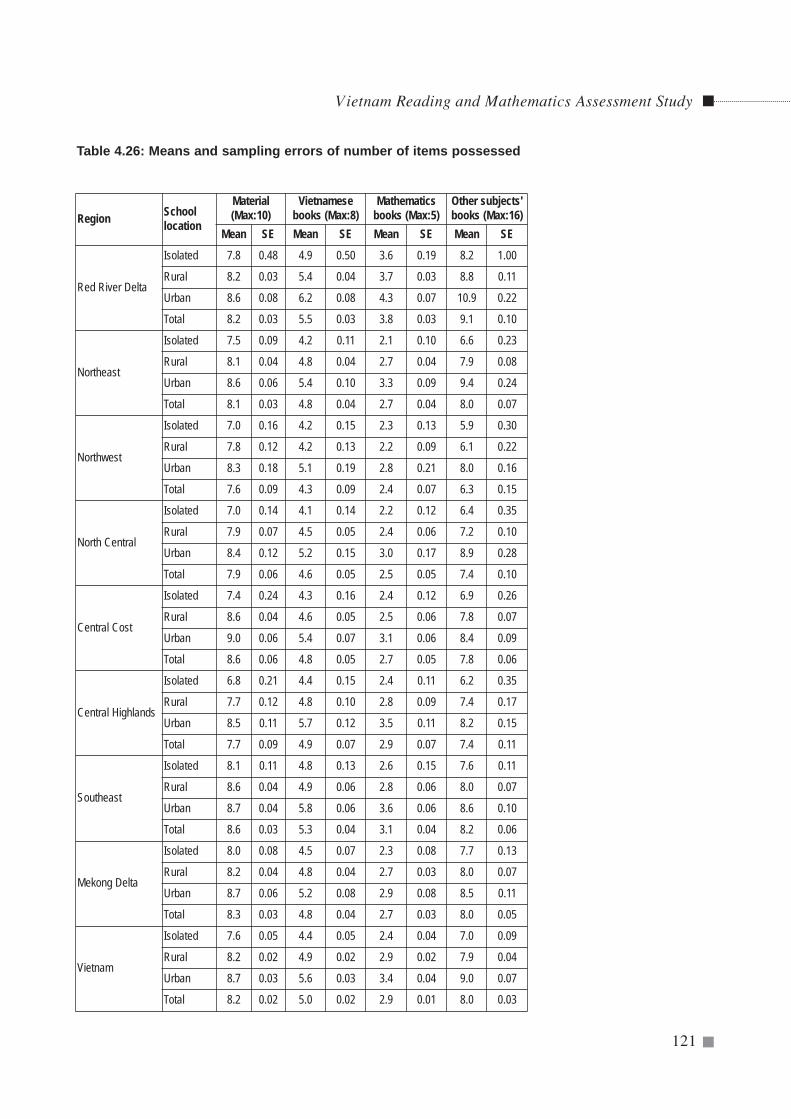
Table 4.26: Means and sampling errors of number of items possessed
Vietnam Reading and Mathematics Assessment Study
121
Region Schoollocation
Material (Max:10)
Vietnamesebooks (Max:8)
Mathematicsbooks (Max:5)
Other subjects'books (Max:16)
Mean SE Mean SE Mean SE Mean SE
Red River Delta
Isolated 7.8 0.48 4.9 0.50 3.6 0.19 8.2 1.00
Rural 8.2 0.03 5.4 0.04 3.7 0.03 8.8 0.11
Urban 8.6 0.08 6.2 0.08 4.3 0.07 10.9 0.22
Total 8.2 0.03 5.5 0.03 3.8 0.03 9.1 0.10
Northeast
Isolated 7.5 0.09 4.2 0.11 2.1 0.10 6.6 0.23
Rural 8.1 0.04 4.8 0.04 2.7 0.04 7.9 0.08
Urban 8.6 0.06 5.4 0.10 3.3 0.09 9.4 0.24
Total 8.1 0.03 4.8 0.04 2.7 0.04 8.0 0.07
Northwest
Isolated 7.0 0.16 4.2 0.15 2.3 0.13 5.9 0.30
Rural 7.8 0.12 4.2 0.13 2.2 0.09 6.1 0.22
Urban 8.3 0.18 5.1 0.19 2.8 0.21 8.0 0.16
Total 7.6 0.09 4.3 0.09 2.4 0.07 6.3 0.15
North Central
Isolated 7.0 0.14 4.1 0.14 2.2 0.12 6.4 0.35
Rural 7.9 0.07 4.5 0.05 2.4 0.06 7.2 0.10
Urban 8.4 0.12 5.2 0.15 3.0 0.17 8.9 0.28
Total 7.9 0.06 4.6 0.05 2.5 0.05 7.4 0.10
Central Cost
Isolated 7.4 0.24 4.3 0.16 2.4 0.12 6.9 0.26
Rural 8.6 0.04 4.6 0.05 2.5 0.06 7.8 0.07
Urban 9.0 0.06 5.4 0.07 3.1 0.06 8.4 0.09
Total 8.6 0.06 4.8 0.05 2.7 0.05 7.8 0.06
Central Highlands
Isolated 6.8 0.21 4.4 0.15 2.4 0.11 6.2 0.35
Rural 7.7 0.12 4.8 0.10 2.8 0.09 7.4 0.17
Urban 8.5 0.11 5.7 0.12 3.5 0.11 8.2 0.15
Total 7.7 0.09 4.9 0.07 2.9 0.07 7.4 0.11
Southeast
Isolated 8.1 0.11 4.8 0.13 2.6 0.15 7.6 0.11
Rural 8.6 0.04 4.9 0.06 2.8 0.06 8.0 0.07
Urban 8.7 0.04 5.8 0.06 3.6 0.06 8.6 0.10
Total 8.6 0.03 5.3 0.04 3.1 0.04 8.2 0.06
Mekong Delta
Isolated 8.0 0.08 4.5 0.07 2.3 0.08 7.7 0.13
Rural 8.2 0.04 4.8 0.04 2.7 0.03 8.0 0.07
Urban 8.7 0.06 5.2 0.08 2.9 0.08 8.5 0.11
Total 8.3 0.03 4.8 0.04 2.7 0.03 8.0 0.05
Vietnam
Isolated 7.6 0.05 4.4 0.05 2.4 0.04 7.0 0.09
Rural 8.2 0.02 4.9 0.02 2.9 0.02 7.9 0.04
Urban 8.7 0.03 5.6 0.03 3.4 0.04 9.0 0.07
Total 8.2 0.02 5.0 0.02 2.9 0.01 8.0 0.03
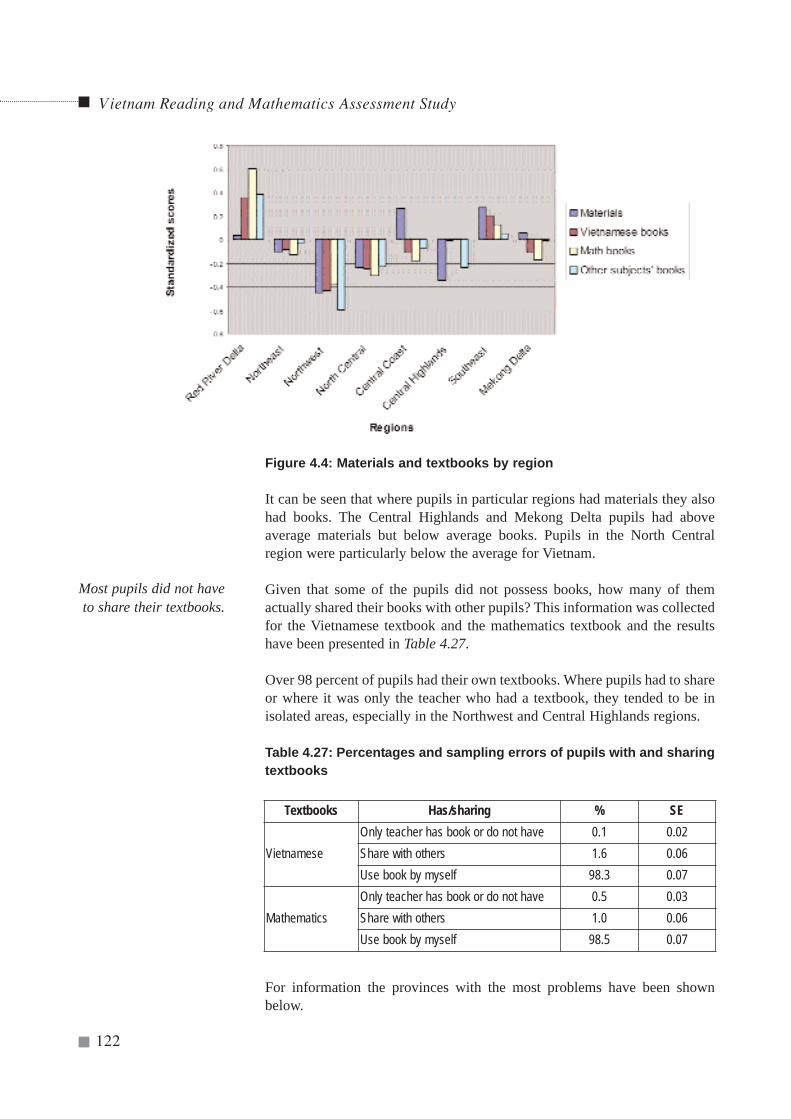
Vietnam Reading and Mathematics Assessment Study
122
Figure 4.4: Materials and textbooks by region
It can be seen that where pupils in particular regions had materials they alsohad books. The Central Highlands and Mekong Delta pupils had aboveaverage materials but below average books. Pupils in the North Centralregion were particularly below the average for Vietnam.
Given that some of the pupils did not possess books, how many of themactually shared their books with other pupils? This information was collectedfor the Vietnamese textbook and the mathematics textbook and the resultshave been presented in Table 4.27.
Over 98 percent of pupils had their own textbooks. Where pupils had to shareor where it was only the teacher who had a textbook, they tended to be inisolated areas, especially in the Northwest and Central Highlands regions.
Table 4.27: Percentages and sampling errors of pupils with and sharingtextbooks
For information the provinces with the most problems have been shownbelow.
Most pupils did not haveto share their textbooks.
Textbooks Has/sharing % SE
Vietnamese Only teacher has book or do not have 0.1 0.02Share with others 1.6 0.06Use book by myself 98.3 0.07
MathematicsOnly teacher has book or do not have 0.5 0.03Share with others 1.0 0.06Use book by myself 98.5 0.07
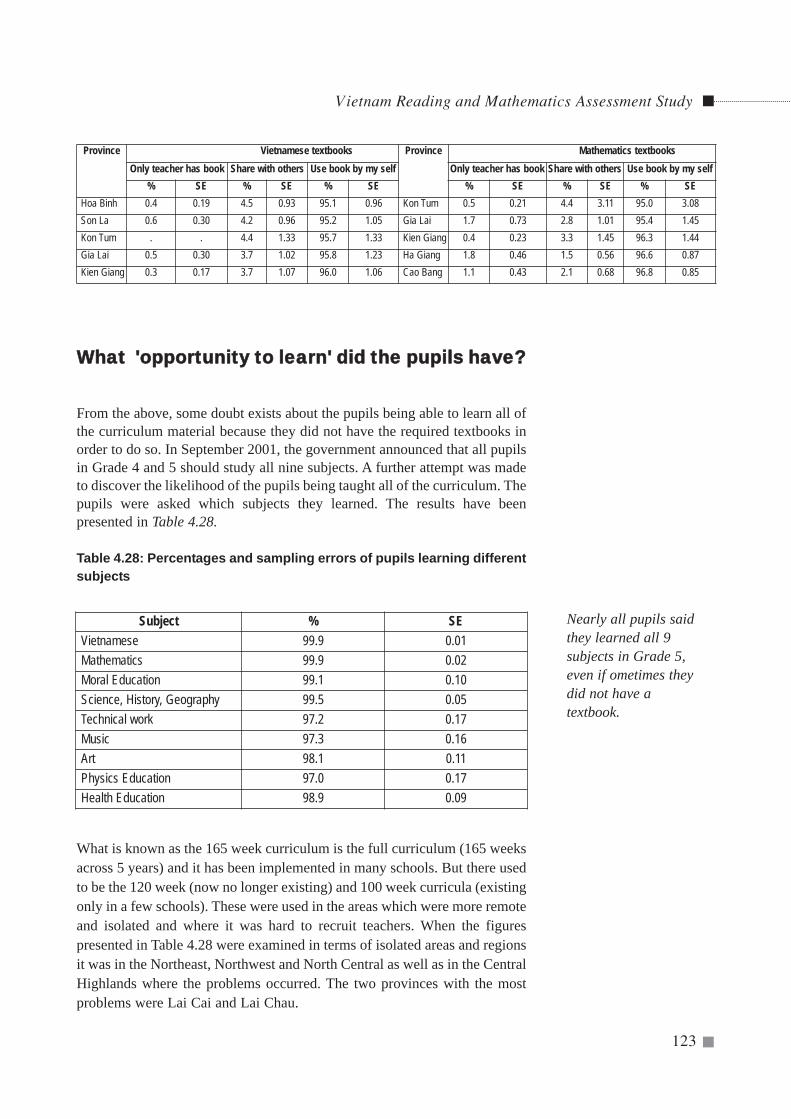
Vietnam Reading and Mathematics Assessment Study
123
WWhhaatt ''ooppppoorrttuunniittyy ttoo lleeaarrnn'' ddiidd tthhee ppuuppiillss hhaavvee??
From the above, some doubt exists about the pupils being able to learn all ofthe curriculum material because they did not have the required textbooks inorder to do so. In September 2001, the government announced that all pupilsin Grade 4 and 5 should study all nine subjects. A further attempt was madeto discover the likelihood of the pupils being taught all of the curriculum. Thepupils were asked which subjects they learned. The results have beenpresented in Table 4.28.
Table 4.28: Percentages and sampling errors of pupils learning differentsubjects
What is known as the 165 week curriculum is the full curriculum (165 weeksacross 5 years) and it has been implemented in many schools. But there usedto be the 120 week (now no longer existing) and 100 week curricula (existingonly in a few schools). These were used in the areas which were more remoteand isolated and where it was hard to recruit teachers. When the figurespresented in Table 4.28 were examined in terms of isolated areas and regionsit was in the Northeast, Northwest and North Central as well as in the CentralHighlands where the problems occurred. The two provinces with the mostproblems were Lai Cai and Lai Chau.
Province Vietnamese textbooks Province Mathematics textbooks Only teacher has book Share with others Use book by my self Only teacher has book Share with others Use book by my self
% SE % SE % SE % SE % SE % SEHoa Binh 0.4 0.19 4.5 0.93 95.1 0.96 Kon Tum 0.5 0.21 4.4 3.11 95.0 3.08Son La 0.6 0.30 4.2 0.96 95.2 1.05 Gia Lai 1.7 0.73 2.8 1.01 95.4 1.45Kon Tum . . 4.4 1.33 95.7 1.33 Kien Giang 0.4 0.23 3.3 1.45 96.3 1.44Gia Lai 0.5 0.30 3.7 1.02 95.8 1.23 Ha Giang 1.8 0.46 1.5 0.56 96.6 0.87Kien Giang 0.3 0.17 3.7 1.07 96.0 1.06 Cao Bang 1.1 0.43 2.1 0.68 96.8 0.85
Subject % SEVietnamese 99.9 0.01Mathematics 99.9 0.02Moral Education 99.1 0.10Science, History, Geography 99.5 0.05Technical work 97.2 0.17Music 97.3 0.16Art 98.1 0.11Physics Education 97.0 0.17Health Education 98.9 0.09
Nearly all pupils saidthey learned all 9subjects in Grade 5,even if ometimes theydid not have atextbook.
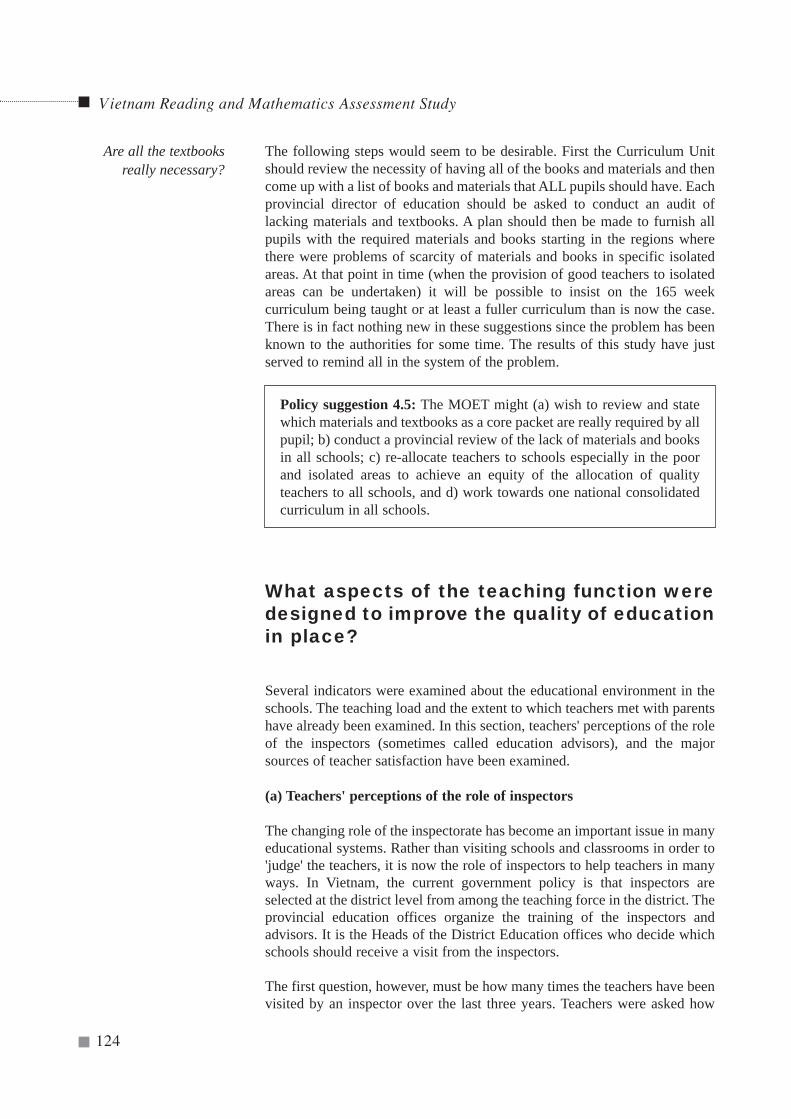
Vietnam Reading and Mathematics Assessment Study
124
The following steps would seem to be desirable. First the Curriculum Unitshould review the necessity of having all of the books and materials and thencome up with a list of books and materials that ALL pupils should have. Eachprovincial director of education should be asked to conduct an audit oflacking materials and textbooks. A plan should then be made to furnish allpupils with the required materials and books starting in the regions wherethere were problems of scarcity of materials and books in specific isolatedareas. At that point in time (when the provision of good teachers to isolatedareas can be undertaken) it will be possible to insist on the 165 weekcurriculum being taught or at least a fuller curriculum than is now the case.There is in fact nothing new in these suggestions since the problem has beenknown to the authorities for some time. The results of this study have justserved to remind all in the system of the problem.
Policy suggestion 4.5: The MOET might (a) wish to review and statewhich materials and textbooks as a core packet are really required by allpupil; b) conduct a provincial review of the lack of materials and booksin all schools; c) re-allocate teachers to schools especially in the poorand isolated areas to achieve an equity of the allocation of qualityteachers to all schools, and d) work towards one national consolidatedcurriculum in all schools.
What aspects of the teaching function weredesigned to improve the quality of educationin place?
Several indicators were examined about the educational environment in theschools. The teaching load and the extent to which teachers met with parentshave already been examined. In this section, teachers' perceptions of the roleof the inspectors (sometimes called education advisors), and the majorsources of teacher satisfaction have been examined.
(a) Teachers' perceptions of the role of inspectors
The changing role of the inspectorate has become an important issue in manyeducational systems. Rather than visiting schools and classrooms in order to'judge' the teachers, it is now the role of inspectors to help teachers in manyways. In Vietnam, the current government policy is that inspectors areselected at the district level from among the teaching force in the district. Theprovincial education offices organize the training of the inspectors andadvisors. It is the Heads of the District Education offices who decide whichschools should receive a visit from the inspectors.
The first question, however, must be how many times the teachers have beenvisited by an inspector over the last three years. Teachers were asked how
Are all the textbooksreally necessary?
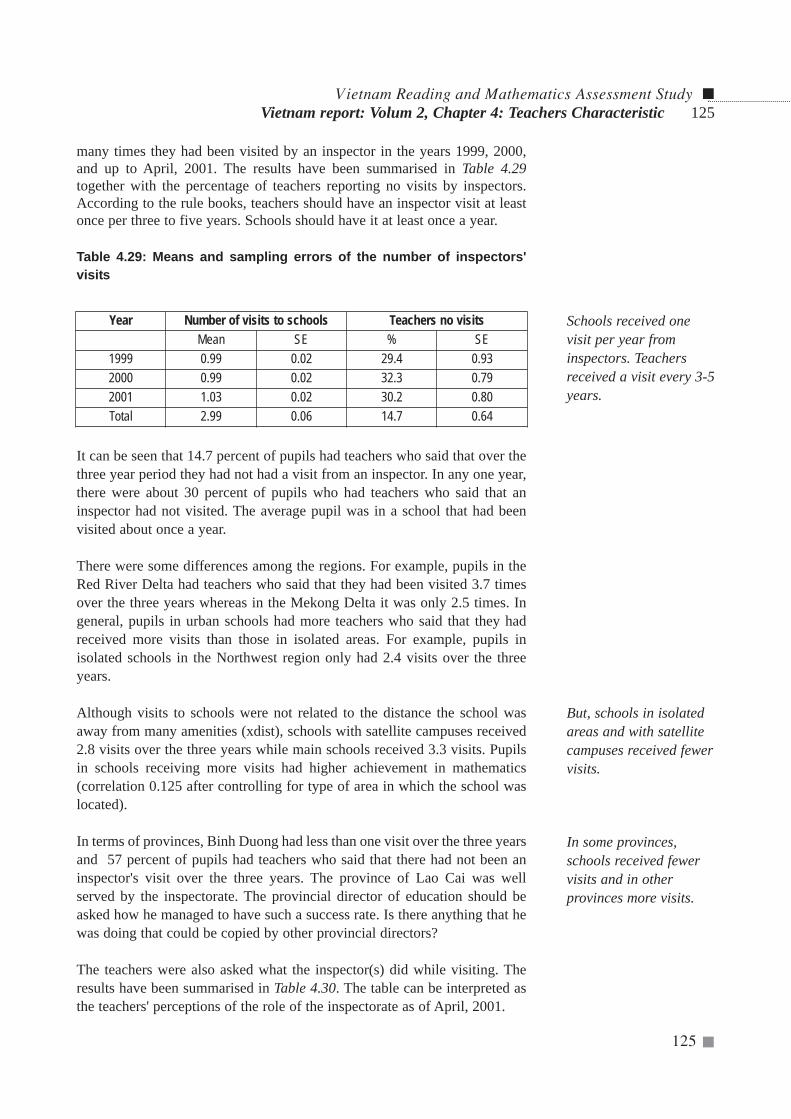
Vietnam Reading and Mathematics Assessment Study
125
many times they had been visited by an inspector in the years 1999, 2000,and up to April, 2001. The results have been summarised in Table 4.29together with the percentage of teachers reporting no visits by inspectors.According to the rule books, teachers should have an inspector visit at leastonce per three to five years. Schools should have it at least once a year.
Table 4.29: Means and sampling errors of the number of inspectors'visits
It can be seen that 14.7 percent of pupils had teachers who said that over thethree year period they had not had a visit from an inspector. In any one year,there were about 30 percent of pupils who had teachers who said that aninspector had not visited. The average pupil was in a school that had beenvisited about once a year.
There were some differences among the regions. For example, pupils in theRed River Delta had teachers who said that they had been visited 3.7 timesover the three years whereas in the Mekong Delta it was only 2.5 times. Ingeneral, pupils in urban schools had more teachers who said that they hadreceived more visits than those in isolated areas. For example, pupils inisolated schools in the Northwest region only had 2.4 visits over the threeyears.
Although visits to schools were not related to the distance the school wasaway from many amenities (xdist), schools with satellite campuses received2.8 visits over the three years while main schools received 3.3 visits. Pupilsin schools receiving more visits had higher achievement in mathematics(correlation 0.125 after controlling for type of area in which the school waslocated).
In terms of provinces, Binh Duong had less than one visit over the three yearsand 57 percent of pupils had teachers who said that there had not been aninspector's visit over the three years. The province of Lao Cai was wellserved by the inspectorate. The provincial director of education should beasked how he managed to have such a success rate. Is there anything that hewas doing that could be copied by other provincial directors?
The teachers were also asked what the inspector(s) did while visiting. Theresults have been summarised in Table 4.30. The table can be interpreted asthe teachers' perceptions of the role of the inspectorate as of April, 2001.
Vietnam report: Volum 2, Chapter 4: Teachers Characteristic 125
Year Number of visits to schools Teachers no visitsMean SE % SE
1999 0.99 0.02 29.4 0.932000 0.99 0.02 32.3 0.792001 1.03 0.02 30.2 0.80Total 2.99 0.06 14.7 0.64
Schools received onevisit per year frominspectors. Teachersreceived a visit every 3-5years.
But, schools in isolatedareas and with satellitecampuses received fewervisits.
In some provinces,schools received fewervisits and in otherprovinces more visits.
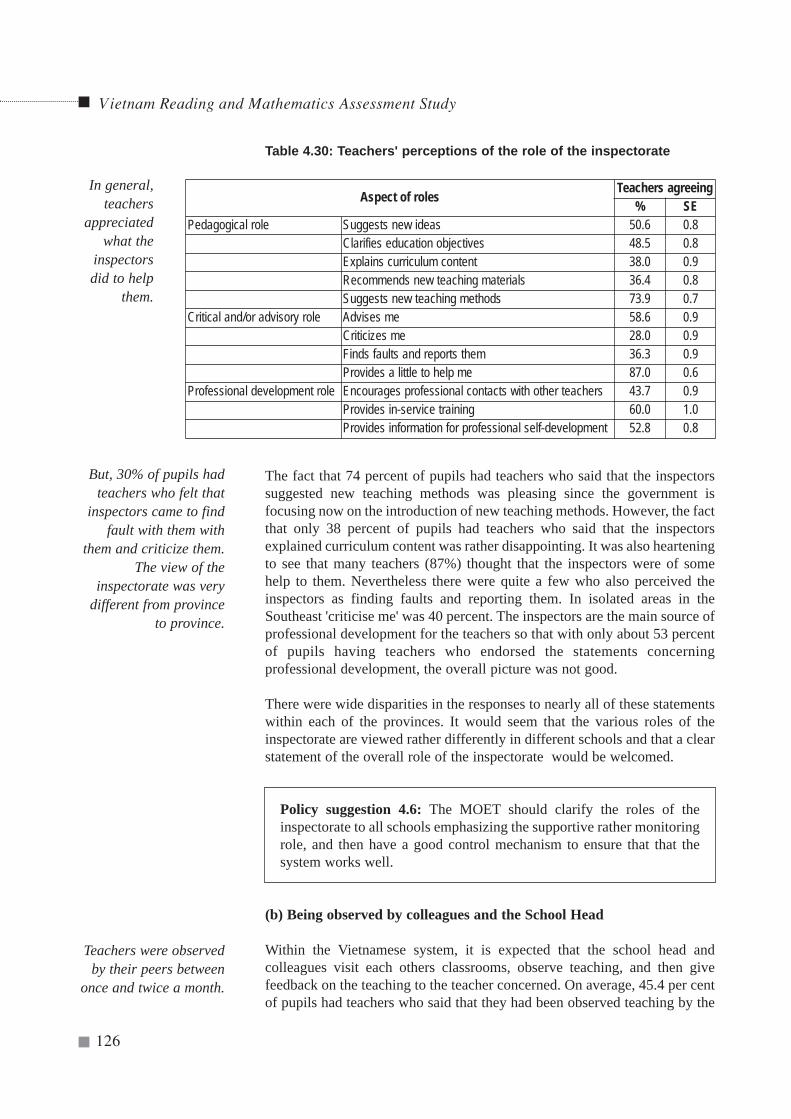
Vietnam Reading and Mathematics Assessment Study
126
Table 4.30: Teachers' perceptions of the role of the inspectorate
The fact that 74 percent of pupils had teachers who said that the inspectorssuggested new teaching methods was pleasing since the government isfocusing now on the introduction of new teaching methods. However, the factthat only 38 percent of pupils had teachers who said that the inspectorsexplained curriculum content was rather disappointing. It was also hearteningto see that many teachers (87%) thought that the inspectors were of somehelp to them. Nevertheless there were quite a few who also perceived theinspectors as finding faults and reporting them. In isolated areas in theSoutheast 'criticise me' was 40 percent. The inspectors are the main source ofprofessional development for the teachers so that with only about 53 percentof pupils having teachers who endorsed the statements concerningprofessional development, the overall picture was not good.
There were wide disparities in the responses to nearly all of these statementswithin each of the provinces. It would seem that the various roles of theinspectorate are viewed rather differently in different schools and that a clearstatement of the overall role of the inspectorate would be welcomed.
Policy suggestion 4.6: The MOET should clarify the roles of theinspectorate to all schools emphasizing the supportive rather monitoringrole, and then have a good control mechanism to ensure that that thesystem works well.
(b) Being observed by colleagues and the School Head
Within the Vietnamese system, it is expected that the school head andcolleagues visit each others classrooms, observe teaching, and then givefeedback on the teaching to the teacher concerned. On average, 45.4 per centof pupils had teachers who said that they had been observed teaching by the
But, 30% of pupils hadteachers who felt that
inspectors came to findfault with them with
them and criticize them.The view of the
inspectorate was verydifferent from province
to province.
Teachers were observedby their peers between
once and twice a month.
In general,teachers
appreciatedwhat the
inspectorsdid to help
them.
Aspect of roles Teachers agreeing% SE
Pedagogical role Suggests new ideas 50.6 0.8Clarifies education objectives 48.5 0.8Explains curriculum content 38.0 0.9Recommends new teaching materials 36.4 0.8Suggests new teaching methods 73.9 0.7
Critical and/or advisory role Advises me 58.6 0.9Criticizes me 28.0 0.9Finds faults and reports them 36.3 0.9Provides a little to help me 87.0 0.6
Professional development role Encourages professional contacts with other teachers 43.7 0.9Provides in-service training 60.0 1.0Provides information for professional self-development 52.8 0.8
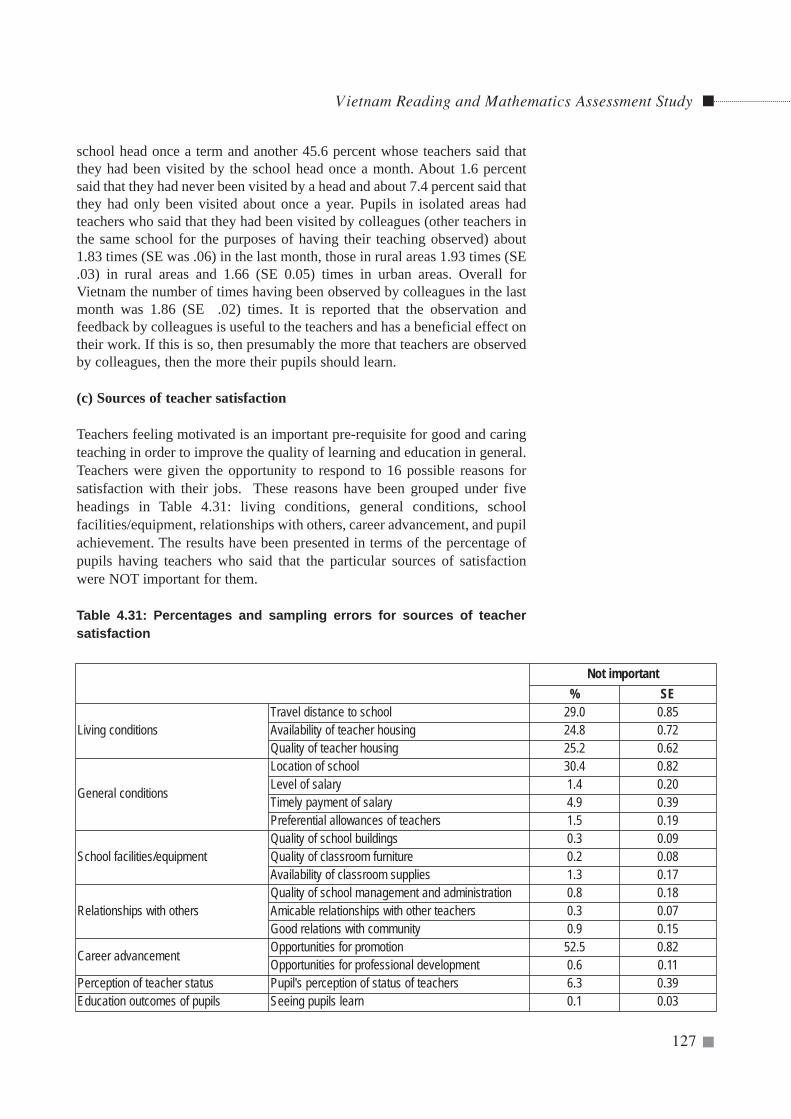
school head once a term and another 45.6 percent whose teachers said thatthey had been visited by the school head once a month. About 1.6 percentsaid that they had never been visited by a head and about 7.4 percent said thatthey had only been visited about once a year. Pupils in isolated areas hadteachers who said that they had been visited by colleagues (other teachers inthe same school for the purposes of having their teaching observed) about1.83 times (SE was .06) in the last month, those in rural areas 1.93 times (SE.03) in rural areas and 1.66 (SE 0.05) times in urban areas. Overall forVietnam the number of times having been observed by colleagues in the lastmonth was 1.86 (SE .02) times. It is reported that the observation andfeedback by colleagues is useful to the teachers and has a beneficial effect ontheir work. If this is so, then presumably the more that teachers are observedby colleagues, then the more their pupils should learn.
(c) Sources of teacher satisfaction
Teachers feeling motivated is an important pre-requisite for good and caringteaching in order to improve the quality of learning and education in general.Teachers were given the opportunity to respond to 16 possible reasons forsatisfaction with their jobs. These reasons have been grouped under fiveheadings in Table 4.31: living conditions, general conditions, schoolfacilities/equipment, relationships with others, career advancement, and pupilachievement. The results have been presented in terms of the percentage ofpupils having teachers who said that the particular sources of satisfactionwere NOT important for them.
Table 4.31: Percentages and sampling errors for sources of teachersatisfaction
Vietnam Reading and Mathematics Assessment Study
127
Not important% SE
Living conditionsTravel distance to school 29.0 0.85Availability of teacher housing 24.8 0.72Quality of teacher housing 25.2 0.62
General conditions
Location of school 30.4 0.82Level of salary 1.4 0.20Timely payment of salary 4.9 0.39Preferential allowances of teachers 1.5 0.19
School facilities/equipmentQuality of school buildings 0.3 0.09Quality of classroom furniture 0.2 0.08Availability of classroom supplies 1.3 0.17
Relationships with othersQuality of school management and administration 0.8 0.18Amicable relationships with other teachers 0.3 0.07Good relations with community 0.9 0.15
Career advancement Opportunities for promotion 52.5 0.82Opportunities for professional development 0.6 0.11
Perception of teacher status Pupil's perception of status of teachers 6.3 0.39Education outcomes of pupils Seeing pupils learn 0.1 0.03
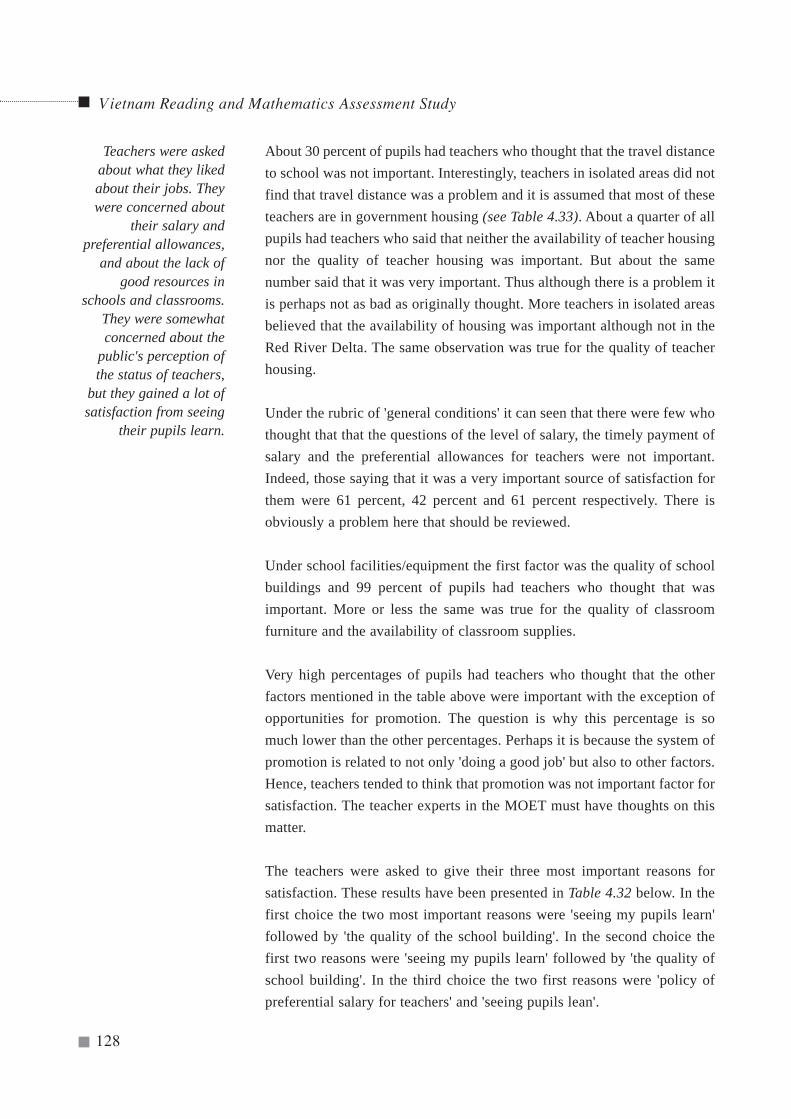
Vietnam Reading and Mathematics Assessment Study
128
About 30 percent of pupils had teachers who thought that the travel distanceto school was not important. Interestingly, teachers in isolated areas did notfind that travel distance was a problem and it is assumed that most of theseteachers are in government housing (see Table 4.33). About a quarter of allpupils had teachers who said that neither the availability of teacher housingnor the quality of teacher housing was important. But about the samenumber said that it was very important. Thus although there is a problem itis perhaps not as bad as originally thought. More teachers in isolated areasbelieved that the availability of housing was important although not in theRed River Delta. The same observation was true for the quality of teacherhousing.
Under the rubric of 'general conditions' it can seen that there were few whothought that that the questions of the level of salary, the timely payment ofsalary and the preferential allowances for teachers were not important.Indeed, those saying that it was a very important source of satisfaction forthem were 61 percent, 42 percent and 61 percent respectively. There isobviously a problem here that should be reviewed.
Under school facilities/equipment the first factor was the quality of schoolbuildings and 99 percent of pupils had teachers who thought that wasimportant. More or less the same was true for the quality of classroomfurniture and the availability of classroom supplies.
Very high percentages of pupils had teachers who thought that the otherfactors mentioned in the table above were important with the exception ofopportunities for promotion. The question is why this percentage is somuch lower than the other percentages. Perhaps it is because the system ofpromotion is related to not only 'doing a good job' but also to other factors.Hence, teachers tended to think that promotion was not important factor forsatisfaction. The teacher experts in the MOET must have thoughts on thismatter.
The teachers were asked to give their three most important reasons forsatisfaction. These results have been presented in Table 4.32 below. In thefirst choice the two most important reasons were 'seeing my pupils learn'followed by 'the quality of the school building'. In the second choice thefirst two reasons were 'seeing my pupils learn' followed by 'the quality ofschool building'. In the third choice the two first reasons were 'policy ofpreferential salary for teachers' and 'seeing pupils lean'.
Teachers were askedabout what they likedabout their jobs. Theywere concerned about
their salary andpreferential allowances,
and about the lack ofgood resources in
schools and classrooms.They were somewhatconcerned about the
public's perception ofthe status of teachers,
but they gained a lot ofsatisfaction from seeing
their pupils learn.
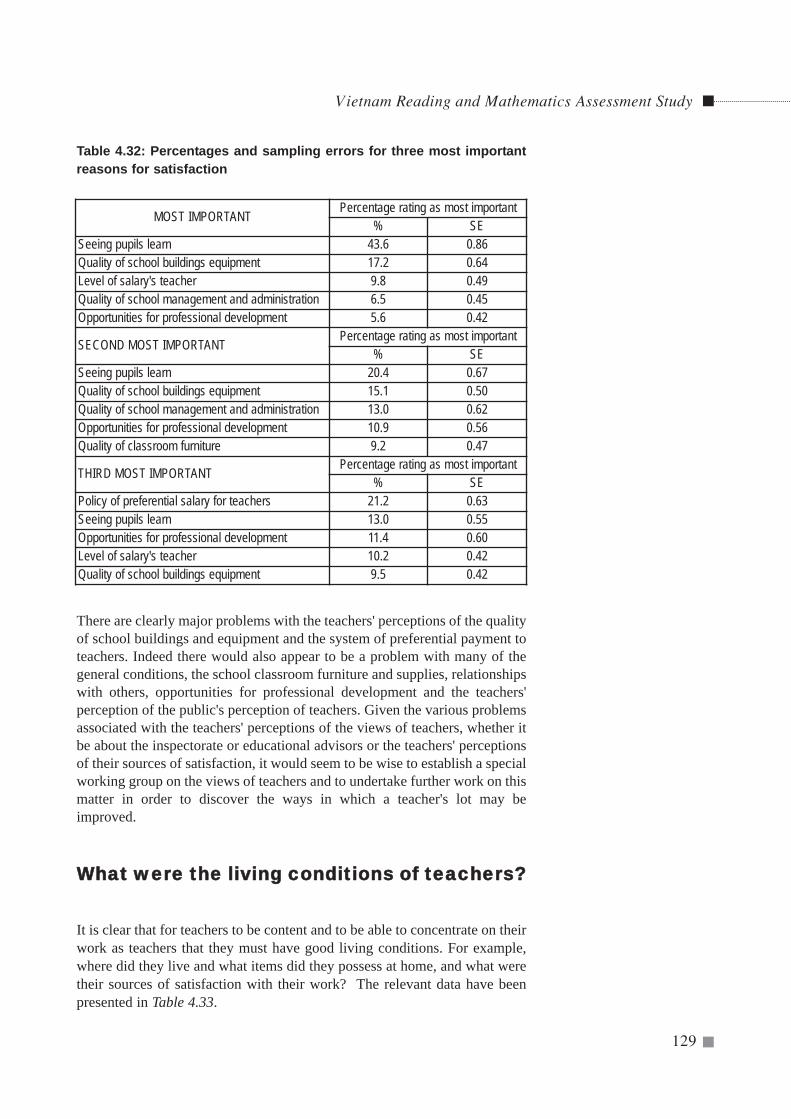
Vietnam Reading and Mathematics Assessment Study
129
Table 4.32: Percentages and sampling errors for three most importantreasons for satisfaction
There are clearly major problems with the teachers' perceptions of the qualityof school buildings and equipment and the system of preferential payment toteachers. Indeed there would also appear to be a problem with many of thegeneral conditions, the school classroom furniture and supplies, relationshipswith others, opportunities for professional development and the teachers'perception of the public's perception of teachers. Given the various problemsassociated with the teachers' perceptions of the views of teachers, whether itbe about the inspectorate or educational advisors or the teachers' perceptionsof their sources of satisfaction, it would seem to be wise to establish a specialworking group on the views of teachers and to undertake further work on thismatter in order to discover the ways in which a teacher's lot may beimproved.
WWhhaatt wweerree tthhee lliivviinngg ccoonnddiittiioonnss ooff tteeaacchheerrss??
It is clear that for teachers to be content and to be able to concentrate on theirwork as teachers that they must have good living conditions. For example,where did they live and what items did they possess at home, and what weretheir sources of satisfaction with their work? The relevant data have beenpresented in Table 4.33.
MOST IMPORTANT Percentage rating as most important% SE
Seeing pupils learn 43.6 0.86Quality of school buildings equipment 17.2 0.64Level of salary's teacher 9.8 0.49Quality of school management and administration 6.5 0.45Opportunities for professional development 5.6 0.42
SECOND MOST IMPORTANT Percentage rating as most important% SE
Seeing pupils learn 20.4 0.67Quality of school buildings equipment 15.1 0.50Quality of school management and administration 13.0 0.62Opportunities for professional development 10.9 0.56Quality of classroom furniture 9.2 0.47
THIRD MOST IMPORTANT Percentage rating as most important% SE
Policy of preferential salary for teachers 21.2 0.63Seeing pupils learn 13.0 0.55Opportunities for professional development 11.4 0.60Level of salary's teacher 10.2 0.42Quality of school buildings equipment 9.5 0.42
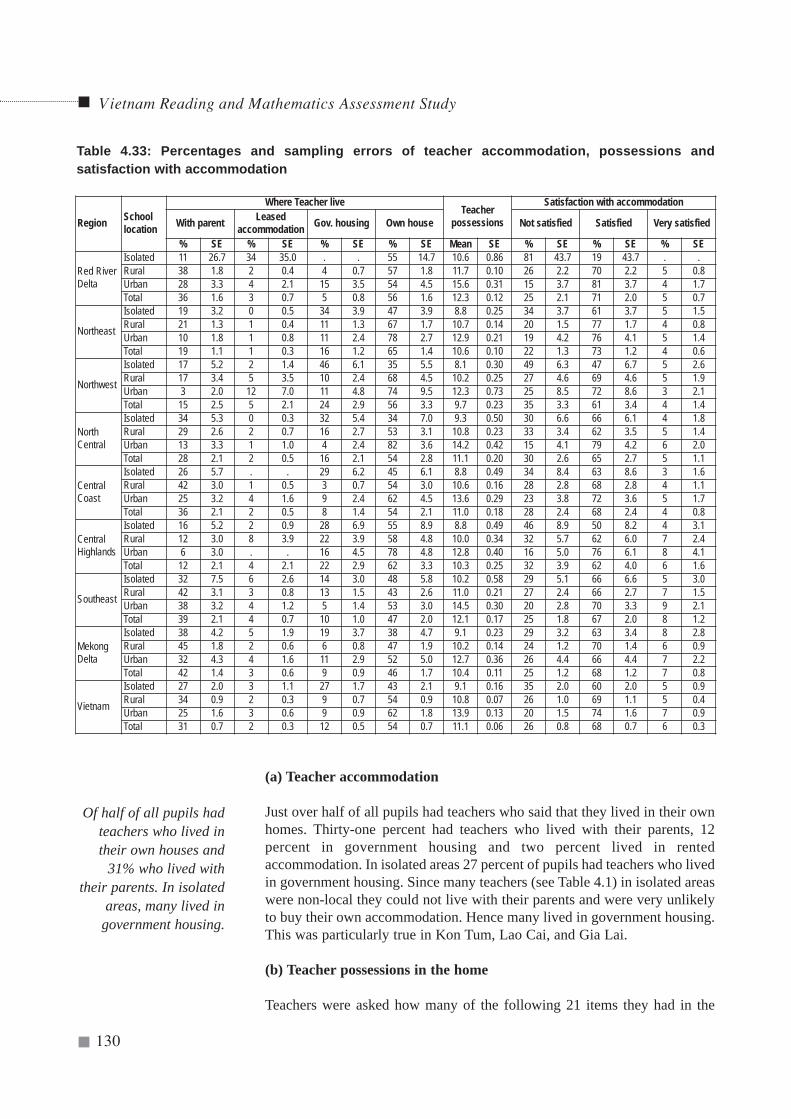
Vietnam Reading and Mathematics Assessment Study
130
(a) Teacher accommodation
Just over half of all pupils had teachers who said that they lived in their ownhomes. Thirty-one percent had teachers who lived with their parents, 12percent in government housing and two percent lived in rentedaccommodation. In isolated areas 27 percent of pupils had teachers who livedin government housing. Since many teachers (see Table 4.1) in isolated areaswere non-local they could not live with their parents and were very unlikelyto buy their own accommodation. Hence many lived in government housing.This was particularly true in Kon Tum, Lao Cai, and Gia Lai.
(b) Teacher possessions in the home
Teachers were asked how many of the following 21 items they had in the
Region Schoollocation
Where Teacher liveTeacher
possessions
Satisfaction with accommodation
With parent Leasedaccommodation Gov. housing Own house Not satisfied Satisfied Very satisfied
% SE % SE % SE % SE Mean SE % SE % SE % SE
Red RiverDelta
Isolated 11 26.7 34 35.0 . . 55 14.7 10.6 0.86 81 43.7 19 43.7 . .Rural 38 1.8 2 0.4 4 0.7 57 1.8 11.7 0.10 26 2.2 70 2.2 5 0.8Urban 28 3.3 4 2.1 15 3.5 54 4.5 15.6 0.31 15 3.7 81 3.7 4 1.7Total 36 1.6 3 0.7 5 0.8 56 1.6 12.3 0.12 25 2.1 71 2.0 5 0.7
Northeast
Isolated 19 3.2 0 0.5 34 3.9 47 3.9 8.8 0.25 34 3.7 61 3.7 5 1.5Rural 21 1.3 1 0.4 11 1.3 67 1.7 10.7 0.14 20 1.5 77 1.7 4 0.8Urban 10 1.8 1 0.8 11 2.4 78 2.7 12.9 0.21 19 4.2 76 4.1 5 1.4Total 19 1.1 1 0.3 16 1.2 65 1.4 10.6 0.10 22 1.3 73 1.2 4 0.6
Northwest
Isolated 17 5.2 2 1.4 46 6.1 35 5.5 8.1 0.30 49 6.3 47 6.7 5 2.6Rural 17 3.4 5 3.5 10 2.4 68 4.5 10.2 0.25 27 4.6 69 4.6 5 1.9Urban 3 2.0 12 7.0 11 4.8 74 9.5 12.3 0.73 25 8.5 72 8.6 3 2.1Total 15 2.5 5 2.1 24 2.9 56 3.3 9.7 0.23 35 3.3 61 3.4 4 1.4
NorthCentral
Isolated 34 5.3 0 0.3 32 5.4 34 7.0 9.3 0.50 30 6.6 66 6.1 4 1.8Rural 29 2.6 2 0.7 16 2.7 53 3.1 10.8 0.23 33 3.4 62 3.5 5 1.4Urban 13 3.3 1 1.0 4 2.4 82 3.6 14.2 0.42 15 4.1 79 4.2 6 2.0Total 28 2.1 2 0.5 16 2.1 54 2.8 11.1 0.20 30 2.6 65 2.7 5 1.1
CentralCoast
Isolated 26 5.7 . . 29 6.2 45 6.1 8.8 0.49 34 8.4 63 8.6 3 1.6Rural 42 3.0 1 0.5 3 0.7 54 3.0 10.6 0.16 28 2.8 68 2.8 4 1.1Urban 25 3.2 4 1.6 9 2.4 62 4.5 13.6 0.29 23 3.8 72 3.6 5 1.7Total 36 2.1 2 0.5 8 1.4 54 2.1 11.0 0.18 28 2.4 68 2.4 4 0.8
CentralHighlands
Isolated 16 5.2 2 0.9 28 6.9 55 8.9 8.8 0.49 46 8.9 50 8.2 4 3.1Rural 12 3.0 8 3.9 22 3.9 58 4.8 10.0 0.34 32 5.7 62 6.0 7 2.4Urban 6 3.0 . . 16 4.5 78 4.8 12.8 0.40 16 5.0 76 6.1 8 4.1Total 12 2.1 4 2.1 22 2.9 62 3.3 10.3 0.25 32 3.9 62 4.0 6 1.6
Southeast
Isolated 32 7.5 6 2.6 14 3.0 48 5.8 10.2 0.58 29 5.1 66 6.6 5 3.0Rural 42 3.1 3 0.8 13 1.5 43 2.6 11.0 0.21 27 2.4 66 2.7 7 1.5Urban 38 3.2 4 1.2 5 1.4 53 3.0 14.5 0.30 20 2.8 70 3.3 9 2.1Total 39 2.1 4 0.7 10 1.0 47 2.0 12.1 0.17 25 1.8 67 2.0 8 1.2
MekongDelta
Isolated 38 4.2 5 1.9 19 3.7 38 4.7 9.1 0.23 29 3.2 63 3.4 8 2.8Rural 45 1.8 2 0.6 6 0.8 47 1.9 10.2 0.14 24 1.2 70 1.4 6 0.9Urban 32 4.3 4 1.6 11 2.9 52 5.0 12.7 0.36 26 4.4 66 4.4 7 2.2Total 42 1.4 3 0.6 9 0.9 46 1.7 10.4 0.11 25 1.2 68 1.2 7 0.8
Vietnam
Isolated 27 2.0 3 1.1 27 1.7 43 2.1 9.1 0.16 35 2.0 60 2.0 5 0.9Rural 34 0.9 2 0.3 9 0.7 54 0.9 10.8 0.07 26 1.0 69 1.1 5 0.4Urban 25 1.6 3 0.6 9 0.9 62 1.8 13.9 0.13 20 1.5 74 1.6 7 0.9Total 31 0.7 2 0.3 12 0.5 54 0.7 11.1 0.06 26 0.8 68 0.7 6 0.3
Table 4.33: Percentages and sampling errors of teacher accommodation, possessions andsatisfaction with accommodation
Of half of all pupils hadteachers who lived intheir own houses and
31% who lived withtheir parents. In isolated
areas, many lived ingovernment housing.
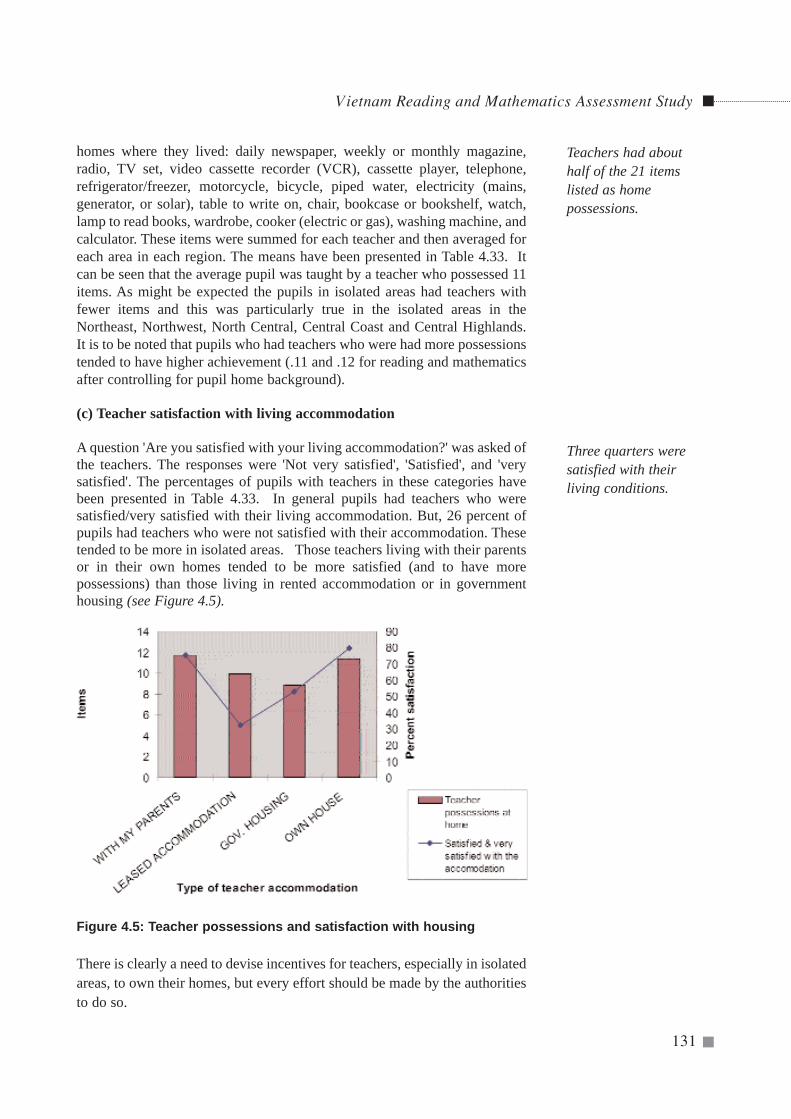
Vietnam Reading and Mathematics Assessment Study
131
homes where they lived: daily newspaper, weekly or monthly magazine,radio, TV set, video cassette recorder (VCR), cassette player, telephone,refrigerator/freezer, motorcycle, bicycle, piped water, electricity (mains,generator, or solar), table to write on, chair, bookcase or bookshelf, watch,lamp to read books, wardrobe, cooker (electric or gas), washing machine, andcalculator. These items were summed for each teacher and then averaged foreach area in each region. The means have been presented in Table 4.33. Itcan be seen that the average pupil was taught by a teacher who possessed 11items. As might be expected the pupils in isolated areas had teachers withfewer items and this was particularly true in the isolated areas in theNortheast, Northwest, North Central, Central Coast and Central Highlands.It is to be noted that pupils who had teachers who were had more possessionstended to have higher achievement (.11 and .12 for reading and mathematicsafter controlling for pupil home background).
(c) Teacher satisfaction with living accommodation
A question 'Are you satisfied with your living accommodation?' was asked ofthe teachers. The responses were 'Not very satisfied', 'Satisfied', and 'verysatisfied'. The percentages of pupils with teachers in these categories havebeen presented in Table 4.33. In general pupils had teachers who weresatisfied/very satisfied with their living accommodation. But, 26 percent ofpupils had teachers who were not satisfied with their accommodation. Thesetended to be more in isolated areas. Those teachers living with their parentsor in their own homes tended to be more satisfied (and to have morepossessions) than those living in rented accommodation or in governmenthousing (see Figure 4.5).
Figure 4.5: Teacher possessions and satisfaction with housing
There is clearly a need to devise incentives for teachers, especially in isolatedareas, to own their homes, but every effort should be made by the authoritiesto do so.
Teachers had abouthalf of the 21 itemslisted as homepossessions.
Three quarters weresatisfied with theirliving conditions.
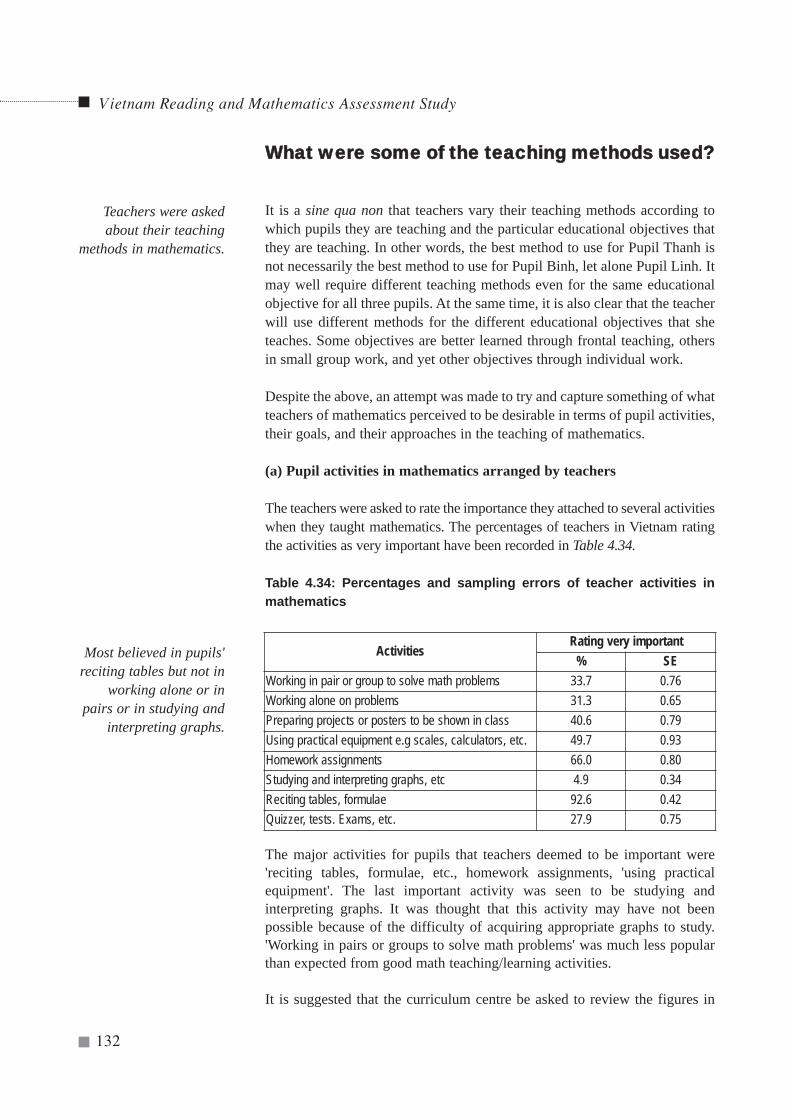
WWhhaatt wweerree ssoommee ooff tthhee tteeaacchhiinngg mmeetthhooddss uusseedd??
It is a sine qua non that teachers vary their teaching methods according towhich pupils they are teaching and the particular educational objectives thatthey are teaching. In other words, the best method to use for Pupil Thanh isnot necessarily the best method to use for Pupil Binh, let alone Pupil Linh. Itmay well require different teaching methods even for the same educationalobjective for all three pupils. At the same time, it is also clear that the teacherwill use different methods for the different educational objectives that sheteaches. Some objectives are better learned through frontal teaching, othersin small group work, and yet other objectives through individual work.
Despite the above, an attempt was made to try and capture something of whatteachers of mathematics perceived to be desirable in terms of pupil activities,their goals, and their approaches in the teaching of mathematics.
(a) Pupil activities in mathematics arranged by teachers
The teachers were asked to rate the importance they attached to several activitieswhen they taught mathematics. The percentages of teachers in Vietnam ratingthe activities as very important have been recorded in Table 4.34.
Table 4.34: Percentages and sampling errors of teacher activities inmathematics
The major activities for pupils that teachers deemed to be important were'reciting tables, formulae, etc., homework assignments, 'using practicalequipment'. The last important activity was seen to be studying andinterpreting graphs. It was thought that this activity may have not beenpossible because of the difficulty of acquiring appropriate graphs to study.'Working in pairs or groups to solve math problems' was much less popularthan expected from good math teaching/learning activities.
It is suggested that the curriculum centre be asked to review the figures in
Vietnam Reading and Mathematics Assessment Study
132
ActivitiesRating very important
% SEWorking in pair or group to solve math problems 33.7 0.76Working alone on problems 31.3 0.65Preparing projects or posters to be shown in class 40.6 0.79Using practical equipment e.g scales, calculators, etc. 49.7 0.93Homework assignments 66.0 0.80Studying and interpreting graphs, etc 4.9 0.34Reciting tables, formulae 92.6 0.42Quizzer, tests. Exams, etc. 27.9 0.75
Teachers were askedabout their teaching
methods in mathematics.
Most believed in pupils'reciting tables but not in
working alone or inpairs or in studying and
interpreting graphs.
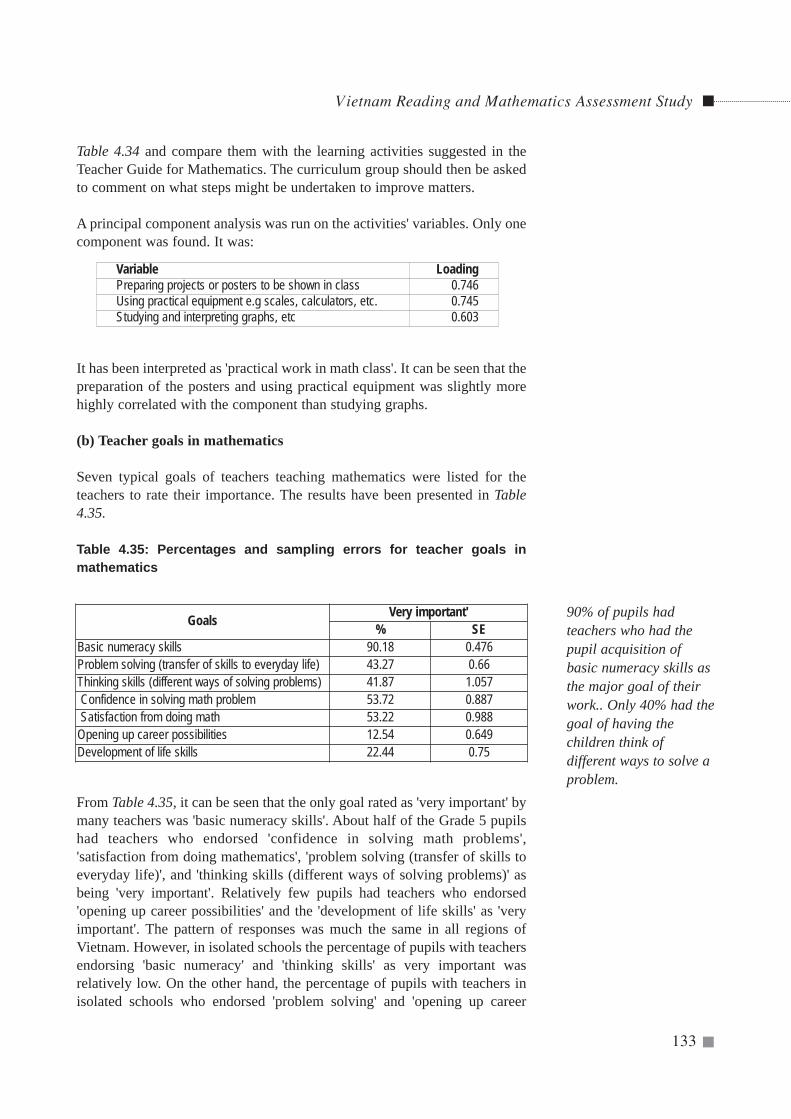
Table 4.34 and compare them with the learning activities suggested in theTeacher Guide for Mathematics. The curriculum group should then be askedto comment on what steps might be undertaken to improve matters.
A principal component analysis was run on the activities' variables. Only onecomponent was found. It was:
It has been interpreted as 'practical work in math class'. It can be seen that thepreparation of the posters and using practical equipment was slightly morehighly correlated with the component than studying graphs.
(b) Teacher goals in mathematics
Seven typical goals of teachers teaching mathematics were listed for theteachers to rate their importance. The results have been presented in Table4.35.
Table 4.35: Percentages and sampling errors for teacher goals inmathematics
From Table 4.35, it can be seen that the only goal rated as 'very important' bymany teachers was 'basic numeracy skills'. About half of the Grade 5 pupilshad teachers who endorsed 'confidence in solving math problems','satisfaction from doing mathematics', 'problem solving (transfer of skills toeveryday life)', and 'thinking skills (different ways of solving problems)' asbeing 'very important'. Relatively few pupils had teachers who endorsed'opening up career possibilities' and the 'development of life skills' as 'veryimportant'. The pattern of responses was much the same in all regions ofVietnam. However, in isolated schools the percentage of pupils with teachersendorsing 'basic numeracy' and 'thinking skills' as very important wasrelatively low. On the other hand, the percentage of pupils with teachers inisolated schools who endorsed 'problem solving' and 'opening up career
Vietnam Reading and Mathematics Assessment Study
133
Goals Very important'% SE
Basic numeracy skills 90.18 0.476Problem solving (transfer of skills to everyday life) 43.27 0.66Thinking skills (different ways of solving problems) 41.87 1.057Confidence in solving math problem 53.72 0.887Satisfaction from doing math 53.22 0.988
Opening up career possibilities 12.54 0.649Development of life skills 22.44 0.75
90% of pupils hadteachers who had thepupil acquisition ofbasic numeracy skills asthe major goal of theirwork.. Only 40% had thegoal of having thechildren think ofdifferent ways to solve aproblem.
Variable LoadingPreparing projects or posters to be shown in class 0.746Using practical equipment e.g scales, calculators, etc. 0.745Studying and interpreting graphs, etc 0.603
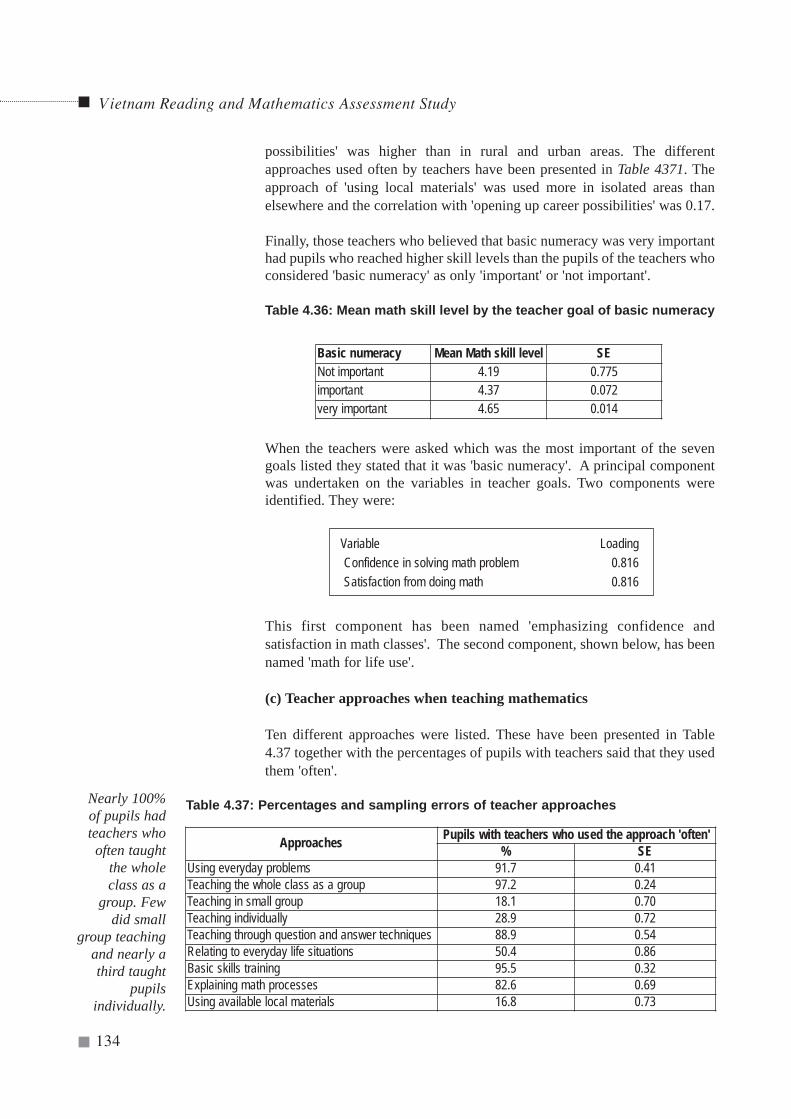
possibilities' was higher than in rural and urban areas. The differentapproaches used often by teachers have been presented in Table 4371. Theapproach of 'using local materials' was used more in isolated areas thanelsewhere and the correlation with 'opening up career possibilities' was 0.17.
Finally, those teachers who believed that basic numeracy was very importanthad pupils who reached higher skill levels than the pupils of the teachers whoconsidered 'basic numeracy' as only 'important' or 'not important'.
Table 4.36: Mean math skill level by the teacher goal of basic numeracy
When the teachers were asked which was the most important of the sevengoals listed they stated that it was 'basic numeracy'. A principal componentwas undertaken on the variables in teacher goals. Two components wereidentified. They were:
This first component has been named 'emphasizing confidence andsatisfaction in math classes'. The second component, shown below, has beennamed 'math for life use'.
(c) Teacher approaches when teaching mathematics
Ten different approaches were listed. These have been presented in Table4.37 together with the percentages of pupils with teachers said that they usedthem 'often'.
Vietnam Reading and Mathematics Assessment Study
134
Basic numeracy Mean Math skill level SENot important 4.19 0.775important 4.37 0.072very important 4.65 0.014
Variable LoadingConfidence in solving math problem 0.816Satisfaction from doing math 0.816
Approaches Pupils with teachers who used the approach 'often'% SE
Using everyday problems 91.7 0.41Teaching the whole class as a group 97.2 0.24Teaching in small group 18.1 0.70Teaching individually 28.9 0.72Teaching through question and answer techniques 88.9 0.54Relating to everyday life situations 50.4 0.86Basic skills training 95.5 0.32Explaining math processes 82.6 0.69Using available local materials 16.8 0.73
Table 4.37: Percentages and sampling errors of teacher approachesNearly 100%of pupils hadteachers whooften taught
the wholeclass as a
group. Fewdid small
group teachingand nearly athird taught
pupilsindividually.
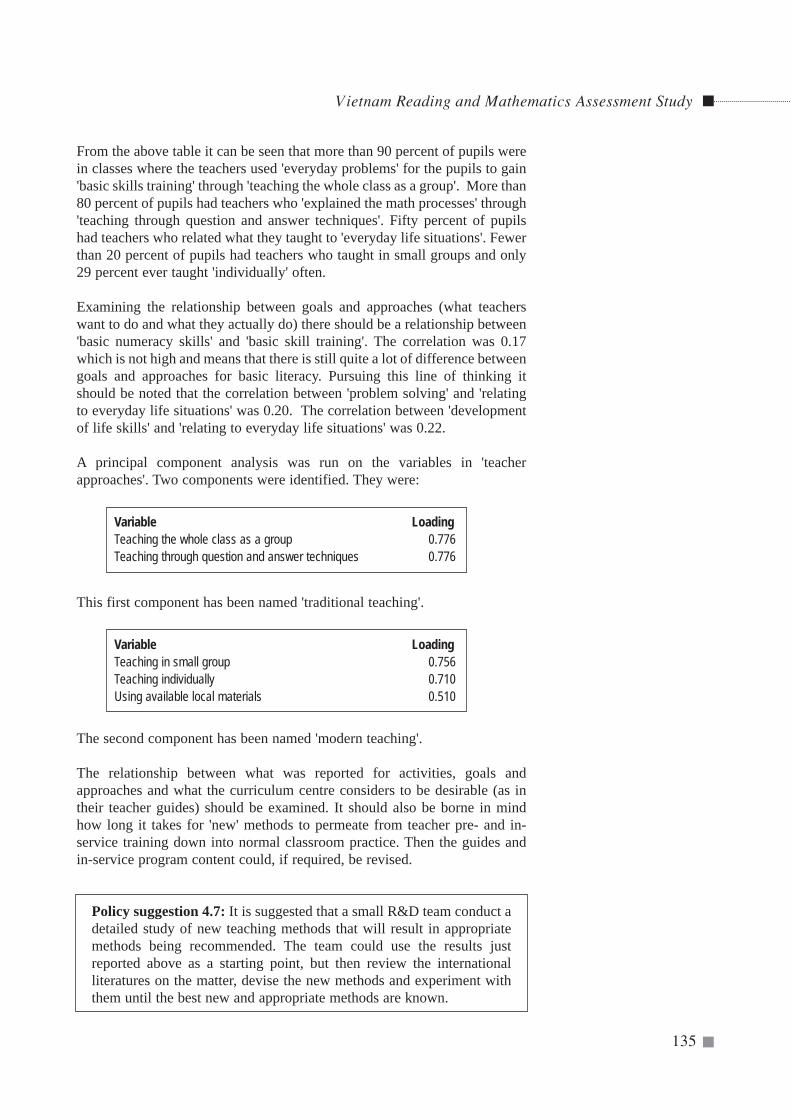
From the above table it can be seen that more than 90 percent of pupils werein classes where the teachers used 'everyday problems' for the pupils to gain'basic skills training' through 'teaching the whole class as a group'. More than80 percent of pupils had teachers who 'explained the math processes' through'teaching through question and answer techniques'. Fifty percent of pupilshad teachers who related what they taught to 'everyday life situations'. Fewerthan 20 percent of pupils had teachers who taught in small groups and only29 percent ever taught 'individually' often.
Examining the relationship between goals and approaches (what teacherswant to do and what they actually do) there should be a relationship between'basic numeracy skills' and 'basic skill training'. The correlation was 0.17which is not high and means that there is still quite a lot of difference betweengoals and approaches for basic literacy. Pursuing this line of thinking itshould be noted that the correlation between 'problem solving' and 'relatingto everyday life situations' was 0.20. The correlation between 'developmentof life skills' and 'relating to everyday life situations' was 0.22.
A principal component analysis was run on the variables in 'teacherapproaches'. Two components were identified. They were:
Variable LoadingTeaching the whole class as a group 0.776Teaching through question and answer techniques 0.776
This first component has been named 'traditional teaching'.
Variable LoadingTeaching in small group 0.756Teaching individually 0.710Using available local materials 0.510
The second component has been named 'modern teaching'.
The relationship between what was reported for activities, goals andapproaches and what the curriculum centre considers to be desirable (as intheir teacher guides) should be examined. It should also be borne in mindhow long it takes for 'new' methods to permeate from teacher pre- and in-service training down into normal classroom practice. Then the guides andin-service program content could, if required, be revised.
Policy suggestion 4.7: It is suggested that a small R&D team conduct adetailed study of new teaching methods that will result in appropriatemethods being recommended. The team could use the results justreported above as a starting point, but then review the internationalliteratures on the matter, devise the new methods and experiment withthem until the best new and appropriate methods are known.
Vietnam Reading and Mathematics Assessment Study
135
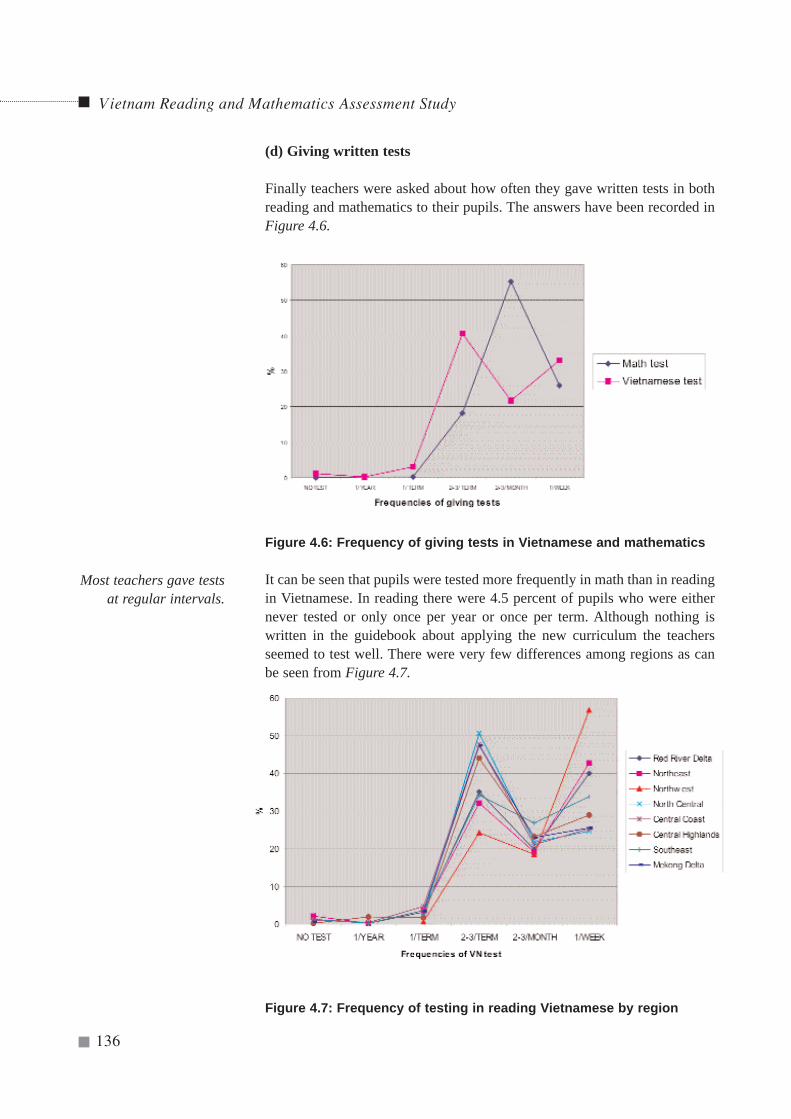
Vietnam Reading and Mathematics Assessment Study
136
(d) Giving written tests
Finally teachers were asked about how often they gave written tests in bothreading and mathematics to their pupils. The answers have been recorded inFigure 4.6.
Figure 4.6: Frequency of giving tests in Vietnamese and mathematics
It can be seen that pupils were tested more frequently in math than in readingin Vietnamese. In reading there were 4.5 percent of pupils who were eithernever tested or only once per year or once per term. Although nothing iswritten in the guidebook about applying the new curriculum the teachersseemed to test well. There were very few differences among regions as canbe seen from Figure 4.7.
Figure 4.7: Frequency of testing in reading Vietnamese by region
Most teachers gave testsat regular intervals.
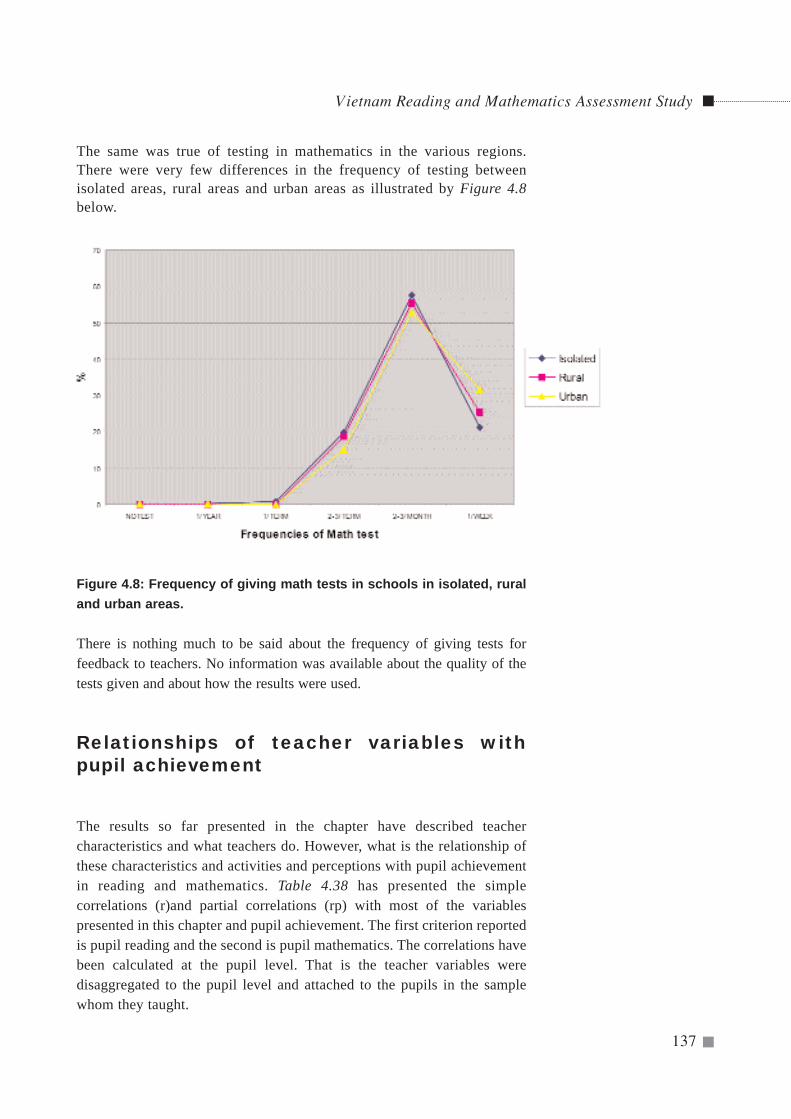
Vietnam Reading and Mathematics Assessment Study
137
The same was true of testing in mathematics in the various regions.There were very few differences in the frequency of testing betweenisolated areas, rural areas and urban areas as illustrated by Figure 4.8below.
Figure 4.8: Frequency of giving math tests in schools in isolated, ruraland urban areas.
There is nothing much to be said about the frequency of giving tests forfeedback to teachers. No information was available about the quality of thetests given and about how the results were used.
Relationships of teacher variables withpupil achievement
The results so far presented in the chapter have described teachercharacteristics and what teachers do. However, what is the relationship ofthese characteristics and activities and perceptions with pupil achievementin reading and mathematics. Table 4.38 has presented the simplecorrelations (r)and partial correlations (rp) with most of the variablespresented in this chapter and pupil achievement. The first criterion reportedis pupil reading and the second is pupil mathematics. The correlations havebeen calculated at the pupil level. That is the teacher variables weredisaggregated to the pupil level and attached to the pupils in the samplewhom they taught.
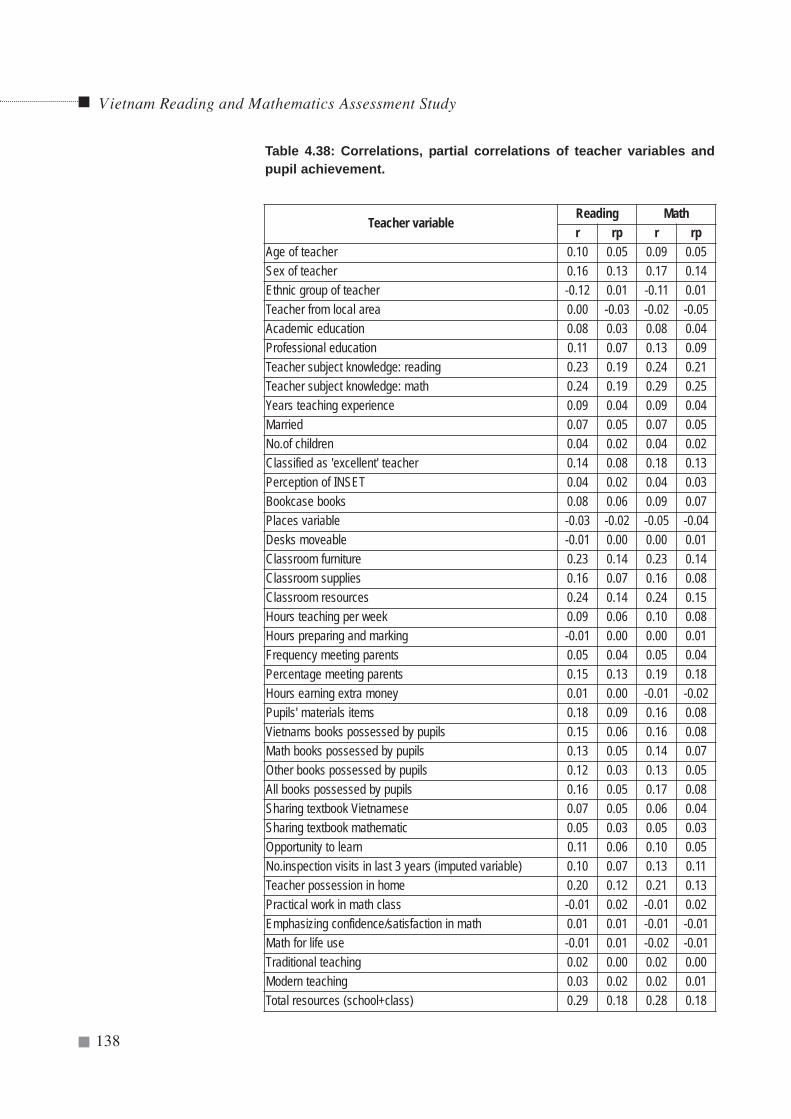
Table 4.38: Correlations, partial correlations of teacher variables andpupil achievement.
Vietnam Reading and Mathematics Assessment Study
138
Teacher variableReading Mathr rp r rp
Age of teacher 0.10 0.05 0.09 0.05Sex of teacher 0.16 0.13 0.17 0.14Ethnic group of teacher -0.12 0.01 -0.11 0.01Teacher from local area 0.00 -0.03 -0.02 -0.05Academic education 0.08 0.03 0.08 0.04Professional education 0.11 0.07 0.13 0.09Teacher subject knowledge: reading 0.23 0.19 0.24 0.21Teacher subject knowledge: math 0.24 0.19 0.29 0.25Years teaching experience 0.09 0.04 0.09 0.04Married 0.07 0.05 0.07 0.05No.of children 0.04 0.02 0.04 0.02Classified as 'excellent' teacher 0.14 0.08 0.18 0.13Perception of INSET 0.04 0.02 0.04 0.03Bookcase books 0.08 0.06 0.09 0.07Places variable -0.03 -0.02 -0.05 -0.04Desks moveable -0.01 0.00 0.00 0.01Classroom furniture 0.23 0.14 0.23 0.14Classroom supplies 0.16 0.07 0.16 0.08Classroom resources 0.24 0.14 0.24 0.15Hours teaching per week 0.09 0.06 0.10 0.08Hours preparing and marking -0.01 0.00 0.00 0.01Frequency meeting parents 0.05 0.04 0.05 0.04Percentage meeting parents 0.15 0.13 0.19 0.18Hours earning extra money 0.01 0.00 -0.01 -0.02Pupils' materials items 0.18 0.09 0.16 0.08Vietnams books possessed by pupils 0.15 0.06 0.16 0.08Math books possessed by pupils 0.13 0.05 0.14 0.07Other books possessed by pupils 0.12 0.03 0.13 0.05All books possessed by pupils 0.16 0.05 0.17 0.08Sharing textbook Vietnamese 0.07 0.05 0.06 0.04Sharing textbook mathematic 0.05 0.03 0.05 0.03Opportunity to learn 0.11 0.06 0.10 0.05No.inspection visits in last 3 years (imputed variable) 0.10 0.07 0.13 0.11Teacher possession in home 0.20 0.12 0.21 0.13Practical work in math class -0.01 0.02 -0.01 0.02Emphasizing confidence/satisfaction in math 0.01 0.01 -0.01 -0.01Math for life use -0.01 0.01 -0.02 -0.01Traditional teaching 0.02 0.00 0.02 0.00Modern teaching 0.03 0.02 0.02 0.01Total resources (school+class) 0.29 0.18 0.28 0.18
Vietnam Reading and Mathematics Assessment Study
139
It is the partial correlations that are important. As stated earlier it is relativelyeasy for teachers to teach pupils from 'good' home backgrounds but muchmore difficult to teach children from 'poor' home backgrounds. The partialcorrelations indicate the relationship of teacher variables with achievementafter the home background of the pupils has been taken into account. It willbe recalled that only 51 percent of pupils were linked with teachers but asseen in Chapter 1 there was no difference between the pupils in the pupil-teacher linked sub-sample and the non-pupil-teacher linked sub-sample.
It can be seen that the variables of teacher subject-matter knowledge in bothreading and mathematics had strong correlations with pupil achievement. Itwill also be seen that after home background was partialled out that thecorrelations were still strong but less large than the simple correlations. Take,for example, the correlation of teacher subject-matter knowledge inmathematics and pupil achievement in mathematics. The simple correlationwas 0.29 and the partial was 0.25. The simple correlation included the homebackground, i.e. the fact that pupils from better homes were in schools withteachers who had more subject matter knowledge. But when the effect ofhome background was removed, the correlation decreased in size to 0.25. But0.25 is still large and therefore important.
No sampling errors were reported in Table 4.38 because any correlationgreater then about 0.02 would be significant with the large N. Therefore, onlypartial correlations greater than 0.07 have been selected as worthy of furtherstudy. These are:
Sex of teacher (Pupils having female teachers had higher achievement)Teacher training (more teacher training associated with better pupilachievement)Teacher subject matter knowledge in both subjects (more teacherknowledge = more pupil achievement)Being classified as an excellent teacher (excellent teachers associatedwith higher pupil achievement)Classroom resources (more furniture and supplies associated withhigher pupil achievement) Percentage meeting parents (more percentage meeting parentsassociated with higher pupil achievement)Pupils' materials in the classroom (the more the pupils have thematerials they need, the higher their achievement)Number of inspection visits in the last three years (the more pupils werein schools visited by inspectors the higher the pupils achievement - butwas it that inspectors decided to visit better schools)Teacher possessions in the home (teachers with more possessionassociated with higher pupil performance)
The relative importance of these variables will be examined in a later chapter.
After taking into accountsocio-economic status ofthe pupils in the system,certain teacher andclassroom variableswere identified as beingstrongly related topupils' achievement.
Vietnam Reading and Mathematics Assessment Study
140
Conclusion
Several aspects of the characteristics and daily lives of the teachers of Grade5 pupils in Vietnam have been reviewed in this chapter. There were largedifferences between the kinds of teachers in isolated areas and the otherareas. For measures of teacher quality such as the years of teacher trainingthey had received or the teacher subject matter achievement, those in theisolated areas were of less quality than the teachers in rural and urban areas.Female teachers tended to have pupils with better achievement than did maleteachers. There were more male teachers in the isolated schools (probably forgood reasons) but these teachers had a lower mastery of the subject-matterthan did the female teachers. Teachers with more years of pre-service teachertraining had better results with their pupils than did teachers with fewer yearsof pre-service teacher training. The teachers in the isolated area schoolstended to have fewer years of pre-service teacher training.
The allocation of teachers to schools in terms of teacher quality was notequitable. In some ways it can be argued that the better teachers should be inthe remote schools in order to compensate for the poorer teachers they havehad for years.
It was not clear how teacher quality is taken into account when allocatingteachers to schools. Thus the first major suggestion was that thoseresponsible for the allocation of teachers to schools should review the currentsystem and affect some improvement in it. Some easy indicators of teacherquality should be used.
A second suggestion was concerned the poor levels of reading andmathematics achievement on the part of some teachers. it was suggested thatthe content of the current teacher training courses to be updated to takeaccount of the new curriculum, that a national level of subject matterknowledge should be established for teachers to become certified, and thatspecial efforts to be made through the in-service programs to up-date theexisting teachers. The excellent teachers at the school and national levels hadpupils who did not achieve more than the pupils who had teachers notclassified as excellent teachers at these levels. On the other hand the excellentteachers at the district and provincial levels had pupils with much higherachievement levels than those pupils without excellent teachers at theselevels. Teachers in general did not think that the in-service teacher trainingcourses were very effective.
A third suggestion was that the MOET should make every effort to strengthenthe supply to schools of many books for their classroom and school libraries.
There were adequate places for the pupils to sit and write in the classrooms.Nearly half the desks were moveable so that the teachers could organizedifferent groupings of pupils. But, over 50 percent were not moveable. It isassumed that the MOET is moving toward a replacement of desks so as tohave all moveable desks. The number of books available in classrooms wasvery limited. This was serious if pupils were to get the opportunity to do lotsof reading. It was also the case that where pupils were in classrooms withsome books in the classroom library, they were also in schools where there
was a school library. What was bad was the number of pupils in schoolswhere there was neither a school or classroom library.
In terms of classroom furniture there were a few pupils in classrooms wherethere was a useable blackboard. This should be remedied immediately. Therewere high percentages of pupils in classrooms without a cupboard, without aclassroom bookcase and without bookshelves. Again it tended to be theisolated schools that had the least furniture. About five percent of pupils werein classrooms where the teacher did not have access to teacher guides inVietnamese and mathematics. This seems to be odd.
A fourth suggestion was that the provincial authorities (or even the regionalauthorities since there were large differences between regions) shouldconsider undertaking as part of the annual census a review of the furnitureand supplies in all schools in their jurisdiction.
Teachers in isolated areas only taught 16.1 hours per week, those in rural andurban areas 16.8 hours per week. This is a low teaching load by internationalstandards. This is a low teaching load by international standards. It is notknown why Vietnamese primary teachers teach such low hours but it issuggested that the matter be reviewed.
The teachers professed to be preparing lessons ands marking homework fora further 20 hours per week but perhaps the MOET might like to check thevalidity of these data.
The extent to which teachers meet parents seems to be a rather rote affair.Given the importance of meeting parents and bearing in mind what waswritten in Chapter 3 about school intervention programs a further suggestionwas that the MOET should conduct a study on how, when and why teachersmeet parents and how this might be improved.
The issue of the materials and textbooks that pupils possessed for the purposeof learning was examined. Whereas nearly all pupils had a copy of the majortextbooks this was not true of many of the other textbooks, even though thepupils said that they were studying all of the subjects. Nearly all of the pupilshad the materials but there were small percentages not having some of therequired materials. Having the wherewithal to learn is so important - and ofcourse it was the pupils in the isolated schools who had least - that it was feltthat the curriculum centre should review which materials and books a Grade5 pupil must have and then make sure that all pupils have what they need tobe able to study.
The teachers' perceptions of the role of inspectors and educational advisorswere examined as well as the teachers' sources of satisfaction with theirwork. Finally, the teaching methods used by the math teachers wereexamined. It was felt that a special study group should review the findings onteaching methods (activities, goals and approaches) and on the basis of theirdeliberations and a review of the international literature revise the teacherguidebooks.
A priority needs to be set on the different suggestions and a plan made as towhere the MOET must act alone and where the donor agencies might help.This matter will be raised again in the last chapter.
Vietnam Reading and Mathematics Assessment Study
141
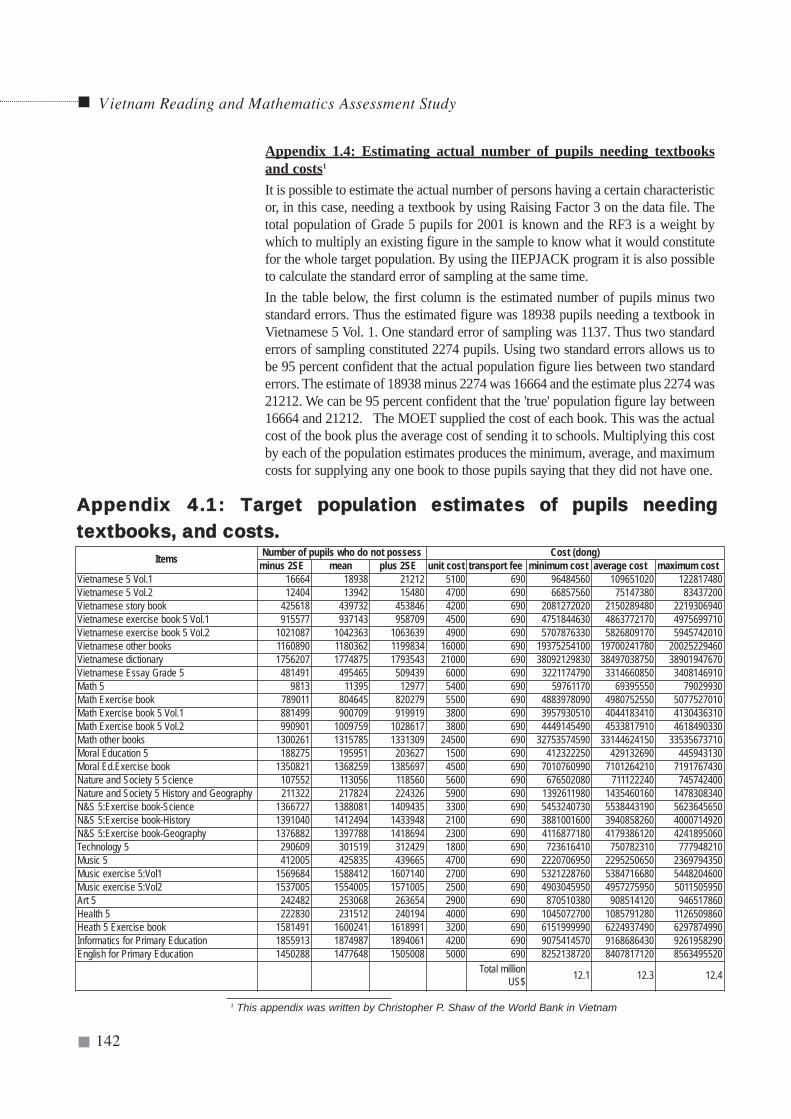
Vietnam Reading and Mathematics Assessment Study
142
AAppppeennddiixx 44..11:: TTaarrggeett ppooppuullaattiioonn eessttiimmaatteess ooff ppuuppiillss nneeeeddiinnggtteexxttbbooookkss,, aanndd ccoossttss..
Items Number of pupils who do not possess Cost (dong)minus 2SE mean plus 2SE unit cost transport fee minimum cost average cost maximum cost
Vietnamese 5 Vol.1 16664 18938 21212 5100 690 96484560 109651020 122817480Vietnamese 5 Vol.2 12404 13942 15480 4700 690 66857560 75147380 83437200Vietnamese story book 425618 439732 453846 4200 690 2081272020 2150289480 2219306940Vietnamese exercise book 5 Vol.1 915577 937143 958709 4500 690 4751844630 4863772170 4975699710Vietnamese exercise book 5 Vol.2 1021087 1042363 1063639 4900 690 5707876330 5826809170 5945742010Vietnamese other books 1160890 1180362 1199834 16000 690 19375254100 19700241780 20025229460Vietnamese dictionary 1756207 1774875 1793543 21000 690 38092129830 38497038750 38901947670Vietnamese Essay Grade 5 481491 495465 509439 6000 690 3221174790 3314660850 3408146910Math 5 9813 11395 12977 5400 690 59761170 69395550 79029930Math Exercise book 789011 804645 820279 5500 690 4883978090 4980752550 5077527010Math Exercise book 5 Vol.1 881499 900709 919919 3800 690 3957930510 4044183410 4130436310Math Exercise book 5 Vol.2 990901 1009759 1028617 3800 690 4449145490 4533817910 4618490330Math other books 1300261 1315785 1331309 24500 690 32753574590 33144624150 33535673710Moral Education 5 188275 195951 203627 1500 690 412322250 429132690 445943130Moral Ed.Exercise book 1350821 1368259 1385697 4500 690 7010760990 7101264210 7191767430Nature and Society 5 Science 107552 113056 118560 5600 690 676502080 711122240 745742400Nature and Society 5 History and Geography 211322 217824 224326 5900 690 1392611980 1435460160 1478308340N&S 5:Exercise book-Science 1366727 1388081 1409435 3300 690 5453240730 5538443190 5623645650N&S 5:Exercise book-History 1391040 1412494 1433948 2100 690 3881001600 3940858260 4000714920N&S 5:Exercise book-Geography 1376882 1397788 1418694 2300 690 4116877180 4179386120 4241895060Technology 5 290609 301519 312429 1800 690 723616410 750782310 777948210Music 5 412005 425835 439665 4700 690 2220706950 2295250650 2369794350Music exercise 5:Vol1 1569684 1588412 1607140 2700 690 5321228760 5384716680 5448204600Music exercise 5:Vol2 1537005 1554005 1571005 2500 690 4903045950 4957275950 5011505950Art 5 242482 253068 263654 2900 690 870510380 908514120 946517860Health 5 222830 231512 240194 4000 690 1045072700 1085791280 1126509860Heath 5 Exercise book 1581491 1600241 1618991 3200 690 6151999990 6224937490 6297874990Informatics for Primary Education 1855913 1874987 1894061 4200 690 9075414570 9168686430 9261958290English for Primary Education 1450288 1477648 1505008 5000 690 8252138720 8407817120 8563495520
Total millionUS$ 12.1 12.3 12.4
Appendix 1.4: Estimating actual number of pupils needing textbooksand costs1
It is possible to estimate the actual number of persons having a certain characteristicor, in this case, needing a textbook by using Raising Factor 3 on the data file. Thetotal population of Grade 5 pupils for 2001 is known and the RF3 is a weight bywhich to multiply an existing figure in the sample to know what it would constitutefor the whole target population. By using the IIEPJACK program it is also possibleto calculate the standard error of sampling at the same time. In the table below, the first column is the estimated number of pupils minus twostandard errors. Thus the estimated figure was 18938 pupils needing a textbook inVietnamese 5 Vol. 1. One standard error of sampling was 1137. Thus two standarderrors of sampling constituted 2274 pupils. Using two standard errors allows us tobe 95 percent confident that the actual population figure lies between two standarderrors. The estimate of 18938 minus 2274 was 16664 and the estimate plus 2274 was21212. We can be 95 percent confident that the 'true' population figure lay between16664 and 21212. The MOET supplied the cost of each book. This was the actualcost of the book plus the average cost of sending it to schools. Multiplying this costby each of the population estimates produces the minimum, average, and maximumcosts for supplying any one book to those pupils saying that they did not have one.
1 This appendix was written by Christopher P. Shaw of the World Bank in Vietnam
Chapter 5
WHAT WERE THE CHARACTERISTICS OF
SCHOOL HEADS AND SCHOOLS?
Introduction
Schools are different within every country in the world. WithinVietnam it is the same. Griffin1 showed that there was tremendousvariation among schools in the five provinces in which the NIEScollected data in 1999. In the present study the sample of schools
and Grade 5 pupils covered the whole of Vietnam. The major thrust of thischapter is to examine the characteristics of school heads and of the schoolsthemselves in order to establish the levels of inputs to schools but also theamount of variation among schools in isolated, rural, and urban areas indifferent regions. These data, as in the previous two chapters, help establisha baseline against which schools can be compared in future studies in orderto see if the situation has improved, remained the same or deteriorated. At thesame time these are the data that will be analysed more extensively in laterchapters. And again the percentages presented are the percentages of pupilsin schools with different characteristics rather then the simple count ofschools. A mean indicates that the average pupil in Vietnam is in a schoolwith the characteristic in question.
Vietnam Reading and Mathematics Assessment Study
143
-------------------------------1 Griffin, Patrick (1999) Vietnam Primary School Monitoring Report. Mimeographed report.World Bank in Vietnam
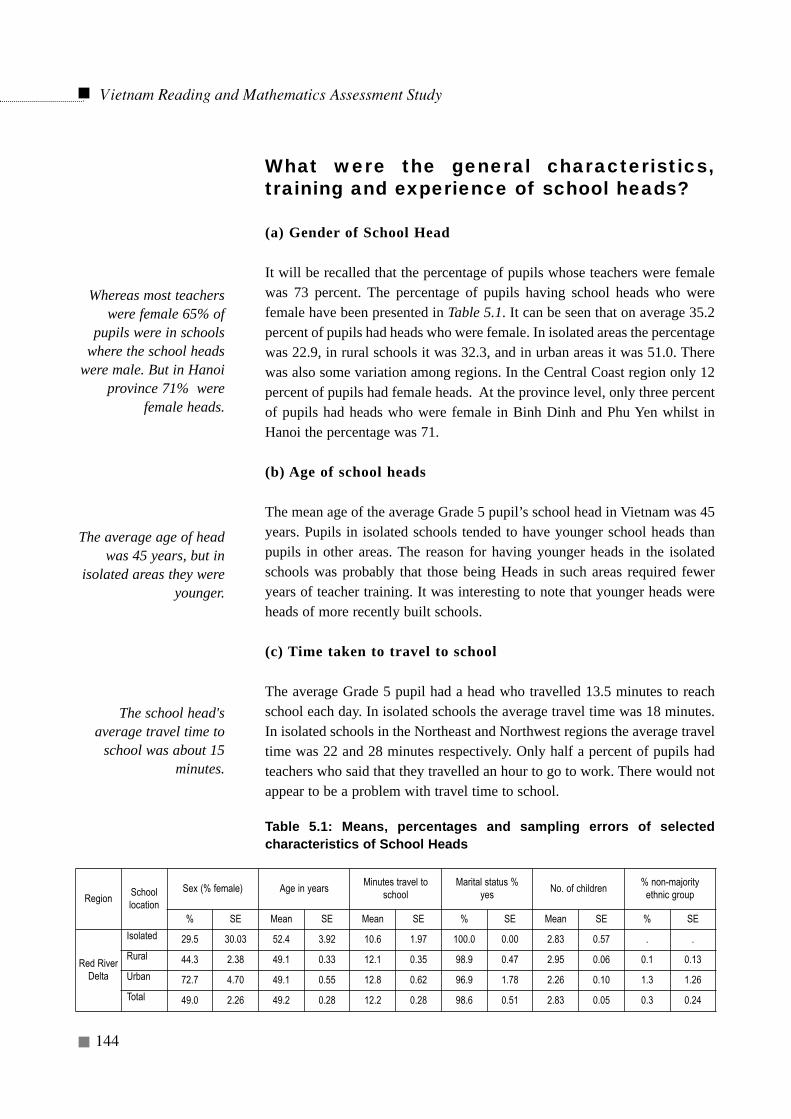
What were the general characteristics,training and experience of school heads?
(a) Gender of School Head
It will be recalled that the percentage of pupils whose teachers were femalewas 73 percent. The percentage of pupils having school heads who werefemale have been presented in Table 5.1. It can be seen that on average 35.2percent of pupils had heads who were female. In isolated areas the percentagewas 22.9, in rural schools it was 32.3, and in urban areas it was 51.0. Therewas also some variation among regions. In the Central Coast region only 12percent of pupils had female heads. At the province level, only three percentof pupils had heads who were female in Binh Dinh and Phu Yen whilst inHanoi the percentage was 71.
(b) Age of school heads
The mean age of the average Grade 5 pupil’s school head in Vietnam was 45years. Pupils in isolated schools tended to have younger school heads thanpupils in other areas. The reason for having younger heads in the isolatedschools was probably that those being Heads in such areas required feweryears of teacher training. It was interesting to note that younger heads wereheads of more recently built schools.
(c) Time taken to travel to school
The average Grade 5 pupil had a head who travelled 13.5 minutes to reachschool each day. In isolated schools the average travel time was 18 minutes.In isolated schools in the Northeast and Northwest regions the average traveltime was 22 and 28 minutes respectively. Only half a percent of pupils hadteachers who said that they travelled an hour to go to work. There would notappear to be a problem with travel time to school.
Table 5.1: Means, percentages and sampling errors of selectedcharacteristics of School Heads
Vietnam Reading and Mathematics Assessment Study
144
The average age of headwas 45 years, but in
isolated areas they wereyounger.
The school head'saverage travel time to
school was about 15minutes.
Whereas most teacherswere female 65% of
pupils were in schoolswhere the school heads
were male. But in Hanoiprovince 71% were
female heads.
RegionSchoollocation
Sex (% female) Age in years Minutes travel to
schoolMarital status %
yesNo. of children
% non-majorityethnic group
% SE Mean SE Mean SE % SE Mean SE % SE
Red RiverDelta
Isolated 29.5 30.03 52.4 3.92 10.6 1.97 100.0 0.00 2.83 0.57 . .
Rural 44.3 2.38 49.1 0.33 12.1 0.35 98.9 0.47 2.95 0.06 0.1 0.13
Urban 72.7 4.70 49.1 0.55 12.8 0.62 96.9 1.78 2.26 0.10 1.3 1.26
Total 49.0 2.26 49.2 0.28 12.2 0.28 98.6 0.51 2.83 0.05 0.3 0.24
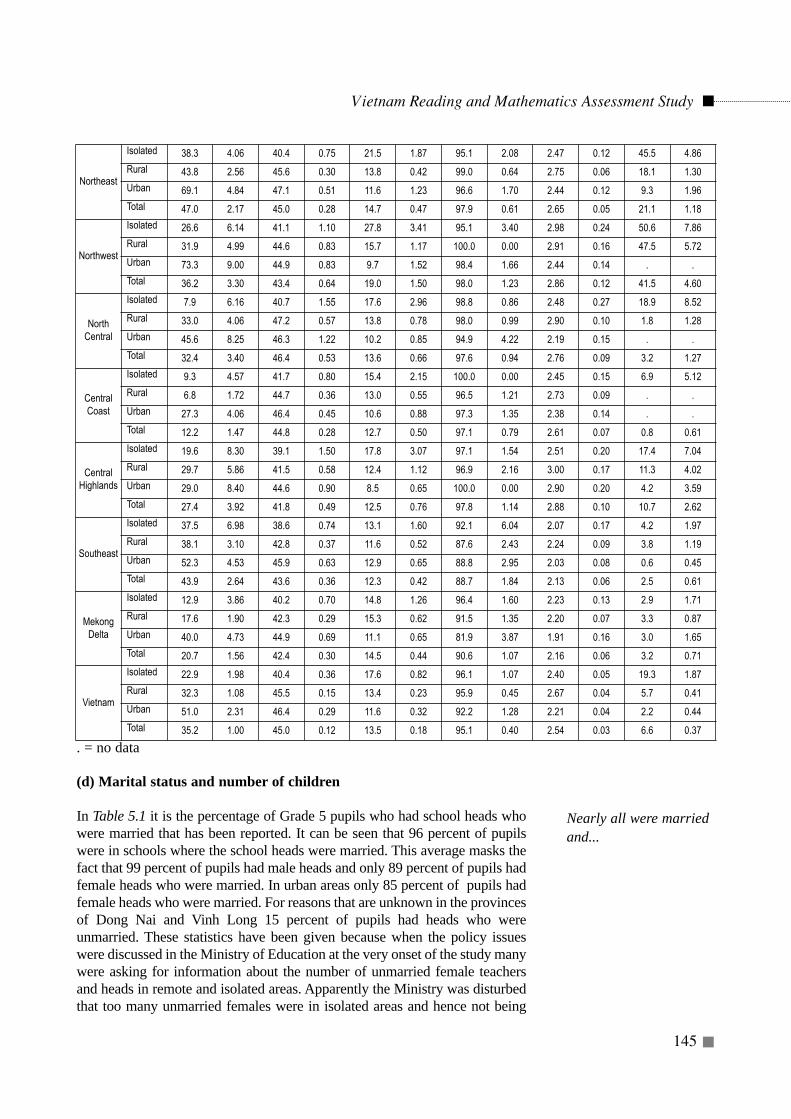
. = no data
(d) Marital status and number of children
In Table 5.1 it is the percentage of Grade 5 pupils who had school heads whowere married that has been reported. It can be seen that 96 percent of pupilswere in schools where the school heads were married. This average masks thefact that 99 percent of pupils had male heads and only 89 percent of pupils hadfemale heads who were married. In urban areas only 85 percent of pupils hadfemale heads who were married. For reasons that are unknown in the provincesof Dong Nai and Vinh Long 15 percent of pupils had heads who wereunmarried. These statistics have been given because when the policy issueswere discussed in the Ministry of Education at the very onset of the study manywere asking for information about the number of unmarried female teachersand heads in remote and isolated areas. Apparently the Ministry was disturbedthat too many unmarried females were in isolated areas and hence not being
Vietnam Reading and Mathematics Assessment Study
145
Northeast
Isolated 38.3 4.06 40.4 0.75 21.5 1.87 95.1 2.08 2.47 0.12 45.5 4.86
Rural 43.8 2.56 45.6 0.30 13.8 0.42 99.0 0.64 2.75 0.06 18.1 1.30
Urban 69.1 4.84 47.1 0.51 11.6 1.23 96.6 1.70 2.44 0.12 9.3 1.96
Total 47.0 2.17 45.0 0.28 14.7 0.47 97.9 0.61 2.65 0.05 21.1 1.18
Northwest
Isolated 26.6 6.14 41.1 1.10 27.8 3.41 95.1 3.40 2.98 0.24 50.6 7.86
Rural 31.9 4.99 44.6 0.83 15.7 1.17 100.0 0.00 2.91 0.16 47.5 5.72
Urban 73.3 9.00 44.9 0.83 9.7 1.52 98.4 1.66 2.44 0.14 . .
Total 36.2 3.30 43.4 0.64 19.0 1.50 98.0 1.23 2.86 0.12 41.5 4.60
NorthCentral
Isolated 7.9 6.16 40.7 1.55 17.6 2.96 98.8 0.86 2.48 0.27 18.9 8.52
Rural 33.0 4.06 47.2 0.57 13.8 0.78 98.0 0.99 2.90 0.10 1.8 1.28
Urban 45.6 8.25 46.3 1.22 10.2 0.85 94.9 4.22 2.19 0.15 . .
Total 32.4 3.40 46.4 0.53 13.6 0.66 97.6 0.94 2.76 0.09 3.2 1.27
CentralCoast
Isolated 9.3 4.57 41.7 0.80 15.4 2.15 100.0 0.00 2.45 0.15 6.9 5.12
Rural 6.8 1.72 44.7 0.36 13.0 0.55 96.5 1.21 2.73 0.09 . .
Urban 27.3 4.06 46.4 0.45 10.6 0.88 97.3 1.35 2.38 0.14 . .
Total 12.2 1.47 44.8 0.28 12.7 0.50 97.1 0.79 2.61 0.07 0.8 0.61
CentralHighlands
Isolated 19.6 8.30 39.1 1.50 17.8 3.07 97.1 1.54 2.51 0.20 17.4 7.04
Rural 29.7 5.86 41.5 0.58 12.4 1.12 96.9 2.16 3.00 0.17 11.3 4.02
Urban 29.0 8.40 44.6 0.90 8.5 0.65 100.0 0.00 2.90 0.20 4.2 3.59
Total 27.4 3.92 41.8 0.49 12.5 0.76 97.8 1.14 2.88 0.10 10.7 2.62
Southeast
Isolated 37.5 6.98 38.6 0.74 13.1 1.60 92.1 6.04 2.07 0.17 4.2 1.97
Rural 38.1 3.10 42.8 0.37 11.6 0.52 87.6 2.43 2.24 0.09 3.8 1.19
Urban 52.3 4.53 45.9 0.63 12.9 0.65 88.8 2.95 2.03 0.08 0.6 0.45
Total 43.9 2.64 43.6 0.36 12.3 0.42 88.7 1.84 2.13 0.06 2.5 0.61
MekongDelta
Isolated 12.9 3.86 40.2 0.70 14.8 1.26 96.4 1.60 2.23 0.13 2.9 1.71
Rural 17.6 1.90 42.3 0.29 15.3 0.62 91.5 1.35 2.20 0.07 3.3 0.87
Urban 40.0 4.73 44.9 0.69 11.1 0.65 81.9 3.87 1.91 0.16 3.0 1.65
Total 20.7 1.56 42.4 0.30 14.5 0.44 90.6 1.07 2.16 0.06 3.2 0.71
Vietnam
Isolated 22.9 1.98 40.4 0.36 17.6 0.82 96.1 1.07 2.40 0.05 19.3 1.87
Rural 32.3 1.08 45.5 0.15 13.4 0.23 95.9 0.45 2.67 0.04 5.7 0.41
Urban 51.0 2.31 46.4 0.29 11.6 0.32 92.2 1.28 2.21 0.04 2.2 0.44
Total 35.2 1.00 45.0 0.12 13.5 0.18 95.1 0.40 2.54 0.03 6.6 0.37
Nearly all were marriedand...
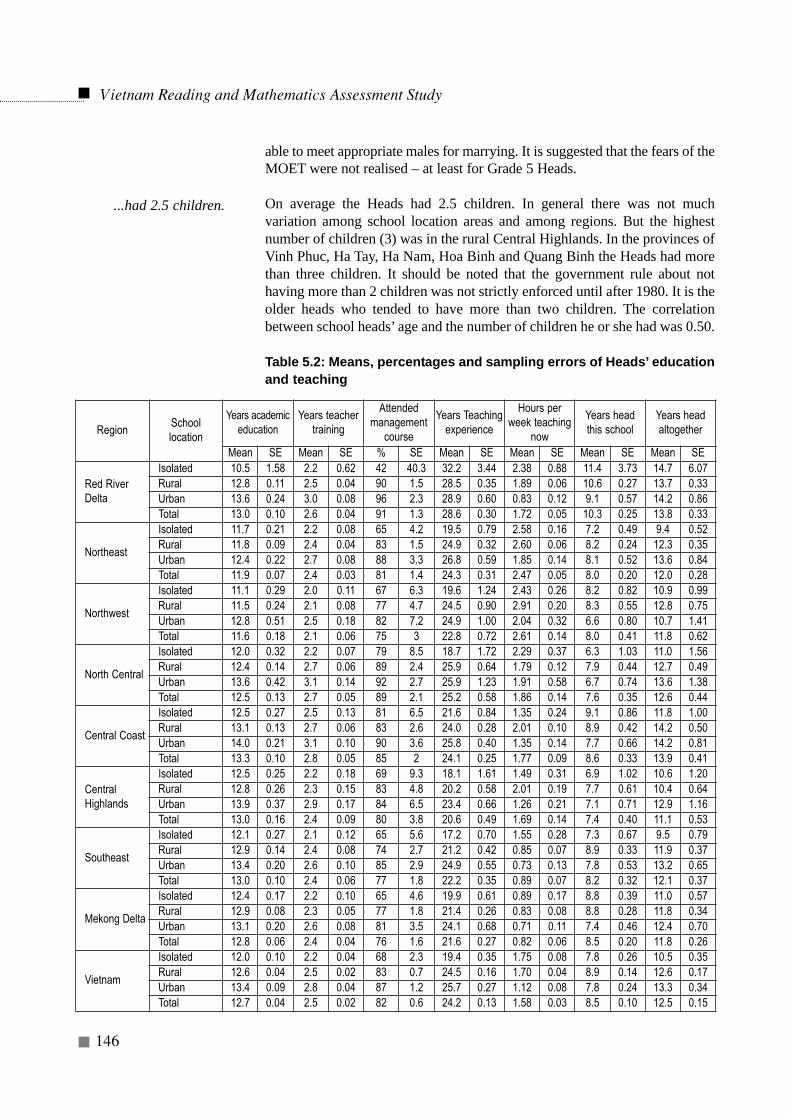
able to meet appropriate males for marrying. It is suggested that the fears of theMOET were not realised – at least for Grade 5 Heads.
On average the Heads had 2.5 children. In general there was not muchvariation among school location areas and among regions. But the highestnumber of children (3) was in the rural Central Highlands. In the provinces ofVinh Phuc, Ha Tay, Ha Nam, Hoa Binh and Quang Binh the Heads had morethan three children. It should be noted that the government rule about nothaving more than 2 children was not strictly enforced until after 1980. It is theolder heads who tended to have more than two children. The correlationbetween school heads’ age and the number of children he or she had was 0.50.
Table 5.2: Means, percentages and sampling errors of Heads’ educationand teaching
Vietnam Reading and Mathematics Assessment Study
146
...had 2.5 children.
RegionSchool location
Years academiceducation
Years teachertraining
Attended management
course
Years Teachingexperience
Hours perweek teaching
now
Years head this school
Years head altogether
Mean SE Mean SE % SE Mean SE Mean SE Mean SE Mean SE
Red RiverDelta
Isolated 10.5 1.58 2.2 0.62 42 40.3 32.2 3.44 2.38 0.88 11.4 3.73 14.7 6.07Rural 12.8 0.11 2.5 0.04 90 1.5 28.5 0.35 1.89 0.06 10.6 0.27 13.7 0.33Urban 13.6 0.24 3.0 0.08 96 2.3 28.9 0.60 0.83 0.12 9.1 0.57 14.2 0.86Total 13.0 0.10 2.6 0.04 91 1.3 28.6 0.30 1.72 0.05 10.3 0.25 13.8 0.33
Northeast
Isolated 11.7 0.21 2.2 0.08 65 4.2 19.5 0.79 2.58 0.16 7.2 0.49 9.4 0.52Rural 11.8 0.09 2.4 0.04 83 1.5 24.9 0.32 2.60 0.06 8.2 0.24 12.3 0.35Urban 12.4 0.22 2.7 0.08 88 3.3 26.8 0.59 1.85 0.14 8.1 0.52 13.6 0.84Total 11.9 0.07 2.4 0.03 81 1.4 24.3 0.31 2.47 0.05 8.0 0.20 12.0 0.28
Northwest
Isolated 11.1 0.29 2.0 0.11 67 6.3 19.6 1.24 2.43 0.26 8.2 0.82 10.9 0.99Rural 11.5 0.24 2.1 0.08 77 4.7 24.5 0.90 2.91 0.20 8.3 0.55 12.8 0.75Urban 12.8 0.51 2.5 0.18 82 7.2 24.9 1.00 2.04 0.32 6.6 0.80 10.7 1.41Total 11.6 0.18 2.1 0.06 75 3 22.8 0.72 2.61 0.14 8.0 0.41 11.8 0.62
North Central
Isolated 12.0 0.32 2.2 0.07 79 8.5 18.7 1.72 2.29 0.37 6.3 1.03 11.0 1.56Rural 12.4 0.14 2.7 0.06 89 2.4 25.9 0.64 1.79 0.12 7.9 0.44 12.7 0.49Urban 13.6 0.42 3.1 0.14 92 2.7 25.9 1.23 1.91 0.58 6.7 0.74 13.6 1.38Total 12.5 0.13 2.7 0.05 89 2.1 25.2 0.58 1.86 0.14 7.6 0.35 12.6 0.44
Central Coast
Isolated 12.5 0.27 2.5 0.13 81 6.5 21.6 0.84 1.35 0.24 9.1 0.86 11.8 1.00Rural 13.1 0.13 2.7 0.06 83 2.6 24.0 0.28 2.01 0.10 8.9 0.42 14.2 0.50Urban 14.0 0.21 3.1 0.10 90 3.6 25.8 0.40 1.35 0.14 7.7 0.66 14.2 0.81Total 13.3 0.10 2.8 0.05 85 2 24.1 0.25 1.77 0.09 8.6 0.33 13.9 0.41
CentralHighlands
Isolated 12.5 0.25 2.2 0.18 69 9.3 18.1 1.61 1.49 0.31 6.9 1.02 10.6 1.20Rural 12.8 0.26 2.3 0.15 83 4.8 20.2 0.58 2.01 0.19 7.7 0.61 10.4 0.64Urban 13.9 0.37 2.9 0.17 84 6.5 23.4 0.66 1.26 0.21 7.1 0.71 12.9 1.16Total 13.0 0.16 2.4 0.09 80 3.8 20.6 0.49 1.69 0.14 7.4 0.40 11.1 0.53
Southeast
Isolated 12.1 0.27 2.1 0.12 65 5.6 17.2 0.70 1.55 0.28 7.3 0.67 9.5 0.79Rural 12.9 0.14 2.4 0.08 74 2.7 21.2 0.42 0.85 0.07 8.9 0.33 11.9 0.37Urban 13.4 0.20 2.6 0.10 85 2.9 24.9 0.55 0.73 0.13 7.8 0.53 13.2 0.65Total 13.0 0.10 2.4 0.06 77 1.8 22.2 0.35 0.89 0.07 8.2 0.32 12.1 0.37
Mekong Delta
Isolated 12.4 0.17 2.2 0.10 65 4.6 19.9 0.61 0.89 0.17 8.8 0.39 11.0 0.57Rural 12.9 0.08 2.3 0.05 77 1.8 21.4 0.26 0.83 0.08 8.8 0.28 11.8 0.34Urban 13.1 0.20 2.6 0.08 81 3.5 24.1 0.68 0.71 0.11 7.4 0.46 12.4 0.70Total 12.8 0.06 2.4 0.04 76 1.6 21.6 0.27 0.82 0.06 8.5 0.20 11.8 0.26
Vietnam
Isolated 12.0 0.10 2.2 0.04 68 2.3 19.4 0.35 1.75 0.08 7.8 0.26 10.5 0.35Rural 12.6 0.04 2.5 0.02 83 0.7 24.5 0.16 1.70 0.04 8.9 0.14 12.6 0.17Urban 13.4 0.09 2.8 0.04 87 1.2 25.7 0.27 1.12 0.08 7.8 0.24 13.3 0.34Total 12.7 0.04 2.5 0.02 82 0.6 24.2 0.13 1.58 0.03 8.5 0.10 12.5 0.15
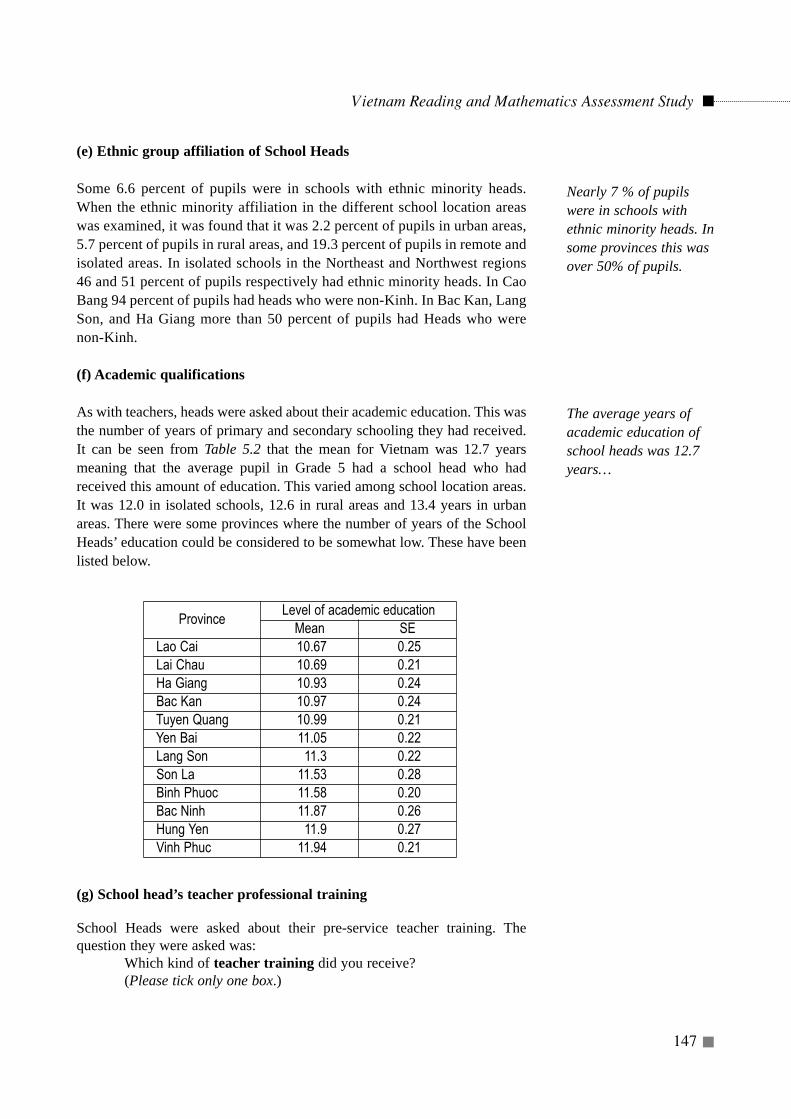
(e) Ethnic group affiliation of School Heads
Some 6.6 percent of pupils were in schools with ethnic minority heads.When the ethnic minority affiliation in the different school location areaswas examined, it was found that it was 2.2 percent of pupils in urban areas,5.7 percent of pupils in rural areas, and 19.3 percent of pupils in remote andisolated areas. In isolated schools in the Northeast and Northwest regions46 and 51 percent of pupils respectively had ethnic minority heads. In CaoBang 94 percent of pupils had heads who were non-Kinh. In Bac Kan, LangSon, and Ha Giang more than 50 percent of pupils had Heads who werenon-Kinh.
(f) Academic qualifications
As with teachers, heads were asked about their academic education. This wasthe number of years of primary and secondary schooling they had received.It can be seen from Table 5.2 that the mean for Vietnam was 12.7 yearsmeaning that the average pupil in Grade 5 had a school head who hadreceived this amount of education. This varied among school location areas.It was 12.0 in isolated schools, 12.6 in rural areas and 13.4 years in urbanareas. There were some provinces where the number of years of the SchoolHeads’ education could be considered to be somewhat low. These have beenlisted below.
(g) School head’s teacher professional training
School Heads were asked about their pre-service teacher training. Thequestion they were asked was:
Which kind of teacher training did you receive? (Please tick only one box.)
Vietnam Reading and Mathematics Assessment Study
147
ProvinceLevel of academic education
Mean SELao Cai 10.67 0.25Lai Chau 10.69 0.21Ha Giang 10.93 0.24Bac Kan 10.97 0.24Tuyen Quang 10.99 0.21Yen Bai 11.05 0.22Lang Son 11.3 0.22Son La 11.53 0.28Binh Phuoc 11.58 0.20Bac Ninh 11.87 0.26Hung Yen 11.9 0.27Vinh Phuc 11.94 0.21
Nearly 7 % of pupilswere in schools withethnic minority heads. Insome provinces this wasover 50% of pupils.
The average years ofacademic education ofschool heads was 12.7years…
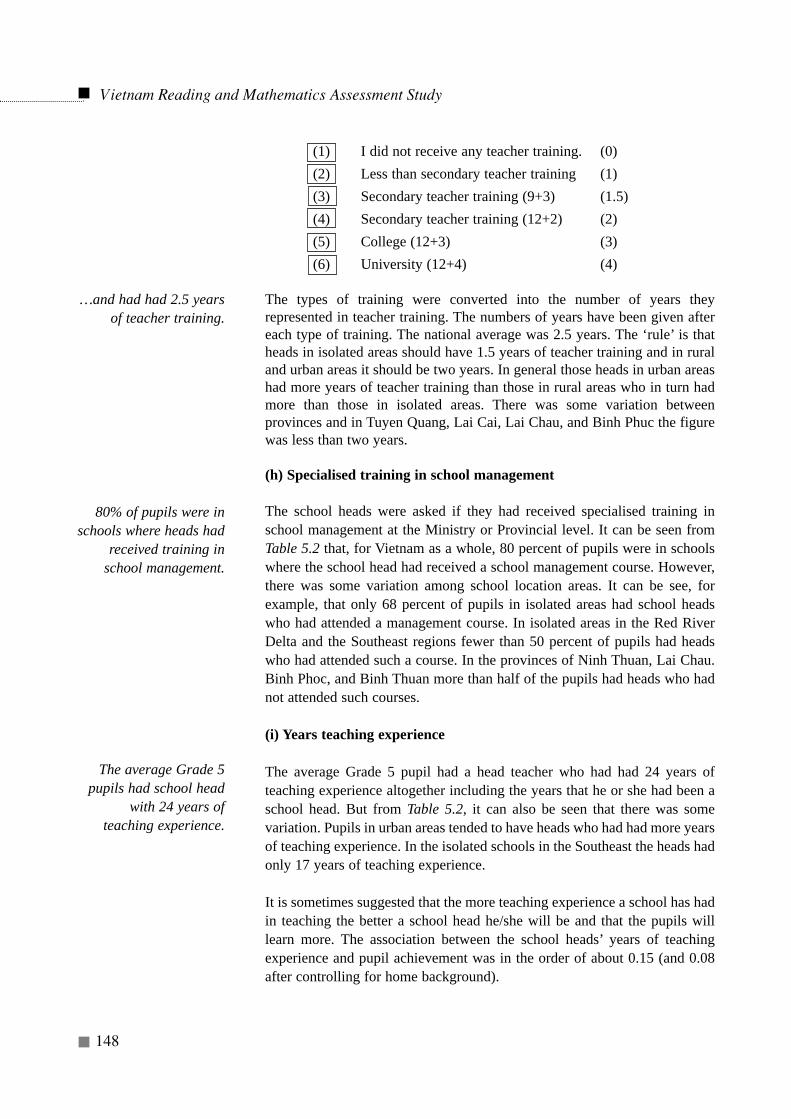
(1) I did not receive any teacher training. (0)(2) Less than secondary teacher training (1)(3) Secondary teacher training (9+3) (1.5)(4) Secondary teacher training (12+2) (2)(5) College (12+3) (3)(6) University (12+4) (4)
The types of training were converted into the number of years theyrepresented in teacher training. The numbers of years have been given aftereach type of training. The national average was 2.5 years. The ‘rule’ is thatheads in isolated areas should have 1.5 years of teacher training and in ruraland urban areas it should be two years. In general those heads in urban areashad more years of teacher training than those in rural areas who in turn hadmore than those in isolated areas. There was some variation betweenprovinces and in Tuyen Quang, Lai Cai, Lai Chau, and Binh Phuc the figurewas less than two years.
(h) Specialised training in school management
The school heads were asked if they had received specialised training inschool management at the Ministry or Provincial level. It can be seen fromTable 5.2 that, for Vietnam as a whole, 80 percent of pupils were in schoolswhere the school head had received a school management course. However,there was some variation among school location areas. It can be see, forexample, that only 68 percent of pupils in isolated areas had school headswho had attended a management course. In isolated areas in the Red RiverDelta and the Southeast regions fewer than 50 percent of pupils had headswho had attended such a course. In the provinces of Ninh Thuan, Lai Chau.Binh Phoc, and Binh Thuan more than half of the pupils had heads who hadnot attended such courses.
(i) Years teaching experience
The average Grade 5 pupil had a head teacher who had had 24 years ofteaching experience altogether including the years that he or she had been aschool head. But from Table 5.2, it can also be seen that there was somevariation. Pupils in urban areas tended to have heads who had had more yearsof teaching experience. In the isolated schools in the Southeast the heads hadonly 17 years of teaching experience.
It is sometimes suggested that the more teaching experience a school has hadin teaching the better a school head he/she will be and that the pupils willlearn more. The association between the school heads’ years of teachingexperience and pupil achievement was in the order of about 0.15 (and 0.08after controlling for home background).
Vietnam Reading and Mathematics Assessment Study
148
…and had had 2.5 yearsof teacher training.
80% of pupils were inschools where heads had
received training inschool management.
The average Grade 5pupils had school head
with 24 years ofteaching experience.
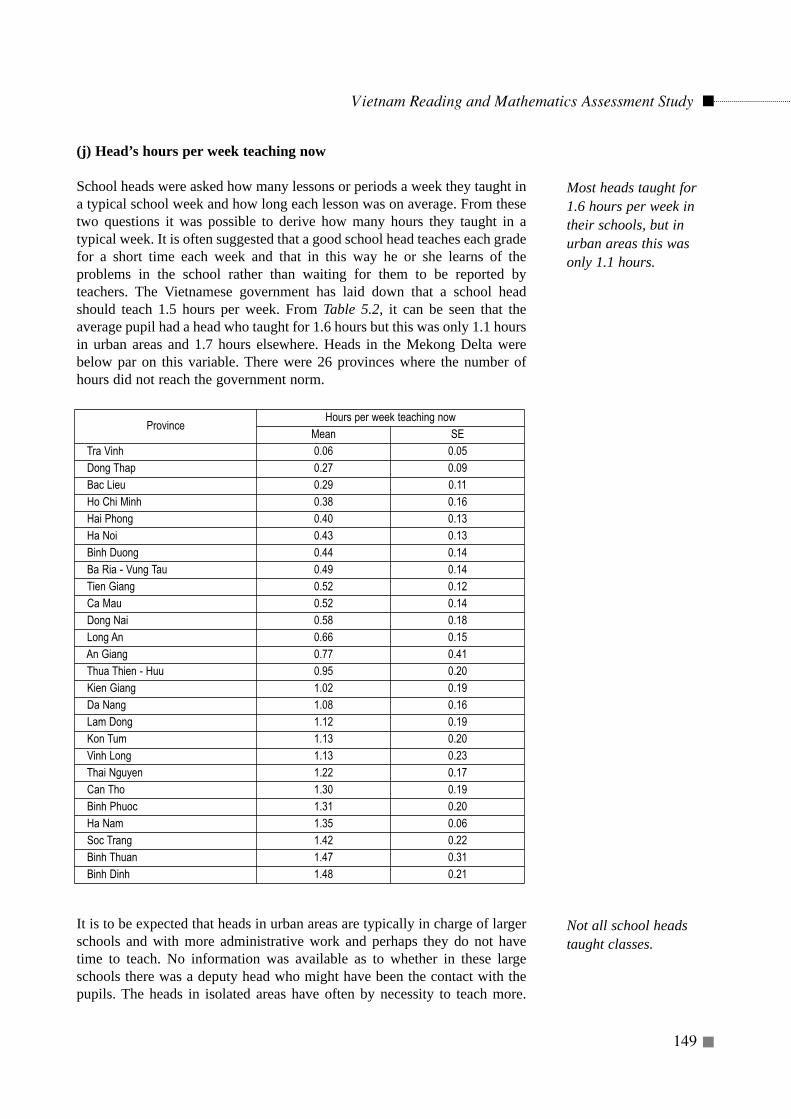
(j) Head’s hours per week teaching now
School heads were asked how many lessons or periods a week they taught ina typical school week and how long each lesson was on average. From thesetwo questions it was possible to derive how many hours they taught in atypical week. It is often suggested that a good school head teaches each gradefor a short time each week and that in this way he or she learns of theproblems in the school rather than waiting for them to be reported byteachers. The Vietnamese government has laid down that a school headshould teach 1.5 hours per week. From Table 5.2, it can be seen that theaverage pupil had a head who taught for 1.6 hours but this was only 1.1 hoursin urban areas and 1.7 hours elsewhere. Heads in the Mekong Delta werebelow par on this variable. There were 26 provinces where the number ofhours did not reach the government norm.
It is to be expected that heads in urban areas are typically in charge of largerschools and with more administrative work and perhaps they do not havetime to teach. No information was available as to whether in these largeschools there was a deputy head who might have been the contact with thepupils. The heads in isolated areas have often by necessity to teach more.
Vietnam Reading and Mathematics Assessment Study
149
Most heads taught for1.6 hours per week intheir schools, but inurban areas this wasonly 1.1 hours.
Not all school headstaught classes.
ProvinceHours per week teaching now
Mean SETra Vinh 0.06 0.05Dong Thap 0.27 0.09Bac Lieu 0.29 0.11Ho Chi Minh 0.38 0.16Hai Phong 0.40 0.13Ha Noi 0.43 0.13Binh Duong 0.44 0.14Ba Ria - Vung Tau 0.49 0.14Tien Giang 0.52 0.12Ca Mau 0.52 0.14Dong Nai 0.58 0.18Long An 0.66 0.15An Giang 0.77 0.41Thua Thien - Huu 0.95 0.20Kien Giang 1.02 0.19Da Nang 1.08 0.16Lam Dong 1.12 0.19Kon Tum 1.13 0.20Vinh Long 1.13 0.23Thai Nguyen 1.22 0.17Can Tho 1.30 0.19Binh Phuoc 1.31 0.20Ha Nam 1.35 0.06Soc Trang 1.42 0.22Binh Thuan 1.47 0.31Binh Dinh 1.48 0.21
Nevertheless, there would appear to be a problem with the heads teaching andthe MOET should examine this problem more.
(k) Years experience as a head
The school heads provided information on how many years they had beenhead of the current school and how many years they had been a headaltogether. Again from Table 5.2 it can be seen that the average was 8.5 yearsfor being head of this school and that there was no difference by schoollocation area. The national average for being a head altogether was 12 years.As might be expected the heads in isolated areas had less experience.
Of all of the characteristics reviewed thus far, it would seem that many thingsare in order as far as School Heads are concerned. However, there were someinequities as far as the number of years of general education and teachertraining that the Heads of different schools had received. This was also truefor the numbers having attended management courses (see Figure 5.1 below).In particular there were several provinces where the heads were not teachingeven the minimum required of 1.5 hours per week.
Figure 5.1: School head education, teacher training, and managementcourse, by school location
Vietnam Reading and Mathematics Assessment Study
150
The average years as aschool head was 12, butthis was less in isolated
areas.
In general, school headsin urban areas hadhigher levels ofacademic education andteacher training and hadalso attendedmanagement coursesmore than heads in ruraland isolated areas..
Policy suggestion 5.1: The MOET may wish to review the data on thedistribution of school heads' characteristics across schools and, togetherwith the relevant provincial directors of education, devise methodswhereby there will be a more equitable allocation of heads to schools interms of their education, teacher training and management training.Every effort should also be made to have the heads teaching at least twoor three periods a week.
What were the general living conditions ofschool heads?
The Ministry of Education and Training was interested to discover moreabout the living conditions of school heads. It was considered that if theheads had good living conditions they would not be worrying about them andcould devote more energy and time to being a school head. Questions wereasked about where they lived, the possessions they had at home, and theextent to which they were satisfied with their living accommodation.
(a) Where school heads lived
School heads were asked if they lived with their parents, in leasedaccommodation, in government accommodation or in their own homes. FromTable 5.3, it can be seen that four-fifths of pupils had school heads who wereliving in their own homes. About 12 percent lived with their parents and fivepercent were in government accommodation. In the Central Highlands thepercentage of pupils with heads living with their parents was quite low. Moreheads in isolated areas were in government housing. Those living in theirown homes tended to be the most satisfied and those living leasedaccommodation were the least satisfied. Less than one percent of pupils hadheads who lived in leased accommodation.
(b) ‘Wealth’ of school heads homes
The ‘wealth’ of the homes was measured by the number of possessions theyhad in their homes. In all, 20 possible possessions were listed and the headshad to say whether or not they had then in their homes. The possessions were:daily newspaper, weekly or monthly magazine, radio, TV set, VCR, cassetteplayer, telephone, refrigerator/freezer, motorcycle, bicycle, piped water,electricity, table to write on, bookcase, watch, lamp to read books, wardrobe,cooker, washing machine, and computer. The average Grade 5 pupil had aHead who had nearly 12 items number of these 20 possessions. In urban areasthis was 14.6 items, in rural areas it was 11.6 items and in isolated areas itwas 10.1 items. The correlation between total possessions owned andsatisfaction with living conditions was 0.24, but as can be seen from Figure
Vietnam Reading and Mathematics Assessment Study
151
Heads tended to live intheir own homes....
...where they had 12 outof 20 possessions items..
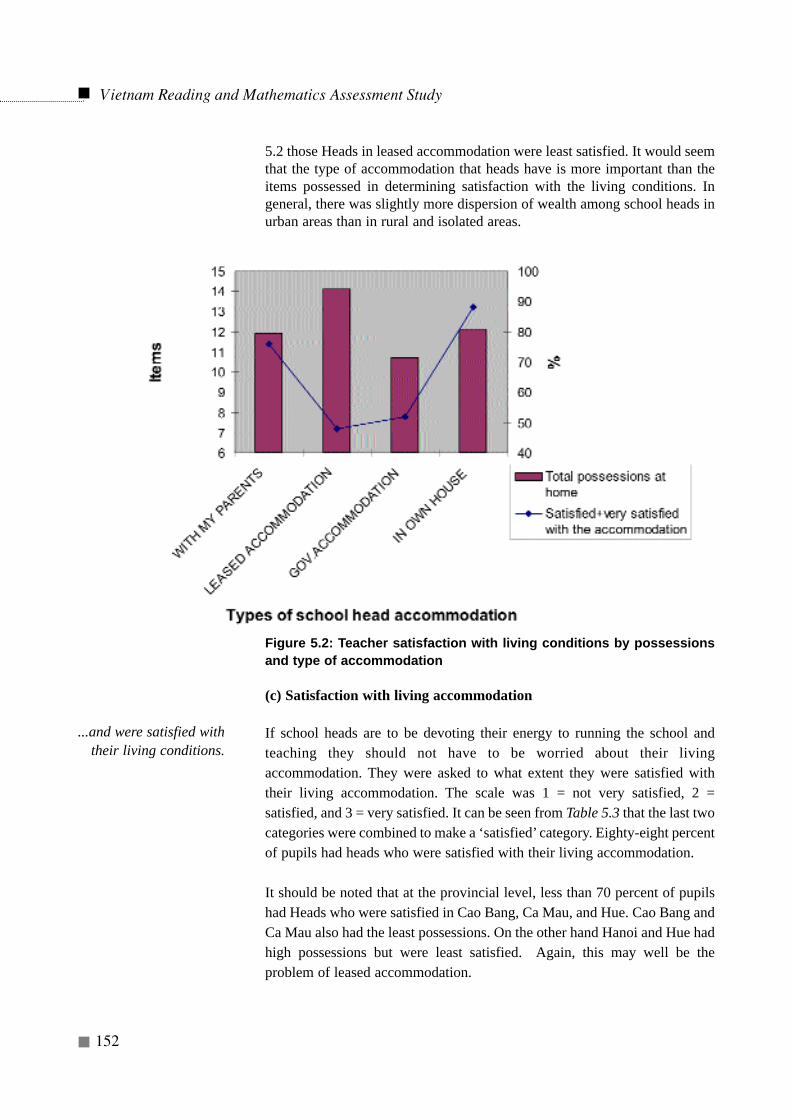
5.2 those Heads in leased accommodation were least satisfied. It would seemthat the type of accommodation that heads have is more important than theitems possessed in determining satisfaction with the living conditions. Ingeneral, there was slightly more dispersion of wealth among school heads inurban areas than in rural and isolated areas.
Figure 5.2: Teacher satisfaction with living conditions by possessionsand type of accommodation
(c) Satisfaction with living accommodation
If school heads are to be devoting their energy to running the school andteaching they should not have to be worried about their livingaccommodation. They were asked to what extent they were satisfied withtheir living accommodation. The scale was 1 = not very satisfied, 2 =satisfied, and 3 = very satisfied. It can be seen from Table 5.3 that the last twocategories were combined to make a ‘satisfied’ category. Eighty-eight percentof pupils had heads who were satisfied with their living accommodation.
It should be noted that at the provincial level, less than 70 percent of pupilshad Heads who were satisfied in Cao Bang, Ca Mau, and Hue. Cao Bang andCa Mau also had the least possessions. On the other hand Hanoi and Hue hadhigh possessions but were least satisfied. Again, this may well be theproblem of leased accommodation.
Vietnam Reading and Mathematics Assessment Study
152
...and were satisfied withtheir living conditions.
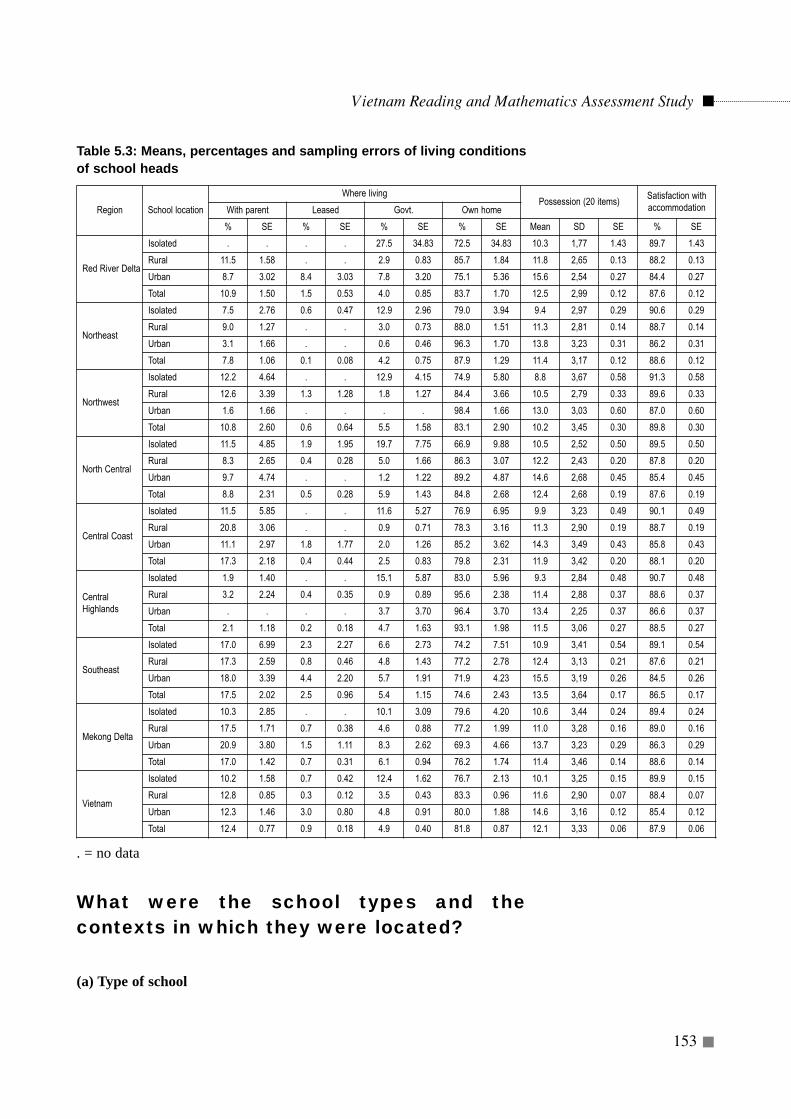
Table 5.3: Means, percentages and sampling errors of living conditionsof school heads
. = no data
What were the school types and thecontexts in which they were located?
(a) Type of school
Vietnam Reading and Mathematics Assessment Study
153
Region School location
Where livingPossession (20 items)
Satisfaction withaccommodationWith parent Leased Govt. Own home
% SE % SE % SE % SE Mean SD SE % SE
Red River Delta
Isolated . . . . 27.5 34.83 72.5 34.83 10.3 1,77 1.43 89.7 1.43
Rural 11.5 1.58 . . 2.9 0.83 85.7 1.84 11.8 2,65 0.13 88.2 0.13
Urban 8.7 3.02 8.4 3.03 7.8 3.20 75.1 5.36 15.6 2,54 0.27 84.4 0.27
Total 10.9 1.50 1.5 0.53 4.0 0.85 83.7 1.70 12.5 2,99 0.12 87.6 0.12
Northeast
Isolated 7.5 2.76 0.6 0.47 12.9 2.96 79.0 3.94 9.4 2,97 0.29 90.6 0.29
Rural 9.0 1.27 . . 3.0 0.73 88.0 1.51 11.3 2,81 0.14 88.7 0.14
Urban 3.1 1.66 . . 0.6 0.46 96.3 1.70 13.8 3,23 0.31 86.2 0.31
Total 7.8 1.06 0.1 0.08 4.2 0.75 87.9 1.29 11.4 3,17 0.12 88.6 0.12
Northwest
Isolated 12.2 4.64 . . 12.9 4.15 74.9 5.80 8.8 3,67 0.58 91.3 0.58
Rural 12.6 3.39 1.3 1.28 1.8 1.27 84.4 3.66 10.5 2,79 0.33 89.6 0.33
Urban 1.6 1.66 . . . . 98.4 1.66 13.0 3,03 0.60 87.0 0.60
Total 10.8 2.60 0.6 0.64 5.5 1.58 83.1 2.90 10.2 3,45 0.30 89.8 0.30
North Central
Isolated 11.5 4.85 1.9 1.95 19.7 7.75 66.9 9.88 10.5 2,52 0.50 89.5 0.50
Rural 8.3 2.65 0.4 0.28 5.0 1.66 86.3 3.07 12.2 2,43 0.20 87.8 0.20
Urban 9.7 4.74 . . 1.2 1.22 89.2 4.87 14.6 2,68 0.45 85.4 0.45
Total 8.8 2.31 0.5 0.28 5.9 1.43 84.8 2.68 12.4 2,68 0.19 87.6 0.19
Central Coast
Isolated 11.5 5.85 . . 11.6 5.27 76.9 6.95 9.9 3,23 0.49 90.1 0.49
Rural 20.8 3.06 . . 0.9 0.71 78.3 3.16 11.3 2,90 0.19 88.7 0.19
Urban 11.1 2.97 1.8 1.77 2.0 1.26 85.2 3.62 14.3 3,49 0.43 85.8 0.43
Total 17.3 2.18 0.4 0.44 2.5 0.83 79.8 2.31 11.9 3,42 0.20 88.1 0.20
CentralHighlands
Isolated 1.9 1.40 . . 15.1 5.87 83.0 5.96 9.3 2,84 0.48 90.7 0.48
Rural 3.2 2.24 0.4 0.35 0.9 0.89 95.6 2.38 11.4 2,88 0.37 88.6 0.37
Urban . . . . 3.7 3.70 96.4 3.70 13.4 2,25 0.37 86.6 0.37
Total 2.1 1.18 0.2 0.18 4.7 1.63 93.1 1.98 11.5 3,06 0.27 88.5 0.27
Southeast
Isolated 17.0 6.99 2.3 2.27 6.6 2.73 74.2 7.51 10.9 3,41 0.54 89.1 0.54
Rural 17.3 2.59 0.8 0.46 4.8 1.43 77.2 2.78 12.4 3,13 0.21 87.6 0.21
Urban 18.0 3.39 4.4 2.20 5.7 1.91 71.9 4.23 15.5 3,19 0.26 84.5 0.26
Total 17.5 2.02 2.5 0.96 5.4 1.15 74.6 2.43 13.5 3,64 0.17 86.5 0.17
Mekong Delta
Isolated 10.3 2.85 . . 10.1 3.09 79.6 4.20 10.6 3,44 0.24 89.4 0.24
Rural 17.5 1.71 0.7 0.38 4.6 0.88 77.2 1.99 11.0 3,28 0.16 89.0 0.16
Urban 20.9 3.80 1.5 1.11 8.3 2.62 69.3 4.66 13.7 3,23 0.29 86.3 0.29
Total 17.0 1.42 0.7 0.31 6.1 0.94 76.2 1.74 11.4 3,46 0.14 88.6 0.14
Vietnam
Isolated 10.2 1.58 0.7 0.42 12.4 1.62 76.7 2.13 10.1 3,25 0.15 89.9 0.15
Rural 12.8 0.85 0.3 0.12 3.5 0.43 83.3 0.96 11.6 2,90 0.07 88.4 0.07
Urban 12.3 1.46 3.0 0.80 4.8 0.91 80.0 1.88 14.6 3,16 0.12 85.4 0.12
Total 12.4 0.77 0.9 0.18 4.9 0.40 81.8 0.87 12.1 3,33 0.06 87.9 0.06
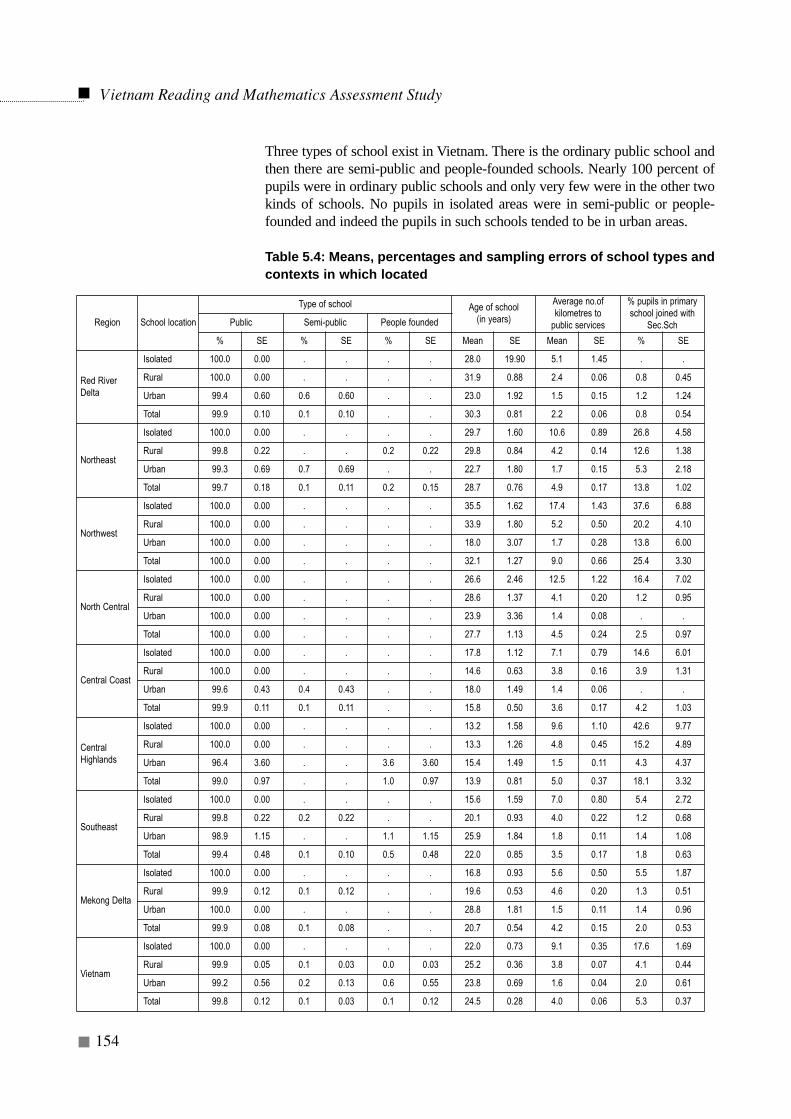
Three types of school exist in Vietnam. There is the ordinary public school andthen there are semi-public and people-founded schools. Nearly 100 percent ofpupils were in ordinary public schools and only very few were in the other twokinds of schools. No pupils in isolated areas were in semi-public or people-founded and indeed the pupils in such schools tended to be in urban areas.
Table 5.4: Means, percentages and sampling errors of school types andcontexts in which located
Vietnam Reading and Mathematics Assessment Study
154
Region School location
Type of school Age of school (in years)
Average no.of kilometres to
public services
% pupils in primaryschool joined with
Sec.SchPublic Semi-public People founded
% SE % SE % SE Mean SE Mean SE % SE
Red RiverDelta
Isolated 100.0 0.00 . . . . 28.0 19.90 5.1 1.45 . .
Rural 100.0 0.00 . . . . 31.9 0.88 2.4 0.06 0.8 0.45
Urban 99.4 0.60 0.6 0.60 . . 23.0 1.92 1.5 0.15 1.2 1.24
Total 99.9 0.10 0.1 0.10 . . 30.3 0.81 2.2 0.06 0.8 0.54
Northeast
Isolated 100.0 0.00 . . . . 29.7 1.60 10.6 0.89 26.8 4.58
Rural 99.8 0.22 . . 0.2 0.22 29.8 0.84 4.2 0.14 12.6 1.38
Urban 99.3 0.69 0.7 0.69 . . 22.7 1.80 1.7 0.15 5.3 2.18
Total 99.7 0.18 0.1 0.11 0.2 0.15 28.7 0.76 4.9 0.17 13.8 1.02
Northwest
Isolated 100.0 0.00 . . . . 35.5 1.62 17.4 1.43 37.6 6.88
Rural 100.0 0.00 . . . . 33.9 1.80 5.2 0.50 20.2 4.10
Urban 100.0 0.00 . . . . 18.0 3.07 1.7 0.28 13.8 6.00
Total 100.0 0.00 . . . . 32.1 1.27 9.0 0.66 25.4 3.30
North Central
Isolated 100.0 0.00 . . . . 26.6 2.46 12.5 1.22 16.4 7.02
Rural 100.0 0.00 . . . . 28.6 1.37 4.1 0.20 1.2 0.95
Urban 100.0 0.00 . . . . 23.9 3.36 1.4 0.08 . .
Total 100.0 0.00 . . . . 27.7 1.13 4.5 0.24 2.5 0.97
Central Coast
Isolated 100.0 0.00 . . . . 17.8 1.12 7.1 0.79 14.6 6.01
Rural 100.0 0.00 . . . . 14.6 0.63 3.8 0.16 3.9 1.31
Urban 99.6 0.43 0.4 0.43 . . 18.0 1.49 1.4 0.06 . .
Total 99.9 0.11 0.1 0.11 . . 15.8 0.50 3.6 0.17 4.2 1.03
CentralHighlands
Isolated 100.0 0.00 . . . . 13.2 1.58 9.6 1.10 42.6 9.77
Rural 100.0 0.00 . . . . 13.3 1.26 4.8 0.45 15.2 4.89
Urban 96.4 3.60 . . 3.6 3.60 15.4 1.49 1.5 0.11 4.3 4.37
Total 99.0 0.97 . . 1.0 0.97 13.9 0.81 5.0 0.37 18.1 3.32
Southeast
Isolated 100.0 0.00 . . . . 15.6 1.59 7.0 0.80 5.4 2.72
Rural 99.8 0.22 0.2 0.22 . . 20.1 0.93 4.0 0.22 1.2 0.68
Urban 98.9 1.15 . . 1.1 1.15 25.9 1.84 1.8 0.11 1.4 1.08
Total 99.4 0.48 0.1 0.10 0.5 0.48 22.0 0.85 3.5 0.17 1.8 0.63
Mekong Delta
Isolated 100.0 0.00 . . . . 16.8 0.93 5.6 0.50 5.5 1.87
Rural 99.9 0.12 0.1 0.12 . . 19.6 0.53 4.6 0.20 1.3 0.51
Urban 100.0 0.00 . . . . 28.8 1.81 1.5 0.11 1.4 0.96
Total 99.9 0.08 0.1 0.08 . . 20.7 0.54 4.2 0.15 2.0 0.53
Vietnam
Isolated 100.0 0.00 . . . . 22.0 0.73 9.1 0.35 17.6 1.69
Rural 99.9 0.05 0.1 0.03 0.0 0.03 25.2 0.36 3.8 0.07 4.1 0.44
Urban 99.2 0.56 0.2 0.13 0.6 0.55 23.8 0.69 1.6 0.04 2.0 0.61
Total 99.8 0.12 0.1 0.03 0.1 0.12 24.5 0.28 4.0 0.06 5.3 0.37
(b) Age of school
During the war many school buildings were damaged and since the war therehas been an extensive program of building schools. School heads were askedto give the year in which the school was opened or, if they did not know, atleast to estimate the year in which it was opened. As can be seen from Table5.4, the average Grade 5 pupil was in a school that was 24.5 years old. Inother words, it was started in 1977. The range of the number of years schoolshad existed was from 0 to 119 years. The distribution of pupils in differentages of schools was as follows:
Less than 5 years old 9.16-10 years old 20.611-20 years old 19.321-30 years old 14.531-40 years old 10.041-50 years old 20.9More than 50 years old 5.5
There was some variation among regions, namely that in the CentralHighlands the average pupil was in a school that was only 14 years old.Isolated and rural schools in the Northwest were about 35 years old onaverage. At the provincial level, pupils in Soc Trang, Bac Lieu, Quang Nga,Dak Lak and Ben Tre were in schools that were less than 14 years old. In CaoBang, the figure was 41 years old.
(c) Average number of kilometres to public services
Two attempts were made to judge the degree of urbanisation and rurality inwhich the schools were located. They have been reported here and under (d)below. In all cases it must be remembered that the head, when answering, wasreferring to the main campus of the school where it was a school with severalcampuses.
School Heads were asked to state how many kilometres it was from theschool to each of the following: nearest health clinic, nearest road for cars,nearest public library, nearest book shop, nearest lower secondary school,and nearest market. These kilometres were then summed and divided by 6 –the number of public services. These averages were then again averaged forprovinces and for all of Vietnam and these figures have been reported inTable 5.4. In all regions the pupils in isolated schools were further frompublic amenities than pupils in rural or urban areas. The national averagedistance for isolated schools was nine kilometres which is considered to bequite far. In the Northwest in isolated areas the distance was 16 kms. And inthe Northeast, North Central and Central Highlands it was more than tenkilometres. In Son La, the average distance was nine kms.
Vietnam Reading and Mathematics Assessment Study
155
The average pupils werein the school there was24.5 years old, but 26%of pupils were in schoolsmore than 40 years old.
Isolated schools were,on average, were ninekms. from publicservices. In rural areas,this was 3.6 kms. And inurban areas, 1.6 kms.
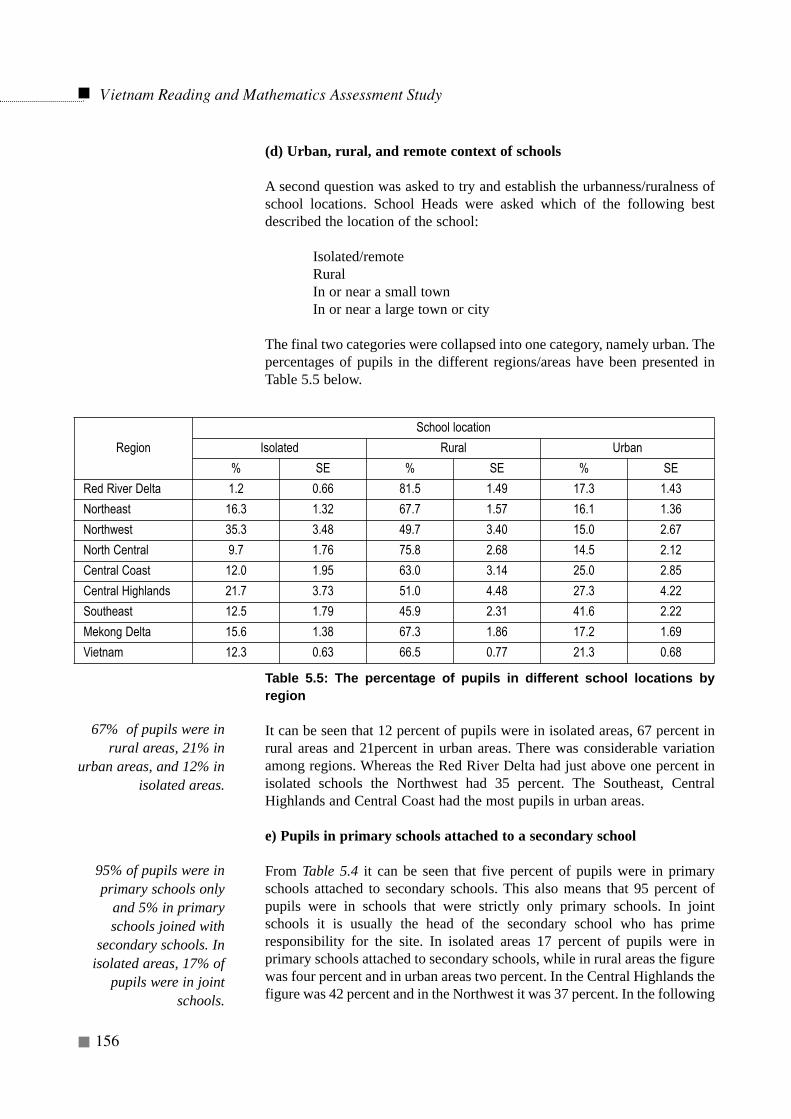
(d) Urban, rural, and remote context of schools
A second question was asked to try and establish the urbanness/ruralness ofschool locations. School Heads were asked which of the following bestdescribed the location of the school:
Isolated/remoteRuralIn or near a small townIn or near a large town or city
The final two categories were collapsed into one category, namely urban. Thepercentages of pupils in the different regions/areas have been presented inTable 5.5 below.
Table 5.5: The percentage of pupils in different school locations byregion
It can be seen that 12 percent of pupils were in isolated areas, 67 percent inrural areas and 21percent in urban areas. There was considerable variationamong regions. Whereas the Red River Delta had just above one percent inisolated schools the Northwest had 35 percent. The Southeast, CentralHighlands and Central Coast had the most pupils in urban areas.
e) Pupils in primary schools attached to a secondary school
From Table 5.4 it can be seen that five percent of pupils were in primaryschools attached to secondary schools. This also means that 95 percent ofpupils were in schools that were strictly only primary schools. In jointschools it is usually the head of the secondary school who has primeresponsibility for the site. In isolated areas 17 percent of pupils were inprimary schools attached to secondary schools, while in rural areas the figurewas four percent and in urban areas two percent. In the Central Highlands thefigure was 42 percent and in the Northwest it was 37 percent. In the following
Vietnam Reading and Mathematics Assessment Study
156
67% of pupils were inrural areas, 21% in
urban areas, and 12% inisolated areas.
95% of pupils were inprimary schools only
and 5% in primaryschools joined with
secondary schools. Inisolated areas, 17% of
pupils were in jointschools.
Region
School location
Isolated Rural Urban
% SE % SE % SE
Red River Delta 1.2 0.66 81.5 1.49 17.3 1.43
Northeast 16.3 1.32 67.7 1.57 16.1 1.36
Northwest 35.3 3.48 49.7 3.40 15.0 2.67
North Central 9.7 1.76 75.8 2.68 14.5 2.12
Central Coast 12.0 1.95 63.0 3.14 25.0 2.85
Central Highlands 21.7 3.73 51.0 4.48 27.3 4.22
Southeast 12.5 1.79 45.9 2.31 41.6 2.22
Mekong Delta 15.6 1.38 67.3 1.86 17.2 1.69
Vietnam 12.3 0.63 66.5 0.77 21.3 0.68
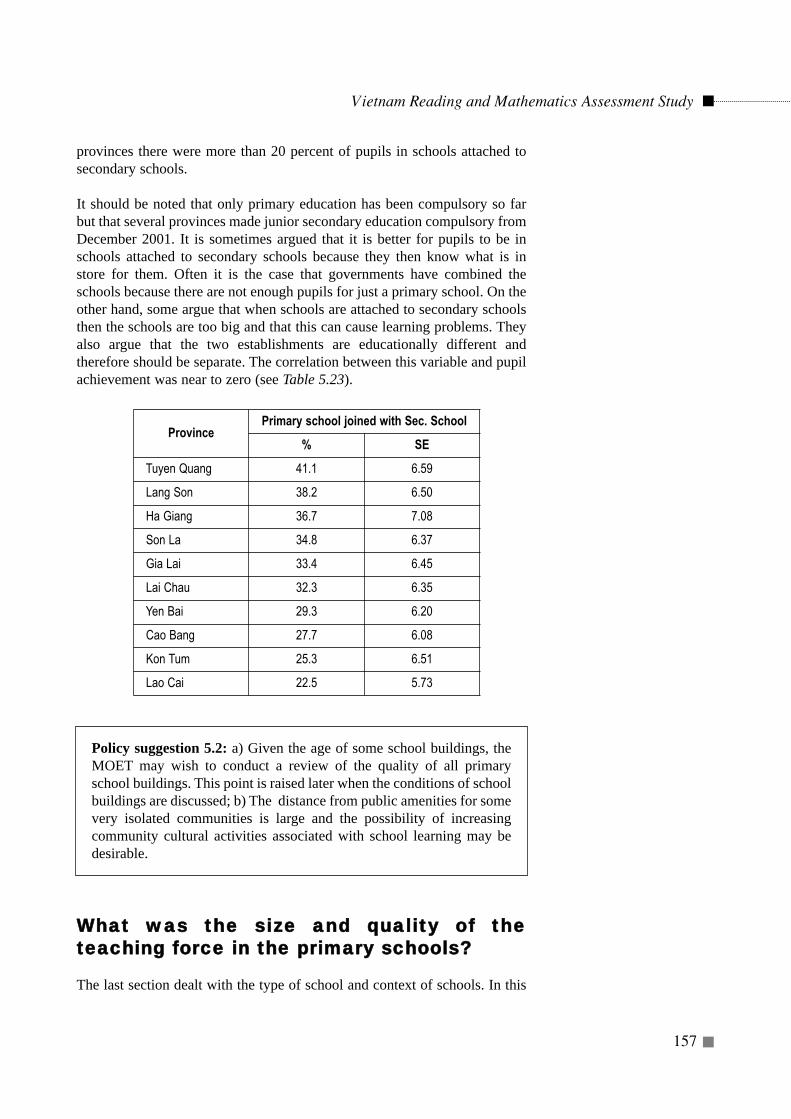
provinces there were more than 20 percent of pupils in schools attached tosecondary schools.
It should be noted that only primary education has been compulsory so farbut that several provinces made junior secondary education compulsory fromDecember 2001. It is sometimes argued that it is better for pupils to be inschools attached to secondary schools because they then know what is instore for them. Often it is the case that governments have combined theschools because there are not enough pupils for just a primary school. On theother hand, some argue that when schools are attached to secondary schoolsthen the schools are too big and that this can cause learning problems. Theyalso argue that the two establishments are educationally different andtherefore should be separate. The correlation between this variable and pupilachievement was near to zero (see Table 5.23).
Policy suggestion 5.2: a) Given the age of some school buildings, theMOET may wish to conduct a review of the quality of all primaryschool buildings. This point is raised later when the conditions of schoolbuildings are discussed; b) The distance from public amenities for somevery isolated communities is large and the possibility of increasingcommunity cultural activities associated with school learning may bedesirable.
WWhhaatt wwaass tthhee ssiizzee aanndd qquuaalliittyy ooff tthheetteeaacchhiinngg ffoorrccee iinn tthhee pprriimmaarryy sscchhoooollss??
The last section dealt with the type of school and context of schools. In this
Vietnam Reading and Mathematics Assessment Study
157
ProvincePrimary school joined with Sec. School
% SE
Tuyen Quang 41.1 6.59
Lang Son 38.2 6.50
Ha Giang 36.7 7.08
Son La 34.8 6.37
Gia Lai 33.4 6.45
Lai Chau 32.3 6.35
Yen Bai 29.3 6.20
Cao Bang 27.7 6.08
Kon Tum 25.3 6.51
Lao Cai 22.5 5.73
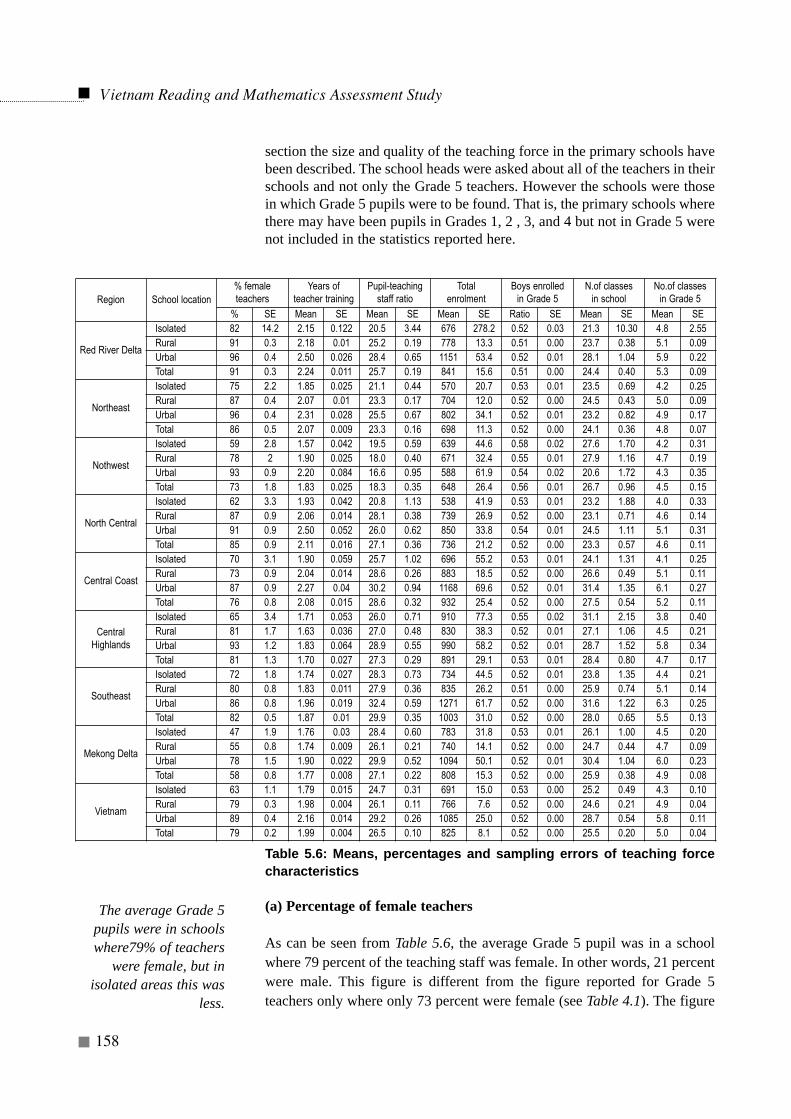
section the size and quality of the teaching force in the primary schools havebeen described. The school heads were asked about all of the teachers in theirschools and not only the Grade 5 teachers. However the schools were thosein which Grade 5 pupils were to be found. That is, the primary schools wherethere may have been pupils in Grades 1, 2 , 3, and 4 but not in Grade 5 werenot included in the statistics reported here.
Table 5.6: Means, percentages and sampling errors of teaching forcecharacteristics
(a) Percentage of female teachers
As can be seen from Table 5.6, the average Grade 5 pupil was in a schoolwhere 79 percent of the teaching staff was female. In other words, 21 percentwere male. This figure is different from the figure reported for Grade 5teachers only where only 73 percent were female (see Table 4.1). The figure
Vietnam Reading and Mathematics Assessment Study
158
Region School location% female teachers
Years of teacher training
Pupil-teachingstaff ratio
Total enrolment
Boys enrolled in Grade 5
N.of classes in school
No.of classes in Grade 5
% SE Mean SE Mean SE Mean SE Ratio SE Mean SE Mean SE
Red River Delta
Isolated 82 14.2 2.15 0.122 20.5 3.44 676 278.2 0.52 0.03 21.3 10.30 4.8 2.55Rural 91 0.3 2.18 0.01 25.2 0.19 778 13.3 0.51 0.00 23.7 0.38 5.1 0.09Urbal 96 0.4 2.50 0.026 28.4 0.65 1151 53.4 0.52 0.01 28.1 1.04 5.9 0.22Total 91 0.3 2.24 0.011 25.7 0.19 841 15.6 0.51 0.00 24.4 0.40 5.3 0.09
Northeast
Isolated 75 2.2 1.85 0.025 21.1 0.44 570 20.7 0.53 0.01 23.5 0.69 4.2 0.25Rural 87 0.4 2.07 0.01 23.3 0.17 704 12.0 0.52 0.00 24.5 0.43 5.0 0.09Urbal 96 0.4 2.31 0.028 25.5 0.67 802 34.1 0.52 0.01 23.2 0.82 4.9 0.17Total 86 0.5 2.07 0.009 23.3 0.16 698 11.3 0.52 0.00 24.1 0.36 4.8 0.07
Nothwest
Isolated 59 2.8 1.57 0.042 19.5 0.59 639 44.6 0.58 0.02 27.6 1.70 4.2 0.31Rural 78 2 1.90 0.025 18.0 0.40 671 32.4 0.55 0.01 27.9 1.16 4.7 0.19Urbal 93 0.9 2.20 0.084 16.6 0.95 588 61.9 0.54 0.02 20.6 1.72 4.3 0.35Total 73 1.8 1.83 0.025 18.3 0.35 648 26.4 0.56 0.01 26.7 0.96 4.5 0.15
North Central
Isolated 62 3.3 1.93 0.042 20.8 1.13 538 41.9 0.53 0.01 23.2 1.88 4.0 0.33Rural 87 0.9 2.06 0.014 28.1 0.38 739 26.9 0.52 0.00 23.1 0.71 4.6 0.14Urbal 91 0.9 2.50 0.052 26.0 0.62 850 33.8 0.54 0.01 24.5 1.11 5.1 0.31Total 85 0.9 2.11 0.016 27.1 0.36 736 21.2 0.52 0.00 23.3 0.57 4.6 0.11
Central Coast
Isolated 70 3.1 1.90 0.059 25.7 1.02 696 55.2 0.53 0.01 24.1 1.31 4.1 0.25Rural 73 0.9 2.04 0.014 28.6 0.26 883 18.5 0.52 0.00 26.6 0.49 5.1 0.11Urbal 87 0.9 2.27 0.04 30.2 0.94 1168 69.6 0.52 0.01 31.4 1.35 6.1 0.27Total 76 0.8 2.08 0.015 28.6 0.32 932 25.4 0.52 0.00 27.5 0.54 5.2 0.11
CentralHighlands
Isolated 65 3.4 1.71 0.053 26.0 0.71 910 77.3 0.55 0.02 31.1 2.15 3.8 0.40Rural 81 1.7 1.63 0.036 27.0 0.48 830 38.3 0.52 0.01 27.1 1.06 4.5 0.21Urbal 93 1.2 1.83 0.064 28.9 0.55 990 58.2 0.52 0.01 28.7 1.52 5.8 0.34Total 81 1.3 1.70 0.027 27.3 0.29 891 29.1 0.53 0.01 28.4 0.80 4.7 0.17
Southeast
Isolated 72 1.8 1.74 0.027 28.3 0.73 734 44.5 0.52 0.01 23.8 1.35 4.4 0.21Rural 80 0.8 1.83 0.011 27.9 0.36 835 26.2 0.51 0.00 25.9 0.74 5.1 0.14Urbal 86 0.8 1.96 0.019 32.4 0.59 1271 61.7 0.52 0.00 31.6 1.22 6.3 0.25Total 82 0.5 1.87 0.01 29.9 0.35 1003 31.0 0.52 0.00 28.0 0.65 5.5 0.13
Mekong Delta
Isolated 47 1.9 1.76 0.03 28.4 0.60 783 31.8 0.53 0.01 26.1 1.00 4.5 0.20Rural 55 0.8 1.74 0.009 26.1 0.21 740 14.1 0.52 0.00 24.7 0.44 4.7 0.09Urbal 78 1.5 1.90 0.022 29.9 0.52 1094 50.1 0.52 0.01 30.4 1.04 6.0 0.23Total 58 0.8 1.77 0.008 27.1 0.22 808 15.3 0.52 0.00 25.9 0.38 4.9 0.08
Vietnam
Isolated 63 1.1 1.79 0.015 24.7 0.31 691 15.0 0.53 0.00 25.2 0.49 4.3 0.10Rural 79 0.3 1.98 0.004 26.1 0.11 766 7.6 0.52 0.00 24.6 0.21 4.9 0.04Urbal 89 0.4 2.16 0.014 29.2 0.26 1085 25.0 0.52 0.00 28.7 0.54 5.8 0.11Total 79 0.2 1.99 0.004 26.5 0.10 825 8.1 0.52 0.00 25.5 0.20 5.0 0.04
The average Grade 5pupils were in schoolswhere79% of teachers
were female, but inisolated areas this was
less.
reported here is for all of the teaching staff. There were proportionately morefemale teachers in schools in urban areas than in rural or isolated areas. Thefigure for the Red River Delta and urban Northeast was 90 percent and forthe Mekong Delta it was only 58 percent. The percentages of female teacherswere high in Ha Noi, Hai Phong and Thai Nguyen but low in Soc Trang andTra Vinh. The correlation between this variable and achievement was high(even after home background had been partialled out). This has implicationsfor the allocation of teachers to schools.
(b) Teaching or professional qualifications
Again the coding of this indicator was the same as for the Grade 5 teacherprofessional qualification. The school heads reported that their teachers hadthe following teacher training.
PercentageNo teacher training = 0 yrs 0.6Below pedagogical HS = 1 yrs 6.8Pedagogical HS (9+3) = 1.5 yrs 20.9Pedagogical HS (12+2) = 2 yrs 55.8College (12+3) = 3 yrs 12.0University (12+4) = 4 yrs 3.9
In Table 5.6 the average value for years of teacher-training in Vietnam was1.99 years. This meant that the average Grade 5 pupil was in a school whereall of the teachers on average had the Pedagogical High School Training oftwo years. The urban schools had teachers with 2.2 years and the isolatedschool had teachers with 1.8 years. Again this raises the question of thecriteria used when allocating teachers to schools. It should be noted that theteachers in the Northwest isolated schools had only 1.6 years and in SocTrang province the average was 1.5 years which is actually below thegovernment minimum.
It would seem that the provinces with low figures should be the first toreceive in-service training.
(c) Pupil-teaching staff ratio
The pupil-teaching staff ratio must not be confused with the pupil-teacherratio for a class. The pupil-staff ratio is the total number of pupils in a schooldivided by the total number of teachers. In other words it is the number ofpupils per average staff member. Not all teachers teach all of the time. Somehave lesson periods when they do not teach and can be used, when necessary,to help other teachers or to take over classes in the case of a teacher beingabsent. The indicator can be regarded as the teacher ‘wealth’ of a school forthe pupils.
Vietnam Reading and Mathematics Assessment Study
159
The average Grade 5pupil was in a schoolwhere 56% of teachingstaff had 12+2 training,21% 9+3, 12% 12+3,and 4% 12+4 training.
On average, primaryschools had 26.5 pupilsper teaching staffmember.
From Table 5.6 it can be seen that the average pupil-teaching staff ratio forVietnam was 26.5 pupils per staff member. Urban schools had 29.2 pupils perstaff member and isolated had 24.7. But, isolated schools in the Mekong Deltahad 28.4 pupils per teacher. The highest figure was for urban schools in theSoutheast region. There did not appear to be a problem with the pupil-staffratio and the relationship to pupil achievement was near zero (see Table 5.18).
(d) Total enrolment or size of school
There has been much discussion about the ‘size of school’ or ‘totalenrolment’ of a primary school. On the one hand, the larger the enrolment aschool has the less is the cost of providing some amenities such aslaboratories for science or sports facilities. On the other hand, a criticism hasbeen that the larger the school the more overwhelming it is for small childrenand that it is not easy for the social integration of the children into the school.What then were the different sizes of school?
The average Grade 5 pupil was in a primary school with an enrolment of 825.As expected, the size of school was smaller in isolated areas (691) and inurban areas it was 1085. The urban areas in the Central Coast and the RedRiver Delta had the highest enrolments. Some of the schools had severalcampuses and hence the enrolment was spread over the various campuses.
In the IEA studies it was, in some cases, found that more than 800 pupils ina school was associated with lower achievement. In Vietnam, 44.6 percent ofchildren were in schools with more than 800 pupils. In Vietnam, a school isallowed to up to a maximum of 30 classes with a maximum of 35 pupils perclass. Hence, the maximum total enrolment is 1050. In Chapter 6 it was seenthat 21 percent of pupils were in schools where this maximum figure wasexceeded. However, the correlation between total enrolment and pupilachievement was near to zero.
(e) Percentage boys in Grade 5
All schools in Vietnam are co-educational. In theory, therefore, there shouldbe a 50:50 split between boys and girls unless there has been sex-biased drop-out before that point. At the same time, it is of interest to determine if a gradewas more boy-biased or more girl-biased. From Table 5.6 it can be seen thatthere were 52 percent boys and 48 percent girls. In the Northwest there wereonly 44 percent girls and 56 percent boys in Grade 5 and in the isolatedschools in this province there were only 42 percent girls.
Vietnam Reading and Mathematics Assessment Study
160
The average schoolenrolment was 825, butin isolated areas, it was
691, in urban areas1085.
But, only 48% girls inGrade 5.
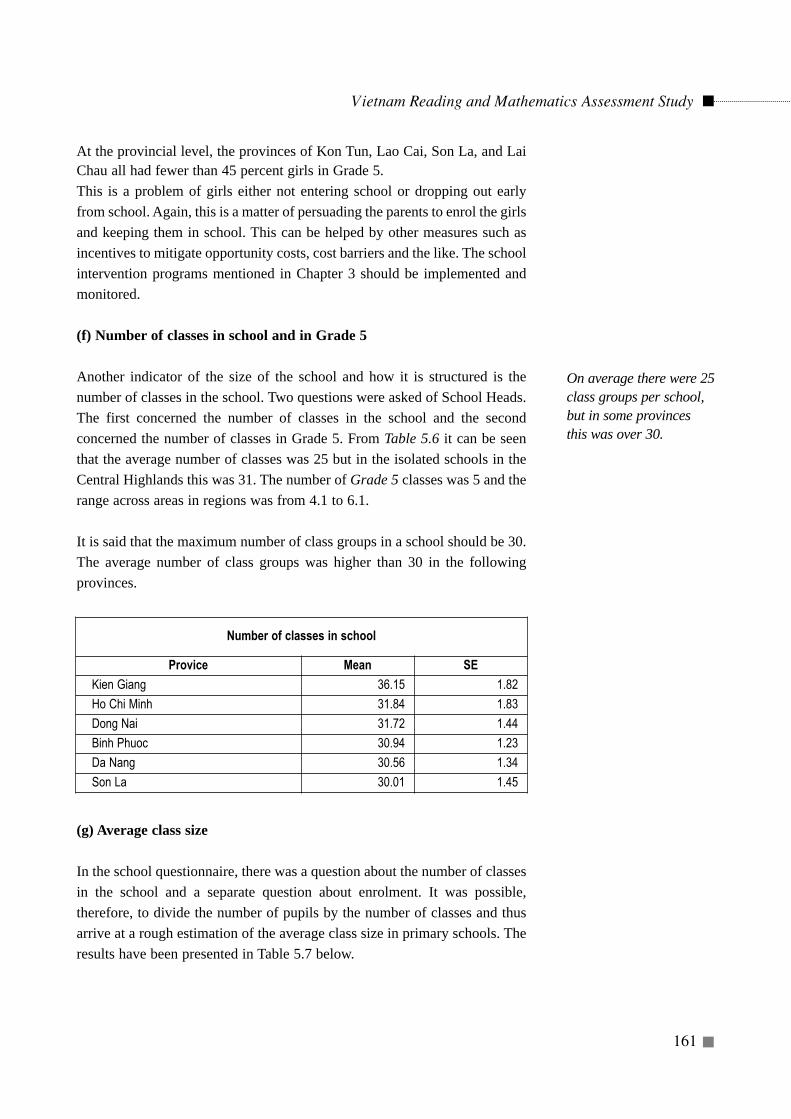
At the provincial level, the provinces of Kon Tun, Lao Cai, Son La, and LaiChau all had fewer than 45 percent girls in Grade 5. This is a problem of girls either not entering school or dropping out earlyfrom school. Again, this is a matter of persuading the parents to enrol the girlsand keeping them in school. This can be helped by other measures such asincentives to mitigate opportunity costs, cost barriers and the like. The schoolintervention programs mentioned in Chapter 3 should be implemented andmonitored.
(f) Number of classes in school and in Grade 5
Another indicator of the size of the school and how it is structured is thenumber of classes in the school. Two questions were asked of School Heads.The first concerned the number of classes in the school and the secondconcerned the number of classes in Grade 5. From Table 5.6 it can be seenthat the average number of classes was 25 but in the isolated schools in theCentral Highlands this was 31. The number of Grade 5 classes was 5 and therange across areas in regions was from 4.1 to 6.1.
It is said that the maximum number of class groups in a school should be 30.The average number of class groups was higher than 30 in the followingprovinces.
(g) Average class size
In the school questionnaire, there was a question about the number of classesin the school and a separate question about enrolment. It was possible,therefore, to divide the number of pupils by the number of classes and thusarrive at a rough estimation of the average class size in primary schools. Theresults have been presented in Table 5.7 below.
Vietnam Reading and Mathematics Assessment Study
161
On average there were 25class groups per school,but in some provincesthis was over 30.
Number of classes in school
Provice Mean SE
Kien Giang 36.15 1.82
Ho Chi Minh 31.84 1.83
Dong Nai 31.72 1.44
Binh Phuoc 30.94 1.23
Da Nang 30.56 1.34
Son La 30.01 1.45
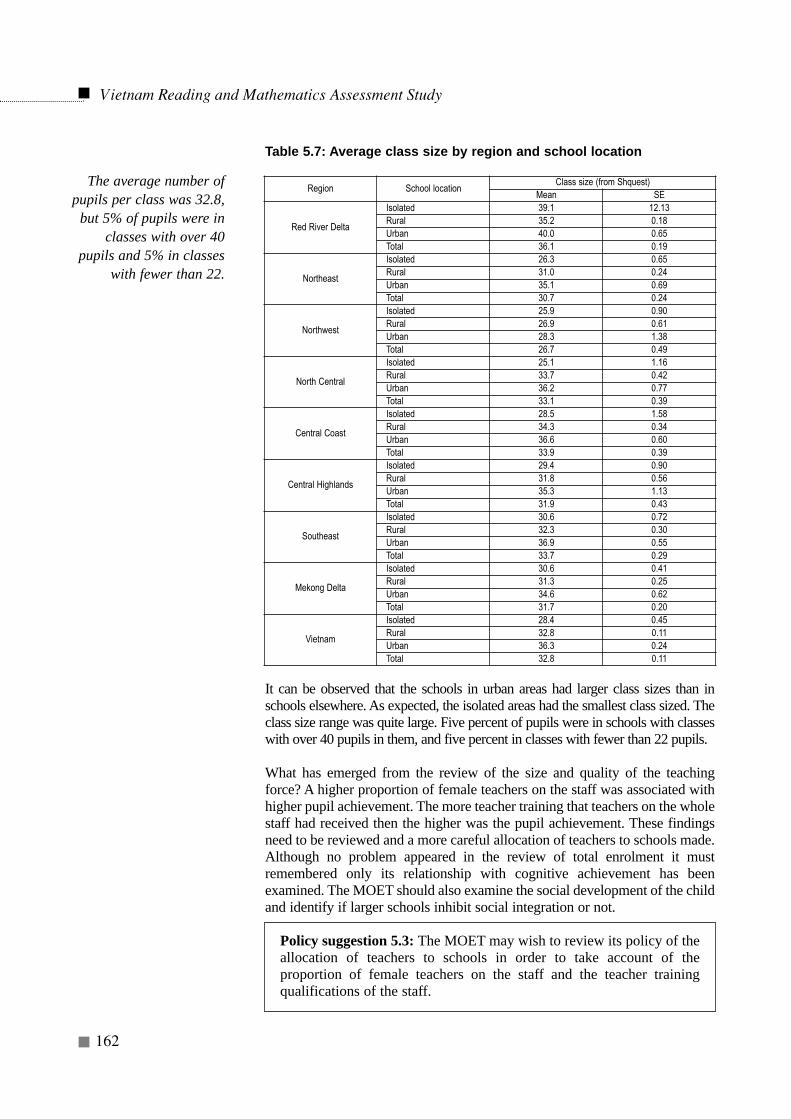
Table 5.7: Average class size by region and school location
It can be observed that the schools in urban areas had larger class sizes than inschools elsewhere. As expected, the isolated areas had the smallest class sized. Theclass size range was quite large. Five percent of pupils were in schools with classeswith over 40 pupils in them, and five percent in classes with fewer than 22 pupils.
What has emerged from the review of the size and quality of the teachingforce? A higher proportion of female teachers on the staff was associated withhigher pupil achievement. The more teacher training that teachers on the wholestaff had received then the higher was the pupil achievement. These findingsneed to be reviewed and a more careful allocation of teachers to schools made.Although no problem appeared in the review of total enrolment it mustremembered only its relationship with cognitive achievement has beenexamined. The MOET should also examine the social development of the childand identify if larger schools inhibit social integration or not.
Policy suggestion 5.3: The MOET may wish to review its policy of theallocation of teachers to schools in order to take account of theproportion of female teachers on the staff and the teacher trainingqualifications of the staff.
Vietnam Reading and Mathematics Assessment Study
162
Region School locationClass size (from Shquest)
Mean SE
Red River Delta
Isolated 39.1 12.13Rural 35.2 0.18Urban 40.0 0.65Total 36.1 0.19
Northeast
Isolated 26.3 0.65Rural 31.0 0.24Urban 35.1 0.69Total 30.7 0.24
Northwest
Isolated 25.9 0.90Rural 26.9 0.61Urban 28.3 1.38Total 26.7 0.49
North Central
Isolated 25.1 1.16Rural 33.7 0.42Urban 36.2 0.77Total 33.1 0.39
Central Coast
Isolated 28.5 1.58Rural 34.3 0.34Urban 36.6 0.60Total 33.9 0.39
Central Highlands
Isolated 29.4 0.90Rural 31.8 0.56Urban 35.3 1.13Total 31.9 0.43
Southeast
Isolated 30.6 0.72Rural 32.3 0.30Urban 36.9 0.55Total 33.7 0.29
Mekong Delta
Isolated 30.6 0.41Rural 31.3 0.25Urban 34.6 0.62Total 31.7 0.20
Vietnam
Isolated 28.4 0.45Rural 32.8 0.11Urban 36.3 0.24Total 32.8 0.11
The average number ofpupils per class was 32.8,
but 5% of pupils were inclasses with over 40
pupils and 5% in classeswith fewer than 22.

Policy suggestion 5.4: This study has been concerned with cognitivelearning. Social development is also an important feature of primaryschooling. It might be desirable for the MOET to initiate a study on thesocial development of pupils in primary school and in that contextexamine the relationship between the social integration of pupils andtotal enrolment of schools.
What were some characteristics of theoperation of the school?
This section is concerned with the operation of the school. How many shiftsdid schools have? How many satellite campuses did a school have? Howoften had it been inspected in the last few years? What was the purpose of theinspectors’ visits? What were the main activities of the school heads? Whatwere the major problems in the schools? How many days were lost last yearin the school’s schedule?
Table 5.8: Percentages and sampling errors of indicators of theoperation of the schools
Vietnam Reading and Mathematics Assessment Study
163
Region School location% pupil in first shift
% pupil in second shift
% pupil in full day
No. of satellite campuses
% SE % SE % SE Mean SE
Red River Delta
Isolated 17 16.6 22 22.1 60 38.7 1.73 1.94Rural 22 1.0 22 1.0 56 1.8 1.63 0.08Urban 20 2.7 18 2.2 62 4.3 0.54 0.09Total 22 0.8 21 0.8 57 1.4 1.44 0.07
Northeast
Isolated 67 2.2 31 2.0 2 1.1 4.49 0.34Rural 48 1.0 38 0.9 14 1.0 2.64 0.12Urban 35 1.7 30 1.9 35 3.0 0.90 0.14Total 49 0.9 36 0.7 16 0.9 2.66 0.11
Northwest
Isolated 71 3.3 28 3.1 1 0.8 5.97 0.57Rural 59 2.1 39 2.1 2 0.9 4.64 0.38Urban 36 5.5 30 5.2 34 6.8 0.89 0.28Total 60 2.0 34 1.7 6 1.4 4.55 0.28
North Central
Isolated 59 4.0 38 4.1 3 1.8 3.58 0.50Rural 44 1.6 42 1.3 14 2.3 1.17 0.12Urban 28 3.8 24 3.4 48 6.8 0.66 0.25Total 43 1.6 39 1.0 18 2.0 1.33 0.12
Central Coast
Isolated 53 1.6 45 1.4 2 1.2 3.66 0.29Rural 46 1.1 45 1.0 9 1.5 2.48 0.10Urban 42 1.4 39 1.5 19 2.6 1.32 0.15Total 46 0.8 44 0.8 11 1.2 2.33 0.09
Central Highlands
Isolated 57 2.2 42 2.2 1 0.6 4.97 0.53Rural 48 1.6 44 1.5 7 2.0 2.54 0.33Urban 39 3.9 34 3.1 27 6.1 1.16 0.18Total 48 1.5 41 1.3 11 2.2 2.69 0.22
Southeast
Isolated 53 1.5 46 1.5 1 0.9 2.27 0.23Rural 51 0.9 43 0.9 6 1.3 1.64 0.09Urban 40 2.0 35 1.7 24 2.9 0.64 0.08Total 47 1.0 40 0.8 13 1.4 1.30 0.06
Mekong Delta
Isolated 51 1.0 47 0.9 1 0.5 3.74 0.23Rural 52 0.6 45 0.5 3 0.5 2.90 0.09Urban 45 1.6 40 1.5 15 2.3 1.14 0.13Total 50 0.5 45 0.4 5 0.5 2.73 0.08
Vietnam
Isolated 57 1.0 40 0.8 3 0.9 3.90 0.14Rural 43 0.5 38 0.4 19 0.7 2.13 0.04Urban 36 1.0 32 0.9 32 1.7 0.84 0.05Total 43 0.4 37 0.3 20 0.6 2.08 0.03
(a) Shift system
Some schools ran a system of two shifts – a morning shift and an afternoonshift. Indeed, 80 percent of pupils were enrolled in these two shifts. A fewschools only in the Mekong Delta had a third shift although efforts have beenmade to eliminate three shifts per day. Some schools have what is called a‘full-day’ school on top of one or two shifts. The government has beenencouraging all schools to move to a full-day system. What is a full-daysystem? A full-day system requires the pupils to attend school morning andafternoon, although there is certain flexibility in the actual number of hoursthis will depend on school location and weather. Parent must pay for theirchildren to attend a full-day school whereas a half-day shift is free.
From Table 5.8 it can be seen that 43 percent of all primary school pupilsattended a first shift, 37 percent a second shift, and 20 percent a full-dayschool. There was considerable variation among school location areas andregions. It can be seen that for first shift schools while only 36 percent ofpupils in urban areas attended them the figure was 57 percent for isolatedschools. The differences were not very large for second shifts but for full-dayschools there were differences: 32 percent for urban schools, 19 percent forrural schools and only three percent for isolated schools. The Red River Deltaschools had most pupils in full-day schooling (57%) while the Northwest hadonly six percent. In the provinces of Nam Dinh, Thai Binh, Hai Duong, HaNoi, and Bac Ninh the average pupil was in a school with more than 50percent full-day shift pupils. In Nam Dinh the figure was 96 percent in full-day schooling. Nam Dinh is a province well known for its progressiveness ineducation. But the provinces of Ninh Thuan and Soc Trang, the average pupilwas in schools with no pupils in full day schooling.
(b) Satellite campuses
In certain areas it was deemed desirable to set up a satellite campus systembecause either the children lived too far from the main school or it was notpossible to extend the current main school building. The average pupil wasin a school with 2.1 satellite campuses. In isolated areas the figure was 3.9satellite campuses, in rural areas it was 2.13 and in urban areas it was lessthan one satellite campus. Thirty-eight percent of pupils were in schools withone or two satellite campuses, twenty percent in schools with three or fourcampuses, and twelve percent in schools with five to ten campuses. Thirtypercent were in schools without satellite campuses. In the isolated Northwestschools and Central Highlands the figures were six and five respectively. Inthe province of Son La the average pupil was in a school with six satellitecampuses. The correlation between the number of satellites and the numberof school resource items was –0.39 indicating that there were fewer resourcesin schools with more satellite campuses. The correlation between thepercentage of pupils in full-day schooling and schools with satellites was–0.25 indicating that there were fewer pupils in full day-schooling in schoolswith more satellite campuses.
Vietnam Reading and Mathematics Assessment Study
164
20% pupils attended afull-day school, 43% amorning half-day shift,
and 37% a second half-day shift..
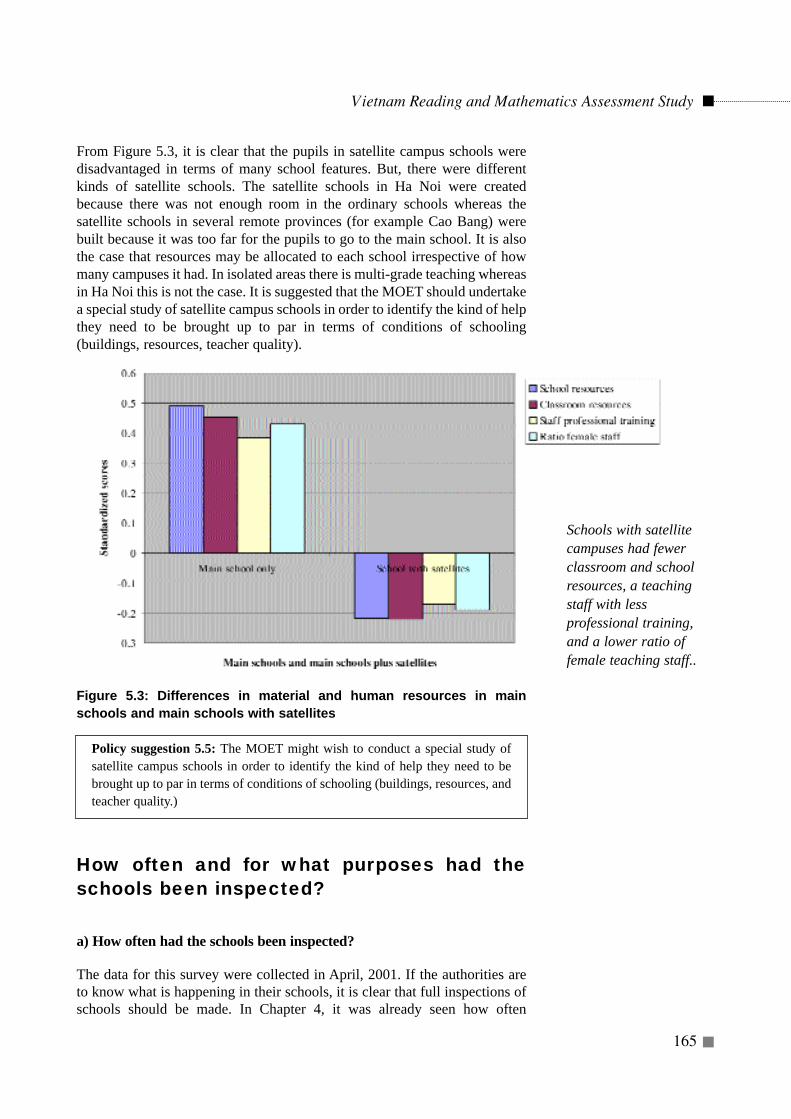
From Figure 5.3, it is clear that the pupils in satellite campus schools weredisadvantaged in terms of many school features. But, there were differentkinds of satellite schools. The satellite schools in Ha Noi were createdbecause there was not enough room in the ordinary schools whereas thesatellite schools in several remote provinces (for example Cao Bang) werebuilt because it was too far for the pupils to go to the main school. It is alsothe case that resources may be allocated to each school irrespective of howmany campuses it had. In isolated areas there is multi-grade teaching whereasin Ha Noi this is not the case. It is suggested that the MOET should undertakea special study of satellite campus schools in order to identify the kind of helpthey need to be brought up to par in terms of conditions of schooling(buildings, resources, teacher quality).
Figure 5.3: Differences in material and human resources in mainschools and main schools with satellites
Policy suggestion 5.5: The MOET might wish to conduct a special study ofsatellite campus schools in order to identify the kind of help they need to bebrought up to par in terms of conditions of schooling (buildings, resources, andteacher quality.)
How often and for what purposes had theschools been inspected?
a) How often had the schools been inspected?
The data for this survey were collected in April, 2001. If the authorities areto know what is happening in their schools, it is clear that full inspections ofschools should be made. In Chapter 4, it was already seen how often
Vietnam Reading and Mathematics Assessment Study
165
Schools with satellitecampuses had fewerclassroom and schoolresources, a teachingstaff with lessprofessional training,and a lower ratio offemale teaching staff..
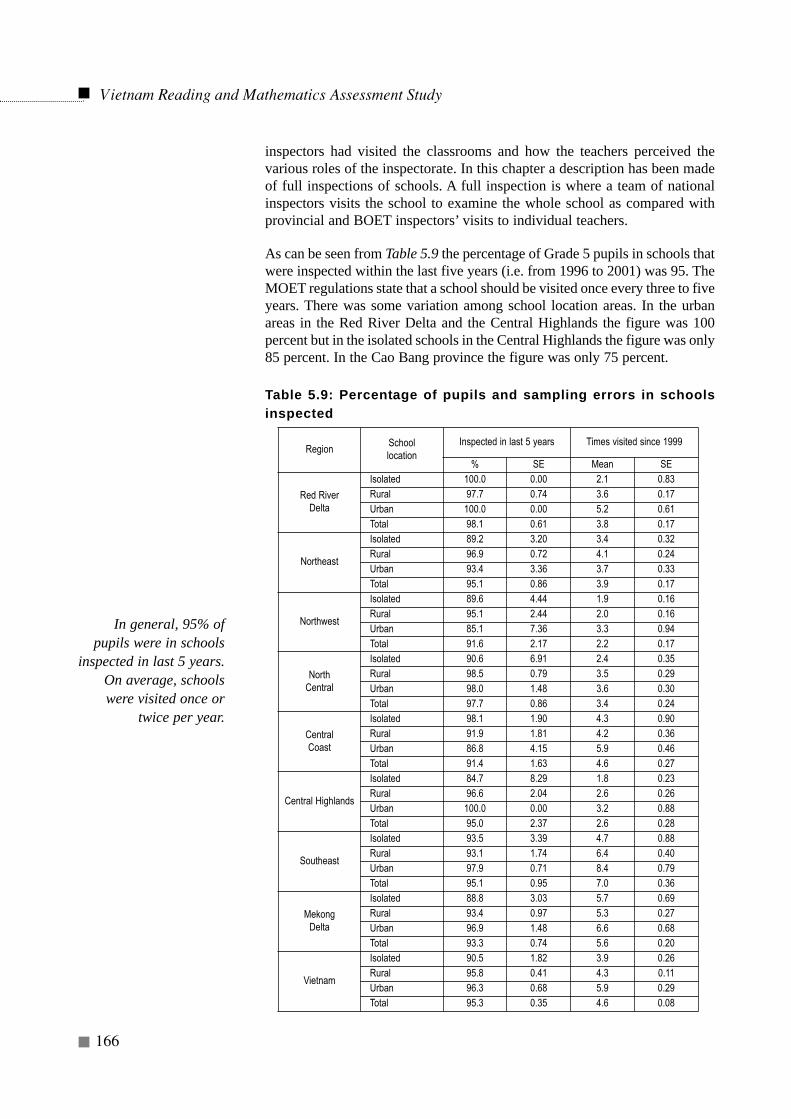
inspectors had visited the classrooms and how the teachers perceived thevarious roles of the inspectorate. In this chapter a description has been madeof full inspections of schools. A full inspection is where a team of nationalinspectors visits the school to examine the whole school as compared withprovincial and BOET inspectors’ visits to individual teachers.
As can be seen from Table 5.9 the percentage of Grade 5 pupils in schools thatwere inspected within the last five years (i.e. from 1996 to 2001) was 95. TheMOET regulations state that a school should be visited once every three to fiveyears. There was some variation among school location areas. In the urbanareas in the Red River Delta and the Central Highlands the figure was 100percent but in the isolated schools in the Central Highlands the figure was only85 percent. In the Cao Bang province the figure was only 75 percent.
Table 5.9: Percentage of pupils and sampling errors in schoolsinspected
Vietnam Reading and Mathematics Assessment Study
166
RegionSchool location
Inspected in last 5 years Times visited since 1999
% SE Mean SE
Red River Delta
Isolated 100.0 0.00 2.1 0.83Rural 97.7 0.74 3.6 0.17Urban 100.0 0.00 5.2 0.61Total 98.1 0.61 3.8 0.17
Northeast
Isolated 89.2 3.20 3.4 0.32Rural 96.9 0.72 4.1 0.24Urban 93.4 3.36 3.7 0.33Total 95.1 0.86 3.9 0.17
Northwest
Isolated 89.6 4.44 1.9 0.16Rural 95.1 2.44 2.0 0.16Urban 85.1 7.36 3.3 0.94Total 91.6 2.17 2.2 0.17
North Central
Isolated 90.6 6.91 2.4 0.35Rural 98.5 0.79 3.5 0.29Urban 98.0 1.48 3.6 0.30Total 97.7 0.86 3.4 0.24
Central Coast
Isolated 98.1 1.90 4.3 0.90Rural 91.9 1.81 4.2 0.36Urban 86.8 4.15 5.9 0.46Total 91.4 1.63 4.6 0.27
Central Highlands
Isolated 84.7 8.29 1.8 0.23Rural 96.6 2.04 2.6 0.26Urban 100.0 0.00 3.2 0.88Total 95.0 2.37 2.6 0.28
Southeast
Isolated 93.5 3.39 4.7 0.88Rural 93.1 1.74 6.4 0.40Urban 97.9 0.71 8.4 0.79Total 95.1 0.95 7.0 0.36
Mekong Delta
Isolated 88.8 3.03 5.7 0.69Rural 93.4 0.97 5.3 0.27Urban 96.9 1.48 6.6 0.68Total 93.3 0.74 5.6 0.20
Vietnam
Isolated 90.5 1.82 3.9 0.26Rural 95.8 0.41 4.3 0.11Urban 96.3 0.68 5.9 0.29Total 95.3 0.35 4.6 0.08
In general, 95% ofpupils were in schools
inspected in last 5 years.On average, schoolswere visited once or
twice per year.
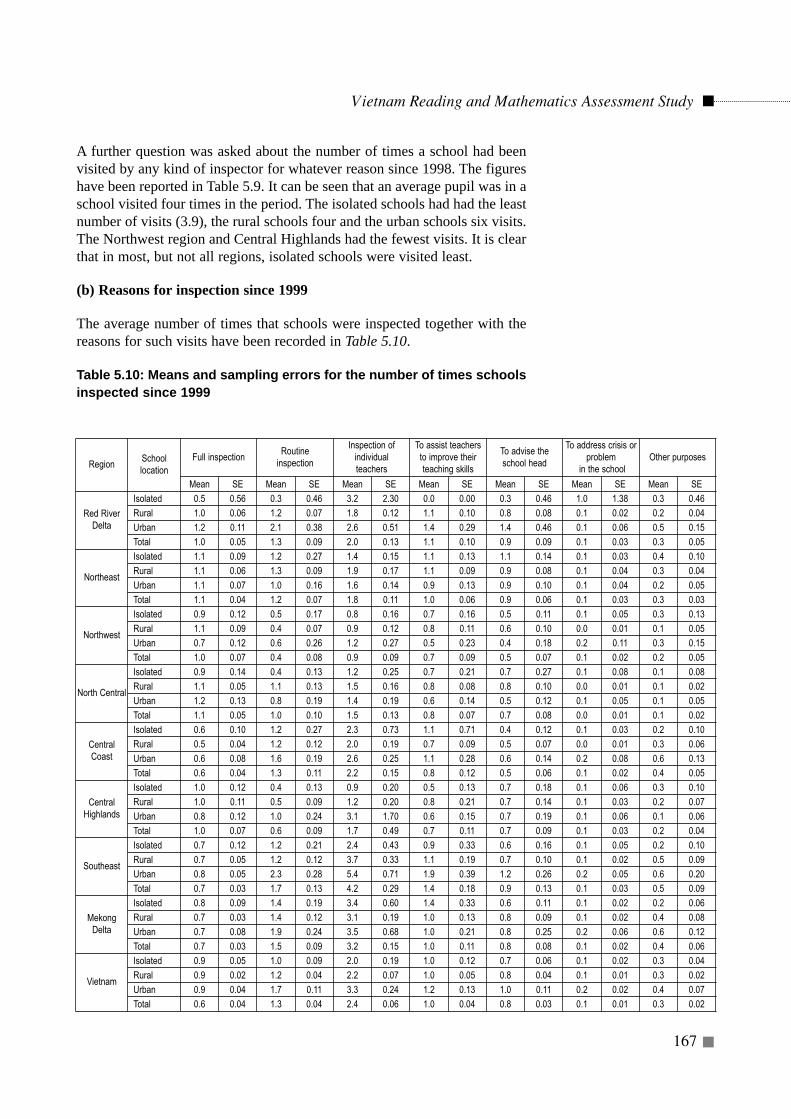
A further question was asked about the number of times a school had beenvisited by any kind of inspector for whatever reason since 1998. The figureshave been reported in Table 5.9. It can be seen that an average pupil was in aschool visited four times in the period. The isolated schools had had the leastnumber of visits (3.9), the rural schools four and the urban schools six visits.The Northwest region and Central Highlands had the fewest visits. It is clearthat in most, but not all regions, isolated schools were visited least.
(b) Reasons for inspection since 1999
The average number of times that schools were inspected together with thereasons for such visits have been recorded in Table 5.10.
Table 5.10: Means and sampling errors for the number of times schoolsinspected since 1999
Vietnam Reading and Mathematics Assessment Study
167
RegionSchoollocation
Full inspectionRoutine
inspection
Inspection of individual teachers
To assist teachersto improve theirteaching skills
To advise theschool head
To address crisis orproblem
in the schoolOther purposes
Mean SE Mean SE Mean SE Mean SE Mean SE Mean SE Mean SE
Red RiverDelta
Isolated 0.5 0.56 0.3 0.46 3.2 2.30 0.0 0.00 0.3 0.46 1.0 1.38 0.3 0.46
Rural 1.0 0.06 1.2 0.07 1.8 0.12 1.1 0.10 0.8 0.08 0.1 0.02 0.2 0.04
Urban 1.2 0.11 2.1 0.38 2.6 0.51 1.4 0.29 1.4 0.46 0.1 0.06 0.5 0.15
Total 1.0 0.05 1.3 0.09 2.0 0.13 1.1 0.10 0.9 0.09 0.1 0.03 0.3 0.05
Northeast
Isolated 1.1 0.09 1.2 0.27 1.4 0.15 1.1 0.13 1.1 0.14 0.1 0.03 0.4 0.10
Rural 1.1 0.06 1.3 0.09 1.9 0.17 1.1 0.09 0.9 0.08 0.1 0.04 0.3 0.04
Urban 1.1 0.07 1.0 0.16 1.6 0.14 0.9 0.13 0.9 0.10 0.1 0.04 0.2 0.05
Total 1.1 0.04 1.2 0.07 1.8 0.11 1.0 0.06 0.9 0.06 0.1 0.03 0.3 0.03
Northwest
Isolated 0.9 0.12 0.5 0.17 0.8 0.16 0.7 0.16 0.5 0.11 0.1 0.05 0.3 0.13
Rural 1.1 0.09 0.4 0.07 0.9 0.12 0.8 0.11 0.6 0.10 0.0 0.01 0.1 0.05
Urban 0.7 0.12 0.6 0.26 1.2 0.27 0.5 0.23 0.4 0.18 0.2 0.11 0.3 0.15
Total 1.0 0.07 0.4 0.08 0.9 0.09 0.7 0.09 0.5 0.07 0.1 0.02 0.2 0.05
North Central
Isolated 0.9 0.14 0.4 0.13 1.2 0.25 0.7 0.21 0.7 0.27 0.1 0.08 0.1 0.08
Rural 1.1 0.05 1.1 0.13 1.5 0.16 0.8 0.08 0.8 0.10 0.0 0.01 0.1 0.02
Urban 1.2 0.13 0.8 0.19 1.4 0.19 0.6 0.14 0.5 0.12 0.1 0.05 0.1 0.05
Total 1.1 0.05 1.0 0.10 1.5 0.13 0.8 0.07 0.7 0.08 0.0 0.01 0.1 0.02
CentralCoast
Isolated 0.6 0.10 1.2 0.27 2.3 0.73 1.1 0.71 0.4 0.12 0.1 0.03 0.2 0.10
Rural 0.5 0.04 1.2 0.12 2.0 0.19 0.7 0.09 0.5 0.07 0.0 0.01 0.3 0.06
Urban 0.6 0.08 1.6 0.19 2.6 0.25 1.1 0.28 0.6 0.14 0.2 0.08 0.6 0.13
Total 0.6 0.04 1.3 0.11 2.2 0.15 0.8 0.12 0.5 0.06 0.1 0.02 0.4 0.05
CentralHighlands
Isolated 1.0 0.12 0.4 0.13 0.9 0.20 0.5 0.13 0.7 0.18 0.1 0.06 0.3 0.10
Rural 1.0 0.11 0.5 0.09 1.2 0.20 0.8 0.21 0.7 0.14 0.1 0.03 0.2 0.07
Urban 0.8 0.12 1.0 0.24 3.1 1.70 0.6 0.15 0.7 0.19 0.1 0.06 0.1 0.06
Total 1.0 0.07 0.6 0.09 1.7 0.49 0.7 0.11 0.7 0.09 0.1 0.03 0.2 0.04
Southeast
Isolated 0.7 0.12 1.2 0.21 2.4 0.43 0.9 0.33 0.6 0.16 0.1 0.05 0.2 0.10
Rural 0.7 0.05 1.2 0.12 3.7 0.33 1.1 0.19 0.7 0.10 0.1 0.02 0.5 0.09
Urban 0.8 0.05 2.3 0.28 5.4 0.71 1.9 0.39 1.2 0.26 0.2 0.05 0.6 0.20
Total 0.7 0.03 1.7 0.13 4.2 0.29 1.4 0.18 0.9 0.13 0.1 0.03 0.5 0.09
MekongDelta
Isolated 0.8 0.09 1.4 0.19 3.4 0.60 1.4 0.33 0.6 0.11 0.1 0.02 0.2 0.06
Rural 0.7 0.03 1.4 0.12 3.1 0.19 1.0 0.13 0.8 0.09 0.1 0.02 0.4 0.08
Urban 0.7 0.08 1.9 0.24 3.5 0.68 1.0 0.21 0.8 0.25 0.2 0.06 0.6 0.12
Total 0.7 0.03 1.5 0.09 3.2 0.15 1.0 0.11 0.8 0.08 0.1 0.02 0.4 0.06
Vietnam
Isolated 0.9 0.05 1.0 0.09 2.0 0.19 1.0 0.12 0.7 0.06 0.1 0.02 0.3 0.04
Rural 0.9 0.02 1.2 0.04 2.2 0.07 1.0 0.05 0.8 0.04 0.1 0.01 0.3 0.02
Urban 0.9 0.04 1.7 0.11 3.3 0.24 1.2 0.13 1.0 0.11 0.2 0.02 0.4 0.07
Total 0.6 0.04 1.3 0.04 2.4 0.06 1.0 0.04 0.8 0.03 0.1 0.01 0.3 0.02
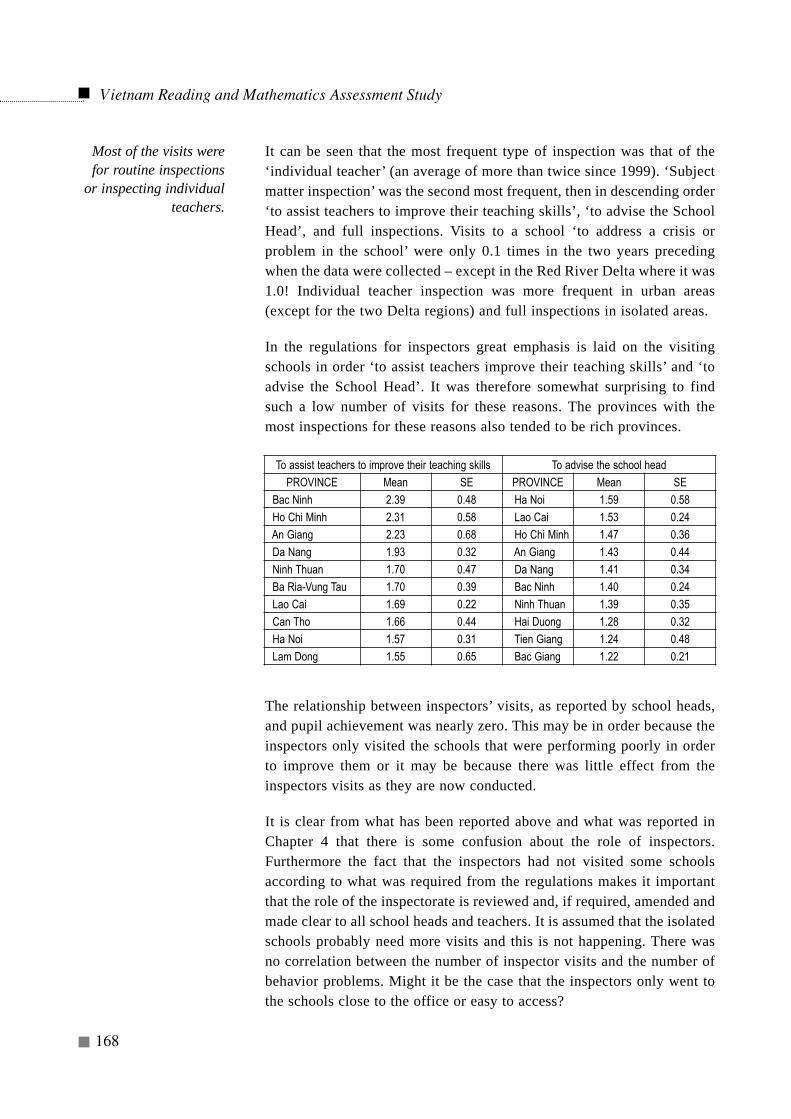
It can be seen that the most frequent type of inspection was that of the‘individual teacher’ (an average of more than twice since 1999). ‘Subjectmatter inspection’ was the second most frequent, then in descending order‘to assist teachers to improve their teaching skills’, ‘to advise the SchoolHead’, and full inspections. Visits to a school ‘to address a crisis orproblem in the school’ were only 0.1 times in the two years precedingwhen the data were collected – except in the Red River Delta where it was1.0! Individual teacher inspection was more frequent in urban areas(except for the two Delta regions) and full inspections in isolated areas.
In the regulations for inspectors great emphasis is laid on the visitingschools in order ‘to assist teachers improve their teaching skills’ and ‘toadvise the School Head’. It was therefore somewhat surprising to findsuch a low number of visits for these reasons. The provinces with themost inspections for these reasons also tended to be rich provinces.
The relationship between inspectors’ visits, as reported by school heads,and pupil achievement was nearly zero. This may be in order because theinspectors only visited the schools that were performing poorly in orderto improve them or it may be because there was little effect from theinspectors visits as they are now conducted.
It is clear from what has been reported above and what was reported inChapter 4 that there is some confusion about the role of inspectors.Furthermore the fact that the inspectors had not visited some schoolsaccording to what was required from the regulations makes it importantthat the role of the inspectorate is reviewed and, if required, amended andmade clear to all school heads and teachers. It is assumed that the isolatedschools probably need more visits and this is not happening. There wasno correlation between the number of inspector visits and the number ofbehavior problems. Might it be the case that the inspectors only went tothe schools close to the office or easy to access?
Vietnam Reading and Mathematics Assessment Study
168
Most of the visits werefor routine inspections
or inspecting individualteachers.
To assist teachers to improve their teaching skills To advise the school head
PROVINCE Mean SE PROVINCE Mean SE
Bac Ninh 2.39 0.48 Ha Noi 1.59 0.58
Ho Chi Minh 2.31 0.58 Lao Cai 1.53 0.24
An Giang 2.23 0.68 Ho Chi Minh 1.47 0.36
Da Nang 1.93 0.32 An Giang 1.43 0.44
Ninh Thuan 1.70 0.47 Da Nang 1.41 0.34
Ba Ria-Vung Tau 1.70 0.39 Bac Ninh 1.40 0.24
Lao Cai 1.69 0.22 Ninh Thuan 1.39 0.35
Can Tho 1.66 0.44 Hai Duong 1.28 0.32
Ha Noi 1.57 0.31 Tien Giang 1.24 0.48
Lam Dong 1.55 0.65 Bac Giang 1.22 0.21
Policy suggestion 5.6: The several roles of the inspectorate shouldbe made clearer. There should be a system of monitoring that theinspectors are doing their jobs well.
What were the Head’s activities and thosehe/she planned for the school?
The amount of teaching that heads do has already been discussed. It is onething to gain insights into the school by teaching at various grade levelsin it but there are many more responsibilities that a head has.
(a) School Heads’ activities
The major activities as perceived by the MOET were listed and each headwas asked to rate how important that he or she perceived the activities tobe. A scale was constructed where ‘not important’ was coded 1, ‘of someimportance’ 2, and ‘very important’ 3. Thus a mean value of 2 meant ‘ofsome importance’ From Table 5.11 it can be seen that nearly all Headsticked either ‘important’ or ‘very important’. The ‘professionaldevelopment of teachers’ was rated to be the most important activity ofSchool Heads. ‘Extra curricular activities’ had the lowest ratings. Thiswas surprising because these activities often give an aura to a school andcan make the difference between an outstanding school and an averageschool. ‘Contacts with the local community’ that were deemed to beimportant were rated more important in isolated areas than in rural orurban areas. So were ‘discussing educational objectives’. This may bebecause more community help is needed in the isolated areas.Furthermore, because the teachers in the isolated areas had lessexperience as teachers, then the heads deemed that it was important todiscuss educational objectives more. But, in general there were fewdifferences between school locations and between regions.
When asked which were the most important activities, the Heads ratedadministrative tasks to be the most important, then the professionaldevelopment of teachers and thirdly the taking care of the schoolbuildings and resources.
Vietnam Reading and Mathematics Assessment Study
169
School heads rated theprofessionaldevelopment of teachersand improving schoolconditions as the mostimportant activities.Organising extracurricular activitiesreceived the lowestrating.
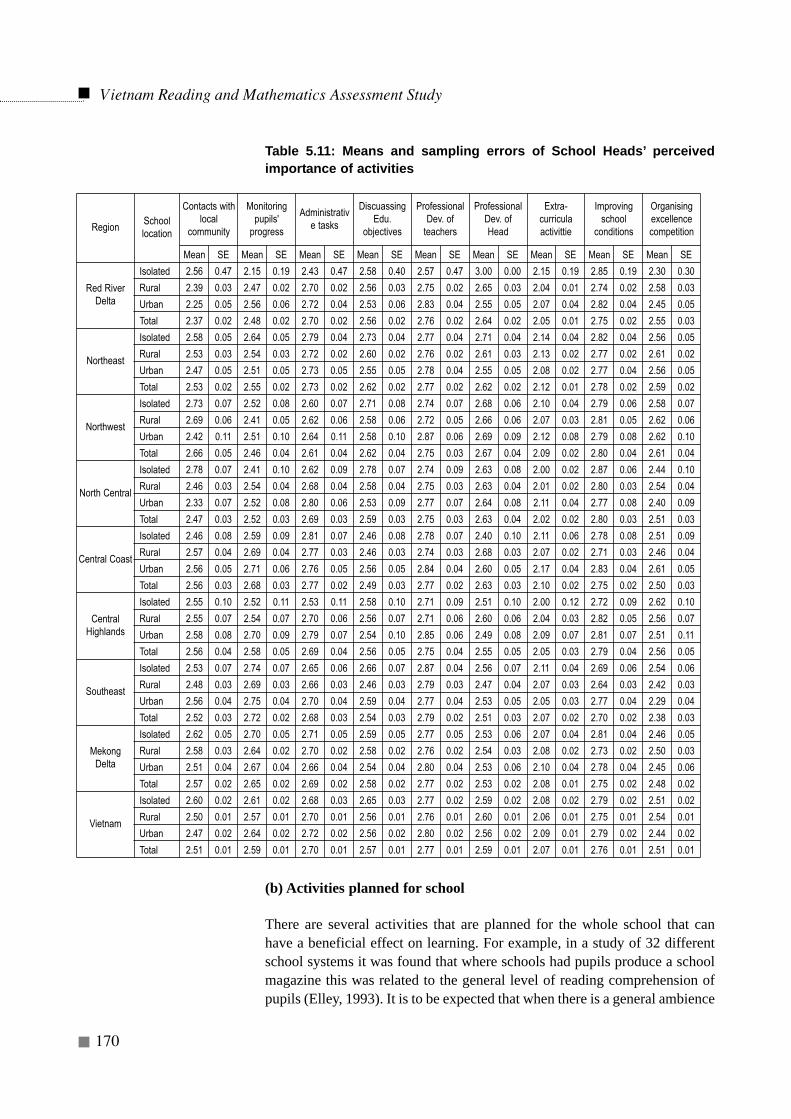
Table 5.11: Means and sampling errors of School Heads’ perceivedimportance of activities
(b) Activities planned for school
There are several activities that are planned for the whole school that canhave a beneficial effect on learning. For example, in a study of 32 differentschool systems it was found that where schools had pupils produce a schoolmagazine this was related to the general level of reading comprehension ofpupils (Elley, 1993). It is to be expected that when there is a general ambience
Vietnam Reading and Mathematics Assessment Study
170
RegionSchoollocation
Contacts withlocal
community
Monitoringpupils'
progress
Administrative tasks
DiscuassingEdu.
objectives
ProfessionalDev. of
teachers
ProfessionalDev. of Head
Extra-curriculaactivittie
Improvingschool
conditions
Organisingexcellencecompetition
Mean SE Mean SE Mean SE Mean SE Mean SE Mean SE Mean SE Mean SE Mean SE
Red RiverDelta
Isolated 2.56 0.47 2.15 0.19 2.43 0.47 2.58 0.40 2.57 0.47 3.00 0.00 2.15 0.19 2.85 0.19 2.30 0.30
Rural 2.39 0.03 2.47 0.02 2.70 0.02 2.56 0.03 2.75 0.02 2.65 0.03 2.04 0.01 2.74 0.02 2.58 0.03
Urban 2.25 0.05 2.56 0.06 2.72 0.04 2.53 0.06 2.83 0.04 2.55 0.05 2.07 0.04 2.82 0.04 2.45 0.05
Total 2.37 0.02 2.48 0.02 2.70 0.02 2.56 0.02 2.76 0.02 2.64 0.02 2.05 0.01 2.75 0.02 2.55 0.03
Northeast
Isolated 2.58 0.05 2.64 0.05 2.79 0.04 2.73 0.04 2.77 0.04 2.71 0.04 2.14 0.04 2.82 0.04 2.56 0.05
Rural 2.53 0.03 2.54 0.03 2.72 0.02 2.60 0.02 2.76 0.02 2.61 0.03 2.13 0.02 2.77 0.02 2.61 0.02
Urban 2.47 0.05 2.51 0.05 2.73 0.05 2.55 0.05 2.78 0.04 2.55 0.05 2.08 0.02 2.77 0.04 2.56 0.05
Total 2.53 0.02 2.55 0.02 2.73 0.02 2.62 0.02 2.77 0.02 2.62 0.02 2.12 0.01 2.78 0.02 2.59 0.02
Northwest
Isolated 2.73 0.07 2.52 0.08 2.60 0.07 2.71 0.08 2.74 0.07 2.68 0.06 2.10 0.04 2.79 0.06 2.58 0.07
Rural 2.69 0.06 2.41 0.05 2.62 0.06 2.58 0.06 2.72 0.05 2.66 0.06 2.07 0.03 2.81 0.05 2.62 0.06
Urban 2.42 0.11 2.51 0.10 2.64 0.11 2.58 0.10 2.87 0.06 2.69 0.09 2.12 0.08 2.79 0.08 2.62 0.10
Total 2.66 0.05 2.46 0.04 2.61 0.04 2.62 0.04 2.75 0.03 2.67 0.04 2.09 0.02 2.80 0.04 2.61 0.04
North Central
Isolated 2.78 0.07 2.41 0.10 2.62 0.09 2.78 0.07 2.74 0.09 2.63 0.08 2.00 0.02 2.87 0.06 2.44 0.10
Rural 2.46 0.03 2.54 0.04 2.68 0.04 2.58 0.04 2.75 0.03 2.63 0.04 2.01 0.02 2.80 0.03 2.54 0.04
Urban 2.33 0.07 2.52 0.08 2.80 0.06 2.53 0.09 2.77 0.07 2.64 0.08 2.11 0.04 2.77 0.08 2.40 0.09
Total 2.47 0.03 2.52 0.03 2.69 0.03 2.59 0.03 2.75 0.03 2.63 0.04 2.02 0.02 2.80 0.03 2.51 0.03
Central Coast
Isolated 2.46 0.08 2.59 0.09 2.81 0.07 2.46 0.08 2.78 0.07 2.40 0.10 2.11 0.06 2.78 0.08 2.51 0.09
Rural 2.57 0.04 2.69 0.04 2.77 0.03 2.46 0.03 2.74 0.03 2.68 0.03 2.07 0.02 2.71 0.03 2.46 0.04
Urban 2.56 0.05 2.71 0.06 2.76 0.05 2.56 0.05 2.84 0.04 2.60 0.05 2.17 0.04 2.83 0.04 2.61 0.05
Total 2.56 0.03 2.68 0.03 2.77 0.02 2.49 0.03 2.77 0.02 2.63 0.03 2.10 0.02 2.75 0.02 2.50 0.03
CentralHighlands
Isolated 2.55 0.10 2.52 0.11 2.53 0.11 2.58 0.10 2.71 0.09 2.51 0.10 2.00 0.12 2.72 0.09 2.62 0.10
Rural 2.55 0.07 2.54 0.07 2.70 0.06 2.56 0.07 2.71 0.06 2.60 0.06 2.04 0.03 2.82 0.05 2.56 0.07
Urban 2.58 0.08 2.70 0.09 2.79 0.07 2.54 0.10 2.85 0.06 2.49 0.08 2.09 0.07 2.81 0.07 2.51 0.11
Total 2.56 0.04 2.58 0.05 2.69 0.04 2.56 0.05 2.75 0.04 2.55 0.05 2.05 0.03 2.79 0.04 2.56 0.05
Southeast
Isolated 2.53 0.07 2.74 0.07 2.65 0.06 2.66 0.07 2.87 0.04 2.56 0.07 2.11 0.04 2.69 0.06 2.54 0.06
Rural 2.48 0.03 2.69 0.03 2.66 0.03 2.46 0.03 2.79 0.03 2.47 0.04 2.07 0.03 2.64 0.03 2.42 0.03
Urban 2.56 0.04 2.75 0.04 2.70 0.04 2.59 0.04 2.77 0.04 2.53 0.05 2.05 0.03 2.77 0.04 2.29 0.04
Total 2.52 0.03 2.72 0.02 2.68 0.03 2.54 0.03 2.79 0.02 2.51 0.03 2.07 0.02 2.70 0.02 2.38 0.03
MekongDelta
Isolated 2.62 0.05 2.70 0.05 2.71 0.05 2.59 0.05 2.77 0.05 2.53 0.06 2.07 0.04 2.81 0.04 2.46 0.05
Rural 2.58 0.03 2.64 0.02 2.70 0.02 2.58 0.02 2.76 0.02 2.54 0.03 2.08 0.02 2.73 0.02 2.50 0.03
Urban 2.51 0.04 2.67 0.04 2.66 0.04 2.54 0.04 2.80 0.04 2.53 0.06 2.10 0.04 2.78 0.04 2.45 0.06
Total 2.57 0.02 2.65 0.02 2.69 0.02 2.58 0.02 2.77 0.02 2.53 0.02 2.08 0.01 2.75 0.02 2.48 0.02
Vietnam
Isolated 2.60 0.02 2.61 0.02 2.68 0.03 2.65 0.03 2.77 0.02 2.59 0.02 2.08 0.02 2.79 0.02 2.51 0.02
Rural 2.50 0.01 2.57 0.01 2.70 0.01 2.56 0.01 2.76 0.01 2.60 0.01 2.06 0.01 2.75 0.01 2.54 0.01
Urban 2.47 0.02 2.64 0.02 2.72 0.02 2.56 0.02 2.80 0.02 2.56 0.02 2.09 0.01 2.79 0.02 2.44 0.02
Total 2.51 0.01 2.59 0.01 2.70 0.01 2.57 0.01 2.77 0.01 2.59 0.01 2.07 0.01 2.76 0.01 2.51 0.01
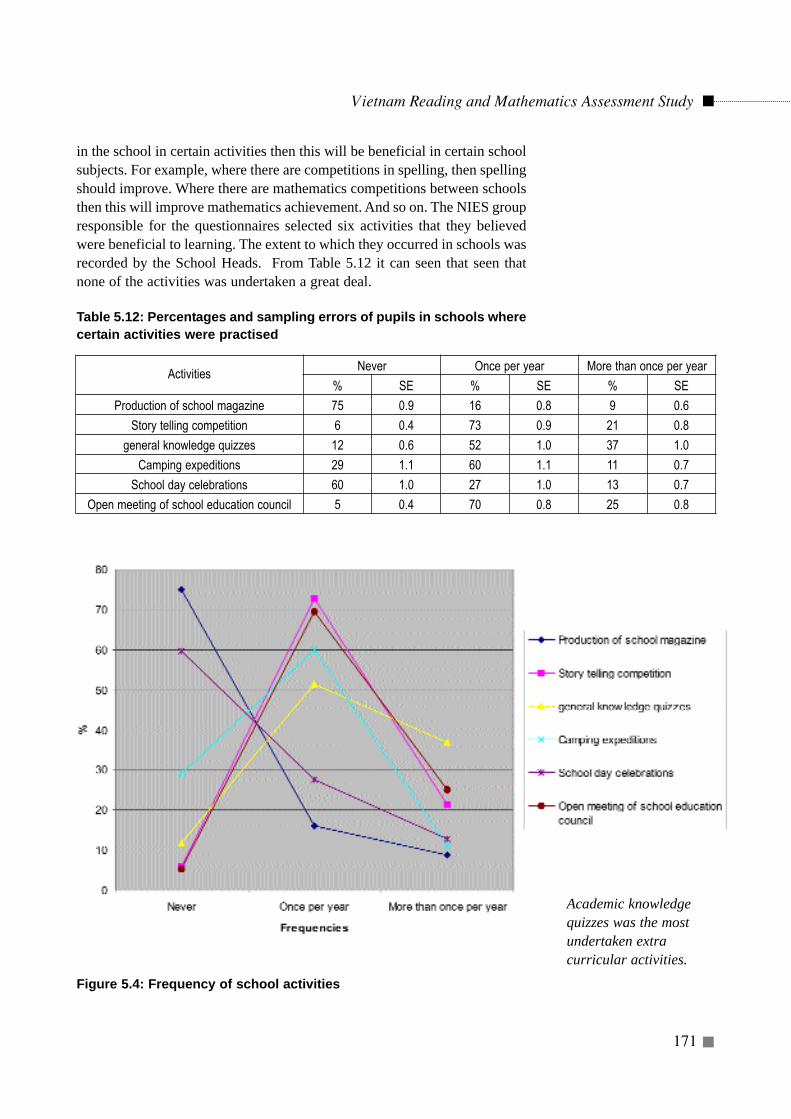
in the school in certain activities then this will be beneficial in certain schoolsubjects. For example, where there are competitions in spelling, then spellingshould improve. Where there are mathematics competitions between schoolsthen this will improve mathematics achievement. And so on. The NIES groupresponsible for the questionnaires selected six activities that they believedwere beneficial to learning. The extent to which they occurred in schools wasrecorded by the School Heads. From Table 5.12 it can seen that seen thatnone of the activities was undertaken a great deal.
Table 5.12: Percentages and sampling errors of pupils in schools wherecertain activities were practised
Figure 5.4: Frequency of school activities
Vietnam Reading and Mathematics Assessment Study
171
ActivitiesNever Once per year More than once per year
% SE % SE % SE
Production of school magazine 75 0.9 16 0.8 9 0.6
Story telling competition 6 0.4 73 0.9 21 0.8
general knowledge quizzes 12 0.6 52 1.0 37 1.0
Camping expeditions 29 1.1 60 1.1 11 0.7
School day celebrations 60 1.0 27 1.0 13 0.7
Open meeting of school education council 5 0.4 70 0.8 25 0.8
Academic knowledgequizzes was the mostundertaken extracurricular activities.
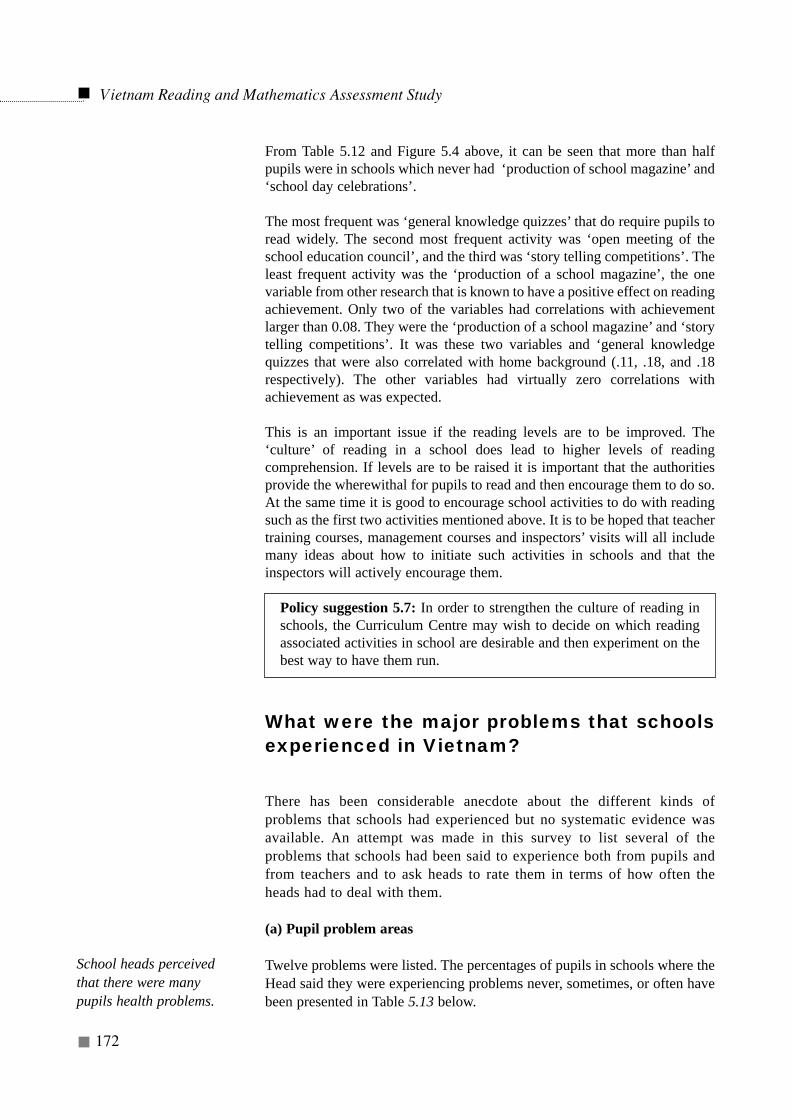
From Table 5.12 and Figure 5.4 above, it can be seen that more than halfpupils were in schools which never had ‘production of school magazine’ and‘school day celebrations’.
The most frequent was ‘general knowledge quizzes’ that do require pupils toread widely. The second most frequent activity was ‘open meeting of theschool education council’, and the third was ‘story telling competitions’. Theleast frequent activity was the ‘production of a school magazine’, the onevariable from other research that is known to have a positive effect on readingachievement. Only two of the variables had correlations with achievementlarger than 0.08. They were the ‘production of a school magazine’ and ‘storytelling competitions’. It was these two variables and ‘general knowledgequizzes that were also correlated with home background (.11, .18, and .18respectively). The other variables had virtually zero correlations withachievement as was expected.
This is an important issue if the reading levels are to be improved. The‘culture’ of reading in a school does lead to higher levels of readingcomprehension. If levels are to be raised it is important that the authoritiesprovide the wherewithal for pupils to read and then encourage them to do so.At the same time it is good to encourage school activities to do with readingsuch as the first two activities mentioned above. It is to be hoped that teachertraining courses, management courses and inspectors’ visits will all includemany ideas about how to initiate such activities in schools and that theinspectors will actively encourage them.
Policy suggestion 5.7: In order to strengthen the culture of reading inschools, the Curriculum Centre may wish to decide on which readingassociated activities in school are desirable and then experiment on thebest way to have them run.
What were the major problems that schoolsexperienced in Vietnam?
There has been considerable anecdote about the different kinds ofproblems that schools had experienced but no systematic evidence wasavailable. An attempt was made in this survey to list several of theproblems that schools had been said to experience both from pupils andfrom teachers and to ask heads to rate them in terms of how often theheads had to deal with them.
(a) Pupil problem areas
Twelve problems were listed. The percentages of pupils in schools where theHead said they were experiencing problems never, sometimes, or often havebeen presented in Table 5.13 below.
Vietnam Reading and Mathematics Assessment Study
172
School heads perceivedthat there were manypupils health problems.
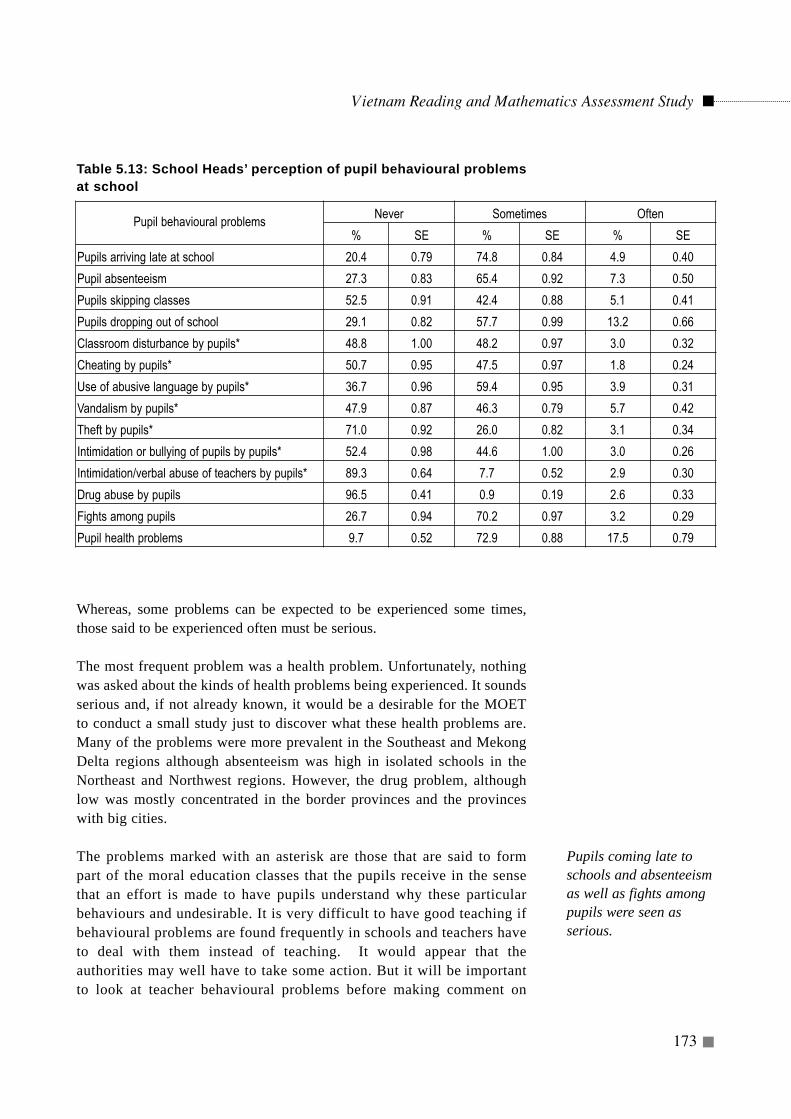
Table 5.13: School Heads’ perception of pupil behavioural problemsat school
Whereas, some problems can be expected to be experienced some times,those said to be experienced often must be serious.
The most frequent problem was a health problem. Unfortunately, nothingwas asked about the kinds of health problems being experienced. It soundsserious and, if not already known, it would be a desirable for the MOETto conduct a small study just to discover what these health problems are.Many of the problems were more prevalent in the Southeast and MekongDelta regions although absenteeism was high in isolated schools in theNortheast and Northwest regions. However, the drug problem, althoughlow was mostly concentrated in the border provinces and the provinceswith big cities.
The problems marked with an asterisk are those that are said to formpart of the moral education classes that the pupils receive in the sensethat an effort is made to have pupils understand why these particularbehaviours and undesirable. It is very difficult to have good teaching ifbehavioural problems are found frequently in schools and teachers haveto deal with them instead of teaching. It would appear that theauthorities may well have to take some action. But it will be importantto look at teacher behavioural problems before making comment on
Vietnam Reading and Mathematics Assessment Study
173
Pupil behavioural problemsNever Sometimes Often
% SE % SE % SE
Pupils arriving late at school 20.4 0.79 74.8 0.84 4.9 0.40
Pupil absenteeism 27.3 0.83 65.4 0.92 7.3 0.50
Pupils skipping classes 52.5 0.91 42.4 0.88 5.1 0.41
Pupils dropping out of school 29.1 0.82 57.7 0.99 13.2 0.66
Classroom disturbance by pupils* 48.8 1.00 48.2 0.97 3.0 0.32
Cheating by pupils* 50.7 0.95 47.5 0.97 1.8 0.24
Use of abusive language by pupils* 36.7 0.96 59.4 0.95 3.9 0.31
Vandalism by pupils* 47.9 0.87 46.3 0.79 5.7 0.42
Theft by pupils* 71.0 0.92 26.0 0.82 3.1 0.34
Intimidation or bullying of pupils by pupils* 52.4 0.98 44.6 1.00 3.0 0.26
Intimidation/verbal abuse of teachers by pupils* 89.3 0.64 7.7 0.52 2.9 0.30
Drug abuse by pupils 96.5 0.41 0.9 0.19 2.6 0.33
Fights among pupils 26.7 0.94 70.2 0.97 3.2 0.29
Pupil health problems 9.7 0.52 72.9 0.88 17.5 0.79
Pupils coming late toschools and absenteeismas well as fights amongpupils were seen asserious.
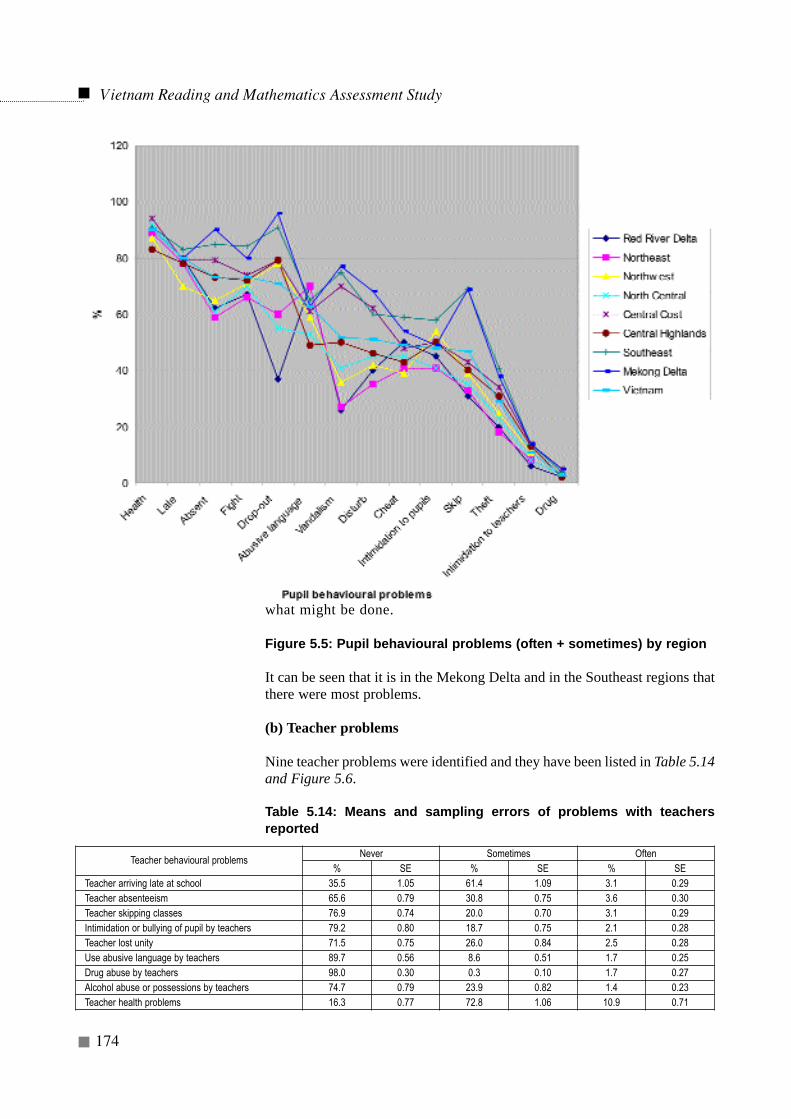
what might be done.
Figure 5.5: Pupil behavioural problems (often + sometimes) by region
It can be seen that it is in the Mekong Delta and in the Southeast regions thatthere were most problems.
(b) Teacher problems
Nine teacher problems were identified and they have been listed in Table 5.14and Figure 5.6.
Table 5.14: Means and sampling errors of problems with teachersreported
Vietnam Reading and Mathematics Assessment Study
174
Teacher behavioural problemsNever Sometimes Often
% SE % SE % SETeacher arriving late at school 35.5 1.05 61.4 1.09 3.1 0.29Teacher absenteeism 65.6 0.79 30.8 0.75 3.6 0.30Teacher skipping classes 76.9 0.74 20.0 0.70 3.1 0.29Intimidation or bullying of pupil by teachers 79.2 0.80 18.7 0.75 2.1 0.28Teacher lost unity 71.5 0.75 26.0 0.84 2.5 0.28Use abusive language by teachers 89.7 0.56 8.6 0.51 1.7 0.25Drug abuse by teachers 98.0 0.30 0.3 0.10 1.7 0.27Alcohol abuse or possessions by teachers 74.7 0.79 23.9 0.82 1.4 0.23Teacher health problems 16.3 0.77 72.8 1.06 10.9 0.71
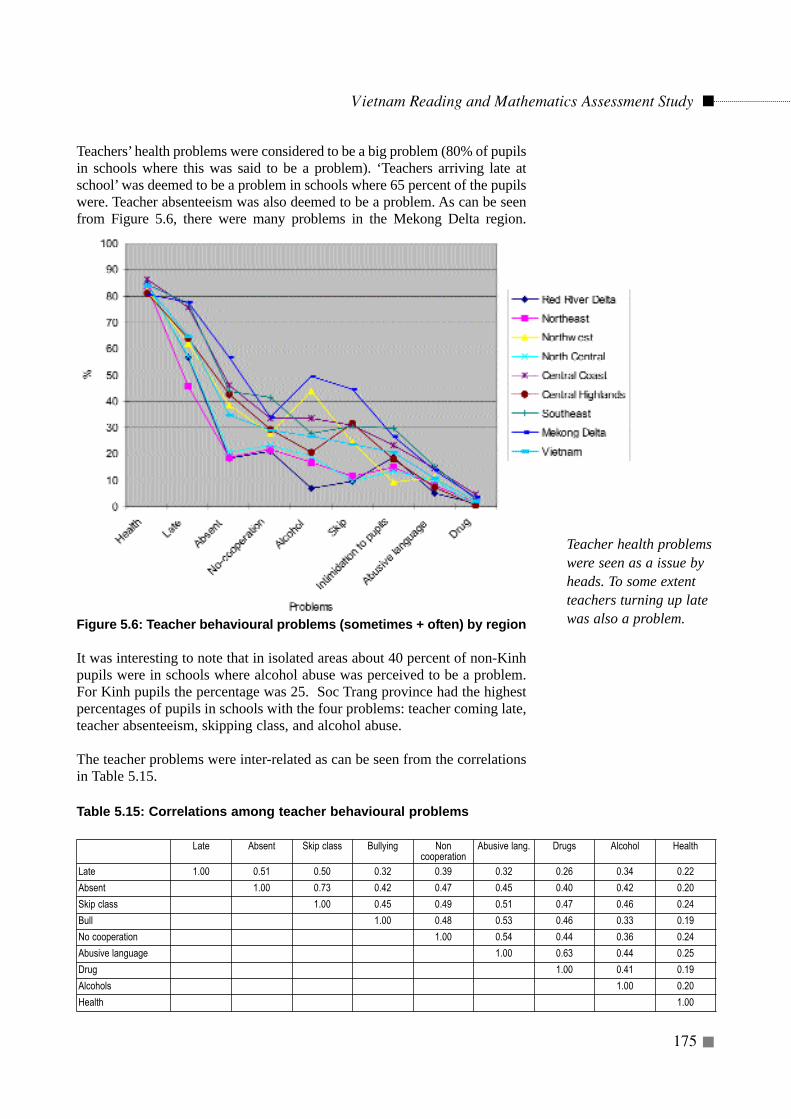
Teachers’ health problems were considered to be a big problem (80% of pupilsin schools where this was said to be a problem). ‘Teachers arriving late atschool’ was deemed to be a problem in schools where 65 percent of the pupilswere. Teacher absenteeism was also deemed to be a problem. As can be seenfrom Figure 5.6, there were many problems in the Mekong Delta region.
Figure 5.6: Teacher behavioural problems (sometimes + often) by region
It was interesting to note that in isolated areas about 40 percent of non-Kinhpupils were in schools where alcohol abuse was perceived to be a problem.For Kinh pupils the percentage was 25. Soc Trang province had the highestpercentages of pupils in schools with the four problems: teacher coming late,teacher absenteeism, skipping class, and alcohol abuse.
The teacher problems were inter-related as can be seen from the correlationsin Table 5.15.
Table 5.15: Correlations among teacher behavioural problems
Vietnam Reading and Mathematics Assessment Study
175
Teacher health problemswere seen as a issue byheads. To some extentteachers turning up latewas also a problem.
Late Absent Skip class Bullying Non cooperation
Abusive lang. Drugs Alcohol Health
Late 1.00 0.51 0.50 0.32 0.39 0.32 0.26 0.34 0.22
Absent 1.00 0.73 0.42 0.47 0.45 0.40 0.42 0.20
Skip class 1.00 0.45 0.49 0.51 0.47 0.46 0.24
Bull 1.00 0.48 0.53 0.46 0.33 0.19
No cooperation 1.00 0.54 0.44 0.36 0.24
Abusive language 1.00 0.63 0.44 0.25
Drug 1.00 0.41 0.19
Alcohols 1.00 0.20
Health 1.00
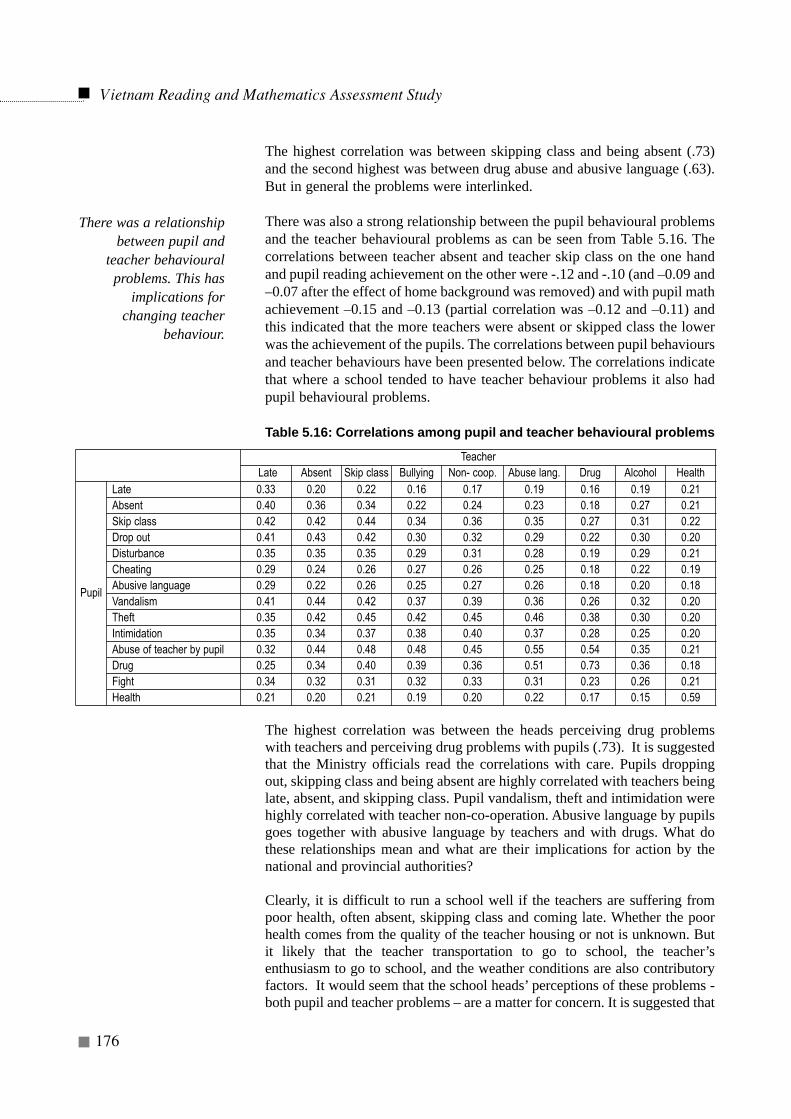
The highest correlation was between skipping class and being absent (.73)and the second highest was between drug abuse and abusive language (.63).But in general the problems were interlinked.
There was also a strong relationship between the pupil behavioural problemsand the teacher behavioural problems as can be seen from Table 5.16. Thecorrelations between teacher absent and teacher skip class on the one handand pupil reading achievement on the other were -.12 and -.10 (and –0.09 and–0.07 after the effect of home background was removed) and with pupil mathachievement –0.15 and –0.13 (partial correlation was –0.12 and –0.11) andthis indicated that the more teachers were absent or skipped class the lowerwas the achievement of the pupils. The correlations between pupil behavioursand teacher behaviours have been presented below. The correlations indicatethat where a school tended to have teacher behaviour problems it also hadpupil behavioural problems.
Table 5.16: Correlations among pupil and teacher behavioural problems
The highest correlation was between the heads perceiving drug problemswith teachers and perceiving drug problems with pupils (.73). It is suggestedthat the Ministry officials read the correlations with care. Pupils droppingout, skipping class and being absent are highly correlated with teachers beinglate, absent, and skipping class. Pupil vandalism, theft and intimidation werehighly correlated with teacher non-co-operation. Abusive language by pupilsgoes together with abusive language by teachers and with drugs. What dothese relationships mean and what are their implications for action by thenational and provincial authorities?
Clearly, it is difficult to run a school well if the teachers are suffering frompoor health, often absent, skipping class and coming late. Whether the poorhealth comes from the quality of the teacher housing or not is unknown. Butit likely that the teacher transportation to go to school, the teacher’senthusiasm to go to school, and the weather conditions are also contributoryfactors. It would seem that the school heads’ perceptions of these problems -both pupil and teacher problems – are a matter for concern. It is suggested that
Vietnam Reading and Mathematics Assessment Study
176
There was a relationshipbetween pupil and
teacher behaviouralproblems. This has
implications forchanging teacher
behaviour.
TeacherLate Absent Skip class Bullying Non- coop. Abuse lang. Drug Alcohol Health
Pupil
Late 0.33 0.20 0.22 0.16 0.17 0.19 0.16 0.19 0.21Absent 0.40 0.36 0.34 0.22 0.24 0.23 0.18 0.27 0.21Skip class 0.42 0.42 0.44 0.34 0.36 0.35 0.27 0.31 0.22Drop out 0.41 0.43 0.42 0.30 0.32 0.29 0.22 0.30 0.20Disturbance 0.35 0.35 0.35 0.29 0.31 0.28 0.19 0.29 0.21Cheating 0.29 0.24 0.26 0.27 0.26 0.25 0.18 0.22 0.19Abusive language 0.29 0.22 0.26 0.25 0.27 0.26 0.18 0.20 0.18Vandalism 0.41 0.44 0.42 0.37 0.39 0.36 0.26 0.32 0.20Theft 0.35 0.42 0.45 0.42 0.45 0.46 0.38 0.30 0.20Intimidation 0.35 0.34 0.37 0.38 0.40 0.37 0.28 0.25 0.20Abuse of teacher by pupil 0.32 0.44 0.48 0.48 0.45 0.55 0.54 0.35 0.21Drug 0.25 0.34 0.40 0.39 0.36 0.51 0.73 0.36 0.18Fight 0.34 0.32 0.31 0.32 0.33 0.31 0.23 0.26 0.21Health 0.21 0.20 0.21 0.19 0.20 0.22 0.17 0.15 0.59
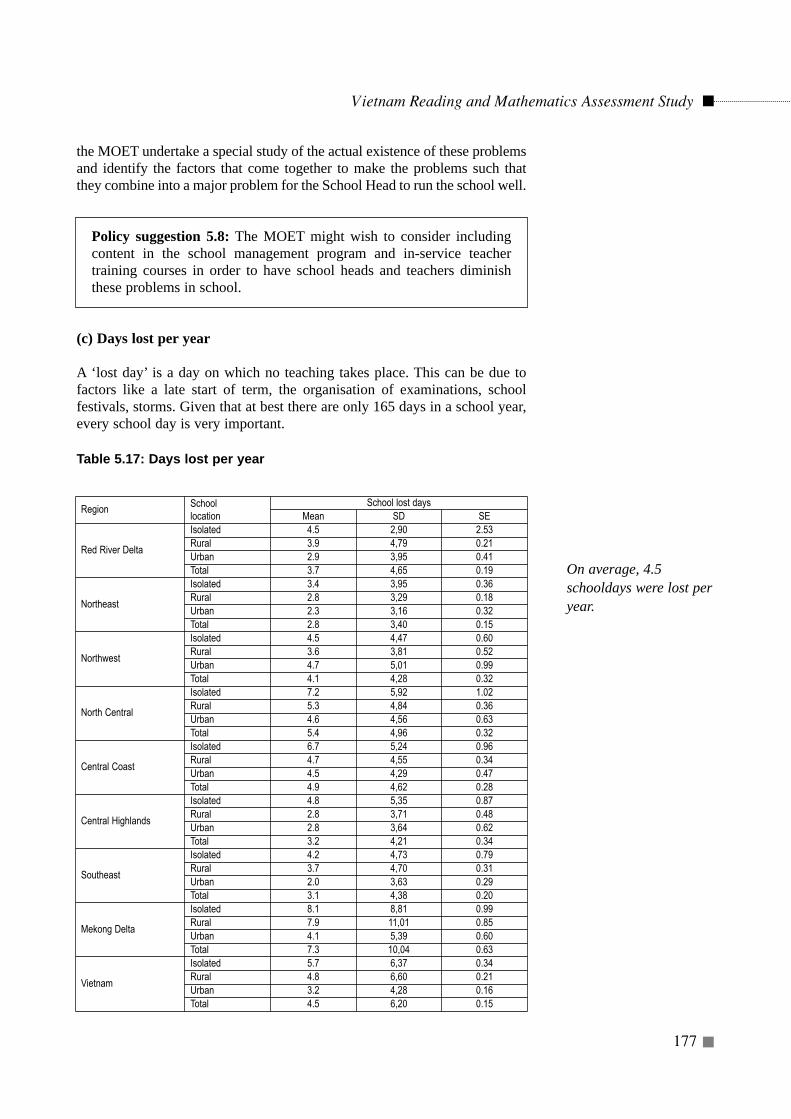
the MOET undertake a special study of the actual existence of these problemsand identify the factors that come together to make the problems such thatthey combine into a major problem for the School Head to run the school well.
Policy suggestion 5.8: The MOET might wish to consider includingcontent in the school management program and in-service teachertraining courses in order to have school heads and teachers diminishthese problems in school.
(c) Days lost per year
A ‘lost day’ is a day on which no teaching takes place. This can be due tofactors like a late start of term, the organisation of examinations, schoolfestivals, storms. Given that at best there are only 165 days in a school year,every school day is very important.
Table 5.17: Days lost per year
Vietnam Reading and Mathematics Assessment Study
177
Region School location
School lost daysMean SD SE
Red River Delta
Isolated 4.5 2,90 2.53Rural 3.9 4,79 0.21Urban 2.9 3,95 0.41Total 3.7 4,65 0.19
Northeast
Isolated 3.4 3,95 0.36Rural 2.8 3,29 0.18Urban 2.3 3,16 0.32Total 2.8 3,40 0.15
Northwest
Isolated 4.5 4,47 0.60Rural 3.6 3,81 0.52Urban 4.7 5,01 0.99Total 4.1 4,28 0.32
North Central
Isolated 7.2 5,92 1.02Rural 5.3 4,84 0.36Urban 4.6 4,56 0.63Total 5.4 4,96 0.32
Central Coast
Isolated 6.7 5,24 0.96Rural 4.7 4,55 0.34Urban 4.5 4,29 0.47Total 4.9 4,62 0.28
Central Highlands
Isolated 4.8 5,35 0.87Rural 2.8 3,71 0.48Urban 2.8 3,64 0.62Total 3.2 4,21 0.34
Southeast
Isolated 4.2 4,73 0.79Rural 3.7 4,70 0.31Urban 2.0 3,63 0.29Total 3.1 4,38 0.20
Mekong Delta
Isolated 8.1 8,81 0.99Rural 7.9 11,01 0.85Urban 4.1 5,39 0.60Total 7.3 10,04 0.63
Vietnam
Isolated 5.7 6,37 0.34Rural 4.8 6,60 0.21Urban 3.2 4,28 0.16Total 4.5 6,20 0.15
On average, 4.5schooldays were lost peryear.
The average number of days lost was 4.5 (see Table 5.17). The range wasfrom no days to 78 days. The standard deviation was 6.20. However, inurban areas there was less dispersion of days lost than in the other areas.The top three schools for the most number of school days lost were inKieng Giang, An Giang, and Tien Gian provinces in the Mekong Delta.Floods may have caused more than 2 months of school days lost in theMekong Delta. More days were lost in isolated areas than in rural areasand in urban areas only 3.2 days were lost. Isolated schools in NorthCentral had a value of 7.2. These many days lost are too many and it wouldseem that the MOET should discover why these many days were lost andtake measures to combat this.
What were the conditions of the schoolfacilities?
In most countries of the world there is a large range in the condition ofschool buildings. Some are very well kept and maintained. Others appearto be in a state of total disrepair. First of all a question was asked about thenumber of classrooms in each school that were permanent (with a concreteroof), semi-permanent (with a tile roof), and temporary (with a leaf roof orno roof).
(a) Number of classrooms and square metrage per pupil
In Table 5.18, the number of permanent, semi-permanent, and temporaryclassrooms have been given together with the average square metrage perpupil for each category. Finally the total square metrage per pupil for thewhole school has been given. Whereas the square metrage per pupil inclassrooms is a normal statistic, the square metrage per pupil for the schoolas a whole is not.
Vietnam Reading and Mathematics Assessment Study
178
There were somewhatmore semi-permanent
than permanentclassrooms and only a
few temporaryclassrooms per school.
Schools in isolated areashad the least amount of
permanent and thegreatest of temporary
classrooms.
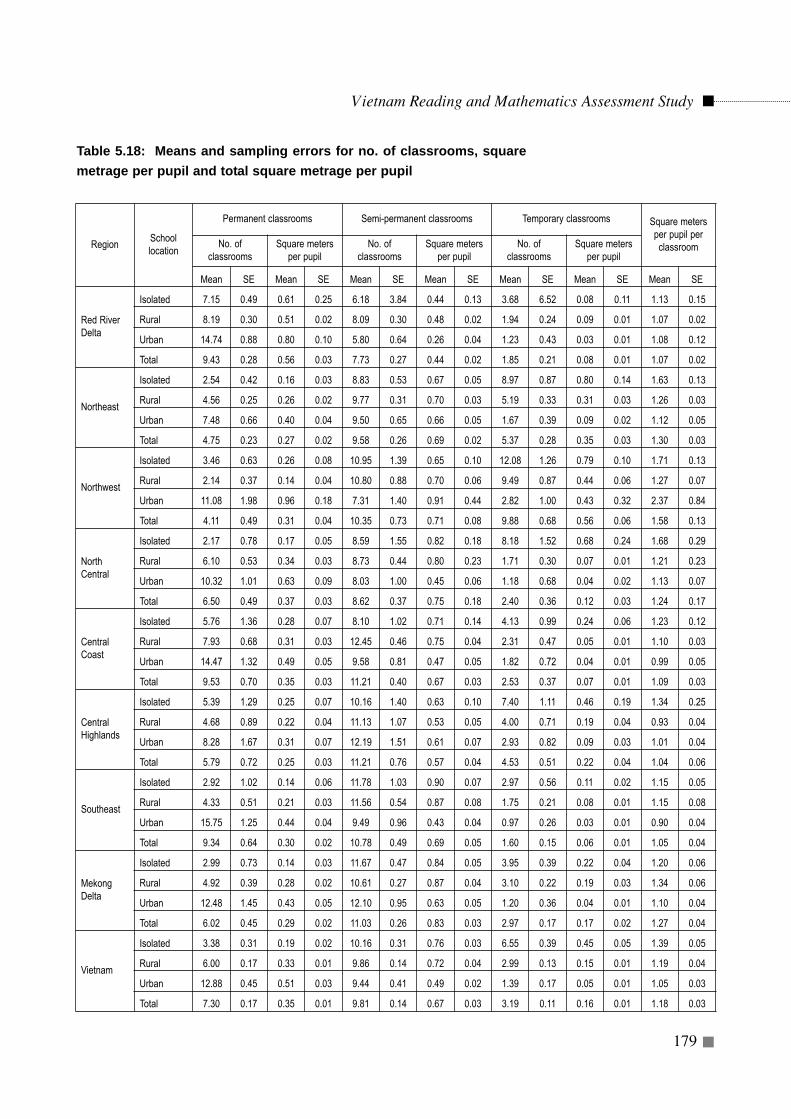
Table 5.18: Means and sampling errors for no. of classrooms, squaremetrage per pupil and total square metrage per pupil
Vietnam Reading and Mathematics Assessment Study
179
RegionSchool location
Permanent classrooms Semi-permanent classrooms Temporary classrooms Square metersper pupil perclassroomNo. of
classroomsSquare meters
per pupilNo. of
classroomsSquare meters
per pupilNo. of
classroomsSquare meters
per pupil
Mean SE Mean SE Mean SE Mean SE Mean SE Mean SE Mean SE
Red RiverDelta
Isolated 7.15 0.49 0.61 0.25 6.18 3.84 0.44 0.13 3.68 6.52 0.08 0.11 1.13 0.15
Rural 8.19 0.30 0.51 0.02 8.09 0.30 0.48 0.02 1.94 0.24 0.09 0.01 1.07 0.02
Urban 14.74 0.88 0.80 0.10 5.80 0.64 0.26 0.04 1.23 0.43 0.03 0.01 1.08 0.12
Total 9.43 0.28 0.56 0.03 7.73 0.27 0.44 0.02 1.85 0.21 0.08 0.01 1.07 0.02
Northeast
Isolated 2.54 0.42 0.16 0.03 8.83 0.53 0.67 0.05 8.97 0.87 0.80 0.14 1.63 0.13
Rural 4.56 0.25 0.26 0.02 9.77 0.31 0.70 0.03 5.19 0.33 0.31 0.03 1.26 0.03
Urban 7.48 0.66 0.40 0.04 9.50 0.65 0.66 0.05 1.67 0.39 0.09 0.02 1.12 0.05
Total 4.75 0.23 0.27 0.02 9.58 0.26 0.69 0.02 5.37 0.28 0.35 0.03 1.30 0.03
Northwest
Isolated 3.46 0.63 0.26 0.08 10.95 1.39 0.65 0.10 12.08 1.26 0.79 0.10 1.71 0.13
Rural 2.14 0.37 0.14 0.04 10.80 0.88 0.70 0.06 9.49 0.87 0.44 0.06 1.27 0.07
Urban 11.08 1.98 0.96 0.18 7.31 1.40 0.91 0.44 2.82 1.00 0.43 0.32 2.37 0.84
Total 4.11 0.49 0.31 0.04 10.35 0.73 0.71 0.08 9.88 0.68 0.56 0.06 1.58 0.13
NorthCentral
Isolated 2.17 0.78 0.17 0.05 8.59 1.55 0.82 0.18 8.18 1.52 0.68 0.24 1.68 0.29
Rural 6.10 0.53 0.34 0.03 8.73 0.44 0.80 0.23 1.71 0.30 0.07 0.01 1.21 0.23
Urban 10.32 1.01 0.63 0.09 8.03 1.00 0.45 0.06 1.18 0.68 0.04 0.02 1.13 0.07
Total 6.50 0.49 0.37 0.03 8.62 0.37 0.75 0.18 2.40 0.36 0.12 0.03 1.24 0.17
CentralCoast
Isolated 5.76 1.36 0.28 0.07 8.10 1.02 0.71 0.14 4.13 0.99 0.24 0.06 1.23 0.12
Rural 7.93 0.68 0.31 0.03 12.45 0.46 0.75 0.04 2.31 0.47 0.05 0.01 1.10 0.03
Urban 14.47 1.32 0.49 0.05 9.58 0.81 0.47 0.05 1.82 0.72 0.04 0.01 0.99 0.05
Total 9.53 0.70 0.35 0.03 11.21 0.40 0.67 0.03 2.53 0.37 0.07 0.01 1.09 0.03
CentralHighlands
Isolated 5.39 1.29 0.25 0.07 10.16 1.40 0.63 0.10 7.40 1.11 0.46 0.19 1.34 0.25
Rural 4.68 0.89 0.22 0.04 11.13 1.07 0.53 0.05 4.00 0.71 0.19 0.04 0.93 0.04
Urban 8.28 1.67 0.31 0.07 12.19 1.51 0.61 0.07 2.93 0.82 0.09 0.03 1.01 0.04
Total 5.79 0.72 0.25 0.03 11.21 0.76 0.57 0.04 4.53 0.51 0.22 0.04 1.04 0.06
Southeast
Isolated 2.92 1.02 0.14 0.06 11.78 1.03 0.90 0.07 2.97 0.56 0.11 0.02 1.15 0.05
Rural 4.33 0.51 0.21 0.03 11.56 0.54 0.87 0.08 1.75 0.21 0.08 0.01 1.15 0.08
Urban 15.75 1.25 0.44 0.04 9.49 0.96 0.43 0.04 0.97 0.26 0.03 0.01 0.90 0.04
Total 9.34 0.64 0.30 0.02 10.78 0.49 0.69 0.05 1.60 0.15 0.06 0.01 1.05 0.04
MekongDelta
Isolated 2.99 0.73 0.14 0.03 11.67 0.47 0.84 0.05 3.95 0.39 0.22 0.04 1.20 0.06
Rural 4.92 0.39 0.28 0.02 10.61 0.27 0.87 0.04 3.10 0.22 0.19 0.03 1.34 0.06
Urban 12.48 1.45 0.43 0.05 12.10 0.95 0.63 0.05 1.20 0.36 0.04 0.01 1.10 0.04
Total 6.02 0.45 0.29 0.02 11.03 0.26 0.83 0.03 2.97 0.17 0.17 0.02 1.27 0.04
Vietnam
Isolated 3.38 0.31 0.19 0.02 10.16 0.31 0.76 0.03 6.55 0.39 0.45 0.05 1.39 0.05
Rural 6.00 0.17 0.33 0.01 9.86 0.14 0.72 0.04 2.99 0.13 0.15 0.01 1.19 0.04
Urban 12.88 0.45 0.51 0.03 9.44 0.41 0.49 0.02 1.39 0.17 0.05 0.01 1.05 0.03
Total 7.30 0.17 0.35 0.01 9.81 0.14 0.67 0.03 3.19 0.11 0.16 0.01 1.18 0.03
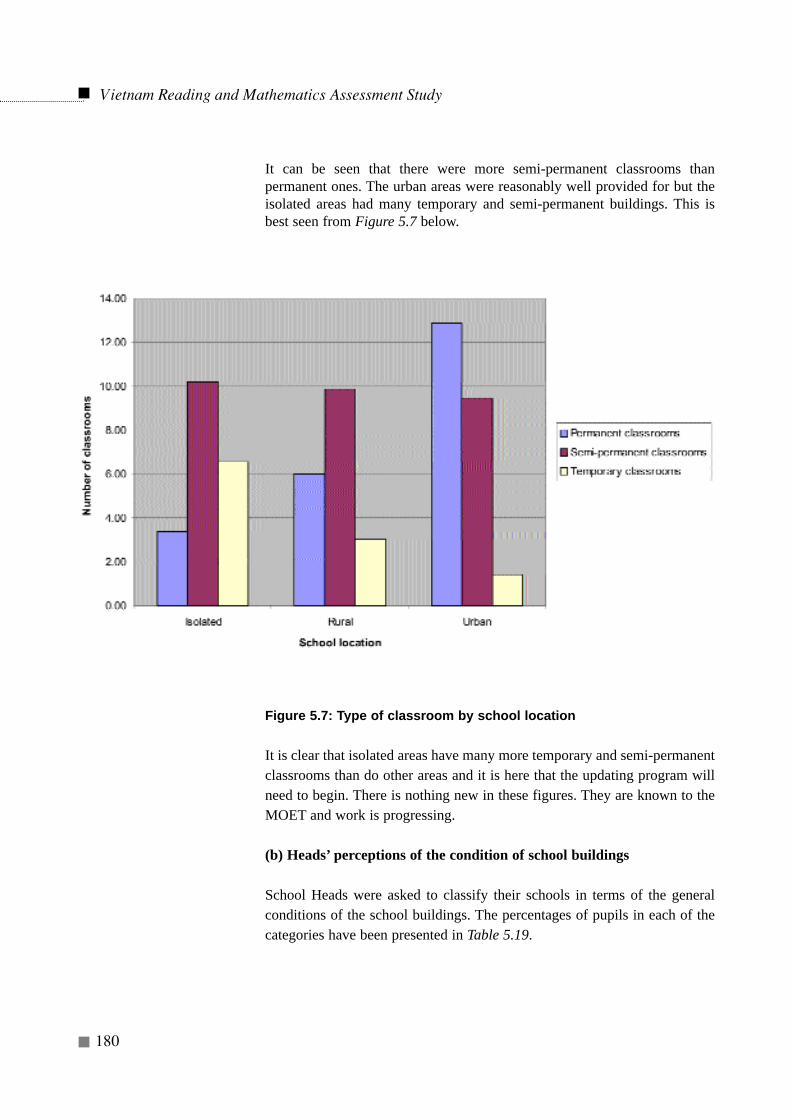
It can be seen that there were more semi-permanent classrooms thanpermanent ones. The urban areas were reasonably well provided for but theisolated areas had many temporary and semi-permanent buildings. This isbest seen from Figure 5.7 below.
Figure 5.7: Type of classroom by school location
It is clear that isolated areas have many more temporary and semi-permanentclassrooms than do other areas and it is here that the updating program willneed to begin. There is nothing new in these figures. They are known to theMOET and work is progressing.
(b) Heads’ perceptions of the condition of school buildings
School Heads were asked to classify their schools in terms of the generalconditions of the school buildings. The percentages of pupils in each of thecategories have been presented in Table 5.19.
Vietnam Reading and Mathematics Assessment Study
180
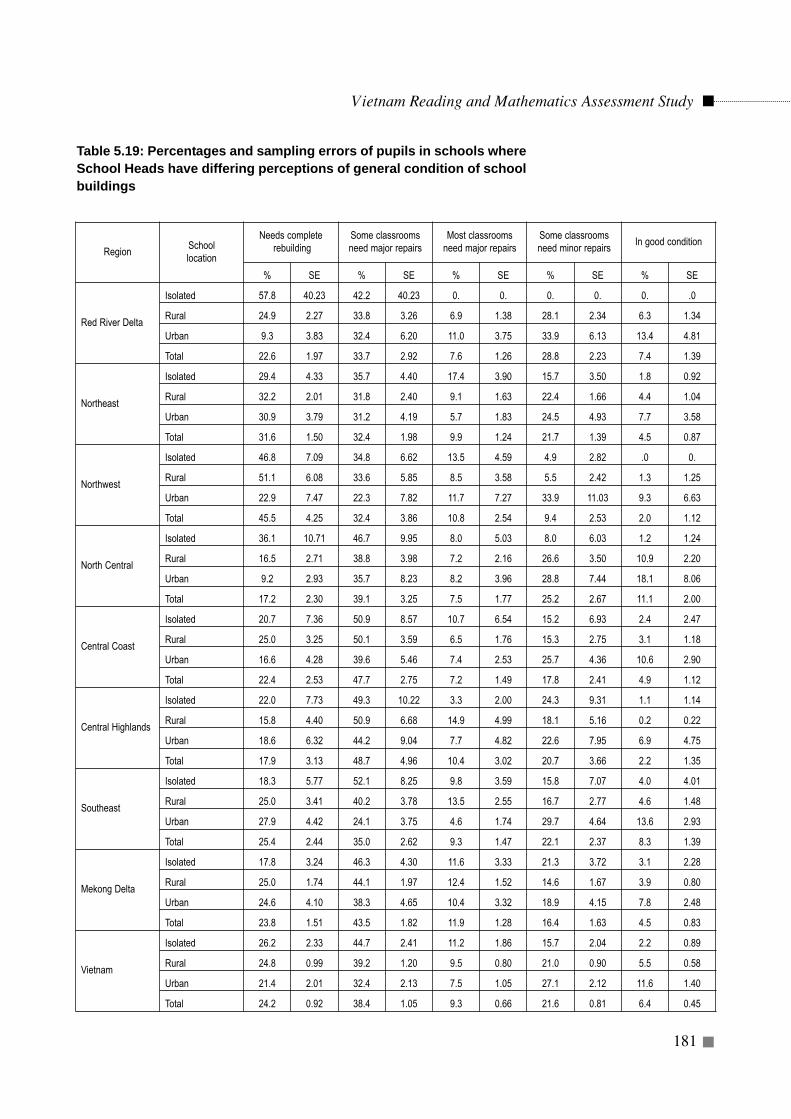
Table 5.19: Percentages and sampling errors of pupils in schools whereSchool Heads have differing perceptions of general condition of schoolbuildings
Vietnam Reading and Mathematics Assessment Study
181
RegionSchool location
Needs completerebuilding
Some classrooms need major repairs
Most classrooms need major repairs
Some classrooms need minor repairs
In good condition
% SE % SE % SE % SE % SE
Red River Delta
Isolated 57.8 40.23 42.2 40.23 0. 0. 0. 0. 0. .0
Rural 24.9 2.27 33.8 3.26 6.9 1.38 28.1 2.34 6.3 1.34
Urban 9.3 3.83 32.4 6.20 11.0 3.75 33.9 6.13 13.4 4.81
Total 22.6 1.97 33.7 2.92 7.6 1.26 28.8 2.23 7.4 1.39
Northeast
Isolated 29.4 4.33 35.7 4.40 17.4 3.90 15.7 3.50 1.8 0.92
Rural 32.2 2.01 31.8 2.40 9.1 1.63 22.4 1.66 4.4 1.04
Urban 30.9 3.79 31.2 4.19 5.7 1.83 24.5 4.93 7.7 3.58
Total 31.6 1.50 32.4 1.98 9.9 1.24 21.7 1.39 4.5 0.87
Northwest
Isolated 46.8 7.09 34.8 6.62 13.5 4.59 4.9 2.82 .0 0.
Rural 51.1 6.08 33.6 5.85 8.5 3.58 5.5 2.42 1.3 1.25
Urban 22.9 7.47 22.3 7.82 11.7 7.27 33.9 11.03 9.3 6.63
Total 45.5 4.25 32.4 3.86 10.8 2.54 9.4 2.53 2.0 1.12
North Central
Isolated 36.1 10.71 46.7 9.95 8.0 5.03 8.0 6.03 1.2 1.24
Rural 16.5 2.71 38.8 3.98 7.2 2.16 26.6 3.50 10.9 2.20
Urban 9.2 2.93 35.7 8.23 8.2 3.96 28.8 7.44 18.1 8.06
Total 17.2 2.30 39.1 3.25 7.5 1.77 25.2 2.67 11.1 2.00
Central Coast
Isolated 20.7 7.36 50.9 8.57 10.7 6.54 15.2 6.93 2.4 2.47
Rural 25.0 3.25 50.1 3.59 6.5 1.76 15.3 2.75 3.1 1.18
Urban 16.6 4.28 39.6 5.46 7.4 2.53 25.7 4.36 10.6 2.90
Total 22.4 2.53 47.7 2.75 7.2 1.49 17.8 2.41 4.9 1.12
Central Highlands
Isolated 22.0 7.73 49.3 10.22 3.3 2.00 24.3 9.31 1.1 1.14
Rural 15.8 4.40 50.9 6.68 14.9 4.99 18.1 5.16 0.2 0.22
Urban 18.6 6.32 44.2 9.04 7.7 4.82 22.6 7.95 6.9 4.75
Total 17.9 3.13 48.7 4.96 10.4 3.02 20.7 3.66 2.2 1.35
Southeast
Isolated 18.3 5.77 52.1 8.25 9.8 3.59 15.8 7.07 4.0 4.01
Rural 25.0 3.41 40.2 3.78 13.5 2.55 16.7 2.77 4.6 1.48
Urban 27.9 4.42 24.1 3.75 4.6 1.74 29.7 4.64 13.6 2.93
Total 25.4 2.44 35.0 2.62 9.3 1.47 22.1 2.37 8.3 1.39
Mekong Delta
Isolated 17.8 3.24 46.3 4.30 11.6 3.33 21.3 3.72 3.1 2.28
Rural 25.0 1.74 44.1 1.97 12.4 1.52 14.6 1.67 3.9 0.80
Urban 24.6 4.10 38.3 4.65 10.4 3.32 18.9 4.15 7.8 2.48
Total 23.8 1.51 43.5 1.82 11.9 1.28 16.4 1.63 4.5 0.83
Vietnam
Isolated 26.2 2.33 44.7 2.41 11.2 1.86 15.7 2.04 2.2 0.89
Rural 24.8 0.99 39.2 1.20 9.5 0.80 21.0 0.90 5.5 0.58
Urban 21.4 2.01 32.4 2.13 7.5 1.05 27.1 2.12 11.6 1.40
Total 24.2 0.92 38.4 1.05 9.3 0.66 21.6 0.81 6.4 0.45
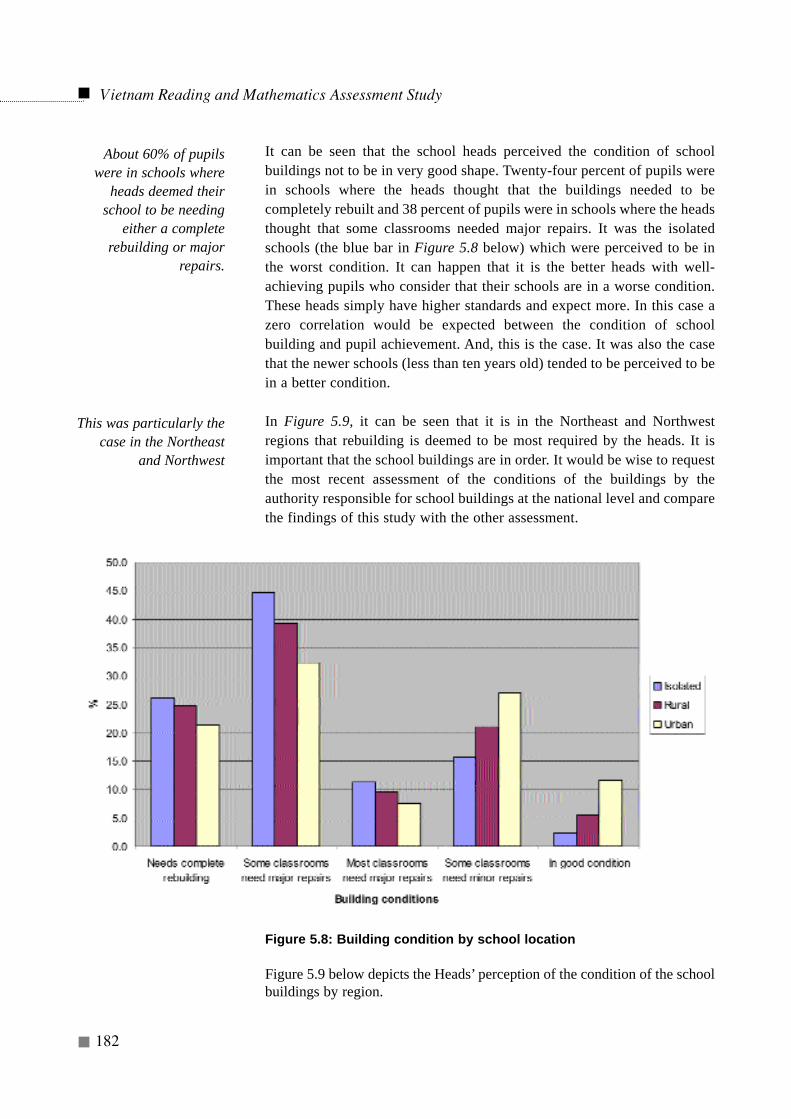
It can be seen that the school heads perceived the condition of schoolbuildings not to be in very good shape. Twenty-four percent of pupils werein schools where the heads thought that the buildings needed to becompletely rebuilt and 38 percent of pupils were in schools where the headsthought that some classrooms needed major repairs. It was the isolatedschools (the blue bar in Figure 5.8 below) which were perceived to be inthe worst condition. It can happen that it is the better heads with well-achieving pupils who consider that their schools are in a worse condition.These heads simply have higher standards and expect more. In this case azero correlation would be expected between the condition of schoolbuilding and pupil achievement. And, this is the case. It was also the casethat the newer schools (less than ten years old) tended to be perceived to bein a better condition.
In Figure 5.9, it can be seen that it is in the Northeast and Northwestregions that rebuilding is deemed to be most required by the heads. It isimportant that the school buildings are in order. It would be wise to requestthe most recent assessment of the conditions of the buildings by theauthority responsible for school buildings at the national level and comparethe findings of this study with the other assessment.
Figure 5.8: Building condition by school location
Figure 5.9 below depicts the Heads’ perception of the condition of the schoolbuildings by region.
Vietnam Reading and Mathematics Assessment Study
182
About 60% of pupilswere in schools where
heads deemed theirschool to be needing
either a completerebuilding or major
repairs.
This was particularly thecase in the Northeast
and Northwest
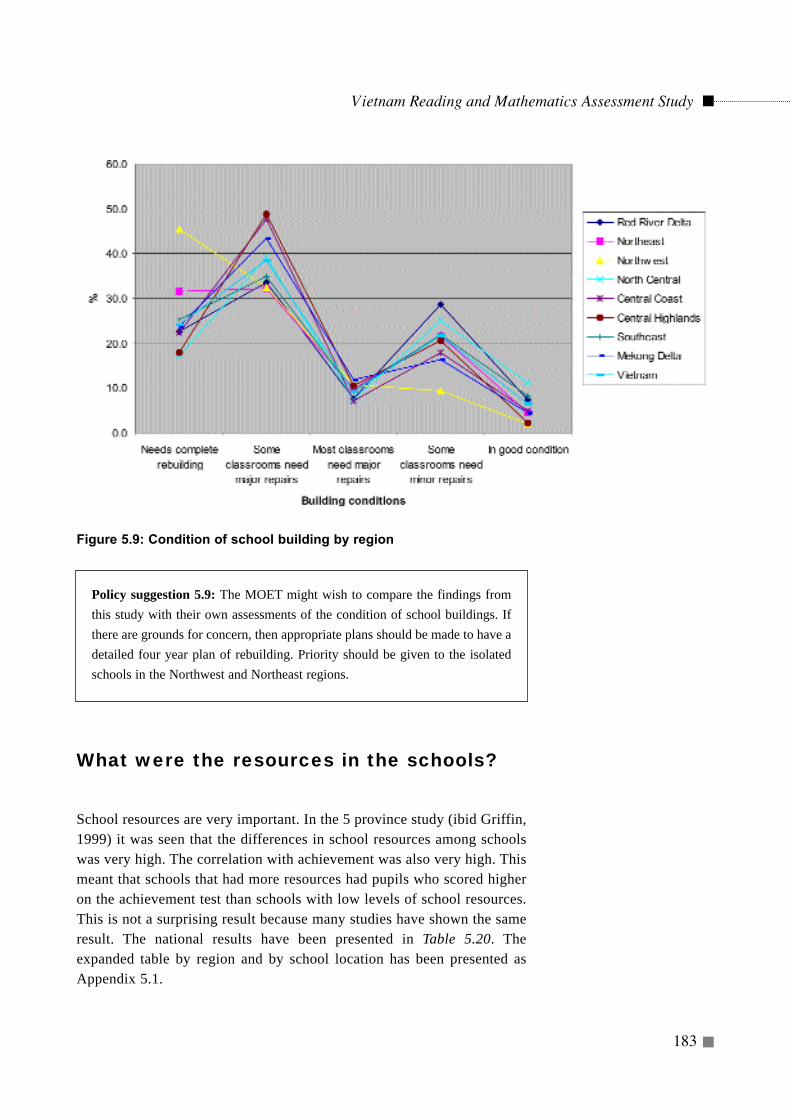
Figure 5.9: Condition of school building by region
Policy suggestion 5.9: The MOET might wish to compare the findings fromthis study with their own assessments of the condition of school buildings. Ifthere are grounds for concern, then appropriate plans should be made to have adetailed four year plan of rebuilding. Priority should be given to the isolatedschools in the Northwest and Northeast regions.
What were the resources in the schools?
School resources are very important. In the 5 province study (ibid Griffin,1999) it was seen that the differences in school resources among schoolswas very high. The correlation with achievement was also very high. Thismeant that schools that had more resources had pupils who scored higheron the achievement test than schools with low levels of school resources.This is not a surprising result because many studies have shown the sameresult. The national results have been presented in Table 5.20. Theexpanded table by region and by school location has been presented asAppendix 5.1.
Vietnam Reading and Mathematics Assessment Study
183
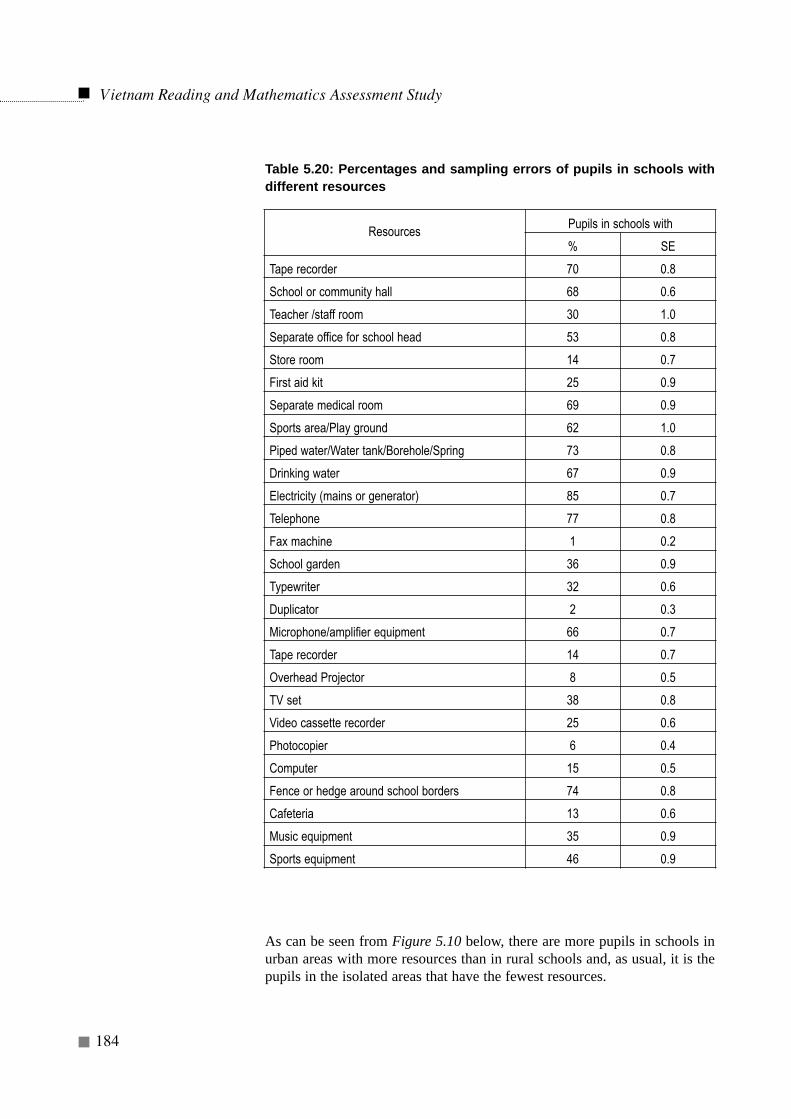
Table 5.20: Percentages and sampling errors of pupils in schools withdifferent resources
As can be seen from Figure 5.10 below, there are more pupils in schools inurban areas with more resources than in rural schools and, as usual, it is thepupils in the isolated areas that have the fewest resources.
Vietnam Reading and Mathematics Assessment Study
184
ResourcesPupils in schools with
% SE
Tape recorder 70 0.8
School or community hall 68 0.6
Teacher /staff room 30 1.0
Separate office for school head 53 0.8
Store room 14 0.7
First aid kit 25 0.9
Separate medical room 69 0.9
Sports area/Play ground 62 1.0
Piped water/Water tank/Borehole/Spring 73 0.8
Drinking water 67 0.9
Electricity (mains or generator) 85 0.7
Telephone 77 0.8
Fax machine 1 0.2
School garden 36 0.9
Typewriter 32 0.6
Duplicator 2 0.3
Microphone/amplifier equipment 66 0.7
Tape recorder 14 0.7
Overhead Projector 8 0.5
TV set 38 0.8
Video cassette recorder 25 0.6
Photocopier 6 0.4
Computer 15 0.5
Fence or hedge around school borders 74 0.8
Cafeteria 13 0.6
Music equipment 35 0.9
Sports equipment 46 0.9
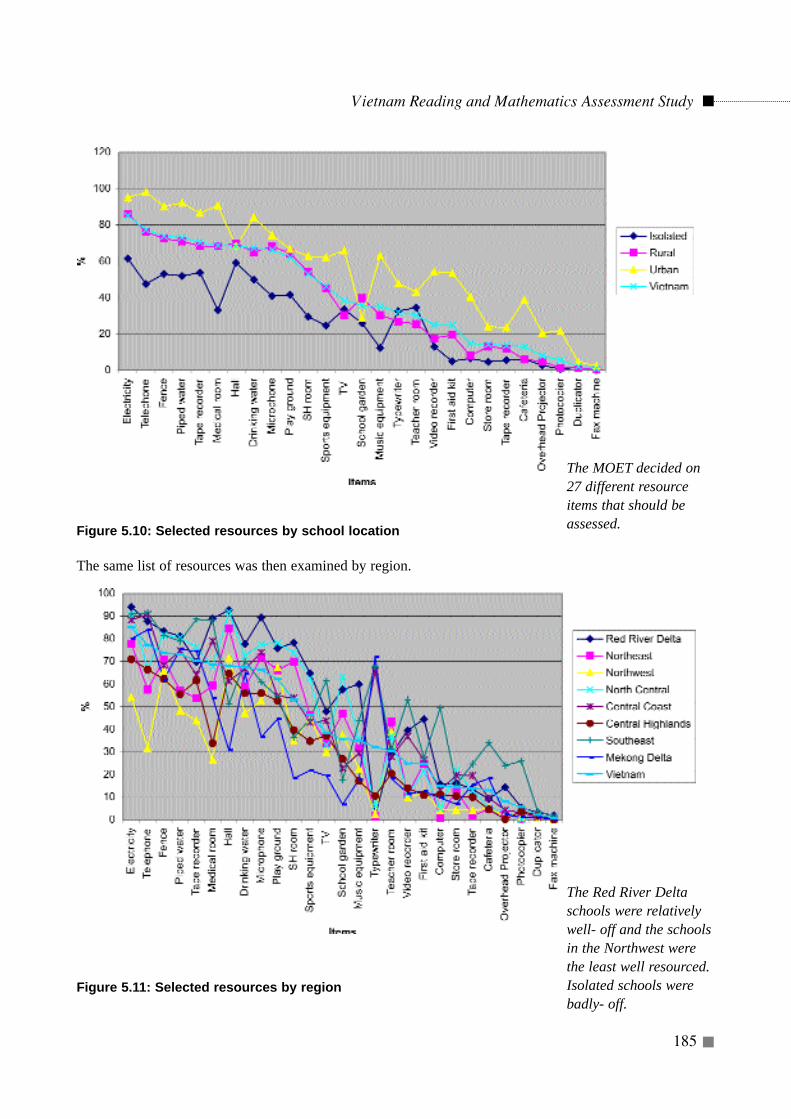
Figure 5.10: Selected resources by school location
The same list of resources was then examined by region.
Figure 5.11: Selected resources by region
Vietnam Reading and Mathematics Assessment Study
185
The MOET decided on27 different resourceitems that should beassessed.
The Red River Deltaschools were relativelywell- off and the schoolsin the Northwest werethe least well resourced.Isolated schools werebadly- off.
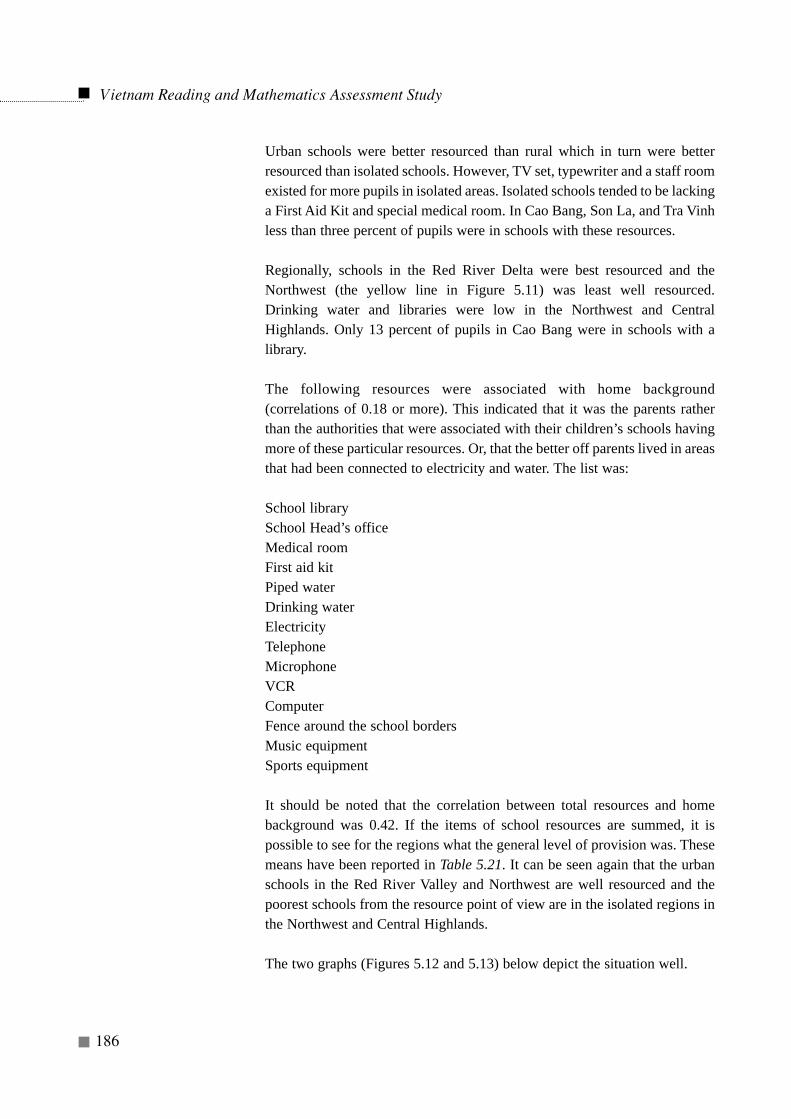
Urban schools were better resourced than rural which in turn were betterresourced than isolated schools. However, TV set, typewriter and a staff roomexisted for more pupils in isolated areas. Isolated schools tended to be lackinga First Aid Kit and special medical room. In Cao Bang, Son La, and Tra Vinhless than three percent of pupils were in schools with these resources.
Regionally, schools in the Red River Delta were best resourced and theNorthwest (the yellow line in Figure 5.11) was least well resourced.Drinking water and libraries were low in the Northwest and CentralHighlands. Only 13 percent of pupils in Cao Bang were in schools with alibrary.
The following resources were associated with home background(correlations of 0.18 or more). This indicated that it was the parents ratherthan the authorities that were associated with their children’s schools havingmore of these particular resources. Or, that the better off parents lived in areasthat had been connected to electricity and water. The list was:
School librarySchool Head’s officeMedical roomFirst aid kitPiped waterDrinking waterElectricityTelephoneMicrophoneVCRComputerFence around the school bordersMusic equipmentSports equipment
It should be noted that the correlation between total resources and homebackground was 0.42. If the items of school resources are summed, it ispossible to see for the regions what the general level of provision was. Thesemeans have been reported in Table 5.21. It can be seen again that the urbanschools in the Red River Valley and Northwest are well resourced and thepoorest schools from the resource point of view are in the isolated regions inthe Northwest and Central Highlands.
The two graphs (Figures 5.12 and 5.13) below depict the situation well.
Vietnam Reading and Mathematics Assessment Study
186
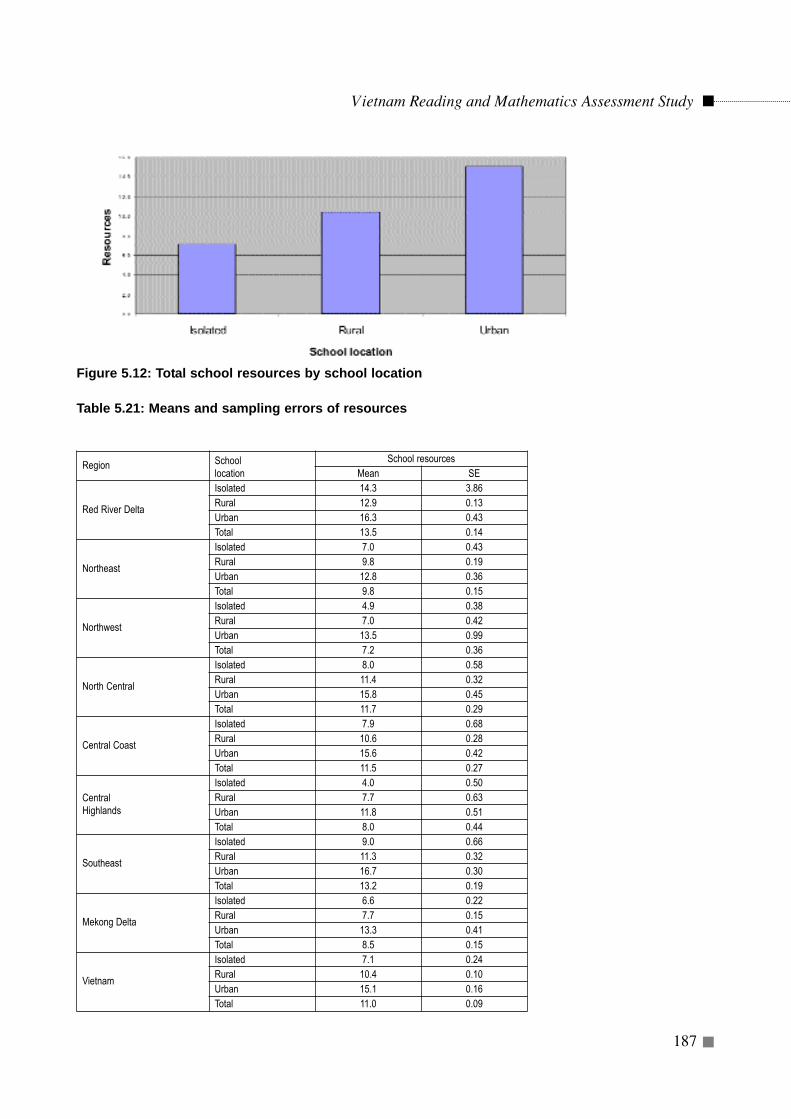
Figure 5.12: Total school resources by school location
Table 5.21: Means and sampling errors of resources
Vietnam Reading and Mathematics Assessment Study
187
Region School location
School resourcesMean SE
Red River Delta
Isolated 14.3 3.86Rural 12.9 0.13Urban 16.3 0.43Total 13.5 0.14
Northeast
Isolated 7.0 0.43Rural 9.8 0.19Urban 12.8 0.36Total 9.8 0.15
Northwest
Isolated 4.9 0.38Rural 7.0 0.42Urban 13.5 0.99Total 7.2 0.36
North Central
Isolated 8.0 0.58Rural 11.4 0.32Urban 15.8 0.45Total 11.7 0.29
Central Coast
Isolated 7.9 0.68Rural 10.6 0.28Urban 15.6 0.42Total 11.5 0.27
Central Highlands
Isolated 4.0 0.50Rural 7.7 0.63Urban 11.8 0.51Total 8.0 0.44
Southeast
Isolated 9.0 0.66Rural 11.3 0.32Urban 16.7 0.30Total 13.2 0.19
Mekong Delta
Isolated 6.6 0.22Rural 7.7 0.15Urban 13.3 0.41Total 8.5 0.15
Vietnam
Isolated 7.1 0.24Rural 10.4 0.10Urban 15.1 0.16Total 11.0 0.09
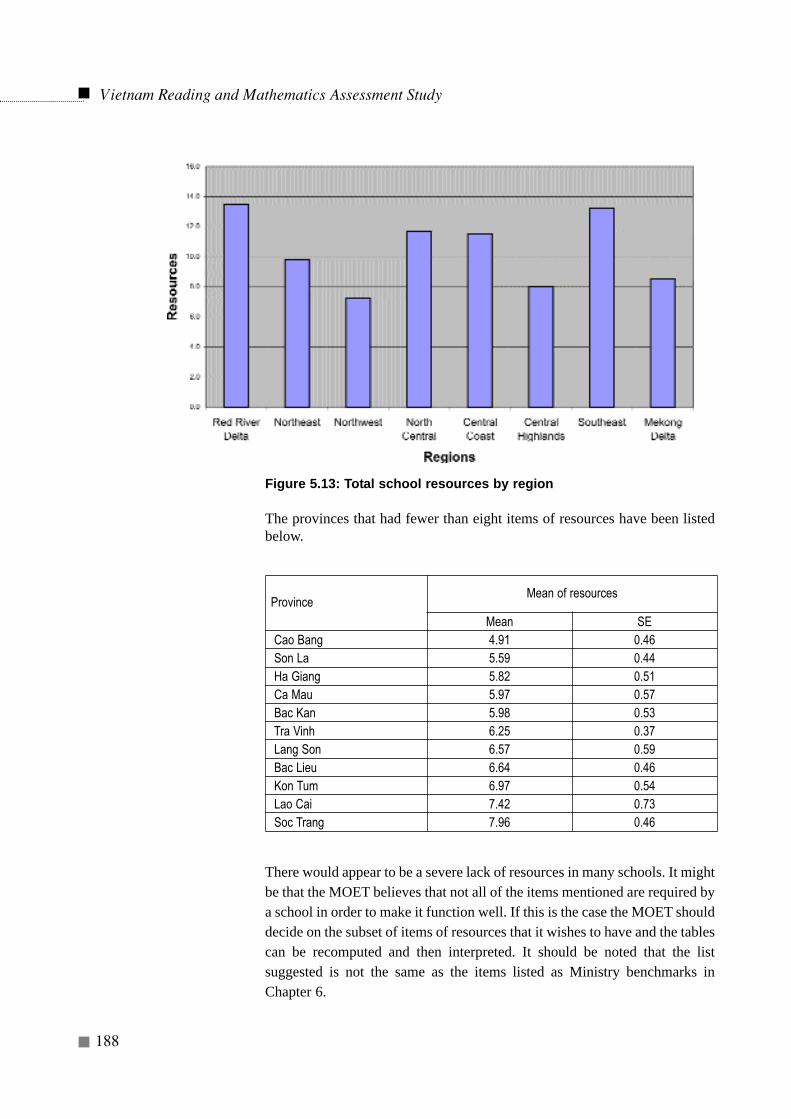
Figure 5.13: Total school resources by region
The provinces that had fewer than eight items of resources have been listedbelow.
There would appear to be a severe lack of resources in many schools. It mightbe that the MOET believes that not all of the items mentioned are required bya school in order to make it function well. If this is the case the MOET shoulddecide on the subset of items of resources that it wishes to have and the tablescan be recomputed and then interpreted. It should be noted that the listsuggested is not the same as the items listed as Ministry benchmarks inChapter 6.
Vietnam Reading and Mathematics Assessment Study
188
ProvinceMean of resources
Mean SECao Bang 4.91 0.46Son La 5.59 0.44Ha Giang 5.82 0.51Ca Mau 5.97 0.57Bac Kan 5.98 0.53Tra Vinh 6.25 0.37Lang Son 6.57 0.59Bac Lieu 6.64 0.46Kon Tum 6.97 0.54Lao Cai 7.42 0.73Soc Trang 7.96 0.46
Once this has been arrived at, the provinces where there is a general lack ofresources is known and the authorities can begin to allocate resources to theseprovinces first.
Policy suggestion 5.10: The MOET may wish to decide on theminimum resources needed for a school to function well and then re-runthe analyses above.
What help was given by the community tothe schools?
A school exists for a community and within a community. The generalambience of the school is much dependent on the community. The disciplinein the school must be supported by the community. The relationship betweenthe school and community has been shown to be important in many studies.Good relationships are associated with more learning and fewer behaviouralproblems and even with less crime
2.
A question was asked of school heads about the contributions that parentsand/or the community made to the school. The percentages of pupils inschools where the community made contributions has been presented inTable 5.22 and the means for the sum of 14 possible contributions have beenpresented for all regions in Figure 5.14 and school locations areas in Figure5.15. Unfortunately for several of the activities it is not known whether thecontributions were in cash or kind or whether the parents actually came andhelped maintain parts of the school as in the first item.
Seventy-eight percent of pupils were in schools where the head stated thatparents helped in the maintenance of school facilities, 70 percent building ofschool facilities, and 53 for the construction or maintenance and repair offurniture, equipment and the like. In all cases it was in the rural areas wherethis was more frequent than in the urban or isolated areas. Twenty-fourpercent of pupils were in school where heads said that the parents donatedbooks to the school (this time more in urban schools), 30 percent were inschools where the parents helped with extra-curricular activities includingschool trips (mostly in urban areas), 25 percent where parents assisted inteaching and/or teach or supervise the pupils themselves without pay (againmostly in urban areas), and finally24 percent provided land for the school andteacher housing mostly in isolated areas).
Vietnam Reading and Mathematics Assessment Study
189
---------------------2 Coleman J. S. (1994) Family, School and Social Capital In: Husén T and Postlethwaite T NInternational Encyclopedia of Education, Oxford, Pergamon
78% of pupils were inschools where parentshelped in themaintenance of schoolfacilities, 70% inbuilding schoolfacilities, 53% inconstruction and repairfurniture. In all cases,these contributions weremore frequent in ruralthan in urban or isolatedareas.
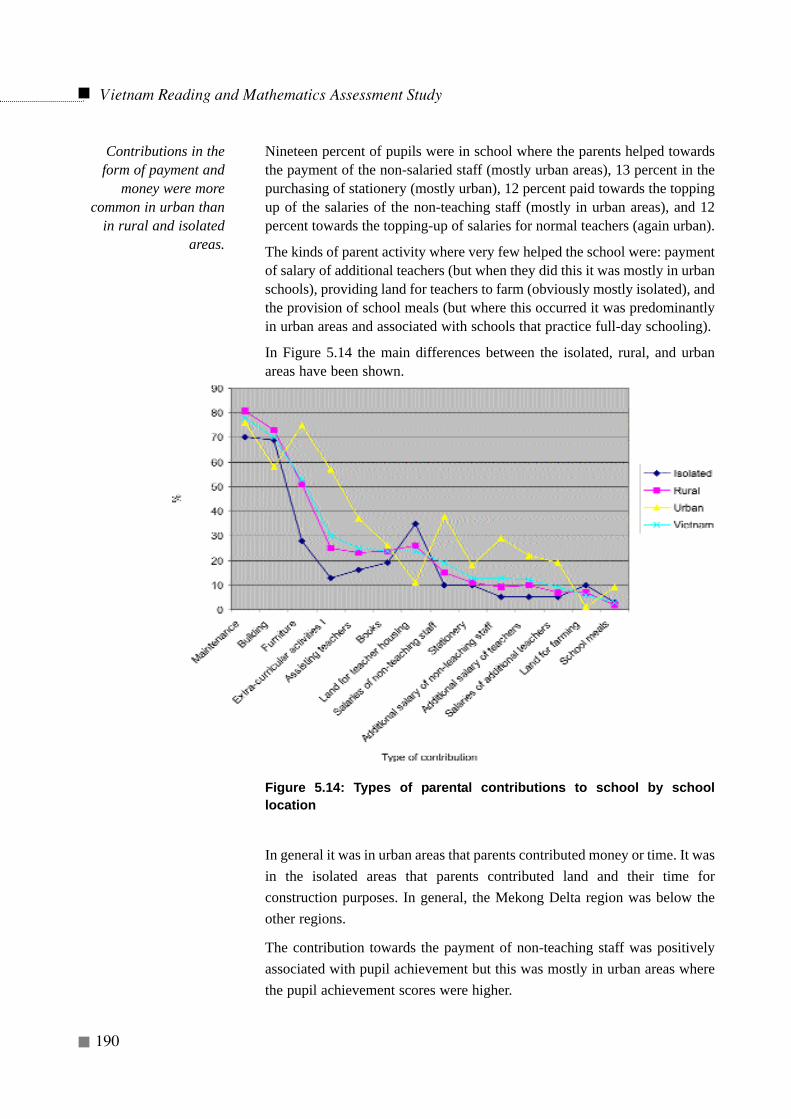
Nineteen percent of pupils were in school where the parents helped towardsthe payment of the non-salaried staff (mostly urban areas), 13 percent in thepurchasing of stationery (mostly urban), 12 percent paid towards the toppingup of the salaries of the non-teaching staff (mostly in urban areas), and 12percent towards the topping-up of salaries for normal teachers (again urban).
The kinds of parent activity where very few helped the school were: paymentof salary of additional teachers (but when they did this it was mostly in urbanschools), providing land for teachers to farm (obviously mostly isolated), andthe provision of school meals (but where this occurred it was predominantlyin urban areas and associated with schools that practice full-day schooling).
In Figure 5.14 the main differences between the isolated, rural, and urbanareas have been shown.
Figure 5.14: Types of parental contributions to school by schoollocation
In general it was in urban areas that parents contributed money or time. It wasin the isolated areas that parents contributed land and their time forconstruction purposes. In general, the Mekong Delta region was below theother regions.
The contribution towards the payment of non-teaching staff was positivelyassociated with pupil achievement but this was mostly in urban areas wherethe pupil achievement scores were higher.
Vietnam Reading and Mathematics Assessment Study
190
Contributions in theform of payment and
money were morecommon in urban than
in rural and isolatedareas.
Table 5.22: Percentages of pupils in schools with different contributionsfrom communities
Vietnam Reading and Mathematics Assessment Study
191

Figure 5.15: Parental contributions by regions and by school location
For this particular combination of parental contributions it can be seenthat the Red River Delta, North Central and Central Coast regions werethe highest and the Mekong Delta was the lowest. In general more of thecontributions (because many of them were money contributions) werefrom urban areas. This was to be expected.
Parents helped the school to a certain extent. They helped in kind inisolated areas and in cash in urban areas. Education is a collaborativeeffort between home and school. When the school and home collaborate,this has been shown to result in better achievement, fewer pupilbehavioural problems, and in the long run less crime in the society.Collaboration involves the setting of standards, whether it be forbehaviour, helping the children learn, parents helping the teachers withschool tasks, and to a much lesser extent donations in cash or kind(Coleman, ibid). Given that the home-school relationship is so important,it would seem to be desirable for further study to be conducted to see howthis can best be enhanced in the Vietnamese context.
Policy suggestion 5.11: The MOET might wish to considerestablishing a study group to examine which action might be takenfor school-home relationship.
Relationships of school variables withpupil achievement
The results so far presented in the chapter have described thecharacteristics of schools and school heads and what school heads do.
Vietnam Reading and Mathematics Assessment Study
192
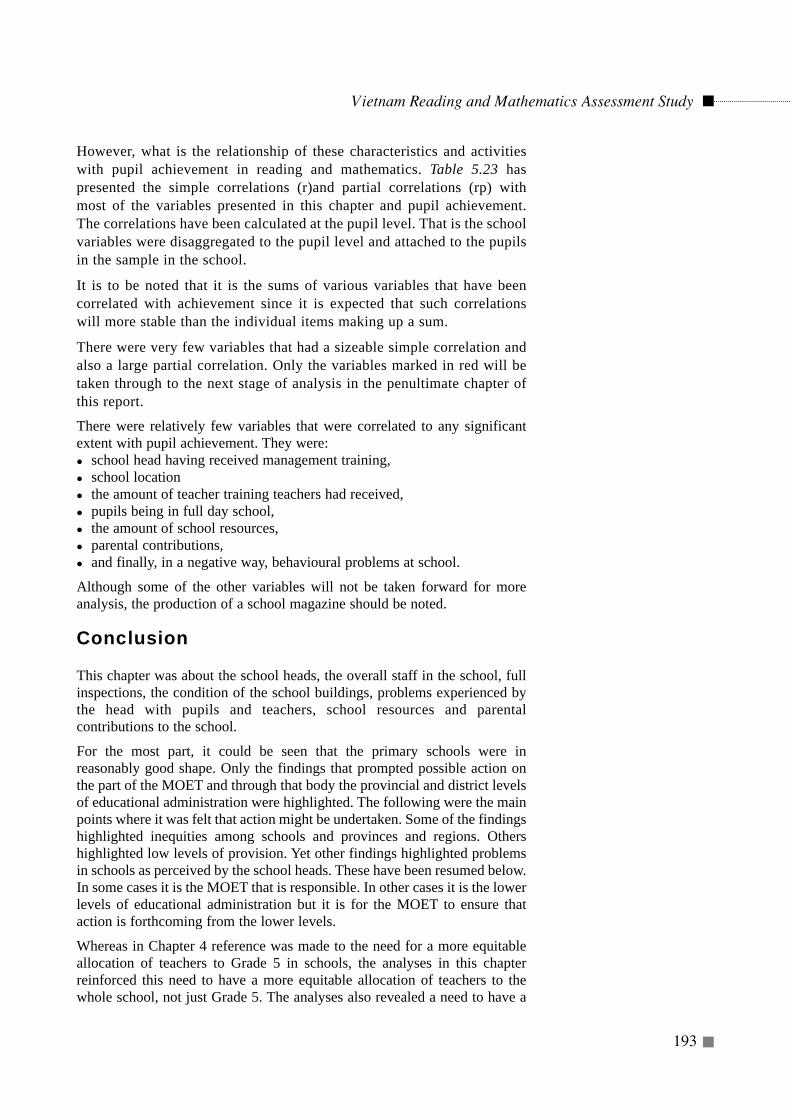
However, what is the relationship of these characteristics and activitieswith pupil achievement in reading and mathematics. Table 5.23 haspresented the simple correlations (r)and partial correlations (rp) withmost of the variables presented in this chapter and pupil achievement.The correlations have been calculated at the pupil level. That is the schoolvariables were disaggregated to the pupil level and attached to the pupilsin the sample in the school.
It is to be noted that it is the sums of various variables that have beencorrelated with achievement since it is expected that such correlationswill more stable than the individual items making up a sum.
There were very few variables that had a sizeable simple correlation andalso a large partial correlation. Only the variables marked in red will betaken through to the next stage of analysis in the penultimate chapter ofthis report.
There were relatively few variables that were correlated to any significantextent with pupil achievement. They were: school head having received management training, school location the amount of teacher training teachers had received, pupils being in full day school, the amount of school resources, parental contributions, and finally, in a negative way, behavioural problems at school.
Although some of the other variables will not be taken forward for moreanalysis, the production of a school magazine should be noted.
Conclusion
This chapter was about the school heads, the overall staff in the school, fullinspections, the condition of the school buildings, problems experienced bythe head with pupils and teachers, school resources and parentalcontributions to the school.
For the most part, it could be seen that the primary schools were inreasonably good shape. Only the findings that prompted possible action onthe part of the MOET and through that body the provincial and district levelsof educational administration were highlighted. The following were the mainpoints where it was felt that action might be undertaken. Some of the findingshighlighted inequities among schools and provinces and regions. Othershighlighted low levels of provision. Yet other findings highlighted problemsin schools as perceived by the school heads. These have been resumed below.In some cases it is the MOET that is responsible. In other cases it is the lowerlevels of educational administration but it is for the MOET to ensure thataction is forthcoming from the lower levels.
Whereas in Chapter 4 reference was made to the need for a more equitableallocation of teachers to Grade 5 in schools, the analyses in this chapterreinforced this need to have a more equitable allocation of teachers to thewhole school, not just Grade 5. The analyses also revealed a need to have a
Vietnam Reading and Mathematics Assessment Study
193
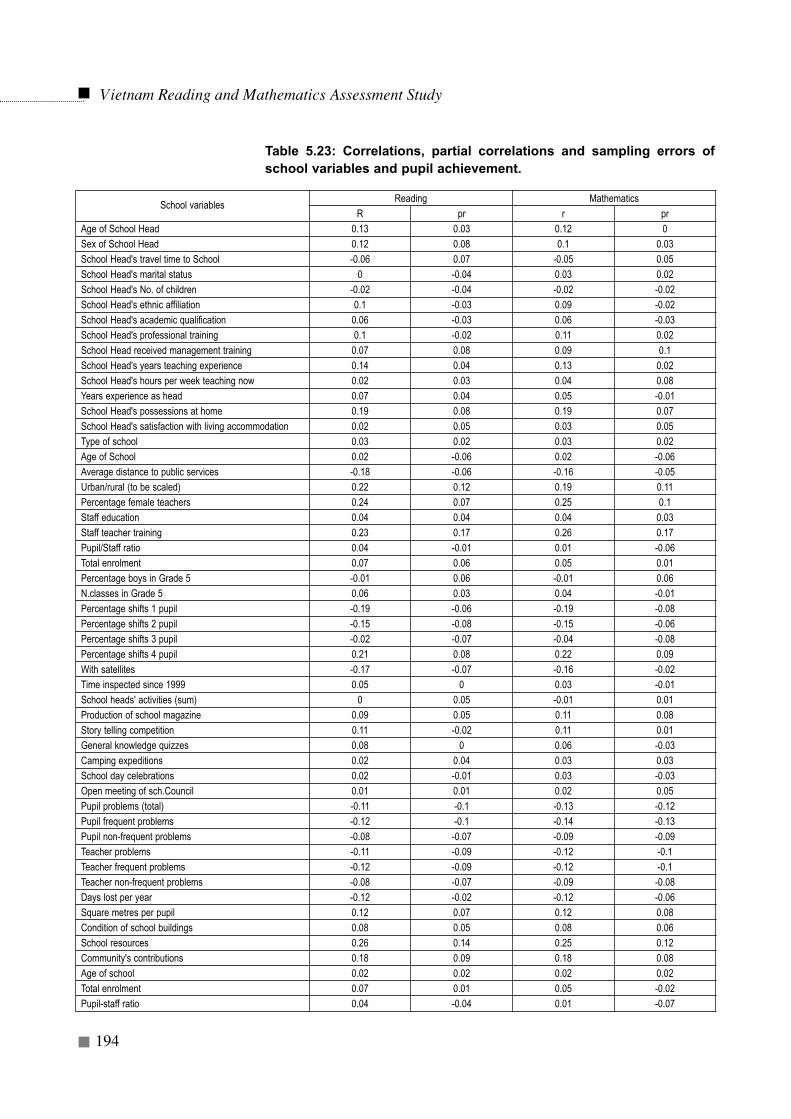
Vietnam Reading and Mathematics Assessment Study
194
School variablesReading Mathematics
R pr r prAge of School Head 0.13 0.03 0.12 0Sex of School Head 0.12 0.08 0.1 0.03School Head's travel time to School -0.06 0.07 -0.05 0.05School Head's marital status 0 -0.04 0.03 0.02School Head's No. of children -0.02 -0.04 -0.02 -0.02School Head's ethnic affiliation 0.1 -0.03 0.09 -0.02School Head's academic qualification 0.06 -0.03 0.06 -0.03School Head's professional training 0.1 -0.02 0.11 0.02School Head received management training 0.07 0.08 0.09 0.1School Head's years teaching experience 0.14 0.04 0.13 0.02School Head's hours per week teaching now 0.02 0.03 0.04 0.08Years experience as head 0.07 0.04 0.05 -0.01School Head's possessions at home 0.19 0.08 0.19 0.07School Head's satisfaction with living accommodation 0.02 0.05 0.03 0.05Type of school 0.03 0.02 0.03 0.02Age of School 0.02 -0.06 0.02 -0.06Average distance to public services -0.18 -0.06 -0.16 -0.05Urban/rural (to be scaled) 0.22 0.12 0.19 0.11Percentage female teachers 0.24 0.07 0.25 0.1Staff education 0.04 0.04 0.04 0.03Staff teacher training 0.23 0.17 0.26 0.17Pupil/Staff ratio 0.04 -0.01 0.01 -0.06Total enrolment 0.07 0.06 0.05 0.01Percentage boys in Grade 5 -0.01 0.06 -0.01 0.06N.classes in Grade 5 0.06 0.03 0.04 -0.01Percentage shifts 1 pupil -0.19 -0.06 -0.19 -0.08Percentage shifts 2 pupil -0.15 -0.08 -0.15 -0.06Percentage shifts 3 pupil -0.02 -0.07 -0.04 -0.08Percentage shifts 4 pupil 0.21 0.08 0.22 0.09With satellites -0.17 -0.07 -0.16 -0.02Time inspected since 1999 0.05 0 0.03 -0.01School heads' activities (sum) 0 0.05 -0.01 0.01Production of school magazine 0.09 0.05 0.11 0.08Story telling competition 0.11 -0.02 0.11 0.01General knowledge quizzes 0.08 0 0.06 -0.03Camping expeditions 0.02 0.04 0.03 0.03School day celebrations 0.02 -0.01 0.03 -0.03Open meeting of sch.Council 0.01 0.01 0.02 0.05Pupil problems (total) -0.11 -0.1 -0.13 -0.12Pupil frequent problems -0.12 -0.1 -0.14 -0.13Pupil non-frequent problems -0.08 -0.07 -0.09 -0.09Teacher problems -0.11 -0.09 -0.12 -0.1Teacher frequent problems -0.12 -0.09 -0.12 -0.1Teacher non-frequent problems -0.08 -0.07 -0.09 -0.08Days lost per year -0.12 -0.02 -0.12 -0.06Square metres per pupil 0.12 0.07 0.12 0.08Condition of school buildings 0.08 0.05 0.08 0.06School resources 0.26 0.14 0.25 0.12Community's contributions 0.18 0.09 0.18 0.08Age of school 0.02 0.02 0.02 0.02Total enrolment 0.07 0.01 0.05 -0.02Pupil-staff ratio 0.04 -0.04 0.01 -0.07
Table 5.23: Correlations, partial correlations and sampling errors ofschool variables and pupil achievement.
more equitable allocation of heads to schools in terms of their education,teacher training and attendance at management courses.
Small studies should be undertaken on the social development of childrenand examine the relations ship of such development to many of the factorstaken up in the present study. A special study should be undertaken todiscover the nature of the health problem that heads said featured sofrequently among pupils and teachers and which were related to absenteeismand drop out. Health was clearly a matter of concern to the heads. But therewere also other behavioural problems and these should be examined in moredetail. A small study should be initiated in satellite schools in isolated areasto identify the special needs of the satellite schools, easy access to them forthe pupils, and in general to identify any problems associated with travel toschool and reasons for the number of days lost in a school year. At the sametime, the actual condition of school buildings should be described by thePublic Works department (the department responsible for school buildings)because it was clear that heads thought that there many deficiencies in thepresent state of the buildings.
How the inspectors carried out their tasks seem to be very varied and it wassuggested that the MOET should review the current roles of the inspectorateand then state clearly what the roles are and make these clear to allconcerned. A small monitoring unit to ensure high quality inspections wouldbe desirable.
The Curriculum Centre should decide on the most desirable reading activitiesthat schools can carry out as extra curricular activities or even as schoolactivities in order to create a culture of reading within each school and eachschool community. These ideas should be included in all teacher trainingprograms and in the management course for teachers. The inspectorate tooshould encourage this as much as possible. The book flood programmentioned in Chapter 3 would also be of use. Related to this suggestion isthat of the overall relationships between schools and homes in order to fostergood education. This is particularly relevant in those schools where the headperceived there to be several behavioural problems. Many of these problemsrequire home and community action as well as school action. It is here thatthe notion of school intervention programs mentioned in the previouschapters can be so fruitful.
Finally, it was seen that there were great disparities in the resources thatschools had. Schools with pupils with wealthier parents had more resourcesbut even when home background had been accounted for there was still afairly strong relationship between school resources and achievement. The listof resources used in this study was developed by the study’s questionnairecommittee and it may well be that others are of a different opinion as to whichgroup of resource items forms what must be considered as essential. Anycombination of resource items (but only from the items for which data areavailable) can be examined and should be. But, it still remains a fact that thereare disparities among schools for resources. It is the isolated schools that forthe most part are most in need. The MOET could develop a plan to identifythe missing resources and then develop a timetable to ensure that the resourceitems are provided to the needy schools first and eventually to all schools.
Vietnam Reading and Mathematics Assessment Study
195
The school variablesthat were related topupil achievement aftertaking account of thepupils' homebackgrounds wereidentified.
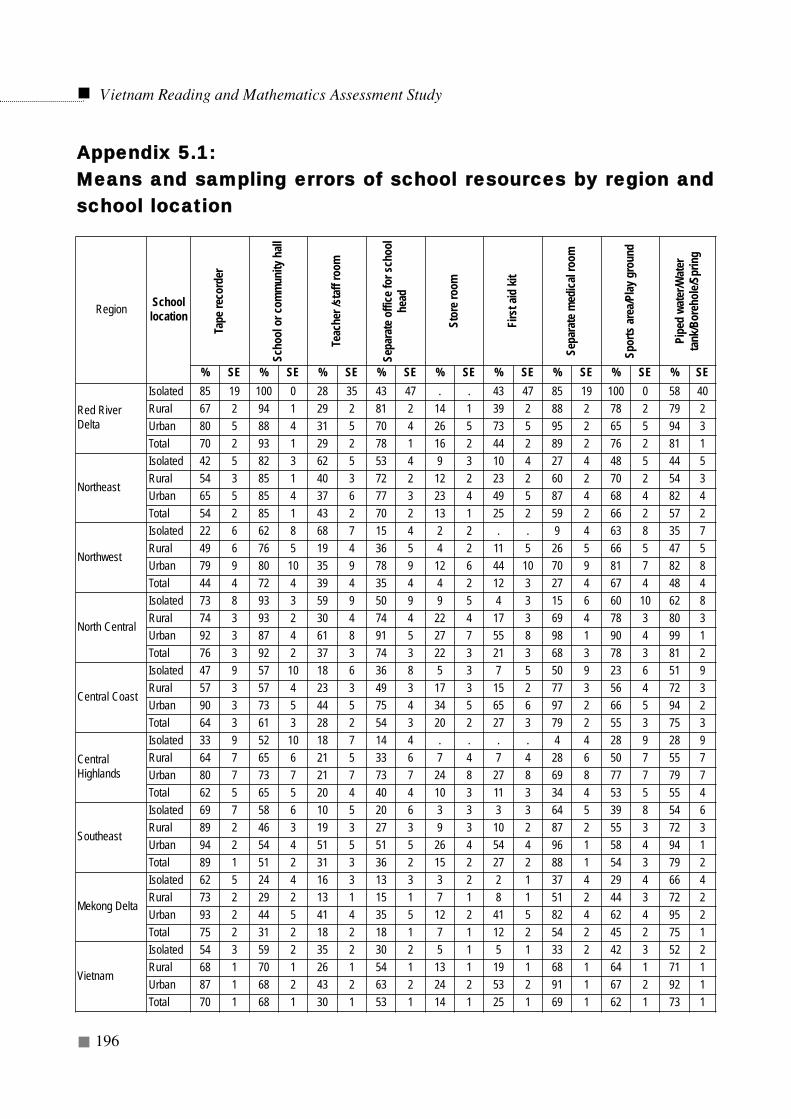
Vietnam Reading and Mathematics Assessment Study
196
Region Schoollocation
Tape
reco
rder
Scho
ol o
r com
mun
ity h
all
Teac
her /
staf
f roo
m
Sepa
rate
offi
ce fo
r sch
ool
head
Stor
e roo
m
Firs
t aid
kit
Sepa
rate
med
ical r
oom
Spor
ts ar
ea/P
lay g
roun
d
Pipe
d wa
ter/W
ater
tank
/Bor
ehol
e/Spr
ing
% SE % SE % SE % SE % SE % SE % SE % SE % SE
Red RiverDelta
Isolated 85 19 100 0 28 35 43 47 . . 43 47 85 19 100 0 58 40Rural 67 2 94 1 29 2 81 2 14 1 39 2 88 2 78 2 79 2Urban 80 5 88 4 31 5 70 4 26 5 73 5 95 2 65 5 94 3Total 70 2 93 1 29 2 78 1 16 2 44 2 89 2 76 2 81 1
Northeast
Isolated 42 5 82 3 62 5 53 4 9 3 10 4 27 4 48 5 44 5Rural 54 3 85 1 40 3 72 2 12 2 23 2 60 2 70 2 54 3Urban 65 5 85 4 37 6 77 3 23 4 49 5 87 4 68 4 82 4Total 54 2 85 1 43 2 70 2 13 1 25 2 59 2 66 2 57 2
Northwest
Isolated 22 6 62 8 68 7 15 4 2 2 . . 9 4 63 8 35 7Rural 49 6 76 5 19 4 36 5 4 2 11 5 26 5 66 5 47 5Urban 79 9 80 10 35 9 78 9 12 6 44 10 70 9 81 7 82 8Total 44 4 72 4 39 4 35 4 4 2 12 3 27 4 67 4 48 4
North Central
Isolated 73 8 93 3 59 9 50 9 9 5 4 3 15 6 60 10 62 8Rural 74 3 93 2 30 4 74 4 22 4 17 3 69 4 78 3 80 3Urban 92 3 87 4 61 8 91 5 27 7 55 8 98 1 90 4 99 1Total 76 3 92 2 37 3 74 3 22 3 21 3 68 3 78 3 81 2
Central Coast
Isolated 47 9 57 10 18 6 36 8 5 3 7 5 50 9 23 6 51 9Rural 57 3 57 4 23 3 49 3 17 3 15 2 77 3 56 4 72 3Urban 90 3 73 5 44 5 75 4 34 5 65 6 97 2 66 5 94 2Total 64 3 61 3 28 2 54 3 20 2 27 3 79 2 55 3 75 3
CentralHighlands
Isolated 33 9 52 10 18 7 14 4 . . . . 4 4 28 9 28 9Rural 64 7 65 6 21 5 33 6 7 4 7 4 28 6 50 7 55 7Urban 80 7 73 7 21 7 73 7 24 8 27 8 69 8 77 7 79 7Total 62 5 65 5 20 4 40 4 10 3 11 3 34 4 53 5 55 4
Southeast
Isolated 69 7 58 6 10 5 20 6 3 3 3 3 64 5 39 8 54 6Rural 89 2 46 3 19 3 27 3 9 3 10 2 87 2 55 3 72 3Urban 94 2 54 4 51 5 51 5 26 4 54 4 96 1 58 4 94 1Total 89 1 51 2 31 3 36 2 15 2 27 2 88 1 54 3 79 2
Mekong Delta
Isolated 62 5 24 4 16 3 13 3 3 2 2 1 37 4 29 4 66 4Rural 73 2 29 2 13 1 15 1 7 1 8 1 51 2 44 3 72 2Urban 93 2 44 5 41 4 35 5 12 2 41 5 82 4 62 4 95 2Total 75 2 31 2 18 2 18 1 7 1 12 2 54 2 45 2 75 1
Vietnam
Isolated 54 3 59 2 35 2 30 2 5 1 5 1 33 2 42 3 52 2Rural 68 1 70 1 26 1 54 1 13 1 19 1 68 1 64 1 71 1Urban 87 1 68 2 43 2 63 2 24 2 53 2 91 1 67 2 92 1Total 70 1 68 1 30 1 53 1 14 1 25 1 69 1 62 1 73 1
AAppppeennddiixx 55..11:: MMeeaannss aanndd ssaammpplliinngg eerrrroorrss ooff sscchhooooll rreessoouurrcceess bbyy rreeggiioonn aannddsscchhooooll llooccaattiioonn
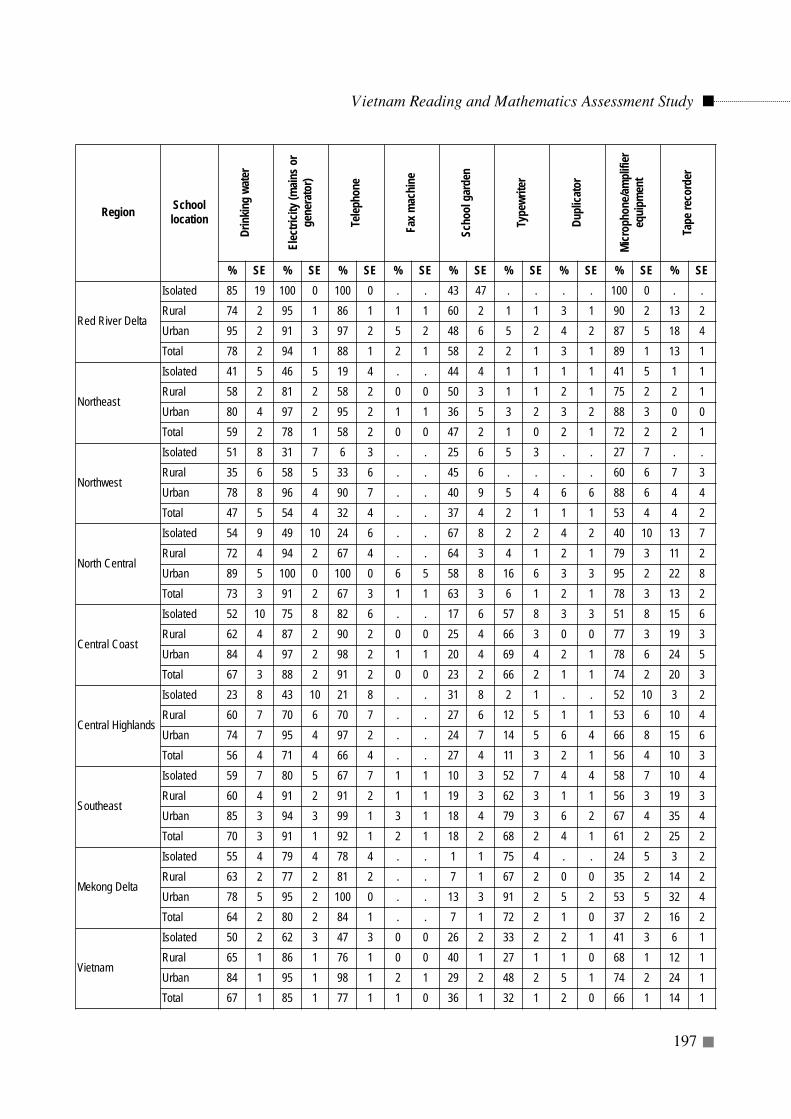
Vietnam Reading and Mathematics Assessment Study
197
Region Schoollocation
Drin
king
wate
r
Elec
tricit
y (m
ains o
rge
nera
tor)
Telep
hone
Fax m
achi
ne
Scho
ol g
arde
n
Type
write
r
Dupl
icato
r
Micr
opho
ne/am
plifi
ereq
uipm
ent
Tape
reco
rder
% SE % SE % SE % SE % SE % SE % SE % SE % SE
Red River Delta
Isolated 85 19 100 0 100 0 . . 43 47 . . . . 100 0 . .Rural 74 2 95 1 86 1 1 1 60 2 1 1 3 1 90 2 13 2Urban 95 2 91 3 97 2 5 2 48 6 5 2 4 2 87 5 18 4Total 78 2 94 1 88 1 2 1 58 2 2 1 3 1 89 1 13 1
Northeast
Isolated 41 5 46 5 19 4 . . 44 4 1 1 1 1 41 5 1 1Rural 58 2 81 2 58 2 0 0 50 3 1 1 2 1 75 2 2 1Urban 80 4 97 2 95 2 1 1 36 5 3 2 3 2 88 3 0 0Total 59 2 78 1 58 2 0 0 47 2 1 0 2 1 72 2 2 1
Northwest
Isolated 51 8 31 7 6 3 . . 25 6 5 3 . . 27 7 . .Rural 35 6 58 5 33 6 . . 45 6 . . . . 60 6 7 3Urban 78 8 96 4 90 7 . . 40 9 5 4 6 6 88 6 4 4Total 47 5 54 4 32 4 . . 37 4 2 1 1 1 53 4 4 2
North Central
Isolated 54 9 49 10 24 6 . . 67 8 2 2 4 2 40 10 13 7Rural 72 4 94 2 67 4 . . 64 3 4 1 2 1 79 3 11 2Urban 89 5 100 0 100 0 6 5 58 8 16 6 3 3 95 2 22 8Total 73 3 91 2 67 3 1 1 63 3 6 1 2 1 78 3 13 2
Central Coast
Isolated 52 10 75 8 82 6 . . 17 6 57 8 3 3 51 8 15 6Rural 62 4 87 2 90 2 0 0 25 4 66 3 0 0 77 3 19 3Urban 84 4 97 2 98 2 1 1 20 4 69 4 2 1 78 6 24 5Total 67 3 88 2 91 2 0 0 23 2 66 2 1 1 74 2 20 3
Central Highlands
Isolated 23 8 43 10 21 8 . . 31 8 2 1 . . 52 10 3 2Rural 60 7 70 6 70 7 . . 27 6 12 5 1 1 53 6 10 4Urban 74 7 95 4 97 2 . . 24 7 14 5 6 4 66 8 15 6Total 56 4 71 4 66 4 . . 27 4 11 3 2 1 56 4 10 3
Southeast
Isolated 59 7 80 5 67 7 1 1 10 3 52 7 4 4 58 7 10 4Rural 60 4 91 2 91 2 1 1 19 3 62 3 1 1 56 3 19 3Urban 85 3 94 3 99 1 3 1 18 4 79 3 6 2 67 4 35 4Total 70 3 91 1 92 1 2 1 18 2 68 2 4 1 61 2 25 2
Mekong Delta
Isolated 55 4 79 4 78 4 . . 1 1 75 4 . . 24 5 3 2Rural 63 2 77 2 81 2 . . 7 1 67 2 0 0 35 2 14 2Urban 78 5 95 2 100 0 . . 13 3 91 2 5 2 53 5 32 4Total 64 2 80 2 84 1 . . 7 1 72 2 1 0 37 2 16 2
Vietnam
Isolated 50 2 62 3 47 3 0 0 26 2 33 2 2 1 41 3 6 1Rural 65 1 86 1 76 1 0 0 40 1 27 1 1 0 68 1 12 1Urban 84 1 95 1 98 1 2 1 29 2 48 2 5 1 74 2 24 1Total 67 1 85 1 77 1 1 0 36 1 32 1 2 0 66 1 14 1
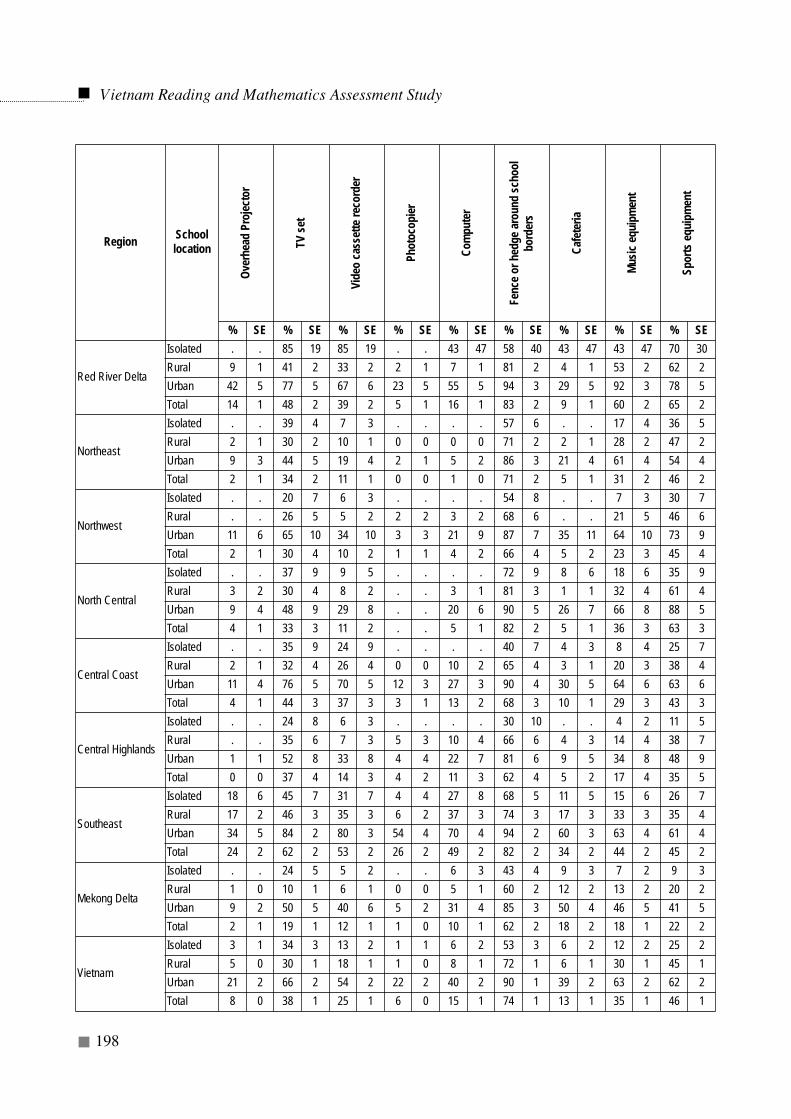
Vietnam Reading and Mathematics Assessment Study
198
Region Schoollocation
Over
head
Pro
jecto
r
TV se
t
Vide
o ca
sset
te re
cord
er
Phot
ocop
ier
Com
pute
r
Fenc
e or h
edge
arou
nd sc
hool
bord
ers
Cafe
teria
Music
equi
pmen
t
Spor
ts eq
uipm
ent
% SE % SE % SE % SE % SE % SE % SE % SE % SE
Red River Delta
Isolated . . 85 19 85 19 . . 43 47 58 40 43 47 43 47 70 30Rural 9 1 41 2 33 2 2 1 7 1 81 2 4 1 53 2 62 2Urban 42 5 77 5 67 6 23 5 55 5 94 3 29 5 92 3 78 5Total 14 1 48 2 39 2 5 1 16 1 83 2 9 1 60 2 65 2
Northeast
Isolated . . 39 4 7 3 . . . . 57 6 . . 17 4 36 5Rural 2 1 30 2 10 1 0 0 0 0 71 2 2 1 28 2 47 2Urban 9 3 44 5 19 4 2 1 5 2 86 3 21 4 61 4 54 4Total 2 1 34 2 11 1 0 0 1 0 71 2 5 1 31 2 46 2
Northwest
Isolated . . 20 7 6 3 . . . . 54 8 . . 7 3 30 7Rural . . 26 5 5 2 2 2 3 2 68 6 . . 21 5 46 6Urban 11 6 65 10 34 10 3 3 21 9 87 7 35 11 64 10 73 9Total 2 1 30 4 10 2 1 1 4 2 66 4 5 2 23 3 45 4
North Central
Isolated . . 37 9 9 5 . . . . 72 9 8 6 18 6 35 9Rural 3 2 30 4 8 2 . . 3 1 81 3 1 1 32 4 61 4Urban 9 4 48 9 29 8 . . 20 6 90 5 26 7 66 8 88 5Total 4 1 33 3 11 2 . . 5 1 82 2 5 1 36 3 63 3
Central Coast
Isolated . . 35 9 24 9 . . . . 40 7 4 3 8 4 25 7Rural 2 1 32 4 26 4 0 0 10 2 65 4 3 1 20 3 38 4Urban 11 4 76 5 70 5 12 3 27 3 90 4 30 5 64 6 63 6Total 4 1 44 3 37 3 3 1 13 2 68 3 10 1 29 3 43 3
Central Highlands
Isolated . . 24 8 6 3 . . . . 30 10 . . 4 2 11 5Rural . . 35 6 7 3 5 3 10 4 66 6 4 3 14 4 38 7Urban 1 1 52 8 33 8 4 4 22 7 81 6 9 5 34 8 48 9Total 0 0 37 4 14 3 4 2 11 3 62 4 5 2 17 4 35 5
Southeast
Isolated 18 6 45 7 31 7 4 4 27 8 68 5 11 5 15 6 26 7Rural 17 2 46 3 35 3 6 2 37 3 74 3 17 3 33 3 35 4Urban 34 5 84 2 80 3 54 4 70 4 94 2 60 3 63 4 61 4Total 24 2 62 2 53 2 26 2 49 2 82 2 34 2 44 2 45 2
Mekong Delta
Isolated . . 24 5 5 2 . . 6 3 43 4 9 3 7 2 9 3Rural 1 0 10 1 6 1 0 0 5 1 60 2 12 2 13 2 20 2Urban 9 2 50 5 40 6 5 2 31 4 85 3 50 4 46 5 41 5Total 2 1 19 1 12 1 1 0 10 1 62 2 18 2 18 1 22 2
Vietnam
Isolated 3 1 34 3 13 2 1 1 6 2 53 3 6 2 12 2 25 2Rural 5 0 30 1 18 1 1 0 8 1 72 1 6 1 30 1 45 1Urban 21 2 66 2 54 2 22 2 40 2 90 1 39 2 63 2 62 2Total 8 0 38 1 25 1 6 0 15 1 74 1 13 1 35 1 46 1
Chapter 6
HOW DO THE CONDITIONS OF SCHOOLING INVIETNAM COMPARE WITH THE MINISTRY'SOWN BENCHMARK STANDARDS?
Introduction
In this chapter the discussion of schooling conditions has been extendedbeyond the descriptions given in Chapters 4 and 5, to a comparativeanalysis in which the conditions have been compared with thebenchmark standards laid down by the Vietnam Ministry of Education
and training. This comparative analysis has permitted judgements to be madeabout key aspects of the educational environment in relation to minimallevels of provision that the Ministry has established for the properfunctioning of the primary schools. In some cases, it was difficult to establishthe ministry benchmarks. In this case, the researchers used either thebenchmarks in the Fundamental School Quality Levels document from the'Disadvantaged children project', or commonly accepted benchmarks wereused.
Some of the benchmark standards were established long ago. At the sametime, there were no benchmark standards available for some key aspects ofschooling such as maximum and minimum total enrolments or per pupilsquared meter in the classroom. In other cases, information was available butno justification for the standards could be found. There would appear to be aneed for the Ministry to re-visit all benchmarks standards in order to checktheir relevance for the first decade of the 21st century, and also to take actionto fill those gaps where standards do not yet exist. This list should be readilyavailable for all, including researchers.
Policy suggestion 6.1: The Ministry might wish to review and, ifnecessary, to revise benchmark standards for the educationalenvironment that are deemed to be reasonable for the proper functioningof primary schools.
Vietnam Reading and Mathematics Assessment Study
199
Benchmarks arestandards set by anexternal body thatschools are meant toattain. In this study, twosets of benchmarks wereused: those set byMOET and those set bythe new fundamentalschool quality levelbody.
In some cases, theministry may wish torevisit and revise somebenchmarks.
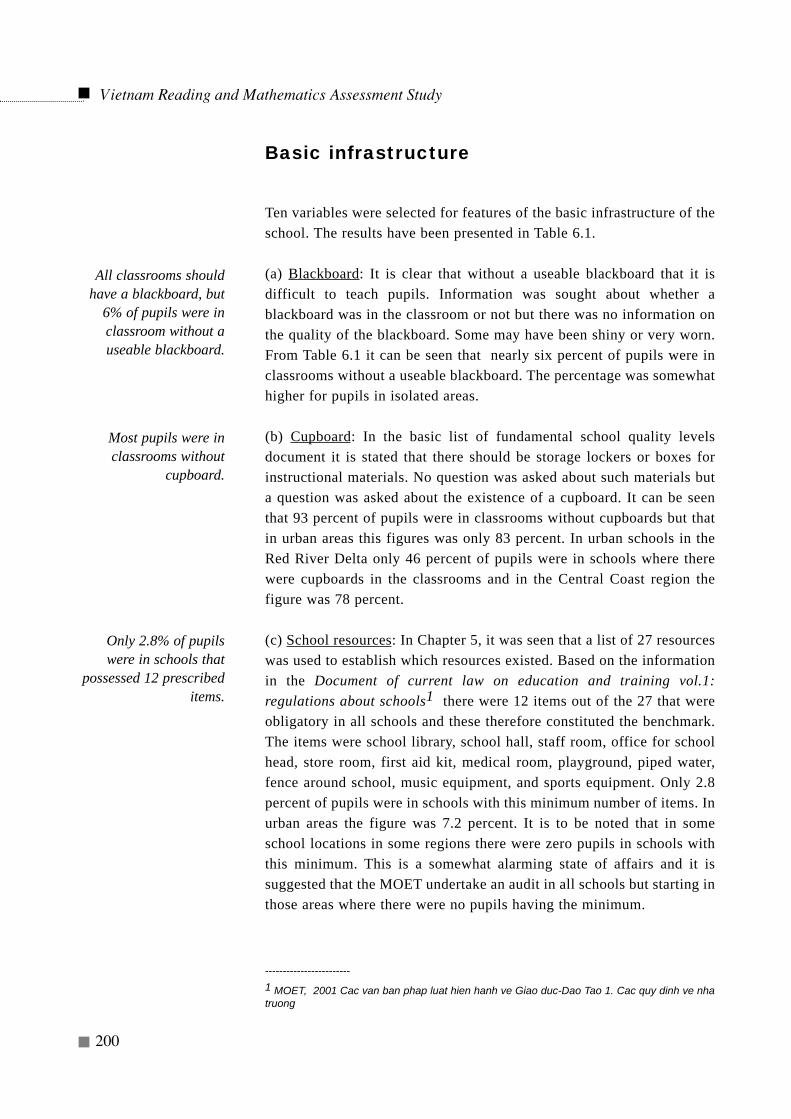
Basic infrastructure
Ten variables were selected for features of the basic infrastructure of theschool. The results have been presented in Table 6.1.
(a) Blackboard: It is clear that without a useable blackboard that it isdifficult to teach pupils. Information was sought about whether ablackboard was in the classroom or not but there was no information onthe quality of the blackboard. Some may have been shiny or very worn.From Table 6.1 it can be seen that nearly six percent of pupils were inclassrooms without a useable blackboard. The percentage was somewhathigher for pupils in isolated areas.
(b) Cupboard: In the basic list of fundamental school quality levelsdocument it is stated that there should be storage lockers or boxes forinstructional materials. No question was asked about such materials buta question was asked about the existence of a cupboard. It can be seenthat 93 percent of pupils were in classrooms without cupboards but thatin urban areas this figures was only 83 percent. In urban schools in theRed River Delta only 46 percent of pupils were in schools where therewere cupboards in the classrooms and in the Central Coast region thefigure was 78 percent.
(c) School resources: In Chapter 5, it was seen that a list of 27 resourceswas used to establish which resources existed. Based on the informationin the Document of current law on education and training vol.1:regulations about schools1 there were 12 items out of the 27 that wereobligatory in all schools and these therefore constituted the benchmark.The items were school library, school hall, staff room, office for schoolhead, store room, first aid kit, medical room, playground, piped water,fence around school, music equipment, and sports equipment. Only 2.8percent of pupils were in schools with this minimum number of items. Inurban areas the figure was 7.2 percent. It is to be noted that in someschool locations in some regions there were zero pupils in schools withthis minimum. This is a somewhat alarming state of affairs and it issuggested that the MOET undertake an audit in all schools but starting inthose areas where there were no pupils having the minimum.
Vietnam Reading and Mathematics Assessment Study
200
All classrooms shouldhave a blackboard, but
6% of pupils were inclassroom without auseable blackboard.
Most pupils were inclassrooms without
cupboard.
Only 2.8% of pupilswere in schools that
possessed 12 prescribeditems.
------------------------1 MOET, 2001 Cac van ban phap luat hien hanh ve Giao duc-Dao Tao 1. Cac quy dinh ve nhatruong
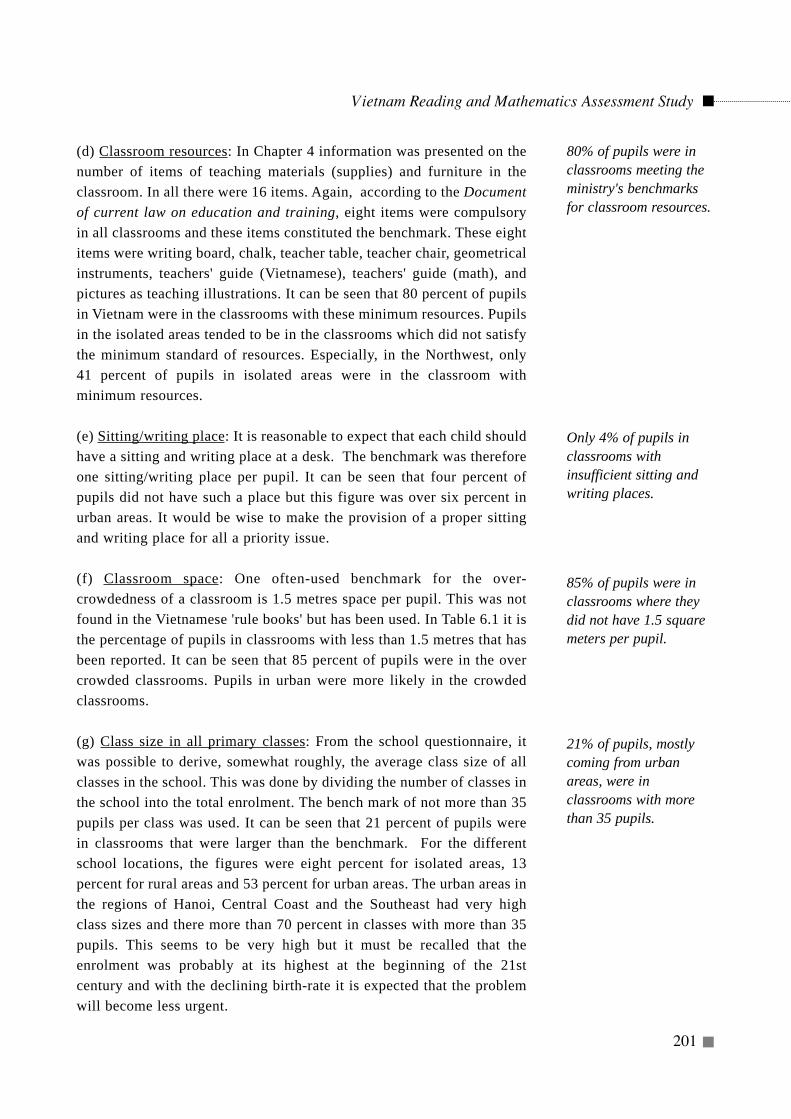
(d) Classroom resources: In Chapter 4 information was presented on thenumber of items of teaching materials (supplies) and furniture in theclassroom. In all there were 16 items. Again, according to the Documentof current law on education and training, eight items were compulsoryin all classrooms and these items constituted the benchmark. These eightitems were writing board, chalk, teacher table, teacher chair, geometricalinstruments, teachers' guide (Vietnamese), teachers' guide (math), andpictures as teaching illustrations. It can be seen that 80 percent of pupilsin Vietnam were in the classrooms with these minimum resources. Pupilsin the isolated areas tended to be in the classrooms which did not satisfythe minimum standard of resources. Especially, in the Northwest, only41 percent of pupils in isolated areas were in the classroom withminimum resources.
(e) Sitting/writing place: It is reasonable to expect that each child shouldhave a sitting and writing place at a desk. The benchmark was thereforeone sitting/writing place per pupil. It can be seen that four percent ofpupils did not have such a place but this figure was over six percent inurban areas. It would be wise to make the provision of a proper sittingand writing place for all a priority issue.
(f) Classroom space: One often-used benchmark for the over-crowdedness of a classroom is 1.5 metres space per pupil. This was notfound in the Vietnamese 'rule books' but has been used. In Table 6.1 it isthe percentage of pupils in classrooms with less than 1.5 metres that hasbeen reported. It can be seen that 85 percent of pupils were in the overcrowded classrooms. Pupils in urban were more likely in the crowdedclassrooms.
(g) Class size in all primary classes: From the school questionnaire, itwas possible to derive, somewhat roughly, the average class size of allclasses in the school. This was done by dividing the number of classes inthe school into the total enrolment. The bench mark of not more than 35pupils per class was used. It can be seen that 21 percent of pupils werein classrooms that were larger than the benchmark. For the differentschool locations, the figures were eight percent for isolated areas, 13percent for rural areas and 53 percent for urban areas. The urban areas inthe regions of Hanoi, Central Coast and the Southeast had very highclass sizes and there more than 70 percent in classes with more than 35pupils. This seems to be very high but it must be recalled that theenrolment was probably at its highest at the beginning of the 21stcentury and with the declining birth-rate it is expected that the problemwill become less urgent.
Vietnam Reading and Mathematics Assessment Study
201
80% of pupils were inclassrooms meeting theministry's benchmarksfor classroom resources.
Only 4% of pupils inclassrooms withinsufficient sitting andwriting places.
85% of pupils were inclassrooms where theydid not have 1.5 squaremeters per pupil.
21% of pupils, mostlycoming from urbanareas, were inclassrooms with morethan 35 pupils.
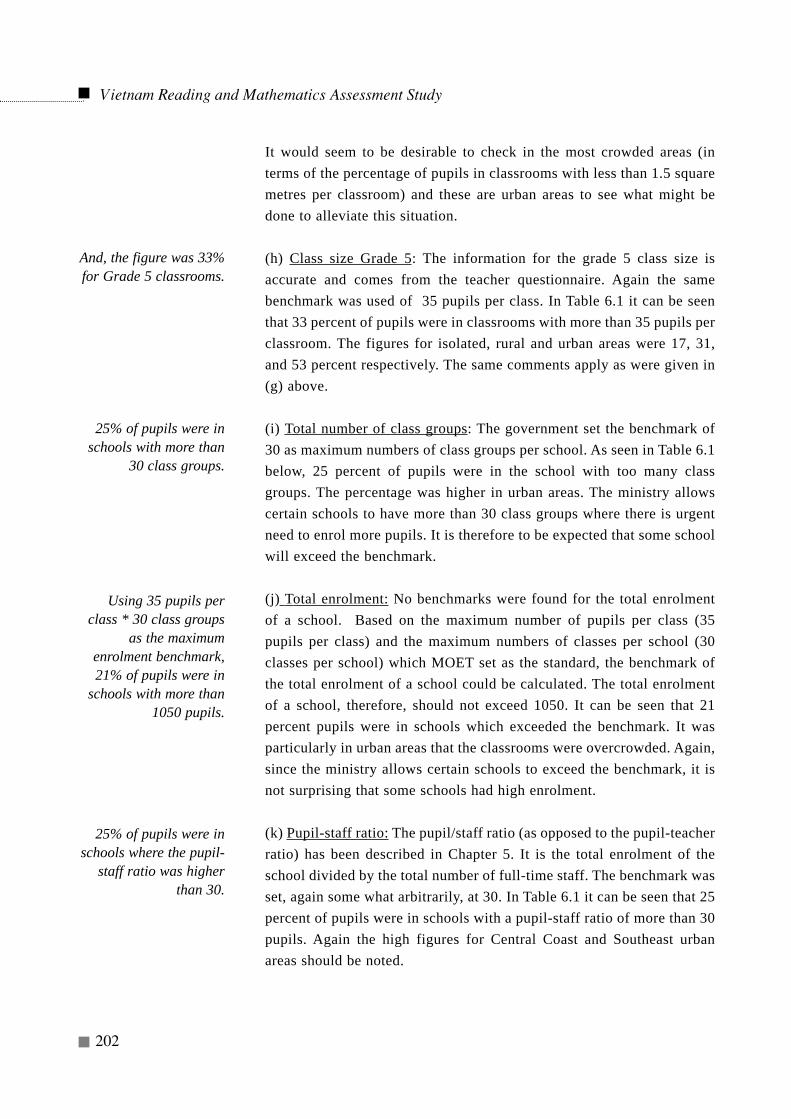
It would seem to be desirable to check in the most crowded areas (interms of the percentage of pupils in classrooms with less than 1.5 squaremetres per classroom) and these are urban areas to see what might bedone to alleviate this situation.
(h) Class size Grade 5: The information for the grade 5 class size isaccurate and comes from the teacher questionnaire. Again the samebenchmark was used of 35 pupils per class. In Table 6.1 it can be seenthat 33 percent of pupils were in classrooms with more than 35 pupils perclassroom. The figures for isolated, rural and urban areas were 17, 31,and 53 percent respectively. The same comments apply as were given in(g) above.
(i) Total number of class groups: The government set the benchmark of30 as maximum numbers of class groups per school. As seen in Table 6.1below, 25 percent of pupils were in the school with too many classgroups. The percentage was higher in urban areas. The ministry allowscertain schools to have more than 30 class groups where there is urgentneed to enrol more pupils. It is therefore to be expected that some schoolwill exceed the benchmark.
(j) Total enrolment: No benchmarks were found for the total enrolmentof a school. Based on the maximum number of pupils per class (35pupils per class) and the maximum numbers of classes per school (30classes per school) which MOET set as the standard, the benchmark ofthe total enrolment of a school could be calculated. The total enrolmentof a school, therefore, should not exceed 1050. It can be seen that 21percent pupils were in schools which exceeded the benchmark. It wasparticularly in urban areas that the classrooms were overcrowded. Again,since the ministry allows certain schools to exceed the benchmark, it isnot surprising that some schools had high enrolment.
(k) Pupil-staff ratio: The pupil/staff ratio (as opposed to the pupil-teacherratio) has been described in Chapter 5. It is the total enrolment of theschool divided by the total number of full-time staff. The benchmark wasset, again some what arbitrarily, at 30. In Table 6.1 it can be seen that 25percent of pupils were in schools with a pupil-staff ratio of more than 30pupils. Again the high figures for Central Coast and Southeast urbanareas should be noted.
Vietnam Reading and Mathematics Assessment Study
202
25% of pupils were inschools with more than
30 class groups.
Using 35 pupils perclass * 30 class groups
as the maximumenrolment benchmark,21% of pupils were in
schools with more than1050 pupils.
25% of pupils were inschools where the pupil-
staff ratio was higherthan 30.
And, the figure was 33%for Grade 5 classrooms.
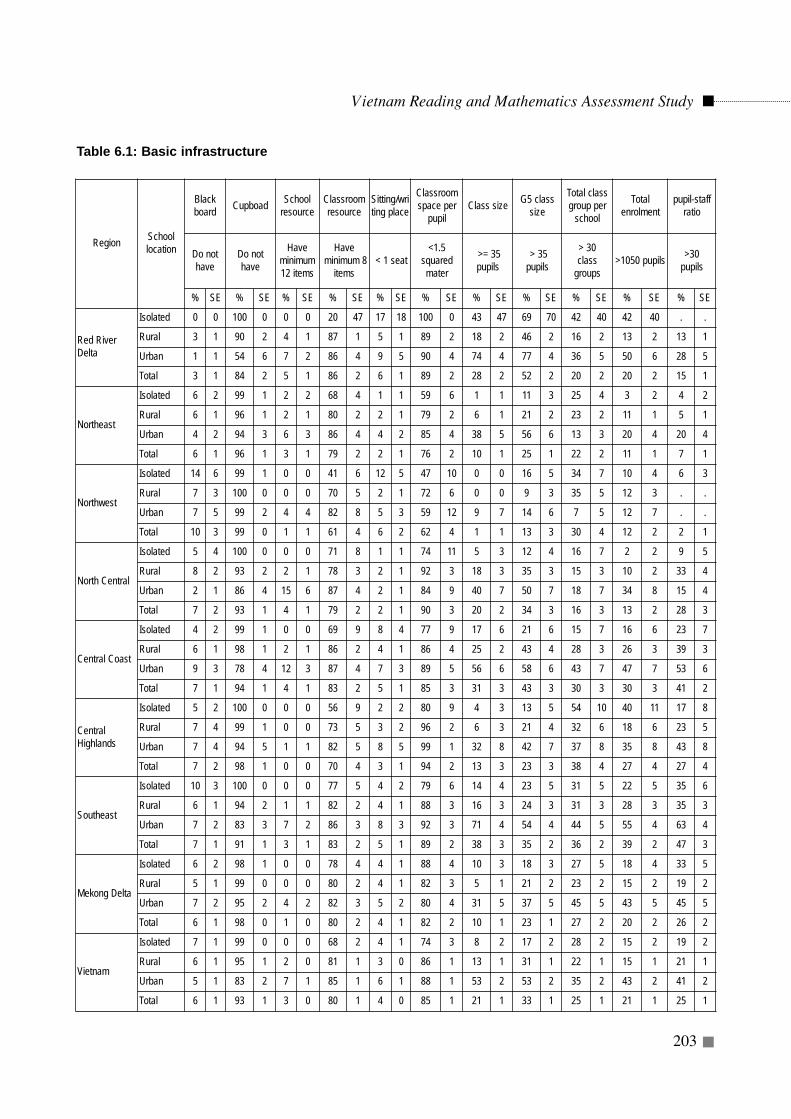
Table 6.1: Basic infrastructure
Vietnam Reading and Mathematics Assessment Study
203
Region Schoollocation
Black board Cupboad School
resourceClassroomresource
Sitting/writing place
Classroomspace per
pupilClass size G5 class
size
Total classgroup per
school
Total enrolment
pupil-staffratio
Do not have
Do not have
Have minimum12 items
Haveminimum 8
items< 1 seat
<1.5squaredmater
>= 35pupils
> 35 pupils
> 30 class
groups >1050 pupils >30
pupils
% SE % SE % SE % SE % SE % SE % SE % SE % SE % SE % SE
Red RiverDelta
Isolated 0 0 100 0 0 0 20 47 17 18 100 0 43 47 69 70 42 40 42 40 . .
Rural 3 1 90 2 4 1 87 1 5 1 89 2 18 2 46 2 16 2 13 2 13 1
Urban 1 1 54 6 7 2 86 4 9 5 90 4 74 4 77 4 36 5 50 6 28 5
Total 3 1 84 2 5 1 86 2 6 1 89 2 28 2 52 2 20 2 20 2 15 1
Northeast
Isolated 6 2 99 1 2 2 68 4 1 1 59 6 1 1 11 3 25 4 3 2 4 2
Rural 6 1 96 1 2 1 80 2 2 1 79 2 6 1 21 2 23 2 11 1 5 1
Urban 4 2 94 3 6 3 86 4 4 2 85 4 38 5 56 6 13 3 20 4 20 4
Total 6 1 96 1 3 1 79 2 2 1 76 2 10 1 25 1 22 2 11 1 7 1
Northwest
Isolated 14 6 99 1 0 0 41 6 12 5 47 10 0 0 16 5 34 7 10 4 6 3
Rural 7 3 100 0 0 0 70 5 2 1 72 6 0 0 9 3 35 5 12 3 . .
Urban 7 5 99 2 4 4 82 8 5 3 59 12 9 7 14 6 7 5 12 7 . .
Total 10 3 99 0 1 1 61 4 6 2 62 4 1 1 13 3 30 4 12 2 2 1
North Central
Isolated 5 4 100 0 0 0 71 8 1 1 74 11 5 3 12 4 16 7 2 2 9 5
Rural 8 2 93 2 2 1 78 3 2 1 92 3 18 3 35 3 15 3 10 2 33 4
Urban 2 1 86 4 15 6 87 4 2 1 84 9 40 7 50 7 18 7 34 8 15 4
Total 7 2 93 1 4 1 79 2 2 1 90 3 20 2 34 3 16 3 13 2 28 3
Central Coast
Isolated 4 2 99 1 0 0 69 9 8 4 77 9 17 6 21 6 15 7 16 6 23 7
Rural 6 1 98 1 2 1 86 2 4 1 86 4 25 2 43 4 28 3 26 3 39 3
Urban 9 3 78 4 12 3 87 4 7 3 89 5 56 6 58 6 43 7 47 7 53 6
Total 7 1 94 1 4 1 83 2 5 1 85 3 31 3 43 3 30 3 30 3 41 2
CentralHighlands
Isolated 5 2 100 0 0 0 56 9 2 2 80 9 4 3 13 5 54 10 40 11 17 8
Rural 7 4 99 1 0 0 73 5 3 2 96 2 6 3 21 4 32 6 18 6 23 5
Urban 7 4 94 5 1 1 82 5 8 5 99 1 32 8 42 7 37 8 35 8 43 8
Total 7 2 98 1 0 0 70 4 3 1 94 2 13 3 23 3 38 4 27 4 27 4
Southeast
Isolated 10 3 100 0 0 0 77 5 4 2 79 6 14 4 23 5 31 5 22 5 35 6
Rural 6 1 94 2 1 1 82 2 4 1 88 3 16 3 24 3 31 3 28 3 35 3
Urban 7 2 83 3 7 2 86 3 8 3 92 3 71 4 54 4 44 5 55 4 63 4
Total 7 1 91 1 3 1 83 2 5 1 89 2 38 3 35 2 36 2 39 2 47 3
Mekong Delta
Isolated 6 2 98 1 0 0 78 4 4 1 88 4 10 3 18 3 27 5 18 4 33 5
Rural 5 1 99 0 0 0 80 2 4 1 82 3 5 1 21 2 23 2 15 2 19 2
Urban 7 2 95 2 4 2 82 3 5 2 80 4 31 5 37 5 45 5 43 5 45 5
Total 6 1 98 0 1 0 80 2 4 1 82 2 10 1 23 1 27 2 20 2 26 2
Vietnam
Isolated 7 1 99 0 0 0 68 2 4 1 74 3 8 2 17 2 28 2 15 2 19 2
Rural 6 1 95 1 2 0 81 1 3 0 86 1 13 1 31 1 22 1 15 1 21 1
Urban 5 1 83 2 7 1 85 1 6 1 88 1 53 2 53 2 35 2 43 2 41 2
Total 6 1 93 1 3 0 80 1 4 0 85 1 21 1 33 1 25 1 21 1 25 1
School head and teacher qualifications
In this section, the term “staff” has been used to describe all of the teachersin the school. Information about all of the teachers was provided by theschool heads in the school questionnaire. Next to the variable name in theaccompanying tables, “from Shquest” has been written. The word “teacher”in the variable headings has been used to refer to the Grade 5 teachers whocompleted the teacher questionnaire. The word “ from Tbooklet” has beenwritten next to the name of the variable. The result for school heads andteachers who had 12+2 years of training have been presented in Table 6.2.The results for school heads and teachers who had 9+3 years of training havebeen presented in Table 6.3.
When reviewing the two types of teacher training, it must be recalled thatuntil 1983 nearly all teachers were trained under the 9+3 system. After 1983,teachers were trained under the 12+2 system. Hence, it is the older teacherswho will have been under the 9+3 system.
(a) School heads’ academic education: There is no benchmark for the yearsof academic education for school heads. However, all school heads muchhave been teachers, and the benchmark for teachers is that they should havecompleted at least upper secondary school. It can be seen from Table 6.2 that10 percent of pupils were in schools with school heads who had notcompleted upper secondary school. However, according to the initial versionof FSQL, minimum academic education all heads should have completed atleast lower secondary school. The percentage of pupils in schools where theheads did not have this qualification have been presented in Table 6.3 and itcan be seen that there were zero percent meaning that all pupils were inschools where heads satisfied the benchmark.
(b) School heads’ teacher training: The MOET set the benchmark that schoolheads in isolated areas should have completed 9+3 and school heads in ruraland urban should have completed 12+2. It can be seen from Table 6.2 that 12percent of pupils in urban and 18 percent of pupils in rural areas were inschools with school heads who had not completed 12+3. It can also be seenfrom Table 6.3 that seven percent of pupils in isolated were in schools withschool heads who had not completed the 9+3 training. On the other hand,according to FSQL, all heads should have completed the teacher trainingknown as 9+3. In Table 6.3, it is the percentage of pupils in schools where theheads did not satisfy the benchmark that have been presented. Just over threepercent of pupils were in schools where the heads had not satisfied thisparticular benchmark. However, isolated schools in the Northeast, Northwestand Mekong Delta as well as rural schools in the Central Highlands give risefor concern. In time this problem will be resolved.
Vietnam Reading and Mathematics Assessment Study
204
10% of pupils were inschools where the school
heads were notcompleted upper
secondary.
More than 90% of pupilswere in schools where
the school heads didmeet the benchmark of
completing 9+3 teachertraining. teacher
training.
(c) Grade 5 teacher education: According to the educational regulation inVietnam, all teachers should have completed at least upper secondaryschool. It can be seen that almost 10 percent of pupils were with teacherswho had not completed secondary school. Pupils in isolated schoolstended to have teachers who had not completed secondary schoolcompared with those in rural and urban areas. Yet again, FSQL set thebenchmark that all teachers should have completed at least lowersecondary school. As can be seen from Table 6.3 that there were very fewpupils in schools where the teachers had not done this.
(d) Teaching staff education: The percentages of pupils have beenpresented in schools where the head said that at least one member of theteaching staff had not completed lower secondary education. This figurewas larger than for the Grade 5 teachers only. The overall figure forVietnam was 18 percent and in isolated areas it was 25 percent. The largestpercentages were in the Northwest, especially in the isolated areas. If thebenchmark were to be set as having completed upper secondary school,then the percentage of pupils who were in schools with school at least onemember of staff had not completed upper secondary would be 72.
(e) Grade 5 teacher training: Similarly to the benchmark for school heads,the MOET set the benchmark that teachers in isolated areas should havecompleted 9+3 and that teachers in rural and urban areas should havecompleted 12+2. As can be seen from Table 6.2, 19 percent of pupils inurban areas and 20 percent of pupils in rural areas were in schools withschool heads who had not completed 12+3. It can be seen from Table 6.3that 5 percent of pupils in isolated were in schools with school heads whohad not completed 9+3. Again, FSQL set a different benchmark, namelythat all teachers should have had the 9+3 teacher training. Only 3.5percent of pupils were in schools where Grade 5 teachers had not had atleast this kind of training. The Central Highlands was somewhat high andit might be worth some further investigation.
(f) Primary school teaching staff teacher training: The same benchmarkwas used as for (e) above. However, this time it was the percentages ofpupils in schools where the school head had said that at least one memberof teaching staff had not received this training that have been reported.When the benchmark was set at 9+3, 50 percent of pupils were in schoolswhere at least one member of staff did not reach the benchmark. Againthere was a small problem in the Central Highlands. When the benchmarkwas set at 12+2, the percentage went up to 80.
Vietnam Reading and Mathematics Assessment Study
205
10% of pupils were inschool where Grade 5teachers did not meetthe benchmark forteacher education.
18% of pupils were inschools where at leastone member of theteaching staff did notmeet the ministry'sbenchmark for teachereducation.
21% of pupils were inschool where Grade 5teachers did not meetthe ministry's benchmarkfor teacher training,
50% of pupils were inschools where at leastmember of the teachingstaff did not meet theministry's benchmark forteacher training.
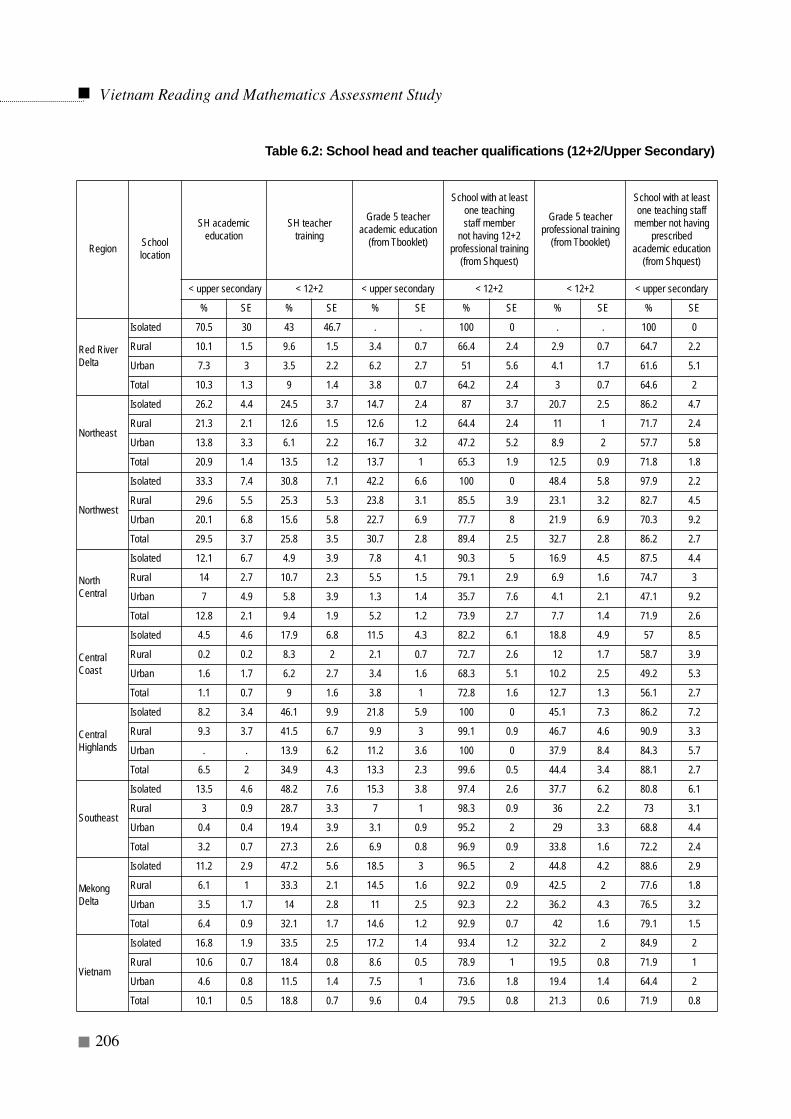
Table 6.2: School head and teacher qualifications (12+2/Upper Secondary)
Vietnam Reading and Mathematics Assessment Study
206
Region School location
SH academic education
SH teacher training
Grade 5 teacher academic education
(from Tbooklet)
School with at leastone teaching staff member
not having 12+2 professional training
(from Shquest)
Grade 5 teacher professional training
(from Tbooklet)
School with at leastone teaching staff
member not havingprescribed
academic education(from Shquest)
< upper secondary < 12+2 < upper secondary < 12+2 < 12+2 < upper secondary
% SE % SE % SE % SE % SE % SE
Red RiverDelta
Isolated 70.5 30 43 46.7 . . 100 0 . . 100 0
Rural 10.1 1.5 9.6 1.5 3.4 0.7 66.4 2.4 2.9 0.7 64.7 2.2
Urban 7.3 3 3.5 2.2 6.2 2.7 51 5.6 4.1 1.7 61.6 5.1
Total 10.3 1.3 9 1.4 3.8 0.7 64.2 2.4 3 0.7 64.6 2
Northeast
Isolated 26.2 4.4 24.5 3.7 14.7 2.4 87 3.7 20.7 2.5 86.2 4.7
Rural 21.3 2.1 12.6 1.5 12.6 1.2 64.4 2.4 11 1 71.7 2.4
Urban 13.8 3.3 6.1 2.2 16.7 3.2 47.2 5.2 8.9 2 57.7 5.8
Total 20.9 1.4 13.5 1.2 13.7 1 65.3 1.9 12.5 0.9 71.8 1.8
Northwest
Isolated 33.3 7.4 30.8 7.1 42.2 6.6 100 0 48.4 5.8 97.9 2.2
Rural 29.6 5.5 25.3 5.3 23.8 3.1 85.5 3.9 23.1 3.2 82.7 4.5
Urban 20.1 6.8 15.6 5.8 22.7 6.9 77.7 8 21.9 6.9 70.3 9.2
Total 29.5 3.7 25.8 3.5 30.7 2.8 89.4 2.5 32.7 2.8 86.2 2.7
NorthCentral
Isolated 12.1 6.7 4.9 3.9 7.8 4.1 90.3 5 16.9 4.5 87.5 4.4
Rural 14 2.7 10.7 2.3 5.5 1.5 79.1 2.9 6.9 1.6 74.7 3
Urban 7 4.9 5.8 3.9 1.3 1.4 35.7 7.6 4.1 2.1 47.1 9.2
Total 12.8 2.1 9.4 1.9 5.2 1.2 73.9 2.7 7.7 1.4 71.9 2.6
CentralCoast
Isolated 4.5 4.6 17.9 6.8 11.5 4.3 82.2 6.1 18.8 4.9 57 8.5
Rural 0.2 0.2 8.3 2 2.1 0.7 72.7 2.6 12 1.7 58.7 3.9
Urban 1.6 1.7 6.2 2.7 3.4 1.6 68.3 5.1 10.2 2.5 49.2 5.3
Total 1.1 0.7 9 1.6 3.8 1 72.8 1.6 12.7 1.3 56.1 2.7
CentralHighlands
Isolated 8.2 3.4 46.1 9.9 21.8 5.9 100 0 45.1 7.3 86.2 7.2
Rural 9.3 3.7 41.5 6.7 9.9 3 99.1 0.9 46.7 4.6 90.9 3.3
Urban . . 13.9 6.2 11.2 3.6 100 0 37.9 8.4 84.3 5.7
Total 6.5 2 34.9 4.3 13.3 2.3 99.6 0.5 44.4 3.4 88.1 2.7
Southeast
Isolated 13.5 4.6 48.2 7.6 15.3 3.8 97.4 2.6 37.7 6.2 80.8 6.1
Rural 3 0.9 28.7 3.3 7 1 98.3 0.9 36 2.2 73 3.1
Urban 0.4 0.4 19.4 3.9 3.1 0.9 95.2 2 29 3.3 68.8 4.4
Total 3.2 0.7 27.3 2.6 6.9 0.8 96.9 0.9 33.8 1.6 72.2 2.4
MekongDelta
Isolated 11.2 2.9 47.2 5.6 18.5 3 96.5 2 44.8 4.2 88.6 2.9
Rural 6.1 1 33.3 2.1 14.5 1.6 92.2 0.9 42.5 2 77.6 1.8
Urban 3.5 1.7 14 2.8 11 2.5 92.3 2.2 36.2 4.3 76.5 3.2
Total 6.4 0.9 32.1 1.7 14.6 1.2 92.9 0.7 42 1.6 79.1 1.5
Vietnam
Isolated 16.8 1.9 33.5 2.5 17.2 1.4 93.4 1.2 32.2 2 84.9 2
Rural 10.6 0.7 18.4 0.8 8.6 0.5 78.9 1 19.5 0.8 71.9 1
Urban 4.6 0.8 11.5 1.4 7.5 1 73.6 1.8 19.4 1.4 64.4 2
Total 10.1 0.5 18.8 0.7 9.6 0.4 79.5 0.8 21.3 0.6 71.9 0.8
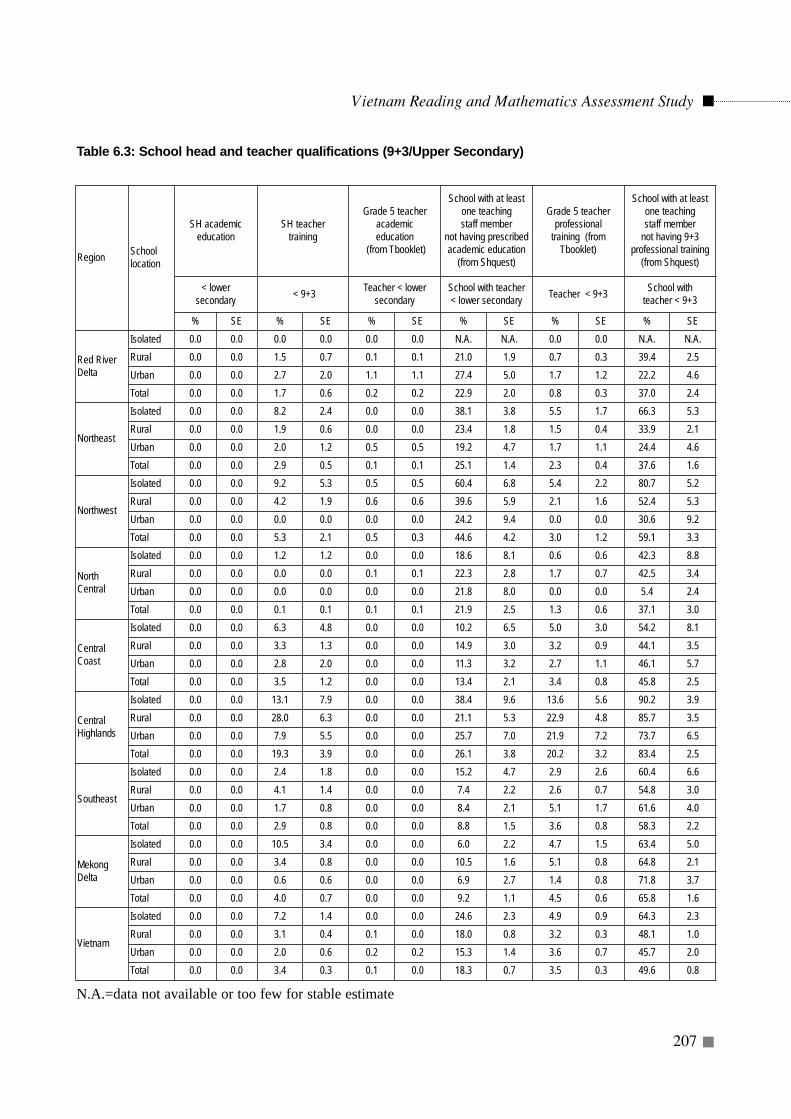
Table 6.3: School head and teacher qualifications (9+3/Upper Secondary)
N.A.=data not available or too few for stable estimate
Vietnam Reading and Mathematics Assessment Study
207
Region Schoollocation
SH academic education
SH teacher training
Grade 5 teacher academic education
(from Tbooklet)
School with at leastone teaching staff member
not having prescribedacademic education
(from Shquest)
Grade 5 teacher professional
training (fromTbooklet)
School with at leastone teaching staff member
not having 9+3 professional training
(from Shquest)
< lower secondary < 9+3 Teacher < lower
secondarySchool with teacher < lower secondary Teacher < 9+3 School with
teacher < 9+3
% SE % SE % SE % SE % SE % SE
Red RiverDelta
Isolated 0.0 0.0 0.0 0.0 0.0 0.0 N.A. N.A. 0.0 0.0 N.A. N.A.Rural 0.0 0.0 1.5 0.7 0.1 0.1 21.0 1.9 0.7 0.3 39.4 2.5Urban 0.0 0.0 2.7 2.0 1.1 1.1 27.4 5.0 1.7 1.2 22.2 4.6Total 0.0 0.0 1.7 0.6 0.2 0.2 22.9 2.0 0.8 0.3 37.0 2.4
Northeast
Isolated 0.0 0.0 8.2 2.4 0.0 0.0 38.1 3.8 5.5 1.7 66.3 5.3Rural 0.0 0.0 1.9 0.6 0.0 0.0 23.4 1.8 1.5 0.4 33.9 2.1Urban 0.0 0.0 2.0 1.2 0.5 0.5 19.2 4.7 1.7 1.1 24.4 4.6Total 0.0 0.0 2.9 0.5 0.1 0.1 25.1 1.4 2.3 0.4 37.6 1.6
Northwest
Isolated 0.0 0.0 9.2 5.3 0.5 0.5 60.4 6.8 5.4 2.2 80.7 5.2Rural 0.0 0.0 4.2 1.9 0.6 0.6 39.6 5.9 2.1 1.6 52.4 5.3Urban 0.0 0.0 0.0 0.0 0.0 0.0 24.2 9.4 0.0 0.0 30.6 9.2Total 0.0 0.0 5.3 2.1 0.5 0.3 44.6 4.2 3.0 1.2 59.1 3.3
NorthCentral
Isolated 0.0 0.0 1.2 1.2 0.0 0.0 18.6 8.1 0.6 0.6 42.3 8.8Rural 0.0 0.0 0.0 0.0 0.1 0.1 22.3 2.8 1.7 0.7 42.5 3.4Urban 0.0 0.0 0.0 0.0 0.0 0.0 21.8 8.0 0.0 0.0 5.4 2.4Total 0.0 0.0 0.1 0.1 0.1 0.1 21.9 2.5 1.3 0.6 37.1 3.0
CentralCoast
Isolated 0.0 0.0 6.3 4.8 0.0 0.0 10.2 6.5 5.0 3.0 54.2 8.1Rural 0.0 0.0 3.3 1.3 0.0 0.0 14.9 3.0 3.2 0.9 44.1 3.5Urban 0.0 0.0 2.8 2.0 0.0 0.0 11.3 3.2 2.7 1.1 46.1 5.7Total 0.0 0.0 3.5 1.2 0.0 0.0 13.4 2.1 3.4 0.8 45.8 2.5
CentralHighlands
Isolated 0.0 0.0 13.1 7.9 0.0 0.0 38.4 9.6 13.6 5.6 90.2 3.9Rural 0.0 0.0 28.0 6.3 0.0 0.0 21.1 5.3 22.9 4.8 85.7 3.5Urban 0.0 0.0 7.9 5.5 0.0 0.0 25.7 7.0 21.9 7.2 73.7 6.5Total 0.0 0.0 19.3 3.9 0.0 0.0 26.1 3.8 20.2 3.2 83.4 2.5
Southeast
Isolated 0.0 0.0 2.4 1.8 0.0 0.0 15.2 4.7 2.9 2.6 60.4 6.6Rural 0.0 0.0 4.1 1.4 0.0 0.0 7.4 2.2 2.6 0.7 54.8 3.0Urban 0.0 0.0 1.7 0.8 0.0 0.0 8.4 2.1 5.1 1.7 61.6 4.0Total 0.0 0.0 2.9 0.8 0.0 0.0 8.8 1.5 3.6 0.8 58.3 2.2
MekongDelta
Isolated 0.0 0.0 10.5 3.4 0.0 0.0 6.0 2.2 4.7 1.5 63.4 5.0Rural 0.0 0.0 3.4 0.8 0.0 0.0 10.5 1.6 5.1 0.8 64.8 2.1Urban 0.0 0.0 0.6 0.6 0.0 0.0 6.9 2.7 1.4 0.8 71.8 3.7Total 0.0 0.0 4.0 0.7 0.0 0.0 9.2 1.1 4.5 0.6 65.8 1.6
Vietnam
Isolated 0.0 0.0 7.2 1.4 0.0 0.0 24.6 2.3 4.9 0.9 64.3 2.3Rural 0.0 0.0 3.1 0.4 0.1 0.0 18.0 0.8 3.2 0.3 48.1 1.0Urban 0.0 0.0 2.0 0.6 0.2 0.2 15.3 1.4 3.6 0.7 45.7 2.0Total 0.0 0.0 3.4 0.3 0.1 0.0 18.3 0.7 3.5 0.3 49.6 0.8
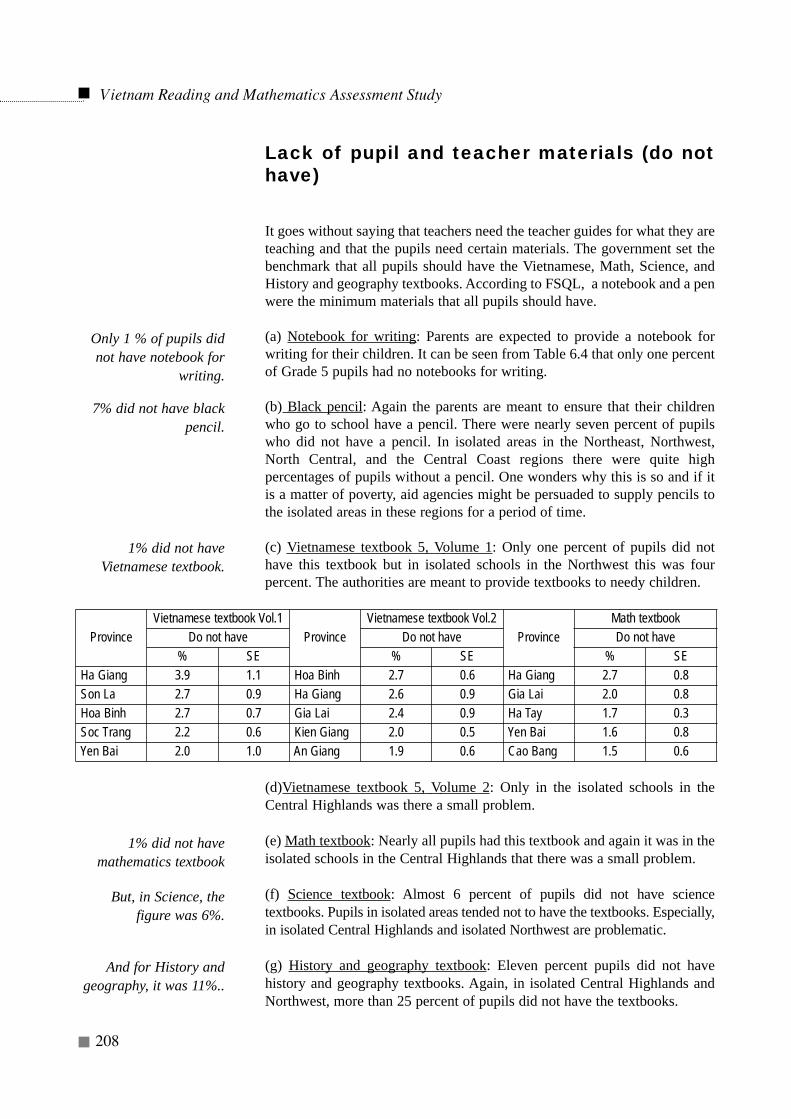
Lack of pupil and teacher materials (do nothave)
It goes without saying that teachers need the teacher guides for what they areteaching and that the pupils need certain materials. The government set thebenchmark that all pupils should have the Vietnamese, Math, Science, andHistory and geography textbooks. According to FSQL, a notebook and a penwere the minimum materials that all pupils should have.
(a) Notebook for writing: Parents are expected to provide a notebook forwriting for their children. It can be seen from Table 6.4 that only one percentof Grade 5 pupils had no notebooks for writing.
(b) Black pencil: Again the parents are meant to ensure that their childrenwho go to school have a pencil. There were nearly seven percent of pupilswho did not have a pencil. In isolated areas in the Northeast, Northwest,North Central, and the Central Coast regions there were quite highpercentages of pupils without a pencil. One wonders why this is so and if itis a matter of poverty, aid agencies might be persuaded to supply pencils tothe isolated areas in these regions for a period of time.
(c) Vietnamese textbook 5, Volume 1: Only one percent of pupils did nothave this textbook but in isolated schools in the Northwest this was fourpercent. The authorities are meant to provide textbooks to needy children.
(d)Vietnamese textbook 5, Volume 2: Only in the isolated schools in theCentral Highlands was there a small problem.
(e) Math textbook: Nearly all pupils had this textbook and again it was in theisolated schools in the Central Highlands that there was a small problem.
(f) Science textbook: Almost 6 percent of pupils did not have sciencetextbooks. Pupils in isolated areas tended not to have the textbooks. Especially,in isolated Central Highlands and isolated Northwest are problematic.
(g) History and geography textbook: Eleven percent pupils did not havehistory and geography textbooks. Again, in isolated Central Highlands andNorthwest, more than 25 percent of pupils did not have the textbooks.
Vietnam Reading and Mathematics Assessment Study
208
Only 1 % of pupils didnot have notebook for
writing.
7% did not have blackpencil.
1% did not haveVietnamese textbook.
1% did not havemathematics textbook
But, in Science, thefigure was 6%.
And for History andgeography, it was 11%..
ProvinceVietnamese textbook Vol.1
ProvinceVietnamese textbook Vol.2
ProvinceMath textbook
Do not have Do not have Do not have% SE % SE % SE
Ha Giang 3.9 1.1 Hoa Binh 2.7 0.6 Ha Giang 2.7 0.8Son La 2.7 0.9 Ha Giang 2.6 0.9 Gia Lai 2.0 0.8Hoa Binh 2.7 0.7 Gia Lai 2.4 0.9 Ha Tay 1.7 0.3Soc Trang 2.2 0.6 Kien Giang 2.0 0.5 Yen Bai 1.6 0.8Yen Bai 2.0 1.0 An Giang 1.9 0.6 Cao Bang 1.5 0.6
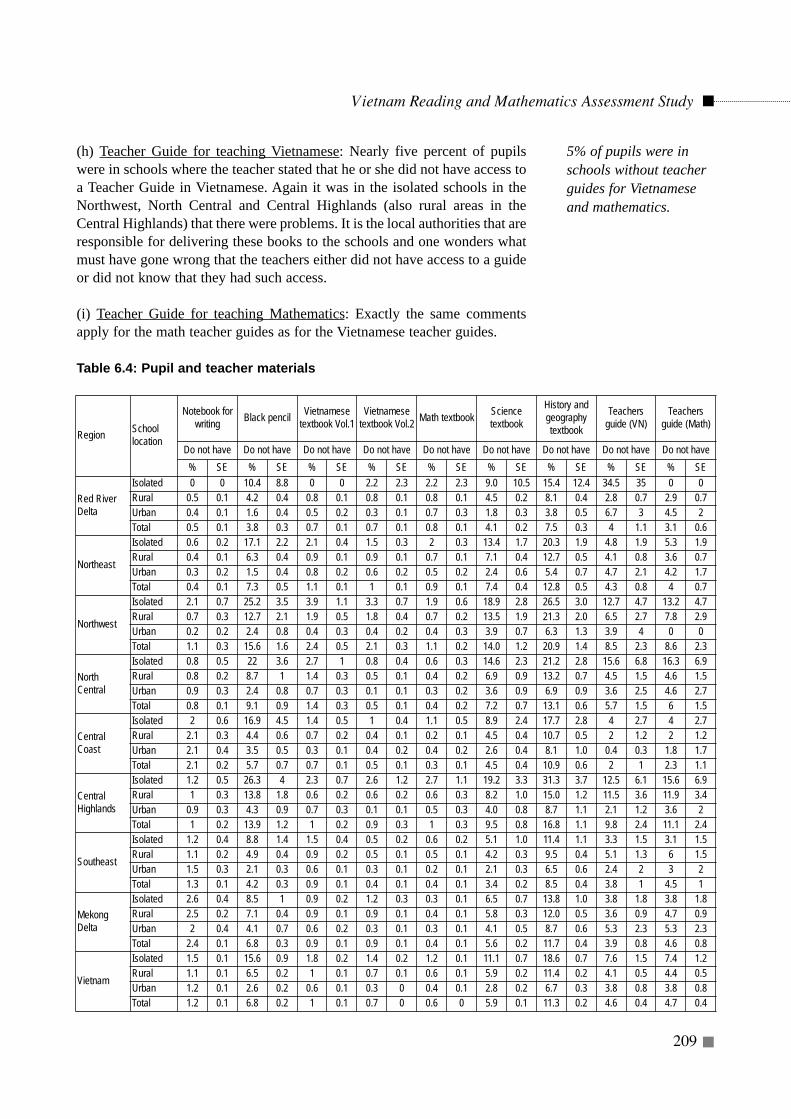
(h) Teacher Guide for teaching Vietnamese: Nearly five percent of pupilswere in schools where the teacher stated that he or she did not have access toa Teacher Guide in Vietnamese. Again it was in the isolated schools in theNorthwest, North Central and Central Highlands (also rural areas in theCentral Highlands) that there were problems. It is the local authorities that areresponsible for delivering these books to the schools and one wonders whatmust have gone wrong that the teachers either did not have access to a guideor did not know that they had such access.
(i) Teacher Guide for teaching Mathematics: Exactly the same commentsapply for the math teacher guides as for the Vietnamese teacher guides.
Table 6.4: Pupil and teacher materials
Vietnam Reading and Mathematics Assessment Study
209
5% of pupils were inschools without teacherguides for Vietnameseand mathematics.
Region Schoollocation
Notebook forwriting Black pencil Vietnamese
textbook Vol.1Vietnamese
textbook Vol.2 Math textbook Sciencetextbook
History andgeographytextbook
Teachersguide (VN)
Teachersguide (Math)
Do not have Do not have Do not have Do not have Do not have Do not have Do not have Do not have Do not have% SE % SE % SE % SE % SE % SE % SE % SE % SE
Red RiverDelta
Isolated 0 0 10.4 8.8 0 0 2.2 2.3 2.2 2.3 9.0 10.5 15.4 12.4 34.5 35 0 0Rural 0.5 0.1 4.2 0.4 0.8 0.1 0.8 0.1 0.8 0.1 4.5 0.2 8.1 0.4 2.8 0.7 2.9 0.7Urban 0.4 0.1 1.6 0.4 0.5 0.2 0.3 0.1 0.7 0.3 1.8 0.3 3.8 0.5 6.7 3 4.5 2Total 0.5 0.1 3.8 0.3 0.7 0.1 0.7 0.1 0.8 0.1 4.1 0.2 7.5 0.3 4 1.1 3.1 0.6
Northeast
Isolated 0.6 0.2 17.1 2.2 2.1 0.4 1.5 0.3 2 0.3 13.4 1.7 20.3 1.9 4.8 1.9 5.3 1.9Rural 0.4 0.1 6.3 0.4 0.9 0.1 0.9 0.1 0.7 0.1 7.1 0.4 12.7 0.5 4.1 0.8 3.6 0.7Urban 0.3 0.2 1.5 0.4 0.8 0.2 0.6 0.2 0.5 0.2 2.4 0.6 5.4 0.7 4.7 2.1 4.2 1.7Total 0.4 0.1 7.3 0.5 1.1 0.1 1 0.1 0.9 0.1 7.4 0.4 12.8 0.5 4.3 0.8 4 0.7
Northwest
Isolated 2.1 0.7 25.2 3.5 3.9 1.1 3.3 0.7 1.9 0.6 18.9 2.8 26.5 3.0 12.7 4.7 13.2 4.7Rural 0.7 0.3 12.7 2.1 1.9 0.5 1.8 0.4 0.7 0.2 13.5 1.9 21.3 2.0 6.5 2.7 7.8 2.9Urban 0.2 0.2 2.4 0.8 0.4 0.3 0.4 0.2 0.4 0.3 3.9 0.7 6.3 1.3 3.9 4 0 0Total 1.1 0.3 15.6 1.6 2.4 0.5 2.1 0.3 1.1 0.2 14.0 1.2 20.9 1.4 8.5 2.3 8.6 2.3
NorthCentral
Isolated 0.8 0.5 22 3.6 2.7 1 0.8 0.4 0.6 0.3 14.6 2.3 21.2 2.8 15.6 6.8 16.3 6.9Rural 0.8 0.2 8.7 1 1.4 0.3 0.5 0.1 0.4 0.2 6.9 0.9 13.2 0.7 4.5 1.5 4.6 1.5Urban 0.9 0.3 2.4 0.8 0.7 0.3 0.1 0.1 0.3 0.2 3.6 0.9 6.9 0.9 3.6 2.5 4.6 2.7Total 0.8 0.1 9.1 0.9 1.4 0.3 0.5 0.1 0.4 0.2 7.2 0.7 13.1 0.6 5.7 1.5 6 1.5
CentralCoast
Isolated 2 0.6 16.9 4.5 1.4 0.5 1 0.4 1.1 0.5 8.9 2.4 17.7 2.8 4 2.7 4 2.7Rural 2.1 0.3 4.4 0.6 0.7 0.2 0.4 0.1 0.2 0.1 4.5 0.4 10.7 0.5 2 1.2 2 1.2Urban 2.1 0.4 3.5 0.5 0.3 0.1 0.4 0.2 0.4 0.2 2.6 0.4 8.1 1.0 0.4 0.3 1.8 1.7Total 2.1 0.2 5.7 0.7 0.7 0.1 0.5 0.1 0.3 0.1 4.5 0.4 10.9 0.6 2 1 2.3 1.1
CentralHighlands
Isolated 1.2 0.5 26.3 4 2.3 0.7 2.6 1.2 2.7 1.1 19.2 3.3 31.3 3.7 12.5 6.1 15.6 6.9Rural 1 0.3 13.8 1.8 0.6 0.2 0.6 0.2 0.6 0.3 8.2 1.0 15.0 1.2 11.5 3.6 11.9 3.4Urban 0.9 0.3 4.3 0.9 0.7 0.3 0.1 0.1 0.5 0.3 4.0 0.8 8.7 1.1 2.1 1.2 3.6 2Total 1 0.2 13.9 1.2 1 0.2 0.9 0.3 1 0.3 9.5 0.8 16.8 1.1 9.8 2.4 11.1 2.4
Southeast
Isolated 1.2 0.4 8.8 1.4 1.5 0.4 0.5 0.2 0.6 0.2 5.1 1.0 11.4 1.1 3.3 1.5 3.1 1.5Rural 1.1 0.2 4.9 0.4 0.9 0.2 0.5 0.1 0.5 0.1 4.2 0.3 9.5 0.4 5.1 1.3 6 1.5Urban 1.5 0.3 2.1 0.3 0.6 0.1 0.3 0.1 0.2 0.1 2.1 0.3 6.5 0.6 2.4 2 3 2Total 1.3 0.1 4.2 0.3 0.9 0.1 0.4 0.1 0.4 0.1 3.4 0.2 8.5 0.4 3.8 1 4.5 1
MekongDelta
Isolated 2.6 0.4 8.5 1 0.9 0.2 1.2 0.3 0.3 0.1 6.5 0.7 13.8 1.0 3.8 1.8 3.8 1.8Rural 2.5 0.2 7.1 0.4 0.9 0.1 0.9 0.1 0.4 0.1 5.8 0.3 12.0 0.5 3.6 0.9 4.7 0.9Urban 2 0.4 4.1 0.7 0.6 0.2 0.3 0.1 0.3 0.1 4.1 0.5 8.7 0.6 5.3 2.3 5.3 2.3Total 2.4 0.1 6.8 0.3 0.9 0.1 0.9 0.1 0.4 0.1 5.6 0.2 11.7 0.4 3.9 0.8 4.6 0.8
Vietnam
Isolated 1.5 0.1 15.6 0.9 1.8 0.2 1.4 0.2 1.2 0.1 11.1 0.7 18.6 0.7 7.6 1.5 7.4 1.2Rural 1.1 0.1 6.5 0.2 1 0.1 0.7 0.1 0.6 0.1 5.9 0.2 11.4 0.2 4.1 0.5 4.4 0.5Urban 1.2 0.1 2.6 0.2 0.6 0.1 0.3 0 0.4 0.1 2.8 0.2 6.7 0.3 3.8 0.8 3.8 0.8Total 1.2 0.1 6.8 0.2 1 0.1 0.7 0 0.6 0 5.9 0.1 11.3 0.2 4.6 0.4 4.7 0.4
It was satisfying to note that for the most part the benchmarks were met. Thismust be very gratifying for the MOET. There were some instances wherepupils did not have the required textbooks and materials and in this caseaction should be taken to ensure that pupils acquire them. There were otherinstances where the benchmarks for teacher training had not been met fullyand there was reason to believe that some further action is needed. Policysuggestions for these last two points have already been made in earlierchapters.
Above all there were two sets of benchmarks and some were even furthersubdivided into isolated vs. rural and urban schools. There were severalinstances where benchmarks did not exist when it would have been desirableto have had them. Once a new set of benchmarks has been arrived at, theseshould be printed into one document and made known to all.
CCoonncclluussiioonn
It would be desirable if the MOET were to re-examine its sets of benchmarksand decide on possible revisions to them. This would involve not onlyrevising existing benchmarks but also deciding on further benchmarks thatmight be useful.
For the most part the existing benchmarks were met and where there was alack of textbooks and materials in a few schools or where there was a dearthof teachers meeting the teacher training standards, then appropriate actionshould be take to have the pupils acquire the textbooks and materials, and theteachers should be upgraded.
Vietnam Reading and Mathematics Assessment Study
210
Chapter 7
HOW EQUITABLY ALLOCATED WEREEDUCATIONAL RESOURCES TO PRIMARYSCHOOLS? HOW EQUITABLY DISTRIBUTEDWAS PUPIL ACHIEVEMENT BETWEENSCHOOLS?
Introduction
The educational goal of giving equality of educational opportunityto all pupils is an issue that goes far beyond giving every childaccess to school education. It also involves giving all of thosepupils who are in school an equal opportunity to learn. One way to
do this is to ensure that there is equitable distribution of educational resourcesamong all schools.
In all school systems where the government wishes to take action to addressthe issue of equity, it is important to know the ‘location’ of differences orvariations in resource inputs to schools. For example, it is important to knowwhether variations in resource inputs are more pronounced among provinces,or whether they are larger among schools within provinces. An answer to thistype of question provides guidance concerning which resources aredistributed evenly or unevenly, and at the same time suggests the level atwhich decisions must be taken (national or provincial) in order to address anymajor inequities that are observed.
In exploring questions of equity, it must be recognised that there is a need toexamine allocation patterns in association with the actual levels of provisionthat were given in chapter 4 and 5. Such information is necessary because itenables policy-makers to identify which resources require attention, and alsoto have some feeling for the amounts of supplementary resources that may beneeded in order to achieve a more equitable distribution.
Vietnam Reading and Mathematics Assessment Study
211
Not only are the levels ofinputs to schoolsimportant (see previouschapters) but howequitable the inputs wereallocated among schoolsis also an importantfeature of anyeducational system.
This chapter concentrates mainly on an examination of the distribution ofeducational resources and not upon absolute resource levels. Consequentlythe results presented in the chapter should be examined in conjunction withthe results from chapters 4, 5, and 6 which examined baseline data andbenchmark allocations.
Two approaches to the measurement ofequity in material and human resourceinputs
(i) Variation among schools within regions compared with overallvariation
It is also possible to quantify the differences among schools within aparticular region by making a comparison with the variation among schoolsat the national level. This can be achieved by using the formula below:
Standard deviation for schools in a region
Standard deviation for schools in the nation
The standard deviation of an indicator for a particular region measures theamount of variation among schools within the region, whereas the standarddeviation for the whole country measures the variation among schools for thewhole nation. The ratio of the standard deviation of an indicator for a regionto the standard deviation for the nation, expressed as a percentage, providesa measure of the degree of equity within a region compared with the nationalpicture.
To illustrate the interpretation of these ratio values it is helpful to considertwo hypothetical regions: Region A and Region B. Assume that the levels ofa resource are measured by an indicator that has a ratio value of 50 percentfor Region A and 150 percent for Region B. This figure would mean that thevariation in resource levels among schools in Region A is 50 percent less thanthe variation in resource levels for the nation as a whole: and the variation inRegion B is 50 percent higher than for the nation as a whole. From these ratiovalues it can be seen that, compared with the national picture, there has beena more equitable allocation of that resource in Region A while in Region Bthere are major inequities among schools compared with the nation as awhole.
Vietnam Reading and Mathematics Assessment Study
212
X 100
Two measures of equitywere employed. The firs
was variation amongschools within regions.
The variation amongschools within regions
was compared with thevariation among schools
for the whole country.
(ii) Variation among provinces
A statistic called the coefficient of intra-class correlation (rho) may be usedto divide the variation in resource inputs into two components: (a) amongprovinces, and (b) among schools within provinces. Rho can range from zeroto 1.00. When used in this way, rho is a ratio that measures the percentage oftotal variation among schools that can be attributed to variation amongprovinces.
To appreciate the meaning of rho, it is useful to consider two hypotheticalschool systems: System A and System B. In school system A, resources areallocated equally, or nearly equally, to all schools and therefore when onecalculates average resource levels for regions or provinces in the system onefinds that these are more or less the same - except perhaps for some minorchance deviations. For such a school system, the value of rho would be closeto zero because of the small variation among regions or provinces. In thissituation most of the variation would be among schools within regions orprovinces.
On the other hand, consider school system B where, because ofadministrative decisions, historical factors, or geographical differentiation ofsocial class groups, etc., there are large variations among the provinces. Inthis case the value of rho would be close to unity. The majority of thevariation in this case would be due to variations among regions or provincesand there would be little variation among schools within regions or provinces
The above examples are extremes that serve to illustrate the interpretation ofrho. In using rho for policy discussion it is common practice to multiply thevalues of rho by 100 in order to present a more readable discussion about the‘percentage of variance’. For example, a rho of, say, 0.20 means that 80percent of the variation is among schools within regions or provinces and 20percent among regions or provinces. In contrast, a rho of 0.8 would indicatethat 80 percent of the variation is among regions or provinces and 20 percentamong schools within regions or provinces.
Equity calculations for material resourceinputs
Two sets of equity measures for material resources have been presented inTable 7.1. The first measure was how the variation among schools within aregion compared with the national variation among schools. For each regionthe value for the comparison of the standard deviation for a resource in theregion with the national standard deviation has been made. The value of101.4 for classroom furniture in the Red River Delta means that the variationamong schools in that region was slightly higher than for the country as awhole. On the other hand the variation for classroom materials amongschools within the region was less than for the country as a whole.
Vietnam Reading and Mathematics Assessment Study
213
The second was theproportion of totalvariation that wasattributable to variationamong province ascompared with amongschools withinprovinces.
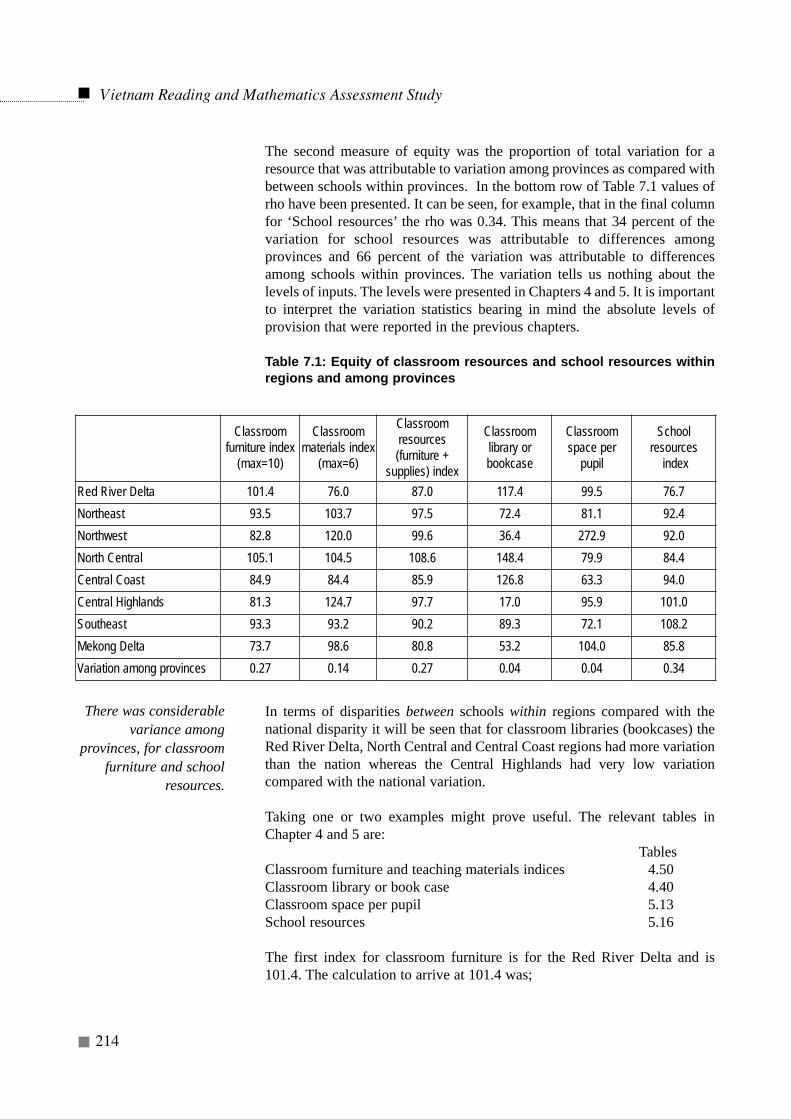
The second measure of equity was the proportion of total variation for aresource that was attributable to variation among provinces as compared withbetween schools within provinces. In the bottom row of Table 7.1 values ofrho have been presented. It can be seen, for example, that in the final columnfor ‘School resources’ the rho was 0.34. This means that 34 percent of thevariation for school resources was attributable to differences amongprovinces and 66 percent of the variation was attributable to differencesamong schools within provinces. The variation tells us nothing about thelevels of inputs. The levels were presented in Chapters 4 and 5. It is importantto interpret the variation statistics bearing in mind the absolute levels ofprovision that were reported in the previous chapters.
Table 7.1: Equity of classroom resources and school resources withinregions and among provinces
In terms of disparities between schools within regions compared with thenational disparity it will be seen that for classroom libraries (bookcases) theRed River Delta, North Central and Central Coast regions had more variationthan the nation whereas the Central Highlands had very low variationcompared with the national variation.
Taking one or two examples might prove useful. The relevant tables inChapter 4 and 5 are:
TablesClassroom furniture and teaching materials indices 4.50Classroom library or book case 4.40Classroom space per pupil 5.13School resources 5.16
The first index for classroom furniture is for the Red River Delta and is101.4. The calculation to arrive at 101.4 was;
Vietnam Reading and Mathematics Assessment Study
214
Classroom furniture index
(max=10)
Classroommaterials index
(max=6)
Classroomresources (furniture +
supplies) index
Classroomlibrary or bookcase
Classroomspace per
pupil
Schoolresources
index
Red River Delta 101.4 76.0 87.0 117.4 99.5 76.7Northeast 93.5 103.7 97.5 72.4 81.1 92.4Northwest 82.8 120.0 99.6 36.4 272.9 92.0North Central 105.1 104.5 108.6 148.4 79.9 84.4Central Coast 84.9 84.4 85.9 126.8 63.3 94.0Central Highlands 81.3 124.7 97.7 17.0 95.9 101.0Southeast 93.3 93.2 90.2 89.3 72.1 108.2Mekong Delta 73.7 98.6 80.8 53.2 104.0 85.8Variation among provinces 0.27 0.14 0.27 0.04 0.04 0.34
There was considerablevariance among
provinces, for classroomfurniture and school
resources.
Standard deviation for Red River Delta = 1.4919
Standard deviation for Vietnam = 1.4707
If the two standard deviations had been identical, then the resultant indexwould have been 100. Hence, it can be seen that the variation in the RedRiver Delta was about the same as for Vietnam as a whole. The level (seeTable 4.5) for furniture in the Red River Delta was 6.5 out of 10 items. Thiswas above the mean of the country, which was 5.5. It can be said that the RedRiver Delta had relatively good level of furniture and about the samevariation among schools as the country as a whole.
The lowest index in the table is 17.0 for classroom library or bookcase in theCentral Highlands. The index of 17.0 shows that there was very littlevariation among schools in this region. In Table 4.4, it can be seen that themean for the region was one book per classroom. The mean for Vietnam was7.8 books per classroom. Thus, the level was extremely low for the CentralHighlands and there was very little variation among schools. That is, allschools had virtually no books in their classroom library or bookcases.
For classroom space the variation in the Northwest region was very largecompared with the nation as a whole.
For the other variables there was not very much difference in variationwithin regions as for the nation altogether.
For the rho values it can be seen that there were three values over 0.20. Thesewere classroom furniture, total classroom resources and school resources. Inthese cases the national authorities need to consider what can be donetogether with the provincial authorities.
Policy suggestion 7.1: The MOET may wish to consider equalizingclassroom resources and school resources between provinces.
Equity calculations for human resourceinputs
Educational planners are not only responsible for the allocation of materialresources to schools but also for the allocation of human resources. If allpupils are to have an equal access to education, it is important that they are inschools that have the basic resources in terms of materials and also teachers.
The statistics for the variation among schools within regions as well as therho between regions have been presented in Table 7.2. It can be seen that therho values for all resources among regions were below the 20 percent limit.For teacher academic qualifications there was slightly more variation in thenorthern regions than in the country as a whole. For teacher professional
Vietnam Reading and Mathematics Assessment Study
215
Within regions theNorthwest had highvariation among schoolsfor classroom space andthe North Central forclassroom library. Therewas low variation inmany provinces forclassroom library whereno school had them.
*100=101.4
There was an equitableallocation of humanresources, except forteacher qualifications inthe Northern regions.
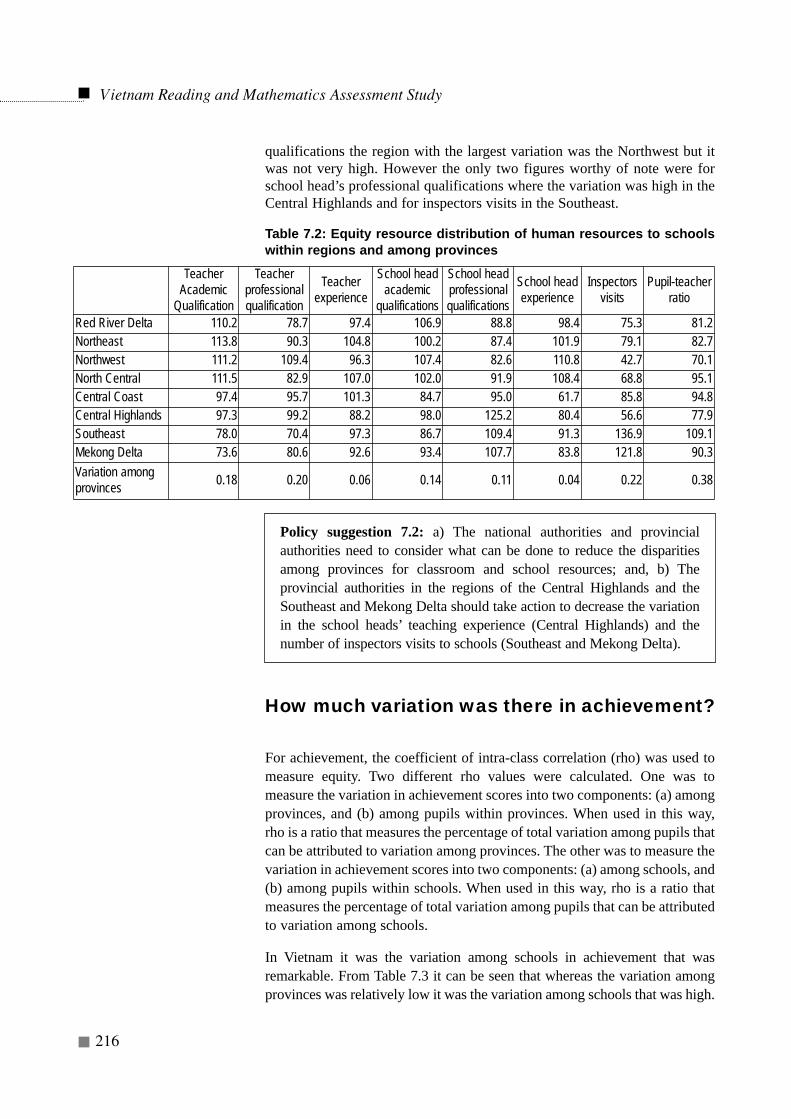
qualifications the region with the largest variation was the Northwest but itwas not very high. However the only two figures worthy of note were forschool head’s professional qualifications where the variation was high in theCentral Highlands and for inspectors visits in the Southeast.
Table 7.2: Equity resource distribution of human resources to schoolswithin regions and among provinces
Policy suggestion 7.2: a) The national authorities and provincialauthorities need to consider what can be done to reduce the disparitiesamong provinces for classroom and school resources; and, b) Theprovincial authorities in the regions of the Central Highlands and theSoutheast and Mekong Delta should take action to decrease the variationin the school heads’ teaching experience (Central Highlands) and thenumber of inspectors visits to schools (Southeast and Mekong Delta).
How much variation was there in achievement?
For achievement, the coefficient of intra-class correlation (rho) was used tomeasure equity. Two different rho values were calculated. One was tomeasure the variation in achievement scores into two components: (a) amongprovinces, and (b) among pupils within provinces. When used in this way,rho is a ratio that measures the percentage of total variation among pupils thatcan be attributed to variation among provinces. The other was to measure thevariation in achievement scores into two components: (a) among schools, and(b) among pupils within schools. When used in this way, rho is a ratio thatmeasures the percentage of total variation among pupils that can be attributedto variation among schools.
In Vietnam it was the variation among schools in achievement that wasremarkable. From Table 7.3 it can be seen that whereas the variation amongprovinces was relatively low it was the variation among schools that was high.
Vietnam Reading and Mathematics Assessment Study
216
TeacherAcademic
Qualification
Teacher professionalqualification
Teacherexperience
School headacademic
qualifications
School headprofessionalqualifications
School headexperience
Inspectorsvisits
Pupil-teacherratio
Red River Delta 110.2 78.7 97.4 106.9 88.8 98.4 75.3 81.2 Northeast 113.8 90.3 104.8 100.2 87.4 101.9 79.1 82.7 Northwest 111.2 109.4 96.3 107.4 82.6 110.8 42.7 70.1 North Central 111.5 82.9 107.0 102.0 91.9 108.4 68.8 95.1 Central Coast 97.4 95.7 101.3 84.7 95.0 61.7 85.8 94.8 Central Highlands 97.3 99.2 88.2 98.0 125.2 80.4 56.6 77.9 Southeast 78.0 70.4 97.3 86.7 109.4 91.3 136.9 109.1 Mekong Delta 73.6 80.6 92.6 93.4 107.7 83.8 121.8 90.3 Variation amongprovinces 0.18 0.20 0.06 0.14 0.11 0.04 0.22 0.38
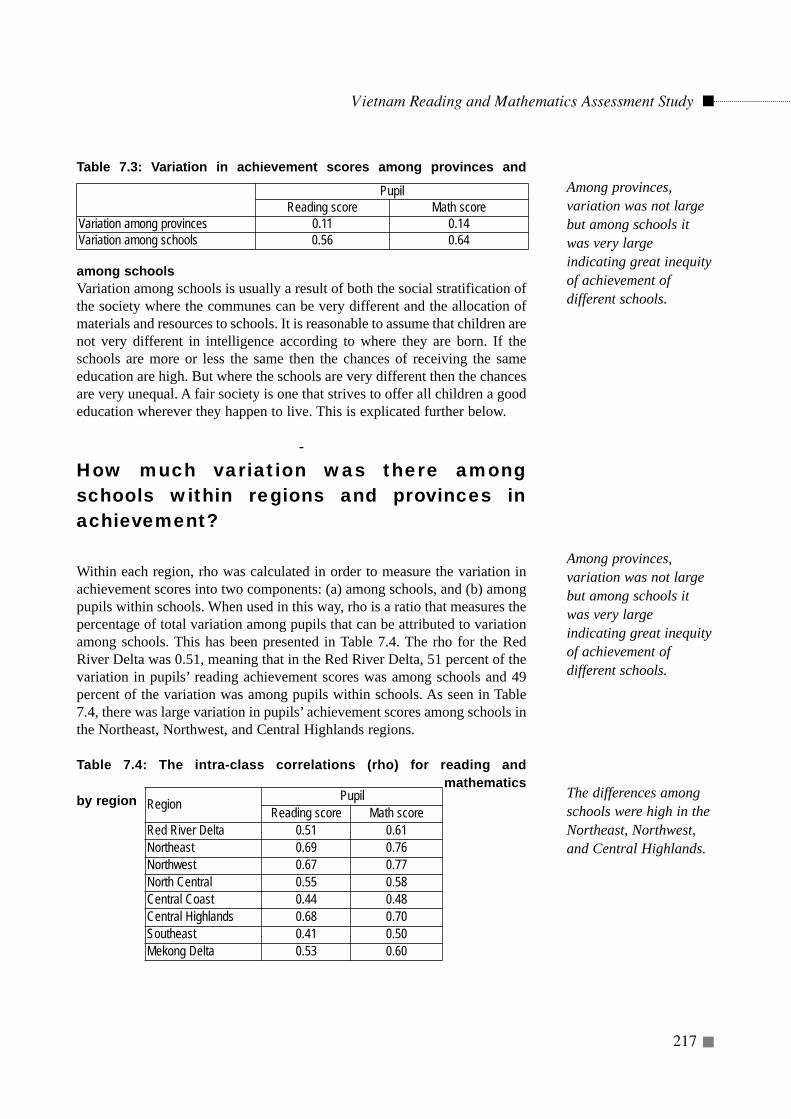
Table 7.3: Variation in achievement scores among provinces and
among schoolsVariation among schools is usually a result of both the social stratification ofthe society where the communes can be very different and the allocation ofmaterials and resources to schools. It is reasonable to assume that children arenot very different in intelligence according to where they are born. If theschools are more or less the same then the chances of receiving the sameeducation are high. But where the schools are very different then the chancesare very unequal. A fair society is one that strives to offer all children a goodeducation wherever they happen to live. This is explicated further below.
-
How much variation was there amongschools within regions and provinces inachievement?
Within each region, rho was calculated in order to measure the variation inachievement scores into two components: (a) among schools, and (b) amongpupils within schools. When used in this way, rho is a ratio that measures thepercentage of total variation among pupils that can be attributed to variationamong schools. This has been presented in Table 7.4. The rho for the RedRiver Delta was 0.51, meaning that in the Red River Delta, 51 percent of thevariation in pupils’ reading achievement scores was among schools and 49percent of the variation was among pupils within schools. As seen in Table7.4, there was large variation in pupils’ achievement scores among schools inthe Northeast, Northwest, and Central Highlands regions.
Table 7.4: The intra-class correlations (rho) for reading andmathematics
by region
Vietnam Reading and Mathematics Assessment Study
217
PupilReading score Math score
Variation among provinces 0.11 0.14Variation among schools 0.56 0.64
Among provinces,variation was not largebut among schools itwas very largeindicating great inequityof achievement ofdifferent schools.
Among provinces,variation was not largebut among schools itwas very largeindicating great inequityof achievement ofdifferent schools.
The differences amongschools were high in theNortheast, Northwest,and Central Highlands.
Region PupilReading score Math score
Red River Delta 0.51 0.61Northeast 0.69 0.76Northwest 0.67 0.77North Central 0.55 0.58Central Coast 0.44 0.48Central Highlands 0.68 0.70Southeast 0.41 0.50Mekong Delta 0.53 0.60
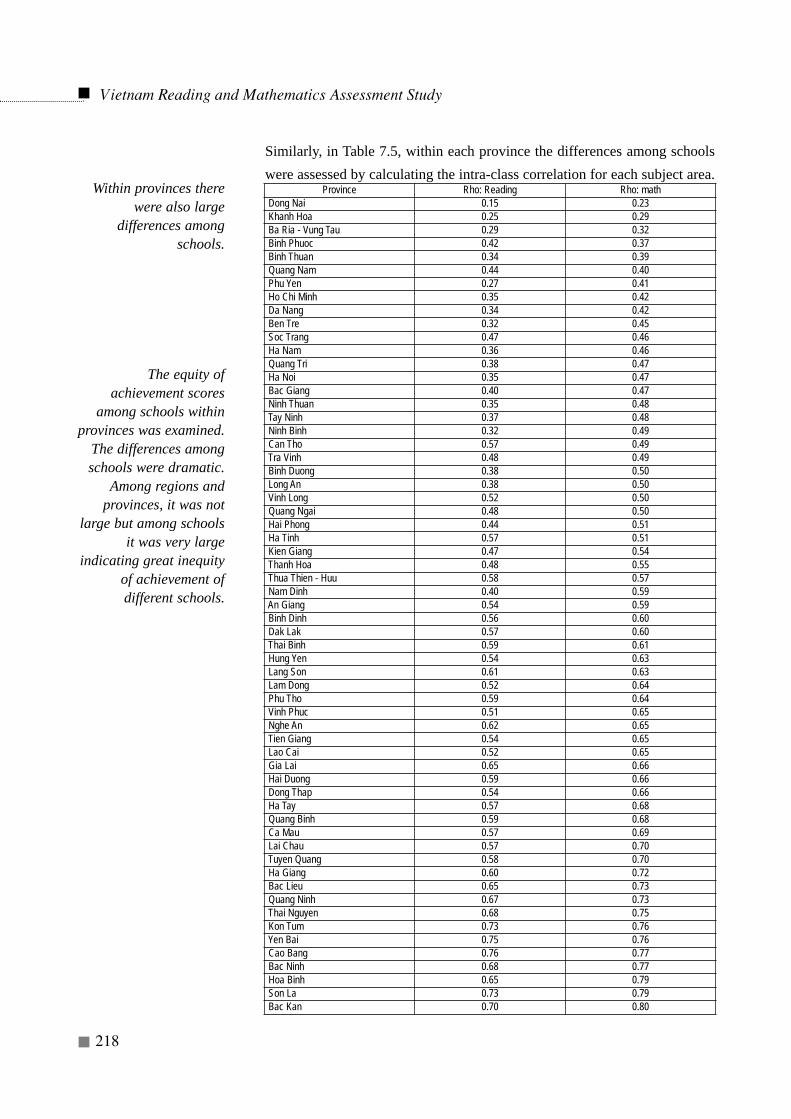
Similarly, in Table 7.5, within each province the differences among schoolswere assessed by calculating the intra-class correlation for each subject area.
Vietnam Reading and Mathematics Assessment Study
218
Province Rho: Reading Rho: mathDong Nai 0.15 0.23Khanh Hoa 0.25 0.29Ba Ria - Vung Tau 0.29 0.32Binh Phuoc 0.42 0.37Binh Thuan 0.34 0.39Quang Nam 0.44 0.40Phu Yen 0.27 0.41Ho Chi Minh 0.35 0.42Da Nang 0.34 0.42Ben Tre 0.32 0.45Soc Trang 0.47 0.46Ha Nam 0.36 0.46Quang Tri 0.38 0.47Ha Noi 0.35 0.47Bac Giang 0.40 0.47Ninh Thuan 0.35 0.48Tay Ninh 0.37 0.48Ninh Binh 0.32 0.49Can Tho 0.57 0.49Tra Vinh 0.48 0.49Binh Duong 0.38 0.50Long An 0.38 0.50Vinh Long 0.52 0.50Quang Ngai 0.48 0.50Hai Phong 0.44 0.51Ha Tinh 0.57 0.51Kien Giang 0.47 0.54Thanh Hoa 0.48 0.55Thua Thien - Huu 0.58 0.57Nam Dinh 0.40 0.59An Giang 0.54 0.59Binh Dinh 0.56 0.60Dak Lak 0.57 0.60Thai Binh 0.59 0.61Hung Yen 0.54 0.63Lang Son 0.61 0.63Lam Dong 0.52 0.64Phu Tho 0.59 0.64Vinh Phuc 0.51 0.65Nghe An 0.62 0.65Tien Giang 0.54 0.65Lao Cai 0.52 0.65Gia Lai 0.65 0.66Hai Duong 0.59 0.66Dong Thap 0.54 0.66Ha Tay 0.57 0.68Quang Binh 0.59 0.68Ca Mau 0.57 0.69Lai Chau 0.57 0.70Tuyen Quang 0.58 0.70Ha Giang 0.60 0.72Bac Lieu 0.65 0.73Quang Ninh 0.67 0.73Thai Nguyen 0.68 0.75Kon Tum 0.73 0.76Yen Bai 0.75 0.76Cao Bang 0.76 0.77Bac Ninh 0.68 0.77Hoa Binh 0.65 0.79Son La 0.73 0.79Bac Kan 0.70 0.80
Within provinces therewere also large
differences amongschools.
The equity ofachievement scores
among schools withinprovinces was examined.
The differences amongschools were dramatic.
Among regions andprovinces, it was not
large but among schoolsit was very large
indicating great inequityof achievement ofdifferent schools.
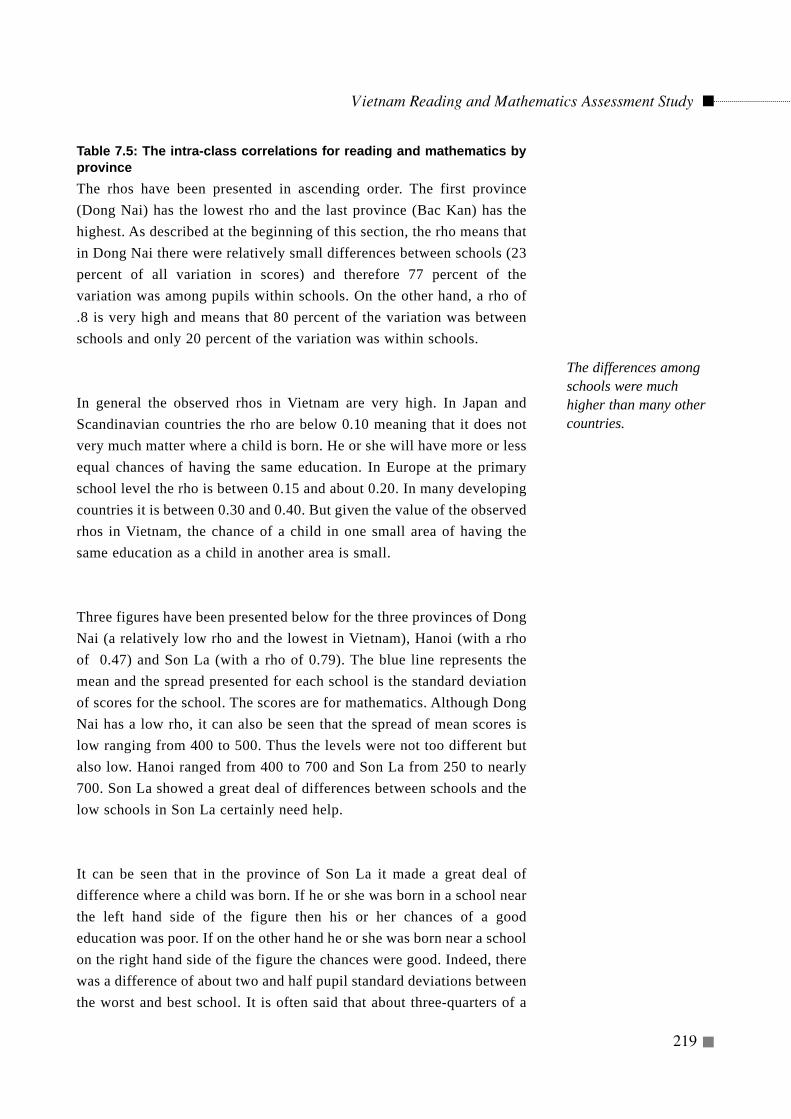
Table 7.5: The intra-class correlations for reading and mathematics byprovinceThe rhos have been presented in ascending order. The first province(Dong Nai) has the lowest rho and the last province (Bac Kan) has thehighest. As described at the beginning of this section, the rho means thatin Dong Nai there were relatively small differences between schools (23percent of all variation in scores) and therefore 77 percent of thevariation was among pupils within schools. On the other hand, a rho of.8 is very high and means that 80 percent of the variation was betweenschools and only 20 percent of the variation was within schools.
In general the observed rhos in Vietnam are very high. In Japan andScandinavian countries the rho are below 0.10 meaning that it does notvery much matter where a child is born. He or she will have more or lessequal chances of having the same education. In Europe at the primaryschool level the rho is between 0.15 and about 0.20. In many developingcountries it is between 0.30 and 0.40. But given the value of the observedrhos in Vietnam, the chance of a child in one small area of having thesame education as a child in another area is small.
Three figures have been presented below for the three provinces of DongNai (a relatively low rho and the lowest in Vietnam), Hanoi (with a rhoof 0.47) and Son La (with a rho of 0.79). The blue line represents themean and the spread presented for each school is the standard deviationof scores for the school. The scores are for mathematics. Although DongNai has a low rho, it can also be seen that the spread of mean scores islow ranging from 400 to 500. Thus the levels were not too different butalso low. Hanoi ranged from 400 to 700 and Son La from 250 to nearly700. Son La showed a great deal of differences between schools and thelow schools in Son La certainly need help.
It can be seen that in the province of Son La it made a great deal ofdifference where a child was born. If he or she was born in a school nearthe left hand side of the figure then his or her chances of a goodeducation was poor. If on the other hand he or she was born near a schoolon the right hand side of the figure the chances were good. Indeed, therewas a difference of about two and half pupil standard deviations betweenthe worst and best school. It is often said that about three-quarters of a
Vietnam Reading and Mathematics Assessment Study
219
The differences amongschools were muchhigher than many othercountries.
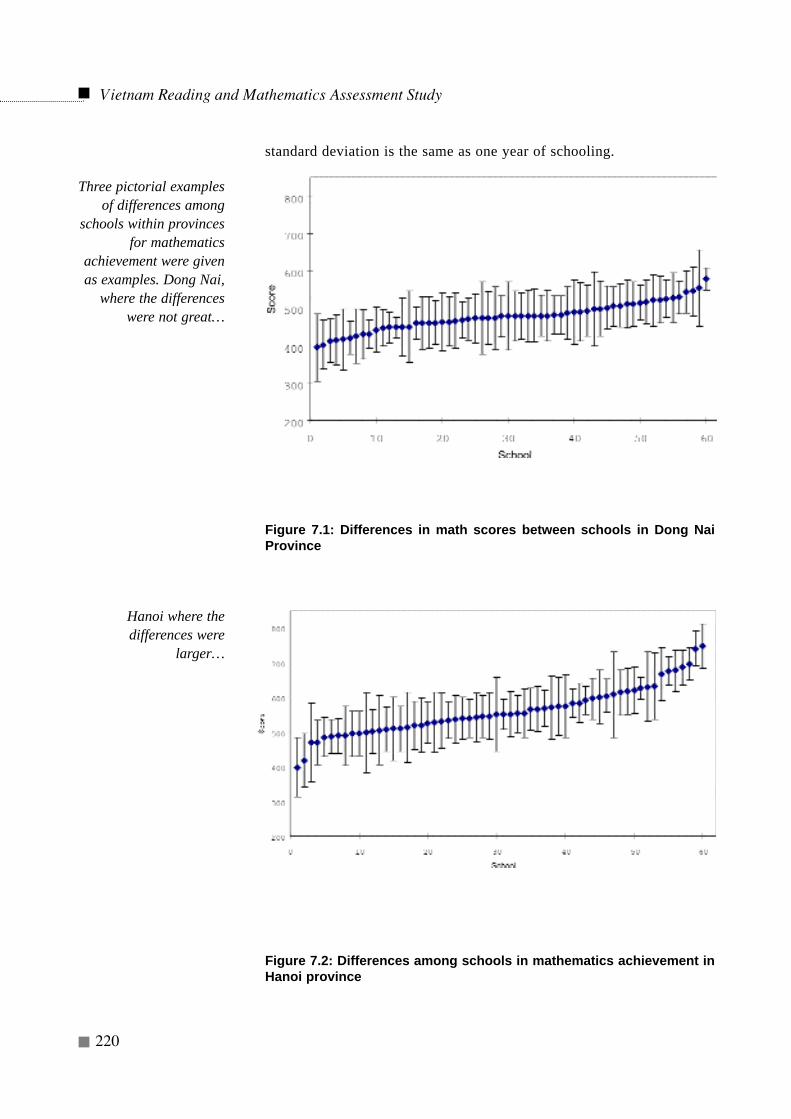
standard deviation is the same as one year of schooling.
Figure 7.1: Differences in math scores between schools in Dong NaiProvince
Figure 7.2: Differences among schools in mathematics achievement inHanoi province
Vietnam Reading and Mathematics Assessment Study
220
Three pictorial examplesof differences among
schools within provincesfor mathematics
achievement were givenas examples. Dong Nai,
where the differenceswere not great…
Hanoi where thedifferences were
larger…
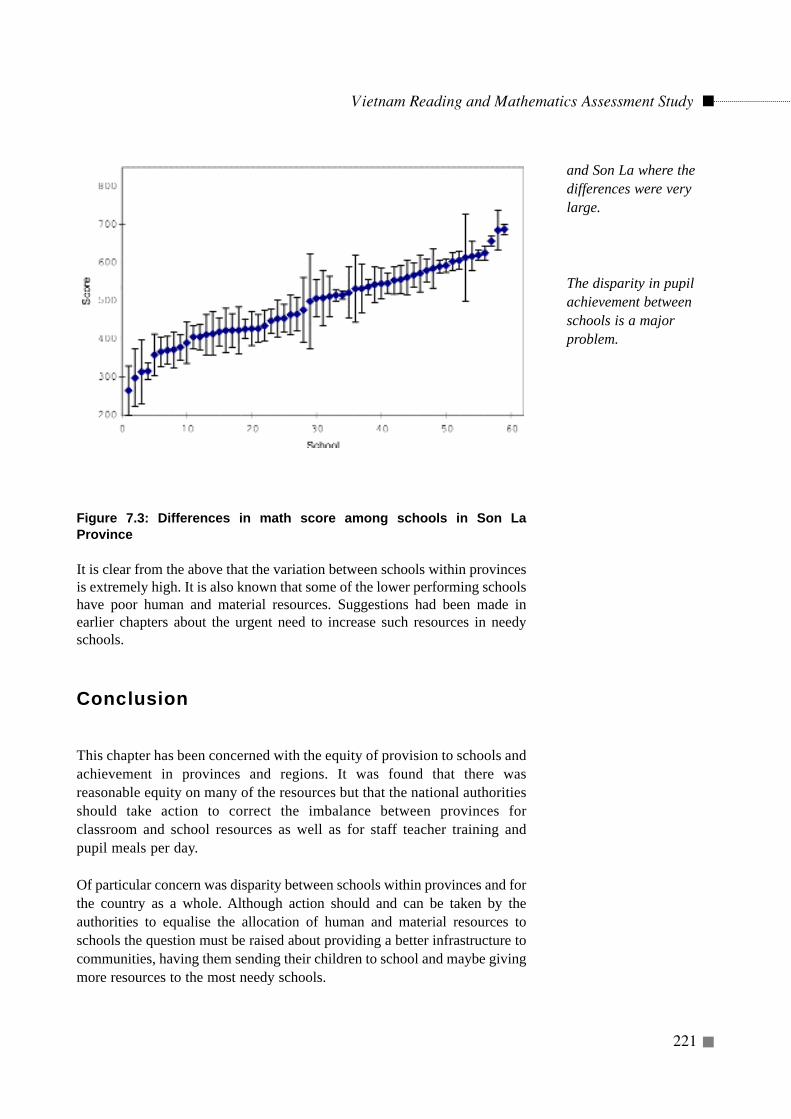
Figure 7.3: Differences in math score among schools in Son LaProvince
It is clear from the above that the variation between schools within provincesis extremely high. It is also known that some of the lower performing schoolshave poor human and material resources. Suggestions had been made inearlier chapters about the urgent need to increase such resources in needyschools.
Conclusion
This chapter has been concerned with the equity of provision to schools andachievement in provinces and regions. It was found that there wasreasonable equity on many of the resources but that the national authoritiesshould take action to correct the imbalance between provinces forclassroom and school resources as well as for staff teacher training andpupil meals per day.
Of particular concern was disparity between schools within provinces and forthe country as a whole. Although action should and can be taken by theauthorities to equalise the allocation of human and material resources toschools the question must be raised about providing a better infrastructure tocommunities, having them sending their children to school and maybe givingmore resources to the most needy schools.
Vietnam Reading and Mathematics Assessment Study
221
and Son La where thedifferences were verylarge.
The disparity in pupilachievement betweenschools is a majorproblem.
The differences among schools overall in the country and also withinprovinces was high compared with other countries. This kind of inequity atthe primary education level is unacceptable and much effort will be neededto reduce these differences. As has been seen in this chapter and also insubsequent chapters it is a number of variables that in conjunction areaccounting for these achievement differences among schools. It is for thenational and provincial authorities to examine the levels if provision for thevariables associated with the achievement differences and decide on a plan ofaction.
It must be recognized that in order to have equality of outcomes it is oftennecessary to have inequity of inputs and particularly processes. At the sametime, there must be a level of provision below which no school should ever be.
Vietnam Reading and Mathematics Assessment Study
222
Chapter 8
EFFECTIVE PRIMARY SCHOOLS INVIETNAM1
Introduction
In Chapters 3, 4, and 5, those variables whose correlations and partialcorrelations were reasonably large were identified as being associatedwith differences in pupil achievement in the Vietnamese primaryeducation system. However, it was considered desirable to analyse the
data in a different way in order to see if similar results were obtained.Certainly, if similar results were obtained from a different way of 'looking atthe data', this would be very reassuring. The 'other' way has been called an'effective schools analysis'
An effective school is one that achieves better than expected given its intakeof pupils. That is to say, on average the pupils achieve better than could beexpected given the relationship between achievement and home backgroundfor all Grade 5 pupils in the country. By definition, an ineffective school istherefore one that achieves less well than expected given its intake of pupils.What is meant by 'given its intake of pupils'? In general, pupils from betterhomes have higher achievement scores than pupils from poorer homes. Whatis meant by a 'good or poor home'? Good homes are those where the parentshave a high level of education, where there are many possessions in the homebecause the parents have sufficient money to buy the possessions. A goodhome will therefore have many books in the home. It is true that a pupil froma home with many books has more opportunity to read than a pupil from ahome where there are few books.
In Vietnam, pupils from poorer homes tend to come from more isolated areas,belong to ethnic groups other than the main ethnic group of Kinh and not tospeak so much Vietnamese outside the school. They tend to speak theirmother-tongue language that is very different from Vietnamese. All of thesefactors can be formed into a construct called 'home background'. In a sense,these variables are proxy measures for the interest that the parents show intheir children learning in school.
Vietnam Reading and Mathematics Assessment Study
223
1 This chapter was written by Miyako Ikeda
An effective school isschool whose pupilsachieved better thanexpected given their"home background". Anineffective school is onethat achieved less wellthan expected.
"Home background"represents the extent towhich parents wereinterested in and caredfor children's education.
There were 3654 schools in the sample. It was of interest to identify theschools that were most effective and the schools that were least effective andthen identify those variables where there were large differences between thetwo groups of schools.
Method of analysis
A home background factor (a principal component) was formed of thefollowing variables with the following loadings:
Variable LoadingSpeaking Vietnamese at home .797Belonging to ethnic minority .794No. of books at home .467Years parental education .591Wealth of home (total possessions) .662
The correlation between this home background factor and readingachievement was 0.30 and with mathematics achievement it was 0.27. Asexpected, pupils with higher values on the home background factor tended toobtain higher scores both in reading and in mathematics. The correlationbetween the two achievement scores was 0.74.
A simple bivariate regression line was established between the homebackground factor and the pupil scores on a) the reading test, and b) themathematics test. The pupils placed above the regression line wereinterpreted as having reading scores (or mathematics) scores that were betterthan could be expected - after taking the home background into account.Conversely, pupils placed below the line had scores that were worse thanmight be expected.
The residual (actual minus predicted scores) scores were then averaged overschools so that a school with a very high mean residual score was identifiedas a 'more effective' school because it had many pupils whose achievementscores were much higher than expected. (This procedure also avoidsaggregation effects that would have occurred if the procedure had beencarried out at the between school level only).
It is important to note that this definition of a 'more effective' schoolmade it possible for a school to be designated as effective even if ithad a relatively low raw mean score - perhaps even considerablylower than the average for all schools in the country. Similarly, aschool with a relatively high mean score might after considering thehome background of its pupils be designated as a 'less effective'school. As seen in Figure 8.1 below, School A is regarded as 'moreeffective' school because it is above the regression line, even thoughthe mean mathematics score of School A was 453, which was lowerthan the national average of 500. On the other hand, School B is
Vietnam Reading and Mathematics Assessment Study
224
Variables with largedifferences between the
group of the mosteffective schools and the
groups of the leasteffective schools were
identified.
Home backgroundconsists of 5 variables.
Pupils with 'higher'home backgrounds had
higher achievementscores in both
mathematics andreading.
An "expected" score foreach pupil was
calculated.
The differences betweenthe expected and
achieved scores at thepupil level were
calculated, then,aggregated to the school
level. Schools where the actual
score was higher thanthe expected score were'more effective.' Schools
where the actual scorewas lower than the
expected score were 'lesseffective.'
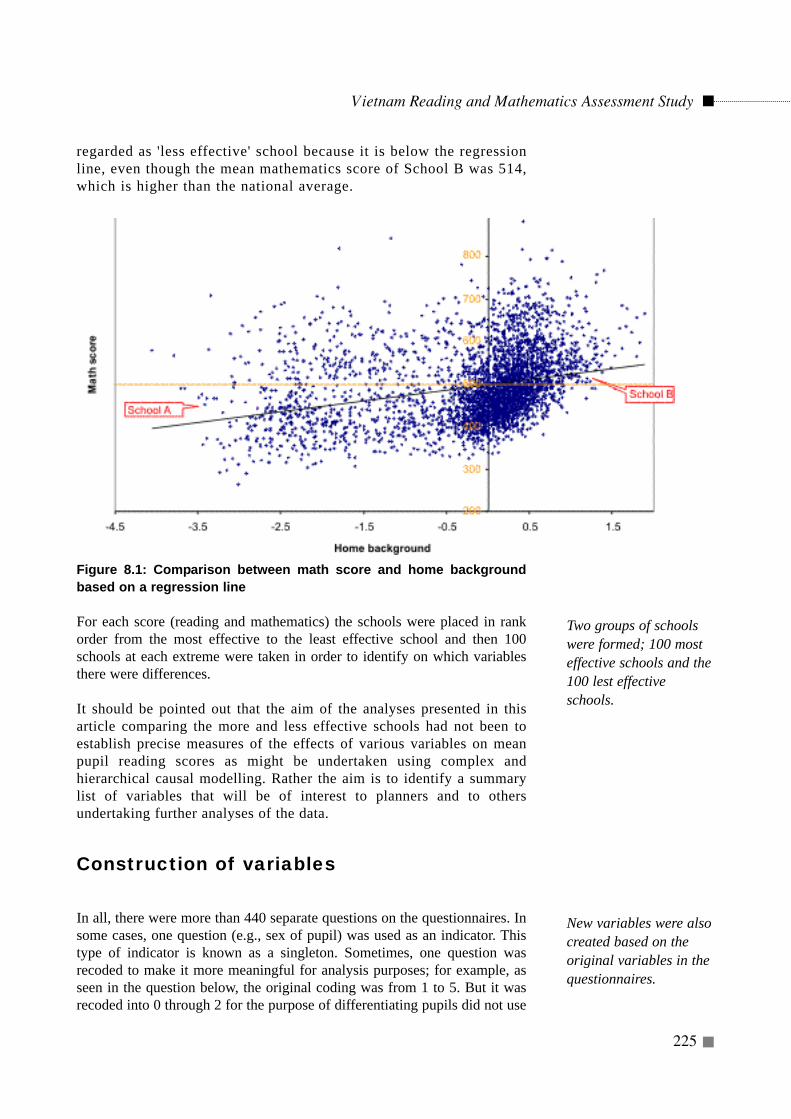
regarded as 'less effective' school because it is below the regressionline, even though the mean mathematics score of School B was 514,which is higher than the national average.
Figure 8.1: Comparison between math score and home backgroundbased on a regression line
For each score (reading and mathematics) the schools were placed in rankorder from the most effective to the least effective school and then 100schools at each extreme were taken in order to identify on which variablesthere were differences.
It should be pointed out that the aim of the analyses presented in thisarticle comparing the more and less effective schools had not been toestablish precise measures of the effects of various variables on meanpupil reading scores as might be undertaken using complex andhierarchical causal modelling. Rather the aim is to identify a summarylist of variables that will be of interest to planners and to othersundertaking further analyses of the data.
Construction of variables
In all, there were more than 440 separate questions on the questionnaires. Insome cases, one question (e.g., sex of pupil) was used as an indicator. Thistype of indicator is known as a singleton. Sometimes, one question wasrecoded to make it more meaningful for analysis purposes; for example, asseen in the question below, the original coding was from 1 to 5. But it wasrecoded into 0 through 2 for the purpose of differentiating pupils did not use
Vietnam Reading and Mathematics Assessment Study
225
Two groups of schoolswere formed; 100 mosteffective schools and the100 lest effectiveschools.
New variables were alsocreated based on theoriginal variables in thequestionnaires.
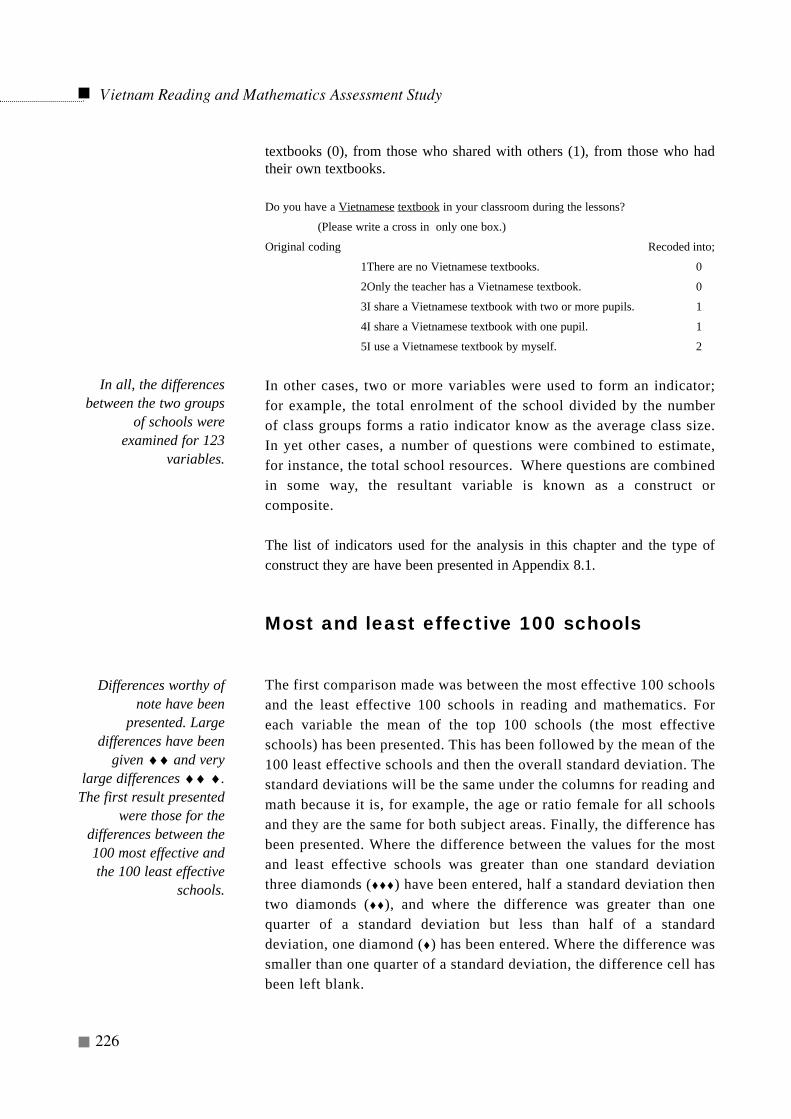
textbooks (0), from those who shared with others (1), from those who hadtheir own textbooks.
Do you have a Vietnamese textbook in your classroom during the lessons?
(Please write a cross in only one box.)
Original coding Recoded into;
1There are no Vietnamese textbooks. 0
2Only the teacher has a Vietnamese textbook. 0
3I share a Vietnamese textbook with two or more pupils. 1
4I share a Vietnamese textbook with one pupil. 1
5I use a Vietnamese textbook by myself. 2
In other cases, two or more variables were used to form an indicator;for example, the total enrolment of the school divided by the numberof class groups forms a ratio indicator know as the average class size.In yet other cases, a number of questions were combined to estimate,for instance, the total school resources. Where questions are combinedin some way, the resultant variable is known as a construct orcomposite.
The list of indicators used for the analysis in this chapter and the type ofconstruct they are have been presented in Appendix 8.1.
Most and least effective 100 schools
The first comparison made was between the most effective 100 schoolsand the least effective 100 schools in reading and mathematics. Foreach variable the mean of the top 100 schools (the most effectiveschools) has been presented. This has been followed by the mean of the100 least effective schools and then the overall standard deviation. Thestandard deviations will be the same under the columns for reading andmath because it is, for example, the age or ratio female for all schoolsand they are the same for both subject areas. Finally, the difference hasbeen presented. Where the difference between the values for the mostand least effective schools was greater than one standard deviationthree diamonds ( ) have been entered, half a standard deviation thentwo diamonds ( ), and where the difference was greater than onequarter of a standard deviation but less than half of a standarddeviation, one diamond ( ) has been entered. Where the difference wassmaller than one quarter of a standard deviation, the difference cell hasbeen left blank.
Vietnam Reading and Mathematics Assessment Study
226
In all, the differencesbetween the two groups
of schools wereexamined for 123
variables.
Differences worthy ofnote have been
presented. Largedifferences have been
given ♦♦ and verylarge differences ♦♦ ♦.
The first result presentedwere those for the
differences between the100 most effective andthe 100 least effective
schools.
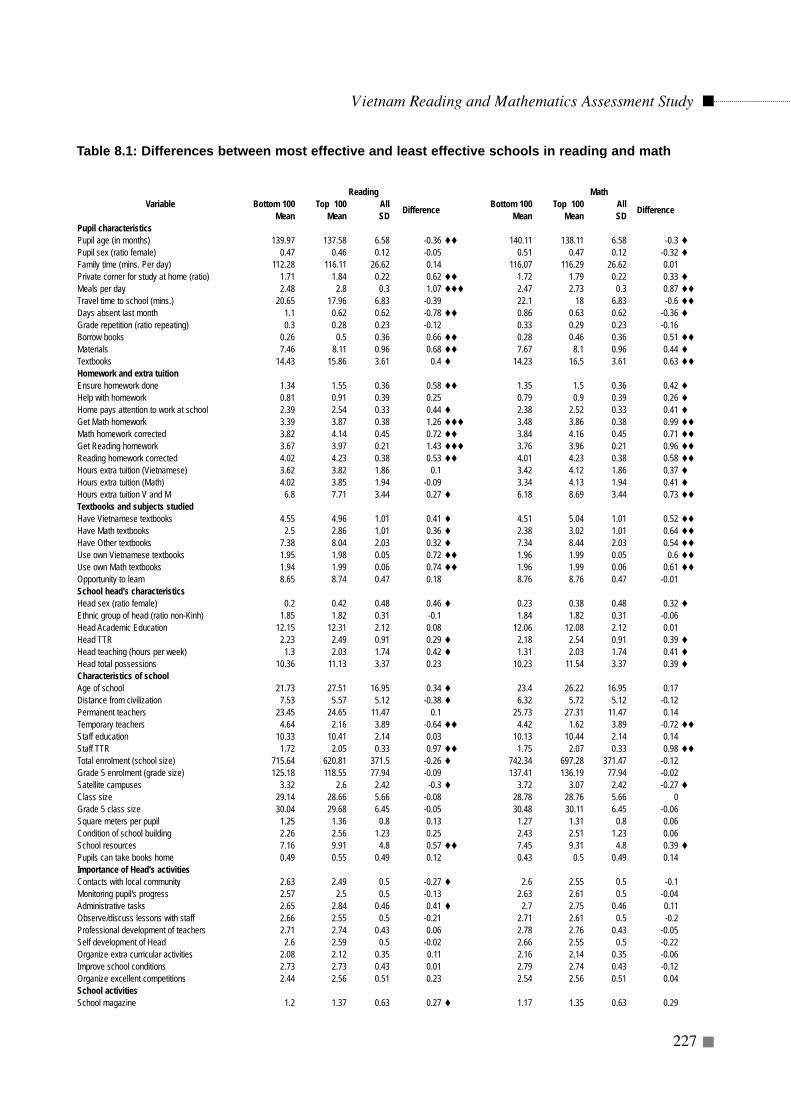
Vietnam Reading and Mathematics Assessment Study
227
VariableReading Math
Bottom 100 Top 100 All Difference Bottom 100 Top 100 All DifferenceMean Mean SD Mean Mean SDPupil characteristicsPupil age (in months) 139.97 137.58 6.58 -0.36 140.11 138.11 6.58 -0.3Pupil sex (ratio female) 0.47 0.46 0.12 -0.05 0.51 0.47 0.12 -0.32Family time (mins. Per day) 112.28 116.11 26.62 0.14 116.07 116.29 26.62 0.01Private corner for study at home (ratio) 1.71 1.84 0.22 0.62 1.72 1.79 0.22 0.33Meals per day 2.48 2.8 0.3 1.07 2.47 2.73 0.3 0.87Travel time to school (mins.) 20.65 17.96 6.83 -0.39 22.1 18 6.83 -0.6Days absent last month 1.1 0.62 0.62 -0.78 0.86 0.63 0.62 -0.36Grade repetition (ratio repeating) 0.3 0.28 0.23 -0.12 0.33 0.29 0.23 -0.16Borrow books 0.26 0.5 0.36 0.66 0.28 0.46 0.36 0.51Materials 7.46 8.11 0.96 0.68 7.67 8.1 0.96 0.44Textbooks 14.43 15.86 3.61 0.4 14.23 16.5 3.61 0.63Homework and extra tuitionEnsure homework done 1.34 1.55 0.36 0.58 1.35 1.5 0.36 0.42Help with homework 0.81 0.91 0.39 0.25 0.79 0.9 0.39 0.26Home pays attention to work at school 2.39 2.54 0.33 0.44 2.38 2.52 0.33 0.41Get Math homework 3.39 3.87 0.38 1.26 3.48 3.86 0.38 0.99Math homework corrected 3.82 4.14 0.45 0.72 3.84 4.16 0.45 0.71Get Reading homework 3.67 3.97 0.21 1.43 3.76 3.96 0.21 0.96Reading homework corrected 4.02 4.23 0.38 0.53 4.01 4.23 0.38 0.58Hours extra tuition (Vietnamese) 3.62 3.82 1.86 0.1 3.42 4.12 1.86 0.37Hours extra tuition (Math) 4.02 3.85 1.94 -0.09 3.34 4.13 1.94 0.41Hours extra tuition V and M 6.8 7.71 3.44 0.27 6.18 8.69 3.44 0.73Textbooks and subjects studiedHave Vietnamese textbooks 4.55 4.96 1.01 0.41 4.51 5.04 1.01 0.52Have Math textbooks 2.5 2.86 1.01 0.36 2.38 3.02 1.01 0.64Have Other textbooks 7.38 8.04 2.03 0.32 7.34 8.44 2.03 0.54Use own Vietnamese textbooks 1.95 1.98 0.05 0.72 1.96 1.99 0.05 0.6Use own Math textbooks 1.94 1.99 0.06 0.74 1.96 1.99 0.06 0.61Opportunity to learn 8.65 8.74 0.47 0.18 8.76 8.76 0.47 -0.01School head's characteristicsHead sex (ratio female) 0.2 0.42 0.48 0.46 0.23 0.38 0.48 0.32Ethnic group of head (ratio non-Kinh) 1.85 1.82 0.31 -0.1 1.84 1.82 0.31 -0.06Head Academic Education 12.15 12.31 2.12 0.08 12.06 12.08 2.12 0.01Head TTR 2.23 2.49 0.91 0.29 2.18 2.54 0.91 0.39Head teaching (hours per week) 1.3 2.03 1.74 0.42 1.31 2.03 1.74 0.41Head total possessions 10.36 11.13 3.37 0.23 10.23 11.54 3.37 0.39Characteristics of schoolAge of school 21.73 27.51 16.95 0.34 23.4 26.22 16.95 0.17Distance from civilization 7.53 5.57 5.12 -0.38 6.32 5.72 5.12 -0.12Permanent teachers 23.45 24.65 11.47 0.1 25.73 27.31 11.47 0.14Temporary teachers 4.64 2.16 3.89 -0.64 4.42 1.62 3.89 -0.72Staff education 10.33 10.41 2.14 0.03 10.13 10.44 2.14 0.14Staff TTR 1.72 2.05 0.33 0.97 1.75 2.07 0.33 0.98Total enrolment (school size) 715.64 620.81 371.5 -0.26 742.34 697.28 371.47 -0.12Grade 5 enrolment (grade size) 125.18 118.55 77.94 -0.09 137.41 136.19 77.94 -0.02Satellite campuses 3.32 2.6 2.42 -0.3 3.72 3.07 2.42 -0.27Class size 29.14 28.66 5.66 -0.08 28.78 28.76 5.66 0Grade 5 class size 30.04 29.68 6.45 -0.05 30.48 30.11 6.45 -0.06Square meters per pupil 1.25 1.36 0.8 0.13 1.27 1.31 0.8 0.06Condition of school building 2.26 2.56 1.23 0.25 2.43 2.51 1.23 0.06School resources 7.16 9.91 4.8 0.57 7.45 9.31 4.8 0.39Pupils can take books home 0.49 0.55 0.49 0.12 0.43 0.5 0.49 0.14Importance of Head's activitiesContacts with local community 2.63 2.49 0.5 -0.27 2.6 2.55 0.5 -0.1Monitoring pupil's progress 2.57 2.5 0.5 -0.13 2.63 2.61 0.5 -0.04Administrative tasks 2.65 2.84 0.46 0.41 2.7 2.75 0.46 0.11Observe/discuss lessons with staff 2.66 2.55 0.5 -0.21 2.71 2.61 0.5 -0.2Professional development of teachers 2.71 2.74 0.43 0.06 2.78 2.76 0.43 -0.05Self development of Head 2.6 2.59 0.5 -0.02 2.66 2.55 0.5 -0.22Organize extra curricular activities 2.08 2.12 0.35 0.11 2.16 2.14 0.35 -0.06Improve school conditions 2.73 2.73 0.43 0.01 2.79 2.74 0.43 -0.12Organize excellent competitions 2.44 2.56 0.51 0.23 2.54 2.56 0.51 0.04School activitiesSchool magazine 1.2 1.37 0.63 0.27 1.17 1.35 0.63 0.29
Table 8.1: Differences between most effective and least effective schools in reading and math
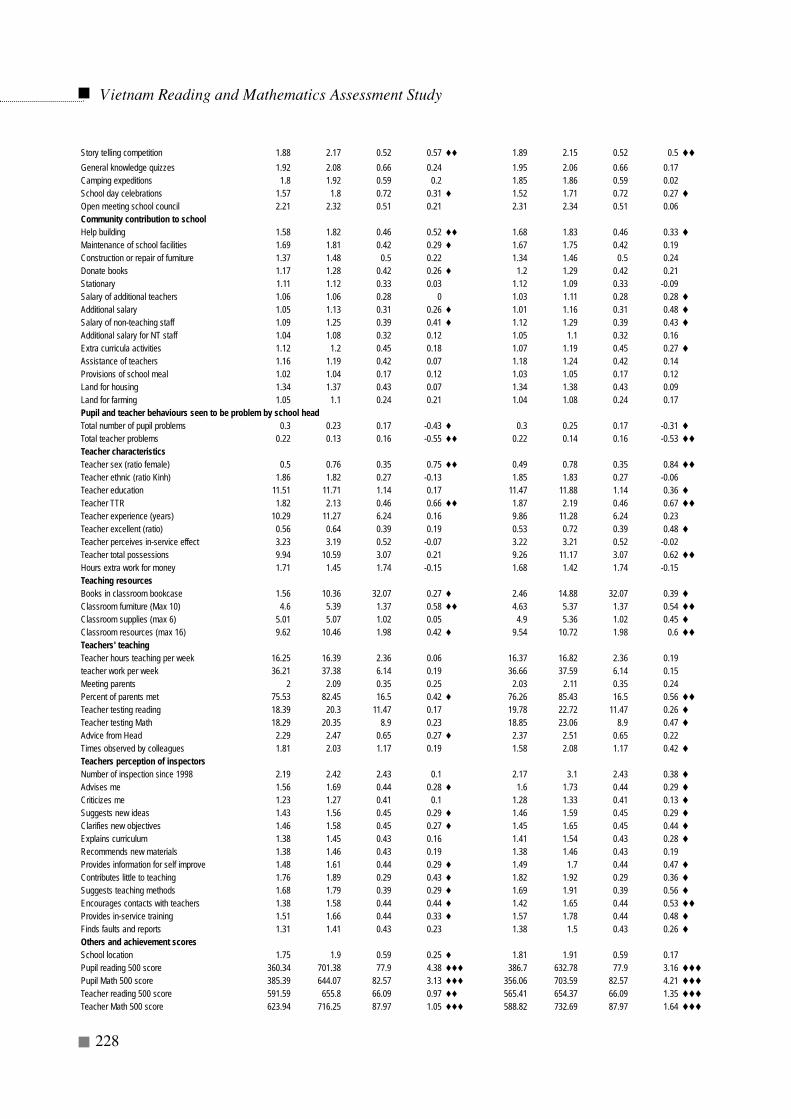
Vietnam Reading and Mathematics Assessment Study
228
Story telling competition 1.88 2.17 0.52 0.57 1.89 2.15 0.52 0.5General knowledge quizzes 1.92 2.08 0.66 0.24 1.95 2.06 0.66 0.17Camping expeditions 1.8 1.92 0.59 0.2 1.85 1.86 0.59 0.02School day celebrations 1.57 1.8 0.72 0.31 1.52 1.71 0.72 0.27Open meeting school council 2.21 2.32 0.51 0.21 2.31 2.34 0.51 0.06Community contribution to schoolHelp building 1.58 1.82 0.46 0.52 1.68 1.83 0.46 0.33Maintenance of school facilities 1.69 1.81 0.42 0.29 1.67 1.75 0.42 0.19Construction or repair of furniture 1.37 1.48 0.5 0.22 1.34 1.46 0.5 0.24Donate books 1.17 1.28 0.42 0.26 1.2 1.29 0.42 0.21Stationary 1.11 1.12 0.33 0.03 1.12 1.09 0.33 -0.09Salary of additional teachers 1.06 1.06 0.28 0 1.03 1.11 0.28 0.28Additional salary 1.05 1.13 0.31 0.26 1.01 1.16 0.31 0.48Salary of non-teaching staff 1.09 1.25 0.39 0.41 1.12 1.29 0.39 0.43Additional salary for NT staff 1.04 1.08 0.32 0.12 1.05 1.1 0.32 0.16Extra curricula activities 1.12 1.2 0.45 0.18 1.07 1.19 0.45 0.27Assistance of teachers 1.16 1.19 0.42 0.07 1.18 1.24 0.42 0.14Provisions of school meal 1.02 1.04 0.17 0.12 1.03 1.05 0.17 0.12Land for housing 1.34 1.37 0.43 0.07 1.34 1.38 0.43 0.09Land for farming 1.05 1.1 0.24 0.21 1.04 1.08 0.24 0.17Pupil and teacher behaviours seen to be problem by school headTotal number of pupil problems 0.3 0.23 0.17 -0.43 0.3 0.25 0.17 -0.31Total teacher problems 0.22 0.13 0.16 -0.55 0.22 0.14 0.16 -0.53Teacher characteristicsTeacher sex (ratio female) 0.5 0.76 0.35 0.75 0.49 0.78 0.35 0.84Teacher ethnic (ratio Kinh) 1.86 1.82 0.27 -0.13 1.85 1.83 0.27 -0.06Teacher education 11.51 11.71 1.14 0.17 11.47 11.88 1.14 0.36Teacher TTR 1.82 2.13 0.46 0.66 1.87 2.19 0.46 0.67Teacher experience (years) 10.29 11.27 6.24 0.16 9.86 11.28 6.24 0.23Teacher excellent (ratio) 0.56 0.64 0.39 0.19 0.53 0.72 0.39 0.48Teacher perceives in-service effect 3.23 3.19 0.52 -0.07 3.22 3.21 0.52 -0.02Teacher total possessions 9.94 10.59 3.07 0.21 9.26 11.17 3.07 0.62Hours extra work for money 1.71 1.45 1.74 -0.15 1.68 1.42 1.74 -0.15Teaching resourcesBooks in classroom bookcase 1.56 10.36 32.07 0.27 2.46 14.88 32.07 0.39Classroom furniture (Max 10) 4.6 5.39 1.37 0.58 4.63 5.37 1.37 0.54Classroom supplies (max 6) 5.01 5.07 1.02 0.05 4.9 5.36 1.02 0.45Classroom resources (max 16) 9.62 10.46 1.98 0.42 9.54 10.72 1.98 0.6Teachers' teachingTeacher hours teaching per week 16.25 16.39 2.36 0.06 16.37 16.82 2.36 0.19teacher work per week 36.21 37.38 6.14 0.19 36.66 37.59 6.14 0.15Meeting parents 2 2.09 0.35 0.25 2.03 2.11 0.35 0.24Percent of parents met 75.53 82.45 16.5 0.42 76.26 85.43 16.5 0.56Teacher testing reading 18.39 20.3 11.47 0.17 19.78 22.72 11.47 0.26Teacher testing Math 18.29 20.35 8.9 0.23 18.85 23.06 8.9 0.47Advice from Head 2.29 2.47 0.65 0.27 2.37 2.51 0.65 0.22Times observed by colleagues 1.81 2.03 1.17 0.19 1.58 2.08 1.17 0.42Teachers perception of inspectorsNumber of inspection since 1998 2.19 2.42 2.43 0.1 2.17 3.1 2.43 0.38Advises me 1.56 1.69 0.44 0.28 1.6 1.73 0.44 0.29Criticizes me 1.23 1.27 0.41 0.1 1.28 1.33 0.41 0.13Suggests new ideas 1.43 1.56 0.45 0.29 1.46 1.59 0.45 0.29Clarifies new objectives 1.46 1.58 0.45 0.27 1.45 1.65 0.45 0.44Explains curriculum 1.38 1.45 0.43 0.16 1.41 1.54 0.43 0.28Recommends new materials 1.38 1.46 0.43 0.19 1.38 1.46 0.43 0.19Provides information for self improve 1.48 1.61 0.44 0.29 1.49 1.7 0.44 0.47Contributes little to teaching 1.76 1.89 0.29 0.43 1.82 1.92 0.29 0.36Suggests teaching methods 1.68 1.79 0.39 0.29 1.69 1.91 0.39 0.56Encourages contacts with teachers 1.38 1.58 0.44 0.44 1.42 1.65 0.44 0.53Provides in-service training 1.51 1.66 0.44 0.33 1.57 1.78 0.44 0.48Finds faults and reports 1.31 1.41 0.43 0.23 1.38 1.5 0.43 0.26Others and achievement scoresSchool location 1.75 1.9 0.59 0.25 1.81 1.91 0.59 0.17Pupil reading 500 score 360.34 701.38 77.9 4.38 386.7 632.78 77.9 3.16Pupil Math 500 score 385.39 644.07 82.57 3.13 356.06 703.59 82.57 4.21Teacher reading 500 score 591.59 655.8 66.09 0.97 565.41 654.37 66.09 1.35Teacher Math 500 score 623.94 716.25 87.97 1.05 588.82 732.69 87.97 1.64
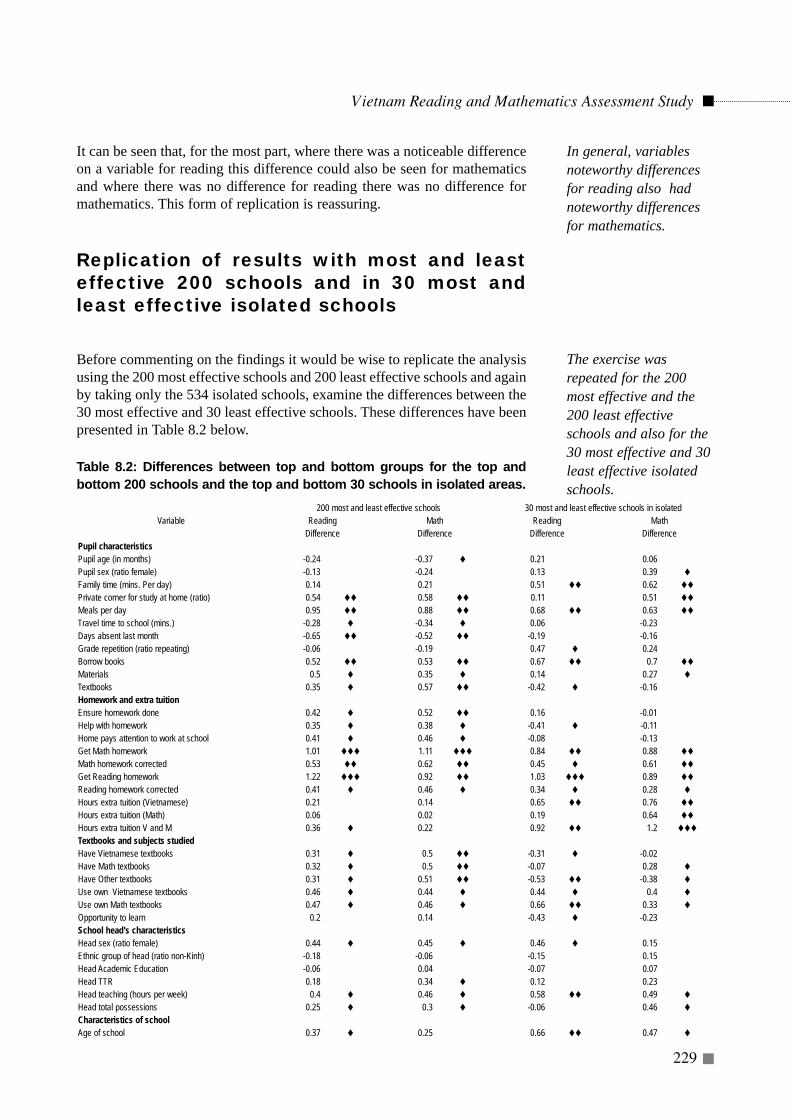
It can be seen that, for the most part, where there was a noticeable differenceon a variable for reading this difference could also be seen for mathematicsand where there was no difference for reading there was no difference formathematics. This form of replication is reassuring.
Replication of results with most and leasteffective 200 schools and in 30 most andleast effective isolated schools
Before commenting on the findings it would be wise to replicate the analysisusing the 200 most effective schools and 200 least effective schools and againby taking only the 534 isolated schools, examine the differences between the30 most effective and 30 least effective schools. These differences have beenpresented in Table 8.2 below.
Table 8.2: Differences between top and bottom groups for the top andbottom 200 schools and the top and bottom 30 schools in isolated areas.
Vietnam Reading and Mathematics Assessment Study
229
In general, variablesnoteworthy differencesfor reading also hadnoteworthy differencesfor mathematics.
The exercise wasrepeated for the 200most effective and the200 least effectiveschools and also for the30 most effective and 30least effective isolatedschools.
Variable200 most and least effective schools 30 most and least effective schools in isolated
Reading Math Reading MathDifference Difference Difference Difference
Pupil characteristicsPupil age (in months) -0.24 -0.37 0.21 0.06Pupil sex (ratio female) -0.13 -0.24 0.13 0.39Family time (mins. Per day) 0.14 0.21 0.51 0.62Private corner for study at home (ratio) 0.54 0.58 0.11 0.51Meals per day 0.95 0.88 0.68 0.63Travel time to school (mins.) -0.28 -0.34 0.06 -0.23Days absent last month -0.65 -0.52 -0.19 -0.16Grade repetition (ratio repeating) -0.06 -0.19 0.47 0.24Borrow books 0.52 0.53 0.67 0.7Materials 0.5 0.35 0.14 0.27Textbooks 0.35 0.57 -0.42 -0.16Homework and extra tuitionEnsure homework done 0.42 0.52 0.16 -0.01Help with homework 0.35 0.38 -0.41 -0.11Home pays attention to work at school 0.41 0.46 -0.08 -0.13Get Math homework 1.01 1.11 0.84 0.88Math homework corrected 0.53 0.62 0.45 0.61Get Reading homework 1.22 0.92 1.03 0.89Reading homework corrected 0.41 0.46 0.34 0.28Hours extra tuition (Vietnamese) 0.21 0.14 0.65 0.76Hours extra tuition (Math) 0.06 0.02 0.19 0.64Hours extra tuition V and M 0.36 0.22 0.92 1.2Textbooks and subjects studiedHave Vietnamese textbooks 0.31 0.5 -0.31 -0.02Have Math textbooks 0.32 0.5 -0.07 0.28Have Other textbooks 0.31 0.51 -0.53 -0.38Use own Vietnamese textbooks 0.46 0.44 0.44 0.4Use own Math textbooks 0.47 0.46 0.66 0.33Opportunity to learn 0.2 0.14 -0.43 -0.23School head's characteristicsHead sex (ratio female) 0.44 0.45 0.46 0.15Ethnic group of head (ratio non-Kinh) -0.18 -0.06 -0.15 0.15Head Academic Education -0.06 0.04 -0.07 0.07Head TTR 0.18 0.34 0.12 0.23Head teaching (hours per week) 0.4 0.46 0.58 0.49Head total possessions 0.25 0.3 -0.06 0.46Characteristics of schoolAge of school 0.37 0.25 0.66 0.47
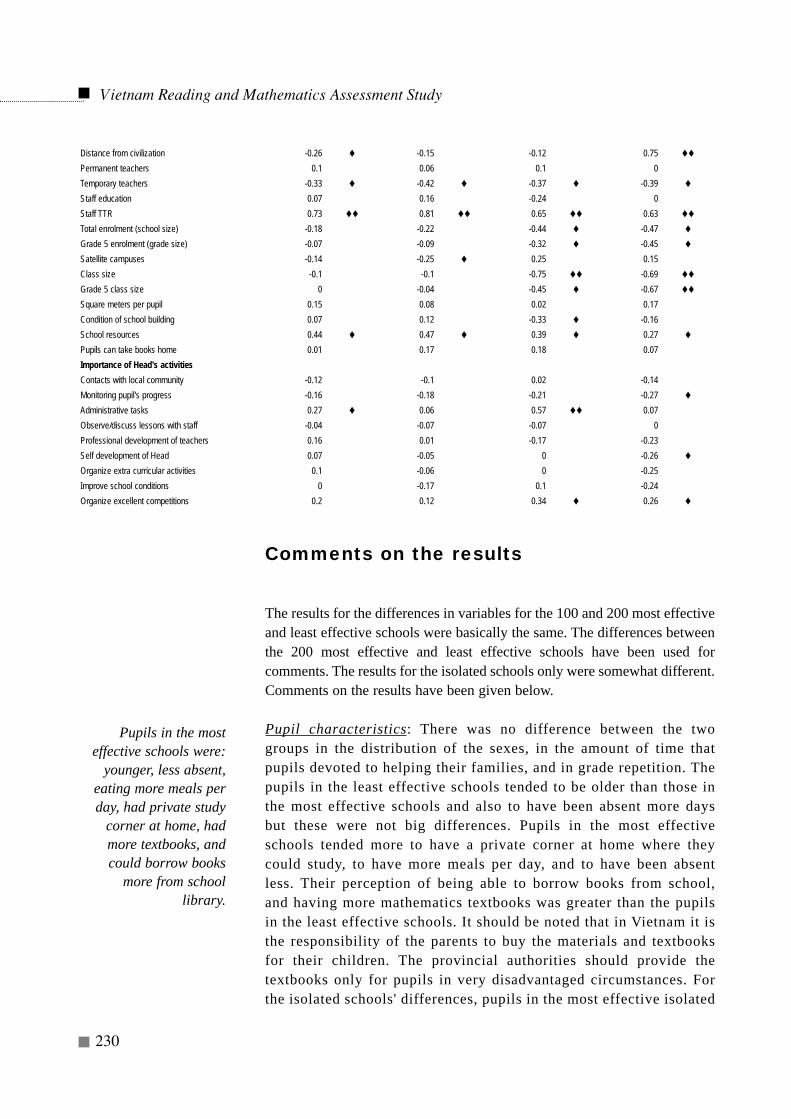
Comments on the results
The results for the differences in variables for the 100 and 200 most effectiveand least effective schools were basically the same. The differences betweenthe 200 most effective and least effective schools have been used forcomments. The results for the isolated schools only were somewhat different.Comments on the results have been given below.
Pupil characteristics: There was no difference between the twogroups in the distribution of the sexes, in the amount of time thatpupils devoted to helping their families, and in grade repetition. Thepupils in the least effective schools tended to be older than those inthe most effective schools and also to have been absent more daysbut these were not big differences. Pupils in the most effectiveschools tended more to have a private corner at home where theycould study, to have more meals per day, and to have been absentless. Their perception of being able to borrow books from school,and having more mathematics textbooks was greater than the pupilsin the least effective schools. It should be noted that in Vietnam it isthe responsibility of the parents to buy the materials and textbooksfor their children. The provincial authorities should provide thetextbooks only for pupils in very disadvantaged circumstances. Forthe isolated schools' differences, pupils in the most effective isolated
Vietnam Reading and Mathematics Assessment Study
230
Distance from civilization -0.26 -0.15 -0.12 0.75Permanent teachers 0.1 0.06 0.1 0Temporary teachers -0.33 -0.42 -0.37 -0.39Staff education 0.07 0.16 -0.24 0Staff TTR 0.73 0.81 0.65 0.63Total enrolment (school size) -0.18 -0.22 -0.44 -0.47Grade 5 enrolment (grade size) -0.07 -0.09 -0.32 -0.45Satellite campuses -0.14 -0.25 0.25 0.15Class size -0.1 -0.1 -0.75 -0.69Grade 5 class size 0 -0.04 -0.45 -0.67Square meters per pupil 0.15 0.08 0.02 0.17Condition of school building 0.07 0.12 -0.33 -0.16School resources 0.44 0.47 0.39 0.27Pupils can take books home 0.01 0.17 0.18 0.07Importance of Head's activitiesContacts with local community -0.12 -0.1 0.02 -0.14Monitoring pupil's progress -0.16 -0.18 -0.21 -0.27Administrative tasks 0.27 0.06 0.57 0.07Observe/discuss lessons with staff -0.04 -0.07 -0.07 0Professional development of teachers 0.16 0.01 -0.17 -0.23Self development of Head 0.07 -0.05 0 -0.26Organize extra curricular activities 0.1 -0.06 0 -0.25Improve school conditions 0 -0.17 0.1 -0.24Organize excellent competitions 0.2 0.12 0.34 0.26
Pupils in the mosteffective schools were:
younger, less absent,eating more meals perday, had private study
corner at home, hadmore textbooks, andcould borrow books
more from schoollibrary.
schools spent more time helping the family, had more meals per day,and could borrow books more than pupils in the least effectiveisolated schools. Thus, every effort should be made to ensure that allpupils have a private corner for study at home, eat regularly, areabsent from school less, and have the required materials andtextbooks.
Parental help and extra tuition: There were major differences between thetwo groups of schools in the homework variables, especially formathematics. Those pupils in the most effective schools tended to get morehomework set by their teachers, have parents who ensured that it was doneand teachers who corrected more of the homework. The parents of thesechildren also 'paid more attention' to school work in general. The mosteffective schools had pupils who tended to attend more extra tuition classesin Vietnamese and mathematics.
In isolated schools, pupils in the more effective schools were given morehomework, had it corrected more, and received more extra tuition than thepupils in the least effective schools.
Homework is an area of education where homes and schools can worktogether. In this Grade 5 survey it has been seen that it is important forthe teachers to give homework, for the children to do it, for the parentsto check that it has been done, and for the teachers to correct all of thehomework. The importance of giving and correcting all homeworkshould be stressed more in the pre- and in-service training of teachers.The management courses for head should also stress this aspect ofschooling. If the school heads in all schools emphasise to the parents thatchecking that their children have done their homework is important, thismay help. Alternatively, having parents sign the homework cansometimes be a useful way of ensuring this. It would be worthwhileconsidering devising various strategies to have this checking occur,evaluate the effect of the different strategies and then implement themost successful one. The following suggestions have been alreadymade, but it is worth re-iterating that the importance of giving andcorrecting homework should be stressed in all teacher training coursesand school head management courses. The inspectorate should ensurethat homework is given regularly and corrected. Finally, a special studyshould be made of extra tuition in schools in isolated areas.
Textbooks and subjects studied: In the most effective schools for readingcomprehension in Vietnamese, the average pupil either had his or her owntextbook or shared a textbook with one other person whereas in the lesseffective schools there were some pupils who had to share with more thanone other pupil. This was true for both subject areas. There are nine subjects
Vietnam Reading and Mathematics Assessment Study
231
They also got morehomework and had itcorrected, and receivedmore support for schoolwork from their families.In isolated schools,pupils in more effectiveschools had more extratuition.
Pupils in more effectiveschools tended to studyslightly more subjectsand had to share theirtextbooks less.
in the curriculum but in the past not all schools have taught all subjectsbecause the introduction of some were optional at the time of firstintroduction. In the 100 most and least effective school comparison, it can beseen that the average child studied only 8.74 subjects in the most effectiveschools and 8.65 in the least effective schools in Vietnamese. However thedifference was small and there were no differences between the moreeffective and less effective schools in mathematics.In the isolated schools it was interesting to note that the pupils in the mosteffective isolated schools had fewer other textbooks but shared them less thanthe pupils in the least effective isolated schools. Again, it has been mentionedearlier, but it would be highly desirable for the curriculum centre to reviewthe actual textbooks required.
School head's characteristics: the most effective schools tended to have moreschool heads who were female, heads with more teacher training, heads whotended to teach more each week, and heads who had slightly morepossessions at home. There was no difference in the ethnic group to whichthe heads belonged, nor in the amount of academic education they hadreceived. In general, though, the differences between the school head'scharacteristics were not great.
In isolated schools it was the amount of teaching per week that the headscarried out that emerged as important. Pupils in the most effective isolatedschools tended to have school heads who were teaching more hours thanthose in the least effective isolated schools.
Presumably the least effective schools were in poorer locations so that it wasnot conducive for female heads to be there. Pupils in the most effectiveschools tended to have teachers teach more in a week. It can be argued thatheads need to teach each week so that they are au fait with what is going onin the school and the types of pupils that the school has. This can only begained through teaching.
Policy suggestion 8.1: The education advisors and the managementcourse personnel should encourage heads to teach each week.
Characteristics of the school: It was re-assuring that there were no, or verysmall, differences in the number of permanent teachers, grade 5 enrolment,class size, and square metres per pupil. This shows that the various levels ofeducational offices had done a good job, Although there were no differencesbetween the most and least effective schools in the head's perceived conditionof the school buildings and the rule about pupils being able to take bookhome to read, it can be argued that the levels of both of these variables wastoo low. Even in the most effective schools the level of the conditions of theschool buildings was between 2.40 and 2.50 signifying classrooms needing
Vietnam Reading and Mathematics Assessment Study
232
There were either onlysmall differences or nodifferences between thetwo group of schools forthe number ofpermanent teachers,Grade 5 enrolment,class size, square metersper pupils, rule for
More effective schoolshad heads who were
female, with moreteacher training, and
who taught more hoursper week.
In effective isolatedschools, school heads
taught more hours perweek.
either major or minor repairs. Only about 50 percent of pupils were in schoolswhere the heads said that they could take books home. This means that therewere fifty percent of schools where either there were no libraries or pupilswere unable to borrow the books to take home.
The variables where there was some replication in the differencesbetween the most and least effective schools were: the age of the school(pupils in more effective schools tended to be in older schools, thedistance from 'developed' social and commercial facilities in isolatedareas (but with a difference in sign for reading and mathematics inisolated areas), the percentage of temporary teachers (the least effectiveschools having more); the amount of teacher training the whole staff hadhad (most effective schools having staff with more years of teachertraining than the total staff in the least effective schools); total enrolmentand Grade 5 enrolment in isolated schools (with the least effectiveschools having higher enrolments), having satellite campuses in isolatedareas (least effective schools having more), and the number of items ofschool resources where the most effective schools had two to three moreitems of school resources than the least effective schools.
These aspects of schools are important and require a long term strategy tocorrect the shortcomings in the least effective schools. Each province andindeed district should have a plan to reduce the number of temporary teachersand replace them with permanent teachers. Care should be taken to replacethe temporary teachers with teachers who have had the full teacher training.At the same time, the planners in the provincial offices should examine theallocation of teachers to schools to ensure a more equitable distribution ofpermanent and fully teacher trained teachers to all schools. The lack of schoolresources is a problem. A study should be undertaken to identify those keyresources needed in any school.
Head's perceived importance of head teachers' activities: it was of interestthat there were no differences between the heads of the most and leasteffective schools.
School activities: The group of persons on the questionnaire committee forthe study identified six different activities that occur in Vietnamese primaryschools that might be though to effect achievement in reading andmathematics. There was quite a bit of disagreement about the variables.Information was collected on all of them. In other studies it has been foundthat where the pupils are actively involved in the writing and producing of aschool magazine the reading achievement of schools where this occurs ishigher. In Vietnam it can be seen that there were differences between the mosteffective and least effective schools in the extent to which the schoolproduced a school magazine, and the extent to which it held story telling
Vietnam Reading and Mathematics Assessment Study
233
borrowing books, andperceived conditions ofschool buildings. (butvery low levels for thelast two variables.)In more effectiveschools, there werefewer temporaryteachers, the wholeteaching staff had moreteacher training, therewere lower enrolment,fewer satellitecampuses, and moreschool resources.
More effective schoolshad a school magazineproduced by pupils andstory-tellingcompetitions, bothreading relatedactivities.
competitions. In other words, where the head and staff fostered thoseactivities concerned with thinking and reading, the pupils in those schoolsachieved better. There were no consistent differences in values for campingexpeditions, school day celebrations and having an open meeting of theschool council.
It is worth re-iterating that all teacher training courses and school heads'management courses should encourage the kinds of school-wide activitiesthat foster intellectual development and especially in reading comprehensionand mathematics.
Community contribution to school: communities differ in the amount ofhelp they offer to schools. There were some small differences betweenthe most and least effective schools on one or two aspects ofcommunity/parental contribution. There was a higher percentage ofpupils from the most effective schools whose parents helped in thepayment of non-salaried staff, and to a lesser extent by building extraclassrooms, and donating books.
There is evidence, not only from Vietnam but from other countries, that themore a community feels and is involved in school matters the better theachievement in the school. Attention should be given to various activities thatschools can undertake in order to have parents (and others in the community)play an active role in helping the school. This should be not only in the formof contributions to the school but also in the form of help of all kindsincluding acting as teaching assistants when this is required. Devising theactivities involving parents in the lives of schools in all areas in the countrywould appear to be an important issue.
Teacher characteristics: The most effective schools had more femaleteachers, more teachers with a higher level of teacher training, more teachersbeing designated as 'excellent', having more education and having morepossessions at home (for mathematics). It was interesting to note that theteachers in the least effective isolated schools devoted more hours to extrawork for money.
One possible mechanism for improving the allocation of teachers to schoolswill be to create provincial data bases for planners to use for the re-allocationand new allocation of teachers to schools.
Teaching resources: There were differences in the amount of classroomresources between the most and least effective schools. This concernedclassroom furniture and the books in the classroom bookcase with the mosteffective schools having more of them.
Vietnam Reading and Mathematics Assessment Study
234
Parents of pupils inmore effective schools
gave more contributions.
The more effectiveschools had more female
teachers, with moreteacher training, and
more of them beingdesignated as excellent.
Effective schools hadmore teaching resources.
Teachers' teaching: There was no difference between the two groups ofschools for the number of hours per week teaching. However, it should benoted that the number of hours teaching was well below the internationalaverage - even in countries where it is expected that teachers do extra workin order to earn enough money. There were differences for the percentage ofpupils' parents that were met by the teacher (the percentage was higher in themost effective schools), in the number of times the classes were observed bycolleagues (in the most effective schools this occurred more frequently) andamount of feedback from the principal to the teachers about their teaching (inthe most effective schools this occurred more frequently). In isolated schoolsand especially for mathematics the pupils in the most effective schools hadteachers who met parents more, met a higher percentage of pupils' parents,tested more frequently, and were observed more frequently by their peers.
It would seem that the teachers meeting a high percentage of pupils' parentsand peer observation were associated with more effective schools and thesetwo aspects of teacher behaviour should be encouraged. Peer observation ofteachers teaching and the meeting of all parents should be stressed in teachertraining courses and in management courses. To ensure that teachersrecognise how these two activities can be preformed efficiently, The MOETcould profitably prepare two booklets that offer specific guidance andillustrative examples of the conduct of peer observation and of conferringwith parents. The booklets could be distributed in pre-service and in-servicecourses for teachers and school heads.
Teachers' perceptions of inspectors: There were some small differencesbetween the two groups of schools where the teachers in the most effectiveschools had a more positive view of the visits of the inspectors. Inmathematics the teachers in the effective schools perceived inspectors to besuggesting teaching methods and encouraging contacts with other teachersmore than the teachers in the least effective schools perceived this to behappening. In isolated schools it was the providing information for self-improvement, encouraging contacts with other teachers, suggesting teachingmethods and providing in-service training that were important.
Heads' perceptions of pupil and teacher problems: a series of questions wasasked of the head about the frequency with which the Head had to deal withbehavioural problems. 'Never' was coded as 1 and 'sometimes or often' as 2.The first problem in the table above is to do with pupils arriving late atschool. The figure of 1.8 in the most effective schools column means that 80percent of pupils were where the head said that the problem occurredsometimes or often. The major differences between the most effective andleast effective schools were for pupil absenteeism, pupils skipping classes,pupils dropping out of school, classroom disturbance by pupils, andvandalism and stealing. Health problems had very high frequencies in bothgroups. The major behaviour problems of teachers where there was adifference between the two types of schools were being late to school, beingabsent, skipping classes, alcohol abuse or possession. Again there was a highfrequency for teacher health problems although there was not a differencebetween the most and least effective schools.
Vietnam Reading and Mathematics Assessment Study
235
Teachers in effectiveschools did not teachmore hours but did meeta higher percentage ofpupils' parents, wereobserved morefrequently by colleagues,and received morefeedback from schoolheads about theirteaching.
In more effectiveschools, the teachershad slightly morepositive view oninspectors.
Heads in more effectiveschools had to deal lessoften with pupil andteacher behaviouralproblems.
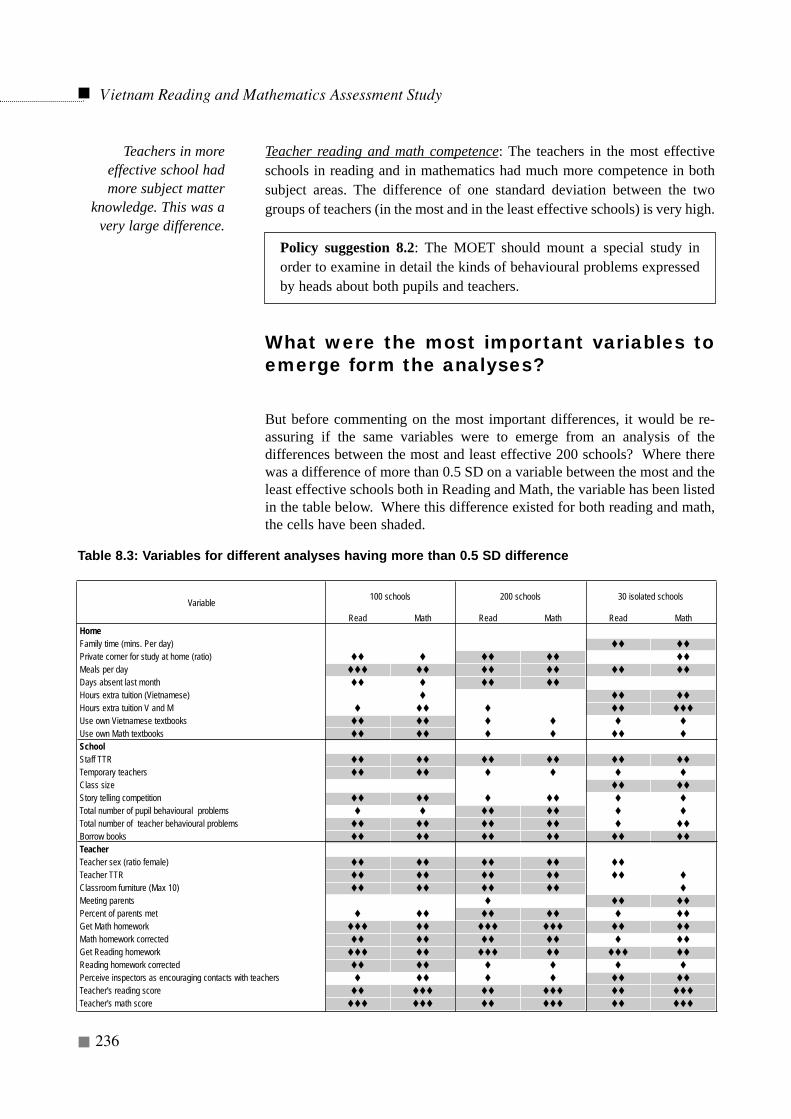
Teacher reading and math competence: The teachers in the most effectiveschools in reading and in mathematics had much more competence in bothsubject areas. The difference of one standard deviation between the twogroups of teachers (in the most and in the least effective schools) is very high.
Policy suggestion 8.2: The MOET should mount a special study inorder to examine in detail the kinds of behavioural problems expressedby heads about both pupils and teachers.
What were the most important variables toemerge form the analyses?
But before commenting on the most important differences, it would be re-assuring if the same variables were to emerge from an analysis of thedifferences between the most and least effective 200 schools? Where therewas a difference of more than 0.5 SD on a variable between the most and theleast effective schools both in Reading and Math, the variable has been listedin the table below. Where this difference existed for both reading and math,the cells have been shaded.
Vietnam Reading and Mathematics Assessment Study
236
Teachers in moreeffective school hadmore subject matter
knowledge. This was avery large difference.
Variable 100 schools 200 schools 30 isolated schools
Read Math Read Math Read MathHomeFamily time (mins. Per day)Private corner for study at home (ratio)Meals per dayDays absent last monthHours extra tuition (Vietnamese)Hours extra tuition V and MUse own Vietnamese textbooksUse own Math textbooksSchoolStaff TTRTemporary teachersClass sizeStory telling competitionTotal number of pupil behavioural problemsTotal number of teacher behavioural problemsBorrow booksTeacherTeacher sex (ratio female)Teacher TTRClassroom furniture (Max 10)Meeting parentsPercent of parents metGet Math homeworkMath homework correctedGet Reading homeworkReading homework correctedPerceive inspectors as encouraging contacts with teachersTeacher's reading scoreTeacher's math score
Table 8.3: Variables for different analyses having more than 0.5 SD difference
It was interesting to note that the home variables emerging as importantwere different for the 100 and 200 school comparisons on the one handand, on the other hand for the 30 isolated school comparisons except forthe variable 'meals per day.' Between 100 the most and the leasteffective school, there were differences in 'using own Vietnamese andMath textbooks.' 'Private corner for study at home' and 'days absent lastmonth' were the variables with big differences between 200 the most andleast effective school. 'Time helping family' and 'extra tuition' came upfor the isolated schools but 'days absent last month' did not.
Among the school variables, 'average staff teacher training' and 'pupilcan borrow books' came up for any comparisons. The 'number oftemporary teachers' only arose in the 100 schools comparison, class sizeonly occurred in the isolated schools and story telling only in the 100school comparison. The 'total number of teachers' behavioural problems'were for both 100 and 200 schools, whereas the 'total number of pupilbehavioural problems' was only for 200 schools comparison.
Amongst the teacher variables the 'teacher subject matter knowledge'emerged as a large difference between the least and most effectiveschools in all comparisons, but 'meeting parents' and the 'inspectorsencouraging teachers to meet other teachers' only came through in theisolated schools comparisons. The 'percentage female', the 'teachers'level of teacher training' and 'classroom furniture' came through only for100 and 200 school comparisons. "Get homework' both in Vietnameseand Math emerged in all comparisons, 'math homework corrected' forboth the 100 and 200 school comparisons, and 'reading homeworkcorrected' only for 100 school comparison.
Summarizing the above, in terms of school and teacher variables, it canbe said that similar findings emerged from the comparison of 100 and200 schools' comparisons, but when only isolated schools wereconsidered there were different variables that emerged.
It is the variables that came through for both the 100 school and 200school comparison that will be carried through to the next chapter wheremultivariate analyses will be reported. The differences of the mosteffective and least effective isolated schools should form the basis of aseparate report that involves some observation work in some if thoseschools.
Vietnam Reading and Mathematics Assessment Study
237
The most importantvariables (more than 0.5standard deviationdifference) were singledout for further analyses(see Chapter 9).
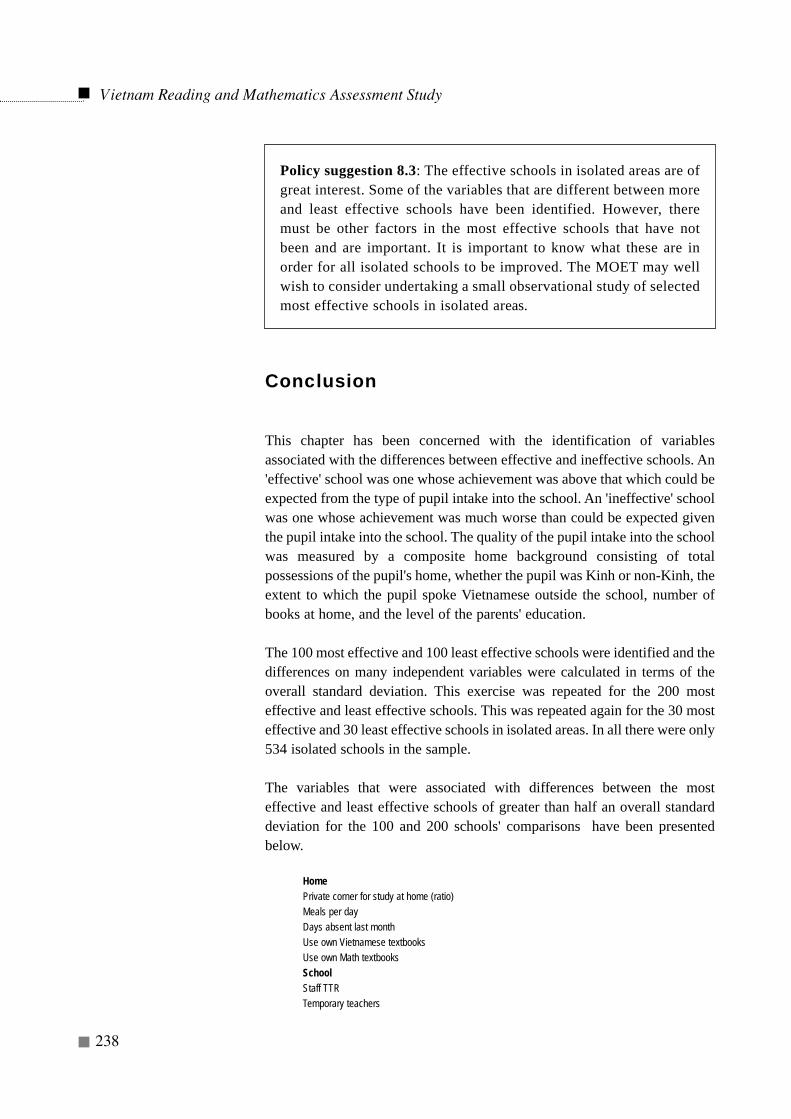
Policy suggestion 8.3: The effective schools in isolated areas are ofgreat interest. Some of the variables that are different between moreand least effective schools have been identified. However, theremust be other factors in the most effective schools that have notbeen and are important. It is important to know what these are inorder for all isolated schools to be improved. The MOET may wellwish to consider undertaking a small observational study of selectedmost effective schools in isolated areas.
Conclusion
This chapter has been concerned with the identification of variablesassociated with the differences between effective and ineffective schools. An'effective' school was one whose achievement was above that which could beexpected from the type of pupil intake into the school. An 'ineffective' schoolwas one whose achievement was much worse than could be expected giventhe pupil intake into the school. The quality of the pupil intake into the schoolwas measured by a composite home background consisting of totalpossessions of the pupil's home, whether the pupil was Kinh or non-Kinh, theextent to which the pupil spoke Vietnamese outside the school, number ofbooks at home, and the level of the parents' education.
The 100 most effective and 100 least effective schools were identified and thedifferences on many independent variables were calculated in terms of theoverall standard deviation. This exercise was repeated for the 200 mosteffective and least effective schools. This was repeated again for the 30 mosteffective and 30 least effective schools in isolated areas. In all there were only534 isolated schools in the sample.
The variables that were associated with differences between the mosteffective and least effective schools of greater than half an overall standarddeviation for the 100 and 200 schools' comparisons have been presentedbelow.
HomePrivate corner for study at home (ratio)Meals per dayDays absent last monthUse own Vietnamese textbooksUse own Math textbooksSchoolStaff TTRTemporary teachers
Vietnam Reading and Mathematics Assessment Study
238
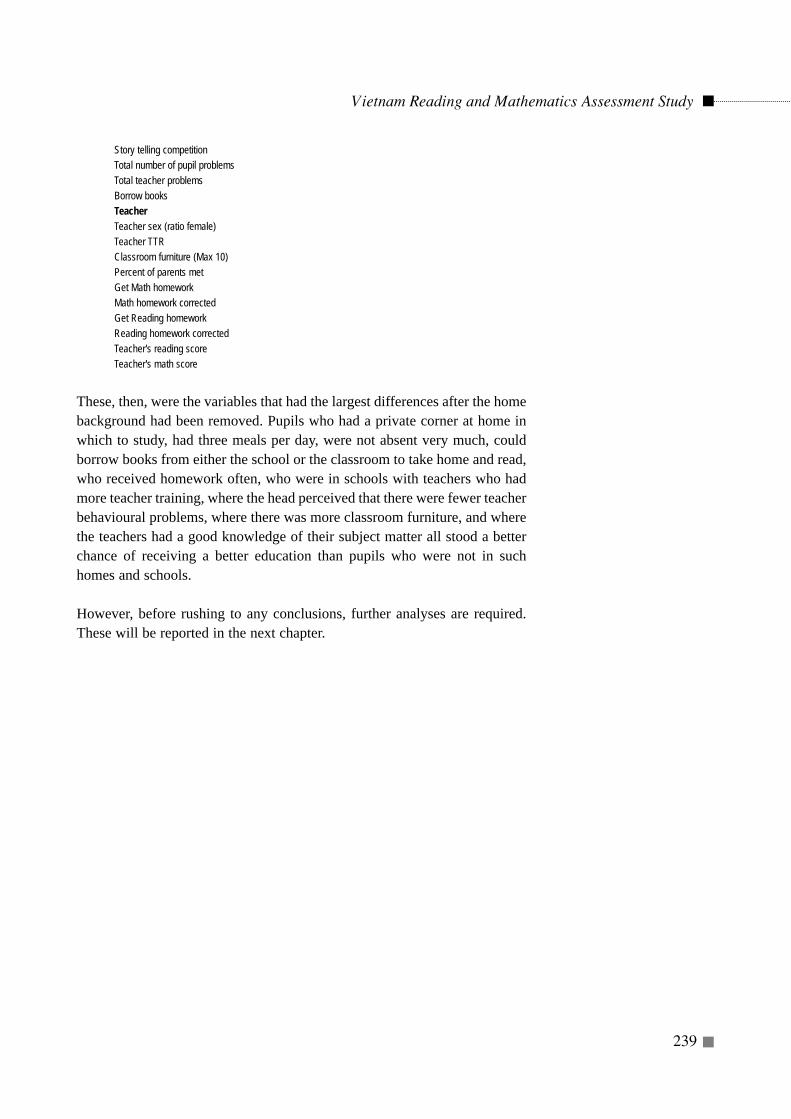
Story telling competitionTotal number of pupil problemsTotal teacher problemsBorrow booksTeacherTeacher sex (ratio female)Teacher TTRClassroom furniture (Max 10)Percent of parents metGet Math homeworkMath homework correctedGet Reading homeworkReading homework correctedTeacher's reading scoreTeacher's math score
These, then, were the variables that had the largest differences after the homebackground had been removed. Pupils who had a private corner at home inwhich to study, had three meals per day, were not absent very much, couldborrow books from either the school or the classroom to take home and read,who received homework often, who were in schools with teachers who hadmore teacher training, where the head perceived that there were fewer teacherbehavioural problems, where there was more classroom furniture, and wherethe teachers had a good knowledge of their subject matter all stood a betterchance of receiving a better education than pupils who were not in suchhomes and schools.
However, before rushing to any conclusions, further analyses are required.These will be reported in the next chapter.
Vietnam Reading and Mathematics Assessment Study
239
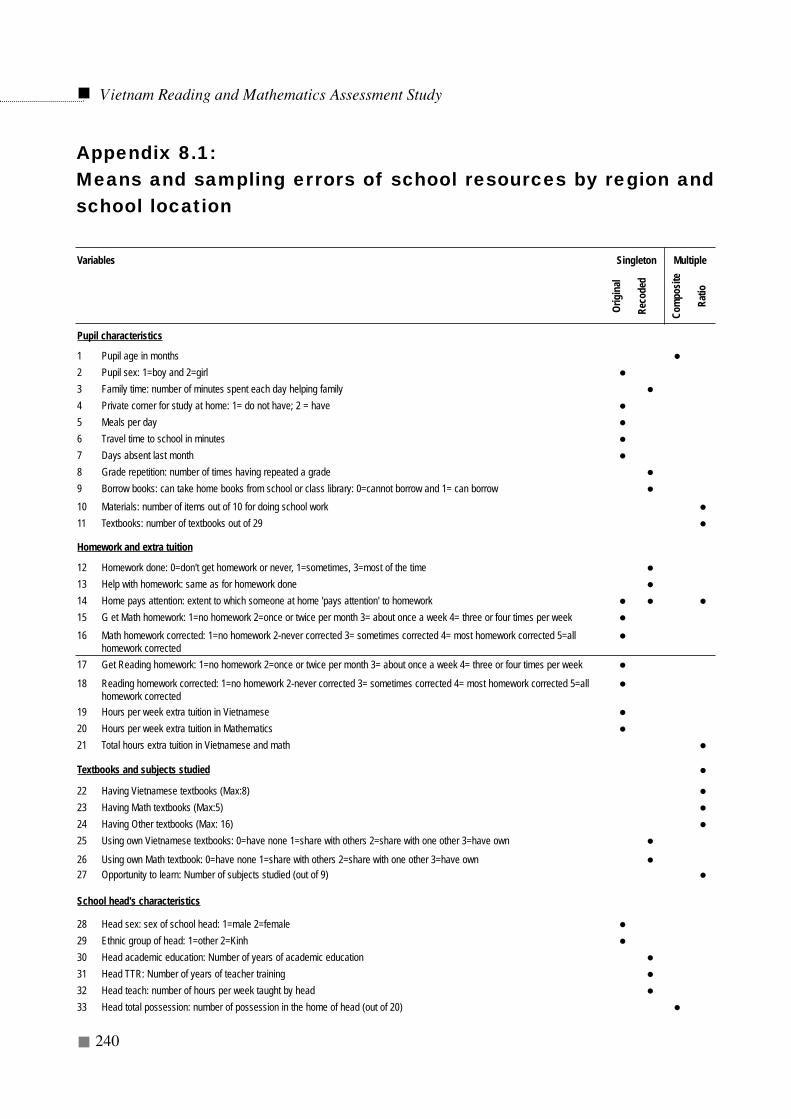
Vietnam Reading and Mathematics Assessment Study
240
Appendix 8.1:Means and sampling errors of school resources by region andschool location
Variables Singleton Multiple
Orig
inal
Reco
ded
Com
posit
e
Ratio
Pupil characteristics
1 Pupil age in months2 Pupil sex: 1=boy and 2=girl3 Family time: number of minutes spent each day helping family4 Private corner for study at home: 1= do not have; 2 = have5 Meals per day6 Travel time to school in minutes7 Days absent last month8 Grade repetition: number of times having repeated a grade9 Borrow books: can take home books from school or class library: 0=cannot borrow and 1= can borrow10 Materials: number of items out of 10 for doing school work11 Textbooks: number of textbooks out of 29
Homework and extra tuition
12 Homework done: 0=don't get homework or never, 1=sometimes, 3=most of the time13 Help with homework: same as for homework done14 Home pays attention: extent to which someone at home 'pays attention' to homework15 G et Math homework: 1=no homework 2=once or twice per month 3= about once a week 4= three or four times per week16 Math homework corrected: 1=no homework 2-never corrected 3= sometimes corrected 4= most homework corrected 5=all
homework corrected17 Get Reading homework: 1=no homework 2=once or twice per month 3= about once a week 4= three or four times per week
18 Reading homework corrected: 1=no homework 2-never corrected 3= sometimes corrected 4= most homework corrected 5=allhomework corrected
19 Hours per week extra tuition in Vietnamese20 Hours per week extra tuition in Mathematics21 Total hours extra tuition in Vietnamese and math
Textbooks and subjects studied
22 Having Vietnamese textbooks (Max:8)23 Having Math textbooks (Max:5)24 Having Other textbooks (Max: 16)25 Using own Vietnamese textbooks: 0=have none 1=share with others 2=share with one other 3=have own
26 Using own Math textbook: 0=have none 1=share with others 2=share with one other 3=have own27 Opportunity to learn: Number of subjects studied (out of 9)
School head's characteristics
28 Head sex: sex of school head: 1=male 2=female29 Ethnic group of head: 1=other 2=Kinh30 Head academic education: Number of years of academic education31 Head TTR: Number of years of teacher training32 Head teach: number of hours per week taught by head33 Head total possession: number of possession in the home of head (out of 20)
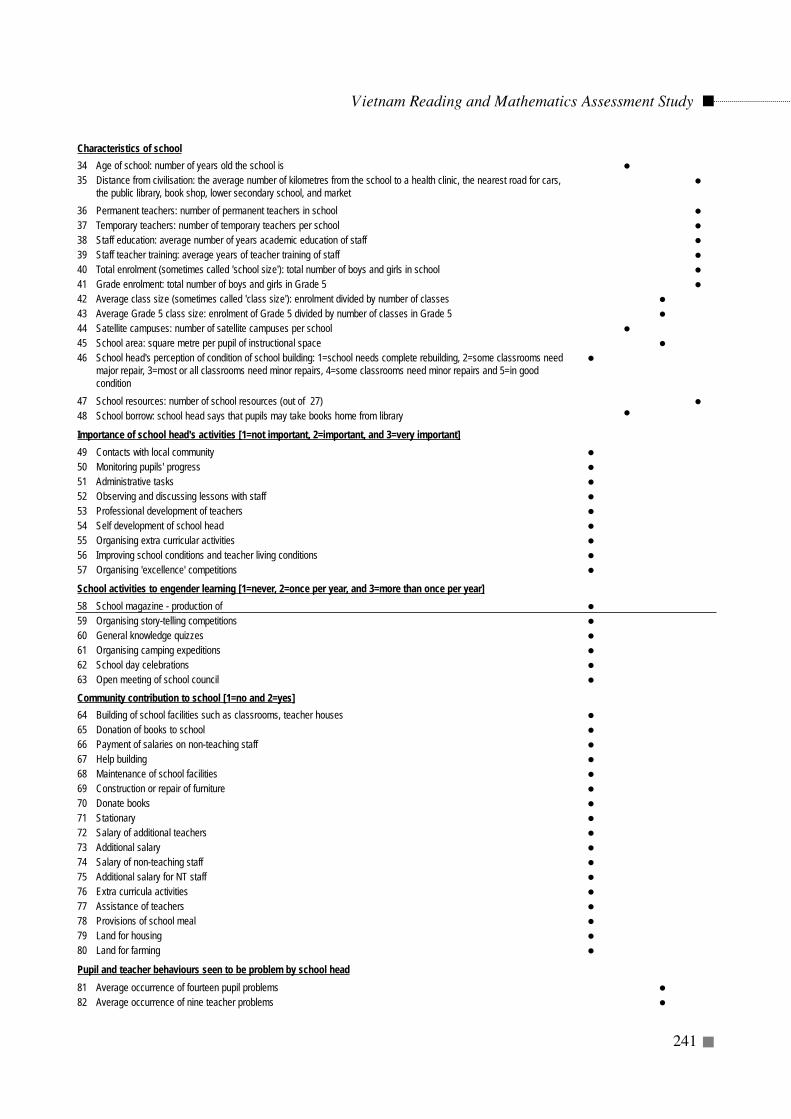
Vietnam Reading and Mathematics Assessment Study
241
Characteristics of school34 Age of school: number of years old the school is35 Distance from civilisation: the average number of kilometres from the school to a health clinic, the nearest road for cars,
the public library, book shop, lower secondary school, and market36 Permanent teachers: number of permanent teachers in school37 Temporary teachers: number of temporary teachers per school38 Staff education: average number of years academic education of staff39 Staff teacher training: average years of teacher training of staff40 Total enrolment (sometimes called 'school size'): total number of boys and girls in school41 Grade enrolment: total number of boys and girls in Grade 542 Average class size (sometimes called 'class size'): enrolment divided by number of classes43 Average Grade 5 class size: enrolment of Grade 5 divided by number of classes in Grade 544 Satellite campuses: number of satellite campuses per school45 School area: square metre per pupil of instructional space46 School head's perception of condition of school building: 1=school needs complete rebuilding, 2=some classrooms need
major repair, 3=most or all classrooms need minor repairs, 4=some classrooms need minor repairs and 5=in goodcondition
47 School resources: number of school resources (out of 27)48 School borrow: school head says that pupils may take books home from library
Importance of school head's activities [1=not important, 2=important, and 3=very important]49 Contacts with local community50 Monitoring pupils' progress51 Administrative tasks52 Observing and discussing lessons with staff53 Professional development of teachers54 Self development of school head55 Organising extra curricular activities56 Improving school conditions and teacher living conditions57 Organising 'excellence' competitions
School activities to engender learning [1=never, 2=once per year, and 3=more than once per year]58 School magazine - production of59 Organising story-telling competitions60 General knowledge quizzes61 Organising camping expeditions62 School day celebrations63 Open meeting of school councilCommunity contribution to school [1=no and 2=yes]64 Building of school facilities such as classrooms, teacher houses65 Donation of books to school66 Payment of salaries on non-teaching staff67 Help building68 Maintenance of school facilities69 Construction or repair of furniture70 Donate books71 Stationary72 Salary of additional teachers73 Additional salary74 Salary of non-teaching staff75 Additional salary for NT staff76 Extra curricula activities77 Assistance of teachers78 Provisions of school meal79 Land for housing80 Land for farming
Pupil and teacher behaviours seen to be problem by school head81 Average occurrence of fourteen pupil problems 82 Average occurrence of nine teacher problems
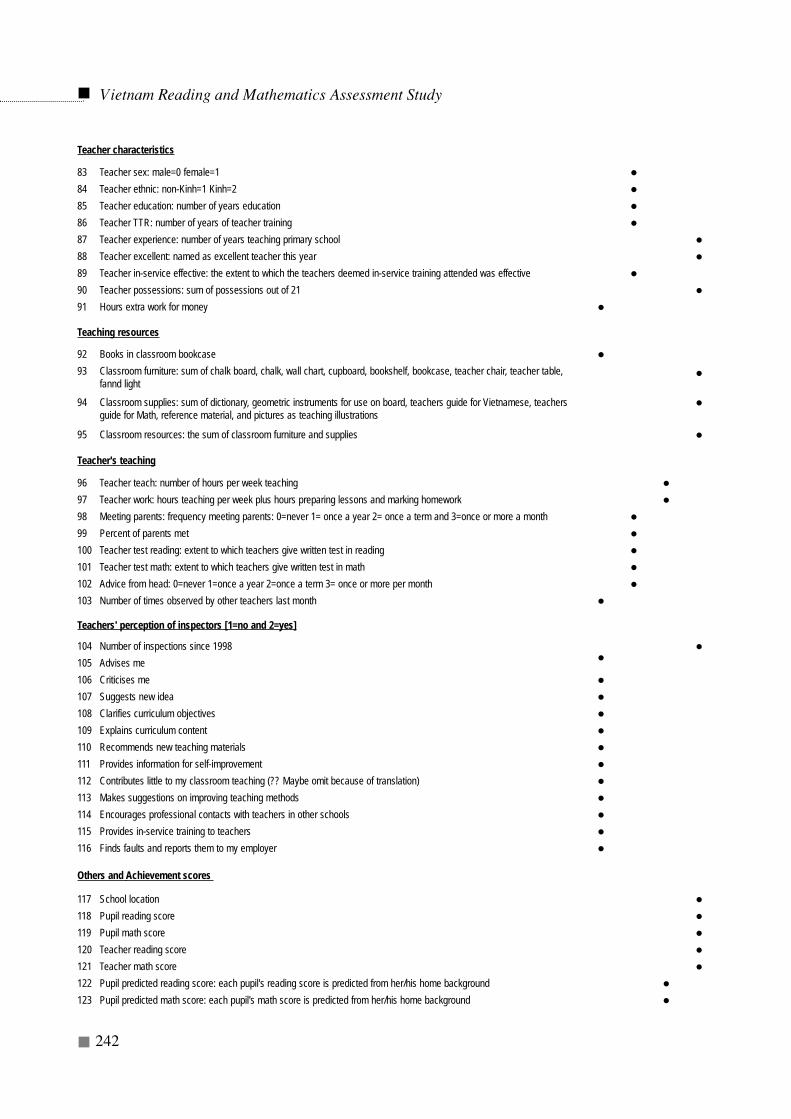
Vietnam Reading and Mathematics Assessment Study
242
Teacher characteristics
83 Teacher sex: male=0 female=184 Teacher ethnic: non-Kinh=1 Kinh=285 Teacher education: number of years education86 Teacher TTR: number of years of teacher training87 Teacher experience: number of years teaching primary school88 Teacher excellent: named as excellent teacher this year89 Teacher in-service effective: the extent to which the teachers deemed in-service training attended was effective90 Teacher possessions: sum of possessions out of 2191 Hours extra work for money
Teaching resources
92 Books in classroom bookcase93 Classroom furniture: sum of chalk board, chalk, wall chart, cupboard, bookshelf, bookcase, teacher chair, teacher table,
fannd light
94 Classroom supplies: sum of dictionary, geometric instruments for use on board, teachers guide for Vietnamese, teachersguide for Math, reference material, and pictures as teaching illustrations
95 Classroom resources: the sum of classroom furniture and supplies
Teacher's teaching
96 Teacher teach: number of hours per week teaching97 Teacher work: hours teaching per week plus hours preparing lessons and marking homework98 Meeting parents: frequency meeting parents: 0=never 1= once a year 2= once a term and 3=once or more a month99 Percent of parents met100 Teacher test reading: extent to which teachers give written test in reading101 Teacher test math: extent to which teachers give written test in math102 Advice from head: 0=never 1=once a year 2=once a term 3= once or more per month103 Number of times observed by other teachers last month
Teachers' perception of inspectors [1=no and 2=yes]
104 Number of inspections since 1998105 Advises me106 Criticises me107 Suggests new idea108 Clarifies curriculum objectives109 Explains curriculum content110 Recommends new teaching materials111 Provides information for self-improvement112 Contributes little to my classroom teaching (?? Maybe omit because of translation)113 Makes suggestions on improving teaching methods114 Encourages professional contacts with teachers in other schools115 Provides in-service training to teachers116 Finds faults and reports them to my employer
Others and Achievement scores
117 School location118 Pupil reading score119 Pupil math score120 Teacher reading score121 Teacher math score122 Pupil predicted reading score: each pupil's reading score is predicted from her/his home background123 Pupil predicted math score: each pupil's math score is predicted from her/his home background
Chapter 9
INITIAL EXPLORATIONS OFRELATIONSHIPS AMONG VARIABLES
Introduction
This study has been a cross-sectional sample survey of the stateof education in Grade 5 in April, 2001. The data were collectedon one day. The study is therefore rather like having a staticpicture taken of the situation of education on that day. It was
not a longitudinal study or an experimental study with a control andtreatment group. It is therefore not possible to prove cause and effect. Theevidence in the study is has been based on various measures ofassociation between variables and the outcome scores of mathematics andreading. Any inference about possible cause and effect must be a functionof the memory, testimony and introspection of the person or persons, inthis case the researchers, working on the study. It can happen that theinference may vary from one interpreter to another. This is ground forcaution in making any inference, but it is not ground for making noinference. For example, the present writer believes from what heremembers (memory) of his personal experience as a teacher (testimony)and from thinking about it (introspection) that doing homework andhaving it corrected by the teacher and given back to the pupil is likely tohelp improve math achievement. The same can be said about several ofthe variables that have been reported in previous chapters.
Similarly, it must be recalled that if there is no variance or very littlevariance in one of the variables there will be no correlation or a verysmall one. Take, for example, the case of the general education ofteachers. In a case where nearly all teachers have had 12 years ofeducation there will be no correlation or one that is not far from zero.This does not mean that the general education of teachers is unimportant.It just means that because there was no variance there was no correlation.
Vietnam Reading and Mathematics Assessment Study
243
Care must be taken ininferring causation fromcross sectional data.
Only variables that hadvariance could beexamined.
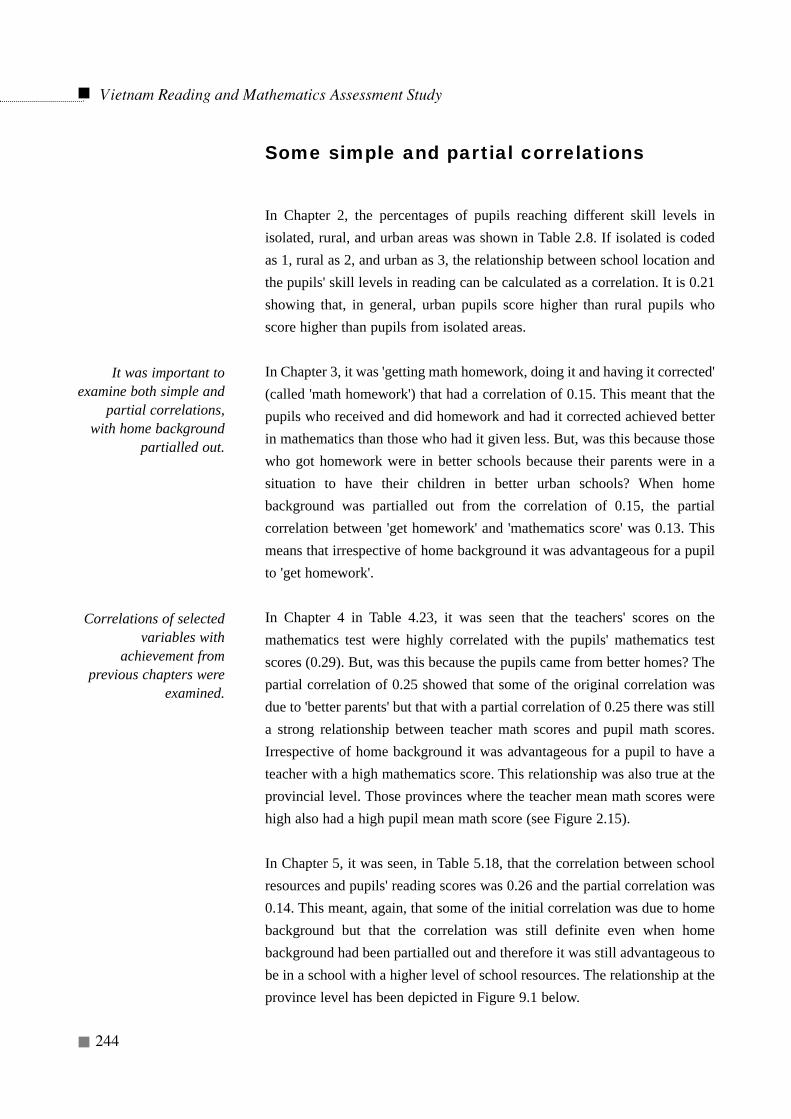
Some simple and partial correlations
In Chapter 2, the percentages of pupils reaching different skill levels inisolated, rural, and urban areas was shown in Table 2.8. If isolated is codedas 1, rural as 2, and urban as 3, the relationship between school location andthe pupils' skill levels in reading can be calculated as a correlation. It is 0.21showing that, in general, urban pupils score higher than rural pupils whoscore higher than pupils from isolated areas.
In Chapter 3, it was 'getting math homework, doing it and having it corrected'(called 'math homework') that had a correlation of 0.15. This meant that thepupils who received and did homework and had it corrected achieved betterin mathematics than those who had it given less. But, was this because thosewho got homework were in better schools because their parents were in asituation to have their children in better urban schools? When homebackground was partialled out from the correlation of 0.15, the partialcorrelation between 'get homework' and 'mathematics score' was 0.13. Thismeans that irrespective of home background it was advantageous for a pupilto 'get homework'.
In Chapter 4 in Table 4.23, it was seen that the teachers' scores on themathematics test were highly correlated with the pupils' mathematics testscores (0.29). But, was this because the pupils came from better homes? Thepartial correlation of 0.25 showed that some of the original correlation wasdue to 'better parents' but that with a partial correlation of 0.25 there was stilla strong relationship between teacher math scores and pupil math scores.Irrespective of home background it was advantageous for a pupil to have ateacher with a high mathematics score. This relationship was also true at theprovincial level. Those provinces where the teacher mean math scores werehigh also had a high pupil mean math score (see Figure 2.15).
In Chapter 5, it was seen, in Table 5.18, that the correlation between schoolresources and pupils' reading scores was 0.26 and the partial correlation was0.14. This meant, again, that some of the initial correlation was due to homebackground but that the correlation was still definite even when homebackground had been partialled out and therefore it was still advantageous tobe in a school with a higher level of school resources. The relationship at theprovince level has been depicted in Figure 9.1 below.
Vietnam Reading and Mathematics Assessment Study
244
It was important toexamine both simple and
partial correlations,with home background
partialled out.
Correlations of selectedvariables with
achievement fromprevious chapters were
examined.
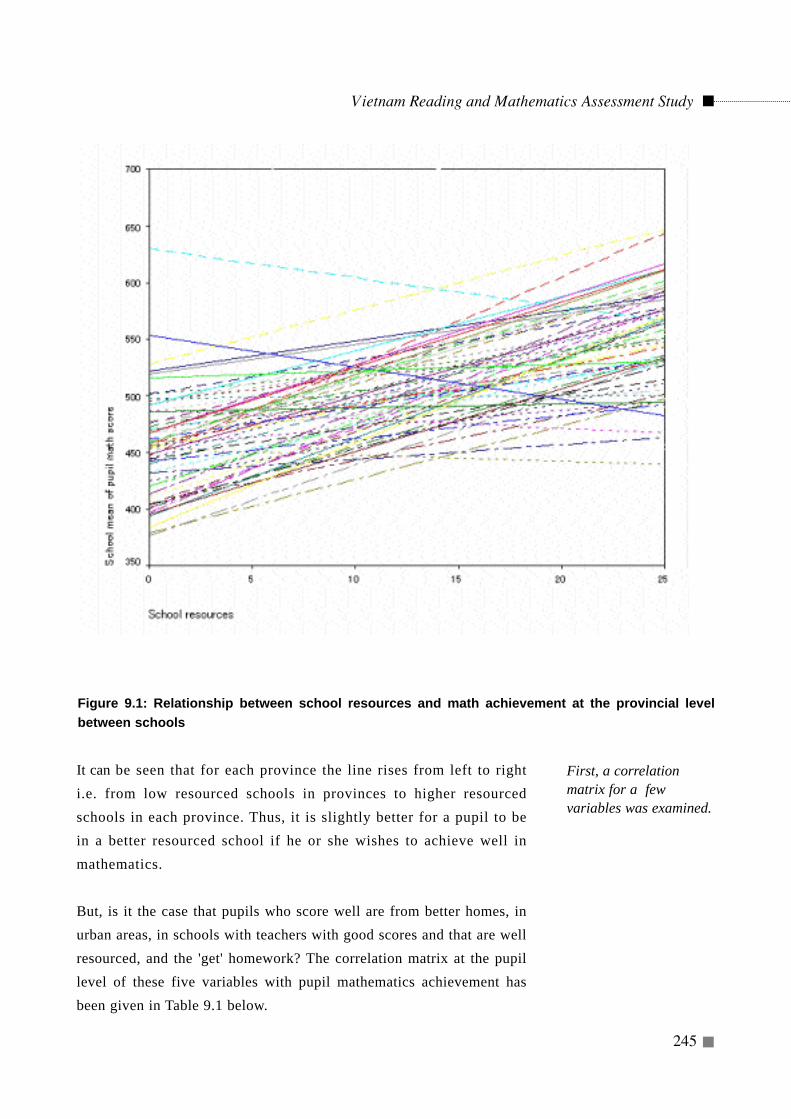
Vietnam Reading and Mathematics Assessment Study
245
It can be seen that for each province the line rises from left to righti.e. from low resourced schools in provinces to higher resourcedschools in each province. Thus, it is slightly better for a pupil to bein a better resourced school if he or she wishes to achieve well inmathematics.
But, is it the case that pupils who score well are from better homes, inurban areas, in schools with teachers with good scores and that are wellresourced, and the 'get' homework? The correlation matrix at the pupillevel of these five variables with pupil mathematics achievement hasbeen given in Table 9.1 below.
Figure 9.1: Relationship between school resources and math achievement at the provincial levelbetween schools
First, a correlationmatrix for a fewvariables was examined.
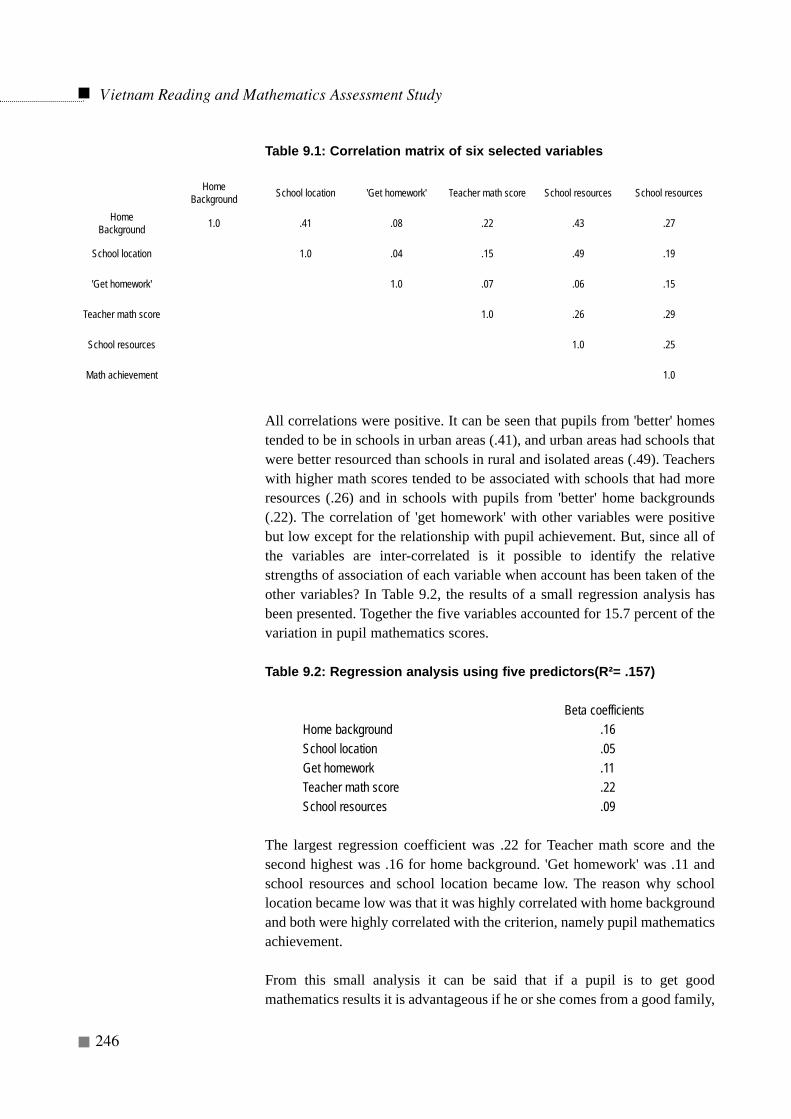
Table 9.1: Correlation matrix of six selected variables
All correlations were positive. It can be seen that pupils from 'better' homestended to be in schools in urban areas (.41), and urban areas had schools thatwere better resourced than schools in rural and isolated areas (.49). Teacherswith higher math scores tended to be associated with schools that had moreresources (.26) and in schools with pupils from 'better' home backgrounds(.22). The correlation of 'get homework' with other variables were positivebut low except for the relationship with pupil achievement. But, since all ofthe variables are inter-correlated is it possible to identify the relativestrengths of association of each variable when account has been taken of theother variables? In Table 9.2, the results of a small regression analysis hasbeen presented. Together the five variables accounted for 15.7 percent of thevariation in pupil mathematics scores.
Table 9.2: Regression analysis using five predictors(R²= .157)
Beta coefficientsHome background .16School location .05Get homework .11Teacher math score .22School resources .09
The largest regression coefficient was .22 for Teacher math score and thesecond highest was .16 for home background. 'Get homework' was .11 andschool resources and school location became low. The reason why schoollocation became low was that it was highly correlated with home backgroundand both were highly correlated with the criterion, namely pupil mathematicsachievement.
From this small analysis it can be said that if a pupil is to get goodmathematics results it is advantageous if he or she comes from a good family,
Vietnam Reading and Mathematics Assessment Study
246
HomeBackground School location 'Get homework' Teacher math score School resources School resources
HomeBackground 1.0 .41 .08 .22 .43 .27
School location 1.0 .04 .15 .49 .19
'Get homework' 1.0 .07 .06 .15
Teacher math score 1.0 .26 .29
School resources 1.0 .25
Math achievement 1.0
attends a school where teachers have high mathematics scores and where theteachers give more homework.
Since the MOET cannot change home background and school location, thetwo variables that can be changed are teacher math score and the giving andcorrecting of homework. The former can be changed through more intensiveteacher training and the latter through a mixture of pre- and in-servicetraining and the inspectorate.
But all in all there were 24 variables and two outcome variables - a total of26. The inter-correlations have been presented, in Table 9.3, for those pupilvariables that had simple correlations higher than 0.07 and for teacher andschool variables that had correlations higher than 0.12.
A quick perusal of the table shows that Home Background has highcorrelations with pupil having a private corner for study at home (.31),school and classroom resources (.49), have materials (.35), teacherpossessions at home (.34), school location (.41), teaching staff teachertraining (.33), percent of pupils in full-day shift, and percent female staff.Stated in other words this means that pupils from better home backgroundswere more likely to have a private corner at home, more likely to be in aschool with good classroom and school resources, more likely to havemore of their own textbooks, more likely to have teachers who are slightlyricher, more likely to be in an urban area, more likely to be in a full-dayschool with more females on the teaching staff. In short children fromricher families are much better off for teachers and schools than pupilsfrom poorer families.
But it can also be seen that pupil age and times having grade repeated werecorrelated .45. This is to be expected. But it could also be seen that pupilswho were older were also in schools with fewer classroom and schoolresources (-.30). The variable 'teacher possessions in the home' was highlycorrelated with home background and school/classroom resources meaningthat the urban areas had the richer teachers who were in schools with moreresources. Schools with more resources were not only in urban areas (.41)and with richer teachers (.50), but also had a teaching staff that had hadmore teacher training (.44), had a higher percentage of pupils following thefull-day school (.47), and had more parents giving contributions to theschool (.40).
In some cases it was seen that there were two variables that were very similarin nature that were highly correlated. For example, it could be seen that theyears of teacher training of Grade 5 teachers and of the whole teaching staffwas correlated .37. In this case it is probably better to drop one of them whenlooking for the relative effect of variables.
Vietnam Reading and Mathematics Assessment Study
247
A larger matrix of 26variables wax examined.It was clear that thehome backgrounds ofpupils were highlycorrelated with schooland classroomresources, teacherquality, the possessionof textbooks. Thesevariables were alsohighly correlated withpupil achievement.
Vietnam Reading and Mathematics Assessment Study
248
Tabl
e 9.
3 C
orre
latio
n m
atrix
for
twen
ty th
ree
varia
bles
.
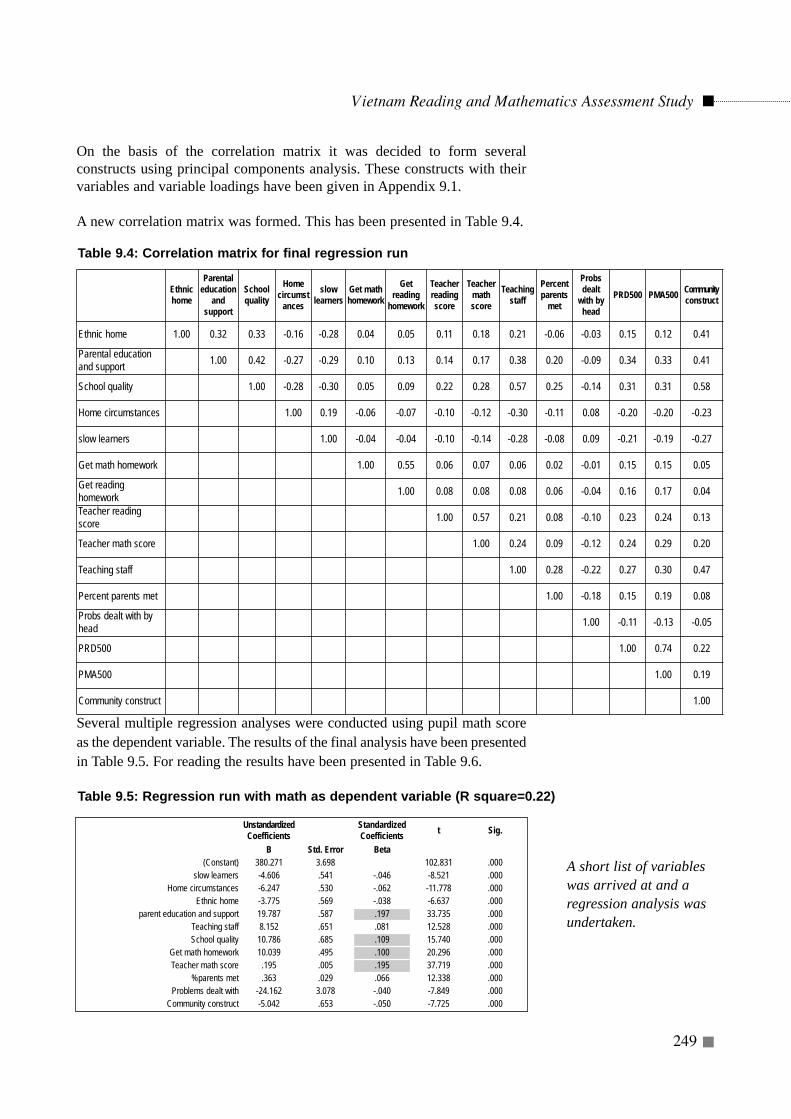
Vietnam Reading and Mathematics Assessment Study
249
On the basis of the correlation matrix it was decided to form severalconstructs using principal components analysis. These constructs with theirvariables and variable loadings have been given in Appendix 9.1.
A new correlation matrix was formed. This has been presented in Table 9.4.
Several multiple regression analyses were conducted using pupil math scoreas the dependent variable. The results of the final analysis have been presentedin Table 9.5. For reading the results have been presented in Table 9.6.
Table 9.4: Correlation matrix for final regression run
Ethnichome
Parentaleducation
andsupport
Schoolquality
Homecircumst
ances
slowlearners
Get mathhomework
Getreading
homework
Teacherreadingscore
Teachermathscore
Teachingstaff
Percentparents
met
Probsdealt
with byhead
PRD500 PMA500 Communityconstruct
Ethnic home 1.00 0.32 0.33 -0.16 -0.28 0.04 0.05 0.11 0.18 0.21 -0.06 -0.03 0.15 0.12 0.41
Parental educationand support 1.00 0.42 -0.27 -0.29 0.10 0.13 0.14 0.17 0.38 0.20 -0.09 0.34 0.33 0.41
School quality 1.00 -0.28 -0.30 0.05 0.09 0.22 0.28 0.57 0.25 -0.14 0.31 0.31 0.58
Home circumstances 1.00 0.19 -0.06 -0.07 -0.10 -0.12 -0.30 -0.11 0.08 -0.20 -0.20 -0.23
slow learners 1.00 -0.04 -0.04 -0.10 -0.14 -0.28 -0.08 0.09 -0.21 -0.19 -0.27
Get math homework 1.00 0.55 0.06 0.07 0.06 0.02 -0.01 0.15 0.15 0.05
Get readinghomework 1.00 0.08 0.08 0.08 0.06 -0.04 0.16 0.17 0.04
Teacher readingscore 1.00 0.57 0.21 0.08 -0.10 0.23 0.24 0.13
Teacher math score 1.00 0.24 0.09 -0.12 0.24 0.29 0.20
Teaching staff 1.00 0.28 -0.22 0.27 0.30 0.47
Percent parents met 1.00 -0.18 0.15 0.19 0.08
Probs dealt with byhead 1.00 -0.11 -0.13 -0.05
PRD500 1.00 0.74 0.22
PMA500 1.00 0.19
Community construct 1.00
Table 9.5: Regression run with math as dependent variable (R square=0.22)
UnstandardizedCoefficients
Standardized Coefficients t Sig.
B Std. Error Beta(Constant) 380.271 3.698 102.831 .000
slow learners -4.606 .541 -.046 -8.521 .000Home circumstances -6.247 .530 -.062 -11.778 .000
Ethnic home -3.775 .569 -.038 -6.637 .000parent education and support 19.787 .587 .197 33.735 .000
Teaching staff 8.152 .651 .081 12.528 .000School quality 10.786 .685 .109 15.740 .000
Get math homework 10.039 .495 .100 20.296 .000Teacher math score .195 .005 .195 37.719 .000
%parents met .363 .029 .066 12.338 .000Problems dealt with -24.162 3.078 -.040 -7.849 .000
Community construct -5.042 .653 -.050 -7.725 .000
A short list of variableswas arrived at and aregression analysis wasundertaken.
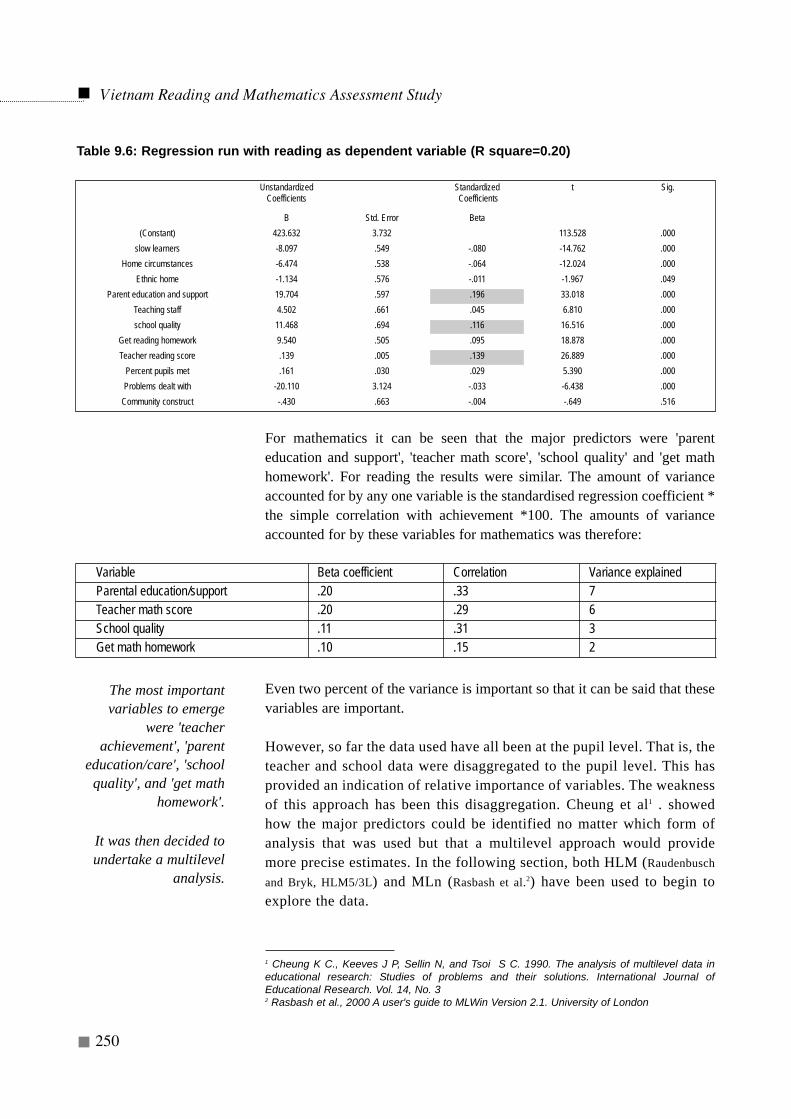
For mathematics it can be seen that the major predictors were 'parenteducation and support', 'teacher math score', 'school quality' and 'get mathhomework'. For reading the results were similar. The amount of varianceaccounted for by any one variable is the standardised regression coefficient *the simple correlation with achievement *100. The amounts of varianceaccounted for by these variables for mathematics was therefore:
Even two percent of the variance is important so that it can be said that thesevariables are important.
However, so far the data used have all been at the pupil level. That is, theteacher and school data were disaggregated to the pupil level. This hasprovided an indication of relative importance of variables. The weaknessof this approach has been this disaggregation. Cheung et al1 . showedhow the major predictors could be identified no matter which form ofanalysis that was used but that a multilevel approach would providemore precise estimates. In the following section, both HLM (Raudenbuschand Bryk, HLM5/3L) and MLn (Rasbash et al.2) have been used to begin toexplore the data.
Vietnam Reading and Mathematics Assessment Study
250
Table 9.6: Regression run with reading as dependent variable (R square=0.20)
UnstandardizedCoefficients
StandardizedCoefficients
t Sig.
B Std. Error Beta(Constant) 423.632 3.732 113.528 .000
slow learners -8.097 .549 -.080 -14.762 .000Home circumstances -6.474 .538 -.064 -12.024 .000
Ethnic home -1.134 .576 -.011 -1.967 .049Parent education and support 19.704 .597 .196 33.018 .000
Teaching staff 4.502 .661 .045 6.810 .000school quality 11.468 .694 .116 16.516 .000
Get reading homework 9.540 .505 .095 18.878 .000Teacher reading score .139 .005 .139 26.889 .000
Percent pupils met .161 .030 .029 5.390 .000Problems dealt with -20.110 3.124 -.033 -6.438 .000
Community construct -.430 .663 -.004 -.649 .516
Variable Beta coefficient Correlation Variance explainedParental education/support .20 .33 7Teacher math score .20 .29 6School quality .11 .31 3Get math homework .10 .15 2
The most importantvariables to emerge
were 'teacherachievement', 'parent
education/care', 'schoolquality', and 'get math
homework'.
It was then decided toundertake a multilevel
analysis.
1 Cheung K C., Keeves J P, Sellin N, and Tsoi S C. 1990. The analysis of multilevel data ineducational research: Studies of problems and their solutions. International Journal ofEducational Research. Vol. 14, No. 32 Rasbash et al., 2000 A user's guide to MLWin Version 2.1. University of London
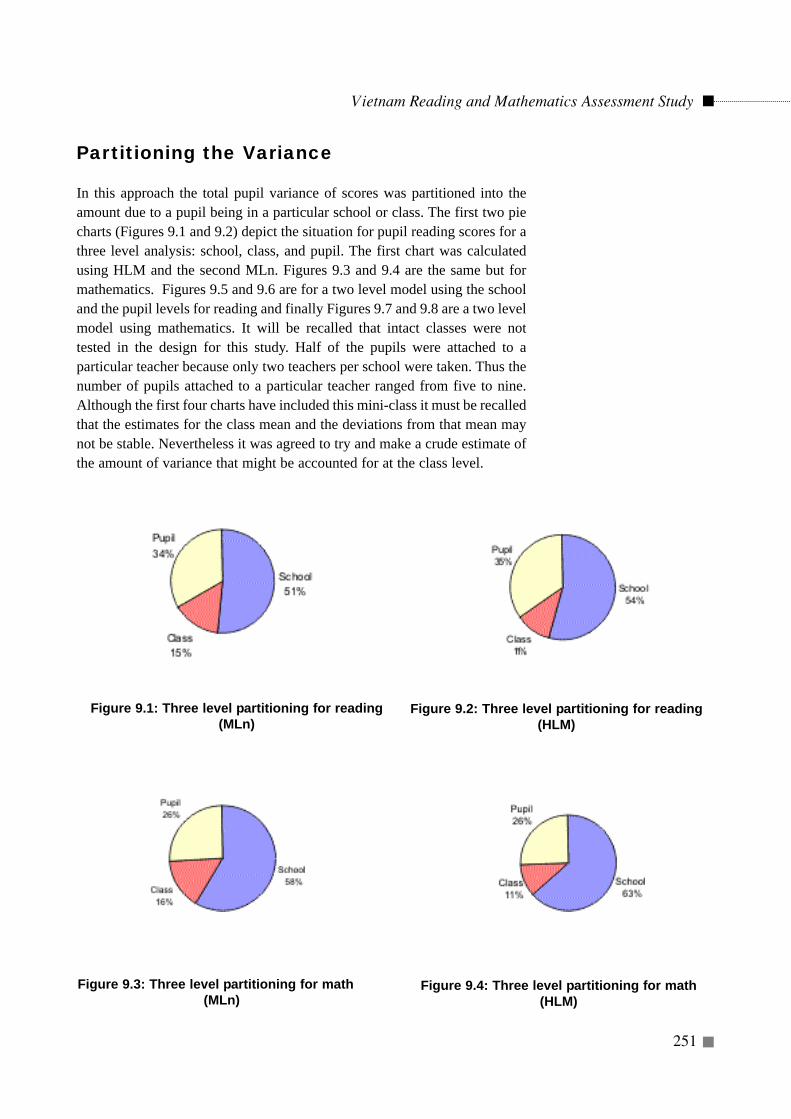
Partitioning the Variance
In this approach the total pupil variance of scores was partitioned into theamount due to a pupil being in a particular school or class. The first two piecharts (Figures 9.1 and 9.2) depict the situation for pupil reading scores for athree level analysis: school, class, and pupil. The first chart was calculatedusing HLM and the second MLn. Figures 9.3 and 9.4 are the same but formathematics. Figures 9.5 and 9.6 are for a two level model using the schooland the pupil levels for reading and finally Figures 9.7 and 9.8 are a two levelmodel using mathematics. It will be recalled that intact classes were nottested in the design for this study. Half of the pupils were attached to aparticular teacher because only two teachers per school were taken. Thus thenumber of pupils attached to a particular teacher ranged from five to nine.Although the first four charts have included this mini-class it must be recalledthat the estimates for the class mean and the deviations from that mean maynot be stable. Nevertheless it was agreed to try and make a crude estimate ofthe amount of variance that might be accounted for at the class level.
Vietnam Reading and Mathematics Assessment Study
251
Figure 9.1: Three level partitioning for reading(MLn)
Figure 9.2: Three level partitioning for reading(HLM)
Figure 9.3: Three level partitioning for math(MLn)
Figure 9.4: Three level partitioning for math(HLM)
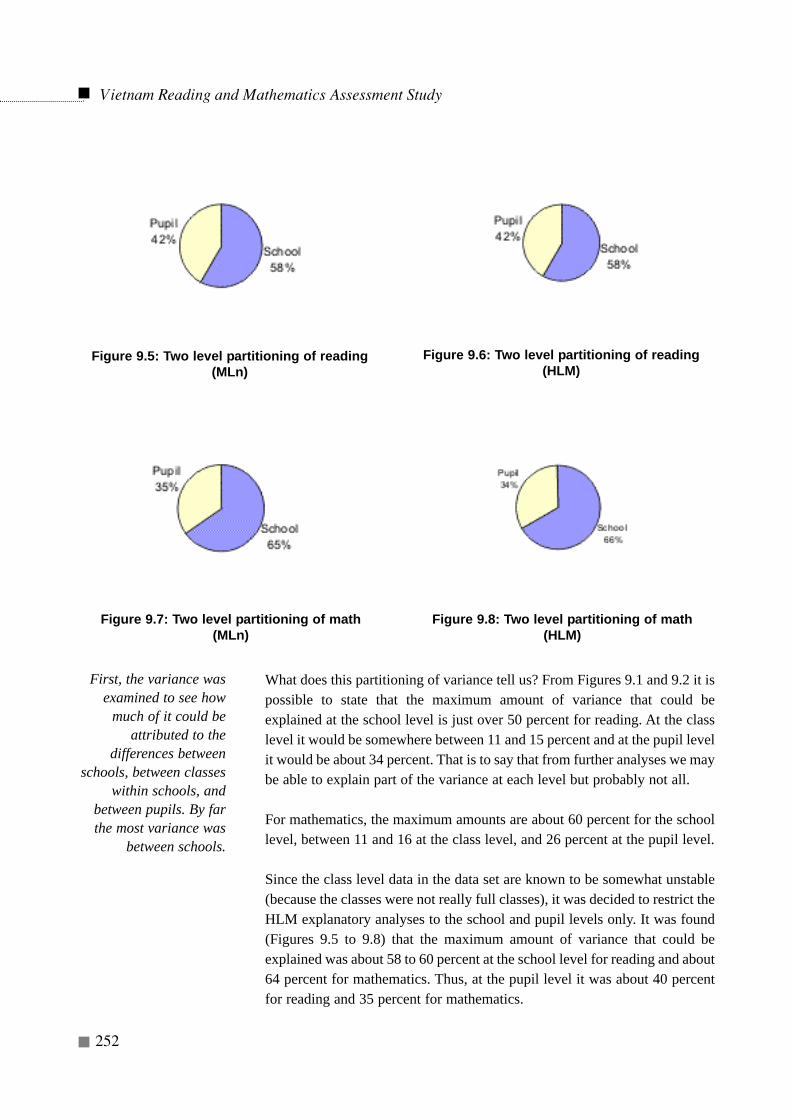
What does this partitioning of variance tell us? From Figures 9.1 and 9.2 it ispossible to state that the maximum amount of variance that could beexplained at the school level is just over 50 percent for reading. At the classlevel it would be somewhere between 11 and 15 percent and at the pupil levelit would be about 34 percent. That is to say that from further analyses we maybe able to explain part of the variance at each level but probably not all.
For mathematics, the maximum amounts are about 60 percent for the schoollevel, between 11 and 16 at the class level, and 26 percent at the pupil level.
Since the class level data in the data set are known to be somewhat unstable(because the classes were not really full classes), it was decided to restrict theHLM explanatory analyses to the school and pupil levels only. It was found(Figures 9.5 to 9.8) that the maximum amount of variance that could beexplained was about 58 to 60 percent at the school level for reading and about64 percent for mathematics. Thus, at the pupil level it was about 40 percentfor reading and 35 percent for mathematics.
Vietnam Reading and Mathematics Assessment Study
252
Figure 9.5: Two level partitioning of reading(MLn)
Figure 9.6: Two level partitioning of reading(HLM)
Figure 9.7: Two level partitioning of math(MLn)
Figure 9.8: Two level partitioning of math(HLM)
First, the variance wasexamined to see how
much of it could beattributed to the
differences betweenschools, between classes
within schools, andbetween pupils. By farthe most variance was
between schools.
It is useful to have this information in terms of the maximum amount ofvariance to be explained at each level because this is what we are aiming for.It also tells us about the system of education. To re-state what has been saidin earlier chapters the amount of variance between schools is very largecompared with many countries. The partitioning of variance has confirmedwhat had already been seen in previous chapters. The variation amongschools was very large; among classes within schools it was not very largeand among pupils it was average.
The major questions then become which were the variables in schools andclasses (including teachers) that were having a large effect on pupils'achievement.
Some exploratory analyses
A series of small exploratory analyses were run using both MLWin and HLM.The tables and figures for the first analyses have been presented in Appendix9.2 and a major HLM analysis has been presented in Table 9.3. Given thecomplexity of the analyses, no detailed explanation has been given. It is leftto those understanding such analyses to read the appendices.
The main results of the analyses were:
there were large between school differences for both subjectsthe importance of home background, especially parental education andsupport, but also travel time, days absent, meals per day, and graderepetition in influencing pupil achievement. Being non-kinh and notspeaking Vietnamese outside of school was a disadvantage.
the importance of being given homework and having it corrected the greater 'effect' of school location on pupil reading score differencesthan on pupil math score differencesthe large 'effect' of teacher subject-matter knowledge on pupil, class andschool achievement
the negative effect of school behavioural problems on pupil achievementthe positive effect on achievement of being in a school with more femaleteachers and having a class female teacher
the positive effect of being in a school where the teachers had more teachertraining, where the head had attended a management course, and wherethe class teacher had been designated as an excellent teacher
the positive effect of being in a classroom and school with more classroomand school resources
Vietnam Reading and Mathematics Assessment Study
253
The main results of theexploratory analysesconfirmed what havebeen found in precedingchapters. There wereextraordinarily highdifferences betweenschools, a majorinequity in the system.The major factorsassociated with theachievement betweenpupils and betweenschools were homebackground, teacherachievement, teachingstaff qualifications,school quality, andhomework being givenand corrected.
When the relative effect of the variables was examined, the same results wereobtained whichever form of analysis was employed. The largest effect wasthe teacher achievement score (the teacher subject-matter knowledge)followed by parental education and support, and then homework being givenand corrected. The largest negative effects were for pupil behaviouralproblems and grade repetition.
These effects were also cumulative. The best schools were in urban areas, hadwell-trained, female teachers with high achievement scores who gave muchhomework and corrected it and who were in classrooms and schools withmany resources. The worst schools were the opposite. Until the schools areequalized on many of the variables, the large inequities in achievement willremain. But the inequities must be remedied by bring the lower levels up tothe higher levels and not vice versa.
The greatest disappointment from these multivariate analyses is that only25 percent of total variance was accounted for. This means that there isa lot of variance, especially between schools, that has not been explainedby the variables that were collected in this study. Before the repeat ofthis study, much conceptualization will be required about which othervariables are 'responsible' for the differences between schools and howthey might be measured. On the other hand, it should be stressed that theresults of the multivariate analyses produced the same results - from apolicy perspective - that were produced from the univariates analyses.This is reassuring.
Conclusion
The aim of this chapter was to establish the relative importance of variablesas input to the MOET. Those of the variables that are considered to bemalleable will be of great importance to the MOET since it provides evidenceon where the most impact will result.
From the previous chapters it was evident that there were pockets of schoolswhere the achievement was high and other pockets where the achievementwas low. The pupils in the schools in the isolated areas had low achievementand in their schools there was a paucity of equipment and supplies as well asof well trained teachers who gave and corrected homework. The pupils inurban areas such as Hanoi/Halong, Ho Chi Minh City and Danang and Hueachieved well and they were in schools where there was more equipment andsupplies, and better qualified teachers who gave and corrected home workmore frequently.
Vietnam Reading and Mathematics Assessment Study
254
The analyses conducted in this chapter confirmed the large betweenschool inequities for so many variables. However, it was variables suchas the teachers' subject matter knowledge, their giving and correctinghomework and the quality of the whole of the teaching staff within aschool that were associated with large differences in achievementbetween pupils and schools. Equipment and supplies were alsoimportant. These are all variables about which something can be done bythe relevant authorities for education.
Many of the analyses confirmed the positive affect of many of the Ministry'sinitiatives taken during the last decade of the 1900s. The effect of excellentteachers, of the teacher training, of the school head management courses bearwitness to this although it was seen that the management courses shouldinclude more training for the heads on how to deal with children havingparents who had low educational levels and did not give much support totheir children.
But some lacunae remain. The achievement in the isolated schools is a matterfor concern and it is in these areas (as well as in some urban pockets) thatthere is a lack of parental support for their children's education. This was alsopresumably coupled with the non-enrolment of children in school or earlydrop-out in some cases. This provides a strong case for the schoolintervention programs mentioned earlier in this report. To change parentalattitudes and behaviours in the home is one of the most difficult things to dobut, given its success elsewhere, it should be attempted.
The main messages for policy suggestions were that teacher subject matterknowledge must be attended to urgently and in ways already suggestedearlier in this report. Secondly, school intervention programs are likely to beuseful in changing parental behaviours and attitudes at home and that thesein turn will have a positive effect on pupil achievement. Thirdly, the givingand correcting of homework must be seen as a priority for all teachers andnot just those in good schools. The ways in which this can be done can bewritten into short booklets but also included in teacher training programs(both pre- and in-service) as well as in the management courses for headteachers. Inspectors can also serve as reinforcing agents. In those schoolsexperiencing pupil behavioural problems, special research studies should becarried out in order to discover why these problems are occurring and thendevising ways of dealing with the problem. Finally, every effort should bemade to eliminate grade repeating. This is much easier said than donebecause it requires a determined effort buy all concerned to provide a highquality education for all pupils, and as already seen, this is a mixture of manyof the variables that have been examined in this report.
Vietnam Reading and Mathematics Assessment Study
255
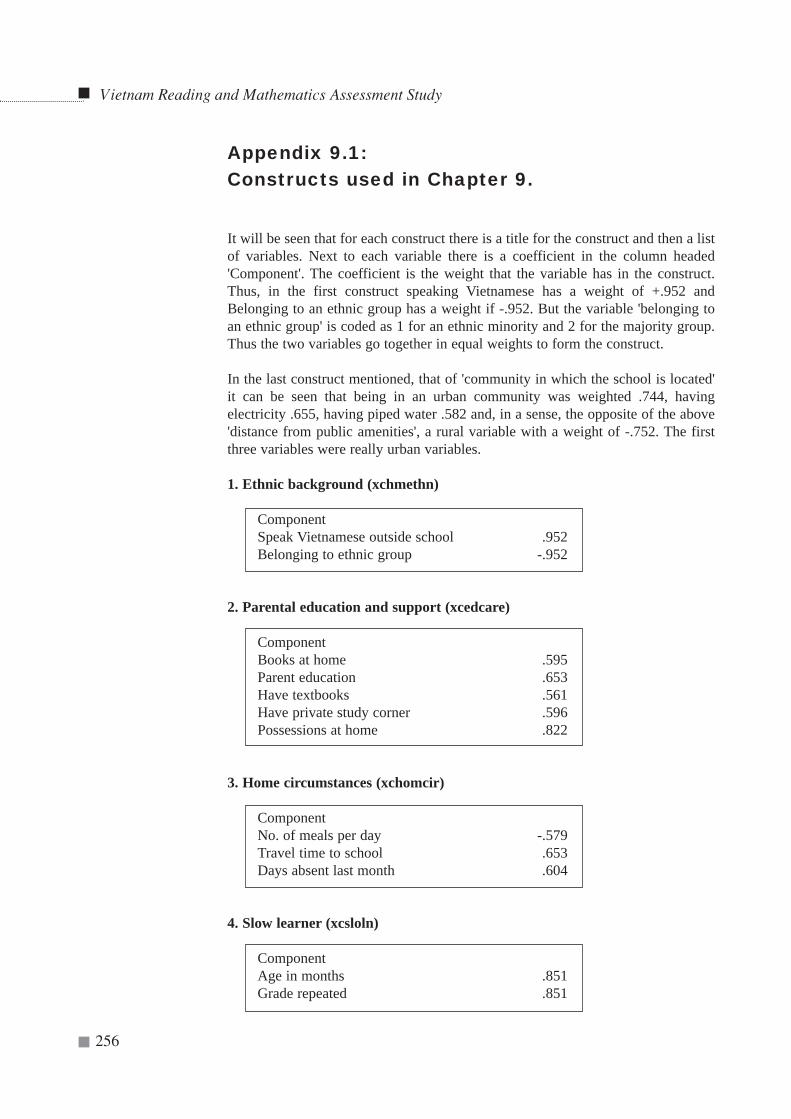
Vietnam Reading and Mathematics Assessment Study
256
Appendix 9.1:Constructs used in Chapter 9.
It will be seen that for each construct there is a title for the construct and then a listof variables. Next to each variable there is a coefficient in the column headed'Component'. The coefficient is the weight that the variable has in the construct.Thus, in the first construct speaking Vietnamese has a weight of +.952 andBelonging to an ethnic group has a weight if -.952. But the variable 'belonging toan ethnic group' is coded as 1 for an ethnic minority and 2 for the majority group.Thus the two variables go together in equal weights to form the construct.
In the last construct mentioned, that of 'community in which the school is located'it can be seen that being in an urban community was weighted .744, havingelectricity .655, having piped water .582 and, in a sense, the opposite of the above'distance from public amenities', a rural variable with a weight of -.752. The firstthree variables were really urban variables.
1. Ethnic background (xchmethn)
ComponentSpeak Vietnamese outside school .952Belonging to ethnic group -.952
2. Parental education and support (xcedcare)
ComponentBooks at home .595Parent education .653Have textbooks .561Have private study corner .596Possessions at home .822
3. Home circumstances (xchomcir)
ComponentNo. of meals per day -.579Travel time to school .653Days absent last month .604
4. Slow learner (xcsloln)
ComponentAge in months .851Grade repeated .851
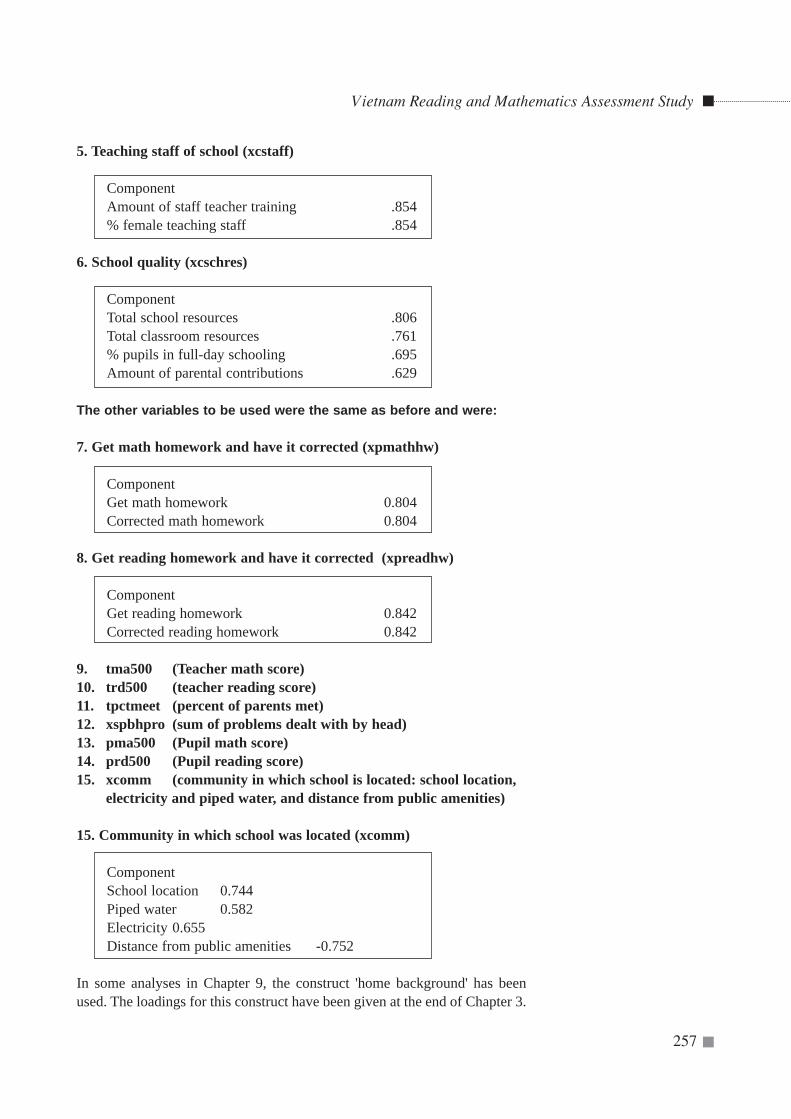
Vietnam Reading and Mathematics Assessment Study
257
5. Teaching staff of school (xcstaff)
ComponentAmount of staff teacher training .854% female teaching staff .854
6. School quality (xcschres)
ComponentTotal school resources .806Total classroom resources .761% pupils in full-day schooling .695Amount of parental contributions .629
The other variables to be used were the same as before and were:
7. Get math homework and have it corrected (xpmathhw)
ComponentGet math homework 0.804Corrected math homework 0.804
8. Get reading homework and have it corrected (xpreadhw)
ComponentGet reading homework 0.842Corrected reading homework 0.842
9. tma500 (Teacher math score)10. trd500 (teacher reading score)11. tpctmeet (percent of parents met)12. xspbhpro (sum of problems dealt with by head)13. pma500 (Pupil math score)14. prd500 (Pupil reading score)15. xcomm (community in which school is located: school location,
electricity and piped water, and distance from public amenities)
15. Community in which school was located (xcomm)
ComponentSchool location 0.744Piped water 0.582Electricity 0.655Distance from public amenities -0.752
In some analyses in Chapter 9, the construct 'home background' has beenused. The loadings for this construct have been given at the end of Chapter 3.
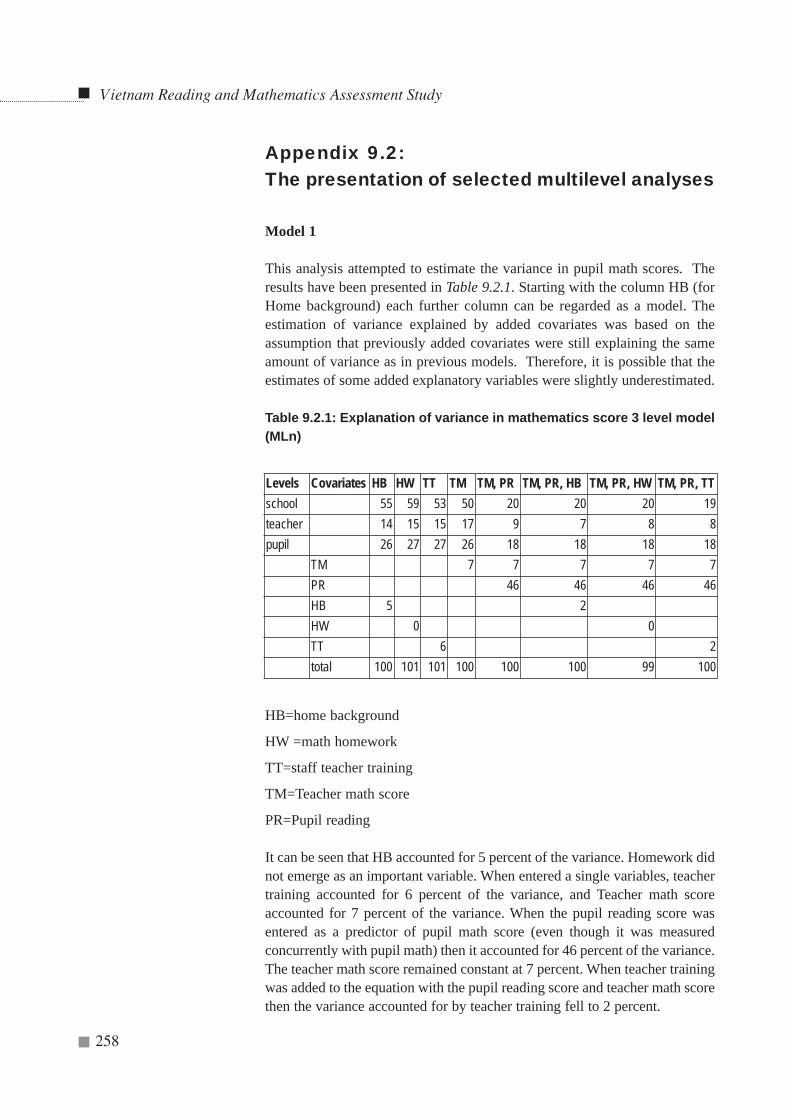
Vietnam Reading and Mathematics Assessment Study
258
Appendix 9.2:The presentation of selected multilevel analyses
Model 1
This analysis attempted to estimate the variance in pupil math scores. Theresults have been presented in Table 9.2.1. Starting with the column HB (forHome background) each further column can be regarded as a model. Theestimation of variance explained by added covariates was based on theassumption that previously added covariates were still explaining the sameamount of variance as in previous models. Therefore, it is possible that theestimates of some added explanatory variables were slightly underestimated.
Table 9.2.1: Explanation of variance in mathematics score 3 level model(MLn)
HB=home background
HW =math homework
TT=staff teacher training
TM=Teacher math score
PR=Pupil reading
It can be seen that HB accounted for 5 percent of the variance. Homework didnot emerge as an important variable. When entered a single variables, teachertraining accounted for 6 percent of the variance, and Teacher math scoreaccounted for 7 percent of the variance. When the pupil reading score wasentered as a predictor of pupil math score (even though it was measuredconcurrently with pupil math) then it accounted for 46 percent of the variance.The teacher math score remained constant at 7 percent. When teacher trainingwas added to the equation with the pupil reading score and teacher math scorethen the variance accounted for by teacher training fell to 2 percent.
Levels Covariates HB HW TT TM TM, PR TM, PR, HB TM, PR, HW TM, PR, TTschool 55 59 53 50 20 20 20 19teacher 14 15 15 17 9 7 8 8pupil 26 27 27 26 18 18 18 18
TM 7 7 7 7 7PR 46 46 46 46HB 5 2HW 0 0TT 6 2total 100 101 101 100 100 100 99 100
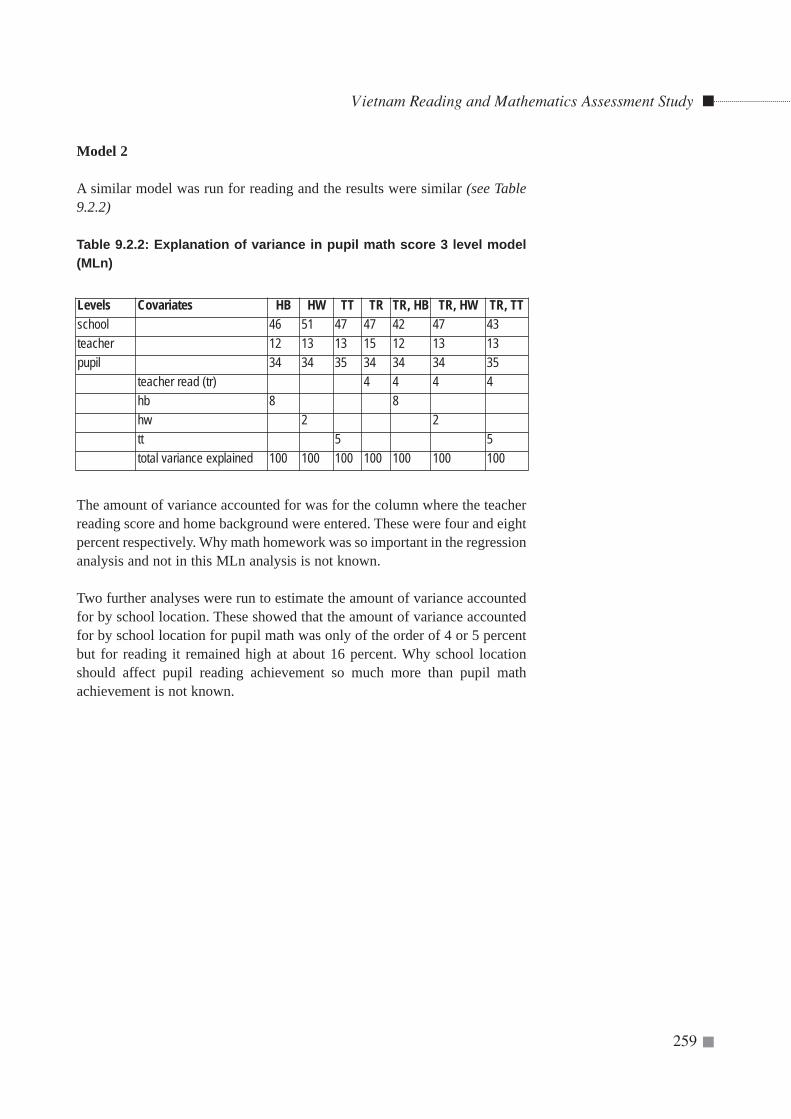
Vietnam Reading and Mathematics Assessment Study
259
Model 2
A similar model was run for reading and the results were similar (see Table9.2.2)
Table 9.2.2: Explanation of variance in pupil math score 3 level model(MLn)
The amount of variance accounted for was for the column where the teacherreading score and home background were entered. These were four and eightpercent respectively. Why math homework was so important in the regressionanalysis and not in this MLn analysis is not known.
Two further analyses were run to estimate the amount of variance accountedfor by school location. These showed that the amount of variance accountedfor by school location for pupil math was only of the order of 4 or 5 percentbut for reading it remained high at about 16 percent. Why school locationshould affect pupil reading achievement so much more than pupil mathachievement is not known.
Levels Covariates HB HW TT TR TR, HB TR, HW TR, TTschool 46 51 47 47 42 47 43teacher 12 13 13 15 12 13 13pupil 34 34 35 34 34 34 35
teacher read (tr) 4 4 4 4hb 8 8hw 2 2tt 5 5total variance explained 100 100 100 100 100 100 100
Vietnam Reading and Mathematics Assessment Study
260
Appendix 9.3:An HLM analysis of the Vietnam Grade 5survey data2
The multilevel analyses reported in this appendix have been carried out inorder to examine factors influencing achievement in mathematics andreading among Grade 5 primary school pupils in Vietnam. The computerpackage used for the multilevel analyses in this study is HLM5 for Windowsdeveloped by Raudenbush, Bryk and Congdon (2000). The HLM programwas initially developed by Bryk et al. (1986) to find a solution for themethodological weakness of educational research studies during the early1980s, which was the failure of many analytical studies to attend to thehierarchical, multilevel character of much of educational field research data(Bryk and Raudenbush, 1992). This failure came from the fact that "thetraditional linear models used by most researchers require the assumptionthat subjects respond independently to educational programs" (Raudenbushand Bryk; 1994, p. 2590). In practice, most educational research studiesselect pupils as a sample who are nested within classrooms, and theclassrooms are in turn nested within schools, schools within geographicallocation, state, or country. In this situation, the pupils selected in the studyare not independent, but rather nested within organizational units andignoring this fact results in the problems of "aggregation bias andmisestimated precision" (Raudenbush and Bryk; 1994, p. 2590).
The multilevel technique employed in this study has been used in otherstudies to tease out factors influencing student achievement in severaldeveloping countries. For example, Willms and Somers (2001) usedhierarchical models to examine socioeconomic factors and other factorsinfluencing mathematics and language achievement among Grades 3 and 4pupils from 13 Latin American countries. In addition, a recent study byHowie (2002) successively employed this multilevel technique to tease outlanguage and other factors influencing student achievement in mathematicsin South Africa using data that were collected as part of the TIMSS-R study.
The structure of this appendix is as follows. A short section has beenprovided in which the criteria employed to select the variables included in themultilevel analyses reported in this appendix have been presented. In thesecond section, the hypothesised multilevel models have been reported. Themultilevel analyses have then been described and, finally, sections containingthe results of the analyses have been presented and interpreted.
2 This appendix was written by Njora Hungi of Flinders University, South Australia
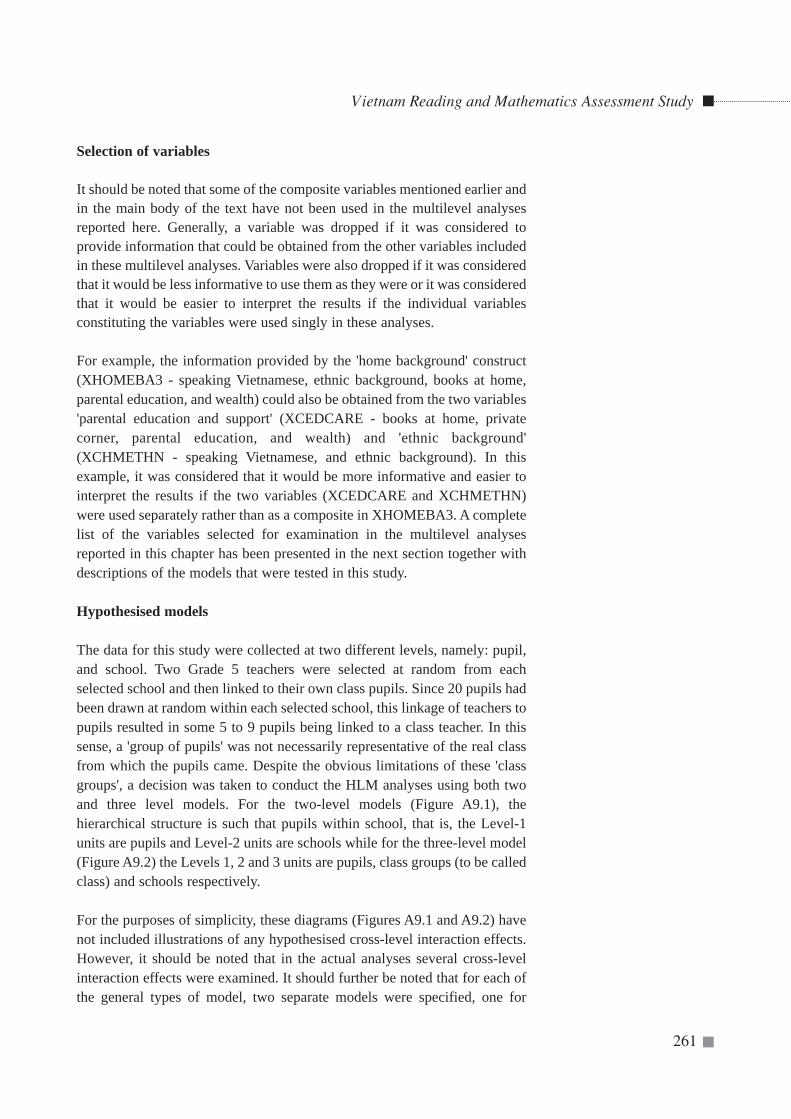
Vietnam Reading and Mathematics Assessment Study
261
Selection of variables
It should be noted that some of the composite variables mentioned earlier andin the main body of the text have not been used in the multilevel analysesreported here. Generally, a variable was dropped if it was considered toprovide information that could be obtained from the other variables includedin these multilevel analyses. Variables were also dropped if it was consideredthat it would be less informative to use them as they were or it was consideredthat it would be easier to interpret the results if the individual variablesconstituting the variables were used singly in these analyses.
For example, the information provided by the 'home background' construct(XHOMEBA3 - speaking Vietnamese, ethnic background, books at home,parental education, and wealth) could also be obtained from the two variables'parental education and support' (XCEDCARE - books at home, privatecorner, parental education, and wealth) and 'ethnic background'(XCHMETHN - speaking Vietnamese, and ethnic background). In thisexample, it was considered that it would be more informative and easier tointerpret the results if the two variables (XCEDCARE and XCHMETHN)were used separately rather than as a composite in XHOMEBA3. A completelist of the variables selected for examination in the multilevel analysesreported in this chapter has been presented in the next section together withdescriptions of the models that were tested in this study.
Hypothesised models
The data for this study were collected at two different levels, namely: pupil,and school. Two Grade 5 teachers were selected at random from eachselected school and then linked to their own class pupils. Since 20 pupils hadbeen drawn at random within each selected school, this linkage of teachers topupils resulted in some 5 to 9 pupils being linked to a class teacher. In thissense, a 'group of pupils' was not necessarily representative of the real classfrom which the pupils came. Despite the obvious limitations of these 'classgroups', a decision was taken to conduct the HLM analyses using both twoand three level models. For the two-level models (Figure A9.1), thehierarchical structure is such that pupils within school, that is, the Level-1units are pupils and Level-2 units are schools while for the three-level model(Figure A9.2) the Levels 1, 2 and 3 units are pupils, class groups (to be calledclass) and schools respectively.
For the purposes of simplicity, these diagrams (Figures A9.1 and A9.2) havenot included illustrations of any hypothesised cross-level interaction effects.However, it should be noted that in the actual analyses several cross-levelinteraction effects were examined. It should further be noted that for each ofthe general types of model, two separate models were specified, one for
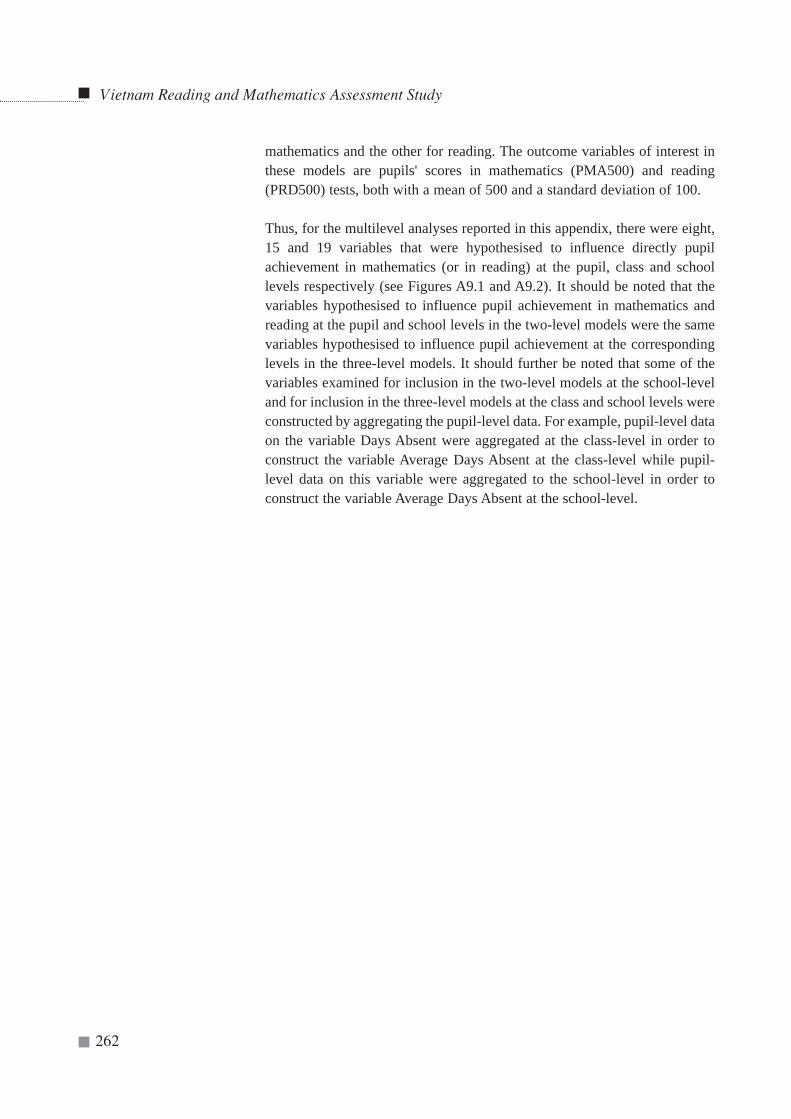
mathematics and the other for reading. The outcome variables of interest inthese models are pupils' scores in mathematics (PMA500) and reading(PRD500) tests, both with a mean of 500 and a standard deviation of 100.
Thus, for the multilevel analyses reported in this appendix, there were eight,15 and 19 variables that were hypothesised to influence directly pupilachievement in mathematics (or in reading) at the pupil, class and schoollevels respectively (see Figures A9.1 and A9.2). It should be noted that thevariables hypothesised to influence pupil achievement in mathematics andreading at the pupil and school levels in the two-level models were the samevariables hypothesised to influence pupil achievement at the correspondinglevels in the three-level models. It should further be noted that some of thevariables examined for inclusion in the two-level models at the school-leveland for inclusion in the three-level models at the class and school levels wereconstructed by aggregating the pupil-level data. For example, pupil-level dataon the variable Days Absent were aggregated at the class-level in order toconstruct the variable Average Days Absent at the class-level while pupil-level data on this variable were aggregated to the school-level in order toconstruct the variable Average Days Absent at the school-level.
Vietnam Reading and Mathematics Assessment Study
262
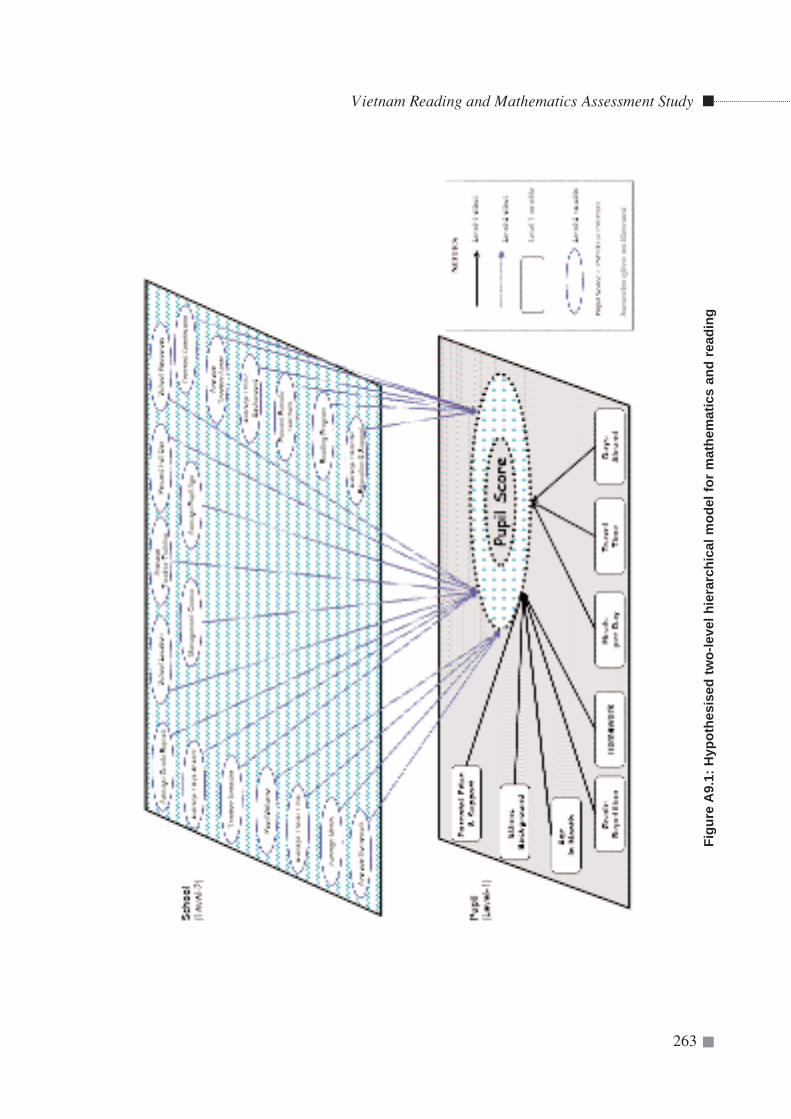
Vietnam Reading and Mathematics Assessment Study
263
Figu
re A
9.1:
Hyp
othe
sise
d tw
o-le
vel h
iera
rchi
cal m
odel
for
mat
hem
atic
s an
d re
adin
g
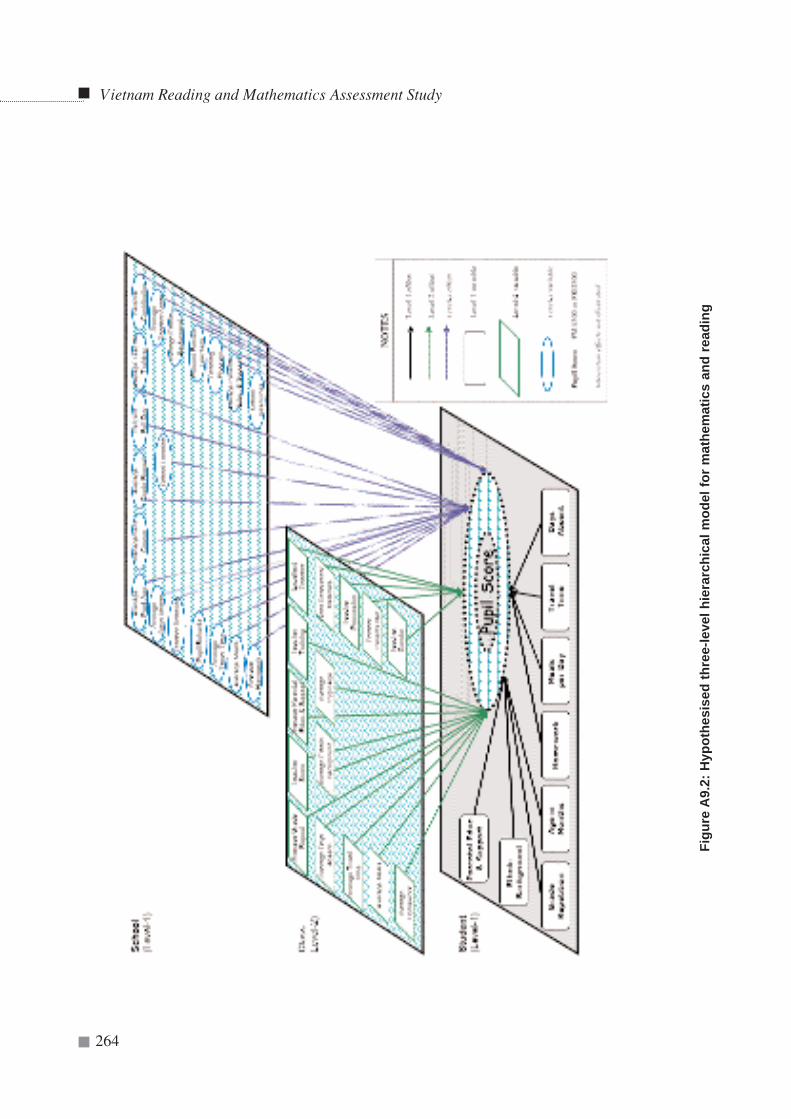
Vietnam Reading and Mathematics Assessment Study
264
Figu
re A
9.2:
Hyp
othe
sise
d th
ree-
leve
l hie
rarc
hica
l mod
el fo
r m
athe
mat
ics
and
read
ing
Vietnam Reading and Mathematics Assessment Study
265
The names and codes of the predictor variables tested for inclusion at eachlevel of the two-level (Figure A9.1) and the three-level (Figure A9.2) modelshave been provided in Table A9.1. The predictor variables listed together inTable A9.1 were considered to be alternative versions of the same underlyingmeasure and therefore, they were not added into the model together to avoidproblems associated with suppressor variables (Keeves, 1997). For example,at the pupil-level, the variable 'Private Corner' (PPRIVCOR) and the variable'Parental Education & Care' (XCEDCARE) were considered as alternativeversions of the same measure (Parental Education & Support) andconsequently have been listed together in Table A9.1. For the same reason,the variables constructed by aggregated pupil-level data on these twovariables at the class-level (PPRIVC_1 and XCEDCA_1) and at the school-level (PPRIVC_2 and XCEDCA_2) have been listed together in Table 9.1.Likewise, the variables XLOCA_2 and XCOMM_2 have been listed togetherindicating that they were considered to be alternative versions of the samemeasure (School Location). The correlation matrices of the variables at pupil,class and school levels can be found in Tables AA9.1, AA9.2, and AA9.3respectively at the end of this appendix.
Construction of the SSM files
The original SPSS data files involved in this part of the study had 36,476pupils in 7,221 classes nested in 3,635 schools. However, in the constructionof the sufficient statistic matrix (SSM) files there were a few schools thatwere dropped because of insufficient data. Indeed, for the three-levelanalyses, the Ns in the SSM file were 35,420 for pupils, 7,090 for classes and3,622 for schools while for the two-level analyses the Ns were 36,383 forpupils and 3,623 for schools. Weighting (with PWEIGHT3) was undertakenin the construction of these SSM files. The descriptive statistics of thevariables included in these SSM files can be found in Tables AA9.5 and A9.6at the end of this appendix.
Analyses
For both the two- and the three-level analyses, the first step undertaken wasto run a null model in order to obtain the amounts of variance available to beexplained at each level of the hierarchy (Bryk and Raudenbush, 1992). Thenull model is the simplest model because it contains only the dependentvariable (for this study, pupil mathematics or reading score) and no predictorvariables are specified at any level.
The second step undertaken was to build up the pupil-level model or the'unconditional' model at Level-1. This involved adding pupil-level predictorsto the model, but without entering predictors at any of the other levels of thehierarchy. The purpose of this step was to examine which pupil-levelvariables had significant (.05 level) effects on the outcome variable. A 'step-
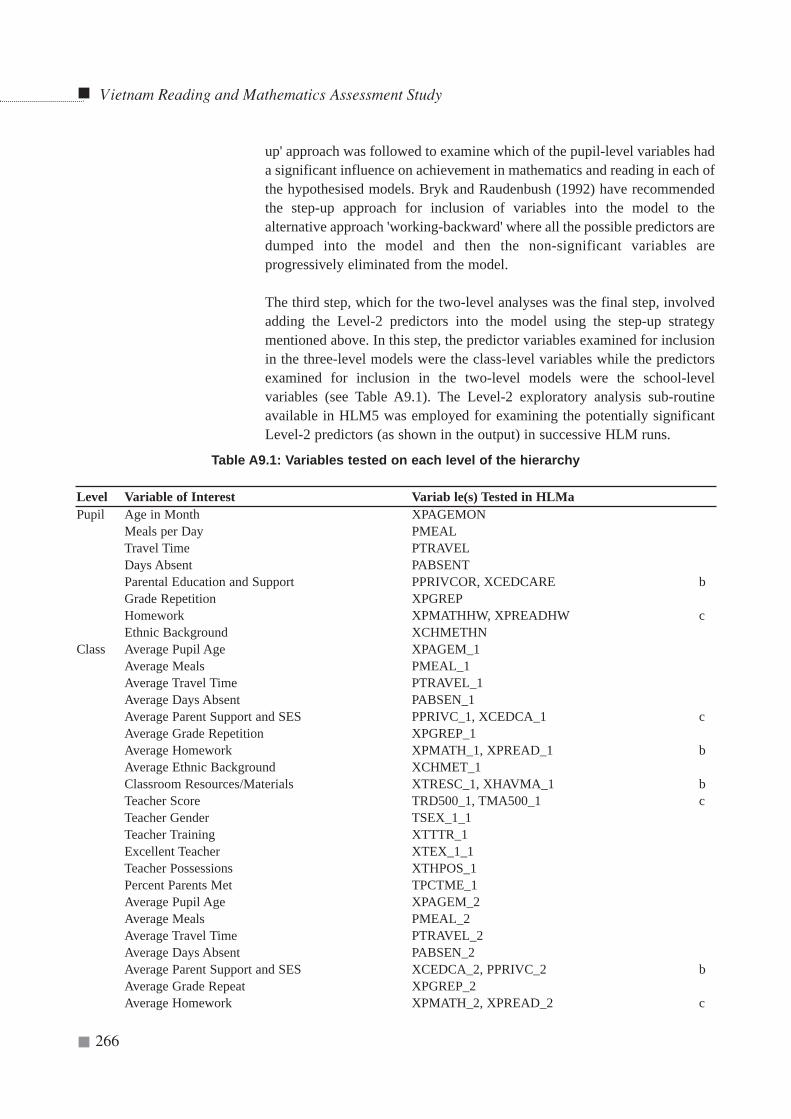
Table A9.1: Variables tested on each level of the hierarchy
Level Variable of Interest Variab le(s) Tested in HLMaPupil Age in Month XPAGEMON
Meals per Day PMEALTravel Time PTRAVELDays Absent PABSENTParental Education and Support PPRIVCOR, XCEDCARE bGrade Repetition XPGREPHomework XPMATHHW, XPREADHW cEthnic Background XCHMETHN
Class Average Pupil Age XPAGEM_1Average Meals PMEAL_1Average Travel Time PTRAVEL_1Average Days Absent PABSEN_1Average Parent Support and SES PPRIVC_1, XCEDCA_1 cAverage Grade Repetition XPGREP_1Average Homework XPMATH_1, XPREAD_1 bAverage Ethnic Background XCHMET_1Classroom Resources/Materials XTRESC_1, XHAVMA_1 bTeacher Score TRD500_1, TMA500_1 cTeacher Gender TSEX_1_1Teacher Training XTTTR_1Excellent Teacher XTEX_1_1Teacher Possessions XTHPOS_1Percent Parents Met TPCTME_1Average Pupil Age XPAGEM_2Average Meals PMEAL_2Average Travel Time PTRAVEL_2Average Days Absent PABSEN_2Average Parent Support and SES XCEDCA_2, PPRIVC_2 bAverage Grade Repeat XPGREP_2Average Homework XPMATH_2, XPREAD_2 c
Vietnam Reading and Mathematics Assessment Study
266
up' approach was followed to examine which of the pupil-level variables hada significant influence on achievement in mathematics and reading in each ofthe hypothesised models. Bryk and Raudenbush (1992) have recommendedthe step-up approach for inclusion of variables into the model to thealternative approach 'working-backward' where all the possible predictors aredumped into the model and then the non-significant variables areprogressively eliminated from the model.
The third step, which for the two-level analyses was the final step, involvedadding the Level-2 predictors into the model using the step-up strategymentioned above. In this step, the predictor variables examined for inclusionin the three-level models were the class-level variables while the predictorsexamined for inclusion in the two-level models were the school-levelvariables (see Table A9.1). The Level-2 exploratory analysis sub-routineavailable in HLM5 was employed for examining the potentially significantLevel-2 predictors (as shown in the output) in successive HLM runs.
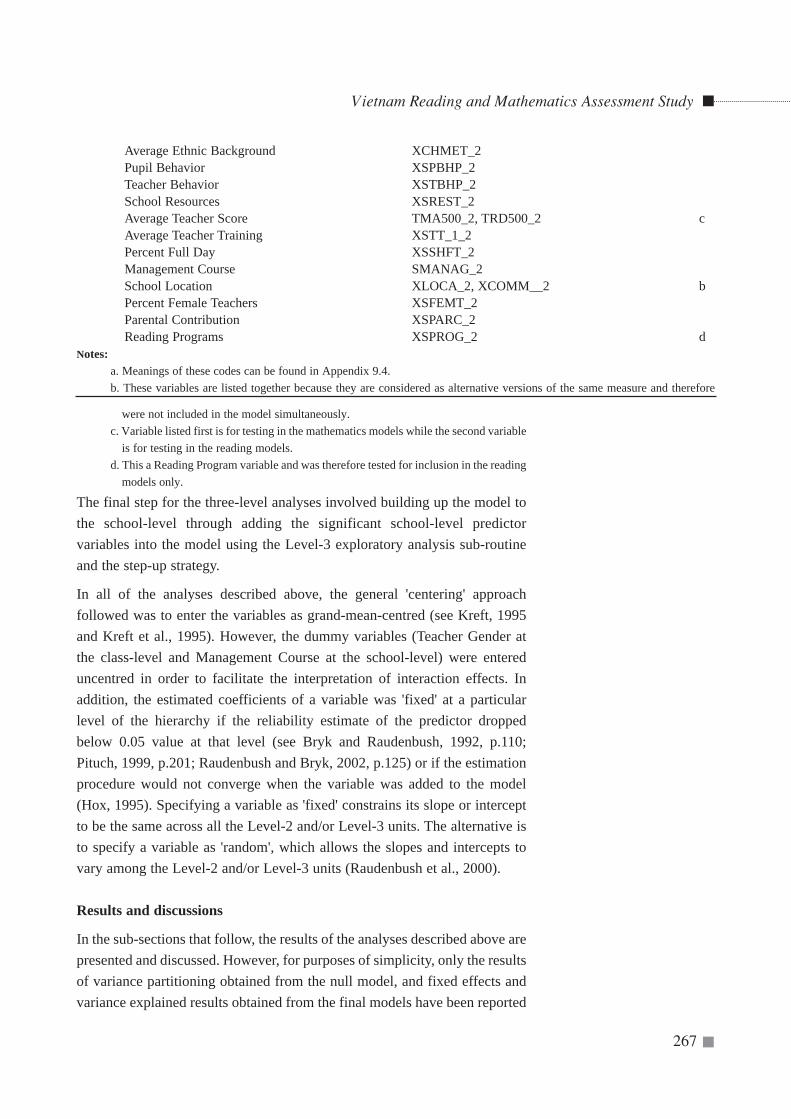
Average Ethnic Background XCHMET_2Pupil Behavior XSPBHP_2Teacher Behavior XSTBHP_2School Resources XSREST_2Average Teacher Score TMA500_2, TRD500_2 cAverage Teacher Training XSTT_1_2Percent Full Day XSSHFT_2Management Course SMANAG_2School Location XLOCA_2, XCOMM__2 bPercent Female Teachers XSFEMT_2Parental Contribution XSPARC_2Reading Programs XSPROG_2 d
Notes:a. Meanings of these codes can be found in Appendix 9.4.b. These variables are listed together because they are considered as alternative versions of the same measure and therefore
Vietnam Reading and Mathematics Assessment Study
267
were not included in the model simultaneously.c. Variable listed first is for testing in the mathematics models while the second variable
is for testing in the reading models. d. This a Reading Program variable and was therefore tested for inclusion in the reading
models only.
The final step for the three-level analyses involved building up the model tothe school-level through adding the significant school-level predictorvariables into the model using the Level-3 exploratory analysis sub-routineand the step-up strategy.
In all of the analyses described above, the general 'centering' approachfollowed was to enter the variables as grand-mean-centred (see Kreft, 1995and Kreft et al., 1995). However, the dummy variables (Teacher Gender atthe class-level and Management Course at the school-level) were entereduncentred in order to facilitate the interpretation of interaction effects. Inaddition, the estimated coefficients of a variable was 'fixed' at a particularlevel of the hierarchy if the reliability estimate of the predictor droppedbelow 0.05 value at that level (see Bryk and Raudenbush, 1992, p.110;Pituch, 1999, p.201; Raudenbush and Bryk, 2002, p.125) or if the estimationprocedure would not converge when the variable was added to the model(Hox, 1995). Specifying a variable as 'fixed' constrains its slope or interceptto be the same across all the Level-2 and/or Level-3 units. The alternative isto specify a variable as 'random', which allows the slopes and intercepts tovary among the Level-2 and/or Level-3 units (Raudenbush et al., 2000).
Results and discussions
In the sub-sections that follow, the results of the analyses described above arepresented and discussed. However, for purposes of simplicity, only the resultsof variance partitioning obtained from the null model, and fixed effects andvariance explained results obtained from the final models have been reported
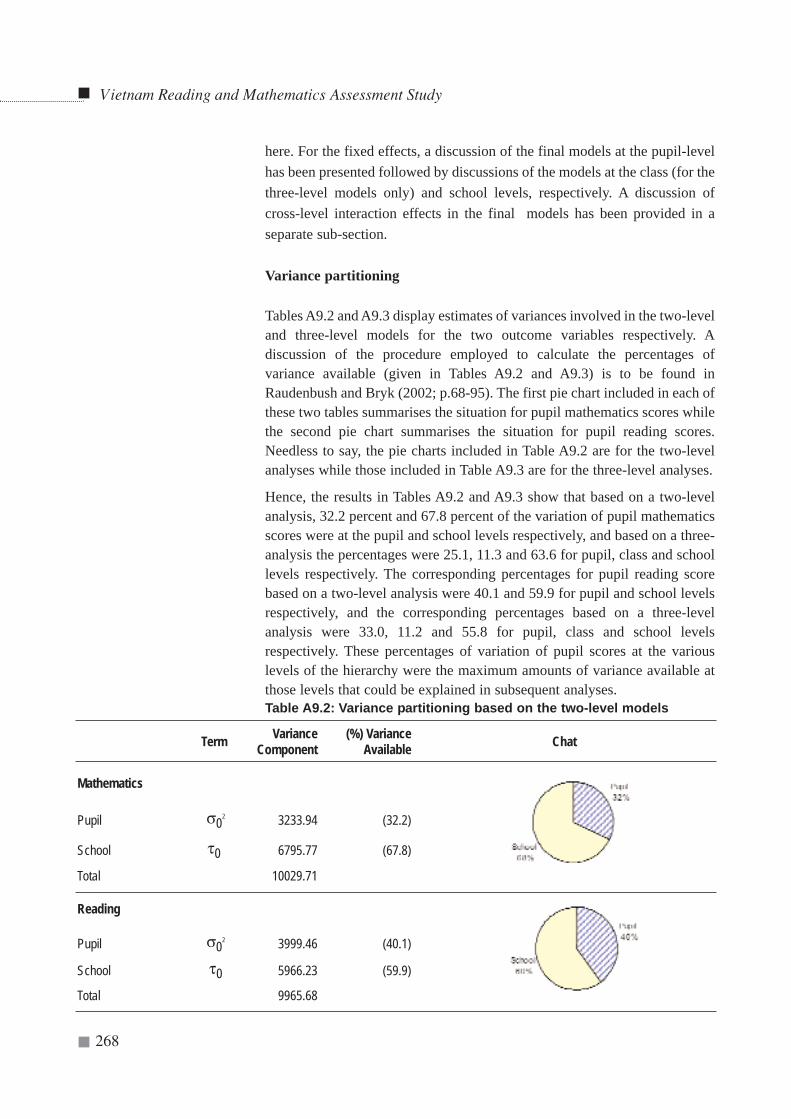
here. For the fixed effects, a discussion of the final models at the pupil-levelhas been presented followed by discussions of the models at the class (for thethree-level models only) and school levels, respectively. A discussion ofcross-level interaction effects in the final models has been provided in aseparate sub-section.
Variance partitioning
Tables A9.2 and A9.3 display estimates of variances involved in the two-leveland three-level models for the two outcome variables respectively. Adiscussion of the procedure employed to calculate the percentages ofvariance available (given in Tables A9.2 and A9.3) is to be found inRaudenbush and Bryk (2002; p.68-95). The first pie chart included in each ofthese two tables summarises the situation for pupil mathematics scores whilethe second pie chart summarises the situation for pupil reading scores.Needless to say, the pie charts included in Table A9.2 are for the two-levelanalyses while those included in Table A9.3 are for the three-level analyses.
Hence, the results in Tables A9.2 and A9.3 show that based on a two-levelanalysis, 32.2 percent and 67.8 percent of the variation of pupil mathematicsscores were at the pupil and school levels respectively, and based on a three-analysis the percentages were 25.1, 11.3 and 63.6 for pupil, class and schoollevels respectively. The corresponding percentages for pupil reading scorebased on a two-level analysis were 40.1 and 59.9 for pupil and school levelsrespectively, and the corresponding percentages based on a three-levelanalysis were 33.0, 11.2 and 55.8 for pupil, class and school levelsrespectively. These percentages of variation of pupil scores at the variouslevels of the hierarchy were the maximum amounts of variance available atthose levels that could be explained in subsequent analyses.Table A9.2: Variance partitioning based on the two-level models
Vietnam Reading and Mathematics Assessment Study
268
Term Variance Component
(%) Variance Available Chat
Mathematics
Pupil σ02 3233.94 (32.2)
School τ0 6795.77 (67.8)
Total 10029.71
Reading
Pupil σ02 3999.46 (40.1)
School τ0 5966.23 (59.9)
Total 9965.68
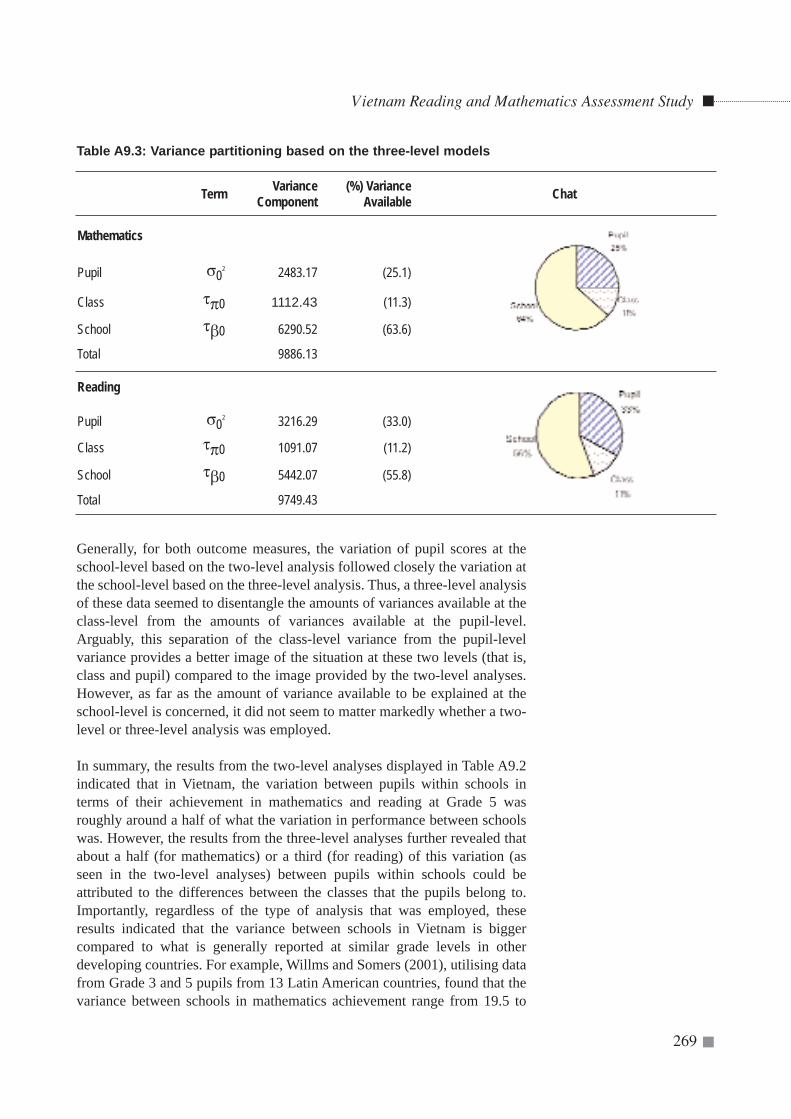
Table A9.3: Variance partitioning based on the three-level models
Generally, for both outcome measures, the variation of pupil scores at theschool-level based on the two-level analysis followed closely the variation atthe school-level based on the three-level analysis. Thus, a three-level analysisof these data seemed to disentangle the amounts of variances available at theclass-level from the amounts of variances available at the pupil-level.Arguably, this separation of the class-level variance from the pupil-levelvariance provides a better image of the situation at these two levels (that is,class and pupil) compared to the image provided by the two-level analyses.However, as far as the amount of variance available to be explained at theschool-level is concerned, it did not seem to matter markedly whether a two-level or three-level analysis was employed.
In summary, the results from the two-level analyses displayed in Table A9.2indicated that in Vietnam, the variation between pupils within schools interms of their achievement in mathematics and reading at Grade 5 wasroughly around a half of what the variation in performance between schoolswas. However, the results from the three-level analyses further revealed thatabout a half (for mathematics) or a third (for reading) of this variation (asseen in the two-level analyses) between pupils within schools could beattributed to the differences between the classes that the pupils belong to.Importantly, regardless of the type of analysis that was employed, theseresults indicated that the variance between schools in Vietnam is biggercompared to what is generally reported at similar grade levels in otherdeveloping countries. For example, Willms and Somers (2001), utilising datafrom Grade 3 and 5 pupils from 13 Latin American countries, found that thevariance between schools in mathematics achievement range from 19.5 to
Vietnam Reading and Mathematics Assessment Study
269
Term Variance Component
(%) Variance Available Chat
Mathematics
Pupil σ02 2483.17 (25.1)
Class τπ0 1112.43 (11.3)
School τβ0 6290.52 (63.6)
Total 9886.13
Reading
Pupil σ02 3216.29 (33.0)
Class τπ0 1091.07 (11.2)
School τβ0 5442.07 (55.8)
Total 9749.43

Vietnam Reading and Mathematics Assessment Study
270
Figu
re A
9.3:
Fin
al tw
o-le
vel h
iera
rchi
cal m
odel
for
mat
hem
atic
s
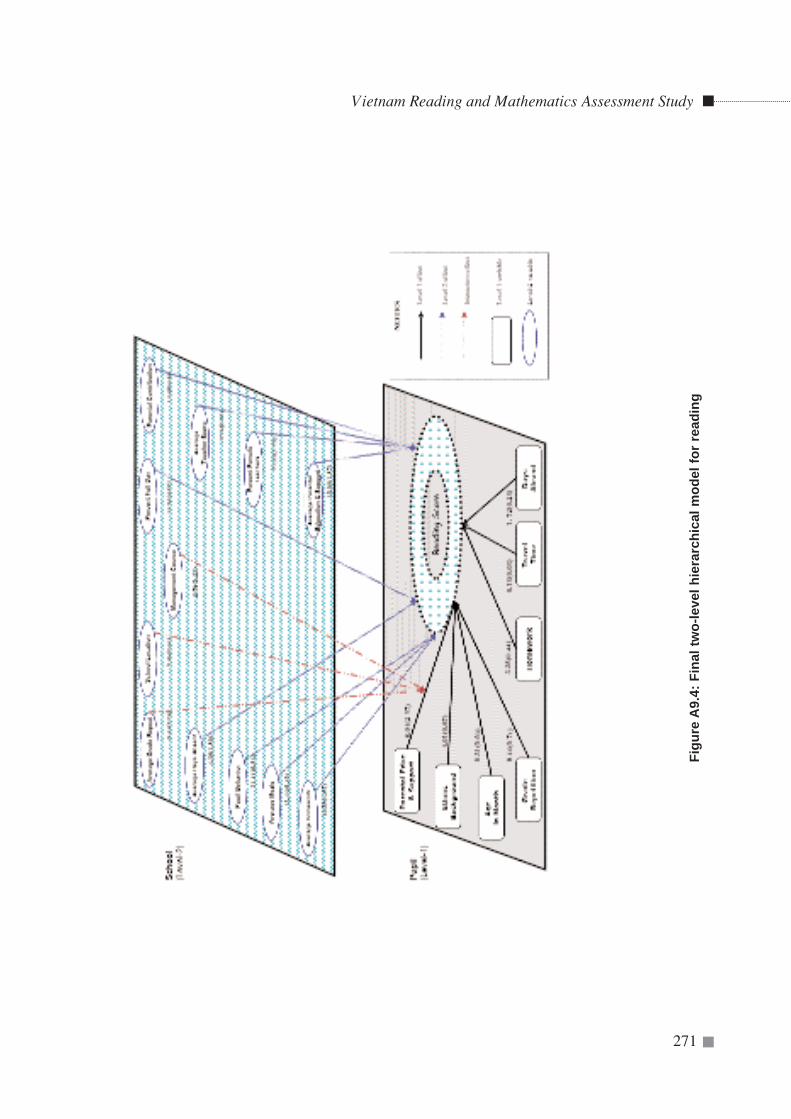
Vietnam Reading and Mathematics Assessment Study
271
Figu
re A
9.4:
Fin
al tw
o-le
vel h
iera
rchi
cal m
odel
for
read
ing
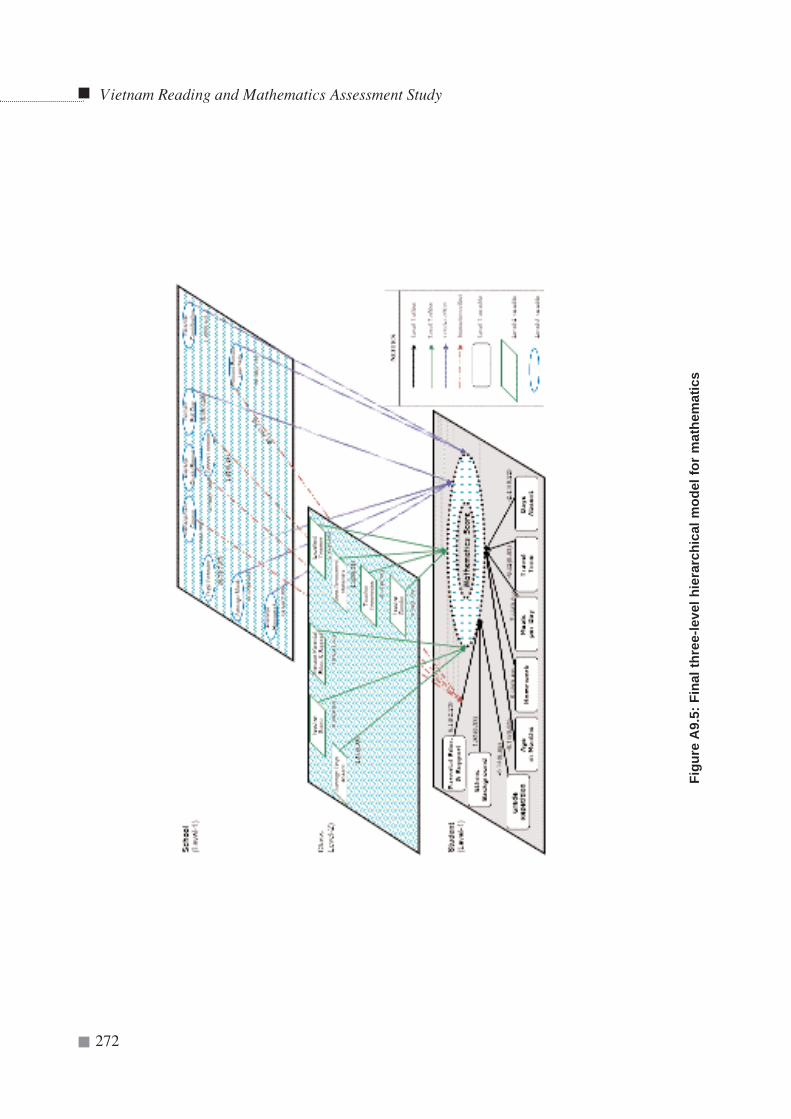
Vietnam Reading and Mathematics Assessment Study
272
Figu
re A
9.5:
Fin
al th
ree-
leve
l hie
rarc
hica
l mod
el fo
r m
athe
mat
ics
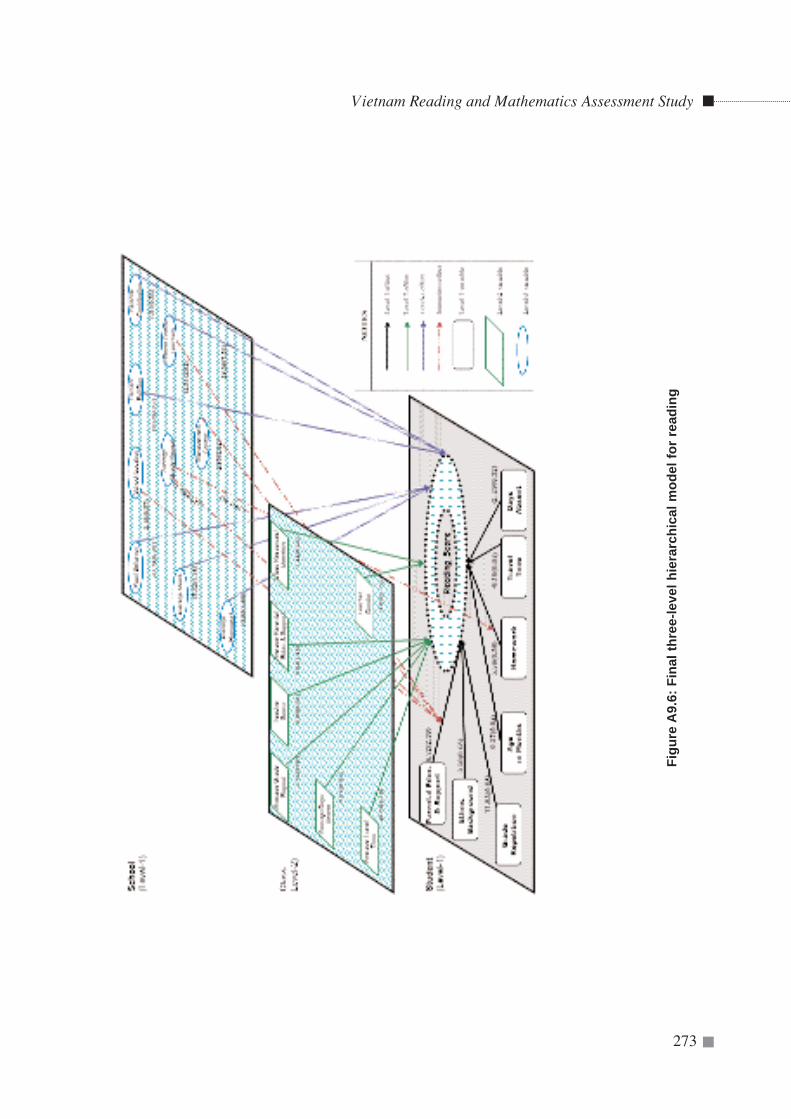
Vietnam Reading and Mathematics Assessment Study
273
Figu
re A
9.6:
Fin
al th
ree-
leve
l hie
rarc
hica
l mod
el fo
r re
adin
g
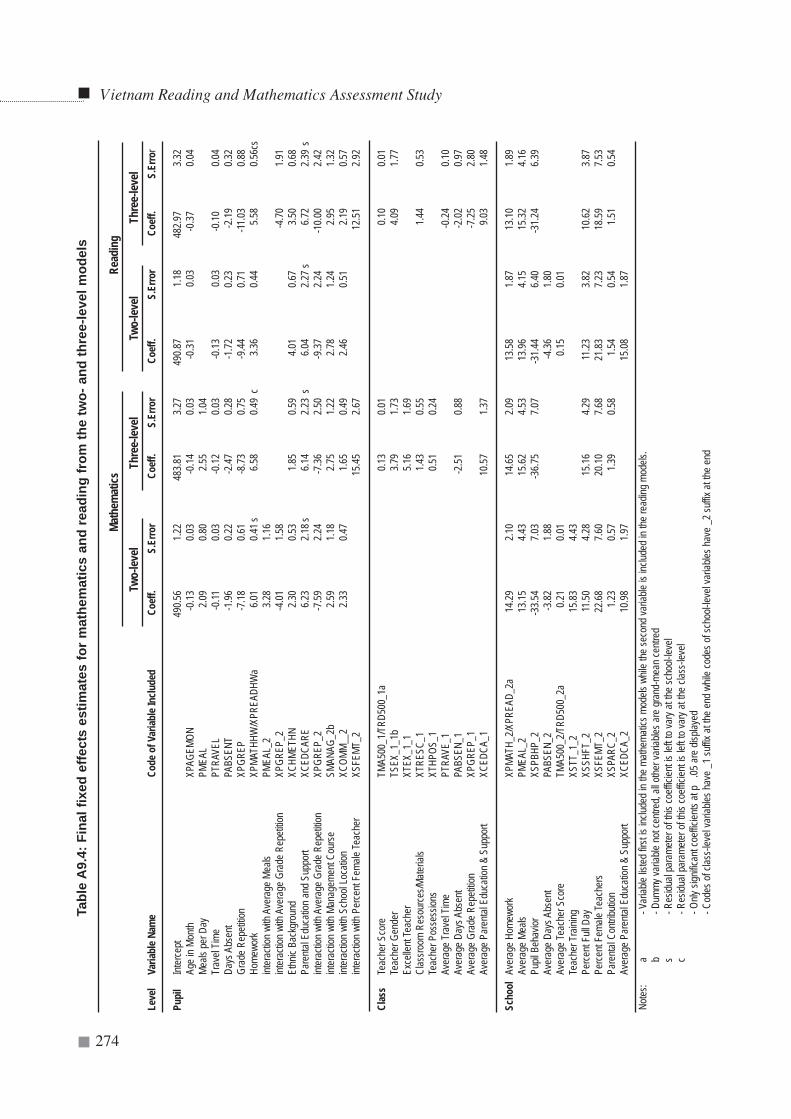
Vietnam Reading and Mathematics Assessment Study
274
Tabl
e A
9.4:
Fin
al fi
xed
effe
cts
estim
ates
for
mat
hem
atic
s an
d re
adin
g fr
om th
e tw
o- a
nd th
ree-
leve
l mod
els
Leve
lVa
riabl
e Nam
eCo
de o
f Var
iable
Inclu
ded
Coef
f.S.
Erro
rCo
eff.
S.Er
ror
Coef
f.S.
Erro
rCo
eff.
S.Er
ror
Pupi
lInt
erce
pt49
0.56
1.22
483.8
13.2
749
0.87
1.18
482.9
73.3
2Ag
e in
Month
XPAG
EMON
-0.13
0.03
-0.14
0.03
-0.31
0.03
-0.37
0.04
Meals
per
Day
PMEA
L2.0
90.8
02.5
51.0
4Tr
avel
Time
PTRA
VEL
-0.11
0.03
-0.12
0.03
-0.13
0.03
-0.10
0.04
Days
Abs
ent
PABS
ENT
-1.96
0.22
-2.47
0.28
-1.72
0.23
-2.19
0.32
Grad
e Re
petiti
onXP
GREP
-7.18
0.61
-8.73
0.75
-9.44
0.71
-11.03
0.88
Home
work
XPMA
THHW
/XPR
EADH
Wa
6.01
0.41s
6.58
0.49
c3.3
60.4
45.5
80.5
6cs
inter
actio
n wi
th Av
erag
e Me
alsPM
EAL_
23.2
81.1
6int
erac
tion
with
Aver
age
Grad
e Re
petiti
onXP
GREP
_2-4
.011.5
8-4
.701.9
1Et
hnic
Back
grou
ndXC
HMET
HN2.3
00.5
31.8
50.5
94.0
10.6
73.5
00.6
8Pa
renta
l Edu
catio
n an
d Su
ppor
tXC
EDCA
RE6.2
32.1
8s6.1
42.2
3s
6.04
2.27
s6.7
22.3
9s
inter
actio
n wi
th Av
erag
e Gr
ade
Repe
tition
XPGR
EP_2
-7.59
2.24
-7.36
2.50
-9.37
2.24
-10.0
02.4
2int
erac
tion
with
Mana
geme
nt Co
urse
SMAN
AG_2
b2.5
91.1
82.7
51.2
22.7
81.2
42.9
51.3
2int
erac
tion
with
Scho
ol Lo
catio
nXC
OMM_
_22.3
30.4
71.6
50.4
92.4
60.5
12.1
90.5
7int
erac
tion
with
Perce
nt Fe
male
Teac
her
XSFE
MT_2
15.45
2.67
12.51
2.92
Clas
sTe
ache
r Sco
reTM
A500
_1/T
RD50
0_1a
0.13
0.01
0.10
0.01
Teac
her G
ende
rTS
EX_1
_1b
3.79
1.73
4.09
1.77
Exce
llent
Teac
her
XTEX
_1_1
5.16
1.69
Clas
sroom
Res
ource
s/Mate
rials
XTRE
SC_1
1.43
0.55
1.44
0.53
Teac
her P
osse
ssion
sXT
HPOS
_10.5
10.2
4Av
erag
e Tra
vel T
ime
PTRA
VE_1
-0.24
0.10
Aver
age
Days
Abs
ent
PABS
EN_1
-2.51
0.88
-2.02
0.97
Aver
age
Grad
e Re
petiti
onXP
GREP
_1-7
.252.8
0Av
erag
e Pa
renta
l Edu
catio
n &
Supp
ort
XCED
CA_1
10.57
1.37
9.03
1.48
Scho
olAv
erag
e Ho
mewo
rkXP
MATH
_2/X
PREA
D_2a
14.29
2.10
14.65
2.09
13.58
1.87
13.10
1.89
Aver
age
Meals
PMEA
L_2
13.15
4.43
15.62
4.53
13.96
4.15
15.32
4.16
Pupil
Beh
avior
XSPB
HP_2
-33.5
47.0
3-3
6.75
7.07
-31.4
46.4
0-3
1.24
6.39
Aver
age
Days
Abs
ent
PABS
EN_2
-3.82
1.88
-4.36
1.80
Aver
age T
each
er S
core
TMA5
00_2
/TRD
500_
2a0.2
10.0
10.1
50.0
1Te
ache
r Tra
ining
XSTT
_1_2
15.83
4.43
Perce
nt Fu
ll Day
XSSH
FT_2
11.50
4.28
15.16
4.29
11.23
3.82
10.62
3.87
Perce
nt Fe
male
Teac
hers
XSFE
MT_2
22.68
7.60
20.10
7.68
21.83
7.23
18.59
7.53
Pare
ntal C
ontrib
ution
XSPA
RC_2
1.23
0.57
1.39
0.58
1.54
0.54
1.51
0.54
Aver
age
Pare
ntal E
duca
tion
& Su
ppor
tXC
EDCA
_210
.981.9
715
.081.8
7
Math
emat
icsRe
adin
gTw
o-lev
elTh
ree-
level
Two-
level
Thre
e-lev
el
Notes
: a
- Var
iable
listed
first
is inc
luded
in th
e ma
thema
tics m
odels
whil
e the
seco
nd va
riable
is in
clude
d in
the re
ading
mod
els.
b- D
ummy
varia
ble n
ot ce
ntred
, all o
ther v
ariab
les a
re g
rand
-mea
n ce
ntred
s- R
esidu
al pa
rame
ter o
f this
coeff
icien
t is le
ft to
vary
at the
scho
ol-lev
elc
- Res
idual
para
meter
of t
his co
effici
ent is
left
to va
ry at
the cl
ass-l
evel
- Only
sign
ifican
t coe
fficien
ts at
p .
05 a
re d
isplay
ed- C
odes
of c
lass-l
evel
varia
bles h
ave
_1 su
ffix a
t the
end
whil
e co
des o
f sch
ool-le
vel v
ariab
les h
ave
_2 su
ffix a
t the
end
41.2 per cent. Thus, the results presented in Table A9.2 appear to warrant acareful look at the Vietnam schooling system to establish exactly what ishappening.
Final model estimates
The final two-level hierarchical models for mathematics and reading havebeen presented in Figures A9.3 and A9.4 respectively while the same, but forthe final three-level models, have been presented in Figures A9.5 and A9.6.Only the factors that had a significant (.05) direct (or interaction) effect onpupil achievement have been displayed in Figures A9.3 to A9.6. An 'effect'was considered to be significant at p=.05 level if its coefficient taken inabsolute terms was more than twice its standard error (given in parenthesis inthese diagrams).
Fixed effects estimates from the final two-level and three-level models HLManalyses for mathematics and reading have been presented together in TableA9.3. That is, Table A9.3 displays a summary of the information presented inFigures A9.3 to A9.6. These results at the various levels of hierarchy arediscussed next.
Pupil-level model
From Table A9.4, it can be observed that the results of the two-level analysesstrongly agreed with the results of the three-level analyses regarding whichpupil-level variables have significant influences on achievement inmathematics and reading. For both the two- and the three-level models, theresults in Table A9.4 show that all the eight pupil-level variables examined inthis study had a significant influence on achievement in mathematics. Theseeight pupil-level variables were: Age in Months, Meals per Day, Travel Time,Days Absent, Grade Repetition, Homework, Ethnic Background, andParental Education & Support. All but one (Meals per Day) of these eightpupil-level variables also had significant influences on achievement inreading in both the two- and three-level models. It is worth noting that in theunconditional models at Level-1, Meals per Day also had a significantinfluence on achievement in reading but this variable was eventually deletedbecause it lost its significance when variables at the subsequent levels of thehierarchical structure were added.
By way of caution, sizes of metric coefficients of the variables provided inTable A9.4 do not indicate the relative magnitude of effects and can nottherefore be used to rank the variables in terms of their relative degree ofinfluence on the outcome. However, the signs of the coefficients indicate thedirections of effects and can be interpreted meaningfully if the coding of thevariables and their standard deviations are consideredAccordingly, for both the two- and the three-level models, the negativecoefficients for the variables Age in Months, Travel Time, Days Absent andGrade Repetition indicated the following effects on achievement in
Vietnam Reading and Mathematics Assessment Study
275
mathematics and reading among Vietnamese Grade 5 pupils when otherthings were equal.
1. Age in Months: Pupils of younger age were likely to achieve betterthan their older counterparts.
2. Travel Time: Pupils who took a shorter time to travel to school (or livenear the school) were likely to achieve better than those pupils whotook a longer time to travel to school (or live far from school).
3. Days Absent: Pupils who were never (or rarely) absent from schoolwere likely to achieve better than those pupils who were frequentlyabsent from school.
4. Grade Repetition: Pupils who had never repeated a grade were likelyto achieve better than pupils who had repeated a grade one or moretimes.
On the other hand, the positive coefficients for the variables Meals per Day,Homework, Ethnic Background and Parental Education & Support indicatedthe following relationships between these factors and achievement ofVietnamese Grade 5 pupils in mathematics and reading when other thingswere equal.
5. Meals per Day: Pupils who ate more meals per day were likely toachieve better in mathematics (but not necessarily in reading) thanpupils who ate fewer meals per day.
6. Homework: Pupils who were given homework more frequently andhad it corrected were likely to achieve better than pupils who weregiven homework and had it corrected less frequently.
7. Ethnic Background: Pupils who always spoke Vietnamese outsideschool or belonged to the Vietnamese ethnic majority group (Kinh)were likely to achieve better than pupils who never speak Vietnameseoutside school or belong to the Vietnamese ethnic minorities groups.
8. Parental Education & Support: Pupils from homes with moreeducated parents, more books and other possessions, and who had aprivate study corner were likely to achieve better than pupils fromhomes with less educated parents, fewer books and other possessionsand no a private study corner.
From Table A9.4 it can also be seen that there were interaction effectsinvolving pupil-level variables (Homework and Parental Education &Support) and some school-level variables. These interaction effects havebeen discussed later in a separate sub-section.
Class-level model
For the three-level models, the results in Table A9.4 showed that out of the21 class-level variables examined in this study (list in Table A9.1), seven hada significant influence on achievement in mathematics. These seven class-level variables were: Teacher Math Score, Teacher Gender, Excellent
Vietnam Reading and Mathematics Assessment Study
276
Vietnam Reading and Mathematics Assessment Study
277
Teacher, Classroom Resources/Materials, Teacher Possessions, Homework,Average Days Absent and Average Parental Education & Support. Five out ofthese seven class-level variables that had a significant influence onachievement in mathematics also had a significant influence on achievementin reading. They were Teacher Reading Score, Teacher Gender, ClassroomResources/Materials, Average Days Absent, and Average Parental Education& Support. A further two class-level variables (Average Travel Time andAverage Grade Repetition) had a significant influence on achievement inreading but not in mathematics.
Among the five class-level variables that had a significant influence onachievement in mathematics as well as in reading, four (Teacher Score,Teacher Gender, Classroom Resources/Materials and Average ParentalEducation & Support) had positive coefficients and one (Average DaysAbsent) had a negative coefficient. Thus, other things being equal, thedirections of effects of these five variables on achievement in mathematicsand reading among Vietnamese Grade 5 pupils were as follows.
1. Teacher Score: Pupils taught by teachers who were moreknowledgeable or skillful on the subject matter (i.e. with highersubject-matter scores) were likely to achieve better than pupils taughtby teachers with lower subject-matter scores.
2. Teacher Gender: Pupils taught by female teachers were likely toachieve better than pupils taught by male teachers.
3. Classroom Resources/Materials: Pupils in classes with a lot ofteaching and learning resources were likely to achieve better whencompared to pupils in classes with few or hardly any teaching andlearning resources.
4. Average Parental Education & Support: Pupils in classes in whicha majority of the pupils had more educated parents and were giveneducational support were likely to achieve better than pupils in classesin which a majority of the pupils were from less educated parents andwere hardly ever provided with educational support.
5. Average Days Absent: Pupils in classes in which a majority of thepupils were never (or rarely) absent from school were likely to achievebetter than pupils in classes in which a majority of the pupils weremore often absent from school.
In addition, for mathematics, the positive coefficients for the class-levelvariables Excellent Teacher and Teacher Possession indicated the followingeffects on achievement among Vietnamese Grade 5 pupils when other thingswere equal.
6. Excellent Teacher: Pupils taught by teachers who were recognised asexcellent in teaching were likely to achieve better in mathematics thanpupils taught by non-excellent teachers.
7. Teacher Possessions: Pupils taught by teachers who had manypossessions (rich) were likely to achieve better in mathematics thanpupils taught by teachers who had few or no possessions (poor).
Vietnam Reading and Mathematics Assessment Study
278
For reading, the negative coefficients for the class-level variables AverageTravel Time and Average Grade Repetition indicated the following effects onachievement among Vietnamese Grade 5 pupils, other things being equal.
8. Travel Time: Pupils in classes in which a majority of the pupils tooka shorter time to travel to school (or lived near the school) were likelyto achieve better in reading when compared with pupils in classes inwhich a majority of the pupils took a longer time to travel to school (orlived far from school).
9. Grade Repetition: Pupils in classes in which a majority of the pupilshad never repeated a grade were likely to achieve better in reading thanpupils who were in classes in which a majority of the pupils hadrepeated a grade one or more times.
School-level model
For the two-level models, it can be seen from the results in Table A9.4 that10 out of the 19 school-level variables examined in this study (listed in TableA9.1) had a significant influence on achievement in mathematics. These 10variables were: Average Homework, Average Meals, Pupil Behavior, AverageDays Absent, Average Teacher Score, Teacher Training, Percent Full Day,Percent Female Teachers, Parental Contribution, and Average ParentalEducation & Support. All but one (Teacher Training) of these 10 school-levelvariables that had a significant effect on achievement in mathematics alsohad a significant effect on achievement in reading in the two-level models.
Similar to what was observed for the pupil-level model, the results of thetwo-level analyses strongly agreed with the results of the three-level analysesin terms of which of the school-level variables had significant influences onachievement in mathematics and reading. Indeed, six school-level variablesthat had a significant effect on achievement in mathematics and reading inthe two-level model also had a significant effect on achievement inmathematics and reading in the three-level models. These six variables were:Average Homework, Average Meals, Pupil Behavior, Percent Full Day,Percent Female Teachers and Parental Contribution. Furthermore, for bothmathematics and reading, all except one (Teacher Training, for mathematics)of the school-level variables that had significant effects in the two-level (butnot in the three-level) analyses had significant effects at the class-level, andtherefore, their effects were observed in both types of models.
Hence, for the two- and three level models, the results in Table A9.4 indicatedthe following school-level effects on achievement in mathematics andreading among Vietnamese Grade 5 pupils, all other things being equal.
3From the SSM file, see (Table AA9.5)
Vietnam Reading and Mathematics Assessment Study
279
1. Average Homework: Pupils in schools where homework was givenand corrected more frequently were likely to achieve better than pupilsin schools where homework was given and corrected less frequently.
2. Average Meals: Pupils in schools where a majority of the pupils atemore meals per day were likely to achieve better than pupils in schoolsin which a majority of the pupils ate fewer meals per day.
3. Pupil Behavior: Pupils in schools in which the occurrences of pupilbehavior problems were rare were likely to achieve better than pupilsin schools in which the occurrences of such problems were veryfrequent.
4. Percent Full Day: Pupils in schools where pupils were attending full-day school were likely to achieve better than pupils in schools nothaving full-day schooling.
5. Percent Female Teachers: Pupils in schools where more of themembers of staff were female were likely to achieve better than pupilsin schools where fewer staff members were female.
6. Parental Contribution: Pupils in schools where parents wereinvolved in school development oriented activities were likely toachieve better than pupils in schools where parents were not involvedin such activities.
In addition, for the two-level models only, the results in Table A9.4 indicatedthe following school-level effects on achievement in mathematics andreading, other things being equal.
7. Average Days Absent: Pupils in schools where a majority of thepupils were never (or rarely) absent from school were likely to achievebetter than pupils in schools where a majority of the pupils were moreoften absent from school.
8. Average Teacher Score: Pupils in schools with teachers who hadhigher subject-matter scores were likely to achieve better than pupilsin schools with teachers with lower subject-matter scores.
9. Average Parental Education & Support: Pupils in schools where amajority of the pupils were from more educated homes and were giveneducational support were likely to achieve better than pupils in schoolswhere a majority of the pupils were from less educated homes andwere hardly ever provided with educational support.
10. Teacher Training: Pupils in schools with teachers who had had manyyears of professional training were likely to achieve better inmathematics (but not necessarily in reading) than pupils in schoolswith teachers who had fewer years of professional training. Thisrelationship is of interest because it could be observed even after theinfluence of the variable Average Teacher Score [(8) above], had beencontrolled for in the model.
The following examples illustrate the impact of the model coefficientsdisplayed in Table A9.4 on pupil's achievement. For the two-level model the achievement in mathematics of Pupil 1 whoseage is two standard deviations below the mean age of the pupils in Grade 5
in Vietnam is likely to be 490.56 + {-0.13 x (-12.29 x 2)} = 493.76, that is[intercept + (coefficient twice standard deviation3)]. For the same model, theachievement of Pupil 2, whose age is two standard deviations above the meanage is likely to be 490.56 + {-0.13 x (12.29 x 2)} = 487.36. Thesecalculations assume that all the other things are equal, that is, the two pupilsbeing compared differed only in age and that all their other characteristics(individual and group) were identical. This means that the difference inmathematics achievement between these two pupils due to the influence ofage alone could be 493.76 - 487.36 = 6.40 score points on the originalmathematics scale. This difference might appear to be small when comparedto the estimated grand mean (490.56), but it should be borne in mind that itis greater than two standard deviations of the mean score, and therefore, it issignificant at .05 level, and should be of interest to the parents, teachers andpolicymakers.
For the socioeconomic variables and again considering the two-levelmathematics model, achievement of Pupil 3 whose score on ParentalEducation & Support scale is two standard deviations below the mean on thisscale is likely to be 490.56 + {6.23 x (-1.05 x 2)} = 477.73. Likewise, basedon the same model, the achievement of Pupil 4 whose score on this scale istwo standard deviations above the mean is likely to be 490.56 + {6.23 x (1.05x 2)} = 503.39. Again, these calculations assume that all the other things areequal. Thus, the difference in mathematics achievement between Pupil 3 andPupil 4 due to the influence of parental education and support alone could be503.39 - 477.73 = 25.66 score points on the original mathematics scale.
Suppose now this effect of Parental Education & Support and the effect ofMeals per Day are considered simultaneously in this model. Furthermore,suppose Pupil 3 (from an impoverished home) gets below average meals perday, which when placed on the Meals per Day scale is say two standarddeviations below the mean while Pupil 4's (from a rich home) score on thisscale is say two standard deviations above the mean. The two-level modelpredicts that Pupil 3's mathematics score adjusted for influences due ParentalEducation & Support and Meals per Day is likely to be 477.73 + {2.09 x (-0.46 x 2)} = 475.81 while the score of Pupil 4 adjusted for these two factorsis likely to be 503.39 + {2.09 x (0.46 x 2)} = 505.31. This means that thedifference in mathematics achievement between Pupil 3 and Pupil 4 due tothe influence of socioeconomic factors at the pupil-level alone could be505.31 - 475.81 = 29.50 score points on the original mathematics scale.
If the effects of socioeconomic status at the school-level are now added, thistwo-level mathematics model predicts that if Pupil 3 attends a school whereAverage Parental Education & Support and Average Meals per Day are eachtwo standard deviations below average will be likely to achieve another25.28 score points lower. On the other hand, if Pupil 4 attends a school where
Vietnam Reading and Mathematics Assessment Study
280
Average Parental Education & Support and Average Meals per Day are eachtwo standard deviations above average, this pupil will be likely to achieve anadditional 25.28 score points higher. Thus, the difference betweenmathematics achievement between these two pupils due to socioeconomicfactors alone at the pupil and the school-level is likely to be 80.06 scorepoints (29.50 for the pupil-level factors plus 50.56 for school-level factors).It should be borne in mind that this difference (80.06) could increase if theinteraction effects between the socioeconomic status variables and othervariables were included in the calculations.
Interaction effects
The results in Table A9.4 also indicated interaction effects in the two-leveland three-level models for mathematics as well as reading. There wereinteraction effects that involve:
(a) Pupil-level Homework with the following school-level variables:
(i) Average Meals (in the two-level mathematics model only), and
(ii) Average Grade Repetition (in the two-level mathematics model andthree-level reading model).
(b) Pupil-level Parental Education & Support with the following school-levelvariables:
(iii) Average Grade Repetition (in the two- and three-level models forboth mathematics and reading),
(iv) Management Course (in the two- and three-level models for bothmathematics and reading),
(v) School Location (in the two- and three-level models for bothmathematics and reading), and
(vi) Percent Female Teachers (in the three-level models for bothmathematics and reading).
All the above interactions were cross-level interactions since they involveinteraction between variables at a higher level with variables at a lower level(Raudenbush and Willms, 1991). Hox (1995, p.26) has pointed out that "theeffect of the interaction and the direct effects of the explanatory variable thatmake up the interaction must be interpreted as a system".
In the sub-sections that follow, discussions of the cross-level interactioneffects listed above have been presented. Graphical representations of theinteraction effects have been used to enhance these discussions. Thecoordinates of the graphs used in these discussions were calculated from the
Vietnam Reading and Mathematics Assessment Study
281
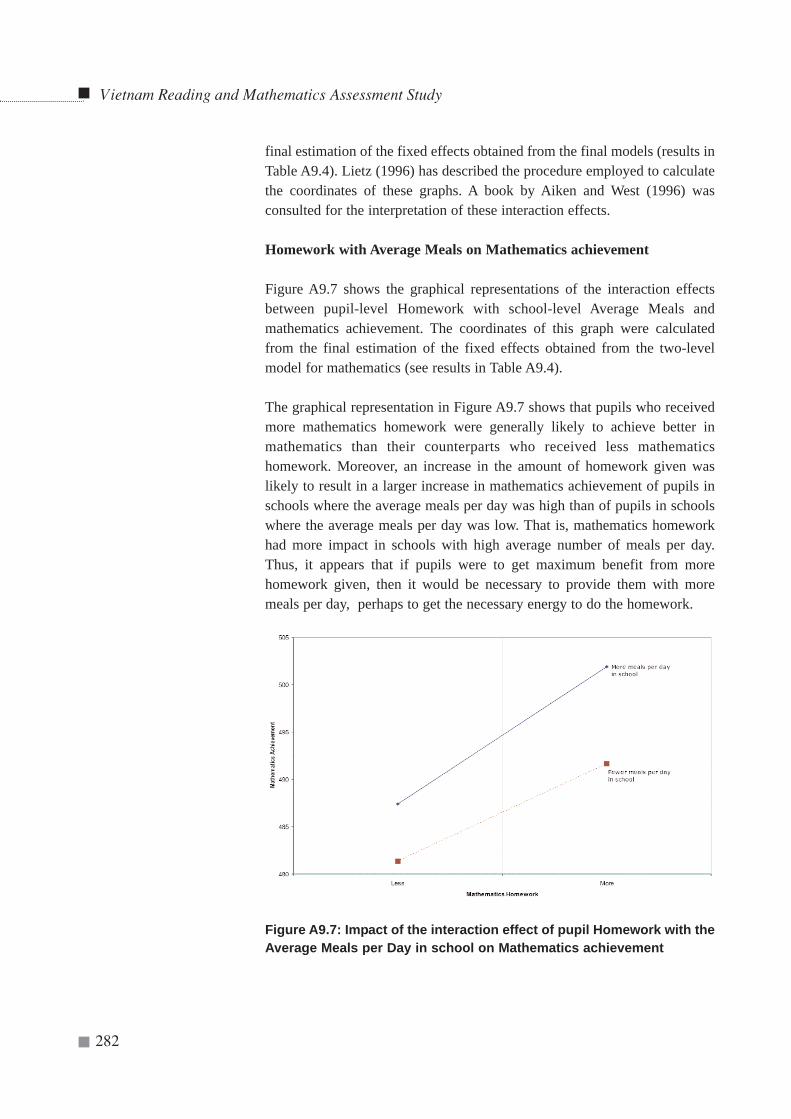
final estimation of the fixed effects obtained from the final models (results inTable A9.4). Lietz (1996) has described the procedure employed to calculatethe coordinates of these graphs. A book by Aiken and West (1996) wasconsulted for the interpretation of these interaction effects.
Homework with Average Meals on Mathematics achievement
Figure A9.7 shows the graphical representations of the interaction effectsbetween pupil-level Homework with school-level Average Meals andmathematics achievement. The coordinates of this graph were calculatedfrom the final estimation of the fixed effects obtained from the two-levelmodel for mathematics (see results in Table A9.4).
The graphical representation in Figure A9.7 shows that pupils who receivedmore mathematics homework were generally likely to achieve better inmathematics than their counterparts who received less mathematicshomework. Moreover, an increase in the amount of homework given waslikely to result in a larger increase in mathematics achievement of pupils inschools where the average meals per day was high than of pupils in schoolswhere the average meals per day was low. That is, mathematics homeworkhad more impact in schools with high average number of meals per day.Thus, it appears that if pupils were to get maximum benefit from morehomework given, then it would be necessary to provide them with moremeals per day, perhaps to get the necessary energy to do the homework.
Figure A9.7: Impact of the interaction effect of pupil Homework with theAverage Meals per Day in school on Mathematics achievement
Vietnam Reading and Mathematics Assessment Study
282
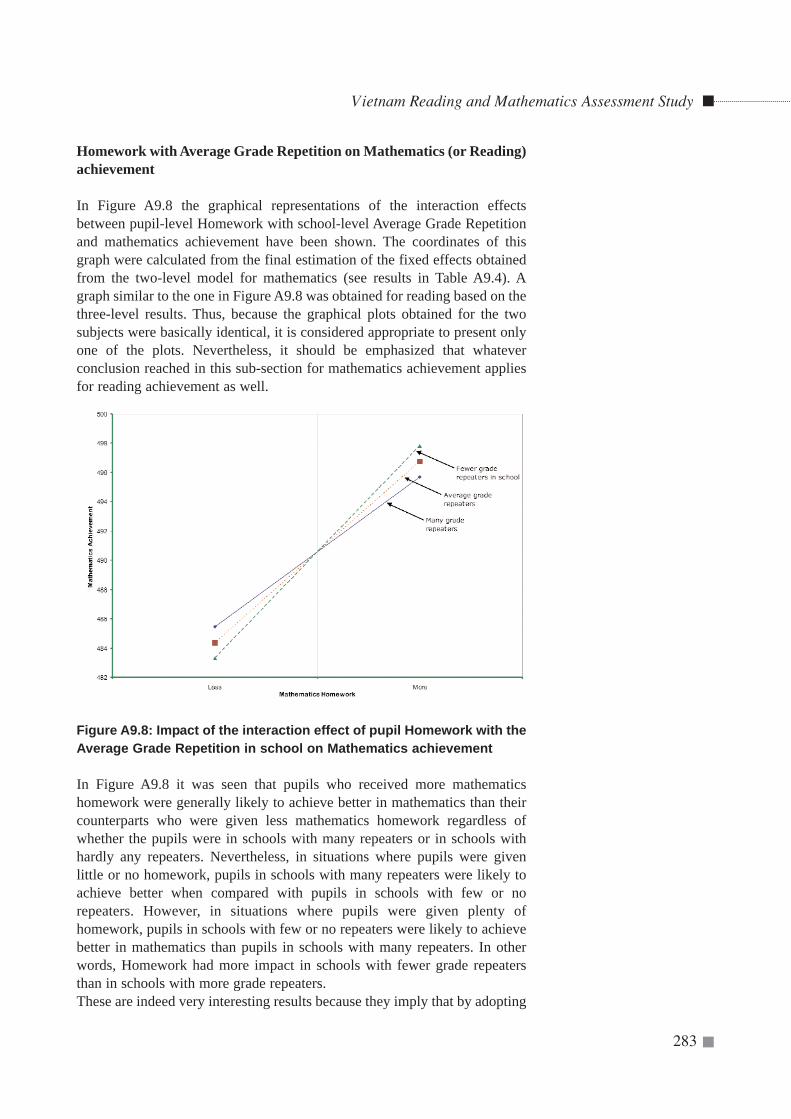
Vietnam Reading and Mathematics Assessment Study
283
Homework with Average Grade Repetition on Mathematics (or Reading)achievement
In Figure A9.8 the graphical representations of the interaction effectsbetween pupil-level Homework with school-level Average Grade Repetitionand mathematics achievement have been shown. The coordinates of thisgraph were calculated from the final estimation of the fixed effects obtainedfrom the two-level model for mathematics (see results in Table A9.4). Agraph similar to the one in Figure A9.8 was obtained for reading based on thethree-level results. Thus, because the graphical plots obtained for the twosubjects were basically identical, it is considered appropriate to present onlyone of the plots. Nevertheless, it should be emphasized that whateverconclusion reached in this sub-section for mathematics achievement appliesfor reading achievement as well.
Figure A9.8: Impact of the interaction effect of pupil Homework with theAverage Grade Repetition in school on Mathematics achievement
In Figure A9.8 it was seen that pupils who received more mathematicshomework were generally likely to achieve better in mathematics than theircounterparts who were given less mathematics homework regardless ofwhether the pupils were in schools with many repeaters or in schools withhardly any repeaters. Nevertheless, in situations where pupils were givenlittle or no homework, pupils in schools with many repeaters were likely toachieve better when compared with pupils in schools with few or norepeaters. However, in situations where pupils were given plenty ofhomework, pupils in schools with few or no repeaters were likely to achievebetter in mathematics than pupils in schools with many repeaters. In otherwords, Homework had more impact in schools with fewer grade repeatersthan in schools with more grade repeaters.These are indeed very interesting results because they imply that by adopting
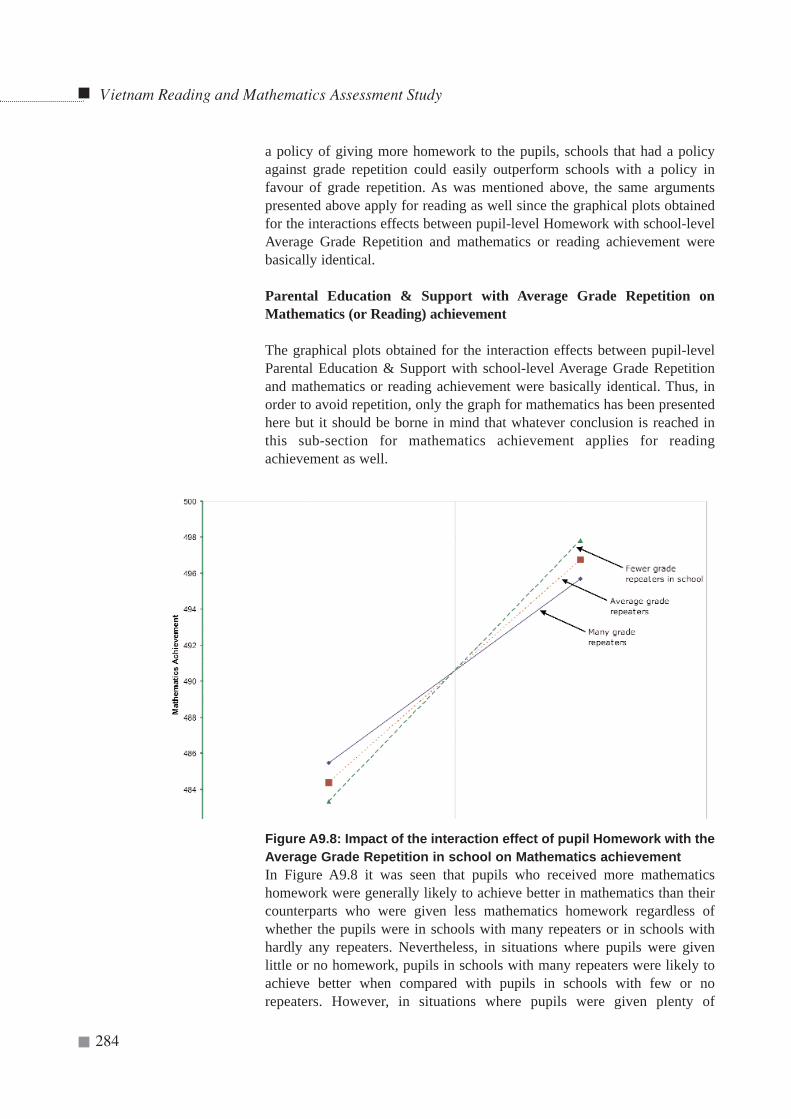
a policy of giving more homework to the pupils, schools that had a policyagainst grade repetition could easily outperform schools with a policy infavour of grade repetition. As was mentioned above, the same argumentspresented above apply for reading as well since the graphical plots obtainedfor the interactions effects between pupil-level Homework with school-levelAverage Grade Repetition and mathematics or reading achievement werebasically identical.
Parental Education & Support with Average Grade Repetition onMathematics (or Reading) achievement
The graphical plots obtained for the interaction effects between pupil-levelParental Education & Support with school-level Average Grade Repetitionand mathematics or reading achievement were basically identical. Thus, inorder to avoid repetition, only the graph for mathematics has been presentedhere but it should be borne in mind that whatever conclusion is reached inthis sub-section for mathematics achievement applies for readingachievement as well.
Figure A9.8: Impact of the interaction effect of pupil Homework with theAverage Grade Repetition in school on Mathematics achievementIn Figure A9.8 it was seen that pupils who received more mathematicshomework were generally likely to achieve better in mathematics than theircounterparts who were given less mathematics homework regardless ofwhether the pupils were in schools with many repeaters or in schools withhardly any repeaters. Nevertheless, in situations where pupils were givenlittle or no homework, pupils in schools with many repeaters were likely toachieve better when compared with pupils in schools with few or norepeaters. However, in situations where pupils were given plenty of
Vietnam Reading and Mathematics Assessment Study
284
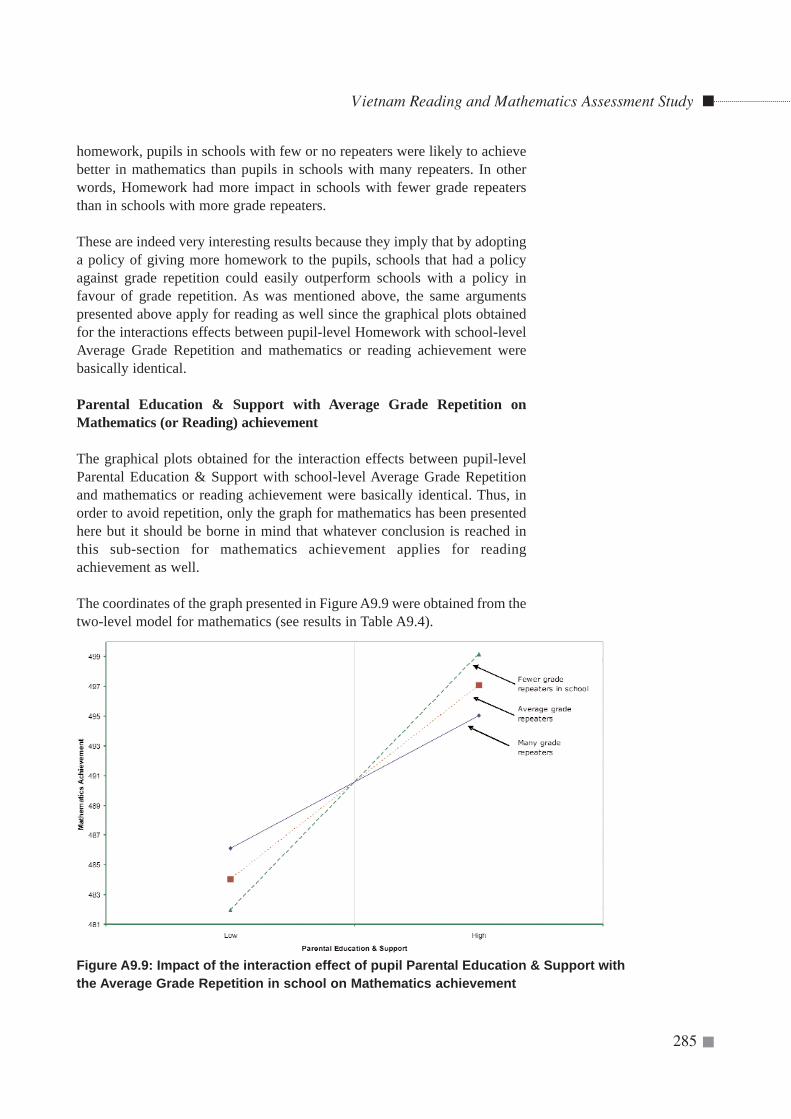
homework, pupils in schools with few or no repeaters were likely to achievebetter in mathematics than pupils in schools with many repeaters. In otherwords, Homework had more impact in schools with fewer grade repeatersthan in schools with more grade repeaters.
These are indeed very interesting results because they imply that by adoptinga policy of giving more homework to the pupils, schools that had a policyagainst grade repetition could easily outperform schools with a policy infavour of grade repetition. As was mentioned above, the same argumentspresented above apply for reading as well since the graphical plots obtainedfor the interactions effects between pupil-level Homework with school-levelAverage Grade Repetition and mathematics or reading achievement werebasically identical.
Parental Education & Support with Average Grade Repetition onMathematics (or Reading) achievement
The graphical plots obtained for the interaction effects between pupil-levelParental Education & Support with school-level Average Grade Repetitionand mathematics or reading achievement were basically identical. Thus, inorder to avoid repetition, only the graph for mathematics has been presentedhere but it should be borne in mind that whatever conclusion is reached inthis sub-section for mathematics achievement applies for readingachievement as well.
The coordinates of the graph presented in Figure A9.9 were obtained from thetwo-level model for mathematics (see results in Table A9.4).
Vietnam Reading and Mathematics Assessment Study
285
Figure A9.9: Impact of the interaction effect of pupil Parental Education & Support withthe Average Grade Repetition in school on Mathematics achievement
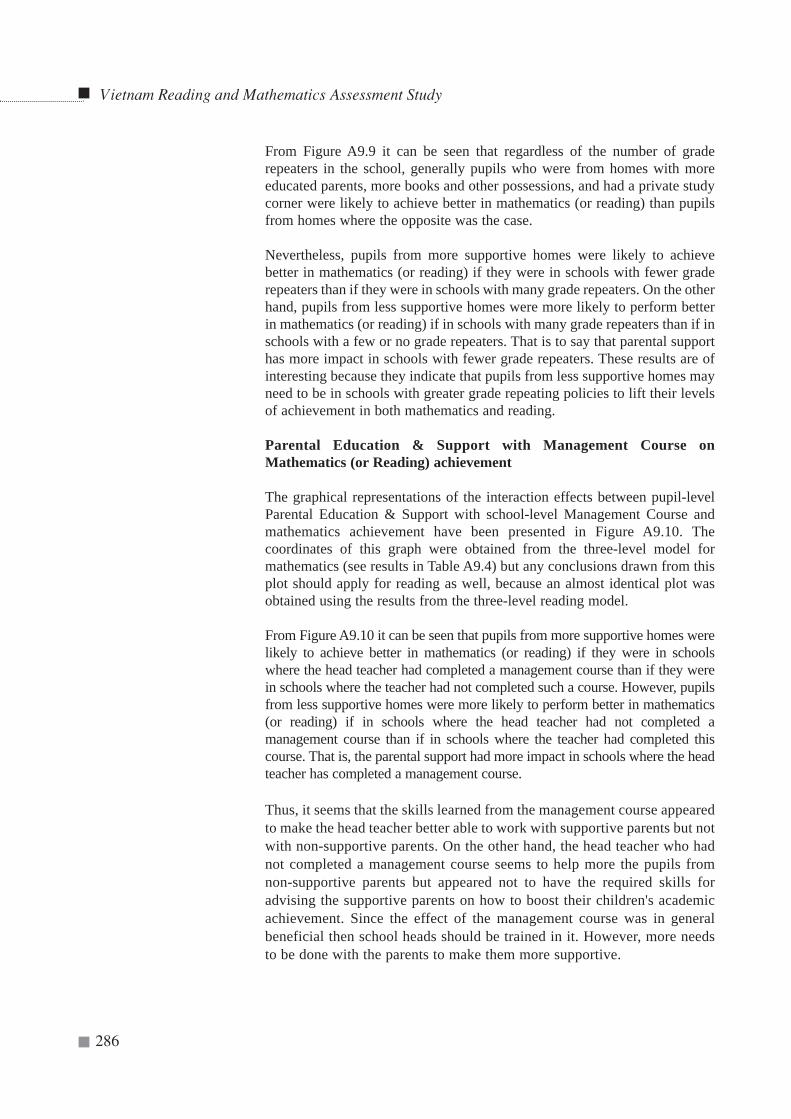
Vietnam Reading and Mathematics Assessment Study
286
From Figure A9.9 it can be seen that regardless of the number of graderepeaters in the school, generally pupils who were from homes with moreeducated parents, more books and other possessions, and had a private studycorner were likely to achieve better in mathematics (or reading) than pupilsfrom homes where the opposite was the case.
Nevertheless, pupils from more supportive homes were likely to achievebetter in mathematics (or reading) if they were in schools with fewer graderepeaters than if they were in schools with many grade repeaters. On the otherhand, pupils from less supportive homes were more likely to perform betterin mathematics (or reading) if in schools with many grade repeaters than if inschools with a few or no grade repeaters. That is to say that parental supporthas more impact in schools with fewer grade repeaters. These results are ofinteresting because they indicate that pupils from less supportive homes mayneed to be in schools with greater grade repeating policies to lift their levelsof achievement in both mathematics and reading.
Parental Education & Support with Management Course onMathematics (or Reading) achievement
The graphical representations of the interaction effects between pupil-levelParental Education & Support with school-level Management Course andmathematics achievement have been presented in Figure A9.10. Thecoordinates of this graph were obtained from the three-level model formathematics (see results in Table A9.4) but any conclusions drawn from thisplot should apply for reading as well, because an almost identical plot wasobtained using the results from the three-level reading model.
From Figure A9.10 it can be seen that pupils from more supportive homes werelikely to achieve better in mathematics (or reading) if they were in schoolswhere the head teacher had completed a management course than if they werein schools where the teacher had not completed such a course. However, pupilsfrom less supportive homes were more likely to perform better in mathematics(or reading) if in schools where the head teacher had not completed amanagement course than if in schools where the teacher had completed thiscourse. That is, the parental support had more impact in schools where the headteacher has completed a management course.
Thus, it seems that the skills learned from the management course appearedto make the head teacher better able to work with supportive parents but notwith non-supportive parents. On the other hand, the head teacher who hadnot completed a management course seems to help more the pupils fromnon-supportive parents but appeared not to have the required skills foradvising the supportive parents on how to boost their children's academicachievement. Since the effect of the management course was in generalbeneficial then school heads should be trained in it. However, more needsto be done with the parents to make them more supportive.
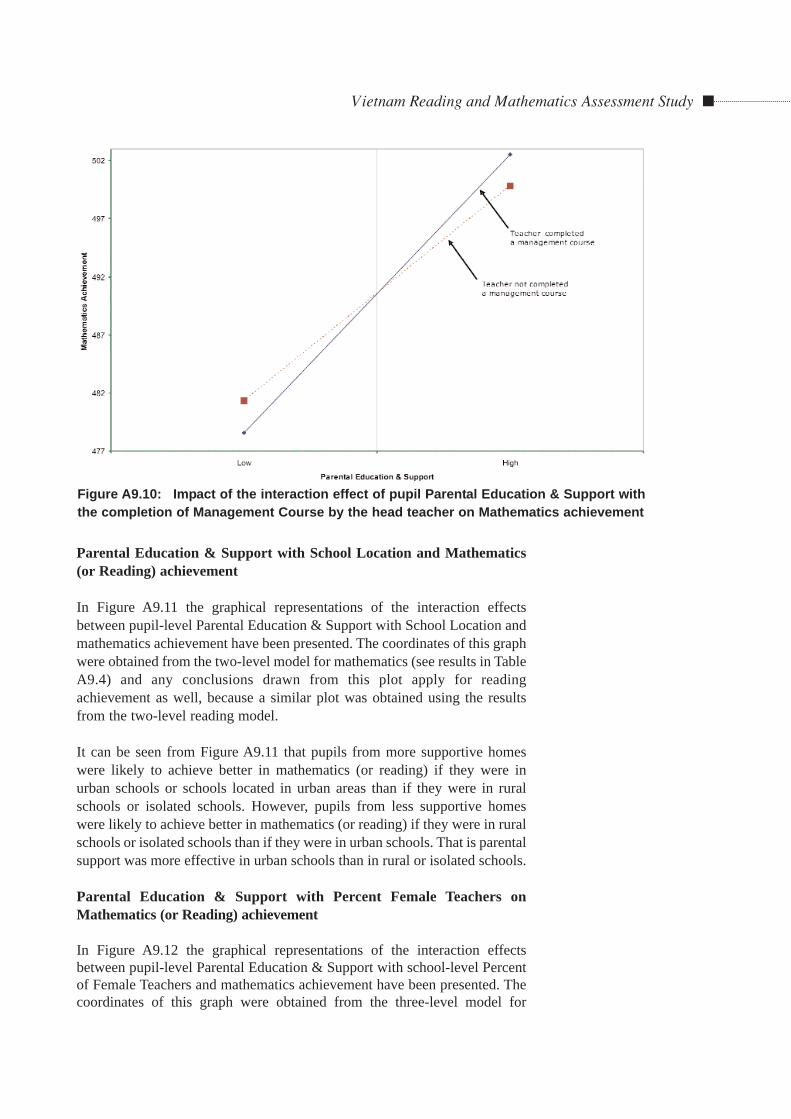
Vietnam Reading and Mathematics Assessment Study
Parental Education & Support with School Location and Mathematics(or Reading) achievement
In Figure A9.11 the graphical representations of the interaction effectsbetween pupil-level Parental Education & Support with School Location andmathematics achievement have been presented. The coordinates of this graphwere obtained from the two-level model for mathematics (see results in TableA9.4) and any conclusions drawn from this plot apply for readingachievement as well, because a similar plot was obtained using the resultsfrom the two-level reading model.
It can be seen from Figure A9.11 that pupils from more supportive homeswere likely to achieve better in mathematics (or reading) if they were inurban schools or schools located in urban areas than if they were in ruralschools or isolated schools. However, pupils from less supportive homeswere likely to achieve better in mathematics (or reading) if they were in ruralschools or isolated schools than if they were in urban schools. That is parentalsupport was more effective in urban schools than in rural or isolated schools.
Parental Education & Support with Percent Female Teachers onMathematics (or Reading) achievement
In Figure A9.12 the graphical representations of the interaction effectsbetween pupil-level Parental Education & Support with school-level Percentof Female Teachers and mathematics achievement have been presented. Thecoordinates of this graph were obtained from the three-level model for
Figure A9.10: Impact of the interaction effect of pupil Parental Education & Support withthe completion of Management Course by the head teacher on Mathematics achievement
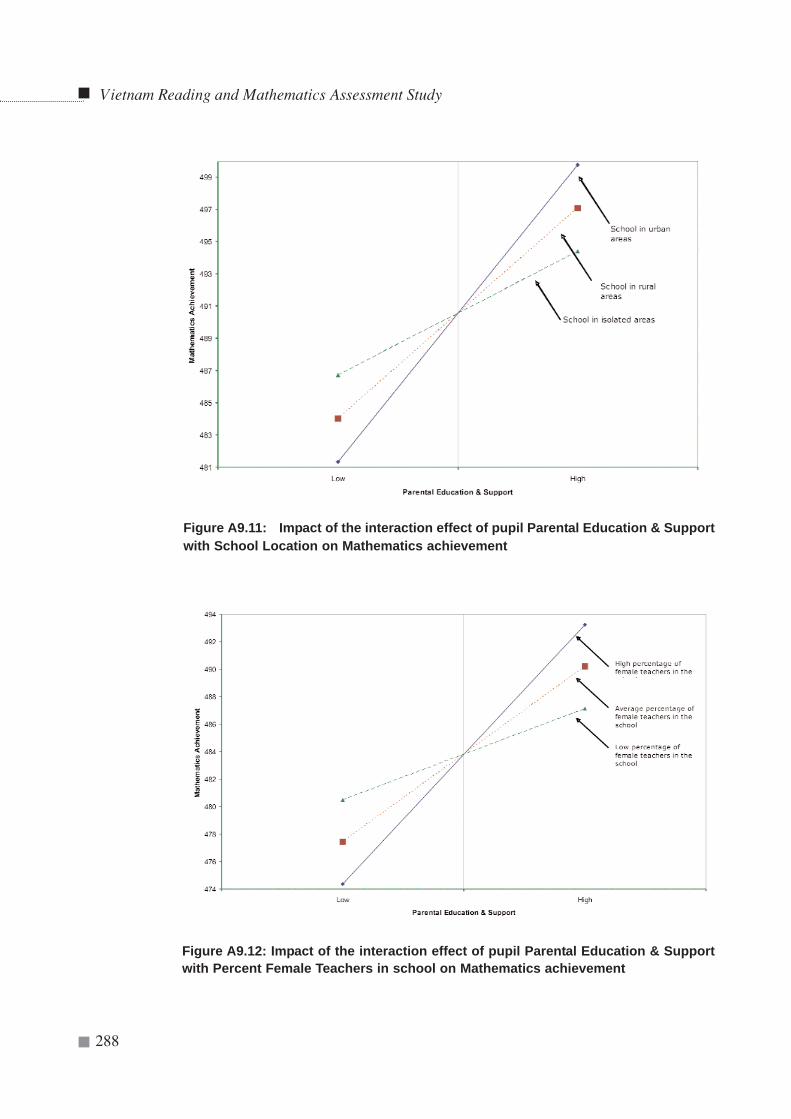
Vietnam Reading and Mathematics Assessment Study
288
Figure A9.11: Impact of the interaction effect of pupil Parental Education & Supportwith School Location on Mathematics achievement
Figure A9.12: Impact of the interaction effect of pupil Parental Education & Supportwith Percent Female Teachers in school on Mathematics achievement
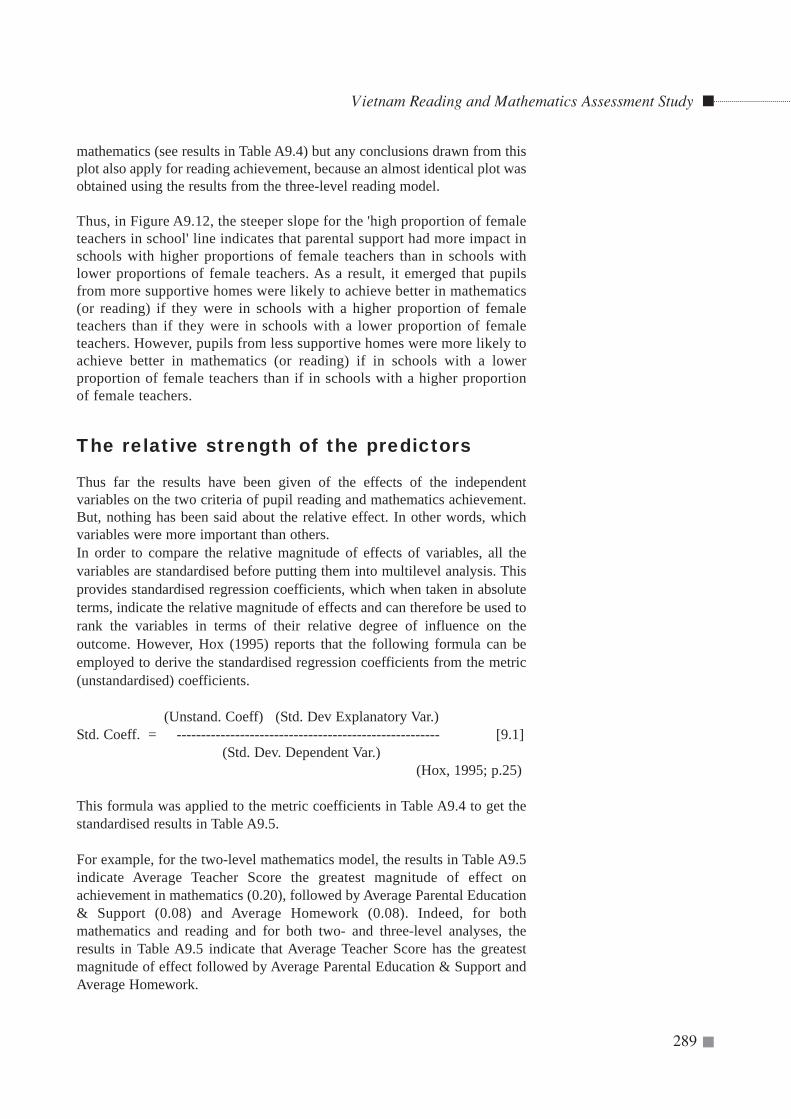
mathematics (see results in Table A9.4) but any conclusions drawn from thisplot also apply for reading achievement, because an almost identical plot wasobtained using the results from the three-level reading model.
Thus, in Figure A9.12, the steeper slope for the 'high proportion of femaleteachers in school' line indicates that parental support had more impact inschools with higher proportions of female teachers than in schools withlower proportions of female teachers. As a result, it emerged that pupilsfrom more supportive homes were likely to achieve better in mathematics(or reading) if they were in schools with a higher proportion of femaleteachers than if they were in schools with a lower proportion of femaleteachers. However, pupils from less supportive homes were more likely toachieve better in mathematics (or reading) if in schools with a lowerproportion of female teachers than if in schools with a higher proportionof female teachers.
The relative strength of the predictors
Thus far the results have been given of the effects of the independentvariables on the two criteria of pupil reading and mathematics achievement.But, nothing has been said about the relative effect. In other words, whichvariables were more important than others. In order to compare the relative magnitude of effects of variables, all thevariables are standardised before putting them into multilevel analysis. Thisprovides standardised regression coefficients, which when taken in absoluteterms, indicate the relative magnitude of effects and can therefore be used torank the variables in terms of their relative degree of influence on theoutcome. However, Hox (1995) reports that the following formula can beemployed to derive the standardised regression coefficients from the metric(unstandardised) coefficients.
(Unstand. Coeff) (Std. Dev Explanatory Var.)Std. Coeff. = ------------------------------------------------------ [9.1]
(Std. Dev. Dependent Var.)(Hox, 1995; p.25)
This formula was applied to the metric coefficients in Table A9.4 to get thestandardised results in Table A9.5.
For example, for the two-level mathematics model, the results in Table A9.5indicate Average Teacher Score the greatest magnitude of effect onachievement in mathematics (0.20), followed by Average Parental Education& Support (0.08) and Average Homework (0.08). Indeed, for bothmathematics and reading and for both two- and three-level analyses, theresults in Table A9.5 indicate that Average Teacher Score has the greatestmagnitude of effect followed by Average Parental Education & Support andAverage Homework.
Vietnam Reading and Mathematics Assessment Study
289
It can be seen that grade repetition and pupil behavioural problems arenegatively associated with achievement.
Estimation of variance explained
The results of the final estimation of variance components for the final two-level and three-model and the results of the analyses of the variancecomponents obtained from the null models (provided in Table A9.2) arepresented in Table A9.6 in rows 'a' and 'b' respectively. From the informationin Table A9.6 rows 'a' and 'b', the information presented in rows 'c' to 'f' werecalculated. A discussion of the calculations involved here is to be found inBryk and Raudenbush (1992; pp.60-76 and p.177).
For example, for mathematics, in the three-level analyses, the predictorsincluded in the final model explain 13.5 per cent of 25.1 per cent varianceavailable at the pupil-level and that is equal to 3.4 per cent (that is, 13.5 ×25.1) of the total variance explained at the pupil-level. Similarly, for the samemodel, predictors included in the final model explain 1.5 per cent (that is,13.4 per cent of 11.3 per cent) at the class-level, and 20.3 per cent (that is,31.9 per cent of 63.6 per cent) at the school-level. Thus, the total varianceexplained by the predictors included in the final three-model for mathematicsis 3.4 + 1.5 + 20.3 = 25.2 per cent, which leaves 74.8 per cent of the totalvariance unexplained.
At the school-level, the information provided in Table A9.6 shows that theresults of the two-level analyses generally agreed with the results of thethree-level analyses regarding the total amounts of variances explained (row'e'), and consequently, the amounts left unexplained (row 'f'). However, forboth mathematics and reading, the total amounts of variances explained inthe two-level analyses at the pupil-level were slightly smaller (by around twoto three per cent) compared with the combined amounts of variancesexplained at pupil and the class levels in the three-level analyses. As a result,the total amounts of variances explained in all the levels combined (given inbold in row 'e') in the two-level analyses were slightly smaller (by 1.5 and 3.0per cent for mathematics and reading respectively) than in the three-levelanalyses. Thus, the three-level analyses offer only a small advantage over thetwo-level analyses as far as the amounts of variance explained in the finalmodels are concerned.In addition, the information provided in Table A9.6 shows that within thesame type of analysis, the total amounts of variances explained in all thelevels combined for mathematics followed closely the amounts explained forreading. Nevertheless, the total amounts explained for mathematics weremarginally larger (by around one to two per cent) when compared to theamounts explained in the corresponding reading models.
Regardless of the type of analysis employed, the total amounts of variancesleft unexplained (in the shaded cell of row 'f') for both mathematics andreading are very large ( 75 per cent). These large amount of variance left
Vietnam Reading and Mathematics Assessment Study
290
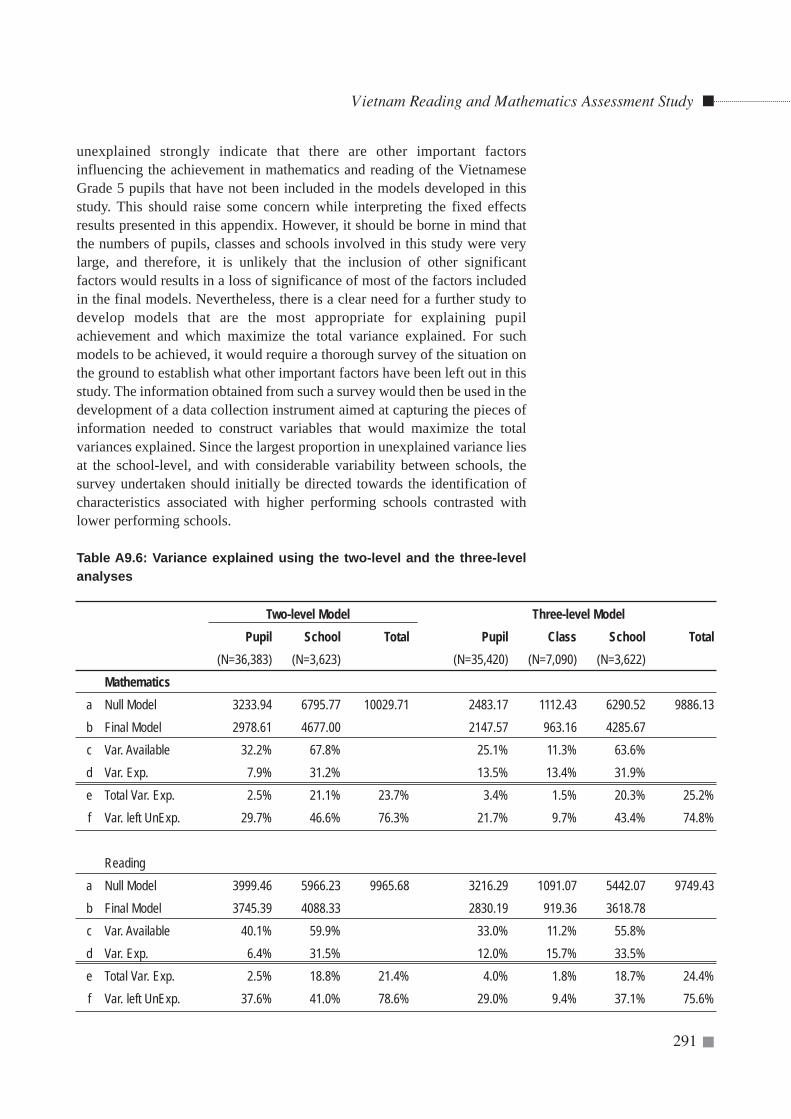
unexplained strongly indicate that there are other important factorsinfluencing the achievement in mathematics and reading of the VietnameseGrade 5 pupils that have not been included in the models developed in thisstudy. This should raise some concern while interpreting the fixed effectsresults presented in this appendix. However, it should be borne in mind thatthe numbers of pupils, classes and schools involved in this study were verylarge, and therefore, it is unlikely that the inclusion of other significantfactors would results in a loss of significance of most of the factors includedin the final models. Nevertheless, there is a clear need for a further study todevelop models that are the most appropriate for explaining pupilachievement and which maximize the total variance explained. For suchmodels to be achieved, it would require a thorough survey of the situation onthe ground to establish what other important factors have been left out in thisstudy. The information obtained from such a survey would then be used in thedevelopment of a data collection instrument aimed at capturing the pieces ofinformation needed to construct variables that would maximize the totalvariances explained. Since the largest proportion in unexplained variance liesat the school-level, and with considerable variability between schools, thesurvey undertaken should initially be directed towards the identification ofcharacteristics associated with higher performing schools contrasted withlower performing schools.
Table A9.6: Variance explained using the two-level and the three-levelanalyses
Vietnam Reading and Mathematics Assessment Study
291
Two-level Model Three-level ModelPupil School Total Pupil Class School Total
(N=36,383) (N=3,623) (N=35,420) (N=7,090) (N=3,622)Mathematics
a Null Model 3233.94 6795.77 10029.71 2483.17 1112.43 6290.52 9886.13b Final Model 2978.61 4677.00 2147.57 963.16 4285.67c Var. Available 32.2% 67.8% 25.1% 11.3% 63.6%d Var. Exp. 7.9% 31.2% 13.5% 13.4% 31.9%e Total Var. Exp. 2.5% 21.1% 23.7% 3.4% 1.5% 20.3% 25.2%f Var. left UnExp. 29.7% 46.6% 76.3% 21.7% 9.7% 43.4% 74.8%
Readinga Null Model 3999.46 5966.23 9965.68 3216.29 1091.07 5442.07 9749.43b Final Model 3745.39 4088.33 2830.19 919.36 3618.78c Var. Available 40.1% 59.9% 33.0% 11.2% 55.8%d Var. Exp. 6.4% 31.5% 12.0% 15.7% 33.5%e Total Var. Exp. 2.5% 18.8% 21.4% 4.0% 1.8% 18.7% 24.4%f Var. left UnExp. 37.6% 41.0% 78.6% 29.0% 9.4% 37.1% 75.6%
CCoonncclluussiioonn
In this appendix the multilevel analyses undertaken in order to tease out thepupil, class and school level factors influencing achievement in mathematicsand reading among Grade 5 Vietnamese pupils have been reported. For eachof the two outcome measures (mathematics and reading), two different typesof hierarchical models were hypothesised and examined in this appendix:two-level and three-level models. Generally, the results of the two-levelanalyses agreed with the results of the three-level analyses regarding theamounts of variance available to be explained especially at the school-level.The results from the two types of models were also very similar in terms ofthe amounts of total variance that was explained in the final models. Theresults were also very similar for the individual-level and group-level factorsthat had significant effects on achievement in mathematics and reading.
Despite the small amounts of variance explained in the final models, theresults described were extremely interesting especially because they showedhow teacher characteristics such as teacher subject matter knowledge andteacher training influenced pupil achievement. The results were alsointeresting because they showed how individual-level and group-level (classor school) factors influenced pupil achievement when consideredsimultaneously. For example, the results from three-level models showed thatthe variable Average Days Absent at the class-level had a negative effect onpupil achievement in both mathematics and reading. Most important, thenegative effect of the variable Average Days Absent was significant (.05)despite the fact that the effect of the variable Days Absent had been includedin the model at the pupil-level. This implied that a high rate of absenteeismat the class-level affected regular attendees within the class as well. Such aconclusion could not have been arrived at based on the conventional multipleregression approaches, which do not allow for modelling of the effects of thefactors at the pupil and group levels, together with cross-level interactionscarried out simultaneously.
RReeffeerreenncceess
Aiken, L. S. and West, S. G. (1996). Multiple Regression: Testing andInterpreting Interactions. Newbury Park: Sage Publications.
Bryk, A. S. and Raudenbush, S. W. (1992). Hierarchical Linear Models:Application and Data Analysis Methods. Newbury Park: SagePublication.
Bryk, A. S., Raudenbush, S. W. and Congdon, R. T. (1986). HierarchicalLinear Modeling with the Hierarchical Linear Modeling/2L andHierarchical Linear Modeling/3L Programs, [Computer Software].Chicago: Scientific Software International.
Howie, S. (2002). English Language Proficiency and Contextual FactorsInfluencing Mathematics Achievement of Secondary School Pupils inSouth Africa. Enschede: Print Partners Ipskamp.
Hox, J. J. (1995). Applied Multilevel Analysis. Amsterdam: TT-Publikaties.
Vietnam Reading and Mathematics Assessment Study
292
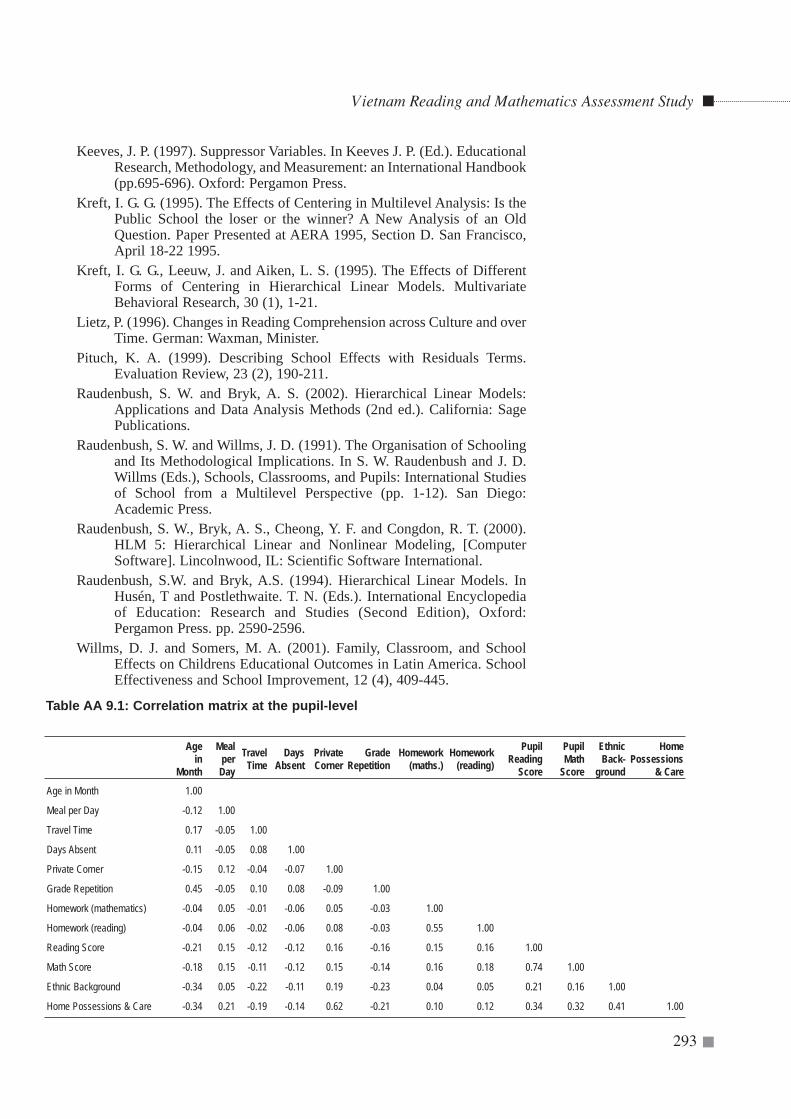
Keeves, J. P. (1997). Suppressor Variables. In Keeves J. P. (Ed.). EducationalResearch, Methodology, and Measurement: an International Handbook(pp.695-696). Oxford: Pergamon Press.
Kreft, I. G. G. (1995). The Effects of Centering in Multilevel Analysis: Is thePublic School the loser or the winner? A New Analysis of an OldQuestion. Paper Presented at AERA 1995, Section D. San Francisco,April 18-22 1995.
Kreft, I. G. G., Leeuw, J. and Aiken, L. S. (1995). The Effects of DifferentForms of Centering in Hierarchical Linear Models. MultivariateBehavioral Research, 30 (1), 1-21.
Lietz, P. (1996). Changes in Reading Comprehension across Culture and overTime. German: Waxman, Minister.
Pituch, K. A. (1999). Describing School Effects with Residuals Terms.Evaluation Review, 23 (2), 190-211.
Raudenbush, S. W. and Bryk, A. S. (2002). Hierarchical Linear Models:Applications and Data Analysis Methods (2nd ed.). California: SagePublications.
Raudenbush, S. W. and Willms, J. D. (1991). The Organisation of Schoolingand Its Methodological Implications. In S. W. Raudenbush and J. D.Willms (Eds.), Schools, Classrooms, and Pupils: International Studiesof School from a Multilevel Perspective (pp. 1-12). San Diego:Academic Press.
Raudenbush, S. W., Bryk, A. S., Cheong, Y. F. and Congdon, R. T. (2000).HLM 5: Hierarchical Linear and Nonlinear Modeling, [ComputerSoftware]. Lincolnwood, IL: Scientific Software International.
Raudenbush, S.W. and Bryk, A.S. (1994). Hierarchical Linear Models. InHusén, T and Postlethwaite. T. N. (Eds.). International Encyclopediaof Education: Research and Studies (Second Edition), Oxford:Pergamon Press. pp. 2590-2596.
Willms, D. J. and Somers, M. A. (2001). Family, Classroom, and SchoolEffects on Childrens Educational Outcomes in Latin America. SchoolEffectiveness and School Improvement, 12 (4), 409-445.
Vietnam Reading and Mathematics Assessment Study
293
Age in
Month
Meal per
Day
Travel Time
Days Absent
Private Corner
GradeRepetition
Homework(maths.)
Homework(reading)
PupilReading
Score
PupilMath
Score
Ethnic Back-
ground
HomePossessions
& Care
Age in Month 1.00
Meal per Day -0.12 1.00
Travel Time 0.17 -0.05 1.00
Days Absent 0.11 -0.05 0.08 1.00
Private Corner -0.15 0.12 -0.04 -0.07 1.00
Grade Repetition 0.45 -0.05 0.10 0.08 -0.09 1.00
Homework (mathematics) -0.04 0.05 -0.01 -0.06 0.05 -0.03 1.00
Homework (reading) -0.04 0.06 -0.02 -0.06 0.08 -0.03 0.55 1.00
Reading Score -0.21 0.15 -0.12 -0.12 0.16 -0.16 0.15 0.16 1.00
Math Score -0.18 0.15 -0.11 -0.12 0.15 -0.14 0.16 0.18 0.74 1.00
Ethnic Background -0.34 0.05 -0.22 -0.11 0.19 -0.23 0.04 0.05 0.21 0.16 1.00
Home Possessions & Care -0.34 0.21 -0.19 -0.14 0.62 -0.21 0.10 0.12 0.34 0.32 0.41 1.00
Table AA 9.1: Correlation matrix at the pupil-level
Table AA 9.2: Correlation matrix at the class-level
Table AA 9.3: Correlation matrix at the school-level
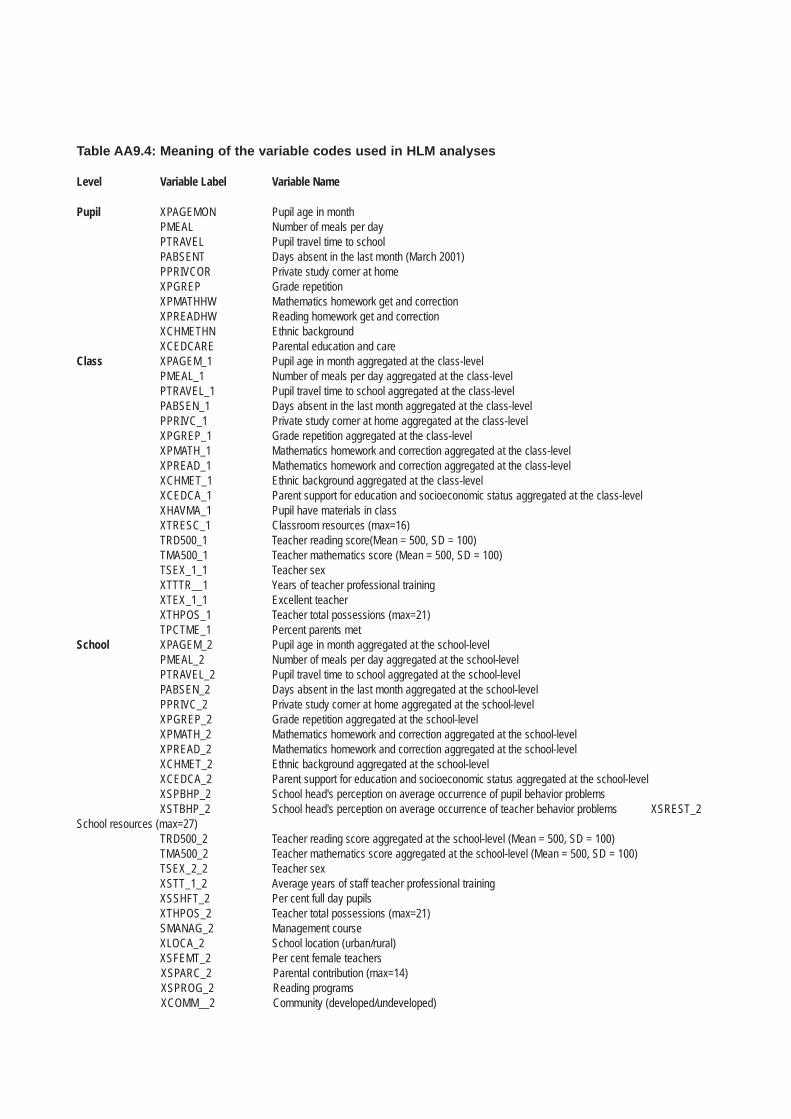
Table AA9.4: Meaning of the variable codes used in HLM analyses
Level Variable Label Variable Name
Pupil XPAGEMON Pupil age in monthPMEAL Number of meals per dayPTRAVEL Pupil travel time to schoolPABSENT Days absent in the last month (March 2001)PPRIVCOR Private study corner at homeXPGREP Grade repetitionXPMATHHW Mathematics homework get and correctionXPREADHW Reading homework get and correctionXCHMETHN Ethnic backgroundXCEDCARE Parental education and care
Class XPAGEM_1 Pupil age in month aggregated at the class-levelPMEAL_1 Number of meals per day aggregated at the class-levelPTRAVEL_1 Pupil travel time to school aggregated at the class-levelPABSEN_1 Days absent in the last month aggregated at the class-levelPPRIVC_1 Private study corner at home aggregated at the class-levelXPGREP_1 Grade repetition aggregated at the class-levelXPMATH_1 Mathematics homework and correction aggregated at the class-levelXPREAD_1 Mathematics homework and correction aggregated at the class-levelXCHMET_1 Ethnic background aggregated at the class-levelXCEDCA_1 Parent support for education and socioeconomic status aggregated at the class-levelXHAVMA_1 Pupil have materials in classXTRESC_1 Classroom resources (max=16)TRD500_1 Teacher reading score(Mean = 500, SD = 100)TMA500_1 Teacher mathematics score (Mean = 500, SD = 100)TSEX_1_1 Teacher sexXTTTR__1 Years of teacher professional trainingXTEX_1_1 Excellent teacherXTHPOS_1 Teacher total possessions (max=21)TPCTME_1 Percent parents met
School XPAGEM_2 Pupil age in month aggregated at the school-levelPMEAL_2 Number of meals per day aggregated at the school-levelPTRAVEL_2 Pupil travel time to school aggregated at the school-levelPABSEN_2 Days absent in the last month aggregated at the school-levelPPRIVC_2 Private study corner at home aggregated at the school-levelXPGREP_2 Grade repetition aggregated at the school-levelXPMATH_2 Mathematics homework and correction aggregated at the school-levelXPREAD_2 Mathematics homework and correction aggregated at the school-levelXCHMET_2 Ethnic background aggregated at the school-levelXCEDCA_2 Parent support for education and socioeconomic status aggregated at the school-levelXSPBHP_2 School head's perception on average occurrence of pupil behavior problemsXSTBHP_2 School head's perception on average occurrence of teacher behavior problems XSREST_2
School resources (max=27)TRD500_2 Teacher reading score aggregated at the school-level (Mean = 500, SD = 100)TMA500_2 Teacher mathematics score aggregated at the school-level (Mean = 500, SD = 100)TSEX_2_2 Teacher sexXSTT_1_2 Average years of staff teacher professional trainingXSSHFT_2 Per cent full day pupilsXTHPOS_2 Teacher total possessions (max=21)SMANAG_2 Management courseXLOCA_2 School location (urban/rural)XSFEMT_2 Per cent female teachersXSPARC_2 Parental contribution (max=14)XSPROG_2 Reading programsXCOMM__2 Community (developed/undeveloped)
Table AA 9.5: Descriptive Statistics of the variables included in the two-level SSM file
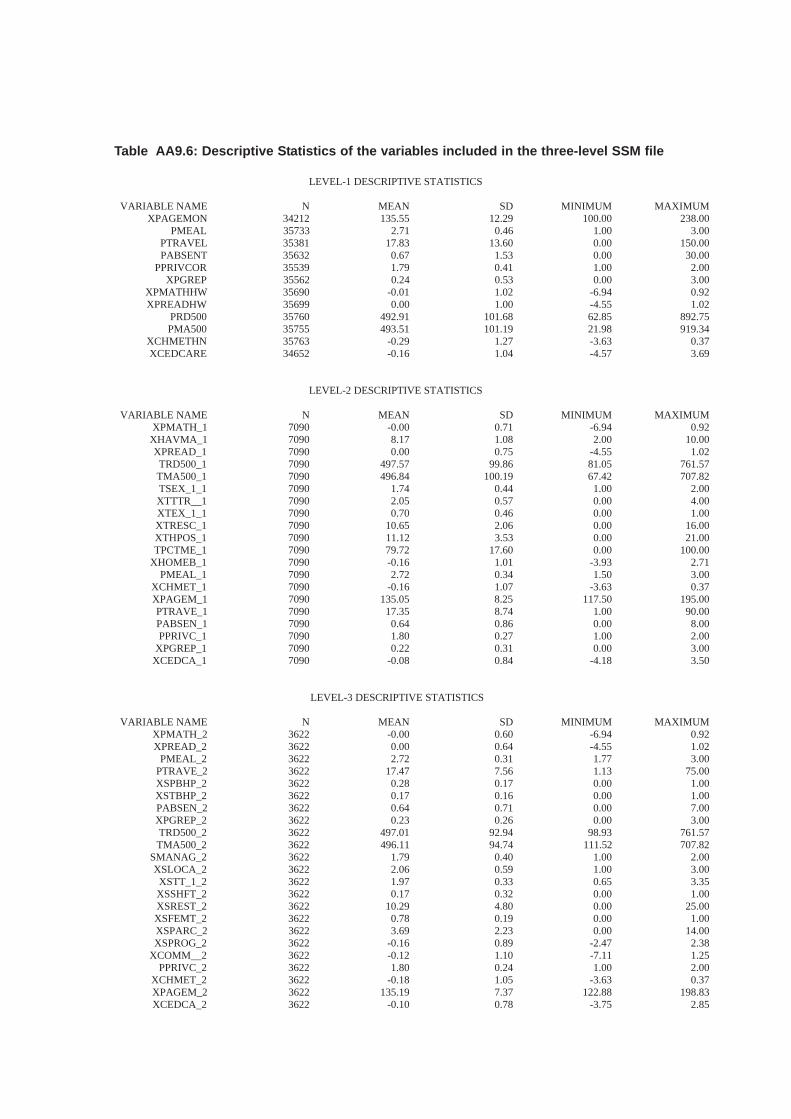
Table AA9.6: Descriptive Statistics of the variables included in the three-level SSM file
LEVEL-1 DESCRIPTIVE STATISTICS
VARIABLE NAME N MEAN SD MINIMUM MAXIMUMXPAGEMON 34212 135.55 12.29 100.00 238.00
PMEAL 35733 2.71 0.46 1.00 3.00PTRAVEL 35381 17.83 13.60 0.00 150.00PABSENT 35632 0.67 1.53 0.00 30.00
PPRIVCOR 35539 1.79 0.41 1.00 2.00XPGREP 35562 0.24 0.53 0.00 3.00
XPMATHHW 35690 -0.01 1.02 -6.94 0.92XPREADHW 35699 0.00 1.00 -4.55 1.02
PRD500 35760 492.91 101.68 62.85 892.75PMA500 35755 493.51 101.19 21.98 919.34
XCHMETHN 35763 -0.29 1.27 -3.63 0.37XCEDCARE 34652 -0.16 1.04 -4.57 3.69
LEVEL-2 DESCRIPTIVE STATISTICS
VARIABLE NAME N MEAN SD MINIMUM MAXIMUMXPMATH_1 7090 -0.00 0.71 -6.94 0.92
XHAVMA_1 7090 8.17 1.08 2.00 10.00XPREAD_1 7090 0.00 0.75 -4.55 1.02
TRD500_1 7090 497.57 99.86 81.05 761.57TMA500_1 7090 496.84 100.19 67.42 707.82TSEX_1_1 7090 1.74 0.44 1.00 2.00XTTTR__1 7090 2.05 0.57 0.00 4.00XTEX_1_1 7090 0.70 0.46 0.00 1.00XTRESC_1 7090 10.65 2.06 0.00 16.00XTHPOS_1 7090 11.12 3.53 0.00 21.00TPCTME_1 7090 79.72 17.60 0.00 100.00
XHOMEB_1 7090 -0.16 1.01 -3.93 2.71PMEAL_1 7090 2.72 0.34 1.50 3.00
XCHMET_1 7090 -0.16 1.07 -3.63 0.37XPAGEM_1 7090 135.05 8.25 117.50 195.00PTRAVE_1 7090 17.35 8.74 1.00 90.00PABSEN_1 7090 0.64 0.86 0.00 8.00PPRIVC_1 7090 1.80 0.27 1.00 2.00
XPGREP_1 7090 0.22 0.31 0.00 3.00XCEDCA_1 7090 -0.08 0.84 -4.18 3.50
LEVEL-3 DESCRIPTIVE STATISTICS
VARIABLE NAME N MEAN SD MINIMUM MAXIMUMXPMATH_2 3622 -0.00 0.60 -6.94 0.92XPREAD_2 3622 0.00 0.64 -4.55 1.02
PMEAL_2 3622 2.72 0.31 1.77 3.00PTRAVE_2 3622 17.47 7.56 1.13 75.00XSPBHP_2 3622 0.28 0.17 0.00 1.00XSTBHP_2 3622 0.17 0.16 0.00 1.00PABSEN_2 3622 0.64 0.71 0.00 7.00XPGREP_2 3622 0.23 0.26 0.00 3.00TRD500_2 3622 497.01 92.94 98.93 761.57TMA500_2 3622 496.11 94.74 111.52 707.82
SMANAG_2 3622 1.79 0.40 1.00 2.00XSLOCA_2 3622 2.06 0.59 1.00 3.00
XSTT_1_2 3622 1.97 0.33 0.65 3.35XSSHFT_2 3622 0.17 0.32 0.00 1.00XSREST_2 3622 10.29 4.80 0.00 25.00XSFEMT_2 3622 0.78 0.19 0.00 1.00XSPARC_2 3622 3.69 2.23 0.00 14.00XSPROG_2 3622 -0.16 0.89 -2.47 2.38
XCOMM__2 3622 -0.12 1.10 -7.11 1.25PPRIVC_2 3622 1.80 0.24 1.00 2.00
XCHMET_2 3622 -0.18 1.05 -3.63 0.37XPAGEM_2 3622 135.19 7.37 122.88 198.83XCEDCA_2 3622 -0.10 0.78 -3.75 2.85
Chapter 10
SUMMARY AND CONCLUSIONS
Introduction
This study has been a cross-sectional sample survey of Grade 5pupils' achievement together with general information on thepupils, their teachers, and their schools. Reasonably accurateestimates were required for each of 61 provinces as well as for
the country as a whole. This involved collecting data from 3660 schools.Only one day was allowed for data collection. The testing time took thewhole day.
This was the first time in Vietnam that a national survey of this kind ineducation had been carried out. The study has yielded an enormousamount of information as can be seen from the foregoing chapters. As afirst survey ir could not provide information on every aspect of theeducational system. Indeed, one proposal for a follow-up activity is thatmore information, using in some instances finer measures and involvingobservation and interviews, should be collected.
The data analyses and writing of this report were conducted in the periodMarch to July, 2002. There are many more analyses that could beundertaken. However, it is believed that the major analyses have beenalready carried out and the major results are known. This is not to saythat further analyses of the existing data set should not be undertaken. Asmany as possible should be undertaken and reported over the months adyears to come.
From the analyses undertaken so far and presented in this publication, a seriesof recommendations have been made to the MOET for its consideration. Inthis final chapter an attempt has been made to draw together the varioussuggestions made throughout the book. It has been seen that the conditions ofschooling are far from ideal. The various suggestions have been clustered intoseven major categories later in this chapter.
Vietnam Reading and Mathematics Assessment Study
299
This was the first large-scale national survey ofpupil achievement..
Review of major findings
The same categories have been used as later for the recommendations. It wasthought to be desirable to review the major findings before coming to theactual recommendations. The categories concern different aspects ofschooling. They do not reflect any priority of action. Comments on thepriority are made after the recommendations.
The Home
The attitudes of the parents towards school and schooling are important. It iswell known that when home and school work in co-operation this can lead tobetter achievement by the children. One of the first findings was that therewere fewer girls than boys in Grade 5 and in some provinces there were only40 percent girls enrolled. This home problem was more acute in the isolatedschool areas. It was felt that school intervention programs may well help inthis matter. This is where the school needs to attract the mothers of suchpupils (in and out of school) to come to school ostensibly to work on someproject or other but the hidden object is to have the teachers in a subtle wayget the message to the mothers that daughters should go to school and notdrop out or be absent. Mothers should also be 'taught' to show an interest inwhat their children are doing at school by asking them to relate in detail whatthey learned each day and also to ask their children to read to them or to tellthem the story of what they have just read. Since meals per day turned out tobe quite a strong predictor of pupil achievement then this too is a matter tobe stressed with mothers.
Materials and textbooks in classrooms and at school
Several pupils were in classrooms where they did not have the wherewithalto write or read. In some cases there was no blackboard and in other cases noteacher guide. Although 99 percent of pupils had the Vietnamese and Mathtextbooks there were many supplementary textbooks that pupils did not have.It was primarily homes that were poor where the parents could not affordthese supplementary materials. The personnel of the curriculum group shouldreview the necessity of all of these materials being available to pupils. Thegroup could prepare a consolidated list of books and materials that all pupilsshould have.
Material resources
Questions were asked about 27 different school resources. However only12 of them were on the benchmark list of the Ministry. Although thepercentage of pupils in schools meeting the benchmarks was high, there
Vietnam Reading and Mathematics Assessment Study
300
First, the major findingshave been reviewed,
and…
…categorized into seventhemes:
• Home…
• Materials andtextbooks in classrooms
and schools…
• Other materialresources…
were still some pupils in schools that did not meet the benchmarks. Thesame was true of classroom benchmarks. Where pupils were inclassrooms without blackboards, it would seem that there would be notmuch chance of learning occurring. It was suggested, inter alia, that thebenchmark list be revisited and revised and that one final list beproduced instead of the two lists at present and then each list sub-dividedinto two different sets of benchmarks, one for rural and urban schoolsand one for isolated schools.
Although the Ministry has a set of national standards, it is quite clear thatthe reality of the implementation is not fully related to the nationalstandards. It is important that there be an approach to implementationthat emphasises increments from the base to increase the standardsgradually. It was also clear that there should be a system of collectingdata in a systematic fashion about the implementation in schools of thebasic material resources. These data could be kept on a data base that isused for ensuring the gradual implementation of resources until allschools meet the standards.
What was surprising was the dearth of reading books, in the form of aclassroom library or school library, in the schools. Indeed there seemed to bea lack of a reading culture in the schools. It was suggested that the MOETshould consider a book flood program. Book flood programs have workedwell elsewhere and also increased the achievement levels of readingcomprehension of pupils.
Above all, there was a good deal of variance among schools for school andclassroom resources including books in classroom library. Again it was theisolated schools that had least, the rural next least and the urban schools thathad most.
Human resources in schools
Teachers are the main human resources in schools. It has been shown that fora pupil to have female teachers with more years of teacher training is anadvantage. It was also shown that where the whole staff was more femaledominated and where the whole staff had a good level of teacher training,then pupils in such schools had higher achievement levels. Finally it wasshown that there were several teachers with low achievement levels in bothmath and reading and that where the teachers in provinces had low levels ofachievement then so did the pupils. Indeed teacher subject matter knowledgewas the largest determinant of pupil achievement. As such it is the mostimportant factor to be tackled by the Ministry. All kinds of action can betaken to ensure that the subject matter knowledge of teachers on both readingand math is improved.
Vietnam Reading and Mathematics Assessment Study
301
• Human resources…
It was further shown that the quality of teachers based on theirmathematical knowledge or reading knowledge as well as on their yearsof teacher training and sex were very unevenly distributed acrossschools. It was the isolated schools that suffered the most. Thisimbalance must be corrected and in the first instance there maybe shouldbe more human resources allocated to those schools that have been mostdeprived until now. Again, a system of collecting and storing data aboutteachers with a view to using such a data base for allocation of teachersto schools should be implemented.
If the overall level of teacher subject matter knowledge is raised then intheory the imbalance across schools should be much diminished. This isa matter for close monitoring. It was shown that the average contacttime in Vietnam was below the average for many OECD countries. TheMOET may wish to consider revising the number of desirable contacthours.
Process variables
The most important variable to emerge from the list of process variableswas that teachers who gave homework and corrected it had pupils withhigher achievement than teachers who neither gave no home work orgave it and then did not mark it. This has direct implications for teachertraining.
It was also a fact that many teachers believed that the best activity forpupils to learn was to learn by reciting tables and in general by learningby rote. The test itself did not really assess what might be called thehigher order skills of the understanding of principles and the applicationof knowledge and comprehension for solving a new problem. It was feltthat more research and development work was needed on optimalapproaches to the learning of higher order skills in order to ensure'better' learning in future.
Achievement
In general achievement was higher in urban areas than in rural areas andhigher in rural areas than in isolated areas. It was the very low levels ofachievement in some isolated areas that were noteworthy. It was felt thatsome further guidance from the curriculum centre about skill basedassessment to help teachers assess where their pupils are would beuseful. It was further felt that some intervention to help teachers intargeted areas improve their own standards of subject matter knowledgewould be desirable.
Vietnam Reading and Mathematics Assessment Study
302
• Process of schooling…
• Achievement…
Further data collections
In some cases the data from this study did not allow particular questions tobe investigated and further small studies were suggested. Above all, it wassuggested that repeat surveys of the kind just conducted should be carriedout about every four or five years. In order that comparisons can be madewith the present study the first step is to develop a good archive of thepresent data set and accompanying instruments and notes. This should bebegun immediately. Plans should also be made for the next study. It wouldbe desirable that those responsible for the study learn some basic statisticsand learn to read English, the language in which 90 percent of researchstudies and research methodology is written up.
There were several aspects of primary education that were not examinedin sufficient detail in the current study. These included more informationon the conditions of schooling on satellite campuses, multi-gradeschooling, extra tuition, teaching methods in both subject areas, and partversus full-day schooling. These aspects could be covered in extra smallresearch studies.
The demands for action
Many of the suggestions listed later in the chapter will demand a high levelof co-operation between the communities, the provincial authorities andthe central government. Thus far, as far as the author is aware, the generalprinciple has been that the central authorities determine policy but it is atthe provincial and district levels that action occurs. But it is obvious fromsome of the results that the central authorities need to monitor what isgoing on at the provincial level in order to check on equity issues. Wherethere are disparities among the provinces, then it is up to the centralgovernment to point out to particular provinces that they are laggingbehind in matters of equity and together the central authorities andprovincial authorities must take action to redress the matter. All of thepersons involved must have the determination to make things happen inthe first place.
The policy suggestions have been written in a provocative manner with theaim of generating wide spread discussion and debate. It is to be hoped thatthe officials within the MOET will join this process of debate and whenthe various actions have been determined then it might be useful if theMOET were to form a small committee to ensure that the actions occurwhen they are meant to occur. This committee might report directly to oneof the Vice-Ministers.
Vietnam Reading and Mathematics Assessment Study
303
• Further datacollections.
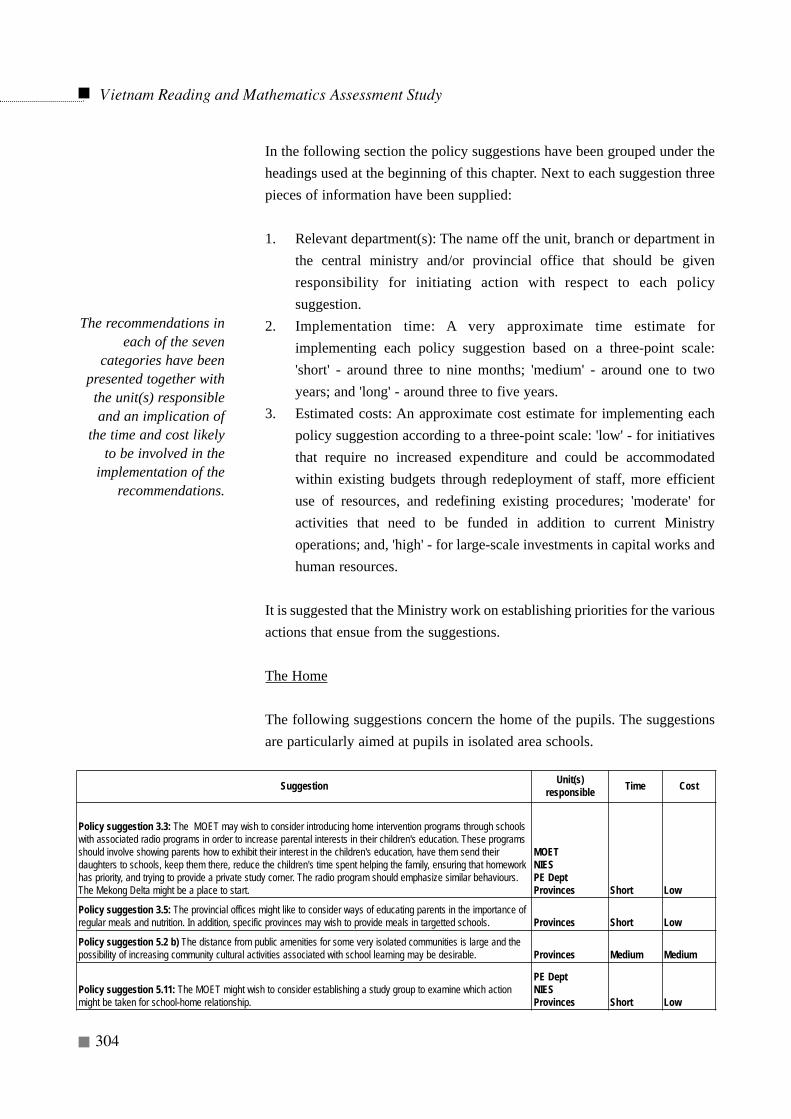
In the following section the policy suggestions have been grouped under theheadings used at the beginning of this chapter. Next to each suggestion threepieces of information have been supplied:
1. Relevant department(s): The name off the unit, branch or department inthe central ministry and/or provincial office that should be givenresponsibility for initiating action with respect to each policysuggestion.
2. Implementation time: A very approximate time estimate forimplementing each policy suggestion based on a three-point scale:'short' - around three to nine months; 'medium' - around one to twoyears; and 'long' - around three to five years.
3. Estimated costs: An approximate cost estimate for implementing eachpolicy suggestion according to a three-point scale: 'low' - for initiativesthat require no increased expenditure and could be accommodatedwithin existing budgets through redeployment of staff, more efficientuse of resources, and redefining existing procedures; 'moderate' foractivities that need to be funded in addition to current Ministryoperations; and, 'high' - for large-scale investments in capital works andhuman resources.
It is suggested that the Ministry work on establishing priorities for the variousactions that ensue from the suggestions.
The Home
The following suggestions concern the home of the pupils. The suggestionsare particularly aimed at pupils in isolated area schools.
Vietnam Reading and Mathematics Assessment Study
304
The recommendations ineach of the seven
categories have beenpresented together withthe unit(s) responsibleand an implication of
the time and cost likelyto be involved in the
implementation of therecommendations.
Suggestion Unit(s)responsible Time Cost
Policy suggestion 3.3: The MOET may wish to consider introducing home intervention programs through schoolswith associated radio programs in order to increase parental interests in their children's education. These programsshould involve showing parents how to exhibit their interest in the children's education, have them send theirdaughters to schools, keep them there, reduce the children's time spent helping the family, ensuring that homeworkhas priority, and trying to provide a private study corner. The radio program should emphasize similar behaviours.The Mekong Delta might be a place to start.
MOETNIESPE DeptProvinces Short Low
Policy suggestion 3.5: The provincial offices might like to consider ways of educating parents in the importance ofregular meals and nutrition. In addition, specific provinces may wish to provide meals in targetted schools. Provinces Short Low
Policy suggestion 5.2 b) The distance from public amenities for some very isolated communities is large and thepossibility of increasing community cultural activities associated with school learning may be desirable. Provinces Medium Medium
Policy suggestion 5.11: The MOET might wish to consider establishing a study group to examine which actionmight be taken for school-home relationship.
PE DeptNIESProvinces Short Low
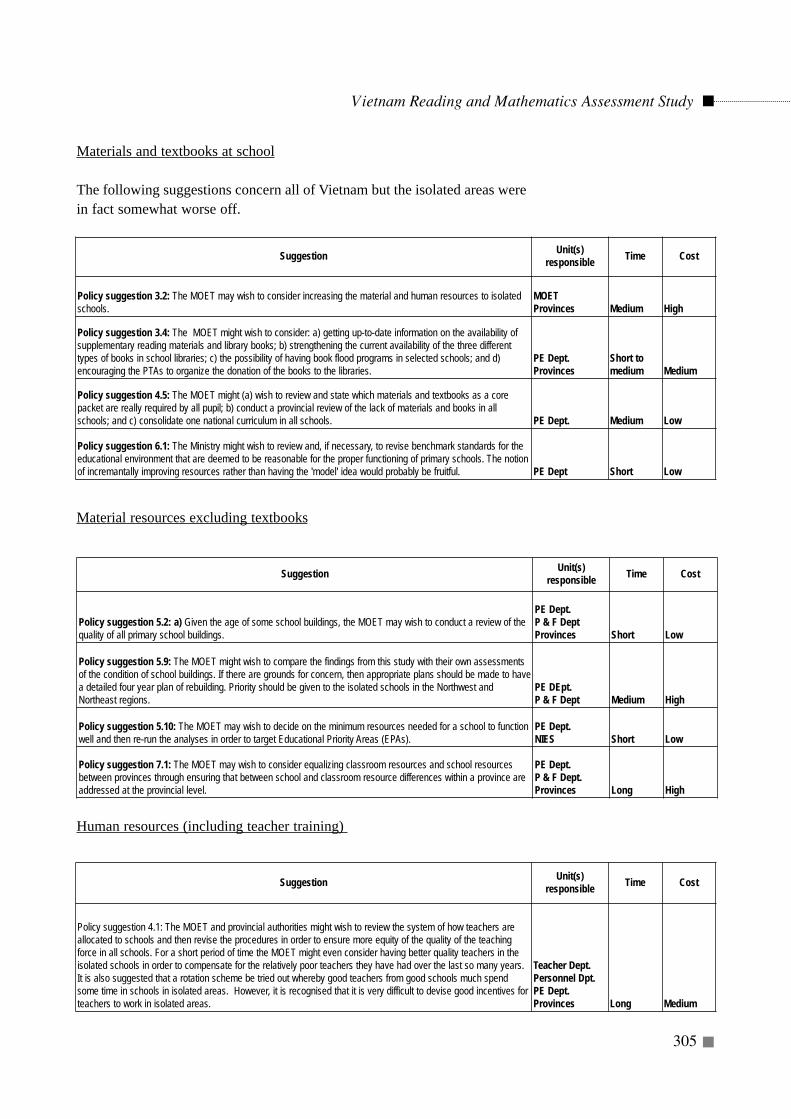
Materials and textbooks at school
The following suggestions concern all of Vietnam but the isolated areas werein fact somewhat worse off.
Material resources excluding textbooks
Human resources (including teacher training)
Vietnam Reading and Mathematics Assessment Study
305
Suggestion Unit(s)responsible Time Cost
Policy suggestion 3.2: The MOET may wish to consider increasing the material and human resources to isolatedschools.
MOETProvinces Medium High
Policy suggestion 3.4: The MOET might wish to consider: a) getting up-to-date information on the availability ofsupplementary reading materials and library books; b) strengthening the current availability of the three differenttypes of books in school libraries; c) the possibility of having book flood programs in selected schools; and d)encouraging the PTAs to organize the donation of the books to the libraries.
PE Dept.Provinces
Short tomedium Medium
Policy suggestion 4.5: The MOET might (a) wish to review and state which materials and textbooks as a corepacket are really required by all pupil; b) conduct a provincial review of the lack of materials and books in allschools; and c) consolidate one national curriculum in all schools. PE Dept. Medium Low
Policy suggestion 6.1: The Ministry might wish to review and, if necessary, to revise benchmark standards for theeducational environment that are deemed to be reasonable for the proper functioning of primary schools. The notionof incremantally improving resources rather than having the 'model' idea would probably be fruitful. PE Dept Short Low
Suggestion Unit(s)responsible Time Cost
Policy suggestion 5.2: a) Given the age of some school buildings, the MOET may wish to conduct a review of thequality of all primary school buildings.
PE Dept.P & F DeptProvinces Short Low
Policy suggestion 5.9: The MOET might wish to compare the findings from this study with their own assessmentsof the condition of school buildings. If there are grounds for concern, then appropriate plans should be made to havea detailed four year plan of rebuilding. Priority should be given to the isolated schools in the Northwest andNortheast regions.
PE DEpt.P & F Dept Medium High
Policy suggestion 5.10: The MOET may wish to decide on the minimum resources needed for a school to functionwell and then re-run the analyses in order to target Educational Priority Areas (EPAs).
PE Dept.NIES Short Low
Policy suggestion 7.1: The MOET may wish to consider equalizing classroom resources and school resourcesbetween provinces through ensuring that between school and classroom resource differences within a province areaddressed at the provincial level.
PE Dept.P & F Dept.Provinces Long High
Suggestion Unit(s)responsible Time Cost
Policy suggestion 4.1: The MOET and provincial authorities might wish to review the system of how teachers areallocated to schools and then revise the procedures in order to ensure more equity of the quality of the teachingforce in all schools. For a short period of time the MOET might even consider having better quality teachers in theisolated schools in order to compensate for the relatively poor teachers they have had over the last so many years.It is also suggested that a rotation scheme be tried out whereby good teachers from good schools much spendsome time in schools in isolated areas. However, it is recognised that it is very difficult to devise good incentives forteachers to work in isolated areas.
Teacher Dept.Personnel Dpt.PE Dept.Provinces Long Medium
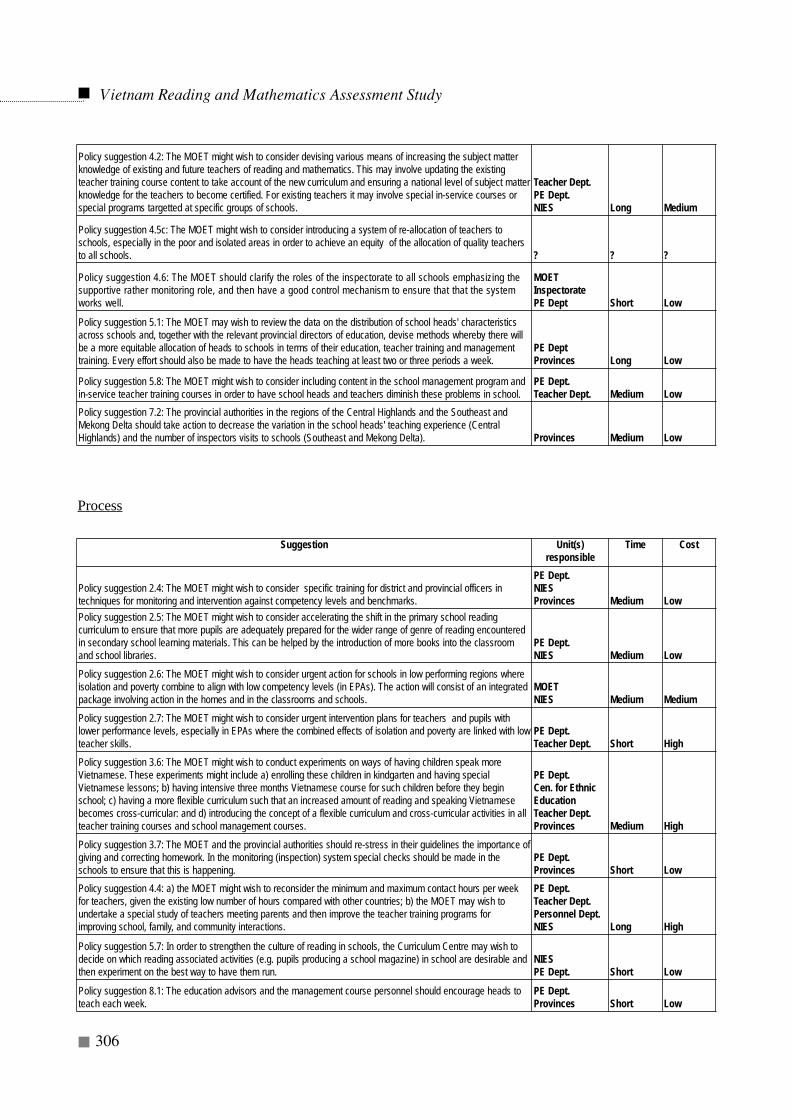
Vietnam Reading and Mathematics Assessment Study
306
Policy suggestion 4.2: The MOET might wish to consider devising various means of increasing the subject matterknowledge of existing and future teachers of reading and mathematics. This may involve updating the existingteacher training course content to take account of the new curriculum and ensuring a national level of subject matterknowledge for the teachers to become certified. For existing teachers it may involve special in-service courses orspecial programs targetted at specific groups of schools.
Teacher Dept.PE Dept.NIES Long Medium
Policy suggestion 4.5c: The MOET might wish to consider introducing a system of re-allocation of teachers toschools, especially in the poor and isolated areas in order to achieve an equity of the allocation of quality teachersto all schools. ? ? ?
Policy suggestion 4.6: The MOET should clarify the roles of the inspectorate to all schools emphasizing thesupportive rather monitoring role, and then have a good control mechanism to ensure that that the systemworks well.
MOETInspectoratePE Dept Short Low
Policy suggestion 5.1: The MOET may wish to review the data on the distribution of school heads' characteristicsacross schools and, together with the relevant provincial directors of education, devise methods whereby there willbe a more equitable allocation of heads to schools in terms of their education, teacher training and managementtraining. Every effort should also be made to have the heads teaching at least two or three periods a week.
PE DeptProvinces Long Low
Policy suggestion 5.8: The MOET might wish to consider including content in the school management program andin-service teacher training courses in order to have school heads and teachers diminish these problems in school.
PE Dept.Teacher Dept. Medium Low
Policy suggestion 7.2: The provincial authorities in the regions of the Central Highlands and the Southeast andMekong Delta should take action to decrease the variation in the school heads' teaching experience (CentralHighlands) and the number of inspectors visits to schools (Southeast and Mekong Delta). Provinces Medium Low
Suggestion Unit(s)responsible
Time Cost
Policy suggestion 2.4: The MOET might wish to consider specific training for district and provincial officers intechniques for monitoring and intervention against competency levels and benchmarks.
PE Dept.NIESProvinces Medium Low
Policy suggestion 2.5: The MOET might wish to consider accelerating the shift in the primary school readingcurriculum to ensure that more pupils are adequately prepared for the wider range of genre of reading encounteredin secondary school learning materials. This can be helped by the introduction of more books into the classroomand school libraries.
PE Dept.NIES Medium Low
Policy suggestion 2.6: The MOET might wish to consider urgent action for schools in low performing regions whereisolation and poverty combine to align with low competency levels (in EPAs). The action will consist of an integratedpackage involving action in the homes and in the classrooms and schools.
MOETNIES Medium Medium
Policy suggestion 2.7: The MOET might wish to consider urgent intervention plans for teachers and pupils withlower performance levels, especially in EPAs where the combined effects of isolation and poverty are linked with lowteacher skills.
PE Dept.Teacher Dept. Short High
Policy suggestion 3.6: The MOET might wish to conduct experiments on ways of having children speak moreVietnamese. These experiments might include a) enrolling these children in kindgarten and having specialVietnamese lessons; b) having intensive three months Vietnamese course for such children before they beginschool; c) having a more flexible curriculum such that an increased amount of reading and speaking Vietnamesebecomes cross-curricular: and d) introducing the concept of a flexible curriculum and cross-curricular activities in allteacher training courses and school management courses.
PE Dept.Cen. for EthnicEducationTeacher Dept.Provinces Medium High
Policy suggestion 3.7: The MOET and the provincial authorities should re-stress in their guidelines the importance ofgiving and correcting homework. In the monitoring (inspection) system special checks should be made in theschools to ensure that this is happening.
PE Dept.Provinces Short Low
Policy suggestion 4.4: a) the MOET might wish to reconsider the minimum and maximum contact hours per weekfor teachers, given the existing low number of hours compared with other countries; b) the MOET may wish toundertake a special study of teachers meeting parents and then improve the teacher training programs forimproving school, family, and community interactions.
PE Dept.Teacher Dept.Personnel Dept.NIES Long High
Policy suggestion 5.7: In order to strengthen the culture of reading in schools, the Curriculum Centre may wish todecide on which reading associated activities (e.g. pupils producing a school magazine) in school are desirable andthen experiment on the best way to have them run.
NIESPE Dept. Short Low
Policy suggestion 8.1: The education advisors and the management course personnel should encourage heads toteach each week.
PE Dept.Provinces Short Low
Process
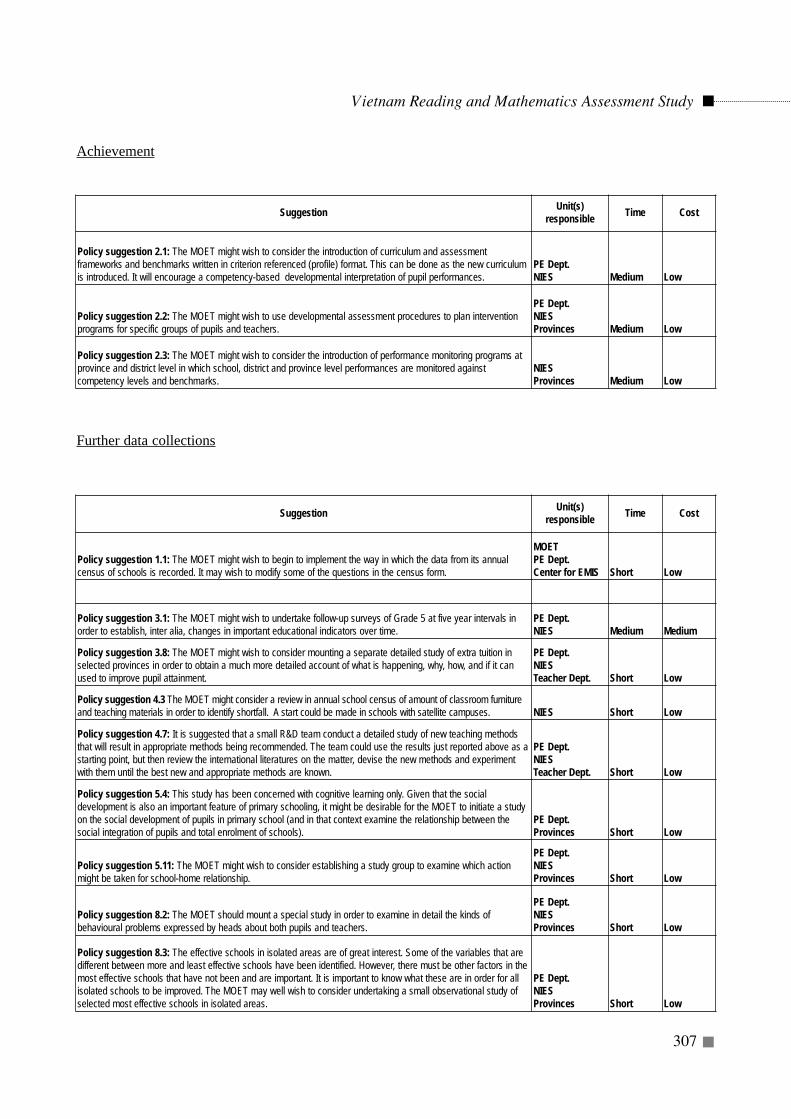
Achievement
Further data collections
Vietnam Reading and Mathematics Assessment Study
307
Suggestion Unit(s)responsible Time Cost
Policy suggestion 2.1: The MOET might wish to consider the introduction of curriculum and assessmentframeworks and benchmarks written in criterion referenced (profile) format. This can be done as the new curriculumis introduced. It will encourage a competency-based developmental interpretation of pupil performances.
PE Dept.NIES Medium Low
Policy suggestion 2.2: The MOET might wish to use developmental assessment procedures to plan interventionprograms for specific groups of pupils and teachers.
PE Dept.NIESProvinces Medium Low
Policy suggestion 2.3: The MOET might wish to consider the introduction of performance monitoring programs atprovince and district level in which school, district and province level performances are monitored againstcompetency levels and benchmarks.
NIESProvinces Medium Low
Suggestion Unit(s)responsible Time Cost
Policy suggestion 1.1: The MOET might wish to begin to implement the way in which the data from its annualcensus of schools is recorded. It may wish to modify some of the questions in the census form.
MOETPE Dept.Center for EMIS Short Low
Policy suggestion 3.1: The MOET might wish to undertake follow-up surveys of Grade 5 at five year intervals inorder to establish, inter alia, changes in important educational indicators over time.
PE Dept.NIES Medium Medium
Policy suggestion 3.8: The MOET might wish to consider mounting a separate detailed study of extra tuition inselected provinces in order to obtain a much more detailed account of what is happening, why, how, and if it canused to improve pupil attainment.
PE Dept.NIESTeacher Dept. Short Low
Policy suggestion 4.3 The MOET might consider a review in annual school census of amount of classroom furnitureand teaching materials in order to identify shortfall. A start could be made in schools with satellite campuses. NIES Short Low
Policy suggestion 4.7: It is suggested that a small R&D team conduct a detailed study of new teaching methodsthat will result in appropriate methods being recommended. The team could use the results just reported above as astarting point, but then review the international literatures on the matter, devise the new methods and experimentwith them until the best new and appropriate methods are known.
PE Dept.NIESTeacher Dept. Short Low
Policy suggestion 5.4: This study has been concerned with cognitive learning only. Given that the socialdevelopment is also an important feature of primary schooling, it might be desirable for the MOET to initiate a studyon the social development of pupils in primary school (and in that context examine the relationship between thesocial integration of pupils and total enrolment of schools).
PE Dept.Provinces Short Low
Policy suggestion 5.11: The MOET might wish to consider establishing a study group to examine which actionmight be taken for school-home relationship.
PE Dept.NIESProvinces Short Low
Policy suggestion 8.2: The MOET should mount a special study in order to examine in detail the kinds ofbehavioural problems expressed by heads about both pupils and teachers.
PE Dept.NIESProvinces Short Low
Policy suggestion 8.3: The effective schools in isolated areas are of great interest. Some of the variables that aredifferent between more and least effective schools have been identified. However, there must be other factors in themost effective schools that have not been and are important. It is important to know what these are in order for allisolated schools to be improved. The MOET may well wish to consider undertaking a small observational study ofselected most effective schools in isolated areas.
PE Dept.NIESProvinces Short Low
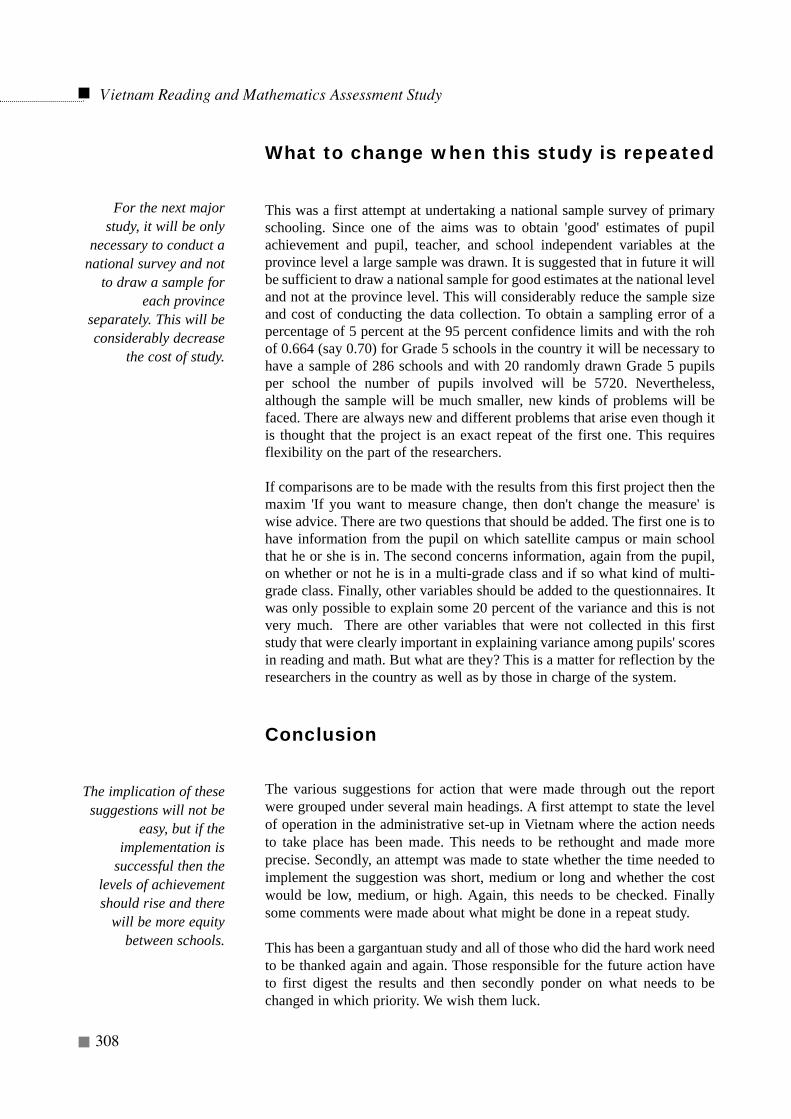
What to change when this study is repeated
This was a first attempt at undertaking a national sample survey of primaryschooling. Since one of the aims was to obtain 'good' estimates of pupilachievement and pupil, teacher, and school independent variables at theprovince level a large sample was drawn. It is suggested that in future it willbe sufficient to draw a national sample for good estimates at the national leveland not at the province level. This will considerably reduce the sample sizeand cost of conducting the data collection. To obtain a sampling error of apercentage of 5 percent at the 95 percent confidence limits and with the rohof 0.664 (say 0.70) for Grade 5 schools in the country it will be necessary tohave a sample of 286 schools and with 20 randomly drawn Grade 5 pupilsper school the number of pupils involved will be 5720. Nevertheless,although the sample will be much smaller, new kinds of problems will befaced. There are always new and different problems that arise even though itis thought that the project is an exact repeat of the first one. This requiresflexibility on the part of the researchers.
If comparisons are to be made with the results from this first project then themaxim 'If you want to measure change, then don't change the measure' iswise advice. There are two questions that should be added. The first one is tohave information from the pupil on which satellite campus or main schoolthat he or she is in. The second concerns information, again from the pupil,on whether or not he is in a multi-grade class and if so what kind of multi-grade class. Finally, other variables should be added to the questionnaires. Itwas only possible to explain some 20 percent of the variance and this is notvery much. There are other variables that were not collected in this firststudy that were clearly important in explaining variance among pupils' scoresin reading and math. But what are they? This is a matter for reflection by theresearchers in the country as well as by those in charge of the system.
Conclusion
The various suggestions for action that were made through out the reportwere grouped under several main headings. A first attempt to state the levelof operation in the administrative set-up in Vietnam where the action needsto take place has been made. This needs to be rethought and made moreprecise. Secondly, an attempt was made to state whether the time needed toimplement the suggestion was short, medium or long and whether the costwould be low, medium, or high. Again, this needs to be checked. Finallysome comments were made about what might be done in a repeat study.
This has been a gargantuan study and all of those who did the hard work needto be thanked again and again. Those responsible for the future action haveto first digest the results and then secondly ponder on what needs to bechanged in which priority. We wish them luck.
Vietnam Reading and Mathematics Assessment Study
308
For the next majorstudy, it will be only
necessary to conduct anational survey and not
to draw a sample foreach province
separately. This will beconsiderably decrease
the cost of study.
The implication of thesesuggestions will not be
easy, but if theimplementation is
successful then thelevels of achievementshould rise and there
will be more equitybetween schools.