286.pdf - GeoScienceWorld
18
Research Paper 286 Sawlan | Alteration, mass analysis, and Sentinel Bluffs geochemistry GEOSPHERE | Volume 14 | Number 1 Alteration, mass analysis, and magmatic compositions of the Sentinel Bluffs Member, Columbia River flood basalt province Michael G. Sawlan U.S. Geological Survey, 345 Middlefield Road, MS 973, Menlo Park, California 94025, USA ABSTRACT Accurate characterization of the magmatic compositions of flood basalt lavas is fundamental to interpretations of magma genesis, stratigraphy, and correlation across these extensive provinces. Analysis of the geochemistry of the Sentinel Bluffs Member of the Grande Ronde Basalt, Columbia River Basalt Group (northwestern USA), demonstrates that a mass-based methodology, similar to those routinely used in studies of weathering and soil formation, enables the identification of subtle and previously unrecognized low-tem- perature alteration, and the determination of primary magmatic geochemical characteristics in rocks modified by secondary processes. This methodology, here termed mass analysis, employs concentrations and ratios of immobile elements, which are not transported by low-temperature alteration processes, to show that alteration has resulted in loss of rock mass due to mineral dis- solution in anoxic groundwater. Immobile element abundances corrected for mass loss permit the identification and province-wide correlation of individual flows and flow packages, even for rocks that have undergone nearly 50% mass loss. The methodology developed with Sentinel Bluffs lavas is applicable to other lavas of the Columbia River flood basalt province, and most likely to other volcanic provinces in which lavas have undergone long-term interaction with groundwater. INTRODUCTION There is perhaps no more important aspect to understanding flood basalt volcanism, and to applying this knowledge to derivative geologic applications, than establishing the magmatic compositions of the lavas. The ability to cor- relate lavas, determine their chemostratigraphy, and understand their petro- genesis relies on the accurate characterization of their magmatic chemistry. The Columbia River Basalt Group (CRBG; northwestern USA) is the young- est and, due to its excellent exposure, preservation, and access, the most thoroughly studied continental flood basalt province on Earth. Despite being the smallest province in terms of erupted magma volume, the CRBG includes some of the most far-traveled lavas known. Several dozen lava flows (flow fields) span ~600 km from eastern Washington and Oregon or western Idaho to the Pacific Ocean. The CRBG also includes some of the largest eruptions of basaltic magma; some eruptions correspond to supereruptions (magnitude, M >8) (Self, 2006; Bryan et al., 2010). The CRBG stratigraphy has been developed from numerous studies in which chemical composition, magnetic polarity, petrography, physical flow characteristics, and stratigraphic position have been used to distinguish indi- vidual flows or packages of compositionally similar flows (e.g., Wright et al., 1973; Swanson et al., 1979; Mangan et al., 1986; Reidel et al., 1989, 2013; Reidel and Tolan, 2013). Although nonchemical characteristics have been useful in distinguishing some post–Grande Ronde Basalt (GRB) lavas, field identifica- tion of GRB flows is problematic in that, with few exceptions, most are aphyric or rarely to sparsely porphyritic (see Reidel and Tolan, 2013, table 2 therein). Swanson et al. (1979) could reliably subdivide and map the GRB only on the basis of four magnetic polarity intervals. Mangan et al. (1986) and Reidel et al. (1989) later subdivided GRB lavas within the four polarity intervals on the basis of chemical differences and stratigraphic position, and Reidel and Tolan (2013) recognized several additional members within the GRB. Increased resolution of the GRB chemostratigraphy has corresponded to improvements in analyti- cal precision of several generations of analytical instruments over the past four decades. Chemical criteria have therefore emerged as the defining criteria for characterizing GRB stratigraphic units. The use of chemical criteria to discriminate among stratigraphic units is straightforward where the chemical differences between units exceed the vari- ations within members. This applies to many post-GRB lavas (Wanapum Ba- salt and Saddle Mountains Basalt). Chemical differences between GRB mem- bers, as currently defined, vary from distinct to ambiguous (see Reidel and Tolan, 2013, figure 7 therein). For example, within the GRB R 2 polarity interval, the Meyer Ridge Member is readily distinguished from other R 2 flows by its markedly higher MgO and compatible trace elements (e.g., Cr). However, a TiO 2 threshold was adopted to distinguish the Grouse Creek and Wapshilla Ridge members among a compositional continuum among low-Mg R 2 flows (Reidel and Tolan, 2013). It is evident from the current chemostratigraphic cri- teria that the chemical variations within GRB members, and even between some members, are not yet understood, and that the distinguishing chemical identity of individual flows within GRB members, including the Sentinel Bluffs Member (SB), cannot be reliably determined. Accordingly, the correlation of GRB flows across the nearly 600 km extent of the GRB (Fig. 1) has mainly been limited to GRB members comprising multiple flows. The problem of distinguishing individual flows within a GRB member is illustrated in Figure 2, which shows the TiO 2 -MgO distribution of SB samples from earlier data sets. These analyses are from samples collected during the GEOSPHERE GEOSPHERE; v. 14, no. 1 doi:10.1130/GES01188.1 13 figures; 4 supplemental files CORRESPONDENCE: [email protected] CITATION: Sawlan, M.G., 2018, Alteration, mass analysis, and magmatic compositions of the Sentinel Bluffs Member, Columbia River flood basalt province: Geosphere, v. 14, no. 1, p. 286–303, doi:10.1130 /GES01188.1. Received 20 March 2015 Revision received 25 July 2017 Accepted 9 October 2017 Published online 8 December 2017 Science Editor: Shanaka de Silva Associate Editor: Julie Roberge OPEN ACCESS GO L D This paper is published under the terms of the CC‑BY‑NC license. © 2017 The Authors Downloaded from http://pubs.geoscienceworld.org/gsa/geosphere/article-pdf/14/1/286/4120162/286.pdf by guest on 02 September 2022
-
Upload
khangminh22 -
Category
Documents
-
view
2 -
download
0
Transcript of 286.pdf - GeoScienceWorld

Research Paper
286Sawlan | Alteration, mass analysis, and Sentinel Bluffs geochemistryGEOSPHERE | Volume 14 | Number 1
Alteration, mass analysis, and magmatic compositions of the Sentinel Bluffs Member, Columbia River flood basalt provinceMichael G. SawlanU.S. Geological Survey, 345 Middlefield Road, MS 973, Menlo Park, California 94025, USA
ABSTRACT
Accurate characterization of the magmatic compositions of flood basalt lavas is fundamental to interpretations of magma genesis, stratigraphy, and correlation across these extensive provinces. Analysis of the geochemistry of the Sentinel Bluffs Member of the Grande Ronde Basalt, Columbia River Basalt Group (northwestern USA), demonstrates that a mass-based methodology, similar to those routinely used in studies of weathering and soil formation, enables the identification of subtle and previously unrecognized low-tem-perature alteration, and the determination of primary magmatic geochemical characteristics in rocks modified by secondary processes. This methodology, here termed mass analysis, employs concentrations and ratios of immobile elements, which are not transported by low-temperature alteration processes, to show that alteration has resulted in loss of rock mass due to mineral dis-solution in anoxic groundwater. Immobile element abundances corrected for mass loss permit the identification and province-wide correlation of individual flows and flow packages, even for rocks that have undergone nearly 50% mass loss. The methodology developed with Sentinel Bluffs lavas is applicable to other lavas of the Columbia River flood basalt province, and most likely to other volcanic provinces in which lavas have undergone long-term interaction with groundwater.
INTRODUCTION
There is perhaps no more important aspect to understanding flood basalt volcanism, and to applying this knowledge to derivative geologic applications, than establishing the magmatic compositions of the lavas. The ability to cor-relate lavas, determine their chemostratigraphy, and understand their petro-genesis relies on the accurate characterization of their magmatic chemistry.
The Columbia River Basalt Group (CRBG; northwestern USA) is the young-est and, due to its excellent exposure, preservation, and access, the most thoroughly studied continental flood basalt province on Earth. Despite being the smallest province in terms of erupted magma volume, the CRBG includes some of the most far-traveled lavas known. Several dozen lava flows (flow fields) span ~600 km from eastern Washington and Oregon or western Idaho to the Pacific Ocean. The CRBG also includes some of the largest eruptions of basaltic magma; some eruptions correspond to supereruptions (magnitude, M >8) (Self, 2006; Bryan et al., 2010).
The CRBG stratigraphy has been developed from numerous studies in which chemical composition, magnetic polarity, petrography, physical flow characteristics, and stratigraphic position have been used to distinguish indi-vidual flows or packages of compositionally similar flows (e.g., Wright et al., 1973; Swanson et al., 1979; Mangan et al., 1986; Reidel et al., 1989, 2013; Reidel and Tolan, 2013). Although nonchemical characteristics have been useful in distinguishing some post–Grande Ronde Basalt (GRB) lavas, field identifica-tion of GRB flows is problematic in that, with few exceptions, most are aphyric or rarely to sparsely porphyritic (see Reidel and Tolan, 2013, table 2 therein). Swanson et al. (1979) could reliably subdivide and map the GRB only on the basis of four magnetic polarity intervals. Mangan et al. (1986) and Reidel et al. (1989) later subdivided GRB lavas within the four polarity intervals on the basis of chemical differences and stratigraphic position, and Reidel and Tolan (2013) recognized several additional members within the GRB. Increased resolution of the GRB chemostratigraphy has corresponded to improvements in analyti-cal precision of several generations of analytical instruments over the past four decades. Chemical criteria have therefore emerged as the defining criteria for characterizing GRB stratigraphic units.
The use of chemical criteria to discriminate among stratigraphic units is straightforward where the chemical differences between units exceed the vari-ations within members. This applies to many post-GRB lavas (Wanapum Ba-salt and Saddle Mountains Basalt). Chemical differences between GRB mem-bers, as currently defined, vary from distinct to ambiguous (see Reidel and Tolan, 2013, figure 7 therein). For example, within the GRB R2 polarity interval, the Meyer Ridge Member is readily distinguished from other R2 flows by its markedly higher MgO and compatible trace elements (e.g., Cr). However, a TiO2 threshold was adopted to distinguish the Grouse Creek and Wapshilla Ridge members among a compositional continuum among low-Mg R2 flows (Reidel and Tolan, 2013). It is evident from the current chemostratigraphic cri-teria that the chemical variations within GRB members, and even between some members, are not yet understood, and that the distinguishing chemical identity of individual flows within GRB members, including the Sentinel Bluffs Member (SB), cannot be reliably determined. Accordingly, the correlation of GRB flows across the nearly 600 km extent of the GRB (Fig. 1) has mainly been limited to GRB members comprising multiple flows.
The problem of distinguishing individual flows within a GRB member is illustrated in Figure 2, which shows the TiO2-MgO distribution of SB samples from earlier data sets. These analyses are from samples collected during the
GEOSPHERE
GEOSPHERE; v. 14, no. 1
doi:10.1130/GES01188.1
13 figures; 4 supplemental files
CORRESPONDENCE: msawlan@usgs .gov
CITATION: Sawlan, M.G., 2018, Alteration, mass analysis, and magmatic compositions of the Sentinel Bluffs Member, Columbia River flood basalt province: Geosphere, v. 14, no. 1, p. 286–303, doi: 10 .1130 /GES01188.1.
Received 20 March 2015Revision received 25 July 2017Accepted 9 October 2017Published online 8 December 2017
Science Editor: Shanaka de SilvaAssociate Editor: Julie Roberge
OPEN ACCESS
GOLD
This paper is published under the terms of the CC‑BY‑NC license.
© 2017 The Authors
Downloaded from http://pubs.geoscienceworld.org/gsa/geosphere/article-pdf/14/1/286/4120162/286.pdfby gueston 02 September 2022

Research Paper
287Sawlan | Alteration, mass analysis, and Sentinel Bluffs geochemistryGEOSPHERE | Volume 14 | Number 1
Basalt Waste Isolation Project (BWIP1) (e.g., Landon and Long, 1989), geo-logic mapping studies (e.g., Hooper and Gillespie, 1996; Reidel, 1988), theses, and previously unpublished analyses, and are mainly from the compilation of Reidel and Valenta (2000). Because this compilation was titled prelimi-nary, these data were reviewed to ensure that only SB lavas would be con-sidered here. As described in Supplemental File 12, this review showed that some analyses from the older data set are not of SB lavas and these samples were excluded from consideration. These earlier SB data define a continuum of compositions, which, at higher MgO values, form a point cloud; with de-creasing MgO, two diffuse, inversely correlated arrays are apparent. A key objective of this study is to assess whether this variation truly represents a
125°
48°
46°
44°
124° 122° 120° 118° 116°
123° 121° 119° 117° 115°
48°
46°
44°
0 100 200km
Pasco
Eugene
Fossil
Spokane
Pullman
Seattle
Portland
Wenatchee
La Grande
PendletonThe Dalles
St. HelensDH
BL
PG
BG
SG
ACWC
Sentinel Blu�sMember
Grande RondeBasalt
WA ID
IDU.S.
CN
MT
OR
WAOR
IDCA
SCA
DESW
illam
ette
Vly
.
RA
NG
E
COA
ST
R
AN
GE
PascoBasin
Col. R.Gorge
PAC
IFIC
OC
EA
N
Figure 1. Map showing approximate ex-tents of the Grande Ronde Basalt and the Sentinel Bluffs Member (SB) (after Reidel and Tolan, 2013), and the locations where SB lavas were sampled for this study. Filled triangles—continuous stratigraphic sections in which two or more SB flows were sampled. Red two-letter identifiers for the continuously sampled sections are explained in Supplemental File 3 (see footnote 4). Open triangles—approximate locations of one or more samples from nearby locations (generally within 10 km) for which constraints on stratigraphic po-sition relative to other analyzed SB lavas are lacking; these locations mostly repre-sent 1–3 samples, but 12 samples from 8 locations are represented by the symbol located west of Saint Helens, Oregon. CN—Canada; ID—Idaho; MT—Montana; OR—Oregon; WA—Washington.
4.0 4.4 4.8 5.2 5.61.6
1.7
1.8
1.9
2.0
2.1
TiO2n
MgOn
Figure 2. TiO2-MgO distribution of pre-viously published analyses for Senti-nel Bluffs Member lavas. Most analy-ses are from the compilation of Reidel and Valenta (2000); a small number of analyses are from Reidel (2005) and Derkey et al. (1999, 2004). Analyses exclude outliers that are most likely from samples of other Grande Ronde Basalt members (Supplemental File 1; see footnote 2). Oxide abundances (in wt%) from analyses normalized to 100% volatile free, as indicated by superscript n.
1The Basalt Waste Isolation Project (1976 to 1988) conducted studies to evaluate the suitability of GRB lava as a deep subsurface repository for nuclear waste beneath the Hanford site located in the Pasco Basin, south-central Washington (Fig. 1). See Dahlem (1987) for a summary descrip-tion of these studies. The BWIP followed preliminary feasibility studies conducted from 1968 to 1972 (e.g., Atlantic Richfield Hanford Company, 1976).
Alteration, mass analysis, and magmatic compositions of the
Sentinel Bluffs Member, Columbia River flood basalt province
Michael G. Sawlan
U.S. Geological Survey, 345 Middlefield Road, Menlo Park, CA 94025 MS-973
SUPPLEMENTAL FILE 1
Previously Published Analyses of Sentinel Bluffs Member Samples
The primary source of the earlier SB data is the compilation of Reidel and Valenta (2000),
which includes 777 unique analyses (not including replicate analyses). In addition, thirty
previously unreported analyses from Reidel (2005) and a total of seven analyses from Derkey et
al. (1999, 2004) were also considered. These analyses were performed at the GeoAnalytical Lab,
WSU, prior to a change in instrumentation (and in some analytical procedures) in mid-2004.
Supplemental File 3 describes differences in the accuracy and precision of these analyses
compared to the more recent analyses. Among the analyses in Reidel and Valenta (2000), most
are from samples collected for the Basalt Waste Isolation Project (BWIP). Other data sources
referenced in Reidel and Valenta (2000) (see their Appendix A) include geologic mapping
studies, theses, and previously unpublished data from several contributors.
2Supplemental File 1. Describes previously published analyses of Sentinel Bluffs Member (SB) samples, the criteria applied in validating samples as SB samples, MI100 Al2O3-TiO2 baseline determinations for these samples, and the basis to identify samples collected from boreholes. Please visit http:// doi .org /10 .1130 /GES01188 .S1 or the full-text article on www .gsapubs .org to view Supplemental File 1.
Downloaded from http://pubs.geoscienceworld.org/gsa/geosphere/article-pdf/14/1/286/4120162/286.pdfby gueston 02 September 2022
Research Paper
288Sawlan | Alteration, mass analysis, and Sentinel Bluffs geochemistryGEOSPHERE | Volume 14 | Number 1
continuum in SB magmatic compositions, or whether this variation results from post emplace ment modification of a limited number of chemically dis-tinct magmatic compositions. This question has implications beyond under-standing the lava chemistry and chemostratigraphy of the SB. The stratig-raphy of the entire GRB is based largely on chemical differences between lavas, mainly in TiO2 and MgO abundances, in concert with magnetic polarity and stratigraphic position (see Reidel and Tolan, 2013, table 2 and figure 7 therein).
Due to their great expanse and rapid emplacement, individual GRB lavas can serve as strain markers in documenting regional structure, identifying faults and their displacements, and defining the geometries of CRBG-hosted aquifers. Regional aquifer systems hosted by GRB lavas (Kahle et al., 2011; Burns et al., 2011; Conlon et al., 2005) support agriculture province-wide, and supply the greater Portland-Vancouver metropolitan area. Previously consid-ered as potential repositories for nuclear waste under the BWIP and predeces-sor studies conducted from 1968 to 1988 (Atlantic Richfield Hanford Company, 1976; Myers and Price, 1979, 1981; Landon and Long, 1989), GRB lavas have recently been evaluated as sites for CO2 sequestration (McGrail et al., 2011, 2014; Zakharova et al., 2012). The precision in the use of GRB lavas as strain markers is dependent on the level of specificity in the identification of chemo-stratigraphic units.
Although CRBG lavas are commonly regarded as well preserved, several lines of evidence suggest that they have undergone water-rock interaction, which potentially can modify their chemical composition. Secondary min-erals in lavas from surface exposures and the subsurface have been amply documented (Ames, 1980; Benson and Teague, 1982; Hearn et al., 1985). R.E. Evarts (2008, personal commun.) and Wells et al. (2009) recognized chemical modifications to GRB lavas, notably iron depletion, and applied an empirically derived, minimum FeO threshold to screen samples deemed weathered. It is important that they noted that many flows with a fresh appearance (e.g., dark gray color, unaltered plagioclase) were nonetheless chemically altered. Their observations corroborated earlier observations (Benson and Teague, 1982) made on samples obtained from deep in the subsurface. Given the indica-tions of post-magmatic water-rock interaction in CRBG lavas, it is therefore important to establish a basis for evaluating whether lava compositions have maintained fidelity to their original magmatic compositions.
The late Pleistocene Missoula floods, which traversed the CRBG, removed much of the surficially weathered rock in areas where the floods were erosive. Examination of only flood-scoured exposures of the CRBG can lead to the mis-impression that CRBG lavas were somehow resistant to weathering over the past 15–16 m.y. Surficial alteration (under oxic conditions) of CRBG lavas is widespread across the province and, except in those areas deeply scoured by Missoula floods, presents an impediment to sampling unweathered rock. In the western parts of the province (Coast Range and Willamette Valley), sapro-lite commonly is developed in CRBG lavas to depths of 5–10 m and, in places, to more than 30 m, where lavas may form laterite. In the eastern parts of the province, in the Columbia Basin and vicinity, thick weathering rinds (to 15 cm)
are common in surface exposures of lava in those areas not scoured by the Missoula floods.
CRBG lavas generally have been considered to be chemically homo-geneous (e.g., Wright et al., 1973; Hooper, 1984, 1988, 2000; Reidel et al., 1989; Tolan et al., 2009), although a few exceptions have been reported (Reidel and Fecht, 1987; Reidel, 1998, 2005; Vye-Brown et al., 2013a; Reidel and Tolan, 2013). Chemical variations within a flow or package of flows are also observed. For example, among stratigraphic units of the Saddle Mountains Basalt, vari-ations in Ti and P abundances are commonly 5%–10% (e.g., Hooper, 2000, fig-ure 3 therein), and such variations have gone unexplained. Intraflow chemical differences have been reported in several studies (Mangan et al., 1986; Reidel, 1998, 2005; Vye-Brown et al., 2013a; Reidel and Fecht, 1987). In accounting for such variations, several studies (Reidel and Fecht, 1987; Reidel, 1998, 2005) have appealed to mixing, distal to vents, of lava flows that were simultane-ously erupted but independently sourced. Vye-Brown et al. (2013a) attributed intraflow variations to inflation of lava fed by chemically zoned magma.
Along with an updated assessment of SB geochemistry and chemostratig-raphy, the development of a mass-based methodology is presented to account for changes in SB compositions resulting from alteration. This methodology, referred to as mass analysis, derives from quantitative relationships among immobile elements. This report focuses on the immobile element variations, using mass analysis, to define the magmatic chemical compositions and chemo stratigraphy of SB lavas, and how these enable province-wide correla-tions of individual flows. Mobile element variations are discussed here only to a limited extent where they bear on the conditions of alteration or on crite-ria used for chemostratigraphic distinctions. The variations in mobile element abundances due to alteration are sufficiently complex that this topic will be addressed subsequently elsewhere.
THE SENTINEL BLUFFS MEMBER
Lavas composing the SB, the uppermost member of the GRB, are the sub-ject of this geochemical study because of their widespread distribution (Fig. 1), well-exposed stratigraphic sections of multiple flows throughout much of the province, a relatively large range in composition, and large numbers of analy-ses available from prior studies noted here. The SB composes a significant part, nearly 5% by volume, of the entire CRBG, and SB lavas span much of the extent of the GRB (Reidel et al., 2013; Reidel and Tolan, 2013) (Fig. 1). SB lavas were erupted during the C5Cn.1n polarity chron (Jarboe et al., 2010), which accord ing to Hilgen et al. (2012) spanned the time interval 16.27–15.97 Ma. Reidel and Tolan (2013) estimated that the SB comprises 11–15 flows or flow lobes. Given the estimated SB volume and number of flows, SB eruptions aver aged ~680 km3.
Despite the accumulation of >1000 chemical analyses of SB lavas, the num-ber of compositionally distinct flows remains uncertain. In their study of SB flows within the Pasco Basin and vicinity, Landon and Long (1989) recognized three flow packages based on chemical criteria, and a total of 12 flows distrib-
Downloaded from http://pubs.geoscienceworld.org/gsa/geosphere/article-pdf/14/1/286/4120162/286.pdfby gueston 02 September 2022

Research Paper
289Sawlan | Alteration, mass analysis, and Sentinel Bluffs geochemistryGEOSPHERE | Volume 14 | Number 1
uted equally among the flow packages. Individual flows within the packages, however, were identified from their thicknesses, other physical characteristics, and paleomagnetic inclinations in multiple boreholes from within a relatively limited area compared to the entire extent of the SB. Among these 12 flows (recognized from contacts), some could possibly correspond to successive lobes of one lava flow or to successive lava flows within a flow field (for defi-nitions of a flow lobe, lava flow, and flow field, see Thordarson and Self, 1998, table 1 therein).
Based on his observation of chemical differences within some flows, Reidel (2005) suggested that the SB stratigraphy is more complex than that of Landon and Long (1989). Relying mostly on TiO2 and P2O5 abundances, he assigned flows, or intervals within flows, to one of six compositional types. Reidel’s (2005) chemical stratigraphy centered on a locally recognized flow within the Pasco Basin (informally named the Cohassett flow) that he proposed was formed from the incomplete mixing of four simultaneously erupted, but com-positionally distinct, lava flows, each of which was designated a SB composi-tional type. Multiple SB lavas stratigraphically below the Cohassett flow were assigned to one compositional type and others above this flow were assigned to another. Reconciliation of the chemical groups defined here with earlier versions of SB stratigraphic nomenclature [i.e., informal flow names from the BWIP studies (Landon and Long, 1989), and the compositional types of Reidel (2005)] is beyond the scope of this report and will be presented elsewhere.
METHODS AND RESULTS
Samples of multiple SB lava flows were collected for this study from well-exposed sections on the Columbia Plateau and in the Columbia River Gorge, and include SB reference sections (Reidel and Tolan, 2013) at Sentinel Gap (Sentinel Bluffs) and at Devils Hole (Columbia Hills Water Gap section of Reidel, 2005; Fig. 1). Samples from the Coast Range are typically from iso-lated exposures lacking detailed stratigraphic context, usually from quarries or other artificial cuts where only one to several lavas are exposed.
For this study I analyzed 112 samples from 75 sites. Major and trace ele-ments were determined by X-ray fluorescence (XRF) using a ThermoARL in-strument at the Peter Hooper GeoAnalytical Lab, Washington State University, Pullman (herein, the GeoAnalytical Lab). Samples were analyzed from 2009 through 2013, except for one sample analyzed in 2007. Analyses, along with supporting documentation, are provided in Supplemental File 23. Field and laboratory sampling protocols, descriptions of the analytical methods, and the accuracy and precision of analyses are provided in Supplemental File 34.
Because chemical differences among SB lavas are small, a clear under-standing of analytical precision is required to distinguish differences in mag-matic compositions from those resulting solely from analytical uncertainty. Thus, an assessment of the analytical precision of the GeoAnalytical Lab XRF analyses of SB samples was carried out. This yielded a relationship that quanti-fies analytical precision as a function of element abundance, thereby enabling the precision to be closely estimated at any measured abundance of an ele-
ment. Sources of intralaboratory bias due to changes in analytical strategy (e.g., background determinations) and grinding media over time are also de-scribed in Supplemental File 3 (see footnote 4).
At all sites, a primary sample internal to alteration rinds (inter-rind sam-ple) was collected from minimally vesicular rock within the dense flow interior, or flow core (per Self et al., 1996, 1997; Vye-Brown et al., 2013b). Sampling was carried out to minimize the amounts of macroscopic secondary miner-als, if present, within the analyzed material. The vesicular parts of lavas were thus avoided because secondary minerals are typically found within vesicles and crystal-bound voids. This has been shown in samples from surface expo-sures (Hearn et al., 1985), as well in samples from deep in the subsurface (see Zakharova et al., 2012, figure 2 therein). Sampling of the freshest possible flow cores restricts the effects of alteration to dissolution of solid phases and trans-port of their soluble constituents, such that any potential change in sample mass will be in one direction, negative. Weathered rock was avoided (except in one instance where strongly weathered lava was intentionally sampled), thereby limiting alteration (if any) to conditions that were anoxic or nearly so. As will be shown, these constraints imposed by careful sampling are critical to understanding the chemical effects of alteration. At several sites, unoxidized alteration rinds were also analyzed in addition to the primary sample from which alteration rinds were removed. The type of material analyzed is identi-fied for each analysis in Supplemental File 2 (see footnote 3).
Samples from the Bingen, Butler Canyon, Devils Hole, Sentinel Gap, and Winter Water Creek sections were additionally subsampled in the lab to mini-mize pervasive, texturally distinct seams, referred to here as hydration seams that are described in Supplemental File 3 (see footnote 4). Subsamples of hy-dration seams were analyzed at 32 sites to test whether these represented in-cipient alteration. No attempt was made to minimize such seams in samples from the Armstrong Canyon and Patrick Grade sections, and from sites within the Coast Range and Willamette Valley. Subsample pairs of inter-seam rock and hydration seams showed minimal chemical differences, if any, between them. In part, the lack of clear differences between these pairs might be caused by the difficulty in separating inter-seam rock from the seams. Most inter-seam samples were not pure separates, but usually contained 30% or more of the seams. In any case, small chemical differences between hydration-seam and inter-seam rock are subordinate to the observed changes associated with bulk rock alteration, and the geochemistry of hydration seams will not be addressed further in this report.
Thus, at most sites one primary sample (±samples of hydration seams and/or alteration rind) was taken from one site within the dense flow core. Five samples were collected, however, from the core of one SB flow exposed in a small quarry located in the Coast Range along Salmon Creek near the city of Saint Helens, Oregon (Fig. 1). Among these samples, three were unoxidized rock from which alteration rinds were removed, one was an alteration rind, and one was severely weathered lava from the quarry margin. As shown here, the chemical variations among these samples provide important clues to interpreting the effects of alter-ation on lava chemistry, notably on immobile element abundances.
Supplemental File 2: Alteration, mass analysis and magmatic compositions of the Sentinel Bluffs Member, Columbia River flood basalt province, by M. G. Sawlan
Unnormalized Major and Trace element Abundances
Chem_ID_field Chem_ID_lab Section_ID SB_Sec_Flow SB_Series SB_Group Sample_type Site_context Coll._By Long_NAD83
080721-1914MS 10MS027 Armstrong Cyn AC-1 3 9 interrind roadcut Sawlan -120.368381080721-1807MS 10MS028 Armstrong Cyn AC-1 3 9 interrind outcrop Sawlan -120.367873080721-1701MS 10MS029 Armstrong Cyn AC-2 3 9 interrind outcrop Sawlan -120.367195CB0119 10MS173 Bingen BG-01 1 1 interrind outcrop Sawlan -121.416668100514-1258MS 10MS174 Bingen BG-02 1 2 interseam outcrop Sawlan -121.413958100514-1258MS-a 10MS175 Bingen BG-02 1 2 hyd. seam outcrop Sawlan -121.413958100514-1106MS 10MS178 Bingen BG-03 1 2 interseam outcrop Sawlan -121.413250100514-1106MS-a 10MS259 Bingen BG-03 1 2 hyd. seam outcrop Sawlan -121.413250100813-1501MS 10MS176 Bingen BG-04 2 4 interseam outcrop Sawlan -121.412506100813-1501MS-a 10MS177 Bingen BG-04 2 4 hyd. seam outcrop Sawlan -121.412506100813-1501MS-b 10MS258 Bingen BG-04 2 4 inner rind-sec. min. outcrop Sawlan -121.412506100512-1730MS 10MS179 Bingen BG-05 2 5 interseam roadcut Sawlan -121.411408100512-1624MS 10MS180 Bingen BG-06 2 5 interseam roadcut Sawlan -121.411090100512-1624MS-a 10MS260 Bingen BG-06 2 5 hyd. seam roadcut Sawlan -121.411090100512-1349MS 10MS181 Bingen BG-07 3 8 interseam roadcut Sawlan -121.410362100512-1349MS-a 10MS261 Bingen BG-07 3 8 hyd. seam roadcut Sawlan -121.410362100512-1349MS-b 10MS262 Bingen BG-07 3 8 interrind roadcut Sawlan -121.410362100512-1256MS 10MS182 Bingen BG-08 3 8 interseam roadcut Sawlan -121.409691100512-1256MS-a 10MS263 Bingen BG-08 3 8 hyd. seam roadcut Sawlan -121.409691100512-1051MS 10MS183 Bingen BG-09 4 10 interseam roadcut Sawlan -121.408681100512-1051MS-a 10MS264 Bingen BG-09 4 10 hyd. seam roadcut Sawlan -121.408681100512-1051MS-b 10MS265 Bingen BG-09 4 10 interrind roadcut Sawlan -121.408681100511-1800MS 10MS184 Bingen BG-10 4 12 interseam roadcut Sawlan -121.407708100511-1800MS-a 10MS266 Bingen BG-10 4 12 interrind roadcut Sawlan -121.407708100511-1303MS 10MS185 Bingen BG-11 5 15 interseam outcrop Sawlan -121.406862100511-1303MS-a 10MS267 Bingen BG-11 5 15 hyd. seam outcrop Sawlan -121.406862100511-1401MS 10MS186 Bingen BG-12 5 15 interseam outcrop Sawlan -121.406806100511-1620MS 10MS187 Bingen BG-13 5 15 interseam outcrop Sawlan -121.406585110427-1738MS 10MS147 Butler Cyn BL-1 2 5 interseam roadcut Sawlan -121.152974110427-1738MS-a 10MS320 Butler Cyn BL-1 2 5 hyd. seam roadcut Sawlan -121.152974100924-1440MS 10MS139 Butler Cyn BL-2 2 6 interseam roadcut Sawlan -121.150920100924-1440MS-a 10MS310 Butler Cyn BL-2 2 6 hyd. seam roadcut Sawlan -121.150920100924-1559MS 10MS140 Butler Cyn BL-3 3 7 interseam roadcut Sawlan -121.149243100924-1559MS-a 10MS311 Butler Cyn BL-3 3 7 hyd. seam roadcut Sawlan -121.149243100924-1559MS-b 10MS312 Butler Cyn BL-3 3 7 interrind roadcut Sawlan -121.149243100924-1742MS 10MS141 Butler Cyn BL-4 3 8 interseam roadcut Sawlan -121.147706100924-1742MS-a 10MS313 Butler Cyn BL-4 3 8 hyd. seam roadcut Sawlan -121.147706100925-1125MS 10MS142 Butler Cyn BL-5 3 9 interseam roadcut Sawlan -121.148144100925-1125MS-a 10MS314 Butler Cyn BL-5 3 9 hyd. seam roadcut Sawlan -121.148144100925-1302MS 10MS143 Butler Cyn BL-6 5 15 interseam roadcut Sawlan -121.147083100925-1302MS-a 10MS315 Butler Cyn BL-6 5 15 hyd. seam roadcut Sawlan -121.147083100930-1545MS 10MS144 Butler Cyn BL-8 5 15 interseam roadcut Sawlan -121.146979100930-1545MS-a 10MS145 Butler Cyn BL-8 5 15 inner rind-sec. min. roadcut Sawlan -121.146979
Alteration, mass analysis, and magmatic compositions of the
Sentinel Bluffs Member, Columbia River flood basalt province
Michael G. SawlanU.S. Geological Survey, 345 Middlefield Road, Menlo Park, CA 94025 MS-973
SUPPLEMENTAL FILE 3
METHODS1.
1.1 Sampling Protocols
Samples were collected using a protocol aimed at minimizing inclusion of altered rock and
secondary minerals in the material to be analyzed. Alteration rinds and secondary minerals
lining open space and fractures were the principal materials avoided in field sampling. An effort
to evaluate the influence of ubiquitous, texturally distinct anastomosing seams, termed
“hydration seams”, was made by sub-sampling in the lab.
1.1.1 Field Sampling
The typical field sampling protocol is illustrated in Figure S2. Several joint-bounded blocks
from the denser parts of flows were broken, compared for sample quality, and one was selected
for sampling. Such blocks were commonly 20 to 40 cm across (see Figure S2B), but were
smaller where more closely spaced fractures limited the size of the largest unfractured block.
Samples were trimmed to remove alteration rinds and pockets of secondary minerals.
3Supplemental File 2. Spreadsheet of XRF analyses of Sentinel Bluffs Member (SB) samples analyzed for this study. Analyses are presented in three forms—un normalized, normalized, and mass-normalized. In-cludes supporting documentation such as strati graphic position, geographic coordinates, sample type, and analysis date. Includes the slope and intercept for MI100 lines used in calculating the sample mass index and mass-normalized analyses. Please visit http:// doi .org /10 .1130 /GES01188 .S2 or the full-text article on www .gsapubs .org to view Supplemental File 2.
4Supplemental File 3. Documents sampling proce-dures, and the precision and accuracy of XRF analyses of Sentinel Bluffs Member (SB) samples performed for this study. Discusses differences between these and earlier (pre-2004) analyses of Sentinel Bluffs Mem-ber (SB) samples. Presents a method for estimating analytical precision, and precision estimates for SB compositions. Describes the supporting documenta-tion provided with analyses in Supplemental File 2. Explains the use of the MI100 calculation spreadsheet provided as Supplemental File 4. Please visit http:// doi .org /10 .1130 /GES01188 .S3 or the full-text article on www .gsapubs .org to view Supplemental File 3.
Downloaded from http://pubs.geoscienceworld.org/gsa/geosphere/article-pdf/14/1/286/4120162/286.pdfby gueston 02 September 2022

Research Paper
290Sawlan | Alteration, mass analysis, and Sentinel Bluffs geochemistryGEOSPHERE | Volume 14 | Number 1
In this report the term lava flow or, more simply, flow, is used to refer to lava cooling units identified from physical contacts (lower and upper chilled vesicular crusts bounding a denser lava core). In order to distinguish between SB lava flows, flow lobes, and flow fields (per Thordarson and Self, 1998), pre-cise characterizations of magmatic chemical compositions are required, which is a key objective of this study.
MASS ANALYSIS AND SB GEOCHEMISTRY
Characterization of Lava Compositions Using Immobile Element Ratios
On the basis of the XRF analyses presented herein, SB lavas are here cate-gorized into five chemical series, each of which comprises three or four chemi-cal groups (Fig. 3). In concept, the series divisions are similar to the three-level separation of SB lavas by Landon and Long (1989). Each SB chemical group spans a limited range in composition and includes one or two flows showing only minor differences in composition. SB chemical series include successive chemical groups having similar immobile element ratios and/or immobile ele-ment abundances defining distinct chemical trends.
Primary chemostratigraphic distinctions between SB lavas were made using Ti/Zr and Sc/Cr ratios (Fig. 3). Several flow sequences (chemical series), and even several individual flows, are distinguished by these ratios. The ear-liest SB lavas (series I) are characterized by high Sc/Cr ratios compared to all
other SB lavas, due mainly to their low Cr values, and these ratios differentiate lavas of SB groups 1 and 2 from those of group 3. Series V lavas, the youngest package of SB flows, are characterized by low Ti/Zr ratios (<65.5) relative to older SB lavas.
Three of the four series V chemical groups (groups 13, 15, and 16) have Ti/Zr and Sc/Cr ratios that are indistinguishable, indicating that these lavas are closely related in their petrogenesis. The group 14 lava has even lower Ti/Zr ratios than other series V lavas due to its higher Zr. Series IV lavas have some-what lower Sc/Cr and Ti/Zr ratios that differentiate these lavas from series II and III, but these ratios cannot distinguish series II from series III lavas. These immobile element ratios, although successful in differentiating chemical series of lavas erupted sequentially, are only partially successful in differentiating indi vidual flow compositions within the SB series. After describing a method for determining initial magmatic compositions of both fresh and altered lavas, I will return to the topic of differentiating individual SB flow compositions.
Distinguishing Magmatic and Alteration Trends Using Immobile Elements
In order to identify magmatic compositions of altered SB lavas, a suite of samples is required that includes essentially unaltered samples spanning the entire range of compositions. Note that a sufficient number of minimally al-tered samples were readily obtained for this study using an appropriate sam-pling protocol (Supplemental File 3; see footnote 4). Selection of an inversely correlated immobile element pair (e.g., Al2O3, TiO2) is also necessary to dif-ferentiate magmatic from alteration-derived trends, the latter forming linear trends with positive slopes in bivariate plots (Fig. 4).
The mass of altered rock decreases from dissolution of solid phases (min-erals and glass) and transport of mobile (soluble) elements, and increases by the transfer of such elements from aqueous fluids, such as by precipitation of secondary minerals. Measured abundances of immobile (insoluble) elements therefore depend on the net change in rock mass, whether by depletion and/or enrichment of mobile elements. The immobile element abundances, how-ever, have actually neither decreased nor increased, because low-temperature aqueous fluids do not transport these elements. Abundances of immobile ele-ments vary proportionally to one another in response to rock mass changes, thereby preserving the ratios among them.
The mass analysis methodology presented here is based on the premise that Al2O3 and TiO2 are enriched in equal proportions due to alteration-gener-ated mass change, and that Al2O3/TiO2 ratios remain constant throughout the alteration. Figure 4A presents Al2O3
n and TiO2n data (the superscript n herein indi-
cates values from analyses normalized to 100% volatile free) for five samples of the same lava flow exposed in the quarry located in the Coast Range near Saint Helens, Oregon (Fig. 1). The lava sampled at the quarry margin, with the high-est Al2O3
n and TiO2n, is severely weathered and is now composed largely, if not
entirely, of clay and other secondary minerals. The other four samples are un-oxidized; two of these are a rind–inter-rind pair. The Al2O3
n and TiO2n abundances
0.6 0.8 1.0 1.2 1.4 1.6 1.8 2.0 2.2 2.4
60
64
68
72
76
Ti/Zr
Sc/Cr
12
3
13, 15, 16
14
10-12
7-9
4-6
16151413
121110
987
654
321
VIVIIIIIISeries
Gro
up
Figure 3. Variation in Ti/Zr versus Sc/Cr ratios illustrating the discrimination of Sentinel Bluffs Member (SB) lavas using immobile element ratio pairs. Data are from samples analyzed in this study. Symbols are by SB chemical group, as explained in inset.
Downloaded from http://pubs.geoscienceworld.org/gsa/geosphere/article-pdf/14/1/286/4120162/286.pdfby gueston 02 September 2022
Research Paper
291Sawlan | Alteration, mass analysis, and Sentinel Bluffs geochemistryGEOSPHERE | Volume 14 | Number 1
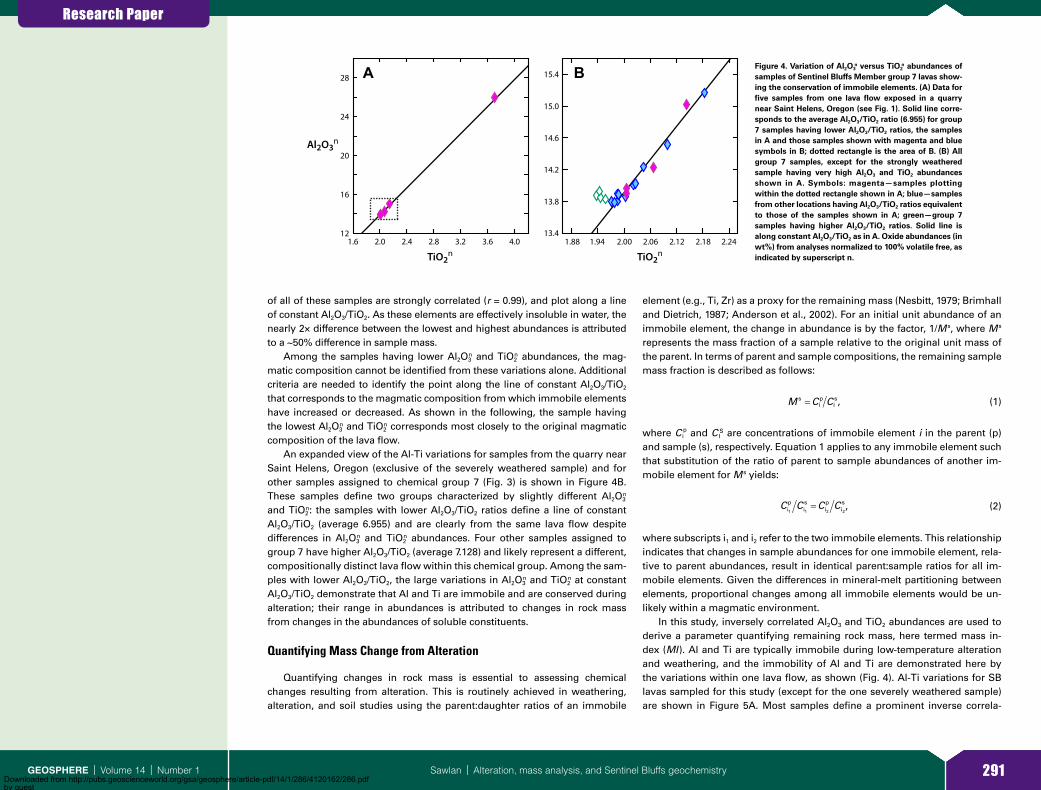
of all of these samples are strongly correlated (r = 0.99), and plot along a line of constant Al2O3/TiO2. As these elements are effectively insoluble in water, the nearly 2× difference between the lowest and highest abundances is attributed to a ~50% difference in sample mass.
Among the samples having lower Al2O3n and TiO2
n abundances, the mag-matic composition cannot be identified from these variations alone. Additional criteria are needed to identify the point along the line of constant Al2O3/TiO2 that corresponds to the magmatic composition from which immobile elements have increased or decreased. As shown in the following, the sample having the lowest Al2O3
n and TiO2n corresponds most closely to the original magmatic
composition of the lava flow.An expanded view of the Al-Ti variations for samples from the quarry near
Saint Helens, Oregon (exclusive of the severely weathered sample) and for other samples assigned to chemical group 7 (Fig. 3) is shown in Figure 4B. These samples define two groups characterized by slightly different Al2O3
n and TiO2
n: the samples with lower Al2O3/TiO2 ratios define a line of constant Al2O3/TiO2 (average 6.955) and are clearly from the same lava flow despite differences in Al2O3
n and TiO2n abundances. Four other samples assigned to
group 7 have higher Al2O3/TiO2 (average 7.128) and likely represent a different, compositionally distinct lava flow within this chemical group. Among the sam-ples with lower Al2O3/TiO2, the large variations in Al2O3
n and TiO2n at constant
Al2O3/TiO2 demonstrate that Al and Ti are immobile and are conserved during alteration; their range in abundances is attributed to changes in rock mass from changes in the abundances of soluble constituents.
Quantifying Mass Change from Alteration
Quantifying changes in rock mass is essential to assessing chemical changes resulting from alteration. This is routinely achieved in weathering, alteration, and soil studies using the parent:daughter ratios of an immobile
element (e.g., Ti, Zr) as a proxy for the remaining mass (Nesbitt, 1979; Brimhall and Dietrich, 1987; Anderson et al., 2002). For an initial unit abundance of an immobile element, the change in abundance is by the factor, 1/M s, where M s represents the mass fraction of a sample relative to the original unit mass of the parent. In terms of parent and sample compositions, the remaining sample mass fraction is described as follows:
M C Csip
is= , (1)
where C ip and C I
S are concentrations of immobile element i in the parent (p) and sample (s), respectively. Equation 1 applies to any immobile element such that substitution of the ratio of parent to sample abundances of another im-mobile element for M s yields:
C CC Cip
is
ip
is
1 21 2= , (2)
where subscripts i1 and i2 refer to the two immobile elements. This relationship indicates that changes in sample abundances for one immobile element, rela-tive to parent abundances, result in identical parent:sample ratios for all im-mobile elements. Given the differences in mineral-melt partitioning between elements, proportional changes among all immobile elements would be un-likely within a magmatic environment.
In this study, inversely correlated Al2O3 and TiO2 abundances are used to derive a parameter quantifying remaining rock mass, here termed mass in-dex (MI). Al and Ti are typically immobile during low-temperature alteration and weathering, and the immobility of Al and Ti are demonstrated here by the variations within one lava flow, as shown (Fig. 4). Al-Ti variations for SB lavas sampled for this study (except for the one severely weathered sample) are shown in Figure 5A. Most samples define a prominent inverse correla-
1.88 1.94 2.00 2.06 2.12 2.18 2.241.6 2.0 2.4 2.8 3.2 3.6 4.012
16
20
24
28
13.4
13.8
14.2
14.6
15.0
15.4
Al2O3n
TiO2n TiO2
n
BA Figure 4. Variation of Al2O3n versus TiO2
n abundances of samples of Sentinel Bluffs Member group 7 lavas show-ing the conservation of immobile elements. (A) Data for five samples from one lava flow exposed in a quarry near Saint Helens, Oregon (see Fig. 1). Solid line corre-sponds to the average Al2O3/TiO2 ratio (6.955) for group 7 samples having lower Al2O3/TiO2 ratios, the samples in A and those samples shown with magenta and blue symbols in B; dotted rectangle is the area of B. (B) All group 7 samples, except for the strongly weathered sample having very high Al2O3 and TiO2 abundances shown in A. Symbols: magenta—samples plotting within the dotted rectangle shown in A; blue—samples from other locations having Al2O3/TiO2 ratios equivalent to those of the samples shown in A; green—group 7 samples having higher Al2O3/TiO2 ratios. Solid line is along constant Al2O3/TiO2 as in A. Oxide abundances (in wt%) from analyses normalized to 100% volatile free, as indicated by superscript n.
Downloaded from http://pubs.geoscienceworld.org/gsa/geosphere/article-pdf/14/1/286/4120162/286.pdfby gueston 02 September 2022

Research Paper
292Sawlan | Alteration, mass analysis, and Sentinel Bluffs geochemistryGEOSPHERE | Volume 14 | Number 1
tion baseline; other samples having higher Al2O3n and TiO2
n values are scattered above this baseline. As shown herein, the seemingly random scatter in sample abundances above the baseline is the result of systematic chemical changes produced by varying degrees of alteration.
Note that no samples plot significantly below the baseline of Al2O3n and
TiO2n abundances. The absence of samples below the baseline arrays indicates
that none of the samples had gained any appreciable mass from precipitation of secondary minerals or other secondary processes. As described here and detailed in Supplemental File 3 (see footnote 4), secondary minerals that could contribute to mass gain were carefully avoided during sampling.
The Al-Ti baseline is interpreted to be magmatic in origin, as inversely correlated immobile element abundances cannot be generated by alteration. Those samples along the baseline have the lowest observed Al2O3
n and TiO2n
abundances at a given Al2O3/TiO2 ratio, and these samples are interpreted as having retained essentially all of their original mass. Altered samples having elevated Al2O3
n and TiO2n and plotting above the baseline arrays (Fig. 5A) have
therefore undergone mass loss due to water-rock interaction.In order to quantify parent (magmatic) compositions, regressions were
performed on those samples defining baseline arrays (solid black lines in Fig. 5A), and these compositions are defined to have a mass index of 100 (MI100). It became apparent that series V samples (Fig. 3) do not share a baseline trend colinear with that of older SB lavas, so separate baseline regressions were made on series I–IV and series V samples.
The regressions to determine MI100 baselines were calculated iteratively, starting with a visually estimated line at the base of the arrays, and applying an interval of MI units, or MI window, to constrain samples included in each regression. An MI window of 0.5 was used, meaning that MI values for the included samples are within 0.25 MI units of MI100. A regression is calculated for samples within the initial MI window, and this regression is used as the input line for a new regression as the sample population within the MI win-
dow changes. The iterative regressions proceed until the input and output lines coincide. These calculations are illustrated in the spreadsheet provided as Supplemental File 45, and the function of this spreadsheet and the iterative calculation process are described in Supplemental File 3 (see footnote 4).
The application of MI100 lines in calculating sample mass index values, or MI s, is illustrated in Figure 5B. For any sample, the parent or MI100 abundance is calculated from the intersection of the MI100 line and the line (dashed) hav-ing a slope equal to the sample Al2O3/TiO2 ratio and intersecting the origin. Solving for the MI100 or parent abundance of TiO2 (C
pTiO2) yields the following
expression,
C b C C mMI MITiOp
Al Os
TiOs
2
100
2 3 3
100
= −( ), (3)
where C sTiO2 and C s
Al2O3 refer to sample TiO2n and Al2O3
n abundances, repectively and mMI 100 and bMI 100 are the slope and intercept, respectively, of the MI100 base-line. In turn, the sample mass index, MI s, is calculated from parent and sample TiO2 abundances as follows,
MI C CsTiOp
TiOs= ⋅
2 2100. (4)
The multiplication by 100 converts the sample mass fraction to percent. Note that this equation has the same form as Equation 1.
Samples from 14 of the 16 SB groups recognized in this study have MI s values within the MI window. The maximum MI s value among group 3 sam-ples from this study is 98.5; however, an unpublished data set of SB samples provided by R. Evarts (2013, personal commun.) includes a high-MI s (99.73) sample. Among group 11 samples, the maximum MI s value (99.68) is slightly lower than the MI window minimum (99.75). This difference in MI s corre-sponds to a difference in TiO2
n (0.001 wt%) that is within analytical precision (Supplemental File 3; see footnote 4). One sample has slightly higher MI s
1.7 1.8 1.9 2.0 2.1 2.2
13.6
14.0
14.4
14.8
15.2
TiO2n
Al2O3n
TiO2n
98
96
94
92
98
96
94
MI 100series I-IV
MI 100series V
/
/
sMI100
s
s
m =
C Al 2O3
C TiO 2
MIs = ·100CTiO2CTiO2
MI 100
Cs
CMI100
CTiO2MI100 CTiO2
s
BA Figure 5. Variation of Al2O3n versus TiO2
n for all Sentinel Bluffs Member samples illustrating the procedure for detecting and quantifying change in sample mass. (A) Symbol shapes differen-tiate samples by Sentinel Bluffs Member chemical series (circles are series I–IV; triangles are series V); solid symbols are sam-ples used to define the MI 100 lines (see text) and having MI s = 99.75–100.25; open symbols are samples with MI s < 99.75 or MI s > 100.25. Black lines indicate the MI100 lines calculated from regressions of data shown with solid symbols. Solid blue and red lines parallel to the MI100 lines are MI isopleths in increments of 2 MI units; red—series I–IV; blue—series V. Constant Al2O3/TiO2 ratios for the maximum and minimum values are shown by dot-ted lines; red—series I–IV; blue—series V. (B) Schematic diagram illustrating calculation of sample mass index, MI s, using TiO2 as the index element. Points labeled C s and CMI100 indicate sample and MI100 Al2O3 and TiO2 abundances, respectively. Slope, m, of dashed line is the sample Al2O3/TiO2 ratio. Oxide abundances are for analyses normalized to 100% volatile free.
coords. for MI 100_est MI window calculation Diff MI 100_regr & MI s100_calcTiO2 Al2O3 0.50 1 diff_slope diff_int
1.700 14.200 +/- 0.25 0.000 0.0002.200 13.400
MI 100_est MI s _calc MI 100_regrslope intercept slope intercept slope intercept-1.600 16.920 -1.629 17.033 -1.629 17.033
Sample ID Unit ID TiO2n Al2O3
n TiO2_MI 100 Al2O3_MI 100 MI s inMI window TiO2n in MI win Al2O3
n in MI win MI s_win Al2O3/TiO2
10MS173 1 2.052 13.769 2.0427 13.7049 99.535 6.70910MS071 1 2.076 13.650 2.0765 13.6499 100.002 OK 2.0765 13.6495 100.002 6.57310MS079 1 2.079 13.669 2.0763 13.6502 99.862 OK 2.0792 13.6690 99.862 6.57410MS174 1 1.966 13.852 1.9632 13.8345 99.873 OK 1.9657 13.8521 99.873 7.04710MS175 1 1.956 13.846 1.9556 13.8468 100.006 OK 1.9555 13.8459 100.006 7.08010MS178 1 1.955 13.894 1.9493 13.8571 99.733 7.10910MS259 1 1.955 13.893 1.9499 13.8562 99.732 7.10607MS023 1 2.042 14.465 1.9552 13.8475 95.729 7.08310MS072 1 2.024 13.715 2.0268 13.7309 100.119 OK 2.0244 13.7145 100.119 6.77510MS080 1 2.019 13.704 2.0235 13.7363 100.239 OK 2.0186 13.7035 100.239 6.78910MS104 1 1.980 13.777 1.9835 13.8013 100.179 OK 1.9800 13.7766 100.179 6.95810MS114 1 2.001 13.799 1.9978 13.7781 99.851 OK 2.0008 13.7986 99.851 6.89710MS283 1 1.984 13.758 1.9893 13.7920 100.250 OK 1.9843 13.7576 100.250 6.93308MS018 1 1.928 14.145 1.8995 13.9383 98.542 7.33810MS042 1 1.949 14.440 1.8849 13.9620 96.692 7.40710MS043 1 1.923 14.369 1.8718 13.9834 97.315 7.47108MS019 1 1.955 14.108 1.9259 13.8952 98.493 7.21510MS176 2 2.045 13.750 2.0390 13.7109 99.716 6.72410MS177 2 2.042 13.737 2.0380 13.7127 99.825 OK 2.0415 13.7368 99.825 6.72910MS258 2 2.025 13.752 2.0230 13.7371 99.890 OK 2.0252 13.7522 99.890 6.79110MS179 2 1.971 13.899 1.9618 13.8367 99.553 7.05310MS180 2 1.992 13.830 1.9871 13.7955 99.749 6.94310MS260 2 1.980 13.821 1.9785 13.8096 99.919 OK 1.9801 13.8207 99.919 6.98010MS147 2 2.035 14.002 2.0013 13.7723 98.362 6.88210MS320 2 2.027 14.024 1.9928 13.7863 98.306 6.91897SH-X49A 2 1.971 13.799 1.9734 13.8178 100.135 OK 1.9708 13.7992 100.135 7.00210MS139 2 1.926 13.933 1.9215 13.9024 99.781 OK 1.9257 13.9329 99.781 7.23510MS310 2 1.925 13.922 1.9218 13.9019 99.855 OK 1.9246 13.9220 99.855 7.23410MS140 3 1.937 13.875 1.9374 13.8764 100.011 OK 1.9372 13.8748 100.011 7.16210MS311 3 1.946 13.852 1.9474 13.8603 100.059 OK 1.9462 13.8521 100.059 7.117
5Supplemental File 4. Spreadsheet used to calculate MI100 baselines using an iterative regression method. Sample data in this spreadsheet are for Sentinel Bluffs Member series I-IV samples; these data and the input parameters were used in determining the MI100 baseline for these samples. Instructions on the use of this spreadsheet are given in Supplemental File 3. Please visit http:// doi .org /10 .1130 /GES01188 .S4 or the full-text article on www .gsapubs .org to view Supplemental File 4.
Downloaded from http://pubs.geoscienceworld.org/gsa/geosphere/article-pdf/14/1/286/4120162/286.pdfby gueston 02 September 2022

Research Paper
293Sawlan | Alteration, mass analysis, and Sentinel Bluffs geochemistryGEOSPHERE | Volume 14 | Number 1
(100.36) than the MI window maximum (100.25); however, the difference of 0.11 MI units corresponds to a small difference in TiO2 (0.002 wt%) that also is within analytical precision.
Where MI100 values are lacking for a chemical group or particular flow within a stratigraphically coherent sequence of lavas, MI s values may be de-termined by assuming that the parent (magmatic) compositions for the lavas in question are represented along the Al-Ti baseline. This equates, in effect, to an inference that the negatively correlated baselines of compositionally similar lavas derive from a common magmatic process. The origin of the inverse Al-Ti correlation is discussed herein.
Mass Normalization
The sample mass index, MI s, can be used as a multiplier to normalize abun-dances within an entire chemical analysis (already normalized to 100% volatile free), and this process is here termed mass normalization. Mass-normalized abundances are therefore defined as
C C MIjmn
js s= ⋅ 100, (5)
where the superscripts mn and s refer to mass-normalized and sample abun-dances, respectively, and the division by 100 compensates for the expression of MI s in percent (Equation 4). Mass normalization removes the inherent nor-malization of abundances to 100% due to the analysis of mass-depleted rock as a unit mass. For immobile elements the mass-normalized abundances (MI100) correspond to their original magmatic values.
Mass-normalized abundances of immobile elements allow more precise, distinctions than those made using immobile element ratios. For the SB sam-ples analyzed in this study, mass-normalized TiO2 and Cr abundances (TiO2
mn
and Crmn, respectively) are consistent with, but allow more precise distinctions (Fig. 6) than, those made using Ti/Zr and Sc/Cr ratios (Fig. 3). Within four of the five chemical series, TiO2
mn and Crmn are inversely correlated, similar to the Al2O3
n–TiO2n variations, but define trends offset from each other, mainly due to
differences in Crmn abundances. Mass-normalized abundances (colored sym-bols, Fig. 6) and normalized abundances (black plus symbols, Fig. 6) are also compared in Figure 6 for samples having MI s < 98.4. For a given sample, tie lines (blue, dotted, Fig. 6) connect normalized abundances with mass-normal-ized abundances. These tie lines correspond to residual concentration vectors, are along constant TiO2/Cr ratios, and have positive slopes defined by mag-matic TiO2/Cr ratios. Differences in the tie-line slopes are caused mainly by a nearly 3× difference in Cr abundances.
For immobile elements, mass normalization enables the comparison of magmatic values for samples of fresh and variably altered lava, and prevents the misidentification of samples with low MI s values. For example, the nor-malized TiO2 and Cr abundances of a group 15 sample plot within the group 9 field (series III), but this lava has a low Ti/Zr ratio characteristic of series V lavas, which erupted later in the SB sequence (Fig. 6). Its mass-normalized TiO2 and Cr abundances are consistent with the group 15 field. Notably, the mass-nor-malized TiO2 and Cr abundances of a severely weathered (MI53) group 7 sam-ple plot among those for unaltered group 7 samples.
As shown in Figure 6, mass normalization eliminates variations in TiO2n
and Crn abundances within a single chemical group (e.g., group 11) that might otherwise be interpreted as unique compositions of separate lava flows or as internal variations within a single lava flow. The mass-normalized TiO2 and Cr abundances for group 11 samples are within analytical uncertainty, and these samples are from locations ~175 km apart, demonstrating the chemical homo-geneity of this flow over large distances. Similarly, groups 13 and 15 each in-clude samples from locations more than 250 km apart.
15 20 25 30 35 40 45 50
1.7
1.8
1.9
2.0
2.1
2.2
TiO2mn, n
Crmn, n
1
2
3
11
1615
14
10
13
12
6
57
8 9
4
MI53
16
V
IV
III
151413
121110
98
7
654
321
Group Series
II
I
Figure 6. Plot of TiO2 versus Cr show-ing the discrimination of Sentinel Bluffs Member (SB) lavas using mass-normal-ized (mn) immobile element abundances. Mass-normalized abundances are plotted for all samples, and SB chemical groups are indicated by colored symbols, as in Figure 3. Normalized (n) abundances (nor-malized only to 100% volatile free) are indicated by black plus symbols and are shown only for samples with MI s < 98.4. Tie lines (blue, dotted) connect normal-ized and mass-normalized abundances for a given sample (TiO2 is in wt%, Cr is in ppm). Arrow labeled MI 53 at upper end of tie line (top center) refers to a weathered sample whose TiO2
n and Crn abundances, 3.71 wt% and 57.9 ppm, respectively, ex-ceed the plot limits.
Downloaded from http://pubs.geoscienceworld.org/gsa/geosphere/article-pdf/14/1/286/4120162/286.pdfby gueston 02 September 2022

Research Paper
294Sawlan | Alteration, mass analysis, and Sentinel Bluffs geochemistryGEOSPHERE | Volume 14 | Number 1
A step-by-step summary of key procedures in mass analysis, including the applicable equations, is presented in Figure 7, and steps mentioned in the fol-lowing refer to the numbered steps in this figure. Initially (step 1), flows are identified that have equivalent immobile element ratios and equivalent strati-graphic positions. These constraints are used to define MI100 baseline values (step 2); unaltered samples would ideally span the range of sample Al2O3/TiO2 ratios. Definition of this line is the foundation for calculations of parent TiO2 (step 3), sample mass index (step 4), and mass-normalized abundances (step 5). Characterization of chemostratigraphic units using mass-normalized im mobile element abundances can then be made (step 6).
DISCUSSION
Magmatic Al-Ti Variations
Sampling was designed to minimize oxidation, textural indications of al-teration, and secondary minerals that can potentially contribute elemental ad-ditions. By avoiding rock altered under oxic conditions, the samples collected were composed primarily of either unaltered rock or rock altered under an-oxic conditions. The resultant data set of chemical analyses for such samples mainly shows inverse baseline trends in Al-Ti variations. Earlier I noted that these trends cannot be generated by alteration, and therefore must be gen-erated by magmatic processes. The origin of the SB Al-Ti baselines is briefly discussed.
Stepwise fractional crystallization (FC) experiments on tholeiitic basalt at 0.7 GPa (Villiger et al., 2007) show that, following initial enrichment of liquids in Al2O3 and TiO2 (from crystallization and removal of mafic silicates), the withdrawal of subequal amounts of clinopyroxene (Cpx) and plagioclase (Pl), along with trace amounts of spinel, generates an inverse Al-Ti trend in liquid abundances (Fig. 8). This trend is linear (r = –0.997) over a large range of tem-peratures (90 °C) and amount of crystallization (84%). The trend’s linearity indicates that the crystal assemblage maintained a constant Al2O3/TiO2 ratio despite changes in Cpx and Pl compositions with decreasing temperature. The 0.7 GPa pressure of these experiments corresponds to lower crustal depths in the eastern CRB. It is also comparable to the maximum pressure (0.66 GPa) de-termined from Cpx geobarometry in GRB and other CRBG lavas by Caprarelli and Reidel (2005), from which they also inferred lower crust crystallization of CRBG magmas.
The SB Al-Ti baseline trends, also shown in Figure 8, are subparallel to the trend of experimental basaltic liquids. The similarity of the SB and exper-imental trends, derived from Cpx + Pl crystallization, suggests their genera-tion by the same process. The smaller range of Al-Ti compositions in SB lavas indi cates that it can be generated by a much smaller amount of fractionation. Offset of the SB trend to lower Al2O3 and/or TiO2 values could potentially result from a variety of factors such as differences in the parent magma composition and pressure conditions. In the context of magma evolution from a primary,
mantle-derived melt, it is clear that the erupted SB magma compositions rep-resent only a small fraction of their overall magmatic history.
Mass balance calculations relating major element abundances of the least and most evolved lavas within four of the SB series (I–III, V) by crystal removal yield results consistent with the FC experiments discussed here. These rela-tively simple mass balance models used SB augite compositions from Ames (1980), and allowed plagioclase compositions to vary between anorthite and albite. The mass balance models also allowed olivine, pigeonite, and spinel or magnetite to be part of the assemblage, but these phases did not appear in the solutions. The model plagioclase compositions are mainly within the range of analyzed Pl compositions, but in some models were slightly higher (to ~10% An content) than the analyzed Pl compositions. Models relating group 16 to other series V groups, however, yielded anomalously calcic plagioclase (An100). The anorthite contents of model plagioclase compositions do not warrant pre-
/ –C )( sAl2O3
C sTiO2
C pTiO2
mMI100= bMI100/ –
/C p C sTiO2TiO2
MI s 100= •
/
100/C sj
smnj MIC = •
• +C pTiO2
C pAl2O3
= mMI100bMI100
5) Calculate mass-normalized abundances of all elements j.
4) Calculate sample mass index (see Fig. 5B).
3) Using an immobile element (e.g., TiO2) as an index element, calculate the parent index element abundances of samples; i.e., abundances at MI100. For each sample, these values are the intersection of lines de�ned by the sample immobile element ratio (e.g., Al2O3/TiO2) and MI100 (see Fig. 5B).
1) De�ne the broader chemical series on the basis of immobile element ratios, taking into account stratigraphic constraints (see Fig. 3).
6) Using mass-normalized abundances of immobile elements, re�ne the chemical series identi�ed in step (1), while taking into account stratigraphic constraints (see Fig. 6).
2) Determine the MI100 (magmatic) baseline(s) for inversely correlated immobile elements (e.g., y = Al2O3 and x = TiO2)(see Fig. 5A). This line is determined using an iterative regression method (see Supplemental File 4, explained in Supplemental File 3), and has the form y = mx + b.
Figure 7. Stepwise summary of mass analysis as applied to a mag-matic suite. Elemental abundances, C ; superscripts: n—sample abun-dance from analysis normalized to 100% volatile free; mn—mass-nor-malized abundance; s and p—sam ple and parent, respectively; subscripts: j—any element, or as specified (e.g., TiO2, Al2O3). The slope (m) and inter-cept (b) of the parent (magmatic) baseline are indi cated by the super-script MI100.
Downloaded from http://pubs.geoscienceworld.org/gsa/geosphere/article-pdf/14/1/286/4120162/286.pdfby gueston 02 September 2022

Research Paper
295Sawlan | Alteration, mass analysis, and Sentinel Bluffs geochemistryGEOSPHERE | Volume 14 | Number 1
cise interpretation because these values varied with the Cpx alumina content. For example, plagioclase compositions differed from An72 to An80 for equally valid models of series I compositions obtained with Cpx compositions having Al2O3 contents that differed by a factor of 2.
Successful mass balance models included assemblages of Cpx and Pl in subequal amounts. The amounts of intraseries fractionation indicated by the models are minor, and, for example, are 6%–10% for series I–III and V. The entire range of series I–IV compositions corresponds to ~15% fractionation if these compositions were generated from one parent magma, but it appears that each series evolved separately. The correspondence of model mineral compositions with those of SB groundmass minerals (except for Pl in series V models) is consistent with fractionation at crustal pressures. Although spinel was present in small amounts in the Villiger et al. (2007) experiments, the mass balance models indicate that spinel is not required to generate the SB Al-Ti array.
The removal of crystal assemblages containing ~50% Cpx, as indicated by both the mass balance models and FC experiments, is consistent with the SB intraseries Crmn variations (Fig. 6). Within all SB series except series IV, Crmn abundances decrease by ~20%–40% from the least to most evolved compo-sitions. These Crmn variations are consistent with the strong partitioning of Cr into Cpx (DCpx
Cr >> 1). The compositional gaps in Crmn variations between series (Fig. 6) suggest that fractionation of SB magmas occurred in batches (series), and not by differentiation of a single parent magma. In addition, Al2O3 and TiO2 abundances of the SB series partially overlap, rather than occupying separate segments of the Al-Ti baseline (Fig. 9). This also indicates that the magmas of each SB series evolved separately, at least in their latest phase of differentiation.
Although the main SB compositional variations can be explained by rela-tively simple Cpx + Pl fractionation, some exceptions are evident. For example, group 14 compositions have anomalous enrichments in incompatible trace ele ments (e.g., Zr, K, Ba) relative to other series V lavas; the enrichment in Zr accounts for their distinctly low Ti/Zr ratio (Fig. 3). The similar enrichments in both immobile and mobile incompatible elements indicate a magmatic ori-gin and require a more complex petrogenesis. In addition, as shown by Ti-Cr variations (Fig. 6), the small variations among series IV lavas do not define a coherent trend. Because these issues are peripheral to the main focus of this paper, they will not be examined further.
Despite their apparently separate evolution in magma batches, composi-tions of SB lavas nonetheless define a linear Al-Ti trend. This is attributed to
0 0.5 1.0 1.5 2.0 2.5 3.0 3.511
12
13
14
15
16
17
Al2O3n
TiO2n
SB
1270
1240
1210
1120
1150
1180
1090
1060OlOl + CpxCpx + Opx + PlCpx + PlCpx + Pl + Im
SC
1.7 1.8 1.9 2.0 2.1
13.6
13.7
13.8
13.9
14.0
14.1
14.2
14.3
Al2O3n
TiO2n
II
III
IV
V
I
IIIIIIVV
Series
I
Figure 8. Comparison of Al2O3n versus TiO2
n for Sentinel Bluffs Member (SB) MI 100 baselines and liquid compositions from stepwise fractional crystallization experiments on tholeiitic magma at 0.7 GPa under dry conditions (Villiger et al., 2007). SB series I–IV and series V baselines are shown with thick red and orange lines, respectively, and are labeled SB. Experimental liquid compositions are shown with colored circles; run temperatures (°C) are indicated next to data points. Colors of data points indicate coexisting phases as shown in legend. Phase abbreviations: Ol—olivine; Opx—orthopyroxene; Cpx—clinopyroxene; Pl—plagioclase; Im—ilmenite. Small amounts of spinel also were reported in all runs. Starting composition is represented by the solid black circle labeled SC. Heavy black line is the regression (r = –0.997) of data for the four liquid compositions related by Cpx + Pl + Sp removal. Arrows indicate liquid evolution with decreasing temperature for other assemblages.
Figure 9. Al2O3n versus TiO2
n for Sentinel Bluffs Member (SB) samples having MI s values from 99.75 to 100.25 (those samples used to de-fine MI 100 baselines), except for samples from SB group 3 (MI s < 98.6) and group 11 (MI s < 99.7), for which mass-normalized abundances are shown. Symbols are by SB chemical series; brackets indicate the compositional range of each series.
Downloaded from http://pubs.geoscienceworld.org/gsa/geosphere/article-pdf/14/1/286/4120162/286.pdfby gueston 02 September 2022

Research Paper
296Sawlan | Alteration, mass analysis, and Sentinel Bluffs geochemistryGEOSPHERE | Volume 14 | Number 1
the saturation of all SB magmas in Cpx and Pl, such that SB major element compositions are constrained to a boundary curve (cotectic) along which liquid compositions vary systematically, as observed in the FC experiments discussed above. It appears, therefore, that processes other than Cpx + Pl frac-tionation that might have influenced SB compositions to a minor extent did not cause SB major element abundances to depart from cotectic compositions.
Inverse Al-Ti variations are not unique to the SB. The Al-Ti arrays of GRB N2 and R2 members sampled in multiple GRB stratigraphic sections have slopes subparallel to those of the SB lavas, but are offset to higher or lower Ti values. The compositions of these upper GRB units are more evolved than the SB lavas and, as such, would be expected to be saturated in Cpx and Pl. Thus, Cpx + Pl fractionation apparently is a common process in the latter evolution-ary stages of GRB and other CRBG magmas. The protracted Cpx + Pl fraction-ation observed at lower crustal pressures (Villiger et al., 2007) likely explains the common occurrence of inverse Al-Ti arrays among GRB lavas.
Alteration-Generated Al-Ti Variations
As discussed herein, positively correlated Al-Ti trends to above-baseline Al2O3 and TiO2 abundances are attributed to the concentration of immobile elements in altered, mass-depleted rock. Positive Al-Ti trends can also be gen-erated by crystal fractionation in magmatic systems with removal of an as-semblage whose bulk composition lacks or contains only minor amounts of Al and Ti. This occurs when the assemblage is composed of mafic silicates (e.g., olivine, clinopyroxene, orthopyroxene), and Al-rich phases, such as plagio-clase, are absent or compose only a minor amount of the assemblage. The ef-fect of mafic silicate fractionation on liquid Al and Ti abundances is illustrated by the highest-temperature FC experiments of Villiger et al. (2007) discussed herein. As shown in Figure 8, removal of such crystal assemblages from the melt prior to the onset of plagioclase crystallization generates a positive Al-Ti trend in their experiments from 1270 to 1210 °C.
Considered in isolation, removal of mafic silicates may appear to be a via-ble explanation for the positive Al-Ti trends observed among SB composi-tions. The fractionation of mafic silicates would affect the abundances of other elements as well. In a magmatic system, mineral-melt partitioning controls element behavior, whereas in a low-temperature water-rock environment, ele-ment solubility is the dominant control. These markedly different processes can be clearly distinguished from the changes to lava chemistry. For some elements, the chemical changes are in the opposite sense.
The mafic silicates (olivine, orthopyroxene, and clinopyroxene) prefer-entially incorporate Mg over Fe relative to basaltic liquid (i.e., KD(Fe-Mg)min-liq ≤ 0.3; see Putirka, 2008). Crystallization and removal of any of these silicates therefore would yield liquids with progressively higher FeO/MgO. Along the positive Al-Ti trends in SB lavas, FeO/MgO decreases with increasing Al and Ti. This change in FeO/MgO is in the opposite sense to that expected from mafic silicate fractionation. The decrease in FeO/MgO results from the strong
depletion of FeO due to alteration. This difference in the sign of changes in FeO/MgO is sufficient to unambiguously distinguish positive Al-Ti variations resulting from crystal fractionation from those generated by alteration under anoxic conditions.
Trace element behavior also differs sharply between magmatic and groundwater-rock systems. For example, if increased Al and Ti abundances were due to olivine fractionation, Ni abundances should be severely depleted in the fractionated magmas due to the strong partitioning of Ni into olivine. For SB lavas, which have low MgO (~4.4–5.2 wt%) in comparison to primary mantle-derived melts, DNi
Ol–liq is likely very high (> 20) given the relationship be-tween DNi
Ol–liqand magma MgO content (Hart and Davis, 1978). In SB lavas, the positive above-baseline Al-Ti trends are not accompanied by strong depletions in Ni abundances.
As discussed here, fractionation of Cpx in subequal amounts with plagio-clase is inferred from intraseries variations of SB lavas. Removal of Cpx, into which Cr is partitioned relative to the melt (i.e., DCr
Cpx–liq >> 1), should signifi-cantly reduce Cr abundances. Systematic decreases in Cr of 20%–40% (mass normalized abundances, Crmn) are observed within 4 SB series (Fig. 6) and are consistent with Cpx fractionation as part of a Cpx + Pl assemblage. For above-baseline samples, normalized Cr abundances (Crn) instead increase due to the concentration of insoluble Cr in mass-depleted rock (Fig. 6).
The increases in Cr abundances are proportional to increases in Al and Ti abundances, and to Zr, Nb, and V abundances. The equivalent sample:parent enrichments of elements that are both compatible (e.g., Cr, V) and incompat-ible (e.g., Zr, Nb) in terms of mineral-melt partitioning in a magmatic system are at odds with crystal fractionation of mafic silicates. The similar behavior of compatible and incompatible elements is instead attributed to their mutual insolubility, which produces proportional changes in their abundances due to alteration-generated changes in rock mass.
Magma Homogeneity
The chemical homogeneity of CRBG lavas across hundreds of kilometers has been a common inference of past geochemical studies, which allowed for some chemical variation within the individual flows (e.g., Wright et al., 1973; Reidel et al., 1989; Hooper, 1984, 1988, 2000; Tolan et al., 2009). For example, many compositionally distinct Saddle Mountains Basalt flows exhibit ranges in P2O5 and TiO2 abundances that are positively correlated (see Hooper, 2000, figure 3 therein), and the varying slopes of these correlations are similar to the arrays of residual concentration trends due to mass loss (Figs. 4 and 6).
Reports of chemical heterogeneity within a single CRBG lava flow have been few, and such chemical differences have been attributed to differences in magmatic compositions, in combination with lava emplacement mechanisms (Reidel and Fecht, 1987; Reidel, 1998, 2005; Reidel and Tolan, 2013; Vye-Brown et al., 2013a). These studies, however, did not evaluate the possibility that sec-ondary processes might be responsible for the chemical differences within
Downloaded from http://pubs.geoscienceworld.org/gsa/geosphere/article-pdf/14/1/286/4120162/286.pdfby gueston 02 September 2022

Research Paper
297Sawlan | Alteration, mass analysis, and Sentinel Bluffs geochemistryGEOSPHERE | Volume 14 | Number 1
flows, perhaps because of a lack of a framework in which to differentiate the effects of chemical alteration from those of magmatic processes.
In this study chemical differences within a flow are observed when ana-lyzed abundances (normalized to 100% volatile free) are considered. Mass-nor-malized immobile element abundances show, however, that such intraflow dif-ferences are the result of alteration, and not of magmatic processes. With the modifications to lava chemistry from chemical alteration taken into account, it appears that SB lavas have a high degree of homogeneity that is indistinguish-able from analytical uncertainty, or nearly so.
The precise SB chemostratigraphy developed here allows the correlation of lavas throughout the SB. This study shows that SB flows, which were sampled in different locations and in equivalent stratigraphic position, have composi-tions that are within narrow ranges of immobile element ratios and mass-nor-malized immobile element abundances. Samples for which stratigraphic context is only broadly constrained (i.e., samples from the Coast Range and Willamette Valley) also have immobile element characteristics that coincide with the fields defined by samples from continuously sampled sections of multi ple SB flows in the Columbia Plateau and Columbia River Gorge.
Conditions of Alteration
Secondary mineral assemblages documented in CRBG lavas indicate that alteration occurred at low temperature (<100 °C) in the presence of ground-water, under conditions equivalent to the present-day environment (Benson and Teague, 1982). As shown in Figure 10, FeOn abundances of SB lavas cor-relate to sample mass index (MI s), indicating that depletion of iron is a signif-icant part of the observed mass loss. In this plot, magmatic FeOn abundances
correspond to the values for high-MI (~100) samples (11.1–12.7 wt%) and, with decreasing mass index, FeOn is progressively depleted. This relationship indi-cates that alteration occurred under anoxic conditions, thereby enabling trans-port of reduced iron (Fe2+) from the altered lava.
Because iron can occur as soluble Fe2+ or the nearly insoluble Fe3+, iron mobility depends on the groundwater’s redox potential, which is largely a function of dissolved oxygen. Dissolved oxygen is consumed by oxidation reactions with redox-active elements such as iron. SB lavas, as well as other CRBG lavas, have a large reservoir of reduced iron (>10 wt% FeO) ~85% of which (molar basis) is likely ferrous iron in unaltered rock. Consumption of dissolved oxygen in water from reaction with GRB lava (Winter Water Mem-ber) has been shown in the experiments of Lane et al. (1984). For example, in their experiments performed at 100 °C over 130 days the dissolved oxy-gen content of initially air-satu rated, synthetic GRB groundwater (see Jones, 1982) decreased nearly 80%. Comparison of dissolved oxygen consumption for a GRB lava (Winter Water Member) and several minerals (from elsewhere) shows similarly high rates of oxygen uptake by basalt and magnetite as com-pared to the rates for augite and plagioclase (White et al., 1985). This suggests that Fe-Ti oxides, which are abundant in the groundmass of GRB lavas, play an important role in oxygen depletion and, therefore, in influencing the redox conditions of groundwater. To account for rapid oxygen diffusion rates and a lack of Fe on exterior mineral surfaces in laboratory experiments simulating al-teration, White et al. (1985) further suggested that oxygen diffuses into interior pore spaces and along the boundaries of grains dominated by Fe-Ti oxides.
Marked increases in dissolved Fe2+ coincident with strong decreases in dis-solved oxygen and Eh have been observed in the groundwater of aquifers with distance from recharge areas (e.g., Champ et al., 1979; Edmunds et al., 1987), as well as within a relatively shallow aquifer (sampled to 60 m depth) in which the flow direction is primarily vertical (White et al., 1990). In these studies, the observed decrease in Eh between oxic and anoxic waters is on the order of 400–500 mV, with oxygen-depleted waters commonly having negative Eh val-ues. These studies were performed on aquifers hosted by sedimentary rocks or granite-derived alluvium having relatively low amounts of ferrous iron, but that could contain other reductants such as carbon in sedimentary rocks.
Iron mobility and immobility under anoxic and oxic conditions, respec-tively, have been shown in batch dissolution experiments performed on lava of the Wapshilla Ridge Member of the GRB (Neaman et al., 2005). The compo-sition of the sample used in the experiments is broadly similar to SB lavas, but has ~0.5 wt% less MgO than the most evolved SB lavas. These experiments were carried out at a pH of ~6–6.5 (end-experiment pH) near the lower range of the modern circum-neutral to moderately alkaline GRB-hosted aquifers (pH 6.7–9.4; Steinkamph and Hearn, 1996). These experiments showed significant iron release under anoxic conditions in which redox potentials measured at the end of experiments were reducing (Eh < 100 mV). Iron release under oxic conditions at atmospheric pressure and Eh ~300–450 mV was not observed.
Secondary pyrite lining vesicles and crystal-bound (diktytaxitic) voids in GRB lavas has been observed in GRB lavas in outcrops in several field sec-
90 92 94 96 98 100
9
10
11
12
13
FeOn
MIs
Figure 10. FeOn versus sample mass index, MIs, for Sentinel Bluffs Mem-ber samples analyzed in this study. A severely weathered sample with MI s ~53 and 21.3% FeOn is not shown.
Downloaded from http://pubs.geoscienceworld.org/gsa/geosphere/article-pdf/14/1/286/4120162/286.pdfby gueston 02 September 2022

Research Paper
298Sawlan | Alteration, mass analysis, and Sentinel Bluffs geochemistryGEOSPHERE | Volume 14 | Number 1
tions, and has been reported in fractures and vesicles within CRBG lavas in borehole core samples (Benson and Teague, 1982; McKinley et al., 2000). The pyrite occurrences are consistent with reducing anoxic conditions.
Reduced groundwaters (Eh <–200 mV) from deep modern CRBG-hosted aquifers contain anaerobic bacteria (e.g., methanogenic, sulfate reducing; Stevens et al., 1993). Stevens and McKinley (1995) further interpreted keroge-nous bacteriomorphs associated with secondary minerals in CRBG lavas as evidence that microbial populations have existed in reducing groundwater of CRBG-hosted aquifers in the geologic past.
Overall various field and laboratory studies of water-rock interaction sup-port the interpretation that Fe2+ is mobile under anoxic and reducing condi-tions. The depletion of FeO with increasing mass loss is in agreement with the observations of Wells et al. (2009), who attributed low FeOn (<11 wt%) in GRB lavas to alteration. The strong iron depletion is also in agreement with petrographic observations of borehole samples by Benson and Teague (1982), who noted that Fe-rich minerals, clinopyroxene and magnetite, are altered to a greater degree than feldspar.
The behavior of iron under anoxic conditions contrasts markedly with its behavior during near-surface weathering, under oxic conditions, in which Fe3+ behaves as an immobile element and is concentrated in the weathered rock residue. For example, the severely weathered and mass-depleted (MI 53) group 7 sample analyzed in this study (see Fig. 4A) has FeOn (21.3 wt%) that is nearly twice that of unaltered samples having MI s values of ~100. Its mass-normalized iron abundance (11.3 wt%) suggests that only minor Fe loss occurred from alteration. Although total iron is discussed here in terms of FeO (Fe2+), the iron in this surficially weathered rock is undoubtedly oxi-dized to Fe3+.
Analysis Totals
Low analysis totals (herein, totals) of the abundances of nonvolatile ele-ments are commonly interpreted as indicators of the degree of alteration. The difference between 100% and the analysis total is attributed mainly to glass hydration and/or the presence of hydrous secondary minerals. Totals for SB lavas do not correlate with MI s, and nearly all samples, including those with MI s values as low as 91, have totals >97 wt% (Fig. 11). This indicates that alter-ation resulting from dissolution of minerals ± glass under anoxic conditions is not accompanied by the hydration of glass in proportion to mass loss or by the formation of significant amounts of hydrous secondary minerals. As noted herein and described in Supplemental File 3 (see footnote 4), minor amounts of secondary minerals that may line the surfaces of or fill vesicles, fractures, and other cavities were avoided with careful sampling.
Mass-depleted rock that contains minimal amounts of hydrous secondary minerals and/or hydrated glass can have high totals in part because the de-pleted residue is analyzed as a unit mass. In effect, the depleted abundances are inherently normalized to 100 wt% in the process of analysis. Rock in which
minerals and glass have been dissolved, and in which negligible amounts of hydrous secondary minerals have formed, can therefore yield analyses with totals approaching 100 wt%. The large range in the totals of high-MI s samples (MI s > 99) indicates that volatile acquisition, such as from glass hydration, may occur without accompanying mineral dissolution. Among group 11 samples, which span a 5% range in mass retention, totals are higher in the low-MI s samples. This suggests a sequence of alteration in which glass was initially hydrated and later the hydrated glass was dissolved. In any case, for rock al-tered under anoxic conditions, analysis totals are not a reliable indicator of the amount of mass loss. The persistence of high totals for rock altered under anoxic conditions does not apply to rock altered under the oxic conditions of surficial weathering. For example, the strongly weathered sample from the quarry near Saint Helens, Oregon, has both very low MI s (~53) and a low analy-sis total (of nonvolatile constituents) of only 74 wt%.
The occurrence of only minimal amounts of hydrous secondary minerals in mass-depleted rock altered under anoxic conditions perhaps results from a lack of available aluminum for clay and zeolite formation due to the preferen-tial dissolution of ferromagnesian minerals having low Al2O3 contents. This is consistent with the petrographic observations of Benson and Teague (1982), who noted that clinopyroxene and magnetite appeared to be most affected by alteration, with plagioclase less so. This is also in agreement with the obser-vations of Wells et al. (2009), who characterized plagioclase in rocks showing evidence of chemical alteration as having a fresh appearance.
90 92 94 96 98 100
97
98
99
100
Total
MIs
Figure 11. Analysis total versus sample mass index, MI s, for Sen-tinel Bluffs Member samples analyzed in this study. Totals are the sum of abundances (in wt%) of major element oxides and trace elements calculated as oxides (from abundances reported in ppm). A severely weathered sample with an analysis total of 74.3 wt% and MI s ~53 is not shown.
Downloaded from http://pubs.geoscienceworld.org/gsa/geosphere/article-pdf/14/1/286/4120162/286.pdfby gueston 02 September 2022

Research Paper
299Sawlan | Alteration, mass analysis, and Sentinel Bluffs geochemistryGEOSPHERE | Volume 14 | Number 1
TiO2-MgO Variations
The use of MgO variation diagrams was initially advocated by Wright et al. (1973), and TiO2-MgO variations have continued to play an important role in differentiating GRB members (Mangan et al., 1986; Reidel et al., 1989; Reidel and Tolan, 2013). Published chemical characterizations of members in terms of TiO2 and MgO abundances have been imprecise (being only greater or less than a given value), however, and the compositions of individual flows within GRB members have not been explicitly defined. Qualitative characterizations of GRB lavas in terms of MgO abundances (as low, intermediate, high, and very high) have since become commonplace.
The TiO2-MgO variations from previously reported SB analyses define a seemingly random distribution at higher MgO that separate into two diffuse, inversely correlated trends at lower MgO (Fig. 2). Here I examine TiO2-MgO variations in SB lavas from analyses of this study (Fig. 12) using a threshold of sample mass index (MI s = 99) to differentiate samples that have lost <1% of their mass (if at all) from those samples that have lost 1%–9% of their mass due to alteration. A lower MI s threshold (98.4) was applied to group 3 samples because samples with higher MI s are unavailable.
The high-MI s samples define two inversely correlated trends, one for series I–IV samples and the other for series V samples, although some series IV samples are between these trends (Fig. 12). Within each of series I–III, suc-cessive chemical groups show an increase in MgO with decreasing TiO2. This progression from more evolved to less evolved compositions is comparable
to that observed for mass-normalized Cr abundances (Fig. 6), and supports the interpretation that the MgO abundances of high-MI s samples represent magmatic abundances. When observations are limited to samples that have retained nearly all of their original mass (using an MI threshold), the composi-tional trends observed for mobile elements are similar to those observed for immobile elements.
Due to the mobility of MgO, the low-MIs samples are not displaced from high-MIs samples of the same chemical group along lines of constant TiO2-MgO ratios, as for immobile elements (Figs. 4–6). Some low-MIs samples have com-positions corresponding to those of high-MIs samples of other chemical groups, or have compositions not represented by any high-MIs samples, such as the samples with <~4.4 wt% MgO. Overall, the trends of low-MIs samples within a chemical group have slightly lower slopes than the magmatic trends, thereby broadening the combined high-MIs and low-MIs sample trends, extending them to lower MgO values, and causing them to merge at higher MgO values. This pattern is similar to that observed in the previously published SB data (Fig. 2).
Previously Published SB Geochemical Analyses
The older analyses of SB samples collected during the BWIP and subse-quent investigations include many samples from deep boreholes, and this earlier data set provides an opportunity to examine whether alteration has generated mass depletion of SB lavas in groundwater environments far from the influences of near-surface weathering. Mass analysis was applied to these data in the same manner as to the data from this study.
The Al2O3-TiO2 variations of the older SB data set are shown in Figure 13, in which symbols for data points are given different colors depending on whether samples were collected from the surface (blue) or the subsurface (red). Subsurface samples, identified from sample number suffixes indicating depth (Supplemental File 1; see footnote 2), come from drill core or rotary drill chips collected from boreholes in and around the Pasco Basin. Most borehole samples are from depths between 540 and 1120 m; the depth of the shallowest borehole sample is ~120 m. The remaining samples are assumed to have been collected at the surface. The MI100 lines calculated for these data were defined to represent the baselines of the main body of samples, and the relatively few samples having lower Al2O3 and TiO2 that were disregarded in this process are discussed in the following. As in this study, MI100 baselines were calculated separately for series I–IV and for series V. Assignments of samples to series I–IV or to series V were made mainly on the basis of Ti/Zr ratios (see Fig. 3) (described further in Supplemental File 1; see footnote 2).
The Al2O3-TiO2 data from these earlier analyses exhibit a pattern similar to that shown by the data of this study (Fig. 5A), i.e., a baseline having nega-tive slope with scattered abundances plotting above it (Fig. 13). These sample populations differ from those of this study, however, in that scattered samples also plot below the main populations. The few outlier samples that plot below the main populations were ignored because these samples apparently have gained mass from alteration, as discussed in the following.
16hi-MIs lo-MIs Group Series
151413
121110
987
654
321
V
IV
III
II
I
3.8 4.2 4.6 5.0 5.4
1.7
1.8
1.9
2.0
2.1
2.2
TiO2n
MgOn
Figure 12. TiO2n versus MgOn for Sentinel Bluffs Member (SB) samples analyzed in this study.
Data points are given symbols by SB chemical group and sample mass index, MI s: color sym-bols, samples with MI s ≥ 99 (hi-MI s in legend); black symbols, samples with MI s < 99 (lo-MI s in legend).
Downloaded from http://pubs.geoscienceworld.org/gsa/geosphere/article-pdf/14/1/286/4120162/286.pdfby gueston 02 September 2022

Research Paper
300Sawlan | Alteration, mass analysis, and Sentinel Bluffs geochemistryGEOSPHERE | Volume 14 | Number 1
Both surface and subsurface samples show evidence of mass loss, and several surface samples have MI s values <92 (Fig. 13). Subsurface samples generally have MI s values ranging from ~100 to 96, similar to the values for most surface samples. These Al2O3-TiO2 relationships demonstrate that mass loss has occurred in SB lavas buried deep in the subsurface. The decreases in mass are attributed to mineral ± glass dissolution from alteration.
A small number of samples from the earlier SB data set that plot below the MI100 baselines indicate minor mass gains (to ~2.6 wt%). The sample with the highest MI s has anomalously high CaO, at least 2.5 wt% higher than the CaO values of samples with MI s ~100, and presumably contains secondary minerals with abundant calcium, such as calcite. The other analyses with anomalously high MI s may likewise contain significant amounts of secondary minerals.
The anomalously high MI s values for a minority of the previously published SB analyses likely represent a net mass change whereby the mass gain from precipitation of secondary minerals exceeded the mass loss (if any) from min-eral dissolution. This underscores the importance of applying (and document-ing) a sampling protocol in which secondary minerals are excluded, thereby limiting mass change to negative values. If visibly altered samples are ana-lyzed for purposes other than investigating the magmatic chemistry of CRBG lavas, this should be made clear so that these data are not later misinterpreted as magmatic compositions.
Intraflow Chemical Variations
Prior characterizations of the geochemistry of SB and other GRB strati-graphic units have been developed without consideration of the effects of low-temperature alteration on lava chemistry, and analyzed abundances of altered samples undoubtedly have often been incorrectly interpreted as being
magmatic in origin. As shown here, TiO2 and other immobile elements are concentrated in the remaining rock after soluble constituents, such as Fe and Mg, have been removed by mineral dissolution. Inverse correlations of TiO2 and MgO can also result from magmatic processes (Fig. 12), but without appli-cation of mass analysis the magmatic compositions cannot be distinguished from those modified by alteration. The use of an immobile element (e.g., TiO2
n) as a function of a mobile element (e.g., MgOn) therefore has limitations in de-fining the chemostratigraphy of SB and other GRB lavas.
The occurrence of alteration under anoxic conditions undoubtedly has con-tributed to the difficulty in recognizing this alteration using physical charac-teristics. The freshest-appearing altered rocks, showing evidence of chemical alteration by anoxic groundwater, are typically dark gray, similar to the color of truly unaltered rock. The abundances of secondary clay and zeolite minerals tend to be minimal, and hydration is limited, so that analytical totals (or loss on ignition) are not significantly affected. In a study characterizing the secondary minerals of CRBG lavas obtained from coring to depths >1300 m, Benson and Teague (1982) described the disparity between an apparent lack of visible alter-ation in hand sample and the pervasive alteration, mainly to clay and zeolite minerals; they concluded that fluids were able to migrate throughout the en-tire basalt thickness via fractures, microfractures, and micropore systems. This view is consistent with groundwater studies documenting regional subsurface flow throughout the CRBG lava pile (Burns et al., 2011, 2015; Kahle et al., 2011; Ely et al., 2014).
Although visible alteration of CRBG lavas has been reported in thin sec-tion (Ames, 1980; Benson and Teague, 1982; White et al., 1985; Caprarelli and Reidel, 2004), such observations may not detect all chemical alteration. Even for comparatively young lavas (younger than 200 ka) on Hawai`i, lavas ap-pearing fresh in thin section are nonetheless chemically altered (Lipman et al.,
TiO2n
Al2O3n
TiO2n
1.6 1.7 1.8 1.9 2.0 2.1 2.213.4
13.8
14.2
14.6
15.0
15.4
15.8
16.2
1.6 1.7 1.8 1.9
13.8
14.2
14.6
15.0
15.4
102
88
98
96
94
92
90
100
102
92
98
96
94
100
Series I-IV Series V
A B Figure 13. Al2O3n versus TiO2
n data for previ-ously reported analyses of Sentinel Bluffs Member lavas. (A) Series I–IV. (B) Series V. Blue symbols indicate samples from out-crop or artificial exposures, and red sym-bols indicate subsurface samples from boreholes. Solid green lines indicate MI 100 values and MI (mass index) isopleths in increments of 2 MI units. Green shading above and below the MI 100 line represents the MI windows (0.3 and 0.5 MI units for series I–IV and V, respectively), and in-cludes the samples used in regression to determine MI 100 lines. Dotted green lines are lines of constant Al2O3/TiO2 at the maximum and minimum sample values. Data are mainly from the compilation of Reidel and Valenta (2000) (Supplemental File 1; see footnote 2).
Downloaded from http://pubs.geoscienceworld.org/gsa/geosphere/article-pdf/14/1/286/4120162/286.pdfby gueston 02 September 2022

Research Paper
301Sawlan | Alteration, mass analysis, and Sentinel Bluffs geochemistryGEOSPHERE | Volume 14 | Number 1
1990). Ames (1980) also noted that alteration in CRBG lavas, apparent under reflected light, was not apparent in transmitted light petrography. In addition, thin sections of GRB lavas from fine-grained, irregularly fractured parts of the lava flow core typically show nearly opaque, cryptocrystalline masses, from which little mineralogical information can be ascertained.
The narrowly defined chemical groups identified in this study greatly increase the resolution of the SB chemostratigraphy. Due to the lack of rec-ognition of the chemical effects of alteration in prior geochemical studies of SB lavas, lava compositions of unaltered and variably altered rock were com-pared to one another as though all compositions were magmatic in origin. This undoubtedly resulted in stratigraphic conflicts and seemingly continuous variations, and in a generalized SB chemostratigraphy of compositional types (Reidel, 2005). For example, the oldest SB compositional type (McCoy Canyon) of Reidel (2005) corresponds to groups 1–9 of this study, and his youngest type (Museum) corresponds to groups 13–16.
The ability to correct for or avoid the effects of chemical alteration reveals that the SB comprises a greater number of flows and indicates a higher fre-quency of eruptions within the SB than previously estimated. The 16 chemical groups recognized in this study indicate that the SB comprises at least this number of compositionally distinct lava flows. Small differences in immobile element ratios (Fig. 4B), and/or mass-normalized immobile element abun-dances, indicate that some SB groups comprise two flows. On this basis, the SB comprises an estimated 21 compositionally distinct flows.
The flows recognized here on the basis of chemical differences are dis-tinct from flow lobes that are distinguished mainly by cooling surfaces and vesicle size-abundance distributions used to identify flow contacts. In the continuous sections sampled, a single, compositionally distinct SB chemical group may be represented by a vertical succession of two or three physically defined flows, which may or may not represent flow lobes or flows of the same eruption.
A prerequisite for assessing the chemostratigraphy of SB (and other CRBG) lavas, therefore, is the application of mass analysis to reverse the influences of secondary processes on lava chemistry. To demonstrate heterogeneity along a vertical chemical profile within a single lava flow, it is necessary to show differences in mass-normalized immobile element abundances, not simply differences in analyzed (normalized to 100%) immobile element abundances, which are sensitive to changes in rock mass.
A magmatic trend defined by unaltered samples, such as the SB inverse Al-Ti baseline, is not essential to the evaluation of magmatic intraflow varia-tions from vertical sampling through a flow at a given location. In addition, a completely unaltered sample is not required for mass normalization because the objective would be to examine only relative differences within a flow, not to identify the original magmatic composition as in this study. Analyses from a vertical profile can be mass normalized to the sample having the lowest abundance of Ti or other immobile element. Tests of intraflow chemical hetero-geneity therefore can be performed on a lava flow that is not part of a related sequence of compositions such as the SB.
CONCLUSIONS
Alteration of CRBG lavas in anoxic groundwater has occurred across the Columbia River flood basalt province. This alteration is subtle in that it is not accompanied by distinct visual cues, such as oxidation and the abundant sec-ondary minerals that accompany surficial weathering under oxic conditions. The groundwater alteration, however, can only be identified by chemical criteria.
The primary effect of alteration under anoxic conditions is mineral disso-lution and reduction in rock mass. Due to the inherent normalization resulting from the analysis of mass-depleted rock as a unit mass, immobile element abundances change in inverse proportion to the remaining mass. The magni-tude of these changes can be comparable to or exceed the subtle magmatic variations within SB lavas as well as those within other GRB members.
Mass analysis allows the quantitative assessment of alteration-generated mass transfer caused by water-rock interaction. Mass analysis employs sys-tematic immobile element variations (i.e., inverse Al-Ti arrays) among rocks that have retained their original mass (MI100) to quantify the sample mass (MI s) remaining after alteration-generated mass loss (if any). Mass normalization, the product of MI s and a sample’s analyzed abundances (normalized to 100%), yields pre-alteration, magmatic immobile element abundances.
With high-precision data, mass analysis permits detailed chemical charac-terizations of individual lava flows from mass-normalized immobile element abundances, and these abundances are consistent with broader chemical dis-tinctions made using immobile element ratios. Immobile element abundances corrected for mass loss indicate that individual lavas are remarkably homo-geneous and can even be identified from rock that has undergone as much as ~50% mass loss. The use of mass-normalized immobile element abundances for chemical characterization of SB lavas eliminates conflicts between chem-ical characteristics and stratigraphic position that result when only analyzed abundances (normalized to 100%) are considered, thereby simplifying the chemo stratigraphy. Individual SB flows can be correlated across the entire ex-tent of the SB, which spans much of the GRB.
Prior interpretations of intraflow differences in the chemistry of CRBG lavas, mainly between the abundantly vesicular, pervasively fractured flow crusts and the dense flow core, have called upon lava emplacement mechanisms to combine magma fed from a heterogeneous magma body or from multiple, simultaneously erupted, chemically distinct but homogeneous magmas into a single lava flow. Such explanations have spawned from the recognition that CRBG lavas are inflated pahoehoe lavas. Given that the more porous and per-meable parts of CRBG lavas currently host regional aquifers, there has been ample opportunity for water-rock interaction in these parts of flows in the sub-surface over much of the ~16 m.y. since these lavas erupted. Commonly, the porous parts of lavas have elevated immobile element abundances compared to the dense flow core. Such intraflow chemical differences are therefore more likely due to alteration of chemically homogeneous lava flows that were fed by well-mixed magma reservoirs. Application of mass analysis is thus a prerequi-site to assessing magmatic intraflow chemical variations in the CRBG.
Downloaded from http://pubs.geoscienceworld.org/gsa/geosphere/article-pdf/14/1/286/4120162/286.pdfby gueston 02 September 2022

Research Paper
302Sawlan | Alteration, mass analysis, and Sentinel Bluffs geochemistryGEOSPHERE | Volume 14 | Number 1
Major and trace element variations of SB lavas indicate that several batches (series) of magmas evolved independently, at least in their later stages of dif-ferentiation. Although SB series evolved separately, their colinear Al-Ti vari-ations and overlapping Al and Ti abundances are attributed to the saturation of all SB magmas in clinopyroxene and plagioclase, reflecting the adherence of liquid compositions to a cotectic. Similar inverse Al-Ti arrays in other GRB members suggest that Cpx + Pl fractionation is a common process that has generated the chemical variations within GRB members.
Prior interpretations of SB chemostratigraphy and lava heterogeneity have been based on the often incorrect assumption that analyzed abundances are equivalent to magmatic abundances. As a result, earlier interpretations of SB chemostratigraphy have been generalized because magmatic compositions could not be distinguished from those modified by alteration. In addition, those magmatic processes previously thought to have been involved in the genesis and emplacement of CRBG lavas warrant reevaluation. With the application of mass analysis, future geochemical studies of CRBG lavas have an opportunity to more precisely refine our understanding of this flood basalt province.
ACKNOWLEDGMENTS
Jon Hagstrum and Russ Evarts provided invaluable detailed constructive reviews of earlier ver-sions of the manuscript. Thoughtful reviews by Marie-Nöelle Guilbaud, Steve Self, and John Wolff, and the editorial work of Julie Roberge and Shan de Silva, contributed to significant improve-ments of the manuscript and are appreciated. Rick Conrey generously provided unpublished data used in determining analytical precision of analyses performed at the Peter Hooper GeoAnalytical Lab, Washington State University (Pullman) as well as information on analytical procedures. I am grateful to Russ Evarts, who graciously served as a sounding board in numerous discussions as the concepts presented in this paper were developed. Russ Evarts and Ray Wells provided samples and/or analyses from locations mainly in the Coast Range and Willamette Valley, and Jon Hag-strum provided core from paleomagnetic sampling sites in several flows from which geochemical samples were prepared. Field introductions to the Patrick Grade and Wallace Canyon sections by Steve Reidel are also appreciated.
REFERENCES CITED
Ames, L.L., 1980, Hanford Basalt Flow Mineralogy: Richland, Washington, Pacific Northwest Lab-oratory Report PNL-2847, 447 p.
Anderson, S.P., Dietrich, W.E., and Brimhall, G.H., Jr., 2002, Weathering profiles, mass-balance analysis, and rates of solute loss: Linkages between weathering and erosion in a small, steep catchment: Geological Society of America Bulletin, v. 114, p. 1143–1158, doi: 10 .1130 /0016 -7606 (2002)114 <1143: WPMBAA>2 .0 .CO;2 .
Atlantic Richfield Hanford Company, 1976, Preliminary feasibility study on storage of radioactive wastes in Columbia River Basalts: Atlantic Richfield Hanford Company Report ARH-ST-137: Richland, Washington, 82 p.
Benson, L.V., and Teague, L.S., 1982, Diagenesis of basalts from the Pasco Basin, Washington—I. Distribution and composition of secondary mineral phases: Journal of Sedimentary Petrol-ogy, v. 52, p. 595–613, doi: 10 .1306 /212F7FAE -2B24 -11D7 -8648000102C1865D .
Brimhall, G.H., and Dietrich, W.E., 1987, Constitutive mass balance relations between chemical composition, volume, density, porosity, and strain in metasomatic hydrochemical systems: Results on weathering and pedogenesis: Geochimica et Cosmochimica Acta, v. 51, p. 567–587, doi: 10 .1016 /0016 -7037 (87)90070 -6 .
Bryan, S.E., Peate, I.U., Peate, D.W., Self, S., Jerram, D.A., Mawby, M.R., Marsh, J.S., and Miller, J.A., 2010, The largest volcanic eruptions on Earth: Earth-Science Reviews, v. 102, p. 207–229, doi: 10 .1016 /j .earscirev .2010 .07 .001 .
Burns, E.R., Morgan, D.S., Peavler, R.S., and Kahle, S.C., 2011, Three Dimensional Model of the Geologic Framework for the Columbia Plateau Regional Aquifer System, Idaho, Oregon, and Washington: U.S. Geological Survey Scientific Investigations Report 2010-5246, 44 p.
Burns, E.R., Williams, C.F., Ingebritsen, S.E., Voss, C.I., Spane, F.A., and DeAngelo, J., 2015, Under standing heat and groundwater flow through continental flood basalt provinces: In-sights gained from alternative models of permeability/depth relationships for the Columbia Plateau, USA: Geofluids, v. 15, p. 120–138, doi: 10 .1111 /gfl .12095 .
Caprarelli, G., and Reidel, S.P., 2004, Physical evolution of Grande Ronde Basalt magmas, Colum-bia River Basalt Group, north-western USA: Mineralogy and Petrology, v. 80, p. 1–25, doi: 10 .1007 /s00710 -003 -0017 -1 .
Caprarelli, G., and Reidel, S.P., 2005, A clinopyroxene–basalt geothermobarometry perspective of Columbia Plateau (NW-USA) Miocene magmatism: Terra Nova, v. 17, p. 265–277, doi: 10 .1111 /j .1365 -3121 .2005 .00611 .x .
Champ, D.R., Gulans, J., and Jackson, R.E., 1979, Oxidation-reduction sequences in ground water flow systems: Canadian Journal of Earth Sciences, v. 16, p. 12–23, doi: 10 .1139 /e79 -002 .
Conlon, T.D., Wozniak, K.C., Woodcock, D., Herrera, N.B., Fisher, B.J., Morgan, D.S., Lee, K.K., and Hinkle, S.R., 2005, Ground-Water Hydrology of the Willamette Basin, Oregon: U.S. Geologi-cal Survey Scientific Investigations Report 2005-5168, 83 p.
Dahlem, D.H., 1987, Basalt Waste Isolation Project overview, in Tsang, C.-F., ed., Coupled Pro-cesses Associated with Nuclear Waste Repositories: Orlando, Florida Academic Press, p. 105–119, doi: 10 .1016 /b978 -0 -12 -701620 -7 .50012 -X .
Derkey, R.E., Hamilton, M.M., Stradling, D.F., and Kiver, E.P., 1999, Preliminary geologic maps of the Spokane NE and SE 7.5-minute quadrangles, Spokane County, Washington: Washington Department of Natural Resources Division of Geology and Earth Sciences Open File Report 99-6, scale 1:24,000.
Derkey, R.E., Hamilton, M.M., and Stradling, D.F., 2004, Geologic map of the Airway Heights 7.5-minute quadrangle, Spokane County, Washington: Washington Department of Natural Resources Division of Geology and Earth Sciences Open File Report 2004-1, scale 1:24,000.
Edmunds, W.M., Cook, J.M., Darling, W.G., Kinniburgh, D.G., Miles, D.L., Bath, A.H., Morgan- Jones, M., and Andrews, J.N., 1987, Baseline geochemical conditions in the Chalk aquifer, Berkshire, U.K.: A basis for groundwater quality management: Applied Geochemistry, v. 2, p. 251–274, doi: 10 .1016 /0883 -2927 (87)90042 -4 .
Ely, D.M., Burns, E.R., Morgan, D.S., and Vaccaro, J.J., 2014, Numerical simulation of ground-water flow in the Columbia Plateau Regional Aquifer System, Idaho, Oregon, and Washing-ton: U.S. Geological Survey Scientific Investigations Report 2014-5127, 90 p.
Hart, S.R., and Davis, K.E., 1978, Nickel partitioning between olivine and silicate melt: Earth and Planetary Science Letters, v. 40, p. 203–219, doi: 10 .1016 /0012 -821X (78)90091 -2 .
Hearn, P.P., Steinkampf, W.C., Bortleson, G.C., and Drost, B.W., 1985, Geochemical controls on dissolved sodium in basalt aquifers of the Columbia Plateau, Washington: U.S. Geological Survey Water-Resources Investigation Report 84-4304, 38 p.
Hilgen, F.J., Lourens, L.J., and Van Dam, J.A., 2012, The Neogene Period, in Gradstein, F.M., et al., The Geologic Time Scale 2012: Oxford, Elsevier BV, p. 923–978, doi: 10 .1016 /B978 -0 -444 -59425 -9 .00029 -9 .
Hooper, P.R., 1984, Physical and chemical constraints on the evolution of the Columbia River basalt: Geology, v. 12, p. 495–499, doi: 10 .1130 /0091 -7613 (1984)12 <495: PACCOT>2 .0 .CO;2 .
Hooper, P.R., 1988, The Columbia River Basalt, in Macdougall, J.D., ed., Continental Flood Ba-salts: Dordrecht, Kluwer Academic Publishers, p. 1–33, doi: 10 .1007 /978 -94 -015 -7805 -9_1 .
Hooper, P.R., 2000, Chemical discrimination of Columbia River basalt flows: Geochemistry, Geo-physics, Geosystems, v. 1, 1024, doi: 10 .1029 /2000GC000040 .
Hooper, P.R., and Gillespie, B.A., 1996, Geologic map of the Pomeroy area, southeastern Washington: Washington Division of Geology and Earth Resources Open File Report 96-5, scale 1:24,000, 26 p.
Jarboe, N.A., Coe, R.S., Renne, P.R., and Glen, J.M., 2010, The age of the Steens reversal and the Columbia River Basalt Group: Chemical Geology, v. 274, p. 158–168, doi: 10 .1016 /j .chemgeo .2010 .04 .001 .
Jones, T.E., 1982, Reference material chemistry—Synthetic groundwater formulation: Rockwell Hanford Operations report RHO-BWI-ST-37-P: Richland, Washington, 10 p.
Kahle, S.C., Morgan, D.S., Welch, W.B., Ely, D.M., Hinkle, S.R., Vaccaro, J.J., and Orzol, L.L., 2011, Hydrogeologic framework and hydrologic budget components of the Columbia Plateau Re-gional Aquifer System, Washington, Oregon, and Idaho: U.S. Geological Survey Scientific Investigations Report 2011-5124, 66 p.
Landon, R.D., and Long, P.E., 1989, Detailed stratigraphy of the N2 Grande Ronde Basalt, Colum-bia River Basalt Group, in the central Columbia Plateau, in Reidel, S.P., and Hooper, P.R., eds., Volcanism and Tectonism in the Columbia River Flood Basalt Province: Geological Society of America Special Paper 239, p. 55–66, doi: 10 .1130 /SPE239 -p55 .
Downloaded from http://pubs.geoscienceworld.org/gsa/geosphere/article-pdf/14/1/286/4120162/286.pdfby gueston 02 September 2022

Research Paper
303Sawlan | Alteration, mass analysis, and Sentinel Bluffs geochemistryGEOSPHERE | Volume 14 | Number 1
Lane, D.L., Jones, T.E., and West, M.H., 1984, Preliminary assessment of oxygen consumption and redox conditions in a nuclear waste repository in basalt, in Barney, G.S., Navratil, J.D., and Shulz, W.W., eds., Geochemical Behavior of Disposed Radioactive Waste, American Chemical Society Symposium Series, v. 246, p. 181–195, doi: 10 .1021 /bk -1984 -0246 .ch011 .
Lipman, P.W., Rhodes, J.M., and Dalrymple, G.B., 1990, The Ninole Basalt—Implications for the structural evolution of Mauna Loa volcano, Hawaii: Bulletin of Volcanology, v. 53, p. 1–19, doi: 10 .1007 /BF00680316 .
Mangan, M.T., Wright, T.L., Swanson, D.A., and Byerly, G.R., 1986, Regional correlation of Grande Ronde Basalt flows, Columbia River Basalt Group, Washington, Oregon, and Idaho: Geologi-cal Society of America Bulletin, v. 97, p. 1300–1318, doi: 10 .1130 /0016 -7606 (1986)97 <1300: RCOGR .
McGrail, B.P., Spane, F.A., Sullivan, E.C., Bacon, D.H., and Hund, G., 2011, The Wallula Basalt Se-questration Pilot Project: Energy Procedia, v. 4, p. 5653–5660, doi: 10 .1016 /j .egypro .2011 .02 .557 .
McGrail, B.P., Spane, F.A., Amonette, J.E., Thompson, C.R., and Brown, C.F., 2014, Injection and monitoring at the Wallula Basalt Pilot Project: Energy Procedia, v. 63, p. 2939–2948, doi: 10 .1016 /j .egypro .2014 .11 .316 .
McKinley, J.P., and Stevens, T.O., and Westall, F., 2000, Microfossils and paleoenvironments in deep subsurface basalt samples: Geomicrobiology Journal, v. 17, p. 43–54, doi: 10 .1080 /014904500270486 .
Myers, C.W., and Price, S.M., eds., 1979, Geologic Studies of the Columbia plateau: A Status Report: Richland, Washington, Rockwell Hanford Operations report RHO-BWI-ST-4, 347 p.
Myers, C.W., and Price, S.M., eds., 1981, Subsurface Geology of the Cold Creek Syncline: Rich-land, Washington, Rockwell Hanford Operations report RHO-BWI-ST-14, 250 p.
Neaman, A., Chorover, J., and Brantley, S.L., 2005, Implications of the evolution of organic acid moieties for basalt weathering over geological time: American Journal of Science, v. 305, p. 147–185, doi: 10 .2475 /ajs .305 .2 .147 .
Nesbitt, H.W., 1979, Mobility and weathering of rare earth elements during weathering of a grano diorite: Nature, v. 279, p. 206–210, doi: 10 .1038 /279206a0 .
Putirka, K.D., 2008, Thermometers and barometers for volcanic systems: Reviews in Mineralogy and Geochemistry, v. 69, p. 61–120, doi: 10 .2138 /rmg .2008 .69 .3 .
Reidel, S.P., 1988, Geologic map of the Saddle Mountains, south-central Washington: Washing-ton Division of Geology and Earth Resources Geologic Map GM-38, 28 p., scale 1:48,000, 5 plates, Washington Department of Natural Resources, Olympia.
Reidel, S.P., 1998, Emplacement of Columbia River flood basalt: Journal of Geophysical Re-search, v. 103, p. 27,393–27,410, doi: 10 .1029 /97JB03671 .
Reidel, S.P., 2005, A lava flow without a source: The Cohassett flow and its compositional com-ponents, Sentinel Bluffs Member, Columbia River Basalt Group: Journal of Geology, v. 113, p. 1–21, doi: 10 .1086 /425966 .
Reidel, S.P., and Fecht, K.R., 1987, The Huntzinger flow: Evidence of surface mixing of the Colum-bia River Basalt and its petrogenetic implications: Geological Society of America Bulletin, v. 98, p. 664–677, doi: 10 .1130 /0016 -7606 (1987)98 <664: THFEOS>2 .0 .CO;2 .
Reidel, S.P., and Tolan, T.L., 2013, The Grande Ronde Basalt, Columbia River Basalt Group, in Reidel, S.P., et al., eds., The Columbia River Flood Basalt Province: Geological Society of America Special Paper 497, p. 117–153, doi: 10 .1130 /2013 .2497 (05) .
Reidel, S.P., and Valenta, M.M., 2000, Preliminary chemistry, petrology, and paleomagnetism data for the Sentinel Bluffs Member, Columbia River Basalt Group: Richland, Washington, Battelle Pacific Northwest Laboratories Report PNWD-3063, 279 p.
Reidel, S.P., Tolan, T.L., Hooper, P.R., Beeson, M.H., Fecht, K.R., Bentley, R.D., and Anderson, J.L., 1989, The Grande Ronde Basalt, Columbia River Basalt Group: Stratigraphic descriptions and correlations in Washington, Oregon, and Idaho, in Reidel, S.P., and Hooper, P.R., eds., Volcanism and Tectonism in the Columbia River Flood Basalt Province: Geological Society of America Special Paper 239, p. 21–54, doi: 10 .1130 /SPE239 -p21 .
Reidel, S.P., Camp, V.E., Tolan, T.L., and Martin, B.S., 2013, The Columbia River flood basalt prov-ince: Stratigraphy, areal extent, volume, and physical volcanology, in Reidel, S.P., et al., eds., The Columbia River Flood Basalt Province: Geological Society of America Special Paper 497, p. 1–43, doi: 10 .1130 /2013 .2497 (01) .
Self, S., 2006, Defining super-eruptions: Purpose, prejudices, and limitations: American Geo-physical Union Fall Meeting, abs. V23G–02.
Self, S., Thordarson, T., Keszthelyi, L., Walker, G.P.L., Murphey, M.T., Long, P., and Finnemore, S., 1996, A new model for the emplacement of Columbia River basalts as large, inflated pahoehoe lava flow fields: Geophysical Research Letters, v. 23, p. 2689–2692, doi: 10 .1029 /96GL02450 .
Self, S., Thordarson, T., and Keszthelyi, L., 1997, Emplacement of continental flood basalt lava flows, in Mahoney, J., and Coffin, F., eds., Large Igneous Provinces: Continental, Oceanic, and Planetary Flood Volcanism: American Geophysical Union Geophysical Monograph 100, p. 381–410, doi: 10 .1029 /GM100p0381 .
Steinkamph, W.C., and Hearn, P.P., 1996, Ground-Water Geochemistry of the Columbia Plateau Aquifer System, Washington, Oregon, and Idaho: U.S. Geological Survey Open-File Report 95-467, 67 p.
Stevens, T.O., and McKinley, J.P., 1995, Lithoautotrophic microbial ecosystems in deep basalt aquifers: Science, v. 270, p. 450–454, doi: 10 .1126 /science .270 .5235 .450 .
Stevens, T.O., McKinley, J.P., and Fredrickson, J.K., 1993, Bacteria associated with deep, alkaline, anaerobic groundwaters in southeast Washington: Microbial Ecology, v. 25, p. 35–50, doi: 10 .1007 /BF00182128 .
Swanson, D.A., Wright, T.L., Hooper, P.R., and Bentley, R.D., 1979, Revisions in Stratigraphic Nomen clature of the Columbia River Basalt Group: U.S. Geological Survey Bulletin 1457-G, 59 p.
Thordarson, T., and Self, S., 1998, The Roza Member, Columbia River Basalt Group: A gigantic pahoehoe lava flow field formed by endogenous processes: Journal of Geophysical Re-search, v. 103, p. 27,411–27,445, doi: 10 .1029 /98JB01355 .
Tolan, T.L., Martin, B.S., Reidel, S.P., Anderson, J.L., Lindsey, K.A., and Burt, W., 2009, An intro-duction to the stratigraphy, structural geology, and hydrogeology of the Columbia River flood-basalt province: A primer for the GSA Columbia River Basalt Group field trips, in O’Connor, J.E., et al., eds., Volcanoes to Vineyards: Geologic Field Trips through the Dy-namic Landscape of the Pacific Northwest: Geological Society of America Field Guide 15, p. 599–643, doi: 10 .1130 /2009 .fld015 (28) .
Villiger, S., Ulmer, P., and Muntener, O., 2007, Equilibrium and fractional crystallization experi-ments at 0.7 GPa; the effect of pressure on phase relations and liquid compositions of tholeiitic magmas: Journal of Petrology, v. 48, p. 159–184, doi: 10 .1093 /petrology /egl058 .
Vye-Brown, C., Gannoun, A., Barry, T.L., Self, S., and Burton, K.W., 2013a, Osmium isotope vari-ations accompanying the eruption of a single lava flow field in the Columbia River Flood Basalt Province: Earth and Planetary Science Letters, v. 368, p. 183–194, doi: 10 .1016 /j .epsl .2013 .02 .003 .
Vye-Brown, C., Self, S., and Barry, T.L., 2013b, Architecture and emplacement of flood basalt flow fields: Case studies from the Columbia River Basalt Group, NW USA: Bulletin of Volcanol-ogy, v. 75, p. 697–717, doi: 10 .1007 /s00445 -013 -0697 -2 .
Wells, R.E., Niem, A.R., Evarts, R.C., and Hagstrum, J.T., 2009, The Columbia River Basalt Group—From the gorge to the sea, in O’Connor, J.E., et al., eds., Volcanoes to Vineyards: Geologic Field Trips through the Dynamic Landscape of the Pacific Northwest: Geological Society of America Field Guide 15, p. 737–774, doi: 10 .1130 /2009 .fld015 (32) .
White, A.F., Yee, A., and Flexser, S., 1985, Surface oxidation-reduction kinetics associated with experimental basalt-water reaction at 25°C: Chemical Geology, v. 49, p. 73–86, doi: 10 .1016 /0009 -2541 (85)90148 -2 .
White, A.F., Peterson, M.L., and Solbau, R.D., 1990, Measurement and interpretation of low levels of dissolved oxygen in ground water: Groundwater, v. 28, p. 584–590, doi: 10 .1111 /j .1745 -6584 .1990 .tb01715 .x .
Wright, T.L., Grolier, M.J., and Swanson, D.A., 1973, Chemical variation related to the stratigra-phy of the Columbia River Basalt: Geological Society of America Bulletin, v. 84, p. 371–386, doi: 10 .1130 /0016 -7606 (1973)84 <371: CVRTTS>2 .0 .CO;2 .
Zakharova, N.V., Goldberg, D.S., Sullivan, E.C., Herron, M.M., and Grau, J.A., 2012, Petrophysical and geochemical properties of Columbia River flood basalt: Implications for carbon seques-tration: Geochemistry, Geophysics, Geosystems, v. 13, Q11001, doi: 10 .1029 /2012GC004305 .
Downloaded from http://pubs.geoscienceworld.org/gsa/geosphere/article-pdf/14/1/286/4120162/286.pdfby gueston 02 September 2022