2.4 N euromagnetism
72
190 Chapter 2 Diomagnetism 2.4 N euromagnetism THOMAS ELBERT The Brain is just the weight of God - For - Heft them - Pound for Pound - And they will differ - if they do - As syllable from Sound - EMILY DICKINSON, 1862 2.4.1 Introduction to Magnetencephalography According to Emily Dickinson, in 1862, brain function cannot be measured by physical scales. Nevertheless, as we near the end of the 20th century our attempts to measure, "pound for pound", pieces of brain structure and function have not been abated. We carry on, despite an ongoing struggle between the frustration of our inability to un- derstand the functioning of the brain and the illusion that we may, at some point, be able to fit the pieces of our knowledge into the grand picture. Indeed, with every observation of normal and abnormal brain processes, the chances of determining the etiology of pathological conditions increases and the prospects of developing better diagnoses and treatment procedures improves. Measuring brain function as precisely as possible in its fluctuation in time and space on different scales constitutes the en- trance for the understanding of brain functioning on a holistic, systemic level. When activational brain patterns have simple spatial configurations, magndoencephalogra- phy allows the macroscopic description of active neural sources with high spatiaf and nearly arbitrary temporary resolution. No other method currently available provides comparable informationI. The present chapter provides an introduction to Magnetoencephalography (MEG) and presents selected examples of studies employing MEG and the MEG-based meth- ods used to locate active regions in the brain (magnetic source imaging -MSI). Reviews of basic work on perceptual processing and studies of movement-related activity in- clude the ones by Hari (1990); Hari & Ilmoniemi (1986); Hoke (1988); Williamson & Kaufman (1987). Clinical applications are summarized by Lewine & Orrison (1995); Makela et al. (1998), and Naatanen et al. (1994) outline the potential of MEG for the studies of human cognition. 2.4.1.1 Overview The sour.ces of biomagnetic signals result mostly from processes of neuronal or muscu- lar excitation. The signals originate from an intracellular current flow with a relatively high current density. The excited portion of the nerve endings or muscle tissue repre- sents a local source of current. At different locations the current penetrates through the cell membrane such that the circuit can be closed over the volume conductor Le., by current pathways through extracellular body tissue. The bioelectric potentials that 1 ]0 the future, optical methods may promise similar or even greater poteritial but non-invasive optical imaging of human brain function remains to be developed.
-
Upload
khangminh22 -
Category
Documents
-
view
2 -
download
0
Transcript of 2.4 N euromagnetism

190 Chapter 2 Diomagnetism 2.4 Neuromagnetism
2.4 N euromagnetism
THOMAS ELBERT
The Brain is just the weight of God For - Heft them - Pound for Pound
And they will differ - if they do -As syllable from Sound -
EMILY DICKINSON, 1862
b.
~~ ~
~
~ :: : ~. : ~
: ~ ~~
originate from the volume currents, like Elec'evoked or event-related potentials (EP, ERP)decades ago, and furthermore, have becomecognitive and behavioral neuroscience. T-,:eEelectrodes attached to the surface of the scameasures the voltage fluctuationsori the surtrades. For our purposes it is significant tbody not only evokes an electric potential dialso elicits a measurable magnetic field. AImagnetic counterparts are found in measureFig. 2.58), and evoked or event-related magi
Biomagnetic fields have a very low amptrue for the magnetic field which appears aactivity, the amplitude of the MEG lies aralmost 5-6 a-rders of magnitude less than th;activity generated by power lines, cars or I
fields of a sensory stimulation lie somewherTesla), one order of magnitude smaller.
Measuring the extremely weak biomagrfree of contact with the subject or patient,for technical equipment. Biomagnetic me1the scientific and clinical importance thatthe clear advantages that they hold over talone. A major advantage lies in the fa(are vertical to the body's surface essentiawhereas the electric potential distribution
2.4.1 Introduction to Magnetencephalography
According to Emily Dickinson, in 1862, brain function cannot be measured by physicalscales. Nevertheless, as we near the end of the 20th century our attempts to measure,"pound for pound", pieces of brain structure and function have not been abated. Wecarry on, despite an ongoing struggle between the frustration of our inability to understand the functioning of the brain and the illusion that we may, at some point,be able to fit the pieces of our knowledge into the grand picture. Indeed, with everyobservation of normal and abnormal brain processes, the chances of determining theetiology of pathological conditions increases and the prospects of developing betterdiagnoses and treatment procedures improves. Measuring brain function as preciselyas possible in its fluctuation in time and space on different scales constitutes the entrance for the understanding of brain functioning on a holistic, systemic level. Whenactivational brain patterns have simple spatial configurations, magndoencephalography allows the macroscopic description of active neural sources with high spatiaf andnearly arbitrary temporary resolution. No other method currently available providescomparable informationI .
The present chapter provides an introduction to Magnetoencephalography (MEG)and presents selected examples of studies employing MEG and the MEG-based methods used to locate active regions in the brain (magnetic source imaging -MSI). Reviewsof basic work on perceptual processing and studies of movement-related activity include the ones by Hari (1990); Hari & Ilmoniemi (1986); Hoke (1988); Williamson &Kaufman (1987). Clinical applications are summarized by Lewine & Orrison (1995);Makela et al. (1998), and Naatanen et al. (1994) outline the potential of MEG for thestudies of human cognition.
2.4.1.1 Overview
The sour.ces of biomagnetic signals result mostly from processes of neuronal or muscular excitation. The signals originate from an intracellular current flow with a relativelyhigh current density. The excited portion of the nerve endings or muscle tissue represents a local source of current. At different locations the current penetrates throughthe cell membrane such that the circuit can be closed over the volume conductor Le.,by current pathways through extracellular body tissue. The bioelectric potentials that
1 ]0 the future, optical methods may promise similar or even greater poteritial but non-invasiveoptical imaging of human brain function remains to be developed.
Fig. 2.58: Example of simultaneous EEG (left)are attached on places as indicated(F: frontal, C: central, P: parietal, T:voltage measured between these posi(c) At the sametinie interval, the IT
a function of time, horn 37 sensor I,left temporal region as indicated. Abecomes also visible in t,he EEG. SI(Data courtesy to Dr. C. Wienbruch
/

2.4 Neuromagnetism 191
: ::~
~ ~
~!
~::
~, : ::: :
Fig. 2.58: Example of simultaneous EEG (left) and MEG (right) recordings. (a) Electrodesare attached on places as indicated by the black dots and also at the earlobes(F: frontal, C: central, P: parietal, T: temporil.l sites). (b) The EEG refers to thevoltage measured between these positions and the eadobes as a function of time.(c) At.the same time interval, theto:agnetiCfield{MEG) was meaSured, also asa functio~ -ofiime"-from 37simsor locations. (d) Sensors were 'locatedover theleft temporal region as indicated. A clear spike can be detected in the MEG andbecomes also visible in the EEG.-Spikes are comlllon in patients with epilepsy.(Data courtesy to Dr. C. Wienbruch)
originate from the volume currents, like Electroencephalogram (EEG - Fig. 2.58) andevoked or event-related potentials (EP, ERP), were integrated into clinical diagnosticsdecades ago, and furthermore, have become a fundamental parameter of research incognitive and behavioral nenroscience. TheEEG refers tothevoltage derived from twoelectrodes attached to the surface of thescalp,-w1i.ifetn-e Electrocorticogram (ECoG)measures t.he voltage fluctua.t.ions on the surface of the brain, using intracranial electrodes. For our purposes it is significant that the current which runs through t.hebody not only evokes an electric potential dist.ribution on the surface of the body, butalso elicits a measurable magnetic field. Analogous to the electric potentials, thesemagnetic counterparts are found in measures of the Magnetoencephalogram (MEG Fig. 2.58), and evoked or event-related magnetic fields (EF, ERF).
Biomagnetic fields have a very low amplitude (see Fig. 2.1). This is part,icularlytrue for the magnetic field which appears as a result of neuronal act.ivity. For brainactivity, the amplitude of the MEG lies around 1 pT (1 picoTesla = 10-12 Tesla),almost 5-6 orders of magnitlldeless than that of urban noise (resulting from magneticactivity generated by power lines, cars or elevators). The evoked cortical magneticfields of a sensory stimulation lie somewhere around 100 IT (100 femtoTesla "" 10- 13
Tesla), one order of magnitude smaller.Measuring the extremely weak biornagnetic fields is completely non-invasive and
free of contact with the subject or patient, but it requires a great initial investmentfor technical equipment. Biornagnetic methods, however, would never have gained
. the scientific and clinical importance that they increasingly have if it were not forthe clear advantages that they hold over the measurements of bioelectric potentialsalone. A maj\Jr advantage lies in the fact that magnetic field components whichare vertical to the body's surface essentially result from intracellular current flow,whereas the electric potential distribution is brought to the surface by the volume
"
/

192 Chapter 2 Biomagnetism 2.4 Neuromagnetism--~----"--------1
current and is therefore still measurable at considerable distances from the SOurce.(One example of this is the measurement of EKG from extremities: T~e IIleasurem~nt
is ·successful even at a great distance from the heart, such as from the distal sectionof the extremities.) Consequently, the volume currents are considerably distorted, asbody tissue varies greatly in its degree of conductivity, and may be even markedlyanisotropic-like, for instance, in muscle tissue. As muscles also cover areas of thescalp, and as conductivities vary greatly for scalp, skull, cerebro-spinal fluid and brainwith their complex geometries, neuronal sources can be modeled only to a very limitedextent when information is based on EEG alone. Under most conditions, biomagneticmeasurements allow for the determination of the source of biological activity with abetter spatial resolution (up to only a few mm) than is possible with the measurementof electric potentials. This is particularly true for the source of magnetic fields whichare evoked by various sensory modalities within the primary representational zones ofcerebral cortex. In many instances, this acitivity can be modeled as a single currentdipole. The accuracy of the localization of the "equivalent current dipoles" (ECD)lies somewhere below one half of a centimeter (Liitkenhi:iner et al., 1990, 1996) and isthus not only considerably better than EEG-based source analysis but also superiorto the localizations of brain-imaging methods which are based on blood flow measuressuch as PET (Positron Emission Tomography) or SPECT (Single Photon EmissionComputed Tomography). The accuracy of source localization is not identical with theaccuracy of separating different, simultaneously active sources. While the localizationaccuracy, as seen above, lies somewhere around a few millimeters (particularly therelative localization accuracy), the ability to separate many different sources is aboutone order lower. .
Currents flowing perpendicularly to the surface of the head emit magnetic fieldswith a relatively small signal strength outside the body. They are, so to speak, magnetically silent, but do create a pronounced electrical potential which can be measuredon the surface. Because magnetic fields and electric potentials contain complementaryinformation with respect to their source(s), the ability to measure both types of signalssimultaneously provide constraints on source localization that are not available whenusing one type of signal alone.
In comparison to other imaging methods (see Fig. 2.59 and Section 2.4.9), it isof particular importance to note that MEG and evoked magnetic.Jields, as well asEEG and evoked potentials, are not only capable of valuable spatial resolution, but,in comparison to PET, SPECT, and fMRI (functional Magnetic Resonance Imaging),they possess a much higher temporal resolution, so that it is possible to follow dynamicaspects of functional processes in real time. One further advantage is that it is alsopossible to track neural source localizations even if the activity to be localized is notaccompanied by secondary phenomena such as the changes of the regional blood flowor with local changes of the metabolic activity, as is required with fMRI, PET andSPECT2 .
2 Biomagnetic techniques do not belong to the catergory of imaging techniques like eT, MRl OrPET, which, on the basis of physical principles alone, allow for the construction of cross sections,i.e. tomograms. The reconstruction of the distribution of sources and their respective intensities fromthe measurements of the magnetic and electric maps outside of the brain is, however, possible if spatialconstraints are included in the mOdelling. Such constraints can be constructed if neurophysiologicalknowledge is taken into consideration. The simplest type of constraint is the assumption of one or afew focal sources. More complex models restrict the sources to the (de)polarization of gray matter.
Log sizeI m -
Brain0.1 m -I·.cm -Map
mm -Column
0.1 mm -Neuron 10 I'm -Dendrile I I'm -Synapse 0.1 I'm - i
ms
Fig. 2.59: Temporal and spatial refunction: EEG Electroen<bination of functional mafunctional Magnetic ResOIphy (see Sections 3.2.2 an,
The advantages of MEG-ba;source imaging is accompanieda series of requirements in ordermeasure the extremely weak magnlfields. Since the discovery ofJosephson Effect and the developmof the SQUID, which resulted frthis discovery, these requirements h,been fulfilled. The Josephson Eflis a phenomenon which only appewith superconductors. In orderfacilitate superconduction, thetectors must be enclosed withinalmost mari~sized, helium-filled "1war" which - in "whole head systeIl- is shaped such that it surroundsscalp, Le., covering the entire nrocranium (see Figs. 2.13 and 2,(Such a highly sensitive measuremdevice not only detects the desiredtivity coming from the brain, but G
records the ever-present environmtal noise which arises from the USE
electra-magnetic devices. Therefoflsecond requirement for MEG meas\:ments is to protect the sensors frdisturbing environmental magnlfields much stronger than those be

2.4 Neuromagnetism
Log size
Brain
Map
Column0.1
Neuron 10 I'm -Dendrite I I'm -Synapse 0.1 I'm - i
ms sec win hours daysLog time
193
Fig. 2.59: Temporal and spatial resolution of imaging techniques for the study of brainfunction: EEG Electroencephalography, MSI: Magnetic Source Imaging (Combination of functional mangetoencephalography with structural MRT); fMRT:functional Magnetic Resonance Tomography; PET: Positron Emission Tomography (see Sections 3.2.2 and 2.4.9)
The advantages of MEG-basedsource imaging is accompanied bya series of requirements in order tomeasure the extremely weak magneticfields. Since the discovery of theJosephson Effect and the developmentof the SQUID, which resulted fromthis discovery, these requirements havebeen fulfilled. The Josephson Effectis a phenomenon which only appearswith superconductors. In order tofacilitate superconduction, the detectors must be enclosed within analmost man-sized, helium-filled "Dewar" which - in "whole head systems"- is shaped such that it surrounds thescalp, Le., covering the entire neurocranium (see Figs. 2.13 and 2.60).Such a highly sensitive measurementdevice not only detects the desired activity coming from the brain, but alsorecords the ever-present environmental noise which arises from the use ofelectro-magnetic devices. Therefore, asecond requirement for MEG measurements is to protect the sensors fromdisturbing environmental magneticfields much stronger than those being
Fig. 2.60: An MEG "whole-head system"typically includes 120 to 150 magnetic sensors that embody pickup coils and SQUIDs, housed ina bath of liquid helium. Heliumboils at a temperature close to absolute zero and thus keeps the sensors in a superconducting. state.The element that contains the sensors, the socalled Dewar, insulatesthe liquid by means of a VacCUffi.

194 Chapter 2 Biomagnetism
~'.'.
2.4 Neuromagnetism
measured. For this reason, MEG measurements are carried out in a magneticallyshielded room which attenuates the magnetic current fields of the environment (seeSection 2.2 for details on biomagnetic instrumentation). '
The combination of MEG with MRI information into a merged graphic data set iscalled Magnetic Source Imaging. While previously practical work just superimposedthe location of an equivalent current dipole determined from MEG data onto thecorresponding MRT section, current techniques have been developed that also useMRI information to constrain source configurations to gray matter of the cortex. Ithas proven to be useful, particularly in clinical practice for reconstructing the corticalsheet by surface rendering and to display anatomy, pathological tissue and functionalactivation in a single image.
2.4.1.2 History and the Relation of Magnetoencephalography to OtherMethods for the Noninvasive Study of Brain Function
With the discovery of x-rays by Rontgen (Rontgenstrahlung) in the year 1895 it became possible to noninvasively image structures within the body for the first time.X-ray diagnostic allowed for the imaging of the structure of bones as well as - bymeans of contrasting agents - blood vessels, the gastro-intenstinal tract, and othertracts containing fluids within the body. Using powerful computers, it is possible toreconstruct the three-dimensional appearance of an object or sections (Greek: Tomos)of an organ using only the shadow that the object casts into the different directions ofspace. Such procedures of computer-assisted tomography (CAT) have not only beendeveloped on the basis of x-rays but also for the imaging of organs using radioactivelylabeled substances that are inhaled or injected into the body (like PET, or SPECT),or for imaging of organ sections that result from the magnetic resonance of protons(Magnet-Resonance-Tomography = MRT; see Chapter 3).
Galavani's observations, made as early as the first half of the 19th century, demonstrate that electrical activity serves as the basis of nerve and muscular activity. In the1870s the physiologist Richard Caton, from Liverpool, discovered that "feeble currentsof var'ying degree pass through the multiplier when the electrodes are placed on two pointsof the external surface, Or one electrode on the gray matter and one on the surface of theskull" (1875, p. 278). Caton also observed responses evoked by external stimuli whichled him to the following conclusion: "When any part of the gray matter is in a state offunctional activity, its electric wrrent voltage usually exhibits negative variation."
In a further and essential step, the psychiatrist Hans Berger fist described electricalrecordings from the human scalp, which he named electroencephalogram (EEG), in19293 . Although it was already assumed at this time that electrical currents alsogenerate magnetic fields, i.e., an MEG, no measurement technique existed until fortyyears later.
In 1963, Baule and McFee measured the Magnetocardiogram (MCG) for the firsttime, thus proving that it is possible to record magnetic activity generated withinthe body (Baule & McFee, 1963). The first measurements of cerebral magnetic fieldswere reported by David Cohen in 1968, at the Massachusetts Institute of Technology,
3 "Da ieh aus spraehliehen Griinden das Wort 'Eleetroeerebrogramm', das sieh aus grieehisehen undlateinisehen Bestandteilen zusammensetzt, fur barbariseh halte, moehte ich flir diese von mir hier zumerstenmal beim Mensehen naehgewiesene Kurve in Anlehnung an den Namen 'Elektrokardiogramm'den Namen 'Elektroenkephalogramm' vorsehlagen." (Berger, 1929).
/
where the first magnetically shieldeet al., 1970). A significant portiorWilliamson and Lloyd Kaufman (I
1980; Williamson & Kaufman, 1911970s the majority of the differendiscovered (Hoke, 1988; Hoke et aiwork remains to be done to investithe beginning of the 1990s, only abin this huge undertaking. The 1\1SQUIDs (see Section 2.2.3). Withbeen a substantial increase in the n
brain activity. Apart from HelsinkiJapan have the highest density witl2.2.7).
2.4.2 The Generation ofBrain
2.4.2.1 Functional Neuroanat
The principal building blocks of thEmore abundant by a factor of 10.the maintenance of proper concentand other substances between capithe information processing units.
When a neuron fires, it sends aization along its axons that travel iwith its neighboring cells, the synar:will travel across the 50mm wide syrotransmitter then changes the menion channels through the cell memtential and consequently extra- and1995, for an introduction). The r:outflow of negative (excitatory: Elextracellular space. These ions willsoma or passively diffuse through tK+ - through adjacent glial cells.such PSPs also create measurable V<
the EEG.
Ions are pumped back through tdrite and the soma, and consequentfrom the dendrites towards the sonSavart law, the intracellular currerWhen tens of thousands of such pcmagnetic flux becomes measurablestimulus generally creates a magnethat about 1 million synapses have

n 2.4 Neuromagnetism 195
y
is:clleleItalal
ele.byertoIS)ofen!lyl') ,illS
Ill
heIIts
IIts
theich, of
ca!in
!sorty
irstIllnMstgy,
ondnunnm'
where the first magnetically shielded room was built in 1967 (Cohen, 1968, 1972; Cohenet al., 1970). A significant portion of the initial work on MEG was done by SamuelWilliamson and Lloyd Kaufman at New York University (Kaufman & Williamson,1980; Williamson & Kaufman, 1981; Williamson et al., 1979). In the course of the1970s the majority of the different types of biomagnetic signals were subsequentlydiscovered (Hoke, 1988; Hoke et al., 1994; Lewine & Orrison, 1995). However, muchwork remains to be done to investigate and understand these signals in detail. Untilthe beginning of the 1990s, only about two dozen laboratories world-wide participatedin this huge undertaking. The MEG measurement method is now fully based onSQUIDs (see Section 2.2.3). With the advent of the whole-head systems, there hasbeen a substantial increase in the number of laboratories investigating neuromagneticbrain activity. Apart from Helsinki as a center in biomagnetic research, Germany andJapan have the highest density with more than a dozen systems each (see also Section2.2.7).
2.4.2 The Generation of Electromagnetic Fields in the HumanBrain
2.4.2.1 Functional Neuroanatomy
The principal building blocks of the brain are neurons and glial cells, the latter beingmore abundant by a factor of 10. The glia are important for structural support, forthe maintenance of proper concentrations of ions, and for the transport of nutrientsand other substances between capillary blood vessels and brain tissue. Neurons arethe information processing units.
When a neuron fires, it sends a transient change in its electrical membrane polarization along its axons that travel into its many axonal branches. At special contactswith its neighboring cells, the synapses, the neuron will secret a neurotransmitter thatwill travel across the 50mm wide synaptic cleft to the neighboring neurons. The neurotransmitter then changes the membrane properties of the postsynaptic cell, openingion channels through the cell membrane, causing slow changes in its membrane potential and consequently extra- and intracellular current flows (see, e.g. Kandel et al.,1995, for an introduction). The postsynaptic potentials (PSP) arise from the netoutflow of negative (excitatory: EPSP) or positive (inhibitory: IPSP) charges intoextracellular space. These ions will be actively pumped back along the dendrite andsoma or passively diffuse through the membrane of the neuron or - as in the case ofK+ - through adjacent glial cells. The extracellular currents that result from manysuch PSPs also create measurable variations in the scalp potentials, thereby producingthe EEG.
Ions are pumped back through the cell membrane at various points along the dendrite and the soma, and consequently, an intracellular branch, Le., current that flowsfrom the dendrites towards the soma closes the current loop. As given by the BiotSavart law, the intracellular current causes, like any current flow, a magnetic field.When tens of thousands of such postsynaptic currents are synchronously active, themagnetic flux becomes measurable as a magnetically evoked response. An externalstimulus generally creates a magnetic response of a magnitude which would suggestthat about 1 million synapses have been synchronously activated in cerebral cortex.
"
196 Chapter 2 Biomagnetism 2.4 Nellromagnetism
The transmembrane ionic and displacement currents contribute little to the extracranial magnetic field because they are radially symmetric around neuronal processes(Swinney & Wikswo, 1980). In principle, the extracellular volume currents may alsocontribute to magnetic activity, but generally this contribution is negligibly small whenonly the magnetic field normal to the head's surface is measured. If the conductivemedium in which the neurons are embedded is of infinite dimensions and uniform conductivity, the extracellular currents are symmetric in such a way that the magneticfield generated by each current path is canceled by the magnetic field generated byother extracellular current elements.
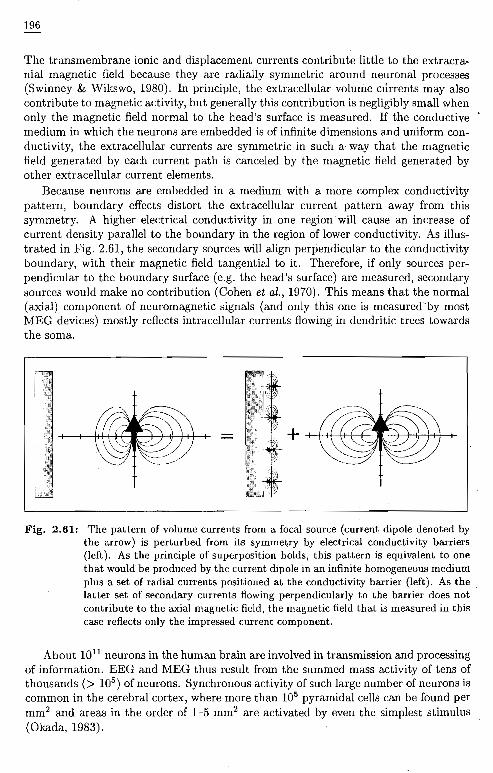
Because neurons are embedded in a medium with a more complex conductivitypattern, boundary effects distort the extracellular current pattern away from thissymmetry. A higher electrical conductivity in one region will cause an increase ofcurrent density parallel to the boundary in the region of lower conductivity. As illustrated in Fig. 2.61, the secondary sources will align perpendicular to the conductivityboundary, with their magnetic field tangential to it. Therefore, if only sources perpendicular to the boundary surface (e.g. the head's surface) are measured, secondarysources would make no contribution (Cohen et al., 1970). This means that the normal(axial) component of neuromagnetic signals (and only this one is measured by mostMEG devices) mostly reflects intracellular currents flowing in dendritic trees towardsthe soma.
Fig. 2.61: The pattern of volume currents from a focal source (current dipole denoted bythe arrow) is perturbed from its symmetry by electrical conductivity barriers(left). As the principle of superposition holds, this pattern is equivalent to onethat would be produced by the current dipole in an infinite homogeneous mediumplus a set of radial currents positioned at the conductivity barrier (left). As thelatter set of secondary currents flowing perpendicularly to the barrier does notcontribute to the axial magnetic field, the magnetic field that is measured in thiscase reflects only the impressed current component.
About lOll neurons in the human brain are involved in transmission and processingof information. EEG and MEG thus result from the summed mass activity of tens ofthousands (> 105 ) of neurons. Synchronous activity of such large number of neurons iscommon in the cerebral cortex, where more than 105 pyramidal cells can be found permm2 and areas in the order of 1-5 mm2 are activated by even the simplest stimulus(Okada, 1983).
Fig. 2.62: The figure illustrates pyrarelative position The mientitude of cell bodies countldensely packed the pyramneurons in the cortex. (Frl
Cortical neurons· can be dividedcells constitute about 85% (Figs. 2.1close to the soma and are densely ccases the axon is directed inward, tmto the cortical surface along a straigthe axon may ascend into upper cortwhite matter before it enters cortex 1
104 axon terminals is quite large in «
star-like across the soma, an apicalayers with horizontal elongations. ]
• They possess many spines. S,that bear plastic synapses, i.1larize the postsynaptic memblprerequisite for learning.
• local and long-range connectic
• at the soma there are probabl,
• on the dendritic tree there are

2.4 Neuromagnetism 197
Fig. 2.62: The figure illustrates pyramidal cells from one Golgi preparation in their correctrelative position The microphotograph inserted at the top right shows the multitude of cell bodies counterstained with a Nisslstain. This insert illustrates howdensely packed the pyramidal cells are; a cell type that constitutes 85% of theneurons in the cortex. (From: Braitenberg & Schiiz, 1991)
Cortical neurons can be divided into two basic types: The excitatory pyramidalcells constitute about 85% (Figs. 2.62 and 2.63). In these neurons, the dendrites startclose to the soma and are densely covered with spines (> 1 spine/j.tm). In nearly allcases the axon is directed inward, towards the white matter and travels perpendicularlyto the cortical surface along a straight line until the first divisions begin. From there,the axon may ascend into upper cortical layers or then, myelinated, constitute a part ofwhite matter before it enters cortex again. The volume that is innervated by the nearly104 axon terminals is quite large in each of these cases. A basal dendritic tree extendsstar-like across the soma, an apical dendritic tree stretches out till the uppermostlayers with horizontal elongations. Pyramidal cells bare the following characteristics:
.• They possess many spines. Spines are bubble-like extensions on the dendritesthat bear plastic synapses, i.e., synapses that may alter their power to depolarize the postsynaptic membrane. The presence of these spines seems to be aprerequisite for learning.
• local and long-range connections
• at the soma there are probably only inhibitory synapses
• on the dendritic tree there are predominantly (95%) excitatory synapses
"

198 Chapter 2 Biomagnetism 2.4 Neuromagnetism--- -------------
• the axon terminals have only excitatory synapses
Stellate cells are, generally, of inhibitory nature. The dendrites, mostly withoutspines, are arranged around the cell body in star-like (stellate) manner. In contrast tothe pyramidal cells, the dendritic trees of stellate cells do not have a preferred directionwith respect to the cortical surface. The axon leaves the soma in an arbitrary directionand branches immediately and in many small volumes. Stellate cells bare the followingcharacteristics:
• few or no spines
• only local connections
• only type II synapses (inhibitory) on the axon
\
the intracellularcurrent that flowsperpendicularIy tothe cortical surfaceproduces the MEG
B ::;:;110I/2nr
Fig. 2.63: Three pyramidal cells are outlined on the right of this graph. The den~ritic treeswith their spines appear thicker than the axonal branches below. Depolarizationof pyramidal cells, caused by excitatory post-synaptic potentials (EPSP), resultsin an outflow of negative charges into extracellular space near the synapses. Thegeneration of EEG (through volume currents) and MEG (induced by the intracellular currents) results from current flows initiated mainly by EPSPs. One neuroncan generate a magnetic field of some 0.002 IT and thus up to 50,000 neuronsmust be depolari~ed synchronously in order to explain a typical sensory evokedmagnetic field.
For our purpose, it does not seem important to differentiate further types, like,e.g. the Martinotti cells, that send spirally axons upward from deeper layers of thecortex. It is, however, important to note that the basic composition of the different celltypes is very similar throughout the cortex. This fact suggests that similar schemataand principles for the processing of information as well as for the generation of electromagnetic activity apply for the whole cortex. A neuron may receive as many as 1000signals, Le. depolarization/hyperpolarization of the membrane potential by neighboring neurons at any given time. If the depolarization at the axon hillock exceeds some
/
-40 mV, a pyramidal cell may exEh-aitenberg & Schuz (1991) estirrthors considered the quantitativesynapses per neuron, the numberof axonal branches per neuron (4mm3 (4.1 km) or just the distribucortex, they could not detect qua,macroscopic bundles that supportthat connects the Wernicke and Econnections between neurons seenmated length of dendrites per neuto 400 m per mm3 cortex). Hencethe majority of which (75%) are I(
The sensory input into the hunall cortical neurons. In other wortributed into a vast network beforeit does not seem astonishing thatbehavior to a much greater extent
When many pyramidal cells Iwhen their apical dendrites are desurface and at the scalp fed by thfThe magnetic fields induced by th,the MEG. Stellate cells do not coractivated cells tend to cancel eachVice versa, it seems reasonable to ggenerated by pyramidal cells, resulpoints toward an increase in corticabe a reduction of excitability or e)lIPSPs at the apical dendrites wouldhowever, that inhibitory synapses cthe cell body, as only when close toveto to a depolarization traveling fthe soma draw current from both tlation of the two current branchesare unlikely to contribute much toare therefore probably due to a red1987; Rockstroh et al., 1989; Elbelof ongoing c~ain-like activation ofet al., 1989).
2.4.2.2 Cell Assemblies
Ultimately, it will only be possiblethat generates MEG and EEG on tl:activity in a plastic network of excitassemblies (Braitenberg, 1978; Brafundamental to models concerned v

2.4 Neuromagnetism 199
-40 mV, a pyramidal cell may excite as many as 5000-10.000 cells. For the mouse,BTaitenberg & Schiiz (1991) estimated a number of 7000-8000 cells. When these authors considered the quantitative characteristics of connectivity, like the number ofsynapses per neuron, the number of synapses per axon (180/mm), the total lengthof axonal branches per neuron (4 cm) or the total length of all axons within a givenmm3 (4.1 km) or just the distribution of different cell types in different regions of thecortex, they could not detect qualitative differences between the different regions. Ifmacroscopic bundles that support long range connections (like the fasciculus arcuatusthat connects the Wernicke and Broca's areas) are not taken into consideration, theconnections between neurons seem to be quite stochastic in nature. The total estimated length of dendrites per neuron can be estimated to be 3~5 mm (correspondingto 400 m per mm3 cortex). Hence, there are about 2 synapses on a fLm of a dendrite,the majority of which (75%) are located on a spine.
The sensory input into the human cerebral cortex comprises only about 1/1000 ofall cortical neurons. In other words, every sensory signal that reaches cortex is distributed into a vast network before it results in a behavioral output. And consequently,it does not seem astonishing that the current status of the network determines thisbehavior to a much greater extent than the particular sensory event.
When many pyramidal cells become synchronously activated, and particularlywhen their apical dendrites are depolarized, a negativity is generated at the corticalsurface and at the scalp fed by the volume currents, generating the EEG (Fig. 2.63).The magnetic fields induced by the many tiny intracellular current flows summate tothe MEG. Stellate cells do not contribute: Due to their lack of a spatial orientation,activated cells tend to cancel each other's contribution to macroscopic measurements.Vice versa, it seems reasonable to generally assume that surface negativity, i.e. activitygenerated by pyramidal cells, results from depolarization of dendritic trees and hencepoints toward an increase in cortical excitability (Elbert, 1992, 1993). Positivity wouldbe a reduction of excitability or excitation. It has often been argued that summatedIPSPs at the apical dendrites would also produce surface positivity. It should be noted,however, that inhibitory synapses are probably not common at greater distances fromthe cell body, as only when close to the axon hillock can they throw in their inhibitoryveto to a depolarization traveling from the dendrites towards the soma. PSP close tothe soma draw current from both the soma and the dendritic tree with partial cancellation of the two current branches at distant sites of measurement. Therefore, IPSPsare unlikely to contribute much to this process. Surface-positive waves like the P300are therefore probably due to a reduction in cortical excitability (Elbert & Rockstroh,1987; Rockstroh et al., 1989; Elbert, 1993) and P300 would indicate an interruptionof ongoing c~ain-like activation of cell assemblies (Birbaumer et al., 1990; Rockstrohet al., 1989).
2.4.2.2 Cell Assemblies("---
Ultimately, it will only be possible to achieve an understanding of mass cooperationthat generates MEG and EEG on the basis ofabrain theory that allows for modeling ofactivity in a plastic network of excitatory (and inhibitory) neurons. The concept of cellassemblies (Braitenberg, 1978; Braitenberg & Schiiz, 1991; Hebb, 1949) has becomefundamentCLl.~o.rnodelsconcerned with the functioning of the brain even though many
"

200 Chapter 2 Biomagnetism 2.4 Neuromagnetism
neuroscientists were initially reluctant to accept this position. Hebb (1949)postulatedthat short-term memory is represented in reverberatory circuits, as described earlierby Lorente de No. Once activated, these circuits can maintain excitation, as they areformed by a set of highly interconnected neurons, each of which receives excitationfrom, and gives excitation to, other members of the same set. If a sufficiently largenumber of neurons in one such cell assembly is activated, then the whole set will becomeactive and produce the function for which it has been sculptured, which includes callingup stored information and outputs to use it.
A key concept related to memory storage is that the structure of these cell assemblies is flexible and can be changed rapidly to update the context of the storedinformation. This requires the continued strengthening of connections between simultaneously active neurons (Hebb's rule "...cells that fire together wire together."), anassumption which has long been considered the physiological basis for the acquisitionof learning and storage of memory. It is thought that increasing the level of postsynaptic activity within neural networks will, in turn, increase the ability of simultaneouslyactive synapses to depolarize the postsynaptic membrane, while insufficient activationis thought to weaken them. Hebbian models of memory were suggested by quite anumber of theorists including Palm (1982) and more recently Brown and associates(1990),~The synapses in the assemblies can be upregulated and down regulated by bothhomosynaptic and heterosynaptic events and by a variety of chemical reactions. Kandel and associates have suggested that the long-term information storage mechanismmay involve the modulation of genetic material (i.e. gene expression) to manufacturea protein within the cell that perpetuates or fixes the specific synaptic gain of a particular synapse in the cell. Probably all of the synapses on dendritic spines are subjectto both short-term and long-term modification in their relative gains, a finding whichsuggests that three out of four cortical synapses are plastic (Braitenberg & Schiiz,1991). The build-up and strengthening of a cell assembly requires that a large portionof synapses in' the neuropil that are not relevant for the incoming information eventbe shut off, otherwise connections would form too randomly. This means that theexcitability of the neuropil must somehow be reduced for a fraction of a second orso before a relevant event can be stored (Birbaumer et al., 1990; Elbert, 1987; Elbertet al., 1992b; Elbert, 1993).
Let us now review the consequences of such a Hebbian view for. the interpretationof brain activity, especially that which can be recorded non-invasively as event-relatedresponses and also observed in its behavioral consequences:
1. The development of cell assemblies depends on plastic ("Hebbian") excitato.rycell systems with a rapid rise time for their construction. The system ideallysuited for this purpose is the apical pyramidal dendritic trees of the upper neocortical layer.
2. A cell assembly sometimes includes widespread cortical neurons including sen~ory, cognitive (meaning) and motor functions. Any restrictive separation intohighly specialized "modules," as is fashionable in present day neuropsychology,ill obsolete; vis-a.-vis the fact that every sufficiently large pool of neurons of thecortex is connected to every other neuronal pool, forming the anatomical basisof our illusion of a unified consciousness. The meaning and qualitative natureof an event, an idea, an emotion, or a percept, is reflected in the local topogra-
phy of its connections and fi"Gestalt" of an assembly inthe cells or its transmitters.
3. This specificity of an assemlfrequency of fast changing elecomponents. It must be fastexplosively as a whole: a wlwithin the fraction of a secOJmeaning-aspects of that delu
The possibility of "observing" con the number of neurons that annumber is not known. Only theOJmany neurons might be involved irange from a few thousand to a fewabout oneflfth of all members wouexpect more than twenty thousanddelectability with MEG. One of thcortical sensory coding is how actneurons leads to a unique and glotformation such that a certain objec'elements is recognized, or how a 0
there is no single area in the cortEbeen suggested that the active neurto one cell assembly by synchronoupercepjcs ..WQuldthenbe.possible tha major .focus .has-been-aILthe.roIE",vent .aIld thereby th~.role that syJlearning, and formation of-memorycally represented .in activity patterrstimulus will activate a population (of a population code. Neurons whicstimulus must be differentiated frOJpopulations in order to avoid falsestim~li. A solutipn to this so-calleof 'seIisdr1<rJtfd~rl{~gb\1 is selected tto be based on temporal coding (Ai.e., when neurons responding to thdischarges with a precision of a fewa temporal synchrony between theto bind Jleuronsdynamically into frelated .or synchronous manner hascell firing and local field potentiale.g., Pantev et al., 1995a). Thesein the gamma-band (from 20 to ovare presented with perceptual task

2.4 Neuromagnetism 201
phy of its connections and firing patterns, or, so to speak, in the topographical"Gestalt" of an assembly in its phase space, not in the properties of its parts,the cells or its transmitters.
3. This specificity of an assembly is best reflected in the spatial distribution andfrequency offast changing electrical activities, such as the EEG and event-relatedcomponents. It must be fast because assemblies must have the ability to ignite(explosively as a whole: a whisper can turn on a full blown paranoid delusionwithin the fraction of a second, including all, or nearly all, sensory, motor, andmeaning-aspects of that delusion.
The possibility of "observing" cell assemblies in action via EEG and MEG dependson the number of neurons that are coherently active in a certain brain region. Thisnumber is not known. Only theoretical considerations provide estimates as to howmany neurons might be involved in a cell assembly. Aertsen et al. (1995) suggest arange from a few thousand to a few ten thousand members of a cell assembly, wherebyabout one fifth of all memher-s would be active at a time. Correspondingly, we cannotexpect more than twenty thousand neurons to be active, a number that may just reachdelectability with MEG. Oneofthefundamental problems in the neurophysiology ofcortical sensory coding is how activity beginning in spatially separated clusters ofneurons leads to a unique and globally coherent percept, how the brain processes information such that a certain object which can be comprised of many different sensoryelements is recognized, or how a certain "Gestalt" comes into our a\\[areness. Sincethere is no single area in the cortex where all I?rQclC~sing pathways converge,'lt hasbeen suggested that the active neuronal clusters peUahiing tQ) a certain object are tied, \""<to one cell assembly by synchronous oscillations. ~irnultaI}~QusJl,djyationofdifferent \percepts_would_then-be-possible through different.oscillatoryJrequenc\es. Ther~fm:e, n
amajorlocus.has-been-oILthe_wle_oLoscillatory brilin responses evoked by ~ given~vent and thereby th~()leJhat synchrony and plasticity play in sensory processing,l~arnii1g~ andfof!nationoLmemory. Within the cerebral cortex, information is typically represented ·in activity patterns of large populations of neurons. Any particularstimulus will activate a population of neurons which describes its properties by meansof a population code. Neurons which belong to a population activated by a particularstimulus must be differentiated from those related to other simultaneously activatedpopulations in order to avoid false conjunctions between features related to differentstimllli. A sol4tion to this so-called "binding problem" (the problem of how a subsetof 'seJs~'rj/'h'lforrl{~fi3n is selected to form the representation of a given object) seemsto be based on temporal coding (Abeles, 1982; von der Malsburg & Schneider, 1986),i.e., when neurons responding to the same stimulus in the visual field synchronize theirdischarges with a precision of a few milliseconds. Indeed, animal research suggests thata temporal synchrony between the response of different neurons could be a mechanismto bind neurons dynamically into functional groups. The firing of cell assemblies in arelated .Qr synchronol.\s manner has been related to synchronous oscillations in singlecell firing and local field potentials (ECoGLof cats and monkeys (for summary see,e.g., Pantev et al., 1995a). These coherent oscillatory brain activities areprorninentin thegaffillla-band (from 20 to oveilOO Hz), for instance, when animals (or humans)are presented with perceptual tasks. -
"

202 Chapter 2 Biomagnetism 2.4 Neuromagnetism--------1
2.4.3 Types of MEG Signals and Techniques of Signal AnalysescL.t; ,(. "'("',"
Neural mass activity produces irregular time series, as can be seen in 'EEG, MEG orECoG. Through visual inspection, it is already apparent that these time series cannotsimply result from an uncoordinated, arbitrary firing of single neurons. Indeed, weexpect that neurons must cooperate and partially synchronize their firing patternsin order to produce meaningful output. A substantial body of research attempts toa) systematically track this code of coordinated activity with linearand stQc:;)lasticstatistical techniques like power spe-Ct~ar~J1~lyses (Hari & Salmelin, 1996) and b) to-trace the dynamics ofthe system, e.g., to "freeze" them in a state space, aspace whichis spanned by the system's variables (Elbert et al., 1994a).
2.4.3.1 Spontaneous Activity Analyzed by Means of Spectral Analyses
Hans Berger was the first to observe the rhythmic oscillations in EEG recordings,which he then labeled according to the Greek alphabet with Alpha (8-12 Hz), as themost prominent activity, Beta (12-20 Hz) and Gamma (> 20 Hz) covering the higherfrequency bands. Only when more sophisticated technology allowed for the examination of the lower frequency ranges and the EEG was recorded during sleep stages,was slower activity divided into Delta (0.5-4 Hz) and Theta (4-8 Hz). Grey Waitersuggested using Theta relating to Thalamus, when he observed that the appearanceof such waves in the course of normal development was related to the maturationof the thalamo-cortical system. Spontaneous rhythms in the Theta and Alpha frequency band reflect a complex interplay for signaling between the cerebral cortex andthe thalamus, which is an essential relay station along the sensory pathways fromthe periphery to the brain and which is also involved in functional loops that coordinate excitability in distant cortical areas (Elbert, 1993). It has been suggested thatthalamo-cortical oscillations contribute to the generation of distinct brain waves.
Greek letters are not only used to denote the different frequency bands, but inaddition, they' indicate typical rhythms or waves that are prominent within thesefrequency bands. Correspondingly, alpha-waves have frequencies within the alphaband, while oscillations with signal power in several frequency bands have their ownletter, such as the Il-rhythms with its components in the alpha- and beta-band.
The alpha waves seem to be primarily generated in those cortical areas that relateto visual input and processing. They are prominent when the subject has the eyesclosed or is in a drowsy state, not paying much attention to the sensory (visual) input.It therefore has been argued that the alpha-waves represent an idling phenomenon thatprevents the build-up of excitation in visual neuronal networks (visual hallucinations)when the eyes are closed and that ascertains that vision is at its peak efficiency assoon as the eyes are opened. For the same reason, a car motor is sometimes left idlingduring a cold winter in Finland, as alii Lounasmaa has put it.
The Il-waves are strongest in amplitude over the central (Rolandic) fissure andFourier analysis suggests that it includes two components, one centered around 10 Hz,the other around 20 Hz. This is already indicated by their 'comb shape', Le. thesimilarity of theses waves to the appearance of repeated "p,": Ilj),j),. MEG investigationsby Hari, Salmelin and coworkers have contributed much to delineate the origin of theserhythms (Hari & Salmelin, 1996). The sources of the j),-rhythm cluster over the centralfissure, with somewhat more anterior dominance for the 20-Hz than for the lO-Hz
cluster. The difference suggests tfrom the precentral motor cortexsomatosensory areas. Support forcome from their different reactivialready smaller 2 s before a volunso after movement. It is thus sirrvisual input and processing. Th<of movement further confirm theunderlie this component.
Suppression of the 20 Hz rh)Its spatial locations follow the honthis Il-rhythm component after megreatest activity in the Vertex regFunctional investigations of this :i.e. when the subject is waiting'1993).
2.4.3.2 Brain Activity Anal~
Theory
The ongoing stream of neuronalpresents itself as an endless variatirregular motion in only one chantraces of brain activity - in thishowever, were selected such that tthe selected time period. Both tralthe conditions during the two obsecompletely different functions evol
Such behavior is well-known fsystems as sensitive dependence 0
dependency in any given determirdefinition of chaos means absence (of chaos is based on non-linear rrestablished during the late 19th c,accessible until the work of Lorenz I
behavior in a deterministic systembehavior totally ruled by (determof thetime-seues=and~me-serchaos._
As physiological systems are rtoolsdeveloped by chaos theory fofor ~xamining EEG andMEc:: jscapproach). If we do not view EECof the brain's engine, but (at leastic regulatory processes of neuronchaos theory to characterize and (theoretical premises cannot be fuIJ

2032.4- Neuromagnetism-"'-----------------------------=-=-=-
cluster. The difference suggests that the 20-Hz activity receives major contributionsfrom the precentral motor cortex, whereas the lO-Hz component seems to reside insomatosensory areas. Support for the functional segregation of these two componentscome from their different reactivity to movements. The level of the 10-Hz rhythm isalready smaller 2 s before a voluntary movement and then returns only within 1 s orso after movement. It is thus similar to the alpha waves that also disappear duringvisual input and processing. The insensitivity of the source locations for the typeof movement further confirm the idea of a widespread idling in sensory areas thatunderlie this component.
Suppression of the 20 Hz rhythm starts later and its rebound may be earlier.Its spatial locations follow the homuncular organization, with most lateral locations ofthis {L-rhythm component after movements offace and lips, foot movements, producinggreatest activity in the Vertex region and movements of digits and hands in between.rtmctlonal investigations of this rhythm suggest that it appears in a "Wait" state,i.e. when the subject is waiting to make a specific response (Kristeva-Feige et al.,1993).
2.4.3.2 Brain Activity Analyzed by Means of Tools Derived frOIu ChaosTheory
The ongoing stream of neuronal mass activity represented in EEG or MEGtracespresents itself as an endless variation of spatio-temporal pattern to the observer. Anirregular motion in only one channel is illustrated in Figure 2.64, in which two suchtraces of brain activity - in this case MEG - were superimposed. The two traces,however, were selected such that there was high resemblance during the beginning ofthe selected time period. Both traces result from the same spatial sensor position, andthe conditions during the two observations are very much the same. Nevertheless, twocompletely different functions evolve quickly, as time progresses.
Such behavior is well-known from the considerations of non-linear deterministicsystems as sensitive dependence on initial conditions. If we observe such a sensitivedependency in any given deterministic system, we call it "chaos". While the classicdefinition of chaos means absence of order and unpredictability, the scientific definitionof chaos is based on non-linear mathematics. Although its principles were already.established during the late 19th century by Poincare, they were not mathematicallyaccessible until the work of Lorenz (Lorenz, 1963). Today, C9110S is_defined as stochasticbehavior in a deterministic system, or more colloquially: Ch!1oS is apparently lawlessbehavior totally ruled by (deterministic)Jil0'J3. Unpredicta.Qilityiii_thede.y~lopmentof theBiii:e-~n~ffemesensitivityto i;itial conditions are the fingerprints ofchaos~ .
As physiological systems !lre non-linear systems, it has.been sugg~st~(Lthat thetools developed by chaos theQry for the analyses of time series might also prove usefulfor ~xamining.EEG andMEG (see e.g. Elbert et al., 1994a, for a summary of thisapproach). If we do not view EEG and MEG as a stochastic signal, e.g., as the noiseof the brain's engine, but (at least partially) as a measure of lawful and deterministic regulatory processes of neuronal mass activity, we can apply the measures fromchaos theory to characterize and quantify the brain mechanisms at work. Even if thetheoretical premises cannot be fulfilled, we may use the theory of chaos to define and
"
./

204 Chapter 2 Biomagnetism 2.4 Neuroma':.gn_e_t_is_m -1
0.1 0.2 0.3 0.4 0.5 0.6 0.7 0.8 o.~
time (sec)
Fig. 2.64: Two traces were selected from one MEG-channel such that a high crosscorrelation existed at their beginning. As can be seen, the original correlationdecays exponentially with time.
quantify complexity as it appears in a given time series. We cannot directly constructa phase space for that part of the brain which generates the EEG, since we do notknow its specific equations or its underlying principles of generation. A revQllltiQni1~y
cliSGQvery irrthe 1980s was the possibility and development of ail algorithm to reconfltrucLan equivalentstateJ5pace. GbYr~n"u~~gle time series such as EE;C;(~) from justolleJocatiQn, how i;;. itP9ssibk tQ.resurrect the dynamics of the generatmg system,a system which possibly inclUdes a large number of independent variables? Takens(1981) and Packard et al. (1980) proposed a reconstruction of the state space by meansof time delays Elt: The values measured at fixed time delays EEG(t), EEG(t+Elt),EEG(t+2Elt) are treated as though they characterized new variables. Other techniques of reconstructing the phase space are summarized in Elbert et al. (1994a).Once a topological equivalent attractor has been reconstructed, we can describe itsfeatures using measures such as the 1JlJ'9~§.t_LyqllU'Tl,I}!L~ponent(LLE) or the fractaldimension of its texture.
This reasoning, however, relies on the assumption that EEG and MEG are generated by a deterministic system. Furthermore, the mathematical computations canonly provide meaningful results in low-dimensional systems. But even if these assumptions arc not strictly fulfilled, we can use such measures to quantify the complexity orthe patterns in a time series and characterize different brain states correspondingly.This is of particular interest if pathological brain states are to be diagnosed.
Attractors are most commonly characterized by the fractal dimension, D2, of theattractor, a measure of the density of points within a certain volume element of the
/
phase space. Depending on theto as dimensional complexity.
The Lyapunov exponent istwo adjacent trajectories. Positquickly with time. As any pression, the error will consequentlya measure for the predictabilit}
Another method of evaluattime series is the '01itu(jl tnfOTnhow rn(inY....9its can_be predicte,measured. history of a function
It is also possible to estimKaplan & Glass (1992) developfon the fact that, in a determinthe region in the phase space..nearly the same orientation. 1serve as an indicator of the detfelements provides an estimator
The most promising applicalthe site of epileptic foci and, pctigation of the determinism incvalues of determinism in intericminism derived from MEG timfbecause the latter picks up moand the lower the system's dimEcome. Genuine epileptic patterrunderlying dynamics by means,a very low fractal dimension (soMal-EEG. Further evidence forseizures came from studying th,(Iasemidis et al., 1990; IasemidiEECoG and discovered abrupt atattack at electrodes close to thusing ECoG and MEG (Elbert
The consistency of results tbsures like LLE and MSI (Elbertclinical diagnosis: As the collaI:cations close to the focus, it mthe MEG provides informationbe developed further such thatavailable (see also Section 2.4.8:
Alterations that can best bein a number of neurological pa(Reviews e.g. Elbert et al., 199'

n 2.4 Neuromagnetism 205
IS
~n
letLOtI[y
0
1stm,nsJlS
t) ,:ha).itstal
~n-
:anIpor~y.
ilieilie
phase space. Depending on the particular algorithm used, this measure is also referredto as dimensional complexity.
The Lyapunov exponent is a quantitative measure describing the separation oftwo adjacent trajectories. Positive LLE indicate that neighboring trajectories divergequickly with time. As any present condition can be specified only with limited precision, the error will consequently inflate over time. The LLE can therefore be considereda measure for the predictability within a time series.
Another method of evaluating complexity and predictability of the EEG/MEGtime series is the 1J1-1l:tu(),ljn[QL11](lti()1!.JY:T!rt{()T!. Thlsmethod refers tQthe~uestionof
how m<lny bi~ can_be predicted on av~age atvarious points in the future,_given themeasuredhistory of a function at time t (Graf & Elbert, 1989).
It is also possible to estimate the determinism inherent in a given time series.Kaplan & Glass (1992) developed a direct test for determinism. Their method is based·on the fact that, in a deterministic system, the trajectory's tangent is a function ofthe region in the phase space. All tangents in a given region of the phase space havenearly the same orientation. The average vector in a volume element can thereforeserve as an indicator of the determinism in this region, and the sum across all volumeelements provides an estimator of the determinism inherent in the time series.
The most promising application of non-linear measures is in the field of diagnosingthe site of epileptic foci and, possibly, the prediction of a seizure. Already the investigation of the determinism indicates that epileptic patients have generally elevatedvalues of determinism in interictual MEG and EEG (Muhlnickel et al., 1994). Determinism derived from MEG time series is consistently greater than for EEG, probablybecause the latter picks lip more widespread activity. The greater the determinismand the lower the system's dimensionality, the more adequate non-linear analyses be- .come. Genuine epileptic patterns comprised the first EEG activity examined for theirunderlying dynamics by means of chaos theory: TIabloyantz & Destexhe (1986) reporta very low fractal dimension (somewhat greater than 2) for the case of strongly PetitMal-EEG. Further evidence for the appearance of a chaotic dynamic during epilepticseizures came from studying the LLE (2.9 ± 0.6 bits/sec). Iasemidis and Sackellares(Iasemidis et al., 1990; Iasemidis & Sackellares, 1991) analyzed intracranially recordedECoG and discovered abrupt attenuation in the LLE prior to and during an epilepticattack at electrodes close to the focus. We were able to confirm these observationsusing ECoG and MEG (Elbert et al., 1997a) as illustrated in Figure 2.65.
The consistency of results that are obtained by applying different non-linear measures like LLE and MSI (Elbert et al., 1997a) suggests that these measures may assistclinical diagnosis: As the collapse of LLE is confined to or at least starts only at locations close to the focus, it may help to define epileptogenic pacemaker zones. Asthe MEG provides information that bears some similarity to ECoG, the method maybe developed further such that more powerful non-invasive diagnostic tools becomeavailable (see also Section 2.4.8).
Alterations that can best be characterized through non-linear measures may existin a number of neurological [Jathologies, such as M. Alzheimer and other dementia(Reviews e.g. Elbert et al., 1994a, 1997a).
-'

Chapter 2 Biomagnetism 2.4 Neuromagnetism~~-~-~---I
N
ERF(t) = M EG(t) = ~ '" 1. N6n=l
TU._.~") noise power = (T~OiBe
If MEG(t)n is considered the sUIground MEG and measurement ernratio (SNR) in proportion to -IN. 1
and SNR can be calculated as followet al., 1988):
. 1 2 11:slgna power = (TSignal = To
withi!1Jhis array. The event is repe.locked signal (ensemble) average isof the epoch. If MEG(t)n denotes t]at time t and trial n, ~he sir;na.~a.ve]
2522.52012.5 15 17.5TIME (min)
107.5
206
20
18
16
14
12
w 10.....I.....I
8
6
4
25
O lJt6ono;n("'. ) .~of th~_~~sump_t~onsof signal aver
Th!§_assumPtion~s."iQ~teR,.,wh~n' th'habittI1l:1esor when its mt~n'cyl%if~~
comP?Il:..nts related to certain cognitivcognitive processes are under investigexceeded, will actually worsen the signOne.Wllyof dealing with. coIIlllonent !<triaL i!!1q align trials on these signals(1967) proposed an iterative procedureach single trial by moving a templatealong the trial to find the latency of rformed by aligning trials on the identias a new template. If the SNR is toesimply reflect random noise.
Another assumption of signal averandom noise. This is only an apprwhen considering the block of alpha acperturbation" (Makeig, 1993; Pantev e
Fig. 2.65: A clear collapse of the LLE can be seen around minute 16, where a seizurehad occurred in a patient with temporal lobe epilepsy. The LLE-indent, how-··ever, remains restricted to distinct locations (thick gray trace). Transient abruptalterations often preceed the attack (in this case at minute 15) and the corresponding sites show reductions in the LLE already 10 minutes before the seizure.The LLE recovers to normal values very quickly after the seizure. (From Elbertet al., 1997a)
2.4.3.3 Signal Analysis of Event-Related Fields
Any external or internal event gives rise to a ch~w!ttl~rj,~~ic pattern in the streamof EEG and MEG. This event-related signal is ~mDeda.ed in the ongoing "spontaneous" fluctuations and must be extracted by averaging techniques. Event-relatedfields (ERF) and event-related potentials (ERP) are theoretically relevant becausethey provide ways of testing theories of abnormal brain functioning that no othermethod can offer. For example, unlike ordinary behavioral tests of cognitive processing, event-related activities give an index of the processing of task-irrelevant events,distracting stimuli, or events subjects have been told to ignore. Th~_t()pographic distribution and method of source localization of ERPs and ERFs gives clues as to whatparts of the brain are active cluring a particl.!lar cognitive activity. The empirical relevance'ofERPs is attested to by the fact that ERP abnormalities have been repeatedlydemonstrated in neurological and psychiatric disorders.
Both ERPs and ERFs benefit greatly from signal averaging and filtering to enhancetheir Sigrial-to-noise ratio. Data are generally digitized at a fixed rate to fill a dataarray, and a stimulus or other synchronizing event defines the time epoch ofinterest
signal - to - noise ratio
Var
=

•• , !,2.4 Neuromagnetism 207
within this array. T)1e event is repeated (each repetition is called atrial), and a timelocke(f~ignal (ensemble) average is calculated across trial epochs for each time pointof the epoch. If MEG(t)n denotes the magnetic field strength at some sensor locationat time t and trial n, t~~gnaLa~erage isdefined as
1 NF?RF(t) = MEG(t) = N L MEG(t)n·
n=1
(2.10)
If MEG(t)n is considered the sum of true signal ERF(t) and random noise (background MEG and measurement error), signal averaging improves the signal-to-noiseratio (SNR) in proportion to ,,(N. Unbiased estimates of signal power, noise power,and SNR can be calculated as follows (Mocks et al., 1984; Roth et al., 1995; 'Duetskyet al., 1988):
. 21fT 2 1 2 ':) szgnal power = O'Signal = T J
oM EG(t) dt - TO'Noise (2.11)
.----"--") noisepower=O'~OiSe T(N1_1)'~ (foT
(MEG(t)n- MEG(t)2)dt)
(2.12)
R; Variance M EG(t)re~- '
pte'e,
,rtsignal - to - noise ratio 2 / 2 .
O'Signal O'Noi.e· (2.13)
lIIl
fa-.ed
~88-
~~~at
~e
~IY
lee~taestII
, I,'
\J.eHxlOly'\((\~']pJCI'iO(C!)One of th<l. assumptions of signal averaging is thatthe sigIlaljsiIlvariantacross trials.This a:§sllmptioIl~s.Vi()~t~4",'~h~r1~eamplitude 6riheEllF compo;ent of interesthabituates or when its mf~n~y ll'anes from trial-to-trial, as is clearly..the case forco~po;;~nts related to certain cognitive processes, such as the 1'300. Particularly whencogilitlve-processes are under investigation, there is an optimum of trials that, whenexceeded, will actually worsen the signal-to-noise ratio as the signal varies or vanishes .One wa.yof dealing with cOIIlP'onentlatency variability is to locate the signal on eachtri9LCl.ndalign trials on these signals rather than on the eliciting stimulus. Woody(1967) proposed an iterative procedure (an adaptive filter) that located the signal oneach single trial by moving a template (initially the signal average) by time incrementsalong the trial to find the latency of maximum correlation. A new average was thenformed by aligning trials on the identified signal latencies, and the new average usedas a new template. If the SNR is too low, this procedure will produce results thatsimply reflect random noise.
Another assumption of signal averaging is that background EEG and MEG israndom noise. This iti only an approximation to the truth, as is already evidentwhen considering the block of alpha activity, or when studying "event-related spectralperturbation" (Makeig, 1993; Pantev et al., 1995a). In normal subjects, auditory tone
"

(2.14)
2.4 Neuromagnetism
Further, Global Dissimilarity Icalculated by subtracting two malet al., 1992).
Once the ERF is obtained, scare extracted, often based on theoretical concept of the response bcomposed by different sub·entitiescalled components.. A componentbe defined as electric or magnetictlvity associated with a specific nelogical or psychological process, forample, as part of a motor act sudmoving one's finger, a part of sewprocessing such as a response to a tpip, or a step in the information 1cessing such as categorizing a stimlas target or non-target (Fig. 2.67).statistical sense, a component expl:experimental variance. Basically,concept of a component rests onidea that information processingbe divided into discrete steps of inmation transformation, each of wlactivates a subprocessor and withdistinct set of regions within the br:Some leads or sensors will pickactivity from those structures belthan others, particularly when SoUlare multiple with overlapping inences. Ever since the stimulating ctributions of Emmanuel Donchin ding the 1970s, the concept of cornnents has been a controversial one.the one hand, the neuronal struCtlwhich are the physiological substIof psychological entities such as "setive attention" or "context updatiare not known and on the other hathe definition of the psychological sunits is often insufficient. EHP lEinsufficiently defined entities. Nevee.g. via the variance explained aCf<
=-20=-8=----_~ ~9_h_'apter 2 Biomagnetism
pips, for instance, reliably produced momentary increases in spectral power 'in the2-8 Hz and 10-40 Hz bands. The phase of the latter activity varies from trial to trialsuch that it cannot be extracted by averaging (see Section 2.4.3.4). '
Before components of the ERF are extracted, it is useful to apply SNR enhancingfilters that incorporate assumptions about frequency, timing, and spatial distributionof the component of interest. For example, the P300cornponentmay be e)(p~cted tohayg a frequency lower than 2 Hz, to peak in a range of 280 to 400 ms (in, a simpleauditory choice reaction time task in young adults). Filters are useful whenever thefrequency of the noise is different from that of the signal. Digital frequency filtershave the advantage over analog filters of being able to operate without introducingdistorting phase shifts into the signal (Elbert, 1991). The most commonly used digitalfilter has been the moving average or boxcar filter, in which each point of the signalis replaced by an average of that point and a certain number of prior and subsequentpoints (Cook & Miller, 1992). It should, however, be kept in mind that analog filtersstill have a place in data acquisition prior to digital filtering, A low-pass analog filterwith a half power frequency below but close to half the sampling rate prevents aliasing.A high-pass analog filter minimizes irrelevant baseline shifts that arise from electrodedrifts in the case of EEG, but may also be present in MEG recordings contaminatedby environmental noise '(e.g. cars, elevators etc.).
For the EEG, current source density maps (also called surface Laplacian or radialcurrent estimate maps; Fig. 2.66) act as spatial filters emphasizing localized components with a high spatial frequency (i.e. more shallow sources). For this to work well, ofcourse, electrodes must be placed with a high spatial frequency (preferably more thanone hundred, when the whole scalp is to be covered (Junghi:ifer et al., 1997). Maps canbe based on unaveraged activity such as epileptic spikes or on signal averages. Theequation for calculating current source density is
('tf2V,' tf2V)
1= P Ox2 + oy2
where V is the voltage, x and y the surface location on the x-y plane, and p the resistivity. In addition, p = k . d2 where d is the distance between electrodes and k isa constant for all electrodes within a subject. In calculating the Laplacian, surfacecontours can be generated by a method called spherical spline interpolation, which isbased on physical principles for minimizing the deformation energy of a thin sphereconstrained to pass through known points (Junghi:ifer et al., 1997; Perrin et al., 1990,1987). It should be noted, however, that an error of measurement for electrode locations as little as a few mm will distort the interpolation and introduce "ghost" sourceswhen the Laplacian is calculated.
For MEG, the spatial gradient (e.g. calculated as the diffElrence between two adjacgnt sensors) can serve as a similar measure that also provides a spatial filter, focusingthe. signal to nearby sources. The Finish Neuromag system uses directly planar gradiometers to n:~cord the MEG, i.e. provides the difference in magnetic field betweentwo adjacent locations.c It is generally useful to obtain a measure for the signal power which is commonly.calculated as the root II.l~an.s.qU:i.J~JItMSl.a(;Eos.sal1cl~anll~ls_aIlg~Qrnetimesreferred
. to_.as_glnba~ power (although po~~r-=wouldjmp!yJh<l:Uhe!1q1l.?:r~Joot.is-noUobe drawn): -'--"- -- •
\..
,:j
IRMS=
1 N
N LMEG(t)~n=l

2.4 Neuromagnetism 209
RMS=1 NN 'L MEG(t)~.
n=l(2.15)
5
o
o
·5
15
10
0.5
-10
-0.5
Scalp - Potential
Scalp - Laplacian
Further,. Global Dissimilarity (GD) is defined as the RMS of the difference mapscalculated by subtracting two maps normalized with respect to their RMS (Brandeiset al., 1992).
Once the ERF is obtained, scoresare extracted, often based on the theoretical c.oncept of the response beingcomposed by different sub-entities, socalled components.. A component canbe defined as electric or magnetic activity associated with a specific neurological or psychologiCal process, for example, as part of a motor act such asmoving one's finger, a part of sensoryprocessing such as a response to a tonepip, or a step in the information prClcessing such as categorizing a stimulusas target or non-target (Fig. 2.67). In astatistical sense, a component explainsexperimental variance. Basically, theconcept of a component rests on theidea that information processing canbe divided into discrete steps of information transformation, each of whichactivates a subprocessor and with it adistinct set of regions within the brain.Some leads or sensors will pick up Fig. 2.66: Comparison of spline-activity from those structures better interpolated scalp potential
and related current source densitythan others, particularly when sources (CSD) for a 65-channel recording.are multiple with overlapping influ- While the scalp potential suggestsences. Ever since the stimulating con- just a single source (tangentialtributions of Emmanuel Donchin dur- current beloW-the vertex), theing the 1970s, the concept of compCl- CSD points at a second sourcenents has been a controversial one. On with a more radial orientationthe one hand, the neuronal structures between Fp1 und F7. It is alsowhich are the physiological substrate obvious that a less dense elec-of psychological entities such as "selec- trode array cannot resolve thesetive attention" or "context updating" sources. For the scalp potentials,are not known and on the other hand, the scale on the right corresponds
th d fi . . f h . hi' I b to lOlLV/unit.e e mtlOn 0 t e psyc 0 oglca su -units is often insufficient. ERP /ERF-components are in the crossing point betweeninsufficiently defined entities. Nevertheless, it is possible to operationalize components,e.g. via the variance explained across distinct experimental conditions.
uyedto
eisceisre0,...es
a~g
'a
en
I)
....
"

210 Chapter 2 Biomagnetism 2.4 Neuromagnetism
Fig. 2.67: Schematic categorization of endogenous components of the event-related potential/field in response to a stimulus (left) and prior to a voluntary response(right). The Nd depends on attentional processes and may be related to memorytraces. The MMN (mismatch negativity, mismatch field) appears when there isa mismatch between the expected stimulus and the actual stimulus perceived,like when a deviant is embedded in a string of standard stimuli. Task relevantevents that interrupt the ongoing processing may give rise to a P300-like component. Preparation for an event, like the preparation for the execution of a motorresponse are preceeded by a surface negative shift in the EEG (Bereitschaftspotential) and a magnetic field change over central and precentral regions.
Measurement procedures include peak-picking, area measurement, W-aveforIllsgbtraction, Principal Components Analysis as well as template correlation, and.9ipolerPodeling (see Coles et al., 1986; Rockstroh et al., 1989; Roth et al., 1995, for reviews).
_.:::' Peak-picking means finding maxima or minima in specified latency ranges and determining peak latency and amplitude with respect to a pre-stimulus baseline. This isthe simplest method of component evaluation, but can be biased when latency rangesare selected after an inspection of the data, and is perhaps unduly restricted in thatit considers only peaks among other waveform features. It should at least be avoidedto base the extracted value on only one point, which may he influenced by noise oroverlapping components. The median over a time interval specified in the range ofmaximal signal power seems to be preferable. This is mand,\tory with multiple sensors where the maxima generally appear at different times.-< Area is ffifasured in aspecifiedlatency range, and thus is based on multiple points. Like peak-picking, areameasurement can be biased and influenced by overlapping components.
, Wavef(}rm subtmetioncan he 11
duce the effects of component overof two_slIIiilar pitches are given inquently than the other. The ERF tthe sensory effects of the tone and L
By subtracting the ERF to the frelthe sensory effects are removed leavthe sensory responses to the two teffects are additive, an assumptionquency specific temporal recovery cthe NIQO to be smaller in response
, Principal Components Analysismeasurement which uses the time pcsensors, and.differentexperimentaiterms, PCA identifies orthogonalspace defined.by .. the .. variables. GI"varimax" procedure. However vamany factors are to be extracted arFurthermore, each experiment give:no establishecLcriterion for decidin!Thus, it is uncertain how many stab!these components with ones previoll
Template correlation assesses thEwaveform to be evaluated. The temrponent shape or on signal averages.by the various procedures? ParametunderlyiI!gumeliability. Fabiani et I
latency estimates of averages to be breliability was similar to peak-pickinQLP300 were most reliable (betweela full cycle 2Hz cQsinusoidal wave.as good as using the output of a velaverages of frequent trials from infrethe probability effect than when thTest-retest reliabilities of both amplisessions, probably due to changes inresult, other components such as thelying between 0.15 to 0.27 (Boutroset al., 1990).
2.4.3.4 Event-Related Spectral
Animal studies suggest that the asstemporal coincidence of neural activifintracranial, single-cell recordings Oblactivity, several studies have examinEby object and/or movement recogni
t. I
Bereltschafts- Ipotential/field I
IIIIIIIII
onset ofbehavioralresponse
.5 s time
'Gi'011Cl
,-.C'J~~OIl,Cl ...C'J'- t~=;,~ I:1.'-''-'''Cl I~-~r! I
;:: u IQ+:l I~ ~
u Cl IE~ stimulusu El I~ .. I I IQ
.I .3
,/

2.4 Neurornagnetism 211
0
seryis
Id,lit10
~r
10-
!bpIe'S) ..erI isgesbat:ledi orlofenD aII"e3
" Wavehrmsubtraction ca.n be used before peak-picking or area measurement to reduce the effects of component overlap. For example, consider a paradigm where tonesoftwosiII!ilar pitches are given in an unpredictable sequence and_one occurs less frequently than the other. The ERF to thtl rare tone can be considered a combination ofthe sensory effects of the tone and the cognitive effects of the tone being a rare deviant.By subtracting the ERF to the frequent tones from the ERF to the infrequent tones,the sensory effects are removed leaving behind the cognitive effects. This assumes thatthe sensory responses to the two tones are identical and that cognitive and sensoryeffects are additive, an assumption which is not always warranted. For example, frequency specific temporal recovery of the auditory NlOO, a non-cognitive effect, causesthe NI00 to be smaller in response to frequent stimuli than to rare stimuli.
-) Principal Components Analysis (PCA) constitute another approach to componentmeasurement whichllsesthe time points on waveforms from different subjeets,gLfferentsensors, and_ different experimental conditions to define components. In statisticalterms, peA. identifies orthogona..l axes of maximal variance in a multidimensionalspace defined by the variables. Generally, these ~es-are rotated according to the"varimax" procedure. However, variO\ls criteria can be determined in terms of howmanyfactors ar(lto be extracted and how many rotations of the factors are possible.Furthermore, each experiment gives slightly different factor structures, and there isno established criterion for deciding whether these differences are significant or not.Thus, it is uncertain how many statistical components to interpret, and how to identifythese components with ones previously described.\, Template correlation assesses the similarity of a template of the component to the
waveform to be evaluated. The template may be based on prior knowledge of the component shape or on signal averages. How reliable are the component scores extractedby the various procedures? Parametric studies have illuminated some of the variablesunderlyiI!Kunreliability. Fabiani et al. (1987) found the split-half reliabilities of P300latency estimates of averages to be between 0.63 and 0.88, and in most paradigms, thereliability was similar to peak-picking and template correlation. Amplitude estimatesofP300 were most reliable (between 0.90 and 0.96) when based on covariance witha full cycle 2 Hz cosinusoidal wave. Taking measurements at pz alone was almostas good as using the output of a vector filter based on Fz, Cz, and Pz. Subtractingaverages of frequent trials from infrequent trials led to more reliable measurement ofthe probability effect than when the two types of trials were measured separately.Test-retest reliabilities of both amplitude and latency were lower between than withinsessions, probably due to changes in P300 over time. In contrast to this encouragingresult, other components such as the P50 produced unsatisfying reliability coefficientslying between 0.15 to 0.27 (Boutros et al., 1991; Kathmann & Engel, 1990; Thretskyet al., 1990).
2.4.3.4 Event-Related Spectral Perturbations
Animal studies suggest that the association of information may be formed throughtemporal coincidence of neural activity in the gamma band. To bridge the gap betweenintracranial, single-cell recordings obtained from animal experiments and human brainactivity, several studies have examined to what extent this oscillatory activity inducedby object and/or movement recognition can also be non-invasively measured in the
"

human EEG and MEG. For instance, visual and auditory evoked and induced transientgamma-band responses (GBR) have been demonstrated in human E,EG and MEG tosimple stimuli and coherent patterns (e.g., Lutzenbergex et al., 1995; Pantev et al.,1995b). Using a similar visual stimulus design, as developed for animal research,MiilIer et al. (1996) detected evoke.d GBRinJLhighJrequenc)' range (30:c'85 Hz). Thisactivity appeared in response to coherently moving bars primarily over posterior areascontralateral to the stimulated hemifield, while no Comparable response was evoked byincoherent patterns (bars moving in opposite directions). It can be assumed that thistopographical pattern reflected activity in the underlying MT (VS) which is associatedwith movement encoding. This work demonstrates the similarity of induced oscillatoryresponses in animals and humans.
However, considerable data processing is mandatory in order to extract this information from EEG, which constitutes a widespread summed activity from manysimultaneously active networks. MEG, and its planar gradient in particular, represents activity from more circumscribed regions, so that signals' are more comparableto ECoG derivation (Okada & Xu, 1993).
The simplest method of analysis for extracting local oscillatory information fromEEG and MEG,consistsin_estimatingthetemporal change .in.spectral.density bycalculating the FFT in a window which slides across the time series. An example ofthe resulting "landscape" is provided in Fignre 2.68. .
Dennis Gabor realized that it is artificial and suboptimal to insist on a seriesof infinitely extended basis functions given that all real signals result from a flowof information, that is, a constant change across time. Instead of composing thesignals by means of an inadequate series of functions and then restricting the arisingproblems hy multiplication with a window function, Gabor directly built the windowinto functions of finite length. A finite signal is better represented by a sum of finiteGabor functions. The resulting evolutionary spectrum provides an ideal compromisebetween frequency and time resolution. One problem, however, is that there will beindefinitely many Gabor-bases, requiring procedures to select a favorable base. As thechoice of different bases will hamper the comparability, it might be useful to searchfor a base which fits the MEG time series under a variety of experimental conditionsand varying subjects.
Another result of previous work in the field of event-related spectral changes(Pfurtscheller & Neuper, 1992; Makeig, 1993; Kristeva-Feige et al., 1993; Feige et al.,1994a) suggests that specific oscillatory generators may appear or vanish in the courseof the event-related response. Consequently, it is of interest to examine the spatialdistribution of these event-related alterations. The scalp distribution of event-relatedresponses is not sufficient to determine the coherence of active oscillatory generators.One and the same topographical distribution may be produced by several coherent orincoherent, simultaneously active generators. In order to uncover the functional meaning of an oscillatory response, a procedure is required which can simultaneously mapseveral non-coherently overlapping spectral field components. The procedure whichwe have developed (Feige et al., 1994b,c) reaches this goal by taking the correlation between all possihle pairs of channels into account. Other procedures, particula~ly thosedeveloped for EEG analyses, often rely solely on the degree of similarity (correlation)ofa pair of signal channels, and interpret this measure. in terms of coupling strengthbetween two cortical areas. Alterations in this correlation, however, may be caused by
212 Chapter 2 Biomagnetisrn 2.4 Neurornagnetism
Time-domain average
Epoch
Epoch:
Epoch:
Epoch 1
Time- and phase- lockedevoked gamma-bandcortical activity
Frequency-domain average
TIme- and phase- nonlockedinduced gamma-bandcortical activity
Fig. 2.68: Example of evoked anIresents the resulting resbandpass from 24-48 Hzwhile the remaining actihowever, an external evewhich are not phase-lockif the spectral power is cery single trial and the fwindow across a trial wipower as displayed in th,
a change in the original coupling,the appearance of a new generateone. Therefore, it is necessary toof an oscillatory activity.
A generator within the cortexwith a fixed phase relation betwe,the generator is focal, the MEG ptIn a more extended network, delawe are ahle to detect any fixed f

2.4 Neuromagnetism
Time-domain average
213
Stimulus onsetT
Epoch 1
Epoch 2 Wt'/JfW~MMIJ!.P~\cfQ'M~'/i4~'\'iN!1JWlffl
Epoch 3
!S
L,le
atIds.orn~
cheseD)~h
by
Time- and phase-lockedevoked gamma-band
-200 -100 0 lW :ID 3D 41l 1lI lID 'Xl) lIDcortical activityTnne (mS)
Frequency-domain average
1.2Norm. 1Spectral
.8Power
Time- and phase- nonlockedinduced gamma-bandcortical activity
Fig. 2.68: Example of evoked and induced gamma-band responses. The thick line represents the resulting response when the auditory evoked field is filtered with abandpass from 24~48 Hz. The time- and phase-locked activity is then extracted,while the remaining activity (gray lines) is treated as noise. In many instances,however, an external event may induce changes in the spectral density functionswhich are not phase-locked to the stimulus onset. This activity can be extractedif the spectral power is calculated in a small time window of, e.g., 300 ms for every single trial and the power is averaged across trials subsequently. Sliding thewindow across a trial will produce the type of time dependency in the spectralpower as displayed in the lower part of the Figure. (From Pantev et al., 1994)
a change in the original coupling, Le., a change in the common generator, but also bythe appearance of a new generator which oscillates independently from the previousone. Therefore, it is necessary to simultaneously determine similarity and amplitudeof an oscillatory activity.
A generator within the cortex will produce a field distribution across the sensorswith a fixed phase relation between the signals picked up by the different sensors. Ifthe generator is focal, the MEG phase differences between the sensors can be 0 or 1800
•
In a more extended network, delays caused by transmission times might require thatwe are able to detect any fixed phase relationships. An oscillatory network is then
"

Fig. 2.70: Normalized power as a fuThe channel with the Ieach hemisphere, respectinon-words (lower diagram(right side). Note the "2Pulvermiiller et al., 1994)
pseudo words
LH
12
I
.8
Norm.SpectralPower
Synchronous activity in thedemonstrated using coherently IT
compared to pseudowords (Fig. ~
in its spatial extension betweenresponse to function words that themisphere, including both Wernindicates synchronous activity reIspeech perception.
2.4 Neuromagnetism
content words
These results illustrate that anivestigation of induced GBR in huavailable. When relating the subjtical correlates of basic processesrecognition can be explored.
We can conclude that oscillatormokeys and man with techniquesECoG, MEG and EEG. The increa
Chapter 2 Biomagnetism
D) PASimaginary
partsimulation
C) PAS real First three SVD map'part _
simulation ~••~dtb.e••~~~ ( ~.J,~
...rl* .n, "DC! ...to.all • zoo 40{1 tOp '" loot
,,",1~'J
....I.£ •
I ·~ ..
."
B) Field maps of the two simulatedoscilating dipoles
A) Sample time course of one channelfor simulated dipole I
214
Fig. 2.69: Simulated oscillatory generators and phase alignment spectrum (PAS). Twodipolar sources were chosen as independent oscillatory generators with a fixedposition and orientation, but a time-varying amplitude. Local coherence background noise was added through the activity of 500 dipoles with random .orientation and random distribution on a spherical surface with a stochasticallyfluctuating amplitude. Additional white noise was added to each recording channel. A) Sample time course of One of the channels for the first of two simulateddipoles, whose begin, phase and duration were randomized. B) Field distribution for the two simulated dipoles. C) and D): PAS matrix (real and imaginarypart) for the two oscillatory generators plus the 500 random dipoles. Each smallcontour plot represents the PAS for OnC reference channel. The first two of threeSVD maps on the upper right recover the two simulated oscillating dipoles nicely.(Figure courtesy of Dr. B. Feige)
defined as a generator whose activity variation exhibits an oscillatory component.The localizing power derives from the assumption of an external reference phase towhich the ongoing MEG is "phase aligned" before averaging, simply by sliding the timewindows to match latency with respect to the event. Any signal occurring phase-lockedto the reference phase will survive the averaging, while random-phase signals will canceleach other. However, as there is no external phase reference available, the referencephase for averaging must be derived from the channels themselves. Feige's method,called "phase-aligned spectrum" , consists of averaging the complex Fourier spectra of anumber of time windows after phase aligning them to the spectra of the correspondingtime windows of a phase reference channel. For k channels, a k x k matrix will resultfrom phase-aligning each channel with each other channel. The underlying coherencepattern is extracted from this matrix by means of the singular value decompositionwith suitable rotations, if more than one generator is to be assumed. We have evaluatedthis procedure with simulated and real data. Figure 2.69 illustrates the validity byapplication to simulated data.
/

2.4 Neuromagnetism 215
Synchronous activity in the gamma-band (GBR) in humans has not only beendemonstrated using coherently moving visual stimuli, but also in response to words ascompared to pseudowords (Fig. 2.70;Pulvermiiller et al., 1994). This activity differedin its spatial extension between function words and content words. It was only inresponse to function words that the observed responses remained restricted to the lefthemisphere, including both Wernicke and Broca's area. This result suggests that GBRindicates synchronous activity related to the functional meaning of word and, thus, tospeech perception.
LH RHcontent words content words
12 12
I 1.00 I 1.00.8 .8
pseudo words pseUdo words
Iodl-
Norm.SpectralPower
Fig. 2.70: Normalized power as a function of frequency and time (data from one subject).The channel with the largest late evoked magnetic response was selected foreach hemisphere, respectively. Responses to content words (upper diagrams) andnon-words (lower diagrams) over the left hemisphere (left side) and over the right(right side). Note the "25 Hz-valley" in the diagram on the lower left. (FromPulvermiiller et al., 1994)
1
Iy11-
~
uryalleeIy.
These results illustrate that animal experiments should be complemented by the investigation of induced GBR in humans, where information about perception is readilyavailable. When relating the subject's response to oscillatory events, the electrocortical correlates of basic processes of sensory encoding such as object or movementrecognition can be explored.
We can conclude that oscillatory event-related brain responses are studied in bothmokeys and man with techniques ranging from single cell recordings to mass action,ECoG, MEG and EEG. The increasing data base contradicts the view that oscillations
-.
/

215 Chapter 2 Biomagnetism---------------------- 2.4 Neuromagnetism~------
are not used for coding but are simply a by-product of the functional architecture ofany neural network. In other words, they are not just the noise of the brain engine,but do bear functional significance. We now also know that oscillations serve morethan one purpose and that their function includes the following:
1. Oscillations reflect idling in neural mass systems which would prevent the systemfrom activating themselves when there is little or no input into the network (likefor Alpha activity, see Section 2.4.3.1).
2. Faster oscillatory synchronization is linked to learning and plasticity:
(a) oscillations are used to form memories (Section 2.4.2.2)
(b) oscillations might tie neural assemblies in various brain regions to form onepercept (feature binding).
Controversial are further suggestions:
3. The stimulus itself might be coded in non-linear dynamic patterns that appear asoscillations to the eye of the naive observer. The attractor governing the dynamicpattern is related to stimulus encoding - everything that is not coherent to thissignal is dismissed as noise (Section 2.4.3.2).
4. The existence of oscillations creates phase, Le., a variable that might serve asa clock signal. (If we assume that the contribution of a particular cell to a cellassembly is measured by the number of spikes it provides to the ensemble, thena time interval needs to be set over which spikes are counted. Oscillations mightprovide the clock signal needed to update the contribution of the individualneurons.)
2.4.4 Magnetic Source Imaging (MSI): Determining the Location of Neural Activity
The measurement of electric and magnetic activity outside lL volume conductor, asfound in the body, does not allow for a definite conclusion about the position andstrength of the source of the activity at this time. In terms of images, the activityonly delivers a two dimensional shadow of three dimensional activity to the surface.In other words, the spatial imaging of the active generator structures constitutes theattempt to determine a solution of electromagnetic equations which, by their nature,is not unique. This inverse problem, first formulated by Helmholtz in the middle ofthe last century, results from the fact that an infinite number of source configurationswithin the body can produce exactly the same distribution of electric and magneticactivity on its surface.
Only if additional information is provided does it become possible to constructconstraints such that only one solution remains which satisfies the equations, Le.,the spatio-temporal distribution of electromagnetic generators becomes unique..Thesimplest, and still most powerful constraint is the assumption of a focal source whichcan then be modeled with good! ~p~r6xi'rriation by a current dipole - regardless of thereal shape of neuronal fields. The location of the equivalent current dipole (ECD)
is allowed to move with time. Amodeled ECD to the real measurethe application of the model. MOlanatomical structures. It is knowor white matter do not incorporatneuromagnetic data, only currentsurface of gray matter contribute
Determining which source is beis possible if additional physiologithe possible source configurations.sume that white matter does not pIoutside of the cranium, and that tJsource of the activity generates a c:bralcortex. The spatial organizati,Magnetic Resonance Imaging. Bythis reconstruction, considerable ccto obtain information concerning efor every time point. This proceduradvanced than the other imagingtion (Dale & Sereno, 1993; Fuchs e1996; Kineses et al., 1998). Onlythe neurophysiological basis of psyethese processes are occurring. Whfields and electric potentials) is prasampling rate, the spatial resoluticchannels (EEG plus MEG). The im;from some number n of cortical patthe procedure which we currently faeach of which can slide across themultiplied by the parameters of ealnumber of channels. Physical modiper variable a saturation of informethis number of channels, however, tlchannel.
Individual anatomical informaticstruct a realistic head model, to geltion, and, finally, to project the coranatomical structures (Hoke et al., ]3D MRI tomograms. If the sourcesand if EEG and MEG are simultaneebined to obtain a solution for the elin principle - uniqne. The result invation has the unique advantage thmetabolism, but images the electricof a second, Static activity, averagtfMRI , is replaced by a moving imaglof the functional sequence in patter

2.4 Neuromagnetism 217
iy
e..,
:t,.. ,K\
:ble
»)
is allowed to move with time. A high goodness of fit of the field produced by themodeled EeD to the real measurement « 0.95) provides a reasonable justification forthe application of the model. More sophisticated approaches utilize the knowledge ofanatomical structures. It is known, for instance, that regions occupied by ventriclesor white matter do not incorporate active structures. More explicitly, for most of theneuromagnetic data, only current dipoles with an orientation perpendicularly to thesurface of gray matter contribute to electromagnetic activity on a macroscopic scale.
Determining which source is being activated in the brain at a specific point in timeis possible if additional physiological-anatomical constraints can be made that limitthe possiblesource configurations. To solve the physical~q'uatIbrisit is sufficient to assume that white matter does not produce any significant electrical or magnetic activityoutside of the cranium, and that the polarization in gray matter which represents thesource of the activity generates a current flow perpendicular to t~e surface of the cerebraf~ortex. The spatial organization of the cerebral cortex can be reconstructed fromMagnetic Resonance Imaging. By limiting the possible source space of the models tothis reconstruction, considerable constraints are provided which may make it possibleto obtain information concerning expansion, position and strength of cortical sourcesfor every time point. This procedure, which is currently in development, could be moreadvanced than the other imaging techniques due to its fine temporal-spatial resolution (Dale & Sereno, 1993; Fuchs et al., 1994; Liitkenhoner et al., 1995; Liitkenhoner,1996; Kincses et al., 1998). Only with this procedure will it be possible to recordthe neurophysiological basis of psychological processes in the temporal range in whichthese processes are occurring. While the time resolution of the measures (magneticfields and electric potentials) is practically unlimited and only restricted through thesampling rate, the spatial resolution will generally be determined by the number ofchannels (EEG plus MEG). The image of the non-invasively measured activity createdfrom some number n of cortical patches is represented by a system of n equations. Inthe procedure which we currently favor, we allow for a number of depolarized patches,each of which can slide across the cortical surface. Ideally, the number of patchesmultiplied by the parameters of each patch should be considerably smaller than thenumber of channels. Physical modeling suggests that with around 150-200 channelsper variable a saturation of information sets in (EEG and MEG) is achieved. Up tothis number of channels, however, the source resolution improves with each additionalchannel.
Individual anatomical information is necessary for three different reasons: to construct a realistic head model, to generate constraints for a realistic source configuration, and, finally, to project the computed source location(s) onto the correspondinganatomical structures (Hoke et al., 1994). The necessary information is available from3D MRI tomograms. If the sources can be restricted to a number of cortical patches,and if EEG and MEG are simultaneously measured from many different sites and combined to obtain a solution for the electromagnetic equations, this solution becomes in principle - unique. The resulting pattern of patches that indicates cortical activation has the unique advantage that it does not display a slowly changing cerebralmetabolism, but images the electric neuronal activation which varies within fractionsof a second. Static activity, averaged across minutes as in PET, or across seconds infMRI , is replaced by a moving image on a millisecond timescale, allowing the detectionof the functional sequence in patterns of neural mass activation.
,/

218 Chapter 2 Biomagnetism 2.4 Neuromagnetism
For the modeling of MEG/EEG data, three constituents become relevant: themodel of the volume conductor, the neuroanatomically based co11straints, and thesource model. These three aspects can be treated separately but need to be combinedfor the imaging of a particular data set.
2.4.4.1 Modeling the Volume Conductor
Volume conductor models may be divided into realistic approaches and into modelswith a simple, basic geometry. The first type of modeling requires excessive numericalcalculations, in contrast to simple models like a sphere or a spheroid (Cuffin & Cohen,HJ77a,b; Munck De, 1989; De Munck et al., 1989). Such simple geometric forms, however, are only rough approximations of the real headshape. For the case of modelingmagnetic data alone, a local homogeneous sphere works remarkably well, which can beexplained by the fact that the body is transparent to low-frequency magnetic fields.Liitkenhoner et al. (1995, 1996) compared simple and realistic modeling, and demonstrated a high degree of similarity for the early sensory components. If the electritdata are included, the different conductivities of brain, cerebra-spinal fluid, skull andskin come into play. For a spherical model with four concentric layers, analytical solutions have been provided by Cuffin & Cohen (1979); Berg & Scherg (1994) developeda very fast computation model. More recently, solutions have also been developed foreccentric sphere models of the head (Cuffin, 1991).
Provided enough computing power is available, there is, however, no need for analytical solutions, and, hence, there is no limitation for the possible shapes of volumeconductors. Given the assumption that the volume conductor consists of a homogenous core and layers of homogenous conductivity, it is possible to employ a boundaryelement model (HamiWiinen & Sarvas, 1989; Meijs et al., 1985), If this assumptionof homogenous conductivities within the different layers is not valid, finite element(Bertrand et al., 1991) or finite-difference-models (Stok et al., 1986) become necessary. In the latter case, a discretization of volume elements is required. In the caseof boundary element models, a discretization of the surfaces is sufficient, and thus atwo- instead of a three-dimensional problem saves computation time.
Menninghaus et al. (1994) investigated the absolute error if a single dipole is localized within a spherical model. A magnetic field was produced by current dipoles placedwithin a realistic phantom head which was filled with saline solution. For depths of thedipole between 1.2 cm and 3.3 cm, measured from the inner surface of the skull, thelocali~ation error ranged from 3.7 mm to 7.9 mm. Using a realistic boundary elementmodel, the error proved to be independent of the depth, reaching an average of only1.9 mm.
2.4.4.2 Neuroanatomical and Neurophysiological Constraints and Reconstruction of Cortex
EPSP or IPSP cause currents to penetrate through the neuronal membrane. Thiswill give rise to an intracellular current loop through the dendritic tree penetratingthe membrane at different locations, and also to the volume current which closes theloop. As the pyramidal cells in the cortex are oriented in parallel, with the apicaldendritic tree closer to the surface than to the soma, thousands of tiny current loopsare created by the depolarization (and sometimes also hyperpolarization) of pyramidal
neurons and they sum up to gen(see Section 2.4.2). Macroscopimatter. The white matter, whi,assumed not to contribute to EEplanar area with a diameter of I
an extended layer with a diame1987). Subcortical structures alaway from the surface, which dil4 to 7 times (Lutzenberger et al.of a subcortical structure is synelements have the same orientawould still amount to only 1%(Thus, an intracranial polarized I,when reasonably extensive in tl1deeper structure (Braun et al., 1activity. Hence, event-related I'
arising from a polarization of tillThus, the availability of a 1"
prerequisite for a realistic sourcefrom MRI data have been desCl
F\lchs et al., 1994; LiitkenhOner ,conductor model in two steps.successively from each of the 128 IThen, a triangulated 3D surface
For the surface reconstructicby Steinstrater (1991). In the filvoxels are distinguished: those Wfcomplement (non-brain-voxels), ,first two sets of voxels can be achiinto three substeps: preprocessilmatter (brain voxels) with a flocdetermine the non-brain voxels. ]to either the brain or the non-br,results in a binary matrix in whicvoxels have the value zero. In th,and smoothed using an algorithrrIn Liitkenhoner et al. 1995, 1996,triangles with about 400,000 Verl
2.4.4.3 The Source Models
Among the source models, the moas it is the dominant term in theareas of less than 2-3 cm in diacurrent dipole (Lutzenberger etparameters, three for its locatiO!of magnetic modeling within a l::

2.4 Neuromagnetism 219
neurons and they sum up to generate the macroscopically measurable EEG and MEG(see Section 2.4.2). Macroscopically, this becomes evident as a polarization of graymatter. The white matter, which includes the axons and glia cells, can generally beassumed not to contribute to EEG and MEG (Rockstroh et al., 1989). A small active,planar area with a diameter of 0.1 cm produces only 5% of the activity produced byan extended layer with a diameter of 1 cm (Braun et al., 1990; Lutzenberger et al.,1987). Subcortical structures are not only small in size, but are also located fartheraway from the surface, which diminishes their contributions to surface signals another4 to 7 times (Lutzenberger et al., 1987; Rockstroh et al., 1989). Even if a large portionof a subcortical structure is synchronously active and even if we assume that activeelements have the same orientation in space, their contribution to scalp potentialswould still amount to only 1% of the signals generated by extended cortical sources.Thus, an intracranial polarized layer of 1 mV might produce a scalp potential of 20 /lV,when reasonably extensive in the cortex, but only 0.2 J.1-V when limited in size in adeeper structure (Braun et al., 1990). This attenuation is even stronger for magneticactivity. Hence, event-related responses with larger amplitudes can be modeled asarising from a polarization of the cortex.
Thus, the availability of a reconstruction of the cortical surface constitutes theprerequisite for a realistic source model. Algorithms suitable to extract these surfacesfrom Mill data have been described by a number of groups (Dale & Sereno, 1993;Fuchs et al., 1994; Liitkenhoner et al., 1995). We construct the surface of the volumeconductor model in two steps. First, rough 2D contours of the brain are extractedsuccessively from each of the 128 MRI slices using an interactive segmentation software.Then, a triangulated 3D surface is generated.
For the surface reconstruction. of the cortex, we use a 3D algorithm developedby Steinstrater (1994). In the first step (rough segmentation), three different sets ofvoxels are distinguished: those which can be attributed to the brain (brain voxels) or itscomplement (non-brain-voxels), and those for which no clear assignment to one of thefirst two sets of voxels can be achieved (remaining voxels). This first step is subdividedinto three substeps: preprocessing (elimination of artifacts), definition of the whitematter (brain voxels) with a flood-filling procedure, and distance transformation todetermine the non-brain voxels. In the second step, the remaining voxels are assignedto either the brain or the non-brain voxels using a concurrent growing process. Thisresults in a binary matrix in which all brain voxels have the value 1 and all non-brainvoxels have the value zero. In the third step, the surface of the brain is triangulatedand smoothed using an algorithm similar to that described by Dale & Sereno (1993).In Liitkenhoner et al. 1995,1996, the cortical surface was represented by about 800,000triangles with about 400,000 Vertex points.
2.4.4.3 The Source Models
Among the source models, the model of an equivalent current dipole plays a central roleas it is the dominant term in the multipole expansion (Katila & Karp, 1983). Activeareas of less than 2-3 cm in diameter can be described well by a single equivalentcurrent dipole (Lutzenberger et al., 1987). A current dipole is determined by sixparameters, three for its location and three for the dipole strength, two in the caseof magnetic modeling within a sphere. Such a moving dipole model has been used
"
/

220 Chapter 2 Biomagnetism,----------~------- 2.4 NeuromagIletism
in most of the earlier publications and has proven to be very useful for the modelingof eariy sensory evoked responses. A typical analysis is described in detail by, e.g.,Liitkenhoner et al. (1990); Liitkenhoner (1996)4.
In more recent approaches, several simultaneously active dipoles with a fixed location and orientation have been assumed (Baumgartner et al., 1991). The concept ofthe fixed dipole was introduced by Scherg & von Cramon (1985, 1986). In this concept,the inverse problem is solved simultaneously for a whole time segment during whichthe location and the orientation of dipoles remain invariant and only the magnitudesare allowed to vary across time. Michael Scherg called this widely used method BESA(brain electrical source analysis Scherg, 1989; Scherg et al., 1989; Scherg, 1990a,b).If these assumptions hold, this approach of spatio-temporal dipole modeling is moreprecise than the modeling with several moving dipoles as the constraints arising fromthe assumption of invariant sources restrict the degrees of freedom of the model. TheMUSIC-algorithm (MUltiple Signal Identification and Classification) constitutes arelated approach in which the data matrix is submitted to a singular value decomposition (Elbert et al., 1995b; Mosher et al., 1992, 1990). The neurophysiologicalplausibility of spatia-temporal dipole models is moderate. Even if only focal activityis considered, its spread along a gyrus cannot be explained well by one"stationarydipole varying only in its moment across time. '
Model simulations (Hari et al., 1988; Kuriki & Mizutani, 1988; Liitkenhoner, 1991;Liitkenhoner et al., 1996), as well as the phantom measurements mentioned above(Menninghaus et al., 1994) suggest that, for magnetic fields generated b~ ~ singledipolar source, the accuracy of source localization is in the order of a few mllhmeters,provided that the signal-to-noise ratio of the biogmagnetic data is sufficient and that anappropriate volume conductor model is used. In the case oftwo or more simultaneouslyactive sources, such a high accuracy can be expected only if the distances betweenthe sources are sufficiently large. A reliable source separation becomes increasinglydifficult with decreasing inter-source distances so that for distances below a certainlimit, the critical inter-source-distance, the sources cannot be distinguished from onesingle equivalent source.
It is generally agreed that at least the more endogenous components of the eventrelated response (Fig. 2.67) originate from multiple, simultaneously active patches inthe cortex. Therefore, models assuming distributed sources have gained increasingattention. These models do not rely on the attempt to explain the observed activitieswith a few current dipoles, but estimate a current density distribution (or a discretiza-
, tion of such a distribution by means of thousands of dipoles). As mentioned above,it had already been shown by Hermann von Helmholtz (1853) that the correspondingphysical equations have an infinite number of solutions and that, hence, this inverseproblem must be solved by introducing additional constraints. Ideally, we could selectthe most probable current density distribution (Clarke, 1991) using a priori information about the probability of different types of density distributions. This idea wasput forward by Wimalainen & Ilmoniemi (1984) for discrete sources. The approach
4 Briefly, the original least-squares fit problem is transformed into a minimization problem for thenon-linear parameters (dipole coordinates) by replacing the linear parameters (components of thedipole moment) with the algebraic solutions available for their least-squares estimates, The resultingminimization problem is then solved iteratively by means of Powell's method (e.g. Press et al., 1992).Starting values for the iteration procedure are obtained by an exhaustive search in a three-dimensionalgrid (5 mm spacing between adjacent gridlines).
/
has been modified for mntinuousA survey for alternative approach
Given that a priori informatsources to a defined volume, a miimization of the squared averageminimum norm estimation. The npected difference between estimat1991).
One basic question concerns thtify them as two different centerset al., 1990; Liitkenhoner, 1991, 1strated that two dipolar sources cathe Sources is at least approximat,and the location of the detector.spatial resolution decreases from 1
the separability also depends onother: If the two dipoles are orthobest, whereas the worst case is an
Junghofer experimentally evahsources within a spherical phantorlogical saline solution. In one case,sinusoidal variations of 9.5 Hz andA single dipole model produces thedipole moments crosses the zero lirthe estimated locations may not onalso at locations which are distant fis important to note that the good]erratic source locations. Only whennot occur. We also evaluated the pbetween two simultaneously activeapproach (Elbert et al., 1995b). Astimuli which evoke activity in SI ~
The idea underlying the dipole pactivities result from a few patchessurface is available in triangular fthese triangles. A dipole is assignesurface of the triangle and locatedthe dipole moment is chosen proIt is obvious that one patch can bdipole. However, the number offreparameters and onc single amplitu
One question that remains tosingle current dipole riding on thethe surface - would be sufficient.negative as a basic feature of theand dipole orientation, Le. it isindependently.

I 2.4 Neuromagrtetism 221
.,
,)f~,
h!S
A).~e
m
lea
naltyry
11;ye
pers,an,lyIeIl
~ly
unme
ntI ining~ies
zawe,~ng
!rselectlIla
was"lch
the. the
Iting192).ional
has been modified for continuous current density distributions (Clarke, 1989, 1991).A survey for alternative approaches can be found in Kullmann (1991) .
Given that a priori information only serves to restrict the location of possiblesources to a defined volume, a minimization of the global error corresponds to a minimization of the squared average of the current density, an approach referred to asminimum norm estimation. The more precise the a priori information, the less the expected difference between estimated and real current density distribution (Ilmoniemi,1991).
One basic question concerns the minimal separation of two sources in order to identify them as two different centers of activity. Liitkenh5ner and others (Liitkenh5neret al., 1990; Liitkenh5ner, 1991, 1996; Tan et al., 1990; Wikswo et al., 1990) demonstrated that two dipolar sources can be securely separated only if the distance betweenthe sources is at least approximately in the range of the distance between the sourcesand the location of the detector. If the two sources are simultaneously active, thespatial resolution decreases from the range of millimeters to centimeters. Of course,the separability also depends on the orientation of the two dipoles relative to eachother: If the two dipoles are orthogonal in orientation to each other, separation is thebest, whereas the worst case is an antiparallel orientation.
Jungh5fer experimentally evaluated such calculations using simultaneously activesources within a spherical phantom consisting of a glass container filled with physiological saline solution. In one case, the two dipoles were activated simultaneously withsinusoidal variations of 9.5 Hz and a phase delay of 90° between the different sources.A single dipole model produces the correct locations when one of the two time-varyingdipole moments crosses the zero line. However, at times when both dipoles are active,the estimated-locations may not only be situated between the two correct locations butalso at locations which are distant from the region of both active sources (Fig. 2.71). Itis important to note that the goodness of fit may reach acceptable levels even for sucherratic source locations. Only when very high GoF-values were required did such errorsnot occur. We also evaluated the possibility that under certain conditions the overlapbetween two simultaneously active sources can be disentangled using a MUSIC-typeapproach (Elbert et al., 1995b). An example for responses to simple somatosensorystimuli which evoke activity in SI and SI! is presented in Figure 2.72.
The idea underlying the dipole patch model is that the source of the electromagneticactivities result from a few patches of activated cortex (Figs. 2.73,2.74). As the corticalsurface is available in triangular form, a patch can be constructed from a number ofthese triangles. A dipole is assigned to each one, its vector being perpendicular to thesurface of the triangle and located at its center. If a uniform activation is desirable,the dipole moment is chosen proportional to the surface of the respective triangle.It is obvious that one patch can be exploited in a similar way as a single equivalentdipole. However, the number offree parameters is halved as there are only two locationparameters and one single amplitude!
One question that remains to be examined is whether simpler models - like asingle current dipole riding on the cortex with its moment oriented perpendicular tothe surface - would be sufficient. We believe that this question must be answered in thenegative as a basic feature of the latter model is a coupling between dipole locationand dipole orientation, Le. it is no longer possible to choose these two quantitiesindependently.
"
/

~Neuromagnetism
Fig. 2.72: The localization piof the spatial data,sensor positions. Ifvidual time average,independent singlewithin the time int,is possible (see Elbcations which resulthe MUSIC-like musections. b) Evokedred segments in thefit was achieved atis marked with a gl
the best fit of ECDdevelopment of twowhich turned out trEtbert et al., 1995t
C~'
IChapter 2 Biomagnetism222
---------~-------------'----~=~=
Fig. 2.71: In a phantom model, two dipoles, fixed in location and orientation, were activatedwith a sinusoidal amplitude. The phase between the sinusoidal currents was 90°.The true locations of the generators are indicated by circles. These locationscorrespond exactly to the locations identified by the MUSIC·type approach. Thesingle ECO identifieij correct positions for the instant of zero-crossing of thesecond generator. At other instances, the trajectory of the single ECO model(crosses) may be quite erratic. (Data courtesy of Dr. M. Junghiifer)
The following consideration illustrates the serious consequences of this fact. Acurrent dipole is usually considered to be an equivalent source. Its location can beinterpreted as something akin to a center of gravity of the real source. However, inthe case of a current source distributed on a curved surface (as the cortex), it is a rareexception that the center of gravity would be located on the surface. Furthermore,even if the center of gravity were located on the surface, it cannot be expected thatthe normal direction at that surface point will be identical with the direction of thevectorial sum of all the currents in the source. In practice, this problem is aggravatedby the fact that only a discretized surface is available, and therefore, the directionperpendicular to the surface is severely affected by discretization errors. Liitkenhoner'sdipole patch model removes all of these problems: Expressed in physiological terms, theunderlying assumptions imply that the level of neural activation is constant throughoutthe patch. Of course, many other activation patterns should be evaluated as well; forexample, a pattern corresponding to a two-dimensional Gaussian distribution. Such ashape would provide a smooth transition between activa.ted and non-activated regionsof the brain.
It is evident that the dipole patch model can replace the simple current dipolemodel and may be integrated into analyses with the MUSIC algorithm. The simultaneous activation of several patches accounts for simultaneously active sources. For theanalysis of slower SEF components one patch might be restricted to, e.g., movementin SIl, while the other could account for activities in SI.
In general, there are two remaining useful alternatives: in many cases, the simplemodel of one equivalent current dipole assumed in each hemisphere can be sufficient.In other cases, restricting the number of polarized patches of the cortex will produce avalid model. Despite rapid progress in the field, the further development and validationof source models and its integration with spatio-temporal modeling approaches remainsa major research goal.
./

2232.4 Neuromagnetism------------------------=.ism
l"Lted,900
,
tionsThe
f thenodel , -,
b) I . Time Course ofI one SelectedI . . Chalmel
l. AUl beer , in~ raremore,I thatof theLvatedectionouer's~, theIghoutell; forSuch a'egions
dipolemulta-ror thevement
simpleIhcient.
Ilduce aidation
\-emains I
II
\
Fig. 2.72: The localization procedure uses the information contained in the time evolutionof the spatial data, i.e. of the magnetic field values recorded simultaneously at Msensor positions. If the dipole moments evolve independently in time, their individual time averaged contribution to the spatia-temporal data gives rise to a timeindependent single dipole equation. This is satisfied by each dipole being activewithin the time interval. Thus, the localization of simultaneously active sourcesis possible (see Elbert et al., 1995b, for a description of the algorithm). a) Locations which result from the single moving ECD-model (red crosses) and fromthe MUSIC-like multidipole-dipole approach (circles) are superimposed onto MRIsections. b) Evoked magnetic waveform (blue) of one selected MEG-channel. Thered segments in the waveform correspond to a signal-ta-noise ratio >6. The bestfit was achieved at 62 ms with a signal-ta-noise ratio of 11.7. This point in timeis marked with a gray bar. The second gray bar, around 122 ms, corresponds tothe best fit of ECD in the region of S-II. The bottom part illustrates the temporaldevelopment of two stationary SOurces assumed by the MUSIC-type approach,which turned out to correspond perfectly to S-I and SoIl-regions. (Adapted fromElbert et al., 1995b)
"
/

224 Chapter 2 Biomagnetism 2.4 Neuromagnetism
I
11
Fig. 2.73: Dipole patch model: The patch shown in this figure has an area of 10 mm2
and is represented by 51 triangles. The green triangle serves as the startingpoint (seed) for the construction of a patch. Each triangle is used as a platformfor a current dipole oriented perpendicularly to the surface (arrows displayed inred and located in the centers of the triangles). The larger magenta arrow canbe interpreted as the equivalent current dipole representing the totality of thedipoles on the patch. The yellow surface represents an extended patch with anarea of 1 cm2 (dipole symbols omitted). The reverse of the cortical surface wasgiven a gray pigment. (From Liitkenhoner et al., 1995, with kind permission)
2.4.5 Functional Cortical Organization as Revealed by MSI
The cortical representations of the sensory perception relates in an orderly way tothe spatial arrangements of receptors in the periphery. The cortical maps of thevisual space, the body surface, or tone frequency (cochlear place) can be individuallydetermined by means of magnetic source imaging. In a similar manner, it is possibleto map motoric organization along the central sulcus and possibly also in other areasof the frontal lobe.
2.4.5.1 Somatosensory System
The following protocol describes a standard scan that we typically apply in Konstanzto map the somatosensory cortex using MSI of ERF components. The first major peakof the ERF evoked by a light superficial pressure stimulator is located in the primary
,/
Fig. 2.74: The dipole patch modesources in the postcentlthe direction of major (different sites: magentaand red stimualtion at tthe expe'cted homunculathe first major peak of t:The individual MRI sena realistiv volume condupermission)
somatosensory representation (SI)procedure is particularly suited toand face area but may also work f,
The SEFs are induced by pneUlnologies Inc.). These stimulators ajthe mechanoreceptors of a defined
The first major peak of these tahemisphere; see Fig. 2.75) and thelocalize the generator of this SEF (in area 3b contralateral to the stiresponse is observed within 30-7Cabout 50 ms; the face latency is apbetween 7-15 nAm. Signal power f,across 37 local sensors). In genera]

2.4 Neuromagnetism 225
Fig.
,2
'gminiLIl
beanIllS
2.74: The dipole patch model demonstrates how somatosensory stimulation activatessources in the postcentral sulcus. The four different arrows (5nAm) illustratethe direction of major current flow activated by somatosensory stimulation atdifferent sites: magenta represents the lip, blue the first, green the fifth digit,and red stimualtion at the collarbone. The locations (base of the arrows) followthe expected homuncular map in area 3b. (A single cortical patch was fitted tothe first major peak of the somatosensory evoked magnetic field - see Fig. 2.75).The individual MRI served to reconstruct the cortex and provided the basis fora realistiv volume conductor model. (From Liitkenhoner et al., 1995, with kindpermission)
towel1lyble
eas
l.eakary
somatosensory representation (SI) with most of its activity in Brodman's area 3b. Theprocedure is particularly suited to locate the representations of all finger tips, the lipand face area but may also work for toes (see Fig. 2.74).
The SEFs are induced by pneumatic stimulators (developed by Biomagnetic Technologies Inc.). These stimulators apply a pressure to the skin and consequently activatethe mechanoreceptors of a defined area of the skin (approximately 8 mm in diameter).
The first major peak of these tactile evoked fields show a fairly dipolar pattern (perhemisphere; see Fig. 2.75) and the single moving dipole reflects an adequate model tolocalize the generator of this SEF component in most cases. This generator is locatedin area 3b contralateral to the stimulated site. This main deflection of the evokedresponse is observed within 30-70 ms poststimulus. For the fingers, the latency isabout 50 ms; the face latency is approximately 35 ms. Dipolemoments typically rangebetween 7-15 nAm. Signal power for the contralateral source reaches 50-100 IT (RMSacross 37 local sensors). In general, these values are somewhat lower for the toe, and
"
/

also lower for stimulations in the face area. For stimulation sites at the trunk, e.g. theshoulder or collar bone, signals can be too small to obtain reliabl~measurements unlessthousands of stimulations are averaged. Data are recorded with a bandpass filteredbetween 0.1 and 200 Hz. The stimulation consists of 500-1000 trials. The stimulusfrequency can be as high as 2/s.
For the source analysis of the field, peak responses are filtered using a low-passof 20 Hz and a high-pass of 1 Hz. Several ways of source modeling are possible:The simplest approach is the moving ECD. Alternatively, a two-dipole model (forstimulation sites of the hand, one contralateral dipole may be enough) can be fittedusing e.g. BESA with one dipolar source per hemisphere as start condition. The fittinginterval should be 15-30 ms around the maximum, whereby 2/3 of the time windoware before and 1/3 after the peak. Alternatively, the source analysis can be basedon the dipole patch-model.. The resulting homuncular organization is illustra.ted inFigure 2.74.
Another standard procedure to evoke the sensory fields uses electric stimuli tothe median or ulnar nerves at the wrist. Stimulus intensity is set above the motorthreshold. Two distinct peaks arise from the contralateral primary somatosensorycortex SI (at 21-22 ms with polarity reversal at 32 ms and at around 40 ms). Inagreement with the homuncular organization, Vanni et al. (1996) demonstrated that
226
Fig.
Chapter 2 Biomagnetism
2.75: The set of waveforms shows the magnetically evoked responses that appear atdifferent sensors in response to a light touch of the tip of the left thumb. Theblack arrows indicates the direction and location of the major current flow thathas created the field maxima around 50 ms
/
2.4 Neuromagnetism
the M20 is more lateral (some,nerve stimulation. When the iseconds, SII becomes active, ge1992). Their ampliutes are largthe magnetic wave at 100 ms prc1992).
Painful stimuli can be appliectypes of stimulation elicit sevenclition to primary somatosensor)(SII; Hari & Ilmoniemi, 1986; H1986) and cingulate gyrus (Kit~
latencies greater than 200 ms hadividual variation. Attentional.latencies, modifying the responsewhether chronic noxious stimula1pain, specifically, to an increaSEsory cortical representation. ME1995a, 1997) suggest that the pcause alterations in the central Iprocess. Patients who experienc,of time seem to produce more exsomatosensory stimuli are applie(
~.4.5.2 Auditory System
In a similar fashion as for the s(been used to detect aspects of j
in the auditory cortex. Evoked1993). The NlOOm (M100) sourhave been localized in the vicinityareas) bilaterally on superior tern]1990). These sources of the N1mJdeeper locations, while in AI, th,frequencies are progressively monThe location of the Pa-map in pIsecondary auditory areas, is in ac(
A typical auditory scan to mamal audiological status (air condu10 dB hearihg level in the range frtained prior to the investigation.responses can be used to map aSj:the transient responses are of inteand decay time, cosine function,sented bilaterally. The interstimulThe carrier frequencies are 500:10(added depending on time constrairrelated epochs of 300 ms (includilstored for further analysis.

2.4 Neuromagnetism---''----------------------- 227
~t
le
U.
ss,e:[)r
~
llg
JW
edin
toorryInI3t
the M20 is more lateral (some 7 mm) along the central sulcus for median than ulnarnerve stimulation. When the interval between stimuli is extended in the range ofseconds, SIr becomes active, generating waves around 90-100 ms (Hari et al., 1990,1992). Their ampliutes are largest if the stimulus is increased to the pain level, andthe magnetic wave at 100 ms probably corresponds to the electric P100 (Kekoni et al.,1992).
Painful stimuli can be applied through electrical or through CO2-laser pulses. Bothtypes of stimulation elicit several stages of cortical activation (Kakigi, 1994). In addition to primary somatosensory activation, bilateral secondary somatosensory areas(SIr; Hari & Ilmoniemi, 1986; Hari et al., 1983; Howlandet al., 1995; Huttunen et al.,1986) and cingulate gyrus (Kitamura et al., 1995) are activated. Components withlatencies greater than 200 ms have more complex source locations with large intraindividual variation. Attentional processes probably play an increasing role at longerlatencies, modifying the response to pain. Using MEG, it is now possible to investigatewhether chronic noxious stimulation leads to changes in the cortical representation ofpain, specifically, to an increased representation of the painful area in somatosensory cortical representation. MEG-investigations by Flor and colleagues (Flor et al.,1995a, 1997) suggest that the persistent incoming stimulation of chronic pain maycause alterations in the central representation of the body parts related to the painprocess. Patients who experience chronic noxious stimulation over extended periodsof time seem to produce more extensive activation of cortical assemblies when phasicsomatosensory stimuli are applied to body sites related to their chronic pain.
2.4.5.2 Auditory System
In a similar fashion as for the somatosensory system, magnetic source imaging hasbeen used to detect aspects of functional - in particular tonotopic - organizationin the auditory cortex. Evoked fields are illustrated in Figure 2.76 (Pantev et al.,1993). The N100m (M100) sources of the auditory evoked magnetic fields (AEFs)have been localized in the vicinity of the primary auditory cortex (primary associationareas) bilaterally on superior temporal surfaces (Hari et al., 1980; Pantev et al., 1989,1990). These sources of the N1m/N1 wave exhibit higher frequencies at progressivelydeeper locations, while in AI, the source of the middle latent Pam/Pa wave, higherfrequencies are progressively more superficially located (Pantev et al., 1994, 1995b).The location of the Pa-map in primary auditory cortex, and its NI-mirror image insecondary auditory areas, is in accord with observations from animal studies.
A typical auditory scan to map N1-tontopy may include the following: The normal audiological status (air conduction and bone conduction thresholds no more than10 dB hearihg level in the range from 250 to 8000 Hz) of the subjects should be ascertained prior to the investigation. The transient or the steady-state auditory evokedresponses can be used to map aspects of the tonotopy of the auditory cortex. Whenthe transient responses are of interest, short tone-bursts of 50 ms duration (3 ms riseand decay time, cosine function, and 60 dB nHL (normative hearing level) are presented bilaterally. The interstimulus interval is randomized between 600 and 800 ms.The carrier frequencies are 500:1000, 4000 Hz for short scans; 250 and 2000 Hz maybeadded depending on time constraints. Using a bandwidth from 0.1 to 200 Hz, stimulusrelated epochs of 300 ms (including 100 ms prestimulus baselines) are recorded andstored for further analysis.
"
/

228 Chapter 2 Biomagnetism-----------~----
2.4 Neuromagnetism
Steady-state responses (SSRs;
maximum amplitude when tone l
SSFs sources determined for the
dency tonotopy resembling that (
sented more deeply within the SUI
tonotopy of the middle latency P
laterally Pantev et al., 1996).
A solid review of magnetoenCfvided by Jacobson (1994).
2.4.5.3 Visual System
In comparison to the other modali1
Noteworthy is the approach by Sal
activation related to viewing, lar
tbat during the conversion from v
bilaterally from the occipital visui
As for the other modalities tr
steady-state visual evoked field' (S:
by a repetitive visual stimulus preo
The SSVEP can be recorded from
having the same fundamental fre(
higher harmonics (Muller et al., 1
-10
1Hz
-50
o 100 m.
IT 50
posteriorextremum
anteriorextremum
(BP 24-48 Hz)
transient GBF
~,(BP 24-48 Hz)
~
~
50 fT ,--t----,-------,-----200 0 200 400
10 fT Iffll ,+i'"pilij "''1,,111
-20 0 20 40 60 80
time (ms)
4s
85
25
1 5
ISI
0.1 5
0.028 s
0.026 s
SSF
W'VXJ" "" " ", , '
~,: \ / ',: "," ,J ,,' _
, NW!':', ,:-', :",
10fT :,,: ~,: :,:' ~-,
,,,,,+,,,,,,4"1"'~"'"-20 0 20 40 60 80
time (ms)
~("'-'o""~
-~
200fT'-~-200 0 200 400
MLF
(BP .1-100 H(~" /,.,,/\~
;'~""10fTI A
1' '''1''''1 '''~?'''I''''I-20 0 20 40 60 80
Fig. 2.16: The auditory evoked fields change with increasing repetition rate (ISI = Inter
Stimulus-Interval): the NI-wave (upper left), the middle latency field (MLF,
middle left) and the steady-state field (SSF, bottom left) can be seen in the
wide-band response. The transient gamma-band field (GBF, right) is extracted
by the 24-48 Hz bandpass (BP). (Reproduced from Pantev et a!., 1993, with kind
permission)
Fig. 2.11: In a study by Miiller e
an array of six light-emshielded recording cham3 mm fiber optic guidesforms evoked by differerlocalizations on the bott,
Using Inter-Stimulus-Intervals of different lengths, Lu et al. (1992) identified the
cortical area whose activity reflects the decay of passive sensory storage of information
about auditory stimuli (echoic memory). The lifetime for decay of the neuronal acti
vation trace in the primary auditory cortex was found to predict the psychophysically
determined duration of memory for the loudness of a tone.
2.4.5.4 Movement-Related J
Characteristic neural activity can
movements. Generally, the onset
tromyography, are used as a fiduc
1983). First (1:-0.5 sec prior to I
/

~ism 2.4 Neuromagnetism 229
,f
Steady-state responses (SSRs) or steady-state fields (SSFs) - Figure 2.76 - showmaximum amplitude when tone pulses are presented at repetition rates near 40 Hz.SSFs sources determined for the different carrier frequencies display a "medial" tendency tonotopy resembling that of the NI (sources for the higher frequencies represented more deeply within the supratemporal sulcus) opposite the "lateral" tendencytonotopy of the middle latency Pa (sources for the higher frequencies situated morelaterally Pantev et al., 1996).
A solid review of magnetoencephalographic studies of the auditory system is provided by Jacobson (1994).
2.4.5.3 Visual System
In comparison to the other modalities, less work has been done using visual stimulation.Noteworthy is the approach by Salmelin et al. (1994) demonstrating how to disentangleactivation related to viewing, language and visualization. The work demonstratedthat during the conversion from visual to symbolic representation activity progressedbilaterally from t·he occipital visual cortex toward temporal and frontal lobes.
As for the other modalities, transient or steady-state responses can be used. Thesteady-state visual evoked field (SSVEF) is a continuous brain response that is elicitedby a repetitive visual stimulus presented at a fixed rate of 5-6 Hz or greater (Fig. 2.77).The SSVEP can be recorded from the scalp as a nearly sinusoidal oscillatory waveformhaving the same fundamental frequency as the driving stimulus and often includinghigher harmonics (Miiller et al., 1997).
fTso
-soo '100,...
1Hz 12Hz 15HzfT ,.
.1OJ~~~-
o 100 m.
= Inter-i (MLF,D in the!X1:ractediith kind,Hied thelrmation,nal aetihysically
Fig. 2.77: In a study by Miiller et al. (1997), flickering visual stimuli were generated byan array of six light-emitting diodes (LEDs) located outside the magneticallyshielded recording chamber. The stimuli were delivered into the chamber via3 mm £iber optic guides that were attached to each LED. The averaged waveforms evoked by different driving frequencies are displayed on the top, sourcelocalizations on the bottom. (Courtesy of Dr. M. Miiller and O. Flofimann)
2.4.5.4 Movement-Related Activity
Characteristic neural activity can be detected prior and during the performance ofmovements. Generally, the onset of spontaneous movements detected, e.g., by electromyography, are used as a fiduciary point for backward averaging (Weinberg et al.,1983). First (1:--0.5 sec prior to movement onset) the Breitschaftsfeld, a slow-rising
"
/

230 Chapter 2 Biomagnetism 2.4 Neuromagnetism--- ----
bilateral shift, appears over frontal and central regions including generators in the supplementary motor area (BMA) (Deecke et al., 1985). During the later pre-movementperiod, the activity becomes predominantly contralateral to the moving limb (Cheyneet al., 1995).
Jerk-locked back-averaging may become a useful tool to explore cortical hyperexcitability in patients with involuntary movements. It can be demonstrated, forinstance, that myoclonic jerks in patients with progressive myoclonus epilepsy arecortically initiated (Makela et al., 1998).
In 1964 Grey Waiter and colleagues (Waiter, 1964) discovered that a slow changein the EEG baseline developed during the warned foreperiod of a reaction time taskwhen a warning stimulus indicated that a second GO-signal would occur a few secondslater. Further investigations soon revealed that a shift towards negativity appears inthe interval between two contingent events, particularly if the second event requires adistinct response (Fig. 2.78).
Although the phenomenon may be a composite of various subcomponents, it hasthereafter been referred to as "contingent negative variation", CNV. Generally, theCNV has been divided into an early aspect, related to the processing of sensory input,and a terminal CNV, related to action preparation (Rockstroh et al., 1989). The significance of such slow potentials with respect to information processing has receivedconsiderable interest as they may represent physiological correlates of psychologicalconstructs such as expectancy, preparation and attention. We have argued that slowbrain potentials can serve as indicators of the regulation of excitability in cortical neural cell assemblies (Birbaumer et al., 1990; Elbert & Rockstroh, 1987; Elbert et al.,1992a). If we assume that brain structures are able to adjust firing thresholds inadvance, threshold control could be considered a mechanism for directing attentionto future action. The question arises whether the anticipatory negativity, and thusthe tuning of controlled processing, would be restricted to motor areas, or whether italso appears in sensory and association areas. In sensory areas, tuning might facilitateselecting sensory input patterns. For the case of auditory stimuli, it is difficult to disentangle the sources in the sensory and motor areas by means of the EEG, as activationof the auditory cortex will project to frontocentral areas as much as the preactivation of motor programs will. The first examinations of the magnetic counterpart ofthe CNV, the contingent magnetic variation (CMV, Fig. 2.78), suggest that both,theearly CMV and the terminal CMV, in particular, are generated by distributed sourcesin motor, sensory and association areas (Elbert et al., 1994c).
2.4.5.5 Presurgical Functional Mapping
In the neurosurgical treatment of brain neoplasms, vascular malformations such asaneurysms, but also for neurosurgical removal of epileptic zones, precise localizationof eloquent cortex is essential to minimize 'neurological deficits yet allow for the maximal removal of nearby dysfunctional tissue (Lewine & Orrison, 1995). Thmors, forexample, may distort brain anatomy so as to render localization of sensory representations or motor areas impossible on the basis of anatomic landmarks. According toLewine and Orrison, "functional mapping of the sensorimotor cortex is now part of theroutine clinical practice of several clinical MEG facilities" (p. 389). Mapping of theauditory cortex is also becoming increasingly relevant. As opposed to the alternatives,
./
EMG
EMG
Cz-EEG
MEG
o
Fig. 2.78: CNV jCMV: Averages r,paradigm. One type of s'cates that the subject hasDuring other trials (NOGIThe EMG (pars indices rn,responded only during thetoid is more negative in tlareas indicates that the diJareas. (Data from Elbert I
ECoG mapping of sensory evoked nmotor cortex, functional mapping uavailable prior to initiation of a pa:site selection and the resection ofsurgical time can be shortened.
Typically, scan protocols for th,that outlined in the sections abovetunity to evaluate the precision ofOrrison, 1995; Sutherling et al., 19!and noninvasive methods has been e

2312.4 Neuromagnetism----=-------------------------
EMG
EMG
I
M~~* It\ [2PT
I sec +o 2 4
Fig. 2.78: CNV/CMV: Averages recorded from a single subject during a two-stimuliparadigm. One type of stimulus (GO - black lines) presented at time 0 indicates that the subject has to respond to an imperative signal presented 4 slater.During other trials (NOGO - blue lines) no overt motor response was required.The EMG (pars indices m. flexor dig. longum, top traces) shows that the subjectresponded only during the GO-condition. The EEG recorded from C z • right mastoid is more negative in the GO-condition. The MEG, recorded over temporalareas indicates that the differentiation results - at least in part - from temporalareas. (Data from Elbert et al., 1994c)
ECoG mapping of sensory evoked responses or the direct electrical stimulation of themotor cortex, functional mapping using MSI has the advantage that the knowledge isavailable prior to initiation of a particular surgical approach. Thus, the craniotomysite selection and the resection of pathological tissue can be carefully planned andsurgical time can be shortened.
Typically, scan protocols for the elicitation of transient responses correspond tothat outlined in the sections above. In several instances, there has been the opportunity to evaluate the precision of MSI localization (Gallen et al., 1993; Lewine &Orrison, 1995; Sutherling et al., 1988). "In all cases the agreement between invasiveand noninvasive methods has been excellent, with the MEG median nerve source local-
"
,/

232
izing within the brain tissue directly beneath the position identified by surface ECoGmonitoring of the somatosensory evoked potential" (Lewine & Orrisan, 1995, p. 392).
The sources of the somatosensory evoked fields (SEFs) to ~edian nerve stimuliare localized on the posterior wall of the central sulcus (Vanni et al., 1996; Woodet al., 1985). The information of this localization can be very useful in neurosurgery(Fig. 2.79) since the primary motor cortex, to be protected during operations, lies onthe anterior wall (Miikelii et al., 1998).
Fig. 2.79: Sources of SEF P30m deflection overlied on 3-D MR image of a patient afterremoval of right frontal glioma. Two years after operation, the patient's symptoms reappeared and reoperation was planned. Sagittal section shows that tumorinfiltrates the primary motor cortex, immediately anterior to the SEF sources.Because of high probability of postoperative hemiparesis, reoperation was cancelled. (From Miikelii, 1998; unpublished data, courtesy of Dr. Forss)
The averaged position of the estimated AEF-NlOOm dipoles lies on the uppersurface of temporal lobes with a vertical 2mm standard (Nakasato et al., 1995). Thisprecision allows to identify auditory cortex, information that can assist for surgeryespecially on the left temporal lobe, because the left auditory cortex is surrounded bythe language-related areas. Disappearance of the NlOOm response (Miikelii & Hari,1992; Miikelii et al., 1991) have been reported in patients with temporal lobe lesions.Currently MEG techniques have been developed to localize areas relevant for theperception of vowels (Eulitz et al., 1995) as well as higher speech-related cortical areasdirectly. Visual stimuli are equally applicable in the functional localization of eloquentcortical regions using, e.g., recordings of pattern reversal VEF (Makela et al., 1998).
The parameters of function used in presurgical evaluation need to be stable acrosspopulations of patients and age-matched controls. N20m stability has been evaluatedin detail (Rossini et al., 1994a). The median nerve, thumb and little finger of the twohands were stimulated. N20m localization, distance between homologous ECDs in thetwo hemispheres, distance between thumb and little finger ECDs and the differencein this distance in the two hemispheres were calculated. In patients 2-7 months afterhemispheric stroke at least one of these parameters was aberrant, implying functional
,
./
2.4 Neuromagnetism
reorganization (Rossini et al., l'important to have predictive parbetween homologous areas in th
2.4.6 Cortical Represe
The central nervous system andto reorganize itself after alteraticfirst Subsection, 2.4.6.1, addresstivity patterns and, in particularas a result of alterations in thetion, 2.4.6.2, focuses on changesattempts to uncover indicators 0
and behavioral functions.
2.4.6.1 Cortical Reorganizaput
Peripheral lesions or deprivationrepresentations. For instance inwill not remain unresponsive: bunormally respond to the now-abs(to Occur after a period of extensivreceptive field in the cortex. In'activated area has been found tohave been made not only duringthese findings have been based tGcortical organization and reorganMEG/MSI in humans, which has flbetween cortical reorganization arStudies have demonstrated such ipain to cortical reorganization in hbetween somatosensory training aet al., 1995a).
Alterations in afferent input leacal reorganization, resulting in altelstudies by Merzenich and colleagu(Merzenich, 1990; Merzenich & Jen~et al., 1992c,d,a,b, 1993) demonstnresults in an altered representationcan .also be observed in humans bycortIcal reorganization has primarib~mputation of an upper extremity·tron, whereby the representationalrepresented by the hand and digitfocus of cortical activation elicitedcentimeters toward the receptive fi,

''11,''" ,Jl'''''ii'!;'\.'-~ ------.'
-:'
2.4 Neuromagnetism 233
reorganization (Rossini et al., 1994b). In the study of plasticity (sce below), it is alsoimportant to have predictive parameters that describe the intra-individual relationshipbetween homologous areas in the two hemispheres.
2.4.6 Cortical Representational Plasticity
The central nervous system and the cerebral cortex, in particular, have the potentialto reorganize itself after alterations of its input from peripheral neural structures. Thefirst Subsection, 2.4.6.1, addresses questions concerning the capacity of neuronal activity patterns and, in particular, of the ability of sensory and motor maps to changeas a result of alterations in the effectiveness of afferent inputs. The second Subsection, 2.4.6.2, focuses on changes in functional maps resulting from brain lesions andattempts to uncover indicators of reorganization that accompany recovery of mentaland behavioral functions.
2.4.6.1 Cortical Reorganization as a Consequence of Altered Afferent Input
Peripheral lesions or deprivation from afferent input alter the organization of centralrepresentations. For instance, in the case of amputation the representational cortexwill not remain unresponsive, but neighboring regions invade the area which wouldnormally respond to the now-absent afferents. Plasticity has also been demonstratedto occur after a period of extensive training which has repetitively activated a certainreceptive field in the cortex. In the case of such repetitive activity, the size of theactivated area has been found to enlarge. It is notworthy that these observationshave been made not only during developmental stages, but also in adults. Whilethese findings have been based to a large extent on animal experiments, functionalcortical organization and reorganization have also been studied using non-invasiveMEG /MSI in humans, which has further allowed for an examination of the relationshipbetween cortical reorganization and perceptual, behavioral and cognitive processes.Studies have demonstrated such important findings as the relationship of phantompain to cortical reorganization in human amputees (Flor et al., 1995b) or the relationbetween somatosensory training and homuncular organization in musicians (Elbertet al., 1995a).
Alterations in afferent input lead to functional cortical modifications, i.e. to cortical reorganization, resulting in alterations in the cortical responses to stimuli. Animalstudies by Merzenich and colleagues (Jenkins et al., 1990; Menninghaus et al., 1994;Merzenich, 1990; Merzenich & Jenkins, 1995; Merzenich et al., 1987, 1984; Recanzoneet al., 1992c,d,a,b, 1993) demonstrated as early as 1984 that an amputation of digitsresults in an altered representation of the hand in area 3b. Today such plastic changescan also be observed in humans by means of non-invasive investigations. In humans,cortical reorganization has primarily been demonstrated for the somatosensory cortex.Amputation of an upper extremity results in alterations of the homuncular organization, whereby the representational zone of the face shifts towards the zones formerlyrepresented by the hand and digits. MEG-based source imaging revealed that thefocus of cortical activation elicited by facial stimulation was shifted up to severalcentimeters toward the receptive field which. would normally receive input from the
./

234 __C_ha--,pter 2 Biomagnetism 2.4 Neuromagnetism
now amputated hand and fingers (Elbert et al., 1994bj Yang et al., 1994). A similartendency was observed for the receptive field of the upper arm (stump). Additional rcsponsiveness of these reorganized cortical areas was evidenced by a~ enhanced evokedelectroencephalographic potential and magnetic field compared to stimulations on theintact side. Observed alterations provide evidence for extensive plastic reorganizationin the adult sensory cortex of humans following nervous system injury.
Knecht and co-workers (Knecht et al.) 1995, 1996) investigated perceptual thresholds in patients with amputation of the arm. The sensory discrimination thresholds inthe face were lower on the side of the amputation, as compared to the intact side, a finding which suggests that the alteration of cortical representation may have perceptualconsequences. Flor et al. (1995b) determined, by use of non-invasive neuromagneticrecording techniques, the extent of cortical reorganization in the primary somatosensory cortex in upper extremity amputees with varying degrees of phantom limb pain.The magnitude of cortical reorganization showed a highly significant positive association with the amount ofphantom limb pain experienced by the amputees (Fig. 2.80).These data indicate that phantom limb pain is related to and may be a consequenceof plastic changes in the primary somatosensory cortex. The intuitive hypotheses thatcortical reorganization constitutes an adaptive mechanism thus need not be true.
Increased use of the other hand will lead to an expansion of the representationalcortical zones and to a reduction of receptive fields (Elbert et al., 1995a, 1997b; Rockstroh et al., 1998). Violinists and other string players provide a good model for thestudy. of the effects of differential afferent input to the two sides of the brain in humans. During practice or performance, the second to the fifth digits (D2-D5) of theleft hand are continuously engaged in fingering the strings, a task involving a greatdeal of manual dexterity and enhanced sensory stimulation, while the thumb graspsthe neck of the instrument and remains relatively stationary. The right hand, in manipulating the bow, engages in a task involving less individual finger movement andfluctuation in tactilc and pressure input than D2-D5 of the left hand. By using MEGbased source imaging, we demonstrated that the brains of string players are differentthan the brains of normal control subjects in that the representation of the digitsof the left hand of string players was substantially expanded compared to the digitsof the left hand in normal control subjects (Elbert et al., 1995a). For the thumb,which has the less active task of holding the neck of the instrument, the expansionwas not as great as for the digits involved in the fingering. The amount of corticalreorganization was strongly correlated with age at inception of musical practice (andwith years of practice) for the digits involved in the fingering, but not for the thumb.Results suggest that ther!l is use-dependent plasticity of cortical zones representingdifferent parts of the body permitting a rapid reallocation of available central nervoussystem circuitry to conform to the current needs of the individual. Another MEGstudy, (Mogilner et al., 1993) demonstrated the reorganization of the somatosensorycortex after surgical separation of webbed fingers (treatment of syndaktylie). UsingMSI we could investigate (Sterr et al., 1998) the opposite effect: repetetive chronicsynchronous and behaviorally relevant stimulation to several digits resulted in a fusionand in a disordered arrangement of digit representation. At the same time subjectsconsistently mislocalized light pressure stimuli applied to the finger tips.
In another MEG study artificial syndactylism effects in adult humans were investigated. The index and middle finger of the non-dominant hand were taped together
/
Fig. 2.80: The amount of reorganizaupper extremity amputeestermined non-invasively bymagnitude of cortical reorgassociation with the degrelThe figure illustrates <.latalimb pain (marked by blalperienced no phantom \imlrepresent the locations (Elt.he lip projected onto a s(hemispheric asymmetry intom pain patient. This st.umay be a consequence of pIFIar et al., 1995b)

2352.4 Neuromagnetism-----------------------
Fig. 2.80: The amount of reorganization in the primary somatosensory cortex in thirteenupper extremity amputees with varying degrees of phantom limb pain was determined non-invasively by the use of neuromagnetic recording techniques. Themagnitude of cortical reorganization showed a very strong and significant positiveassociation with the degree of phantom limb pain experienced by the amputees.The figure illustrates data from a representative subject with intense phantomlimb pain (marked by black filled symbols) and from another subject who experienced no phantom limb pain (marked by white filled symbols). The squaresrepresent the locations (EeD) of the digits, the circles represent the location ofthe lip projected onto a schematic coronal section of the brain. A pronouncedhemispheric asymmetry in the location of the lips can be observed in the phantom pain patient. This study indicates that phantom limb pain is related to andmay be a consequence of plastic changes in primary somatosensory cortex. (FromFlor et al., 1995b)
"
./

236 Chapter 2 Biomagnetism 2.4 Neuromagnetism
holds true, the -t;xtension of acti,another pathway, i.e. another leleye, for instance, results in the ethe intact eye (Stryker, 1991). Dlneighboring face area (Elbert et I
ing in a hearing loss of a particul;fields into the cortex representing
In regions in which differentticity may lead to changes acrossresults in an extension of the neirespond to visual processing (R,result from various types of neU!input, axional sprouting, or Hebh1995). In humans, suggestive e,ported: RosIer, Roder et al. (1993a haptIC mental rotation task whblind people and blindfolded sightblind subjects showed a pronouncblindfolded, sighted subjects exhi~ontal predominance of the negatJects and a similar occipital predcrotation task proper. Adventitiousnegative potential over both the flgest that reorganization occurs ratdevelopment 'varies depending onuh). Furthermore, it is apparent tin mediating reorganization.
Studies relating behavioral andsparse. One reason for this lies in th,or consequences of neuronal plasticistudies. It is therefore necessary teemploying MSl.
2.4.6.2 Cprtical and Behavior
~o: the field of neurological rehabilitJCIty and functional reorganizatiorically, future MSI research should frecovery and plasticity of function:ortical functions in sensory and meI~farct, and the impact of particulatJon. In several laboratories, for in~~ovement are currently employed tlIn patients who had suffered from ~
by Edward Taub (Taub et al. 1993'the various ways in which sU~h beh:and plasticity.
3rd finger
Control
Index finger3rd finger
Syndactylism
Index finger
2.81: Subject before (above) and after (below) three weeks of artificial syndactylism:index finger representation increased; area of middle finger in SI with shrunkencurrent density. In the control subject (pictures on the right side) the currentdensity of both finger representations appears reduced after three weeks of syndactylism. (From Ziemuset al., 1997)
Fig.
for three weeks and MEG recordings were performed before, immediately after, andthree weeks after the period of syndactylism. Using current den~ity reconstructionanalysis (Puchs & Diissel, 1992), Ziemus et al. (1997) demonstrated that this form ofperipheral, passive, synchronous co-activation induced a change in the current density pattern, showing two different effects: either enlargement of both or shrinking ofone finger-representation at the cost of the other. These plasticity effects appearedto be reversible in the follow-up MEG recordings. In equivalent MEG measurementsof a group of control subjects the current density pattern remained unchanged (seeFig. 2.81).
Consistent with earlier work in animals (e.g. Clark et al., 1988), we conclude thatsynchronous stimulation creates a fusion of cortical representational zones while asynchronous stimulation leads to separation. These processes may underlie certain mysterious illnesses such as the focal dystonia of the hand in musicians (Byl et al., 1996,1995).
Such cortical plasticity is thought to result from changes in synaptic efficacy thatfollow Hebb's rule (Rauschecker, 1995). Consequently, peripheral lesions can demonstrate hidden pathways which would normally not be sufficiently activated to result ina firing of the postsynaptic neuron (Merzenich, 1990). Even simple behavioral training may result in similar phenomena and produce an enlargement of the cortical areathat is activated by a particular task (Recanzone et al., 1993). In extreme cases, extensions spanning an area of several millimeters have been observed in the relativelysmall brains of monkeys (Pons et al., 1991). The growth or the sprouting ofaxonshas been considered another basic mechanism underlying plastic alterations (DarlanSmith & Gilbert, 1994; Garraghty & Kaas, 1992). Yet regardless of which mechanism
/

2.4 Neuromagnetism 237
'Is
D
holds true, the extension of active pathways or brain regions occurs at the expense ofanother pathway, i.e. another less active region. Consequently, the deprivation of aneye, for instance, results in the extension of the neighboring stripe with dominance ofthe intact eye (Stryker, 1991). Deafferentation of the hand leads to an extension of theneighboring face area (Elbert et al., 1994b; Pons et al., 1991). Cochlear lesions resulting in a hearing loss of a particular frequency band cause extensions of those receptivefields into the cortex representing neighboring frequencies (Robertson & Irvine, 1989).
In regions in which different sensory representations are processed, cortical plasticity may lead to changes across the borders of a modality. Thus, visual deprivationresults in an extension of the neighboring non-visual regions which do not normallyrespond to visual processing (Rauschecker, 1995). Such intermodal plasticity mayresult from various types of neuronal mechanisms among which activation of silentinput, axional sprouting, or Hebb-like mechanisms have been discussed (Rauschecker,1995). In humans, suggestive evidence for intermodal plasticity has also been reported. Rosier, Roder et al. (1993), for instance, compared event-related potentials ina haptic mental rotation task, which involved the tactile discrimination of letters, inblind people and blindfolded sighted subjects. While the tactile stimuli were encoded,blind subjects showed a pronounced occipital activity (a negative slow wave), whileblindfolded, sighted subjects exhibited frontal predominance of activity. A similarfrontal predominance of the negative slow wave occurred in blindfolded sighted subjects and a similar occipital predominance in congenitally blind subjects during therotation task proper. Adventitiously blind subjects, however, exhibited a pronouncednegative potential over both the frontal and the occipital cortex. These results suggest that reorganization occurs rather quickly following vision loss, but that temporaldevelopment 'varies depending on the process (such as encoding or processing stimuli). Furthermore, it is apparent that frontal structures may play an important rolein mediating reorganization.
Studies relating behavioral and perceptual elements to cortical reorganization aresparse. One reason for this lies in the difficulty to operationalize the functional meaningor consequences of neuronal plasticity for perception, cognition and behavior in animalstudies. It is therefore necessary to complement animal studies with humans studiesemploying MSI.
2.4.6.2 C.ortical and Behavioral Plasticity Following Brain Lesions
For the field of neurological rehabilitation it is of utmost interest to examine the plasticity and functional reorganization following brain lesions in humans. More specifically, future MSI research should focus on the investigation of processes underlyingrecovery and plasticity of function, such as the organization and reorganization ofcortical functions in sensory and motor impairment following ischemic or hemorrhagicinfarct, and the impact of particular rehabilitation procedures on cortical reorganization. In several laboratories, for instance, constraint-induced facilitation of impairedmovement are currently employed to overcome non-use of an affected upper extremityin patients who had suffered from stroke, following the training procedure developedby Edward Taub (Taub et al., 1993). To extend the training, it is important to targetthe various ways in which such behavioral plasticity relates to cortical reorganizationand plasticity.
"
/

238 Chapter 2 Biomagnetism 2.4 Neuromagnetism
So far, research on plasticity and reorganizatioll following brain lesions has beenfocused on the following functions:
1. Recovery of sensory and motor function: Brain damage such as that resultingfrom cerebrovascular accidents can lead to a variety of alterations:
(a) complete destruction of a given brain structure combined with total loss ofactivity in this area;
(b) remaining structural integrity, but decrease of brain activity;
(c) disintegration of distributed cooperative activities, i.e., alteration of spatiotemporal patterning of brain activity secondary to focal damage..
In all three cases it is important to gain detailed information about the extentof the necrotic center versus the surrounding area of reduced perfusion (penumbra) and the outer edematous zones in focal brain damage. In addition, it isimportant to obtain information about the functional status of each particulararea. While the structural information can routinely be determined by MR.I,procedures determining the status of function of the particular area remain tobe developed further. Such methods can be based on MSI.
2. The assessment of functionality in areas directly affected by strokes and theirneighboring regions can, for instance, be evaluated by somatosensory evokedmagnetic fields to sensory alterations (Maclin et al., 1994). The location ofthe estimated EeD was always in non-infarcted tissue, in the region of the somatosensory cortex. Only recently has access been made to the study of corticalplasticity and reorganization in the somatosensory cortex, in particular (see previous Section).
3. Recovery of attention and language function is another field where MSI offersinteresting perspectives. Research on aphasia suggests that symptoms do notexclusively reflect impaired sensory, input-related functions of the lesioned areasbut are also consequences of impaired cognitive processes that are not directlylinked to speech perception and language production.
In summa-ry, recent studies suggest that brain lesions following trauma not only lead toimpairment of sensory functions related to the particular area destroyed by the lesion,but also to impairment in higher cognitive functions related to input processing. Ithas further been suggested that reorganization, Le., restitutional and substitutionalprocesses, may take place following stroke and during rehabilitation. However, mostimportantly, studies suggest that the areas and the amount of reorganization eitherthrough spontaneous recovery or through training remains to the specified. It is thisuncertainty that requires future research.
2.4.7 Application of MSr to Epilepsy
About 0.25% of the population suffer from drug-resistent focal epilepsy, Le. anticonvulsants are not sufficiently effective or even contraindicated to control seizures. Itis estimated that about 10-15% of these patients would profit from surgical removalof the epileptogenic tissue. The resection of brain tissue requires careful presurgical diagnosis that determines the location of the relevant pathological tissue, i.e., the
/
epileptogenic zones as accurately avide the necessary information. 'Ithe skull and implantation of electrcost intensive, but also puts the pielectrodes can only scan a limited aBy choosing an inadequate implantable for diagnosis. It is thus highlywould allow for the non-invasive deithe epileptic focus.
Two approaches have been ta1ized during interictual periods andMethohexital, a short-term barbituepileptogenic acitivity is generatedure 2.58 provides an example of a si
2.4.7.1 Localization of Interict
The usefulness of localizing epileptiperiods is still debated, at least as f,According to Liiders et al. (1993), iIl1zone, which in general is larger theseizure onset corresponds best to tresected in order to achieve seizureconcept of irritative and epileptogeand ECoG recordings is well definelMEG recordings with respect to focu(Brockhaus et al., 1997). Furtherrnrepresent an inconstant and infreque
Nevertheless, it is now establishelin the evaluation of patients when itshow independent spiking versus conQuick visual inspection is generally ~
between spikes generated in the twoa number of cases that demonstratecan have a direct and positive effect 1
study on 50 patients with focal epilEa 37-channel gradiometer already pr,convexity foci (Sm5th et al., 1995)..evaluation. In patients with orbitofrobe mandatory before localization bee
2.4.7.2 Non-invasive LocalizatiActivity
As indicated above, interictual activitzone, i.e., the region the removal of'is generated in the irritative zone (Inecessarily overlap with the epileptog

~.I
2.4 Neuromagnetism 239
epileptogenic zones as accurately as possible. To date, only invasive procedures provide the necessary information. The surgical intervention that includes opening ofthe skull and implantation of electrodes for the diagnostic procedure alone is not onlycost intensive, but also puts the patient at a considerable risk. Furthermore, depthelectrodes can only scan a limited area of the brain in, generally, only one hemisphere.By choosing an inadequate implantation site, important information may not be avilable for diagnosis. It is thus highly desirable to advance MSI-based procedures whichwould allow for the non-invasive detection of epilepitic activity and the localization ofthe epileptic focus.
Two approaches have been taken: a) epileptiform transients have been localized during interictual periods and b) seizure-like activity has been induced applyingMethohexital, a short-term barbiturate that puts the patient into light coma whileepileptogenic acitivity is generated at the same time (Brockhaus et al., 1997). Figure 2.58 provides an example of a single epileptic spike.
2.4.7.1 Localization of Interictual Epileptic Activity
The usefulness of localizing epileptic transients that are recorded during interictualperiods is still debated, at least as far as the primary epileptogenic area is concerned.According to Liiders et al. (1993), interictal spike activity mainly reflects the irritativezone, which in general is larger than the primary epileptogenic zone. The area ofseizure onset corresponds best to the primary epileptogenic zone which has to beresected in order to achieve seizure free outcome after surgery. According to theconcept of irritative and epileptogenic zone, the value of interictal spikes in EEGand ECoG recordings is well defined, but the significance of interictal spikes in theMEG recordings with respect to focus localization has not been established until now(Brockhaus et al., 1997). Furthermore, in most epilepsy patients, interictal spikesrepresent an inconstant and infrequent phenomenon.
Nevertheless, it is now established that whole-head MEG recordings can be usefulin the evaluation of patients when it is difficult to determine if the two hemispheresshow independent spiking versus correlated spiking (with one side leading the other).Quick visual inspection is generally sufficient to determine the temporal relationshipbetween spikes generated in the two hemispheres. Lewine & Orrison (1995) presenta number of cases that demonstrate that "MEG evaluation of epileptiform activitycan have a direct and positive effect on patient care" (p. 403). Furthermore, a recentstudy on 50 patients with focal epilepsy showed that MEG recordings using simplya 37-channel gradiometer already provided good localizing results for patients withconvexity foci (Sm.ith et al., 1995). Results were judged on the basis of presurgicalevaluation. In patients with orbitofrontal or deep foci, whole-head recordings seem tobe mandatory before localization becomes meaningful and clinically helpful.
2.4.7.2 Non-invasive Localization of Barbiturate-Induced EpileptiformActivity
As indicated above, interictual activity generally does not result from the epileptogeniczone, i.e., the region the removal of which would abolish the seizures, but generallyis generated in the irritative zone (EIger, 1992) that often surrounds but does notnecessarily overlap with the epileptogenic zone. Localization of the epileptogenic zone
./

240 Chapter 2 Biomagnetism 2.4 Neuromagnetism
in drug-induced spike densities in ta correct lateralization of the epileta similar lateralizing power of thetrates the time course of the signaldisplayed in Fig. 2.58). The contoua singel spike, source configurationin spatial location. This is confirmspike activity (Fig. 2.83). In patienlsource must often be assumed. Cothe magnetic fields were predominaby 37-channel gradiometersystem u.primary epileptogenic focus could nMagnetometers and whole-head-systlis known about the source configUJfocal epilepsies. In order to assess tlperform simultaneous ECoG and Mlthat ECoG only detects a limited paECoG are necessarily restricted to 1The source is where the elcectrodes ,
Fig. 2.83: The localizations in the c<localization of the first peapanel the localization for t
upper to the lower bank ofspreading excitation is SUP]
black lines).
25
17
201510
16
,..- 4.8 pT
-5o+---.,..---,--,..--,-----,----,-----r------,
-ID
0.5
2.5
15
-4.3 pT
requires its stimulation while EEG and MEG are recorded. Most of the techniquesthat provoke epileptic seizures will result in movements, rendering MEG registrationdifficult. Short-acting barbiturates such as Methohexital, however, put the patientat rest while stimulating the epileptogenic zone at the same time (Brockhaus et al.,1997; Wienbruch, 1997). The patterns induced by this technique allow the localization of the epileptogenic zone, particularly in patients with temporal lobe epilepsy.A substantial body of literature report that epileptiform discharges are induced byvarious barbiturates, such as Methohexital, Amobarbital, Thiopental and the narcotic Propofol. Among them, Methohexital seems one with a high potency to activateepileptiform discharges in EEG and ECoG. Hufnagel and coworkers (1992) showed thatMethohexital increases the spike density and, furthermore, activates a distinct type ofepileptiform pattern, best described as spike-burst-suppression pattern (SBS). SBS ischaracterized by a high amplitude spike burst followed by a suppression in the EEG IECoG consisting of isoelectrical activity or subdelta background activity. Spikes andSBS induced by Methohexital in the ECoG recorded with temporal subdural stripelectrodes have a high validity for the localization of the primary epileptogenic zone.
Brockhaus et al.(1997) evaluated thequality of localization ofthe epileptogenic areausing spontaneous andMethohexital"inducedspikes. The MEG wasrecorded from 15 patients with temporallobe epilepsy using a37-channel-first-ordergradiometer. All patients underwent separate electrocorticographic (ECoG) recordings of Methohexitalinduced epileptiformdischarges. No adverseeffects during or afterthe short narcosis werenoticed by either thepatient or the inve~tiga
tors. Patients fell asleepabout 1 minute after
Fig. 2.82: Contourplots for the two extrema in signal inten- application of Metho-sity (RMS) that typically appear in the course of hexital and recovereda spike. The plots demonstrate that the source within 10 minutes. Noconfiguration must have changed while the spike clinical excitatory effectsreverses its polarity. like nausea or vomiting
were observed nor were any seizures elicited. Spike densities in MEG and simultaneousEEG recordings increased significantly after Methohexital application. Differences
./

2.4 Neuromagnetism 241
in drug-induced spike densities in the MEG recordings between both sides alloweda correct lateralization of the epiletogenic area in 11 of the 15 patients, confirminga similar lateralizing power of the MEG and ECoG recordings. Figure 2.82 illustrates the time course of the signal intensity for a typical focal spike (like the onedisplayed in Fig. 2.58). The contourplots already demonstrate that in the course ofa singel spike, source configurations do not simply reverse in polarity, but changein spatial location. This is confirmed when a moving ECD is used to localize thespike activity (Fig. 2.83). In patients with temporal lobe epilepsy, an unstable deepsource must often be assumed. Consequently, it is not surprising that extrema ofthe magnetic fields were predominantly located at the margins of the area coveredby 37-channel gradiometersystem used in the Brockhaus et al. study. Hence, theprimary epileptogenic focus could reliably be identified in only 4 of the 15 patients.Magnetometers and whole-head-systems should improve this ratio considerably. Littleis known about the source configuration corresponding to epileptiform activity infocal epilepsies. In order to assess the localizing power of MSI, it would be useful toperform simultaneous ECoG and MEG recordings. It should be mentioned, however,that ECoG only detects a limited part of the total activity - sources identified by theECoG are necessarily restricted to locations where electrodes have been implanted:The source is where the elcectrodes are!
Fig. 2.83: The localizations in the course of a single spike: The upper panel shows thelocalization of the first peak in signal intensity (single EeD-model); the lowerpanel the localization for the second peak. The localization moves from theupper to the lower bank of the supratemporal gyrus. The interpretation of aspreading excitation is supported by the reversal in current flow (indicated byblack lines).
./

242 Chapter 2 Biomagnetism 2.4 Neuromagnetism
Lewine and colleagues (1995; 19!a sample of 50 unselected epileptic r
I30B
I20
eyes closed/// eyes open
I10
Io
5.5 8.7 n.l Hz\ / /'
dominate the recorded signal duri1995; Lewine & Orrison, 1995). ThEthe MEG signal in the theta or dEsorting for a high goodness of fit (:and low confidence volume. The USI
analyses has also been suggested (Vof slow waves is generally lower and I
of brain tissue is rare as opposed tcWhen this type of analysis is ap
activity can be detected in aboutparticularly in those with corticalsubcortical lesions as well as in pattivity may be present in patients '"neuropsychological deficits (Lewineliminary data suggest that the freewaves changes in the course of reh,sitution (as opposed to substitutiofunction).
Clusters of locations of slow waplasms (MiikeUi et al., 1998). In thtumor as completely as possible wSources of focal slow waves can betumor (Fig. 2.85). Mirror clusters, Eseen in about 30% of patients with
Fig. 2.85: Left: 'Spectra of spontane(after a stroke in the left anifrequencies. Right: The Ml
2.4.8.1 Localization Based on Abnormal Low Frequency Waves
2.4.8 Localization of Dysfunctional Structures and StructuresRelated to Abnormal Information Processing
The abnormal waves commonly appear below the alpha band, mostly in the 1-6 Hzrange. The field patterns of this activity are usually complex as multiple generatorareas are simultaneously active. At some time instances, however, a single source may
Fig. 2.84: This patient experienced the abrupt onset of a dense right hemiparesis andaphasia due to a stroke, as visually observable on the above CT scans. Squarescorrespond to the locations of the primary receptive somatosensory area, as determined by the. first major peak (30-70 ms) in the magnetically evoked field.Circles indicate the location of equivalent dipoles of large local slow waves inthedelta band (1-6 Hz). Note that these locations circumscribe a dysfunctional region around the structurally visible lesion in the MRl. Typical lesions producingfocal slow activity include cerebral infarcts, contusions, local infections, tumors,developmental defects, degenerative defects of subdural hematomas. (Courtesyof Dr. C. Gallen)
In sum, current attempts deserve further investigation, whereby the induction ofepileptiform activity by means of short-acting barbiturates will at least work in patientswith more shallow sources. .
The investigation of brain functioning in cases of lesions of circumscribed brain structures or neural pathways constitutes a central paradigm for basic neuroscientific research. At the same time, the improved understanding of the consequences of lesions inthe various brain regions provides a basis for innovative therapeutic possibilities. Neuropsychological testing combined with functional brain imaging with a high tempora1and spatial resolution will open new ways of observing dynamic alterations of cerebralorganization which occurs after brain damage as well as the accompanying dynamicprocess of lesion-induced impairment and recovery of mental functioning. Figure 2.84illustrates that structural information, easily provided by MRI and CT-scans, is notsufficient to describe the regions affected by brain injury. A dysfunctional area canbe defined through the mapping of abnormal brain waves which often surround thestructurally obvious lesion.
,/

2.4 Neuromagnetism 243
dominate the recorded signal during abnormal low-frequency events (Lewine et al.,1995; Le.wine & Orrison, 1995). These instances can be identified by bandpass-filteringthe MEG signal in the theta or delta range and then applying the ECD model andsorting for a high goodness of fit (>0.9-0.95), high signal power (RMS >200-400 IT)and low confidence volume. The use of clustering algorithms and principal componentanalyses has also been suggested (Vieth et al., 1996). In healthy subjects the frequencyof slow waves is generally lower and co-localization ofthe dipolar sources in about 1 cm3
of brain tissue is rare as opposed to cases with brain pathologies (Vieth et al., 1996).When this type of analysis is applied, abnormal clusters of sources of spontaneous
activity can be detected in about 80% of patients after cerebrovascular accidents,particularly in those with cortical lesions. The ratio drops to 50% in patients withsubcortical lesions as well as in patients after head trauma. Extensive slow wave activity may be present in patients with large infarcts and persistent neurological andneuropsychological deficits (Lewine et al., 1995; Lewine & Orrison, 1995). Some preliminary data suggest that the frequency and Clustering of abnormal low frequencywaves changes in the course of rehabilitation and may thus serve as an index of resitution (as opposed to substitution that may also be responsible for a recovery offunction).
Clusters of locations of slow waves are also observed in about 70% of brain neoplasms (Makela et al., 1998). In the surgical resection it is important to remove thetumor as completely as possible without, however, damaging healthy brain tissue.Sources of focal slow waves can be found in the cortex immediately adjacent to thetumor (Fig. 2.85). Mirror clusters, corresponding foci in the healthy hemispheres, areseen in about 30% of patients with neoplasms and with cerebrovascular insults.
5,5 8,7 1Ll Hz\ / /
I30Hz
I20
eyes closed/
eyes open
I10
Io
Fig. 2,85: Left: ·Spectra of spontaneous parieto-occipital activity in a 23-year old patientafter a stroke in the left anteromedial thalamus. Note the increase in the 1-6 Hzfrequencies. Right: The MRI showing the lesion. (From Miikelii et aI., 1998)
Lewine and colleagues (1995; 1995) also found focal slow wave activity in 80% ofa sample of 50 unselected epileptic patients. Such activity can be pff~sent even in the
"
./

244 Chapter 2 Biomagnetism 2.4 Neur()magnetism------
absence of structural lesions or interictal spikes, however, multiple foci are identifiedin more than half of the patients. It seems that the site with the most intense focusis generally the one with the side and lobe of pathology. '
Functional disturbance foreruns structural changes e.g., in ischemia; thus it maybe possible to localize functional perturbations not visible in morphological imagingtechniques before they become permanent. Observations of significant amounts of slowactivity during the first four weeks following transient ischemic attacks and minor headpoint in this direction (Miikelii et al., 1998).
Clusters also occur in patients with schizophrenia and dementia and substanceabuse, when no structural lesions can be detected. It remains to be seen if theseclusters can reliably identify dysfunctional brain regions.
2.4.8.2 Magnetoencephalographic Localization of Abnormal InformationProcessing and Deviant Cognition
Recent research has also begun to examine MEG correlates of cognitive deviances characteristic for impairments that may contribute to neuropsychological and to psychiatric symptoms and deficits. The majority of work so far has focused on schizophrenia(Rockstroh et al., 1997b; Roth et al., 1995). A substantial body of research has elucidated the covariation between deviant cognitive processes and event-related potentials.For instance, hypotheses regarding cortical functional characteristics in schizophrenia(e.g., frontocortical vs. temporal lobe activity) have been tested by means of eventrelated potentials and their source modeling (Rockstroh et al., 1997a). Source modeling based on electrical data alone, however, did not prove sufficient for uncovering thestructures with aberrant patterns of activity occurring with psychopathological processes. With the addition of magnetoencephalographic data, a major step forward isto be expected as the combination of EEG and MEG will allow, for instance, the quantification 'of the relative weight of deviant patterns in frontal and temporal structures.Considerable effort in the last 10-20 years has been devoted to the use of event-relatedpotentials in the attempt to uncover characteristically deviant cognitive processes invarious cases with psychopathology. For instance, smaller amplitudes of later aspectsof the event-related potentials (ERPs), in particular reduced 'amplitudes of N100, P300and CNV, were reported in schizophrenic patients during acute episodes (summary ofevidence by Cohen et al., 1991). The findings are so reliable that they have even beendiscussed as "markers" of the disease. Larger amplitudes of early aspects of the ERPbefore 100 ms have been attributed to inefficient inhibition of irrelevant sensory input,probably even on a subcortical level. It has been argued that this lack of inhibitionleads to an information o~erload which subsequently impairs controlled processing andwhich then becomes manifest in attenuated late ERP-components. An exception tothe rule of attenuated ERP amplitudes is the negative potential shift following animperative stimulus and the response. In forewarned reaction tasks, a postimperativenegativity (PINV) is commonly observed in schizophrenic patients, but rarely foundin healthy control subjects. However, in healthy subjects, a PINV can be induced byspecific experimental manipulations such as unexpected changes in the contingenciesbetween stimulus, response, and response outcome (for summary see Cohen et al.,1991; Rockstroh et al., 1989).
Only a few magnetoencephalographic studies have been performed withschizophrenic patients. These have concentrated mainly on earlier components
/
of the event-related response. 1the magnetic counterpart of thEorie~tation (Reite et al., 1989),spatial regulation of cortical excdeviant temporal COurse of dipol~ared to controls provides furthfmterest for the explanation of selof the pe~k latency of the magnEw~en Schizophrenic patients IistelWithout hallucinations (TiihonenN10?m peak latency produced b)mUSIC maskers), suggests "that tJnot by external input from the ea1992, p. 257), and may be an app
2.4.9 The Relation of MNon-invasive Stud
Brain imaging techniques can be dibrain function (Fig. 2.59) and thOSEabout brain activation in time and
Methods for structural imagiIJ
• X-raY~Computerized Tomogr.raphy)
• Magnetic Resonance Tomogn
Methods for functional imaginl
• functional Magnetic Resonanochanges ~n blood flow paramoxygenation (BOLD)
• Positron Emission Tomograp£(rCBF) or metabolic rates (Ithr.ough ,-rays that result froITor mhaled.
• ~ingle-Photon-Emission-Complm regional cerebral blood flow tXenon inhaled by the subject.
• Non-invasive optical spectos~roopment, see Section 2.4.9.3)
• MEG and EEG-basedsourcelocwith MRT)

2.4 Neuromagnetism----"'--~-------~~--------
245
of the event-related response. They point to reduced interhemispheric asymmetry ofthe magnetic counterpart of the N100 and - compared to controls - deviant dipoleorientation (Reitc et al., 1989), a finding which supports the notion of an atypicalspatial regulation of cortical excitability in schizophrenics (Rockstroh et al., 1989). Adeviant temporal course of dipole orientation for N100 in schizophrenic patients compared to controls provides further evidence (Roth et al., 1995). Finally, of particularinterest for the explanation of schizophrenic symptoms is the finding of a :!O-ms delayof the peak latency of the magnetic counterpart of the NlOO (N100m) that occurredwhen schizophrenic patients listened to tones while hallucinating compared to periodswithout hallucinations (Tiihonen et al., 1992). This effect, which parallels a change inN100m peak latency produced by distracting external stimulation (such as speech ormusic maskers), suggests "that the auditory cortex is activated during hallucinationsnot by external input from the ear but by endogenous neural firing" (Tiihonen et al.,1992, p. 257), and may be an approach to uncover generators of hallucinations.
2.4.9 The Relation of MEG and MSr to Other Methods for theNon-invasive Study of Brain Function
Brain imaging techniques can be divided into the non-invasive methods for the study ofbrain function (Fig. 2.59) and those of brain structure. The former provide informationabout brain activation in time and space.
Methods for structural imaging:
• X-ray-Computerized Tomography (CT, or CAT for Computer-Assisted Tomography)
• Magnetic Resonance Tomography (MRT - see Chapter 3)
Methods for functional imaging:
• functional Magnetic Resonance Tomography (fMRT - see Section 3.2.2) measureschanges in blood flow parameters, in particular alterations in regional bloodoxygenation (BOLD)
• Positron Emission Tomography (PET), measures regional cerebral blood flow(rCBF) or metabolic rates (e.g. of glucose) by tracking decaying positronsthrough ,-rays that result from this decay. The radioactive substance is injectedor inhaled.
• Single-Photon-Emission-Computer Tomography (SPECT), measures alterationsin regional cerebral blood flow through scanning of ,-rays emitted by radiocativeXenon inhaled by the subject.
• Non-invasive optical spectoscropy (includes a variety of techniques under development, see Section 2.4.9.3)
• MEG and EEG-based source localization; MSI (MEG localization in combinationwith MRT)
"
/

246 ChapteT 2 Biomagnetism 2.4 Neuwmagnetism
2.4.9.1 Methods Mapping Alterations in Regional Cerebral Blood Flow:PET, SPECT, fMRT
When MEG is compared to measures of regional cerebral blood flow, it is often mentioned that PET, SPECT and flvIRI, but not MEG, rely on physical principles thatallow the unequivocal reconstruction of spatial pattern. In fact, all of these methodsrequire considerable data processing and assumptions about links of a certain measure to neurophysiological processes. Depending on a particular type and procedurethat is chosen for the data analyses, each of these imaging techniques can produce avariety of outcomes for one and the same original data set. The interpretations thenvary with the assumptions of what physiological process might have caused the alterations extracted by the signal analysis. Therefore, it is not surprising that some ofthe papers in the field may remind the reader more of a psychoanalytic approach thanof straightforward science. It is desirable to replicate results in different laboratoriesand, most of all, to validate the outcome using different imaging methods, a proceduresometimes referred to as multi-modal imaging.
A first study compared magnetic and metabolic brain activity during a verb generation task (Eulitz et al., 1994). While PET results revealed activation of Broca's andWernicke's areas and their homologues in the right hemisphere, MEG results couldnot be explained by limiting sources to theses structures but, in addition, indicatedsources in the primary and secondary auditory cortices, as well as in parietal regions.Clear interhemispheric pattern differences between MEG and PET, which may be dueto variant physiological mechanisms underlying rCBF increase and magnetic activity,suggest that PET data will most likely not provide physiologically meaningful constraints and, therefore, may not necessarily validate results of the distributed sourceanalysis of MEG data.
The following differences between MSI and PETIfMRT need to be kept in mind:
• Procedures that image blood flow parameters generally require difference mapsbetween two conditions,in order to account for the structural patterns. Assumea resting condition is subtracted from an active task condition. The resultingblood flow pattern may then tell us where the task is processed. It may, however,be determined by the type of rest (like lying in a small tube without distractors)or by the non-linear inteTaction between the two conditions.
• The link between blood flow and neural acitvity is not well understood. It iscertainly non-linear and it is possible that blood flow changes only occur forcertain types or strengths of neural activations. On the other hand, not everyneural mass activity will create the kind of open fields that can be detected byEEG or MEG.
• The relationship between cytoarchitecture and brain morphology is variable.
• Blood flow does not change quickly enough to allow a temporal resolution thatwould be high enough to monitor cognitive processing in real time.
• PET and SPECT expose the subject to radioactive radiation.
2.4.9.2 EEG and MEG Provi,
While approximative theoretical COlcesses seem to underly EEG and ?Iinformation in real measurements amal information. This may be counsimilar in appearance to EEG signatical differences are noteworthy (foret al., 1993):
• In the past, most of the EEGto the international 10-20 Sy1to compute the CSD, high re,original system has become ilEEG electrodes cover only abetween two electrodes and tshallow sources that have theelectrodes are 'needed (when eto avoid spatial aliasing (GevinSrinivasan et al., 1996).
• Application of larger numbersfixation may produce artefactresults in distortion of the interroneous ghost sources when I
• Artefacts, except subject moveMEG, as EEG may be contamand volume-conducted EKG. SEEG than for MEG. Subjectwhereas, in EEG, it might be I
implications for the design of s
• EEG and MEG require quite (calization. While for pure MECaccurate one compartment BE1989), for EEG, three concentrimodel are necessary. Also, conthan MEG (Haueisen et al., 19!
• Unlike in EEG, in MEG it is •sessions because it is hardly pthe same position with respectSince the recorded magnetic fiethe source, it is therefore errona readjustment of the MEG d!One can compute from the meeconfiguration for all recordingsstrength (e.g. dipole strength) f

2.4 Neuromagnetism
2.4.9.2 EEG and MEG Provide Different Information
247
While approximative theoretical considerations suggest that similar physiological processes seem to underly EEG and MEG, the signals generally provide quite differentinformation in real measurements and therefore are ideally combined to extract maximal information. This may be counterintuitive since the neuromagnetic signals can besimilar in appearance to EEG signals. Comparing EEG and MEG, the following practical differences are noteworthy (for review see also Anogianakis et al., 1992; Wikswoet al., 1993):
• In the past, most of the EEG studies have used electrode placements accordingto the international 10-20 system (Fig. 2.58). In order to localize sources orto compute the CSD, high resolution EEG with many more points than in theoriginal system has become increasingly useful. In contrast to MEG sensors,EEG electrodes cover only a relatively small area compared to the distancebetween two electrodes and thus, EEG is vulnerable to spatial aliasing. Forshallow sources that have the highest spatial frequencies, a hundred or moreelectrodes are 'needed (when equally spaced across the head's surface) in orderto avoid spatial aliasing (Gevins et al., 1990; Gevins, 1993; Junghofer et al., 1997;Srinivasan et al., 1996).
• Application of larger numbers of EEG electrodes is cumbersome and improperfixation may produce artefacts. Improper measurement of electrode locationresults in distortion of the interpolated surface potential and consequently inerroneous ghost sources when CSD is calculated.
• Artefacts, except subject movements, are generally more severe in EEG than inMEG, as EEG may be contaminated by movement of electrodes, electrode driftand volume-conducted EKG. Similarly, ocular artefacts are also more severe forEEG than for MEG. Subject movements can cause severe artefacts in MEG,whereas, in EEG, it might be no problem at all. The latter fact has importantimplications for the design of studies.
• EEG and MEG require quite different volume conductor models for source localization. While for pure MEG analysis a simple sphere or a more realistic andaccurate one compartment BEM model are sufficient (Hamiilainen & Sarvas,1989), for EEG, three concentric spheres or a realistic three compartment BEMmodel are necessary. Also, conductivity changes in the head affect EEG morethan MEG (Haueisen et al., 1997).
• Unlike in EEG, in MEG it is not easy to compare signal amplitudes betweensessions because it is hardly possible to readjust the MEG system to exactlythe same position with respect to the human head and the sources within it.Since the recorded magnetic field strength strongly depends on the distance tothe source, it is therefore erroneous to compare magnetic field amplitudes aftera readjustment of the MEG device. There are two solutions to this problem.One can compute from the measured fields a magnetic field for a virtual sensorconfiguration for all recordings (Burghoff et al., 1997) or one can use the sourcestrength (e.g. dipole strength) for further analysis.
"
/'

248 Chapter 2 Biomagnetism 2.4 Neuromagnetism~------
As mentioned in Section 2.4.2, the same brain processes may be differentially imaged by MEG and EEG. A study by Eulitz et al. (1997) quantitatively illustrated thispoint. From a theoretical point of view, such differences are plausible. EEG resultsfrom the extracellular volume currents triggered mainly by postsynaptic potentials.MEG is thought to arise from the intracellular branch of this process Le., from thecurrents that flow from the dendrite to the soma. ·Thereby, MEG is mainly sensitive tocurrents flowing tangentially to the surface of the scalp and to a lesser degree - about10% - to radial sources. As a consequence EEG and MEG are affected differently byaveraging. If sources vary across trials and appear in different cerebral regions fromtrial to trial, their impact on the event-related brain responses will be suppressed byaveraging. Therefore, this "biological noise" is more strongly reduced for tangentialsources than for radial ones (as tangential sources in opposing walls of a sulcus maypartially cancel, leaving only the radially directed currents in the average). Sources in.the primary and secondary sensory projection areas such as the Brodman areas 3b (somatosensory), 41/42 (auditory) or 17 (visual) are primarily tangentially oriented andare consistently evoked in each trial. Consequently, for such sources activated earlyin information processing, the signal-to-noise ratio is considerably higher for MEGmeasurements than for EEG measurements. When higher processing stages are investigated, the corresponding sources may become more distributed and currents flowingsimultaneoulsy in opposing walls of a sulcus may partially cancel each other out. Theremaining equivalent current dipole may have a stronger radial than tangential orientation (Lutzenberger et al., 1987) and thus will appear with a relatively greater weightin EEG than MEG responses. Therefore, complementary information such as EEGshould be used in addition to MEG when brain activations beyond the primary andsecondary projection areas are being studied. This statement is supported by studiesindicating superadditive information in MEG and EEG (e.g., Pflieger et al., 1998,also own unpublished observations), and lower error bounds for source localizationsbased on. simultaneous EEG and MEG measurements (Mosher et al., 1993). However,a recent theoretical study (Malmivuo et al., 1997) claimed that EEG and MEG recordthe electric activity of the brain in a very similar way. We believe that more theoreticalresearch must be performed to fully resolve this contradiction.
2.4.9.3 Perspectives
Animated images of brain activity in three dimensions with a resolution on the millisecond time scale are still somewhat visionary but can already be performed by meansof MSr under certain conditions. An example of such a sequence of cortical activations is presented in Figure 2.86. MSr is o.nly possible for the less complex sourceconfigurations, but no other method can currently compete with the spatio-temporalresolution. This might change when £MRr methods are developed that allow the imaging of Sodium-ions (Na+). As the sodium currents are related to neural firing, such atechnique would allow direct tracking of neural activity. The nuclear resonance from~a+ is relatively weak, but averaging, like in the case of evoked responses, might allowfor extracting the brain responses that occur consistently to an external event.
Furthermore, mass activation of neural cell assemblies alters the optical propertiesof brain tissue in which these cells are embedded. Changes include hemoglobinoxygenation, cytochrome-c-oxidase redox state and light scattering reflecting eithermembrane potential (fast signal) or cell swelling (slow). Studies of exposed brain
/
Fig. 2.86:' Sources from somatmsomatosensory stimul,cortical sheet. The paments (from 60 to 12orthogonal slice comb(using the proceduretemporal covariance IT
from the averaged reSj.ance matrix and the foof each source dipole.inverse operator as athen used to calculate'to be locally perpendi(M. Sereno, A. Dale an,
tissue thus allow for excellentmade to optically image brain(VilIringer & Chance, 1997). Ccan be developed to usefully nexpected from new techniquesMSl and £MRl remain the moststudy of brain function. Their (the way to even more wonders in

2.4 Neuromagnetism 249
Fig. 2.86:- Sources from somatosensory (left), auditory (right) and combined auditory andsomatosensory stimulation (middle column) are superimposed onto the inflatedcortical sheet. The panels from top to bottom correspond to different time segments (from 60 to 120 ms). In this subject, the cortical sheet was found byorthogonal slice combination, flood-filling, and deformable template refinement(using the procedure described in Sereno & Dale, 1992). The sensor spatiotemporal covariance matrix is then estimated using a finite series of time stepsfrom the averaged response. An Eigenvalue decomposition of the sensor covari
.ance matrix and the forward solution are used to obtain estimates of the varianceof each source dipole. These are inserted into the equation for the optimal linearinverse operator as a priori source variance estimates. The inverse operator isthen used to calculate a solution for each time step. Source dipole are restrictedto be locally perpendicular to the cortical sheet. (Collaborative study with Drs.M. Sereno, A. Dale and C. Pantev; unpublished)
tissue thus allow for excellent temporo-spatial rsolution. Attempts are now beingmade to optically image brain activity in human subjects through the intact skull(Villringer & Chance, 1997). Currently, it is unclear to what extend these methodscan be developed to usefully map brain activity. Another innovative leap can beexpected from new techniques employing nuclear magnetic resonance. Till then,MSI and fMRI remain the most valuable sources of information for the non-invasivestudy of brain function. Their current usefulness and potential promise will show usthe way to even more wonders in neuroscience, materializing Emily Dickinson's verse.
"
/

250 Chapter 2 Biomagnetism
~I
2.4 Neuromagnetism
Acknowledgements
The author wishes to thank Hannes Nowak and Jens Hauei~en for their helpfulscientific comments on earlier versions of the manuscript and Christina Robert, andLisa Green for language editing. Research was supported by grants from the DeutscheForschungsgemeinschaft and the Stiftung Volkswagenwerk.
References
Abeles, M. (1982). Local Cortical Circuits. An Eleetrophysiological Study. Springer, Berlin.
Aertsen, A., Erb, M., Schiiz, A., & Palm, G. (1995). In C. Pantev, T. Elbert, &B. Liitkenhiiner, (Eds.), Oscillatory Event-Related Brain Dynamics, Coherent assemblydynamics in the cortex: mulit-neuron recordings, network simulations and anatomical considerations, pp. 59-84. Plenum Publishing Cooperation, New York.
Anogianakis, G., Badier, J., Barrett, G., Erne, S., Fenici, R., Fenwick, P., Grandori, F., Hari,R., Ilmoniemi, R., Mauguiere, F., Lehmann, D., Perrin, F., Peters, M., Romani, G.-L.,& Rossini, P. (1992). A consensus statement on the relative merits of EEG and MEG(editorial). Electroenceph. Clin. Neurophysiol., 82, 317 - 319.
Babloyantz, A. & Destexhe, A. (1986). Low dimensional chaos in an instance of epilepsy.Proc. Nat!. Acad. Sci. USA, 83, 3513-3517.
Baule, G. M. & McFee, R. (1963). Detection of the magnetic field of the heart. Am. Heart.J., 55, 95-96. .
Baumgartner, C., Sutherling, W. W., Di, S., & Barth, D. S. (1991). Spatiotemporal modeling of cerebral evoked magnetic fields to median nerve stimulation. Electroenceph. Clin.Neurophysiol., 79, 27-35.
Berg, P. & Scherg, M. (1994). A fast method for forward computation of multiple-shellspherical head models. Electroenceph. Clin. Neurophysiol., 90, 58-64.
Bertrand, 0., Thevenet, M., & Perrin, F. (1991). In J. Nenonen, H. M. Rajala, & T. Katila,(Eds.), Biomagnetic Localization and 3D Modelling, volume Report TKK-F-A689, 3D finite element method in hrain electrical activity studies, pp. 154-171. Helsinki: HelsinkiUniversity of Technology, Department of Physics.
Birbaumer, N., Elbert, T., Canavan, A., & Rockstroh, B. (1990). Slow potentials of thecerebral cortex and behavior. Physiological Reviews, 70, 1--41.
Boutros, N. N., Overall, J., & Zouridakis, G. (1991). Test-retest reliability of the P50 midlatency auditory evoked response. Psychiatry Research, 39, 181-192.
Braitenberg, V. (1978). I-n R. .Heim & G. Palm, (Eds.), Theoretical Approach to ComplexSystems, Cell assemblies in the cerebral cortex. Springer, Berlin, Heidelberg.
Braitenberg, V. & Schiiz, A. (1991). Anatomy of the Cortex. Statistics and Geometry.Springer, Berlin.
Brandeis, D., Naylor, H., Halliday, R., Callaway, E., & Yano, L. (1992). Scopolamine effectson visual information processing, attention, and event-related potential map latencies.Psychophysiology, 29, 315-336.
Braun, C., Lutzenberger, W., Miltner, W., & Elbert, T. (1990). In C. H. M. Brunia, A. W. K.Gaillard, & A. Kok, (Eds.), Psychophysiological Brain Research, volume 1, Can subcorticalstructures generate potentials large in amplitude?, pp. 31-35. Tilburg University Press,Tilburg.
,
/
Brockhaus, A., Lehnertz, K., WM., & Eiger, C. E. (1997). P,methohexital-induced epileptifoceph. Cl'in. Neurophysiol., 102(
Brown, T: H., Kairiss, E. W., &mechanisms and algorithms. AI
Burghoff, M., Steinhoff, U., & Halobtained with multi-squid-systESupercond., 7(2), 3465-3468.
Byl, N., Wilson, F., Merze~ich, M.Sensory dysfunction associateddystonia: a comparative study.
Byl, N. N., Merzenich, M. M., & Jparalleled by degradation ofreplfor Neuroscience, Annual Meetil
Cheyne, D., 'Weinberg, H., Gaetz,predicting side movement: Neurfields. Neurosci. Lett., 188, 1-4.
Clark, S. A., AlIard, T., Jenkins, Vbody-surface map in adult cortE444-445.
Clarke, C.J. S. (1989). ProbabiliProblems, 5, 999-1012.
Clarke, C. J. S. (1991). In J. Nelocalization and 3D modelling, .continuous current sources, pp. :partment of Physics.
Cohen, D. (1968). Magnetoencepharhythm currents. Science, 161, ,
Cohen, D. (1972). Magnetoenceph<a superconducting magnetometel
Cohen, D., Edelsack, E. A., & Zima shielded room with a supercon16, 278-280.
Cohen, L.-G., Bandinelli, S., Satodetection of somatosensory stilllClin. Neurophysiol., 81(5), 366-3
Coles, M. G. H., Gratton, G., KraE. Donchin, & S. W. Porges, (E(tions, Principles of signal acquisil
Cook, E. W. & Miller, G. A. (19~
chophysiologists. Psychophysiolo,Cllffin, B. N. (1991). Eccentric sph;
871-878.
Cuffin, B. N. & Cohen, D. (1977a).shapes. IEEE-BME 'I'rans. Biom
Cuffin, B. N. & Cohen, D. (1977b).sources. J. Appl. Phys., 48, 3971

2.4 Neuromagnetism 251
I
Brockhaus, A., Lehnertz, K., Wienbruch, C., Kowalik, A., Burr, W., Elbert, T., Hoke,M., & Eiger, C. E. (1997). Possibilities and limitations of magnetic source imaging ofmethohexital-induced epileptiform patterns in temporal lobe epilepsy patients. Electroenceph. Clin. Ne1.lrophysiol., 102(5), 423-436.
Brown, T. H., Kairiss, E. W., & Keenan, C. L. (1990). Hebbian synapses: biophysicalmechanisms and algorithms. Ann. Rev. Neurosci., 13, 475-511.
Burghoff, M., Steinhoff, U., & Haberkorn, W. (1997). Comparability of measurement resultsobtained with multi-squid-systems of different sensor configurations. IEEE Trans. Appl.Supercond., 7(2), 3465-~468.
Byl, N., Wilson, F., Merzenich, M., Melnick, M., Scott, P., Oakes, A., & McKenzie, A. (1996).Sensory dysfunction associated with repetetive strain injuries of tendinitis and focal handdystonia: a comparative study. JOSPT, 23, 234-244.
Byl, N. N., Merzenich, M. M., & Jenkins, W. M. (1995). Occupational hand cramps genesisparalleled by degradation of representation in the SI cortex. Paper presented at the Societyfor Neuroscience, Annual Meeting, San Diego.
Cheyne, D., tWeinberg, H., Gaetz, W., & Jantzen, K. J. (1995). Motor cortex activity andpredicting side movement: Neural network and dipole analysis of pre-movement magneticfields. Neurosci. Lett., 188, 1-4.
Clark, S. A., Allard, T., Jenkins, W. M., & Merzenich, M. M. (1988). Receptive fields in thebody-surface map in adult cortex defined by temporally correlated inputs. Nature, 332,444-445.
Clarke, C.J. S. (1989). Probabilistic methods in a biomagnetic inverse problem. InverseProblems, 5, 999-1012.
Clarke, C. J. S. (1991). In J. Nenonen, H. M. Rajala, & T. Katila, (Eds.), Biomagneticlocalization and 3D modelling, volume Report TKK-F-A689, Probabilistic modelling ofcontinuous current sources, pp. 117-124. Helsinki: Helsinki University of Technology, Department of Physics.
Cohen, D. (1968). Magnetoencephalography: Evidence of magnetic fields produced by alpharhythm currents. Science, 161, 784-786.
Cohen, D. (1972). Magnetoencephalography: Detection of the brains electrical activity witha superconducting magnetometer. Science, 175, 664-666.
Cohen, D., Edelsack, E. A., & Zimmerman, J. E. (1970). Magnetocardiograms taken insidea shielded room with a superconducting point-contact magnetometer. Appl. Phys. Lett.,16, 278-280.
Cohen, L.-G., Bandinelli, S., Sato, S., Kufta, C., & Hallett, M. (1991). Attenuation indetection of somatosensory stimuli by transcranial magnetic stimulation. Electroenceph.Clin. Neurophysiol., 81(5), 366-376.
Coles, M. G. H., Gratton, G., Kramer, A. F., & Miller, G. A. (1986). In M. G. H. Cole,E. Donchin, & S. W. Porges, (Eds.), Psychophysiology: Systems, Processes, and Applications, Principles of signal acquisition and analysis, pp. 183-221. Guilford, New York.
Cook, E. W. & Miller, G. A. (1992). Digital filtering: background and tutorial for psychophysiologists. Psychophysiology, 29, 350-367.
Cuffin, B. N. (1991). Eccentric spheres models of the head. IEEE 1rans. Biomed. Eng., 38,871-878.
Cuffin, B. N. & Cohen, D. (1977a). Magnetic fields of a dipole in special volume conductorshapes. IEEE-BME Trans. Biomed. Eng., 24, 372-381.
Cuffin, B. N. & Cohen, D. (1977b). Magnetic fields produced by models of biological currentsources. J. Appl. Phys., 48, 3971-3980. .
./

252 Chapter 2 Biomagnetism 2.4 Neuromagnetism
Cuffin, B. N. & Cohen, D. (1979). Comparison of the magnetoencephalogram and electroen-cephalogram. Electroenceph. Clin. Neurophysiol., 47, 132-146. •
Dale, A. M. & Sereno, M. I. (1993). Improved localization of cortical activity by combiningEEG and MEG with MRI cortical surface reconstruction: A linear approach. J. Cog.Neurosci., 5, 162-176.
Darlan-Smith, C. & Gilbert, C. D. (1994). Axonal sprouting accompanies functional reorganization in adult cat striate cortex. Nature, 368, 737-740.
De Munck, J. C., Vijn, P. C. M., & Spekreijse, H. (1989). In S. J. Williamson, M. Hoke,G. Stroink, & M. Kotani, (Eds.), Advances in Biomagnetism, Random dipoles as a modelfor spontaneous EEG- and MEG-activity, pp. 595-598. Plenum Press, New York.
Deecke, L., Boschert, J., Brickett, P., & Weinberg, H. (1985). In H. Weinberg, G. Stroink, &T. Katila, (Eds.), Biomagnetism: Applications and Theory, Magnetoencephalographic evidence for possible supplementary motor area participation in human voluntary movement,pp. 369-372. Pergamon Press, New York.
Elbert, T. (1987). In H. M. Weinmann, (Ed.), Zugang zum Verstiindnis hoherer Himfunktionen durch das EEG, Regulation corticaler Erregbarkeit. Im EEG ein deterministischesChaos?, pp, 93-107. W. Zuckschwerdt Verlag, Miinchen, Bern, Wien, San Francisco.
Elbert, T. (1991). In R. Weitkunat, (Ed.), Digital Biosignal Processing, Analoe; signal condi-tioning, pp. 13-25. Elsevier, Amsterdam. . .
Elbert, T. (1992). A theoretical approach to the late components of the event-related brainpotential. Paper presented at the Proceedings of the Ringberg Meeting on Brain Theory.
Elbert, T. (1993). In W. C. McCallum & S. H. Curry, (Eds.), Slow potential changes inthe human brain, Slow cortical potentials reflect the regulation of cortical excitability, pp.235-252. Plenum Press, New York, London.
Elbert, T. & Rockstroh, B. (1987). Threshold regulation - a key to the understanding of thecombined dynamics of EEG and event-related potentials. J. Psychophysiology, 4, 317-333.
Elbert, T., Roberts, L. E., Lutzenberger, W., & Birbaumer, N. (1992a). Modulation of slowcortical potentials by instrumentally learned blood pressure responses. Psychophysiology,29(2), 154-164.
Elbert, T., Lutzenberger, W., Rockstroh, W., Berg, P., & Cohen, R. (1992b). Physical aspectsof the EEG in schizophrenics. Biological Psychiatry, 32(758), 181-193.
Elbert, T, Ray, W. J., Kowalik, Z, J., Skinner, J. E., Graf, K. E., & Birbaumer, N. (1994a).Chaos and physiology - Deterministic chaos in excitable cell assemblies. PhysiologicalReviews, 14, 1-47.
Elbert, T., Flor, H., Birbaumer, N., Knecht, S., Hampson, S., & Taub, E. (1994b). Extensivereorganisation of the somatosensory cortex in adult humans after nervous system injury.Neuroreport, 5, 2593-2597.
Elbert, T., Rockstroh, B., Hampson, S., Pantev, C., & Hoke, M. et al. (1994c). The magneticcounterpart of the contingent negative variation. Electroenceph. Clin. Neurophysiol., 92(3),262-272.
Elbert, T., Pantev, C., Wienbruch, C., Rockstrob, B., & Taub, E. (1995a). Increased corticalrepresentation of the fingers of the left hand in string players. Science, 210(234), 305-307,
Elbert, T., Junghiifer, M., Scholz, B., & Schneider, S. (1995b). The separation of overlappingneuromagnetic sources in first and second somatosensory cortices. Brain Topogr., 1(4),275-282.
Elbert, T., Rockstroh, B., Kowalik, Z. J.,'& Hoke, M. (I997a). In F. Angelieri, S. R. Butler,S. Giaquinto, & J. Majkowski, (Eds.), Analysis of the Electrical Activity of the Brain,Clinical applications of EEG analyses using tools derived from non-linear system theory,
,/
pp. 45-67. John Wiley & Sons, ]
Elbert, T., Sterr, A., Flor, H., Ro,Input-increase and input-decreaamputation in humans. Exp. Br
Eiger, C. E. (1992). In M. Hoke,magnetism: Clinical aspects, Exerelevance for biomagnetism, pp.
Eulitz, C., Elbert, T., Bartenstein,and metabolic brain activity dur
Eulitz, C., Diesch, E., Pantev, C., Iactivity evoked by the processing
Eulitz, C., Eulitz, H., & Elbert, T.cognition using magneto-and elee
Fabiani, M., Gratton, G., Karis, r:reliability of measurement of th,Advances in Psychophysiology, 2,
Feige, B., Kristeva-Feige, R., MakGantchev, V. S. Gurfinkel, & M.tional Symposium on Motor Conmotor. system. AZ. Motor Contro
Feige, B., Makeig, S., Kristeva-Feithe 17th Annual Meeting of the ECoherent oscillatory brain activit.
Feige, B., Makeig, S., Kristeva-Feig,Abstracts of the VIIth Swiss Brainof coherent oscillatory activity us
Flor, H., Braun, C., Birbaumer, N.,gartner, L. Deecke, G. Stroink, &Research and Clinical Applicationfield evoked at the site of pain, PI
Flor, H., Elbert, T., Knecht, S., WiTaub, E. (1995b). Phantom-limbfollowing arm amputation. Natun
FIar, H., Braun, C., Elbert, T., & Bilsomatosensory cortex in chronic b
Fuchs, M. & Dossel, O. (1992). In(Eds.), Diamagnetism: Clinical f
measurements, pp. 869-873. Elsev
Fuchs, M., Wagner, M., Wischmann,T. Elbert, & B. Liitkenhoner, (Elbilities of functional brain imaginlPlenum Press, New York.
Gallen, C. C., Sohel, D. F., Lewin,W.Orrison, W. (1993). Neuroma~867.
Garraghty, P. & Kaas, J. (1992).
Gevins, A. (1993). High resolution e
Gevins, A., Brickett, P., Costales, 1

2.4 Neuromagnetism 253
pp. 45-67. John Wiley & Sons, London.
Elbert, T., Sterr, A., Flor, H., Rockstroh, B., Knecht, S., Pantev, C., & Taub, E. (1997b).Input-increase and input-decrease types of cortical reorganization after upper extremityamputation in humans. Exp. Brain Res., 117, 161-164.
Eiger, C. E. (1992). In M. Hoke, S. N. Erne, Y. C. Okada, & G. L. Romani, (Eds.), Biomagnetism: Clinical aspects, Excerpta Medica, Facts in epileptology which are of possiblerelevance for biomagnetism, pp. 53-60. Elsevier Science Publishers, Amsterdam.
Eulitz, C., Elbert, T., Bartenstein, P., & Weiller, C. et at. (1994). Comparison of magneticand metabolic brain activity during a verb generation task. Neuroreport, 6(1), 97-100.
Eulitz, C., Diesch, E., Pantev, C., & Hampson, S. et at. (1995). Magnetic and electric brainactivity evoked by the processing of tone and vowel stimuli. J. Neurosci., 15(4), 2748-2755.
Eulitz, C., Eulitz, H., & Elbert, T. (1997). Differential outcomes for the analysis of humancognition using magneto-and electroencephalography. Neurosci. Lett., 227, 185-188.
Fabiani, M., Gratton, G., Karis, D., & Donchin, E. (1987). Definition, identification, andreliability of measurement of the P300 component of the event-related brain potential.Advances in Psychophysiology, 2, 1-78.
Feige, B., Kristeva-Feige, R., Makeig, S., & Elbert, T. (1994a). In D. G.Stuart, G. N.Gantchev,V. S. Gurfinkel, & M. Wiesendanger, (Eds.), Proceedings of the VIlth International Symposium on Motor Control held in Borovets, Oscillatory activity in the humanmotor. system. AZ. Motor Control Press.
Feige, B., Makeig, S., Kristeva-Feige, R., & Liitkenhoner, B. (1994b). In Proceedings ofthe 17th Annual Meeting of the European Neuroscience Association, September 4-8, 1994,Coherent oscillatory brain activity during a motor task. Vienna.
Feige, B., Makeig, S., Kristeva-Feige, R., & Liitkenhoner, B. (1994c). In Brain TopographYiAbstracts of the VIlth Swiss Brain Mapping Meeting held in Zurich, March 11-12, Mappingof coherent oscillatory activity using phase reference channel analysis.
Flor, H., Braun, C., Birbaumer, N., Elbert, T., Ross, B., & Hoke, M. (1995a). In C. Baumgartner, L. Deecke, G. Stroink, & S. J. Williamson, (Eds.), Biomagnetism: FundamentalResearch and Clinical Application, Chronic pain enhances the magnitude of the magneticfield evoked at the site of pain, pp. 107-111. Elsevier Science IOS Press, Amsterdam.
Flor, H., Elbert, T., Knecht, S., Wienbruch, C., Pantev, C., Birbaumer, N., Larbig, W., &Taub,' E. (1995b). Phantom-limb pain as a perceptual correlate of cortical reorganizationfollowing arm amputation. Nature, 653, 482-484.
Flor, H., Braun, C., Elbert, T., & Birbaumer, N. (1997). Extensive reorganisation of primarysomatosensory cortex in chronic backpain. Neurosci. Lett., 22(4), 5-8.
Fuchs, M. & Dossel, O. (1992). In M. Hoke, S. N. Erne, Y. C. Okada, & G. L. Romani,(Eds.), Biomagnetism: Clinical Aspects, On-line head position determination for MEGmeasurements, pp. 869-873. Elsevier Science Publishers, Amsterdam.
Fuchs, M., Wagner, M., Wischmann, H. A., Ottenberg, K., & Dossel, O. (1994). In C. Pantev,T. Elbert, & B. Liitkenhoner, (Eds.), Oscillatory Event Related Brain Dynamics, Possibilities of functional brain imaging using a combination of MEG and MRT, pp. 435-462.Plenum Press, New York.
Gallen, C. C., Sobel, D. F., Lewine, J. D., Sanders, J. A., Hart, B. L., Davis, L. E., &W.Orrison, W. (1993). Neuromagnetic mapping of brain function. Radiology, 187, 863867.
Garraghty, P. & Kaas, J. (1992).
Gevins, A. (1993). High resolution eeg. Brain Topogr., 5(4),321 - 325.
Gevins, A., Brickett, P., Costales, B., Le, J., & Reutter, B. (1990). Beyond topographic
"
./

254 Chapter 2 Biomagnetism 2.4 Neuromagnetism
mapping: towards functional-anatomical imaging with 124-channel EEGs and 3-D MRls.Brain Topogr., 3(1),53 - 64.
Graf, K. E. & Elbert, T. (1989). In E. Basar & T. H. Bullock, (Eds.), Brain Dynamics.Progress and Perspectives, volume 2, Dimensional analysis of the waking EEG, pp. 174191. Springer, Heidelberg, Berlin, New York.
HiimaJiiinen, M. & Sarvas, J. (1989). Realistic model of the conductivity geometry of thehuman head for MEG interpretation. IEEE Trans. Biomed. Engn., 36(2), 165-171.
Hamaliiinen, M. S. & Jlmoniemi, R J. (1984). Interpreting measured magnetic fields of thebrain: Estimates of current distributions. Report TKK-F-A559, Helsinki University ofTechnology.
Hari, R.. (1990). In F. Grandori & M. G. L. R. Hoke, (Eds.), Auditory evoked magnetic fieldsand electric potentials, volume 6, The neuromagnetic method in the study of the humanauditory cortex, pp. 222-282. Karger Verlag, Basel.
Hari, R. & Ilmoniemi, R. J. (1986). Cerebral magnetic fields. CRC Critical Reviews inBiomedical Engineering, 14, 93-126.
Hari, R & Salmelin, R (1996). Human cortical oscillations: a neuromagnetic view throughthe skull. Trends in Neurosciences, 20, 44-48.
Hari, R., Aittoniemi, M., Jarvinen, M. L., Katila, T., & Varpula, T. (1980). Auditory evokedtransient and sustained magnetic fields of the human brain. Exp. Brain Res., 40, 237-240.
Hari, R.., Kaukoranta, E., Reinikainen, K., Houpaniemie, T., & Mauno, J. (1983). Neuromagnetic localization of cortical activity evoked by painful dental stimulation in man.Neurosci. Lett., 42, 77-82.
Hari, R., Joutsiniemi, S. L., & Sarves, J. (1988). Spatial resolution ofneuromagnetic records:Theoretical calculations in a spherical model. Electroenceph. Clin. Neurophysiol., 71, 6472-
Hari, R, Hamiiliiinen, H., Tiihonen, J., J., K., & Sams, M. (1990). Separate finger representations at the human second somatosensory cortex. Neurosci., 37, 245-249.
Hari, R., Karhu, J., Sams, M., Hamaliiinen, H., & Knuutila, J. (1992). In M. Hoke, S. N. Erne,Y. C. Okada, & G. L. Romani, (Eds.), Biomagnetism: Clinical Aspects, Magnetic responsesreveal somatotopic organization of the second somatosensory cortex, pp. 229-232. ElsevierScience Publishers, Amsterdam.
Haueisen, J., Ramon, C., Eiselt, M., & Nowak, H. (1997). Inf\uence of tissue resistivitieson neuromagnetic fields and electric potentials studied with a finite element model of thehead. IEEE Trans. Biomed. Eng., 44, 727 - 735.
Hebb, D. O. (1949). The Organization of Behavior. John Wiley & Sons, New York.
Helmholtz, H. (1853). Uber einige Gesetze der Vertheilung elektrischer Strome in korperlichenLeitern mit Anwendung auf die thierisch-elektrischen Versuche. Ann. Phys. Chem., 89,211-233, 353-377.
Hoke, M. (1988). In B. Kramer, (Ed.), The Art of Measurement. Metrology in fundamentaland applied physics, SQUID-based measuring techniques - A challenge for the functionaldiagnostics in medicine, pp. 287-335. VCH Verlagsgesellschaft, Weinheim.
Hoke, M., Elbert, T., & Pantev, C. (1994). In B. Albowitz, K. Albus, U. Kuhnt, H. C.Nothdurft, & P. Wahle, (Eds.), Structural and functional Organization of the Neocortex,Magnetoencephalography: A new window into the functional organisation of the cerebralcortex, pp. 453-461. Springer, Berlin, Heidelberg, New York.
Howland, E.-W., Wakai, R-T., Mjaanes, B.-A., & Balog, J.-P. (1995). Whole head mappingof magnetic fields following painful electric finger shock. 'Cogn. Brain Res., 2(3), 165-172.
Hufnagel, A., Burr, W., Eiger, C., Nadstawek, J., & Hefner, G. (1992). Localization of the
/
epiletogenic focus during methohex
Huttunen, J., Kobal, G., KaukorantaC02 stimulation of nasal mucosa; a rClin. Neurophysiol., 64, 347-349.
lasemidis, L. D. & Sackellares, J. C. (Chaos in the Human Brain, The l
largest Lyapunov exponent on theSingapore.
lasemidis, L. D., Sackellares, J., Zaverand the lyapunov exponent of electr<201).
Ilmoniemi, R J. (1991). Estimates 0
491,80-87.
Jacobson, G. E. (1994). MagnetoencfClin. Neurophysiol., 11(3), 343-364
Jenkins, W. M., Merzenich, M. M.,Functional reorganization of primabehaviorally controlled tactile stimu
JunghOfer, M., Elbert, T., Leiderer, Fpotentials on the surface of the bnTopogr., 9(3), 203-217.
Kakigi, R. (1994). SomatosensoryevokNeurosci. Res., 20(2), 165-174.
Kandel, E. R., Schwartz, J. H., & JegBehavior. Prentice Hall Internatiom
Kaplan, D. & Glass, L. (1992). DirectLetters, 68, 427-430.
Kathmann, N. & Engel, R. R (1990)failure to find strong P50 suppressio
Katila, T. & Karp, P. (1983). In S. J. ,(Eds.), Biomagnetism, an interdisciland multipole presentations, pp. 237
Kaufman, L. & Williamson, S. J. (191Annuals New York Academy of Sciel
Kekoni, J., Tiihonen, J., & HiimiiliiinenERPs generated by neuronal systemsand magnetic evoked response recorc
Kincses, W. E., Braun, C., Kaiser, S.,Event-Related Potentials Using AnalClin. Neurophysiol. in press.
Kitamura, Y., Kakigi, R, & Hoshiyam.magnetic fields. Electroenceph. Clin.
Knecht, S., Henningsen, H., Elbert, T.,Taub, E. (1995). Cortical reorganizatstimuli to the phantom limb. Neurol
Knecht, S., Henningsen, H., Elbert, T.,Reorganizational and perceptional ch
Kristeva-Feige, R., Feige, S., Makeig,

~,-"If;~ ;7,""
I
2.4 Neuromagnetism 255
epiletogenic focus during methohexital-induced anesthesia. Epilepsia; 33(2),271-284.
Huttunen, J., Kobal, G., Kaukoranta, E., & Hari, R. (1986). Cortical responses to painfulC02 stimulation of nasal mucosa; a magnetoencephalographic study in man. Electroenceph.C/in. Neurophysiol., 64, 347-349.
Iasemidis, L. D. & Sackellares, J. C. (1991). In D. Duke & W. Pritchard, (Eds.), MeasuringChaos in the Human Brain, The evolution with time of the spatial distribution of thelargest Lyapunov exponent on the human epileptic cortex, pp. 49-82. World Scientific,Singapore.
Iasemidis, L. D., Sackellares, J., Zaveri, H., & Williams, W. (1990). Phase space topographyand the Iyapunov exponent of electrocorticograms in partial seizures. Brain Topogr., 2(187201).
Ilmoniemi, R. J. (1991). Estimates of neuronal current distributions. Acta Oto-Laryngol.,491, 80-87.
Jacobson, G. E. (1994). Magnetoencephalographic studies of auditory system function. J.Clin. Neurophysiol., 11(3), 343-364.
Jenkins, W. M., Merzenich, M. M., Ochs, M. T., Allard, T., & Guic-Robles, E. (1990).Functional reorganization of primary somatosensory cortex in adult owl monkeys afterbchaviorally controlled tactile stimulation. J. Neurophysiol., 63, 82-104.
Junghiifer, M., Elbert, T., Leiderer, P., Berg, P., & Rockstroh, B. (1997). Mapping EEGpotentials on the surface of the brain. A strategy for uncovering cortical source. BrainTopogr., 9(3), 203-217.
Kakigi, R. (1994). Somatosensory evoked magnetic fields following median nerve stimulation.Neurosci. Res., 20(2), 165-174.
Kandel, E. R., Schwartz, J. H., & Jessell, T. M. (1995). Essentials of Neural Science andBehavior. Prentice Hall International Inc, London.
Kaplan, D. & Glass, L. (1992). Direct test for determinism in a time series. Physical ReviewLetters, 68, 427-430.
Kathmann, N. & Engel, R. R. (1990). Sensory gating in normals and schizophrenics: Afailure to find strong P50 suppression in normals. Bioi. Psychiatry, 20, 1216-1226.
Katila, T. & Karp, P. (1983). In S. J. Williamson, G. L. Romani, L. Kaufman, & 1. Modena,(Eds.), Biomagnetism, an interdisciplinary approach., Magnetocardiography: Morphologyand multipole presentations, pp. 237-263. Plenum Press, New York.
Kaufman, L. & Williamson, S. J. (1980). The evoked magnetic field of the human brain.Annuals New York Academy of Sciences, 340, 45-65.
Kekoni, J., Tiihonen, J., & Hamii.lainen, H. (1992). Fast decrement with stimulus repetition inERPs generated by neuronal systems involving somatosensory SI and SI! cortices: Electricand magnetic evoked response recordings in humans. Int. J. Psychophys., 12(3), 281-288.
Kineses, W. E., Braun, C., Kaiser, S., & Elbert, T. (1998). Modeling Extended Sources ofEvent-Related Potentials Using Anatomical and Physiological Constraints. Electroenceph.Clin. Neurophysiol. in press.
Kitamura, Y., Kakigi, R., & Hoshiyama, M. et al. (1995). Pain-related somatosensory evokedmagnetic fields. Electroenceph. Clin. Neurophysiol., 95, 463-474,.
Knecht, S., Henningsen, H., Elbert, T., Flor, H., Hohiing, C., Pantev, C., Birbaumer, N., &Taub, E. (1995). Cortical reorganization in human amputees and mislocalization of painfulstimuli to the phantom limb. Neurosci. Lett., 201(3), 262-264.
Knecht, S., Henningsen, H., Elbert, T., Flor, H., Hohling, C., Pantev, C., & Taub, E. (1996).Reorganizational and perceptional changes after amputation. Brain, 119(Pt 4),1213-1219.
Kristeva-Feige, R., Feige, B., Makeig, S., Ross, B., & Elbert, T. (1993). Oscillatory brain
"
,/

2'56 Chapter 2 Biomagnetism 2.4 Neuromagnetism
activity during a moLor task. Neuroreport, 4(12), 1291-1294.
Kullmann, W. H. (1991). In J. Nenonen, H. M. Rajala, & T. Katila, (Eds.), Biomagneticlocalization and 3D modeling, volume Report TKK-F-A689, Can vol'ume conductor modeling improve biomagnetic distributed source modelling?, pp. 137-153. Helsinki Universityof Technology, Department of Physics.
Kuriki, S. & Mizutani, Y. (1988). In K. Atsumi, M. Kotani, S. Ueno, T. Katila, & S. J.Williamson, (Eds.), Biomagnetism '87, Magnetic responses evoked in cervical cord andbrain by somatic stimulation, pp. 50-57. Tokyo Denki University Press, Tokyo.
Lewine, J. D. & Orrison, W. W. (1995). In W. W. Orrison, J. D. Lewine, J. A. Sanders,& M. F. Hartshome, (Eds.), FUnctional Brain Imaging, Magnetoencephalography andMagnetic Source Imaging, pp. 369-418. Mospy, St. Louis.
Lewine, J. D., Orrison , W. W., & Astur, R S. (1995). In C. Baumgartner, L. Deecke,G. Stroink, & S. J. Williamson, (Eds.), Biomagnetism: FUndamental Research and Clinical Applications, Explorations of pathophysical spontaneous activity by magnetic sourceimaging, pp. 55-59. Elsevier Science IOS Press, Amsterdam.
Lorenz, E. N. (1963). Deterministic nonperiodic flow. J. Atmos. Sci., 20, 130-141.
Lu, Z. L., Williamson, S. J., & Kaufman, L. (1992). Behavioral lifetime of hUlllan auditorysensory memory predicted by physiological measures. Science, 258, 1668-1670.
Liiders, H., Engel, J., & Munari, C. (1993). In J. J. Engel, (Ed.), Surgical Treatment of theEpilepsies, General principles, pp. 137-153. Raven Press, New York, 2nd edition.
Liitkenhoner, B. (1991). A simulation study of the resolving power of the biomagnetic inverseprocedure. Clin. Phys. Physiol. Meas, 12(Suppl. A), 73-78.
Liitkenhoner, B. (1996). Current dipole localization with an ideal mangnetometer system.IEEE, 43(11), 1049-1061.
Liitkenhoner, B., Lehnertz, K., Hake, M., & Pantev, C. (1990). On the spatial resolutionof the biomagnetic inverse procedure in the case of multiple dipoles. Brain Topogr., 3,253-254.
Liitkenhoner, R, Menninghaus, K, Steinstrater, 0., Wienbruch, C., Gissler, H. M., & Elbert, T. (1995). Neuromagnetic source analysis using magnetic resonance images for theconstruction of source and volume conductor model. Brain Topogr., 7(4), 291-299.
Liitkenhoner, B., Elbert, T., Menninghaus, E., Steinstrater, 0., & Wienbruch, C. (1996). InH. J. Herrmann, D. E. Wolf, & E. Poppel, (Eds.), Supercomputing in Brain Research: FromTomography to Neural Networks, Electra- and magnetoencephalographic source analysis:current status and future requirements, pp. 175-192. World Scientific, Singapore.
Lutzenberger, W., Elbert, T., & Rockstroh, R (1987). A brief tutorial on the implicationsof volume conduction for the interpretation of the EEG. J. Psychophysiol., 1,81-90.
Lutzenberger, W., Pulvermiiller, F., Elbert, T., & Birbaumer, N. (1995). Visual stimulationalters local 40-Hz respons~s in humans: an EEG-study. Neurosci. Lett., 183(1-2), 39-42.
Maclin, E.-L., Rose, D.-F., Knight, J.-E., & Orrison, W.-W. et al. (1994). Somatosensoryevoked magnetic fields in patients with stroke. Electroenceph. Clin. Neurophysiol., 91(6),468-475.
Makeig, S. (1993). Auditory event-related dynamics of the EEG spectrum and effects ofexposure to tones. Electroenceph. Clin. Neurophysiol., 86, 283-293.
Makela, J.-P. & Hari, R (1992). Neuromagnetic auditory evoked responses after a stroke inthe right temporal lobe. Neuroreport, 3(1), 94-96.
Makelii, J. P., Hari, R., & Valanne, L. et al. (1991). Auditory evoked magnetic fields aftercerebral vascular lesion. Ann. Neurol., 30, 76-82.
Miikelii, J. P., Elbert, T., Kakigi, R., Lopez, L., Nagamine, T., Nakasato, N., & Sannita, W.
/
(1998). In C. Aine, Y. Okada, G. StrcAdvances in Biornagnetisrn Research,York. in press.
Malmivuo, J., Suihko, V., & Eskola, H.measurements. IEEE Trans. Biorned.
Meijs, J. W. H., Peters, M. J., & vanEEGs using a realistically shaped muComput., 23(Suppl. Part 1), 36-37.
Menninghaus, E., Liitkenhoner, B., &source in a skull phantom: Realistic .41, 986-989.
Merzenich, M. M. (1990). In K. E. Bamalof Experience, Development and Main1Functional "Maps" and NeuroanatomiPress, Madison.
Merzenich, M. M. & Jenkins, W. M. (19Windows and Adult Cortical Plasticit,tion, pp. 247-272. Santa Fe Institute,
Merzenich, M. M., Nelson, R. J., StrykelJ. M. (1984). Somatosensory corticalmonkeys. J. Comparat. Neurol., 224,
Merzenich, M. M., Nelson, R. J., Kaas, .Cynader, M. S., & Schoppmann, A. (area 3b and 1 in adult owl and squirre
Mocks, J., Gasser, T., & Than, P. D. (1evaluated by two new statistical tests.
Mogilner, A., Grossmann, J. A., Ribary, 1R ~., & Llinas, R R. (1993). Somatoby magnetoencephalography. Proc. Na
Mosher, J., Lewis, P., & Leahy, R (1992spatio-temporal MEG data. IEEE Tra
Mosher, J., Spencer, M., Leahy, R., & Ldipole source localization. Electroencep
Mosher, J. C., Lewis, P., Leahy, R., & Sirtemporal MEG data. Paper presented,Rochester, New York.
Miihlnickel, W., Rendtorff,· N., Kowalik, Zdeterminism of EEG and MEG. Integl262-269.
Muller, M. M., Bosch, J., Elbert, T., KrB. (1996). Visually induced gamma-!activity-a link to animal studies. Exp j
Muller, M. M., Teder, W., & Hillyard, S.steady-state visual evoked cortical aciti
Munck De, J. C. (1989). A mathematicalfield of the brain. Ph.D. thesis, Amster,
Niiiitiinen, R, Ilmoniemi, R-J., & Alho,human cognitive brain function. Trend,

2.4 Neuromagnetism 257
(1998). In C. Aine, Y. Okada, G. Stroink, S. Swithenby, & C. Woods, (Eds.), Biomag '96:Advances in Biomagnetism Research, MEG: Clinical applications. Springer Verlag, NewYork. in press.
Malmivuo, J., Suihko, V., & Eskola, H. (1997). Sensitivity distributions of EEG and MEGmeasurements. IEEE Trans. Biomed. Eng., 44(3), 196 - 208.
Meijs, J. W. H., Peters, M. J., & van Oosterom, A. (1985). Computation of MEGs andEEGs using a realistically shaped multicompartment model of the head. Med. Bioi. Eng.Comput., 23(Suppl. Part 1),36-37.
Menninghaus, E., Liitkenhoner, B., & Gonzalez, S. L. (1994). Localization of a dipolarsource in a skull phantom: Realistic versus spherical model. IEEE Trans. Biomed. Eng,41, 986-989.
Merzenich, M. M. (1990). In K. E. Barnard & T. B. Brazelton, (Eds.), Touch: The Foundationof Experience, Development and Maintenance of Cortical Somatosensory; Representations:Functional "Maps" and Neuroanatomical Repertoires, pp. 47-71. International DniversitiyPress, Madison.
Merzenich, M. M. & Jenkins, W. M. (1995). In B. Julesz & 1. Kovacs, (Eds.), MaturationalWindows and Adult Cortical Plasticity, Cortical Plasticity, learning and learning dysfunction, pp. 247-,-272. Santa Fe Institute, Santa Fe.
Merzenich, M. M., Nelson, R. J., Stryker, M. P., Cynader, M. S., Schoppmann, A., & Zook,J. M. (1984). Somatosensory cortical map changes following digit amputation in adultmonkeys. J. Comparat. Neurol., 224, 591-605.
Merzenich, M. M., Nelson, R. J., Kaas,J. H., Stryker, M. P., Jenkins, W. M., Zook, J. M.,Cynader, M. S., & Schoppmann, A. (1987). Variability of hand surface represenation inarea 3b and 1 in adult owl and squirrel monkeys. J. Comparat. Neurol., 258, 281-296.
Mocks, J., Gasser, T., & Than, P. D. (1984). Variability of single visual evoked potentialsevaluated by two new statistical tests. Eleetroenceph. Clin. Neurophysiol., 57, 571-580.
Mogilner, A., Grossmann, J. A., Ribary, D., Joliot, M., Volkmann, J., Rapaport, D., Beasley,R. W., & Llinas, R. R. (1993). Somatosensory cortical plasticity in adult humans revealedby ~agnetoencephalography.Proc. Nat!. Acad. Sci., 90, 3593-3597.
Mosher, J., Lewis, P., & Leahy, R. (1992). Multiple dipole modeling and localization fromspatio-temporal MEG data. IEEE Trans. Biomed. Eng., 39, 541-557.
Mosher, J., Spencer, M., Leahy, R., & Lewis, P. (1993). Error bounds for EEG and MEGdipole source localization. Electroenceph. Clin. Neurophysiol., 86(5), 303 - 321.
Mosher, J. C., Lewis, P., Leahy, R., &Singh, M. (1990). Multiple dipole modeling of spatiotemporal MEG data. Paper presented at the Digital Image Synthesis and Inverse Optics.,Rochester, New York.
Miihlnickel, W., Rendtorff, N., Kowalik, Z.-J., Rockstroh, B., & Elbert, T. (1994). Testing thedeterminism of EEG and MEG. Integrative Physiological and Behavioral Science, 29(3),262-269.
Miiller, M. M., Bosch, J., Elbert, T., Kreiter, A., Sosa, M. V., Sosa, P. V., & Rockstroh,B. (1996). Visually induced gamma-band responses in human electroencephalographicactivity-a link to animal studies. Exp Brain Res., 112(1),96-102.
Miiller, M. M., Teder, W., & Hillyard, S. A. (1997). Magnetoencephalographic recording ofsteady-state visual evoked cortical acitivty. Brain Topogr., 9(3), 163-168.
Munck De, J. C. (1989). A mathematical and physical interpretation of the electromagneticfield of the brain. Ph.D. thesis, Amsterdam. unpublished.
Naatanen, R., Ilmoniemi, R.-J., & Alho, K. (1994). Magnetoencephalography in studies ofhuman cognitive brain function. Trends in Neurosciences, 17(9), 389-395.
:-~
/

258 Chapter 2 Biomagnetism
-~"
2.4 Neuromagnetism
Nakasato, N., Fujita, S., & Seki, K. (1995). Functional localization of bilateral auditorycortices using an MRI~linked whole head magnetoencephalography (MEG) system. Elec-troenceph. Clin. Neurophysiol., 94, 183-190. .
Okada, Y. (1983). In S J. Williamson, G. L. Romani, 1. Kaufman, & I. Modena, (Eds.),Biomagnetism: An Interdisciplinary Approach, Neurogenesis of evoked magnetic fields, pp.399-408. Plenum Press, N'ew York.
Okada, Y. & Xu, C. (1993). In L. Deecke, C. Baumgartner, G. Stroink, & S. J. WiIliamson,(Eds.), Recent Advances in Biomagnetism, 9th International Conference on Biomagnetism,Magnetocorticography, pp. 408-409. Book of Abstracts.
Packard, N. H., Crutchfield, J. P., Farmer, J. D., & Shaw, R. S. (1980). Geometry from atime series. Phys. Rev. Lett., 45, 712-716.
Palm, G. (1982). Neural Assemblies: An Alterantive Approach to Artificial Intelligence.Springer, Berlin.
Pantev, C., Hoke, M., Liitkenhaner, B., & Lehnertz, K. (1989). Tonotopic organization ofthe auditory cortex: Pitch versus frequency representation. Science, 246, 486-488.
Pantev, C., Hoke, M., Lehnertz, K., Liitkenhaner, B., Fahrendorf, G., & Staber, U. (1990).Identification of sources of brain neuronal activity with high spatiotemporal resolutionthrough combination of neuromagnetic source localization (NMSL) and magnetic resonanceimaging (MRI). Electroenceph. Clin. Neurophysiol., 75, 173-184.
Pantev, C., Elbert, T., Makeig, S., Hampson, S., Eulitz, C., & Hoke, M. (1993). Relationshipof transient and steady-state auditory evoked fields. Eleetroenceph. Clin. Neurophysiol.,88, 389-396.
Pantev, C., Eulitz, C., Elbert, T., & Hoke, M. (1994). The auditory evoked sustained field:origin and frequency dependence. Electroenceph. Clin. Neurophysiol., 90(1), 82-90.
Pantev, C., Elbert, T., & Liitkenhaner, B. (1995a). Event-Related Oscillatory Brain Dynamics. Plenum, New York.
Pantev, c., Bertrand, 0., Eulitz, C., Verkindt, C., Hampson, S., Schuierer, G., & Elbert,T. (1995b). Specific tonotopic organizations of different areas of the human auditorycortex revealed by simultaneous magnetic and electric recordings. Electroenceph. Clin.Neurophysiol., 94(1), 26-40.
Pantev, C., Roberts, L. E., Elbert, T., Ross, B., & Wienbruch, 0. (1996). Tonotopic organization of the sources of human auditory steady-state responses. Hear. Res., 101(1-2),62-74.
Perrin, F., Pernier, J., Bertrand, 0., Giard, M. H., & Echallier, J. F. (1987). Mapping ofscalp potentials by surface spline interpolation. Electroenceph. Clin. Neurophysiol., 66,75-8l.
Perrin, F., Pernier, J., Bertrand, 0., & Echallier, J. F. (1990). Spherical splines for scalppotential and current_density mapping. Electroenceph. Clin. Neurophysiol., 72, 184-187.
Pflieger, M. E., Simpson, G. V., Ahlfors, S. P., & I1moniemi, R. J. (1998). In C. Aine,Y. Okada, G. Stroink, S. Swithenhy, & C. Woods, (Eds.), Biomag '96: Advances in Biomagnetism Research, Superadditive Information from simultaneous MEG/EEG data. SpringerVerlag, New York. in press.
PJurtscheller, G. & Neuper, C. (1992). Simultaneous EEG 10 Hz desynchronization and 40Hz synchronization during finger movements. NeuroReport, 3, 1057-1060.
Pons, T. P., Garraghty, A. K., Ommaya, A. K., Kaas, J. H., Taub,. E., & Mishkin, M. (1991).Massive cortical reorganization after sensory deafferentation in adult macaques. Sc~ence,
252, 1857-1860.Press, W. H., Teukolsky, S. A., Vetterling, W. T., & Flannery, B. P. (1992). Numerical
,
./
Recipes in Fortran: The Art of
Pulvermiiller, F., Preissl, H., Eullbaumer, N. (1994). In C. PantC'Related Brain Dymanics, Gamm243-258. Plenum Press, New Yc
Rauschecker, J. P. (1995). Compelcortex. Trends in Neurosciences
Recanzone, G. H., Merzenich, M.temporal response properties ofon a temporally based tactile dii
Recanzone, G. H., Merzenich, M. 1training engaging a restricted skizone in cortical area 3a. J. Neur
Recanzone, G. H., Jenkins, W. M.,discriminative abilities in adult 0
task. J. Neurophysiol., 67, 1015Recanzone, G. H., Merzenich, M. !I
Topographic reorganization of thin a frequency discrimination tas
Recanzone, G. H., Schreiner, C. E.,representation of primary auditomonkeys. J. Neurosci., 13, 87-10
Reite, M., Teale, P., Goldstein, L., Vsources may differ in the left heITArch. Gen. Psychiat., 46, 565-57:
Robertson, D. & Irvine, D. R. F. (cortex of guinea pigs with partial
Rockstroh, B., Elbert, T., CanavanBrain Potentials and Behaviour. I
Rockstroh, B., Elbert, T., & Berg,(Eds.), Impulse fur die Klinische .der experimentellen PsychopatholGiittingen.
Rockstroh, B., Elbert, T., & WatzHogrefe, Gattingen.
Rockstroh, B., Vanni, S., Elbert, T.,S. Swithenby, & C. Woods, (EdsExtensive somatosensory stimulatiNew York. in press.
RosIer, F., Rader, B., Heil, M., & He:event-related brain potentials in blCognitive Brain Research, 1, 145-J
Rossini, P. M., Narici, L., Martino,spheric asymmetries of somatosernerve stimulation. Electroenceph. I
Rossini, P. M., Martino, G., Narici,ticity" in humans: Transient fingefollowing ischemic anesthesia. Bra'

2592.4 Neuromagnetism-----------------------~-
Recipes in Fortran: The Art of Scientific Computing, p. 964. Cambridge University Press.
pulvermiiller, F., Preissl, H., Eulitz, C., Pantev, C., Lutzenberger, W., Elbert, T., & Birbaumer, N. (1994). In C. Pantev, T. Elbert, & B. Liitkenhoner, (Eds.), Oscillatory EventRelated Brain Dymanics, Gamm'l--Band responses reflect word/pseudoword processing, pp.243-258. Plenum Press, New York, London.
Rauschecker, J. P. (1995). Compensatory plasticity and sensory substitution in the cerebralcortex. Trends in Neurosciences, 18(1),36-43.
Recanzone, G. H., Merzenich, M. M., & Schreiner, J. (1992a). Changes in the distributedtemporal response properties of SI cortical neurons reflect improvements in performanceon a temporally based tactile discrimination task. J. Neurophysiol., 67, 1071-1091.
Recanzone, G. H., Merzenich, M. M., & Jenkins, W. M. (1992b). Frequency discriminationtraining engaging a restricted skin surface results in an emergence of a cutaneous response"one in cortical area 3a. J. Neurophysiol., 67, 1057-1070.
Recanzone, G. H., Jenkins, W. M., & Merzenich, M. M. (1992c). Progressive improvement indiscriminative abilities in adult owl monkeys performing a tactile frequency discriminationtask. J. Neurophysiol., 67, 1015-1030.
Recanzone, G. H., Merzenich, M. M., Jenkins, W. M., Grajski, A., & Dinse, H. R. (1992d).Topographic reorganization of the hand representation in area 3b of owl monkeys trainedin a frequency discrimination task. J. Neurophysiol., 67, 1031-1056.
Recanzone, G. H., Schreiner, C. E., & Merzenich, M. M. (1993). Plasticity in the frequencyrepresentation of primary auditory cortex following discrimination training in adult owlmonkeys. J. Neurosci., 13, 87-103.
Reite, M., Teale, P., Goldstein, 1., Whalen, J., & Linnville, S. (1989). Late auditory magneticsources may differ in the left hemisphere of schizophrenic patients: A preliminary report.Arch. Gen. Psychiat., 46, 565-572.
Robertson, D. & Irvine, D. R. F. (1989). Plasticity of frequency organization in auditorycortex of guinea pigs with partial unilateral deafness. J. Comp. Neurol., 282, 456-471.
Rockstroh, B., Elbert, T., Canavan, A., Lutzenberger, W., & Birbaumer, N. (1989). SlowBrain Potentials and Behaviour. Urban & Schwarzenberg, Baltimore.
Rockstroh, B., Elbert, T., & Berg, B. (1997a). In B. Rockstroh, T. Elbert, & H. Watzl,(Eds.), Impulse fur die Klinische Psychologie, Die Untersuchung von Gehirnfunktionen inder experimentellen Psychopathologie am Beispiel der Schizophrenie, pp. 1-27. Hogrefe,Gottingen.
Rockstroh, B., Elbert, T., & Watzl, H. (1997b). Impulse fur die Klinische Psychologie.Hogrefe, Gottingen.
Rockstroh, B., Vanni, S., Elbert, T., & Hari, R. (1998). In C. Aine, Y. Okada, G. Stroink,S. Swithenby, & C. Woods, (Eds.), Biomag '96: Advances in Biomagnetism Research,Extensive somatosensory stimulation alters somatosensory evoked fields. Springer Verlag,New York. in press.
Rosier, F., R.oder, B., Heil, M., & Henninghausen, E. (1993). Topographic differences of slowevent-related brain potentials in blind and sighted subjects during haptic mental rotation.Cognitive Brain Research, 1, 145-159.
Rossinl, P. M., Narici, L., Martino, G., & Pasquarelli, A. (1994a). Analysis of interhemispheric asymmetries of somatosensory evoked magnetic fields to right and left mediannerve stimulation. Electroenceph. Clin. Neurophysiol., 91(6), 476-482.
Rossini, P. M., Martino, G., Narici, L., & Pasquarelli, A. (1994b). Short-term brain "plasticity" in p-umans: Transient finger representation changes in sensory cortex somatotopyfollowing ischemic anesthesia. Brain Research, 642(1-2), 169-177.
,/

260 ______________________Chapter 2 Biomagnetism 2.4 Neuromagnetism
Roth, W. T., Ford, J. M., Pfefferbaum, A., & Elbert, T. (1995). In F. E. Bloom & D. J.I{upfer, (Eds.), Psychopharmacology, The Fourth Generation of Progress, Methodologicalissues in event-related potential and magnetic field studies, pp. 895-910. Raven Press, NewYork.
Salmelin, R., Hari, R, Lounasmaa, O. V., & Sams, M. (1994). Dynamics of brain activationduring picture naming. Nature, 368, 463-465. .
Scherg, M. (1989). Separation and identification of event-related potential components bybrain electric source analysis. Paper presented at the Ninth International Conference onEvent-Related Potentials of the Brain (EPIC), Noordwijk, The Netherlands.
Scherg, M. (1990a). In H. Grandori & G. L. Romani, (Eds.), Auditory evoked magnetic fieldsand electric potentials, volume 6, Fundamentals of dipole source potential analysis, pp.40-69. Karger, Basel.
Scherg, M. (1990b). Brain electric source analysis: The importance of physiological constraints. Brain Topogr., 3, 268-269.
Scherg, M. & von Cramon, D. (1985). Two bilateral sources of the late AEP as identified bya spatio-temporal model. Electroenceph. C/in. NeuTophysiol., 62, 32-44.
Scherg, M. & von Cramon, D. (1986). Evoked dipole source potentials of the human auditorycortex. Electroenceph. Clin. Neurophysiol., 65, 344-360. .
Scherg, M., Vajsar, J., & Picton, T. W. (1989). A source analysis of the late human auditoryevoked potentials. J. Cogn. Neurosci., 4, 336-354.
Smith, R. J., Schwartz, B. J., Gallen, C., Orrison, W., Lewine, J., Mnrro, A. J., King, D. W.,& Park, Y. D. (1995). Utilization of multichannel magnetoencephalography in the guidanceof ablative seizure surgery. J. Epilepsy, 8, 119-130.
Srinivasan, R, Nunez, P., Tucker, D., Silberstein, R, & Cadusch, P. (1996). Spatial samplingand filtering of EEG with spline laplacians to estimate cortical potentials. Brain Topogr.,8(4),355 - 366.
Steinstrater, O. (1994). Ph.D. thesis, Univ. Miinster. Diplomarbeit.
Sterr, A., Miiller, M., Elbert, T., Rockstroh, B., Pantev, C., & Taub, E. (1998). Perceptualcorrelates of use-dependent changes in cortical representation of the fingers in blind braillereaders. Nature, 39l.
Stok, C. J., Meijs, J. W. H., Peters, M. J., & Rutten, W. L. C. (1986). Model evaluationusing electroencephalography and magnetoencephalography. Acta Oto-Laryng., (Stockh.),432 (Suppl.), 5-10.
Stryker, M. P. (1991). In D. Lam & C. Shatz, (Eds.), Development of the Visual System, pp.267-287. MIT Press
Sutherling, W. W., Crandall, P. H., Darcey, T. M., Becker, D. P., Levesque, M. F., & Barth,D. S. (1988). The magnetic and electrical fields agree with intracranial localizationsofsomatosensory cortex. Neurology, 38, 1705-1714.
Swinney; K. R & Wikswo, Jr., J. P. (1980). A calculation of the magnetic field of a nerveaction potential. Biophys. J., 32, 719-731.
Takens, F. (1981). In D. A. Rand & L. S. Young, (Eds.), Lecture Notes in Mathematics,volume 898, Detectmg strange attractors in turbulence, pp. 368-381. Springer, Berlin.
Tan, S., Ruth, B. J., & Wikswo, Jr., J. P. (1990). The magnetic field of cortical currentsources: the application of a spatial filtering model to the forward and inverse problems.Electroenceph. Chn. Neurohysiol., 76, 73-85.
Taub, E., Miller, N. E., Novack, T. A., Cook, E. W. 1., Fleming, W. C., Nepomuceno, C. S.,Connell, J. S., & Crago, J. E. (1993). Technique to improve motor deficit after stroke.Arch. Phys. Med. Rehabil., 74,347-354.
,/
Tiihonen, J., Hari, R., Naukkarin,audditory cortex during audito
Turetsky, B., Raz, J., & Fein, G.data using a dipole component rP300. Electroenceph. Clin. Neu
Turetsky, B. 1., Raz, J., & Fein, G.potential estimation. Electroeni
Vanni, S., Rockstroh, B., & Harimatosensory evoked fields to me
Vieth, J., Kober, H., & Grummichwith brain lesions, localised by 1
ViIJringer, A..& Chance, B. (1997)bram functIOn. Trends in Neuro
von der Malsburg, C. & SchneidECybern, 54, 29-40.
Walter,.W. G. (1964). The contingassociation in the human brain.
Weinberg, H., Brickett, P., Deeckebrain preceding movements and:
Wienbruch, C. (1997). Uber Magrtlenten unter Methohexitalaktivie
Wikswo, J., Gevins, A., & Williamtroenceph. Clin. Neurophysiol., 8'
Wikswo,. Jr., J. P., van Egeraat, J.& WI]esinghe, R. S. (1990). InshImagmg. Paper presented at the;
Williamson, S. J. & Kaufman, L. (19BlOmagnetlsm, Magnetic fields o'Berlin.
Williamson, S. J. & Kaufman, L. (1F!lectroencephalography and ClinicSignals, pp. 405-448. Elsevier, Am
Williamson, S. J., Kaufman, L., & Ihuman brain. J. Appl. Phys., 50,
Wood, C. C., Cohen, D., Cuffin, B. l\human somatosensory cortex: IdeScience, 227, 1051-1053. .
Woody, C. D. (1967). Characterizationeuroelectronic signals. Med. BioI
Yang, T.-T., Gallen, C. C., Ramachc(1994). Noninvasive detection of Cl
Neuroreport, 5(6),701-704.
Ziemus, R, Huonker, R., Spengler,cortical plasticity induced by synd

2.4 Neuromagnetism 261
.,
alle
ID
.j,
;h,IOf
J.e
ICS,
entIDS.
S.,,ke.
Tiihonen, J., Hari, R, Naukkarinen, H., & Rimon, R. (1992). Modified activity of the humanaudditory cortex during auditory hallucinations. Am. J. Psychiatry, 149(2), 255-257.
Turetsky, B., Raz, J., & Fein, G. (1990). Representation of multi-channel evoked potentialdata using a dipole component model of intracranial generators - application to the auditoryP300. Electroenceph. Clin. Neurophysiol., 76, 540-556.
Turetsky, B. 1., Raz, J., & Fein, G. (1988). Noise and signal power and their effects on evokedpotential estimation. Electroenceph. Clin. Neurophysiol., 71, 310-318.
Vanni, S., Rockstroh, B., & Hari, R (1996). Cortical sources of human short-latency somatosensory evoked fields to median and ulnar nerve stimuli. Brain-Res., 737(1-2), 25-33.
Vieth, J., Kober, H., & Grummich, P. (1996). Sources of spontaneous slow waves associatedwith brain lesions, localised by using the MEG. Brain Topogr., 8, 215-221.
Villringer, A. & Chance, B. (1997). Non-invasive optical spectroscopy and imaging of humanbrain function. Trends in Neuroscience, 20(10), 435-442.
von der Malsburg, C. & Schneider, W. (1986). A neural cocktail-party processor. Bioi.Cybern, 54, 29-40.
Waiter, W. G. (1964). The contingent negative variation. an electrical sign of significance ofassociation in the human brain. Science, 146, 434.
Weinberg, H., Brickett, P., Deecke, L., & Broschert, J. (1983). Slow magnetic fields of thebrain preceding movements and speech. n Nuovo Cimento, 2D, 495-504.
Wienbruch, C. (1997). Uber Magnetoenzephalographische Untersuchungen bei Epilepsiepatienten unter Methohexitalaktivierung. Shaker Verlag, Aachen.
Wikswo, J., Gevins, A., & Williamson, S. (1993). The future of the EEG and MEG. Elec·troenceph. Clin. Neurophysiol., 87, 1 - 9.
Wikswo, Jr., J. P., van Egeraat, J., Ma, Y. P., Sepulveda, N. G., Station, D. J., Tan, S.,& Wijesinghe, R. S. (1990). Instrumentation and techniques for high-resolution magneticimaging. Paper presented at the SPIE.
Williamson, S. J. & Kaufman, 1. (1981). In S. N. Erne, H. D. Hahlbohm, & H. Liibbig, (Eds.),Biomagnetism, Magnetic fields of the cerebral cortex, pp. 353-402. WaIter de Gruyter,Berlin.
Williamson, S. J. & Kaufman, L. (1987). In A. Gevins & A. Remond, (Eds.), Handbook ofElectroencephalography and Clinical Neurophysiology, Revised, Analysis of neuromagneticsignals, pp. 405-448. Elsevier, Amsterdam.
Williamson, S. J., Kaufman, 1., & Brenner, D. (1979). Evoked neuromagnetic fields of thehuman brain. J. Appl. Phys., 50, 2418-2421.
Wood, C. C., Cohen, D., Cuffin, B. N., Yarita, M., & Allison, T. (1985). Electrical sources inhuman somatosensory cortex: Identified by combined magnetic and potential recordings.Science, 227, 1051-1053.
Woody, C. D. (1967). Characterization of an adaptive filter for the analysis of variable latencyneuroelectronic signals. Med. Bioi. Eng. Comp., 5, 539-553.
Yang, T.-T., Gallen, C. C., Ramachandran, V. S., Cobb, S., Schwartz, B. J., & Blum, F. E.(1994). Noninvasive detection of cerebral plasticity in adult human somatosensory cortex.Neuroreport, 5(6), 701-704.
Ziemus, B., Huonker, R, Spengler, F., Nowak, H., & Weiller, C. (1997). Examination ofcortical plasticity induced by syndactyly - an MSI study. Neuroimage, (5), 218.
,/