225th Technical Committee Meeting - ORSANCO
147
225 th Technical Committee Meeting Commissioner Bruno Pigott, Chairman Presiding February 9-10, 2021 The meeting will begin shortly at 1:00 P.M. Below are a few tips to effectively navigate the meeting: - Confirm that your first and last name is entered correctly in the GoToMeeting software. - Mute your microphone at all times unless speaking. - Disable your camera unless you are a Technical Committee member. - The presenter will prompt participants for verbal questions, or use the Chat feature. - Detailed GoToMeeting instructions and important information can be found in the previously emailed document, “ORSANCO Virtual Technical Committee and Commission Meeting Instructions.” - If you need assistance during the meeting, please call our office at 513-231-7719 ext. 100. 1
-
Upload
khangminh22 -
Category
Documents
-
view
9 -
download
0
Transcript of 225th Technical Committee Meeting - ORSANCO

225th Technical Committee MeetingCommissioner Bruno Pigott, Chairman
PresidingFebruary 9-10, 2021
The meeting will begin shortly at 1:00 P.M. Below are a few tips to effectively navigate the meeting:
- Confirm that your first and last name is entered correctly in the GoToMeeting software.
- Mute your microphone at all times unless speaking.
- Disable your camera unless you are a Technical Committee member.
- The presenter will prompt participants for verbal questions, or use the Chat feature.
- Detailed GoToMeeting instructions and important information can be found in the previously emailed document, “ORSANCO Virtual Technical Committee and Commission Meeting Instructions.”
- If you need assistance during the meeting, please call our office at 513-231-7719 ext. 100.
1

Chairman’s Welcome & Roll Call
Commissioner Bruno Pigott
Chairman, Technical Committee
2
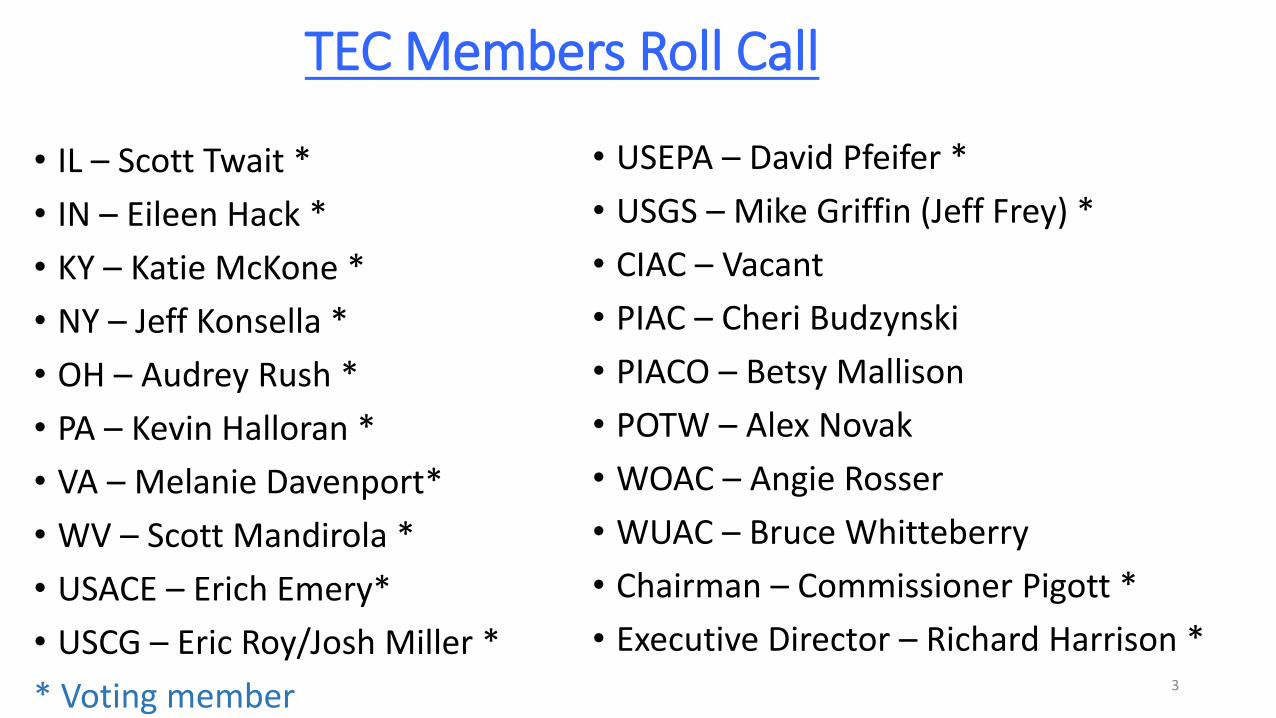
TEC Members Roll Call
• IL – Scott Twait *
• IN – Eileen Hack *
• KY – Katie McKone *
• NY – Jeff Konsella *
• OH – Audrey Rush *
• PA – Kevin Halloran *
• VA – Melanie Davenport*
• WV – Scott Mandirola *
• USACE – Erich Emery*
• USCG – Eric Roy/Josh Miller *
* Voting member
• USEPA – David Pfeifer *
• USGS – Mike Griffin (Jeff Frey) *
• CIAC – Vacant
• PIAC – Cheri Budzynski
• PIACO – Betsy Mallison
• POTW – Alex Novak
• WOAC – Angie Rosser
• WUAC – Bruce Whitteberry
• Chairman – Commissioner Pigott *
• Executive Director – Richard Harrison *3

4
CHAIRMAN’S WELCOME AND ROLL CALL (1:00 P.M.)
ACTION ITEMS AND REPORTS
1. Action on Minutes of 224th Technical Committee Meeting*
2. Chief Engineer’s Report
3. Support for Partnerships Between Water Utilities and Agriculture Producers to Utilize
Farm Bill Funds for Source Water Protection – Tracy Mehan, AWWA *
4. Status of ORSANCO’s Monitoring Programs (Current and Future) Resulting from COVID-
19 Shutdown
5. Biological Programs Update
6. Source Water Protection and Emergency Response Programs Update
7. Review and Approval of Harmful Algal Blooms Monitoring, Response and
Communications Plan*
8. Report on Ohio River Water Quality Conditions
Adjourn by 5:00 p.m./Reconvene Wednesday at 9:00 a.m.
9. Technical Committee Member Reports
10. Review of ORSANCO’s Bimonthly/Clean Metals Monitoring Programs*
11. PFAS Project Update
12. Status of Abatement for Ohio River CSO Systems
OTHER BUSINESS
Comments by Guests
Announcement of Upcoming Meetings
Adjourn by Noon
Agenda for the 225th Meeting of the Technical Committee

Agenda Item 1:Request for action on minutes of the 224th Technical Committee Meeting
Chairman Pigott
The minutes were emailed with the agenda package on January 28, 2021
5

Agenda Item 2:Chief Engineer’s Report
Executive Director Harrison
6

Plan for the Ohio River Basin Highlights
ORSANCO TEC MeetingFebruary 9, 2021

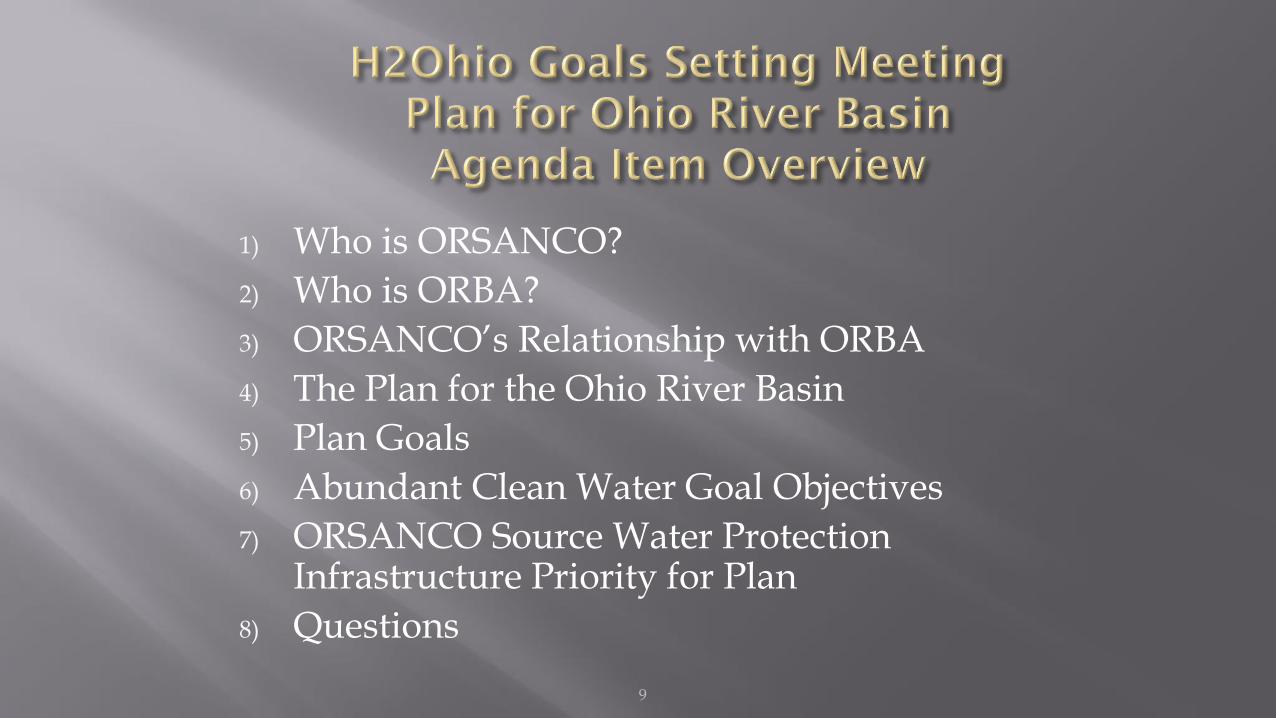
1) Who is ORSANCO?
2) Who is ORBA?
3) ORSANCO’s Relationship with ORBA
4) The Plan for the Ohio River Basin
5) Plan Goals
6) Abundant Clean Water Goal Objectives
7) ORSANCO Source Water Protection Infrastructure Priority for Plan
8) Questions
9

Formed in 1948 by signing of Compact by Governors of 8
states and was approved by the US Congress.
IL, IN, KY, NY, OH, PA, VA, WV, Federal Govt.
3 Commissioners from each state and 3 federal
Commissioners form ORSANCO’s “Board of Directors”.
These are the decision-makers.
The “Compact” provides ORSANCO’s mission and
authorities.
Control of future pollution and the abatement of existing pollution.
Accomplished through the cooperation of the States situated therein.

ORBA is the Ohio River Basin Alliance.
ORBA is a Collaborative Group to Coordinate Ohio River Basin Wide Planning Centered around Water Resource Related Areas.
These areas are being addressed through the Plan for the Ohio River Basin.
ORBA is the Group Convening Stakeholders to Implement the Plan for the Ohio River Basin.

ORSANCO is the Fiscal Sponsor for ORBA.
ORSANCO is the lead agency developing the Water Quality and Water Resources aspects of ORBA’s Work.
ORSANCO is Facilitating the Development of the Plan for the Ohio River Basin’s Abundant Clean Water Working Group.
ORSANCO’s Foundation Executive Director Heather Mayfield is Chairing the Knowledge and Education Goal Work Group
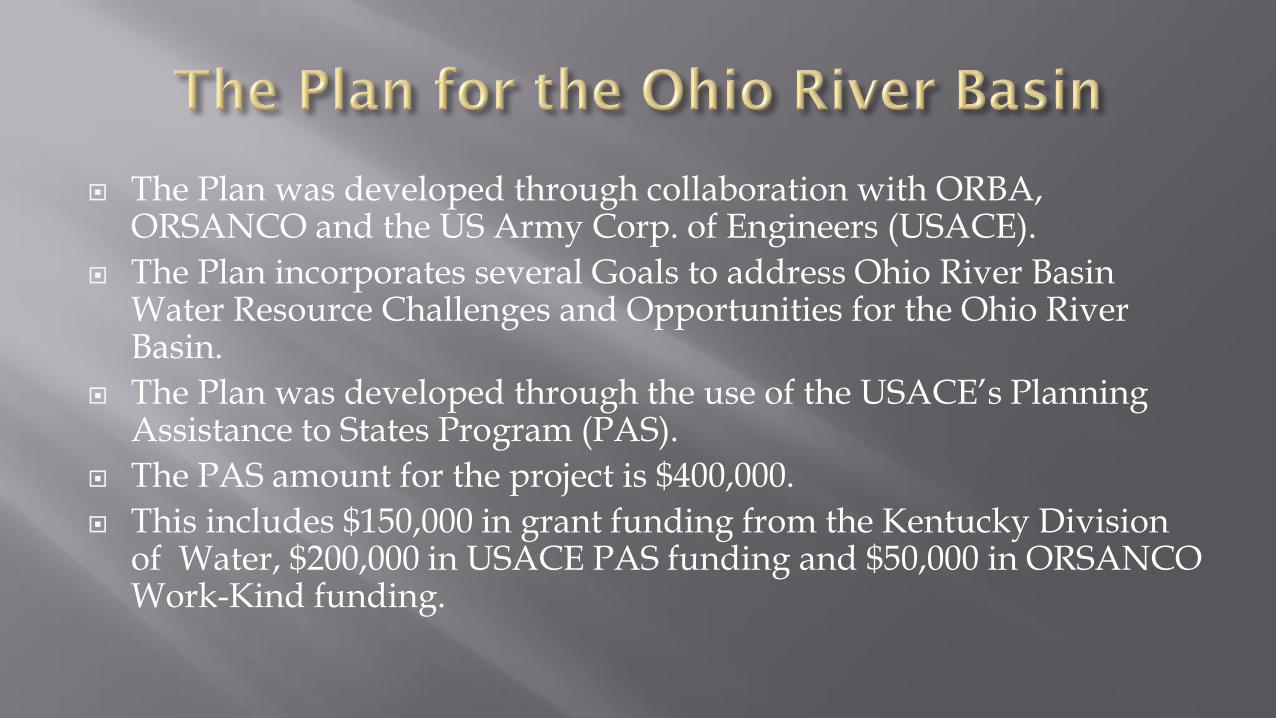
The Plan was developed through collaboration with ORBA, ORSANCO and the US Army Corp. of Engineers (USACE).
The Plan incorporates several Goals to address Ohio River Basin Water Resource Challenges and Opportunities for the Ohio River Basin.
The Plan was developed through the use of the USACE’s Planning Assistance to States Program (PAS).
The PAS amount for the project is $400,000.
This includes $150,000 in grant funding from the Kentucky Division of Water, $200,000 in USACE PAS funding and $50,000 in ORSANCO Work-Kind funding.

Integrated approaches to challenges on a Watershed basis are effective and efficient.
This Plan provides an unique opportunity to convene numerous stakeholders to address significant Basin Wide challenges.
Funding on par with other USEPA Geographic Program Areas have not been provided to Ohio River Basin States to address Basin challenges.
This should be an efficient mechanism to secure Congressional Funding for the Basin.

DEPARTMENT OF THE INTERIOR, ENVIRONMENT, AND
RELATED AGENCIES APPROPRIATIONS BILL, 2020
USEPA Geographic Program Funding Levels:
Great Lakes Restoration Initiative - $320 M
Chesapeake Bay - $ 85 M
Puget Sound - $ 33 M
Long Island Sound - $ 21 M
Gulf of Mexico - $ 17.55 M
Lake Champlain - $ 13.39 M
Southern New England Estuaries - $ 5.4 M
San Francisco Bay - $ 5.019 M
South Florida - $ 3.504 M
Columbia River Basin - $ 1.1 M

Abundant Clean Water
Healthy and Productive Ecosystems
Knowledge and Education to Inform Decisions
Nation’s Most Valuable River Transportation and Commerce Corridor
Reliable Flood Control and Risk Reduction
World-class Nature-based Recreation Opportunities

1) Clean Water Act Designated Use Attainment.
2) Source Water Protection Enhancement.
3) Reduction of Harmful Algal Bloom Occurrence.
4) Enhanced Water Quantity Management.
5) Address Drinking Water and Waste Water Infrastructure Challenges.


Agenda Item 3:Support for Partnerships Between Water Utilities and Agriculture Producers to Utilize Farm Bill Funds for Source Water Protection
Tracy Mehan, Adam Carpenter
AWWA
19

Farm Bill Brings Major Source Water Opportunities
Adam Carpenter
Manager of Energy and Environmental Policy, AWWA
Prepared for the Ohio River Valley Sanitation Commission
February 2021(Photos and much of the material courtesy of Dave White and Kira Jacobs)


22

Spoiler Alert:• The key takeaway from this presentation is to…
• Establish relations with the Natural Resources Conservation Service and Agricultural interests in your area
This Photo by Unknown Author is licensed under CC BY

Extent and Value of Private Lands• 70 percent of the land in
the lower 48 states is owned
by private landowners.
• 88 percent of all surface
water falls on private land
before reaching lakes, streams, and groundwater aquifers.
• The quality of our environment depends on the millions of individual decisions private landowners make every day.

Rise of Nonpoint & Urban Stormwater Runoff
Source: William Ruckelshaus, A New Shade of Green,The Wall Street Journal, April 17, 2010
Point Source vs. Nonpoint Source
Water Quality Impairments
19702010
40 yrs

Before

After!
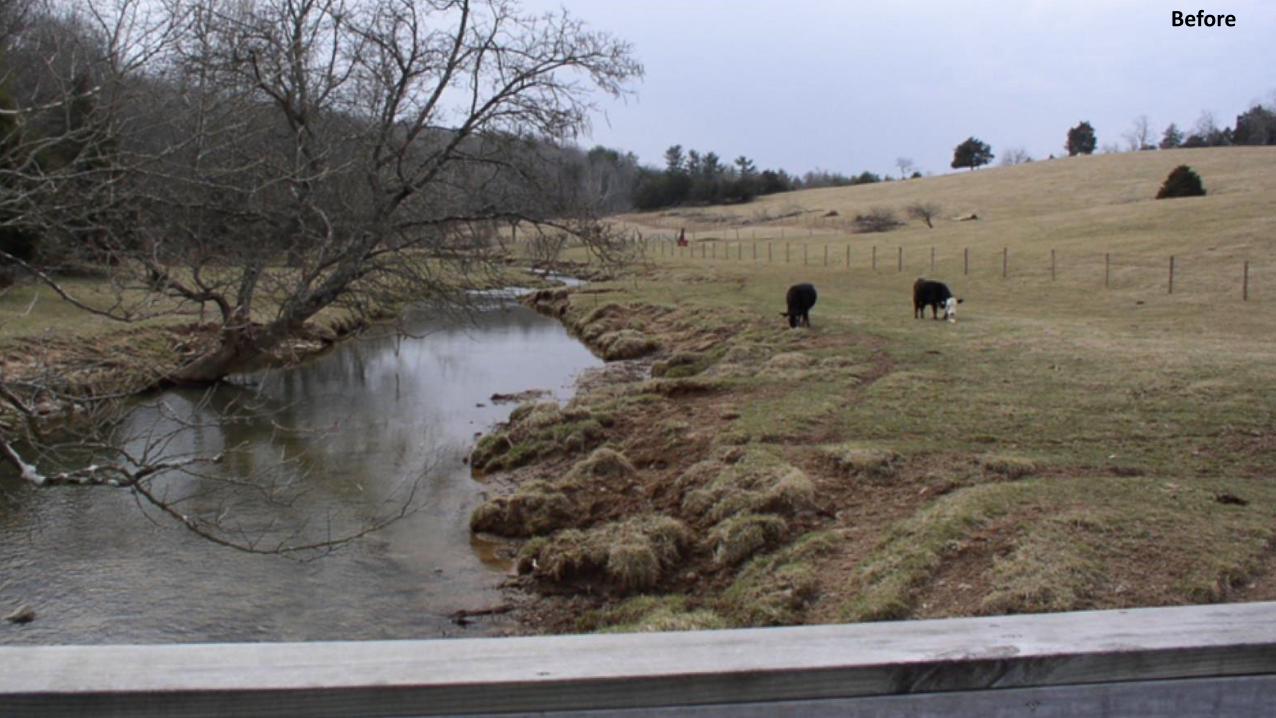
Before

After!

Before
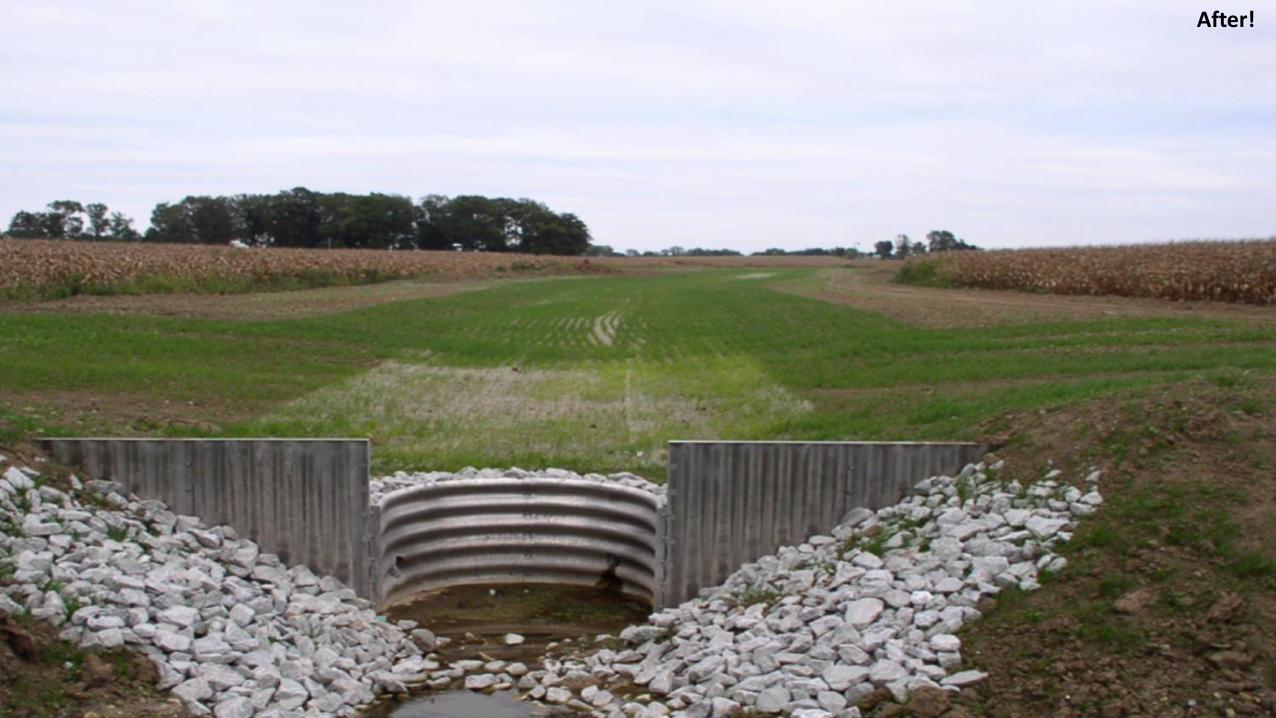
After!

Before

After!

Before
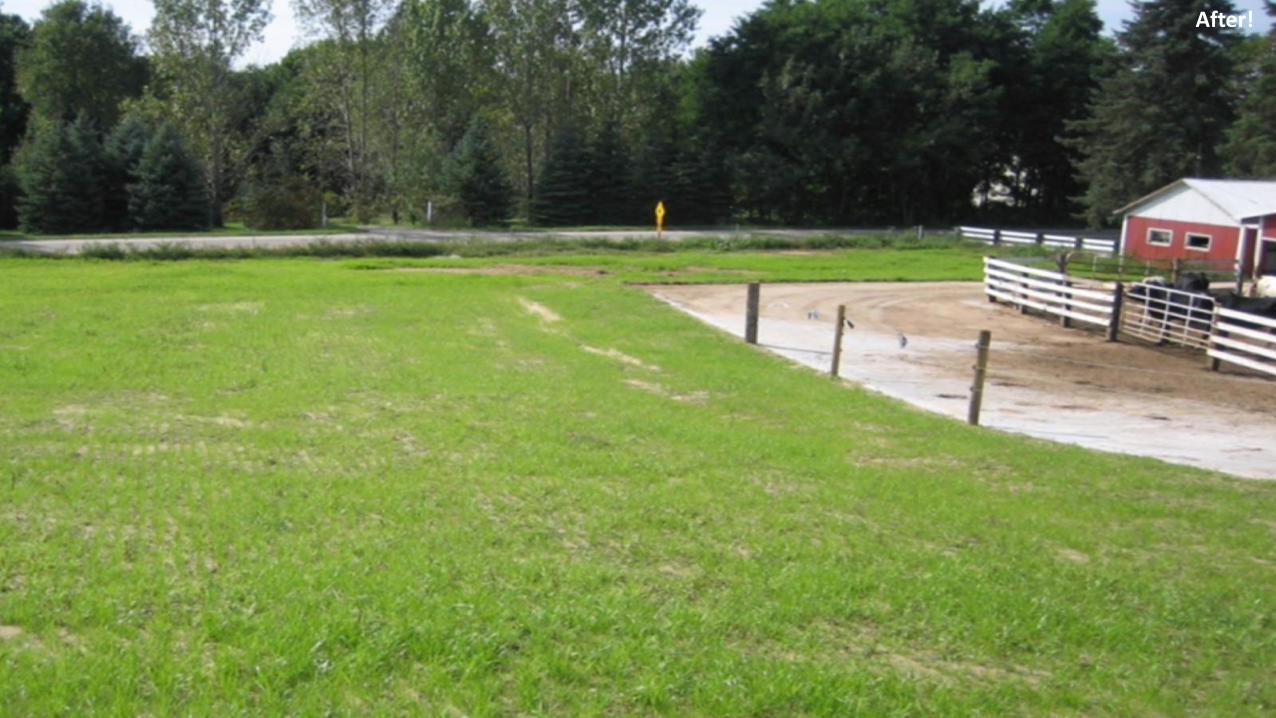
After!

Goals of AWWA Strategy for Farm Bill
Engage Capitol Hill during the reauthorization of the Farm Bill (2018 and into the future) to advocate for more attention, resources, and funding to protect the source waters for millions of Americans

Farm Bill TitlesTitle I: CommodityTitle II: ConservationTitle III: TradeTitle IV: NutritionTitle V: CreditTitle VI: Rural DevelopmentTitle VII: Research and ExtensionTitle VIII: ForestryTitle IX: EnergyTitle X: HorticultureTitle XI: Crop InsuranceTitle XII: Miscellaneous

What AWWA Wanted in the Conservation Title
38
1. Making source water protection a goal of the conservation programs
2. Ensure utilities could participate on state and local committees that inform the programs
3. Increasing cost share of practices that help to protect source waters
4. Spending at least 10% of conservation funding on source water protection
This Photo by Unknown Author is licensed under CC BY-ND

What AWWA Got in the Conservation Title
1. Makes Source Water Protection an explicit goal of the conservation programs
2. Requires NRCS to work with utilities in identifying source water protection areas and consult with them on program policy
3. Increases federal cost share for practices that help protect source waters to up to 90%
4. Requires that at least 10% of conservation funding be spent on SWP (except Conservation Reserve Program)

Key Agency: NRCS
• Agency is Technical
• Focused on Agriculture
• Highly Decentralized
• 10,000 employees
• 3,000 offices
• Works closely with local soil and water conservation districts
Photo Credits: Wayne Munroe, Maine NRCS

How Does it Work for Utilities?
• Identify source water protection issues with agricultural connection
• Work with NRCS on ways to focus conservation programs to address issues
• Work with Soil & Water Conservation Districts and other established partners
• Apply for relevant programs
Local photo
Photo of Lake Massabesic courtesy of John O'Neil, Manchester Water Works

Key NRCS Programs
• Conservation Stewardship Program
• Environmental Quality Incentives Program
• Agricultural Conservation Easement Program
• Regional Conservation Partnership Program

Regional Conservation Partnership Program
• $300 million per year
• Focuses on locally identified resource issues
• Uses an annual RFP process (most recent just closed)
• Requires match – both in-kind and cash
• Priority given to projects with 50% match or greater
• NRCS caps its funding for a single project at $10 million
https://www.nrcs.usda.gov/wps/portal/nrcs/main/national/programs/financial/rcpp/

National Water Quality Initiative• NRCS-EPA Initiative to increase
funding in high priority watersheds
• NRCS directs additional funding to NWQI watersheds
• States have the opportunity to select
watersheds annually. Stakeholders have opportunity to help choose watersheds
Click to add text
Photo of Lake Massabesic courtesy of John O'Neil, Manchester Water Works

Source Water Protection Areas• The 2018 Farm Bill required NRCS to identify
high priority areas for drinking water protection working with State Technical Advisory Committees, public water utilities, and state agencies.
• Usually at HUC 12 level
• This was done in 2019 and updated in September 2020
• There will be annual revisions and updates to these areas Photo courtesy of South Central CT
Regional Water Authority
Recap: Recent & Ongoing Opportunities
• RCPP funding ($360 million) announcement recently closed on November 30th
• Another RCPP AFA and RCPP Classic expected this year
• NWQI watersheds will be selected annually
• Annual review of Source Water Priority Areas
How can you get involved?
47
• Identify source water protection challenges with agricultural or private forest connection
• Establish relationship with NRCS, join state technical committee and source water protection subcommittees
• Connect with state source water program
• Participate, participate, participate!
• Apply for relevant programs

NRCS Contacts• To find your State Conservationist, click
on:
• https://www.nrcs.usda.gov/wps/portal/nrcs/main/national/contact/states/
• The States are listed alphabetically and provide key names and numbers
• To find your local NRCS office start with the Service Center Locator:
• https://offices.sc.egov.usda.gov/locator/app- Click on your State and then your County
First Contact
• Best bet: pick up the phone and call state conservationist and local NRCS offices
• Let them know who you are and who you represent
• Mention the Farm Bill and the emphasis on source water protection
• Offer to schedule with them to discuss further

QUESTIONS?

Agenda Item 4:Status of ORSANCO’s Monitoring Programs Resulting from COVID-19 Shutdown
Ryan Argo
Informational Item
51

ORSANCO Field Activity Protocols• Restrictions maintained from Mid-March – Early July
• Only single person day-trips were allowed
• Additional permitted activities beginning July 14th
• Multi-person Field Work• One person per vehicle• Face coverings whilst indoors, or outdoors when 6’ distancing can’t be maintained
• Overnight Travel• Permitted on case-by-case basis, guidance provided on how to mitigate exposure/transmission
• Boat-based• Conducted with minimal staff required to complete task• Activities requiring staff to operate within 6’ for prolonged periods are prohibited • Face coverings worn during intermittent periods when 6’ distancing cannot be maintained
• Effective November 23, 2020 – No overnight travel and limit 7 staff (1/3) at office
• Restrictions would not apply to emergency response field activities if a significant spill occurred

Emergency Response
Program Details
• ORSANCO provides a number of services when spills occur including:
• 24/7 Notifications
• Field sampling
• Time-of-travel modeling
• Analytical support
Impacts to Program
• Spill response deemed an essential function.
• No change to services provided during COVID response.
• No major spills requiring field response occurred since restrictions were initiated
53

Continuous WQ Monitoring Stations
Program Details• ORSANCO maintains 4 continuous
water quality monitoring stations.• D.O, pH, conductivity, temperature,
chlrophyll, phycocyanin
• Pike Island and Meldahl are deployed from June thru October
• Markland and Newburgh stations are maintained year-round as part of IN HAB grant project.
• Sites serviced twice per month
Impacts to Program
• One site visit was postponed for Markland & Newburgh stations in March.
• Site visits to Markland & Newburgh resumed in April.
• Pike Island & Meldahl deployed in July as normally scheduled.
• All sampling up-to-date.
54

Bacteria Monitoring
Program Details
• Bacteria samples collected weekly in the six largest CSO communities from April thru October.
• Data used to assess impairment and to inform the public regarding suitability of the river for recreational activities.
Impacts to Program
55
APR MAY JUN JUL AUG SEP OCT
Pittsburgh 10 10 10 10 10 10 10
Wheeling 10 10 10 10 10 10 10
Huntington 10 10 10 10 10 10 10
Cincinnati 15 15 15 15 15 15 15
Louisville 10 10 10 10 10 10 10
Evansville 10 10 10 10 10 10 10
GRAY denotes bacteria samples not collected (135).
GREEN indicates samples collected as scheduled (320).
70%

Organics Detection System
Program Details• ORSANCO maintains a network
of gas chromatographs at 17 stations as early warning spill detection system.
• Units are owned and maintained by ORSANCO.
• Stations operated by host facilities (water utilities and industries)
Impacts to Program• Repair visits maintained through
out COVID response for sites that could be serviced as a day-trip by single crew member
• Some sites prohibited visitors• Overnight repairs allowed (Sept-Nov)
• Preventative maintenance visits suspended for March and April.
• Training visits resumed in September
56

Bimonthly and Clean Metals
• May & July No overnight travel, single person sampling• 11 day-trip stations on main stem• 3 stations in Pittsburgh area via contract sampler• 3 tributaries near Cincinnati (G. Miami, L. Miami, Licking rivers)• Added additional tributaries as resources allowed
• Sept. – November (prior to overnight restriction)• Returned to full suite of stations as overnight travel allowed
• January 2021 – Forward• Return to day-trip subset of sites until overnight travel allowed
BackgroundUsed for 305(b) assessmentsMix of day-trip and overnight travelCan require 2 person boat crews30 sites sampled in January, March, May, July, Sep., & Nov.

Biological Activity Requirements
Activity Index Period Crew SizeOvernight
Travel
Electrofishing July - Oct3 personminimum
Required
Macros Aug - Oct 2-4 person Required
Paired Collections July - Oct 2-4 person Required
Fish Tissue April - Nov 2 person Optional
BWQSC agreed to postpone 2020 probabilistic surveys,Focus efforts on fish tissue collections
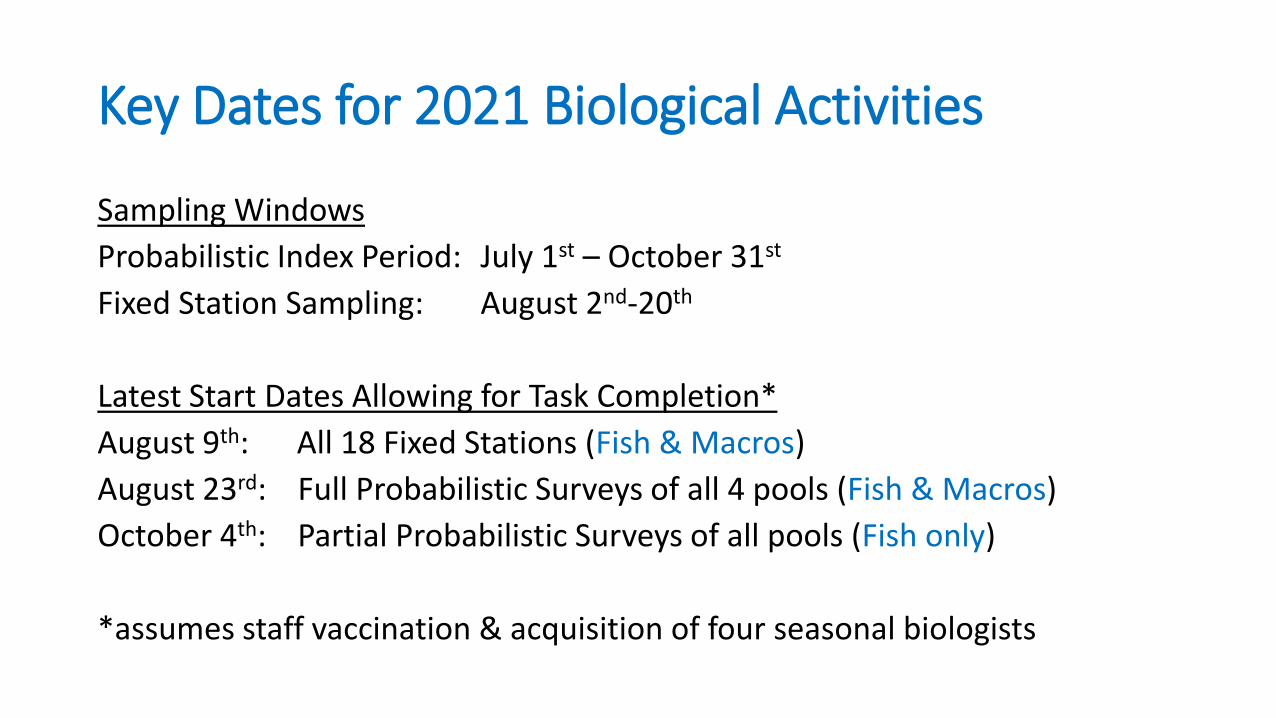
Key Dates for 2021 Biological Activities
Sampling Windows
Probabilistic Index Period: July 1st – October 31st
Fixed Station Sampling: August 2nd-20th
Latest Start Dates Allowing for Task Completion*
August 9th: All 18 Fixed Stations (Fish & Macros)
August 23rd: Full Probabilistic Surveys of all 4 pools (Fish & Macros)
October 4th: Partial Probabilistic Surveys of all pools (Fish only)
*assumes staff vaccination & acquisition of four seasonal biologists
Agenda Item 5: Biological Programs Update
Summary of the Biological Water Quality Subcommittee
(BWQSC) Annual Meeting - Jan. 19th & 20th, 2021
60
Reported by: Ryan Argo

2020 Shifted Focus - Fish Tissue Collections
• Used for consumption advisories and 305(b)MeHg assessments
• 2022 Biennial 305(b) report• Covers years 2016 – 2020
• Minimum Requirement - 2 composite samples of different species from Trophic Levels 3 & 4
• 2018/19 NRSA and fewer pool surveys = fewer samples• Exacerbated pre-existing gaps
• Requested assistance of local state & federal partners in far reaches of Ohio R.
• Refocused available resources to FT day trips (overnight travel as necessary)
61Staff Lead: Rob Tewes

Goal: 36 CompositesPool TL3 TL4
Emsworth 2 1
Dashields 0 0
Montgomery 0 4
New Cumberland 3 3
Pike Island 0 1
Hannibal 0 2
Willow Island 2 6
Belleville 0 0
Racine 0 0
R.C. Byrd 1 2
Greenup 2 5
Meldahl 0 6
Markland 0 8
McAlpine 0 4
Cannelton 0 0
Newburgh 1 6
J.T. Myers 2 4
Smithland 5 6
Olmsted 0 0
Open Water 2 2
ORSANCO Overnight
ORSANCODay Trips
62Staff Lead: Rob Tewes
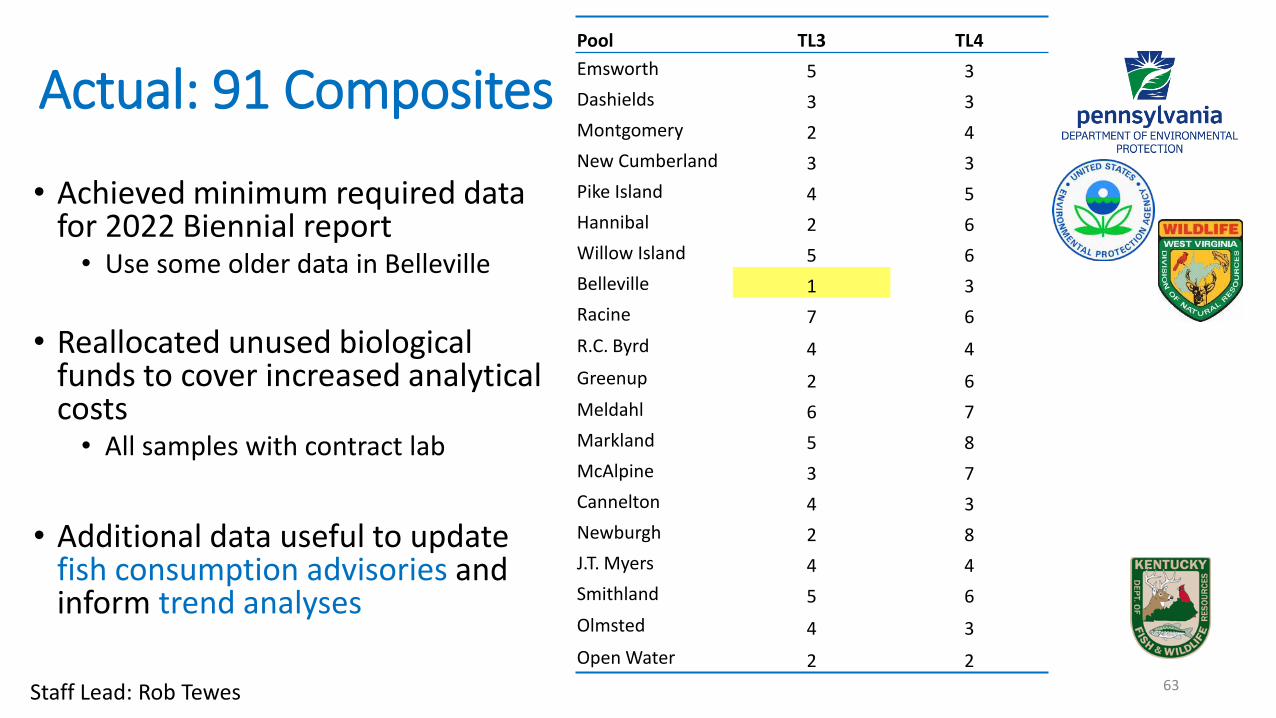
Pool TL3 TL4
Emsworth 5 3
Dashields 3 3
Montgomery 2 4
New Cumberland 3 3
Pike Island 4 5
Hannibal 2 6
Willow Island 5 6
Belleville 1 3
Racine 7 6
R.C. Byrd 4 4
Greenup 2 6
Meldahl 6 7
Markland 5 8
McAlpine 3 7
Cannelton 4 3
Newburgh 2 8
J.T. Myers 4 4
Smithland 5 6
Olmsted 4 3
Open Water 2 2
Actual: 91 Composites
• Achieved minimum required data for 2022 Biennial report
• Use some older data in Belleville
• Reallocated unused biological funds to cover increased analytical costs
• All samples with contract lab
• Additional data useful to update fish consumption advisories and inform trend analyses
63Staff Lead: Rob Tewes

Continue FT Contaminants Trends Analyses - PCBs
64Staff Lead: Daniel Cleves
Do Not Eat
6 meals/yr
1 meal/wk
1 meal/day
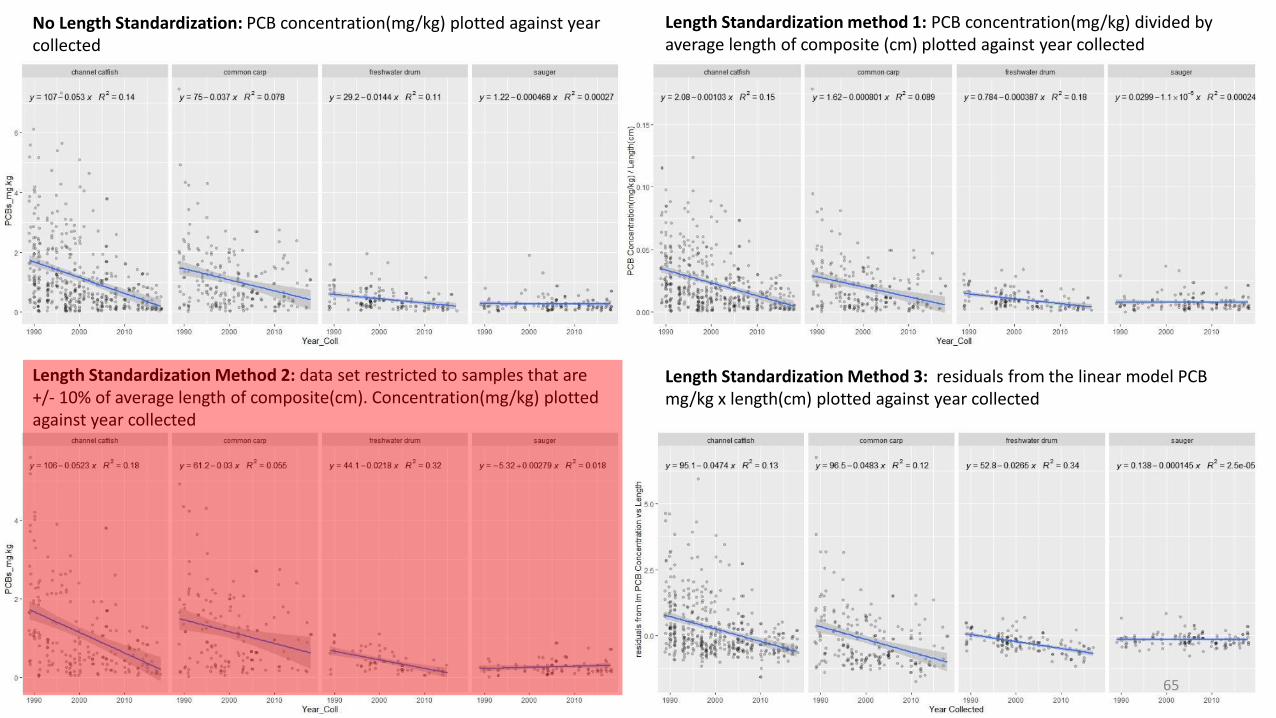
Length Standardization method 1: PCB concentration(mg/kg) divided by average length of composite (cm) plotted against year collected
Length Standardization Method 2: data set restricted to samples that are +/- 10% of average length of composite(cm). Concentration(mg/kg) plotted against year collected
No Length Standardization: PCB concentration(mg/kg) plotted against year collected
Length Standardization Method 3: residuals from the linear model PCB mg/kg x length(cm) plotted against year collected
65

Sander Micropterus
Morone Ictaluridae
66

Sander Micropterus
Morone Ictaluridae
p-value = 1.709e-09
p-value = 0.01821 p-value = 7.654e-09
p-value = 0.008734
R output: Pairwise comparisons using Wilcoxon rank sum test (Mann-Whitney U)
Blue Catfish Channel CatfishChannel Catfish 0.00094 -Flathead Catfish 0.64968 3.3e-07
R output: Pairwise comparisons using Wilcoxon rank sum test (Mann-Whitney U)
Hybrid Striper Striped BassStriped Bass 0.710 -White Bass 0.031 0.130
R output: Pairwise comparisons using Wilcoxon rank sum test (Mann-Whitney U)
Sauger SaugeyeSaugeye 0.30 -Walleye 0.01 0.26
R output: Pairwise comparisons using Wilcoxon rank sum test (Mann-Whitney U)
Largemouth SmallmouthSmallmouth 1.2e-09 -Spotted 0.06376 0.00013
67

68
Continue FT Contaminants Trends Analyses - PCBs
• Preliminary analyses highlighted need to• Adjust for observed correlations (e.g. length, rivermile)
• Exercise caution when applying length standardization methods
• Test validity of aggregating data at higher taxonomic levels
• Use findings to inform future trends analyses• Incorporate 2019 & 2020 data
• Produce repeatable approach
Staff Lead: Daniel Cleves
Micropterus

Review 2019 Smithland Macro Data w/ BWQSC
• Initial data return was delayed due to pandemic-related issues at contract lab
• Data returned in late 2020 lacked necessary taxonomic resolution
• damaged specimens or insufficient SOP specifications?
• Samples were sent to a second laboratory for identification/enumeration confirmation
• Data returned late January, will review with BWQSC at later date
69Staff Lead: Bridget Borrowdale
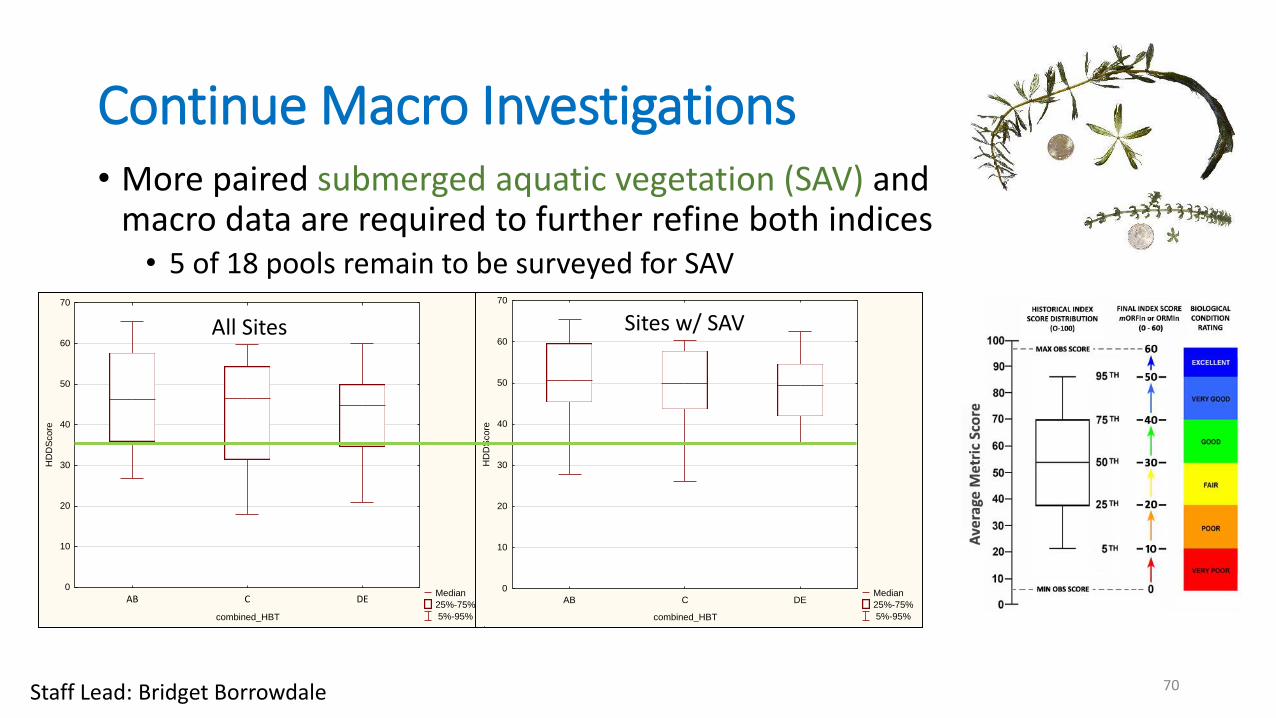
Continue Macro Investigations• More paired submerged aquatic vegetation (SAV) and
macro data are required to further refine both indices • 5 of 18 pools remain to be surveyed for SAV
• Nutrient criteria data
• How necessary to adapt field and lab protocols to ensure best taxonomic resolution
• Incorporate lessons learned in first assessment cycle using the ORMIn
• Effects of SAV and flow, Taxonomic Resolution
• Adjust index and protocols accordingly Median
25%-75%
5%-95%
AB C DE
combined_HBT
0
10
20
30
40
50
60
70
HD
DS
core
Median
25%-75%
5%-95%
AB C DE
combined_HBT
0
10
20
30
40
50
60
70
HD
DS
co
re
All Sites Sites w/ SAV
70Staff Lead: Bridget Borrowdale

• More paired submerged aquatic vegetation (SAV) and macro data are required to further refine both indices
• 5 of 18 pools remain to be surveyed for SAV
• Nutrient criteria data
Continue Macro Investigations
71Staff Lead: Bridget Borrowdale

• More paired submerged aquatic vegetation (SAV) and macro data are required to further refine both indices
• 5 of 18 pools remain to be surveyed for SAV
• Nutrient criteria data
• Incorporate lessons learned from first assessment cycle applying the ORMIn (macro index)
• Effects of SAV and flow, Taxonomic Resolution
• Adjust/refine index and protocols accordingly
Continue Macro Investigations
72Staff Lead: Bridget Borrowdale

Yrs Since last
Assmnt
Cycle 3 Cycle 4
PoolTimes
Assessed2015 2016 2017 2018 2019 2020
IDEM 2021
IDEM 2022
IDEMNRSA2023
IDEM NRSA 2024 2025 2026 2027 2028
Emsworth 3 2 X XDashields 2 7
Ass
ess
men
ts P
ost
po
ned
-C
OV
ID
X XMontgomery 3 5 X X*
New Cumberland 3 3 X XPike Island 3 2 X XHannibal 2 7 X X
Willow Island 3 4 X XBelleville 2 6 X X
Racine 3 5 X XRC Byrd 2 1 X XGreenup 3 4 X XMeldahl 3 3 X X
Markland 3 6 X XMcAlpine 2 6 X XCannelton 3 4 X XNewburgh 3 2 X XJT Myers 3 5 X X*
Smithland 3 1 X XOlmsted 2 6 X X
Open Water 6 X XEverything past the double yellow line is hypothetical
Indiana pools highlighted *first pools in 4th Assessment
Approve Adjusted Pool Survey Schedule
73
Factors Considered
• Concluding 3rd Cycle• Paired SAV & DO
• 4 pool potential
• IDEM FT Project
• NRSA Anticipation

INTRODUCTION
This SOP has been developed to maintain continuity and ensure physical habitat and biological
data collected per ORSANCO SOPs are used to appropriately qualify and assess an Ohio River
navigational pool for aquatic life use. Each individual navigational pool will serve as a separate and
distinct Assessment Unit (AU). Observations indicate that biologically, each navigational pool more
closely resembles a lake as opposed to a free flowing river. Therefore, biological condition becomes more
homogeneous throughout, exhibiting little longitudinal change.
Navigational dams serve as barriers, isolating individual populations as supported by University of
Louisville research indicating little or no synchrony between navigational pools. Each navigational pool
behaves independent of even its nearest neighbor, indicating isolated and independent populations
among pools. ORSANCO’s Biological Water Quality Subcommittee (BWQSC) believes that a subset of 15
randomly selected sites within each navigational pool can accurately describe the target populations’ (fish
and macroinvertebrate (macro)) condition. This document describes the procedure the BWQSC will use
to determine biological assessment endpoints as defined by aquatic life use support following these 6
Steps:
EVALUATION GUIDELINES
Step 1: Do biological data require explanation or qualification? Qualification: data passes QAQC
yet is not representative of results achieved through standardized collection protocol as
influenced by non-pollutant factors (e.g. elevated discharge or velocity and subsequent hydrologic
events, equipment malfunction, loss or sampling device tampering, instream habitat or other
factors that would contribute to either Type 1 or Type 2 error).
· If yes, proceed to Step 2. · If no, proceed to Step 3. Step 2: If data require qualification based on input from the biological staff, can qualified data be
described in such a way or statistically adjusted (account for variation due to above listed
stressors) that they are comparable to other assessment data and therefore useable in indicator
results?
· If yes, include sample data and proceed to Step 3.
· If no, exclude sample data from further analyses, and proceed to Step 3.
Step 3: Were the minimum number of samples collected for each indicator? 15 fish samples,
and a minimum of 10 macro samples need to be collected. The 10 macro samples must be
comprised of deep Hester-Dendy’s and / or multihabitat kick samples. Multihabitat kick samples
will only be used when deep Hester-Dendy samples are lost, unrecoverable or otherwise
disturbed, provided the multihabitat kick samples contain at least 200 individuals. Minimum
sample number criteria (15 fish and 10 macro respectively) are standardized and necessary to
ensure comparability between assessments.
· If neither indicator from a single pool meets the required minimum, additional samples
will be necessary to obtain an assessment. Budget and staffing resources must be
sufficient to do so. The pool may remain unassessed for that cycle only if resources for
additional samples are insufficient and/or a pool assessment was made in the previous
cycle.
· Proceed to Step 4 with an indicator failing to meet the required minimum.
· Proceed to Step 5 with an indicator meeting the required minimum.
Approve New SOP - Evaluation of Biological Survey Results
• Decision tree for evaluation of probabilistic survey data• In development since 2019, multiple BWQSC reviews/discussions• Formalizes typical BQWSC evaluation approach to maintain continuity across years
• Pertinent Decision Nodes• Are the data qualified?• Can the qualified data be statistically adjusted?• Were the minimum data requirements met for index application?• Was the indicator assessed in the prior cycle?• Do the indicator statistic error bars straddle the criterion?
• Document available upon request
STANDARD OPERATING PROCEDURES
FOR EVALUATION OF BIOLOGICAL POOL SURVEY RESULTS
Ohio River Valley Water Sanitation Commission 5735 Kellogg Avenue
Cincinnati, Ohio 45230 (513) 231-7719
March 2019
74
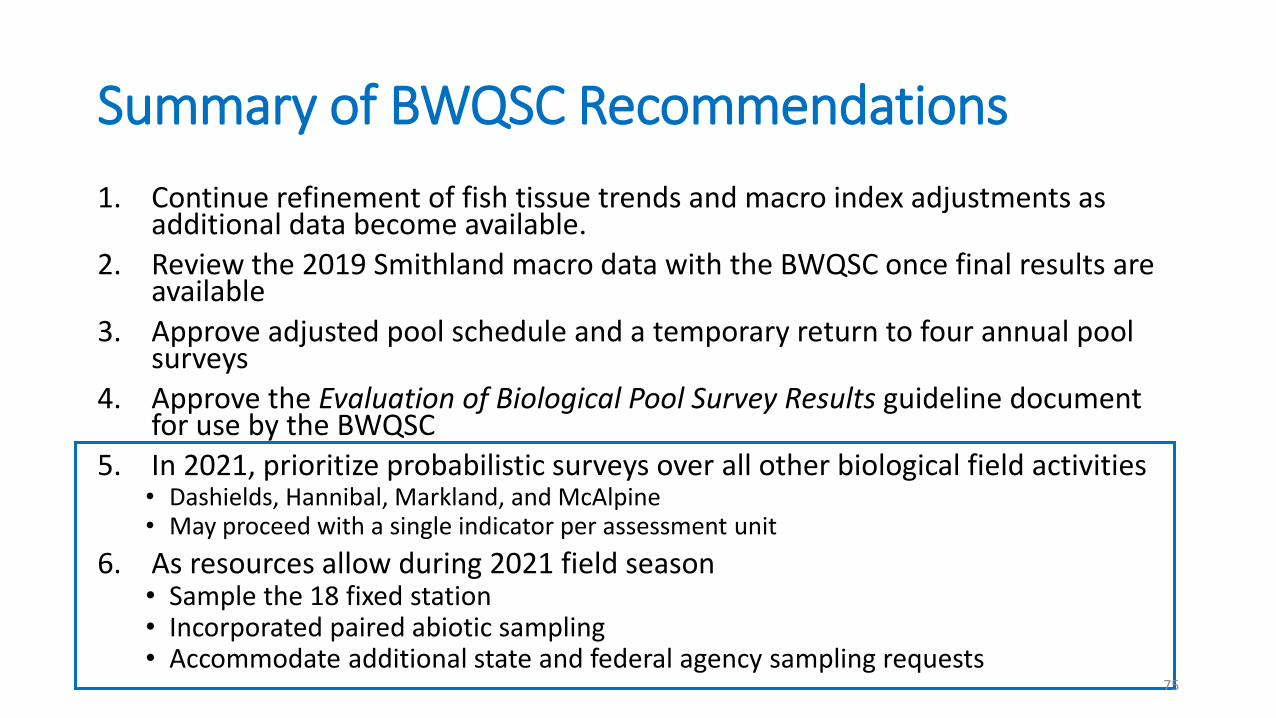
Summary of BWQSC Recommendations
1. Continue refinement of fish tissue trends and macro index adjustments as additional data become available.
2. Review the 2019 Smithland macro data with the BWQSC once final results are available
3. Approve adjusted pool schedule and a temporary return to four annual pool surveys
4. Approve the Evaluation of Biological Pool Survey Results guideline document for use by the BWQSC
5. In 2021, prioritize probabilistic surveys over all other biological field activities• Dashields, Hannibal, Markland, and McAlpine• May proceed with a single indicator per assessment unit
6. As resources allow during 2021 field season • Sample the 18 fixed station• Incorporated paired abiotic sampling• Accommodate additional state and federal agency sampling requests
75

Additional Informative Item: 305b Workgroup
• Will reconvene earlier than in prior cycles• Full review of assessment methodologies for each use
• Development of Harmful Algal Bloom (HAB) methodology• What constitutes a HAB assessment for the Ohio R.?
• Allow staff more time to receive and review data after methodologies are approved
• Have experienced some pandemic related delays in both data collection and contract lab analyses
76

ORSANCO biological staff and BWQSC members would like to recognize
John Wirts of WVDEPoutgoing subcommittee chair
for his many years of service as both member and chair of the BWQSC. We will miss your thoughtful contributions and guidance.
Thanks John!
77

Agenda Item 6:Source Water Protection Programs Update
Sam Dinkins
78

17 ODS stations, 15 are operational.◦ Inoperable
St. Albans (Kanawha) - COVID
Chemours (Parkersburg, WV) – COVID
◦ Operable with Limited Data
Hays Mine (Monongahela) – COVID
West View (Pittsburgh, PA) - COVID

GCMS Software Upgrades◦ Chromeleon 7
Software upgrades on schedule
Louisville and Evansville software installed and training completed
Huntington & Wheeling upgrades planned for 2nd half FY21
Will evaluate budget at end of FY21 to determine if additional sites can be upgraded now
◦ Windows 10/PC Upgrades On-going; will update PCs at locations before Chrom 7 install

ODS Equipment Replacement Account◦ $178K allocated for equipment purchases in FY21
FY21 Plan◦ Purchase two Inficon CMS 5000 units ($50K each)◦ Will reduce downtime while units are repaired◦ First unit received in October – Currently testing◦ Purchase of second unit later in FY21
Purge & Trap Replacement◦ Replace ORSANCO purge & trap unit ($45K)◦ Chronic performance issues◦ Inhibiting progress on VOC analyte list evaluation◦ Could be used to swap out when other sites experience
problems with P&T

Louisville Sub-Area Team◦ Developing sub-area plan like Cincy◦ Summer field recon efforts
postponed due to COVID◦ Oct - Held field demonstration of
spill response field data collection GIS apps Survey 123 app
Collector app
◦ Allows for multiple agencies to share a common GIS platform for spill planning and response data collection

Have maintained full readiness during pandemic
Emergency Response Directory ◦ December 2020 update now available
Compiling Industrial Intake Directory
Spill Response Activity◦ Several noteworthy spills since last meeting, though
none required a field response by ORSANCO staff

Jan 7 – 1,000 gal of hexane◦ Reported at ORM 227.1; Actual ORM 754.0
Jan 6 – 3,000-5,000 gal Ecoat rinse water◦ Hite Creek, Louisville, KY
Dec 9 – Chemical plant explosion◦ Belle, WV – Kanawha River
◦ CBD63, methanol, firefighting runoff
◦ No foam used

Nov 11 – I-75 Bridge Truck Fire◦ ORM 470 (Cincinnati)
◦ 3:30 am
◦ Potassium hydroxide 685 lbs 110 lbs released
◦ Diesel – 400 gal; 100 gal recovered
◦ Firefighting foam – 125 to 200 gal used
◦ Nearest intake 130 miles downstream (Louisville)


Agenda Item 7:Harmful Algae BloomsReview and Consideration for Approval of Monitoring, Response, and Communication Plan
Greg Youngstrom
Action Item: Would the Technical Committee like to endorse the plan or is further review and comment needed?
87

Revision to HAB Monitoring Response
and Communication Plan
First full update since 2016
Changes to state and federal drinking water and recreational
advisory levels for algal toxins
Responded to a second large HAB event
This draft reflects comments from federal and state partners
There were changes to the WV contacts that were received
after the plan was sent to the Technical Committee
Will be asking for approval of the plan
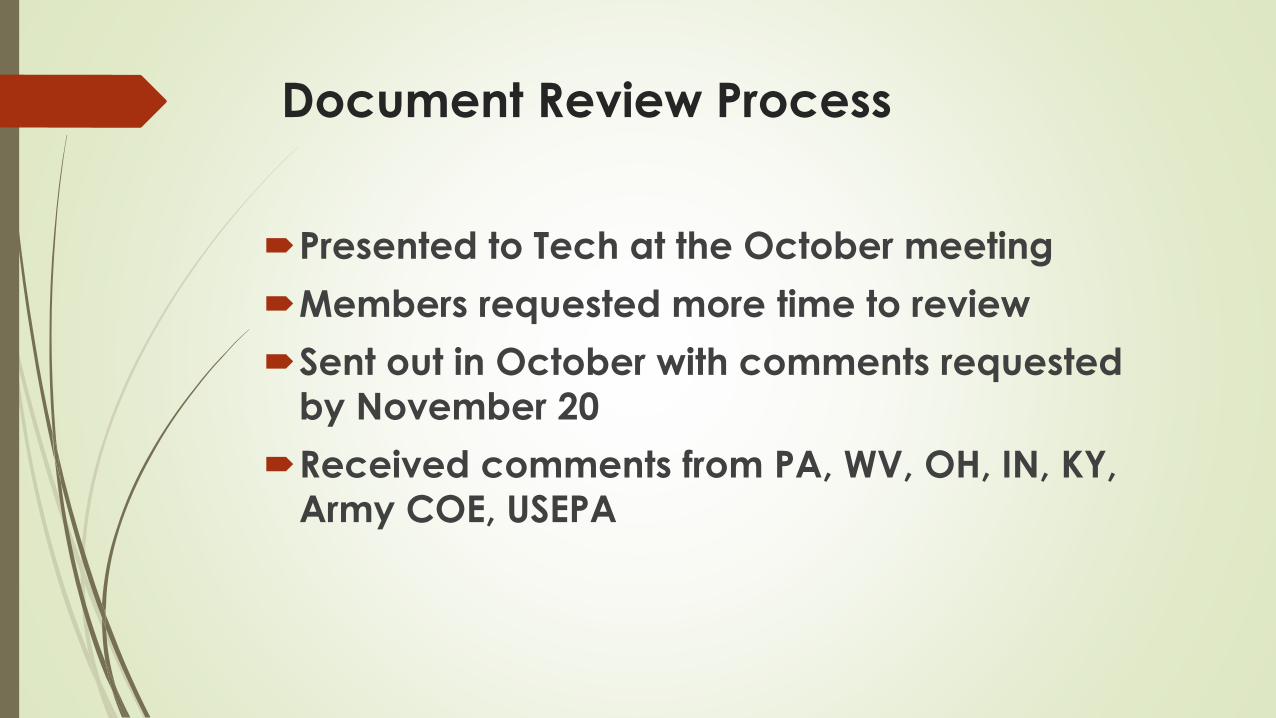
Document Review Process
Presented to Tech at the October meeting
Members requested more time to review
Sent out in October with comments requested
by November 20
Received comments from PA, WV, OH, IN, KY,
Army COE, USEPA

Summary of Comments
Changes to Advisory Levels for drinking water
and contact recreation
Clarification of algal toxin effects
Don’t use the word Standards
Changes to websites and contacts

Comments not Incorporated
USEPA Comment for page 6 Goals B. Consider the use of the
word safe here, as some drinking water treatment plants treat
water to routinely and effectively manage for HABs.
Response: “Safe” is part of the designated use as defined in
ORSANCOs compact.
Pennsylvania comment: Monitoring, Satellite Imagery, Page
10. Use of EPA’s Cyanobacteria Assessment Network Mobile
Application (CyAN app) would be useful here and should be
added.
Response: USEPA’s CyANapp is designed for use with lakes
and reservoirs. Currently the resolution available does not
lend itself to use on a river. If in the future the app is changed
to incorporate satellites with greater resolution it will be a
useful tool for the Ohio River.

ORSANCO Roles and Responsibilities
Advisories
ORSANCO does not issue advisories for drinking water
or recreation
Monitoring
ORSANCO works with State and Federal partners as
well as drinking water utilities to quickly identify all
reported blooms

ORSANCO Roles and Responsibilities
Response
ORSANCO coordinates with States/Federal partners to
ensure adequate coverage of ongoing HABs
ORSANCO serves as a repository for data and updates
the data weekly
Communications
ORSANCO communicates all identified HABs to WUAC
and general Spills list
ORSANCO convenes weekly calls during HAB
response

Questions
Requesting approval of the Plan

Agenda Item 8:2020 Monitoring Activities:Summer Water Quality Conditions
Greg Youngstrom, Ryan Argo, Sam Dinkins
Informational Item
95

2020 Sampling Sites


Ave
rage
Mo
nth
ly S
tre
amfl
ow
May
–O
cto
be
r 2
02
0
0
10
20
30
40
50
May June July Aug Sept Oct
Ave
rage
Mo
nth
ly F
low
(K
cfs)
Pittsburgh (ORM 13)
Observed Long-Term
0
50
100
150
200
250
May June July Aug Sept Oct
Ave
rage
Mo
nth
ly F
low
(K
cfs)
Cincinnati (ORM 471)Observed Long-Term
0
50
100
150
200
250
300
350
May June July Aug Sept Oct
Ave
rage
Mo
nth
ly F
low
(K
cfs)
Evansville (ORM 791)Observed Long-Term
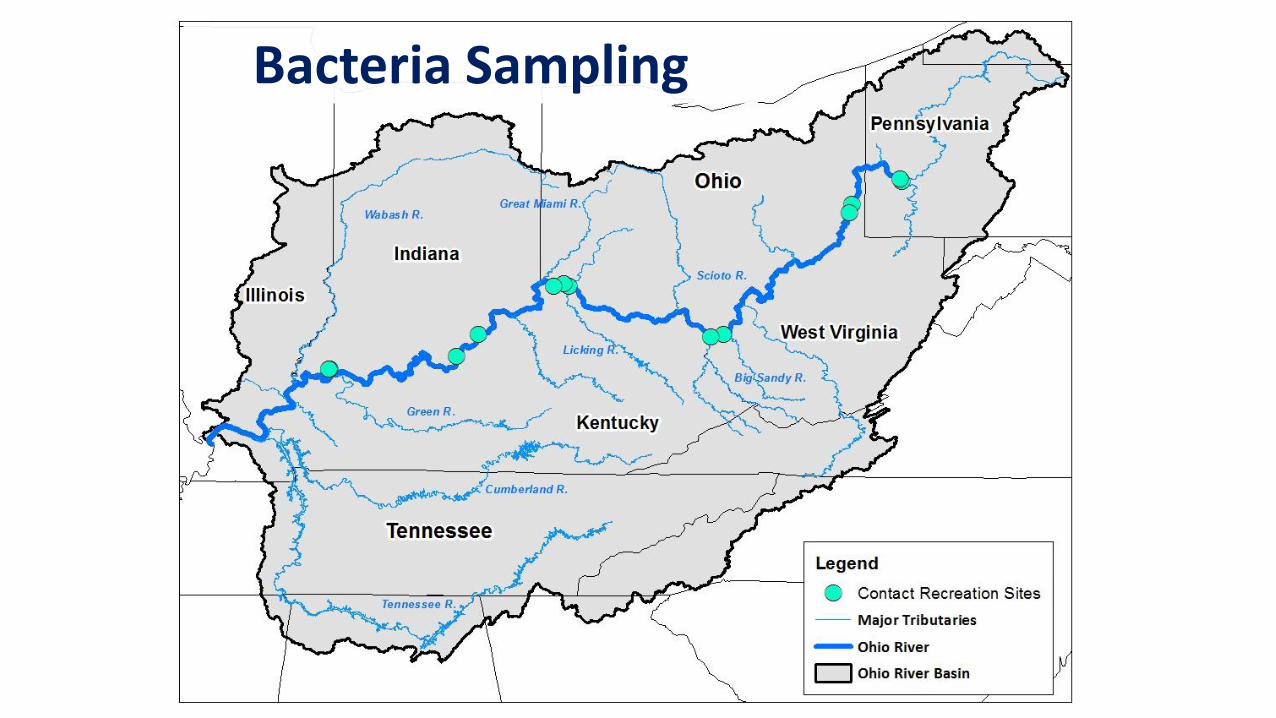
Bacteria Sampling

• May thru October•No samples were collected in April due to
Covid-19•No samples were collected at Pittsburgh•Samples were collected starting in June at
Wheeling
• 5 rounds monthly
• Analyzed for E. coli
•Criteria:•GeoMean: 130 CFU/100mL•Single Sample: 240 CFU/100mL
Bacteria Monitoring
Percent Exceeded
May-September 2020Pittsburgh Wheeling Huntington Cincinnati Louisville Evansville
Monthly Geometric Mean NA 40% 67% 33% 17% 33%
Single Sample NA 28% 47% 33% 17% 27%
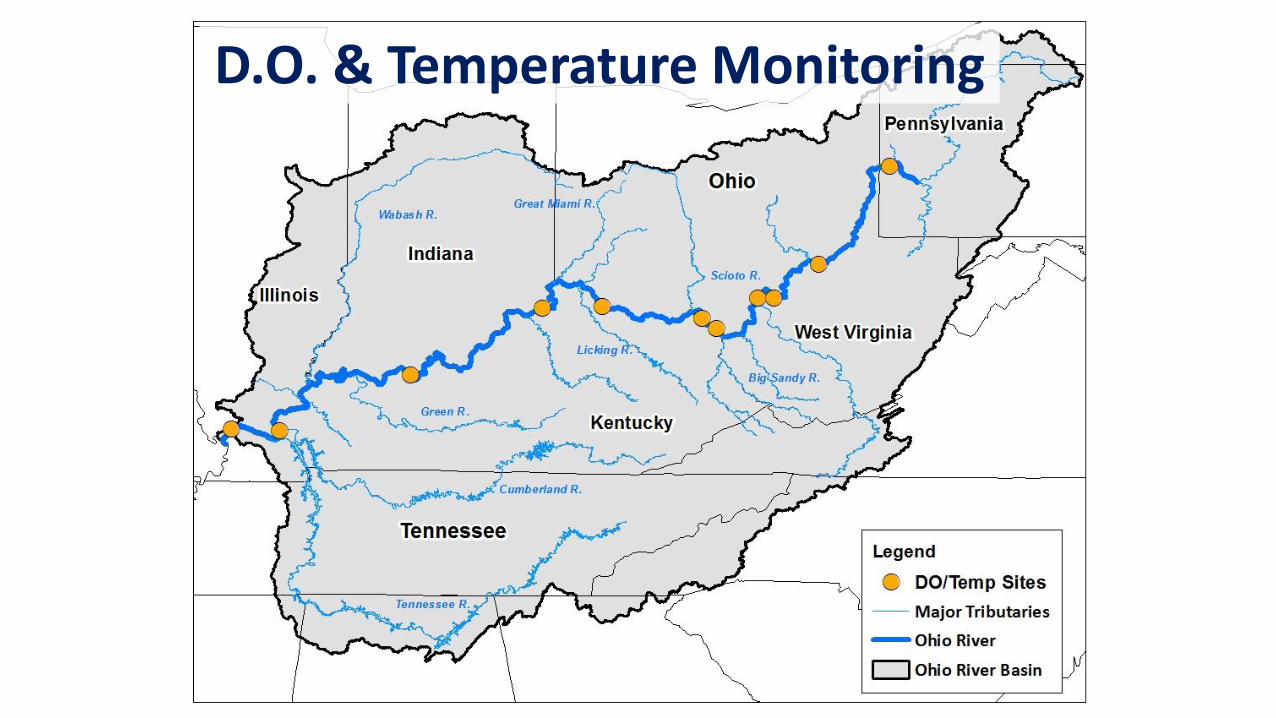
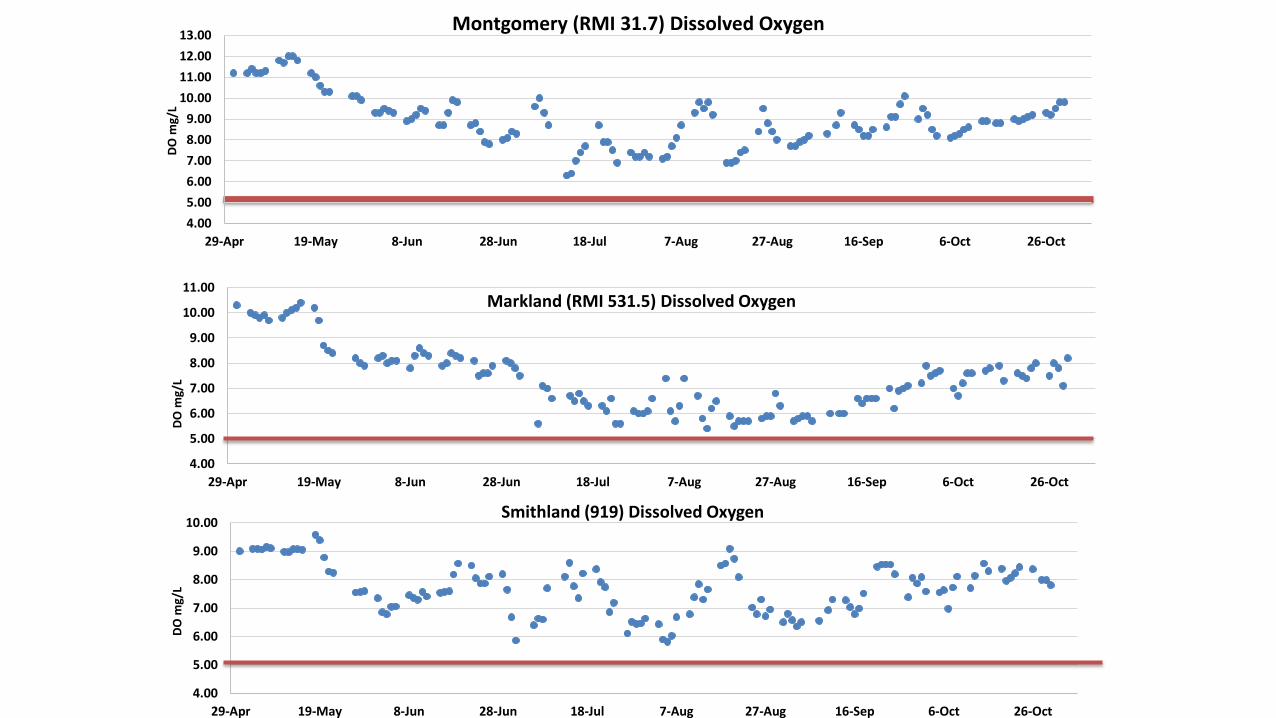
D.O. & Temperature Monitoring

Dissolved Oxygen and Temperature Monitoring
Dissolved Oxygen• Monitored by the Army Corp of Engineers, United States Geological Survey, and electric utility/hydropower agencies for the assessment of aquatic life use.
• All three stations maintained above the 5.0 mg/L criteria.
•Temperature• The allowable temperature varies each month and ranges from 71°-89°F.
•Temperatures did not exceed the criteria at any of the three stations.
4.00
5.00
6.00
7.00
8.00
9.00
10.00
11.00
12.00
13.00
29-Apr 19-May 8-Jun 28-Jun 18-Jul 7-Aug 27-Aug 16-Sep 6-Oct 26-Oct
DO
mg/
L
Montgomery (RMI 31.7) Dissolved Oxygen
4.00
5.00
6.00
7.00
8.00
9.00
10.00
11.00
29-Apr 19-May 8-Jun 28-Jun 18-Jul 7-Aug 27-Aug 16-Sep 6-Oct 26-Oct
DO
mg/
L
Markland (RMI 531.5) Dissolved Oxygen
4.00
5.00
6.00
7.00
8.00
9.00
10.00
29-Apr 19-May 8-Jun 28-Jun 18-Jul 7-Aug 27-Aug 16-Sep 6-Oct 26-Oct
DO
mg/
L
Smithland (919) Dissolved Oxygen

50
55
60
65
70
75
80
85
90
29-Apr 19-May 8-Jun 28-Jun 18-Jul 7-Aug 27-Aug 16-Sep 6-Oct 26-Oct
Max
Te
mp
era
ture
F°
Montgomery (RMI 31.7) Temperature
50
55
60
65
70
75
80
85
90
29-Apr 19-May 8-Jun 28-Jun 18-Jul 7-Aug 27-Aug 16-Sep 6-Oct 26-Oct
Max
Te
mp
era
ture
F°
Markland (RMI 531.5) Temperature
50
55
60
65
70
75
80
85
90
29-Apr 19-May 8-Jun 28-Jun 18-Jul 7-Aug 27-Aug 16-Sep 6-Oct 26-Oct
Max
Te
mp
era
ture
F°
Smithland (RMI 919) Temperature
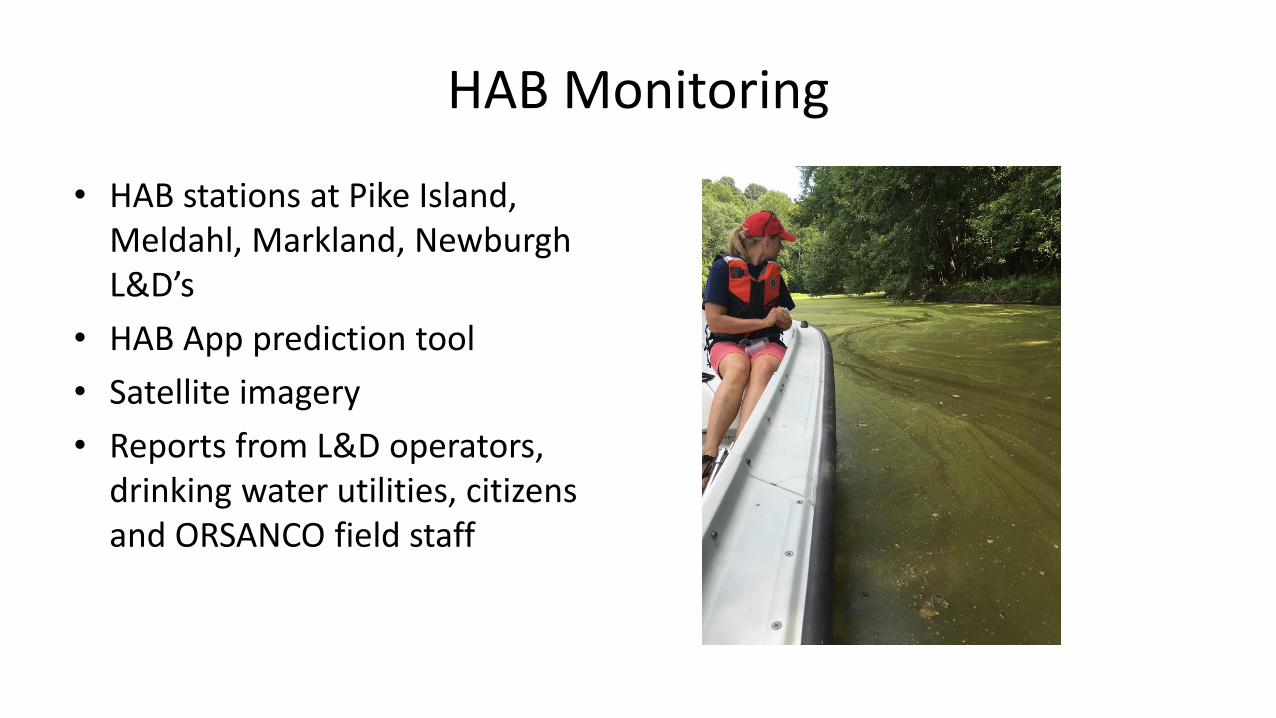
HAB Monitoring
• HAB stations at Pike Island, Meldahl, Markland, Newburgh L&D’s
• HAB App prediction tool
• Satellite imagery
• Reports from L&D operators, drinking water utilities, citizens and ORSANCO field staff

2020 HAB Response
• No Ohio River HAB reports
• Filter clogging issues reported from Maysville-Louisville in late July/early August.
• Large amounts of filamentous diatom Aulacoseira present in samples
• HAB App showed a greater than 50% likelihood of an HAB at the time
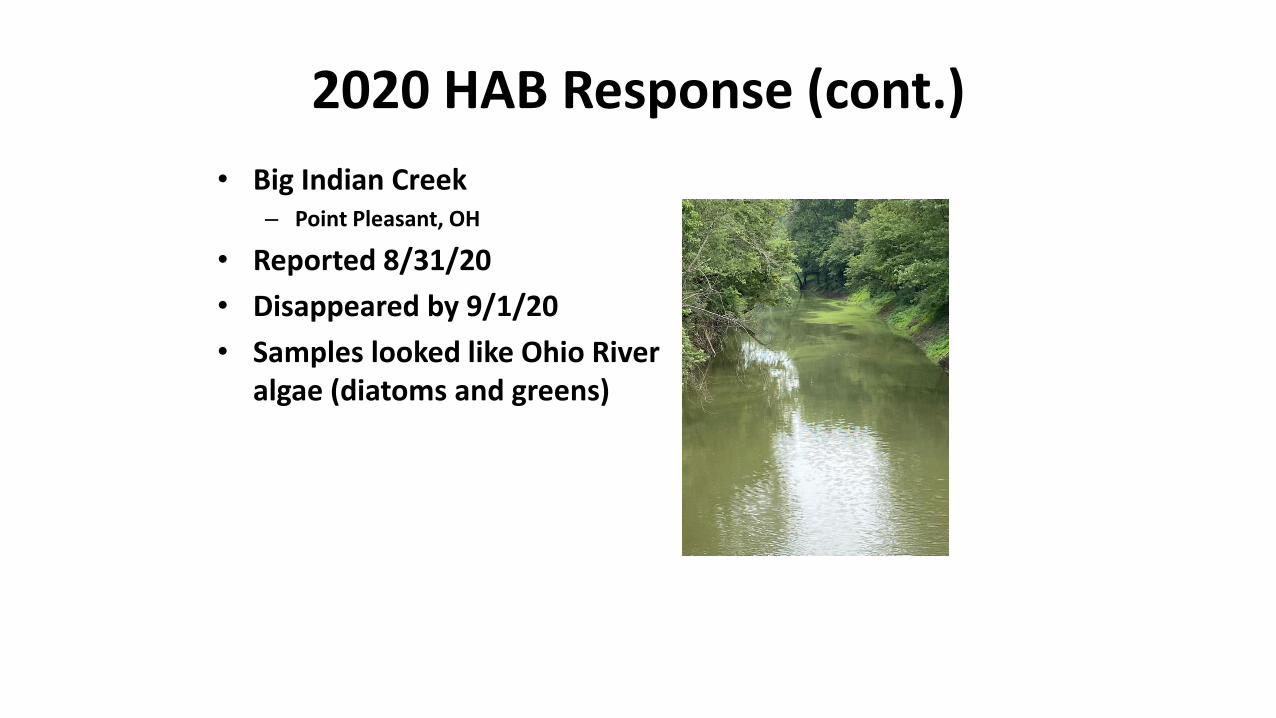
2020 HAB Response (cont.)
• Big Indian Creek– Point Pleasant, OH
• Reported 8/31/20
• Disappeared by 9/1/20
• Samples looked like Ohio River algae (diatoms and greens)

Clean Metals and Bimonthly Sampling

Metals and Bimonthly ParametersMetals
MercuryAluminumChromiumManganeseNickelCopperZincArsenicSeleniumSilverCadmiumAntimonyThalliumLeadMagnesiumCalciumIronBarium
Nutrients, Major IonsAmmonia NitrogenBromideChlorideHardnessNitrate-Nitrite NitrogenPhenolsSulfateTotal Dissolved SolidsTotal Kjeldahl NitrogenTotal Organic CarbonTotal PhosphorusTotal Suspended SolidsCyanide

Hg criteria: >12ng/LWV Fe criteria: >1,500 µg/LKY Fe criteria: >3,500 µg/L*KY Fe criteria for impaired waterway: >1,000 µg/L
Clean Metals WQC Exceedances
July 2019 - Sept 2020 (8 Sampling Months)
Site River MileFe
ViolationsHg
ViolationSample
Type# of Months
Sampled
New Cumberland 54.4 0 0 Total 6
Pike Island 84.2 1 0 Total 8
Hannibal 126.4 1 0 Total 8
Willow Island 161.8 0 0 Total 8
Belleville 203.9 0 0 Total 7
R.C. Byrd 279.2 3 0 Total 8
Greenup 341 0 0 Total 7
Meldahl 436.2 0 0 Total 7
Markland 531.5 1 0 Total 8
McAlpine 606.8 1 0 Total 6
Cannelton 720.7 1 0 Total 8
Newburgh* 776 4 0 Total 8
J.T. Myers* 846 2 0 Total 6
Smithland* 918.5 2 0 Total 6
L&D 52 938.9 1 0 Total 1
Olmsted 964.4 0 1 Total 6
Exceedances this year 17 1
Exceedances last year 21 5
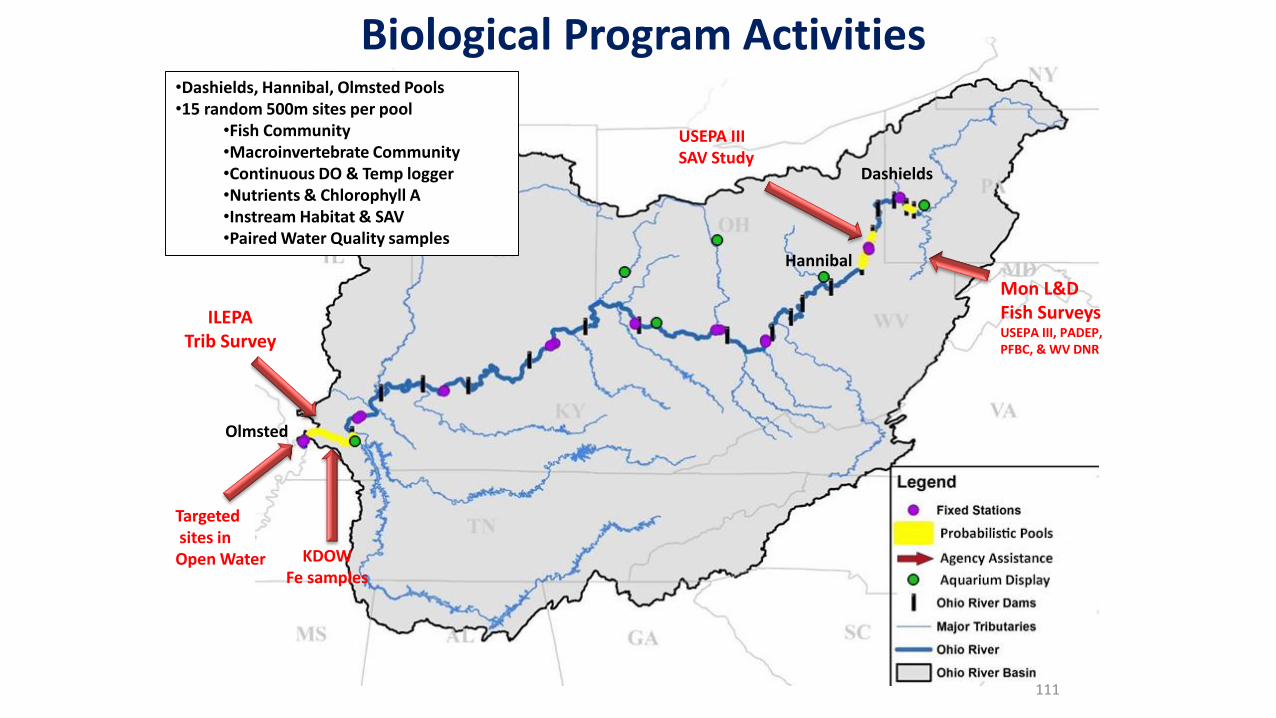
•Dashields, Hannibal, Olmsted Pools•15 random 500m sites per pool
•Fish Community•Macroinvertebrate Community•Continuous DO & Temp logger•Nutrients & Chlorophyll A•Instream Habitat & SAV•Paired Water Quality samples
ILEPATrib Survey
Mon L&D Fish SurveysUSEPA III, PADEP, PFBC, & WV DNR
Targetedsites in Open Water KDOW
Fe samples
USEPA IIISAV Study
Olmsted
Hannibal
Dashields
111
Biological Program Activities

Agenda Item 9:TEC Members Reports
• IL – Scott Twait
• IN – Eileen Hack
• KY – Katie McKone
• NY – Jeff Konsella
• OH – Audrey Rush
• PA – Kevin Halloran
• VA – Melanie Davenport
• WV – Scott Mandirola
• USACE – Erich Emery
• USCG – Eric Roy/Josh Miller
• USEPA – David Pfeifer
• USGS – Jeff Frey
• CIAC – Vacant
• PIAC – Cheri Budzynski
• PIACO – Betsy Mallison
• POTW – Alex Novak
• WOAC – Angie Rosser
• WUAC – Bruce Whitteberry112

Agenda Item 10:Review of ORSANCO’s Bimonthly and Clean Metals Monitoring Programs
Jason Heath
Status Report
113

Background• Initiated a review of ORSANCO’s Bimonthly & Clean Metals monitoring
programs following the June 2020 TEC meeting.
• Bimonthly monitoring began in 1975 (monthly at the time), and moved to bimonthly in the early 90’s (budget constraints). Includes conventional water quality parameters and total metals.
• Clean Metals began in 1998 which includes total and dissolved metals.
• Prior to the Clean Metals program and dissolved metals criteria, there would often be total metals criteria exceedances for lead associated with high suspended solids concentrations and flow.
• We do not have criteria exceedances for dissolved metals.
• ORSANCO uses the data from these monitoring programs primarily for 305b use assessments and trends.
• Today, exceedances occur for Total Iron & Total Mercury.

Bimonthly & Clean Metals Sampling Sites

Stations Nutrients, Major Ions Symbol Units Method Number Reporting Limit
16 Ohio River stations
14 major tributaries
Bromide Br- mg/L EPA 300.0 0.05
Chloride Cl- mg/L SM 4500 Cl E 2.0
Hardness Hardness mg/L SM 2340 B 3.0
Ammonia Nitrogen NH3-N mg/L EPA 350.1 0.03
Nitrate-Nitrite Nitrogen NO2-NO3-N mg/L EPA 353.2 0.05
pH pH Std. Units Physical N/A
Sulfate SO4 mg/L ASTM D516-90 12.5
Specific Conductivity SpCond us/cm Physical N/A
Total Kjeldahl Nitrogen TKN mg/L EPA 351.2 0.1
Total Organic Carbon TOC mg/L SM 5310 C 0.5
Total Phosphorus TP mg/L EPA 365.3 0.01
Total Suspended Solids TSS mg/L SM 2540 D 1.0
Total Dissolved Solids TDS mg/L SM 2540 C 5.0
Total Nitrogen TN mg/L TKN+(N+N) Calculation 0.5
Phenols Phenols ug/L EPA 420.4 0.01
Dissolved Oxygen DO mg/L Physical N/A
Temperature Temp Deg. C Physical N/A
Turbidity Turbidity NTU Physical N/A
5 Upper Ohio Basin
Winter months only (Nov,
Jan, Mar)
Cyanide CN ug/L EPA 335.4 5.0
Bimonthly Parameter List
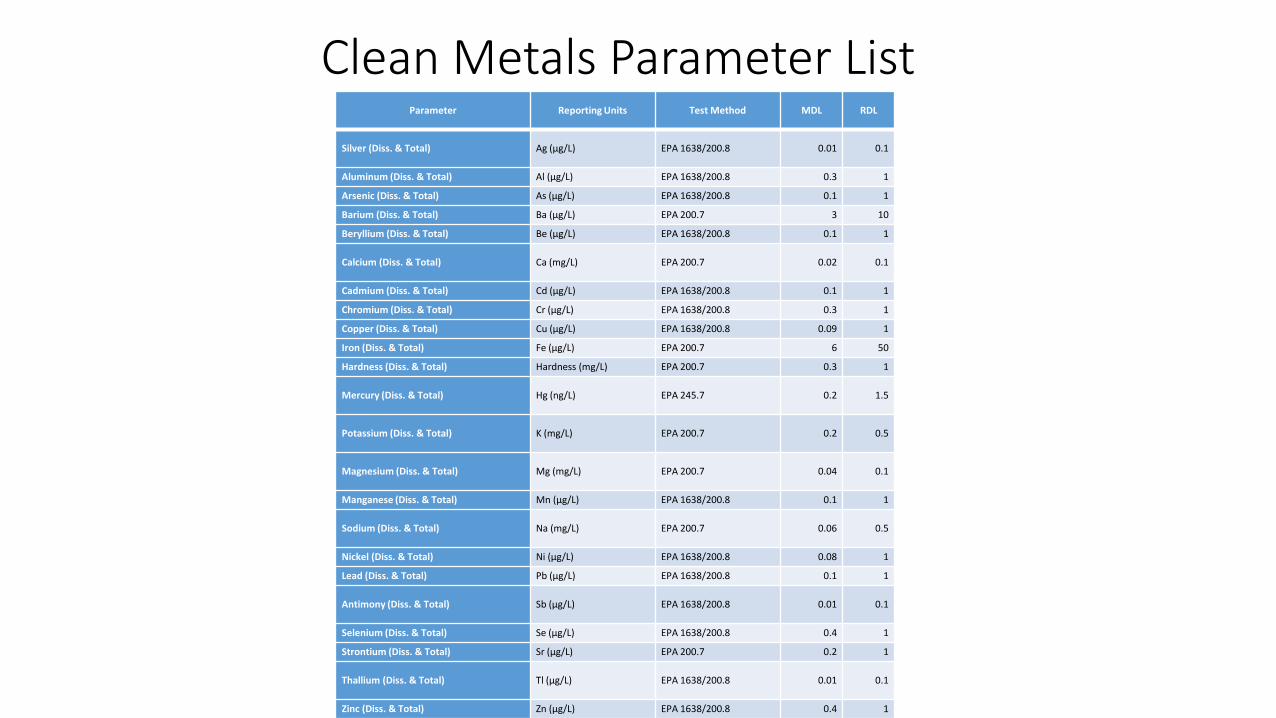
Parameter Reporting Units Test Method MDL RDL
Silver (Diss. & Total) Ag (µg/L) EPA 1638/200.8 0.01 0.1
Aluminum (Diss. & Total) Al (µg/L) EPA 1638/200.8 0.3 1
Arsenic (Diss. & Total) As (µg/L) EPA 1638/200.8 0.1 1
Barium (Diss. & Total) Ba (µg/L) EPA 200.7 3 10
Beryllium (Diss. & Total) Be (µg/L) EPA 1638/200.8 0.1 1
Calcium (Diss. & Total) Ca (mg/L) EPA 200.7 0.02 0.1
Cadmium (Diss. & Total) Cd (µg/L) EPA 1638/200.8 0.1 1
Chromium (Diss. & Total) Cr (µg/L) EPA 1638/200.8 0.3 1
Copper (Diss. & Total) Cu (µg/L) EPA 1638/200.8 0.09 1
Iron (Diss. & Total) Fe (µg/L) EPA 200.7 6 50
Hardness (Diss. & Total) Hardness (mg/L) EPA 200.7 0.3 1
Mercury (Diss. & Total) Hg (ng/L) EPA 245.7 0.2 1.5
Potassium (Diss. & Total) K (mg/L) EPA 200.7 0.2 0.5
Magnesium (Diss. & Total) Mg (mg/L) EPA 200.7 0.04 0.1
Manganese (Diss. & Total) Mn (µg/L) EPA 1638/200.8 0.1 1
Sodium (Diss. & Total) Na (mg/L) EPA 200.7 0.06 0.5
Nickel (Diss. & Total) Ni (µg/L) EPA 1638/200.8 0.08 1
Lead (Diss. & Total) Pb (µg/L) EPA 1638/200.8 0.1 1
Antimony (Diss. & Total) Sb (µg/L) EPA 1638/200.8 0.01 0.1
Selenium (Diss. & Total) Se (µg/L) EPA 1638/200.8 0.4 1
Strontium (Diss. & Total) Sr (µg/L) EPA 200.7 0.2 1
Thallium (Diss. & Total) Tl (µg/L) EPA 1638/200.8 0.01 0.1
Zinc (Diss. & Total) Zn (µg/L) EPA 1638/200.8 0.4 1
Clean Metals Parameter List

Review Work Group
• Has met 3 times since June 2020.• IL – Scott Twait OH – Audrey Rush
• IN – Eileen Hack PA – Kevin Halloran
• KY – Katie McKone WV – Scott Mandirola/John Wirts
• Reviewed monitoring networks.
• States developed individual recommendations.
• Staff assigned costs to each recommendation.
• States prioritized the recommendations.

Summary of Recommendations & Priorities• Recommendations and priorities are included with agenda materials.***Costs are annual , include analytical, travel, and shipping, and presume can be accomplished with existing staff for the purposes of this presentation. Implementing all site additions may necessitate additional staff. Addition of parameters would change costs. These are estimates dependent on many factors including how many recommendations would be implemented and are intended to give TEC a “sense” of costs.
• Maintain existing networks and sampling frequency (every other month).• Add locations:
• Mainstem in PA downstream of Beaver R. confluence (Bimonthly & Clean Metals) - $13,000.• Kentucky R., Salt R., and Green R. site further towards confluence w/Ohio R (Bimonthly) - $700 per site, $4K travel
for all sites combined – Total $6,100 for all 3 locations.• White R. (flows into Wabash R.), Wabash R. upstream of White R. (Bimonthly) - $700 per site, $4000 travel – Total
$5,500.• Add parameters to all sites (additional parameters could add up to $10,000 in shipping):
• DOC - $ 6,400• BOD (or CBOD) - $ 6,000• Orthophosphate - $ 2,700• Continuous pH monitoring at all 30 sites (revised metals criteria pH dependent) – pH/temp loggers are $700 each,
travel could be $6,000 or more, and this “could” necessitate additional staff – Total $ 27,000 excluding staff.• Add metals to tributary Bimonthly stations – Upwards of $30,000 for analytical, travel and shipping. Could
necessitate additional staff. • Alkalinity ($4,000), MBAS ($19,000), and osmotic pressure ($22,500).
• There are multiple variations that could be considered for some of these recommendations.

Next Steps
• Additional recommendations and priorities from TEC Committee? Deadline for TEC comments?
• Refine and order priorities.
• Refine costs.
• Present to Program and Finance Committee.
• Potentially seek additional funding opportunities as necessary.
• FYI, we will also be proposing to Program & Finance Committee, repeat of a Broad Scan survey that was first completed ~10 years ago.
• The Broad Scan survey included sampling for all constituents in ORSANCO’s Pollution Control Standards that are not included in our regular monitoring programs. It included the EDI sampling method at 3 Ohio River locations (upper, middle, and lower river), and no exceedances were identified in that first study.
• Intention is to repeat this on some regular frequency in the future.

Agenda Item 11:PFAS Project Update
Heath, Dinkins
121

Ohio River PFAS Survey Development
1) Study Objectives2) Site Selection3) Sample Collection Methodology4) Analytical Services5) Schedule/QA samples6) Pre-Survey QA Study7) Review of QAPP, sampling plan, and SOP.

Study Objective
Characterize ambient conditions relative to PFASs in the Ohio River at 20 locations, for 2 rounds of sampling under two separate seasons. 1 higher flow & 1 lower flow event.
Probabilistic-systematic approach used for site selection.
Outside of any regulatory mixing zones.
The survey is not intended to focus on drinking water.
Survey will set a baseline for ambient conditions that may be repeated in the future to track changes in Ohio River conditions.
Results may inform states, EPA, utilities & other interested parties on Ohio River ambient water quality conditions. The Commission is developing a communication plan.

Site Selection
20 Ohio River sites. Probabilistic-Systematic selection approach.
Sites not within regulatory mixing zones
States have previously approved final site selection.
West Virginia Water Resources Institute/Three Rivers QUEST has asked us to collect 1 Allegheny River and 1 Monongahela River sample during first round with possible second round.
Will defer to Three Rivers QUEST on exact locations for Allegheny & Mon, downstream near confluence with Ohio River but outside mixing with Ohio River.

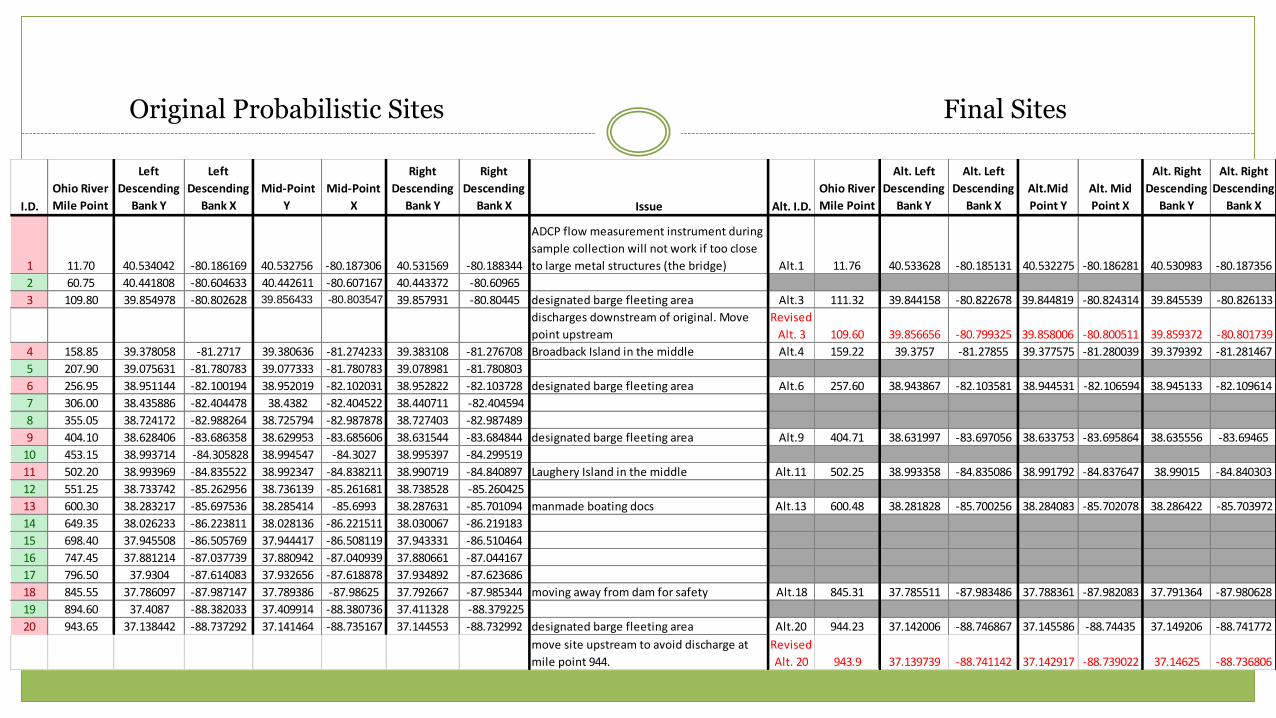
Systematic-Probabilistic Approach
I.D.
Ohio River
Mile Point
Left
Descending
Bank Y
Left
Descending
Bank X
Mid-Point
Y
Mid-Point
X
Right
Descending
Bank Y
Right
Descending
Bank X Issue Alt. I.D.
Ohio River
Mile Point
Alt. Left
Descending
Bank Y
Alt. Left
Descending
Bank X
Alt.Mid
Point Y
Alt. Mid
Point X
Alt. Right
Descending
Bank Y
Alt. Right
Descending
Bank X
1 11.70 40.534042 -80.186169 40.532756 -80.187306 40.531569 -80.188344
ADCP flow measurement instrument during
sample collection will not work if too close
to large metal structures (the bridge) Alt.1 11.76 40.533628 -80.185131 40.532275 -80.186281 40.530983 -80.187356
2 60.75 40.441808 -80.604633 40.442611 -80.607167 40.443372 -80.60965
3 109.80 39.854978 -80.802628 39.856433 -80.803547 39.857931 -80.80445 designated barge fleeting area Alt.3 111.32 39.844158 -80.822678 39.844819 -80.824314 39.845539 -80.826133
discharges downstream of original. Move
point upstream
Revised
Alt. 3 109.60 39.856656 -80.799325 39.858006 -80.800511 39.859372 -80.801739
4 158.85 39.378058 -81.2717 39.380636 -81.274233 39.383108 -81.276708 Broadback Island in the middle Alt.4 159.22 39.3757 -81.27855 39.377575 -81.280039 39.379392 -81.281467
5 207.90 39.075631 -81.780783 39.077333 -81.780783 39.078981 -81.780803
6 256.95 38.951144 -82.100194 38.952019 -82.102031 38.952822 -82.103728 designated barge fleeting area Alt.6 257.60 38.943867 -82.103581 38.944531 -82.106594 38.945133 -82.109614
7 306.00 38.435886 -82.404478 38.4382 -82.404522 38.440711 -82.404594
8 355.05 38.724172 -82.988264 38.725794 -82.987878 38.727403 -82.987489
9 404.10 38.628406 -83.686358 38.629953 -83.685606 38.631544 -83.684844 designated barge fleeting area Alt.9 404.71 38.631997 -83.697056 38.633753 -83.695864 38.635556 -83.69465
10 453.15 38.993714 -84.305828 38.994547 -84.3027 38.995397 -84.299519
11 502.20 38.993969 -84.835522 38.992347 -84.838211 38.990719 -84.840897 Laughery Island in the middle Alt.11 502.25 38.993358 -84.835086 38.991792 -84.837647 38.99015 -84.840303
12 551.25 38.733742 -85.262956 38.736139 -85.261681 38.738528 -85.260425
13 600.30 38.283217 -85.697536 38.285414 -85.6993 38.287631 -85.701094 manmade boating docs Alt.13 600.48 38.281828 -85.700256 38.284083 -85.702078 38.286422 -85.703972
14 649.35 38.026233 -86.223811 38.028136 -86.221511 38.030067 -86.219183
15 698.40 37.945508 -86.505769 37.944417 -86.508119 37.943331 -86.510464
16 747.45 37.881214 -87.037739 37.880942 -87.040939 37.880661 -87.044167
17 796.50 37.9304 -87.614083 37.932656 -87.618878 37.934892 -87.623686
18 845.55 37.786097 -87.987147 37.789386 -87.98625 37.792667 -87.985344 moving away from dam for safety Alt.18 845.31 37.785511 -87.983486 37.788361 -87.982083 37.791364 -87.980628
19 894.60 37.4087 -88.382033 37.409914 -88.380736 37.411328 -88.379225
20 943.65 37.138442 -88.737292 37.141464 -88.735167 37.144553 -88.732992 designated barge fleeting area Alt.20 944.23 37.142006 -88.746867 37.145586 -88.74435 37.149206 -88.741772
move site upstream to avoid discharge at
mile point 944.
Revised
Alt. 20 943.9 37.139739 -88.741142 37.142917 -88.739022 37.14625 -88.736806
Final SitesOriginal Probabilistic Sites

Sample Collection Methodology
Proceeding with EDI-Equal Discharge Increment Method. Allows for a larger portion of the water column to be sampled and composited to better
represent an “average” flow-weighted cross-sectional concentration (transect composite).
Reduces the uncertainty associated with single point grabs within a very large cross-sectional area where the variability in concentration across the river is unknown.
Discrete grab samples at 3 existing sampling sites comparing transect composite to discrete grab samples within the transect. 9 single point grab samples at 3 depths and 3 widths (surface, middle & bottom grabs at left-
bank, mid-stream & right-bank.
Decision Point: Which 3 existing transects should we conduct the discrete sampling events?

Discrete Sampling at 3 Transects
Below diagram represents one transect from the 20 selected sites.
9 discrete samples will be collected with peristaltic pump and silicone tubing.
The purpose is to investigate how PFASs are distributed in the water column.
This will be done on the same day as the EDI composite sample.

Selection of 3 Sites to Conduct the Discrete Sampling Study
Need to select 3 sites/transects from the 20 already selected Ohio River sites to conduct the discrete sampling study.
This will allow for a look at the distribution of PFASs in the water column. Is it well mixed or does it tend to concentrate in a particular part of the water column (such as at the surface)?
Work group met on December 15 and recommended the sites selected be at 3 of the 20 already selected sites.
They should be at sites likely to produce detections or downstream of tributaries.
Staff will look at available Ohio River data to select 2 sites that appear to be in higher concentration areas, and one sites downstream of the confluence of a major tributary.
A recommendation will be made to the work group for consideration.

Analytical Services
USEPA is securing analytical services with Battelle labs.
Using DoD compliant method based on EPA 537.1.
28 PFAS compounds including GenX.
Flow measurements at every site with ADCP (Acoustic Doppler Current Profiler) instrumentation considers full X-sectional flows.
Suspended solids, physical parameters.
Analytical QAPP requires some revisions.

Analyte CAS No. MDL LOD LOQ
(ng/L) (ng/L) (ng/L)
PFBA 375-22-4 0.45 1.0 5.0
PFPeA 2706-90-3 0.26 1.0 5.0
PFHxA 307-24-4 0.53 1.5 5.0
PFHpA 375-85-9 0.26 1.0 5.0
PFOA 335-67-1 0.51 1.5 5.0
PFNA 375-95-1 0.31 1.0 5.0
PFDA 335-76-2 0.14 0.5 5.0
PFUnA 2058-94-8 0.22 0.5 5.0
PFDoA 307-55-1 0.19 0.5 5.0
PFTrDA 72629-94-8 0.15 0.5
PFTeDA 376-06-7 0.73 2.0 5.0
NMeFOSAA 2355-31-9 0.35 1.0 5.0
NEtFOSAA 2991-50-6 0.50 1.0 5.0
PFOSA 754-91-6 0.46 1.0 5.0
PFBS 375-73-5 0.14 0.5 5.0
PFAS Detection Limits for Surface Water Samples Aqueous Samples per Battelle SOPs based on EPA Method 537.1 and Compliant with DoD QSM Ver. 5.3
Analyte CAS No. MDL LOD LOQ
(ng/L) (ng/L) (ng/L)
PFPeS 2706-91-4 0.26 1.0 5.0
PFHxS 355-46-4 0.11 0.4 5.0
PFHpS 375-92-8 0.85 2.0 5.0
PFOS 1763-23-1 0.44 1.0 5.0
PFNS 68259-12-1 0.36 1.0 5.0
PFDS 335-77-3 0.27 1.0 5.0
4:2FTS 747124-72-4 0.50 1.0 5.0
6:2FTS 27619-97-2 0.53 1.5 5.0
8:2FTS 39108-34-4 0.60 2.0 5.0
HFPO-DA 13252-13-6 0.25 0.5 5.0
Adona 919005-14-4 0.27 1.0 5.0
11Cl-PF3OUdS 763051-92-9 0.23 0.5 5.0
9Cl-PF3ONS 756426-58-1 0.27 1.0 5.0

Sampling Schedule with QA Samples
Currently targeting late spring/early summer 2021 for initial round of sampling. Dependent on COVID considerations with overnight travel & 3-sampler boat crew
requirements.
Theoretically will be the higher flow event.
Second round in fall, 2021. Timing to coincide with lower flow conditions.
Sampling schedule also presents a schedule for QA samples One equipment blank collected with every EDI sample.
One discrete sampling equipment blank collected on days with discrete sampling.
Equipment, field and trip blank procedures described in QAPP.
Sampling schedule proposes to begin downstream and systematically move upstream.
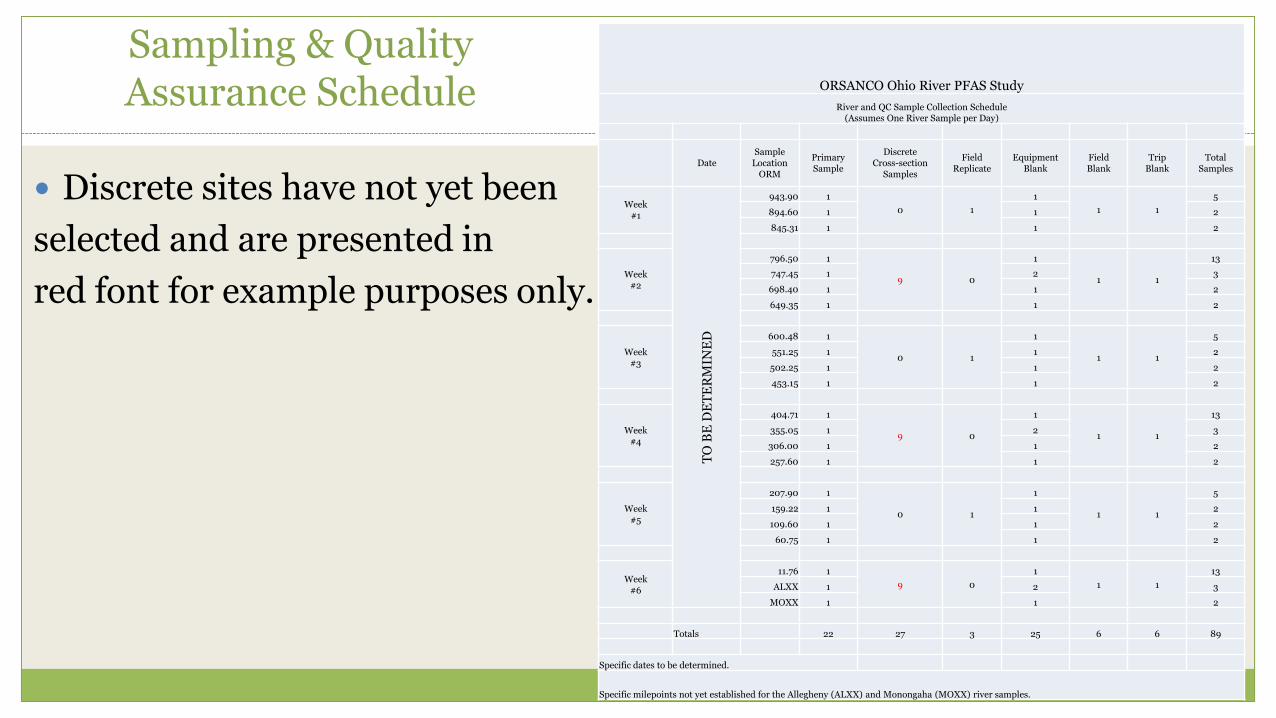
ORSANCO Ohio River PFAS Study
River and QC Sample Collection Schedule(Assumes One River Sample per Day)
DateSample
LocationORM
PrimarySample
DiscreteCross-section
Samples
FieldReplicate
EquipmentBlank
FieldBlank
TripBlank
TotalSamples
Week#1
TO
BE
DE
TE
RM
INE
D
943.90 1
0 1
1
1 1
5
894.60 1 1 2
845.31 1 1 2
Week#2
796.50 1
9 0
1
1 1
13
747.45 1 2 3
698.40 1 1 2
649.35 1 1 2
Week#3
600.48 1
0 1
1
1 1
5
551.25 1 1 2
502.25 1 1 2
453.15 1 1 2
Week#4
404.71 1
9 0
1
1 1
13
355.05 1 2 3
306.00 1 1 2
257.60 1 1 2
Week#5
207.90 1
0 1
1
1 1
5
159.22 1 1 2
109.60 1 1 2
60.75 1 1 2
Week#6
11.76 1
9 0
1
1 1
13
ALXX 1 2 3
MOXX 1 1 2
Totals 22 27 3 25 6 6 89
Specific dates to be determined.
Specific milepoints not yet established for the Allegheny (ALXX) and Monongaha (MOXX) river samples.
Sampling & Quality Assurance Schedule
Discrete sites have not yet been
selected and are presented in
red font for example purposes only.

Proposed Pre-Survey QA Study
Collect 2 EDI equipment blanks, one before and one after the river sample, to evaluate nozzle and connections, bag, and churn splitter following collection of river sample and equipment decontamination procedures.
Collect 2 discrete sampler equipment blanks, one before collecting the river sample and one after.
Collect one river sample.
Collect one field and one trip blank.
Conduct the study on the Ohio River as COVID sampling restrictions allow and with enough time to have results before start of the regular survey.

USEPA Passive Sampler Project
USEPA Passive Sampler Study of PFASs in the Ohio River to be conducted in conjunction with the ORSANCO surveys.
Work group recommended that passive sampling sites be selected as a subset of the set of 20 already selected sites.
Work group also recommended that passive sampling sites coincide with sites selected for discrete sampling.
Work group recommended that passive samplers be placed during the same timeframe to coincide with ORSANCO’s sampling schedule.
USEPA is working on a QAPP for this study.

Documents Review
PFAS work group met on Dec. 15, 2020 to review and comment on QAPP, Sampling Plan & EDI method SOP specific to PFASs.
Staff received extensive comments by Jan. 15, 2021 from the PFAS work group and is working on them now.
After revisions are completed the documents will go back to the work group.
If anyone on TEC would like to review these documents, we would like to have comments turned around quickly.
The USEPA has a QAPP for analytical services that isn’t currently available for distribution. We are forwarding comments relating to analytical services to them.

QUESTIONS?

Agenda Item 12:Status of Combined Sewer Overflow Abatement for Ohio River CSO Systems
Stacey Cochran
138

Pennsylvania – 10 Communities
West Virginia – 10 Communities
Ohio – 10 Communities
Kentucky – 9 Communities
Indiana – 7 Communities
Illinois – 2 Communities


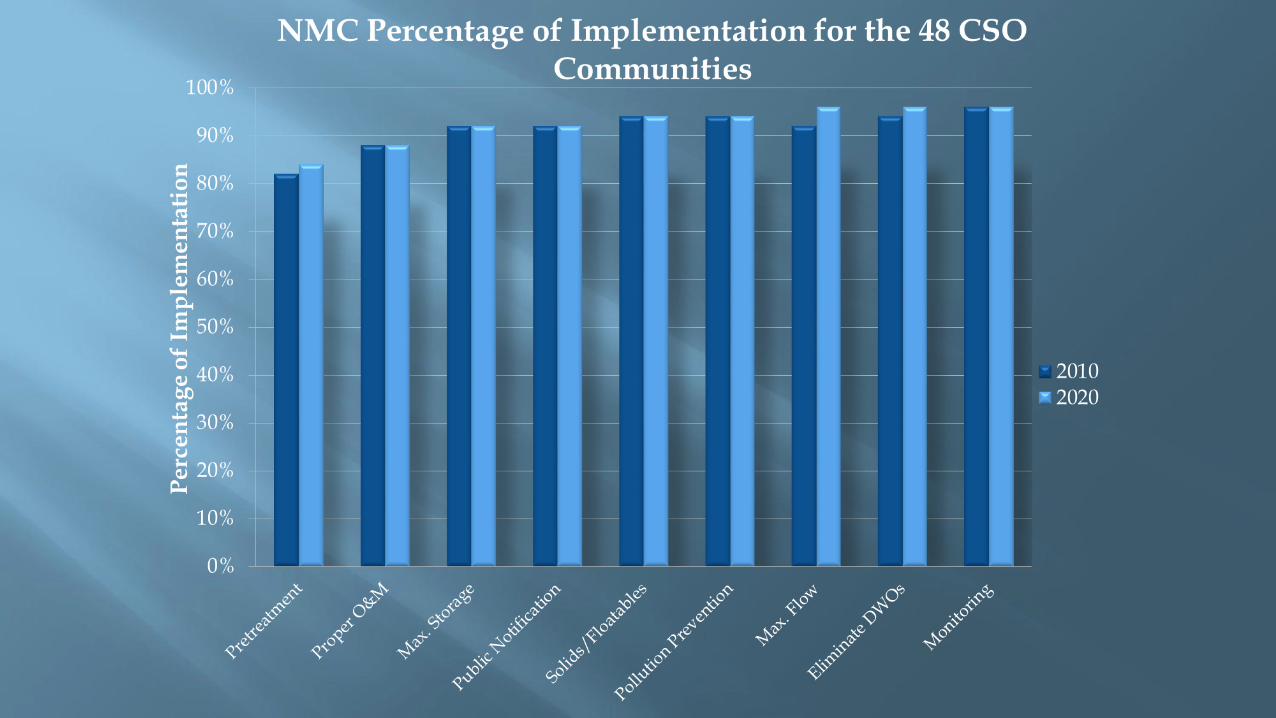
Measures that can reduce CSOs and their effects on receiving water quality.
1. Proper Operation & Maintenance
2. Maximize Storage
3. Pretreatment
4. Maximize Flow for Treatment
5. Dry Weather CSO Prohibition
6. Control of Solids and Floatables
7. Pollution Prevention
8. Public Notification
9. Monitoring of CSO Impacts

*New Boston is not required to submit a LTCP.

ALCOSAN Modified Consent Decree approved
Reduce 7 billion gallons by 2036
Expand Northside plant from 250 MGD to 600 MGD by end of 2027
Cincinnati MSD All Phase 1 projects (100) were completed
Continued effort on the completion of Bridge projects (25) and early Phase 2A projects
Lick Run Greenway project to be completed by Spring 2021.
Louisville MSD Louisville MSD Waterway Protection Tunnel is projected for
completion Spring 2021
Shawnee Park CSO Basin Project was named one of the twelve “Infrastructure Game Changers” by the ASCE

R² = 0.2703
0
50
100
150
200
250
300
350
2000 2002 2004 2006 2008 2010 2012 2014 2016
Geometric Mean Ambient-fecal Geo mean of all sites, river-wide, by year. p=0.047
-When all factors are considered,it appears to be a significant decrease in bacteria concentrations in the Ohio River between 2001-1015.
-Likely a combination of several management practices, including CSO/SSO reduction, better agriculture maintenance, septic upgrades, stormwater BMPs, etc
CF
U/
100M
L

Questions?

Other Business:- Comments by Guests- Announcement of Upcoming Meetings- Adjourn
Chairman Bruno Pigott
147