2021/2022 Interim Report - VTech
31
-
Upload
khangminh22 -
Category
Documents
-
view
1 -
download
0
Transcript of 2021/2022 Interim Report - VTech


VTech Holdings Limited 2021/2022 Interim Report 1
Chairman’s Statement
The first half of the financial year 2022 was challenging for VTech. Critical component shortages, supply chain issues and disruption of production in Malaysia due to coronavirus (COVID-19) negatively impacted the Group’s manufacturing and order fulfilment, preventing VTech from meeting the strong demand for its products. This led to slightly lower revenue for the first six months. Meanwhile, soaring material prices and freight costs significantly affected the Group’s gross profit margin, resulting in a substantial decline in profit attributable to shareholders of the Company.
Results and DividendGroup revenue for the six months ended 30 September 2021 decreased by 0.8% to US$1,114.8 million, from US$1,123.6 million in the corresponding period last year. Higher sales in North America were insufficient to offset lower sales in Europe, Asia Pacific and Other Regions. The revenues of all three businesses were negatively impacted by global material shortages and shipment delays.
Profit attributable to shareholders of the Company fell by 37.8% to US$76.9 million. The decline in profit was mainly attributable to a drop in gross profit margin arising from the significant increase in costs and lower revenues from electronic learning products (ELPs) and telecommunication (TEL) products.
Basic earnings per share consequently decreased by 37.8% to US30.5 cents, compared to US49.0 cents in the same period of the financial year 2021.
The Board of Directors has declared an interim dividend of US17.0 cents per ordinary share, unchanged from the interim dividend declared in the first half of the financial year 2021.
CostsThe Group’s gross profit margin in the first six months of the financial year 2022 was 27.4%, as compared with 31.8% in the same period last year.
The decline in gross profit margin was mainly attributable to higher material prices, especially of electronic components and plastic materials, as well as a drastic increase in freight costs arising from container shortages. Direct labour costs and manufacturing overheads were also higher than the same period last year, with appreciation of the Renminbi and the unstable supply of materials impacting productivity. A change in product mix also contributed to the decrease in gross profit margin.
Segment ResultsNorth America
Group revenue in North America increased by 1.0% to US$497.9 million in the first six months of the financial year 2022. Higher sales of TEL products and contract manufacturing services (CMS) offset lower sales of ELPs. North America remained VTech’s largest market, accounting for 44.6% of Group revenue.
ELPs revenue in North America declined by 8.3% to US$255.0 million, as material shortages and supply chain issues led to production and shipment delays, despite strong orders. This resulted in low channel inventory and the delayed availability of some new products. Both standalone and platform products experienced sales declines. During the first nine months of the calendar year 2021, the Group maintained its leadership as the number one manufacturer of electronic learning toys from infancy through toddler and preschool in the US1. In Canada, VTech remained the number one manufacturer in the infant, toddler and preschool toys category2.
1 The NPD Group, Retail Tracking Service. Ranking based on total retail sales of VTech and LeapFrog products in the combined toy categories of early electronic learning, toddler figure and playset, walker, electronic entertainment (excluding tablets) and preschool electronic learning for the calendar year ended September 2021
2 The NPD Group, Retail Tracking Service
The first half of the financial year 2022 was challenging for VTech. Critical component shortages, supply chain issues and disruption of production in Malaysia due to coronavirus (COVID-19) negatively impacted the Group’s manufacturing and order fulfilment, preventing VTech from meeting the strong demand for its products. This led to slightly lower revenue for the first six months.
VTech Holdings Limited 2021/2022 Interim Report2
Chairman’s Statement
During the first six months of the financial year 2022, the Group’s ELPs won numerous awards and recommendations from toy and parenting industry experts, key retailers and toy advisory boards in the US. Hover Pup™ and KidiZoom PrintCam made Walmart’s “Top Rated by Kids” toy list. There were ten mentions in The Toy Insider Holiday Gift Guide, which additionally named Choppin’ Fun Learning Pot and KidiZoom PrintCam to its “Hot 20” list. Marble Rush Ultimate Set, 100 Words About Places I Go™, KidiGo™ Basketball Hoop and Get Ready For School Learning Desk™ were among many “2021 National Parenting Product Awards” winners. Go! Go! Cory Carson, the animated preschool series inspired by VTech’s popular Go! Go! Smart Wheels line, won three Daytime Emmy Awards in July 2021.
TEL products revenue in North America rose by 0.8% to US$131.3 million, as higher sales of commercial phones and other telecommunication products offset lower sales of residential phones.
Commercial phones benefited from the gradual resumption of business activities. Snom branded VoIP (Voice over Internet Protocol) phones and small to medium sized business (SMB) phones saw higher sales, supported by increased orders from value-added resellers. Sales of hotel phones also recovered. For headsets, the sales increase came from an existing customer. Other telecommunication products were boosted by rising sales of baby monitors, as the Group secured additional placements in key retailers, expanded its online presence and launched new models. In the first six months of the financial year 2022, VTech baby monitors strengthened their position as the number one brand in the US and Canada3. They also scooped up a number of awards. In the US, six models garnered “Women’s Choice Awards” while in Canada, the VTech brand picked up the “2021 BrandSpark Most Trusted Awards” in the baby monitor category, based on a survey of more than 18,000 consumers.
Sales of residential phones saw a decline as the market returned to normal following the lifting of lockdowns, during which consumers had purchased more residential phones for home use. VTech nevertheless maintained its leadership position in the US residential phones market during the period4.
Standalone products saw lower sales of both VTech and LeapFrog brands. For VTech, growth in the KidiZoom® camera and Switch & Go® Dinos ranges was offset by declines in the Go! Go! Smart family of products, Go! Go! Cory Carson® vehicles and playsets, preschool products and the Kidi line. Sales of infant and toddler products, meanwhile, held steady. The standalone products category was expanded with the introduction of KidiZoom PrintCam™, which lets children create instant photos using cost-effective thermal paper. In addition, the introduction of the new Marble Rush™ line added incremental sales. It allows children to build their own marble run courses or use easy-to-follow building instructions to build pre-set designs, before launching marbles to bring the playsets to life. A new range of eco-friendly toys made from plant-based and reclaimed plastics saw four new vehicles added to the Go! Go! Smart Wheels® line and the launch of Sort & Recycle Ride-On Truck™.
For LeapFrog, sales of infant, toddler and preschool products were lower. The brand’s offering was, however, expanded by the launch of exciting new products. LeapLand Adventures™ is a unique plug-and-play TV video game adventure for early learners, with curriculum-based games and activities. On-the-Go Story Pal™, a portable audio player for listening to stories, poems, songs and lullabies, also hit the shelves. It was joined by a new range of role-play toys, including Count-Along Basket & Scanner™ and Choppin’ Fun Learning Pot™, an interactive cooking pot set that utilises plant-based plastic. The brand also launched a line of eco-friendly toys made with 100% FSC-certified wood, which kicked off with Touch & Learn Nature ABC Board™ and Interactive Wooden Animals Puzzle™.
Platform products recorded sales decreases for both the VTech and LeapFrog brands. At VTech, higher sales of Touch & Learn Activity Desk™ were insufficient to offset lower sales of KidiBuzz™ and KidiZoom Smartwatches, as the new KidiBuzz 3 and KidiZoom Smartwatch DX3 did not reach retail shelves until September owing to material supply and logistics delays. At LeapFrog, growth for Magic Adventures Globe™ was offset by declines in children’s educational tablets and interactive reading systems. To strengthen the reading product offerings, the LeapStart® range saw the addition of LeapStart Learning Success Bundle™, while LeapReader® was expanded with the LeapReader Learn-to-Read 10-Book Mega Pack™.
3 The NPD Group Inc., Retail Tracking Service, US & Canada, Baby Monitors, April 2021 – September 2021 combined vs April 2020 – September 2020 combined4 MarketWise Consumer Insights, LLC, April 2021 – September 2021

VTech Holdings Limited 2021/2022 Interim Report 3
CMS revenue in North America increased by 31.9% to US$111.6 million, as the lifting of COVID-19 restrictions led to a surge in demand for certain types of professional audio equipment, industrial products, solid-state lighting and medical and health products. Sales of professional audio equipment used in lecture theatres, music concerts and churches rose as social distancing measures were relaxed. Industrial products benefited from the resumption of business activities, boosting orders for printed circuit board assembly (PCBA) for coin and note recognition machines. Orders for industrial printers recovered as the market returned to normal. Sales of solid-state lighting rebounded as project-based demand resumed, while those of medical and health products trended higher, driven by increased orders for hearing aids. In July 2021, VTech CMS was selected as one of the “Top 10 Contract Manufacturing Services Companies-2021” by Manufacturing Outlook magazine.
Revenue in North America by Product Line
Total: US$497.9 million
for the six months ended 30 September 2021
Electronic LearningProducts
51.2%US$255.0 million
ContractManufacturing
Services
22.4%US$111.6 million
TelecommunicationProducts
26.4%US$131.3 million
Europe
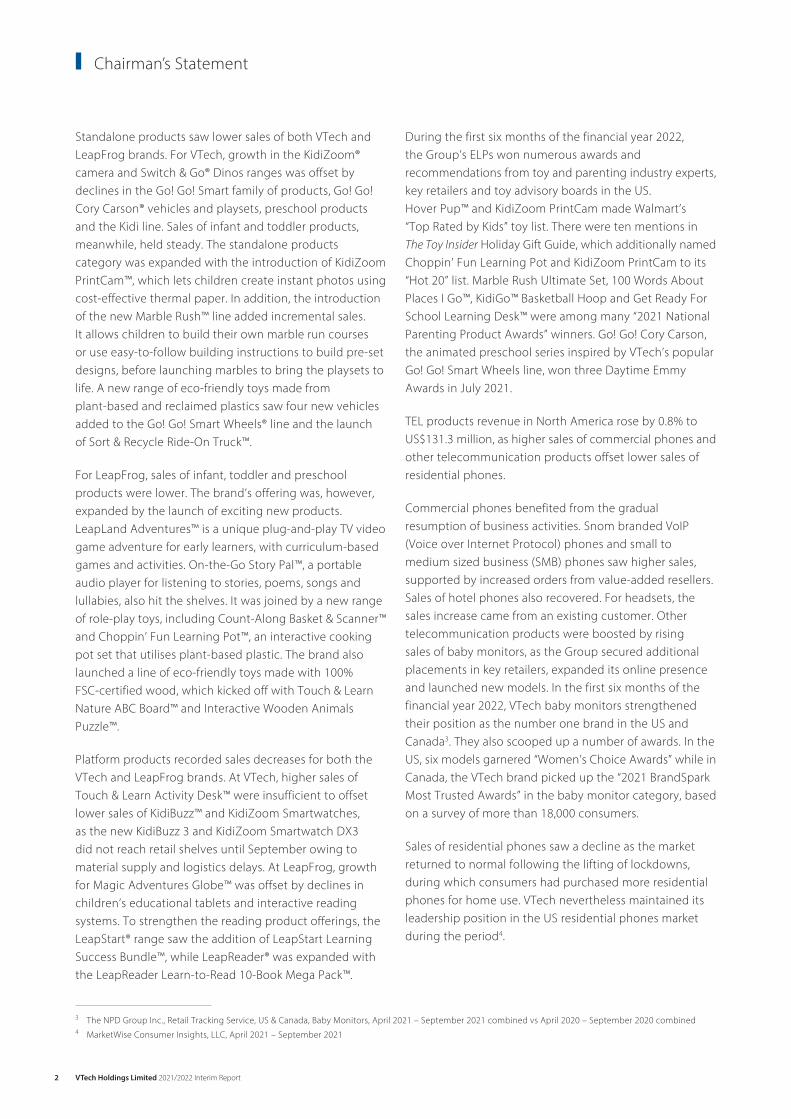
Group revenue in Europe decreased by 0.3% to US$485.8 million in the first six months of the financial year 2022, as higher sales of CMS were offset by lower revenues from ELPs and TEL products. Europe remained VTech’s second largest market, accounting for 43.6% of Group revenue.
ELPs revenue in Europe fell by 4.1% to US$151.1 million, with lower sales of both standalone and platform products. Material shortages and logistics issues led to production and shipment delays. These resulted in low inventory
levels, the late availability of some new products and delayed sales contributions. Geographically, sales increased in France but declined in other key markets in the region. In the first nine months of the calendar year 2021, VTech remained the number one infant and toddler toys manufacturer in France, the UK, Germany and the Benelux countries5.
In standalone products, the LeapFrog brand achieved higher sales. Growth was led by infant, toddler and preschool products, augmented by the launch of LeapLand Adventures. For the VTech brand, higher sales of Switch & Go Dinos were offset by declines in other categories. In September, the new product line Marble Rush hit the shelves in all major European markets, adding incremental sales. During the first six months, VTech expanded its award-winning KidiZoom camera offerings with the addition of KidiZoom Video Studio HD and KidiZoom PrintCam in key European markets. Initial sell-through of both products has been good.
For platform products, both the VTech and LeapFrog brands posted sales declines. The decrease came as material supply and logistics problems resulted in certain new products not reaching the shelves until after September, delaying their sales contributions. These included a new generation of the interactive reading systems LeapStart/Magibook® and KidiCom® Advance 3.0, a sleek, touch-screen mobile phone-like device. VTech branded children’s educational tablets recorded higher sales. These, however, were offset by lower revenues from KidiZoom Smartwatches, Touch & Learn Activity Desk and KidiCom Max. For LeapFrog, sales of interactive reading systems and Magic Adventures Globe registered declines.
In the first six months of the financial year 2022, VTech ELPs won five “Grand Prix du Jouet 2021” awards given by La Revue du Jouet magazine in France, the highest among all manufacturers. They included Ruby Mon Chat Paillettes Magiques (Glitter Me Kitten™), Kidi DJ Mix, Funny Sunny, Marble Rush Ultimate Set and Genio My First Laptop. In the UK, Marble Rush Adventure Set and Choppin’ Fun Learning Pot gained gold and silver medals respectively in the “2021 Independent Toy Awards” given by Toy Shop UK.
5 The NPD Group, Retail Tracking Service
VTech Holdings Limited 2021/2022 Interim Report4
Chairman’s Statement
Revenue from TEL products in Europe decreased by 9.1% to US$47.7 million as lower sales of residential phones offset growth in commercial phones and other telecommunication products.
In Europe, the Group sells residential phones in the region on an original design manufacturing basis. The shortage of semiconductors led to the deferral of shipments and a reduction in sales to customers.
Commercial phones and other telecommunication products benefited from the resumption of business activities as COVID-19 restrictions were eased, which led to rising sales of Snom branded business phones and a recovery in sales of hotel phones. CAT-iq (Cordless Advanced Technology – internet and quality) handsets also registered a sales increase as orders from an existing customer grew. Baby monitors, in contrast, experienced a sales decline, mainly due to the shortage of semiconductors. Despite this, VTech baby monitors made good inroads in the UK, following the launch of a new product line-up. Integrated access devices (IADs) saw the launch of a new product featuring Wi-Fi 6 in the first half of the financial year 2022. Sales of this product category were down, however, due to the shortage of semiconductors. During the period, VTech’s VM5463 video baby monitor, featuring a 5-inch colour LCD screen with a pan and tilt camera, was named Best Baby Monitor – Gold Winner, Best Video Monitor – Platinum Winner and Best Innovative Baby Monitor – Platinum Winner in the “2021 Loved by Parents Awards” in the UK.
CMS revenue in Europe increased by 3.5% to US$287.0 million as COVID-19 restrictions eased. Sales of home appliances, IoT (Internet-of-Things) products, medical and health products, communication products and automotive related products rose, offsetting declines in professional audio equipment and hearables. Home appliances saw demand recover to pre-pandemic levels, while IoT products were boosted by the resumption of smart meter installations. Medical and health products grew on increasing orders for health and beauty products
and hearing aids. Communication products benefited from higher orders for Wi-Fi routers, while sales of automotive related products were supported by increasing orders for smart electric vehicle chargers. Although demand for hearables remained strong, sales were negatively affected by material shortages, which also reduced sales of professional audio equipment for home use.
Revenue in Europe by Product Line
Total: US$485.8 million
for the six months ended 30 September 2021
Electronic LearningProducts
31.1%US$151.1 million
ContractManufacturing
Services
59.1%US$287.0 million
TelecommunicationProducts
9.8%US$47.7 million
Asia Pacific
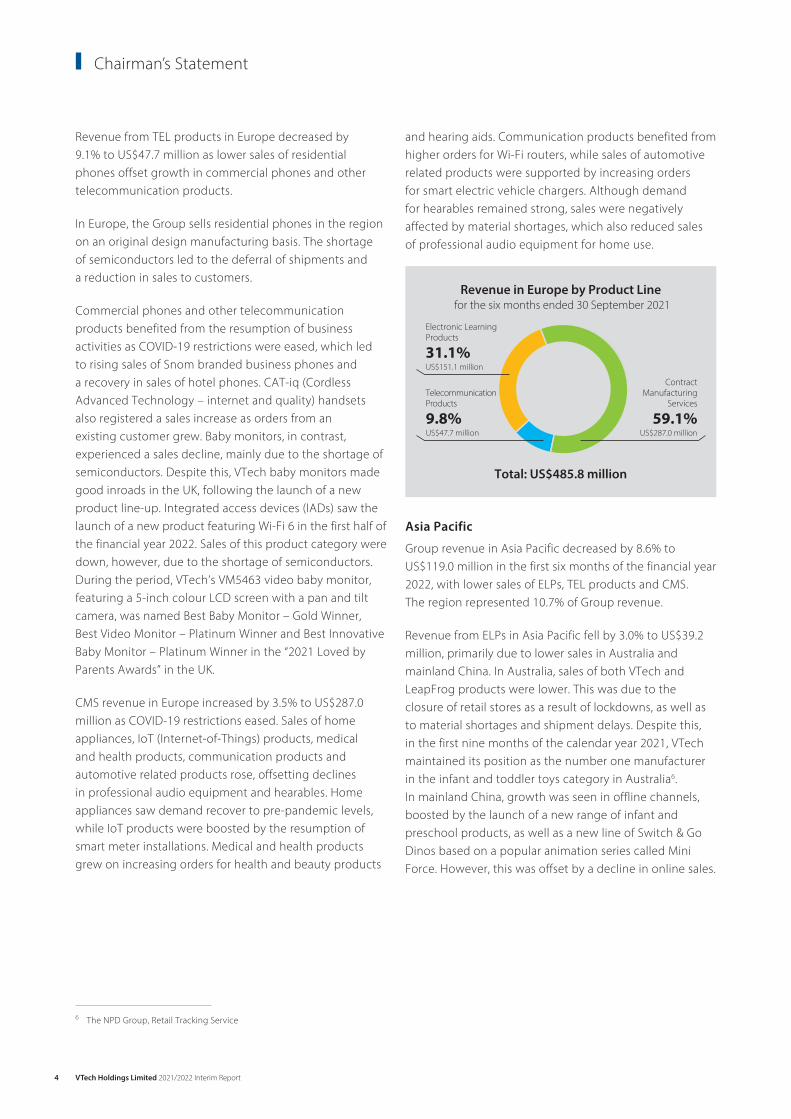
Group revenue in Asia Pacific decreased by 8.6% to US$119.0 million in the first six months of the financial year 2022, with lower sales of ELPs, TEL products and CMS. The region represented 10.7% of Group revenue.
Revenue from ELPs in Asia Pacific fell by 3.0% to US$39.2 million, primarily due to lower sales in Australia and mainland China. In Australia, sales of both VTech and LeapFrog products were lower. This was due to the closure of retail stores as a result of lockdowns, as well as to material shortages and shipment delays. Despite this, in the first nine months of the calendar year 2021, VTech maintained its position as the number one manufacturer in the infant and toddler toys category in Australia6. In mainland China, growth was seen in offline channels, boosted by the launch of a new range of infant and preschool products, as well as a new line of Switch & Go Dinos based on a popular animation series called Mini Force. However, this was offset by a decline in online sales.
6 The NPD Group, Retail Tracking Service
VTech Holdings Limited 2021/2022 Interim Report 5
TEL products revenue in Asia Pacific decreased by 15.8% to US$13.3 million, as lower sales in Japan and Hong Kong offset growth in Australia. In Japan, sales were lower as orders for residential phones from an existing customer declined. In Hong Kong, lower sales of IADs resulted in an overall decrease. VTech nonetheless launched a new generation of home gateway in Hong Kong that supports Wi-Fi 6 and has a changeable faceplate, which received good market feedback. In Australia, higher sales of baby monitors contributed to growth in the country, offsetting a decline in residential phones. During the period in Australia, VTech’s RM7764HD 7-inch smart Wi-Fi baby monitor with a pan and tilt camera was named “Best Baby Monitor 2021 – Bronze Winner” in the “Bounty Baby Award” and an “Editor’s Picks Product” in the “My Child Excellence Awards 2021” given by My Child magazine.
CMS revenue in Asia Pacific decreased by 10.1% to US$66.5 million, as lower sales of professional audio equipment offset increases in medical and health products. The professional audio category was affected by lower sales of DJ equipment, as production at the Group’s factory in Malaysia was impacted by the COVID-19 Movement Control Order in the country. In contrast, sales of medical and health products rebounded. Orders for diagnostic ultrasound systems and hearing aids increased, as hospitals began to rebalance budgets away from COVID-19 related equipment purchases, while the resumption of business activities boosted orders for hearing aids.
Revenue in Asia Paci�c by Product Line
Total: US$119.0 million
for the six months ended 30 September 2021
Electronic LearningProducts
32.9%US$39.2 million
ContractManufacturing
Services
55.9%US$66.5 million
TelecommunicationProducts
11.2%US$13.3 million
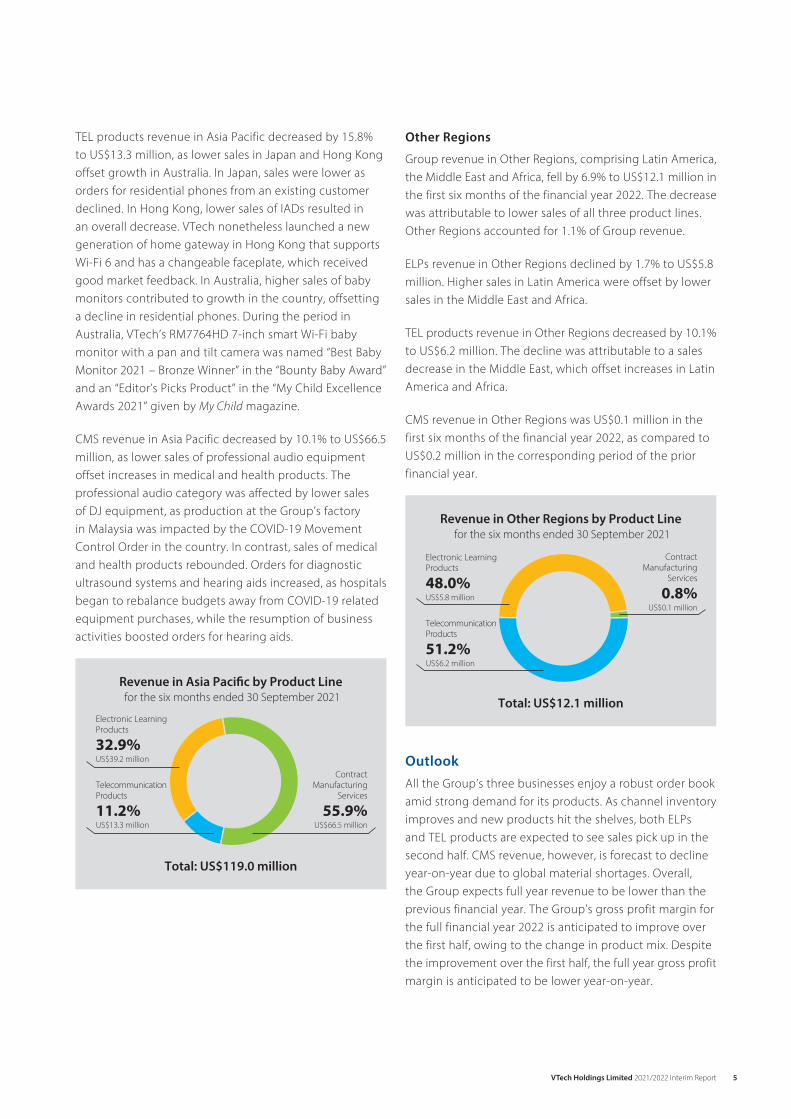
Other Regions
Group revenue in Other Regions, comprising Latin America, the Middle East and Africa, fell by 6.9% to US$12.1 million in the first six months of the financial year 2022. The decrease was attributable to lower sales of all three product lines. Other Regions accounted for 1.1% of Group revenue.
ELPs revenue in Other Regions declined by 1.7% to US$5.8 million. Higher sales in Latin America were offset by lower sales in the Middle East and Africa.
TEL products revenue in Other Regions decreased by 10.1% to US$6.2 million. The decline was attributable to a sales decrease in the Middle East, which offset increases in Latin America and Africa.
CMS revenue in Other Regions was US$0.1 million in the first six months of the financial year 2022, as compared to US$0.2 million in the corresponding period of the prior financial year.
Revenue in Other Regions by Product Line
Total: US$12.1 million
for the six months ended 30 September 2021
Electronic LearningProducts
48.0%US$5.8 million
ContractManufacturing
Services
0.8%US$0.1 million
TelecommunicationProducts
51.2%US$6.2 million
OutlookAll the Group’s three businesses enjoy a robust order book amid strong demand for its products. As channel inventory improves and new products hit the shelves, both ELPs and TEL products are expected to see sales pick up in the second half. CMS revenue, however, is forecast to decline year-on-year due to global material shortages. Overall, the Group expects full year revenue to be lower than the previous financial year. The Group’s gross profit margin for the full financial year 2022 is anticipated to improve over the first half, owing to the change in product mix. Despite the improvement over the first half, the full year gross profit margin is anticipated to be lower year-on-year.

VTech Holdings Limited 2021/2022 Interim Report6
Chairman’s Statement
Given our strong financial position and continued success in product innovation, I am confident that VTech will successfully navigate the current complexities to emerge even stronger from this extraordinary time.
conference speaker with audio recording function and professional headsets, will start to ship globally in the fourth quarter of the financial year. A new series of advanced Snom SIP (Session Initiation Protocol) desksets and a multi-cell SIP DECT (Digital Enhanced Cordless Telecommunications) mobility system will be rolled out in Europe in the last quarter of this financial year.
CMS revenue is expected to decline year-on-year. Despite a solid order book and a large backlog, the strong second half performance in the previous financial year will be difficult to repeat due to the global material shortages. As part of VTech’s efforts to improve the situation, the Group is recommending alternative components to its customers and providing material suppliers high visibility on demand forecasts. The COVID-19 surge in Malaysia appears to have peaked, enabling the production of DJ equipment gradually to return to normal. Looking at new avenues for growth, the NPI (New Product Introduction) centre in Shenzhen has been successful in attracting new business from start-ups and is building a strong reputation in the Greater Bay Area of southern China. In April 2021, the Group completed the acquisition of a facility in Tecate, Mexico. While it continues to engage in manufacturing professional loudspeakers, once the COVID-19 situation stabilises, VTech will begin developing and expanding the EMS capability of the facility.
Demand for the Group’s products remains strong and VTech colleagues are working diligently to minimise the impact of global supply chain disruptions. Given our strong financial position and continued success in product innovation, I am confident that VTech will successfully navigate the current complexities to emerge even stronger from this extraordinary time.
Allan Wong Chi YunChairman
Hong Kong, 15 November 2021
As material supply and logistics issues look set to continue in the short run, VTech has put in place a number of measures to mitigate the negative impacts. The Group is re-engineering products to lower cost and accommodate alternative parts, signing long-term contracts with material suppliers to secure stable supply, sourcing alternative shipping carriers to secure containers, as well as increasing stocks of critical components. It is also starting production earlier to allow a longer time for shipment and transportation, in order to mitigate the impact of logistics delays.
ELPs revenue is forecast to show a slight increase for the full financial year 2022. Owing to the shipment delays, some orders were postponed to the second half. Sales in North America and Europe are now gaining momentum as the entire range of new products that reached shelves in September begins to sell through and overall channel inventory improves. New content for the award-winning Go! Go! Cory Carson animation series is being launched globally throughout the Autumn and Winter. Subscriptions to LeapFrog Academy™, however, have flattened out since schools reopened. In Asia Pacific, Australia is expecting sales to rebound as lockdowns are lifted and retail stores resume trading, but overall sales in mainland China are expected to show a full year decline.
Sales of TEL products in the second half are expected to improve as compared with the first six months, driven by new product launches. However, given the ongoing global material shortages, full year revenue is hard to predict. Nevertheless, the good performance of baby monitors and recovery in commercial phones are expected to continue. The baby monitor offering will expand as the full range of LeapFrog branded baby monitors with baby care app will be launched in North America in November 2021. VHush, a smart sleep training device with 100 bed-time stories and bluetooth feature, will hit the shelf in the fourth quarter of the financial year. A new feature-rich VTech work-from-home desktop cordless telephone will also be available in the US in January 2022. In addition, a work-from-anywhere series, whose features include an all-in-one projector and camera, a bluetooth

VTech Holdings Limited 2021/2022 Interim Report 7
Management Discussion and Analysis
Group Revenuefor the six months ended 30 September
US$ million
2020 2021
1,200
1,000
600
800
200
400
0
1,114.81,123.6
Financial OverviewSix months ended 30 September
2021 2020 ChangeUS$ million US$ million US$ million
Revenue 1,114.8 1,123.6 (8.8) Gross profit 304.9 357.0 (52.1)Gross profit margin 27.4% 31.8%Other net income 0.4 2.9 (2.5)Total operating expenses (214.5) (217.3) 2.8Total operating expenses as a percentage of revenue 19.2% 19.3% Operating profit 90.8 142.6 (51.8)Operating profit margin 8.1% 12.7%Net finance expense (4.8) (3.4) (1.4)Share of results of an associate 0.3 0.1 0.2 Profit before taxation 86.3 139.3 (53.0)Taxation (9.4) (15.7) 6.3Effective tax rate 10.9% 11.3% Profit for the period and attributable to shareholders
of the Company 76.9 123.6 (46.7)
RevenueGroup revenue for the six months ended 30 September 2021 decreased by 0.8% to US$1,114.8 million as compared with the same period of the previous financial year of US$1,123.6 million. The decrease in revenue was largely driven by the lower sales in Europe, Asia Pacific and Other Regions, which offset the increase in revenue in North America.
Six months ended30 September 2021
Six months ended30 September 2020 Increase/(decrease)
US$ million % US$ million % US$ million %
North America 497.9 44.6% 492.9 43.9% 5.0 1.0%Europe 485.8 43.6% 487.5 43.4% (1.7) (0.3%)Asia Pacific 119.0 10.7% 130.2 11.6% (11.2) (8.6%)Other Regions 12.1 1.1% 13.0 1.1% (0.9) (6.9%)
1,114.8 100.0% 1,123.6 100.0% (8.8) (0.8%)
Gross Profit/MarginGross profit for the six months ended 30 September 2021 was US$304.9 million, a decrease of US$52.1 million or 14.6% compared with the same period last year. Gross profit margin for the period also decreased from 31.8% to 27.4%. It was mainly attributable to the higher material prices, especially electronic components and plastic materials, as well as a drastic increase in freight costs arising from container shortages. As for the direct labour costs and manufacturing overheads, they were also higher than same period last year, which were mainly due to the appreciation of Renminbi and the unstable supply of materials impacting the productivity gain. A change in product mix also contributed to the decline in gross profit margin.

VTech Holdings Limited 2021/2022 Interim Report8
Management Discussion and Analysis
Profit Attributable to Shareholders and Earnings per ShareProfit attributable to shareholders of the Company for the six months ended 30 September 2021 was US$76.9 million, a decrease of US$46.7 million or 37.8% compared with the same period last year. Net profit margin also decreased from 11.0% to 6.9%.
Basic earnings per share for the six months ended 30 September 2021 were US30.5 cents as compared to US49.0 cents in the first half of the previous financial year.
Pro�t Attributable to Shareholders of the Companyfor the six months ended 30 September
US$ million
2020 2021
140
120
80
100
20
60
40
0
76.9
123.6
DividendsSince the end of the relevant financial period, the directors of the Company (the “Directors”) have declared an interim dividend of US17.0 cents per share, which is estimated to be US$42.9 million.
Liquidity and Financial ResourcesAs at 30 September 2021, the Group had a net cash balance of US$25.8 million including deposits and cash of US$52.2 million and a bank loan of US$26.4 million, a decrease of 81.2% as compared to US$137.1 million as of 30 September 2020. It was mainly due to the decrease in EBITDA, increase in working capital investment and higher dividend payment compared with the same period last year. Nevertheless, the Group’s financial position remains strong and it has adequate liquidity to meet the current and future working capital requirements.
Operating Profit/MarginOperating profit for the six months ended 30 September 2021 was US$90.8 million, a decrease of US$51.8 million or 36.3% compared with the same period of the previous financial year. Operating profit margin also decreased from 12.7% to 8.1%. The reduction in both operating profit and operating profit margin was mainly due to the decrease in gross profit and gross profit margin, which offset the decrease in total operating expenses. Operating profit for the six months ended 30 September 2021 also included government subsidies of US$0.2 million in response to COVID-19, as compared with an amount of US$4.0 million in the same period last year. The Group invests in an investment holding company which has a shareholding in a listed entity that designs and distributes integrated circuit products (the “Investment”). Other net income included a fair value gain of US$0.2 million on the Investment as compared with a fair value loss of US$1.1 million in the same period last year.
Total operating expenses decreased from US$217.3 million to US$214.5 million compared with the same period last year. Total operating expenses as a percentage of Group revenue also dropped from 19.3% to 19.2%.
Selling and distribution costs decreased from US$135.2 million to US$134.7 million, a decrease of 0.4% compared with the same period last year. It was mainly attributable to the reduced spending on advertising and promotional activities. As a percentage of Group revenue, selling and distribution costs increased from 12.0% to 12.1%.
Administrative and other operating expenses decreased from US$40.4 million to US$37.2 million compared with the same period last year. It was mainly due to the decrease of employee related costs. Administrative and other operating expenses as a percentage of Group revenue also decreased from 3.6% to 3.3%.
During the first half of the financial year 2022, the research and development expenses were US$42.6 million, an increase of 2.2% compared with the same period last year. The increase was mainly attributable to higher employee related costs. Research and development expenses as a percentage of Group revenue also increased from 3.7% to 3.8%.
VTech Holdings Limited 2021/2022 Interim Report 9
Treasury PoliciesThe Group’s treasury policies are designed to mitigate the impact of fluctuations in foreign currency exchange rates arising from the Group’s global operations. The Group principally uses forward foreign exchange contracts as appropriate to hedge the foreign exchange risks in the ordinary course of business. It is the Group’s policy not to enter into derivative transactions for speculative purposes.
Capital Expenditure and ContingenciesFor the six months ended 30 September 2021, the Group invested US$18.1 million in the purchase of tangible assets including machinery and equipment, leasehold improvements, office equipment, as well as the improvement of manufacturing working environment.
All of these capital expenditures were financed from internal resources.
As of 30 September 2021, the Group had no material contingencies.
Working CapitalStocks as of 30 September 2021 were US$599.4 million, increased from US$414.0 million as of 31 March 2021 with turnover days of 103 days. The higher stock level was mainly due to the seasonality of most of the Group’s businesses. As compared with the corresponding period of last financial year, stocks increased by US$163.3 million or 37.4%, and turnover days also increased from 120 days to 141 days. The higher stock level was mainly attributable to the stock-up of raw materials in view of the unstable materials supply, as well as the deferrals of shipments to the customers due to shortage of containers from shipping carriers.
Trade debtors as of 30 September 2021 were US$507.9 million, increased from US$270.7 million as of 31 March 2021 with turnover days of 61 days. This was mainly due to the seasonal nature of most of the Group’s businesses. As compared with the corresponding period of last financial year, trade debtors decreased by US$13.8 million or 2.6%, while turnover days increased from 60 days to 66 days. The increase in turnover days was mainly due to the change in customer mix.
Trade creditors as of 30 September 2021 were US$403.1 million, increased from US$236.7 million as of 31 March 2021 with turnover days of 79 days. As compared to the corresponding period of last financial year, trade creditors increased by US$83.8 million or 26.2%, and turnover days also increased from 82 days to 93 days. The increase in trade creditors was mainly due to the increase in purchase of raw materials compared with the same period last year.
VTech Holdings Limited 2021/2022 Interim Report10
Interim Financial Report
Consolidated Statement of Profit or LossFor the six months ended 30 September 2021
Six months ended 30 September
Year ended 31 March
2021 2020 2021(Unaudited) (Unaudited) (Audited)
Note US$ million US$ million US$ million
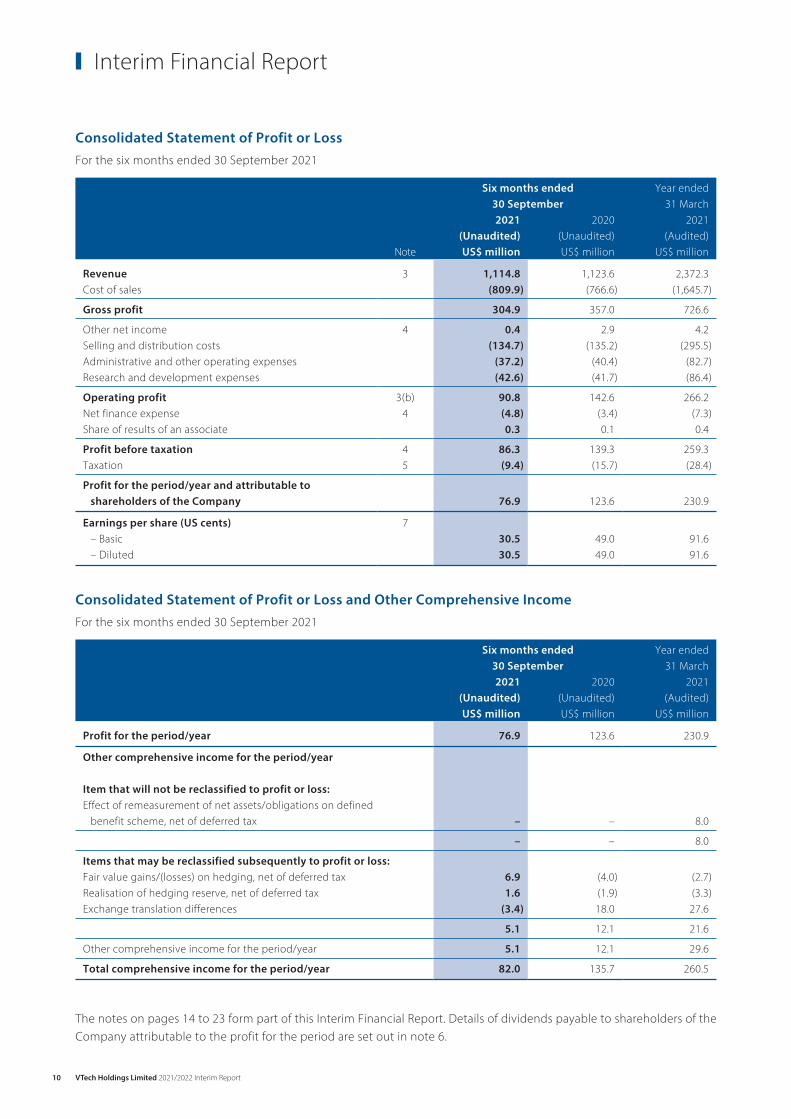
Revenue 3 1,114.8 1,123.6 2,372.3Cost of sales (809.9) (766.6) (1,645.7) Gross profit 304.9 357.0 726.6 Other net income 4 0.4 2.9 4.2Selling and distribution costs (134.7) (135.2) (295.5)Administrative and other operating expenses (37.2) (40.4) (82.7)Research and development expenses (42.6) (41.7) (86.4) Operating profit 3(b) 90.8 142.6 266.2Net finance expense 4 (4.8) (3.4) (7.3)Share of results of an associate 0.3 0.1 0.4 Profit before taxation 4 86.3 139.3 259.3Taxation 5 (9.4) (15.7) (28.4) Profit for the period/year and attributable to
shareholders of the Company 76.9 123.6 230.9 Earnings per share (US cents) 7
– Basic 30.5 49.0 91.6– Diluted 30.5 49.0 91.6
Consolidated Statement of Profit or Loss and Other Comprehensive IncomeFor the six months ended 30 September 2021
Six months ended 30 September
Year ended 31 March
2021 2020 2021(Unaudited) (Unaudited) (Audited)US$ million US$ million US$ million
Profit for the period/year 76.9 123.6 230.9 Other comprehensive income for the period/year
Item that will not be reclassified to profit or loss:Effect of remeasurement of net assets/obligations on defined
benefit scheme, net of deferred tax – – 8.0 – – 8.0
Items that may be reclassified subsequently to profit or loss:Fair value gains/(losses) on hedging, net of deferred tax 6.9 (4.0) (2.7)Realisation of hedging reserve, net of deferred tax 1.6 (1.9) (3.3)Exchange translation differences (3.4) 18.0 27.6
5.1 12.1 21.6 Other comprehensive income for the period/year 5.1 12.1 29.6 Total comprehensive income for the period/year 82.0 135.7 260.5
The notes on pages 14 to 23 form part of this Interim Financial Report. Details of dividends payable to shareholders of the Company attributable to the profit for the period are set out in note 6.

VTech Holdings Limited 2021/2022 Interim Report 11
Consolidated Statement of Financial PositionAs at 30 September 2021
30 September 31 March2021 2020 2021
(Unaudited) (Unaudited) (Audited)Note US$ million US$ million US$ million
Non-current assetsTangible assets 8 89.7 86.7 92.2Right-of-use assets 199.3 148.7 193.1Intangible assets 16.4 17.1 16.8Goodwill 36.1 36.1 36.1Interest in an associate 3.7 3.1 3.4Investments 3.4 7.2 6.8Net assets on defined benefit scheme 6.9 – 6.9Deferred tax assets 12.1 8.4 10.0
367.6 307.3 365.3 Current assetsStocks 9 599.4 436.1 414.0Debtors, deposits and prepayments 10 575.4 580.0 318.9Taxation recoverable 3.9 2.9 3.6Deposits and cash 52.2 137.1 343.8
1,230.9 1,156.1 1,080.3 Current liabilitiesCreditors and accruals 11 (678.2) (605.0) (461.8)Provisions for defective goods returns and other liabilities (27.9) (26.9) (26.4)Bank loans (26.4) – –Lease liabilities (22.5) (16.8) (17.5)Taxation payable (21.1) (17.8) (17.3)
(776.1) (666.5) (523.0) Net current assets 454.8 489.6 557.3 Total assets less current liabilities 822.4 796.9 922.6 Non-current liabilitiesNet obligations on defined benefit scheme – (1.9) –Deferred tax liabilities (2.9) (2.6) (2.9)Lease liabilities (191.1) (143.3) (188.6)
(194.0) (147.8) (191.5) Net assets 628.4 649.1 731.1 Capital and reservesShare capital 12(a) 12.6 12.6 12.6Reserves 615.8 636.5 718.5 Total equity 628.4 649.1 731.1
The notes on pages 14 to 23 form part of this Interim Financial Report.
VTech Holdings Limited 2021/2022 Interim Report12
Interim Financial Report
Condensed Consolidated Statement of Cash FlowsFor the six months ended 30 September 2021
Six months ended 30 September
Year ended 31 March
2021 2020 2021(Unaudited) (Unaudited) (Audited)US$ million US$ million US$ million
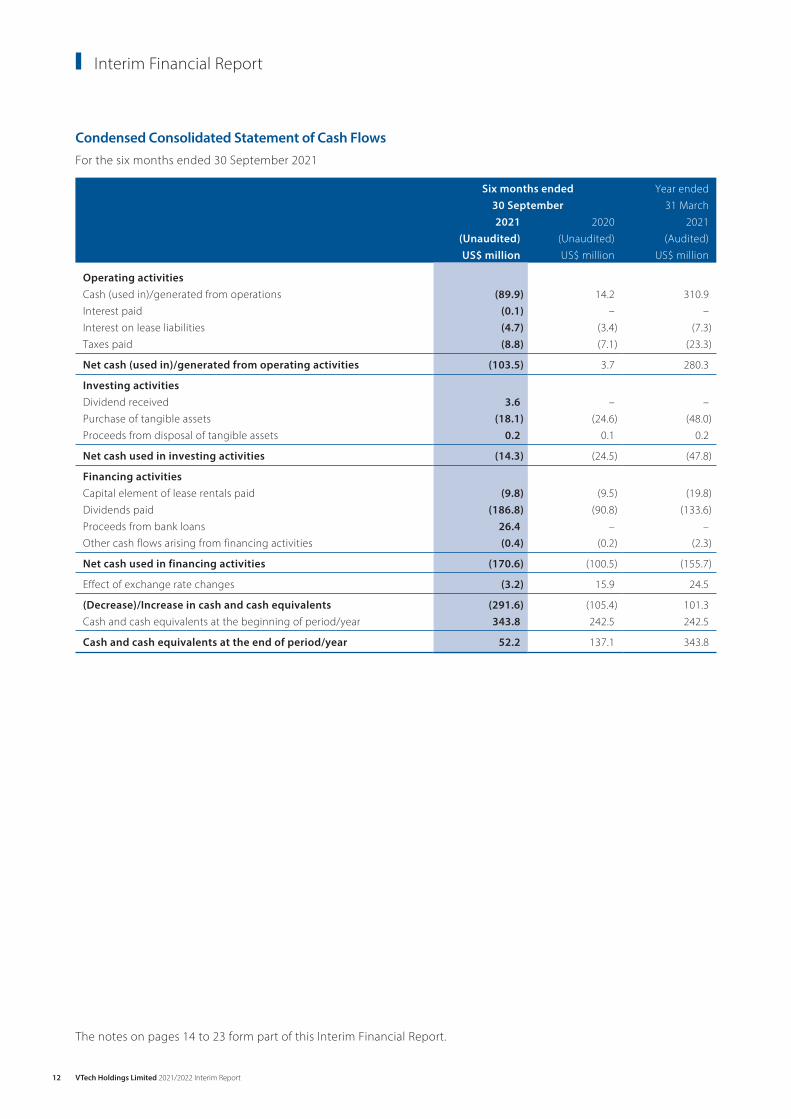
Operating activitiesCash (used in)/generated from operations (89.9) 14.2 310.9Interest paid (0.1) – –Interest on lease liabilities (4.7) (3.4) (7.3)Taxes paid (8.8) (7.1) (23.3) Net cash (used in)/generated from operating activities (103.5) 3.7 280.3 Investing activitiesDividend received 3.6 – –Purchase of tangible assets (18.1) (24.6) (48.0)Proceeds from disposal of tangible assets 0.2 0.1 0.2 Net cash used in investing activities (14.3) (24.5) (47.8) Financing activitiesCapital element of lease rentals paid (9.8) (9.5) (19.8)Dividends paid (186.8) (90.8) (133.6)Proceeds from bank loans 26.4 – –Other cash flows arising from financing activities (0.4) (0.2) (2.3) Net cash used in financing activities (170.6) (100.5) (155.7) Effect of exchange rate changes (3.2) 15.9 24.5 (Decrease)/Increase in cash and cash equivalents (291.6) (105.4) 101.3Cash and cash equivalents at the beginning of period/year 343.8 242.5 242.5 Cash and cash equivalents at the end of period/year 52.2 137.1 343.8
The notes on pages 14 to 23 form part of this Interim Financial Report.
VTech Holdings Limited 2021/2022 Interim Report 13
Consolidated Statement of Changes in EquityFor the six months ended 30 September 2021 – unaudited
Attributable to shareholders of the Company
Share capital
Share premium
Shares held for Share Purchase
SchemeExchange
reserveHedging
reserveRevenue
reserveTotal
equityNote US$ million US$ million US$ million US$ million US$ million US$ million US$ million
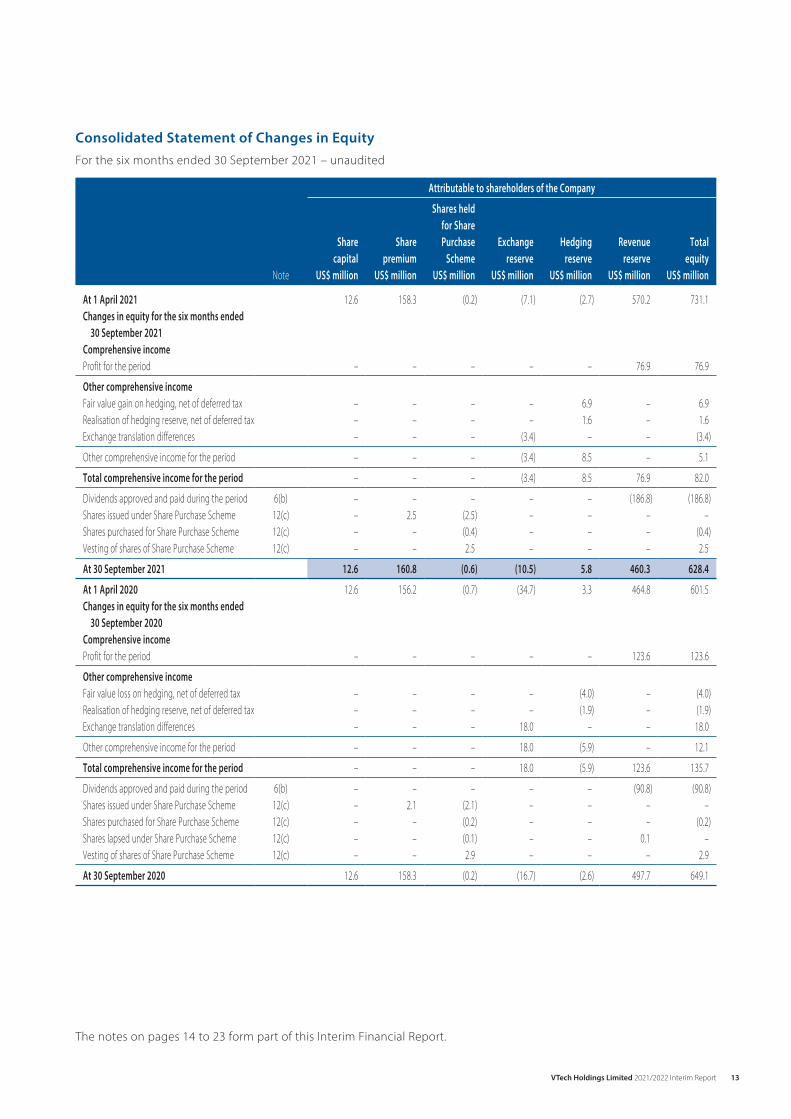
At 1 April 2021 12.6 158.3 (0.2) (7.1) (2.7) 570.2 731.1Changes in equity for the six months ended
30 September 2021Comprehensive incomeProfit for the period – – – – – 76.9 76.9 Other comprehensive incomeFair value gain on hedging, net of deferred tax – – – – 6.9 – 6.9Realisation of hedging reserve, net of deferred tax – – – – 1.6 – 1.6Exchange translation differences – – – (3.4) – – (3.4) Other comprehensive income for the period – – – (3.4) 8.5 – 5.1 Total comprehensive income for the period – – – (3.4) 8.5 76.9 82.0 Dividends approved and paid during the period 6(b) – – – – – (186.8) (186.8)Shares issued under Share Purchase Scheme 12(c) – 2.5 (2.5) – – – –Shares purchased for Share Purchase Scheme 12(c) – – (0.4) – – – (0.4)Vesting of shares of Share Purchase Scheme 12(c) – – 2.5 – – – 2.5 At 30 September 2021 12.6 160.8 (0.6) (10.5) 5.8 460.3 628.4 At 1 April 2020 12.6 156.2 (0.7) (34.7) 3.3 464.8 601.5Changes in equity for the six months ended
30 September 2020Comprehensive incomeProfit for the period – – – – – 123.6 123.6 Other comprehensive incomeFair value loss on hedging, net of deferred tax – – – – (4.0) – (4.0)Realisation of hedging reserve, net of deferred tax – – – – (1.9) – (1.9)Exchange translation differences – – – 18.0 – – 18.0 Other comprehensive income for the period – – – 18.0 (5.9) – 12.1 Total comprehensive income for the period – – – 18.0 (5.9) 123.6 135.7 Dividends approved and paid during the period 6(b) – – – – – (90.8) (90.8)Shares issued under Share Purchase Scheme 12(c) – 2.1 (2.1) – – – –Shares purchased for Share Purchase Scheme 12(c) – – (0.2) – – – (0.2)Shares lapsed under Share Purchase Scheme 12(c) – – (0.1) – – 0.1 –Vesting of shares of Share Purchase Scheme 12(c) – – 2.9 – – – 2.9 At 30 September 2020 12.6 158.3 (0.2) (16.7) (2.6) 497.7 649.1
The notes on pages 14 to 23 form part of this Interim Financial Report.
VTech Holdings Limited 2021/2022 Interim Report14
Notes to the Unaudited Interim Financial Report
1 Basis of PreparationThe Directors are responsible for preparing the Interim Financial Report in accordance with applicable law and regulations. This unaudited Interim Financial Report has been prepared in accordance with the applicable disclosure provisions of the Rules Governing the Listing of Securities (the “Listing Rules”) on The Stock Exchange of Hong Kong Limited (the “Stock Exchange”) including compliance with International Accounting Standard (“IAS”) 34, Interim Financial Reporting, issued by the International Accounting Standards Board (the “IASB”). It was authorised for issue on 15 November 2021.
The Interim Financial Report has been prepared in accordance with the same accounting policies adopted in the 2021 annual consolidated financial statements, except for the accounting policy changes that are expected to be reflected in the 2022 annual consolidated financial statements. Details of any changes in accounting policies are set out in note 2.
The preparation of an Interim Financial Report in conformity with IAS 34 requires management to make judgements, estimates and assumptions that affect the application of policies and reported amounts of assets and liabilities, income and expenses on a year to date basis. Actual results may differ from these estimates.
The Interim Financial Report contains condensed consolidated financial statements and selected explanatory notes. The notes include an explanation of events and transactions that are significant to an understanding of the changes in financial position and performance of the Group since the 2021 annual consolidated financial statements. The condensed consolidated interim financial statements and notes thereto do not include all of the information required for a full set of financial statements prepared in accordance with International Financial Reporting Standards (“IFRSs”).
The Interim Financial Report has not been audited or reviewed by the auditors pursuant to International Standards on Auditing or International Standards on Review Engagements.
The financial information relating to the financial year ended 31 March 2021 that is included in the Interim Financial Report as comparative information does not constitute the Company’s annual consolidated financial statements for that financial year but is derived from those financial statements. The annual consolidated financial statements for the year ended 31 March 2021 are available from the Company’s registered office. The auditors have expressed an unqualified opinion on those financial statements in their report dated 18 May 2021.
2 Changes in Accounting PoliciesThe IASB has issued the following amendments to IFRSs that are first effective for the current accounting period of the Group:
• AmendmenttoIFRS16,Covid-19-related rent concessions beyond 30 June 2021
None of these developments have had a material effect on how the Group’s results and financial position for the current or prior periods have been prepared or presented in this Interim Financial Report. The Group has not applied any new standard or interpretation that is not yet effective for the current accounting period.
VTech Holdings Limited 2021/2022 Interim Report 15
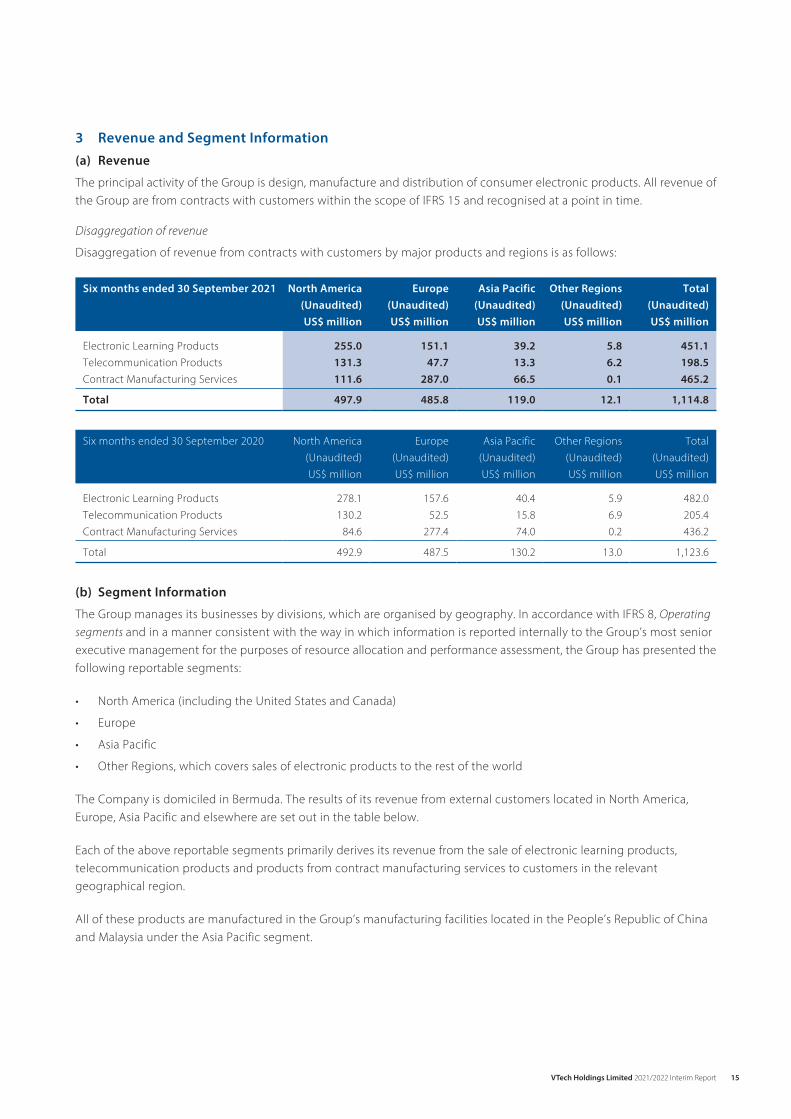
3 Revenue and Segment Information(a) Revenue
The principal activity of the Group is design, manufacture and distribution of consumer electronic products. All revenue of the Group are from contracts with customers within the scope of IFRS 15 and recognised at a point in time.
Disaggregation of revenue
Disaggregation of revenue from contracts with customers by major products and regions is as follows:
Six months ended 30 September 2021 North America Europe Asia Pacific Other Regions Total(Unaudited) (Unaudited) (Unaudited) (Unaudited) (Unaudited)US$ million US$ million US$ million US$ million US$ million
Electronic Learning Products 255.0 151.1 39.2 5.8 451.1Telecommunication Products 131.3 47.7 13.3 6.2 198.5Contract Manufacturing Services 111.6 287.0 66.5 0.1 465.2 Total 497.9 485.8 119.0 12.1 1,114.8
Six months ended 30 September 2020 North America Europe Asia Pacific Other Regions Total(Unaudited) (Unaudited) (Unaudited) (Unaudited) (Unaudited)US$ million US$ million US$ million US$ million US$ million
Electronic Learning Products 278.1 157.6 40.4 5.9 482.0Telecommunication Products 130.2 52.5 15.8 6.9 205.4Contract Manufacturing Services 84.6 277.4 74.0 0.2 436.2 Total 492.9 487.5 130.2 13.0 1,123.6
(b) Segment Information
The Group manages its businesses by divisions, which are organised by geography. In accordance with IFRS 8, Operating segments and in a manner consistent with the way in which information is reported internally to the Group’s most senior executive management for the purposes of resource allocation and performance assessment, the Group has presented the following reportable segments:
• NorthAmerica(includingtheUnitedStatesandCanada)
• Europe
• AsiaPacific
• OtherRegions,whichcoverssalesofelectronicproductstotherestoftheworld
The Company is domiciled in Bermuda. The results of its revenue from external customers located in North America, Europe, Asia Pacific and elsewhere are set out in the table below.
Each of the above reportable segments primarily derives its revenue from the sale of electronic learning products, telecommunication products and products from contract manufacturing services to customers in the relevant geographical region.
All of these products are manufactured in the Group’s manufacturing facilities located in the People’s Republic of China and Malaysia under the Asia Pacific segment.

VTech Holdings Limited 2021/2022 Interim Report16
Notes to the Unaudited Interim Financial Report
3 Revenue and Segment Information (Continued)
(b) Segment Information (Continued)
For the purposes of assessing segment performance and allocating resources between segments, the Group’s senior executive management monitors the results and assets attributable to each reportable segment on the following bases:
(i) Segment revenues and results
Revenue is allocated to the reportable segments based on the location of external customers. Expenses are allocated to the reportable segments with reference to sales generated by those segments and the expenses incurred by those geographical locations or which otherwise arise from the depreciation or amortisation of assets attributable to those segments.
The measure used for reporting segment profit is operating profit.
In addition to receiving segment information concerning operating profit, management is provided with segment information concerning revenue and depreciation and amortisation.
(ii) Segment assets and liabilities
Segment assets include all non-current assets and current assets with the exception of deferred tax assets, taxation recoverable and other corporate assets including intangible assets, goodwill, investments and interest in an associate.
Segment liabilities include creditors and accruals, provisions for defective goods returns and other liabilities, bank loans, lease liabilities and net obligations on defined benefit scheme with the exception of taxation payable and deferred tax liabilities.
Segment information regarding the Group’s revenue, results, assets and liabilities by geographical market is presented below:
Reportable segment revenueSix months ended
30 September
Reportable segment profitSix months ended
30 September2021 2020 2021 2020
(Unaudited) (Unaudited) (Unaudited) (Unaudited)US$ million US$ million US$ million US$ million
North America 497.9 492.9 50.8 78.1Europe 485.8 487.5 23.1 37.9Asia Pacific 119.0 130.2 14.7 23.8Other Regions 12.1 13.0 2.2 2.8
1,114.8 1,123.6 90.8 142.6
Reportable segment assets Reportable segment liabilities30 September
202131 March
202130 September
202131 March
2021(Unaudited) (Audited) (Unaudited) (Audited)US$ million US$ million US$ million US$ million
North America 224.2 180.1 (115.7) (83.7)Europe 206.8 103.6 (60.9) (36.7)Asia Pacific 1,091.9 1,085.2 (769.5) (573.9)Other Regions – – – –
1,522.9 1,368.9 (946.1) (694.3)

VTech Holdings Limited 2021/2022 Interim Report 17
Notes:(i) Included in other net income in the Consolidated Statement of Profit or
Loss.(ii) The Group invests in an investment holding company which has a
shareholding in a listed entity that designs and distributes integrated circuit products (the “Investment”). Upon the partial disposal of the listed entity during the period, a dividend income of US$3.6 million was received from the investment holding company and the Group recognised a fair value loss of the same amount on the Investment accordingly. A fair value gain of US$0.2 million on the Investment relating to the unsold shareholding in the listed entity was also recorded in the current period.
(iii) Included in net finance expense in the Consolidated Statement of Profit or Loss.
5 Taxation
Six months ended 30 September2021 2020
(Unaudited) (Unaudited)US$ million US$ million
Current tax– Hong Kong 6.0 11.5– Overseas 5.6 4.2
Under/(Over)-provision in respect of prior years– Overseas 0.3 (0.4)
Deferred tax– Origination and reversal of
temporary differences (2.5) 0.4 9.4 15.7
Current tax 11.9 15.3Deferred tax (2.5) 0.4
9.4 15.7
Provision for Hong Kong Profits Tax and overseas taxation has been calculated at the current rates of taxation prevailing in the jurisdiction in which the Group operates.
6 Dividends(a) Dividend attributable to the period:
Six months ended 30 September2021 2020
(Unaudited) (Unaudited)US$ million US$ million
Interim dividend of US17.0 cents (2020: US17.0 cents) per share declared 42.9 42.9
The interim dividend was proposed after the end of the relevant financial period and has not been recognised as a liability at the end of the relevant financial period.
3 Revenue and Segment Information (Continued)
(b) Segment Information (Continued)
(iii) Reconciliations of reportable segment assets and liabilities
30 September 2021
31 March 2021
(Unaudited) (Audited)US$ million US$ million
AssetsReportable segment assets 1,522.9 1,368.9Intangible assets 16.4 16.8Goodwill 36.1 36.1Interest in an associate 3.7 3.4Investments 3.4 6.8Taxation recoverable 3.9 3.6Deferred tax assets 12.1 10.0 Consolidated total assets 1,598.5 1,445.6 LiabilitiesReportable segment liabilities (946.1) (694.3)Taxation payable (21.1) (17.3)Deferred tax liabilities (2.9) (2.9) Consolidated total liabilities (970.1) (714.5)
4 Profit before TaxationProfit before taxation is arrived at after charging/(crediting) the following:
Six months ended 30 September2021 2020
(Unaudited) (Unaudited)US$ million US$ million
Cost of inventories 809.9 766.6Dividend income
(Notes (i) & (ii)) (3.6) –Fair value loss on investments
measured at fair value through profit or loss (Notes (i) & (ii)) 3.4 1.1
Government subsidies (Note (i)) (0.2) (4.0)Depreciation of tangible assets 20.4 17.6Depreciation of right-of-use
assets 11.1 10.2Amortisation of intangible assets 0.4 0.6Write-down of inventories,
net of reversals 3.9 6.1Loss allowance for trade debtors 0.3 0.4Reversal of loss allowance for
trade debtors (0.8) (1.6)Interest on lease liabilities (Note (iii)) 4.7 3.4Other interest expenses,
net (Note (iii)) 0.1 –Net foreign exchange gain – (0.4)
VTech Holdings Limited 2021/2022 Interim Report18
Notes to the Unaudited Interim Financial Report
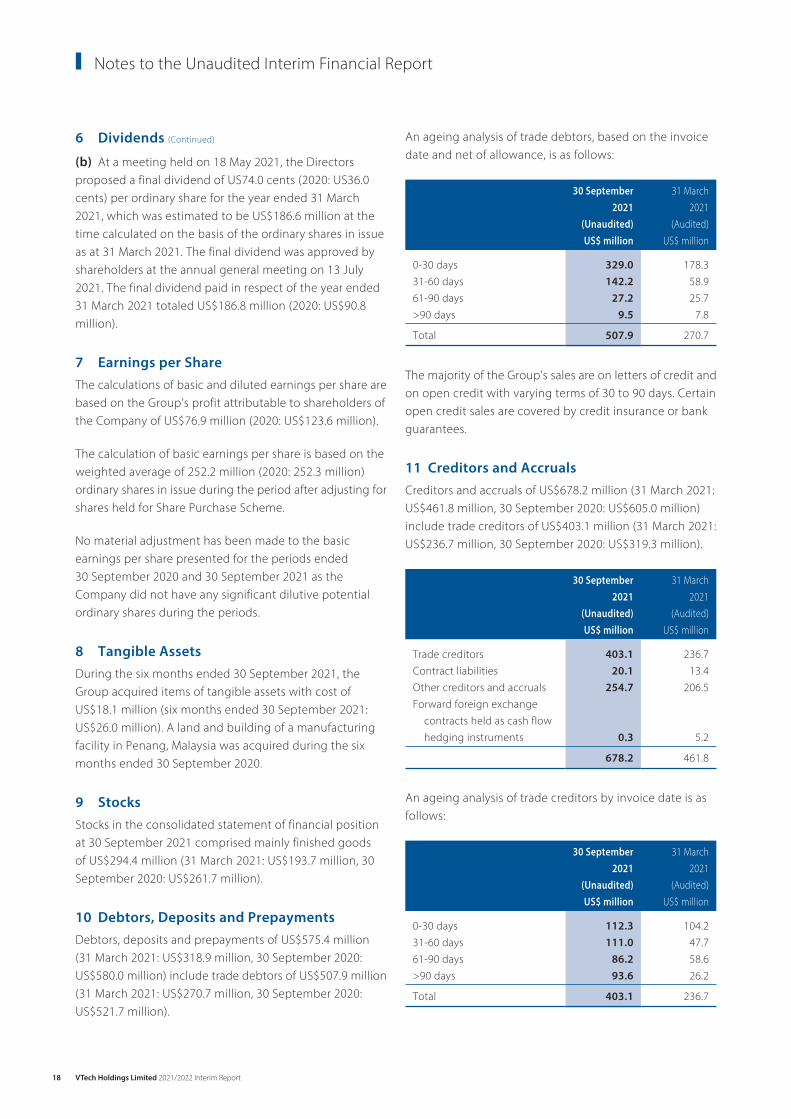
An ageing analysis of trade debtors, based on the invoice date and net of allowance, is as follows:
30 September 2021
31 March 2021
(Unaudited) (Audited)US$ million US$ million
0-30 days 329.0 178.331-60 days 142.2 58.961-90 days 27.2 25.7>90 days 9.5 7.8 Total 507.9 270.7
The majority of the Group’s sales are on letters of credit and on open credit with varying terms of 30 to 90 days. Certain open credit sales are covered by credit insurance or bank guarantees.
11 Creditors and AccrualsCreditors and accruals of US$678.2 million (31 March 2021: US$461.8 million, 30 September 2020: US$605.0 million) include trade creditors of US$403.1 million (31 March 2021: US$236.7 million, 30 September 2020: US$319.3 million).
30 September2021
31 March2021
(Unaudited) (Audited)US$ million US$ million
Trade creditors 403.1 236.7Contract liabilities 20.1 13.4Other creditors and accruals 254.7 206.5Forward foreign exchange
contracts held as cash flow hedging instruments 0.3 5.2
678.2 461.8
An ageing analysis of trade creditors by invoice date is as follows:
30 September2021
31 March2021
(Unaudited) (Audited)US$ million US$ million
0-30 days 112.3 104.231-60 days 111.0 47.761-90 days 86.2 58.6>90 days 93.6 26.2 Total 403.1 236.7
6 Dividends (Continued)
(b) At a meeting held on 18 May 2021, the Directors proposed a final dividend of US74.0 cents (2020: US36.0 cents) per ordinary share for the year ended 31 March 2021, which was estimated to be US$186.6 million at the time calculated on the basis of the ordinary shares in issue as at 31 March 2021. The final dividend was approved by shareholders at the annual general meeting on 13 July 2021. The final dividend paid in respect of the year ended 31 March 2021 totaled US$186.8 million (2020: US$90.8 million).
7 Earnings per ShareThe calculations of basic and diluted earnings per share are based on the Group’s profit attributable to shareholders of the Company of US$76.9 million (2020: US$123.6 million).
The calculation of basic earnings per share is based on the weighted average of 252.2 million (2020: 252.3 million) ordinary shares in issue during the period after adjusting for shares held for Share Purchase Scheme.
No material adjustment has been made to the basic earnings per share presented for the periods ended 30 September 2020 and 30 September 2021 as the Company did not have any significant dilutive potential ordinary shares during the periods.
8 Tangible AssetsDuring the six months ended 30 September 2021, the Group acquired items of tangible assets with cost of US$18.1 million (six months ended 30 September 2021: US$26.0 million). A land and building of a manufacturing facility in Penang, Malaysia was acquired during the six months ended 30 September 2020.
9 StocksStocks in the consolidated statement of financial position at 30 September 2021 comprised mainly finished goods of US$294.4 million (31 March 2021: US$193.7 million, 30 September 2020: US$261.7 million).
10 Debtors, Deposits and PrepaymentsDebtors, deposits and prepayments of US$575.4 million (31 March 2021: US$318.9 million, 30 September 2020: US$580.0 million) include trade debtors of US$507.9 million (31 March 2021: US$270.7 million, 30 September 2020: US$521.7 million).
VTech Holdings Limited 2021/2022 Interim Report 19
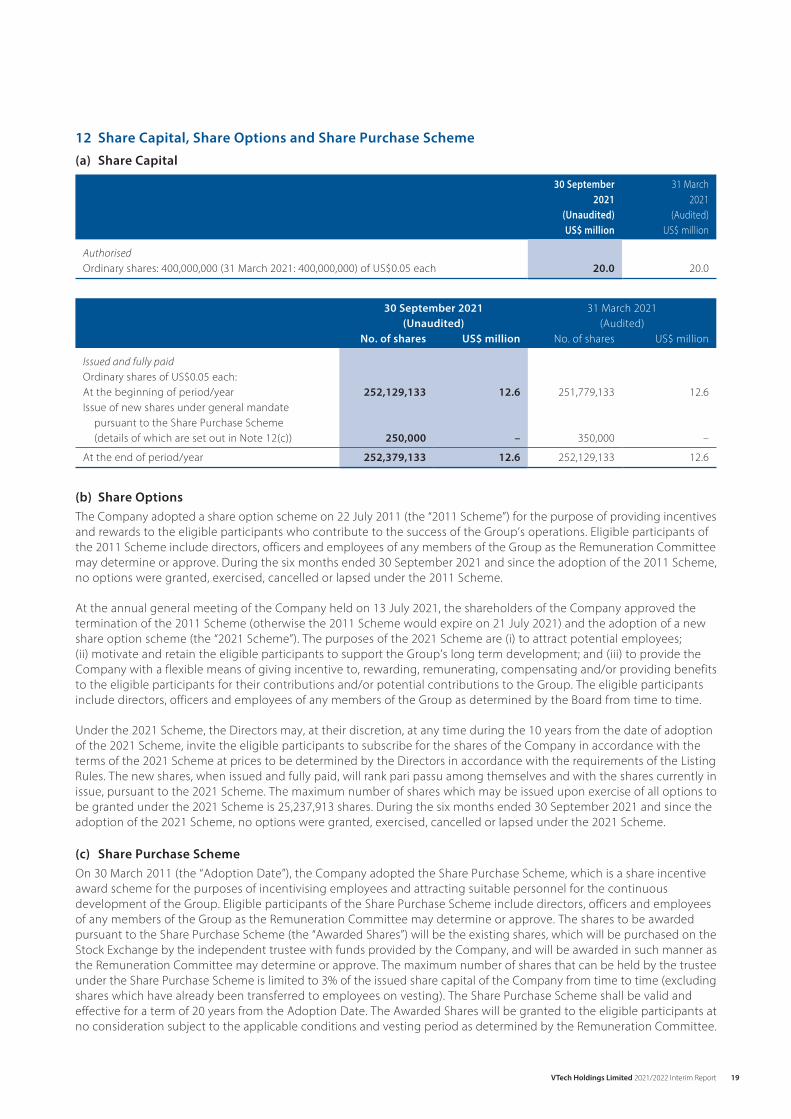
12 Share Capital, Share Options and Share Purchase Scheme(a) Share Capital
30 September 2021
31 March 2021
(Unaudited) (Audited)US$ million US$ million
AuthorisedOrdinary shares: 400,000,000 (31 March 2021: 400,000,000) of US$0.05 each 20.0 20.0
30 September 2021(Unaudited)
31 March 2021(Audited)
No. of shares US$ million No. of shares US$ million
Issued and fully paidOrdinary shares of US$0.05 each:At the beginning of period/year 252,129,133 12.6 251,779,133 12.6Issue of new shares under general mandate
pursuant to the Share Purchase Scheme (details of which are set out in Note 12(c)) 250,000 – 350,000 –
At the end of period/year 252,379,133 12.6 252,129,133 12.6
(b) Share OptionsThe Company adopted a share option scheme on 22 July 2011 (the “2011 Scheme”) for the purpose of providing incentives and rewards to the eligible participants who contribute to the success of the Group’s operations. Eligible participants of the 2011 Scheme include directors, officers and employees of any members of the Group as the Remuneration Committee may determine or approve. During the six months ended 30 September 2021 and since the adoption of the 2011 Scheme, no options were granted, exercised, cancelled or lapsed under the 2011 Scheme.
At the annual general meeting of the Company held on 13 July 2021, the shareholders of the Company approved the termination of the 2011 Scheme (otherwise the 2011 Scheme would expire on 21 July 2021) and the adoption of a new share option scheme (the “2021 Scheme”). The purposes of the 2021 Scheme are (i) to attract potential employees; (ii) motivate and retain the eligible participants to support the Group’s long term development; and (iii) to provide the Company with a flexible means of giving incentive to, rewarding, remunerating, compensating and/or providing benefits to the eligible participants for their contributions and/or potential contributions to the Group. The eligible participants include directors, officers and employees of any members of the Group as determined by the Board from time to time.
Under the 2021 Scheme, the Directors may, at their discretion, at any time during the 10 years from the date of adoption of the 2021 Scheme, invite the eligible participants to subscribe for the shares of the Company in accordance with the terms of the 2021 Scheme at prices to be determined by the Directors in accordance with the requirements of the Listing Rules. The new shares, when issued and fully paid, will rank pari passu among themselves and with the shares currently in issue, pursuant to the 2021 Scheme. The maximum number of shares which may be issued upon exercise of all options to be granted under the 2021 Scheme is 25,237,913 shares. During the six months ended 30 September 2021 and since the adoption of the 2021 Scheme, no options were granted, exercised, cancelled or lapsed under the 2021 Scheme.
(c) Share Purchase SchemeOn 30 March 2011 (the “Adoption Date”), the Company adopted the Share Purchase Scheme, which is a share incentive award scheme for the purposes of incentivising employees and attracting suitable personnel for the continuous development of the Group. Eligible participants of the Share Purchase Scheme include directors, officers and employees of any members of the Group as the Remuneration Committee may determine or approve. The shares to be awarded pursuant to the Share Purchase Scheme (the “Awarded Shares”) will be the existing shares, which will be purchased on the Stock Exchange by the independent trustee with funds provided by the Company, and will be awarded in such manner as the Remuneration Committee may determine or approve. The maximum number of shares that can be held by the trustee under the Share Purchase Scheme is limited to 3% of the issued share capital of the Company from time to time (excluding shares which have already been transferred to employees on vesting). The Share Purchase Scheme shall be valid and effective for a term of 20 years from the Adoption Date. The Awarded Shares will be granted to the eligible participants at no consideration subject to the applicable conditions and vesting period as determined by the Remuneration Committee.
VTech Holdings Limited 2021/2022 Interim Report20
Notes to the Unaudited Interim Financial Report
12 Share Capital, Share Options and Share Purchase Scheme (Continued)
(c) Share Purchase Scheme (Continued)
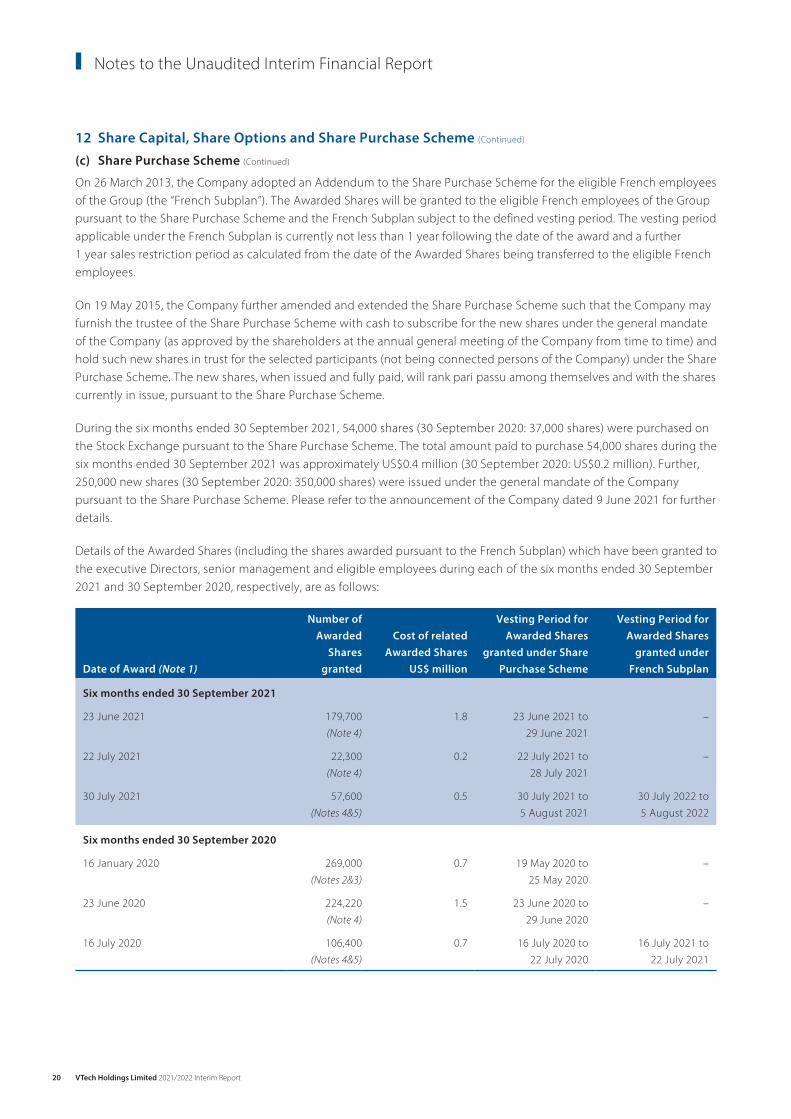
On 26 March 2013, the Company adopted an Addendum to the Share Purchase Scheme for the eligible French employees of the Group (the “French Subplan”). The Awarded Shares will be granted to the eligible French employees of the Group pursuant to the Share Purchase Scheme and the French Subplan subject to the defined vesting period. The vesting period applicable under the French Subplan is currently not less than 1 year following the date of the award and a further 1 year sales restriction period as calculated from the date of the Awarded Shares being transferred to the eligible French employees.
On 19 May 2015, the Company further amended and extended the Share Purchase Scheme such that the Company may furnish the trustee of the Share Purchase Scheme with cash to subscribe for the new shares under the general mandate of the Company (as approved by the shareholders at the annual general meeting of the Company from time to time) and hold such new shares in trust for the selected participants (not being connected persons of the Company) under the Share Purchase Scheme. The new shares, when issued and fully paid, will rank pari passu among themselves and with the shares currently in issue, pursuant to the Share Purchase Scheme.
During the six months ended 30 September 2021, 54,000 shares (30 September 2020: 37,000 shares) were purchased on the Stock Exchange pursuant to the Share Purchase Scheme. The total amount paid to purchase 54,000 shares during the six months ended 30 September 2021 was approximately US$0.4 million (30 September 2020: US$0.2 million). Further, 250,000 new shares (30 September 2020: 350,000 shares) were issued under the general mandate of the Company pursuant to the Share Purchase Scheme. Please refer to the announcement of the Company dated 9 June 2021 for further details.
Details of the Awarded Shares (including the shares awarded pursuant to the French Subplan) which have been granted to the executive Directors, senior management and eligible employees during each of the six months ended 30 September 2021 and 30 September 2020, respectively, are as follows:
Date of Award (Note 1)
Number of Awarded
Shares granted
Cost of related Awarded Shares
US$ million
Vesting Period for Awarded Shares
granted under Share Purchase Scheme
Vesting Period for Awarded Shares
granted under French Subplan
Six months ended 30 September 2021
23 June 2021 179,700(Note 4)
1.8 23 June 2021 to 29 June 2021
–
22 July 2021 22,300(Note 4)
0.2 22 July 2021 to 28 July 2021
–
30 July 2021 57,600(Notes 4&5)
0.5 30 July 2021 to5 August 2021
30 July 2022 to5 August 2022
Six months ended 30 September 2020
16 January 2020 269,000(Notes 2&3)
0.7 19 May 2020 to 25 May 2020
–
23 June 2020 224,220(Note 4)
1.5 23 June 2020 to29 June 2020
–
16 July 2020 106,400(Notes 4&5)
0.7 16 July 2020 to22 July 2020
16 July 2021 to22 July 2021
VTech Holdings Limited 2021/2022 Interim Report 21
13 Fair Value Measurements of Financial Instruments
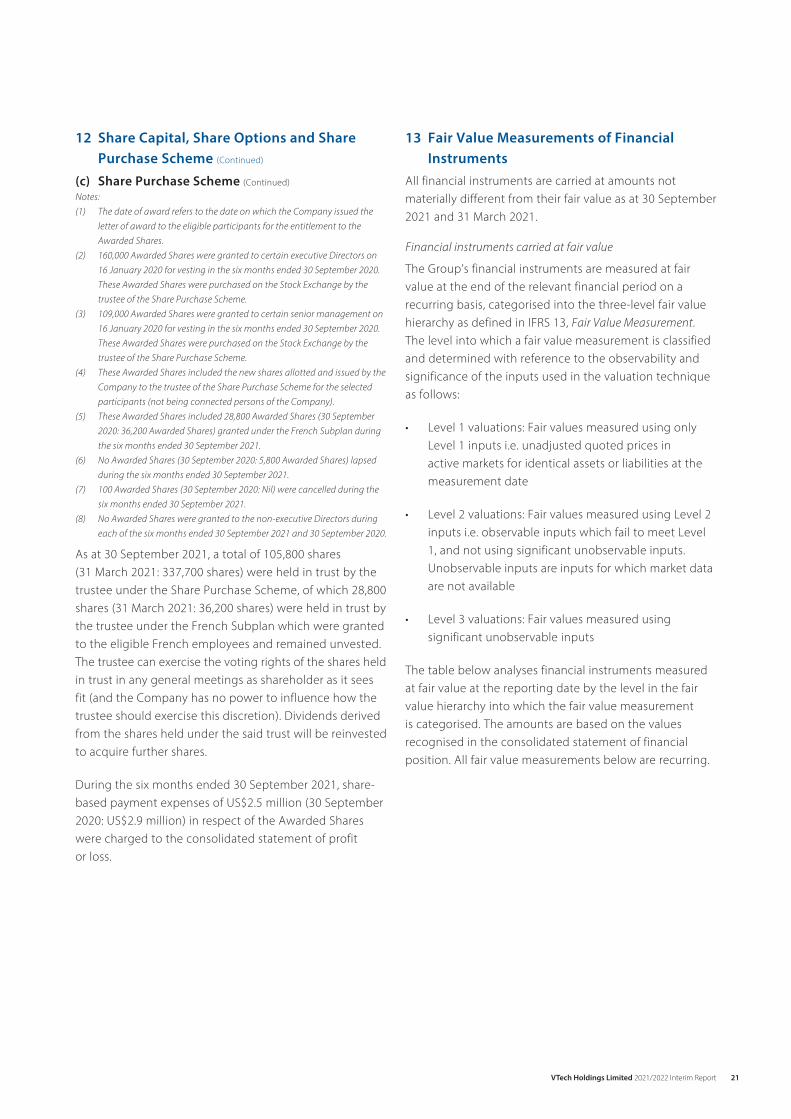
All financial instruments are carried at amounts not materially different from their fair value as at 30 September 2021 and 31 March 2021.
Financial instruments carried at fair value
The Group’s financial instruments are measured at fair value at the end of the relevant financial period on a recurring basis, categorised into the three-level fair value hierarchy as defined in IFRS 13, Fair Value Measurement. The level into which a fair value measurement is classified and determined with reference to the observability and significance of the inputs used in the valuation technique as follows:
• Level1valuations:FairvaluesmeasuredusingonlyLevel 1 inputs i.e. unadjusted quoted prices in active markets for identical assets or liabilities at the measurement date
• Level2valuations:FairvaluesmeasuredusingLevel2inputs i.e. observable inputs which fail to meet Level 1, and not using significant unobservable inputs. Unobservable inputs are inputs for which market data are not available
• Level3valuations:Fairvaluesmeasuredusingsignificant unobservable inputs
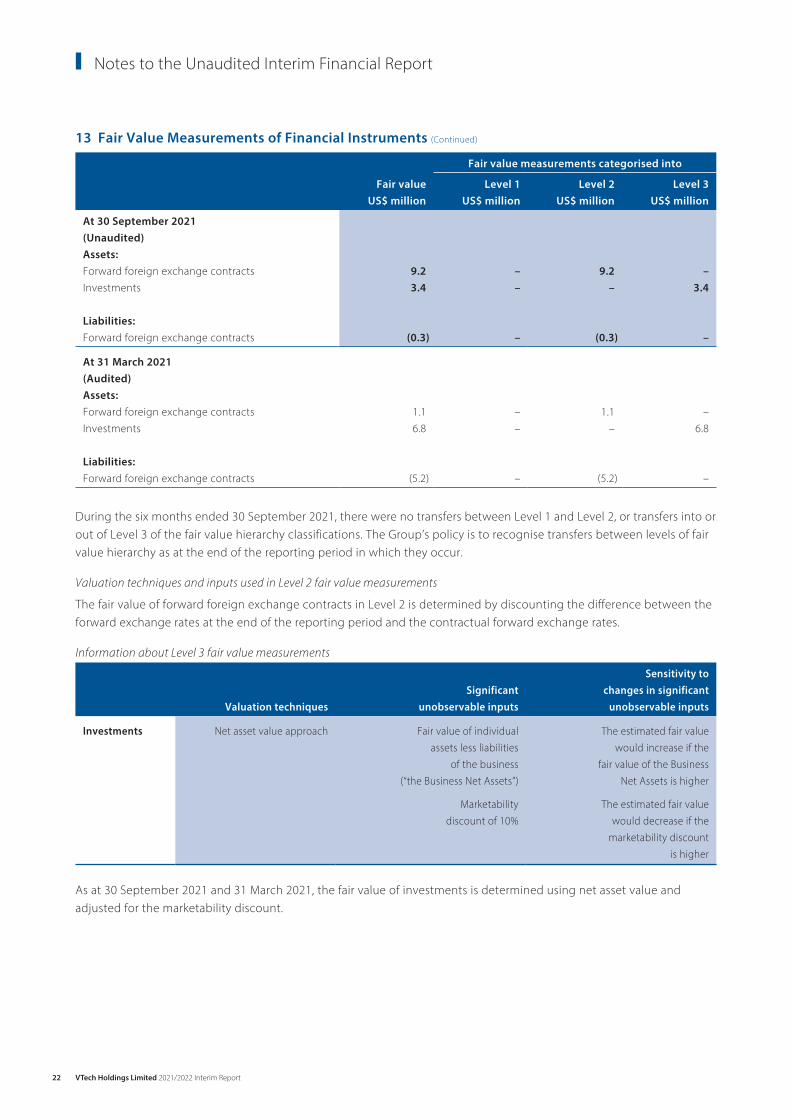
The table below analyses financial instruments measured at fair value at the reporting date by the level in the fair value hierarchy into which the fair value measurement is categorised. The amounts are based on the values recognised in the consolidated statement of financial position. All fair value measurements below are recurring.
12 Share Capital, Share Options and Share Purchase Scheme (Continued)
(c) Share Purchase Scheme (Continued)
Notes:(1) The date of award refers to the date on which the Company issued the
letter of award to the eligible participants for the entitlement to the Awarded Shares.
(2) 160,000 Awarded Shares were granted to certain executive Directors on 16 January 2020 for vesting in the six months ended 30 September 2020. These Awarded Shares were purchased on the Stock Exchange by the trustee of the Share Purchase Scheme.
(3) 109,000 Awarded Shares were granted to certain senior management on 16 January 2020 for vesting in the six months ended 30 September 2020. These Awarded Shares were purchased on the Stock Exchange by the trustee of the Share Purchase Scheme.
(4) These Awarded Shares included the new shares allotted and issued by the Company to the trustee of the Share Purchase Scheme for the selected participants (not being connected persons of the Company).
(5) These Awarded Shares included 28,800 Awarded Shares (30 September 2020: 36,200 Awarded Shares) granted under the French Subplan during the six months ended 30 September 2021.
(6) No Awarded Shares (30 September 2020: 5,800 Awarded Shares) lapsed during the six months ended 30 September 2021.
(7) 100 Awarded Shares (30 September 2020: Nil) were cancelled during the six months ended 30 September 2021.
(8) No Awarded Shares were granted to the non-executive Directors during each of the six months ended 30 September 2021 and 30 September 2020.
As at 30 September 2021, a total of 105,800 shares (31 March 2021: 337,700 shares) were held in trust by the trustee under the Share Purchase Scheme, of which 28,800 shares (31 March 2021: 36,200 shares) were held in trust by the trustee under the French Subplan which were granted to the eligible French employees and remained unvested. The trustee can exercise the voting rights of the shares held in trust in any general meetings as shareholder as it sees fit (and the Company has no power to influence how the trustee should exercise this discretion). Dividends derived from the shares held under the said trust will be reinvested to acquire further shares.
During the six months ended 30 September 2021, share-based payment expenses of US$2.5 million (30 September 2020: US$2.9 million) in respect of the Awarded Shares were charged to the consolidated statement of profit or loss.
VTech Holdings Limited 2021/2022 Interim Report22
Notes to the Unaudited Interim Financial Report
13 Fair Value Measurements of Financial Instruments (Continued)
Fair value measurements categorised into Fair value Level 1 Level 2 Level 3
US$ million US$ million US$ million US$ million
At 30 September 2021(Unaudited)Assets:Forward foreign exchange contracts 9.2 – 9.2 –Investments 3.4 – – 3.4
Liabilities:Forward foreign exchange contracts (0.3) – (0.3) –
At 31 March 2021(Audited)Assets:Forward foreign exchange contracts 1.1 – 1.1 –Investments 6.8 – – 6.8
Liabilities:Forward foreign exchange contracts (5.2) – (5.2) –
During the six months ended 30 September 2021, there were no transfers between Level 1 and Level 2, or transfers into or out of Level 3 of the fair value hierarchy classifications. The Group’s policy is to recognise transfers between levels of fair value hierarchy as at the end of the reporting period in which they occur.
Valuation techniques and inputs used in Level 2 fair value measurements
The fair value of forward foreign exchange contracts in Level 2 is determined by discounting the difference between the forward exchange rates at the end of the reporting period and the contractual forward exchange rates.
Information about Level 3 fair value measurements
Valuation techniquesSignificant
unobservable inputs
Sensitivity to changes in significant
unobservable inputs
Investments Net asset value approach Fair value of individualassets less liabilities
of the business(“the Business Net Assets”)
The estimated fair valuewould increase if the
fair value of the BusinessNet Assets is higher
Marketabilitydiscount of 10%
The estimated fair valuewould decrease if the
marketability discountis higher
As at 30 September 2021 and 31 March 2021, the fair value of investments is determined using net asset value and adjusted for the marketability discount.
VTech Holdings Limited 2021/2022 Interim Report 23
13 Fair Value Measurements of Financial Instruments (Continued)
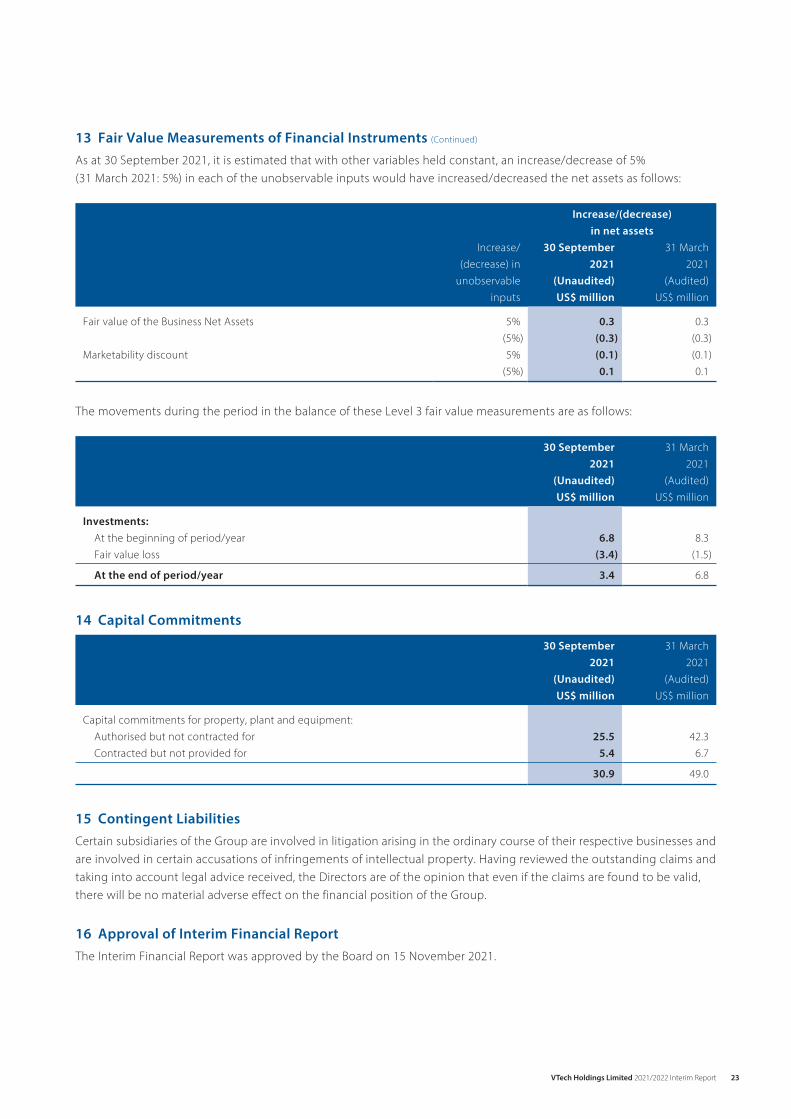
As at 30 September 2021, it is estimated that with other variables held constant, an increase/decrease of 5% (31 March 2021: 5%) in each of the unobservable inputs would have increased/decreased the net assets as follows:
Increase/(decrease)in net assets
Increase/(decrease) in
unobservableinputs
30 September2021
31 March2021
(Unaudited) (Audited)US$ million US$ million
Fair value of the Business Net Assets 5% 0.3 0.3(5%) (0.3) (0.3)
Marketability discount 5% (0.1) (0.1)(5%) 0.1 0.1
The movements during the period in the balance of these Level 3 fair value measurements are as follows:
30 September 2021
31 March 2021
(Unaudited) (Audited)US$ million US$ million
Investments:At the beginning of period/year 6.8 8.3Fair value loss (3.4) (1.5) At the end of period/year 3.4 6.8
14 Capital Commitments
30 September 2021
31 March 2021
(Unaudited) (Audited)US$ million US$ million
Capital commitments for property, plant and equipment:Authorised but not contracted for 25.5 42.3Contracted but not provided for 5.4 6.7
30.9 49.0
15 Contingent LiabilitiesCertain subsidiaries of the Group are involved in litigation arising in the ordinary course of their respective businesses and are involved in certain accusations of infringements of intellectual property. Having reviewed the outstanding claims and taking into account legal advice received, the Directors are of the opinion that even if the claims are found to be valid, there will be no material adverse effect on the financial position of the Group.
16 Approval of Interim Financial ReportThe Interim Financial Report was approved by the Board on 15 November 2021.
VTech Holdings Limited 2021/2022 Interim Report24
Disclosure of Interests
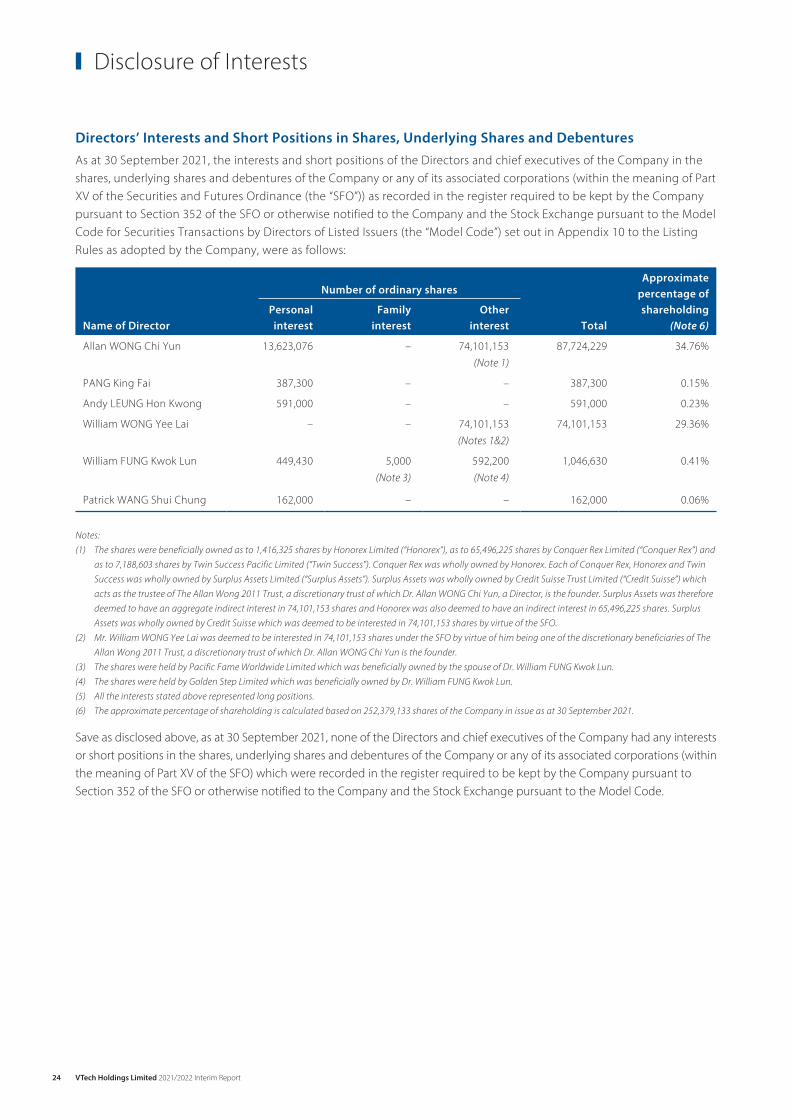
Directors’ Interests and Short Positions in Shares, Underlying Shares and DebenturesAs at 30 September 2021, the interests and short positions of the Directors and chief executives of the Company in the shares, underlying shares and debentures of the Company or any of its associated corporations (within the meaning of Part XV of the Securities and Futures Ordinance (the “SFO”)) as recorded in the register required to be kept by the Company pursuant to Section 352 of the SFO or otherwise notified to the Company and the Stock Exchange pursuant to the Model Code for Securities Transactions by Directors of Listed Issuers (the “Model Code”) set out in Appendix 10 to the Listing Rules as adopted by the Company, were as follows:
Number of ordinary sharesApproximate
percentage of shareholding
(Note 6)
Name of DirectorPersonal interest
Family interest
Other interest Total
Allan WONG Chi Yun 13,623,076 – 74,101,153 (Note 1)
87,724,229 34.76%
PANG King Fai 387,300 – – 387,300 0.15%
Andy LEUNG Hon Kwong 591,000 – – 591,000 0.23%
William WONG Yee Lai – – 74,101,153 (Notes 1&2)
74,101,153 29.36%
William FUNG Kwok Lun 449,430 5,000 (Note 3)
592,200 (Note 4)
1,046,630 0.41%
Patrick WANG Shui Chung 162,000 – – 162,000 0.06%
Notes:(1) The shares were beneficially owned as to 1,416,325 shares by Honorex Limited (“Honorex”), as to 65,496,225 shares by Conquer Rex Limited (“Conquer Rex”) and
as to 7,188,603 shares by Twin Success Pacific Limited (“Twin Success”). Conquer Rex was wholly owned by Honorex. Each of Conquer Rex, Honorex and Twin Success was wholly owned by Surplus Assets Limited (“Surplus Assets”). Surplus Assets was wholly owned by Credit Suisse Trust Limited (“Credit Suisse”) which acts as the trustee of The Allan Wong 2011 Trust, a discretionary trust of which Dr. Allan WONG Chi Yun, a Director, is the founder. Surplus Assets was therefore deemed to have an aggregate indirect interest in 74,101,153 shares and Honorex was also deemed to have an indirect interest in 65,496,225 shares. Surplus Assets was wholly owned by Credit Suisse which was deemed to be interested in 74,101,153 shares by virtue of the SFO.
(2) Mr. William WONG Yee Lai was deemed to be interested in 74,101,153 shares under the SFO by virtue of him being one of the discretionary beneficiaries of The Allan Wong 2011 Trust, a discretionary trust of which Dr. Allan WONG Chi Yun is the founder.
(3) The shares were held by Pacific Fame Worldwide Limited which was beneficially owned by the spouse of Dr. William FUNG Kwok Lun.(4) The shares were held by Golden Step Limited which was beneficially owned by Dr. William FUNG Kwok Lun.(5) All the interests stated above represented long positions.(6) The approximate percentage of shareholding is calculated based on 252,379,133 shares of the Company in issue as at 30 September 2021.
Save as disclosed above, as at 30 September 2021, none of the Directors and chief executives of the Company had any interests or short positions in the shares, underlying shares and debentures of the Company or any of its associated corporations (within the meaning of Part XV of the SFO) which were recorded in the register required to be kept by the Company pursuant to Section 352 of the SFO or otherwise notified to the Company and the Stock Exchange pursuant to the Model Code.

VTech Holdings Limited 2021/2022 Interim Report 25
Substantial ShareholdingsAs at 30 September 2021, other than the interests of the Directors and chief executives of the Company as disclosed above, shareholders who had interests or short positions in the shares or underlying shares of the Company of 5% or more which fell to be disclosed to the Company under Part XV of the SFO or which were recorded in the register required to be kept by the Company pursuant to Section 336 of the SFO, were as follows:
Name of shareholder CapacityNumber of
shares held
Approximate percentage of shareholding
(Note 3)
Credit Suisse Trust Limited Trustee (Note 1) 74,101,153 29.36%
Surplus Assets Limited Interest of controlled corporation (Note 1) 74,101,153 29.36%
Honorex Limited Interest of controlled corporation (Note 1) 65,496,225 25.95%
Beneficial owner (Note 1) 1,416,325 0.56%
Conquer Rex Limited Beneficial owner (Note 1) 65,496,225 25.95%
Notes:(1) Please refer to Note (1) disclosed under the section headed “Directors’ Interests and Short Positions in Shares, Underlying Shares and Debentures” in this Interim Report.(2) All the interests stated above represented long positions.(3) The approximate percentage of shareholding is calculated based on 252,379,133 shares of the Company in issue as at 30 September 2021.
Save as disclosed above, as at 30 September 2021, the Company had not been notified by any persons (other than the Directors and chief executives of the Company) who had interests or short positions in the shares and underlying shares of the Company which fell to be disclosed to the Company under Part XV of the SFO or which were recorded in the register required to be kept by the Company pursuant to Section 336 of the SFO.
VTech Holdings Limited 2021/2022 Interim Report26
Corporate Governance
The Board of Directors (the “Board”) and the management of VTech Holdings Limited (“VTech” or the “Company”) are committed to good corporate governance and the application of the principles including transparency, accountability and independence to achieve sustainable performance of the Company and enhance its value for the shareholders.
VTech and its subsidiaries (the “Group”) also recognise that a comprehensive corporate governance management structure is crucial in helping the Company to implement its strategies and policies effectively and consistently throughout the Group, and safeguard the long-term interests of its shareholders. The Group has also continuously reviewed its policies and procedures to ensure that it meets the requirements of the applicable laws and regulations, industry best practices, global trends, and market expectations.
Corporate Governance PracticesThe corporate governance rules applicable to the Company are the Corporate Governance Code (the “Code”) set out in Appendix 14 to the Listing Rules. Corporate governance practices adopted by the Company during the six months ended 30 September 2021 are in line and consistent with those practices set out in the Company’s 2021 Annual Report. Throughout the six months ended 30 September 2021, the Company has complied with all the code provisions of the Code and to a large extent the recommended best practices in the Code, except for the deviation from code provision A.2.1 of the Code as described below.
Under code provision A.2.1 of the Code, the roles of chairman and chief executive should be separate and should not be performed by the same individual. Dr. Allan WONG Chi Yun has the combined role of Chairman and Group Chief Executive Officer. As half of the Board members are Independent Non-executive Directors, the Board considers that this structure will not impair the balance of power and authority between the Board and the management of the Group. Furthermore, as Dr. Allan WONG Chi Yun is the founder of the Group and has substantial professional experience in the industry, the Board believes the appointment of Dr. Allan WONG Chi Yun to the combined role of Chairman and Group Chief Executive Officer is beneficial to the sustainable development of the Group, and for the long-term interests of the shareholders.
VTech is also committed to following the Environmental, Social and Governance (“ESG”) Reporting Guide set out in Appendix 27 of the Listing Rules. Details of VTech’s ESG performance were set out in the Company’s 2021 Sustainability Report.
The Audit Committee reviewed and discussed with management and the external auditor the Group’s Unaudited Interim Financial Report and unaudited interim results for the six months ended 30 September 2021.
Risk Management and Internal ControlEffective risk management plays an integral role in the overall achievement of the Group’s strategic objectives which are to ensure the resilience of our business for the long term. Details of the Group’s risk management and internal control systems were set out in the “Risk Management and Sustainability Committee Report” on pages 71 to 75 of the Company’s 2021 Annual Report. The Risk Management and Sustainability Committee continued to review the Group’s risk management and internal control systems, and monitor the sustainability performance progress during the six months ended 30 September 2021 and up to the date of this Interim Financial Report.
Furthermore, the Data Security Governance Board reviewed and monitored the implementation and execution of the Data Security Policy and practices of the Group for the compliance with the latest privacy ordinances and data protection regulations in the respective countries during the six months ended 30 September 2021 and up to the date of this Interim Financial Report. It also reviewed the implementation progress of the additional preventive measures, technological enhancement and staff trainings for mitigating the Group’s exposure to cybersecurity risks.
Based on the information received from the management (including the Risk Management and Sustainability Committee and the Data Security Governance Board), the external auditor and the Internal Audit Department, the Audit Committee is satisfied that the overall financial and operational controls, risk management and internal control system, and the internal audit function of the Group for the six months ended 30 September 2021 and up to the date of this Interim Financial Report continued to be effective and adequate.
Model Code for Securities TransactionsThe Company has adopted the Model Code set out in Appendix 10 to the Listing Rules regarding securities transactions for both its Directors and senior management. After having made specific enquiries, all Directors and senior management confirmed that they have complied with the required standard of dealings set out in the Model Code throughout the six months ended 30 September 2021.

VTech Holdings Limited 2021/2022 Interim Report 27
Other Information
Interim DividendThe Board has declared an interim dividend (the “Interim Dividend”) of US17.0 cents per ordinary share in respect of the six months ended 30 September 2021, payable on 17 December 2021 to the shareholders whose names appear on the register of members of the Company as at the close of business on 8 December 2021.
The Interim Dividend will be payable in United States dollars save that those shareholders with a registered address in Hong Kong will receive an equivalent amount in Hong Kong dollars which will be calculated at the rate of exchange as quoted to the Company by The Hongkong and Shanghai Banking Corporation Limited at its middle rate of exchange prevailing on 8 December 2021.
Closure of Register of MembersThe register of members of the Company will be closed on 8 December 2021, during which no transfer of shares will be effected.
In order to qualify for the Interim Dividend, all transfer documents, accompanied by the relevant share certificates, must be lodged with the share registrars of the Company for registration no later than 4:30 p.m. (the local time of the relevant share registrar) on Tuesday, 7 December 2021.
The principal registrar is MUFG Fund Services (Bermuda) Limited, 4th Floor North, Cedar House, 41 Cedar Avenue, Hamilton HM 12, Bermuda and the branch registrar in Hong Kong is Computershare Hong Kong Investor Services Limited, Shops 1712-16, 17th Floor, Hopewell Centre, 183 Queen’s Road East, Wan Chai, Hong Kong.
Purchase, Sale or Redemption of Listed SharesThe Company and its subsidiaries have not redeemed any of its shares during the six months ended 30 September 2021. Neither the Company nor any of its subsidiaries has purchased or sold any of the Company’s shares during the six months ended 30 September 2021, except that the trustee of the Share Purchase Scheme, pursuant to the rules and trust deed of the Share Purchase Scheme, purchased on the Stock Exchange a total of 54,000 Company’s shares at a consideration of approximately US$0.4 million.
Changes to Information in respect of DirectorsIn accordance with Rule 13.51B(1) of the Listing Rules, the changes to information required to be disclosed by Directors are set out below:
– Dr. William FUNG Kwok Lun (“Dr. FUNG”) was appointed as the non-executive chairman of Convenience Retail Asia Limited with effect from 26 May 2021; and
Dr. FUNG was re-designated as an executive director of Global Brands Group Holding Limited (“GBG”) and remains as the chairman of GBG with effect from 10 August 2021. As disclosed in the announcement of the Company dated 9 November 2021, the Bermuda Court ordered that GBG be wound up pursuant to the Bermuda Companies Act 1981 on 5 November 2021.
– Mr. WONG Kai Man retired as a member of Financial Reporting Council on 30 September 2021.
VTech Holdings Limited 2021/2022 Interim Report28
Corporate Information
Board of DirectorsExecutive Directors
Allan WONG Chi Yun(Chairman and Group Chief Executive Officer)PANG King FaiAndy LEUNG Hon Kwong
Non-executive Director
William WONG Yee Lai
Independent Non-executive Directors
William FUNG Kwok LunKO Ping KeungPatrick WANG Shui ChungWONG Kai Man
Audit CommitteeWONG Kai Man (Chairman)William FUNG Kwok LunKO Ping KeungPatrick WANG Shui Chung
Nomination CommitteeWilliam FUNG Kwok Lun (Chairman)KO Ping KeungPatrick WANG Shui ChungWONG Kai ManAllan WONG Chi Yun
Remuneration CommitteePatrick WANG Shui Chung (Chairman)William FUNG Kwok LunKO Ping KeungWONG Kai Man
Risk Management and Sustainability CommitteeAllan WONG Chi Yun (Chairman)PANG King FaiAndy LEUNG Hon KwongWONG Kai ManHillson CHEUNG HoiShereen TONG Ka HungCHANG Yu Wai
Company SecretaryCHANG Yu Wai
Registered OfficeClarendon House2 Church StreetHamilton HM 11Bermuda
Principal Office23rd Floor, Tai Ping Industrial Centre, Block 157 Ting Kok RoadTai Po, New TerritoriesHong Kong
Principal BankersThe Hongkong and Shanghai Banking Corporation LimitedStandard Chartered Bank (Hong Kong) LimitedThe Bank of East Asia, Limited
AuditorKPMGCertified Public AccountantsPublic Interest Entity Auditor registered in accordance with the Financial Reporting Council Ordinance

Information for Shareholders
Share ListingShares of VTech Holdings Limited are:
• Listed on The Stock Exchange of Hong Kong Limited• On the list of Southbound trading through
Shanghai-Hong Kong Stock Connect and Shenzhen-Hong Kong Stock Connect
Stock CodeThe Stock Exchange of Hong Kong Limited: 303
Financial CalendarClosure of Register of Members: 8 December 2021
Payment of Interim Dividend: 17 December 2021
FY2022 Annual Results Announcement: May 2022
Share InformationBoard lot: 100 shares
Issued shares as at 30 September 2021: 252,379,133 shares
DividendDividend per ordinary share for the six months ended 30 September 2021: US17.0 cents per share
Share RegistrarsPrincipal
MUFG Fund Services (Bermuda) Limited4th Floor NorthCedar House41 Cedar AvenueHamilton HM 12Bermuda
Hong Kong Branch
Computershare Hong Kong Investor Services LimitedShops 1712-16, 17th Floor, Hopewell Centre183 Queen’s Road East, Wan ChaiHong KongTel: (852) 2862 8555Fax: (852) 2865 0990Enquiries: www.computershare.com/hk/en/online_feedback
Investor Relations Contact and WebsiteCorporate Marketing Department23rd Floor, Tai Ping Industrial Centre, Block 157 Ting Kok RoadTai Po, New TerritoriesHong KongTel: (852) 2680 1000Fax: (852) 2680 1788Email: [email protected]/en/investors