
2020, Vol. 29, No. 7 (July)
128
Advances in Clinical and Experimental Medicine Impact Factor (IF) – 1.514 Ministry of Science and Higher Education – 40 pts. Index Copernicus (ICV) – 155.19 pts. 2020, Vol. 29, No. 7 (July) MONTHLY ISSN 1899-5276 (PRINT) ISSN 2451-2680 (ONLINE) www.advances.umed.wroc.pl
-
Upload
khangminh22 -
Category
Documents
-
view
1 -
download
0
Transcript of 2020, Vol. 29, No. 7 (July)
Advances in Clinical and Experimental M
edicine2020, Vol. 29, N
o. 7 (July)
Advances in Clinical and Experimental Medicine
Impact Factor (IF) – 1.514Ministry of Science and Higher Education – 40 pts.Index Copernicus (ICV) – 155.19 pts.
2020, Vol. 29, No. 7 (July)
MONTHLY ISSN 1899-5276 (PRINT) ISSN 2451-2680 (ONLINE) www.advances.umed.wroc.pl

Advances in Clinical and Experimental M
edicine2020, Vol. 29, N
o. 7 (July)
Advances in Clinical and Experimental
Medicine

ISSN 1899-5276 (PRINT) ISSN 2451-2680 (ONLINE) www.advances.umed.wroc.pl
Advances in Clinical and Experimental Medicine
MONTHLY 2020 Vol. 29, No. 7 (July)
Editor-in-ChiefMaciej Bagłaj
Vice-Editor-in-ChiefDorota Frydecka
Advances in Clinical and Experimental Medicine is a peer-reviewed open access journal published by Wroclaw Medical University. Its abbreviated title is Adv Clin Exp Med. Journal publishes original papers and reviews encompassing all aspects of medicine, including molecular biology, biochemi-stry, genetics, biotechnology, and other areas. It is published monthly, one volume per year.
Editorial BoardPiotr DzięgielMarian KlingerHalina MilnerowiczJerzy Mozrzymas
International Advisory BoardReinhard Berner (Germany)Vladimir Bobek (Czech Republic)Marcin Czyz (UK) Buddhadeb Dawn (USA)Kishore Kumar Jella (USA)
Thematic EditorsMarzenna Bartoszewicz (microbiology)Marzena Dominiak (dentistry)Paweł Domosławski (surgery)Maria Ejma (neurology)Jacek Gajek (cardiology)Mariusz Kusztal
(nephrology and transplantology)Rafał Matkowski (oncology)Ewa Milnerowicz-Nabzdyk (gynecology)Katarzyna Neubauer (gastroenterology)Marcin Ruciński (basic sciences)Robert Śmigiel (pediatrics)Paweł Tabakow (experimental medicine)Anna Wiela-Hojeńska
(pharmaceutical sciences)Dariusz Wołowiec (internal medicine)
SecretaryKatarzyna Neubauer
Piotr PonikowskiMarek SąsiadekLeszek SzenbornJacek Szepietowski
Statistical EditorsDorota DiakowskaLeszek NogaLesław Rusiecki
Technical EditorshipJoanna GudarowskaPaulina KunickaMarek Misiak
English Language Copy EditorsEric HiltonSherill Howard PociechaJason SchockMarcin Tereszewski
Pavel Kopel (Czech Republic) Tomasz B. Owczarek (USA)Ivan Rychlík (Czech Republic)Anton Sculean (Switzerland)Andriy B. Zimenkovsky (Ukraine)
Editorial Officeul. Marcinkowskiego 2–6 50-368 Wrocław, PolandTel.: +48 71 784 11 36 E-mail: [email protected]
PublisherWroclaw Medical UniversityWybrzeże L. Pasteura 1 50-367 Wrocław, Poland
Online edition is the original version of the journal
Editorial Policy Advances in Clinical and Experimental Medicine (Adv Clin Exp Med) is an independent multidisciplinary forum for exchange of scientific and clinical information, publishing original research and news encompassing all aspects of medicine, including molecular biology, biochemistry, genetics, biotechnology and other areas. During the review process, the Editorial Board conforms to the “Uniform Requirements for Manuscripts Submitted to Biomedical Journals: Writing and Editing for Biomedical Publication” approved by the International Committee of Medical Journal Editors (www.ICMJE.org/). The journal publishes (in English only) original papers and reviews. Short works considered original, novel and significant are given priority. Experimental studies must include a statement that the experimental protocol and informed consent procedure were in compliance with the Helsinki Convention and were approved by an ethics committee.
For all subscription-related queries please contact our Editorial Office: [email protected]
For more information visit the journal’s website: www.advances.umed.wroc.pl
Pursuant to the ordinance No. 134/XV R/2017 of the Rector of Wroclaw Medical University (as of December 28, 2017) from January 1, 2018 authors are required to pay a fee amounting to 700 euros for each manuscript accepted for publication in the journal Advances in Clinical and Experimental Medicine.
“Enhancing the scientific standards and internationalization level of published scientific journals, and improving the level of informationdissemination on scientific research outcomes or development work results” – project financed based on agreement No. 915/P-DUN/2019 from the resources of Ministry of Science and Higher Education allocated to science dissemination activities.
Ministry of Science and Higher EducationRepublic of Poland
„Podniesienie poziomu naukowego i poziomu umiędzynarodowienia wydawanych czasopism naukowych oraz upowszechniania informacji o wynikach badań naukowych lub prac rozwojowych” – zadanie finansowane w ramach umowy 915/P-DUN/2019 ze środków Ministra Nauki i Szkolnictwa Wyższego przeznaczonych na działalność upowszechniającą naukę.
Indexed in: MEDLINE, Science Citation Index Expanded, Journal Citation Reports/Science Edition, Scopus, EMBASE/Excerpta Medica, Ulrich’sTM International Periodicals Directory, Index Copernicus
Typographic design: Monika Kolęda, Piotr GilDTP: Wydawnictwo UMWCover: Monika KolędaPrinting and binding: EXDRUK

MONTHLY 2020, Vol. 29, No. 7 (July)
ISSN 1899-5276 (PRINT) ISSN 2451-2680 (ONLINE)
www.advances.umed.wroc.pl
Advancesin Clinical and Experimental Medicine
ContentsOriginal papers777 Yunyu Wu, Jie Li, Shuying Chen, Zhiwu Yu
The effects of miR-140-5p on the biological characteristics of ovarian cancer cells through the Wnt signaling pathway
785 Hui Wang, Zhengdong Zhang, Zhe Yan, Shihong MaPD-L1, PDK-1 and p-Akt are correlated in patients with papillary thyroid carcinoma
793 Xiaolei Zhang, Xianfeng Li, Bin Li, Chengfeng Sun, Peng ZhangmiR-21-5p protects hippocampal neurons of epileptic rats via inhibiting STAT3 expression
803 Chuannan Zhai, Hongliang Cong, Kai Hou, Yuecheng Hu, Jingxia Zhang, Yingyi Zhang, Ying Zhang, Hong ZhangEffects of miR-124-3p regulation of the p38MAPK signaling pathway via MEKK3 on apoptosis and proliferation of macrophages in mice with coronary atherosclerosis
813 Dong Xu, Xang Sun, Yang Zhang, Li CaoKetamine alleviates HMGB1-induced acute lung injury through TLR4 signaling pathway
819 Hyun Jung Park, Jinpyo Hong, Yibo Piao, Hyo Jung Shin, Se Jeong Lee, Im Joo Rhyu, Min-Hee Yi, Jinhyun Kim, Dong Woon Kim, Jaewon BeomExtracorporeal shockwave therapy enhances peripheral nerve remyelination and gait function in a crush model
825 Yonghui Yang, Xiaoxia Li, Xiaoying An, Ling Zhang, Xingbin Li, Liang Wang, Guiyun ZhuContinuous exposure of PM2.5 exacerbates ovalbumin-induced asthma in mouse lung via a JAK-STAT6 signaling pathway
833 Zhen-Zhou Li, Zi-Wei Zhang, Huan Wang, Yong-Quan Chen, Xiao-Fang Zhou, Li-Shuang Duan, Xiao-Xiao Wang, Feng Xu, Jian-Rong GuoAutologous transfusion of “old” red blood cells-induced M2 macrophage polarization through IL-10-Nrf2-HO-1 signaling complexes
841 Anna Pietrzak, Alicja Kalinowska-Łyszczarz, Krystyna Osztynowicz, Alima Khamidulla, Wojciech Kozubski, Sławomir MichalakA long-term follow-up study on biochemical and clinical biomarkers of response to interferon beta-1b treatment in relapsing-remitting multiple sclerosis
853 Marta Kostrzewa, Ewa Głowacka, Tomasz Stetkiewicz, Mariusz Grzesiak, Krzysztof Szyłło, Grzegorz Stachowiak, Jacek Radosław WilczyńskiIs serum anti-Müllerian hormone (AMH) assay a satisfactory measure for ovarian reserve estimation? A comparison of serum and peritoneal fluid AMH levels
857 Kajetan Juszczak, Agata Gastecka, Jan Adamowicz, Przemysław Adamczyk, Marta Pokrywczyńska, Tomasz DrewaHealth-related quality of life is not related to laparoscopic or robotic technique in radical cystectomy
865 Katarzyna Ura-Sabat, Joanna Morawska, Wojciech Domka, Marta Gamrot-Wrzoł, Wojciech Scierski, Ewa Niebudek-BoguszThe assessment of phonatory and ventilatory functions in patients after microsurgery for Reinke’s edema
873 Jiying Wang, Yong Cai, Zhaoying ShengExperimental studies on the protective effects of the overexpression of lentivirus-mediated sirtuin 6 on radiation-induced lung injury
879 Li Zhou, Shao-Bin Wang, Shu-Guang Chen, Qiang Qu, Jing-An RuiThe prognostic value and non-invasive predictors of splenomegaly in cirrhotic patients with hepatocellular carcinoma following curative resection
887 Li Zhou, Shao-Bin Wang, Shu-Guang Chen, Qiang Qu, Jing-An RuiRisk factors of recurrence and poor survival in curatively resected hepatocellular carcinoma with microvascular invasion
Reviews893 Feifei Pu, Jing Feng, Ping Xia
Association between heparin-binding hemagglutinin and tuberculosis

Cite asWu Y, Li J, Chen S, Yu Z. The effects of miR-140-5p on the biological characteristics of ovarian cancer cells through the Wnt signaling pathway. Adv Clin Exp Med. 2020;29(7):777–784. doi:10.17219/acem/121933
DOI10.17219/acem/121933
CopyrightCopyright by Author(s) This is an article distributed under the terms of theCreative Commons Attribution 3.0 Unported (CC BY 3.0)(https://creativecommons.org/licenses/by/3.0/)
Address for correspondenceZhiwu YuE-mail: [email protected]
Funding sourcesThis work was supported by the Medical Health Science and Technology Project of Guangzhou City (grant No. 20161A010087).
Conflict of interestNone declared
Received on January 2, 2020Reviewed on February 13, 2020Accepted on May 1, 2020
Published online on August 4, 2020
AbstractBackground. Ovarian cancer is usually not diagnosed until the late stage, and it is resistant to platinum and other standard chemotherapy drugs, resulting in high mortality.
Objectives. To investigate the effects of miR-140-5p on cell proliferation, apoptosis, invasion, and migration capability in the SKOV3 and OVCAR3 ovarian cancer cell lines through Wnt signaling pathway.
Material and methods. Expression levels of miR-140-5p were checked using quantitative real-time polymerase chain reaction (qRT-PCR). The expression of miR-140-5p was upregulated by transfecting cells with a miR-140-5p mimic or a mimic negative control (NC). Cell proliferation was assessed using a CCK8 assay, and cell cycle distribution and apoptosis percentage were detected with flow cytometry. A transwell invasion assay was employed to evaluate cell migration and invasion ability. The target complementary rela-tionship between miR-140-5p and WNT1 was verified using a dual-luciferase reporter assay while β-catenin in the nuclei was observed using immunofluorescence. The expression of Wnt signaling pathway-related proteins was examined using western blot and qRT-PCR.
Results. The relative expression level of miR-140-5p in SKOV3 and OVCAR3 cells was obviously decreased compared with that in the IOSE80 cells (p < 0.05). Besides, upregulated miR-140-5p effectively suppressed cell proliferation and increased the apoptosis ratio of SKOV3 and OVCAR3 cells (p < 0.05). In addition, the invasion and migration capability of SKOV3 and OVCAR3 cells in miR-140-5p mimic group was largely suppressed compared with the NC group (p < 0.05). What is more, the target complementary relationship between miR-140-5p and the WNT1 gene was revealed; upregulated miR-140-5p suppressed the expression of Wnt signaling-related genes, and restrained nuclear transfer of β-catenin (p < 0.05).
Conclusions. The overexpression of miR-140-5p restricted the proliferation, migration and invasion abili-ties, and accelerated cell apoptosis in ovarian cancer cell lines SKOV3 and OVCAR3 through the Wnt signaling pathway.
Key words: apoptosis, ovarian cancer, cell proliferation, Wnt signaling pathway, miR-140-5p
Original papers
The effects of miR-140-5p on the biological characteristics of ovarian cancer cells through the Wnt signaling pathway
Yunyu Wu1,A,B,E,F, Jie Li2,B–F, Shuying Chen3,B–D, Zhiwu Yu3,A–C
1 Department of Gynecology, Affiliated Cancer Hospital & Institute of Guangzhou Medical University, China2 Department of Intensive Care Unit, Guangdong Provincial Geriatrics Institute, Guangdong Provincial People’s Hospital, Guangdong Academy of Medical Sciences, Guangzhou,
China3 Department of Clinical Laboratory, Affiliated Cancer Hospital & Institute of Guangzhou Medical University, China
A – research concept and design; B – collection and/or assembly of data; C – data analysis and interpretation; D – writing the article; E – critical revision of the article; F – final approval of the article
Advances in Clinical and Experimental Medicine, ISSN 1899–5276 (print), ISSN 2451–2680 (online) Adv Clin Exp Med. 2020;29(7):777–784
Y. Wu et al. Effects of miR-140-5p on ovarian cancer cells778
Ovarian cancer has the 7th highest incidence and 8th highest fatality rate among malignant gynecological dis-eases in the world, with a five-year survival rate lower than 45%.1–4 At present, the most common therapy for ovarian cancer is surgical resection of visible lesions, combined with chemotherapy using targeted platinum drugs (such as cisplatin or carboplatin) and paclitaxel.5 However, long-term use of these chemotherapy regimens carries the risk of drug resistance. Various advances in surgical technol-ogy and chemotherapy have been made in recent years. However, instead of early detection, ovarian cancer is usu-ally not diagnosed until the late stages, and it is resistant to platinum and other standard chemotherapy drugs, thus resulting in high mortality.6,7 Therefore, it is urgent to ex-plore new and effective treatments for ovarian cancer.
Gene therapy, especially microRNA-regulated gene therapy, has attracted extensive attention recently years.8 MicroRNAs (miRs) are able to regulate cell proliferation, differentiation and apoptosis, as well as the occurrence and development of cancer.9 Regulation of miR expression has provided important ideas for the prevention and control of a variety of malignant diseases, including papillary thy-roid cancer, prostate cancer, breast cancer, non-small cell lung cancer (NSCLC), and so on.10–13 For example, miR-140-5p overexpression has effectively inhibited the growth, metastasis, invasion, and epithelial-mesenchymal transfor-mation of hepatocellular carcinoma (HCC) and NSCLC.14,15 However, the effects of miR-140-5p on ovarian cancer have not been clearly illustrated. We learned from a biological information website that complementary binding sites exist between miR-140-5p and the WNT1 gene, and we know that WNT1 is an important gene in the Wnt signaling pathway, whose abnormal expression plays a key regula-tion function in the onset and progress of many cancers.16
The aim of our study was to research the expression of miR-140-5p and the WNT1 gene in ovarian cancer cells, and the effects of miR-140-5p on the biological characteristics of ovarian cancer cells through the Wnt signaling pathway.
Material and methods
Cell culture and transfection
The human epithelial ovarian cancer SKOV3 and OVCAR3 cell lines used here were originally purchased from the ATCC cell bank (Manassas, USA). Human normal ovarian epithelial cells IOSE80 were acquired from the cell bank of the Chinese Academy of Sciences ( Shanghai, China). The cells were kept in RPMI 1640 medium with 10% fetal bovine serum (FBS), 100 μg/mL of streptomycin and 100 U/mL of penicillin (Gibco BioSciences, Dublin, Ireland) at 37° in 5% CO2, and the cells were not sub-cul-tured until cell density was up to 80%.
SKOV3 and OVCAR3 cells at the logarithmic growth stage were inoculated into six-well plates (5*105 cells/mL)
and were then co-transfected with miR-140-5p mimic or mimic negative control (NC) (Gemma Biological Co., Ltd., Shanghai, China) using Lipofectamin 2000 (Invitro-gen Corp., Carlsbad, USA) following standard instructions.
Dual-luciferase reporter assay
Binding sites between miR-140-5p and WNT1 were first predicted on the Bioinformatics & Research Computing website (www.targetscan.org) and the fragment sequence containing the binding sites was obtained. Synthetic WNT1-WT or WNT1-MUT was inserted into the 3ʹUTR of the pMIR-reporter (Thermo Fisher Scientific, Waltham, USA) to package recombinant plasmids pMIR-WNT1-WT and pMIR-WNT1-MUT, respectively. Correctly identified recombinant plasmids WNT1-WT or WNT1-MUT were co-transfected into HEK293T cells with miR-140-5p or NC plasmids, respectively. After incubating for 48 h, cells were cleaved in 1 × passive lysate, and luciferase activity was as-sessed using a luciferase test kit (Promega, Madison, USA) using a dual-luciferase reporter assay system (Promega). The related target effect was shown as relative luciferase ac-tivity (the ratio of firefly luciferase intensity to that of renilla). Renilla luciferase activity was used as the internal reference.
qRT-PCR
Total RNA was first extracted using cold Trizol (Invit-rogen). After the RNA concentration was measured, 1 μg of total RNA was transcribed reversely using a cDNA Re-verse Transcription Kit (Takara Biomedical Technology, Beijing, China). Quantitative real-time polymerase chain reaction (qRT-PCR) was carried out in an ABI7500 quan-titative PCR instrument (Thermo Fisher Scientific) using a Fluorescence Quantitative PCR kit (Takara Biomedical Technology) according to the following procedure: pre-denaturation for 10 min at 95°C and 40 PCR cycles (denatur-ation for 15 s at 95°C, annealing for 30 s at 56°C, extension for 35 s at 72°C). U6 and GAPDH were the internal refer-ences for miRNA and mRNAs, respectively. The results were analyzed with the 2−ΔΔCt method. All related prim-ers were provided by the Jima Pharmaceutical Technology Co., Ltd. (Shanghai, China) and the primer sequences are listed in Table 1. The RT-PCR was carried out in strict ac-cordance with the instructions, and all consumables used in the experiment were soaked in diethyl pyrocarbonate (DEPC) (Rongyue Biotechnology Co., Ltd., Shanghai, Chi-na) to inactivate the enzymes, and were sterilized at a high temperature.
Western blot
The protein in the cells was extracted using RIPA lysate (R0010; Solarbio Science & Technology Co. Ltd, Beijing, China) containing phenylmethylsulfonyl fluoride (PMSF), and then incubated on ice for 30 min; the supernatant was
Adv Clin Exp Med. 2020;29(7):777–784 779
obtained by centrifuging at 12,000 × g for 10 min at 4°C. The protein concentration was examined using a Pierce BCA Kit (23225; Thermo Fisher Scientific), and adjusted to equilib-rium using deionized water. Forty-microgram protein sam-ples were added to wells on SDS-PAGE gel and the proteins were separated at 80 V using 10% SDS-PAGE gel (P0012A; Biyun Tian Biotechnology Research Institute, Shanghai, China) for 2 h. The wet transfer method was used to transfer the protein to the polyvinylidene difluoride (PVDF) mem-branes (iseq00010; Merck Millipore, Burlington, USA), then the membranes were blocked for 2 h with tris-buffered sa-line with Tween 20 (TBST) buffer containing 5% skimmed milk powder. After being washed 3 times using TBST buffer, the membranes were incubated with primary antibodies as listed, respectively: β-catenin rabbit antibody (1:1,000, ab32572; Abcam, Cambridge, UK), WNT1 mouse antibody (1:500, ab15251; Abcam), C-myc rabbit antibody (1:1,000, 5605; Cell Signaling Technology, Leiden, the Netherlands), MMP-7 antibody (1:1,000, 71031; CST), and GAPDH rabbit monoclonal antibody (1:10,000, ab181602; Abcam) at 4°C overnight. After being washed 3 times using TBST buffer, the membranes were conjugated with diluted sheep anti-rabbit second antibody (1:2,000–1:50,000, ab205718; Abcam) and sheep anti-mouse second antibody (1:10,000, Jackson; Jackson Immunoresearch, USA) at room temperature for 90 min. An electrochemiluminescence (ECL) fluorescence detection kit (Amersham, Little Chalfont, UK) was used. The membranes were treated with enhanced chemilumi-nescence reagent (Amersham) and imaged with the Bio-Rad image analysis system (Bio-Rad Laboratories Inc., Hercules, USA) in gel imager. The protein content was analyzed us-ing Quantity One v. 4.6.2 software (Bio-Rad Laboratories Inc.) and relative protein content was shown as a grey value of a targeted protein band/gray value of a GAPDH band.
CCK8 assay
Digested SKOV3 and OVCAR3 cells were seeded into 96-well plates, and the absorbance of cells in the NC group and the miR-140-5p mimic group were each measured 3 times.
After 0 h, 24 h, 48 h, and 72 h of culture, cell absorbance was measured using a commercial CCK8 Kit (Solarbio Science & Technology Co. Ltd.).
Flow cytometry
Cell apoptosis was evaluated using an Annexin V-FITC/PI Double Staining Kit (CA1050; Solarbio Science & Technol-ogy Co. Ltd.) as follows: SKOV3 and OVCAR3 cells were centrifuged, re-suspended and then mixed with 5 µL of An-nexin V-FITC. The cell suspension was reacted with the 5 µL of Annexin V-FITC added before in the dark at room tem-perature for 15 min. Then, 5 µL of propidium iodide (PI) was added 5 min before detection. Subsequently, 5 µL of prop-idium iodide (PI) was added and reacted on ice in the dark for 5 min, and then cell apoptosis was detected using Cube6 flow cytometry (Sysmex Partec GmbH, Münster, Germany).
The cell cycles of the NC group and the miR-140-5p mimic group were detected using a cell cycle DNA detec-tion kit (Solarbio Science & Technology Co. Ltd.) as fol-lows: The cells were centrifuged and re-suspended after washing, and then centrifuged again to remove the super-natant. After being fixed and washed, the cells were gently and evenly blown and passed through the cell strainer to prevent agglomeration. The cells were re-suspended, bathed in water at 37°C for 30 min, mixed with 400 μL of PI staining solution, incubated in the dark at 4°C for 30 min, and detected using flow cytometry.
Transwell migration and invasion assay
After being transfected for 48 h, the cells were starved in serum-free medium for another 24 h. After being digest-ed and washed, the cells were re-suspended in RPMI1640 medium with 10 g/L of bovine serum albumin (BSA) (Thermo Fisher Scientific).
For the invasion assay, a transwell chamber was put into a 24-well plate. The upper chamber surface of the bot-tom membrane in the transwell chamber was coated with matrigel diluent (40111es08; Shanghai Yisheng Bio-technology Co., Ltd., Shanghai, China). After air-drying at room temperature, the chamber was cleaned twice using serum-free RPMI1640 medium (Gibco, Waltham, USA). The density of the cell suspension was adjusted to 1*105/mL, and 200 μL of cell suspension was added to the upper chamber. At the same time, 600 μL of com-plete medium accompanied with 10% FBS was added to the lower chamber. After 24 h, the cells adhering to the upper surface were cleaned with cotton swabs, and the invading cells on the bottom surface were fixed with 4% paraformaldehyde (Leigen Biotechnology Co. Ltd., Beijing, China) for 15 min. After staining for 15 min with 0.5% crystal violet (Solarbio Technology Co. Ltd.), the cells were washed 3 times with PBS and 6 fields of vision were randomly selected to be photographed with an inverted microscope, and the cell number was counted.
Table 1. Related primer sequences of qRT-PCR
Name Sequence
WNT1F: 5’-CGCTCTTCCAGTTCTCAGACAC-3’
R: 5’-CAGGATGGCAAAGGGTTCG-3’
miR-140-5pF: 5’-GAGTGT-CAGTGGTTACCGT-3’R: 5’-GCATGGTCC-GAGGTATTC-3’
β-cateninF: 5’-GCCACAGGATTACAAGAAGC-3’R: 5’-CCACCAGAGTGAAAAGAACG-3’
R: 5’-ATCCAGACTCTGACCTTTT-3’
MMP-7F: 5’-GGGATTAACTTCCTGTATGC-3’
R: 5’-GATCTCCATTTCCATAGGTTG-3’
GAPDHF: 5’-GGGTGTGAACCATGAGAAGTATG-3’
R: 5’-GATGGCATGGACTGTGGTCAT-3’
U6F: 5’-CTCGGACTCAGCCTGCA-3’
R: 5’- TCAATATTACCGAGCTGCGT-3’
Y. Wu et al. Effects of miR-140-5p on ovarian cancer cells780
The migration assay was the same as the invasion assay, except that matrigel coating was not used on the transwell chambers.
Immunofluorescence test
The cells were inoculated into 24-well plates in which sterile cell climbing slices had already been placed. After 24 h, the supernatant of the culture medium was discarded and the cells were fixed with 4% paraformaldehyde for 20 min and penetrated for 10 min by 0.1% Triton-100. The cells were then washed 3 times and blocked with 5% BSA before being incubated with 0.1 mL of β-catenin pri-mary antibody (1:250, ab32572; Abcam) for 1 h at room temperature. After being washed 3 times, the cells were incubated with 0.1 mL of a fluorescent second antibody (ab150075; Abcam) in the dark for 30 min. After stain-ing the nuclei with DAPI for 5 min, the slides were care-fully taken out after being washed 3 more times. Finally, the slides were sealed and observed under a microscope.
Statistical analysis
The statistical analysis was performed using SPSS v. 21.0 statistical software (SPSS Inc., Chicago, USA). Related measurement data was shown as means ± standard devia-tion (SD). A t-test was used to compare differences between 2 groups and a one-way analysis of variance (ANOVA) with the Bonferroni correction was used to compare differences among multiple groups. A p-value of <0.05 indicated sta-tistically significant differences.
Results
Downregulation of miR-140-5p in human ovarian cancer cells
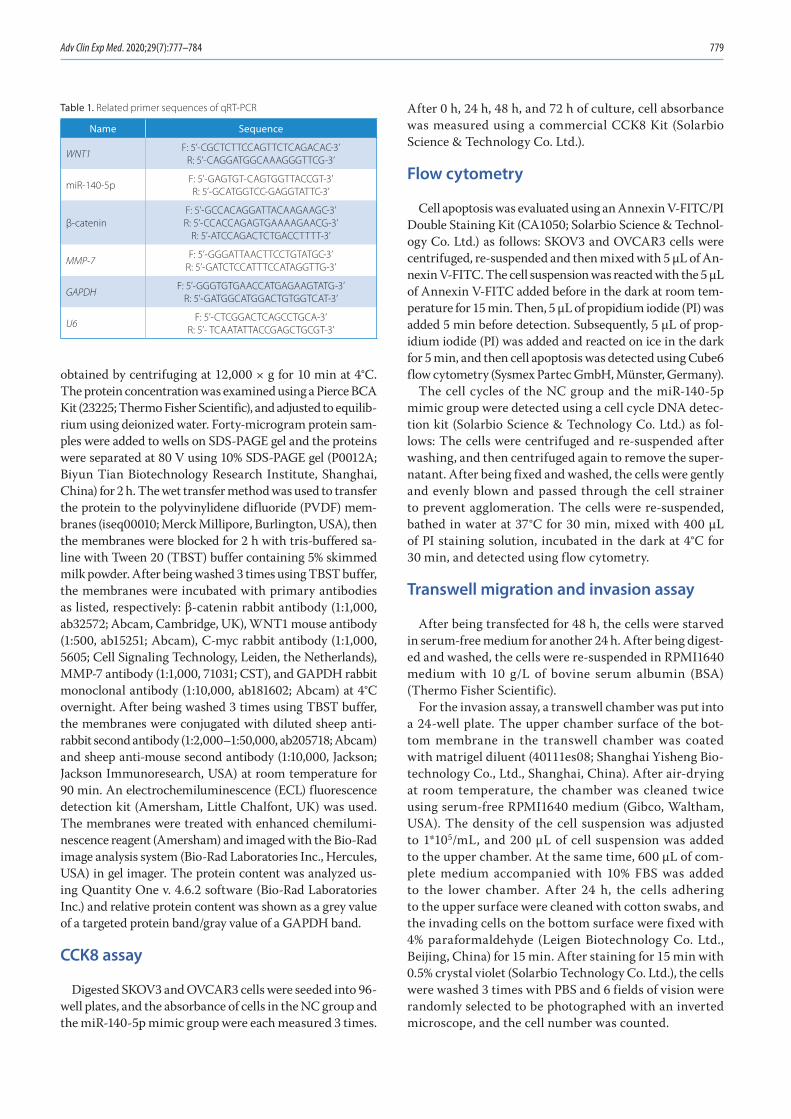
With the aim of studying the effects of miR-140-5p on human ovarian cancer cells, the expression difference of miR-140-5p in the human epithelial ovarian cancer cell line SKOV3, the ovarian cancer cell line OVCAR3 and the human normal ovarian epithelial cell line IOSE80 was first assessed using qRT-PCR (Fig. 1). The results showed that the expression of miR-140-5p in both SKOV3 and OVCAR3 cells was sharply decreased compared with the expression in IOSE80 cells (p < 0.05).
Effects of miR-140-5p overexpression on the proliferation and apoptosis of human ovarian cancer cells
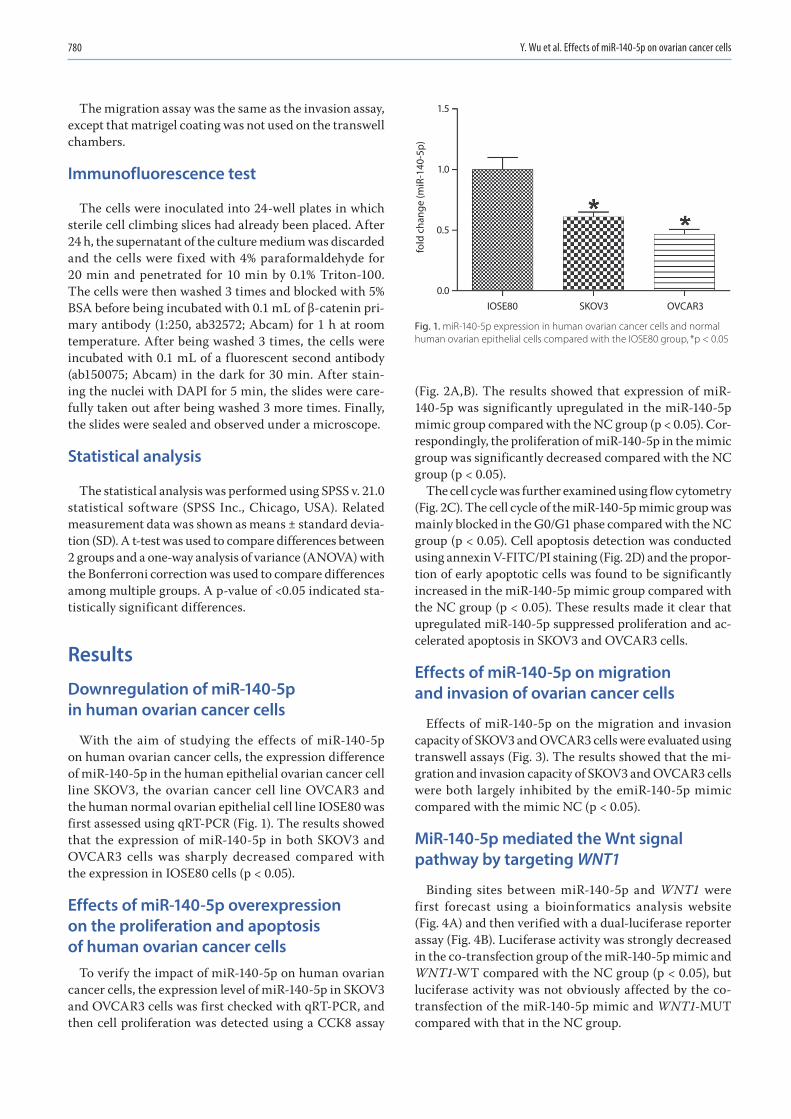
To verify the impact of miR-140-5p on human ovarian cancer cells, the expression level of miR-140-5p in SKOV3 and OVCAR3 cells was first checked with qRT-PCR, and then cell proliferation was detected using a CCK8 assay
(Fig. 2A,B). The results showed that expression of miR-140-5p was significantly upregulated in the miR-140-5p mimic group compared with the NC group (p < 0.05). Cor-respondingly, the proliferation of miR-140-5p in the mimic group was significantly decreased compared with the NC group (p < 0.05).
The cell cycle was further examined using flow cytometry (Fig. 2C). The cell cycle of the miR-140-5p mimic group was mainly blocked in the G0/G1 phase compared with the NC group (p < 0.05). Cell apoptosis detection was conducted using annexin V-FITC/PI staining (Fig. 2D) and the propor-tion of early apoptotic cells was found to be significantly increased in the miR-140-5p mimic group compared with the NC group (p < 0.05). These results made it clear that upregulated miR-140-5p suppressed proliferation and ac-celerated apoptosis in SKOV3 and OVCAR3 cells.
Effects of miR-140-5p on migration and invasion of ovarian cancer cells
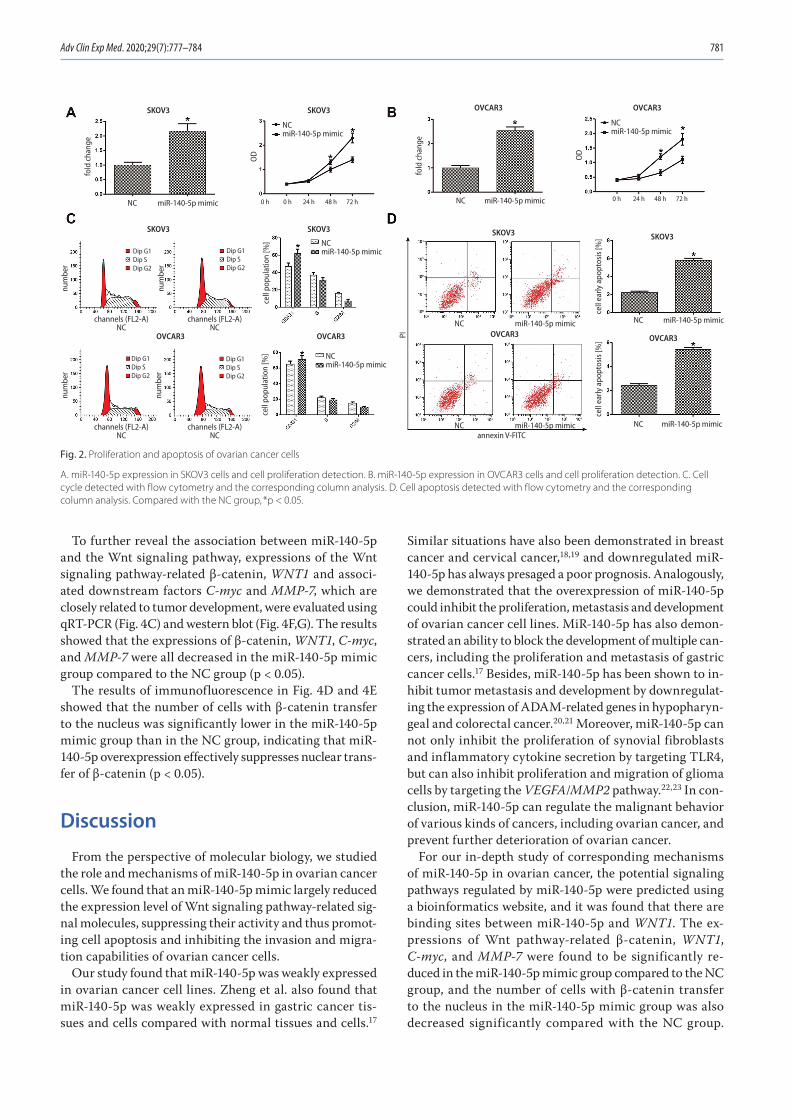
Effects of miR-140-5p on the migration and invasion capacity of SKOV3 and OVCAR3 cells were evaluated using transwell assays (Fig. 3). The results showed that the mi-gration and invasion capacity of SKOV3 and OVCAR3 cells were both largely inhibited by the emiR-140-5p mimic compared with the mimic NC (p < 0.05).
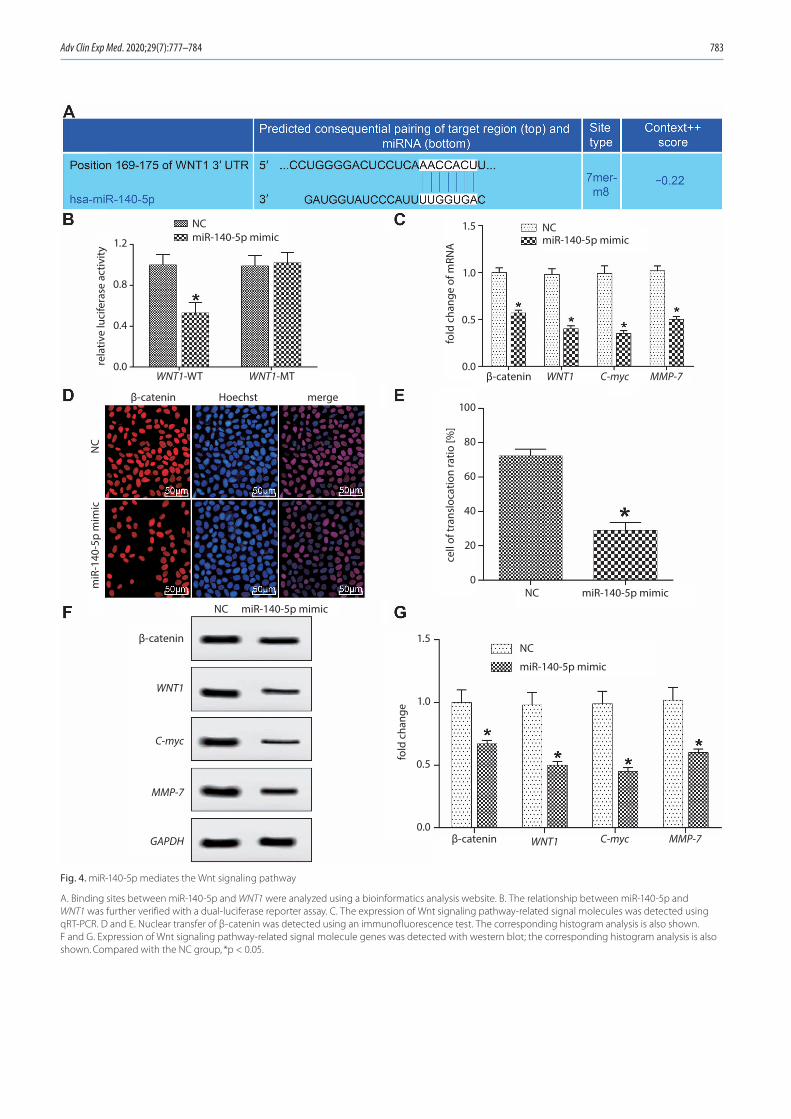
MiR-140-5p mediated the Wnt signal pathway by targeting WNT1
Binding sites between miR-140-5p and WNT1 were first forecast using a bioinformatics analysis website (Fig. 4A) and then verified with a dual-luciferase reporter assay (Fig. 4B). Luciferase activity was strongly decreased in the co-transfection group of the miR-140-5p mimic and WNT1-WT compared with the NC group (p < 0.05), but luciferase activity was not obviously affected by the co-transfection of the miR-140-5p mimic and WNT1-MUT compared with that in the NC group.
Fig. 1. miR-140-5p expression in human ovarian cancer cells and normal human ovarian epithelial cells compared with the IOSE80 group, *p < 0.05
fold
cha
nge
(miR
-140
-5p)
1.5
1.0
0.5
0.0IOSE80 SKOV3 OVCAR3
Adv Clin Exp Med. 2020;29(7):777–784 781
To further reveal the association between miR-140-5p and the Wnt signaling pathway, expressions of the Wnt signaling pathway-related β-catenin, WNT1 and associ-ated downstream factors C-myc and MMP-7, which are closely related to tumor development, were evaluated using qRT-PCR (Fig. 4C) and western blot (Fig. 4F,G). The results showed that the expressions of β-catenin, WNT1, C-myc, and MMP-7 were all decreased in the miR-140-5p mimic group compared to the NC group (p < 0.05).
The results of immunofluorescence in Fig. 4D and 4E showed that the number of cells with β-catenin transfer to the nucleus was significantly lower in the miR-140-5p mimic group than in the NC group, indicating that miR-140-5p overexpression effectively suppresses nuclear trans-fer of β-catenin (p < 0.05).
Discussion
From the perspective of molecular biology, we studied the role and mechanisms of miR-140-5p in ovarian cancer cells. We found that an miR-140-5p mimic largely reduced the expression level of Wnt signaling pathway-related sig-nal molecules, suppressing their activity and thus promot-ing cell apoptosis and inhibiting the invasion and migra-tion capabilities of ovarian cancer cells.
Our study found that miR-140-5p was weakly expressed in ovarian cancer cell lines. Zheng et al. also found that miR-140-5p was weakly expressed in gastric cancer tis-sues and cells compared with normal tissues and cells.17
Similar situations have also been demonstrated in breast cancer and cervical cancer,18,19 and downregulated miR-140-5p has always presaged a poor prognosis. Analogously, we demonstrated that the overexpression of miR-140-5p could inhibit the proliferation, metastasis and development of ovarian cancer cell lines. MiR-140-5p has also demon-strated an ability to block the development of multiple can-cers, including the proliferation and metastasis of gastric cancer cells.17 Besides, miR-140-5p has been shown to in-hibit tumor metastasis and development by downregulat-ing the expression of ADAM-related genes in hypopharyn-geal and colorectal cancer.20,21 Moreover, miR-140-5p can not only inhibit the proliferation of synovial fibroblasts and inflammatory cytokine secretion by targeting TLR4, but can also inhibit proliferation and migration of glioma cells by targeting the VEGFA/MMP2 pathway.22,23 In con-clusion, miR-140-5p can regulate the malignant behavior of various kinds of cancers, including ovarian cancer, and prevent further deterioration of ovarian cancer.
For our in-depth study of corresponding mechanisms of miR-140-5p in ovarian cancer, the potential signaling pathways regulated by miR-140-5p were predicted using a bioinformatics website, and it was found that there are binding sites between miR-140-5p and WNT1. The ex-pressions of Wnt pathway-related β-catenin, WNT1, C-myc, and MMP-7 were found to be significantly re-duced in the miR-140-5p mimic group compared to the NC group, and the number of cells with β-catenin transfer to the nucleus in the miR-140-5p mimic group was also decreased significantly compared with the NC group.
Fig. 2. Proliferation and apoptosis of ovarian cancer cells
A. miR-140-5p expression in SKOV3 cells and cell proliferation detection. B. miR-140-5p expression in OVCAR3 cells and cell proliferation detection. C. Cell cycle detected with flow cytometry and the corresponding column analysis. D. Cell apoptosis detected with flow cytometry and the corresponding column analysis. Compared with the NC group, *p < 0.05.
NC
SKOV3 SKOV3
SKOV3 SKOV3 SKOV3
OVCAR3 OVCAR3 OVCAR3
SKOV3
OVCAR3
OVCAR3 OVCAR3
fold
cha
nge
OD
fold
cha
nge
num
ber
cell
popu
latio
n [%
]
PI
cell
popu
latio
n [%
]
cell
early
apo
ptos
is [%
]ce
ll ea
rly a
popt
osis
[%]
OD
num
ber
num
ber
num
ber
miR-140-5p mimic
NC miR-140-5p mimic
NC miR-140-5p mimic NC miR-140-5p mimic
NC miR-140-5p mimicchannels (FL2-A)NC
channels (FL2-A)NC
channels (FL2-A)NC
channels (FL2-A)NC annexin V-FITC
NCmiR-140-5p mimic
NCmiR-140-5p mimic
NCmiR-140-5p mimicDip G1
Dip SDip G2
Dip G1Dip SDip G2
Dip G1Dip SDip G2
Dip G1Dip SDip G2
NCmiR-140-5p mimic
0 h 0 h 24 h 48 h 72 h 0 h 24 h 48 h 72 hNC miR-140-5p mimic
Y. Wu et al. Effects of miR-140-5p on ovarian cancer cells782
Fig. 3. Cell migration and invasion capacity detection
A. Cell migration detection in SKOV3 cells and the related histogram analysis. B. Cell migration detection in OVCAR3 cells and the related histogram analysis. C. Cell invasion detection in SKOV3 cells and the related histogram analysis. D. Cell invasion detection in OVCAR3 cells and the related histogram analysis. Compared with the NC group, *p < 0.05.
Adv Clin Exp Med. 2020;29(7):777–784 783
Fig. 4. miR-140-5p mediates the Wnt signaling pathway
A. Binding sites between miR-140-5p and WNT1 were analyzed using a bioinformatics analysis website. B. The relationship between miR-140-5p and WNT1 was further verified with a dual-luciferase reporter assay. C. The expression of Wnt signaling pathway-related signal molecules was detected using qRT-PCR. D and E. Nuclear transfer of β-catenin was detected using an immunofluorescence test. The corresponding histogram analysis is also shown. F and G. Expression of Wnt signaling pathway-related signal molecule genes was detected with western blot; the corresponding histogram analysis is also shown. Compared with the NC group, *p < 0.05.
β-catenin
β-catenin Hoechst merge
WNT1 C-myc MMP-7
β-catenin WNT1 C-myc MMP-7
β-catenin
NC miR-140-5p mimicNC miR-140-5p mimic
NC
miR
-140
-5p
mim
ic
NC1.5
1.0
0.5
0.0
1.5
1.0
0.5
0.0
1.2
0.8
0.4
0.0
100
80
60
40
20
0
miR-140-5p mimic
NCmiR-140-5p mimic
NCmiR-140-5p mimic
GAPDH
WNT1
C-myc
MMP-7
WNT1-MTWNT1-WT
fold
cha
nge
of m
RNA
fold
cha
nge
cell
of tr
ansl
ocat
ion
ratio
[%]
rela
tive
luci
fera
se a
ctiv
ity
Y. Wu et al. Effects of miR-140-5p on ovarian cancer cells784
WNT1 is an important regulatory gene of the Wnt signal-ing pathway, and overexpression of WNT1 has been shown to upregulate the expression of β-catenin, C-myc, MMP-7, and related other factors, thus accelerating the prolifera-tion and development of lung cancer cells.24 In most cases, the Wnt pathway activates its target genes by promoting β-catenin transfer into the nucleus.25 However, abnormal activation of the Wnt signal has the ability to regulate cancer stem cells and plays a key role in the production and deterioration of multiple types of cancer.26 Similar-ly, Wu et al. found that miR-140-5p can inhibit the Wnt signaling pathway so as to reduce cell proliferation and strengthen drug efficacy in breast cancer cells.27
Although we have shown that miR-140-5p regulates the proliferation, apoptosis, migration, and invasion abil-ity of ovarian cancer cells by regulating WNT1, it is still unclear whether miR-140-5p could also regulate the pro-gression of ovarian cancer through other signal factors. Thus, more experiments are needed to further explore the function and molecular mechanisms of miR-140-5p in ovarian cancer, in order to provide a more powerful basis for clinical application.
Conclusions
We found that miR-140-5p inactivates the Wnt/β-catenin signaling pathway by regulating WNT1, and prevents fur-ther deterioration of ovarian cancer. MiR-140-5p is ex-pected to provide novel ideas for the treatment of ovarian cancer.
ORCID iDsYunyu Wu https://orcid.org/0000-0002-2975-5365Jie Li https://orcid.org/0000-0002-4734-1940Shuying Chen https://orcid.org/0000-0002-0148-0048Zhiwu Yu https://orcid.org/0000-0002-1870-1409
References1. Webb PM, Jordan SJ. Epidemiology of epithelial ovarian cancer. Best
Pract Res Clin Obstet Gynaecol. 2017;41:3–14.2. Heintz APM, Odicino F, Maisonneuve P, et al. Carcinoma of the ovary.
FIGO 26th Annual Report on the Results of Treatment in Gynecologi-cal Cancer. Int J Gynaecol Obstet. 2006;95(Suppl 1):S161–S192.
3. Reid BM, Permuth JB, Sellers TA. Epidemiology of ovarian cancer: A review. Cancer Biol Med. 2017;14(1):9–32.
4. Li W, Liu Z, Chen L, Zhou L, Yao Y. MicroRNA-23b is an independent prog-nostic marker and suppresses ovarian cancer progression by targeting runt-related transcription factor-2. FEBS Lett. 2014;588(9):1608–1615.
5. Chen W, Huang L, Hao C, et al. MicroRNA-155 promotes apoptosis in SKOV3, A2780, and primary cultured ovarian cancer cells. Tumour Biol. 2016;37(7):9289–9299.
6. Li X, Chen W, Zeng W, et al. microRNA-137 promotes apoptosis in ovar-ian cancer cells via the regulation of XIAP. Br J Cancer. 2017;116(1):66–76.
7. Wang M, He Y, Shi L, Shi C. Multivariate analysis by Cox proportional hazard model on prognosis of patient with epithelial ovarian cancer. Eur J Gynaecol Oncol. 2011;32(2):171–177.
8. Li Y, Chen Y, Li J, et al. Co-delivery of microRNA-21 antisense oligo-nucleotides and gemcitabine using nanomedicine for pancreatic cancer therapy. Cancer Sci. 2017;108(7):1493–1503.
9. Li P, Sun Y, Liu Q. MicroRNA-340 induces apoptosis and inhibits metas-tasis of ovarian cancer cells by inactivation of NF-x03BA;B1. Cell Physiol Biochem. 2016;38(5):1915–1927.
10. Kan Q, Su Y, Yang H. MicroRNA-335 is downregulated in papillary thyroid cancer and suppresses cancer cell growth, migration and invasion by directly targeting ZEB2. Oncol Lett. 2017;14(6):7622–7628.
11. Liu C, Liu R, Zhang D, et al. MicroRNA-141 suppresses prostate can-cer stem cells and metastasis by targeting a cohort of pro-metasta-sis genes. Nat Commun. 2017;8:14270–14270.
12. Santos JC, Lima NDS, Sarian LO, et al. Exosome-mediated breast can-cer chemoresistance via miR-155 transfer. Sci Rep. 2018;8(1):829–829.
13. Flamini V, Jiang W, Cui Y. Therapeutic role of MiR-140-5p for the treat-ment of non-small cell lung cancer. Anticancer Res. 2017;37(8):4319–4327.
14. Zhai H, Fesler A, Ba Y, Wu S, Ju J. Inhibition of colorectal cancer stem cell survival and invasive potential by hsa-miR-140-5p mediated suppres-sion of Smad2 and autophagy. Oncotarget. 2015;6(23):19735–19746.
15. Yang P, Xiong J, Zuo L, Liu K, Zhang H. miR-140-5p regulates cell migration and invasion of non-small cell lung cancer cells through targeting VEGFA. Mol Med Rep. 2018;18(3):2866–2872.
16. Dihlmann S, von Knebel Doeberitz M. Wnt/beta-catenin-pathway as a molecular target for future anti-cancer therapeutics. Int J Cancer. 2005:113(4):515–524.
17. Fang Z, Yin S, Sun R, et al. miR-140-5p suppresses the proliferation, migration and invasion of gastric cancer by regulating YES1. Mol Cancer. 2017;16(1):139–139.
18. Lu Y, Qin T, Li J, et al. MicroRNA-140-5p inhibits invasion and angio-genesis through targeting VEGF-A in breast cancer. Cancer Gene Ther. 2017;24(9):386–392.
19. Su Y, Xiong J, Hu J, et al. MicroRNA-140-5p targets insulin like growth factor 2 mRNA binding protein 1 (IGF2BP1) to suppress cervical can-cer growth and metastasis. Oncotarget. 2016;7(42):68397–68411.
20. Jing P, Sa N, Xu W. miR-140-5p affects the migration and invasion of hypopharyngeal carcinoma cells by downregulating ADAM10 expression [in Chinese]. Zhonghua Er Bi Yan Hou Tou Jing Wai Ke Za Zhi. 2016;51(3):189–196.
21. Yu L, Lu Y, Han X, et al. microRNA-140-5p inhibits colorectal cancer invasion and metastasis by targeting ADAMTS5 and IGFBP5. Stem Cell Res Ther. 2016;7(1):180.
22. Li H, Guan S, Lu Y, Wang F. MiR-140-5p inhibits synovial fibroblasts proliferation and inflammatory cytokines secretion through target-ing TLR4. Biomed Pharmacother. 2017;96:208–214.
23. Hu Y, Li Y, Wu C, et al. MicroRNA-140-5p inhibits cell proliferation and invasion by regulating VEGFA/MMP2 signaling in glioma. Tumour Biol. 2017;39(4):1010428317697558. doi:10.1177/1010428317697558.
24. Huang CL, Liu D, Ishikawa S, et al. Wnt1 overexpression promotes tumour progression in non-small cell lung cancer. Eur J Cancer. 2008; 44(17):2680–2688.
25. Lustig B, Behrens J. The Wnt signaling pathway and its role in tumor development. J Cancer Res Clin Oncol. 2003;129(4):199–221.
26. Duchartre Y, Kim YM, Kahn M. The Wnt signaling pathway in cancer. Crit Rev Oncol Hematol. 2016;99:141–149.
27. Wu D, Zhang J, Lu Y, et al. miR-140-5p inhibits the proliferation and enhances the efficacy of doxorubicin to breast cancer stem cells by targeting Wnt1. Cancer Gene Ther. 2019;26(3–4):74–82.
Cite asWang H, Zhang Z, Yan Z, Ma S. PDK-1 and p-Akt are correlated in patients with papillary thyroid carcinoma. Adv Clin Exp Med. 2020;29(7):785–792. doi:10.17219/acem/121518
DOI10.17219/acem/121518
CopyrightCopyright by Author(s) This is an article distributed under the terms of theCreative Commons Attribution 3.0 Unported (CC BY 3.0)(https://creativecommons.org/licenses/by/3.0/)
Address for correspondenceShihong MaE-mail: [email protected]
Funding sourcesThe study was funded by the Foundation for Develop-ment of Clinical Medical Science and Technology (grant No. JLY20180041) and the Research Foundation of Xuhui Center Hospital (grant No. 2018XHYY-10).
Conflict of interestNone declared
Received on February 19, 2020Reviewed on March 6, 2020Accepted on April 30, 2020
Published online on August 4, 2020
AbstractBackground. Papillary thyroid carcinoma (PTC) is the most common type of thyroid carcinoma.
Objectives. To investigate the clinical significance of programmed death ligand 1 (PD-L1) and phosphoinosit-ide-dependent protein kinase 1 (PDK1) in PTC.
Material and methods. A total of 194 PTC patients were recruited. Contralateral normal thyroid tissues were obtained and used as controls (n = 80). The expression levels of PD-L1, PDK1 and p-Akt were determined using immunohistochemistry.
Results. The PD-L1, PDK1 and p-Akt were upregulated in cancer tissues compared to the normal tissues. The mean optical density (MOD) values of PD-L1, PDK1 and p-Akt were significantly higher in the PTC tissues. The expression of PD-L1 positively correlated with the levels of PDK1 and p-Akt. In addition, the expression of PD-L1, PDK1 and p-Akt in PTC patients without chronic lymphocytic thyroiditis (CLT) was significantly higher than the expression of those proteins in the CLT patients. The patients with higher expression levels of PD-L1, PDK1 or p-Akt had remarkably larger tumors and higher rates of TNM III–IV, capsular infiltration, lymph node metastasis, and of recurrence. The Kaplan–Meier curve showed that patients with lower expression of PD-L1, PDK1 or p-Akt had significantly longer recurrence-free time. The logistic regression analysis revealed that only CLT, PD-L and capsular infiltration were risk factors for patients’ five-year recurrence.
Conclusions. The PD-L1, PDK1 and p-Akt were found to be positively correlated with a poor prognosis in PTC.
Key words: prognosis, papillary thyroid carcinoma, p-Akt, sPD-L1, PDK-1
Original papers
PD-L1, PDK-1 and p-Akt are correlated in patients with papillary thyroid carcinoma
Hui WangA,B, Zhengdong ZhangB,C,F, Zhe YanB,C,F, Shihong MaA,E,F
Department of General Surgery, Shanghai Xuhui Center Hospital, China
A – research concept and design; B – collection and/or assembly of data; C – data analysis and interpretation; D – writing the article; E – critical revision of the article; F – final approval of the article
Advances in Clinical and Experimental Medicine, ISSN 1899–5276 (print), ISSN 2451–2680 (online) Adv Clin Exp Med. 2020;29(7):785–792
H. Wang et al. PD-L1, PDK-1 and p-Akt in PTC786
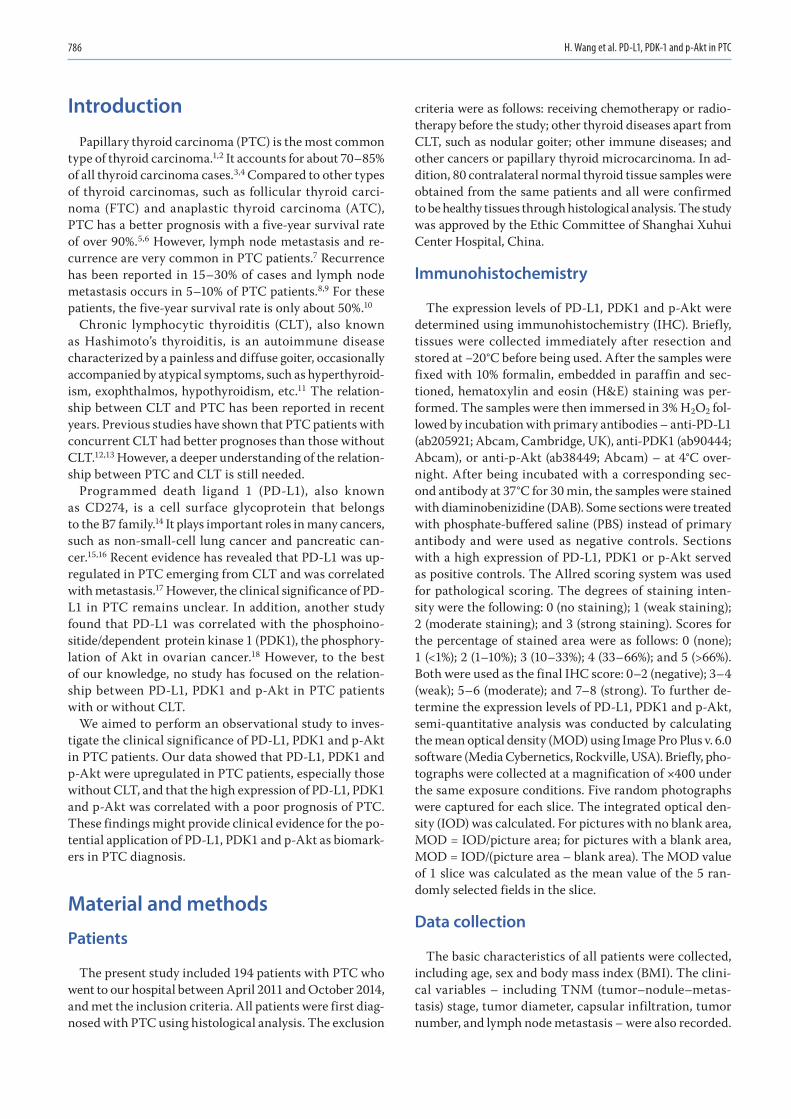
Introduction
Papillary thyroid carcinoma (PTC) is the most common type of thyroid carcinoma.1,2 It accounts for about 70–85% of all thyroid carcinoma cases.3,4 Compared to other types of thyroid carcinomas, such as follicular thyroid carci-noma (FTC) and anaplastic thyroid carcinoma (ATC), PTC has a better prognosis with a five-year survival rate of over 90%.5,6 However, lymph node metastasis and re-currence are very common in PTC patients.7 Recurrence has been reported in 15–30% of cases and lymph node metastasis occurs in 5–10% of PTC patients.8,9 For these patients, the five-year survival rate is only about 50%.10
Chronic lymphocytic thyroiditis (CLT), also known as Hashimoto’s thyroiditis, is an autoimmune disease characterized by a painless and diffuse goiter, occasionally accompanied by atypical symptoms, such as hyperthyroid-ism, exophthalmos, hypothyroidism, etc.11 The relation-ship between CLT and PTC has been reported in recent years. Previous studies have shown that PTC patients with concurrent CLT had better prognoses than those without CLT.12,13 However, a deeper understanding of the relation-ship between PTC and CLT is still needed.
Programmed death ligand 1 (PD-L1), also known as CD274, is a cell surface glycoprotein that belongs to the B7 family.14 It plays important roles in many cancers, such as non-small-cell lung cancer and pancreatic can-cer.15,16 Recent evidence has revealed that PD-L1 was up-regulated in PTC emerging from CLT and was correlated with metastasis.17 However, the clinical significance of PD-L1 in PTC remains unclear. In addition, another study found that PD-L1 was correlated with the phosphoino-sitide/dependent protein kinase 1 (PDK1), the phosphory-lation of Akt in ovarian cancer.18 However, to the best of our knowledge, no study has focused on the relation-ship between PD-L1, PDK1 and p-Akt in PTC patients with or without CLT.
We aimed to perform an observational study to inves-tigate the clinical significance of PD-L1, PDK1 and p-Akt in PTC patients. Our data showed that PD-L1, PDK1 and p-Akt were upregulated in PTC patients, especially those without CLT, and that the high expression of PD-L1, PDK1 and p-Akt was correlated with a poor prognosis of PTC. These findings might provide clinical evidence for the po-tential application of PD-L1, PDK1 and p-Akt as biomark-ers in PTC diagnosis.
Material and methods
Patients
The present study included 194 patients with PTC who went to our hospital between April 2011 and October 2014, and met the inclusion criteria. All patients were first diag-nosed with PTC using histological analysis. The exclusion
criteria were as follows: receiving chemotherapy or radio-therapy before the study; other thyroid diseases apart from CLT, such as nodular goiter; other immune diseases; and other cancers or papillary thyroid microcarcinoma. In ad-dition, 80 contralateral normal thyroid tissue samples were obtained from the same patients and all were confirmed to be healthy tissues through histological analysis. The study was approved by the Ethic Committee of Shanghai Xuhui Center Hospital, China.
Immunohistochemistry
The expression levels of PD-L1, PDK1 and p-Akt were determined using immunohistochemistry (IHC). Briefly, tissues were collected immediately after resection and stored at −20°C before being used. After the samples were fixed with 10% formalin, embedded in paraffin and sec-tioned, hematoxylin and eosin (H&E) staining was per-formed. The samples were then immersed in 3% H2O2 fol-lowed by incubation with primary antibodies – anti-PD-L1 (ab205921; Abcam, Cambridge, UK), anti-PDK1 (ab90444; Abcam), or anti-p-Akt (ab38449; Abcam) – at 4°C over-night. After being incubated with a corresponding sec-ond antibody at 37°C for 30 min, the samples were stained with diaminobenizidine (DAB). Some sections were treated with phosphate-buffered saline (PBS) instead of primary antibody and were used as negative controls. Sections with a high expression of PD-L1, PDK1 or p-Akt served as positive controls. The Allred scoring system was used for pathological scoring. The degrees of staining inten-sity were the following: 0 (no staining); 1 (weak staining); 2 (moderate staining); and 3 (strong staining). Scores for the percentage of stained area were as follows: 0 (none); 1 (<1%); 2 (1–10%); 3 (10–33%); 4 (33–66%); and 5 (>66%). Both were used as the final IHC score: 0–2 (negative); 3–4 (weak); 5–6 (moderate); and 7–8 (strong). To further de-termine the expression levels of PD-L1, PDK1 and p-Akt, semi-quantitative analysis was conducted by calculating the mean optical density (MOD) using Image Pro Plus v. 6.0 software (Media Cybernetics, Rockville, USA). Briefly, pho-tographs were collected at a magnification of ×400 under the same exposure conditions. Five random photographs were captured for each slice. The integrated optical den-sity (IOD) was calculated. For pictures with no blank area, MOD = IOD/picture area; for pictures with a blank area, MOD = IOD/(picture area – blank area). The MOD value of 1 slice was calculated as the mean value of the 5 ran-domly selected fields in the slice.
Data collection
The basic characteristics of all patients were collected, including age, sex and body mass index (BMI). The clini-cal variables – including TNM (tumor–nodule–metas-tasis) stage, tumor diameter, capsular infiltration, tumor number, and lymph node metastasis – were also recorded.
Adv Clin Exp Med. 2020;29(7):785–792 787
All patients were followed up for 5 years from admission. To analyze the recurrence rate, the recurrence-free time was calculated during the study period from admission to death or to the end of follow-up.
Statistical analysis
The measurement data are expressed as means ± stan-dard deviation (SD). Comparisons between 2 groups of continuous data were performed using Student’s t-test. The χ2 test was used to compare the categorical variables. Pearson’s correlation analysis was performed to analyze the correlation of PD-L1, PDK1 and p-Akt. For recurrence analysis, Kaplan–Meier curve was used with the log-rank test. For logistic analysis, logistic regression was con-ducted using the stepwise method. A p-value <0.05 was considered to be statistically significant. All data analysis was performed using SPSS v. 22.0 software (IBM Corp., Armonk, USA).
Results
Basic characteristics of all patients
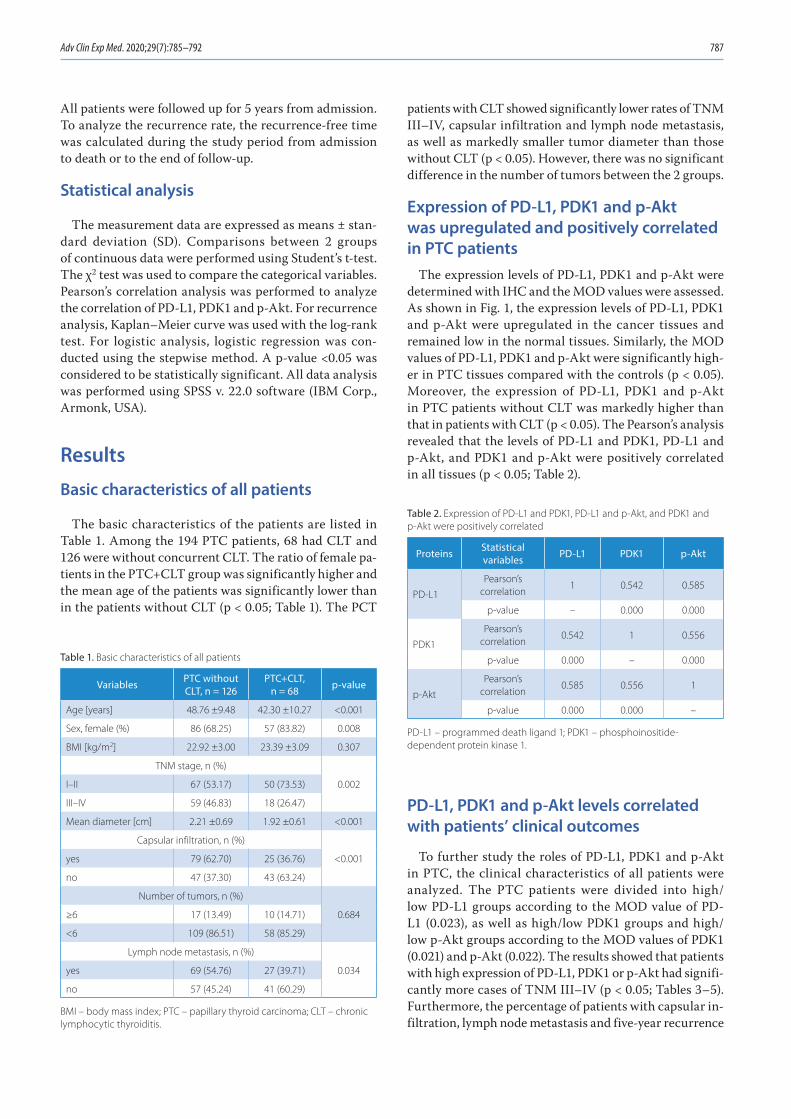
The basic characteristics of the patients are listed in Table 1. Among the 194 PTC patients, 68 had CLT and 126 were without concurrent CLT. The ratio of female pa-tients in the PTC+CLT group was significantly higher and the mean age of the patients was significantly lower than in the patients without CLT (p < 0.05; Table 1). The PCT
patients with CLT showed significantly lower rates of TNM III–IV, capsular infiltration and lymph node metastasis, as well as markedly smaller tumor diameter than those without CLT (p < 0.05). However, there was no significant difference in the number of tumors between the 2 groups.
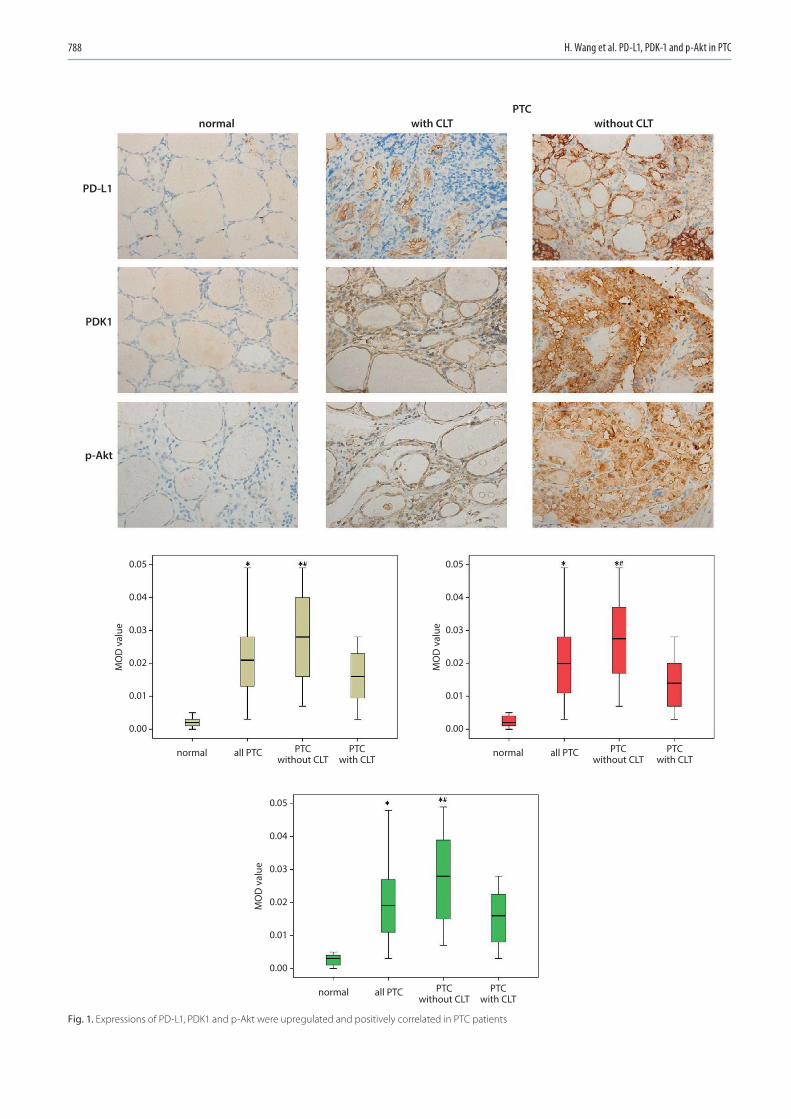
Expression of PD-L1, PDK1 and p-Akt was upregulated and positively correlated in PTC patients
The expression levels of PD-L1, PDK1 and p-Akt were determined with IHC and the MOD values were assessed. As shown in Fig. 1, the expression levels of PD-L1, PDK1 and p-Akt were upregulated in the cancer tissues and remained low in the normal tissues. Similarly, the MOD values of PD-L1, PDK1 and p-Akt were significantly high-er in PTC tissues compared with the controls (p < 0.05). Moreover, the expression of PD-L1, PDK1 and p-Akt in PTC patients without CLT was markedly higher than that in patients with CLT (p < 0.05). The Pearson’s analysis revealed that the levels of PD-L1 and PDK1, PD-L1 and p-Akt, and PDK1 and p-Akt were positively correlated in all tissues (p < 0.05; Table 2).
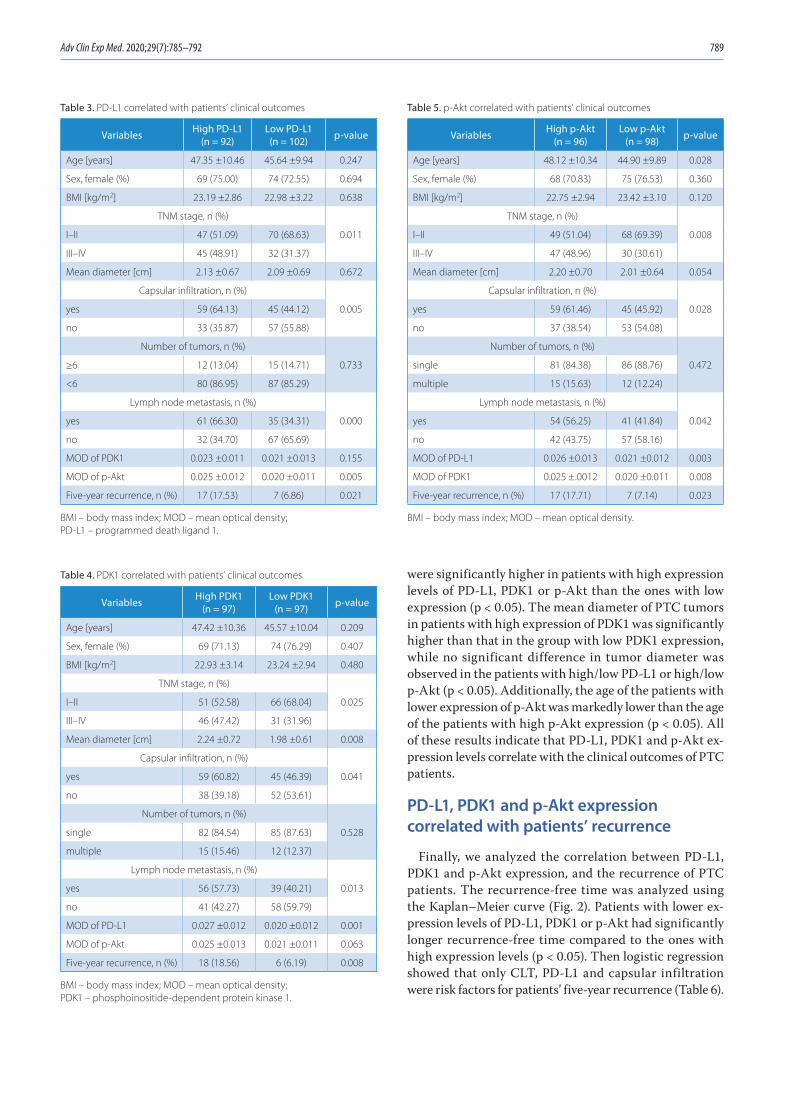
PD-L1, PDK1 and p-Akt levels correlated with patients’ clinical outcomes
To further study the roles of PD-L1, PDK1 and p-Akt in PTC, the clinical characteristics of all patients were analyzed. The PTC patients were divided into high/low PD-L1 groups according to the MOD value of PD-L1 (0.023), as well as high/low PDK1 groups and high/low p-Akt groups according to the MOD values of PDK1 (0.021) and p-Akt (0.022). The results showed that patients with high expression of PD-L1, PDK1 or p-Akt had signifi-cantly more cases of TNM III–IV (p < 0.05; Tables 3–5). Furthermore, the percentage of patients with capsular in-filtration, lymph node metastasis and five-year recurrence
Table 1. Basic characteristics of all patients
Variables PTC without CLT, n = 126
PTC+CLT, n = 68 p-value
Age [years] 48.76 ±9.48 42.30 ±10.27 <0.001
Sex, female (%) 86 (68.25) 57 (83.82) 0.008
BMI [kg/m2] 22.92 ±3.00 23.39 ±3.09 0.307
TNM stage, n (%)
0.002I–II 67 (53.17) 50 (73.53)
III–IV 59 (46.83) 18 (26.47)
Mean diameter [cm] 2.21 ±0.69 1.92 ±0.61 <0.001
Capsular infiltration, n (%)
<0.001yes 79 (62.70) 25 (36.76)
no 47 (37.30) 43 (63.24)
Number of tumors, n (%)
0.684≥6 17 (13.49) 10 (14.71)
<6 109 (86.51) 58 (85.29)
Lymph node metastasis, n (%)
0.034yes 69 (54.76) 27 (39.71)
no 57 (45.24) 41 (60.29)
BMI – body mass index; PTC – papillary thyroid carcinoma; CLT – chronic lymphocytic thyroiditis.
Table 2. Expression of PD-L1 and PDK1, PD-L1 and p-Akt, and PDK1 and p-Akt were positively correlated
Proteins Statistical variables PD-L1 PDK1 p-Akt
PD-L1Pearson’s
correlation1 0.542 0.585
p-value – 0.000 0.000
PDK1Pearson’s
correlation0.542 1 0.556
p-value 0.000 – 0.000
p-AktPearson’s
correlation0.585 0.556 1
p-value 0.000 0.000 –
PD-L1 – programmed death ligand 1; PDK1 – phosphoinositide-dependent protein kinase 1.
H. Wang et al. PD-L1, PDK-1 and p-Akt in PTC788
Fig. 1. Expressions of PD-L1, PDK1 and p-Akt were upregulated and positively correlated in PTC patients
0.05
0.04
0.03
0.02
0.01
0.00
0.05
0.04
0.03
0.02
0.01
0.00
0.05
0.04
0.03
0.02
0.01
0.00
normal
MO
D v
alue
MO
D v
alue
MO
D v
alue
PD-L1
PDK1
p-Akt
all PTC PTCwithout CLT
PTCwith CLT
normal with CLTPTC
without CLT
normal all PTC PTCwithout CLT
PTCwith CLT
normal all PTC PTCwithout CLT
PTCwith CLT
Adv Clin Exp Med. 2020;29(7):785–792 789
were significantly higher in patients with high expression levels of PD-L1, PDK1 or p-Akt than the ones with low expression (p < 0.05). The mean diameter of PTC tumors in patients with high expression of PDK1 was significantly higher than that in the group with low PDK1 expression, while no significant difference in tumor diameter was observed in the patients with high/low PD-L1 or high/low p-Akt (p < 0.05). Additionally, the age of the patients with lower expression of p-Akt was markedly lower than the age of the patients with high p-Akt expression (p < 0.05). All of these results indicate that PD-L1, PDK1 and p-Akt ex-pression levels correlate with the clinical outcomes of PTC patients.
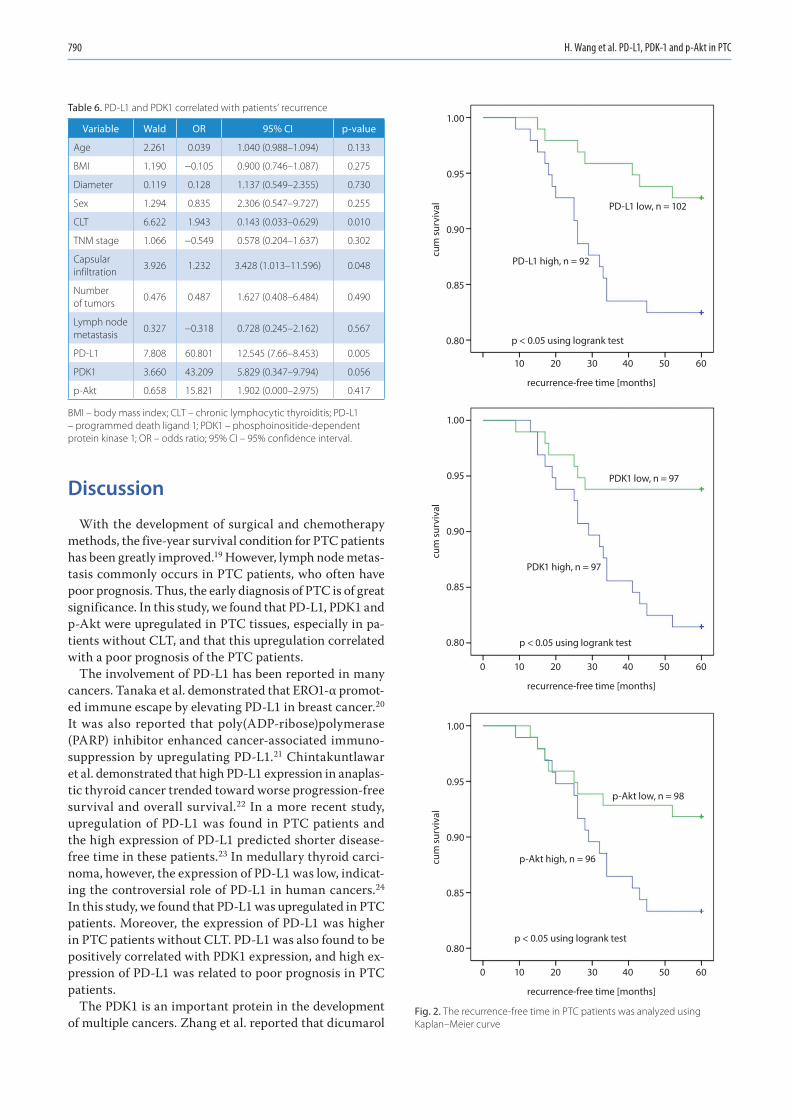
PD-L1, PDK1 and p-Akt expression correlated with patients’ recurrence
Finally, we analyzed the correlation between PD-L1, PDK1 and p-Akt expression, and the recurrence of PTC patients. The recurrence-free time was analyzed using the Kaplan–Meier curve (Fig. 2). Patients with lower ex-pression levels of PD-L1, PDK1 or p-Akt had significantly longer recurrence-free time compared to the ones with high expression levels (p < 0.05). Then logistic regression showed that only CLT, PD-L1 and capsular infiltration were risk factors for patients’ five-year recurrence (Table 6).
Table 3. PD-L1 correlated with patients’ clinical outcomes
Variables High PD-L1 (n = 92)
Low PD-L1 (n = 102) p-value
Age [years] 47.35 ±10.46 45.64 ±9.94 0.247
Sex, female (%) 69 (75.00) 74 (72.55) 0.694
BMI [kg/m2] 23.19 ±2.86 22.98 ±3.22 0.638
TNM stage, n (%)
0.011I–II 47 (51.09) 70 (68.63)
III–IV 45 (48.91) 32 (31.37)
Mean diameter [cm] 2.13 ±0.67 2.09 ±0.69 0.672
Capsular infiltration, n (%)
0.005yes 59 (64.13) 45 (44.12)
no 33 (35.87) 57 (55.88)
Number of tumors, n (%)
0.733≥6 12 (13.04) 15 (14.71)
<6 80 (86.95) 87 (85.29)
Lymph node metastasis, n (%)
0.000yes 61 (66.30) 35 (34.31)
no 32 (34.70) 67 (65.69)
MOD of PDK1 0.023 ±0.011 0.021 ±0.013 0.155
MOD of p-Akt 0.025 ±0.012 0.020 ±0.011 0.005
Five-year recurrence, n (%) 17 (17.53) 7 (6.86) 0.021
BMI – body mass index; MOD – mean optical density; PD-L1 – programmed death ligand 1.
Table 4. PDK1 correlated with patients’ clinical outcomes
Variables High PDK1 (n = 97)
Low PDK1 (n = 97) p-value
Age [years] 47.42 ±10.36 45.57 ±10.04 0.209
Sex, female (%) 69 (71.13) 74 (76.29) 0.407
BMI [kg/m2] 22.93 ±3.14 23.24 ±2.94 0.480
TNM stage, n (%)
0.025I–II 51 (52.58) 66 (68.04)
III–IV 46 (47.42) 31 (31.96)
Mean diameter [cm] 2.24 ±0.72 1.98 ±0.61 0.008
Capsular infiltration, n (%)
0.041yes 59 (60.82) 45 (46.39)
no 38 (39.18) 52 (53.61)
Number of tumors, n (%)
0.528single 82 (84.54) 85 (87.63)
multiple 15 (15.46) 12 (12.37)
Lymph node metastasis, n (%)
0.013yes 56 (57.73) 39 (40.21)
no 41 (42.27) 58 (59.79)
MOD of PD-L1 0.027 ±0.012 0.020 ±0.012 0.001
MOD of p-Akt 0.025 ±0.013 0.021 ±0.011 0.063
Five-year recurrence, n (%) 18 (18.56) 6 (6.19) 0.008
BMI – body mass index; MOD – mean optical density; PDK1 – phosphoinositide-dependent protein kinase 1.
Table 5. p-Akt correlated with patients’ clinical outcomes
Variables High p-Akt (n = 96)
Low p-Akt (n = 98) p-value
Age [years] 48.12 ±10.34 44.90 ±9.89 0.028
Sex, female (%) 68 (70.83) 75 (76.53) 0.360
BMI [kg/m2] 22.75 ±2.94 23.42 ±3.10 0.120
TNM stage, n (%)
0.008I–II 49 (51.04) 68 (69.39)
III–IV 47 (48.96) 30 (30.61)
Mean diameter [cm] 2.20 ±0.70 2.01 ±0.64 0.054
Capsular infiltration, n (%)
0.028yes 59 (61.46) 45 (45.92)
no 37 (38.54) 53 (54.08)
Number of tumors, n (%)
0.472single 81 (84.38) 86 (88.76)
multiple 15 (15.63) 12 (12.24)
Lymph node metastasis, n (%)
0.042yes 54 (56.25) 41 (41.84)
no 42 (43.75) 57 (58.16)
MOD of PD-L1 0.026 ±0.013 0.021 ±0.012 0.003
MOD of PDK1 0.025 ±.0012 0.020 ±0.011 0.008
Five-year recurrence, n (%) 17 (17.71) 7 (7.14) 0.023
BMI – body mass index; MOD – mean optical density.
H. Wang et al. PD-L1, PDK-1 and p-Akt in PTC790
Discussion
With the development of surgical and chemotherapy methods, the five-year survival condition for PTC patients has been greatly improved.19 However, lymph node metas-tasis commonly occurs in PTC patients, who often have poor prognosis. Thus, the early diagnosis of PTC is of great significance. In this study, we found that PD-L1, PDK1 and p-Akt were upregulated in PTC tissues, especially in pa-tients without CLT, and that this upregulation correlated with a poor prognosis of the PTC patients.
The involvement of PD-L1 has been reported in many cancers. Tanaka et al. demonstrated that ERO1-α promot-ed immune escape by elevating PD-L1 in breast cancer.20 It was also reported that poly(ADP-ribose)polymerase (PARP) inhibitor enhanced cancer-associated immuno-suppression by upregulating PD-L1.21 Chintakuntlawar et al. demonstrated that high PD-L1 expression in anaplas-tic thyroid cancer trended toward worse progression-free survival and overall survival.22 In a more recent study, upregulation of PD-L1 was found in PTC patients and the high expression of PD-L1 predicted shorter disease-free time in these patients.23 In medullary thyroid carci-noma, however, the expression of PD-L1 was low, indicat-ing the controversial role of PD-L1 in human cancers.24 In this study, we found that PD-L1 was upregulated in PTC patients. Moreover, the expression of PD-L1 was higher in PTC patients without CLT. PD-L1 was also found to be positively correlated with PDK1 expression, and high ex-pression of PD-L1 was related to poor prognosis in PTC patients.
The PDK1 is an important protein in the development of multiple cancers. Zhang et al. reported that dicumarol
Table 6. PD-L1 and PDK1 correlated with patients’ recurrence
Variable Wald OR 95% CI p-value
Age 2.261 0.039 1.040 (0.988–1.094) 0.133
BMI 1.190 −0.105 0.900 (0.746–1.087) 0.275
Diameter 0.119 0.128 1.137 (0.549–2.355) 0.730
Sex 1.294 0.835 2.306 (0.547–9.727) 0.255
CLT 6.622 1.943 0.143 (0.033–0.629) 0.010
TNM stage 1.066 −0.549 0.578 (0.204–1.637) 0.302
Capsular infiltration
3.926 1.232 3.428 (1.013–11.596) 0.048
Number of tumors
0.476 0.487 1.627 (0.408–6.484) 0.490
Lymph node metastasis
0.327 −0.318 0.728 (0.245–2.162) 0.567
PD-L1 7.808 60.801 12.545 (7.66–8.453) 0.005
PDK1 3.660 43.209 5.829 (0.347–9.794) 0.056
p-Akt 0.658 15.821 1.902 (0.000–2.975) 0.417
BMI – body mass index; CLT – chronic lymphocytic thyroiditis; PD-L1 – programmed death ligand 1; PDK1 – phosphoinositide-dependent protein kinase 1; OR – odds ratio; 95% CI – 95% confidence interval.
Fig. 2. The recurrence-free time in PTC patients was analyzed using Kaplan–Meier curve
recurrence-free time [months]
PD-L1 low, n = 102
PD-L1 high, n = 92
p < 0.05 using logrank test
PDK1 low, n = 97
PDK1 high, n = 97
p < 0.05 using logrank test
p-Akt low, n = 98
p-Akt high, n = 96
p < 0.05 using logrank test
cum
surv
ival
1.00
0.95
0.90
0.85
0.80
cum
surv
ival
1.00
0.95
0.90
0.85
0.80
cum
surv
ival
1.00
0.95
0.90
0.85
0.80
10 20 30 40 50 60
recurrence-free time [months]
0 10 20 30 40 50 60
recurrence-free time [months]
0 10 20 30 40 50 60
Adv Clin Exp Med. 2020;29(7):785–792 791
facilitated the progression of ovarian cancer by suppress-ing PDK1.25 It was found that PDK1 induced the invasion and migration of gallbladder cancer.26 Fujiwara et al. re-ported that the inhibition of PDK1 could also be consid-ered as a novel therapeutic target in multiple myeloma.27 In this study, we demonstrated for the first time that a high expression level of PDK1 correlated with poor prognosis and positively correlated with the expression of PD-L1 in PTC patients.
Additionally, the relationship between PD-L1 and PDK1 was also observed in several previous studies. Recent data showed that aberrant upregulation of PDK1 was correlated with the overexpression of PD-L1,18 which was consis-tent with our data. The p-Akt is the downstream protein of PDK1, which is also reported to play important roles in PTC. A recent study found that Akt inhibitor sup-pressed the proliferation of PTC cells.28 Also, the activa-tion of the Akt signaling pathway promoted the develop-ment of PTC.29 Consistent with the above in vitro studies, we showed that the expression of p-Akt was upregulated in PTC tissues and that it predicted worse prognosis of PTC. We also found that the expression of p-Akt was higher in patients without CLT. Further investigations are needed to elucidate the molecular mechanism under-lying the regulation of PD-L1, PDK1 and p-Akt in PTC progression.
The present study has some limitations. Firstly, the sam-ple size was small. Secondly, only PTC patients were included. Other histological types of thyroid carcinoma were not investigated. Thirdly, the molecular mecha-nisms of PD-L1, PDK1 and p-Akt in PTC development are not clear yet and their relationship with CLT needs to be clarified.
Conclusions
This observational study evaluated the clinical signifi-cance of PD-L1, PDK1 and p-Akt in PTC. The results show that PD-L1, PDK1 and p-Akt were upregulated in PTC patients, and their expression levels were higher in patients without CLT. The high expression of PD-L1, PDK1 and p-Akt correlated with poor prognosis of PTC. This study provided clinical evidence for the potential use of PD-L1, PDK1 and p-Akt as novel potential biomarkers in PTC diagnosis.
ORCID iDsHui Wang https://orcid.org/0000-0002-0045-8797Zhengdong Zhang https://orcid.org/0000-0002-1033-4763Zhe Yan https://orcid.org/0000-0002-4823-3327Shihong Ma https://orcid.org/0000-0002-5548-9777
References1. Abdullah MI, Junit SM, Ng KL, Jayapalan JJ, Karikalan B, Hashim OH.
Papillary thyroid cancer: Genetic alterations and molecular biomarker investigations. Int J Med Sci. 2019;16(3):450–460.
2. Liang J, Cai W, Feng D, et al. Genetic landscape of papillary thyroid carcinoma in the Chinese population: Somatic mutational profile of PTC in China. J Pathol. 2017;244(2):215–226.
3. Lim H, Devesa SS, Sosa JA, Check D, Kitahara CM. Trends in thyroid cancer incidence and mortality in the United States, 1974–2013. JAMA. 2017;317(13):1338–1348.
4. Lai X, Xia Y, Zhang B, et al. A meta-analysis of Hashimoto’s thyroiditis and papillary thyroid carcinoma risk. Oncotarget. 2017;8(37):62414–62424.
5. Chen JP, Bai J, Yang K. Prognostic value of cervical lymph node metas-tasis ratio in Asian papillary thyroid carcinoma 5-year relapse-free survival: A meta-analysis. Int Jof Clin Exp Med. 2018;11(3):1401–1410.
6. Dincel O, Bayraktar C. Evaluation of platelet indices as a useful marker in papillary thyroid carcinoma. Bratisl Lek Listy. 2017;118(3):153–155.
7. Ji WS, Han K, Lee J, et al. Application of metabolomics in prediction of lymph node metastasis in papillary thyroid carcinoma. PLoS One. 2018;13(3):e0193883.
8. Haugen BR, Alexander EK, Bible KC, et al. 2015 American Thyroid Association Management Guidelines for Adult Patients with Thyroid Nodules and Differentiated Thyroid Cancer. Thyroid. 2016;26(1):1–133.
9. Arianpoor A, Asadi M, Amini E, Ziaeemehr A, Ahmadi Simab S, Seyed Zakavi SR. Investigating the prevalence of risk factors of papillary thy-roid carcinoma recurrence and disease-free survival after thyroidec-tomy and central neck dissection in Iranian patients. Acta Chir Belg. 2019;120(3):173–178.
10. Liu W, Cheng R, Su Y, et al. Risk factors of central lymph node metas-tasis of papillary thyroid carcinoma: A single-center retrospective analysis of 3273 cases. Medicine (Baltimore). 2017;96(43):e8365.
11. Vita R, Ieni A, Tuccari G, Benvenga S. The increasing prevalence of chronic lymphocytic thyroiditis in papillary microcarcinoma. Rev Endocr Metab Disord. 2018;19(4):301–309.
12. Pilli T, Toti P, Occhini R, et al. Chronic lymphocytic thyroiditis (CLT) has a positive prognostic value in papillary thyroid cancer (PTC) patients: The potential key role of Foxp3+ T lymphocytes. J Endocrinol Invest. 2018;41(6):703–709.
13. Resende de Paiva C, Grønhøj C, Feldt-Rasmussen U, von Buchwald C. Association between Hashimoto’s thyroiditis and thyroid cancer in 64,628 patients. Front Oncol. 2017;7:53.
14. Trotter DEG, Meng X, McQuade P, et al. In vivo imaging of the pro-grammed death ligand 1 by 18 F positron emission tomography. J Nucl Med. 2017;58(11):1852–1857.
15. Rehman JA, Han G, Carvajal-Hausdorf DE, et al. Quantitative and pathologist-read comparison of the heterogeneity of programmed death-ligand 1 (PD-L1) expression in non-small cell lung cancer. Mod Pathol. 2017;30(3):340–349.
16. Nomi T, Sho M, Akahori T, et al. Clinical significance and therapeutic potential of the programmed death-1 ligand/programmed death-1 pathway in human pancreatic cancer. Clin Cancer Res. 2007;13(7): 2151–2157.
17. Lubin D, Baraban E, Lisby A, Jalali-Farahani S, Zhang P, Livolsi V. Pap-illary thyroid carcinoma emerging from Hashimoto thyroiditis dem-onstrates increased PD-L1 expression, which persists with metastasis. Endocr Pathol. 2018;29(4):317–323.
18. Wang JJ, Siu MK, Jiang, YX, et al. Aberrant upregulation of PDK1 in ovarian cancer cells impairs CD8+ T cell function and survival through elevation of PD-L1. Oncoimmunology. 2019;8(11):e1659092.
19. Boos LA, Schmitt A, Moch H, et al. MiRNAs are involved in tall cell mor-phology in papillary thyroid carcinoma. Cancers (Basel). 2019;11(6):885.
20. Tanaka T, Kutomi G, Kajiwara T, et al. Cancer-associated oxidore-ductase ERO1-α promotes immune escape through upregulation of PD-L1 in human breast cancer. Oncotarget. 2017;8(15):24706–24718.
21. Jiao S, Xia W, Yamaguchi H, et al. PARP inhibitor upregulates PD-L1 expression and enhances cancer-associated immunosuppression. Clin Cancer Res. 2017;23(14):3711–3720.
22. Chintakuntlawar AV, Rumilla KM, Smith CY, et al. Expression of PD-1 and PD-L1 in anaplastic thyroid cancer patients treated with multi-modal therapy: Results from a retrospective study. J Clin Endocrinol Metab. 2017;102(6):1943–1950.
23. Aghajani M, Roberts T, Yang T, et al. Elevated levels of soluble PD-L1 are associated with reduced recurrence in papillary thyroid cancer. Endocr Connect. 2019;8(7):1040–1051.
24. Bongiovanni M, Rebecchini C, Saglietti C, et al. Very low expres-sion of PD-L1 in medullary thyroid carcinoma. Endocr Relat Cancer. 2017;24(6):L35–L38.

H. Wang et al. PD-L1, PDK-1 and p-Akt in PTC792
25. Zhang W, Su J, Xu H, et al. Dicumarol inhibits PDK1 and targets multi-ple malignant behaviors of ovarian cancer cells. PLoS One. 2017;12(6): e0179672.
26. Lian SX, Shao YB, Liu HB, et al. PDK1 induces JunB, EMT, cell migration and invasion in human gallbladder cancer. Oncotarget. 2015;6(30): 29076–29086.
27. Fujiwara S, Kawano Y, Yuki H, et al. PDK1 inhibition is a novel thera-peutic target in multiple myeloma. Br J Cancer. 2013;108(1):170–178.
28. LeBoeuf B, Anderson B, Young M, Franco A, MacDonald L. Evaluat-ing the effectiveness of MAPK, AKT, and mTOR inhibitors in reduc-ing proliferation in cellular models of papillary and follicular thyroid cancer [abstract]. Cancer Res. 2018;78(13 Suppl):2887.
29. Xu J, Cai J, Jin X, et al. PIG3 plays an oncogenic role in papillary thy-roid cancer by activating the PI3K/AKT/PTEN pathway. Oncol Rep. 2015;34(3):1424–1430.
Cite asZhang X, Li X, Li B, Sun C, Zhang P. miR-21-5p protects hippocampal neurons of epileptic rats via inhibiting STAT3 expression. Adv Clin Exp Med. 2020;29(7):793–801. doi:10.17219/acem/121929
DOI10.17219/acem/121929
CopyrightCopyright by Author(s) This is an article distributed under the terms of theCreative Commons Attribution 3.0 Unported (CC BY 3.0)(https://creativecommons.org/licenses/by/3.0/)
Address for correspondencePeng ZhangE-mail: [email protected]
Funding sourcesNone declared
Conflict of interestNone declared
* Xiaolei Zhang and Xianfeng Li contributed equally to this work.
Received on December 1, 2019Reviewed on January 30, 2020Accepted on May 1, 2020
Published online on August 3, 2020
AbstractBackground. Epilepsy is a common chronic neurological disorder worldwide.
Objectives. To investigate the effects of miR-21-5p and signal transducer and activator of transcription-3 (STAT3) expressions on the apoptosis of hippocampal neurons in epileptic rats.
Material and methods. We created a rat model of epilepsy and examined the relationship between miR-21-5p and STAT3 using a bioinformatics website and dual the luciferase reporter (DLR) assay. Real-time quantitative polymerase chain reaction (RT-qPCR) and western blot were used to detect the expression levels of miR-21-5p and STAT3 in hippocampal neurons as well as the protein expression levels of cleaved caspase-3, Bax and Bcl-2, which were related to apoptosis of hippocampal neuron. The apoptosis and sur-vival of hippocampal neurons were detected using TUNEL and Nissl staining. Expressions of inflammatory factors interleukin (IL)-6 and tumor necrosis factor α (TNF-α) in serum were examined with enzyme-linked immunosorbent assay (ELISA).
Results. miR-21-5p can bind to STAT3. Compared with the miR-21-5p inhibitor negative control (NC) group, the expression levels of caspase-3 and Bax were higher and the expression level of Bcl-2 was lower in the miR-21-5p inhibitor group, whereas the caspase-3 and Bax levels were lower and Bcl-2 level was higher in the si-STAT3 (interfering STAT3 gene expression by transfecting small interfering RNA) group (all p < 0.05). Treatment with miR-21-5p inhibitor can lead to significant loss and apoptosis of hippocampal neurons, while interfering with STAT3 expression can reduce the loss and apoptosis of the neurons (all p < 0.05). Compared with the miR-21-5p inhibitor NC group, the level of IL-6 was lower in the si-STAT3 group and higher in the miR-21-5p inhibitor group (both p < 0.05).
Conclusions. miR-21-5p can inhibit STAT3 expression and reduce apoptosis and loss of hippocampal neurons and IL-6 level, thereby achieving protective effects on hippocampal neurons of epileptic rats.
Key words: epilepsy, STAT3, hippocampal neuron, miR-21-5p, epileptic rats
Original papers
miR-21-5p protects hippocampal neurons of epileptic rats via inhibiting STAT3 expression
*Xiaolei Zhang1,A,D,F, *Xianfeng Li2,A,C,D,F, Bin Li3,B,F, Chengfeng Sun4,B,F, Peng Zhang5,E,F
1 Department of Neurology, Jining Combine Traditional Chinese and Western Medicine Hospital, China2 Department of Neurosurgery, Penglai People’s Hospital, Yantai, China3 Second Department of Neurology, The Second People’s Hospital of Liaocheng, China4 Department of Traditional Chinese Medicine, Linyi County Hospital of Traditional Chinese Medicine, Dezhou, China5 Department of Neurology, Gaomi People’s Hospital, Weifang, China
A – research concept and design; B – collection and/or assembly of data; C – data analysis and interpretation; D – writing the article; E – critical revision of the article; F – final approval of the article
Advances in Clinical and Experimental Medicine, ISSN 1899–5276 (print), ISSN 2451–2680 (online) Adv Clin Exp Med. 2020;29(7):793–801
X. Zhang et al. miR-21-5p inhibits STAT3 expression794
Introduction
Epilepsy is a common chronic neurological disorder worldwide. It is characterized by recurrent unpredictable seizures and often results from overstimulation of neu-rons or disorders of metabolism and the nervous system due to brain damage.1–3 According to the statistics from the World Health Organization (WHO) on the worldwide prevalence rate of diseases in 2010, epilepsy ranked second among neurological diseases.4 The lifespan of patients with epilepsy is much shorter than of healthy people.5 Even though the treatment for epilepsy, including medication, neuromodulation, surgical management, and diet control, have been advancing in recent years, nearly 30% of the pa-tients still do not respond to epilepsy medications and experience regular onset after treatment.6,7 Therefore, it is necessary to develop new drugs or gene therapies for better treatment of this disease.
In recent years, the molecular mechanism of gene regu-lation by microRNA (miRNA) has been gaining attention. MicroRNA can bind to the 3ʹuntranslated region (3ʹUTR) of its target gene to inhibit mRNA translation.8 Some stud-ies have found that miRNA serves a critical role in various biological process, including cell proliferation and growth, inflammation progression, neuronal progenitor synthe-sis, as well as growth and differentiation of immature neurons.9 Of all the discovered miRNAs, about 70% are specifically expressed in the brain and take a critical part in the function and development of the nervous system.10 miR-21-5p, a type of miRNA mainly expressed in brain and neurons, has an essential role in various brain diseases.11–13 In the present study, we used bioinformatics website and dual luciferase reporter (DLR) assay to determine whether miR-21-5p can target signal transducer and activator of transcription-3 (STAT3). Other studies have demonstrated that STAT3 overexpression can promote neuronal apop-tosis, while inhibiting STAT3 expression can reduce brain damage and neuroinflammation (including the neuroin-flammation in patients with cerebral ischemia).14,15 There-fore, in the present study, we hypothesized that miR-21-5p could protect the hippocampal neurons of epileptic rats through regulating STAT3 signaling pathway.
Material and methods
Transfection of miRNA and model creation
Male Sprague Dawley rats at the age of 6–8 weeks (weight 300 g, purchased from SJA Laboratory Animal, Changsha, China) were kept in separate cages with a constant tempera-ture and humidity. They were fed with a standard diet and sterile water for 1 week and randomized into the following 6 groups with 6 rats in each group: 1) normal group (blank control); 2) model group (epilepsy model); 3) miR-21-5p inhibitor negative control (NC) group (epilepsy model +
miR-21 inhibitor negative control); 4) miR-21-5p inhibitor group (epilepsy model + miR-21-5p inhibition); 5) si-STAT3 group (epilepsy model + STAT3 interference); and 6) miR-21-5p inhibitor + si-STAT3 group (epilepsy model + both miR-21-5p inhibition and STAT3 interference).
All animal experiments followed the institutional guide for the care and use of laboratory animals, and the study was approved by the Ethics Committee of our hospital.
Rat model of epilepsy was induced through an intra-peritoneal injection of 127 mg/kg of lithium chloride, fol-lowed by 10 mg/kg of atropine methobromide 18–24 h later and another 30 mg/kg of pilocarpine 30 min later.16 Rats in the normal group were intraperitoneally injected with an equal volume of normal saline. The behavior of the rats was observed. According to the Racine’s scale, if there was no seizure or the seizure did not reach level IV, intraperito-neal injection of 10 mg/kg of pilocarpine would be adminis-tered every 15 min until status epilepticus (SE) occurred.17 Since SE was defined as epilepsy reaching level IV–V and lasting for over 30 min, the SE model was considered to be successfully established if the rats survived and had and epilepsy level over IV. All the reagents used in the model creation were from Sigma-Aldrich (St. Louis, USA).
Lithium chloride-pilocarpine rat model is a common model used in the study on epilepsy. The mechanism of this model creation may be related to the reaction with the acetylcholine receptor. Pilocarpine is an agonist for muscarinic acetylcholine receptors (mAChRs), which can induce a persistent generalized tonic-clonic seizure. The mAChRs can couple with G protein, while G protein can pass the stimulus to phospholipase C, which then hydrolyzes phosphatidylinositol 4,5-bisphosphate (PIP2) to generate two-second messengers, inositol triphosphate (IP3) and diacylglycerol (DG). Excessive levels of IP3 and DG can damage the neuron. Lithium chloride can in-hibit the decomposition of IP3, thereby synergizing with pilocarpine.
The sequences of miR-21-5p inhibitor NC, miR-21-5p inhibitor and si-STAT3 (interfering STAT3 gene expres-sion by transfecting small interfering RNA) were synthe-sized and provided by Ribobio (Guangzhou, China; 5 nmol in each tube). They were diluted with 50 μL nuclease-free water to make 5 nmol/50 μL solution and were divided into 5 tubes of 10 μL each, followed by storage at −20°C. Before use, the solution of the sequences was diluted to 1 nmol/50 μL with 40 μL pre-cooled normal saline. Five hours after successful modeling, the stereotaxic technique was conducted for administering miR-21-5p inhibitor NC, miR-21-5p inhibitor and si-STAT3.18 The rats were fixed onto an animal brain solid positioner after anesthesia. After preoperative skin preparation and disinfection, the skin and muscle were separated to expose the skull bone. The anterior fontanelle was regarded as the origin of coordinate and the right cerebral ventricle was located for drug administration. A microsyringe was inserted for slow administration (1 nmol/50 μL within 30 min) and
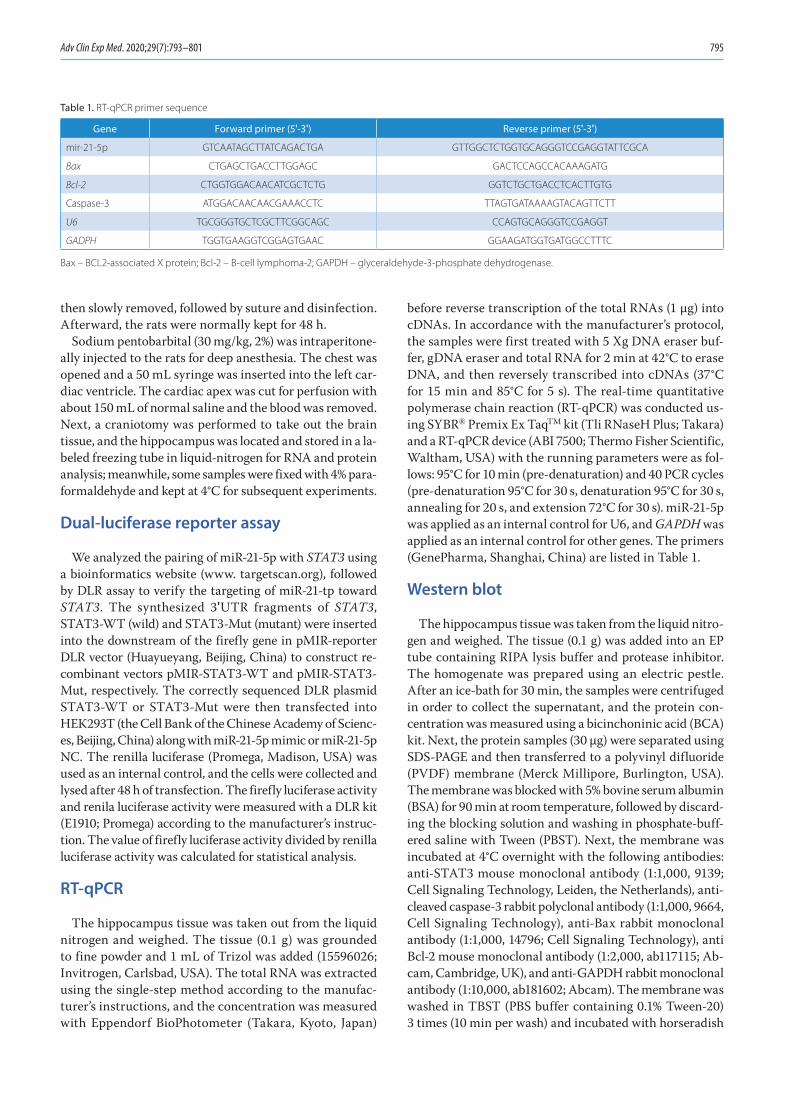
Adv Clin Exp Med. 2020;29(7):793–801 795
then slowly removed, followed by suture and disinfection. Afterward, the rats were normally kept for 48 h.
Sodium pentobarbital (30 mg/kg, 2%) was intraperitone-ally injected to the rats for deep anesthesia. The chest was opened and a 50 mL syringe was inserted into the left car-diac ventricle. The cardiac apex was cut for perfusion with about 150 mL of normal saline and the blood was removed. Next, a craniotomy was performed to take out the brain tissue, and the hippocampus was located and stored in a la-beled freezing tube in liquid-nitrogen for RNA and protein analysis; meanwhile, some samples were fixed with 4% para-formaldehyde and kept at 4°C for subsequent experiments.
Dual-luciferase reporter assay
We analyzed the pairing of miR-21-5p with STAT3 using a bioinformatics website (www. targetscan.org), followed by DLR assay to verify the targeting of miR-21-tp toward STAT3. The synthesized 3ʹUTR fragments of STAT3, STAT3-WT (wild) and STAT3-Mut (mutant) were inserted into the downstream of the firefly gene in pMIR-reporter DLR vector (Huayueyang, Beijing, China) to construct re-combinant vectors pMIR-STAT3-WT and pMIR-STAT3-Mut, respectively. The correctly sequenced DLR plasmid STAT3-WT or STAT3-Mut were then transfected into HEK293T (the Cell Bank of the Chinese Academy of Scienc-es, Beijing, China) along with miR-21-5p mimic or miR-21-5p NC. The renilla luciferase (Promega, Madison, USA) was used as an internal control, and the cells were collected and lysed after 48 h of transfection. The firefly luciferase activity and renila luciferase activity were measured with a DLR kit (E1910; Promega) according to the manufacturer’s instruc-tion. The value of firefly luciferase activity divided by renilla luciferase activity was calculated for statistical analysis.
RT-qPCR
The hippocampus tissue was taken out from the liquid nitrogen and weighed. The tissue (0.1 g) was grounded to fine powder and 1 mL of Trizol was added (15596026; Invitrogen, Carlsbad, USA). The total RNA was extracted using the single-step method according to the manufac-turer’s instructions, and the concentration was measured with Eppendorf BioPhotometer (Takara, Kyoto, Japan)
before reverse transcription of the total RNAs (1 μg) into cDNAs. In accordance with the manufacturer’s protocol, the samples were first treated with 5 Xg DNA eraser buf-fer, gDNA eraser and total RNA for 2 min at 42°C to erase DNA, and then reversely transcribed into cDNAs (37°C for 15 min and 85°C for 5 s). The real-time quantitative polymerase chain reaction (RT-qPCR) was conducted us-ing SYBR® Premix Ex TaqTM kit (Tli RNaseH Plus; Takara) and a RT-qPCR device (ABI 7500; Thermo Fisher Scientific, Waltham, USA) with the running parameters were as fol-lows: 95°C for 10 min (pre-denaturation) and 40 PCR cycles (pre-denaturation 95°C for 30 s, denaturation 95°C for 30 s, annealing for 20 s, and extension 72°C for 30 s). miR-21-5p was applied as an internal control for U6, and GAPDH was applied as an internal control for other genes. The primers (GenePharma, Shanghai, China) are listed in Table 1.
Western blot
The hippocampus tissue was taken from the liquid nitro-gen and weighed. The tissue (0.1 g) was added into an EP tube containing RIPA lysis buffer and protease inhibitor. The homogenate was prepared using an electric pestle. After an ice-bath for 30 min, the samples were centrifuged in order to collect the supernatant, and the protein con-centration was measured using a bicinchoninic acid (BCA) kit. Next, the protein samples (30 µg) were separated using SDS-PAGE and then transferred to a polyvinyl difluoride (PVDF) membrane (Merck Millipore, Burlington, USA). The membrane was blocked with 5% bovine serum albumin (BSA) for 90 min at room temperature, followed by discard-ing the blocking solution and washing in phosphate-buff-ered saline with Tween (PBST). Next, the membrane was incubated at 4°C overnight with the following antibodies: anti-STAT3 mouse monoclonal antibody (1:1,000, 9139; Cell Signaling Technology, Leiden, the Netherlands), anti-cleaved caspase-3 rabbit polyclonal antibody (1:1,000, 9664, Cell Signaling Technology), anti-Bax rabbit monoclonal antibody (1:1,000, 14796; Cell Signaling Technology), anti Bcl-2 mouse monoclonal antibody (1:2,000, ab117115; Ab-cam, Cambridge, UK), and anti-GAPDH rabbit monoclonal antibody (1:10,000, ab181602; Abcam). The membrane was washed in TBST (PBS buffer containing 0.1% Tween-20) 3 times (10 min per wash) and incubated with horseradish
Table 1. RT-qPCR primer sequence
Gene Forward primer (5ʹ-3ʹ) Reverse primer (5ʹ-3ʹ)
mir-21-5p GTCAATAGCTTATCAGACTGA GTTGGCTCTGGTGCAGGGTCCGAGGTATTCGCA
Bax CTGAGCTGACCTTGGAGC GACTCCAGCCACAAAGATG
Bcl-2 CTGGTGGACAACATCGCTCTG GGTCTGCTGACCTCACTTGTG
Caspase-3 ATGGACAACAACGAAACCTC TTAGTGATAAAAGTACAGTTCTT
U6 TGCGGGTGCTCGCTTCGGCAGC CCAGTGCAGGGTCCGAGGT
GADPH TGGTGAAGGTCGGAGTGAAC GGAAGATGGTGATGGCCTTTC
Bax – BCL2-associated X protein; Bcl-2 – B-cell lymphoma-2; GAPDH – glyceraldehyde-3-phosphate dehydrogenase.
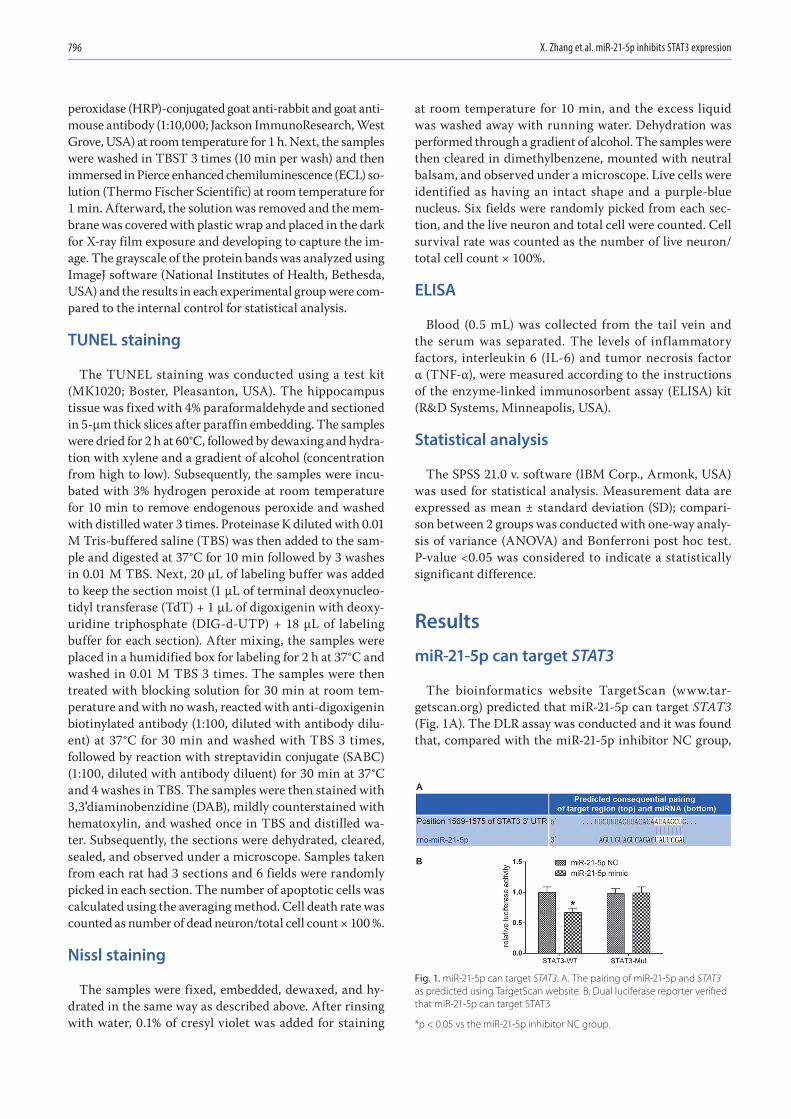
X. Zhang et al. miR-21-5p inhibits STAT3 expression796
peroxidase (HRP)-conjugated goat anti-rabbit and goat anti-mouse antibody (1:10,000; Jackson ImmunoResearch, West Grove, USA) at room temperature for 1 h. Next, the samples were washed in TBST 3 times (10 min per wash) and then immersed in Pierce enhanced chemiluminescence (ECL) so-lution (Thermo Fischer Scientific) at room temperature for 1 min. Afterward, the solution was removed and the mem-brane was covered with plastic wrap and placed in the dark for X-ray film exposure and developing to capture the im-age. The grayscale of the protein bands was analyzed using ImageJ software (National Institutes of Health, Bethesda, USA) and the results in each experimental group were com-pared to the internal control for statistical analysis.
TUNEL staining
The TUNEL staining was conducted using a test kit (MK1020; Boster, Pleasanton, USA). The hippocampus tissue was fixed with 4% paraformaldehyde and sectioned in 5-μm thick slices after paraffin embedding. The samples were dried for 2 h at 60°C, followed by dewaxing and hydra-tion with xylene and a gradient of alcohol (concentration from high to low). Subsequently, the samples were incu-bated with 3% hydrogen peroxide at room temperature for 10 min to remove endogenous peroxide and washed with distilled water 3 times. Proteinase K diluted with 0.01 M Tris-buffered saline (TBS) was then added to the sam-ple and digested at 37°C for 10 min followed by 3 washes in 0.01 M TBS. Next, 20 μL of labeling buffer was added to keep the section moist (1 μL of terminal deoxynucleo-tidyl transferase (TdT) + 1 μL of digoxigenin with deoxy-uridine triphosphate (DIG-d-UTP) + 18 μL of labeling buffer for each section). After mixing, the samples were placed in a humidified box for labeling for 2 h at 37°C and washed in 0.01 M TBS 3 times. The samples were then treated with blocking solution for 30 min at room tem-perature and with no wash, reacted with anti-digoxigenin biotinylated antibody (1:100, diluted with antibody dilu-ent) at 37°C for 30 min and washed with TBS 3 times, followed by reaction with streptavidin conjugate (SABC) (1:100, diluted with antibody diluent) for 30 min at 37°C and 4 washes in TBS. The samples were then stained with 3,3ʹdiaminobenzidine (DAB), mildly counterstained with hematoxylin, and washed once in TBS and distilled wa-ter. Subsequently, the sections were dehydrated, cleared, sealed, and observed under a microscope. Samples taken from each rat had 3 sections and 6 fields were randomly picked in each section. The number of apoptotic cells was calculated using the averaging method. Cell death rate was counted as number of dead neuron/total cell count × 100 %.
Nissl staining
The samples were fixed, embedded, dewaxed, and hy-drated in the same way as described above. After rinsing with water, 0.1% of cresyl violet was added for staining
at room temperature for 10 min, and the excess liquid was washed away with running water. Dehydration was performed through a gradient of alcohol. The samples were then cleared in dimethylbenzene, mounted with neutral balsam, and observed under a microscope. Live cells were identified as having an intact shape and a purple-blue nucleus. Six fields were randomly picked from each sec-tion, and the live neuron and total cell were counted. Cell survival rate was counted as the number of live neuron/total cell count × 100%.
ELISA
Blood (0.5 mL) was collected from the tail vein and the serum was separated. The levels of inflammatory factors, interleukin 6 (IL-6) and tumor necrosis factor α (TNF-α), were measured according to the instructions of the enzyme-linked immunosorbent assay (ELISA) kit (R&D Systems, Minneapolis, USA).
Statistical analysis
The SPSS 21.0 v. software (IBM Corp., Armonk, USA) was used for statistical analysis. Measurement data are expressed as mean ± standard deviation (SD); compari-son between 2 groups was conducted with one-way analy-sis of variance (ANOVA) and Bonferroni post hoc test. P-value <0.05 was considered to indicate a statistically significant difference.
Results
miR-21-5p can target STAT3
The bioinformatics website TargetScan (www.tar-getscan.org) predicted that miR-21-5p can target STAT3 (Fig. 1A). The DLR assay was conducted and it was found that, compared with the miR-21-5p inhibitor NC group,
Fig. 1. miR-21-5p can target STAT3. A. The pairing of miR-21-5p and STAT3 as predicted using TargetScan website. B. Dual luciferase reporter verified that miR-21-5p can target STAT3
*p < 0.05 vs the miR-21-5p inhibitor NC group.
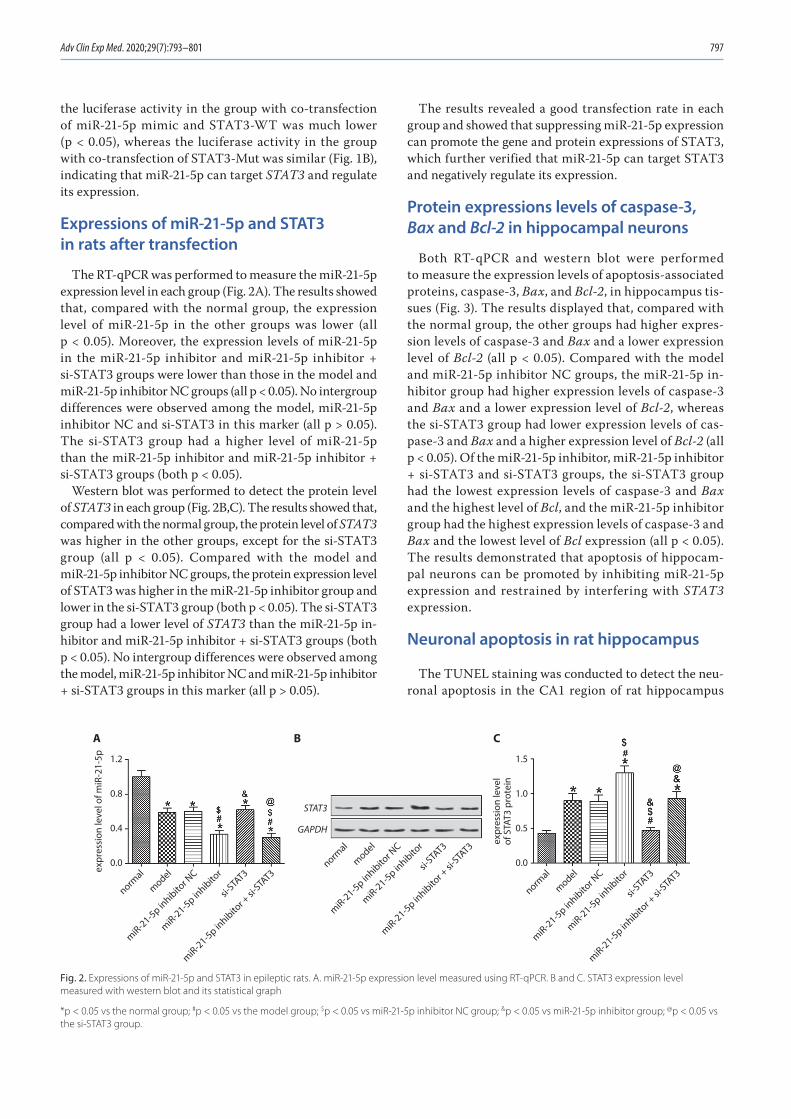
Adv Clin Exp Med. 2020;29(7):793–801 797
the luciferase activity in the group with co-transfection of miR-21-5p mimic and STAT3-WT was much lower (p < 0.05), whereas the luciferase activity in the group with co-transfection of STAT3-Mut was similar (Fig. 1B), indicating that miR-21-5p can target STAT3 and regulate its expression.
Expressions of miR-21-5p and STAT3 in rats after transfection
The RT-qPCR was performed to measure the miR-21-5p expression level in each group (Fig. 2A). The results showed that, compared with the normal group, the expression level of miR-21-5p in the other groups was lower (all p < 0.05). Moreover, the expression levels of miR-21-5p in the miR-21-5p inhibitor and miR-21-5p inhibitor + si-STAT3 groups were lower than those in the model and miR-21-5p inhibitor NC groups (all p < 0.05). No intergroup differences were observed among the model, miR-21-5p inhibitor NC and si-STAT3 in this marker (all p > 0.05). The si-STAT3 group had a higher level of miR-21-5p than the miR-21-5p inhibitor and miR-21-5p inhibitor + si-STAT3 groups (both p < 0.05).
Western blot was performed to detect the protein level of STAT3 in each group (Fig. 2B,C). The results showed that, compared with the normal group, the protein level of STAT3 was higher in the other groups, except for the si-STAT3 group (all p < 0.05). Compared with the model and miR-21-5p inhibitor NC groups, the protein expression level of STAT3 was higher in the miR-21-5p inhibitor group and lower in the si-STAT3 group (both p < 0.05). The si-STAT3 group had a lower level of STAT3 than the miR-21-5p in-hibitor and miR-21-5p inhibitor + si-STAT3 groups (both p < 0.05). No intergroup differences were observed among the model, miR-21-5p inhibitor NC and miR-21-5p inhibitor + si-STAT3 groups in this marker (all p > 0.05).
The results revealed a good transfection rate in each group and showed that suppressing miR-21-5p expression can promote the gene and protein expressions of STAT3, which further verified that miR-21-5p can target STAT3 and negatively regulate its expression.
Protein expressions levels of caspase-3, Bax and Bcl-2 in hippocampal neurons
Both RT-qPCR and western blot were performed to measure the expression levels of apoptosis-associated proteins, caspase-3, Bax, and Bcl-2, in hippocampus tis-sues (Fig. 3). The results displayed that, compared with the normal group, the other groups had higher expres-sion levels of caspase-3 and Bax and a lower expression level of Bcl-2 (all p < 0.05). Compared with the model and miR-21-5p inhibitor NC groups, the miR-21-5p in-hibitor group had higher expression levels of caspase-3 and Bax and a lower expression level of Bcl-2, whereas the si-STAT3 group had lower expression levels of cas-pase-3 and Bax and a higher expression level of Bcl-2 (all p < 0.05). Of the miR-21-5p inhibitor, miR-21-5p inhibitor + si-STAT3 and si-STAT3 groups, the si-STAT3 group had the lowest expression levels of caspase-3 and Bax and the highest level of Bcl, and the miR-21-5p inhibitor group had the highest expression levels of caspase-3 and Bax and the lowest level of Bcl expression (all p < 0.05). The results demonstrated that apoptosis of hippocam-pal neurons can be promoted by inhibiting miR-21-5p expression and restrained by interfering with STAT3 expression.
Neuronal apoptosis in rat hippocampus
The TUNEL staining was conducted to detect the neu-ronal apoptosis in the CA1 region of rat hippocampus
Fig. 2. Expressions of miR-21-5p and STAT3 in epileptic rats. A. miR-21-5p expression level measured using RT-qPCR. B and C. STAT3 expression level measured with western blot and its statistical graph
*p < 0.05 vs the normal group; #p < 0.05 vs the model group; $p < 0.05 vs miR-21-5p inhibitor NC group; &p < 0.05 vs miR-21-5p inhibitor group; @p < 0.05 vs the si-STAT3 group.
normal
model
miR-21-5p inhibito
r NC
miR-21-5p inhibito
r
si-STA
T3
miR-21-5p inhibito
r + si-
STAT3
normal
model
miR-21-5p inhibito
r NC
miR-21-5p inhibito
r
si-STA
T3
miR-21-5p inhibito
r + si-
STAT3
normal
model
miR-21-5p inhibito
r NC
miR-21-5p inhibito
r
si-STA
T3
miR-21-5p inhibito
r + si-
STAT3
1.2
0.8
0.4
0.0
1.5
1.0
0.5
0.0
STAT3
GAPDH
expr
essi
on le
vel o
f miR
-21-
5p
expr
essi
on le
vel
of S
TAT3
pro
tein
A B C
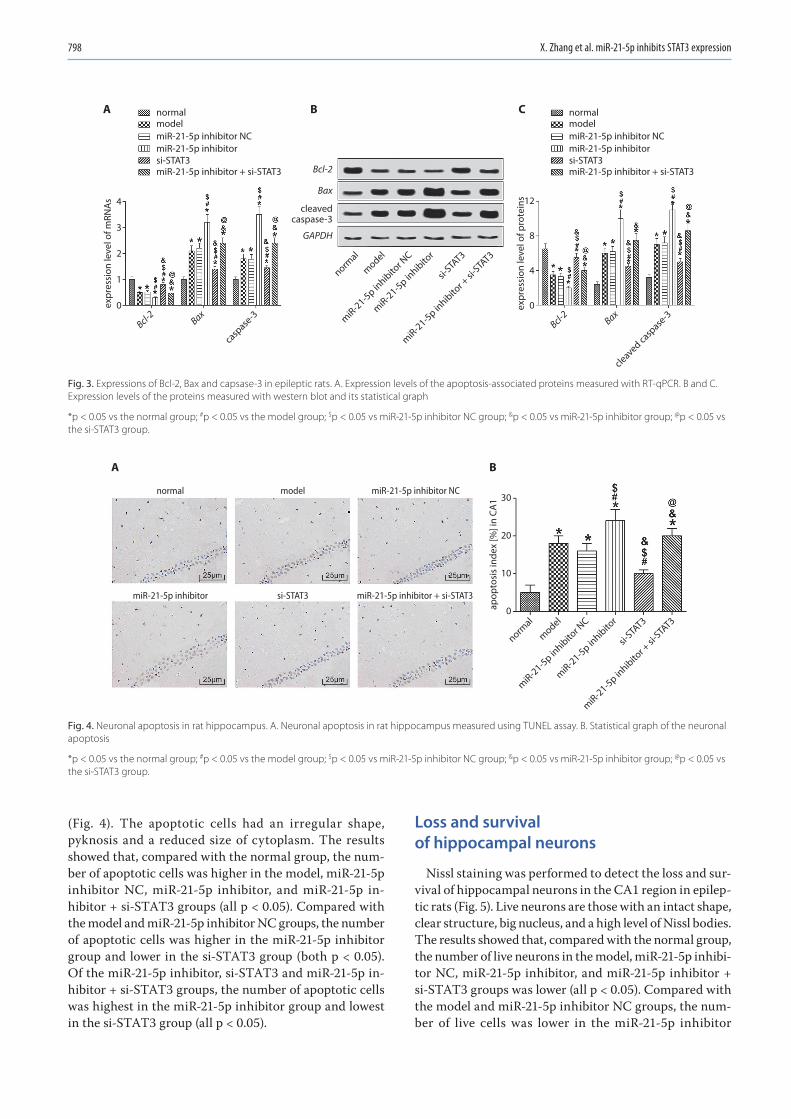
X. Zhang et al. miR-21-5p inhibits STAT3 expression798
(Fig. 4). The apoptotic cells had an irregular shape, pyknosis and a reduced size of cytoplasm. The results showed that, compared with the normal group, the num-ber of apoptotic cells was higher in the model, miR-21-5p inhibitor NC, miR-21-5p inhibitor, and miR-21-5p in-hibitor + si-STAT3 groups (all p < 0.05). Compared with the model and miR-21-5p inhibitor NC groups, the number of apoptotic cells was higher in the miR-21-5p inhibitor group and lower in the si-STAT3 group (both p < 0.05). Of the miR-21-5p inhibitor, si-STAT3 and miR-21-5p in-hibitor + si-STAT3 groups, the number of apoptotic cells was highest in the miR-21-5p inhibitor group and lowest in the si-STAT3 group (all p < 0.05).
Loss and survival of hippocampal neurons
Nissl staining was performed to detect the loss and sur-vival of hippocampal neurons in the CA1 region in epilep-tic rats (Fig. 5). Live neurons are those with an intact shape, clear structure, big nucleus, and a high level of Nissl bodies. The results showed that, compared with the normal group, the number of live neurons in the model, miR-21-5p inhibi-tor NC, miR-21-5p inhibitor, and miR-21-5p inhibitor + si-STAT3 groups was lower (all p < 0.05). Compared with the model and miR-21-5p inhibitor NC groups, the num-ber of live cells was lower in the miR-21-5p inhibitor
Fig. 4. Neuronal apoptosis in rat hippocampus. A. Neuronal apoptosis in rat hippocampus measured using TUNEL assay. B. Statistical graph of the neuronal apoptosis
*p < 0.05 vs the normal group; #p < 0.05 vs the model group; $p < 0.05 vs miR-21-5p inhibitor NC group; &p < 0.05 vs miR-21-5p inhibitor group; @p < 0.05 vs the si-STAT3 group.
Fig. 3. Expressions of Bcl-2, Bax and capsase-3 in epileptic rats. A. Expression levels of the apoptosis-associated proteins measured with RT-qPCR. B and C. Expression levels of the proteins measured with western blot and its statistical graph
*p < 0.05 vs the normal group; #p < 0.05 vs the model group; $p < 0.05 vs miR-21-5p inhibitor NC group; &p < 0.05 vs miR-21-5p inhibitor group; @p < 0.05 vs the si-STAT3 group.
normalmodelmiR-21-5p inhibitor NCmiR-21-5p inhibitorsi-STAT3miR-21-5p inhibitor + si-STAT3
normalmodelmiR-21-5p inhibitor NCmiR-21-5p inhibitorsi-STAT3miR-21-5p inhibitor + si-STAT3
normal
Bcl-2 Bax
casp
ase-3
Bcl-2 Bax
cleaved ca
spase
-3
cleavedcaspase-3
model
miR-21-5p inhibito
r NC
miR-21-5p inhibito
r
si-STA
T3
miR-21-5p inhibito
r + si-
STAT3
4
3
2
1
0
GAPDH
Bax
Bcl-2
expr
essi
on le
vel o
f mRN
As 12
8
4
0expr
essi
on le
vel o
f pro
tein
s
A B C
normal model miR-21-5p inhibitor NC
miR-21-5p inhibitor si-STAT3 miR-21-5p inhibitor + si-STAT3
normal
model
miR-21-5p inhibito
r NC
miR-21-5p inhibito
r
si-STA
T3
miR-21-5p inhibito
r + si-
STAT3
30
20
10
0apop
tosi
s in
dex
[%] i
n CA
1
A B
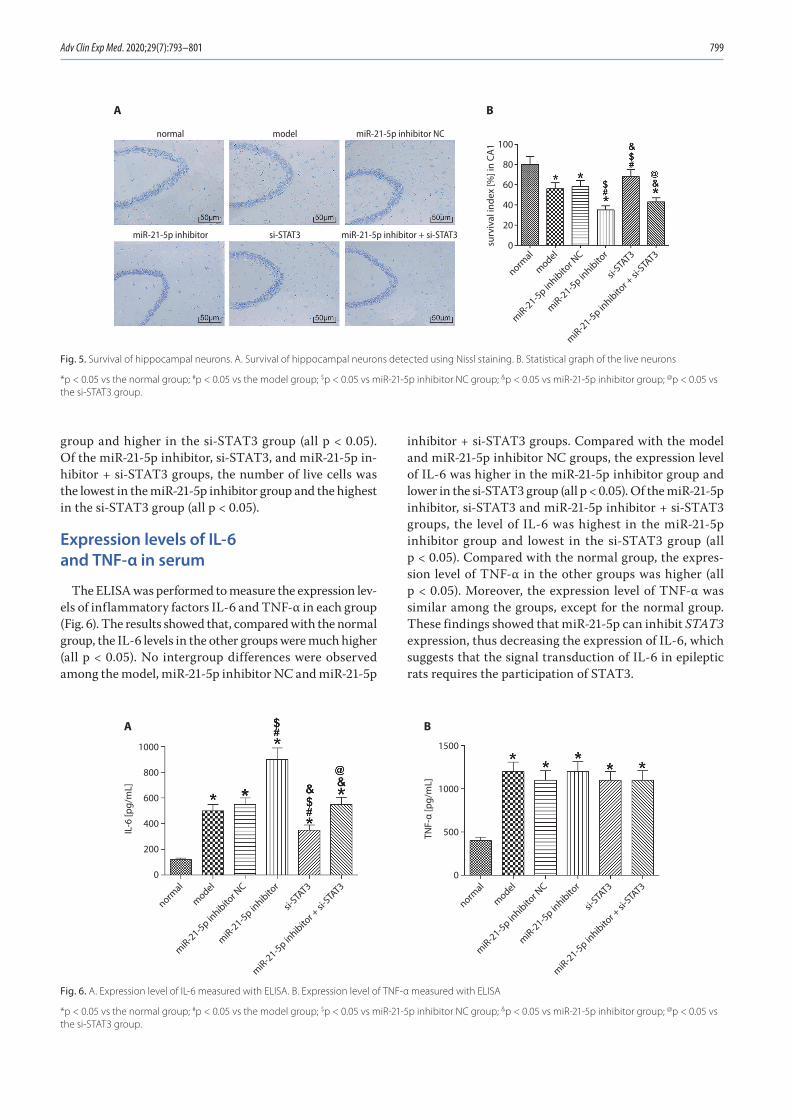
Adv Clin Exp Med. 2020;29(7):793–801 799
group and higher in the si-STAT3 group (all p < 0.05). Of the miR-21-5p inhibitor, si-STAT3, and miR-21-5p in-hibitor + si-STAT3 groups, the number of live cells was the lowest in the miR-21-5p inhibitor group and the highest in the si-STAT3 group (all p < 0.05).
Expression levels of IL-6 and TNF-α in serum
The ELISA was performed to measure the expression lev-els of inflammatory factors IL-6 and TNF-α in each group (Fig. 6). The results showed that, compared with the normal group, the IL-6 levels in the other groups were much higher (all p < 0.05). No intergroup differences were observed among the model, miR-21-5p inhibitor NC and miR-21-5p
inhibitor + si-STAT3 groups. Compared with the model and miR-21-5p inhibitor NC groups, the expression level of IL-6 was higher in the miR-21-5p inhibitor group and lower in the si-STAT3 group (all p < 0.05). Of the miR-21-5p inhibitor, si-STAT3 and miR-21-5p inhibitor + si-STAT3 groups, the level of IL-6 was highest in the miR-21-5p inhibitor group and lowest in the si-STAT3 group (all p < 0.05). Compared with the normal group, the expres-sion level of TNF-α in the other groups was higher (all p < 0.05). Moreover, the expression level of TNF-α was similar among the groups, except for the normal group. These findings showed that miR-21-5p can inhibit STAT3 expression, thus decreasing the expression of IL-6, which suggests that the signal transduction of IL-6 in epileptic rats requires the participation of STAT3.
Fig. 5. Survival of hippocampal neurons. A. Survival of hippocampal neurons detected using Nissl staining. B. Statistical graph of the live neurons
*p < 0.05 vs the normal group; #p < 0.05 vs the model group; $p < 0.05 vs miR-21-5p inhibitor NC group; &p < 0.05 vs miR-21-5p inhibitor group; @p < 0.05 vs the si-STAT3 group.
Fig. 6. A. Expression level of IL-6 measured with ELISA. B. Expression level of TNF-α measured with ELISA
*p < 0.05 vs the normal group; #p < 0.05 vs the model group; $p < 0.05 vs miR-21-5p inhibitor NC group; &p < 0.05 vs miR-21-5p inhibitor group; @p < 0.05 vs the si-STAT3 group.
normal model miR-21-5p inhibitor NC
miR-21-5p inhibitor si-STAT3 miR-21-5p inhibitor + si-STAT3
normal
model
miR-21-5p inhibito
r NC
miR-21-5p inhibito
r
si-STA
T3
miR-21-5p inhibito
r + si-
STAT3
100
80
60
40
20
0surv
ival
inde
x [%
] in
CA1
A B
normal
model
miR-21-5p inhibito
r NC
miR-21-5p inhibito
r
si-STA
T3
miR-21-5p inhibito
r + si-
STAT3
normal
model
miR-21-5p inhibito
r NC
miR-21-5p inhibito
r
si-STA
T3
miR-21-5p inhibito
r + si-
STAT3
1000
800
600
400
200
0
IL-6
[pg/
mL]
1500
1000
500
0
TNF-
α [p
g/m
L]
BA
X. Zhang et al. miR-21-5p inhibits STAT3 expression800
Discussion
Our results showed that in the hippocampus of epilep-tic rats, the expression level of miR-21-5p was low, while the level of STAT3 was high. miR-21 can exert cerebral pro-tective effects in various diseases, alleviate the secondary blood–brain barrier damage after traumatic brain injury in rats, inhibit the neuron death mediated by microglia af-ter hypoxia and ischemia, and prevent hypoxia and low glu-cose-induced apoptosis of human neural stem cell through suppressing JNK and p38 MAPK signaling pathways.19–23 The overexpression of STAT3 gene can lead to neuroinflam-mation, induce schizophrenia, and is involved in the neuro-toxicity caused by arsenic.24–26 In our study, we found that miR-21-5p can target STAT3 and regulate its expression after conducting an analysis using a website on bioinfor-matics and a DLR assay. Compared with the model and miR-21-5p inhibitor NC groups, the miR-21-5p inhibitor group had a higher STAT3 protein expression level, whereas the si-STAT3 group had a lower STAT3 protein expression level, revealing that inhibiting miR-21-5p expression can promote the expression level of STAT3. This finding fur-ther demonstrates that miR-21-5p can target STAT3 and negatively regulate its expression.
To further understand the mechanism of miR-21-5p in regulating the gene expression of STAT3 in epilepsy, we measured the levels of apoptosis-associated proteins in rat hippocampus and found that the expression levels of caspase-3 and Bax were higher and expression level of Bcl-2 was lower in the hippocampus of epileptic rats. Moreover, when the miR-21-5p expression was inhibited, the expression levels of caspase-3 and Bax were further increased and the expression level of Bcl-2 was further reduced, whereas silencing STAT3 reversed these changes. Some studies have demonstrated that miR-21 can suppress apoptosis of many types of cells, including neurons.22,27,28 In a study by Shi et al., miR-21 was found to be able to in-hibit the protein activity of caspase-3 and downregulate the ratio of Bax to Bcl-2.29 Caspase-3 and Bax are known to be common apoptosis-associated factors and can pro-mote cell apoptosis when highly expressed.30,31 Bcl-2 is an anti-apoptotic protein, which can regulate the perme-ability of the mitochondrial membrane; however, Bax can damage mitochondrial membrane, thereby promoting cell apoptosis.32 Mao et al. have documented that the activation of STAT3 can participate in the induction of neurotoxicity and promote neuronal apoptosis.25 Based on these find-ings and our study results, we concluded that miR-21-5p can reduce the expression of STAT3, thereby inhibiting the neuronal apoptosis in the hippocampus.
Some studies have revealed that neuron activity in the hippocampus can be reduced by a low expression of miR-21-5p and increased by silencing STAT3. Our re-sults showed that in the rat model of epilepsy, the levels of IL-6 and TNF-α rose significantly. Both IL-6 and TNF-α are common inflammatory factors, serving critical roles
in the development of many diseases.33,34 In our study, IL-6 level was increased by silencing miR-21-5p, while TNF-α level remained unchanged after silencing miR-21-5p or in-hibiting STAT3 expression. These results showed that miR-21-5p can inhibit STAT3 expression, thus lowering the expression level of IL-6, which indicated that the signal transduction of IL-6 in epileptic rats requires the partici-pation of STAT3.
Conclusions
miR-21-5p can target STAT3 and negatively regulate its expression, increase the neuronal activity in the hippo-campus and inhibit the expression of apoptosis-related fac-tors, thereby suppressing neuronal apoptosis. Meanwhile, miR-21-5p can alleviate neuroinflammation in epileptic rats by reducing the inflammatory factor IL-6 in serum. The understanding of this miRNA may provide some new insights into the treatment of epilepsy. However, the pres-ent study only analyzed the mechanism of miR-21-5p in regulating STAT3 and did not investigate the signaling pathways or other molecules that were involved. Therefore, more studies need to be conducted in the future to provide a strong basis for the clinical application of miR-21-5p.
ORCID iDsXiaolei Zhang https://orcid.org/0000-0001-5075-0780Xianfeng Li https://orcid.org/0000-0002-3364-4051Bin Li https://orcid.org/0000-0002-0461-7759Chengfeng Sun https://orcid.org/0000-0001-6540-2164Peng Zhang https://orcid.org/0000-0003-1937-6860
References1. Vezzani A, Fujinami RS, White HS, et al. Infections, inflammation and
epilepsy. Acta Neuropathol. 2016;131(2):211–234.2. Herzberg JL, Fenwick PB. The aetiology of aggression in temporal-
lobe epilepsy. Br J Psychiatry. 1988:153:50–55.3. Orsini A, Zara F, Striano P. Recent advances in epilepsy genetics.
Neurosci Lett. 2018;667:4–9.4. Zack M, Kobau R. Letter re: Prevalence and incidence of epilepsy:
A systematic review and meta-analysis of international studies. Neurology. 2017;89(6):641.
5. Devinsky O, Hesdorffer DC, Thurman DJ, Lhatoo S, Richerson G. Sudden unexpected death in epilepsy: Epidemiology, mechanisms, and pre-vention. Neurology. 2016;15(10):1075–1088.
6. Jacobs J, Staba R, Asano E, et al. High-frequency oscillations (HFOs) in clinical epilepsy. Prog Neurobiol. 2012;98(3):302–315.
7. O’Connell BK, Gloss D, Devinsky O. Cannabinoids in treatment-resis-tant epilepsy: A review. Epilepsy Behav. 2017;70(Pt B):341–348.
8. Shioya M, Obayashi S, Tabunoki H, et al. Aberrant microRNA expres-sion in the brains of neurodegenerative diseases: miR-29a decreased in Alzheimer disease brains targets neurone navigator 3. Neuropathol Appl Neurobiol. 2010;36(4):320–330.
9. Dong RF, Zhang B, Tai LW, Liu HM, Shi FK, Liu NN. The neuroprotec-tive role of miR-124-3p in a 6-hydroxydopamine-induced cell model of Parkinson’s disease via the regulation of ANAX5. J Cell Biochem. 2018;119(1):269–277.
10. Sun ZZ, Lv ZY, Tian WJ, Yang Y. MicroRNA-132 protects hippocampal neurons against oxygen-glucose deprivation-induced apoptosis. Int J Immunopathol Pharmacol. 2017;30(3):253–263.
11. Ge X, Huang S, Gao H, et al. miR-21-5p alleviates leakage of injured brain microvascular endothelial barrier in vitro through suppressing inflammation and apoptosis. Brain Res. 2016;1650:31–40.
Adv Clin Exp Med. 2020;29(7):793–801 801
12. Yao X, Wang Y, Zhang D. microRNA-21 confers neuroprotection against cerebral ischemia-reperfusion injury and alleviates blood–brain barrier disruption in rats via the MAPK signaling pathway. J Mol Neurosci. 2018;65(1):43–53.
13. Buller B, Liu X, Wang X, et al. MicroRNA-21 protects neurons from ischemic death. FEBS J. 2010;277(20):4299–4307.
14. Wan J, Fu AK, Ip FC, et al. Tyk2/STAT3 signaling mediates beta-amy-loid-induced neuronal cell death: Implications in Alzheimer’s disease. J Neurosci. 2010;30(20):6873–6881.
15. Hu GQ, Du X, Li YJ, Gao XQ, Chen BQ, Yu L. Inhibition of cerebral isch-emia/reperfusion injury-induced apoptosis: Nicotiflorin and JAK2/STAT3 pathway. Neural Regen Res. 2017;12(1):96–102.
16. Curia G, Longo D, Biagini G, Jones RS, Avoli M. The pilocarpine model of temporal lobe epilepsy. J Neurosci Methods. 2008;172(2–4):143–157.
17. Racine RJ. Modification of seizure activity by electrical stimulation. I. After-discharge threshold. Electroencephalogr Clin Neurophysiol. 1972;32(3):269–279.
18. Aronica E, Fluiter K, Iyer A, et al. Expression pattern of miR-146a, an inflammation-associated microRNA, in experimental and human temporal lobe epilepsy. Eur J Neurosci. 2010;31(6):1100–1107.
19. Peng J, Omran A, Ashhab MU, et al. Expression patterns of miR-124, miR-134, miR-132, and miR-21 in an immature rat model and children with mesial temporal lobe epilepsy. J Mol Neurosci. 2013;50(2):291–297.
20. Zhang H, Wang Y, Lv Q, Gao J, Hu L, He Z. MicroRNA-21 overexpression promotes the neuroprotective efficacy of mesenchymal stem cells for treatment of intracerebral hemorrhage. Front Neurol. 2018;9:931.
21. Ge X, Han Z, Chen F, et al. MiR-21 alleviates secondary blood–brain barrier damage after traumatic brain injury in rats. Brain Res. 2015; 1603:150–157.
22. Zhang L, Dong LY, Li YJ, Hong Z, Wei WS. miR-21 represses FasL in microglia and protects against microglia-mediated neuronal cell death following hypoxia/ischemia. Glia. 2012;60:1888–1895.
23. Chen R, Tai Y, Zhang Y, et al. MicroRNA-21 attenuates oxygen and glucose deprivation induced apoptotic death in human neural stem cells with inhibition of JNK and p38 MAPK signaling. Neurosci Lett. 2019;690:11–16.
24. Wang LC, Liao LX, Zhao MB, Dong X, Zeng KW, Tu PF. Protosappanin A exerts anti-neuroinflammatory effect by inhibiting JAK2-STAT3 pathway in lipopolysaccharide-induced BV2 microglia. Chin J Nat Med. 2017;15(9):674–679.
25. Mao J, Yang J, Zhang Y, et al. Arsenic trioxide mediates HAPI microglia inflammatory response and subsequent neuron apoptosis through p38/JNK MAPK/STAT3 pathway. Toxicol Appl Pharmacol. 2016;303: 79–89.
26. Ma X, Zhou Y, Chai Y, Wang X, Huang X. STAT3 controls maturation and terminal differentiation in mouse hippocampal neurons. J Mol Neurosci. 2017;61(1):88–95.
27. Han Z, Chen F, Ge X, Tan J, Lei P, Zhang J. miR-21 alleviated apopto-sis of cortical neurons through promoting PTEN-Akt signaling path-way in vitro after experimental traumatic brain injury. Brain Res. 2014; 1582:12–20.
28. Zhou S, Zhang S, Wang Y, et al. MiR-21 and miR-222 inhibit apoptosis of adult dorsal root ganglion neurons by repressing TIMP3 follow-ing sciatic nerve injury. Neurosci Lett. 2015;586:43–49.
29. Shi L, Chen J, Yang J, Pan T, Zhang S, Wang Z. MiR-21 protected human glioblastoma U87MG cells from chemotherapeutic drug temozolo-mide induced apoptosis by decreasing Bax/Bcl-2 ratio and caspase-3 activity. Brain Res. 2010;1352:255–264.
30. Szobi A, Rajtik T, Carnicka S, Ravingerova T, Adameova A. Mitigation of postischemic cardiac contractile dysfunction by CaMKII inhibition: Effects on programmed necrotic and apoptotic cell death. Mol Cell Biochem. 2014;388(1–2):269–276.
31. Fan Y, Lu H, An L, et al. Effect of active fraction of Eriocaulon sieboldianum on human leukemia K562 cells via proliferation inhibition, cell cycle arrest and apoptosis induction. Environ Toxicol Pharmacol. 2016;43:13–20.
32. Lv J, Liang Y, Tu Y, Chen J, Xie Y. Hypoxic preconditioning reduces propofol-induced neuroapoptosis via regulation of Bcl-2 and Bax and downregulation of activated caspase-3 in the hippocampus of neonatal rats. Neurol Res. 2018;40(9):767–773.
33. Zhang C, Chen Z, Meng X, Li M, Zhang L, Huang A. The involvement and possible mechanism of pro-inflammatory tumor necrosis factor alpha (TNF-alpha) in thoracic ossification of the ligamentum flavum. PLoS One. 2017;12(6):e0178986.
34. Cosenza S, Ruiz M, Maumus M, Jorgensen C, Noel D. Pathogenic or therapeutic extracellular vesicles in rheumatic diseases: Role of mesenchymal stem cell-derived vesicles. Int J Mol Sci. 2017;18(4):889.

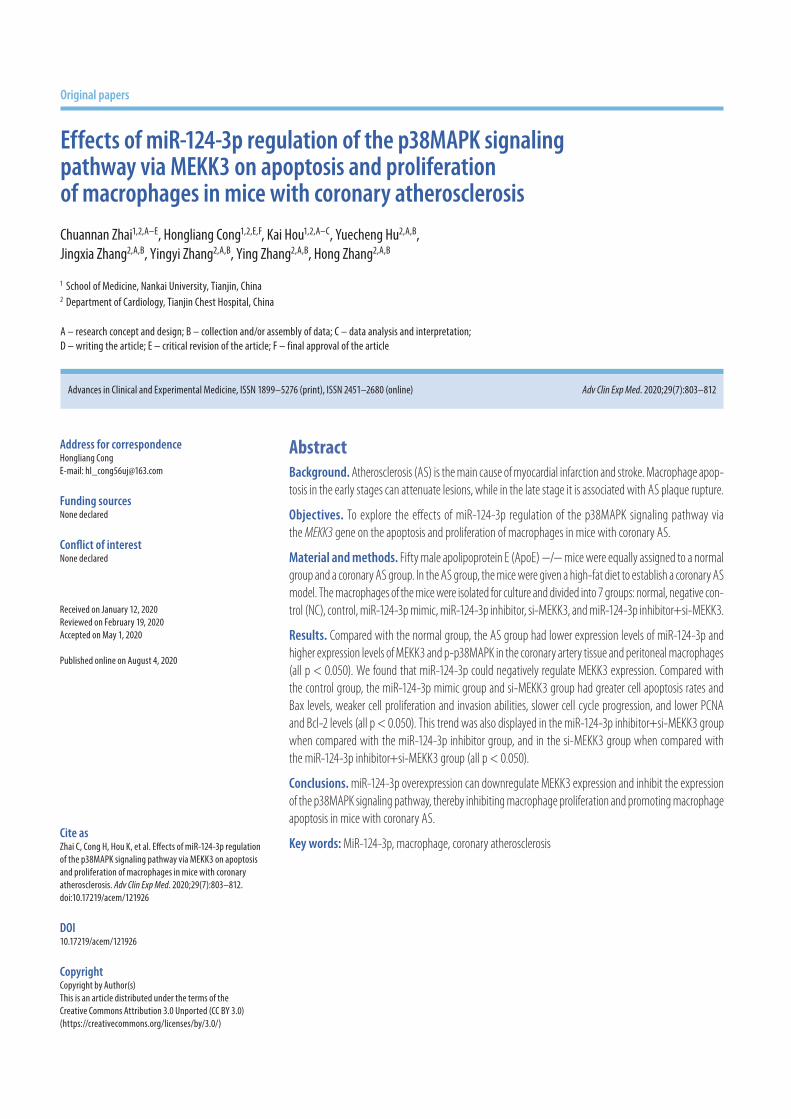
Cite asZhai C, Cong H, Hou K, et al. Effects of miR-124-3p regulation of the p38MAPK signaling pathway via MEKK3 on apoptosis and proliferation of macrophages in mice with coronary atherosclerosis. Adv Clin Exp Med. 2020;29(7):803–812. doi:10.17219/acem/121926
DOI10.17219/acem/121926
CopyrightCopyright by Author(s) This is an article distributed under the terms of theCreative Commons Attribution 3.0 Unported (CC BY 3.0)(https://creativecommons.org/licenses/by/3.0/)
Address for correspondenceHongliang CongE-mail: [email protected]
Funding sourcesNone declared
Conflict of interestNone declared
Received on January 12, 2020Reviewed on February 19, 2020Accepted on May 1, 2020
Published online on August 4, 2020
AbstractBackground. Atherosclerosis (AS) is the main cause of myocardial infarction and stroke. Macrophage apop-tosis in the early stages can attenuate lesions, while in the late stage it is associated with AS plaque rupture.
Objectives. To explore the effects of miR-124-3p regulation of the p38MAPK signaling pathway via the MEKK3 gene on the apoptosis and proliferation of macrophages in mice with coronary AS.
Material and methods. Fifty male apolipoprotein E (ApoE) −/− mice were equally assigned to a normal group and a coronary AS group. In the AS group, the mice were given a high-fat diet to establish a coronary AS model. The macrophages of the mice were isolated for culture and divided into 7 groups: normal, negative con-trol (NC), control, miR-124-3p mimic, miR-124-3p inhibitor, si-MEKK3, and miR-124-3p inhibitor+si-MEKK3.
Results. Compared with the normal group, the AS group had lower expression levels of miR-124-3p and higher expression levels of MEKK3 and p-p38MAPK in the coronary artery tissue and peritoneal macrophages (all p < 0.050). We found that miR-124-3p could negatively regulate MEKK3 expression. Compared with the control group, the miR-124-3p mimic group and si-MEKK3 group had greater cell apoptosis rates and Bax levels, weaker cell proliferation and invasion abilities, slower cell cycle progression, and lower PCNA and Bcl-2 levels (all p < 0.050). This trend was also displayed in the miR-124-3p inhibitor+si-MEKK3 group when compared with the miR-124-3p inhibitor group, and in the si-MEKK3 group when compared with the miR-124-3p inhibitor+si-MEKK3 group (all p < 0.050).
Conclusions. miR-124-3p overexpression can downregulate MEKK3 expression and inhibit the expression of the p38MAPK signaling pathway, thereby inhibiting macrophage proliferation and promoting macrophage apoptosis in mice with coronary AS.
Key words: MiR-124-3p, macrophage, coronary atherosclerosis
Original papers
Effects of miR-124-3p regulation of the p38MAPK signaling pathway via MEKK3 on apoptosis and proliferation of macrophages in mice with coronary atherosclerosis
Chuannan Zhai1,2,A–E, Hongliang Cong1,2,E,F, Kai Hou1,2,A–C, Yuecheng Hu2,A,B, Jingxia Zhang2,A,B, Yingyi Zhang2,A,B, Ying Zhang2,A,B, Hong Zhang2,A,B
1 School of Medicine, Nankai University, Tianjin, China2 Department of Cardiology, Tianjin Chest Hospital, China
A – research concept and design; B – collection and/or assembly of data; C – data analysis and interpretation; D – writing the article; E – critical revision of the article; F – final approval of the article
Advances in Clinical and Experimental Medicine, ISSN 1899–5276 (print), ISSN 2451–2680 (online) Adv Clin Exp Med. 2020;29(7):803–812
C. Zhai et al. miR-124-3p regulates p38MAPK via MEKK3804
Introduction
Atherosclerosis (AS) is the main cause of myocardial infarction and stroke.1 It is believed that both macrophages and monocytes play critical roles in AS. The occurrence of AS is associated with unstable plaque in which macro-phages are among the main components.2 Recent stud-ies have demonstrated that macrophages in the arterial plaque can proliferate, while differences exist in macro-phage apoptosis between the early and late stages of AS.3 Macrophage apoptosis in early stages can attenuate lesions, whereas apoptosis in the late stage is associated with AS plaque rupture.4,5
The mammalian genome contains hundreds of mi-croRNAs (miRNAs), a type of non-coding RNA molecule of about 18–25 nucleotides regulating the expression of 30% of human genes.6 MiRNAs can inhibit the tran-scription and translation of target proteins, thereby affect ing cell apoptosis, development and growth.7 Some studies have found that miRNA plays an essential part in the pathogenesis of AS through regulating multi-targets or signaling pathways.8,9 Recent studies have document-ed that homocysteine can downregulate the expression of miR-124-3p in AS, and its mechanism may be related to a change in hypermethylation in the promoter region of miR-124-3p.10 However, the role of miR-124-3p in AS is yet to be clarified.
As a mitogen-activated protein kinase (MAPK), MEKK3 has a vital role in cardiovascular development and can induce nuclear factor kappa-B activation. All eu-karyotes have various MAPK pathways that control gene expression and cellular physiological activities.11 Normal MAPKs include extracellular signal-regulated kinase (ERK) 1/2, JNK 1/2/3, p38 (α, β, γ, δ), and big MAPK (ERK5).12 So far, there has been little research on the role of MEKK3 in AS. The p38MAPK pathway, a member of the MAPK superfamily, is a key pathway in regulating cell proliferation and death, and can participate in many physiological processes. Meanwhile, the correlation be-tween p38MAPK and MEKK3, another MAPK, cannot be neglected, as MEKK3 and MEKK4 are upstream regulators of p38 in many cells.13 Previous studies have documented that the MAPK pathway participates in cardiomegaly.14,15 However, the role of the MAPK pathway in the apoptosis and proliferation of macrophages in mice with coronary AS is unclear. The Targetscan bioinformatics website (www.targetscan.org) predicted that miR-124-3p can target MEKK3, and that miR-124-3p expression is downregulated in AS. Therefore, we infer that miR-124-3p may suppress the p38MAPK signaling pathway through downregulating MEKK3 expression, thereby inhibiting coronary AS and promoting the apoptosis of mouse macrophages.
In the present study, we established the AS model in apolipoprotein E (ApoE) knockout (ApoE −/−) mice and cultured mouse macrophages, which were then trans-fected with a miR-124-3p mimic, a miR-124-3p inhibitor,
si-MEKK3, and miR-124-3p inhibitor+si-MEKK3, re-spectively. RAW2647 cell apoptosis, cycle, proliferation, and invasion were examined in each group to investi-gate whether miR-124-3p can suppress phosphorylation of the p38MAPK signaling pathway by downregulating MEKK3 expression and finally affect the apoptosis and proliferation of macrophages in mice with AS.
Material and methods
Animal subjects
The study was approved by the Ethics Committee of Nankai University.
Fifty male ApoE −/− mice at 5 weeks of age were included as subjects and were assigned to a normal group and a cor-onary AS group (AS group), n = 25 mice each. In the AS group, the mice were given a high-fat diet including 1% cholesterol and 15% lard to establish a coronary AS mod-el16; the mice in the normal group were given a normal diet. The feeding lasted 4 weeks and all the mice had access to water ad libitum. After 3 weeks, the coronary artery tissue from the AS and normal mice were collected for examination.
The mice were sacrificed and 3 mL of phosphate-buff-ered saline (PBS) was injected into the abdominal cavities. A gentle abdominal massage was applied to obtain the buf-fer from the abdomen. These steps were repeated 3 times. Afterward, the buffer was centrifuged (300 × g for 15 min), the supernatant was removed and the peritoneal macro-phages in the precipitation were harvested. The cells were cultured in RPMI 1640 (Gibco, Thermo Fisher Scientific, Waltham, USA) which contained 10% fetal bovine serum (FBS), 50 U/mL of penicillin and 100 μg/mL of streptomy-cin (all from Gibco) at 37°C in an atmosphere of 5% CO2 (incubator model: Thermo3111; Jinan Beisheng Medical Instruments Co. Ltd, Jinan, China). The medium was re-newed after 2 days, and the cells were sub-cultured every 3–4 days. The cells in good condition and at the logarith-mic phase were selected for transfection.
Cell grouping and transfection
The macrophages at the logarithmic phase from the AS mice were harvested and planted in a six-well culture plate (1*105/well). Serum-free RPMI 1640 medium without pen-icillin-streptomycin was used 1 day before transfection. The cells were assigned to 6 groups: the control group (macrophages from the AS mice), the negative control (NC) group (macrophages from the AS mice transfected with NC plasmid), the miR-124-3p mimic group (macrophage from the AS mice transfected with 4 μg miR-124-3p mimic plasmid), the miR-124-3p inhibitor group (macrophages from the AS mice transfected with 4 μg miR-124-3p inhib-itor plasmid), the si-MEKK3 group (macrophages from
Adv Clin Exp Med. 2020;29(7):803–812 805
the AS mice transfected with 4 μg of si-MEKK3 plasmid), and miR-124-3p inhibitor+si-MEKK3 group (macrophages from the AS mice co-transfected with 2 μg miR-124-3p inhibitor plasmid and 2 μg si-MEKK3 plasmid). The cells from the normal non-AS mice were cultured in a routine way without any other treatment.
The vectors used were constructed by Tianjin Saier Bio-technology Inc. (Tianjin, China) (see above).
Transfection was performed with Lipofectamine 2000 transfection reagent (Invitrogen, Carlsbad, USA) in accor-dance with the manufacturer’s protocol. After 6 h of trans-fection, RPMI 1640 with 10% FBS (Gibco) was used as the medium. The cells were harvested for subsequent experiments 48 h after transfection.
Dual luciferase reporter assay
The miR-124-3p binding site on MEKK3 was first ana-lyzed on the www.targetscan.org bioinformatics website, followed by a dual luciferase reporter test to validate this relationship. MEKK3 dual luciferase reporter gene vec-tors with and without mutant miR-124-3p binding sites were constructed and named MEKK3mut and MEKK3wt, respectively. These 2 reporter plasmids were co-transfect-ed with the NC mimic or miR-124-3p mimic into HEK 293T cells. Renilla luciferase was used as a control. After 24 h of transfection, we performed a dual luciferase re-porter assay. Cells from each group were lysed and then centrifuged (4800 × g for 1 min), and the supernatant was collected. A commercial dual luciferase reporter assay kit (Promega Biotech Co. Ltd., Beijing, China) was used in ac-cordance with the manufacturer’s instruction for measur-ing the activity of luciferase. The lysed cells were pipetted into Eppendorf tubes and 100 μL of firefly luciferase solu-tion was added to each 10 μL sample. The activity of firefly luciferase was then measured, followed by the addition of 100 μL of renilla luciferase solution to detect the activ-ity of renilla luciferase. The formula is as follows: relative luciferase activity = firefly luciferase activity/renilla lucif-erase activity.8
qRT-PCR
After 48 h of transfection, cells were harvested from each group. Total RNAs were extracted using Trizol (16096020 from Thermo Fisher Scientific; and B1802 from HaiGene Bio, Quezon City, Philippines) followed by reverse tran-scription into cDNAs using TaqMan MicroRNA Assays Reverse Transcription Primer (Thermo Fisher Scientific). Next, SYBR® Premix ExTaqTM II kit (Xingzhi Biotech,
Guangzhou, China) was used for quantitative real-time polymerase chain reaction (qRT-PCR). Reagents were added in the following order: SYBR® Premix ExTaqTM II (2×, 25 μL), forward primer (2 μL), reverse primer (2 μL), ROX Reference Dye (50×, 1 μL), DNA template (4 μL), and double distilled H2O (16 μL). An ABI Prism® 7300 fluo-rescence quantitative PCR instrument (Shanghai Kunke Instrument & Equipment Co., Shanghai, China) was used to conduct qRT-PCR with the following running param-eters: 95°C for 10 min (pre-denaturation), 32 cycles of 95°C for 15 s (denaturation) and 60°C for 30 s (annealing) before extension at 72°C for 1 min. ΔCt = Ct target gene − Ct GAPDH;
ΔΔCt = ΔCt study group − ΔCt control group. U6 and GAPDH were the internal controls for miR-124-3p and other genes, respectively. The relative gene expression of the target gene was calculated using the 2−ΔΔCt method. The primers are listed in Table 1.
Western blot
After 48 h of transfection and culture, the cells were washed 3 times in pre-cooled PBS. The total protein was extracted from the cells using RIPA lysis buffer (R0010; So-larbio Science & Technology Co. Ltd., Beijing, China) con-taining phenylmethylsulfonyl fluoride (PMSF). The protein concentration was measured with a BCA kit (Thermo Fish-er Scientific), and the deionized water was used for zeroing.
Table 1. qRT-PCR primer sequence
Gene Primer Sequence
miR-124-3pforward 5’-GCGAGGATCTGTGAATGCCAAA-3’
reverse 5’-AGGGGCTGCTTGAGTTGTAGTA-3’
MEKK3forward 5’-TGTACCTGAGCGACAACAGC-3’
reverse 5’-CACTGCTGAGGGGATCTAGC-3’
p38MAPKforward 5’-CCCGAACGATACCAGAACC-3’
reverse 5’-GCGTGAATGATGGACTGAAA-3’
PCNAforward 5’-TCACGCCTGTGGTGGTTAC-3’
reverse 5’-GGTCGGCTTCTGAGTTTCC-3’
Bcl-2forward 5’-AGTACCTGAACCGGCATCTG-3’
reverse 5’-GCTGAGCAGGGTCTTCAGAG-3’
Baxforward 5’-CGAGCTGATCAGAACCATCA-3’
reverse 5’-GGTCCCGAAGTAGGAGAGGA-3’
U6forward 5’-GCTTCGGCAGCACATATACTAAAAT-3’
reverse 5’-GCACTCCCGCCACAAAGATG-3’
GAPDHforward 5’-GGGAAATTCAACGGCACAGT-3’
reverse 5’-AGATGGTGATGGGCTTCCC-3’
MAPK – mitogen-activated protein kinase; GAPDH – glyceraldehyde 3-phosphate dehydrogenase.
NC: 5’-AGCTTTGCGGGAGTCAACCCAGCTTTTTTCAAGAGAAAAGCTGGGTTGACTCCCGCACCGC-3’; miRNA-124 mimic: 5’-CCGUAAGUGGCGCACGGAAU-3’; miR-124 inhibitor: 5’-GGCAUUCACCGCGUGCCUUA-3’, siRNA: 5’-GGAGAGACGAAUUAUAGCATT-3’, 5’-UGCUAUAAUUCGUCUCUCC-3’.
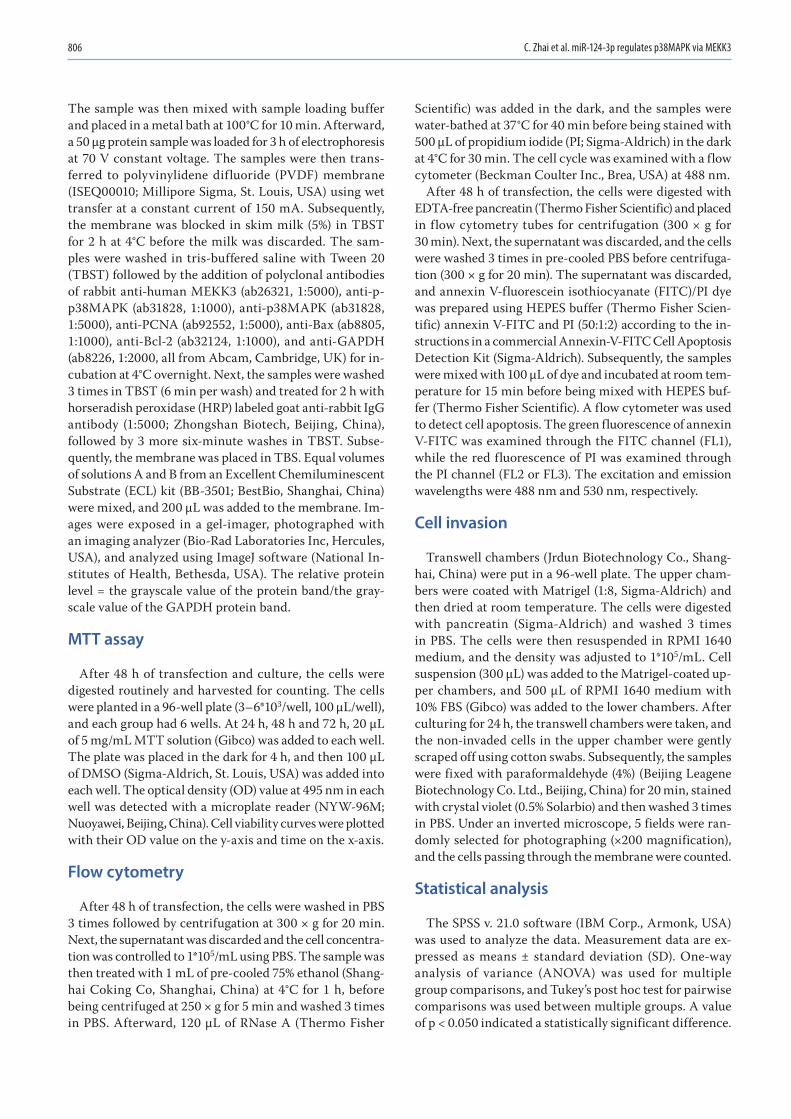
C. Zhai et al. miR-124-3p regulates p38MAPK via MEKK3806
The sample was then mixed with sample loading buffer and placed in a metal bath at 100°C for 10 min. After ward, a 50 µg protein sample was loaded for 3 h of electrophoresis at 70 V constant voltage. The samples were then trans-ferred to polyvinylidene difluoride (PVDF) membrane (ISEQ00010; Millipore Sigma, St. Louis, USA) using wet transfer at a constant current of 150 mA. Subsequently, the membrane was blocked in skim milk (5%) in TBST for 2 h at 4°C before the milk was discarded. The sam-ples were washed in tris-buffered saline with Tween 20 (TBST) followed by the addition of polyclonal antibodies of rabbit anti-human MEKK3 (ab26321, 1:5000), anti-p-p38MAPK (ab31828, 1:1000), anti-p38MAPK (ab31828, 1:5000), anti-PCNA (ab92552, 1:5000), anti-Bax (ab8805, 1:1000), anti-Bcl-2 (ab32124, 1:1000), and anti-GAPDH (ab8226, 1:2000, all from Abcam, Cambridge, UK) for in-cubation at 4°C overnight. Next, the samples were washed 3 times in TBST (6 min per wash) and treated for 2 h with horseradish peroxidase (HRP) labeled goat anti-rabbit IgG antibody (1:5000; Zhongshan Biotech, Beijing, China), followed by 3 more six-minute washes in TBST. Subse-quently, the membrane was placed in TBS. Equal volumes of solutions A and B from an Excellent Chemiluminescent Substrate (ECL) kit (BB-3501; BestBio, Shanghai, China) were mixed, and 200 μL was added to the membrane. Im-ages were exposed in a gel-imager, photographed with an imaging analyzer (Bio-Rad Laboratories Inc, Hercules, USA), and analyzed using ImageJ software (National In-stitutes of Health, Bethesda, USA). The relative protein level = the grayscale value of the protein band/the gray-scale value of the GAPDH protein band.
MTT assay
After 48 h of transfection and culture, the cells were digested routinely and harvested for counting. The cells were planted in a 96-well plate (3–6*103/well, 100 μL/well), and each group had 6 wells. At 24 h, 48 h and 72 h, 20 μL of 5 mg/mL MTT solution (Gibco) was added to each well. The plate was placed in the dark for 4 h, and then 100 μL of DMSO (Sigma-Aldrich, St. Louis, USA) was added into each well. The optical density (OD) value at 495 nm in each well was detected with a microplate reader (NYW-96M; Nuoyawei, Beijing, China). Cell viability curves were plotted with their OD value on the y-axis and time on the x-axis.
Flow cytometry
After 48 h of transfection, the cells were washed in PBS 3 times followed by centrifugation at 300 × g for 20 min. Next, the supernatant was discarded and the cell concentra-tion was controlled to 1*105/mL using PBS. The sample was then treated with 1 mL of pre-cooled 75% ethanol (Shang-hai Coking Co, Shanghai, China) at 4°C for 1 h, before being centrifuged at 250 × g for 5 min and washed 3 times in PBS. Afterward, 120 μL of RNase A (Thermo Fisher
Scientific) was added in the dark, and the samples were water-bathed at 37°C for 40 min before being stained with 500 μL of propidium iodide (PI; Sigma-Aldrich) in the dark at 4°C for 30 min. The cell cycle was examined with a flow cytometer (Beckman Coulter Inc., Brea, USA) at 488 nm.
After 48 h of transfection, the cells were digested with EDTA-free pancreatin (Thermo Fisher Scientific) and placed in flow cytometry tubes for centrifugation (300 × g for 30 min). Next, the supernatant was discarded, and the cells were washed 3 times in pre-cooled PBS before centrifuga-tion (300 × g for 20 min). The supernatant was discarded, and annexin V-fluorescein isothiocyanate (FITC)/PI dye was prepared using HEPES buffer (Thermo Fisher Scien-tific) annexin V-FITC and PI (50:1:2) according to the in-structions in a commercial Annexin-V-FITC Cell Apoptosis Detection Kit (Sigma-Aldrich). Subsequently, the samples were mixed with 100 μL of dye and incubated at room tem-perature for 15 min before being mixed with HEPES buf-fer (Thermo Fisher Scientific). A flow cytometer was used to detect cell apoptosis. The green fluorescence of annexin V-FITC was examined through the FITC channel (FL1), while the red fluorescence of PI was examined through the PI channel (FL2 or FL3). The excitation and emission wavelengths were 488 nm and 530 nm, respectively.
Cell invasion
Transwell chambers (Jrdun Biotechnology Co., Shang-hai, China) were put in a 96-well plate. The upper cham-bers were coated with Matrigel (1:8, Sigma-Aldrich) and then dried at room temperature. The cells were digested with pancreatin (Sigma-Aldrich) and washed 3 times in PBS. The cells were then resuspended in RPMI 1640 medium, and the density was adjusted to 1*105/mL. Cell suspension (300 μL) was added to the Matrigel-coated up-per chambers, and 500 μL of RPMI 1640 medium with 10% FBS (Gibco) was added to the lower chambers. After culturing for 24 h, the transwell chambers were taken, and the non-invaded cells in the upper chamber were gently scraped off using cotton swabs. Subsequently, the samples were fixed with paraformaldehyde (4%) (Beijing Leagene Biotechnology Co. Ltd., Beijing, China) for 20 min, stained with crystal violet (0.5% Solarbio) and then washed 3 times in PBS. Under an inverted microscope, 5 fields were ran-domly selected for photographing (×200 magnification), and the cells passing through the membrane were counted.
Statistical analysis
The SPSS v. 21.0 software (IBM Corp., Armonk, USA) was used to analyze the data. Measurement data are ex-pressed as means ± standard deviation (SD). One-way analysis of variance (ANOVA) was used for multiple group comparisons, and Tukey’s post hoc test for pairwise comparisons was used between multiple groups. A value of p < 0.050 indicated a statistically significant difference.
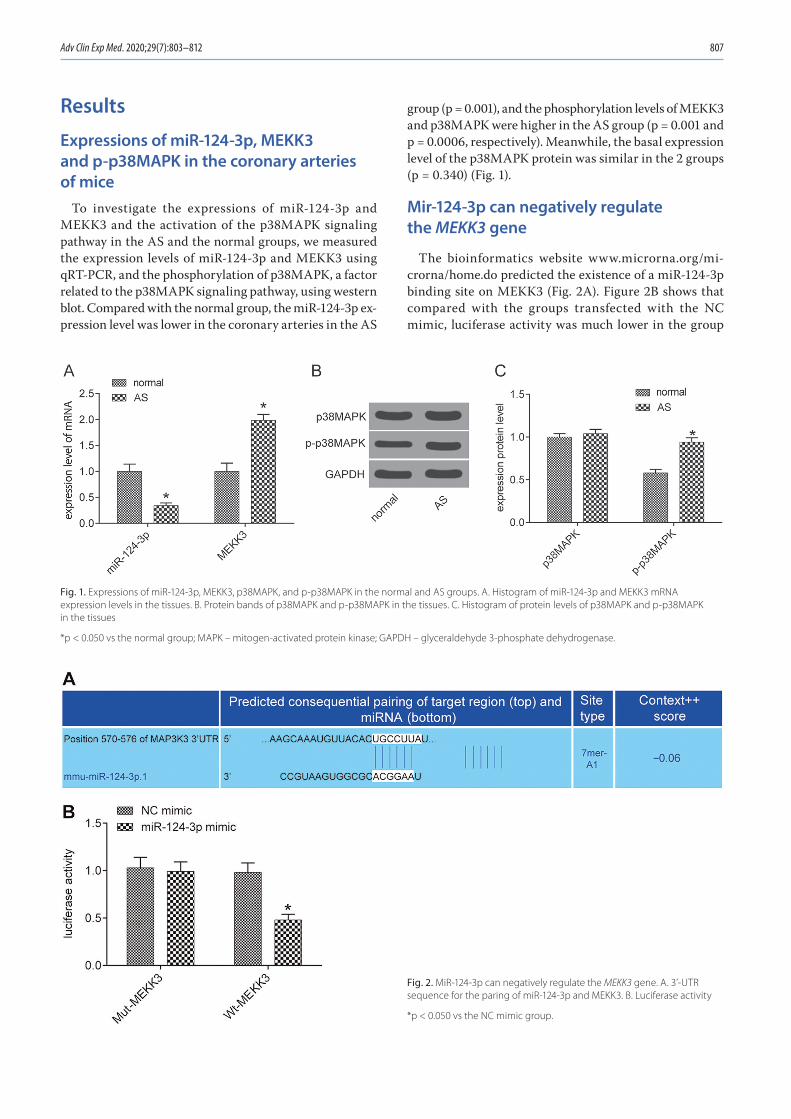
Adv Clin Exp Med. 2020;29(7):803–812 807
Results
Expressions of miR-124-3p, MEKK3 and p-p38MAPK in the coronary arteries of mice
To investigate the expressions of miR-124-3p and MEKK3 and the activation of the p38MAPK signaling pathway in the AS and the normal groups, we measured the expression levels of miR-124-3p and MEKK3 using qRT-PCR, and the phosphorylation of p38MAPK, a factor related to the p38MAPK signaling pathway, using western blot. Compared with the normal group, the miR-124-3p ex-pression level was lower in the coronary arteries in the AS
group (p = 0.001), and the phosphorylation levels of MEKK3 and p38MAPK were higher in the AS group (p = 0.001 and p = 0.0006, respectively). Meanwhile, the basal expression level of the p38MAPK protein was similar in the 2 groups (p = 0.340) (Fig. 1).
Mir-124-3p can negatively regulate the MEKK3 gene
The bioinformatics website www.microrna.org/mi-crorna/home.do predicted the existence of a miR-124-3p binding site on MEKK3 (Fig. 2A). Figure 2B shows that compared with the groups transfected with the NC mimic, luciferase activity was much lower in the group
Fig. 1. Expressions of miR-124-3p, MEKK3, p38MAPK, and p-p38MAPK in the normal and AS groups. A. Histogram of miR-124-3p and MEKK3 mRNA expression levels in the tissues. B. Protein bands of p38MAPK and p-p38MAPK in the tissues. C. Histogram of protein levels of p38MAPK and p-p38MAPK in the tissues
*p < 0.050 vs the normal group; MAPK – mitogen-activated protein kinase; GAPDH – glyceraldehyde 3-phosphate dehydrogenase.
Fig. 2. MiR-124-3p can negatively regulate the MEKK3 gene. A. 3’-UTR sequence for the paring of miR-124-3p and MEKK3. B. Luciferase activity
*p < 0.050 vs the NC mimic group.
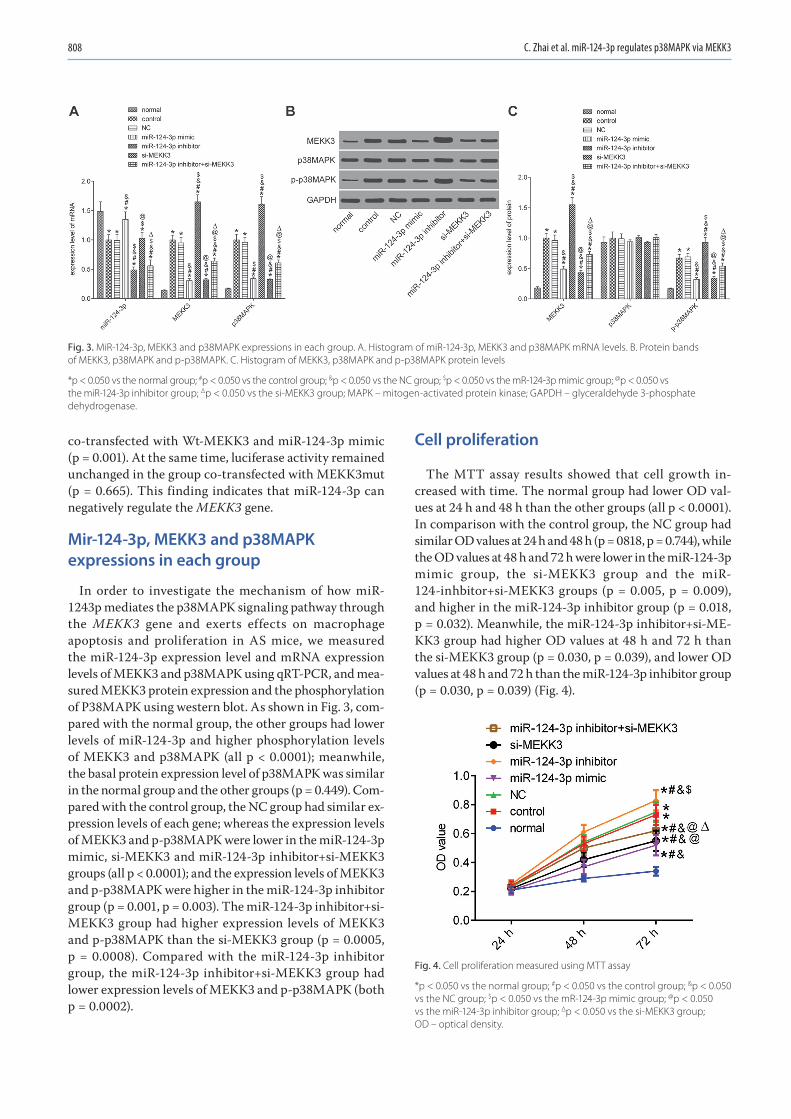
C. Zhai et al. miR-124-3p regulates p38MAPK via MEKK3808
co-transfected with Wt-MEKK3 and miR-124-3p mimic (p = 0.001). At the same time, luciferase activity remained unchanged in the group co-transfected with MEKK3mut (p = 0.665). This finding indicates that miR-124-3p can negatively regulate the MEKK3 gene.
Mir-124-3p, MEKK3 and p38MAPK expressions in each group
In order to investigate the mechanism of how miR-1243p mediates the p38MAPK signaling pathway through the MEKK3 gene and exerts effects on macrophage apoptosis and proliferation in AS mice, we measured the miR-124-3p expression level and mRNA expression levels of MEKK3 and p38MAPK using qRT-PCR, and mea-sured MEKK3 protein expression and the phosphorylation of P38MAPK using western blot. As shown in Fig. 3, com-pared with the normal group, the other groups had lower levels of miR-124-3p and higher phosphorylation levels of MEKK3 and p38MAPK (all p < 0.0001); meanwhile, the basal protein expression level of p38MAPK was similar in the normal group and the other groups (p = 0.449). Com-pared with the control group, the NC group had similar ex-pression levels of each gene; whereas the expression levels of MEKK3 and p-p38MAPK were lower in the miR-124-3p mimic, si-MEKK3 and miR-124-3p inhibitor+si-MEKK3 groups (all p < 0.0001); and the expression levels of MEKK3 and p-p38MAPK were higher in the miR-124-3p inhibitor group (p = 0.001, p = 0.003). The miR-124-3p inhibitor+si-MEKK3 group had higher expression levels of MEKK3 and p-p38MAPK than the si-MEKK3 group (p = 0.0005, p = 0.0008). Compared with the miR-124-3p inhibitor group, the miR-124-3p inhibitor+si-MEKK3 group had lower expression levels of MEKK3 and p-p38MAPK (both p = 0.0002).
Cell proliferation
The MTT assay results showed that cell growth in-creased with time. The normal group had lower OD val-ues at 24 h and 48 h than the other groups (all p < 0.0001). In comparison with the control group, the NC group had similar OD values at 24 h and 48 h (p = 0818, p = 0.744), while the OD values at 48 h and 72 h were lower in the miR-124-3p mimic group, the si-MEKK3 group and the miR-124-inhbitor+si-MEKK3 groups (p = 0.005, p = 0.009), and higher in the miR-124-3p inhibitor group (p = 0.018, p = 0.032). Meanwhile, the miR-124-3p inhibitor+si-ME-KK3 group had higher OD values at 48 h and 72 h than the si-MEKK3 group (p = 0.030, p = 0.039), and lower OD values at 48 h and 72 h than the miR-124-3p inhibitor group (p = 0.030, p = 0.039) (Fig. 4).
Fig. 4. Cell proliferation measured using MTT assay
*p < 0.050 vs the normal group; #p < 0.050 vs the control group; &p < 0.050 vs the NC group; $p < 0.050 vs the mR-124-3p mimic group; @p < 0.050 vs the miR-124-3p inhibitor group; Δp < 0.050 vs the si-MEKK3 group; OD – optical density.
Fig. 3. MiR-124-3p, MEKK3 and p38MAPK expressions in each group. A. Histogram of miR-124-3p, MEKK3 and p38MAPK mRNA levels. B. Protein bands of MEKK3, p38MAPK and p-p38MAPK. C. Histogram of MEKK3, p38MAPK and p-p38MAPK protein levels
*p < 0.050 vs the normal group; #p < 0.050 vs the control group; &p < 0.050 vs the NC group; $p < 0.050 vs the mR-124-3p mimic group; @p < 0.050 vs the miR-124-3p inhibitor group; Δp < 0.050 vs the si-MEKK3 group; MAPK – mitogen-activated protein kinase; GAPDH – glyceraldehyde 3-phosphate dehydrogenase.
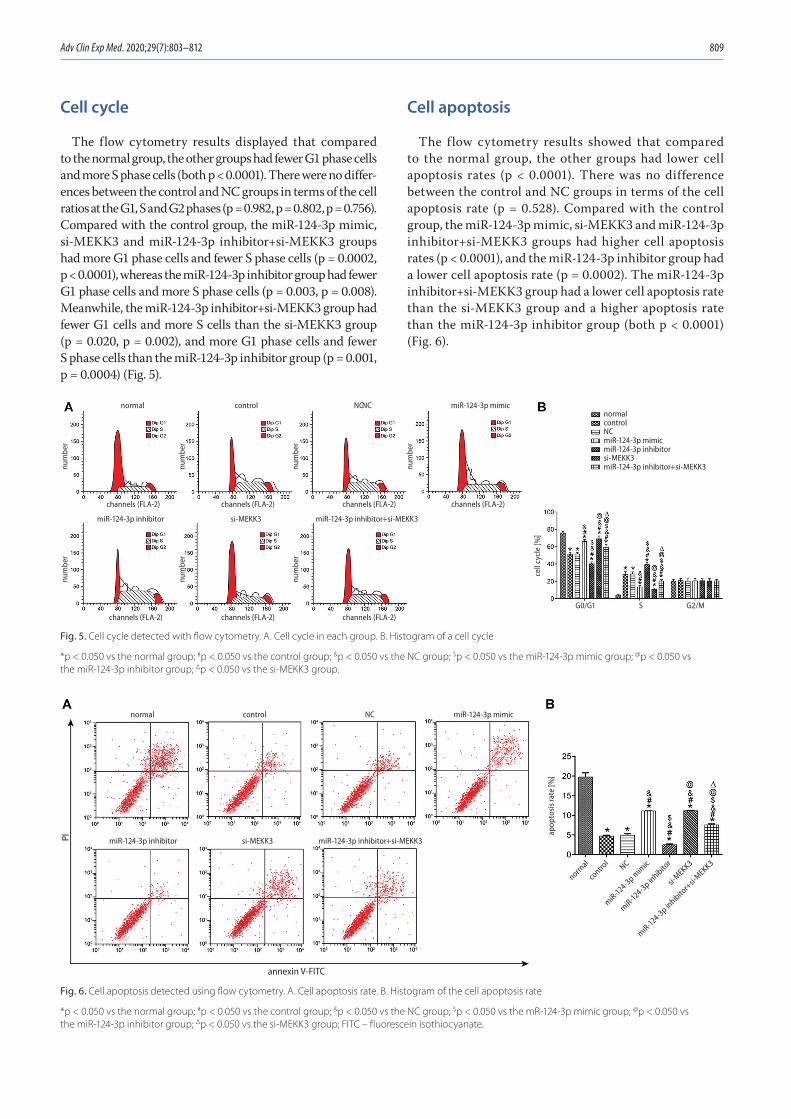
Adv Clin Exp Med. 2020;29(7):803–812 809
Cell cycle
The flow cytometry results displayed that compared to the normal group, the other groups had fewer G1 phase cells and more S phase cells (both p < 0.0001). There were no differ-ences between the control and NC groups in terms of the cell ratios at the G1, S and G2 phases (p = 0.982, p = 0.802, p = 0.756). Compared with the control group, the miR-124-3p mimic, si-MEKK3 and miR-124-3p inhibitor+si-MEKK3 groups had more G1 phase cells and fewer S phase cells (p = 0.0002, p < 0.0001), whereas the miR-124-3p inhibitor group had fewer G1 phase cells and more S phase cells (p = 0.003, p = 0.008). Meanwhile, the miR-124-3p inhibitor+si-MEKK3 group had fewer G1 cells and more S cells than the si-MEKK3 group (p = 0.020, p = 0.002), and more G1 phase cells and fewer S phase cells than the miR-124-3p inhibitor group (p = 0.001, p = 0.0004) (Fig. 5).
Cell apoptosis
The flow cytometry results showed that compared to the normal group, the other groups had lower cell apoptosis rates (p < 0.0001). There was no difference between the control and NC groups in terms of the cell apoptosis rate (p = 0.528). Compared with the control group, the miR-124-3p mimic, si-MEKK3 and miR-124-3p inhibitor+si-MEKK3 groups had higher cell apoptosis rates (p < 0.0001), and the miR-124-3p inhibitor group had a lower cell apoptosis rate (p = 0.0002). The miR-124-3p inhibitor+si-MEKK3 group had a lower cell apoptosis rate than the si-MEKK3 group and a higher apoptosis rate than the miR-124-3p inhibitor group (both p < 0.0001) (Fig. 6).
Fig. 6. Cell apoptosis detected using flow cytometry. A. Cell apoptosis rate. B. Histogram of the cell apoptosis rate
*p < 0.050 vs the normal group; #p < 0.050 vs the control group; &p < 0.050 vs the NC group; $p < 0.050 vs the mR-124-3p mimic group; @p < 0.050 vs the miR-124-3p inhibitor group; Δp < 0.050 vs the si-MEKK3 group; FITC – fluorescein isothiocyanate.
Fig. 5. Cell cycle detected with flow cytometry. A. Cell cycle in each group. B. Histogram of a cell cycle
*p < 0.050 vs the normal group; #p < 0.050 vs the control group; &p < 0.050 vs the NC group; $p < 0.050 vs the miR-124-3p mimic group; @p < 0.050 vs the miR-124-3p inhibitor group; Δp < 0.050 vs the si-MEKK3 group.
channels (FLA-2)channels (FLA-2) channels (FLA-2)
channels (FLA-2)channels (FLA-2) channels (FLA-2) channels (FLA-2)
G0/G1 S G2/M
cell
cycl
e [%
]
miR-124-3p mimicnormalcontrolNCmiR-124-3p mimicmiR-124-3p inhibitorsi-MEKK3miR-124-3p inhibitor+si-MEKK3
miR-124-3p inhibitor miR-124-3p inhibitor+si-MEKK3si-MEKK3
NCNCcontrolnormal
num
ber
num
ber
num
ber
num
ber
num
ber
num
ber
num
ber
PI
annexin V-FITC
apop
tosi
s rat
e [%
]
miR-124-3p mimic
NC
normal
miR-124-3p mim
ic
miR-124-3p inhibito
r
si-MEKK3
miR-124-3p inhibito
r+si-
MEKK3
contro
l
miR-124-3p inhibitor miR-124-3p inhibitor+si-MEKK3si-MEKK3
NCcontrolnormal
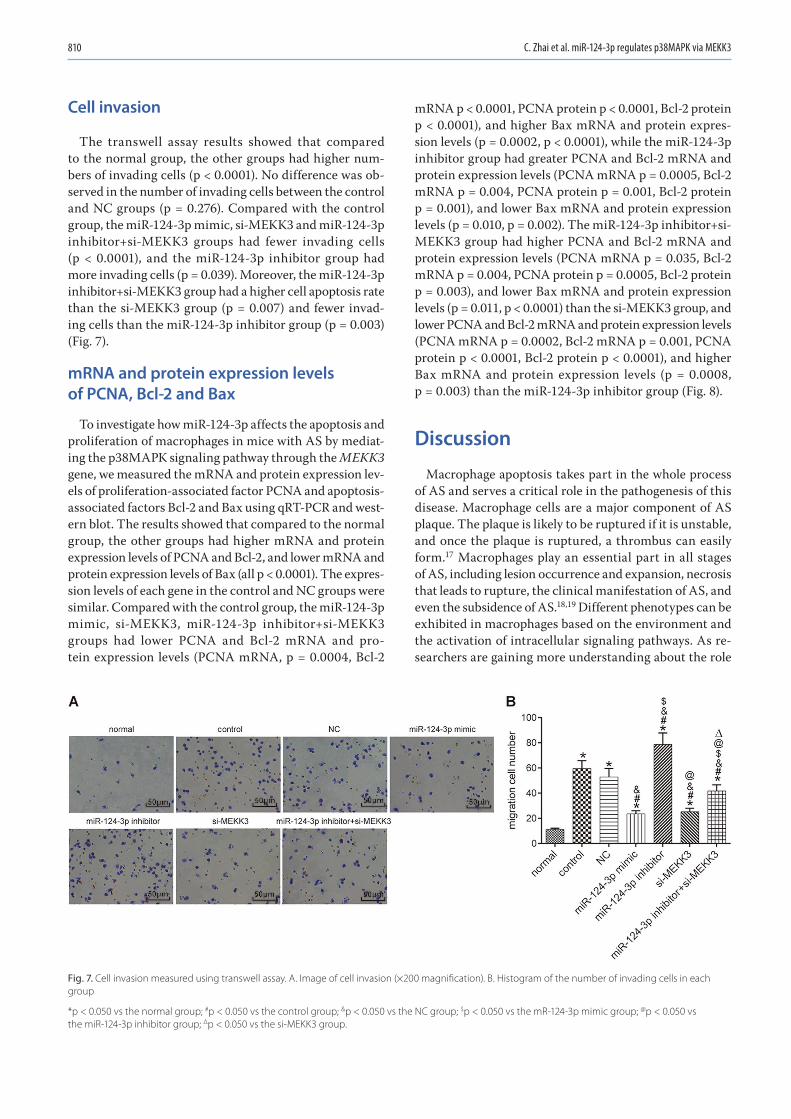
C. Zhai et al. miR-124-3p regulates p38MAPK via MEKK3810
Cell invasion
The transwell assay results showed that compared to the normal group, the other groups had higher num-bers of invading cells (p < 0.0001). No difference was ob-served in the number of invading cells between the control and NC groups (p = 0.276). Compared with the control group, the miR-124-3p mimic, si-MEKK3 and miR-124-3p inhibitor+si-MEKK3 groups had fewer invading cells (p < 0.0001), and the miR-124-3p inhibitor group had more invading cells (p = 0.039). Moreover, the miR-124-3p inhibitor+si-MEKK3 group had a higher cell apoptosis rate than the si-MEKK3 group (p = 0.007) and fewer invad-ing cells than the miR-124-3p inhibitor group (p = 0.003) (Fig. 7).
mRNA and protein expression levels of PCNA, Bcl-2 and Bax
To investigate how miR-124-3p affects the apoptosis and proliferation of macrophages in mice with AS by mediat-ing the p38MAPK signaling pathway through the MEKK3 gene, we measured the mRNA and protein expression lev-els of proliferation-associated factor PCNA and apoptosis-associated factors Bcl-2 and Bax using qRT-PCR and west-ern blot. The results showed that compared to the normal group, the other groups had higher mRNA and protein expression levels of PCNA and Bcl-2, and lower mRNA and protein expression levels of Bax (all p < 0.0001). The expres-sion levels of each gene in the control and NC groups were similar. Compared with the control group, the miR-124-3p mimic, si-MEKK3, miR-124-3p inhibitor+si-MEKK3 groups had lower PCNA and Bcl-2 mRNA and pro-tein expression levels (PCNA mRNA, p = 0.0004, Bcl-2
mRNA p < 0.0001, PCNA protein p < 0.0001, Bcl-2 protein p < 0.0001), and higher Bax mRNA and protein expres-sion levels (p = 0.0002, p < 0.0001), while the miR-124-3p inhibitor group had greater PCNA and Bcl-2 mRNA and protein expression levels (PCNA mRNA p = 0.0005, Bcl-2 mRNA p = 0.004, PCNA protein p = 0.001, Bcl-2 protein p = 0.001), and lower Bax mRNA and protein expression levels (p = 0.010, p = 0.002). The miR-124-3p inhibitor+si-MEKK3 group had higher PCNA and Bcl-2 mRNA and protein expression levels (PCNA mRNA p = 0.035, Bcl-2 mRNA p = 0.004, PCNA protein p = 0.0005, Bcl-2 protein p = 0.003), and lower Bax mRNA and protein expression levels (p = 0.011, p < 0.0001) than the si-MEKK3 group, and lower PCNA and Bcl-2 mRNA and protein expression levels (PCNA mRNA p = 0.0002, Bcl-2 mRNA p = 0.001, PCNA protein p < 0.0001, Bcl-2 protein p < 0.0001), and higher Bax mRNA and protein expression levels (p = 0.0008, p = 0.003) than the miR-124-3p inhibitor group (Fig. 8).
Discussion
Macrophage apoptosis takes part in the whole process of AS and serves a critical role in the pathogenesis of this disease. Macrophage cells are a major component of AS plaque. The plaque is likely to be ruptured if it is unstable, and once the plaque is ruptured, a thrombus can easily form.17 Macrophages play an essential part in all stages of AS, including lesion occurrence and expansion, necrosis that leads to rupture, the clinical manifestation of AS, and even the subsidence of AS.18,19 Different phenotypes can be exhibited in macrophages based on the environment and the activation of intracellular signaling pathways. As re-searchers are gaining more understanding about the role
Fig. 7. Cell invasion measured using transwell assay. A. Image of cell invasion (×200 magnification). B. Histogram of the number of invading cells in each group
*p < 0.050 vs the normal group; #p < 0.050 vs the control group; &p < 0.050 vs the NC group; $p < 0.050 vs the mR-124-3p mimic group; @p < 0.050 vs the miR-124-3p inhibitor group; Δp < 0.050 vs the si-MEKK3 group.
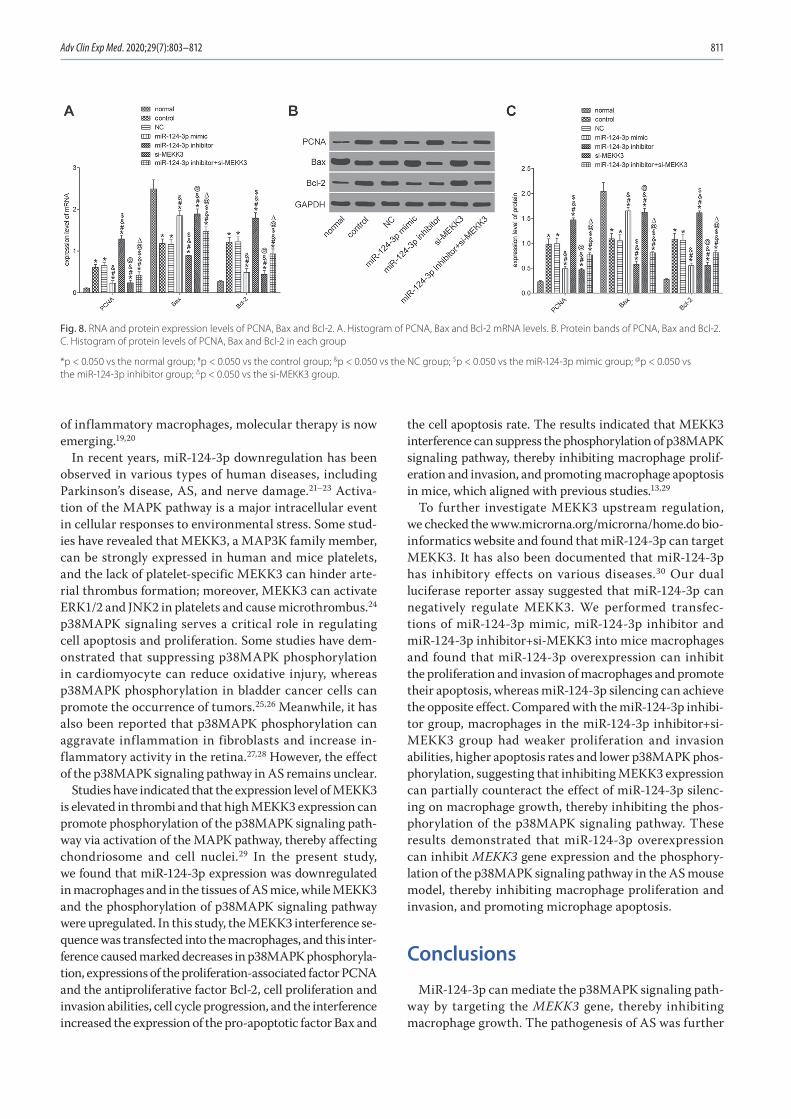
Adv Clin Exp Med. 2020;29(7):803–812 811
of inflammatory macrophages, molecular therapy is now emerging.19,20
In recent years, miR-124-3p downregulation has been observed in various types of human diseases, including Parkinson’s disease, AS, and nerve damage.21–23 Activa-tion of the MAPK pathway is a major intracellular event in cellular responses to environmental stress. Some stud-ies have revealed that MEKK3, a MAP3K family member, can be strongly expressed in human and mice platelets, and the lack of platelet-specific MEKK3 can hinder arte-rial thrombus formation; moreover, MEKK3 can activate ERK1/2 and JNK2 in platelets and cause microthrombus.24 p38MAPK signaling serves a critical role in regulating cell apoptosis and proliferation. Some studies have dem-onstrated that suppressing p38MAPK phosphorylation in cardiomyocyte can reduce oxidative injury, whereas p38MAPK phosphorylation in bladder cancer cells can promote the occurrence of tumors.25,26 Meanwhile, it has also been reported that p38MAPK phosphorylation can aggravate inflammation in fibroblasts and increase in-flammatory activity in the retina.27,28 However, the effect of the p38MAPK signaling pathway in AS remains unclear.
Studies have indicated that the expression level of MEKK3 is elevated in thrombi and that high MEKK3 expression can promote phosphorylation of the p38MAPK signaling path-way via activation of the MAPK pathway, thereby affecting chondriosome and cell nuclei.29 In the present study, we found that miR-124-3p expression was downregulated in macrophages and in the tissues of AS mice, while MEKK3 and the phosphorylation of p38MAPK signaling pathway were upregulated. In this study, the MEKK3 interference se-quence was transfected into the macrophages, and this inter-ference caused marked decreases in p38MAPK phosphoryla-tion, expressions of the proliferation-associated factor PCNA and the antiproliferative factor Bcl-2, cell proliferation and invasion abilities, cell cycle progression, and the interference increased the expression of the pro-apoptotic factor Bax and
the cell apoptosis rate. The results indicated that MEKK3 interference can suppress the phosphorylation of p38MAPK signaling pathway, thereby inhibiting macrophage prolif-eration and invasion, and promoting macrophage apoptosis in mice, which aligned with previous studies.13,29
To further investigate MEKK3 upstream regulation, we checked the www.microrna.org/microrna/home.do bio-informatics website and found that miR-124-3p can target MEKK3. It has also been documented that miR-124-3p has inhibitory effects on various diseases.30 Our dual luciferase reporter assay suggested that miR-124-3p can negatively regulate MEKK3. We performed transfec-tions of miR-124-3p mimic, miR-124-3p inhibitor and miR-124-3p inhibitor+si-MEKK3 into mice macrophages and found that miR-124-3p overexpression can inhibit the proliferation and invasion of macrophages and promote their apoptosis, whereas miR-124-3p silencing can achieve the opposite effect. Compared with the miR-124-3p inhibi-tor group, macrophages in the miR-124-3p inhibitor+si-MEKK3 group had weaker proliferation and invasion abilities, higher apoptosis rates and lower p38MAPK phos-phorylation, suggesting that inhibiting MEKK3 expression can partially counteract the effect of miR-124-3p silenc-ing on macrophage growth, thereby inhibiting the phos-phorylation of the p38MAPK signaling pathway. These results demonstrated that miR-124-3p overexpression can inhibit MEKK3 gene expression and the phosphory-lation of the p38MAPK signaling pathway in the AS mouse model, thereby inhibiting macrophage proliferation and invasion, and promoting microphage apoptosis.
Conclusions
MiR-124-3p can mediate the p38MAPK signaling path-way by targeting the MEKK3 gene, thereby inhibiting macrophage growth. The pathogenesis of AS was further
Fig. 8. RNA and protein expression levels of PCNA, Bax and Bcl-2. A. Histogram of PCNA, Bax and Bcl-2 mRNA levels. B. Protein bands of PCNA, Bax and Bcl-2. C. Histogram of protein levels of PCNA, Bax and Bcl-2 in each group
*p < 0.050 vs the normal group; #p < 0.050 vs the control group; &p < 0.050 vs the NC group; $p < 0.050 vs the miR-124-3p mimic group; @p < 0.050 vs the miR-124-3p inhibitor group; Δp < 0.050 vs the si-MEKK3 group.
C. Zhai et al. miR-124-3p regulates p38MAPK via MEKK3812
elucidated in this study, which can contribute to the theo-retical basis for treating AS. However, more clinical data needs to be included, and the way in which how MEKK3 participates in the p38MAPK signaling pathway needs to be investigated in future studies in order to verify our results and further clarify the relationship between miR-124-3p and AS, the inhibitory effect of miR-124-3p on MEKK3 and the effect of miR-124-3p in AS.
ORCID iDsChuannan Zhai https://orcid.org/0000-0003-3504-5957Hongliang Cong https://orcid.org/0000-0001-6525-064XKai Hou https://orcid.org/0000-0002-0341-8117Yuecheng Hu https://orcid.org/0000-0001-7292-3996Jingxia Zhang https://orcid.org/0000-0002-4936-7554Yingyi Zhang https://orcid.org/0000-0002-9134-7055Ying Zhang https://orcid.org/0000-0003-2639-504XHong Zhang https://orcid.org/0000-0002-0650-0482
References1. Babaev VR, Huang J, Ding L, Zhang Y, May JM, Linton MF. Loss of ric-
tor in monocyte/macrophages suppresses their proliferation and viability reducing atherosclerosis in LDLR null mice. Front Immunol. 2018;9:215.
2. Kruth HS. Fluid-phase pinocytosis of LDL by macrophages: A novel target to reduce macrophage cholesterol accumulation in athero-sclerotic lesions. Curr Pharm Des. 2013;19(33):5865–5872.
3. McCurdy S, Baumer Y, Toulmin E, Lee BH, Boisvert WA. Macrophage-specific expression of IL-37 in hyperlipidemic mice attenuates athero-sclerosis. J Immunol. 2017;199(10):3604–3613.
4. Xiao Y, He M, Liang X, et al. Pu-erh tea ameliorates atherosclero-sis associated with promoting macrophage apoptosis by reducing NF-kappaB activation in ApoE knockout mice. Oxid Med Cell Longev. 2018;2018:3197829.
5. Gonzalez L, Qian AS, Tahir U, Yu P, Trigatti BL. Sphingosine-1-phos-phate receptor 1, expressed in myeloid cells, slows diet-induced ath-erosclerosis and protects against macrophage apoptosis in Ldlr KO mice. Int J Mol Sci. 2017;18(12):2721.
6. Zhang YL, Li XB, Hou YX, Fang NZ, You JC, Zhou QH. The lncRNA XIST exhibits oncogenic properties via regulation of miR-449a and Bcl-2 in human non-small cell lung cancer. Acta Pharmacol Sin. 2017;38(3): 371–381 [Erratum in: The lncRNA XIST exhibits oncogenic properties via regulation of miR-449a and Bcl-2 in human non-small cell lung cancer. Acta Pharmacol Sin. 2017;38(3):443.
7. O’Connell RM, Rao DS, Chaudhuri AA, Baltimore D. Physiologi-cal and pathological roles for microRNAs in the immune system. Nat Rev Immunol. 2010;10(2):111–122.
8. Song K, Li L, Sun G, Wei Y. MicroRNA-381 regulates the occurrence and immune responses of coronary atherosclerosis via cyclooxygenase-2. Exp Ther Med. 2018;15(5):4557–4563.
9. Ahmadi R, Heidarian E, Fadaei R, Moradi N, Malek M, Fallah S. miR-342-5p expression levels in coronary artery disease patients and its asso-ciation with inflammatory cytokines. Clin Lab. 2018;64(4):603–609.
10. Wang X, Lian Y, Wen X, et al. Expression of miR-126 and its potential function in coronary artery disease. Afr Health Sci. 2017;17(2):474–480.
11. Zhao L, Jiao Y, Yang AN, et al. The effect of miR-124 on homocyste-ine-induced atherosclerosis via promoter region DNA methylation in ApoE(−/−) mice [in Chinese]. Sheng Li Xue Bao. 2015;67(2):207–213.
12. Yang J, Lin Y, Guo Z, et al. The essential role of MEKK3 in TNF-induced NF-kappaB activation. Nat Immunol. 2001;2(7):620–624.
13. Padda R, Wamsley-Davis A, Gustin MC, Ross R, Yu C, Sheikh-Hamad D. MEKK3-mediated signaling to p38 kinase and TonE in hypertoni-cally stressed kidney cells. Am J Physiol Renal Physiol. 2006;291(4): F874–F881.
14. Feng H, Cao J, Zhang G, Wang Y. Kaempferol attenuates cardiac hyper-trophy via regulation of ASK1/MAPK signaling pathway and oxida-tive stress. Planta Med. 2017;83(10):837–845.
15. Ren R, Chen SD, Fan J, Zhang G, Li JB. miRNA-138 regulates MLK3/JNK/MAPK pathway to protect BV-2 cells from H2O2-induced apoptosis. Bratisl Lek Listy. 2018;119(5):284–288.
16. Li Q, Park K, Xia Y, et al. Regulation of macrophage apoptosis and ath-erosclerosis by lipid-induced PKCdelta isoform activation. Circ Res. 2017;121(10):1153–1167.
17. van Diepen JA, Berbee JF, Havekes LM, Rensen PC. Interactions between inflammation and lipid metabolism: Relevance for efficacy of anti-inflammatory drugs in the treatment of atherosclerosis. Atherosclerosis. 2013;228(2):306–315.
18. Tabas I, Bornfeldt KE. Macrophage phenotype and function in dif-ferent stages of atherosclerosis. Circ Res. 2016;118(4):653–667.
19. Zhang Q, Lenardo MJ, Baltimore D. 30 years of NF-kappaB: A blossom-ing of relevance to human pathobiology. Cell. 2017;168(1–2):37–57.
20. Liu Z, Gan L, Xu Y, et al. Melatonin alleviates inflammasome-induced pyroptosis through inhibiting NF-kappaB/GSDMD signal in mice adi-pose tissue. J Pineal Res. 2017;63(1). doi:10.1111/jpi.12414
21. Dong RF, Zhang B, Tai LW, Liu HM, Shi FK, Liu NN. The neuroprotec-tive role of miR-124-3p in a 6-hydroxydopamine-induced cell model of Parkinson’s disease via the regulation of ANAX5. J Cell Biochem. 2018;119(1):269–277.
22. de Ronde MWJ, Kok MGM, Moerland PD, et al. High miR-124-3p expres-sion identifies smoking individuals susceptible to atherosclerosis. Atherosclerosis. 2017;263:377–384.
23. Geng L, Liu W, Chen Y. miR-124-3p attenuates MPP(+)-induced neu-ronal injury by targeting STAT3 in SH-SY5Y cells. Exp Biol Med (Maywood). 2017;242(18):1757–1764.
24. Fan X, Wang C, Shi P, et al. Platelet MEKK3 regulates arterial throm-bosis and myocardial infarct expansion in mice. Blood Adv. 2018;2(12): 1439–1448.
25. Ding SK, Wang LX, Guo LS, et al. Syringic acid inhibits apoptosis path-ways via downregulation of p38MAPK and JNK signaling pathways in H9c2 cardiomyocytes following hypoxia/reoxygenation injury. Mol Med Rep. 2017;16(2):2290–2294.
26. He H, Chang R, Zhang T, Yang C, Kong Z. ATM mediates DAB2IP-defi-cient bladder cancer cell resistance to ionizing radiation through the p38MAPK and NF-kappaB signaling pathway. Mol Med Rep. 2017;16(2): 1216–1222.
27. Menon MB, Gropengiesser J, Fischer J, et al. p38(MAPK)/MK2-depen-dent phosphorylation controls cytotoxic RIPK1 signalling in inflam-mation and infection. Nat Cell Biol. 2017;19(10):1248–1259.
28. Cai Y, Li W, Tu H, et al. Curcumolide reduces diabetic retinal vascular leukostasis and leakage partly via inhibition of the p38MAPK/NF-kappa B signaling. Bioorg Med Chem Lett. 2017;27(8):1835–1839.
29. Xu J, Tang S, Yin B, Sun J, Bao E. Co-enzyme Q10 upregulates Hsp70 and protects chicken primary myocardial cells under in vitro heat stress via PKC/MAPK. Mol Cell Biochem. 2018;449(1–2):195–206.
30. Cui M, Wang J, Li Q, Zhang J, Jia J, Zhan X. Long non-coding RNA HOXA11-AS functions as a competing endogenous RNA to regulate ROCK1 expression by sponging miR-124-3p in osteosarcoma. Biomed Pharmacother. 2017;92:437–444.
Cite asXu D, Sun X, Zhang Y, Chao L. Ketamine alleviates HMGB1-induced acute lung injury through TLR4 signaling pathway. Adv Clin Exp Med. 2020;29(7):813–817. doi:10.17219/acem/121936
DOI10.17219/acem/121936
CopyrightCopyright by Author(s) This is an article distributed under the terms of theCreative Commons Attribution 3.0 Unported (CC BY 3.0)(https://creativecommons.org/licenses/by/3.0/)
Address for correspondenceLei ChaoE-mail: [email protected]
Funding sourcesNone declared
Conflict of interestNone declared
Received on June 1, 2018Reviewed on September 8, 2019Accepted on May 1, 2020
Published online on July 28, 2020
AbstractBackground. Acute lung injury (ALI) is a common critical respiratory disease that seriously threatens human health. Ketamine has good anti-inflammatory and immune-regulating properties that can delay the lung injury process.
Objectives. High mobility group box protein 1 (HMGB1) plays an important role in the occurrence, devel-opment and treatment of ALI. Toll-like receptor 4 (TLR4) is the receptor for HMGB1. The aim of this study was to determine the role of the HMGB1 TLR4 signaling pathway in the treatment of ALI using ketamine.
Material and methods. A total of 30 healthy, male, 8-week-old Sprague-Dawley rats were randomly, equally divided into a control group, an lipopolysaccharide (LPS) group and a ketamine group. In order to establish a rat ALI model, 15 mg/kg of LPS was injected into the femoral veins. Ketamine was intravenously injected (10 mg/kg) into the experimental group rats. The rats were euthanized 24 h after modeling and lung tissue samples were collected. Western blot was used to test TLR4, MyD88, TRAF-6, LOX-1, and HMGB1 protein expression in the lung tissue. Real-time polymerase chain reaction (RT-PCR) was performed to detect TLR4, MyD88, TRAF-6, LOX-1, and HMGB1 mRNA levels.
Results. Compared with the controls, the LPS group had significantly higher TLR4, MyD88, TRAF-6, LOX-1, and HMGB1 mRNA and protein levels (p < 0.05). These levels were significantly lower after ketamine inter-vention in comparison with the LPS group (p < 0.05). A positive correlation was found between TLR4 and HMGB1 expression in the LPS and ketamine groups (r = 0.952, p < 0.001; r = 0.941, p < 0.001).
Conclusions. Ketamine attenuates HMGB1-induced ALI, possibly by regulating the TLR4 signaling pathway.
Key words: ketamine, acute lung injury, TLR4, HMGB1
Original papers
Ketamine alleviates HMGB1-induced acute lung injury through TLR4 signaling pathway
Dong Xu1,B,C, Xang Sun2,A,B, Yang Zhang3,E,F, Li Cao1,C,D
1 Department of Anesthesiology, Jinan Central Hospital Affiliated to Shandong University, China2 Department of Intensive Care Unit, Jinan Central Hospital Affiliated to Shandong University, China3 Department of Anesthesiology, Binzhou People’s Hospital, China
A – research concept and design; B – collection and/or assembly of data; C – data analysis and interpretation; D – writing the article; E – critical revision of the article; F – final approval of the article
Advances in Clinical and Experimental Medicine, ISSN 1899–5276 (print), ISSN 2451–2680 (online) Adv Clin Exp Med. 2020;29(7):813–817
D. Xu et al. Ketamine alleviates acute lung injury814
Introduction
Acute lung injury (ALI) is a type of pulmonary inflam-matory reaction which is caused by severe trauma, shock, severe infections, acidosis, and injuries of capillary endo-thelial cells and alveolar epithelial cells triggered by in-flammatory cell cascade.1 It may lead to diffuse pulmonary interstitial and alveolar edema, resulting in hypoxia and causing tissue necrosis and dysfunction. Acute lung in-jury may advance to acute respiratory distress syndrome. It is a common critical disease featuring rapid onset, quick development, poor prognosis, and high mortality.2 In re-cent years, although ALI treatment has achieved certain progress, the mortality of ALI is still higher than 40%.3
Ketamine is widely used in clinical intravenous anesthesia. It has anti-inflammatory and immune-regulating functions, and presents a great inhibitory effect which prevents the pro-duction of a variety of inflammatory cytokines, the function of neutrophils and the expression of adhesion molecule.4–6 Studies have shown that small doses of ketamine can alleviate the symptom of pulmonary edema,7 indicating that ketamine has a therapeutic effect on ALI.6,8 In addition, a previous study demonstrated that ketamine can improve the blood gas and pulmonary function index of patients with ALI caused by mechanical ventilation.9 However, its mechanism has not been fully elucidated. Therefore, this study investigated the mechanism of ketamine in treating ALI in a rat model.
High mobility group box protein 1 (HMGB1) is wide-ly distributed in the nucleus and cytoplasm of all types of cells. The HGMB1 in immune cells translocates from the nucleus to the cytoplasm and is secreted extracel-lularly under stimulus.10 Wang et al. first found in 1999 that HMGB1 was an important inflammatory mediator in sepsis.11 It was reported that HMGB1 was also involved in ALI as an important inflammatory factor.12,13 Timely blocking the secretion of inflammatory factors is the key to ALI treatment.14,15 Thus, inhibiting HMGB1 secretion can delay the lung injury process. Toll-like receptor 4 (TLR4) also plays a critical role in the inflammatory re-sponse. As the receptor of HMGB1, the TLR4 signaling pathway plays pro-inflammatory roles.16,17 It was revealed that knockdown of the TLR4 gene can alleviate HMGB1-induced inflammatory response.18 Therefore, this study tested whether molecules related to the TLR4 signaling pathway and HMGB1 expression are involved in the effects of ketamine on treating ALI, aiming to provide a theoretical basis for using ketamine in the clinical treatment of ALI.
Material and methods
Main instruments and reagents
Lipopolysaccharide (LPS) was purchased from Sigma-Aldrich (St. Louis, USA). Ketamine hydrochloride was obtained from Fujian Gutian Pharmaceutical Co., Ltd.
(Ningde, China). A rat HMGB1 ELISA kit was sourced from Shanghai Yaji Biological Technology Co., Ltd. (Shang-hai, China), while a rat TLR4 enzyme-linked immuno-sorbent assay (ELISA) kit was purchased from Shanghai Ricky Biological Technology Co., Ltd. (Shanghai, China). A total protein extraction kit came from BestBio Technolo-gies (Shanghai, China). A Coomassie Brilliant Blue protein detection kit was purchased from MajorBio Technology, Ltd. (Shanghai, China). The SDS-PAGE system, phosphate-buffered saline-Tween (PBST) solution, electrophoresis apparatus, and a GIS-2020D gel image analysis system were obtained from Sigma-Aldrich. HMGB1, TLR4 and GAPDH antibodies came from Abcam (Cambridge, UK). Horseradish peroxidase (HRP)-tagged goat anti-rabbit IgG obtained from Dycent Biotech (Shanghai, China).
Animal modeling
A total of 30 healthy, male, 8-week-old Sprague Dawley rats (180–220 g) were purchased from the Chinese Academy of Medical Sciences Animal Experiment Center (Beijing, China), and randomly, equally divided into a control group (n = 10) an LPS group (n = 10), and a ketamine group (n = 10). Following the study by Gokcinar et al., 15 mg/kg of LPS was intravenously injected to establish an ALI model.19 Ketamine was intravenously injected (10 mg/kg) into the ketamine intervention group. An equal amount of normal saline was administered to the controls. The rats were euthanized using CO2 24 h after modeling, and lung tissue samples were collected and stored at −80°C.
Rats were used for all experiments, and all procedures were approved by the Animal Ethics Committee of China Meitan General Hospital (Beijing, China).
PaO2 to FiO2 ratio
The arterial blood gases were analyzed using a Bayer Rap-idlab 348 Analyzer (Bayer Diagnostics, Leverkusen, Ger-many) to calculate the ratio of partial pressure of arterial oxygen (PaO2) to the percentage of inspired oxygen (FiO2).
Real-time PCR
Tissue RNA was extracted using TRIzol reagent, and the integrity of the RNA was identified using 1% agarose gel electrophoresis. A total of 1 μg of RNA was reverse-transcribed to cDNA with a kit (Takara, Kyoto, Japan). The real-time polymerase chain reaction (RT-PCR) re-action system contained 5 μL of 2 × SYBR Green Mix-ture, 0.5 μL of cDNA, 0.5 μL of Primer (10 μM), and 4 μL of ddH2O. The reaction conditions consisted of 10 min at 95°C, followed by 40 cycles of 95°C for 15 s and 60°C for 60 s. The RT-PCR reaction was performed on a ViiA™ 7 Re-al-Time PCR System (Thermo Fisher Scientific, Waltham, USA). Each sample was set in 3 parallel trials. β-actin was selected as the internal reference.
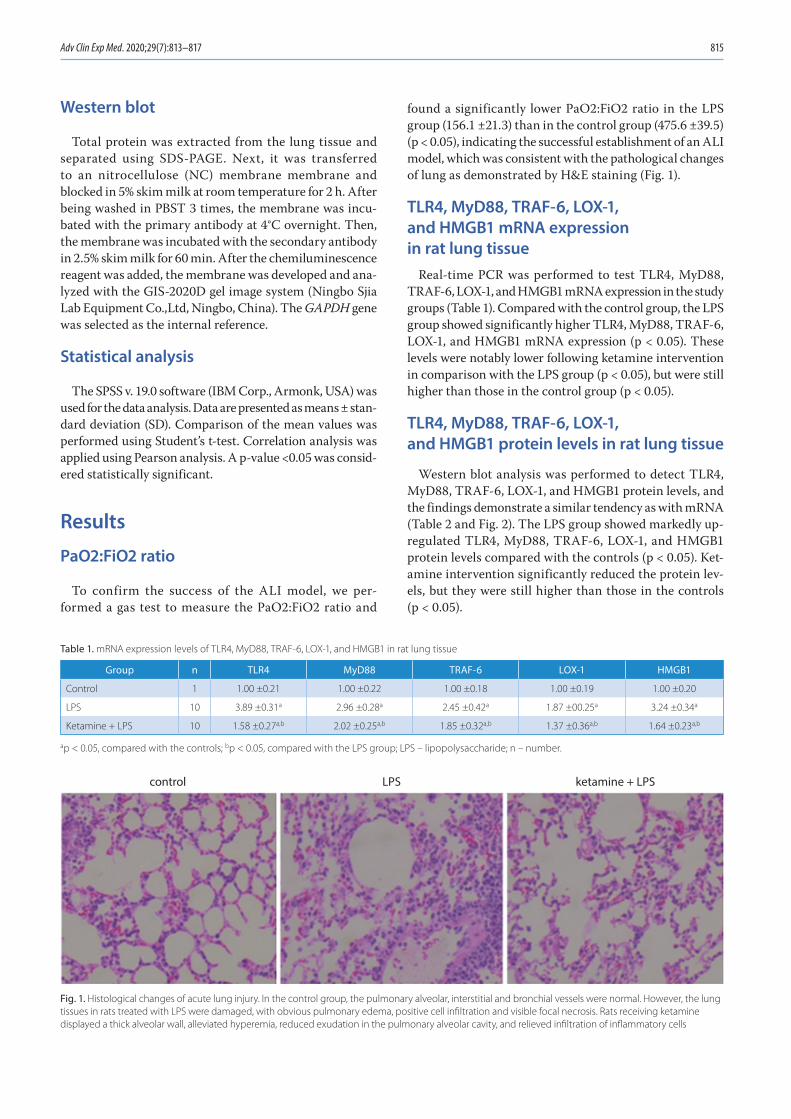
Adv Clin Exp Med. 2020;29(7):813–817 815
Western blot
Total protein was extracted from the lung tissue and separated using SDS-PAGE. Next, it was transferred to an nitro cellulose (NC) membrane membrane and blocked in 5% skim milk at room temperature for 2 h. After being washed in PBST 3 times, the membrane was incu-bated with the primary antibody at 4°C overnight. Then, the membrane was incubated with the secondary antibody in 2.5% skim milk for 60 min. After the chemiluminescence reagent was added, the membrane was developed and ana-lyzed with the GIS-2020D gel image system (Ningbo Sjia Lab Equipment Co.,Ltd, Ningbo, China). The GAPDH gene was selected as the internal reference.
Statistical analysis
The SPSS v. 19.0 software (IBM Corp., Armonk, USA) was used for the data analysis. Data are presented as means ± stan-dard deviation (SD). Comparison of the mean values was performed using Student’s t-test. Correlation analysis was applied using Pearson analysis. A p-value <0.05 was consid-ered statistically significant.
Results
PaO2:FiO2 ratio
To confirm the success of the ALI model, we per-formed a gas test to measure the PaO2:FiO2 ratio and
found a significantly lower PaO2:FiO2 ratio in the LPS group (156.1 ±21.3) than in the control group (475.6 ±39.5) (p < 0.05), indicating the successful establishment of an ALI model, which was consistent with the pathological changes of lung as demonstrated by H&E staining (Fig. 1).
TLR4, MyD88, TRAF-6, LOX-1, and HMGB1 mRNA expression in rat lung tissue
Real-time PCR was performed to test TLR4, MyD88, TRAF-6, LOX-1, and HMGB1 mRNA expression in the study groups (Table 1). Compared with the control group, the LPS group showed significantly higher TLR4, MyD88, TRAF-6, LOX-1, and HMGB1 mRNA expression (p < 0.05). These levels were notably lower following ketamine intervention in comparison with the LPS group (p < 0.05), but were still higher than those in the control group (p < 0.05).
TLR4, MyD88, TRAF-6, LOX-1, and HMGB1 protein levels in rat lung tissue
Western blot analysis was performed to detect TLR4, MyD88, TRAF-6, LOX-1, and HMGB1 protein levels, and the findings demonstrate a similar tendency as with mRNA (Table 2 and Fig. 2). The LPS group showed markedly up-regulated TLR4, MyD88, TRAF-6, LOX-1, and HMGB1 protein levels compared with the controls (p < 0.05). Ket-amine intervention significantly reduced the protein lev-els, but they were still higher than those in the controls (p < 0.05).
Table 1. mRNA expression levels of TLR4, MyD88, TRAF-6, LOX-1, and HMGB1 in rat lung tissue
Group n TLR4 MyD88 TRAF-6 LOX-1 HMGB1
Control 1 1.00 ±0.21 1.00 ±0.22 1.00 ±0.18 1.00 ±0.19 1.00 ±0.20
LPS 10 3.89 ±0.31a 2.96 ±0.28a 2.45 ±0.42a 1.87 ±00.25a 3.24 ±0.34a
Ketamine + LPS 10 1.58 ±0.27a,b 2.02 ±0.25a,b 1.85 ±0.32a,b 1.37 ±0.36a,b 1.64 ±0.23a,b
ap < 0.05, compared with the controls; bp < 0.05, compared with the LPS group; LPS – lipopolysaccharide; n – number.
Fig. 1. Histological changes of acute lung injury. In the control group, the pulmonary alveolar, interstitial and bronchial vessels were normal. However, the lung tissues in rats treated with LPS were damaged, with obvious pulmonary edema, positive cell infiltration and visible focal necrosis. Rats receiving ketamine displayed a thick alveolar wall, alleviated hyperemia, reduced exudation in the pulmonary alveolar cavity, and relieved infiltration of inflammatory cells
control LPS ketamine + LPS
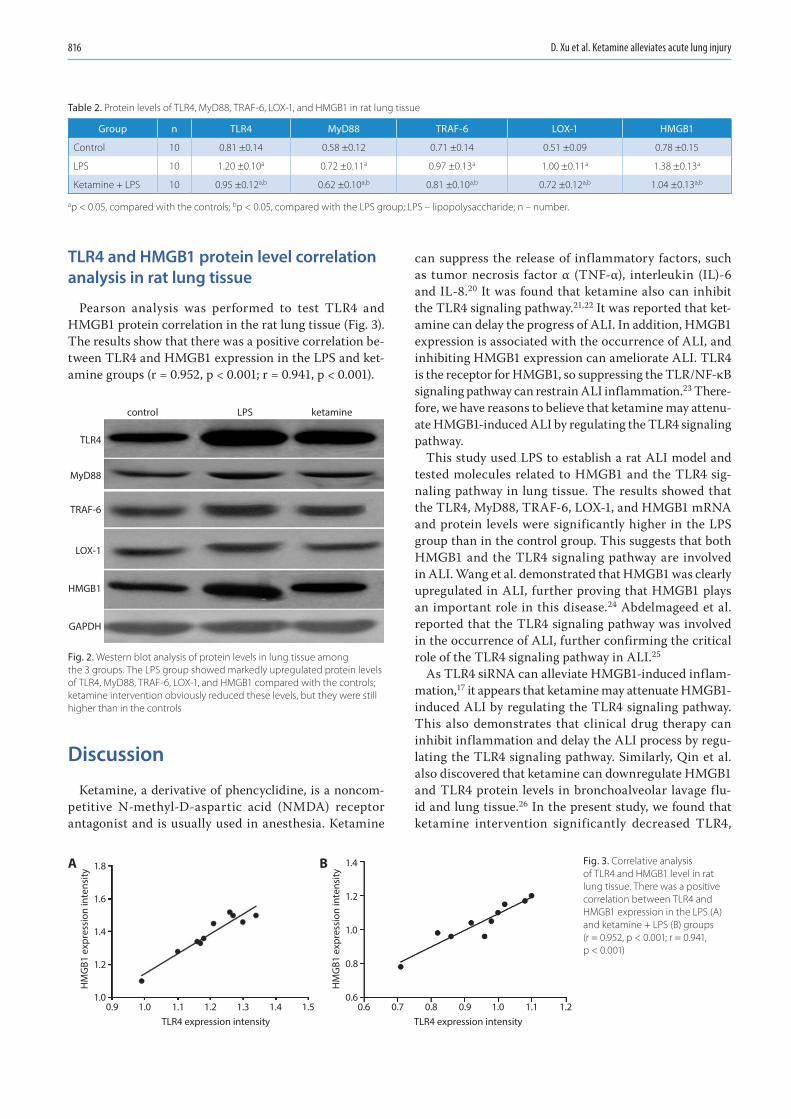
D. Xu et al. Ketamine alleviates acute lung injury816
TLR4 and HMGB1 protein level correlation analysis in rat lung tissue
Pearson analysis was performed to test TLR4 and HMGB1 protein correlation in the rat lung tissue (Fig. 3). The results show that there was a positive correlation be-tween TLR4 and HMGB1 expression in the LPS and ket-amine groups (r = 0.952, p < 0.001; r = 0.941, p < 0.001).
Discussion
Ketamine, a derivative of phencyclidine, is a noncom-petitive N-methyl-D-aspartic acid (NMDA) receptor antagonist and is usually used in anesthesia. Ketamine
can suppress the release of inflammatory factors, such as tumor necrosis factor α (TNF-α), interleukin (IL)-6 and IL-8.20 It was found that ketamine also can inhibit the TLR4 signaling pathway.21,22 It was reported that ket-amine can delay the progress of ALI. In addition, HMGB1 expression is associated with the occurrence of ALI, and inhibiting HMGB1 expression can ameliorate ALI. TLR4 is the receptor for HMGB1, so suppressing the TLR/NF-κB signaling pathway can restrain ALI inflammation.23 There-fore, we have reasons to believe that ketamine may attenu-ate HMGB1-induced ALI by regulating the TLR4 signaling pathway.
This study used LPS to establish a rat ALI model and tested molecules related to HMGB1 and the TLR4 sig-naling pathway in lung tissue. The results showed that the TLR4, MyD88, TRAF-6, LOX-1, and HMGB1 mRNA and protein levels were significantly higher in the LPS group than in the control group. This suggests that both HMGB1 and the TLR4 signaling pathway are involved in ALI. Wang et al. demonstrated that HMGB1 was clearly upregulated in ALI, further proving that HMGB1 plays an important role in this disease.24 Abdelmageed et al. reported that the TLR4 signaling pathway was involved in the occurrence of ALI, further confirming the critical role of the TLR4 signaling pathway in ALI.25
As TLR4 siRNA can alleviate HMGB1-induced inflam-mation,17 it appears that ketamine may attenuate HMGB1-induced ALI by regulating the TLR4 signaling pathway. This also demonstrates that clinical drug therapy can inhibit inflammation and delay the ALI process by regu-lating the TLR4 signaling pathway. Similarly, Qin et al. also discovered that ketamine can downregulate HMGB1 and TLR4 protein levels in bronchoalveolar lavage flu-id and lung tissue.26 In the present study, we found that ketamine intervention significantly decreased TLR4,
Fig. 3. Correlative analysis of TLR4 and HMGB1 level in rat lung tissue. There was a positive correlation between TLR4 and HMGB1 expression in the LPS (A) and ketamine + LPS (B) groups (r = 0.952, p < 0.001; r = 0.941, p < 0.001)
Fig. 2. Western blot analysis of protein levels in lung tissue among the 3 groups. The LPS group showed markedly upregulated protein levels of TLR4, MyD88, TRAF-6, LOX-1, and HMGB1 compared with the controls; ketamine intervention obviously reduced these levels, but they were still higher than in the controls
Table 2. Protein levels of TLR4, MyD88, TRAF-6, LOX-1, and HMGB1 in rat lung tissue
Group n TLR4 MyD88 TRAF-6 LOX-1 HMGB1
Control 10 0.81 ±0.14 0.58 ±0.12 0.71 ±0.14 0.51 ±0.09 0.78 ±0.15
LPS 10 1.20 ±0.10a 0.72 ±0.11a 0.97 ±0.13a 1.00 ±0.11a 1.38 ±0.13a
Ketamine + LPS 10 0.95 ±0.12a,b 0.62 ±0.10a,b 0.81 ±0.10a,b 0.72 ±0.12a,b 1.04 ±0.13a,b
ap < 0.05, compared with the controls; bp < 0.05, compared with the LPS group; LPS – lipopolysaccharide; n – number.
control
TLR4
MyD88
TRAF-6
LOX-1
HMGB1
GAPDH
LPS ketamine
1.8
1.6
1.4
1.2
1.0
TLR4 expression intensity0.9 1.0 1.1 1.2 1.3 1.4 1.5
TLR4 expression intensity0.6 0.7 0.8 0.9 1.0 1.1 1.2
HM
GB1
exp
ress
ion
inte
nsity
A 1.4
1.2
1.0
0.8
0.6
HM
GB1
exp
ress
ion
inte
nsity
B
Adv Clin Exp Med. 2020;29(7):813–817 817
MyD88, TRAF-6, and LOX-1 mRNA and protein expres-sion in comparison with the LPS group. In addition, TLR4 and HMGB1 expression displayed a positive correlation. Our study suggests that ketamine ameliorates ALI, pos-sibly by regulating the TLR4/HMGB1 signaling pathway, thus exerting anti-inflammatory effects. However, future studies are required to confirm this finding.
The mechanism of ALI is complicated, while ketamine may also have an intricate network in treating ALI. This study only found that ketamine may attenuate HMGB1-induced ALI by regulating the TLR4 signaling pathway. Further investigation is needed in order to clarify its spe-cific mechanism.
ORCID iDsLei Chao https://orcid.org/0000-0001-8247-897XDong Xu https://orcid.org/0000-0002-5199-1110Xang Sun https://orcid.org/0000-0002-3338-5432Yang Zhang https://orcid.org/0000-0002-4141-6630
References1. Kao RL, Xu X, Xenocostas A, et al. Induction of acute lung inflammation
in mice with hemorrhagic shock and resuscitation: Role of HMGB1. J Inflamm (Lond). 2014;11(1):30.
2. Luh SP, Chiang CH. Acute lung injury/acute respiratory distress syn-drome (ALI/ARDS): The mechanism, present strategies and future perspectives of therapies. J Zhejiang Univ Sci B. 2007;8(1):60–69.
3. Villar J, Sulemanji D, Kacmarek RM. The acute respiratory distress syn-drome: Incidence and mortality, has it changed? Curr Opin Crit Care. 2014;20(1):3–9.
4. Berger MM, Pitzer B, Zugel S, et al. Alveolar but not intravenous S-ket-amine inhibits alveolar sodium transport and lung fluid clearance in rats. Anesth Analg. 2010;111(1):164–170.
5. Yang CL, Chen CH, Tsai PS, Wang TY, Huang CJ. Protective effects of dexmedetomidine-ketamine combination against ventilator-induced lung injury in endotoxemia rats. J Surg Res. 2011;167(2):e273–e281.
6. Yang CH, Tsai PS, Wang TY, Huang CJ. Dexmedetomidine-ketamine combination mitigates acute lung injury in haemorrhagic shock rats. Resuscitation. 2009;80(10):1204–1210.
7. Shen H, Jin L, Zhuang X, Zhou Y. A single small dose of ketamine pre-vents lung injury following hepatic ischemia-reperfusion in rabbits. J Chin Med Assoc. 2011;74(8):350–356.
8. Erdem MK, Yurdakan G, Yilmaz-Sipahi E. The effects of ketamine, midazolam and ketamine/xylazine on acute lung injury induced by alpha-naphthylthiourea in rats. Adv Clin Exp Med. 2014;23(3):343–351.
9. Wang WF, Liu S, Xu B. A study of the protective effect and mecha-nism of ketamine on acute lung injury induced by mechanical ven-tilation. Eur Rev Med Pharmacol Sci. 2017;21(6):1362–1367.
10. Dange RB, Agarwal D, Teruyama R, Francis J. Toll-like receptor 4 inhi-bition within the paraventricular nucleus attenuates blood pressure and inflammatory response in a genetic model of hypertension. J Neuroinflammation. 2015;12:31.
11. Wang H, Bloom O, Zhang M, et al. HMG-1 as a late mediator of endo-toxin lethality in mice. Science. 1999;285(5425):248–251.
12. Zhou M, Zhang Y, Chen X, et al. PTEN-Foxo1 signaling triggers HMGB1-mediated innate immune responses in acute lung injury. Immunol Res. 2015;62(1):95–105.
13. Entezari M, Javdan M, Antoine DJ, et al. Inhibition of extracellular HMGB1 attenuates hyperoxia-induced inflammatory acute lung injury. Redox Biol. 2014;2:314–322.
14. Haitsma JJ, Lachmann B, Papadakos PJ. Additives in intravenous anes-thesia modulate pulmonary inflammation in a model of LPS-induced respiratory distress. Acta Anaesthesiol Scand. 2009;53(2):176–182.
15. Liu XX, Yu DD, Chen MJ, et al. Hesperidin ameliorates lipopolysaccha-ride-induced acute lung injury in mice by inhibiting HMGB1 release. Int Immunopharmacol. 2015;25(2):370–376.
16. Chen Y, Huang XJ, Yu N, et al. HMGB1 contributes to the expression of P-glycoprotein in mouse epileptic brain through toll-like recep-tor 4 and receptor for advanced glycation end products. PLoS One. 2015;10(10):e0140918.
17. Li G, Wu X, Yang L, et al. TLR4-mediated NF-kappaB signaling path-way mediates HMGB1-induced pancreatic injury in mice with severe acute pancreatitis. Int J Mol Med. 2016;37(1):99–107.
18. Lai CH, Wang KC, Lee FT, et al. Toll-like receptor 4 is essential in the development of abdominal aortic aneurysm. PLoS One. 2016; 11(1):e0146565.
19. Gokcinar D, Ergin V, Cumaoglu A, Menevse A, Aricioglu A. Effects of ketamine, propofol, and ketofol on pro-inflammatory cytokines and markers of oxidative stress in a rat model of endotoxemia-induced acute lung injury. Acta Biochim Pol. 2013;60(3):451–456.
20. Lange M, Broking K, van Aken H, Hucklenbruch C, Bone HG, Westphal M. Role of ketamine in sepsis and systemic inflammatory response syndrome [in German]. Anaesthesist. 2006;55(8):883–891.
21. Wu Y, Li W, Zhou C, et al. Ketamine inhibits lipopolysaccharide-induced astrocytes activation by suppressing TLR4/NF-kB pathway. Cell Physiol Biochem. 2012;30(3):609–617.
22. Yu M, Shao D, Yang R, Feng X, Zhu S, Xu J. Effects of ketamine on pul-monary inflammatory responses and survival in rats exposed to poly-microbial sepsis. J Pharm Pharm Sci. 2007;10(4):434–442.
23. Tianzhu Z, Shumin W. Esculin inhibits the inflammation of LPS-induced acute lung injury in mice via regulation of TLR/NF-kappaB pathways. Inflammation. 2015;38(4):1529–1536.
24. Wang SY, Li ZJ, Wang X, Li WF, Lin ZF. Effect of ulinastatin on HMGB1 expression in rats with acute lung injury induced by sepsis. Genet Mol Res. 2015;14(2):4344–4353.
25. Abdelmageed ME, El-Awady MS, Suddek GM. Apocynin ameliorates endotoxin-induced acute lung injury in rats. Int Immunopharmacol. 2016;30:163–170.
26. Qin MZ, Gu QH, Tao J, et al. Ketamine effect on HMGB1 and TLR4 expression in rats with acute lung injury. Int J Clin Exp Pathol. 2015; 8(10):12943–12948.

Cite asPark HJ, Hong J, Piao Y, et al. Extracorporeal shockwave therapy enhances peripheral nerve remyelination and gait function in a crush model. Adv Clin Exp Med. 2020;29(7): 819–824. doi:10.17219/acem/122177
DOI10.17219/acem/122177
CopyrightCopyright by Author(s) This is an article distributed under the terms of theCreative Commons Attribution 3.0 Unported (CC BY 3.0)(https://creativecommons.org/licenses/by/3.0/)
Address for correspondenceJaewon BeomE-mail: [email protected]
Funding sourcesThe Basic Science Research Program through the National Research Foundation of Korea (NRF) (grants No. 2016R1D1A1B03933919 and No. 2016R1A2B4009409) funded this research.
Conflict of interestNone declared
Received on April 8, 2019Accepted on May 8, 2020
Published online on July 31, 2020
AbstractBackground. Conservative treatment, such as electrical stimulation and steroid injection, have been em-ployed in an attempt to improve symptoms after peripheral nerve injury, without significant success. Although non-invasive and safe extracorporeal shockwave therapy (ESWT) can be a practical alternative, the therapeutic effects of ESWT on peripheral nerve remyelination has not been established.
Objectives. To investigate the effects of ESWT on peripheral nerve remyelination and gait function for 5 weeks in a sciatic nerve crush model.
Material and methods. In total, we divided 97 rats into 5 groups: group 1 – a healthy negative control group; group 2 – 3 weeks after sciatic nerve crush and 3 sessions of ESWT; group 3 – 5 weeks after crush injury with 3 sessions of ESWT; group 4 – 3 weeks after crush injury with no ESWT; and group 5 – 5 weeks after crush injury with no ESWT. The focused ESWT was applied to the unilateral sciatic nerve injury site. One session consisted of 1,500 stimuli, and the session were performed at intervals of 1 week.
Results. The degree of myelination and expression of myelin basic protein at the distal part of the injured sciatic nerve tended to increase in the ESWT groups compared with the no-ESWT groups 3 and 5 weeks after crush injury. Regarding the functional gait recovery, the print width and area of the injured leg in the ESWT groups was significantly larger than that in the no-ESWT groups 3 and 5 weeks after crush injury.
Conclusions. The ESWT may enhance peripheral nerve remyelination and gait function in a nerve crush model. Long-term follow-up after ESWT and investigation of molecular mechanisms will be needed to confirm these therapeutic effects.
Key words: peripheral nerve injuries, extracorporeal shockwave therapy, myelin basic protein, remyelination, gait
Original papers
Extracorporeal shockwave therapy enhances peripheral nerve remyelination and gait function in a crush model
Hyun Jung Park1,B,C, Jinpyo Hong1,B, Yibo Piao1,B, Hyo Jung Shin1,2,B, Se Jeong Lee3,B, Im Joo Rhyu3,B, Min-Hee Yi4,A,B, Jinhyun Kim5,A, Dong Woon Kim1,2,A,E, Jaewon Beom6,A,C,D,F
1 Department of Anatomy, Brain Research Institute, Chungnam National University School of Medicine, Daejeon, South Korea2 Department of Medical Science, Chungnam National University School of Medicine, Daejeon, South Korea3 Department of Anatomy, Korea University College of Medicine, Seoul, South Korea4 Department of Neurology, Mayo Clinic, Rochester, USA5 Department of Internal Medicine, Chungnam National University Hospital, Chungnam National University School of Medicine, Daejeon, South Korea6 Department of Rehabilitation Medicine, Seoul National University Bundang Hospital, Seongnam, South Korea
A – research concept and design; B – collection and/or assembly of data; C – data analysis and interpretation; D – writing the article; E – critical revision of the article; F – final approval of the article
Advances in Clinical and Experimental Medicine, ISSN 1899–5276 (print), ISSN 2451–2680 (online) Adv Clin Exp Med. 2020;29(7):819–824
H. Park et al. ESWT enhances peripheral nerve remyelination820
Introduction
Trauma or entrapment, herniated intervertebral discs, and cancer metastasis can cause damage to the periph-eral nervous system, resulting in various neuromus-cular disorders, depending on the location and extent of the lesion. These conditions present focal neuropathy, plexopathy and radiculopathy, all of which are associated with neuropathic pain and muscle paralysis. The clinical importance of peripheral neuropathy is increasing be-cause of the rising number of neuromuscular diseases due to aging of the society. The aim of treatment is to improve the function and quality of life, in patients with peripheral neuropathy.
Inflammatory reactions occur as macrophages invade the tissue surrounding damaged peripheral nerves. Next, Wallerian degeneration, demyelination and axon regen-eration processes are initiated, with various signaling pathways involved. During this process, Schwann cells play a key role in orchestrating repair.1–3 Extracorporeal shockwave therapy (ESWT) has long been used in uri-nary stone lithotripsy treatment. In the musculoskeletal field, it has been widely used and researched in lateral and medial epicondylosis, plantar fasciitis, calcific tendinitis of the shoulder, and bony union after fracture. Recently, it has been suggested that these indications should be ex-panded to include muscle rigidity, muscular pain, knee degenerative arthritis, and lymphedema.4
Peripheral nerves regenerate slowly in the human tissues. Various conservative treatments such as electrical stimu-lation and steroid injection have been used in an attempt to alleviate symptoms after peripheral nerve injury, but without significant results. Recently, stem cell injection has been proven to be effective in animal studies of periph-eral nerve injury, but its safety has not been established for long-term follow-up in clinical practice. Thus, non-invasive ESWT may be a realistic alternative. However, the effects of ESWT on angiogenesis, metabolic activation and inflammation response have been suggested but re-main to be established. In addition, stimulation parameters such as optimized stimulation intensity (mJ/mm2), and number and duration of treatment sessions are also differ-ent and remain controversial between studies. Although the efficacy and safety of ESWT have been established, studies on the mechanism of effect are essential in order to expand clinical applications.
The ESWT is thought to cause molecular and biological changes, in addition to mechanical and physical stimulation by shockwave, but it is difficult to determine which among various signaling pathways is involved. It has previously been shown that adipose-derived stem cells maintain pluri-potency when ESWT is applied and promote differentiation into Schwann-like cells.5 It has also been shown that ESWT induces the proliferation of bone marrow stromal cells and their differentiation into osteoprogenitors via induction
of TGF-β1.6 Recent animal studies have also shown that ESWT stimulates peripheral nerve regeneration.7–8
Although ESWT is actively used to treat various dis-eases other than peripheral nerve damage, its therapeutic effects need to be investigated through animal experi-ments to validate clinical use and study. We investigated the effects of ESWT on peripheral nerve remyelination and gait function for 5 weeks in a sciatic nerve crush model.
Material and methods
Animal model
Nine-week old male Sprague Dawley rats were anesthe-tized with isoflurane inhalation, and were subject to right sciatic nerve crush proximal to the bisection area with for-ceps for 40 s. After the crushed nerve was released, the sci-atic nerve remained compressed and became pale (Fig. 1). A single endoneurial suture was conducted using 8-0 nylon in order to identify the site of injury when collecting tissue. After the rat recovered from general anesthesia, acetamino-phen syrup was administered orally to relieve postoperative pain. Ninety-seven rats were divided into 5 groups: group 1 – healthy group as a negative control; group – 3 weeks after crush injury with 3 sessions of ESWT; group 3 – 5 weeks after crush injury with 3 sessions of ESWT; group 4 – 3 weeks after crush injury with no ESWT applied; and group 5 – 5 weeks after crush injury with no ESWT. The study protocol was reviewed and approved by the Institutional Animal Care and Use Committee of Chungnam National University Hospital, Daejeon, South Korea.
Extracorporeal shockwave therapy
The focused ESWT device (Dornier MedTech, Weßling, Germany), which is widely used in clinical fields, was applied only to the unilateral sciatic nerve injury site. One session consisted of 1,500 stimuli, and the sessions were performed at intervals of 1 week. Peripheral nerves and surrounding tissues were collected from different animals at 1 week and 3 weeks after the 3 sessions of ESWT were completed.
Immunostaining
Immunofluorescence was performed on tissue collected 3 or 5 weeks after crush injury. The rats were anesthetized with sodium pentobarbital (50 mg/kg, intraperitoneal) and perfused transcardially with heparinized phosphate-buffered saline (PBS, pH 7.4), followed by perfusion with 4% paraformaldehyde for 15 min. The sciatic nerve from the injured site was removed immediately. Cryoblocks were sectioned and immunostained with anti-myelin basic pro-tein (MBP) primary antibody (1:400; #MAB386, Merck Millipore, Burlington, USA).
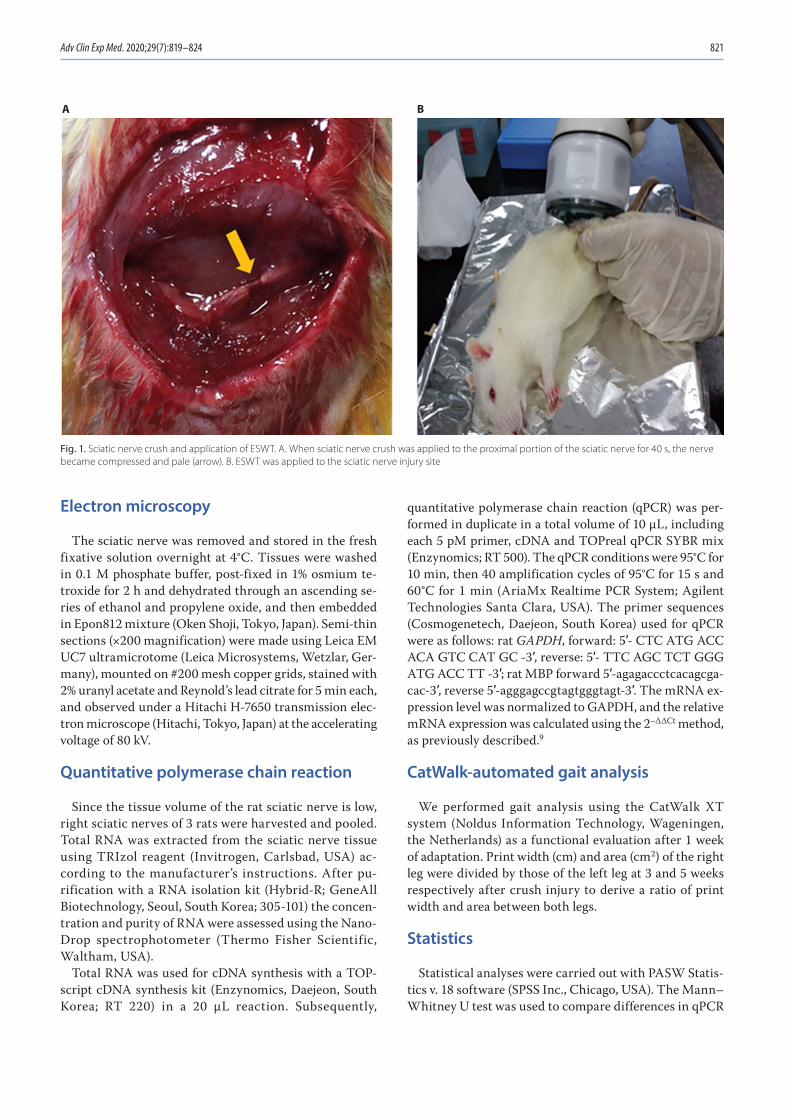
Adv Clin Exp Med. 2020;29(7):819–824 821
Electron microscopy
The sciatic nerve was removed and stored in the fresh fixative solution overnight at 4°C. Tissues were washed in 0.1 M phosphate buffer, post-fixed in 1% osmium te-troxide for 2 h and dehydrated through an ascending se-ries of ethanol and propylene oxide, and then embedded in Epon812 mixture (Oken Shoji, Tokyo, Japan). Semi-thin sections (×200 magnification) were made using Leica EM UC7 ultramicrotome (Leica Microsystems, Wetzlar, Ger-many), mounted on #200 mesh copper grids, stained with 2% uranyl acetate and Reynold’s lead citrate for 5 min each, and observed under a Hitachi H-7650 transmission elec-tron microscope (Hitachi, Tokyo, Japan) at the accelerating voltage of 80 kV.
Quantitative polymerase chain reaction
Since the tissue volume of the rat sciatic nerve is low, right sciatic nerves of 3 rats were harvested and pooled. Total RNA was extracted from the sciatic nerve tissue using TRIzol reagent (Invitrogen, Carlsbad, USA) ac-cording to the manufacturer’s instructions. After pu-rification with a RNA isolation kit (Hybrid-R; GeneAll Biotechnology, Seoul, South Korea; 305-101) the concen-tration and purity of RNA were assessed using the Nano-Drop spectrophotometer (Thermo Fisher Scientific, Waltham, USA).
Total RNA was used for cDNA synthesis with a TOP-script cDNA synthesis kit (Enzynomics, Daejeon, South Korea; RT 220) in a 20 µL reaction. Subsequently,
quantitative polymerase chain reaction (qPCR) was per-formed in duplicate in a total volume of 10 µL, including each 5 pM primer, cDNA and TOPreal qPCR SYBR mix (Enzynomics; RT 500). The qPCR conditions were 95°C for 10 min, then 40 amplification cycles of 95°C for 15 s and 60°C for 1 min (AriaMx Realtime PCR System; Agilent Technologies Santa Clara, USA). The primer sequences (Cosmogenetech, Daejeon, South Korea) used for qPCR were as follows: rat GAPDH, forward: 5′- CTC ATG ACC ACA GTC CAT GC -3′, reverse: 5′- TTC AGC TCT GGG ATG ACC TT -3′; rat MBP forward 5′-agagaccctcacagcga-cac-3′, reverse 5′-agggagccgtagtgggtagt-3′. The mRNA ex-pression level was normalized to GAPDH, and the relative mRNA expression was calculated using the 2−ΔΔCt method, as previously described.9
CatWalk-automated gait analysis
We performed gait analysis using the CatWalk XT system (Noldus Information Technology, Wageningen, the Netherlands) as a functional evaluation after 1 week of adaptation. Print width (cm) and area (cm2) of the right leg were divided by those of the left leg at 3 and 5 weeks respectively after crush injury to derive a ratio of print width and area between both legs.
Statistics
Statistical analyses were carried out with PASW Statis-tics v. 18 software (SPSS Inc., Chicago, USA). The Mann–Whitney U test was used to compare differences in qPCR
Fig. 1. Sciatic nerve crush and application of ESWT. A. When sciatic nerve crush was applied to the proximal portion of the sciatic nerve for 40 s, the nerve became compressed and pale (arrow). B. ESWT was applied to the sciatic nerve injury site
A B
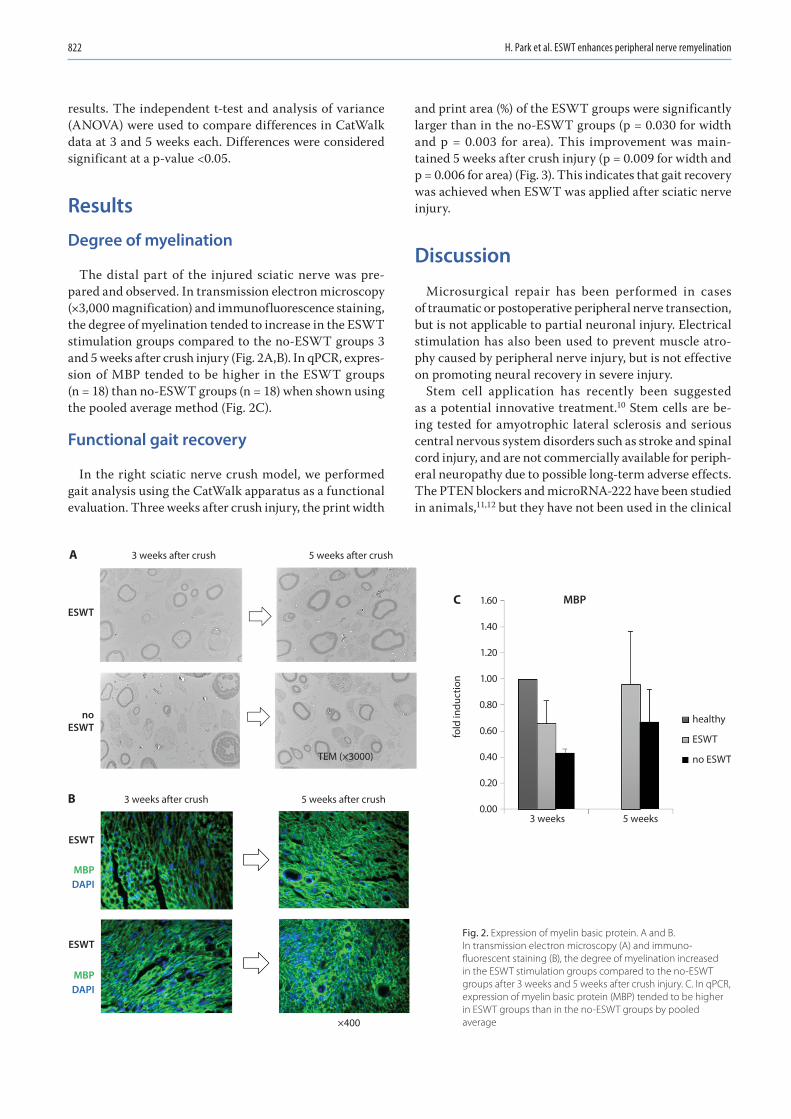
H. Park et al. ESWT enhances peripheral nerve remyelination822
results. The independent t-test and analysis of variance (ANOVA) were used to compare differences in CatWalk data at 3 and 5 weeks each. Differences were considered significant at a p-value <0.05.
Results
Degree of myelination
The distal part of the injured sciatic nerve was pre-pared and observed. In transmission electron microscopy (×3,000 magnification) and immunofluorescence staining, the degree of myelination tended to increase in the ESWT stimulation groups compared to the no-ESWT groups 3 and 5 weeks after crush injury (Fig. 2A,B). In qPCR, expres-sion of MBP tended to be higher in the ESWT groups (n = 18) than no-ESWT groups (n = 18) when shown using the pooled average method (Fig. 2C).
Functional gait recovery
In the right sciatic nerve crush model, we performed gait analysis using the CatWalk apparatus as a functional evaluation. Three weeks after crush injury, the print width
and print area (%) of the ESWT groups were significantly larger than in the no-ESWT groups (p = 0.030 for width and p = 0.003 for area). This improvement was main-tained 5 weeks after crush injury (p = 0.009 for width and p = 0.006 for area) (Fig. 3). This indicates that gait recovery was achieved when ESWT was applied after sciatic nerve injury.
Discussion
Microsurgical repair has been performed in cases of traumatic or postoperative peripheral nerve transection, but is not applicable to partial neuronal injury. Electrical stimulation has also been used to prevent muscle atro-phy caused by peripheral nerve injury, but is not effective on promoting neural recovery in severe injury.
Stem cell application has recently been suggested as a potential innovative treatment.10 Stem cells are be-ing tested for amyotrophic lateral sclerosis and serious central nervous system disorders such as stroke and spinal cord injury, and are not commercially available for periph-eral neuropathy due to possible long-term adverse effects. The PTEN blockers and microRNA-222 have been studied in animals,11,12 but they have not been used in the clinical
3 weeks
5 weeks after crush
TEM (×3000)
ESWT
noESWT
healthy
ESWT
no ESWT
ESWT
ESWT
MBPDAPI
MBPDAPI
×400
5 weeks after crush
3 weeks after crush
3 weeks after crush
fold
indu
ctio
n
1.60
1.40
1.20
1.00
0.80
0.60
0.40
0.20
0.005 weeks
MBPC
A
B
Fig. 2. Expression of myelin basic protein. A and B. In transmission electron microscopy (A) and immuno-fluorescent staining (B), the degree of myelination increased in the ESWT stimulation groups compared to the no-ESWT groups after 3 weeks and 5 weeks after crush injury. C. In qPCR, expression of myelin basic protein (MBP) tended to be higher in ESWT groups than in the no-ESWT groups by pooled average
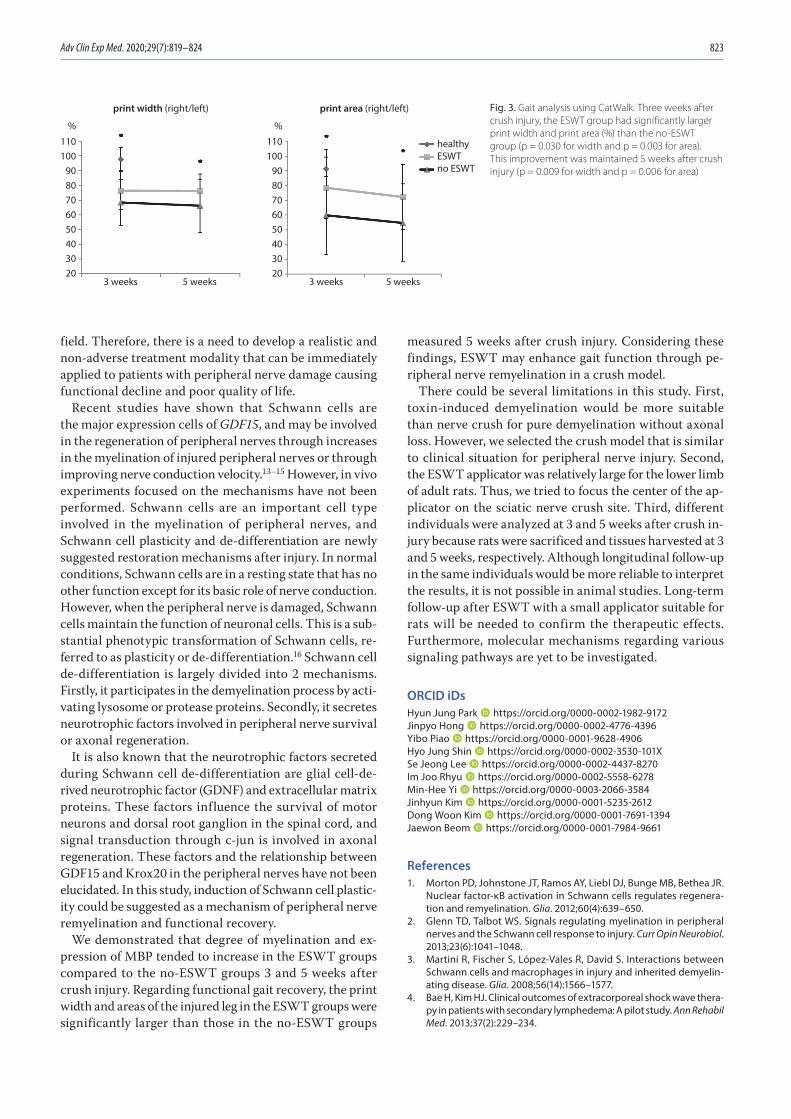
Adv Clin Exp Med. 2020;29(7):819–824 823
field. Therefore, there is a need to develop a realistic and non-adverse treatment modality that can be immediately applied to patients with peripheral nerve damage causing functional decline and poor quality of life.
Recent studies have shown that Schwann cells are the major expression cells of GDF15, and may be involved in the regeneration of peripheral nerves through increases in the myelination of injured peripheral nerves or through improving nerve conduction velocity.13–15 However, in vivo experiments focused on the mechanisms have not been performed. Schwann cells are an important cell type involved in the myelination of peripheral nerves, and Schwann cell plasticity and de-differentiation are newly suggested restoration mechanisms after injury. In normal conditions, Schwann cells are in a resting state that has no other function except for its basic role of nerve conduction. However, when the peripheral nerve is damaged, Schwann cells maintain the function of neuronal cells. This is a sub-stantial phenotypic transformation of Schwann cells, re-ferred to as plasticity or de-differentiation.16 Schwann cell de-differentiation is largely divided into 2 mechanisms. Firstly, it participates in the demyelination process by acti-vating lysosome or protease proteins. Secondly, it secretes neurotrophic factors involved in peripheral nerve survival or axonal regeneration.
It is also known that the neurotrophic factors secreted during Schwann cell de-differentiation are glial cell-de-rived neurotrophic factor (GDNF) and extracellular matrix proteins. These factors influence the survival of motor neurons and dorsal root ganglion in the spinal cord, and signal transduction through c-jun is involved in axonal regeneration. These factors and the relationship between GDF15 and Krox20 in the peripheral nerves have not been elucidated. In this study, induction of Schwann cell plastic-ity could be suggested as a mechanism of peripheral nerve remyelination and functional recovery.
We demonstrated that degree of myelination and ex-pression of MBP tended to increase in the ESWT groups compared to the no-ESWT groups 3 and 5 weeks after crush injury. Regarding functional gait recovery, the print width and areas of the injured leg in the ESWT groups were significantly larger than those in the no-ESWT groups
measured 5 weeks after crush injury. Considering these findings, ESWT may enhance gait function through pe-ripheral nerve remyelination in a crush model.
There could be several limitations in this study. First, toxin-induced demyelination would be more suitable than nerve crush for pure demyelination without axonal loss. However, we selected the crush model that is similar to clinical situation for peripheral nerve injury. Second, the ESWT applicator was relatively large for the lower limb of adult rats. Thus, we tried to focus the center of the ap-plicator on the sciatic nerve crush site. Third, different individuals were analyzed at 3 and 5 weeks after crush in-jury because rats were sacrificed and tissues harvested at 3 and 5 weeks, respectively. Although longitudinal follow-up in the same individuals would be more reliable to interpret the results, it is not possible in animal studies. Long-term follow-up after ESWT with a small applicator suitable for rats will be needed to confirm the therapeutic effects. Furthermore, molecular mechanisms regarding various signaling pathways are yet to be investigated.
ORCID iDsHyun Jung Park https://orcid.org/0000-0002-1982-9172Jinpyo Hong https://orcid.org/0000-0002-4776-4396Yibo Piao https://orcid.org/0000-0001-9628-4906Hyo Jung Shin https://orcid.org/0000-0002-3530-101XSe Jeong Lee https://orcid.org/0000-0002-4437-8270Im Joo Rhyu https://orcid.org/0000-0002-5558-6278Min-Hee Yi https://orcid.org/0000-0003-2066-3584Jinhyun Kim https://orcid.org/0000-0001-5235-2612Dong Woon Kim https://orcid.org/0000-0001-7691-1394Jaewon Beom https://orcid.org/0000-0001-7984-9661
References1. Morton PD, Johnstone JT, Ramos AY, Liebl DJ, Bunge MB, Bethea JR.
Nuclear factor-κB activation in Schwann cells regulates regenera-tion and remyelination. Glia. 2012;60(4):639–650.
2. Glenn TD, Talbot WS. Signals regulating myelination in peripheral nerves and the Schwann cell response to injury. Curr Opin Neurobiol. 2013;23(6):1041–1048.
3. Martini R, Fischer S, López-Vales R, David S. Interactions between Schwann cells and macrophages in injury and inherited demyelin-ating disease. Glia. 2008;56(14):1566–1577.
4. Bae H, Kim HJ. Clinical outcomes of extracorporeal shock wave thera-py in patients with secondary lymphedema: A pilot study. Ann Rehabil Med. 2013;37(2):229–234.
Fig. 3. Gait analysis using CatWalk. Three weeks after crush injury, the ESWT group had significantly larger print width and print area (%) than the no-ESWT group (p = 0.030 for width and p = 0.003 for area). This improvement was maintained 5 weeks after crush injury (p = 0.009 for width and p = 0.006 for area)
print width (right/left) print area (right/left)
3 weeks 5 weeks 3 weeks 5 weeks
healthyESWTno ESWT
110100
9080706050403020
%
110100
9080706050403020
%
H. Park et al. ESWT enhances peripheral nerve remyelination824
5. Schuh CM, Heher P, Weihs AM, et al. In vitro extracorporeal shock wave treatment enhances stemness and preserves multipotency of rat and human adipose-derived stem cells. Cytotherapy. 2014; 16(12):1666–1678.
6. Hausner T, Pajer K, Halat G, et al. Improved rate of peripheral nerve regeneration induced by extracorporeal shock wave treatment in the rat. Exp Neurol. 2012;236(2):363–370.
7. Wu YH, Liang HW, Chen WS, Lai JS, Luh JJ, Chong FC. Electrophysi-ological and functional effects of shock waves on the sciatic nerve of rats. Ultrasound Med Biol. 2008;34(10):1688–1696.
8. Wang FS, Yang KD, Chen RF, Wang CJ, Sheen-Chen SM. Extracorpo-real shock wave promotes growth and differentiation of bone-mar-row stromal cells towards osteoprogenitors associated with induc-tion of TGF-beta1. J Bone Joint Surg Br. 2002;84(3):457–461.
9. Livak KJ, Schmittgen TD. Analysis of relative gene expression data using real-time quantitative PCR and the 2(-delta delta C(T)) method. Methods. 2001;25(4):402–408.
10. Lee EJ, Xu L, Kim GH, et al. Regeneration of peripheral nerves by trans-planted sphere of human mesenchymal stem cells derived from embryonic stem cells. Biomaterials. 2012;33(29):7039–7046.
11. Zhou S, Shen D, Wang Y, et al. microRNA-222 targeting PTEN pro-motes neurite outgrowth from adult dorsal root ganglion neurons following sciatic nerve transection. PLoS One. 2012;7(9):e44768.
12. Wu D, Murashov AK. Molecular mechanisms of peripheral nerve regeneration: Emerging roles of microRNAs. Front Physiol. 2013;4:55.
13. Mensching L, Börger AK, Wang X, Charalambous P, Unsicker K, Haastert- Talini K. Local substitution of GDF-15 improves axonal and sensory recovery after peripheral nerve injury. Cell Tissue Res. 2012;350(2): 225–238.
14. Pereira JA, Lebrun-Julien F, Suter U. Molecular mechanisms regulat-ing myelination in the peripheral nervous system. Trends Neurosci. 2012;35(2):123–134.
15. Hung HA, Sun G, Keles S, Svaren J. Dynamic regulation of Schwann cell enhancers after peripheral nerve injury. J Biol Chem. 2015;290(11): 6937–6950.
16. Jessen KR, Mirsky R. Negative regulation of myelination: Relevance for development, injury, and demyelinating disease. Glia. 2008;56(14): 1552–1565.
Cite asYang Y, Li X, An X, et al. Continuous exposure of PM2.5 exacerbates ovalbumin-induced asthma in mouse lung via a JAK-STAT6 signaling pathway. Adv Clin Exp Med. 2020;29(7):825–832. doi:10.17219/acem/121009
DOI10.17219/acem/121009
CopyrightCopyright by Author(s) This is an article distributed under the terms of theCreative Commons Attribution 3.0 Unported (CC BY 3.0)(https://creativecommons.org/licenses/by/3.0/)
Address for correspondenceGuiyun ZhuE-mail: [email protected]
Funding sourcesThe China government funds of excellent clinical medical talents and basic research projects.
Conflict of interestNone declared
Received on September 1, 2019Reviewed on December 28, 2019Accepted on April 24, 2020
Published online on June 28, 2020
AbstractBackground. Epidemiological studies and mice models have demonstrated that air pollution containing par-ticulate matter smaller than 2.5 µm (PM2.5) exacerbates acute episodes of asthma in both children and adults.
Objectives. To investigate the effect of continuous PM2.5 treatment on asthma regulation mechanism behind this effect.
Material and methods. In this study, the effects of continuous exposure to PM2.5 on asthma and eosinophil recruitment was compared to the effect of a single pre-ovalbumin (OVA)-sensitization exposure to PM2.5. Wild-type mice were either challenged once with PM2.5 + OVA before sensitization and asthma induction over a 27-day period, or with 5 times of PM2.5 + OVA treatment and sensitization/asthma induction over the same period.
Results. Continuous exposure to PM2.5 significantly increased total plasma immunoglobulin E (IgE), bronchial alveolar lavage fluid (BALF) cell numbers, eosinophils, and macrophages, leading to increased lung injury. This effect was regulated through increased production of chemokines and cytokines, such as interleukin (IL)-1β, monocyte chemoattractant protein 1 (MCP-1), IL-12, IL-5, IL-13, and prostaglandin D2 (PGD2). Eosinophil recruitment during continuous PM2.5 treatment was regulated through phosphorylation of the JAK/STAT6 pathway. As this study shows, continuous PM2.5 treatment significantly worsens asthma as compared to single exposure to PM2.5 or OVA exposure alone.
Conclusions. Our findings reveal that continuous exposure of PM2.5 exacerbates OVA-induced asthma in mouse lung through JAK-STAT6 signaling pathway.
Key words: inflammation, asthma, PM2.5, JAK-STAT6 pathway
Original papers
Continuous exposure of PM2.5 exacerbates ovalbumin-induced asthma in mouse lung via a JAK-STAT6 signaling pathway
Yonghui Yang1,A–C, Xiaoxia Li1,B,C, Xiaoying An2,B–D, Ling Zhang3,B,C, Xingbin Li3,B,C, Liang Wang3,B,C, Guiyun Zhu1,D–F
1 Department of Pathology, Hebei Province Chest Hospital, Lung Cancer Prevention and Control Center of Hebei Province, Shijiazhuang, China2 Laboratory of Molecular Biology, Hebei Province Chest Hospital, Lung Cancer Prevention and Control Center of Hebei Province, Shijiazhuang, China3 Department of Pneumology, Hebei Province Chest Hospital, Lung Cancer Prevention and Control Center of Hebei Province, Shijiazhuang, China
A – research concept and design; B – collection and/or assembly of data; C – data analysis and interpretation; D – writing the article; E – critical revision of the article; F – final approval of the article
Advances in Clinical and Experimental Medicine, ISSN 1899–5276 (print), ISSN 2451–2680 (online) Adv Clin Exp Med. 2020;29(7):825–832
Y. Yang et al. PM2.5 aggravates asthma via JAK-STAT6 pathway826
Introduction
A combination of enormous population growth, rapid ur-banization and industrialization in China has led to a mas-sive increase of air pollution, a phenomenon previously observed in developed countries.1–3 A detrimental effect from increased air pollution is that the general population is exposed to harmful air pollutants containing particu-late matter (PM). Particulate matter contains an extensive variety of toxic substances derived from industrial and vehicular emissions, coal combustions, sea salt, and soil dusts.3 Depending on the city where the pollutant is col-lected, PM can contain varying amounts of fossil fuel com-bustion remains, such as polycyclic aromatic hydrocar-bons, sulfates (SO4
2−), nitrates (NO3−), microbial material, and chemical elements such as iron, zinc, silica, sodium, and aluminium.4–6 Furthermore, these PMs can remain in the atmosphere for a lengthy amount of time, transverse great distances and easily trigger lung disease.7 It has been shown that the smaller the particle size, the greater injury PM causes to the lungs.8
Particulate matter has been categorized into 2 grades: PM10, whose aerodynamic diameter is less than or equal to 10 µm, and PM2.5, whose aerodynamic diameter is less than or equal to 2.5 µm. PM2.5, a fine particulate matter, poses the greatest risk, as it induces stronger pulmonary and allergic inflammatory responses as compared to larger counterparts when tested at an equal mass dose.9,10 This was mainly due to a larger surface area to mass ratio. It must also be noted that, in addition to PM surface area, the chemical composition is also an important deter-minant of the inflammatory response. Since Asian dust aerosols can spread over a large area, including East Asia, the Korean peninsula and Japan, during spring, anthropo-genic pollution has become a major public health concern in Eastern Asia.11
Asthma, in both children and adults, is a common re-spiratory disease worldwide. Asthma is characterized by chronic allergic airway inflammation, with episodes of superimposed acute inflammation.12 Studies have now shown that PM2.5 is correlated with the exacerbation of asthma in Europe, the Americas, Korea, Japan, and China,13–17 where ambient air PM2.5 increases such in-cidences as asthma-related emergency department visits, worsened wheezing and dyspnea, and children hospital admissions for asthma.18–21 Asthma morbidity is also posi-tively associated with daily ambient PM2.5 levels. In Asia, daily admissions in the clinic for asthma, acute respiratory events in children as well as allergic rhinitis in Taipei, Tai-wan coincided with Asian dust storm events containing toxic pollutants.22–25
During acute exacerbations of asthma, clinical mani-festations include eosinophilic airway inflammation in the distal portion of the lung with symptom exaggera-tion, such as cough, chest tightness and dyspnea.26 Dur-ing presentation of asthma, the typical cytokine profile
is generally observed as a TH2-type airway inflammation with increased levels of eosinophils, immunoglobulin E (IgE) and the production of TH2-related cytokines such as interleukin (IL)-4, IL-5 and IL-13.27,28 Interleukin 4 is necessary for the polarization of T helper cells towards a TH2-phenotype,29 IL-5 helps promote proliferation and differentiation of B cells30 and IL-13 induces the induction of TH2 cells.31 Apart from eosinophil recruitment, macro-phages are described to play a role in inflammation during allergic airway inflammation.32,33 In addition, the TLR2/TLR4/MyD88-signaling pathway has been shown to regu-late the exacerbation of murine lung eosinophilia during PM2.5/ovalbumin (OVA)-induced asthma.34
In this study, urban PM was harvested from the atmo-sphere in Hebei, China. PM2.5 was administered to mice, together with OVA, to examine the effects of long-term exposure of pollutants on asthma exacerbation. This ef-fect was compared to a short-term sensitization exposure of PM2.5 to mice. The study investigated pathological changes of lungs, cellular infiltration in the bronchoal-veolar lavage fluid (BALF), inflammatory cytokine changes in BALF, OVA-specific IgE antibodies in serum, as well as the role of the JAK/STAT signaling pathway in the re-cruitment of eosinophils into the lungs. This study was performed to determine the inflammatory mechanism responsible for asthma exacerbation resulting from long-term exposure to PM2.5 pollutants.
Material and methods
Experimental animals
BALB/c mice were kept in pathogen-free conditions and received sterile OVA-free food and water. The mice were maintained on a 12-hour light/dark cycle, under constant room temperature (24°C) and relative humidity (40–80%). The experimental protocols shown in this study were ap-proved by the Institutional Animal Care and Research Advisory Committee at Chongqing Medical University, China. The use of animals in these experiments was in ac-cordance with the guidelines issued by the Chinese Coun-cil on Animal Care.
PM2.5 particles preparation
Methods of preparing PM2.5 were provided by the Hu-bei Province Center for Disease Control and Prevention, China. First, PM2.5 was collected on a glass fiber filter using a Thermon Anderson high-volume sampler (Ther-mon Anderson, San Marcos, USA). The sample membrane was equilibrated at 60°C for 6 h before weighing using an analytical balance. The ambient PM2.5 concentration was calculated from sample weight and air volume. PM2.5 was recovered from the membrane using a modification of an aqueous extraction technique: the PM2.5-adsorbed
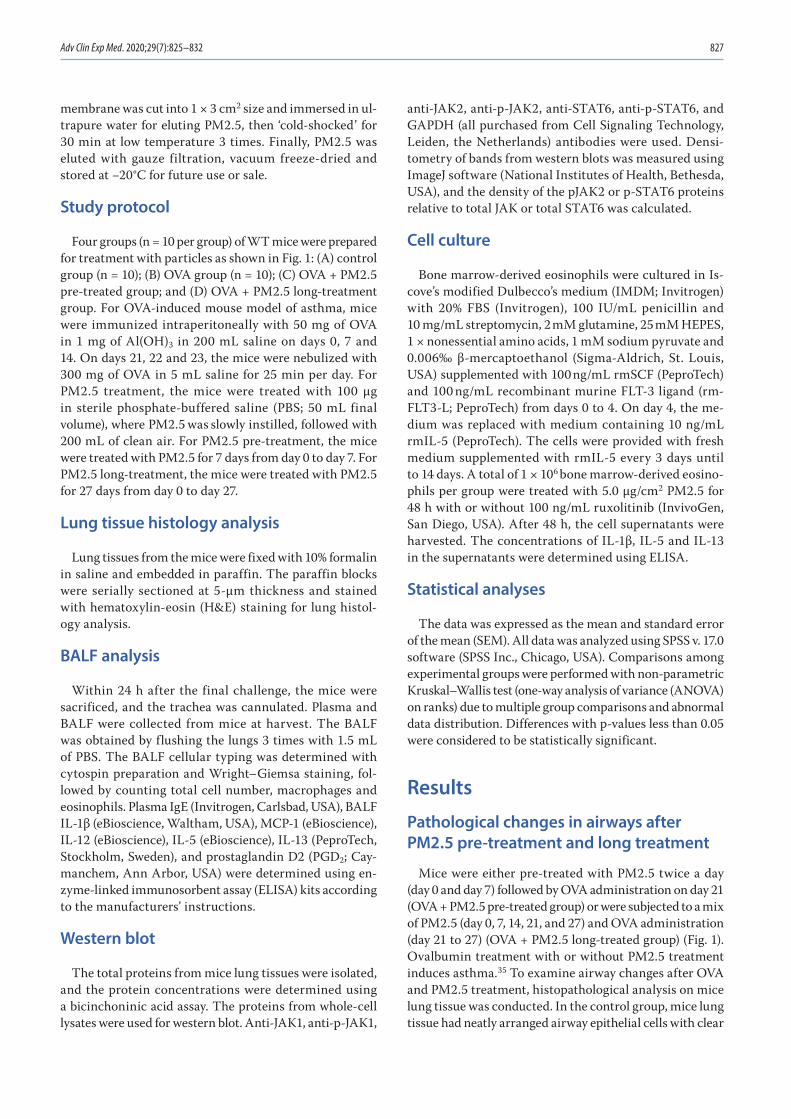
Adv Clin Exp Med. 2020;29(7):825–832 827
membrane was cut into 1 × 3 cm2 size and immersed in ul-trapure water for eluting PM2.5, then ‘cold-shocked’ for 30 min at low temperature 3 times. Finally, PM2.5 was eluted with gauze filtration, vacuum freeze-dried and stored at −20°C for future use or sale.
Study protocol
Four groups (n = 10 per group) of WT mice were prepared for treatment with particles as shown in Fig. 1: (A) control group (n = 10); (B) OVA group (n = 10); (C) OVA + PM2.5 pre-treated group; and (D) OVA + PM2.5 long-treatment group. For OVA-induced mouse model of asthma, mice were immunized intraperitoneally with 50 mg of OVA in 1 mg of Al(OH)3 in 200 mL saline on days 0, 7 and 14. On days 21, 22 and 23, the mice were nebulized with 300 mg of OVA in 5 mL saline for 25 min per day. For PM2.5 treatment, the mice were treated with 100 µg in sterile phosphate-buffered saline (PBS; 50 mL final volume), where PM2.5 was slowly instilled, followed with 200 mL of clean air. For PM2.5 pre-treatment, the mice were treated with PM2.5 for 7 days from day 0 to day 7. For PM2.5 long-treatment, the mice were treated with PM2.5 for 27 days from day 0 to day 27.
Lung tissue histology analysis
Lung tissues from the mice were fixed with 10% formalin in saline and embedded in paraffin. The paraffin blocks were serially sectioned at 5-μm thickness and stained with hematoxylin-eosin (H&E) staining for lung histol-ogy analysis.
BALF analysis
Within 24 h after the final challenge, the mice were sacrificed, and the trachea was cannulated. Plasma and BALF were collected from mice at harvest. The BALF was obtained by flushing the lungs 3 times with 1.5 mL of PBS. The BALF cellular typing was determined with cytospin preparation and Wright–Giemsa staining, fol-lowed by counting total cell number, macrophages and eosinophils. Plasma IgE (Invitrogen, Carlsbad, USA), BALF IL-1β (eBioscience, Waltham, USA), MCP-1 (eBioscience), IL-12 (eBioscience), IL-5 (eBioscience), IL-13 (PeproTech, Stockholm, Sweden), and prostaglandin D2 (PGD2; Cay-manchem, Ann Arbor, USA) were determined using en-zyme-linked immunosorbent assay (ELISA) kits according to the manufacturers’ instructions.
Western blot
The total proteins from mice lung tissues were isolated, and the protein concentrations were determined using a bicinchoninic acid assay. The proteins from whole-cell lysates were used for western blot. Anti-JAK1, anti-p-JAK1,
anti-JAK2, anti-p-JAK2, anti-STAT6, anti-p-STAT6, and GAPDH (all purchased from Cell Signaling Technology, Leiden, the Netherlands) antibodies were used. Densi-tometry of bands from western blots was measured using ImageJ software (National Institutes of Health, Bethesda, USA), and the density of the pJAK2 or p-STAT6 proteins relative to total JAK or total STAT6 was calculated.
Cell culture
Bone marrow-derived eosinophils were cultured in Is-cove’s modified Dulbecco’s medium (IMDM; Invitrogen) with 20% FBS (Invitrogen), 100 IU/mL penicillin and 10 mg/mL streptomycin, 2 mM glutamine, 25 mM HEPES, 1 × nonessential amino acids, 1 mM sodium pyruvate and 0.006‰ β-mercaptoethanol (Sigma-Aldrich, St. Louis, USA) supplemented with 100 ng/mL rmSCF (PeproTech) and 100 ng/mL recombinant murine FLT-3 ligand (rm-FLT3-L; PeproTech) from days 0 to 4. On day 4, the me-dium was replaced with medium containing 10 ng/mL rmIL-5 (PeproTech). The cells were provided with fresh medium supplemented with rmIL-5 every 3 days until to 14 days. A total of 1 × 10⁶ bone marrow-derived eosino-phils per group were treated with 5.0 μg/cm2 PM2.5 for 48 h with or without 100 ng/mL ruxolitinib (InvivoGen, San Diego, USA). After 48 h, the cell supernatants were harvested. The concentrations of IL-1β, IL-5 and IL-13 in the supernatants were determined using ELISA.
Statistical analyses
The data was expressed as the mean and standard error of the mean (SEM). All data was analyzed using SPSS v. 17.0 software (SPSS Inc., Chicago, USA). Comparisons among experimental groups were performed with non-parametric Kruskal–Wallis test (one-way analysis of variance (ANOVA) on ranks) due to multiple group comparisons and abnormal data distribution. Differences with p-values less than 0.05 were considered to be statistically significant.
Results
Pathological changes in airways after PM2.5 pre-treatment and long treatment
Mice were either pre-treated with PM2.5 twice a day (day 0 and day 7) followed by OVA administration on day 21 (OVA + PM2.5 pre-treated group) or were subjected to a mix of PM2.5 (day 0, 7, 14, 21, and 27) and OVA administration (day 21 to 27) (OVA + PM2.5 long-treated group) (Fig. 1). Ovalbumin treatment with or without PM2.5 treatment induces asthma.35 To examine airway changes after OVA and PM2.5 treatment, histopathological analysis on mice lung tissue was conducted. In the control group, mice lung tissue had neatly arranged airway epithelial cells with clear
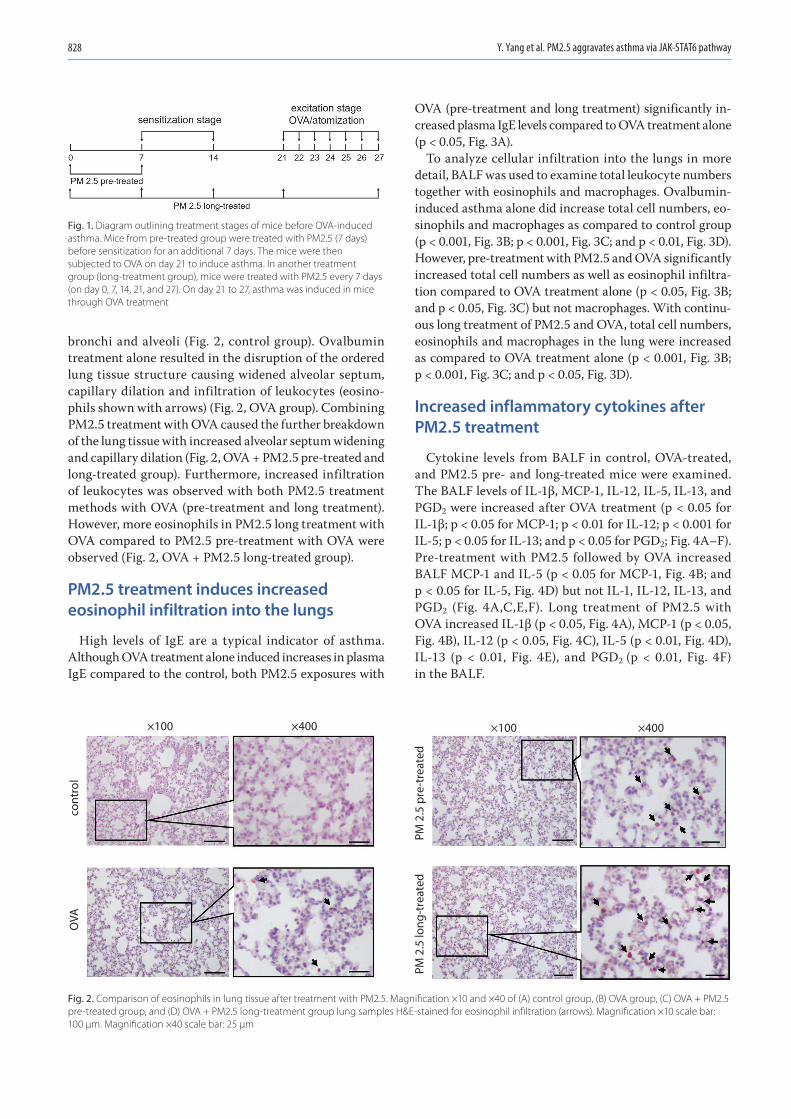
Y. Yang et al. PM2.5 aggravates asthma via JAK-STAT6 pathway828
bronchi and alveoli (Fig. 2, control group). Ovalbumin treatment alone resulted in the disruption of the ordered lung tissue structure causing widened alveolar septum, capillary dilation and infiltration of leukocytes (eosino-phils shown with arrows) (Fig. 2, OVA group). Combining PM2.5 treatment with OVA caused the further breakdown of the lung tissue with increased alveolar septum widening and capillary dilation (Fig. 2, OVA + PM2.5 pre-treated and long-treated group). Furthermore, increased infiltration of leukocytes was observed with both PM2.5 treatment methods with OVA (pre-treatment and long treatment). However, more eosinophils in PM2.5 long treatment with OVA compared to PM2.5 pre-treatment with OVA were observed (Fig. 2, OVA + PM2.5 long-treated group).
PM2.5 treatment induces increased eosinophil infiltration into the lungs
High levels of IgE are a typical indicator of asthma. Although OVA treatment alone induced increases in plasma IgE compared to the control, both PM2.5 exposures with
OVA (pre-treatment and long treatment) significantly in-creased plasma IgE levels compared to OVA treatment alone (p < 0.05, Fig. 3A).
To analyze cellular infiltration into the lungs in more detail, BALF was used to examine total leukocyte numbers together with eosinophils and macrophages. Ovalbumin-induced asthma alone did increase total cell numbers, eo-sinophils and macrophages as compared to control group (p < 0.001, Fig. 3B; p < 0.001, Fig. 3C; and p < 0.01, Fig. 3D). However, pre-treatment with PM2.5 and OVA significantly increased total cell numbers as well as eosinophil infiltra-tion compared to OVA treatment alone (p < 0.05, Fig. 3B; and p < 0.05, Fig. 3C) but not macrophages. With continu-ous long treatment of PM2.5 and OVA, total cell numbers, eosinophils and macrophages in the lung were increased as compared to OVA treatment alone (p < 0.001, Fig. 3B; p < 0.001, Fig. 3C; and p < 0.05, Fig. 3D).
Increased inflammatory cytokines after PM2.5 treatment
Cytokine levels from BALF in control, OVA-treated, and PM2.5 pre- and long-treated mice were examined. The BALF levels of IL-1β, MCP-1, IL-12, IL-5, IL-13, and PGD2 were increased after OVA treatment (p < 0.05 for IL-1β; p < 0.05 for MCP-1; p < 0.01 for IL-12; p < 0.001 for IL-5; p < 0.05 for IL-13; and p < 0.05 for PGD2; Fig. 4A–F). Pre-treatment with PM2.5 followed by OVA increased BALF MCP-1 and IL-5 (p < 0.05 for MCP-1, Fig. 4B; and p < 0.05 for IL-5, Fig. 4D) but not IL-1, IL-12, IL-13, and PGD2 (Fig. 4A,C,E,F). Long treatment of PM2.5 with OVA increased IL-1β (p < 0.05, Fig. 4A), MCP-1 (p < 0.05, Fig. 4B), IL-12 (p < 0.05, Fig. 4C), IL-5 (p < 0.01, Fig. 4D), IL-13 (p < 0.01, Fig. 4E), and PGD2 (p < 0.01, Fig. 4F)
in the BALF.
Fig. 1. Diagram outlining treatment stages of mice before OVA-induced asthma. Mice from pre-treated group were treated with PM2.5 (7 days) before sensitization for an additional 7 days. The mice were then subjected to OVA on day 21 to induce asthma. In another treatment group (long-treatment group), mice were treated with PM2.5 every 7 days (on day 0, 7, 14, 21, and 27). On day 21 to 27, asthma was induced in mice through OVA treatment
Fig. 2. Comparison of eosinophils in lung tissue after treatment with PM2.5. Magnification ×10 and ×40 of (A) control group, (B) OVA group, (C) OVA + PM2.5 pre-treated group, and (D) OVA + PM2.5 long-treatment group lung samples H&E-stained for eosinophil infiltration (arrows). Magnification ×10 scale bar: 100 µm. Magnification ×40 scale bar: 25 µm
×100
cont
rol
OVA
PM 2
.5 lo
ng-t
reat
edPM
2.5
pre
-tre
ated
×400 ×100 ×400
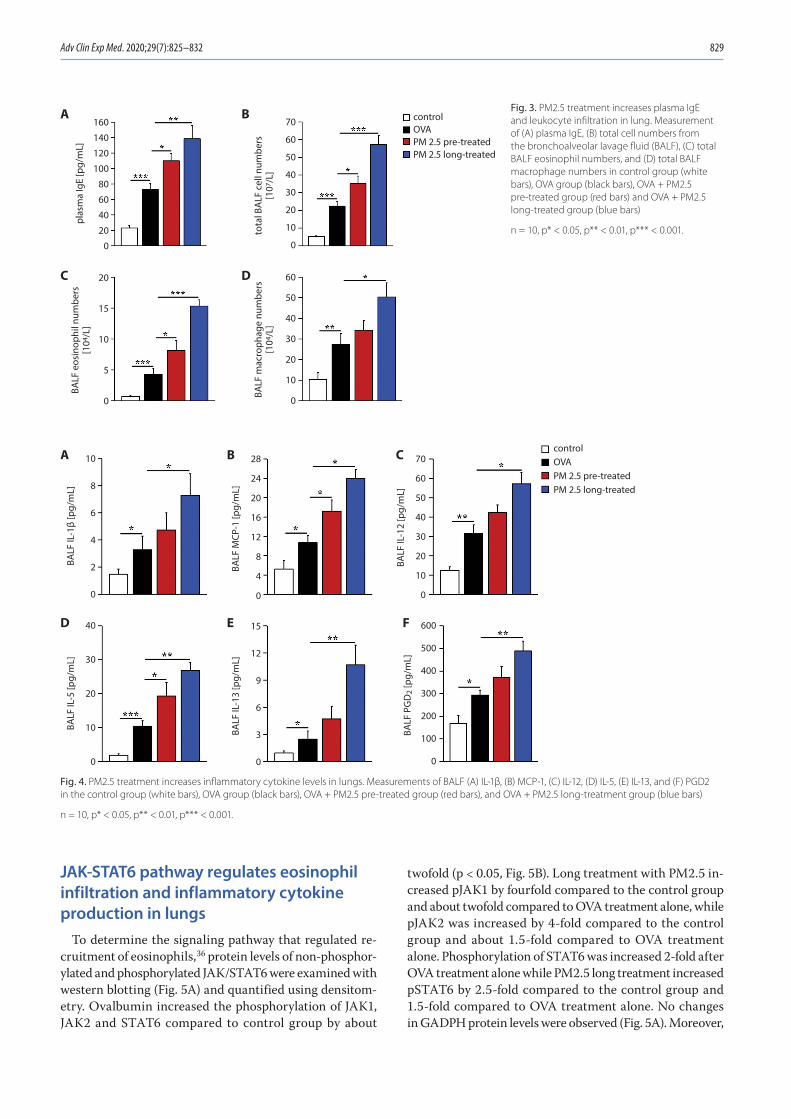
Adv Clin Exp Med. 2020;29(7):825–832 829
JAK-STAT6 pathway regulates eosinophil infiltration and inflammatory cytokine production in lungs
To determine the signaling pathway that regulated re-cruitment of eosinophils,36 protein levels of non-phosphor-ylated and phosphorylated JAK/STAT6 were examined with western blotting (Fig. 5A) and quantified using densitom-etry. Ovalbumin increased the phosphorylation of JAK1, JAK2 and STAT6 compared to control group by about
twofold (p < 0.05, Fig. 5B). Long treatment with PM2.5 in-creased pJAK1 by fourfold compared to the control group and about twofold compared to OVA treatment alone, while pJAK2 was increased by 4-fold compared to the control group and about 1.5-fold compared to OVA treatment alone. Phosphorylation of STAT6 was increased 2-fold after OVA treatment alone while PM2.5 long treatment increased pSTAT6 by 2.5-fold compared to the control group and 1.5-fold compared to OVA treatment alone. No changes in GADPH protein levels were observed (Fig. 5A). Moreover,
Fig. 4. PM2.5 treatment increases inflammatory cytokine levels in lungs. Measurements of BALF (A) IL-1β, (B) MCP-1, (C) IL-12, (D) IL-5, (E) IL-13, and (F) PGD2 in the control group (white bars), OVA group (black bars), OVA + PM2.5 pre-treated group (red bars), and OVA + PM2.5 long-treatment group (blue bars)
n = 10, p* < 0.05, p** < 0.01, p*** < 0.001.
Fig. 3. PM2.5 treatment increases plasma IgE and leukocyte infiltration in lung. Measurement of (A) plasma IgE, (B) total cell numbers from the bronchoalveolar lavage fluid (BALF), (C) total BALF eosinophil numbers, and (D) total BALF macrophage numbers in control group (white bars), OVA group (black bars), OVA + PM2.5 pre-treated group (red bars) and OVA + PM2.5 long-treated group (blue bars)
n = 10, p* < 0.05, p** < 0.01, p*** < 0.001.
70
60
50
40
30
20
10
0
160
140
120
100
80
60
40
20
0
60
50
40
30
20
10
0
20
15
10
5
0
controlOVAPM 2.5 pre-treatedPM 2.5 long-treated
plas
ma
IgE
[pg/
mL]
BALF
eos
inop
hil n
umbe
rs[1
04/L
]
BALF
mac
roph
age
num
bers
[104
/L]
tota
l BA
LF c
ell n
umbe
rs[1
07/L
]
A B
C D
70
60
50
40
30
20
10
0
40
30
20
10
0
10
8
6
4
2
0
600
500
400
300
200
100
0
15
12
9
6
3
0
28
24
20
16
12
8
4
0
controlOVAPM 2.5 pre-treatedPM 2.5 long-treated
BALF
IL-1
2 [p
g/m
L]
BALF
IL-1
β [p
g/m
L]BA
LF IL
-5 [p
g/m
L]
BALF
IL-1
3 [p
g/m
L]
BALF
PG
D2
[pg/
mL]
BALF
MCP
-1 [p
g/m
L]
A B C
D E F
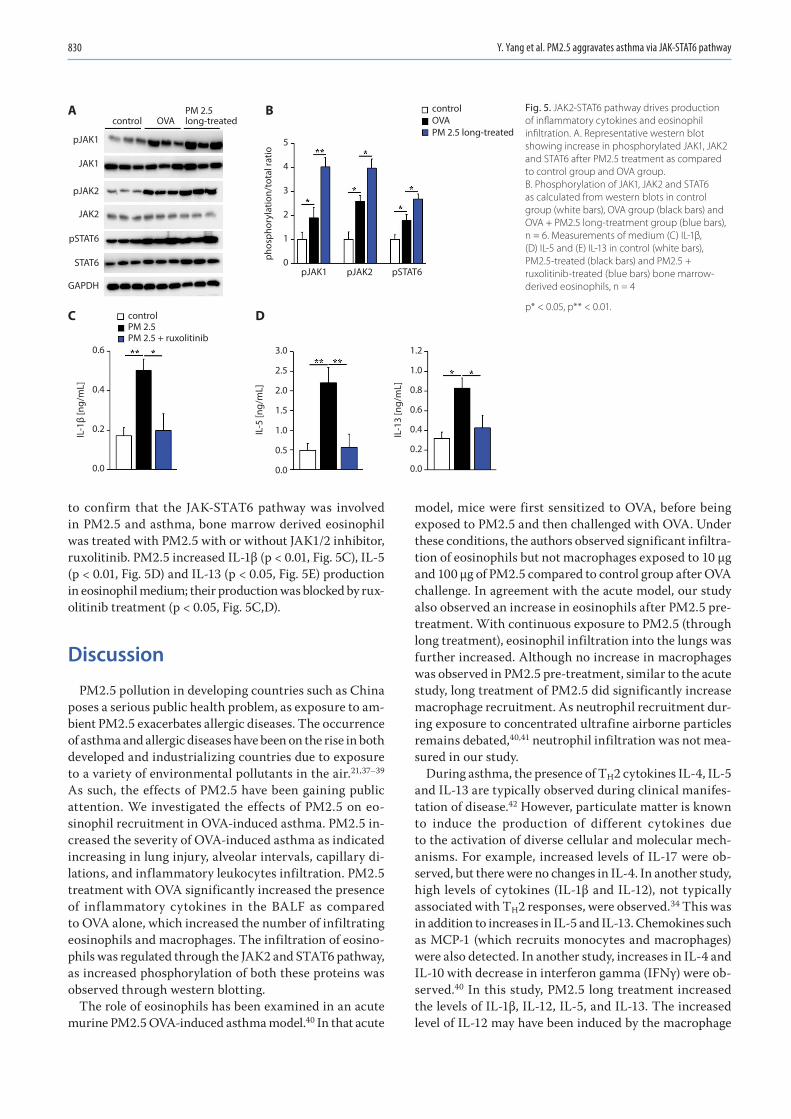
Y. Yang et al. PM2.5 aggravates asthma via JAK-STAT6 pathway830
to confirm that the JAK-STAT6 pathway was involved in PM2.5 and asthma, bone marrow derived eosinophil was treated with PM2.5 with or without JAK1/2 inhibitor, ruxolitinib. PM2.5 increased IL-1β (p < 0.01, Fig. 5C), IL-5 (p < 0.01, Fig. 5D) and IL-13 (p < 0.05, Fig. 5E) production in eosinophil medium; their production was blocked by rux-olitinib treatment (p < 0.05, Fig. 5C,D).
Discussion
PM2.5 pollution in developing countries such as China poses a serious public health problem, as exposure to am-bient PM2.5 exacerbates allergic diseases. The occurrence of asthma and allergic diseases have been on the rise in both developed and industrializing countries due to exposure to a variety of environmental pollutants in the air.21,37–39 As such, the effects of PM2.5 have been gaining public attention. We investigated the effects of PM2.5 on eo-sinophil recruitment in OVA-induced asthma. PM2.5 in-creased the severity of OVA-induced asthma as indicated increasing in lung injury, alveolar intervals, capillary di-lations, and inflammatory leukocytes infiltration. PM2.5 treatment with OVA significantly increased the presence of inflammatory cytokines in the BALF as compared to OVA alone, which increased the number of infiltrating eosinophils and macrophages. The infiltration of eosino-phils was regulated through the JAK2 and STAT6 pathway, as increased phosphorylation of both these proteins was observed through western blotting.
The role of eosinophils has been examined in an acute murine PM2.5 OVA-induced asthma model.40 In that acute
model, mice were first sensitized to OVA, before being exposed to PM2.5 and then challenged with OVA. Under these conditions, the authors observed significant infiltra-tion of eosinophils but not macrophages exposed to 10 µg and 100 µg of PM2.5 compared to control group after OVA challenge. In agreement with the acute model, our study also observed an increase in eosinophils after PM2.5 pre-treatment. With continuous exposure to PM2.5 (through long treatment), eosinophil infiltration into the lungs was further increased. Although no increase in macrophages was observed in PM2.5 pre-treatment, similar to the acute study, long treatment of PM2.5 did significantly increase macrophage recruitment. As neutrophil recruitment dur-ing exposure to concentrated ultrafine airborne particles remains debated,40,41 neutrophil infiltration was not mea-sured in our study.
During asthma, the presence of TH2 cytokines IL-4, IL-5 and IL-13 are typically observed during clinical manifes-tation of disease.42 However, particulate matter is known to induce the production of different cytokines due to the activation of diverse cellular and molecular mech-anisms. For example, increased levels of IL-17 were ob-served, but there were no changes in IL-4. In another study, high levels of cytokines (IL-1β and IL-12), not typically associated with TH2 responses, were observed.34 This was in addition to increases in IL-5 and IL-13. Chemokines such as MCP-1 (which recruits monocytes and macrophages) were also detected. In another study, increases in IL-4 and IL-10 with decrease in interferon gamma (IFNγ) were ob-served.40 In this study, PM2.5 long treatment increased the levels of IL-1β, IL-12, IL-5, and IL-13. The increased level of IL-12 may have been induced by the macrophage
Fig. 5. JAK2-STAT6 pathway drives production of inflammatory cytokines and eosinophil infiltration. A. Representative western blot showing increase in phosphorylated JAK1, JAK2 and STAT6 after PM2.5 treatment as compared to control group and OVA group. B. Phosphorylation of JAK1, JAK2 and STAT6 as calculated from western blots in control group (white bars), OVA group (black bars) and OVA + PM2.5 long-treatment group (blue bars), n = 6. Measurements of medium (C) IL-1β, (D) IL-5 and (E) IL-13 in control (white bars), PM2.5-treated (black bars) and PM2.5 + ruxolitinib-treated (blue bars) bone marrow-derived eosinophils, n = 4
p* < 0.05, p** < 0.01.
controlOVAPM 2.5 long-treated
controlPM 2.5 PM 2.5 + ruxolitinib
PM 2.5long-treatedOVAcontrol
pJAK1
JAK1
pJAK2
JAK2
pSTAT6
pJAK1
1.2
1.0
0.8
0.6
0.4
0.2
0.0
0.6
0.4
0.2
0.0
3.0
2.5
2.0
1.5
1.0
0.5
0.0
phos
phor
ylat
ion/
tota
l rat
io
IL-1
β [n
g/m
L]
IL-5
[ng/
mL]
IL-1
3 [n
g/m
L]
5
4
3
2
1
0pJAK2 pSTAT6
STAT6
GAPDH
A B
C D
Adv Clin Exp Med. 2020;29(7):825–832 831
recruitment in BALF (Fig. 3D). Alveolar macrophages are primed for the production of IL-10 and IL-12 in asthma.43 However, IL-12 could induce the type I immune response which is antagonistic with type II immune responses. Mac-rophages appear more as a consequence than as an initi-ating factor of the T-cell TH2 commitment and could be involved in the resolution of the asthmatic inflammation. Together with the chemokine MCP-1, these cytokines were important in the recruitment of macrophages and eosino-phils into the lung.
The JAK-STAT pathway is important in the devel-opment of asthma.36 For example, IL-4 induces JAK1/JAK3 resulting in STAT6 activation, which further po-larizes the TH2 pathway. Another important pathway in asthma development is IL-13-JAK2-STAT6 pathway, which upon activation markedly increases mucous secre-tion.44 In this study, eosinophil recruitment was dem-onstrated to be reliant on the phosphorylation of JAK2 and STAT6. Ovalbumin treatment alone triggers this pathway but co-treatment with PM2.5 significantly in-creases the amount of phosphorylation of both JAK2 and STAT6. As a result of JAK2/STAT6 pathway activa-tion, IL-13 was significantly increased and contributed to airway inflammation.
There are several limitations to our study. First, the poly-cyclic aromatic hydrocarbons, chemicals and metals were not analyzed in our study. Although these components are typically found in PM2.5, PM2.5 from different cit-ies are composed of different compounds, which induces different responses in vivo. In addition, this meant that the component which contributed most to asthma exac-erbation in PM2.5 long, continuous treatment could not be identified. Second, as the data is from a single city, it might be challenging to extend these findings to other cities due to differences in climate and pollution content. Finally, cytokines typically associated with asthma (such as IL-5 and IL-13), pro-inflammatory cytokines (IL-1β and IL-12) and leukocyte chemokines (MCP-1 and PGD2) were observed to increase during PM2.5 long treatment in this study. These factors isolated from the BALF likely contributed to the induction of leukocyte recruitment into the lung and resulted in exacerbating the disease. However, the mechanistic contribution of individual cytokines to eosinophil recruitment was not examined in this study.
Conclusions
Although the effect of PM2.5 has been examined by oth-er researchers, their studies have focused on the acute ef-fects of PM2.5 on aggravating asthma. By providing con-tinuous treatment of PM2.5 together with OVA treatment, our study demonstrates that prolonged exposure of PM2.5 increases the severity of asthma through exacerbated in-flammation by increasing eosinophil recruitment.
ORCID iDsYonghui Yang https://orcid.org/0000-0001-5955-2289Xiaoxia Li https://orcid.org/0000-0001-5401-2398Xiaoying An https://orcid.org/0000-0002-4799-8862Ling Zhang https://orcid.org/0000-0002-9313-4758Xingbin Li https://orcid.org/0000-0003-4411-1303Liang Wang https://orcid.org/0000-0002-5385-3045Guiyun Zhu https://orcid.org/0000-0002-9734-2001
References1. Li L, Liu DJ. Study on an air quality evaluation model for Beijing City
under haze-fog pollution based on new ambient air quality stan-dards. Int J Environ Res Public Health. 2014;11(9):8909–8923.
2. Lu S, Wang Y, Teng Y, Yu X. Heavy metal pollution and ecological risk assessment of the paddy soils near a zinc-lead mining area in Hunan. Environ Monit Assess. 2015;187(10):627.
3. Xie J, Teng J, Fan Y, Xie R, Shen A. The short-term effects of air pol-lutants on hospitalizations for respiratory disease in Hefei, China. Int J Biometeorol. 2019;63(3):315–326.
4. Wang Y, Smith JA, Wilmers CC. Residential development alters behavior, movement, and energetics in an apex predator, the puma. PLoS One. 2017;12(10):e0184687.
5. Maki T, Puspitasari F, Hara K, et al. Variations in the structure of air-borne bacterial communities in a downwind area during an Asian dust (Kosa) event. Sci Total Environ. 2014;488–489:75–84.
6. He M, Ichinose T, Song Y, et al. Effects of two Asian sand dusts trans-ported from the dust source regions of Inner Mongolia and north-east China on murine lung eosinophilia. Toxicol Appl Pharmacol. 2013; 272(3):647–655.
7. Kim KH, Kabir E, Kabir S. A review on the human health impact of air-borne particulate matter. Environ Int. 2015;74:136–143.
8. Cai Y, Shao Y, Wang C. The association of air pollution with the patients’ visits to the department of respiratory diseases. J Clin Med Res. 2015;7(7):551–555.
9. de Haar C, Hassing I, Bol M, Bleumink R, Pieters R. Ultrafine but not fine particulate matter causes airway inflammation and allergic air-way sensitization to co-administered antigen in mice. Clin Exp Allergy. 2006;36(11):1469–1479.
10. Singh S, Shi T, Duffin R, et al. Endocytosis, oxidative stress and IL-8 expression in human lung epithelial cells upon treatment with fine and ultrafine TiO2: Role of the specific surface area and of surface meth-ylation of the particles. Toxicol Appl Pharmacol. 2007;222(2):141–151.
11. Primbs T, Simonich S, Schmedding D, et al. Atmospheric outflow of anthropogenic semivolatile organic compounds from East Asia in spring 2004. Environ Sci Technol. 2007;41(10):3551–3558.
12. Shadie AM, Herbert C, Kumar RK. Ambient particulate matter induces an exacerbation of airway inflammation in experimental asthma: Role of interleukin-33. Clin Exp Immunol. 2014;177(2):491–499.
13. Jacquemin B, Siroux V, Sanchez M, et al. Ambient air pollution and adult asthma incidence in six European cohorts (ESCAPE). Environ Health Perspect. 2015;123(6):613–621.
14. Baccarelli AA, Zheng Y, Zhang X, et al. Air pollution exposure and lung function in highly exposed subjects in Beijing, China: A repeated- measure study. Part Fibre Toxicol. 2014;11:51.
15. Hopke PK, Croft D, Zhang W, et al. Changes in the acute response of respiratory diseases to PM2.5 in New York State from 2005 to 2016. Sci Total Environ. 2019;677:328–339.
16. Hasunuma H, Yamazaki S, Tamura K, et al. Association between daily ambient air pollution and respiratory symptoms in children with asthma and healthy children in western Japan. J Asthma. 2018;55(7): 712–719.
17. Jo EJ, Lee WS, Jo HY, et al. Effects of particulate matter on respiratory disease and the impact of meteorological factors in Busan, Korea. Respir Med. 2017;124:79–87.
18. Mar TF, Koenig JQ, Primomo J. Associations between asthma emer-gency visits and particulate matter sources, including diesel emis-sions from stationary generators in Tacoma, Washington. Inhal Toxicol. 2010;22(6):445–448.
19. Vempilly J, Abejie B, Diep V, Gushiken M, Rawat M, Tyner TR. The syn-ergetic effect of ambient PM2.5 exposure and rhinovirus infection in airway dysfunction in asthma: A pilot observational study from the Central Valley of California. Exp Lung Res. 2013;39(10):434–440.
Y. Yang et al. PM2.5 aggravates asthma via JAK-STAT6 pathway832
20. Iskandar A, Andersen ZJ, Bonnelykke K, Ellermann T, Andersen KK, Bisgaard H. Coarse and fine particles but not ultrafine particles in urban air trigger hospital admission for asthma in children. Thorax. 2012;67(3):252–257.
21. Tecer LH, Alagha O, Karaca F, Tuncel G, Eldes N. Particulate matter (PM(2.5), PM(10-2.5), and PM(10)) and children’s hospital admissions for asthma and respiratory diseases: A bidirectional case-crossover study. J Toxicol Environ Health A. 2008;71(8):512–520.
22. Yang CY, Tsai SS, Chang CC, Ho S-C. Effects of Asian dust storm events on daily admissions for asthma in Taipei, Taiwan. Inhal Toxicol. 2005; 17(14):817–821.
23. Yoo Y, Choung JT, Yu J, Kim KD, Koh YY. Acute effects of Asian dust events on respiratory symptoms and peak expiratory flow in chil-dren with mild asthma. J Korean Med Sci. 2008;23(1):66–71.
24. Watanabe M, Yamasaki A, Burioka N, et al. Correlation between Asian dust storms and worsening asthma in Western Japan. Allergol Int. 2011;60(3):267–275.
25. Kanatani KT, Ito I, Al-Delaimy WK, et al. Desert dust exposure is asso-ciated with increased risk of asthma hospitalization in children. Am J Respir Crit Care Med. 2010;182(12):1475–1481.
26. Dougherty RH, Fahy JV. Acute exacerbations of asthma: Epidemiolo-gy, biology and the exacerbation-prone phenotype. Clin Exp Allergy. 2009;39(2):193–202.
27. Kim HY, DeKruyff RH, Umetsu DT. The many paths to asthma: Pheno-type shaped by innate and adaptive immunity. Nat Immunol. 2010; 11(7):577–584.
28. Miyauchi K. Helper T cell responses to respiratory viruses in the lung: Development, virus suppression, and pathogenesis. Viral Immunol. 2017;30(6):421–430.
29. Kirstein F, Nieuwenhuizen NE, Jayakumar J, Horsnell WGC, Brombacher F. Role of IL-4 receptor alpha-positive CD4(+) T cells in chronic airway hyperresponsiveness. J Allergy Clin Immunol. 2016;137(6):1852–1862.e9.
30. Horikawa K, Takatsu K. Interleukin-5 regulates genes involved in B-cell terminal maturation. Immunology. 2006;118(4):497–508.
31. McKenzie GJ, Bancroft A, Grencis RK, McKenzie AN. A distinct role for interleukin-13 in Th2-cell-mediated immune responses. Curr Biol. 1998;8(6):339–342.
32. Lumeng CN. Lung macrophage diversity and asthma. Ann Am Thorac Soc. 2016;13(Suppl 1):S31–S34.
33. Fricker M, Gibson PG. Macrophage dysfunction in the pathogenesis and treatment of asthma. Eur Respir J. 2017;50(3):1700196.
34. He M, Ichinose T, Yoshida Y, et al. Urban PM2.5 exacerbates allergic inflammation in the murine lung via a TLR2/TLR4/MyD88-signaling pathway. Sci Rep. 2017;7(1):11027.
35. Nials AT, Uddin S. Mouse models of allergic asthma: Acute and chronic allergen challenge. Dis Model Mech. 2008;1(4–5):213–220.
36. Pernis AB, Rothman PB. JAK-STAT signaling in asthma. J Clin Invest. 2002;109(10):1279–1283.
37. Li S, Batterman S, Wasilevich E, et al. Association of daily asthma emergency department visits and hospital admissions with ambient air pollutants among the pediatric Medicaid population in Detroit: Time-series and time-stratified case-crossover analyses with thresh-old effects. Environ Res. 2011;111(8):1137–1147.
38. Lerchl A. Comments on “Radiofrequency electromagnetic fields (UMTS, 1,950 MHz) induce genotoxic effects in vitro in human fibro-blasts but not in lymphocytes” by Schwarz et al. (Int Arch Occup Environ Health 2008: doi:10.1007/s00420-008-0305-5). Int Arch Occup Environ Health. 2009;82(2):275–278.
39. Nordenhall C, Pourazar J, Ledin MC, Levin JO, Sandström T, Adelroth E. Diesel exhaust enhances airway responsiveness in asthmatic subjects. Eur Respir J. 2001;17(5):909–915.
40. Zhang X, Zhong W, Meng Q, et al. Ambient PM2.5 exposure exacerbates severity of allergic asthma in previously sensitized mice. J Asthma. 2015;52(8):785–794.
41. Kleinman MT, Sioutas C, Froines JR, et al. Inhalation of concentrat-ed ambient particulate matter near a heavily trafficked road stimu-lates antigen-induced airway responses in mice. Inhal Toxicol. 2007; 19(Suppl 1):117–126.
42. Barnes PJ. Targeting cytokines to treat asthma and chronic obstruc-tive pulmonary disease. Nat Rev Immunol. 2018;18(7):454–466.
43. Magnan A, van Pee D, Bongrand P, et al. Alveolar macrophage inter-leukin (IL)-10 and IL-12 production in atopic asthma. Allergy. 1998;53: 1092–1095.
44. Ding F, Liu B, Zou W, et al. LPS exposure in early life protects against mucus hypersecretion in ovalbumin-induced asthma by downreg-ulation of the IL-13 and JAK-STAT6 pathways. Cell Physiol Biochem. 2018;46(3):1263–1274.
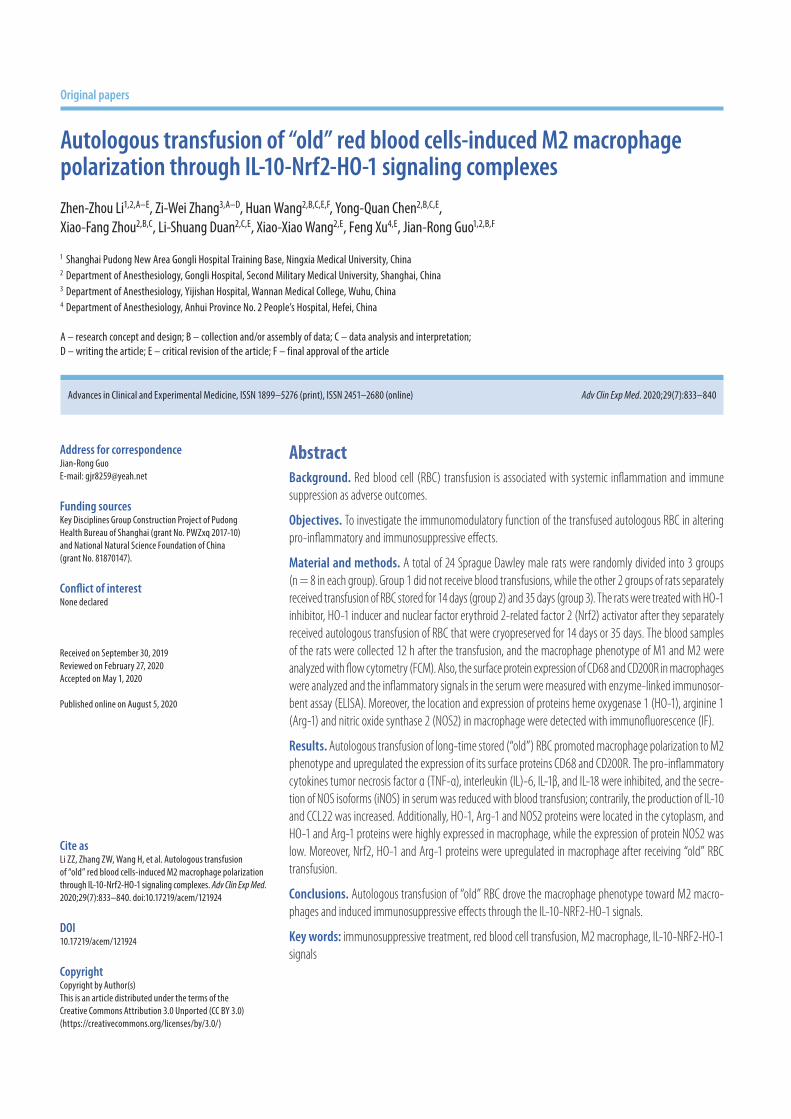
Cite asLi ZZ, Zhang ZW, Wang H, et al. Autologous transfusion of “old” red blood cells-induced M2 macrophage polarization through IL-10-Nrf2-HO-1 signaling complexes. Adv Clin Exp Med. 2020;29(7):833–840. doi:10.17219/acem/121924
DOI10.17219/acem/121924
CopyrightCopyright by Author(s) This is an article distributed under the terms of theCreative Commons Attribution 3.0 Unported (CC BY 3.0)(https://creativecommons.org/licenses/by/3.0/)
Address for correspondenceJian-Rong GuoE-mail: [email protected]
Funding sourcesKey Disciplines Group Construction Project of Pudong Health Bureau of Shanghai (grant No. PWZxq 2017-10)and National Natural Science Foundation of China (grant No. 81870147).
Conflict of interestNone declared
Received on September 30, 2019Reviewed on February 27, 2020Accepted on May 1, 2020
Published online on August 5, 2020
AbstractBackground. Red blood cell (RBC) transfusion is associated with systemic inflammation and immune suppression as adverse outcomes.
Objectives. To investigate the immunomodulatory function of the transfused autologous RBC in altering pro-inflammatory and immunosuppressive effects.
Material and methods. A total of 24 Sprague Dawley male rats were randomly divided into 3 groups (n = 8 in each group). Group 1 did not receive blood transfusions, while the other 2 groups of rats separately received transfusion of RBC stored for 14 days (group 2) and 35 days (group 3). The rats were treated with HO-1 inhibitor, HO-1 inducer and nuclear factor erythroid 2-related factor 2 (Nrf2) activator after they separately received autologous transfusion of RBC that were cryopreserved for 14 days or 35 days. The blood samples of the rats were collected 12 h after the transfusion, and the macrophage phenotype of M1 and M2 were analyzed with flow cytometry (FCM). Also, the surface protein expression of CD68 and CD200R in macrophages were analyzed and the inflammatory signals in the serum were measured with enzyme-linked immunosor-bent assay (ELISA). Moreover, the location and expression of proteins heme oxygenase 1 (HO-1), arginine 1 (Arg-1) and nitric oxide synthase 2 (NOS2) in macrophage were detected with immunofluorescence (IF).
Results. Autologous transfusion of long-time stored (“old”) RBC promoted macrophage polarization to M2 phenotype and upregulated the expression of its surface proteins CD68 and CD200R. The pro-inflammatory cytokines tumor necrosis factor α (TNF-α), interleukin (IL)-6, IL-1β, and IL-18 were inhibited, and the secre-tion of NOS isoforms (iNOS) in serum was reduced with blood transfusion; contrarily, the production of IL-10 and CCL22 was increased. Additionally, HO-1, Arg-1 and NOS2 proteins were located in the cytoplasm, and HO-1 and Arg-1 proteins were highly expressed in macrophage, while the expression of protein NOS2 was low. Moreover, Nrf2, HO-1 and Arg-1 proteins were upregulated in macrophage after receiving “old” RBC transfusion.
Conclusions. Autologous transfusion of “old” RBC drove the macrophage phenotype toward M2 macro-phages and induced immunosuppressive effects through the IL-10-NRF2-HO-1 signals.
Key words: immunosuppressive treatment, red blood cell transfusion, M2 macrophage, IL-10-NRF2-HO-1 signals
Original papers
Autologous transfusion of “old” red blood cells-induced M2 macrophage polarization through IL-10-Nrf2-HO-1 signaling complexes
Zhen-Zhou Li1,2,A–E, Zi-Wei Zhang3,A–D, Huan Wang2,B,C,E,F, Yong-Quan Chen2,B,C,E, Xiao-Fang Zhou2,B,C, Li-Shuang Duan2,C,E, Xiao-Xiao Wang2,E, Feng Xu4,E, Jian-Rong Guo1,2,B,F
1 Shanghai Pudong New Area Gongli Hospital Training Base, Ningxia Medical University, China 2 Department of Anesthesiology, Gongli Hospital, Second Military Medical University, Shanghai, China3 Department of Anesthesiology, Yijishan Hospital, Wannan Medical College, Wuhu, China4 Department of Anesthesiology, Anhui Province No. 2 People’s Hospital, Hefei, China
A – research concept and design; B – collection and/or assembly of data; C – data analysis and interpretation; D – writing the article; E – critical revision of the article; F – final approval of the article
Advances in Clinical and Experimental Medicine, ISSN 1899–5276 (print), ISSN 2451–2680 (online) Adv Clin Exp Med. 2020;29(7):833–840
Z.Z. Li et al. Autologous transfusion of old red blood cells834
Introduction
Blood transfusion is widely used in clinical practice; it is estimated that the transfusion of red blood cells (RBC) is the major type, accounting for nearly 50% of transfu-sions.1 The obtained RBC cryopreserved at 4 ±2°C for 35–42 days were recognized as safe2; however, in recent years, more adverse effects have occurred after blood transfusions,3–5 which is why the storage lesions of RBC have attracted more attention. Even though low-temper-ature storage slows down the metabolism of RBC, studies have revealed that the structure and physiological and immunological characteristics of the long-time stored RBC (also named “old” RBC) have changed. The research of Karon et al. showed that the levels of RBC membrane 2,3-diphosphoglycerate (2,3-DPG) had decreased during storage.6 The proteomic analysis identified the membrane structural proteins in RBC, such as spectrin, band 3 and band 4.1, which were changed.7 Moreover, the stored RBC induced hemolysis and the release of free heme, hemoglo-bin and free iron, which play important roles in immu-nomodulation.8 The free heme was not only sequestered by plasma haptoglobin, but also initiated the Fenton reac-tion to induce the release of iron9; then, the accumulation of iron induced the generation of reactive oxygen species (ROS) and radical chains, which thus led to tissue dam-age and inflammation.10,11 Additionally, the free heme act as a pro-inflammatory factor engaged in the immune re-sponse of monocytes, macrophages, Tregs, and endothelial cells.12,13 A study showed that free heme mediated macro-phage polarization and shaped the expression of M1 and M2 markers.14 More interestingly, the microvesicles were also found in the stored “old” RBC, which participated in the activity of endothelial activation,15 blood coagula-tion16 and immunomodulation.17 Hence, the variability of stored RBC is closely associated with systemic pro-inflammatory and immunosuppressive effects in blood post-transfusion.
The “old” RBC transfusion also burdened the phagocytic ability of monocytes and macrophages. A study conducted by Dinkla et al. identified that the storage-induced auto-antibodies in RBC membrane accelerated phagocytosis by macrophages.18 This correspondingly resulted in heme accumulation in macrophages, which in turn shaped the macrophages toward M2 phenotype through upregu-lating the heme oxygenase 1 (HO-1) and promoted the se-cretion of interleukin (IL)-10.19 Therefore, the stored RBC transfusion induced adverse effects, owing to systemic inflammation and immune suppression. The aim of this study was to investigate the immunomodulation effects on macrophage of the “old” RBC transfusion in animal study and its related mechanism.
Material and methods
Material
A total of 24 Sprague Dawley male rats, 6–7 weeks old, 205.45 ±20.55 g (Shanghai Lab Animal Research Center, Shanghai, China); animal blood-taking needles (G-5mm, Braintree Scientific, USA); uncoated vacutainer tube with sodium citrate (Greiner Bio-One International GmbH, Kremsmünster, Austria); peripherally inserted central cath-eter (PICC; Bard Access Systems, Inc., Salt Lake City, USA); blood transfusion tube needle (Bard Access Systems, Inc.); plastic storage bag prefilled with mannitol adenine phos-phate (MAP) storage solution (Sichuan Nigale Biomedical Co. Ltd., Chengdu, China); HO-1 inducer-cobalt protoporphyrin (CoPP, catalog No. ALX-430-076-M025; Jiangxi Haoran Bio-Pharma Co., Ltd., Nanchang, China); HO-1 inhibitor-zinc protoporphyrin IX (ZnPP IX, catalog No. 282820-50MG; Jiangxi Haoran Bio-Pharma Co,. Ltd.); and Nrf2 activator-oltipraz (catalog No. MB2316; Dalian Meilun Biotech Co., Ltd., Dalian, China).
This study conformed to the standards of the animal ethics committee.
Sample collection
Following transfusion, the fresh whole bloods were col-lected from the aorta abdominalis after the 10 rats were anesthetized with 2% isoflurane and sacrificed. The ob-tained blood was leukocyte-depleted with automatic leu-kocyte filter (catalog No. PXL8Y; Shanghai Jiading Photo-electric Instrument Co., Ltd., Shanghai, China) The left RBC units were then all stored in a plastic storage bag and separately stored at 4°C.
Transfusion model
The 24 Sprague Dawley male rats were maintained in adapt-ed cultivation at 22–25°C, in a 50–70% relative humidity environment with a 12-hour light/dark cycle for 2 weeks. Then, they were divided into 3 groups: group 1 did not receive blood transfusions, while the other 2 groups of rats separately received transfusion of RBC stored for 14 days (group 2) and 35 days (group 3). The collected RBC samples stored for 14 and 35 days were separately transported in a blood transfu-sion tube needle connected with a PICC, which was injected into the vein. After a six-hour blood transfusion, the rats were anesthetized with 2% isoflurane and sacrificed; then, the blood samples were collected from the eyeball with an un-coated vacutainer tube with sodium citrate.
Flow cytometry
The blood samples collected from the eyeball were di-luted 1:3 with phosphate-buffered saline (PBS) containing heparin, and 3 mL of Ficoll-Hypaque solution (Tianjin
Adv Clin Exp Med. 2020;29(7):833–840 835
Haoyang Commercial Co., Ltd., Tianjin, China) was slowly added into the tube, which was then centrifuged twice at 3,000 × g for 15 min at 4°C. Afterward, the supernatant in the middle class was transferred into a new tube, where its density was adjusted at 5 × 10⁵ – 3 × 10⁶ with Dulbecco’s modified Eagle’s medium (DMEM) containing 10% fetal calf serum (FCS). Later, we firstly analyzed the percentage of macrophages. The steps were as follows: the monocytes were stained with allophycocyanin (APC)-conjugated monoclonal antibody against mouse CD16 (catalog No. 17-0168-41; eBioscience, Thermo Fisher Scientific, Waltham, USA); subsequently, the phycoerythrin (PE)-conjugated monoclonal antibody against mouse CD68 (catalog No. MA5-23572; Invitrogen, Carlsbad, USA) and CD200R (catalog No. 12-9201-42; eBioscience) were separately stained with the monocytes for 1 h at 4°C. Afterward, the cells were washed with PBS and the second antibody – anti-mouse immunoglobulin G (IgG) – was added. Fi-nally, the monocytes were fixed with paraformaldehyde for 30 min and analyzed with FACSCaliburTM (eBiosci-ence). We obtained the monocyte medium and stained the primary conjugated antibody as above. The Fc was blocked and the isotypic antibodies were used as a control; similarly, the surface proteins CD68 and CD200R were analyzed with FACSCalibur.
ELISA assay
The blood samples collected from the eyeball were centrifuged twice at 3,000 × g for 15 min at 4°C; then, the supernatants were transferred into a new tube and ana-lyzed for the inflammatory-associated molecules of tumor necrosis factor α (TNF-α; catalog No. 70-ab35884-050; MultiSciences Biotech Co., Ltd., Hangzhou, China), IL-1β (catalog No. 70-ab33591-050; MultiSciences Biotech Co., Ltd.), IL-6 (catalog No. 70-ab36529-050; MultiSciences Biotech Co., Ltd.), IL-10 (catalog No. 70-ab33577-050; Mul-tiSciences Biotech Co., Ltd.), nitric oxide synthase isoform (iNOS; catalog No. 93-E4649-100; BioVision Inc., Milpitas, USA), IL-18 (catalog No. 70-ab33588-050; MultiSciences Biotech Co., Ltd.), and CCL22 (catalog No. 70-ab2243-050; MultiSciences Biotech Co., Ltd.) with enzyme-linked im-munosorbent assay (ELISA) kits according to the manu-facturer’s instructions.
Immunofluorescence
The blood samples collected from the eyeball were di-luted 1:3 with PBS containing heparin, and 3 mL of Ficoll-Hypaque solution (Tianjin Haoyang Commercial Co., Ltd.) was slowly added into the tube, which were then centrifuged twice at 3000 × g for 15 min at 4°C. Afterward, the superna-tants in the middle class were transferred into a new tube, and the monocytes were cultivated with DMEM contain-ing 10% FCS and and cell slides were made in each group.
Afterwards, the cell slides were permeabilized with 0.1% TritonX-100 for 5 min, and then they were blocked with 10% bovine serum albumin (BSA) for 1 h at room tempera-ture. After that, the primary antibodies HO-1 (catalog No. ab13248; Abcam, Cambridge, UK), arginine 1 (Arg-1; cata-log No. 43933; Cell Signaling Technology, USA) and nitric oxide synthase 2 (NOS2; catalog No. ab15323; Abcam) were separately immunoblotted in the cells for 12 h, 4°C; then, the cells were incubated with anti-mouse IgG antibody for 1 h at 37°C. Thereafter, the cell slides were washed with PBS 3 times, and then the cell nucleus were dyed with 4′,6-di-amidino-2-phenylindole (DAPI) and mounted on the cell slide with anti-fade mounting medium; finally, the stained images were examined under confocal microscopy (Leica Camera AG, Wetzlar, Germany).
Western blot
The 60 rats after adapted cultivation were divided into 3 groups: group 1 (n = 20) did not receive a blood transfu-sion, while the rats in the other 2 groups (group 2: n = 20 and group 3: n = 20) separately received a transfusion of RBC stored for 14 days (group 2) and 35 days (group 3). Meanwhile, the rats from each of the 3 parts were divided into 4 subgroups (n = 5 in each subgroup) – control sub-group, HO-1 inhibitor administration (ZnPP IX) subgroup, HO-1 inducer administration (CoPP) subgroup, and Nrf2 activator administration (oltipraz) subgroup. After 12 h, the rats were anesthetized with 2% isoflurane and sac-rificed. The blood samples were collected from each rat from the aorta abdominalis and then diluted 1:1 with PBS; subsequently, they were centrifuged and the monocytes were isolated with Ficoll-Hypaque solution. Thereafter, the total proteins of the monocytes were extracted with radioimmunoprecipitation assay (RIPA) buffer containing phenylmethylsulfonyl fluoride (PMSF), and then they were denatured and the protein concentration was evaluated. Afterward, the proteins were isolated with sodium do-decyl sulfate (SDS) polyacrylamide gels and the gels were transferred to polyvinylidene difluoride (PVDF) mem-branes. They were then blocked with 5% fat-free milk for 1 h; subsequently, the protein membranes were separately incubated with primary antibodies: anti-HO-1 (catalog No. ab13248; Abcam), anti-Arg-1 (catalog No. 43933, Cell Signaling Technology, Danvers, USA) and anti-Nrf2 (catalog No. ab89443; Abcam) for 12 h at 4°C. Afterward, the protein membranes were incubated with anti-mouse IgG antibody for 1 h. The glyceraldehyde-3-phosphate dehydrogenase (GAPDH) protein was used as control. Finally, the electrochemiluminescence (ECL) detection reagents were added into the protein bands, which were visualized with a bandscan instrument (Cytiva, Marl-borough, USA), while the gray intensity of the proteins was analyzed with ImageJ software ( National Institutes of Health, Bethesda, USA).
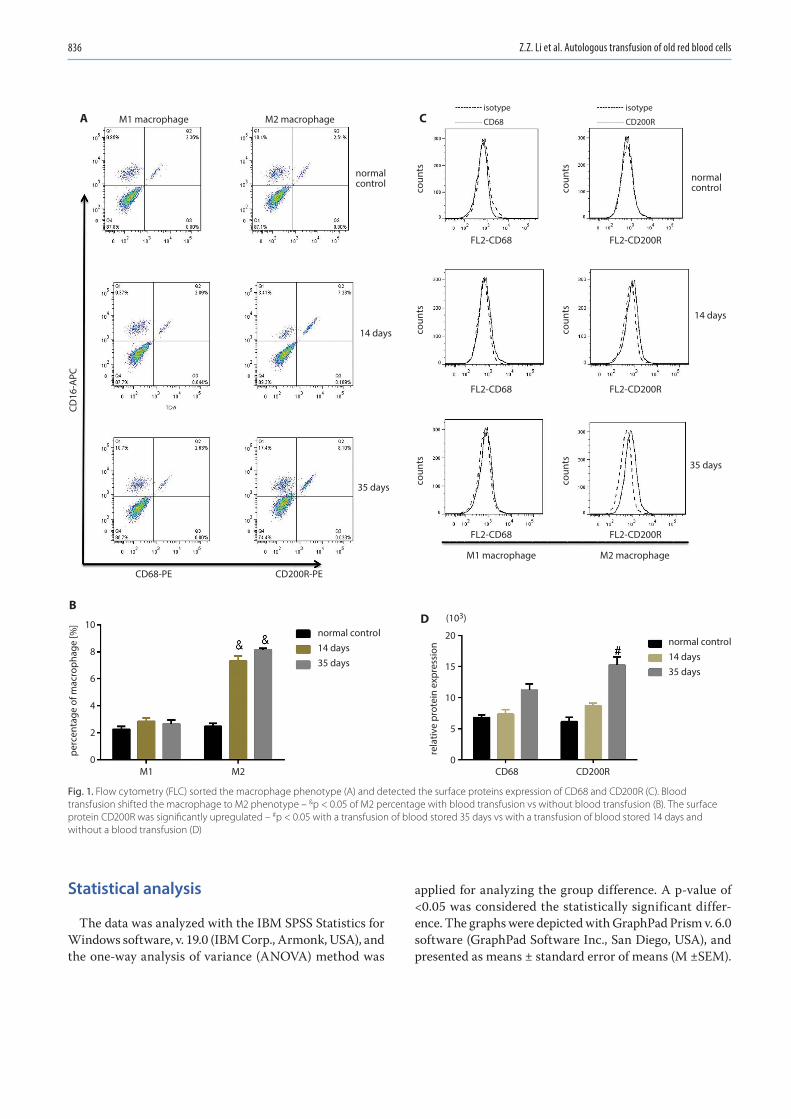
Z.Z. Li et al. Autologous transfusion of old red blood cells836
Statistical analysis
The data was analyzed with the IBM SPSS Statistics for Windows software, v. 19.0 (IBM Corp., Armonk, USA), and the one-way analysis of variance (ANOVA) method was
applied for analyzing the group difference. A p-value of <0.05 was considered the statistically significant differ-ence. The graphs were depicted with GraphPad Prism v. 6.0 software (GraphPad Software Inc., San Diego, USA), and presented as means ± standard error of means (M ±SEM).
Fig. 1. Flow cytometry (FLC) sorted the macrophage phenotype (A) and detected the surface proteins expression of CD68 and CD200R (C). Blood transfusion shifted the macrophage to M2 phenotype – &p < 0.05 of M2 percentage with blood transfusion vs without blood transfusion (B). The surface protein CD200R was significantly upregulated – #p < 0.05 with a transfusion of blood stored 35 days vs with a transfusion of blood stored 14 days and without a blood transfusion (D)
normalcontrol
isotype
CD200R
isotype
CD68
normalcontrol
14 days
coun
tsco
unts
coun
tsco
unts
coun
ts
CD16
-APC
perc
enta
ge o
f mac
roph
age
[%]
coun
ts
14 days
FL2-CD68 FL2-CD200R
FL2-CD68 FL2-CD200R
FL2-CD68 FL2-CD200R
M1 macrophage
CD68-PE CD200R-PE
M1 M2 CD68 CD200R
M2 macrophage
M1 macrophage M2 macrophage
35 days
normal control14 days35 days
(103)10
8
6
4
2
0
rela
tive
prot
ein
expr
essi
on
20
15
10
5
0
normal control14 days35 days
35 days
A
BD
C
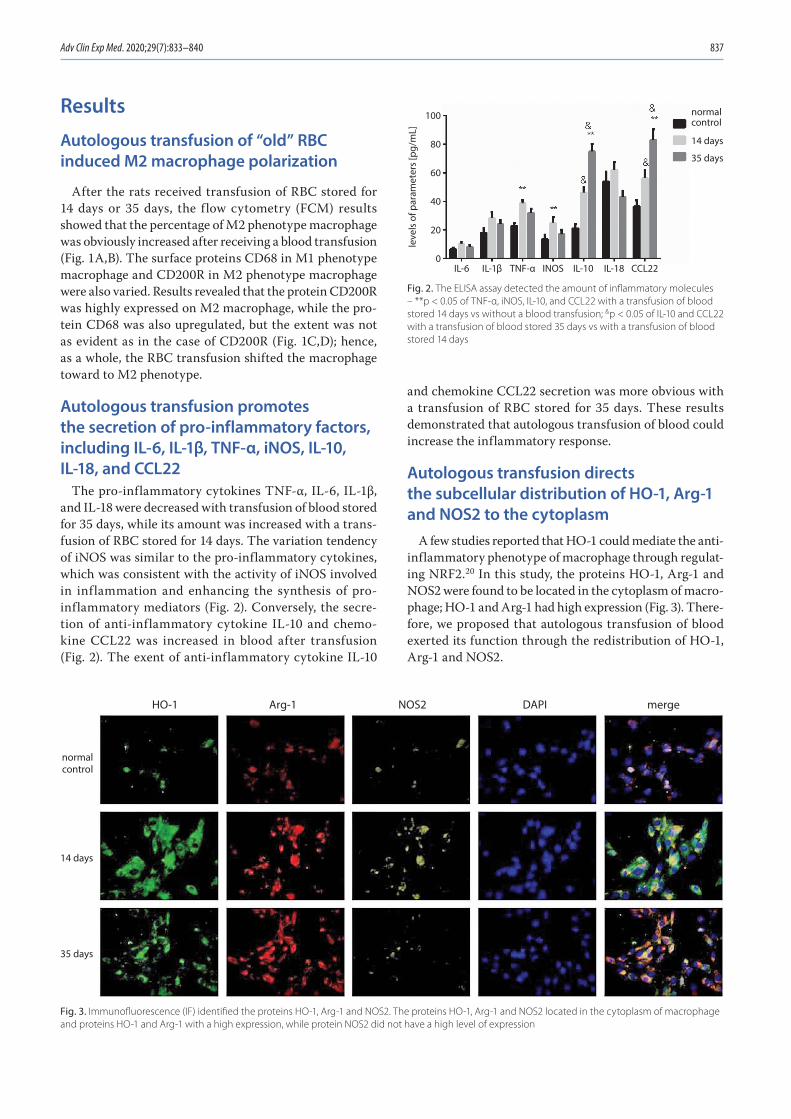
Adv Clin Exp Med. 2020;29(7):833–840 837
Results
Autologous transfusion of “old” RBC induced M2 macrophage polarization
After the rats received transfusion of RBC stored for 14 days or 35 days, the flow cytometry (FCM) results showed that the percentage of M2 phenotype macrophage was obviously increased after receiving a blood transfusion (Fig. 1A,B). The surface proteins CD68 in M1 phenotype macrophage and CD200R in M2 phenotype macrophage were also varied. Results revealed that the protein CD200R was highly expressed on M2 macrophage, while the pro-tein CD68 was also upregulated, but the extent was not as evident as in the case of CD200R (Fig. 1C,D); hence, as a whole, the RBC transfusion shifted the macrophage toward to M2 phenotype.
Autologous transfusion promotes the secretion of pro-inflammatory factors, including IL-6, IL-1β, TNF-α, iNOS, IL-10, IL-18, and CCL22
The pro-inflammatory cytokines TNF-α, IL-6, IL-1β, and IL-18 were decreased with transfusion of blood stored for 35 days, while its amount was increased with a trans-fusion of RBC stored for 14 days. The variation tendency of iNOS was similar to the pro-inflammatory cytokines, which was consistent with the activity of iNOS involved in inflammation and enhancing the synthesis of pro-inflammatory mediators (Fig. 2). Conversely, the secre-tion of anti-inflammatory cytokine IL-10 and chemo-kine CCL22 was increased in blood after transfusion (Fig. 2). The exent of anti-inflammatory cytokine IL-10
and chemokine CCL22 secretion was more obvious with a transfusion of RBC stored for 35 days. These results demonstrated that autologous transfusion of blood could increase the inflammatory response.
Autologous transfusion directs the subcellular distribution of HO-1, Arg-1 and NOS2 to the cytoplasm
A few studies reported that HO-1 could mediate the anti-inflammatory phenotype of macrophage through regulat-ing NRF2.20 In this study, the proteins HO-1, Arg-1 and NOS2 were found to be located in the cytoplasm of macro-phage; HO-1 and Arg-1 had high expression (Fig. 3). There-fore, we proposed that autologous transfusion of blood exerted its function through the redistribution of HO-1, Arg-1 and NOS2.
Fig. 3. Immunofluorescence (IF) identified the proteins HO-1, Arg-1 and NOS2. The proteins HO-1, Arg-1 and NOS2 located in the cytoplasm of macrophage and proteins HO-1 and Arg-1 with a high expression, while protein NOS2 did not have a high level of expression
Fig. 2. The ELISA assay detected the amount of inflammatory molecules – **p < 0.05 of TNF-α, iNOS, IL-10, and CCL22 with a transfusion of blood stored 14 days vs without a blood transfusion; &p < 0.05 of IL-10 and CCL22 with a transfusion of blood stored 35 days vs with a transfusion of blood stored 14 days
14 days
35 days
normal control
IL-6 IL-1β TNF-α INOS IL-10 IL-18 CCL22
100
80
60
40
20
0
leve
ls o
f par
amet
ers
[pg/
mL]
14 days
normalcontrol
35 days
HO-1 Arg-1 NOS2 DAPI merge
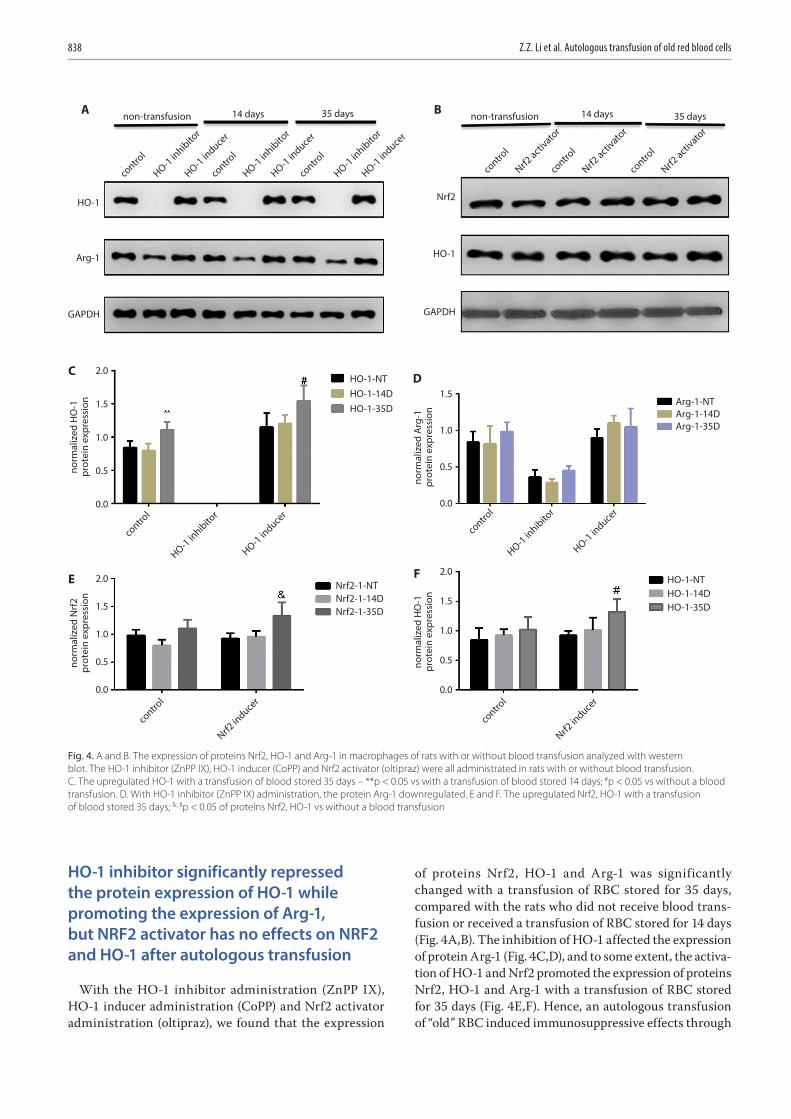
Z.Z. Li et al. Autologous transfusion of old red blood cells838
HO-1 inhibitor significantly repressed the protein expression of HO-1 while promoting the expression of Arg-1, but NRF2 activator has no effects on NRF2 and HO-1 after autologous transfusion
With the HO-1 inhibitor administration (ZnPP IX), HO-1 inducer administration (CoPP) and Nrf2 activator administration (oltipraz), we found that the expression
of proteins Nrf2, HO-1 and Arg-1 was significantly changed with a transfusion of RBC stored for 35 days, compared with the rats who did not receive blood trans-fusion or received a transfusion of RBC stored for 14 days (Fig. 4A,B). The inhibition of HO-1 affected the expression of protein Arg-1 (Fig. 4C,D), and to some extent, the activa-tion of HO-1 and Nrf2 promoted the expression of proteins Nrf2, HO-1 and Arg-1 with a transfusion of RBC stored for 35 days (Fig. 4E,F). Hence, an autologous transfusion of “old” RBC induced immunosuppressive effects through
Fig. 4. A and B. The expression of proteins Nrf2, HO-1 and Arg-1 in macrophages of rats with or without blood transfusion analyzed with western blot. The HO-1 inhibitor (ZnPP IX), HO-1 inducer (CoPP) and Nrf2 activator (oltipraz) were all administrated in rats with or without blood transfusion. C. The upregulated HO-1 with a transfusion of blood stored 35 days – **p < 0.05 vs with a transfusion of blood stored 14 days; #p < 0.05 vs without a blood transfusion. D. With HO-1 inhibitor (ZnPP IX) administration, the protein Arg-1 downregulated. E and F. The upregulated Nrf2, HO-1 with a transfusion of blood stored 35 days; &, #p < 0.05 of proteins Nrf2, HO-1 vs without a blood transfusion
contro
l
HO-1 inhibito
r
HO-1 induce
r
contro
l
HO-1 inhibito
r
HO-1 induce
r
contro
l
HO-1 inhibito
r
HO-1 induce
r
contro
l
HO-1 inhibito
r
HO-1 induce
r
contro
l
HO-1 inhibito
r
HO-1 induce
r
contro
l
Nrf2 activ
ator
contro
l
Nrf2 activ
ator
contro
l
Nrf2 in
ducer
contro
l
Nrf2 in
ducer
contro
l
Nrf2 activ
ator
14 days
HO-1
Arg-1
GAPDH
2.0
1.5
1.0
0.5
0.0
2.0
1.5
1.0
0.5
0.0
2.0
1.5
1.0
0.5
0.0
1.5
1.0
0.5
0.0
norm
aliz
ed H
O-1
prot
ein
expr
essi
on
norm
aliz
ed H
O-1
prot
ein
expr
essi
onno
rmal
ized
Arg
-1pr
otei
n ex
pres
sion
norm
aliz
ed N
rf2
prot
ein
expr
essi
on
HO-1
Nrf2
GAPDH
Arg-1-NTArg-1-14DArg-1-35D
HO-1-NTHO-1-14DHO-1-35D
HO-1-NTHO-1-14DHO-1-35D
Nrf2-1-NTNrf2-1-14DNrf2-1-35D
35 days 35 days14 daysnon-transfusionnon-transfusionA B
C D
E F
Adv Clin Exp Med. 2020;29(7):833–840 839
the IL-10-Nrf2-HO-1 signals. These results indicated that an autologous transfusion of blood functioned through HO-1 and Arg-1, but not through Nrf2.
Discussion
The mechanism responsible for the adverse outcomes of systemic inflammation and immune suppression was con-troversial. In our study, we found that the transfusion of “old” RBC in rats induced the polarization of macrophages to M2 phenotype and upregulated their surface marker CD200R expression. The levels of anti-inflammatory signals IL-10 and CCL22 were also enhanced. More interestingly, the pro-in-flammatory signals TNF-α, iNOS, IL-6, IL-1β, and IL-18 were increased after a transfusion of RBC stored for 14 days, while their levels were decreased after a transfusion of RBC stored for 35 days. This feature might be caused by the regulation of both pro-inflammation and anti-inflammation response. However, a RBC transfusion in a human study showed that there was no increase in pro-inflammatory cytokines, except for a small increase in non-transferrin-bound iron (NTBI).21 However, a rat model with of blood transfusion suggested that a pro-inflammatory cytokine storm and an increase of NTBI occurred.22 Hence, the debatable results may be caused by species difference and the limitation of study samples. The transfusion of stored blood resulting in in-creased hemolysis and erythrophagocytosis features were increasingly confirmed, which lead to a significant increase in serum iron, free heme and bilirubin levels.23–25 The free heme was suggested as a pro-inflammatory signal, involved in the activity of IL-1 and TNF-a, and ROS generation.26,27 Hence, this may be the reason that the pro-inflammatory signals TNF-α, iNOS, IL-6, IL-1β, and IL-18 were increased with the transfusion blood stored for 14 days. Moreover, HO-1 was suggested as a free heme scavenger, which had anti-inflammatory effects with a reduction of TNF-a, IL-8 and macrophage inflammatory protein (MIP)-1β levels and upregulation of IL-12.28 This evidence was in line with our study that the pro-inflammatory signals were decreased with a transfusion of blood stored for 35 days. On the other hand, studies also showed that HO-1 was involved in the activity of polarizing M2 phenotype29,30; hence, this may be poten-tially involved in polarizing M2 phenotype.
With further studies, we found that HO-1, Arg-1, NOS2, and Nrf2 proteins were indeed engaged in M2 polarization. The HO-1, Arg-1 and Nrf2 proteins were obviously ex-pressed in macrophages. This finding was consistent with the conclusion of Park et al.31 that Nrf2 was an essential regulator of HO-1 participating in antioxidative stress-induced inflammatory activity. Moreover, the results of M1 subtype marker molecule – NOS2 and M2 marker – Arg-132 further confirmed our finding that “old” RBC transfusion induced M2 phenotype polarization. Hence, the immunomodulation mechanism of our study was closely associated with Nrf2-HO-1 signals. Additionally,
in our study, the secretion of CCL22 was also increased after transfusion. The CCL22 played roles in the traffick-ing of activated/effector T-lymphocytes. The study also showed that heme could drive the expansion of Tregs by in-ducing HO-1 expression in non-classical monocytes,33 so there is a sign that Tregs lymphocytes may also be involved in the immunosuppressive activity.
On the other hand, numerous studies have identified the cluster of differentiation (CD) molecules that are closely associated with the phagocytosis ability. The CD47, an in-tegrin-associated protein of RBC, was proved to be a self-marker in deciding its phagocytosis by binding to the sig-nal regulatory protein α (SIRPα) of the macrophage.34,35 Furthermore, the microvesicles of CD47, PS, CD55, and CD59 also shaped the phagocytosis of RBC.36,37 Therefore, we should further investigate the changes in RBC, such as the change in membrane proteins, the secretion of mi-crovesicles or spontaneous hemolysis, so as to more clearly reveal the mechanism of “old” RBC transfusion. Our study showed that the transfusion of “old” RBC in rats induced the polarization of macrophages to M2 phenotype through the IL-10-NFR2-HO-1 signals.
ORCID iDsZhen-Zhou Li https://orcid.org/0000-0003-3774-7565Zi-Wei Zhang https://orcid.org/0000-0002-2140-4886Huan Wang https://orcid.org/0000-0003-3646-2656Yong-Quan Chen https://orcid.org/0000-0002-3525-1518Xiao-Fang Zhou https://orcid.org/0000-0002-9300-4478Li-Shuang Duan https://orcid.org/0000-0001-8510-7277Xiao-Xiao Wang https://orcid.org/0000-0003-4764-2281Feng Xu https://orcid.org/0000-0002-7750-7809Jian-Rong Guo https://orcid.org/0000-0002-3995-2995
References1. Carson JL, Guyatt G, Heddle NM, et al. Clinical practice guidelines
from the AABB: Red blood cell transfusion thresholds and storage. JAMA. 2016;316(19):2025–2035.
2. Dagur PK, McCoy JP. Collection, storage, and preparation of human blood cells. Curr Protoc Cytom. 2015;73:5.1.1–5.1.16. doi:10.1002/ 0471142956.cy0501s73
3. Muszynski JA, Spinella PC, Cholette JM, et al; Pediatric Critical Care Blood Research Network (Blood Net). Transfusion-related immuno-modulation: Review of the literature and implications for pediatric critical illness. Transfusion. 2017;57(1):195–206.
4. Hod EA, Godbey EA. The outsider adverse event in transfusion: Inflam-mation. Presse Med. 2016;45(7–8 Pt 2):e325–e329.
5. van de Watering L. Red cell storage and prognosis. Vox Sang. 2011; 100(1):36–45.
6. Karon BS, Hoyer JD, Stubbs JR, Thomas DD. Changes in Band 3 oligo-meric state precede cell membrane phospholipid loss during blood bank storage of red blood cells. Transfusion. 2009;49(7):1435–1442.
7. D’Amici GM, Rinalducci S, Zolla L. Proteomic analysis of RBC mem-brane protein degradation during blood storage. J Proteome Res. 2007;6(8):3242–3255.
8. Ozment CP, Mamo LB, Campbell ML, Lokhnygina Y, Ghio AJ, Turi JL. Transfusion-related biologic effects and free hemoglobin, heme, and iron. Transfusion. 2013;53(4):732–740.
9. Banerjee S. Glyoxal-induced modification enhances stability of hemoglobin and lowers iron-mediated oxidation reactions of the heme protein: An in vitro study. Int J Biol Macromol. 2018;107(Pt A): 494–501.
10. Spitalnik SL. Stored red blood cell transfusions: Iron, inflammation, immunity, and infection. Transfusion. 2014;54(10):2365–2371.
Z.Z. Li et al. Autologous transfusion of old red blood cells840
11. Baek JH, Yalamanoglu A, Gao Y, et al. Iron accelerates hemoglobin oxidation increasing mortality in vascular diseased guinea pigs fol-lowing transfusion of stored blood. JCI Insight. 2017;2(9):e93577.
12. Dutra FF, Bozza MT. Heme on innate immunity and inflammation. Front Pharmacol. 2014;5:115.
13. Haldar M, Kohyama M, Yick-Lun So A, et al. Heme-mediated SPI-C induction promotes monocyte differentiation into iron-recycling macrophages. Cell. 2014;156(6):1223–1234.
14. Vinchi F, Costa da Silva M, Ingoglia G, et al. Hemopexin therapy reverts heme-induced pro-inflammatory phenotypic switching of macro-phages in a mouse model of sickle cell disease. Blood. 2016;127(4): 473–486.
15. Straat M, van Hezel ME, Böing A, et al. Monocyte-mediated activa-tion of endothelial cells occurs only after binding to extracellular ves-icles from red blood cell products, a process mediated by β-integrin. Transfusion. 2016;56(12):3012–3020.
16. Rubin O, Delobel J, Prudent M, et al. Red blood cell-derived mic-roparticles isolated from blood units initiate and propagate throm-bin generation. Transfusion. 2013;53(8):1744–1754.
17. Straat M, Böing AN, Tuip-De Boer A, Nieuwland R, Juffermans NP. Extracellular vesicles from red blood cell products induce a strong pro-inflammatory host response, dependent on both numbers and storage duration. Transfus Med Hemother. 2016;43(4):302–305.
18. Dinkla S, Novotný VMJ, Joosten I, Bosman GJCGM. Storage-induced changes in erythrocyte membrane proteins promote recognition by autoantibodies. PLoS One. 2012;7(8):e42250.
19. Yazdanbakhsh K, Bao W, Zhong H. Immunoregulatory effects of stored red blood cells. Hematology Am Soc Hematol Educ Program. 2011;2011:466–469.
20. Hod EA, Brittenham GM, Billote GB, et al. Transfusion of human vol-unteers with older, stored red blood cells produces extravascular hemolysis and circulating non-transferrin-bound iron. Blood. 2011; 118(25):6675–6682.
21. Hod EA, Zhang N, Sokol SA, et al. Transfusion of red blood cells after prolonged storage produces harmful effects that are mediated by iron and inflammation. Blood. 2010;115(21):4284–4292.
22. Hult A, Malm C, Oldenborg PA. Transfusion of cryopreserved human red blood cells into healthy humans is associated with rapid extra-vascular hemolysis without a pro-inflammatory cytokine response. Transfusion. 2013;53(1):28–33.
23. Knutson MD, Vafa MR, Haile DJ, Wessling-Resnick M. Iron loading and erythrophagocytosis increase ferroportin 1 (FPN1) expression in J774 macrophages. Blood. 2003;102(12):4191–4197.
24. Youssef LA, Rebbaa A, Pampou S, et al. Increased erythrophagocy-tosis induces ferroptosis in red pulp macrophages in a mouse model of transfusion. Blood. 2018;131(23):2581–2593.
25. Hao K, Hanawa H, Ding L, et al. Free heme is a danger signal induc-ing expression of pro-inflammatory proteins in cultured cells derived from normal rat hearts. Mol Immunol. 2011;48(9–10):1191–1202.
26. Larsen R, Gouveia Z, Soares MP, Gozzelino R. Heme cytotoxicity and the pathogenesis of immune-mediated inflammatory diseases. Front Pharmacol. 2012;3:77.
27. Cherry AD, Piantadosi CA. Regulation of mitochondrial biogenesis and its intersection with inflammatory responses. Antioxid Redox Signal. 2015;22(12):965–976.
28. Naito Y, Takagi T, Higashimura Y. Heme oxygenase-1 and anti-inflam-matory M2 macrophages. Arch Biochem Biophys. 2014;564:83–88.
29. Weis N, Weigert A, von Knethen A, Brüne B, Luo K. Heme oxygenase-1 contributes to an alternative macrophage activation profile induced by apoptotic cell supernatants. Mol Biol Cell. 2009;20(5):1280–1288.
30. Park EJ, Kim YM, Park SW, et al. Induction of HO-1 through p38 MAPK/Nrf2 signaling pathway by ethanol extract of Inula helenium L. reduces inflammation in LPS-activated RAW 264.7 cells and CLP-induced septic mice. Food Chem Toxicol. 2013;55:386–395.
31. Lu S, Li D, Xi L, Calderone R. Interplay of interferon-gamma and mac-rophage polarization during Talaromyces marneffei infection. Microb Pathogen. 2019;134:103594.
32. Zhong H, Yazdanbakhsh K. Hemolysis and immune regulation. Curr Opin Hematol. 2018;25(3):177–182.
33. Hagmann M. A new way to keep immune cells in check. Science. 2000;288(5473):1945–1946.
34. Oldenborg PA. Role of CD47 as a marker of self on red blood cells. Science. 2000;288(5473):2051–2054.
35. Stachurska A, Dorman M, Korsak J, et al. Selected CD molecules and the phagocytosis of microvesicles released from erythrocytes ex vivo. Vox Sang. 2019;114(6):576–587.
36. van Manen L, Peters AL, van der Sluijs PM, Nieuwland R, van Brug-gen R, Juffermans NP. Clearance and phenotype of extracellular vesi-cles after red blood cell transfusion in a human endotoxemia model. Transfus Apher Sci. 2019;58(4):508–511.
Cite asPietrzak A, Kalinowska-Łyszczarz A, Osztynowicz K, Khamidulla A, Kozubski W, Michalak S. A long-term follow-up study on biochemical and clinical biomarkers of response to interferon beta-1b treatment in relapsing-remitting multiple sclerosis. Adv Clin Exp Med. 2020;29(7):841–851. doi:10.17219/acem/121063
DOI10.17219/acem/121063
CopyrightCopyright by Author(s) This is an article distributed under the terms of theCreative Commons Attribution 3.0 Unported (CC BY 3.0)(https://creativecommons.org/licenses/by/3.0/)
Address for correspondenceAnna PietrzakE-mail: [email protected]
Funding sourcesThis research was funded by the Poznan University of Medical Sciences young scientists grant (No. 502-14-01111145-41212). Anna Pietrzak received travel compensation from Zentiva. Alicja Kalinowska-Łyszczarz received personal compensa-tion for speaking services and/or travel cost compensation and/or research grants from Biogen, Bayer, Merck Serono, Novartis, Teva Pharmaceuticals, CSL Behring, Shire, Sanofi-Genzyme, and Roche. Sławomir Michalak received a travel grant from Bayer.
Conflict of interestNone declared
Received on November 20, 2019Reviewed on March 13, 2020Accepted on April 27, 2020
Published online on June 5, 2020
AbstractBackground. While interferon beta-1b (IFN-β-1b) is still a commonly used disease-modifying drug in the treatment of multiple sclerosis (MS), therapeutic possibilities are expanding, and treatment failure should be identified early. Markers to predict response to IFN-β-1b, either clinical or biochemical, are therefore urgently needed. Interferon-induced proteins, including viperin, suppressor of cytokine signaling 3 (SOCS3), ubiquitin specific peptidase-18 (USP18), and myxovirus resistance protein A (MxA), are possible markers of IFN-β-1b bioavailability and treatment response.
Objectives. To evaluate viperin, SOCS3, USP18 and MxA as markers of treatment response in Polish IFN-β-1b- treated patients with MS.
Material and methods. In 45 IFN-β-1b-treated Polish patients with MS, serum concentrations of viperin, SOCS3, USP18, and MxA were assessed before and after 24 months of IFN-β-1b treatment. The patients were followed clinically and with magnetic resonance imaging (MRI) for a median of 6.8 years.
Results. Low viperin, USP18 and MxA at baseline and 24 months and high SOCS3 at 24 months correlated with higher disease activity up to the 6th year of observation, but only baseline MxA and USP18 were inde-pendently related to outcome, with higher concentrations predicting less disease activity in the first 3 years and after the 1st year, respectively.
Conclusions. We confirm the predictive value of MxA and propose USP18 as a possible new prognostic biomarker in IFN-β-1b- treated MS patients.
Key words: multiple sclerosis, interferon beta, viperin, suppressor of cytokine signaling 3, ubiquitin specific peptidase 18
Original papers
A long-term follow-up study on biochemical and clinical biomarkers of response to interferon beta-1b treatment in relapsing-remitting multiple sclerosis
Anna Pietrzak1,A–D, Alicja Kalinowska-Łyszczarz2,C–E, Krystyna Osztynowicz2,B, Alima Khamidulla3,B, Wojciech Kozubski1,A,E,F, Sławomir Michalak2,A,C,E,F
1 Department of Neurology, Poznan University of Medical Sciences, Poland2 Department of Neurochemistry and Neuropathology, Department of Neurology, Poznan University of Medical Sciences, Poland3 Department of Neurology, West Kazakhstan Marat Ospanov Medical University, Aktobe, Kazakhstan
A – research concept and design; B – collection and/or assembly of data; C – data analysis and interpretation; D – writing the article; E – critical revision of the article; F – final approval of the article
Advances in Clinical and Experimental Medicine, ISSN 1899–5276 (print), ISSN 2451–2680 (online) Adv Clin Exp Med. 2020;29(7):841–851
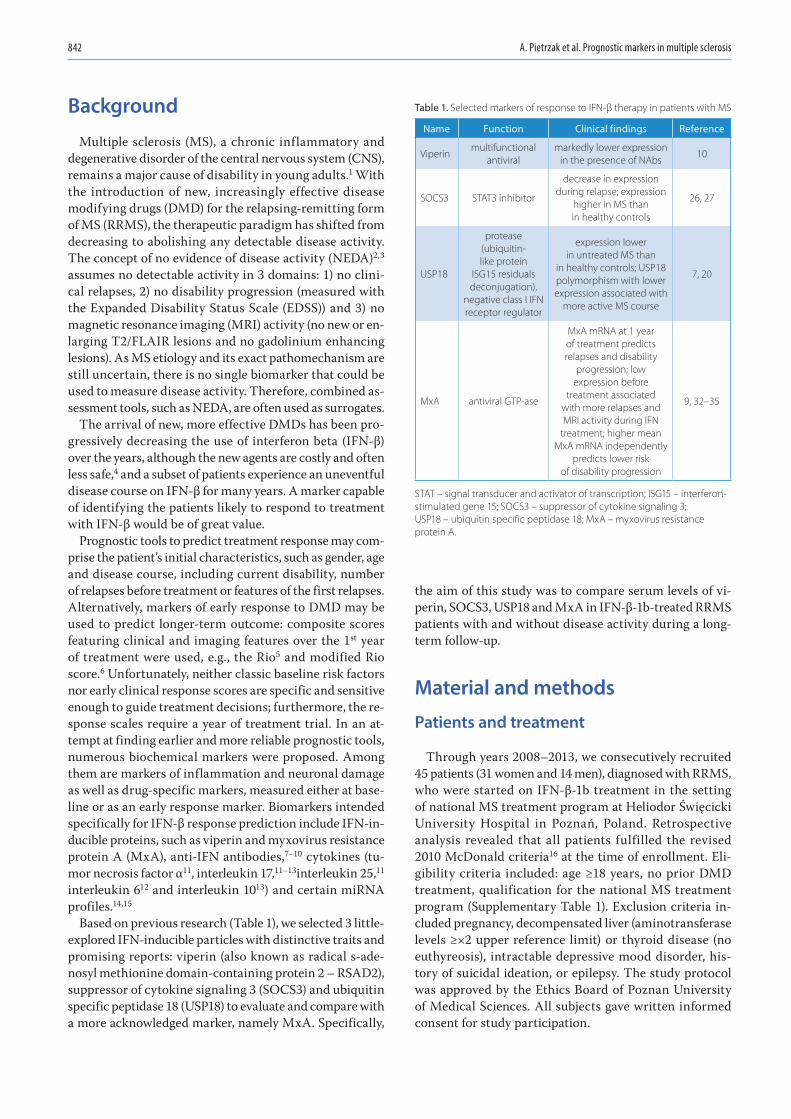
A. Pietrzak et al. Prognostic markers in multiple sclerosis842
Background
Multiple sclerosis (MS), a chronic inflammatory and degenerative disorder of the central nervous system (CNS), remains a major cause of disability in young adults.1 With the introduction of new, increasingly effective disease modifying drugs (DMD) for the relapsing-remitting form of MS (RRMS), the therapeutic paradigm has shifted from decreasing to abolishing any detectable disease activity. The concept of no evidence of disease activity (NEDA)2,3 assumes no detectable activity in 3 domains: 1) no clini-cal relapses, 2) no disability progression (measured with the Expanded Disability Status Scale (EDSS)) and 3) no magnetic resonance imaging (MRI) activity (no new or en-larging T2/FLAIR lesions and no gadolinium enhancing lesions). As MS etiology and its exact pathomechanism are still uncertain, there is no single biomarker that could be used to measure disease activity. Therefore, combined as-sessment tools, such as NEDA, are often used as surrogates.
The arrival of new, more effective DMDs has been pro-gressively decreasing the use of interferon beta (IFN-β) over the years, although the new agents are costly and often less safe,4 and a subset of patients experience an uneventful disease course on IFN-β for many years. A marker capable of identifying the patients likely to respond to treatment with IFN-β would be of great value.
Prognostic tools to predict treatment response may com-prise the patient’s initial characteristics, such as gender, age and disease course, including current disability, number of relapses before treatment or features of the first relapses. Alternatively, markers of early response to DMD may be used to predict longer-term outcome: composite scores featuring clinical and imaging features over the 1st year of treatment were used, e.g., the Rio5 and modified Rio score.6 Unfortunately, neither classic baseline risk factors nor early clinical response scores are specific and sensitive enough to guide treatment decisions; furthermore, the re-sponse scales require a year of treatment trial. In an at-tempt at finding earlier and more reliable prognostic tools, numerous biochemical markers were proposed. Among them are markers of inflammation and neuronal damage as well as drug-specific markers, measured either at base-line or as an early response marker. Biomarkers intended specifically for IFN-β response prediction include IFN-in-ducible proteins, such as viperin and myxovirus resistance protein A (MxA), anti-IFN antibodies,7–10 cytokines (tu-mor necrosis factor α11, interleukin 17,11–13interleukin 25,11 interleukin 612 and interleukin 1013) and certain miRNA profiles.14,15
Based on previous research (Table 1), we selected 3 little-explored IFN-inducible particles with distinctive traits and promising reports: viperin (also known as radical s-ade-nosyl methionine domain-containing protein 2 – RSAD2), suppressor of cytokine signaling 3 (SOCS3) and ubiquitin specific peptidase 18 (USP18) to evaluate and compare with a more acknowledged marker, namely MxA. Specifically,
the aim of this study was to compare serum levels of vi-perin, SOCS3, USP18 and MxA in IFN-β-1b-treated RRMS patients with and without disease activity during a long-term follow-up.
Material and methods
Patients and treatment
Through years 2008–2013, we consecutively recruited 45 patients (31 women and 14 men), diagnosed with RRMS, who were started on IFN-β-1b treatment in the setting of national MS treatment program at Heliodor Święcicki University Hospital in Poznań, Poland. Retrospective analysis revealed that all patients fulfilled the revised 2010 McDonald criteria16 at the time of enrollment. Eli-gibility criteria included: age ≥18 years, no prior DMD treatment, qualification for the national MS treatment program (Supplementary Table 1). Exclusion criteria in-cluded pregnancy, decompensated liver (aminotransferase levels ≥×2 upper reference limit) or thyroid disease (no euthyreosis), intractable depressive mood disorder, his-tory of suicidal ideation, or epilepsy. The study protocol was approved by the Ethics Board of Poznan University of Medical Sciences. All subjects gave written informed consent for study participation.
Table 1. Selected markers of response to IFN-β therapy in patients with MS
Name Function Clinical findings Reference
Viperinmultifunctional
antiviralmarkedly lower expression
in the presence of NAbs10
SOCS3 STAT3 inhibitor
decrease in expression during relapse; expression
higher in MS than in healthy controls
26, 27
USP18
protease (ubiquitin-like protein
ISG15 residuals deconjugation),
negative class I IFN receptor regulator
expression lower in untreated MS than
in healthy controls; USP18 polymorphism with lower expression associated with
more active MS course
7, 20
MxA antiviral GTP-ase
MxA mRNA at 1 year of treatment predicts relapses and disability
progression; low expression before
treatment associated with more relapses and MRI activity during IFN
treatment; higher mean MxA mRNA independently
predicts lower risk of disability progression
9, 32–35
STAT – signal transducer and activator of transcription; ISG15 – interferon-stimulated gene 15; SOCS3 – suppressor of cytokine signaling 3; USP18 – ubiquitin specific peptidase 18; MxA – myxovirus resistance protein A.
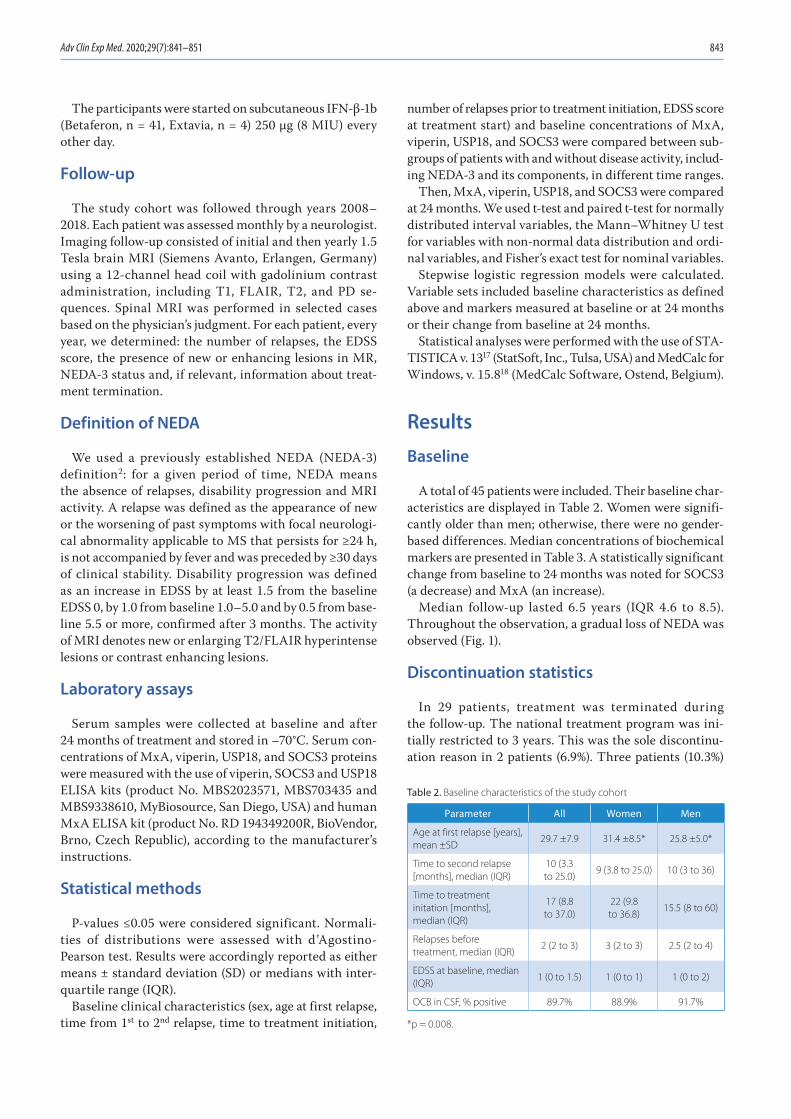
Adv Clin Exp Med. 2020;29(7):841–851 843
The participants were started on subcutaneous IFN-β-1b (Betaferon, n = 41, Extavia, n = 4) 250 μg (8 MIU) every other day.
Follow-up
The study cohort was followed through years 2008–2018. Each patient was assessed monthly by a neurologist. Imaging follow-up consisted of initial and then yearly 1.5 Tesla brain MRI (Siemens Avanto, Erlangen, Germany) using a 12-channel head coil with gadolinium contrast administration, including T1, FLAIR, T2, and PD se-quences. Spinal MRI was performed in selected cases based on the physician’s judgment. For each patient, every year, we determined: the number of relapses, the EDSS score, the presence of new or enhancing lesions in MR, NEDA-3 status and, if relevant, information about treat-ment termination.
Definition of NEDA
We used a previously established NEDA (NEDA-3) definition2: for a given period of time, NEDA means the absence of relapses, disability progression and MRI activity. A relapse was defined as the appearance of new or the worsening of past symptoms with focal neurologi-cal abnormality applicable to MS that persists for ≥24 h, is not accompanied by fever and was preceded by ≥30 days of clinical stability. Disability progression was defined as an increase in EDSS by at least 1.5 from the baseline EDSS 0, by 1.0 from baseline 1.0–5.0 and by 0.5 from base-line 5.5 or more, confirmed after 3 months. The activity of MRI denotes new or enlarging T2/FLAIR hyperintense lesions or contrast enhancing lesions.
Laboratory assays
Serum samples were collected at baseline and after 24 months of treatment and stored in –70°C. Serum con-centrations of MxA, viperin, USP18, and SOCS3 proteins were measured with the use of viperin, SOCS3 and USP18 ELISA kits (product No. MBS2023571, MBS703435 and MBS9338610, MyBiosource, San Diego, USA) and human MxA ELISA kit (product No. RD 194349200R, BioVendor, Brno, Czech Republic), according to the manufacturer’s instructions.
Statistical methods
P-values ≤0.05 were considered significant. Normali-ties of distributions were assessed with d’Agostino-Pearson test. Results were accordingly reported as either means ± standard deviation (SD) or medians with inter-quartile range (IQR).
Baseline clinical characteristics (sex, age at first relapse, time from 1st to 2nd relapse, time to treatment initiation,
number of relapses prior to treatment initiation, EDSS score at treatment start) and baseline concentrations of MxA, viperin, USP18, and SOCS3 were compared between sub-groups of patients with and without disease activity, includ-ing NEDA-3 and its components, in different time ranges.
Then, MxA, viperin, USP18, and SOCS3 were compared at 24 months. We used t-test and paired t-test for normally distributed interval variables, the Mann–Whitney U test for variables with non-normal data distribution and ordi-nal variables, and Fisher’s exact test for nominal variables.
Stepwise logistic regression models were calculated. Variable sets included baseline characteristics as defined above and markers measured at baseline or at 24 months or their change from baseline at 24 months.
Statistical analyses were performed with the use of STA-TISTICA v. 1317 (StatSoft, Inc., Tulsa, USA) and MedCalc for Windows, v. 15.818 (MedCalc Software, Ostend, Belgium).
Results
Baseline
A total of 45 patients were included. Their baseline char-acteristics are displayed in Table 2. Women were signifi-cantly older than men; otherwise, there were no gender-based differences. Median concentrations of biochemical markers are presented in Table 3. A statistically significant change from baseline to 24 months was noted for SOCS3 (a decrease) and MxA (an increase).
Median follow-up lasted 6.5 years (IQR 4.6 to 8.5). Throughout the observation, a gradual loss of NEDA was observed (Fig. 1).
Discontinuation statistics
In 29 patients, treatment was terminated during the follow-up. The national treatment program was ini-tially restricted to 3 years. This was the sole discontinu-ation reason in 2 patients (6.9%). Three patients (10.3%)
Table 2. Baseline characteristics of the study cohort
Parameter All Women Men
Age at first relapse [years], mean ±SD
29.7 ±7.9 31.4 ±8.5* 25.8 ±5.0*
Time to second relapse [months], median (IQR)
10 (3.3 to 25.0)
9 (3.8 to 25.0) 10 (3 to 36)
Time to treatment initation [months], median (IQR)
17 (8.8 to 37.0)
22 (9.8 to 36.8)
15.5 (8 to 60)
Relapses before treatment, median (IQR)
2 (2 to 3) 3 (2 to 3) 2.5 (2 to 4)
EDSS at baseline, median (IQR)
1 (0 to 1.5) 1 (0 to 1) 1 (0 to 2)
OCB in CSF, % positive 89.7% 88.9% 91.7%
*p = 0.008.
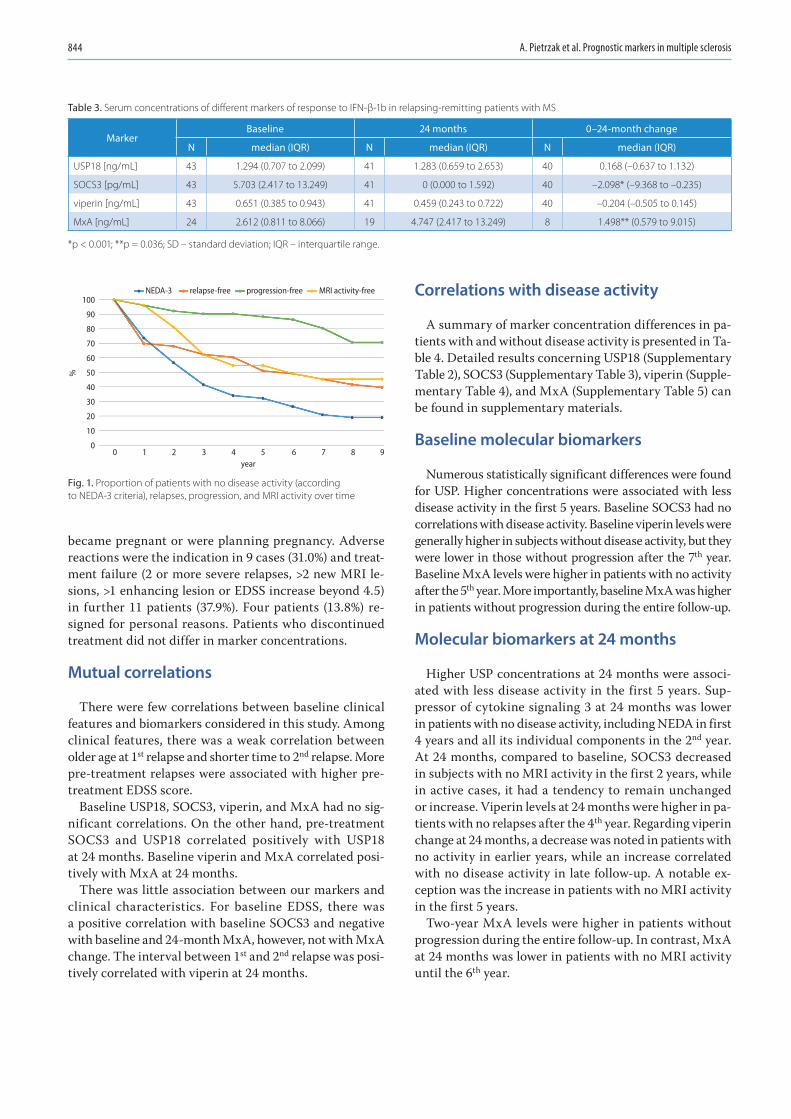
A. Pietrzak et al. Prognostic markers in multiple sclerosis844
became pregnant or were planning pregnancy. Adverse reactions were the indication in 9 cases (31.0%) and treat-ment failure (2 or more severe relapses, >2 new MRI le-sions, >1 enhancing lesion or EDSS increase beyond 4.5) in further 11 patients (37.9%). Four patients (13.8%) re-signed for personal reasons. Patients who discontinued treatment did not differ in marker concentrations.
Mutual correlations
There were few correlations between baseline clinical features and biomarkers considered in this study. Among clinical features, there was a weak correlation between older age at 1st relapse and shorter time to 2nd relapse. More pre-treatment relapses were associated with higher pre-treatment EDSS score.
Baseline USP18, SOCS3, viperin, and MxA had no sig-nificant correlations. On the other hand, pre-treatment SOCS3 and USP18 correlated positively with USP18 at 24 months. Baseline viperin and MxA correlated posi-tively with MxA at 24 months.
There was little association between our markers and clinical characteristics. For baseline EDSS, there was a positive correlation with baseline SOCS3 and negative with baseline and 24-month MxA, however, not with MxA change. The interval between 1st and 2nd relapse was posi-tively correlated with viperin at 24 months.
Correlations with disease activity
A summary of marker concentration differences in pa-tients with and without disease activity is presented in Ta-ble 4. Detailed results concerning USP18 (Supplementary Table 2), SOCS3 (Supplementary Table 3), viperin (Supple-mentary Table 4), and MxA (Supplementary Table 5) can be found in supplementary materials.
Baseline molecular biomarkers
Numerous statistically significant differences were found for USP. Higher concentrations were associated with less disease activity in the first 5 years. Baseline SOCS3 had no correlations with disease activity. Baseline viperin levels were generally higher in subjects without disease activity, but they were lower in those without progression after the 7th year. Baseline MxA levels were higher in patients with no activity after the 5th year. More importantly, baseline MxA was higher in patients without progression during the entire follow-up.
Molecular biomarkers at 24 months
Higher USP concentrations at 24 months were associ-ated with less disease activity in the first 5 years. Sup-pressor of cytokine signaling 3 at 24 months was lower in patients with no disease activity, including NEDA in first 4 years and all its individual components in the 2nd year. At 24 months, compared to baseline, SOCS3 decreased in subjects with no MRI activity in the first 2 years, while in active cases, it had a tendency to remain unchanged or increase. Viperin levels at 24 months were higher in pa-tients with no relapses after the 4th year. Regarding viperin change at 24 months, a decrease was noted in patients with no activity in earlier years, while an increase correlated with no disease activity in late follow-up. A notable ex-ception was the increase in patients with no MRI activity in the first 5 years.
Two-year MxA levels were higher in patients without progression during the entire follow-up. In contrast, MxA at 24 months was lower in patients with no MRI activity until the 6th year.
Table 3. Serum concentrations of different markers of response to IFN-β-1b in relapsing-remitting patients with MS
Marker Baseline 24 months 0–24-month change
N median (IQR) N median (IQR) N median (IQR)
USP18 [ng/mL] 43 1.294 (0.707 to 2.099) 41 1.283 (0.659 to 2.653) 40 0.168 (–0.637 to 1.132)
SOCS3 [pg/mL] 43 5.703 (2.417 to 13.249) 41 0 (0.000 to 1.592) 40 –2.098* (–9.368 to –0.235)
viperin [ng/mL] 43 0.651 (0.385 to 0.943) 41 0.459 (0.243 to 0.722) 40 –0.204 (–0.505 to 0.145)
MxA [ng/mL] 24 2.612 (0.811 to 8.066) 19 4.747 (2.417 to 13.249) 8 1.498** (0.579 to 9.015)
*p < 0.001; **p = 0.036; SD – standard deviation; IQR – interquartile range.
Fig. 1. Proportion of patients with no disease activity (according to NEDA-3 criteria), relapses, progression, and MRI activity over time
0
100
90
80
70
60
50
40
30
20
10
01 2 3 4 5
year
%
6 7
NEDA-3 relapse-free progression-free MRI activity-free
8 9
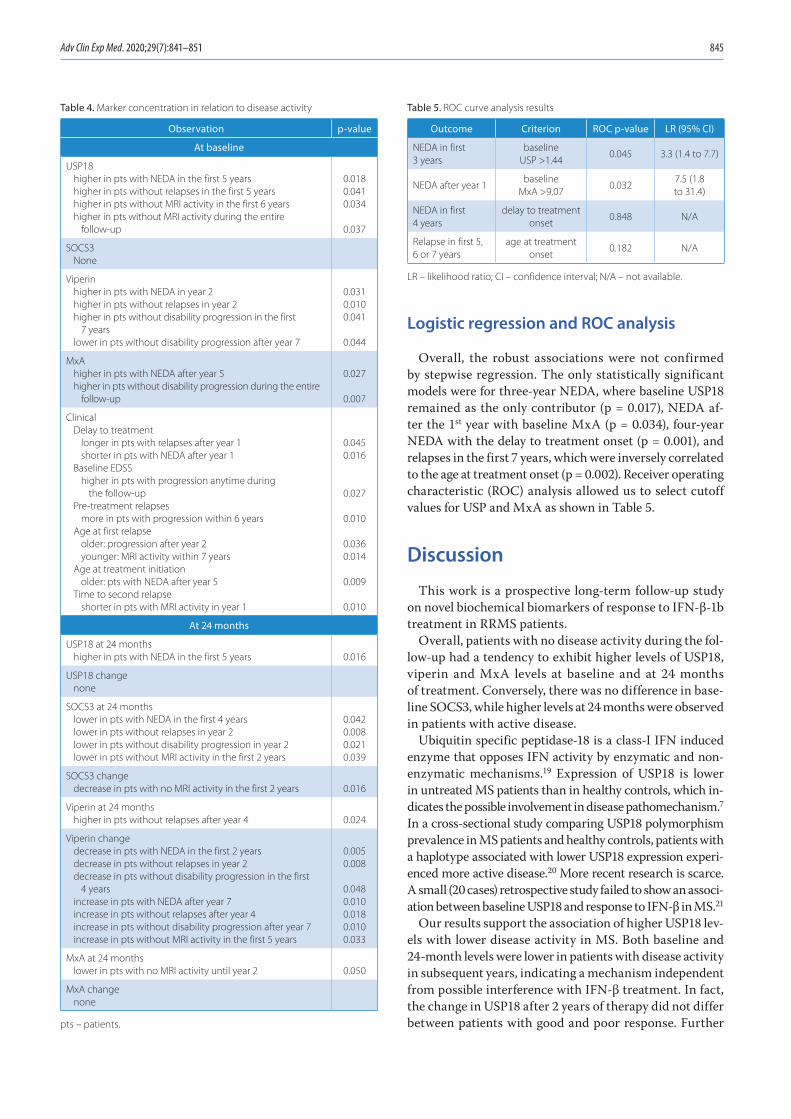
Adv Clin Exp Med. 2020;29(7):841–851 845
Logistic regression and ROC analysis
Overall, the robust associations were not confirmed by stepwise regression. The only statistically significant models were for three-year NEDA, where baseline USP18 remained as the only contributor (p = 0.017), NEDA af-ter the 1st year with baseline MxA (p = 0.034), four-year NEDA with the delay to treatment onset (p = 0.001), and relapses in the first 7 years, which were inversely correlated to the age at treatment onset (p = 0.002). Receiver operating characteristic (ROC) analysis allowed us to select cutoff values for USP and MxA as shown in Table 5.
Discussion
This work is a prospective long-term follow-up study on novel biochemical biomarkers of response to IFN-β-1b treatment in RRMS patients.
Overall, patients with no disease activity during the fol-low-up had a tendency to exhibit higher levels of USP18, viperin and MxA levels at baseline and at 24 months of treatment. Conversely, there was no difference in base-line SOCS3, while higher levels at 24 months were observed in patients with active disease.
Ubiquitin specific peptidase-18 is a class-I IFN induced enzyme that opposes IFN activity by enzymatic and non-enzymatic mechanisms.19 Expression of USP18 is lower in untreated MS patients than in healthy controls, which in-dicates the possible involvement in disease pathomechanism.7 In a cross-sectional study comparing USP18 polymorphism prevalence in MS patients and healthy controls, patients with a haplotype associated with lower USP18 expression experi-enced more active disease.20 More recent research is scarce. A small (20 cases) retrospective study failed to show an associ-ation between baseline USP18 and response to IFN-β in MS.21
Our results support the association of higher USP18 lev-els with lower disease activity in MS. Both baseline and 24-month levels were lower in patients with disease activity in subsequent years, indicating a mechanism independent from possible interference with IFN-β treatment. In fact, the change in USP18 after 2 years of therapy did not differ between patients with good and poor response. Further
Table 4. Marker concentration in relation to disease activity
Observation p-value
At baseline
USP18higher in pts with NEDA in the first 5 yearshigher in pts without relapses in the first 5 yearshigher in pts without MRI activity in the first 6 yearshigher in pts without MRI activity during the entire
follow-up
0.0180.0410.034
0.037
SOCS3None
Viperinhigher in pts with NEDA in year 2higher in pts without relapses in year 2higher in pts without disability progression in the first
7 yearslower in pts without disability progression after year 7
0.0310.0100.041
0.044
MxAhigher in pts with NEDA after year 5higher in pts without disability progression during the entire
follow-up
0.027
0.007
ClinicalDelay to treatment
longer in pts with relapses after year 1 shorter in pts with NEDA after year 1
Baseline EDSShigher in pts with progression anytime during
the follow-upPre-treatment relapses
more in pts with progression within 6 yearsAge at first relapse
older: progression after year 2younger: MRI activity within 7 years
Age at treatment initiationolder: pts with NEDA after year 5
Time to second relapseshorter in pts with MRI activity in year 1
0.0450.016
0.027
0.010
0.0360.014
0.009
0.010
At 24 months
USP18 at 24 monthshigher in pts with NEDA in the first 5 years 0.016
USP18 changenone
SOCS3 at 24 monthslower in pts with NEDA in the first 4 yearslower in pts without relapses in year 2lower in pts without disability progression in year 2lower in pts without MRI activity in the first 2 years
0.0420.0080.0210.039
SOCS3 changedecrease in pts with no MRI activity in the first 2 years 0.016
Viperin at 24 monthshigher in pts without relapses after year 4 0.024
Viperin changedecrease in pts with NEDA in the first 2 yearsdecrease in pts without relapses in year 2decrease in pts without disability progression in the first
4 yearsincrease in pts with NEDA after year 7 increase in pts without relapses after year 4increase in pts without disability progression after year 7increase in pts without MRI activity in the first 5 years
0.0050.008
0.0480.0100.0180.0100.033
MxA at 24 monthslower in pts with no MRI activity until year 2 0.050
MxA changenone
pts – patients.
Table 5. ROC curve analysis results
Outcome Criterion ROC p-value LR (95% CI)
NEDA in first 3 years
baseline USP >1.44
0.045 3.3 (1.4 to 7.7)
NEDA after year 1baseline
MxA >9.070.032
7.5 (1.8 to 31.4)
NEDA in first 4 years
delay to treatment onset
0.848 N/A
Relapse in first 5, 6 or 7 years
age at treatment onset
0.182 N/A
LR – likelihood ratio; CI – confidence interval; N/A – not available.
A. Pietrzak et al. Prognostic markers in multiple sclerosis846
supporting our observation, baseline USP18 remained the only independent variable in stepwise regression model for NEDA in the first 3 years.
The family of suppressors of cytokine signaling (SOCS) contains regulators of intracellular signaling pathways of various cytokines induced predominately by the JAK-STAT cascade.
Suppressor of cytokine signaling 3 is induced by STAT3 and acts as an inhibitor of STAT3, with a complex impact on the immune system. It attenuates responses to class I and II IFNs, inhibits maturation of Th17 cells and directs macrophage polarization towards the M2 phenotype.22 At the same time, SOCS3 may play a role in neuroprotec-tion, as SOCS3 overexpression promotes neural differen-tiation and survival in vitro.23
Animal studies indicate both protective and harmful ef-fects on the CNS in experimental autoimmune encephalitis (EAE).24 Experimental autoimmune encephalitis in SOCS3-transfected mice develops later, but is more severe.25
Little research has been done on SOCS3 in human MS subjects. During relapse, a decrease in leukocyte SOCS3 expression was observed.26 On the other hand, in a small American study,27 SOCS3 expression was significantly higher in MS patients than in the healthy controls, with a trend towards more disability in patients with higher expression. This observation was not confirmed in a more recent study.28
In our study, baseline SOCS3 levels were not different in patients with and without disease activity. However, the levels rose and were higher at 24 months in those with activity in the 2nd year, possibly reflecting a maintained, but unbeneficial drug effect. However, the observation was lost when controlled for other variables.
Viperin is an anti-viral protein induced by class I inter-ferons29 and a specific marker of IFN-β activity.7 In the INSIGHT trial, viperin and MxA expression were com-pared among patients with and without anti-IFN antibod-ies.10 In patients with NAbs, the expression levels of all 3 proteins were lower or absent at NAb titres ≥100 TRU. The study was not designed to assess correlations between marker expression and disease activity.
In our cohort, baseline viperin concentrations were higher in patients with no disease activity. However, the baseline values were lower in those with no progression later on. At 24 months, viperin levels were higher in those who did not experience relapses in the subsequent years.
While the absolute values were higher in cases with better outcome, viperin change between baseline and 24 months showed a general trend to be more negative in patients with no disease activity in earlier years (up to the 4th) and more positive in those stable in later follow-up. This was appar-ent for NEDA, relapses and progression. For MRI activity, which is considered to be the earliest indicator of disease activity among NEDA components, there was a concordant rise in viperin in stable patients in both earlier and later years, with a similar trend for the entire follow-up.
Overall, no independent association with prognosis was found in regression models. Myxovirus resistance protein A (MxA), a class I IFN-induced GTP-ase with antiviral proper-ties,29 is considered one of the most reliable markers of IFN-β bioavailability.30 The absence of MxA induction signifies total loss of IFN activity, as no other IFN-induced proteins are detected in this setting.31 Unsurprisingly, numerous studies reported an association between low MxA mRNA and poor response to IFN. MxA mRNA measured at 1 year of treat-ment was a better predictor of relapses than NAb titers.9,32 In another study, MxA induction at 1 year predicted a longer time to a relapse or EDSS progression.33 More intriguing is that low MxA expression before treatment was also as-sociated with a higher risk of relapses or EDSS worsening while on IFN.34 Higher mean MxA mRNA, measured over the period from 6 months to 2 years of treatment, predicted a lower risk of disability progression in the first 3 years, in-dependently from relapse activity.35 On the other hand, in 2 more recent studies 21,36 MxA mRNA levels failed to predict treatment response to IFN-β in a two-year observation.
Our results replicated the association of higher MxA levels, both during IFN therapy and in treatment-naive patients, with less disease activity. What is more, base-line MxA was the only independent predictor of disease activity past year 1, with the highest levels >9.07 ng/mL associated with a 7.5 likelihood ratio for no disease activity.
The heterogeneity of immunologic profiles in MS, as well as their associations with treatment response, has been ad-dressed in several recent works.11–13,37 Our study lends sup-port to the notion that certain alterations convey a higher risk of poor outcome. The study yielded multiple find-ings. However, only several have potential clinical utility. In logistic regression, higher baseline USP18 remained the only independent prognostic factor for NEDA, and only in the first 3 years of treatment. High baseline MxA, on the other hand, was independently associated with NEDA in the observation after the 1st year.
Our study has several limitations. The choice of testing material requires commentary. Previous studies concern-ing their expression utilized either mRNA (MxA, viperin, USP18, SOCS3) or protein measurement (MxA) in periph-eral blood cells. Quantitative real-time polymerase chain reaction (qRT-PCR) for mRNA is more sensitive, but protein detection methods are cheaper; furthermore, the short half-life of mRNA forces strict timing of sample collection in re-lation to drug administration: For MxA, mRNA levels begin to increase at 3 and peak at 12 h post-injection, decreasing two-fold by 24 h38; MxA protein levels remain more stable,39 allowing more flexible sampling. It is also worth noting that, on the one hand, mRNA detection reflects the earli-est expression stage most closely related to gene induction by IFN and, on the other, protein measurement accounts for all post-transcription and post-translation regulatory processes and may, therefore, more accurately correlate with actual biological activity. For MxA, a dose effect of IFN is apparent at protein level, but not at mRNA level.40
Adv Clin Exp Med. 2020;29(7):841–851 847
All the assessed proteins are intracellular. Due to technical limitations, no cellular material was available for this study. We, therefore, performed a number of preliminary measure-ments on healthy donors (data not published) and found that the aforementioned particles are detectable at various levels in sera. This may reflect either protein release from fragmented cells or the protein contained in nanoparticles.
By detecting associations with disease activity, this study confirms that serum is a valid material for the measure-ment of USP18, SOCS3, viperin, and MxA. What is more, we provide evidence that the differences in IFN-inducible gene products expression are apparent at the protein stage, not only at mRNA, as shown in previous studies.
A considerable proportion of cases was lost during obser-vation, and other cases were recruited late in the study, re-sulting in a median follow-up of almost 7 years. The lower number of cases in years 6–9 may have contributed to the fact that most of the significant associations were not present beyond the 5th year. Knowing that the baseline marker levels kept their associations until then, the true prognostic value of measurements at 24 months may be underappreciated in our study.
A number of peculiarities concerning treatment deci-sions in our cohort need to be addressed. The considerable delay between diagnosis and treatment initiation is caused by procedural barriers, including limited access to imag-ing facilities and long waiting queues at MS treatment centers in Poland. Due to treatment program rules and lack of registered second-line therapies, many patients with ongoing disease activity continued IFN treatment. In ad-dition, 2 patients were excluded from further treatment due to treatment program duration restriction that was in force until 2012.
Unanswered questions leave implications for future re-search. It would be informative to assess USP18, viperin, SOCS3, and MxA levels in patients on other DMDs and without treatment, in order to separate their natural vari-ance in SM from drug effects and to assess whether they are predictive of response to any particular drug. In ad-dition, it might be prudent to focus on early dynamics of the markers included in this study.
Conclusions
Low levels of plasma USP-18, viperin and MxA at baseline and at 24 months of treatment and high levels of SOCS3 at 24 months are associated with more disease activity and worse outcome in IFN-β-1b-treated MS patients.
However, only baseline USP18 and MxA were independent predictors of disease activity: Baseline USP18 > 1.44 ng/mL was associated with NEDA in the first 3 years with LR of 3.3, while baseline MxA > 9.07 ng/mL was associated with NEDA in the entire observation beyond year 1 with LR of 7.5, identifying infrequent patients with very mild disease and sustained good response to IFN-β-1b.
Suppressor of cytokine signaling 3 was the only marker with higher instead of lower concentrations in the cases with more active MS. Moreover, its concentration decreased dur-ing two-year IFN treatment and at that time point, higher values were observed in patients currently experiencing relapses, MRI activity or progression. While SOCS3 failed to predict later course, this association appears to reflect an important qualitative variability of response to IFN-β-1b.
ORCID iDsAnna Pietrzak https://orcid.org/0000-0002-3606-7296Alicja Kalinowska-Łyszczarz https://orcid.org/0000-0002-0618-1637Krystyna Osztynowicz https://orcid.org/0000-0003-4782-1474Alima Khamidulla https://orcid.org/0000-0002-5007-8151Wojciech Kozubski https://orcid.org/0000-0003-2777-261XSławomir Michalak https://orcid.org/0000-0002-5602-4306
References1. Dobson R, Giovannoni G. Multiple sclerosis: A review. Eur J Neurol.
2019;26(1):27–40. doi:10.1111/ene.138192. Kappos L, De Stefano N, Freedman MS, et al. Inclusion of brain volume
loss in a revised measure of “no evidence of disease activity” (NEDA-4) in relapsing-remitting multiple sclerosis. Mult Scler. 2016;22(10): 1297–1305. doi:10.1177/1352458515616701
3. Mayssam EN, Eid C, Khoury SJ, Hannoun S. “No evidence of disease activity”: Is it an aspirational therapeutic goal in multiple sclero-sis? Mult Scler Relat Disord. 2020;40:101935. doi:10.1016/j.msard.2020. 101935
4. Freedman MS, Selchen D, Prat A, Giacomini PS. Managing multiple sclerosis: Treatment initiation, modification, and sequencing. Can J Neurol Sci. 2018;45(5):489–503. doi:10.1017/cjn.2018.17
5. Río J, Castilló J, Rovira A, et al. Measures in the first year of therapy predict the response to interferon β in MS. Mult Scler. 2009;15(7):848–853. doi:10.1177/1352458509104591
6. Sormani MP, Rio J, Tintorè M, et al. Scoring treatment response in patients with relapsing multiple sclerosis. Mult Scler J. 2013;19(5):605–612. doi:10.1177/1352458512460605
7. Malhotra S, Bustamante MF, Miralles F, et al. Search for specific bio-markers of IFNβ bioactivity in patients with multiple sclerosis. PLoS One. 2011;6(8). doi:10.1371/journal.pone.0023634
8. Malucchi S, Gilli F, Caldano M, et al. One-year evaluation of factors affecting the biological activity of interferon beta in multiple sclerosis patients. J Neurol. 2011;258(5):895–903. doi:10.1007/s00415-010-5844-5
9. Malucchi S, Gilli F, Caldano M. Predictive markers for response to interferon therapy in patients with multiple sclerosis. Neurology. 2008;(70):1119–1127. doi:10.1212/01.wnl.0000304040.29080.7b
10. Pachner AR, Warth JD, Pace A, Goelz S. Effect of neutralizing antibodies on biomarker responses to interferon beta: The INSIGHT study. Neurology. 2009;73(18):1493–1500. doi:10.1212/WNL.0b013e3181bf98db
11. Bărcuţean LI, Romaniuc A, Maier S, et al. Clinical and serological bio-markers of treatment’s response in multiple sclerosis patients treated continuously with interferon β-1b for more than a decade. CNS Neurol Disord Drug Targets. 2018;17(10):780–792. doi:10.2174/1871527317666 180917095256
12. Taheri M, Ghafouri-Fard S, Solgi G, Sayad A, Mazdeh M, Omrani MD. Determination of cytokine levels in multiple sclerosis patients and their relevance with patients’ response to Cinnovex. Cytokine. 2017; 96:138–143. doi:10.1016/j.cyto.2017.04.007
13. Balasa R, Maier S, Voidazan S, et al. Assessment of interleukin-17A, interleukin-10 and transforming growth factor-beta1 serum titers in relapsing remitting multiple sclerosis patients treated with avonex, possible biomarkers for treatment response. CNS Neurol Disord Drug Targets. 2017;16(1):93–101. doi:10.2174/1871527315666160615110739
14. Manna I, Iaccino E, Dattilo V, et al. Exosome-associated miRNA pro-file as a prognostic tool for therapy response monitoring in multi-ple sclerosis patients. FASEB J. 2018;32(8):4241–4246. doi:10.1096/fj.201701533R
15. Magner WJ, Weinstock-Guttman B, Rho M, et al. Dicer and microRNA expression in multiple sclerosis and response to interferon therapy. J Neuroimmunol. 2016;292:68–78. doi:10.1016/j.jneuroim.2016.01.009
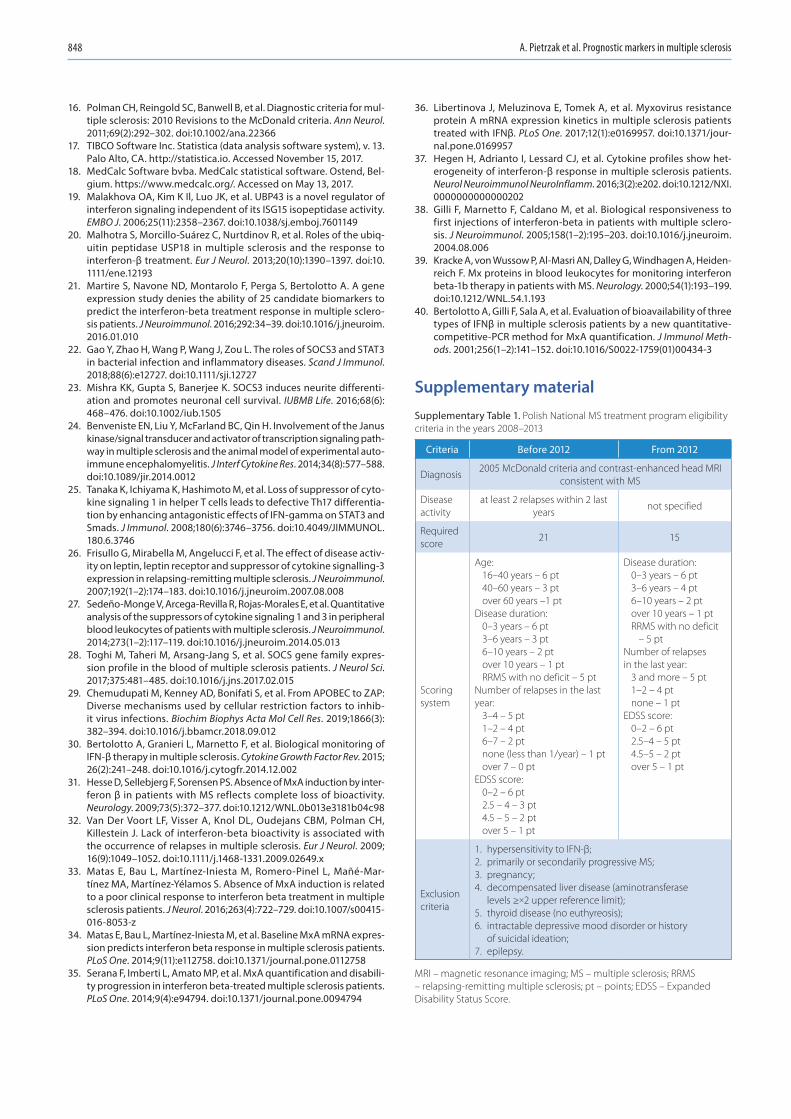
A. Pietrzak et al. Prognostic markers in multiple sclerosis848
16. Polman CH, Reingold SC, Banwell B, et al. Diagnostic criteria for mul-tiple sclerosis: 2010 Revisions to the McDonald criteria. Ann Neurol. 2011;69(2):292–302. doi:10.1002/ana.22366
17. TIBCO Software Inc. Statistica (data analysis software system), v. 13. Palo Alto, CA. http://statistica.io. Accessed November 15, 2017.
18. MedCalc Software bvba. MedCalc statistical software. Ostend, Bel-gium. https://www.medcalc.org/. Accessed on May 13, 2017.
19. Malakhova OA, Kim K Il, Luo JK, et al. UBP43 is a novel regulator of interferon signaling independent of its ISG15 isopeptidase activity. EMBO J. 2006;25(11):2358–2367. doi:10.1038/sj.emboj.7601149
20. Malhotra S, Morcillo-Suárez C, Nurtdinov R, et al. Roles of the ubiq-uitin peptidase USP18 in multiple sclerosis and the response to interferon-β treatment. Eur J Neurol. 2013;20(10):1390–1397. doi:10. 1111/ene.12193
21. Martire S, Navone ND, Montarolo F, Perga S, Bertolotto A. A gene expression study denies the ability of 25 candidate biomarkers to predict the interferon-beta treatment response in multiple sclero-sis patients. J Neuroimmunol. 2016;292:34–39. doi:10.1016/j.jneuroim. 2016.01.010
22. Gao Y, Zhao H, Wang P, Wang J, Zou L. The roles of SOCS3 and STAT3 in bacterial infection and inflammatory diseases. Scand J Immunol. 2018;88(6):e12727. doi:10.1111/sji.12727
23. Mishra KK, Gupta S, Banerjee K. SOCS3 induces neurite differenti-ation and promotes neuronal cell survival. IUBMB Life. 2016;68(6): 468–476. doi:10.1002/iub.1505
24. Benveniste EN, Liu Y, McFarland BC, Qin H. Involvement of the Janus kinase/signal transducer and activator of transcription signaling path-way in multiple sclerosis and the animal model of experimental auto-immune encephalomyelitis. J Interf Cytokine Res. 2014;34(8):577–588. doi:10.1089/jir.2014.0012
25. Tanaka K, Ichiyama K, Hashimoto M, et al. Loss of suppressor of cyto-kine signaling 1 in helper T cells leads to defective Th17 differentia-tion by enhancing antagonistic effects of IFN-gamma on STAT3 and Smads. J Immunol. 2008;180(6):3746–3756. doi:10.4049/JIMMUNOL. 180.6.3746
26. Frisullo G, Mirabella M, Angelucci F, et al. The effect of disease activ-ity on leptin, leptin receptor and suppressor of cytokine signalling-3 expression in relapsing-remitting multiple sclerosis. J Neuroimmunol. 2007;192(1–2):174–183. doi:10.1016/j.jneuroim.2007.08.008
27. Sedeño-Monge V, Arcega-Revilla R, Rojas-Morales E, et al. Quantitative analysis of the suppressors of cytokine signaling 1 and 3 in peripheral blood leukocytes of patients with multiple sclerosis. J Neuro immunol. 2014;273(1–2):117–119. doi:10.1016/j.jneuroim.2014.05.013
28. Toghi M, Taheri M, Arsang-Jang S, et al. SOCS gene family expres-sion profile in the blood of multiple sclerosis patients. J Neurol Sci. 2017;375:481–485. doi:10.1016/j.jns.2017.02.015
29. Chemudupati M, Kenney AD, Bonifati S, et al. From APOBEC to ZAP: Diverse mechanisms used by cellular restriction factors to inhib-it virus infections. Biochim Biophys Acta Mol Cell Res. 2019;1866(3): 382–394. doi:10.1016/j.bbamcr.2018.09.012
30. Bertolotto A, Granieri L, Marnetto F, et al. Biological monitoring of IFN-β therapy in multiple sclerosis. Cytokine Growth Factor Rev. 2015; 26(2):241–248. doi:10.1016/j.cytogfr.2014.12.002
31. Hesse D, Sellebjerg F, Sorensen PS. Absence of MxA induction by inter-feron β in patients with MS reflects complete loss of bioactivity. Neuro logy. 2009;73(5):372–377. doi:10.1212/WNL.0b013e3181b04c98
32. Van Der Voort LF, Visser A, Knol DL, Oudejans CBM, Polman CH, Kille stein J. Lack of interferon-beta bioactivity is associated with the occurrence of relapses in multiple sclerosis. Eur J Neurol. 2009; 16(9):1049–1052. doi:10.1111/j.1468-1331.2009.02649.x
33. Matas E, Bau L, Martínez-Iniesta M, Romero-Pinel L, Mañé-Mar-tínez MA, Martínez-Yélamos S. Absence of MxA induction is related to a poor clinical response to interferon beta treatment in multiple sclerosis patients. J Neurol. 2016;263(4):722–729. doi:10.1007/s00415-016-8053-z
34. Matas E, Bau L, Martínez-Iniesta M, et al. Baseline MxA mRNA expres-sion predicts interferon beta response in multiple sclerosis patients. PLoS One. 2014;9(11):e112758. doi:10.1371/journal.pone.0112758
35. Serana F, Imberti L, Amato MP, et al. MxA quantification and disabili-ty progression in interferon beta-treated multiple sclerosis patients. PLoS One. 2014;9(4):e94794. doi:10.1371/journal.pone.0094794
36. Libertinova J, Meluzinova E, Tomek A, et al. Myxovirus resistance protein A mRNA expression kinetics in multiple sclerosis patients treated with IFNβ. PLoS One. 2017;12(1):e0169957. doi:10.1371/jour-nal.pone.0169957
37. Hegen H, Adrianto I, Lessard CJ, et al. Cytokine profiles show het-erogeneity of interferon-β response in multiple sclerosis patients. Neurol Neuroimmunol NeuroInflamm. 2016;3(2):e202. doi:10.1212/NXI. 0000000000000202
38. Gilli F, Marnetto F, Caldano M, et al. Biological responsiveness to first injections of interferon-beta in patients with multiple sclero-sis. J Neuroimmunol. 2005;158(1–2):195–203. doi:10.1016/j.jneuroim. 2004.08.006
39. Kracke A, von Wussow P, Al-Masri AN, Dalley G, Windhagen A, Heiden-reich F. Mx proteins in blood leukocytes for monitoring interferon beta-1b therapy in patients with MS. Neurology. 2000;54(1):193–199. doi:10.1212/WNL.54.1.193
40. Bertolotto A, Gilli F, Sala A, et al. Evaluation of bioavailability of three types of IFNβ in multiple sclerosis patients by a new quantitative-competitive-PCR method for MxA quantification. J Immunol Methods. 2001;256(1–2):141–152. doi:10.1016/S0022-1759(01)00434-3
Supplementary material
Supplementary Table 1. Polish National MS treatment program eligibility criteria in the years 2008–2013
Criteria Before 2012 From 2012
Diagnosis2005 McDonald criteria and contrast-enhanced head MRI
consistent with MS
Disease activity
at least 2 relapses within 2 last years
not specified
Required score
21 15
Scoring system
Age:16–40 years – 6 pt40–60 years – 3 ptover 60 years –1 pt
Disease duration:0–3 years – 6 pt3–6 years – 3 pt6–10 years – 2 ptover 10 years – 1 ptRRMS with no deficit – 5 pt
Number of relapses in the last year:
3–4 – 5 pt1–2 – 4 pt6–7 – 2 ptnone (less than 1/year) – 1 ptover 7 – 0 pt
EDSS score:0–2 – 6 pt2.5 – 4 – 3 pt4.5 – 5 – 2 ptover 5 – 1 pt
Disease duration:0–3 years – 6 pt3–6 years – 4 pt6–10 years – 2 ptover 10 years – 1 ptRRMS with no deficit
– 5 ptNumber of relapses in the last year:
3 and more – 5 pt1–2 – 4 ptnone – 1 pt
EDSS score:0–2 – 6 pt2.5–4 – 5 pt4.5–5 – 2 ptover 5 – 1 pt
Exclusion criteria
1. hypersensitivity to IFN-β;2. primarily or secondarily progressive MS;3. pregnancy;4. decompensated liver disease (aminotransferase
levels ≥×2 upper reference limit);5. thyroid disease (no euthyreosis);6. intractable depressive mood disorder or history
of suicidal ideation;7. epilepsy.
MRI – magnetic resonance imaging; MS – multiple sclerosis; RRMS – relapsing-remitting multiple sclerosis; pt – points; EDSS – Expanded Disability Status Score.
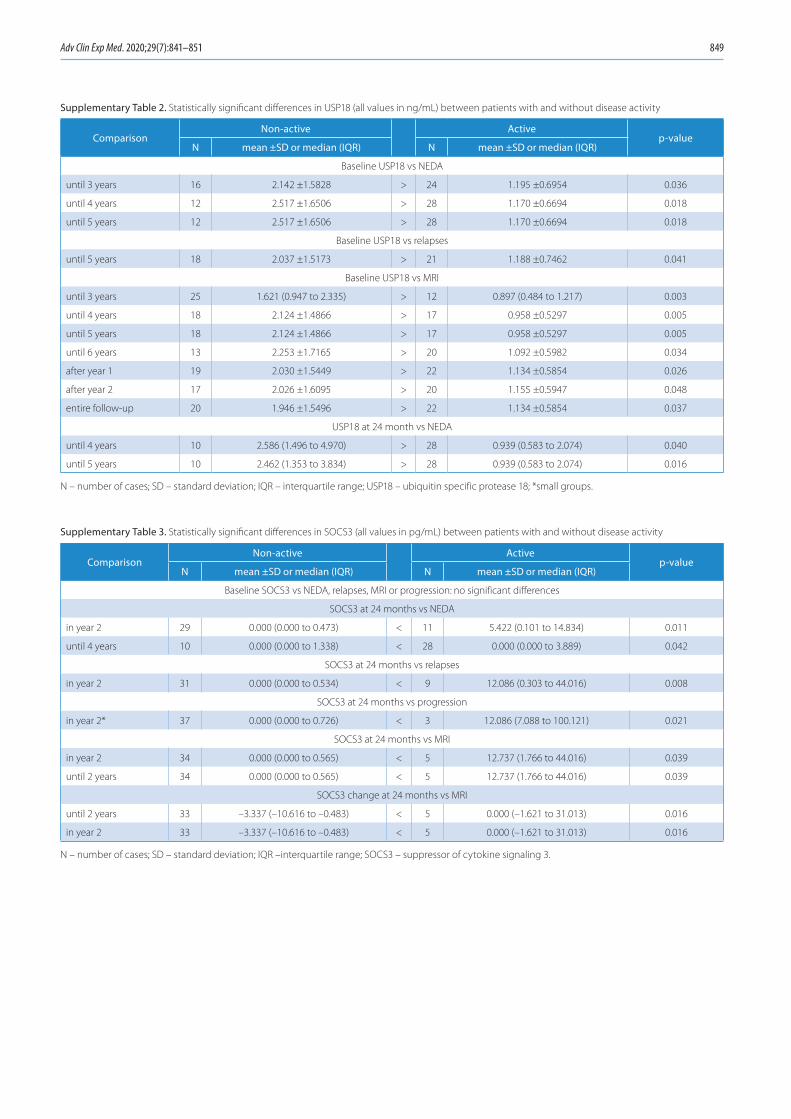
Adv Clin Exp Med. 2020;29(7):841–851 849
Supplementary Table 2. Statistically significant differences in USP18 (all values in ng/mL) between patients with and without disease activity
ComparisonNon-active Active
p-valueN mean ±SD or median (IQR) N mean ±SD or median (IQR)
Baseline USP18 vs NEDA
until 3 years 16 2.142 ±1.5828 > 24 1.195 ±0.6954 0.036
until 4 years 12 2.517 ±1.6506 > 28 1.170 ±0.6694 0.018
until 5 years 12 2.517 ±1.6506 > 28 1.170 ±0.6694 0.018
Baseline USP18 vs relapses
until 5 years 18 2.037 ±1.5173 > 21 1.188 ±0.7462 0.041
Baseline USP18 vs MRI
until 3 years 25 1.621 (0.947 to 2.335) > 12 0.897 (0.484 to 1.217) 0.003
until 4 years 18 2.124 ±1.4866 > 17 0.958 ±0.5297 0.005
until 5 years 18 2.124 ±1.4866 > 17 0.958 ±0.5297 0.005
until 6 years 13 2.253 ±1.7165 > 20 1.092 ±0.5982 0.034
after year 1 19 2.030 ±1.5449 > 22 1.134 ±0.5854 0.026
after year 2 17 2.026 ±1.6095 > 20 1.155 ±0.5947 0.048
entire follow-up 20 1.946 ±1.5496 > 22 1.134 ±0.5854 0.037
USP18 at 24 month vs NEDA
until 4 years 10 2.586 (1.496 to 4.970) > 28 0.939 (0.583 to 2.074) 0.040
until 5 years 10 2.462 (1.353 to 3.834) > 28 0.939 (0.583 to 2.074) 0.016
N – number of cases; SD – standard deviation; IQR – interquartile range; USP18 – ubiquitin specific protease 18; *small groups.
Supplementary Table 3. Statistically significant differences in SOCS3 (all values in pg/mL) between patients with and without disease activity
ComparisonNon-active Active
p-valueN mean ±SD or median (IQR) N mean ±SD or median (IQR)
Baseline SOCS3 vs NEDA, relapses, MRI or progression: no significant differences
SOCS3 at 24 months vs NEDA
in year 2 29 0.000 (0.000 to 0.473) < 11 5.422 (0.101 to 14.834) 0.011
until 4 years 10 0.000 (0.000 to 1.338) < 28 0.000 (0.000 to 3.889) 0.042
SOCS3 at 24 months vs relapses
in year 2 31 0.000 (0.000 to 0.534) < 9 12.086 (0.303 to 44.016) 0.008
SOCS3 at 24 months vs progression
in year 2* 37 0.000 (0.000 to 0.726) < 3 12.086 (7.088 to 100.121) 0.021
SOCS3 at 24 months vs MRI
in year 2 34 0.000 (0.000 to 0.565) < 5 12.737 (1.766 to 44.016) 0.039
until 2 years 34 0.000 (0.000 to 0.565) < 5 12.737 (1.766 to 44.016) 0.039
SOCS3 change at 24 months vs MRI
until 2 years 33 –3.337 (–10.616 to –0.483) < 5 0.000 (–1.621 to 31.013) 0.016
in year 2 33 –3.337 (–10.616 to –0.483) < 5 0.000 (–1.621 to 31.013) 0.016
N – number of cases; SD – standard deviation; IQR –interquartile range; SOCS3 – suppressor of cytokine signaling 3.
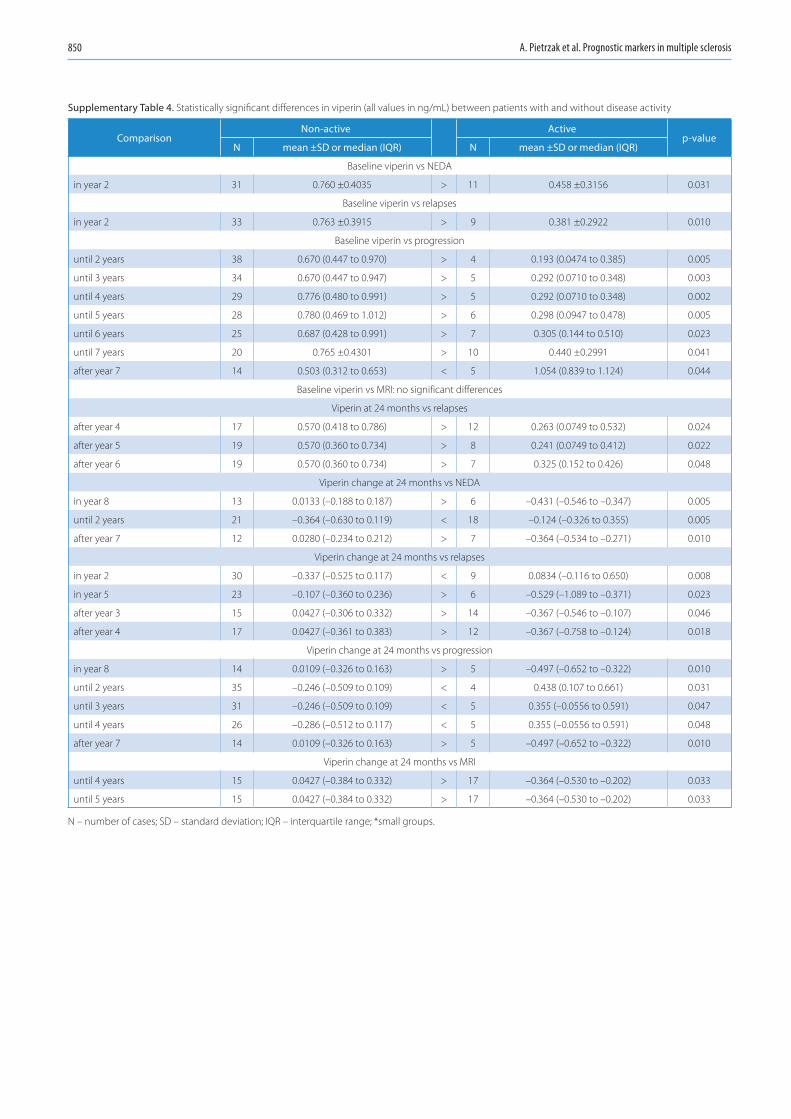
A. Pietrzak et al. Prognostic markers in multiple sclerosis850
Supplementary Table 4. Statistically significant differences in viperin (all values in ng/mL) between patients with and without disease activity
ComparisonNon-active Active
p-valueN mean ±SD or median (IQR) N mean ±SD or median (IQR)
Baseline viperin vs NEDA
in year 2 31 0.760 ±0.4035 > 11 0.458 ±0.3156 0.031
Baseline viperin vs relapses
in year 2 33 0.763 ±0.3915 > 9 0.381 ±0.2922 0.010
Baseline viperin vs progression
until 2 years 38 0.670 (0.447 to 0.970) > 4 0.193 (0.0474 to 0.385) 0.005
until 3 years 34 0.670 (0.447 to 0.947) > 5 0.292 (0.0710 to 0.348) 0.003
until 4 years 29 0.776 (0.480 to 0.991) > 5 0.292 (0.0710 to 0.348) 0.002
until 5 years 28 0.780 (0.469 to 1.012) > 6 0.298 (0.0947 to 0.478) 0.005
until 6 years 25 0.687 (0.428 to 0.991) > 7 0.305 (0.144 to 0.510) 0.023
until 7 years 20 0.765 ±0.4301 > 10 0.440 ±0.2991 0.041
after year 7 14 0.503 (0.312 to 0.653) < 5 1.054 (0.839 to 1.124) 0.044
Baseline viperin vs MRI: no significant differences
Viperin at 24 months vs relapses
after year 4 17 0.570 (0.418 to 0.786) > 12 0.263 (0.0749 to 0.532) 0.024
after year 5 19 0.570 (0.360 to 0.734) > 8 0.241 (0.0749 to 0.412) 0.022
after year 6 19 0.570 (0.360 to 0.734) > 7 0.325 (0.152 to 0.426) 0.048
Viperin change at 24 months vs NEDA
in year 8 13 0.0133 (–0.188 to 0.187) > 6 –0.431 (–0.546 to –0.347) 0.005
until 2 years 21 –0.364 (–0.630 to 0.119) < 18 –0.124 (–0.326 to 0.355) 0.005
after year 7 12 0.0280 (–0.234 to 0.212) > 7 –0.364 (–0.534 to –0.271) 0.010
Viperin change at 24 months vs relapses
in year 2 30 –0.337 (–0.525 to 0.117) < 9 0.0834 (–0.116 to 0.650) 0.008
in year 5 23 –0.107 (–0.360 to 0.236) > 6 –0.529 (–1.089 to –0.371) 0.023
after year 3 15 0.0427 (–0.306 to 0.332) > 14 –0.367 (–0.546 to –0.107) 0.046
after year 4 17 0.0427 (–0.361 to 0.383) > 12 –0.367 (–0.758 to –0.124) 0.018
Viperin change at 24 months vs progression
in year 8 14 0.0109 (–0.326 to 0.163) > 5 –0.497 (–0.652 to –0.322) 0.010
until 2 years 35 –0.246 (–0.509 to 0.109) < 4 0.438 (0.107 to 0.661) 0.031
until 3 years 31 –0.246 (–0.509 to 0.109) < 5 0.355 (–0.0556 to 0.591) 0.047
until 4 years 26 –0.286 (–0.512 to 0.117) < 5 0.355 (–0.0556 to 0.591) 0.048
after year 7 14 0.0109 (–0.326 to 0.163) > 5 –0.497 (–0.652 to –0.322) 0.010
Viperin change at 24 months vs MRI
until 4 years 15 0.0427 (–0.384 to 0.332) > 17 –0.364 (–0.530 to –0.202) 0.033
until 5 years 15 0.0427 (–0.384 to 0.332) > 17 –0.364 (–0.530 to –0.202) 0.033
N – number of cases; SD – standard deviation; IQR – interquartile range; *small groups.
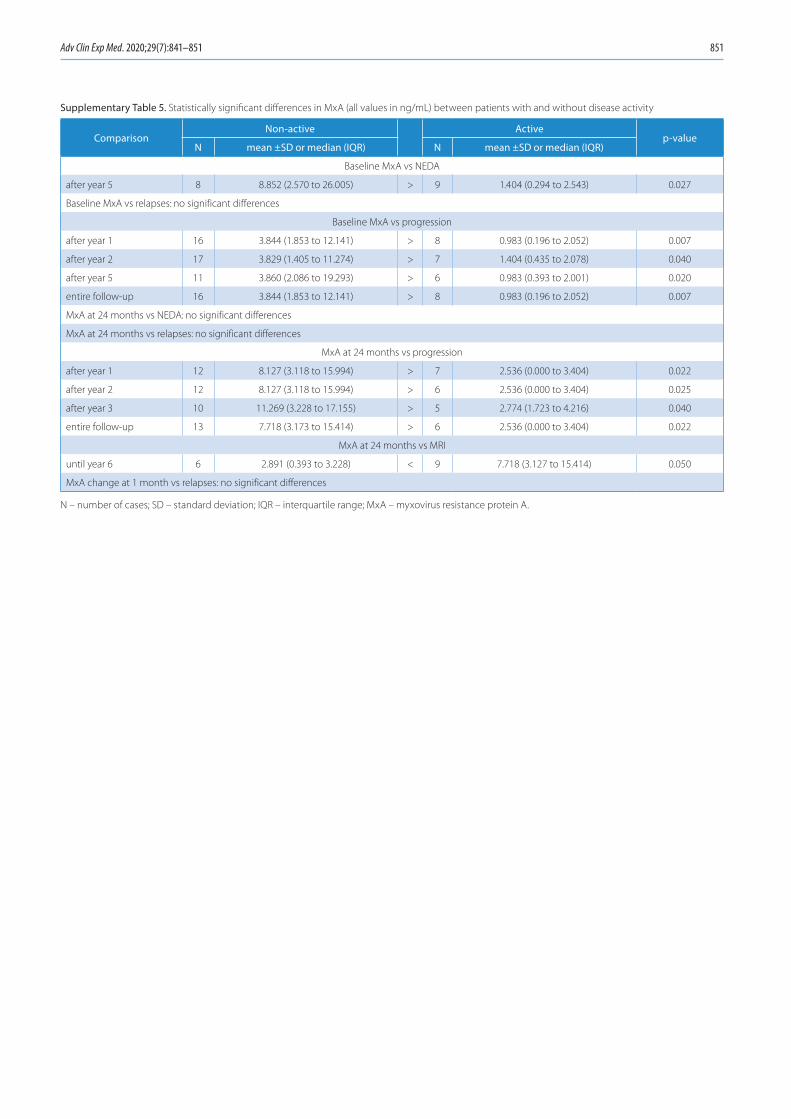
Adv Clin Exp Med. 2020;29(7):841–851 851
Supplementary Table 5. Statistically significant differences in MxA (all values in ng/mL) between patients with and without disease activity
ComparisonNon-active Active
p-valueN mean ±SD or median (IQR) N mean ±SD or median (IQR)
Baseline MxA vs NEDA
after year 5 8 8.852 (2.570 to 26.005) > 9 1.404 (0.294 to 2.543) 0.027
Baseline MxA vs relapses: no significant differences
Baseline MxA vs progression
after year 1 16 3.844 (1.853 to 12.141) > 8 0.983 (0.196 to 2.052) 0.007
after year 2 17 3.829 (1.405 to 11.274) > 7 1.404 (0.435 to 2.078) 0.040
after year 5 11 3.860 (2.086 to 19.293) > 6 0.983 (0.393 to 2.001) 0.020
entire follow-up 16 3.844 (1.853 to 12.141) > 8 0.983 (0.196 to 2.052) 0.007
MxA at 24 months vs NEDA: no significant differences
MxA at 24 months vs relapses: no significant differences
MxA at 24 months vs progression
after year 1 12 8.127 (3.118 to 15.994) > 7 2.536 (0.000 to 3.404) 0.022
after year 2 12 8.127 (3.118 to 15.994) > 6 2.536 (0.000 to 3.404) 0.025
after year 3 10 11.269 (3.228 to 17.155) > 5 2.774 (1.723 to 4.216) 0.040
entire follow-up 13 7.718 (3.173 to 15.414) > 6 2.536 (0.000 to 3.404) 0.022
MxA at 24 months vs MRI
until year 6 6 2.891 (0.393 to 3.228) < 9 7.718 (3.127 to 15.414) 0.050
MxA change at 1 month vs relapses: no significant differences
N – number of cases; SD – standard deviation; IQR – interquartile range; MxA – myxovirus resistance protein A.

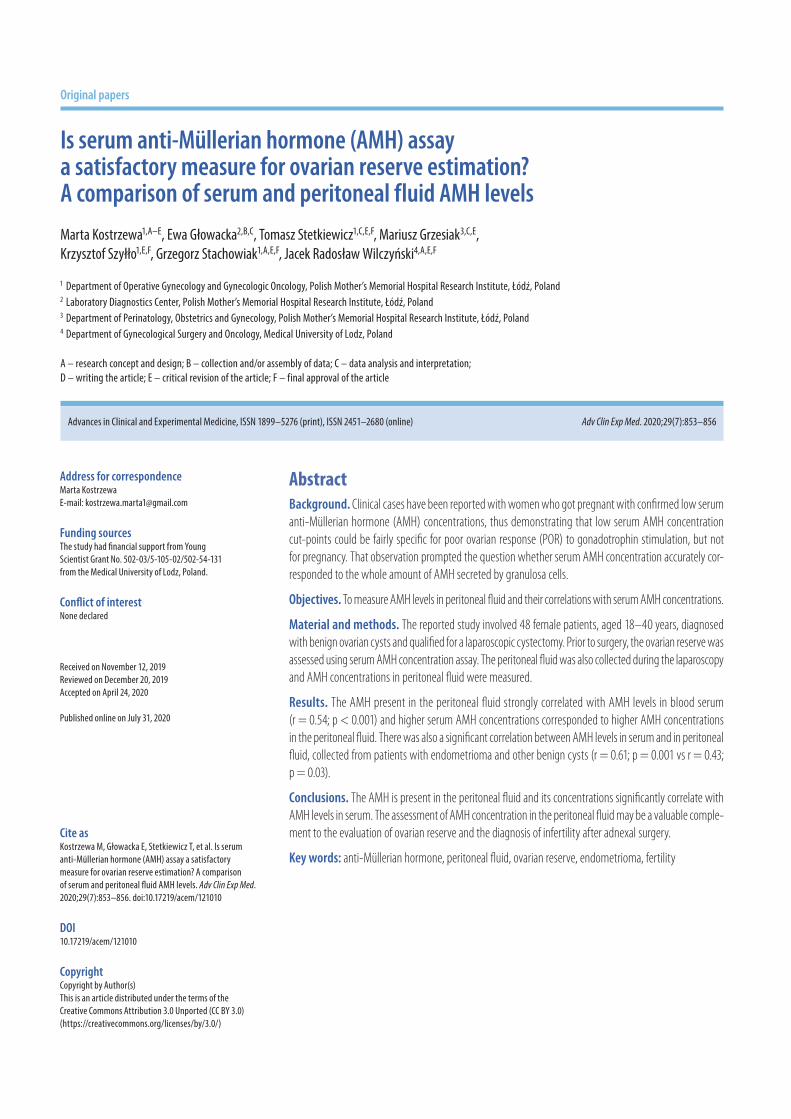
Cite asKostrzewa M, Głowacka E, Stetkiewicz T, et al. Is serum anti-Müllerian hormone (AMH) assay a satisfactory measure for ovarian reserve estimation? A comparison of serum and peritoneal fluid AMH levels. Adv Clin Exp Med. 2020;29(7):853–856. doi:10.17219/acem/121010
DOI10.17219/acem/121010
CopyrightCopyright by Author(s) This is an article distributed under the terms of theCreative Commons Attribution 3.0 Unported (CC BY 3.0)(https://creativecommons.org/licenses/by/3.0/)
Address for correspondenceMarta KostrzewaE-mail: [email protected]
Funding sourcesThe study had financial support from Young Scientist Grant No. 502-03/5-105-02/502-54-131 from the Medical University of Lodz, Poland.
Conflict of interestNone declared
Received on November 12, 2019Reviewed on December 20, 2019Accepted on April 24, 2020
Published online on July 31, 2020
AbstractBackground. Clinical cases have been reported with women who got pregnant with confirmed low serum anti-Müllerian hormone (AMH) concentrations, thus demonstrating that low serum AMH concentration cut-points could be fairly specific for poor ovarian response (POR) to gonadotrophin stimulation, but not for pregnancy. That observation prompted the question whether serum AMH concentration accurately cor-responded to the whole amount of AMH secreted by granulosa cells.
Objectives. To measure AMH levels in peritoneal fluid and their correlations with serum AMH concentrations.
Material and methods. The reported study involved 48 female patients, aged 18–40 years, diagnosed with benign ovarian cysts and qualified for a laparoscopic cystectomy. Prior to surgery, the ovarian reserve was assessed using serum AMH concentration assay. The peritoneal fluid was also collected during the laparoscopy and AMH concentrations in peritoneal fluid were measured.
Results. The AMH present in the peritoneal fluid strongly correlated with AMH levels in blood serum (r = 0.54; p < 0.001) and higher serum AMH concentrations corresponded to higher AMH concentrations in the peritoneal fluid. There was also a significant correlation between AMH levels in serum and in peritoneal fluid, collected from patients with endometrioma and other benign cysts (r = 0.61; p = 0.001 vs r = 0.43; p = 0.03).
Conclusions. The AMH is present in the peritoneal fluid and its concentrations significantly correlate with AMH levels in serum. The assessment of AMH concentration in the peritoneal fluid may be a valuable comple-ment to the evaluation of ovarian reserve and the diagnosis of infertility after adnexal surgery.
Key words: anti-Müllerian hormone, peritoneal fluid, ovarian reserve, endometrioma, fertility
Original papers
Is serum anti-Müllerian hormone (AMH) assay a satisfactory measure for ovarian reserve estimation? A comparison of serum and peritoneal fluid AMH levels
Marta Kostrzewa1,A–E, Ewa Głowacka2,B,C, Tomasz Stetkiewicz1,C,E,F, Mariusz Grzesiak3,C,E, Krzysztof Szyłło1,E,F, Grzegorz Stachowiak1,A,E,F, Jacek Radosław Wilczyński4,A,E,F
1 Department of Operative Gynecology and Gynecologic Oncology, Polish Mother’s Memorial Hospital Research Institute, Łódź, Poland2 Laboratory Diagnostics Center, Polish Mother’s Memorial Hospital Research Institute, Łódź, Poland3 Department of Perinatology, Obstetrics and Gynecology, Polish Mother’s Memorial Hospital Research Institute, Łódź, Poland4 Department of Gynecological Surgery and Oncology, Medical University of Lodz, Poland
A – research concept and design; B – collection and/or assembly of data; C – data analysis and interpretation; D – writing the article; E – critical revision of the article; F – final approval of the article
Advances in Clinical and Experimental Medicine, ISSN 1899–5276 (print), ISSN 2451–2680 (online) Adv Clin Exp Med. 2020;29(7):853–856
M. Kostrzewa et al. Anti-Müllerian hormone in peritoneal fluid854
Introduction
The anti-Müllerian Hormone (AMH) is produced in granulosa cells and its highest concentration is present in the granulosa cells of the secondary, preantral and small antral follicles.1 It exerts an inhibitory effect on primordial follicle recruitment and may also inhibit, through its para-crine action, the follicle-stimulating, hormone-dependent selection of follicles for dominance.2 It is secreted into the blood, which makes it possible to measure it in blood serum. The AMH concentration in serum reflects the pool of ovarian follicles, while a reduced amount of antral fol-licles may result in a decreased serum AMH level. That is why AMH concentration in serum seems to be a reliable marker in the evaluation of ovarian reserve.1–3
According to the opinions of both the American Society for Reproductive Medicine and the American College of Obstetricians and Gynecologists, no test of ovar-ian reserve is likely to be precise enough for an accurate evaluation of the chances for spontaneous conception. On the other hand, there is a prevailing opinion that AMH and the antral follicle count (AFC) are promising predic-tive markers, especially in the cases of poor ovarian reserve (POR), which corresponds to women in the reproductive age and with regular menses whose response to ovarian stimulation or fecundity is reduced compared to other women in a comparable age.3–6 The studies revealed that AMH concentrations between 0.2 ng/mL and 0.7 ng/mL had been highly sensitive (40–97%) and specific (78–92%) to discriminate a diminished ovarian reserve (<3 follicles or 2–4 retrieved oocytes) or a poor response to gonado-trophin stimulation in a population of women qualified to in vitro fertilization (IVF); however, those cut-points were neither sensitive nor specific enough to precisely predict the chances for pregnancy.3,7,8 The average AMH levels, which corresponded to normal ovarian reserve, ranged between 2.5 ng/mL and 2.7 ng/mL. Regarding those values, the AMH test demonstrated sensitivity and speci-ficity to clinical pregnancy with 83% and 82% accuracy, respectively, with the positive predictive value of 67–77%, and the negative predictive value of 61–87%, respectively.9
As we can see, measuring serum AMH concentrations to estimate chances for clinical pregnancy at very low or even hardly detectable values does not always validate the actual status. There have been a few clinical cases of women who responded to gonadotrophin stimulation or got pregnant, regardless of very low AMH concentra-tions – below 1.1 ng/mL.3
Those findings prompted the question of whether se-rum AMH concentrations accurately reflect the amount of AMH secreted by granulosa cells, thereby corresponding to the woman’s reproductive potential. In order to answer this question and assuming that ovarian follicles release their contents (including AMH) into the peritoneal cavity, a comparison juxtaposing AMH concentration levels in se-rum with those in the peritoneal fluid seemed necessary.
The aim of the study was to determine the presence of AMH in the peritoneal fluid and compare its concen-tration with that of blood serum.
Material and methods
The study was carried out at the Department of Opera-tive Gynecology and Gynecological Oncology at the Pol-ish Mother’s Memorial Hospital Research Institute, Łódź, Poland, during the years 2014–2016. Peritoneal f luid samples were collected from female patients at the age of 18–40 years to assess AMH concentration levels. All those patients were qualified for a laparoscopic cystectomy for benign unilateral ovarian cysts. The exclusion criteria eliminated women at the age below 18 or above 40.
During laparoscopy, when a camera and 2 trocars were inserted, a volume of 5 mL of peritoneal fluid was aspi-rated from the Douglas cavity. The fluid samples were collected before the onset of cystectomy procedure and the cyst sac opening, to avoid contamination with either blood or cyst secretions. Prior to the operation, each pa-tient provided 5 mL of blood for serum AMH concentra-tion assay. The collected peritoneal fluid was centrifuged and serum was separated from the whole blood, trans-ferred to sterile polypropylene tubes and stored at −20°C until assay. Serum AMH concentrations were measured using a Beckman Coulter Gen II enzyme immunoassay kit (Beckman Coulter Poland, Warszawa, Poland; www.beckman.com), according to its manufacturer’s instruc-tions. A total of 48 patients were recruited, out of whom 24 were diagnosed with endometrioma and 24 with ovarian cysts other than endometrioma.
The study was approved by the Ethics Committee of the Medical University of Lodz, Poland, and informed consent forms were obtained from all the included patients.
Statistical analysis
All the data was analyzed using STATISTICA v. 12 software package (StatSoft, Inc., Tulsa, USA). The Mann–Whitney U test was applied instead of Student’s t test, when variables did not pass the normality test. Spearman’s correlation coefficient and the simple regression test were used to reveal relations among variables. P-value <0.05 was considered statistically significant.
Results
Table 1 presents clinical characteristics of the recruit-ed patients, including their obstetric and gynecological history, histopathological evaluation of operated cysts and the clinical stage of endometriosis observed during laparoscopy. The mean age of the recruited patients was 30.3 ±5.2 years.
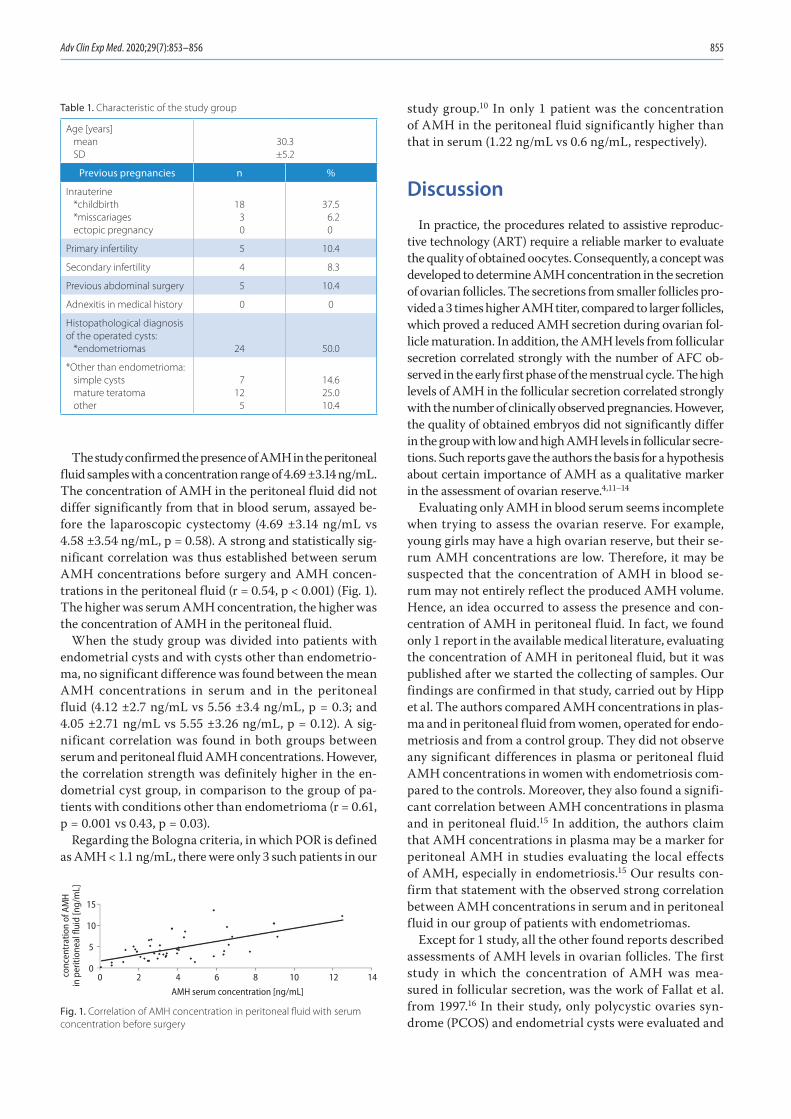
Adv Clin Exp Med. 2020;29(7):853–856 855
The study confirmed the presence of AMH in the peritoneal fluid samples with a concentration range of 4.69 ±3.14 ng/mL. The concentration of AMH in the peritoneal fluid did not differ significantly from that in blood serum, assayed be-fore the laparoscopic cystectomy (4.69 ±3.14 ng/mL vs 4.58 ±3.54 ng/mL, p = 0.58). A strong and statistically sig-nificant correlation was thus established between serum AMH concentrations before surgery and AMH concen-trations in the peritoneal fluid (r = 0.54, p < 0.001) (Fig. 1). The higher was serum AMH concentration, the higher was the concentration of AMH in the peritoneal fluid.
When the study group was divided into patients with endometrial cysts and with cysts other than endometrio-ma, no significant difference was found between the mean AMH concentrations in serum and in the peritoneal fluid (4.12 ±2.7 ng/mL vs 5.56 ±3.4 ng/mL, p = 0.3; and 4.05 ±2.71 ng/mL vs 5.55 ±3.26 ng/mL, p = 0.12). A sig-nificant correlation was found in both groups between serum and peritoneal fluid AMH concentrations. However, the correlation strength was definitely higher in the en-dometrial cyst group, in comparison to the group of pa-tients with conditions other than endometrioma (r = 0.61, p = 0.001 vs 0.43, p = 0.03).
Regarding the Bologna criteria, in which POR is defined as AMH < 1.1 ng/mL, there were only 3 such patients in our
study group.10 In only 1 patient was the concentration of AMH in the peritoneal fluid significantly higher than that in serum (1.22 ng/mL vs 0.6 ng/mL, respectively).
Discussion
In practice, the procedures related to assistive reproduc-tive technology (ART) require a reliable marker to evaluate the quality of obtained oocytes. Consequently, a concept was developed to determine AMH concentration in the secretion of ovarian follicles. The secretions from smaller follicles pro-vided a 3 times higher AMH titer, compared to larger follicles, which proved a reduced AMH secretion during ovarian fol-licle maturation. In addition, the AMH levels from follicular secretion correlated strongly with the number of AFC ob-served in the early first phase of the menstrual cycle. The high levels of AMH in the follicular secretion correlated strongly with the number of clinically observed pregnancies. However, the quality of obtained embryos did not significantly differ in the group with low and high AMH levels in follicular secre-tions. Such reports gave the authors the basis for a hypothesis about certain importance of AMH as a qualitative marker in the assessment of ovarian reserve.4,11–14
Evaluating only AMH in blood serum seems incomplete when trying to assess the ovarian reserve. For example, young girls may have a high ovarian reserve, but their se-rum AMH concentrations are low. Therefore, it may be suspected that the concentration of AMH in blood se-rum may not entirely reflect the produced AMH volume. Hence, an idea occurred to assess the presence and con-centration of AMH in peritoneal fluid. In fact, we found only 1 report in the available medical literature, evaluating the concentration of AMH in peritoneal fluid, but it was published after we started the collecting of samples. Our findings are confirmed in that study, carried out by Hipp et al. The authors compared AMH concentrations in plas-ma and in peritoneal fluid from women, operated for endo-metriosis and from a control group. They did not observe any significant differences in plasma or peritoneal fluid AMH concentrations in women with endometriosis com-pared to the controls. Moreover, they also found a signifi-cant correlation between AMH concentrations in plasma and in peritoneal fluid.15 In addition, the authors claim that AMH concentrations in plasma may be a marker for peritoneal AMH in studies evaluating the local effects of AMH, especially in endometriosis.15 Our results con-firm that statement with the observed strong correlation between AMH concentrations in serum and in peritoneal fluid in our group of patients with endometriomas.
Except for 1 study, all the other found reports described assessments of AMH levels in ovarian follicles. The first study in which the concentration of AMH was mea-sured in follicular secretion, was the work of Fallat et al. from 1997.16 In their study, only polycystic ovaries syn-drome (PCOS) and endometrial cysts were evaluated and
Table 1. Characteristic of the study group
Age [years]meanSD
30.3±5.2
Previous pregnancies n %
Inrauterine*childbirth*misscariagesectopic pregnancy
18 3 0
37.5 6.2
0
Primary infertility 5 10.4
Secondary infertility 4 8.3
Previous abdominal surgery 5 10.4
Adnexitis in medical history 0 0
Histopathological diagnosis of the operated cysts:
*endometriomas 24 50.0
*Other than endometrioma:simple cystsmature teratomaother
712 5
14.625.010.4
Fig. 1. Correlation of AMH concentration in peritoneal fluid with serum concentration before surgery
AMH serum concentration [ng/mL]
0conc
entr
atio
n of
AM
Hin
per
ition
eal f
luid
[ng/
mL]
15
10
5
02 4 6 8 10 12 14
M. Kostrzewa et al. Anti-Müllerian hormone in peritoneal fluid856
a higher concentration of AMH in the follicular secretion in women with PCOS was found, compared to women with endometrial cysts. The authors did not, however, compare the concentrations of AMH in follicles and in blood serum.
Currently, a report can be found in which AMH was assayed in secretion from the ovarian follicles during quali-fication for ART.4,11–13 As mentioned above, those studies showed a decrease in AMH secretion during ovarian fol-licular maturation and a strong correlation of AMH con-centration with the number of antral follicles in the early first phase of the menstrual cycle.4,11–13 However, the fol-licular secretion of AMH was not compared either with AMH concentration in serum or peritoneal fluid.
The results of our study did not show any significant difference between AMH concentrations in serum and in the peritoneal fluid. On the other hand, a strong and sta-tistically significant correlation was found between serum AMH concentration before surgery and the concentration of AMH in peritoneal fluid. The higher was the concen-tration of AMH in the peritoneal fluid, the higher was the concentration of AMH in blood serum. These results prove that the amount of AMH secreted to peritoneal flu-id corresponds to AMH concentration in serum, which means that serum AMH concentration correctly reflects the secretion of AMH by granulosa cells and, therefore, the ovarian reserve.
Our results also suggest that our patient, whose AMH concentration levels in peritoneal fluid significantly dif-fered from those in serum AMH concentration before sur-gery, may have had an abnormal secretion of AMH into blood serum. We thus believe that peritoneal fluid collec-tion during laparoscopic cystectomy for AMH assay may be a valuable complement to ovarian reserve evaluation and a fairly reliable prognosis of fertility after surgery, especially in patients with low serum AMH values (<1.1 ng/mL) prior to surgery and in patients with endometriomas, in whom the surgery may potentially diminish the ovarian reserve. However, this hypothesis requires further research.
The weakness of our study was the rather small num-ber of patients with low AMH in whom the difference between serum and peritoneal fluid AMH levels was evident. The strength of the study was the measurement of AMH in peritoneal fluid and its comparative juxtaposi-tion with serum AMH levels in a very homogeneous group of patients.
Conclusions
The AMH is present in the peritoneal fluid and its con-centrations significantly strongly correlate with AMH levels in blood serum. The assay of AMH levels in perito-neal fluid may then be a valuable complement to ovarian reserve evaluation and a valuable marker for the prognosis of infertility after adnexal surgery.
ORCID iDsMarta Kostrzewa https://orcid.org/0000-0001-9078-5814Ewa Głowacka https://orcid.org/0000-0003-1688-6523Tomasz Stetkiewicz https://orcid.org/0000-0002-4477-6340Mariusz Grzesiak https://orcid.org/0000-0002-6900-4347Krzysztof Szyłło https://orcid.org/0000-0001-7198-4957Grzegorz Stachowiak https://orcid.org/0000-0003-0463-3676Jacek Radosław Wilczyński https://orcid.org/0000-0002-2072-6533
References1. Weenen C, Laven JS, von Bergh AR, et al. Anti-Müllerian hormone
expression pattern in the human ovary: Potential implications for ini-tial and cyclic follicle recruitment. Mol Hum Reprod. 2004;10(2):77–83.
2. Themmen AP. Anti-Müllerian hormone: Its role in follicular growth initiation and survival and as an ovarian reserve marker. J Natl Cancer Inst Monogr. 2005;34:18–21.
3. Practice Committee of the American Society for Reproductive Medi-cine. Testing and interpreting measures of ovarian reserve: A Commit-tee opinion. Fertil Steril. 2015;103(3):e9–e17.
4. La Marca A, Giulini S, Tirelli A, et al. Anti-Müllerian hormone mea-surement on any day of the menstrual cycle strongly predicts ovar-ian response in assisted reproductive technology. Hum Reprod. 2007; 22(3):766–777.
5. American College of Obstetricians and Gynecologists (ACOG). Com-mittee opinion: Ovarian reserve testing. Fertil Steril. 2015;103(3):9–17.
6. Bancsi LF, Broekmans FJ, Eijkemans MJ, de Jong FH, Habbema JD, te Velde ER. Predictors of poor ovarian response in in vitro fertilization: A prospective study comparing basal markers of ovarian reserve. Fertil Steril. 2002;77(2):328–336.
7. Gnoth C, Schuring AN, Friol K, Tigges J, Mallmann P, Godehardt E. Relevance of anti-Müllerian hormone measurement in a routine IVF program. Hum Reprod. 2008;23(6):1359–1365.
8. Penarrubia J, Fabregues F, Manau D, et al. Basal and stimulation day 5 anti-Müllerian hormone serum concentrations as predictors of ovar-ian response and pregnancy in assisted reproductive technology cycles stimulated with gonadotropin-releasing hormone agonist–gonadotropin treatment. Hum Reprod. 2005;20(4):915–922.
9. Elgindy EA, El-Haieg DO, El-Sebaey A. Anti-Müllerian hormone: Cor-relation of early follicular, ovulatory and midluteal levels with ovar-ian response and cycle outcome in intracytoplasmic sperm injection patients. Fertil Steril. 2007;89(9):1670–1676.
10. Ferraretti AP, La Marca A, Fauser BC, Tarlatzis B, Nargund G, Gianaroli L. ESHRE consensus on the definition of “poor response” to ovarian stimulation for in vitro fertilization: The Bologna criteria. Hum Reprod. 2011;26(7):1616–1624.
11. Fanchin R, Louafi N, Mendez Lozano DH, Frydman N, Frydman R, Taieb J. Per-follicle measurements indicate that anti-Müllerian hor-mone secretion is modulated by the extent of follicular development and luteinization and may reflect qualitatively the ovarian follicular status. Fertil Steril. 2005;84(1):167–173.
12. Fanchin R, Taieb J, Lozano DH, Ducot B, Frydman R, Bouyer J. High reproducibility of serum anti-Müllerian hormone measurements suggests a multi-staged follicular secretion and strengthens its role in the assessment of ovarian follicular status. Hum Reprod. 2005;20(4): 923–927.
13. Fanchin R, Mendez Lozano DH, Frydman N, et al. Anti-Müllerian hormone concentrations in the follicular fluid of the pre-ovulatory follicle are predictive of the implantation potential of the ensuing embryo obtained by in vitro fertilization. J Clin Endocrinol Metab. 2007;92(5):1796–1802.
14. Lekamge DN, Barry M, Kolo M, Lane M, Gilchrist RB, Tremellen KP. Anti-Müllerian hormone as a predictor of IVF outcome. Reprod Biomed Online. 2007;14(5):602–610.
15. Hipp H, Loucks TL, Nezhat C, Sidell N, Session DR. Anti-Müllerian hor-mone in peritoneal fluid and plasma from women with and without endometriosis. Reprod Sci. 2015;22(9):1129–1133.
16. Fallat ME, Siow Y, Marra M, Cook C, Carrillo C. Müllerian-inhibiting substance in follicular fluid and serum: A comparison of patients with tubal factor infertility, polycystic ovary syndrome, and endometriosis. Fertil Steril. 1997;67(5):962–965.
Cite asJuszczak K, Gastecka A, Adamowicz J, Adamczyk P, Pokrywczyńska M, Drewa T. Health-related quality of life is not related to laparoscopic or robotic technique in radical cystectomy. Adv Clin Exp Med. 2020;29(7):857–863. doi:10.17219/acem/121937
DOI10.17219/acem/121937
CopyrightCopyright by Author(s) This is an article distributed under the terms of theCreative Commons Attribution 3.0 Unported (CC BY 3.0)(https://creativecommons.org/licenses/by/3.0/)
Address for correspondenceAgata GasteckaE-mail: [email protected]
Funding sourcesThe work was partly financed by the National Centre for Research and Development under the STRATEGMED I program “Prevention and Treatment of Lifestyle Diseases” project entitled “Innovative urine draining prothesis for patients with urinary bladder cancer treated with minimum invasive urinary bladder oncological surgeries” (STRATEGMED1/235368/8/NCBR/2014 (Smart AUCI)).
Conflict of interestNone declared
AcknowledgementsThe authors would like to thank the National Centre for Research and Development for their support.
* Kajetan Juszczak and Agata Gastecka contributed equally to this work.
Received on March 30, 2020Reviewed on April 15, 2020Accepted on May 1, 2020
Published online on July 28, 2020
AbstractBackground. Evaluating health-related quality of life (HR-QoL) is important in urological oncology.
Objectives. To evaluate the impact of minimally invasive radical cystectomy (RC) on the patients’ QoL depending on the surgical strategy (laparoscopic compared to robotic).
Material and methods. The study involved 110 patients divided into 2 groups: group 1 (n = 65), quali-fied for robotic-assisted RC (RARC), and group 2 (n = 45), qualified for laparoscopic RC (LRC). A prospective analysis of QoL was performed. In the study, we used sociodemographic data taken from the patients’ medical records, and data from standardized questionnaires of QoL surveys entitled Functional Assessment of Cancer Therapy – General (FACT-G) and Functional Assessment of Cancer Therapy for Bladder Cancer (FACT-Bl).
Results. In the patients who had undergone LRC, a statistically significant difference in HR-QoL was noted only for the subjective well-being (SWB) domain regarding family and social life: The patients had higher SWB values before surgery than after it. In the patients who had undergone RARC, statistically significant differences in HR-QoL were noted in 3 domains: 1) SWB – family and social life, 2) FACT-Bl assessment and 3) FACT-G assessment. Both before and after surgery, no statistically significant differences were found between the 2 groups for any of the HR-QoL domains.
Conclusions. The surgical technique of minimally invasive endoscopic RC used (laparoscopic or robotic) does not affect HR-QoL domains.
Key words: radical cystectomy, quality of life, urinary diversion, laparoscopic, robotic-assisted
Original papers
Health-related quality of life is not related to laparoscopic or robotic technique in radical cystectomy
*Kajetan Juszczak1,A,C–F, *Agata Gastecka1,A–D, Jan Adamowicz1,B–D, Przemysław Adamczyk2,B–D, Marta Pokrywczyńska3,E,F, Tomasz Drewa1,2,E,F
1 Department of General and Oncologic Urology, Collegium Medicum, Nicolaus Copernicus University, Bydgoszcz, Poland2 Department of General and Oncological Urology, Nicolaus Copernicus Hospital, Toruń, Poland3 Department of Regenerative Medicine Cell and Tissue Bank, Department of Urology, Collegium Medicum, Nicolaus Copernicus University, Bydgoszcz, Poland
A – research concept and design; B – collection and/or assembly of data; C – data analysis and interpretation; D – writing the article; E – critical revision of the article; F – final approval of the article
Advances in Clinical and Experimental Medicine, ISSN 1899–5276 (print), ISSN 2451–2680 (online) Adv Clin Exp Med. 2020;29(7):857–863
K. Juszczak et al. HR-QoL is not related to RC technique858
Introduction
In modern urological oncology, more and more emphasis is being placed nowadays on evaluating patients’ health-related quality of life (HR-QoL). In general, the research largely focuses on patients with urinary bladder cancer who have been qualified for radical cystectomy (RC).1,2 The RC is the standard treatment for localized muscle-invasive bladder cancer. An integral part of RC is the cre-ation of a urinary diversion after the cystectomy. Currently, 2 types of urinary diversion are commonly used: abdomi-nal diversion (ureterocutaneostomy or ileal conduit) and urethral diversion (orthotopic bladder substitution).3 Uri-nary diversion rather than urinary bladder removal seems to have a significant impact on the patients’ QoL, necessitat-ing lifestyle changes and often causing stress to the patient.
The ultimate goal of HR-QoL assessment is to examine the impact of the type of treatment on the patient’s health, taking into account their physical and emotional condition as well as social and functional domains. There are several instruments for HR-QoL assessment in patients with uri-nary bladder cancer. These tools are characterized by dif-ferent development and validation phases and different contexts of use, depending on the depth of tumor infiltra-tion, the applied therapeutic method or the urinary diver-sion technique after RC. Initial assessments of HR-QoL use basic tools designed to assess the overall QoL in patients with cancer: the European Organization for the Research and Treatment of Cancer Quality of Life Questionnaire (EORTC QLQ-C30) and the Functional Assessment of Cancer Therapy – General (FACT-G) questionnaire.4,5
The aim of the current study was to evaluate the impact of minimally invasive RC on the HR-QoL of patients de-pending on the surgical strategy used: laparoscopic com-pared to robotic.
Material and methods
Study groups
Out of 156 consecutive patients with muscle-invasive uri-nary bladder cancer, 110 were included in the study. The pa-tients were divided into 2 groups according to the mini-mally invasive surgical technique used during RC. Group 1 consisted of 65 patients qualified for robotic-assisted RC (RARC); group 2 encompassed 45 patients qualified for lap-aroscopic RC (LRC). In each of the main groups, the patients were divided into subgroups depending on whether or not they had postoperative complications during their planned hospitalization. The division of the patients into these sub-groups was based on the Clavien–Dindo classification.
The study was approved by the Ethics Committee of the Collegium Medicum, Nicolaus Copernicus Uni-versity (Bydgoszcz, Poland; approval No. 60/2016 dated January 26, 2016, and the annex dated March 21, 2017).
Inclusion and exclusion criteria
The inclusion criteria for the study were: 1) urinary blad-der cancer qualified for RC; and 2) voluntary informed written consent to participate in the study. The exclusion criteria were: 1) RC due to neuromuscular urinary bladder dysfunction, prostate cancer or a primary tumor of an or-gan other than the urinary bladder; 2) changing the op-erating technique from LRC or RARC to open surgery, 3) senile dementia and/or the presence of a mental illness preventing an informed and voluntary decision regarding participation in the study; 4) confirmed homelessness; and 5) refusal to participate in the study for subjective reasons.
On the basis of the exclusion criteria, 46 patients out of 156 were not enrolled in the study, including 20 who underwent LRC and 26 who underwent RARC. Twelve patients from the LRC group did not agree to participate in the study, and the remaining 8 patients did not meet the inclusion criteria. In the non-included RARC group, 13 refused to participate and 13 were excluded.
HR-QoL assessment
A prospective analysis of QoL of the patients qualified for RC was performed. In order to find out the QoL of patients undergoing RC, depending on the surgical technique used and long-term complications noted, the diagnostic survey method was used. In the study, we used sociodemographic data taken from medical records of patients and data from standardized questionnaires of QoL surveys: FACT-G, used to assess the physical condition, family and social life, emo-tional state and functioning in everyday life in patients with any type of cancer, and the Functional Assessment of Can-cer Therapy – Bladder (FACT-Bl) to assess complaints and treatment related directly to urinary bladder cancer.
The FACT-Bl is a reliable, approved and flexible ques-tionnaire used in many types and stages of urinary bladder cancer treatment developed by the Functional Assessment of Chronic Illness Therapy (FACIT) group.6 It differs from EORTC instruments in that it has been validated and de-signed to compare HR-QoL between patients with muscle-invasive bladder cancer (MIBC) and those with non-mus-cle-invasive bladder cancer (NMIBC). The form consists of 27 questions from the general version of the FACT-G ques-tionnaire, divided into 4 domains − physical, social/family, emotional, and functional − accompanied by 12 questions specific to urinary bladder cancer. These questions relate to urine function, bowel function, sexual function, body image, appetite and stoma care, and are rated on a scale of 0 to 4. The bladder-specific answers are added together and added to the FACT-G result. A high number of points indicates better HR-QoL. All the questions in the survey relate to the patient’s HR-QoL over the previous week.
On the basis of the FACT-G form, a questionnaire en-titled Functional Assessment of Cancer Therapy – Bladder Cystectomy (FACT-Bl) formerly known as the Venderbilt
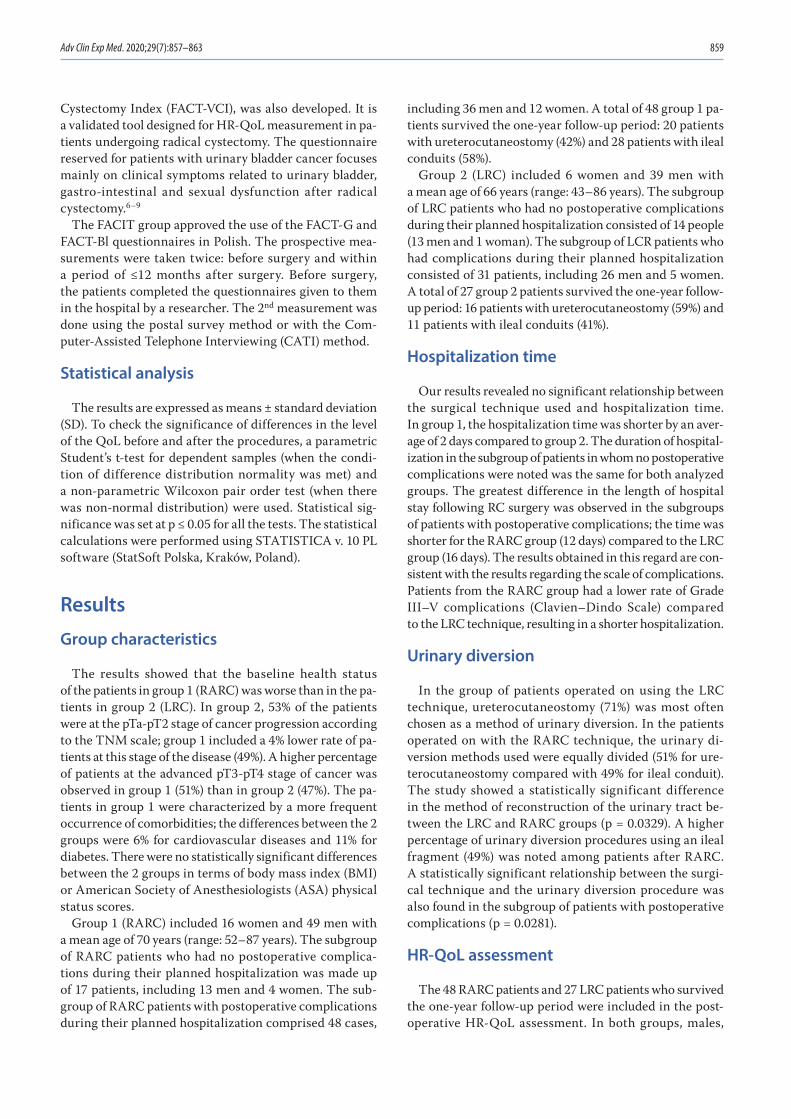
Adv Clin Exp Med. 2020;29(7):857–863 859
Cystectomy Index (FACT-VCI), was also developed. It is a validated tool designed for HR-QoL measurement in pa-tients undergoing radical cystectomy. The questionnaire reserved for patients with urinary bladder cancer focuses mainly on clinical symptoms related to urinary bladder, gastro-intestinal and sexual dysfunction after radical cys tectomy.6–9
The FACIT group approved the use of the FACT-G and FACT-Bl questionnaires in Polish. The prospective mea-surements were taken twice: before surgery and within a period of ≤12 months after surgery. Before surgery, the patients completed the questionnaires given to them in the hospital by a researcher. The 2nd measurement was done using the postal survey method or with the Com-puter-Assisted Telephone Interviewing (CATI) method.
Statistical analysis
The results are expressed as means ± standard deviation (SD). To check the significance of differences in the level of the QoL before and after the procedures, a parametric Student’s t-test for dependent samples (when the condi-tion of difference distribution normality was met) and a non-parametric Wilcoxon pair order test (when there was non-normal distribution) were used. Statistical sig-nificance was set at p ≤ 0.05 for all the tests. The statistical calculations were performed using STATISTICA v. 10 PL software (StatSoft Polska, Kraków, Poland).
Results
Group characteristics
The results showed that the baseline health status of the patients in group 1 (RARC) was worse than in the pa-tients in group 2 (LRC). In group 2, 53% of the patients were at the pTa-pT2 stage of cancer progression according to the TNM scale; group 1 included a 4% lower rate of pa-tients at this stage of the disease (49%). A higher percentage of patients at the advanced pT3-pT4 stage of cancer was observed in group 1 (51%) than in group 2 (47%). The pa-tients in group 1 were characterized by a more frequent occurrence of comorbidities; the differences between the 2 groups were 6% for cardiovascular diseases and 11% for diabetes. There were no statistically significant differences between the 2 groups in terms of body mass index (BMI) or American Society of Anesthesiologists (ASA) physical status scores.
Group 1 (RARC) included 16 women and 49 men with a mean age of 70 years (range: 52–87 years). The subgroup of RARC patients who had no postoperative complica-tions during their planned hospitalization was made up of 17 patients, including 13 men and 4 women. The sub-group of RARC patients with postoperative complications during their planned hospitalization comprised 48 cases,
including 36 men and 12 women. A total of 48 group 1 pa-tients survived the one-year follow-up period: 20 patients with ureterocutaneostomy (42%) and 28 patients with ileal conduits (58%).
Group 2 (LRC) included 6 women and 39 men with a mean age of 66 years (range: 43–86 years). The subgroup of LRC patients who had no postoperative complications during their planned hospitalization consisted of 14 people (13 men and 1 woman). The subgroup of LCR patients who had complications during their planned hospitalization consisted of 31 patients, including 26 men and 5 women. A total of 27 group 2 patients survived the one-year follow-up period: 16 patients with ureterocutaneostomy (59%) and 11 patients with ileal conduits (41%).
Hospitalization time
Our results revealed no significant relationship between the surgical technique used and hospitalization time. In group 1, the hospitalization time was shorter by an aver-age of 2 days compared to group 2. The duration of hospital-ization in the subgroup of patients in whom no postoperative complications were noted was the same for both analyzed groups. The greatest difference in the length of hospital stay following RC surgery was observed in the subgroups of patients with postoperative complications; the time was shorter for the RARC group (12 days) compared to the LRC group (16 days). The results obtained in this regard are con-sistent with the results regarding the scale of complications. Patients from the RARC group had a lower rate of Grade III–V complications (Clavien–Dindo Scale) compared to the LRC technique, resulting in a shorter hospitalization.
Urinary diversion
In the group of patients operated on using the LRC technique, ureterocutaneostomy (71%) was most often chosen as a method of urinary diversion. In the patients operated on with the RARC technique, the urinary di-version methods used were equally divided (51% for ure-terocutaneostomy compared with 49% for ileal conduit). The study showed a statistically significant difference in the method of reconstruction of the urinary tract be-tween the LRC and RARC groups (p = 0.0329). A higher percentage of urinary diversion procedures using an ileal fragment (49%) was noted among patients after RARC. A statistically significant relationship between the surgi-cal technique and the urinary diversion procedure was also found in the subgroup of patients with postoperative complications (p = 0.0281).
HR-QoL assessment
The 48 RARC patients and 27 LRC patients who survived the one-year follow-up period were included in the post-operative HR-QoL assessment. In both groups, males,
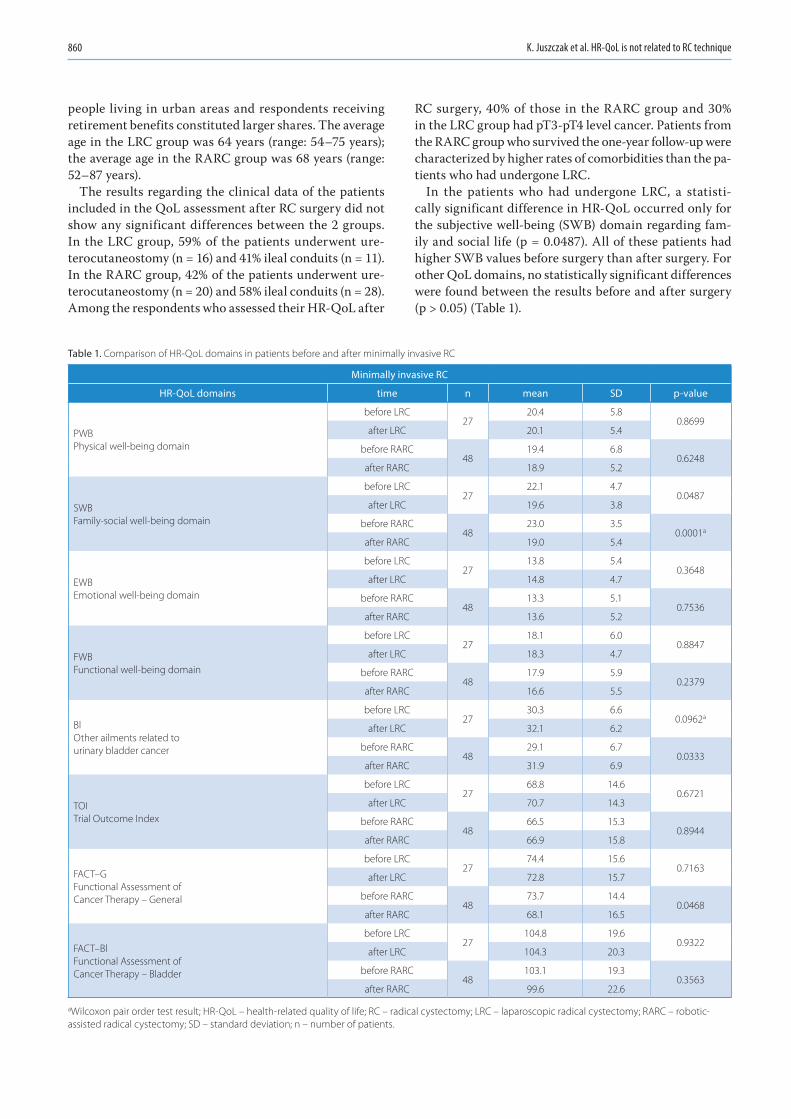
K. Juszczak et al. HR-QoL is not related to RC technique860
people living in urban areas and respondents receiving retirement benefits constituted larger shares. The average age in the LRC group was 64 years (range: 54–75 years); the average age in the RARC group was 68 years (range: 52–87 years).
The results regarding the clinical data of the patients included in the QoL assessment after RC surgery did not show any significant differences between the 2 groups. In the LRC group, 59% of the patients underwent ure-terocutaneostomy (n = 16) and 41% ileal conduits (n = 11). In the RARC group, 42% of the patients underwent ure-terocutaneostomy (n = 20) and 58% ileal conduits (n = 28). Among the respondents who assessed their HR-QoL after
RC surgery, 40% of those in the RARC group and 30% in the LRC group had pT3-pT4 level cancer. Patients from the RARC group who survived the one-year follow-up were characterized by higher rates of comorbidities than the pa-tients who had undergone LRC.
In the patients who had undergone LRC, a statisti-cally significant difference in HR-QoL occurred only for the subjective well-being (SWB) domain regarding fam-ily and social life (p = 0.0487). All of these patients had higher SWB values before surgery than after surgery. For other QoL domains, no statistically significant differences were found between the results before and after surgery (p > 0.05) (Table 1).
Table 1. Comparison of HR-QoL domains in patients before and after minimally invasive RC
Minimally invasive RC
HR-QoL domains time n mean SD p-value
PWBPhysical well-being domain
before LRC27
20.4 5.80.8699
after LRC 20.1 5.4
before RARC48
19.4 6.80.6248
after RARC 18.9 5.2
SWBFamily-social well-being domain
before LRC27
22.1 4.70.0487
after LRC 19.6 3.8
before RARC48
23.0 3.50.0001a
after RARC 19.0 5.4
EWBEmotional well-being domain
before LRC27
13.8 5.40.3648
after LRC 14.8 4.7
before RARC48
13.3 5.10.7536
after RARC 13.6 5.2
FWBFunctional well-being domain
before LRC27
18.1 6.00.8847
after LRC 18.3 4.7
before RARC48
17.9 5.90.2379
after RARC 16.6 5.5
BlOther ailments related tourinary bladder cancer
before LRC27
30.3 6.60.0962a
after LRC 32.1 6.2
before RARC48
29.1 6.70.0333
after RARC 31.9 6.9
TOITrial Outcome Index
before LRC27
68.8 14.60.6721
after LRC 70.7 14.3
before RARC48
66.5 15.30.8944
after RARC 66.9 15.8
FACT–GFunctional Assessment of Cancer Therapy – General
before LRC27
74.4 15.60.7163
after LRC 72.8 15.7
before RARC48
73.7 14.40.0468
after RARC 68.1 16.5
FACT–BlFunctional Assessment of Cancer Therapy – Bladder
before LRC27
104.8 19.60.9322
after LRC 104.3 20.3
before RARC48
103.1 19.30.3563
after RARC 99.6 22.6
aWilcoxon pair order test result; HR-QoL – health-related quality of life; RC – radical cystectomy; LRC – laparoscopic radical cystectomy; RARC – robotic-assisted radical cystectomy; SD – standard deviation; n – number of patients.
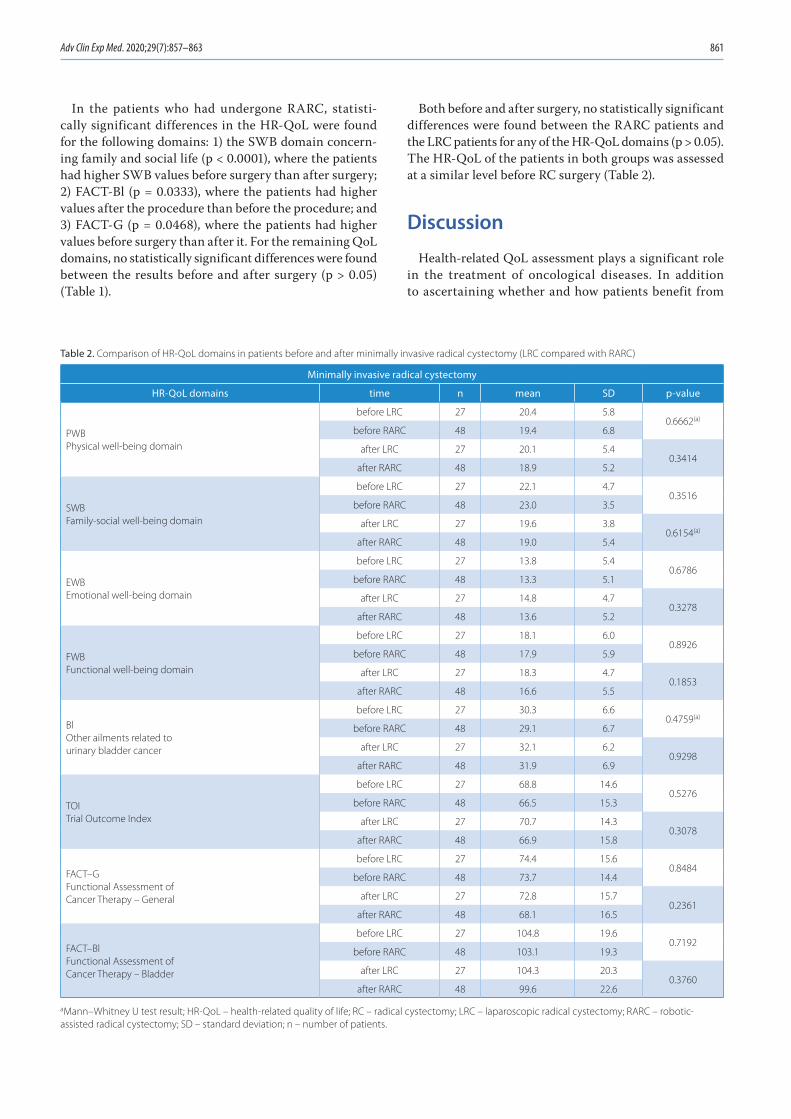
Adv Clin Exp Med. 2020;29(7):857–863 861
In the patients who had undergone RARC, statisti-cally significant differences in the HR-QoL were found for the following domains: 1) the SWB domain concern-ing family and social life (p < 0.0001), where the patients had higher SWB values before surgery than after surgery; 2) FACT-Bl (p = 0.0333), where the patients had higher values after the procedure than before the procedure; and 3) FACT-G (p = 0.0468), where the patients had higher values before surgery than after it. For the remaining QoL domains, no statistically significant differences were found between the results before and after surgery (p > 0.05) (Table 1).
Both before and after surgery, no statistically significant differences were found between the RARC patients and the LRC patients for any of the HR-QoL domains (p > 0.05). The HR-QoL of the patients in both groups was assessed at a similar level before RC surgery (Table 2).
Discussion
Health-related QoL assessment plays a significant role in the treatment of oncological diseases. In addition to ascertaining whether and how patients benefit from
Table 2. Comparison of HR-QoL domains in patients before and after minimally invasive radical cystectomy (LRC compared with RARC)
Minimally invasive radical cystectomy
HR-QoL domains time n mean SD p-value
PWBPhysical well-being domain
before LRC 27 20.4 5.80.6662(a)
before RARC 48 19.4 6.8
after LRC 27 20.1 5.40.3414
after RARC 48 18.9 5.2
SWBFamily-social well-being domain
before LRC 27 22.1 4.70.3516
before RARC 48 23.0 3.5
after LRC 27 19.6 3.80.6154(a)
after RARC 48 19.0 5.4
EWBEmotional well-being domain
before LRC 27 13.8 5.40.6786
before RARC 48 13.3 5.1
after LRC 27 14.8 4.70.3278
after RARC 48 13.6 5.2
FWBFunctional well-being domain
before LRC 27 18.1 6.00.8926
before RARC 48 17.9 5.9
after LRC 27 18.3 4.70.1853
after RARC 48 16.6 5.5
BlOther ailments related tourinary bladder cancer
before LRC 27 30.3 6.60.4759(a)
before RARC 48 29.1 6.7
after LRC 27 32.1 6.20.9298
after RARC 48 31.9 6.9
TOITrial Outcome Index
before LRC 27 68.8 14.60.5276
before RARC 48 66.5 15.3
after LRC 27 70.7 14.30.3078
after RARC 48 66.9 15.8
FACT–GFunctional Assessment of Cancer Therapy – General
before LRC 27 74.4 15.60.8484
before RARC 48 73.7 14.4
after LRC 27 72.8 15.70.2361
after RARC 48 68.1 16.5
FACT–BlFunctional Assessment of Cancer Therapy – Bladder
before LRC 27 104.8 19.60.7192
before RARC 48 103.1 19.3
after LRC 27 104.3 20.30.3760
after RARC 48 99.6 22.6
aMann–Whitney U test result; HR-QoL – health-related quality of life; RC – radical cystectomy; LRC – laparoscopic radical cystectomy; RARC – robotic-assisted radical cystectomy; SD – standard deviation; n – number of patients.
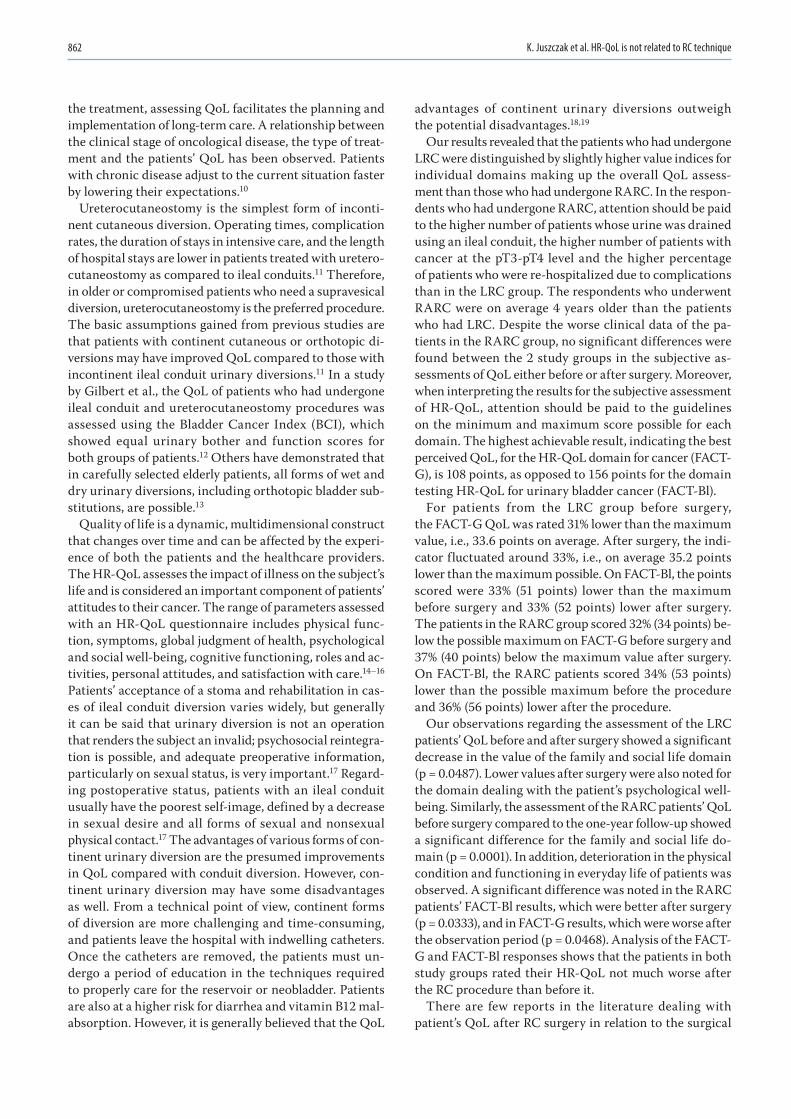
K. Juszczak et al. HR-QoL is not related to RC technique862
the treatment, assessing QoL facilitates the planning and implementation of long-term care. A relationship between the clinical stage of oncological disease, the type of treat-ment and the patients’ QoL has been observed. Patients with chronic disease adjust to the current situation faster by lowering their expectations.10
Ureterocutaneostomy is the simplest form of inconti-nent cutaneous diversion. Operating times, complication rates, the duration of stays in intensive care, and the length of hospital stays are lower in patients treated with uretero-cutaneostomy as compared to ileal conduits.11 Therefore, in older or compromised patients who need a supravesical diversion, ureterocutaneostomy is the preferred procedure. The basic assumptions gained from previous studies are that patients with continent cutaneous or orthotopic di-versions may have improved QoL compared to those with incontinent ileal conduit urinary diversions.11 In a study by Gilbert et al., the QoL of patients who had undergone ileal conduit and ureterocutaneostomy procedures was assessed using the Bladder Cancer Index (BCI), which showed equal urinary bother and function scores for both groups of patients.12 Others have demonstrated that in carefully selected elderly patients, all forms of wet and dry urinary diversions, including orthotopic bladder sub-stitutions, are possible.13
Quality of life is a dynamic, multidimensional construct that changes over time and can be affected by the experi-ence of both the patients and the healthcare providers. The HR-QoL assesses the impact of illness on the subject’s life and is considered an important component of patients’ attitudes to their cancer. The range of parameters assessed with an HR-QoL questionnaire includes physical func-tion, symptoms, global judgment of health, psychological and social well-being, cognitive functioning, roles and ac-tivities, personal attitudes, and satisfaction with care.14–16 Patients’ acceptance of a stoma and rehabilitation in cas-es of ileal conduit diversion varies widely, but generally it can be said that urinary diversion is not an operation that renders the subject an invalid; psychosocial reintegra-tion is possible, and adequate preoperative information, particularly on sexual status, is very important.17 Regard-ing postoperative status, patients with an ileal conduit usually have the poorest self-image, defined by a decrease in sexual desire and all forms of sexual and nonsexual physical contact.17 The advantages of various forms of con-tinent urinary diversion are the presumed improvements in QoL compared with conduit diversion. However, con-tinent urinary diversion may have some disadvantages as well. From a technical point of view, continent forms of diversion are more challenging and time-consuming, and patients leave the hospital with indwelling catheters. Once the catheters are removed, the patients must un-dergo a period of education in the techniques required to properly care for the reservoir or neobladder. Patients are also at a higher risk for diarrhea and vitamin B12 mal-absorption. However, it is generally believed that the QoL
advantages of continent urinary diversions outweigh the potential disadvantages.18,19
Our results revealed that the patients who had undergone LRC were distinguished by slightly higher value indices for individual domains making up the overall QoL assess-ment than those who had undergone RARC. In the respon-dents who had undergone RARC, attention should be paid to the higher number of patients whose urine was drained using an ileal conduit, the higher number of patients with cancer at the pT3-pT4 level and the higher percentage of patients who were re-hospitalized due to complications than in the LRC group. The respondents who underwent RARC were on average 4 years older than the patients who had LRC. Despite the worse clinical data of the pa-tients in the RARC group, no significant differences were found between the 2 study groups in the subjective as-sessments of QoL either before or after surgery. Moreover, when interpreting the results for the subjective assessment of HR-QoL, attention should be paid to the guidelines on the minimum and maximum score possible for each domain. The highest achievable result, indicating the best perceived QoL, for the HR-QoL domain for cancer (FACT-G), is 108 points, as opposed to 156 points for the domain testing HR-QoL for urinary bladder cancer (FACT-Bl).
For patients from the LRC group before surgery, the FACT-G QoL was rated 31% lower than the maximum value, i.e., 33.6 points on average. After surgery, the indi-cator fluctuated around 33%, i.e., on average 35.2 points lower than the maximum possible. On FACT-Bl, the points scored were 33% (51 points) lower than the maximum before surgery and 33% (52 points) lower after surgery. The patients in the RARC group scored 32% (34 points) be-low the possible maximum on FACT-G before surgery and 37% (40 points) below the maximum value after surgery. On FACT-Bl, the RARC patients scored 34% (53 points) lower than the possible maximum before the procedure and 36% (56 points) lower after the procedure.
Our observations regarding the assessment of the LRC patients’ QoL before and after surgery showed a significant decrease in the value of the family and social life domain (p = 0.0487). Lower values after surgery were also noted for the domain dealing with the patient’s psychological well-being. Similarly, the assessment of the RARC patients’ QoL before surgery compared to the one-year follow-up showed a significant difference for the family and social life do-main (p = 0.0001). In addition, deterioration in the physical condition and functioning in everyday life of patients was observed. A significant difference was noted in the RARC patients’ FACT-Bl results, which were better after surgery (p = 0.0333), and in FACT-G results, which were worse after the observation period (p = 0.0468). Analysis of the FACT-G and FACT-Bl responses shows that the patients in both study groups rated their HR-QoL not much worse after the RC procedure than before it.
There are few reports in the literature dealing with patient’s QoL after RC surgery in relation to the surgical
Adv Clin Exp Med. 2020;29(7):857–863 863
technique used. Most authors compare assessments of QoL for continent and incontinent urinary diversions. Bochner et al. indicated that there are no significant differences in the QoL of patients who had undergone open RC and those who had had RARC, taking into account follow-up periods of 3 and 6 months.20 Messer et al. reported that HR-QoL returned to the baseline 3 months after RC sur-gery, with no difference between open RC and RARC.21
The one-year follow-up period adopted in our study may have contributed to obtaining slightly better indicators for the QoL domains those mostly regarding emotional states. Assessing QoL a full year after RC surgery could have result-ed in patients accepting their cancer and adapting to their changed body and life conditions. There were decreases in the value of domains concerning physical condition and social life in both groups of patients (LRC and RARC).
The results obtained on FACT-Bl are also notewor-thy: The values noted for patients from both the LRC and RARC groups were higher at the 2nd measurement, although one might expect that the necessity of living with a stoma, sexual dysfunction or scarring would sig-nificantly reduce the score. Positive adaptation to life with a stoma, and thus a better perception of QoL, largely de-pends on the patient’s proficiency in urostomy care.22–24 According to observations reported by Kristensen et al., in order to ensure a sense of self-sufficiency, urostomy care requires manual skill and adaptive in the emotional sphere.25 Providing the patient with relevant information about the stoma and education in its use and care are ex-tremely important elements of the process of improving the patients’ self-sufficiency after surgery and their per-ception of their QoL.26,27 Performing RC procedures using minimally invasive techniques does not negatively affect the patients’ self-image.
Conclusions
The results of our study indicate that the choice of min-imally invasive endoscopic RC used (LRC compared to RARC) does not affect patients’ HR-QoL.
ORCID iDsKajetan Juszczak https://orcid.org/0000-0003-0354-0822Agata Gastecka https://orcid.org/0000-0002-3214-2287Jan Adamowicz https://orcid.org/0000-0003-2479-7133Przemysław Adamczyk https://orcid.org/0000-0002-7217-841XMarta Pokrywczyńska https://orcid.org/0000-0003-3259-087XTomasz Drewa https://orcid.org/0000-0001-5347-4136
References1. Moncrief TJ, Balaji P, Lindgren BB, Weight CJ, Konety BR. Compar-
ative evaluation of bladder-specific Health-Related Quality of Life (HRQOL) instruments for bladder cancer. Urology. 2017;108:76–81.
2. Sosnowski R, Kulpa M, Ziętalewicz U, et al. Basic issues concerning health-related quality of life. Cent European J Urol. 2017;70(2):206–211.
3. Stein JP, Lieskovsky G, Cote R, et al. Radical cystectomy in the treat-ment of invasive bladder cancer: Long-term results in 1,054 patients. J Clin Oncol. 2001;19(3):666–675.
4. Webster K, Cella D, Yost K. The Functional Assessment of Chronic Ill-ness Therapy (FACIT) measurement system: Properties, applications, and interpretation. Health Qual Life Outcomes. 2003;16(1):79.
5. Danna BJ, Metcalfe MJ, Wood EL, Shah JB. Assessing symptom bur-den in bladder cancer: An overview of bladder cancer-specific Health-Related Quality of Life instruments. Bladder Cancer. 2016;2(3):329–340.
6. Degboe A, Ivanescu C, Rohay JM, Turner RR, Cella D. Validity and per-formance of the Functional Assessment of Cancer Therapy – Bladder (FACT-Bl) among advanced urothelial cancer patients. Support Care Cancer. 2019;27(11):4189–4198.
7. Mason SJ, Downing A, Wright P, et al. Health-related quality of life after treatment for bladder cancer in England. Br J Cancer. 2018;118(11): 1518–1528.
8. Anderson CB, Feurer ID, Large MC, et al. Psychometric character-istics of a condition-specific, health-related quality-of-life survey: The FACT-Vanderbilt Cystectomy Index. Urology. 2012;80(1):77–83.
9. Cookson MS, Dutta SC, Chang SS, Clark T, Smith JA Jr, Wells N. Health-related quality of life in patients treated with radical cystectomy and urinary diversion for urothelial carcinoma of the bladder: Develop-ment and validation of a new disease specific questionnaire. J Urol. 2003;170(5):1926–1930.
10. Radecka B. Health-related quality of life: The role and manners of assessment in cancer patients. Curr Gynecol Oncol. 2015;13(3):172–179.
11. Parkinson JP, Konety BR. Health-related quality of life assessments for patients with bladder cancer. J Urol. 2004;172(6 Pt 1):2130–2136.
12. Gilbert SM, Wood DP, Dunn RL, et al. Measuring health-related qual-ity of life outcomes in bladder cancer patients using the Bladder Can-cer Index (BCI). Cancer. 2007;109(9):1756–1762.
13. Shih C, Porter MP. Health-related quality of life after cystectomy and urinary diversion for bladder cancer. Adv Urol. 2011;2011:715892.
14. Saber A. Urinary diversion: Historical aspect and patient’s satisfac-tion. Urol Nephrol Open Access J. 2014;1(3):86–93.
15. Somani BK, MacLennan SJ, N’Dow J. Quality of life with urinary diver-sion. Eur Urol Supp. 2010;9(10):763–771.
16. Varricchio CG, Ferrans CE. Quality of life assessments in clinical prac-tice. Semin Oncol Nurs. 2010;26(1):12–17.
17. Asgari MA, Safarinejad MR, Shakhssalim N, Soleimani M, Shahabi A, Amini E. Quality of life after radical cystectomy for bladder cancer in men with an ileal conduit or continent urinary diversion: A com-parative study. Urol Ann. 2013;5(3):190–196.
18. Saika T, Arata R, Tsushima T, et al; Okayama Urological Research Group. Health-related quality of life after radical cystectomy for bladder can-cer in elderly patients with an ileal conduit, ureterocutaneostomy, or orthotopic urinary reservoir: A comparative questionnaire survey. Acta Med Okayama. 2007;61(4):199–203.
19. Porter MP, Penson DF. Health-related quality of life after radical cys-tectomy and urinary diversion for bladder cancer: A systematic review and critical analysis of the literature. J Urol. 2005;173(4):1318–1322.
20. Bochner BH, Dalbagni G, Sjoberg DD, et al. Comparing open radi-cal cystectomy and robot-assisted laparoscopic radical cystectomy: A randomized clinical trial. Eur Urol. 2015;67(6):1042–1050.
21. Messer JC, Punnen S, Fitzgerald J, Svatek R, Parekh DJ. Health-related quality of life from a prospective randomised clinical trial of robot-assist-ed laparoscopic vs open radical cystectomy. BJU Int. 2014;114(6):896–902.
22. Jensen BT, Kiesbye B, Soendergaard I, Jensen JB, Ammitzboell Kris-tensen S. Efficacy of preoperative uro-stoma education on self-effi-cacy after radical cystectomy: Secondary outcome of a prospective randomized controlled trial. Eur J Oncol Nurs. 2017;28:41–46.
23. Danielsen AK, Rosenberg J. Health-related quality of life may increase when patients with a stoma attend patient education: A case-control study. PLoS One. 2014;9(3):e90354.
24. O’Connor G. Teaching stoma-management skills: The importance of self-care. Br J Nurs. 2005;14(6):320–324.
25. Kristensen SA, Laustsen S, Kiesbye B, Jensen BT. The Urostomy Edu-cation Scale: A reliable and valid tool to evaluate urostomy self-care skills among cystectomy patients. J Wound Ostomy Continence Nurs. 2013;40(6):611–617.
26. Kozell K, Frecea M, Thomas JT. Preoperative ostomy education and stoma site marking. J Wound Ostomy Continence Nurs. 2014;41(3): 206–207.
27. Fujimura T. Current status and future perspective of robot-assisted radical cystectomy for invasive bladder cancer. Int J Urol. 2019;26(11): 1033–1042.

Cite asUra-Sabat K, Morawska J, Domka W, Gamrot-Wrzoł M, Scierski W, Niebudek-Bogusz E. The assessment of phonatory and ventilatory functions in patients after microsurgery for Reinke’s edema. Adv Clin Exp Med. 2020;29(7):865–871. doi:10.17219/acem/116755
DOI10.17219/acem/116755
CopyrightCopyright by Author(s) This is an article distributed under the terms of theCreative Commons Attribution 3.0 Unported (CC BY 3.0)(https://creativecommons.org/licenses/by/3.0/)
Address for correspondenceKatarzyna Ura-SabatE-mail: [email protected]
Funding sourcesNone declared
Conflict of interestNone declared
Received on May 12, 2019Reviewed on May 31, 2019Accepted on January 21, 2020
Published online on July 3, 2020
AbstractBackground. Short and long-term results of microsurgical treatment with the mini-microflap technique in patients with Reinke’s edema (RE) were assessed based on the phonatory and ventilatory functions of the larynx.
Objectives. To assess the short and long-term results of microsurgical treatment with the mini-microflap technique in patients with RE based on the phonatory and ventilatory functions of the larynx.
Material and methods. Twenty patients diagnosed with advanced stage of RE confirmed with laryngo-videostroboscopy (LVS) were enrolled in the study. Phonatory function disturbances were additionally assessed on the basis of Maximum Phonation Time (MPT) measurement, Voice Handicap Index (VHI) and Voice-Related Quality of Life (V-ROOL) questionnaires. Ventilatory function was assessed using spirometry. The aforemen-tioned complex examinations were conducted prior to surgery and 1, 6 and 9 months following the surgery.
Results. Good postsurgical results were obtained in subjective and objective evaluation, which assessed the phonatory function and ventilatory parameters. Post-surgery increase in MPT, VHI and VQROL was noticed in all patients in 3 check points (p < 0.001). The results demonstrate postsurgical improvement for some LVS parameters, including assessment of glottis closure (p < 0.003) observed 6 months after the surgery. An improvement in most of the ventilation parameters was observed also 6 months after surgery (p < 0.001). For the spirometry flow parameter PEF, significant improvement was noted in each check point (p1 < 0.004, p6 < 0.001, p9 < 0.001). The study revealed a correlation between phonatory parameter – MPT and PEF observed 1 month after the procedure (p = 0.026), confirming the interdependence of ventilatory efficiency and phonatory condition of larynx.
Conclusions. Mini-microflap surgery brings satisfactory clinical effect in patients with advanced stages of RE by optimization of phonatory and ventilatory functions of the larynx.
Key words: spirometry, voice quality, long-term outcomes, mini-microflap surgery, Reinke’s edema
Original papers
The assessment of phonatory and ventilatory functions in patients after microsurgery for Reinke’s edema
Katarzyna Ura-Sabat1,A–D, Joanna Morawska2,C,D, Wojciech Domka1,C,D, Marta Gamrot-Wrzoł3,C,D, Wojciech Scierski3,A,E, Ewa Niebudek-Bogusz2,A,F
1 Clinical Department of Otorhinolaryngology, Frederic Chopin Clinical Voivodeship Hospital No. 1, Rzeszów, Poland2 Nofer Institute of Occupational Medicine, Department of Audiology and Phoniatrics, Łódź, Poland3 Department of Otorhinolaryngology and Laryngological Oncology in Zabrze, Medical University of Silesia, Katowice, Poland
A – research concept and design; B – collection and/or assembly of data; C – data analysis and interpretation; D – writing the article; E – critical revision of the article; F – final approval of the article
Advances in Clinical and Experimental Medicine, ISSN 1899–5276 (print), ISSN 2451–2680 (online) Adv Clin Exp Med. 2020;29(7):865–871
K. Ura-Sabat et al. The functions of larynx after microsurgery866
Introduction
Reinke’s edema (RE) belongs to a group of benign masses of vocal folds (BVFM) deteriorating both phonatory and ven-tilatory function of the larynx.1–3 Precisely, RE is classified as a disease of the lamina propria, and as its name indicates, superficial lamina propria, also referred to as Reinke’s space of the vocal fold layer, is affected by this disorder.4 Reinke’s edema constitutes about 6–10% of all non-malignant pa-thologies within the glottis and is most commonly observed in middle-aged women.5,6 Longlasting smoking has been found to be the most important risk factor in the etiopatho-genesis of RE.1,7 Four clinical stages can be distinguished, depending both on the extent of lesions on vocal folds and on glottis area narrowing caused by swollen folds.8 One of the first symptoms of RE are voice disorders, most fre-quently manifesting themselves as persistent hoarseness and a lower than normal pitch, deteriorating the quality of voice, especially in women.9–11 In more advanced stages of RE, due to the narrowing of the glottis area, ventilatory capacity can also be compromised, which is typically observed as gradu-ally aggravating respiratory problems.12 In the case of large, bilateral RE, stridor can be noticed, caused by chronic edem-atous hypertrophy of vocal folds obstructing the glottis, especially its posterior part responsible for the respiratory function of larynx.13 Diagnosis of RE is made during a rou-tine laryngological examination, although instrumental evaluation of the larynx by means of laryngovideostrobos-copy is a valuable contribution in the diagnostic procedure.14
The management depends on the stage of the disease. At the 1st and 2nd clinical stages of RE conservative treat-ment is usually effective.4 Microsurgery is the first treat-ment of choice at the 3rd and 4th stages because of the po-tential ventilatory function disorders. The previously used decortication technique (stripping)15,16 was unsatisfactory both for the surgeon and the patient because of the poor post-surgery quality of the voice.12,15–17 For this reason, the mini-microflap technique has become a more fre-quently used method in phonosurgical treatment of RE as a technique widening the ventilatory area of glottis and, at the same time, saving the phonatory function of the larynx.18–21
When reviewing the available literature, the authors did not find any studies that evaluated the effects of the com-plex microsurgical treatment of RE, including those that monitored both phonatory and respiratory functions simultaneously. The aim of the study was to compara-tively assess the abovementioned functions of the larynx in patients with RE who underwent mini-microflap phonosurgery.
Material and methods
The prospective study was carried out in 20 patients with advanced RE. The patients were qualified for phonosurgery
on the basis of laryngological examination complemented with instrumental examination – laryngovideostrobos-copy (LVS). Additionally, the assessment of the phonatory and ventilatory function of the larynx was performed be-fore and after the surgery according to a scheme described below. The examinations after opera tion were conducted in 3 check points: at short-term (1 month) and long-term periods (6 and 9 months after the surgery).
The mini-microflap technique
The applied surgical mini-microflap technique was intended to both decrease the mass of the vocal folds and broaden the glottis, as well as to maintain layered, functional composition of the vocal fold. All patients underwent laryngeal microsurgery under general anes-thesia. The mini-microflap technique was applied in all cases as a one-step procedure. It is based on performing an incision of the upper edge of the vocal fold without affecting its middle part. The surgery was performed with the Kleinsasser set. The Reinke’s space was opened along the superior surface of the vocal fold near the ventricle, saving the anterior commissure. Subepithelial layer was dissected to aspirate fluid accumulated in the Reinke’s space. The mucous, dense content of Reinke’s space was sucked out and the excess mucosa was removed mini-mally as necessary. The surgical site was covered with a tissue layer to form a strong bond and to hold the tis-sue in place to facilitate healing. Tissue glue was applied when necessary.2,4,5,7,13 All the patients were hospitalized for 1 day after the surgery. The patients were instructed to follow 1 week of complete vocal rest, so as not to trau-matize vocal folds and were advised to respect vocal hy-giene rules, with particular emphasis put on the absolute necessity of smoking cessation. They were also informed about the terms of postoperative care and examinations scheduled in 3 check points according to the scheme de-scribed below.
Evaluation of the phonatory function
The evaluation of the phonatory function was carried out using objective and subjective methods. The instrumental methods of voice assessment included the following:
– Laryngovideostroboscopy (LVS), in which the fol-lowing parameters were examined: the quality of mucosal wave, regularity of vocal fold vibration, amplitude of vocal fold vibration, and the configuration of glottal closure. Each stroboscopic parameter was rated on a 0–2 scale, where 0 – normal, 1 – limited dysfunction, 2 – severe dysfunction, e.g., absence of mucosal wave or inability of assessment.
– Measurement of the Maximum Phonation Time (MPT), which is an objective and noninvasive measure-ment of aerodynamic parameter of the phonatory func-tion of the larynx. To measure MPT, the subject was
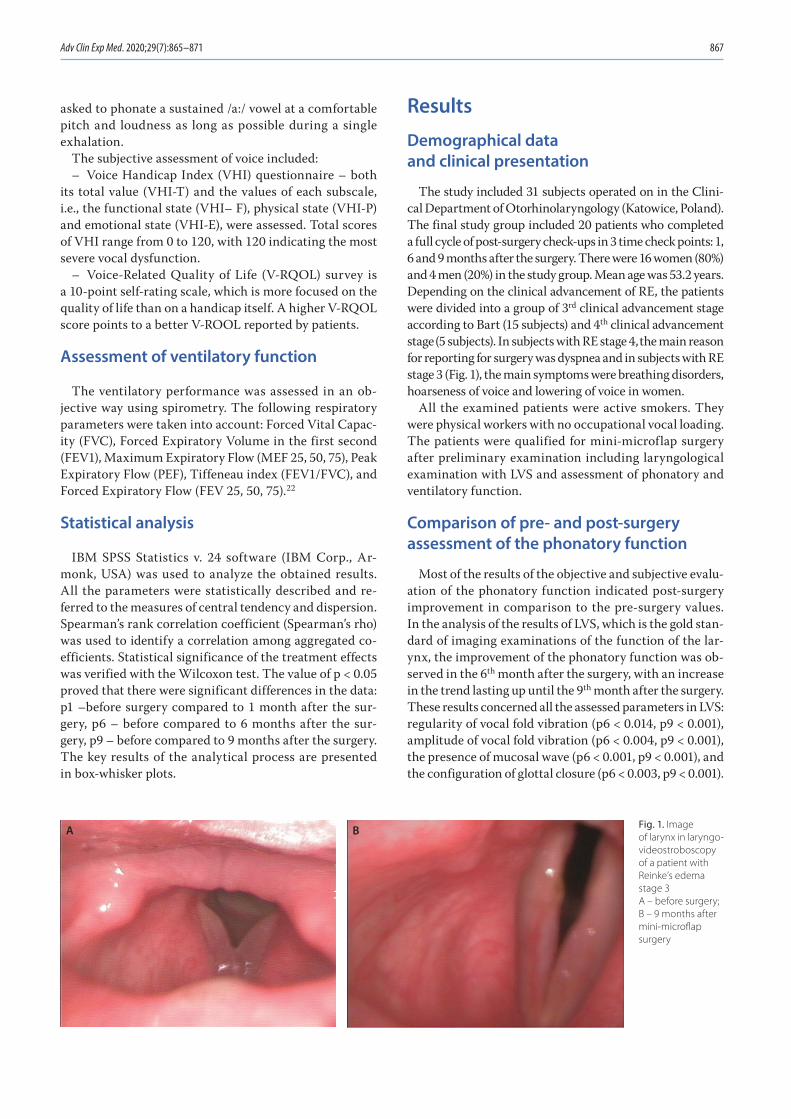
Adv Clin Exp Med. 2020;29(7):865–871 867
asked to phonate a sustained /a:/ vowel at a comfortable pitch and loudness as long as possible during a single exhalation.
The subjective assessment of voice included:– Voice Handicap Index (VHI) questionnaire – both
its total value (VHI-T) and the values of each subscale, i.e., the functional state (VHI– F), physical state (VHI-P) and emotional state (VHI-E), were assessed. Total scores of VHI range from 0 to 120, with 120 indicating the most severe vocal dysfunction.
– Voice-Related Quality of Life (V-RQOL) survey is a 10-point self-rating scale, which is more focused on the quality of life than on a handicap itself. A higher V-RQOL score points to a better V-ROOL reported by patients.
Assessment of ventilatory function
The ventilatory performance was assessed in an ob-jective way using spirometry. The following respiratory parameters were taken into account: Forced Vital Capac-ity (FVC), Forced Expiratory Volume in the first second (FEV1), Maximum Expiratory Flow (MEF 25, 50, 75), Peak Expiratory Flow (PEF), Tiffeneau index (FEV1/FVC), and Forced Expiratory Flow (FEV 25, 50, 75).22
Statistical analysis
IBM SPSS Statistics v. 24 software (IBM Corp., Ar-monk, USA) was used to analyze the obtained results. All the parameters were statistically described and re-ferred to the measures of central tendency and dispersion. Spearman’s rank correlation coefficient (Spearman’s rho) was used to identify a correlation among aggregated co-efficients. Statistical significance of the treatment effects was verified with the Wilcoxon test. The value of p < 0.05 proved that there were significant differences in the data: p1 –before surgery compared to 1 month after the sur-gery, p6 – before compared to 6 months after the sur-gery, p9 – before compared to 9 months after the surgery. The key results of the analytical process are presented in box-whisker plots.
Results
Demographical data and clinical presentation
The study included 31 subjects operated on in the Clini-cal Department of Otorhinolaryngology (Katowice, Poland). The final study group included 20 patients who completed a full cycle of post-surgery check-ups in 3 time check points: 1, 6 and 9 months after the surgery. There were 16 women (80%) and 4 men (20%) in the study group. Mean age was 53.2 years. Depending on the clinical advancement of RE, the patients were divided into a group of 3rd clinical advancement stage according to Bart (15 subjects) and 4th clinical advancement stage (5 subjects). In subjects with RE stage 4, the main reason for reporting for surgery was dyspnea and in subjects with RE stage 3 (Fig. 1), the main symptoms were breathing disorders, hoarseness of voice and lowering of voice in women.
All the examined patients were active smokers. They were physical workers with no occupational vocal loading. The patients were qualified for mini-microflap surgery after preliminary examination including laryngological examination with LVS and assessment of phonatory and ventilatory function.
Comparison of pre- and post-surgery assessment of the phonatory function
Most of the results of the objective and subjective evalu-ation of the phonatory function indicated post-surgery improvement in comparison to the pre-surgery values. In the analysis of the results of LVS, which is the gold stan-dard of imaging examinations of the function of the lar-ynx, the improvement of the phonatory function was ob-served in the 6th month after the surgery, with an increase in the trend lasting up until the 9th month after the surgery. These results concerned all the assessed parameters in LVS: regularity of vocal fold vibration (p6 < 0.014, p9 < 0.001), amplitude of vocal fold vibration (p6 < 0.004, p9 < 0.001), the presence of mucosal wave (p6 < 0.001, p9 < 0.001), and the configuration of glottal closure (p6 < 0.003, p9 < 0.001).
Fig. 1. Image of larynx in laryngo-videostroboscopy of a patient with Reinke’s edema stage 3 A – before surgery; B – 9 months after mini-microflap surgery
A B
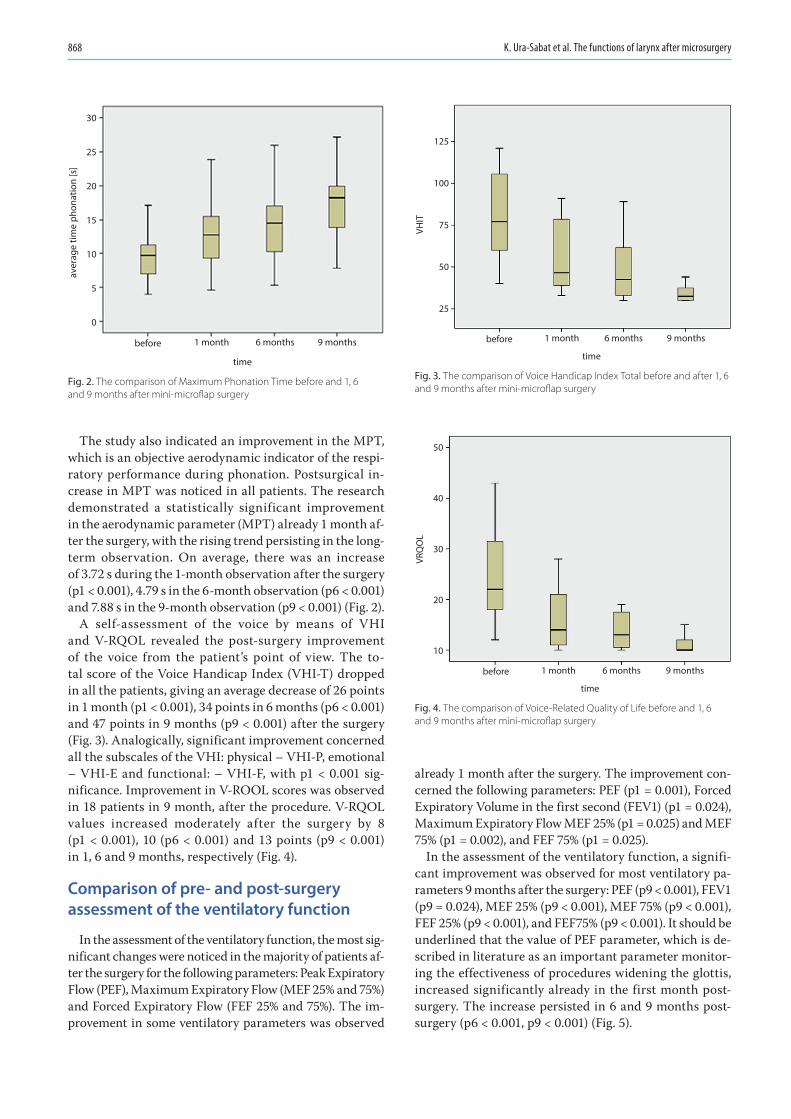
K. Ura-Sabat et al. The functions of larynx after microsurgery868
The study also indicated an improvement in the MPT, which is an objective aerodynamic indicator of the respi-ratory performance during phonation. Postsurgical in-crease in MPT was noticed in all patients. The research demonstrated a statistically significant improvement in the aerodynamic parameter (MPT) already 1 month af-ter the surgery, with the rising trend persisting in the long-term observation. On average, there was an increase of 3.72 s during the 1-month observation after the surgery (p1 < 0.001), 4.79 s in the 6-month observation (p6 < 0.001) and 7.88 s in the 9-month observation (p9 < 0.001) (Fig. 2).
A self-assessment of the voice by means of VHI and V-RQOL revealed the post-surgery improvement of the voice from the patient’s point of view. The to-tal score of the Voice Handicap Index (VHI-T) dropped in all the patients, giving an average decrease of 26 points in 1 month (p1 < 0.001), 34 points in 6 months (p6 < 0.001) and 47 points in 9 months (p9 < 0.001) after the surgery (Fig. 3). Analogically, significant improvement concerned all the subscales of the VHI: physical – VHI-P, emotional – VHI-E and functional: – VHI-F, with p1 < 0.001 sig-nificance. Improvement in V-ROOL scores was observed in 18 patients in 9 month, after the procedure. V-RQOL values increased moderately after the surgery by 8 (p1 < 0.001), 10 (p6 < 0.001) and 13 points (p9 < 0.001) in 1, 6 and 9 months, respectively (Fig. 4).
Comparison of pre- and post-surgery assessment of the ventilatory function
In the assessment of the ventilatory function, the most sig-nificant changes were noticed in the majority of patients af-ter the surgery for the following parameters: Peak Expiratory Flow (PEF), Maximum Expiratory Flow (MEF 25% and 75%) and Forced Expiratory Flow (FEF 25% and 75%). The im-provement in some ventilatory parameters was observed
already 1 month after the surgery. The improvement con-cerned the following parameters: PEF (p1 = 0.001), Forced Expiratory Volume in the first second (FEV1) (p1 = 0.024), Maximum Expiratory Flow MEF 25% (p1 = 0.025) and MEF 75% (p1 = 0.002), and FEF 75% (p1 = 0.025).
In the assessment of the ventilatory function, a signifi-cant improvement was observed for most ventilatory pa-rameters 9 months after the surgery: PEF (p9 < 0.001), FEV1 (p9 = 0.024), MEF 25% (p9 < 0.001), MEF 75% (p9 < 0.001), FEF 25% (p9 < 0.001), and FEF75% (p9 < 0.001). It should be underlined that the value of PEF parameter, which is de-scribed in literature as an important parameter monitor-ing the effectiveness of procedures widening the glottis, increased significantly already in the first month post-surgery. The increase persisted in 6 and 9 months post-surgery (p6 < 0.001, p9 < 0.001) (Fig. 5).
Fig. 4. The comparison of Voice-Related Quality of Life before and 1, 6 and 9 months after mini-microflap surgery
before 1 month 6 months
time
VRQ
OL
50
40
30
20
10
9 months
Fig. 3. The comparison of Voice Handicap Index Total before and after 1, 6 and 9 months after mini-microflap surgery
Fig. 2. The comparison of Maximum Phonation Time before and 1, 6 and 9 months after mini-microflap surgery
before 1 month 6 months
time
VHIT
125
100
75
50
25
9 monthsbefore 1 month 6 months
time
aver
age
time
phon
atio
n [s
]
30
25
20
15
10
5
0
9 months
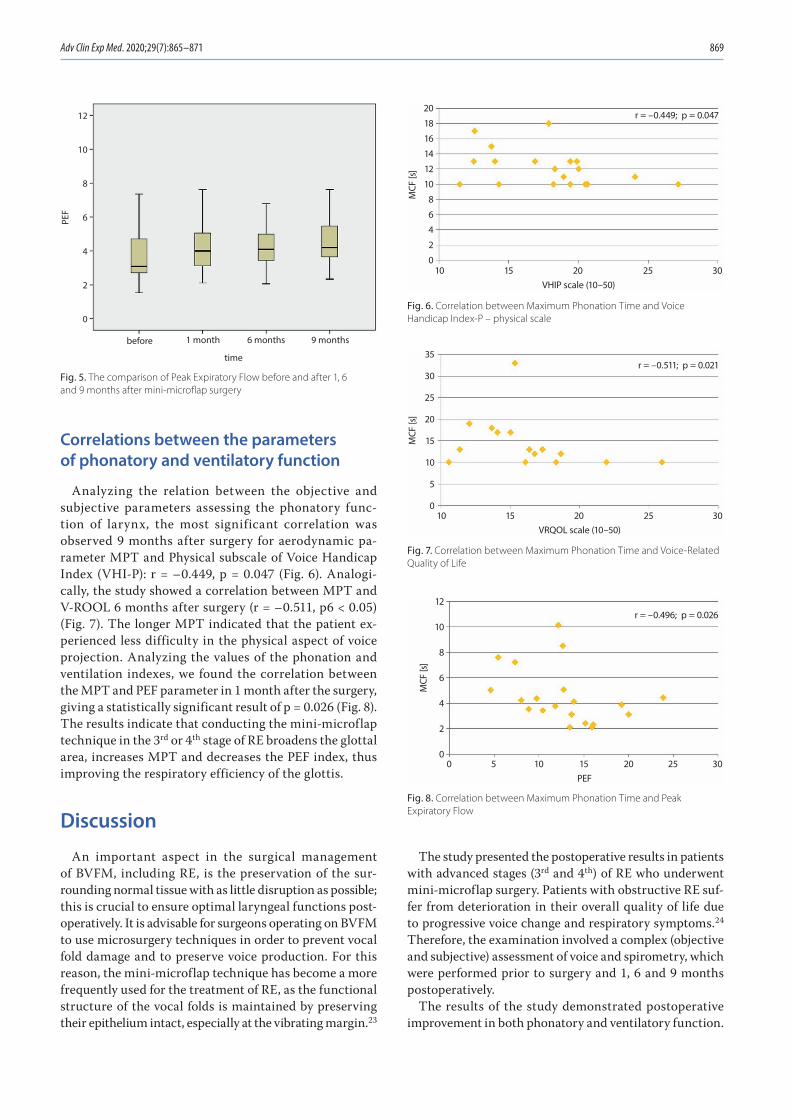
Adv Clin Exp Med. 2020;29(7):865–871 869
Correlations between the parameters of phonatory and ventilatory function
Analyzing the relation between the objective and subjective parameters assessing the phonatory func-tion of larynx, the most significant correlation was observed 9 months after surgery for aerodynamic pa-rameter MPT and Physical subscale of Voice Handicap Index (VHI-P): r = –0.449, p = 0.047 (Fig. 6). Analogi-cally, the study showed a correlation between MPT and V-ROOL 6 months after surgery (r = –0.511, p6 < 0.05) (Fig. 7). The longer MPT indicated that the patient ex-perienced less difficulty in the physical aspect of voice projection. Analyzing the values of the phonation and ventilation indexes, we found the correlation between the MPT and PEF parameter in 1 month after the surgery, giving a statistically significant result of p = 0.026 (Fig. 8). The results indicate that conducting the mini-microflap technique in the 3rd or 4th stage of RE broadens the glottal area, increases MPT and decreases the PEF index, thus improving the respiratory efficiency of the glottis.
Discussion
An important aspect in the surgical management of BVFM, including RE, is the preservation of the sur-rounding normal tissue with as little disruption as possible; this is crucial to ensure optimal laryngeal functions post-operatively. It is advisable for surgeons operating on BVFM to use microsurgery techniques in order to prevent vocal fold damage and to preserve voice production. For this reason, the mini-microflap technique has become a more frequently used for the treatment of RE, as the functional structure of the vocal folds is maintained by preserving their epithelium intact, especially at the vibrating margin.23
The study presented the postoperative results in patients with advanced stages (3rd and 4th) of RE who underwent mini-microflap surgery. Patients with obstructive RE suf-fer from deterioration in their overall quality of life due to progressive voice change and respiratory symptoms.24 Therefore, the examination involved a complex (objective and subjective) assessment of voice and spirometry, which were performed prior to surgery and 1, 6 and 9 months postoperatively.
The results of the study demonstrated postoperative improvement in both phonatory and ventilatory function.
Fig. 8. Correlation between Maximum Phonation Time and Peak Expiratory Flow
Fig. 7. Correlation between Maximum Phonation Time and Voice-Related Quality of Life
Fig. 6. Correlation between Maximum Phonation Time and Voice Handicap Index-P – physical scale
Fig. 5. The comparison of Peak Expiratory Flow before and after 1, 6 and 9 months after mini-microflap surgery
before 1 month 6 months
time
PEF
12
10
8
6
4
2
0
9 months
10
20
18
16
14
12
10
8
6
4
2
015 20
VHIP scale (10–50)
MCF
[s]
25 30
r = –0.449; p = 0.047
10
35
30
25
20
15
10
5
015 20
VRQOL scale (10–50)
MCF
[s]
25 30
r = –0.511; p = 0.021
1050
12
10
8
6
4
2
015 20PEF
MCF
[s]
25 30
r = –0.496; p = 0.026
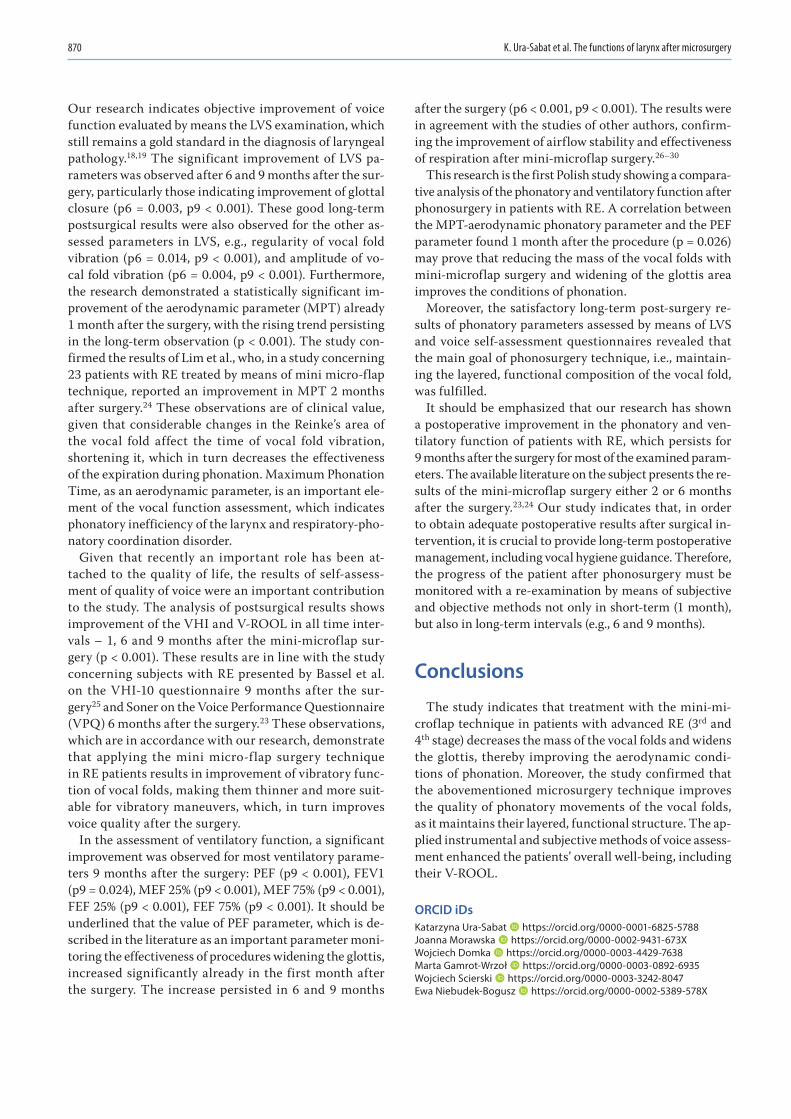
K. Ura-Sabat et al. The functions of larynx after microsurgery870
Our research indicates objective improvement of voice function evaluated by means the LVS examination, which still remains a gold standard in the diagnosis of laryngeal pathology.18,19 The significant improvement of LVS pa-rameters was observed after 6 and 9 months after the sur-gery, particularly those indicating improvement of glottal closure (p6 = 0.003, p9 < 0.001). These good long-term postsurgical results were also observed for the other as-sessed parameters in LVS, e.g., regularity of vocal fold vibration (p6 = 0.014, p9 < 0.001), and amplitude of vo-cal fold vibration (p6 = 0.004, p9 < 0.001). Furthermore, the research demonstrated a statistically significant im-provement of the aerodynamic parameter (MPT) already 1 month after the surgery, with the rising trend persisting in the long-term observation (p < 0.001). The study con-firmed the results of Lim et al., who, in a study concerning 23 patients with RE treated by means of mini micro-flap technique, reported an improvement in MPT 2 months after surgery.24 These observations are of clinical value, given that considerable changes in the Reinke’s area of the vocal fold affect the time of vocal fold vibration, shortening it, which in turn decreases the effectiveness of the expiration during phonation. Maximum Phonation Time, as an aerodynamic parameter, is an important ele-ment of the vocal function assessment, which indicates phonatory inefficiency of the larynx and respiratory-pho-natory coordination disorder.
Given that recently an important role has been at-tached to the quality of life, the results of self-assess-ment of quality of voice were an important contribution to the study. The analysis of postsurgical results shows improvement of the VHI and V-ROOL in all time inter-vals – 1, 6 and 9 months after the mini-microflap sur-gery (p < 0.001). These results are in line with the study concerning subjects with RE presented by Bassel et al. on the VHI-10 questionnaire 9 months after the sur-gery25 and Soner on the Voice Performance Questionnaire (VPQ) 6 months after the surgery.23 These observations, which are in accordance with our research, demonstrate that applying the mini micro-flap surgery technique in RE patients results in improvement of vibratory func-tion of vocal folds, making them thinner and more suit-able for vibratory maneuvers, which, in turn improves voice quality after the surgery.
In the assessment of ventilatory function, a significant improvement was observed for most ventilatory parame-ters 9 months after the surgery: PEF (p9 < 0.001), FEV1 (p9 = 0.024), MEF 25% (p9 < 0.001), MEF 75% (p9 < 0.001), FEF 25% (p9 < 0.001), FEF 75% (p9 < 0.001). It should be underlined that the value of PEF parameter, which is de-scribed in the literature as an important parameter moni-toring the effectiveness of procedures widening the glottis, increased significantly already in the first month after the surgery. The increase persisted in 6 and 9 months
after the surgery (p6 < 0.001, p9 < 0.001). The results were in agreement with the studies of other authors, confirm-ing the improvement of airflow stability and effectiveness of respiration after mini-microflap surgery.26–30
This research is the first Polish study showing a compara-tive analysis of the phonatory and ventilatory function after phonosurgery in patients with RE. A correlation between the MPT-aerodynamic phonatory parameter and the PEF parameter found 1 month after the procedure (p = 0.026) may prove that reducing the mass of the vocal folds with mini-microflap surgery and widening of the glottis area improves the conditions of phonation.
Moreover, the satisfactory long-term post-surgery re-sults of phonatory parameters assessed by means of LVS and voice self-assessment questionnaires revealed that the main goal of phonosurgery technique, i.e., maintain-ing the layered, functional composition of the vocal fold, was fulfilled.
It should be emphasized that our research has shown a postoperative improvement in the phonatory and ven-tilatory function of patients with RE, which persists for 9 months after the surgery for most of the examined param-eters. The available literature on the subject presents the re-sults of the mini-microflap surgery either 2 or 6 months after the surgery.23,24 Our study indicates that, in order to obtain adequate postoperative results after surgical in-tervention, it is crucial to provide long-term postoperative management, including vocal hygiene guidance. Therefore, the progress of the patient after phonosurgery must be monitored with a re-examination by means of subjective and objective methods not only in short-term (1 month), but also in long-term intervals (e.g., 6 and 9 months).
Conclusions
The study indicates that treatment with the mini-mi-croflap technique in patients with advanced RE (3rd and 4th stage) decreases the mass of the vocal folds and widens the glottis, thereby improving the aerodynamic condi-tions of phonation. Moreover, the study confirmed that the abovementioned microsurgery technique improves the quality of phonatory movements of the vocal folds, as it maintains their layered, functional structure. The ap-plied instrumental and subjective methods of voice assess-ment enhanced the patients’ overall well-being, including their V-ROOL.
ORCID iDsKatarzyna Ura-Sabat https://orcid.org/0000-0001-6825-5788Joanna Morawska https://orcid.org/0000-0002-9431-673XWojciech Domka https://orcid.org/0000-0003-4429-7638Marta Gamrot-Wrzoł https://orcid.org/0000-0003-0892-6935Wojciech Scierski https://orcid.org/0000-0003-3242-8047Ewa Niebudek-Bogusz https://orcid.org/0000-0002-5389-578X
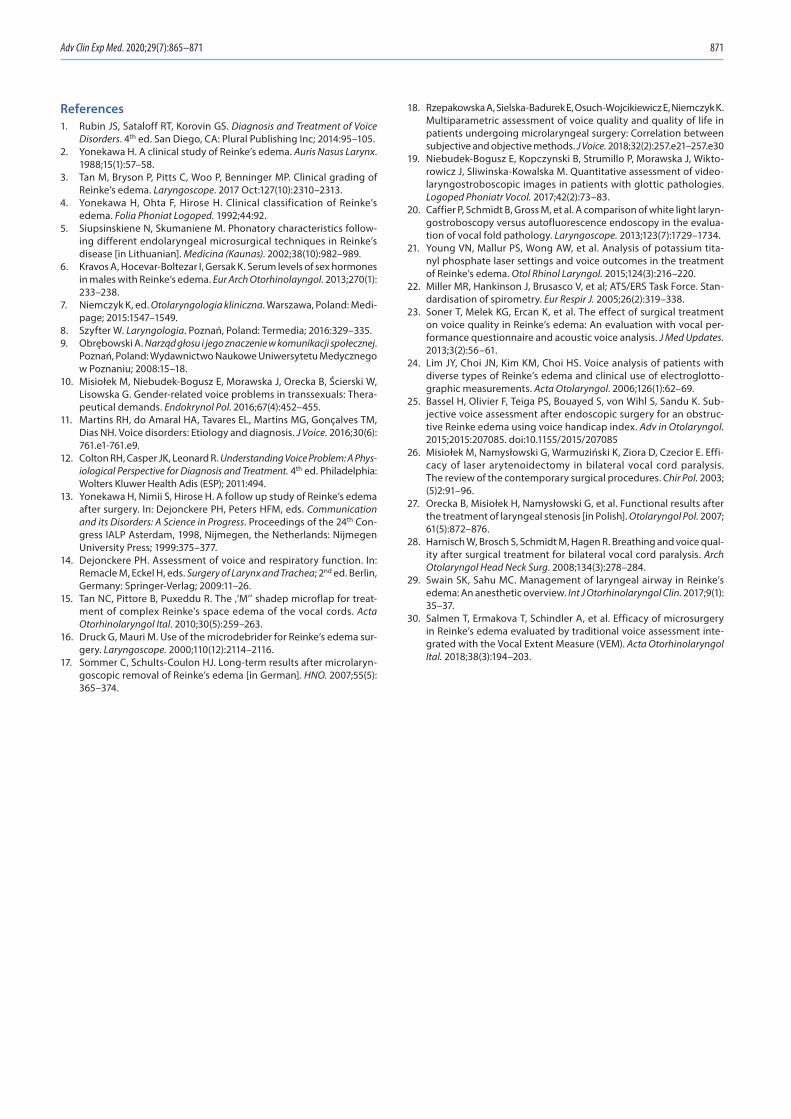
Adv Clin Exp Med. 2020;29(7):865–871 871
References1. Rubin JS, Sataloff RT, Korovin GS. Diagnosis and Treatment of Voice
Disorders. 4th ed. San Diego, CA: Plural Publishing Inc; 2014:95–105.2. Yonekawa H. A clinical study of Reinke’s edema. Auris Nasus Larynx.
1988;15(1):57–58.3. Tan M, Bryson P, Pitts C, Woo P, Benninger MP. Clinical grading of
Reinke’s edema. Laryngoscope. 2017 Oct:127(10):2310–2313.4. Yonekawa H, Ohta F, Hirose H. Clinical classification of Reinke’s
edema. Folia Phoniat Logoped. 1992;44:92.5. Siupsinskiene N, Skumaniene M. Phonatory characteristics follow-
ing different endolaryngeal microsurgical techniques in Reinke’s disease [in Lithuanian]. Medicina (Kaunas). 2002;38(10):982–989.
6. Kravos A, Hocevar-Boltezar I, Gersak K. Serum levels of sex hormones in males with Reinke’s edema. Eur Arch Otorhinolayngol. 2013;270(1): 233–238.
7. Niemczyk K, ed. Otolaryngologia kliniczna. Warszawa, Poland: Medi-page; 2015:1547–1549.
8. Szyfter W. Laryngologia. Poznań, Poland: Termedia; 2016:329–335. 9. Obrębowski A. Narząd głosu i jego znaczenie w komunikacji społecznej.
Poznań, Poland: Wydawnictwo Naukowe Uniwersytetu Medycznego w Poznaniu; 2008:15–18.
10. Misiołek M, Niebudek-Bogusz E, Morawska J, Orecka B, Ścierski W, Lisowska G. Gender-related voice problems in transsexuals: Thera-peutical demands. Endokrynol Pol. 2016;67(4):452–455.
11. Martins RH, do Amaral HA, Tavares EL, Martins MG, Gonçalves TM, Dias NH. Voice disorders: Etiology and diagnosis. J Voice. 2016;30(6): 761.e1-761.e9.
12. Colton RH, Casper JK, Leonard R. Understanding Voice Problem: A Physiological Perspective for Diagnosis and Treatment. 4th ed. Philadelphia: Wolters Kluwer Health Adis (ESP); 2011:494.
13. Yonekawa H, Nimii S, Hirose H. A follow up study of Reinke’s edema after surgery. In: Dejonckere PH, Peters HFM, eds. Communication and its Disorders: A Science in Progress. Proceedings of the 24th Con-gress IALP Asterdam, 1998, Nijmegen, the Netherlands: Nijmegen University Press; 1999:375–377.
14. Dejonckere PH. Assessment of voice and respiratory function. In: Remacle M, Eckel H, eds. Surgery of Larynx and Trachea; 2nd ed. Berlin, Germany: Springer-Verlag; 2009:11–26.
15. Tan NC, Pittore B, Puxeddu R. The ‚’M’’ shadep microflap for treat-ment of complex Reinke’s space edema of the vocal cords. Acta Otorhinolaryngol Ital. 2010;30(5):259–263.
16. Druck G, Mauri M. Use of the microdebrider for Reinke’s edema sur-gery. Laryngoscope. 2000;110(12):2114–2116.
17. Sommer C, Schults-Coulon HJ. Long-term results after microlaryn-goscopic removal of Reinke’s edema [in German]. HNO. 2007;55(5): 365–374.
18. Rzepakowska A, Sielska-Badurek E, Osuch-Wojcikiewicz E, Niem czyk K. Multiparametric assessment of voice quality and quality of life in patients undergoing microlaryngeal surgery: Correlation between subjective and objective methods. J Voice. 2018;32(2):257.e21–257.e30
19. Niebudek-Bogusz E, Kopczynski B, Strumillo P, Morawska J, Wikto-rowicz J, Sliwinska-Kowalska M. Quantitative assessment of video-laryngostroboscopic images in patients with glottic pathologies. Logoped Phoniatr Vocol. 2017;42(2):73–83.
20. Caffier P, Schmidt B, Gross M, et al. A comparison of white light laryn-gostroboscopy versus autofluorescence endoscopy in the evalua-tion of vocal fold pathology. Laryngoscope. 2013;123(7):1729–1734.
21. Young VN, Mallur PS, Wong AW, et al. Analysis of potassium tita-nyl phosphate laser settings and voice outcomes in the treatment of Reinke’s edema. Otol Rhinol Laryngol. 2015;124(3):216–220.
22. Miller MR, Hankinson J, Brusasco V, et al; ATS/ERS Task Force. Stan-dardisation of spiro metry. Eur Respir J. 2005;26(2):319–338.
23. Soner T, Melek KG, Ercan K, et al. The effect of surgical treatment on voice quality in Reinke’s edema: An evaluation with vocal per-formance questionnaire and acoustic voice analysis. J Med Updates. 2013;3(2):56–61.
24. Lim JY, Choi JN, Kim KM, Choi HS. Voice analysis of patients with diverse types of Reinke’s edema and clinical use of electroglotto-graphic measurements. Acta Otolaryngol. 2006;126(1):62–69.
25. Bassel H, Olivier F, Teiga PS, Bouayed S, von Wihl S, Sandu K. Sub-jective voice assessment after endoscopic surgery for an obstruc-tive Reinke edema using voice handicap index. Adv in Otolaryngol. 2015;2015:207085. doi:10.1155/2015/207085
26. Misiołek M, Namysłowski G, Warmuziński K, Ziora D, Czecior E. Effi-cacy of laser arytenoidectomy in bilateral vocal cord paralysis. The review of the contemporary surgical procedures. Chir Pol. 2003; (5)2:91–96.
27. Orecka B, Misiołek H, Namysłowski G, et al. Functional results after the treatment of laryngeal stenosis [in Polish]. Otolaryngol Pol. 2007; 61(5):872–876.
28. Harnisch W, Brosch S, Schmidt M, Hagen R. Breathing and voice qual-ity after surgical treatment for bilateral vocal cord paralysis. Arch Otolaryngol Head Neck Surg. 2008;134(3):278–284.
29. Swain SK, Sahu MC. Management of laryngeal airway in Reinke’s edema: An anesthetic overview. Int J Otorhinolaryngol Clin. 2017;9(1): 35–37.
30. Salmen T, Ermakova T, Schindler A, et al. Efficacy of microsurgery in Reinke’s edema evaluated by traditional voice assessment inte-grated with the Vocal Extent Measure (VEM). Acta Otorhinolaryngol Ital. 2018;38(3):194–203.

Cite asWang J, Cai Y, Sheng Z. Experimental studies on the protec-tive effects of the overexpression of lentivirus-mediated sirtuin 6 on radiation-induced lung injury. Adv Clin Exp Med. 2020;29(7):873–877. doi:10.17219/acem/117685
DOI10.17219/acem/117685
CopyrightCopyright by Author(s) This is an article distributed under the terms of theCreative Commons Attribution 3.0 Unported (CC BY 3.0)(https://creativecommons.org/licenses/by/3.0/)
Address for correspondenceYong CaiE-mail: [email protected]
Funding sourcesThe research was sponsored by the Natural Science Foundation of Shanghai, China (grant No. 15ZR1434300).
Conflict of interestNone declared
Received on January 31, 2018Reviewed on October 17, 2018Accepted on January 30, 2020
Published online on July 28, 2020
AbstractBackground. Sirtuin 6 (SIRT6) can increase the radiosensitivity of non-small cell lung cancer and exert protective effects on radiation-induced lung injury.
Objectives. To investigate protective effects of SIRT6 overexpression on radiation-induced lung injury in rats.
Material and methods. Male Wistar rats (n = 72) were randomly divided into 3 groups. Models were made by radiating both lungs with a 6MV X linear accelerator. Each group was injected through the tail vein with normal saline (the control group and radiation group) and lentivirus carrying overexpressed SIRT6 (the Lent-SIRT6 group) on the same day as the modeling. Routine blood indexes (white blood cells (WBC), red blood cells (RBC), neutrophils and lymphocytes) were recorded; the rats were sacrificed and their lung tissues taken; pathological changes in the lungs were evaluated using hematoxylin and eosin (H&E) stain-ing; and tumor necrosis factor α (TNF-α), interleukin 6 (IL-6) and interleukin 1β (IL-1β) were detected with enzyme-linked immunosorbent assay (ELISA) 8 weeks after radiotherapy.
Results. The lung structure including alveolar walls and interstitium in the control group was normal, but the alveolar walls in the radiation group were obviously thickened and a large amount of hyperplastic fibrous tissue was found in the alveolar interstitium. The thickness and interstitial fibrosis of the alveolar walls were more alleviated in the Lent-SIRT6 group than in the radiation group. Compared with those in the control group, the respiratory rates, levels of TNF-α and IL-6 in serum, neutrophils and levels of TNF-α, IL-6 and IL-1β in the liver all were increased, while WBCs and lymphocytes were decreased in the radiation group. The respiratory rates, levels of TNF-α and IL-6 in serum, neutrophils and levels of TNF-α, IL-6 and IL-1β in the liver were all decreased, and WBCs and lymphocytes were increased after injection with lentivirus carrying overexpressed SIRT6.
Conclusions. Sirtuin 6 inhibits inflammation and alleviates radioactive pneumonia and lung injury. Therefore, SIRT6 can exert certain protective effects on lung injury.
Key words: inflammation, lung injury, sirtuin 6, radioactive pneumonia
Original papers
Experimental studies on the protective effects of the overexpression of lentivirus-mediated sirtuin 6 on radiation-induced lung injury
Jiying Wang1,A–F, Yong Cai2,A,E,F, Zhaoying Sheng2,B–D,F
1 Department of Oncology, Shanghai Pulmonary Hospital, Tongji University School of Medicine, China2 Department of Radiation Oncology, Shanghai Pulmonary Hospital, Tongji University School of Medicine, China
A – research concept and design; B – collection and/or assembly of data; C – data analysis and interpretation; D – writing the article; E – critical revision of the article; F – final approval of the article
Advances in Clinical and Experimental Medicine, ISSN 1899–5276 (print), ISSN 2451–2680 (online) Adv Clin Exp Med. 2020;29(7):873–877
J. Wang, Y. Cai, Z. Sheng. Effects of SIRT6 on lung injury874
Introduction
At present, lung cancer has become one of the common malignant diseases with the highest incidence and mor-tality worldwide. The global annual death toll of cancer is up to 1.2 million, and radiotherapy is the main treat-ment for late-stage or postoperatively recurring lung can-cer. Radiation-induced lung injury not only affects lung functions but sharply reduces the patients’ quality of life, which is a common complication of lung cancer after ra-diotherapy. It is of great significance to protect the lungs of patients undergoing radiotherapy from damage. Sirtuin is a NAD+-dependent histone deacetylase that can alter the activity of the target protein by lysine deacetylation.1
The 7 widely expressed sirtuin subtypes (SIRT1–SIRT7) encoded in mammalian genomes play an important role in various physiological processes, including cell growth and apoptosis.2 Several studies have reported that SIRT1 exerts protective effects on lung injury of different types3,4 and plays a crucial role in this process.5 Our previous study found that SIRT6 could increase the radiosensitivity of non-small cell lung cancer, and that it exerts protective effects on radiation-induced lung injury.6
Pulmonary inflammation plays a crucial role in the oc-currence and development of radiation-induced lung in-jury, and various inflammation factors are involved in this process, such as tumor necrosis factor α (TNF-α) and in-terlukin 6 (IL-6). The aim of this study was to transfect lentiviral vectors of overexpressed SIRT6 in models of rats with radiation-induced lung injury and observe the pro-tective effects of SIRT6 on radiation-induced lung injury. In the present study, lung injury was induced by routine radiation of the thoracic cavity, and changes in lung pa-thologies, plasma and pulmonary inflammation were com-pared randomly between 2 groups: 1 with overexpressed SIRT6 lentivirus and 1 with no treatment.
Material and methods
Main reagents
The overexpressed lentivirus vector construction of SIRT6 was completed by the Shanghai Genechem Company Ltd. (Shanghai, China); the enzyme-linked immunosorbent as-say (ELISA) kits for IL-6 and interleukin 1β (IL-1β) were purchased from the R&D Systems Inc. (Minneapolis, USA); and ELISA kits for TNF-α were purchased from the Nan-jing Jiancheng Bioengineering Institute (Nanjing, China).
Animals and grouping
Male 150–200-gram specific pathogen-free (SPF)-grade Wistar rats (n = 72) were purchased from the Beijing Vital River Laboratory Animal Technology Co., Ltd. (Beijing,
China). They were given national-standard rodent food ad libitum. We randomly chose 48 of the rats to be radi-ated with a 6MV X linear accelerator for the lung models. The radiated rats were randomly divided into 2 groups of 24: the radiation group and the Lent-SIRT6 group. The rats in the Lent-SIRT6 group were injected with 5 × 10⁷ TU overexpressed SIRT6 lentivirus through the tail vein, while those in the radiation group received the same vol-ume (100 μL) of normal saline. The other 24 animals were only injected with the same volume of normal saline, with-out X-ray radiation.
Establishment of models of radiation-induced lung injury
The rats were intraperitoneally injected with pentobarbi-tal sodium and then placed on the radiating table in a supine position after full anesthesia. The radiation field, adjusted according to the location of both lungs, was up to 5 × 4 cm, from armpit midpoint of the forelimbs down to the xiphoid process. A 6MV X linear accelerator was used to perform a single round of chest radiation with a total dose of 20 Gy at 300 cGy/min. The rats in the control group were placed on the radiating table without being subjected to radiation. All these procedures were performed in the Department of Radiotherapy of the Affiliated Shanghai Pulmonary Hos-pital of Tongji University (Shanghai, China).
Specimen collection and processing
Six rats were selected at every time point 1, 2, 4, and 8 weeks after radiation. Respiratory rates and weights were recorded, followed by intraperitoneal injection of pento-barbital sodium according to their weight. Their hearts were opened in a supine position and their right auricles were cut for 5 mL of blood. Eight weeks after radiation, 6 rats were selected and fixed with blood pincers for liga-tion of the lungs. After removal, the left lungs were fixed with 4% formaldehyde solution and stained with hema-toxylin and eosin (H&E) for observation of pathological changes in the lungs, while the right lungs were preserved with liquid nitrogen to detect the levels of pulmonary in-flammation factors.
Detection indexes
Changes in respiratory rates, body weight and levels of TNF-α and IL-6 in serum were measured at 1, 2, 4, and 8 weeks after radiation, respectively. Blood routine indexes (white blood cells (WBC), red blood cells (RBC), neutro-phils, and lymphocytes) were recorded at 8 weeks after radiation. The rats were sacrificed with their lung tissues taken and pathological changes of lungs were evaluated using H&E staining; the levels of TNF-α, IL-6 and IL-1β were detected using ELISA at 8 weeks after radiation.
Adv Clin Exp Med. 2020;29(7):873–877 875
Statistical analysis
All statistical analyses were performed with the IBM SPSS Statistics for Windows software v. 20.0 (IBM Corp., Armonk, USA). Data in this study was expressed as X ± stan-dard deviation (SD). The t-test was used for comparisons between every 2 groups, and univariate analysis for com-parisons among various groups; a = 0.05. The threshold of statistical significance was p < 0.05.
Results
Pathological changes in lung tissues of different groups of rats
The lung structure, including the alveolar walls and in-terstitium, were normal in the control group, but the alveo-lar walls in the radiation group were obviously thickened and a large amount of hyperplastic fibrous tissues were found in the alveolar interstitium. The thickness and in-terstitial fibrosis of the alveolar walls were more alleviated in the Lent-SIRT6 group than in the radiation group, but were still more seriously affected than those in the control group.
Comparison of respiratory rates in different groups of rats after routine radiation
Compared with the control group without radiation and the Lent-SIRT6 transfected rats, the respiratory rates of the rats in the radiation group increased 1 week after ra-diation; reached their highest value at 2 weeks after radia-tion; and remained high from 4 to 8 weeks after radiation. As shown in Table 1, the differences among the groups were statistically significant at each time point (p < 0.05). The respiratory rates of the rats in the Lent-SIRT6 group were lower than those in the radiation group, and the dif-ferences were statistically significant (p < 0.05). As shown in Table 1, the respiratory rates in the radiation group were higher than those in the control group (p < 0.05), except at 8 weeks after radiation.
Changes in the body weight of different groups of rats after routine radiation
As shown in Table 2, changes in body weight among the 3 groups at 1, 2, 4, and 8 weeks after radiation were in the normal range, and the differences among groups were not statistically significant (p > 0.05).
Comparison of serum TNF-α levels in different groups of rats after routine radiation
As shown in Table 3, compared with the control group without routine radiation and the Lent-SIRT6 transfect-ed rats, the serum TNF-α levels in the radiation group increased at 1, 2, 4, and 8 weeks after radiation. The dif-ferences were statistically significant (p < 0.05). The serum TNF-α levels in the Lent-SIRT6 group were lower than those in the radiation group, and the differences were sta-tistically significant (p < 0.05). The serum TNF-α levels in the Lent-SIRT6 group were higher than those in the ra-diation group, and these differences were also statistically significant (p < 0.05).
Comparison of serum IL-6 levels in different groups of rats after routine radiation
As shown in Table 4, compared with the control group without routine radiation and the Lent-SIRT6 transfected rats, the serum IL-6 levels in the radiation group increased at 1, 2, 4, and 8 weeks after radiation. The differences were
Table 1. Respiratory rates of the 3 groups of rats at different time points
Group 1 week 2 weeks 4 weeks 8 weeks
Control group 115 ±12 117 ±13 121 ±11 118 ±12
Radiation group 143 ±15a 152 ±17a 147 ±18a 136 ±16a
Lent-SIRT6 group 127 ±0.18ab 131 ±16ab 132 ±15ab 124 ±14a
Compared with the control group: a p < 0.05; compared with the radiation group; b p < 0.05.
Table 2. The body weight [g] of the 3 groups of rats after routine radiation (3 min)
Group 1 week 2 weeks 4 weeks 8 weeks
Control group 62 ±17 89 ±15 141 ±13 169 ±23
Radiation group 71 ±16 87 ±21 136 ±20 172 ±19
Lent-SIRT6 group 65 ±11 94 ±18 139 ±17 165 ±21
Table 3. Comparison of serum TNF-α levels in the 3 groups after routine radiation [ng/L]
Group 1 week 2 weeks 4 weeks 8 weeks
Control group
41.25 ±5.47 39.50 ±6.39 40.77 ±5.83 43.14 ±5.02
Radiation group
53.64 ±6.29a 66.28 ±6.11a 69.03 ±7.34a 79.75 ±8.46a
Lent-SIRT6 group
57.31 ±5.48ab 55.41 ±7.36ab 51.43 ±6.15ab 49.26 ±6.93ab
Compared with the control group: a p < 0.05; compared with the radiation group; b p < 0.05.
J. Wang, Y. Cai, Z. Sheng. Effects of SIRT6 on lung injury876
statistically significant (p < 0.05). The serum IL-6 levels in the Lent-SIRT6 group were lower than those in the radia-tion group, and the differences were statistically significant (p < 0.05). The serum IL-6 levels in the Lent-SIRT6 group were higher than those in the control group, and these differences were also statistically significant (p < 0.05).
Comparison of blood routine indexes of different groups of rats at 8 weeks after routine radiation
As shown in Table 5, compared with the control group without routine radiation and the Lent-SIRT6 transfected rats, the number of lymphocytes in the radiation group decreased, while the number of neutrophils increased. The differences were statistically significant (p < 0.05). The number of lymphocytes in the Lent-SIRT6 group was higher than that in the radiation group, while the num-ber of neutrophils was higher than in the radiation group. These differences were also statistically signifi-cant (p < 0.05). The differences in the number of neutro-phils and lymphocytes between the Lent-SIRT6 group and the control group were also statistically significant (p > 0.05). The differences in RBCs among the 3 groups were statistically significant as well.
Comparison of levels of pulmonary inflammation factors in different groups of rats at 8 weeks after routine radiation
As shown in Table 6, compared with the control group without routine radiation and the Lent-SIRT6 transfect-ed rats, the IL-6 and IL-1β levels in the radiation group
increased after radiation. The differences were statistically significant (p < 0.05). The L-6 and IL-1β levels in the Lent-SIRT6 group were lower than those in the radiation group, and higher than those in the control group; these differ-ences were all statistically significant (p < 0.05).
Discussion
The therapeutic effect of radiotherapy for lung cancer is dose-dependent. High-dose radiotherapy can improve the remission rate and local control rate of tumors, but at the same time can bring about serious side effects.7 The incidence of radiation-induced lung injury is 6–20%. It has been found that gene activation during radiotherapy leads to early lung injury, including tissue and cellular dys-function, increased vascular permeability and radiation-induced inflammation which may be caused by cytokines secreted in macrophages and leukocytes.8,9 As a stimulus, inflammatory responses in radiation-induced lung injury can promote the initiation of collagen genes and stimulate fibroblast hyperplasia.10
In this study, we found that the respiratory rates in the ra-diation group increased after X-ray radiation. The most obvious increase occurred at 2 weeks after radiation, which was consistent with the results of related studies.11 How-ever, the increase in the respiratory rates of rats receiving overexpressed Lent-SIRT6 were a little lower and tended to become slower. These results suggested that the rats in the radiation group had significant lung injury, whereas rats in the overexpressed Lent-SIRT6 group could allevi-ate the dyspnea caused by radiation-induced lung injury.
Pathological changes in the lungs are the most direct evidence for evaluating lung injury.12 In this study, H&E staining showed that the rats in the radiation group had obvious lung injury compared with the control group; it was mainly manifested by thickened alveolar walls and fibrosis, and a large amount of hyperplastic fibrous tissues in the alve olar interstitium. In the group administered with overexpressed Lent-SIRT6, these pathological changes were improved, which provided direct evidence for the pro-tective effects of SIRT6 against lung injury.
The TNF-α can promote inflammatory responses, while IL-6 can induce lung fibrosis by preventing the apopto-sis of lung fibroblasts.13 Therefore, this study analyzed changes in both the process of radiation-induced lung
Table 5. Comparison of blood routine indexes of the 3 groups at 8 weeks after routine radiation [×109/L]
Group RBC Neutrophil Lymphocyte
Control group 6.72 ±0.85 0.61 ±0.36 4.39 ±0.37
Radiation group 6.34 ±0.91 1.28 ±0.54a 1.65 ±0.84a
Lent-SIRT6 group 6.80 ±0.79 0.93 ±0.47ab 1.29 ±0.61ab
Compared with the control group: a p < 0.05; compared with the radiation group; b p < 0.05.
Table 6. Comparison of levels of pulmonary inflammation factors in the 3 groups after routine radiation [pg/mg]
Group TNF-α IL-6 IL-1β
Control group 19.44 ±4.52 59.13 ±6.78 41.92 ±5.06
Radiation group 46.36 ±7.16a 82.49 ±8.63a 60.37 ±8.42a
Lent-SIRT6 group 27.58 ±6.24ab 67.80 ±5.92ab 43.63 ±0.47b
Compared with the control group: a p < 0.05; compared with the radiation group; b p < 0.05.
Table 4. Comparison of serum IL-6 levels in the 3 groups of rats after routine radiation [ng/L]
Group 1 week 2 weeks 4 weeks 8 weeks
Control group
0.91 ±0.35 1.03 ±0.44 0.98 ±0.36 1.15 ±0.37
Radiation group
1.45 ±0.62a 1.66 ±0.77a 1.87 ±0.71a 1.72 ±0.84a
Lent-SIRT6 group
1.32 ±0.49ab 1.24 ±0.52ab 1.36 ±0.75ab 1.29 ±0.55ab
Compared with the control group: a p < 0.05; compared with the radiation group; b p < 0.05.
Adv Clin Exp Med. 2020;29(7):873–877 877
injury and the overexpression of SIRT6. The results showed that the levels of TNF-α and IL-6 increased at 1 week after radiation, and could last through 8 weeks after ra-diation, which indicated that inflammatory responses were sustained throughout the entire process of lung injury. However, in the group of animals administered with overexpressed Lent-SIRT6, the levels of TNF-α and IL-6 decreased and had protective effects on pulmonary inflammation during the process of lung injury. In our experiments, increased Lent-SIRT6 levels also decreased the levels of pulmonary inflammation factors. Blood tests also suggested that overexpressed Lent-SIRT6 could im-prove radiation-induced neutrophils, decrease the content of lymphocytes, and exert certain effects on inflammation, which was one of the possible ways to improve the patho-logical changes in lung injury.
Conclusions
In summary, SIRT6 could effectively inhibit inflamma-tory responses and alleviate radiation-induced lung injury, exerting certain protective effects on lung injury. How-ever, the mechanisms and pathways of this process call for further study.
References1. Finkel T, Deng CX, Mostoslavsky R. Recent progress in the biology
and physiology of sirtuins. Nature. 2009;460(7255):587.2. Yao T, Quan L. Research progress of MMP-9, HIF-1 and SIRT1 in acute
lung injury. Chin J Emerg Med. 2016;25(3):384–388.3. Imanishi S, Hayashi R, Ichikawa T, et al. SRT1720, a SIRT1 activator,
aggravates bleomycin-induced lung injury in mice. Food Nutr Sci. 2012;3(2):157–163.
4. Li T, Zhang J, Feng J, et al. Resveratrol reduces acute lung injury in a LPS-induced sepsis mouse model via activation of Sirt1. Mol Med Rep. 2013;7(6):1889–1895.
5. Smith LM, Wells JD, Vachharajani VT, Yoza BK, McCall CE, Hoth JJ. SIRT1 mediates a primed response to immune challenge after trau-matic lung injury. J Trauma Acute Care Surg. 2015;78(5):1034–1038.
6. Cai Y, Sheng ZY, Liang SX. Radiosensitization effect of overexpres-sion of adenovirus-mediated SIRT6 on A549 non-small cell lung can-cer cells. Asian Pac J Cancer Prev. 2014;15(17):7297–7301.
7. Luhua W, Xiaolong F, Ming C, et al. Diagnosis and treatment of radi-ation-induced lung injury. Chin J Rad Oncol. 2015;24(1):4–9.
8. Zhixi Y, Chuanxi C. Analysis of clinical characteristics of radiation-induced lung injury in patients with non-small cell lung cancer. Chin J Clin Oncol Rehabil. 2015;22(1):7–8.
9. Jing J, Bingsheng W. Research progress of cytokines in radiation-induced lung injury. J Mod Oncol. 2016;24(3):488–491.
10. Cuiying Z, Hong S, Yanyang W, et al. Relationship among expression of TGFβ1, α-SMA, Col1a1 and FN mRNA in lung tissues of mice with radiation-induced lung injury. J Ningxia Univ. 2015;6(5):33–36.
11. Xin M, Qian Z, Yingmei L, et al. Experimental study on the protective effects of amifostine on radiation-induced lung injury in rats. Chin Oncol. 2013;23(1):1–9.
12. Weihua Y, Chunhua N, Hongmei X, et al. Experimental study on the effect of thalidomide on radiation-induced lung injury. J Mod Oncol. 2016;24(19):3012–3016.
13. Tingzhen X, Qichu Y, Jiaojiao A. Effect of polygonum cuspidate on plasma levels of TGF-β IL-6 and ACE in rats with radiation-induced lung injury. Chin J Trad Med Sci Technol. 2016;23(1):32–36.

Cite asZhou L, Wang S-B, Chen S-G, Qu Q, Rui J-A. The prognostic value and non-invasive predictors of splenomegaly in cirrhotic patients with hepatocellular carcinoma following curative resection. Adv Clin Exp Med. 2020;29(7):879–886. doi:10.17219/acem/81935
DOI10.17219/acem/81935
CopyrightCopyright by Author(s) This is an article distributed under the terms of the Creative Commons Attribution Non-Commercial License(http://creativecommons.org/licenses/by-nc-nd/4.0/)
Address for correspondenceLi ZhouE-mail: [email protected]
Funding sourcesNone declared
Conflict of interestNone declared
Received on September 8, 2017Reviewed on December 7, 2017Accepted on January 6, 2018
Published online on August 3, 2020
AbstractBackground. The prognostic value and non-invasive predictors of splenomegaly in cirrhotic patients with hepatocellular carcinoma (HCC) after curative resection remain unknown.
Objectives. To investigate the prognostic value and non-invasive predictors of splenomegaly in cirrhotic patients with HCC after curative resection.
Material and methods. The medical records of 78 patients with HCC and liver cirrhosis who underwent curative resection were retrospectively reviewed. The influence of spleen size, measured with clinically routine ultrasonography (USG), on overall and disease-free survival was evaluated using univariate and multivariate analyses. The efficiency of some frequently used blood-derived liver function parameters and non-invasive fibrosis markers to predict splenomegaly was also assessed.
Results. It was shown that tumor size >5 cm, the presence of microvascular invasion, tumor-node metastasis (TNM) stage III–IVA of the tumor, spleen size >11.45 cm, and age ≤52 years were associated with poor overall survival and/or disease-free survival in univariate analyses (all p < 0.05). In multivariate analyses, spleen size was identified as an independent predictor for both overall and disease-free survival (p < 0.001 and p = 0.012, respectively). On the other hand, platelet count, aspartate aminotransferase (AST) to platelet ratio index (APRI) and Fibrosis-4 index (FIB-4) scores were significantly different between small and large spleen groups (p = 0.026, 0.003 and 0.003, respectively), while statistical differences for albumin, alanine aminotransferase (ALT), AST, total bilirubin, AST to ALT ratio (AAR), and age-platelet index (API) were not found. Using receiver operating characteristic (ROC) curves, high powers of platelet count, APRI and FIB-4 in splenomegaly prediction were confirmed.
Conclusions. Splenomegaly, which can be predicted by some non-invasive variables, serves as a strong determinant for postresectional prognoses of cirrhotic patients with HCC.
Key words: splenomegaly, prognosis, hepatocellular carcinoma, non-invasive markers
Original papers
The prognostic value and non-invasive predictors of splenomegaly in cirrhotic patients with hepatocellular carcinoma following curative resection
Li ZhouA–F, Shao-Bin WangB, Shu-Guang ChenB, Qiang QuC, Jing-An RuiC–E
Department of General Surgery, Peking Union Medical College Hospital, Beijing, China
A – research concept and design; B – collection and/or assembly of data; C – data analysis and interpretation; D – writing the article; E – critical revision of the article; F – final approval of the article
Advances in Clinical and Experimental Medicine, ISSN 1899–5276 (print), ISSN 2451–2680 (online) Adv Clin Exp Med. 2020;29(7):879–886
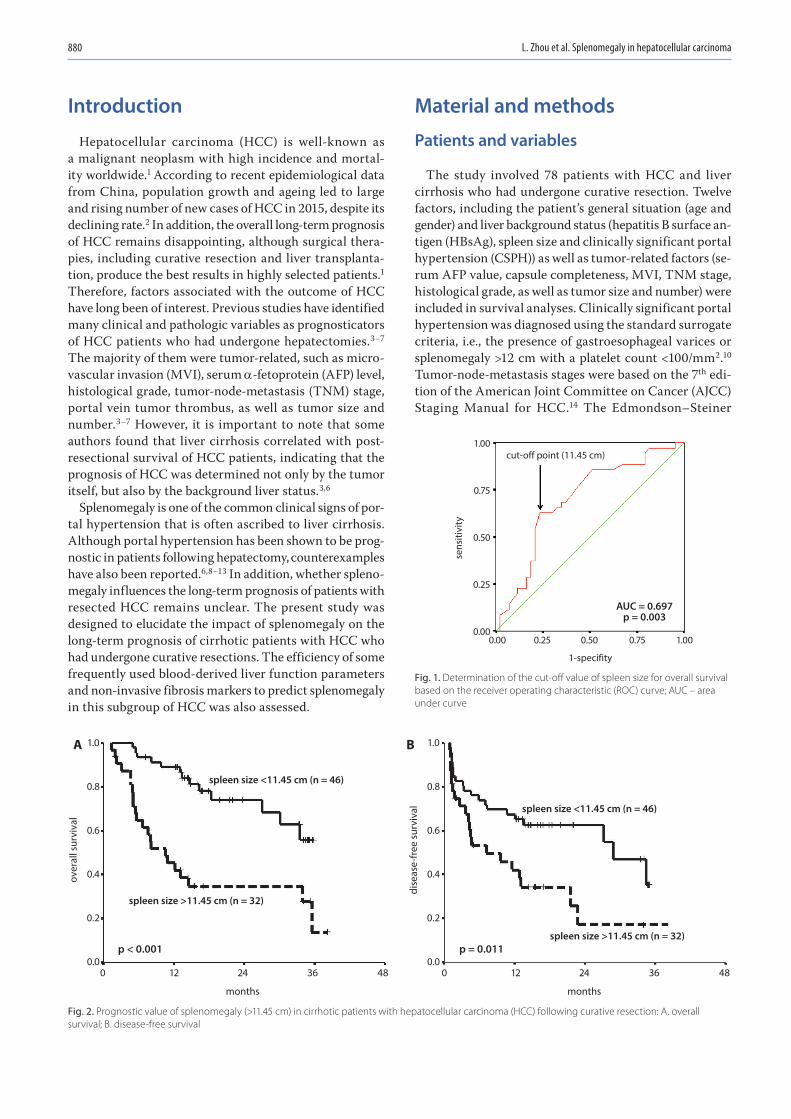
L. Zhou et al. Splenomegaly in hepatocellular carcinoma880
Introduction
Hepatocellular carcinoma (HCC) is well-known as a malignant neoplasm with high incidence and mortal-ity worldwide.1 According to recent epidemiological data from China, population growth and ageing led to large and rising number of new cases of HCC in 2015, despite its declining rate.2 In addition, the overall long-term prognosis of HCC remains disappointing, although surgical thera-pies, including curative resection and liver transplanta-tion, produce the best results in highly selected patients.1 Therefore, factors associated with the outcome of HCC have long been of interest. Previous studies have identified many clinical and pathologic variables as prognosticators of HCC patients who had undergone hepatectomies.3–7 The majority of them were tumor-related, such as micro-vascular invasion (MVI), serum α-fetoprotein (AFP) level, histological grade, tumor-node-metastasis (TNM) stage, portal vein tumor thrombus, as well as tumor size and number.3–7 However, it is important to note that some authors found that liver cirrhosis correlated with post-resectional survival of HCC patients, indicating that the prognosis of HCC was determined not only by the tumor itself, but also by the background liver status.3,6
Splenomegaly is one of the common clinical signs of por-tal hypertension that is often ascribed to liver cirrhosis. Although portal hypertension has been shown to be prog-nostic in patients following hepatectomy, counterexamples have also been reported.6,8–13 In addition, whether spleno-megaly influences the long-term prognosis of patients with resected HCC remains unclear. The present study was designed to elucidate the impact of splenomegaly on the long-term prognosis of cirrhotic patients with HCC who had undergone curative resections. The efficiency of some frequently used blood-derived liver function parameters and non-invasive fibrosis markers to predict splenomegaly in this subgroup of HCC was also assessed.
Material and methods
Patients and variables
The study involved 78 patients with HCC and liver cirrhosis who had undergone curative resection. Twelve factors, including the patient’s general situation (age and gender) and liver background status (hepatitis B surface an-tigen (HBsAg), spleen size and clinically significant portal hypertension (CSPH)) as well as tumor-related factors (se-rum AFP value, capsule completeness, MVI, TNM stage, histological grade, as well as tumor size and number) were included in survival analyses. Clinically significant portal hypertension was diagnosed using the standard surrogate criteria, i.e., the presence of gastroesophageal varices or splenomegaly >12 cm with a platelet count <100/mm2.10 Tumor-node-metastasis stages were based on the 7th edi-tion of the American Joint Committee on Cancer (AJCC) Staging Manual for HCC.14 The Edmondson–Steiner
Fig. 1. Determination of the cut-off value of spleen size for overall survival based on the receiver operating characteristic (ROC) curve; AUC – area under curve
Fig. 2. Prognostic value of splenomegaly (>11.45 cm) in cirrhotic patients with hepatocellular carcinoma (HCC) following curative resection: A. overall survival; B. disease-free survival
1-specifity
cut-off point (11.45 cm)
AUC = 0.697p = 0.003
sens
itivi
ty
0.00
1.00
0.75
0.50
0.25
0.000.25 0.50 0.75 1.00
0 12 24 36
months
480 12 24 36
months
48
1.0
0.8
0.6
0.4
0.2
0.0
A B
over
all s
urvi
val
1.0
0.8
0.6
0.4
0.2
0.0
dise
ase-
free
sur
viva
l
spleen size <11.45 cm (n = 46)
spleen size <11.45 cm (n = 46)
spleen size >11.45 cm (n = 32)
spleen size >11.45 cm (n = 32)p < 0.001 p = 0.011
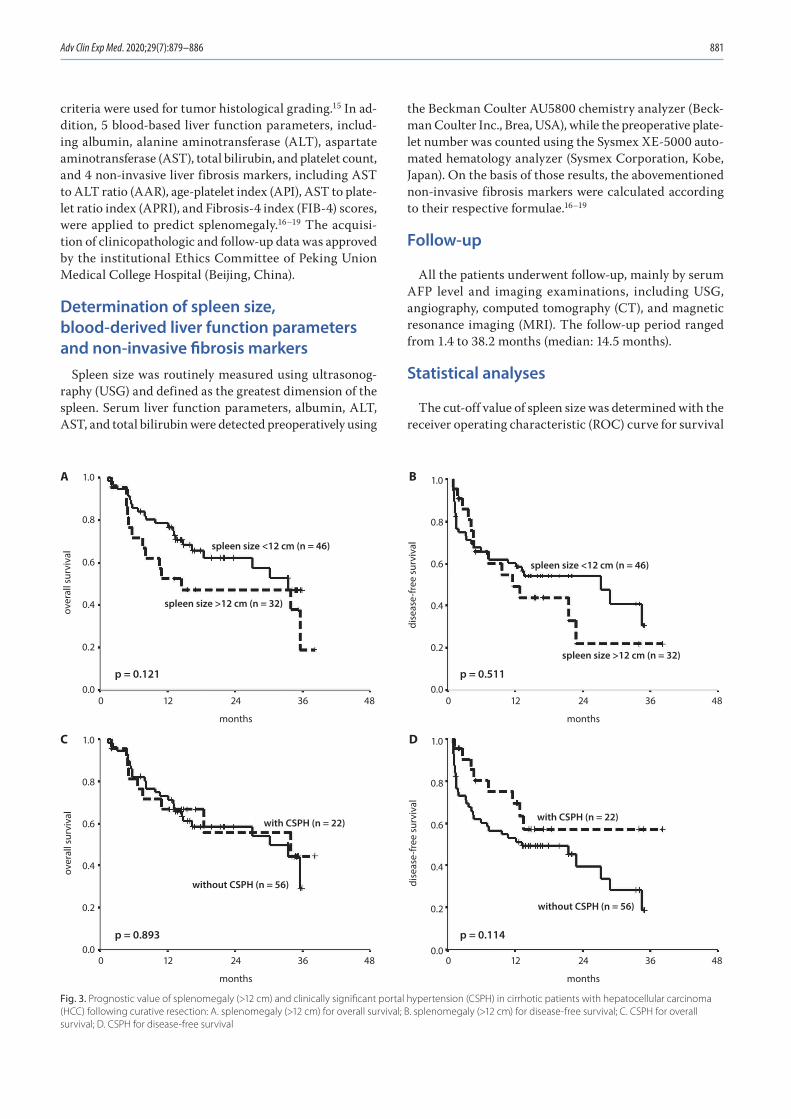
Adv Clin Exp Med. 2020;29(7):879–886 881
criteria were used for tumor histological grading.15 In ad-dition, 5 blood-based liver function parameters, includ-ing albumin, alanine aminotransferase (ALT), aspartate aminotransferase (AST), total bilirubin, and platelet count, and 4 non-invasive liver fibrosis markers, including AST to ALT ratio (AAR), age-platelet index (API), AST to plate-let ratio index (APRI), and Fibrosis-4 index (FIB-4) scores, were applied to predict splenomegaly.16–19 The acquisi-tion of clinicopathologic and follow-up data was approved by the institutional Ethics Committee of Peking Union Medical College Hospital (Beijing, China).
Determination of spleen size, blood-derived liver function parameters and non-invasive fibrosis markers
Spleen size was routinely measured using ultrasonog-raphy (USG) and defined as the greatest dimension of the spleen. Serum liver function parameters, albumin, ALT, AST, and total bilirubin were detected preoperatively using
the Beckman Coulter AU5800 chemistry analyzer (Beck-man Coulter Inc., Brea, USA), while the preoperative plate-let number was counted using the Sysmex XE-5000 auto-mated hematology analyzer (Sysmex Corporation, Kobe, Japan). On the basis of those results, the abovementioned non-invasive fibrosis markers were calculated according to their respective formulae.16–19
Follow-up
All the patients underwent follow-up, mainly by serum AFP level and imaging examinations, including USG, angiography, computed tomography (CT), and magnetic resonance imaging (MRI). The follow-up period ranged from 1.4 to 38.2 months (median: 14.5 months).
Statistical analyses
The cut-off value of spleen size was determined with the receiver operating characteristic (ROC) curve for survival
Fig. 3. Prognostic value of splenomegaly (>12 cm) and clinically significant portal hypertension (CSPH) in cirrhotic patients with hepatocellular carcinoma (HCC) following curative resection: A. splenomegaly (>12 cm) for overall survival; B. splenomegaly (>12 cm) for disease-free survival; C. CSPH for overall survival; D. CSPH for disease-free survival
0 12 24 36
months
480 12 24 36
months
48
0 12 24 36
months
480 12 24 36
months
48
1.0
0.8
0.6
0.4
0.2
0.0
A B
C D
over
all s
urvi
val
1.0
0.8
0.6
0.4
0.2
0.0
dise
ase-
free
sur
viva
l
1.0
0.8
0.6
0.4
0.2
0.0
over
all s
urvi
val
1.0
0.8
0.6
0.4
0.2
0.0
dise
ase-
free
sur
viva
lspleen size <12 cm (n = 46)
spleen size >12 cm (n = 32)
spleen size >12 cm (n = 32)
spleen size <12 cm (n = 46)
without CSPH (n = 56)
without CSPH (n = 56)
with CSPH (n = 22)with CSPH (n = 22)
p = 0.893 p = 0.114
p = 0.121 p = 0.511
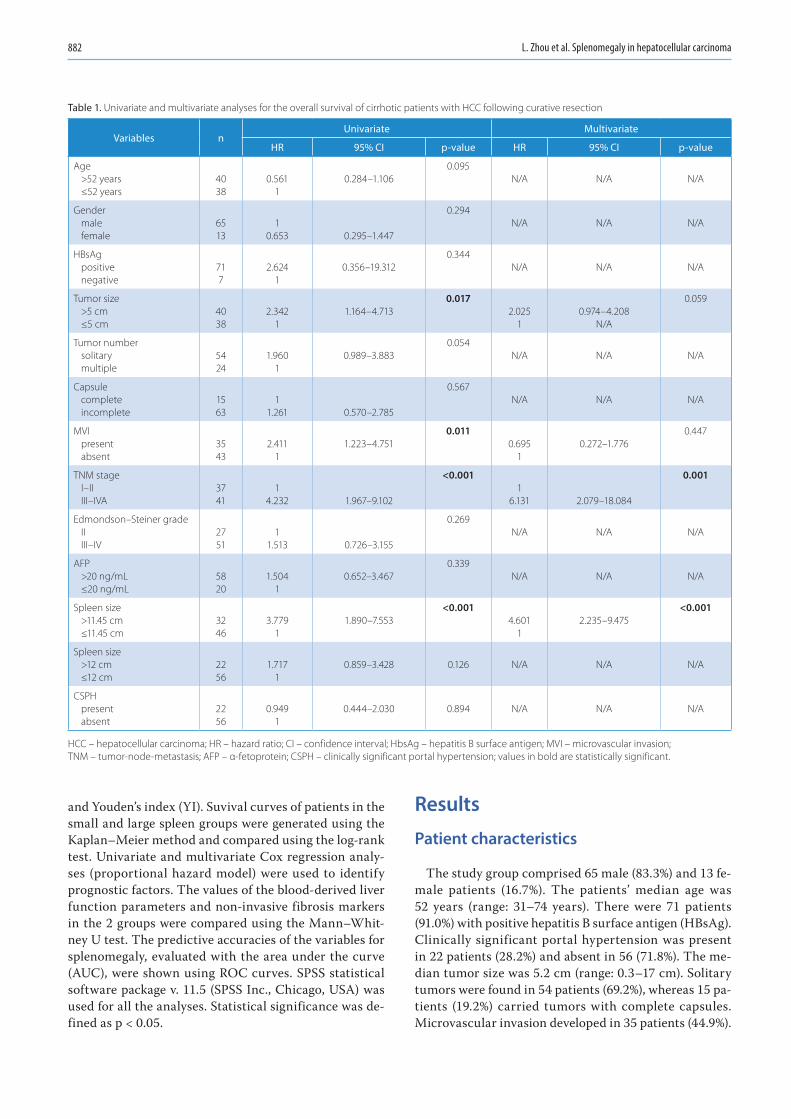
L. Zhou et al. Splenomegaly in hepatocellular carcinoma882
and Youden’s index (YI). Suvival curves of patients in the small and large spleen groups were generated using the Kaplan–Meier method and compared using the log-rank test. Univariate and multivariate Cox regression analy-ses (proportional hazard model) were used to identify prognostic factors. The values of the blood-derived liver function parameters and non-invasive fibrosis markers in the 2 groups were compared using the Mann–Whit-ney U test. The predictive accuracies of the variables for splenomegaly, evaluated with the area under the curve (AUC), were shown using ROC curves. SPSS statistical software package v. 11.5 (SPSS Inc., Chicago, USA) was used for all the analyses. Statistical significance was de-fined as p < 0.05.
Results
Patient characteristics
The study group comprised 65 male (83.3%) and 13 fe-male patients (16.7%). The patients’ median age was 52 years (range: 31–74 years). There were 71 patients (91.0%) with positive hepatitis B surface antigen (HBsAg). Clinically significant portal hypertension was present in 22 patients (28.2%) and absent in 56 (71.8%). The me-dian tumor size was 5.2 cm (range: 0.3–17 cm). Solitary tumors were found in 54 patients (69.2%), whereas 15 pa-tients (19.2%) carried tumors with complete capsules. Microvascular invasion developed in 35 patients (44.9%).
Table 1. Univariate and multivariate analyses for the overall survival of cirrhotic patients with HCC following curative resection
Variables nUnivariate Multivariate
HR 95% CI p-value HR 95% CI p-value
Age>52 years≤52 years
4038
0.5611
0.284–1.1060.095
N/A N/A N/A
Gendermalefemale
6513
10.653 0.295–1.447
0.294N/A N/A N/A
HBsAgpositivenegative
717
2.6241
0.356–19.3120.344
N/A N/A N/A
Tumor size>5 cm≤5 cm
4038
2.3421
1.164–4.7130.017
2.0251
0.974–4.208N/A
0.059
Tumor numbersolitarymultiple
5424
1.9601
0.989–3.8830.054
N/A N/A N/A
Capsule completeincomplete
1563
11.261 0.570–2.785
0.567N/A N/A N/A
MVI presentabsent
3543
2.4111
1.223–4.7510.011
0.6951
0.272–1.7760.447
TNM stage I–IIIII–IVA
3741
14.232 1.967–9.102
<0.0011
6.131 2.079–18.084
0.001
Edmondson–Steiner grade IIIII–IV
2751
11.513 0.726–3.155
0.269N/A N/A N/A
AFP >20 ng/mL≤20 ng/mL
5820
1.5041
0.652–3.4670.339
N/A N/A N/A
Spleen size>11.45 cm≤11.45 cm
3246
3.7791
1.890–7.553<0.001
4.6011
2.235–9.475<0.001
Spleen size>12 cm≤12 cm
2256
1.7171
0.859–3.428 0.126 N/A N/A N/A
CSPHpresentabsent
2256
0.9491
0.444–2.030 0.894 N/A N/A N/A
HCC – hepatocellular carcinoma; HR – hazard ratio; CI – confidence interval; HbsAg – hepatitis B surface antigen; MVI – microvascular invasion; TNM – tumor-node-metastasis; AFP – α-fetoprotein; CSPH – clinically significant portal hypertension; values in bold are statistically significant.
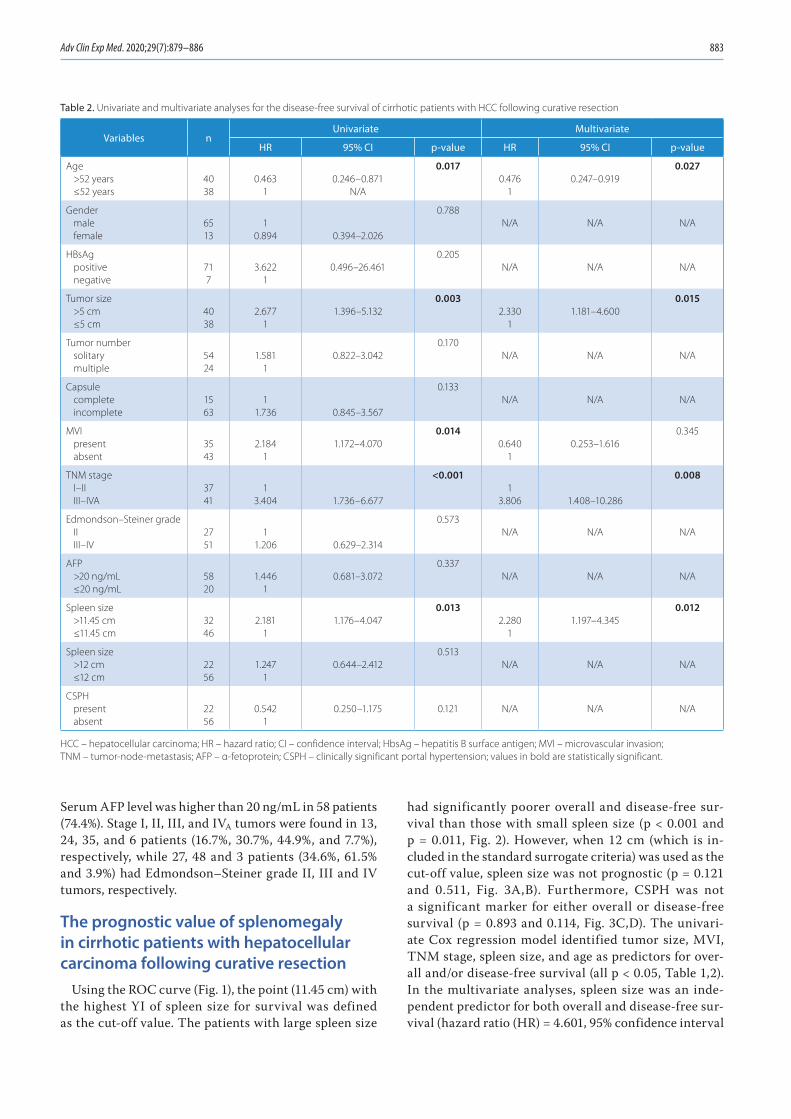
Adv Clin Exp Med. 2020;29(7):879–886 883
Serum AFP level was higher than 20 ng/mL in 58 patients (74.4%). Stage I, II, III, and IVA tumors were found in 13, 24, 35, and 6 patients (16.7%, 30.7%, 44.9%, and 7.7%), respectively, while 27, 48 and 3 patients (34.6%, 61.5% and 3.9%) had Edmondson–Steiner grade II, III and IV tumors, respectively.
The prognostic value of splenomegaly in cirrhotic patients with hepatocellular carcinoma following curative resection
Using the ROC curve (Fig. 1), the point (11.45 cm) with the highest YI of spleen size for survival was defined as the cut-off value. The patients with large spleen size
had significantly poorer overall and disease-free sur-vival than those with small spleen size (p < 0.001 and p = 0.011, Fig. 2). However, when 12 cm (which is in-cluded in the standard surrogate criteria) was used as the cut-off value, spleen size was not prognostic (p = 0.121 and 0.511, Fig. 3A,B). Furthermore, CSPH was not a significant marker for either overall or disease-free survival (p = 0.893 and 0.114, Fig. 3C,D). The univari-ate Cox regression model identified tumor size, MVI, TNM stage, spleen size, and age as predictors for over-all and/or disease-free survival (all p < 0.05, Table 1,2). In the multivariate analyses, spleen size was an inde-pendent predictor for both overall and disease-free sur-vival (hazard ratio (HR) = 4.601, 95% confidence interval
Table 2. Univariate and multivariate analyses for the disease-free survival of cirrhotic patients with HCC following curative resection
Variables nUnivariate Multivariate
HR 95% CI p-value HR 95% CI p-value
Age>52 years≤52 years
4038
0.4631
0.246–0.871N/A
0.0170.476
10.247–0.919
0.027
Gendermalefemale
6513
10.894 0.394–2.026
0.788N/A N/A N/A
HBsAgpositivenegative
717
3.6221
0.496–26.4610.205
N/A N/A N/A
Tumor size>5 cm≤5 cm
4038
2.6771
1.396–5.1320.003
2.3301
1.181–4.6000.015
Tumor numbersolitarymultiple
5424
1.5811
0.822–3.0420.170
N/A N/A N/A
Capsule completeincomplete
1563
11.736 0.845–3.567
0.133N/A N/A N/A
MVI presentabsent
3543
2.1841
1.172–4.0700.014
0.6401
0.253–1.6160.345
TNM stage I–IIIII–IVA
3741
13.404 1.736–6.677
<0.0011
3.806 1.408–10.286
0.008
Edmondson–Steiner grade IIIII–IV
2751
11.206 0.629–2.314
0.573N/A N/A N/A
AFP >20 ng/mL≤20 ng/mL
5820
1.4461
0.681–3.0720.337
N/A N/A N/A
Spleen size>11.45 cm≤11.45 cm
3246
2.1811
1.176–4.0470.013
2.2801
1.197–4.3450.012
Spleen size>12 cm≤12 cm
2256
1.2471
0.644–2.4120.513
N/A N/A N/A
CSPHpresentabsent
2256
0.5421
0.250–1.175 0.121 N/A N/A N/A
HCC – hepatocellular carcinoma; HR – hazard ratio; CI – confidence interval; HbsAg – hepatitis B surface antigen; MVI – microvascular invasion; TNM – tumor-node-metastasis; AFP – α-fetoprotein; CSPH – clinically significant portal hypertension; values in bold are statistically significant.
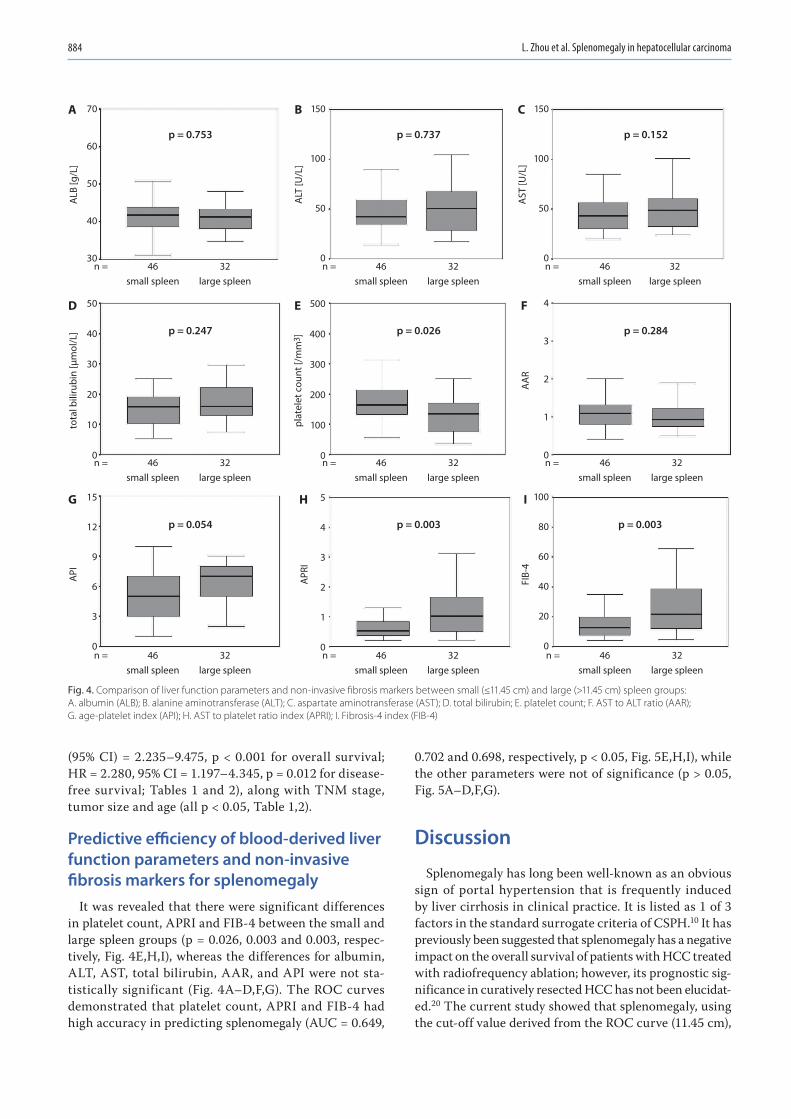
L. Zhou et al. Splenomegaly in hepatocellular carcinoma884
(95% CI) = 2.235–9.475, p < 0.001 for overall survival; HR = 2.280, 95% CI = 1.197–4.345, p = 0.012 for disease-free survival; Tables 1 and 2), along with TNM stage, tumor size and age (all p < 0.05, Table 1,2).
Predictive efficiency of blood-derived liver function parameters and non-invasive fibrosis markers for splenomegaly
It was revealed that there were significant differences in platelet count, APRI and FIB-4 between the small and large spleen groups (p = 0.026, 0.003 and 0.003, respec-tively, Fig. 4E,H,I), whereas the differences for albumin, ALT, AST, total bilirubin, AAR, and API were not sta-tistically significant (Fig. 4A–D,F,G). The ROC curves demonstrated that platelet count, APRI and FIB-4 had high accuracy in predicting splenomegaly (AUC = 0.649,
0.702 and 0.698, respectively, p < 0.05, Fig. 5E,H,I), while the other parameters were not of significance (p > 0.05, Fig. 5A–D,F,G).
Discussion
Splenomegaly has long been well-known as an obvious sign of portal hypertension that is frequently induced by liver cirrhosis in clinical practice. It is listed as 1 of 3 factors in the standard surrogate criteria of CSPH.10 It has previously been suggested that splenomegaly has a negative impact on the overall survival of patients with HCC treated with radiofrequency ablation; however, its prognostic sig-nificance in curatively resected HCC has not been elucidat-ed.20 The current study showed that splenomegaly, using the cut-off value derived from the ROC curve (11.45 cm),
Fig. 4. Comparison of liver function parameters and non-invasive fibrosis markers between small (≤11.45 cm) and large (>11.45 cm) spleen groups: A. albumin (ALB); B. alanine aminotransferase (ALT); C. aspartate aminotransferase (AST); D. total bilirubin; E. platelet count; F. AST to ALT ratio (AAR); G. age-platelet index (API); H. AST to platelet ratio index (APRI); I. Fibrosis-4 index (FIB-4)
46
A 70
60
50
40
30n = 32
small spleen
p = 0.753
ALB
[g/L
]
large spleen46
B 150
100
50
0n = 32
small spleen
p = 0.737
ALT
[U/L
]
C 150
100
50
0
AST
[U/L
]
large spleen46n = 32
small spleen
p = 0.152
large spleen
46
D 50
40
30
20
10
0n = 32
small spleen
p = 0.247
tota
l bili
rubi
n [µ
mol
/L]
large spleen46
E 500
400
300
200
100
0n = 32
small spleen
p = 0.026
plat
elet
cou
nt [/
mm
3 ]F 4
3
2
1
0
AA
R
large spleen46n = 32
small spleen
p = 0.284
large spleen
46
G 15
12
9
6
3
0n = 32
small spleen
p = 0.054
API
large spleen46
H 5
4
3
2
1
0n = 32
small spleen
p = 0.003 p = 0.003
APR
I
I 100
80
60
40
20
0
FIB-
4
large spleen46n = 32
small spleen large spleen
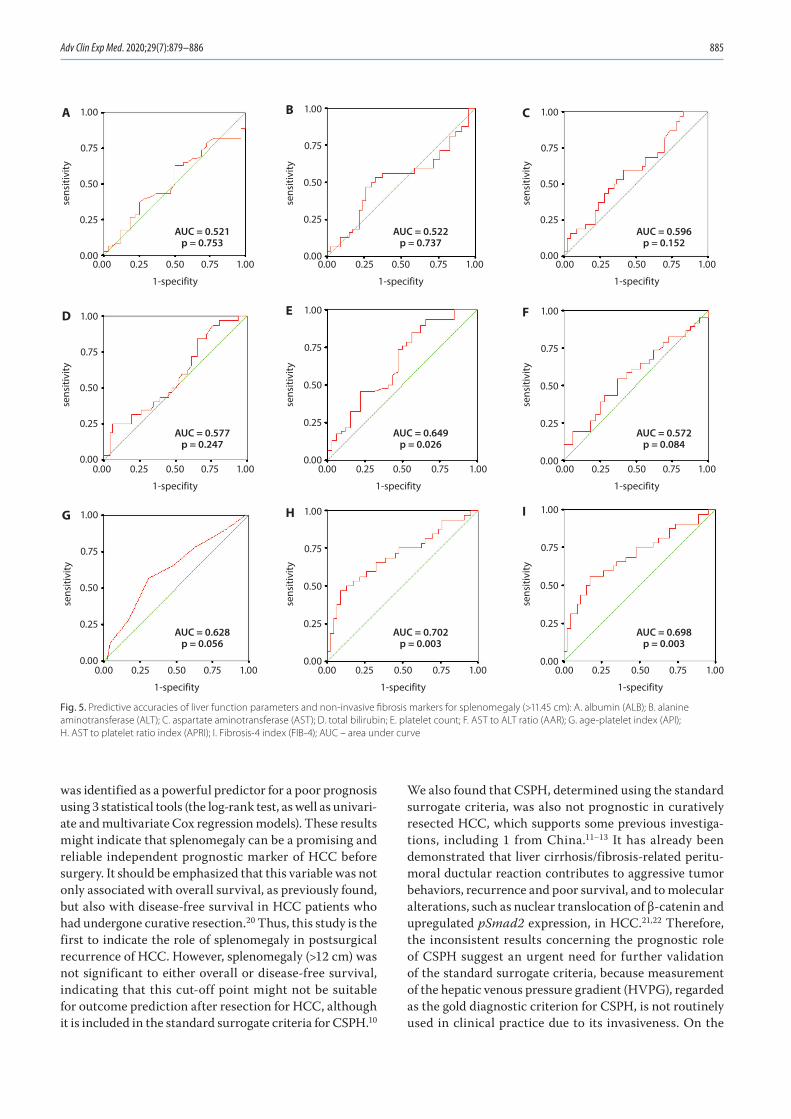
Adv Clin Exp Med. 2020;29(7):879–886 885
was identified as a powerful predictor for a poor prognosis using 3 statistical tools (the log-rank test, as well as univari-ate and multivariate Cox regression models). These results might indicate that splenomegaly can be a promising and reliable independent prognostic marker of HCC before surgery. It should be emphasized that this variable was not only associated with overall survival, as previously found, but also with disease-free survival in HCC patients who had undergone curative resection.20 Thus, this study is the first to indicate the role of splenomegaly in postsurgical recurrence of HCC. However, splenomegaly (>12 cm) was not significant to either overall or disease-free survival, indicating that this cut-off point might not be suitable for outcome prediction after resection for HCC, although it is included in the standard surrogate criteria for CSPH.10
We also found that CSPH, determined using the standard surrogate criteria, was also not prognostic in curatively resected HCC, which supports some previous investiga-tions, including 1 from China.11–13 It has already been demonstrated that liver cirrhosis/fibrosis-related peritu-moral ductular reaction contributes to aggressive tumor behaviors, recurrence and poor survival, and to molecular alterations, such as nuclear translocation of β-catenin and upregulated pSmad2 expression, in HCC.21,22 Therefore, the inconsistent results concerning the prognostic role of CSPH suggest an urgent need for further validation of the standard surrogate criteria, because measurement of the hepatic venous pressure gradient (HVPG), regarded as the gold diagnostic criterion for CSPH, is not routinely used in clinical practice due to its invasiveness. On the
Fig. 5. Predictive accuracies of liver function parameters and non-invasive fibrosis markers for splenomegaly (>11.45 cm): A. albumin (ALB); B. alanine aminotransferase (ALT); C. aspartate aminotransferase (AST); D. total bilirubin; E. platelet count; F. AST to ALT ratio (AAR); G. age-platelet index (API); H. AST to platelet ratio index (APRI); I. Fibrosis-4 index (FIB-4); AUC – area under curve
0.00
1.00
0.75
0.50
0.25
0.000.25 0.50 0.75 1.00
1-specifity
sens
itivi
ty
AUC = 0.521p = 0.753
A
0.00
1.00
0.75
0.50
0.25
0.000.25 0.50 0.75 1.00
1-specifityse
nsiti
vity
AUC = 0.522p = 0.737
B
0.00
1.00
0.75
0.50
0.25
0.000.25 0.50 0.75 1.00
1-specifity
sens
itivi
ty
AUC = 0.596p = 0.152
C
0.00
1.00
0.75
0.50
0.25
0.000.25 0.50 0.75 1.00
1-specifity
sens
itivi
ty
AUC = 0.577p = 0.247
D
0.00
1.00
0.75
0.50
0.25
0.000.25 0.50 0.75 1.00
1-specifity
sens
itivi
ty
AUC = 0.649p = 0.026
E
0.00
1.00
0.75
0.50
0.25
0.000.25 0.50 0.75 1.00
1-specifity
sens
itivi
ty
AUC = 0.572p = 0.084
F
0.00
1.00
0.75
0.50
0.25
0.000.25 0.50 0.75 1.00
1-specifity
sens
itivi
ty
AUC = 0.628p = 0.056
G
0.00
1.00
0.75
0.50
0.25
0.000.25 0.50 0.75 1.00
1-specifity
sens
itivi
ty
AUC = 0.702p = 0.003
H
0.00
1.00
0.75
0.50
0.25
0.000.25 0.50 0.75 1.00
1-specifity
sens
itivi
ty
AUC = 0.698p = 0.003
I
L. Zhou et al. Splenomegaly in hepatocellular carcinoma886
other hand, in comparison to total splenic volume calcu-lations based on 3D reconstructions of spleen CT data, measurements of spleen size using USG might be simpler, more convenient and easier to apply in clinical practice.20 Recently, it was shown that HVPG could be precisely pre-dicted by the CT-based liver/spleen volume ratio.23 In the future, determining whether USG could be used to predict HVPG might be of interest.
In addition, it was believed that the accuracy of USG-based spleen assessment could be significantly influenced by the examiner’s experience, especially due to irregular contours of the spleen and overlapping with bone, kidney or bowel gas.24 For inexperienced examiners or under dif-ficult conditions, variables to aid in assessments might be of particular significance. Thus far, many non-invasive markers for predicting liver fibrosis and cirrhosis, such as AAR, API, APRI, and FIB-4, have been developed, based mainly on platelet number, liver biochemical parameters and age, and have been shown to have strong predictive power.16–19 However, a counterexample was also shown.25 Previously, API, APRI, FIB-4, and the platelet number were found to be effectively predictive for splenomegaly in HCC patients who underwent radiofrequency ablation.20 The present study is the first validation of the efficiency of those parameters and routine liver function tests for splenomegaly in curatively resected HCC. Like Wu et al., we suggested that platelet number, APRI and FIB-4, unlike AAR, are significant variables, while albumin, ALT, AST, and total bilirubin are not of significance.20 However, the predictive power of API in resected HCC deserves to be further confirmed, because its p-values were very close to the statistical limit in both direct comparison and the ROC curve.
Conclusions
Our data indicated that splenomegaly (>11.45 cm), which can be predicted by some non-invasive variables, serves as a powerful determinant for postresectional prognoses of cirrhotic patients with HCC. However, the present work might be limited by its retrospective design and relatively small sample size. The unsatisfactory AUCs of significant parameters (around 0.7) might be associated with the lat-ter. In the future, further large-scale prospective studies that address these issues are expected.
References1. El-Serag HB. Hepatocellular carcinoma. N Engl J Med. 2011;365(12):
1118–1127.2. Chen W, Zheng R, Baade PD, et al. Cancer statistics in China, 2015.
CA Cancer J Clin. 2016;66(2):115–132.3. Kluger MD, Salceda JA, Laurent A, et al. Liver resection for hepa-
tocellular carcinoma in 313 Western patients: Tumor biology and underlying liver rather than tumor size drive prognosis. J Hepatol. 2015;62(5):1131–1140.
4. Chen HW, Shan L, Wan-Yee L, et al. Prognostic impact of hepatic resection for hepatocellular carcinoma. The role of the surgeon in achieving R0 resection: A retrospective cohort study. Int J Surg. 2015; 13:297–301.
5. Xu XS, Chen W, Miao RC, et al. Survival analysis of hepatocellular car-cinoma: A comparison between young patients and aged patients. Chin Med J (Engl). 2015;128(13):1793–1800.
6. Goh BK, Teo JY, Chan CY, et al. Importance of tumor size as a prog-nostic factor after partial liver resection for solitary hepatocellular carcinoma: Implications on the current AJCC staging system. J Surg Oncol. 2016;113(1):89–93.
7. Liu W, Wang K, Bao Q, Sun Y, Xing BC. Hepatic resection provided long-term survival for patients with intermediate and advanced-stage resectable hepatocellular carcinoma. World J Surg Oncol. 2016;14:62.
8. Ishizawa T, Hasegawa K, Aoki T, et al. Neither multiple tumors nor portal hypertension are surgical contraindications for hepatocellu-lar carcinoma. Gastroenterology. 2008;134(7):1908–1916.
9. Tang YH, Zhu WJ, Wen TF. Influence of clinically significant portal hypertension on hepatectomy for hepatocellular carcinoma: A meta-analysis. Asian Pac J Cancer Prev. 2014;15(4):1649–1654.
10. Berzigotti A, Reig M, Abraldes JG, Bosch J, Bruix J. Portal hypertension and the outcome of surgery for hepatocellular carcinoma in compen-sated cirrhosis: A systematic review and meta-analysis. Hepatology. 2015;61(2):526–536.
11. Cucchetti A, Ercolani G, Vivarelli M, et al. Is portal hypertension a con-traindication to hepatic resection? Ann Surg. 2009;250(6):922–928.
12. Santambrogio R, Kluger MD, Costa M, et al. Hepatic resection for hepatocellular carcinoma in patients with Child–Pugh’s A cirrhosis: Is clinical evidence of portal hypertension a contraindication? HPB (Oxford). 2013;15(1):78–84.
13. He W, Zeng Q, Zheng Y, et al. The role of clinically significant por-tal hypertension in hepatic resection for hepatocellular carcinoma patients: A propensity score-matching analysis. BMC Cancer. 2015; 15:263.
14. Cheng CH, Lee CF, Wu TH, et al. Evaluation of the new AJCC staging system for resectable hepatocellular carcinoma. World J Surg Oncol. 2011;9:114.
15. Edmondson HA, Steiner PE. Primary carcinoma of the liver: A study of 100 cases among 48,900 necropsies. Cancer. 1954;7(3):462–503.
16. Su CW, Chan CC, Hung HH, et al. Predictive value of aspartate ami-notransferase to alanine aminotransferase ratio for hepatic fibrosis and clinical adverse outcomes in patients with primary biliary cir-rhosis. J Clin Gastroenterol. 2009;43(9):876–883.
17. Poynard T, Bedossa P. Age and platelet count: A simple index for predicting the presence of histological lesions in patients with anti-bodies to hepatitis C virus. METAVIR and CLINIVIR Cooperative Study Groups. J Viral Hepat. 1997;4(3):199–208.
18. Wai CT, Greenson JK, Fontana RJ, et al. A simple noninvasive index can predict both significant fibrosis and cirrhosis in patients with chronic hepatitis C. Hepatology. 2003;38(2):518–526.
19. Vallet-Pichard A, Mallet V, Nalpas B, et al. FIB-4, an inexpensive and accurate marker of fibrosis in HCV infection: Comparison with liver biopsy and fibrotest. Hepatology. 2007;46(1):32–36.
20. Wu WC, Chiou YY, Hung HH, et al. Prognostic significance of com-puted tomography scan-derived splenic volume in hepatocellular carcinoma treated with radiofrequency ablation. J Clin Gastroenterol. 2012;46(9):789–795.
21. Xu M, Xie F, Qian G, et al. Peritumoral ductular reaction: A poor postop-erative prognostic factor for hepatocellular carcinoma. BMC Cancer. 2014;14:65.
22. Cai X, Li F, Zhang Q, et al. Peritumoral ductular reaction is related to nuclear translocation of β-catenin in hepatocellular carcinoma. Biomed Pharmacother. 2015;76:11–16.
23. Iranmanesh P, Vazquez O, Terraz S, et al. Accurate computed tomog-raphy-based portal pressure assessment in patients with hepatocel-lular carcinoma. J Hepatol. 2014;60(5):969–974.
24. Ishibashi H, Higuchi N, Shimamura R, Hirata Y, Kudo J, Niho Y. Sono-graphic assessment and grading of spleen size. J Clin Ultrasound. 1991;19(1):21–25.
25. Eminler AT, Ayyildiz T, Irak K, et al. AST/ALT ratio is not useful in pre-dicting the degree of fibrosis in chronic viral hepatitis patients. Eur J Gastroenterol Hepatol. 2015;27(12):1361–1366.
Cite asZhou L, Wang SB, Chen SG, Qu Q, Rui JA. Risk factors of recurrence and poor survival in curatively resected hepatocellular carcinoma with microvascular invasion. Adv Clin Exp Med. 2020;29(7):887–892. doi:10.17219/acem/76750
DOI10.17219/acem/76750
CopyrightCopyright by Author(s) This is an article distributed under the terms of the Creative Commons Attribution Non-Commercial License(http://creativecommons.org/licenses/by-nc-nd/4.0/)
Address for correspondenceLi ZhouE-mail: [email protected]
Funding sourcesNone declared
Conflict of interestNone declared
Received on April 18, 2017Reviewed on August 16, 2017Accepted on September 1, 2017
Published online on August 4, 2020
AbstractBackground. Microvascular invasion (MVI) is a significant sign of the invasive property and a strong predictor of poor prognosis in hepatocellular carcinoma (HCC), a life-threatening malignancy. However, recurrence-associated and post-surgical long-term prognosis-associated factors in HCC with MVI remain unknown.
Objectives. To address the abovementioned issues, based on a Chinese patient cohort with HCC after curative hepatic resection.
Material and methods. The patient cohort consisted of 62 consecutive patients with HCC and MVI who underwent curative hepatic resection. The associations between clinicopathologic variables and recurrence, as well as patient overall/disease-free survival, were uni- and multivariately evaluated.
Results. Univariate χ2 test identified hepatitis B surface antigen (HBsAg) positivity, high Edmondson–Steiner grade and male gender as risk factors of recurrence, whereas Edmondson–Steiner grade and HBsAg positivity were significant or marginally significant in the multivariate stepwise logistic regression analysis. Subsequently, univariate log-rank test showed that Edmondson–Steiner grade, HBsAg positivity and Child–Pugh grade were associated with overall and/or disease-free survival. Among them, the independent prognostic impact of Edmondson–Steiner grade and HBsAg positivity for both overall and disease-free survival were proven in the multivariate Cox regression analysis.
Conclusions. Our data suggested that Edmondson–Steiner grade and HBsAg positivity might serve as useful indicators of recurrence and pessimistic prognosis in HCC with MVI.
Key words: prognostic factor, recurrence, survival, hepatocellular carcinoma, hepatic resection
Original papers
Risk factors of recurrence and poor survival in curatively resected hepatocellular carcinoma with microvascular invasion
Li ZhouA–F, Shao-Bin WangB, Shu-Guang ChenB, Qiang QuC, Jing-An RuiC–E
Department of General Surgery, Chinese Academy of Medical Sciences/Peking Union Medical College, Beijing, China
A – research concept and design; B – collection and/or assembly of data; C – data analysis and interpretation; D – writing the article; E – critical revision of the article; F – final approval of the article
Advances in Clinical and Experimental Medicine, ISSN 1899–5276 (print), ISSN 2451–2680 (online) Adv Clin Exp Med. 2020;29(7):887–892
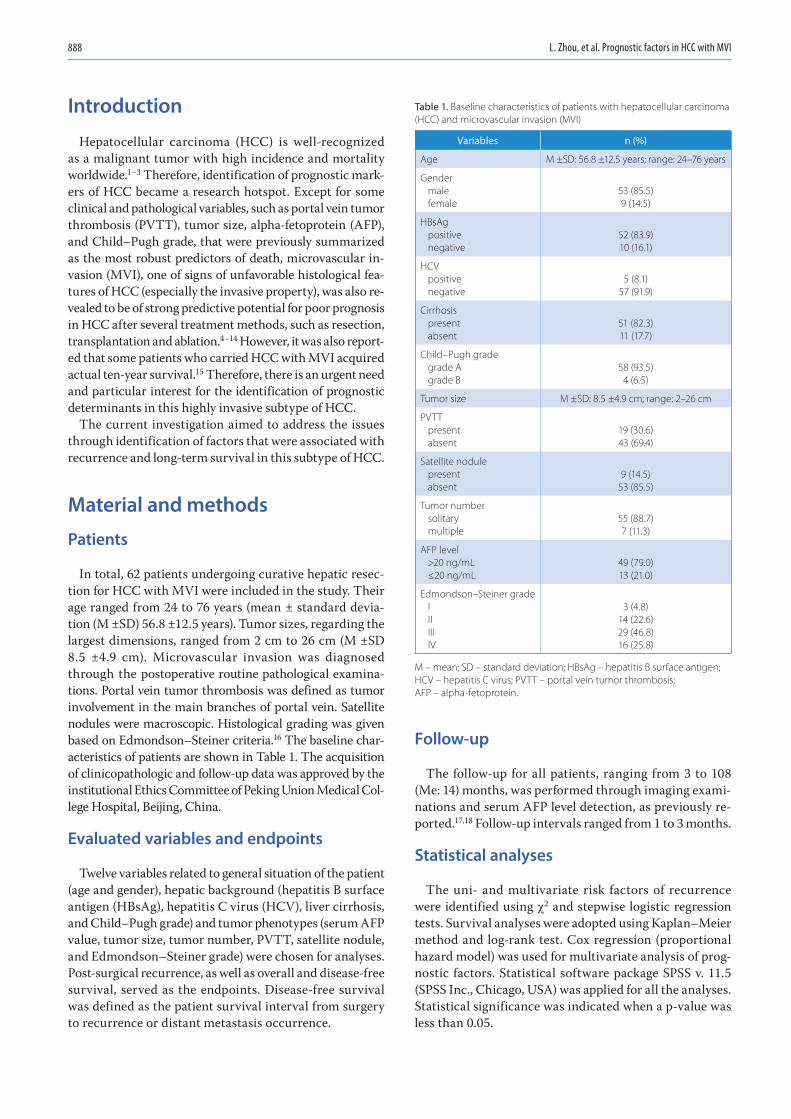
L. Zhou, et al. Prognostic factors in HCC with MVI888
Introduction
Hepatocellular carcinoma (HCC) is well-recognized as a malignant tumor with high incidence and mortality worldwide.1–3 Therefore, identification of prognostic mark-ers of HCC became a research hotspot. Except for some clinical and pathological variables, such as portal vein tumor thrombosis (PVTT), tumor size, alpha-fetoprotein (AFP), and Child–Pugh grade, that were previously summarized as the most robust predictors of death, microvascular in-vasion (MVI), one of signs of unfavorable histological fea-tures of HCC (especially the invasive property), was also re-vealed to be of strong predictive potential for poor prognosis in HCC after several treatment methods, such as resection, transplantation and ablation.4–14 However, it was also report-ed that some patients who carried HCC with MVI acquired actual ten-year survival.15 Therefore, there is an urgent need and particular interest for the identification of prognostic determinants in this highly invasive subtype of HCC.
The current investigation aimed to address the issues through identification of factors that were associated with recurrence and long-term survival in this subtype of HCC.
Material and methods
Patients
In total, 62 patients undergoing curative hepatic resec-tion for HCC with MVI were included in the study. Their age ranged from 24 to 76 years (mean ± standard devia-tion (M ±SD) 56.8 ±12.5 years). Tumor sizes, regarding the largest dimensions, ranged from 2 cm to 26 cm (M ±SD 8.5 ±4.9 cm). Microvascular invasion was diagnosed through the postoperative routine pathological examina-tions. Portal vein tumor thrombosis was defined as tumor involvement in the main branches of portal vein. Satellite nodules were macroscopic. Histological grading was given based on Edmondson–Steiner criteria.16 The baseline char-acteristics of patients are shown in Table 1. The acquisition of clinicopathologic and follow-up data was approved by the institutional Ethics Committee of Peking Union Medical Col-lege Hospital, Beijing, China.
Evaluated variables and endpoints
Twelve variables related to general situation of the patient (age and gender), hepatic background (hepatitis B surface antigen (HBsAg), hepatitis C virus (HCV), liver cirrhosis, and Child–Pugh grade) and tumor phenotypes (serum AFP value, tumor size, tumor number, PVTT, satellite nodule, and Edmondson–Steiner grade) were chosen for analyses. Post-surgical recurrence, as well as overall and disease-free survival, served as the endpoints. Disease-free survival was defined as the patient survival interval from surgery to recurrence or distant metastasis occurrence.
Follow-up
The follow-up for all patients, ranging from 3 to 108 (Me: 14) months, was performed through imaging exami-nations and serum AFP level detection, as previously re-ported.17,18 Follow-up intervals ranged from 1 to 3 months.
Statistical analyses
The uni- and multivariate risk factors of recurrence were identified using c2 and stepwise logistic regression tests. Survival analyses were adopted using Kaplan–Meier method and log-rank test. Cox regression (proportional hazard model) was used for multivariate analysis of prog-nostic factors. Statistical software package SPSS v. 11.5 (SPSS Inc., Chicago, USA) was applied for all the analyses. Statistical significance was indicated when a p-value was less than 0.05.
Table 1. Baseline characteristics of patients with hepatocellular carcinoma (HCC) and microvascular invasion (MVI)
Variables n (%)
Age M ±SD: 56.8 ±12.5 years; range: 24–76 years
Gendermalefemale
53 (85.5)9 (14.5)
HBsAgpositivenegative
52 (83.9)10 (16.1)
HCVpositivenegative
5 (8.1)57 (91.9)
Cirrhosispresentabsent
51 (82.3)11 (17.7)
Child–Pugh gradegrade Agrade B
58 (93.5)4 (6.5)
Tumor size M ±SD: 8.5 ±4.9 cm; range: 2–26 cm
PVTTpresentabsent
19 (30.6)43 (69.4)
Satellite nodulepresentabsent
9 (14.5)53 (85.5)
Tumor numbersolitarymultiple
55 (88.7)7 (11.3)
AFP level>20 ng/mL≤20 ng/mL
49 (79.0)13 (21.0)
Edmondson–Steiner gradeIIIIIIIV
3 (4.8)14 (22.6)29 (46.8)16 (25.8)
M – mean; SD – standard deviation; HBsAg – hepatitis B surface antigen; HCV – hepatitis C virus; PVTT – portal vein tumor thrombosis; AFP – alpha-fetoprotein.
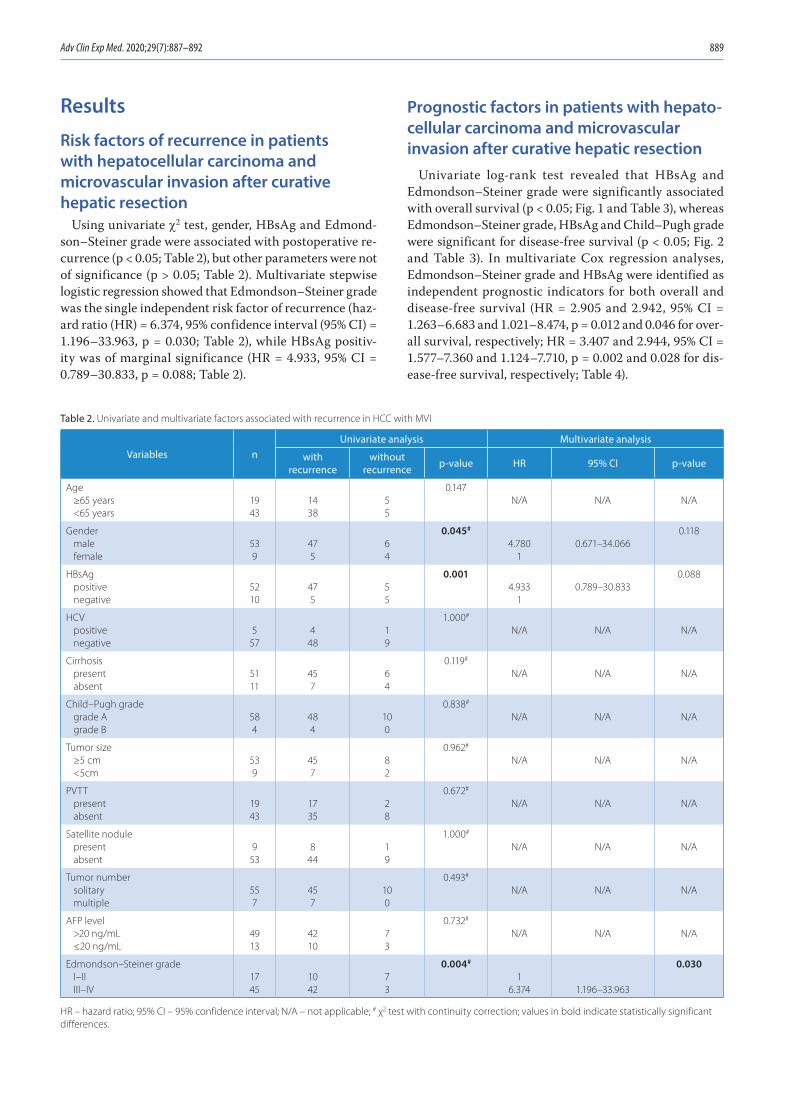
Adv Clin Exp Med. 2020;29(7):887–892 889
Results
Risk factors of recurrence in patients with hepatocellular carcinoma and microvascular invasion after curative hepatic resection
Using univariate c2 test, gender, HBsAg and Edmond-son–Steiner grade were associated with postoperative re-currence (p < 0.05; Table 2), but other parameters were not of significance (p > 0.05; Table 2). Multivariate stepwise logistic regression showed that Edmondson–Steiner grade was the single independent risk factor of recurrence (haz-ard ratio (HR) = 6.374, 95% confidence interval (95% CI) = 1.196–33.963, p = 0.030; Table 2), while HBsAg positiv-ity was of marginal significance (HR = 4.933, 95% CI = 0.789–30.833, p = 0.088; Table 2).
Prognostic factors in patients with hepato-cellular carcinoma and microvascular invasion after curative hepatic resection
Univariate log-rank test revealed that HBsAg and Edmondson–Steiner grade were significantly associated with overall survival (p < 0.05; Fig. 1 and Table 3), whereas Edmondson–Steiner grade, HBsAg and Child–Pugh grade were significant for disease-free survival (p < 0.05; Fig. 2 and Table 3). In multivariate Cox regression analyses, Edmondson–Steiner grade and HBsAg were identified as independent prognostic indicators for both overall and disease-free survival (HR = 2.905 and 2.942, 95% CI = 1.263–6.683 and 1.021–8.474, p = 0.012 and 0.046 for over-all survival, respectively; HR = 3.407 and 2.944, 95% CI = 1.577–7.360 and 1.124–7.710, p = 0.002 and 0.028 for dis-ease-free survival, respectively; Table 4).
Table 2. Univariate and multivariate factors associated with recurrence in HCC with MVI
Variables nUnivariate analysis Multivariate analysis
with recurrence
without recurrence p-value HR 95% CI p-value
Age≥65 years<65 years
1943
1438
55
0.147N/A N/A N/A
Gendermalefemale
539
475
64
0.045#
4.7801
0.671–34.0660.118
HBsAgpositivenegative
5210
475
55
0.0014.933
10.789–30.833
0.088
HCVpositivenegative
557
448
19
1.000#
N/A N/A N/A
Cirrhosispresentabsent
5111
457
64
0.119#
N/A N/A N/A
Child–Pugh gradegrade Agrade B
584
484
100
0.838#
N/A N/A N/A
Tumor size≥5 cm<5cm
539
457
82
0.962#
N/A N/A N/A
PVTTpresentabsent
1943
1735
28
0.672#
N/A N/A N/A
Satellite nodulepresentabsent
953
844
19
1.000#
N/A N/A N/A
Tumor numbersolitarymultiple
557
457
100
0.493#
N/A N/A N/A
AFP level>20 ng/mL≤20 ng/mL
4913
4210
73
0.732#
N/A N/A N/A
Edmondson–Steiner gradeI–IIIII–IV
1745
1042
73
0.004#
16.374 1.196–33.963
0.030
HR – hazard ratio; 95% CI – 95% confidence interval; N/A – not applicable; # χ2 test with continuity correction; values in bold indicate statistically significant differences.
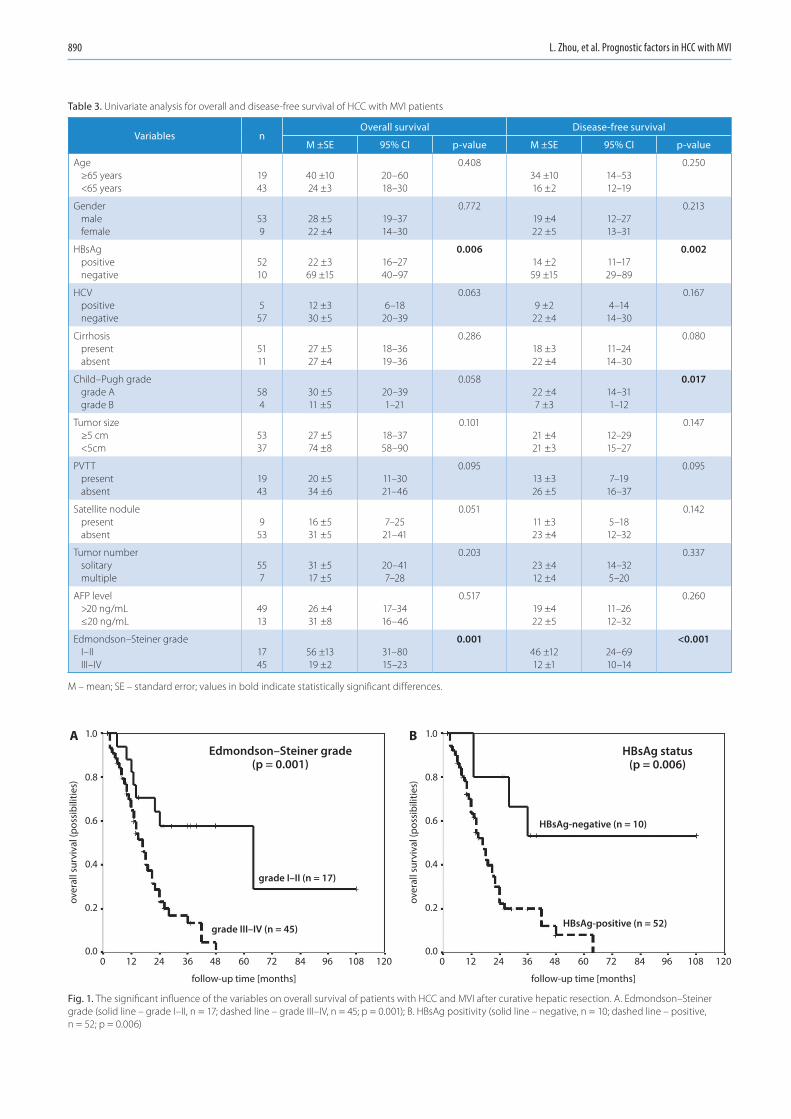
L. Zhou, et al. Prognostic factors in HCC with MVI890
Table 3. Univariate analysis for overall and disease-free survival of HCC with MVI patients
Variables nOverall survival Disease-free survival
M ±SE 95% CI p-value M ±SE 95% CI p-value
Age≥65 years<65 years
1943
40 ±1024 ±3
20–6018–30
0.40834 ±1016 ±2
14–5312–19
0.250
Gendermalefemale
539
28 ±522 ±4
19–3714–30
0.77219 ±422 ±5
12–2713–31
0.213
HBsAgpositivenegative
5210
22 ±369 ±15
16–2740–97
0.00614 ±259 ±15
11–1729–89
0.002
HCVpositivenegative
557
12 ±330 ±5
6–1820–39
0.0639 ±2
22 ±44–14
14–30
0.167
Cirrhosispresentabsent
5111
27 ±527 ±4
18–3619–36
0.28618 ±322 ±4
11–2414–30
0.080
Child–Pugh grade grade Agrade B
584
30 ±511 ±5
20–391–21
0.05822 ±47 ±3
14–311–12
0.017
Tumor size ≥5 cm<5cm
5337
27 ±574 ±8
18–3758–90
0.10121 ±421 ±3
12–2915–27
0.147
PVTT presentabsent
1943
20 ±534 ±6
11–3021–46
0.09513 ±326 ±5
7–1916–37
0.095
Satellite nodule presentabsent
953
16 ±531 ±5
7–2521–41
0.05111 ±323 ±4
5–1812–32
0.142
Tumor number solitarymultiple
557
31 ±517 ±5
20–417–28
0.20323 ±412 ±4
14–325–20
0.337
AFP level >20 ng/mL≤20 ng/mL
4913
26 ±431 ±8
17–3416–46
0.51719 ±422 ±5
11–2612–32
0.260
Edmondson–Steiner grade I–IIIII–IV
1745
56 ±1319 ±2
31–8015–23
0.00146 ±1212 ±1
24–6910–14
<0.001
M – mean; SE – standard error; values in bold indicate statistically significant differences.
Fig. 1. The significant influence of the variables on overall survival of patients with HCC and MVI after curative hepatic resection. A. Edmondson–Steiner grade (solid line – grade I–II, n = 17; dashed line – grade III–IV, n = 45; p = 0.001); B. HBsAg positivity (solid line – negative, n = 10; dashed line – positive, n = 52; p = 0.006)
1.0
0.8
0.6
0.4
0.2
0.00
A B
12 24 36
follow-up time [months]
Edmondson–Steiner grade(p = 0.001)
HBsAg status(p = 0.006)
HBsAg-negative (n = 10)
HBsAg-positive (n = 52)grade III–IV (n = 45)
grade I–II (n = 17)
over
all s
urvi
val (
poss
ibili
ties)
1.0
0.8
0.6
0.4
0.2
0.0
over
all s
urvi
val (
poss
ibili
ties)
48 60 72 84 96 108 120 0 12 24 36
follow-up time [months]
48 60 72 84 96 108 120
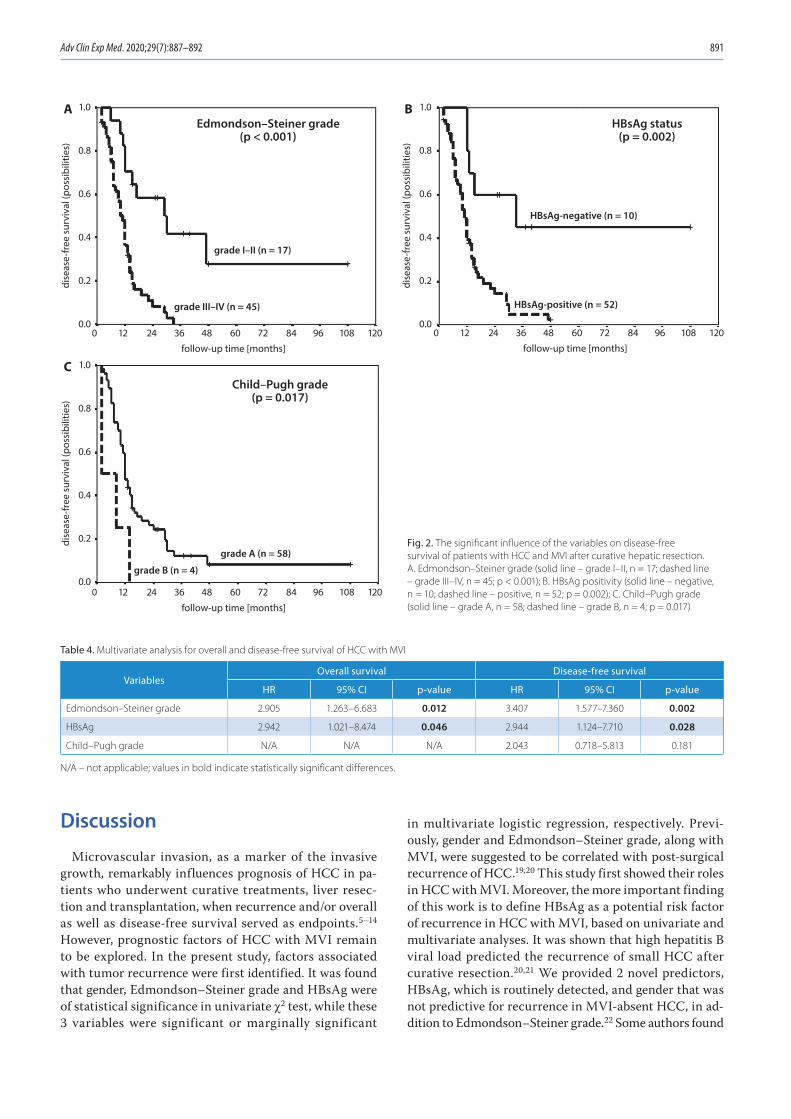
Adv Clin Exp Med. 2020;29(7):887–892 891
Discussion
Microvascular invasion, as a marker of the invasive growth, remarkably influences prognosis of HCC in pa-tients who underwent curative treatments, liver resec-tion and transplantation, when recurrence and/or overall as well as disease-free survival served as endpoints.5–14 However, prognostic factors of HCC with MVI remain to be explored. In the present study, factors associated with tumor recurrence were first identified. It was found that gender, Edmondson–Steiner grade and HBsAg were of statistical significance in univariate c2 test, while these 3 variables were significant or marginally significant
in multivariate logistic regression, respectively. Previ-ously, gender and Edmondson–Steiner grade, along with MVI, were suggested to be correlated with post-surgical recurrence of HCC.19,20 This study first showed their roles in HCC with MVI. Moreover, the more important finding of this work is to define HBsAg as a potential risk factor of recurrence in HCC with MVI, based on univariate and multivariate analyses. It was shown that high hepatitis B viral load predicted the recurrence of small HCC after curative resection.20,21 We provided 2 novel predictors, HBsAg, which is routinely detected, and gender that was not predictive for recurrence in MVI-absent HCC, in ad-dition to Edmondson–Steiner grade.22 Some authors found
Table 4. Multivariate analysis for overall and disease-free survival of HCC with MVI
VariablesOverall survival Disease-free survival
HR 95% CI p-value HR 95% CI p-value
Edmondson–Steiner grade 2.905 1.263–6.683 0.012 3.407 1.577–7.360 0.002
HBsAg 2.942 1.021–8.474 0.046 2.944 1.124–7.710 0.028
Child–Pugh grade N/A N/A N/A 2.043 0.718–5.813 0.181
N/A – not applicable; values in bold indicate statistically significant differences.
1.0
0.8
0.6
0.4
0.2
0.0
C
Edmondson–Steiner grade(p < 0.001)
Child–Pugh grade(p = 0.017)
HBsAg status(p = 0.002)
HBsAg-negative (n = 10)
HBsAg-positive (n = 52)grade III–IV (n = 45)
grade I–II (n = 17)
grade A (n = 58)
grade B (n = 4)
dise
ase-
free
sur
viva
l (po
ssib
ilitie
s)
1.0
0.8
0.6
0.4
0.2
0.0
A
dise
ase-
free
sur
viva
l (po
ssib
ilitie
s)
1.0
0.8
0.6
0.4
0.2
0.0
B
dise
ase-
free
sur
viva
l (po
ssib
ilitie
s)
0 12 24 36
follow-up time [months]
48 60 72 84 96 108 120
0 12 24 36
follow-up time [months]
48 60 72 84 96 108 120
0 12 24 36
follow-up time [months]
48 60 72 84 96 108 120
Fig. 2. The significant influence of the variables on disease-free survival of patients with HCC and MVI after curative hepatic resection. A. Edmondson–Steiner grade (solid line – grade I–II, n = 17; dashed line – grade III–IV, n = 45; p < 0.001); B. HBsAg positivity (solid line – negative, n = 10; dashed line – positive, n = 52; p = 0.002); C. Child–Pugh grade (solid line – grade A, n = 58; dashed line – grade B, n = 4; p = 0.017)
L. Zhou, et al. Prognostic factors in HCC with MVI892
the association between HBsAg positivity and high AFP level, whereas AFP is reported to be involved in many ma-lignant phenotypes of hepatoma cells, even in the activity of dendritic cells, through different mechanisms.23–25 Fur-thermore, the finding that knockdown of HBsAg expres-sion inhibits HCC growth provides the direct evidence for the role of HBsAg.26 Therefore, our results about HBsAg and tumor recurrence might have a molecular basis.
On the other hand, it is well-known that HCC carries unsatisfactory prognosis. Thus far, its prognostic indica-tors, including MVI, have been identified.4–14 However, prognostic indicators in HCC with MVI remain unclear and need in-depth exploration, because different survival status was also found in patients who carried HCC with MVI.15 Our results showed that HBsAg and Edmondson–Steiner grade univariately and multivariately predicted both overall and disease-free survival, in consistence with reports on other types of HCC.27,28 Considering the fact that these variables were independent or marginally in-dependent risk factors for recurrence, their impact on pa-tient survival of HCC with MVI might be understandable. Previously, the impact of HBsAg positivity on prognosis of HCC after radical or palliative therapies was also sug-gested.27 This study first links HBsAg and HCC with MVI. Here, the authors preliminarily speculate on the possible route of its action in this subtype of HCC, as this protein stimulates tumor growth, then facilitates recurrence, and finally causes worse prognosis. Of course, this hypothesis needs to be extensively validated.
Conclusions
Our data suggests that Edmondson–Steiner grade and HBsAg positivity might function as significant predictors for recurrence and poor prognosis in HCC with MVI after curative resection.
References1. Pisani P, Parkin DM, Bray F, Ferlay J. Estimating the world cancer bur-
den: Globocan 2000. Int J Cancer. 2001;94(2):153–156.2. Parkin DM, Bray F, Ferlay J, Pisani P. Global cancer statistics (2002).
CA Cancer J Clin. 2005;55(2):74–108.3. Chen W, Zheng R, Baade PD, et al. Cancer statistics in China (2015).
CA Cancer J Clin. 2016;66(2):115–132.4. Tandon P, Garcia-Tsao G. Prognostic indicators in hepatocellular carci-
noma: A systematic review of 72 studies. Liver Int. 2009;29(4):502–510.5. Ng KM, Yan TD, Black D, Chu FC, Morris DL. Prognostic determinants
for survival after resection/ablation of a large hepatocellular carci-noma. HPB (Oxford). 2009;11(4):311–320.
6. Belli G, Fantini C, Belli A, Limongelli P. Laparoscopic liver resection for hepatocellular carcinoma in cirrhosis: Long-term outcomes. Dig Surg. 2011;28(2):134–140.
7. Bertuzzo VR, Cescon M, Ravaioli M, et al. Analysis of factors affect-ing recurrence of hepatocellular carcinoma after liver transplanta-tion with a special focus on inflammation markers. Transplantation. 2011;91(11):1279–1285.
8. Lim KC, Chow PK, Allen JC, et al. Microvascular invasion is a better predictor of tumor recurrence and overall survival following surgi-cal resection for hepatocellular carcinoma compared to the Milan criteria. Ann Surg. 2011;254(1):108–113.
9. Fan ST, Poon RT, Yeung C, et al. Outcome after partial hepatectomy for hepatocellular cancer within the Milan criteria. Br J Surg. 2011; 98(9):1292–1300.
10. Adam R, Bhangui P, Vibert E, et al. Resection or transplantation for early hepatocellular carcinoma in a cirrhotic liver: Does size define the best oncological strategy? Ann Surg. 2012;256(6):883–891.
11. Shindoh J, Hasegawa K, Inoue Y, et al. Risk factors of post-operative recurrence and adequate surgical approach to improve long-term outcomes of hepatocellular carcinoma. HPB (Oxford). 2013;15(1):31–39.
12. Abdel-Wahab M, Sultan AM, Fathy OM, et al. Factors affecting recur-rence and survival after living donor liver transplantation for hepato-cellular carcinoma. Hepatogastroenterology. 2013;60(128):1847–1853.
13. Li SH, Wei W, Guo RP, et al. Long-term outcomes after curative resec-tion for patients with macroscopically solitary hepatocellular carci-noma without macrovascular invasion and an analysis of prognos-tic factors. Med Oncol. 2013;30(4):696.
14. Zhao H, Chen C, Fu X, et al. Prognostic value of a novel risk classifi-cation of microvascular invasion in patients with hepatocellular car-cinoma after resection. Oncotarget. 2017;8(3):5474–5486.
15. Zheng J, Kuk D, Gönen M, et al. Actual 10-year survivors after resection of hepatocellular carcinoma. Ann Surg Oncol. 2017;24(5):1358–1366.
16. Edmondson HA, Steiner PE. Primary carcinoma of the liver: A study of 100 cases among 48,900 necropsies. Cancer. 1954;7(3):462–503.
17. Zhou L, Rui JA, Wang SB, Chen SG, Qu Q. The significance of serum AFP cut-off values, 20 and 400 ng/mL in curatively resected patients with hepatocellular carcinoma and cirrhosis might be of difference. Hepatogastroenterology. 2012;59(115):840–843.
18. Zhou L, Rui JA, Wang SB, Chen SG, Qu Q. Risk factors of poor progno-sis and portal vein tumor thrombosis after curative resection of sol-itary hepatocellular carcinoma. Hepatobiliary Pancreat Dis Int. 2013; 12(1):68–73.
19. Jeng KS, Sheen IS, Tsai YC. Circulating messenger RNA of alpha-feto-protein: A possible risk factor of recurrence after resection of hepa-tocellular carcinoma. Arch Surg. 2004;139(10):1055–1060.
20. Qu LS, Jin F, Huang XW, Shen XZ. High hepatitis B viral load predicts recurrence of small hepatocellular carcinoma after curative resec-tion. J Gastrointest Surg. 2010;14(7):1111–1120.
21. Xia F, Lai EC, Lau WY, et al. High serum hyaluronic acid and HBV viral load are main prognostic factors of local recurrence after complete radiofrequency ablation of hepatitis B-related small hepatocellular carcinoma. Ann Surg Oncol. 2012;19(4):1284–1291.
22. Zhou L, Rui JA, Zhou WX, Wang SB, Chen SG, Qu Q. Edmondson –Steiner grade: A crucial predictor of recurrence and survival in hepa-tocellular carcinoma without microvascular invasion. Pathol Res Pract. 2017;213(7):824–830.
23. Peng SY, Chen WJ, Lai PL, Jeng YM, Sheu JC, Hsu HC. High alpha-fetoprotein level correlates with high stage, early recurrence and poor prognosis of hepatocellular carcinoma: Significance of hepati-tis virus infection, age, p53 and beta-catenin mutations. Int J Cancer. 2004;112(1):44–50.
24. Pardee AD, Shi J, Butterfield LH. Tumor-derived α-fetoprotein impairs the differentiation and T cell stimulatory activity of human dendritic cells. J Immunol. 2014;193(11):5723–5732.
25. Lu Y, Zhu M, Li W, et al. Alpha fetoprotein plays a critical role in pro-moting metastasis of hepatocellular carcinoma cells. J Cell Mol Med. 2016;20(3):549–558.
26. Xiangji L, Feng X, Qingbao C, et al. Knockdown of HBV surface anti-gen gene expression by a lentiviral microRNA-based system inhibits HBV replication and HCC growth. J Viral Hepat. 2011;18(9):653–660.
27. Peng ZW, Chen MS, Liang HH, et al. A case-control study compar-ing percutaneous radiofrequency ablation alone or combined with transcatheter arterial chemoembolization for hepatocellular carci-noma. Eur J Surg Oncol. 2010;36:257–263.
28. Liu XY, Xu JF. Liver resection for young patients with large hepatocel-lular carcinoma: A single center experience from China. World J Surg Oncol. 2014;12:175.
Cite asPu F, Feng J, Xia P. Association between heparin-binding hemagglutinin and tuberculosis. Adv Clin Exp Med. 2020;29(7):893–897. doi:10.17219/acem/121011
DOI10.17219/acem/121011
CopyrightCopyright by Author(s) This is an article distributed under the terms of theCreative Commons Attribution 3.0 Unported (CC BY 3.0)(https://creativecommons.org/licenses/by/3.0/)
Address for correspondencePing XiaE-mail: [email protected]
Funding sourcesThis work was supported by a research project of the Hubei Health and Family Planning Commission (grant No. WJ2017Z022), a research project of the Hubei Science and Technology Department (grant No. 2016CFB666), a research project of the Wu Jieping Medical Foundation (grant No. 320.6750.17566), a research project of the Wuhan Health and Family Planning Commission (grants No. WZ18Q05 and No. WX18Z20), and a research project of Wuhan No. 1 Hospital (Wuhan Integrated TCM & Western Medicine Hospital) (grant No. 2017Y01).
Conflict of interestNone declared
* Feifei Pu and Jing Feng have made equal contributions to this work.
Received on December 24, 2018Reviewed on April 24, 2020Accepted on April 24, 2020
Published online on July 31, 2020
AbstractThe current global burden of tuberculosis (TB) is one of the greatest challenges to public health, particularly in developing countries, and thus effective diagnostic methods and treatment options for TB remain a central topic in basic and clinical research. Heparin-binding hemagglutinin (HBHA)-specific immune responses have been linked to protection against TB. The binding of HBHA-coated beads to epithelial and endothelial cell layers may trigger transcytosis of the beads, which is the basis for extrapulmonary dissemination. In addition, HBHA has been confirmed as a potential diagnostic marker for TB, and it is important in developing new TB vaccines and anti-TB drugs. Recently, basic research on HBHA has been intensified. The HBHA application in the field of prevention and treatment should be further explored. In addition, the existing research achieve-ments have shown its broad application prospects. Currently, there are no relevant specialized products, and research should be accelerated. These products may contribute to the application of HBHA in the diagnosis, prevention and treatment of TB.
Key words: heparin-binding hemagglutinin, tuberculosis, diagnosis, treatment
Reviews
Association between heparin-binding hemagglutinin and tuberculosis
*Feifei PuA,B, *Jing FengD,E, Ping XiaE,F
Department of Orthopedics, Wuhan No. 1 Hospital (Wuhan Integrated TCM & Western Medicine Hospital), Tongji Medical College, Huazhong University of Science and Technology, China
A – research concept and design; B – collection and/or assembly of data; C – data analysis and interpretation; D – writing the article; E – critical revision of the article; F – final approval of the article
Advances in Clinical and Experimental Medicine, ISSN 1899–5276 (print), ISSN 2451–2680 (online) Adv Clin Exp Med. 2020;29(7):893–897
F. Pu, J. Feng, P. Xia. HBHA and tuberculosis894
Introduction
Tuberculosis (TB), an infectious disease caused by Myco-bacterium tuberculosis (Mtb), remains a global health problem, with an estimated 10.4 million incident cases of active TB (aTB) in 2015.1 It is a major infectious dis-ease that kills almost two million people every year, mostly in developing countries, where it poses a major health, social and economic burden.2 The development of improved, clinically sensitive, rapid, and economical diagnostic tests may provide a powerful tool to better control the epidemic. Recently, polymerase chain reaction (PCR)-based methods and automatic culture systems have been made available, and these methods are in extensive regular use in laboratories in developed countries.3 How-ever, these diagnostic systems are not suitable for field use. The idea to develop a test for TB diagnosis through a serological assay has been pursued for many decades, but the results so far have been poor. Many of the antigens which have been tested did not possess adequate sensitiv-ity or specificity, and these assays could not properly dis-tinguish between individuals vaccinated with the Myco-bacterium bovis bacillus Calmette–Guérin (BCG) vaccine or testing positive for purified protein derivative (PPD) and those with aTB.4
Recently, it has been demonstrated that several myco-bacterial proteins undergo a process of post-translational modification in mycobacteria, providing important im-munological properties. Among these proteins is hepa-rin-binding hemagglutinin (HBHA), which is methylated in lysine residues present at the C-terminus.5,6 Since the re-combinant proteins produced in Escherichia coli cannot be properly processed, the use of these antigens in sero-logical assays is precluded by the cumbersome procedures required to purify the native antigens. Recently, a rapid and effective system for the purification of methylated HBHA (mHBHA) has been developed, and the use of these proteins in such assays is now feasible.7 The HBHA plays an important role during infection, especially during ex-trapulmonary dissemination to other systems in the hu-man host. It has also been investigated as a potential diagnostic tool for latent TB, as a possible vaccine and as a booster of BCG immunity, probably by inducing cy-tokines that may contribute to the generation of T helper 1 (Th1) effector memory lymphocytes. The HBHA is known to bind to heparin.
The HBHA of Mtb, a dissemination factor that has been identified as an immunodominant antigen able to induce interferon gamma (IFNγ), is associated with protection against TB.8 This surface protein interacts with non-phagocytic cells, attaches to sulfated glycoconjugates, and has the ability to agglutinate red blood cells.9,10 The specific methylation of the antigen has been shown to be impor-tant in mounting an immune response against this anti-gen, and it has been suggested that HBHA can be used in IFNγ release assays (IGRAs) to diagnose Mtb infection
or to discriminate between the active and latent forms of the disease. Current preclinical strategies involve ad-ministering the HBHA vaccine as a booster following vac-cination with BCG.11
Material and methods
A systematic search of electronic databases, including PubMed, EMBASE and Google Scholar, was performed in order to identify relevant articles (published until No-vember 21, 2018) characterizing the role of HBHA in TB. To maximize the number of eligible articles, the following keywords were used in combination: [HEPARIN-BINDING HEMAGGLUTININ], [HBHA] and [TUBERCULOSIS]. Additional studies were sought from the references of all the articles retrieved; only studies examining HBHA in TB were included, while non-English language studies and review articles were excluded.
Two independent reviewers screened all the titles and abstracts, and disagreements related to inclusion or ex-clusion of a particular study were resolved through con-sensus. Once the study was selected for inclusion based on its title and abstract, the full text was further screened by 2 independent reviewers. A total of 88 articles were identified.
Discussion
Biochemical characteristics of HBHA
The encoding gene of hbha is approx. 600 bp long, and the corresponding protein is composed of 199 amino ac-ids. The molecular mass is about 28,000 Da. The HBHA contains 3 domains: a transmembrane domain composed of 18 amino acid residues at the N-terminus, a helical re-gion containing 81 amino acid residues of curly helical type, and it can be modified by methylation after trans-lation into the C-terminal junction.12,13 The N-terminal transmembrane region was inserted into the surface mem-brane to fix HBHA to the lipid membrane of the surface of the bacteria, thereby enhancing virulence, while the C-terminal domain plays an important role in mediating combination and sulfating the polysaccharide receptor.9,10
The HBHA can form a homodimer or polymer. The mo-lecular weight of HBHA was measured using force micros-copy.14 Peaks represent HBHA forming dimers or poly-mers. At the same time, it is also found that similar effects exist in viable bacteria that produce HBHA. This phenom-enon was not found in the hbha gene deletion mutant. Combined with the fact that HBHA mediates bacterial agglutination, it is speculated that a dimer or a polymer is formed through the interaction of the source HBHA and body agglutination. Methylation prevents the hydrolysis of HBHA protein.15
Adv Clin Exp Med. 2020;29(7):893–897 895
Expression of HBHA in different carriers
Although it is generally accepted that the interac-tion of Mtb with alveolar macrophages is a key step in the pathogenesis of TB, interactions with other cell types, especially epithelial cells, may also be important.16 In this study, we characterized the molecular proper-ties of mycobacterial HBHA, a protein that functions as an adhesin for epithelial cells.17 The gene was cloned from Mtb and M. bovis BCG, and the sequence was found to be identical between the 2 species. The calculated re-sult was smaller than the finding from SDS/PAGE analy-sis; this difference may be due to the Lys/Pro-rich repeats of the C-terminal end of the protein and to a putative carbohydrate moiety. Glycosylation of HBHA appears to protect the protein from proteolytic degradation, which results in the removal of the C-terminal Lys/Pro-rich region responsible for binding HBHA to sulfated carbo-hydrates.18 Evidence suggests that glycosylation is also important for HBHA-mediated hemagglutination and for certain immunological properties of the protein. Finally, the absence of a signal peptide in the coding region of HBHA raises the possibility that this protein is not secreted through the general secretory pathway.
The Mtb and M. bovis BCG HBHA is required for ex-trapulmonary dissemination, and laminin-binding pro-tein (LBP) is involved in cytoadherence through laminin recognition.19,20 These adhesins bear post-translational modifications that are not present when the proteins are produced in a recombinant (r) form in E. coli. Mass spec-trometry analysis of HBHA reveals that the post-transla-tional modifications are borne by the C-terminal moiety, which comprises the heparin-binding domain consisting of repeated lysine-rich motifs. Amino acid sequencing showed that these modifications consist of mono- and dimethyllysines within these motifs. The methyllysine-containing repeats were recognized by mAb 4057D2 and were also detected in LBP, which is also recognized by mAb 4057D2. This antibody does not recognize the recombi-nant forms of these proteins. However, when recombinant HBHA (rHBHA) and rLBP were subjected to NaOH and formalin treatment to induce lysine methylation, reactiv-ity with mAb 4057D2 was recovered. Methylated rHBHA displayed enhanced resistance to proteolysis compared with unmethylated rHBHA, as previously observed for native HBHA. S-adeno sylmethionine-dependent HBHA methyltransferase activity was detected in the cell-wall fractions of M. bovis BCG and of Mycobacterium smegma-tis, a species that produces LBP but naturally lacks HBHA, suggesting that the same enzyme methylates both LBP and HBHA. This hypothesis was confirmed by the fact that HBHA produced by recombinant M. smegmatis was also methylated. These results show that mycobacteria use enzymatic methylation of lysines to ensure greater stability of their adhesins.
A recombinant M. smegmatis strain that overexpressed HBHA under the control of a strong furA promoter was constructed to discriminate IGRAs between aTB and latent tuberculosis infection (LTBI). The methylated ac-tivity of the purified protein was verified using hybrid-ization with anti-methylated Lys antibody, and mHBHA was further evaluated for antigen-specific IFNγ responses in a BCG-vaccinated Chinese population. Taken together, evaluation of the immune response to mHBHA can dis-criminate between healthy LTBI cases and aTB patients.
Infection and pathogenesis of HBHA and M. tuberculosis
By virtue of their position at the crossroads between the innate and adaptive immune response, macrophages play an essential role in the control of bacterial infections. Paradoxically, macrophages serve as the natural habitat of Mtb. The Mtb subverts the macrophage’s mechanisms of intracellular killing and antigen presentation, ultimately leading to the development of TB. The HBHA, a viru-lence factor involved in extrapulmonary dissemination and a strong diagnostic antigen for TB, is both surface-associated and secreted. Disruption of the hbha gene led to the restoration of impairment in infected macrophages, resulting in reduced apoptosis. Taken together, the data suggests that HBHA may act as a strong pathogenic fac-tor to cause apoptosis of professional phagocytes infected with Mtb.21 A recent study suggested that HBHA induces cytosolic [Ca(2+)]i, which influences the generation of re-active oxygen species (ROS) associated with the produc-tion of pro-inflammatory cytokines. These concerted and complex cellular responses induce endoplasmic reticu-lum stress-associated apoptosis during HBHA stimulation in macrophages. These results indicate that the endoplas-mic reticulum stress pathway contributes significantly to HBHA-induced apoptosis during mycobacterial infection.22
Importantly, in vitro studies have demonstrated that the Mtb hbha and esxA gene products HBHA and ESAT6 directly or indirectly influence alveolar epithelial cell sur-vival.23 In vitro assays with the recombinant histone-like protein and HBHA, which are considered to be major my-cobacterial adhesins, confirmed their function of promot-ing bacterial attachment to epithelial cells. In addition, these experiments suggested that the airway epithelium may act as a reservoir and/or portal of entry for Myco-bacterium leprae in humans.24 A previous study used im-munoblotting to examine the humoral immune responses of aTB patients against triton-soluble proteins extracted from Mtb. Of interest, the pooled sera from TB patients that contained anti-HBHA IgM antibodies neutralized the entry of Mtb into epithelial cells. These findings sug-gest that IgM antibodies against HBHA may help protect against extrapulmonary dissemination.25
F. Pu, J. Feng, P. Xia. HBHA and tuberculosis896
Detection of HBHA in tuberculosis immunology
In recent years, T-cell-based IGRAs have been developed for immunodiagnosis of Mtb infection. Currently, these assays do not discriminate between disease and latency. Therefore, more promising antigens and diagnostic tools are continuously being searched for TB immunodiagnos-tics. The HBHA is a surface protein of Mtb, which pro-motes bacterial aggregation and adhesion to non-phago-cytic cells. It has been previously assumed that the native, methylated form of this protein would be a promising an-tigen to discriminate between latent and active infection. A pilot investigation was performed to study the humoral and T-cell-mediated immunological responses to recom-binant HBHA produced in M. smegmatis and to synthetic peptides in patients with recent or past TB, with atypical mycobacteriosis, and in healthy, vaccinated individuals. T-cell reactivity to HBHA was compared to the respec-tive reactivity toward PPD and 2 surface-secreted pro-teins, i.e., early secretory antigen target-6 (ESAT-6) and culture filtrate protein-10 (CFP-10).26 The preliminary results indicate that methylated rHBHA induced a strong T-cell-mediated immune response and the production of IgG and IgM-class antibodies in all patient groups, most surprisingly in young Finnish vaccinees. They observed a positive correlation between the reactivity to HBHA and non-specific PPD among the entire study population. As expected, ESAT-6 and CFP-10 were the most powerful antigens to distinguish between disease and immunity caused by vaccination.27 On the basis of this exploratory investigation, we raise concerns that in countries like Fin-land, where BCG vaccination was routinely used, HBHA may not be sufficient for diagnostics because of the in-ability to explicitly discriminate between TB infection and immunoreactivity caused by previous BCG vaccination.28
The IGRAs based on region of difference 1 (RD1) anti-gens have improved the diagnosis of Mtb infection. How-ever, IGRAs of these antigens cannot distinguish between aTB and LTBI. The Mtb HBHA induces relatively high IFNγ responses in LTBI individuals and low responses in aTB patients, but purification of the native methylated HBHA from Mtb cultures for immunological tests is com-plex and time-consuming. The study showed that T-cell responses against mHBHA were always lower in aTB pa-tients than in LTBI individuals, regardless of the site of in-fection or the results of bacteriological tests. This allowed for a high discrimination between these 2 groups of Mtb-infected individuals, even in the BCG-vaccinated and high-TB-incidence setting of China. Additionally, the combina-tion of mHBHA and RD 1 antigens in an IGRA enhanced the diagnostic efficacy for aTB cases. Taken together, inclu-sion of the immune response to mHBHA can differentiate between healthy LTBI cases and aTB patients.15
In a recent study, 165 outpatients and 133 healthy volun-teers were included in an investigation of the role of HBHA
in TB diagnosis, including serodiagnostic tests and IGRAs. None of the healthy volunteers had been BCG-vaccinated, including 73 individuals with PPD (−) and 60 with PPD (+) (i.e., P−B− and P+B−). Of all 165 outpatients, 77 had pulmonary tuberculosis (PTB) and 88 had extrapulmo-nary tuberculosis (EPTB). The HBHA protein was used for serodiagnostic tests and IGRAs in peripheral blood mononuclear cells. They found that HBHA serodiag-nostic tests with IGRAs had a limited potential for use as auxiliary tools for the differential diagnosis of PTB and EPTB, because both methods showed low sensitivity and specificity.29
Conclusions and future prospects
Tuberculosis is one of the greatest challenges to pub-lic health, particularly in developing countries, and thus effective diagnostic methods and treatment options for TB remain a central topic in basic and clinical research. The HBHA-specific immune responses have been linked to protection against TB. Lately, the investigation of HBHA in basic research has been intensified. The HBHA appli-cation in the field of prevention and treatment should be further explored. In addition, recent findings have shown its broad application prospects. Currently, there are no rele-vant specialized products, and research should be accel-erated. These products may contribute to the application of HBHA in the diagnosis, prevention and treatment of TB.
ORCID iDsFeifei Pu https://orcid.org/0000-0002-9174-8780Jing Feng https://orcid.org/0000-0001-9895-6534Ping Xia https://orcid.org/0000-0002-5544-3082
References1. Wang Y, Wang Q, Zhu R, et al. Trends of spinal tuberculosis research
(1994–2015): A bibliometric study. Medicine (Baltimore). 2016;95(38): e4923.
2. Kumar K. Spinal tuberculosis: Natural history of disease, classifica-tions and principles of management with historical perspective. Eur J Orthop Surg Traumatol. 2016;26(6):551–558.
3. Chen CH, Chen YM, Lee CW, Chang YJ, Cheng CY, Hung JK. Early diagnosis of spinal tuberculosis. J Formos Med Assoc. 2016;115(10): 825–836.
4. Nagashima H, Tanishima S, Tanida A. Diagnosis and management of spinal infections. J Orthop Sci. 2018;23(1):8–13.
5. De Maio F, Squeglia F, Goletti D, Delogu G. The mycobacterial HBHA protein: A promising biomarker for tuberculosis. Curr Med Chem. 2018;26(11):2051–2060. doi:10.2174/0929867325666181029165805
6. Raze D, Verwaerde C, Deloison G, et al. Heparin-binding hemagglu-tinin adhesin (HBHA) is involved in intracytosolic lipid inclusions for-mation in Mycobacteria. Front Microbiol. 2018;9:2258.
7. Sali M, Buonsenso D, D’Alfonso P, et al. Combined use of Quantiferon and HBHA-based IGRA supports tuberculosis diagnosis and therapy management in children. J Infect. 2018;77(6):526–533.
8. Loxton AG, Black GF, Stanley K, Walzl G. Heparin-binding hemaggluti-nin induces IFN-γ(+) IL-2(+) IL-17(+) multifunctional CD4(+) T cells during latent but not active tuberculosis disease. Clin Vaccine Immunol. 2012; 19(5):746–751.
9. Lanfranconi MP, Alvarez HM. Functional divergence of HBHA from Mycobacterium tuberculosis and its evolutionary relationship with TadA from Rhodococcus opacus. Biochimie. 2016;127:241–248.
Adv Clin Exp Med. 2020;29(7):893–897 897
10. Huang TY, Irene D, Zulueta MM, et al. Structure of the complex between a heparan sulfate octasaccharide and mycobacterial heparin-binding hemagglutinin. Angew Chem Int Ed Engl. 2017;56(15):4192–4196.
11. Segura-Cerda CA, Aceves-Sánchez MJ, Marquina-Castillo B, et al. Immune response elicited by two rBCG strains devoid of genes involved in c-di-GMP metabolism affect protection versus challenge with M. tuberculosis strains of different virulence. Vaccine. 2018;36(16): 2069–2078.
12. Delogu G, Brennan MJ. Functional domains present in the mycobac-terial hemagglutinin, HBHA. J Bacteriol. 1999;181(24):7464–7469.
13. Biet F, de Melo Marques MA, Grayon M, et al. Mycobacterium smegmatis produces an HBHA homologue which is not involved in epi-thelial adherence. Microbes Infect. 2007;9(2):175–182.
14. Esposito C, Cantisani M, D’Auria G, et al. Mapping key interactions in the dimerization process of HBHA from Mycobacterium tuberculosis, insights into bacterial agglutination. FEBS Lett. 2012;586(6):659–667.
15. Wen HL, Li CL, Li G, et al. Involvement of methylated HBHA expressed from Mycobacterium smegmatis in an IFN-γ release assay to aid discrim-ination between latent infection and active tuberculosis in BCG-vacci-nated populations. Eur J Clin Microbiol Infect Dis. 2017;36(8):1415–1423.
16. Raze D, Verwaerde C, Deloison G, Berisio R. A structural overview of mycobacterial adhesins: Key biomarkers for diagnostics and ther-apeutics. Protein Sci. 2018;27(2):369–380.
17. Silva CA, Danelishvili L, McNamara M, et al. Interaction of Mycobacterium leprae with human airway epithelial cells: Adherence, entry, sur-vival, and identification of potential adhesins by surface proteome analysis. Infect Immun. 2013;81(7):2645–2659.
18. Lefrancois LH, Bodier CC, Lecher S, et al. Purification of native HBHA from Mycobacterium avium subsp. paratuberculosis. BMC Res Notes. 2013;6:55.
19. Pethe K, Bifani P, Drobecq H, et al. Mycobacterial heparin-binding hemagglutinin and laminin-binding protein share antigenic methyl-lysines that confer resistance to proteolysis. Proc Natl Acad Sci U S A. 2002;99(16):10759–10764.
20. Pethe K, Puech V, Daffé M, et al. Mycobacterium smegmatis laminin-binding glycoprotein shares epitopes with Mycobacterium tuberculosis heparin-binding haemagglutinin. Mol Microbiol. 2001;39(1):89–99.
21. Sohn H, Kim JS, Shin SJ, et al. Targeting of Mycobacterium tuberculosis heparin-binding hemagglutinin to mitochondria in macrophages. PLoS Pathog. 2011;7(12):e1002435.
22. Choi JA, Lim YJ, Cho SN, et al. Mycobacterial HBHA induces endo-plasmic reticulum stress-mediated apoptosis through the genera-tion of reactive oxygen species and cytosolic Ca2+ in murine mac-rophage RAW 264.7 cells. Cell Death Dis. 2013;4(12):e957.
23. Pavlicek RL, Fine-Coulson K, Gupta T, et al. Rv 3351c, a Mycobacterium tuberculosis gene that affects bacterial growth and alveolar epi-thelial cell viability. Can J Microbiol. 2015;61(12):938–947.
24. Silva CA, Danelishvili L, McNamara M, et al. Interaction of Mycobacterium leprae with human airway epithelial cells: Adherence, entry, sur-vival, and identification of potential adhesins by surface proteome analysis. Infect Immun. 2013;81(7):2645–2659.
25. Shin AR, Lee KS, Lee JS, et al. Mycobacterium tuberculosis HBHA pro-tein reacts strongly with the serum immunoglobulin M of tubercu-losis patients. Clin Vaccine Immunol. 2006;13(8):869–875.
26. Dirix V, Schepers K, Massinga-Loembe M, et al. Added value of long-term cytokine release assays to detect Mycobacterium tuberculosis infection in HIV-infected subjects in Uganda. J Acquir Immune Defic Syndr. 2016;72(3):344–352.
27. Hutchinson P, Barkham TM, Tang W, Kemeny DM, Bin-Eng Chee C, Wang YT. Measurement of phenotype and absolute number of cir-culating heparin-binding hemagglutinin, ESAT-6 and CFP-10, and purified protein derivative antigen-specific CD4 T cells can discrim-inate active from latent tuberculosis infection. Clin Vaccine Immunol. 2015;22(2):200–212.
28. Savolainen L, Pusa L, Kim HJ, Sillanpää H, Seppälä I, Tuuminen T. Pilot study of diagnostic potential of the Mycobacterium tuberculosis recombinant HBHA protein in a vaccinated population in Finland. PLoS One. 2008;(9):e3272.
29. Sun Z, Nie L, Zhang X, Li Y, Li C. Mycobacterial heparin-binding hae-magglutinin adhesion-induced interferon & antibody for detection of tuberculosis. Indian J Med Res. 2011;133(4):421–425.


![Vincentiana Vol. 29, No. 2-3 [Full Issue] - Via Sapientiae](https://static.fdokumen.com/doc/165x107/631e53945ff22fc74506a45c/vincentiana-vol-29-no-2-3-full-issue-via-sapientiae.jpg)