2020 Resident Survey Report - Ottawa County
18
Ottawa County Parks and Recreation Commission 2020 Resident Survey Report
-
Upload
khangminh22 -
Category
Documents
-
view
0 -
download
0
Transcript of 2020 Resident Survey Report - Ottawa County
Ottawa County Parks and Recreation Commission
2020 Resident Survey Report
2020 Resident Survey Report
Prepared by: Ottawa County Planning & Performance Improvement (July 2020)
Page 2
Table of Contents
Page:
3. Introduction & Methodology
4. Survey Results
4. Demographics of Respondents
7. Park Usage and Recreation Data
10.Survey Goal 1: Gauge residents’ perception and satisfaction with the overall parks system
11. Survey Goal 2: Ensure long-term goals of the Plan reflect the desire of the community
16. Survey Goal 3: Gauge residents’ support for the County Parks’ funding model/millage
18. Summary of Survey Results
19. Appendix: Open-ended survey responses
2020 Resident Survey Report
Prepared by: Ottawa County Planning & Performance Improvement (July 2020)
Page 3
Introduction
This survey of Ottawa County residents was conducted to help build and guide the Ottawa County Parks & Recreation Commission’s five-year Parks, Recreation & Open Space Plan that will be released in 2021. The goals of the survey include:
• Gauge residents' perception and satisfaction with the overall parks system.• Ensure long-term goals of the Plan reflect the desire of the community.• Gauge residents' support for the County Parks' funding model/millage.
This collaborative project between the Ottawa County Parks and Recreation Department and the Ottawa County Planning and Performance Improvement Department resulted in 4,471 survey responses from Ottawa County residents.
Methodology
Survey responses were collected electronically from March 10 through June 30, 2020 using Qualtrics. The survey was promoted to county residents through a number of channels including the Ottawa County Parks newsletter, Ottawa County website, GovDelivery, press releases, Facebook and Instagram posts, and through partner organization promotions. After identifying the need to diversify demographics of participants, special attention was given to promotion through partner organizations. Despite this, the demographics of survey respondents are not representative of Ottawa County’s population demographics.
The survey results were obtained using a non-probability convenience sample of Ottawa County residents. As a result, the results of the survey represent the perceptions of the Ottawa County residents who opted to participate. The survey results may not be representative of all county residents.
A resident survey was also conducted in 2015 as part of the five-year Parks, Recreation & Open Space Plan that was released in 2016. However, comparability between 2015 survey results and this survey are limited for two reasons. The first limitation is that the phrasing of some questions and answer options changed from 2015 to 2020. The second limitation is that both surveys involved a convenience sample design which is not representative of the Ottawa County resident population. Regardless, 2015 survey comparisons and any notable changes in respondent feedback that occurred between the 2015 and 2020 surveys are included throughout the report. Notable changes are defined as a 10 percentage point increase or decrease in the percent of respondents who answered “Strongly agree”/”Somewhat agree” or “Much more needed”/”More needed.”
Survey responses were exported from Qualtrics into Excel and SPSS for cleaning, coding, and analysis purposes. Survey data was cross tabulated with demographic and recreation data from survey respondents and any notable findings are included throughout the report. Notable findings are defined as a 10 percentage point deviation from the response provided by all respondents.
2020 Resident Survey Report
Prepared by: Ottawa County Planning & Performance Improvement (July 2020)
Page 4
Survey Results
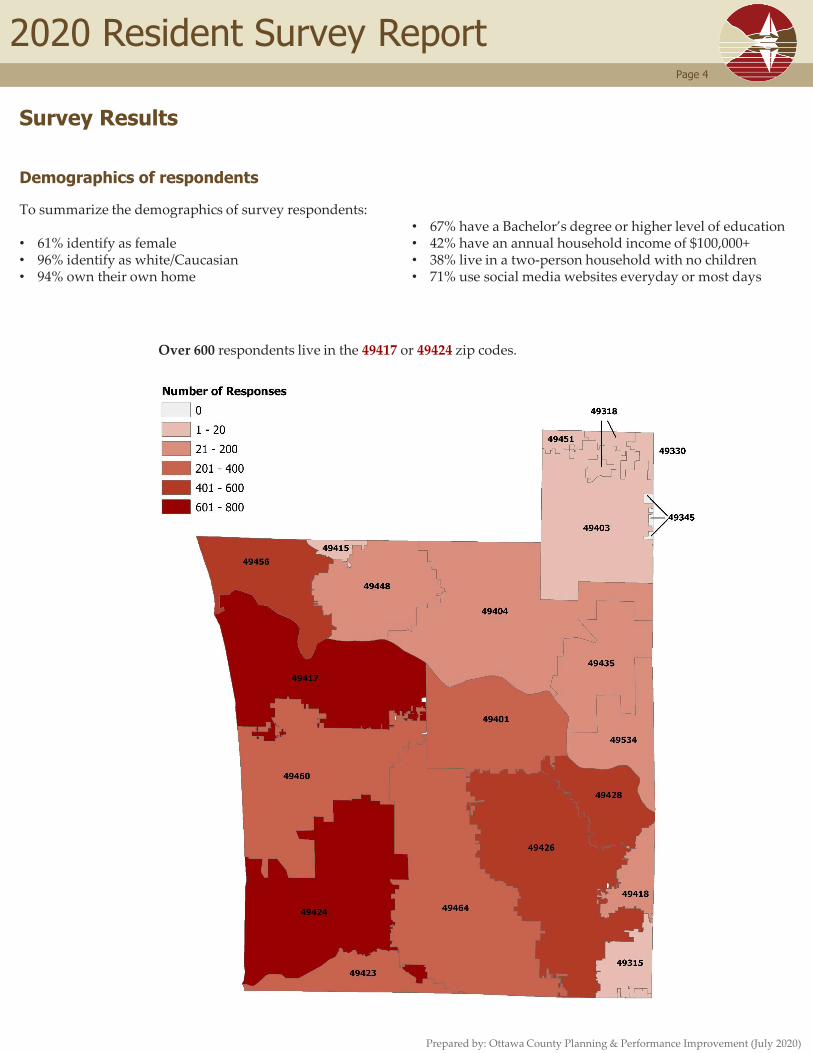
Demographics of respondents
To summarize the demographics of survey respondents:
• 61% identify as female• 96% identify as white/Caucasian • 94% own their own home
• 67% have a Bachelor’s degree or higher level of education• 42% have an annual household income of $100,000+• 38% live in a two-person household with no children• 71% use social media websites everyday or most days
Over 600 respondents live in the 49417 or 49424 zip codes.
2020 Resident Survey Report
Prepared by: Ottawa County Planning & Performance Improvement (July 2020)
Page 5
Use every day
or most days
71%
Use a few times a
week or less
29%
Use every day
or most days
86%
Use a few
times a
week or less
14%
96%
2%
1%
< 1%
< 1%
< 1%
White/Caucasian
Multiple ethnicity/other ethnicity
Hispanic
Asian/Pacific Islander
American Indian or Alaskan Native
Black or African American
4%
16%
22%
21%
21%
13%
2%
< 1%
75 or older
65 - 74
55 - 64
45 - 54
35 - 44
25 - 34
18 - 24
17 or under
61%
39%
< 1%
Female
Male
Other gender identity
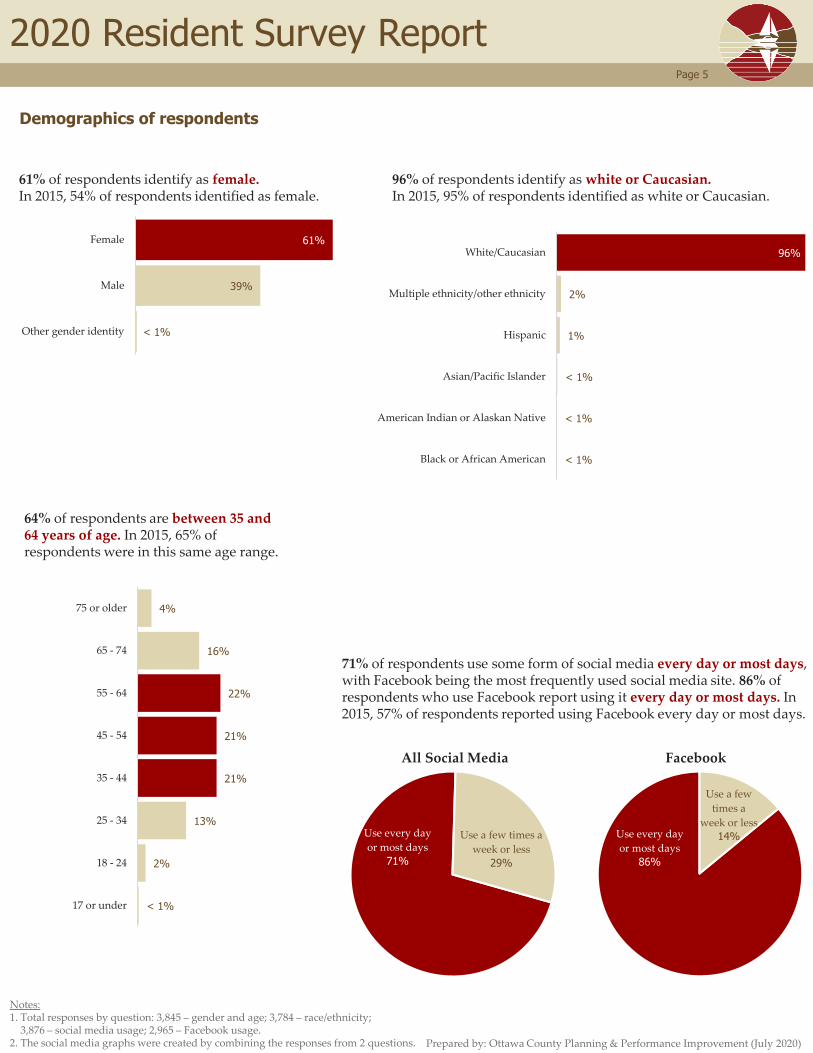
Demographics of respondents
64% of respondents are between 35 and 64 years of age. In 2015, 65% of respondents were in this same age range.
96% of respondents identify as white or Caucasian.In 2015, 95% of respondents identified as white or Caucasian.
61% of respondents identify as female.In 2015, 54% of respondents identified as female.
71% of respondents use some form of social media every day or most days, with Facebook being the most frequently used social media site. 86% of respondents who use Facebook report using it every day or most days. In 2015, 57% of respondents reported using Facebook every day or most days.
All Social Media Facebook
Notes:1. Total responses by question: 3,845 – gender and age; 3,784 – race/ethnicity;
3,876 – social media usage; 2,965 – Facebook usage.2. The social media graphs were created by combining the responses from 2 questions.
2020 Resident Survey Report
Prepared by: Ottawa County Planning & Performance Improvement (July 2020)
Page 6
27%
40%
22%
3%
7%
< 1%
< 1%
Master's degree or higher
Bachelor's degree
Some college
Non-college post high school training
High school graduate
GED
Less than a high school degree or GED
15%
27%
10%
8%
10%
7%
7%
6%
4%
3%
2%
1%
More than $150k
$100-149k
$90-99k
$80-89k
$70-79k
$60-69k
$50-59k
$40-49k
$30-39k
$20-29k
$10-19k
Less than $10k
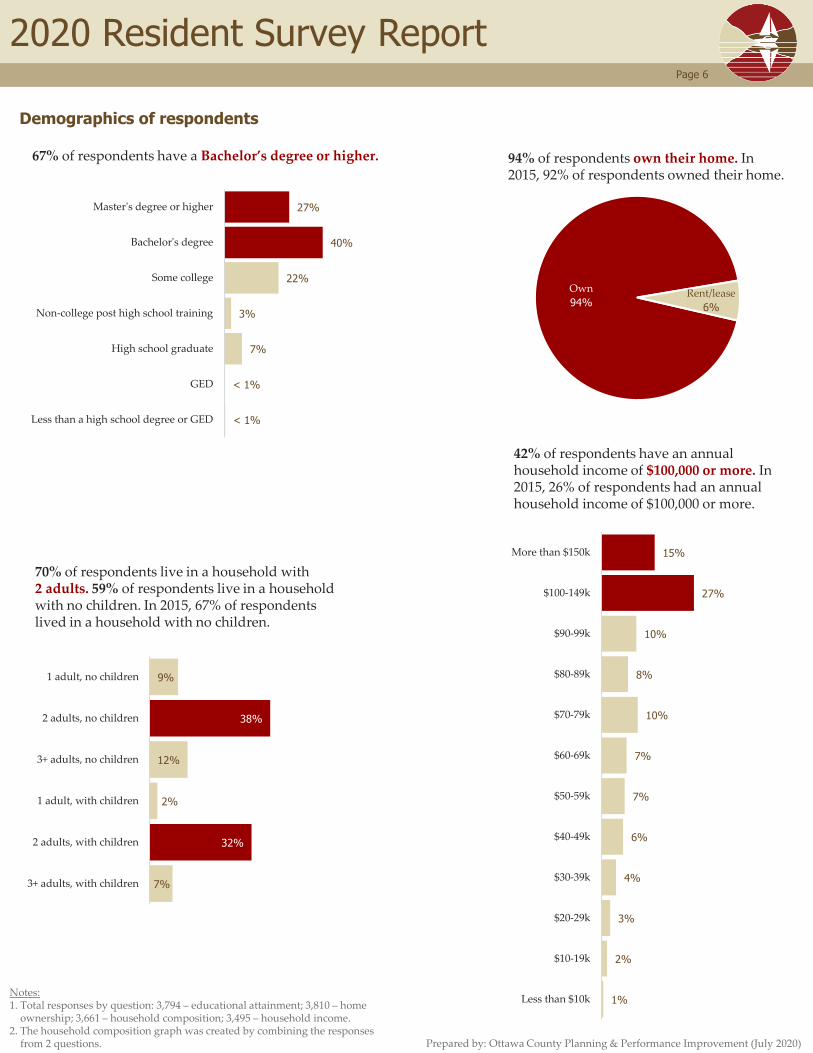
Demographics of respondents
42% of respondents have an annual household income of $100,000 or more. In 2015, 26% of respondents had an annual household income of $100,000 or more.
67% of respondents have a Bachelor’s degree or higher.
9%
38%
12%
2%
32%
7%
1 adult, no children
2 adults, no children
3+ adults, no children
1 adult, with children
2 adults, with children
3+ adults, with children
70% of respondents live in a household with 2 adults. 59% of respondents live in a household with no children. In 2015, 67% of respondents lived in a household with no children.
Own
94%Rent/lease
6%
94% of respondents own their home. In 2015, 92% of respondents owned their home.
Notes:1. Total responses by question: 3,794 – educational attainment; 3,810 – home
ownership; 3,661 – household composition; 3,495 – household income.2. The household composition graph was created by combining the responses
from 2 questions.
2020 Resident Survey Report
Prepared by: Ottawa County Planning & Performance Improvement (July 2020)
Page 7
25%
17%
12%
10%
9%
6%
6%
6%
5%
4%
4%
4%
3%
2%
2%
1%
1%
1%
Not sure where parks are located
Parks are too busy
No reason/no interest
I have mobility issues
Afraid of walking alone
Other
Afraid of disease
I have another exercise preference
I enjoy my own property
I go to non-County parks closer to home
I don't like being outside
Perceive parks as not being dog friendly
It is too expensive
Afraid of getting lost
Park locations are too far away
I don't have transportation
I have difficulty reading the park signs
Limited parking
Park user
96%
Not a park user
4%
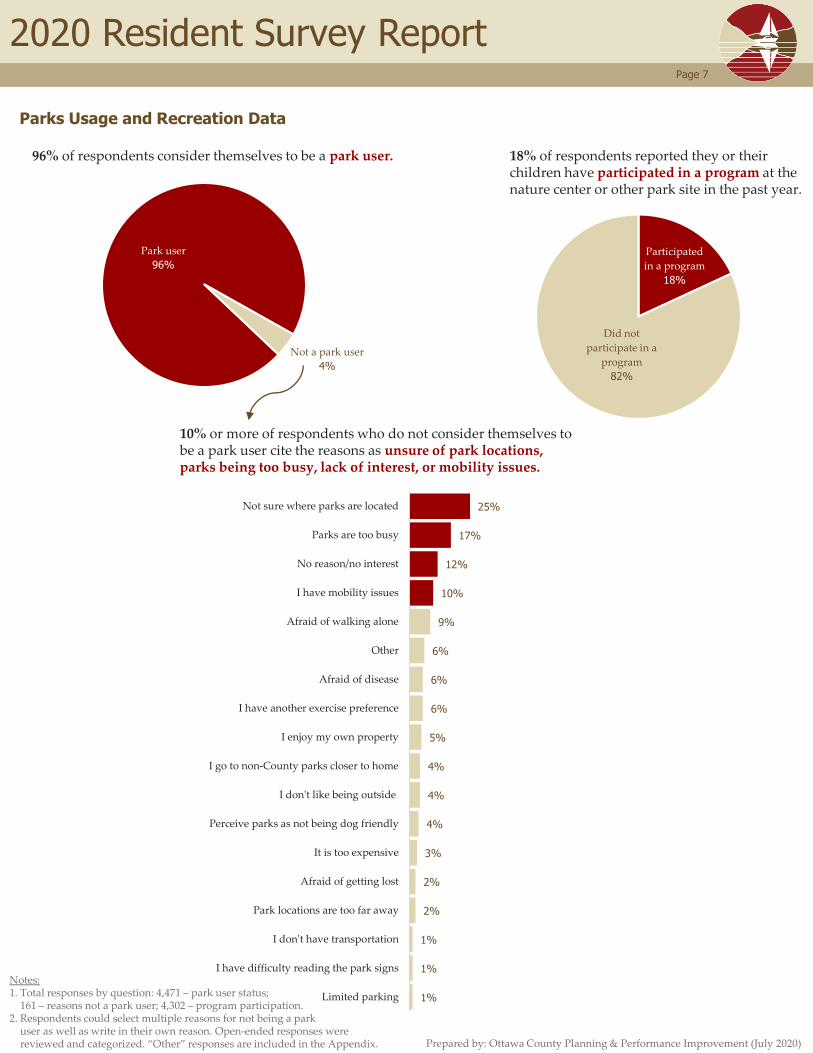
Parks Usage and Recreation Data
96% of respondents consider themselves to be a park user.
10% or more of respondents who do not consider themselves to be a park user cite the reasons as unsure of park locations, parks being too busy, lack of interest, or mobility issues.
Participated
in a program
18%
Did not
participate in a
program
82%
18% of respondents reported they or their children have participated in a program at the nature center or other park site in the past year.
Notes:1. Total responses by question: 4,471 – park user status;
161 – reasons not a park user; 4,302 – program participation.2. Respondents could select multiple reasons for not being a park
user as well as write in their own reason. Open-ended responses were reviewed and categorized. “Other” responses are included in the Appendix.
2020 Resident Survey Report
Prepared by: Ottawa County Planning & Performance Improvement (July 2020)
Page 8
49%
46%
46%
46%
42%
42%
37%
33%
30%
30%
28%
28%
26%
24%
23%
22%
19%
18%
17%
14%
14%
13%
12%
11%
10%
9%
6%
3%
< 1%
Rosy Mound Natural Area
Kirk Park
Pigeon Creek
Tunnel Park
Grand Ravines
Hemlock Crossing
Nature Center at Hemlock Crossing
Riley Trails
Hager Park
North Beach Park
North Ottawa Dunes
Mt. Pisgah
Ottawa Sands
Upper Macatawa Natural Area
Grand River Park
Riverside Park
Olive Shores
Connor Bayou
Pine Bend/Weaver House
Eastmanville Farm
Crockery Creek
Paw Paw Park
Musketawa Trail
Spring Grove Park
Stearns Creek
Other
Deer Creek Park
Grose Park
None
Grose Park
Musketawa Trail
Spring Grove Park
Hager Park
Grand River Park
Grand Ravines
Connor Bayou
Hemlock Crossing
Crockery Creek
Deer Creek Park
Eastmanville Farm
North Beach Park
North Ottawa Dunes
Olive Shores
Mt. Pisgah
Kirk Park
Ottawa Sands
Pine Bend/Weaver House
Pigeon Creek
Paw Paw Park
Riley Trails
Riverside ParkRosy Mound
Stearns Creek
Tunnel Park
Upper Macatawa Natural Area
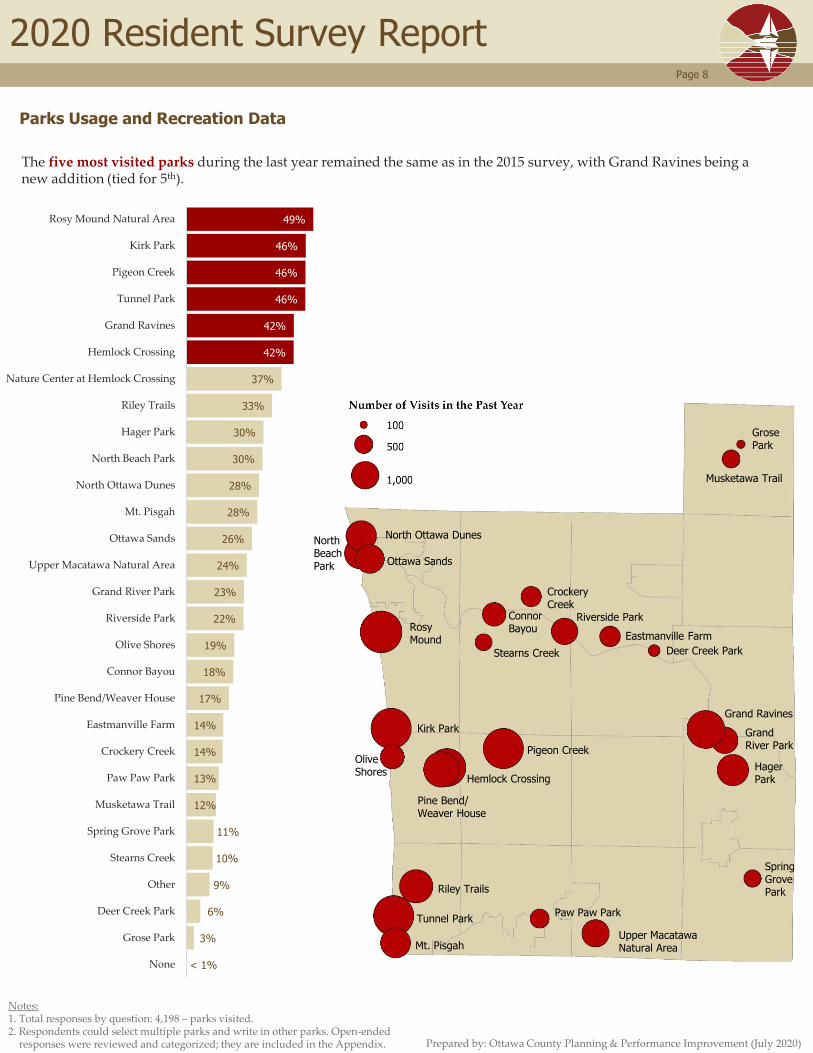
Parks Usage and Recreation Data
The five most visited parks during the last year remained the same as in the 2015 survey, with Grand Ravines being a new addition (tied for 5th).
Notes:1. Total responses by question: 4,198 – parks visited. 2. Respondents could select multiple parks and write in other parks. Open-ended
responses were reviewed and categorized; they are included in the Appendix.
2020 Resident Survey Report
Prepared by: Ottawa County Planning & Performance Improvement (July 2020)
Page 9
51%
46%
38%
30%
14%
13%
12%
8%
5%
3%
3%
Parks Newsletter
County Parks Website
Friends/word of mouth
Local Newspaper
mlive.com
GovDelivery Emails
Local television
Local radio
Other
95%
80%
67%
62%
58%
54%
54%
46%
38%
38%
34%
31%
30%
29%
25%
24%
24%
24%
20%
19%
16%
16%
14%
12%
11%
10%
7%
7%
7%
6%
6%
6%
5%
4%
2%
< 1%
Walking
Hiking
Swimming/water play
Bicycling
Picnicking
Dog walking
Kayaking/canoeing
Sunbathing
Nature photography
Fishing
Sledding
Tent camping
Birdwatching
Cross-country skiing
Nature study/programs
Motor boating
Mountain biking
Trail running
RV camping
Snowshoeing
Disc/frisbee golf
Hunting
Downhill skiing
Ice skating
Rollerblading
Sand volleyball
Fat tire biking
ORV'ing
Snowboarding
Rock climbing
Sailing
Horseback riding
Snowmobiling
Horseshoes
Other
None
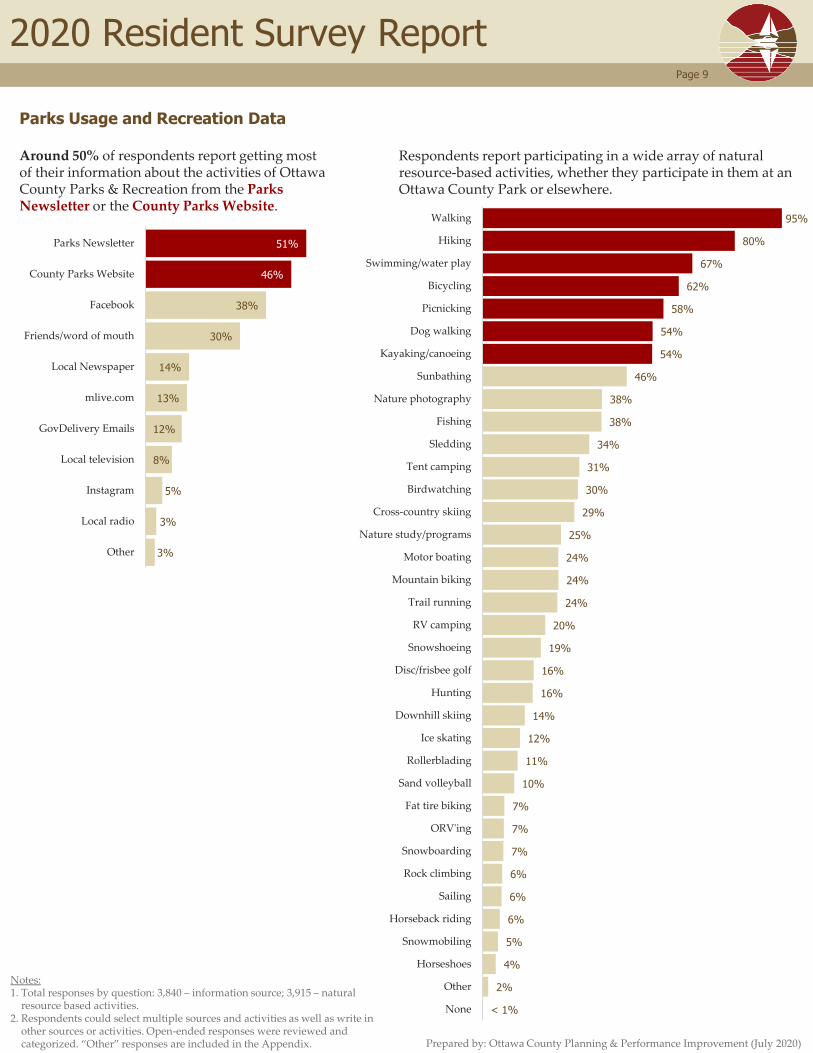
Parks Usage and Recreation Data
Respondents report participating in a wide array of natural resource-based activities, whether they participate in them at an Ottawa County Park or elsewhere.
Around 50% of respondents report getting most of their information about the activities of Ottawa County Parks & Recreation from the Parks Newsletter or the County Parks Website.
Notes:1. Total responses by question: 3,840 – information source; 3,915 – natural
resource based activities.2. Respondents could select multiple sources and activities as well as write in
other sources or activities. Open-ended responses were reviewed and categorized. “Other” responses are included in the Appendix.
2020 Resident Survey Report
Prepared by: Ottawa County Planning & Performance Improvement (July 2020)
Page 10
30%
33%
10%
1%
26%
Excellent
Good
Average
Poor
Don't Know
63%
33%
3%
0%
1%
Excellent
Good
Average
Poor
Don't Know
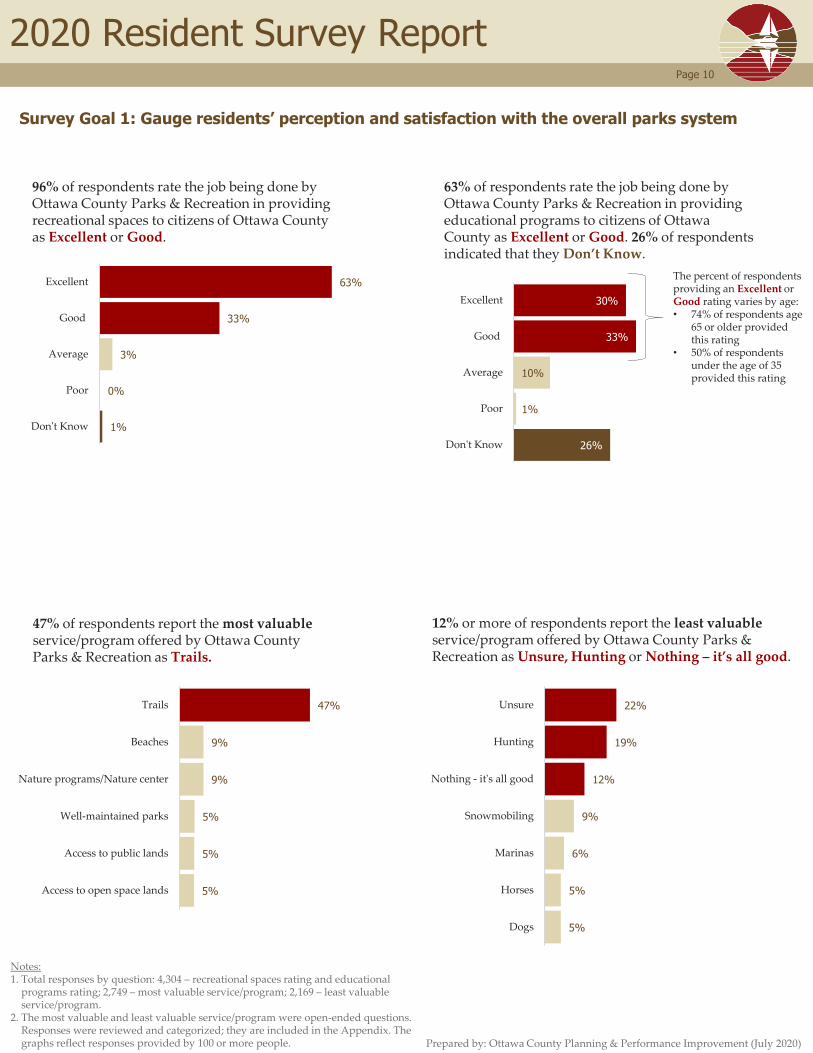
Survey Goal 1: Gauge residents’ perception and satisfaction with the overall parks system
96% of respondents rate the job being done by Ottawa County Parks & Recreation in providing recreational spaces to citizens of Ottawa County as Excellent or Good.
63% of respondents rate the job being done by Ottawa County Parks & Recreation in providing educational programs to citizens of Ottawa County as Excellent or Good. 26% of respondents indicated that they Don’t Know.
22%
19%
12%
9%
6%
5%
5%
Unsure
Hunting
Nothing - it's all good
Snowmobiling
Marinas
Horses
Dogs
12% or more of respondents report the least valuable service/program offered by Ottawa County Parks & Recreation as Unsure, Hunting or Nothing – it’s all good.
The percent of respondents providing an Excellent orGood rating varies by age:• 74% of respondents age
65 or older provided this rating
• 50% of respondents under the age of 35 provided this rating
47%
9%
9%
5%
5%
5%
Trails
Beaches
Nature programs/Nature center
Well-maintained parks
Access to public lands
Access to open space lands
47% of respondents report the most valuable service/program offered by Ottawa County Parks & Recreation as Trails.
Notes:1. Total responses by question: 4,304 – recreational spaces rating and educational
programs rating; 2,749 – most valuable service/program; 2,169 – least valuable service/program.
2. The most valuable and least valuable service/program were open-ended questions. Responses were reviewed and categorized; they are included in the Appendix. The graphs reflect responses provided by 100 or more people.
2020 Resident Survey Report
Prepared by: Ottawa County Planning & Performance Improvement (July 2020)
Page 11
63%
24%
10%
2%
1%
Strongly agree
Somewhat agree
Neither agree nor disagree
Somewhat disagree
Strongly disagree
49%
49%
51%
56%
38%
35%
35%
32%
26%
34%
12%
12%
13%
13%
22%
4%
4%
4%
5%
6%
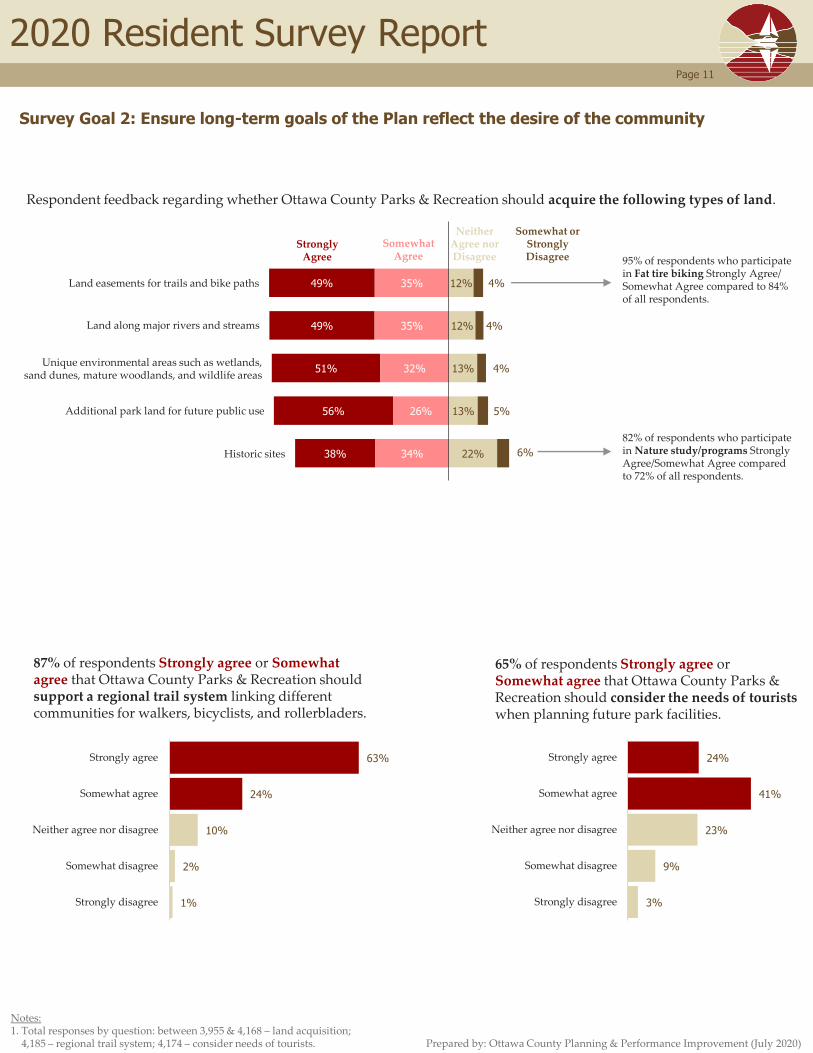
Survey Goal 2: Ensure long-term goals of the Plan reflect the desire of the community
Respondent feedback regarding whether Ottawa County Parks & Recreation should acquire the following types of land.
Land easements for trails and bike paths
Land along major rivers and streams
Unique environmental areas such as wetlands, sand dunes, mature woodlands, and wildlife areas
Additional park land for future public use
Historic sites
StronglyAgree
Somewhat Agree
NeitherAgree nor Disagree
Somewhat or Strongly Disagree
87% of respondents Strongly agree or Somewhat agree that Ottawa County Parks & Recreation should support a regional trail system linking different communities for walkers, bicyclists, and rollerbladers.
95% of respondents who participate in Fat tire biking Strongly Agree/ Somewhat Agree compared to 84% of all respondents.
82% of respondents who participate in Nature study/programs Strongly Agree/Somewhat Agree compared to 72% of all respondents.
Notes:1. Total responses by question: between 3,955 & 4,168 – land acquisition;
4,185 – regional trail system; 4,174 – consider needs of tourists.
24%
41%
23%
9%
3%
Strongly agree
Somewhat agree
Neither agree nor disagree
Somewhat disagree
Strongly disagree
65% of respondents Strongly agree orSomewhat agree that Ottawa County Parks & Recreation should consider the needs of tourists when planning future park facilities.
2020 Resident Survey Report
Prepared by: Ottawa County Planning & Performance Improvement (July 2020)
Page 12
14%
12%
11%
11%
8%
6%
51%
46%
44%
43%
33%
30%
35%
40%
44%
46%
57%
60%
0%
2%
1%
0%
2%
4%
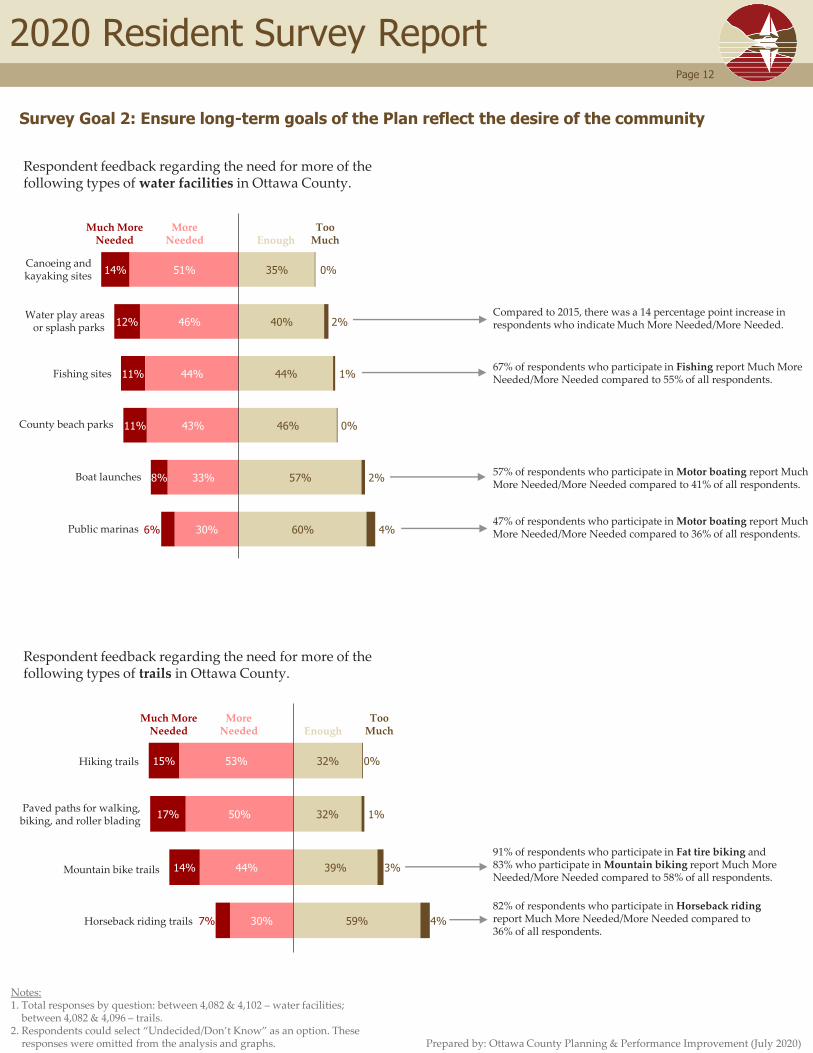
Survey Goal 2: Ensure long-term goals of the Plan reflect the desire of the community
Respondent feedback regarding the need for more of the following types of water facilities in Ottawa County.
County beach parks
Water play areas or splash parks
Canoeing and kayaking sites
Boat launches
Much More Needed
More Needed Enough
Too Much
Public marinas
Fishing sites
15%
17%
14%
7%
53%
50%
44%
30%
32%
32%
39%
59%
0%
1%
3%
4%
Respondent feedback regarding the need for more of the following types of trails in Ottawa County.
Hiking trails
Mountain bike trails
Horseback riding trails
Much More Needed
More Needed Enough
Too Much
Paved paths for walking, biking, and roller blading
67% of respondents who participate in Fishing report Much More Needed/More Needed compared to 55% of all respondents.
57% of respondents who participate in Motor boating report Much More Needed/More Needed compared to 41% of all respondents.
47% of respondents who participate in Motor boating report Much More Needed/More Needed compared to 36% of all respondents.
91% of respondents who participate in Fat tire biking and 83% who participate in Mountain biking report Much More Needed/More Needed compared to 58% of all respondents.
82% of respondents who participate in Horseback riding report Much More Needed/More Needed compared to 36% of all respondents.
Compared to 2015, there was a 14 percentage point increase in respondents who indicate Much More Needed/More Needed.
Notes:1. Total responses by question: between 4,082 & 4,102 – water facilities;
between 4,082 & 4,096 – trails.2. Respondents could select “Undecided/Don’t Know” as an option. These
responses were omitted from the analysis and graphs.
2020 Resident Survey Report
Prepared by: Ottawa County Planning & Performance Improvement (July 2020)
Page 13
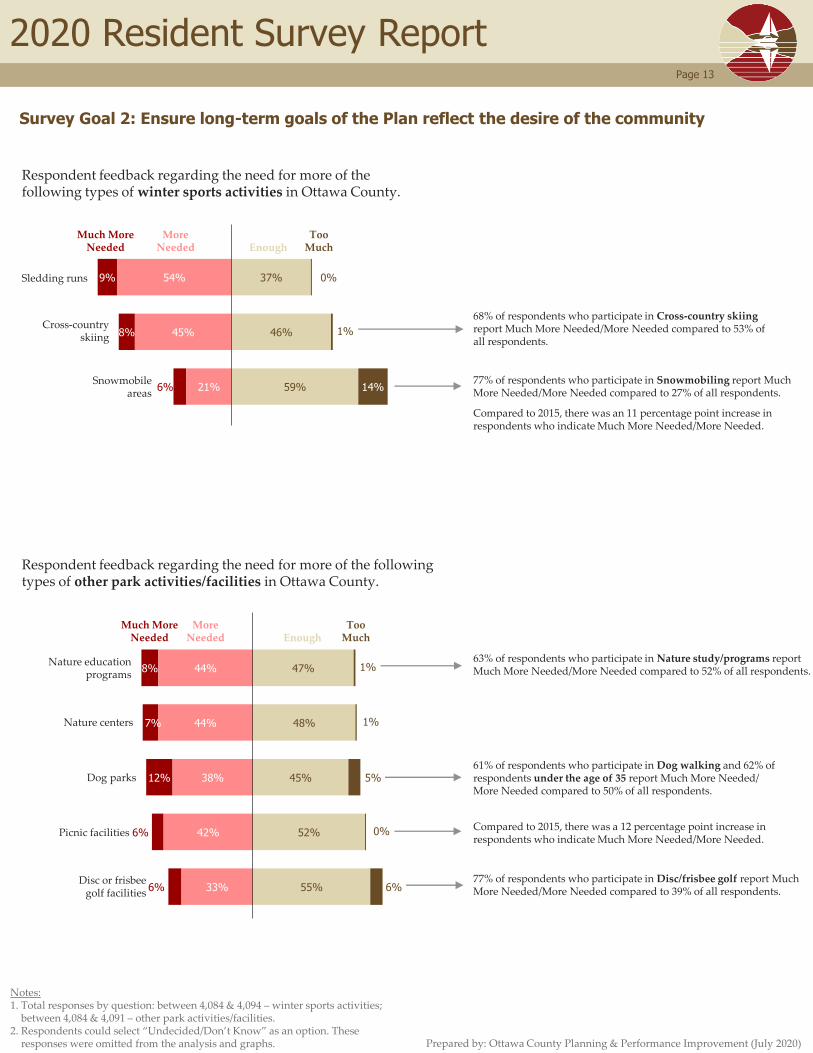
Survey Goal 2: Ensure long-term goals of the Plan reflect the desire of the community
9%
8%
6%
54%
45%
21%
37%
46%
59%
0%
1%
14%
Respondent feedback regarding the need for more of the following types of winter sports activities in Ottawa County.
Cross-country skiing
Sledding runs
Much More Needed
More Needed Enough
Too Much
Snowmobile areas
77% of respondents who participate in Snowmobiling report Much More Needed/More Needed compared to 27% of all respondents.
68% of respondents who participate in Cross-country skiing report Much More Needed/More Needed compared to 53% of all respondents.
8%
7%
12%
6%
6%
44%
44%
38%
42%
33%
47%
48%
45%
52%
55%
1%
1%
5%
0%
6%
Respondent feedback regarding the need for more of the following types of other park activities/facilities in Ottawa County.
Nature education programs
Disc or frisbee golf facilities
Dog parks
Much More Needed
More Needed Enough
Too Much
Picnic facilities
Nature centers
63% of respondents who participate in Nature study/programs report Much More Needed/More Needed compared to 52% of all respondents.
61% of respondents who participate in Dog walking and 62% of respondents under the age of 35 report Much More Needed/ More Needed compared to 50% of all respondents.
77% of respondents who participate in Disc/frisbee golf report Much More Needed/More Needed compared to 39% of all respondents.
Compared to 2015, there was an 11 percentage point increase in respondents who indicate Much More Needed/More Needed.
Compared to 2015, there was a 12 percentage point increase in respondents who indicate Much More Needed/More Needed.
Notes:1. Total responses by question: between 4,084 & 4,094 – winter sports activities;
between 4,084 & 4,091 – other park activities/facilities.2. Respondents could select “Undecided/Don’t Know” as an option. These
responses were omitted from the analysis and graphs.
2020 Resident Survey Report
Prepared by: Ottawa County Planning & Performance Improvement (July 2020)
Page 14
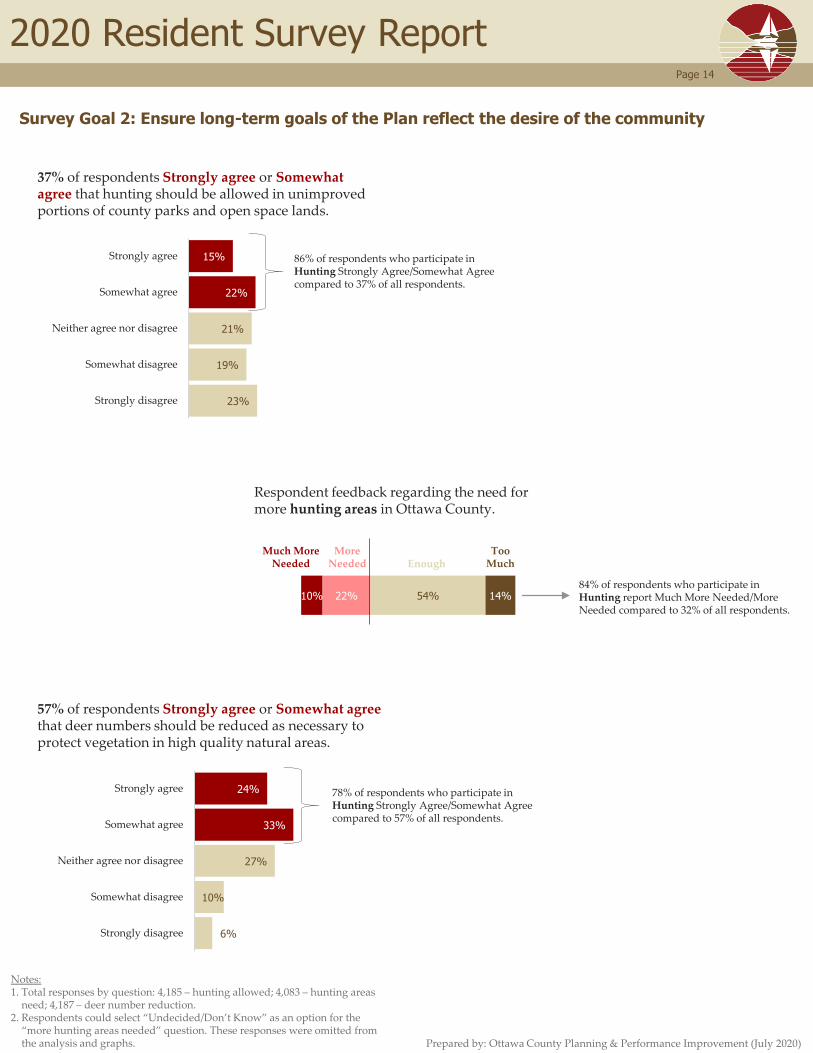
Survey Goal 2: Ensure long-term goals of the Plan reflect the desire of the community
37% of respondents Strongly agree or Somewhat agree that hunting should be allowed in unimproved portions of county parks and open space lands.
Respondent feedback regarding the need for more hunting areas in Ottawa County.
57% of respondents Strongly agree or Somewhat agree that deer numbers should be reduced as necessary to protect vegetation in high quality natural areas.
15%
22%
21%
19%
23%
Strongly agree
Somewhat agree
Neither agree nor disagree
Somewhat disagree
Strongly disagree
24%
33%
27%
10%
6%
Strongly agree
Somewhat agree
Neither agree nor disagree
Somewhat disagree
Strongly disagree
10% 22% 54% 14%
Much More Needed
More Needed Enough
Too Much
84% of respondents who participate in Hunting report Much More Needed/More Needed compared to 32% of all respondents.
78% of respondents who participate in Hunting Strongly Agree/Somewhat Agree compared to 57% of all respondents.
86% of respondents who participate in Hunting Strongly Agree/Somewhat Agree compared to 37% of all respondents.
Notes:1. Total responses by question: 4,185 – hunting allowed; 4,083 – hunting areas
need; 4,187 – deer number reduction.2. Respondents could select “Undecided/Don’t Know” as an option for the
“more hunting areas needed” question. These responses were omitted from the analysis and graphs.
2020 Resident Survey Report
Prepared by: Ottawa County Planning & Performance Improvement (July 2020)
Page 15
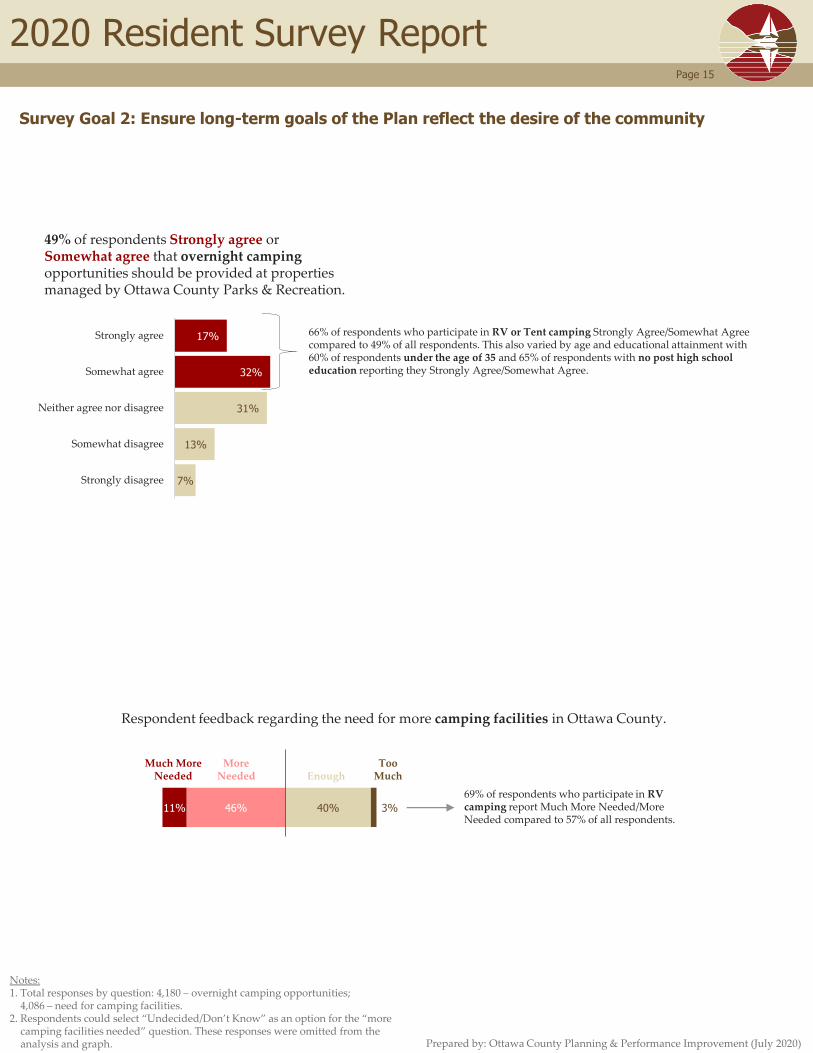
Survey Goal 2: Ensure long-term goals of the Plan reflect the desire of the community
11% 46% 40% 3%
17%
32%
31%
13%
7%
Strongly agree
Somewhat agree
Neither agree nor disagree
Somewhat disagree
Strongly disagree
49% of respondents Strongly agree orSomewhat agree that overnight camping opportunities should be provided at properties managed by Ottawa County Parks & Recreation.
Respondent feedback regarding the need for more camping facilities in Ottawa County.
Much More Needed
More Needed Enough
Too Much
69% of respondents who participate in RV camping report Much More Needed/More Needed compared to 57% of all respondents.
66% of respondents who participate in RV or Tent camping Strongly Agree/Somewhat Agree compared to 49% of all respondents. This also varied by age and educational attainment with 60% of respondents under the age of 35 and 65% of respondents with no post high school education reporting they Strongly Agree/Somewhat Agree.
Notes:1. Total responses by question: 4,180 – overnight camping opportunities;
4,086 – need for camping facilities.2. Respondents could select “Undecided/Don’t Know” as an option for the “more
camping facilities needed” question. These responses were omitted from the analysis and graph.
2020 Resident Survey Report
Prepared by: Ottawa County Planning & Performance Improvement (July 2020)
Page 16
60%
24%
12%
3%
1%
Strongly favor
Somewhat favor
Neither favor nor oppose
Somewhat oppose
Strongly oppose
Aware of
current millage
52%
Not aware of
current millage
48%
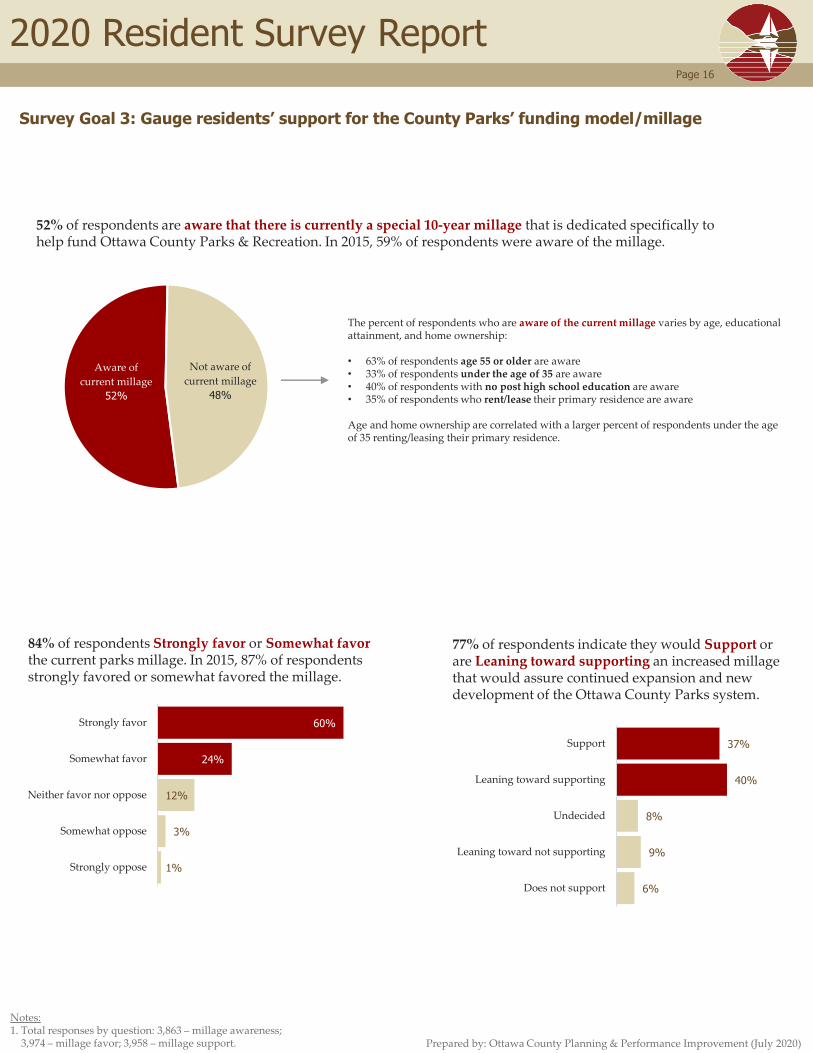
Survey Goal 3: Gauge residents’ support for the County Parks’ funding model/millage
52% of respondents are aware that there is currently a special 10-year millage that is dedicated specifically to help fund Ottawa County Parks & Recreation. In 2015, 59% of respondents were aware of the millage.
84% of respondents Strongly favor or Somewhat favor the current parks millage. In 2015, 87% of respondents strongly favored or somewhat favored the millage.
The percent of respondents who are aware of the current millage varies by age, educational attainment, and home ownership:
• 63% of respondents age 55 or older are aware• 33% of respondents under the age of 35 are aware• 40% of respondents with no post high school education are aware• 35% of respondents who rent/lease their primary residence are aware
Age and home ownership are correlated with a larger percent of respondents under the age of 35 renting/leasing their primary residence.
Notes:1. Total responses by question: 3,863 – millage awareness;
3,974 – millage favor; 3,958 – millage support.
37%
40%
8%
9%
6%
Support
Leaning toward supporting
Undecided
Leaning toward not supporting
Does not support
77% of respondents indicate they would Support or are Leaning toward supporting an increased millage that would assure continued expansion and new development of the Ottawa County Parks system.
2020 Resident Survey Report
Prepared by: Ottawa County Planning & Performance Improvement (July 2020)
Page 17
Would consider
an extra fee
52%
Would not
consider an
extra fee
48%
17%
72%
5%
6%
Too high
Just right
Too low
Other
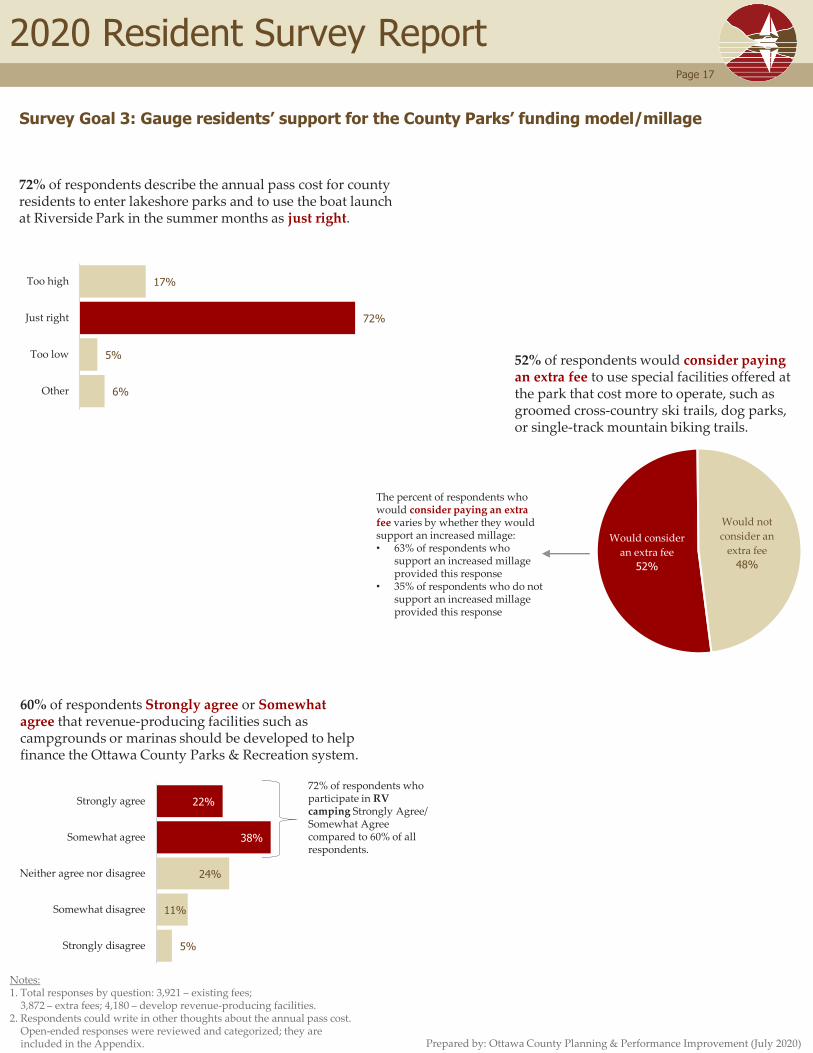
Survey Goal 3: Gauge residents’ support for the County Parks’ funding model/millage
60% of respondents Strongly agree or Somewhat agree that revenue-producing facilities such as campgrounds or marinas should be developed to help finance the Ottawa County Parks & Recreation system.
22%
38%
24%
11%
5%
Strongly agree
Somewhat agree
Neither agree nor disagree
Somewhat disagree
Strongly disagree
72% of respondents describe the annual pass cost for county residents to enter lakeshore parks and to use the boat launch at Riverside Park in the summer months as just right.
52% of respondents would consider paying an extra fee to use special facilities offered at the park that cost more to operate, such as groomed cross-country ski trails, dog parks, or single-track mountain biking trails.
72% of respondents who participate in RV camping Strongly Agree/ Somewhat Agree compared to 60% of all respondents.
Notes:1. Total responses by question: 3,921 – existing fees;
3,872 – extra fees; 4,180 – develop revenue-producing facilities.2. Respondents could write in other thoughts about the annual pass cost.
Open-ended responses were reviewed and categorized; they are included in the Appendix.
The percent of respondents who would consider paying an extra fee varies by whether they would support an increased millage:• 63% of respondents who
support an increased millage provided this response
• 35% of respondents who do not support an increased millage provided this response
2020 Resident Survey Report
Prepared by: Ottawa County Planning & Performance Improvement (July 2020)
Page 18
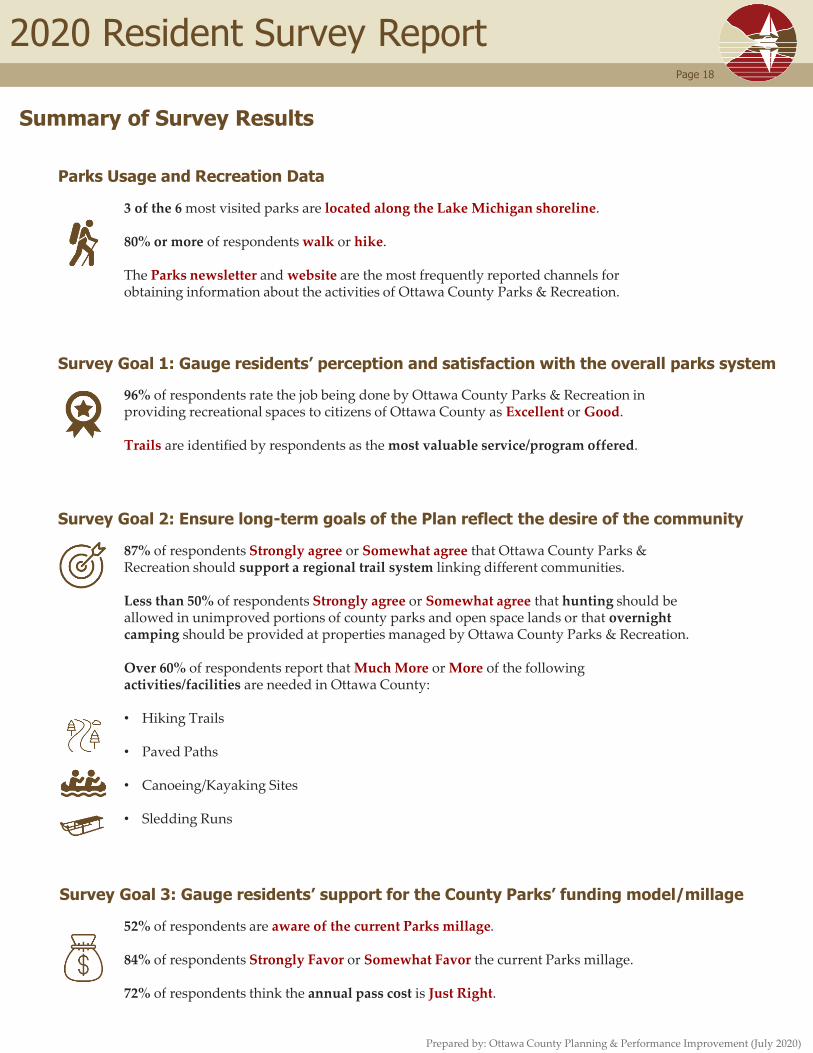
Summary of Survey Results
Parks Usage and Recreation Data
Survey Goal 1: Gauge residents’ perception and satisfaction with the overall parks system
Survey Goal 2: Ensure long-term goals of the Plan reflect the desire of the community
Survey Goal 3: Gauge residents’ support for the County Parks’ funding model/millage
3 of the 6 most visited parks are located along the Lake Michigan shoreline.
80% or more of respondents walk or hike.
The Parks newsletter and website are the most frequently reported channels for obtaining information about the activities of Ottawa County Parks & Recreation.
96% of respondents rate the job being done by Ottawa County Parks & Recreation in providing recreational spaces to citizens of Ottawa County as Excellent or Good.
Trails are identified by respondents as the most valuable service/program offered.
87% of respondents Strongly agree or Somewhat agree that Ottawa County Parks & Recreation should support a regional trail system linking different communities.
Less than 50% of respondents Strongly agree or Somewhat agree that hunting should be allowed in unimproved portions of county parks and open space lands or that overnight camping should be provided at properties managed by Ottawa County Parks & Recreation.
Over 60% of respondents report that Much More or More of the following activities/facilities are needed in Ottawa County:
• Hiking Trails
• Paved Paths
• Canoeing/Kayaking Sites
• Sledding Runs
52% of respondents are aware of the current Parks millage.
84% of respondents Strongly Favor or Somewhat Favor the current Parks millage.
72% of respondents think the annual pass cost is Just Right.