2020 Energy Primer
150
-
Upload
khangminh22 -
Category
Documents
-
view
2 -
download
0
Transcript of 2020 Energy Primer


The Energy Primer is a staff product and does not necessarily reflect the views of the Commission or any Commissioner.
Energy PrimerA Handbook of Energy Market Basics
April 2020

Energy Primer | i
Energy PrimerA Handbook of Energy Market Basics
Table of Contents
Chapter 1 Introduction ............................................................................................................. 1
Physical Fundamentals ............................................................................................... 1
Financial Markets and Trading ................................................................................... 2
Market Manipulation ................................................................................................... 3
Additional Information ................................................................................................ 3
Chapter 2 Wholesale Natural Gas Markets .............................................................................. 5
Natural Gas .................................................................................................................. 5
Natural Gas Industry ................................................................................................... 5
Natural Gas Demand ................................................................................................... 7
Natural Gas Supply .................................................................................................... 10
Liquefied Natural Gas ............................................................................................... 18
Natural Gas Processing and Transportation ............................................................. 21
Natural Gas Storage ................................................................................................... 28
Natural Gas Markets and Trading .............................................................................. 32
Chapter 3 Wholesale Electricity Markets ................................................................................ 35
Electric Power Industry ............................................................................................. 36
Electricity Demand .................................................................................................... 41
Electricity Supply and Delivery ................................................................................. 47
Wholesale Electricity Markets and Trading............................................................... 56
RTO Markets and Features ......................................................................................... 59
Regions ....................................................................................................................... 66
Southeast Wholesale Market Region ........................................................................ 66
Western Wholesale Market Regions .......................................................................... 68
CAISO .......................................................................................................................... 72
ISO-NE ........................................................................................................................ 77
MISO ........................................................................................................................... 82
NYISO .......................................................................................................................... 87
PJM .............................................................................................................................. 93
SPP ............................................................................................................................. 98

ii | Energy Primer Federal Energy Regulatory Commission
Chapter 4 U.S. Crude Oil and Petroleum Products Markets ................................................ 103
Petroleum ................................................................................................................ 104
U.S. Crude Oil Supply ............................................................................................... 105
Petroleum Reserves ................................................................................................ 106
Crude Oil Refining ................................................................................................... 107
Crude Oil and Petroleum Products Transportation ................................................ 109
Crude Oil and Petroleum Products Demand .......................................................... 110
Crude Oil and Petroleum Products Markets and Trading ...................................... 111
Chapter 5 Financial Markets and Trading ............................................................................. 113
Financial Markets and Mechanisms ........................................................................ 113
Physical Products .................................................................................................... 119
Financial Products ................................................................................................... 120
Trading and Transacting .......................................................................................... 121
Capital Markets ........................................................................................................ 123
Chapter 6 Market Manipulation ............................................................................................ 127
Manipulative Trading Techniques and Cross-Product Manipulations .................. 128
Information-Based Manipulations .......................................................................... 129
Withholding .............................................................................................................. 119
Representative Matters ............................................................................................ 130
The Federal Energy Regulatory Commission retains rights to all photographic images included in the Energy Primer.

Energy Primer | 1
Introduction
Natural gas, electricity, and crude oil are forms of energy that are of particular interest to the Federal Energy Regulatory Commission (FERC) pursuant to its authority under the Natural Gas Act, the Federal Power Act, and the Interstate Commerce Act. This primer explores the workings of the wholesale markets for these forms of energy, as well as energy-related financial markets.
Energy markets consist of both physical and financial elements. The physical markets contain the natural resources, infrastructure, institutions and market participants involved in producing energy and delivering it to consumers. The financial markets include the buying and selling of financial instruments that derive value from the price of the physical commodity. These financial markets have their own set of market structures and institutions, market participants, and traded products which have their own drivers of supply and demand. In general, physical and financial markets can be distinguished by the products and by the intentions of the market participants involved.
Much of the wholesale natural gas and electric power industry in the United States trades competitively, while some markets and their prices are established through administrative processes based on the cost of providing service. In competitive markets, prices are largely driven by the economic concepts of supply and demand. Underlying the supply and demand for energy are physical fundamentals - the physical realities of how markets produce and deliver
energy to consumers and how they form prices. These physical fundamentals will be covered in Chapter 1 (Wholesale Natural Gas Markets), Chapter 2 (Wholesale Electricity Markets), and Chapter 3 (U.S. Crude Oil and Petroleum Products Markets).
Market participants buy and sell energy based financial contracts for a number of reasons. Physical market participants, such as producers and large consumers, usually use financial contracts to manage price risk and to protect against price volatility. That is, financial contracts can serve as a tool for managing risk akin to insurance. Other market participants use the energy markets to speculate, or to assume a market risk in hope of profiting from market fluctuations. Additionally, companies turn to the capital markets if they need to raise or invest money. This primer explores the market participants, products, market mechanisms and trading at work for natural gas and electricity in the financial markets in Chapter 4, Financial Markets and Trading.

2 | Energy Primer Federal Energy Regulatory Commission
Where there are markets, there will be those who attempt to manipulate the markets for their own benefit. These practices undermine the market’s ability to operate efficiently, reduce other market participants’ confidence in the markets and distort market outcomes, including prices. Some of these practices are discussed in Chapter 5, Market Manipulation.
This primer is written to be used either as a traditional text – read front to back – or as a reference guide. Consequently, some material is repeated in different sections and references are provided to other parts of the primer where a concept is addressed in greater detail.
Further information about various aspects of energy markets and FERC regulation can be found at www.ferc.gov; then navigate to the Market Oversight tab. You can find the market oversight pages here: https://www.ferc.gov/market-assessments/guide/guide.asp

Energy Primer | 3
1 Wholesale Natural Gas Markets
Natural gas markets have a significant effect on the economy and on the individuals who rely on the fuel for electric generation, manufacturing, heating, cooking and other purposes. The Department of Energy’s Energy Information Administration (EIA)
estimates that natural gas supplies approximately 29 percent of the energy used in the United States,1 or about 27 trillion cubic feet (Tcf) of gas a year.2 Under the Natural Gas Act (NGA), the Federal Energy Regulatory Commission (FERC) has jurisdiction over the transportation and sale of natural gas in interstate commerce and the companies engaged in those activities.
The natural gas market is an amalgamation of a number of subsidiary markets. There is a physical market, in which natural gas is produced, transported, stored and consumed. There is also a financial market in which physical natural gas is bought and sold as a financial product derived from physical natural gas. Natural gas markets are also regional, with prices for natural gas varying with the demand characteristics of the market, the regions’ access to different supply basins, pipelines and storage facilities.
1 Derived from EIA, Monthly Energy Review, Table 1.3 (Nov. 20,
2018), https://www.eia.gov/totalenergy/data/browser/index.php?tbl=T01.03#
/?f=M&start=200001.
2 See EIA, Natural Gas Consumption by End Use (Sept. 29, 2017),
https://www.eia.gov/dnav/ng/ng_cons_sum_dcu_nus_a.htm.
Natural Gas
Natural gas is primarily methane, which is a molecule made of one carbon atom and four hydrogen atoms (CH4), and is among the materials known as hydrocarbons. Natural gas is colorless and odorless in its natural pure form, but is often odorized with mercaptan or other odorants to allow for easy detection. It is also highly combustible, giving off a great deal of energy and fewer emissions than fuels such as coal and oil. Natural gas occurs in geological formations in different ways: as a gas phase associated with crude oil, as a gas dissolved in the crude oil, as a gas phase not associated with any significant crude oil, or as a supercritical fluid. Natural gas is “rich” or “wet” if it contains significant amounts of natural gas liquids (NGL) – e.g., ethane, propane and pentane – mixed with the methane. In contrast, natural gas is “lean” or “dry” if it consists of mostly methane.3 Excess NGLs are separated
3 Dry Gas contains “insufficient quantities of hydrocarbons
heavier than methane to allow their commercial extraction or to require
their removal in order to render the gas suitable for fuel use.” Society of
Petroleum Engineers, Glossary of Terms Used in Petroleum Reserves and

4 | Energy Primer Federal Energy Regulatory Commission
from the methane and sold separately. Natural gas reservoirs often contain other elements and compounds, such as carbon dioxide, hydrogen sulfide, nitrogen, helium, water, dissolved salts and other dissolved gases. The natural gas is further processed to remove the impurities from the methane to make the natural gas suitable for sale. While natural gas is typically a gas, it can be cooled to a liquid and transported in trucks or ships. In this form, it is referred to as liquefied natural gas, or LNG.
Natural Gas Industry
The markets of the natural gas industry are both physical and financial. This chapter focuses on the physical natural gas markets, but it should be noted that financial markets can have a significant influence on the physical natural gas market.
The natural gas industry has three major segments, the upstream (supply), the midstream (transportation), and the downstream (consumption). The upstream segment includes exploration and development of natural gas resources and reserves, production, which includes drilling and extraction at the wellhead, and gathering. Gathering entails using small diameter pipeline systems to transport the gas from the wellhead to local pooling points or to natural gas processing facilities, where impurities and NGLs are removed to create pipeline-quality natural gas. The midstream segment includes transportation on intrastate and interstate pipeline systems that move natural gas through large-diameter pipelines to storage facilities and a variety of consumers. The downstream segment includes large gas consumers, such as power plants and industrial facilities, and local distribution companies (LDCs), which deliver the natural gas to retail consumers.
Each component of the supply chain is critical in serving customers. The quantity of reserves and production can affect market participants’ expectations about current and future supply, and thus can affect prices. Similarly, the availability of
Resources Definitions, at 4 (n.d.), https://www.spe.org/industry/docs/
GlossaryPetroleumReserves-ResourcesDefinitions_2005.pdf.
pipeline and storage capacity determines which supply basins are used and the amount of gas that can be transported from producers to consumers. All of these factors affect the supply chain, but they also affect the supply-demand balance, both nationally and regionally. More specifically, the differences in supply and demand result in different prices for natural gas at various locations. Prices tend to be lowest in areas such as the Gulf Coast and Midwest, which are supplied by multiple production areas and have robust pipeline infrastructures. In contrast, prices tend to be highest in areas where production or transportation and storage are limited and demand is high, such as New England and Southern California. Transportation costs and limitations in pipeline capacity from supply to demand areas are generally the major factors driving regional price differentials.
Various factors have shifted the dynamics of natural gas supply and demand within the last decade. These include, but are not limited to:
Development of hydraulic fracturing and horizontal drilling techniques that have enabled producers to access unconventional resources, such as those in shale formations. These techniques have expanded the amount of available economically accessible natural gas reserves and have increased domestic natural gas production. The increased supply has helped to moderate prices across the country as some of these newer resources are located closer to eastern population centers and have provided those regions with access to lower cost natural gas supplies and transportation costs.
Natural gas demand for power generation has expanded considerably over the past decade and is likely to continue to increase in the coming years. Power plant demand for natural gas reflects lower natural gas prices, the operating flexibility of natural gas-fired generators, and the environmental benefits of the fuel. Natural gas-fired power plants emit less air pollution than power plants using coal or oil. These plants are also relatively easier to site, can be built in a range of sizes and can increase or decrease output flexibly. The ability to quickly change output provides electric system grid operators with

Energy Primer | 5
the flexibility to support variations in output from renewable energy resources, changes in demand from customer load, as well as unexpected power system events and disruptions.
Pipeline expansions linking the new supply regions to markets have enabled regions such as the Northeast and Mid-Atlantic to access new supply sources, expanding the amount of natural gas that can flow from traditional supply sources, and enhancing the amount of natural gas that can flow to markets. This has reduced overall price levels and tempered extreme price movements during periods of peak demand.
Natural Gas Demand
Natural gas is the fuel of choice for many sectors of the U.S. economy. Over the long-term, natural gas use is driven by overall economic and population growth, environmental policy, energy efficiency, technological changes and prices for natural gas and substitute energy sources such as oil, coal and electricity. In the short-term, gas demand can fluctuate substantially, due to weather, economic activity, and competition from other fuel sources such as coal and oil.
Weather
Weather is the most significant factor affecting seasonal natural gas demand, which can swing considerably within a given day, especially during periods of extreme temperatures. Short-term changes in weather, such as heat waves and winter storms, can send demand and prices soaring – or dropping – within the course of a day, sometimes unexpectedly. The weather’s unpredictability challenges suppliers and pipelines, especially when demand is high and pipelines are full.
Economic Activity and Growth
Economic growth can increase the amount of natural gas used by industry, power plants and commercial entities as consumers want more of their products and services. During a recession, gas use typically declines.
Structural changes in the economy can also affect natural gas demand, such as varying levels of manufacturing and service sector activity. Additionally, new domestic markets for products and services may increase the consumption of natural gas, whereas the movement of manufacturing overseas may reduce demand. Lastly, demand for exports of natural gas, to Mexico and globally via liquefied natural gas shipping, have also had a significant effect on aggregate demand.
Daily and weekly economic activity creates cyclical demand patterns. During the work day, demand rises as people get up and go to work or school. Similarly, it declines as they go to sleep. On the weekend, demand tends to vary less over the course of the day.
Prices of Natural Gas and Coal
Just as a home-owner may decide to invest in a furnace and associated piping to use natural gas for heating, so, too, a power producer may decide to make long-term investments in natural gas-fired generators. Decisions requiring long-term capital investments are cheapest and easiest to make at the time a home or power plant is being built, and are more complicated to change later. Thus, over the long term, demand for natural gas can be affected by the expected costs of alternative energy sources: the cost of a natural gas furnace versus an electric one; the cost of a coal-fired generating plant versus one fueled by natural gas.
In the short-term, the opportunity for fuel switching has been significant in power generation. Electric grid operators have choices as to which power plant to dispatch to meet electric demand. As explained in greater detail in the electric chapter, dispatch is often based on the marginal cost of generation at

6 | Energy Primer Federal Energy Regulatory Commission
each available plant in the generation fleet. While the degree to which these fuels are used varies regionally, plants with lower marginal costs, such as nuclear plants, are typically dispatched before plants with higher marginal costs, such as natural gas plants. As natural gas prices drop relative to coal prices, natural gas-fired generation can get dispatched ahead of coal-fired generation, increasing natural gas demand from the power sector.
Demographics and Social Trends
Long-term demand can also be affected by shifting demographics and social trends. Population growth in warmer climates and population declines in certain areas of the North have affected natural gas use. So has the trend toward larger houses, which have greater heating and cooling needs, yet are generally more energy efficient.
Environmental Concerns and Energy Efficiency
Natural gas emits much fewer pollutants than other competing fossil fuels, which has been an important factor in some decisions to use natural gas for power generation. This is particularly significant in states and regions that have experienced challenges in meeting air quality standards.
The natural gas emissions profile has also encouraged some urban mass transit bus systems, West Coast port operations and other vehicle fleets to shift to natural gas from gasoline or diesel fuel.
Customer Sectors and Demand
In 2007, natural gas consumption for electric generation overtook gas-for-industrial load and became the largest customer class for natural gas. In 2017, power generation used 9.3 Tcf of the 24.8 Tcf of natural gas delivered to consumers.4 Industrial, residential, and commercial consumers used 7.9 Tcf, 4.4 Tcf, and 3.2 Tcf, respectively.5 An additional 1.6 Tcf was
4 See EIA, Natural Gas Consumption by End Use (May 31, 2018),
https://www.eia.gov/dnav/ng/ng_cons_sum_dcu_nus_a.htm.
5 Id.
used for lease and plant fuel operations.6
Each customer sector has a unique demand profile, both in the amount that the demand varies over a season and whether its peak demand coincides with the overall system peak. Residential demand, for example, can be highly variable in colder climates, and its peak coincides with the overall system peak. Power generation’s peak does not coincide with the overall winter gas-demand peak, but the use of natural gas to produce electricity for air conditioning has created robust summer demand, which competes with natural gas supply that traditionally would flow into underground storage for later use. Industrial demand is fairly constant year-round.
In the short term, residential and commercial natural gas use tends to be inelastic – consumers use what they need, regardless of the price. Power plant demand, on the other hand, is more price-responsive as natural gas competes with other fuels, especially coal. Price inelasticity implies that a potential for price spikes exists during periods of supply constraints.
Consequently, the mix of customers in a region can affect system operations and costs. Pipelines and other equipment are sized to account for peak demand. Load that has fairly constant demand presents fewer operational challenges to suppliers and usually enjoys lower prices. Highly variable demand will result in pipelines and equipment being used at less than full capacity for much of the year. As a result, the cost to provide service may be higher because the pipelines may become constrained during peak times and because the capacity is not consistently utilized.
Power Generation
Natural gas-fired generators can flexibly manage their output and are frequently called on to respond to changes in demand or when called upon by power grid operators. Seasonally, generating plants tend to consume more natural gas in the summer to meet air conditioning loads, but also increase output in the winter to provide electric heating
6 Id.

Energy Primer | 7
and lighting. Generation demand can also be influenced by the relative prices for natural gas and other fuels, especially coal. Since late 2008, natural gas-fired generators generally have been dispatched before many of the lesser efficient coal plants because of the decrease in natural gas prices. In 2016, electricity generation from natural gas overtook coal generation for the first time on an annual basis.7
Industrial
Natural gas as a fuel is used to produce items such as steel, glass, paper, clothing and brick. It also is an essential raw material for paints, fertilizer, plastics, antifreeze, dyes, medicines, and explosives. Industrial load tends to show the least seasonal variation of natural gas use.
Residential
Despite population growth, natural gas used in the residential sector has remained fairly flat over the past decade. This has primarily occurred because homes and appliances like furnaces, water heaters, clothes dryers and stoves have become more energy efficient. Slightly more than half of the homes in the United States use natural gas as their main heating fuel. Separately, much of the year-to-year demand variation in this sector can be attributed to the weather during a particular year. A year with a long, cold winter will see higher gas demand than a year with a mild winter, especially in cold-winter regions where demand soars during winter months as consumers turn on their furnaces.
Commercial
Like the residential sector, commercial consumption experiences year-to-year variation based on weather. Commercial consumers include hotels, restaurants, wholesale and retail stores and government agencies, which use natural
7 See EIA, Electricity Net Generation: Electric Power Sector, Table
7.2b (May 31, 2018), https://www.eia.gov/totalenergy/data/browser/?tbl=T07.
02B#/?f=A&start=1949&end=2017&charted=1-2-3-5-8-14.
gas primarily for heat. Consequently, its demand varies over the seasons, weeks and days.
Natural Gas Supply
Natural Gas Resources, Reserves and Production
The amount of natural gas in the ground is estimated by a variety of techniques, taking into account the technology available to extract the gas. Estimating the technically recoverable oil and natural gas resources in the United States is an evolving process. Analysts use different methods and systems to make natural gas estimates. Natural gas supplies are characterized as resources, proved reserves and production.
Resources, the largest category of supply, refers to the quantity of a natural resource that is known to exist with a reasonable degree of certainty and can be extracted using existing or feasibly commercial technology. Reserves are a subset of resources which are known to exist with a reasonable degree of certainty and can be economically extracted under current or assumed prices. Resources and reserves are dynamic as both change when new natural resources are discovered via exploration, as a natural resources are extracted, and as prices fluctuate. All estimates of reserves involve some degree of uncertainty, which depends primarily on the amount of reliable geologic and engineering data available at the time of the estimate. According to the Society of Petroleum Engineers, “proved reserves are those quantities of petroleum which, by analysis of geological and engineering data, can be estimated with a reasonable certainty to be commercially recoverable, from a given date forward, from known reservoirs and under current economic conditions, operating methods, and government regulations.”8 Lastly, production describes the amount of
8 Probabilistic reserves are often used, for instance a P90 reserve
figure indicates there should be at least a 90 percent probability that
quantities actually recovered will equal or exceed the estimate. Society of
Petroleum Engineers, World Petroleum Congresses, and American Association

8 | Energy Primer Federal Energy Regulatory Commission
natural gas that is actually extracted over a period of time.
Conventional and Unconventional Natural Gas
Natural gas is a fossil fuel. It has historically been found in underground reservoirs formed when organic material was buried and pressurized. The remains of that organic material were trapped in the surrounding rock as oil or natural gas, and the two fuels are often found together. The depth of the organic materials and the temperatures at which they are buried often determine whether the organic matter turns into oil or natural gas. Oil is generally found at depths of 3,000 to 9,000 feet, while organic materials at greater depths and higher temperatures result in natural gas.
Natural gas basins are frequently referred to as conventional or unconventional basins or plays. These basins differ in the geology of the basin and the depth at which gas can be found. The schematic illustrates differing geologic formations in which natural gas can be found. Source: EIA9
Conventional Natural Gas
Natural gas has historically been produced from what is traditionally known as conventional natural gas resources. These supplies are found in geological basins or reservoirs made of porous and permeable rock, holding significant amounts of natural gas in spaces in the rock.10 For more than a century, up until the early 2000s, nearly all of the country’s production of natural gas was obtained from conventional sources.
of Petroleum Geologists, Guidelines for the Evaluation of Petroleum Reserves
and Resources, at 45 (2001), https://www.spe.org/industry/docs/Guidelines-
Evaluation-Reserves-Resources-2001.pdf.
9 U.S. Energy Information Administration and U.S. Geological
Survey, Today in Energy (Feb. 14, 2011), https://www.eia.gov/todayinenergy/
detail.php?id=110.
10 Permeability refers to the ability of a porous medium to transport
a fluid. The natural gas found in permeable rock formations contains trapped
or slowly migrating natural gas molecules, where the migration of the gas
molecules takes place over the course of millions of years.
Conventional resources have been found both on land and offshore (see map), with the major fields in an arc from the Rocky Mountains to the Gulf of Mexico to Appalachia. The largest conventional fields reside in Texas, Wyoming, Oklahoma, New Mexico and the federal offshore area of
the Gulf of Mexico. In 2000, offshore natural gas production represented 24 percent of total U.S. production; by 2016 that amount had fallen to 6 percent.11
Federal offshore natural gas wells are drilled into the ocean floor off the coast of the United States in waters that are jurisdictional to the federal government. Most states have jurisdiction over natural resources within three nautical miles of their coastlines; Florida and Texas claim nine nautical miles of jurisdiction.12
Roughly 4,000 oil and gas platforms are producing in federal waters at water depths approaching 7,500 feet (at total well depths of 25,000-30,000 feet) and at distances as far as 200 miles from shore.13 Most of these offshore wells are in the Gulf
11 Derived from EIA, U.S Natural Gas Gross Withdrawals Offshore (Sept.
29, 2017), https://www.eia.gov/dnav/ng/hist/na1090_nus_2a.htm.
12 Florida and Texas were provided an exemption to the federal
government’s jurisdiction over natural resource beyond three nautical miles
of state coastlines, up to a 9 nautical mile limit, because each state proved the
further boundary based on its constitution or laws prior to when it came into
the Union or was approved by Congress. See Submerged Lands Act of 1953.
43 U.S.C. § 1301-1315 at § 1312 (2002).
13 Bureau of Safety and Environmental Enforcement, Platform
Structures Online Query (May 7, 2018), https://www.data.bsee.gov/
Platform/PlatformStructures/Default.aspx, and Bureau of Offshore Energy

Energy Primer | 9
of Mexico.
Offshore wells have produced natural gas for decades. As close-in, shallow-water wells became less economic to produce, companies looked to reserves at greater water depth. Technological improvements contributed to continuing production from deep offshore wells.
Unconventional Natural Gas
Unconventional natural gas is found in coal seams (also referred to as coal beds), shale, and tight, low-permeability rock formations (also referred to as tight sands). The National Petroleum Council (NPC) defines unconventional gas as “natural gas that cannot be produced at economic flow rates
Management, Offshore Statistics by Water Depth (May 7, 2018), https://www.
data.boem.gov/Leasing/OffshoreStatsbyWD/Default.aspx.
Gas Production in Conventional Fields, Lower 48 States
nor in economic volumes unless the well is stimulated by a large hydraulic fracture treatment, a horizontal wellbore, or by using multilateral wellbores or some other technique to Source: EIA14
expose more of the reservoir to the wellbore.”15
In recent years, innovations in exploration and drilling technology have led to rapid growth in the production of unconventional natural gas. The majority of unconventional production in the U.S. natural gas comes from shale and tight
14 Derived from EIA, U.S Natural Gas Gross Withdrawals and Production
(Nov. 30, 2018), https://www.eia.gov/dnav/ng/ng_prod_sum_dc_NUS_
MMCF_m.htm.
15 See National Petroleum Council Global Oil & Gas Study, Topic
Paper #29 Unconventional Gas, at 5 (Jul. 18, 2007), http://www.npc.org/
Study_Topic_Papers/29-TTG-Unconventional-Gas.pdf

10 | Energy Primer Federal Energy Regulatory Commission
Source: EIA
Horizontal and Directional Drilling with Hydraulic Fracturing
The presence of natural gas in unconventional plays had been common knowledge for decades. Historically, the lower permeability of rock in shale formations typically yielded too little natural gas for a company’s investment when using traditional drilling methods. In the early 1990s, after years of experimenting in the Barnett Shale in Texas, George Mitchell and Mitchell Energy Co. developed new techniques that made production from these types of formations more economically feasible. The new techniques combined horizontal drilling with slickwater hydraulic fracturing (slickwater hydraulic fracturing fluids are water-based fluids, generally containing a friction reducer, that facilitate rapid pumping of the fluid into the well), allowing Mitchell to drill into specific target areas and release the natural gas trapped in the formation. Horizontal drilling allows producers to target the specific cross-sections of rock formations where the natural gas is trapped, greatly improving the likelihood of a productive well.
Source: Energy Information Administration
sands.
Coalbed Methane
Coalbed methane (CBM) is natural gas trapped in coal seams. Fractures, or cleats, that permeate coalbeds are usually filled with water; the deeper the coalbed, the less water is present. To release the gas from the coal, pressure in the fractures is created by removing water from the coalbed. While the venting of methane from coal mines had been in practice

Energy Primer | 11
for years, commercial production of this resource began in earnest in the 1980s. According to the U.S. Geological Survey, there is more than 700 Tcf of domestic CBM, but less than 100 Tcf of it may be economically recoverable.16 Most CBM production in the United States is concentrated in the Rocky Mountain area, although there is significant activity in the Midcontinent and the Appalachian area.
Shale and Tight Sands
Shale gas is natural gas found in fine-grained sedimentary rock with low permeability, including mudstone, clay stone and what is commonly known as shale. Natural gas in shale formations tends to concentrate in natural fractures and the rock adjacent them. Historically, extraction of natural gas from shale formations has been difficult to achieve. Growth
16 See U.S. Geological Society, Coalbed Gas: Overview (Oct. 13,
2017), https://energy.usgs.gov/OilGas/UnconventionalOilGas/CoalbedGas.
aspx#380476-overview.
Coalbed Methane Fields, Lower 48 States
Source: FERC staff
Source: EIA

12 | Energy Primer Federal Energy Regulatory Commission
in shale resources is discussed further below (see “The Shale Revolution”).
Tight sands gas is natural gas contained in sandstone, siltstone and carbonate reservoirs of such low permeability that it will not naturally flow at economic production rates when a well is drilled. There are about 20 shale and tight sands basins in the U.S. (see map).
Growth in shale gas in particular has been substantial since 2007 and has contributed to a significant increase in U.S. proved natural gas reserves. Proven shale reserves grew by more than 800 percent between 2007 and 2016 to total over 209 Tcf.17
Shale and tight sands require a special technique known as hydraulic fracturing (fracking) to release the natural gas. This technique involves fracturing the rock in the horizontal shaft using a series of radial explosions and water pressure. Over the past decade, the processes for finding geological formations has improved, and producers have accumulated knowledge of subsurface oil and gas deposits over that span of time. As a result, most wells targeting shale and tight sands formations result in drill contact with formations and successful new natural gas production. Improved exploration techniques, coupled with improved drilling and production methods, have lowered the cost of finding and producing shale gas, and have resulted in a significant increase in production.
As of 2017, the largest gas producing unconventional shale plays in the United States were Eagle Ford, Haynesville, Marcellus, Niobrara, Permian, and Utica (see map on next page).18 Other shale formations have experienced heavy exploration activity and depending on economic conditions may become major contributors of natural gas supply.
17 EIA, Shale Natural Gas Proved Reserves as of December 31 (Feb.
13, 2018), https://www.eia.gov/dnav/ng/ng_enr_shalegas_a_EPG0_R5301_
Bcf_a.htm.
18 See EIA, Drilling Productivity Report, Production by Region (Oct. 16,
2017), https://www.eia.gov/petroleum/drilling/#tabs-summary-2.
The Shale Revolution
The estimated resources, proven reserves and production of shale gas rose rapidly subsequent to 2005, and the development of shale gas has transformed gas production in the United States. In 2017, shale gas provided 57 percent of gross production of natural gas and was the dominant source of domestically produced gas. By comparison, coalbed methane accounted for about 3 percent of production, while nearly 20 percent of the natural gas came from oil wells and 20 percent was produced from conventional natural gas wells.19
New shale plays increased dry shale gas production from 1.9 Tcf in 2007 to approximately 19 Tcf in 2017.20 Wet shale gas reserves, those rich in oil and/or natural gas liquids, account for about 20 percent of the overall United States natural gas reserves. According to the EIA, shale gas and production from tight formations will account for greater than 85 percent of United States natural gas production in 2050.
19 Derived from EIA, U.S Natural Gas Gross Withdrawals and
Production (Nov. 30, 2018), https://www.eia.gov/dnav/ng/ng_prod_sum_dc_
NUS_MMCF_m.htm.
20 Id.
Rig Count and Rig Productivity
The rig count is used to measure exploration activity by assessing the number of rotary drilling rigs actively drilling for oil and gas. Historically, rig counts were used as a rough predictor of future production. However, improvements in drilling technology and practices have caused a decoupling between rig count and production. The adoption of horizontal drilling significantly increased production per rig, making historical comparisons of rig counts problematic as horizontal rigs are considerably more productive than vertical rigs. Within the total rig count, the use of horizontal drilling rigs, used in the production of natural gas and oil in shale formations, has been growing for years, while the traditional vertical rig count has steadily declined.

Energy Primer | 13
Source:EIA21
Shale Gas Production by Region
Shale gas well productivity improved considerably over the past 10 years, with technological advances in drilling and fracking technology reducing exploration, drilling, and production expenses. Rising well productivity and falling costs resulted in larger amounts of shale gas production at lower costs to the producers.
The presence of NGLs in many shale gas plays may add to shale gas well profitability. NGL prices are more closely linked to oil prices than natural gas prices and natural gas wells with high liquids content are often more profitable than wells producing natural gas alone. A typical barrel of NGL might contain 40-45 percent ethane, 25-30 percent propane, 5-10 percent butane and 10-15 percent natural gasoline.22 This can
21 See EIA, Annual Energy Outlook 2018, Oil and Gas Supply (Table 14)
(Feb. 6, 2018), https://www.eia.gov/outlooks/aeo/tables_ref.php.
22 See EIA, NGL 101 (Jun. 6, 2012), https://www.eia.gov/conference/
make the production from shale gas wells less sensitive to natural gas prices than wells solely producing natural gas.
The Marcellus Shale formation in Appalachia is particularly notable because of its location, size and resource potential. The formation extends from West Virginia to New York, near the high population centers of the Northeast and Mid-Atlantic. Marcellus Shale’s estimated proven reserves reached 77.2 Tcf at year end 2015.23 Although Marcellus Shale produced significant amounts of gas only since 2008, production has been prolific, with high initial well pressures and high production rates.
The growth in production in the Marcellus Shale has significantly affected U.S. natural gas transportation. As more natural gas has flowed out of Marcellus, less has been needed from the Rockies or the Gulf Coast to serve the eastern
ngl_virtual/eia-ngl_workshop-anne-keller.pdf.
23 EIA, Marcellus Shale Play Geology Review, (Jan. 2018), https://
www.eia.gov/maps/pdf/MarcellusPlayUpdate_Jan2017.pdf.

14 | Energy Primer Federal Energy Regulatory Commission
United States. This has resulted in changing flow patterns of natural gas on pipelines that traditionally served eastern and midwestern markets. In some instances, pipelines which transported natural gas into northeastern markets, which have relied on production from outside of the region, have reversed flow direction to export natural gas produced in the Marcellus and Utica to markets across the United States. This new production has contributed to a reduction in natural gas prices and the long-standing price differentials between the Northeast and other parts of the United States. It has also caused imports from Canada to decrease.
FERC Jurisdiction
Section 1(b) of the Natural Gas Act (NGA) exempts production and gathering facilities from FERC jurisdiction. Moreover,
the Wellhead Decontrol Act of 1989 completely removed federal controls on new natural gas, except sales for resale of domestic natural gas by interstate pipelines, LDCs or their affiliates.24 In Order No. 636, FERC required interstate pipelines to separate, or unbundle, their sales of gas from their transportation service, and to provide comparable transportation service to all shippers whether they purchase natural gas from the pipeline or another gas seller.
Imports and Exports
The U.S. has historically been a net importer of natural gas by pipeline from Canada, with shipments of LNG from foreign nations playing an important role in serving pipeline capacity-constrained regions during periods of peak natural
24 Pub. L. No. 101-60 (1989); 15 U.S.C. § 3431(b)(1)(A)
Shale Gas Production by Region

Energy Primer | 15
gas demand. However, the increase in U.S. natural gas production, spurred by the shale revolution, has reduced the need for imports and enabled greater exports.
Net natural gas imports peaked in 2007 at 3,785 Bcf, or about 15 percent of the natural gas used in the U.S.25 Since then, imports have declined and by 2017, imports totaled 3,040 Bcf, or about 10 percent of total U.S. consumption.26 The vast majority of imports have been delivered by pipeline from Canada, with additional waterborne shipments of liquefied natural gas from Trinidad and Tobago, Egypt, Morocco, as well as other gas-exporting nations.
Corresponding with the reduction in imports, the U.S. has become a net exporter of natural gas. Exports have flowed through pipelines to Canada and Mexico for decades, with
25 Derived from EIA, U.S. Net Gas Imports (Nov. 30, 2018), https://
www.eia.gov/dnav/ng/hist/n9180us1A.htm.
26 Derived from EIA, U.S. Net Gas Summary (Nov. 30, 2018), https://
www.eia.gov/dnav/ng/ng_sum_lsum_dcu_nus_a.htm.
Source: Derived from ABB, Velocity Suite
quantities in the 660 to 1,590 Bcf range in the period from 2004 through 2014.27 Total exports reached 3,167 Bcf following the first large scale exports of LNG that started in 2015 and ramped up in 2016 (see discussion on LNG following).28 As a result of these developments, the U.S. became a net exporter of natural gas in 2017 for the first time since 1957.29
Liquefied Natural Gas
Liquefied natural gas (LNG) is natural gas cooled to minus 260 degrees Fahrenheit to liquefy it, which reduces its volume
27 Derived from EIA, U.S. Natural Gas Pipeline Exports to Canada (Jul.
31, 2018), https://www.eia.gov/dnav/ng/hist/n9132cn2A.htm and EIA, U.S.
Natural Gas Pipeline Exports to Mexico (Jul. 31, 2018), https://www.eia.gov/
dnav/ng/hist/n9132mx2A.htm.
28 See EIA, Natural Gas Summary (Jul. 31, 2018), https://www.eia.
gov/dnav/ng/ng_sum_lsum_dcu_nus_a.htm.
29 See EIA, The United States exported more natural gas than it
imported in 2017 (Mar. 19, 2018), https://www.eia.gov/todayinenergy/detail.
php?id=35392.
Natural Gas Import and Export Entry Points

16 | Energy Primer Federal Energy Regulatory Commission
by 600 times. The volumetric reduction makes it possible to economically transport natural gas in ships and trucks to locations not connected by a pipeline network.
The LNG Supply Chain
Natural gas is sent through the pipeline network to liquefaction facilities for conversion to LNG. These liquefaction facilities, which convert methane from a gas to a liquid, are major industrial complexes, typically costing $10 billion or more, with some costing as much as $50 billion.30
Once liquefied, the LNG is typically transported by specialized ships with cryogenic, or insulated, tanks.
When LNG reaches an import (regasification) terminal, it is unloaded and stored as a liquid until ready for sendout. To send out the gas, the regasification terminal warms the LNG to return it to a gaseous state and then sends it into the pipeline transportation network for delivery to consumers. Currently, over 100 Bcfd of regasification capacity exists globally, which is nearly 2.3 times the amount of liquefaction capacity.31 Excess regasification capacity provides greater flexibility
30 See, for example, Chenier Energy Partners, L.P., Annual Report,
SEC Form 10-K, at 4 (Feb. 24, 2017), https://www.sec.gov/Archives/edgar/
data/1383650/000138365017000011/cqp2016form10-k.htm#s569b7029a90e4
dd19894f10c84a51e70.
31 Figures converted from million metric tons per annum (MTPA)
using 7.6 MTPA per Bcfd. See International Group of LNG Importers, The LNG
Industry: GIIGNL Annual Report 2018, at 22, 32 (Oct. 5, 2018), https://giignl.org/
sites/default/files/PUBLIC_AREA/Publications/rapportannuel-2018pdf.pdf.
to LNG suppliers, by enabling them to land cargoes in the highest-priced markets.
The cost of the LNG process is $2-$10 per million British thermal units (MMBtu), depending on the costs of natural gas production and liquefaction and the distance over which the LNG is shipped. Liquefaction and shipping form the largest portion of the LNG supply chain costs, while regasification is the least of any of the cost components. The cost of a regasification facility varies considerably; however, the majority of these costs arise from the development of the port facilities and the storage tanks. A 700-MMcfd regasification terminal, which converts methane from a liquid to a gas, may cost $500 million or more32.
LNG in the United States
The United States was historically an importer of LNG, with more regasification capacity than any other country except Japan. As of 2017, there were 11 LNG receiving or regasification terminals in the continental United States, with approximately 19 Bcfd of import capacity and 100 Bcf of storage capacity. All of these facilities are on the Gulf or East coasts, or just offshore. Additionally, the United States can import regasified LNG via pipeline into New England from the Canaport LNG terminal in New Brunswick, Canada. The Energia Costa Azul LNG terminal in Baja California, online in 2008, provided for the flow of re-gasified LNG from Mexico into Southern California.33
Between 2003 and 2008, the United States met between 1 to 3 percent of its natural gas demand through LNG imports.34
32 EIA, Understanding Natural Gas and LNG Options (Nov. 2016),
https://www.energy.gov/sites/prod/files/2016/12/f34/Understanding%20
Natural%20Gas%20and%20LNG%20Options.pdf.
33 The Costa Azul project was built to meet expectations of increased
U.S. and Mexican demand and falling U.S. domestic natural gas production.
However, the terminal has been underused following increases in U.S.
production with the Shale Revolution and lower cost natural gas supplies
flowing into the Western and Southwestern regions.
34 Derived from EIA, U.S. Net Gas Imports (Jul. 31, 2018), https://www.
eia.gov/dnav/ng/hist/n9180us1A.htm.

Energy Primer | 17
Source: FERC staff35
LNG imports peaked at about 100 Bcf/month in the summer of 2007. Subsequently, competition from relatively low-cost U.S. shale gas production has trimmed imports, affecting
Gulf Coast terminals the most. Today, less than 1 percent of U.S. natural gas demand is met through LNG imports.36 About half of the total LNG enters the United States under long-term contracts through the Everett (Boston) and Elba Island (Georgia) LNG terminals. The remainder of the LNG enters the United States under short-term contracts or as spot cargoes. LNG prices in the United States are generally linked to the prevailing price at the closest trading point to the import terminal.
35 FERC, Natural Gas Industry (May 1, 2017), https://www.ferc.gov/
industries/gas/indus-act/lng/lng-existing.pdf.
36 See EIA, Natural Gas Summary, (Jul. 31, 2018), https://www.eia.
gov/dnav/ng/ng_sum_lsum_dcu_nus_a.htm.
Starting in 2010, numerous proposals to export domestically produced LNG were prompted by increased U.S. natural gas production, largely due to shale gas. No large-scale liquefaction facilities existed in the continental United States at the time, though the Kenai LNG plant in Nikiski, Alaska, had produced small volumes since the late 1960s. Cheniere’s Sabine Pass LNG was the first LNG export terminal in the lower 48 US states, shipping its first cargo in 2015. The facility is a large LNG terminal which will be capable of processing over 4.2 Bcfd of natural gas when fully operational. Like several other projects under construction, Sabine Pass was formerly an import terminal, from which the developers utilized common facilities like docks and storage tanks to add liquefaction trains. In addition, the 0.82 Bcfd Dominion Cove Point LNG facility exported its first commercial cargo in April 2018. By the end of 2018, four additional liquefaction projects
North American LNG Import/Export Terminals-Existing

18 | Energy Primer Federal Energy Regulatory Commission
Source: FERC staff37
were under construction along the Gulf Coast and one was under construction on the East Coast. By 2020, nearly 10 Bcfd of LNG export capacity is expected to be online.
FERC Jurisdiction
FERC has exclusive authority under the NGA to authorize the siting of facilities for imports or exports of LNG. This authorization, however, is conditioned on the applicant’s satisfaction of other statutory requirements not administered by FERC for various aspects of the project. In addition, the Department of Energy has authority over permits to import and export the commodity.
37 FERC, Natural Gas Industry (May 1, 2017), https://www.ferc.gov/
industries/gas/indus-act/lng/lng-approved.pdf.
North American LNG Import/Export Terminals-Approved

Energy Primer | 19
Natural Gas ProcessiNG aNd traNsPortatioN
Most natural gas production must be transported via pipeline to natural gas consumers. To get gas from the wellhead to consumers requires a vast network of processing facilities and a national network of 2.5 million miles of pipelines.38 In 2016, there was more than 25 Tcf of natural gas delivered to millions of consumers.39 The U.S. pipeline system can transport natural gas to and from almost any location in the Lower 48 states.
Efficient markets require this network to be robust and allow consumers to access gas from more than one production
38 See U.S. Department of Transportation, Pipeline and Hazardous
Materials Safety Administration, Pipeline Mileage and Facilities (Aug. 2017),
https://hip.phmsa.dot.gov/analyticsSOAP/saw.dll?Portalpages.
39 See EIA, U.S. Natural Gas Summary (Sept. 29, 2017), https://www.
eia.gov/dnav/ng/ng_move_poe2_a_EPG0_ENG_Mmcf_a.htm.
Source: EIA40
center. Supply diversity tends to improve reliability and moderate prices, while constraints have the effect of increasing prices during peak demand periods.
Processing
The midstream segment of the natural gas industry, between the wellhead and pipelines, is shown in the graphic. This involves gathering the gas from the wellhead, processing the gas to remove liquids and impurities and moving the processed (dry) natural gas to pipelines. The composition of raw, or wellhead, natural gas differs by region. Consequently, processing will differ depending on the quality of the natural gas.
Once a well is constructed and production starts, the natural gas moves into gathering pipelines, typically small-diameter lines that move the gas from the wellhead to either a processing plant or a larger pipeline. Natural gas may also be dissolved in oil underground, but separates out from the oil as it comes to the surface due to reduced pressure. In these
40 EIA, Natural Gas Explained: Delivery and Storage of Natural Gas
(Mar. 2018), https://www.eia.gov/energyexplained/index.php?page=natural_
gas_delivery

20 | Energy Primer Federal Energy Regulatory Commission
instances, the oil and gas are sent to separate processing facilities. Where it does not separate naturally, processing is required.
At the processing plant, various products (NGLs) and contaminants (e.g., sulfur and carbon dioxide) are removed from the incoming wet natural gas stream and the gas is dehydrated. The extracted NGLs are then separated into individual components by fractionation, which uses the different boiling points of the various hydrocarbons to separate them. The extracted liquids are high-value products used by the petrochemical industry, refineries and other industrial consumers. Once processing is completed, the gas is of pipeline quality and is ready to be moved by intrastate and interstate pipelines. There were about 550 gas processing plants operating in the United States in 2014.41
Natural Gas Transportation
Interstate pipelines account for 63 percent of the natural gas pipeline miles in the United States and carry natural gas across state boundaries.42 Intrastate pipelines account for the remaining 37 percent, and have similar operating and market characteristics.
The interstate network moves dry natural gas from producing areas to LDCs, large industrial customers, electric power plants and natural gas storage facilities. The pipelines, which generally range in diameter from 16 inches to as large as 48 inches, move gas between major hubs to lateral lines. Smaller diameter delivery laterals then transport gas to end-users and LDCs.
The large pipelines are known as mainline transmission
41 See EIA, Natural Gas Annual Respondent Query System, EIA-757
(2014), https://www.eia.gov/cfapps/ngqs/ngqs.cfm?f_report=RP9&f_
sortby=&f_items=&f_year_start=&f_year_end=&f_show_compid=&f_
fullscreen.
42 See U.S. Department of Transportation, Pipeline and Hazardous
Materials Safety Administration, Pipeline Mileage and Facilities (Aug. 2017),
https://hip.phmsa.dot.gov/analyticsSOAP/saw.dll?Portalpages.
pipelines and typically consist of steel sufficient to meet standards set by the U.S. Department of Transportation’s Pipeline and Hazardous Materials Safety Administration (PHMSA). These pipes are also coated to reduce corrosion. Smaller distribution lines, which operate under much lower pressures, may be made of plastic materials, which provide flexibility and ease of replacement.
Nearly one-sixth of all natural gas transmission pipelines, by mileage, are located in Texas. More than half are located in nine states: Texas, Louisiana, Kansas, Oklahoma, California, Illinois, Michigan, Mississippi and Pennsylvania.
Natural Gas Infrastructure
The United States natural gas market is accommodated by extensive infrastructure:
Roughly 303,000 miles of large-diameter, high pressure inter- and intrastate pipelines make up the mainline pipeline transportation network, run by more than 210 companies.
More than 1,400 compressor stations maintain pressure on the natural gas pipeline network.
More than 5,000 receipt points, 11,000 delivery points and 1,400 interconnection points implement the flow of gas across the United States.
More than 20 hubs or market centers provide additional interconnections.
Over 400 underground natural gas storage facilities increase the flexibility of the system.
49 locations enable natural gas to be imported or exported via pipelines.
There are 11 LNG import facilities and 100 LNG peaking facilities (stored gas held for peak demand periods).
More than 1,300 local distribution companies deliver natural gas to retail customers. Source: EIA43
43 EIA, About U.S. Natural Gas Pipelines (n.d.), https://www.eia.gov/

Energy Primer | 21
Compressor stations are typically located every 50-100 miles along the pipe to add or maintain the pressure of the natural gas, propelling it down the pipeline. Natural gas travels through pipelines at high pressures, ranging from 200 pounds per square inch (psi) to 1,500 psi. The natural gas is compressed by turbines, motors or engines. Most facilities power the compressors with turbines and reciprocating natural gas engines that use some of the gas from the line to fuel their operations, while others rely upon very large electric motors.
Metering stations are placed along the pipelines to measure the flow of natural gas as it moves through the system. Movement of natural gas along a pipeline is controlled in part by a series of valves, which can be opened to allow the gas
naturalgas/archive/analysis_publications/ngpipeline/index.html
to move freely or closed to stop gas flow along a section of pipe. Large valves may be placed every 5 to 20 miles along the pipeline.
Pipeline operators and engineers use supervisory control and data acquisition (SCADA) systems to track and control the natural gas as it travels through the system. SCADA is a centralized communication system that collects, assimilates and manages the meter and compressor station data.
FERC Jurisdiction
The NGA gives FERC comprehensive regulatory authority over companies that engage in either the sale in interstate commerce of natural gas for resale or the transportation of natural gas in interstate commerce. The Commission regulates
Source: ABB, Velocity Suite
Natural Gas Transportation System

22 | Energy Primer Federal Energy Regulatory Commission
entry into the transportation market by issuing certificates of public convenience and necessity under Section 7 of the NGA, 15 U.S.C. § 717f, subject to such conditions as the Commission deems appropriate. To this end, FERC reviews applications for the construction and operation of interstate natural gas pipelines. Applicants for a certificate must certify that they will comply with PHMSA safety standards. FERC has no jurisdiction over pipeline safety or security, but actively works with other agencies on safety and security responsibilities. The Commission regulates market exit through its authority to abandon certificated service and facilities, 15 U.S.C. § 717f(b).
Hubs and Citygates
A key element of the pipeline transmission and distribution network is the natural gas hub. Typically, a hub is a specific point where pipeline interconnections allow the transfer of gas from one pipeline to another. Hubs also provide a convenient location to establish natural gas prices.
There are dozens of natural gas hubs in the country, with
Source: EnLink Midstream
over 20 major hubs. The dominant benchmark point in the physical natural gas market is the Henry Hub, which is strategically located in the Gulf Coast’s producing area at a series of pipeline connections to the East Coast and Midwest consumption centers. It is located in south central Louisiana, in the town of Erath, and comprised of 12 delivery points and 4 major receipt points. More than a dozen major natural gas pipelines converge and exchange gas at the Henry Hub.
In addition to market hubs, other major pricing locations include citygates. Citygates are the locations at which distribution companies receive gas from a pipeline. Citygates at major metropolitan centers offer another convenient point at which to price natural gas.
Physical natural gas can be bought and sold at the Henry Hub or other hubs around the country in daily and monthly markets. In addition, the New York Mercantile Exchange (NYMEX) established a natural gas futures contract centered at the Henry Hub in 1990 that gained widespread acceptance and is generally used as the reference price for natural gas in the United States.
Sabine Pipe Line LLC, Henry Hub
Sabine Pipe Line LLC, Henry Hub

Energy Primer | 23
Distribution lines typically take natural gas from the large transportation pipelines and deliver the gas to retail customers. While some large consumers – industrial and electric generation, for example – may take service directly off a transmission pipeline, most receive their gas through their local gas utility, or LDC. These companies typically purchase natural gas and ship it on behalf of their customers, taking possession of the gas from the pipelines at local citygates and delivering it to customers at their meters.
Some states allow competition in natural gas service at the local level. In these circumstances, natural gas marketers purchase the natural gas and arrange for it to be shipped over both the interstate pipeline network and the LDC system.
Pipeline Services
Customers or shippers have a choice between a variety of services on interstate pipelines. One is firm transportation service in which an agreement is executed directly between the pipeline and a customer, providing the customer with rights to transport natural gas from primary receipt point(s) to delivery points. Shippers with firm transportation service generally receive priority to use their capacity over those customers without firm capacity.
A shipper can also contract for interruptible transportation service, which is offered to customers on an as-available basis. This service may not be available during periods of peak demand. Due to the interruptible nature of the service, customers pay lower rates than those that contract for firm service.
A secondary market for firm transportation rights enables shippers to sell their pipeline capacity to a third party through the FERC’s capacity release program. Services offered in the primary market can be offered in the secondary market by the holder of the primary service. Released capacity offers market participants the opportunity to buy and sell from each other as well as from the pipeline. Holders of firm capacity can release segments rather than their full holdings, provided segmentation is operationally feasible on the interstate pipeline’s system.
Some interstate pipelines also provide “no-notice service” which enable pipeline customers to receive delivery of gas on demand up to their firm entitlements on a daily basis without incurring daily balancing and scheduling penalties. No-notice service enables customers to receive natural gas volumes that have not been scheduled and thereby helps meet unexpected requirements caused, for example, by unexpected changes in temperature.44 This service is especially helpful to LDCs that must serve their load without knowing their exact load level each day. No-notice service is generally priced at a premium to firm transportation service and is provided through a combination of storage and transportation services. Shippers may temporarily release this service to other parties, using FERC-approved capacity release guidelines.
Interstate Transportation Rates
Pipeline transportation rates can be priced on zones or miles, or be a fixed postage stamp rate. In zonal pricing, the price of transportation varies by the location of the receipt and delivery points, across a series of zones.
Under postage stamp rates, shippers pay the same rate for transportation regardless of how far the gas is moved, similar to the way a postage stamp costs the same amount regardless of whether a letter is sent to New York or California. Pipelines using postage stamp rates include Northwest Pipeline, Colorado Interstate Gas and Columbia Gas Transmission.
With mileage-based rates, shippers pay based on the distance between where the gas enters the pipeline and where it is taken out of the pipeline. The rate is designed to reflect the
44 See Order No. 636, FERC Stats. & Regs. ¶ 30,939 at P 88 (1992).

24 | Energy Primer Federal Energy Regulatory Commission
Source: FERC45
distance involved in transporting the gas. Gas Transmission Northwest (GTN) uses mileage-based rates.
Other pipelines use hybrid or mixed-rate systems. Northern Natural Gas, for example, uses a combination zonal rate for upstream receipts and a postage stamp rate for market area deliveries.
Scheduling
Pipelines have rigorous schedules that shippers must follow. Typically, shippers nominate gas in the day-ahead market, and may update their nominations at various points during the day in which the natural gas flows. The Pipeline Capacity Scheduling graphic illustrates a particular schedule.
45 FERC, Coordination of the Scheduling Processes of Interstate
Natural Gas Pipelines and Public Utilities, Order No. 809, FERC Stats. & Regs.
¶ 31,368, at Appendix (2015).
Pipeline Usage or Load Factor
Load factor measures the use of a pipeline network. It is the average capacity used at a given point or segment relative to a measurement of maximum or peak available capacity. Customers with a 100 percent load factor use their maximum capacity every day; one with a 50 percent load factor uses its capacity only half the time. Different types of customers use pipeline capacity differently. Historically, industrial customers have exhibited high load factors and residential customers that primarily rely upon seasonal gas to heat homes have had lower load factors.
Pipelines are accustomed to serving different demands, which can affect how much of their capacity is used at various times. For example, Kern River Gas Transmission has operated at around 93 percent of capacity since 2005, while Algonquin Gas Transmission’s load factor is considerably less. Algonquin’s pipeline is used more seasonally than Kern River’s, reflecting the seasonal demand in the Northeast.
Pipeline Capacity Scheduling

Energy Primer | 25
Park and Loan Service
Park and loan service (PAL) is a way for shippers to balance their takes of gas with their supply, by providing a short-term load-balancing service to help shippers meet their load. Using the PAL service, shippers can take less gas than scheduled, thus parking their excess supply in the pipeline at times when the demand is lower than anticipated. If demand is higher than expected, shippers can adjust their take upward, in effect borrowing gas from the pipeline
PAL characteristics include:
Park and loan services typically generate low revenue and are offered with the lowest service level priority among all pipeline services.
Market centers, or hubs, routinely offer these services.
Charges are usually commensurate with interruptible service rates.
Pipeline Constraints and Capacity Growth
Pipeline capacity limits the amount of natural gas supply that can be delivered to a specific region and, therefore, is a key factor in regional prices. In recent years, the natural gas pipeline network has expanded significantly, which has removed many bottlenecks and enabled access to previously unreached supply areas.
This development includes a considerable amount of new pipeline capacity in the Northeast, where natural gas production increased from 2.4 Bcfd in 2010 to more than 27 Bcfd by 2017.46 New pipelines have also increased the flow of Barnett Shale gas into the interstate network and have reduced congestion across the Texas-Louisiana border.
New England, on the other hand, experiences pipeline constraints on peak demand days during the winter months. Most of the year, there is excess pipeline capacity into New
46 EIA, Natural Gas Gross Withdrawals and Production (Apr. 30, 2018),
https://www.eia.gov/dnav/ng/ng_prod_sum_a_EPG0_FPD_mmcf_a.htm.
England. However, when high demand from the power sector coincides with peak heating demand from LDC customers, customers without firm (priority) pipeline service compete for the scarce remaining pipeline capacity. This can lead to substantial price volatility in the natural gas spot market.
The Florida Panhandle and Northern California were also some of the most frequently constrained regions of the country, but each region constructed significant new pipeline capacity. Expansion of Florida Gas Transmission in 2011 added about 800 MMcfd of gas transmission capacity to peninsular Florida.47 Sabal Trail entered service in July 2017, which provided over 800 MMcfd of transportation capacity from Alabama into central Florida.48 The 680-mile, 42-inch-diameter Ruby Pipeline, which began operations in 2011, flows Rockies gas from Opal, Wyo., to Malin, Ore.49
Building a pipeline project requires careful planning, as the projects typically entail significant costs that must be recovered over years of operations. However, unanticipated changes in supply and demand patterns can have unexpected effects on even the best-planned projects. For example, one of the largest additions to the natural gas infrastructure came when the 1.8-Bcfd Rockies Express Pipeline (REX) was completed in 2009.50 REX was designed to move natural gas from Wyoming to eastern Ohio in order to relieve pipeline constraints that bottled up production and depressed prices in the Rockies, while at the same time providing needed supplies into the East. When REX first went into service, Rockies producers saw a rise in prices. The Rockies gas flowing eastward displaced gas from the Permian Basin. Permian natural gas, in turn, began moving to the Southern California market. Consequently, regional price differences moderated. However, the rapid increase in Marcellus Shale production pushed Rockies supplies away from the Northeast
47 FERC, Order Issuing Certificate (CP09-17-000), 129 FERC ¶ 61,150,
at P 1 (2009).
48 Spectra Energy Partners, NextEra Energy, Inc., and Duke Energy,
Sabal Trail Transmission (2013), http://sabaltrailtransmission.com/.
49 Kinder Morgan, Natural Gas Pipelines, Ruby Pipeline LLC (n.d.),
https://www.kindermorgan.com/business/gas_pipelines/west/Ruby/.
50 Tallgrass Energy and Phillips 66, Rockies Express Pipeline (REX)
(n.d.), http://www.tallgrassenergylp.com/Operations_REX.aspx.

26 | Energy Primer Federal Energy Regulatory Commission
and caused flows on REX to decrease sharply, putting the pipeline at financial risk. In 2014, REX began the process of reversing flows on parts of the pipeline to move natural gas from the east to the Midwest. This development is making more Rockies natural gas available to Western Markets, and more Midcontinent production available for the Gulf Coast and Southeast states.
In total, more than 54.5 Bcfd of incremental pipeline capacity was added between 2010 and 2017.51
Local Distribution
Distribution lines typically take natural gas from the large interstate pipelines and deliver the gas to retail customers. While some large consumers – industrial and electric generators, for example – may take service directly off an interstate pipeline, most receive their natural gas through their LDC. The LDCs typically purchase natural gas and ship it on behalf of their customers, taking possession of the natural gas from interstate pipelines at local citygates and deliver the natural gas to their customers at the customer’s meter. According to PHMSA, this distribution involves a network of smaller pipelines totaling more than two million miles, as well as smaller scale compressors and meters.
FERC Jurisdiction
The NGA requires that interstate natural gas pipelines charge just and reasonable rates for the transportation and sale of natural gas. To promote compliance with this mandate, the NGA requires gas pipelines to file rate schedules with the FERC and to notify the FERC of any subsequent changes in rates and charges. On submission of a pipeline tariff revision, the FERC may hold a hearing to determine whether the pipeline has met its burden to show that the amended rates and charges are just and reasonable.
Under Sections 4 and 5 of the NGA, 15 U.S.C. §§ 717c and 717d, the Commission regulates the rates and other terms of
51 EIA, Pipeline Projects, Historical Projects (May 7, 2018), https://
www.eia.gov/naturalgas/pipelines/EIA-NaturalGasPipelineProjects.xlsx.
jurisdictional transportation and sales, ensuring that rates and charges for such services, as well as all rules, regulations, practices, and contracts affecting those rates and charges, are just and reasonable and not the product of undue discrimination (15 U.S.C. §§ 717c(a) and (b)).

Energy Primer | 27
Natural Gas storaGe
Although natural gas production rose steadily from 2005 through 2017 because of the increase in shale gas production, day-to-day production remains relatively steady throughout the year. Demand, however, changes considerably with the seasons. Natural gas storage enables producers and purchasers to store gas during periods of relatively low demand – and low prices – then withdraw the gas during periods of relatively higher demand and prices.
Working gas storage capacity, as tracked by EIA, was more than 4,850 Bcf in 2017.52 The amount injected or withdrawn
52 See EIA, Underground Natural Gas Storage Capacity (Sep. 28, 2018),
https://www.eia.gov/dnav/ng/ng_stor_cap_a_EPG0_SACW0_Mmcf_a.htm.
Underground Natural Gas Storage Facilities in the Lower 48 States
is the difference between demand and production. Storage capacity adds flexibility to pipeline and distribution systems and helps moderate prices by providing an outlet for excess gas during periods of low demand. Storage facilities also provide a readily accessible supply in periods of high demand. Some natural gas can also be stored in the pipelines as linepack, in which more molecules of gas are held in a segment of pipeline under greater-than-normal pressure.
EIA’s weekly storage report provides a high-level snapshot of the natural gas supply and demand balance. EIA releases its storage report at 10:30 a.m. eastern time (ET) on Thursdays. The price for natural gas futures can change dramatically within seconds of the report’s release. If the reported injection or withdrawal significantly differs from market expectations, the price for natural gas futures may rise or fall.

28 | Energy Primer Federal Energy Regulatory Commission
Source: EIA53
Storage Facilities
The bulk of the storage capacity in the United States is below ground. Differing cost and operational characteristics affect how each facility is used:
• Deliverability rate is the rate at which inventory can be withdrawn. The faster the natural gas can be removed from storage, the more suitable the storage facility is to helping serve rapidly changing demand.
• Cycling capability is the ability of the resource to quickly allow injections and withdrawals, which is useful for bal-ancing supply and demand. Salt caverns tend to have high withdrawal and injection rates, enabling them to handle as many as a dozen withdrawal and injection cycles each year. LNG storage also demonstrates these capabilities.
53 See EIA, Map of Storage Facilities (May 2018), https://www.eia.gov/
cfapps/ngqs/images/storage_2015.png
Types of Underground Storage Facilities
Natural gas in an underground storage facility is divided into two general categories, base gas and working gas. Base gas is the volume of natural gas, including native gas, needed as a permanent inventory in a storage reservoir to maintain adequate reservoir pressure and deliverability rates throughout the withdrawal season. Working gas is the volume of gas in the reservoir above the designed level of base gas and that can be extracted during the normal operation of the storage facility.
Most of the nation’s gas storage is in depleted reservoirs (former oil and gas fields). These facilities reuse the infrastructure – wells, gathering systems and pipeline connections – originally created to support the field when it was producing. About 50 percent of total capacity goes to base gas used to maintain operating pressure at the facility, and inventory usually turns over once or twice a year.

Energy Primer | 29
Other storage facilities reside in aquifers that have been transformed into gas storage facilities. These are mostly in the Midwest. These aquifers consist of water-bearing sedimentary rock overlaid by an impermeable cap rock. Aquifers are the most expensive type of natural gas facility because they do not have the same retention capability as depleted reservoirs. Source: EIA54
Therefore, base gas can be well over 50 percent of the total gas volume. This makes the facility more sensitive to withdrawal and injection patterns, so inventory usually turns over just once a year.
Salt cavern formations exist primarily in the Gulf Coast region. These air- and water-tight caverns are created by removing salt through solution-mining, leaving a cavern that acts as a pressurized vessel. Little base gas is required, which allows inventory to turn over as many as a dozen times during the year, and results in high injection and withdrawal rates. Salt caverns generally hold smaller volumes than depleted-reservoir or aquifer gas storage facilities.
Natural gas may also be stored in above-ground tanks as LNG. There is LNG storage at all of the onshore LNG-receiving terminals, and there are about a hundred standalone LNG storage facilities in the United States, as well. LNG ships can also serve as storage, depending on timing and economics. LNG storage is highly flexible, allowing multiple inventory turns per year with high injection and withdrawal rates.
Regional Storage
The EIA divides the United States into five storage regions: East, Midwest, South Central, Mountain, and Pacific.55 As of November 2017, nearly a third of the underground storage in the United States, about 1,550 Bcf, sits in the South Central region in a mix of depleted reservoirs, aquifers, and high-deliverability salt caverns. Close to 500 Bcf of the South
54 EIA, Natural Gas Storage Basics (n.d.), https://www.eia.gov/
naturalgas/storage/basics/.
55 EIA, Weekly Natural Gas Storage Report, Notes and Definitions (Oct.
2017), http://ir.eia.gov/ngs/notes.html.
Central region’s working gas capacity is in these purpose-built salt caverns. The East and Midwest each have more than 1,000 Bcf of working gas capacity, generally near major population centers. The remaining roughly 900 Bcf resides in depleted fields throughout the Mountain and Pacific regions, for total working gas capacity amongst all the regions of nearly 4,700 Bcf.56 Depending on storage levels at the end of the previous winter, and the temperatures over the injection season, U.S. working gas in storage will typically be between 80 and 90 percent full when the official winter season begins on November 1.
Storage Service and Uses
Approximately 140 entities – including interstate and intrastate pipeline companies, LDCs and independent storage service providers – operate the nearly 400 underground storage facilities active in the continental United States.57 Facilities operated by interstate pipelines and many others are operated on an open-access basis, with much of the working gas capacity available for use on a nondiscriminatory basis.
The ability to store large quantities of natural gas improves reliability and usually has a moderating influence on natural gas prices. Storage inventory augments natural gas supply during the winter, and acts as an additional demand component during the summer injection season. The storage injection season typically starts April 1 and continues through October 31, when demand for gas heating is lowest. Storage withdrawals generally start in November and last throughout the winter.
The ability to use storage to provide for winter peaks creates an intrinsic storage value. This is the value from buying during cheaper periods of the year for use during higher-
56 See EIA, Underground Natural Gas Working Storage Capacity
(2017), https://www.eia.gov/naturalgas/storagecapacity.
57 See EIA, Natural Gas Annual Respondent Query System, EIA-191
(Sept. 2017), https://www.eia.gov/cfapps/ngqs/ngqs.cfm?f_report=RP7&f_
sortby=&f_items=&f_year_start=&f_year_end=&f_show_compid=&f_
fullscreen.

30 | Energy Primer Federal Energy Regulatory Commission
cost seasons. Depleted reservoirs or aquifers – with limited ability to turn over inventory – support this type of use. Local distribution companies or pipelines store their gas in these facilities to ensure adequate supplies for peak seasons, balance load and diversify their resources.
Storage may be priced at cost-based or market-based rates. Pricing mechanisms for low-cycling depleted fields and aquifers may use a traditional cost-of-service structure, including:
• Capacity charges for firm contract rights to physical storage capacity
• Deliverability charges for transportation to and from the storage facility
• Withdrawal charges for the removal of gas from storage
• Injection charges for the injection of gas into storage
A salt cavern, with its ability to turn over inventory frequently and quickly, allows for additional uses, enabling users to capture extrinsic value. Many salt dome facilities can cycle between injection and withdrawal at almost a moment’s notice, giving users greater flexibility. Entities contracting for storage capacity may move gas in and out of storage as prices change in attempts to maximize profits or minimize costs. Storage may be a component in producer or consumer hedging strategies, helping them to manage the risk of price movements. Further, storage helps shippers avoid system imbalances and associated penalties, and supports swing gas supply services, which are short-term contracts that provide flexibility when either the supply of gas from the seller, or the demand for gas from the buyer, are unpredictable. Storage also facilitates title transfers and parking and lending services. This helps shippers balance daily receipts and deliveries, manage their overall supply portfolio or take advantage of price movements. Consequently, storage operators have begun offering a more varied menu of services, and users have begun using storage as a commercial tool and as part of a comprehensive supply portfolio strategy.
Merchant storage, frequently using salt caverns, uses market-based prices, recognizing the dynamics affecting value at any given point in time. Prices often take into account the prices at which the NYMEX futures contracts are trading. They may also reflect the storage volume, the number of times the gas will be cycled, the length of the contract and the timeframe it covers and the maximum daily quantity that may be injected or withdrawn. Energy marketers have increasingly used these facilities as they try to profit from price volatility. It is also attractive to shippers, industrial consumers with uncertain loads and gas-fired generators whose needs change rapidly.
Pipelines also offer storage service, both firm and interruptible, as part of their open access transportation service under FERC rules. Rates are rarely market-based. Instead, prices are based on cost of service, with rates containing reservation and usage components for firm service and a usage component for interruptible.
Market Effects
Storage can mitigate large seasonal price swings by absorbing natural gas during low demand periods and making it available when demand rises.
Further, storage levels can affect the market’s expectations about prices during the coming winter high-demand season. The amount of gas in storage in November is a key benchmark of the gas industry’s ability to respond to changes in winter weather. Higher storage levels tend to reduce forward prices; lower storage levels tend to increase them, all other market conditions being equal.
FERC Jurisdiction
The underground storage of natural gas has historically been critical in assuring that the needs of natural gas customers are met. The Energy Policy Act of 2005 added a new section to the Natural Gas Act stating that the Commission may authorize natural gas companies to provide storage and storage-related services at market-based rates for new storage capacity, even

Energy Primer | 31
though the company cannot demonstrate it lacks market power (15 U.S.C. § 717c(f)). To make this authorization, the FERC must determine that market-based rates are in the public interest and are needed to encourage the construction of new capacity, and that customers are adequately protected.
Natural Gas Markets and
TradingThe natural gas industry in the United States is highly
competitive, with thousands of producers, consumers and
intermediate marketers. Some producers have the ability
to market their natural gas and may sell it directly to LDCs,
to large industrial buyers and to power plants. Other pro-
ducers sell their gas to marketers who aggregate natural
gas into quantities that fit the needs of different types of
buyers and then transport the gas to their buyers.
Most residential and commercial customers purchase natural gas from a LDC. In contrast, many industrial customers and most power plants have the option to purchase natural gas from a marketer or producer instead of from the LDC, thereby avoiding any LDC charges.
Historically, natural gas pipelines served as gas merchants, buying natural gas at the wellhead and selling the transportation and commodity as a bundled product directly to consumers. However, in 1992, FERC Order No. 636 restructured the natural gas market by regulating interstate pipelines as open access transporters.58 Although, interstate pipelines may buy and sell natural gas, they now do so for operational reasons and no longer act as merchants. As noted, interstate pipelines transport natural gas at rates approved by the FERC.
Natural Gas Marketers
Most gas trading in the United States is performed by natural gas marketers. Any party engaging in the sale of natural gas
58 Pipeline Service Obligations and Revisions to Regulations Governing
Self-Implementing Transportation; and Regulation of Natural Gas Pipelines
After Partial Wellhead Decontrol, Order No. 636, FERC Stats. & Regs. ¶ 30,939
(1992).

32 | Energy Primer Federal Energy Regulatory Commission
can be termed a marketer; however, marketers are usually specialized business entities dedicated solely to transacting in the physical and financial energy markets. It is commonplace for natural gas marketers to be active in a number of energy markets, taking advantage of their knowledge of these markets to diversify their business.
Marketers can be producers of natural gas, pipeline marketing affiliates, LDC marketing affiliates, independent marketers, financial institutions, or large-volume users of natural gas. Some marketing companies may offer a full range of services, marketing numerous forms of energy and financial products, while others may be more limited in their scope. For instance, most marketing firms affiliated with producers do not sell natural gas from third parties; they are more concerned with selling their own production and hedging to protect their profit margin from these sales.
Generally speaking, there are five categories of marketing companies: major nationally integrated marketers, producer marketers, small geographically focused marketers, aggregators and brokers.
• Nationally integrated marketers offer a full range of services, and market numerous different products. They operate on a nationwide basis and have large amounts of capital to support their trading and marketing operations.
• Producer marketers are those entities generally concerned with selling their own natural gas production or the production of their affiliated natural gas production company.
• Smaller geographically focused marketers target particular regional areas and specific natural gas markets. Many marketing entities affiliated with LDCs are of this type, focusing on marketing gas for the geographic area in which their affiliated distributor operates.
• Aggregators generally gather small volumes from various sources, combine them and sell the larger volumes for
more favorable prices and terms than would be possible selling the smaller volumes separately.
• Brokers are a unique class of marketers because they never take ownership of natural gas themselves. They simply act as facilitators, bringing buyers and sellers of natural gas together.
Most marketing companies have significant operations capabilities in addition to the core trading group. These support staff are responsible for coordinating everything related to the sale and purchase of physical and financial natural gas, including arranging transportation and storage, posting completed transactions, billing, accounting and any other activity that is required to complete the purchases and sales arranged by the traders. These companies also have risk-management operations that are responsible for ensuring that the traders do not expose the marketing company to excessive risk.
Hub Prices and Basis
Natural gas is traded at different locations throughout the country and the prices at specific hubs and citygates are determined by the relative supply and demand for natural gas at the particular locations. Additionally, the difference between the Henry Hub price and another hub (or citygate) is called the location differential, or basis.
Basis usually reflects the variable cost to transport gas between the Henry Hub and another hub. Basis can change, sometimes dramatically, depending on local market conditions, and can widen considerably when pipelines between two points are congested. Basis in excess of transportation costs results from pipeline constraints and lack of pipeline competition. The gas price at a hub in Florida, for example, would be the price at the Henry Hub and the basis to the Florida hub.
In addition to being the country’s benchmark hub, the Henry Hub is also the delivery point for the NYMEX natural gas futures contract. Changes in price at the Henry Hub provide a

Energy Primer | 33
Source: ABB, Velocity Suite59
good indicator of how prices are generally changing across the country.
Physical Trading of Natural Gas
Physical natural gas contracts are negotiated between buyers and sellers. There are many types of physical natural gas contracts, but most share some standard specifications, including the buyer and seller, the price, the amount of natural gas to be sold (usually expressed in a volume per day), the receipt and delivery points, the tenure of the contract (usually expressed in number of days, beginning on a specified day) and other terms and conditions. Other special terms and conditions can outline such things as the payment dates, quality of the natural gas to be sold, and any other specifications agreed to by both parties. Physical natural gas contracts are negotiated between buyers and sellers over the phone or executed on electronic bulletin boards and e-commerce trading sites.
59 Derived from IntercontinentalExchange data and mapped using
ABB, Velocity Suite.
There are three main types of physical natural gas contracts: swing contracts, baseload contracts, and firm contracts:
• Swing (or interruptible) contracts are usually short-term contracts between one day and a month in length. These contracts are the most flexible, and are usually put in place when either the supply of gas from the seller, or the demand for gas from the buyer, are not guaranteed.
• Baseload contracts are similar to swing contracts. Neither the buyer nor seller is obligated to deliver or receive the exact volume specified. However, it is agreed that both parties will attempt to deliver or receive the specified volume, on a best-efforts basis.
• Firm contracts are different from swing and baseload contracts in that both parties are legally obligated to either receive or deliver the amount of gas specified in the contract. These contracts are used primarily when both the supply and demand for the specified amount of natural gas are unlikely to change.
Hubs for Physical Trading on ICE

34 | Energy Primer Federal Energy Regulatory Commission
Price Discovery
Spot (Cash) Market
The U.S. natural gas marketplace has a highly competitive spot, or cash, market where brokers and others buy and sell natural gas daily in short-term deals for next-day delivery. The daily spot market for natural gas is active, and trading can occur 24 hours a day, seven days a week. The map on the previous page shows some of the points where natural gas for next-day physical delivery is actively traded on the IntercontinentalExchange (ICE). These points include market centers, where brokers actively trade and prices are established. In addition to these market centers, natural gas is actively traded at many other locations, including segments of individual pipelines and locations where pipelines interconnect with LDCs.
Spot market transactions are normally conducted on electronic exchanges or by telephone, with the buyer agreeing to pay a negotiated price for the natural gas to be delivered by the seller at a specified point on the next day. Natural gas spot prices reflect daily supply and demand balances and can be volatile.
Bidweek
Bidweek is the name given to the last five business days of a month, when producers sell their core production and consumers buy natural gas for their core needs for the upcoming month.
Index Prices
Several publications, such as Platts Gas Daily, Natural Gas Intelligence and Natural Gas Week, survey the market for daily physical transaction prices that are used to form and publish a daily index that is made available the night before or the morning of the next business day. Many market participants also report their bidweek prices to publications, which
convert these prices into monthly locational price indexes that are available on the first business day following the last day of bidweek. These daily and monthly indexes, in turn, are used as the basis for pricing for those firms that do not choose to enter into fixed-price contracts (or are prohibited from using them by state or local regulators).
The Financial Market
In addition to trading physical natural gas, there is a significant market for natural gas derivatives and financial instruments in the United States. In the financial market, market participants are interested in profiting from the movement of the price of natural gas rather than delivering or receiving natural gas. The pricing and settlement of these financial products are tied to physical natural gas. It is estimated that the value of trading that occurs on the financial market is at least a dozen times greater than the value of physical natural gas trading.
Derivatives are financial instruments that derive their value from an underlying fundamental – in this case, the price of natural gas. Derivatives can range from being quite simple to being exceedingly complex. Traditionally, most derivatives are traded on the over-the-counter (OTC) market, which is essentially a group of market players interested in exchanging certain derivatives among themselves.
More information on financial markets appears in Chapter 4.

Energy Primer | 35
2 Wholesale Electricity MarketsElectricity is a physical product – the flow of electrons. It is a secondary energy source that is a result of the conversion of other energy forms such as natural gas, coal or uranium, or the energy inherent in wind, sunshine or the flow of water in a river. Electricity is not visible or directly observable, but it can be turned on and off and measured.
Quick Facts: Measuring Electricity
A key measure of electricity used in industry is the rate at which it is produced, transferred, or consumed (e.g., how much energy per unit of time a generator produces), with the units called watts. Similar measures are kilowatts (1,000 watts) and megawatts (1,000 kilowatts). A watt (kilowatt, or megawatt) is a unit of power.
The amount of electric energy generated, transmitted, or used over time is measured as the number of watt-hours (or kilowatt-hours, or megawatt-hours).
The aggregation of units of power (typically aggregating units of megawatts when looking at wholesale electricity markets) a generator, for example, is capable of producing is its capacity. The aggregation of power consumed at any location is the demand at that point.
Electricity markets have retail and wholesale components. Retail markets involve the sales of electricity to consumers; wholesale markets typically involve the sales of electricity among electric utilities and electricity traders before it is eventually sold to consumers. Because FERC has jurisdiction over the wholesale markets, and not the retail markets, this document focuses on wholesale electricity markets, although it does address retail demand and other instances where retail markets strongly influence wholesale markets.
Much of the wholesale market and certain retail markets rely upon competitive market forces to set prices, while other prices are based on the service provider’s cost of service. For wholesale markets, FERC either authorizes jurisdictional entities to sell at market-based rates or reviews and authorizes cost-based rates.
In competitive markets, prices reflect the factors driving supply and demand – the physical fundamentals. Where rates are set based on costs, market fundamentals matter as well because changes in supply and demand will affect consumers by influencing the cost and reliability of electricity. Supply

36 | Energy Primer Federal Energy Regulatory Commission
incorporates generation and transmission, which must be adequate to meet all customers’ demand simultaneously, instantaneously and reliably.
Consequently, key supply factors that affect power prices include fuel costs, capital costs, transmission capacity and constraints, and the operating characteristics of power plants. Likewise, changes in demand can affect prices. An example of this interaction is serving peak load on a hot summer day where less-efficient, more-expensive power plants must be activated and consequently drive up prices.
Electric Power Industry
Electricity on Demand
In the United States and other developed countries, consumers expect electricity to be available whenever they need it. Electricity use has grown as consumers integrated various devices and amenities like lighting, refrigerators, and computers into their everyday lives. Consumers also expect to pay reasonable prices for the electricity that they use.
Meeting these customer expectations requires substantial efforts and activities. While technology continues to develop and make advances, it is a challenge to store any appreciable quantities of electricity economically. Thus, the vast majority of electricity must be produced instantaneously as needed. Further, unlike most other markets, electricity’s historical inelastic demand does not move with prices. To provide electricity on demand, electric system operations have to be planned and conducted with that goal in mind. In the absence of storage and responsive demand, operators must plan and operate power plants and the transmission grid so that demand and supply exactly match, every moment of the day, every day of the year, in every location.
Economies of Scale
Electric power is one of the most capital intensive industries. Generation alone can account for roughly 60 percent of a customer’s electric bill, depending upon customer type and location.1 Spreading these significant fixed costs over more customers helps bring down the cost that each customer pays.
Thomas Edison’s first street lighting project in the 1880s grew to electrifying whole neighborhoods, towns, and cities. Providing service over larger areas allowed utilities to take advantage of economies of scale and the cost per unit of production dropped as power plants grew larger and larger. The companies building these facilities were basically self-contained and not connected to each other. They owned and operated the generation, transmission, and distribution facilities and were vertically integrated.
While successful for launching the electric utility industry, this market structure had limitations. The larger generating units were difficult to replace if they experienced unexpected shutdowns. Also, for a single utility building a new and larger unit, the only way to ensure reliable service was to build two units – creating a capacity reserve. When coal and nuclear unit sizes grew to 500 or 1,000 MW, building two units became very expensive for any individual company.
Reserve Sharing, Interconnection and Power Pools
The solution to high reserve costs was to share reserves with adjacent utilities. Instead of building two large units, utilities could buy power from their neighbors in times of need, and cut their costs significantly. To facilitate reserve sharing, utilities built interconnecting transmission lines large enough to deliver power in case of a major generator outage or some other system disruption. Today’s bulk power grid began as
1 EIA, Annual Energy Outlook 2018 (February 2018), https://www.eia.
gov/outlooks/aeo/pdf/AEO2018.pdf.

Energy Primer | 37
a way to maintain reliable service while lowering costs. The value of reserve-sharing agreements led to the formation of power pools, the forerunners of today’s regional transmission organizations.
Coordinating exchanges of energy and reserves also led to closer coordination of other utility functions, such as the process of determining which generating units to utilize, called unit commitment. Operators want to commit just enough capacity to ensure reliability, but no more than is needed to be most efficient. This began a new phase of using economies of scale in system operations encompassing whole regions of the country.
Regional coordination also was spurred by special circumstances, particularly in the West. Large federally-owned dams on the Columbia and Colorado rivers generate power from the spring runoff of melting mountain snow. When the reservoirs are full and hydroelectric plants are generating plentiful amounts of power, there is not enough local demand to use the available supply. Since the hydropower was cheaper than any alternative, long distance transmission lines were built to deliver the excess power from the Northwest and Southwest to load centers in California. With these transmission interconnections in place, northwestern utilities found that they could get cheaper power from southern power generation at other times of the year. These seasonal and regional disparities in availability and price introduced a lively bilateral trading market.
In the 1960s, the electric power industry created an informal, voluntary organization of operating staff to aid in coordinating the bulk power system. Then, in 1965, the largest power blackout until that time hit the northeastern United States and southeastern Ontario, Canada, affecting 30 million people. The blackout led to the development of the National Electric Reliability Council in 1968, shortly thereafter renamed the North American Electric Reliability Council (NERC), and nine regional reliability councils.2 Rather than serving as a pool
2 The North American Electric Reliability Council later formed an
affiliate - the North American Electric Reliability Corporation (also referred
to as NERC) – that FERC certified as the electric reliability organization for
the United States. See https://elibrary.ferc.gov/idmws/common/OpenNat.
or other entity for sharing resources, NERC focused on reliability. In 2006, using authority granted in the Energy Policy Act of 2005 (EPAct 2005), FERC certified NERC as the electric reliability organization for the United States, and reliability standards became mandatory and enforceable.
Optimizing Unit Commitment and Economic Dispatch
The industry has continually reduced costs by using computers and communication technology to optimize system operations. Utilities use algorithms for optimizing the commitment of their generating units, while day-ahead market software does this for suppliers bidding into regional transmission organization markets.
In real time, demand is changing all the time. The output of some generators must change to follow the constantly changing demand. This is known as load following. Utilities use economic dispatch to optimize the use of these units and minimize real-time costs.
Economy Energy Trade
Transmission interconnections were originally built for the primary purpose of delivering reserves in emergencies. However, this created excess transmission capacity, since these events were rare. The interconnections allowed utilities to trade power, which became profitable when the cost of operating their marginal generation was higher or lower than that of their neighbors. Transmission availability provided opportunities for utilities to save money by buying energy when it was cheaper than generating and selling energy to utilities with higher costs. This is called economy energy trading.
Evolving Public Policies
Different public policy theories can be used to describe the
asp?fileID=11089385.

38 | Energy Primer Federal Energy Regulatory Commission
electric power industry over its history. All of these public policies are still in play to some extent today. Five concepts that helped shape the electricity industry and markets are outlined below.
Regulated Monopolies
In the early years of the industry, investors provided funds and took ownership shares in the power stations and electric distribution systems. These privately-owned utilities, also referred to as investor-owned utilities (IOU), became regulated, typically by state agencies. Initially, IOUs agreed to be regulated to overcome a lack of retail competition, address concerns of electric generation and distribution being a natural monopoly, and to bring stability to a capital-intensive industry. Stability took the form of the granting of exclusive service territories (or franchises), transparent financial statements, and the formulaic setting of electricity rates. The regulatory model for setting electricity rates was almost exclusively cost of service-based until about 30 years ago. Today, retail regulation is still based on cost of service, while wholesale generation rate regulation has become increasingly market-based. State regulators are responsible for approving retail rates, as well as utilities’ investments in generation and distribution facilities. Some states eventually developed elaborate integrated resource planning (IRP) processes to determine what facilities should be built.3
Not-for-Profit Utilities
Another approach to serving customers emerged in the form of nonprofit electric providers. Also in the early years of the industry, the electrification started in towns and cities where utility service was provided by municipal power agencies or city governments. The federal government also stepped in to develop and market the nation’s significant hydroelectric
3 For additional background and context on the early years of the
electrification of the U.S., see National Museum of American History, Powering
a Generation of Change, Emergence of Electrical Utilities in America (2002),
http://americanhistory.si.edu/powering/past/h1main.htm.
resources. The Depression-era rural electrification program relied on customer-owned rural electric cooperatives and low-interest government loans. There are currently more than 1,700 municipal and almost 900 cooperative utilities in the United States.
Power Pools
Power pools are multilateral arrangements with members ceding operational control over their generating units and transmission facilities to a common operator. Members provide incremental cost data about their units and system status data to the operator. The operator then runs an energy management system that uses the unit cost data to optimize the overall unit commitment and economic dispatch.
The first of the power pools was PJM, which began in 1927 for utilities to share their generating resources. The Electric Reliability Council of Texas (ERCOT) and the Southwest Power Pool (SPP) formed in 1941 to pool resources for the war effort. Later, the New York Power Pool was formed in 1966 and the New England Power Pool in 1971, in response to the 1965 Northeast blackout.
Competition, Part 1: Competitive Generation and Open Access
Environmental policy and initiatives to open the airline and trucking industries to competition helped shape the energy industry in the 1970s. A provision in President Carter’s energy plan led to passage of the Public Utility Regulatory Policies Act of 1978 (PURPA), which ushered in the next era.
PURPA established a program implemented by states and overseen by FERC to encourage the use of efficient cogeneration (using the heat from industrial or other processes to generate electricity) and small scale renewable generation. FERC’s role was to issue regulations for the program and certify that qualifying facilities (QFs) met statutory requirements. States administratively set the price to be paid to these generators at the cost the utilities would

Energy Primer | 39
avoid by purchasing the power rather than generating it themselves. Such prices are referred to as avoided-cost rates.
Most states set their avoided cost rates so low that they got little QF capacity. However, California, Texas, and Massachusetts set very generous avoided-cost rates and were overwhelmed with QF capacity, much of which received prices that turned out to be higher than the actual costs avoided by the purchasing utilities. The rapid growth and size of the QF industry surprised many policymakers and entrepreneurs, and got them thinking about the viability of generation independent of regulated monopolies.
In 1988, FERC proposed rules to allow states to set their avoided-cost rate based on an auction. Instead of requiring all utilities to take all QF capacity at a set rate, states could set the rate based on bids to supply a certain amount of needed capacity. FERC also opened the avoided-cost auction up to independent power producers (IPPs) that did not qualify as QFs. In this way, a regulatory program was transformed into a competitive initiative.
Under the regulated monopoly model, utilities owned and operated the transmission lines with no obligation to allow others to use them. This posed a significant barrier to the development of an independent power industry. FERC started conditioning approval in merger cases on the utility’s voluntary provision of open transmission access. The Energy Policy Act of 1992 gave FERC the authority to grant transmission access on request. These approaches to open access resulted in a patchwork of transmission access.
By the mid-1990s, support for opening the transmission grid to all users encouraged FERC to pursue a generic solution. FERC issued Order No. 888 in 1996 and required mandatory open transmission access by all transmitting utilities and a reciprocity provision successfully extended open access to non-jurisdictional entities (municipal, cooperative and federal utilities).
Order No. 889 addressed matters needed to implement open access. The rule established the Internet-based Open Access Same-Time Information System (OASIS) for posting available
transmission capacity and reserving transmission capacity. These rules required significant changes to utility control room operations and limited the ability of companies to share transmission-related information with their own power marketing operating units.
Competition, Part 2: Integrating Markets and
Operations – ISOs and RTOs
While the industry had historically traded electricity through bilateral transactions and power pool agreements, Order No. 888 promoted the concept of independent system operators (ISO). Along with facilitating open-access to transmission, an ISO would operate the transmission system independently of wholesale market participants and foster competition for electricity generation. Several groups of transmission owners formed ISOs, some from existing power pools.
In Order No. 2000, FERC encouraged utilities to join regional transmission organizations (RTO) which, like an ISO, would operate the transmission systems and develop innovative procedures to manage transmission equitably. FERC’s proceedings in Orders Nos. 888 and 2000, along with the efforts of the states and the industry, led to the voluntary organization of ISOs and RTOs. Each of the ISOs and RTOs subsequently developed full-scale energy and ancillary service markets in which buyers and sellers could bid for or offer generation. Both organizations use the bid-based markets to determine economic dispatch. Throughout the subsequent sections of the primer, when referring to the organized RTO and ISO markets generally and collectively, the term RTO/ISO is used.
Major parts of the country operate under more traditional market structures, notably the West (excluding California) and the Southeast. Two-thirds of the nation’s electricity load is served in RTO/ISO regions.

40 | Energy Primer Federal Energy Regulatory Commission
Source: ABB, Velocity Suite
Electricity Demand
Americans consume electricity for an ever increasing range of uses. While consumption has grown over the years, it varies annually based on many influences, such as weather, economic activity, and other factors. Overall sales of power to end users reached a recent peak of more than 3,681,000 gigawatt-hours (GWh) in 2017.4
Vertically integrated IOUs, federal entities, municipally
4 EIA, Electric Power Monthly (March 2018), https://www.eia.gov/
electricity/monthly/epm_table_grapher.php?t=epmt_5_01.
North American Regional Transmission Organization and Independent System Operator Regions
owned, and co-operatively owned utilities sell the bulk of electric generation to retail consumers. Additionally, some retail consumers generate all or part of the power that they consume. The rest of the electricity ultimately consumed by retail customers is bought and sold through wholesale electricity markets.
Demand Characteristics
The amount of electricity consumed (demand) is continuously varying and follows cycles throughout the day and year. Regionally, electric demand may peak in either the summer or the winter. Spring and fall are considered shoulder months, with lower peak demand. Seasonal peaks vary regionally,

Energy Primer | 41
although the highest levels of power load in almost all regions of the United States occur during summer heat waves, in the late afternoon. However, a minority of regions reach their peak load when the weather is extremely cold. These are primarily areas with significant space-heating requirements and little summer air conditioning load, such as the far northern areas of the United States.
Throughout the year, and in most locations, daily demand typically peaks in the late afternoon, as commercial and domestic activities peak, and, in the winter, when lighting needs grow. Electricity use also varies between weekdays and weekends. Commercial and industrial activities are lower on weekends and peoples’ noncommercial activities change with their personal schedules. The load on different weekdays can also have distinct usage. For example, Mondays and Fridays, being adjacent to weekends, may have different loads than Tuesday through Thursday. This is particularly true in the summer.
Since supply must rise and fall to provide exactly the amount of electricity customers need, the cost of providing power typically rises as demand grows, and falls as demand declines. This is because higher levels of demand require activation of increasingly more expensive sources of power generation, and reductions as demand declines. As a result, power prices are typically highest during periods of peak demand.
Demand Drivers
In general, the amount of electricity demanded is relatively inelastic —i.e., consumption is insensitive to the price in the short-term. One reason for this is that most customers – especially smaller customers – do not get price signals to which they can respond. A vast majority of residential customers are billed monthly on a preset rate structure. Large industrial customers, on the other hand, may receive real-time price signals.
Further, electricity is a necessity to most people and businesses. While they may be able to reduce their demand in the short-term – by turning down the thermostat or turning off
lights, for example – electricity consumers find it difficult to do without electricity altogether. There is relatively little storage for electricity and few realistic substitutes. Consequently, demand tends to drive price, especially when the system is stressed.
In the longer-term, options for reducing electricity use include switching to natural gas for heating and cooking, installing insulation and implementing other energy efficiency measures. Larger consumers may also consider building their own generation facilities.
Governments and businesses are also developing demand-response programs, which may provide reduced rates or other compensation to customers who agree to reduce load in periods of electric system stress.
Demographics
Population levels affect demand, with larger populations consuming more electricity. Shifts in population also affect regional demand. Population flight in the 1980s from northern industrial regions to warmer climates in the South affected residential consumption patterns. In the 1990s, consumption in the South surpassed that in the Midwest, making it the region with the greatest electricity use.
Climate and Weather
Weather is one of the primary factors affecting demand. General climatic trends drive long-term consumption patterns and therefore the infrastructure needed to ensure reliable service.
Weather also can have extreme short-term effects on electricity usage. A sudden cold snap can drive heating use up quickly and a heat wave can push air conditioning loads. Other, less obvious weather patterns affect demand – rain and wind, for example, may result in sudden cooling, affecting heating or air conditioning usage.

42 | Energy Primer Federal Energy Regulatory Commission
Economic Activity
The overall level of economic activity affects power demand. During periods of robust activity, loads increase. Conversely, loads drop during recessions. These changes are most evident in the industrial sector, where businesses and plants may close, downsize, or eliminate factory shifts. In addition to reducing overall demand, these changes affect the pattern of demand; for example, a factory may eliminate a night shift, cutting off-peak use but continue its use of power during peak hours. In some cases these effects can be significant.
Electricity consumption also varies based on the pattern of socioeconomic life. This occurs on a daily basis with weekends and holidays showing different utilization than weekdays. Similarly, demand typically rises as people wake up and go to work, peaking in the afternoon and continuing into evenings.
Quick Facts: Heating and Cooling Degree Days
In the United States, engineers developed the concept of heating and cooling degree days to measure the effects of temperature on demand. Average daily temperatures are compared to a 65°F standard - those in excess of 65° yield cooling degree days; those below 65° yield heating degree days. For example, a day with an average temperature of 66° would yield one cooling degree day.
Energy Policies and Regulations
State regulatory agencies, such as public utility commissions, set prices and policies affecting retail customer service. Some states are considering changes that would enable customers to receive more accurate price signals. They include, among other things, changing rate structures so that the rate varies with the time of day and the cost of providing electricity.
Efforts to reduce overall demand by improving energy efficiency are also supported by governmental and utility programs. These include rebates for the purchase of energy efficient appliances and home improvements, as well as capacity market payments for load reductions that are made available in certain markets.
Retail Customer Mix
Most electric utilities serve three distinct classes of customers: residential, commercial, and industrial. Each class uses electricity differently, resulting in a differing load profile, or the amount that each customer class uses and the daily shape of the load. If a consumer uses electricity consistently throughout the day and seasons, the load shape is flat. Another consumer may use more at some times than others. The greater variability in demand is typically more expensive to serve, especially if the peak occurs at the same time as other customers’ use peaks. Consequently, the mix of customer types affects a region’s overall demand and costs.
Residential consumers form one of the top two customer segments in the United States at approximately 37 percent of electricity demand.5 Residential consumers use electricity for air conditioning, refrigerators, space and water heating, lighting, washers and dryers, computers, televisions, and other appliances. Prices for residential service are typically highest, reflecting both their variable load shape and their service from lower-voltage distribution facilities, meaning that more power lines and related assets are needed to provide service to them.
Commercial use, the next customer segment, represents approximately 37 percent of electricity demand. This customer segment includes office buildings, hotels and motels, restaurants, street lighting, retail stores, wholesale businesses, and medical, religious,
5 EIA, Electric Annual Sales by Sector for 2017 (Jun. 2018), https://
www.eia.gov/electricity/data.php#sales

Energy Primer | 43
educational, and social facilities.6 More than half of commercial consumers’ electricity use is for heating and lighting.
Industrial consumers use about 26 percent of the nation’s electricity.7 This customer segment includes manufacturing, construction, mining, agriculture and forestry operations. Industrial customers often see the lowest rates, reflecting their relatively flat load structure and their ability to take service at higher voltage levels.
Transportation demand for electricity stems primarily from trains and urban transportation systems. This is less than 1 percent of total electricity demand.8
Load Forecasting
Demand is constantly changing, which challenges grid operators and suppliers who are responsible for ensuring that supply will meet demand at all times. Consequently, they expend considerable resources to forecast demand.
Load forecasting uses mathematical models to predict demand across a region, such as a utility service territory or an RTO/ISO footprint. Forecasts can be divided into three categories: short-term forecasts, which range from one hour to one week ahead; medium-term forecasts, usually a week to a year ahead; and long-term forecasts, which are longer than a year. It is possible to predict the next-day load with an accuracy of approximately one to three percent of what will actually happen. The accuracy of these forecasts is limited by the accuracy of the weather forecasts used in their preparation and the uncertainties of human behavior.
The forecasts for different time horizons are important for different operations within a utility company. Short-term load forecasting can help to estimate transmission system power flows and to make decisions that can prevent overloading of transmission systems. Timely implementation of such
6 Id.
7 Id.
8 Id.
decisions leads to the improvement of network reliability and to the reduced occurrences of equipment failures and blackouts. Forecasted weather parameters are the most important factors in short-term load forecasts; with temperature and humidity as the most commonly used load predictors.
The medium- and long-term forecasts take into account historical load and weather data, the number of customers in different customer classes, appliances used in the area and their characteristics, economic and demographic data, and other factors. For the next-year peak forecast, it is possible to provide an estimated load based on historical weather observations. Long-term forecasts extending 10 to 20 years into the future are used for system infrastructure planning and are meant to ensure that there are sufficient resources available to meet the needs of the expected future peak demand.
Forecasts are necessary for the variety of actions that must occur to ensure that sufficient supply is available in the immediate and long term. These include the planning of long-term infrastructure, purchasing fuel and other supplies, and ensuring adequate staffing of specific personnel. Load forecasts are also extremely important for suppliers, financial institutions, and other participants in electric energy generation, transmission, distribution, and trading. Missed forecasts, where actual demand differs significantly from the forecast, can cause wholesale prices to be significantly higher or lower than they otherwise might have been.
Demand Response
Electricity demand is generally insensitive to price, meaning that demand does not typically fall when prices rise. This occurs for several reasons, including that most end use consumers of electricity are not exposed to real-time electricity prices. However, some utilities and grid operators have developed ways to stimulate a response from consumers through demand-response programs.
Demand response is the reduction in consumption of

44 | Energy Primer Federal Energy Regulatory Commission
electricity by customers from their expected consumption levels, in response to either reliability or price signals. Customers will forego power use for short periods, shift some high energy use activities to other times, or use onsite generation in response to price signals or incentives for load reduction. The signals to respond to electric power system needs or high market prices may come from a utility or other load-serving entity, an RTO/ISO, or an independent provider of demand response. Both retail and wholesale entities administer these programs. Demand response has the potential to lower system-wide power costs and assist in maintaining reliability. It can mitigate system stress and allow operators to resolve shortages, avoid operating inefficient power plants or relieve transmission congestion. There can also be environmental benefits, such as lower levels of power plant-related emissions that result from not operating peaking units.
Measuring and verifying the amount of reduced consumption during a demand response activation requires development of consumers’ baseline usage, against which their actual use is measured.
Demand-Response Programs
Programs generally fall into three categories: curtailing, shifting, or on-site generation.
Curtailing, or forgoing, involves reducing power use (load) during times of high prices or threats to reliability without making up the use later. For example, residential customers might turn off lights or raise thermostats during hot weather. Commercial facilities may turn off office equipment, lower building lighting or change thermostat settings by a few degrees.
Shifting involves moving or rescheduling high energy-use activities in response to high prices or demand response program events to off-peak periods – evenings, nights, or weekends. Industrial customers might reschedule batch production processes to evening hours or the next day. Commercial establishments may delay high-energy
operations. Residential customers may wait until evening or night to use high-energy consuming appliances, such as clothes dryers or dishwashers. In shifting, the lost amenity or service is made up at a subsequent time.
On-site generation is when customers respond by turning on an on-site or backup emergency generator to supply some or all of their electricity needs. Although these customers may have little or no interruption to their electrical usage, their net load and requirements from the power system are reduced. The ability to use on-site generation is most common for institutional customers, such as hospitals, large schools, or data centers.
Demand response programs can be further distinguished by whether they are controlled by the system operator (dispatchable) or the customer (non-dispatchable). Dispatchable demand response refers to programs that reduce customer energy use, such as direct load control of residential appliances or directed reductions to industrial customers. Dispatchable programs can be used for both reliability and economic reasons. Non-dispatchable demand response lets the retail customer decide whether and when to reduce consumption in response to the price of power. This includes time-sensitive pricing programs that are based on rates that charge higher prices during high-demand hours and lower prices at other times.
As a result of technological innovations and policy directions, new types and applications of demand response are emerging that encompass the use of smart appliances that respond in near real-time to price or other signals. These models may allow customers to respond more easily, as they require little customer monitoring or interaction.
Retail Demand Response Programs
Utilities and third-party aggregators offer a variety of demand response programs that include time-based rates and interruptible contracts. Also, some states mandate Energy Efficiency Resource Standards that include peak load reduction targets.

Energy Primer | 45
Time-based rates include time-of-use rates and dynamic pricing. Time-based rates depend on advanced meters at customer premises that can record usage over short increments, typically groupings of hours or individual hours. In time-of-use programs, customers are charged different prices at different times of the day, with hours on or near peak demand costing more than off-peak hours. Dynamic pricing is a category of programs where rates change frequently to better reflect system costs. The practice of adjusting prices as costs change provides an incentive for consumers to shift load to other periods or to reduce peak load. One form of dynamic pricing is termed real-time pricing. In these programs, customers are charged prices reflecting the immediate cost of power. Industrial or very large commercial customers are the most likely to choose real-time tariffs.
Another form of dynamic pricing is critical peak pricing. These programs use real-time prices at times of extreme system peak, but are restricted to a limited number of hours annually. They feature higher prices than time-of-use prices during the critical peak. Consumers do not know in advance when a critical peak might be called. Critical peak programs for residential customers typically use rebates as an incentive to participate in the program, but customers take the risk of paying higher prices or reducing load during critical peak periods. These programs seek to have customers respond to price signals, as opposed to being penalized if they do not lower their use in the critical peak hours.
Interruptible contracts are used by utilities to control load and address potential reliability issues, such as reducing stress on the electric system during heat waves. The two primary forms of this category of demand response are direct load control and interruptible rates. Direct load control entails the utility curtailing a portion of customer load as described above. Under interruptible rates, customers agree to turn off equipment or switch their energy supply to an on-site generator.
Energy Efficiency Resource Standards exist in 20 states, while eight states have energy efficiency goals.9 The standards
9 DSIRE, N.C. Clean Energy Technology Center, Energy Efficiency
typically require utilities to achieve electric energy savings and many include peak load reduction targets. These mandates provide incentives for utilities to reduce customers’ energy consumption and include mechanisms that decouple profits from the amount of electricity sold or performance bonuses for utilities that meet or exceed reduction targets.
Wholesale Market Demand Response Programs
On the wholesale level, market operators have some programs that dispatch the demand response resources. Other demand response programs are dispatched by the utilities or aggregators that sponsor the programs, rather than the market operator. Note that with most retail demand response programs, which can also aid wholesale markets, market operators may not be able to invoke them or even see the specific amount of response that occurs.
Demand response participation in RTO/ISOs has been encouraged in U.S. national energy policy and by various FERC orders.10 Overall, approximately 27.5 GW of demand response participated in RTO/ISOs in 2017.11 These resources primarily participate in RTO/ISOs as capacity resources and receive advance reservation payments in
Resource Standards (and Goals), at 1 (Oct. 2016), http://ncsolarcen-prod.
s3.amazonaws.com/wp-content/uploads/2016/10/Energy-Efficiency-
Resource-Standards.pdf.
10 EPAct 2005 includes policy encouraging time-based pricing and
other forms of demand response and the elimination of barriers to demand
response participation in the energy, capacity, and ancillary services markets.
Examples of FERC orders include Order No. 719 (requires market operators
to receive bids from aggregators of demand response except when state
regulatory authorities overseeing the users’ retail purchases bars demand
response participation) and Order No. 745 (requires that RTO/ISOs pay
demand response resources the LMP for energy when those resources have
the capability to balance supply and demand as an alternative to generation
and when dispatch of those resources is cost-effective).
11 FERC, Assessment of Demand Response and Advanced Metering
Staff Report, at 15 (Nov. 2018), https://www.ferc.gov/legal/staff-reports/2018/
DR-AM-Report2018.pdf.

46 | Energy Primer Federal Energy Regulatory Commission
return for their commitment to participate when called upon or activated. Additionally, demand resources may Source: U.S. Department of Energy12
offer into the RTO/ISO day-ahead markets, specifying the hours, number of megawatts and price at which they are willing to curtail.
Some of the RTO/ISO demand response comes from individual entities; the rest is accumulated through third-party aggregators, or curtailment service providers, who recruit customers too small to participate on their own, such as schools, commercial chains or groups of residential customers. In aggregating small customers, curtailment service providers have increased customer participation in many wholesale reliability and emergency programs.
12 U.S. Department of Energy, Benefits of Demand Response in
Electricity Markets and Recommendations for Achieving Them: A report to the
United States Congress Pursuant to Section 1252 of the Energy Policy Act of
2005, 15 (2006).
< 15 minyearssystem planning
monthsoperational planning
day-aheadeconomic scheduling
day-ofeconomic dispatch
Incentive-Based Demand Response
Price-Based Demand Response
capacity/ancillaryservices programs
< 15 min
demand bidding/buyback
emergencyprograms
energyefficiency
day-ahead hourlypricing (RTP)
real-time hourlypricing (RTP)/ CPP
time-of-userates
direct loadcontrol
interruptibleprograms
loadcommitment
timescales
power &load
reductiondelivery
dispatchcommitment
Demand Response and Energy Efficiency in Electric System Planning and Operations
Demand Response and Energy Efficiency in Planning and Operations
Different demand response programs can be used at various times to support planning and operations (see graphic). Energy efficiency programs that reduce baseload or peak demand over the long-term are incorporated into system planning. Dispatchable programs that are quickly implemented and targeted for short-term peak reductions – such as direct load control – lie on the other end of the spectrum, and are used in the moment of operation.
Electricity Supply and Delivery
Unlike many other products, electricity cannot be stored in any appreciable quantity relative to the total consumed across the country each day. Further, electricity is a necessity for most consumers, whose use responds little to price changes. Finally, electric equipment and appliances are tuned to very specific standards of power, measured as voltage

Energy Primer | 47
Source: The NEED Project13
and frequency. For example, deviations in voltage can cause devices to operate poorly or may even damage them. Consequently, the supply side of the electricity market must provide and deliver exactly the amount of power customers want at all times, at all locations. This requires constant monitoring of the grid and close coordination among industry participants.
Electricity service relies on a complex system of infrastructure that falls into two general categories: generation and the delivery services of transmission and distribution. Together, the power generation and high-voltage transmission lines that deliver power to distribution facilities constitute the bulk power system. Transmission and distribution facilities are also referred to as the power grid. These are coordinated and at times operated by a grid coordinator.
Nationally, the grid is geographically split into three main sections – the Western, Eastern and Texas Interconnections. These sections operate independently and have limited interconnections between them.
The nation, along with Canada and a small part of Mexico, is also divided into regional entities. The regional reliability
13 National Energy Education Development Project, Electricity, at 56
(2017), http://www.need.org/Files/curriculum/infobook/Elec1S.pdf.
Electricity Supply and Delivery
entities fall under the purview of NERC, which was designated by FERC as the nation’s energy reliability organization and which develops standards, among other things, to ensure the grid’s reliability. The standards, once approved by FERC, must be met by all industry participants – the standards are mandatory and enforceable. Consequently, the grid is designed and operated to meet these standards.
NERC’s regions include:
• Florida Reliability Coordinating Council (FRCC)
• Midwest Reliability Organization (MRO)
• Northeast Power Coordinating Council (NPCC)
• Reliability First Corporation (RFC)
• SERC Reliability Corp. (SERC)
• Texas Reliability Entity (TRE)
• Western Electricity Coordinating Council (WECC)

48 | Energy Primer Federal Energy Regulatory Commission
Source: NERC
FERC Jurisdiction
Under the Federal Power Act (FPA), FERC regulates the transmission of electric energy in interstate commerce and the sale of electric energy at wholesale in interstate commerce. The FPA requires that every public utility must file with FERC all rates and charges for any transmission or sale subject to the jurisdiction of FERC. 16 U.S.C. §§ 824, 824d. Under Sections 205 and 206 of the FPA, 16 U.S.C. §§ 824d, 824e, FERC ensures that the rates and charges made, demanded, or received by any public utility for or in connection with the transmission or sale of electric energy subject to the jurisdiction of FERC, and all rules and regulations affecting or pertaining to such rates or charges are just and reasonable and not unduly preferential or unduly discriminatory.
NERC Regions
Generation
Power generators are typically categorized by the fuel that they use and subcategorized by their specific operating technology. The United States has more than 1,000 gigawatts (GW) of total generating capacity.14 The majority of power generation is produced from coal, natural gas, nuclear fuels, and renewables.
Power plants each have differing costs and operational characteristics, both of which determine when, where and how plants will be built and operated. Plant costs
14 EIA, Electric Power Annual, Table 1.2. (December 7, 2017), https://www.eia.gov/electricity/annual/.

Energy Primer | 49
fall into two general categories: capital investment costs, which are amounts spent to build the plant, and operational costs, the amounts spent to maintain and run the plant. In general, there is a trade-off between these expenses: more capital intensive plants tend to be cheaper to run – they have lower variable costs – and, conversely, the least capital intensive tend to be more expensive to run – they have higher variable cost. For example, nuclear plants produce vast amounts of power at low variable costs, but are expensive to build. Conversely, natural gas-fired combustion turbines are far less expensive to build, but can be more expensive to run. Grid operators dispatch plants – or, call them into service – with the simultaneous goals of providing reliable power at the lowest cost. Because various generation technologies have differing variable costs, plants are dispatched only when they are part of the most economic combination of plants needed to supply the customers on the grid. For plants operating in RTO/ISOs, this cost is determined by the price that generators offer. In other areas, it is determined by the marginal cost of the available generating plants.
Conventional Generation
Natural gas power plants feature three major technologies, each with its distinct set of market advantages and limitations. They are steam boilers, gas turbines and combined cycle generators. Natural gas fuels nearly a third of electricity generation.
• Steam boiler technology is an older design that burns gas in a large boiler furnace to generate steam at both high pressure and high temperature. The steam is then run through a turbine that is attached to a generator, which spins and produces electricity. Typical plant size ranges from 300 MW to 1,000 MW. Because of their size and the limited flexibility that is inherent in the centralized boiler design, these plants require fairly long start-up times to become operational and are limited in their flexibility to produce power output beyond a certain
range. Furthermore, these plants are generally not as economical or easy to site as some newer technologies – which explains why few have been built in recent years.
• Gas turbines (GT) are small, quick-start units similar to an aircraft jet engine. These plants are also called simple cycle turbines or combustion turbines (CT). GTs are relatively inexpensive to build, but are expensive to operate because they are relatively inefficient, providing low power output for the amount of gas burned, and have high maintenance costs. They are not designed to run on a continuous basis and are used to serve the highest demand during peak periods, such as hot summer afternoons. GTs also run when there are system-wide shortages, such as when a power line or generator trips offline. GTs typically have a short operational life due to the wear-and-tear caused by cycling. The typical capacity of a GT is 10-50 MW and they are usually installed in banks of multiple units.
• Combined cycle power plants (CCPPs) are a hybrid of the GT and steam boiler technologies. Specifically, this design incorporates a gas-combustion turbine unit along with an associated generator, and a heat recovery steam generator along with its own steam turbine. The result is a highly efficient power plant. They produce negligible amounts of SO2 and particulate emissions and their NOx and CO2 emissions are significantly lower than a conventional coal plant. CCPPs, on average, require 80 percent less land than a coal-fired plant, typically 100 acres for a CCPP versus 500 acres for comparable coal plant, and CCPPs also use modest amounts of water, compared to other technologies.
Coal plants produce approximately one-third of the electricity in the United States.15 These facilities generate power by creating steam which is used to spin a very large turbine. These plants tend to be used as baseload units, meaning that they run continuously and are not especially flexible in raising or lowering their power output. They
15 Id.

50 | Energy Primer Federal Energy Regulatory Commission
have high initial capital costs, with complex designs and operational requirements. However, coal plants have low marginal costs and can produce substantial amounts of power. Most of the coal-fired plants in the United States are located in the Southeast and Midwest.
Oil-fired plants generally produce only a small amount of the total electricity generated in the U.S. power markets. These facilities are expensive to run and also emit more pollutants than natural gas plants. They are frequently uneconomic and typically run at low capacity factors. Like natural gas-fired generators, there are several types of units that burn oil; primarily, these are steam boilers and combustion turbines.
Generally, two types of oil are used for power generation: number 2 and number 6 (bunker) fuel oil. Number 2 is a lighter and cleaner fuel. It is more expensive, but because it produces fewer pollutants when burned, it is better for locations with stringent environmental regulations such as major metropolitan areas. Conversely, number 6 fuel oil is cheaper, but considered dirty because of its higher emissions. It is highly viscous (thick and heavy) and it comes from the bottom of the barrel in the refining process.
Nuclear plants provide roughly 20 percent of the nation’s electricity; there are close to 100 operating units with a total capacity of approximately 100 GW. 16 Like coal, they tend to be large, baseload units that run continuously. Nuclear plants have high capital and fixed costs, but low variable costs, which includes fuel cost. They typically run at full power for 18 or 24 months, which is the duration of a unit’s fuel cycle and are then taken off-line for refueling and maintenance. Outages typically last from 20 days to significantly longer, depending on the work needed.
Renewable Generation
Renewable resources use fuels that are not reduced or used up in the process of making electricity. They generally include biomass, geothermal, hydropower, solar, onshore and offshore wind, hydrokinetic projects, and fuel cells using
16 Id.
renewables and biogas.
Such generation (generation termed renewable generation or “renewables”) is an increasingly important part of total U.S. supply, accounting for 15 percent of electric energy produced in 2017.17 As total generation from all fuels has remained relatively constant in the recent years, renewable generation’s share has risen, spurred by technological advancements, state policy, and federal tax credits.
Wind and solar capacity have grown faster than other renewable resources in recent years. Wind capacity grew substantially (from approximately 11 GW to 82 GW) between 2006 and 2016. Utility-scale solar capacity grew even faster (from approximately 0.4 GW to 22 GW) over the same period.18
Additions of renewable generation capacity are usually reported in megawatts of nameplate capacity. Actual capability varies from the nameplate for any unit type due to such factors as age, wear, maintenance and ambient conditions. But as renewable resources are often weather-dependent, their capacity factors – the ratio of average generation to the nameplate capacity for a specific period – have been lower (for example, approximately 30 percent), depending on the technology type, than for fossil-fuel-fired generation. Grid operators play close attention to the difference between nameplate and capacity factor values when they evaluate capacity available to cover expected load, however, capacity factors have risen with technological innovation and improved manufacturing processes.
Wind generation is among the fastest-growing renewable resources, in part due to cost declines and technology improvements, as well as receipt of federal tax credits. Increases in average hub heights and rotor diameters have increased average wind turbine capacity. Because the best wind resources are often far
17 Id. Table 3.1
18 See EIA, Form EIA-860 (November 9, 2017), https://www.eia.gov/
electricity/data/eia860/.

Energy Primer | 51
from load centers, obtaining sufficient transmission presents a challenge to delivering its output. Other market challenges for future wind development include its variable output, which is often inversely correlated to demand (seasonally and daily); system operators’ limited ability to dispatch wind resources to meet load increases; difficulties related to accurately forecasting its ramping; and the need for companion generation (usually fossil-fueled) to be available to balance wind generation when the wind is not blowing.
Geothermal generation taps into reservoirs of steam and hot water deep beneath the earth’s surface to produce power. The majority of the plants are based in California and Nevada. Geothermal potential is determined by thermal conductivity, thickness of sedimentary rock, geothermal gradient, heat flow and surface temperature. Geothermal generation increased 19 percent from 2006 to 2016, but it decreased as a portion of total renewable output, due to the growth of other renewables. California hosts about 76 percent of geothermal U.S. operating capacity.19
Solar generation transforms sunlight into electricity using one of two technologies: photovoltaic (PV) or concentrating solar power (CSP). PV modules, or panels, transform sunlight directly into power using cells made out of silicon or thin-film materials. They can be installed on roofs of buildings or at ground-level PV farms. CSP plants use a two-step process to transform the sun’s energy. First, mirrors direct sunlight towards a receiver that captures the heat. CSP then employs a thermal process to create steam, driving an engine or turbine to produce electricity. CSP plants, which are dispatchable, can include low-cost energy storage that extends their availability later in peak hours.
PV growth has increased greatly as a result of policy incentives and cost declines. Annual PV installations increased over fifty fold from 2006 to 2016 as PV system costs decreased. PV growth has been relatively concentrated; 10 states had 88 percent of PV capacity in 2016, while California alone had over
19 Id.
42 percent.20 Total PV capacity for 2017 was 74 GW, with 50 GW of capacity coming from utility scale facilities and 24 GW of capacity from small scale generation.21
By the end of 2017, 1.8 GW of CSP was operational, a figure lower than for PV owing to PV’s lower costs.22 Seven western and southwestern states have extensive CSP potential: Utah, New Mexico, Arizona, Nevada, Texas, California and Colorado.23 Developing that potential will require overcoming challenges of cost, siting, transmission and the need for extensive water supplies to clean mirrors.
Hydroelectric generation is powered by the kinetic energy of falling water that drives turbine generators, which convert the energy into electricity. There are two types of hydroelectric projects: conventional and pumped storage. Conventional projects, which use a dam in a waterway, can operate in a run-of-river mode, in which water outflow from the project approximates inflow, or in a peaking mode, in which the reservoir is mostly drained to generate power during peak periods when energy is more valuable. Pumped storage projects use bodies of water at two different elevations. Water is pumped into elevated storage reservoirs during off-peak periods when pumping energy is cheaper; the water is then used to generate power during peak periods as it flows back to the lower elevation reservoir.
Biomass generation includes power production from many waste byproducts, such as agricultural residues, landfill gas, municipal solid waste and wood resources. The largest biomass category is wood waste, burned for heat and power in the lumber, pulp and paper industries. Challenges to biomass production include impacts on food supplies (for example, converting corn into ethanol), conserving natural
20 Id.
21 EIA, Electric Power Annual, Table 3.1.B. (October 22, 2018), https://
www.eia.gov/electricity/annual/.
22 See National Renewable Energy Laboratory, Annual Technology
Baseline (Jul., 2018), https://atb.nrel.gov/electricity/2018/summary.html.
23 See EIA, Form EIA-860 (September 13, 2018), https://www.eia.gov/
electricity/data/eia860/.

52 | Energy Primer Federal Energy Regulatory Commission
resources and minimizing water pollution.
Biogas energy is created through the anaerobic (without oxygen) bacterial decomposition of biodegradable waste, which is turned into a gas containing 60-70 percent methane. Biogas recovery is typically installed at farms and used to run farm operations and reduce methane emissions from natural manure decomposition.
Electric Storage
Historically, utility-scale storage of electricity for later use had been limited to pumped-hydro storage facilities. Recent advances in technology have made other types of electric storage resources, including batteries and flywheels, more economically feasible. The lower costs and improved capabilities of electric storage, along with favorable state and federal policies, increased the penetration of variable energy resources and a continued focus on grid reliability have helped spur the development of electric storage resources.24
As of 2016, utility-scale electric storage projects represented less than 2 percent of total generating capacity in the United States. The vast majority of this capacity is pumped-hydro storage, which makes up 22 GW, or 95 percent of electric capacity.25 Batteries are the second largest category of electric storage technology with 560 MW of nameplate capacity in 2016.26
Electric storage projects are increasingly available to help balance supply and demand particularly during periods of high demand or excess supply. These resources can charge during periods of low demand or excess generation, when electricity is less expensive, and discharge when demand is high and electricity is more
24 FERC has issued various orders to help remove barriers to
the development of electric storage resources. See, e.g., Electric Storage
Participation in Markets Operated by Regional Transmission Organizations and
Independent System Operators, Order No. 841, 162 FERC ¶ 61,127 (2018).
25 See EIA, Form EIA-860 Detailed Data, June 1, 2018, https://www.eia.
gov/electricity/data/eia860/
26 Id.
expensive. Batteries, flywheels, and other fast acting electric storage technologies can also provide ancillary services which help maintain grid reliability. The vast majority of battery storage capacity in the electricity markets is used to provide ancillary services or capacity, because these applications provide the most revenue for storage owners.27
Some states have passed legislation to incentivize investment in storage projects. In 2013, California adopted targets for utilities to procure 1,325 MW of energy storage capacity by 2024 and subsequently increased the capacity requirement target and reduced timelines.28 Other states, including Massachusetts and New York have also created targets for energy storage procurement.
Distributed Energy Resources
In the 2016 Storage NOPR, the Commission defined Distributed Energy Resources (DERs) as sources or sinks of power located on the distribution system, any subsystem thereof, or behind a customer meter.29 DERs include electric storage resources, distributed generation, thermal storage, and electric vehicles and their supply equipment. In most instances these resources are located close to the end user of power. While individual installations of DER tend to have capacities much smaller than that of central station power plants (for example DER installations may range from a fraction of a kilowatt to systems producing less than 10 MW), the overall quantity of DER installations have grown
27 See EIA, U.S. Battery Storage Market Trends, at P 6-11 (May 2018),
https://www.eia.gov/analysis/studies/electricity/batterystorage/pdf/battery_
storage.pdf.
28 See California Public Utilities Commission, Energy Storage, (n.d.)
http://www.cpuc.ca.gov/General.aspx?id=3462
29 This is a proposed definition that is subject to change. See Notice
of Proposed Rulemaking, Electric Storage Participation in Markets Operated by
Regional Transmission Organizations and Independent System Operators, 157
FERC ¶ 61,121, at P 1 (2016) (2016 Storage NOPR).

Energy Primer | 53
tremendously, particularly in states with beneficial policies toward DERs.
One such policy is known as, “net metering.” Net metering is a system in which DERs are connected behind the meter to a distribution system and any surplus power is transferred onto the grid, allowing customers to offset the cost of power drawn from a distribution utility. Such surplus flow typically occurs during periods when the DER’s production outstrips the customer’s total demand. Under one measure of DER, as tracked by EIA, total net-metered capacity grew by approximately 120 percent between 2014 and 2017, from approximately 7.5 GW of capacity to 16.4 GW. The bulk of this capacity was solar photovoltaic which made up 96 percent of net-metered capacity in 2017, with 60 percent of that capacity owned by residential customers.30 In some cases, surplus power from a large DER or a set of net metered DERs may flow on to the transmission system. The Commission and other stakeholders continue to study DERs and their potential effects on markets and reliability.31
Renewable Energy Policies
Renewable development is frequently tied to policies promoting their use, which include tax credits, low-cost loans, rebates and production incentives. Federal funding of research and development (R&D) has played an important role in lowering the costs or reducing the time it takes for renewable technologies to become commercially viable.
Congress has provided tax incentives to spur renewable resource investments. Originally enacted in 1992, wind, biomass, geothermal, and other forms of renewable
30 See EIA, Electric Power Annual (Oct. 22, 2018), https://www.eia.
gov/electricity/annual/.
31 The Commission initiated action to explore the participation of
distributed energy resource aggregations in markets operated by Regional
Transmission Organizations and Independent System Operators under Docket
No. RM18-9-000.
generation have been able to receive federal production tax credits (PTC) based on a facility’s production. An inflation-adjusted credit, the PTC generally has a duration of 10 years from the date the facility goes online. The credit was initially set at 1.5¢/kilowatt hour (kWh) and its value has been adjusted for inflation each year. In 2017, the value was 2.3¢/kWh for plants commencing construction before 2017.32 For plants commencing construction in later years, the PTC amount is reduced until the credit is phased out after 2020.33
Another form of tax credit for renewables, including solar and other types of projects, has been a federal investment tax credit (ITC). This rate has generally been set at 30 percent of a project’s equipment and construction costs. However, the ITC will gradually step down for future projects with the rebate dropping in 2020 and later years.34
State renewable portfolio standards (RPS) and renewable energy standards (RES) have been significant drivers in the growth of investment in renewable generation. An RPS requires a certain percentage of energy sales (MWh) to come from renewable resources. Percentages usually increase incrementally from a base year to an ultimate target. Currently, 29 states plus Washington, D.C., have an RPS and eight states have renewable goals without financial penalties for non-achievement.35 As utilities build more renewable-powered generation, the markets in which they participate continue to address the integration of renewable output into their day-ahead and real-time operations and model expected growth as part of their long-term transmission-planning processes.
32 Federal Register, 81 Fed. Reg. 25, 760 (2016).
33 U.S. Department of Energy, Advancing the Growth of the U.S. Wind
Industry: Federal Incentives, Funding, and Partnership Opportunities (February
2020), https://www.energy.gov/sites/prod/files/2020/02/f71/weto-funding-
factsheet-2020.pdf.
34 See 26 U.S. Code § 38, 46, 48.
35 Barbose, Galen. Lawrence Berkeley National Laboratory, U.S.
Renewables Portfolio Standards: 2017 Annual Status Report (July 2017),
https://emp.lbl.gov/publications/us-renewables-portfolio-standards-0.

54 | Energy Primer Federal Energy Regulatory Commission
Renewable energy certificates (RECs) allow state regulators to track compliance with mandatory RPS targets or verify progress in voluntary state renewable programs. They also allow compliance entities to purchase credits – subject to state imposed limits on amount and price - if they have not generated or bought enough renewable energy to meet their annual requirements.
Transmission
The alternating current (AC) power grid operates like an interconnected web, where, with a few exceptions, the flow of power is not specifically controlled by the operators on a line-by-line basis. Instead, power flows from sources of generation to consumers across any number of lines simultaneously, following the path of least resistance. There are also a limited number of direct current (DC) lines, which are set up as specific paths with definite beginning and end points for scheduling and moving power. These lines are controllable by operators and have other characteristics that make them attractive to grid planners and operators, such as providing greater grid stability and lower line losses. However, DC lines cost significantly more than AC lines to construct. Consequently, DC lines are typically built for certain specialized applications involving the movement of large amounts of power over long distances, such as the Pacific Intertie, which extends between the Northwest and California.
Transmission lines provide a certain amount of resistance to the flow of power as electricity travels through them. This resistance is not unlike the wind resistance that a car must overcome as it travels along a highway. The resistance in power lines creates losses: the amount of power injected into a power line diminishes as it travels through the line. The amount of these losses is contingent on many factors including the voltage of the transmission facilities.
Transmission Service
FERC requires that public utilities that own transmission
lines used in interstate commerce offer transmission service on a nondiscriminatory basis to all eligible customers. The rates and terms of service are published in each utility’s Open Access Transmission Tariff (OATT). The two most common types of service are point-to-point service and network service. Point-to-point service involves paying for and reserving a fixed quantity of transmission capacity and moving power up to the reservation amount from one location, the point of receipt (POR), to another location, the point of delivery (POD). Depending on availability, customers may purchase point-to-point service for durations of one hour to multiple years. Network service allows a transmission customer the use of the entire transmission network to provide generation service for specified resources and specific loads, without having to pay multiple charges for each resource-load paring. The price for service is cost-based and published in the OATT. Capacity reassignment is the term for the resale of point-to-point transmission capacity in the secondary market.
An entity holding transmission rights may want to resell that capacity to another transmission customer in the secondary market because it is unneeded, or to make a profit. Resellers of transmission capacity are permitted to charge market-based rates for capacity reassignments, instead of the original cost-based rate at which they purchased the capacity. The number of capacity reassignment transactions was approximately 117,000 in 2017.36 Most of the capacity reassignments were hourly, although capacity can also be reassigned on a daily, weekly, monthly, or yearly basis.
If the market price of energy is greater at the POD than at the POR, the transmission has value. The transmission holder can capture this value by using the transmission – buying energy at the POR, moving it to the POD and selling it. Alternatively, the transmission holder can sell the transmission through a capacity reassignment. Thus, the price of a capacity reassignment should be consistent with, and rarely exceed, the expected price 36 See FERC, Electric Quarterly Reports, Downloads, Quarterly Filings
(2017), https://eqrreportviewer.ferc.gov.

Energy Primer | 55
differential between the POD and the POR.
Grid Operations
Grid operators dispatch their systems using the least costly generation, consistent with the constraints of the transmission system and reliability requirements. The dispatch process occurs in two stages: day-ahead unit commitment, or planning for the next day’s dispatch, and economic dispatch, or dispatching the system in real time.
Day-Ahead Unit Commitment
In the unit commitment stage, operators decide which generating units should be committed to be online for each hour, typically for the next 24-hour period. This is done in advance of real-time operations because some generating units require several hours of lead time before they are brought online. In selecting the most economic generators to commit, operators take into account forecast load requirements and each unit’s physical operating characteristics, such as how quickly output can be changed, maximum and minimum output levels and the minimum time a generator must run once it is started. Operators must also take into account each generating unit’s cost factors, such as fuel and nonfuel operating costs and the cost of environmental compliance.
Forecast conditions can also affect how the transmission grid is optimally dispatched to reliably meet load. This is the security aspect of commitment analysis. The factors that can affect grid capabilities include generation and transmission facility outages, line capacities as affected by loading levels and flow direction, and weather conditions. If the security analysis indicates that the optimal economic dispatch cannot be carried out reliably, relatively expensive generators may have to be called upon to replace less-expensive units.
System and Unit Dispatch
In the system dispatch stage, operators must decide the
appropriate level at which each available resource from the unit commitment stage should be operated, given the actual real-time load and grid conditions, so that overall production costs are minimized. Actual conditions will vary from those forecast in the day-ahead commitment and operators must adjust the dispatch accordingly. As part of real-time operations, demand, generation and interchange (imports and exports) must be continually kept in balance to maintain a system frequency of 60 hertz. This is typically done by automatic generation control (AGC) to change the generation dispatch as needed.
The chart below is a depiction of the market supply curve for the New York Independent System Operator (NYISO). This is also commonly called the supply stack. In it, all of the generating units in the New York market are shown, sorted according to their marginal cost of production. Their cost of production is shown on the vertical axis in terms of dollars per MWh. The cheapest units to run are to the left and the most expensive to the right.
Dispatch in New York, for example, first calls upon wind generating units, followed successively by hydroelectric, nuclear and coal-, gas- and oil-fired generating units. This assumes that the generating units have sufficient resources – enough wind for the wind powered generators or enough river flow for the hydroelectric plants, for example – and that sufficient transmission capability exists to deliver generator output and meet reliability needs.

56 | Energy Primer Federal Energy Regulatory Commission
Source: ABB, Velocity Suite37
In addition to these considerations, transmission flows must be monitored to ensure that the grid operates within voltage and reliability limits. If transmission flows exceed accepted limits, the operator must take corrective action, which could involve curtailing schedules, changing the dispatch or shedding load. Operators may check conditions and issue adjusted dispatch instructions as often as every five minutes.
Ancillary Services
Ancillary services maintain electric reliability and support the transmission of electricity. These services are produced
37 Based on Form EIA 860, NERC Electric Supply and Demand
database, FERC Form 1, FERC Form 714, ISO Load Data, ABB Primary
Research, et al., derived from Supply Curve Analyst, ABB Velocity Suite.
Market Supply Curve for NYISO
and consumed in real-time, or in the very near term. NERC and regional entities establish the minimum amount of each ancillary service that is required for maintaining grid reliability.38
Regulation matches generation with very short-term changes in load by moving the output of selected resources up and down via an automatic control signal, typically every few seconds. The changes to output are designed to maintain system frequency at 60 hertz. Failure to maintain a 60-hertz frequency can result in systemic failure of an electric grid.
Operating reserves are needed to restore load and
38 For additional information on the definitions of ancillary services,
see NERC, Glossary of Terms Used in NERC Reliability Standards, at 19-30
(Jun. 2018), https://www.nerc.com/files/glossary_of_terms.pdf.

Energy Primer | 57
generation balance when a supply resource trips off line. Operating reserves are provided by generating units and demand resources that can act quickly, by increasing output or reducing demand, to make up a generation deficiency. There are three types:
1. Spinning reserves are provided by generators that are on-line (synchronized to the system frequency) with some unloaded (spare) capacity and capable of increasing its electricity output within a specified period of time, such as 10 minutes. During normal operation, these reserves are provided by increasing output on electrically synchronized equipment or by reducing load on pumped storage hydroelectric facilities. Synchronized reserve can also be provided by demand-side resources.
2. Non-spinning reserves are provided by generating units that are not necessarily synchronized to the power grid, but can be brought online within a specified amount of time, such as 10 minutes. Non-spinning reserve can also be provided by demand-side resources.
3. Supplemental reserves are provided by generating units that can be made available within a specified amount of time, such as 30 minutes, and are not necessarily synchronized with the system frequency.
Black start generating units have the ability to go from a shutdown condition to an operating condition and start delivering power without any outside assistance from the electric grid. Hydroelectric facilities and diesel generators predominately have this capability. These are the first facilities to be started up in the event of a system failure or blackout to restore the rest of the grid.
Reactive power: Electricity consists of current, the flow of electrons, and voltage, the force that pushes the current through the wire. Reactive power is the portion of power that establishes and maintains electric and magnetic fields in AC equipment. It is necessary for transporting AC power over transmission lines, and for operating magnetic equipment, including rotating machinery and transformers. It is
consumed by current as it flows. As the amount of electricity flowing on a line increases, so does the amount of reactive power needed to maintain voltage and move current. Power plants can produce both real and reactive power, and can be adjusted to change the output of both. Special equipment installed on the transmission grid is also capable of injecting reactive power to maintain voltage.
Weather
Weather is the single most important factor affecting the level of electricity demand and, thus, is a major factor in grid operations. System operators therefore rely heavily on weather forecasts to ensure they have the right generation, in the right locations to run the grid reliably.
Weather affects grid operations in other ways, as well. Primary among these is on the productivity of certain types of power generators: wind and hydroelectric. Wind turbines’ power output changes with wind availability and speed, which affects the cost of wholesale power.
Hydroelectric plants rely on rain and snowfall to provide the river flow needed for their output. Geographically, this is most important in the Pacific Northwest, where seasonal hydroelectric plant output is a critical source of power. Rain and the melting of winter snowpack feed the Columbia and Snake River systems. Surplus power from these generators is typically exported to California to help meet summer peak demand and provide a combination of increased reliability and lower prices.
Temperature can also affect the output of other power plants and capacity of transmission lines. Thermal plants that use a turbine – coal, gas, oil and nuclear plants – become less efficient at higher temperatures. Additionally, the capacity of transmission lines is limited by heat because the conductive material used in fabrication becomes more electrically resistant as they heat up, limiting their throughput capability.

58 | Energy Primer Federal Energy Regulatory Commission
Wholesale Electricity Markets and Trading
Overview
Markets for delivering power to consumers in the United States are split into two systems: traditionally regulated markets and those run by RTO/ISOs. Trading for power is also split into over-the-counter (OTC) or bilateral transactions, and RTO/ISO transactions. Bilateral transactions occur in both traditional systems and in RTO/ISO regions, but in different ways. Pricing in both RTO/ISO and traditional regions incorporates both cost-of-service and market-based rates.
Traditional systems rely on management to make operational decisions, usually based on the cost of using the various generation options. In general, RTO/ISOs use their markets to make those decisions, such as generator dispatch.
Supplying Load
Suppliers serve customer load through a combination of self-supply, bilateral market purchases and spot purchases from the RTO/ISO market. The choices are:
• Self-supply means that the supplying company generates power from plants it owns or operates to meet demand.
• Supply from bilateral purchases means that the load-serving entity buys power from a supplier.
• Supply from spot RTO/ISO market purchases means the supplying company purchases power from the RTO/ISO.
LSEs’ sources of energy vary considerably. In ISO-NE, NYISO and CAISO, the LSEs have divested much or all of their generation. In these circumstances, LSEs supply their customers’ requirements through bilateral and RTO/ISO market purchases. In PJM, MISO and SPP, LSEs may own significant amounts of generation, either directly or through affiliates, and therefore use self-supply as well as bilateral and RTO market purchases.
Bilateral Transactions
Bilateral or OTC transactions between two parties do not occur through an RTO/ISO and can occur through direct contact and negotiation, through a voice broker or through an electronic brokerage platform, such as the Intercontinental Exchange (ICE). The deals can range from standardized contract packages, such as those traded on ICE, to customized, complex contracts known as structured transactions. In bilateral transactions, buyers and sellers know the identity of the party with whom they are doing business.
Whether the trade is done on ICE, directly between parties or through another type of broker, the trading of standard physical and financial products, such as next-day on-peak firm or swaps, allows index providers to survey traders and publish price indexes. These indexes provide price transparency.
Physical bilateral trades involving the movement of the energy from one point to another require the parties to reserve transmission capacity to move the power over the transmission grid. Transmitting utilities are required to post the availability of transmission capacity and offer service on an Open Access Same-Time Information System (OASIS) website. Traders usually reserve transmission capacity on OASIS at the same time they arrange the power contract.
Transfers of power between balancing authority areas (BAA) require one of the parties to the transaction to submit a request for interchange, also known as an eTag.39 The receiving BAA (the entity to which the power is transferred or sinks), or its agent, will process the tag, ensure a reliability assessment has been completed, and send it to all parties named on the eTag. This ensures
39 A Balancing Authority Area is a collection of generation,
transmission, and loads within the metered boundaries of the entity (a
Balancing Authority) that is responsible for balancing load, generation, and
net interchange between other Balancing Authority Areas. See Glossary of
Terms Used in NERC Reliability Standards, at 4 (Jan. 31, 2018), https://www.
nerc.com/files/glossary_of_terms.pdf.

Energy Primer | 59
Source: ABB, Velocity Suite
an orderly transfer of energy and provides transmission system operators with the information that they need to institute curtailments, as needed. Curtailments may be necessary when a change in system conditions reduces the capability of the transmission system to move power and requires some transactions to be reduced or cut.
Bilateral physical transactions that are conducted in RTO/ISOs are settled financially. Generators offer their power into the markets and load is served through the power dispatched by the RTO/ISO. The RTO/ISO then settles bilateral transactions based on the prices in the contracts and the prices that occurred in their markets.
North American Regional Transmission Organization and Independent System Operator Regions
Cost-Based Rates
Cost-based rates are used to price most transmission services and some electricity when FERC determines that market-based rates are not appropriate, or when an entity does not seek market-based rate authority. Cost-based rates are set to recover costs associated with providing service and give a fair return on capital. These rates are typically listed in a published tariff.
The following are major inputs to setting cost-based electricity rates:
• Determining used-and-useful electricity plants. This may include generation facilities, transmission facilities, distribution plants and office and related administration facilities.

60 | Energy Primer Federal Energy Regulatory Commission
Source: PJM
• Determining expenses from the production, transmission and distribution of electricity, including fuel and purchased power, taxes and administrative expenses.
• Establishing a fair return on capital, known as the cost of capital. This includes determining the cost of debt, common equity, preferred stock and commercial paper and other forms of short-term borrowing, such as lines of credit used to finance projects and provide cash for day-to-day operations.
• Allocating electric plant and other expenses among various customer classes and setting the rate structure and rate levels.
Market-Based Rates
Under market-based rates, the terms of an electric transaction are negotiated by the sellers and buyers in bilateral markets or through RTO/ISO market operations. FERC grants market-based rate authority to electricity sellers that demonstrate that they and their affiliates lack, or have adequately mitigated, horizontal market power (typically based on whether the seller is a pivotal supplier and on the percent of generation owned by the seller relative to the total amount of generation available in a market), and vertical market power (the ability to erect barriers to entry or influence the cost of production for competitive electricity suppliers).
Options for Energy Supply
Energy Primer | 61
Wholesale sellers who have market-based rate authority and sell into day-ahead or real-time markets administered by a RTO/ISO do so subject to the specific RTO/ISO market rules approved by FERC. Thus, a seller in such markets must have an authorization from FERC and must also abide by the additional rules contained in the RTO/ISO tariff.
Traditional Wholesale Electricity Markets
Traditional wholesale electricity markets exist primarily in the Southeast and the West outside of California where utilities are responsible for system operations and management, and, typically, for providing power to retail consumers. Utilities in these markets are frequently vertically integrated – they own the generation, transmission and distribution systems used to serve electricity consumers. They may also include federal systems, such as the Bonneville Power Administration, the Tennessee Valley Authority and the Western Area Power Administration. Wholesale physical power trading typically occurs through bilateral transactions. A utility in a traditional region has the following responsibilities:
• Generating or obtaining the power needed to serve customers (this varies by state)
• Ensuring the reliability of its transmission grid
• Balancing supply and demand instantaneously
• Dispatching its system resources as economically as possible
• Coordinating system dispatch with neighboring balancing authorities
• Planning for transmission requirements within the utility’s footprint
• Coordinating its system development with neighboring systems
Regional Electricity Markets
Two-thirds of the population of the United States is served by electricity markets run by regional transmission organizations or independent system operators (RTO/ISOs or organized markets). The main distinction between RTO/ISO markets and their predecessors (such as vertically integrated utilities, municipal utilities and co-ops) is that RTO/ISO markets deliver electricity through competitive market mechanisms.
The basic functions of an RTO/ISO include the following:
• Ensure the reliability of the transmission grid
• Operate the grid in a defined geographic footprint
• Balance supply and demand instantaneously
• Operate competitive, nondiscriminatory electricity markets
• Provide nondiscriminatory interconnection service to generators
• Plan for transmission expansion on a regional basis
In performing these functions, RTO/ISOs have operational control of the transmission system and are independent of their members. They also transparently manage transmission congestion, coordinate the maintenance of generation and transmission system, and oversee a transmission planning process to identify needed upgrades in both the near- and long-term. RTO/ISOs do not own transmission or generation assets or perform the actual maintenance on generation or transmission equipment.
Currently, seven RTO/ISOs operate in the United States, listed below in order of the size of their all-time peak load:40
40 For source information on the peak load statistics for PJM
Interconnection, Midcontinent ISO, Southwest Power Pool, California ISO,
New York ISO, and New England ISO, see the individual region’s description
later in this chapter.

62 | Energy Primer Federal Energy Regulatory Commission
• PJM, 165 GW (summer of 2011)
• MISO, 127 GW (summer of 2011)
• ERCOT, 71 GW (summer of 2016) 41
• SPP, 51 GW (summer of 2016)
• CAISO, 50 GW (summer of 2006)
• NYISO, 34 GW (summer of 2013)
• ISO-NE, 28 GW (summer of 2006)
41 ERCOT, History (n.d.), http://www.ercot.com/about/profile/history.
RTO/ISO Markets and
FeaturesRTO/ISO operations encompass multiple services that are needed to provide reliable and economically efficient electric service to customers. Each of these services has its own parameters and pricing, and the RTO/ISOs use computer-based algorithms to determine the providers and prices to most efficiently procure these products. The RTO/ISO markets include the day-ahead energy market, real-time energy market (sometimes called a balancing market), capacity markets (designed to ensure enough generation is available to reliably meet peak power demands), ancillary services markets, and financial transmission rights markets (markets for congestion revenue contracts for hedging the cost of limited transmission capability).
RTO/ISO Energy Markets
All RTO/ISO electricity markets have day-ahead and real-time markets. The day-ahead market schedules electricity production, ancillary services commitments and consumption before the operating day, whereas the real-time market reconciles any differences between the schedule in the day-ahead market and the real-time load while observing reliability criteria, such as forced or unplanned outages and the electricity flow limits on transmission lines.
The day-ahead energy market produces financially binding schedules for the production and consumption of electricity one day before its production and use (the operating day). The purpose of the day-ahead market is to give generators and load-serving entities a means for scheduling their activities with sufficient lead time. The day-ahead bids and offers are based on a forecast of loads and are consistent with their business strategies.
In day-ahead markets, the schedules for supply and usage of energy are compiled hours ahead of the beginning of the operating day. The RTO/ISO then runs a computerized market model that matches buyers and sellers throughout the market footprint for each hour throughout the day. The model then evaluates the bids and offers of the participants, based on the power flows needed to move the electricity throughout the grid from generators to consumers. Additionally, the model must account for changing system capabilities that occur, based on weather and equipment outages, plus the rules and procedures that are used to ensure system reliability.42 The market rules dictate that generators submit supply offers and that loads submit demand bids to the RTO/ISO by a deadline that is typically in the morning of the day-ahead scheduling. Typically, 95 percent of all load is scheduled in the day-ahead market and the rest is scheduled in real-time.
42 In evaluating which generators provide the power to meet
hourly load, the market model assesses whether the power flows can travel
without exceeding the physical capability of any transmission path. If the
model shows such a violation of transmission capability, the combination of
assigned generators will be changed in a process known as redispatch.

Energy Primer | 63
Source: ISO-NE
Generation and demand bids that are scheduled in the day-ahead market are settled at the day-ahead market prices. Inputs into setting a day-ahead market schedule include:
• Generators’ offers to sell electricity for each hour
• Load-serving entities’ bids to buy electricity for each hour
• Demand-response offers by customers to curtail usage of electricity
• Virtual demand bids and supply offers
• Operational information about the transmission grid and generating resources, including planned or known
transmission and generator outages, the physical characteristics of generating resources including minimum and maximum output levels and minimum run time, and the status of interconnections to external markets.
The real-time market is used to balance the differences between the day-ahead scheduled amounts of electricity cleared in the day-ahead market and the actual real-time load. The real-time market is run in five-minute intervals and clears a much smaller volume of energy and ancillary services than the day-ahead market. The real-time market also provides
ISO-NE Wholesale Electricity Market

64 | Energy Primer Federal Energy Regulatory Commission
Source: ISO-NE
supply resources with additional opportunities for offering energy into the market. When the real-time generation and load are different from the day-ahead cleared amount, the difference is settled at the real-time price.
Real-time market prices are significantly more volatile than the day-ahead market prices. This stems from demand uncertainty, transmission and generator forced outages and other unforeseen events. Since the day-ahead market generally is not presented with these events, it produces more stable prices than in real-time. Also, because the volumes in the real-time market are much smaller, there is an increased likelihood of supply and demand imbalances, which can lead to both positive and negative price movements.
RTO/ISOs use markets to deal with transmission constraints
through locational marginal pricing (LMP). The RTO/ISO markets calculate a LMP at each location on the power grid. The LMP reflects the marginal cost of serving load at the specific location, given the set of generators that are being dispatched and the limitations of the transmission system. LMP has three elements: an energy charge, a congestion charge and a charge for transmission system energy losses.
If there are no transmission constraints, or congestion, LMPs will not vary significantly across the RTO/ISO footprint. However, when transmission congestion occurs, LMPs will vary across the footprint because operators are not able to dispatch the least-cost generators across the entire region and some more expensive generation must be dispatched to meet demand in the constrained area.
ISO-NE Electric Energy Market

Energy Primer | 65
Source: PJM
When there are transmission constraints, the highest variable cost unit that must be dispatched to meet load within transmission-constrained boundaries will set the LMP in that area. All sellers receive the LMP for their location and all buyers pay the price for their location.
The primary means used for relieving transmission congestion constraints is by changing the output of generation at different locations on the grid. The market-based LMP sends price signals that reflect congestion costs to market participants. Thus, LMPs take into account both the impact of specific generators on the constrained facility and the cost to change (redispatch) the generation output to serve load. This process is known as security-constrained economic dispatch.
This redispatch could be implemented by using nonmarket procedures, such as transmission loading relief (TLR). NERC established the TLR process for dealing with reliability concerns when the transmission network becomes overloaded and power flows must be reduced to protect the network. A TLR is used to ration transmission capacity when the demand for transmission is greater than the available transmission capacity (ATC). The rationing is a priority system that cuts power flows based on size, contractual terms and scheduling.
Scarcity pricing (or shortage pricing) is a mechanism used by RTO/ISOs to send price signals in the real-time market when there is a shortage of energy or energy reserves. These events occur when there is a shortage of available capacity to meet
Security Constrained Re-Dispatch

66 | Energy Primer Federal Energy Regulatory Commission
load and provide sufficient backup reserves, which can be caused by unexpectedly high power loads, supply disruptions, or both.
The common method that RTO/ISOs employ to implement scarcity pricing is through the use of an operating reserve demand curve. The demand curve specifies price levels up to the cost of not serving load as scarcity conditions are approached.43
Reliability must-run (RMR) units are generating plants that would otherwise retire but the RTO/ISO has determined they are needed to ensure reliability. They can also be units that have market power due to their location on the grid. RTO/ISOs enter into cost-based contracts with these generating units and allocate the cost of the contract to transmission customers. In return for these payments to the generator, the RTO/ISO may call on the owner of an RMR generating unit to run the unit for grid reliability. The payment must be sufficient to pay for the cost of owning and maintaining the unit, even if it does not operate. Transmission upgrades can reduce the need for RMR units by increasing generation deliverability throughout the RTO/ISO.
RTO/ISO Capacity Markets
RTO/ISOs, like other electric systems, are required to maintain adequate generation reserves to ensure that sufficient generation and demand-resource capacity are available to meet load and reliability requirements. LSEs have typically satisfied their reserve obligations with owned generation or bilateral contracts with other suppliers. Some RTO/ISOs have mechanisms to obtain capacity commitments, such as capacity auctions and capacity payments.
Most RTO/ISOs run a capacity market that allows LSEs to
43 RTO/ISOs apply scarcity pricing in the LMP for all intervals in
which the operating software indicates that there is insufficient available
capacity to provide system or localized demand and reserves. See Settlement
Intervals and Shortage Pricing in Markets Operated by Regional Transmission
Organizations and Independent System Operators, Order No. 825, 81 Fed. Reg.
42,882 (June 30, 2016), FERC Stats. & Regs. ¶ 31,384 (2016).
satisfy their reserve obligation. The markets cover short-term capacity, such as a month, season or year. PJM and ISO-NE run capacity auctions up to three years prior to when the capacity is needed. The capacity markets are intended to provide more certainty for investment in new capacity resources while including an opportunity for all resources to recover their fixed costs over time.
Financial Transmission Rights
Financial transmission rights (FTRs) are contracts that give market participants an offset, or hedge, against transmission congestion costs in the day-ahead market.
FTRs were originally developed in part to give native load-serving entities in the nascent RTO/ISOs price certainty similar to that available to traditional vertically-integrated utilities operating in non-RTO/ISO markets. This practice continues, as FTRs are allocated to load-serving entities, transmission owners or firm transmission right holders in RTO/ISOs, typically based on historical usage. Entities that fund the construction of specific new transmission facilities may also be eligible to receive FTRs. The details of the allocations vary by RTO/ISO.
FTRs allow customers to protect against the risk of congestion-driven price increases in the day-ahead market in the RTO/ISOs. Specifically, FTRs grant their holders the right to day-ahead congestion revenues over specific paths and periods of time. Congestion costs occur as the demand for scheduled power over a transmission path exceeds that path’s flow capabilities. This causes the price at the source to decline or the price at sink to increase, or both, causing the congestion cost of serving Point B from Point A to increase. By buying an FTR over the path from Point A to Point B, the FTR holder is paid the difference of the congestion price components at the sink and source, thus allowing it to hedge against the congestion costs incurred in the day-ahead market.
FTRs are acquired through allocations and purchases. Purchases take place in the RTO-administered auctions or in

Energy Primer | 67
a secondary market. Allocations stem from a related product, the auction revenue rights (ARR). ARRs provide the firm transmission capacity holders, transmission owners or LSEs with the rights to revenue from the FTR auctions. In general, ARRs are allocated based on historical load served and, in some RTO/ISOs, ARRs can be converted to FTRs. If converted to FTRs, the holder receives revenue from congestion. If kept as ARRs, the holder receives revenue from the FTR auction.
The main method for procuring FTRs is through an auction, which typically includes an annual (or multiyear) auction of one-year FTRs and monthly (or semiannual) auctions of shorter-term FTRs provided by existing FTR holders or made available by the RTO/ISO. The auctions are scheduled and run by the RTO, which requires bidding parties to post credit to cover the positions taken. FTR auction revenues are used to pay the holders of ARRs and assist the funding of future congestion payments to FTR holders. There is also a secondary market for FTRs (such as PJM’s eFTR), but historically only a small number of transactions have been reported.
The quantity of FTRs made available by the RTO/ISO is bounded by the physical limits of the grid, as determined by a simultaneous feasibility test across all potential flowgates. This test is performed by the RTO/ISO prior to making FTRs available at auction, and takes into account existing FTR positions and system constraints. The resulting portfolio of FTRs allocated or offered at auction represents an absolute constraint on the size of the net positions that can be held by the market. Participants in FTR auctions can procure counterflow FTRs, which directly offset prevailing flow FTR capacity, thereby allowing the value at risk on a given path to exceed the physical limits of the line. However, such bids are physically constrained, as the net position held on the path must always conform to the simultaneous feasibility test.
FTRs can also be purchased by a creditworthy entity seeking their financial attributes as a speculative investment. In this regard, FTRs are similar to financial swaps that are executed as a contract for differences between two day-ahead LMPs (swaps are explained in Chapter 4, Financial Markets, Trading
and Capital Markets). However, FTRs are substantially different from swaps in that the quantity of FTRs is linked to physical constraints in the transmission grid, while the quantity of swaps is not. Further, FTRs are procured by allocation or FTR auction, while swaps are procured through financial over-the-counter markets or exchanges.
Variation in RTO/ISO FTRs
All six FERC-jurisdictional RTO/ISOs trade FTRs or FTR equivalent products. However, the types and qualities of the rights traded across the organized markets vary, as do differences in the methods used to allocate, auction and transfer these rights. These attributes of the FTR markets are discussed below.
Flow Type: Prevailing Flow and Counterflow. A prevailing flow FTR generally has a source in a historical generation-rich location and a sink that is in a historical load-heavy location. Alternatively, the source of a prevailing flow FTR is on the unconstrained side of a transmission interface and the sink on the constrained side. Auction clearing prices for prevailing flow FTRs are positive. Conversely, a counterflow FTR often has a source in a historical load-heavy location and a sink in a historical generation-rich location. As a result, auction clearing prices for counterflow FTRs are negative; bidders are paid to take the counterflow FTR position.
Peak Type: On-peak, Off-peak, 24-hour. FTRs can be purchased for either 16-hour on-peak blocks, 8-hour off-peak blocks or around-the-clock. Only PJM offers all three peak type products. NYISO offers only the 24-hour product. The other RTO/ISOs offer on-peak and off-peak products.
Allocated Rights: The RTO/ISOs allocate transmission rights to transmission owners or load-serving entities within their markets. In PJM, MISO, SPP, and ISO-NE, these are allocated as auction revenue rights (ARRs), which give their holders the right to receive a share of the funds raised during the FTR auctions. The CAISO allocates congestion revenue rights (CRR), which provide their holders a stream of payments based on the actual congestion occurring on associated paths.

68 | Energy Primer Federal Energy Regulatory Commission
NYISO allocates both auction-based and congestion-based rights through multiple instruments. PJM and MISO allow ARR holders to convert all of these rights to FTRs; NYISO allows only a portion of ARR-equivalent instruments to be converted to its version of FTRs, called Transmission Congestion Credits (TCCs). ISO-NE does not allow such conversions, while the CAISO’s allocation is already in a form equivalent to an FTR. Converted ARRs are fully fungible in PJM, MISO and NYISO; CAISO only allows the sale of allocated CRRs in its secondary market, and ISO-NE has no converted instruments to sell.
Auctioned Rights: All RTOs provide FTRs (or equivalent CRRs, or TCCs) for sale to the public through two or more auctions held at various times of the year. The products vary by market and by auction, with some products made available only at specific auctions.
Secondary Markets: With the exception of the NYISO, each of the markets that auction FTRs also operates a bulletin board or similar venue designed to enable a secondary trading platform for FTRs. However, none of these platforms has had significant volume. NYISO offered to create a bulletin board for its participants, if requested, but received no requests.
Virtual Transactions
Virtual bids and offers (collectively, virtuals) are used by market participants to hedge physical positions and by speculative traders to profit from differences between day-ahead and real-time prices. The quantity of megawatts (MW) purchased or sold in the day-ahead market is offset by a sale or purchase of an identical quantity of MW in the real-time, so that the net effect on the market quantity traded is zero. A virtual trader pays (or is paid) the day-ahead price while being paid (or paying) the real-time price.
Although a trader does not have to deliver power, the transaction is not strictly financial as virtual transactions can set LMPs; the price is applied to physical as well as financial transactions. Virtual transactions can also affect the resource selection in the day-ahead market.
For each hour in the day-ahead market, virtual trades are added to the demand – i.e., day-ahead scheduled load – if virtual demand is greater than virtual supply. This has the effect of raising the price in the day-ahead market and, more importantly, increasing the amount of generation resources procured by the RTO/ISO. Since these generation resources will be available to the real-time market, the fact that virtual load does not carry forward into the real-time market will decrease the real-time demand below day-ahead scheduled load, thus placing downward pressure on real-time prices. The placement of virtuals affects the dispatch of physical capacity.
The primary benefits of virtual transactions are achieved through their financial impact on the markets. Virtuals sometimes are referred to as convergence bidding, as a competitive virtual market should theoretically cause the day-ahead and real time prices to converge in each hour. The convergence of day-ahead and real-time prices within the RTO/ISOs is intended to mitigate market power and improve the efficiency of serving load.
Transmission Operations
Each RTO/ISO’s Open Access Transmission Tariff (OATT) specifies the transmission services that are made available and customers submit requests for transmission service through the Open Access Same-Time Information System (OASIS). RTO/ISOs evaluate each transmission-service request using a model of the grid called a state estimator. Based on the model’s estimation of the effects on the system, the request for transmission service is either approved or denied.
Transmission operators, including RTO/ISOs, offer two major types of transmission service: point-to-point service and network service. Network service generally has priority over point-to-point service. RTO/ISOs work with transmission owners to plan and coordinate the operation, maintenance and expansion of transmission facilities in order to provide network and point-to-point customers with transmission service.

Energy Primer | 69
Network transmission service is used for the transmission of energy from network generating resources to an RTO/ISO’s network loads. This service enables network customers to use their generation resources to serve their network loads in an RTO/ISO.
Point-to-point transmission service uses an RTO/ISO’s system for the transmission of energy between a point of receipt and a point of delivery, which can be into, out of, or through the RTO/ISO’s footprint. RTO/ISOs offer firm and non-firm point-to-point transmission service for various lengths of time.
• Firm service has reservation priority over non-firm point-to-point service.
• Non-firm point-to-point transmission service is provided from the available transmission capability beyond network and firm point-to-point transmission service.
Transmission Planning
Each of the RTO/ISOs has system-wide or regional planning processes that identify transmission system additions and improvements that are needed to keep electricity flowing. Studies are conducted to test the transmission system against mandatory national reliability standards, as well as regional reliability standards.
The RTO/ISO transmission planning studies may look 10-15 years into the future to identify transmission overloads, voltage limitations and other reliability problems. RTO/ISOs then develop transmission plans in collaboration with transmission owners to resolve potential problems that could otherwise lead to overloads and blackouts. This process culminates in one recommended plan for the entire RTO/ISO footprint.
Financial Policies
Financial settlement is the process through which payments due from customers, and to generators, are calculated. Such settlements are based upon day-ahead schedules, real-time metering, interchange schedules, internal energy schedules, ancillary service obligations, transmission reservations, energy prices, FTR positions and capacity positions. Each market participant’s invoice of charges and credits includes the costs of services used to serve load and the costs for operating the RTO/ISO.
Generally, customers receive weekly or monthly invoices stating their charges and credits. Weekly invoices must be settled within a few days of being issued, while monthly invoices must be paid within either one or two weeks, depending on the policies of each RTO/ISO. All payments are made electronically and disbursements are made within several days of the date payments are due.
Credit Policies
Credit requirements are important in organized electricity markets in which RTO/ISOs must balance the need for market liquidity against corresponding risk of default. Defaults by market participants in RTO/ISOs are rare and the costs have generally been spread across the market. To minimize this risk, RTO/ISOs have credit policies in their tariffs, which contain provisions related to credit evaluations, credit limits, forms of collateral and the consequences of violations or defaults.

70 | Energy Primer Federal Energy Regulatory Commission
Regions
Markets vary around the United States by market type – traditional or RTO/ISO – generation types, customer use, climate, fuel costs, political and regulatory conditions, and other factors. Consequently, prices vary, driven by these market factors.
Southeast Wholesale
Market RegionThe Southeast electricity market is a bilateral market that includes all or parts of Florida, Georgia, Alabama, Mississippi, North Carolina, South Carolina, Missouri and Tennessee. It encompasses all or part of two NERC regions: the Florida Reliability Coordinating Council (FRCC) and the Southeastern Electric Reliability Council (SERC). Major hubs include Into Southern and the Tennessee Valley Authority (TVA). The Southeast region’s peak demand is greater than 170 GW.44
The Southeastern power markets have their roots in the 1960s and, in the wake of the Northeast Blackout of 1967, the Southeast began to build out its electric transmission grid. This was primarily to ensure reliability, but it also had economic consequences. There is now increased grid integration that has allowed utilities to more effectively share reserves, as well as the costs and risks of new plant construction.
A stronger transmission system has also allowed for more economic transactions, including both short-term transactions -- e.g., sales that are 24 hours or less – and long-term firm power deliveries. External sales have resulted in more efficient use of grid resources and reduced costs to both buyers and sellers.
44 Hourly load at peak in 2017. Based on FERC Form 714, Annual
Electric Balancing Authority Area and Planning Area Report. Derived from ABB,
Historical Demand by Planning Area-Hourly Dataset, Velocity Suite.
Source: ABB, Velocity Suite
Supply ResourcesThe total generating capacity in the Southeast Electric Region is over 250 GW and is predominately composed of natural gas and coal-fired generators. Hydroelectric and nuclear capacity are also substantial resources in the region.
Southeast Electric Region Capacity Mix
Source: ABB, Velocity Suite45
The Southeast uses a greater proportion of natural gas-
45 Based on installed nameplate capacity as of Dec. 31, 2018. Derived
from Form EIA-860, Annual Electric Generator Report, NERC Electric Supply
and Demand (ES&D) database, ABB Primary Research, et al. (ABB, Generating
Unit Capacity Dataset, Velocity Suite).
Southeast Electric Region

Energy Primer | 71
and oil-fired generation combined than compared to the continental U.S. as a whole.46 Historically, the Southeast generated most of its electricity from coal and nuclear plants. In recent years, natural gas use for generating electricity has become increasingly replied upon, as natural gas supplies increased and prices declined. Consequently, natural gas-fired power plants began to displace older, less-efficient coal-fired generation.
The TVA sub-region has a majority of its capacity and output from coal and nuclear, while the Virginia-Carolina (VACAR) sub-region has the highest utilization of nuclear generation in the Southeast.
Trading and Market Features
Virtually all physical sales in the Southeast are done bilaterally and long-term energy transactions are particularly prominent, compared to short-term transactions. Many long-term agreements involve full-requirements contracts or long-term power purchase agreements. For example, Southern Company’s short-term transactions accounted for less than 15 percent of its total wholesale energy sales in 2016.47
Short-term energy is traded among various entities including investor-owned utilities, municipal utilities, public utility districts, independent power producers, and marketers. Some of the largest sellers of short-term power include Southern Company, North Carolina Municipal Power Agency, Cargill, and Exelon.
Industry-referenced trading points for short-term bilateral transactions in the Southeast include the following locations: Into Southern, TVA, VACAR, and Florida. Volumes for short-term transactions can be low, particularly under normal weather conditions. Overall demand for short-term transactions tends to rise during periods of system stress, for example summer heat waves or winter cold snaps.
46 See EIA, Net Generation by State by Type of Producer by Energy
Source (EIA-906, EIA-920, and EIA-923) (Mar. 9, 2018), https://www.eia.gov/
electricity/data/state/.
47 See, FERC, Electric Quarterly Reports, Downloads, Quarterly Filings
(2016), https://eqrreportviewer.ferc.gov.
The Southeast has relatively low volumes of short-term trades compared to the Western regions (discussed below). Thus, there is limited data on which price index publishers have to base their price reporting. In Florida, in particular, volumes for short-term transactions are among the lowest in the Southeast and index publishers typically report no volumes for short-term bilateral index prices. Given the bilateral nature of wholesale power transactions in the Southeast, and a relatively small market for short-term transactions, interest in financial power products in the Southeast is weak. As a result, ICE does not provide a financial product in the Southeast.
Southern Company Auction
Southern Company has held daily and hourly auctions for power within its balancing area since April 2009 as a requirement of Southern Company’s market-based rate tariff. This balancing authority area encompasses the service territories of Southern Company utilities: Georgia Power, Alabama Power, Mississippi Power and Gulf Power. The products included in the auction are day-ahead power and real-time power. 48
According to the auction rules, Southern Company must offer all of its available uncommitted thermal generation capacity into the auction, after regulation and contingency reserves are met. The auction is intended to mitigate the potential ability of Southern Company to exercise market power within its balancing authority area and certain adjacent balancing authority areas. In February 2017, Southern Company revised its market-based rate tariff to reflect that all market based sales of less than one year made outside of the auction are to be capped at a cost-based tariff rate.49
48 See Southern Company Services, Inc., 125 FERC ¶ 61,316 (2008)
(Dec. 2008 Order) (conditionally accepting Southern Companies’ proposal to
establish day-ahead and hour-ahead energy auctions as mitigation).
49 See Alabama Power Company, 158 FERC ¶ 61,131 (2017) (Feb. 2,
2017 Order) (order accepting market-based rate tariff revisions subject to
condition).

72 | Energy Primer Federal Energy Regulatory Commission
Florida Electrical Power Plant Siting Act
The Florida Public Service Commission (PSC) determines the need for new electric power plant units greater than 75 MW through the Electrical Power Plant Siting Act.50 The PSC’s competitive bidding rules require IOUs to issue requests for proposal for new generating projects, exclusive of single-cycle combustion-turbines.51 The bidding requirement can be waived by the PSC if the IOU can demonstrate that it is in the best interests of its rate-payers.
50 29 Fl. Leg. § 403 (2017).
51 Fl. Admin. Code ch. 25, § 22.082. Selection of Generating Capacity,
Jun. 17, 2003.
Western Wholesale
Market RegionsThe power markets in the western United States are primarily bilateral markets. A key exception is most of California and portions of Nevada, which operate under CAISO.52 The West includes the Northwest Power Pool (NWPP), the Rocky Mountain Power Area (RMPA), and the Arizona, New Mexico, Southern Nevada Power Area (AZ/NM/SNV) within the Western Electricity Coordinating Council (WECC), a regional entity. These areas contain over 30 BAAs responsible for dispatching generation, procuring power, operating the transmission grid reliably, and maintaining adequate reserves.
Northwest Electric Region
The Northwest Region is composed of all or major portions of the states of Washington, Oregon, Idaho, Wyoming, Montana, Nevada and Utah, and a small portion of Northern California. The peak demand is approximately 50 GW.53
Supply ResourcesThe total capacity in the Northwest Electric Region is approximately 90 GW and is primarily composed of hydroelectric, natural gas and coal-fired generators. Wind generator capacity is also a significant resource for the region.
52 A market to meet intra-hour changes in energy demand and
supply, entitled the Western Energy Imbalance Market, is discussed below.
53 Hourly load at peak in 2017. ABB, Historical Demand by Planning
Area-Hourly Dataset, Velocity Suite.

Energy Primer | 73
Northwest Electric Region Capacity Mix
Source: ABB, Velocity Suite54
The Northwest has a unique resource mix, with hydroelectric generation capacity comprising approximately 40 percent of the power supply, which is sourced from many dams that are in the Columbia River system. The largest dam, Grand Coulee, can produce up to as much power as six nuclear plants. Due to the large amount of hydroelectric generation, the Northwest typically has low cost power during the spring and early summer. During these periods, the region exports power to neighboring regions, especially California, where power prices are typically higher.
Northwest Electric Region
Source: ABB, Velocity Suite
The amount of hydroelectric power produced depends on a number of factors, some natural and some controllable. On a seasonal basis, the intensity and duration of the water flow is driven by snowpack in the mountains, the fullness of the reservoirs, and rainfall. On a short-term basis, the levels
54 Based on installed nameplate capacity as of Dec. 31, 2018. Derived
from ABB, Generating Unit Capacity Dataset, Velocity Suite.
of hydroelectric power generation output are influenced by decisions to release water locally and upstream to generate power, as well as local water-use decisions that are independent of the economics of the power markets, such as recreation, irrigation, and wildlife considerations. The peak hydroelectric power generation period begins in the spring, when the snow melts, and may last into early summer. When there is less water available, the Northwest may rely more on its coal and natural gas generation, and occasionally import power from neighboring regions, including Canada, when loads are high.
Trading and Market FeaturesThe water forecast affects the forward market for electricity in the Northwest. Similarly, the daily water flow conditions influence the prices in the daily physical market. When there is an abundance of hydroelectric generation, the Northwest will export as much as possible on the transmission lines leading into California. Sometimes in off-peak hours there is so much generation that power prices are negative because the transmission lines are full and there is not enough local load to utilize all of the power.
The largest seller of wholesale power in the region is the Bonneville Power Administration (BPA), a federal agency that markets the output from federally owned hydroelectric facilities, as well as a non-federal nuclear plant and several other smaller non-federal power plants. It meets approximately one-third of the firm energy supply in its service territory, and owns 75 percent of the region’s high voltage transmission.55 BPA gives preference to municipal and other publicly owned electric systems in allocating its generation output.56
Two Canadian BAAs, Alberta Electric System Operator and British Columbia Hydro are also substantial suppliers of energy to the U.S. via the Northwest electric region. These Canadian BAAs often import power to and export power from
55 Bonneville Power Administration, BPA Overview, at 45 (n.d.),
https://energy.gov/sites/prod/files/2016/01/f28/0911review_ikakoula.pdf.
56 See, e.g., Bonneville Project Act, 16 U.S.C. §§ 832-832m (2000).

74 | Energy Primer Federal Energy Regulatory Commission
the U.S., depending on market conditions. The Canadian BAAs generally import power from the U.S. when prices are low in order to save water in their hydroelectric reservoirs. The water is later released to generate and sell hydroelectric power during higher priced periods.57
The Northwest region trading points for bilateral transactions include Mid-Columbia (Mid-C), California-Oregon Border (COB), Nevada-Oregon Border (NOB), and Mona (Utah). Of these, Mid-C is the most actively traded location.
Southwest Electric Region
The Southwest electric market encompasses the Arizona, New Mexico, Southern Nevada (AZ/NM/SNV), and the Rocky Mountain Power Area (RMPA) subregions of the Western Electric Coordinating Council (WECC). Peak demand is approximately 47 GW.58
Southwest Electric Region
Source: ABB, Velocity Suite
Supply ResourcesThe total capacity in the Southwest Electric Region is over 70
57 National Energy Board, Market Snapshot: Electricity exports from
B.C. to California are increasing (Mar. 2017), https://www.neb-one.gc.ca/nrg/
ntgrtd/mrkt/snpsht/2017/03-03lctrctxprtbcclfrn-eng.html.
58 Hourly load at peak in 2017. Historical Demand by Planning Area-
Hourly Dataset, ABB Velocity Suite.
GW and is predominately composed of natural gas and coal-fired and nuclear generators. Hydroelectric, wind, solar, and nuclear capacity account for the majority of the remaining capacity.
Southwest Electric Region Capacity Mix
Source: ABB, Velocity Suite59
The majority of generation in the Southwest is produced from natural gas and coal. The coal generators are generally located in close proximity to coal mines, resulting in low delivered fuel costs. Some generation is jointly owned among multiple nearby utilities, including the Palo Verde nuclear plant, a plant with three units totaling approximately 4,000 MW, which has owners in California and the Southwest. 60 The Southwest is also characterized by large amounts of solar capacity, as this region has the highest solar potential in the nation.61
Trading and Market FeaturesThe Southwest region is summer-peaking and experiences peak loads coincident with air conditioning demand. The daily high temperatures average above 100 degrees in June through August in Phoenix. However, power prices tend to be the highest when there is also hot weather in Southern California, creating competition for the region’s generation resources. The Southwest trading points include Palo Verde, Four Corners, and West Wing. Of these, Palo Verde is the most actively traded location.
59 Based on installed nameplate capacity as of Dec. 31, 2018. Derived
from ABB, Generating Unit Capacity Dataset, Velocity Suite.
60 EIA, Form EIA-860, Annual Electric Generator Report (2016),
https://www.eia.gov/electricity/data/eia860/.
61 Western Electricity Coordinating Council, State of the Interconnection, at 9 (Sep. 2017), https://www.wecc.biz/epubs/StateOfTheInterconnection/.

Energy Primer | 75
ISO-NENew England Independent System Operator
Market Profile
Geographic Scope
As the RTO for New England, ISO-NE is responsible for operating wholesale power markets that trade electricity, capacity, transmission congestion contracts and related products, in addition to administering auctions for the sale of capacity. ISO-NE operates the region’s high-voltage transmission network and performs long-term planning for the New England system. ISO-NE serves the six New England states: Connecticut, Maine, Massachusetts, New Hampshire, Rhode Island and Vermont.
Peak DemandNew England’s all-time peak load was 28 GW in summer 2006.62
Import and ExportsISO-NE is interconnected with the New York Independent System Operator (NYISO), TransEnergie (Québec) and the New Brunswick System Operator and imports around 15 percent of its annual energy needs. New England receives imports from Québec and New Brunswick in most hours and power flows in alternate directions between New England and New York, depending on market conditions.
Market ParticipantsThe ISO-NE participants consist of end-users, investor owned utilities, publicly-owned utilities, generators, transmission owners and financial institutions.
62 ISO New England, Key Grid and Market Stats, at 1 (n.d.), https://
www.iso-ne.com/about/key-stats/.
Membership and GovernanceISO-NE is a not-for-profit entity governed by a 10-member, independent, non-stakeholder board of directors. The sitting members of the board elect people to fill board vacancies.
NEPOOL is the principal stakeholder organization for the ISO-NE and is authorized to represent its more than 440 members in proceedings before FERC. It was organized in 1971 and its members include all of the electric utilities rendering or receiving services under the ISO-NE Tariff, as well as independent power generators, marketers, load aggregators, brokers, consumer-owned utility systems, demand response providers, developers, end users and a merchant transmission provider.
Source: ABB, Velocity Suite
Transmission OwnersISO-NE’s largest transmission owners include:
• Central Maine Power Company
• Cross Sound Cable Company, LLC
• Emera Maine, Inc.
• Eversource Energy Service Company
• Maine Electric Power Company

76 | Energy Primer Federal Energy Regulatory Commission
• National Grid USA
• NSTAR Electric Company
• The United Illuminating Company
• VT Transco, LLC
Chronic ConstraintsConstraints in the ISO-NE are concentrated in the Northeast Massachusetts-Boston zone. However, New England completed a series of major transmission projects in 2009 to improve reliability, including projects serving Boston, southwestern Connecticut and southeastern Massachusetts. These grid enhancements significantly reduced the frequency and severity of transmission congestion.
Transmission PlanningEach year, ISO-NE prepares a comprehensive 10-year regional system plan (RSP) that reports on the results of ISO system planning processes. Each plan includes forecasts of future loads (i.e., the demand for electricity measured in megawatts) and addresses how this demand may be satisfied by adding supply resources; demand resources, including demand response and energy efficiency; and new or upgraded transmission facilities. The plans also summarizes the region’s overall needs, as well as the needs in specific areas, and includes solutions and processes required to ensure the reliable and economic performance of the New England power system.
Supply ResourcesThe total capacity in ISO-NE is over 36 GW and is predominately composed of natural gas-fired, oil-fired and nuclear capacity. The region has a substantial proportion of oil-fired generation that is a particularly important resource to address potential power plant fuel shortages in the winter months during periods of local natural gas market stress.
ISO-NE Capacity Mix
Source: ABB, Velocity Suite63
Demand ResponseISO-NE administers the following demand-response programs for the New England wholesale electricity market:
• Real-Time Demand Response Resources (RTDR): These resources are required to respond within 30 minutes of the ISO’s instructions.
• Real-Time Emergency Generation Resources (RTEG): Resources that the ISO calls on to operate during a 5-percent voltage reduction that requires more than 10 minutes to implement. They must begin operating within 30 minutes of receiving a dispatch instruction.
• Transitional Price-Response Demand: An optional program that allows market participants with assets registered as RTDRs to offer load reductions in response to day-ahead LMP. The participant is paid the day-ahead LMP for the cleared interruptions and real-time deviations are charged or credited at the real-time LMP.
• Price Responsive Demand (PRD): In June, 2018, ISO New England launched a new price-responsive demand (PRD) structure that fully integrates active demand resources into the regional wholesale electricity marketplace. With PRD, ISO-NE deploys its active demand resources as part of the energy dispatch and reserve-designation process along with generating resources. PRD incorporates demand response into the energy market, the reserves market and the capacity market.64
63 Based on installed nameplate capacity as of Dec. 31, 2018. Derived
from ABB, Generating Unit Capacity Dataset, Velocity Suite.
64 ISO-NE, Price-responsive demand explained: Q&A with Henry

Energy Primer | 77
Market Features
Energy Markets
Day-Ahead MarketThe day-ahead energy market allows market participants to secure prices for electric energy the day before the operating day and hedge against price fluctuations that can occur in real time. One day ahead of actual dispatch, participants submit supply offers and demand bids for energy. These bids are applied to each hour of the day and for each pricing location on the system.
In the day-ahead energy market, incremental offers and decremental bids (virtual supply offers and demand bids) can also be submitted, which indicate prices at which supply or demand are willing to increase or decrease their injection or withdrawal on the system. These INCs and DECs are tools that market participants can use to hedge their positions in the day-ahead energy market.
From the offers and bids, ISO-NE constructs aggregate supply and demand curves for each location. The intersection of these curves identifies the market-clearing price at each location for every hour. Supply offers below and demand bids above the identified price are cleared and are scheduled. Offers and bids that clear are entered into a pricing software system along with binding transmission constraints to produce the LMPs for all locations.
Real-Time MarketISO-NE coordinates the dispatch of generation and demand resources to meet the instantaneous demand for electricity. Supply or demand for the operating day can change for a variety of reasons, including unforeseen generator or transmission outages, transmission constraints or changes from the expected demand. While the day-ahead energy
Yoshimura, ISO Director of Demand Resource Strategy (June 6, 2018), http://
isonewswire.com/updates/2018/6/6/price-responsive-demand-explained-qa-
with-henry-yoshimura-is.html.
market produces the schedule and financial terms for the majority of energy production and use in each operating day, a number of factors can change that schedule. Thus, ISO-NE operates a spot market for energy, the real-time energy market, to meet energy needs within each hour of the current day.
ISO-NE clears the real-time energy market using supply offers, real-time load and offers and bids to sell or buy energy over the external interfaces. For generators, the market provides additional opportunities to offer supply to help meet incremental supply needs. LSEs whose actual demand comes in higher than scheduled in the day-ahead energy market may secure additional energy from the real-time energy market.
The real-time energy market financially settles the differences between the day-ahead scheduled amounts of load and generation and the actual real-time load and generation. Differences from the day-ahead quantities cleared are settled at the real-time LMP.
In real time, ISO-NE issues dispatch rates and dispatch targets to generators. These are five-minute price and megawatt signals sent to the generators to produce the required energy production. Market participants can offer imports or request exports of electricity from neighboring control areas with at least one hour’s notice throughout the day.
Ancillary and Other ServicesAncillary services are functions performed by electric generating, transmission and system-control equipment to support the transmission of electric power from generating resources to load. RTOs procure or direct the supply of ancillary services to maintain the reliability of the transmission system.
ISO-NE procures ancillary services in the real-time and forward reserve markets, which include compensation to generators for making available unloaded operating capacity that can be converted into electric energy when needed, such as to meet system contingencies caused by unexpected outages. The specific ancillary services include the following:

78 | Energy Primer Federal Energy Regulatory Commission
• Ten-Minute Spinning Reserves are provided by resources already synchronized to the grid and able to generate electricity within 10 minutes.
• Ten-Minute Non-spinning Reserves are provided by resources not necessarily synchronized to the grid but capable of starting and providing output within 10 minutes.
• Thirty-Minute Operating Reserves are provided by resources not necessarily synchronized to the grid but capable of starting and providing output within 30 minutes.
• Regulation is provided by specially equipped resources with the capability to increase or decrease their generation output in response to signals they receive from ISO-NE to control slight changes on the system.
In addition to reserves, there are other specialized ancillary services that are not bought and sold in the ISO’s markets, which include voltage support and black-start capability. Voltage support allows the New England control area to maintain transmission voltages. Black-start capability is the ability of a generating unit to independently go from a shutdown condition to an operating condition and start delivering power without assistance from the power system. ISO-NE procures these services via cost-based rates.
Capacity Markets
ISO-NE’s capacity market is termed the Forward Capacity Market (FCM). The FCM includes annual Forward Capacity Auctions (FCA) where both generator and demand resources offer capacity three years in advance of the period for which capacity will be supplied. The three-year lead time is intended to encourage new resource entry by affording market participants additional time to plan and make decisions relative to the forward market prices. Resources whose capacity clears the FCA acquire capacity supply obligations (CSOs). ISO-NE held its first two FCAs in 2008 for the 2010-
11 and 2011-12 delivery years. The first full year of capacity market commitments began on June 1, 2010. The FCA process includes the modeling of transmission constraints to determine if load zones will be import- or export-constrained.
The FCM includes rules known as Pay-for-Performance which mandate performance-based financial incentives for capacity resources during times of system stress.65 Under Pay-For-Performance, resource owners are subject to charges or incentive payments, based on performance during shortage conditions. Those resources that are unable to fulfill their capacity supply obligations are penalized and compensate the over performing resources that relieve the capacity shortfall. ISO-NE additionally requires the owners of capacity resources to offer into the day-ahead and real-time energy markets.
Market Power Mitigation
In electric power markets, some sellers have the ability to raise market prices. Market power mitigation is a mechanism to ensure competitive offers even when competitive conditions are not present.
In ISO-NE, mitigation is applied for physical withholding, economic withholding, uneconomic production, certain types of virtual transactions and other conduct, if the activity has a material effect on prices or uplift payments. The market monitor uses defined thresholds to identify physical and economic withholding and uneconomic generation. Additionally, defined thresholds determine whether bids and offers would, if not mitigated, cause a material effect on LMPs or uplift charges.
Offer Caps
ISO-NE has a $1,000/MWh generator energy market offer cap.
65 ISO-NE’s Pay-For-Performance rules became effective June 1, 2018
for Forward Capacity Auction 9. See ISO-NE, Internal Market Monitor, 2017
Annual Markets Report, at 138 (2018), https://www.iso-ne.com/static-assets/
documents/2018/05/2017-annual-markets-report.pdf.

Energy Primer | 79
However, when a resource’s costs exceed the cap, a cost-based incremental energy offer greater than that amount is allowed, up to an absolute offer limit of $2,000/MWh. Energy offers greater than $1,000/MWh require cost justification. High cost-based offers are most likely to occur when fuel costs spike to very high levels, such as during periods of extremely cold weather.
Special Provisions for Resources Needed to Ensure Grid Reliability
When a resource owner requests to withdraw from the capacity market (termed a “delist bid”) or to retire the resource (termed a “non-price retirement request”), the ISO evaluates whether the resource is needed for reliability, such as when a resource’s withdrawal could lead to a violation of a reliability requirement – e.g., inadequate reserve margins or a loss of electric system stability.
In New England, the resource owner has the option to retire the unit or continue to operate it while the ISO works with regional stakeholders to find alternate supply or engineering solutions that could allow the resource to retire and still maintain grid reliability. Alternative solutions might include obtaining emergency sources of generation or more expensive generation from outside the region. If no other alternative is available, the ISO may compensate the unit through certain payment provisions of the capacity market or by entering into a cost of service agreement with the resource owner while other options are pursued.
Financial Transmission Rights
New England FTRs are monthly and annual products that provide market participants with a means to offset or hedge against transmission congestion costs in the day-ahead energy market. An FTR is an instrument that entitles the FTR holder to a payment for costs that arise with transmission congestion over a selected path, or source-and-sink pair of locations on the grid. The FTR also requires its holder to pay a charge for those hours when congestion occurs in the
opposite direction of the selected source-and-sink pair. The RTO holds FTR auctions to allow market participants the opportunity to acquire FTRs or to sell FTRs they currently hold. In New England, ARRs represent the right to receive revenues from the FTR auctions. ISO-NE allocates ARRs to both LSEs, in relation to historical load, and to entities who make transmission upgrades that increase the capability of the transmission system.
Virtual Transactions
New England’s market includes a virtual transaction feature. Virtual transactions allow for more participation in the day-ahead price setting process, allow participants to manage risk, and promote price convergence between the day-ahead and real-time markets. In ISO-NE’s terminology, virtual transactions consist of market participants submitting increment offers and decrement bids in the day-ahead energy market. An increment offer is an offer to sell energy at a specific location in the day-ahead energy market which is not associated with a physical supply. An accepted increment offer results in scheduled generation at the specified location in the day-ahead energy market. A decrement bid is a bid to purchase energy at a specific location in the day-ahead energy market which is not associated with a physical load. An accepted decrement bid results in scheduled load at the specified location in the day-ahead energy market. The participant receives the day-ahead LMP for each megawatt of incremental supply that clears in the day-ahead energy market and is financially obligated to pay the real-time LMP at the same location. Conversely, the participant pays the day-ahead LMP for each megawatt of cleared decremental demand and receives the real-time LMP at that location.
Credit Requirements
ISO-NE’s tariff includes credit requirements for participants that assist in mitigating the potential effects of defaults that would otherwise be borne among all market participants. ISO-NE assesses and calculates the required credit dollar amounts

80 | Energy Primer Federal Energy Regulatory Commission
for the segments of the market in which an entity requests to participate. ISO-NE then establishes a credit limit for each market participant in accordance with tariff formulas that include various creditworthiness-related specifications, such as tangible net worth and total amounts due to the ISO-NE market.
NYISONew York Independent System Operator
Market Profile
Geographic Scope
Prior to restructuring of the electric industry in the 1990s, New York’s private utilities and public power authorities owned and operated New York’s electric system. Operation of the electric grid was coordinated by a voluntary collaboration of the utilities and power authorities as the New York Power Pool (NYPP). The creation of the New York Independent System Operator (NYISO) was authorized by FERC in 1998. The formal transfer of the NYPP’s responsibilities to the NYISO took place on Dec. 1, 1999. The NYISO footprint covers the entire state of New York.
NYISO is responsible for operating wholesale power markets that trade electricity, capacity, transmission congestion contracts, and related products, in addition to administering auctions for the sale of capacity. NYISO operates New York’s high-voltage transmission network and performs long-term planning. NYISO also serves as the reliability coordinator for its footprint.
Peak DemandNYISO’s all-time peak load was 34 GW in summer 2013.66
66 New York Independent System Operator, Power Trends 2017,
Imports and ExportsNYISO imports and exports energy through interconnections with ISO-NE, PJM, TransEnergie (Quebec) and Ontario.
Market ParticipantsNYISO’s market participants include generators, transmission owners, financial institutions, traditional local utilities, electric co-ops and industrials.
Membership and GovernanceNYISO is governed by an independent 10-member board of directors, ISO management, and the business issues and operating committees. Each committee oversees its own set of working groups or subcommittees. These committees comprise transmission owners, generation owners and other suppliers, consumers, public power and environmental entities. Tariff revisions on market rules and operating procedures filed with FERC are largely developed through consensus by these committees. The members of the board, as well as all employees, must not be directly associated with any market participant or stakeholder.
Transmission OwnersNYISO’s largest transmission owners include:
• Central Hudson Gas & Electric Corp.
• Consolidated Edison Co. of New York
• Long Island Power Authority (LIPA)67
• New York Power Authority (NYPA)
• New York State Electric and Gas Corp. (NYSEG)
at 14 (May, 2017), http://www.nyiso.com/public/webdocs/media_room/
publications_presentations/Power_Trends/Power_Trends/2017_Power_
Trends.pdf.
67 On January 1, 2014 PSEG Long Island became responsible
for LIPA’s day-to-day operations, while LIPA retains financial control over
generation and transmission assets. See LIPA Reform Act 2013.

Energy Primer | 81
• National Grid
• Orange & Rockland Utilities
• Rochester Gas and Electric Corp.
Source: ABB, Velocity Suite
Chronic ConstraintsThe chronic transmission constraints in NYISO are in the southeastern portion of the state, leading into New York City and Long Island. As a result of their dense populations, New York City and Long Island are the largest consumers of electricity. Consequently, energy flows from the west and the north towards these two large markets, frequently requiring transmission facilities to operate near their limits. This results in transmission constraints in several key areas, often resulting in higher prices in the New York City and Long Island markets.
Transmission PlanningNYISO conducts a biennial transmission planning process with stakeholders that includes both short-term and long-term projects as part of its Comprehensive System Planning Process (CSPP). This work evaluates the adequacy and security of the bulk power system in New York over a ten-year study period. Reliability needs are addressed through the development of a reliability plan. Planning focuses
on congestion on the bulk power system and possible projects to alleviate the congestion. A component of NYISO’s transmission planning includes evaluating proposals to meet transmission needs driven by public policy requirements identified by the New York Public Service Commission.
Supply ResourcesThe total capacity in NYISO is nearly 45 GW and is predominately composed of natural gas-fired, hydroelectric, nuclear and oil-fired generators. The region’s hydroelectric capacity is particularly important and includes the Niagara Falls and St. Lawrence facilities.
NYISO Capacity Mix
Source: ABB, Velocity Suite68
Demand ResponseNYISO has four demand-response (DR) programs: the emergency demand-response program (EDRP), the installed capacity (ICAP) special case resources program (SCR), the Day-Ahead Demand-Response Program (DADRP) and the Demand-Side Ancillary Services Program (DSASP).
Both the emergency and special cases programs can be deployed in energy shortage situations to maintain the reliability of the bulk power grid. The participants in these programs are paid by NYISO for reducing energy consumption when asked to do so and reductions are voluntary for EDRP participants. However, SCR participants are required to reduce power usage as part of their agreement and are compensated for this obligation.
NYISO’s DADRP program allows energy users to bid their load
68 Based on installed nameplate capacity as of Dec. 31, 2018. Derived
from ABB, Generating Unit Capacity Dataset, Velocity Suite.

82 | Energy Primer Federal Energy Regulatory Commission
reductions into the day-ahead market and offers that are determined to be economic are paid the market clearing price. Under day-ahead DR, flexible loads may effectively increase the amount of supply in the market and moderate prices.
The DSASP provides retail customers that can meet telemetry and other qualifications with the ability to bid their load curtailment capability into either the day-ahead market or real-time market to provide reserves and regulation service. Accepted offers are paid the market clearing price for the supplied reserves or regulation services.
Market Features
Energy Markets
Day-Ahead MarketThe day-ahead market allows market participants to secure prices for electric energy the day before the operating day and to hedge against price fluctuations that can occur in real time. One day ahead of actual dispatch, participants submit supply offers and demand bids for energy. These bids are applied to each hour of the day and for each pricing location on the system. Virtual supply offers and demand bids can also be submitted in the day-ahead market. These are tools that market participants can use to hedge their positions in the day-ahead market.
The RTO constructs aggregate supply and demand curves for each location from the offers and bids. The intersection of these curves identifies the market-clearing price at each location for every hour. Supply offers below, and demand bids above, the identified price are scheduled. Offers and bids that clear are then entered into a pricing software system, along with binding transmission constraints to produce the LMPs for all locations. The NYISO refers to LMPs as locational based marginal prices, or LBMPs.
Generators and offers are scheduled in the day-ahead market and are paid the day-ahead LBMP for the megawatts
accepted. Scheduled suppliers must produce the committed quantity during real-time or buy power from the real-time marketplace to replace what was not produced. Likewise, wholesale buyers of electricity and virtual demand whose bids to buy are accepted in the day-ahead market pay for and lock in their right to consume the cleared quantity at the day-ahead LBMP. Electricity used in real-time that exceeds the day-ahead purchase is paid for at the real-time LBMP.
Hour-Ahead MarketThe hour-ahead market allows buyers and sellers of electricity to balance unexpected increases or decreases of electricity consumption after the day-ahead market closes. Bids and offers are submitted an hour ahead of time and prices are set based on those bids and offers, generally for use in matching generation and load requirements, but those prices are advisory only. Hour-ahead scheduling is completed at least 45 minutes prior to the beginning of the dispatch hour after NYISO reviews transmission outages, the load forecast, reserve requirements and hour-ahead generation and firm transaction bids, among other things.
Real-Time MarketNYISO must coordinate the dispatch of generation and demand resources to meet the instantaneous demand for electricity. Supply or demand for the operating day can change for a variety of reasons, including unforeseen generator or transmission outages, transmission constraints or changes from the expected demand. While the day-ahead market produces the schedule and financial terms of energy production and use for the operating day, a number of factors can change that schedule. Thus, NYISO operates a spot market for energy, the real-time energy market, to meet energy needs within each hour of the current day.
Real-time market outcomes are based on supply offers, real-time load and offers and bids to sell or buy energy. LSEs whose actual demand is higher than the amount scheduled in the day-ahead market may secure additional energy from the real-time market. For generators, the market provides additional opportunities to offer supply.

Energy Primer | 83
The real-time market financially settles the differences between the day-ahead scheduled amounts of load and generation and the actual real-time load and generation. Those who were committed to produce in the day-ahead are compensated at (or pay) the real-time LBMP for the megawatts under- or over-produced in relation to the cleared amount.
Real-time dispatch of generators in NYISO occurs every five minutes, as does the setting of the real-time prices used for settlement purposes. Market participants may participate in the day-ahead, hour-ahead, and the real-time market.
Ancillary and Other Services
Ancillary services are those functions performed by electric generating, transmission and system-control equipment to support the transmission of electric power from generating resources to load. RTOs procure or direct the supply of ancillary services to maintain the reliability of the transmission system.
NYISO administers competitive markets for ancillary services, which include operating reserves and regulation. These two services are typically provided by generators, but NYISO also allows demand-side providers to participate in these markets. Operating reserve resources can either be spinning (online with additional ramping ability) or non-spinning (off-line, but able to start and synchronize quickly). NYISO also relies on regulating resources that can quickly adjust their output or consumption in response to constantly changing load conditions to maintain system balance.
The NYISO reserve and regulation ancillary services include the following:
• Ten-Minute Spinning Reserves are provided by resources that are already synchronized to the grid and able to provide output within 10 minutes.
• Ten-Minute Non-Synchronized Reserves are provided by resources that are not synchronized to the grid but
capable of starting and providing output within 10 minutes.
• Thirty-Minute Spinning Reserves are provided by resources that are already synchronized to the grid and able to provide output within 30 minutes.
• Thirty-Minute Non-Synchronized Reserves are provided by resources that are not currently synchronized to the grid but capable of starting and providing output within 30 minutes.
• Regulation services are provided by resources with the capability to increase or decrease their generation output within seconds in order to control changes on the system.
Capacity Markets
NYISO’s capacity market requires LSEs to procure capacity through installed-capacity (ICAP) auctions, self-supply and bilateral arrangements based on their forecasted peak load plus a margin. New York has capacity requirements for four zones: New York City, Long Island, Lower Hudson Valley, and New York-Rest of State. The NYISO conducts auctions for three time periods: the capability period auction (covering six months), the monthly auction and the spot market auction. The resource requirements do not change in the monthly auctions and spot market auctions relative to the capability period auction. The shorter monthly auctions are designed to account for incremental changes in LSE’s load forecasts.
Under the NYISO capacity auction rules, entities that offer capacity into an auction that is subsequently purchased by load are required to offer that amount of capacity into the day-ahead energy market. This rule ensures that capacity sold through the capacity auctions is actually delivered into the

84 | Energy Primer Federal Energy Regulatory Commission
market.
Market Power Mitigation
In electric power markets, some sellers have the ability to raise market prices. Market power mitigation is a mechanism to ensure competitive offers, even when competitive conditions are not present. The categories of conduct that may warrant mitigation by NYISO include physical withholding, economic withholding and uneconomic production by a generator or transmission facility to obtain benefits from a transmission constraint. NYISO does not impose mitigation unless the conduct causes or contributes to a material change in prices, or substantially increases guarantee payments to participants.
Local Market Power Mitigation
Generators in New York City are subject to automated market power mitigation procedures because New York City is frequently separated by transmission congestion from other parts of New York. Additionally, generators in New York City have been deemed to have market power.
These automated procedures determine whether any day-ahead or real-time energy bids, including start-up cost bids and minimum generation bids, but excluding ancillary services bids, exceed the tariff’s thresholds for economic withholding. The protocols also determine whether such bids would cause material price effects or changes in guarantee payments. If these two tests are met, mitigation is imposed automatically and the applicable reference level is substituted for the entity’s actual bid to determine the clearing price.
Offer Caps
NYISO has an offer cap of $1,000/MWh for its day-ahead and real-time markets or $2,000/MWh for cost-based offers.
Capacity for New York City is subject to offer caps and floors. Offer caps in New York City are based on reference levels or
avoided costs. Capacity from generators within New York City must be offered in each ICAP spot market auction, unless that capacity has been exported out of New York or sold to meet ICAP requirements outside New York City.
Special Provisions for Resources Needed to Ensure Reliability
Generation owners within New York that seek to retire or suspend a generator must first obtain approval from state regulators. After an assessment, if the generator is found to be necessary for reliability purposes, the local transmission owner can be compelled to reach a contract (Reliability Support Services Agreement) with the generator where compensation provisions are included to continue operation of the plant until the reliability need is resolved.
Financial Transmission Rights
FTRs provide market participants with a means to offset or hedge against transmission congestion costs in the day-ahead market. The NYISO refers to FTRs as Transmission Congestion Contracts (TCCs). A TCC is an instrument that entitles the holder to a payment for the costs that arise with transmission congestion over a selected path, or source-and-sink pair of locations (or nodes) on the grid. The TCC also requires its holder to pay a charge for those hours when congestion is in the opposite direction of the selected source-and-sink pair. The payment, or charges, are calculated relative to the difference in congestion prices in the day-ahead market across the specified FTR transmission path.
A related product, ARRs, provide their holders with a share of the revenue generated in the TCC auctions. In general, ARRs are allocated based on historical load served. As with TCCs, ARRs provide transmission owners and eligible transmission service customers an offset, or hedge, against transmission congestion costs in the day-ahead market.

Energy Primer | 85
Virtual Transactions
NYISO’s market includes a virtual transaction feature that allows a participant to buy or sell power in the day-ahead market without requiring physical generation or load. Virtual transactions allow for more participation in the day-ahead price setting process, allow participants to manage risk, and promote price convergence between the day-ahead and real-time markets. Cleared virtual supply in the day-ahead energy market, at a particular location, in a certain hour creates a financial obligation for the participant to buy back the bid quantity in the real-time market at that location, in that hour. Cleared virtual demand in the day-ahead market creates a financial obligation to sell the bid quantity in the real-time market. The financial outcome is determined by the difference between the hourly day-ahead and real-time LBMPs at the location, at which the offer or bid clears. Virtual trading in NYISO takes place on a zonal level, not a nodal level.
Credit Requirements
NYISO’s tariff includes credit requirements that assist in mitigating the effects of defaults that would otherwise be borne among all market participants. NYISO assesses and calculates the required credit dollar amounts for the segments of the market in which an entity requests to participate. The market participant may request an unsecured credit allowance subject to certain restrictions – e.g., NYISO must review the entity’s request relative to various creditworthiness-related specifications such as investment grade or equivalency rating and payment history.
PJMThe PJM Interconnection
Market Profile
Geographic ScopeThe PJM Interconnection operates a competitive wholesale electricity market and manages the reliability of its transmission grid. PJM provides open access to the transmission and performs long-term planning. In managing the grid, PJM centrally dispatches generation and coordinates the movement of wholesale electricity in all or part of 13 states (Delaware, Illinois, Indiana, Kentucky, Maryland, Michigan, New Jersey, North Carolina, Ohio, Pennsylvania, Tennessee, Virginia and West Virginia) and the District of Columbia. PJM’s markets include energy (day-ahead and real-time), capacity and ancillary services.
PJM was founded in 1927 as a power pool of three utilities serving customers in Pennsylvania and New Jersey. In 1956, with the addition of two Maryland utilities, it became the Pennsylvania-New Jersey-Maryland Interconnection, or PJM. PJM became a fully functioning ISO in 1996 and, in 1997, it introduced markets with bid-based pricing and locational market pricing (LMP). PJM was designated an RTO in 2001.
Peak DemandPJM’s all-time peak load was 165 GW in summer 2011.69
Imports and ExportsPJM has interconnections with Midcontinent ISO and New York ISO. PJM also has direct interconnections with TVA, Progress Energy Carolinas and the Virginia and Carolinas Area (VACAR), among other systems. PJM market participants import energy from, and export energy to, external regions
69 PJM Interconnection, PJM Statistics, at 1 (Dec. 2017), http://www.
pjm.com/-/media/about-pjm/newsroom/fact-sheets/pjm-statistics.ashx.

86 | Energy Primer Federal Energy Regulatory Commission
continuously. At times, PJM is a net importer of electricity and, at other times, PJM is a net exporter of electricity. times
Source: ABB, Velocity Suite
Market ParticipantsPJM’s market participants include power generators, transmission owners, electric distributors, power marketers, and large consumers.
Membership and GovernancePJM has a two-tiered governance model consisting of a board of managers and the members committee. PJM is governed by a 10-member board, nine of whom PJM members elect. The board appoints the tenth, the president and CEO, to supervise day-to-day operations. The board is generally responsible for oversight of system reliability, operating efficiency and short and long-term planning. The board ensures that no member or group of members exerts undue influence. The members committee, which advises the board, is composed of five voting sectors representing power generators, transmission owners, electric distributors, power marketers and large consumers.
Transmission OwnersPJM’s largest transmission owners include:
• Public Service Electric and Gas Company
• Virginia Electric and Power Company
• Commonwealth Edison Company
• PPL Electric Utilities Corporation, d/b/a PPL Utilities
• American Transmission Systems, Inc.
• Appalachian Power Company
• Ohio Power Company
• AEP Ohio Transmission Company, Inc.
• Trans-Allegheny Interstate Line Company
• Baltimore Gas and Electric Company
Chronic ConstraintsHistorically the largest constraints in PJM were associated with west-to-east power flows over the 500 kV transmission lines, mostly in and around western and central Pennsylvania. Various lower voltage lines experience congestion, especially around the load centers in New Jersey, eastern Pennsylvania, central and eastern Maryland, northern Virginia, the District of Columbia, and Delaware.
Congestion from power flows across Pennsylvania declined following a moderation in natural gas prices (stemming from the fuel’s production in shale formations, as discussed in Chapter 1) along with construction of natural gas-fired generation in the eastern areas of PJM. The top locations of congestion occur on 230 kV lines connecting Pennsylvania with Maryland and Northern Virginia.
Transmission PlanningPJM’s Regional Transmission Expansion Plan identifies transmission system additions and improvements needed to keep electricity flowing within PJM. Studies are conducted to test the transmission system against national and regional reliability standards. These studies look forward to identify future transmission overloads, voltage limitations and other reliability standards violations. PJM then develops

Energy Primer | 87
transmission plans to resolve violations that could otherwise lead to overloads and blackouts.
Supply ResourcesThe total capacity in PJM is over 220 GW and is predominately comprised of coal, natural gas-fired and nuclear generators. Much of the RTO’s gas-fired capacity is proximate to the Marcellus shale formation.
PJM Capacity Mix
Source: ABB, Velocity Suite70
Demand ResponseEnd-use customers providing demand response have the opportunity to participate in PJM’s energy, capacity, synchronized reserve and regulation markets. PJM’s demand response programs can be grouped into emergency or economic programs. The emergency program compensates end-use customers who reduce their usage during emergency conditions on the PJM system. Participation in the emergency program may be voluntary or mandatory and payments may include energy payments, capacity payments or both.
The economic program allows end-use customers to reduce electricity consumption in the energy markets and receive a payment when LMPs are high. Under this program, all hours are eligible and all participation is voluntary. Participation in the program takes three forms: submitting an offer into the day-ahead market that clears; submitting an offer into the real-time market that is dispatched; and self-scheduling load reductions while providing notification to PJM. End-use customers participate in demand response in PJM through members called curtailment service providers, or CSPs, who act as agents for the customers. CSPs aggregate the demand of retail customers, register that demand with PJM, submit the
70 Based on installed nameplate capacity as of Dec. 31, 2018. Derived
from ABB, Generating Unit Capacity Dataset, Velocity Suite.
verification of demand reductions for payment by PJM and receive the payment from PJM.
Market Features
Energy Markets
Day-Ahead MarketThe day-ahead market allows market participants to secure prices for electric energy the day before the operating day and hedge against price fluctuations that can occur in real-time. One day ahead of actual dispatch, participants submit supply offers and demand bids for energy. These bids are applied to each hour of the day and for each pricing location on the system.
From the offers and bids, the RTO constructs aggregate supply and demand curves for each location. The intersection of these curves identifies the market-clearing price at each location for every hour. Supply offers below and demand bids above the identified price are said to clear, meaning they are scheduled. Offers and bids that clear are entered into a pricing software system along with binding transmission constraints to produce the LMPs for all locations.
Generators and offers scheduled in the day-ahead settlement are paid the day-ahead LMP for the megawatts accepted. Scheduled suppliers must produce the committed quantity during real-time or buy power from the real-time marketplace to replace what was not produced. Likewise, wholesale buyers of electricity whose bids to buy clear in the day-ahead market settlement pay for and lock in their right to consume the cleared quantity at the day-ahead LMP. Electricity use in real-time that exceeds the day-ahead purchase is paid for at the real-time LMP.
Real-Time MarketPJM coordinates the dispatch of generation and demand resources to meet the instantaneous demand for electricity.

88 | Energy Primer Federal Energy Regulatory Commission
Supply or demand for the operating day can change for a variety of reasons, including unforeseen generator or transmission outages, transmission constraints or changes from the expected demand. While the day-ahead energy market produces the schedule and financial terms of energy production and use for the operating day, a number of factors can change that schedule. Thus, PJM operates the real-time energy market to meet energy needs within each hour of the current day.
Real-time LMPs are calculated at five-minute intervals based on actual grid operating conditions as calculated in PJM’s market systems. Generators that are available but not selected in the day-ahead scheduling may alter their offers for use in the real-time market during the generation rebidding period from 4 p.m. to 6 p.m.; otherwise, their original day-ahead market offers remain in effect for the real-time market.
Ancillary and Other Services
Ancillary services are those functions performed by electric generating, transmission and system-control equipment to support the transmission of electric power from generating resources to load. RTOs procure or direct the supply of ancillary services to maintain the reliability of the transmission system.
PJM operates the following markets for ancillary services:
• Regulation service is provided by resources that are able quickly increase or decrease their output in response to a signal received from PJM to control slight changes in the balance of electricity supply and usage.
• Synchronized reserves are provided by resources that are already synchronized to the grid and are capable of increasing output or decreasing load within 10 minutes (the equivalent of what is commonly referred to as spinning reserves). In PJM synchronized and non-synchronized reserves make up what the RTO terms Primary Reserves.
• Non-synchronized reserves are provided by resources that are not currently synchronized to the grid and can provide energy within 10 minutes.
• Secondary reserves are provided by resources that can be converted to energy in 30 minutes. PJM maintains a market for the service entitled the Day-Ahead Scheduling Reserves (DASR) market.
Two other ancillary services PJM provides are: (1) black start service, which helps ensure the reliable restoration of the grid following a blackout; and (2) reactive power, which supports the voltages that must be controlled for system reliability. Both of these services are provided on a cost basis.
Capacity Markets
Capacity markets provide a means for LSEs to procure capacity needed to meet forecast load and to allow generators to recover a portion of their fixed costs. They also provide economic incentives to attract investment in new and existing supply-side and demand-side capacity resources in PJM, as needed to maintain bulk power system reliability.
PJM’s capacity market is called the Reliability Pricing Model (RPM). The RPM market was implemented in 2007 and is designed to ensure the future availability of capacity resources, including demand-resources and energy-efficiency resources that will be needed to keep the regional power grid operating reliably. The RPM market design is based on three-year, forward-looking annual obligations for locational capacity, under which supply offers are cleared against a downward sloping demand curve, called the variable resource requirement (VRR) curve. The VRR curve establishes the amount of capacity that PJM requires its LSE customers to purchase, and the price for that capacity, in each capacity zone (locational delivery area or LDA). Under RPM, when an LDA is transmission-constrained in the auction (i.e., limited in the amount of generation that can be imported into those areas), capacity prices generally rise in that area relative to the overall PJM footprint.

Energy Primer | 89
Annual auctions are referred to as base residual auctions (BRA). LSEs that are able to fully supply their own capacity needs can choose not to participate in the auctions. The largest amounts of capacity in PJM are procured through the BRA, with lesser quantities procured through self-supply and contracted (bilateral) resources.
Market power mitigation in PJM’s capacity market includes rules delineating a must offer requirement, offer caps, minimum offer prices, exceptions for competitive entry, among others. Demand Resources and Energy Efficiency Resources may be offered into RPM auctions and receive the clearing price without mitigation.
Specific RPM rules, termed Capacity Performance, provide performance incentives for power plants, demand response, and energy efficiency resources to provide electricity at peak demand regardless of extreme weather events and system emergencies. Capacity Performance rules provide performance bonus payments for resources that over-perform during system emergencies, and severe financial penalties for resources that do not perform during such events.
Existing generation resources in PJM have a must offer requirement into the capacity market. Any generator that has a commitment from the capacity market must submit an offer into the day-ahead energy market.
Market Power Mitigation
In electric power markets, some sellers have the ability to raise market prices. Market power mitigation is a mechanism to ensure competitive offers even when competitive conditions are not present. In PJM, mitigation is performed when conditions for local market power arise. The RTO performs a test to determine locations where the largest suppliers are pivotal, meaning that without their output transmission constraints into the area cannot be relieved.
PJM imposes offer capping for any hour in which there are three or fewer generation suppliers available for re-dispatch
that are jointly pivotal, meaning they have the ability to increase the market price above the competitive level. In PJM this is called the Three Pivotal Supplier Test. When this occurs generator offers are adjusted to price levels reflecting short-run marginal costs.
Offer Caps
PJM has a $1,000/MWh generator energy market offer cap. However, when a resource’s costs exceed the cap, a cost-based incremental energy offer greater than that amount is allowed, up to an absolute offer limit of $2,000/MWh. Energy offers greater than $1,000/MWh require cost justification.
Special Provisions for Resources Needed to Ensure Grid Reliability
A generator owner who wishes to retire a unit must request permission from PJM to deactivate the unit at least 90 days in advance of the planned date. The request includes an estimate of the amount of project investment necessary to keep the unit in operation and PJM, in turn, analyzes if the retirement would lead to a reliability issue. Additionally, the RTO estimates the period of time it would take to complete transmission upgrades necessary to alleviate the reliability issue.
If PJM requests the unit to operate past the desired deactivation date, the generator owner may file with FERC for cost recovery associated with operating the unit until it may be deactivated. Alternatively, the owner may choose to receive avoided cost compensation calculated according to PJM’s tariff.
Financial Transmission Rights
PJM conducts auctions for selling and buying FTRs made available for the PJM transmission system. Proceeds from the auctions are paid to Auction Revenue Right (ARR) holders, where the ARRs are allocated to firm transmission service customers. PJM conducts its auctions on a long-term, annual,

90 | Energy Primer Federal Energy Regulatory Commission
and monthly basis. In PJM, market participants are able to acquire financial transmission rights in the form of options or obligations. The RTO includes a secondary market for its FTRs, which facilitates bilateral trading of existing FTRs between PJM members through an internet-based computer application.
Virtual Transactions
PJM’s market includes a virtual transaction feature that allows a participant to buy or sell power in the day-ahead market without requiring physical generation or load. Virtual transactions allow for more participation in the day-ahead price setting process, allow participants to manage risk, and promote price convergence between the day-ahead and real-time markets. Cleared virtual supply (increment or virtual offers, or INCs) in the day-ahead energy market at a particular location, in a certain hour, creates a financial obligation for the participant to buy back the bid quantity in the real-time market. Cleared virtual demand (decrement or virtual bids, or DECs) in the day-ahead market creates a financial obligation to sell the bid quantity in the real-time market. The financial outcome for a particular participant is determined by the difference between the hourly day-ahead and real-time LMPs at the location at which the offer or bid clears.
Up to Congestion transactions (UTCs) are a spread bid transaction and are defined as a virtual product in PJM. In a UTC transaction, a market participant submits an offer to simultaneously inject energy at a specified source and withdraw the same megawatt quantity at a specified sink in the day-ahead market, and specifies the maximum difference in locational marginal prices (LMP) at the transaction’s source and sink that the market participant is willing to pay. PJM accepts the bid if the day-ahead LMP differential, i.e., the difference in day-ahead LMPs at the sink and the source, does not exceed the participant’s UTC transaction bid. UTC positions are liquidated in the real-time energy market.
Credit Requirements
PJM’s tariff includes credit requirements that a market participant needs to meet in order to participate in the market. The credit requirements assist in mitigating the effects of defaults that would otherwise be borne among all market participants. The RTO assesses and calculates the required credit amounts for the segments of the market in which an entity requests to participate. The market participant may request an unsecured credit allowance subject to certain restrictions – e.g., the RTO must review the entity’s request relative to various creditworthiness-related specifications such as tangible net worth and credit scores.

Energy Primer | 91
MISOMidcontinent Independent System Operator
Market Profile
Geographic ScopeMISO operates the transmission system and a centrally dispatched market in portions of 15 states in the Midwest and the South, extending from Michigan and Indiana to Montana and from the Canadian border to the southern areas of Louisiana and Mississippi. The system is operated from three control centers: Carmel, Indiana; Eagan, Minnesota; and Little Rock, Arkansas. MISO also serves as the reliability coordinator for additional systems outside of its market area, primarily to the north and northwest of the market footprint.
Source: ABB, Velocity Suite
MISO was not a power pool before organizing as an ISO in December 2001. It began market operations in April 2005. In January 2009, MISO implemented a market redesign that added auctioned and optimized ancillary services along with energy. As part of the market update, MISO combined
its 24 separate balancing areas into a single balancing area. In 2013, the RTO began operations in the MISO South region, including the utility footprints of Entergy, Cleco, and South Mississippi Electric Power Association, among others, in parts of Arkansas, Mississippi, Louisiana, and Texas.
Peak DemandMISO’s all-time peak load was 127 GW in summer 2011.71
Import and ExportsMISO has interconnections with the PJM and SPP RTOs. It is also directly connected to Southern Company, TVA, the electric systems of Manitoba and Ontario, and several smaller systems. MISO is a net importer of power overall, but the interchange with some areas can flow in either direction, depending on the relative loads and prices in the adjoining regions. Manitoba Hydro supplies a large part of MISO’s load with its excess capacity, particularly in the summer.
Market ParticipantsMISO includes approximately 51 transmission owners, whose assets define the MISO market area. MISO’s market participants include generators, power marketers, transmission-dependent utilities and load-serving entities.72
Membership and GovernanceAn independent board of directors of ten members, including the CEO, governs MISO. Directors are elected by the MISO membership from candidates provided by the board.73
MISO relies upon a stakeholder process that works to find collaborative solutions to problems faced by the RTO. These entities have an interest in MISO’s operation and include state regulators, consumer advocates, transmission owners, independent power
71 MISO, Corporate Fact Sheet, at 1 (Jul. 2018), https://www.
misoenergy.org/about/media-center/corporate-fact-sheet.
72 Id.
73 MISO, Principals of Corporate Governance, at 3 (n.d.), https://cdn.
misoenergy.org/Principles%20of%20Corporate%20Governance110859.pdf.

92 | Energy Primer Federal Energy Regulatory Commission
producers, power marketers and brokers, municipal and cooperative utilities and large-volume customers.
Transmission OwnersMISO’s largest transmission owners include:
• American Transmission Co.
• Ameren (Missouri and Illinois)
• American Transmission Systems
• Duke
• Cleco
• Entergy
• Indianapolis Power and Light
• ITC
• Michigan Public Power Agency
• NSP Companies (Xcel)
• Northern Indiana Public Service Co.
• Otter Tail Power
• MidAmerican Energy
Chronic ConstraintsMISO has certain pathways that are more likely to become congested, but the likelihood and pattern of congestion in any area is subject to weather patterns, wind production and interchange with external regions. When load is high in the eastern part of MISO and to the east in PJM, constraints occur on pathways from the Minnesota and Wisconsin areas through Chicago and across Indiana. A particular congestion point with this pattern is northern Indiana. When colder weather
occurs in Minnesota and the Dakotas, there is often congestion in the northern direction, particularly in Iowa. Higher wind production can cause localized constraints in some areas and can cause congestion in pathways from southern Minnesota and western Iowa moving eastward. New Orleans and east Texas are two constrained areas in MISO South. Additionally, constraints frequently arise between MISO Midwest with MISO South.
Transmission PlanningThe main vehicle MISO uses for transmission planning is the MISO Transmission Expansion Plan developed by the MISO planning department in collaboration with transmission owners and other stakeholders who form the planning advisory committee. The plan is updated annually. Once approved by the board, the plan becomes the responsibility of the transmission owners.
Supply ResourcesThe total capacity in MISO is over 200 GW and is predominately composed of coal and natural gas-fired generators, with each providing roughly 40 percent of the total capacity. Nuclear and wind are also important resources for the region.
MISO Capacity Mix
Source: ABB, Velocity Suite74
Demand Response
MISO has more than 11.5 GW of demand response resources, including behind-the-meter generation. A large part of these resources are operated through local utility programs and are not under the direct control of MISO. MISO has provisions
74 Based on installed nameplate capacity as of Dec. 31, 2018. Derived
from ABB, Generating Unit Capacity Dataset, Velocity Suite.

Energy Primer | 93
for demand-side resources to participate in the energy and reserve markets, but participation is a small part of demand response. Some of the demand response under MISO’s direct control is only available under emergency conditions.75
Market Features
Energy Markets
Day-Ahead MarketMISO’s day-ahead market allows market participants to secure prices for electric energy the day before the operating day and hedge against price fluctuations that can occur in real time. One day ahead of actual dispatch, participants submit supply offers and demand bids for energy. These bids are applied to each hour of the day and for each pricing location on the system.
In the day-ahead market, incremental offers and decremental bids (virtual supply offers and demand bids) can also be submitted, although they are not associated with physical resources or actual load. Virtual supply and virtual demand are tools that market participants can use to hedge their real time commitments or to arbitrage MISO’s day-ahead to real-time price spread.
From the offers and bids, MISO solves a computer-based optimization model where transmission limits and generator parameters are constraints. The solution of MISO’s model identifies the market-clearing price at each location for every hour. Supply offers below and demand bids above the identified price are scheduled.
MISO pays the generators for the offers scheduled in the day-ahead settlement the day-ahead LMP for the megawatts dispatched. Scheduled suppliers must produce the committed quantity during real-time or buy power from the real-time
75 See Potomac Economics, 2017 State of the Market Report for the
MISO Electricity Markets, at 78 (Jun. 2018), https://www.potomaceconomics.
com/wp-content/uploads/2018/07/2017-MISO-SOM_Report_6-26_Final.pdf.
marketplace to replace what was not produced.
Likewise, wholesale buyers of electricity and virtual demand, whose bids to buy clear in the day-ahead market settlement, pay for and lock in their right to consume the cleared quantity at the day-ahead LMP. Electricity use in real-time that exceeds the day-ahead purchase is paid for at the real-time LMP.
Real-Time MarketSupply or demand in the operating day can change from the day-ahead results for a variety of reasons, including unforeseen generator or transmission outages, transmission constraints or changes from the expected demand. While the day-ahead market produces the schedule and financial terms for the bulk of the physical transactions, a number of factors usually change the day-ahead result. Thus, MISO operates a spot market for energy, the real-time energy market, to meet actual energy needs within each hour of the operating day.
MISO clears the real-time market using supply offers, real-time load and external offers. For generators, the market provides additional opportunities to offer supply to help meet incremental needs. LSEs whose actual demand comes in higher than what was scheduled in the day-ahead market may secure additional energy from the real-time market.
The real-time market financially settles the differences between the day-ahead scheduled amounts of load and generation and the actual real-time load and generation. Participants either pay, or are paid, the real-time LMP for the amount of load or generation in megawatt-hours that deviates from their day-ahead schedule.
In real-time, generators can also deviate from the day-ahead clearing schedule by self-scheduling, which means that MISO will run a given unit without regard to the unit’s economics unless running the unit presents a reliability concern.
Ancillary and Other Services
Ancillary services are those functions performed by electric generating, transmission and system-control equipment

94 | Energy Primer Federal Energy Regulatory Commission
to support the transmission of electric power from generating resources to load. RTOs procure or direct the supply of ancillary services to maintain the reliability of the transmission system.
MISO procures ancillary services via the co-optimized energy and ancillary services market and includes the following services:
• Ten-Minute Spinning Reserves are provided by resources already synchronized to the grid and able to generate electricity within 10 minutes.
• Supplemental (non-spinning) Reserves are provided by resources that are not currently synchronized to the grid but capable of starting and providing output within 10 minutes.
• Regulation is provided by units that are specially equipped resources with the capability to increase or decrease their generation output every four seconds in response to signals they receive to control slight changes on the system.
Capacity Markets
MISO maintains an annual capacity requirement on all LSEs based on the load forecast plus reserves. LSEs are required to specify to MISO what physical capacity, including demand-side resources, they have designated to meet their load forecast. This capacity can be acquired either through an annual capacity auction, bilateral purchase, or self-supply. For the capacity market, MISO is divided into 10 zones whose forecast demand must be met by internal generation, demand-side resources or deliverable external capacity.
Resources used to meet LSEs’ annual capacity requirements must offer that capacity into MISO’s energy markets and, when qualified, into the ancillary services markets, for each hour of each day for the entire Planning Year. Must-offer requirements support MISO’s mitigation process by providing an objective measure with which to identify physical withholding.
Market Power Mitigation
When congestion occurs, there may be limits on the number of generators that can satisfy load in some areas, so that they may be able to exercise market power. In response, MISO may impose mitigation for those generators whose offers are significantly higher than their costs and have a significant impact on one or more LMPs. When these conditions are met, MISO reduces the generator’s offer to an offer that is consistent with a competitive result.
Offer Caps
MISO has an offer cap of $1,000/MWh. MISO plans to implement new tariff provisions where verified cost-based offers may set LMPs up to $2,000/MWh per Order No. 831.
Special Provisions for Resources Needed to Ensure Grid Reliability
Power plant owners that seek to retire or suspend a generator must first obtain approval from MISO. The RTO evaluates plant retirement or suspension requests for reliability need, and System Support Resource (SSR) designations are made where reliability is threatened. Once an agreement has been reached, SSRs receive compensation associated with remaining online and available.
Financial Transmission Rights
FTRs provide market participants with a means to offset or hedge against transmission congestion costs in the day-ahead market. They are also a means for MISO to offset congestion costs for LSEs who gave up rights to transmission capacity to serve their native load at the time the RTO was formed. An FTR is an instrument that entitles the FTR holder to a payment for costs that arise with transmission congestion over a selected path, or source-and-sink pair of locations, on the grid. The FTR also requires its holder to pay a charge for those hours when congestion is in the opposite direction of the selected source-and-sink pair.

Energy Primer | 95
MISO holds FTR auctions to allow market participants the opportunity to acquire FTRs, sell FTRs that they currently hold, or to convert ARRs to FTRs. ARRs provide LSEs, and entities who make transmission upgrades, with a share of the revenues generated in the FTR auctions. MISO allocates ARRs to transmission customers relative to historical usage, or upgraded capability, of the transmission system. MISO FTRs are monthly and annual products.
Virtual Transactions
MISO’s market includes a virtual transaction feature that allows a participant to buy or sell power in the day-ahead market without requiring physical generation or load. Virtual transactions allow for more participation in the day-ahead price setting process, allow participants to manage risk, and promote price convergence between the day-ahead and real-time markets.
These transactions are a component of the day-ahead market where the bids and offers are included in the determination of the LMP along with physical resource offers and actual load bids. Market participants, whose virtual transactions clear in the day-ahead market, have their positions cleared in the real-time market at the real-time price. Virtual bids and offers are allowed in MISO at any pricing node or aggregate of pricing nodes.
Credit Requirements
MISO’s tariff includes credit requirements that a market participant needs to meet in order to participate in the market. The credit requirements assist in mitigating the effects of defaults that would otherwise be borne among all market participants. The RTO assesses and calculates the required credit dollar amounts for the segments of the market in which an entity requests to participate. The market participant may request an unsecured credit allowance subject to certain restrictions – e.g., the RTO must review the entity’s request relative to various creditworthiness-related specifications such as tangible net worth and credit scores.
SPPSouthwest Power Pool
Market Profile
Geographic ScopeFounded as an 11-member tight power pool in 1941, SPP achieved RTO status in 2004, ensuring reliable power supplies, adequate transmission infrastructure, and competitive wholesale electricity prices for its members. Based in Little Rock, Arkansas, SPP manages transmission in fourteen states: Arkansas, Iowa, Kansas, Louisiana, Minnesota, Missouri, Montana, Nebraska, New Mexico, North Dakota, Oklahoma, South Dakota, Texas, and Wyoming.
SPP began operating its real-time Energy Imbalance Service (EIS) market in 2007. In the same year, SPP became a FERC-approved Regional Entity. The SPP Regional Entity serves as the reliability coordinator for the NERC region, overseeing compliance with reliability standards.
SPP implemented its Integrated Marketplace in March 2014 which includes a day-ahead energy market, a real-time energy market, and an operating reserve market. SPP’s Integrated Marketplace also includes a market for Transmission Congestion Rights. The SPP Integrated Marketplace co-optimizes the deployment of energy and operating reserves to dispatch resources on a least-cost basis.
SPP expanded its footprint in 2015, incorporating the Western Area Power Administration – Upper Great Plains region, the Basin Electric Power Cooperative, and the Heartland Consumers Power District. The expansion nearly doubled SPP’s service territory by square miles, adding more the 5 GW of peak demand and over 7 GW of generating capacity.76
76 Southwest Power Pool, Western, Basin, Heartland join Southwest
Power Pool, at 1 (October 2015), https://www.spp.org/about-us/newsroom/
western-basin-heartland-join-southwest-power-pool/.

96 | Energy Primer Federal Energy Regulatory Commission
Peak DemandSPP’s peak demand of 51 GW occurred in summer 2016.77
Imports and ExportsSPP has interties with MISO, Tennessee Valley Authority, and other systems. Additionally, SPP has two direct-current (DC) interties with ERCOT and seven DC interties to the western interconnection through New Mexico, Colorado, Nebraska, South Dakota and Montana. At times, SPP is a net importer of electricity and, at other times, SPP is a net exporter of electricity.
s
Source: ABB, Velocity Suite
Market ParticipantsSPP’s market participants include investor-owned utilities, generation and transmission cooperatives, independent power producers, municipal utilities, state authorities,
77 Southwest Power Pool, Fast Facts, at 1 (n.d.), https://www.spp.
org/about-us/fast-facts/.
independent transmission companies, power marketers, financial participants, and a federal power marketing administration.
Membership and GovernanceSPP is governed by a board of directors representing and elected by its members. Supporting the board is the members committee, which provides input to the board on all actions pending before the board. The members committee is composed of representatives from each sector of its membership.
Transmission OwnersSPP’s largest transmission owners include:
• American Electric Power
• Oklahoma Gas and Electric
• Westar Energy
• Southwestern Public Service (Xcel Energy)
• Great Plains Energy
• Kansas City Power & Light
• Omaha Public Power District
• Nebraska Public Power District
• Tri-State Generation and Transmission
• Empire District Electric
• Western Area Power Administration – Upper Great Plains
• Western Farmers Electric Cooperative

Energy Primer | 97
Chronic ConstraintsSPP has certain pathways that are more likely to become congested, based on the physical characteristics of the transmission grid and associated transfer capability, the geographic distribution of load, and the geographic differences in fuel costs. The eastern side of the SPP footprint has a higher concentration of load and congestion can occur when wind-powered generation from the west tries to travel across limited connections to the east. The most significant congestion has typically occurred in the Oklahoma and Texas Panhandle region. 78
Transmission PlanningSPP conducts its transmission planning according to its Integrated Transmission Planning process, which is a three-year planning process that includes 20-year, 10-year, and near-term assessments designed to identify transmission solutions that address both near-term and long-term transmission needs. The Integrated Transmission Planning process focuses on identifying cost-effective regional transmission solutions, which are identified in an annual SPP Transmission Expansion Plan report.
Supply ResourcesThe total capacity in SPP is approximately 95 GW and is predominately composed of natural gas and coal-fired generators. Wind generator capacity is also an important resource in the region.
SPP Capacity Mix
Source: ABB, Velocity Suite79
78 See Southwest Power Pool Market Monitoring Unit, State of the
Market 2017 (May 2018), https://www.spp.org/documents/57928/spp_mmu_
asom_2017.pdf.
79 Based on installed nameplate capacity as of Dec. 31, 2018. Derived
from ABB, Generating Unit Capacity Dataset, Velocity Suite.
Demand ResponseSPP allows Market Participants to register two types of demand response resources: Block Demand Response (BDR) resources and Dispatchable Demand Response (DDR) resources. BDR resources are able to participate in SPP’s markets in providing energy and reserves in 60-minute blocks. DDR resources are able to participate in SPP’s markets in providing energy, regulation, and reserves in 5-minute blocks.80 To date, participation of demand response resources has been modest.
Market Features
Energy Markets
Day-Ahead MarketThe day-ahead market allows market participants to secure prices for electric energy the day before the operating day and hedge against price fluctuations that can occur in real-time. One day, or more, ahead of actual dispatch, participants submit supply offers and demand bids for energy. These bids are applied to each hour of the day and for each pricing location on the system.
From the offers and bids, the RTO constructs aggregate supply and demand curves for each location. The intersection of these curves identifies the market-clearing price at each location for every hour. Supply offers below and demand bids above the identified price are said to clear, meaning they are scheduled. Offers and bids that clear are entered into a pricing software system along with binding transmission constraints to produce the LMPs for all locations.
Generators and offers scheduled in the day-ahead settlement are paid the day-ahead LMP for the megawatts accepted. Scheduled suppliers must produce the committed quantity
80 See Southwest Power Pool, SPP Learning Center (May 2018),
https://www.spp.org/stakeholder-center/customer-training/spp-learning-
center/.

98 | Energy Primer Federal Energy Regulatory Commission
during real-time or buy power from the real-time marketplace to replace what was not produced. Likewise, wholesale buyers of electricity and virtual demand whose bids to buy clear in the day-ahead market settlement pay for and lock in their right to consume the cleared quantity at the day-ahead LMP. Electricity use in real-time that exceeds the day-ahead purchase is paid for at the real-time LMP.
Real-Time MarketSPP coordinates the dispatch of generation and demand resources to meet the instantaneous demand for electricity. While the day-ahead energy market produces the schedule and financial terms of energy production and use for the operating day, a number of factors can change that schedule. Thus, to meet energy needs within each hour of the current day, SPP operates a spot market for energy called the real-time market. The real-time market uses final day-ahead schedules for resources within the RTO and imports and exports as a starting point. It then operates a five-minute market to balance generation and loads.
Ancillary and Other Services
Ancillary services are those functions performed by electric generating, transmission and system-control equipment to support the transmission of electric power from generating resources to load while maintaining the reliability of the transmission system.
SPP procures ancillary services via the co-optimized energy and ancillary services market and includes the following services:
• Regulation is provided by resources that are able to increase or decrease output quickly above or below their scheduled operating point in response to automated signals from the RTO to maintain the frequency on the system by balancing generation and demand.
• Spinning Reserves are provided by resources that are already synchronized to the grid and available to serve
load within a short period following a contingency event, such as an unexpected failure or outage of generator, transmission line, or other electrical element.
• Supplemental Reserves are provided by resources that are on-line or off-line, but capable of being synchronized to the grid and fully available to serve load following a specified period following a contingency event.
Capacity Markets
SPP does not offer a capacity market. However, it requires each market participant to have sufficient energy supply (capacity) to cover its energy obligations. SPP performs a supply adequacy analysis for each market participant based on a load forecast, resource plan, ancillary service plan and schedules received from market participants. This analysis is performed for each hour of the next operating day, with results available by 3 p.m. of the day prior to the operating day.
Market rules in RTOs include must-offer requirements for certain categories of resources for which withholding, which could be an exercise of market power, may be a concern. In SPP, generators who supply capacity to meet the RTO resource adequacy requirement for load are required to offer into the day-ahead and real-time markets for energy and the ancillary services for which they are qualified.
Market Power Mitigation
In electric power markets, some sellers have the ability to raise market prices. Market power mitigation is a mechanism to ensure competitive offers, even when competitive conditions are not present.
SPP applies a set of behavioral and market outcomes tests to determine if the local market is competitive and if generator offers should be adjusted to approximate price levels that would be seen in a competitive market – i.e., offer prices close to short-run marginal costs. SPP’s mitigation test includes a

Energy Primer | 99
local market power test, a conduct test, and a market impact test. Where mitigation measures are triggered by the tests, SPP generates a mitigated market solution that the RTO then uses for dispatch, commitment, and settlement purposes.
Offer Caps
SPP has an offer cap of $1,000/MWh. SPP plans to implement new tariff provisions where verified cost-based offers may set LMPs up to $2,000/MWh per Order No. 831.
Special Provisions for Resources Needed to Ensure Grid Reliability
SPP prepares annual reliability studies as part of its system planning responsibilities. In the event that the studies reveal a potential constraint on SPP’s ability to deliver power to a local area on the transmission system, the RTO works with regional stakeholders to find alternate transmission, operating procedure, or generation solutions for the constraint and thus maintain grid reliability. The SPP parties then determine an appropriate sharing of the costs, and, if unable to reach agreement, the RTO will submit a proposed cost sharing arrangement to FERC for approval.
Financial Transmission Rights
FTRs provide market participants with a means to offset or hedge against transmission congestion costs in the day-ahead market. SPP refers to FTRs as Transmission Congestion Rights (TCRs). A TCR is an instrument that entitles the holder to receive compensation, or requires the holder to pay a charge, for costs that arise with transmission congestion over a selected path, or source-and-sink pair of locations on the grid. A TCR provides the holder with revenue, or charges, equal to the difference in congestion prices in the day-ahead market across the selected TCR transmission path. SPP TCRs include monthly and annual products, as well as a long-term instrument called Long-Term Congestion Rights.
A related product, ARRs, provide their holders with a share of
the revenue generated in the TCR auctions. In general, ARRs are allocated based on firm transmission rights. As with TCRs, ARRs provide transmission owners and eligible transmission service customers an offset or hedge against transmission congestion costs in the day-ahead market.
Virtual Transactions
SPP’s market includes a virtual transaction feature that allows a participant to buy or sell power in the day-ahead market without requiring physical generation or load. Virtual transactions allow for more participation in the day-ahead price setting process, allow participants to manage risk, and promote price convergence between the day-ahead and real-time markets. Cleared virtual supply (virtual offers) in the day-ahead energy market at a particular location in a certain hour creates a financial obligation for the participant to buy back the same quantity in the real-time market at that location, in that hour. Cleared virtual demand (virtual bids) in the day-ahead market creates a financial obligation to sell the same quantity in the real-time market. The financial outcome is determined by the difference between the hourly day-ahead and real-time LMPs at the location at which the offer or bid clears.
Credit Requirements
SPP’s tariff includes credit requirements that a market participant needs to meet in order to participate in the market. The credit requirements assist in mitigating the effects of defaults that would otherwise be borne among all market participants. The RTO assesses and calculates the required credit amounts for the segments of the market in which an entity requests to participate. The market participant may request an unsecured credit allowance subject to certain restrictions – e.g., the RTO must review the entity’s request relative to various creditworthiness-related specifications such as tangible net worth and various financial measures.

100 | Energy Primer Federal Energy Regulatory Commission
CAISOCalifornia Independent System Operator
Market Profile
Geographic ScopeCAISO is a California nonprofit public benefit corporation started in 1998 when the state restructured its electric power industry. CAISO manages wholesale electricity markets, centrally dispatching electric generators. In managing the grid, CAISO provides open access to the transmission system and performs long-term transmission planning. It manages energy and ancillary markets in day-ahead and real-time markets and is responsible for regional reliability.
Peak DemandCAISO’s all-time peak load was 50 GW in summer 2006.81
Import and ExportsUp to about one-third of CAISO’s energy is supplied by imports, principally from the Southwest (Arizona, Nevada, and New Mexico) and the Pacific Northwest (Oregon, Washington, and British Columbia). Imports from the Pacific Northwest generally increase in the late spring when hydroelectric production peaks from increases in winter snowmelt and runoff.
Market ParticipantsCAISO’s market participants include load-serving investor-owned utilities, load-serving municipal utilities, generators, power marketers, utility customers, and financial entities.
81 California ISO, California ISO Peak Load History 1998 through 2017,
at 1 (n.d.), http://www.caiso.com/documents/californiaisopeakloadhistory.
pdf.
Membership and GovernanceThe CAISO has a board of governors that consists of five members appointed by the governor and confirmed by the California Senate. The board provides corporate direction, reviews and approves management’s annual strategic plans, and approves CAISO’s operating and capital budgets.
CAISO uses an informal stakeholder process to propose solutions to problems that may ultimately require a filing at FERC. Unlike other RTOs, which have a formal committee structure, CAISO’s stakeholder process generally consists of rounds of dialogue with stakeholders on major policy issues.
Transmission OwnersCAISO’s largest transmission owners include:
• Pacific Gas and Electric
• Southern California Edison
• San Diego Gas and Electric
• Valley Electric Association
• Municipal utilities such as Vernon, Anaheim, and Riverside
Chronic ConstraintsCAISO has several locally constrained areas, such as near population centers and where transmission lines have relatively low voltage (115 kV and below). The locally constrained areas that have local capacity requirements include the Greater Bay Area, Greater Fresno, Sierra, Humboldt, Los Angeles Basin, San Diego, and North Coast/North Bay.

Energy Primer | 101
Source: ABB, Velocity Suite
Transmission PlanningCAISO conducts an annual transmission planning process with stakeholders that includes both short-term and long-term projects.
Supply Resources The total capacity in CAISO is over 80 GW and is predominately composed of natural gas-fired and hydroelectric generators. CAISO also has substantial renewable resources, including roughly half of the installed solar capacity in the U.S.
CAISO Capacity Mix
Source: ABB, Velocity Suite82
82 Based on installed nameplate capacity as of Dec. 31, 2018. Derived
from ABB, Generating Unit Capacity Dataset, Velocity Suite.
Demand ResponseDemand response participation in the wholesale energy market includes programs entitled Proxy Demand Response, Reliability Demand Response Resources, and CAISO’s Participating Load program. Proxy Demand Response allows for customer loads, aggregated by LSEs or third-party providers, to offer load reduction into CAISO’s day-ahead, real-time, and ancillary services markets in return for compensation. Reliability Demand Response Resources allows customer loads, also aggregated by LSEs or third-party providers, to reduce load for compensation when triggered for reliability-related events. Reliability Demand Response Resources can also offer into the day-ahead market. The Participating Load program allows the CAISO operators to directly curtail end-users’ load, rather than through aggregators. This is a relatively small program that is primarily composed of the power demand from California’s water pumping projects. Other demand response in California consists of programs for managing peak summer demands operated by the state’s electric utilities. In general, activation of the utility demand response programs is based on criteria that are internal to the utility or when CAISO issues a Flex Alert. Flex Alerts also inform consumers of how and when to conserve electricity usage.
Market Features
Energy Markets
Day-Ahead MarketThe day-ahead market allows participants to secure prices for electric energy the day before the operating day and hedge against price fluctuations that can occur in real time. On the day ahead of actual dispatch, participants submit supply offers and demand bids for energy. These bids are applied to each hour of the day and for each pricing location on the system.

102 | Energy Primer Federal Energy Regulatory Commission
From the offers and bids, CAISO constructs aggregate supply and demand curves. The intersection of these curves, along with binding system constraints, determine the market-clearing price at each location for every hour. Supply offers below, and demand bids above, the identified price are said to clear, meaning they are scheduled for dispatch. Offers and bids that clear are entered into a pricing software system along with binding transmission constraints to produce the locational marginal prices (LMP) for all locations.
Generator offers scheduled in the day-ahead settlement are paid the day-ahead LMP for the megawatts accepted. Scheduled suppliers must produce the committed quantity during real time or buy power from the real-time market to replace what was not produced.
Likewise, wholesale buyers of electricity whose bids clear in the day-ahead market settlement pay for and lock in their right to consume the cleared quantity at the day-ahead LMP. Electricity use in real time that exceeds the day-ahead purchase is paid for at the real-time LMP.
Real-Time MarketCAISO must coordinate the dispatch of generation and demand resources to meet the instantaneous demand for electricity. While the day-ahead energy market produces the schedule and financial terms of energy production and use for the operating day, a number of factors can change that schedule. Thus, to meet energy needs within each hour of the current day the CAISO operates a spot market for energy called the real-time market.
The real-time market uses final day-ahead schedules for resources within the ISO and imports and exports as a starting point. It then operates a 15 minute market to adjust resource schedules, and then a five minute market to balance generation and loads.
Prices resulting from the real-time market are only applicable to incremental adjustments to each resource’s day-ahead schedule. Real-time bids can be submitted up to 75 minutes before the start of the operating hour.
CAISO also procures capacity in the real-time market to provide upward and downward ramping of generation in order to accommodate changes in net load with the Flexible Ramping Product.83 This service provides compensation to the generators selected to provide the desired flexible ramping capability.84
Ancillary and Other Services
Ancillary services are those functions performed by electric generating, transmission, and system-control equipment to support the reliability of the transmission system. RTOs procure or direct the supply of ancillary services.
CAISO procures ancillary services in the day-ahead and real-time markets:
• Regulation is provided by resources that are able to quickly increase or decrease output above or below their scheduled operating point. This is done in response to automated signals from the ISO to maintain the frequency on the system by balancing generation and demand.
• Spinning reserve are provided by resources that are synchronized with the grid (online, or spinning) and be able to respond within 10 minutes.
• Non-spinning reserves are provided by resources that are able to synchronize with the grid and respond within 10 minutes.
Regulation up and regulation down are used continually to maintain system frequency by balancing generation and demand. Spinning and non-spinning resources are used to maintain system frequency and stability during emergency
83 Net load in CAISO is total market demand minus generation
output from solar and wind resources.
84 CAISO describes ramping capability as a resource’s ability to move
from one energy output to a higher (upward ramp) or lower (downward ramp)
energy output. See California Independent System Operator Corp., 156 FERC ¶
61,226, at P 2 (2016).

Energy Primer | 103
operating conditions (such as unplanned outage of generation or transmission facilities) and major unexpected variations in load. Spinning and non-spinning resources are often referred to collectively as operating reserves.
Resource Adequacy Requirements
The CAISO does not operate a formal capacity market, but it does have a mandatory resource adequacy (RA) requirement. The program requires LSEs to procure 115 percent of their aggregate system load on a monthly basis, unless a different reserve margin is mandated by the LSE’s local regulatory authority. The program provides deliverability criteria that each LSE must meet, as well as system and local capacity requirements and flexibility requirements.
The CAISO market rules also include must-offer provisions pertaining to resources procured as RA resources. These resources must make themselves available to the CAISO day-ahead and real-time markets for the capacity for which they were counted.
Market Power Mitigation
In electric power markets, some sellers have the ability to raise market prices. Market power mitigation is a mechanism to ensure competitive offers even when competitive conditions are not present. Market power may need to be mitigated, for example, when a transmission constraint creates the potential for local market power. CAISO applies a set of behavioral and market outcome tests to determine if the local market is competitive and if generator offers should be adjusted to approximate price levels that would be seen in a competitive market – close to short-run marginal costs.
Special Provisions for Resources Needed to Ensure Grid Reliability
CAISO employs RMR contracts to assure that it has the ability to reliably serve load in local import constrained areas. RMR contracts also help to mitigate any local market power that
one or more units may have. Over time, CAISO has been able to significantly decrease its RMR designations in much of the system. Remaining generators with RMR contracts are located primarily near the San Francisco and Los Angeles areas.
Financial Transmission Rights
As discussed earlier in this chapter, FTRs provide market participants with a means to offset or hedge against transmission congestion costs in the day-ahead market. In California, FTRs are referred to as Congestion Revenue Rights (CRR). A CRR is an instrument that entitles the CRR holder to a payment for costs that arise with transmission congestion over a selected path, or source-and-sink pair of locations on the grid. The CRR also requires its holder to pay a charge for those hours when congestion occurs in the opposite direction of the selected source-and-sink pair. CRRs are monthly or quarterly products. CRRs can be bought at auction or allocated by CAISO. Allocated CRRs receive the congestion value for a specific path, similar to a converted FTR. CAISO also allocates open market CRR auction revenues to LSEs, based on their physical participation in the market, similar to an ARR in other markets.
Virtual Transactions
CAISO’s market includes a virtual transactions feature, termed convergence bidding. This allows more participation in the day-ahead price-setting process, allows participants to manage risk, and enables arbitrage that promotes price convergence between the day-ahead and real-time energy markets. CAISO’s convergence bidding includes both virtual supply and virtual demand transactions. A virtual supply transaction is an offer to sell at the day-ahead price and a bid to buy at the real-time price. A virtual demand transaction is a bid to buy at the day-ahead price and an offer to sell at the real-time price. The virtual supply offer and the virtual demand bid may be submitted at any eligible pricing node in the CAISO system and there is no requirement for physical generation or load. The financial outcome for a particular

104 | Energy Primer Federal Energy Regulatory Commission
participant is determined by the difference between the hourly day-ahead and real-time LMPs at the location at which the offer or bid clears.
Credit Requirements
CAISO’s tariff includes credit requirements that a market participant needs to meet in order to participate in the market. The credit requirements assist in mitigating the effects of defaults that would otherwise be absorbed by all market participants. CAISO assesses and calculates the required credit dollar amounts for the segments of the market in which an entity requests to participate. The market participant may request an unsecured credit allowance subject to certain restrictions – e.g., CAISO must review the entity’s request relative to various creditworthiness-related specifications such as tangible net worth, net assets, and credit rating.
Western Energy Imbalance Market
On Nov. 1, 2014, CAISO began operation of an energy imbalance market (EIM) with PacifiCorp’s two balancing authority areas, PacifiCorp East (PACE) and PacifiCorp West (PACW). The EIM is an extension of the CAISO’s real-time market into other balancing authority areas in the Western Interconnection. The market dispatches resources inside the participating entities’ BAAs to meet intra-hour changes in their energy demand and supply. The EIM’s imbalance energy helps the BAAs meet their energy demand in real time. Overall, EIM energy represents about two to three percent of the energy used to meet load in the participating BAAs. With the balancing authorities in the Pacific Northwest, the EIM integrates low-cost hydroelectric power generation with the significant amount of solar and wind generation capacity in CAISO.
The EIM is a voluntary market where the participating balancing authorities can choose which resources to include in the market. The market participants have the flexibility to add and remove capacity from the EIM on an hourly basis. The transmission system operators for each participating BAA preserve the responsibility and flexibility to respond to events such as a sudden large imbalance between load and supply caused by a loss of a power plant or transmission line.
As of April 2018, the EIM consisted of the following LSEs and their respective BAAs: Puget Sound Energy, Portland General Electric, PacifiCorp West, PacifiCorp East, Idaho Power, NV Energy, Arizona Public Service, and CAISO. Additionally, Powerex (the marketing arm of the Canadian utility, BC Hydro) joined the EIM, providing contributions of generation and load imbalance – i.e., the difference between generation supply and demand schedules.85 Other balancing authorities have expressed interest in becoming EIM Entities.
85 Powerex (BC Hydro) also makes transmission rights available to
the EIM, providing its power to the EIM at the British Columbia-U.S. border.

Energy Primer | 105
Source: ABB, Velocity Suite
The EIM provides a market mechanism for dispatching generation resources to meet imbalance energy needs along with a limited amount of power flows between the participating BAAs. The market dispatches generation based on the relative costliness of the resources, resulting in cost savings for the participants. Before the EIM, a balancing authority such as PacifiCorp West or PacifiCorp East resolved imbalances between energy demand and supply in real-time by dispatching its resources and using ancillary services (mainly regulation). Under the EIM, by contrast, the market automates the dispatch of enough resource capacity within the BAAs, along with transmission flows between BAAs, to resolve energy imbalances.86 The automated EIM sets LMPs at both 15-minute and 5-minute intervals.
Along with dispatch cost savings, the EIM also helps integrate renewable generation resources. Prior to the EIM, CAISO imported power from outside its service territory to balance load throughout most hours of the day. However, with the growth of solar and wind generation, particularly in California, there were periods when these resources were forced to curtail because there was too much energy offered into the market. Now, with the EIM, any excess power can be exported
86 The EIM software calculates dispatch solutions for the EIM market
area as a whole. Consequently, participating balancing authorities need not
maintain high levels of reserves.
throughout the participating BAAs. In some hours, this results in power exports from CAISO to other BAAs.87
As the independent system operator of the EIM, CAISO addresses local market power mitigation at 5-minute intervals across the EIM area, which includes the non-CAISO balancing authority areas. CAISO also procures Flexible Ramp Product to provide upward and downward flexible capacity to meet energy ramp requirements. In these respects CAISO’s operator responsibilities have grown in the EIM as enhancements to the market design have been implemented.
87 See Department of Market Monitoring – California ISO, 2017 Annual
Report on Market Issues & Performance, at 118 (June 2018), http://www.caiso.
com/Documents/2017AnnualReportonMarketIssuesandPerformance.pdf.

106 | Energy Primer Federal Energy Regulatory Commission

Energy Primer | 107
3 U.S. Crude Oil and Petroleum Products Markets
Petroleum, or crude oil, and its derived products play a key role in the U.S. economy, accounting for approximately 22 percent of
primary energy consumption in the U.S. in 2017.1 Petroleum is not directly consumed in its natural form, but is distilled and refined into an array of products that can be used for various applications. These include fuels for transportation, power generation and heating. Other applications include petrochemical feedstocks used to manufacture various products, such as plastics, pharmaceuticals, fertilizers and construction materials. Petroleum is especially important in the transportation sector, where it accounted for 92 percent of all transportation fuels used in 2017.2
1 EIA, Monthly Energy Review, Table 1.2 (Jun. 26, 2018), https://www.eia.gov/totalenergy/data/browser/index.php?tbl=T01.02#/?f=A&start=2017&end=2017&charted=1-2-3-4-6-13.
2 Id. Table 2.5, https://www.eia.gov/totalenergy/data/browser/index.php?tbl=T02.05#/?f=A&start=2000&end=2017&charted=3-4-7.
U.S. Petroleum Products Supply in 2017 (Million gallons/day)
Source: EIA3
3 EIA, Petroleum & Other Liquids (Apr. 2, 2018), https://www.eia.gov/
dnav/pet/pet_cons_prim_dcu_nus_a.htm.

108 | Energy Primer Federal Energy Regulatory Commission
Petroleum and petroleum products, such as gasoline, diesel fuel, and jet fuel, are both domestically produced and imported. The percent of imported petroleum and petroleum products has been decreasing in recent years as U.S. crude oil production from shale has increased. Nearly 50 percent of the domestic U.S. crude oil production comes from two states, Texas and North Dakota. Alaska, California, New Mexico, Oklahoma and the Gulf of Mexico are also significant sources of production.4 U.S. refineries, which separate crude oil into usable products, are found throughout the country but are most heavily concentrated on the Gulf Coast.
4 Derived from EIA, Crude Oil Production (Jun. 29, 2018), https://
www.eia.gov/dnav/pet/pet_crd_crpdn_adc_mbblpd_a.htm.
FERC Jurisdiction
The Federal Energy Regulatory Commission’s jurisdiction over the oil markets is limited to the setting of interstate pipeline transportation rates and ensuring open access to the interstate pipeline system.
Petroleum Characteristics
Petroleum is a mixture of hydrocarbons that were primarily formed from plants and organisms that lived millions of years ago. It is found in tiny spaces within sedimentary rocks, in underground reservoirs or near the surface in tar (or oil) sands. Crude oil is highly heterogeneous, and naturally ranges in density and consistency, depending on the geological setting. Its color can vary from a light golden yellow to a deep black.
Different countries, regions, and geological formations produce different types of crude, which are generally described as light or heavy, depending on their density, and sweet or sour, depending on their sulfur content. In general, heavy oils are sour, as they contain more sulfur. West Texas Intermediate (WTI), the U.S. pricing benchmark, is a light, sweet oil that is delivered to Cushing, Oklahoma. The European benchmark oil, Brent, is also a light, sweet oil and is based on a basket of North Sea oils that are used to set petroleum prices around the world. By contrast, Mexico’s Maya crude is both heavy and high in sulfur content (sour).
Density of an oil (API Gravity)
The density, or “weight,” of an oil is one of the largest determinants of its market value (another key characteristic is sulfur content – see text box, “Sweet or Sour?”). The density of an oil is often referred to as “light” or “heavy” and is measured using API gravity. API gravity is determined using the specific gravity of an oil, which is the ratio of its density to that of water (density of the oil/density of water) at 60 degrees Fahrenheit. Oils are generally classified as:
Light – API > 31.1 Medium – API between 22.3 and 31.1Heavy – API < 22.3 Extra Heavy – API < 10.0
However, specific oils may be categorized differently depending on the region where they are produced and how the oil is referred to by commodity traders.
Though specific gravity is a unitless number, API gravity values in practice are often referred to as degrees. The API gravity of West Texas Intermediate is said to be 39.6 degrees. API gravity moves inversely to the density of an oil, which means the denser an oil the lower its API gravity. An API of 10 is equivalent to water, which means oils with an API above 10 will float on water while oils with an API below 10 will sink.
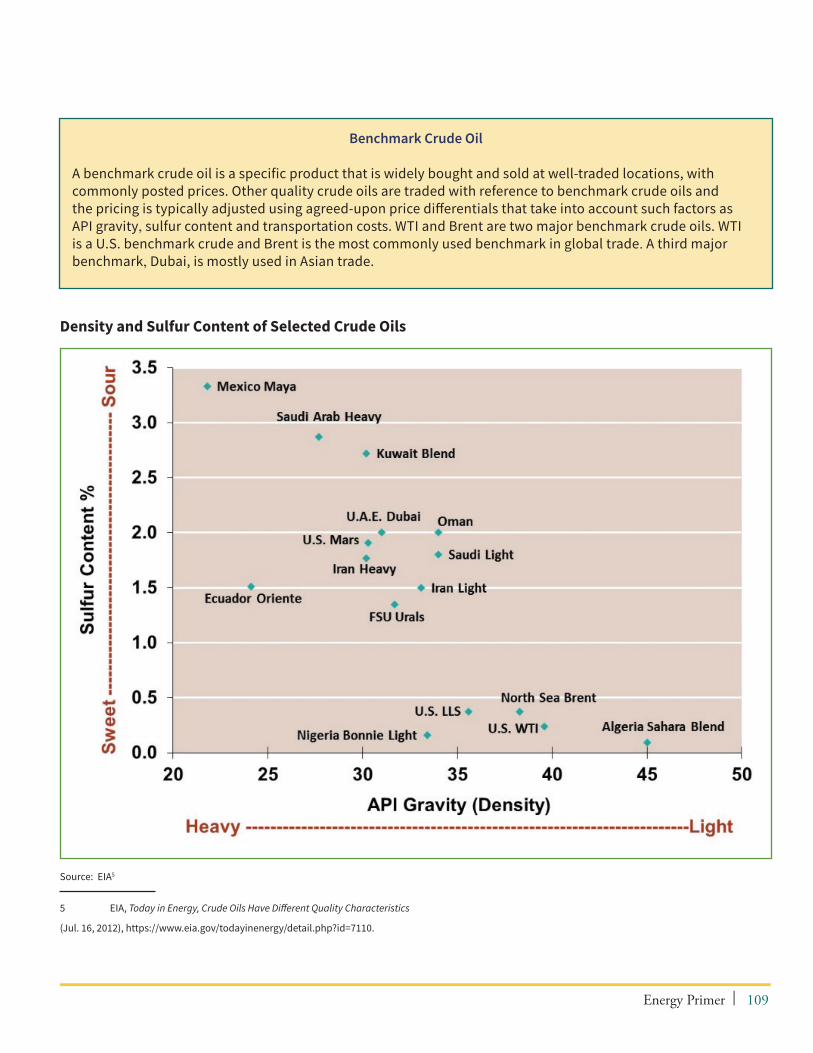
Energy Primer | 109
Density and Sulfur Content of Selected Crude Oils
Source: EIA5
5 EIA, Today in Energy, Crude Oils Have Different Quality Characteristics
(Jul. 16, 2012), https://www.eia.gov/todayinenergy/detail.php?id=7110.
Benchmark Crude Oil
A benchmark crude oil is a specific product that is widely bought and sold at well-traded locations, with commonly posted prices. Other quality crude oils are traded with reference to benchmark crude oils and the pricing is typically adjusted using agreed-upon price differentials that take into account such factors as API gravity, sulfur content and transportation costs. WTI and Brent are two major benchmark crude oils. WTI is a U.S. benchmark crude and Brent is the most commonly used benchmark in global trade. A third major benchmark, Dubai, is mostly used in Asian trade.

110 | Energy Primer Federal Energy Regulatory Commission
Crude oils that are light and sweet usually command higher prices than heavy, sour crude oils. This is partly because gasoline and diesel fuel, which typically sell at a significant premium to the heavier products produced in the refining process, are more readily and cheaply produced from light, sweet crude oil. However, individual refineries are optimized to process crude oil with specific properties, and deviations from any given refinery’s optimal crude oil can significantly impact profitability. Thus, the value of a given crude oil can often be refinery specific.
Sweet or Sour?
The terms sweet and sour refer to the sulfur content of crude oil. Early prospectors would taste oil to determine its quality, with low sulfur oil tasting relatively sweet. Crude is considered sweet if it contains less than 0.5 percent sulfur.
Sweet crude is easier to refine and safer to extract and transport than sour crude. Because sulfur is corrosive, sweet crude also causes less equipment damage to refineries and results in lower maintenance costs over time. Due to these factors, sweet crude commands a price premium over sour crude.
Major sources of sweet crude include the Appalachian Basin in Eastern North America, West Texas, the Bakken Formation of North Dakota and Saskatchewan, Saudi Arabia, the North Sea of Europe, North Africa, Australia, and the Far East including Indonesia.
Sour crude oil has greater than 0.5 percent sulfur, with some of the sulfur in the form of hydrogen sulfide, known for its “rotten egg” smell. Hydrogen sulfide is considered an industrial hazard and, thus, sour crude must be stabilized by removing hydrogen sulfide before it can be transported by oil tankers.
Sour crude is more common in the Gulf of Mexico, Mexico, South America, and Canada. Crude produced by OPEC Member Nations also tends to be relatively sour, with an average sulfur content of 1.77 percent.
U.S. Crude Oil Supply
Petroleum Reserves
Crude oil resource estimates are categorized in several ways. The most certain is the category “proved reserves,” which takes into account the potential to extract crude oil based on current technology and economic feasibility.
At the end of 2016, there was an estimated 35 billion barrels of proved crude oil and condensate reserves in the United States.6 While the measure can fluctuate from year to year, from 2009 to 2017 proved reserves increased by more than 60
6 EIA, U.S. Crude Oil and Natural Gas Proved Reserves, Year-end
2016, at 2 (Feb. 2018), https://www.eia.gov/naturalgas/crudeoilreserves/pdf/
usreserves.pdf.
Proved Oil Reserves
Estimated quantities of oil that analysis of geologic and engineering data demonstrates with reasonable certainty are recoverable under existing economic and operating conditions.

Energy Primer | 111
percent.7 This growth was substantially driven by exploration and drilling in shale formations and technological advances, such as horizontal drilling and hydraulic fracturing (horizontal drilling and hydraulic fracturing were discussed in Chapter 1, Wholesale Natural Gas Markets).
Shale and tight oil formations accounted for 44 percent of all U.S. crude oil proved reserves by the end of 2016.8 The top three areas in the country for proved reserves are Texas (home to Eagle Ford), North Dakota (home to much of the Bakken formation) and the Gulf of Mexico.9
Outside the United States, other top countries by proved reserves include Venezuela and Canada. As a region, most of the world’s proved reserves are in the Middle East, including Saudi Arabia, Iran, Iraq, Kuwait, and the United Arab Emirates.10
Domestic Production and Imports
From the 1970s to the early 2000s, the U.S. imported a growing proportion of its crude oil supply, which peaked at 10.1 million barrels per day (MMbd), or 66 percent of total U.S. supply in 2005.11 However, improvements in domestic production that started in the late 2000s began a reversal of that trend. In 2017, imports fell to 7.9 MMbd, or 46 percent of the 17.3 MMbd total U.S. supply. This compared to 9.4 MMbd of domestic production in the same year.12
7 Id.
8 Id., 10.
9 Id., 2-3.
10 BP, Statistical Review of World Energy, at 10 (Jun. 13, 2018),
https://www.bp.com/content/dam/bp/en/corporate/pdf/energy-economics/
statistical-review/bp-stats-review-2018-full-report.pdf.
11 See EIA, U.S. Imports of Crude Oil (Aug. 31, 2018), https://www.eia.
gov/dnav/pet/hist/LeafHandler.ashx?n=PET&s=MCRIMUS2&f=A.
12 See EIA, Supply and Disposition (Jun. 29, 2018), https://www.eia.
gov/dnav/pet/pet_sum_snd_d_nus_mbblpd_a_cur.htm.
U.S. Crude Oil Supply – Increased Production Displaces Imports
Source: EIA13
Crude oil imports to the U.S. came from over 35 countries in 2017. Canada was the largest foreign supplier to the U.S. and provided 3.4 MMbd of crude oil in 2017, or more than 43 percent of total imports, and included robust output from the oil sands region in Alberta.14 The second largest supplier to the U.S. was Saudi Arabia, with 0.9 MMbd, followed by Venezuela, Mexico, and Iraq.15
13 EIA, U.S. Field Production of Crude Oil (Jun. 29, 2018), https://
www.eia.gov/dnav/pet/hist/LeafHandler.ashx?n=pet&s=mcrfpus2&f=a, and
EIA, U.S. Imports of Crude Oil (Jun. 29, 2018), https://www.eia.gov/dnav/pet/
hist/LeafHandler.ashx?n=PET&s=MCRIMUS2&f=A.
14 EIA, U.S. Imports by Country of Origin (Jun. 29, 2018), https://www.
eia.gov/dnav/pet/pet_move_impcus_a2_nus_epc0_im0_mbblpd_a.htm.
15 Id.

112 | Energy Primer Federal Energy Regulatory Commission
Source: EIA16
Just as the case with proved reserves, the increase in domestic oil production followed the successful commercialization of horizontal drilling and hydraulic fracturing. Texas has historically been the largest producer among the states and has also substantially increased its production output with shale oil from its Eagle Ford (South Texas) and Permian Basin (West Texas) formations. The overall production in Texas reached 3.5 MMbd in 2017, up from an average of 1.1 MMbd from 2000 through 2007.17
North Dakota, with its Bakken Shale, produced 1.1 MMbd in 2017, up from an average of only 136 thousand barrels per day between 2000 and 2007.18 The shift positioned North Dakota as the second largest crude oil producing state in the country.
16 Id.
17 See EIA, Texas Field Production of Crude Oil (Jun.
29, 2018), https://www.eia.gov/dnav/pet/hist/LeafHandler.
ashx?n=PET&s=MCRFPTX2&f=A.
18 See EIA, North Dakota Field Production of Crude Oil
(Jun. 29, 2018), https://www.eia.gov/dnav/pet/hist/LeafHandler.
ashx?n=PET&s=MCRFPND2&f=A.
Top Ten Foreign Suppliers of Crude Oil to the U.S. in 2017
With the increases in shale production driving nearly all U.S. oil production growth since 2008, crude oil growth has been largely comprised of light, sweet oil, which has also affected refinery investments and operations. These refinery changes, likewise, tend to influence future changes in the types of crude oil imported and processed in the U.S.

Energy Primer | 113
Top U.S. Crude Oil Producing Locations
Source: EIA19
19 EIA, Crude Oil Production (Jun. 29, 2018), https://www.eia.gov/
dnav/pet/pet_crd_crpdn_adc_mbblpd_a.htm.
Top U.S. Crude Oil Producing Locations
Crude Oil and Petroleum Products Demand
The largest demand sector for petroleum products in the U.S. is transportation, which accounted for approximately 90 percent of total domestic consumption in 2017. Among the specific product categories, motor gasoline alone made up
Prime Suppliers – Companies that produce, import, or transport products across state boundaries, to sell to local distributors, retailers, or end users. Prime supplier sales are a good proxy for demand.
56 percent of petroleum products sold by prime suppliers into the U.S. market. The second largest was No. 2 distillate, accounting for 26 percent of sales, and includes diesel fuel, fuel oil for space heating and, in a lesser capacity, oil for electric generation. The third largest demand category was jet fuel, with nine percent of sales.20
20 EIA, Prime Supplier Sales Volume (Apr. 2, 2018), http://www.eia.
gov/dnav/pet/pet_cons_prim_dcu_nus_a.htm.

114 | Energy Primer Federal Energy Regulatory Commission
Petroleum Use in the U.S.
Source: EIA21
Other petroleum products include propane used for space heating and in petrochemical processes; kerosene used in heating and lighting; No. 1 fuel oil, which can be blended into heating fuel or diesel fuel; No. 4 fuel oil used for commercial heating and power generation; residual fuels (includes No. 5 and No. 6 fuel oils) used in power generation and ship boilers; and asphalt used to build roads.
21 Id.
Gasoline and No. 2 Distillates Account For Most of the Petroleum Use in the U.S.

Energy Primer | 115
Crude Oil Refining
In 2017, the U.S. had over 18 MMbd of refinery capacity.22 For historical reasons dating back to gasoline rationing during World War II, the U.S. is divided into five geographical regions called Petroleum Administration for Defense Districts, or PADDs. Approximately 52 percent, or 9.6 MMbd of refining capacity, is located along the Gulf Coast, in PADD 3.
Most of the larger and more modern refineries are situated along the Gulf Coast in Texas, Louisiana, Mississippi, and Alabama. Many refineries are located close to the traditional crude oil production areas, near import centers in the Gulf Coast or proximate to major population centers where demand for refined products is greatest, including California and the areas near Philadelphia, New York City, and Chicago.
U.S Refinery Locations
Source: ABB, Velocity Suite
In general, crude oil refining involves processing crude oil through distillation facilities where the crude oil is heated and separated into its lighter and heavier components. Distillation
22 EIA, Refinery Utilization and Capacity (Jun. 29, 2018), https://www.
eia.gov/dnav/pet/pet_pnp_unc_dcu_nus_a.htm.
occurs in a fractionating column, which uses a temperature differential across the column to separate the liquid mixture into its component parts. The heat causes the lighter, more volatile hydrocarbon molecules to vaporize and rise. As they cool, the heavier components with higher boiling points, such as heavy fuels and residual fuels, liquefy and settle into trays where they are carried out of the unit into their own processing streams. The lighter molecules rise higher in the unit and are processed into light products, such as gasoline and naphtha. Depending on the refinery configuration, heavier components may be further processed to yield higher amounts of the more valuable light products. Breaking down the heavier products into lighter ones requires more specialized and expensive equipment and processes such as catalytic crackers and cokers.
Diagram of a Basic Distillation Unit
Source: EIA23
23 EIA, Oil: Crude and Petroleum Products Explained (Aug. 14, 2018),
https://www.eia.gov/energyexplained/index.php?page=oil_refining#tab2.
Crude oil distillation unit and products

116 | Energy Primer Federal Energy Regulatory Commission
Crude Oil and Petroleum Products
TransportationThere are over 138,000 miles of petroleum pipelines in the United States.24 Crude oil pipeline mileage grew 17,000 miles, or 14 percent between 2012 and 2016, and was driven by increased shale production.25 Crude pipelines move oil from the production fields and import terminals to refineries for processing. Products pipelines then distribute the fuels to consumers across the country.
Colonial Pipeline Company is the largest pipeline in the U.S., transporting 818 billion barrel-miles (one barrel transported one mile) of petroleum products in 2017.26 It carries supply from the refining centers in Texas and Louisiana to the major demand centers along the U.S. east coast. It also transports gasoline, diesel fuel, jet fuel, and other products from Houston, Texas to Linden, New Jersey on a 5,500-mile network, crossing 13 states. The second largest pipeline is Enbridge Energy, with 756 billion barrel-miles transported in 2017.27 This pipeline begins in the oil sands producing region in Alberta, Canada and transports crude oil from North Dakota to Chicago and south to Cushing, Oklahoma. A distant third-largest pipeline is the TransCanada Keystone Pipeline, which transported 221 billion barrel-miles of crude oil in 2017 from
24 API-AOPL, Annual Liquids Pipeline Report, at 45 (2018),
http://www.energyinfrastructure.org/~/media/Files/Policy/
Infrastructure/2018/2018-API_AOPL-Annual-Pipeline-Safety-Report.pdf.
25 Id.
26 Colonial Pipeline Company, Annual Report of Oil Pipeline
Companies (FERC Form 6), at 600.2 (Apr. 18, 2018), https://elibrary.ferc.gov/
idmws/common/opennat.asp?fileID=14893903.
27 Enbridge Energy, Limited Partnership, FERC Form 6, at 600
(Apr. 18, 2018), https://elibrary.ferc.gov/idmws/common/opennat.
asp?fileID=14893986.
Canada to the U.S. mid-continent and the Gulf Coast.28
FERC Jurisdiction
Under the Interstate Commerce Act (ICA), FERC regulates the transportation of oil in interstate commerce. The ICA requires that all charges made for the transportation of oil or oil products be just and reasonable, and not unduly discriminatory.29 In this regard, FERC does not regulate the oversight of oil pipeline construction or oil pipeline safety.
FERC’s jurisdictional responsibilities regarding crude oil and petroleum product pipelines include:
• Regulation of rates and practices of oil pipeline companies engaged in interstate transportation
• Ensuring the furnishing of pipeline transportation to shippers on a non-discriminatory and non-preferential basis
• Establishment of just and reasonable rates for transporting crude oil and petroleum products by pipeline
Outside of FERC’s jurisdictional responsibilities, the regulation of crude oil and petroleum product pipelines falls under a number of different government entities. The Department of Transportation’s (DOT) Pipeline and Hazardous Materials Safety Administration (PHMSA) is responsible for regulating and ensuring the safe and secure movement of hazardous materials to industry and consumers by all modes of transportation, including pipelines. Its Office of Pipeline Safety ensures safety in the design, construction, operation and maintenance, and spill response of oil and natural gas pipelines and other hazardous liquid transportation pipelines.
28 TransCanada Keystone Pipeline, LP, FERC Form 6, at 600
(Apr. 17, 2018), https://elibrary.ferc.gov/idmws/common/opennat.
asp?fileID=14892395.
29 See 49 App. U.S.C. §§ 1(5)(a) and 3(1).

Energy Primer | 117
Movement of Crude Oil Within and Exports from the U.S.
Two Federal statutes have played a role in shaping the movement of crude oil and crude oil products. First, the Jones Act30 generally prohibits any foreign built or foreign-flagged vessel from engaging in trade that begins at any point within the United States and delivers commercial cargo to any other point within the United States.31 Because of the limited numbers of oil and petroleum products vessels that meet the Jones Act requirements, the ability to move crude oil and refined products between domestic marine ports is periodically constrained. That means, for example, that producers can be limited in their ability to move crude oil to the Gulf Coast via pipeline and then ship it to East Coast refiners. Likewise, Gulf Coast refiners can be limited in their ability to move refined products up the East Coast via waterborne vessels.
The second was a ban on most exports of crude oil in a policy stemming from the 1970’s oil crisis. While highly restrictive, certain licensed exports were allowed, including slightly refined crude oil condensate, shipments of crude oil owned by a company to an affiliate refinery in Canada, and heavy-for-light crude oil swaps with Mexico. The export ban was repealed in late 2015 as part of the Consolidated Appropriations Act of 2016.32 Following the repeal, the U.S. exported 1.1 million barrels per day of crude oil to various countries in 2017, up from approximately 100 thousand barrels per day from 1975 through 2015, with Canada as the largest recipient of the exports.33
30 The term “Jones Act” refers to section 27 of the Merchant Marine
Act of 1920, 46 U.S.C. § 50101, et seq. (2012).
31 46 U.S.C. at § 55102.
32 Consolidated Appropriations Act, 2016, Division O – Other Matters,
Title I, Sec. 101 (a – b).
33 EIA, This Week in Petroleum (Mar. 7, 2018), www.eia.gov/
petroleum/weekly/archive/2018/180307/includes/analysis_print.php.
Crude Oil and Petroleum Products
Markets and Trading
As a global commodity, crude oil’s price on the world markets is set by the traders who buy and sell the commodity at various locations around the world. However, most trades are based on, or derivative to, a handful of benchmark crude prices, such as WTI, Brent, and Dubai. There are also benchmark locations for petroleum products, including New York Harbor in the U.S., Amsterdam-Rotterdam-Antwerp (ARA) in Europe, and Singapore in Asia.
Unlike U.S. natural gas markets, which have historically been shielded from international supply and developments, domestic crude oil markets are more closely tied to global trends because of the tremendous world-wide production of crude oil which enjoys relatively low shipping costs. The cost to ship crude oil internationally is typically on the order of one dollar per barrel.34 In comparison, natural gas faces additional costs to ship overseas because of the need for liquefaction and regasification facilities, which require multi-billion dollar investments.
Crude oil and petroleum prices are greatly influenced by global supply and demand, which include notable international events. World oil prices have historically experienced periods of great volatility, often driven by supply and demand fundamentals and external shocks, such as production disruptions related to geopolitical events and speculative trading. Crude oil prices rose following supply
34 Cost at crude oil weight of approximately 275 pounds per barrel.
See EIA, Low Tanker Rates Are Enabling More Long Distance Crude Oil and
Petroleum Product Trade (Oct. 27, 2016), https://www.eia.gov/todayinenergy/
detail.php?id=28532.

118 | Energy Primer Federal Energy Regulatory Commission
disruptions that occurred during international events such as the Arab Oil Embargo in 1973 and 1974, the Iranian Revolution, the Iran-Iraq War in the 1980s, and the Persian Gulf War in 1990 and 1991. For example, WTI spot prices were $4.31/bbl in June 1973, By December 1974 crude oil prices reached $11.16/bbl, a 159% increase. Global economic events can also affect crude markets. For instance, during the recession of 2008 and 2009, the WTI benchmark reached $145.31/bbl on July 3, 2008 and, by December 19, 2008, the price had fallen to $30.28/bbl, a decline of nearly 80%.
From 1987 through 2010, WTI and Brent traded within a few cents of each other, with WTI generally commanding a small price premium. However, the sharp increase in production of shale oil in the U.S. resulted in a surge in supply at Cushing, causing WTI prices to drop below Brent. Between 2011 and 2014, the Brent benchmark price reached a premium of $27/barrel in September 2011, but the spread narrowed to about $5/barrel by late 2017.35 Crude oil became oversupplied at Cushing because of large increases in oil production that outpaced the development of transportation and storage infrastructure. The then-current ban on exports of crude oil further limited the options for addressing the supply pressures. Since 2011, the construction of additional infrastructure combined with the repeal of export restrictions has reduced the oversupply at Cushing and, in turn, narrowed the price differential between WTI and Brent.
35 See EIA, Spot Prices (Crude Oil) Sep. 6, 2018, https://www.eia.gov/
dnav/pet/pet_pri_spt_s1_d.htm.

Energy Primer | 119
4 Trading and Capital MarketsRestructuring of the energy markets and changes in the industry during the 1980s and 1990s resulted in the expansion of the commodity markets associated with natural gas and electricity. In particular, it resulted in the growth of financial products that derive their value from the underlying energy products. Expansion in physical and financial market trading for natural gas and electricity has tightened the traditional relationship between the markets and made it more bidirectional. As a result, activities
in the physical markets affect the value in financial markets. Likewise, activities in the financial markets can also affect value in the physical markets as well.
This chapter explores the trading of physical and financial contracts for natural gas and electricity. It also provides an overview of capital markets and their importance to investments in industry infrastructure.
Trading Physical and Financial Natural Gas and Electricity
Natural gas and electricity are often bought and sold using standardized contracts that contain terms and conditions that make them appealing to a wide variety of market participants. However, contracts can also be customized to meet the needs of individual buyers and sellers through a vast array of differing pricing and delivery mechanisms, as well as customized terms and conditions. Contracts in these markets are also referred to as instruments or securities.
In general, when a contract provides an obligation to physically deliver natural gas or electricity in exchange for payment, the contract is referred to as a physical contract.1 As discussed in Chapters 1 and 2 (Wholesale Natural Gas Markets and Wholesale Electricity Markets), producers and consumers of natural gas and electricity sell and buy energy products to service a variety of their enterprise operations that include production, marketing, meeting customer demand, and managing risk.
When a contract does not require the delivery of natural gas or electricity, but instead provides a right to a financial payout in exchange for a payment, the contract is referred to as a financial contract. The payment is often based on the underlying value of the physical commodity or financial product specified by the contract, called the underlier. Because the value of the financial contracts is derived from
1 As discussed below, a buyer of a commodity under a physical
contract may in many instances elect not to take delivery. The buyer may do
so by reselling the commodity, where the reselling is referred to as obtaining
an offsetting contract.

120 | Energy Primer Federal Energy Regulatory Commission
the value of the underlier, the contracts are also called derivatives, which is a general term for contracts whose value is derived from some other physical or financial product.
Market participants buy and sell energy based financial contracts for a number of reasons. Physical market participants, such as producers and consumers, typically use financial contracts to manage price risk and protect against price volatility. That is, financial contracts can serve as a tool for managing risk akin to insurance. Other market participants use the energy markets to speculate, or to assume a market risk in the hope of profiting from market fluctuations.
Contract Characteristics
Every contract, whether physical or financial, is identified by a number of characteristics, such as the product conveyed, location, timeframe, size or quantity, and the price or mechanism for determining the settlement. Additionally, there are different types of contracts based on uses and obligations of the participants, which are further described in the section below on Contract Types.
Product conveyed: Each contract specifies what is being bought and sold. For physical contracts, this would be natural gas or electricity. For derivatives, it may be a payout derived from natural gas or electricity prices.
Location: Natural gas and electricity are traded at different locations throughout the country. For natural gas, these locations are usually located at the intersections of major pipeline systems and are referred to as market hubs. The Henry Hub is the country’s benchmark hub and is also the delivery point for the New York Mercantile Exchange (NYMEX) natural gas futures contract. For electricity, contracts are often based on locations known as nodes, zones, or hubs. Examples of frequently traded electricity locations are the PJM Western Hub and the Mid-Columbia Hub.
Standardized contracts traded on exchanges and on Over-the-Counter (OTC) electronic brokerage platforms such as the InterContinental Exchange (ICE) use predetermined
locations or pricing points (exchanges and OTC are discussed further below). Other bilateral OTC transactions can use any location desired by the counterparties. For physical contracts, the location must be physically viable. Because financial contracts do not result in actual physical delivery, the location represents only the price that will be exchanged for a specific quantity. As a result, traders can negotiate complex pricing mechanisms based on a number of locations or proxy locations.
Timeframe: Each contract has a number of time elements. The trade date is the date on which the contract is executed. The expiration date, or termination date, is the last day a contract is in force. The settlement date establishes when payment is due under the contract. Also, physical contracts specify the delivery day(s) or month – the day(s) or month during which the product is to be delivered. Physical and financial electricity contracts may also specify peak or off-peak delivery, with the peak or off-peak hours defined by the contract.
For physical contracts, begin and end dates are the timeframe during which a physical product (natural gas or electricity) is to be delivered. Next-day physical natural gas contracts generally have the same begin and end dates. For example, a next-day physical natural gas contract may have a trade date of August 7, a begin date of August 8, and an end date of August 8. A monthly physical natural gas contract may trade on August 7, its trade date; the flow of natural gas would have a begin date of September 1 and an end date of September 30. Monthly physical contracts are generally for delivery in equal parts per day over a month for natural gas and equal parts per hour for electricity. For financial contracts, the begin and end dates indicate the underlying prices to be used in setting the payout for a specific quantity of natural gas or power over the time period.
Quantity: All physical contracts specify the amount of natural gas or electricity to be delivered. For standardized contracts traded on an exchange or on an OTC electronic brokerage platform, the quantity is predetermined and specified in the contract. For bilateral contracts traded in OTC markets, the

Energy Primer | 121
contract quantity can be any amount agreed upon by the parties.
Price: All physical contracts specify a price that will be exchanged for physical delivery. All financial contracts specify a price, or prices, which will determine a cash exchange between two parties.
Fixed prices are known at the time a transaction is entered into. It is a set price at which the seller agrees to sell and the buyer agrees to buy. A fixed price would be represented, for example, as $3/MMBtu for natural gas or $30/MWh for electricity.
Floating prices are not known at the time a transaction is entered into, but will be known at the time of settlement. For example, a price may be tied to the average of all of the daily prices at a location over the course of a month, typically as published as an index. Indices referenced in contracts in the natural gas market are published using a known methodology by a variety of index developers, such as Platts or Natural Gas Intelligence (NGI).2 NYMEX and other exchanges also publish prices for standardized contracts that can be referenced in contracts. Electricity contracts often reference the Locational Marginal Prices (LMPs) set by the RTO/ISOs or indices published by index developers, such as Platts or Dow Jones.
Options contracts also include prices, such as a strike price and a premium. Options contracts are discussed in the following section.
Contract Types
The most common contract types are forwards, futures, swaps, and options.
Forward Contract: A forward contract is an agreement between two parties to buy or sell a commodity at a specified date in the future. A forward contract is often used for physical delivery. The buyer pays an agreed upon forward purchase
2 Data used for developing price indices is collected from market
participants who voluntarily report the quantities and prices of their trades to
the index developers.
price and the seller delivers the natural gas or electricity on the designated date. Once the product is delivered, the contract is referred to as physically settled. Forward contracts may also be financially settled where no delivery of commodity takes place. A financially settled contract, also referred to as cash settled, has the parties paying and receiving in cash the loss or gain based on the price of the underlying product. A forward contract may be traded through the OTC, including electronic brokerage platforms. If the forward contract is traded on an exchange, it is known as a futures contract.
Futures Contract: A futures contract is a standardized forward contract which is traded on an exchange, such as the NYMEX. Each contract represents the same quantity and quality of the underlying physical commodity, valued in the same pricing format, to be delivered and received at the same delivery location. In addition, the specific dates of delivery and receipt are the same for all contracts traded for a particular calendar month. Because futures are interchangeable with one another and are traded on centralized exchanges, futures markets generally offer superior liquidity to forward markets.
Swap Contract: A swap is an exchange of one asset or liability for a similar asset or liability. An example of a swap is the buying on the spot market and simultaneously selling it forward. Swaps also may involve exchanging income flows, such as from a string of successive forward contracts. In effect, this means that the counterparties to a swap agree to exchange payments at set times repeatedly in the future. Some swaps with standardized terms are traded on exchanges like futures.
Option Contract: An option is an instrument that gives its holder the right, but not the obligation, to buy or sell an underlying physical or financial contract in the future. The right to buy the underlying is called a “call” option, and the right to sell is called a “put” option. The price paid to buy or sell the option is known simply as the option’s price, or premium. The price at which the option may be exercised is the strike price. Electing to buy or sell the underlying commodity or security at the future date is known as

122 | Energy Primer Federal Energy Regulatory Commission
exercising the option. The options themselves may be bought or sold, and are frequently standardized and traded on an exchange. Options traded on an exchange or an electronic trading platform may be traded up to the contract’s expiration. Consequently, the owner of an option may sell it rather than exercise the option, or may let it expire if it not
Examples of Contracts
Electricity Forward Contract
In the electric industry, the Edison Electric Institute (EEI) Master Power Purchase and Sale Agreement is a commonly used contract that can be employed for forward sales of power. Transacting parties may enter into a bilateral sale by agreeing to transaction-specific values for price, quantity, delivery location, period of delivery, among other details pertinent to the negotiated transaction. The terms of the transaction are documented on a transaction-specific confirmation.
NYMEX Natural Gas Futures Contract
For the natural gas industry, the dominant physical futures contract is the NYMEX Henry Hub Natural Gas Futures contract. For this contract, the standard contract specifications are the delivery location – Sabine Pipeline Hub at the Henry Hub in Louisiana; the term – monthly; and the quantity – 10,000 MMBtu delivered equally over the course of the month.
Natural Gas Basis Swap
A basis swap contract is a financial instrument that provides payments calculated on the price difference between two natural gas delivery points. An example is the ICE contract, Basis Swap – Consumers Energy Citygate, in which traders buy and sell the contract which derives its price from the subtraction of the NYMEX Henry Hub futures contract price (the reference hub price) from the Consumers Energy Citygate (Michigan) price. The settlement is determined each month until the contract expires and the standard contract size is 2,500 MMBtu. Traders can use these contracts for either hedging or speculative trades.
Natural Gas Options Contract
A natural gas options contract, such as ICE’s Option on Socal Fixed Price Futures (the futures price location is the Southern California Border, as recorded by the index publisher Natural Gas Intelligence), gives the purchaser the right, but not the obligation, to buy a specified number of futures contracts at a predetermined price, at a future date. The put option gives the option buyer the right, but not the obligation, to sell the natural gas futures at a minimum selected floor (strike) price. A natural gas consumer, such as a gas-fired power plant, might buy a call option to protect against having to pay more than the selected strike price. Similarly, a natural gas producer or marketer could use a put option to protect against price drops below the strike price as a means of ensuring the profitability of future production. Traders also use options to speculate on the price of the underlying commodity, in anticipation of future market prices or as part of more complex financial structures.
profitable to exercise it. Traders may use options to boost their trading income or to reduce the volatility of their returns.

Energy Primer | 123
Markets for Trading Physical and Financial Natural Gas and Electricity
Contracts in both physical and financial markets are transacted through exchanges or bilaterally, OTC. In the case of electricity, transactions also take place in Regional Transmission Organizations and Independent System Operators (Chapter 2 addresses RTO/ISOs).
Exchanges
An exchange is a central marketplace with established rules and regulations where buyers and sellers trade commodities, derivatives, and other financial instruments. A market participant (e.g., a buyer or seller) does not interact directly with its counterparty on an exchange. Instead, the counterparties place their orders with the exchange which then matches the buyer and seller anonymously. Exchange-traded contracts are standardized and the specifications for the contract, such as quantity and location, are established in advance by the exchange.
Historically, exchange trading occurred in trading pits where traders actively called out orders to buy and sell, known as open outcry. However, with the advent of electronic trading, open outcry has largely become obsolete and most trading is now done electronically.
Forward and Futures Curves
Standardized forwards, futures, and swaps are traded for every month, years into the future; the NYMEX natural gas futures contract, for example, is traded more than eight years into the future although only the first few years may be actively traded. Each of the contracts for which trading occurs has a price. Together, the prices for future contract months creates a trajectory of prices known as forward or futures curves.
Natural gas and electricity are traded on exchanges such as the NYMEX, the world’s largest commodity futures exchange. In addition to energy contracts for natural gas and power, NYMEX facilitates the sale and purchase of financial and physical contracts for other commodities, including metals and agricultural products. ICE also offers natural gas and electricity contracts, as well as emissions allowances among a host of other commodities. Nodal Exchange offers locational (nodal) futures contracts to market participants in the organized electricity markets, as well as electricity contracts for forward months at RTO hubs, zones, and nodes.
Margin, or equity contributed as a percentage of the current market value of a commodity contract, provides market participants with the ability to trade without having to pay cash for the full value of the trade. Effectively, someone who trades on margin borrows much of the money used to buy or sell from the exchange or another entity. The trader posts collateral by putting down a certain amount of money or percentage of the trade value in cash or other items of value acceptable to the exchange.
Over-The-Counter Markets
An OTC market is a market where buyers and sellers interact with one another, usually via electronic or telephone communications, and without the supervision of an exchange. In OTC markets, contracts are bilateral -- i.e., the process of negotiating the completion of a purchase or sale is between the two market participants. OTC transactions are not required to be standardized, but can range from complicated negotiations for one-off structured contracts to standardized contracts traded through an electronic brokerage platform. The ability to tailor a contract to the exact needs of the counterparties is one of the chief benefits of OTC markets.
While contracts can be negotiated individually in the OTC markets, standardized contracts can also be transacted OTC. Many negotiations begin with a standardized contract, such as the natural gas contract developed by the North American Energy Standards Board (NAESB), and are then modified.

124 | Energy Primer Federal Energy Regulatory Commission
Others are negotiated from scratch with very specific terms and conditions, called structured contracts.
OTC transactions may be conducted via brokers that include voice brokers (brokers who conduct most business by phone or instant messaging) and electronic brokerage platforms. Unlike an exchange, the broker performs the function of matching specific buyers and sellers. In these trades, buyers and sellers are not anonymous to one another.
RTO/ISO Markets
Electricity is also bought and sold through RTO/ISOs. In general, these markets are operated to support the physical operation of the electric grid, dispatching generation to meet customer demand. RTO/ISO markets are multilateral; buyers and sellers are not matched individually against each other. RTO/ISOs also allow for bilateral physical transactions, although each market handles them differently. For example, RTO/ISOs make settlement services available for the parties engaging in bilateral transactions, where such details as charge calculations and administrative fees vary by market.
RTO/ISO markets have products that have some similarities to financial contracts. These include virtual transactions, such as virtual supply offers or virtual demand bids, which allow a market participant to trade on the expected price difference between an RTO/ISO’s day-ahead and real-time markets. Virtual transactions (often referred to as virtuals), are directly integrated into the operation of the physical market and affect physical supply and demand, and prices. However, these trades do not result in physical delivery. Chapter 2 further discusses virtuals.
Additionally, RTO/ISOs offer financial transmission rights (FTRs). FTRs and similar instruments are designed to provide financial compensation to offset transmission congestion costs over specific transmission paths. FTRs are allocated to transmission owners and also auctioned to firm transmission rights holders by the RTO/ISOs on a periodic basis. The amount of available FTRs is linked to the physical operation of the transmission system and the amount of expected
transmission capacity. FTRs are also discussed in Chapter 2.
RTO/ISOs maintain credit policies and allocate the costs of defaults or other performance failures across market participants. These policies are discussed in Chapter 2.
Also, in the case of RTO/ISOs, the electric market operators use the word clearing to refer to the matching of supply and demand, or put another way, to clear the market means the RTO/ISO accepts sufficient generation offers to meet demand. If a generator’s offer in the day-ahead market clears, it means that its generation was offered at or below the locational marginal price and is expected to deliver power.
Trading Concepts and Terminology
TradingTrading is the act of buying and selling of contracts. A trade is a single purchase or sale.
Trading Volumes and TransactionsTrading volume refers to the total amount of commodity traded or the number of related contracts that have changed hands in a given energy market for a given period of time -- e.g., a single trading day. Trading volumes give an indication of the nature of the market activity and traders may track increases or decreases in trading volumes over time to gage the tendency for a price trend to continue.3
Market Prices, Bids and OffersThe market price of a contract is the average price (or volume-weighted average price) of all individual trades for that contract. Trading requires a buyer and a seller, each willing to transact for a price. A buyer bids a price he or she is willing to pay to purchase a contract; this is the bid price. A seller
3 Note that, with transactions involving standardized financial
contracts such as an ICE natural gas swap contract, one can also readily
determine a notional amount of energy volume represented by the number of
trades because each contract trades a standardized amount of energy -- e.g.,
2,500 MMBtu per contract.

Energy Primer | 125
offers a product for sale; the price at which the seller offers it is the offer price. The price at which buyers want to buy and sellers want to sell may not be the same. When they differ, the distance between them is the bid-offer or bid-ask spread. This spread is the difference between the highest price at which buyers are currently willing to buy (the highest bid) versus the lowest price at which sellers are currently willing to sell (the lowest offer). For example, if a buyer bids $7 and the seller offers at $10, the bid-ask spread is $3.
Spot PricesSpot price is a cash market price for a physical commodity that is available for immediate (next day) delivery.
SettlementSettlement is the exchange of physical commodities or currency to close out a physical or financial contract. At settlement, a contract will indicate if delivery is to be made for a physical contract (physically settled) or a financial payout made for a financial contract (financially settled). Settlement occurs both on exchanges and for OTC transactions. On
exchanges, settlement occurs per a documented process and timeframe established by the exchange, while OTC transaction settlement occurs under the terms agreed upon by the parties.
Most market participants avoid trading during the settlement period of a contract. As the time to contract expiry approaches, price risk and volatility may increase significantly, while market liquidity and the remaining open positions (open interest) may be decreasing.
Daily settlement prices are used to revalue traders’ positions to the current market price for accounting and for margin calculations. Daily and LD settlement prices are also reported in publications and indexes, and are used for price discovery.
Mark-to-MarketMark-to-Market (MTM) is an accounting methodology that provides a daily update of the value of a portfolio of market positions, all revalued to current market prices. This results in near real-time updates to financial and accounting gains and losses, even though a trader might not actually transact to cash out of the positions.
PositionA position is the accumulated unexpired contracts purchased or sold, at a point in time. Traders may have positions in each contract, as well as an overall position reflecting the balance of all of their contracts.
Long and Short PositionsTraders are aware of their positions at all times and are constantly evaluating how market changes will affect the value of their positions, for example, by knowing whether a position benefits or loses when prices go up or down. A trader has a long position when he or she purchases an asset and currently owns it with the expectation that the value of the asset will rise. In other words, a long position benefits from price increases. A trader has short position when he or she sells an asset with a goal, or need, to repurchase the asset at a lower price. A short position benefits from falling prices. If a
Settlement Example
The final settlement for the NYMEX natural gas futures contract for a given month occurs three business days prior to the start of the month of delivery (the prompt month). The contract expires and the last-day settlement (LD settlement) is calculated, based upon the trading in the last half-hour. LD settlement is the final price for that particular futures contract term. For the NYMEX natural gas futures contract, most market participants either liquidate or “roll” their positions well before the settlement period. Rolling is the process of liquidating the current month’s contract before it expires and purchasing a comparable position in the upcoming month. The trader holds the same number of contracts, but the contract month changes as time passes and contracts expire.

126 | Energy Primer Federal Energy Regulatory Commission
position is neutral, the trader benefits from neither a rise nor a fall in prices and is said to be “flat.”
Position LimitsPosition limits are imposed on exchanges, such as ICE and NYMEX, in accordance with the rules of the Commodity Futures Trading Commission.4 The position limits restrict the number of contracts a trader may hold at any point in time, during the month that the contract expires, or during some period closer to settlement. For example, NYMEX imposes accountability levels for any one month and for all months, and has limits for expiration-month positions. Accountability levels for the NYMEX Henry Hub natural gas futures contract are 12,000 contracts for all months, 6,000 contracts for one month and 1,000 contracts in the expiration month.5 Trading entities can petition to have these waived or modified.
ClearingClearing is a process in which financial or physical transactions are brought to a single entity to manage counterparty risk. The entity (referred to as a clearing house) steps into the middle of the transaction and becomes the counterparty to each buyer and seller. The clearing house assumes the risk that either the buyer or seller will fail to perform its contractual obligations, and thus maintains rules about the creditworthiness of traders, collateral that must be posted and fees that must be paid for the service. NYMEX and ICE act as clearing houses for transactions occurring on their platforms.
LiquidatingLiquidating a position is the process of getting rid of a position. A trader who purchased a contract will sell it to
4 The CME Group owns NYMEX. The CME Group offers a marketplace
for derivatives composed of its exchanges: Chicago Mercantile Exchange
(CME), New York Mercantile Exchange (NYMEX), Chicago Board of Trade
(CBOT), and COMEX (formerly known as the Commodity Exchange, Inc.).
See CME Group, Driving Global Growth and Commerce (n.d.), https://www.
cmegroup.com/company/history/.
5 CME Group, Position Limits, NYMEX & COMEX Position Limits (n.d.),
http://www.cmegroup.com/market-regulation/position-limits.html.
liquidate it. A trader who has sold a contract will buy a contract to liquidate it. After liquidation, the trader holds no contracts.
LiquidityLiquidity refers to the ability of a trader to transact with a substantial volume (e.g., to liquidate his or her position) at any time and to do so without, or with limited, effect on market price. A market is “thin,” or less liquid, if it experiences few transactions or little volume; in these instances, significantly large trades may result in a noticeable movement in market price.
Open InterestOpen interest is the aggregation of all traders’ existing, or “open,” positions. For example, in futures and options markets, it is the total number of futures or options contracts transacted in a given period (e.g., in the delivery month) or market that have not yet been liquidated by an offsetting transaction or fulfilled by delivery. As the number of existing contracts generally changes from day to day, open interest is often tracked by traders and analysts to assess trends in market activity pertaining to beginning (or opening) positions or ending (or closing) positions in the market. Open interest (both in terms of the total number of contracts and the number of counterparties) rapidly decreases as contracts near expiration and are settled.
Trading Analysis and Strategy
In deciding whether to trade, both hedgers and speculators pay attention to what is going on in the market, and develop their own view of where the market is likely to go. They may develop complicated forecasts as the basis for decisions on a number of transactions: whether, when, and where to build a merchant power plant, how to hedge natural gas production, and of course, when to buy and sell in the markets.

Energy Primer | 127
Fundamental Analysis
Two general schools of thought influence traders’ thinking when analyzing markets for trading opportunities. The first is fundamental analysis, which takes into account physical demand and supply fundamentals including production, pipeline and transmission capacity, planned and unplanned outages, weather and economic and demographic changes. Changes in information about fundamentals (or changes in perceptions of fundamentals) alter traders’ views of the supply-demand balance, and therefore, of prices. Fundamental analysis is used often to determine the impacts of longer term trends in the physical market – the development of shale gas supplies, for example.
Technical Analysis
The second school of thought is technical analysis, which forecasts price movements based on patterns of price changes, rates of change, changes in trading volumes, and open interest, without regard to the underlying fundamental conditions. Instead of looking at the market for a physical good, technical analysis primarily looks at trading and price changes. Technical analysis is used most often to determine short-term movements and trends, helping traders time their buys and sells.
Traders Strategy
A trader’s strategy consists of a defined plan that includes decisions such as what contracts to trade and how to trade them. A trader’s strategy will depend on the objectives of his or her company. Trading strategies in natural gas and electricity markets include activities such as buying or selling the physical product, managing the risk of physical and financial positions, also known as hedging, and attempting to make money through speculation.
HedgingHedging is the act of establishing an offsetting position with the intent of minimizing substantial losses should an original position lose its value. More specifically, market participants and traders with physical positions are exposed to potential gains or losses, as market prices change over time. In order to manage this risk, they may use any of a variety of transactions with opposing risk exposures to reduce or eliminate the original market risk.
An LDC, for example, is concerned with obtaining sufficient volumes of natural gas to serve variable customer demand at the lowest possible price. To ensure sufficient quantities and diversify the risk associated with price swings, an LDC trader may create a portfolio of supplies, with a block of firm supply to meet minimum daily needs. An LDC trader may also decide to buy in the next-day market to meet demand peaks. Additionally, an LDC trader may diversify the sources of gas, to both improve the reliability of supply and also to diversify its price. Physical market participants can also manage risk by trading financial contracts. Physical market participants may also hedge for other reasons, such as establishing a predictable cash flow to support financing or to show state regulators that purchasing practices are prudent.
SpeculatingSpeculators, or traders seeking to profit from financial or physical markets without any other underlying energy production or consumption requirements, may employ different strategies in an attempt to profit from the market. Some traders may take a passive approach, seeking to benefit from long-term price movements or to diversify a broader portfolio. Others may buy and sell relative to short-or-medium term movements in prices or price spreads. Some market participants may use High Frequency Trading (HFT), a trading activity guided by computer algorithms which process buy and sell orders in extremely short timeframes. HFT trades are executed in milliseconds and HFT trading programs are capable of executing thousands and thousands of trades per day.

128 | Energy Primer Federal Energy Regulatory Commission
Capital Markets
Capital markets refer to the markets for equity, or ownership capital, and debt. These markets provide the money needed to make investments in infrastructure such as power plants or natural gas pipelines, to operate plants and companies and to trade or conduct transactions. Most corporate financing is funded through a mixture of equity and debt capital.
Equity capital is most commonly raised through a direct sale of shares in a company to the public, after which shares may be traded on one or more stock exchanges. Note that, in recent years, a substantial amount of private equity has invested in the energy markets as well.
Debt capital may take the form of bonds, which are debt obligations sold directly to investors, generally defining the borrowing as occurring at a particular interest rate for a fixed period of time. Companies may also borrow funds by employing a bank loan. These loans are frequently sold onward to investors through a process known as syndication.
Equity Debt and Financing
Equity financing is money provided in exchange for a share in the ownership, or shares of stock, of the business. A company does not have to repay the capital received, and shareholders are entitled to benefit from the company’s operations through dividends and potential gains from appreciation in the original investment.
Characteristics of equity include:
• Equity capital can be kept by the company indefinitely.
• Companies can issue shares in the company – stock – through financial markets. They may also use private equity – money from venture capital firms or private investment entities.
• The most common form of stock is common stock, which does not require regular dividend payments. Investor-owned utilities often issue preferred stock that entitles
the holder to a fixed dividend, whose payment takes priority over that of common stock dividends.
• Stockholders and private equity investors get a say in how the company is operated and may impose restrictions.
• Equity investors may be more willing to assume higher risks in return for higher potential returns. Electric utilities are typically considered fairly conservative investments. Natural gas producers attract a more risk-inclined investor.
• The return required to attract equity is usually higher than the interest paid to debt holders.
• Equity capital does not require collateral; it gets a share in the company.
• Additional equity capital infusions may dilute, or reduce, the value of existing shares.
Debt financing involves borrowing money to be repaid over time, along with interest at a fixed or variable interest rate. With debt, the investor does not become an owner of the company. Some common types of debt include bonds – securities that companies issue in financial markets with maturities (when the loan has to be repaid) of more than a year; shorter-term debt issued by companies through financial markets; and bank loans, such as lines of credit. A revolving line of credit is an assurance from a bank or other institution that a company may borrow and repay funds up to some limit at any time. Municipal and cooperative utilities typically use debt; since they have no ownership to sell.
Characteristics of debt include:
• Capital obtained through debt must be repaid or refinanced.
• Debt may be short-term, such as lines of credit from banks or corporate paper, or it may be long-term.

Energy Primer | 129
• Companies must make their interest payments and repayment on schedule, or the debt holders can take action, including forcing the company into bankruptcy. A company must generate sufficient cash through its operations or through other financing to make these payments.
• Interest gets paid before equity dividends.
• Debt gives lenders little or no control of the company (unless it gets into financial trouble).
• Debt can leverage company profits; similarly, it can magnify losses.
• Lenders are typically conservative, wanting to minimize downside risks.
• Borrowers may be required to provide collateral to secure debt. Debt without collateral is known as unsecured debt.
Companies often try to match the type of financing with the investment that they are making. Pipelines, power plants, and transmission facilities are long-lived assets. These investments are typically financed using long-term capital, such as stock and long-term bonds, which can have 30-year maturities.
Other capital is also needed to conduct day-to-day operations. Some of the cash needed to fund operations comes from a company’s revenues. However, revenues do not always come in when payments are due. Consequently, companies also rely on working capital. This can include some long-term capital from stocks and medium- and long-term bonds. Short-term investments and day-to-day operations also rely on commercial paper and bank loans to cover day-to-day cash needs. If a company faces significant problems, it may have to issue higher-priced debt to obtain financing, which is a form of compensation to the lender, in return for the added risk of lending. High-yield or “junk” bonds are issued by entities lacking investment grade credit ratings (see below).
Capital Expenditures
The overall stability of the capital markets – or the desire and ability of investors and lenders to provide capital – is an important issue for the overall health of the capital-intensive energy industry. The recession of 2008 and 2009 took a toll on capital spending as financial commitments to infrastructure fell for the first time in years, but spending has been rising since 2011 (see bar chart).
Electric and Natural Gas Company Capital Expenditures
Source: S&P Global Market Intelligence6
The electricity industry makes up the bulk of the capital expenditures in the utilities sector, specifically on electric transmission, distribution and generation.
6 Capital expenditures are from 50 selected electric and natural gas
companies assessed by Regulatory Research Associates, a group within S&P
Global Market Intelligence. S&P Global Market Intelligence, RRA Financial
Focus, Utility Capital Expenditures Update, at 1 (Oct. 30, 2018).

130 | Energy Primer Federal Energy Regulatory Commission
Credit Ratings
Access to capital markets depends on the perceived riskiness of the entity seeking the capital.7 To measure relative riskiness, many providers of capital look at different measures, including company financial reports, third-party analysis, and credit ratings assigned by the three major crediting rating agencies -- Standard and Poor’s (S&P), Moody’s and Fitch.
Not all companies (or governmental entities) present the same level of riskiness to the capital markets. Market participants, such as investors and traders, consider the risks their counterparty may present, including the risk of default. One standardized tool used to assess relative risk is the credit rating. The credit rating agencies usually assess a company’s riskiness every time it issues debt. A credit rating represents the rating agency’s estimation of the likelihood that an issuer will be unable to repay its debt, as well as the capacity and willingness of the borrower to meet its financial obligations. Many organizations, including RTO/ISOs, consider credit ratings, among other things, when setting their credit policies, which determine with whom companies may transact and whether the counterparty will need to post collateral. Each credit rating agency has its own way of assessing risk, reflected in the rating system they use.
Credit quality tends to vary across industry sectors and may fluctuate over time, and is dependent both on the amount of debt issued by a company as well as the stability of a company’s cash flow. As a result, companies with predictable income and capital expenditures, such as regulated electric utilities and natural gas LDCs, tend to have higher credit quality than companies subject to more variable cash flows. In contrast, merchant generators (known as independent
7 In general, the risker a company is perceived to be, the higher rate
of return an investor will require to invest in the equity or debt security of the
company. Returns for an equity investor can come in the form of the return
of capital through a dividend or stock buyback, or through an expectation
of higher future profitability on which the investor will have a claim. Debt
securities provide a return through the interest rate which accrues to the
purchaser, known as the yield.
power producers or IPPs) have experienced challenges with matching volatile cash flows against their capital and debt burdens. As a result, IPPs have experienced a number of credit rating downgrades and even bankruptcies over the past decade.
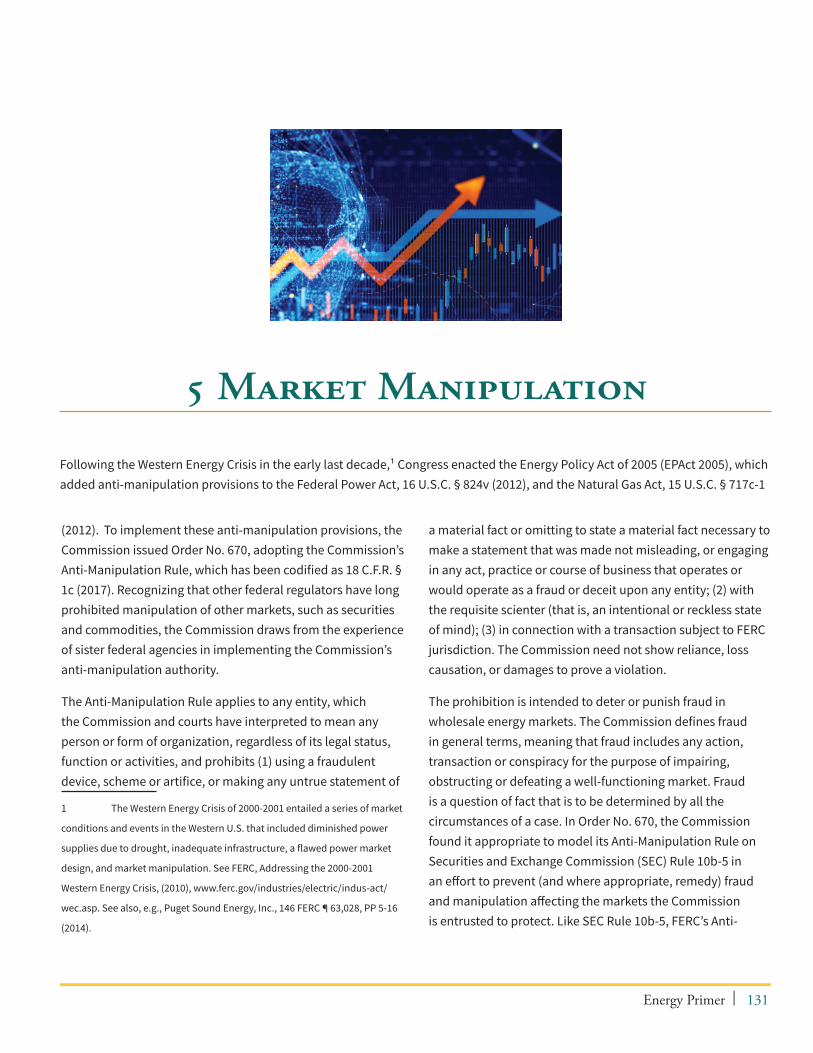
Energy Primer | 131
5 Market Manipulation
Following the Western Energy Crisis in the early last decade,¹ Congress enacted the Energy Policy Act of 2005 (EPAct 2005), which added anti-manipulation provisions to the Federal Power Act, 16 U.S.C. § 824v (2012), and the Natural Gas Act, 15 U.S.C. § 717c-1
(2012).1To implement these anti-manipulation provisions, the Commission issued Order No. 670, adopting the Commission’s Anti-Manipulation Rule, which has been codified as 18 C.F.R. § 1c (2017). Recognizing that other federal regulators have long prohibited manipulation of other markets, such as securities and commodities, the Commission draws from the experience of sister federal agencies in implementing the Commission’s anti-manipulation authority.
The Anti-Manipulation Rule applies to any entity, which the Commission and courts have interpreted to mean any person or form of organization, regardless of its legal status, function or activities, and prohibits (1) using a fraudulent device, scheme or artifice, or making any untrue statement of
1 The Western Energy Crisis of 2000-2001 entailed a series of market
conditions and events in the Western U.S. that included diminished power
supplies due to drought, inadequate infrastructure, a flawed power market
design, and market manipulation. See FERC, Addressing the 2000-2001
Western Energy Crisis, (2010), www.ferc.gov/industries/electric/indus-act/
wec.asp. See also, e.g., Puget Sound Energy, Inc., 146 FERC ¶ 63,028, PP 5-16
(2014).
a material fact or omitting to state a material fact necessary to make a statement that was made not misleading, or engaging in any act, practice or course of business that operates or would operate as a fraud or deceit upon any entity; (2) with the requisite scienter (that is, an intentional or reckless state of mind); (3) in connection with a transaction subject to FERC jurisdiction. The Commission need not show reliance, loss causation, or damages to prove a violation.
The prohibition is intended to deter or punish fraud in wholesale energy markets. The Commission defines fraud in general terms, meaning that fraud includes any action, transaction or conspiracy for the purpose of impairing, obstructing or defeating a well-functioning market. Fraud is a question of fact that is to be determined by all the circumstances of a case. In Order No. 670, the Commission found it appropriate to model its Anti-Manipulation Rule on Securities and Exchange Commission (SEC) Rule 10b-5 in an effort to prevent (and where appropriate, remedy) fraud and manipulation affecting the markets the Commission is entrusted to protect. Like SEC Rule 10b-5, FERC’s Anti-

132 | Energy Primer Federal Energy Regulatory Commission
Manipulation Rule is intended to be a broad antifraud catch-all clause.
Manipulation comes in many varieties. As a federal court of appeals has stated in the context of commodities manipulation, “We think the test of manipulation must largely be a practical one.… The methods and techniques of manipulation are limited only by the ingenuity of man.”2 The Commission recognized this reality by framing its Anti-Manipulation Rule broadly, rather than articulating specific conduct that would violate its rules. While not an exhaustive list, the following are broad categories of illustrative manipulations that have surfaced in energy, other commodity, and securities markets over the years. The borders of these categories are flexible and some can belong to multiple categories, such as wash trading (i.e., a trader executes a simultaneous purchase and sale of same financial instruments to create misleading, artificial activity in the marketplace). Traders may also combine elements of various schemes to effect a manipulation.
In addition to the information provided here, the Commission’s Office of Enforcement (Enforcement) staff has published a white paper providing additional background on types of manipulative schemes discussed here.3
2 Cargill, Inc. v. Hardin, 452 F.2d 1154, 1163 (8th Cir. 1971).
3 FERC Staff White Paper on Anti-Market Manipulation Enforcement
Efforts Ten Years after EPAct 2005 (2016) (Enforcement Staff White Paper on
Manipulation), available at https://www.ferc.gov/legal/staff-reports/2016/
marketmanipulationwhitepaper.pdf.
Manipulative Trading
Techniques and Cross-Product Manipulations
A number of manipulative trading techniques may be subject to the Commission’s Anti-Manipulation Rule. Traders may seek to inflate trading volumes or trade at off-market prices to serve purposes such as maintaining market confidence in a company’s portfolio or to move a price to trigger an option. “Marking the close” is a manipulative practice in which a trader executes a number of transactions near the close of a day’s or contract’s trading to affect the closing or settlement price. This may be done to obtain mark-to-market marks for valuation, to avoid margin calls, or to benefit other positions in related instruments. “Banging the open” is a similar practice in which a trader buys or sells a large quantity at the opening of trading to induce others to trade at that price level and to signal information on fundamentals. Other manipulative trading techniques exist, and practices like wash and round-trip trading that are discussed in more detail below fit under this description as well.
Manipulators have grown more sophisticated with the expanded use of derivative products, whose value is set by the price of transactions in a related product. Many of the manipulative schemes that Enforcement staff has investigated and prosecuted are cross-product schemes in which an entity engages in trades in one market (e.g., the physical market), often at a loss, with the intent to affect the settlement price of derivative instruments. Such trading can violate the Anti-Manipulation Rule because the trading is not undertaken in response to supply-and-demand fundamentals but rather is undertaken to benefit another position. Such trading could be considered to undermine the functioning of jurisdictional markets.

Energy Primer | 133
Key to understanding cross-product manipulation is that financial and physical energy markets are interrelated: physical natural gas or electric transactions can help set energy prices on which financial products are based, so that a manipulator can use physical trades (or other energy transactions that affect physical prices) to move prices in a way that benefits his overall financial position. One useful way of looking at manipulation is that the transaction is a “trigger” that is used to “target” a price. Commonly, the trigger is a physical product, but cases have also arisen where the trigger was a financial product. For example, the trigger could be a physical power flow scheduled in a day-ahead electricity market at a particular node, and the target could be the day-ahead price established by the market operator for that node. Or the trigger could be a purchase of natural gas at a trading point located near a pipeline, and the target could be a published index price corresponding to that trading point. The purpose of using the trigger to target a price is to raise or lower that price in a way that will increase the value of a “benefiting position” (e.g., Financial Transmission Right or FTR product in power markets, a swap, a futures contract, or other derivative).
Usually, increasing the value of the benefiting position (i.e. to increase profits or mitigate losses) is the goal or motive of the manipulative scheme. Understanding the nature and scope of a manipulator’s benefiting financial positions—and how they relate to the triggering transactions—can be a key focus of manipulation cases. The Commission’s Anti-Manipulation Rule is an intent-based rule: a finding of manipulation requires proving that the manipulator intended (or in some cases, acted recklessly) to move prices or otherwise distort the proper functioning of the energy markets the Commission regulates. A company can put on a large trade that may affect market prices, but if the purpose of that trade is to hedge risk or speculate based on market fundamentals—rather than to move prices to benefit a related financial position—this conduct, without more, would not violate the Commission’s Anti-Manipulation Rule.
Information-Based
ManipulationsMany manipulative schemes rely on spreading false information, which involves knowingly disseminating untrue information about an asset’s value in order to move its price. A well-known scheme in the securities markets is the “pump and dump,” in which a participant spreads a rumor that drives the price up and then sells the shares after the price rises. In the energy markets, a common way to misrepresent a commodity’s value is to misrepresent the price of the commodity or its level of trading activity. False reporting and wash-trading schemes were well-documented information-based manipulations that took place in the early 2000s and contributed to the Western Energy Crisis. False reporting occurs when a market participant submits fictitious transactions or information to a price-index publisher to affect the index-settlement price. Another form of information-based manipulation involves providing misinformation through conduct that is intended to misrepresent a market participant’s characteristics, circumstances, or intentions, in order to receive a benefit, payment, or award for which it would not be eligible but for the misleading conduct. This includes engaging in trading strategies that are intended to create market results that are inconsistent with the purpose of the transactions.
Similarly, wash trading may involve actual but offsetting trades for the same (possibly nonmarket) price and volume between the same market participants such that no economic exchange takes place; however, it may falsely inflate trading volumes at a price level and give the impression of greater trading activity. False reporting and wash trading have resulted in a number of criminal prosecutions by the Department of Justice.

134 | Energy Primer Federal Energy Regulatory Commission
GamingMany of the cases investigated and prosecuted by Enforcement staff concern gaming of tariff provisions or market rules. The Commission has made clear that gaming includes behavior that circumvents or takes unfair advantage of market rules or conditions in a deceptive manner that harms the proper functioning of the market and potentially other market participants or consumers. The prohibition on gaming is longstanding and applied to a number of pre-EPAct 2005 schemes including those that arose during the Western Energy Crisis.4 More recently, the Commission has pursued cases involving gaming, including, as discussed below, GDF Suez Energy Marketing NA, Inc., JPMorgan Ventures Energy Corp., and the PJM Up-To Congestion Cases. In considering these cases, the Commission has found gaming to include effectively riskless transactions executed for the purpose of receiving a collateral benefit; conduct that is inconsistent or interferes with a market design function; and conduct that takes unfair advantage of market rules to the detriment of other market participants and market efficiency.
4 See Enforcement Staff White Paper on Manipulation 23-25.
WithholdingWithholding is the removal of supply from the market and is one of the oldest forms of commodities manipulation. The classic manipulative scheme referred to as a “market corner” involves taking a long contract position in a deliverable commodity and stockpiling physical supply to force those who have taken a short position to buy back those positions at an inflated price.
Withholding played an important role in the Western Energy Crisis in the early 2000s. Market participants, particularly Enron, exploited supply-demand imbalances and poor market design. Generation operators scheduled maintenance outages during peak demand periods, which is an example of physical withholding. In addition, transmission lines were overscheduled to create the appearance of congestion in an effort to reduce the supply of electricity. These efforts, in combination with economic withholding and information-based schemes discussed above, resulted in a dramatic rise in wholesale electricity prices. Utilities such as Pacific Gas & Electric (PG&E) and Southern California Edison were unable to pass on these high prices to their retail customers because of state price caps. The crisis precipitated widespread blackouts, impaired the state’s economy, and led to the bankruptcy filing in April 2001 by PG&E.
Economic withholding, which also contributed to the Western Energy Crisis, is similar to physical withholding, but rather than turning off a generator or stockpiling a physical commodity, the manipulator sets an offer price for a needed resource that is so high that the resource will not be selected in the market. For example, a generator in a constrained market such as New York City could purposely set its offer price high enough that it would not be called on to run. This scheme would create a shortage of generation and, thus, would raise prices for the benefit of the rest of its generation fleet or its financial positions.

Energy Primer | 135
Representative Matters
The following representative matters involve at least one of the types of manipulative schemes previously described. Each of these matters has either been resolved through settlement or is currently pending before a district court or administrative law judge.
Barclays Bank, PLC, Daniel Brin, Scott Connelly, Karen Levine, and Ryan Smith (Barclays and Traders)
On July 16, 2013, the Commission issued an order determining that Barclays and Traders violated the Commission’s Anti-Manipulation Rule.5 The Commission found that Barclays and Traders engaged in loss-generating trading of day-ahead, fixed-price physical electricity on the ICE with the intent to benefit financial swap positions at primary electricity trading points in the western United States. In sum, Barclays undertook fixed-price, day-ahead physical trades at various western trading points to change the ICE daily index for the benefit of its financial swap positions whose price was based on that index.
Barclays and Traders failed to pay the penalties assessed by the Commission. Enforcement staff filed an action to affirm the Commission’s assessment in the United States District Court for the Eastern District of California on October 9, 2013. In May 2015, the Court rejected defendants’ motion to dismiss and ruled that the conduct alleged was actionable as manipulation, that the Commission had jurisdiction over the manipulative trading at issue, and that the Commission had authority to pursue individuals. Following a mediation under the Court’s supervision, Enforcement staff and defendants reached a settlement for $105 million. Barclays agreed to pay
5 Barclays Bank PLC, Daniel Brin, Scott Connelly, Karen Levine, and
Ryan Smith, 144 FERC ¶ 61,041 (2013) (Order Assessing Civil Penalties).
a $70 million civil penalty and $35 million in disgorgement.6
The Commission approved the settlement on November 7, 2017.7
BP America, Inc. and Affiliates (BP)
On August 5, 2013, the Commission issued an order to show cause and notice of proposed penalty to BP.8 In that proceeding, Enforcement staff alleged that BP made uneconomic natural gas sales at Houston Ship Channel and took steps to increase its market share at Houston Ship Channel as part of a manipulative scheme to suppress the Houston Ship Channel Gas Daily index and that this scheme was motivated by a desire to benefit certain physical and financial positions held by BP whose price was set by the same index. Enforcement staff further alleged that this conduct was inappropriate cross-product manipulation. On May 15, 2014, the Commission set the matter for hearing to determine whether BP’s conduct violated the Anti-Manipulation Rule.9
A hearing took place in March-April of 2015, and the parties filed post-hearing briefs shortly thereafter. On August 13, 2015, Administrative Law Judge (ALJ) Cintron issued her Initial Decision finding that BP violated the Anti-Manipulation Rule and section 4A of the NGA.10 On July 11, 2016, the Commission issued an order affirming the ALJ’s Initial Decision and directing BP to pay $20,160,000 in civil penalties and disgorge unjust profits in the amount of $207,169 to the Low Income Home Energy Assistance Program of Texas for the benefit of its energy consumers.11 The Commission simultaneously denied BP’s pending motion for rehearing of the Commission’s earlier order setting the case for hearing. BP’s August 10, 2016
6 FERC v. Barclays Bank PLC, 105 F. Supp. 3d 1121 (2015).
7 Barclays Bank PLC, Daniel Brin, Scott Connelly, and Karen Levine,
161 FERC ¶ 61,147 (Order Approving Stipulation and Consent Agreement)
(2017).
8 BP America Inc., 144 FERC ¶ 61,100 (2013).
9 BP America Inc., 147 FERC ¶ 61,130 (2014).
10 BP America Inc., 152 FERC ¶ 63,016 (2015).
11 BP America Inc., 156 FERC ¶ 61,031 (2016).

136 | Energy Primer Federal Energy Regulatory Commission
Request for Rehearing of the July 2016 order remains pending.
Constellation Energy Commodities Group
On March 9, 2012, the Commission approved a settlement with Constellation Energy Commodities Group (CCG) in which CCG agreed to disgorge $110 million in unjust profits and pay a civil penalty of $135 million.12 Enforcement staff had alleged that CCG entered into significant loss-generating physical and virtual day-ahead transactions in electricity markets in and around New York State with the intent to move day-ahead price settlements to benefit financial swap positions that were priced based on those settlements.
ETRACOM LLC and Michael Rosenberg
On June 17, 2016, the Commission found that ETRACOM LLC (ETRACOM) and Michael Rosenberg violated the Commission’s Anti-Manipulation Rule by implementing a scheme to submit virtual transactions for the purpose of economically benefitting ETRACOM’s Congestion Revenue Rights (CRR) positions.13 Specifically, in May 2011, ETRACOM submitted continuous and uneconomic virtual supply offers at New Melones, a node near the eastern border of CAISO, in every hour over an 18-day period with the intent to artificially lower prices there. Many of ETRACOM’s virtual supply offers were placed near the offer floor of negative $30, and ETRACOM accumulated $42,000 in losses related to its virtual supply offers over that period. At the same time, the artificially-lowed prices increased the profit on ETRACOM’s CRR positions at New Melones by over $315,000 during that period. The Commission assessed civil penalties against ETRACOM and Rosenberg of $2.4 million and $100,000, respectively. The Commission further directed ETRACOM to disgorge the $315,000 of unjust profits, with interest.
12 Constellation Energy Commodities Group, Inc., 138 FERC ¶ 61,168
(2012).
13 ETRACOM LLC and Michael Rosenberg, 155 FERC ¶ 61,284 (2016)
(Order Assessing Civil Penalties).
ETRACOM and Rosenberg failed to pay the penalties assessed by the Commission. Therefore, on August 17, 2016, the Commission filed a petition for an order to review and affirm the penalties in the United States District Court for the Eastern District of California. On April 10, 2018, the Commission approved a settlement in which Etracom agreed to pay the full disgorgement amount (with interest) and a penalty of $1,500,508.14
GDF Suez Energy Marketing NA, Inc. (GDF Suez)
On February 1, 2017, the Commission approved a settlement with GDF Suez resolving an investigation relating to lost opportunity cost credits (LOCs) in the PJM market.15 Under the terms of the settlement, GDF Suez agreed to pay a civil penalty of $41 million and disgorgement to PJM of $40.8 million.
Enforcement staff concluded that GDF Suez violated the Commission’s Anti-Manipulation Rule by targeting and inflating its receipt of LOCs. PJM pays LOCs to combustion turbine units that clear the day-ahead market but are not subsequently dispatched in the real-time market. During the period of GDF Suez’s conduct (2011-2013), PJM calculated LOCs for combustion turbine units based on the difference between the real-time locational marginal price and the higher of a unit’s price-based and cost-based offers. GDF Suez targeted and inflated its receipt of LOCs by discounting its offers below-cost in order to clear the day-ahead market at times when the units likely would not have cleared based on undiscounted offers and when GDF Suez expected that PJM would not dispatch the units in the real-time. This resulted in profits from LOCs when PJM did not dispatch the units and they would have operated at a loss if dispatched. GDF Suez’s discounted offers did not reflect the price at which it could
14 ETRACOM LLC and Michael Rosenberg, 163 FERC ¶ 61,022 (2018)
(Order Approving Stipulation and Consent Agreement).
15 GDF SUEZ Energy Marketing NA, Inc., 158 FERC ¶ 61,102 (2017)
(Order Approving Stipulation and Consent Agreement).

Energy Primer | 137
economically generate power, but rather the price at which it could obtain a day-ahead award and then receive LOCs when the units could not have operated profitably.
ISO-NE Day-Ahead Load Response Program (DALRP)
Based on an Enforcement investigation of Rumford Paper Company (Rumford), Lincoln Paper and Tissue LLC (Lincoln), Competitive Energy Services, LLC (CES), and Richard Silkman, the Commission in July 2012 issued each subject an order to show cause alleging that their conduct related to the DALRP in the ISO-NE market violated the Commission’s Anti-Manipulation Rule. The Office of Enforcement and Rumford settled the allegations against the company, which the Commission approved in March 2013.16 On August 29, 2013, the Commission issued Orders Assessing Civil Penalties to Lincoln, CES, and Silkman, finding that the subjects fraudulently inflated load baselines and repeatedly offered load reductions at the minimum offer price in order to maintain the inflated baseline.17 The Commission found that the scheme involved uneconomic energy purchases that served no legitimate purpose and were designed to increase DALRP payments that would not have otherwise been obtained. The Commission determined that this scheme misled ISO-NE, inducing payments to these entities based on the inflated baselines for load reductions that never occurred.
The Commission ordered Lincoln to pay $5 million in civil penalties and approximately $379,000 in disgorgement; CES to pay $7.5 million in civil penalties and approximately $167,000 in disgorgement; and Silkman to pay $1.25 million in civil penalties. None of the respondents paid the amounts assessed by the Commission. Enforcement staff filed two
16 Rumford Paper Co., 142 FERC ¶ 61,218 (2013) (Order Approving
Stipulation and Consent Agreement).
17 Lincoln Paper and Tissue, LLC, 144 FERC ¶ 61,162 (2013) (Order
Assessing Civil Penalty); Competitive Energy Services, LLC, 144 FERC ¶ 61,163
(2013) (Order Assessing Civil Penalty); Richard Silkman, 144 FERC ¶ 61,164
(2013) (Order Assessing Civil Penalty).
petitions in the United States District Court for the District of Massachusetts on December 2, 2013 seeking review and affirmance of the Commission’s orders. On April 11, 2016, the Court denied Lincoln, Silkman and CES’s motions to dismiss the Commission’s petitions for failure to state a claim and transferred these cases to the United States District Court for the District of Maine.18 The Commission subsequently approved a settlement in which Lincoln agreed to a $5 million penalty, subject to certain conditions on account of its bankruptcy and disgorgement of $379,016.19 The Commission’s case against Silkman and CES remains pending.
JP Morgan Ventures Energy Corporation (JPMVEC)
On July 30, 2013, the Commission approved a settlement between Enforcement and JPMVEC resolving an investigation of JPMVEC’s bidding practices.20 JPMVEC paid $285 million in civil penalties, $124 million in disgorgement to CAISO ratepayers, and $1 million in disgorgement to MISO. In addition, the company agreed to waive its claims that CAISO owed it money from two of the strategies that Enforcement staff had investigated, and to conduct a comprehensive external assessment of its policies and practices in the power business.
Enforcement staff determined that JPMVEC violated the Commission’s Anti-Manipulation Rule by engaging in twelve manipulative bidding schemes in CAISO and MISO. These schemes distorted a well-functioning market in several ways, including but not limited to, misleading CAISO and MISO into paying JPMVEC at rates far above market prices; submitting bids that were expected to, and did, lose money at market
18 FERC v. Silkman, 177 F.Supp.3d 683 (D.Mass. 2016) (order
regarding motions to dismiss); FERC v. Silkman, 2016 WL 1444604 (D.Mass.
April 11, 2016) (order regarding transfer).
19 Lincoln Paper and Tissue, LLC, 155 FERC ¶ 61,228 (2016) (Order
Approving Stipulation and Consent Agreement)
20 In Re Make-Whole Payments and Related Bidding Strategies, 144
FERC ¶ 61,068 (2013) (Order Approving Stipulation and Consent Agreement).

138 | Energy Primer Federal Energy Regulatory Commission
rates, as they were not driven by the market forces of supply and demand; defrauding the ISOs by obtaining payments for benefits that JPMVEC did not deliver; and displacing other generation and influencing energy and congestion prices.
Maxim Power Corp.
On May 1, 2015, the Commission assessed $5 million in civil penalties against Maxim Power Corp. (Maxim) and its affiliates and $50,000 against an individual employee principally responsible for the conduct, finding that Maxim’s offers to ISO-NE for its Pittsfield, Massachusetts power plant were manipulative.21 Although the Pittsfield plant could burn either natural gas or fuel oil, Maxim almost always burned gas because it was usually much cheaper to do so. In the summer of 2010, on hot days when it expected the Pittsfield plant to receive day-ahead awards for reliability, Maxim submitted offers to ISO-NE based on oil prices even though the unit actually burned natural gas. Because the unit was needed for reliability, Maxim received make-whole payments for costly oil that Maxim did not in fact burn, generating substantial profits for the firm. Maxim also sent emails to the Market Monitor that the Commission found had falsely communicated to the ISO-NE market monitor that the unit was actually burning oil.
Maxim failed to pay the assessed penalties. The Commission filed a petition for an order to review and affirm the penalties in the United States District Court for the District of Massachusetts. After the court denied Maxim’s motion to dismiss,22 the Commission on September 26, 2016 approved a settlement negotiated by Enforcement and Maxim in which Maxim agreed to pay a total of $8 million, an amount divided equally between disgorgement (paid to ISO-NE) and civil penalties.23
21 Maxim Power Corporation, Maxim Power (USA), Inc., Maxim Power
(USA) Holding Company Inc., Pawtucket Power Holding Co., LLC, Pittsfield
Generating Company, LP, and Kyle Mitton, 151 FERC ¶ 61,094 (2015) (Order
Assessing Civil Penalties).
22 FERC v. Maxim Power Corp., 196 F. Supp. 3d 181 (D. Mass. 2016).
23 Maxim Power Corp., Maxim Power (USA), Inc., Maxim Power
(USA) Holding Company Inc., Pawtucket Power Holding Company, LLC, and
PJM Up-To Congestion (UTC) Cases
In August 2010, the Commission opened an investigation into whether certain market participants were manipulating the PJM Up-To Congestion market. Following three separate show cause proceedings that commenced between May 2015 and May 2016, the Commission found certain trading by five entities and eight individuals to violate the Anti-Manipulation Rule and assessed civil penalties.24 The manipulative trading involved the reservation of large volumes of transmission in connection with spread trades that were either found to be wash trades (i.e., placed equal and offsetting trading volumes between the same two pricing points for the same time period) or placed between points with de minimis or zero price spreads. Thus, the lack of price spread allowed the traders to reserve exceptionally large volumes of transmission, which in turn enabled the traders to claim certain credits that PJM was allocating to paid-for transmission.
When the assessed penalties were not paid, the Commission filed petitions for review and enforcement in three district courts: in the Eastern District of Virginia seeking $28.8 million in penalties and $3.47 million in disgorgement against Powhatan Energy Fund, LLC and other funds and $1 million against Houlian Chen; in the District of the District of Columbia seeking $14 million in penalties and $1.28 million in disgorgement against City Power Marketing, LLC and $1 million in penalties from K. Stephen Tsingas; and in the Southern District of Ohio seeking $26 million in penalties and $4.12 million in disgorgement against Coaltrain Energy, L.P
Pittsfield Generating Company, LP, 156 FERC ¶ 61,223 (2016) (Order Approving
Stipulation and Consent Agreement).
24 Houlian Chen, Powhatan Energy Fund, LLC, HEEP Fund, LLC, CU
Fund, Inc., 151 FERC ¶ 61,179 (2015) (Order Assessing Civil Penalties); City
Power Marketing, LLC and K. Stephen Tsingas, 152 FERC ¶ 61,012 (2015)
(Order Assessing Civil Penalties); and Coaltrain Energy, L.P., Peter Jones,
Shawn Sheehan, Robert Jones, Jeff Miller, Jack Wells, and Adam Hughes 155
FERC ¶ 61,204 (2016) (Order Assessing Civil Penalties).

Energy Primer | 139
and $12 million in total penalties from four individuals.
In the City Power case, the Court rejected defendants’ motion to dismiss, holding that the alleged conduct was actionable as manipulation and that the Commission could penalize individuals.25 Subsequently, in February 2017, defendants settled for a $9 million penalty against City Power, a $1.42 million penalty against Tsingas, and $1.3 million in disgorgement.26
In the Coaltrain case, as in City Power, the court denied defendants’ motions to dismiss, holding, among other things, that the Commission had alleged actionable manipulation, pled fraud with specificity, has jurisdiction over financially-settled transactions, and can penalize individuals.27 The Chen/Powhatan and Coaltrain cases remain pending.
25 FERC v. City Power Marketing, LLC, 199 F. Supp. 3d 218 (D.D.C.
2016).
26 City Power Marketing, LLC and K. Stephen Tsingas, 160 FERC ¶
61,013 (2017) (Order Approving Stipulation and Consent Agreement).
27 FERC v. Coaltrain Energy, L.P., et al., Case No. 2:16-cv-732-MHW-
KLJ (S.D. Oh. Mar. 30, 2018).

140 | Energy Primer Federal Energy Regulatory Commission

Energy Primer | 141
Acronyms
ABB – ABB Ltd Corporation
AOPL – Association of Oil Pipelines
API – American Petroleum Institute
BAA – Balancing Authority Area
Bcf – Billion cubic feet
Bcfd – Billion cubic feet per day
Btu – British Thermal Unit
b/d – Barrels per day
CAISO – California Independent System Operator Corporation
CRR – Congestion Revenue Rights
DEC – Decrement or virtual bid
DER - Distributed Energy Resource
EIA – The U.S. Energy Information Administration, U.S. Department of Energy
EEI – Edison Electric Institute
ERCOT – Electric Reliability Council of Texas, Inc.
FERC – Federal Energy Regulatory Commission
FTR – Financial Transmission Rights
FPA – Federal Power Act
ICA – Interstate Commerce Act
ICE – Intercontinental Exchange, Inc.
INC – Increment or virtual offer
IOU – Investor-owned Utility
IPP – Independent Power Producer
ISO – Independent System Operator
ISO-NE – ISO New England, Inc.
kW – Kilowatt
kWh – Kilowatt-hour
LDC – Local Distribution Company
LSE – Load serving entity
LMP – Locational Marginal Price
MISO – Midcontinent Independent System Operator, Inc.
MM – Million
MMBtu – Million British Thermal Units
MW – Megawatt
MWh –Megawatt-hour
NAESB – North American Energy Standards Board
NERC – North American Electric Reliability Corporation

142 | Energy Primer Federal Energy Regulatory Commission
NGA – Natural Gas Act
NGL – Natural gas liquids
NYISO – New York Independent System Operator, Inc.
OATT – Open Access Transmission Tariff
PHMSA – U.S. Department of Transportation’s Pipeline and Hazardous Materials Safety Administration
PJM – PJM Interconnection, L.L.C.
QF – Qualifying Facility
RMR – Reliability Must-Run
RTO – Regional Transmission Organization
SEC – Securities and Exchange Commission
SPP – Southwest Power Pool, Inc.
TCC – Transmission Congestion Contracts
Tcf – Trillion cubic feet
TCR – Transmission Congestion Rights
TVA – Tennessee Valley Authority
UTC – Up To Congestion