2020-2021 - annual report - Maharashtra Pollution Control ...
151
2020-2021 ANNUAL REPORT MAHARASHTRA POLLUTION CONTROL BOARD
-
Upload
khangminh22 -
Category
Documents
-
view
2 -
download
0
Transcript of 2020-2021 - annual report - Maharashtra Pollution Control ...

2020-2021
ANNUAL REPORT
MAHARASHTRA POLLUTION CONTROL BOARD

Foreword
An efficient way to analyze overall environmental quality is required for
any decision maker who study the environment and as an
environmental consciousness in almost every activity has risen in recent
years, the importance of environmental communication and social
accountability, which promote active and voluntary disclosure of
environmental information has become quintessential. In addition, when
citizens make a decision to act on their environmental awareness, it is
necessary to know significant information about the environment they live in, and this
importance is widely recognized to fulfill the needs of every stakeholder by providing and
reporting the environmental information in their respective regions.
It gives me pleasure to present herewith Annual report of FY 2020-2021 publishing latest
happenings of MPCB who is constantly thriving for sharing information through several means.
MPCB’s priority is to sensitize each & every concerned associated with activities of MPCB
directly or indirectly. This report is a tool for providing wider information on activities carried
out and services provided by the Board.
In this report the Board presents information on the status and condition of environmental
resources, the associated environmental trends and implications and other related efforts. In
this report, to evaluate the status of environment; the most up-to-date information from a range
of data collected through various real-time monitoring stations and sampling is used. Further
every evaluation and assessment completed during a reporting period includes a summary of
its findings and conclusion. This latest report also includes the challenges we have overcome
by implementing various action plans, noted the issues we are still working on, and explores
emerging challenges. With a view to have ready information on the activities of Maharashtra
Pollution Control Board, an attempt is made to present the relevant and latest statistics about
key indicators and parameters e.g. Industries covered under the purview of the environmental
legislations, Grant of Consent, Authorization issued under Bio-Medical Waste (Mgmt. and
Handling) Rules, 1998 & Municipal Solid Waste (M & H) Rules, 2000, Legal Actions initiated
against defaulters, Public Complaints, Central Action Plan, Industrial pollution load, CETP
Status, Performance of Regional Offices, Central & Regional Laboratories, environmental
Water & Air quality, Organization, Staff Strength etc. Further new developments by the Board
during the said year are also briefly explained in the report.
Shri. Ashok Shingare [IAS]
Member Secretary,
Maharashtra Pollution Control Board


1
LIST OF TABLES
1. INTRODUCTION ................................................................................................................ 1
2. CONSTITUTION OF THE BOARD ..................................................................................... 3
3. MEETINGS OF THE BOARD ............................................................................................. 4
4. COMMITTEES CONSTITUTED BY THE BOARD .............................................................. 8
4.1 Consent Appraisal Committee (CAC) ....................................................................... 8
4.2 Consent Committee (CC) ......................................................................................... 8
4.3 Committees formed for Solid Waste Management Rule, 2016................................. 9
4.4 Committees formed for Hazardous & Other Waste (T & M) Rule, 2016 & E-waste Rule, 2016 .............................................................................................................. 10
4.5 Committee constituted for deciding Guidelines for issuance for Registration to Producer/ Brand Owner / Manufacturer under Plastic Waste Management Rule, 2016 and amendment thereto; ............................................................................... 11
5. AIR AND WATER MONITORING NETWORK AND PRESENT STATUS OF THE ENVIRONMENT ............................................................................................................ 13
5.1 Monitoring Network and Region-wise Air Quality in Maharashtra ............................... 13
5.1.1 Amravati ................................................................................................................ 15
5.1.2 Aurangabad .......................................................................................................... 16
5.1.3 Chandrapur ........................................................................................................... 17
5.1.4 Kalyan ................................................................................................................... 17
5.1.5 Kolhapur ............................................................................................................... 18
5.1.6 Mumbai ................................................................................................................. 19
5.1.7 Nagpur .................................................................................................................. 20
5.1.8 Nashik ................................................................................................................... 20
5.1.9 Navi Mumbai ......................................................................................................... 21
5.1.10 Pune ................................................................................................................... 22
5.1.11 Raigad ............................................................................................................... 23
5.1.12 Thane .................................................................................................................. 23
5.2 Conclusion for Air Quality in the State of Maharashtra................................................ 24
5.2.1 Trend Analysis of AQI share over 5 years. ........................................................... 24
5.3 Ambient Noise Quality at Various Locations in the State of Maharashtra ................... 26
5.3.1 Mumbai ................................................................................................................. 27
5.3.2 Navi Mumbai ......................................................................................................... 27
5.3.4 Pune ..................................................................................................................... 27
5.3.3 Thane .................................................................................................................... 28
5.3.5 Nashik ................................................................................................................... 28
5.3.6 Aurangabad .......................................................................................................... 29
5.3.7 Nagpur .................................................................................................................. 29
5.3.8 Kalyan ................................................................................................................... 29
5.3.9 Amaravati .............................................................................................................. 30
5.3.10 Kolhapur ............................................................................................................. 30

5.3.11 Chandrapur ......................................................................................................... 30
5.3.12 Panvel ( Raigad ) ................................................................................................ 31
5.4 Water Quality in Maharashtra ..................................................................................... 31
5.4.1 Water Quality Index .............................................................................................. 32
5.4.2 Analysis of Surface Water Quality with Statistical details ................................ 35
5.4.3 Analysis of Groundwater Quality with Statistical details .................................. 41
5.4.4 Conclusion for WQI for Surface Water and Groundwater ............................... 42
5.4.5 Trend Analysis of WQI across basins over 5 years ......................................... 42
5.5 Industrial Pollution .................................................................................................. 48
5.5.1 Analysis and Performance of CETP with Statistical Details ............................ 49
5.6 Domestic Wastewater Treatment ........................................................................... 59
5.6.1 Analysis of Performance of Sewage Treatment Plants with Statistical Details 59
5.7 Solid Waste Management in Maharashtra ............................................................. 67
5.7.1 Analysis of Municipal Solid Waste Management with Statistical details (Region-wise) ................................................................................................................ 68
5.7.2 Trend Analysis of Municipal Solid Waste Generation and Treatment over 5 years ................................................................................................................ 69
5.7.3 Trend Analysis of MSW treatment over 5 years .............................................. 69
5.8 Hazardous Waste Generation during the year 2020-21 ......................................... 70
5.8.1 Status of Common Hazardous Waste Treatment, Storage & Disposal Facility 71
5.8.2 Trend analysis of Hazardous Waste received at disposal sites over 5 years.. 73
5.9 Bio-medical Waste .................................................................................................. 73
5.9.1 Implementation of Biomedical Waste Management Rules, 2016 .................... 73
5.9.2 Status of Bio-medical Waste Treatment Facilities ........................................... 74
5.10 Electronic Waste ..................................................................................................... 74
5.10.1 Implementation of E-waste (Management and Handling) Rules, 2016 ........... 75
5.11 Plastic Waste Management in the State of Maharashtra........................................ 76
5.12 Construction & Demolition Waste ........................................................................... 78
5.13 Performance of MPCB Laboratories ....................................................................... 80
6. REGIONAL ENVIRONMENTAL PROBLEMS & CONTROL MEASURES TAKEN IN RESPECTIVE REGIONS............................................................................................... 83
6.1 Amravati ................................................................................................................. 83
6.1.1 Air Issue .......................................................................................................... 83
6.1.2 Water Issues ................................................................................................... 83
6.1.3 Solid Waste Issues .......................................................................................... 84
6.2 Aurangabad ............................................................................................................ 84
6.2.1 Air Issues ......................................................................................................... 84
6.2.2 Water Issues ................................................................................................... 85
6.2.3 Solid Waste Issues .......................................................................................... 85
6.2.4 Noise Issues .................................................................................................... 86
6.3 Kolhapur ................................................................................................................. 86

6.3.1 Air Issues ......................................................................................................... 86
6.3.2 Water Issues ................................................................................................... 87
6.3.3 Solid Waste Issues .......................................................................................... 88
6.3.4 Noise Issues .................................................................................................... 89
6.4 Navi Mumbai ........................................................................................................... 89
6.4.1 Air Issues ......................................................................................................... 89
6.4.2 Water Issues ................................................................................................... 90
6.4.3 Solid Waste Issues .......................................................................................... 90
6.5 Nagpur .................................................................................................................... 90
6.5.1 Air Issues ......................................................................................................... 90
6.5.2 Water Issues ................................................................................................... 91
6.5.3 Solid Waste Issues .......................................................................................... 91
6.6 Raigad .................................................................................................................... 91
6.6.1 Air Issues ......................................................................................................... 91
6.6.2 Water Issues ................................................................................................... 92
6.6.3 Solid Waste Issues .......................................................................................... 92
6.7 Pune ....................................................................................................................... 92
6.7.1 Air Issues ......................................................................................................... 92
6.7.2 Water Issues ................................................................................................... 93
6.7.3 Solid Waste Issues .......................................................................................... 94
6.8 Chandrapur ............................................................................................................. 94
6.8.1 Air Issues ......................................................................................................... 94
6.8.2 Water Issues ................................................................................................... 95
6.8.3 Solid Waste Issues .......................................................................................... 95
6.8.4 Noise Issues .................................................................................................... 95
6.9 Kalyan ..................................................................................................................... 96
6.9.1 Air Issues ......................................................................................................... 96
6.9.2 Water Issues ................................................................................................... 96
6.9.3 Solid Waste Issues .......................................................................................... 97
6.10 Nashik ..................................................................................................................... 97
6.10.1 Air Issues ......................................................................................................... 97
6.10.2 Water Issues ................................................................................................... 98
6.11 Mumbai ................................................................................................................... 98
6.11.1 Air Issues ......................................................................................................... 98
6.11.2 Water Issues ................................................................................................... 99
6.11.3 Solid Waste Issues .......................................................................................... 99
6.11.4 Noise Issues .................................................................................................... 99
6.12 Thane ..................................................................................................................... 99
6.12.1 Air Issues ....................................................................................................... 100
6.12.2 Water Issues ................................................................................................. 100

6.12.3 Solid Waste Issues ........................................................................................ 100
6.12.4 Noise Issues .................................................................................................. 101
7. ENVIRONMENTAL STUDIES AND SURVEYS .......................................................... 102
7.1 Noise Monitoring during Ganesh Festival 2020 .................................................... 102
7.1.1 Conclusion- Noise Monitoring during Ganesh Festival’2020 ......................... 103
7.2 Noise Monitoring during Diwali 2020. ................................................................... 105
7.2.1 Conclusion – Noise Monitoring During Diwali’2020 ....................................... 106
7.3 Impact Evaluation of COVID 19 Pandemic on Environmental Attributes.............. 108
7.3.1 Conclusion of Impact of COVID 19 Pandemic on Environmental Attributes . 109
8. ENVIRONMENTAL TRAINING .................................................................................... 112
9. FINANCE AND ACCOUNTS ....................................................................................... 113
10. IMPLEMENTATION OF ACTS & RULES ................................................................ 114
10.1 Status of Legal Enforcement for the year April 2020- March 2021 ....................... 114
11. ENVIRONMENTAL AWARENESS & PUBLIC PARTICIPATION ............................ 116
12. IMPORTANT MATTERS DEALT WITH BY THE BOARD ....................................... 118
ANNEXURES ......................................................................................................................122
Annexure 1a -Oranizational Structure Of The Board .......................................................... 123
Annexure 1b -Charts Of Field Offices And Board Laboratories .......................................... 124
Annexure 1c -Board Laboratories Chart ............................................................................. 125
Annexure 2 - Staff Strength As On 31/03/2021 .................................................................. 126
Converted Temporary Establishment As On 31/03/2021 ................................................... 127
Annexure 3 - Details Of Regional & Sub-Regional Offices With Their Jurisdictions ........... 128
Annexure 4 - Industry Statistics For The Year 2020-21 ...................................................... 134
Annexure 5 - Details Of Training Programs Attended By Mpcb Officials During The Year 2020-2021. .......................................................................................................................... 135
Annexure 6 - Finance And Accounts For The Year 2020-21 .............................................. 138

LIST OF TABLES
Table 1.0 Constitution of M.P.C. Board during 2020-21 .................................................... 3
Table 5.1 Statistical Monitoring of Annual Average Air Quality in Amaravati Region ...... 15
Table 5.2 Exceedance factor for PM10 for Amravati Region ............................................ 16
Table 5.3 Statistical Monitoring of Annual Average Air Quality in Aurangabad Region .. 16
Table 5.4 Exceedance factors for PM10 for Aurangabad Region ..................................... 16
Table 5.5 Statistical Monitoring of Annual Average Air Quality in Chandrapur Region ... 17
Table 5.6 Exceedance factors for PM10 for Chandrapur Region ..................................... 17
Table 5.7 Statistical Monitoring of Annual Average Air Quality in Kalyan Region ........... 18
Table 5.8 Exceedance factors for NOx and PM10 for Kalyan Region .............................. 18
Table 5.9 Statistical Monitoring of Annual Average Air Quality in Kolhapur Region........ 18
Table 5.10 Exceedance factors for NOx and PM10 for Kolhapur Region ........................... 19
Table 5.11 Statistical Monitoring of Annual Average Air Quality in Mumbai Region ......... 19
Table 5.12 Exceedance factors for NOx & PM10 for Mumbai Region ................................ 19
Table 5.13 Statistical Monitoring of Annual Average Air Quality in Nagpur Region .......... 20
Table 5.14 Exceedance factors for PM10 for Nagpur Region ............................................ 20
Table 5.15 Statistical Monitoring of Annual Average Air Quality in Nashik Region ........... 20
Table 5.16 Exceedance factors for PM10 for Nashik Region ............................................. 21
Table 5.17 Statistical Monitoring of Annual Average Air Quality in Navi Mumbai Region . 21
Table 5.18 Exceedance factors for NOx for Navi Mumbai Region .................................... 22
Table 5.19 Statistical Monitoring Annual Average Air Quality in Pune Region .................. 22
Table 5.20 Exceedance factors for NOx and PM10 for Pune Region ................................. 23
Table 5.21 Statistical Monitoring of Annual Average Air Quality in Raigad Region........... 23
Table 5.22 Statistical Monitoring of Annual Average Air Quality in Thane Region ............ 23
Table 5.23 Exceedance factors for PM10 for Thane Region .............................................. 24
Table 5.24 Legend for reading AQI. .................................................................................. 24
Table 5.25 Noise Standards by CPCB. ............................................................................. 26
Table 5.26 Modified Weights for Computation of WQI Based on DO, FC, pH and BOD. . 33
Table 5.27 Sub-Index Equation Used to Calculate NSF WQI for DO, FC, pH and BOD. . 33
Table 5.28 Surface Water Classification based on Water Quality Index. .......................... 33
Table 5.29 Relative Weights of Each Parameter for WQI of Groundwater ....................... 34
Table 5.30 Groundwater Classification Based on Water Quality Index ............................. 34
Table 5.31 WQI for Ground Water in Various Region ....................................................... 41
Table 5.32 Categorization of industries in Maharashtra. ................................................... 48
Table 5.33 Statistical Analysis Data for CETP Performance in Amaravati Region ........... 50
Table 5.34 Statistical Analysis Data for CETP Performance in Aurangabad Region ........ 51
Table 5.35 Statistical Analysis Data for CETP Performance in Kalyan Region. ............... 52
Table 5.36 Statistical Analysis Data for CETP Performance in Kolhapur Region ............. 53
Table 5.37 Statistical Analysis Data for CETP Performance in Nagpur Region. ............... 54
Table 5.38 Statistical Analysis Data for CETP Performance in Navi Mumbai Region. ...... 55
Table 5.39 Statistical Analysis Data for CETP Performance in Pune Region ................... 56
Table 5.40 Statistical Analysis Data for CETP Performance in Raigad Region. ............... 57
Table 5.41 Statistical Analysis Data for CETP Performance in Thane Region ................. 58
Table 5.42 Mean of Annual Performance of STPs in Pune Region .................................. 59
Table 5.43 Mean of Annual Performance of STPs in Chandrapur Region ........................ 61
Table 5.44 Mean of Annual Performance of STPs in Nagpur Region ............................... 62
Table 5.45 Mean of Annual Performance of STPs in Nashik Region ................................ 62
Table 5.46 Mean of Annual Performance of STPs in Navi Mumbai Region ...................... 63

Table 5.47 Mean of Annual Performance of STPs in Thane Region ................................ 64
Table 5.48 Mean of Annual Performance of STPs in Aurangabad Region ....................... 65
Table 5.49 Mean of Annual Performance of STPs in Amaravati Region........................... 65
Table 5.50 Mean of Annual Performance of STPs in Kolhapur Region ............................ 66
Table 5.51 Mean of Annual Performance of STPs in Raigad Region ............................... 66
Table 5.52 Mean of Annual Performance of STPs in Kalyan Region ................................ 67
Table 5.53 Mean of Annual Performance of STPs in Mumbai Region. ............................. 67
Table 5.54 Total number of local bodies: 396 and Cantonment Board-07 ........................ 68
Table 5.55 Solid Waste Generation .................................................................................. 68
Table 5.56 Solid Waste Treatment .................................................................................... 68
Table 5.57 Region-wise Statistical analysis of MSW (Generation & Treatment)............... 68
Table 5.58 Details on total generation Hazardous Waste during the year 2020-21 .......... 70
Table 5.59 Summary of Individual Capacities of CHWTSDFs. ......................................... 71
Table 5.60 Summary of Hazardous Waste Received at disposal sites in 2020-21 ........... 72
Table 5.61 District wise Updation for HW authorizatons ................................................... 72
Table 5.62 Present Status of E-Waste Generation and Recycling in Maharashtra State . 75
Table 5.63 Showing operational plant for processing of Construction and Demolition waste
........................................................................................................................ 79
Table 5.64 Analysis of Performance of Board Laboratories (2020-21) ............................. 80
Table 7.1 Noise monitoring locations in Maharashtra during Ganesh Festival 2020 .... 102
Table 7.2 Noise Monitoring Locations in Maharashtra during Diwali 2020. .................. 105
Table 8.1 Training Abstract for the year 2020-21. ......................................................... 112

1
1. INTRODUCTION
Maharashtra Pollution Control Board (MPCB) was established on 7th September 1970 under
the provisions of Maharashtra Water (Prevention and control of Pollution) Act, 1969. The
Water (P & C. P) Act, 1974 was adopted in Maharashtra on 1st June 1981 and accordingly
Maharashtra Pollution Control Board was formed under the provisions of Section 4 of Water
(P & CP) Act, 1974. The Air (P & CP) Act 1981 was adopted in Maharashtra in 1983 and
initially some areas were declared as Air Pollution Control Areas on 2nd May 1983. The entire
state of Maharashtra has been declared as Air Pollution Control Area since 6th November
1996. The Board also functions as the State Board under Section 5 of the Air (P & CP) Act,
1981.
The MPCB implements various environmental legislations in the State of Maharashtra,
including the Water (Prevention and Control of Pollution) Act, 1974, Air (Prevention and
Control of Pollution) Act, 1981 and some of the provisions under Environmental (Protection)
Act, 1986 and Rules framed there under, from time to time, such as, Bio-Medical Waste
Management Rules, Hazardous and Other Wastes (Management and Transboundary
Movement) Rules, Solid Waste Management Rules etc. MPCB implements these
environmental legislations via its 12 Regional Offices (ROs) in the State and functions under
the administrative control of Environment Department, Government of Maharashtra. The
Organizational structure of the Board and information of Regional and Sub-Regional offices
and staff strength are provided in Annexures 1A, 1B and 2.
To deal with depletion of natural resource and environmental degradation, prudent
environmental management is necessary. Since environmental problems are diverse, their
solutions must be Region-specific. Preparation of Annual Reports is a mandatory requirement,
aimed at producing an informative account of the environmental conditions and the action plan
to achieve sustainable growth. MPCB has established twelve Regional Offices and forty-three
Sub-Regional offices across the State to implement various provisions in the acts and rules to
safeguard the natural environment and curb pollution with necessary control measures.
The Board has strengthened its monitoring network further for assessing ambient air and water
quality. Data on ambient air quality is compiled under the National Ambient Air Monitoring
Program (NAMP). Similarly, data on water quality of surface water and groundwater is
monitored under the State Water Quality Monitoring Program (SWMP). All related data is
compiled and updated regularly on the MPCB website. During festivals, noise levels are
monitored regularly, and the data duly analysed is updated on the website to make information
available to the public. Efforts are also being made to create awareness to celebrate all
festivals in an eco-friendly manner.
To maintain transparency and increase its overall efficiency, the Board, through Integrated
Management Information System (IMIS), has computerized its processes and operations. This
system includes Consent Management, Laboratory Management, Waste Management,
Human Resource and Financial Management. This information is used to determine if pollution
control strategies as adopted by implementing authority are giving desirable results and are
thereby lowering pollution levels and if new or additional controls are required to achieve
desirable levels. The Board has introduced a system for disposal for consent and authorization
applications made by industries and other projects under environment protection legislations,

2
in shortest possible time. These steps taken by MPCB have been widely appreciated by
industries and developers as the status of their applications can now be easily tracked.
Information related to consents and authorizations granted by the Board is also updated on
the website in a timely manner.
As a part of Common Infrastructure for Environment Protection, facilities have been
established across the State for providing common facilities for treatment and disposal of
Hazardous and Bio-Medical Waste. Common Effluent treatment plants are also provided in
industrial areas. Common facilities for management of Hazardous Waste have been set up at
Taloja, Mahape, Ranjangaon and Butibori. The Board also encourages local bodies to treat
and dispose Municipal Solid Waste (MSW) in a scientific and legalized manner. The Board
also motivates industries to adopt measures and cleaner technologies for controlling pollution.
For creating general awareness among the people regarding environmental issues, the Board
constantly endeavours to conduct various awareness programs involving press, media,
NGOs, artists and students throughout the State. As a part of environmental campaigns, street
plays are also organized through NGOs, at schools, colleges, and public spaces such as
railway stations and these are widely appreciated by the public.

3
2. CONSTITUTION OF THE BOARD
The Maharashtra Pollution Control Board comprises of Chairman, Members from the
categories as shown below and a full time Member Secretary, as Chief Executive Officer as
per the Rules under Water (P&CP) Act, 1974 notified by the State Government in 1983.
The composition of the Board is as under:
1. Chairman: (Part time or fulltime) 2. Representatives of the State Government (not exceeding five) 3. Representatives of local bodies (not exceeding five) 4. Representatives of companies or corporations of the State Government(two) 5. Members representing interests of agriculture, fishery or industry or trade etc. (Not exceeding three) 6. Member Secretary (fulltime) Government of Maharashtra has powers under section 4 of the Water (Prevention and Control
of Pollution) Act, 1974 to constitute State Pollution Control Board (MPCB).
Table 1.0 Constitution of M.P.C. Board during 2020-21
Shri. Sudhir Shrivastava, Retired IAS Chairman
Principal Secretary, Environment Department, Government of Maharashtra
Member
Additional Chief Secretary Public Health Dept. Government of Maharashtra, Mantralaya, Mumbai
Member
Principal Secretary-II Urban Development Dept., Government of Maharashtra, Mumbai
Member
Principal Secretary Water Supply and Sanitation, Government of Maharashtra, Mantralaya, Mumbai
Member
Secretary Home (Transport) Dept., Government of Maharashtra, Mantralaya, Mumbai
Member
Chief Executive Officer MIDC, Mahakali Caves Road, Andheri (E), Mumbai
Member
Member Secretary (Technical) Maharashtra Jeevan Pradhikaran, Express Towers, Nariman Point, Mumbai
Member
Shri. E. Ravendiran [IAS] Member Secretary, Maharashtra Pollution Control Board
Member Secretary Upto 9th September
2020
Shri. Ashok Shingare [IAS] Member Secretary, MPCB, Mumbai.
Member Secretary 9 September to till
date

4
3. MEETINGS OF THE BOARD 1.0 During the reporting year, the 175th meeting of the Maharashtra Pollution Control
Board was held. The major decisions taken in the meeting are as below.
A. Post facto approval for long-term field validation of low-cost air quality sensor-based
monitoring network in Mumbai The use of low-cost air quality sensor-based monitoring stations has been successfully field
evaluated by lIT Kanpur in DST-Intel supported project titled "SAlVAM"(Streaming Analytics
over Temporal Variables for Air quality Monitoring). Rigorous scientific field evaluations done
by lIT Kanpur using indigenously developed low-cost air quality sensor monitors,
collaboratively developed by industry partner & established the precision and accuracy of
Particulate Matter (PM2.5 and PM10) over long-term spatial and temporal variations for a city-
level air quality monitoring network. Board has approved post facto for the above project
activity by lIT Kanpur at the cost Rs. 46,02,000.
B. Post facto approval of carrying capacity study of Navi-Mumbai & Nagpur cities and undertaking Carrying Capacity study in remaining Non-Attainment Cities in Maharashtra. As per the directives of Hon'ble National Green Tribunal (NGT), Principal Bench, New Delhi
in original application No: 681/ 2018, dtd. 20.11.2019, it is required to conduct Carrying
Capacity study for Non-Attainment Cities (NACs). As notified in NGT order, Maharashtra is
having 18 Non-Attainment cities namely: Mumbai, Pune, Nagpur, Nashik, Amravati,
Aurangabad, Chandrapur, Kolhapur, Navi-Mumbai, Solapur, Akola, Jalna, Latur, Ulhasnagar,
Jalgaon, Badlapur, Sangli and Thane. The objective of this proposed study is to conduct
carrying capacity study for the listed cities of Maharashtra and prepare an effective
assimilative capacity based regional developmental planning with environmental management
plan, incorporating baseline data.
NEERI, Nagpur vide letter dtd. 4/2/2020, shared the detail proposal of carrying capacity of
Non-Attainment cities to MPCB. The total cost of the project is 50.15Cr+ Tax and time duration
of completion of the project with final report submission & workshop is given as 36 months.
Board discussed agenda in detail and accords the post facto approval for conducting carrying
capacity of Nagpur & Navi-Mumbai cities through NEERI, Nagpur at the cost of Rs. 6.4 cr +
applicable taxes.
C. Tracking of Hazardous Waste Transporting Vehicles through ICC/NICER Globe on HAZMAT Tracking System. As per the Provision in the Hazardous and Other Wastes (Management and Transboundary
Movement) Rules, 2016, Board has granting Authorization to private transporter for
transportation of Hazardous waste from various locations of the Maharashtra to CHWTSD
facilities (4 Facilities). Board has granted authorization to 200 private transporters for
transportation of Hazardous waste (about 610 Numbers of vehicles). Average number of
vehicle trips in the CHWTSD Facilities in the one month is about 4000. Also, Board is granting
the authorization to transporter with condition to install GPS (Global Positioning System) to
each HW transport vehicle. But this system is limited up to vehicle owner only. Board has no
access to track the vehicles.

5
It is proposed to monitor the movement of HW transportation vehicle in the state of
Maharashtra & Board has discussed agenda in detail and accords approval to the said
proposal having total cost of project of Rs. 38 Lakh + taxes. Further, Member Secretary is
authorized take further course of action by following due process for selecting agency.
2.0 During the reporting year, the 176th meeting of the Maharashtra Pollution Control
Board was held. The major decisions taken in the meeting are as below.
A. Post facto approval for Revised Delegation of Powers for Consent Management
Board has noted the agenda item regarding the revised delegation of Powers for consent Management
It is resolved that, Board accords Post Facto approval to Office Order issued on 23/12/2020
for revised delegation of powers of consent management. Power is delegated to Sub Regional
Officer for grant of consent under Water Act 1974 & Authorization under Solid Waste
Management Rule 2016 to Nagar Panchayat in addition to C class Municipal Council.
Separate amendment order will be issued. Member Secretary is authorized to issue amended
circular in delegation of power of consent management
B. Mobile Vans for Calibration of Sensors installed for Monitoring Ambient Air Quality
w.r.t. PM10 and PM2.5 parameters in Maharashtra. Calibration of sensors with CAAQMS analysers certified by the EPA.TUV, MCERT is essential
to find out suitable sensors system which can work in the field conditions and generate
acceptable values in comparison with CAAQMS analysers. Presently, there is no facility
available in India to certify these low-cost sensors. CPCB/NPL is working to setup calibration
of these sensors and monitoring systems manufactured in India.
In view of the above, it is proposed to procure 5 Mobile calibration Vans fitted with PM10 and
PM2.5 analysers of CAAQMS for deployment and calibration of Sensors proposed to be
installed across Maharashtra which will facilitate the optimum use of sensor based monitoring
and valid data generation with respect to Ambient Air Quality for these parameters.
Similarly, it is proposed to procure 2 Mobile Vans fitted with Ozone monitoring in urban area
to understand the concentration levels at ground level. Ground level Ozone levels are showing
increased in urban area as per the available data of CAAQMS installed at selected locations
and needs to cover more locations for Ozone monitoring.
Board has noted the agenda item and principally approved for procurement of Mobile
monitoring vans for calibration of Sensors and Ozone monitoring 5+2 numbers for the Board
following due e-tendering process. It is also approved the approximate capital cost of Rs. 2.65
Cr + 0 & M cost for five years@ of 12% per year. The expenditure shall be met from Boards
fund.
C. Purchase/hiring of Beach Cleaning Machines for costal district of Maharashtra. The MPC Board proposes to undertake beach cleaning activity across the state which help to
rejuvenate beaches for sustainable tourism & ecological conservation. The Board proposes
this activity on experimental basis for beaches located in Mumbai & Mumbai Suburban which
could be extended for entire state and to undertake this activity, the Board needs machinery

6
& equipment's required for beach cleaning which includes beach cleaner machine & ancillary
set-up. The Board has carried out literature review of equipment's required for beach cleaning
and have observed machines of different specifications, price & capacities are available in the
market. There are mostly various types of machines viz. Walk behind beach cleaning machine
& tractor mounted beach cleaning machines, tracked loader beach cleaning machine available
in the market.
In consideration of the same, the Board has resolved that; Board will procure 07 compact
tracked loader beach cleaning machines through e-bidding process or GEM portal and allotted
budget of Rs. 5.15 Cr plus taxes for procurement of above machines & handover the same to
District Collector (Mumbai-01, Mumbai Suburban-01, Raigad-1, Palghar-01, Thane-01,
Ratnagiri- 01, Sindhudurg-01) for purpose of beach cleaning activity under his jurisdiction.
D. Development of Majhi Vasundhara Web- portal and related IT activities Most of the development mentioned above is complete and hosted on-to Cloud Storage. The
development of Majhi Vasundhara web-portal has been done by Board's MIS implementor-
M/s Webwerks India Pvt. Ltd. at pre-approved IT expert/ developer resource man-month e-
Tender rates. The Cloud storage is also hired as per Government of Maharashtra's Cloud
Services GR through Government empaneled Cloud Service Provider- M/s Netmagic IT
Services Pvt. Ltd.
Board accords its approval to the above IT related expenditure for successful and timely
implementation of Majhi Vasundhara Project in the State of Maharashtra. Member Secretary
is authorized to initiate and execute above stated IT related activities required for Majhi
Vasundhara project in consultation with Environment and Climate Change Dept. GoM
E. Proposal to study Ambient Air Quality and Atmospheric Haze condition in Mahul
area
To understand the process and dynamics involve in the haze formation and the resulting built
of pollutants due to haze formation, a short-term monitoring study in the Mahul area is
proposed. Also, as Mahul is designated as a CEPI area, the study proposed will help in
identifying the responsible sources contributing to pollution and the weather dynamics.The
proposal is only for carrying out the short-term monitoring studies in the Mahul area at the cost
of Rs. Rs. 62.50 lakhs +taxes as applicable with the condition that the equipments that will be
used for monitoring and analysis shall be handed over to MPC Board in working condition
after the completion of the study.
Board has accorded the approval for carrying out short-term monitoring study for Ambient air
quality and atmospheric haze condition in Mahul area. Member Secretary is authorized to take
further course of action.
F. Financial Assistance for Majhi Vasundhara Abhiyan. The Environment and Climate Change Department, Govt. of Maharashtra had notified
Government Resolution for the Majhi Vasundhara Abhiyan. Which is the first initiative under
Majhi Vasundhara. It focuses on identifying potential action points under the five elements of
nature (Panchamahabhuta) for the betterment of the Environment for the local bodies in

7
Maharashtra. The Abhiyan was launched by Hon'ble Minister Tourism, Environment and
Climate Change on 2nd October 2020. It is a competition for Urban Local Bodies and
Panchayat Raj Institutions. The Department had requested Board to make a provision of
financial assistance for Creating of various films, Facebook live talk shows, Majhi Vasundhara
summit, Theme Songs etc. for public Awareness. The Abhiyan had identified 713 participant
ULBs/PRis from Maharashtra. The participants had already started working on the Majhi
Vasundhara Abhiyan. The evaluation for the Abhiyan will be done in two stages i.e Stage1 for
Desktop Assessment and Stage 2 for Site Visit and Citizen feedback collection in the month
of April and May 2021. A tentative budget of 1.5 Crore will be required for the evaluation
process. It also includes two stage evaluation and identification of the winners in all four
verticals (i.e. Amrut Corporations, Municipal Councils, Nagar Panchayat and Gram
Panchayat) by 31st May 2021.
Board has accorded the approval for public awareness activities and to scrutinize participated
entries of Majhi Vasundhara Abhiyan of Environmental and climate change department.
Member Secretary is authorized to take further course of act.
8
4. COMMITTEES CONSTITUTED BY THE BOARD With a view to have smooth functioning of the Board, as provided under section 9 of the Water
(Prevention and Control of Pollution) Act 1974 and section 11 of the Air (Prevention and
Control of Pollution Act 1981; the Board has constituted various committees for efficient and
effective implementation of the Acts and Rules. During the year 2020-21, the following
Committees were in existence.
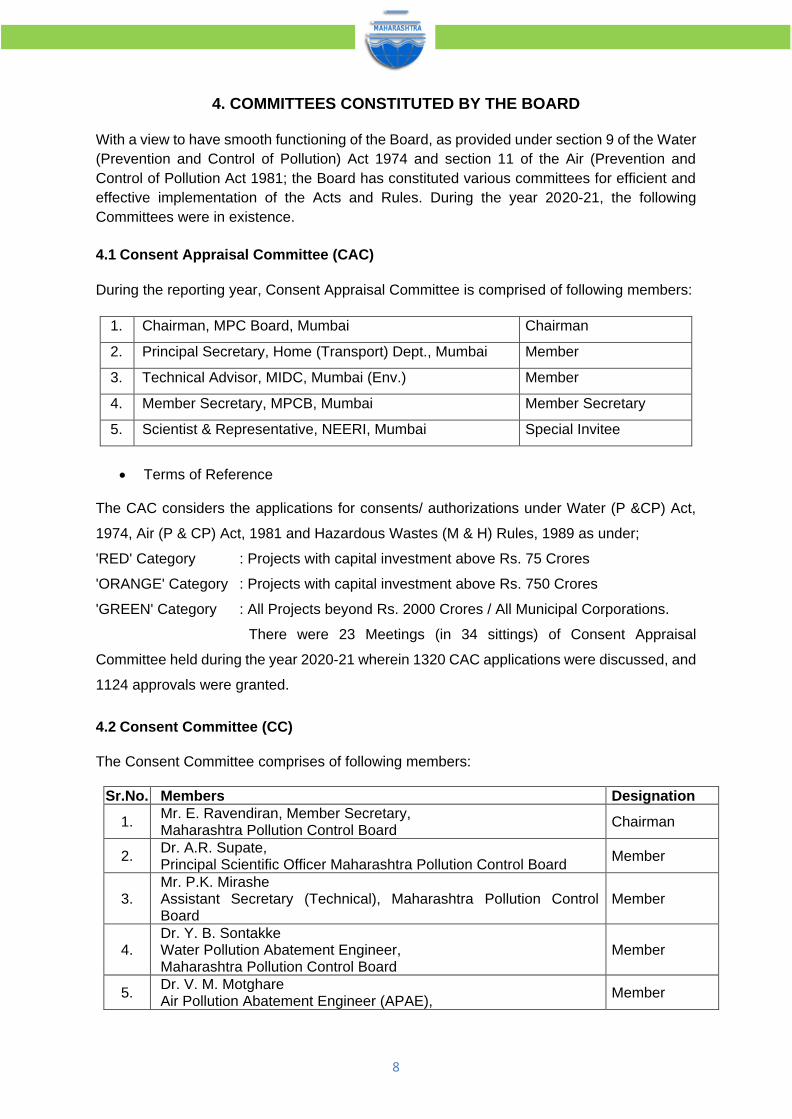
4.1 Consent Appraisal Committee (CAC)
During the reporting year, Consent Appraisal Committee is comprised of following members:
1. Chairman, MPC Board, Mumbai Chairman
2. Principal Secretary, Home (Transport) Dept., Mumbai Member
3. Technical Advisor, MIDC, Mumbai (Env.) Member
4. Member Secretary, MPCB, Mumbai Member Secretary
5. Scientist & Representative, NEERI, Mumbai Special Invitee
• Terms of Reference
The CAC considers the applications for consents/ authorizations under Water (P &CP) Act,
1974, Air (P & CP) Act, 1981 and Hazardous Wastes (M & H) Rules, 1989 as under;
'RED' Category : Projects with capital investment above Rs. 75 Crores
'ORANGE' Category : Projects with capital investment above Rs. 750 Crores
'GREEN' Category : All Projects beyond Rs. 2000 Crores / All Municipal Corporations.
There were 23 Meetings (in 34 sittings) of Consent Appraisal
Committee held during the year 2020-21 wherein 1320 CAC applications were discussed, and
1124 approvals were granted.
4.2 Consent Committee (CC) The Consent Committee comprises of following members:
Sr.No. Members Designation
1. Mr. E. Ravendiran, Member Secretary, Maharashtra Pollution Control Board
Chairman
2. Dr. A.R. Supate, Principal Scientific Officer Maharashtra Pollution Control Board
Member
3. Mr. P.K. Mirashe Assistant Secretary (Technical), Maharashtra Pollution Control Board
Member
4. Dr. Y. B. Sontakke Water Pollution Abatement Engineer, Maharashtra Pollution Control Board
Member
5. Dr. V. M. Motghare Air Pollution Abatement Engineer (APAE),
Member

9
Maharashtra Pollution Control Board
6. Mr. N. N. Gurav, Regional Officer HQ, Maharashtra Pollution Control Board
Member
7. Mr. R. G. Pethe Retired Water Pollution Abatement Engineer (WPAE), Maharashtra Pollution Control Board
Member
➢ Terms of Reference The Consent Committee considers the applications for consent/ authorization under water (P
& CP) Act. 1974, Air (P & CP) Act, 1981 and Hazardous Wastes (M&H) Rules, 1989 as under;
‘RED ‘Category : Projects with capital investment above Rs.25Crores and up to
Rs.75Crores
‘ORANGE ‘Category : Projects with capital investment above Rs. 250Crores and up to
Rs.750Crores
‘GREEN Category : Projects with capital investment above Rs. 1000 Crores and up to
Rs. 2000Crores
'Infrastructure Project : Project with capital investment above Rs. 25 Crores and up to
Rs.350 Crores
There were 15 meetings of Consent Committee held during the year 2020-21 and total 914
applications were discussed and 892 were disposed off.
4.3 Committees formed for Solid Waste Management Rule, 2016 There were 8 meetings of Technical advisory committee held during the year 2020-21 for
implementation of SWM in the state & 29 Divisional level committee held during year 2020-21
for monitoring of implementation of SWM in the state.
Sr.No. Name of Committee Date of Formation
Division/Area of work
1.
Divisional Level Committee for Monitoring of Implementation of Solid Waste Management in the State of Maharashtra
17/01/2019 Nashik
2.
Divisional Level Committee for Monitoring of Implementation of Solid Waste Management in the State of Maharashtra
20/12/2018 Pune
3.
Divisional Level Committee for Monitoring of Implementation of Solid Waste Management in the State of Maharashtra
17/01/2019 Nagpur
4.
Divisional Level Committee for Monitoring of Implementation of Solid Waste Management in the State of Maharashtra
03/12/2018 Aurangabad
5.
Divisional Level Committee for Monitoring of Implementation of Solid Waste Management in the State of Maharashtra
03/12/2018 Konkan

10
6.
Committee for scrutiny of authorizations for all Corporations/Councils as per the Municipal Solid Waste (M & H) Rules, 2000, dated 02/04/2014
17/04/2015
Scrutiny of applications for MSW authorizations
During the year 2020-21, Authorization Committee for Scrutiny of applications for MSW
Authorizations is comprised of following members:
1. Shri P.K. Mirashe, Assistant Secretary (Tech) HQ, MPCB, Mumbai
Chairman
2. Dr. Sneha Palnitkar or Representative, All India Institute of Local Self Govt.
Expert Member
3. Shri. Bhalchandra P. Patil Ex. Dy. Municipal Commissioner, MCGM
Expert Member
4. Shri N.N. Gurav, Regional officer, HQ, MPCB, Mumbai
Member Convener
Total 21 applications were discussed by the Committee for Scrutiny of applications for MSW
authorizations and 7 were rejected due to non-compliance of MSW Rules and 9 applications
were granted/ renewed during the year 2020-21
4.4 Committees formed for Hazardous & Other Waste (T & M) Rule, 2016 & E-waste
Rule, 2016
1.
Committee for implementing liabilities for environmental damages due to handling and disposal of hazardous waste, and penalty
08/08/2017
Head Office level
2.
Committee for implementation of procedure for issuance of grant/renewal of authorization of industrial units possessing environmentally sound management facilities for reprocessing/recycling, and actual users/co-processing/utilization of the hazardous waste and recycling of electronic waste (E-waste)
04/10/2016
Head Office level
During the year 2020-21, Authorization Committee for Environment Sound Management of
Hazardous & Other Waste and E-Waste is comprised of following members:
1. Shri. R.K. Garg,
Former Managing Director, Indian Rare Earths Ltd Chairman
2. Shree. B. Sharma,
Regional Director, Pune, CPCB Member
3. Shri Dr. B. R. Naidu, Member

11
Ex Regional Director, West Zone, CPCB Vadodara.
4. Shri. Bharat Nimbarte,
Ex Joint Director (WPC), MPCB Member
5. Shri P.K. Mirashe,
Assistant Secretary (Tech) HQ, MPCB, Mumbai Member
6. Scientist – 1 or 2,
Environment Department, Govt. of Maharashtra Member
7. Shri N.N. Gurav,
Regional officer, HQ, MPCB, Mumbai Member Convener
➢ Terms of Reference The Authorization Committee for considering the applications for consents/ authorizations
under Water (P &CP) Act, 1974, Air (P & CP) Act, 1981 and Hazardous Wastes (M & H) Rules,
1989 and E-Waste Rules, 2016 as under;
There were 6 Meetings of Authorization Committee for Hazardous waste held during the year
2020-21. During the meeting total number of 130 applications of authorization under HW Rules
were discussed; out of which 108 were approved and 39 number of applications for
authorization under E-waste Rules, 2016 were discussed and 22 were approved.
4.5 Committee constituted for deciding Guidelines for issuance for Registration to
Producer/ Brand Owner / Manufacturer under Plastic Waste Management Rule, 2016 and amendment thereto;
1. Committee for deciding guidelines for issuance of registrations to producers and brand owners
21/11/2016 Head Office
level
During the year 2020-21, Committee constituted for deciding Guidelines for issuance for
Registration under PWM rules, 2016 is comprised of following members:
1. Joint Director (WPC), MPC Board, Mumbai Chairman
2. Representative of ICT, Mumbai- Prof. Shashank Mhaske, HOD, Polymer, ICT, Mumbai
Member
3. Representative of Environment Dept., GoM Member
4. Representative of Urban Development Dept., GoM Member
5. Regional Officer (HQ), MPC Board, Mumbai Member Convener
➢ Terms of Reference
A) For examining application for grant of registration scheme to producer/ Brand-owners
under the Plastic Waste Management, 2016
B) To recommend applications for issuance of grant of Registration scheme to producer/
Brand-owners under the Plastic Waste Management, 2016
C) For implementation of the procedure for issuance of grant of Registration scheme to
producer/ brand-owners under the Plastic waste management, 2016

12
There are 5 stake holders under PWM Rules, 2016 who are required to obtain registration
under PWM rules, 2016 and amendment thereto viz. Producer, Brand-owner, Importer,
Manufacturer, Recycler. The concept of Extended Producer’s Responsibility is applicable to
the Producer/ Importer/ Brand-owners. However, EPR is not applicable to Recyclers as per
present rules. Thus, this committee was constituted to decide guidelines and line of action for
issuance of registration in view of this impending EPR policy.
Only one meeting of the said Committee was held during the year 2020-21 wherein 21
applications were discussed. As per the minutes of meeting of committee held on 1.10.2020,
111 nos. of recyclers were granted registration under PWM Rules, 2016 during the year 2020-
21.

13
5. AIR AND WATER MONITORING NETWORK AND PRESENT STATUS OF THE ENVIRONMENT
Air pollution is caused mainly by transportation, fuel combustion in stationary sources, burning
of fossil fuels like coal, wood, dry grass, and construction activities. Motor vehicles produce
high levels of carbon monoxide (CO), hydrocarbons (HC) and nitrogen oxides (NO).
Construction activities, bad roads and burning of fossil fuels are responsible for dust
(particulate matter) pollution. Residential and commercial activities also contribute to air
pollution. Human health is affected due to poor air quality. Principally, air pollution affects the
body's respiratory system and the cardiovascular system. Though the individual reactions to
air pollutants depend on the type of pollutant a person is exposed to and the degree of
exposure, air pollution may cause long term health problems. The health effects caused by air
pollutants may range from biochemical and physiological changes like difficulty in breathing,
wheezing, coughing and aggravation of existing respiratory and cardiac conditions.
Maharashtra Pollution Control Board has established Ambient Air Quality Network in
Maharashtra covering major cities to comply with the mandate of Air (Prevention & Control)
Act 1981 and to disseminate information regarding status of air quality prevailing in the State
of Maharashtra. Also, monitoring is necessary for evaluation of the effectiveness of control
programs and to identify areas in need of prioritization and long-term air quality management.
Air quality monitoring is carried out to understand natural scavenging or cleansing processes
in the environment through pollution dilution, dispersion, wind movement, dry deposition,
precipitation, and chemical transformation of pollutants generated.
Water demand for various consumptive uses, such as drinking, agriculture and industries from
groundwater and surface water resources is higher than the availability. Distribution of rainfall
is highly uneven in the State and in many areas the soil conditions and topography are
unfavorable to groundwater recharge through percolation. Further, over-use and misuse of
resources is responsible for water scarcity. Wide disparities exist in sanitation facilities in urban
and rural areas. Thus, meeting the increased needs for water supply and sanitation facilities
is a challenge for authorities.
5.1 Monitoring Network and Region-wise Air Quality in Maharashtra
Central Pollution Control Board initiated National Ambient Air Quality Monitoring (NAAQM)
program in the year 1984 to get spatial and temporal variation of ambient air concentrations
for a wide range of pollutants that are considered relevant for evolving strategic management
plans. The program was subsequently renamed as NAMP (National Air Quality Monitoring
Program). Under NAMP, three air pollutants viz., Sulphur dioxide (SO2), nitrogen dioxides
(NO2) and Respirable Suspended Particulate Matter (RSPM/PM10) have been identified for
regular monitoring at all the locations. Monitoring of pollutants is carried out for 24 hours (4-
hourly sampling for gaseous pollutants and 8-hourly sampling for particulate matter) with a
frequency of twice a week, to have 104 observations in a year as per CPCB monitoring
protocol.
As per CPCB monitoring protocol, locations are selected to represent different land use
categories such as residential, industrial, and commercial, to capture air quality levels under
different activity profiles. MPCB, with a presence across the state through its 12 Regional
Offices (RO), regularly monitors pollutant levels through a medium of an established network

14
of Ambient Air Quality Monitoring Stations (AAQMS) installed in various regions across
Maharashtra. These AAQMS are installed under the National Air Monitoring Program (NAMP)
and State Air Monitoring Program (SAMP). In the year 2020-21, there are 92 active AAQMS
in Maharashtra of which 61 are under NAMP, 04 SAMP and 23 Continuous AAQMS
(CAAQMS) are in operation. MPCB has commissioned 40 new manual monitoring station
during 2020-2021. Also Board is in process of installing 47 numbers of new CAAQMS stations
at various cities. These air quality monitoring stations are operated through educational
institutes, local bodies which are having infrastructure to monitor air quality stations as per
Central Pollution Control Board (CPCB) monitoring protocol. As these agencies have long
agreement with MPCB for operation of monitoring stations their performance is reviewed by
the Board. The data generated by these stations are verified at HQ level before forwarding it
to CPCB. These stations are connected to the AQI server at CPCB, New Delhi.
Figure.5.1. Continuous Ambient Air Quality Monitoring Stations at Colaba (left) and Kurla (right) in Mumbai.
Air pollution can be effectively tackled only through the support of citizens who are well
informed about local and national air pollution problems and about the required mitigation
measures. To achieve this, the concept of an Air Quality Index (AQI) was developed and is
used by several nations to effectively represent the air quality scenario in their respective
countries. AQI is an air quality guide wherein a color index is used to document air quality as
represented in table below. The index provides a single number or a set of numbers by
transforming the series of multiple values of respective air pollutants recorded over a span of
time. It simply transforms the complex datasets into an easy-to-understand range of values
which gets depicted in the form of different colors indicating the extent of air pollution. Increase
in AQI indicates an increased level of air pollution and respective threats to human health
associated with these pollutants. Various international environmental agencies such as United
States’ Environment Protection Agency (US-EPA) have developed their own set of
mathematical algorithms to determine AQI, which are based on human exposure dose of air
pollutants. In India, CPCB in consultation with the Indian Institute of Technology – Kanpur (IIT-
K), developed an AQI system after conducting literature review, understanding air quality
monitoring procedures and protocols, Indian National Air Quality Standards (INAQS) and
dose-response relationships of pollutants with human health.
Air quality in the State is assessed through routine and specific monitoring. To assess the

15
ambient air quality with respect to criteria pollutants as per National Ambient Air Quality
standards, data has been collected for the year 2020-21. The data is analysed for SO2, NOX
and particulate matter (PM10) or respirable suspended particulate matter (RSPM). The
locations under different class areas like industrial, residential, and commercial were
monitored Region-wise and the observations have been made using NAAQM standards
annual average concentration as represented in following sections. Further Exceedance
Factor (E.F. = Annual Average/ Standard Value) has also been calculated for Particulate
Matter to understand the data sets and approximate average numbers of samples exceeded
the standard limit. To represent the analysis of data, colour coding system is used for
identification and comparison as shown in below;
Air Quality classification based on colour coding
Gasses and particulate matter Colour code used
➢ Locations Within the limit
➢ Locations Exceeding the limit
➢ Location having Maximum value
➢ Location having Minimum value
5.1.1 Amravati
Amravati Region contains 6 Ambient Air Monitoring Stations out of which 2 are present in
residential area, 2 are in industrial area, 1 is in commercial area and 1 is in rural area. The
annual average concentration of all the parameters analyzed at all locations is represented in
Table 5.1. It is observed that the annual average concentrations of SO2, NOx and PM10 were
within the NAAQM standard limits at all the locations. Details of annual average statistical data
recorded throughout the year 2020-2021 are represented in Table 5.1.
Table 5.1 Statistical Monitoring of Annual Average Air Quality in Amaravati
Region
Location
Parameters
SO2 NOx PM10
Standards (µg/m3)
50 40 60
Govt. College of Engineering 10 11 48
A-23 MIDC Amravati 12 13 53
Raja Kamal Chowk, Amravati 12 14 56
College of Engineering & Technology (Architechture Branch) (Akola)
14 14 55
L R College of Engg. (Akola) 13 14 54
MIDC Water Works (Akola) 16 16 59
Form table 5.1, minimum SO2 concentration of 10µg/m3 & NOx concentration of 11µg/m3 was
found at Govt. College of Engineering. The maximum SO2 concentration and maximum NOx
concentration of 16µg/m3 was found at MIDC Water Works. The Minimum PM10 concentration
of 48µg/m3 was found at Govt. College of Engineering and the maximum concentration of
59µg/m3 was found at MIDC Water Works, Amaravati. The minimum and maximum
exceedance factors for PM10 are shown in Table 5.2

16
Table 5.2 Exceedance factor for PM10 for Amravati Region
Exceedance Factor – Amravati
Min 0.48
Max 0.59
5.1.2 Aurangabad
In the jurisdiction of Regional Office, MPCB, Aurangabad, major air polluting industries are
Steel Industries, Re-rolling mills, Stone Crushers, Thermal Power Plant, etc. The main
contributors of environmental pollution are the parameters like SPM/TPM, SO2 and NOX. Most
of the industries have provided air pollution control systems with adequate height of Chimney.
There are 9 Air Quality Monitoring stations in this Region, 5 in residential areas, 3 in industrial
areas and 1 in a rural area. The annual average concentration of all the parameters analyzed
at all locations is represented in Table 5.3. It is observed that SO2 and NOx concentrations at
all locations were within the NAAQM standard limits. However, PM10 concentrations at three
locations were beyond NAAQM standard limit. Details of annual average statistical data
recorded throughout the year 2020-21 are represented in Table 5.3.
Table 5.3 Statistical Monitoring of Annual Average Air Quality in Aurangabad
Region
Location
Parameters
SO2 NOx PM10
Standards (µg/m3 )
50 40 60
MIDC Walunj, Auranagabad 12 15 65
CADA Office 15 31 60
SBES College 16 31 57
Collector Office, Aurangabad 15 29 60
Jalna Krishna Dhan 10 33 85
Jalna Bachat Bhavan 9 34 85
Terrace of Sidhheshwar Sahakari Bank 4 9 52
Terrace of Keshavraj Vidyalay 4 9 51
MIDC Water Works, Latur 4 9 53
From Table 5.3, minimum SO2 concentration of 4µg/m3 was found at Terrace of Keshavraj
Vidyalay, MIDC Water Works, Latur and Terrace of Sidhheshwar Sahakari Bank. The
minimum NOx concentration of 9µg/m3 was found at the same three locations as SO2.
Minimum PM10 concentration of 51µg/m3 was found at Terrace of Keshavraj Vidyalay.
Maximum SO2 concentration of 16µg/m3 was found at SBES College while maximum NOx
concentration of 34µg/m3 was found at Jalna Bachat Bhavan. Maximum PM10 concentration
of 85µg/m3 was found at Jalna – Bachat Bhavan and Jalna Krishna Dhan. The exceedance
factors for PM10 for this Region are shown in Table 5.4.
Table 5.4 Exceedance factors for PM10 for Aurangabad Region
Exceedance Factor – Aurangabad
Min 0.51
Max 0.85

17
5.1.3 Chandrapur
There are 6 Air Monitoring stations in Chandrapur Region out of which 3 are located in
industrial area. The annual average concentration of all the parameters analyzed at all
locations is represented in Table 5.5.
From Table 5.5. it was observed those concentrations of SO2 and NOx were within the
NAAQM standard limits at all locations. However, PM10 concentrations at all the given
locations were beyond the NAAQM standards. Details of annual average statistical data
recorded throughout the year 2020-21 are represented in Table 5.5
Table 5.5 Statistical Monitoring of Annual Average Air Quality in Chandrapur
Region
Location
Parameters
SO2 NOx PM10
Standards (µg/m3)
80 80 100
Old MIDC Chandrapur (CAAQMS) 15 15 83
MIDC Chandrapur 4 33 96
Ghuggus 4 33 197
Rajura 4 28 159
Ballarshah 4 30 121
Tadali MIDC (CAAQMS) 4 29 117
It can be observed from Table 5.5. that minimum SO2 concentration of 4µg/m3 was recorded
at 5 locations - MIDC Chandrapur, Ghuggus, Rajura, Ballarshah and Tadali MIDC. Minimum
NOx concentration of 15µg/m3 was found at Old MIDC Chandrapur. Maximum SO2
concentration of 15µg/m3 and maximum NOx concentration of 33µg/m3 were found at Old
MIDC Chandrapur and MIDC Chandrapur, Ghuggus respectively. Minimum PM10
concentration of 83µg/m3 was recorded at Old MIDC Chandrapur. Maximum PM10
concentration of 197µg/m3 was recorded at Ghuggus. The exceedance factors for PM10 for
Chandrapur Region are shown in Table 5.6
Table 5.6 Exceedance factors for PM10 for Chandrapur Region
Exceedance Factor - Chandrapur
PM10
Min 0.83
Max 1.97
5.1.4 Kalyan
There are 9 Air Monitoring stations in Kalyan Region. The annual average concentration of all
the parameters analyzed at all locations is represented in Table 5.7. It is evident that
concentrations of SO2 at all locations were within the NAAQM standard limits. Similary,
concentrations of NOx at all locations except MPCB RO Kalyan Office and Powai Chowk were
within the NAAQM standard limits. Concentrations of PM10 exceeded the standard limits at 4
locations. Details of annual average statistical data recorded throughout the year 2020-21 are
represented in Table 5.7.

18
Table 5.7 Statistical Monitoring of Annual Average Air Quality in Kalyan Region
Location
Parameters
SO2 NOx PM10
Standards (µg/m3 )
50 40 60
Ambernath 17 37 59
Badlapur 18 38 68
Prematai Hall, Bhiwandi 27 38 53
IGM Hospital 31 40 56
Dombivali CETP 7 30 131
MIDC Office Dombivali 19 40 69
MPCB RO Kalyan Office 29 43 51
Powai Chowk 18 41 67
Smt. CHM College Campus 17 39 65
From Table 5.7, it is observed that minimum SO2 concentration of 7µg/m3 was found at
Dombivali. The minimum NOx concentration of 37µg/m3 was found at Ambernath. The
minimum PM10 concentration of 51µg/m3 was found atMPCB RO Kalyan Office. The maximum
SO2 concentration of 31µg/m3 and maximum NOx concentration of 43µg/m3 was found at IGM
Hospital and MPCB RO Kalyan Office respectively. Maximum PM10 concentration of 131µg/m3
was found at Dombivali. The exceedance factors for NOx and PM10 for Kalyan Region are
shown in Table 5.8.
Table 5.8 Exceedance factors for NOx and PM10 for Kalyan Region
Exceedance Factor - Kalyan
NOx PM10
Min 0.37 0.51
Max 0.43 1.31
5.1.5 Kolhapur
There are 6 Air Monitoring stations in Kolhapur Region out of which 3 are located in residential
areas, 1 in an industrial area and 2 in rural areas. The annual average concentration of all the
parameters analyzed at all locations is represented in Table 5.9.
From Table 5.9. It can be observed that SO2 and NOx concentrations (except at Sangli Miraj
Primary Municipal School in case of NOx) at all locations was within the NAAQM standard
limits.PM10 concentrations were within the prescribed standards expect at Shivaji university.
Details of annual average statistical data recorded throughout the year 2020-21 are
represented in Table 5.9.
Table 5.9 Statistical Monitoring of Annual Average Air Quality in Kolhapur Region
Location
Parameters
SO2 NOx PM10
Standards (µg/m3 )
50 40 60
Shivaji University 10 15 52
Ruikar Trust 24 37 106
Mahadwar Road 19 29 85

19
Terrace of SRO-Sangli, Udyog Bhavan 9 35 64
Sangli Miraj Primary Municipal School 9 43 76
Krishna Valley School 8 39 72
It is evident from Table 5.9. that minimum SO2 concentration of 8µg/m3 was found at Krishna
Valley School. Minimum NOx concentration of 15µg/m3 and the minimum PM10 concentration
of 52µg/m3 was found at Shivaji University. The maximum SO2 concentration of 24µg/m3 and
maximum NOx concentration of 43µg/m3 was found at Ruikar Trust and Sangli Miraj Primary
Municipal School respectively. Maximum PM10 concentration of 106µg/m3 was found at Ruikar
Trust. The exceedance factors for NOx and PM10 for Kolhapur Region are shown in Table
5.10.
Table 5.10 Exceedance factors for NOx and PM10 for Kolhapur Region
Exceedance Factor - Kolhapur
NOx PM10
Min 0.15 0.52
Max 0.43 1.06
5.1.6 Mumbai
Mumbai has two Ambient Air Monitorin Stations at two different residential locations at Sion
and Bandra.The annual average concentration of all the parameters analyzed at all locations
is represented in Table 5.11.
From Table 5.11, it can be observed that the average SO2 concentrations at Sion and Bandra
were well within the NAAQM standard limits whereas concentration of NOx and PM10 at Sion
station was beyond the standards. Details of annual average statistical data recorded
throughout the year 2020-21 are represented in Table 5.11.
Table 5.11 Statistical Monitoring of Annual Average Air Quality in Mumbai Region
Location
Parameters
SO2 NOx PM10
Standards (µg/m3 )
50 40 60
Sion 17 52 179
Bandra (CAAQMS) 14 20 57
From Table 5.11. it is observed that minimum SO2 concentration of 14µg/m3 was found at
Bandra and a maximum of 17µg/m3 was found at Sion. Minimum NOx concentration of
20µg/m3 was found at Bandra and a maximum of 52µg/m3 was found at Sion. Minimum PM10
concentration of 57µg/m3 was found at Bandra whereas maximum PM10 concentration of
179µg/m3 was found at Sion. The exceedance factors for PM10 for Mumbai Region are shown
in Table 5.12.
Table 5.12 Exceedance factors for NOx & PM10 for Mumbai Region
Exceedance Factor – Mumbai
NOx PM10
Min 0.20 0.57
Max 0.52 1.79

20
5.1.7 Nagpur
Nagpur has four Ambient Air Monitoring Stations.The annual average concentration of all the
parameters analyzed at all locations is represented in Table 5.13.
From Table 5.13. It can be observed that SO2 and NOx concentrations at all locations are
within the NAAQM standard limits. PM10 concentrations at all locations are beyond the
prescribed limits. Details of annual average statistical data recorded throughout the year 2020-
21 are represented in Table 5.13
Table 5.13 Statistical Monitoring of Annual Average Air Quality in Nagpur Region
Location
Parameters
SO2 NOx PM10
Standards (µg/m3 )
50 40 60
Civil Lines, Nagpur 8 21 61
North Ambazari Road 8 24 96
Hingna Road 10 26 105
Sadar 8 22 101
From Table 5.13, it is observed that minimum SO2 concentration of 8µg/m3 was recorded at
Civil Lines, Sadar and North Ambazari Road. Minimum NOx concentration of 21µg/m3 and
minimum PM10 concentration of 61µg/m3 was recorded at Civil Lines, Nagpur. Maximum SO2
concentration of 10µg/m3, maximum NOx concentration of 26µg/m3 and maximum PM10
concentration of 105µg/m3 was recorded at Hingna Road. The exceedance factors for PM10
for Nagpur Region are shown in Table 5.14
Table 5.14 Exceedance factors for PM10 for Nagpur Region
Exceedance Factor - Nagpur
Min 0.61
Max 1.05
5.1.8 Nashik
There are 8 AAQMS in this Region of which 5 have been located at residential areas, 2 at
industrial areas and 1 at a commercial area. The annual average concentration of all the
parameters analyzed at all locations is represented in Table 5.15
From Table 5.15, it can be observed that SO2, NOx and PM10 concentrations at all locations
are within the NAAQM standard limits. Details of annual average statistical data recorded
throughout the year 2020-21 are represented in Table 5.15.
Table 5.15 Statistical Monitoring of Annual Average Air Quality in Nashik Region
Location
Parameters
SO2 NOx PM10
Standards (µg/m3 )
50 40 60
SRO Office Nashik 6 21 36

21
From Table 5.15, it can be observed that minimum SO2 concentration of 5µg/m3 and minimum
NOx concentration of 12µg/m3 was recorded at KTHM College. Minimum PM10 concentration
of 36µg/m3 was recorded at two locations - SRO Office Nashik and MIDC Satpur. Maximum
SO2 concentration of 11µg/m3 was recorded at MIDC Jalgaon and Old B. J. Highest NOx
concentration of 22µg/m3 was observed at MIDC Satpur, RTO Colony and NMC Nashik.
Maximum PM10 concentration of 55µg/m3 was recorded at KTHM College. The exceedance
factors for PM10 for Nashik Region are shown in Table 5.16
Table 5.16 Exceedance factors for PM10 for Nashik Region
Exceedance Factor - Nashik
Min 0.36
Max 0.55
5.1.9 Navi Mumbai
Out of the 6 AAQMS in Navi Mumbai Region, 2 are located in residential areas, 3 in industrial
areas and 1 in a rural area. The annual average concentration of all the parameters analyzed
at all locations is represented in Table 5.17.
From Table 5.17, It can be observed that the average SO2 concentrations at all locations are
within the NAAQM standard limits. However, NOx concentrations at all locations except Nerul
were beyond the prescribed standard. PM10 concentrations at all locations except Airoli were
within the NAAQM standard limit. Details of annual average statistical data recorded
throughout the year 2020-21 are represented in Table 5.17. It can be observed that minimum
SO2 concentration of 8µg/m3 was found at Airoli. Minimum NOx concentration of 39µg/m3 was
recorded at Nerul. Similary, Minimum PM10 concentration of 48µg/m3 was also found at the
same location.
Table 5.17 Statistical Monitoring of Annual Average Air Quality in Navi Mumbai
Region
Location
Parameters
SO2 NOx PM10
Standards (µg/m3 )
50 40 60
Airoli 8 96 196
Nerul 14 39 48
Rabale 15 45 55
Mahape 15 45 54
Kharghar 14 42 49
MIDC Taloja 15 46 58
KTHM College 5 12 55
MIDC Satpur 7 22 36
RTO Colony 6 22 37
NMC Nashik 6 22 37
MIDC Jalgaon 11 21 54
Girna Water Tank 10 21 51
Old B. J. Market 11 21 54

22
Maximum SO2 concentration of 15µg/m3 was observed at three locations - Rabale, Mahape
and MIDC Taloja. Maximum NOx concentration (96µg/m3) and maximum PM10 concentration
(196µg/m3) was observed at Airoli. Table 5.18 reprrsents the exceedance factor for NOx
Table 5.18 Exceedance factors for NOx for Navi Mumbai Region
Exceedance Factor - Navi Mumbai
Min 0.39
Max 0.96
5.1.10 Pune
Pune City has always been appreciated as a “Pensioner's Paradise”. Its salubrious climate
and clean air lead to decrease in illness rate which is good but this rate is seemingly
deteriorating with time. Air pollution has reached to such an extent that, this metropolis is
choking on its own vehicular exhaust. Looking at the continuous increase in air pollution, there
are 8 AAQMS in this Region of which 6 are in residential areas, 1 in an industrial and 1 in a
rural area. Samples have been analyzed to assess the air quality in entire region for all the
areas i.e., residential, rural area& industrial. The annual average concentration of all
parameters is represented in Table 5.19
From Table 5.19, It can be observed that the SO2 concentrations at all locations are within the
NAAQM standard limits. NOx concentrations at all locations except Nal Stop, PCMC and
Swargate were beyond the standard limits. PM10 concentrations at all locations except Karve
Road CAAQMS were beyond the standard limits. Details of annual average statistical data
recorded throughout the year 2020-21 are represented in Table 5.19
Table 5.19 Statistical Monitoring Annual Average Air Quality in Pune Region
Location
Parameters
SO2 NOx PM10
Standards (µg/m3 )
50 40 60
PCMC 21 50 80
Karve Road CAAQMS 12 32 39
Nal Stop 17 51 101
Bhosari 15 40 79
Swargate 20 60 145
Solapur 9 30 69
WIT Campus 7 13 67
Saat Rasta 7 13 65
From Table 5.19. It can be observed that minimum SO2 concentration of 7µg/m3 was found at
WIT Campus and Saat Rasta. Minimum NOx concentration of 13µg/m3 was found at WIT
Campus and Saat Rasta. The minimum PM10 concentration of 65µg/m3 was found at Saat
Rasta. Maximum SO2 concentration of 21µg/m3 was found at PCMC. Maximum NOx
concentration of 60µg/m3 was found at Swargate. Maximum PM10 concentration of 145µg/m3
was found at Swargate. The exceedance factors for NOx and PM10 for Pune Region are shown
in Table 5.20

23
Table 5.20 Exceedance factors for NOx and PM10 for Pune Region
Exceedance Factor – Pune
NOx PM10
Min 0.13 0.65
Max 0.60 1.45
5.1.11 Raigad
The AAQMS at Panvel Water Supply Plant is located in a residential area. The annual average
concentration of all the parameters analyzed at this location is represented in Table 5.21. It
can be observed that the SO2, NOx and PM10 concentrations were within the NAAQM standard
limits. Details of annual average statistical data recorded throughout the year 2020-21 are
represented in Table 5.21
Table 5.21 Statistical Monitoring of Annual Average Air Quality in Raigad Region
From Table 5.21, the SO2 concentration at Panvel Water Supply Plant was 14µg/m3, NOx
concentration was 40µg/m3 and PM10 concentration was 48µg/m3.
5.1.12 Thane
There are 3 AAQMS established in this Region, of which 1 is in a residential area, 1 is in an
industrial area and 1 is in a rural area. The annual average concentration of all the parameters
analyzed at all locations is represented in Table 5.22.
From Table 5.22, It is evident that SO2 and NOx concentrations at all locations are within the
NAAQM prescribed standard limits. However, the PM10 concentrations at all locations are
beyond the standard limits. Details of annual average statistical data recorded throughout the
year 2020-21 are represented in Table 5.22.
Table 5.22 Statistical Monitoring of Annual Average Air Quality in Thane Region
Location
Parameters
SO2 NOx PM10
Standards (µg/m3 )
50 40 60
Balkum/Glaxo 16 28 74
Naupada 19 29 65
Kopri 17 29 67
From Table 5.22, minimum SO2 concentration of 16µg/m3 was found at Balkum/Glaxo while
the maximum 19µg/m3 was found at Naupada. Minimum NOx concentration of 28µg/m3 was
found at Balkum/Glaxo while the maximum NOx concentration of 29µg/m3 was found at
Naupada and Kopri. Minimum PM10 concentration of 65µg/m3 was found at Naupada while the
maximum PM10 concentration of 74µg/m3 was found at Balkum/Glaxo.
Location
Parameters
SO2 NOx PM10
Standards (µg/m3 )
50 40 60
Panvel Water Supply Plant 14 40 48

24
Table 5.23 Exceedance factors for PM10 for Thane Region
Exceedance Factor – Thane
Min 0.65
Max 0.74
5.2 Conclusion for Air Quality in the State of Maharashtra
An overview of the AQI for the reading recorded by the AAQMS in Maharashtra has been
calculated using three parameters, viz., SO2, NOx and RSPM as per the calculation and AQI
categories released by CPCB and IIT Kanpur in October 2014. After determining the sub-
indices for a region, the highest sub-index from that AAQMS has been considered as the AQI
for the area thus represented.
In the year 2020-21, air quality monitoring was carried out across 69 active AAQMS installed
in various regions of Maharashtra. As shown in Figure 5.2, around 83% observations came
under the ‘Good’ and ‘Satisfactory’ categories, as compared to 75.7% in the previous year
2019-20. Thus, an increase in the percentage of non-polluted days by almost 7.3% was
recorded. In ‘Moderate’ category, 16 % observations were recorded this year as compared to
23.68% last year. Increasing trend was found in ‘Poor’ category, 1% in year 2020-21 as
compared to 0.64% in year 2019-20. No observations were found in ‘Very Poor’ and ‘Severe’
category, while a very minute part came under ‘No Data’. Table 5.24 represents colour codes
for various ranges pf AQI.
Table 5.24 Legend for reading AQI.
AQI 0-50 51-100 101-200 201-300 301-400 401-500
Remarks Good Satisfactory Moderate Poor Very Poor Severe
Air Quality Index (AQI) is a comprehensive index value calculated by transforming weighted
values of impacts of individual air pollutants (e.g., SO2, CO, NOx,) into a single number or set
of numbers. It reflects air quality of an area in terms of health impacts on the population. This
makes it an easy-to-understand parameter of air quality that can be communicated to the
masses and can be used by decision makers for devising policies on air pollution abatement.
The standard AQI values in India are based on health breakpoints for the following eight
pollutants- CO, NO2, SO2, PM10, PM2.5, O3, Pb and NH3. AQI has diverse uses and applications
for policy makers, researchers and the public. It is a key tool in air quality monitoring and
regulation. The subsequent sections elaborate the AQI trend in Maharashtra during the year
2020-21.
5.2.1 Trend Analysis of AQI share over 5 years.
Analysis of the trend of share of mean Air Quality Index between the years 2016 and 2021
was carried out in order to compare and study the contributions of each AQI category during
these years. Figure 5.3, shows the trends of share of categories of AQI during the years 2016-
17, 2017- 18, 2018-19 ,2019-20 and 2020-21.
From Figure 5.3, it can be observed that, the highest share in 2020-21 is of ‘Satisfactory’
category, which is similar to that of previous trend. In this year, ‘Good’ category follows second
to the ‘Satisfactory’ category which was not the case in 2019-2020.Last year ‘Moderate’
category followed second to the Satisfactory category. From 2016-2020, the share of the

25
‘Good’ category was found to be the third most. This year, i.e. in 2020-2021, the share of
‘Good” category was found to be the second most. The share of the AQI categories of ‘Poor’,
‘Very Poor’ and ‘Severe’ was negligible during all years.
Figure 5.2 Share of AQI categories for air quality of monitored observations across all AAQMS in Maharashtra (2020-21)
Figure 5.3. Trends in year-wise share of AQI categories
0.00
5.00
10.00
15.00
20.00
25.00
30.00
35.00
40.00
45.00
Good (0-50) Satisfactory(51-100)
Moderate(101-200)
Poor (201-300)
Very Poor(301-400)
Severe (401-500)
Me
an A
QI s
har
e
AQI categories
16-17
17-18
18-19
19-20
20-21
32%
51%
16%
1%
0%
0%Share of AQI categroies 2020-2021
Good (0-50)
Satisfactory (51-100)
Moderate (101-200)
Poor (201-300)
Very Poor (301-400)
Severe (401-500)
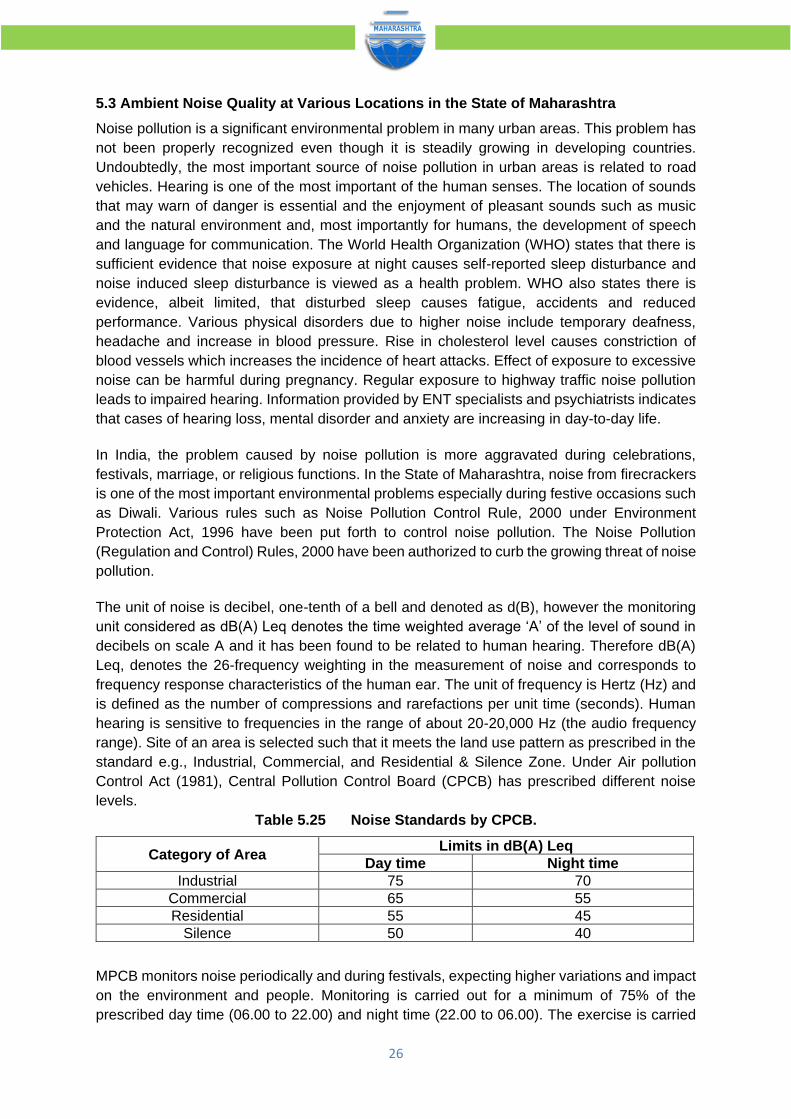
26
5.3 Ambient Noise Quality at Various Locations in the State of Maharashtra
Noise pollution is a significant environmental problem in many urban areas. This problem has
not been properly recognized even though it is steadily growing in developing countries.
Undoubtedly, the most important source of noise pollution in urban areas is related to road
vehicles. Hearing is one of the most important of the human senses. The location of sounds
that may warn of danger is essential and the enjoyment of pleasant sounds such as music
and the natural environment and, most importantly for humans, the development of speech
and language for communication. The World Health Organization (WHO) states that there is
sufficient evidence that noise exposure at night causes self-reported sleep disturbance and
noise induced sleep disturbance is viewed as a health problem. WHO also states there is
evidence, albeit limited, that disturbed sleep causes fatigue, accidents and reduced
performance. Various physical disorders due to higher noise include temporary deafness,
headache and increase in blood pressure. Rise in cholesterol level causes constriction of
blood vessels which increases the incidence of heart attacks. Effect of exposure to excessive
noise can be harmful during pregnancy. Regular exposure to highway traffic noise pollution
leads to impaired hearing. Information provided by ENT specialists and psychiatrists indicates
that cases of hearing loss, mental disorder and anxiety are increasing in day-to-day life.
In India, the problem caused by noise pollution is more aggravated during celebrations,
festivals, marriage, or religious functions. In the State of Maharashtra, noise from firecrackers
is one of the most important environmental problems especially during festive occasions such
as Diwali. Various rules such as Noise Pollution Control Rule, 2000 under Environment
Protection Act, 1996 have been put forth to control noise pollution. The Noise Pollution
(Regulation and Control) Rules, 2000 have been authorized to curb the growing threat of noise
pollution.
The unit of noise is decibel, one-tenth of a bell and denoted as d(B), however the monitoring
unit considered as dB(A) Leq denotes the time weighted average ‘A’ of the level of sound in
decibels on scale A and it has been found to be related to human hearing. Therefore dB(A)
Leq, denotes the 26-frequency weighting in the measurement of noise and corresponds to
frequency response characteristics of the human ear. The unit of frequency is Hertz (Hz) and
is defined as the number of compressions and rarefactions per unit time (seconds). Human
hearing is sensitive to frequencies in the range of about 20-20,000 Hz (the audio frequency
range). Site of an area is selected such that it meets the land use pattern as prescribed in the
standard e.g., Industrial, Commercial, and Residential & Silence Zone. Under Air pollution
Control Act (1981), Central Pollution Control Board (CPCB) has prescribed different noise
levels.
Table 5.25 Noise Standards by CPCB.
Category of Area Limits in dB(A) Leq
Day time Night time
Industrial 75 70
Commercial 65 55
Residential 55 45
Silence 50 40
MPCB monitors noise periodically and during festivals, expecting higher variations and impact
on the environment and people. Monitoring is carried out for a minimum of 75% of the
prescribed day time (06.00 to 22.00) and night time (22.00 to 06.00). The exercise is carried

27
out for 6 to 8 hours in the prescribed time frame of day and night. Details of noise pollution
monitoring and analysis per region are discussed in detail in following sections.
5.3.1 Mumbai
In Mumbai a total of 15 locations were monitored. The highest noise level during day time on
21st and 22nd February 2021 was observed with 76.8dB(A) at Santacruz Airport and 77.9db(A)
at Goregaon East respectively. During night time the highest noise level on 21st February was
observed at Antop Hill with 65.0dB(A) and on 22nd February was observed at Santacruz Airport
with 69.7 dB(A).
5.3.2 Navi Mumbai
In Navi Mumbai a total of 3 locations were monitored. The highest noise level during day time
on 21st and 22nd February 2021 was observed with 70.8dB(A) and 70.5dB(A) both at APMC
Market Vashi. During night time the highest noise level on 21st February was observed at Ryan
International School, Uran Phata, Nerul with 54.4 dB(A) and on 22nd February was observed
at APMC Market Vashi with 66.3 dB(A).
5.3.4 Pune
Five locations were monitored in Pune region. On 21st and 22nd February, the highest noise
level at both day time and night time was observed at Hadpsar.
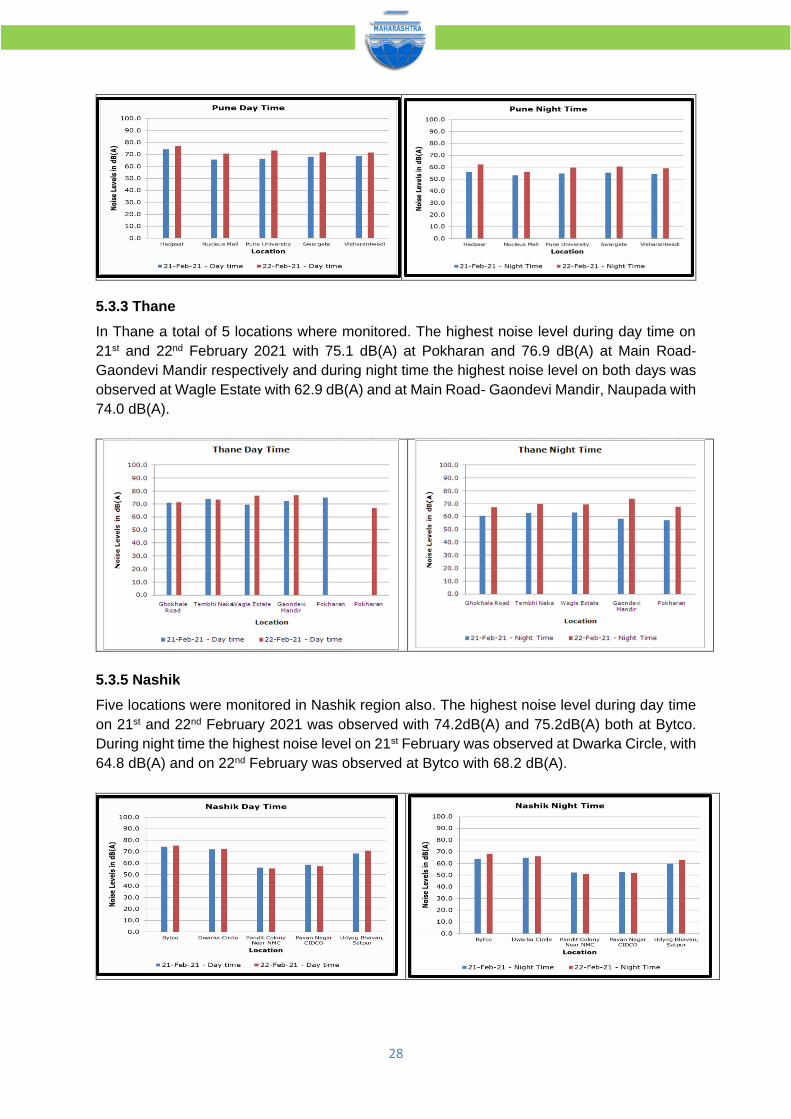
28
5.3.3 Thane
In Thane a total of 5 locations where monitored. The highest noise level during day time on
21st and 22nd February 2021 with 75.1 dB(A) at Pokharan and 76.9 dB(A) at Main Road-
Gaondevi Mandir respectively and during night time the highest noise level on both days was
observed at Wagle Estate with 62.9 dB(A) and at Main Road- Gaondevi Mandir, Naupada with
74.0 dB(A).
5.3.5 Nashik
Five locations were monitored in Nashik region also. The highest noise level during day time
on 21st and 22nd February 2021 was observed with 74.2dB(A) and 75.2dB(A) both at Bytco.
During night time the highest noise level on 21st February was observed at Dwarka Circle, with
64.8 dB(A) and on 22nd February was observed at Bytco with 68.2 dB(A).

29
5.3.6 Aurangabad
Five locations were monitored for Aurangabad region. The highest noise level on 21st February
both during day time and night time was observed at Nirala Bazaar. On 22nd February the
highest noise level during day time was observed at Nirala Bazaar with 47.3 dB(A) and during
night time the highest noise level was observed at Ghati Hospital 46.7 dB(A).
5.3.7 Nagpur
In Nagpur region 5 loactions was monitored. On 21st and 22nd February, the highest noise level
during daytime were observed at Sitabardi Police Station with 71.4 dB(A) and at Shivaji Nagar
with 73 dB(A). On both days at night time, the highest noise level was observed at Sitabardi
Police Station.
5.3.8 Kalyan
Three locations were monitored in Kalyan region on 21st and 22nd February the highest noise
level both during day time was observed at Bail Bazar and during night time the highest noise
level was observed at Birla College with 60.5 dB(A) and at Bail Bazar with 63.9 dB(A).

30
5.3.9 Amaravati
Three locations were monitored for Amravati region. On 21st and 22nd February the highest
noise level during day time was observed atBudhwara with 60.1 dB(A) and at Rajkamal Chowk
with 74 dB(A). During night time at both days the highest noise level was observed at Rajkamal
Chowk.
5.3.10 Kolhapur
In Kolhapur region four locations were monitored. On both the days of monitoring, the highest
noise level both during day time was observed at Gokhale College with 77.1 dB(A) and 80.7
dB(A). During night time was observed at Shambhaji Nagar with 57.8 dB(A) and at Gokhale
College with 71 dB(A).
5.3.11 Chandrapur
In Chandrapur region also three locations were monitored. During both 21st and 22nd February,
the highest noise level on both day and night time was observed at Jetpura Gate.

31
5.3.12 Panvel ( Raigad )
Three locations was monitored from Panvel Municipal Corporation. On 21st and 22nd February
The highest noise level during day timewas observed at Khanda Colony with74 dB(A) and at
Utsav chowk, Kharghar with 75 dB(A). During night time on both days, the highest noise level
was observed at Utsav chowk, Kharghar.
Conclusion
Maharashtra Pollution Control Board have carried out Noise monitoring at104locations from
27 Municipal Corporation of Maharashtra for 2 days period including one working and one
non-working day i.e. on 21st (Non-working day) and 22nd (Working day) February 2021 for 24
hours for each location which comprise of residential, commercial and silence zone. The study
reveals comparing the laid down noise norms for respective zones (Industrial, Commercial,
Residential or Silence) the noise levels are exceeded at many locations. The ever-increasing
use of automobiles is a major cause of this pollution. People honk unnecessarily in the traffic
and listen to loud music on the way which creates high levels of noise.
Noise pollution is the most common problem faced by humans, thanks to various reasons that
pushes many people to face health issues. Following standard measures can be helpful in the
long term for both humans and the environment. The ultimate aim is to bring down the noise
pollution for a better environment.
There are many measures taken by the government and people to reduce the effect of noise
pollution. Soundproof walls and windows are now being installed in many houses. Many
flyovers in cities have soundproof walls to bring down the noise level to a nearby resident from
vehicles running. As a responsible citizen, we must contribute towards bringing down the noise
pollution. Needless honking should be stopped and officials should fine people doing it heavily.
Hospitals and schools are build in silent zone. There should be rules to avoid noise in
residential and sensitive areas. It is important for people to be aware of health Hazard from
noise pollution. One of the best ways to bring down the noise pollution is by planting more and
more plants. This process of planting tress can help to reduce the travelling of noise from one
place to another.
5.4 Water Quality in Maharashtra
In 1997, the World Health Organization (WHO) defined water pollution as any change in the
physical, chemical and biological properties of water that has a harmful effect on living things.
Water pollution results from various point sources such as industrial effluents and domestic

32
waste, and non-point sources such as fertilizer and pesticide run-offs in rural areas from the
agricultural fields. Along with human activities, various microbiological agents also cause
water pollution which may cause various water-borne diseases. When toxic substances enter
lakes, streams, oceans, and other water bodies, they get dissolved or lie suspended in water
or get deposited on the bed. This results in the pollution of water whereby the quality of the
water deteriorates, affecting aquatic ecosystems. Further the pollutants can also seep down
and affect the groundwater deposits and aquifers.
The effects of water pollution are not only devastating to humans but also to flora and fauna.
Water pollution can also significantly increase the rate of algal blooms which can cause
depletion of oxygen in the water affecting the aquatic life. The consumption of water
contaminated with pesticides can result in cellular and Deoxyribonucleic Acid (DNA) damage,
suppression of immune system, cancers, tumours and lesions on fish and animals, and
physical deformities such as hooked beaks in birds and thinning of egg shell can occur in
avifauna. The consumption of polluted water may lead to not only poisoning of humans,
animals, birds, but also disturbs the fragile aquatic and riparian ecosystem.
Dumping of solid wastes is also an important factor resulting in deterioration of the
groundwater quality. Solid waste includes all the discarded solid materials from commercial,
municipal, industrial, and agricultural activities.
The quality of water is affected by various factors like rate of monsoon, dilution during
monsoon, high evaporation rate during the summers, sporadic pollution loads from various
anthropogenic activities, flow rate of water and so on. Hence, there could be varied fluctuations
in the quality of water at the same monitoring location leading to seasonal variations.
The Maharashtra Pollution Control Board (MPCB) regularly monitors the water quality across
250 Water Quality Monitoring Stations (WQMS) for both surface and ground water (200 for
surface water and 50 for groundwater) under Central Pollution Control Board’s project of
NWMP. Surface water samples are monitored every month whereas the ground water
samples are monitored every six months.
5.4.1 Water Quality Index A water quality index provides a single number (like a grade) that expresses overall water
quality of a certain water sample (location and time specific) for several water quality
parameters. The objective of developing an index is to simplify the complex water quality
parametric data into comprehensive information for easy understanding. A water quality index
based on important parameters provides a simple indicator of water quality and a general idea
of the possible problems with the water in the region. Upon determining the Water Quality
Index (WQI), water quality is described for easy understanding and interpretation. The
modified weights as per Central Pollution Control Board are given in Table 5.26 and the
equations used to determine the sub-index values are given Table 5.27
In 1970, the National Sanitation Foundation, USA developed the Water Quality Index
(NSFWQI), a standardized method for comparing the water quality of various water bodies.
NSFWQI is one of the most respected and utilized water quality index in the United States.
Nine water quality parameters selected for calculating the index include dissolved oxygen
(DO), fecal coliforms (FC), pH, biochemical oxygen demand (BOD), temperature change, total

33
phosphate, nitrate, turbidity and total solids.
5.4.1.1 WQI for Surface Water Given the parameters monitored in India under the NWMP and to maintain the uniformity while
comparing the WQI across the nation, the NSF WQI has been modified and relative weights
been assigned by CPCB. The modified weights as per CPCB are given in Table --. and the
equations used to determine the sub-index values are given 5.26 Upon determining the Water
Quality Index, water quality is described for easy understanding and interpretation. The
description used in the report for classifying and the describing the water quality is presented
in Table 5.27
Table 5.26 Modified Weights for Computation of WQI Based on DO, FC, pH and
BOD.
Parameters Original Weights from
NSF WQI Modified Weights by CPCB
Dissolved Oxygen (DO) 0.17 0.31
Fecal Coli form (FC) 0.15 0.28
pH 0.12 0.22
BOD 0.1 0.19
Total 0.54 1
Table 5.27 Sub-Index Equation Used to Calculate NSF WQI for DO, FC, pH and BOD.
Water Quality Parameters
(units) Range Applicable Equation
Dissolved Oxygen (DO) (%
Saturation)
0-40 0.18 + 0.66 × % Saturation DO
40-100 (-13.55) + 1.17 × % Saturation DO
100-140 163.34 - 0.62 × % Saturation DO
Fecal Coliform (FC)
(counts/100 ml)
1 – 103 97.2 - 26.6 × log FC
103 – 105 42.33 - 7.75 × log FC
>105 2
pH
02 – 05 16.1 + 7.35 × (pH)
05 - 7.3 (-142.67) + 33.5 × (pH)
7.3 – 10 316.96 - 29.85 × (pH)
10 – 12 96.17 - 8.0 × (pH)
<2, >12 0
BOD (mg/l)
0 – 10 96.67 - 7 × (BOD)
10 – 30 38.9 - 1.23 × (BOD
>30 2
Table 5.28 Surface Water Classification based on Water Quality Index.
WQI Value
Water Quality
Class by
CPCB
Class by MPCB
Remarks
Colour code
used in this.
report

34
63 – 100 Good – Excellent A A -I Non-Polluted
50 – 63 Good water B Not Prescribed Non-Polluted
38 – 50 Poor Water C A –II Polluted
38 & less Very Poor water D, E A – III, A- IV Heavily Polluted
5.4.1.2 WQI for Groundwater
MPCB monitors ground water quality for parameters like pH, total hardness, calcium,
magnesium, chloride, total dissolved solids, fluoride, manganese, nitrates, and Sulphates
once in six months. Based on the stringency of the parameters and its relative importance in
the overall quality of water for drinking purposes each parameter has been assigned specific
weight by CPCB. These weights indicate the relative harmfulness when present in water. The
relative weights of the nine parameters (pH, Total Hardness, Calcium Hardness, Magnesium
Hardness, Chloride, Total Dissolved Solids, Fluoride, Nitrate, Sulphate) have been determined
and presented in Table 5.29. for water samples monitored by MPCB in the year 2019-20.
Based on the absolute value of the index determined from calculations, water quality is
classified as presented in Table 5.30
Table 5.29 Relative Weights of Each Parameter for WQI of Groundwater
Chemical
Indian Standards for Drinking Water Quality
Weight (Wi)
Parameters Acceptable
Limit Permissible
Limits Weight
Relative Weight
Weight w/o Iron,
Relative Weight w/o Iron,
Manganese
& Bicarbonate
Manganese & Bicarbonate
pH 6.5-8.5 No
relaxation 4 0.09756 4 0.13333
Total Hardness
(TH) 300 600 2 0.04878 2 0.06667
Calcium 75 200 2 0.04878 2 0.06667
Magnesium 30 No
relaxation 2 0.04878 2 0.06667
Bicarbonate 244 732 3 0.07317 - -
Chloride 250 1000 3 0.07317 3 0.10000
Total Dissolved
Solids (TDS) 500 2000 4 0.09756 4 0.13333
Fluoride 1 1.5 4 0.09756 4 0.13333
Manganese 0.1 0.3 4 0.09756 - -
Nitrate 45 No
relaxation 5 0.12195 5 0.16667
Sulphate 200 400 4 0.09756 4 0.13333
Total 41 1 30 1
Table 5.30 Groundwater Classification Based on Water Quality Index
WQI Value Water Quality Colour code used in this report
<50 Excellent

35
50-100 Good water
100-200 Poor Water
200-300 Very Poor water
>300 Water Unsuitable for drinking
5.4.2 Analysis of Surface Water Quality with Statistical details
As per provisions made by Water Quality Assessment Authority constituted under Sub-
Sections (1) and (3) of Section 3 of the Environment (Protection) Act, 1986 (Act No. 29 of
1986) water quality in Maharashtra is monitored by various agencies namely Hydrology
Project (SW), Groundwater Surveys & Development Agency (GSDA), Central Pollution
Control Board (CPCB), Maharashtra Pollution Control Board (MPCB), Central Water
Commission (CWC) and Central Ground Water Board (CGWB). Water quality testing under
CPCB’s NWMP in Maharashtra is monitored by MPCB (State nodal agency). Maharashtra has
the highest number of monitoring stations under NWMP across all states in India. MPCB
possesses infrastructure to monitor 44 parameters covering field observations, general
parameters, core parameters and trace metals. The samples are monitored at monthly and
six monthly frequencies for surface water and groundwater stations respectively. In order to
have continuous vigilance check on water quality, MPCB has installed WQMS (Water Quality
Monitoring Stations) across the State.
Quality of surface water is monitored per month across all stations. The spatial presence of
the stations is presented basin wise in the respective sections below. Basin-wise water quality
index is presented in this section for the basins of Tapi, Krishna, Godavari and Coastal basin
5.4.2.1 Tapi Basin
The intra-basin performance of Tapi Basin across six districts in the Maharashtra is depicted
in Figure 5.4 It can be observed that the water quality index (WQI) in Dhule district was ‘good
to excellent’ during the months of April 2020, August 2020, September 2020, October 2020,
November 2020, December 2020,January 2021, February 2021 and March 2021. The water
quality during all these months was not polluted. In the month of May 2020, June 2020 and
July 2020 WQI was not recorded as locations were dry and sample couldn’t be collected.
In Amaravati district, the WQI was recorded as ‘good to excellent’ during the months of July,
August, September, October, November 2020. The water quality was not polluted. WQI was
not recorded during the months of April, May, June, December 2020 and January, February,
March 2021 because the water samples were not collected.
In Akola district, the WQI was ‘good-excellent’ in the months of April, July, October and
November 2020 and the water was not polluted. The WQI was recorded as ‘good’ in the month
of August 2020 and September 2020 and the water was unpolluted. During the months of
May, June, December 2020 and January, February, March 2021, the WQI was not recorded
as the locations were dry.
In Jalgaon district, the WQI was recorded as ‘good to excellent’ during the months of April,
May, July, August, September, October, November, December 2020 and January, February
and March 2021 and the water was not polluted during these months.

36
In the district of Nandurbar, the WQI was recorded as ‘good to excellent’ during the months of
April 2020 and from July 2020 to March 2021 and the water quality during these months was
not polluted. In the months of May and June 2020, WQI was not recorded as locations were
dry and sample couldn’t be collected.
In Nashik district, the WQI was recorded as ‘good to excellent’ in the months of April, June,
August, October, November, December 2020 and January 2021. During May, July, September
2020 and February, March 2021 WQI was not recorded as locations were dry and sample
couldn’t be collected.
Figure 5.4. The intra-basin performance of Tapi Basin across six districts in the Maharashtra FY 2020-21
5.4.2.2 Godavari Basin 1
Figure 5.5 shows the monthly trend in WQI along Godavari Basin 1 across 7 districts during
the year 2020-21. From the figure it is evident that the WQI of all districts in this basin was
recorded as ‘good to excellent’ during the year 2020-21 and the water was unpolluted
throughout the year. However, WQI was not recorded from October 2020 to March 2021 in
Aurangabad, Beed, Jalna, Nanded and Parbhani. In case of Jalna and Beed district, WQI was
not recorded during September 2020 to March 2021. WQI was not recorded throughout the
year in Latur district. This was because the locations were dry and hence, it was not possible
to collect samples.
5.4.2.3 Godavari 2 Basin
Figure 5.6 shows the monthly trend in WQI along Godavari Basin 2 across 5 districts during
the year 2020-21. In Bhandara district the WQI was recorded as ‘good to excellent’ on April
2020 and from June 2020 to March 2021. The WQI of Chandrapur district was recorded as
‘good to excellent’ throughout the year 2020-21 and the water was unpolluted. In Nagpur
0
10
20
30
40
50
60
70
80
90
100
Apr-20 May-20 Jun-20 Jul-20 Aug-20 Sep-20 Oct-20 Nov-20 Dec-20 Jan-21 Feb-21 Mar-21
WQ
I
Tapi Basin
Very Poor Water Poor water Good water Good-Excellent
Amaravati Akola Dhule Jalgaon
Nandurbar Nashik

37
district the WQI was found to be ‘good to excellent’ during all months and the water was
unpolluted throughout the year. In the district of Wardha the WQI was recorded as ‘good to
excellent’ during the months of April,July, August, September, October, November, December
2020 and January, February and March 2021. The water was unpolluted during these months.
During May and June 2020 WQI was not recorded as locations were dry and sample couldn’t
be collected.
In Yavatmal district the WQI was recorded as ‘good to excellent’ throughout the year 2020-21
and the water was unpolluted.
Figure 5.5 The intra-basin performance of Godavari Basin 1 across six districts in the Maharashtra FY 2020-21
0
10
20
30
40
50
60
70
80
90
100
Apr-20 May-20 Jun-20 Jul-20 Aug-20 Sep-20 Oct-20 Nov-20 Dec-20 Jan-21 Feb-21 Mar-21
WQ
I
Godavari Basin 1
Very Poor Water Poor water Good water Good-Excellent
Aurangabad Beed Jalna Latur
Nanded Nashik Parbhani

38
Figure 5.6 The intra-basin performance of Godavari Basin 2 across six districts in the Maharashtra FY 2020-21
5.4.2.4 Krishna Basin
Figure 5.7 shows the monthly trend in WQI along Krishna basin across five districts during the
year 2020-21. In Kolhapur district the WQI was recorded as ‘good to excellent’ during all
months of the year 2020-21. The water quality was unpolluted throughout the year. In Pune
as well as Satara district, the WQI was recorded as ‘good-excellent’ for all the months from
April 2020 to March 2021. The water was unpolluted during these months. In Sangli and
Solapur districts, the WQI was found to be ‘good to excellent’ throughout the year except in
May 2020, when WQI was not recorded..The water was unpolluted throughout these months.
0
10
20
30
40
50
60
70
80
90
100
Apr-20 May-20 Jun-20 Jul-20 Aug-20 Sep-20 Oct-20 Nov-20 Dec-20 Jan-21 Feb-21 Mar-21
WQ
IGodavari Basin 2
Very Poor Water Poor water Good water
Good-Excellent Chandrapur Bhandarad
Nagpur Wardha Yavatmal

39
Figure 5.7 The intra-basin performance of Krishna Basin 1 across six districts in the
Maharashtra FY 2020-21
5.4.2.5 Coastal Basin
5.4.2.5.1 West Flowing Rivers
The monthly trend of WQI along the basin of west flowing rivers across four districts in
Maharashtra during the year 2020-21 is shown in Figure 5.8. In the districts of Raigad,
Ratnagiri and Thane, the WQI was recorded as ‘good to excellent’ during all months of the
year 2020-21 and the water quality was recorded as not polluted throughout the year. In
Mumbai, the WQI was recorded as ‘very poor’ during the months of April, May, December
2020 and March 2021.The water was heavily polluted during these months. In the month of
June 2020 and February 2021, the WQI was observed to be poor and the water was polluted.
The WQI was recorded to be ‘good’ in the months of July, August, October and November
2020 and the water was unpolluted during this time. The water was clean and the WQI was
‘good-excellent’ only in the month of September 2021.
0
10
20
30
40
50
60
70
80
90
100
Apr-20 May-20 Jun-20 Jul-20 Aug-20 Sep-20 Oct-20 Nov-20 Dec-20 Jan-21 Feb-21 Mar-21
WQ
IKrishna Basin
Very Poor Water Poor water Good water
Good-Excellent Kolhapur Pune
Sangli Satara Solapur

40
Figure 5.8 The intra-basin performance of West Flowing Rivers across six districts in the Maharashtra FY 2020-21
5.4.2.5.2 Saline (Sea and Creek) Basin
Figure 5.9 shows the monthly trend in WQI along the Saline (sea & creek) basin across 5
districts during the year 2020-2021. In Kalyan, the WQI was recorded as ‘good to excellent’
during the months of June, July, August, September, October, November, and December
2020. In the months of May and April 2020 and Janaury and March 2021, the WQI was
recorded as ‘good’. The water was unpolluted throughout the year except in the month of
February 2022, when the WQI was recorded as poor.
In Mumbai, the WQI was recorded as ‘good’ during the months of April, May, June, July,
August, September, October, November, December 2020 and January, March 2021 and the
water was unpolluted during these months. The WQI was recorded as ‘poor’ during the month
of February 2021 and the water was polluted during this month.
In Raigad district the WQI was recorded as ‘good to excellent’ throughout the year except in
July 2020, when the WQI was recorded as ‘good’. The water was unpolluted throughout the
year.
In Ratnagiri district, the WQI was recorded as ‘good to excellent’ during all months of the year
2020-21 and the water was unpolluted throughout the year. In Thane district, the WQI was
recorded as ‘good to excellent’ from July to November 2020. During the months of April, May,
June, December 2020 and January, February and March 2021, the WQI was recorded as
‘good’ and the water quality was not polluted throughout the year.
0
10
20
30
40
50
60
70
80
90
100
Apr-20 May-20 Jun-20 Jul-20 Aug-20 Sep-20 Oct-20 Nov-20 Dec-20 Jan-21 Feb-21 Mar-21
WQ
IWest Flowing River
Very Poor Water Poor water Good water Good-Excellent
Mumbai Raigad Ratnagiri Thane

41
Figure 5.9 The intra-basin performance of Saline Basin across six districts in the Maharashtra FY 2020-21
5.4.3 Analysis of Groundwater Quality with Statistical details
In Maharashtra, CGWB (Central Ground Water Board), GSDA (Groundwater Survey and
Development Agency) and MPCB monitor the ground water quality across various districts of
the State. MPCB has 66 ground water monitoring stations which monitor water quality twice a
year for parameters like pH, Nitrate, TDS, Hardness, Fluoride, microbial content, and
sulphates. The water quality for groundwater across various Regions in the State is
represented in Table 5.31
Legend for WQI for Ground Water in Various Regions
Excellent Good Poor Very Poor Not suitable for drinking
Dry No Data
Table 5.31 WQI for Ground Water in Various Region
Apr-20 N/A N/A N/A 287.69
277.33
45.3
N/A N/A 294.94
N/A 48.26
318.21
N/A
Oct-20 150.75
70.05
152.01
80.85
86.66
N/A
74.64
156.1
81.37
22.04
24.4
32.98
22.05
Station Code
2004
2005
2006
2007
2008
2202
2829
2830
2831
2832
2833
2834
2835
Region
Kolhapur
0
10
20
30
40
50
60
70
80
90
100
Apr-20 May-20 Jun-20 Jul-20 Aug-20 Sep-20 Oct-20 Nov-20 Dec-20 Jan-21 Feb-21 Mar-21
WQ
ISaline( sea/creek)
Very Poor Water Poor water Good water
Good-Excellent Kalyan Mumbai
Raigad Ratnagiri Thane
Apr-20 N/A N/A N/A 106.91 109.08 111.01 N/A 110.56 N/A N/A
Oct-20 N/A N/A 59.32 78.14 43.87 N/A N/A 69.79 63.97 62.89
Station Code 2001 2002 2003 1993 2200 2201 2824 2825 1994 2828
Region Amravati Aurangabad Chandrapur
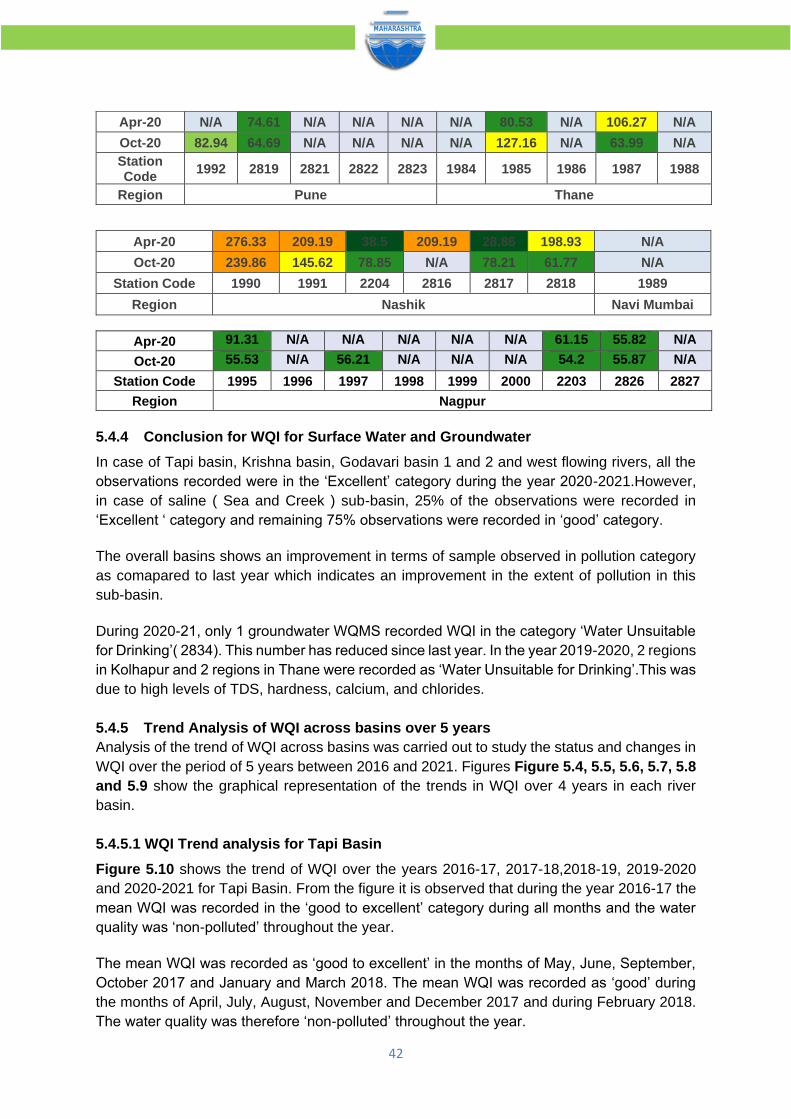
42
Apr-20 276.33 209.19 38.5 209.19 28.86 198.93 N/A
Oct-20 239.86 145.62 78.85 N/A 78.21 61.77 N/A
Station Code 1990 1991 2204 2816 2817 2818 1989
Region Nashik Navi Mumbai
5.4.4 Conclusion for WQI for Surface Water and Groundwater
In case of Tapi basin, Krishna basin, Godavari basin 1 and 2 and west flowing rivers, all the
observations recorded were in the ‘Excellent’ category during the year 2020-2021.However,
in case of saline ( Sea and Creek ) sub-basin, 25% of the observations were recorded in
‘Excellent ‘ category and remaining 75% observations were recorded in ‘good’ category.
The overall basins shows an improvement in terms of sample observed in pollution category
as comapared to last year which indicates an improvement in the extent of pollution in this
sub-basin.
During 2020-21, only 1 groundwater WQMS recorded WQI in the category ‘Water Unsuitable
for Drinking’( 2834). This number has reduced since last year. In the year 2019-2020, 2 regions
in Kolhapur and 2 regions in Thane were recorded as ‘Water Unsuitable for Drinking’.This was
due to high levels of TDS, hardness, calcium, and chlorides.
5.4.5 Trend Analysis of WQI across basins over 5 years
Analysis of the trend of WQI across basins was carried out to study the status and changes in
WQI over the period of 5 years between 2016 and 2021. Figures Figure 5.4, 5.5, 5.6, 5.7, 5.8
and 5.9 show the graphical representation of the trends in WQI over 4 years in each river
basin.
5.4.5.1 WQI Trend analysis for Tapi Basin
Figure 5.10 shows the trend of WQI over the years 2016-17, 2017-18,2018-19, 2019-2020
and 2020-2021 for Tapi Basin. From the figure it is observed that during the year 2016-17 the
mean WQI was recorded in the ‘good to excellent’ category during all months and the water
quality was ‘non-polluted’ throughout the year.
The mean WQI was recorded as ‘good to excellent’ in the months of May, June, September,
October 2017 and January and March 2018. The mean WQI was recorded as ‘good’ during
the months of April, July, August, November and December 2017 and during February 2018.
The water quality was therefore ‘non-polluted’ throughout the year.
Apr-20 N/A 74.61 N/A N/A N/A N/A 80.53 N/A 106.27 N/A
Oct-20 82.94 64.69 N/A N/A N/A N/A 127.16 N/A 63.99 N/A
Station Code
1992 2819 2821 2822 2823 1984 1985 1986 1987 1988
Region Pune Thane
Apr-20 91.31 N/A N/A N/A N/A N/A 61.15 55.82 N/A
Oct-20 55.53 N/A 56.21 N/A N/A N/A 54.2 55.87 N/A
Station Code 1995 1996 1997 1998 1999 2000 2203 2826 2827
Region Nagpur

43
Figure 5.10 Trend Analysis for Tapi Basin
During the year 2018-19, the mean WQI was recorded as ‘good’ during the months of May,
June and July 2018, and as ‘good to excellent’ during the remaining months. The water quality
was ‘non-polluted’ throughout the year.
For the year 2019-20, the mean WQI was recorded in the ‘Good to Excellent’ category during
all months and the water quality was ‘Non-Polluted’ throughout the year
In the year 2020-2021, the WQI was recorded as ‘good-excellent’ throughout the year from
April 2020 to March 2021 and the water was clean and not polluted.Hence, it can be inferred
that the overall water quality was unpolluted in the Tapi basin during all the five years .
5.4.5.2 WQI Trend analysis for Godavari Basin 1
Figure 5.11 shows the trend of WQI over the years 2016-17, 2017-18,2018-19, 2019-2020
and 2020-2021 for Godavari Basin 1.
From Figure 5.5. During the years 2016-17 and 2017-18, the mean WQI was recorded as
‘Good to excellent’ during all months. The mean WQI was recorded as ‘good’ during the
months of May, June and July 2018 during the year 2018-19, while it was recorded as ‘good
to excellent’ during the remaining months. During the year 2019-20 as well as 2020-2021, it
was recorded as ‘Good to Excellent’ for all the months.
5.4.5.3 WQI Trend analysis for Godavari Basin 2 Figure 5.12 shows the trend of WQI over the years 2016-17, 2017-18,2018-19, 2019-2020
and 2020-2021 for Godavari Basin 2.
0
10
20
30
40
50
60
70
80
90
100
Axis
Title
Tapi Basin
Good-Excellent
Good water
Poor water
Very Poor Water
2016-17
2017-18
2018-19
2019-20
2020-21

44
Figure 5.11 Trend Analysis for Godavarin Basin 1
Figure 5.12 Trend Analysis for Godavari Basin 2.
From Figure 5.12 it can be observed that the water quality was non-polluted during the years
2016-17, 2017-18, 2018-19,2019-2020 and 2020-2021.
During 2016-17, the mean WQI was recorded as ‘good to excellent’ in all months except during
May and June 2016 and January 2017, when it was recorded as ‘good’. During the year 2017-
18, the mean WQI was recorded as ‘good’ in the months of November 2017 and March 2018.
0
10
20
30
40
50
60
70
80
90
100
WQ
IGodavari Basin 1
Good-Excellent
Good water
Poor water
Very Poor Water
2016-17
2017-18
2018-19
2019-20
2020-21
0
10
20
30
40
50
60
70
80
90
100
WQ
I
Godavari Basin 2
Good-Excellent
Good water
Poor water
Very Poor Water
2016-17
2017-18
2018-19
2019-20
2020-21

45
The mean WQI was recorded as ‘good to excellent’ between April amd October 2017, during
December 2017 and during Janaury and February 2018.
The mean WQI was recorded as ‘good’ during the months of May, June and July 2018 in 2018-
19. The mean WQI was recorded as ‘good to excellent’ during the remaining months of the
year. During 2019-20, the mean WQI was recorded in the ‘Good to Excellent’ category during
all months and the water quality was ‘Non-Polluted’ throughout the year. Just like last year,
this year (2020-2021) too , the WQI was recorded as ‘good-excellent’ throughout the year.
5.4.5.4 WQI Trend Analysis for Krishna Basin
Figure 5.13 shows the trend of WQI over the years 2016-17, 2017-18,2018-19, 2019-2020
and 2020-2021 for Krishna Basin. It is evident from Figure 5.7. that the overall water quality
was non-polluted during all the 5 years.
Figure 5.13 Trend analysis for Krishna Basin
During the year 2016-17, the mean WQI was recorded as ‘good to excellent’ during the months
of April, August, September and November 2016. The mean WQI was recorded as ‘good’
during the months of May, June, July, October, December 2016 and January, February and
March 2017.During 2017-18, the mean WQI was recorded as ‘Good to Excellent’ in all months
except during April, May, and June 2017. During the year 2018-19, the mean WQI was
recorded as ‘Good to Excellent’ in all the months.
During 2019-20, the mean WQI was recorded in the ‘Good to Excellent’ category from
September’ 19 to March’ 20 and the water quality was ‘Non-Polluted’ during these months.
However, at the beginning of the year, i.e., from May 2019 to August 2020, the WQI was
recorded as ‘good’. The WQI was recorded as ‘good – excellent’ during all the months in the
year 2020- 2021.
0
10
20
30
40
50
60
70
80
90
100
WQ
I
Krishna Basin
Very Poor Water Poor water Good water
Good-Excellent 2016-17 2017-18
2018-19 2019-20 2020-2021

46
5.4.5.5 WQI Trend Analysis for West Flowing Rivers
Figure 5.14 shows the trend of WQI over the years 2016-17, 2017-18,2018-19, 2019-2020
and 2020-2021 for the basin of West Flowing Rivers.
From the above figure it can be observed that during the years 2015-16, 2016-17, 2018-19
and 2019-20, the mean WQI was recorded as ‘Good to Excellent’ during all months of the
year. During the year 2017-18, the mean WQI was recorded as ‘Good’ during all months
except between April and June 2017, where the mean WQI was recorded as ‘Good to
Excellent’.
Figure 5.14 Trend Analysis for West Flowing Rivers.
From the above figure it can be observed that during the years 2016-17 ,2018-19, 2019-20
and 2020-21 the mean WQI was recorded as ‘good to excellent’ during all months of the year.
During the year 2017-18, the mean WQI was recorded as ‘good’ during all months except
between April and June 2017, where the mean WQI was recorded as ‘good to excellent’.
5.4.5.6 WQI Trend Analysis for Saline (sea & creek) sub-basin
Figure 5.15 shows the trend of WQI over the years 2016-17, 2017-18,2018-19, 2019-2020
and 2020-2021 for the sub-basin of Saline (sea and creek).
From Figure 5.9 During the year 2016-17, the mean WQI was recorded as ‘good’ between
April and December 2016 and in February 2017. The water quality was non-polluted. During
the months of Janaury and March 2017, the mean WQI was recorded as ‘poor’ and the water
quality was therefore polluted.
During the year 2017-18, the WQI was recorded as ‘good to excellent; during the months of
July, August and September 2017. The mean WQI was recorded as ‘good’ during the months
0
10
20
30
40
50
60
70
80
90
100
WQ
I
West Flowing river
Good-Excellent
Good water
Poor water
Very Poor Water
2016-17
2017-18
2018-19
2019-20
2020-2021

47
of April, May, June, October, November and December 2017 and January, February and
March 2018. The water quality was non-polluted throughout the year.
Figure 5.15 Trend Analysis for Saline (Sea and Creek) sub-basin.
The mean WQI was recorded as ‘good to excellent’ during the months of July, August,
September, October, November and December 2018 and February 2019 during the year
2018-19. The mean WQI was recorded as ‘good’ during the months of April, May, June 2018
and January and March 2019. The water quality was non-polluted throughout the year.
During the year 2019-20, the WQI was recorded as ‘Good to Excellent; during the months of
July, August, September and October. The mean WQI was recorded as ‘good’ for rest of year.
The water quality was ‘non-Polluted throughout the year.
In the year 2020-2021, the WQI was recorded as good during April, May, June 2020 and from
November 2020 to March 2021.The WQI was recorded as ‘good-excellent’ during July,
August, September and october 2020. The water was unpolluted throughout the year.
0
10
20
30
40
50
60
70
80
90
100
WQ
I
Saline ( sea and creek) sub-basin
Good-Excellent
Good water
Poor water
Very Poor Water
2016-17
2017-18
2018-19
2019-20
2020-2021

48
5.5 Industrial Pollution
The Ministry of Environment, Forest, and Climate Change (MoEF & CC) had brought out
notifications in 1989, with the purpose of prohibiting/restricting operations of certain industries
to protect ecologically sensitive areas. The notifications have introduced the concept of
categorization of industries as "Red", "Orange", "Green" and “White” with the purpose of
facilitating decisions related to the location of these industries. Subsequently, the application
of this concept was extended in other parts of the country not only for the purpose of location
of industries, but also for the purpose of Consent management and formulation of norms
related to the surveillance/inspection of industries. The process of categorization thus far was
primarily based on the size of the industries and consumption of resources. Pollution due to
discharge of emissions and effluents and its likely impact on health was not considered as the
primary criterion.
Based on brainstorming sessions among CPCB, SPCBs and MoEF & CC, the following criteria
on "Range of Pollution Index" for the purpose of categorization of industrial sectors have been
finalized.
• Industrial Sectors having Pollution Index score of 60 and above - Red category.
• Industrial Sectors having Pollution Index score of 41 to 59 - Orange category.
• Industrial Sectors having Pollution Index score of 21 to 40 - Green category.
• Industrial Sectors having Pollution Index score including and up to 20 - White category.
Maharashtra is one of the most highly industrialized states in India. With a rise in industrial
estates in the State, areas like Mumbai, Thane, Navi Mumbai, Kalyan, Nashik, Pune, and
Pimpri-Chinchwad that have many pollution-prone industries are facing chronic industrial
pollution. To maintain a safe distance between industrial units and rivers to avoid discharge of
effluent into waterbodies, the State has its policy which also states that no industry will be
allowed to establish along a riverbank. Industries are being encouraged to recycle and reuse
waste.
Maharashtra Pollution Control Board has 12 Regions viz. Mumbai, Navi Mumbai, Raigad,
Thane, Kalyan, Pune, Nashik, Aurangabad, Nagpur, Amaravati, Kolhapur and Chandrapur.
The total number of industries under these categories in Maharashtra is 1,06,014. These
industries are categorized as red, orange, and green and white, and are further divided into
small, large, and medium based on their pollution index. The total number of red industries in
Maharashtra is 23,744, orange is 29,917, and green is 48,432. The total number of large
industries is 11,942, medium, 2,839, and small, 86,312. The total number of white industries
in the State is 3921.The categorization as well as size of industries within Maharashtra is given
in Table 5.32
Table 5.32 Categorization of industries in Maharashtra.
Large Medium Small
Red 5,512 1,338 16,894
Orange 3,950 1,773 24,194
Green 2,480 728 45,224
White 3,921

49
5.5.1 Analysis and Performance of CETP with Statistical Details
Common Effluent Treatment Plants not only help industries to control pollution with ease but
also act as a step towards a cleaner environment and service to the society at large. The
concept of CETP has many advantages. Wastewater from few industries often contains a
significant concentration of pollutants and to reduce it to the desired concentration becomes
techno-economically difficult.
➢ Number and total capacity of CETPs (details of existing/ under construction /
proposed) - 26 Nos of CETPs with capacity of 244.85 MLD
➢ The total number of operational CETPs in Maharashtra is 26
➢ Status of compliance and operation of the CETPs: 25 CETPs are complied, 1Nos
are non-complied
➢ Numbers of Industries in the state : 106014
➢ Nos of water polluting industries in the state : 16,597
➢ Quantity of effluent generated from the industries : 2100 MLD
➢ Quantity of Hazardous Sludge generated from the Industries : 2,738.53TPD
➢ Number of industrial units having ETPs : 16597
➢ Number of industrial units connected to CETP : 7856
➢ Number and total capacity of ETPs (details of existing/ under construction
proposed): No. of ETPs-16,597 with capacity of 2100 MLD
➢ Compliance status of the ETPs: 16,451 complied and 146 non-complied
Region wise information regarding the number of industries under each category as well as
the amount of effluent generated, and amount treated along with the performance of CETPs
operating in these regions is illustrated below. Standards of 100 mg/l for BOD and 250 mg/l
for COD as determined by the CPCB have been considered for evaluation of performance of
CETPs.The tables in the following paragraphs show the minimum and maximum values
recorded by individual CETPs for BOD and COD during the year 2020-21 along with the
annual mean as well as standard deviation (SD).

49
Amravati
LSI MSI SSI
4650 4 584
104 21 2106
97 44 350
White total - 355
Aurangabad
LSI MSI SSI
285 45 5897
169 111 2475
395 142 988
White total - 117
Chandrapur
LSI MSI SSI
44 4 584
47 8 523
228 9 295
White total - 90
Thane
LSI MSI SSI
101 25 1491
359 65 621
293 57 1141
White Total - 61
Kolhapur
LSI MSI SSI
358 47 9865
164 91 4310
424 122 1885
White total - 820
Navi Mumbai
LSI MSI SSI
180 70 1655
190 200 1057
262 48 1228
White total - 286
Nagpur
LSI MSI SSI
134 24 2130
164 63 2539
529 60 1379
White Total - 140
Nashik
LSI MSI SSI
344 62 6933
216 95 2918
596 148 2343
White Total - 856
Mumbai
LSI MSI SSI
60 43 2149
647 281 773
494 96 699
White total - 35
Pune
LSI MSI SSI
530 336 7677
1606 712 5279
1622 401 4041
White total - 852
Raigad
LSI MSI SSI
67 28 533
147 47 484
301 61 503
White Total - 31
Kalyan
LSI MSI SSI
155 34 1660
137 79 1109
271 150 2042
White total - 278
Figure 5.16 Industrial categorization in the state

50
5.5.1.1 Amravati
There is one CETP in Amravati Region. The treatment capacity of this CETP is 5MLD. The
total industrial effluent received at this CETP was 1.5MLD and all the received effluent was
treated during the year 2020-21. The annual performance of the CETP for the year 2020-21
is represented in Table 5.33 The total number of industries in Amravati under each category
is demonstrated in Figure 5.16
Table 5.33 Statistical Analysis Data for CETP Performance in Amaravati Region
Parameters
Location
Additional Amravati Industrial
Area
Inlet
BOD (mg/L)
min 110
max 282
mean 230.37
SD 38.57
COD (mg/L)
min 412
max 896
mean 614.06
SD 87.75
Outlet
BOD (mg/L)
min 4
max 5.5
mean 4.55
SD 0.37
COD (mg/L)
min 16
max 28
mean 22.46
SD 2.87
0
100
200
300
400
500
600
700
Inlet Outlet Inlet Outlet
BOD COD
Co
nce
ntr
atio
n (
mg/
l)
Amravati Additional Amravati Industrial Area

51
From Table 5.33 it can be observed that the in BOD at the CETP at Additional Amaravati
Industrial Area was 98% whereas the COD was being reduced with about 96% efficiency.
5.5.1.2 Aurangabad
There is one operational CETP provided viz. M/s. Waluj CETP Pvt. Ltd. located at MIDC Area,
Waluj with a treatment capacity of 10 MLD. Total industrial effluent treated at CETP in the year
2020-2021 was 4-5 MLD.The total number of industries in Aurangabad under each category
is presented in Figure 5.16 and performance of the CETP is presented in Table 5.34.
Table 5.34 Statistical Analysis Data for CETP Performance in Aurangabad Region
Parameters Location
SMS Waluj CETP Pvt Ltd
Inlet
BOD (mg/L)
min 10
max 1240
mean 310.25
SD 236.77
COD (mg/L)
min 72
max 3600
mean 1055.17
SD 631.58
Outlet
BOD (mg/L)
min 7
max 44
mean 22.64
SD 5.76
COD (mg/L)
min 44
max 280
mean 116.62
SD 43.49
From Table 5.34, it is evident that the CETP at Aurangabad was performing with 93%
efficiency in reducing BOD and about 89% efficiency in reducing COD. Also, the post
treatment concentration of BOD and COD was within the prescribed discharge limits of 100
mg/l and 250 mg/l respectively.
0
200
400
600
800
1000
1200
Inlet Outlet Inlet Outlet
BOD COD
Co
nce
ntr
atio
n (
mg/
l)
Aurangabad
SMS Waluj CETP Pvt Ltd

52
5.5.1.3 Kalyan
There are 5 operational CETPs in this Region. The collective treatment capacity of these
CETPs is 26.55 MLD. The total effluent received by CETPs during the year 2020-21 was 23.7
MLD, all of which was treated by these CETPs during the year 2020-21. The total number of
industries in Kalyan under each of the categories is demonstrated in Figure 5.16 and the
performance of these CETPs during the year 2020-21 is presented in Table 5.35
Table 5.35 Statistical Analysis Data for CETP Performance in Kalyan Region.
Parameters
Location
ACMA - CETP-
Co-operative Society
Ltd
Badlapur CETP
Association
Dombivli Better
Environment System
Association
Chikhloli-Morivali Effluent
Treatment
Dombivli
CETP (Chemical) (Phase-
II)
Inlet
BOD (mg/L)
min 24 220 160 80 65
max 800 1600 1025 625 4000
mean 212 675 556 289 878
SD 164 333 215 115 816
COD (mg/L)
min 92 760 190 296 224
max 2352 4560 3056 1600 12560
mean 627 2000 1440 822 2621
SD 481 970 632 260 2248
Outlet
BOD (mg/L)
min 4 11 12 8 14
max 42 450 115 80 850
mean 20 86 51 34 72
SD 12 82 23 15 136
COD (mg/L)
min 20 56 30 44 20
max 152 1232 312 316 1680
mean 79 264 169 123 202
SD 39 219 67 47 260
From Table 5.35 The performance of all the CETPs was more than 85% in BOD and COD
reduction. Also, the outlet values at all CETPs were within the prescribed discharge limits of
100 mg/l for BOD and 250 mg/l for COD except for Badlapur CETP Association.
0
500
1000
1500
2000
2500
3000
Inlet Outlet Inlet Outlet
BOD COD
Co
nce
ntr
atio
n (
mg/
l)
KalyanACMA CETP Cooperative Society Ltd. Badlapur CETP Association
Chikhloli-Morivali Effluent Treatment Dombivli Better Environment System Association
Dombivli CETP (Chemical) (Phase-II)

53
5.5.1.4 Kolhapur
There are 5 operational CETPs in this Region. The collective treatment capacity of these
CETPs is 29.8 MLD. The total effluent generated and treated by industries in this Region was
15.4 MLD. The total number of industries in Kolhapur under each of the categories is
demonstrated in Figure 5.16. and performance of CETPs is presented in Table 5.36
Table 5.36 Statistical Analysis Data for CETP Performance in Kolhapur Region
Parameters
Location Location Location Locatio
n Location
Ichalkaranji
Textile Developmen
t Cluster Ltd. (1 MLD)
Ichalkaranji
Textile Developmen
t Cluster Ltd. (12 MLD)
Kagal-Hatkanangale C.E.T.P.,
L.K. Akiwate Industri
al Co Op,
Estate Ltd
Lote Parshuram Environme
nt Protection
Co-op Societ
Inlet
BOD (mg/L)
min 90 10 26 12 56
max 3250 1550 340 1650 2750
mean 718 837 85 567 333
SD 562 353 54 427 382
COD (mg/L)
min 240 28 96 40 172
max 7936 3666 912 3760 12480
mean 1832 2089 256 1448 1010
SD 1340 831 147 1075 1735
Outlet
BOD (mg/L)
min 10 5 4 12 12
max 675 110 390 235 98
mean 224 37 41 71 46
SD 153 27 65 45 24
COD (mg/L)
min 32 44 16 92 48
max 1808 284 960 660 264
mean 612 132 135 223 145
SD 390 65 155 120 56
It is evident from Table 5.36 that Kagal-Hatkanangale CETP was performing with the least
efficiency of about 51% in BOD reduction and 47% in COD reduction. The CETP at L.K.
Akiwate Industrial Co-op. Estate Ltd. was performing at 87% efficiency in reducing BOD and
0
500
1000
1500
2000
2500
Inlet Outlet Inlet Outlet
BOD COD
Co
nce
ntr
atio
n (
mg/
l)
KolhapurIchalkaranji Textile Development Cluster Ltd. (1 MLD) Ichalkaranji Textile Development Cluster Ltd. (12 MLD)
Kagal-Hatkanangale CETP L.K. Akiwate Industrial Co-op. Estate Ltd.
Lote Parshuram Environment Protection Co-op. Society

54
at 85% efficiency in reducing COD. The Lote Parshuram Environment Protection Co-op.
Society were performing with 86% efficiency in reducing BOD and at 86% efficiency in
reducing COD. CETP with capacity 12 MLD at Ichalkaranji Textile Development Cluster Ltd
operated at more than 90% efficiency in BOD and COD reduction. However, the CETP with
capacity 1 MLD at Ichalkaranji Textile Development Cluster Ltd performed with efficiency of
about 69% in BOD reduction and 67% in COD reduction. The prescribed discharge limits were
met at all CETPs except Ichalkaranji Textile Development Cluster Ltd. (1 MLD)
5.5.1.5 Nagpur There is one CETP provided in Nagpur Region. The treatment capacity of this CETP is 5 MLD.
The total industrial effluent received at the CETP during the year 2020-21 was 4.5 MLD, all of
which was treated at this CETP. Total number of industries in Nagpur under each category is
presented in Figure 5.16 and performance of the CETP is presented in Table 5.37.
Table 5.37 Statistical Analysis Data for CETP Performance in Nagpur Region.
Parameters Location
Butibori CETP Pvt. Ltd.
Inlet
BOD (mg/L)
min 110
max 290
mean 218
SD 48
COD (mg/L)
min 264
max 736
mean 536
SD 122
Outlet
BOD (mg/L)
min 10
max 30
mean 26
SD 4
COD (mg/L)
min 26
max 96
mean 77
SD 15
From the table the CETP at Butibori is performing with 88% efficiency in BOD reduction and
86% efficiency in COD reduction. The BOD and COD outlet values after treatment are well
within the prescribed limits.
0
100
200
300
400
500
600
Inlet Outlet Inlet Outlet
BOD COD
Co
nce
ntr
atio
n (
mg/
l)
Nagpur
Butibori CETP Pvt. Ltd.

55
5.5.1.6 Navi Mumbai There are two operational CETPs in this Region with a collective treatment capacity of 49.5
MLD. The total numbers of industries under each category in this Region are shown in Figure
5.16 and performance of the CETPs is shown in Table 5.38
Table 5.38 Statistical Analysis Data for CETP Performance in Navi Mumbai Region.
Parameters
Location
Taloja CETP Co Operative Society
Thane-Belapur Association
Inlet
BOD (mg/L)
min 130 80
max 3800 1075
mean 1135 357
SD 785 238
COD (mg/L)
min 392 184
max 11840 3400
mean 3108 1143
SD 2299 777
Outlet
BOD (mg/L)
min 28 16
max 480 170
mean 146 48
SD 129 33
COD (mg/L)
min 100 60
max 1952 520
mean 431 160
SD 439 93
From Table 5.38 that the CETP at Thane-Belapur Association is performing well with more
than 87% efficiency in reducing BOD and at 86% efficiency in reducing COD. The Taloja CETP
Cooperative Society has about 87% efficiency in reducing BOD and 86% in reducing COD.
However, the outlet values of BOD and COD post treatment were beyond the prescribed limits
of 100 mg/l and 250 mg/l respectively at both CETPs.
0
500
1000
1500
2000
2500
3000
3500
Inlet Outlet Inlet Outlet
BOD COD
CO
nce
ntr
atio
n (
mg/
l)
Navi Mumbai
Taloja CETP Cooperative Society Thane-Belapur Association

56
5.5.1.7 Pune
There are 5 operational CETPs in Pune Region. Their collective treatment capacity is 12.5
MLD. The total industrial effluent generated in this Region during the year 2020-21 was 6.37
MLD. The total number of industries under each category in this Region is shown in Figure
5.16 and performance of the CETPs is shown in Table 5.39
Table 5.39 Statistical Analysis Data for CETP Performance in Pune Region
Parameters
Location Location Location Location Location
Kurkumbh Environment Protection
Co op Society
Akkalkot Cetp
Greenfield CET Plant
P. Ltd
Hydro Air Tectonics
(PCD)
Ranjangaon CETP
Inlet
BOD (mg/L)
min 42 105 80 7 10
max 1650 975 380 480 1300
mean 317 319 193 98 156
SD 271 182 79 81 188
COD (mg/L)
min 100 232 216 40 24
max 3920 1960 896 1280 3104
mean 786 794 479 254 385
SD 654 428 181 211 448
Outlet
BOD (mg/L)
min 20 42 24 10 24
max 360 140 275 125 450
mean 97 95 94 62 135
SD 53 27 45 37 101
COD (mg/L)
min 48 92 56 24 56
max 48 388 656 316 1280
mean 241 238 231 150 339
SD 127 70 103 92 264
From Table 5.39, it is evident that the CETP at Kurkumbh Environment Protection Co-op.
Society is performing at about 69% efficiency in reducing BOD and COD. The CETP at Hydro
Air Tectonics (PCD) had the performance of about 51% in reducing BOD and 52% in reducing
COD. Akkalkot CETP was performing with 70% efficiency in reducing BOD and COD. The
Greenfield CET Plant P. Ltd. was performing at 51% efficiency in reducing BOD and at 52%
efficiency in reducing COD. The Ranjangaon CETP was performing with 14% at reducing BOD
and with 12% efficiency in reducing COD. The discharge limit for BOD was being met at all
CETPs.
0
100
200
300
400
500
600
700800
900
Inlet Outlet Inlet Outlet
BOD COD
Co
nce
ntr
atio
n (
mg/
l )
Pune
Akkalkot CETP
Greenfield CET Plant P. Ltd
Hydro Air Tectonics (PCD)
Kurkumbh Environment ProtectionCo-op. Society
Ranjangaon CETP

57
5.5.1.8 Raigad
There are 3 operational CETPs in this Region with a collective treatment capacity of 32.5 MLD.
The total amount of effluent generated by industries in this Region during the year 2020-21
was 33 MLD, all of which was treated by these CETPs. The total number of industries under
each category in this Region is shown in Figure 5.16 and performance of the CETPs is shown
in Table 5.40.
Table 5.40 Statistical Analysis Data for CETP Performance in Raigad Region.
From Table 5.40, it is evident that the The PRIA CETP (I) Ltd.was performing very well with
91% efficiency in reducing BOD and with 91% efficiency in reducing COD. TheRIA CETP Co-
op. Society Ltd..was performing least efficiently with 71% efficiency in reducing BOD and 73%
efficiency in reducing COD. The MMA-CETP Co Operative Society Ltd. was performing at
0
500
1000
1500
2000
2500
3000
Inlet Outlet Inlet Outlet
BOD COD
Co
nce
ntr
atio
n(m
g/l)
RaigadPRIA CETP (I) Ltd. MMA-CETP Co Operative Society Ltd. RIA CETP Co-op. Society Ltd.
Parameters
Location Location Location
PRIA CETP (I) Ltd. MMA-CETP Co Operative Society Ltd.
RIA CETP Co-
op. Society
Ltd.
Inlet
BOD (mg/L)
min 8 28 190
max 1250 925 3100
mean 145 291 794
SD 368 185 518
COD (mg/L)
min 32 80 592
max 4040 1696 9680
mean 481 754 2607
SD 1189 434 1621
Outlet
BOD (mg/L)
min 6 12 46
max 29 320 825
mean 13 59 227
SD 7 44 170
COD (mg/L)
min 20 44 160
max 80 832 2640
mean 45 183 711
SD 20 107 536
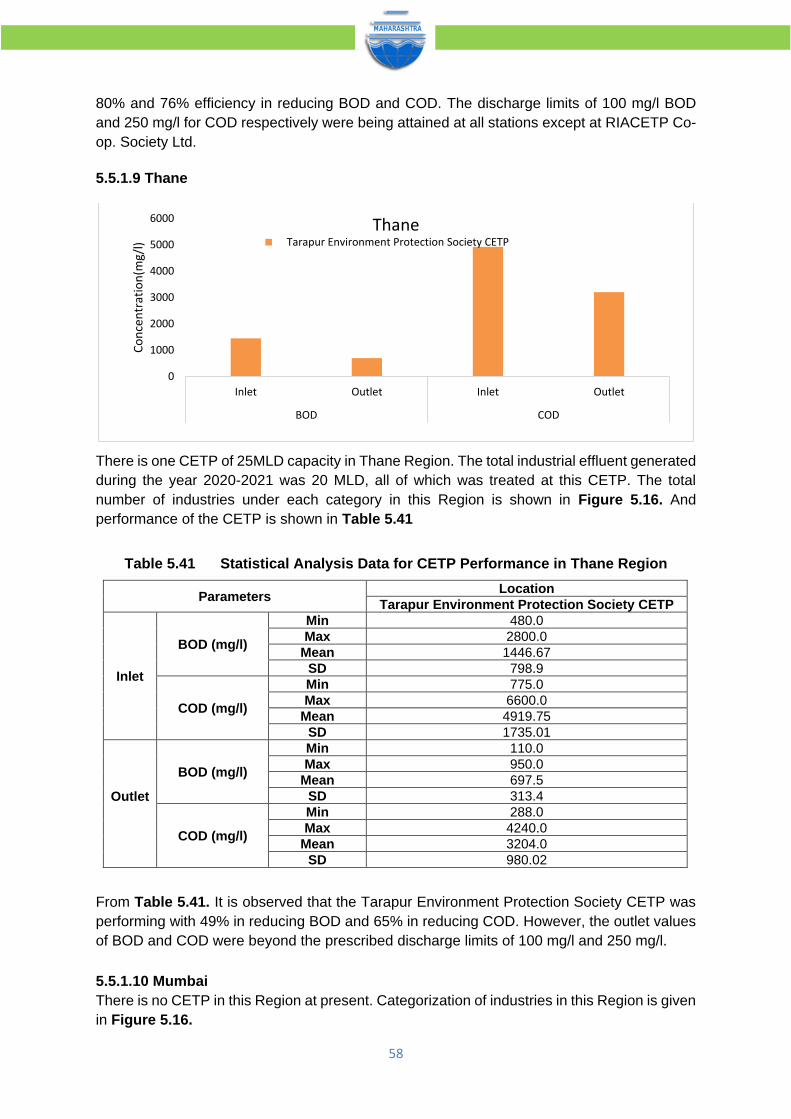
58
80% and 76% efficiency in reducing BOD and COD. The discharge limits of 100 mg/l BOD
and 250 mg/l for COD respectively were being attained at all stations except at RIACETP Co-
op. Society Ltd.
5.5.1.9 Thane
There is one CETP of 25MLD capacity in Thane Region. The total industrial effluent generated
during the year 2020-2021 was 20 MLD, all of which was treated at this CETP. The total
number of industries under each category in this Region is shown in Figure 5.16. And
performance of the CETP is shown in Table 5.41
Table 5.41 Statistical Analysis Data for CETP Performance in Thane Region
Parameters Location
Tarapur Environment Protection Society CETP
Inlet
BOD (mg/l)
Min 480.0
Max 2800.0
Mean 1446.67
SD 798.9
COD (mg/l)
Min 775.0
Max 6600.0
Mean 4919.75
SD 1735.01
Outlet
BOD (mg/l)
Min 110.0
Max 950.0
Mean 697.5
SD 313.4
COD (mg/l)
Min 288.0
Max 4240.0
Mean 3204.0
SD 980.02
From Table 5.41. It is observed that the Tarapur Environment Protection Society CETP was
performing with 49% in reducing BOD and 65% in reducing COD. However, the outlet values
of BOD and COD were beyond the prescribed discharge limits of 100 mg/l and 250 mg/l.
5.5.1.10 Mumbai
There is no CETP in this Region at present. Categorization of industries in this Region is given
in Figure 5.16.
0
1000
2000
3000
4000
5000
6000
Inlet Outlet Inlet Outlet
BOD COD
Co
nce
ntr
atio
n(m
g/l)
ThaneTarapur Environment Protection Society CETP

59
5.5.1.11 Nashik
There presently exists no CETP in this Region. Total number of industries in Nashik under
each category is demonstrated in Figure 5.16.
5.5.1.12 Chandrapur
There presently exists no CETP in this Region. However, industries are treating their effluent
individually within the premises. Therefore, all the effluent generated was treated during the
year 2020-21The total number of industries in Chandrapur under each of the category is
demonstrated in Figure5.16.
5.6 Domestic Wastewater Treatment
5.6.1 Analysis of Performance of Sewage Treatment Plants with Statistical Details
Details of STPs according to Regions in the State of Maharashtra are presented in the
following sections and the performance of STPs is analyzed based on standards of 10 mg/l
for Biochemical Oxygen Demand (BOD) and 20 mg/l for Total Suspended Solids (TSS) as
prescribed by CPCB in the Environment (Protection) Rules, 1986 in Schedule – VI.
Sewage generated & treated in urban local bodies of the State during 2020-21;
➢ Estimated sewage generation: 7,541.2 MLD
➢ Treatment Capacity (installed): 6,740.84 MLD
5.6.1.1 Pune
There are 41 STPs in this region of which 39 are operation during the year 2020-2021. The
Old Naidu STP is not in operation at present. The STP in Lonavala is currently not operational
and the council has started revamping of STP to enhance the capcity from 3.69 MLD to 6 MLD
The STP with treatment capacity of 6 MLD at Shirur is operational; however, results of the
sample collected were not received. Also, samples were not collected at both STPs located at
Malkapur. Therefore, the results of STP performance were not available for the above
mentioned STPs. The total domestic effluent received at these STPs during the year 2020-21
was 961 MLD of which 803 MLD was the total sewage treated. The mean of annual
performance and analysis of all STPs provided in Pune Region are represented in Table 5.42.
Table 5.42 Mean of Annual Performance of STPs in Pune Region
Location of STP Parameters (mg/l)
pH BOD (Mean) S.S. (Mean)
Inlet Outlet Inlet Outlet Inlet Outlet
Erandwane STP, 18.487378 /73.828207
… 7.6 … 8.2 … 10
Bopodi STP, 18.572866 / 73.834808
… 7.5 14.8 15
Tanajiwadi 18.338226 / 73.853294
… 7.5 12.3 12
Bhairoba STP, 18.538394 / 73.902304
… 7.6 8.2 34
Mundhawa STP, 18.547650 / 73.950455
… 7.5 8.6 14
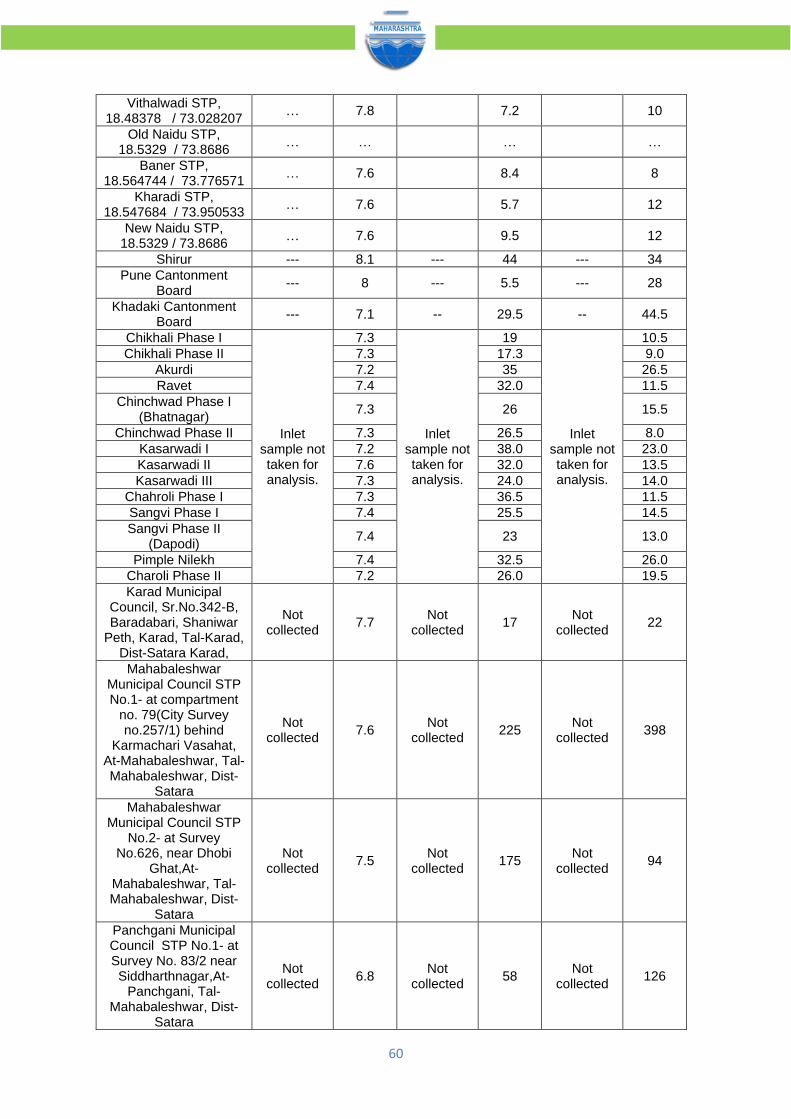
60
Vithalwadi STP, 18.48378 / 73.028207
… 7.8 7.2 10
Old Naidu STP, 18.5329 / 73.8686
… … … …
Baner STP, 18.564744 / 73.776571
… 7.6 8.4 8
Kharadi STP, 18.547684 / 73.950533
… 7.6 5.7 12
New Naidu STP, 18.5329 / 73.8686
… 7.6 9.5 12
Shirur --- 8.1 --- 44 --- 34
Pune Cantonment Board
--- 8 --- 5.5 --- 28
Khadaki Cantonment Board
--- 7.1 -- 29.5 -- 44.5
Chikhali Phase I
Inlet sample not taken for analysis.
7.3
Inlet sample not taken for analysis.
19
Inlet sample not taken for analysis.
10.5
Chikhali Phase II 7.3 17.3 9.0
Akurdi 7.2 35 26.5
Ravet 7.4 32.0 11.5
Chinchwad Phase I (Bhatnagar)
7.3 26 15.5
Chinchwad Phase II 7.3 26.5 8.0
Kasarwadi I 7.2 38.0 23.0
Kasarwadi II 7.6 32.0 13.5
Kasarwadi III 7.3 24.0 14.0
Chahroli Phase I 7.3 36.5 11.5
Sangvi Phase I 7.4 25.5 14.5
Sangvi Phase II (Dapodi)
7.4 23 13.0
Pimple Nilekh 7.4 32.5 26.0
Charoli Phase II 7.2 26.0 19.5
Karad Municipal Council, Sr.No.342-B, Baradabari, Shaniwar
Peth, Karad, Tal-Karad, Dist-Satara Karad,
Not collected
7.7 Not
collected 17
Not collected
22
Mahabaleshwar Municipal Council STP No.1- at compartment
no. 79(City Survey no.257/1) behind
Karmachari Vasahat, At-Mahabaleshwar, Tal-Mahabaleshwar, Dist-
Satara
Not collected
7.6 Not
collected 225
Not collected
398
Mahabaleshwar Municipal Council STP
No.2- at Survey No.626, near Dhobi
Ghat,At-Mahabaleshwar, Tal-Mahabaleshwar, Dist-
Satara
Not collected
7.5 Not
collected 175
Not collected
94
Panchgani Municipal Council STP No.1- at Survey No. 83/2 near Siddharthnagar,At-
Panchgani, Tal-Mahabaleshwar, Dist-
Satara
Not collected
6.8 Not
collected 58
Not collected
126

61
Panchgani Municipal Council STP No.2- at
Plot no. 497/4 & 5 near Shivajinagar,At-Panchgani, Tal-
Mahabaleshwar, Dist-Satara
Not collected
6.7 Not
collected 130
Not collected
266
Panchgani Municipal Council STP No.3- at Hindu Crematorium,At-
Panchgani, Tal-Mahabaleshwar, Dist-
Satara
7.7 7.9 520 35 832 60
Degaon STP 7.8 7.68 80 6.07 151 15.88
Kumathe STP .-- 7.6 .-- 6 .-- 9.3
Pratap Nagar STP
.-- 7.8 .-- 5 .-- 11.9
Gopalpur STP .-- 8.11 .-- 24 .-- 11.83
STP, 65 Acre,Pandharpur
7.3 7.85 135 46.66 9 9
It can be observed from Table 5.42. that the outlet values of BOD were greater than the
prescribed discharge standard of 10 mg/l at Bopodi, Tanajiwadi, Shirur, Khadki Cantonment
Board,Chikhali Phase 1 and 2,Akurdi, Ravet, Chichwad Phase I and II,Kasarwadi Phase I,II,III,
Charoli Phase I,Sangvi Phase I and II,Pimple Nikesh, Charoli Phase II, STP 65 Acre
Pandharpur and also at all the STPs in Satara region. The outlet values of suspended solids
were greater than the prescribed discharge standard of 20 mg/l at Bhairoba STP, Shirur,
Akurdi, Kasarwadi I, Pimple Nikesh, Pune Cantonment Board, Khadaki Cantonment Board,
Chahroli phase II and at all STPs in Satara region.
5.6.1.2 Chandrapur
There are 2 operational STPs in this Region provided by Chandrapur Municipal Corporation.
The collective treatment capacity of these STPs is 70 MLD. The total quantity of domestic
effluent received and treated at these STPs during the year 2020-21 was 35.5 MLD. The mean
of annual performance and analysis of all STPs provided in Chandrapur Region are
represented in Table 5.43.
Table 5.43 Mean of Annual Performance of STPs in Chandrapur Region
Location of STP
Parameters (mg/l)
pH BOD (Mean) S.S. (Mean)
Inlet Outlet Inlet Outlet Inlet Outlet
Pathanpura 7.74 7.9 43.4 60.5 30.1 34.5
Rehmat Nagar 7.93 8.02 60.8 17.35 44.2 29.8
It is evident from Table 5.43. that the outlet values of BOD as well as the outlet values of
suspended solids were not within the prescribed discharge standards at Chandrapur STP.
5.6.1.3 Nagpur
There are six operational STPs in this Region provided by Nagpur Municipal Corporation
(NMC). The collective treatment capacity of these STPs is 345.3 MLD. The total effluent
received at these STPs was 520 MLD of which 345.3 MLD was treated during the year 2020-

62
21. The mean of annual performance and analysis of all STPs provided in Nagpur Region are
represented in Table 5.44.
Table 5.44 Mean of Annual Performance of STPs in Nagpur Region
Location of STP
Parameters (mg/l)
pH BOD (Mean) S.S. (Mean)
Inlet Outlet Inlet Outlet Inlet Outlet
Bhandewadi, Nagpur 7.4 to
7.89
7.5 to
8.28 40 7.13 32 14.67
Bhandewadi, Nagpur 7.6 to
8.05
7.5 to
8.03 33 12.4 25.5 15
Ghat Road, Nagpur 9.98 7.26 to
8.26 14 8.1 22 21
Mankapur Mokhdham,
Nagpur 7.95
7.7 to
8.07 52 18 44 21
Kachimet, Nagpur 7.82 7.4 to
7.93 58 11 42 22
Sonegaon 7.68 7.4 to
8.04 68 20.4 36 24
From Table 5.44 it can be observed that outlet values for BOD at Bhandewadi, Mankapur and
Sonegaon were beyond the standard limit of 10mg/l.Similarly,the outlet value of suspended
solids at Mankapur STP, Ghat road Nagpur STP, Kachiment Nagpur STP, Sanegaon STP
were greater than the prescribed discharge standard of 20 mg/l.
5.6.1.4 Nashik
There are 14 operational STPs in this Region, 10 which have provided by Nashik Municipal
Corporation, one has been provided by Shirdi Municipal Council, Dist. Ahmednagar and One
has been provided by Shirpur Municipal Council, Dist. Dhule, one has been provided by
Nandurbar Municipal council, Dist. Nandurbar and one has been provided by Municipal
Council Trimbak.The collective treatment capacity of these STPs is 403.6 MLD. The total
domestic effluent generated in this Region during the year 2020-21 was 355.64. The total
quantity of domestic effluent received at the STPs provided at Nashik 325 MLD.The total
sewage received at Shirdi STP was 9MLD, The total sewage received at the STPs at Shirpur
was 12.5 MLD, the total amount of sewage received at the STPs at Nandurbar was 13.5 MLD
and in case of STP at Triambak, it was 1 MLD. The mean of annual performance and analysis
of all STPs provided in Nashik Region are represented in Table 5.45.
Table 5.45 Mean of Annual Performance of STPs in Nashik Region
Location of STP
Parameters (mg/l)
pH BOD (Mean) S.S. (Mean)
Inlet Outlet Inlet Outlet Inlet Outlet
Chehedi STP (20 MLD) NA 7.6 NA 18.13 NA 52.66
Chehedi STP (22 MLD) NA 7.54 NA 17.8 NA 51.66
Panchak (7.5 MLD) NA 7.48 NA 19.5 NA 63.75
Panchak (21 MLD) NA 7.46 NA 18.25 NA 55.75
Panchak (32 MLD) NA 7.4 NA 13 NA 28.5
Tapvan (78 MLD) NA 7.27 NA 20 NA 47

63
Tapvan (52 MLD) NA 7.27 NA 20 NA 47
Agar Takali (70 MLD) NA 7.5 NA 24.2 NA 52.8
Agar Takali (40 MLD) NA 6.4 NA 20.6 NA 54.2
Gangapur (18 MLD) NA 7.23 NA 10 NA 28
Municipal Council Trimbak (1 MLD)
NA 8 NA 92 NA 178
Shirdi Nagarpanchayat, Shirdi, Tal-Rahata Dist-Ahmednagar.
8.5 7.4 250 6 200 10
Municipal Council - Shirpur , Tq Shirpur Dist Dhule
-- 7.76 -- 7.5 -- 30.8
Municipal Council - Nandurbar , Tq Dist-
Nandurbar. -- 7.74 -- 5.57 -- 27
From Table 5.45. It is evident that the outlet values for suspended solids were within the
prescribed standard of 20 mg/l only at Shirdi Nagarpanchayat and the outlet values for BOD
were within the prescribed standard of 10 mg/l at Shirdi Nagarpanchyat, Shirur Municipal
Council and Nandarbur Municipal Council.
5.6.1.5 Navi Mumbai
There are 8 operational STPs in Navi Mumbai Region. The collective treatment capacity of
these STPs is 461 MLD. The total effluent received at these STPs was 320.2 MLD all of which
was collectively treated during the year 2020-21 by these STPs. The mean of annual
performance and analysis of all STPs provided in Navi Mumbai Region are represented in
Table 5.46.
Table 5.46 Mean of Annual Performance of STPs in Navi Mumbai Region
Location of STP
Parameters (mg/l) No. of samples
pH BOD (Mean) S.S. (Mean)
Inlet Outlet Inlet Outlet Inlet Outlet
STP CBD Belapur Sector-12
-- 7.13 -- 5.4 -- 12 3
STP Sector-18 Vashi -- 7.2 -- 11.3 -- 11.3 3
STP Nerul Sector-2 -- 6.85 -- 24 -- 36 3
STP Sanpada Sector-20
-- 7.2 -- 4.6 -- 12 3
STP Nerul Sector-50 -- 7.1 -- 5.3 -- 25.3 3
Ghansoli STP, Sector 15
NC 7.00 NC 5.1 NC 15.20 9
Airoli STP, Sector 18 NC 7.10 NC 5 NC 13.5 9
Koperkhairne STP NC 7.30 NC 7.60 NC 20.00 9
Nil (Uran Municipal council has not provided STP)
NA NA NA NA NA NA
* NC = Not collected
From Table 5.46 it can be observed that outlet values for BOD were greater than the
prescribed discharge standards of 10 mg/l at the STP at Nerul Sector – 2 and Sector-18 Vashi.
Outlet values of suspended solids exceeded prescribed limits of 20mg/l at Nerul Sector – 2
and Nerul Sector-50.

64
5.6.1.6 Thane
There are 19 operational STPs in Thane Region with a collective treatment capacity of 355.1
MLD. The total quantity of domestic effluent treated by these STPs 257 MLD. The mean of
annual performance and analysis of all STPs provided in Thane Region are represented in
Table 5.47.
Table 5.47 Mean of Annual Performance of STPs in Thane Region
Location of STP
Parameters (mg/l)
pH BOD (Mean) S.S. (Mean)
Inlet Outlet Inlet Outlet Inlet Outlet
TMC STP Kopri, Thane 5.6 6.6 222 8.15 37.33 12.13
TMC STP Mumbra, Thane
6.78 6.95 281 8.83 149 16
TMC STP Vartak Nagar 6.2 6.6 380 8.6 159 28.8
Vitava 6.4 6.9 38 5.5 204 16
Everest World, Kolshet 6.9 7.55 10.5 5 13.5 10
Lodha 7.05 7.15 6.5 5 11.5 10.5
Jessel Park, Bhayander (E)
JVS not collected due to COVID 19 pandemic situation
Shrushti Mira Road (E ) JVS not collected due to COVID 19 pandemic situation
Shanti Nagar, Mira Road (E ), Nr. Ayappa
Mandir 7.1 18 12
Shanti Park, Sanghavi, Mira Road (E )
7.2 110 72
Kanakiya, Mira Road (E )
7 14 12
S. No. 233, Ghodbunder Mira Road
Hatkesh to Highway Kashigaon,
Maschapada, Bhayandar (E )
7.1 16 11
Golden nest road, Bhayander (E )
7 5 12
Bhayander (W) Near Garden Court Tower
6.7 4 13
Bhayander (W) Near Nazareth Church
JVS not collected due to COVID 19 pandemic situation
Kashigaon, Bhayandar (E )
JVS not collected due to COVID 19 pandemic situation
Mhada Colony JVS not collected due to COVID 19 pandemic situation
Reservation No. 170, Kanugo, Mira Road (E )
JVS not collected due to COVID 19 pandemic situation
Viilage : Bolinj, Survey No. 397A, Opposite Vinay Unique, Near Aggrawal Meadows,
Gokul Township, Virar (W)
6.7 48 29
Prescribed standard of 10 mg/l for BOD were observed at Kopri, Mumbra, Vartak Nagar,
Vitava, Everest World, Lodha, Golden Nest Road and Near Garden Court. However, the outlet
value of suspended solids was greater than the prescribed standard of 20 mg/l at Vartak nagar,
Shanti Park, Sanghavi, Mira Road and Bolinj, Survey No. 397A, Opposite Vinay Unique, Near
Aggrawal Meadows, Gokul Township, Virar (W).

65
5.6.1.7 Aurangabad
There are 7 STPs in this Region, 4 of which have been provided by Aurangabad Municipal
Corporation. The STPs at Bondar and Elichpur & Sangavi have been provided by the Nanded-
Waghala City Municipal Corporation. The total treatment capacity of these STPs is 343MLD.
The total domestic effluent received at these STPs during the year 2019-20 was 148.0MLD
and 148.0MLD was treated by these STPs. The mean of annual performance and analysis of
all STPs provided in Aurangabad Region is represented in Table 5.48.
Table 5.48 Mean of Annual Performance of STPs in Aurangabad Region
Location of STP
Parameters (mg/l)
pH BOD (Mean) S.S. (Mean)
Inlet Outlet Inlet Outlet Inlet Outlet
Kanchanwadi, Aurangabad
- 7.86 - 48.8 - -
Padegaon, Aurangabad
- 7.9 - 56.26 - -
Salim Ali Lake, Aurangabad
- 7.6 - 60.78 - -
At Zalta, Aurangabad
- 7.8 - 29.07 - -
Bondar STP - 6.2 to 8.5 - 49.9 - 44.2
Elichpur STP - 6.3 to 8.6 - 40.5 - 36.9
Sangvi STP - 6.2 to 8.8 - 52.6 - 42.9
It can be observed from Table 5.48. that the outlet values of BOD as well as Suspended Solids
were not within the prescribed standards at all STPs.
5.6.1.8 Amaravati
There are 3 STPs in this region, two of which are located in Amaravati District while one is
located in Buldana district. The total treatment capacity of these STPs is 81.5 MLD and the
same quantity of total sewage load was received at these STPs during the year 2020-21. All
the received domestic effluent was treated at these STPs. The mean of annual performance
and analysis of all STPs provided in Amaravati Region is represented in Table 5.49.
Table 5.49 Mean of Annual Performance of STPs in Amaravati Region
Location of STP
Parameters (mg/l)
pH BOD (Mean) S.S. (Mean)
Inlet Outlet Inlet Outlet Inlet Outlet
STP-I Lalkhadi Amravati 8.47 7.70 125 15 78 24
STP-II Lalkhadi Amravati 7.76 7.56 190 20 92 26
located at Shegaon, Dist. Buldana. .. 8.1 … 18 … 20
From Table 5.49 it is evident that the outlet values for BOD were beyond the prescribed
discharge standard of 10 mg/l at all the three STPs. The outlet values for suspended solids
were beyond the prescribed standard of 20 mg/l only at Lalkhadi STP-Iand Amaravati STP II.
5.6.1.9 Kolhapur
There are 6 STPs in this Region, the collective treatment capacity of which is 172.7 MLD. The
total effluent generated in this Region was 191.7 MLD. The total domestic effluent received at
these STPs was 191.7MLD of which 166.7MLD was treated during the year 2020-21. The
mean off annual performance and analysis of all STPs provided in Kolhapur Region are

66
represented in Table 5.50.
Table 5.50 Mean of Annual Performance of STPs in Kolhapur Region
Location of STP
Parameters (mg/l)
pH BOD (Mean) S.S. (Mean)
Inlet Outlet Inlet Outlet Inlet Outlet
Kasaba Bawada - 7.45 - 9.32 - 16.33
Dudhali - 7.8 - 5.2 - 13.61
Ichalkaranji - 7.6 - 6.03 - 14.41
Dhulgaon -- 7.2 -- 4 -- 13
Miraj -- 7.5 -- 18 -- 16
100 ft. Road -- 7.3 -- 6.4 -- 14
From the table it can be observed that the outlet values for BOD were within the prescribed
discharge standards of 10 mg/l at all STPs except at Miraj. However, the outlet values for
suspended solids at all STPs were within the prescribed standards of 20 mg/l respectively.
5.6.1.10 Raigad
There are 9 STPs in this Region which have a collective treatment capacity of 330 MLD. The
total sewage generated in this Region was 188.5MLD. The amount of domestic sewage
received and treated during the year 2020-21 was the same and it was 144.5 MLD. The mean
of annual performance and analysis of all STPs provided in Raigad Region are represented
in Table 5.51.
Table 5.51 Mean of Annual Performance of STPs in Raigad Region
Location of STP
Parameters (mg/l)
pH BOD (Mean) S.S. (Mean)
Outlet Outlet Outlet
CIDCO STP, Sector - 16, Kharghar 7.24 16 18
CIDCO STP, Sector - 16, Kharghar 7.18 10 20.4
CIDCO STP, Sector - 12, Kalamboli 7.45 6.25 16
CIDCO STP, Sector - 32, Kamothe 7.07 31 28
PMC STP, Panvel 7.28 5.4 13
CIDCO STP, Sector-6, Ulwe 8 6 14
CIDCO STP Kalundare 7.44 28 22
CIDCO STP Karanjade 7.2 6 13
CIDCO STP Taloja Phase 1 & 2 8 5.4 15
From the Table 5.51 it can be observed that the outlet values for BOD and Suspended solids,
were beyond the prescribed standards of 10 mg and 20 mg respectively at Sector -16,
Kharghar, Sector - 32, Kamothe and Kalundare.
5.6.1.11 Kalyan
There are 11 STPs in this Region, the collective treatment capacity of which is 249 MLD. The
total domestic effluent received at these STPs was 429 MLD of which 115.5 MLD was treated
during the year 2020-21. The mean off annual performance and analysis of all STPs provided
in Kalyan Region are represented in Table 5.52.
From Table 5.52, it can be observed that the outlet values of BOD were greater than the
prescribed discharge standard of 10 mg/l at STP at Vadalgaon only. The outlet values of
suspended solids exceeded prescribed discharge standard of 20 mg/l at Vadalgaon and
Bhiwandi Nizampur City Municipal Corporation, Bhiwandi, Tal.-Bhiwandi, Dist.-Thane.

67
Table 5.52 Mean of Annual Performance of STPs in Kalyan Region
Location
Parameters (mg/l)
pH BOD (Mean) S.S. (Mean)
Inlet Outlet Inlet Outlet Inlet Outlet
Barve STP: Mouje - Barve, Tal. Kalyan - 7.2 - 9.5 - 21.7
Adharwadi STP: Tal. Kalyan - 7.1 - 6.8 - 13.7
Chinchapada STP: Mouje- Kate Manivali - 7.2 - 6.7 - 16.3
Dombivali Thakurli STP: Motagon, Dombivali Operational
Titwala (E) STP: Mouje- Manda (E), Tal. Kalyan - 7.1 - 4 - 12.3
Titwala (W) STP: Mouje- Manda (E), Tal. Kalyan. - 7.5 - 5.8 - 13
Vadalgaon 6.8 7.4 60 6 30 14
Chikloli 6.8 7.1 64 20 26 12
Badlapur 6.2 6.7 12 4 18 12
Ulhasnagar Vadolgaon Nil
Bhiwandi Nizampur City Municipal Corporation, Bhiwandi, Tal.-Bhiwandi, Dist.-Thane
7.35 7.55 125 10 153 23
5.6.1.12 Mumbai
There are 8 operational STPs in Mumbai Region. The collective treatment capacity of these
STPs is 2758.5 MLD. The total effluent received at these STPs was 1825.5 MLD of which
1823 MLD was collectively treated during the year 2020-21 by these STPs. The mean of
annual performance and analysis of all STPs provided in Mumbai Region are represented in
Table 5.53.
Table 5.53 Mean of Annual Performance of STPs in Mumbai Region.
Location
Parameters (mg/l)
pH BOD (Mean) S.S. (Mean)
Inlet Outlet Inlet Outlet Inlet Outlet
Colaba 7.6 7.03 124 89.6 82 64
Worli 7.2 6.98 118 71.5 65 41.6
Bandra 7.7 7.6 190 35 110 24
Varsova 7.3 7.1 172 42 90 38
Bhandup - 7.3 - 15 - 22
Ghatkopar - 6.8 - 40 - 30
Malad 6.9 7 250 90 35 18
Charkop 7.5 7.3 80 78 115 16
From Table 5.53, it can be observed that outlet values for BOD were greater than the
prescribed discharge standard of 10 mg/l at all STPs whereas the outlet values for suspended
solids were greater than the prescribed standard of 20 mg/l at Colaba, Worli, Varsova,
Ghatkopar and Malad.
5.7 Solid Waste Management in Maharashtra
Municipal Solid Waste (Management &Handling) Rules, 2000, came into force as per the
notification published by Ministry of Environment &Forest, New Delhi on 25.09.2000 is
superseded by Solid Waste Management Rules, 2016.
The inventory of solid waste generation and disposal from the state during the year 2020 is
presented in following sections. Table 5.54 shows total number of local bodies and
cantonment board in the state responsible for generation of the waste Table -- represents

68
quantity of solid waste generated from these local bodies whereas Table -- represents
treatment (%) of generated waste.
Table 5.54 Total number of local bodies: 396 and Cantonment Board-07
1. Municipal Corporations 27
2. ‘A’ Class Municipal Council 18
3. ‘B’ Class Municipal Council 71
4. ‘C’ Class Municipal Council 149
5. Nagar Panchayat 131
6. Cantonment Board 07
Table 5.55 Solid Waste Generation
Local Body No. of ULBs Qty (MT/Day) Percentage (%)
Municipal Corporation 27 18720.96 82.72
A Class Municipal Councils 18 992.88 4.39
B Class Municipal Councils 71 1275.65 5.64
C Class Municipal Councils 149 1034.74 4.57
Nagar Panchayats 131 480.47 2.12
Total 396 22504.7
Cantonment Board 07 128.01 0.57
Gross Total 403 22632.71 100
Table 5.56 Solid Waste Treatment
Local Body No. of ULBs
Qty (MT/Day) Percentage (%)
Municipal Corporation 27 13349.45 81.34
A Class Municipal Councils 18 593.315 3.62
B Class Municipal Councils 71 1121.11 6.83
C Class Municipal Councils 149 888.175 5.41
Nagar Panchayats 131 354.553 2.16
Total 396 16306.6
Cantonment Board 07 104.86 0.64
Gross Total 403 16411.46 100%
5.7.1 Analysis of Municipal Solid Waste Management with Statistical details (Region-
wise) The detailed report on the quantity of different categories of MSW generated and treated in all
the regions in Maharashtra during the year 2020-21 is given in Table 5.57
Table 5.57 Region-wise Statistical analysis of MSW (Generation & Treatment)
Sr.No. Region MSW Generation (MT) MSW treated (MT) Treatment (%)
1. Mumbai 6533 4632 70.90
2. Navi Mumbai 757.01 755 99.73
3. Raigad 574.94 556.16 96.73
4. Thane 2181.6 995.6 45.64
5. Kalyan 1635 1007.5 61.62
6. Pune 3688.35 3613.83 97.98
7. Nashik 1994.33 1705.21 85.50

69
8. Aurangabad 1748.63 1170.653 66.95
9. Nagpur 1403.66 559.92 39.89
10. Amravati 875.34 284.66 32.52
11. Kolhapur 793.2 720.184 90.79
12. Chandrapur 447.65 410.75 91.76
Total 22632.71 16411.46 72.51
5.7.2 Trend Analysis of Municipal Solid Waste Generation and Treatment over 5 years Analysis of the trends of Municipal Solid Waste generation and treatment in all Regions over
the years 2016-17, 2017-18, 2018, 2019 and 2020 has been carried out to study and compare
the trends of generation and treatment of MSW over duration of 5 years. Figures 5.11 and
5.12 graphically represent the trends of average MSW generation and treatment over the span
of 5 years in all regions.
From Figure 5.17 the generation of MSW shows an increasing trend over the 5 years in most
of the regions in the State. The most striking increase in generation of MSW since the year
2016-17 is observed in the Regions of Aurangabad, Nashik & Thane. However, it has to be
noted that in Mumbai and Kalyan waste generation has reduced since 2016-17. Kolhapur,
Navi-Mumbai and Pune show a slight increase in the amount of waste generated since 2018
while Nagpur shows a decrease in the amount of waste generated since 2018. In the
remaining Regions of Amravati and Chandrapur the waste generation remained constant from
2018 uptil 2020.
Figure 5.17 Trend Analysis of MSW generation over 5 years. 5.7.3 Trend Analysis of MSW treatment over 5 years
Trend analysis of MSW treatment over past 5 years in the State of Maharashtra reveals,
quantity of MSW treated has definitively increased with considerably high differences in most
regions. The quantity of treated MSW treated in 2020 is slightly less than last year i.e. 2019 in
case of Mumbai and Thane.
0100020003000400050006000700080009000
10000
MSW
Gen
erat
ed (
MT/
Day
)
MSW Generation
16-17 17-18 2018 2019 2020

70
Figure 5.18. Trend Analysis of MSW treatment over 5 years.
In the Regions of Amravati, Aurangabad, Chandrapur,Kolhapur,Nagpur,Nashik,Navi-
Mumbai,Pune and Raigad the quantity of MSWtreated shows an increasing trend in
succeeding years. The most significant increase in quantities of MSW treated can be observed
at Kalyan.
5.8 Hazardous Waste Generation during the year 2020-21
Table 5.58 Details on total generation Hazardous Waste during the year 2020-21
HW INVENTORY
Sr. No.
No of industries
Name of the
District
Landfillable
Recyclable
Incinerable
Utilizable Qty.
TOTAL
1 146 Ahmedna
gar 4984.46 4129.98 23452.35 16266.45 48833.24
2 40 Akola 862.14 457.78 455.82 391.56 2167.30
3 55 Amravati 3882.92 134.50 130.06 281.40 4428.87
4 349 Aurangab
ad 39319.73 17165.88 29795.91 75079.60
161361.12
5 14 Beed 62.40 142.28 873.95 35.20 1113.83
6 16 Bhandara 2040.39 91.57 6072.93 190.48 8395.36
7 26 Buldhana 2080.73 217.80 23.30 280.80 2602.63
8 74 Chandrap
ur 657.10 1667.76 1863.94 189367.59
193556.38
9 41 Dhule 15214.62 49.32 4269.88 626.72 20160.54
10 2 Gadchiroli 0.00 0.00 2.00 0.00 2.00
11 4 Gondia 0.00 200.00 403.05 12.00 615.05
12 5 Hingoli 0.00 78.38 1.50 0.00 79.88
13 99 Jalgaon 4063.23 1932.70 3524.42 68573.75 78094.10
14 19 Jalna 18556.32 7905.16 194.70 17.20 26673.38
15 354 Kolhapur 34121.78 15296.36 4770.16 1599.27 55787.57
16 19 Latur 661.18 896.13 13.36 5.84 1576.51
17 423
Mumbai 23119.63 14242.74
111764.95
9864.08 158991.3
9 18 Mumbai
Suburban
19 256 Nagpur 17470.27 6144.52 36574.02 8550.12 68738.92
0
1000
2000
3000
4000
5000
6000
MSW
Tre
ated
(M
T/D
ay)
MSW Treatment
16-17 17-18 2018 2019 2020.00

71
20 17 Nanded 124.34 10.11 133.44 110.40 378.28
21 14 Nandurba
r 170.42 162.04 353.40 9.60 695.46
22 414 Nashik 14574.40 9434.25 28455.02 55897.96 108361.6
3
23 16 Osmanab
ad 247.71 1130.80 32.26 8.70 1419.46
24 998 Palghar 83132.36 16387.49 65580.64 429333.49 594433.9
8
25 6 Parbhani 0.00 24.08 4.70 0.00 28.77
26 1341 Pune 96118.27 63416.90 77242.17 157730.31 394507.6
5
27 703 Raigad 195046.7
0 66873.41
351250.60
69762.78 682933.4
9
28 122 Ratnagiri 24559.77 4827.99 14460.32 66529.09 110377.1
8
29 95 Sangli 4487.97 19306.68 5997.72 1372.26 31164.64
30 189 Satara 4914.45 4888.72 5912.04 3911.61 19626.83
31 10 Sindhudur
g 1.58 3.80 22.56 12.00 39.95
32 126 Solapur 4705.35 1408.84 7574.73 471.62 14160.54
33 1512 Thane 127408.2
4 27707.20
144951.26
95206.63 395273.3
4
34 18 Wardha 1915.22 14.80 2647.64 98.40 4676.06
35 4 Washim 68.40 0.96 10.50 0.00 79.86
36 32 Yavatmal 2580.03 6616.27 547.02 13.00 9756.31
7559 727154.0
8 292970.1
7 929366.3
2 1251614.90
3201091.47
5.8.1 Status of Common Hazardous Waste Treatment, Storage & Disposal Facility
There are total 4 number of Common Hazardous Waste Treatment, Storage & Disposal
Facilities installed and operating successfully in the State of Maharashtra, 2 facilities namely
Mumbai Waste Management [MWM], Taloja, Trans Thane Waste Management Association
[TTCWMA], Mahape, are located under Navi Mumbai Region, 1 facility namely Maharashtra
Enviro Power Ltd [MEPL], Ranjangaon is located under Pune region &Maharashtra Enviro
Protection Ltd. [MEPL], Buttibori is located under Nagpur region. Presently around 7559
industries are member of these 4 facilities and disposing their Hazardous Waste.
Table 5.59 Summary of Individual Capacities of CHWTSDFs.
Name of Facility & Address
M/s. Mumbai Waste Management
Limited, Plot No. P-32, MIDC, Taloja,
M/s. Trans Thane Waste Management
Association P-128, Shil-Mahape Road, Next to L&T
Infotech Ltd.
M/s. Maharashtra Enviro Power
Ltd. Ranjangaon
M/s. Maharashtra Enviro Power Ltd.
(SPV of M/s. Shaktikumar M. Sancheti Ltd)
Buttibori
Capacity of the
Facility
SLF- 1,20,000 MT/ Year
SLF- 21,600 MT/Year
SLF- 60,000 MT/Year
SLF- 60,000 MT/Year
1. INC - 1.5 TPH. INC-No Facility
INC- 3.0 TPH INC- 3.0 TPH 2. INC- 1.5 TPH
(Incinerable HW sent to Taloja)
There are currently 7559 industries that are generating Hazardous Waste in the state. Various
methods viz. SLF & INC are used for the treatment of this Hazardous Waste. 285228.38MT/A
of HW is treated by SLF method and 54010.18 MT/A by INC method while 494914.13MT of
HW is recycled.

72
Table 5.60 Summary of Hazardous Waste Received at disposal sites in 2020-21
Sr. No. SITE SLF
(MT/A) INC
(MT/A) TOTAL (MT/A)
1 MWML - TALOJA 186778 31979 218757
2 TTCWMA - MAHAPE 10829.06 - 10829.06
3 MEPL - RANJANGAON 71131.32 19194.9 90325.32
4 VEPL - BUTIBORI 16490 2836.28 19326.28
TOTAL 285228.38 54010.18 339238
In the State of Maharashtra 439 No. of facilities authorized for recycling / utilization of
Hazardous & Other Wastes having total authorized capacity of 1384925.6 MT. In the year
2020-21, in Maharashtra state 494914.13 MT Waste is recycled.
Table 5.61 District wise Updation for HW authorizatons
Authorizations- District wise updation as of 31st March 2021
Sr. No. Districts Total Nos of Units
1 Ahmednagar 146
2 Akola 40
3 Amravati 55
4 Aurangabad 349
5 Beed 14
6 Bhandara 16
7 Buldhana 26
8 Chandrapur 74
9 Dhule 41
10 Gadchiroli 2
11 Gondia 4
12 Hingoli 5
13 Jalgaon 99
14 Jalna 19
15 Kolhapur 354
16 Latur 19
17 Mumbai Mumbai Suburban
423 18
19 Nagpur 256
20 Nanded 17
21 Nandurbar 14
22 Nashik 414
23 Osmanabad 16
24 Palghar 998
25 Parbhani 6
26 Pune 1341
27 Raigad 703
28 Ratnagiri 122
29 Sangli 95
30 Satara 189
31 Sindhudurg 10
32 Solapur 126
33 Thane 1512
34 Wardha 18
35 Washim 4
36 Yavatmal 32
Total 7559

73
5.8.2 Trend analysis of Hazardous Waste received at disposal sites over 5 years
Analysis of the trends of Hazardous Waste received at all disposal sites in the State over the
years 2016-17, 2017-18, 2018-19, 2019-20 and 2020-21 has been carried out. Figure 5.19
graphically represents the trend of average Hazardous Waste received over the span of 5
years at disposal sites.
Figure 5.19 Trend Analysis of Hazardous Waste received at disposal sites over 5 years
It can be observed from Figure 5.13. That the quantity of Hazardous Waste received at MWML,
Taloja was the least during the years 2017-18 followed by 2018-19, 2019-20 and 2016-17
respectively. The quantity of HW received at this site was maximum during the year 2020-21.
At TTCWMA, the quantity of HW received during the years 2016-17 & 2017-18 was almost
similar, with a slight increase during the year 2018-19 and 2019-20. The amount of HW
received again dropped during 2020-21 and was the lowest during this year.
The quantity of Hazardous Waste received at MEPL, Ranjangaon (Pune) increased from
2016-17 to 2019-2020. However, it reduced during the year 2020-2021 was 90325.32 MT
during this year. Amount of HW received at MEPL, Butibori (Nagpur) has been relatively
constant over these 5 years with only a slight increase in the year 2018-19.
5.9 Bio-medical Waste
5.9.1 Implementation of Biomedical Waste Management Rules, 2016
• The MoEF & CC has notified Biomedical Waste Management Rules, 2016 on 28th March,
2016.
• As per new Biomedical Waste Management Rules, 2016, all hospitals, nursing homes,
clinics, dispensaries, veterinary institutions, animal houses, pathological laboratories,
blood banks, clinical establishments, research or educational institutions, health camps,
medical or surgical camps, vaccination camps, blood donation camps, first aid rooms in
schools, forensic laboratories and research laboratories are include under the purview of
these rules.

74
• It is mandatory for all non-bedded HCEs to obtain one time BMW authorization from the
Board.
• Under the Government mission of ‘Ease of Doing Business’ and on account of efforts taken
to ensure transparent operation, this office has developed a protocol for an online Consent
and BMW authorization. Real-time grant of provisional authorization is subject to online
submission of application with necessary documents and fees.
• The Board has been implementing Biomedical Waste Management Rules, 2016 in the
State. Presently, there are 30 Common Waste Treatment and Disposal Facilities in
operation in the State of Maharashtra.
5.9.2 Status of Bio-medical Waste Treatment Facilities
(1) Total no. of Health Care Facilities/Occupiers: 64,266
(2) Total No. of beds: 2,97,565
(3) Status of authorization
(i) Total no. of occupiers applied for authorization : 8184
(ii) Total no. of occupiers granted authorization : 8143
(iii) Total no. of applications under consideration : 272
(iv) Total no. of applications rejected : 429
(v) Total no. of occupiers in operation without applying for authorization :75
(4) Bio-medical waste generation
(i) Bio-medical waste generated by bedded hospitals: 61745Kg/day
(ii) Bio-medical waste generated by non-bedded hospitals: 18965Kg/day
(iii) Any other: 1437
(5) Bio-medical waste treatment and disposal
(a) By captive bio-medical waste treatment and disposal by Health Care Facilities
(i) Number of Health Care Facilities having captive treatment and disposal facilities: 240
(ii) Total bio-medical waste treated and disposed by captive treatment facilities: 494 Kg/day
(b) Bio-Medical Waste Treatment and Disposal by Common Bio-Medical Waste
Treatment Facilities (CBMWFT)
(i) Number of CBMWTF in Operation : 30
(ii) Number of CBMWTF under construction : 1
(iii) Total bio-medical waste treated by CBMWTF : 81618 Kg/Day
(iv) Total treated bio-medical waste disposed through authorized recyclers: 11783 Kg/day
5.10 Electronic Waste
Electronic waste or e-waste describes discarded electrical or electronic devices. Used
electronics which are destined for reuse, resale, salvage, recycling, or disposal are also
considered e-waste. Informal processing of e-waste in developing countries can lead to
adverse human health effects and environmental pollution. Electronic scrap components, such
as CPUs, contain potentially harmful components such as lead, cadmium, beryllium, or
brominated flame retardants. Recycling and disposal of e-waste may involve significant risk to
health of workers and communities in developed countries and great care must be taken to
avoid unsafe exposure in recycling operations and leaking of materials such as heavy metals

75
from landfills and incinerator ashes.
5.10.1 Implementation of E-waste (Management and Handling) Rules, 2016
• E-Waste (Management) Rules, 2016 notified on 23rd March 2016 and came into force
from 1st Oct. 2016.
• Applicability of these newly modified rules expanded to manufacturer, dealer,
refurbisher and Producer Responsibility Organization (PRO)Producers are responsible
for setting up collection centre on own or in association.
• Obtaining authorization for producers from multiple SPCs is removed. Single EPR
authorization for producers from CPCB is introduced.
• Target based approach for collection under EPR is introduced.
• Simplification of permissions by giving only authorizations instead of authorization and
registrations
• Responsibility is fixed on manufacturers to collect E-Waste and channelize it for
recycling at authorized site
• Responsibility is fixed on dealers and Refurbishers
• Responsibility is of the State Industry Department to earmark or allocate industrial
space for-Waste dismantling and recycling facilities
• Department of Labour is responsible for recognition and registration of workers in
dismantling and recycling. Annual monitoring and ensuring safety and health of
workers is also the responsibility of the Department
• State Government to prepare integrated plan for effective implementation of these
rules and to submit annual report to MoEF & CC
• Concept of manifest system for transportation of E-Waste is introduced
• Concept of liability provisions is introduced
• Maharashtra Pollution Control Board has constituted a Technical Committee for
scrutiny of Applications received for grant / renewal of Authorization for dismantling /
recycling / refurbishing of E-Waste under the Chairmanship of Mr R. K. Garg.
• MPC Board has carried out E-waste inventory for State of Maharashtra through M/s
IRG Systems South Asia Pvt. Ltd.
Details of authorizations issued under the E-waste (M & H) Rules, 2016 to dismantlers/
recyclers/collection /producers are as shown in Table 5.62
Table 5.62 Present Status of E-Waste Generation and Recycling in Maharashtra
State
Present Status of E-Waste dismantling and recycling capacity
1 E-Waste Dismantlers 97 89335 MTA.
2 E-waste Recyclers 14
Total 111

76
5.11 Plastic Waste Management in the State of Maharashtra
The plastic waste generation is 3,11,254 TPA, collected is 2,51,556 TPA and disposal is
1,99,703 TPA as per the information obtained from Annual Report submitted by Urban Local
Bodies for financial year 2020-21. Out of this, following are main modes of use:
• Plastic waste used for Refuse Derived Fuel (RDF) = 124,725 tonnes
• Plastic waste sent for co-processing= 25,400 tonnes
• Plastic waste used for granule making= 29,485 tonnes
• Plastic waste used for pyrolysis= 4,918 tonnes
• Plastic waste used for road construction= 13,513 tonnes
• Plastic waste sent to landfilling facility= 23,237 tonnes
Plastic Waste (Management & Handling) Rules, 2011, came into the force as per the
notification published by Ministry of Environment & Forest; New Delhi on 4.2.2011 has been
superseded by the Plastic Waste Management Rules, 2016 notified on 18.3.2016, which have
been amended on 27.03.2018.Rule 16 of the PWM Rules, 2016 requires setting up of State
Level Advisory Committee for effective implementation of PWM Rules, 2016 in each State.
Accordingly, Government of Maharashtra has constituted State Level Advisory Committee
vide Govt. Resolution Plastic 2013/ (284/ 2013) dated 4th January 2017 under the
Chairmanship of the Principal Secretary, Urban Development Department-II, Govt. of
Maharashtra.
Under Plastic Waste Management Rules, 2016 and amendment thereto, 111 nos. of Plastic
waste Recyclers of capacity 3,65,236 Tonnes per annum and 7 nos. of Compostable Material
Producers have been registered with Maharashtra Pollution Control Board as of 31st March
2021. Out of 111 recyclers, 45 have been registered in FY 2020-21. The list of registered
Plastic Waste Recyclers and Compostable Material Producers is published and updated in
MPCB’s website regularly.
Government of Maharashtra has published Maharashtra Plastic and Thermocol Products
(Manufacture, Usage, Sale, Transport, Handling and Storage) Notification, 2018. This
notification is applicable for the whole of Maharashtra. There are two committees constituted
under the provisions of this notification namely i) the Expert Committee under chairmanship
of Principal Secretary, Environment Department for technical guidance in the matters of
Maharashtra Plastic and Thermocol Notification, to the Government and ii) Empowered
Committee under chairmanship of Hon’ble Minister (Environment) to decide necessary
amendments and review implementation of the said notification. So far, several meetings of
Expert Committee and Empowered Committee have been conducted and thereafter
necessary amendments in the Notification have been issued.
Effective implementation of Maharashtra Plastic and Thermocol Products (Manufacture,
Usage, Sale, Transport, Handling and Storage) Notification, 2018 has resulted in around 18%
reduction in plastic waste generation in the urban local bodies of the state, from 5.01 lakh
tonnes in FY 2017-18 to 4.09 lakh tonnes in FY 2018-19. Officials from other State pollution
control boards such as Tamil Nadu, Madhya Pradesh, Kerala, Bihar etc. have discussed with
MPCB about the plastic ban and its implementation in Maharashtra. Some of these states
have issued their own notifications for the plastic ban on similar line of Maharashtra’s Plastic
and Thermocol notification, 2018.

77
Effective implementation of concept “Extended Producer’s Responsibility (EPR)” is seen as a
result of the Maharashtra Plastic and Thermocol Products (Manufacture, Usage, Sale,
Transport, Handling and Storage) Notification, 2018. Around 450 EPR action plans are
received under EPR for post-consumer plastic waste management from leading brand owners
and plastic producers.
The Board has also constituted EPR scrutiny committee to list criteria/parameters for EPR and
scrutiny of submitted EPR plans. According to the directions from Environment Department,
the EPR plans have been submitted to Environment Department for further decision.
Plastic industries/ brand owners are implementing or planning to implement the EPR plan
through Producer Responsibility Organizations (PROs).To achieve the targets, plastic
producers have signed agreements with Producer Responsibility Organizations (PRO’s) such
as Gem Recycler, IPCA, Shakti Plastic, NEPRA Environmental Solutions Pvt. Ltd., Sampurna
Earth Environment Solutions Pvt. Ltd. etc.
Regular surveys have been carried out in jointly by local body authorities and MPCB officials
within Corporation limits and separately by MPCB officials for industries, to implement the said
notification. The status of fine collected during FY 2020-21 is as below:
Period No of shops
visited
Action initiated
against no. of shops
Total fine collected (Rs.
Cr)
Total Qty of banned items seized ( MT)
FY 2020-21 1,041,541 15,587 3.91 213
As per the Plastic Waste Management Rules, 2016 and amendment thereto “Every local body
shall prepare and submit an annual report in Form –V to the concerned Secretary-in-charge
of the Urban Development Department under intimation to the concerned State Pollution
Control Board or Pollution Control Committee. Each State Pollution Control Board or Pollution
Control Committee shall prepare and submit an annual report in Form VI to the CPCB on the
implementation of these rules”. Accordingly, MPCB has prepared an online portal for
submission of annual report from urban local bodies for speedy submission of the report. The
region-wise information on plastic waste generation, collected and disposal for the year 2020-
21 obtained from ULB’s Annual Report is represented as below:
10.5 No. of ULBs
Plastic Waste generated (in tons)
Plastic Waste collected (in tons)
Plastic Waste channelized for
recycling (in tons)
Amravati 42 3,219 3,050 2,528
Aurangabad 79 36,592 36,619 29,104
Chandrapur 40 6,564 6,519 4,597
Kalyan 8 35,701 35,701 26,142
Kolhapur 42 7,310 9,507 4,538
Mumbai 1 62,793 8,409 8,409
Nagpur 47 14,229 14,190 11,446
Nashik 62 37,647 37,222 30,083
Navi Mumbai 2 6,814 15 2,179
Pune 47 59,295 59,234 59,136
Raigad 15 7,840 7,840 6,743
Thane 9 33,249 33,249 14,800
Grand Total 394 3,11,254 2,51,556 1,99,703

78
As per the provisions of Plastic Waste Management Rules, 2016 and Maharashtra Plastic and
Thermocol Items Notification, 2018 and amendment thereto, Producers/ Brand-owners are
obligated to prepare and implement EPR plan on their own or by engaging agency / Producer
Responsibility Organizations (PROs). Hence, a number of Producers and Brand-owners have
appointed PROs to prepare their EPR plan and implement the same. There are 13 major
PROs operating in Maharashtra. MPCB is collecting data regarding collection and disposal of
Plastic Waste from these PROs. A brief summary is as below:
Collection and Disposal of Plastic Waste by PROs during the year 2020-21
Disposal mode Processing (tonnes)
Recycling 42,463
Co-processing 21,435
Aggregator 636
RDF 127
Waste to Energy 97
Pyrolysis 62
Grand Total 64,931
Further Board has taken initiative to develop online platform for plastic waste management
EPR in the state of Maharashtra.Recity Networks Pvt. Ltd. is working with MPCB for the digital
platform for plastic EPR monitoring. It has successfully completed a pilot scale project in the
Pune Municipal Corporation area involving Swach and ITC-major brand owner, where all the
stakeholders involved, including producers/brand owners, PROs, regulatory bodies (MPCB)
will be on the platform for carrying out their role in the EPR implementation process.
5.12 Construction & Demolition Waste
Annual report in form III submitted by 384 ULBs for the financial year 2020-21 out of 403 ULBs
including Cantonment Boards as represented below;
Total 3852757.79 MT/A Construction & Demolition (C&D) Waste is generated by these ULBs.
Name of PRO Collection (Tonnes)
Shakti Plastic 16,837
NEPRA 9,651
IPCA 8,474
GEM Enviro 5,810
UNDP 4,190
EPR Plastics 3,642
Sampurn(e)arth 3,470
Social Labs 2,663
Geminicorp 1,189
Recykal 709
Kapila 624
Karo Sambhav 308
Swach Plus 29
Saahas 0
Grand Total 57,597

79
Total 99800.34 MT/A Waste processed / recycled by ULBs. The C&D disposed by land filling
without processing (last option) or filling low lying area waste quantity is 353552115.0 MT/A.
These ULBs having 718 storage facilities to store C&D waste securely. Total 169 Municipal
magistrates appointed for taking penal action for non-compliance with these rules by these
ULBs and 175 No’s of cases were registered under this rules.
Table 5.63 showing operational and proposed plants for processing of Construction and
Demolition waste.
Table 5.63 Showing operational plant for processing of Construction and
Demolition waste
Sr.No. Name of Corporation Plant capacity (TPD) Present Status
1 Thane Municipal Corporation 300 In operation
2 Pimpri-Chinchwad Municipal
Corporation 200
Work order issued
Proposed plant
3 Navi Mumbai Municipal
Corporation 150 Proposed plant
4 Municipal Corporation of
Greater Mumbai 1200
E-Tendered
Proposed Plant
5 Pune Municipal Corporation 200 Proposed Plant
C & D Waste Abstract of ULBs and Cantonment Boards
ULBs
Total Qty of C & D
waste Generated
during whole year
in MT
Total Qty of C & D waste
processed/recycled in MT
Total Qty of C & D waste
Disposed by landfilling
without processing (last option) or filling low lying area
Number of
Storage Facilities for C&D Waste
Storage
Municipal magistrates appointed for taking
penal action for
non-compliance with these
rules
No of Penal action cases
registered
Municipal Corporation
3759479.67 80631.9 3519754.69 186 12 114
“A” Class Municipal
council 14562.4 3158.1 5765,1 34 15 1
“C” Class Municipal
council 16475.51 6284.84 5250.19 230 64 41
Nagar panchayats
49404.12 6712.62 1456.79 130 43 7
Cantonment Boards
270 0.2 239.8 0 1 0
Total 3852757.7 99800.34 353552115 718 169 175

80
5.13 Performance of MPCB Laboratories
Maharashtra Pollution Control Board has established a Central Laboratory at Navi Mumbai
and seven Regional Laboratories at Pune, Nashik, Aurangabad, Nagpur, Chiplun, Thane and
Chandrapur, under sub-section 2 of Section 17 of the Water (P&CP) Act, 1974 and the Air
(P&CP) Act, 1981. These laboratories are equipped and approved by Ministry of Environment,
Forest and Climate Change (MoEF & CC), Government of India, Delhi under E (P) Act, 1986.
The laboratories are ISO 9001:2015 and OHSAS 18001:2007 certified since 2014.
All MPCB laboratories function as ‘Board Laboratories’ as defined under Water and Air Act,
and Environment (Protection) Act, 1986 and rules made there under to analyze the samples
collected by officers authorized to collect samples from respective jurisdictions for analysis of
water, air and hazardous waste, Municipal Solid Waste, Biomedical Waste samples and
submit the reports to respective authorities for further actions. Regional Laboratory
Chandrapur has facility to analyze only air samples. MPCB’s laboratories are well equipped
with modern sophisticated instruments and equipment UV Spectrophotometer, Gas
Chromatograph (GC), Mass Spectrophotometer, Atomic Adsorption Spectrophotometer
(AAS), Ion Chromatography (IC), Inductive Couple Plasma (ICP), Absorbable Organic Halide
Analyzer (AOx), CHNS Analyzer and others. Table 5.64 represents total numbers of samples
and parameters analysed in these laboratories over the FY 2020-21 and Figure 5.20, 5.21 &
5.22 graphically represents total number of water, air & HW samples analysed respectively.
Table 5.64 Analysis of Performance of Board Laboratories (2020-21)
Sr.
No Laboratory
Samples Analyzed Total
Parameters Analyzed Total
Water Air H.W Coal Water Air H.W Coal
1
C. Lab.*,
Navi
Mumbai
4156 228 96 0 4480 60835 1491 828 0 63154
2 R. Lab.*,
Nagpur 1416 127 30 0 1573 22301 251 279 0 22831
3 R. Lab.,
Pune 3104 183 20 0 3307 39838 462 193 0 40493
4 R. Lab.,
Nashik 1159 295 9 0 1463 18742 1602 84 0 20428
5 R. Lab.,
Aurangabad 1319 190 9 0 1518 15876 1194 57 0 17127
6 R. Lab.,
Chiplun 2200 70 28 0 2298 29417 161 247 0 29825
7 R. Lab.,
Thane 845 199 0 0 1044 4914 1235 0 0 6149
8 R. Lab.,
Chandrapur 0 29 0 0 29 0 71 0 0 71
TOTAL 14199 1321 192 0 15712 191923 6467 1688 0 200078
(-) Indicates Facility Not Available C. Lab- Central Laboratory. R. Lab - Regional Laboratory.

81
Fig 5.20 Annual total of water samples analyzed at each MPCB laboratory (2020-21)
Note: there was no water sample analysed at Chandrapur Laboratory during year 2020-21
Fig 5.21 Annual total of air samples analyzed at each MPCB laboratory (2020-21)
C. Lab.*,Navi
Mumbai
R. Lab.*,Nagpur
R. Lab.,Pune
R. Lab.,Nashik
R. Lab.,Auranga
bad
R. Lab.,Chiplun
R. Lab.,Thane
R. Lab.,Chandra
pur
Series1 4156 1416 3104 1159 1319 2200 845 0
0
500
1000
1500
2000
2500
3000
3500
4000
4500
Tota
l No
. of
An
alys
edTotal No of water (Env./STP/ETP) samples analysed (2020-21)
C.Lab.*,Navi
Mumbai
R.Lab.*,Nagpu
r
R.Lab.,Pune
R.Lab.,
Nashik
R.Lab.,
Aurangabad
R.Lab.,
Chiplun
R.Lab.,
Thane
R.Lab.,
Chandrapur
Laboratory Air 228 127 183 295 190 70 199 29
0
50
100
150
200
250
300
350
Tota
l No
of
sam
ple
s A
nal
ysed
Total No of air (AAQ+ Stack) samples analysed (2020-21)
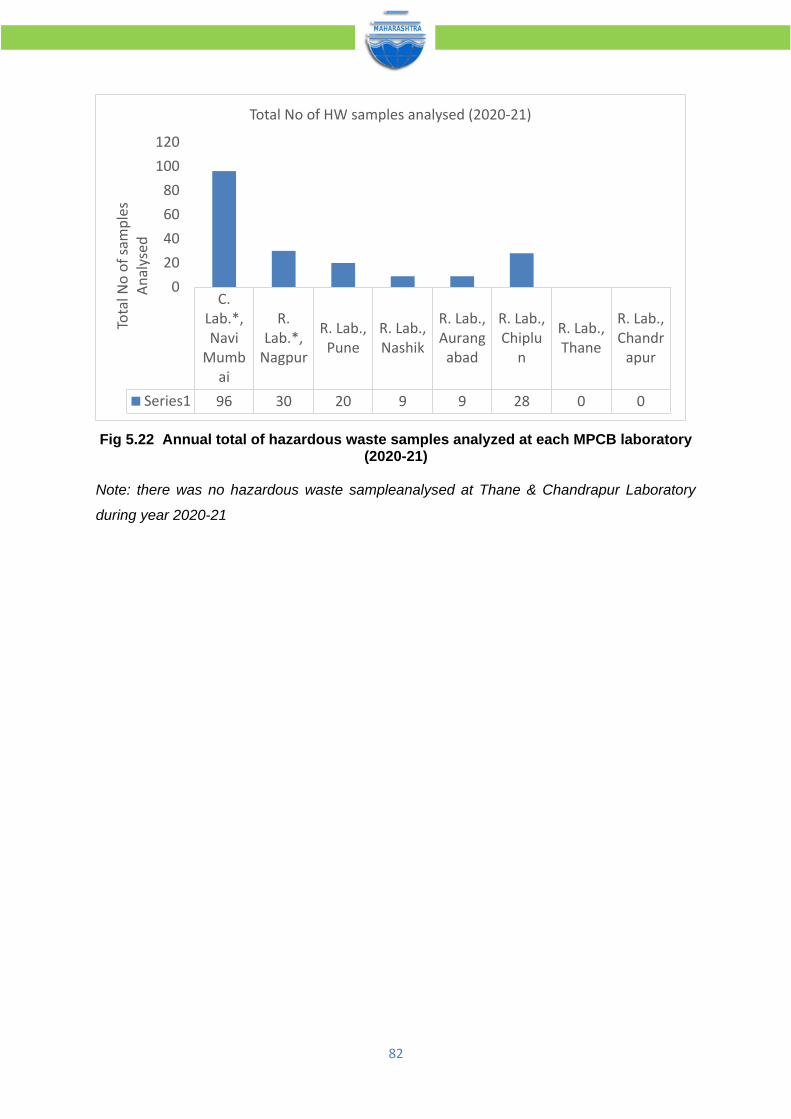
82
Fig 5.22 Annual total of hazardous waste samples analyzed at each MPCB laboratory (2020-21)
Note: there was no hazardous waste sampleanalysed at Thane & Chandrapur Laboratory
during year 2020-21
C.Lab.*,Navi
Mumbai
R.Lab.*,
Nagpur
R. Lab.,Pune
R. Lab.,Nashik
R. Lab.,Aurang
abad
R. Lab.,Chiplu
n
R. Lab.,Thane
R. Lab.,Chandr
apur
Series1 96 30 20 9 9 28 0 0
0
20
40
60
80
100
120
Tota
l No
of
sam
ple
s A
nal
ysed
Total No of HW samples analysed (2020-21)

83
6. REGIONAL ENVIRONMENTAL PROBLEMS & CONTROL MEASURES TAKEN IN RESPECTIVE REGIONS
The environmental issues faced by different regions in the State of Maharashtra and the
control measures implemented by the Board are described below.
6.1 Amravati
6.1.1 Air Issue
The Municipal Corporation Amravati has population of 6.48lacks and under “D” Class
Municipal Corporation. There are 3 NAMP Monitoring Stations in operation within the
Corporation Area, viz. Rajkamal Chowk, Govt. Engineering Collage premises and MIDC
Amravati. The Government Collage of Engineering Amravati is the agency appointed for
operation of these stations. From the Analysis Results of these stations, it is observed that,
the parameter RSPM is exceeding the limit particularly during summer and winter session.
The Amravati city is under NCAP. The parameter RSPM is observed exceeding due to the
construction activities of concrete road in the city.
The Board has already given directions to Municipal Corporation Amravati to take all
precautionary measures to minimize the Air Pollution. The site for CAAQMS at Amravati has
been identified and Consents for installation has been received from the following agencies
as follows:-
1. Government college of Engineering Amravati
2. Divisional Commissioner Office Amravati
3. Sipna College of Engineering Amravati
4. Bhartiya Mahavidyalaya, Amravati 6.1.1.1 Current status of Action Plans
6.1.2 Water Issues
There are around 15 effluent generating industries (including 5 textile processing industries)
located in this region. To treat the effluent from these industries 5MLD capacity CETP is
provided and around 10acres of SSHEHS (Soil-Sand High Efficiency Hybrid System) is
provided to dispose the treated effluent from CETP. During monsoon the incidence of
discharge of effluent along with rain water runoff is observed intermittently. As the location of
the SSHEHS is near the low-lying MIDC area, the effluent along with rain water runoff flows
towards in Nalla and creates environmental issues.
Current Action Plan Mid Term Action Plan Long Term Action Plan
MPCB has issued work order to IIT Mumbai and NEERI Mumbai to prepare the action plan in respect of Air Quality within the Municipal Corporation area and the Action Plan is at final stage.
MPCB has issued directions to the Municipal Corporation Amravati to minimise the Air Pollution by preventing burning of MSW. Municipal Corporation Amravati has submitted the revised Action Plan regarding NCAP on 21/12/2019 along with timely progress.
MPCB has proposed 3 NAMP stations at Washim to monitor the Ambient Air Quality.

84
Further, Purna and Pedhi river stretches in this region are included in the polluted river
stretches by CPCB viz. the river stretch from Asegaon Purna to Wathoda Shukleshwar
(Amravati District Border) and river stretch from Narayanpur to Bhatkuli etc.
6.1.2.1 Current Status of Action Plan
MPCB has issued directions to the MIDC authorities to take precautionary measures to avoid
such incidence & also submitted the action plan to CPCB for restoration of the water quality
of the polluted river stretches of Purna, Pedhi & Penganga Rivers. Akola Municipal
Corporation has proposed 2 nos. of STP's of 37 MLD capacity. Special Environment
Surveillance Task Force for Amravati & Akola District has been constituted to mitigate the
issues related to river water quality.
6.1.3 Solid Waste Issues
The Municipal Solid Waste is dumped on the treatment & disposal site without any segregation
as there is no waste processing facility provided by Municipal Corporation at the site.
6.1.3.1 Current Status of Action Plan
MPCB has issued notices/directions to the Municipal Councils in Akola & Amravati to setup a
treatment facility for Municipal Solid Waste and they have initiated the process of Establishing
waste processing facilities at 3 locations viz. Sukali MSW Site, Akoli Bypass and Badnera.
6.2 Aurangabad
6.2.1 Air Issues
The CPCB has declared Aurangabad, Jalna & Latur cities as non-attainment city out of 17
cities from Maharashtra state. The area of Aurangabad City, MIDC Waluj, MIDC Chikalthana,
MIDC Railway station & Paithn Road units are comes in CEPI area.
There are 12 nos of steel units engaged in manufacturing of ingots from M.S. scrap generating
air emissions mainly during loading of raw material into the furnace and unloading of molten
metal from the furnace. The major industrial pollution is due to fuel burning in the Boiler and
dust pollution due to Stone Crusher units, Manufacturing of traditional bricks.
Industrial activities and Urban Air Pollution due to commercial activity, vehicular & construction
activity are the other sources of air pollution in the area.
6.2.1.1 Current Status of Action Plan
Current Action Plan Mid Term Action Plan
Long Term Action Plan
To control pollution from industries, meeting with industry representative at HQ under the Chairmanship of Member Secretary on 18/10/2019 has been conducted and issued directions for upgradation of existing APCS. In MIDC Jalna area MPCB is taking continuous follow up
As per NCAP action plan Municipal Corporation has installed fountains near Siddharth Garden. 02 no’s of CAAQMS propose at Deogiri College & MPCB, Aurangabad, Latur MC installed fountains in Basweshwar Chowk &
Upgradation of existing pollution control system in industrial area, As per the provision of Air act (P&CP) 1981 consent granted to all industries under stipulated conditions, Almost all major industries has provided APC system such as Dust Collector, Bag Filter, Wet Scrubber & ESP etc.& also adopted green fuel technology by using agro base/LPG fuel to reduce air

85
with the industries to provide adequate capacity of Dust Collector, Bag Filter, and Wet Scrubber & ESP system. The vigilance is kept on pollution due to stone crusher & hot mix activity.
Rajiv Gandhi Chowk, 01 no’s of CAAQMS is also proposed
emission in the environment, Most of the stone crusher units has provided water sprinkler system, covered vibrating screen & conveyer belts by tin sheet, wind breaking wall, Metallic road & Massive tree plantation.
6.2.2 Water Issues
1. Ground water contamination is observed at Waluj Industrial area.
2. Godavari River D/S of Paithan to Shahgad (Aurangabad District, Manjra River Latur to
Nanded road bridge at Vill, Bhatkeda (Latur District), Godavari River at Gangakhed,
Dist- Parbhani, Bindusara River at Beed & Godavari River at Nanded are identified as
Critically Polluted stretches by CPCB.
6.2.2.1 Current Status of Action Plan
Current Action Plan Mid Term Action Plan Long Term Action Plan
NEERI, CGWA and MPCB have conducted detailed survey of Ground Water Quality of Waluj Area &MPCB has formed committee at Board level. Preliminary study and testing has been carried out regarding removal of Chromium in the said area. Task Force Committee was constituted at District levels for follow up and regular meetings are conducted for implementation and execution. During Ganesh & Durga Festivals insisted ULB's to provide artificial ponds for immersion of idols also awareness programmers are conducted by this office to to promote use of eco-friendly Ganpati idols
Nanded Waghala Municipal Corporation has submitted proposal of 10 MLD STP for treatment of untreated sewage discharged into Godavari river through 34 Nalls causing river water pollution &said work of STP is expected to be completed by December 2021.
3 STPs are proposed for Paithan, 2 no’s of STP of Capacity 32 MLD & 40MLD is proposed by Latur Municipal Corporation, 35MLD STP is under progress at Beed & 5MLD STP is proposed at Gangalhed for treatment of sewage. Nanded Waghala Municipal Corporation has provided 3 STP of capacity- Bondar- 87MLD, Elichpur- 30MLD & Sangvi - 15MLD AMC has provided at 5 STPs having total capacity of 211MLD.
6.2.3 Solid Waste Issues
There is no scientific process for treatment and disposal followed by any of the Municipal
Councils/ Nagarpanchyat (alna, Latur,Nanded, Parbhani) except Aurangabad city.
6.2.3.1 Status of Current Action Plan
Nanded Waghala Municipal Corporation has provided door to door MSW collection with segregation & Transportation of MSW is through M/s. R & B Infra Project Pvt. Ltd. Nanded Waghala Municipal Corporation is Bio-mining 1Lac m3MSW (legacy waste). All other
ULB's have been instructed by the Board to provide the scientific treatment facility and

86
accordingly most of the ULB's have prepared &sanctioned DPR's & the installation work will
be started very soon.
6.2.4 Noise Issues
Noise pollution due to use of DJ during Shri Ganesh & Durga Pooja festivals.
Noise and Air problems due to fire crackers in Diwali festival.
Noise pollution due to vehicles.
6.2.4.1 Status of Current Action Plan
Current Action Plan Mid Term Action Plan Long Term Action Plan
Awareness programme, field noise monitoring in major city areas are being carried out by Board offices, if necessary noise monitoring is carried with police dept. as per their request. MPCB is also carrying out AAQM monitoring during the festivals.
Guidelines circulated to local bodies for celebration of eco-friendly Ganesh& Durga festival, Diwali and Holi etc. Awareness campaigns and programs are conducted in the area.
Advertisement on TV and Radio is prposed. Board is conducting monitoring during Diwali festival for controlling of high dB fire cracker through the committee constituting member from DISH &police department to control the noise level.
6.3 Kolhapur
6.3.1 Air Issues
1. Kolhapur & Sangli has been identified as non -attainment cities as per NCAP.
2. Baggase is used as a fuel in most of the Sugar and other industries in the area causing
air pollution.
3. Air pollution complaints from Sindhudurg district due to stone quarry & stone crushers.
6.3.1.1 Status of Current Action Plan
Current Action Plan Mid Term Action Plan Long Term Action Plan
Air quality monitoring is carried out under National Ambient Air Monitoring Programme (NAMP) in Kolhapur and Sangli city. Action plan for Control of Air Pollution for Kolhapur city is being prepared by NEERI. Industries have been instructed to install adequate APC's to control source and fugitive emissions. Continuous Ambiant Air Quality Monitoring stations are proposed at 3 different locations in the city. Monitoring of air pollution due to stone crusher & issuance of notices to the crushers. For improvement of air quality in Sangli city the MPCB has taken special task in
Monitoring of VOC in ambient air is to be carried out and provision of appropriate control measures for VOC levels in Chiplun area to be proposed. Accordingly, industries will be directed to install appropriate APC's in Chiplun area. Provision of APC's to the crushers located at Sindhudurg distircts. To mitigate the problems of air pollution in Sangli city, Sangli Municipal Corporation has taken short term
The installation of Continuous Ambient Air Quality Monitoring Stations (CAAQMS) at 3 different locations in the Kolhapur city.

87
association with Sangli Municipal Corporation, Sangli. The air action plan has been prepared and submitted to Government for further approval and necessary action.
measures, such as maintaince of roads, cleaning of Muncipal Solid waste, banning on open burning of solid waste etc.
6.3.2 Water Issues
1. Panchaganga River & Vashishti River from village Dalvatane to Kherdi is categorized in
priority-V by CPCB under “Most polluted river stretches in the country”.
2. Marine water pollution at Mirkarwada (fishing harbor), Ratnagiri due to disposal of untreated
sewage by Ratnagiri Nagarpalika & disposal of waste by Fisherman at jetty.
6.3.2.1 Status of Current Action Plan
Current Action Plan Mid Term Action Plan Long Term Action Plan
1. Increased vigilance of CETP & industrial waste water generating units. 2. Regular follow up with local bodies for completion of sewerage system & installation of new STP. 3. Action plan for rejuvantion of Panchganga river is prepared by the board. 4. 68 textile processing industries have been directed to achieve zero liquid discharge & 6 major textile units of five star MIDC have been directed to provide Zero Liquid Discharge for 50% of their existing effluent quantity. This unit has provided 50% ZLD facilities. Repair & Maintenance work of five star MIDC CETP is proposed & will be completed within short period. 5. Kolhapur Municipal Corporation has been directed to earmark a sum of Rs. 2.6 lacs per day in a seperate account for expenses towards remedial measures. 6. Kolhapur Municipal Council - out of 96 MLD daily sewage, 91 MLD sewage is treated in 2 No. of STPs having total capacity 93 MLD, additional 2 New STPs are under commissioning capacity 4 MLD & 6 MLD. 7. Board has agreed to provide soft loans to five STP's for clusters of Villages on the bank of Panchganga River. 8. MPCB has prepared an action plan for clean -up of Polluted Stretch of Vashishti River. 9. Issued Prosecution Notice to Ratnagiri nagarpalika for provision of Sewage treatment plant & scientific disposal of Solid Waste. 10. The Government has declared River Action Plans/Polluted River Stretches for
1. Implementation of Short-term action plan as proposed in the action plan prepared by the board for rejuvenation of Panchganga river by various stake holders. 2. Implementation of short term action plan as per action plan prepared. 3. Provision of STP through Ratnagiri & Malvan Nagarpalika 4. Local Bodies in Sangli District are the other sources of water pollution. Necessary follow up has been taken with them to adopt good sewage management practices & provide STP of adequate capacities. In addition to above solid waste generation form local bodies are also sources of water pollution. Necessary follow up has been taken for scientific collection, segregation, treatment & disposal of MSW generated so as to avoid leachate generation mixing the same with storm water & cause water pollution
1. Implementation of Long-term action plan as proposed in the action plan prepared by the board for rejuvenation of Panchganga river by various stake holders. Implementation of Long- term action plan as per action plan prepared. 2. All local bodies located on the bank of rivers in Sangli district are directed to install adequate capacities of STP's for treatment and disposal of sewage generated from their cities. Special Environment Survillance Task Force has been formed as per the orders of Hon'ble National Green Tribunal.
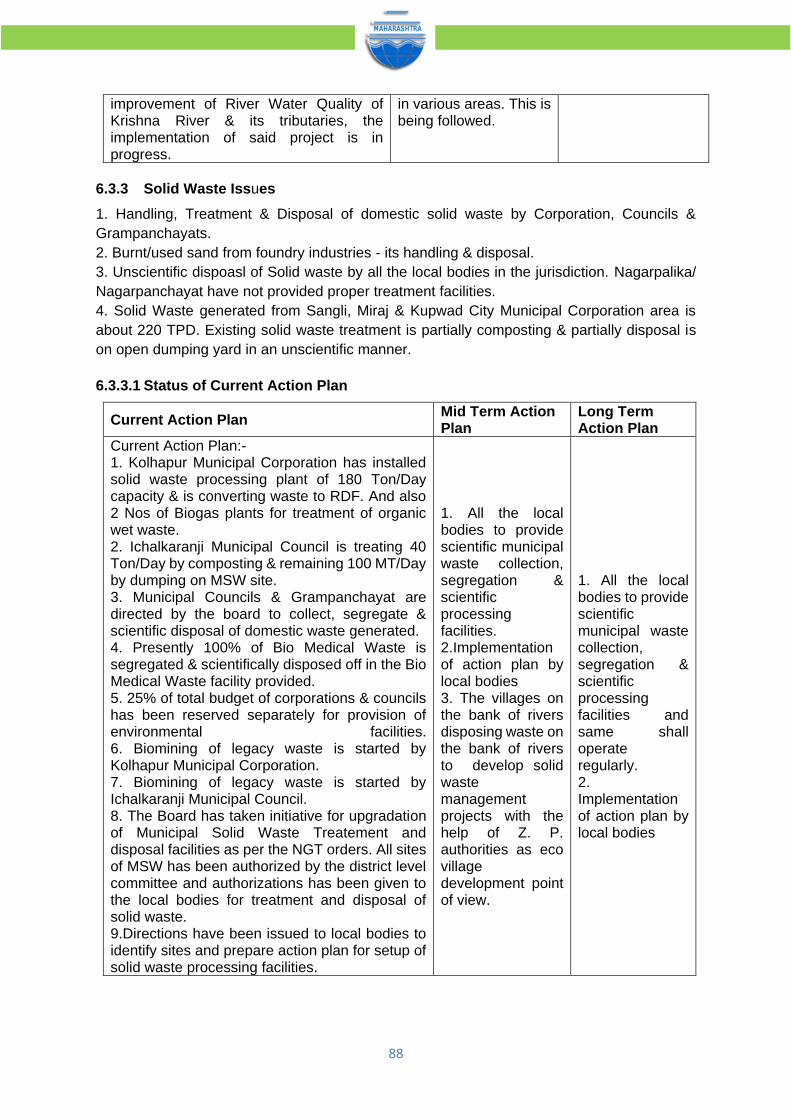
88
improvement of River Water Quality of Krishna River & its tributaries, the implementation of said project is in progress.
in various areas. This is being followed.
6.3.3 Solid Waste Issues
1. Handling, Treatment & Disposal of domestic solid waste by Corporation, Councils &
Grampanchayats.
2. Burnt/used sand from foundry industries - its handling & disposal.
3. Unscientific dispoasl of Solid waste by all the local bodies in the jurisdiction. Nagarpalika/
Nagarpanchayat have not provided proper treatment facilities.
4. Solid Waste generated from Sangli, Miraj & Kupwad City Municipal Corporation area is
about 220 TPD. Existing solid waste treatment is partially composting & partially disposal is
on open dumping yard in an unscientific manner.
6.3.3.1 Status of Current Action Plan
Current Action Plan Mid Term Action Plan
Long Term Action Plan
Current Action Plan:- 1. Kolhapur Municipal Corporation has installed solid waste processing plant of 180 Ton/Day capacity & is converting waste to RDF. And also 2 Nos of Biogas plants for treatment of organic wet waste. 2. Ichalkaranji Municipal Council is treating 40 Ton/Day by composting & remaining 100 MT/Day by dumping on MSW site. 3. Municipal Councils & Grampanchayat are directed by the board to collect, segregate & scientific disposal of domestic waste generated. 4. Presently 100% of Bio Medical Waste is segregated & scientifically disposed off in the Bio Medical Waste facility provided. 5. 25% of total budget of corporations & councils has been reserved separately for provision of environmental facilities. 6. Biomining of legacy waste is started by Kolhapur Municipal Corporation. 7. Biomining of legacy waste is started by Ichalkaranji Municipal Council. 8. The Board has taken initiative for upgradation of Municipal Solid Waste Treatement and disposal facilities as per the NGT orders. All sites of MSW has been authorized by the district level committee and authorizations has been given to the local bodies for treatment and disposal of solid waste. 9.Directions have been issued to local bodies to identify sites and prepare action plan for setup of solid waste processing facilities.
1. All the local bodies to provide scientific municipal waste collection, segregation & scientific processing facilities. 2.Implementation of action plan by local bodies 3. The villages on the bank of rivers disposing waste on the bank of rivers to develop solid waste management projects with the help of Z. P. authorities as eco village development point of view.
1. All the local bodies to provide scientific municipal waste collection, segregation & scientific processing facilities and same shall operate regularly. 2. Implementation of action plan by local bodies

89
6.3.4 Noise Issues
Religious programs are the occasions of causing noise pollution.
6.3.4.1 Status of current action plan
The Sangli, Miraj & Kupwad City Municipal Corporation, Sangli is in process of preparing the
action plan for control of Noise Pollution in Sangli city.
The Police department and Municipal Corporation is being taken effective steps and measures
for control of Noise pollution during festivals.
6.4 Navi Mumbai
6.4.1 Air Issues
A.SRO Navi Mumbai I: Navi Mumbai area is covered under CEPI. Navi Mumbai Municiapl
Corporation is covered under N-CAP.
B.SRO Navi Mumbai II: The Alok nalla pollution is due to overflow of chambers provided on
MIDC effluent carrying pipeline, discharge of untreated domestic effluent from slum areas in
to nallas, CETP etc., which causes smell nuisance in that area. There may increase in SPM
level due to heavy traffic on Thane - Belapur Road, construction activities etc. C.SRO Navi
Mumbai-III: Compalints regarding Smell nuisance from industries loacted at MIDC Taloja are
being received from residential area such as Kharghar, Kalamboli, Kamothe, Taloja etc.
6.4.1.1 Status of Current Action Plan
Current Action Plan Mid Term Action Plan Long Term Action Plan
Current Action Plan:- A. SRO Navi Mumbai I :Implementation of both CEPI and NCAP action plan is under progress. B. SRO Navi Mumbai II: Direction issued to MIDC to avoid the chamber overflow, to CETP to take necessary precautions to avoid smell nuisance. It is insisted industries to change fuel pattern to PNG. C. SRO Navi Mumbai III: The Board Officials have already started the night vigilance of the Taloja MIDC Industrial Area. Board has taken various actions from time to time for the non-compliances observed during the field visits of the MPCB Officials. The Board has issued various instructions to the Industrial Association and asked to communicate the member industries and to check the APC system and ensure no emission of pollutants and not to cause smell nuisance. Board has issued directions to the MIDC and CETP from time to time for stoppage of leakage from the effluent carrying pipeline and stop entering the same at river/creek except designated location. Regular vigilance is continuous process.
Mid-term action plan:- A.SRO Navi Mumbai I: 1.Action plan for replacement of old pipeline of CETP in TTC MIDC area by MIDC authority is under progress. 2.Introduction of Cleaner fuel like CNG/LPG and about 71 nos. of industries has switched over to cleaner fuel by replacing fuel like Furnace Oil and Coal etc. 3.Installation of CAAQM Stations with digital display Board. 4.Setup of new AAQM stations for strengthening air monitoring under NCAP . B.SRO Navi Mumbai II: 1. Introduction of Cleaner fuel like CNG/LPG . 2. Installation of CAAQM Stations with digital display on screen. 3. Setup of new AAQM station . 4. On Display of AAQM data. C. SRO Navi Mumbai III: 1. Introduction of Cleaner fuel like CNG/LPG . 2. Installation of CAAQM Stations with digital display on screen. 3. Setup of new AAQM station. 4. On Display of AAQM data.
Long-term action plan:- 1.Development of Green belt & gardens. 2.Repairing of internal roads & proper maintenance of the same. 3.Performance Evaluation of ECS. 4. Health Impact Assessment Study. 5. Smell nuisence study from Reupted institute like IIT, NEERI (similar like Study Carried out at Chembur, Mumbai).

90
6.4.2 Water Issues
1. Accidental discharge of effluent due to breakdown of effluent carrying pipeline of CETP
at some places.
2. Discharge of effluent in to the Alok nalla due to overflow of chambers provided on
MIDC effluent carrying pipeline, discharge of untreated domestic effluent from slum
areas in to nallas, CETP etc
3. The JVS analysis reports are not conforming to the outlet standards of CETP
6.4.2.1 Current Status of action Plan
Directions issued to MIDC for maintenance of Pipeline and to take necessary measures to
avoid rain water logging problem near inlet CETP collection sump in MIDC, Khairane area.
STP shall be provided for the treatment of domestic effluent generated from Slum area located
in MIDC. CETP Taloja expansion and upgradation of existing CETP is under process.
6.4.3 Solid Waste Issues
There aren’t any problems related to disposal of Municipal solid waste or hazardous waste
generated from Local Body and various industries located in the TTC industrial area. NMMC
has already developed MSW disposal facility at Turbhe which is already in operation. They
had appointed M/s NEERI to study problems and to suggest proper measures. Accordingly,
NMMC had installed full-fledged Leachate Treatment plant. Also installed Waste to Compost
and RDF plant. M/s TTCWMA has installed site for scientific disposal of hazardous waste
generated from the industries located in TTC industrial area.
6.4.3.1 Current status of Action Plan
Uran Municipal Council has proposed MSW Site for treatment and disposal of Municipal waste
from Uran Municipal Council.
6.5 Nagpur
6.5.1 Air Issues
1) Higher emissions from the Old plant of Koradi Thermal Power Plant, Khaperkheda Thermal
Power Plant.
2) Vehicular Pollution in the city.
6.5.1.1 Current Status of Action Plan
➢ NMC has prepared an action plan from the NEERI which is approved by the CPCB
which shall be implemented with the co-ordination of the various stakeholders.
➢ Review meetings were conducted time to time.
➢ Thermal Power plants conditional consents has been issued for compliance of the
MoEF&CC notifications regarding implementation of FGD, Real time ash analyzer etc.
➢ Encouraged polluting industries to switch over cleaner fuel.
➢ The Board has planned to strengthen CAAQM stations network in Nagpur city.
Presently one station at Commissioner office is in operation. Additional three locations
have been identified 1) LIT, 2) VNIT 3) Town Hall Mahal, Nagpur foundation work is in
progress.
➢ AAQM Station at Kamptee is in operational. Also manuaul AAQM is carried out in the
city area at three locations.
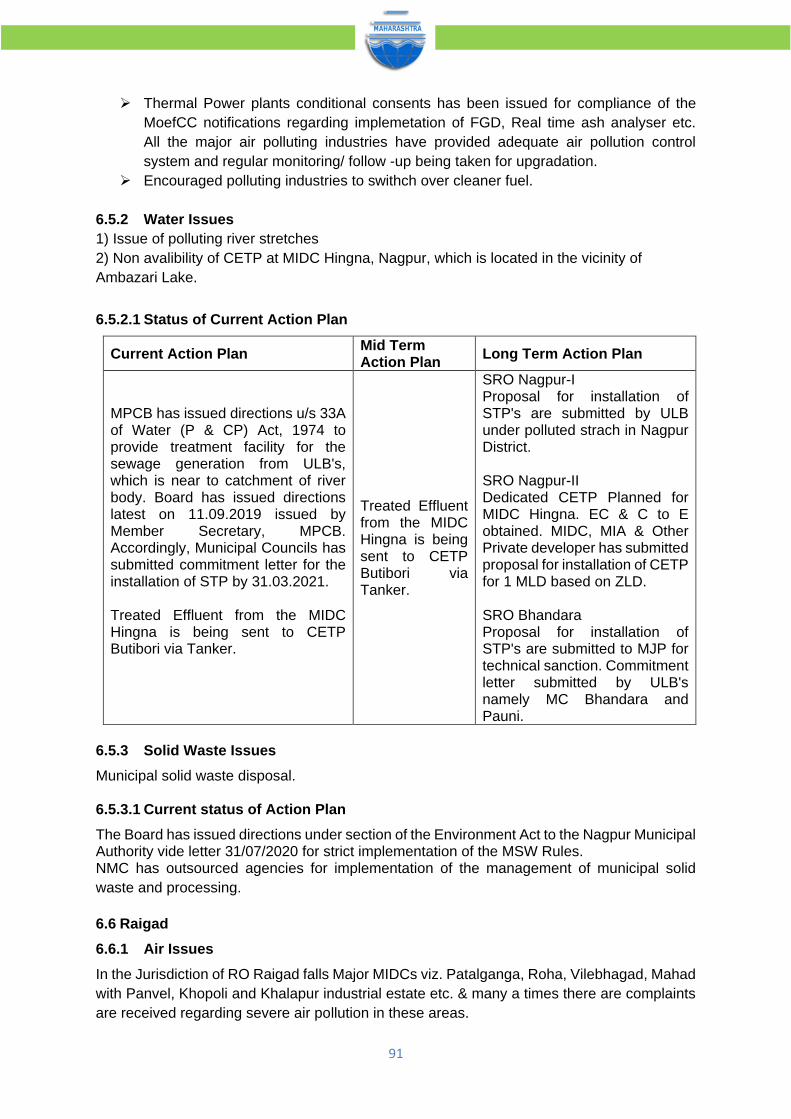
91
➢ Thermal Power plants conditional consents has been issued for compliance of the
MoefCC notifications regarding implemetation of FGD, Real time ash analyser etc.
All the major air polluting industries have provided adequate air pollution control
system and regular monitoring/ follow -up being taken for upgradation.
➢ Encouraged polluting industries to swithch over cleaner fuel.
6.5.2 Water Issues
1) Issue of polluting river stretches
2) Non avalibility of CETP at MIDC Hingna, Nagpur, which is located in the vicinity of
Ambazari Lake.
6.5.2.1 Status of Current Action Plan
Current Action Plan Mid Term Action Plan
Long Term Action Plan
MPCB has issued directions u/s 33A of Water (P & CP) Act, 1974 to provide treatment facility for the sewage generation from ULB's, which is near to catchment of river body. Board has issued directions latest on 11.09.2019 issued by Member Secretary, MPCB. Accordingly, Municipal Councils has submitted commitment letter for the installation of STP by 31.03.2021. Treated Effluent from the MIDC Hingna is being sent to CETP Butibori via Tanker.
Treated Effluent from the MIDC Hingna is being sent to CETP Butibori via Tanker.
SRO Nagpur-I Proposal for installation of STP's are submitted by ULB under polluted strach in Nagpur District. SRO Nagpur-II Dedicated CETP Planned for MIDC Hingna. EC & C to E obtained. MIDC, MIA & Other Private developer has submitted proposal for installation of CETP for 1 MLD based on ZLD. SRO Bhandara Proposal for installation of STP's are submitted to MJP for technical sanction. Commitment letter submitted by ULB's namely MC Bhandara and Pauni.
6.5.3 Solid Waste Issues
Municipal solid waste disposal. 6.5.3.1 Current status of Action Plan
The Board has issued directions under section of the Environment Act to the Nagpur Municipal Authority vide letter 31/07/2020 for strict implementation of the MSW Rules. NMC has outsourced agencies for implementation of the management of municipal solid
waste and processing.
6.6 Raigad
6.6.1 Air Issues
In the Jurisdiction of RO Raigad falls Major MIDCs viz. Patalganga, Roha, Vilebhagad, Mahad
with Panvel, Khopoli and Khalapur industrial estate etc. & many a times there are complaints
are received regarding severe air pollution in these areas.

92
6.6.1.1 Status of Current Action Plan
Current Action Plan Mid Term Action Plan
Long Term Action Plan
MPCB is initiating actions against polluting &defaulting industries and taking follow up to rectify it.
Nil 02 nos. CAAQM stations are proposed to install at Khaghar and Mahad MIDC. Upgradation of existing APC system will be completed within 6 months. Already inform to Panvel Tahsil for shifting of brick kline units
6.6.2 Water Issues
Untreated sewage from Municipal Councils are being discharged into River
Partially treated effluent is also being discharged into rivers as presently RIA CETP; Roha is
non-complied CETP.
6.6.2.1 Status of Current Action Plan
Current Action Plan Mid Term Action Plan Long Term Action Plan
Monitoring of CETP every Monday is scheduled Improvement in O & M with upgradation of RIA CETP, Roha. Upgradation in ETP of M/s. Roha Dyechem, MIDC Roha.
To take continuous follow up with local bodies so as to commission the STPs as well as complete drainage network at the earliest. Continuous monitoring on defaulting industries with CETP.
Installation of STPs & achieve standards of treated effluent as per consent conditions and the treated effluent shall be recycled
6.6.3 Solid Waste Issues
Municipal council & 05 Nagarpanchyat are not carrying out scientific MSW processing and
treatment.
6.6.3.1. Status of Current Action Plan
Current Action Plan Mid Term Action Plan Long Term Action Plan
MPCB has directed Municipal councils to prepare DPR for MSW management.
Continuous followup with local bodies to get the progress for disposal of solid wastes as per MSW Rule, 2016.
To provide full fledge MSW treatment in time with proper segregation.
6.7 Pune
6.7.1 Air Issues
1) In the Jurisdiction of SRO Satara there are complaints regarding;
2) Fire incidences at MSW dumping site
3) Fire incidences in Hilly Areas.
4) Vehicular pollution in urban areas.
5) Air pollution caused due to stone crusher within cluster area
6) Smell nuisance due to foundry activity in MIDC Satara.
Solapur District
1. Over civilization there is rise in vehicles & inadequate road conditions are the major sources

93
of air pollution in the city.
2. Air pollution problem in Solapur dist. As many Sugar &Chemical Industries in the area are
using Baggase as a fuel.
6.7.1.1 Status of Current Action Plan
Current Action Plan Mid Term Action Plan
Long Term Action Plan
MPCB has taken special task in association with Solapur Municipal Corporation, Solapur and NEERI for reducing air pollution. The air action plan has been prepared and submitted to Government for further approval and necessary action.
Solapur Municipal Corporation has taken short term measures, such as maintenance of roads, cleaning of Municipal Solid waste, banning on open burning of solid waste etc.
The air action plan for Solapur city has been prepared and submitted to government for further approval and necessary action. Considering the industrial development, CAAQMS- Continuous Ambient Air Quality Monitoring Stations to be installed in each MIDC in consultation with MIDC authority.
6.7.2 Water Issues
Untreated domestic effluent is discharged into Pawana, Indrayani & Bhima rivers and at
various locations it is resulting into deterioration of river water quality.
6.7.2.1 Status of Current Action Plan
Current Action Plan Mid Term Action Plan Long Term Action Plan
In the jurisdiction of this office 17-category industries are provided online continuous effluent quality monitoring systems to their ETP outlets which are connected to MPCB & CPCB servers. PCMC has submitted proposed plan for 4 no’s of new STP at various locations namely, 1) PCMC Tathavade village STP -10 MLD. 2) PCMC Chilkhali STP-12 MLD 3) PCMC Bhopkhel STP -5 MLD 4) PCMC Pimple Nilakh STP-15 MLD. SRO Solapur Jurisdictions: -- The Government has declared Namami Chandrabhaga Abhiyan Project for improvement of River Water Quality of Bhima river, the implementation of said project is in progress.
Taking continuous follow up with all local bodies, so as to commission the STPs as well as complete drainage network at the earliest and expecting short term measure to treat the Domestic effluent and Operation of existing STP with its full capacity. Necessary follow up has been taken with Solapur Local bodies to adopt good sewage management practices & provide STP of adequate capacities. Necessary follow up has been taken for scientific collection, segregation, treatment & disposal of MSW generated so as to avoid leachate generation mixing the same with storm water & cause water pollution in various areas.
All these local bodies to have STP so as to strictly achieve standards of treated effluent and the treated effluent should use for recycling. MIDC shall install CETPs at Chakan MIDC phase wise so that maximum trade / domestic effluent can be treated and disposed off scientifically. All local bodies located on the bank of rivers in Solapur district are directed to install adequate capacities of STP's for treatment and disposal of sewage generated from their cities.

94
6.7.3 Solid Waste Issues
Municipal Solid Waste collection, segregation and its scientific disposal is major hindrance in
this area. Municipal Corporation and other local bodies have not carrying out scientific process
to treat the 100% solid waste. MSW dumping site causing smell, water pollution, related
nuisance.
6.7.3.1 Status of Current Action Plan
Current Action Plan Mid Term Action Plan
Long Term Action Plan
PMC has MSW dumping ground at Urali Devachi where generated MSW is dumped partly and over all 48 MSW processing plants at various locations are in operation in PMC area. The Municipal council are directed to stop burning of waste immediately. And also instructed to Local bodies to attend the fire incident immediately & undertake spraying of organic deodorants to reduce smell nuisance Board has given conditional authorizations to the local bodies for treatment and disposal of solid waste.
SRO Solapur is in process of short listing villages having population having 5000 & the villages on the bank of rivers flowing in the district to develop various affordable projects to develop solid waste management projects with the help of Z.P. authorities. This is also considered to be one point from eco village development point of view.
PMC has proposed 10 New plants for processing of Mixed Waste. The waste quantity will be treated in this new plant to tone of 1600 MT/day. PCMC has submitted proposal for waste to energy plant having capacity 1000 MTD, Consent to Establish is also granted by the Board office & accordingly, the installation work of Waste to Energy is started. Board has granted Consent to Establish to PCMC for C & D waste management project & work of facility will be started.
6.8 Chandrapur
6.8.1 Air Issues
Chandrapur is declared as critically polluted area in the year 2009 by CPCB, New Delhi.
Thereafter, by proper implementation of CEPI, score was reduced by providing proper APC
provisions.
Chandrapur city is listed under Non-Attainment Cities
Activity of coal mines, coal storage, transport & trading (loading & unloading) near to the
highways creating air pollution problem.
6.8.1.1 Status of Current Action Plan
Current Action Plan Mid Term Action Plan Long Term Action Plan
MPCB is Carrying out extensive survey and air sampling Also issued Closure Directions to various coal depots. To reduce air pollution due to transportation & other activities, stakeholders
Providing CAAQMS & manual AAQMS sampling stations additionally at different locations to access the data of air pollution. Directed the stakeholders to provide closed transportation system for coal and form a surveillance team to observe the same. Action completed by WCL
Transportation system to be improved. 100% closed coal transportation system to be implemented. Implementation of District Environment Plan for each district under jurisdiction of RO,
95
were directed to provide tar roads, to provide & install air sampling machineries, provide adequate water sprinklers, etc.
authorities. Proposal towards providing underground sewer line till STPs so as to treat 100% sewage & to stop excess discharge into Erai & Zarpat River.
Chandrapur
6.8.2 Water Issues
1. 100% sewage is not treated by Chandrapur Municipal Corporation as there are no provision of underground sewer line.
2. Discharge of excess mine water by WCL into nearby rivers without any treatment.
6.8.2.1 Status of Current Action Plan
Current Action Plan Mid Term Action Plan
Long Term Action Plan
MPCB has formed District Level Committee under the Chairmanship of Hon'ble District Collector, Chandrapur and directed to stakeholders not to discharge untreated effluent into nearby rivers. Action Plan was submitted by Chandrapur Municipal Corporation to comply the same. Directions were issued & Bank Guarantees were forfeited & directed WCL authorities to provide settling tanks for mine water treatment & reuse the mine water for sprinkling purpose.
1) Survey & sampling of water polluting industries/activities nearby to the rivers. 2) Initially, temporary barriers to be suggested to stop the discharge of sewage directly into rivers.
Providing underground sewer line till STPs so as to treat 100% sewage & to stop excess discharge into Erai & Zarpat River. Implementation of District Environment Plan for each district under jurisdiction of RO, Chandrapur
6.8.3 Solid Waste Issues
1) Non-provision of treatment facility as per MSW Rules, 2016 6.8.3.1 Status of Current Action plan
1. Formation of District Level Committee under the Chairmanship of Hon'ble District Collectors.
Issuing MSW authorizations to ULBs.
2. Initial segregation at source is directed to implement to all the ULBs.
3. Directed to Finalize the MSW sites as per MSW Rules, 2016
6.8.4 Noise Issues
1) Noise Pollution from Handling, Processing and Recycling of End-of-Life Vehicles (ELVs)
2) Noise pollution due to old vehicles & heavy activities like construction, etc.
6.8.4.1 Status of Current Action Plan
Current Action Plan Mid Term Action Plan Long Term Action Plan
1) Implementation of CPCB Guideline for “Environmentally sound facilities for Handling, Processing and Recycling of End-of-Life Vehicles
Current status was seeking from Regional Transport Department to assess the data towards compliance of Environmentally sound facilities for Handling, Processing and Recycling of
CPCB directed to SPCBs to issue the consent to scrap traders & environmentally sound facilities for Handling, Processing and Recycling of End of Life Vehicles (ELVs). Implementation of District

96
(ELVs)” End-of-Life Vehicles (ELVs) Environment Plan for each district under jurisdiction of RO, Chandrapur.
6.9 Kalyan
6.9.1 Air Issues
There is no buffer zone between residential and industrial area located in Ph-I and Ph-II MIDC
Dombivali area. Around 82 no’s of textile units are using coal as a fuel and contributing to air
pollution in the area. In winter due to dispersion, complaints are received regarding air
pollution. Also complaints w.r.t gases emissions are received to this office.
6.9.1.1 Status of Current Action Plan
6.9.2 Water Issues
1. Illegal jean wash units were in operation without provision of ETP and untreated effluent
was being discharged into Nalla which further meets to creek.
2. Kalyan Dombivali Municipal Corporation are operating their STPs under capacity due to
lack of drainage arrangement.
3. Due to incomplete work of underground drainage network, partial quantity of domestic
effluent in Kalyan - Dombivali area is also disposed into Nalla which creates water pollution
problem.
4. Breakages/leakages of effluent carrying pipeline/Chambers in the MIDC area lead to water
pollution.
5. Illegal disposal of unknown tankers in the MIDC area creates air pollution and water pollution
Current Action Plan Mid Term Action Plan
Long Term Action Plan
Board has visited all the jeanwash units and closure directions are already issued. Breakages/leakages are informed to MIDC as well as Corporation authorities and rectified on war footing basis.
Effluent carrying pipeline in the MIDC area needs to be regularly cleaned and maintained properly.
The final disposal of treated effluent is to be discharged in to the creek @7.5 KM as per NIO and which will be completed by March-2022.
Current Action Plan Mid Term Action Plan
Long Term Action Plan
Most of the unit has provided adequate air pollution control system like dust collector and wet scrubber followed by stack. Vigilance on industry is kept by carrying out air monitoring. Board is perused with the industry to adopt cleaner fuel like PNG.
The road within the MIDC area needs to be improved.
Analysis to switch-over fuel pattern from coal to PNG is in process.

97
6.9.3 Solid Waste Issues
Presently in the Kalyan Dombivali Municipal Corporation, most of the waste is dumped at
Aadharwadi dumping ground. The solid waste generated in the residential area of MIDC is
temporary stored in the plot.
6.9.3.1 Status of Current Action Plan
Current Action Plan Mid Term Action Plan Long Term Action Plan
KDMC has obtained authorization for scientific disposal of MSW at Umbarde, Barve and Manda wherein there is disposal of 650 MT of MSW. Kalyan Dombivali Municipal Corporation has obtained authorization at 13 various palaces which valid up to 31.01.2022. Umbarde site is partially operated which needs to be operated fully. Methenization plant at Umbarde and Aayre is in working condition.
MSW waste shall not be sent to the Aadharwadi dumping ground. Umberde MSW site to make operational fully fledged. 13 bio methanization needs to be in operational at the earliest. MPC Board is following the matter of operation of methenization plant at Barve, Raju Nagar and Kachore Gaon.
13 bio methanization needs to be in operational at the earliest. MPC Board is following the matter of operation of methenization plant at Barve, Raju Nagar and Kachore Gaon. In this regard Board has filed affidavit in the court of law. The unauthorized site at Aadharwadi needs to be close in time bound manner.
6.10 Nashik
6.10.1 Air Issues
Nashik area is declared severely polluted as per CEPI Index. Nashik and Jalgaon cities are
declared non-attainment cities due to poor Air Quality.
6.10.1.1 Status of Current Action Plan
Current Action Plan Mid Term Action Plan Long Term Action Plan
1. Air Quality Improvement Action plan is prepared for Nashik City. The MoEF is preparing plan for Nashik under ' Clean Air Project ' (CAP) for Nashik city. Monitoring is carried out through 1 CAQMS at KTHM College Nashik and 4 manual stations at (i) Old NMC Building, main road
Nashik (ii) RTO Office old, Sharnapur Road. (iii) VIP Industries Ltd. MIDC Satpur. & (iv) Udyog Bhavan, ITI Signal, Nashik.
As per population criteria proposed 4 locations of CAQMS are identified. The installation work will be completed within 1 year.
1 No CAAQMS station is proposed for Jalgaon, Dhule & Nagar City each.
This will be implemented by the concerned stockholders as per Air Action Plan. This office taking continuous follow up or issued notices to industries are not operating APC Systems. It is continuous process. Conversion 100 % city transport bus in to CNG. Conversion of Auto in to PNG & CNG based fuel. Sweeping should be mechanical dust collector in city.
Industries are suggested to use Green fuel for the Boiler and Modern technology for to minimizing the Air pollution. The use of green fuel for the vehicle and use of E vehicles for public transport. Improvement in Road quality and traffic.

98
6.10.2 Water Issues
There is no sewage network and treatment facilities in most of the urban local bodies Municipal
councils and Nagar Panchyat resulting into discharge of sewage into river and causing
Pollution of Godavari River.
Current Action Plan Mid Term Action Plan Long Term Action Plan
Nashik Municipal corporation had provided 10 no’s of Sewage Treatment plant on the bank of the Godavari river. For Godavari River Pollution problems PIL No.176/2012 was filed in the Bombay High Court same is disposed on 18/12/2018. As per the directions in the PIL No.176/2012, Committee consitituted under the chaimanship of Divisional Commissioner, Nashik for the implementation of the Judgement as follow.i) Municipal Corporation , Nashik, ii) MPCB, iii) District Council, iv) Publicity of Godavari Conservation. v) MIDC . These committes prepare plan of work for Godavari Pollution control at their respective office level
Presently Nashik Municipal Corporation does not have underground drainage network for newly added villages. They have started laying of pipeline for these villages, drainage network coverage 210 KM. Addtional STP 43 MLD is proposed by NMC at Malegaon MC has started construction work of STP which is 64 % complete. As the CETP in MIDC Satpur & MIDC Ambad is not taken progressed hence metal surface treatment industries has installed ZLD treatment induvidully for the treatment of Eflluent generation. Till the entire sewage is not collected due to poor maintannace / Break up/ Chock up/ Overflow of Sewere line issue & find its wayy to River godavari by Nalla etc. The ULB/ Village situated on River Godavari / Darana has not provided STP, which further detoriate the quality of Rivers Godavari & Darana at downstream. Ecesssive use of fertilizer in the farm field by farmers on the bank of godavari/darana which further lead the run off by rain / percolate through ground water etc etc to near by water bodies may lead to increase eutrophication problmes in water bodies & problems to aquatic life.
Revamping & Upgradation of existing STPs for achieving new standards. Construction of STPs for other local bodies like Municipal Councils, Nagar Panchayat/ Villages. CEPT Construction for SSI unit in MIDC area Nashik.
6.11 Mumbai
6.11.1 Air Issues
Air pollution problem in Mumbai is mainly caused due to heavy vehicular traffic.
In Ambapad - Mahul, Chembur area, air pollution problem is mainly due to Volatile Organic
Compounds (VOC). Also, burning of waste at Deonar Dumping ground also causes air
pollution.
In addition to this, regularly complaints are received from RMC Plants.

99
6.11.1.1 Current Status of Action Plan
Current Action Plan Mid Term Action Plan
Long Term Action Plan
Action plan under NCAP has been prepared by MCGM and has been apporved by CPCB. First meeting of the stakeholder was conducted and implementation of action plan is under progress. Third party monitoring was carried out by TO 17 using ATD – GC-MS at 20 Ambient locations and 12 fugitive locations for 54 VOC’s and on the basis of the results action plan was prepared. On this basis of action plan directions were issued to modify/upgrade and install air pollution control systems Installation of fire fighting systems and proper management of municipal solid waste.
Action plan for Mumbai city is developed. Chembur action plan under CEPI & CPCB action plan for Mahul Ambapada Area, is also prepared in process of execution
Action plan for Mumbai city prepared. Chembur action plan under CEPI & CPCB action plan for Mahul Ambapada Area, is also developed.
6.11.2 Water Issues
Restoration & beautification of Mithi, Dhaisar, Oshiwara & Poaisar Rivers is needed.
6.11.2.1 Current Status of Action Plan
Current Action Plan Mid Term Action Plan Long Term Action Plan
Action plan is prepared by MCGM for restoration & beautification of Mithi, Dhaisar, Oshiwara & Poaisar Rivers.
Action plan is prepared by MCGM for restoration & beautification of Mithi, Dhaisar, Oshiwara & Poaisar Rivers.
7 nos of new STP proposed to be provided by MCGM for treatment and disposal of sewage generated.
6.11.3 Solid Waste Issues
The Waste disposed at M/s. Deonar Dumping Ground situated at Deonar is not treated
scientifically.
6.11.3.1 Status of Current Action Plan Nil.
6.11.4 Noise Issues
Various complaints have been regarding Noise violation during Ganpati festival & Eid
celebration. This office has filed 150 nos. of cases in respective district Courts.
6.11.4.1 Status of Current Action Plan
Current Action Plan Mid Term Action Plan Long Term Action Plan
Aprroximately 150 nos. of
cases filed for violation of
Noise Regulation.
Nil Nil
6.12 Thane

100
6.12.1 Air Issues
Smell nuisance is observed during monsoon & winter season.
Severe air pollution problem nearby residence, Chitralaya , Boisar, Salwad, Pasthal, Kolwade,
Pam, Kumbhvali & adjacent area.
Air pollution problem is also caused by frequent burning of solid waste and plastic waste by
local Grampanchayat in MIDC area i.e. Salwad, Kolawade, Boisar & Khairapada Railway
Bridge.
6.12.1.1 Current Status of Action Plan
Current Action Plan Mid Term Action Plan
Long Term Action Plan
Common letter issued every years during pre-monsoon & pre-winter season in MIDC Tarapur industries. CAAQM station installation work in process.
To monitor the stack, process emission & Ambient emissions.
To provide CAAQMs in premises along with SCADA & display system which connectivity to MPCB & CPCB server.
6.12.2 Water Issues
1. Frequent MIDC breakages of sewerage/treated effluent carrying pipeline network.
2. Overflow of MIDC raw water & treated water collection sumps.
3. Removal of old sewerage collection pipeline which causes effluent (substandard) flowing
through nallah instead of reaching TEPS-CETP for further treatment.
4. Untreated domestic effluent emerging from adjacent villages & public toilets flowing through
natural nallah passing through MIDC.
5. Illegal activity of washing chemically contaminated plastic in natural nallah.
6.12.2.1 Current Status of Action Plan
Current Action Plan Mid Term Action Plan
Long Term Action Plan
1. MIDC to provide temporary Bondharas over natural nallah & pumping system to nearest chamber to present downstream pollution. 2. Up-gradation of TEPS-CETP. 3. Provide continuous monitoring system with Two way SCADA for I/L & O/L of industries. 4. MIDC to stop illegal water supply through tanker & bore-well. 5. To monitor ZLD & partially ZLD units. 6. MPCB to grant consent for washing of chemically contaminated plastic waste.
1. MIDC to identify & remove old pipeline of the sewerage collection system. 2. Lock & Key arrangement to individual industries. 3. Identify & dispose of high COD stream of individual industries to M/s. TEPS-CETP
1. Segregation & disposal of high COD stream of individual industries to M/s. TEPS-CETP. 2. To make operational 50 MLD CETP. 3. Extend disposal pipeline of existing 25 MLD TEPS-CETP. 4. Adjoining local bodies provide STP for treatment for domestic. 5. To make mandatory for all the LSI & MSI units to provide separate STP for domestic effluent generated & use of same for gardening purpose.
6.12.3 Solid Waste Issues
1. Illegal storage of spent solvents & ETP sludge in factory premises & illegal storage sites.

101
2. Illegal transportation & dumping of process waste by industries located in MIDC Tarapur
area & adjacent nearby area.
3. Chocking of raw effluent carrying pipeline due to accumulation of sludge.
6.12.3.1 Status of Current Action Plan
Current Action Plan Mid Term Action Plan Long Term Action Plan
MIDC to ensure that all the member industries disposing trade effluent into MIDC chamber to provide single day storage tank for treated effluent.
MIDC to ensure that all the member industries disposing trade effluent into MIDC chamber to provide positive discharge system into MIDC chamber.
In order to avoid illegal disposal of ETP sludge in MIDC chamber all the member industries may be directed to compulsorily provide overhead settling tank in factory premises.
6.12.4 Noise Issues
Noise Pollution by forging, textile weaving units located in MIDC Tarapur area.
6.12.4.1 Status of Current Action Plan
Current Action Plan Mid Term Action Plan Long Term Action Plan
To provide acoustics/ adoption of appropriate technology for identified noise generating sources to prevent from noise pollution.
To obtain Bank Guarantees & time bond program to seek compliance.
Nil

102
7. ENVIRONMENTAL STUDIES AND SURVEYS 7.1 Noise Monitoring during Ganesh Festival 2020
Ambient noise monitoring was carried out during the period of Ganesh Festival at 132
locations which are covered under 27 Municipal Corporations all over the State of
Maharashtra. Monitoring was carried out for 5 days considering the noise that was generated
during the festival. Noise monitoring was carried out for 6 hours between 6PM to 12AM on
22nd, 23rd, 26th, 28th August 2020 and 1st September 2020. Noise monitoring was carried out
using calibrated Sound Level Meters (Type I). The number of noise monitoring locations in
different Municipal Corporations all over Maharashtra is provided in Table 7.1.
Table 7.1 Noise monitoring locations in Maharashtra during Ganesh Festival 2020
Municipal Corporation No of locations
Mumbai 25
Navi Mumbai 5
Thane 8
Pune 18
Nashik 5
Aurangabd 5
Nagpur 5
Kalyan 3
Amaraati 3
Jalgaon 3
Kolhapur 3
Sangali 3
Mira Bhayander 3
Vasai – Virar 3
Ulhasnagar 3
Bhiwandi- Nizampur 3
Chandrapur 3
Nanded Waghala 3
Ahmednagar 3
Dhule 3
Malegaon 3
Pimpri- Chinchwad 3
Parbhani 3
Latur 3
Akola 3
Solapur 4
Panvel 3
Total No of stations 132
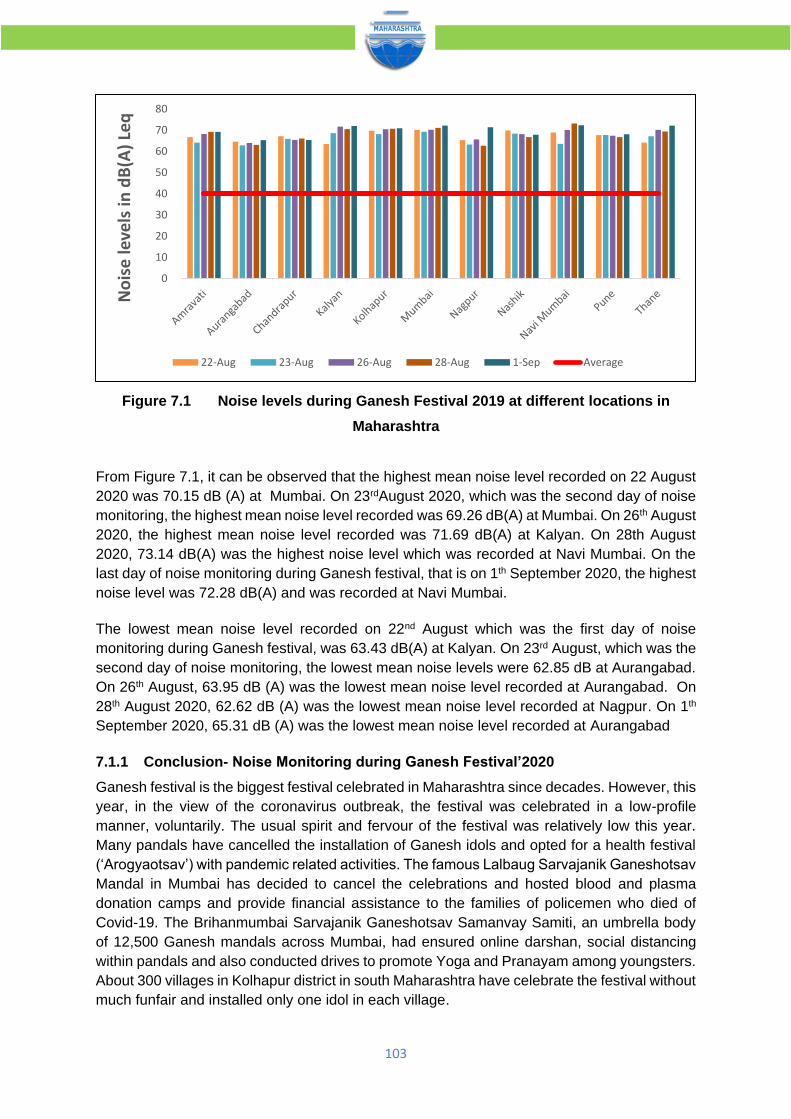
103
Figure 7.1 Noise levels during Ganesh Festival 2019 at different locations in
Maharashtra
From Figure 7.1, it can be observed that the highest mean noise level recorded on 22 August
2020 was 70.15 dB (A) at Mumbai. On 23rdAugust 2020, which was the second day of noise
monitoring, the highest mean noise level recorded was 69.26 dB(A) at Mumbai. On 26th August
2020, the highest mean noise level recorded was 71.69 dB(A) at Kalyan. On 28th August
2020, 73.14 dB(A) was the highest noise level which was recorded at Navi Mumbai. On the
last day of noise monitoring during Ganesh festival, that is on 1th September 2020, the highest
noise level was 72.28 dB(A) and was recorded at Navi Mumbai.
The lowest mean noise level recorded on 22nd August which was the first day of noise
monitoring during Ganesh festival, was 63.43 dB(A) at Kalyan. On 23rd August, which was the
second day of noise monitoring, the lowest mean noise levels were 62.85 dB at Aurangabad.
On 26th August, 63.95 dB (A) was the lowest mean noise level recorded at Aurangabad. On
28th August 2020, 62.62 dB (A) was the lowest mean noise level recorded at Nagpur. On 1th
September 2020, 65.31 dB (A) was the lowest mean noise level recorded at Aurangabad
7.1.1 Conclusion- Noise Monitoring during Ganesh Festival’2020
Ganesh festival is the biggest festival celebrated in Maharashtra since decades. However, this
year, in the view of the coronavirus outbreak, the festival was celebrated in a low-profile
manner, voluntarily. The usual spirit and fervour of the festival was relatively low this year.
Many pandals have cancelled the installation of Ganesh idols and opted for a health festival
(‘Arogyaotsav’) with pandemic related activities. The famous Lalbaug Sarvajanik Ganeshotsav
Mandal in Mumbai has decided to cancel the celebrations and hosted blood and plasma donation camps and provide financial assistance to the families of policemen who died of
Covid-19. The Brihanmumbai Sarvajanik Ganeshotsav Samanvay Samiti, an umbrella body
of 12,500 Ganesh mandals across Mumbai, had ensured online darshan, social distancing
within pandals and also conducted drives to promote Yoga and Pranayam among youngsters.
About 300 villages in Kolhapur district in south Maharashtra have celebrate the festival without
much funfair and installed only one idol in each village.
0
10
20
30
40
50
60
70
80
No
ise
leve
ls in
dB
(A)
Leq
22-Aug 23-Aug 26-Aug 28-Aug 1-Sep Average

104
The Maharashtra government has also issued guidelines regarding Ganesh Chaturthi
celebrations which mentioned the following:
1. The heights of Lord Ganesh idols installed by sarvajanik (community) mandals and at
household-level should be limited to 4 feet and 2 feet, respectively, this year.
2. All mandals (associations) need to set up mandaps (decorated temporary covered
structures) in line with the policies formulated by municipal corporations or the local
administration.
3. Ganesh Chaturthi is to be celebrated in a simple manner this year, so there should be no
pomp in the decorations by sarvajanik mandals or individuals installing idols in homes.
4. People should possibly worship idols made of metals, marbles or other elements instead
of installing conventional ones this year.
5. If the idols installed are made of clay or are eco-friendly, then those should be immersed
at home itself. Idols should be immersed at a nearby artificial pond if it is not possible to
immerse them at homes.
6. If possible, the send-off of idols should be postponed until the time of immersions of idols
installed during Maghi Ganeshotsav or during the month of Bhadrapad 2021, that is, next year.
7. Health-related advertisements should be displayed during the 10-day festival to help
people keep themselves safe and avoid the infection.
8. The mandals to undertake health initiatives instead of organising cultural programmes.
9. Mandals should try to arrange for online darshan of Lord Ganesh’s idols
10. The mandaps should be disinfected, thermal screening should be arranged and physical
distancing related norms to be strictly adhered to by devotees turning up at mandaps to seek
darshan of Lord Ganesh.
This year as per the actual observation during the survey, air pollution levels were very low as
compared to previous year. There was no use of crackers at all in all regions the survey has
taken place which marked the reduction of Air pollution. Also, loudspeakers, dhols, drums or
any kind of musical instruments was not used during the visarjan procession nor at night time
in societies or pandals. This year people have opted for eco-friendly Ganesh idols and carried
out visarjan at their home itself. The procession for visargan also had very less crowd this
year. There was vigilance by Police department also in many areas especially contaminated
zones to ensure the fulfilment of Covid-19 protocol of wearing mask, social distancing etc.
which added up to ensuring a healthy festival.
The observed levels are higher due to following reasons:
1. Use of more no. of vehicles as trains or public transport is either closed OR there is fear of
infection from it
2. More two-wheelers and Cars are on road, and the noise is from vehicular traffic
3. Honking was relatively less, as most of the vehicles were driven by owners
4. Traffic should be diverted during the procession time and on Visarjan route
5. Congestion should be avoided on procession routes.
6. The increased noise level beyond the Noise Level standards is due to collective noise of
human population, traffic and as such no one source or activity was responsible for the
exceedance of the noise level
7. Vehicular traffic should be avoided on the procession routes
8. General awareness of the public should be increased by sensitizing them for the increased
noise level
9. Festival should emphasize on noise nuisance in the urban areas in general as the

105
background levels itself during the high-activity time period is exceeding the average noise
levels.
10. dB(A) Leq values over the period of time would be relatively significantly less vis-à-vis
peak values that are measured due to sensitive dB(A) measurements.
Further, city specific geneneral common observations are given in “Noise Monitoring during
Ganesh Festival’2020” report which is available at Board’s official website.
7.2 Noise Monitoring during Diwali 2020.
In order to assess the ambient noise levels in the environment during Diwali festival, the MPCB
has taken an initiative to carry out noise monitoring at 158 locations all over Maharashtra for
a period of 3 days: 11th, 14th and 16th November 2020. , for 24 hours at various locations in
different cities in Maharashtra. The main aim of the project was to determine the trends and
variations of noise levels at various areas in the cities over different land uses and to create
awareness about noise pollution through availability of scientific noise level data.
Noise monitoring was carried out using calibrated Sound Level Meters (Type I) kept at fast
response mode keeping in view the quickly changing nature of noise levels, and using ‘A’ filter.
The number of noise monitoring locations in different Municipal Corporations all over the State
of Maharashtra is provided in Table7.2.
Also from Figure 7.2.it is observed that during day time on 11 November the highest mean
noise levels of 71.9 dB(A) was recorded at Chandrapur. During day time on 14thNovember,
the highest mean noise level of 60.8 dB (A) was recorded at Nashik. Similarly on
16thNovember, the highest mean noise levels of 75.5 dB (A) was recorded at Kolhapur. The
highest mean noise levels of 66.9 dB (A), 74.0 dB (A) and 62.3 dB (A) were recorded during
night time on 11th, 14th and 16thNovember at Nagpur, Thane and Chandrapur.
Table 7.2 Noise Monitoring Locations in Maharashtra during Diwali 2020.
Municipal Corporation No of locations
Mumbai South 15
Mumbai western suburbs 15
Mumbai Eastern Suburbs 15
Navi Mumbai 9
Thane 5
Pune 15
Nashik 5
Aurangabd 5
Nagpur 10
Kalyan 3
Amaraati 3
Jalgaon 3
Kolhapur 7
Sangali 3
Mira Bhayander 3
Vasai – Virar 3
Ulhasnagar 3
Bhiwandi- Nizampur 3
Chandrapur 3

106
Nanded Waghala 3
Ahmednagar 3
Dhule 3
Malegaon 3
Pimpri- Chinchwad 3
Parbhani 3
Latur 3
Akola 3
Solapur 3
Panvel 3
Total No of stations 158
The lowest mean noise levels of 61.8dB(A) , 53.1 dB(A) and 63.8 Db(A) were recorded during
day time on 11th, 14th and 16thNovember respectively, at Aurangabad. The lowest mean noise
levels of 53.9dB(A), 63.5 dB(A) and 51.6 dB(A) were recorded during nighttime on 11th, 14th
and 16thNovember respectively, at Aurangabad.
Figure 7.2 Noise levels during Diwali 2020 at different locations in Maharashtra
7.2.1 Conclusion – Noise Monitoring During Diwali’2020
This year with the outbreak of Covid-19 the Diwali festival which is celebrated all over the India
was celebrated in a different way. Guidelines was published by Government in controlling the
spread of the virus in the festive season. The pollution level of noise is less this year comparing
to the previous years in many municipal corporations. People have tired celebrating the festival
being in the constrains of the protocol published by Government. Police department also
played a very important role in many areas especially contaminated zones to ensure the
fulfilment of Covid-19 protocol of wearing mask, social distancing etc. which added up to
ensuring a healthy festival.
Apart from above general common observations, city specific observations are given as
hereunder. Municipal Corporation wise Conclusions / Observations for the noise level
generated are provided below.
0.0
10.0
20.0
30.0
40.0
50.0
60.0
70.0
80.0
No
ise
leve
ls in
dB
(A)
Leq
Day time 11st November Day time 14th November Day time 16th November
Night time 11st November Night time 14th November Night time 16th November

107
1. Mumbai - The noise level in Mumbai ranged from 49.6 dB(A) to 81.2 dB(A) this year. The
increase in noise level in some location is mainly due to road traffic and rain. In comparison
to the noise level last year there is a tremendous decrease in the range of noise level
generated.
2. Navi Mumbai - The noise level in Navi Mumbai ranged from 43.5 dB(A) to 79.8 dB(A) this
year. The noise level at all five locations was higher this year. There reason for increase
in nose level was due to the crowd in locations and vehicular activities.
3. Thane - In Thane the noise level ranged from 49.7 dB(A) to 77.9 dB(A) this year. The
increase in noise levels was due to the traffic congestion and rain.
4. Pune - Out of 18 locations monitored, the noise level was high only at Shivaji Nagar,
Mahatma Phule Mandai, Khadki Bazar, M G Road and Aundh Parihar Chowk as compared
to last year. In Pune also the noise level due to festival was very less due to Covid 19. In
many locations the level of noise was 10 dB less than what was generated last year. The
noise level in Pune ranged from 42.9 dB(A) to 86.3 db(A).
5. Nashik - In Nashik the noise level ranged from 50 dB(A) to 72 dB(A). The noise level was
less at all locations in Nashik on all 5 days as compared to last year. There was not much
crowd or traffic congestions also in Nashik region.
6. Aurangabad - The noise level was less at all locations in of Aurangabad also on all 5 days
as compared to last year. The noise level in Aurangabad ranged from 42 dB(A) to 72
dB(A). The noise level generated was due to traffic.
7. Nagpur - The noise level in Nagpur ranged from 49.7 dB(A) to 79.9 dB(A) this year. The
level of noise was high in commercial zones and was caused due to traffic mainly.
8. Kalyan - The noise level in Kalyan ranged from 50.2 dB(A) to 77.5 dB(A) this year. The
noise level was high mainly due to the crowd and traffic. Ulhasnagar station showed higher
noise level and to an extent the honking of trains also contributed to the increase in noise
level.
9. Amravati - The noise level in Amravathi ranged from 54.3 dB(A) to 73.7 dB(A) this year.
Irvin Hospital Square showed a little increase in noise level this year and the main reason
was due to the crowd and traffic
10. Jalgaon - The noise level was less at all locations in of Jalgaon on all 5 days as compared
to last year. The noise level in Jalgaon ranged from 5O dB(A) to 79.1 dB(A) this year. The
noise level in Jalgaon also was due to traffic at commercial zone.
11. Kolhapur - The noise level was less at all locations in Kolhapur on all 5 days as compared
to last year. The noise level ranged from 37 dB (A) to 79.1 dB (A) this year. The noise level
near Khas Baug Maidan had highest noise levels.
12. Sangli - The noise level was less at all locations in of SangIi also on all 5 days as compared
to last year. The noise level in Sangli ranged from 59 dB(A) to 80.8 dB(A) this year. The
noise level was high at Miraj Market between 6 pm to 8 pm due to the crowd and traffic
congestions.
13. Mira Bhayander - The noise level in Mira - Bhayander ranged from 51dB(A) to 90 B(A) this
year. The noise level was high at Golden police chowki in the peak time between 6pm to
9 pm and was caused due to the traffic congestions.
14. Vasai Virar - The noise level in Vasai - Virar ranged from 50 dB(A) to 77.2 dB(A) this year.
15. Ulhasnagar - The noise level generation in Ulhasnagar was also mainly due to traffic and
crowd. The noise level in Ulhasnagar ranged from 49.6 dB(A) to 76.1dB(A) this year.
16. Bhiwandi Nizampur - The highest noise levels of Bhiwandi-Nizampur was observed at
Shelar Near Nadi naka with 73.7 dB(A).

108
17. Chandrapur - The noise level in Chandrapur ranged from 57.2 dB(A) to 81.6 dB(A) this
year and the reason for such high level of noise is due to traffic.
18. Nanded Waghala - The noise level was less at all locations in of Nanded - Waghala on all
5 days as compared to last year. The noise level in Nanded - Waghala ranged from
51dB(A) to 71 dB(A) this year.
19. Ahmednagar - The noise level was less at all locations in of Ahmednagar also on all 5
days as compared to last year. The noise level in Ahmednagar ranged from 50 dB(A) to
70 dB(A) this year. The highest noise level was observed at Chitale Road and was due to
traffic congestions.
20. Dhule - The noise level was less at alI locations In of Dhule also on all 5 days as compared
to last year. The noise level in Dhule ranged from 50 dB(A) to 74 dB(A) this year.
21. Malegaon - The noise level was less at all locations in of Malegaon also on all 5 days as
compared to last year. The noise level in Malegaon ranged from 51dB(A) to 74 dB(A) this
year.
22. Pimpri Chinchwad - The noise level was less at all locations in of Pimpri - Chinchwad also
on all 5 days as compared to last year. The noise level in Pimpri - Chinchwad ranged from
46.5 dB(A) to 78.5 dB(A) this year. The noise level in Pimpri - Chinchwad also was due to
traffic at commercial zone.
23. Parbhani - The noise level was less at all locations in of Parbhani also on all 5 days as
compared to last year. The noise level in Parbhani ranged from 51dB(A) to 72 dB(A) this
year.
24. Latur - The noise level was less at all locations in of Latur also on all 5 days as compared
to last year. The noise level in Latur ranged from 55 dB(A) to 71 dB(A) this year.
25. Akola - The noise level in Akola ranged from 53.4 db(A) to 81.8 dB(A) this year. The highest
noise level observed at City Kotawali Chowk all five days of noise monitoring and the
increase in noise level was due to traffic.
26. Solapur - The noise level was less in all locations of Solapur on all 5 days as compared to
last year. The noise level in Solapur ranged from 42.6 dB(A) to 77.1 db(A) this year. The
highest noise level was observed at Ashok Chowk on 22nd August with 71.4 dB (A) and
increase in noise level was due to traffic.
27. Panvel - The noise level in Panvel ranged from 54.1 dB(A) to 77.7 dB(A) this year. The
highest noise level out of three locations was observed at Khanda Colony with and the
increase in noise was due to the heavy rain and traffic.
7.3 Impact Evaluation of COVID 19 Pandemic on Environmental Attributes.
Came 1st June & the so-called period of Unlock Phase I, ending the last day of the 4th phase
of lockdown implemented in the country to prevent the spread of Coronavirus infection. The
4th lockdown was imposed from 18th May to 31st May. Earlier, lockdowns were announced from
25th March to 14th April, 15th April to 3rd May and from 4th May to 17th May. This COVID-19 or
Coronavirus has cast a global gloom by causing severe damage to health, the economy and
general societal disruption. The entire world is facing economic & health crisis due the existing
health pandemic caused through uncontrolled widespread community transfer of this virus.
Not known till recently to cause infections in human, this new infectious respiratory disease
emerged in Wuhan, Hubei province, China & named as COVID-19 (Coronavirus Disease
2019) by World Health Organization. This new class of virus, known as SARS-CoV-2 (severe
acute respiratory syndrome Coronavirus 2) has been found to be responsible for over
58,19,962 confirmed global infection cases of COVID-19, including 3,62,786 deaths, as
reported by WHO as of 30th May 2020.

109
As lockdowns were implemented in response to the deadly Coronavirus pandemic, the
dramatic changes expected to be brought about by these restrictions have been described as
the ‘largest scale experiment ever’ into air quality. In India too, after many years, the blue sky
can be spotted in normally hazy regions, as corroborated by satellite images, pollution data,
and social media posts. This also magnetizes discussions regarding lockdown to be the
effectual alternative measures to be implemented for controlling mainly air pollution but not
limited to it since overall limited use of resource & equivalent restrictions in people’s activity is
expected to have positive impact on environmental attributes.
Overall, the significance & impacts of lockdown are still not well understood and likely to have
significant role on restoration of environmental quality, Nevertheless it also provides a unique
opportunity to work in this direction to understand the upshot of lockdown measures on various
parameters of environmental quality particularly when there is a need to implement such
alternative control actions. The present study is an effort in this direction to assess the
usefulness of the lockdown as a strategic investigation for understanding changes in
environmental quality in the State & the probable apportionment of sources. The study is
thought to be a useful supplement to the regulatory bodies since it may show pollution source
contributions towards specific environmental attribute especially for quantitative aspects like
air emissions load, organic loads in surface water, bio-medical waste due to health pandemic
as well as impacts of migration on MSW & so on.
The idea is to understand the environmental clean-up (as anticipated through the improved
environmental scenario) that is supposedly shaped due to the ongoing event of COVID-19 &
further to evaluate & account for prevailing environmental improved conditions to various
barriers / restrictions on activities / source imposed due to lockdown.
Thereby, aligning the objectives of the present study as follows;
(i) Compare various aspects of environmental pollution in Maharashtra through various
timelines of Pre & Phases of Lockdown
(ii) Map activities that can provide causal effect evaluation for changes in environmental
attributes
(iii) Quantify & correlate environmental quality throughout the State in tandem with the
lockdown regulations & restricted activities
(iv) Unveil the Sustenance Options for creating alternative equivalence for various
activities, if at all possible, through source–impact matrix in order to provide strategic
options for exponential activity expected to be speeded up post COVID-19
Focusing on the objectives, the study is thought to be a credible addition to the scientific
community and policy makers not only to assess the impacts of lockdown on quality of air,
water etc., but also its efficiency as corrective alternative action plan as practiced in several
countries including India for improving overall environmental quality & limiting public exposure
to extreme environmental conditions.
7.3.1 Conclusion of Impact of COVID 19 Pandemic on Environmental Attributes
Conclusively enough it can be stated that the slowdown / restrictions of activities has had
direct positive impact on almost all the essential environmental attributes to a great extent
except for the biomedical waste parameter, COVID-19 being recognized as health

110
pandemic.This subjective perception of people witnessing clean air, water & land is objectified
through this report not only as a research orientation but also to provide insights into possible
& probable apportionment of causal effect of all such activities that are known to impact a
particular environmental attribute.
The activity in industries surely has taken the hit that is directly reflected with the reduction in
fuel consumption (computed from already granted Consent database of these industries @
MPCB) from 9.5 Lakh TPD by about 80% in L-I up to 53.8% by L-IV that in turn reflects an
average reduction to extent of 83% in PM10 & 90% gases (SO2, NOx & CO) during L-I further
proving to be effectively 64% & 73% for PM10 & gases respectively by end of L-IV.Another
important & major point source emission are the Thermal Power Plants in Maharashtra
generating 21,176MWh electricity using coal @ 3.55Lakh TPD during normalcy times Pre-
COVID-19. The emissions in range of 1000TPD of PM10 whereas 1100TPD of SO2 & 600TPD
of NOx in usual times are reduced by 27, 24, 14.7 & 10.7% during phase of L-I to L-IV
equivalent to the reduction in coal use to the same extent in these phases. Line source
however shows absolutely remarkable impact with almost the entire transportation sector
bought to a standstill except for the essential vehicles movement. It is breath taking to know
that 472cr km/day is travelled by the vehicles during business as usual (Pre-COVID-19 times)
on the road network of about 3 Lakh km that the State maintains. However, this enormous
road activity not only has direct tail pipe emissions of about 667TPD but also lead to re
suspension of dust (accounted as Resuspended PM10) that accounts to 4972TPD i.e. about 8
times higher than the tail pipe emissions especially due to accounting of the unpaved road
dust in rural areas & the equivalent vehicle movement there. Subsequent imposition of
limitations on travel & transport resulted in marked emissions reductions to the tune of 5%,
22%, 24% & 23% during the L-I to L-IV phases.
Area sources too are one of the factors accountable for the overall ambient air quality thereby
the load from various hotels, bakeries, street vendors & construction activities are computed
for even though they are extremely scattered emitters. Out of the 7,119TPD of PM10 emitted
along with 5,800TPD of gases from this sector during the business as usual going, reductions
to the tune of almost 98% was observed during the L-I & with time the very limited activities
gained momentum still with 86% reductions in PM10 & about 45% in gases by the end of L-IV.
Agriculture land preparation has been one of the highest contributors to PM10 amongst the
area sources whereas CO accounts for the maximum share amongst gases load mostly due
to high emission factor related to uncontrolled / incomplete combustion of low quality /
adulterated and mixture of fuels.Thereby, computing load of pollutants for entire Maharashtra,
it seems there the 1st phase of lockdown L-I witnesses about 86% subsequently with activities
& life coping up with the COVID-19 event, L-II showing 73%, L-III with 64 & finally L-IV with
58% reductions in overall emissions load.
On the other hand, Water being the prime source of life & activities also shows marked
variations not only in its consumption but also waste generation potential across the lockdown
phases. The rivers & saline basins including nallahs that are connected to some of them of
monitored at 250 locations under NWMP & SWMP of MPCB were compared at 125 locations
FY April 2019 & 2020. The enhancement in quality is evident for all of the 6 river basins,
showing changes in water quality that in terms of BOD are better at 84% of locations whereas
for COD at 65% of the locations (viz. Tapi, Godavari, west flowing rivers & Nallah basins)
whereas the other 2 River basins shows improvement at 30% locations. pH of water at all

111
locations was observed to be varying in the range of 7-9 for both April’2019 & April’2020 period
& DO is proportionally increased wherever the organic contents are observed to be lowered.
The observed improvement in water quality can be very well correlated with the limited activity
wherein 1656 tons of BOD load was avoided in the phases of lockdown, of which avoidance
amounted to 75% in rivers, 15% in seas & 10% on land (with variations over each of the
phases). Such disposal pathways are accommodated using spatial distribution of industrial &
domestic population in areas of river & coastal nearness. Avoidance of load was highest from
industrial sector which is obvious whereas domestic sector though contributed very small %
(up to 3.1% by end of L-IV) in absolute BOD load it amounted to about 1,165 tons of BOD
translating into 25-75% concentration reduction of organic matter whereas 10-35% increase
in DO concentration.
Similarly hazardous waste generation due to restricted industrial activity reduced pressures
on handling of it by average 75% though it needs to be considered that this is a short-time
impact. The only contrary negative impact on environmental attributes whereby the pandemic
has massively created huge demand for revisiting system is of biomedical waste management.
The increase number of COVID-19 patients reaching almost 70,000 by 31st May of 2020 the
BMW generation (in worst case scenario of all patients being hospitalized) to the tune of
computed 90.6TPD seems to have almost increased by 45% from the average 62.5TPD
quantity (during Pre-COVID-19 times); thereby posing challenge to the managers,
transporters as well as facility handlers.
Conclusively, Maharashtra State seems to have witnessed the environmental betterment to
the tune of about 90-50% emissions load reduction of PM10whereas 85-60% of gaseous load
during L-I to L-IV phases of lockdown translating into approximately 60% concentration
improvements averaged across all of the 22 monitored locations. River water quality has
improved at more than 84% & 65% for BOD & COD in Tapi, Godavari, west flowing rivers &
Nallah basins whereas the other 2 River basins shows improvement at 30% locations. With
respect to concentrations of monitored parameters for water quality, ample with evidence from
monitored data is available that the lockdown BOD & COD parameters enhanced by 25-75%
concentration reduction of organic matter whereas 10-35% increase in DO concentration
needless to mention the 50-75% reductions in Nitrates & Fecal Coliforms concentration as
compared to the April 2019 data. Residential solid waste was the only major contributor
towards challenges in SWM in the State whereas the total shutdown of commercial activities
& restaurants as well as limited industrial activities augmented with migration though may have
varied spatial distribution, have definitely reduced pressures on SWM systems ranging from
58% during L-I to 35% by end of L-IV. The only negative impact of COVID-19 as anticipated
is found on the biomedical waste generation with an expected rate of doubling of wastes by
end of L-IV. Nevertheless, many of the percolating impacts that may be associated further with
environmental attributes such as changing patterns of consumerism, lifestyle, work culture,
travel & transport it is equally important that this natures alarm of corrective attenuation be
understood & anthropogenic sources be controlled effectively placing strategic environmental
management systems well in advance to be able to sustain the so felt “correction”.

112
8. ENVIRONMENTAL TRAINING
Training constitutes an integral and continuous process for any learning and development.
Understanding advancements in technology and new provisions in environmental aspects,
quality of work, responsibilities in respective fields and overall development in the field of
environment and work all boils down to effective training programs imparted to each
accountable member of the Staff and Officers of the Board.
It is therefore one of the primary functions of the Board to plan and organize these training
programs of varied capacities in different aspects of prevention, abatement and control of
pollution. The Board deputes its staff and officers for training of different aspects for knowledge
in environment protection and pollution control, cleaner technologies, waste minimization and
amendments in respective Acts and Rules to adequately equip them to perform their duties
with highest efficiency.
During the year 2020-21, the Board had deputed 466 officers to attend training in technical,
scientific and administrative courses organizing 24 training programs during the year. Table
8.1 shows the total number of training programs conducted with the total number of
participants and fees. The various training courses/workshops/seminars/lectures attended by
the Staff and the Officers of the Board conducted during this year are summarized in
Annexure 5.
Table 8.1 Training Abstract for the year 2020-21.
Total Training Programs Conducted Total Participants
24 466

113
9. FINANCE AND ACCOUNTS
Annual Accounts of Maharashtra Pollution Control Board for the Financial Year 2020-21 are
prepared as per section 40 of the Water (P & CP) Act, 1974 and as per the guidelines given
in the Water (P & CP) Rule 1983, in the form Receipt & Payments, Income & Expenditure and
Balance Sheet along with schedule of Fixed Assets.
Comptroller & Auditor General of India (CAG) have allotted the statutory audit work of Board
to M/s. Kirtane & Pandit LLP, Chartered Accountant. The Audit of Final Accounts was done
by M/s. Kirtane & Pandit LLP, Chartered Accountant for the Financial Year 2020-21.
The Audited Final Accounts submitted to the Board for approval and adoption. After approval
of the Board same will be submitted to Environment Department, Government of Maharashtra
and Account General Maharashtra.
The gist of annual Receipts and Payment Accounts, Income and Expenditure Accounts and
Balance Sheet for the year 2020-21 is given in this chapter.
A) Total Income of Board for the year 2020-21 is Rs.490.69 Crores
1. Consent Fees Rs. 356.52 Crores.
2. Analysis Charges Rs. 2.54 Crores.
3. Interest on Investment Rs. 124.98 Crores.
4. Other Income Rs. 6.65 Crores.
B) Total Expenditure of Board for the year 2020-21 is Rs. 150.38 Crores.
1. Salary & CPF Contribution Expenditure Rs. 56.83 Crores.
2. Expenditure from Cess Fund Rs. 4.02 Crores.
3. Expenses on Projects from Cess Fund Rs. 50.55 Crores.
4. Office Expenditure & Depreciation Rs. 38.98 Crores.
C) Excess of Income over expenditure for the year Rs. 340.31 Crores.
D) Capital Expenditure Rs. 11.43 Crores.
E) Investment in Fixed Deposits as on 31/03/21 Rs. 2628.19 Crores.
Details of accounts for the year 2020-21 are attached as Annexure 6.

114
10. IMPLEMENTATION OF ACTS & RULES Maharashtra Pollution Control Board (MPCB) implements various environmental legislations
in Maharashtra, including Water (Prevention and Control of Pollution) Act, 1974, Air
(Prevention and Control of Pollution) Act, 1981 and some of the provisions under
Environmental (Protection) Act 1986. MPCB functions under the administrative control of
Environment Department, Govt. of Maharashtra. The list of various Acts and Rules
implemented by MPCB is as follows:
1. Water (Prevention & Control of Pollution) Act, 1974.
2. Air (Prevention & Control of Pollution) Act, 1981.
3. Maharashtra Water (Prevention & Control of Pollution) Rules, 1983.
4. Maharashtra Air (Prevention & Control of Pollution) Rules, 1983.
5. Maharashtra Biodegradable and Non-biodegradable Waste (Control) Act, 2006
6. Environment (Protection) Act, 1986 and Rules & Amended Rules made thereunder,
which are as below:
(i) The Environment (Protection) Rules, 1986 and (Amendment Rules, 2016).
(ii) The Hazardous and Other Wastes (Management and Transboundary Movement)
Rules, 2016.
(iii) The Bio-Medical Waste Management Rules, 2016.
(iv) The Solid Waste Management Rules, 2016.
(v) The Construction and Demolition Waste Management Rules, 2016.
(vi) The Plastic Waste Management Rules 2016
(vii) The E-waste (Management) Rules, 2016
(viii) The Manufacture, Storage and Import of Hazardous Chemicals Rules, 1989.
(ix) The Noise Pollution (Regulation and Control) Rules, 2000.
(x) The Batteries (Management and Handling) Rules, 2001
(xi) The Wetlands (Conservation and Management) Rules, 2010
7. Notifications:
(i) Environment Impact Assessment Notification, 2006.
(ii) Coastal Regulation Zone Notification, 2011.
(iii) Maharashtra Plastic and Thermal Products (Manufacture, Usage, Sale, Transport,
Handling and Storage) Notification, 2018 (As amended)
As per these Acts and Rules the following prosecutions have been launched and
convictions have been accordingly secured for the year 2020-21
10.1 Status of Legal Enforcement for the year April 2020- March 2021
I) Status of cases filed before Hon’bleTrial Courts
SN. Name of the Act No. of cases
filed No. of cases disposed off
No. of cases pending
1. Water (P&CP) Act, 1974 3 -- 3

115
2. Air (P&CP) Act, 1981 -- -- --
3. Environment (Protection) Act, 1986 & Rules made
thereunder 81 -- 81
II) Status of Writ Petitions / PILs filed before Hon’ble High Court of Judicature at
Bombay Bench at Mumbai/Aurangabad/Nagpur
SN. No. of Writ
Petitions/PILs filed No. of Writ Petitions /PILS
disposed off No. of Writ Petitions
pending
1. 58 13 45
III) Status of cases before the Hon’ble Supreme Court of India
SN. No. of Special Leave Petitions/ PILs filed
No. of Special Leave Petitions /PILS disposed off
No. of Special Leave Petitions pending
1. 19 -- 19
IV) Status of Appeals/Applications filed before the Hon’bleNational Green Tribunal,
Principal Bench, New Delhi and Western Zone, Pune
SN. No. of Appeals/
Applications filed
No. of Appeals/ Applications disposed
off
No. of Appeals /Applications pending
1. 70 14 56
V) Status of Appeals/Applications filed before the Public Information Officer/Appellate
Authority (P&L Divn.), MPCB, Mumbai under the Right to information Act , 2005 during
the period from April,2019 to March, 2020
SN. Particulars No. of Appeals/
Applications filed
No. of Appeals /Applications disposed off
No. of Appeals /Applications
pending
1. Application 8 8 --
2. Appeals -- -- --

116
11. ENVIRONMENTAL AWARENESS & PUBLIC PARTICIPATION For sustainable development it is necessary to promote and create environmental awareness
among communities, businesses and governments. Therefore, the Board also organizes
various environmental awareness programs across the State of Maharashtra. During the year
2020-2021 the following programs on environmental awareness were conducted by the Board.
1. 22nd April - World Earth Day
On the occasion of this day, the message of environmental awareness was published in the
leading newspapers of the state. Considering the accompaniment of COVID19, in order to
maintain the balance of changing environment and resources, the message of the Hon’ble
Chief Minister regarding environmental awareness was published.
2. Newspaper on the occasion of World Environment Day on 5th June
On the occasion of World Environment Day, one page on environmental awareness was
published in newspapers viz. Maharashtra Times, Loksatta, Sakal, Lokmat, Saamana, Indian
Express, Times of India, Mid Day, DNA, Hindustan Times, Punyanagari, Pudhari, Navakal,
Navbharat etc.
3. Various Awareness Activities to Celebrate Environmentally Friendly Ganesh Utsav
Awareness messages were published at bus stop shelters in Mumbai, Nagpur, Pune and at
Mumbai Airport, Mumbai Metro and Best Buses in Mumbai to celebrate the environment
friendly Ganesh Utsav.
4. Eco-friendly domestic Ganpati competition organized by MPC Board and Loksatta
MPC Board and Loksatta jointly organized the “Eco Friendly Domestic Ganeshotsav
competition” at six divisional levels of Loksatta dailies namely Mumbai, Pune, Nashik, Nagpur,
Ahmednagar and Aurangabad. In this competition more than three thousand competitors had
participated.
5. Times Green Ganesha
An Eco Friendly Green Ganesha Competition was organized for the Public Ganeshotsav
Mandal and Housing Societies in this Mumbai & Pune by MPC Board, Department of
Environment, Government of Maharashtra and Times of India
6. ABP Mazha: My Environment Friendly Ganesh Utsav Competition
MPC Board and ABP Mazha; a news channel, organized a special public awareness
campaign to celebrate eco-friendly Ganeshotsav in housing societies in major cities of the
state. A special headline was broadcast on their behalf in the newsletter on the eco-friendly
Ganeshotsav celebrated in the housing societies of Mumbai, Pune, Nashik and Nagpur. This
time a special half hour talk show was organized on this TV channel. In this initiative, a special
program was also presented on the housing societies celebrating environment friendly
Ganeshotsav through newsletter through ABP Mazha channel. Also Marathi television popular
artist Tejashree Pradhan and Ashutosh Patki promoted to celebrate the eco-friendly domestic
Ganeshotsav in the entire state.

117
7. Ganesh Utsav Idol Competition organized by MPC Board and Loksatta
Ganesh Utsav idol competition was organized by LokSatta & the competition was attended by
the MPC Board as a coconvenor. In this competition, a special prize was given to the best
eco-friendly Ganesh Murti category.
8. Eco-friendly domestic Ganpati competition organized by MPCB and Zee 24 Hours
MPC Board and Zee 24 Hours Home Eco Friendly Ganeshotsav Competition 2019. This state
level competition was organized. Or The competition was well received. Awareness was
created through special promos to participate in this competition. On the occasion of this
competition, news capsules were distributed during the festival on eminent persons
celebrating eco-friendly domestic Ganesh Utsav.
9. Environment friendly Ganpati competition for school students and housing society
organized by Sam Marathi and MPCB
Sam TV & MPC Board organised an environment Friendly Ganpati competition for the housing
society and school children in the state. The competition was well received. Sam TV had
appealed for participation in the competition through promos for the competition.
10. Environmentally Friendly Ganesh Utsav Competition for Housing Society organized
by Jay Maharashtra and MPCB
An environmentally friendly Ganesh Utsav competition was organized for housing societies in
the state jointly by Jay Maharashtra and MPC Board. Jai Maharashtra Vahini had made a wide
appeal to participate in this competition.
11. Pollution Free Diwali Awareness Campaign
In order to celebrate pollution free Diwali, a massive public awareness campaign was
organized by the MPC Board and the Environment Department. In this, digital sign boards and
hoardings displaying public awareness messages for eco-friendly Diwali were published at
bus stands in Mumbai, Nagpur and Pune, airports and metro railways.

118
12. IMPORTANT MATTERS DEALT WITH BY THE BOARD Achievements of Water Pollution Control section;
1. Prepared inventory of tannery industry, dairy & gaushalas, food industry and paper
industry.
2. Revised Action Plans for rejuvenation of Priority III, IV & V polluted river stretches (total
38) submitted to CPCB and Hon'ble NGT.
3. Action Plan for utilization of treated sewage prepared and submitted to CPCB.
4. Under the National Water Monitoring Program (NWMP), river biodiversity
monitoring of 156 places in 56 rivers of Maharashtra is done in two seasons and
its report is expected to be completed by July 2021.
5. During the year 2020-21, under the project of Central Pollution Control Board, the
National Water Monitoring Program collected samples of rivers, seas, creeks, and
gullies of 200 places in Maharashtra every month and monitored their water quality.
The results were calculated and published on the website of MPC Board. He also
calculated the water quality index of rivers and published it on the website of MPC
Board every month for awareness of public.
6. Groundwater samples of 50 places are collected twice a year and their results are
published on the website of MPC Board for awareness of public.
7. Prepared the annual report of Maharashtra Water Quality 2019-20 and published it on
the website of MPC Board for awareness of public.
8. Work order has been issued for preparation of Annual Report on Water Quality of
Maharashtra 2020-2021 and this work is in progress.
9. Common Effluent Treatment Plant (CETP) – The Board was successful in bringing
down non-compliant CETPs from 4 to 1. A new phase II 25 MLD CETP at Tarapur is
opened and is expected to reduce the burden on non-compliant Phase I Tarapur
CETP.
10. Polluted River Stretches;
a. Priority I - Reduced from initial 9 stretches to 1
b. Priority II – Reduced from initial 6 stretches to 0
c. Priority III - Reduced from initial 14 stretches to 5
d. Total polluted stretches down from 53 to 51.
After reviewing the water quality data of the designated locations in the rivers of
Maharashtra for the 2020-21, it is found that there is overall improvement in the water
quality of the rivers in Maharashtra.
11. As an alternate technology for sewage treatment, 55 Faecal Sludge Treatment Plants
have been operational in the entire state, out of that 15 FSTPs have been installed
along polluted river stretches, with treatment capacity of 290 KLD.
12. Circular published to provide financial & technical assistance to A, B & C Municipal
Councils, Nagar Panchayats and Gram Panchayats for setting up of facilities for
management of sewage. Assistance will be provided up to 2.5 Cr as an interest free
loan for the tenure of 10 Years. Assistance of Rs. 2.0 Lac also will be provided for
preparation of DPR.
13. Online Sewage Management Portal launched to collect Local Body wise sewage
related information and monitor the progress.

119
14. Benchmarking of sugar industries in Maharashtra to represent all variability and
commonalities in process, technology, resource & Pollution potential- carried out
through third party.
15. Benchmarking of Distillery & Jaggery industries in Maharashtra to represent all
variability and commonalities in process, technology, resource & Pollution potential-
Work Order issued.
16. The MPC Board monitors the water quality during the Ganeshotsav festival season
every year. All the local bodies are instructed to follow the Ganesh Idol Immersion
guidelines of published by Central Pollution Control Board during Ganeshotsav festival
period. MPC Board has been carried out water quality monitoring before and after idol
immersion during Ganeshotsav Festival and water quality monitoring reports are
displayed on the MPC Board website for awareness of public.
17. Action plan for restoration of lakes/water bodies in Maharashtra state prepared and
submitted to CPCB in compliance of Hon NGT order no 325/2015.
18. Development of Standard bidding document for STP in order to facilitate Local Bodies
for awarding STP related contracts.
19. State Environment Plan and District Environment Plans (36 districts) prepared and
submitted to CPCB in compliance of Hon NGT Order OA 360/2018.
Achievements during the past year: Developments Post January 2020
MAJOR DEVELOPMENTS IN MPCB – Software related
Integrated Management Information System (IMIS) deployed by the Board consists of various
modules pertaining to its functions. New modules are developed as per the requirement. The
new modules developed are shown below.
1. e-signature and Blockchain: Presently consent documents are stored securely in Block
Chain so that there can no change in the documents. However, the final processed document
had to be signed manually by the issuing authority. In view of total Office automation and move
towards Digital First, Board has implemented e-Signature in PFX format (no hardware key
required). This does away with manual signature and the document gets authenticated
digitally. This process is integrated with the IMIS application. Thus, the documents are digitally
secured. This ensures security of consent documents and prevent tampering of the same
2. LIMS (June 2021)– Laboratory Inventory Management Module was developed and
integrated with existing IMIS to ensure complete end to end flow for sample registration and
processing. The modules consist of
1. Lab Assistant authority
• Physical sample inspection (look for damage, leakage etc)
• Barcode scanning
• Verify all sample details and parameters
• Accept samples with or without reason
• Report generation
2. Lab Analyst
• Based on the parameter assignment (work-distribution) analyse sample parameters
• Calculate and submit analysis (Single view and Grid view)

120
3. Approving Authority
• Sample acceptance
• Approving parameter analysis
• Generating analysis reports
• Re-test / Re-assign sample parameters
4. Reviewing Authority
• Review analysis reports
• Approving parameter analysis
• Generating analysis reports
• Re-test / Re-assign sample parameters
5. Lab admin
• Parameter distribution
• Manager users
6. LIMS Admin
• Lab management
• User management
• Parameter management
3. JVS Payments (July 2021)
This module is developed for collection of sampling and analysis charges from project
proponent. This module is also integrated with IMIS and LIMS. In existing system Visit
Scheduler has been developed, which allocates visits to Department Officers. At the time of
visit, samples are collected which are analysed at laboratories. In view of the same, it is
required to generate the Bill which would consist of sampling as well as analysis charges.
Also, payment gateway from M/s Bill Desk, has been integrated to collect payment online.
4. Auto Consent Templates (2020-2021)
Consent certificates were issued manually. In order to issue consent certificates online without
any manual intervention, consent templates have been designed based on industry type and
category of application.
5. Authorization Committee (Sept 2021)
Agenda is prepared before the Board meeting. Under one agenda there are several cases. In
order to prepare the Minutes of Meeting for each case, this module has been developed. It is
developed for Hazardous and E-waste Application for Authorization Committee meeting.
IT Infrastructure enhancement
1. Software Defined Data Centre (SDDC)
The virtualization of the Servers through VMware software has now been extended to storage
with the inclusion of new hardware. As VMware software is applied to compute Software
Defined Storage (SDS) provides virtual storage by means of a Virtual data Plane – utilization
of the disk space of other servers. By configuring virtual Storage Area Network (SAN), the
storage capacity space on the server can be utilised efficiently. Thus, software defines the
storage making a Software Defined Data Center (SDDC).

121
2. Security- WAF (Web Application Firewall)
Considering the much-required Security of data, Board has implemented the Web Application
Firewall of SonicWall make, along with SIEM (Security Information and Event Management)
software. With the application of WAF data traffic entering the internal network of the Board is
thoroughly checked with he applied algorithms and hardening of entry ports for the incoming
data traffic. Malicious codes and viruses are filtered before entering the internal applications,
thus securing the internal network of the Board.
3. SD WAN
SD WAN refers to Software Defined WAN in which the Wide Area Network or the connectivity
of Board’s Statewide Offices is controlled through software implemented on independent
devices. Appliances are installed at all office locations with a centrally administered Appliance
at Head Office. All appliances are connected to independent Internet connections and these
configured Appliances are controlled from the Head Office. The IMIS application running in
Board’s Data Centre at Mumbai can be accessed by all other Offices in the State. This has
replaced Board’s costly MPLS connections with high bandwidth Internet connections.
Moreover, with any change in the location of the Office, no configuration or change in
infrastructure/device needs to be done. Thus, SD WAN is economical and also offers ease of
operation.
Two new SD Wan firewall devices from M/s Fortinet are installed in the Data Centre for
redundancy and high availability.
3. Information Security Certification
To optimize Board’s work processes and as a step towards best practices, Board has recently
qualified itself with ISO 9001:2015 for Quality Management Systems for its Offices and ISO
27001 Information Security Management Systems for Board’s Data Center.
Committed to best practices, Board has employed CERT empaneled Information Security
Auditor to perform Information Security (IS) audit of its Desktops and Servers in the Data
Centere as well as the applications it is using for its work processes.

122
ANNEXURES

123
ANNEXURE 1A – ORANIZATIONAL STRUCTURE OF THE BOARD
ABBREVIATIONS: APAE – Joint Director Air Pollution Abatement Engineer, WPAE – Joint Director Water Pollution Abatement Engineer, AST – Assistant Secretary (Technical), CAO – Chief Accounts Officer, PSO – Principal Scientific Officer, RO (HQ) – Regional Officer (Headquarter) EIC – Environment Information Centre

124
ANNEXURE 1B –CHARTS OF FIELD OFFICES AND BOARD LABORATORIES FIELD OFFICES CHART
Regional Office
Sub-Regional Office

125
ANNEXURE 1C BOARD LABORATORIES CHART

126
ANNEXURE 2 - STAFF STRENGTH AS ON 31/03/2021
Sr.
No.
Posts Salary Band Grade
salary
Sanctioned Filled
In
Vacant
1 Chairman 1 1 0
2 Member Secretary (PB-4) 37400-
67000
10000 1 1 0
3 Joint Director (Water) 15600-39100 7600 1 1 0
4 Joint Director (Air) 15600-39100 7600 1 1 0
5 Principal Scientific
Officer
15600-39100 7600 1 1 0
6 Chief Accounts Officer 15600-39100 7600 1 1 0
7 Assistant Secretary
(Technical)
15600-39100 7600 1 1 0
8 Senior Law Officer 15600-39100 7600 2 0 2
9 Senior Administrative
Officer
15600-39100 6600 1 0 1
10 Executive Engineer 15600-39100 6600 1 1 0
11 Material Officer 15600-39100 6600 1 0 1
12 Regional Officer 15600-39100 6600 15 6 9
13 Law Officer 15600-39100 6600 2 2 0
14 Senior Scientific Officer 15600-39100 6600 3 1 2
15 Sub-Regional Officer 15600-39100 5400 55 53 2
16 Statistical Officer 15600-39100 5000 1 1 0
17 Assistant Secretary (EB) 15600-39100 5000 1 1 0
18 Private Secretary 9300-34800 5000 2 0 2
19 Administrative Officer 15600-39100 5000 1 0 1
20 Scientific Officer 15600-39100 5000 9 4 5
21 Account Officer 15600-39100 5000 2 2 0
22 Junior Scientific Officer 9300-34800 4400 26 20 6
23 Assistant Accounts
Officer
9300-34800 4400 11 2 9
24 Assistant Law Officer 9300-34800 4400 3 1 2
25 Deputy Engineer 9300-34800 4400 1 0 1
26 Senior Steno 9300-34800 4400 5 5 0
27 Junior Steno 9300-34800 4300 27 10 17
28 Field Officer 9300-34800 4300 204 161 43
29 Head Accountant 9300-34800 4300 20 12 8
30 Legal Assistant 9300-34800 4300 4 0 4
31 Junior Scientific
Assistant
9300-34800 4200 40 27 13
32 First Clerk 9300-34800 4200 17 14 3
33 Statistical Assistant 9300-34800 4200 1 0 1
34 Draftsman 5200-20200 2800 1 0 1
35 Field Inspector 5200-20200 2800 42 3 39
36 Senior Clerk 5200-20200 2400 50 36 14
37 Assistant Draftsman 5200-20200 2400 2 0 2
38 Electrician 5200-20200 2400 2 1 1
39 Tracer 5200-20200 2000 6 1 5
40 Laboratory Assistant 5200-20200 2000 7 3 4
41 Junior Clerk 5200-20200 1900 64 54 10
42 Driver 5200-20200 1900 74 49 25
43 Instrument Fitter 5200-20200 1900 1 1 0
44 Daftari 5200-20200 1900 14 1 13
45 Naik 4440-7440 1600 2 0 2

127
CONVERTED TEMPORARY ESTABLISHMENT AS ON 31/03/2021
SN. Posts Salary Band Grade salary Filled In
1. Junior Scientific Assistant 9400-34800 4200 11
2. Laboratory Assistant 5200-20200 2000 5
3. Junior Clerk 5200-20200 1900 4
4. Driver 4200-20200 1900 1
5. Peon 4440-7440 1300 3
Total 24
46 Roneo Operator 4440-7440 1600 1 0 1
47 Peons 4440-7440 1300 88 32 56
48 Chowkidar 4440-7440 1300 20 9 11
49 Sweepers 4440-7440 1300 3 3 0
Total 839 523 316

128
ANNEXURE 3 - DETAILS OF REGIONAL & SUB-REGIONAL OFFICES WITH THEIR JURISDICTIONS
Sr.
No.
Name of the
Region Name and address Jurisdiction Telephone & Fax No.
1 Head Office
Maharashtra Pollution Control Board
Kalpataru Point, 3rd and 4th floor, Opp. PVR
Theatre, Sion (E), Mumbai-400 022
Tel - 022-
24010437/24020781
2 Central Lab
Central Laboratory, Maharashtra Pollution
Control Board, "Nirmal Bhavan", P-3, MIDC
Industrial Area, Mahape, Navi Mumbai- 400
701.
Tel -
02267195031/67195032
Regional Offices, Sub-Regional Offices and Regional Laboratories of the Board
3 Regional Office
Mumbai
Maharashtra Pollution Control Board,
Kalpataru Point, 1st floor, Opp. PVR Theatre,
Sion (E), Mumbai-400 022
Mumbai Municipal Corporation Area Tel – 022-24020781
I) SRO Mumbai - I Kalpataru Point, 1st floor, Opp. PVR Theatre,
Sion (E), Mumbai-400 022
Mumbai Island, Ward No. A.B.C. D.F
F(South) F(North) G(South) and G(North)
Tel – 022-24020781
II) SRO Mumbai - II Kalpataru Point, 1st floor, Opp. PVR Theatre,
Sion (E), Mumbai-400 022
Part Of Mumbai Suburb, Ward No. M(East) M(West), H(East)
H(West) and L. Tel – 022-24020781
III) SRO Mumbai -
III
Kalpataru Point, 1st floor, Opp. PVR Theatre,
Sion (E), Mumbai-400 022
Part Of Mumbai Suburb, Ward No. (East) K(West), S, N, and P
(South). Tel – 022-24020781
IV) SRO Mumbai -
IV
Kalpataru Point, 1st floor, Opp. PVR Theatre,
Sion (E), Mumbai-400 022
Suburb of Mumbai, Ward No. P(North), R(North), R(South) and
T. Tel – 022-24020781
4 Regional Office
Thane
Maharashtra Pollution Control Board, Plot No
P-30, 5th floor Office Complex Building, Near
Mulund Checknaka, Thane- 400604.
Part of Thane district as mentioned against the Sub-Regional
Offices. Tel –022 -25802272
Thane Lab Plot No. P-30, 5th floor, Office Complex
Building Mulund Checknaka, Thane. Tel - 022- 25829582
I) SRO Thane - I Maharashtra Pollution Control Board, Plot No Thane Municipal Corporation Area Tel – 022 25829582

129
P-30, 5th floor Office Complex Building, Near
Mulund Checknaka, Thane
II) SRO Thane - II
Maharashtra Pollution Control Board, Plot No
P-30, 5th floor Office Complex Building, Near
Mulund Checknaka, Thane
Thane taluka excluding Thane Municipal Corporation Area) Vasai
taluka Tel –022 25829582
III) SRO Tarapur - I MIDC Office Building, Boisar Station, Post Taps,
Tarapur, Dist.Thane Tarapur MIDC and related area. Tel - 02525 -273314
IV) SRO Tarapur - II MIDC Office Building Boisar Station, Post Taps,
Tarapur, Dist. Thane
Dahanu, Talasari, Mokhada, Javhar and Vikramgadh Taluka and
Palghar taluka (Except SRO - Tarapur I jurisdiction). Tel - 02525 -261581
5
Regional
Office Navi
Mumbai
Maharashtra Pollution Control Board, Raigad
Bhavan, 7th floor, Sector - 11, C.B.D Belapur,
Navi Mumbai
Part of Thane and Raigad district as mentioned against the Sub-
Regional Offices Tel – 022-27572739
I) SRO Navi
Mumbai - I
Raigad Bhavan, 7th floor Sector - 11, C.B.D
Belapur, Navi Mumbai
Southward direction of Road in front of CETP (Hills to Pune
Highway). The following areas Mahape, Koparkhairne, Sarvali,
Ghansoli, Rabale, Dive, Airoli, Dighe (NMMC) AAQM stations,
TTC (WMA) activities + Diva Creek
Tel – 022-27572740
II) SRO Navi
Mumbai - II
Raigad Bhavan, 7th floor, Sector - 11, C.B.D
Belapur, Navi Mumbai
North limit Navi Mumbai Municipal Corporation (NMMC)
starting with village-Dighe. The areas of Vashi, Borivli, Ravane,
Turbhe, Sanpada, Belapur + CETP activities + Vashi Creek.
Tel – 022-27572740
III) SRO Taloja Raigad Bhavan, 7th floor, Sector - 11, C.B.D
Belapur, Navi Mumbai MIDC Taloja and Uran Taluka. Tel – 022-27572740
6 Regional Office
Raigad
Maharashtra Pollution Control Board, Raigad
Bhavan, 6th floor, Sector – 11, C.B.D Belapur,
Navi Mumbai
Part of Raigad district as mentioned against the Sub-Regional
Offices under him. Tel – 022-27572620
I) SRO Raigad - I Raigad Bhavan, 6th floor, Sector – 11, C.B.D
Belapur, Navi Mumbai Khalapur taluka and Panvel taluka (Except MIDC) Tel -022-27572739
II) SRO Raigad - II Raigad Bhavan, 6th floor, Sector – 11, C.B.D
Belapur, Navi Mumbai Pen, Karjat, Sudhagad taluka. Tel – 022-27572739
III) SRO Mahad Samaik Suvidha Kendra Bldg., MIDC - Mahad,
District Raigad - 402 309 Mahad, Mhasla, Mangaon, Mrwardhan and Poladpur taluka. Tel – 02145-232372
7 Regional Office Maharashtra Pollution Control Board, Kalyan, Bhiwandi, Ulhasnagar, Badlapur, Wada, Murbad and Tel – 0251-2027343/0251-

130
Kalyan Sidhivinayak Sankul,3rd and 4th Floor, Station
Road, Kalyan (West) - 421301
Shahapur talukas of Thane district. 2310212
I) SRO Kalyan - I
Maharashtra Pollution Control Board,
Sidhivinayak Sankul,3rd and 4th Floor, Station
Road,Kalyan (West) - 421301
Kalyan taluka. Tel - 0251 - 2310167
II) SRO Kalyan - II
Maharashtra Pollution Control Board,
Sidhivinayak Sankul,3rd and 4th Floor, Station
Road,Kalyan (West) - 421301
Ulhasnagar, Badlapur taluka. Tel - 0251 - 2310167
III) SRO Kalyan - III
Maharashtra Pollution Control Board,
Sidhivinayak Sankul,3rd and 4th Floor, Station
Road,Kalyan (West) - 421301
Wada, Murbad, Shahapur Taluka Tel - 0251 - 2310167
IV) SRO Bhiwandi
Maharashtra Pollution Control Board,
Sidhivinayak Sankul, 3rd and 4th Floor, Station
Road, Kalyan (West ) - 421301
Bhiwandi taluka. Tel – 0251 - 2310167
8 Regional Office
Pune
Jog Center, 3rd floor, Mumbai Pune Road,
Wakadewadi, Pune - 411 003. Pune, Satara and Solapur district. Tel – 020-25811627
Pune Lab Jog Center, 3rd floor, Mumbai Pune Road,
Wakdewadi, Pune - 411003. Tel - 020-25811694
I) SRO Pune - I Jog Center, 3rd floor, Mumbai Pune Road,
Wakadewadi, Pune - 411 003.
Pune corporation area, Daund, Indapur, Baramati, Purandar,
Bhor and Velhe taluka of Pune district. Tel - 020 -25811694
II) SRO Pune - II Jog Center, 3rd floor, Mumbai Pune Road,
Wakadewadi, Pune - 411 003.
Haveli taluka: (excluding Pimpri Chinchwad Corporation Area)
Khed, Mulshi, Ambegaon, Junnar, Maval and Shirur taluka of
Pune district.
Tel – 020-25816451
III) SRO Pimpri -
Chinchwad
Jog Center, 3rd floor, Mumbai Pune Road,
Wakadewadi, Pune - 411 003.
Pimpri Chinchwad Municipal Corporation area including MIDC
Pimpri, Bhosari and Akurdi. Tel - 020-25810222
IV) SRO Satara
Sub-Regional Office, Satara New Government
Bhavan, 2nd Floor, Near S.T. Sand, Sadar Bazar,
Satara - 415 001
Satara district. Tel - 02162-
233527/237789
V) SRO Solapur 4/B, Bali Block, Civil Lines, Opp. Government
Milk Scheme, Saat Rasta, Dist. Solapur - 413003 Solapur district. Tel - 0217– 2319850
9 Regional Office Udyog Bhavan, First floor, Trimbak Road, Near Nashik, Ahmednagar, Jalgaon, Dhule, Nandurbar district. Tel - 0253-2365150

131
Nashik ITI, Satpur, Nashik - 422 007
Nashik Lab Udyog Bhavan, First Floor, Trimbak Road, Near
ITI, Satpur, Nashik - 422007 Tel - 0253-2365161
I) SRO Nashik Udyog Bhavan, first floor, Trimbak Road, Near
ITI, Satpur, Nashik - 422 007 Nashik distrct. Tel - 0253-2365161
II) SRO Jalgaon Old Mr Bhikamchand Jain Municipal Market
Building, Hall No. A, 3rd floor, Jalgaon - 425 001 Jalgaon district. Tel - 0257-2221288
III) SRO Dhule
2nd floor, Fulchand Plaza, B.C. College Road,
Near S.S.V.P.S. Engineering College, Near Vidya
Nagari, Devpur, Dhule – 424 001.
Dhule district Tel - 07184-260629
IV) SRO
Ahmednagar
Savitribai Fule Vyapari Sankul, 1st Floor, Hall
No. 2 & 3, Near TV Center, Savedi,
Ahmednagar- 414003
Ahmednagar district. Tel - 0241-2470852
10 Regional Office
Aurangabad
Paryavaran Bhavan, A - 4/1, MIDC Area,
Chikalthana, Near Seth Nandlal Dhoot
Hospital, Jalna Road, Aurangabad - 431 210
Aurangabad, Jalna, Parbhani, Hingoli, Nanded, Beed, Latur,
Osmanabad district of Marathawada Tel - 0240-2473462
Aurangabad
Lab
Paryavaran Bhavan, A - 4/1 , MIDC Area ,
Chikalthana,Near Seth Nandlal Dhoot Hospital
, Jalna Road , Aurangabad - 431 210
Tel - 0240-2473463
I) SRO
Aurangabad - I
Paryavaran Bhavan, A - 4/1, MIDC Area,
Chikalthana, Near Seth Nandlal Dhoot Hospital,
Jalna Road, Aurangabad - 431 210
Aurangabad district Tel - 0240-2473463
II) SRO Latur
Sub-Regional Office Latur, Dev Towers,
Opposite Tahasil Office, Plot No. RL-2045, Main
Road, Latur - 413512
Latur, Osmanabad district Tel - 02382-252672
III) SRO Parbhani
Sub-Regional Office Parbhani, Devkripa
Building, 1st Floor, Rangnath Maharaj Nagar,
Nandkheda Road, Parbhani - 431401
Parbhani district (part), Hingoli and Parli Tel - 02452-226687
IV) SRO Nanded Sub-Regional Office Nanded, Lahuti Complex,
2nd Floor, Near Shivaji Statue, Vajirabad Nanded District Tel - 02462-242492

132
Nanded- 431601
V) SRO Jalna
Sub-Regional Office, Jalna, plot no. p 3/1 and p
3/2, Phase-2, MIDC Jalna, Near Hotel Aadarsh
Palace, Jalna Aurangabad Road - 431203
Jalna District Tel - 02482-220120
11 Regional Office
Nagpur
Maharashtra Pollution Control Board, Udyog
Bhavan, 6th floor, Near Sales Tax Office, Civil
Line, Nagpur - 440 001
Nagpur, Wardha, Bhandara, Gondia, Chandrapur, and
Gadchiroli district. Tel - 0712-2565308
Nagpur Lab Udyog Bhavan , 5th floor , Near Sales Tax
Office, Civil Line , Nagpur - 440 001 Tel - 0712-2560152
I) SRO Nagpur - I Udyog Bhavan, 5th floor, Near Sales Tax Office,
Civil Line, Nagpur - 440 001
Nagpur Municipal Corporation area, Kamati Katol, Kalmeshwar,
Ramtek and Parshivani, Narkhed talukas of Nagpur district. Tel - 0712-2560152
II) SRO Nagpur - II Udyog Bhavan, 5th floor, Near Sales Tax Office,
Civil Line, Nagpur - 440 001
Wardha district, Hingana taluka, (excluding Nagpur Municipal
Corporation area) Umred Bhivapur, Kuhi and Nagpur Gramin
taluka of Nagpur district.
Tel -0712-2560152
III) SRO Bhandara
Sub-Regional Office, Bhandara, Tatya Tope
ward near city petrol pump, Miskin Mahal
Road, Bhandara-441 904
Bhandara and Gondia District. Tel - 07184-260629
12 Regional Office
Amaravati
"Sahakar Surbhi" Bapatwadi near Vevekanand
Colony, Amaravati - 444606 Amaravati, Akola, Buldhana, Vashim and Yavatmal District.
Tel - 0721-
2563592/93/94/97
I) SRO Amaravati
– I
Sahakar Surbhi Bapatwadi near Vevekanand
Colony, Amaravati - 444606 Amaravati District.
Tel - 0721-
2563592/93/94/97
II) SRO Amaravati
– II
Sahakar Surbhi Bapatwadi near Vevekanand
Colony, Amaravati - 444606 Yavatmal district, Vashim District.
Tel - 0721-
2563592/93/94/97
III) SRO Akola ALSI Plot, in front of Hutatma Statue, Nehru
Park Square, Akola - 444001 Akola and Buldhana District. Tel - 0724-2402344
13 Regional Office
Kolhapur
Maharashtra Pollution Control Board, Udyog
Bhavan Building, Near Collector Office,
Kolhapur - 416 002
Sangli, Kolhapur and Sindhudurg district Tel - 0231-2652952
Chiplun Lab
Parkar Complex, 1st floor, Behind Nagar
Parishad Office, Chiplun Taluka. Chiplun Dist.
Ratnagiri - 415 605
Tel - 02355 -261570

133
I) SRO Kolhapur Udyog Bhavan Building, Near Collectorate
Office, Kolhapur - 416 002
Kolhapur district. Tel - 0231 -2652952
II) SRO Sangli 300/2, Udyog Bhavan, Near Government Rest
House, Vishrambaug, Sangli - 416 416
Sangli district. Tel - 0233-2672032
III) SRO Ratnagiri
Central Administrative Building No. 2,
2nd Floor, Collectors Office Compound,
Ratnagiri – 415 612
Sindhudurga district and Rajapur, Lanja, Ratnagiri, Deorukh and
Sangmeshwar taluka Tel - 02352-220813
IV) SRO Chiplun
Parkar Complex, 1st floor, Behind Nagpur
Parishad Office, Chiplun Taluka, Chiplun Dist.
Ratnagiri
Chiplun, Guhagar, Khed, Dapoli and Mandangad taluka of
Ratnagiri district. Tel - 02355-261570
14 Regional Office
Chandrapur
Udyog Bhavan, 1st Floor, Opp. Buss Stand,
Railway Station Road, Chandrapur - 442401 Chandrapur, Yavatmal, Gadchiroli district. Tel -07172-251965
Chandrapur Lab
Regional Laboratory, MPCB, Block No 13 & 14
New Administrative Building. Mul Road,
Chandrapur- 442 401
Tel – (07172) 272416
I) SRO Chandrapur
- I
Udyog Bhavan, 1st Floor, Opp. Buss Stand,
Railway Station Road, Chandrapur - 442401
Chandrapur, Yavatmal district. Tel - 07172-251965

134
ANNEXURE 4 – INDUSTRY STATISTICS FOR THE YEAR 2020-21
Region Green Green
Total
Orange Orange Total
Red Red Total
White White Total
Grand Total LSI MSI SSI LSI MSI SSI LSI MSI SSI SSI
RO Amravati 222 10 4650 4882 104 21 2106 2231 97 44 350 491 355 355 7959
RO Aurangabad 285 45 5897 6227 169 111 2475 2755 395 142 988 1525 117 117 10624
RO Chandrapur 44 4 584 632 47 8 523 578 228 9 295 532 90 90 1832
RO Kalyan 155 34 1660 1849 137 79 1109 1325 271 150 2042 2463 278 278 5915
RO Kolhapur 358 47 9865 10270 164 91 4310 4565 424 122 1885 2431 820 820 18086
RO Mumbai 60 43 2149 2252 647 281 773 1701 494 96 699 1289 35 35 5277
RO Nagpur 134 24 2130 2288 164 63 2539 2766 529 60 1379 1968 140 140 7162
RO Nashik 344 62 6933 7339 216 95 2918 3229 596 148 2343 3087 856 856 14511
RO Navi Mumbai 180 70 1655 1905 190 200 1057 1447 262 48 1228 1538 286 286 5176
RO Pune 530 336 7677 8543 1606 712 5279 7597 1622 401 4041 6064 852 852 23056
RO Raigad 67 28 533 628 147 47 484 678 301 61 503 865 31 31 2202
RO Thane 101 25 1491 1617 359 65 621 1045 293 57 1141 1491 61 61 4214
Grand Total 2480 728 45224 48432 3950 1773 24194 29917 5512 1338 16894 23744 3921 3921 106014
Note – LSI: Large Scale Industries MSI: Medium Scale Industries SSI: Small Scale Industries

135
ANNEXURE 5 - DETAILS OF TRAINING PROGRAMS ATTENDED BY MPCB OFFICIALS DURING THE YEAR 2020-2021.
Sr. No.
Training/Workshop Dates and Period
Training Venue
Subject No of Participants
Name of Participants
1 31/08/2020 to 14/09/2020 Online Training
ISO 9001:2015 Certification 356 Online training
2 02/11/2020 to 06/11/2020 Online Training
ISO internal Auditors Training 12 Online training
3 10/11/2020 to 29/11/2020 Online Training
Online Training course on Multisector Strategies for Clean air action in cities of India
2 1)Shri. Nikhil More 2)Shri.Sameer Hundlekar
4 19/01/2021 to 21/01/2021 Online Training
Air pollution Control Devices & OCEMS for various Sector.
2 1)Shri.Rakesh Dafade 2)Shri.Pranav Pakhle
5 08/02/2021 to 12/02/2021 Online Training
Environmental Data Interpretation, compilation, analysis, presentation and reporting hands on training
2 1)Shri. Ashok Kare 2)Dr. Seema Dalavi.
6 27/01/2021 to 29/01/2021 Online Training
Detailed insight into Management of Various wastes Like hazardous waste, E waste, C & D Waste Municipal Solid Waste and Biomedical Waste.
2 1)Shri.Upendra Kulkarni 2)Mrs.Madhurima Joshi
7 28/01/2021 to 30/01/2021 Online Training
Hazardous waste and plastic waste inventory
2 1)Dr.H D Gandhe 2)Dr. Sagar Warhekar
8 05/02/21 to 06/02/2021 Online Training
Operating mechanism and performance evaluation of CBWTF.
2 1)Shri.Kiran Hasbnis 2)Shri.Amol Satpute
9 09/02/2021 to 11/02/2021 Online Training
Aspects of hazardous waste TSDF from initiation till commissioning and issue pertaining to compliance monitoring.
2 1)Shri.Rahul Mote 2)Shri.Anand Katole
10 09/02/2021 to 11/02/2021 Online Training
Performance evaluation of ETP/STP/CETP.
2 1)Smt.Madurmia Joshi 2)Smt.Priyashree Deshmukh
11 08/02/2021 to 12/02/2021 Online Training
Environmental Legislation Interpretation, Enforcement Legal and statutory requirement.
2 1)smt.Netra Chaphekar 2)Smt.Neelam Kubal

136
12 02/02/2021 to 04/02/2021 Online Training
Analysis of pesticide & other organic chemicals in Environmental Samples
2 1)Smt.Ranjana Rane 2)Shri. Sangam Taide
13 17/02/2021 to 19/02/2021 Online Training
Environmental Sustainability of sugarcane, ethanol industries.
2 1)Dr.Y B Sontakke 2)Shri.Prashant Gaikwad
14 17/02/2021 to 19/02/2021 Online Training
Occupation health and saftery management system
2 1)Shri.sunil Salunkhe 2)Shri.Heena Khalokar
15 17/02/2021 to 19/02/2021 Online Training
Environmental monitoring sample collection of effluent, AAQM stack and testing of various Environmental Parameters like Air, Water and noise in the laboratory.
2 1)Shri.Jaydeep Kumbhar 2)Smt.Jyoti Sutar
16 13/02/2021 to 26/02/2021 Online Training
Strategies to reduce emission from transport.
3 1)Dr. V M Moteghare 2)Shir. Vikrant Bhalerao 3)Shri.Nikhil More
17 08/02/2021 to 11/02/2021 Online Training
ISO/IEC17025/2017 Laboratory QMS IA & UM as per NABL accrediation.
25 List Attached
18 23/02/2021 to 24/02/2021 Online Training
Water Expo International Conference
9 1)Shri.R A Rajput 2)Shri. S L Waghmare 3)Shri.Kishor Kerlikar 4)Shri.Promod Mane 5)Shri.Tanaji Yadav 6)Shri.V V Killedar 7)Shri.B M Kukde 8)Shri.S R Bhosle 8)Shri.D R Bansod
19 22/02/2021 to 25/02/2021 Online Training
ISO/IEC17025/2017 Laboratory QMS IA & UM as per NABL accrediation.
25 List Attached
20 09/02/2021 to 11/02/2021 Online Training
Sustainable construction and demolition waste Management.
2 1)Shri.Promod mane 2)Shri.Sujit Dholam
21 15/03/2021 to 17/03/2021 Online Training
Sophisticated instruments for analysis of toxic heavy metals in Environmental GC operation
2 1)Dr.Dayanand Tare 2)Shri.Anil Patil

137
22 24/03/2021 to 25/03/2021 Online Training
Urban air quality Management 2 1)Shri.amar Durgule 2)Shri.V V Killedar
23 10/02/2021 to 12/02/2021 Online Training
Monitoring of Implementation status of extended producer resposiblity under E Waste and plastic waste management
2 1)Smt.Rutuja Bhosle 2)Smt. Kalyani Kulkarni
24 17/03/2021 to 19/03/2021 Online Training
Control of Air pollution source apportionment studies and preparation of emission Inventory.
2 1)Shri.Devanand Jadhav 2)Shri.RaviRaj Patil
Total Number of Programmes -24 Total Number of Participants -466

138
ANNEXURE 6 - FINANCE AND ACCOUNTS FOR THE YEAR 2020-21

139

140

Kalpataru Point, 3rd and 4th floor, Opp. PVR Cinema, Sion Circle,
Mumbai-400 022
MAHARASHTRA POLLUTION CONTROL BOARD
www.mpcb.gov.in