2019 - Bank of Namibia
288
ANNUAL REPORT Bank of Namibia 2019
-
Upload
khangminh22 -
Category
Documents
-
view
1 -
download
0
Transcript of 2019 - Bank of Namibia
ANNUAL REPORT
Bank of Namibia
2019Bank of Nam
ibia 2019 AN
NU
AL R
EP
OR
T


The Bank of Namibia Annual Report and Financial Statements for the financial year
ended 31 December 2019 are prepared pursuant to section 52(1) of the Bank of
Namibia Act (Act No. 15 of 1997).
© Bank of Namibia, 2020
All rights reserved. No part of this publication may be reproduced, copied or transmitted
in any form or by any means, including but not limited to photocopying, recording and
storing, without fully acknowledging the Bank of Namibia Annual Report 2019 as the
source. The contents of this publication are intended for general information only and
are not intended to serve as financial or other advice. While every precaution is taken to
ensure the accuracy of information, the Bank of Namibia is not liable to any person for
inaccurate information or for any opinion contained in this publication.
Published by the Bank of Namibia
71 Robert Mugabe Avenue
P.O. Box 2882
Windhoek
NAMIBIA
Tel.: +264 61 283 5111
Fax: +264 61 283 5231
http://www.bon.com.na
Enquiries: [email protected]
ISBN: 978-99916-61-97-1
1Bank of Namibia Annual Report 2019

Content
Message from the Governor 3
Part A 8Operations and Affairs of the Bank
Part B 74Annual Financial Statements for the Financial Year
ended 31 December 2019
Part C 124Economic and Financial Developments in 2019
Theme Chapter 185
Part D 202Banking Supervision
Part E 227Statistical Appendix
List of Abbreviations 280
2 Bank of Namibia Annual Report 2019

During the year 2019, the Bank remained committed to good corporate governance practices and accountability to the public. The Bank continued to practice the culture of openness and accountability, and of adhering to good governance principles in line with its Mission and Vision. The Bank of Namibia Act, the Corporate Charter and the Strategic Plan are the means that direct our pursuance of our Mission and Vision. Moreover, the communication strategy of the Bank continued to explain the Bank’s actions and ensures accountability to the general public. The Bank is committed to continuously improve its abilities to appropriately respond to the challenges of an ever-evolving central banking environment.
In 2019, the Bank continued with the implementation of its 2017 – 2021 Strategic Plan, which outlines the Bank’s Strategic Objectives, Strategies and Outcomes, and Special Focus Areas. Measurable strategies are designed with clear outcomes in order to achieve the eight Strategic Objectives. Therefore, to ensure successful implementation of the Strategic Plan, the Strategic Objectives have been transformed into areas of concentration with clear, measurable targets. Through its dedicated staff and the guidance provided by the Board of the Bank, the Bank remains steadfast
in delivering its Strategic Objectives, as outlined in this report.
The year 2019 was characterised by slowing momentum of global economic growth, trade policy uncertainty, geopolitical tensions, social unrest, and weather-related disasters. Growth in the global economy slowed to 2.9 percent in 2019, down from 3.6 percent in 2018, and well below its ten-year average of 3.8 percent. This subdued growth was recorded in both Advanced Economies (AEs) and Emerging Market and Developing Economies (EMDEs), mainly on the back of weaker growth in foreign demand and a drawdown of inventories. Considering the macroeconomic environment, monetary policy stances remained generally accommodative in both AEs and EMDEs during 2019. Average inflation rates in most AEs and EMDEs declined in 2019 compared to 2018, due to weaker global growth and lower oil prices, and remained generally aligned with or below targeted levels.
Going forward, global growth is projected to weaken in 2020, below the initial projections on the back of COVID-19. The intensification of the coronavirus outbreak and escalation of measures to contain it are having a strong negative effect on the
This Annual Report has been prepared pursuant to Section 52(1) of the Bank of Namibia
Act (No. 15 of 1997). The report outlines the governance of the Bank of Namibia (hereinafter
referred to as “the Bank”), global and domestic economic and financial developments, the
banking supervision report, the audited annual financial statements and key achievements
of the Bank in 2019.
Message from the Governor Mr Iipumbu Shiimi
3Bank of Namibia Annual Report 2019
economy, so global growth in 2020 is now expected to fall below that of 2019. Further risks to world growth include escalation in the US-China trade tensions, social unrest and geopolitical strains.
In Namibia, real GDP is estimated to have contracted in 2019, after registering mild growth in 2018, mainly due to slower activity in the primary industry and some sectors in the secondary and tertiary industries. Real GDP is estimated to have contracted by 1.1 percent in 2019, from a positive but low growth rate of 0.7 percent in 2018. The dismal performance in 2019 is mainly ascribed to the declines in the mining, agriculture, electricity and water, construction, wholesale and retail trade, and public sectors. Some growth in the manufacturing sector, led by beverage and meat processing, sustained the activity in secondary industry during 2019.
On a positive note for the domestic economy, annual inflation in Namibia continued to decline during 2019, mainly as a result of lower oil prices, coupled with weak economic activity. Annual average inflation for 2019 stood at 3.7 percent, down from 4.3 percent in 2018, and is expected to remain low and manageable during 2020. The lower inflation in 2019 was largely reflected in transport and housing, mainly on account of lower oil prices and weak economic activity leading to a switch in the demand-supply situation in the rental market. Meanwhile, inflation for food rose on average during the period under review, partly due to the poor domestic and regional harvests.
While contracting in 2019, the economy continued to rebalance its external position. Namibia’s current account deficit narrowed further to 2.3 percent of GDP during 2019, down from 2.8 percent in 2018, mainly due to weaker imports and rising commodity exports, partly supported by an increase in SACU receipts. The improvement was mainly ascribed to the shrinking merchandise trade deficit that reflected a modest decline in the import bill and slight increase in export
earnings. This was supported by lower net outflows on the primary income account, coupled with increased SACU receipts. Overall, Namibia’s international investment position recorded a lower net liability in 2019 than in 2018, due to an increase in other foreign assets. Conversely, international reserves declined in nominal terms but remained above adequate levels, recording 4.1 months of import cover at the end of December 2019. In addition, the real effective exchange rate (REER) of the Namibia Dollar depreciated slightly on average during 2019 compared to 2018, a sign of a marginal improvement in external competitiveness.
The Bank of Namibia’s Monetary Policy Committee (MPC) pursued a moderately accommodative but cautious monetary policy stance during 2019, to ensure price stability in the interest of sustainable economic growth. The MPC reduced the repo rate by 25 basis points to 6.50 percent at its August 2019 MPC meeting. The decision was taken to support domestic economic activity and to maintain the one-to-one link between the Namibia Dollar and the South African Rand. Similar trends were also observed in the commercial banks’ rates during the period under review. A further 25 basis points reduction followed in February 2020, taking the repo rate to 6.25 percent. Most recently the MPC at a special meeting held on 20 March 2020 reduced the repo rate by a further 100 basis points to 5.25 percent. This was done to provide support to the economy in the wake of the intensification of the coronavirus pandemic with its associated disruptions to economic activity.
Growth in broad money supply (M2) declined during 2019 while growth in private sector credit extension (PSCE) rose over the same period. Growth in M2 declined to 8.5 percent in 2019, down from 9.1 percent in 2018, in line with the weak economy and the decline in inflation. On the other hand, annual growth in PSCE rose slightly on a yearly basis by 0.5 percentage point to 6.8 percent during 2019. The rise in PSCE was due to a higher uptake of credit by the business sector in the form of other loans and advances
4 Bank of Namibia Annual Report 2019
Message from the GovernorMr Iipumbu Shiimi

and overdraft credit to the manufacturing, services, construction and fishing sectors.
During 2019, the Government of the Republic of Namibia (hereinafter “the Government”) continued to implement fiscal consolidation measures to reduce the budget deficit with the aim of stabilising its public debt ratio. As a result, the overall budget deficit is estimated to have narrowed both in nominal terms and as a ratio to GDP. The 2019/20 Government budget deficit as a percentage of GDP narrowed to 4.4 percent, from 5.2 percent recorded in 2018/19. This was due to an increase in revenue, stemming from higher SACU receipts, supported by the slow pace of growth of government expenditure as fiscal consolidation continued. Total Government debt as a percentage of GDP continued to rise, however, increasing to 50.5 percent at the end of December 2019. While most of the increase in debt as a percentage of GDP compared to previous readings was due to a downward revision in the official estimates of nominal GDP, this was exacerbated by the slow pace of activity in the domestic economy, coupled with the sustained incurrence of primary deficits.
The Bank recorded a significantly higher profit for the year 2019 in comparison to 2018, and paid a record high dividend to the Government. The increase is mainly attributable to improved earnings on the Bank’s Rand investments, enhanced by higher actual average reserves balances, partly as a result of an increase in SACU receipts. In addition, the improved net gains on foreign investments, arising from a decrease in bond yields mirrored by an appreciation of bond prices had a positive impact on the profit. A decrease in total operational expenses also contributed to higher profit. As a result, the Bank declared a record high dividend of N$399.9 million to the State Revenue Fund.
The banking sector remained resilient and sound during 2019, amidst the weakened domestic economy. Capital of banks remained strong during
2019 and supported the balance sheet expansion and risk coverage. The banks’ liquid asset holdings remained adequate to meet near-term obligations. Due to the unfavourable domestic economic conditions, asset quality deteriorated, as the ratio of non-performing loans (NPLs) increased from 3.6 percent of total loans in 2018 to 4.8 percent in 2019. The increase in NPLs was observed in mortgages, overdrafts and other loans and advances.
The Bank continued to fulfil its regulatory mandate as the overseer of the National Payment System (NPS) in 2019. The efficient functioning of the NPS allows for payments to be completed in a safe and timely manner, contributing to overall economic activity. Given its importance, the promotion of a secure, safe and efficient payment system is one of the main pillars of the Bank accomplished through risk-based on-site and off-site oversight activities, as well as policy driven initiatives. The Bank revised two regulations in the NPS, namely the Determination on issuing of Electronic Money in Namibia (PSD-3), as well as the Determination on the Standards for a Basic Bank Account and Cash Deposit Fees within the National Payment System (PSD-5). The revised PSD-3 serves as a medium through which the Bank authorises the issuance of electronic money (e-money) in Namibia, and PSD-5 serves as a financial inclusion tool, where the Bank revised the previously gazetted standards and zero-rated cash deposit fees for all cash deposits on all individual accounts as well as for business accounts that record credits of N$1.3 million or less per annum. The Namibia Interbank Settlement System (NISS) remained resilient throughout the reporting period and maintained a 99.9 percent availability.
During 2019, the Bank continued with targeted interventions for staff members to strengthen the Bank’s Vision of being a centre of excellence. Through these interventions, the Bank continued to inculcate its Vision, Mission and Values by focusing on interpersonal and intergroup communication, as
5Bank of Namibia Annual Report 2019
Message from the GovernorMr Iipumbu Shiimi

well as strengthening relationships through emotional intelligence awareness sessions. Furthermore, the Bank continued to use its performance management system to ensure that a high-performance culture is maintained. In order to enable employees to accomplish the Bank’s mandate as articulated in its Strategic Plan, the Bank continued to invest in various capacity-building initiatives. During 2019, approximately 35 percent of the Bank’s employees were provided with both technical and soft-skills training in various aspects of central banking and related fields. The Bank also continued to run appropriate wellness and safety programmes to impact the staff’s work-life balance, health and safety to ensure a secure and healthy work environment.
As a responsible corporate citizen, the Bank places Corporate Social Responsibility and Investment at the heart of its interactions with stakeholders. With the aim of creating sustainable development opportunities for the greater good of society, the Bank identified general education and the Technical and Vocational Education Training sector as focal areas of its Corporate Social Responsibility and Investment programme. In 2019, the Bank signed a Memorandum of Understanding with the Namibia Training Authority (NTA) to provide assistance of N$4.5 million to support the apprenticeship programme under the NTA over a three-year period (2019–2021). The 50 apprentices who will benefit from the programme will undergo intensive on-the-job training, incorporating theoretical and practical exposure in the areas of agriculture, tourism and auto-mechanics.
The Bank continued with its investment in education by granting bursaries to Namibian learners and providing experiential learning opportunities through its Graduate Accelerated Programme (GAP) and internship programmes. Eleven new undergraduate bursaries and one post-graduate scholarship were awarded to Namibian students to study at recognised institutions within the SADC region, which brought the total number of
undergraduate bursaries to 31 for 2019. GAP trainees completed their programme in August 2019. The programme provides exposure to graduates in the areas of banking, economics and finance with the intention to gain relevant work experience in various aspects of central banking over a period of 18 months. In addition, the Bank took in 14 students from the Namibia University of Science and Technology, University of Namibia, International University of Management and Namibian Institute of Mining and Technology, to do their internship as part of their study programmes.
The Bank places a high value on stakeholder engagement as a means to achieving its strategic objectives. In 2019, the Bank expanded the nature and scope of its interactions with stakeholders by making use of a wide array of communication modes. These modes have allowed the Bank to engage in meaningful dialogue with various stakeholder groups. The dialogues took place within the development and implementation of the Annual Stakeholder Engagement Plan, which is derived from the Stakeholder Identification and Engagement Procedures of the Bank. These engagements enjoy high-level support from all parties involved. The engagement in dialogue on this level afforded the Bank with the opportunity to hear the views of stakeholders on the economy and other policy-related issues.
The Bank made remarkable progress in the establishment of the Namibia Deposit Guarantee Authority. The Authority is established in terms of the Namibia Deposit Guarantee Act and its mandate is to ensure that depositors are protected and fully compensated in the event of the failure of a commercial bank, up to a maximum limit, in an efficient, transparent and speedy manner. The Board of Directors for the Authority was appointed for a period of five years, effective 4 September 2019. All determinations and regulations to enable the Deposit Guarantee Scheme to start functioning were adopted by the Board of Directors and will be gazetted early in 2020.
6 Bank of Namibia Annual Report 2019
Message from the GovernorMr Iipumbu Shiimi

During 2019 the parliamentary process of enacting the new Bank of Namibia Act was concluded. The new Act repeals the Bank of Namibia Act 15 of 1997 and the Bank of Namibia Amendment Act 11 of 2004. The Act was drafted based on consultations between the Ministry of Finance, the Bank, and other stakeholders. Some of the key changes introduced in the Act are that the Bank is explicitly entrusted with the responsibility of macro-prudential oversight through a coordination role in safeguarding financial stability, and the enhancement of the Monetary Policy and the Financial Stability Committees. Furthermore, the accountability mechanism and reporting are enriched through regular reporting on activities of the Bank to the National Assembly at least once a year. The Act was Gazetted in February 2020.
The achievements noted in this report would not have been possible without the invaluable contributions of our staff and Board, and the unwavering support of all our stakeholders. I would like to thank our staff members for their tireless hard work and focus on putting our core Values into practice through innovation, commitment and dedication. Let me also acknowledge the important role played by the members of the Board of the Bank through their independent views and strategic focus on attaining the objectives of the Bank. We would also like to express
our gratitude to the Minister of Finance and his staff for the invaluable support they have extended to the Bank. Our appreciation equally goes to all our stakeholders, who granted their cooperation and provided us with information and data throughout the year, which the Bank used to compile this report and other publications. In the year ahead and as we look to the future, we will continue to be guided by our ethos of hard work and shall continue to be guided by a determination to fulfil the Bank’s Mission through unwavering commitment and dedication to always acting in the public interest. We will strive to fulfil the Bank’s Mission to foster stability, integrity and efficiency of the nation’s monetary, financial and payment systems. In the face of the unique challenges posed by the COVID-19 pandemic and its economic and financial fallout, we will redouble our efforts in this regard, ensuring a quick return to calmer waters.
Iipumbu ShiimiGovernor
7Bank of Namibia Annual Report 2019
Message from the GovernorMr Iipumbu Shiimi

Contents
ORGANISATIONAL STRUCTURE OF THE BANK OF NAMIBIA
MEMBERS OF THE BOARD 11
MANAGEMENT STRUCTURE 13
THE BANK’S SENIOR MANAGEMENT TEAM 14
GOVERNANCE 18
OBJECTIVES AND ACCOUNTABILITY OF THE BANK 18
CORPORATE CHARTER 18
STRATEGIC OBJECTIVES 2017–2021 19
ACCOUNTABILITY 19
THE GOVERNOR 20
THE BOARD OF THE BANK OF NAMIBIA 20
MANAGEMENT STRUCTURES 22
REPORTING OBLIGATIONS 23
COMMUNICATION AND STAKEHOLDER RELATIONS 23
THE YEAR IN REVIEW 30
STRATEGIC OBJECTIVE 1: SAFEGUARD AND ENHANCE FINANCIAL
STABILITY 30
STRATEGIC OBJECTIVE 2: PROMOTE PRICE STABILITY 37
STRATEGIC OBJECTIVE 3: MANAGE RESERVES PRUDENTLY 38
STRATEGIC OBJECTIVE 4: PROVIDE CURRENCY, GOVERNMENT
DEBT ISSUANCE AND BANKING SERVICES 43
STRATEGIC OBJECTIVE 5: PROMOTE A POSITIVE REPUTATION 48
STRATEGIC OBJECTIVE 6: PROMOTE FINANCIAL SECTOR
DEVELOPMENT 55
STRATEGIC OBJECTIVE 7: ENHANCE CONTRIBUTION TOWARDS
SUSTAINABLE ECONOMIC GROWTH 58
STRATEGIC OBJECTIVE 8: OPTIMISE ORGANISATIONAL EFFICIENCY
AND COST-EFFECTIVENESS 65
FIVE YEAR HISTORICAL FINANCIAL OVERVIEW 72
8 Bank of Namibia Annual Report 2019
Part AOperations and Affairs of the Bank

Our Vision Our vision is to be a centre of excellence and
a professional and credible institution
working in the public interest and supporting
the achievement of national economic
development goals.
Our Mission To support economic growth and development in Namibia, we
act as fiscal advisor and banker to the Government;
promote price stability;
manage reserves and currency;
ensure sound financial systems; and
conduct economic research.
Our ValuesWe speak our hearts, we deliver as a team,
we do the right things right, we work smarter,
we value our differences, and
we help each other grow.
9Bank of Namibia Annual Report 2019
Part AOperations and Affairs of the Bank

CorporateBoard Members and Management Team
10 Bank of Namibia Annual Report 2019

Mr Iipumbu W Shimi
POSITION HELD• Governor of the Bank of Namibia• Chairperson and Executive Member
of the Board
TERM• Incumbent since 26 March 2010• Previous term ended 31 December
2016• Current term ended 23 March 2020
POSITION HELD• Deputy Governor of the Bank of
Namibia• Executive Member of the Board
TERM• Incumbent since 1 January 2012• Previous term ended 31 December
2016• Renewed until 31 December 2021
POSITION HELD• Ex Officio Member of the Board• Executive Director of the Ministry
of Finance
TERM• Incumbent since 3 April 2010
POSITION HELD• Non-executive Member of the Board• Member of the Audit Committee• Member of the Remuneration
Committee
TERM• Incumbent since 30 May 2012• Current term ends 31 January 2024
QUALIFICATIONS• MSc Financial Economics (UL)• P/G Diploma Economic Principles (UL)• Diploma in Foreign Trade and
Management (MSM)• Hons. Economics (UWC)• BComm Economics and Accounting
(UWC)• Specialised training in Management
Development Programme, Economicsand Finance (US & Wits)
• Advanced Management Program,Harvard Business School
QUALIFICATIONS• MSc Economic Policy Analysis (AAU)• BEcon (UNAM)• Advanced Management Program
(Harvard Business School)• Senior Executive Fellow (Harvard-KSG)• Senior Management Programme
(USB)• Project Management Programme
(USB)
QUALIFICATIONS• MSc Ed (Mathematics)• MSc Biostatistics• MSc in Leadership and Change
Management• Dip. in Accounting and Finance
QUALIFICATIONS• MBA (Cum Laude) (US)• LLB (US)
YEARS OF EXPERIENCE25
EXPERTISE• Economic policy research• Macroeconomics• Central banking• Development policy• Leadership and corporate
governance
YEARS OF EXPERIENCE23
EXPERTISE• Economic policy research• Central banking• Public policy• Leadership and corporate
governance
YEARS OF EXPERIENCE23
EXPERTISE• Accounting• Finance• Public policy• Governance
YEARS OF EXPERIENCE16
EXPERTISE• Commercial and related
litigation• Arbitration• Leadership development• Corporate governance
Mr Ebson Uanguta
Ms Ericah Shafudah
Adv. Charmaine van der Westhuisen
Members of the Board As at 31 December 2019
11Bank of Namibia Annual Report 2019
CorporateMembers of the Board

POSITION HELD• Non-executive Member of the Board• Chairperson of the Audit Committee• Member of the IT Governance
Committee
TERM• Incumbent since 01 February 2019• Current term ends 31 January 2024
POSITION HELD• Non-Executive member of the Board• Member of the Audit Committee• Chairperson of the Remuneration
Committee• Member of the IT Governance
Committee
TERM• Incumbent since 01 February 2019• Current term ends 31 January 2024
QUALIFICATIONS• Chartered Accountant (Nam, SA)• MBA (University of Stellenbosch, SA)• Hons. Bachelor of Commerce (UWC,
SA)• Bachelor of Commerce (UNAM)
QUALIFICATIONS• MSc Economics (A &T State University,
North Carolina, US)• BSc Economics (A &T State University,
North Carolina, US)• Economic Analysis of Structural
Adjustments (Word Bank)• Financial Programming and Analysis (IMF)• Senior Management Programme
(University of Stellenbosch)• Advanced Course for Research
Economists (Switzerland)• Risk Management Training (Intuition Web)
YEARS OF EXPERIENCE26
EXPERTISE• Financial management• Risk management
YEARS OF EXPERIENCE28
EXPERTISE• Risk management• Economic policy research• Currency management• Banking regulation
Mr Fanuel Tjivau
Mr Ehrenfried Meroro
POSITION HELD• Non-executive Member of the Board• Member of the Remuneration
Committee
TERM• Incumbent since 18 July 2014• Current term ends 31 December 2023
POSITION HELD• Non-Executive Member of the Board• Chairperson of the IT Governance
Committee
TERM• Incumbent since 01 February 2019• Current term ends 31 January 2024
QUALIFICATIONS• MBA Corporate Strategy and Economic
Policy (MSM)• Diploma in Personnel Management
(PoN)• Specialised training in Senior Management
Development Programme (US),• Project Management Estara Skills
Development (Bloemfontein SA/NIPAM)• Driving Government Performance
(Harvard-KSG)• Leadership, Innovation, and Change
Management (US/ NIPAM)
QUALIFICATIONS• MSc Information Systems Engineering
(University of Manchester, UK)• BSc Computer Science and
Mathematics (UNAM)
YEARS OF EXPERIENCE27
EXPERTISE• Strategic human resources
management• Training and development• Course facilitation• Strategic planning• Policy formulation• Performance management
YEARS OF EXPERIENCE25
EXPERTISE• Leadership• Information technology
Ms E. Shangeelao Tuyakula Haipinge
Mr Apollus Christiaan Baisako
Members of the Board As at 31 December 2019
12 Bank of Namibia Annual Report 2019
CorporateMembers of the Board

Director: Exchange Control & Legal Services
Bryan Eiseb
Director of Information Technology
Marsorry Ickua
GovernorIipumbu Shiimi
Deputy GovernorEbson Uanguta
Director of Banking Supervision
Romeo Nel
Director of Banking Services
Sam SHIVUTE
Director of Finance & Administration
Johanna Iiyambula
Director of Payment and Settlement Systems
Barbara Dreyer
Technical Advisor to the Governor
Emile van Zyl
Head of Risk Management and Assurance
Magreth Tjongarero
Senior Advisor to the Governor
Kuruvilla Mathew
Director of Financial Markets
Nicholas Mukasa
Director of Strategic Comm. & Financial Sector Development
Emma Haiyambo
Director of Human Resources
Lea Namoloh
Director of Financial Intelligence Centre
Leonie Dunn
Director of Research & Financial Stability
Florette Nakusera
Management Structure As at 31 December 2019
13Bank of Namibia Annual Report 2019
CorporateManagement Structure

14 Bank of Namibia Annual Report 2019
Management Team
POSITION HELD• Governor of the Bank of Namibia• (Monetary Policy Committee (MPC)
member)
YEARS OF EXPERIENCE25
POSITION HELD• Deputy Governor of the Bank of
Namibia• (MPC member)
YEARS OF EXPERIENCE23
POSITION HELD• Director: Research and Financial
Stability• (MPC member)
YEARS OF EXPERIENCE21
POSITION HELD• Technical Advisor to the Governor• (MPC member)
YEARS OF EXPERIENCE35
QUALIFICATIONS• MSc Financial Economics (UL)• P/G Diploma Economic Principles (UL)• Diploma Foreign Trade and Management
(MSM)• Hons Economics (UWC)• BComm Economics and Accounting (UWC)• Specialised Training in Management
Development Programme, Economics andFinance (US & Wits)
• Advanced Management Program, HarvardBusiness School
QUALIFICATIONS• MSc Economic Policy Analysis (AAU)• BEcon (UNAM)• Advanced Management Program
(Harvard Business School)• Senior Executive Fellow (Harvard-KSG)• Senior Management Programme (USB)• Project Management Programme (USB)
QUALIFICATIONS• MComm Economics (US)• Hons BComm Economics (US)• BComm with majors in Economics,
Management Science and Auditing(UNAM)
• Executive Development Programme(EDP) (USB)
• International Executive DevelopmentProgramme (IEDP) (WBS/LBS)
QUALIFICATIONS• MComm Economics (UP)
EXPERTISE• Economic policy research• Macroeconomics• Central banking• Development policy• Leadership and corporate
governance
EXPERTISE• Economic policy research• Central banking• Public policy• Leadership and corporate
governance
EXPERTISE• Macroeconomic policy• Economic research and
statistics• Central banking• Finance• Strategic management• Leadership and corporate
governance• Environmental economics
and policy
EXPERTISE• Economics• Banking• Financial markets
Mr Iipumbu W Shiimi
Mr Ebson Uanguta
Ms Florette Nakusera
Mr Emile Van Zyl
As at 31 December 2019
CorporateManagement Team

15Bank of Namibia Annual Report 2019
Management Team
POSITION HELDSenior Advisor to the Governor
YEARS OF EXPERIENCE30
POSITION HELDDirector: Human Resources
YEARS OF EXPERIENCE26
POSITION HELDDirector: Banking Supervision
YEARS OF EXPERIENCE27
POSITION HELDDirector: Financial Intelligence Centre
YEARS OF EXPERIENCE21
QUALIFICATIONS• MSc Accounting (University of
Glamorgan, UK)• Chartered Certified Accountant
(FCCA, UK)• International Executive Development
Programme (WBS/LBS)
QUALIFICATIONS• MBA (Maastricht University),
Netherlands• MEd (UNAM)• BEd (Honours), Bristol UK• International Executive Development
Programme (Wits)• Diploma TEFL, University of
Edinburgh• Certificate Board of Director, Univ. Of
Stellenbosch
QUALIFICATIONS• M Banking (UL)• BEcon (UNAM)• P/G Intermediate Certificate
Accountancy (UKZN)• International Executive Development
Programme (WBS/LBS)
QUALIFICATIONS• LLM cum laude (UNICAF)• LLB (US)• BA Law (US)• Admitted Legal Practitioner of the High
Court and the Supreme Court of Namibia• Women in Leadership Development
USA• International Executive• Development Programme• (WBS/LBS)• International Leaders Programme• (HMFCO UK)
EXPERTISE• Financial management• Management accounting• Financial reporting• Procurement• Facilities and asset
management
EXPERTISE• Human resources
management• Project management• Currency management• Banking services• Strategic leadership
EXPERTISE• Customs and excise• Finance• Banking regulation• Risk management
EXPERTISE• Commercial and criminal law• Financial services regulation• Financial market integrity• Policy and legislative
development and implementation• Anti-money laundering CFT/
CPF compliance, monitoring,supervision, administrativeenforcement and strategicanalyses establishment
• Financial intelligence unitstrategic leadership
Mr Kuruvilla Mathew
Ms Lea Namoloh
Mr Romeo Nel
Ms Leonie Dunn
As at 31 December 2019
CorporateManagement Team

16 Bank of Namibia Annual Report 2019
POSITION HELD• Director: Financial Markets• (MPC member)
YEARS OF EXPERIENCE17
POSITION HELDDirector: Information Technology
YEARS OF EXPERIENCE19
POSITION HELD• Director: Strategic
Communication andFinancial SectorDevelopment
• (MPC member)
YEARS OF EXPERIENCE23
POSITION HELDDirector: Payment and Settlement Systems
YEARS OF EXPERIENCE27
QUALIFICATIONS• BBA (UNAM)• Chartered Financial Analyst• Senior Management Development
Programme (SMDP) (USB)
QUALIFICATIONS• MSc Information Systems Management
(ULIV, UK)• Diploma PC Support (BCC, SA)• Diploma Business Computing (SA)• Management Development Programme
(USB)• International Executive Development
Programme (WBS/LBS)Programme (WBS/LBS)
QUALIFICATIONS• PhD Development Finance (US)• MSc Financial Economics (UL)• M International Business (PoN)• P/G Diploma in Financial Economics (UL)• BEcon (UNAM)• Diploma in Public Administration (TN)• Fellow at the Fletcher School Leadership Program for
Financial Inclusion (2017), Tufts University, Boston, MA• Certified Expert in Financial Inclusion Policy (Frankfurt
School of Finance and Management)• International Executive Development Programme
(WBS/LBS)• Management Development Programme (USB)
QUALIFICATIONS• MBA (SMC University)• MEd (State University of New York –
Buffalo)• BA Hons and BEd (UWC)• P/G Diploma Social Science Research
Methods (US)• P/G Diploma Higher Education (UWC)• Fellow at the Fletcher School Leadership
Program for Financial Inclusion (2013)(Tufts University, Boston, MA)
• International Executive DevelopmentProgramme (Wits, LBS)
EXPERTISE• Portfolio management• Financial analysis• Asset valuation• Capital markets• Reserves management• Risk management
EXPERTISE• Information technology, strategy and
governance• Technology innovation• Programme management• Information technology security
management• Resource planning and IT risk• Disaster recovery and business
continuity management
EXPERTISE• Macroeconomic research
and statistics• Financial sector
development• Development finance• Project management• Strategic planning and
management• Corporate governance
EXPERTISE• Payment systems strategy• Payment systems risk management• Payment system policy and regulation
development and implementation• Corporate governance• Human resources management
strategy• Remuneration strategy and organisation
development• Strategic management and leadership• Knowledge management• Organisation learning
Mr Nicholas Mukasa
Mr Marsorry Ickua
Dr Emma Haiyambo
Ms Barbara Dreyer
Management Team As at 31 December 2019
CorporateManagement Team

17Bank of Namibia Annual Report 2019
POSITION HELDDirector: Banking Services
YEARS OF EXPERIENCE24
POSITION HELDDirector: Finance and Administration
YEARS OF EXPERIENCE19
POSITION HELDDirector: Exchange Control and Legal Services
YEARS OF EXPERIENCE30
POSITION HELDHead: Risk Management and Assurance
YEARS OF EXPERIENCE19
QUALIFICATIONS• LLM International Finance and Banking
Law (ULIV, UK)• LLB (Hons) and B. Juris (UNAM)• BTech Policing (TUOT)• National Diploma Police Science (PoN)• Transformational Coaching Diploma
(Animas- UK)• International Executive Development
Programme (WBS/LBS)• Management Development Programme
(SBS)
QUALIFICATIONS• Bachelor of Accounting (UNAM)• B Compt (Honours) CTA (UNISA)• Qualified Chartered Accountant (ICAN &
SAICA)• Management Development Programme
(USB)
QUALIFICATIONS• LLM Corporate Law (UNISA)• LLB (Hons) & B. Juris (UNAM)• Admitted Legal Practitioner of the High
Court of Namibia• National Diploma in Police Science• Senior Management Programme
(USB-ED)• International Executive Development
Programme (WBS/LBS)• Central Bank Governance (Deutsche
Bundesbank)
QUALIFICATIONS• BAcc (UNAM)• International Executive Development
Programme (WBS/LBS)• ISO22301:2012 Business Continuity
Management Systems: LeadImplementer
EXPERTISE• Currency management• Criminal investigation• Security management• Tax law• Transfer pricing• Corporate governance• Transformational coaching• Public speaking
EXPERTISE• Financial accounting and reporting
(IFRS)• Management accounting• Financial management• Auditing• Indirect tax (VAT)
EXPERTISE• Corporate law• Banking law• Corporate governance• Criminal investigations• Corporate security management• Exchange control administration
EXPERTISE• Auditing• Credit risk auditing• Risk management• Business continuity
Mr Sam Shivute
Ms Johanna Iiyambula
Mr Bryan Eiseb
Ms Magreth Tjongarero
Management Team As at 31 December 2019
CorporateManagement Team

18 Bank of Namibia Annual Report 2019
GOVERNANCE
OBJECTIVES AND ACCOUNTABILITY OF THE BANKThe Bank of Namibia is the central bank of the Republic of Namibia, created under Article 128(1) of the Namibian Constitution. The Constitution mandates the Bank of Namibia (“the Bank”) to serve as the principal instrument of the Government of the Republic of Namibia (“the Government”) to control money supply, the currency and banking institutions and any other financial institutions. The objectives of the Bank as defined in the Bank of Namibia Act (No. 15 of 1997), as amended, are, inter alia:
• to promote and maintain a sound monetary,credit and financial system in Namibia andsustain the liquidity, solvency, and functioningof that system;
• to promote and maintain internal and externalmonetary stability and an efficient paymentsmechanism;
• to foster monetary, credit and financialconditions that are conducive to theorderly, balanced and sustained economicdevelopment of Namibia;
• to serve as the Government’s banker, financialadvisor and fiscal agent; and
• to assist in the attainment of national economic goals.
In addition, the Bank fulfils other key functions as defined in other Acts, including:
• the Banking Institutions Act (No. 2 of 1998),as amended, which empowers the Bank tosupervise banking institutions;
• the Payment System Management Act (No.18 of 2003), as amended, which provides forthe management, administration, operation,regulation, oversight and supervision ofpayment, clearing and settlement systems inNamibia, as well as for incidental matters;
• the Financial Intelligence Act (No. 13 of 2012),as amended, which obliges the Bank to
provide administrative services to the Financial Intelligence Centre of the Republic of Namibia;
• the Currency and Exchanges Act, 1933(No.9 of 1933), as amended, which regulatesexchange control in Namibia; and
• the Deposit Guarantee Act, 2018 (No. 16of 2018), which obliges the Bank to providecertain administrative and support services tothe Deposit Guarantee Authority.
In line with section 3(b) of the Bank of Namibia Act, the Bank performs its functions independently, subject to regular consultation with the Minister of Finance. The relationship between the Government, as a shareholder, and the Bank is broadly defined in the Act. The Bank’s specific obligations are clearly defined in a Memorandum of Understanding entered into between the Ministry of Finance and the Bank. The Memorandum covers the terms and conditions of banking services rendered to the Government, public debt management arrangements, and the nature and frequency of consultations. The Minister of Finance and the Governor of the Bank of Namibia also hold regular consultations on relevant matters.
During 2019 the parliamentary process of enacting the new Bank of Namibia Act was concluded. The new Act repeals the Bank of Namibia Act 15 of 1997 and the Bank of Namibia Amendment Act 11 of 2004. The Act was drafted based on consultations between the Ministry of Finance, the Bank, and other stakeholders. Some of the key changes introduced in the Act are that the Bank is explicitly entrusted with the responsibility of macro-prudential oversight through a coordination role in safeguarding financial stability, the once enhancement of the Monetary Policy and the Financial Stability Committees. Furthermore, the accountability mechanism and reporting are enriched through regular reporting on activities of the Bank to the National Assembly at least once a year. The Act was Gazetted in February 2020.
CORPORATE CHARTERApart from its statutory mandate, the Bank’s actions and the way it carries out its mandate are guided by its Mission Statement and Vision
Statement as detailed in its Corporate Charter. The Bank’s Vision portrays the desired state of the Bank in terms of how the institution would like to carry
Part AOperations and Affairs of the Bank

19Bank of Namibia Annual Report 2019
out its Mission. The Mission defines the fundamental purpose of the Bank and describes why it exists and the importance of achieving the Vision. The Bank’s Values express the essence of the culture and beliefs that are shared among the stakeholders of the Bank. The Values drive the Bank’s culture and articulate the code of conduct that guides the Bank in mobilising all
its resources in pursuit of its Mission and Vision. All the Bank’s stakeholders are expected to conform to and identify with these standards and principles relating to ethical behaviour and excellence. The Charter strives to promote a sense of shared expectations among all levels and generations of employees regarding the Mission, the Vision, and standards of ethical behaviour.
STRATEGIC OBJECTIVES 2017–2021The Bank’s Strategic Objectives are linked to its Mission and functional priorities. Eight principal objectives were derived from the Mission and Vision and reflect the Bank’s desire to meet its statutory mandate. The Strategic Objectives essentially refer to what the Bank aspires to achieve. The Strategic Objectives are to:
1. safeguard and enhance financial stability;2. promote price stability;3. manage reserves prudently;4. provide currency, Government debt issuance and
banking services;5. promote a positive reputation;6. promote financial sector development;7. enhance the Bank’s contribution towards
sustainable economic growth; and8. optimise organisational efficiency and cost-
effectiveness.
Measurable strategies are designed with clear outcomes in order to achieve the eight Strategic
Objectives. Thus, to ensure successful Strategic Plan implementation, the Strategic Objectives have been transformed into areas of concentration with clear, measurable targets. The Directors of the various departments report biannually on progress in their areas of concentration and the achievement of their targets. The entire Strategic Plan is reviewed and refreshed annually. It is therefore important not only to design strategies that can be engaged in pursuit of these objectives, but also to clearly describe the strategic outcomes that would reveal whether or not a particular objective has been met.
To promote ownership of the Strategic Plan and to attain performance excellence, the Areas of concentrations are rolled out across the board through a Performance Management System. Individual performance goals are crafted for each employee, and performance progress is evaluated by means of performance appraisals. The section titled “The Year in Review” in this report explains the activities and progress under each of the eight Strategic Objectives during the review period.
ACCOUNTABILITYThe Bank is committed to good governance practices and accountability to the public. It is of paramount importance that the Bank always remains accountable to the public at large by adhering to sound corporate governance principles. Relevant legislation and the Bank’s Corporate Charter and Strategic Plan are some of the tools that guide the Bank in living up to the standards of good governance. The Bank also strives to be transparent by putting in place a concrete communication strategy that enables the open and clear expression of why and how the Bank does what it does. The aspects of good governance that the Bank is committed to meeting include:
• being responsible, respected, trustworthy andcredible;
• being accountable to the Bank’s shareholders andthe Namibian people;
• demonstrating an exceptionally high degree ofintegrity;
• ensuring that the Bank’s actions and policies areefficient, effective and transparent;
• maintaining professionalism and excellence in thedelivery of its services; and
• being flexible and forward-looking in its approach,while still avoiding undue risks.
Part AOperations and Affairs of the Bank
20 Bank of Namibia Annual Report 2019
THE GOVERNORThe Governor serves the Bank of Namibia as its Chief Executive Officer and is accountable to the Board for the management of the Bank and the implementation of its policies. The Governor also represents the Bank in its relations with the Government and other institutions. In most other matters, comprehensive and Board-approved delegations
of power are in place to enable the Governor and his delegates to carry out their duties related to the implementation of policies. The Governor is appointed for a five-year term. The Act sets specific criteria for the appointment, reappointment and dismissal of a Governor.
THE BOARD OF THE BANK OF NAMIBIAThe Board is responsible for the policies, internal controls, risk management and general administration of the Bank. In addition to their typical fiduciary duties, Board members are also charged with many high-level responsibilities directly related to the policies and operations of the Bank, including approving the licensing of banking institutions and ensuring the prudent management of international reserves. In addition, the Board is responsible for approving the Bank’s financial statements and annual budget, promoting effective corporate governance practices, and monitoring internal controls and risk management frameworks.
The Bank’s Board members are appointed by the President of the Republic of Namibia; there are eight Board members: two executive members,
one ex officio member (non-executive), and a further five non-executive members. The Governor (Chairperson) and the Deputy Governor are the executive members, while the Executive Director of the Ministry of Finance is the ex officio member. The rest of the non-executive members are one staff member from the public service, and four other persons with divergent portfolios.
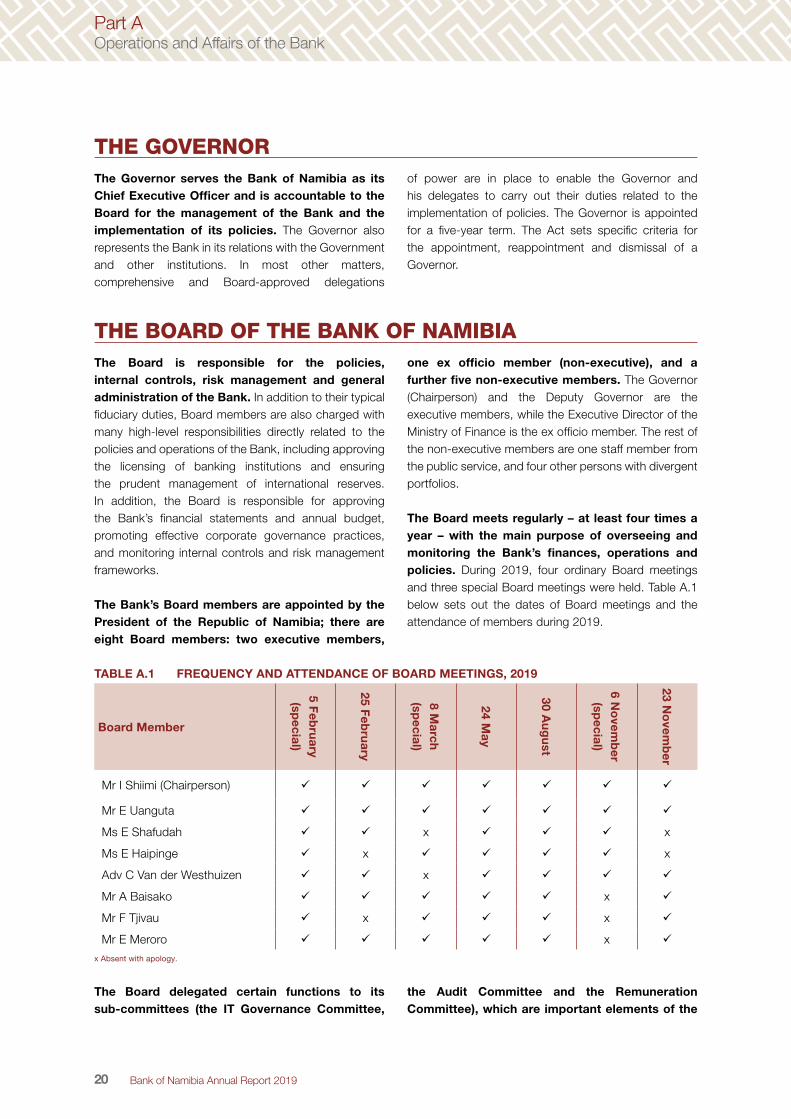
The Board meets regularly – at least four times a year – with the main purpose of overseeing and monitoring the Bank’s finances, operations and policies. During 2019, four ordinary Board meetings and three special Board meetings were held. Table A.1 below sets out the dates of Board meetings and the attendance of members during 2019.
TABLE A.1 FREQUENCY AND ATTENDANCE OF BOARD MEETINGS, 2019
Board Member
5 Feb
ruary
(special)
25 Feb
ruary
8 March
(special)
24 May
30 Au
gu
st
6 No
vemb
er (sp
ecial)
23 No
vemb
er
Mr I Shiimi (Chairperson)
Mr E Uanguta
Ms E Shafudah x x
Ms E Haipinge x x
Adv C Van der Westhuizen x
Mr A Baisako x
Mr F Tjivau x x
Mr E Meroro x
x Absent with apology.
The Board delegated certain functions to its sub-committees (the IT Governance Committee,
the Audit Committee and the Remuneration Committee), which are important elements of the
Part AOperations and Affairs of the Bank

21Bank of Namibia Annual Report 2019
governance structure. All three sub-committees have been established through formal terms of reference and report to the Board. The Board can assure stakeholders that the sub-committees held several meetings during the period under review and that they met their respective obligations in all material respects.
The IT Governance Committee was established to assist the Board in discharging IT-related duties and responsibilities. The purpose of the committee is
to provide a strategic oversight role in order to ensure alignment of the IT strategy with the Bank’s strategy through the approval, prioritisation and monitoring of strategic IT projects and initiatives for value creation, risk mitigation and resources assessments. This Committee consists of three non-executive Board members and its meetings are held quarterly. The dates of the IT Governance Committee meetings and the attendance of members during 2019 are set out in Table A.2.
TABLE A.2 DATES AND ATTENDANCE OF IT GOVERNANCE COMMITTEE MEETINGS, 2019
It Governance Committee Member 14 May 22 August 14 November
Mr C Baisako (Chairperson) ü ü ü
Mr E Meroro ü ü ü
Mr F Tjivau ü x ü
x Absent with apology.
The Audit Committee is responsible for evaluating the adequacy and efficiency of the Bank’s corporate governance practices, including its internal control systems, risk control measures, accounting standards and auditing processes. The independence of the Board committees is paramount. Three non-executive Board members currently serve as members of the Audit Committee, whose meetings are also attended by the Bank’s Deputy Governor and Head of Risk Management and Assurance, the external auditors, and relevant staff members. In general, the
Audit Committee is responsible for considering all audit plans as well as the scope of external and internal audits in order to ensure that the coordination of audit efforts is optimised. The Audit Committee is also required to introduce measures to enhance the credibility and objectivity of financial statements and reports prepared regarding the affairs of the Bank, and to enhance the Bank’s corporate governance, with emphasis on the principles of accountability and transparency. Table A.3 below sets out the dates of Audit Committee meetings and the attendance of members during 2019.
TABLE A.3 DATES AND ATTENDANCE OF AUDIT COMMITTEE MEETINGS, 2019
Audit Committee Member 20 February 17 May 23 August 15 November
Mr F Tjivau (Chairperson) x ü ü ü
Mr E Meroro ü ü ü ü
Adv C Van der Westhuizen ü ü x ü
x Absent with apology.
The Remuneration Committee is responsible for overseeing and coordinating the Bank’s remuneration policy and strategy to ensure its competitiveness and comprehensiveness, in order to attract and retain quality staff and Board
members. This Committee consists of three non-executive Board members and the Deputy Governor. The dates of the Remuneration Committee meetings and the attendance of members during 2019 are set out in Table A.4.
TABLE A.4 DATES AND ATTENDANCE OF REMUNERATION COMMITTEE MEETINGS, 2019
Remuneration Committee Member 21 August 13 November
Mr E Meroro (Chairperson) ü ü
Ms T Haipinge ü ü
Adv C van der Westhuizen ü ü
Part AOperations and Affairs of the Bank

22 Bank of Namibia Annual Report 2019
MANAGEMENT STRUCTURESThe Bank’s Senior Management Team consists of the Governor, the Deputy Governor, the Advisor(s) to the Governor, and the Directors of the Bank’s various departments, as outlined above. The positions of Governor and Deputy Governor are required by law. To ensure that the Bank implements its policies effectively, various committees have been created. These are the Monetary Policy Committee, the Financial System Stability Committee, the Management Committee, the Investment Committee, the Risk Management Committee, the Innovation and Efficiency Committee, the Budget Committee, the Tender Committee and the Information Technology Management Committee.
The function of the Monetary Policy Committee is to implement an appropriate monetary policy stance. The Bank’s Monetary Policy Committee (MPC) consists of the Governor (Chair), the Deputy Governor, the Technical Advisor to the Governor, the Director of Research and Financial Stability Department, the Director of Financial Markets, the Director of Strategic Communications and Financial Sector Development, and the Technical Expert in the Research and Financial Stability Department. The MPC meets every second month to deliberate on an appropriate monetary policy stance to be implemented by the Bank in the two-month period that follows. The monetary policy decision is communicated to the public through a media statement delivered at a media conference. Decision-making at the MPC is by consensus.
The Financial System Stability Committee assesses the vulnerability and risk exposure of the entire financial system. The Financial System Stability Committee is an inter-agency body set up between the Bank and the Namibia Financial Institutions Supervisory Authority (NAMFISA), with the Ministry of Finance as an observer. The chairpersonship alternates every second year between the Bank’s Deputy Governor and NAMFISA’s Deputy Chief Executive Officer: Prudential Supervision. The Committee, which is currently chaired by the Deputy Governor, consists of representatives from these institutions and meets on a quarterly basis to assess the potential risks that apply to the financial system as a whole, and to discuss and recommend appropriate policy measures to address such risks.
The Management Committee is responsible for reviewing the Bank’s policies on financial and other administrative matters. In addition, the Committee is responsible for reviewing and approving policies
relating to regulations and determinations resulting from the regulatory duties of the Bank. The Management Committee consists of the Governor (Chair), Deputy Governor, Advisor(s) to the Governor, all Directors, and the Head of Risk Management and Assurance. The Management Committee meets every second week.
The Investment Committee is responsible for reviewing the management of Namibia’s foreign exchange reserves. While the Board approves the International Reserves Management Policy, the Investment Committee reviews the investment guidelines for final approval by the Governor. The Investment Committee is also expected to ensure that investments comply with approved policy. The Investment Committee consists of the Governor (Chair), Deputy Governor, Advisor(s) to the Governor, the Director of Financial Markets, the Director of Research and Financial Stability, the Director of Strategic Communications and Financial Sector Development, and the Director of Finance and Administration.
The role of the Risk Management Committee is to assist the Audit Committee to ensure that the Bank has implemented an effective risk management policy. The committee also supports the annual workplan that will enhance the Bank’s ability to achieve its strategic objectives and ensure that disclosure regarding risks is comprehensive, timely and relevant. The committee consists of all members of the Management Committee and is chaired by the Governor or the Deputy Governor. Its meetings are held on a quarterly basis before the Audit Committee meetings.
The Innovation and Efficiency Committee is responsible for stimulating critical thinking, which should then lead to the formulation of innovative business processes and business systems and result in efficiency gains and the curtailment of costs. The Committee also places great importance on environmentally sustainable initiatives so that environmental ecosystems are safeguarded and the Bank’s contribution to the national carbon emission footprint is noticeably reduced, with such reduction being consistently maintained in the future. The Committee membership is predominantly Directors from various Departments in the Bank; given its strategic importance, it is chaired by the Deputy Governor.
The function of the Budget Committee is to oversee the budget deliberations of the Bank. The Budget Committee meets as part of the normal
Part AOperations and Affairs of the Bank

23Bank of Namibia Annual Report 2019
annual budget process of determining and providing for the Bank’s expenditures (both recurrent and capital) to be incurred in the execution of its functions and responsibilities. Each department presents and defends anticipated annual budgetary allocations before the Budget Committee. The Budget Committee consists of the Governor, the Deputy Governor, and the Director and senior staff members of the Finance and Administration Department, which also provides administrative and support services. The Budget Committee is chaired by the Governor. One representative each from the Employee Liaison Forum (ELF) and the employees’ bargaining union are permitted to attend and participate in the budget deliberations to ensure transparency.
The Tender Committee is responsible for ensuring sustainable, ethical, transparent and cost-effective procurement and tendering of the Bank’s assets, goods and services. In so doing, the Committee takes into consideration the following:• quality of the product/service;
• cost/price;• reliability of suppliers;• delivery time and after-sales service support; and• Black Economic Empowerment/Previously
Disadvantaged Namibian where applicable.• Support to SMEs
The Information Technology Management Committee facilitates the development of IT strategies and plans that ensure cost effective application and management of IT systems and resources in the Bank. The Committee monitors the implementation of significant IT projects and initiatives to ensure the Bank gets maximum value from IT investments, practices and services. The Committee consists of the Governor (Chair), Deputy Governor, Advisor(s) to the Governor, all Directors, and the Head of Risk Management and Assurance. The IT Management Committee meets at least four (4) times per calendar year before the Board subcommittee (ITGC) meetings to provide strategic advice and recommendations.
REPORTING OBLIGATIONSThe Bank of Namibia Act requires the Bank to submit various reports to the Minister of Finance. The requirement includes the obligation to submit a copy of the Bank’s Annual Report to the Minister of Finance within three months of the end of each financial year. The Minister, in turn, is required to table the Annual Report in the National Assembly within 30
days of receiving it. The Report is obliged to contain the Bank’s annual accounts, certified by external auditors, information about the Bank’s operations and affairs, and information about the state of the economy. Apart from the Annual Report, the Bank submits a monthly balance sheet to the Minister of Finance, which is also published in the Government Gazette.
COMMUNICATION AND STAKEHOLDER RELATIONSThe Bank values stakeholder engagement that ensures the active participation of key stakeholders in exploring options and finding viable solutions to economic challenges in Namibia, within the policy mandate of the Bank. The Bank upholds the values of transparency and open communication, and thus seeks to create platforms to engage stakeholders in an active and open dialogue. This is done through the development and implementation of the Annual Stakeholder Engagement Plan, which is derived from the Stakeholder Identification and Engagement Procedures of the Bank. These engagements enjoy high-level support and are facilitated by the Governor. Some of the engagements held during the review period are outlined in the following paragraph.
The Bank hosted the Deutsche Bundesbank President, Dr Jens Weidmann, and its Executive Board Member, Mr. Buckhard Balz, on two separate occasions during the year under review. The President of the Deutsche Bundesbank and the Executive Board Member visited the Bank of Namibia in February 2019 and October 2019. The visits to Namibia by the two central bankers renewed the bilateral relationship that exists between the Bank and the Deutsche Bundesbank, and the parties explored new areas of further potential cooperation. During the two visits, constructive engagements took place with relevant stakeholders, namely the President of the Republic of Namibia, the Minister of Finance, and the Bank of Namibia Management Committee, while site visits to the operations of the Namibia Diamond Trading Company, and tourism establishments rounded off the engagements.
Part AOperations and Affairs of the Bank

24 Bank of Namibia Annual Report 2019
Dr Jens Weidmann (President: Deutsche Bundesbank) and Governor Iipumbu Shiimi (seated) photographed together with members of the Management Committee of the Bank of Namibia, and Ms Jens Kilp, (former representative of the Deutsche Bundesbank in South Africa), third
from the left
Mr. Buckhard Balz (Member of the Executive Board: Deutsche Bundesbank), Mrs Ellen Gölz (Charge d’Affaires: German Embassy in Windhoek), and Governor Iipumbu Shiimi (seated) pose
with members of the Management Committee of the Bank
Part AOperations and Affairs of the Bank

25Bank of Namibia Annual Report 2019
The Governor of the Bank was invited by the Speaker of the National Assembly to engage Members of Parliament (MPs) on economic matters. The Governor met with lawmakers and shared information on domestic, regional and global economic developments as well as on the general operations of the central bank. During the meeting, views were exchanged on how to navigate through and mitigate challenges facing the domestic economy. Among other topics,
discussions centred on access to finance, investment in agriculture, tourism and housing as enablers of growth, and avenues to raise government revenue. The Governor undertook to make these presentations a regular feature to ensure that lawmakers have access to relevant economic information to enhance their oversight function provided for in the Constitution.
Members of Parliament paying close attention to Mr Shiimi facilitating a presentation hosted by the Speaker of the National Assembly, Professor Peter Katjavivi
The Bank hosted its 20th Annual Symposium on 19 September 2019, under the theme: Escaping the middle-income trap: A perspective from Namibia. The selection of the theme was informed by the disappointing economic growth recorded in Namibia since 2016 that has given rise to the notion that Namibia might be in a middle-income trap, in other words a situation where per capita income lingers in the middle-income range for a protracted period instead of rising into the higher-income category. The 20th Annual Symposium sought to achieve the following objectives:
a) to assess whether Namibia is potentially in a middle-income trap;
b) to look for growth-enhancing strategies; andc) to learn from what countries who were in a middle-
income trap have done to increase their growth, thereby moving to a higher income category.
These issues were addressed through presentations given by local and international speakers, supplemented by the discussions of
panel members drawn from the private sector and the Government. The following papers were presented to provide context to the discussions:• Is Namibia in a middle-income trap? A comparative
analysis;• Escaping the middle–income trap: International
experiences; and• Notes on the middle-income trap and how Namibia
could avoid it.
Delegates who attended the event were drawn from the public and private sectors, and included academics, researchers and policymakers, and youth representatives. At the Government executive level, the Prime Minister of the Republic of Namibia, who was also the keynote speaker, attended the full duration of the symposium, joined by some Ministers, other members of the legislature, and captains of industry. The attendees’ evaluation of the event was positive, with 97 percent of respondents concluding that they had a “very good” overall experience.
Part AOperations and Affairs of the Bank
26 Bank of Namibia Annual Report 2019
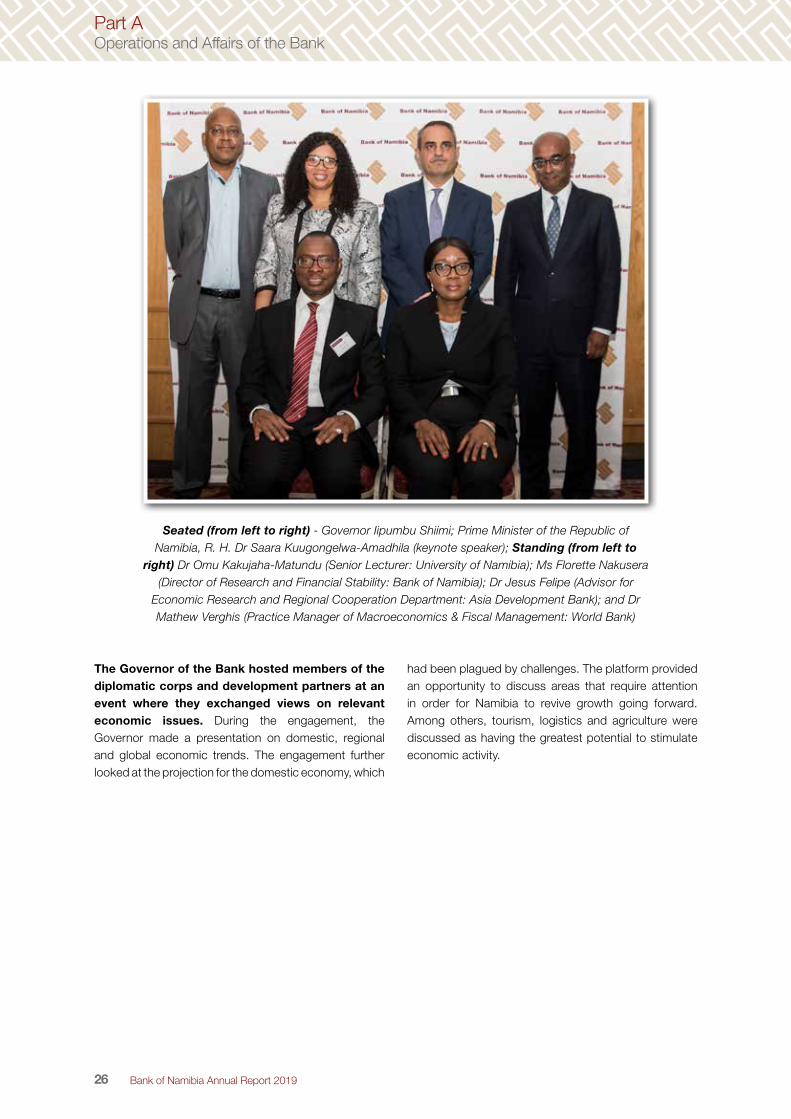
Seated (from left to right) - Governor Iipumbu Shiimi; Prime Minister of the Republic of Namibia, R. H. Dr Saara Kuugongelwa-Amadhila (keynote speaker); Standing (from left to
right) Dr Omu Kakujaha-Matundu (Senior Lecturer: University of Namibia); Ms Florette Nakusera (Director of Research and Financial Stability: Bank of Namibia); Dr Jesus Felipe (Advisor for
Economic Research and Regional Cooperation Department: Asia Development Bank); and Dr Mathew Verghis (Practice Manager of Macroeconomics & Fiscal Management: World Bank)
The Governor of the Bank hosted members of the diplomatic corps and development partners at an event where they exchanged views on relevant economic issues. During the engagement, the Governor made a presentation on domestic, regional and global economic trends. The engagement further looked at the projection for the domestic economy, which
had been plagued by challenges. The platform provided an opportunity to discuss areas that require attention in order for Namibia to revive growth going forward. Among others, tourism, logistics and agriculture were discussed as having the greatest potential to stimulate economic activity.
Part AOperations and Affairs of the Bank

27Bank of Namibia Annual Report 2019
Governor Iipumbu Shiimi (standing, centre) poses with the Heads of diplomatic missions and Heads of multilateral organisations during the Annual Diplomatic Stakeholder Engagement
Internally, the Bank continued to promote an effective and favourable working relationship with its employees. The Bank’s intranet, triannual internal newsletter, corporate email system and regular staff meetings are key platforms used for disseminating corporate information and reaching every employee. These included performance reviews conducted at the end of the two performance cycles (November–April, and May–October). During these reviews, the Senior Management Team provided feedback to the rest of the Bank’s employees regarding progress made in the implementation of respective departmental strategies and areas of concentration for the year.
Following each MPC meeting, internal monetary policy announcements were made. This provided
staff with the opportunity to discuss matters pertaining to monetary policy with members of the MPC, in line with the strategic objective of maintaining price stability.
The Employee Liaison Forum (ELF) continued to strengthen the internal communication channels within the Bank. The Forum, an internal structure that serves as a communication link between management and employees, continued to provide constructive inputs related to policy and operational matters of the Bank. In further executing its mandate to improve internal communication between management and non-management employees, the ELF solicited agenda items for general staff meetings. Below are the ELF members nominated by staff who perform these tasks:
Part AOperations and Affairs of the Bank

28 Bank of Namibia Annual Report 2019
Employee Liaison Forum Members As at 31 December 2019
Erastus PaulusChairperson
FIC Department
Paulus NdamanomhataVice Chairperson
Payments Department
Tamukondjo NamukwambiSecretary
Banking Supervision
Devin van RooyenMember
Payments Department
Kamunima MbambiMember
Exchange Control and Legal Services Department
Roline TjipuejaMember
Banking Supervision Department
Feni AweneMember
Oshakati Branch
Elifas IiyambulaMember
Research and Financial Stability Department
Sandra GarisesMember
Strategic Communications and Financial Sector Development
Wendy KairaTreasurer
IT Department
Sevelia Joseph Vice Secretary
Financial Markets Department
Helena Mboti Member
Research and Financial Stability Department
Peter NangoloMember
IT Department
Graciana MwenyoMember
Financial Intelligence Department
Vistorina NamukwambiMember
Human Resources Department
Bernard ShiyaveMember
Oshakati Branch
Sesilia NambambiVice Treasurer
Financial Markets Department
Fillemon NangonyaMember
Strategic Communications and Financial Sector Development
Leena ElagoMember
Human Resources Department
Julius RodriguesMember
Banking Services Department
Annely IyamboMember
Finance and Administration Department
Selma Shingenge Member
Finance and Administration Department
Part AOperations and Affairs of the Bank

29Bank of Namibia Annual Report 2019
During 2019, the Bank continued to produce statutory publications, as well as publications presenting general information about the Bank, the economy and the financial sector. The Bank releases these publications both as per statutory requirements and to broaden the public’s understanding of the Bank’s functions and operations, and of economic and financial developments. The publications outlined below were issued during the review period and are available on the Bank’s corporate website.
In line with statutory requirements, the Bank’s 2018 Annual Report was released in March 2019. The Report covered the operations and affairs of the Bank, information on the Bank’s annual financial statements, and information on the macroeconomic state of the country.
The Financial Stability Report, which provides an assessment of the financial system in Namibia, was issued at the end of April 2019. The Report,
which is a joint publication of the Bank of Namibia and the Namibia Financial Institutions Supervisory Authority (NAMFISA), highlighted the potential risks to financial stability emanating from developments in the national and international community. The Report further recommended appropriate policy actions to continue deepening the resilience of the financial sector.
The Bank also produces its Quarterly Bulletin that serves as a prime source of information on economic and financial developments in Namibia. It contains a description and analysis of developments as well as a comprehensive set of data covering the real sector, monetary and financial developments, public finance, and the balance of payments.
Editions of the Economic Outlook Report were released in April and July. These reports highlighted global, regional and domestic economic growth prospects, and presented domestic sectoral estimates and forecasts for the two-year period 2019–2020.
Part AOperations and Affairs of the Bank

30 Bank of Namibia Annual Report 2019
THE YEAR IN REVIEW
As mentioned above, the Bank of Namibia’s activities are focussed on eight Strategic Objectives that guide its operations over five-year periods. These Strategic Objectives are directly connected to the Bank’s functional priorities, its Mission and its Vision, as well as to developments in the internal and external environments. The Bank has determined appropriate initiatives and strategies in order to accomplish each Strategic Objective. In this section, each Strategic Objective is presented in tabular format
along with its associated initiatives and strategies. These are complemented by a list of strategic outcomes which serve as indicators of success in achieving the objective in question. Each presentation is concluded with a report on key actual outcomes, and an assessment of whether or not the strategic objective was achieved during the course of the year. The more detailed discussions on strategic objectives numbers one and five appear in Part C and Part D of this report.
STRATEGIC OBJECTIVE 1: SAFEGUARD AND ENHANCE FINANCIAL STABILITY
INITIATIVES AND STRATEGIES
STRATEGIC OUTCOMES ACTUAL OUTCOMES
STRATEGIC OBJECTIVE ACHIEVED (YES/NO/N/A)
1.1 Deter illegal financial schemes1
All known and detected schemes declared illegal within three months of determination
All illegal schemes were investigated timely and promoters were contacted.
Yes
1.2 Supervise and regulate deposit-taking institutions and credit bureaus2
Sound and stable banking system: Early warning indicators in place
Capital adequacy not less than 11 percent
The Capital adequacy ratio stood at a level of 15.3 percent.
Yes
Liquidity ratio not less than 10.5 percent
The banks recorded a liquid assets ratio of 15.3 percent.
Yes
Non-performing loans (NPLs) not more than 4 percent
NPLs ratio rose to 4.8 percent in 2019.
No
Examination cycle to be finalised within three months
The supervisory team conducted three targeted examinations and a thematic review on the four Domestic Systemically Important Banking Institutions, which was finalised on time.
Yes
Adequate risk management and all high risk and medium risk issues identified in examination report are addressed within agreed timelines
Corrective actions were implemented as per action plans and within agreed timelines, with extension sought or agreed upon with the Bank where applicable.
Yes
95 percent acceptance rate for submission of credit information to credit bureaus
The credit bureaus met the acceptance rate with 99.3 percent data acceptance.
Yes
1 Developments under this strategy are further discussed in Part D of this report
2 Developments under this strategy are further discussed in Part D of this report
Part AOperations and Affairs of the Bank

31Bank of Namibia Annual Report 2019
INITIATIVES AND STRATEGIES
STRATEGIC OUTCOMES ACTUAL OUTCOMES
STRATEGIC OBJECTIVE ACHIEVED (YES/NO/N/A)
Coverage: credit providers that hold 80 percent of credit data in the market should submit data to all registered credit bureaus
Banking institutions, retailers, microlenders and insurers submitted data to Credit Bureaus and ensured that 80 percent coverage was achieved.
Yes
1.3 Licencing3 Entities that have submitted all information should be processed within three months within BON (if more than one application is received the processing period is within six months) and one month with the relevant Ministry
The Bank did not receive any new banking license applications during the period under review.
n/a
Renewal of licence a month before expiry
All Authorised Dealers and Authorised Dealers with Limited Authority are licensed, and renewals were processed on time where applicable.
Yes
1.4 Ensure efficient, safe and effective payment and settlement systems
Cost-effective provision of payment systems services in line with set cost standards
The Namibia Inter-Bank Settlement System (NISS) cost-effectiveness for 2019 was 97 percent. This was well within the set cost-effectiveness range of 75 percent to 125 percent. NISS fee per transaction must be the lowest of 1 USD or the average Real-Time Gross Settlement System (RTGS) transaction fee for at least 8 economies in the Southern African Development Community (SADC)). The NISS fee per transaction for 2019 was 80 US cents.
Yes
There is compliance with the Safety Index, per the following indicators:
Fraud-to-turnover ratio below 0.05 percent
The fraud-to-turnover ratio was 0.00089 percent for 2019.
Yes
99 percent availability of retail payment system, participants’ systems and NISS
The retail payment systems were available 99 percent of the time.NISS was available 99.9 percent of the time.
Yes
3 Developments under this strategy are further discussed in Part D of this report
Part AOperations and Affairs of the Bank
32 Bank of Namibia Annual Report 2019
INITIATIVES AND STRATEGIES
STRATEGIC OUTCOMES ACTUAL OUTCOMES
STRATEGIC OBJECTIVE ACHIEVED (YES/NO/N/A)
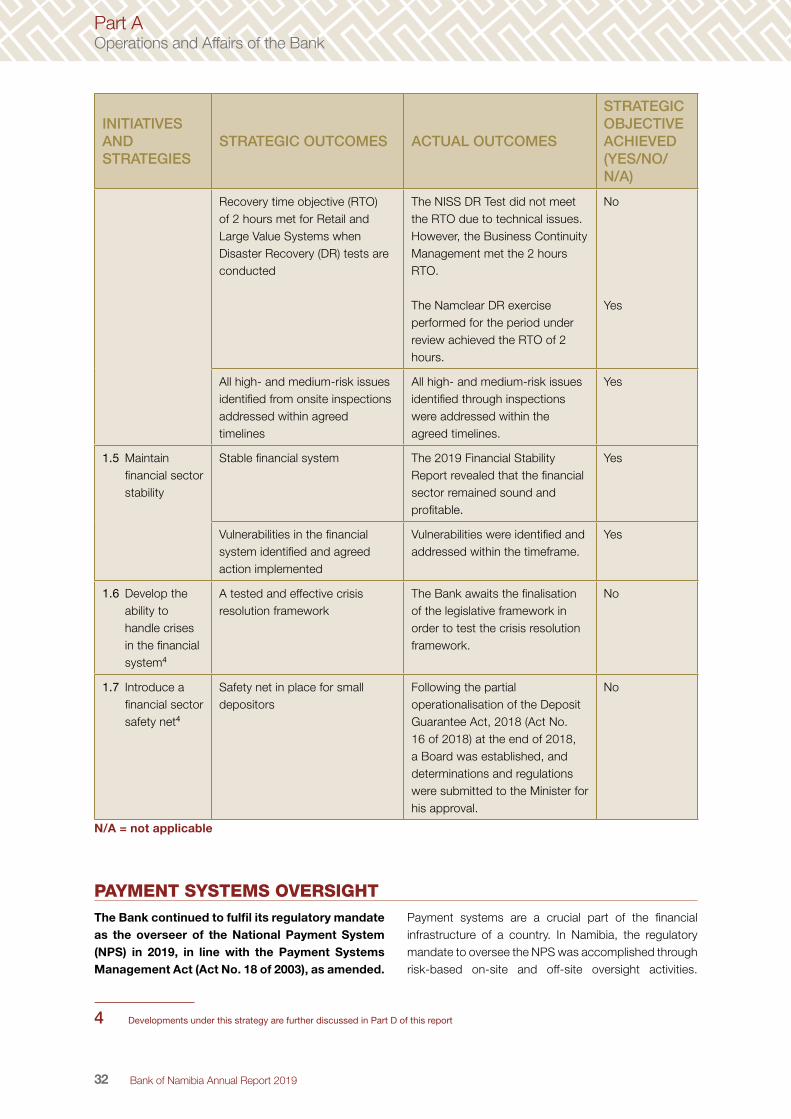
Recovery time objective (RTO) of 2 hours met for Retail and Large Value Systems when Disaster Recovery (DR) tests are conducted
The NISS DR Test did not meet the RTO due to technical issues. However, the Business Continuity Management met the 2 hours RTO.
The Namclear DR exercise performed for the period under review achieved the RTO of 2 hours.
No
Yes
All high- and medium-risk issues identified from onsite inspections addressed within agreed timelines
All high- and medium-risk issues identified through inspections were addressed within the agreed timelines.
Yes
1.5 Maintain financial sector stability
Stable financial system The 2019 Financial Stability Report revealed that the financial sector remained sound and profitable.
Yes
Vulnerabilities in the financial system identified and agreed action implemented
Vulnerabilities were identified and addressed within the timeframe.
Yes
1.6 Develop the ability to handle crises in the financial system4
A tested and effective crisis resolution framework
The Bank awaits the finalisation of the legislative framework in order to test the crisis resolution framework.
No
1.7 Introduce a financial sector safety net4
Safety net in place for small depositors
Following the partial operationalisation of the Deposit Guarantee Act, 2018 (Act No. 16 of 2018) at the end of 2018, a Board was established, and determinations and regulations were submitted to the Minister for his approval.
No
N/A = not applicable
PAYMENT SYSTEMS OVERSIGHTThe Bank continued to fulfil its regulatory mandate as the overseer of the National Payment System (NPS) in 2019, in line with the Payment Systems Management Act (Act No. 18 of 2003), as amended.
Payment systems are a crucial part of the financial infrastructure of a country. In Namibia, the regulatory mandate to oversee the NPS was accomplished through risk-based on-site and off-site oversight activities.
4 Developments under this strategy are further discussed in Part D of this report
Part AOperations and Affairs of the Bank

33Bank of Namibia Annual Report 2019
During the review period, the Bank, with the assistance of an external audit firm, assessed the information and cyber security maturity of Nedbank Namibia, Standard Bank Namibia, Bank Windhoek, First National Bank Namibia, and Namclear (the automated clearing house). Namclear underwent the assessment by virtue of it being a designated financial market infrastructure (FMI). In addition thereto, the Bank continued with its off-site activities by monitoring system participants through a combination of assessments based on information provided by the regulated institutions in the NPS.
During the period under review, the Bank revised the Determination on Issuing of Electronic Money in Namibia (PSD-3) as well as the Determination on the Standards for a Basic Bank Account and Cash Deposit Fees within the National Payment System (PSD-5). Due to the ever-evolving payments landscape, the Bank conducts periodic reviews of its legal and regulatory framework to ensure that the regulatory framework remains relevant and robust. As such, PSD-3, which serves as the medium through which the Bank authorises the issuance of electronic money (e-money) in Namibia, was subsequently updated and came into force on 28 November 2019. Additionally, PSD-5, which serves as a financial inclusion tool, was similarly updated with the revised determination coming into force on 18 December 2019. PSD-5, was initially issued in 2018 and it has introduced the Basic Bank Account (BBA), which is a bank account tailor-made for low income earners as defined in the regulation. PSD-5 also introduced zero rated cash deposit fees for all cash deposits on all individual accounts as well as business accounts that record credits of N$1.3 million or less per annum.
The banking industry, with the support of the Bank, successfully decommissioned cheques as a payment instrument in the National Payment System (NPS), whereby the last processing day
for a cheque to be cleared by the cheque payment stream was 29 June 2019. The initiative to phase out cheques was conducted over a period of several years, notably through engagements with all relevant stakeholders, including the Ministry of Finance, to ensure a smooth transition for all parties that would be affected by this change. Additionally, the banking industry engaged with and sensitised their respective customers and the public at large throughout the process. The decision to phase out cheques was mainly attributable to the inefficiencies surrounding cheques as well as the declining use of this payment instrument. Consequently, the cheque payment stream had its last day of operation on 29 June and was fully decommissioned effective 4 November 2019.
MobiCash Payment Solutions (Pty) Ltd trading as Mobipay (Mobipay), which had been authorised by the Bank as an e-money issuer, exited the e-money stream with effect from 31 March2019. Mobipay has returned its e-money license andceased to participate in the e-money stream, but wasauthorised as a service provider by the PaymentsAssociation of Namibia (PAN) in terms of section 3(6) ofthe Payment System Management Act 2003, (Act No.18 of 2003), which decision was endorsed by the Bank.Mobipay will therefore no longer issue e-money in itsown name; however, it will be able to provide paymentsystem services as defined in the Payment SystemManagement Act to the payments industry.
In promoting financial sector development, the Bank conducted and concluded its third cost and income survey. The findings of the survey will assist the Bank to formulate a position on bank fees and charges. During the course of 2020, the Bank will commence with the drafting of standards for fees and charges, in line with the mandate given under sections 2(d) and 2(e) of the Payment System Management Act 2003, (Act No. 18 of 2003), as amended.
SETTLEMENT SERVICES The Bank continued to provide interbank settlement services to authorised institutions through the Namibian Interbank Settlement System (NISS). Interbank transactions settled in NISS constitute retail payments, such as electronic funds transfers (EFTs), cards etc., that are cleared through Namclear, as well as single-item large-value transactions processed by the participants in NISS. During 2019, one announced disaster recovery test was conducted for NISS, which was unsuccessful because the two-hour recovery time objective (RTO) was not met. Furthermore, the Bank conducted two business continuity management
exercises on its most critical systems, including NISS. All the tests with the NISS component within the business continuity management exercises conducted during 2019 were successful.
The Bank continued to provide collateralised lending to NISS participants through the overnight and intra-day lending facilities. Accessibility to intra-day and overnight credit facilities by NISS participants allows for the fulfilment of settlement obligations within NISS.
Part AOperations and Affairs of the Bank
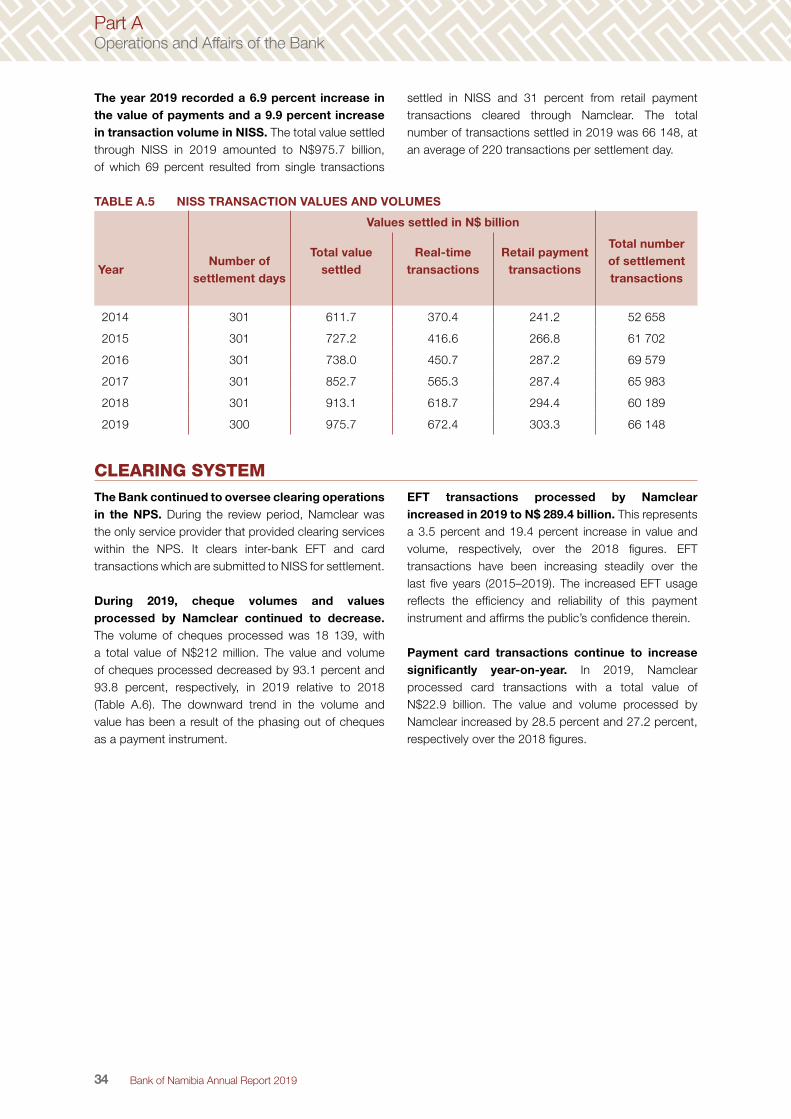
34 Bank of Namibia Annual Report 2019
The year 2019 recorded a 6.9 percent increase in the value of payments and a 9.9 percent increase in transaction volume in NISS. The total value settled through NISS in 2019 amounted to N$975.7 billion, of which 69 percent resulted from single transactions
settled in NISS and 31 percent from retail payment transactions cleared through Namclear. The total number of transactions settled in 2019 was 66 148, at an average of 220 transactions per settlement day.
TABLE A.5 NISS TRANSACTION VALUES AND VOLUMES
Values settled in N$ billion
YearNumber of
settlement days
Total value settled
Real-time transactions
Retail payment transactions
Total number of settlement transactions
2014 301 611.7 370.4 241.2 52 658
2015 301 727.2 416.6 266.8 61 702
2016 301 738.0 450.7 287.2 69 579
2017 301 852.7 565.3 287.4 65 983
2018 301 913.1 618.7 294.4 60 189
2019 300 975.7 672.4 303.3 66 148
CLEARING SYSTEM The Bank continued to oversee clearing operations in the NPS. During the review period, Namclear was the only service provider that provided clearing services within the NPS. It clears inter-bank EFT and card transactions which are submitted to NISS for settlement.
During 2019, cheque volumes and values processed by Namclear continued to decrease. The volume of cheques processed was 18 139, with a total value of N$212 million. The value and volume of cheques processed decreased by 93.1 percent and 93.8 percent, respectively, in 2019 relative to 2018 (Table A.6). The downward trend in the volume and value has been a result of the phasing out of cheques as a payment instrument.
EFT transactions processed by Namclear increased in 2019 to N$ 289.4 billion. This represents a 3.5 percent and 19.4 percent increase in value and volume, respectively, over the 2018 figures. EFT transactions have been increasing steadily over the last five years (2015–2019). The increased EFT usage reflects the efficiency and reliability of this payment instrument and affirms the public’s confidence therein.
Payment card transactions continue to increase significantly year-on-year. In 2019, Namclear processed card transactions with a total value of N$22.9 billion. The value and volume processed by Namclear increased by 28.5 percent and 27.2 percent, respectively over the 2018 figures.
Part AOperations and Affairs of the Bank

35Bank of Namibia Annual Report 2019
TABLE A.6 NAMCLEAR TRANSACTION VALUES AND VOLUMES
Year Cheque transactions EFT transactions Card transactions Total value cleared
(N$ million)Value (N$ million)
Volume (‘000)
Value (N$ million)
Volume (‘000)
Value (N$ million)
Volume (‘000)
2015 26 783 1 607 236 055 15 641 8 038 15 324 270 876
2016 10 670 1 078 260 356 17 250 9 668 17 922 280 706
2017 6 238 660 269 556 18 279 13 270 25 205 289 064
2018 3 057 292 279 698 19 395 17 844 33 730 300 599
2019 212 18 289 402 23 159 22 937 42 901 312 550
Annual percent change
2015 -4.8 -11.8 13.8 3.7 38.2 39.1 12.2
2016 -60.2 -32.9 10.3 10.3 20.3 17.0 3.6
2017 -41.5 -38.8 3.5 6.0 37.3 40.6 3.0
2018 -51.0 -55.8 3.8 6.1 34.5 33.8 4.0
2019 -93.1 -93.8 3.5 19.4 28.5 27.2 4.0
5 Within the context of the NPS, this represents the amount of money lost when any of the payment instruments the Bank oversees is compromised.
REGIONAL PAYMENT SYSTEMSThe Bank remained a participant in the SADC Real-Time Gross Settlement System (SADC RTGS). The SADC RTGS is a regional settlement system that processes time-critical or high-value payments between participating SADC countries. In 2019, there were 83 SADC Integrated Regional Settlement System (SIRESS) participants (i.e. registered banking institutions, as well as central banks within the respective SADC jurisdictions) of which five, including the central bank, were Namibian at the end of the reporting period. During 2019, the total value of payments processed in the SADC RTGS amounted to R1.2 trillion. Namibian banks accounted for R393 billion, which is 32 percent of the SADC RTGS total. This reflects the optimal usage of Namibian banks of the SADC RTGS in support of regional payments integration in accordance with the Finance and Investment Protocol.
The Common Monetary Area (CMA) Payment System Oversight Committee issued an Amendment Notice Directive which aims to provide guidance on the implementation for the Directive (Directive 1 of 2018) on Cross-border Low-Value EFT transactions within the CMA.
Following the implementation of the interim solution by member countries on 20 October 2019, member countries processed cross-border low-value credit EFT transactions, as prescribed by relevant Financial Action Task Force (FATF) Recommendations.
The SADC Bankers Association (SADC BA) launched the Transaction Cleared on an Immediate Basis (TCIB) initiative for low value cross-border transfers. During July 2019, the SADC BA officially launched the TCIB initiative. The overall objective of this initiative is to promote regional integration; sustainable economic growth and social development; and the eradication of poverty and improvements in the quality of life of the people within the SADC community. This will be achieved through the integration of payment systems and infrastructure of the various countries within the SADC to enable cross-border payments to be cleared instantaneously at a regional level. The Bank facilitated sensitisation and awareness sessions on the initiative with the Bankers Association of Namibia, participants within the National Payment Systems and other stakeholders during October 2019.
INDUSTRY FRAUD STATISTICS The total value of fraudulent5 transactions perpetrated within the NPS has decreased over a five-year period. For the period under review, however,
the total value of fraudulent transactions increased in comparison with 2018. The industry recorded an increase of N$5.4 million in EFT payments fraud from
Part AOperations and Affairs of the Bank

36 Bank of Namibia Annual Report 2019
2018. This increase was primarily due to phishing incidents perpetrated via internet banking platforms and mobile applications. Card and cheque payments fraud decreased by 40.1 percent and 53.0 percent, respectively. The total value of fraud attributable to Card, EFT and Cheque streams amounted to N$3.1 million,
N$5.6 million and N$320 000, respectively. Despite the increase in 2019, the total fraud perpetrated within the NPS remained within the fraud safety index indicator of 0.05 percent as per the Bank’s Strategic Goal, resulting in an actual figure of 0.00089 percent.
TABLE A.7 INDUSTRY FRAUD STATISTICS (NPS)
Year Card Fraud EFT Fraud Cheque Fraud Total Fraud
Value (N$ ‘000) Value (N$ ‘000) Value (N$ ‘000) Value (N$ ‘000)
2015 7 017 0 565 3 175 10 757
2016 13 440 0 768 3 315 17 523
2017 4 555 528 2 071 7 850
2018 5 216 194 677 6 087
2019 3 126 5 648 320 9 093
FINANCIAL STABILITY ASSESSMENT AND SURVEILLANCEOn a regular basis, the Bank assesses risks and vulnerabilities in the financial system to ascertain the resilience of the sector with respect to its capacity to withstand both internal and external shocks. Such assessments are published in the Financial Stability Report (FSR), once a year. The FSR analyses developments in the global and domestic economic environments, household and corporate indebtedness, the banking sector, the non-bank financial sector (NBFS), and the payment and settlement systems, and recommends policies to mitigate inherent risks to which they are subject. The 2019 FSR, published in April, revealed that the banking sector remained sound, profitable and well capitalised amidst sluggish economic conditions and growing concerns regarding the deterioration of asset quality measured in the form of the ratio of non-performing loans to total loans (NPL ratio). Moreover, it was established that the NBFS was financially stable and continued to grow its assets.
The financial system remained sound, solvent and profitable in 2019, albeit within subdued economic conditions. The capital adequacy ratio of the banking sector declined to 14.7 percent in 2019 from 16.8 percent in 2018, but remained above the statutory minimum benchmark of 11.0 percent. The decline in the capital adequacy ratio was mainly ascribed to the switch from Basel II to Basel III Capital Adequacy standards for Domestic Systemically Important Banks (DSIBs), which caused some items to no longer be eligible
for inclusion in capital. On the liquidity front, a slight improvement was recorded in the period under review, with the banking sector maintaining liquidity levels of 16.1 percent in 2019, compared to 15.6 percent in 2018, which is well above the prudential requirement of 10.0 percent of average total liabilities to the public. The overall NPL ratio increased to 4.8 percent in 2019 from 3.6 percent in the preceding year due to recessionary economic conditions. The deterioration was largely a consequence of worsening NPLs in the loan categories of mortgages, personal loans, and other loans and advances. Despite recessionary economic conditions, the funding and solvency levels of the NBFS were above prudential benchmarks, as is evident in the risk rating indicators, demonstrating its financial soundness and stability during the period under review.
Activities in the residential property market were sluggish during 2019, as reflected in a deeper contraction in prices. In this regard, house prices contracted on average at a faster rate of 6.2 percent in 2019 compared to 3.1 percent in 2018, mainly resulting from the subdued economy. Mindful that the risk of an overheated property market had dissipated, the loan-to-value regulation for non-primary residential properties was revised and gazetted on 7 November 2019. The revised loan-to-value ratios reduced the required deposit when purchasing a second property to 10 percent, from 20 percent previously. Moreover, the deposit on a third and subsequent properties is capped at 20 percent.
Part AOperations and Affairs of the Bank

37Bank of Namibia Annual Report 2019
STRATEGIC OBJECTIVE 2: PROMOTE PRICE STABILITY6
6 Developments under this strategy are further discussed in Part C of this report.
INITIATIVES AND STRATEGIES
STRATEGIC OUTCOMES ACTUAL OUTCOMES
STRATEGIC OBJECTIVE ACHIEVED (YES/NO)
2.1 Ensure reliability of economic data to support economic policy
Timely and reliable balance of payments (BOP) data and monetary and financial statistics (MFS) that meet international standards are provided;timely and reliable other economic data provided to relevant stakeholders
MFS data were provided to the public on a monthly basis.
Both BOP and MFS data were provided to the public on a quarterly and annual basis.
All macroeconomic data were provided to the MPC every two months and to external stakeholders on time.
Yes
2.2 Pursue monetary policy in accordance with the Monetary Policy Framework
Headline inflation below 7 percent is maintained without compromising economic growth
Average annual consumer price inflation was 3.7 percent in 2019.
Yes
MONETARY POLICY STANCE DURING 2019The Bank of Namibia’s Monetary Policy Committee (MPC) pursued a moderately accommodative but cautious monetary policy stance in 2019, reducing the policy interest rate once during the course of the year. This decision was taken in order to support domestic economic activity while maintaining the one-to-one link to the South African Rand (ZAR). The monetary policy stance taken was mindful of the slowdown in the global economy as well as the rather weak performance of the domestic economy during 2019. The lacklustre performance was particularly reflected in key sectors such as mining, wholesale and retail trade, and agriculture. Annual inflation levels declined and remained subdued, registering an average of 3.7 percent, compared to 4.3 percent in 2018. With regard to the conduct of its monetary policy, the Bank of Namibia kept its repo rate at 6.75 percent at its February, April and June 2019 meetings. Being mindful of the sluggish economy, absence of inflation pressure and slightly lower interest rate levels in South Africa, the MPC cut the repo rate at its August meeting by 25 basis points to 6.50 percent. This lower level was maintained at its subsequent meetings in October and December. A slight further easing of policy in the form of raising the maximum loan-to-value ratios for non-primary residential properties was also announced in August.
The monetary policy stances adopted were considered appropriate to continue supporting
domestic economic activity and safeguarding the one-to-one link between the Namibia Dollar and the South African Rand. The level of foreign reserves fluctuated broadly sideways during the year. In terms of import cover and relative to currency in circulation, it remained adequate to maintain the peg, but a cautious approach was deemed necessary so as not to compromise the gains made. Therefore, the MPC in its assessment of developments in both the global and domestic economy only saw scope to ease its monetary policy stance once during 2019.
A significantly more accommodative monetary policy stance was introduced in early 2020. Although falling beyond the year 2019 that is the focal point of this report, significant adjustments to monetary policy were made in the first quarter of 2020. In February 2020 the MPC lowered the repo rate by 25 basis points to 6.25 percent, mindful of the need to support the economy amidst a lower inflation trajectory, and confident that the reserves remained adequate to continue supporting the currency peg. As the COVID-19 pandemic worsened and more and more damage to the global, regional and local economy became apparent, the MPC in a special meeting on 20 March 2020 reduced the repo rate by a full 100 basis points to 5.25 percent so as to provide some relief to the economy. Events will continue to be closely monitored going forward.
Part AOperations and Affairs of the Bank

38 Bank of Namibia Annual Report 2019
STRATEGIC OBJECTIVE 3: MANAGE RESERVES PRUDENTLY7
7 A detailed description of the developments under this strategy is provided in Part C of this report.
INITIATIVES AND STRATEGIES
STRATEGIC OUTCOMES ACTUAL OUTCOMES
STRATEGIC OBJECTIVE ACHIEVED (YES/NO)
Manage foreign reserves prudently in accordance with the Investment Policy
Foreign reserves are safe and easily convertible assets which produce risk-adjusted returns in line with the approved strategic benchmarks
All internally and externally managed sub-portfolios met their respective objectives over the review period.
Yes
Foreign reserves shall meet the international 3-months import coverage ratio benchmark
The import coverage ratio remained above the international benchmark and stood at 4.1 months at the end of December 2019.
Yes
Enforce exchange control in accordance with the Currency and Exchanges Act (No. 9 of 1933), as amended
All foreign exchange transactions are authorised in line with the relevant law
The onsite examinations and the offsite monitoring of foreign exchange payments indicate that all Authorised Dealers (ADs) and Authorised Dealers with Limited Authority (ADLAs) have authorised foreign payments in terms of the law.
Yes
All confiscated currencies are recommended to the Minister for forfeiture after all due processes
The Bank conducted the required processes and thereafter recommended to the Minister the exercising its power in respect of forfeiting confiscated currencies.
Yes
Examinations cycle to be completed within three months and identified weaknesses addressed within the agreed time frame
The Bank conducted (17) supervisory onsite inspections compared to (6) initially planned in the Examination Plan of 2019 within the stipulated three months. (3) were thematic reviews while (14) were system certification on-site inspections.
Yes
All illegal forex activities are investigated and dealt with in line with the Currencies and Exchanges Act and reported to law enforcement within 30 days
During 2019, one case was investigated within the stipulated timelines. The matter is pending before court.
Yes
Manage liquidity in the banking system proactively to support reserves
100 percent compliance with reserve adequacy threshold as stated in the Market Intervention Framework
The level of foreign exchange reserves remained adequate and well above currency in circulation plus a buffer equal to three months of average commercial bank outflows by a ratio of 3.7 times.
Yes
Part AOperations and Affairs of the Bank

39Bank of Namibia Annual Report 2019
As stipulated in Section 27 of the Bank of Namibia Act 1997 (Act No. 15 of 1997), as amended, the Bank is entrusted with prudently managing Namibia’s foreign exchange reserves. As such, the reserve assets are held to provide support for the issue of domestic currency, as required in terms of the Bilateral Monetary Agreement between the Government of the Republic of Namibia and the Government of the Republic of South Africa. Reserve assets are also held to enable funding of international transactions and to serve other strategic objectives like maintaining confidence in the country’s monetary and exchange rate policies, providing confidence to the international community that the country can service its external debt when due, and ensuring resilience to external shocks.
To uphold the purposes of holding foreign reserves, the Bank needs to ensure that the primary objectives of capital preservation and liquidity management are met. Subject to meeting the former objectives, excess reserves shall be managed to pursue and maximise investment returns. These objectives are achieved through exposure to a range of eligible foreign assets set within limits which are informed by the Bank’s annual strategic asset allocation exercise and Investment Policy and Guidelines.
The stock of international reserves decreased in 2019 due to higher outflows through commercial
banks. Foreign reserves declined by 6.7 percent year-on-year, closing off 2019 at a level of N$28.9 billion. The decline in foreign reserves is partly attributed to higher commercial bank outflows, on the back of higher imports from the South African market. Another notable driver of the decline in reserves is higher foreign payments on behalf of the Government, which were recorded at N$4.8 billion in 2019 compared to N$4.3 billion in 2018. The 2.13 percent year-on-year appreciation of the Namibia Dollar against the United States Dollar (USD) also contributed to the decline in foreign reserves when expressed in Namibia Dollar terms. The impact of these outflows was somewhat cushioned by the relatively higher SACU revenue, which was recorded at N$18.5 billion in 2019 compared to N$17.9 billion the previous year.
In terms of reserve adequacy, foreign reserves remained adequate when measured in terms of import coverage as well as currency in circulation (CIC) plus a buffer of three times the monthly commercial bank outflows. Despite reporting a weaker estimated import coverage ratio of 4.1 months at the end of 2019 (2018: 4.5 months) due to the lower reserve level, the ratio remains above the international benchmark of 3 months (see Figure A.1). The second measure sufficiently covered the CIC plus the buffer by a ratio of 3.7 times.
FIGURE A.1 OFFICIAL FOREIGN EXCHANGE RESERVE STOCK AND IMPORT COVER
The stock of international reserves decreased by 6.7 percent year-on-year but remained above the benchmark international import coverage ratio of 3 months.
0
1
2
3
4
5
6
0
5,000
10,000
15,000
20,000
25,000
30,000
35,000
Q1 Q2 Q3 Q4 Q1 Q2 Q3 Q4 Q1 Q2 Q3 Q4 Q1 Q2 Q3 Q4 Q1 Q2 Q3 Q4 Q1 Q2 Q3 Q42014 2015 2016 2017 2018 2019
Mon
ths
N$ m
illio
n
Reserve Stock International Benchmark (Import Cover) Import Cover (Months)
The USD and ZAR currencies continued to constitute the biggest share of the Bank’s overall foreign exchange reserves. As at 31st December 2019, the USD and ZAR currencies accounted for 54.0
percent and 40.2 percent of overall foreign exchange reserves, respectively (2018: 44.7 percent and 50.0 percent, respectively). The aforementioned can be ascribed to relatively higher ZAR cross-border outflows
Part AOperations and Affairs of the Bank

40 Bank of Namibia Annual Report 2019
during 2019 and a 2 percent switch in allocation of ZAR assets towards USD assets. The remaining portion of 5.8 percent foreign reserves was made up of the Special Drawing Rights basket of currencies, namely
8 The Settlement Account rate refers to the interest rate paid on commercial banks’ deposits at the Bank.
the Euro (EUR), British Pound Sterling (GBP), Japanese Yen (JPY) and Chinese Yuan/Renminbi (CNY), up from 5.3 percent in 2018 (Figure A.2).
FIGURE A.2 CURRENCY MIX OF FOREIGN EXCHANGE RESERVES
The largest currency allocation of the overall reserves was apportioned among the USD and ZAR in both 2018 and 2019.
ZAR USD Other
31 DECEMBER 201931 DECEMBER 2018
40.2%
54.0%
5.8%
50.0%
44.7%
5.3%
LIQUIDITY MANAGEMENTThe Bank employs various liquidity management tools to safeguard the level of international reserves. Accordingly, the Bank intervenes in the market by temporarily absorbing funds destined to
leave the country in search of alternative investment opportunities. The common interventions include the issuance of Bank of Namibia Bills, as well as appropriate adjustments to the Settlement Account rate8.
ADMINISTRATION OF EXCHANGE CONTROLIn accordance with the powers delegated to it by the Minister of Finance as provided for by the Currency and Exchanges Act (Act No. 9 of 1933) and the Exchange Control Regulations of 1961, as amended, the Bank is mandated to administer exchange controls in support of the country’s foreign reserves management objectives. The Bank conducted the Exchange Control activities during the year through a risk-based regulatory oversight of the regulated populace. The department leveraged data analytics to enhance the monitoring of transactions as the Bank continued with the phased liberalisation of controls. The objective was to enforce compliance with the Regulations, Rules and Orders in order to enhance surveillance and supervision, thereby fostering a sound and stable foreign exchange market.
During the period under review, the Bank successfully implemented Version 3 of the Electronic Reporting System for cross-border foreign transactions. With effect from 12 May 2019, the Bank implemented Version 3 of the Cross Border Foreign Exchange Transaction Reporting (also known as the BoPCus Version 3 System). The system is modelled on the International Monetary Fund IMF’s Manual 6 for Balance of Payments categorisation of foreign exchange transactions. The implementation of version 3 of the Reporting System was conducted on a phased approach from 30 April to September 2019. Fourteen reporting entities consisting of the six ADs and eight ADLAs now successfully report data on the reporting system. The reporting system enhances the Bank’s capacity to collect all the cross-border foreign exchange transactions to assist in Exchange Control policy formulation, enhance the collection of data for
Part AOperations and Affairs of the Bank

41Bank of Namibia Annual Report 2019
Balance of Payment statistical purposes, and assist with economic research used for economic policy and monetary policy development. Additionally, the system will improve the Department’s statistical compilation and reporting to other stakeholders such as the IMF, the Ministry of Finance and the Financial Intelligence Centre, and the Bank’s Research and Financial Stability Department.
The Bank continued to play a coordinating role for the Task team responsible for mitigating illicit financial flows. The Task team held bi-monthly meetings to share information and to enforce mitigation measures and strategies to contain this risk. The exchange of information and ideas enhanced collaborative efforts to close the loopholes that are used to circumvent the country’s laws by illegally externalising funds, and to commit other financial crimes.
The Bank continued to shape the compliance environment of the regulated populace. This included ADs and ADLAs through onsite inspections and regular industry engagements in various forums, all geared toward instilling a compliance culture across the entire industry.
The Bank recognises that the skills and competencies of the staff of the ADs and ADLAs tasked with the responsibility to manage the foreign exchange function are critical. Staff capacity in these institutions is a critically important factor for attaining effective compliance with the Regulations and Rules of Exchange Control which aims for the preservation and utilisation of foreign reserves in the best interest of the country. The Bank therefore carried out skills audits to assess the staff complement, academic qualifications, training and the years of experience of Exchange Control staff in ADs and ADLAs. The assessment found that the staff members are adequately skilled and trained to perform the Exchange Control function at these institutions. However, despite the investment made in training, this area still needs re-enforcement due to the complexity and evolving nature of capital transfers and the potential for illicit financial flows.
The Bank has commenced with a project to reconcile import and export data (payments) between the Research and Financial Stability Department data and the BOPCUS data, to determine any discrepancies and the extent thereof. Focusing on data for the first quarter of 2019, the preliminary results indicated that there were significant data discrepancies. The second phase of the project will entail resource
mobilisation between the Bank and Ministry of Finance’s Customs and Excise Department to sample companies for detailed inspection. This entails obtaining data on the movement of goods, comparing the values with the instructed payments made by the commercial banks, and valuation audits on the prices of the goods and services, to isolate cases of abusive transfer pricing, mis-invoicing, fraud and tax evasion.
The reconciliation project also triggered the Bank in conducting three risk-based thematic onsite inspections. These inspections focused on assessing compliance with the Exchange Control laws and identifying any forms of potentially illicit flows. The onsite inspections were conducted on two ADs and one ADLA. The examination revealed that although there was an improvement in general compliance, improvement was still needed in some areas, specifically the accurate Balance of Payment classification of transactions.
The Bank further conducted 14 on-site system certifications during the year. The objective was to verify that the ADs and ADLAs have developed their BOPCUS Version 3 systems in compliance with the technical specifications and business requirements. All the systems were pre-certified before go-live date, with some participants given certain conditions which will be reviewed during a post-implementation review in 2020.
During the period under review, the Bank issued a license to one Authorised Dealer. TrustCo Bank Namibia Ltd was approval by the Minister of Finance as an AD, and the Bank will do all pre-opening inspections to ensure compliance with license conditions, as determined by the Bank.
The Bank continued to make concerted efforts to arrest the problem of illegal dealings in foreign currency. This was done through close collaboration with the law enforcement agencies. An amount of approximately N$189 000 was forfeited to the Criminal Assets Recovery Fund established under the Prevention of Organised Crime Act (Act No. 29 of 2004). During the period under review, two persons were arrested for illegal forex dealings worth N$1.2 million, and a preservation order was issued for two apartments out of which the illegal forex dealings were conducted. One person was also arrested for attempting to export foreign currency to the value of N$3 million. The Department has also made recommendations to the Ministry of Finance to consider forfeiting confiscated foreign currencies totalling almost N$2 million.
Part AOperations and Affairs of the Bank

42 Bank of Namibia Annual Report 2019
The Bank investigated potential violations of the single discretionary allowance limits. The permissible single discretionary allowance threshold is N$1 million per individual in a calendar year. An amount of N$129 million has been detected on individual accounts where the limit was exceeded in violation of Exchange Control Rules.
As an integral part of the international system, the Bank continued to fulfil its multilateral obligations. In keeping with the tenets governing the Common
Monetary Area (CMA), the country’s Exchange Control matrix remains aligned with the rest of the CMA member countries. Furthermore, the Bank has been an active participant in the CMA review to enhance the measurements used in ECLI (the Exchange Control Liberalisation Index), which aims to chart the way for exchange control liberalisation in the SADC. The reviewed matrix will be submitted to the SADC Exchange Control Committee in 2020 as a joint contribution by all the CMA countries.
Part AOperations and Affairs of the Bank

43Bank of Namibia Annual Report 2019
STRATEGIC OBJECTIVE 4: PROVIDE CURRENCY, GOVERNMENT DEBT ISSUANCE AND BANKING SERVICES
INITIATIVES AND STRATEGIES
STRATEGIC OUTCOMES ACTUAL OUTCOMES
STRATEGIC OBJECTIVE ACHIEVED (YES/NO)
4.1 Effective and efficient provision of banking services
All (100 percent) Government payments and deposits are correctly effected and recorded within 3 days.
All Government payments processed and recorded within the stipulated timeframe of 3 days.
Yes
BoN complies with anti-money laundering laws
All Government payments, both local and foreign, screened against the UN sanctioned list. No suspicious transactions were detected.
Yes
Previous day State Account balance made available to the Ministry of Finance (MoF) the next day before 12h00 noon
State Account balances were provided to the MoF daily by the stipulated time (12h00).
Yes
4.2 Issue and manage Government securities
Meet funding requirements ofGovernment in line with the approved Borrowing Plan
The Bank succeeded in raising the required funding for the Government as per the Borrowing Plan.
Yes
4.3. Provide effective lending facilities to the banking institutions
Meet 100 percent of banking institutions’ borrowing needs in line with BoN’s conditions
All banking institutions’ liquidity needs were met.
Yes
4.4. Manage and issue currency
Quality, cost-effective and sufficient currency supplied to commercial banks as per demand and in line with BoN’s approved denomination mix
The Bank supplied the commercial banks with sufficient and good quality currency as per the Bank’s approved denomination mix.
Yes
Counterfeits detected and in circulation do not exceed the threshold of 10 pieces per 1 million notes in circulation
The ratio of counterfeits recorded in 2019 was 7 pieces per million banknotes in circulation and was thus below the Bank’s threshold.
Yes
All commercial banks’ deposits and withdrawals to be processed on the system within one hour of conclusion of the said transaction
The Bank managed to process all commercials banks’ deposits and withdrawals within the stipulated time frame of one hour.
Yes
Part AOperations and Affairs of the Bank

44 Bank of Namibia Annual Report 2019
BANKING SERVICES
9 The electronic transfer of low-value payments to and from the Government via the Bank of Namibia’s EFT System.
10 These are electronic transactions effected by the Bank on behalf of the Government to foreign beneficiaries using the Swift system.
11 Local transfers are electronic payments effected by the Bank on behalf of the Government to local beneficiaries using the Namibian Interbank Settlement System (NISS).
The Bank, in executing its mandate of being the Banker to the Government, ensured the timely processing of domestic EFT transactions during 2019. During 2019, the Bank noted a decrease in EFT
payments9 effected by the Government. The total volume of EFT payments effected amounted to 2 190 972, in comparison to 2 430 757 in 2018 (see Table A.8), which equates to a decline of 9.9 percent.
TABLE A.8 GOVERNMENT EFT PAYMENTS
Calendar year EFT transfers (volume) EFT transfers (value N$)
2015 2 395 920 27 332 351 655
2016 2 545 720 31 365 656 013
2017 2 321 348 26 465 988 529
2018 2 430 757 23 298 805 112
2019 2 190 972 25 096 469 490
The Bank ensured timely and accurate processing of the local and foreign payments on behalf of the Government. A marginal reduction of 0.7 percent was recorded in the number of foreign transfers effected on behalf of the Government compared to the preceding financial year. The total number of foreign transfers10
processed in 2019 amounted to 1 603 in comparison to 1 614 in 2018, as shown in Table A.9. Equally, a decline was noted with the number of local transfers11 processed in 2019, down to 884 from 1 009 in 2018, which translates to a reduction of 12.4 percent.
TABLE A.9 VOLUME OF LOCAL AND FOREIGN TRANSFERS BY THE GOVERNMENT
Calendar year Local transfers (Volume) Foreign transfers (Volume)
2015 978 2 366
2016 1 153 2 173
2017 1 052 1 720
2018 1 009 1 614
2019 884 1 474
The Bank recorded a 100 percent reduction in the volume of cheque transactions in 2019, in comparison to the preceding year. The Government complied with the industry cheque
phasing out strategy by already discontinuing the use of cheques in 2018 (Table A.10). No cheques were therefore processed during the 2019 financial year.
TABLE A.10 GOVERNMENT CHEQUES PROCESSED
Calendar year VolumeChange
(% decrease)/% increase
2015 229 050 -1.1%
2016 219 675 -4.1%
2017 88 707 -59.6%
2018 423 -99.5%
2019 0 -100.0%
Part AOperations and Affairs of the Bank

45Bank of Namibia Annual Report 2019
During the 2019 financial year, the Bank continued to ensure that all the Government’s payments processed were in compliance with the anti-money laundering and counter terrorism financing
laws as outlined in the Financial Intelligence Act (Act No. 13 of 2012), as amended. No suspicious transactions were noted during the period under review.
ISSUANCE OF GOVERNMENT DEBT As an agent for issuing Government debt securities, the Bank continued to offer both short and long-dated debt instruments at primary auctions. This is intended to assist the Government to finance the deficit from the National Budget in an orderly manner and simultaneously to support its efforts and commitment towards financial market development. During 2019, the Bank of Namibia held several auctions for both short-term and long-term Government debt instruments. The
Government also introduced an additional Inflation-Linked Bond (GI36) and two longer-dated Fixed-Income Bonds (GC43 and GC50) which will mature in 2036, 2043 and 2050, respectively. The Government managed to switch N$2.3 billion of the N$3.1 billion outstanding on the GC20 into longer dated instruments during 2019. As at 31 December 2019, the outstanding balance in the GC20 amounted to N$773.15 million. The GC20 is due to mature on 15 April 2020.
CURRENCY OPERATIONS During the period under review, the Bank continued to supply the Namibian market with sufficient, good quality currency of all denominations at all times. One of the main strategic objectives of the Bank is to ensure that banknotes in circulation continue to meet the needs of the Namibian market and that the national currency is resilient to counterfeiting. The Bank oversaw the complete life cycle of the national currency, which includes the production, quality control, distribution and destruction thereof. All unfit, soiled or mutilated banknotes are deposited by the commercial banks with the Bank for destruction.
During the review period, a slight decrease was noted in the volume of total currency in circulation. The total volume of banknotes in circulation decreased by 0.2 percent in 2019, to 50.1 million pieces, compared to the increase of 3.3 percent to a level of 50.7 million pieces recorded in 2018. The volume of coins in circulation in 2019 increased by 1.7 percent over the year, compared to the 2.9 percent increase recorded for 2018. Overall
growth was observed for all coin denominations during the 2019 year (see Figure A.3 and Table A.11).
The value of currency in circulation in 2019 remained almost at the same level as in 2018. The total value of currency in circulation stood at N$4.5 billion at the end of 2019, essentially unchanged from that recorded at the end of 2018.
The N$200 banknote denomination was the most issued in 2019, with an outstanding stock of 13.4 million notes. The aforesaid banknote denomination recorded a 3.4 percent increase in the value of notes in circulation in 2019, whereas 2018 recorded negative growth of 2.2 percentage. Moreover, the N$20, N$50 and N$100 banknote denominations all recorded negative growth in value of notes in circulation, with percentage changes of -5.5 percent, -2.7 percent and -7.7 percent, respectively. The N$10 banknote denomination displayed a 4.5 percentage growth in value of notes in circulation.
Part AOperations and Affairs of the Bank

46 Bank of Namibia Annual Report 2019
FIGURE A.3 GROWTH OF CURRENCY IN CIRCULATION
A reduction was noted in the total currency in circulation during the review period compared to the previous financial year.
8.4
6.0
-0.1
- 4.0
- 2.0
0.0
2.0
4.0
6.0
8.0
10.0
2015 2016 2017 2018 2019
Annu
al %
cha
nge
-2.3-2.9
The Bank discontinued the minting of the five-cent coin during the 2019 financial year as its production cost exceeded its face value. The five-
cent coin denomination will remain legal tender and will continue to be used as a medium of exchange for goods and services in Namibia.
TABLE A.11 COMPOSITION OF CURRENCY IN CIRCULATION (31 DECEMBER)
Denomination
2018 2019% change in
valueValue(N$ million)
Volume(million)
Value(N$ million)
Volume(million)
5c coin 13.4 267.8 13.9 277.7 3.7
10c coin 19.8 197.6 20.4 204.4 3.4
50c coin 15.8 31.6 16.1 32.1 1.8
N$1 coin 112.3 112.3 113.3 113.3 0.9
N$5 coin 64.3 12.9 65.9 13.2 2.5
N$10 coin 16.8 1.7 16.8 1.7 0.3
TOTAL - COINS 242.3 623.9 246.4 642.4 1.7
N$10 notes 103.7 10.4 108.4 10.8 4.5
N$20 notes 198.6 9.9 187.6 9.4 -5.5
N$50 notes 365.0 7.3 355.1 7.1 -2.7
N$100 notes 1 014.1 10.1 936.0 9.4 -7.7
N$200 notes 2 597.4 13.0 2 684.6 13.4 3.4
TOTAL - NOTES 4 278.8 50.7 4 271.8 50.1 -0.2
GRAND TOTAL 4 521.2 674.6 4 518.2 692.5 -0.1
The quality of currency in circulation remained a key strategic area for the Bank during 2019. The value of new banknotes issued during the 2019 financial year amounted to N$2.6 billion, compared to the N$1.7 billion issued in 2018. The 52.9 percent increase in the issuance of new banknotes is directly correlated to the withdrawal of unfit banknotes from circulation. Furthermore, the Bank checked the authenticity
and fitness of banknotes for recirculation, which subsequently resulted in the withdrawal of 41.8 million banknote pieces with a face value of N$2.5 billion in 2019, compared to 29.2 million pieces with a face value of N$1.6 billion in 2018.
In 2019, an increase was recorded in the value of Rand notes repatriated to South Africa compared to
Part AOperations and Affairs of the Bank

47Bank of Namibia Annual Report 2019
2018. In accordance with the Bilateral Common Monetary Agreement between Namibia and South Africa dated 14 September 1993, the Bank of Namibia is required to repatriate to the South African Reserve Bank any Rand banknotes that are deposited in Namibia. The commercial banks continue to repatriate the South African rand coins on behalf of the Bank of
Namibia to South Africa. The Bank repatriated a total of R225 million rand notes to South Africa, compared to R150 million in 2018, which equated to an increase of 50.0 percent. Rand repatriation values and the value of Namibia Dollars in circulation over the past five reporting years are presented in Table A.12.
TABLE A.12 REPATRIATION OF SOUTH AFRICAN RAND BANKNOTES AND NAMIBIA DOLLAR BANKNOTES IN CIRCULATION
Calendar Year
Value of Rand repatriation N$ in Circulation
Rand (million)Change in value
(percent)N$ (million) Change (percent)
2015 450.0 -53.8 4 495.8 8.4
2016 600.0 33.3 4 394.5 -2.3
2017 225.0 -62.5 4 658.5 6.0
2018 150.0 -33.3 4 521.2 -2.9
2019 225.0 50.0 4 518.2 -0.1
The Bank noted a decrease in the number of counterfeit banknotes detected in 2019 compared to 2018. The total number of counterfeit Namibia Dollar banknotes detected in 2019 decreased to 339 pieces, compared to 602 pieces recorded in 2018 (Table A.13). The N$200 banknote was the most targeted denomination by the counterfeiters, accounting for 37.4 percent of total counterfeits detected in 2019.
In 2019, a significant reduction was recorded in the number of counterfeits per million in respect
of all Namibia Dollar banknote denominations in circulation, which stood at seven pieces of counterfeit per million banknotes. This number is far below the international benchmark of 70 banknote pieces per million banknotes in circulation. The Bank continued the implementation of its Counterfeit Management Framework by carrying out counterfeit awareness and deterrence activities with key stakeholders such as retailers and law enforcement agencies.
TABLE A.13 COUNTERFEIT NAMIBIA DOLLAR BANKNOTES
Denomination
Number of counterfeit banknotes detected Counterfeits per single
denomination per million notes in
2018
Counterfeits per single
denomination per million notes in
2019
2015 2016 2017 2018 2019
N$10 4 0 2 5 1 0.5 0.1
N$20 7 11 24 64 21 6 2
N$50 33 29 74 214 97 29 14
N$100 169 38 81 130 92 13 10
N$200 252 199 259 189 128 15 10
TOTAL 465 277 440 602 339 12 7
Total counterfeits per million notes for all denominations
9 6 9 12 7
Part AOperations and Affairs of the Bank

48 Bank of Namibia Annual Report 2019
STRATEGIC OBJECTIVE 5: PROMOTE A POSITIVE REPUTATION
INITIATIVES AND STRATEGIES
STRATEGIC OUTCOMES ACTUAL OUTCOMES
STRATEGIC OBJECTIVE ACHIEVED (YES/NO)
5.1 Enhanced corporate image
Positive media tone of more than 80 percent based on systematic media analysis
The Bank achieved a positive media tonality of 97 percent for the period under review.
Yes
Achieve 70 percent attendance of targeted audience at Bank events
The events hosted by the Bank continued to be well subscribed with attendance above the 70 percent audience target.
Yes
Stakeholder confidence in the Bank measured by satisfaction of > 80 percent based on minimum response rate of 70 percent
The average stakeholder satisfaction rate was 83.5 percent, based on a response rate of 72 percent, as measured through the 2019 External Stakeholder Perception Survey.
Yes
ENHANCED CORPORATE IMAGE The Bank of Namibia maintained its positive corporate image by building and maintaining long-term relationships with various stakeholders, policymakers and opinion leaders. During the year under review, the Bank recorded 97 percent positive media tonality based on a systematic media analysis of news articles featuring the Bank and its activities. Events
organised by the Bank continued to attract stakeholders. During the year, the Bank undertook an externally-run Stakeholder and Customer Satisfaction Survey to assess the strength of the Bank’s relationship with its stakeholders. The overall perception performance rating improved to 84 percent from 78 percent recorded in the last Survey, which was conducted in 2015.
PUBLIC EDUCATION The Bank has undertaken to raise its profile amongst the general public by creating awareness of its role. The Bank’s Public Education Programme continued to educate various stakeholders on issues relating to its functions, role and operational activities. To fulfil this role in 2019, the Bank carried out the activities outlined below.
The Bank hosted its biennial National High School Competition, which is held in view of the need to educate learners on the functions of the Bank, the economy and financial literacy matters. The competition is jointly organised with the Ministry of Education, Arts and Culture, and attracts the participation of schools from all 14 regions of Namibia, with regional competitions proving to be popular according to an evaluation conducted among learners and teachers. The competition brings together learners
in teams of four who participate in a quiz on topics ranging from economics and finance to central banking functions. An impressive 716 learners from 179 schools located in all 14 regions of the country participated in the competition in 2019.
In 2019, Duinesig High School from the Erongo region emerged as the overall winner of the Competition, taking home N$50 000. The first runner-up, Epako High School from Omaheke Region, was awarded N$30 000. Etosha Secondary School, from Oshikoto Region, took the third place and received a cash prize of N$10 000, while Dr. Romanus Kampungu Senior Secondary School from Kavango East came in the fourth place and was awarded a printer for the school. A recording of the competition was broadcast on One Africa Television.
Part AOperations and Affairs of the Bank

49Bank of Namibia Annual Report 2019
Deputy Governor Ebson Uanguta, Dr. Postrick Mushendami (Head Judge), and Acting Deputy Executive Director: Ministry of Education, Arts and Culture, Ms Eda Bohn (centre), photographed
with the winning teams of the 2019 Bank of Namibia National High School Competition
During the year, staff members participated in the inaugural Bank of Namibia Ambassador Programme. The initiative aims to inspire social investment and responsibility among staff members of the Bank by volunteering to deliver talks at schools countrywide, while boosting the Bank’s public education efforts to foster a better understanding of the central bank. With the exception of those who choose economics as a school subject or participate in the National High School Competition, many learners have no contact with or knowledge of the central bank, despite the significant role that it plays in the economy. The Ambassador Programme therefore aims to reach
learners and their communities by encouraging staff members of the Bank to give talks at a secondary school of their choice. In addition to sharing information about the role of the Bank, the talks would also focus on opportunities offered by the Bank such as the bursary and scholarship schemes, the Graduate Accelerated Programme, and internships. Lastly, the talks seek to uplift learners and motivate them to consider a career in central banking and become productive citizens. The Programme reached learners in Kunene, Khomas and Hardap regions in 2019.
Part AOperations and Affairs of the Bank

50 Bank of Namibia Annual Report 2019
Learners at the Goreangab Junior Secondary School in Khomas Region listening attentively to a talk delivered by an Ambassador of BoN
The annual Media Economic Reporting Workshop was hosted in July 2019. The Bank continued to refresh media practitioners on reporting about business and economic topics and on the role of the central bank in the economy, through an intensive two-day workshop. The 2019 workshop was restructured with the objective of fostering a better understanding of the central bank
functions, while providing journalistic tools for accurate reporting and interpretation of publications released by the Bank. The workshop was conducted over two days in July 2019 with 20 participants, including journalists from both print and broadcast media institutions, and journalism and media students from local tertiary institutions.
Deputy Governor Ebson Uanguta (centre) and Director of Exchange Control and Legal Services, Bryan Eiseb (far left), photographed with participants at the 2019 Media Economic Reporting Workshop
In an effort to comprehensively cater for all readers of the Bank’s publications, a method was introduced to simplify the content of selected publications. This method, referred to as “the layering of messages”, aims to provide the reader with information
that is simplified, clear and easy to comprehend. This is done by providing infographic representations of key messages. This approach is demonstrated in messages on Pyramid Schemes and on economic and financial developments as covered in the Quarterly Bulletin and
Part AOperations and Affairs of the Bank

51Bank of Namibia Annual Report 2019
Economic Outlook, as well as the Money and Banking Statistics Reports. These messages were appropriately
packaged for and disseminated through the Bank’s corporate social media platforms during the year.
An infographic designed to make information easily accessible to the general public
CORPORATE SOCIAL RESPONSIBILITY AND INVESTMENTAs a responsible corporate citizen, the Bank places Corporate Social Responsibility and Investment at the heart of its interactions with stakeholders. With the aim of creating sustainable development opportunities for the greater good of society, the Bank has identified general education and the Technical and Vocational Education Training sector as focal areas of its Corporate Social Responsibility and Investment
programme. In 2019, the Bank signed a Memorandum of Understanding with the Namibia Training Authority (NTA) providing for assistance of N$4.5 million to support the apprenticeship programme of the NTA over a three-year period (2019–2021). The 50 apprentices who will benefit from the programme will undergo intensive, on-the-job training incorporating theoretical training in the areas of agriculture, tourism and auto-mechanics.
Part AOperations and Affairs of the Bank

52 Bank of Namibia Annual Report 2019
Deputy Governor Ebson Uanguta and Chief Executive Officer: Namibia Training Authority, Mr Jerry Beukes, at the signing ceremony of the apprenticeship programme Memorandum
of Understanding
The Bank granted bursaries to deserving Namibian students, enabling them to pursue undergraduate
and postgraduate degrees in areas relevant to the operations of the Bank.
Deputy Governor Ebson Uanguta (middle) and Director of Human Resources, Lea Namoloh (far left) with the 2019 undergraduate bursary recipients
Part AOperations and Affairs of the Bank

53Bank of Namibia Annual Report 2019
Eleven new undergraduate bursaries and one post-graduate scholarship were awarded to Namibian students to study at recognised institutions within the SADC region in the fields of Accounting/Finance, Economics, Actuarial Science, and Education (Accounting and Science), which brought the total number of undergraduate
bursaries to 31 for the 2019 financial year (Table A.14). As part of its corporate social responsibility, theBank took a deliberate policy decision to sponsor twostudents every year from marginalised communities. Infulfilment of this commitment, the Bank sought out twodeserving students from the San community who wereoffered bursaries to study at the University of Namibia.
TABLE A.14 NAMIBIAN STUDENTS SPONSORED BY THE BANK’S BURSARY SCHEME
Field of studyNumber of
students: 2016
Number of students:
2017
Number of students:
2018
Number of Students:
2019
Accounting/Finance 13 10 11 7
Computer Science/IT 2 1 0 2
Economics 8 11 12 16
Actuarial Science 1 2 2 1
Education (Accounting and Science) 4 4 4 3
Environmental Biology - - - 2
Total 28 28 29 31
During the year under review, the Bank also sponsored various activities. The sponsorships were targeted at various institutions and efforts that demonstrated the potential to contribute to the attainment of Namibia’s developmental, economic and social empowerment goals. Below are some of the major projects and activities that benefited from the sponsorship:
• A donation of N$100 000 towards the NamibiaEconomic Growth Summit: In July 2019, theBank donated N$100 000 towards the hosting of the 2019 Economic Growth Summit, organisedby the High-Level Panel on the NamibianEconomy appointed by the President. TheSummit was hosted from 31 July to 1 August 2019,under the theme “Economic Revival for InclusiveGrowth – Strengthening the Namibian House”.
Dr Emma Haiyambo, (Director of Strategic Communications and Financial Sector Development: Bank of Namibia) pictured with Mr. Johannes !Gawaxab (Chairperson: High Level Panel on the
Namibian Economy)
Part AOperations and Affairs of the Bank

54 Bank of Namibia Annual Report 2019
• A Contribution of N$5 Million Towards Drought Relief Efforts: In July 2019, the Bank heeded the call by the Government for institutions and individuals to make contributions towards drought relief efforts after the declaration of a State of Emergency by the President. The Bank’s
contribution of N$5 million towards the National Emergency Disaster Fund was in recognition of the fact that the drought conditions affect and threaten the livelihoods of many Namibians and their livestock.
Governor Iipumbu Shiimi hands over a donation to R. H. Dr Saara Kuugongelwa-Amadhila (Prime Minister of the Republic of Namibia) and Mr Japhet Haitenge (Director of Disaster Risk
Management: Office of the Prime Minister)
As part of the Nationhood and National Pride Campaign, staff members of the Bank lived up to the Bank’s value of CARE by voluntarily donating blood to the Namibia Blood Transfusion Service twice during the year under review. Led by the Governor, staff members participated in the blood donation campaign on 20 May 2019 and 28 November
2019, in order to contribute to efforts to bolster the country’s limited supply of blood and thereby help to save lives. On these two occasions staff were further encouraged to become regular blood donors, as only about 1% of the Namibian population donate blood on a regular basis.
Governor Iipumbu Shiimi cheerfully donating blood to the Namibia Blood Transfusion Service in November 2019
Part AOperations and Affairs of the Bank

55Bank of Namibia Annual Report 2019
STRATEGIC OBJECTIVE 6: PROMOTE FINANCIAL SECTOR DEVELOPMENT
INITIATIVES AND STRATEGIES
STRATEGIC OUTCOMES ACTUAL OUTCOMES
STRATEGIC OBJECTIVE ACHIEVED (YES/NO)
6.1 Promote financial sector development
Namibia Financial Sector Strategy (NFSS) implementation coordinated in line with agreed implementation action plan
The Bank continued to coordinate and execute initiatives aimed at improving access to finance not only for individuals earning a low income, but also for small and medium enterprises.
Yes
FINANCIAL SECTOR DEVELOPMENTAs Secretariat to the Namibia Financial Sector Strategy (NFSS), the Bank of Namibia remained committed to the effective coordination of the implementation of the NFSS during 2019. The 10-year strategy provides a guide for the achievement of the financial sector reform areas as set out in the various National Development Plans. The Bank continued to play a key role in the coordination and execution of the NFSS during the period under review. The Bank‘s execution role entails carrying out projects that are in line with the NFSS and the mandate of the Bank, while the coordination role involves the harmonisation of activities of relevant stakeholders as per the action plan, as well as the provision of secretariat services to the governance structure of the NFSS.
Following approval by the Cabinet, the SME Financing Strategy was launched on 6 November
2019 by the Minister of Finance. The Strategy, which is under the stewardship of the Ministry of Finance, comprises three complementary facilities, namely the Credit Guarantee Scheme, the Catalytic First Loss Venture Capital Fund, and the Mentoring and Coaching Programme. The hosting and administration will be facilitated by the Development Bank of Namibia, as delegated by the Ministry of Finance. During the year under review, the Board of Directors of the Bank of Namibia made an additional N$50 million available for the operationalisation of the SME Financing Strategy, bringing the Bank’s contribution toward this Strategy to N$70 million. The donated funds will capitalise the Credit Guarantee Schemes and the Venture Capital Fund. The revised Memorandum of Agreement was signed on 6 December 2019 between the Development Bank of Namibia and the Bank of Namibia.
Governor Iipumbu Shiimi and Ms Hanri Jacobs (Chief Financial Officer, Development Bank of Namibia) at the official signing of the Memorandum of Agreement
Part AOperations and Affairs of the Bank

56 Bank of Namibia Annual Report 2019
As part of its executive role, the Bank made remarkable progress in the establishment of the Namibia Deposit Guarantee Authority (NDGA). The NDGA is established in terms of the Namibia Deposit Guarantee Act (Act No. 16 of 2018). Following the promulgation of the Act and the related preparatory work, the Board of Directors for the Authority were appointed for a period of five years, effective 4 September 2019. The mandate of the NDGA is to ensure that most depositors
are protected and fully compensated in the event of the failure of a commercial bank, up to a maximum limit, in an efficient, transparent and speedy manner. The Board of Directors held their inception meeting on 5 November 2019. All determinations and regulations to enable the Deposit Guarantee Scheme to become fully operational were adopted by the Board of Directors of the NDGA and will be gazetted early in 2020.
Bank of Namibia staff with the Board of Directors of the Namibia Deposit Guarantee Authority during their inception meeting: (standing, from the left): Mr Petrus Shifotoka (Principal
Economist: BoN), Mr. Festus Nghifenwa (Board member: NDGA), Mr Ulrich Eiseb (Board member: NDGA), Mr. Iipumbu Shiimi (Governor: BoN), Mr Ebson Uanguta (Deputy Governor: BoN and Chairperson: NDGA Board), Mr Emile Van Zyl (Technical Advisor to the Governor:
BoN); (seated, from the left): Ms Linda Dumba Chicalu (Board member: NDGA) and Dr Emma Haiyambo (Director of Strategic Communication and Financial Sector Development: BoN and
Head of the NDGA)
One of the initiatives advocated by the NFSS is to conduct a skills-needs assessment for the financial sector of Namibia and implement a skills development plan. The skills assessment is deemed necessary to assist with the identification of current skills gaps and future needs of the sector, with a view to establishing a skills development plan. The findings and recommendations of a study undertaken by the Bank, including the skills development plan, were approved by the Financial Inclusion Council. As a coordinator, the Bank further requested that the various industries within the financial sector provide a set of critical skills-needs, which were submitted to a number of key institutions of higher learning for incorporation in their curricula and programme development. The Bank will continue to coordinate engagements between the financial sector
and the institutions of higher learning in pursuit of the goals of this important undertaking.
As part of its coordination role, the Bank continued to serve on both the Executive Committee and the Tender Committee of the National Financial Literacy Initiative in 2019. Furthermore, the Bank served on a working group that was specifically set up for the drafting of the National Policy on Financial Education. This Policy will outline a clear vision focused on the identification, planning, and coordination of national financial education programmes countrywide, as well as on the necessary institutional arrangements to implement financial literacy programmes. It will further direct all stakeholders to align their financial initiatives and take full responsibility for the achievement of the
Part AOperations and Affairs of the Bank

57Bank of Namibia Annual Report 2019
targeted outcomes of the NFSS. Additionally, the policy will hold all stakeholders equally accountable for their responsibilities regarding financial education. The draft policy has been developed and is currently being reviewed in stakeholder consultations.
The Bank and other relevant institutions supported NAMFISA in drafting the Consumer Credit Policy, which will inform the drafting of the Consumer Credit Bill. The drafting of the Policy, and thereafter the Bill, is under the stewardship of NAMFISA, in collaboration with representatives from the
Bank of Namibia, the Ministry of Finance and the Ministry of Industrialisation, Trade and SME Development. During the review period, background research work was concluded, and the draft policy paper was submitted to the Steering Committee for approval and public consultation. The Consumer Credit Bill will consolidate outdated laws regulating consumer credit, such as the Credit Agreements Act (Act No. 75 of 1980), as amended, and the Usury Act (Act No.73 of 1968), as amended, and once enacted, it will regulate all consumer credit-related issues in Namibia.
Part AOperations and Affairs of the Bank

58 Bank of Namibia Annual Report 2019
STRATEGIC OBJECTIVE 7: ENHANCE CONTRIBUTION TOWARDS SUSTAINABLE ECONOMIC GROWTH
INITIATIVES AND STRATEGIES STRATEGIC OUTCOMES ACTUAL OUTCOMES
STRATEGIC OBJECTIVE ACHIEVED (YES/NO)
7.1 Deliver and assist with implementation of relevant and high-quality policy advice
>80% of national economic policy advice accepted and 60% implemented within a period of five years
88 percent of national economic policy advice was accepted and implemented during the period under review.
Yes
7.2 Deliver innovative and quality research output
At least one of the working and occasional papers per year should be published in a peer reviewed journal and presented at conferences in Namibia
Two research papers were published in peer reviewed journals:Macroeconomic variables and the current account balance in an open economy: evidence from Namibia (2019). Journal for Studies in Economics & Econometrics (SEE), Volume 43, No. 2.The Output Gap and Potential Output in Namibia. Journal of Economics and Behavioral Studies, 11(5(J)), 69-75.
Yes
7.3 Promote regional integration
Advice on regional integration matters accepted and implemented
The Bank has been made responsible for implementing seven of the eleven annexes of the SADC Finance and Investment Protocol; the implementation progress was monitored in 2019.
Yes
POLICY RESEARCH AND ADVICE As part of its statutory mandate, the Bank is required to provide policy advice to the Government. In this regard, the Bank conducts economic and financial research, as well as other research of strategic importance. The main aim of the research undertaken by the Bank is to inform specific policy direction and actions. The following is a summary of activities and research carried out in 2019:
On 19 September 2019, the Bank held its 20th Annual Symposium, under the theme “Escaping the middle-income trap: A perspective from
Namibia”. Several policy recommendations emanated from the symposium: (i) If Namibia wishes to be an industrialised nation by
2030, the country will have to invest heavily in niche manufacturing of complex goods.
(ii) Rising capability to introduce new and improved technologies will enable Namibia to sustain productivity growth over time.
(iii) Namibia needs to prioritise its development undertakings, by focusing on activities with the most developmental impact. Despite the many challenges that face the country, disbursing resources to fix everything will spread resources
Part AOperations and Affairs of the Bank

59Bank of Namibia Annual Report 2019
too thinly. Namibia should decide on what is most important that will effectively transform the economy and focus resources on those.
(iv) The private sector plays a vital role in any economy,and as such the Government should ensure anenvironment that is conducive to the efficientfunctioning of the private sector. This inherentlyimplies creating a business-friendly environment forprivate sector activities, which is free of distortionsand underpinned by efficient public institutionsand transparent regulatory frameworks, therebyenhancing the competitiveness of the Namibianeconomy.
Furthermore, on an annual basis the Bank provides the Ministry of Finance with technical advice on Government debt sustainability. Debt sustainability analysis is an important element in the macroeconomic analysis of fiscal policy. A careful analysis of Namibia’s macroeconomic and fiscal indicators confirms the need for the Government to stick to its fiscal consolidation plans and to minimise further borrowing. The recommendations include that overall government expenditure be set on a stable path, aligned with expected smoothed government revenue; and that future borrowing should be strictly for growth-enhancing projects with high economic returns.
Part AOperations and Affairs of the Bank

60 Bank of Namibia Annual Report 2019
ESCAPING THE MIDDLE-INCOME TRAP – A PERSPECTIVE FROM NAMIBIA
INTRODUCTION
The Bank of Namibia held its 20th annual symposium at the Safari Court Hotel on 19 September 2019 under the theme: “Escaping the Middle-Income Trap – A Perspective from Namibia”. The selection of the theme stemmed from the disappointing growth record in Namibia since 2016 that has given rise to the notion that Namibia might be in a middle-income trap. GDP growth rates had been on an upward trajectory over a number of years, averaging 3.5 percent between 1990 and 1999, then increasing to 4.3 percent between 2000 and 2009. Between 2010 and 2015, the average growth rate picked up further to 5.7 percent, mainly due to an expansionary fiscal policy and the development of large mines. However, since 2016, real GDP has contracted as the temporary stimulus from the construction of mines and public sector infrastructure dissipated, and the Government undertook significant fiscal adjustments to stabilise public debt dynamics. It is against this backdrop that the symposium was organised under this theme, in the hope of finding solutions on how to avoid the middle-income trap, and to become a high-income economy through sustained economic growth.
The 20th annual symposium aimed to achieve the following objectives:
(i) to ascertain if Namibia is indeed in a middle-income trap;
(i) to determine what kind of activities or sectors Namibia should target, as the understanding is that the country needs to be focused, and cannot be good at everything; and
(i) to learn from countries that have successfully moved to higher income levels and significantly improved the living standards of their citizens.
These issues were addressed through presentations given by local and international speakers, supplemented by a discussion by a panel comprised of representatives from international organisations, the private sector and the Government. The papers and discussions raised several options with regards to increasing growth in Namibia. Below is a summary of the key policy issues that emerged from the symposium.
KEY POLICY ISSUES EMANATING FROM THE SYMPOSIUM
(i) Develop niches in complex products in manufacturing
If Namibia wishes to be an industrialised nation by 2030, the country will have to invest heavily in the niche manufacturing of complex goods. What a country produces and exports determines its wages (income): therefore, Namibia needs to become involved in the manufacturing of complex products that have a high income elasticity of demand. Policies to enhance industrialisation should be deliberate and relentless, supported by political will and capabilities.
ii) Attract foreign direct investment (FDI) inflow
that will increase technological progress in the country
A rising capacity to introduce new and improved technologies will enable Namibia to sustain
productivity growth over time. For example, the Republic of Korea and Taiwan Province of China, the technological leaders in the developing world, adopted highly interventionist strategies on trade and domestic resource allocation, with a clear preference for promoting indigenous enterprises and deepening local capabilities.
iii) Increase modern tradable services Modern services have high wages as they have
high elasticity of demand. In order to transform the economy, there is a need to increase the amount of money to be spent in the country, and since modern services have high wages, it is important to invest in modern tradable services which increase employment in the country, and can also be exported.
Part AOperations and Affairs of the Bank
61Bank of Namibia Annual Report 2019
iv) Focus on fixing only a few objectives and not everything at once
Namibia needs to prioritise its development undertakings, by focusing on activities with the most developmental impact. Despite the many challenges that face the country, disbursing resources to fix everything will spread resources too thinly. Namibia should decide on what activities are most important because they will effectively transform the economy, and focus resources on these. The Asian economies picked only a few activities that offered significant technological benefits and linkages, and these helped transform their economies.
v) Enhance the private sector to be an engine
of future growth The private sector plays a vital role in any
economy, and as such the government should ensure an environment that is conducive to the efficient functioning of the private sector. This will require creating a business-friendly
environment for private sector activities which is free of distortions and is underpinned by efficient public institutions and transparent regulatory frameworks. Doing so will certainly enhance the competitiveness of the Namibian economy.
vi) Enhance laws that enable the importation
of skilled labour Introduce and enforce the implementation
of enabling laws that attract foreign labour with critical skills. In instances of critical skills shortages in Namibia, the laws should be conducive to enable obtaining the necessary critical skills from abroad. As such, focus should be on foreign skills that complement rather than substitute local labour. This will enable knowledge spill-overs, i.e. the desire to obtain knowledge on key technologies that are not yet nationally available. Immigration policies should therefore be accommodating to enable the country to import the needed skills.
POLICY RECOMMENDATIONS
Several options with regards to increasing growth in Namibia were proposed:
(i) The private sector plays a vital role in any economy, and the Government should therefore ensure an environment that provides certainty and is conducive to the efficient functioning of the private sector.
(i) In instances of critical skills shortages in Namibia, laws, regulations and practices
should be conducive to the obtaining of the necessary critical skills from abroad.
(i) Namibia’s education system needs to be linked with industrial targets: The public and private sectors, as well as academia, should have open and honest dialogue on how to take the country forward.
Part AOperations and Affairs of the Bank
62 Bank of Namibia Annual Report 2019
INTERNATIONAL AND REGIONAL COOPERATIONThe Bank continued to collaborate with international and regional stakeholders during 2019. The Bank collaborated with other central banks, the IMF and the World Bank Group (WBG), and the Alliance for Financial Inclusion at an international level. At the continental level, the Bank, as a member of the Association of African Central Banks (AACB), participated in the meetings and symposium of the
AACB. Furthermore, the Bank continued to participate in SADC activities through the Committee of Central Bank Governors (CCBG) and the Macroeconomic and Financial Management Institute of Eastern and Southern Africa (MEFMI). As has become the norm, the Bank also actively participated in CMA and SACU activities. The details of each cooperation arrangement are presented below.
COOPERATION WITH THE INTERNATIONAL MONETARY FUND AND THE WORLD BANK GROUP (WBG)The Bank took part in the annual meetings of the Boards of Governors of the IMF and the WBG in 2019. The annual meetings were held in Washington, DC, 14–20 October 2019. The annual meetings bring together central bankers, ministers of finance and development, parliamentarians, private sector executives, representatives from civil society organisations and academics to discuss issues of global concern, including the world economic outlook, poverty eradication, economic development, and aid
effectiveness. In 2019, it was noted that the WBG, in cooperation with the IMF, considered how they could help emerging and low-income countries bolster potential growth, increase their resilience to shocks, boost domestic revenues and continue building policy buffers. In order to strengthen its existing bilateral agreements, the Bank also used the opportunity to engage with its counterparts in central banking, as well as relevant departments at the two Bretton Woods institutions.
INTERNATIONAL MONETARY FUND
As part of its annual engagements with the IMF, in 2019 the Bank again participated in the annual surveillance activities of the IMF Article IV mission under the Articles of Agreement. The IMF Article IV mission engaged the Bank, parastatals and relevant Government institutions on issues pertaining to financial stability, real sector developments, the economic outlook, monetary policy and the financial sector, the anti-money laundering and combating of terrorism financing regime, and balance of payments (BOP) developments. Through its surveillance activities, the IMF monitors economies and provides policy advice to its member states in order to identify weaknesses that are causing or could lead to financial or economic instability.
The Regional Technical Assistance Center in Southern Africa (AFRITAC South – AFS) offered specialised training to the Bank in 2019. The IMF offers training through AFRITAC South, and Bank staff members attended training on fiscal policy analysis, monetary policy and exchange rate regimes, and macroeconomic diagnostics. Several staff members have attended these training sessions that are usually hosted by Mauritius, where the AFRITAC South – AFS is based. In-country technical assistance was afforded to Namclear as a financial market infrastructure (FMI), and the Bank in its capacity as a regulator. The technical assistance focused on Principles for Financial Market Infrastructure, particularly on FMI Risk Management and Oversight, and was provided by AFRITAC South, in conjunction with the World Bank.
WORLD BANK GROUP
The WBG’s Reserves Advisory and Management Program offered specialised training to staff of the Bank in 2019. The Bank has had an investment management and consulting agreement with the Reserves Advisory and Management Program since May 2008. In terms of the Program, the Bank receives certain technical advisory and asset management services. For
the year under review, the staff members of the Bank received on-site training on Credit Risk Management, Fundamentals of Asset Allocation, Investing in Chinese Financial Markets, and Risk Budgeting and Operational Risk Management. In addition, staff members attended a workshop on the Portfolio Analytics Tool as well as in-house training on Strategic Asset Allocation.
Part AOperations and Affairs of the Bank

63Bank of Namibia Annual Report 2019
COOPERATION WITH THE ALLIANCE FOR FINANCIAL INCLUSIONAs a member of the Alliance for Financial Inclusion
(AFI), the Bank continued to participate in relevant
AFI activities and programmes during the year
under review. The AFI is a member-owned global
network that promotes and develops evidence-based
policy solutions to challenges faced by member
countries. The Bank participates in the Alliance’s
activities as a primary member. The highlight for 2019
was the Bank’s participation at the 2019 AFI Global
Policy Forum (GPF) from 11–13 September 2019 in
Kigali, Rwanda. Hailed for its gender equality policies
and equal participation of women in all spheres of life,
the 2019 GPF showcased the experience of Rwanda
and highlighted how the use of technology has brought
progress in financial inclusion for the most vulnerable
groups, especially women and the youth. The GPF
adopted two model policies, namely a model policy
on electronic money (E-money) and a model policy on
core datasets. Since the adoption of the Denarau Action
Plan at the 2016 GPF, AFI member countries have
pledged to cut the gender gap in half by 2021 within
their respective jurisdictions. The 2019 GPF was thus
an occasion to take stock of the progress made and set
out steps ahead to reach the goal of halving the financial
inclusion gender gap.
COOPERATION WITH THE ASSOCIATION OF AFRICAN CENTRAL BANKS (AACB)The Bank actively participated in the activities of
the AACB in 2019. As has become the norm, officials
from the Bank attended the 42nd ordinary meeting of
the AACB Assembly of Governors held in August
2019 in Kigali, Rwanda. The AACB hosted its annual
symposium under the theme: “‘Rising African Sovereign
Debt: Implications for Monetary Policy and Financial
Stability”. In addition, the Bank took part in the activities
of the Community of African Banking Supervisors
(CABS) and attended meetings of the CABS Working
Group on Cross-border Banking Supervision.
COOPERATION WITH THE MACROECONOMIC AND FINANCIAL MANAGEMENT INSTITUTE OF EASTERN AND SOUTHERN AFRICA The Bank attended the annual meetings of the
Board of Governors of the Macroeconomic and
Financial Management Institute of Eastern and
Southern Africa (MEFMI) during the IMF/WBG
annual meeting in 2019. As has become tradition,
the MEFMI meetings preceded the IMF and WBG
annual meetings in Washington DC in October 2019.
The three institutions, namely MEFMI, the IMF and the
WBG, collaborate in providing training in the areas of
debt management, macroeconomic management and
financial sector management.
COOPERATION WITH THE COMMITTEE OF CENTRAL BANK GOVERNORS IN THE SADCAs a member central bank, the Bank continued to
participate in activities of the Committee of Central
Bank Governors in SADC (CCBG) in 2019. Staff
members of the Bank attended two CCBG meetings
that were held in South Africa and Madagascar in 2019.
At these meetings, the governors discussed economic
and financial developments in the SADC region, as well
as the SADC’s progress towards monetary integration.
The CCBG also discussed other important issues, such
as SIRESS, settlement currencies for SIRESS, and a
clearing house for low-value electronic EFTs.
COOPERATION WITH COMMON MONETARY AREA STRUCTURESThe Bank continued its active participation in CMA
activities and related issues. The purpose of the
CMA central bank governors’ meetings was to assess
recent economic developments in member countries
as well as global economic developments and their
potential impact on the CMA economies. In addition,
the meetings discussed issues related to payment
systems, exchange control, banking regulation and
Part AOperations and Affairs of the Bank

64 Bank of Namibia Annual Report 2019
supervision, and financial stability. Moreover, common
risks and challenges confronting CMA countries and
policy options to address these risks and challenges
were also part of the discussions. The three meetings
that were held in 2019 were hosted by the central banks
of South Africa, Eswatini and Lesotho, in February, July
and November, respectively.
COOPERATION WITH THE SOUTHERN AFRICAN CUSTOMS UNIONThe Bank continued to provide its technical
support to the Namibian Government on SACU-
related matters during 2019. The Bank participated in
meetings of Finance and Audit Committee, and Senior
Trade Officials during 2019.
BILATERAL COOPERATION WITH OTHER CENTRAL BANKSThe Bank of Namibia and Banco Naçional de Angola
strengthened relations through a Memorandum of
Agreement regarding areas of central banking.
The two banks signed the agreement on 20 November
2019. The agreement provides for cooperation in the
areas of exchange control administration; financial
market and foreign reserve management; economic
research; banking supervision and regulation; payment
systems management; financial sector development;
and other areas which the sister institutions consider to
be important.
Part AOperations and Affairs of the Bank
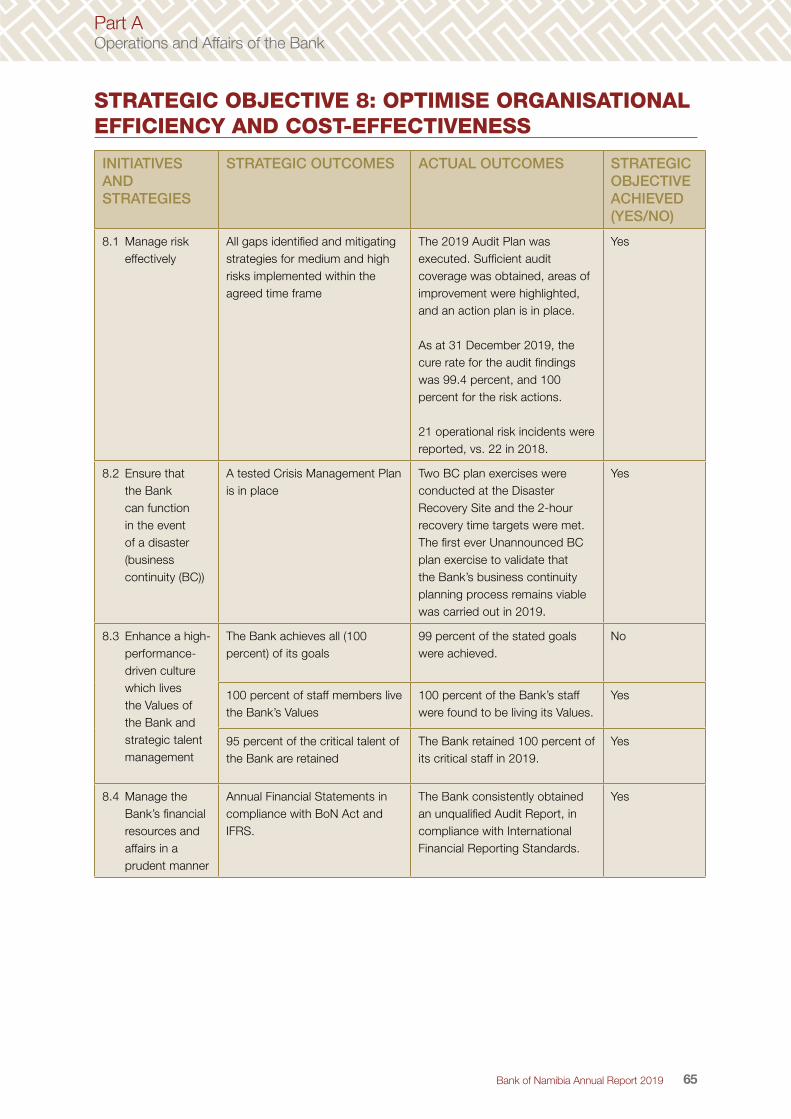
65Bank of Namibia Annual Report 2019
STRATEGIC OBJECTIVE 8: OPTIMISE ORGANISATIONAL EFFICIENCY AND COST-EFFECTIVENESS
INITIATIVES AND STRATEGIES
STRATEGIC OUTCOMES ACTUAL OUTCOMES STRATEGIC OBJECTIVE ACHIEVED (YES/NO)
8.1 Manage risk effectively
All gaps identified and mitigating strategies for medium and high risks implemented within the agreed time frame
The 2019 Audit Plan was executed. Sufficient audit coverage was obtained, areas of improvement were highlighted, and an action plan is in place.
As at 31 December 2019, the cure rate for the audit findings was 99.4 percent, and 100 percent for the risk actions.
21 operational risk incidents were reported, vs. 22 in 2018.
Yes
8.2 Ensure that the Bank can function in the event of a disaster (business continuity (BC))
A tested Crisis Management Plan is in place
Two BC plan exercises were conducted at the Disaster Recovery Site and the 2-hour recovery time targets were met. The first ever Unannounced BC plan exercise to validate that the Bank’s business continuity planning process remains viable was carried out in 2019.
Yes
8.3 Enhance a high-performance-driven culture which lives the Values of the Bank and strategic talent management
The Bank achieves all (100 percent) of its goals
99 percent of the stated goals were achieved.
No
100 percent of staff members live the Bank’s Values
100 percent of the Bank’s staff were found to be living its Values.
Yes
95 percent of the critical talent of the Bank are retained
The Bank retained 100 percent of its critical staff in 2019.
Yes
8.4 Manage the Bank’s financial resources and affairs in a prudent manner
Annual Financial Statements in compliance with BoN Act and IFRS.
The Bank consistently obtained an unqualified Audit Report, in compliance with International Financial Reporting Standards.
Yes
Part AOperations and Affairs of the Bank

66 Bank of Namibia Annual Report 2019
INITIATIVES AND STRATEGIES
STRATEGIC OUTCOMES ACTUAL OUTCOMES STRATEGIC OBJECTIVE ACHIEVED (YES/NO)
8.5 Ensure functionality, security and availability of facilities, other assets and infrastructure that support its operations in an environmentally friendly manner
Buildings and other infrastructure that are environmentally friendly so that the Bank contributes in reducing carbon emissions and embarks on the journey to achieve 4-star rating by the Green Building Council of Namibia
The Bank continued to invest in various green initiative projects during 2019 and they are envisaged to contribute significantly to the reduction in energy consumption once successfully implemented in 2020.
No
Security systems and equipment are functional and maintain 97 percent availability to provide maximum protection to employees and the Bank’s assets
Security systems have been functional at more than 97 percent and provide maximum protection to employees and Bank assets.
Yes
97 percent availability and functionality of all facilities, other assets and infrastructure that supports its operations in an environmentally friendly manner
98.5 percent facilities availability was achieved during the period under review.
Yes
8.6 Manage technology to optimise Bank operations
Relevant and secure IT systems that are 99.9 percent available (8 hours off-time).
The Bank realised an overall availability of 99.12 percent for critical systems and infrastructure during 2019.
No
5 Priority IT processes at agreedCOBIT-5 targets
Of the 5 technology governance processes, 3 have met their respective targets, with 2 still requiring attention at the end of 2019.
No
8.7 Ensure efficient procurement practices
Procurement practices that result in cost savings of 1.0 percent and maintain procurement cycle time of 2 days, and travel management cycle of 1 day
The Bank continued to employ effective and efficient procurement practices during 2019, in line with its procurement policy, and oversight from the Tender Committee, and achieved its objectives for the year.
Yes
8.8 Manage the legal affairs of the Bank
All court matters handled in terms of the timelines set out in legislation, court rules and practice directives.
All litigation matters in the courts handled by either the Bank or instructed law firms are adhering to the strict rules of the courts.
Yes
All contracts managed as per Contract Management Guidelines
The Bank has implemented a new Contract Management System; migration is underway; contracts are not fully managed as per Contract Management Guidelines.
No
Part AOperations and Affairs of the Bank

67Bank of Namibia Annual Report 2019
INITIATIVES AND STRATEGIES
STRATEGIC OUTCOMES ACTUAL OUTCOMES STRATEGIC OBJECTIVE ACHIEVED (YES/NO)
Legal opinions provided within 7 days of request
At times due to the complexity of legal opinions, the Bank could not provide the opinions within 7 days.
No
8.9 Ensure knowledge and information management of the Bank
Knowledge (e-library services, e-resources collection, and picture/video management) managed in line with the agreed guidelines and procedures
The Bank’s explicit knowledge has been documented through video recordings and pictures and effectively managed.
Yes
RISK MANAGEMENT AND ASSURANCEThe Bank of Namibia’s risk management function facilitates enterprise risk management practices across the board, in order to manage risks in a proactive, coordinated, prioritised and cost-effective manner. The top strategic and operational risks and their identified response strategies continued to be monitored at the Bank’s quarterly Risk Management and Audit Committee meetings. Enterprise risk management activities are designed to increase the probability of success and reduce uncertainty relating to the achievement of the Bank’s objectives. In 2019, 21 operational risk incidents were reported, down from 22 in 2018. These were risk events resulting from a failure of people, processes, systems or external events that could bring about losses or near misses. The actual financial losses incurred as a result of these incidents amounted to N$163 343.63, compared to N$23 972.00 in 2018. Remedial actions to address, wherever possible, the root causes of the incidents in question were identified and appropriate measures were introduced. The Bank is in the process of updating its risk universe, which is a central repository of all the risks that could affect the Bank, to provide a better understanding of inherent risks.
The Bank-wide compliance management process continues to be embedded in the Bank. Scanning of the current legal and regulatory environment was carried out to update the current regulatory universe. An assessment against the newly approved Whistle Blowing Act (Act No. 10 of 2017) was completed. The Bank will review the Code of Ethics and Conduct to include a high-level whistle-blowing principle and to define a separate detailed whistle-blowing procedure to ensure alignment with the approved Act.
Compliance monitoring was carried out by the various departments during the period under review. This monitoring process is to ascertain the compliance status and ensure adequate compliance with the relevant laws, regulations, policies and procedures; gaps were highlighted. Corrective actions were subsequently identified, and their implementation was monitored by the Bank’s Risk Management function.
Business continuity management at the Bank has continued to improve from year to year. One unannounced business continuity (BC) plan test limited to testing the availability of critical resources suppliers/vendors, infrastructure, facilities, security restrictions, and the crisis communication plan, and two planned BC management exercises were conducted in 2019. These included all departments, and the Maximum Allowable Outage time of two hours was met. Various issues identified during the 2018 exercise were successfully addressed before executing the 2019 plan. In the event of a major disruption, the Bank would, at the least, be able to recover and continue its key business environments within the determined Maximum Allowable Outage timeline at the disaster recovery site.
The approved risk-based Internal Audit Plan for 2019 provided comprehensive assurance over the processes which manage key risks. This was undertaken as planned, and all material issues that arose were reported to the appropriate level of management and to the Board’s Audit Committee. As per the completed assignments, sufficient audit coverage was achieved that enabled the Bank to state that it had adequate and effective risk management practices, and that controls and governance processes
Part AOperations and Affairs of the Bank

68 Bank of Namibia Annual Report 2019
were in place for the achievement of the objective of the Strategic Plan of the Bank.
The tracking and accountability for corrective actions on issues raised during audits were
prioritised by way of quarterly reporting to the Audit Committee in respect of the Bank-wide cure (resolution) rate. The cure rate result for December 2019 was 99.4 percent (2018: 94 percent), which is still below the required target of 100 percent.
HUMAN RESOURCE DEVELOPMENTS
ORGANISATIONAL DEVELOPMENT AND WORKPLACE CULTURE
During 2019, staff performance was managed and tracked on an ongoing basis to ensure that employees remained optimally engaged. As a means of establishing a shared vision amongst all staff members, the performance management process at the Bank was aimed at aligning the organisational objectives with the employees’ agreed measures, skills, competency requirements, developmental plans and delivery of results to achieve the overall business strategy.
During the year under review the Bank embarked upon targeted interventions with the aim of strengthening the Bank’s Vision of being a centre of excellence. Through these interventions, the Bank continued to inculcate the Vision, Mission and Values of the Bank by focusing on interpersonal and intergroup communication, as well as on relationships through emotional intelligence awareness sessions. The Bank staff members were assessed, and they seemed to exhibit the desired behaviour and align themselves with the Values of the Bank.
STAFFING
The Bank maintained an adequate staff complement throughout 2019 to meet its objectives. The staff complement as at 31 December 2019 stood at 290 employees, 21 less than the approved establishment of 311. The decline was attributed to vacancies resulting
from retirements, promotions and resignations during the year under review (Table A.15). Despite the vacancies, the operations of the Bank were not impacted as the Bank managed to retain 100% of its critical skills.
TABLE A.15 NUMBER OF STAFF AS AT 31 DECEMBER
Staff category 2015 2016 2017 2018 2019*
General staff 269 265 253 263 254
Management 21 22 21 21 22
Senior management 11 11 11 12 12
Executive management 2 2 2 2 2
Total employed 303 300 287 298 290
* The numbers for the year under review exclude FIC numbers, as it has been an independent reporting entity since 2015.
EMPLOYMENT EQUITYAs part of embracing its value of diversity, the Bank continued to comply with the requirements of the Affirmative Action (Employment) Act (Act No. 29 of 1998). In this regard, the Bank ensured that all its policies and practices were aligned with affirmative action requirements and guidelines. The
Bank consistently implemented the current three-year Employment Equity Plan it had set itself, which runs from 2019 to 2021. During the current year, the Bank met and, in some instances, exceeded its employment equity targets.
Part AOperations and Affairs of the Bank

69Bank of Namibia Annual Report 2019
TABLE A.16 EMPLOYMENT EQUITY DATA, 2015–2019
Workforce 2015 2016 2017 2018 2019
Male 144 136 127 133 129
Female 159 164 160 161 161
Racially disadvantaged 291 288 276 289 286
Racially advantaged 6 6 5 4 4
Persons with disabilities 6 6 5 4 4
Non-Namibians 0 0 1 1 1
CAPACITY DEVELOPMENT
In order to enable employees to accomplish the Bank’s mandate as articulated in its Strategic Plan, the Bank continued to invest in various capacity-building initiatives. In 2019, 99 employees were provided with both technical and soft-skills training in various aspects of central banking and related fields. Of this group, 39 were male and 60 were female. In addition, loans and bursaries were granted to deserving staff members who consistently met their performance goals, enabling them to pursue undergraduate and postgraduate degrees in areas relevant to the operations of the Bank. Seventeen staff members were awarded study loans, while six staff received fully funded bursaries for undergraduate and postgraduate studies to study locally and internationally. One staff member was funded to attend an IFC Milken Fellowship Program at the George Washington University in the United States of America.
As part of its contribution to capacity building and to offer experiential learning to young graduates in the Namibian labour market, the Bank has a Graduate Accelerated Training Programme that provides on-the-job exposure to graduates. The programme aims to provide graduates in the areas of banking, economics and finance with the opportunity to gain relevant work experience in various aspects of central banking over a period of 18 months. During 2019, five out of the six Graduate Accelerated Programme trainees completed their 18-month programme, which ended in August 2019, while one trainee exited the programme early to take up full time employment at another organisation. Of the five trainees who completed the programme, two have been offered permanent employment at the Bank, while three are employed at the Bank on a temporary basis.
EMPLOYEE WELLNESS
To ensure the physical and mental wellbeing of the staff, an appropriate Wellness Programme remains an important component within the Bank. During the period under review, the Bank’s staff benefited from various wellness interventions which were focused on preventative measures to deal with potential health and safety risks. The Bank’s wellness programme continues to have a positive impact on the Bank staff’s work life balance through awareness and knowledge sessions on issues related to lifestyle diseases. Physical training
and financial coaching were also used as strategies to provide physical fitness and financial prudence. The Bank has a general duty to ensure that all aspects of the safety of staff members while at work are taken care of. To this end, during the period under review a safety risk assessment was carried out at the Banks’ Head Office in Windhoek to enable the Bank to determine possible safety risks to which staff may be exposed, and to take necessary measures to address and contain them.
FINANCIAL MANAGEMENT The Bank manages its financial affairs in a prudent manner. The Bank continues to publish unqualified financial statements which comply with all appropriate regulations and prescribed standards. The Bank maintains adequate controls to mitigate all potential
transaction processing risks. There are defined limits within the accounting system to ensure adherence to the approved budget. On a quarterly basis, variance analysis reports for both income and expenditure are presented to the Management Committee.
Part AOperations and Affairs of the Bank

70 Bank of Namibia Annual Report 2019
FACILITIES MANAGEMENT The Bank ensures the availability and functionality of the facilities that support the Bank in achieving its strategic objectives. The facilities management function includes infrastructure development, general repairs and maintenance, fire safety, utility services and business continuity.
As a responsible institution, the Bank continued to invest in systems such as the Building Management System (BMS) to assist in the proper management of its infrastructure. In an effort to have the Bank buildings certified by the Green Building
Council, the BMS will contribute towards this ultimate objective. BMS is a solution which contributes to the Bank’s objective of providing an environment that is safe, secure, comfortable and energy efficient. Another project that commenced in 2019 aimed at contributing towards a green building rating is the solar-photovoltaic system installation at both Head Office and the Oshakati branch. By investing in green energy generation such as the solar photovoltaic system installation, the Bank contributes to a safer environment as well as the country’s own energy generation capacity. It is envisaged that the project will be completed during 2020.
SECURITY AND SAFETY MANAGEMENT The Bank has an efficient and effective security system in place. During the period under review, the
Bank ensured that all its assets and personnel were duly protected.
INFORMATION TECHNOLOGY
TECHNOLOGY GOVERNANCE
The Bank made progress on the IT Master Plan towards achieving its technology-related objectives. The plan commenced in 2017 and will run till 2021, in line with the Bank’s strategic plan. The Bank reduced inefficiencies in various business operations, enhanced IT security, implemented numerous approved business systems and better managed general IT controls through technology governance.
The IT Master Plan is supported by a three-year plan to implement five priority IT Governance processes. The plan included IT risk management,
business continuity, IT security, benefits delivery, and capacity planning and availability management. The plan concluded in 2019 with three of the five processes achieving acceptable targets set by the Board. Two processes, namely benefits delivery and IT security, did not achieve acceptable standards according to the set plan. Both are ongoing activities that will continue to receive attention in years to come. The Bank planned a new priority list with five processes that will be executed from 2020 till 2022. This would form part of the Board’s enterprise technology governance agenda.
IT INFRASTRUCTURE AND SECURITY
The Bank’s IT Infrastructure maintained high availability during the year under review. The Bank has a target availability of 99.9 percent in its strategic plan. In 2019, 99.12 percent was achieved across all critical infrastructure and business systems. Having experienced considerable availability challenges in 2016, the Bank prioritised the Availability and Capacity
Management governance process. The Bank improved its capabilities within this governance process.
Cyber security was one of the Bank’s focus areas in 2019. Some progress was made in mitigating much of the risk. The Bank’s Governance controls remained sound, while aiming for compliance with higher global standards of cyber security capability.
IT BUSINESS SYSTEM INVESTMENTS
The Bank committed resources to improve technological operational efficiency in various business units. The EFT project continued with the aim to achieve the objectives of the Payment Systems
Determination 7. The Balance of Payments Cross Border Customer Reporting solution was successfully upgraded to Version 3. The project went live in May and by September, all the regulated entities reported balance
Part AOperations and Affairs of the Bank

71Bank of Namibia Annual Report 2019
of payments (BOP) data adequately via the system. In anticipation of the planned Centralised Securities Depository (CSD) for the country, the Bank partially tested its SAP enterprise resource planning (ERP) tool for collateral management functionality. The CSD will only become operational after the promulgation of the Financial Markets Bill.
The Bank engaged in several innovative technology initiatives during the year under review. As a maturing platform, Cloud Computing was tested in 2018 and it was used in production in 2019. The Bank uses this technology in operational areas such as email,
file services and team collaboration. A cloud computing framework was drafted for consideration before other areas of the Bank could be considered. Testing and thorough risk management were also required prior to considering its use in the Banking industry, facilitated through the Banking Supervision Department. The Bank completed a feasibility study into upgrading its ERP solution to a more modern platform. The initiative was considered favourably for the coming years. Similarly, the Bank also completed a feasibility study on Robotics which was also considered favourably. However, this initiative was postponed until the Bank could complete a comprehensive digital transformation strategy.
PROCUREMENT PRACTICESThe Bank strives for efficient procurement practices. Every financial year, the Bank sets a target of 1% cost savings on the procurement budget. Without compromising on quality of goods or services, the Bank seeks out suppliers/service providers that
are competitive in their pricing. The Bank has an internal Tender Committee which ensures that as a public institution, procurement processes are always transparent, fair and competitive.
KNOWLEDGE AND INFORMATION MANAGEMENT Explicit knowledge management relies on the effective management of the Bank’s databases, documents and processes in the various departments, as well as on the documentation of relevant events. The Bank continued to capture events of relevance through still pictures and videos, and to make these media accessible to staff while preserving them as part of institutional memory. These included high-level visits to the Bank, monetary policy announcements, corporate events, vision-building activities, and other memorable events.
During the period under review, the Bank continued to embed a culture of effective and efficient management of records. The records management programme of the Bank aims to support the Bank’s core functions, by accounting for actions, facilitating overall governance, and complying with legal and regulatory obligations. The approved new File Plan was implemented in September 2019 to enforce a common understanding across the Bank on how records should be stored and retrieved. Interventions aimed at implementing the comprehensive Records Management Improvement Strategy adopted in 2018 included several training and awareness-raising sessions in departments to orient staff members to the proper protection of both physical and electronic records.
Part AOperations and Affairs of the Bank
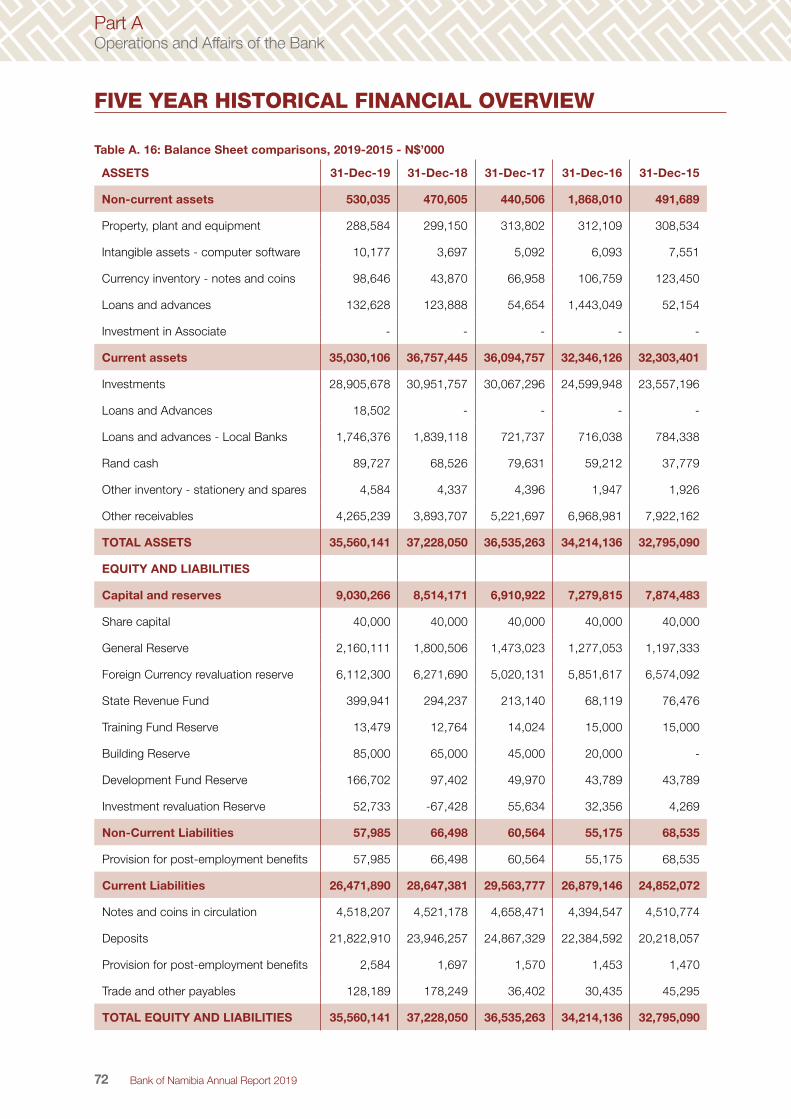
72 Bank of Namibia Annual Report 2019
FIVE YEAR HISTORICAL FINANCIAL OVERVIEW
Table A. 16: Balance Sheet comparisons, 2019-2015 - N$’000
ASSETS 31-Dec-19 31-Dec-18 31-Dec-17 31-Dec-16 31-Dec-15
Non-current assets 530,035 470,605 440,506 1,868,010 491,689
Property, plant and equipment 288,584 299,150 313,802 312,109 308,534
Intangible assets - computer software 10,177 3,697 5,092 6,093 7,551
Currency inventory - notes and coins 98,646 43,870 66,958 106,759 123,450
Loans and advances 132,628 123,888 54,654 1,443,049 52,154
Investment in Associate - - - - -
Current assets 35,030,106 36,757,445 36,094,757 32,346,126 32,303,401
Investments 28,905,678 30,951,757 30,067,296 24,599,948 23,557,196
Loans and Advances 18,502 - - - -
Loans and advances - Local Banks 1,746,376 1,839,118 721,737 716,038 784,338
Rand cash 89,727 68,526 79,631 59,212 37,779
Other inventory - stationery and spares 4,584 4,337 4,396 1,947 1,926
Other receivables 4,265,239 3,893,707 5,221,697 6,968,981 7,922,162
TOTAL ASSETS 35,560,141 37,228,050 36,535,263 34,214,136 32,795,090
EQUITY AND LIABILITIES
Capital and reserves 9,030,266 8,514,171 6,910,922 7,279,815 7,874,483
Share capital 40,000 40,000 40,000 40,000 40,000
General Reserve 2,160,111 1,800,506 1,473,023 1,277,053 1,197,333
Foreign Currency revaluation reserve 6,112,300 6,271,690 5,020,131 5,851,617 6,574,092
State Revenue Fund 399,941 294,237 213,140 68,119 76,476
Training Fund Reserve 13,479 12,764 14,024 15,000 15,000
Building Reserve 85,000 65,000 45,000 20,000 -
Development Fund Reserve 166,702 97,402 49,970 43,789 43,789
Investment revaluation Reserve 52,733 -67,428 55,634 32,356 4,269
Non-Current Liabilities 57,985 66,498 60,564 55,175 68,535
Provision for post-employment benefits 57,985 66,498 60,564 55,175 68,535
Current Liabilities 26,471,890 28,647,381 29,563,777 26,879,146 24,852,072
Notes and coins in circulation 4,518,207 4,521,178 4,658,471 4,394,547 4,510,774
Deposits 21,822,910 23,946,257 24,867,329 22,384,592 20,218,057
Provision for post-employment benefits 2,584 1,697 1,570 1,453 1,470
Trade and other payables 128,189 178,249 36,402 30,435 45,295
TOTAL EQUITY AND LIABILITIES 35,560,141 37,228,050 36,535,263 34,214,136 32,795,090
Part AOperations and Affairs of the Bank

73Bank of Namibia Annual Report 2019
Table A.17: Income Statement comparisons, 2019–2015 – N$’000
31-Dec-19 31-Dec-18 31-Dec-17 31-Dec-16 31-Dec-15
Interest income 850,862 828,371 739,892 435,251 324,608
Interest expense (208,193) (283,372) (262,995) (174,245) (88,956)
Net interest income 642,669 544,999 476,897 261,006 235,652
Rand compensation 407,594 401,963 326,107 296,463 260,288
Other income 37,849 53,116 31,809 33,598 42,391
Total income 1,088,112 1,000,078 834,813 591,067 538,331
Operating expenses (359,023) (449,414) (358,802) (407,925) (342,736)
Net gains/(loss) on investment portfolio 106,174 19,688 (13,418) 12,784 (33,914)
Profit for the year before net foreign exchange translation gain/(loss)
835,263 570,352 462,593 195,926 161,681
Net foreign exchange translation gains/ (losses)
(159,390) 1,251,559 (831,486) (722,475) 3,263,472
Profit/(Loss) for the year 675,873 1,821,911 (368,893) (526,549) 3,425,153
Other comprehensive income 134,459 (55 123) - - -
Unrealised Gains/(Losses) on investment portfolio
115,836 (56 766)
Allowance for credit losses - FVTOCI 4,325 1,643 - - -
Actuarial gain on post-employment benefits
14,298 - - - -
Total comprehensive income 810,332 1,823,554 (368,893) (526,549) 3,425,153
Revaluation Reserve 159,390 (1,251,559) 831,486 722,475 (3,263,472)
Investment revaluation Reserve (115,836) 56,766 (23,278) (28,087) (1,729)
Allowance for credit losses (4,325) (1,643) - - -
Net income available for distribution 849,561 627,118 439,315 167,839 159,952
Appropriations: 849,561 627,118 439,315 167,839 159,952
General Reserve 357,463 262,881 191,175 79,720 68,476
Building Reserve 20,000 20,000 25,000 20,000 -
Training Fund Reserve 2,157 - - - 5,000
Development Fund Reserve 70,000 50,000 10,000 - 10,000
State Revenue Fund 399,941 294,237 213,140 68,119 76,476
Part AOperations and Affairs of the Bank

Notes to the Annual Financial Statement31 December 2019
FINANCIAL STATEMENTS OVERVIEW 75
BOARD’S STATEMENT OF RESPONSIBILITIES 76
INDEPENDENT AUDITORS’ REPORT 77
STATEMENT OF COMPREHENSIVE INCOME 79
STATEMENT OF FINANCIAL POSITION 80
STATEMENT OF CHANGES IN EQUITY 81
STATEMENT OF CASH FLOWS 82
NOTES TO THE ANNUAL FINANCIAL STATEMENTS 83
Part BAnnual Financial Statements
Contents
74 Bank of Namibia Annual Report 2019
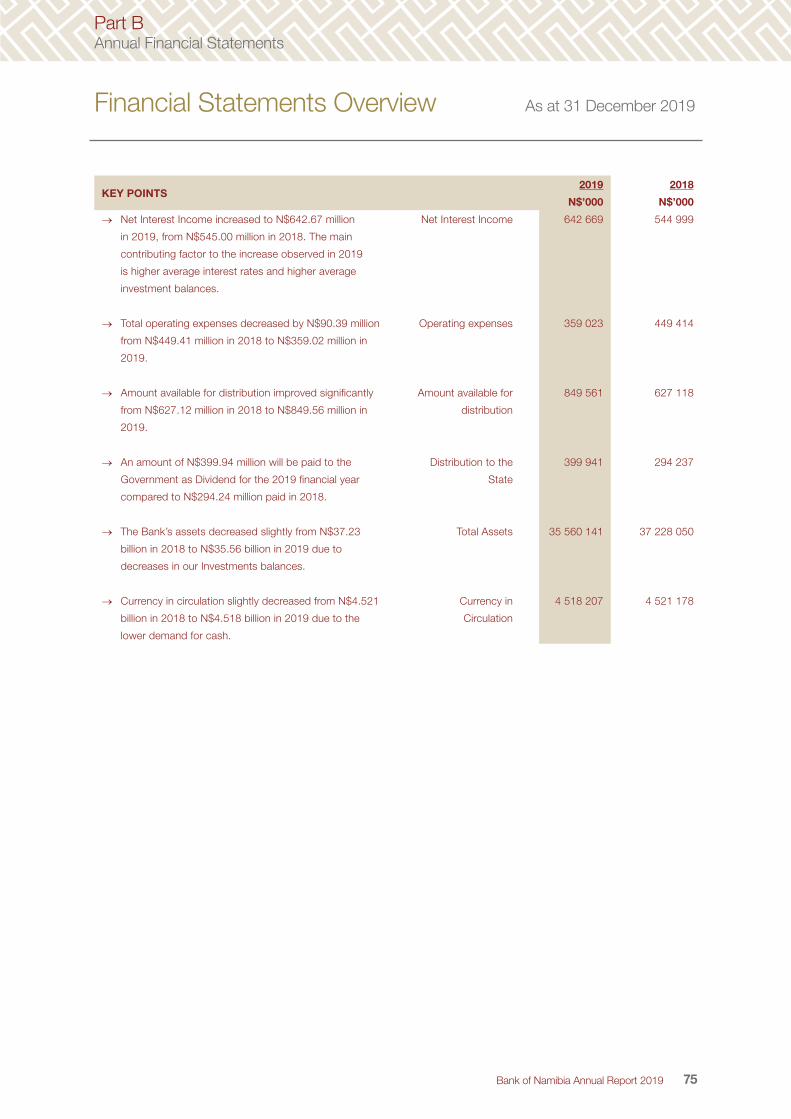
KEY POINTS2019
N$’000
2018
N$’000
→ Net Interest Income increased to N$642.67 million
in 2019, from N$545.00 million in 2018. The main
contributing factor to the increase observed in 2019
is higher average interest rates and higher average
investment balances.
Net Interest Income 642 669 544 999
→ Total operating expenses decreased by N$90.39 million
from N$449.41 million in 2018 to N$359.02 million in
2019.
Operating expenses 359 023 449 414
→ Amount available for distribution improved significantly
from N$627.12 million in 2018 to N$849.56 million in
2019.
Amount available for
distribution
849 561 627 118
→ An amount of N$399.94 million will be paid to the
Government as Dividend for the 2019 financial year
compared to N$294.24 million paid in 2018.
Distribution to the
State
399 941 294 237
→ The Bank’s assets decreased slightly from N$37.23
billion in 2018 to N$35.56 billion in 2019 due to
decreases in our Investments balances.
Total Assets 35 560 141 37 228 050
→ Currency in circulation slightly decreased from N$4.521
billion in 2018 to N$4.518 billion in 2019 due to the
lower demand for cash.
Currency in
Circulation
4 518 207 4 521 178
Financial Statements Overview As at 31 December 2019
75
Part BAnnual Financial Statements
Bank of Namibia Annual Report 2019

The main statutory provisions relating to the role and duties of members of the Board are covered under Section 8(1) of the Bank of Namibia Act, 1997, we confirm that:
1. The Board members are responsible for thepreparation of the annual financial statements andfor the judgements used therein.
2. The Board has overall responsibility for the systemof internal financial control in the Bank, which isdesigned to safeguard the assets of the Bank,prevent and detect fraud and other irregularities.To discharge this responsibility, an appropriateorganisational structure has been established.In this regard, the Audit Committee of the Boardmeets periodically with Internal and ExternalAuditors and members of Management of the Bankto discuss control issues, financial reporting andrelated matters. The Internal and External Auditorshave full access to the Audit Committee. Further,the Bank has a comprehensive Risk ManagementStrategy in place.
3. The Board is satisfied that the Bank complies withInternational Financial Reporting Standards and therequirements of the Bank of Namibia Act, 1997.
4. The Board members confirm that they are satisfiedthat the Bank has adequate resources to continue in business for the foreseeable future. The Board hasfurther assessed the impact of COVID-19 on theBank’s assets, liquidity and access to capital, andhas concluded that the impact is not considered tobe significant and the Bank has adequate reservesto continue supporting its operations. For this
reason, they continue to adopt the going concern basis in preparing the financial statements.
5. The Board’s Audit Committee is composed ofmembers who are neither officers nor employeesof the Bank and who have the required mix of skills,with at least one member being a financial expert.The committee is therefore qualified to review theBank’s annual financial statements and recommendthe approval by the Board Members. The committee has a duty to review the adoption of, and changesin accounting principles including risk managementissues and makes recommendations on the samefor approval. The Board considers and wherenecessary approves the Board Audit Committeerecommendations.
The annual financial statements on pages 79 to 123 were approved by the Board and are signed on its behalf by:
_______________ Deputy Chairman 27 March 2020
_______________Board Member27 March 2020
Board’s Statements of Responsibilities
76
Part BAnnual Financial Statements
Bank of Namibia Annual Report 2019

Opinion
We have audited the annual financial statements of Bank of Namibia set out on pages 79 to 123, which comprise the statement of financial position as at 31 December 2019 and the statement of comprehensive income, the statement of changes in equity and the statement of cash flows for the year then ended, and notes to the annual financial statements, including a summary of significant accounting policies.
In our opinion, the annual financial statements present fairly, in all material respects, the financial position of Bank of Namibia as at 31 December 2019 and its financial performance and cash flows for the year then ended in accordance with International Financial Reporting Standards (IFRSs) and in the manner required by the Bank of Namibia Act, 1997.
Basis for Opinion
We conducted our audit in accordance with International Standards on Auditing (ISAs). Our responsibilities under those standards are further described in the Auditor’s Responsibilities for the audit of the Financial Statements section of our report. We are independent of the Bank in accordance with sections 290 and 291 of the International Ethics Standards Board for Accountants Code of Ethics for Professional Accountants (Revised July 2016), parts 1 and 3 of the International Ethics Standards Board for Accountants International Code of Ethics for Professional Accountants (including International Independence Standards) (Revised July 2018) and other independence requirements applicable to performing audits of financial statements in Namibia. We have fulfilled our other ethical responsibilities in accordance with these requirements. We believe that the audit evidence we have obtained is sufficient and appropriate to provide a basis for our opinion.
Other Information
The Board members are responsible for the other information. The other information comprises the Message from the Governor, Part A (Operations and Affairs of the Bank), Financial Statement Overview, Board’s Statement of Responsibilities, Part C (Economic and Financial Developments in 2019 and Theme Chapter), Part D (Banking Supervision) and Part
E (Statistical Appendix and List of Abbreviations) which we obtained prior to the date of this auditors’ report. The other information does not include the annual financial statements and our auditor’s report thereon.
Our opinion on the annual financial statements does not cover the other information and we do not express an audit opinion or any form of assurance conclusion thereon.
In connection with our audit of the annual financial statements, our responsibility is to read the other information and, in doing so, consider whether the other information is materially inconsistent with the annual financial statements or our knowledge obtained in the audit, or otherwise appears to be materially misstated.
If, based on the work we have performed on the other information obtained prior to the date of this auditor’s report, we conclude that there is a material misstatement of this other information, we are required to report that fact. We have nothing to report in this regard.
Responsibilities of the Board members’ Financial Statements
The Board members are responsible for the preparation and fair presentation of the annual financial statements in accordance with International Financial Reporting Standards and in the manner required by the Bank of Namibia Act, 1997 and for such internal control as the Board members determine is necessary to enable the preparation of annual financial statements that are free from material misstatement, whether due to fraud or error.
In preparing the annual financial statements, the Board members are responsible for assessing the Bank’s ability to continue as a going concern, disclosing, as applicable, matters related to going concern and using the going concern basis of accounting unless the Board members either intend to liquidate the Bank or to cease operations, or have no realistic alternative but to do so.
Auditor’s Responsibilities for the Audit of the Annual Financial Statements
Our objectives are to obtain reasonable assurance about whether the annual financial statements as a
Independent Auditor’s Reportto the Members of the Bank of Namibia
77
Part BAnnual Financial Statements
Bank of Namibia Annual Report 2019

whole are free from material misstatement, whether due to fraud or error, and to issue an auditor’s report that includes our opinion. Reasonable assurance is a high level of assurance but is not a guarantee that an audit conducted in accordance with ISAs will always detect a material misstatement when it exists. Misstatements can arise from fraud or error and are considered material if, individually or in the aggregate, they could reasonably be expected to influence the economic decisions of users taken on the basis of these annual financial statements.
As part of an audit in accordance with ISAs, we exercise professional judgement and maintain professional scepticism throughout the audit. We also:o Identify and assess the risks of material
misstatement of the annual financial statements,whether due to fraud or error, design and performaudit procedures responsive to those risks,and obtain audit evidence that is sufficient andappropriate to provide a basis for our opinion.The risk of not detecting a material misstatementresulting from fraud is higher than for one resultingfrom error, as fraud may involve collusion, forgery,intentional omissions, misrepresentations, or theoverride of internal control.
o Obtain an understanding of internal control relevantto the audit in order to design audit proceduresthat are appropriate in the circumstances, but notfor the purpose of expressing an opinion on theeffectiveness of the Bank’s internal control.
o Evaluate the appropriateness of accounting policiesused and the reasonableness of accountingestimates and related disclosures made by theBoard members.
o Conclude on the appropriateness of the Boardmembers’ use of the going concern basis ofaccounting and based on the audit evidenceobtained, whether a material uncertainty existsrelated to events or conditions that may castsignificant doubt on the Bank’s ability to continueas a going concern. If we conclude that a materialuncertainty exists, we are required to draw attentionin our auditor’s report to the related disclosuresin the annual financial statements or, if suchdisclosures are inadequate, to modify our opinion.Our conclusions are based on the audit evidenceobtained up to the date of our auditor’s report.However, future events or conditions may cause theBank to cease to continue as a going concern.
o Evaluate the overall presentation, structureand content of the annual financial statements,including the disclosures, and whether the annualfinancial statements represent the underlyingtransactions and events in a manner that achievesfair presentation.
We communicate with the Audit Committee regarding, among other matters, the planned scope and timing of the audit and significant audit findings, including any significant deficiencies in internal control that we identify during our audit.
We also provide the Audit Committee with a statement that we have complied with relevant ethical requirements regarding independence and communicate with them all relationships and other matters that may reasonably be thought to bear on our independence, and where applicable, related safeguards.
____________________ Deloitte & Touche Registered Accountants and AuditorsChartered Accountants (Namibia) PO Box 47, WindhoekPer: Helen de Bruin (Partner) Partners: RH Mc Donald (Managing Partner), H de Bruin, J Cronjé, A Akayombokwa, AT Matenda, J Nghikevali, G Brand*, M Harrison**DirectorAssociate of Deloitte Africa, a member of DeloitteTouche Tohmatsu Limited
____________________Grand NamibiaRegistered Accountants and AuditorsChartered Accountants (Namibia)PO Box 24304, WindhoekPer: Richard Theron (Partner)Partners: R Theron (Managing Partner), RN Beukes
27 March 2020
Independent Auditor’s Reportto the Members of the Bank of Namibia
78
Part BAnnual Financial Statements
Bank of Namibia Annual Report 2019

Notes 2019
N$’000
2018
N$’000
Net interest income 642 669 544 999
Interest income 2 850 862 828 371
Interest expense 2 (208 193) (283 372)
445 443 455 079
Rand compensation income 2 407 594 401 963
Other income 2 37 849 53 116
Total income 1 088 112 1 000 078
(252 849) (429 726)
Operating expenses 2 (359 023) (449 414)
Net gain on investment portfolio 106 174 19 688
Profit for the year before net foreign exchange translation
(loss)/gain
835 263 570 352
Net foreign exchange translation (loss)/gain 16 (159 390) 1 251 559
Profit/(Loss) for the Year 675 873 1 821 911
Other Comprehensive Income 134 459 1 643
Unrealised gains/(losses) on investment portfolio 115 836 -
Allowance for credit losses - FVTOCI 9.1 4 325 1 643
Actuarial gain on Post-employment benefits 21 14 298 -
Total Comprehensive income 810 332 1 823 554
Profit/(loss) attributable to:
Revaluation reserve 16 (159 390) 1 251 559
Investment revaluation reserve 20 115 836 (56 766)
Allowance for credit losses 9.1 4 325 1 643
Amount available for distribution 3 849 561 627 118
810 332 1 823 554
Statement of Comprehensive Incomefor the Year ended 31 December 2019
79
Part BAnnual Financial Statements
Bank of Namibia Annual Report 2019

Notes 2019
N$’000
2018
N$’000
ASSETS
Non-current Assets 530 035 470 605
Property and equipment 4 288 584 299 150
Intangible assets – computer software 5 10 177 3 697
Currency inventory 6 98 646 43 870
Loans and advances 7 132 628 123 888
Investment in Associate 8 - -
Current Assets 35 030 106 36 757 445
Investments 9 28 905 678 30 951 757
Loans and advances 7 18 502 -
Loans and advances – Local Banks 10 1 746 376 1 839 118
Rand deposits 11 89 727 68 526
Other inventory – stationery and spares 12 4 584 4 337
Other receivables 13 4 265 239 3 893 707
TOTAL ASSETS 35 560 141 37 228 050
EQUITY AND LIABILITIES
Capital and Reserves 9 030 266 8 514 171
Share capital 14 40 000 40 000
General reserve 15 2 160 111 1 800 506
Foreign currency revaluation reserve 16 6 112 300 6 271 690
State Revenue Fund 3 399 941 294 237
Development Fund reserve 17 166 702 97 402
Building Fund reserve 18 85 000 65 000
Training Fund reserve 19 13 479 12 764
Investment revaluation reserve 20 52 733 (67 428)
Non-Current Liabilities 57 985 66 498
Provision for post-employment benefits 21 57 985 66 498
Current Liabilities 26 471 890 28 647 381
Notes and coins in circulation 22 4 518 207 4 521 178
Deposits 23 21 822 910 23 946 257
Provision for post-employment benefits 21 2 584 1 697
Trade and other payables 24 128 189 178 249
TOTAL EQUITY AND LIABILITIES 35 560 141 37 228 050
Statement of Financial Position as at 31 December 2019
80
Part BAnnual Financial Statements
Bank of Namibia Annual Report 2019
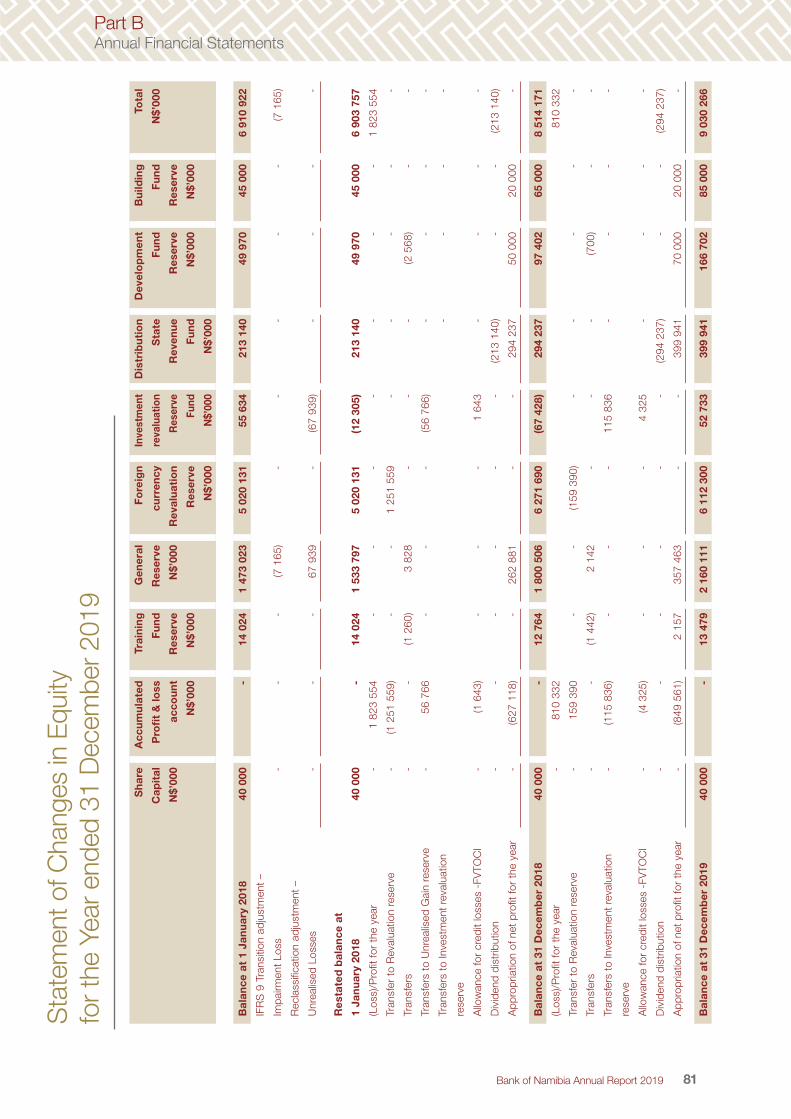
Sh
are
Cap
ital
N$’
000
Acc
um
ula
ted
Pro
fit
& lo
ss
acco
un
t
N$’
000
Trai
nin
g
Fu
nd
Res
erve
N$’
000
Gen
eral
Res
erve
N$’
000
Fo
reig
n
curr
ency
Rev
alu
atio
n
Res
erve
N$’
000
Inve
stm
ent
reva
luat
ion
Res
erve
Fund
N$’
000
Dis
trib
uti
on
Sta
te
Rev
enu
e
Fu
nd
N$’
000
Dev
elo
pm
ent
Fu
nd
Res
erve
N$’
000
Bu
ildin
g
Fu
nd
Res
erve
N$’
000
Tota
l
N$’
000
Bal
ance
at
1 Ja
nu
ary
2018
40 0
00-
14 0
241
473
023
5 02
0 13
155
634
213
140
49 9
7045
000
6 91
0 92
2
IFR
S 9
Tra
nsiti
on a
djus
tmen
t –
Impa
irmen
t Lo
ss-
--
(7 1
65)
--
--
-(7
165
)
Rec
lass
ifica
tion
adju
stm
ent
–
Unr
ealis
ed L
osse
s-
--
67 9
39-
(67
939)
--
--
Res
tate
d b
alan
ce a
t
1 Ja
nu
ary
2018
40 0
00-
14 0
241
533
797
5 02
0 13
1(1
2 30
5)21
3 14
049
970
45 0
006
903
757
(Los
s)/P
rofit
for
the
year
-1
823
554
--
--
--
-1
823
554
Tran
sfer
to
Rev
alua
tion
rese
rve
-(1
251
559
)-
-1
251
559
--
--
-
Tran
sfer
s-
-(1
260
)3
828
--
-(2
568
)-
-
Tran
sfer
s to
Unr
ealis
ed G
ain
rese
rve
-56
766
--
-(5
6 76
6)-
--
-
Tran
sfer
s to
Inve
stm
ent
reva
luat
ion
rese
rve
--
--
Allo
wan
ce fo
r cr
edit
loss
es -
FVTO
CI
-(1
643
)-
--
1 64
3-
--
-
Div
iden
d di
strib
utio
n-
--
--
-(2
13 1
40)
--
(213
140
)
App
ropr
iatio
n of
net
pro
fit fo
r th
e ye
ar-
(627
118
)-
262
881
--
294
237
50 0
0020
000
-
Bal
ance
at
31 D
ecem
ber
201
840
000
-12
764
1 80
0 50
66
271
690
(67
428)
294
237
97 4
0265
000
8 51
4 17
1
(Los
s)/P
rofit
for
the
year
-81
0 33
281
0 33
2
Tran
sfer
to
Rev
alua
tion
rese
rve
-15
9 39
0-
-(1
59 3
90)
--
--
-
Tran
sfer
s-
-(1
442
)2
142
--
-(7
00)
--
Tran
sfer
s to
Inve
stm
ent
reva
luat
ion
rese
rve
-(1
15 8
36)
--
-11
5 83
6-
--
-
Allo
wan
ce fo
r cr
edit
loss
es -
FVTO
CI
-(4
325
)-
--
4 32
5-
--
-
Div
iden
d di
strib
utio
n-
--
--
-(2
94 2
37)
--
(294
237
)
App
ropr
iatio
n of
net
pro
fit fo
r th
e ye
ar-
(849
561
)2
157
357
463
--
399
941
70 0
0020
000
-
Bal
ance
at
31 D
ecem
ber
201
940
000
-13
479
2 16
0 11
16
112
300
52 7
3339
9 94
116
6 70
285
000
9 03
0 26
6
Sta
tem
ent o
f Cha
nges
in E
quity
for t
he Y
ear e
nded
31
Dec
embe
r 201
9
81
Part BAnnual Financial Statements
Bank of Namibia Annual Report 2019

Notes 2019
N$’000
2018
N$’000
CASH FLOWS FROM OPERATING ACTIVITIES
Cash generated by operations A 340 846 429 792
CASH FLOWS FROM INVESTING ACTIVITIES (43 638) (79 359)
Proceeds on disposals of property & equipment and intangible assets 315 21
Purchase of property & equipment (12 654) (7 616)
Purchase of intangible asset – computer software (3 120) (1 007)
(Increase)/Decrease in Non-current loans and advances (27 316) (69 234)
Interest acquired in Associate (863) (1 523)
CASH FLOWS FROM FINANCING ACTIVITIES (297 208) (350 433)
Distribution to the State revenue fund B (294 237) (213 140)
(Decrease) in Notes and coins in circulation (2 971) (137 293)
- -
NOTES:A. RECONCILIATION OF PROFIT FOR THE YEAR TO CASHGENERATED BY OPERATIONS
Profit for the year before net foreign exchange translation gain(loss)
Adjusted for:
835 263 570 352
Depreciation 16 254 22 017
Adjustments of PPE 1 334 -
National Bank of Angola (BNA) fair value adjustment - (12 244)
Provision post-employment benefits 6 672 6 061
Amortisation of computer software 2 244 2 404
Loss/(Profit) on disposal of property & equipment (288) 230
Net gains on Investment Portfolio (106 174) (19 688)
Impairment Loss -ECL 968 3 063
Impairment of Investment in Associate 863 1 523
Operating cash flows before movements in working capital 757 136 573 718
(Increase)/Decrease in currency inventory* (54 776) 23 088
(Increase)/Decrease in other inventory* (247) 59
Decrease/ (Increase) in Current loans and advances 92 742 (1 117 381)
(Increase)/Decrease in Rand cash (21 201) 11 105
(Increase)/Decrease in other receivables and receivable from FIC (371 458) 1 360 101
(Decrease) in deposits (2 123 347) (921 077)
(Decrease)/ Increase in trade and other payables (50 060) 141 847
Decrease in investments 2 112 057 358 334
340 846 429 794
B. DISTRIBUTION TO STATE REVENUE FUND
Opening balance (294 237) (213 140)
Appropriations of net profit for the year 849 561 294 237
Closing balance in reserves (849 561) (294 237)
Paid for the year (294 237) (213 140)
*Items were moved from cash flows from investing activities to cash flows from operating activities.
Statement of Cash Flows for the Year ended 31 December 2019
82
Part BAnnual Financial Statements
Bank of Namibia Annual Report 2019

Notes to the Annual Financial Statement31 December 2019
1. ACCOUNTING POLICIES
The Bank’s annual financial statements are prepared in accordance with the going concern principle under the historical cost basis, except for financial assets and liabilities where the fair value and amortised cost basis of accounting is adopted. The principal accounting policies, which have been consistently applied in all material respects, are set out below. The preparation of financial statements in conformity with International Financial Reporting Standards (IFRS) requires the use of certain critical accounting estimates. It also requires management to exercise its judgement in the process of applying accounting policies. The areas involving a higher degree of judgement or complexity, or areas where assumptions and estimates are significant to the financial statements are disclosed in note 1.3. The annual financial statements have been prepared to comply with the requirements of the Bank of Namibia Act, 1997 and with the requirements of International Financial Reporting Standards (IFRS).
1.1. NEW AND REVISED INTERNATIONAL FINANCIAL REPORTING STANDARDS
International Financial Reporting Standards and amendments issued but not effective for 31st December 2019 year-end:
Number Effective date Executive summary
IFRS 3
Business
Combinations
1 January 2020 Definition of a Business: The amendments:
• confirmed that a business must include inputs and a process, and
clarified that:
– the process must be substantive; and
– the inputs and process must together significantly contribute
to creating outputs.
• narrowed the definitions of a business by focusing the definition of
outputs on goods and services provided to customers and other
income from ordinary activities, rather than on providing dividends
or other economic benefits directly to investors or lowering costs;
and
• added a test that makes it easier to conclude that a company has
acquired a group of assets, rather than a business, if the value
of the assets acquired is substantially all concentrated in a single
asset or group of similar assets.
No impact expected on the Bank’s financial statements.
IFRS 10
Consolidated
Financial Statements
The effective date
of this amendment
has been deferred
indefinitely until
further notice
Sale or Contribution of Assets between an Investor and its Associate
or Joint Venture (Amendments to IFRS 10 and IAS 28): Narrow scope
amendment address an acknowledged inconsistency between the
requirements in IFRS 10 and those in IAS 28 (2011), in dealing with the
sale or contribution of assets between an investor and its associate or
joint venture.
No impact expected on the Bank’s financial statements.
IAS 1
Presentation of
Financial Statements
1 January 2020 Disclosure Initiative: The amendments clarify and align the definition
of ‘material’ and provide guidance to help improve consistency in the
application of that concept whenever it is used in IFRS Standards.
The Bank is assessing the impact on the financial statements.
83
Part BAnnual Financial Statements
Bank of Namibia Annual Report 2019

Notes to the Annual Financial Statement31 December 2019
Number Effective date Executive summary
IFRS 17
Insurance contracts
1 January 2021 • IFRS 17 creates one accounting model for all insurance contracts
in all jurisdictions that apply IFRS.
• IFRS 17 requires an entity to measure insurance contracts using
updated estimates and assumptions that reflect the timing of cash
flows and take into account any uncertainty relating to insurance
contracts.
• The financial statements of an entity will reflect the time value of
money in estimated payments required to settle incurred claims.
• Insurance contracts are required to be measured based only
on the obligations created by the contracts. • An entity will be
required to recognise profits as an insurance service is delivered,
rather than on receipt of premiums.
• This standard replaces IFRS 4 – Insurance contracts.
No impact expected on the Bank’s financial statements.
IAS 8
Presentation of
Financial Statements
1 January 2019 Disclosure Initiative: The amendments clarify and align the definition
of ‘material’ and provide guidance to help improve consistency in the
application of that concept whenever it is used in IFRS Standards.
The Bank is assessing the impact on the financial statements.
1 ACCOUNTING POLICIES (CONTINUED)
1.1 NEW AND REVISED INTERNATIONAL FINANCIAL REPORTING STANDARDS (CONTINUED)
84
Part BAnnual Financial Statements
Bank of Namibia Annual Report 2019

Notes to the Annual Financial Statement31 December 2019
1.2. ADOPTION OF NEW AND REVISED STANDARDS
New and amended IFRS Standards effective from the year ended 31 December 2019.
1.2.1 APPLICATION OF IFRS 16
The Bank has considered the implications of IFRS 16 on the recognition of Leases in the preparation of the financial statements with no significant impact.
1.3 CRITICAL ACCOUNTING ESTIMATES AND JUDGEMENTS IN APPLYING ACCOUNTING POLICIES
The Bank makes estimates and assumptions that affect the reported amounts of assets and liabilities within the financial year. Estimates and judgments are continually evaluated and are based on historical experience and other factors, including expectations of future events that are believed to be reasonable under the circumstances. The major areas where management has used its judgment and accounting estimates are with regards to:
1. Impairment of Financial Assets
IFRS 9 requires that financial instruments be tested for impairments on a forward-looking basis. The main aim is to determine whether the credit risk of an instrument has changed materially since the previous reporting period. In order to make this calculation, the IASB requires entities to develop and use an Expected Credit Loss (ECL) model. Generally, it can be summarised that the ECL model aims to anticipate shortfalls of contractual cash flows of financial instruments in the event of a default.
2. Provision for post-employment benefits disclosed under note 21
An Actuarial valuation is performed once every three years to determine the Bank’s obligation in this regard. The assumptions and judgments used by the actuary were considered by the Bank and were deemed reasonable considering the prevailing and anticipated future economic conditions.
3. Evaluation of useful lives and residual values
The residual value and useful life evaluation exercise is performed by internal staff members who have technical knowledge of specific classes of assets. Market information with regards to pricing is also obtained to ensure the required level of objectivity is maintained in the whole evaluation process.
4. Accounting for off-market loans as disclosed under note 7
Management judgement was applied to determine the average repayment period on the various classes of loans granted by the Bank. Prevailing interest rates at year end was however applied to determine the impairment charge for the year on new off-market loans.
B
1. ACCOUNTING POLICIES (CONTINUED)
85
Part BAnnual Financial Statements
Bank of Namibia Annual Report 2019

Notes to the Annual Financial Statement31 December 2019
1.4 REVENUE RECOGNITION
Interest income is recognised on a time proportioned basis, taking account of the principal outstanding and the effective interest rate over the period to maturity. The effective interest rate takes into account all directly attributable external costs, discounts or premiums on the financial assets.
Rand compensation income is received from the South African Government as compensation for the Rand currency in circulation in Namibia. The Bank accounts for this income on an accrual basis.
Other income consists of rental received, bank supervision fees and charges as well as sundry income. Other income is recognised to the extent that it is probable that the economic benefit will flow to the Bank and revenue can be reliably measured.
1.5 FINANCIAL INSTRUMENTS
Financial instruments as reflected on the Bank’s Statement of financial position include all financial assets and financial liabilities. Management determines the appropriate classification at initial recognition of the financial instrument. Depending on their classification, financial instruments are carried at fair value or amortised cost as described below.
Fair value is the price that would be received to sell an asset or paid to transfer a liability in an orderly transaction between market participants at the measurement date. A financial instrument is regarded as quoted in an active market if quoted prices are readily and regularly available from an exchange or other institution and those prices represent actual and regularly occurring market transactions on an arm’s length basis.
It is to be noted that the Bank does not invest in financial instruments which are not quoted in an active market, however should our investment philosophy change, valuation techniques such as cash flows models and consideration of financial data of the investees will be used to fair value certain financial instruments for which external market pricing information is not available. Valuation techniques may require assumptions not supported by observable market data. Disclosures will be made in the financial statements if changing any such assumptions to a reasonably possible alternative would result in significantly different profit, income, total assets or total liabilities.
Cost is the amount of cash or cash equivalents paid or the fair value of other consideration given to acquire an asset at the time of its acquisition and includes transaction costs. Transaction costs are incremental costs that are directly attributable to the acquisition, issue or disposal of a financial instrument. An incremental cost is one that would not have been incurred if the transaction had not taken place. Transaction costs do not include debt premiums or discounts, financing costs or internal administrative or holding costs.
Amortised costs is the amount at which the financial instrument was recognised at initial recognition less any principal repayments, plus accrued interest, and for financial assets less any write-down for incurred impairment losses. Accrued interest includes amortisation of transaction costs deferred at initial recognition and of any premium or discount to maturity amount using the effective interest rate method. Accrued interest income and accrued interest expense, including both accrued coupon and amortised discount or premium, are not presented separately and are included in the carrying values of related Statement of financial position items.
1 ACCOUNTING POLICIES (CONTINUED)
86
Part BAnnual Financial Statements
Bank of Namibia Annual Report 2019

Notes to the Annual Financial Statement31 December 2019
The effective interest method is a method of allocating interest income or interest expense over the relevant period so as to achieve a constant periodic rate of interest (effective interest rate on the carrying amount). The effective interest rate is the rate that exactly discounts estimated future cash payments or receipts (excluding future credit losses) through the expected life of the financial instrument or a short period, if appropriate, to the net carrying amount of the financial instrument.
The effective interest rate discounts cash flows of variable interest instruments to the next interest repricing date except for the premium or discount which reflects the credit spread over the floating rate specified in the instrument, or other variables that are not reset to market rates. Such premiums or discounts are amortised over the whole expected life of the instrument. The present value calculation includes all fees paid or received between parties to the contract that are an integral part of the effective interest rate.
Recognition
The Bank recognises financial instruments including, “regular way” purchases and sales on settlement date and thus applies settlement date accounting to these transactions.
Financial assets and financial liabilities are recognised in the Bank’s statement of financial position when the Bank becomes a party to the contractual provisions of the instrument.
Loans and advances, other receivables and other financial liabilities are recognised on the day they are transferred to the Bank or on the day the funds are advanced.
Measurement
Financial assets and financial liabilities are initially measured at fair value. Transaction costs that are directly attributable to the acquisition or issue of financial assets and financial liabilities (other than financial assets and financial liabilities at fair value through profit or loss) are added to or deducted from the fair value of the financial assets or financial liabilities, as appropriate, on initial recognition. Transaction costs directly attributable to the acquisition of financial assets or financial liabilities at fair value through profit or loss are recognised immediately in profit or loss.
Subsequent to initial measurement financial instruments are measured at fair value or amortised cost depending on their classification.
Reclassification
It is a requirement that institutions should disclose when it has reclassified a financial asset between one measured at amortised cost, FVTOCI or FVTPL. The Bank has not reclassified any of its financial assets during the year under review.
Financial assets
All recognised financial assets are measured subsequently in their entirety at either amortised cost or fair value, depending on the classification of the financial assets.
1. ACCOUNTING POLICIES (CONTINUED)
1.5 FINANCIAL INSTRUMENTS (CONTINUED)
87
Part BAnnual Financial Statements
Bank of Namibia Annual Report 2019

Notes to the Annual Financial Statement31 December 2019
1. Classification of financial assets
Financial assets that meet the following conditions are measured subsequently at amortised cost:
• The financial asset is held within a business model whose objective is to hold financial assets in order to collect contractual cash flows; and
• The contractual terms of the financial asset give rise on specified dates to cash flows that are solely payments of principal and interest on the principal amount outstanding.
Financial assets that meet the following conditions are measured subsequently at fair value through other comprehensive income (FVTOCI):
• The financial asset is held within a business model whose objective is achieved by both collecting contractual cash flows and selling the financial assets; and
• The contractual terms of the financial asset give rise on specified dates to cash flows that are solely payments of principal and interest on the principal amount outstanding.
By default, all other financial assets are measured subsequently at fair value through profit or loss (FVTPL).
Despite the foregoing, the Bank may make the following irrevocable election/designation at initial recognition of a financial asset:
the Bank may irrevocably designate a debt investment that meets the amortised cost or FVTOCI criteria as measured at FVTPL if doing so eliminates or significantly reduces an accounting mismatch.
2. Impairment of financial assets
The Bank recognises a loss allowance for expected credit losses (ECL) on investments in financial assets that are measured at amortised cost or at FVTOCI, lease receivables, trade receivables and contract assets. The amount of expected credit losses is updated at each reporting date to reflect changes in credit risk since initial recognition of the respective financial instrument.
The Bank always recognises lifetime expected credit losses ECL for trade receivables, contract assets and lease receivables. The expected credit losses on these financial assets are estimated using a provision matrix based on the Bank’s historical credit loss experience, adjusted for factors that are specific to the debtors, general economic conditions and an assessment of both the current as well as the forecast direction of conditions at the reporting date, including time value of money where appropriate.
For all other financial instruments, the Bank recognises lifetime ECL when there has been a significant increase in credit risk since initial recognition. However, if the credit risk on the financial instrument has not increased significantly since initial recognition, the Bank measures the loss allowance for that financial instrument at an amount equal to 12-month ECL.
1. ACCOUNTING POLICIES (CONTINUED)
1.5 FINANCIAL INSTRUMENTS (CONTINUED)
88
Part BAnnual Financial Statements
Bank of Namibia Annual Report 2019

Notes to the Annual Financial Statement31 December 2019
Lifetime ECL represents the expected credit losses that will result from all possible default events over the expected life of a financial instrument. In contrast, 12-month ECL represents the portion of lifetime ECL that is expected to result from default events on a financial instrument that are possible within 12 months after the reporting date.
2.1 Definitions
(i) Significant increase in credit risk
In assessing whether the credit risk on a financial instrument has increased significantly since initial recognition, the Bank compares the risk of a default occurring on the financial instrument at the reporting date with the risk of a default occurring on the financial instrument at the date of initial recognition. In making this assessment, the Bank considers both quantitative and qualitative information that is reasonable and supportable, including historical experience and forward-looking information that is available without undue cost or effort.
In particular, the following information is considered when assessing whether credit risk has increased significantly since initial recognition:
• an actual or expected significant deterioration in the financial instrument’s external (if available) or internal credit rating;
• significant deterioration in external market indicators of credit risk for a particular financial instrument, e.g. a significant increase in the credit spread, the credit default swap prices for the debtor, or the length
of time or the extent to which the fair value of a financial asset has been less than its amortised cost;• existing or forecast adverse changes in business, financial or economic conditions that are expected
to cause a significant decrease in the debtor’s ability to meet its debt obligations;• an actual or expected significant deterioration in the operating results of the debtor;• significant increases in credit risk on other financial instruments of the same debtor;• an actual or expected significant adverse change in the regulatory, economic, or technological
environment of the debtor that results in a significant decrease in the debtor’s ability to meet its debt obligations.
Irrespective of the outcome of the above assessment, the Bank presumes that the credit risk on a financial asset has increased significantly since initial recognition when contractual payments are more than 30 days past due, unless the Bank has reasonable and supportable information that demonstrates otherwise.
Despite the foregoing, the Bank assumes that the credit risk on a financial instrument has not increased significantly since initial recognition if the financial instrument is determined to have low credit risk at the reporting date. A financial instrument is determined to have low credit risk if:
(1) The financial instrument has a low risk of default,(2) The debtor has a strong capacity to meet its contractual cash flow obligations in the near term, and(3) Adverse changes in economic and business conditions in the longer term may, but will not necessarily,
reduce the ability of the borrower to fulfil its contractual cash flow obligations.
1. ACCOUNTING POLICIES (CONTINUED)
1.5 FINANCIAL INSTRUMENTS (CONTINUED)
89
Part BAnnual Financial Statements
Bank of Namibia Annual Report 2019

Notes to the Annual Financial Statement31 December 2019
The Bank considers a financial asset to have low credit risk when the asset has external credit rating of ‘investment grade’ in accordance with the globally understood definition or if an external rating is not available, the asset has an internal rating of ‘performing’. Performing means that the counterparty has a strong financial position and there is no past due amount.
The Bank regularly monitors the effectiveness of the criteria used to identify whether there has been a significant increase in credit risk and revises them as appropriate to ensure that the criteria can identify significant increase in credit risk before the amount becomes past due.
(ii) Definition of default
The Bank considers the following as constituting an event of default for internal credit risk management purposes as historical experience indicates that financial assets that meet either of the following criteria are generally not recoverable:
• when there is a breach of financial covenants by the debtor; or• information developed internally or obtained from external sources indicates that the debtor is unlikely
to pay its creditors, including the Bank, in full (without considering any collateral held by the Bank).
Irrespective of the above analysis, the Bank considers that default has occurred when a financial asset is more than 90 days past due unless the Bank has reasonable and supportable information to demonstrate that a more lagging default criterion is more appropriate.
(iii) Credit-impaired financial assets
A financial asset is credit-impaired when one or more events that have a detrimental impact on the estimated future cash flows of that financial asset have occurred. Evidence that a financial asset is credit-impaired includes observable data about the following events:
(a) significant financial difficulty of the issuer or the borrower;(b) a breach of contract, such as a default or past due event (see (ii) above);(c) the lender(s) of the borrower, for economic or contractual reasons relating to the borrower’s financial
difficulty, having granted to the borrower a concession(s) that the lender(s) would not otherwiseconsider;
(d) it is becoming probable that the borrower will enter bankruptcy or other financial re-organisation; or(e) the disappearance of an active market for that financial asset because of financial difficulties.
3. Write-off policy
The Bank writes off a financial asset when there is information indicating that the debtor is in severe financial difficulty and there is no realistic prospect of recovery, e.g. when the debtor has been placed under liquidation or has entered into bankruptcy proceedings. Financial assets written off may still be subject to enforcement activities under the Banks’s recovery procedures, taking into account legal advice where appropriate. Any recoveries made are recognised in profit or loss.
1. ACCOUNTING POLICIES (CONTINUED)
1.5 FINANCIAL INSTRUMENTS (CONTINUED)
90
Part BAnnual Financial Statements
Bank of Namibia Annual Report 2019

Notes to the Annual Financial Statement31 December 2019
4. Measurement and recognition of expected credit losses
The measurement of expected credit losses is a function of the probability of default, loss given default (i.e. the magnitude of the loss if there is a default) and the exposure at default. The assessment of the probability of default and loss given default is based on historical data adjusted by forward-looking information as described above.
As for the exposure at default, for financial assets, this is represented by the assets’ gross carrying amount at the reporting date.
For financial assets, the expected credit loss is estimated as the difference between all contractual cash flows that are due to the Bank in accordance with the contract and all the cash flows that the Bank expects to receive, discounted at the original effective interest rate.
If the Bank has measured the loss allowance for a financial instrument at an amount equal to lifetime ECL in the previous reporting period, but determines at the current reporting date that the conditions for lifetime ECL are no longer met, the Bank measures the loss allowance at an amount equal to 12-month ECL at the current reporting date.
The Bank recognises an impairment gain or loss in profit or loss for all financial instruments with a corresponding adjustment to their carrying amount through a loss allowance account, except for investments in financial assets that are measured at FVTOCI, for which the loss allowance is recognised in other comprehensive income and accumulated in the investment revaluation reserve, and does not reduce the carrying amount of the financial asset in the statement of financial position.
5. De-recognition of financial assets
The Bank derecognises a financial asset only when the contractual rights to the cash flows from the asset expire, or when it transfers the financial asset and substantially all the risks and rewards of ownership of the asset to another entity.
If the Bank neither transfers nor retains substantially all the risks and rewards of ownership and continues to control the transferred asset, the Bank recognises its retained interest in the asset and an associated liability for amounts it may have to pay. If the Bank retains substantially all the risks and rewards of ownership of a transferred financial asset, the Bank continues to recognise the financial asset and also recognises a collateralised borrowing for the proceeds received.
On de-recognition of a financial asset measured at amortised cost, the difference between the asset’s carrying amount and the sum of the consideration received and receivable is recognised in profit or loss. In addition, on de-recognition of an investment in a debt instrument classified as at FVTOCI, the cumulative gain or loss previously accumulated in the investment’s revaluation reserve is reclassified to profit or loss.
The Bank did not transfer financial assets in such a way that part of the asset did not qualify for de- recognition.
1. ACCOUNTING POLICIES (CONTINUED)
1.5 FINANCIAL INSTRUMENTS (CONTINUED)
91
Part BAnnual Financial Statements
Bank of Namibia Annual Report 2019

Notes to the Annual Financial Statement31 December 2019
Financial Liabilities
These are measured at amortised cost. Amounts due to the Government, bankers reserve and current accounts are stated at cost as these accounts do not have fixed maturity dates.
Notes and coins issued are measured at face value as this liability does not have a fixed maturity date.
Accounts payable are stated at cost as this approximates fair value due to the short-term nature of such obligations.
1.6. GENERAL RESERVE
The general reserve is established in terms of Section 16 of the Bank of Namibia Act, 1997 and may only be used for the purpose specified below:
• increase the paid-up capital of the Bank;• offset losses sustained by the Bank during a financial year;• fund a Development Reserve Account; and• redeem any securities issued by the Bank.
The amount maintained in this account relates to the annual appropriation of distributable profits determined by Section 15 of the Bank of Namibia Act. The Act prescribes that not less than 25% of the net profits of the Bank for a financial year be transferred to the General Reserve Account.
1.7. FOREIGN CURRENCY ACTIVITIES AND REVALUATION RESERVE
The Revaluation Reserve has been created in accordance with Section 31 of the Bank of Namibia Act and is used to accommodate any net gains or losses in any financial year of the Bank arising from any change in the book value or realised/unrealised value of the Bank’s Assets or Liabilities denominated in currencies or units of account other than the Domestic Currency, such as gold, special drawing rights and foreign currencies. Any change in the value of such currencies or units of account in terms of the currency of Namibia, shall be credited to the Revaluation Reserve Account before any appropriation to any other reserve.
Assets and liabilities in foreign currencies are translated to Namibia Dollars at year-end exchange rates. In terms of Section 31 of the Bank of Namibia Act, 1997, exchange gains and losses of the Bank are for the account of the Government and are consequently transferred to the Revaluation Reserve Account before appropriation of profits.
1.8. BUILDING FUND RESERVE
This reserve was reactivated in the financial year 2016 to set aside funds for the construction of a Currency Museum and to extend the parking facilities at the Bank premises. Annual profits appropriated will be credited to the reserve and on completion of the construction, the reserve so created will be released to the General Reserve.
1. ACCOUNTING POLICIES (CONTINUED)
1.5 FINANCIAL INSTRUMENTS (CONTINUED)
92
Part BAnnual Financial Statements
Bank of Namibia Annual Report 2019

Notes to the Annual Financial Statement31 December 2019
1.9. PROPERTY AND EQUIPMENT
Property and equipment are stated at cost and are depreciated on the straight-line method over their estimated useful lives. The estimated useful lives, residual values and depreciation methods are reviewed every third year, with the effect of any changes in estimate accounted for on a prospective basis. The Bank reassesses the residual value and useful life of all assets every third year and the revised useful life in years, is as detailed below:
Freehold buildings 50 yearsComputer hardware 2-6 yearsMotor vehicles 4 yearsFurniture, fittings and equipment 1-20 yearsNote Sorting Machines 9-17 years
The residual value on the building is benchmarked to similar structures in the country and did not call for any adjustment in residual value both in the previous year and the current year. Subsequent costs are included in the assets carrying value only when it is probable that future economic benefits associated with the assets will accrue to the Bank. All other repairs and maintenance costs are charged to the Statement of Comprehensive income during the financial period in which they are incurred.
1.10. INTANGIBLE ASSETS – COMPUTER SOFTWARE
On acquisition the software is capitalised at purchase price and amortised on a straight-line basis with zero residual value. The estimated useful lives, residual values and amortisation methods are reviewed at each year end, with the effect of any changes in the estimate accounted for on a prospective basis. The Bank reassesses the residual value and useful life of Computer software on an annual basis and the useful life has been set to range between 1 and 8 years.
1.11. INVENTORY
Currency Costs
The costs of new Namibia bank notes and coins are capitalised and amortised on the earlier of issue of the currency or over five years. Cost comprises of printing and minting costs, carriage, insurance and freight landed at the Bank’s premises or designated port of consignment arrival. Currency is issued using the weighted average cost.
Stationery and spares
Stationery and spares inventory are capitalised and stated at the lower of cost and net realisable value. Cost comprises of purchase price as well as applicable freight for imported spare parts. Inventory is issued using the weighted average costs.
1. ACCOUNTING POLICIES (CONTINUED)
93
Part BAnnual Financial Statements
Bank of Namibia Annual Report 2019

Notes to the Annual Financial Statement31 December 2019
1.12. PENSION FUND
It is the policy of the Bank to contribute to the retirement benefits for employees. The Bank operates a Defined Contribution pension fund; contributions to the Bank of Namibia Provident Fund are charged against income in the year in which they become payable.
1.13. IMPAIRMENT OF NON-FINANCIAL ASSETS
The carrying amount of the assets of the Bank are reviewed at each Statement of financial position date to determine whether there is any indication of impairment, in which case their recoverable amounts are estimated.
An impairment loss is recognised in the statement of comprehensive income whenever the carrying amount of an asset exceeds its recoverable amount. A previously expensed impairment loss will be reversed if the recoverable amount increases as a result of a change in the estimates used previously to determine the recoverable amount, but not to an amount higher than the carrying amount that would have been determined had no impairment loss been recognised.
1.14. POST-EMPLOYMENT MEDICAL BENEFITS
The Bank provides for post-employment medical benefits in the form of a medical aid scheme for eligible employees and pensioners. The cost of providing benefits is determined using the projected unit credit method. The liability for the Bank’s contribution to the scheme is, in respect of current and future pensioners, provided for by means of an on-Statement of financial position liability. The magnitude of the liability is based on an actuarial valuation. Actuarial gains and losses on the post-retirement medical benefits are accounted for in the year in which they arise in other comprehensive income.
1.15. CASH FLOW STATEMENT
The definition of cash in the Standard is not wholly appropriate to the Bank. Due to its role in the creation and withdrawal of currency, the Bank has no cash balances on its Statement of financial position.
1.16. PROVISIONS
Provisions are recognised when the Bank has a present legal or constructive obligation as a result of past events, for which it is probable that an outflow of economic benefits will be required to settle the obligation, and a reliable estimate can be made of the amount of the obligation.
1.17. TRANSACTIONS ON BEHALF OF GOVERNMENT
The Bank undertakes several transactions on behalf of the Government, which include among others, payments and receipts, opening and maintenance of accounts for donor funded projects and the maintenance of accounts for line ministries. All such accounts opened are pre-funded with the funds received invested and the corresponding liability recorded in the books of the Bank. The transactions where the Bank only acts as an agent, as well as the assets and liabilities arising from such transactions, are not reflected in the annual financial statements of the Bank.
1. ACCOUNTING POLICIES (CONTINUED)
94
Part BAnnual Financial Statements
Bank of Namibia Annual Report 2019

Notes to the Annual Financial Statement31 December 2019
1.18. BORROWING COSTS
Borrowing costs are primarily interest and other costs incurred by the Bank in connection with the borrowing of funds. Borrowing costs are recognised on a time proportioned basis, taking account of the principal outstanding and the effective interest rate over the period of the loan and are expensed accordingly.
1.19. ACCOUNTING FOR IMF - SPECIAL DRAWING RIGHTS (SDR)
The Bank of Namibia is both the fiscal and depository agents for the Government of the Republic of Namibia. Given this relationship all transaction entered into with the International Monetary Fund are recorded in the books of Bank of Namibia.
The SDR is an international reserve asset, created by the International Monetary Fund (IMF) in 1969 to supplement the existing official reserves of member countries. SDRs are allocated to member countries in proportion to their IMF quotas. The SDR also serves as the unit of account of the IMF and some other international organisations. The SDR is defined in terms of a basket of currencies. Its value is determined as the weighted sum of exchange rates of the five major currencies (Euro, Japanese yen, Pound sterling, US dollar and Chinese renminbi). In as far as Namibia is concerned the total allocation of SDR by the IMF is recorded in the books of the Bank as an asset under “SDR and Other Receivables” classification and as a liability under “Deposits” classification.
1.20 NOTES AND COINS IN CIRCULATION
One of the primary functions of the Bank is the printing and minting of Namibia Dollar currency and issuance thereof into circulation. Costs of printing and minting the currency are capitalised and amortised based on issuance of the currency into circulation. New currency notes and coins are issued to the Commercial Banks at face value which then flows into circulation through the monetary and financial systems operational in the country. Once issued into circulation the notes and coins are reflected in the books of the Bank as a liability and the liability is only extinguished when the currency is no longer in circulation.
1.21. LENT OUT SECURITIES
The Bank derives income from securities lending activity. The counterparties involved in these transactions are highly rated institutions and a cash collateral is deposited by the counterparty with the custodians as guarantee for the lent out securities. Our custodians are responsible for the administration and management of this activity. The income generated from the lent out securities activities, are recorded in the books of the Bank accordingly.
1.22. INVESTMENT REVALUATION RESERVE
The Reserve has been created to retain unrealised gains and losses on the Bank’s portfolio investments that are measured at fair value through other comprehensive income (FVTOCI) as per IFRS 9, until they are realised. Unrealised gains when realised become available for distribution and unrealised losses when realised are charged to the Statement of Comprehensive Income.
1. ACCOUNTING POLICIES (CONTINUED)
95
Part BAnnual Financial Statements
Bank of Namibia Annual Report 2019

Notes to the Annual Financial Statement31 December 2019
2019 2018
N$’000 N$’000
2. RESULTS FOR THE YEAR
Profit for the year is arrived at after taking the following items into account:
Interest Income
Namibia Dollar & Rand Currency 637 652 596 079
Debt Securities and Money Market instruments 637 652 596 079
Other Currency 207 305 215 251
Debt securities 200 841 207 815
Money market instruments 6 464 7 436
Unwinding of present value adjustments (BNA Receivable) - 12 244
Unwinding of present value adjustments (Staff Loans) 5 905 4 797
850 862 828 371
Interest Paid
Government - 15 561
Commercial Banks 181 438 244 064
Other 26 755 23 747
208 193 283 372
Other Income
Rand compensation income 407 594 401 963
Sundry income 37 561 53 116
Profit on disposal of property, equipment and intangible assets 288 -
445 443 455 079
Operating Expenses
Depreciation 16 254 22 017
Amortisation of computer software 2 244 2 404
Currency inventory amortisation costs 33 840 21 182
Salaries and related personnel costs 242 458 235 024
Staff training and development 5 017 4 878
Social responsibility 8 264 641
Board members’ fees - for services as board members 1 377 876
Auditors’ remuneration - audit fees 1 118 1 561
Membership fees 6 855 3 090
Building, IT and other maintenance costs (38 427) 74 731
Loss on disposal of property, equipment and intangible assets - 456
Amortisation of pre-paid long-term employee benefit 5 905 4 797
Impairment of Investment in Associate 863 1 523
Credit losses on Investments – IFRS 9 968 3 063
Other expenditure 72 287 73 171
Total operational expenditure 359 023 449 414
Number of employees 290 298
Interest income relates to interest earned on investments which are invested in the Rand, EURO and USD money and capital markets as well as interest earned in NAD on the Commercial banks settlement accounts, Repurchase agreements and staff loans.
Interest expense mainly relates to interest paid to the Government of the Republic of Namibia, BON Bills issued, Commercial Banks settlement accounts and Special Drawing Rights allocations by the IMF.
96
Part BAnnual Financial Statements
Bank of Namibia Annual Report 2019

Notes to the Annual Financial Statement31 December 2019
3. APPROPRIATION OF PROFITS IN TERMS OF THE BANK OF NAMIBIA ACT, 1997
Notes 2019 2018
N$’000 N$’000
Total Comprehensive income for the year 810 332 1 823 554
Unrealised (Gains)/Losses transferred to the Investment
Revaluation Reserve (115 836) 56 766
Exchange Rate (Gains)/Losses transferred to the Revaluation
Reserve 159 390 (1 251 559)
Allowance for credit losses - FVTOCI (4 325) (1 643)
Net Profit for the Year 849 561 627 118
Appropriation of Profits 849 561 627 118
General Reserve 15 357 463 262 881
Building Fund Reserve 18 20 000 20 000
Development Fund Reserve 17 70 000 50 000
Training Fund Reserve 19 2 157 -
State Revenue Fund 399 941 294 237
The foreign exchange gain reflected on the Statement of Comprehensive Income includes translation gains for the year that has been charged to the Statement of Comprehensive Income to comply with the requirements of IAS 21 – Effect of changes in Foreign Exchange Rates. In terms of section 31 of the Bank of Namibia Act, 1997, gains and losses arising based on changes in the book or realised value of assets or liabilities, denominated in currencies other than the domestic currency, are to be transferred to the Revaluation Reserve. The Net Profit for the year in line with the compliance requirements of the Bank of Namibia Act, 1997 would therefore amount to N$849.56 million (2018: N$627.12 million). Appropriations of profits are based on this Net Profit figure.
97
Part BAnnual Financial Statements
Bank of Namibia Annual Report 2019

Notes to the Annual Financial Statement31 December 2019
4. PROPERTY AND EQUIPMENT
2019
Cost
Freehold
Land and
Buildings
N$’000
Computer
Hardware
N$’000
Furniture
Fittings &
Equipment
N$’000
Motor
Vehicles
N$’000
Total
N$’000
At 1 January 2019 334 394 24 241 117 148 9 133 484 916
Additions 2 640 1 171 4 385 4 458 12 654
Disposals (1 460) (3) (722) (637) (2 822)
Transfer (3 181) - (2 423) - (5 604)
At 31 December 2019 332 393 25 409 118 388 12 954 489 144
Accumulated depreciation
At 1 January 2019 71 353 20 927 85 401 8 085 185 766
Current year charge 6 478 2 902 5 676 1 198 16 254
Disposals (348) - (475) (637) (1 460)
At 31 December 2019 77 483 23 829 90 602 8 646 200 560
Carrying value
At 1 January 2019 263 041 3 314 31 747 1 048 299 150
At 31 December 2019 254 910 1 580 27 786 4 308 288 584
2018Cost
At 1 January 2018 329 305 29 330 116 754 8 518 483 907
Additions 5 090 994 917 615 7 616
Disposals (1) (6 083) (523) - (6 607)
At 31 December 2018 334 394 24 241 117 148 9 133 484 916
Accumulated depreciation
At 1 January 2018 64 912 20 858 76 823 7 512 170 105
Current year charge 6 441 5 857 9 146 573 22 017
Disposals - (5 788) (568) - (6 356)
At 31 December 2018 71 353 20 927 85 401 8 085 185 766
Carrying value
At 1 January 2018 264 393 8 472 39 931 1 006 313 802
At 31 December 2018 263 041 3 314 31 747 1 048 299 150
In line with the requirements of IAS 16: Property, Plant & Equipment the Bank is required to perform a brief overview of the residual value and useful life of all classes of Assets. The useful life of assets was revised during the current year.
Impact of change in accounting estimates is summarised below
Depreciation based on new useful life estimates 749
Depreciation based on previous estimates (1,548)
Reduction in current year depreciation (799)Increase in depreciation for future periods 799
A register containing details of land and buildings is available for inspection at the registered office of the Bank.
98
Part BAnnual Financial Statements
Bank of Namibia Annual Report 2019
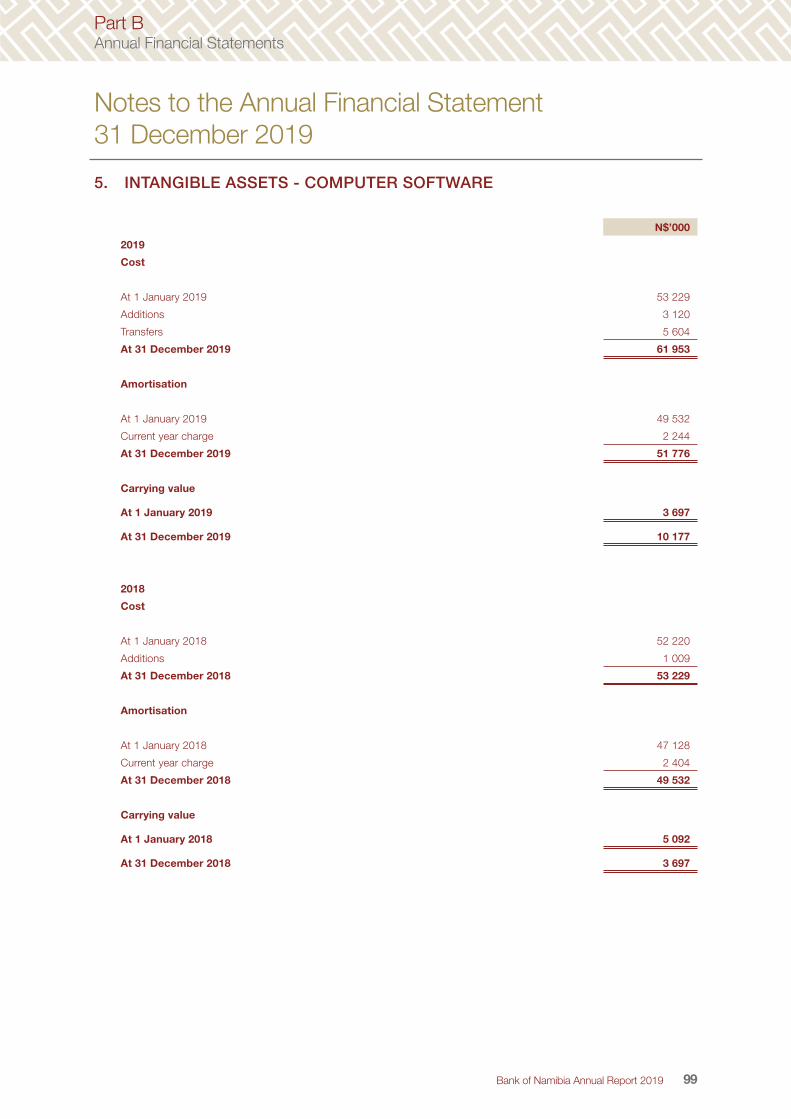
Notes to the Annual Financial Statement31 December 2019
5. INTANGIBLE ASSETS - COMPUTER SOFTWARE
N$’000
2019
Cost
At 1 January 2019 53 229
Additions 3 120
Transfers 5 604
At 31 December 2019 61 953
Amortisation
At 1 January 2019 49 532
Current year charge 2 244
At 31 December 2019 51 776
Carrying value
At 1 January 2019 3 697
At 31 December 2019 10 177
2018
Cost
At 1 January 2018 52 220
Additions 1 009
At 31 December 2018 53 229
Amortisation
At 1 January 2018 47 128
Current year charge 2 404
At 31 December 2018 49 532
Carrying value
At 1 January 2018 5 092
At 31 December 2018 3 697
99
Part BAnnual Financial Statements
Bank of Namibia Annual Report 2019

Notes to the Annual Financial Statement31 December 2019
2019
N$’000
2018
N$’000
6. CURRENCY INVENTORY
Opening Balance 43 870 66 958
Purchases current year 88 636 3 736
Currency revaluation (20) (5 642)
Amortisation current year (33 840) (21 182)
Closing Balance 98 646 43 870
7. LOANS AND ADVANCES
Staff loans 86 541 62 830
Less: Present value adjustment for off-market loans (33 379) (17 364)
Opening balance – 1 January (7 770) (5 387)
Current year fair value adjustment of new loans (19 704) (7 180)
Amortisation of pre-paid long-term employee benefit (5 905) (4 797)
Add: Staff Long-term benefit 33 379 17 364
Opening balance – 1 January 7 770 5 387
Current year Fair value adjustment of new loans 19 704 7 180
Amortisation of pre-paid long-term employee benefit 5 905 4 797
Net staff loans 86 541 62 830
Lifetime credit loss allowance (74) -
Other loans 64 663 61 058
Current portion of staff loans (18 502) -
Closing Balance 132 628 123 888
8. INVESTMENT IN ASSOCIATE
The Bank holds a 49% interest in the Central Securities Depository (Pty) Ltd. The company is incorporated in Namibia
and the interest is equity accounted for.
Increase in Investment 863 1 523
Impairment of Investment (863) (1 523)
Total Investment in Associate – 31 December 2019 - -
The company incurred a loss of N$ 871 000 in the current year (2018: N$865 000) and generated no income.
100
Part BAnnual Financial Statements
Bank of Namibia Annual Report 2019
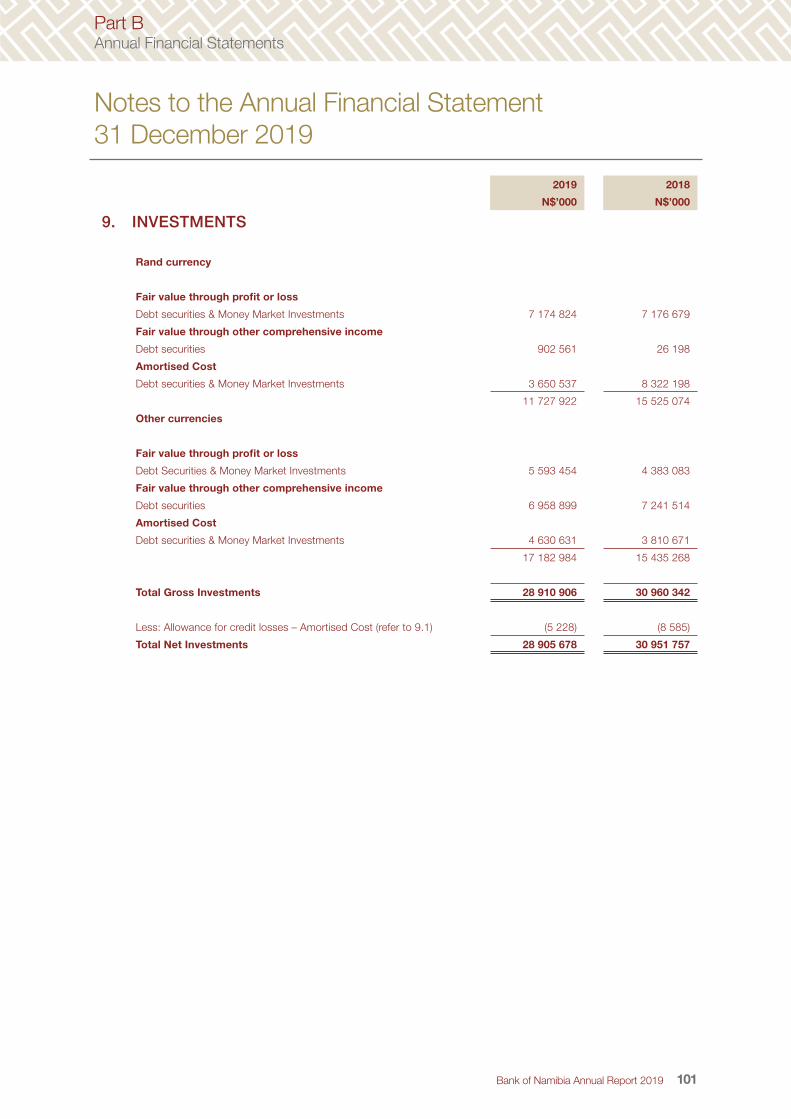
Notes to the Annual Financial Statement31 December 2019
2019
N$’000
2018
N$’000
9. INVESTMENTS
Rand currency
Fair value through profit or loss
Debt securities & Money Market Investments 7 174 824 7 176 679
Fair value through other comprehensive income
Debt securities 902 561 26 198
Amortised Cost
Debt securities & Money Market Investments 3 650 537 8 322 198
11 727 922 15 525 074
Other currencies
Fair value through profit or loss
Debt Securities & Money Market Investments 5 593 454 4 383 083
Fair value through other comprehensive income
Debt securities 6 958 899 7 241 514
Amortised Cost
Debt securities & Money Market Investments 4 630 631 3 810 671
17 182 984 15 435 268
Total Gross Investments 28 910 906 30 960 342
Less: Allowance for credit losses – Amortised Cost (refer to 9.1) (5 228) (8 585)
Total Net Investments 28 905 678 30 951 757
101
Part BAnnual Financial Statements
Bank of Namibia Annual Report 2019
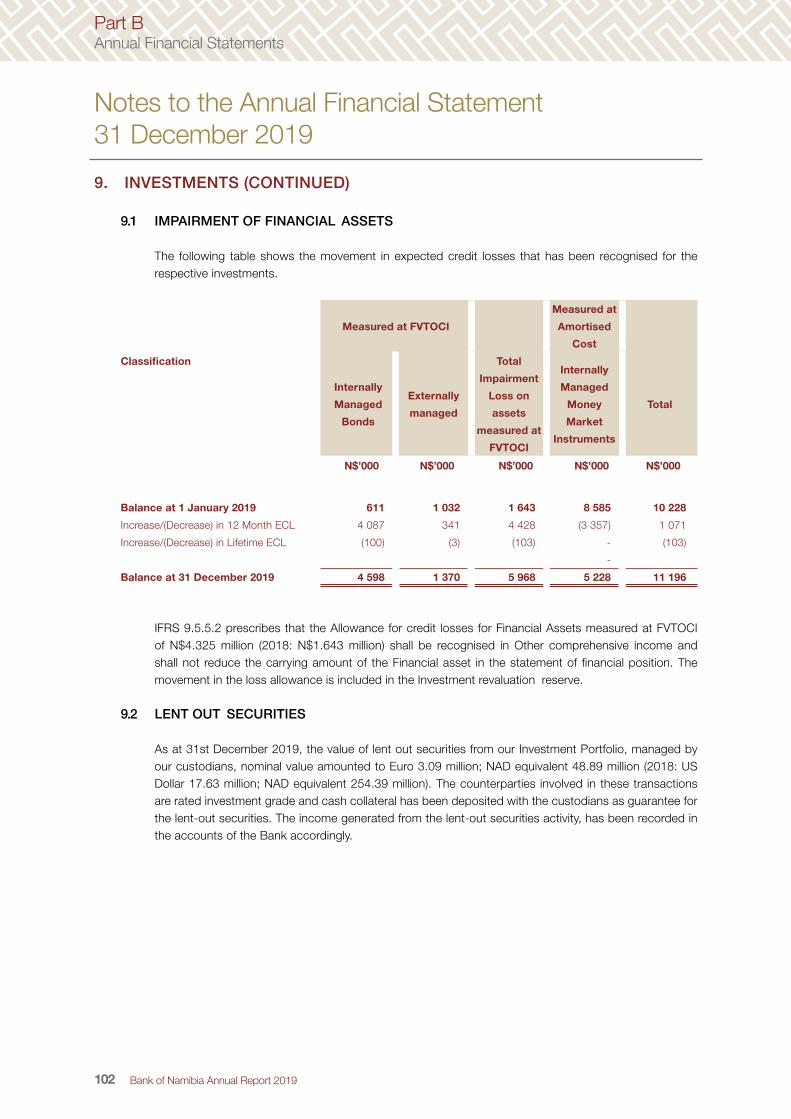
Notes to the Annual Financial Statement31 December 2019
9.1 IMPAIRMENT OF FINANCIAL ASSETS
The following table shows the movement in expected credit losses that has been recognised for the respective investments.
Measured at FVTOCI
Measured at
Amortised
Cost
Classification
Internally
Managed
Bonds
Externally
managed
Total
Impairment
Loss on
assets
measured at
FVTOCI
Internally
Managed
Money
Market
Instruments
Total
N$’000 N$’000 N$’000 N$’000 N$’000
Balance at 1 January 2019 611 1 032 1 643 8 585 10 228
Increase/(Decrease) in 12 Month ECL 4 087 341 4 428 (3 357) 1 071
Increase/(Decrease) in Lifetime ECL (100) (3) (103) - (103)
-
Balance at 31 December 2019 4 598 1 370 5 968 5 228 11 196
IFRS 9.5.5.2 prescribes that the Allowance for credit losses for Financial Assets measured at FVTOCI of N$4.325 million (2018: N$1.643 million) shall be recognised in Other comprehensive income and shall not reduce the carrying amount of the Financial asset in the statement of financial position. The movement in the loss allowance is included in the Investment revaluation reserve.
9.2 LENT OUT SECURITIES
As at 31st December 2019, the value of lent out securities from our Investment Portfolio, managed by our custodians, nominal value amounted to Euro 3.09 million; NAD equivalent 48.89 million (2018: US Dollar 17.63 million; NAD equivalent 254.39 million). The counterparties involved in these transactions are rated investment grade and cash collateral has been deposited with the custodians as guarantee for the lent-out securities. The income generated from the lent-out securities activity, has been recorded in the accounts of the Bank accordingly.
9. INVESTMENTS (CONTINUED)
102
Part BAnnual Financial Statements
Bank of Namibia Annual Report 2019

Notes to the Annual Financial Statement31 December 2019
9.3 FAIR VALUE HIERARCHY OF FINANCIAL INSTRUMENTS
The levels of hierarchy used to determine the fair value of financial instruments is as detailed below:Fair value of instruments that fall in the Level 1 category would be based on the unadjusted quoted prices in an active market for identical assets or liabilities. Level 2 category would be based on quoted prices that are observable for the asset or liability, either directly as prices or indirectly as derived from prices. Level 3 category would be based on inputs for the asset or liability that are not based on observable market data.
Level 1The fair value of the Bank’s financial instruments traded in active markets are based on the quoted prices obtained from the custodians at the statement of financial position date. A market is regarded as active if quoted prices are readily and regularly available from an exchange, dealer broker or pricing services, and the prices represent actual and regularly occurring market transactions on an arm’s length basis.
Level 2The Fair value of financial instruments not traded in an active market is determined using available observable market data and rely as little as possible on entity specific estimates. Some of the techniques used include market prices for similar instruments and discounted cash flows were future cashflows are discounted using a market related interest rate.
As at 31st December 2019, the fair value of financial instruments that were classified under the various hierarchies is detailed in the tables below:
As at 31st December 2019
Level 1 Level 2 Total
N$’000 N$’000 N$’000
Rand and Other currencies Investments 2 142 742 18 486 996 20 629 738
2 142 742 18 486 996 20 629 738
As at 31st December 2018
Level 1 Level 2 Total
N$’000 N$’000 N$’000
Rand and Other currencies Investments 2 995 783 15 831 691 18 827 474
2 995 783 15 831 691 18 827 474
The fair value for the amotised cost instruments not included above amounts to N$8,281,168 (2018: N$12,132,869).
9. INVESTMENTS (CONTINUED)
103
Part BAnnual Financial Statements
Bank of Namibia Annual Report 2019

Notes to the Annual Financial Statement31 December 2019
2019
N$’000
2018
N$’000
10. LOANS AND ADVANCES - LOCAL BANKS
Repurchase agreements – local banks 1 746 376 1 839 118
1 746 376 1 839 118
Repurchase agreements are overnight and seven-day loan facilities granted to the commercial banks to cover for temporary liquidity shortages. The overnight and seven-day repurchase agreements are granted to banking institutions to draw under the credit facility an amount equal to the total adjusted value of eligible securities pledged by each banking institution as collateral to Bank of Namibia.
11. RAND DEPOSITS
Closing Balance 89 727 68 526
89 727 68 526
Rand deposits is the value of Rand bank notes held by the Bank of Namibia. Commercial banks deposit the Rand notes collected at their various branches at the Bank of Namibia. The Bank of Namibia in turn repatriates the said currency to the South African Reserve Bank based on predetermined currency values.
12. OTHER INVENTORY - STATIONERY AND SPARES
Opening Balance 4 337 4 396
Purchases current year 725 374
Issues current year (473) (417)
Adjustments (5) (16)
Closing Balance 4 584 4 337
13. OTHER RECEIVABLES
Accounts receivable 37 267 46 584
Rand compensation receivable - SARB 407 594 389 771
Receivable – Financial Intelligence Centre (FIC) - 25 291
IMF Quota 3 786 064 3 369 939
IMF – Special Drawing Rights 34 314 62 122
4 265 239 3 893 707
104
Part BAnnual Financial Statements
Bank of Namibia Annual Report 2019

Notes to the Annual Financial Statement31 December 2019
2019
N$’000
2018
N$’000
14. SHARE CAPITAL & CAPITAL MANAGEMENT
Authorised share capital
100 000 000 ordinary shares of N$1 each 100 000 100 000
Issued share capital
40 000 000 ordinary shares of N$1 each 40 000 40 000
The Capital is the amount subscribed by the Government in accordance with Section 14 of the Bank ofNamibia Act, 1997. The Bank is not subject to any externally imposed capital requirements; however annuallythe appropriation of the profits is approved by the Government which requires that a minimum percentage ofthe annual profits is transferred to the general reserve which forms part of the Bank’s capital.
15. GENERAL RESERVE
Opening Balance 1 800 506 1 473 023
IFRS 9 Transition Adjustments – Impairment Loss - (7 165)
Reclassification Adjustment – Unrealised Losses - 67 939
Restated opening balance 1 800 506 1 533 797
Transfers 2 142 3 828
Appropriation of net profit for the year 357 463 262 881
Closing Balance 2 160 111 1 800 506
The General Reserve is a Statutory Reserve that can be utilised for increasing the paid-up Capital of the Bank, offset losses incurred, fund a Development Reserve and redeem any securities issued by the Bank.
16. FOREIGN CURRENCY REVALUATION RESERVE
Opening Balance 6 271 690 5 020 131
Net foreign exchange gains/(losses) (159 390) 1 251 559
Closing Balance 6 112 300 6 271 690
The Revaluation reserve has been created in accordance with Section 31 of the Bank of Namibia Act, 1997. The Act requires that both realised and unrealised gains and losses be transferred to the Revaluation Reserve account.
105
Part BAnnual Financial Statements
Bank of Namibia Annual Report 2019

Notes to the Annual Financial Statement31 December 2019
2019
N$’000
2018
N$’000
17. DEVELOPMENT FUND RESERVE
Opening Balance 97 402 49 970
Transfer to general reserves (700) (2 568)
Appropriation of net profit for the year 70 000 50 000
Closing Balance 166 702 97 402
This reserve was established under section 53(1)(a) of the Bank of Namibia Act, 1997 for the purpose of promoting or financing economic development in Namibia.
18. BUILDING FUND RESERVE
Opening Balance 65 000 45 000
Appropriation of net profit for the year 20 000 20 000
Closing Balance 85 000 65 000
This reserve was established under section 53(1)(a) of the Bank of Namibia Act, 1997 for the purpose of accumulating funds for building projects that the Bank intends to embark upon in the future.
19. TRAINING FUND RESERVE
Opening Balance 12 764 14 024
Transfer to general reserves (1 442) (1 260)
Appropriation of net profit for the year 2 157
Closing Balance 13 479 12 764
The training fund reserve has been created to provide funds to up-skill the Bank’s human capacity in order to meet challenges of a rapidly changing and complex financial environment under which the Bank operates.
20. INVESTMENT REVALUATION RESERVE
Opening Balance (67 428) 55 634
Transfers to Investment revaluation reserve for the year 115 836 (56 766)
Reclassification adjustment – unrealised losses - (67 939)
Allowance for credit losses 4 325 1 643
Closing Balance 52 733 (67 428)
106
Part BAnnual Financial Statements
Bank of Namibia Annual Report 2019

Notes to the Annual Financial Statement31 December 2019
21. PROVISION FOR POST-EMPLOYMENT BENEFITS
The Bank provides post-employment medical benefits to retired staff members. A provision for the Liability has been determined based on the Projected Unit Credit Method. The valuation was performed for the year ended 31 December 2019. The Actuarial valuation was performed by ARCH Actuarial consulting, a member of the Actuarial Society of South Africa (“ASSA”) with 20 years’ experience in performing similar valuations.
2019
N$’000
2018
N$’000
Opening Liability 68 195 62 134
Interest costs 6 296 5 735
Current service costs 2 073 1 896
Benefit payments (1 697) (1 570)
Actuarial loss/(gain) (14 298) -
Closing Liability 60 569 68 195
Current portion of post-employment benefits obligation (2 584) (1 697)
Non-current portion of post-employment benefits obligation 57 985 66 498
Key assumptions 2019 2018
Discount rate 9.79% p.a. 9.35 % p.a.
Medical inflation 6.71% p.a. 8.06 % p.a.
Valuation date 31 December 2019 31 December 2016
The effect of a 1% movement in the assumed medical cost trend rate is as
follows:
Increase
N$’000
Decrease
N$’000
Effect on the aggregate of the current service cost and interest cost 1 564 1 301
Effect on the defined benefit obligation 62 133 69 496
At 31 December 2019
N$’000
2018
N$’000
2017
N$’000
2016
N$’000
2015
N$’000
Present value of post-retirement benefit obligation 60 569 68 195 62 134 56 628 70 005
The Bank’s post-retirement plan is unfunded.
107
Part BAnnual Financial Statements
Bank of Namibia Annual Report 2019
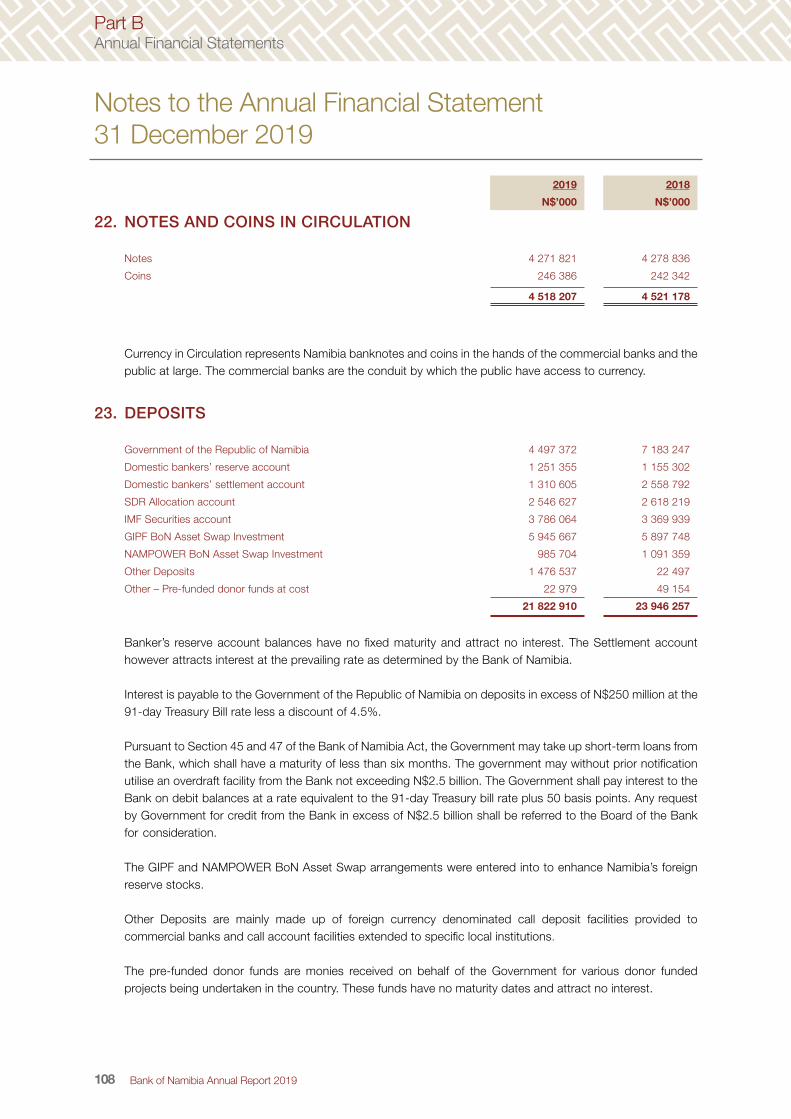
Notes to the Annual Financial Statement31 December 2019
2019
N$’000
2018
N$’000
22. NOTES AND COINS IN CIRCULATION
Notes 4 271 821 4 278 836
Coins 246 386 242 342
4 518 207 4 521 178
Currency in Circulation represents Namibia banknotes and coins in the hands of the commercial banks and the public at large. The commercial banks are the conduit by which the public have access to currency.
23. DEPOSITS
Government of the Republic of Namibia 4 497 372 7 183 247
Domestic bankers’ reserve account 1 251 355 1 155 302
Domestic bankers’ settlement account 1 310 605 2 558 792
SDR Allocation account 2 546 627 2 618 219
IMF Securities account 3 786 064 3 369 939
GIPF BoN Asset Swap Investment 5 945 667 5 897 748
NAMPOWER BoN Asset Swap Investment 985 704 1 091 359
Other Deposits 1 476 537 22 497
Other – Pre-funded donor funds at cost 22 979 49 154
21 822 910 23 946 257
Banker’s reserve account balances have no fixed maturity and attract no interest. The Settlement account however attracts interest at the prevailing rate as determined by the Bank of Namibia.
Interest is payable to the Government of the Republic of Namibia on deposits in excess of N$250 million at the 91-day Treasury Bill rate less a discount of 4.5%.
Pursuant to Section 45 and 47 of the Bank of Namibia Act, the Government may take up short-term loans from the Bank, which shall have a maturity of less than six months. The government may without prior notification utilise an overdraft facility from the Bank not exceeding N$2.5 billion. The Government shall pay interest to the Bank on debit balances at a rate equivalent to the 91-day Treasury bill rate plus 50 basis points. Any request by Government for credit from the Bank in excess of N$2.5 billion shall be referred to the Board of the Bank for consideration.
The GIPF and NAMPOWER BoN Asset Swap arrangements were entered into to enhance Namibia’s foreign reserve stocks.
Other Deposits are mainly made up of foreign currency denominated call deposit facilities provided to commercial banks and call account facilities extended to specific local institutions.
The pre-funded donor funds are monies received on behalf of the Government for various donor funded projects being undertaken in the country. These funds have no maturity dates and attract no interest.
108
Part BAnnual Financial Statements
Bank of Namibia Annual Report 2019
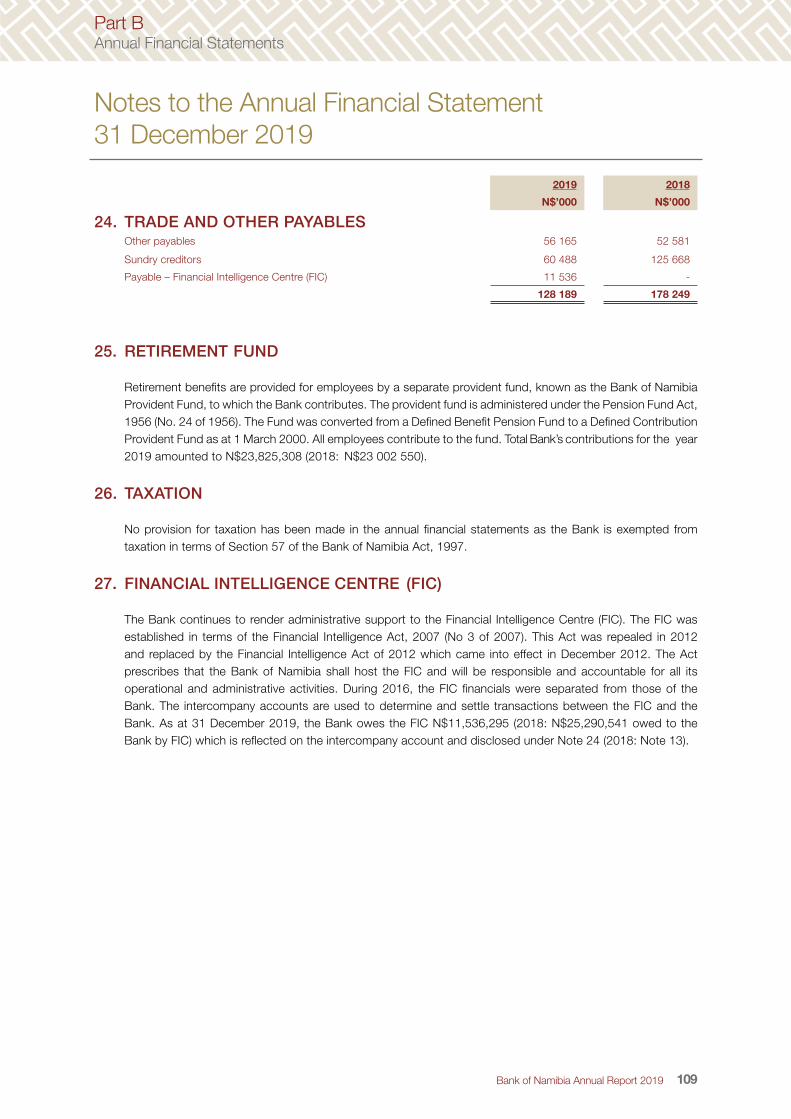
Notes to the Annual Financial Statement31 December 2019
2019
N$’000
2018
N$’000
24. TRADE AND OTHER PAYABLESOther payables 56 165 52 581
Sundry creditors 60 488 125 668
Payable – Financial Intelligence Centre (FIC) 11 536 -
128 189 178 249
25. RETIREMENT FUND
Retirement benefits are provided for employees by a separate provident fund, known as the Bank of Namibia Provident Fund, to which the Bank contributes. The provident fund is administered under the Pension Fund Act, 1956 (No. 24 of 1956). The Fund was converted from a Defined Benefit Pension Fund to a Defined Contribution Provident Fund as at 1 March 2000. All employees contribute to the fund. Total Bank’s contributions for the year 2019 amounted to N$23,825,308 (2018: N$23 002 550).
26. TAXATION
No provision for taxation has been made in the annual financial statements as the Bank is exempted from taxation in terms of Section 57 of the Bank of Namibia Act, 1997.
27. FINANCIAL INTELLIGENCE CENTRE (FIC)
The Bank continues to render administrative support to the Financial Intelligence Centre (FIC). The FIC was established in terms of the Financial Intelligence Act, 2007 (No 3 of 2007). This Act was repealed in 2012 and replaced by the Financial Intelligence Act of 2012 which came into effect in December 2012. The Act prescribes that the Bank of Namibia shall host the FIC and will be responsible and accountable for all its operational and administrative activities. During 2016, the FIC financials were separated from those of the Bank. The intercompany accounts are used to determine and settle transactions between the FIC and the Bank. As at 31 December 2019, the Bank owes the FIC N$11,536,295 (2018: N$25,290,541 owed to the Bank by FIC) which is reflected on the intercompany account and disclosed under Note 24 (2018: Note 13).
109
Part BAnnual Financial Statements
Bank of Namibia Annual Report 2019

Notes to the Annual Financial Statement31 December 2019
28. FINANCIAL INSTRUMENTS AND RISK MANAGEMENT
The investment of foreign currency (FX) reserves in financial instruments gives rise to exposure to various types of risk which include market, currency, interest rate, credit and liquidity risk. Risk management at the Bank of Namibia forms an integral part of foreign reserves management within the governance structures of the Bank. Foreign reserves are managed in a three-tier governance structure consisting of the Board of Directors, the Investment Committee and the Financial Markets Department (FMD). The Board defines the investment policy of the Bank, which guides the management and risk appetite of the foreign exchange reserves. The Board authority is delegated to the Investment Committee to ensure compliance with the investment mandate. The FMD is responsible for managing the reserves and, within the FMD there is a Risk & Analytics section that proactively monitors compliance of investments to assigned risk parameters daily. The different types of risk that the foreign exchange reserves are exposed to and the Bank’s risk management approaches are stated below:
28.1 MARKET RISK
Market risk is the risk of loss or decline in the value of foreign reserve assets resulting from changes in market conditions and macroeconomic variables such as interest rates, exchange rate and inflation. Bank of Namibia employs duration management, diversification, correlation analysis and risk budgeting to mitigate market risk. In managing the foreign exchange reserves, the Bank follows an enhanced indexation approach which aims to outperform traditional passive portfolio management techniques by investing in a defined benchmark as well as employing an active management strategy to enhance returns.
Sensitivity analysis on Interest rate risk
This has been considered under the interest rate risk below. Refer to Note 28.2.
Sensitivity Analysis on Currency risk
The Bank of Namibia follows an Asset-Liability Management Approach to determine its currency composition (an exercise which is undertaken annually during the Strategic Asset Allocation review).
The Bank has a currency risk exposure arising from Investments and Bank accounts held in foreign currency as well as foreign currency denominated Liabilities. An analysis was done on the impact a 10% depreciation in the Namibian dollar against other currencies would have on the Profit/Loss of the Bank. There is no impact on the balances denominated in ZAR due to the currency peg between the NAD and ZAR.
110
Part BAnnual Financial Statements
Bank of Namibia Annual Report 2019

Notes to the Annual Financial Statement31 December 2019
2019 2018
Total Assets (Increase)/
Decrease
profit/Loss
Total Assets (Increase)/
Decrease
profit/Loss
Assets
USD 15 609 660 (1 560 971) 13 864 054 (1 386 405)
EUR 840 663 (73 361) 840 204 (84 021)
OTHER CURRENCIES 760 672 (74 609) 785 475 (78 548)
17 210 995 (1 708 941) 15 489 734 (1 548 974)
% Impact on Investments 6% 5%
Liabilities
USD (7 069 533) 706 930 (4 406 321) 440 632
EUR (11 359) 1 118 (6 989 125) -
(7 080 892) 708 048 (11 395 446) 442 313
% Impact on Liabilities 5% 4%
28.2 INTEREST RATE RISK
Foreign exchange reserve assets are sensitive to the interest rate movement path. Changes in interest rates impacts the value of these assets as well the potential interest income. A commonly used measure for interest rate risk on a bond or money market portfolio is the Dollar Value (DV01) approach. This approach considers the weighted average cash flows and represents the change in value of an asset or portfolio in value terms due to a 0.01 percent change in yield. The following table summarises the Bank’s interest rate exposure using this methodology and also applies a 1 percent interest rate shock. The table can therefore be used as a basis for an assessment of the sensitivity of the Bank’s net income to interest rate movements.
28. FINANCIAL INSTRUMENTS AND RISK MANAGEMENT (CONTINUED)
28.1 MARKET RISK (CONTINUED)
111
Part BAnnual Financial Statements
Bank of Namibia Annual Report 2019

Notes to the Annual Financial Statement31 December 2019
IMPACT OF INTEREST RATE CHANGE ON EUR PORTFOLIO - 2019Instrument Amount
invested
€’000
Actual Portfolio
Weight
Interest Rate
Duration (Yrs)
Estimated Loss/Gain
Assuming 1 bps Change
(‘000)
Estimated Loss/Gain Assuming
1% Change (‘000)
Amount invested
NAD ’000
Estimated Loss/Gain Assuming
1% Change (NAD ‘000)
Working Capital 3,703 100% -0.500% 0.003 0.00 0.10 58,606 1.63
Liquidity Tranche - 0% 0.000% - - - - -
Investment Tranche - 0% 0.000% - - - - -
3,703 100% -0.500% 0.00 0.10 58,606 1.63
IMPACT OF INTEREST RATE CHANGE ON USD PORTFOLIO - 2019Instrument Amount
invested
US$’000
Actual Portfolio
Weight
Interest Rate
Duration (Yrs)
Estimated Loss/Gain
Assuming 1 bps Change
(‘000)
Estimated Loss/Gain Assuming
1% Change (‘000)
Amount invested
NAD ’000
Estimated Loss/Gain Assuming
1% Change (NAD ‘000)
Working Capital 10,407 2% 1.443% 0.003 0.00 0.29 146,980 4.08
Liquidity Tranche 52,136 8% 1.956% 0.003 0.01 1.45 736,346 20.45
Investment Tranche 38,891 6% 1.690% 2.490 9.68 968.23 549,282 13,674.77
Externally Managed Portfolios 425,020 68% 1.469% 3.547 150.74 15,074.34 6,002,751 212,901.64
Endowment Fund - 0% 2.620% 0.058 - - - -
CFC 100,062 16% 1.641% 0.003 0.03 2.78 1,413,220 39.26
626,516 100% 1.550% 160 16,047.09 8,848,579 226,640.20
IMPACT OF INTEREST RATE CHANGE ON ZAR PORTFOLIO - 2019Instrument Amount
invested
R’000
Actual Portfolio
Weight
Interest Rate
Duration (Yrs)
Estimated Loss/Gain
Assuming 1 bps Change
(‘000)
Estimated Loss/Gain Assuming
1% Change (‘000)
Amount invested
NAD ’000
Estimated Loss/Gain Assuming
1% Change (NAD ‘000)
Working Capital 1,023,388 22% 7.190% 0.003 0.28 28.04 1,023,388 28.04
Liquidity Tranche 2,052,396 45% 7.289% 0.003 0.56 56.23 2,052,396 56.23
Investment Tranche 1,473,687 32% 7.670% 0.229 33.73 3,372.72 1,473,687 3,372.72
4,549,471 100.0% 7.390% 34.57 3,456.99 4,549,471 3,456.99
IMPACT OF INTEREST RATE CHANGE ON SDR PORTFOLIO - 2019Instrument Amount
invested
Respective Currency
’000
Actual Portfolio
Weight
Interest Rate
Duration(Yrs)
Estimated Loss/Gain
Assuming 1 bps Change
(‘000)
Estimated Loss/Gain Assuming
1% Change (‘000)
Amount invested
NAD ’000
Estimated Loss/Gain Assuming
1% Change (NAD ‘000)
USD 78,531 42% 2.045% 0.003 0.02 2.15 1,109,129 30.39
EUR 49,393 30% -0.212% 0.003 0.01 1.35 781,630 21.41
GBP 11,720 8% 0.900% 0.378 0.44 44.27 217,083 820.04
JPY 1,600,959 8% 0.000% 0.003 0.44 43.86 208,093 5.70
CNY 149,036 12% 2.600% 0.178 2.65 264.95 301,754 536.45
100.00% 1.180% 3.57 356.59 2,617,689 1,414.00
28. FINANCIAL INSTRUMENTS AND RISK MANAGEMENT (CONTINUED)
28.2 INTEREST RATE RISK (CONTINUED)
112
Part BAnnual Financial Statements
Bank of Namibia Annual Report 2019

Notes to the Annual Financial Statement31 December 2019
IMPACT OF INTEREST RATE CHANGE ON THE EUR PORTFOLIO - 2018Instrument Amount
invested
€’000
Actual Portfolio
Weight
Interest Rate
Duration
(Yrs)
Estimated Loss/Gain Assuming
1 bps Change
(‘000)
Estimated Loss/Gain Assuming
1% Change
(‘000)
Working Capital 1,264 100% -0.480% 0.003 0.00 0.04
Liquidity Tranche - 0% 0.000% - - -
Investment Tranche - 0% 0.000% - - -
1,264 100% -0.480% 0.00 0.04
IMPACT OF INTEREST RATE CHANGE ON THE USD PORTFOLIO - 2018Instrument Amount
invested
US$’000
Actual Portfolio
Weight
Interest Rate
Duration
(Yrs)
Estimated Loss/Gain Assuming
1 bps Change
(‘000)
Estimated Loss/Gain Assuming
1% Change
(‘000)
Working Capital 7 975 1% 2.450% 0.003 0.00 0.00
Liquidity Tranche 66 780 8% 2.450% 0.003 0.02 1.85
Investment Tranche 97 612 12% 2.597% 2.490 24.30 2 430.11
Externally Managed Portfolios 400 416 50% 2.142% 3.386 47.90 4 790.46
Endowment Fund 1 366 1% 2.620% 0.058 0.01 0.80
CFC 4 0% 2.450% 0.003 0.00 0.00
SDR 228 464 28% 1.690% 1.530 34.95 3 495.35
802 617 100% 2.108% 107.19 10 718.57
IMPACT OF INTEREST RATE CHANGE ON THE ZAR PORTFOLIO - 2018Instrument Amount
invested
R’000
Actual Portfolio
Weight
Interest Rate
Duration
(Yrs)
Estimated Loss/Gain
Assuming 1 bps Change
(‘000)
Estimated Loss/Gain Assuming
1% Change (‘000)
Working Capital 1,141,368 21% 7.660% 0.003 0.31 31.27
Liquidity Tranche 503,280 10% 7.660% 0.003 0.14 13.79
Investment Tranche 3,683,270 69% 7.669% 0.184 67.76 6,775.91
BoN Bill - 0% - - - -
5,327,918 100.0% 7.667% 68.21 6,820.97
28. FINANCIAL INSTRUMENTS AND RISK MANAGEMENT (CONTINUED)
28.2 INTEREST RATE RISK (CONTINUED)
113
Part BAnnual Financial Statements
Bank of Namibia Annual Report 2019

Notes to the Annual Financial Statement31 December 2019
INTEREST RATE REPRICING PROFILE
The following table summarises the Bank’s interest rate exposure in the form of an interest rate repricing table. This shows when the interest rate earned or charged on assets and liabilities are expected to change based on the various maturities. The table can therefore be used as the basis for an assessment of the sensitivity of the Bank’s net income to interest rate movements.
AS AT YEAR ENDED 31 DECEMBER 2019
N$’0000 – 3
Months
3 – 12
Months
1 – 5
Years
5 – 10
Years
Non-
Interest
Bearing
Total
Assets
Loans and advances - - 151 204 - - 151 204
Investment 7 049 466 6 938 707 6 260 672 8 448 568 208 265 28 905 678
Loans and advances – Local banks 1 746 376 - - - - 1 746 376
Rand deposits - - - - 89 727 89 727
Other receivables 4 265 165 - - - - 4 265 165
Total Financial Assets 13 061 007 6 938 707 6 411 876 8 448 568 297 992 35 158 150
Liabilities
Deposits 20 548 575 - - - 1 274 335 21 822 910
Trade and other payables 128 189 - - - - 128 189
Total Financial Liabilities 20 676 764 - - - 1 274 335 21 951 099
Interest rate repricing gap (7 615 757) 6 938 707 6 411 876 8 448 568 (976 343) 13 207 051
AS AT YEAR ENDED 31 DECEMBER 2018
N$’0000 – 3
Months
3 – 12
Months
1 – 10
Years
Non-
Interest
Bearing
Total
Assets
Loans and advances - non-current - - 123 888 - 123 888
Investment 8 502 054 3 759 688 18 551 003 147 597 30 960 342
Loans and advances - current 1 839 118 - - - 1 839 118
Rand deposits - - - 68 526 68 526
Other receivables 3 893 707 - - - 3 893 707
Total Financial Assets 14 234 879 3 759 688 18 674 891 216 123 36 885 581
Liabilities
Deposits 8 170 702 - 14 571 099 1 204 456 23 946 257
Trade and other payables 178 249 - - - 178 249
Total Financial Liabilities 8 348 951 - 14 571 099 1 204 456 24 124 506
Interest rate repricing gap 5 885 928 3 759 688 4 103 792 (988 333) 12 761 075
28. FINANCIAL INSTRUMENTS AND RISK MANAGEMENT (CONTINUED)
28.2 INTEREST RATE RISK (CONTINUED)
114
Part BAnnual Financial Statements
Bank of Namibia Annual Report 2019

Notes to the Annual Financial Statement31 December 2019
28.3 CURRENCY RISK
In terms of the Investment Policy and Guidelines, foreign exchange risk is managed on risk neutral basis through a currency composition (benchmark) that provides a natural hedge against potential liabilities. The currency composition of the foreign exchange reserves reflects the currency distribution of the country’s short-term external debt, imports and other contingent liabilities. The Bank’s foreign reserves are divided into three tranches, namely: Working Capital, Liquidity and Investment Tranche which are further composed of its various reserve currencies. The currency composition of reserves is determined using a liability approach whereby the potential calls on the reserves form the basis for the respective currency allocations. For the year 2019, the following portfolios (tranches) was managed in-line with the stipulated currency exposure limits.
Instruments ZAR Portfolio USD Portfolio EUR Portfolio Other Portfolio
Working Capital 500mil – 2.5bn 0mil – 10mil 0mil – 5mil 0
Liquidity Tranche 500mil ≤ 0mil – 125mil 0mil – 50mil 0
Investment Tranche (%) 88 12 0 0
Risk-return preferences per trancheTranche Horizon Objective
Working Capital 0-3 Months Provide Liquidity, no negative returns allowed on any period
(100% Cash)
Liquidity 1 Year Maximize returns subject to avoiding negative returns at 99%
confidence (as measured on an annual basis)
Investment 1 Year Maximize returns subject to a negative return of 100 bps with
95% probability (as measured on an annual basis)
The effect of Namibia dollar exchange rates against the foreign currencies can have an impact on the level of foreign currency reserves in terms of the reporting currency. The weakening of the NAD against the USD as well as other major currencies, will favourably affect the reserve position when reported in the local currency. The opposite effect holds when the NAD appreciates against these currencies. The Namibia Dollar is pegged to the South African Rand at one to one parity, and hence there is no currency risk on the portion of foreign reserves invested in that currency.
28. FINANCIAL INSTRUMENTS AND RISK MANAGEMENT (CONTINUED)
115
Part BAnnual Financial Statements
Bank of Namibia Annual Report 2019

Notes to the Annual Financial Statement31 December 2019
AT 31 DECEMBER 2019 THE BANK HAD THE FOLLOWING CURRENCY POSITION EXPOSURES
N$
‘000
ZAR
‘000
Euro
‘000
US$
‘000
Other
‘000
Total
N$‘000
Assets
Loans and advances 151 204 - - - - 151 204
Investment - 11 860 985 840 236 15 600 146 604 311 28 905 678
Loans and advances – Local banks 1 746 376 - - - - 1 746 376
Rand deposits - 89 727 - - - 89 727
Other receivables 37 193 407 594 - - 3 820 378 4 265 165
Total Financial Assets 1 934 773 12 358 306 840 236 15 600 146 4 424 689 35 158 150
Liabilities
Deposits 7 083 033 6 931 372 - 1 475 814 6 332 691 21 822 910
Trade and other payables 128 189 - - - - 128 189
Total Financial Liabilities 7 211 222 6 931 372 - 1 475 814 6 332 691 21 951 099
Net Financial Instruments (5 276 449) 5 426 934 840 236 14 124 332 (1 908 002) 13 207 051
AT 31 DECEMBER 2018 THE BANK HAD THE FOLLOWING CURRENCY POSITION EXPOSURES
N$
‘000
ZAR
‘000
Euro
‘000
US$
‘000
Other
‘000
Total
N$‘000
Assets
Loans and advances - non-current 123 888 - - - - 123 888
Investment - 15 532 401 840 224 11 797 821 2 789 896 30 960 342
Loans and advances - current 1 839 118 - - - - 1 839 118
Rand deposits - 68 526 - - - 68 526
Other receivables 71 875 389 771 - - 3 432 061 3 893 707
Total Financial Assets 2 034 881 15 990 698 840 224 11 797 821 6 221 957 37 885 581
Liabilities
Deposits 9 913 337 6 989 125 16 753 4 408 823 2 618 219 23 946 257
Trade and other payables 178 249 - - - - 178 249
Total Financial Liabilities 10 091 586 6 989 125 16 753 4 408 823 2 618 219 24 124 506
Net Financial Instruments (8 056 705) 9 001 573 823 471 7 388 998 (3 603 738) 12 761 075
28. FINANCIAL INSTRUMENTS AND RISK MANAGEMENT (CONTINUED)
28.3 CURRENCY RISK (CONTINUED)
116
Part BAnnual Financial Statements
Bank of Namibia Annual Report 2019

Notes to the Annual Financial Statement31 December 2019
28.4 LIQUIDITY RISK
Liquidity risk is the risk that the Bank will be unable to meet its financial obligations as they fall due or the possibility that the Bank will incur substantial capital losses when it disposes its securities in the secondary market. Liquidity is the second most important foreign exchange reserves management objective after capital preservation. The Bank seeks to maintain enough liquidity by investing in securities with an active secondary market. As at 31 December 2019, 49 percent (2018: 40 percent) of investments could be liquidated within two working days, reflecting the highly liquid nature of the portfolio.
LIQUIDITY/OBLIGATIONS RISK ANALYSIS STATEMENT AS AT 31 DECEMBER 2019N$’000 0 – 3
Months
4 – 12
Months
1–10
YearsNo maturity Total
AssetsLoans and advances - - 151 204 - 151 204Investment 7 257 785 6 938 707 6 259 833 8 449 353 28 905 678Loans and advances – Local banks 1 746 376 - - - 1 746 376SDR Holdings -IMF - - - 34 314 34 314SDR Quota - - - 3 786 064 3 786 064Rand deposits 89 727 - - 89 727Other receivables 37 193 407 594 - - 444 787
Total Financial Assets 9 131 081 7 346 301 6 411 037 12 269 731 35 158 150
LiabilitiesDeposits 5 807 977 - - 9 682 242 15 490 219SDR Allocation - IMF* - - - 2 546 627 2 546 627IMF Securities Account* - - - 3 786 064 3 786 064Trade and other payables 128 189 - - - 128 189Total Financial Liabilities 5 936 166 - - 16 014 933 21 951 099
Liquidity sensitivity gap 3 194 915 7 346 301 6 411 037 (3 745 202) 13 207 051
Cumulative liquidity sensitivity gap 3 194 915 10 541 216 16 952 253 13 207 051 -
*Relates to reserves that are held as a result of the Bank’s IMF membership. Refer to Note 1.19
LIQUIDITY/OBLIGATIONS RISK ANALYSIS STATEMENT AS AT 31 DECEMBER 2018N$’000 0 – 3
Months
4 – 12
Months
1–10
YearsNo maturity Total
AssetsLoans and advances - non-current - - 123 888 - 123 888Investment 8 711 466 3 759 688 18 489 188 - 30 960 342Loans and advances - current 1 839 118 - - - 1 839 118SDR Holdings -IMF - - - 62 122 62 122SDR Quota - - - 3 369 939 3 369 939Rand deposits 68 526 - - - 68 526Other receivables 461 646 - - - 461 646
Total Financial Assets 11 080 756 3 759 688 18 613 076 3 432 061 36 885 581
LiabilitiesDeposits 2 160 047 - 14 571 099 1 226 954 17 958 100SDR Allocation - IMF - - - 2 618 219 2 618 219IMF Securities Account - - - 3 369 939 3 369 939Trade and other payables 178 249 - - - 178 249
Total Financial Liabilities 2 338 296 - 14 571 099 7 215 112 24 124 507
Liquidity sensitivity gap 8 742 460 3 759 688 4 041 977 (3 783 051) 12 761 075
Cumulative liquidity sensitivity gap 8 742 460 12 502 148 16 544 125 12 761 075 -
28. FINANCIAL INSTRUMENTS AND RISK MANAGEMENT (CONTINUED)
117
Part BAnnual Financial Statements
Bank of Namibia Annual Report 2019

Notes to the Annual Financial Statement31 December 2019
28.5 CREDIT RISK
This is the risk that the Bank’s counterparties will default on their contractual obligations resulting in a financial loss to the Bank. The risk of default of counterparties as well as the spread widening of bonds held by the Bank are both influenced by the probability of default of the concerned counterparties.
With safety of principal being the foremost investment objective, the Bank seeks to manage credit risk by investing in money market instruments issued by counterparts with a minimum short-term credit rating of F1 by Fitch or the equivalent rating by Standard & Poor and Moody’s rating agencies. Longer-dated fixed income instruments are limited to issues by members of the Group of 7 Nations (G7), Organisation for Economic Cooperation and Development (OECD), and the People’s Republic of China with a minimum credit rating of BBB- by Fitch Rating Agency or equivalent. In light of the downgrade of South Africa to non-investment grade, a special provision has been made to allow short-term exposure (maximum one year) to South African Issuers with a minimum short-term rating of F3 and a minimum long-term rating of BB by Fitch or equivalent. This is of strategic importance given the peg of the Namibian Dollar to the South African Rand.
Detailed below is a table which presents the Bank’s total financial asset exposure over various regions as well as their credit ratings:
CREDIT RISK RATING ANALYSIS AS AT 31 DECEMBER 2019
REGIONAL EXPOSURE CREDIT RATING N$’m
2019United States AA+ 4 923 145
North America (excl USA) AAA 518 072
Euro Area AA- 4 347 861
United Kingdom AA 438 154
Japan A 3 632 123
Other Advanced Economies AA 486 734
China A+ 11 717 238
South Africa BB 1 706 221
Other Emerging Market & Developing Economies BBB+ 339 057
Multilaterals AAA 797 072
Namibia BB 6 252 473
TOTAL ASSETS 35 158 150
28. FINANCIAL INSTRUMENTS AND RISK MANAGEMENT (CONTINUED)
28.5 LIQUIDITY RISK (CONTINUED)
118
Part BAnnual Financial Statements
Bank of Namibia Annual Report 2019

Notes to the Annual Financial Statement31 December 2019
CREDIT RISK RATING ANALYSIS AS AT 31 DECEMBER 2018
REGIONAL EXPOSURE CREDIT RATING N$’m
2018
United States AA+ 6 501 675
North America (excl. USA) AAA 491 075
Euro Area AA 3 105 158
United Kingdom AA 325 936
Japan A 1 459 444
Other Advanced Economies AAA 414 762
China A+ 1 808 756
South Africa BB 15 281 976
Other Emerging Market & Developing Economies A 758 748
Multilaterals AAA 812 812
Namibia BB+ 5 925 239
TOTAL ASSETS 36 885 581
The Bank invests/buys securities in reputable institutions who are rated by Fitch, Moody’s and Standard & Poor rating agencies. The Bank’s credit risk exposure has remained static and movements in the fair values of our external portfolio investments were as a result of movements in interest rate risk, foreign exchange risk, etc.
28.6 SETTLEMENT RISK
The Bank is exposed to settlement risk when settling or clearing transactions. This type of risk occurs in an event that the Bank or the counterparty in the dealing contract fails to settle or clear transactions where the exchange of cash, securities is not instantaneous. This risk is of particular significance as this could result in penalties, interest forgone and consequently affect the reputation of the Bank. In order to control this risk, the Bank has imposed counterparty and dealer limits so as to limit the bank’s exposure to a counterparty at any given time in the deal cycle.
28.7 OPERATIONAL RISK
Like any other institution, the Bank is exposed to operational risk, which is the risk of financial losses or damage to the Bank’s reputation resulting from one or more risk factors such as human factors, failed or inadequate processes, failed or inadequate systems and external events.
These factors are defined in detail as follows:
• Human Factors: insufficient personnel, lack of knowledge, skills or experience, inadequate training and development, inadequate supervision, loss of key personnel, inadequate succession planning or lack of integrity or ethical standards.
• Failed or inadequate processes: a process is poorly designed or unsuitable, or not properly documented, understood, implemented, followed or enforced.
28. FINANCIAL INSTRUMENTS AND RISK MANAGEMENT (CONTINUED)
28.5 CREDIT RISK (CONTINUED)
119
Part BAnnual Financial Statements
Bank of Namibia Annual Report 2019

Notes to the Annual Financial Statement31 December 2019
• Failed or inadequate systems: a system is poorly designed, unsuitable or unavailable or does notoperate as intended.
• External events: the occurrence of an event having an adverse impact on the Bank but outside itscontrol.
The operational risk at the Bank is managed by having a suitable operational organisational structure with clear segregation of duties as well as defined built-in systematic controls. Bank-wide operations manuals are in place to be followed by staff. The Bank-wide business continuity plans which clearly state effective disaster recovery plans are currently being developed.
In as far as the treasury operations are concerned the Bank ensures that dealers and analysts are well trained in instruments in which they are trading and that the systems they need to operate on is in place. The Bank also makes sure that all investment officers are aware of procedures in place and have access to relevant documents. The Financial Markets Department Director reviews all procedures, documentation requirements and the operational practices.
28.8 LEGAL RISK
Legal risk is the risk arising from failure to comply with statutory or regulatory obligations. Legal risk also comes about if the rights and obligations of parties involved in a payment are subject to significant uncertainty, for example if a payment participant declares bankruptcy. Legal disputes that delay or prevent the resolution of payment settlement can cause credit, liquidity, or reputation risks at individual institutions. Legal risk also results from a financial institution’s failure to comply with the bylaws and contractual agreements established with the counter-parties with which it participates in processing, clearing, and settling payment transactions. The Bank therefore manages this risk by having appropriate documentation and using the market-customary, standard master-agreements where possible.
28.9 COLLATERAL
The Bank provides overnight and seven day loans (Repo’s) to Commercial Banks to cover for temporary liquidity shortages. The commercial banks pledge eligible securities in the form of Government bonds, treasury bills, etc. as collateral for this facility. The Bank is not permitted to sell or re-pledge these securities in the absence of default from the said commercial banks. As at 31 December 2019 the Repo’s to Commercial Banks were to the tune of N$1.75 billion (2018: N$1.8 billion).
28.10 CREDIT LOSSES
The Bank’s financial assets were not impaired as a consequence of credit losses, however when instances of this nature occur the Bank records the impairment in a separate impairment account rather than directly reducing the carrying amount of the concerned assets.
28.11 DEFAULTS AND BREACHES
The Bank did not default on any of its loan commitments both during the current and previous financial year.
28. FINANCIAL INSTRUMENTS AND RISK MANAGEMENT (CONTINUED)
28.7 OPERATIONAL RISK (CONTINUED)
120
Part BAnnual Financial Statements
Bank of Namibia Annual Report 2019

Notes to the Annual Financial Statement31 December 2019
29. CAPITAL COMMITMENTS
2019 2018
N$’ 000 N$’ 000
Contracted 39 215 42 718
30. RELATED PARTY INFORMATION
During the year the Bank, in its ordinary course of business, entered into various transactions. These transactions were undertaken on commercial terms and conditions. The Bank of Namibia Act, 1997 prescribes that the emoluments of the Governor, Deputy Governor and Board members be determined by the Minister of Finance. The emoluments of the Board members are primarily sitting fees and the annual stipend. The Governor and the Deputy Governor’s emoluments are all inclusive packages which comprises of salaries, pension contributions, medical aid and leave pay. The gross emoluments of executive, senior management and Board members are detailed below. Transactions with the Namibian Government who is the sole shareholder of the institution are detailed in note 1.17 of this report. Note 27 provides more information on the Financial Intelligence Centre.
Gross Emoluments Retirement Medical Aid Total Total
Salaries Benefit Benefit 2019 2018
N$’000 N$’000 N$’000 N$’ 000 N$’000
Executive Management
Governors 4 446 805 164 5 415 5 154
Senior Management 22 243 2 790 813 25 846 23 396
Non-Executive Board
Ms S T Haipinge 152 126
Ms A S I Angula - 158
Mr V Malango - 155
Dr O Kakujaha- Matundu - 155
Ms E B Shafudah - -
Ms C v/d Westhuizen 202 185
Mr E I Meroro 296 -
Mr C A Baisako 207 -
Mr F Tjivau 246 -
1 103 779
There were no other related party transactions with either the executive management or non-executive Board members.
121
Part BAnnual Financial Statements
Bank of Namibia Annual Report 2019

Notes to the Annual Financial Statement31 December 2019
31. APPROVAL OF FINANCIAL STATEMENTS
The Annual Financial Statements have been approved by the Board of Directors at the Board meeting held on 13 March 2020.
32. SUBSEQUENT EVENTS
On the 23rd March 2020, The Governor of the Bank, Mr. Iipumbu Shiimi was appointed as Minister of Finance and the Deputy Governor Mr. Ebson Uanguta has assumed executive responsibilities in conjunction with the Board of the Bank and he will be supported by the senior management team.
There are no other material events subsequent to the reporting date other than the declaration of Dividends to the State of N$ 399.94 million.
122
Part BAnnual Financial Statements
Bank of Namibia Annual Report 2019

Statement of Comprehensive Income for the Year ended 31 December 2019
(In compliance with the Bank of Namibia Act, 1997)
Notes 2019
N$’000
2018
N$’000
Net interest income 642 669 544 999
Interest income 2 850 862 828 371
Interest expense 2 (208 193) (283 372)
445 443 455 079
Rand Compensation Income 2 407 594 401 963
Other income 2 37 849 53 116
Total income 1 088 112 1000 078
(252 849) (429 726)
Operating expenses 2 (359 023) (449 414)
Net gain/(loss) on investment portfolio 106 174 19 688
Profit for the year before net foreign exchange
translation gain/(loss)
835 263 570 352
Net foreign exchange translation gain/(loss)* 16 (159 390) 1 251 559
Profit/(Loss) for the Year 675 873 1 821 911
Other Comprehensive Income 134 459 1 643
Unrealised (Loss)/Gain reserve 115 836 -
Allowance for credit losses - FVTOCI 9.1 4 325 1 643
Auctuarial gain on Post-employment benefits 21 14 298 -
Total Comprehensive Profit for the Year 810 332 1 823 554
Profit/(Loss) Profit attributable to:
Foreign currency revaluation reserve 16 (159 390) 1 251 559
Investment revaluation reserve 20 115 836 (56 766)
Allowance for credit losses 9.1 4 325 1 643
Amount available for distribution 3 849 561 627 118
810 332 1 823 554
Profits available for Distribution 849 561 627 118
State Revenue Fund 399 941 294 237
General reserve 15 357 463 262 881
Building fund reserve 18 20 000 20 000
Development fund reserve 17 70 000 50 000
Training fund reserve 19 2 157 -
123
Part BAnnual Financial Statements
Bank of Namibia Annual Report 2019

Bank of Namibia Annual Report 2019124
SELECTED FINANCIAL AND ECONOMIC INDICATORS 125
SUMMARY OF ECONOMIC AND FINANCIAL DEVELOPMENTS 126
GLOBAL ECONOMIC AND FINANCIAL DEVELOPMENTS 128
DOMESTIC ECONOMIC AND FINANCIAL DEVELOPMENTS 134REAL SECTOR DEVELOPMENTS 134
PRICE DEVELOPMENTS 143
MONETARY AND FINANCIAL MARKET DEVELOPMENTS 146
PUBLIC FINANCE 160
FOREIGN TRADE AND PAYMENTS 168
THEME CHAPTER 185
Part CEconomic and Financial Developments
Contents

Bank of Namibia Annual Report 2019 125
Part CEconomic and Financial Developments
SELECTED FINANCIAL AND ECONOMIC INDICATORS
12 A decrease in the Real Effective Exchange Rate index means that the national currency depreciated, reflecting a gain in the competitiveness of the Namibian products on the international market. An increase in the index, on the other hand, represents an effective appreciation of the national currency, indicating a loss in competitiveness of the local products on the international market.
13 These are fiscal year data starting, 2015/16, ending 2019/20.
14 Includes government, parastatal and private sector debt.
2015 2016 2017 2018 2019
Actual Estimates
(Annual percentage change)
Real GDP growth 4.5 -0.3 -0.3 0.7 -1.1
GDP deflator 3.7 8.5 8.3 4.3 1.5
Consumer price inflation (period average) 3.4 6.7 6.2 4.3 3.7
Consumer price inflation (end-of-period) 3.7 7.3 5.2 5.1 2.6
Exports of goods -0.9 13.8 6.5 11.5 0.8
Imports of goods 11.2 0.6 -10.4 3.4 -0.9
Real effective exchange rate12 (period average) -2.1 -1.3 5.2 1.1 -0.9
Private sector credit extension (period average) 15.3 11.4 6.6 6.3 6.8
Broad money supply (end-of-period) 10.2 4.9 14.1 6.4 10.5
Repo rate (end-of-period) 6.50 7.00 6.75 6.75 6.50
10-year Government bond yield (period average,percent)
9.32 10.40 10.54 10.21 9.96
In percent of GDP, unless otherwise stated
Investment 30.5 21.9 17.5 14.6 12.7
Public 4.7 3.4 2.7 3.0 3.5
Private 25.8 18.5 14.8 11.6 9.3
Savings 30.5 21.9 17.5 14.6 12.7
External 13.7 15.9 4.0 2.8 2.3
Domestic 16.8 6.1 13.5 11.7 10.4
Public -1.6 -5.5 -2.9 -3.7 -0.9
Private 18.4 11.6 16.4 15.5 11.4
Public Finance
Overall Government deficit13 -8.4 -7.1 -5.3 -5.2 -4.5
Public debt outstanding 38.1 40.2 42.4 48.6 51.2
Public guaranteed debt outstanding 5.0 5.6 6.0 6.1 6.1
External Sector
Current account balance -13.7 -15.9 -4.0 -2.8 -2.3
Excluding official transfers -26.1 -25.8 -15.3 -13.3 -13.1
Gross official reserves (end-of-period)
In millions of Namibia Dollar 23 577 24 720 30 177 31 024 28 941
In millions of US Dollar 1 516 1 814 2 435 2 150 2 049
In months of imports 3.1 3.2 4.4 4.5 4.1
External debt14 59.6 56.0 62.1 68.0 66.8
Exchange rate to US Dollar (end-of-period) 15.5553 13.6240 12.3930 14.4309 14.1235
Exchange rate to US Dollar (period average) 12.7507 14.7088 13.3129 13.2339 14.4484
GDP at current market prices (N$ million) 145 207 156 879 169 529 178 052 178 677

Bank of Namibia Annual Report 2019126
Part CEconomic and Financial Developments
SUMMARY OF ECONOMIC AND FINANCIAL DEVELOPMENTS
Global economic growth is estimated to have slowed in 2019 across both advanced economies (AEs) and Emerging Markets and Developing Economies (EMDEs). Global GDP for 2019 slowed in most of the monitored AEs and EMDEs, relative to 2018. The decline was generally due to weak business investment as a result of rising trade barriers; elevated uncertainty surrounding trade and geopolitics; unique factors causing macroeconomic strain; and structural factors, such as low productivity growth and aging demographics.
World economic growth for 2020 is likely to weaken further on account of the COVID-19 pandemic. Global growth was in January 2020 still projected to rise from an estimated 2.9 percent in 2019 to 3.3 percent in 2020, according to the IMF’s World Economic Outlook (WEO) Update. The rapidly escalating impact of the current COVID-19 pandemic has however made it clear that global growth in 2020 will be much worse than in 2019. Some further risks remain in the background, and include rising geopolitical tensions, notably between the US and Iran, renewed worsening of US-China trade relations, weather-related disasters and social unrest.
Global financial market sentiments and confidence were negatively affected by the escalating trade tensions and uncertainties around Brexit in 2019. Against this background, the financial conditions were accommodative, as central banks in both the AEs and EMDEs adopted accomodative monetary policy stances to counterbalance the negative impacts. Global stock markets performed solidly in 2019, partly due to monetary policy easing by the US and the European Central Bank (ECB). EMDE currencies depreciated in 2019 fuelled by the strong US dollar and the capital outflows from the EMDE economies as investors reassessed their risk appetite. Prices of most metal and energy commodities fell in 2019 amid mounting concerns about slowing global growth and a stronger US dollar. The exception was gold, the price of which increased notably in 2019 on safe-haven demand pressures, renewed monetary policy easing and purchases by central banks around the world.
Average inflation was subdued in both monitored AEs and EMDEs in 2019, prompting most central banks to reduce their benchmark rates. Inflation in most of the monitored AEs and EMDEs slowed in
2019 compared to 2018, due to lower energy prices and weaker economic growth. The exceptions were India and China, where inflation increased. Several of the monitored central banks adopted accommodative monetary policy stances in 2019.
In Namibia, real GDP is estimated to have contracted in 2019, after registering mild growth in 2018, mainly due to slower activity in the primary and tertiary industries. Real GDP is estimated to have contracted by 1.1 percent in 2019, from positive low growth rate of 0.7 percent in 2018. The dismal performance in 2019 is mainly ascribed to the declines in the agriculture, mining, hotels and restaurants, wholesale and retail trade, construction, and public sectors. Some growth in the manufacturing sector, led by beverage and animal feed products, sustained the activity in the secondary industry during 2019.
Namibia’s inflation rate slowed in 2019 compared to 2018, mainly due to a decline in inflation for transport and housing. The inflation rate averaged 3.7 percent in 2019, lower than the 4.3 percent recorded in 2018. The lower inflation was largely reflected in housing and transport during the period under review. This was mainly on account of weak economic activity coupled with a switch in the demand-supply situation in the rental market. Inflation for food rose on average during the period under review, reflected in higher inflation in most sub-categories of food, but the monthly rate has been on a declining trend since January 2019.
In 2019, the Bank’s Monetary Policy Committee (MPC) relaxed its monetary policy stance in the August MPC meeting to support domestic growth. Following a review of global, regional and domestic economic and financial developments, in its August 2019 meeting, the MPC cut the repo rate by 25 basis points to 6.50 percent, down from 6.75 percent in August 2017. During the February 2020 MPC meeting, the repo rate was further reduced by 25 basis points to 6.25 percent. Most recently, the MPC at a special meeting held on 20 March 2020 reduced the repo rate by a further 100 basis points to 5.25 percent. This was done to provide support to the economy in the wake of the intensification of the coronavirus pandemic with its associated disruptions of economic activity.

Bank of Namibia Annual Report 2019 127
Part CEconomic and Financial Developments
Developments in the monetary and credit aggregates in 2019 were characterised by a decline in growth in the broad money supply (M2), while growth in private sector credit extension (PSCE) rose marginally. Growth in M2 declined to 8.5 percent in 2019, compared to 9.1 percent in 2018. The slower growth in M2 during the period under review was consistent with the weak economy and decline in inflation, dampening the transactions demand for money. Growth in PSCE rose on average during 2019, due to a higher uptake of credit by business in the form of other loans and advances, and overdraft credit in the manufacturing, services, construction and fishing sectors during the year under review.
In 2019, the overall liquidity position of the Namibian banking industry declined substantially. The liquid balances of the banking industry averaged N$2.9 billion during 2019, notably lower than the average of N$3.5 billion recorded during 2018. The annual decrease was largely on account of higher ZAR outflows, coupled with lower diamond export earnings in comparison with the previous year. Despite the decline in liquidity levels in the banking sector, the overall banking industry has maintained its ratio of liquid assets to outstanding liabilities significantly above the minimum prudential requirement.
During 2019/20, the Government’s overall deficit is estimated to have narrowed both in nominal terms and as a ratio to GDP. The 2019/20 Central
Government deficit as a percentage of GDP was estimated at 4.5 percent, lower than the 5.2 percent deficit recorded in 2018/19. This was due to an increase in revenue, which grew at a faster pace than expenditure due to higher SACU receipts. Total Government debt as a percentage of GDP increased to 51.2 percent at the end of December 2019, thus remaining above the ceiling set by the Government of 35 percent.
During 2019, Namibia’s current account deficit narrowed further, mainly due to an improvement in the merchandise trade deficit, lower outflows on the primary income account, and a higher surplus on the secondary income account. The current account deficit narrowed by 18.3 percent to N$4.1 billion during 2019, compared to 2018. The improvement is mainly ascribed to the shrinking merchandise trade deficit that reflected a bigger decline in the import bill and a slight increase in export earnings. This was supported by lower net outflows in the primary income account, coupled with increased inflows in the secondary income account as a result of increased SACU receipts. Namibia’s international investment position recorded a lower net liability position in 2019 compared with 2018 due to an increase in foreign assets. In addition, the nominal effective exchange rate (NEER) appreciated while the real effective exchange rate (REER) displayed a moderate depreciation during 2019 compared to 2018. The depreciation of the REER implies that Namibia’s external competitiveness improved during the year.

Bank of Namibia Annual Report 2019128
Part CEconomic and Financial Developments
GLOBAL ECONOMIC AND FINANCIAL DEVELOPMENTS
OUTPUT GROWTH AND OUTLOOK BY MAIN REGION AND ECONOMIC BLOCK
Global economic growth is estimated to have slowed in 2019 compared to the previous year, deteriorating in both Advanced Economies (AEs) and Emerging Market and Developing Economies (EMDEs). Growth in the global economy is estimated to have slowed to 2.9 percent in 2019, from 3.6 percent in 2018, and well below its ten-year average of 3.8 percent. The subdued growth was mainly attributed to trade policy uncertainty, geopolitical tensions, social unrests in several countries, and weather-related disasters. Going forward, the IMF in its January 2020 World Economic Outlook Update expected a recovery
in 2020 as the effects of substantial monetary easing across AEs and EMDEs in 2019 would continue to filter through to the global economy. The realisation of the higher projected growth rate however has subsequently been severely compromised by the escalation of the COVID-19 outbreak and its economic consequences. It is clear that growth in 2020 will be lower than in 2019, with a significant probability that global GDP may in fact contract. This is not even factoring in the risk of renewed escalation in US-China trade disputes, social unrest and geopolitical tensions.
TABLE C.1 WORLD ECONOMIC OUTPUT (ANNUAL PERCENTAGE CHANGE)
2017 20182019
(estimated)
World Output 3.8 3.6 2.9
AEs 2.4 2.2 1.7
USA 2.2 2.9 2.3
Eurozone 2.4 1.9 1.2
Germany 2.2 1.5 0.5
France 2.3 1.7 1.4
Italy 1.7 0.8 0.2
Spain 3.0 2.4 2.0
Japan 1.9 0.3 1.0
UK 1.8 1.3 1.4
Other AEs 2.9 2.6 1.5
EMDEs 4.8 4.5 3.7
China 6.8 6.6 6.1
Russia 1.6 2.3 1.1
India 7.2 6.8 4.8
Brazil 1.1 1.3 1.2
Sub-Saharan Africa 2.9 3.2 3.3
Angola -0.1 -1.2 -0.3
South Africa 1.4 0.8 0.2
Nigeria 0.8 1.9 2.3
Source: IMF World Economic Outlook Update (WEO) January 2020, Statistics SA, Office of National Statistics (UK)

Bank of Namibia Annual Report 2019 129
Part CEconomic and Financial Developments
Economic growth in the monitored AEs is estimated to have weakened in 2019 compared to 2018, except in Japan, where growth was marginally firmer, and the UK, where it was flat. US GDP growth slowed to 2.3 percent in 2019 compared to 2.9 percent in 2018, which reflects trade-related policy uncertainty (Table C.1). The Euro area registered growth of 1.2 percentin 2019, lower than the 1.9 percent recorded in 2018,on the back of weaker growth in foreign demand and adrawdown of inventories. Similarly, economic growth inthe UK is estimated to have recorded a growth rate of1.4 percent in 2019, slightly higher than that of 2018,as fears of a hard Brexit diminished, thereby supportinginvestors’ risk appetite. Japan’s economy registered agrowth rate of 1.0 percent in 2019 compared to 0.3percent in 2018, backed by firm private consumptionand public spending.
GDP growth for EMDEs is estimated to have slowed in 2019, partly due to weak domestic demand in major economies. EMDE economic growth is estimated to be slower at 3.7 percent in 2019, from 4.5 percent in 2018, as country-specific shocks weighed on domestic demand (Table C.1). China’s growth rate
is estimated at 6.1 percent in 2019, down from 6.6 percent in 2018, mainly because of escalating tariffs and weakening external demand. India’s economy is estimated to have slowed to 4.8 percent growth in 2019, down from 6.8 percent in 2018, as concerns about the health of the Non-Bank Financial Sector (NBFS) and a decline in credit growth weighed on demand. Brazil’s economic growth rate is estimated to have slowed to 1.2 percent in 2019, down from 1.3 percent in 2018, as the impact of mining supply disruptions continued to hamper economic activity. Similarly, growth in the economy of Russia slowed to 1.1 percent in 2019, down from 2.3 percent in 2018, mainly because of industrial output growth that declined on the back of a downturn in mining activity. Angola’s economy is estimated to have registered a smaller contraction of 0.3 percent in 2019, lower than the contraction of 1.2 percent in 2018, because of a decline in oil production. Furthermore, South Africa’s estimated economic growth rate slowed to 0.2 percent in 2019, down from 0.8 percent in 2018, reflecting structural constraints and deteriorating public finances that negatively affected business confidence and private investment.
ECONOMIC OUTLOOK FOR 2020The global economy was initially projected to improve in 2020 compared to 2019, but is now set to suffer a severe setback induced by the COVID-19 pandemic. Growth in the global economy was in January 2020 forecast to increase to 3.3 percent in 2020 from 2.9 percent in 2019, as the effects of substantial monetary easing across AEs and EMDEs in 2019 were expected to continue working their way through the global economy. The impact of the recent COVID-19 outbreak is however so strong that global growth in 2020 is now expected to be very weak. Other downside risks such as rising geopolitical tensions between the US and Iran, higher tariff barriers between the US and its trading partners (notably China), and weather-related disasters are now seen as of secondary importance.
GDP growth in the AEs is now likely to be very disappointing in 2020. According to the IMF WEO for January 2020, growth in AEs was projected to moderate to 1.6 percent in 2020, from 1.7 percent in 2019. The disruptions to travel, tourism, and normal patterns of production and consumption brought about by the COVID-19 pandemic will detract considerably from this projected growth rate.
Growth in EMDEs now faces extreme headwinds. EMDE economic growth was initially expected to increase to 4.4 percent in 2020, compared to 3.7 percent in 2019. The impact of the COVID-19 pandemic is now expected to affect growth negatively to a severe extent as prices of export commodities collapse, tourism and travel activity shrinks, and production, employment, income and expenditure spiral downward.
Economic growth in Sub-Saharan Africa is likely to turn negative in 2020. Regional growth was initially expected to pick up to 3.5 percent in 2020, up from 3.3 percent in 2019. However, the consequences of the collapse in the prices of key export products in the wake of the pandemic are harsh. Angola and Nigeria face a halving in the price of oil, their main export product. Severe setbacks to export earnings extend to all countries in the region. On top of that, the weakened reliability of electricity supply remains a significant impediment to growth in South Africa. Financial systems in the region will also face strain as cash flows deteriorate and bad debts accumulate. Fiscal challenges are similarly set to escalate.

Bank of Namibia Annual Report 2019130
Part CEconomic and Financial Developments
INFLATION AND INTEREST RATE DEVELOPMENTS
Inflation in the monitored AEs declined in 2019 due to weaker global growth and lower oil prices. Inflation in the US declined to an average of 1.8 percent in 2019 from 2.5 percent in 2018 as the prices of energy, food and transportation declined. Similarly, the average annual inflation rate in the UK fell to 1.8 percent in 2019 from 2.5 percent in 2018 amid a slowdown in the cost of transport, and clothing and footwear. Japan’s consumer price inflation rate fell to 0.4 percent in 2019 compared to 1.0 percent in 2018 as the cost of food, utilities, medical care, transport and communication declined. Furthermore, the Euro area registered an average inflation rate of 1.2 percent, compared to 1.7 percent in 2018, amid a slowdown in the cost of food, alcohol and tobacco, and a further fall in energy prices. The central banks of the US and the Euro area adopted accommodative monetary policy stances, while the UK and Japan maintained theirs in 2019. The US Federal Open Market Committee lowered the target range for the Federal funds rate by a total of 75
basis points to a range of 1.50 – 1.75 percent at the end of 2019, citing weaker global growth and uncertainty regarding trade policy, as well as muted inflation pressures (Table C.2). The European Central Bank (ECB) lowered the deposit interest rate by 10 basis points to -0.50 percent but maintained the main refinancing operations rate in 2019. The ECB also approved a new round of bond purchases at a monthly pace of €20 billion as from 1 November 2019, to boost growth and inflation amid global trade tensions and Brexit uncertainty. On the other hand, the Bank of England’s Monetary Policy Committee left the Bank Rate at 0.75 percent in 2019. The Bank also reaffirmed its pledge to gradual and limited rate increases in the event of greater clarity that the economy is on a path to a smooth Brexit, and assuming some recovery in global growth. Similarly, the Bank of Japan left its key short-term interest rate unchanged at -0.10 percent and the target for the 10-year Japanese government bond yield at around zero percent in 2019.
TABLE C. 2 LATEST POLICY RATES OF SELECTED ECONOMIES
Country or grouping
Policy rate namePolicy rates
at end of 2019 (%)
Month of last
meeting in 2019
Policy rate change in 2019
(percentage points)
Inflation rate at end of 2019 (%)
Real interest
rate at end of 2019 (%)
AEs
USA Federal funds rate 1.50-1.75 Dec -0.75 2.1 -0.4
UK Bank rate 0.75 Dec 0.00 1.3 -0.6
Euro area Refinancing rate 0.00 Dec 0.00 1.3 -1.3
Japan Call rate -0.10 Dec 0.00 0.2 -0.3
EMDEs
Brazil SELIC rate 4.50 Dec -2.00 4.3 0.2
Russia Key rate 6.25 Dec -1.50 3.0 3.3
India Repo rate 5.15 Dec -1.35 7.4 -2.2
China Lending rate 4.35 Dec 0.00 4.5 -0.2
SA Repo rate 6.50 Nov -0.25 4.0 2.5
Angola Basic interest rate 15.50 Nov -1.00 16.9 -1.4Source: Trading Economics and Respective Central Banks
Average inflation rates in most of the monitored EMDEs declined in 2019 compared to 2018, except for Russia and China, where they increased. Brazil recorded an average inflation rate of 3.6 percent in 2019, down from 3.7 percent in 2018, mainly as a result of a slowdown in the cost of food, transport and housing. Similarly, average inflation in India declined to 3.5 percent in 2019, compared to 4.0 percent in 2018. In
addition, South Africa’s inflation declined to 4.1 percent in 2019, down from 4.6 percent in 2018 driven mostly by lower costs for housing and utilities, and transport. Similarly, inflation for Angola was lower at an average of 17.0 percent in 2019, down from 19.7 percent in 2018. Average inflation in Russia was higher at 4.5 percent in 2019 compared to 2.9 percent over the previous year. China’s inflation also increased to 2.9 percent in 2019,

Bank of Namibia Annual Report 2019 131
Part CEconomic and Financial Developments
from 2.1 percent in 2018, mainly reflecting higher prices for food, particularly owing to a continued surge in pork prices as African swine fever damaged the country’s pig farm industry.
Most of the central banks in the monitored EMDEs reduced their benchmark interest rates in 2019. The central bank of Brazil cut its benchmark rate by a total of 200 basis points to 4.50 percent in 2019 against the background of the global economic slowdown and continuation of key domestic reforms (Table C.2). Similarly, the Central Bank of Russia cut its benchmark one-week repo rate by 150 basis points to 6.25 percent in 2019 on the back of slowing inflation, although
inflation expectations remained elevated. Furthermore, the Reserve Bank of India lowered its benchmark repo rate by 135 basis points to 5.15 percent in 2019 to boost slowing economic growth. The South African Reserve Bank reduced the repo rate by 25 basis points to 6.50 percent in 2019, on the back of lower inflation forecasts and concerns about economic growth. Furthermore, the National Bank of Angola cut its benchmark interest rate by 100 basis points to 15.75 percent in 2019, mainly due to slowing inflation and the sustained weakness of the economy. The People’s Bank of China left its benchmark interest rate at 4.35 percent in 2019 but cut the loan prime rate by 5 basis points to 4.20 percent, partly to soften the impact of the trade war with the US.
COMMODITY PRICE DEVELOPMENTS AND PROSPECTS
FIGURE C.1 (A–D) SELECTED COMMODITY PRICES AND PRICE INDICES
a. Energy and metal prices declined in 2019, while those of food increased.
b. The price of Brent crude oil declined, while uranium prices increased on average during 2019.
150
155
160
165
170
175
180
185
556065707580859095
100
J F MA MJJ A S OND J F MA MJ J A S OND J F MA MJ J A S OND2017 2018 2019
US
$ In
dex
US$
Inde
x
Metals Energy Food (RHS)
0
5
10
15
20
25
30
35
2535455565758595
105115125
US$
per p
ound
US$
per b
arre
l
Brent crude oil Uranium (RHS)
J F MA MJJ A S OND J F MA MJ J A S OND J F MA MJ J A S OND2017 2018 2019
c. On average, the international prices of copper and zinc declined in 2019.
d. The average price of gold increased in 2019 compared to 2018 on the back of safe-haven considerations and accommodative monetary policies.
80013001800230028003300380043004800
2000
3000
4000
5000
6000
7000
8000
9000
J F MA M J J A S OND J F MA M J J A S OND J F MA M J J A S OND2017 2018 2019
US$
per t
onne
US$
per
tonn
e
Copper Zinc (RHS)
J F M A M J J A S O N D J F M A M J J A S O N D J F M A M J J A S O N D2017 2018 2019
105011001150120012501300135014001450150015501600
US
$ pe
r ou
nce
Gold
Source: IMF
Energy and metal prices declined following weak global demand, while food prices increased moderately in 2019. The World Bank metals and energy
price indices declined by 12.7 percent to 75.9 index points, and by 5.0 percent to 78.4 index points in 2019, respectively (Figure C.1a). The decline in both indices

Bank of Namibia Annual Report 2019132
Part CEconomic and Financial Developments
could mainly be attributed to US-China trade tensions and fears of a global economic slowdown. However, the UN Food and Agricultural Organization food price index increased by 1.8 percent to 171.5 index points in 2019, which can mainly be attributed to increases in the prices of sugar, cereals and vegetable oils.
Crude oil prices declined, while uranium prices increased on average during 2019. The spot price of uranium recorded a gain of 5.0 percent to an average of U$25.82 per pound in 2019 on account of reduced global supply following a decision by Kazatomprom, the world’s largest uranium producer by volume, to cut production through 2021 (Figure C.1b). The price of Brent crude oil declined by 9.9 percent to average U$64.03 per barrel in 2019, which can mainly be ascribed to increased global economy uncertainty, coupled with trade tensions between the US and China which sparked concerns about a potential fall in demand for oil.
On average the international prices of copper and zinc declined in 2019, mainly due to weak global
demand. Copper prices declined by 8.0 percent to average US$6 010 per metric tonne in 2019. This too can mainly be ascribed to the US-China trade tensions that reinforced fears about the world economy (Figure C.1c). In addition, the bearish views of investors on theeconomic growth of China, the largest consumer ofcopper, also resulted in a lower copper price. Similarly,the price of zinc declined by 12.7 percent to anaverage of US$2 550 per metric tonne in 2019, mainlyattributable to relatively lower demand from end-usesectors such as housing and autos, notably in China.
The average price of gold increased in 2019 compared to 2018 amid safe-haven demand. The price of gold increased by 9.7 percent to reach an average of U$1 393 per ounce in 2019 (Figure C.1d). The increase was partly on the back of flight-to-safety considerations amid trade tensions and weaker global growth prospects. In addition, a turn in many parts of the world towards a somewhat more accommodative monetary policy, as demonstrated by the lowering of US interest rates, as well as active buying of gold by central banks, contributed to higher demand.
DEVELOPMENTS IN FINANCIAL MARKETS
All the monitored share price indices rose in 2019, mainly due to monetary policy easing by major central banks. The US Standard & Poor’s 500 rose by 28.9 percent to end 2019 at 3 231 index points (Figure C.2). In addition, the Nikkei recorded gains of 18.1percent to 23 640 index points. Similarly, the GermanDAX generated gains of 25.5 percent to end at 13 249index points in 2019. London’s FTSE100 generatedgains 12.1 percent to end 2019 at 7 542 index points.The South African JSE also generated gains of 8.2
percent to 57 084 index points. The gains recorded on these stock indices were aided by the US-China Phase 1 trade agreement and the UK Prime Minister’s victory towards the end of the year in passing a Brexit deal through Parliament, thereby reducing uncertainty around Brexit. In addition, accomodative monetary policies adopted by major central banks and low interest rates, especially in AEs, helped to improve investor sentiment towards stocks.
FIGURE C.2 STOCK PRICE INDICES: END OF MONTH
The monitored stock price indices generated positive returns in 2019 partly due to a turn towards more accommodative monetary policies boosting demand for the asset class.
0
10000
20000
30000
40000
50000
60000
70000
1000
3000
5000
7000
9000
11000
13000
15000
J M M J S N J M M J S N J M M J S N
2017 2018 2019
Inde
x
Inde
x
DAX FTSE100 S & PNikkei (RHS) JSE (RHS)
Source: Bloomberg

Bank of Namibia Annual Report 2019 133
Part CEconomic and Financial Developments
WORLD TRADE DEVELOPMENTS
The volume of world trade in goods and services rose at a very slow pace in 2019 compared to 2018, facing headwinds in both AEs and EMDEs. The volume of world trade in goods and services expanded by only 1.1 percent in 2019, from 3.6 percent in 2018 (Table C.3). The slowdown in trade volumes was mainly due to heightened trade tensions, along with temporary shocks such as the Federal government shutdown in the
US and production problems in the automotive sector in Germany. These developments caused consumers and businesses to postpone purchases and production decisions rather than cancelling them outright. The volume is projected to increase by 3.2 percent in 2020, although the recent Wuhan coronavirus outbreak presents a risk to this outcome.
TABLE C.3 PERCENTAGE GROWTH IN THE VOLUME OF WORLD TRADE (GOODS AND SERVICES) 2017–2019 (ANNUAL PERCENTAGE CHANGE)
2017 2018 2019 (est.) 2020 (F)
World trade volume (goods and services) 5.3 3.6 1.1 3.2
Average growth rates of export and import volumes
AEs 4.3 3.1 1.1 2.6
EMDEs 7.1 4.5 1.3 4.2
Source: IMF WEO
IMPLICATIONS OF GLOBAL DEVELOPMENTS
The slowing global economy presented a strong headwind to the Namibian economy in 2019. The slower global growth was a result of rising trade barriers, increased uncertainty surrounding trade and geopolitics, unique factors causing macroeconomic strain in several EMDEs, and low productivity growth and aging demographics in some AEs. These factors restrained export volume growth in Namibia. Global inflation remained subdued overall, due to low oil prices and mild growth, which prompted most monitored central banks to adopt more accommodative monetary policies in 2019. Prices of commodities generally declined in 2019, which was a further negative factor for
Namibia’s export revenue. The US Dollar was stronger, while conversely, the Euro and most EMDE currencies were weaker in 2019. Stock markets were stronger in 2019 partly due to monetary easing by the US and the ECB. Overall, the developments in the global economy were negative for the performance of the Namibian economy, particularly in terms of export earnings. On a positive note, the moderation in the price of Brent crude oil could bring some relief to consumers of fuel. Renewed uncertainty has recently been added by the COVID-19 pandemic and electricity constraints in South Africa.

Bank of Namibia Annual Report 2019134
Part CEconomic and Financial Developments
DOMESTIC ECONOMIC AND FINANCIAL DEVELOPMENTS
REAL SECTOR DEVELOPMENTS
FIGURE C.3 (A–D) REAL SECTOR DEVELOPMENTS
a. The Namibian economy is estimated to haveregistered a contraction in 2019, compared to marginalgrowth recorded in 2018 …
b. … mainly due to dismal performance observed in theprimary industries arising from a substantial decline invalue added in the mining and agriculture sectors.
Annu
al p
erce
ntag
e ch
ange
GDP growth
4.5
-0.3 -0.3
0.7
-1.1
-4.0
-2.0
0.0
2.0
4.0
6.0
2015 2016 2017 2018 2019
Annu
al p
erce
ntag
e ch
ange
Agriculture, forestry and fishing Mining and Quarrying
Primary industry (RHS)
-11.0
-6.0
-1.0
4.0
9.0
14.0
-13.3
0.7
7.0
-1.9
-15.0
-10.0
-5.0
0.0
5.0
10.0
15.0
20.0
2015 2016 2017 2018 2019
-2.6
c. Tertiary sector activity recorded a marginal positivegrowth in 2019, compared to the contraction in 2018,driven mainly by information and communication andfinancial and insurance services activities.
d. However, marked growth in the beverage, animalfeed and other food products industries sustainedactivity in the secondary industry during 2019.
Annu
al p
erce
ntag
e ch
ange
Wholesale and retail Hotels and restaurantsTransport and storage Public administration and defenceTertiary industry Information and communication
-10.0
0.0
10.0
20.0
30.0
2015 2016 2017 2018 2019
Annu
al p
erce
ntag
e ch
ange
Manufacturing Electricity and water Construction
Secondary industry
- 50.0
- 40.0
- 30.0
- 20.0
- 10.0
0.0
10.0
20.0
30.0
2015 2016 2017 2018 2019
Sources: NSA for 2015-2018 figures, BoN 2019 estimates
Namibia’s economy is estimated to have contracted in 2019, mainly due to slow activity in the primary industry, amid marginal positive output growth in the secondary and tertiary industries. Real GDP is estimated to have contracted by 1.1 percent in 2019, following a mild positive growth rate of 0.7 percent registered during the previous year (Figure C.3a). The
contraction was mainly ascribed to declines in the agriculture, mining, hotels and restaurants, wholesale and retail trade and construction sectors, as well as the public sector. Some growth in the manufacturing sector, led by beverages and animal feed products, sustained the activity in the secondary industry during 2019.

Bank of Namibia Annual Report 2019 135
Part CEconomic and Financial Developments
PRIMARY INDUSTRY DEVELOPMENTS
FIGURE C.4 (A–F) PRIMARY INDUSTRY
a. The primary industry contracted in 2019, driven in part by a decline in the production of rough diamonds during the year under review.
b. Uranium production also declined during 2019, compared to the previous year, owing to high base effects, as one of the mines was placed under care and maintenance in August 2018.
-20.0
-15.0
-10.0
-5.0
0.0
5.0
10.0
15.020.0
0
500
1,000
1,500
2,000
2,500
2015 2016 2017 2018 2019
Perc
ent
Cara
ts ('
000)
Diamond production Diamond growth (RHS)
0.0
10.0
20.0
30.0
40.0
50.0
60.0
70.0
0.0
40.0
80.0
120.0
160.0
200.0
2015 2016 2017 2018 2019
US$
per
poun
d
Inde
x: 2
015
= 10
0Uranium production Price (RHS)
c. Production of zinc concentrate declined during the period under review, as a result of low-grade ore mined.
d. Meanwhile, production of gold rose during the year under review, as a result of high-grade ore mined during the period under review.
0.0
500.0
1 000.0
1 500.0
2 000.0
2 500.0
3 000.0
3 500.0
50.0
70.0
90.0
110.0
130.0
150.0
US$
per
met
ric to
nne
Inde
x: 2
015
= 10
0
Zinc concentrate Price (RHS)
2015 2016 2017 2018 20190.0
500.0
1 000.0
1 500.0
0.0
20.0
40.0
60.0
80.0
100.0
120.0
140.0
2015 2016 2017 2018 2019US
$ pe
r oun
ce
Inde
x: 2
015
= 10
0
Gold production Price (RHS)
e. Farmers’ marketing activity for cattle rose while that of small stock declined during the year under review.
f. Crop farming output declined significantly during 2019 due to the drought conditions.
0.0
10.0
20.0
30.0
40.0
50.0
60.0
0.0
50.0
100.0
150.0
2015 2016 2017 2018 2019
N$ p
er k
g
Inde
x: 2
015
= 10
0
Small stock marketed index Total cattle marketed IndexSmall stock price (RHS) Weaner price (RHS)
Annu
al p
erce
ntag
e ch
ange
Crop farming and forestry (real output)
-13.8-10.4
15.7
-6.9
-13.5-20.0
-15.0
-10.0
-5.0
0.0
5.0
10.0
15.0
20.0
2015 2016 2017 2018 2019
Source: Various companies

Bank of Namibia Annual Report 2019136
Part CEconomic and Financial Developments
MiningThe mining sector is estimated to have contracted in 2019, due to a decline in production of rough diamonds, uranium and zinc concentrate. Value added in the mining sector is estimated to have contracted by 11.1 percent in 2019 compared to a growth of 16.1 percent in 2018. The contraction in the mining sector was attributed to fewer diamond carats mined onshore as a result of the closure of one of the mines. In addition, fewer diamonds being recovered offshore contributed to the contraction, as a result of the scheduled maintenance of one of the mining vessels during the year under review. Diamond production decreased by 15.5 percent to 1 713 044 carats during the period under review (Figure C.4a). Uranium production declined by 1.4 percent to 6 529 tonnes during the period under review (Figure C.4b). The decrease was attributed to high base effects, as one
of the mines was placed under care and maintenance coupled with operational challenges experienced by the current producers. Global excess supply exerted downward pressure on spot prices of uranium to decline by 1.2 percent to an average of US$24.23 per pound in 2019. Zinc concentrate production declined by 6.7 percent due to low grade ore being mined (Figure C.4c). Zinc spot prices declined by 12.6 percent to US$2 553 per metric tonne due to weaker demand from China. However, gold production rose by 5.7 percent to 6 527 kg owing to high grade ore mined during the period under review (Figure C.4d). Gold spot prices rose by 9.7 percent to an average of US$1 393 per fine ounce as investors moved to safe assets as a result of the weak global prospects coupled with persistent trade tensions and lower interest rates in a number of key economies.
Agriculture, forestry and fishingAgricultural output is estimated to have registered a deeper contraction during 2019, compared to a smaller contraction registered during 2018. Real value addition in the agricultural, forestry and fishing sector is estimated to have contracted by 2.6 percent in 2019, compared to a smaller contraction of 1.9 percent in 2018. This was reflected in a deeper contraction in livestock farming and crop production output during 2019, owing mainly to the drought conditions. Real value addition in livestock farming is estimated to have contracted by 21.8 percent in 2019, from a small decline of 0.8 percent in the previous year. This resulted in farmers marketing more animals during the period under review. Total cattle marketed rose by 4.9 percent to 462 646 heads. The rise was mirrored in the number of cattle slaughtered for export due to drought-induced sales during the review period (Figure C.4e). However, the number of live weaners exported as well as the number of cattle slaughtered for local consumption declined by 9.2 percent and 7.7 percent, to 289 580 heads and 43 331 heads, respectively. The decline in live exports was mainly due to excess supply of animals in South Africa coupled with the higher cost of animal feed experienced by the feedlots. Furthermore, cattle slaughtered by the abattoirs to cater for the local market declined. The average price of beef rose by 3.4 percent to N$42.20 per kilogram during the period under review. Meanwhile, the average price of weaners declined by 22.2 percent to N$24.04 per kilogramme mainly owing to the excess supply that emanated from a foot and
mouth disease outbreak in South Africa and higher yellow maize prices causing increases in costs borne by feedlots.
The total number of small stock marketed declined during 2019. Small stock (sheep and goats) marketed declined by 8.9 percent to 886,799 heads during 2019, in contrast to the positive growth rate of 4.9 percent registered in 2018 (Figure C.4e). This was reflected in the number of small stock slaughtered for both export and local consumption as well as the number of small stock exported live during the period under review. The decline was due to the drought conditions over a number of years, which led to a significant reduction in the population of small stock. The average price of small stock declined by 11.1 percent to N$39.05 per kilogramme.
Production of milk declined during 2018, compared to the previous year. Milk production declined by 8.1 percent to 22.0 million litres during the year under review. This resulted from unfavourable grazing conditions and reduced availability of affordable animal feed.
Fishing sector output is estimated to have risen at a higher rate in 2019 than in the previous year. Real value addition in the fishing sector is estimated to have risen by 6.1 percent during the year under review, compared to a lower growth rate of 0.1 percent in 2018.

Bank of Namibia Annual Report 2019 137
Part CEconomic and Financial Developments
SECONDARY INDUSTRY DEVELOPMENTS
FIGURE C.5 (A–F) SECONDARY INDUSTRY
a. The real value of Government construction works picked up in 2019, in relation to the previous year’s level.
b. However, the real value of building plans approved and buildings completed decreased during the year under review.
0
1,500
3,000
4,500
6,000
7,500
2015 2016 2017 2018 2019
N$ m
illio
n, 2
012
pric
es
Government construction works
0
500
1,000
1,500
2,000
2,500
3,000
3,500
2015 2016 2017 2018 2019
Building plans approved Buildings completed N$
mill
ion,
201
2 pr
ices
c. The production of both beer and soft drinks increased during 2019.
d. Refined zinc production rose markedly during the year under review.
25
50
75
100
125
2015 2016 2017 2018 2019
Inde
x: 2
015
= 10
0
Beer Soft drinks
1,500.0
1,750.0
2,000.0
2,250.0
2,500.0
2,750.0
3,000.0
0
20
40
60
80
100
120
140
2015 2016 2017 2018 2019
US$
per m
etric
ton
ne
Inde
x: 2
015
= 10
0
Refined zinc production Zinc price (RHS)
e. However, the production of blister copper declined during 2019.
f. Similarly, electricity generation registered a decline during 2019, mainly owing to the lower water inflow at the Ruacana hydroelectric power plant.
3,000
4,500
6,000
7,500
9,000
50
70
90
110
2015 2016 2017 2018 2019
US$
per t
onne
Inde
x: 2
015
= 1
00
Blister copper production Copper price (RHS)
50
75
100
125
2015 2016 2017 2018 2019
Inde
x: 2
015=
100
Electricity consumption Local generation Imports
Source: Municipalities, MOF and various companies

Bank of Namibia Annual Report 2019138
Part CEconomic and Financial Developments
ConstructionDuring 2019 the construction sector is estimated to have contracted, albeit less steeply than the contraction registered in 2018. Real value added in the construction sector is estimated to have contracted by 7.9 percent in 2019, compared to a steeper contraction of 8.7 percent in 2018. A decline in the real value of private construction drove the contraction in the sector. In this regard, the real value of buildings completed declined by 6.0 percent in 2019,
compared to a substantial increase of 40.0 percent registered in 2018 (Figure C.5b). Similarly, the real value of building plans approved, which is a leading indicator for construction activity, decreased by 13.9 percent to N$2.0 billion over the same period. However, the real value of the Government’s expenses for construction works increased by 13.8 percent in 2019, compared to a decline of 8.2 percent registered in 2018 (Figure C.5a).
ManufacturingThe manufacturing sector is estimated to have registered an improved growth in 2019. The sector is estimated to have recorded growth of 3.5 percent in 2019, compared to a slight growth of 1.0 percent in 2018. The growth was mainly attributed to the rise in the production of both beer and soft drinks that continued to sustain activity in secondary industry, increasing by 9.1 percent and 4.8 percent, respectively (Figure C.5c).
The production of animal feed and other food products also registered a noticeable increase. Furthermore, production of refined zinc rose by 8.7 percent in 2019 compared with the preceding year (Figure C.5f). However, production of both blister copper (Figure C.5d) and diamond processing decreased by 6.4 percent and 2.6 percent, respectively, over the same period.
Electricity and waterThe electricity and water sector is estimated to have recorded a decline in 2019 compared to 2018. The sector is estimated to have registered a decline of 5.4 percent in 2019, compared to a strong positive growth rate of 13.2 percent in 2018. The contraction in 2019 was largely due to base effects, as the previous year was marked by higher water inflow at the Ruacana hydroelectric power plant, refurbishment
of the Van Eck coal power station and commissioning of some additional local solar power generation plants. As a result of the low rainfall in the year under review, local electricity generation decreased by 18.2 percent, compared to an increase of 16.5 percent in 2018 (Figure C.5e). This, in turn, gave rise to higher imports of electricity, which rose by 8.1 percent over the same period.

Bank of Namibia Annual Report 2019 139
Part CEconomic and Financial Developments
TERTIARY SECTOR DEVELOPMENTS
FIGURE C.6 (A–F) TERTIARY INDUSTRY
a. The tertiary industry is estimated to have registereda positive growth in 2019, after contracting in 2018 …
b. … driven largely by less negative growth in wholesaleand retail activity and a rebound in information andcommunication, and financial services output.
Annu
al p
erce
ntag
e ch
ange
Tertiary industry
-2
0
2
4
6
8
2015 2016 2017 2018 2019
Annu
al p
erce
ntag
e ch
ange
Wholesale and retail trade
-10
-5
0
5
10
2015 2016 2017 2018 2019
c. The decrease in the wholesale and retail trade sectorsales was partly mirrored in the decline in the numberof the new vehicles sold over the same period, owingto subdued demand.
d. Tourism activity also remained weak during 2019, asreflected in fewer room and bed nights sold.
0
5,000
10,000
15,000
20,000
25,000
2015 2016 2017 2018 2019
Num
ber
Passenger Commercial
20
50
80
110
140
2015 2016 2017 2018 2019
Inde
x: 2
015
= 10
0
Rooms sold Beds sold
e. The number of visitor arrivals decreased, acrossboth international and regional arrivals.
f. In the transport sector, the sea cargo volumesdeclined, while those of road and rail rose.
0
100
200
300
400
500
600
2015 2016 2017 2018 2019
Num
ber (
000)
International arrivals Regional arrivals
Metri
c ton
nes (
000)
Road Rail Sea
-
2,800
5,600
8,400
11,200
14,000
16,800
2015 2016 2017 2018 2019
Source: NSA, NAAMSA, Namport, TransNamib, Road Authority and other transport operators, Namibia Airports Company and Hospitality Association of Namibia
Bank of Namibia Annual Report 2019140
Part CEconomic and Financial Developments
Wholesale and retail tradeThe wholesale and retail trade sector is estimated to have declined in 2019, although less steeply than in the previous year. The real value addition in the wholesale and retail trade sector is estimated to have contracted by 4.4 percent in 2019, thereby displaying less downward momentum than in 2018 when it contracted by 6.2 percent (Figure C.6b). This nevertheless demonstrates continued weak demand due to subdued local economic activity. The real turnover of the wholesale and retail trade sector decreased, year-on-year, by 2.5 percent to N$23.0
billion in 2019. The decrease was reflected in virtually all subsectors, but more pronounced in the vehicles, furniture and clothing subsectors. The total number of new vehicles sold declined substantially by 9.5 percent in 2019, reflected in commercial and passenger vehicles sold that decreased by 14.7 percent and 11.8 percent, respectively, over the same period. The decline in sales of new vehicles was in line with a contraction in instalment credit, coupled with reduced Government procurement of vehicles.
Tourism The growth of the tourism sector, which is measured by the real value added by hotels and restaurants, is estimated to have remained weak in 2019, as reflected in the lower level of room and bed nights sold and of arrivals. The sector is estimated to have recorded a positive growth of
2.7 percent in 2019, after registering a higher growth rate of 4.9 percent in 2018. The lower growth momentum was evident in declines in the number of bed and room nights sold, as well as regional and international arrivals (Figure C.6e).
Transport and storageGrowth in the transport and storage sector is estimated to have contracted in 2019, compared to 2018. The real value added in the transport and storage sector is estimated to have contracted by 3.4 percent in 2019, compared to a contraction of 3.5
percent recorded during 2018. The decrease in the value addition of this sector was reflected in the decline of sea transport cargo (Figure C.6f). However, road and rail transport cargo volumes increased over the same period.
Information and communication Growth in the information and communication sector is estimated to have improved significantly in 2019 compared to contraction registered in 2018. The value addition in the information and
communication sector is estimated to have registered a higher growth of 8.6 percent in 2019, following a contraction of 2.2 percent in 2018.
Public administration and defenceThe public administration and defence sector is estimated to have improved during 2019. The sector is estimated to have recorded a growth of 2.2 percent
in 2019, compared to the marginally growth rate of 0.7 percent recorded during the previous year.
Gross national income and gross national disposable incomeNamibia’s gross national income (GNI) and gross national disposable income (GNDI) are estimated to have increased moderately during 2019. GNI at current prices is estimated to have risen to N$173.7 billion in 2019, up from N$172.6 billion in 2018, an increase of 0.6 percent (Figure C.7). Similarly, GNDI is estimated to have risen by 0.9 percent to N$192.9 billion in 2019, from N$191.2 billion in the preceding
year. Moreover, GNDI remained higher than GNI in 2019, indicating that Namibians continued to receive more income transfers from the rest of the world than they sent abroad. During the period from 2013 to 2019, GNDI has been higher than the GNI because of net inflows in current transfers, which are largely made up of SACU receipts.

Bank of Namibia Annual Report 2019 141
Part CEconomic and Financial Developments
FIGURE C.7 (A–C) GNI, GNDI AND SAVINGS
a. GNDI continued to be higher than GNI, indicating that Namibia is a net recipient of current transfers.
b. Gross domestic expenditure as a ratio of GDP is estimated to have increased marginaly in 2019, due to an increase in final consumption.
0.0
20.0
40.0
60.0
80.0
100.0
120.0
N$ b
illio
n
Gross national income Gross national disposable income
2015 2016 2017 2018 20190.0
10.0
20.0
30.0
40.0
50.0
60.0
70.0
80.0
As p
erce
ntag
e of
GDP
Private sector final consumption General Government final consumption
Gross fixed capital formation
2015 2016 2017 2018 2019
c. As ratios of GDP, both domestic savings and external savings are estimated to have declined during 2019.
External savings Domestic Private savings
Domestic Public Savings Investment
-5.0
0.0
5.0
10.0
15.0
20.0
25.0
30.0
35.0
As a
per
cent
age
of G
DP
2015 2016 2017 2018 2019
Source: NSA for 2015 – 2018, Bank of Namibia estimates for 2019
Gross domestic expenditure
Gross domestic expenditure (GDE) as a ratio of
GDP is estimated to have increased slightly in
2019 largely driven by an increase in private final
consumption. GDE at current prices is estimated
to have increased slightly to N$199.9 billion in 2019,
from N$196.0 billion in the previous year, representing
a 2.0 percent rise. As a ratio of GDP, GDE increased
to 111.9 percent in 2019, from 111.1 percent in 2018.
This increase was attributed to an improvement in
Government final consumption expenditure during
2019. As ratios of GDP, private sector consumption
expenditure increased significantly, while government
consumption expenditure increased marginally during
2019 (Figure C.7b) .
Savings and investment balance
Namibia’s total domestic savings as percentage
of GDP is estimated to have decreased in 2019.
Total domestic savings as a ratio of GDP is estimated
to have decreased to 10.4 percent in 2019, from 11.7
percent in the preceding year. National savings are
critical in any economy as they contribute to investment
funding, which in turn stimulates economic growth. The
decrease in the overall domestic savings was attributed
to a fall in domestic private savings during the same
period. Domestic private savings as a percentage of
Bank of Namibia Annual Report 2019142
Part CEconomic and Financial Developments
GDP declined from 15.5 percent in 2018 to 11.4 percent
in 2019, which is very low for a developing country like
Namibia (Figure C.7c). During 2019, Namibia’s gross
capital formation (investment) was equivalent to 12.7
percent of GDP, while domestic saving was 10.4 percent
of GDP, leaving a savings-investment gap equivalent to
2.3 percent of GDP. This gap was financed by savings
from abroad.

Bank of Namibia Annual Report 2019 143
Part CEconomic and Financial Developments
PRICE DEVELOPMENTS15
15 The analyses in this section are based on the National Consumer Price Index (NCPI) series based on the 2009/2010 Namibia Household Income and Expenditure Survey (NHIES), as released by the NSA in November 2014.
16 During March 2019, the Ministry of Mines and Energy discontinued the sales of diesel 500ppm in the Namibian market, in line with Government’s policy on cleaner fuels.
FIGURE C.8 (A–F) PRICE DEVELOPMENTS
a. Annual inflation in Namibia was lower during 2019, when compared to the previous year.
b. The decline was mainly driven by lower inflation in housing …
2.0
4.0
6.0
8.0
10.0
12.0
JFMAMJ J ASOND JFMAMJ J ASOND JFMAMJ J ASOND JFMAMJ JASOND2016 2017 2018 2019
Annu
al p
erce
ntag
e ch
ange
Overall inflation
0.01.02.03.04.05.06.07.08.09.0
10.011.012.0
JFMAMJJASOND JFMAMJJASOND JFMAMJ JASONDJFMAMJ JASOND2016 2017 2018 2019
Annu
al p
erce
ntag
e ch
ange
Inflation for housing, water, electricity, gas & others
c. … coupled with a deceleration in inflation for transport.
d. Pump prices for petrol and diesel16 remained flat for most of 2019 and had limited impact on transport inflation.
-6.0-4.0-2.00.02.04.06.08.0
10.012.014.0
JFMAMJ JASONDJFMAMJ JASONDJFMAMJJASOND JFMAMJJASOND2016 2017 2018 2019
Annu
al p
erce
ntag
e ch
ange
Transport
8.0
9.0
10.0
11.0
12.0
13.0
14.0
15.0
16.0
JFMAMJ JASONDJFMAMJ JASONDJFMAMJ JASONDJFMAMJ JASOND2016 2017 2018 2019
N$ p
er li
tre
ULP95 Diesel 500 ppm Diesel 50 ppm
e. Furthermore, inflation for food rose during the period under review on an annual average basis, as reflected in most sub-categories of food, but shows a declining trend during 2019.
f. Namibia’s inflation was lower than that of South Africa during 2019, owing to lower electricity and rental inflation in Namibia.
0.0
2.0
4.0
6.0
8.0
10.0
12.0
14.0
JFMAMJ J ASOND JFMAMJ J ASOND JFMAMJ J ASOND JFMAMJ J ASOND2016 2017 2018 2019
Annu
al p
erce
ntag
e ch
ange
Inflation for food & non alcoholic beverages
JFMAMJ J ASOND JFMAMJ J ASOND JFMAMJ J ASOND JFMAMJ J ASOND2016 2017 2018 2019
0.01.02.03.04.05.06.07.08.09.0
Annu
al p
erce
ntag
e ch
ange
Namibia South Africa
Source: NSA and Stats SA

Bank of Namibia Annual Report 2019144
Part CEconomic and Financial Developments
Namibia’s inflation declined during 2019, driven mainly by a decline in inflation for transport and housing. Namibia’s inflation declined by 0.6 percentage points to an annual average rate of 3.7 percent during 2019 (Figure C.8a). The decline was largely reflected in a decrease in inflation for the categories of housing and transport during the period under review. This was mainly on account of weak economic activity coupled with a switch to a situation of excess supply in the rental market. Meanwhile, inflation for food rose on average during the period under review, reflected in higher inflation in most sub-categories of food.
The inflation rate for housing, water, electricity, gas and other fuels declined during 2019, compared to the previous year. The inflation rate for this category slowed by 1.5 percentage points to 2.1 percent during the period under review (Figure C.8c). The slowdown was on account of a decline in most inflation sub-categories, particularly electricity, gas and other fuels, which declined by 7.5 percentage points to 0.0 percent. This is explained by the Electricity Control Board approval of a 2.5 percent electricity tariff decrease for electricity supplied by NamPower. Furthermore, the demand-supply situation in the rental market resulted in excess supply, leading to lower rental prices. Meanwhile, inflation for the regular maintenance and repairs sub-category rose by 0.5 percentage points to 3.5 percent.
Transport inflation declined during the period under review. Transport inflation declined by 3.7 percentage points to 5.2 percent during 2019 (Figure C.8b). This was reflected in the lower inflation for sub-categories such as operation of personal transport equipment (which includes fuel) and purchases of vehicles. These subcategories declined by 6.8 percentage points and 3.0 percentage points, respectively, to 3.3 percent and 4.1 percent during the period under review. The decrease
was attributed to the somewhat lower international oil prices in 2019 alongside the current weak economic activity in the country. Meanwhile, the public transport services sub-category rose by 7.0 percentage points to 14.2 percent, partially offsetting the decline in other components of transport inflation.
Petrol and diesel pump prices rose during 2019, compared to 2018, owing to a rise in the landed cost of fuel and in the fuel levy. The average pump prices for petrol and diesel rose somewhat during 2019, mainly as a result of exchange rate depreciation. Pump prices for petrol and diesel 50 ppm rose to N$12.69 and N$13.44 per litre, respectively, during the period under review, up from N$12.41 and N$12.78 per litre registered during 2018. This mainly reflected movements in international fuel prices and the exchange rate, prompting the Ministry of Mines and Energy to approve price increases in June 2019, whereafter the prices remained unchanged. Furthermore, an upward adjustment in the fuel levy in May 2019 also partly contributed to the increase in fuel prices.
Annual inflation for food and non-alcoholic beverages increased during 2019 compared to the previous year. The inflation rate for this category rose by 1.1 percentage points, to 4.3 percent during 2019 (Figure C.8e). The rise was reflected in most sub-categories, particularly vegetables including potatoes and other tubers; bread and cereal; sugar, jam, honey, syrups, chocolate and confectionery; milk, cheese and eggs; and coffee, tea and cocoa. These inflation subcategories rose by 7.3 percentage points, 4.8 percentage points, 3.0 percentage points, 3.1 percentage points and 0.9 percentage point to 13.1 percent, 6.4 percent, 4.2 percent, 3.8 percent and 4.0 percent, respectively. This rise was partly due to the poor harvests in Namibia and South Africa during the period under review.

Bank of Namibia Annual Report 2019 145
Part CEconomic and Financial Developments
TABLE C.4 INFLATION FOR FOOD AND NON-ALCOHOLIC BEVERAGES
Percent 2015 2016 2017 2018 2019
All items 3.4 6.7 6.2 4.3 3.7
Food and non-alcoholic beverages 5.6 10.8 5.7 3.2 4.3
Food 5.8 11.1 5.3 3.3 4.5
Bread and cereals 3.9 13.4 0.5 1.6 6.4
Meat 7.0 5.0 8.9 6.3 0.8
Fish 7.2 14.0 15.4 2.8 2.0
Milk, cheese and eggs 7.6 7.8 4.4 0.7 3.8
Oils and fats 3.2 15.0 2.6 2.6 0.5
Fruit 8.5 15.6 5.2 9.5 10.6
Vegetables including potatoes and other tubers 6.3 15.6 1.3 5.7 13.1
Sugar, jam, honey, syrups, chocolate and confectionery 7.2 13.9 11.8 1.2 4.2
Food products n.e.c.17 5.6 10.2 8.6 2.5 1.6
Non-alcoholic beverages 4.2 7.4 9.3 2.4 2.5
Coffee, tea and cocoa 8.1 15.3 15.0 3.1 4.0
Mineral waters, soft drinks and juices 3.3 5.4 7.8 2.2 2.0
Source: NSA
17 Food Product (n.e.c) is a United Nation statistical classification to help clarify individual consumption expenditures incurred by households, non-profit institutions serving households and general government according to their purpose. It includes food items such as spices (pepper, pimento, ginger, etc.), culinary herbs (parsley, rosemary, thyme, etc.), sauces, condiments, seasonings (mustard, mayonnaise, ketchup, soy sauce, etc.), vinegar; – prepared baking powders, baker’s yeast, dessert preparations, soups, broths, stocks, culinary ingredients, etc.; – homogenized baby food and dietary preparations irrespective of the composition. Furthermore, the classification excludes food items such as milk-based desserts, soya milk, artificial sugar substitutes and cocoa-based dessert preparation.
Inflation in South Africa remained higher than in Namibia for the most part of 2019, owing to higher housing inflation in the former. At 4.1 percent during the year under review, South Africa’s inflation rate remained above that of Namibia from May 2019, which stood at 3.7 percent. This was mainly due to higher
inflation for electricity registered in South Africa which averaged 9.5 percent during the period under review, compared to 0.0 percent electricity inflation registered in Namibia and to higher rental inflation in South Africa than in Namibia.

Bank of Namibia Annual Report 2019146
Part CEconomic and Financial Developments
MONETARY AND FINANCIAL MARKET DEVELOPMENTS
FIGURE C.9 (A-E) MONETARY AND FINANCIAL MARKET DEVELOPMENTS
a. The annual growth in broad money supply (M2) slowed during 2019.
b. Growth in private sector credit extension (PSCE) rose marginally on average during 2019 compared to growth in 2018.
J F M AM J J A SO N D J F M AM J J A SO N D J F M AM J J A SO N D2017 2018 2019
-30.0
-10.0
10.0
30.0
50.0
70.0
Annu
al p
erce
ntag
e ch
ange
M2 NFA Domestic claims
0.0
2.0
4.0
6.0
8.0
10.0
12.0
14.0
16.0
J F MA M J J A S O N D J F MA M J J A S O N D J F MA M J J A S O N D2017 2018 2019
Annu
al p
erce
nata
ge c
hang
e PSCE Businesses Individuals
c. The overall liquidity position of the Namibian banking industry declined during 2019 to levels generally well below those of the preceding year.
d. During 2019, the repo and banks’ prime lending rates declined after the August 2019 Monetary Policy Committee meeting, while the other money market rates varied.
J F MA M J J A S O N D J F MA M J J A S O N D J F MA M J J A S O N D2017 2018 2019
Overall liquidity position
-500
1,000 1,500 2,000 2,500 3,000 3,500 4,000 4,500 5,000
N$ m
illio
n
J F MA M J J A S O N D J F MA M J J A S O N D J F MA M J J A S O N D2017 2018 2019
1.00
3.00
5.00
7.00
9.00
11.00
13.00
Annu
al p
erce
ntag
e ch
ange
Prime lending rate Repo rate
Average deposit rate Average lending rate
e. The overall and local share price indices of the Namibian Stock Exchange fluctuated sideways and on balance declined slightly in 2019.
320.0
365.0
410.0
455.0
500.0
545.0
590.0
635.0
700.0800.0900.0
1,000.01,100.01,200.01,300.01,400.01,500.01,600.01,700.01,800.0
J F M A M J J A S O N D J F M A M J J A S O N D J F M A M J J A S O N D
2017 2018 2019
Inde
x
Inde
x
NSX Overall Index NSX Local Index (RHS)

Bank of Namibia Annual Report 2019 147
Part CEconomic and Financial Developments
MONETARY AGGREGATES
18 Other sectors category is comprised of the following sectors, Non-banking financial institutions, Regional and local authorities, State-owned enterprises, Businesses and Individuals.
Developments in the monetary and credit aggregates in 2019 were characterised by a decline in growth in the broad money supply (M2), while growth in credit extended to the private sector rose marginally. Growth in M2 was subdued, which was consistent with the recessionary conditions and low inflation in 2019. The slower growth in M2 was from an accounting perspective driven by the subdued
growth in total claims on other sectors18 and was further concentrated in short-term deposits (i.e. transferable deposits) which declined over the review period. A contraction in the currency in circulation during 2019 also contributed to the subdued growth in M2. Domestic demand as reflected in PSCE rose marginally in 2019 due to an increase in the uptake of credit by businesses.
TABLE C.5 MONETARY AND CREDIT AGGREGATES, AVERAGE BASIS
(N$ million, average) 2015 2016 2017 2018 2019
Net Foreign Assets 22,853 30,296 33,461 34,845 41,344
Net Domestic Assets 82,178 90,288 99,702 111,348 118,628
Total Claims on Private Sector 79,252 87,960 93,824 100,518 106,783
of which: claims on individuals 41,193 47848 51,591 56,796 58,986
: claims on businesses 30,757 34,419 35,949 38,849 40,554
Net claims on Central Government 2,926 2,328 5,878 10,829 12,553
Claims on Central Government 9,639 11,309 13,376 18,030 21,742
less Government deposits 6,713 7,909 7,499 7,201 9,189
Other Items, net -25,283 -34,942 -40,471 -45,093 -50,275
Broad Money 79,748 85,642 92,692 101,100 109,697
(Change during period, N$ million)
Net Foreign Assets -917 -7,443 3,165 1,384 6,499
Net Domestic Assets 12,777 8,110 9,414 11,646 7,280
Total Claims on Private Sector 11,355 8,708 5,864 3,981 6,265
of which: claims on individuals 2,911 6,655 3,743 6,694 2,190
: claims on businesses 4,959 3,662 1,530 5,205 1,706
Net claims on Central Government 1,422 -598 3,550 2,900 1,724
Claims on Central Government 2,543 1,670 2,067 4,941 3,712
less Government deposits 1,121 1,196 -410 -298 1,988
Other Items, net -3,598 -9,659 -5,529 -4,622 -5,182
Broad Money 8,262 5,894 7,050 8,408 8,597
(Annual percentage growth rates)
Net Foreign Assets 3.9 32.6 10.4 4.1 18.7
Total Claims on Private Sector 16.7 11.0 6.7 7.1 6.2
of which: claims on individuals 7.6 16.2 7.8 10.1 3.9
: claims on businesses 19.2 11.9 4.4 8.1 4.4
Broad Money 11.6 7.4 8.2 9.1 8.5
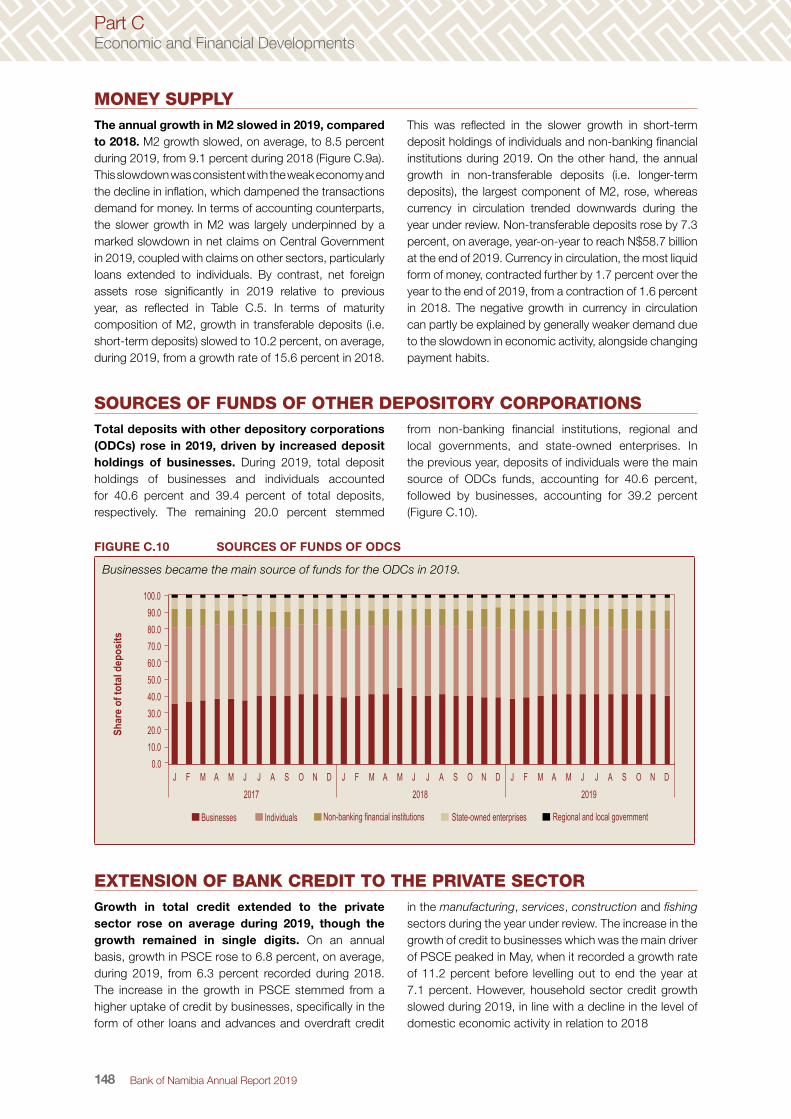
Bank of Namibia Annual Report 2019148
Part CEconomic and Financial Developments
MONEY SUPPLYThe annual growth in M2 slowed in 2019, compared to 2018. M2 growth slowed, on average, to 8.5 percent during 2019, from 9.1 percent during 2018 (Figure C.9a). This slowdown was consistent with the weak economy and the decline in inflation, which dampened the transactions demand for money. In terms of accounting counterparts, the slower growth in M2 was largely underpinned by a marked slowdown in net claims on Central Government in 2019, coupled with claims on other sectors, particularly loans extended to individuals. By contrast, net foreign assets rose significantly in 2019 relative to previous year, as reflected in Table C.5. In terms of maturity composition of M2, growth in transferable deposits (i.e. short-term deposits) slowed to 10.2 percent, on average, during 2019, from a growth rate of 15.6 percent in 2018.
This was reflected in the slower growth in short-term deposit holdings of individuals and non-banking financial institutions during 2019. On the other hand, the annual growth in non-transferable deposits (i.e. longer-term deposits), the largest component of M2, rose, whereas currency in circulation trended downwards during the year under review. Non-transferable deposits rose by 7.3 percent, on average, year-on-year to reach N$58.7 billion at the end of 2019. Currency in circulation, the most liquid form of money, contracted further by 1.7 percent over the year to the end of 2019, from a contraction of 1.6 percent in 2018. The negative growth in currency in circulation can partly be explained by generally weaker demand due to the slowdown in economic activity, alongside changing payment habits.
SOURCES OF FUNDS OF OTHER DEPOSITORY CORPORATIONSTotal deposits with other depository corporations (ODCs) rose in 2019, driven by increased deposit holdings of businesses. During 2019, total deposit holdings of businesses and individuals accounted for 40.6 percent and 39.4 percent of total deposits, respectively. The remaining 20.0 percent stemmed
from non-banking financial institutions, regional and local governments, and state-owned enterprises. In the previous year, deposits of individuals were the main source of ODCs funds, accounting for 40.6 percent, followed by businesses, accounting for 39.2 percent (Figure C.10).
FIGURE C.10 SOURCES OF FUNDS OF ODCS
Businesses became the main source of funds for the ODCs in 2019.
0.010.020.030.040.050.060.070.080.090.0
100.0
J F M A M J J A S O N D J F M A M J J A S O N D J F M A M J J A S O N D2017 2018 2019
Shar
e of
tota
l dep
osits
Businesses Individuals Non-banking financial institutions State-owned enterprises Regional and local government
EXTENSION OF BANK CREDIT TO THE PRIVATE SECTORGrowth in total credit extended to the private sector rose on average during 2019, though the growth remained in single digits. On an annual basis, growth in PSCE rose to 6.8 percent, on average, during 2019, from 6.3 percent recorded during 2018. The increase in the growth in PSCE stemmed from a higher uptake of credit by businesses, specifically in the form of other loans and advances and overdraft credit
in the manufacturing, services, construction and fishing sectors during the year under review. The increase in the growth of credit to businesses which was the main driver of PSCE peaked in May, when it recorded a growth rate of 11.2 percent before levelling out to end the year at 7.1 percent. However, household sector credit growth slowed during 2019, in line with a decline in the level of domestic economic activity in relation to 2018

Bank of Namibia Annual Report 2019 149
Part CEconomic and Financial Developments
FIGURE C.11 (A-C) CREDIT DEVELOPMENTS
a. Growth in credit extended to businesses rose on average in 2019 when compared to the preceding year …
b. … whereas the pace of growth in total credit extended to individuals slowed on average during 2019.
J F MA M J J A S O N D J F MA M J J A S O N D J F MA M J J A S O N D2017 2018 2019
(20.00)
(10.00)
-
10.00
20.00
30.00
Annu
al p
erce
ntag
e ch
ange
Total credit to businesses
Overdraft to businessesOther loans & advances to businesses
Instalment credit to businesses
J F MA M J J A S O N D J F MA M J J A S O N D J F MA M J J A S O N D2017 2018 2019
(10.00)
-
10.00
20.00
30.00
Annu
al p
erce
ntag
e ch
ange
Instalment credit to individuals Mortgage credit to individuals
Total credit to individuals Other loans and advances to individuals
c. Mortgage loans continued to be the main contributor to total PSCE in 2019, followed by other loans and advances and overdrafts in the second and third places, respectively.
DECEMBER 2019DECEMBER 2018
52.8
12.0
21.5
12.9
MortgageInstalment sales credit & leasing Other loans and advancesOverdrafts
52.5
10.9
23.4
13.0
MortgageInstalment sales credit & leasing Other loans and advancesOverdrafts
19 The category other loans and advances is comprised of personal/commercial loans and credit card advances; in terms of methodological compilation it is different from the category other loans and advances under Section D of this report.
Growth in total credit extended to businesses rose on average in 2019 and sustained the growth in PSCE during the year. The annual growth in total credit extended to businesses stood at 7.1 percent on average during 2019, higher than the 4.8 percent average registered a year earlier (Figure C.11a). The growth observed in credit extended to businesses was reflected mainly in other loans and advances19 and overdraft credit. The stronger growth in credit extended to businesses, especially in the middle months of the year, was a result of higher uptake of credit by corporates in the fishing, manufacturing, retail trade, commercial property development, and mining services sectors.
Growth in total credit extended to individuals slowed moderately during 2019, in line with the recessionary conditions in the domestic economy. On an annual basis, average growth in total credit extended to individuals slowed to 6.7 percent during 2019, compared to 7.4 percent in 2018 and 7.9 percent in 2017. The slower growth in credit extended to individuals was more evident in the category of instalment credit, in which growth has persistently remained in negative territory since mid-2017. The contraction in the growth in instalment credit was due to a lower uptake of credit and major repayments made during 2019. This could partly be a sign that household disposable income is overstretched due to the tough

Bank of Namibia Annual Report 2019150
Part CEconomic and Financial Developments
economic conditions, with only a marginal easing of interest rates when the repo rate was reduced in August 2019. The growth in the other loans and advances was robust during 2019 (Figure C.11b).
In 2019, mortgage credit continued to account for more than half of the total credit extended to the private sector. Mortgage credit remained
the largest contributor to total PSCE, representing 52.5 percent of the total, followed by other loans and advances and overdrafts in the second and third places, with contributions of 23.4 percent and 13.1 percent, respectively. Instalment sales and leasing contributed 11.2 percent over the same period, respectively (Figure C.11c).
OTHER/NON-BANK FINANCIAL CORPORATIONS In 2019 the total assets of other/non-bank financial corporations (OFCs) rose on an annual basis. The total asset value of OFCs stood at N$188.7 billion at the end of 2019, representing an increase of 6.6 percent when compared to 2018. The increase primarily stemmed from pension fund contributions received and higher insurance premiums collected, coupled with
reasonable market performance experienced during the period under review. In terms of absolute size, the pension funds continued to dominate the OFC sector, with N$123.0 billion of net equity of households, while net equity of households in life assurance amounted to N$22.2 billion at the end of 2019 (Table C.6).
TABLE C.6 KEY FINANCIAL AGGREGATES
(N$ million end of period) 2017 2018 2019
1. Central Bank survey
Central Bank total asset value 30 381 34 337 31 854
Net foreign assets 26 122 28 114 24 746
Claims on other sectors 46 63 87
2. Other depository corporations
Other depository corporations’ total asset value 159 011 176 732 189 041
Net foreign assets 4 942 9 861 11 695
Claims on other sectors 96 490 103 517 110 190
of which: individuals 53 460 57 255 61 425
businesses 36 396 38 656 41 698
3. Depository corporations survey (1+2)
Depository corporations’ total asset value 189 392 211 069 220 899
Net foreign assets 31 063 37 975 36 440
Net domestic assets 106 201 113 610 127 622
of which: claims on individuals 53 506 57 318 61 513
claims on businesses 36 396 39 068 41 698
Broad money supply 98 078 104 345 115 336
4. Other financial corporations survey
Other financial corporations’ total asset value 159 669 176 978 188 742
Net foreign assets 81 625 93 834 86 019
Claims on other sectors 23 629 24 089 27 151
Insurance technical reserves 126 021 130 627 157 422
5. Financial corporations survey (3+4)
Financial corporations’ total asset value 349 061 388 047 409 641
Net foreign assets 112 688 131 809 122 459
Net domestic assets 138 212 148 632 165 198
Insurance technical reserves 126 021 130 627 157 422
Net equity of households in life insurance 20 452 21 971 22 241
Net equity of households in pension funds 95 261 96 528 123 016
Prepayments of premiums 10 308 12 123 12 164

Bank of Namibia Annual Report 2019 151
Part CEconomic and Financial Developments
The net foreign assets of OFCs declined on an annual basis at the end of 2019. Net foreign assets slowed in 2019 compared to earlier years, partly in response to higher domestic asset requirements for institutional investors. Net foreign assets of OFCs stood at N$86.0 billion at the end 2019, nevertheless far higher
20 The category “other” is comprised of non-financial assets, loans, receivables and financial derivatives.
21 The liquidity position of the Namibian banking system is influenced mainly by Government spending, the level of required reserves,currency in circulation, corporate tax payments, inflows and outflows of funds to South Africa, and mineral sale proceeds.
than the N$36.4 billion of the depository corporations (Table C.6). This brought the total net foreign assets for the Financial Corporations Survey to N$122.5 billion at the end of 2019, a further indication of the significance of the non-banking financial institutions in the Namibian financial sector.
FIGURE C.12 ASSET HOLDINGS OF NON-BANK FINANCIAL INSTITUTIONS AT 31 DECEMBER
With regards to asset allocation, equities remained the most preferred asset class in which OFCs funds were channelled during 2019.
7.5
18.2
63.8
10.5
2019
Cash and Deposits Securities Equities Other
2018 8.6
23.5
59.4
8.5
With regards to asset allocation, equities remained the most preferred asset class in which OFC funds were channelled during 2019. Figure C.12 shows that almost two thirds of OFC funds wereplaced into equities, which is commensurate with thelong-term nature of pension funds, followed by interest-
bearing securities with a share of 18.2 percent. Equities normally provide higher long-term growth despite being highly volatile and are therefore a preferred investment instrument for OFCs. These were followed by cash and deposits, and by other20 assets, comprising 7.5 percent and 10.5 percent of OFCs funds, respectively.
Banking system liquidity21
The cash balances of the Namibian banking industry declined markedly in 2019 in comparison to the preceding year. The liquidity of the domestic banking sector averaged N$2.9 billion during 2019, 20.7 percent lower than the average balance of N$3.5 billion observed in 2018 (Figure C.9). The lower liquidity levels were mostly observed at the beginning and end of the year, with January and December recording average balances of N$256 million and N$948 million,
respectively. As shown in Figure C.9 above, the highest liquidity levels were recorded in June 2019. The decline in the liquidity levels during 2019 was largely on the account of higher ZAR outflows, coupled with lower diamond export earnings relative to the previous year. In term of liquid assets, the overall banking industry has maintained its liquid assets at an average ratio of 15.3 percent of its outstanding liabilities, significantly higher than the 10.0 percent prudential requirement.
Money market developmentsMoney market rates declined during 2019 and were lower on average than in 2018 in line with the cut in the repo rate. In this regard, the average interbank market call rate declined from 6.74 percent in 2018 to
an average of 6.67 percent during 2019. Similarly, the average three-month Windhoek Interbank Agreed Rate (WIBAR) declined by 23 basis points to 7.26 percent in 2019, while the average six-month, nine-month

Bank of Namibia Annual Report 2019152
Part CEconomic and Financial Developments
and 12-month WIBAR dropped to 7.51 percent, 7.51 percent, and 8.02 percent, respectively. Meanwhile, the average overnight WIBAR increased by 35 basis points to an average of 6.64 percent in 2019, coming from a low base following the very high excess liquidity levels
in 2018. Similarly, the average lending rate declined to 9.93 percent in 2019, from 10.19 percent in 2018, in line with the downward adjustment in the repo rate (Figure C.9d).
Interbank market activitiesIn line with the lower level of liquidity in the banking industry, the value of transactions in the interbank market increased during 2019 in comparison to 2018. As indicated in Figure C.13a, the total local interbank transactions amounted to N$4.3 billion during 2019, higher than the total of N$2.8 billion observed
during the preceding year. The highest monthly value of interbank transactions was recorded in May, with a value of N$650 million, while no interbank transactions were recorded in February and July 2019, and only N$150 million worth of transactions were recorded in December.
FIGURE C.13 (A–B) INTERBANK TRADING ACTIVITIES AND THE WIBAR
a. Interbank transactions increased during 2019 relative to 2018.
b. Money market rates followed a down-ward trend during 2019.
4.50
5.00
5.50
6.00
6.50
7.00
7.50
8.00
8.50
-100 200 300 400 500 600 700 800 900
1,000
J F MA MJ J A S OND J F MA MJ J A S OND J F MA MJ J A S OND2017 2018 2019
Perc
ent
N$ m
illio
n
Interbank transactions Interbank call rate
Overnight WIBAR
5.50
6.00
6.50
7.00
7.50
8.00
8.50
9.00
J F M A M J J A S O N D J F M A M J J A S O N D2018 2019
Perc
ent
6 Months WIBAR 9 Months WIBAR 12 Months WIBAR
3-months WIBAR Overnight WIBAR

Bank of Namibia Annual Report 2019 153
Part CEconomic and Financial Developments
Bond market developments
22 US fixed rate (8%) Treasury bond, maturing on 15 November 2021
23 US fixed rate (2.25%) Treasury bond, maturing on 15 November 2025
FIGURE C.14 (A–F) BOND MARKET DEVELOPMENTS
a. The trading of Government bonds in the secondary market remained weak during 2019.
b. The GC20, GC22, GC40 and GI25 were the most traded bonds in 2019.
0.0
5.0
10.0
15.0
20.0
25.0
30.0
35.0
0
10,000
20,000
30,000
40,000
2015 2016 2017 2018 2019
Perc
ent
N$ m
illio
n
Secondary market Total Bonds (millions)
Turnover ratio (RHS)
0
100
200
300
400
500
600
GC18GC20GC21GC22GC23GC24GC25GC27GC30GC32GC35GC37GC40GC45GC50GI22GI25GI29GI33
N$ M
illio
n
2019 2018
c. On average, yields on shorter- and medium-term Government bonds declined during 2019, before picking up towards the end of the year.
d. Similarly, yields on longer-dated Government bonds trended downward but also edged up in the last few months of the year.
7.0
8.0
9.0
10.0
11.0
12.0
J F MA M J J A S O N D J F MA M J J A S O N D J F MA M J J A S O N D2017 2018 2019
Perc
ent
GC27 GC30 GC32 GC23
10.0
10.5
11.0
11.5
12.0
12.5
J F M A M J J A S O N D J F M A M J J A S O N D J F M A M J J A S O N D2017 2018 2019
Perc
ent
GC35 GC37 GC40 GC45 GC43 GC50
e. The spread between the Namibian 2021 Eurobond and the US benchmark (T 8% / 11/15/21)22 varied during 2019.
f. Similarly, the spread between the Namibian 2025 Eurobond and the US benchmark (T 2 ¼ 11/15/25)23 remained volatile in 2019.
100
150
200
250
300
350
0.0
1.0
2.0
3.0
4.0
5.0
6.0
7.0
J FMAMJ J A SO ND J FMAMJ J A SO ND J FMAMJ J A SO ND2017 2018 2019
Basi
s po
ints
Perc
ent
NAM 5 11/21 T 8% / 11/15/21 Spread (basis points)
100
150
200
250
300
350
400
450
500
1.0
2.0
3.0
4.0
5.0
6.0
7.0
8.0
J F MA MJ J A S OND JFMA MJ J A S OND JFMA MJ J A S OND2017 2018 2019
Basi
s po
ints
Perc
ent
NAM 5 10/25 T 2 11/15/25 Spread (basis points)
Source: NSX, Bloomberg and JSE

Bank of Namibia Annual Report 2019154
Part CEconomic and Financial Developments
Government domestic bonds
In line with the 2019/20 fiscal year financing requirements, the value of outstanding Government domestic bonds increased during 2019. The nominal amount of outstanding domestic Government bonds increased from N$32.7 billion at the end of 2018 to a total of N$38.1 billion by the end of December 2019. Fixed-rate bonds constituted 84.7 percent of this amount, while 15.3 per cent was made up of inflation-linked bonds.
As part of domestic market development, the Government continued to introduce various instruments across the yield curve in 2019. In this regard, two fixed-rate bonds (GC43, GC50), maturing in 2043 and 2050, respectively, and one inflation-linked bond (GI36) maturing in 2036, were introduced during 2019. This brings the total number of outstanding domestic Government bonds to 20.
TABLE C.7 DOMESTIC GRN BONDS
BondsCoupon rate
(percent)Coupon Dates Maturity
Date
Outstanding Amount 31 December 2019
(N$)
Fixed rate bonds 32,230,185,000
GC20 8.25 15 April, 15 October 15-Apr-20 773,150,000
GC21 7.75 15 April, 15 October 15-Oct-21 1,424,240,000
GC22 8.75 15 January, 15 July 15-Jan-22 2,830,290,000
GC23 8.85 15 April, 15 October 15-Oct-23 1,783,910,000
GC24 10.50 15 April, 15 October 15-Oct-24 3,524,000,000
GC25 8.50 15 April, 15 October 15-Apr-25 3,396,440,000
GC27 8.00 15 January, 15 July 15-Jan-27 3,753,180,000
GC30 8.00 15 January, 15 July 15-Jan-30 3,169,760,000
GC32 9.00 15 April, 15 October 15-Apr-32 2,619,650,000
GC35 9.50 15 January, 15 July 15-Jul-35 2,278,525,000
GC37 9.50 15 January, 15 July 15-Jul-37 2,010,690,000
GC40 9.80 15 April, 15 October 15-Oct-40 2,226,710,000
GC43 10.00 15 January, 15 July 15-Jul-43 289,790,000
GC45 9.85 15 January, 15 July 15-Jul-45 1,853,910,000
GC50 10.25 15 January, 15 July 15-Jul-50 295,940,000
Inflation linked bonds 5,822,610,000
GI22 3.55 15 April, 15 October 15-Oct-22 2,300,330,000
GI25 3.80 15 April, 15 October 15-Jul-25 1,962,710,000
GI29 3.80 15 January, 15 July 15-Jan-29 829,520,000
GI33 4.50 15 April, 15 October 15-Apr-33 500,050,000
GI36 4.80 15 January, 15 July 15-Jul-36 230,000,000
Total domestic bonds 38,052,795,000
Secondary market activities
The value of Government bonds traded in the secondary market remained largely unchanged during 2019, in comparison to 2018. As depicted in Figure C.14, the value of Government bonds traded on
the secondary market during the year under review was about N$2.3 billion, compared to N$2.4 billion recorded in 2018. As a result of this, coupled with an increase in the value of government bonds, the turnover ratio

Bank of Namibia Annual Report 2019 155
Part CEconomic and Financial Developments
dropped to 5.93 percent in 2019 from the ratio of 7.25 percent in 2018. As it was nearing its maturity, the GC20 was the most traded bond during the year, accounting
for 25.0 percent of total trades, followed by the GC40 and the GC22 with 9.0 percent and 7.0 percent of total trades, respectively (Figure C.14).
Government bond yields
Yields on Government bonds dropped during most of 2019 before picking up again towards the end of the year. In this regard, the GC23 and the GC27 recorded the largest drop in yields, declining by 100 basis points on an annual average basis, while the GC35 had the lowest drop in yield of 40 basis points.
Similarly, the yields on the longer-dated bonds (GC37, GC40 and GC45) decreased by an average of 50 basis points (Figure C.14). The movements in bond yields reflect the movements in the benchmark South African bonds, as well as buoyant demand conditions for Namibian government debt securities.
Yield spreads
The difference between the yields on the South
African and Namibian Government bonds,
commonly known as yield spread, narrowed
during 2019. The spread on the GC23 against the
R208 averaged 98 basis points, dropping from an
average spread of 105 basis points in 2018. Meanwhile,
the spreads on the medium-term bonds (the GC27 and
the GC30) were 82 basis points and 88 basis points,
respectively. A similar trend was observed with the
GC32, the GC35 and the GC37, with their spreads
dropping by 60 basis points, on average, while the
average spread on the GC40 and the GC45 declined
by 65 and 35 basis points, respectively. The narrowing
spreads for domestic bonds reflect improved demand
for Government bonds in the domestic market relative
to the previous year, following the introduction of higher
domestic asset requirements for Namibian institutional
investors.
FIGURE C.15 (A–B) SPREADS BETWEEN NAMIBIAN GOVERNMENT BONDS AND SOUTH AFRICAN BENCHMARK BONDS
a. On average, yield spreads between the short-to-medium term Namibian Government bonds and their respective South African benchmarks narrowed during 2019.
b. Longer term bonds also recorded declines in the yield spreads against their corresponding SA benchmarks, with minor pick-ups towards the end of the year.
0.3
0.8
1.3
1.8
2.3
J F M A M J J A S O N D J F M A M J J A S O N D J F M A M J J A S O N D2017 2018 2019
Perc
ent
GC23 GC30 GC27 GC32
0.50
1.00
1.50
2.00
2.50
J F M A M J J A S O N D J F M A M J J A S O N D J F M A M J J A S O N D2017 2018 2019
Perc
ent
GC35 GC37 GC40 GC45
Corporate bonds
The value of corporate bonds outstanding dropped
during 2019. In this regard, the stock of bonds issued
by Namibian corporates listed on both the Namibian
Stock Exchange (NSX) and the Johannesburg Stock
Exchange (JSE) declined to N$8.3 billion from the total
of N$9.2 billion seen in the preceding year. Of the N$8.3
billion, a total of N$5.6 billion was listed on the NSX,
while N$2.7 billion was listed through issuance on the
JSE. The value of corporate bonds declined due to
several bonds maturing during 2019. In addition, there
were fewer bond issuances during 2019 in comparison
to the preceding year. Meanwhile, N$6.5 billion of the
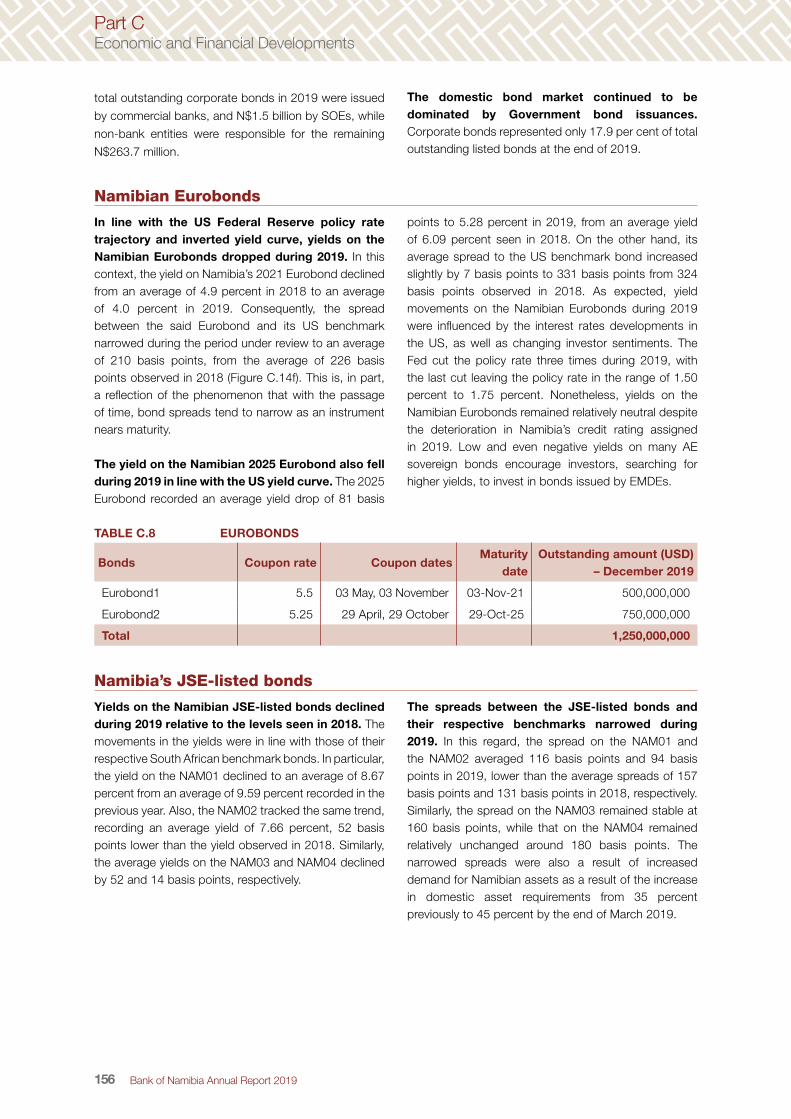
Bank of Namibia Annual Report 2019156
Part CEconomic and Financial Developments
total outstanding corporate bonds in 2019 were issued
by commercial banks, and N$1.5 billion by SOEs, while
non-bank entities were responsible for the remaining
N$263.7 million.
The domestic bond market continued to be dominated by Government bond issuances. Corporate bonds represented only 17.9 per cent of total outstanding listed bonds at the end of 2019.
Namibian Eurobonds
In line with the US Federal Reserve policy rate trajectory and inverted yield curve, yields on the Namibian Eurobonds dropped during 2019. In this context, the yield on Namibia’s 2021 Eurobond declined from an average of 4.9 percent in 2018 to an average of 4.0 percent in 2019. Consequently, the spread between the said Eurobond and its US benchmark narrowed during the period under review to an average of 210 basis points, from the average of 226 basis points observed in 2018 (Figure C.14f). This is, in part, a reflection of the phenomenon that with the passage of time, bond spreads tend to narrow as an instrument nears maturity.
The yield on the Namibian 2025 Eurobond also fell during 2019 in line with the US yield curve. The 2025 Eurobond recorded an average yield drop of 81 basis
points to 5.28 percent in 2019, from an average yield of 6.09 percent seen in 2018. On the other hand, its average spread to the US benchmark bond increased slightly by 7 basis points to 331 basis points from 324 basis points observed in 2018. As expected, yield movements on the Namibian Eurobonds during 2019 were influenced by the interest rates developments in the US, as well as changing investor sentiments. The Fed cut the policy rate three times during 2019, with the last cut leaving the policy rate in the range of 1.50 percent to 1.75 percent. Nonetheless, yields on the Namibian Eurobonds remained relatively neutral despite the deterioration in Namibia’s credit rating assigned in 2019. Low and even negative yields on many AE sovereign bonds encourage investors, searching for higher yields, to invest in bonds issued by EMDEs.
TABLE C.8 EUROBONDS
Bonds Coupon rate Coupon datesMaturity
dateOutstanding amount (USD)
– December 2019
Eurobond1 5.5 03 May, 03 November 03-Nov-21 500,000,000
Eurobond2 5.25 29 April, 29 October 29-Oct-25 750,000,000
Total 1,250,000,000
Namibia’s JSE-listed bonds
Yields on the Namibian JSE-listed bonds declined during 2019 relative to the levels seen in 2018. The movements in the yields were in line with those of their respective South African benchmark bonds. In particular, the yield on the NAM01 declined to an average of 8.67 percent from an average of 9.59 percent recorded in the previous year. Also, the NAM02 tracked the same trend, recording an average yield of 7.66 percent, 52 basis points lower than the yield observed in 2018. Similarly, the average yields on the NAM03 and NAM04 declined by 52 and 14 basis points, respectively.
The spreads between the JSE-listed bonds and their respective benchmarks narrowed during 2019. In this regard, the spread on the NAM01 and the NAM02 averaged 116 basis points and 94 basis points in 2019, lower than the average spreads of 157 basis points and 131 basis points in 2018, respectively. Similarly, the spread on the NAM03 remained stable at 160 basis points, while that on the NAM04 remained relatively unchanged around 180 basis points. The narrowed spreads were also a result of increased demand for Namibian assets as a result of the increase in domestic asset requirements from 35 percent previously to 45 percent by the end of March 2019.
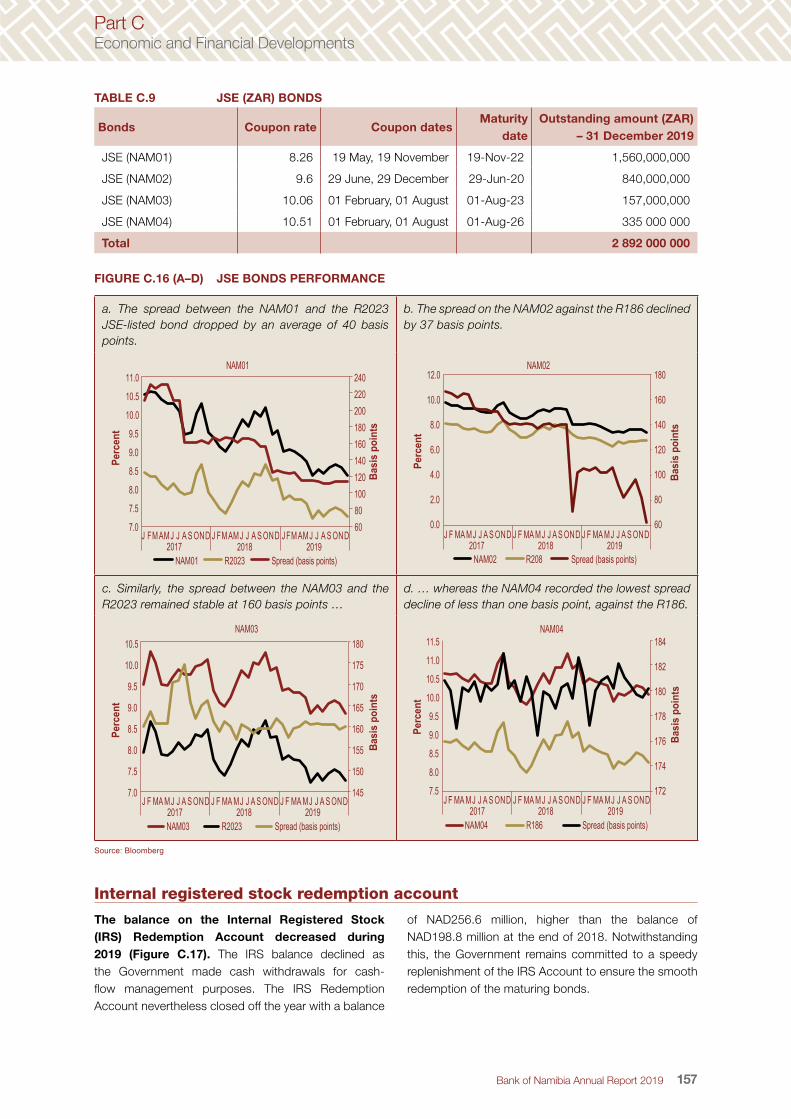
Bank of Namibia Annual Report 2019 157
Part CEconomic and Financial Developments
TABLE C.9 JSE (ZAR) BONDS
Bonds Coupon rate Coupon datesMaturity
dateOutstanding amount (ZAR)
– 31 December 2019
JSE (NAM01) 8.26 19 May, 19 November 19-Nov-22 1,560,000,000
JSE (NAM02) 9.6 29 June, 29 December 29-Jun-20 840,000,000
JSE (NAM03) 10.06 01 February, 01 August 01-Aug-23 157,000,000
JSE (NAM04) 10.51 01 February, 01 August 01-Aug-26 335 000 000
Total 2 892 000 000
FIGURE C.16 (A–D) JSE BONDS PERFORMANCE
a. The spread between the NAM01 and the R2023JSE-listed bond dropped by an average of 40 basispoints.
b. The spread on the NAM02 against the R186 declined by 37 basis points.
6080100120140160180200220240
7.0
7.5
8.0
8.5
9.0
9.5
10.0
10.5
11.0
J FMAMJ J A S OND J FMAMJ J A S OND J FMAMJ J A S OND2017 2018 2019
Basi
s po
ints
Perc
ent
NAM01
NAM01 R2023 Spread (basis points)
60
80
100
120
140
160
180
0.0
2.0
4.0
6.0
8.0
10.0
12.0
J F MA MJ J A S OND J F MA MJ J A S OND J F MA MJ J A S OND2017 2018 2019
Basi
s po
ints
Perc
ent
NAM02
NAM02 R208 Spread (basis points)
c. Similarly, the spread between the NAM03 and theR2023 remained stable at 160 basis points …
d. … whereas the NAM04 recorded the lowest spreaddecline of less than one basis point, against the R186.
145
150
155
160
165
170
175
180
7.0
7.5
8.0
8.5
9.0
9.5
10.0
10.5
J F MA MJ J A S OND J F MA MJ J A S OND J F MA MJ J A S OND2017 2018 2019
Basi
s po
ints
Perc
ent
NAM03
NAM03 R2023 Spread (basis points)
172
174
176
178
180
182
184
7.5
8.0
8.5
9.0
9.5
10.0
10.5
11.0
11.5
J F MA MJ J A S OND J F MA MJ J A S OND J F MA MJ J A S OND2017 2018 2019
Basi
s po
ints
Perc
ent
NAM04
NAM04 R186 Spread (basis points)
Source: Bloomberg
Internal registered stock redemption account
The balance on the Internal Registered Stock (IRS) Redemption Account decreased during 2019 (Figure C.17). The IRS balance declined as the Government made cash withdrawals for cash-flow management purposes. The IRS Redemption Account nevertheless closed off the year with a balance
of NAD256.6 million, higher than the balance of NAD198.8 million at the end of 2018. Notwithstanding this, the Government remains committed to a speedy replenishment of the IRS Account to ensure the smooth redemption of the maturing bonds.

Bank of Namibia Annual Report 2019158
Part CEconomic and Financial Developments
Meanwhile, the balance on the Eurobond sinking fund increased during 2019. In this regard, the Eurobond sinking fund increased to USD396.0 million
from a total of USD303.7 million at the end of 2018. The Government employed a strategy to build up the fund in preparation for the Eurobonds’ maturities.
FIGURE C.17 INTERNAL REGISTERED STOCK REDEMPTION ACCOUNT
The balance on the IRS Redemption Account declined during 2019, while the Eurobond sinking fund increased.
0
50
100
150
200
250
300
350
400
450
0
200
400
600
800
1,000
1,200
1,400
1,600
1,800
J F M A M J J A S O N D J F M A M J J A S O N D J F M A M J J A S O N D2017 2018 2019
USD
Mill
ions
N$ m
illio
n
ZAR Sinking Fund Eurobond Sinking Fund (USD)
Sovereign credit ratings
Fitch Ratings downgraded Namibia’s Long-Term Foreign-Currency Issuer Default Rating to ‘BB’ from ‘BB+’ with a stable outlook, on 1 October 2019. According to Fitch, the downgrade of Namibia’s credit rating reflects the deterioration in economic growth and fiscal metrics. According to the agency, the worsened macroeconomic environment presents lower growth prospects over the short- to medium-term. The assessment also highlighted that the subdued economic activity, coupled with elevated inequality and high unemployment, could pose significant challenges for the Government’s plan to stabilise its debt. Amongst other issues emphasised is the lack of sufficient measures to achieve fiscal consolidation; high SOE debt; the high wage bill; the volatility of SACU transfers; and the rapid depletion of onshore diamond mining reserves that raises downside risks for public finances.
Correspondingly, Moody’s Investor Service also downgraded Namibia’s long-term issuer and senior unsecured ratings from Ba1 to a Ba2 sub-investment grade, with a stable outlook in December 2019. The decision was underpinned by several factors such as the Government’s reduced ability to stabilise growth in the public debt through cutting back on spending; and in particular, the Government’s inability to reduce the high wage bill costs in a low
growth environment. Moody’s also pointed out the negative impact of the severe drought in the agricultural sector and the weak growth in the mining sector, as well as the declining national competitiveness relative to global rankings.
Nevertheless, the agency pointed out several catalysts to the country’s economic recovery and growth prospect. Among these are a relatively robust institutional framework, strong governance standards, national capacity to respond to shocks, the liquidity capacity of the domestic financial sector, and monetary and price stability.
In line with these credit rating downgrades, the government reiterated its commitment to growth-friendly fiscal consolidation. This means employing a structural policy reforms package that supports domestic economic activity, thereby bringing about economic recovery, while at the same time holding the public debt within sustainable levels. This includes the implementation of SME and youth entrepreneurship financing facilities at the Development Bank of Namibia, execution of the recommendations of the 2019 Economic Growth Summit in the broad areas of structural policy reforms, and the implementation of public-sector-wide wage bill reforms to reduce the wage bill.

Bank of Namibia Annual Report 2019 159
Part CEconomic and Financial Developments
TABLE C.10 NSX SUMMARY STATISTICS
Category 2018 2019 Percentage change
Overall
Index (end of year) 1,307 1,306 (0.0)
Market capitalisation (N$ million) (end of year) 1,965,664 1,943,009 (1.2)
Free-float market capitalisation (N$ million) (end of year) 1,238,615 1,483,778 19.8
Volume traded (‘000) 183,209 203,205 10.9
Value traded (N$ million) 11,949 8,607 (28.0)
Number of deals 4,921 4,839 (1.7)
Number of new listings 1 6 500.0
Number of de-listings 1 2 100.0
Local
Index (end of year) 621 614 (1.2)
Market capitalisation (N$ million) (end of year) 35,406 36,339 2.6
Volume traded (‘000) 34,589 92,117 166.3
Value traded (N$ ‘000) 886,134 1,372,838 54.9
Number of deals 1,031 861 (16.5)
Number of new listings - -
Number of de-listings - -
The Overall Index dropped slightly at the end of 2019, to close at 1 306.30 points, compared to 1 307.76 at the end of 2018. Consequently, market capitalisation at the end of 2019 declined to N$1.94 trillion. This represents a decline of 1.2 percent when compared to the closing amount at the end of 2018. The decline in the market capitalisation was partly due to the delisting of Bidvest Namibia Ltd on 11 June 2019
coupled with the decline in the share price of Old Mutual Ltd among others which declined by 12.2 percent to close at N$19.66 in December 2019 partly due to the legal battle between the former CEO and the board chairperson. The Local Index similarly declined by 1.2 percent during the period under review to close at 613.87 index points (Table C.10).

Bank of Namibia Annual Report 2019160
Part CEconomic and Financial Developments
PUBLIC FINANCE
FIGURE C.18 (A–E) PUBLIC FINANCE
a. The Central Government deficit is expected to narrow during the Fiscal Year (FY) 2019/20 compared to thepreceding fiscal year, and to decline further over the Medium-term Expenditure Framework (MTEF) period, asrevenue rises faster than expenditure.
-9.0
-8.0
-7.0
-6.0
-5.0
-4.0
-3.0
-2.0
-1.00.0
-14,000
-12,000
-10,000
-8,000
-6,000
-4,000
-2,000
0
Perc
ent
N$ m
illio
n
Overall balance Deficit target (RHS) As % of GDP (RHS)
2015/16 2016/17 2017/18 2018 /19(est.) 2019 /20(proj)
b. Central Government’s expenditure is expected torise during FY2019/20 and gradually pick-up over theMTEF period.
c. Revenue collection is also expected to rise duringFY2019/20 and further over the MTEF period.
0.0
10,000.0
20,000.0
30,000.0
40,000.0
50,000.0
60,000.0
70,000.0
2015/16 2016/17 2017/18 2018/19 2019/20(est.)
N$ m
illio
n
Total expenditure
46,000.0
48,000.0
50,000.0
52,000.0
54,000.0
56,000.0
58,000.0
60,000.0
2015/16 2016/17 2017/18 2018/19 2019/ 20 (est.)
N$ m
illio
n
Total revenue and grants
d. Central Government total debt as a percentage ofGDP rose at the end of 2019 when compared to theprevious year and continued to trend above the debtceiling.
e. Central Government loan guarantees as a percentage of GDP declined marginally during 2019 and continuedto trend below the ceiling.
-
10.0
20.0
30.0
40.0
50.0
60.0
2015 2016 2017 2018 2019
Perc
enta
ge
Total Debt as % of GDP Debt Ceiling as % of GDP
0.0
2.0
4.0
6.0
8.0
10.0
12.0
2015 2016 2017 2018 2019
As a
% o
f GDP
Total Guarantees as % of GDP Ceiling as % of GDP
Source: MoF

Bank of Namibia Annual Report 2019 161
Part CEconomic and Financial Developments
THE NATIONAL GOVERNMENT BUDGET
Budget balance
TABLE C.11 CENTRAL GOVERNMENT REVENUE AND EXPENDITURE OUTTURN AND PROJECTION (N$ MILLION/PERCENT)
2015/16 2016/17 2017/18 2018/19 2019-20
Actual Actual Actual Actual Budget Revised
Fiscal GDP 148,125 160,041 171,660 178,208 182,022 182,022
Revenue 52,215 50,865 58,659 55,882 58,397 58,406
% of GDP 35.3 31.8 34.2 31.4 32.1 29.7
Expenditure 64,638 62,228 67,523 67,766 66,550 66,550
% of GDP 43.6 38.9 39.5 36.5 36.6 33.8
Budget Balance -12,423 -11,363 -8,864 -9,107 -8,153 -8,144
% of GDP -8.4 -7.1 -5.3 -5.2 -4.5 -4.5
Debt 59,789 62,865 74,468 87,533 96,271 96,934
% of GDP 40.4 39.3 43.4 49.1 52.9 53.3
Interest payments 2,630 4,192 5,430 6,308 6,404 6,404
% of Revenue 5.0 8.2 9.3 11.3 11.0 11.0
Guarantees 6,457 8,774 11,036 10,889 11,107 11,107
% of GDP 4.4 5.5 6.4 6.1 6.1 6.1
Sources: MoF, BoN and NSA
The Central Government’s budget deficit is expected to narrow during FY2019/20 compared to the preceding fiscal year and to decline further over the MTEF period. The Central Government deficit as a percentage of GDP for FY2019/20 is estimated at 4.5 percent, the same as the earlier estimate in the
main budget in March 2019 (Figure 18a). However, this is lower than the deficit for FY2018/19, which was estimated at 5.2 percent. The lower deficit was due to an increase in revenue, which grew at a faster pace than expenditure as a result of higher SACU receipts.
Expenditure
TABLE C.12 CURRENT AND CAPITAL EXPENDITURE (N$ MILLION)
2015/16 2016/17 2017/18 2018/19 2019/20
Current Expenditure
Personnel expenditure 23 849 26 753 29 171 28 927 29 969
Expenditure on goods and other services 7 915 10 362 8 421 6 171 6 562
Interest and borrowing related charges 2 623 4 310 5 430 5 783 6 404
Subsidies and other current transfers 17 834 13 105 18 838 15 781 15 540
Total Current Expenditure 52 221 54 530 61 860 56 662 58 475
Capital Expenditure 2015/16 2016/17 2017/18 2018/19 2019/20
Acquisition of capital goods 6 913 6 687 4 556 6 790 6 822
Goods and other services 658 261 229 230 -
Capital transfers 1 565 1 024 1 025 975 1 253
Total Capital Expenditure 9 135 7 972 5 810 7 995 8 075 Sources: MoF

Bank of Namibia Annual Report 2019162
Part CEconomic and Financial Developments
Central Government expenditure is estimated to have risen during FY 2019/20, from a slightly lower level registered during the previous fiscal year, mainly due to a rise in interest- and borrowing-related charges. During the recent mid-year budget review, Central Government expenditure was estimated at N$66.6 billion, which is similar to the estimate in the 2019 main budget (Figure C.18b). This was a slight increase from the N$65.1 billion registered during
FY2018/19. The rise in expenditure was the result of personnel expenditure, which rose by 4.0 percent to N$30.0 billion during the period under review. This was mainly due to an increase in remuneration as a result of increased recruitment of teachers and police officers. The increase in expenditure on interest- and borrowing-related charges, as well as capital transfers, also contributed to the increase in total Central Government expenditure.
FIGURE C.19 BUDGET ALLOCATION BY SECTOR EXCLUDING INTEREST PAYMENTS (PERCENTAGE)
The social sector continued to take up the highest share of the budgetary allocation during FY2019/20, similar to the previous year.
2018/19 2019/20
7.0
13.8
Social sector Public safety sector Administrative sector
Economic sector Infrastructure sector
49.8
7.9
13.96.8 6.8
50.422.0 21.7
The social sector continued to take up the biggest share of the total budget allocation during the period under review. In FY2019/20, the portion of the total budgetary allocation allocated to the social sector, which comprises health, education, poverty eradication and social welfare, amounted to 49.8 percent. These funds supported the procurement of pharmaceuticals, clinical suppliers, the recruitment of health professionals, teachers and police officers, purchases of textbooks
and school feeding programmes. In addition, budgetary provision was made to fund the old age and disability social grants. The share allocated to the social sector declined slightly, however, by 0.7 percentage points, as a result of increased allocations to the administrative and economic sectors. The public safety and economic sectors were the second and third biggest recipients of the total budget allocation during FY2019/20.
Revenue
Central Government revenue is expected to rise during FY2019/20, compared to the previous fiscal year, as a result of higher SACU receipts. Central Government revenue is expected to rise by 4.5 percent
to N$58.4 billion during FY2019/20. This is mainly due to higher SACU receipts, which rose by 8.9 percent to N$18.9 billion during FY2019/20, compared to the previous fiscal year.

Bank of Namibia Annual Report 2019 163
Part CEconomic and Financial Developments
Central Government debt
24 The exchange rate used in this section is the end-of-period exchange rate.
Central Government’s debt stock rose over the year to the end of 2019 on account of increased domestic borrowing. The total Government debt stock stood at N$93.2 billion at the end of 2019, representing an increase of 7.5 percent over the debt stock registered at the end of 2018. The increase was mostly reflected in domestic debt as a result of the further allotments of treasury bills (TBs) and IRS in order to finance the budget deficit. Meanwhile, external
debt declined by 4.1 percent owing to exchange rate appreciation24 of the local currency against major trading currencies, particularly the USD and the RMB. Total debt as a percentage of GDP stood at 51.2 percent at the end of 2019, reflecting an increase of 2.6 percentage points over its level at the end of 2018 (Table C.13). The debt-to-GDP ratio remains higher than the Central Government debt ceiling of 35.0 percent of GDP.
TABLE C.13 CENTRAL GOVERNMENT DEBT AS AT 31 DECEMBER (N$ MILLION)
Value (N$ million) / Percent 2015 2016 2017 2018 2019
Fiscal year GDP 148,125 160,041 171,660 178,208 182,022
Foreign debt stock 28,332 25,262 26,426 32,156 30,852
Bilateral 3,549 2,997 2,879 3,027 2,723
As % of total 12.5 11.9 10.9 9.4 8.8
Multilateral 2,939 2,342 5,164 8,198 7,583
As % of total 10.4 9.3 19.5 25.5 24.6
Eurobond 19,444 17,030 15,491 18,039 17,654
As % of total 68.6 67.4 58.6 56.1 57.2
JSE Listed bond 2,400 2,892 2,892 2,892 2,892
As % of total 8.5 11.4 10.9 9.0 9.4
Foreign debt service 976 1,865 1,952 2,194 2,373
Domestic debt stock 28,045 39,119 46,337 54,492 62,300
Treasury bills 12,716 14,328 17,937 21,789 24,247
As % of total 45.3 36.6 39 40.0 38.9
Internal registered stock 15,330 24,791 28,400 32,703 38,053
As % of total 54.7 63.4 61.3 60.0 61.1
Total Central Government debt 56,377 64,381 72,763 86,647 93,151
End of Period Exchange rate in terms of N$ per foreign currency unit
US Dollar 15.5553 13.6240 12.3930 14.4309 14.1235
EUR 16.9997 14.3403 14.8063 16.4917 15.8247
RMB 2.3961 1.9610 1.9013 2.0982 2.0247
CHF 15.7356 13.3511 12.6743 14.6520 14.5985
JPY 0.1292 0.1167 0.1100 0.1308 0.1300
KWD 50.6476 44.7096 41.0204 47.4078 46.0937
Proportion of total debt
Foreign debt stock 50.3 39.2 36.3 37.1 33.1
Domestic debt stock 49.7 60.8 63.7 62.9 66.9
As % of GDP
Foreign debt stock 19.1 15.8 15.4 18.0 17.0
Domestic debt stock 18.9 24.4 27.0 30.6 34.2
Total debt 38.1 40.2 42.4 48.6 51.2 Sources: MoF, BoN and NSA

Bank of Namibia Annual Report 2019164
Part CEconomic and Financial Developments
Domestic debt
Total domestic debt rose during the year under review, as reflected in the issuance of TBs and IRS. The Government’s total domestic debt rose by 14.3 percent to N$62.3 billion at the end of 2019 (Table C.13). The increase was reflected in both TBs and IRS, which rose by 11.3 percent and 16.4 percent,
respectively, on account of increased borrowing to meet the Government’s financing requirements. Most of the TBs were allotted to the banking sector, while the IRS were mainly allotted to non-banking financial institutions. As a percentage of GDP, domestic debt rose by 3.7 percentage points, to 34.2 percent at the end of 2019.
Foreign debt
The stock of external debt declined during 2019, compared to the previous year, as a result of exchange rate appreciation. Central Government’s external debt stock declined by 4.1 percent to N$31.0 billion during the period under review (Table C.13). The decline was attributed to revaluation changes arising from the appreciation of the local currency against major
trading currencies, particularly the USD and the RMB. As a ratio of GDP, external debt declined from 18.0 percent in 2018 to 17.0 percent in 2019. External debt servicing rose to N$2.4 billion during the year under review, from N$2.2 billion in 2018. As a percentage of total revenue, external debt servicing rose by 0.1 percentage points to 4.0 percent.
FIGURE C.20 EXTERNAL DEBT BY TYPE (PERCENT)
The Eurobonds continued to be the major contributor to the Government’s external debt portfolio.
31 December 20188.8
24.6
57.256.1
9.49.4
25.5
9.0
31 December 2019
Bilateral Loans Multilateral Loans Eurobonds JSE listed bonds
Bilateral Loans Multilateral Loans Eurobonds JSE listed bonds
The Eurobonds remained the major contributor to the Government’s external debt stock during the year under review. At the end of 2019, Eurobonds accounted for 57.2 percent of the Government’s external debt stock, which was 1.1 percentage points higher than at the end of 2018 (Figure C.20). This was mainly due to principal repayments of some multilateral and bilateral loans during the period under review. In
this regard, the share of both multilateral and bilateral loans to the Central Government debt portfolio declined by 0.9 percentage points and 0.6 percentage points to 24.6 percent and 8.8 percent, respectively, which was lower than the previous year. The share of the JSE-listed bonds rose by 0.4 percentage points to stand at 9.4 percent at the end of 2019.

Bank of Namibia Annual Report 2019 165
Part CEconomic and Financial Developments
FIGURE C.21 EXTERNAL DEBT CURRENCY COMPOSITION (PERCENTAGE SHARE)
The US Dollar continued to be the leading currency in the Government external debt portfolio.
Euro 6.1
US Dollar 56.7
Rand 28.3
Yen 1.8 RMB 6.8Euro 5.0
US Dollar 58.4
Rand 28.8
31 December-2018 31 December-2019 Other 0.3 Yen 1.1
RMB 6.4 Other 0.3
Source: MoF
Currency composition
The US Dollar continued to be the dominant currency in the Government’s total external debt portfolio during the period under review. The Government’s external debt stock was largely denominated in US Dollars, which accounted for 58.4 percent of the external debt during the year under review (Figure C.21). This represents an increase of 1.8 percentage points compared to the previous year.
The share of the Rand, which is the second-most dominant currency in the Central Government external debt portfolio, rose by 0.5 percentage points to 28.8 percent during the year under review. The Renminbi and the Euro were the third and fourth highest currencies in the Government’s external debt portfolio during the period under review, accounting for 6.4 percent and 5.0 percent, respectively.
Central Government loan guaranteesTotal Central Government loan guarantees rose during 2019, compared to the previous year. Central Government total loan guarantees rose by 2.7 percent to N$11.2 billion during the period under review, reflecting a rise in foreign guarantees (Table C.14). Domestic loan guarantees declined during the
period under review. As a percentage of GDP, Central Government loan guarantees remained unchanged at 6.1 percent during 2019. At this ratio, total loan guarantees remained well below the ceiling set by the Government of 10.0 percent of GDP, thus signifying a lower Government contingency liability risk.
TABLE C.14 CENTRAL GOVERNMENT LOAN GUARANTEES AS AT 31 DECEMBER (N$ MILLION)
2015 2016 2017 2018 2019
Fiscal GDP 148,125 160,041 171,660 178,208 182,022
Domestic Guarantees 1,452 1,214 1,745 1,750 1,537
As % of GDP 1.0 0.8 1.0 1.0 0.8
As % of Total Guarantees 19.7 13.6 16.9 16.1 13.8
Foreign Guarantees 5,914 7,742 8,595 9,129 9,630
As % of GDP 4.0 4.8 5.0 5.1 5.3
As % of Total Guarantees 80.3 86.4 83.1 83.9 86.2
Total Guarantees 7,366 8,956 10,340 10,879 11,168
As % of GDP 5.0 5.6 6.0 6.1 6.1
Sources: MoF, BoN and NSA

Bank of Namibia Annual Report 2019166
Part CEconomic and Financial Developments
Foreign loan guarantees
Total foreign loan guarantees increased during the year under review. Total foreign loan guarantees increased by 5.5 percent to N$9.6 billion over the course of 2019. The rise was due to more foreign loan
guarantees being issued to the transport sector. As a percentage of GDP, total foreign loan guarantees rose by 0.2 percentage point to 5.3 percent during the year under review (Table C.14).
FIGURE C.22 FOREIGN LOAN GUARANTEES BY SECTOR
0.0
10.0
20.0
30.0
40.0
50.0
60.0
70.0
80.0
90.0
100.0
2015 2016 2017 2018 2019
Perc
enta
ge s
hare
Development Finance InstitutionsEnergyTransportCommunication
Regarding sectoral allocations, the development finance institutions sector remained the dominant sector in the foreign loan guarantee portfolio during the year under review. Development finance institutions which is the dominant sector in terms of the total share of foreign loan guarantees issued, stood at 50.2 percent of total foreign loan guarantees at the
end of 2019. This was a decline of 0.6 percentage point, compared to the share registered during the previous year. The share of the transport sector stood at 48.7 percent of the total foreign loan guarantees; the remaining portion belongs both to the energy and communication sectors, at 0.6 percent and 0.5 percent, respectively.
Domestic loan guarantees
Domestic loan guarantees declined over the year to the end of 2019. Total domestic loan guarantees declined by 12.2 percent compared to 2018 to stand at N$1.5 billion at the end of 2019 (Table C.14). The rise was due to principal repayment of loans in the education
and fisheries sectors during the year under review. As a percentage of GDP, domestic loan guarantees declined by 0.1 percentage points to 0.8 percent over the same period.
FIGURE C.23 DOMESTIC LOAN GUARANTEES BY SECTOR
0.0
10.0
20.0
30.0
40.0
50.0
60.0
70.0
80.0
90.0
100.0
2015 2016 2017 2018 2019
Perc
enta
ge s
hare
EnergyEducationFisheriesDevelopment Finance InstitutionsAgricultureTourism
The energy sector continued to dominate the total domestic loan guarantees during the year under
review. The share of total domestic loan guarantees issued to the energy sector, which is the dominant

Bank of Namibia Annual Report 2019 167
Part CEconomic and Financial Developments
sector with respect to total domestic loan guarantees, stood at 43.7 percent, which is a increased of 5.4 percentage points compared to the previous year. The agriculture sector was the second-most dominant sector, with a share of 31.5 percent (Figure C.23). The
development finance institutions were the third-most dominant sector, with a share of 15.3 percent, while the tourism, fisheries and transport sectors accounted for the remaining shares of 5.3 percent, 3.1 percent and 1.1 percent, respectively.

Bank of Namibia Annual Report 2019168
Part CEconomic and Financial Developments
FOREIGN TRADE AND PAYMENTS25
25 p in this section stands for provisional.
26 The sum of the balances on the current and capital accounts represents the net lending (surplus) or net borrowing (deficit) by theeconomy with the rest of the world.
FIGURE C.24 (A–F) EXTERNAL DEVELOPMENTS
a. During 2019, Namibia’s net borrowing26 from the rest of the
world declined, due to an improvement in the current account
deficit.
b. Namibia’s merchandise trade deficit narrowedduring 2019, reflecting a moderate decline in importsand slightly higher exports.
-30,000
-25,000
-20,000
-15,000
-10,000
-5,000
0
2015 2016 (p) 2017 (p) 2018 (p) 2019 (p)
N$ m
illio
n
Net lending (+) / Net borrowing (-) Current account balance
Financial account balance
-50.0
-30.0
-10.0
10.0
30.0
50.0
70.0
90.0
2015 2016 2017 (p) 2018 (p) 2019 (p)
N$ b
illio
n
Exports Imports Trade balance
c. The stock of international reserves declined in 2019,mainly due to banks purchasing foreign currency fromthe Bank of Namibia.
d. Namibia’s international investment position recordeda reduced net liability position in comparison with 2018,due to an increase in foreign assets.
23.6 24.7
30.2 31.028.9
1.0
1.5
2.0
2.5
3.0
3.5
4.0
4.5
5.0
0.0
5.0
10.0
15.0
20.0
25.0
30.0
35.0
2015 2016 2017 2018 2019
Mon
ths
N$ b
illio
n
Stock of international reserves Currency in circulation
Import cover (RHS)
-25
-20
-15
-10
-5
0
2015 2016 2017 (p) 2018 (p) 2019 (p)
N$ b
illio
n
Net international investment position
e. On average, the Namibia Dollar depreciated against all
major currencies during 2019 in comparison with 2018.
f. The nominal effective exchange rate (NEER) appreciated
slightly while the real effective exchange rate (REER)
depreciated marginally during 2019 in comparison with 2018
on an annual average basis.
0.03
0.04
0.05
0.06
0.07
0.08
0.09
0.10
2015 2016 2017 2018 2019
Mon
thly
ave
rage
Euro US$ British Pound
90
95
100
105
110
2015 2016 2017 2018 2019
Inde
x:20
15=1
00
NEER REER

Bank of Namibia Annual Report 2019 169
Part CEconomic and Financial Developments
TABLE C.15 EXTERNAL VULNERABILITY INDICATORS
2015 2016 2017 2018 2019
i. Solvency (percentages)
Gross External Debt/GDP 59.6 56.0 62.1 68.0 66.8
Gross External Debt/Exports of Goods and Services 164.5 158.2 176.4 185.4 181.7
External Debt Service/Exports of Goods and Services 42.9 44.7 27.1 31.0 36.3
Current account/GDP -13.7 -15.9 -4.0 -2.8 -2.3
ii. Reserves Adequacy
Reserves/Imports of Goods and Services (months) 3.1 3.2 4.4 4.5 4.1
Reserves/Broad Money Liabilities (percent) 28.8 28.8 30.8 29.7 26.3
Reserves/Short-term External Debt (Ratio) 2.5 2.6 2.4 2.1 2.0
CURRENT ACCOUNTNamibia’s current account deficit narrowed during 2019, primarily due to an improvement in the merchandise trade deficit, lower outflows on the primary income account, and a higher surplus on the secondary income account. The current account deficit narrowed by 18.2 percent to N$4.1 billion during 2019, compared to 2018 (Figure C.24a). The reduction in the current account deficit emanated from the shrinking merchandise trade deficit that reflected a moderate
decline in the import bill and slightly higher export earnings. Moreover, lower net outflows on the primary income account, coupled with increased inflows on the secondary income account as a result of increased SACU receipts, contributed to this development. As a percentage of GDP, the current account deficit stood at 2.3 percent during 2019, compared to a deficit of 2.8 percent during the previous year (Table C.15).
Merchandise trade balance
The merchandise trade deficit narrowed in 2019, driven by a moderate decline in import payments and slightly higher exports. Namibia’s trade deficit narrowed by 5.2 percent to N$19.4 billion during 2019 (Figure C.24b). This was partly due to an increase in merchandise exports, which rose by 0.8 percent to N$56.0 billion in 2019 as earnings from manufactured exports, uranium and gold increased. Earnings from exports were significantly weighed down by a substantial decline in foreign earnings from rough diamonds and
food and live animals in 2019. Furthermore, a contraction in the value of merchandise imports contributed to the narrowing trade deficit. In this regard, imports declined marginally by 0.9 percent to N$75.4 billion during 2019, reflecting the weak demand for goods and services as mirrored in depressed wholesale and retail trade activity, weak construction activity, and a contraction in instalment credit extended to the domestic private sector.

Bank of Namibia Annual Report 2019170
Part CEconomic and Financial Developments
Exports
27 This category includes gold, zinc concentrate, copper concentrates, lead, salt, manganese and dimension stone
FIGURE C.25 (A–F) EXPORTS 27
a. Export earnings from rough diamonds declined, as fewer
diamonds were recovered from both onshore and offshore
operations during 2019.
b. Foreign earnings from uranium rose during 2019, which
was mainly attributed to the depreciation of the Namibia Dollar
against major trading currencies.
0
500
1 000
1 500
2 000
2 500
5.0
6.0
7.0
8.0
9.0
10.0
11.0
12.0
2015 2016 2017 2018 2019Ca
rats
('00
0)
N$ b
illio
n
Diamond export value Diamond export volume (RHS)
0.0
5.0
10.0
15.0
20.0
25.0
30.0
35.0
40.0
01 0002 0003 0004 0005 0006 0007 0008 0009 000
10 000
2015 2016 2017 2018 2019
U$ p
er p
ound
(spo
t pric
e)
N$ m
illio
n Uranium export Uranium average price (RHS)
c. Export receipts from other minerals6 increased, primarily
due to higher earnings from gold.
d. Export earnings from food and live animals decreased,
mainly as a result of a decline in earnings from live animals
exported to South Africa.
-
1,000
2,000
3,000
4,000
5,000
6,000
7,000
8,000
0
1,000
2,000
3,000
4,000
5,000
6,000
7,000
2015 2016 2017 2018 2019
N$ m
illio
n
US$
Other minerals exports (RHS) Zinc price (per tonne)
Copper price (per tonne)
Lead price (per tonne)
Gold price (per ounce)
0.0
1.0
2.0
3.0
4.0
5.0
2015 2016 2017 2018 2019
N$ b
illio
n
Food and live animals
e. Export earnings from live animals as well as average prices
of weaners and sheep declined during 2019.
f. The value of manufactured exports increased in 2018,
mainly on account of higher earnings from processed meat,
refined zinc, and beverages.
0.005.0010.0015.0020.0025.0030.0035.0040.0045.0050.00
0
500
1,000
1,500
2,000
2,500
2015 2016 2017 2018 2019
N$ p
er k
g
N$ m
illio
n
Live small stock Live cattle
Average price for sheep (RHS) Weaners average price (RHS)
0.0
5.0
10.0
15.0
20.0
25.0
2015 2016 2017 2018 2019
N$ b
illio
n
Manufactured products - export value
Source: BoN surveys

Bank of Namibia Annual Report 2019 171
Part CEconomic and Financial Developments
Mineral exports
Rough diamonds
28 This includes dimension stones, marble stones, fluorspar, cement and manganese.
Export earnings from rough diamonds declined during 2019, mainly due to fewer diamonds recovered from both onshore and offshore operations. The volume of rough diamonds exported declined substantially by 17.6 percent to 1.5 million carats, resulting in a decrease in export earnings of 15.0 percent, to N$9.4 billion during 2019 compared to 2018 (Figure C.25a). The decline in the volume
exported was mainly due to the decrease in the number of diamonds recovered from land operations following the closure of one of the mines, coupled with fewer diamonds recovered offshore due to the scheduled maintenance of one of the mining vessels. Moreover, these developments coincided with a weakening in the global market for diamonds, which negatively affected prices during 2019.
Uranium
Uranium export earnings increased in 2019 compared to 2018, primarily due to a favourable exchange rate. Export earnings from uranium rose by 6.7 percent to N$9.2 billion during 2019 (Figure C.25b). The increase in uranium export earnings waslargely driven by the favourable exchange rate andhigher realised prices, offsetting the lower volume thatwas exported due to operational challenges and the
discontinued production from a large mine that was placed under care and maintenance. On the spot market, the average international price of uranium increased by 4.3 percent to US$25.64 per pound, mainly due to lower global production since 2018, coupled with the removal of restrictions based on section 232 of the US Trade Expansion Act of 1962.
Other mineral exports
The other minerals category recorded higher export earnings in 2019, mainly due to increased earnings from gold and the subcategory other28. Export earnings from other minerals increased significantly by 17.1 percent to N$7.3 billion during 2019 (Figure C.25c). The increase was mainly reflected in higher earnings from gold and the subcategory other. The increase in earnings for the subcategory other was mainly underpinned by the favourable exchange rate, while earnings from gold increased substantially by 26.5 percent to N$4.5 billion during 2019, largely supported
by a rise in the gold price, increased volumes exported and the favourable exchange rate. On average, the international price of gold increased by 9.7 percent to US$ 1 392 per ounce, mainly due to increased demand for safe-haven assets amid weaker global growth prospects, intensifying trade tensions and monetary policy easing by the US Federal Reserve Bank. In contrast, commodity prices of zinc concentrate, copper concentrate and lead declined during 2019 as a result of weaker global demand.
Non-mineral exports
Food and live animals
During 2019, export earnings for food and live animals decreased, mainly as a result of a drop in earnings from live animals exported to South Africa. Foreign earnings for the food and live animals’ category declined by 10.4 percent to N$3.4 billion in 2019, when compared to the previous year. This was mainly due to a decline in foreign earnings from live animals, which fell by 22.4 percent to N$2.1 billion during 2019. This was mainly underpinned by the decline in weaner prices, as well as a reduction in the number of live weaners exported. On the contrary, there was an increase in earnings from other food products, particularly grapes destined for European markets, mainly supported by the depreciation of the Namibia Dollar against major trading currencies.
The average prices of weaners and sheep declined during 2019. Average prices of live weaners decreased significantly by 22.2 percent to N$24.04 per kilogramme during 2019, when compared to 2018 (Figure C.25e). This was largely due to the outbreak of foot-and-mouth disease in certain areas of South Africa during the first part of the year, which led to excess supply, consequently resulting in depressed weaner prices.This was exacerbated by a higher cost of yellow maize, which increased the costs of South African feedlots. Similarly, average prices of sheep declined by 8.6 percent to N$40.13 per kilogramme, mainly owing to the drought conditions experienced.

Bank of Namibia Annual Report 2019172
Part CEconomic and Financial Developments
Manufactured exports
Export earnings from manufactured products increased during 2019, mainly on account of increases in proceeds from processed meat, refined zinc and beverages. During 2019, the value of manufactured exports rose by 3.2 percent to N$23.7 billion (Figure C.25f). This was underpinned by increases in receipts from processed meat, refined zinc and beverages. Proceeds from processed meat increased by 24.1 percent to N$1.5 billion, mainly on
account of a significant increase in the number of cattle slaughtered for export at the local export abattoirs, as well as the weakening of the local currency against major trading currencies. Moreover, the increase in earnings from refined zinc was largely driven by higher volumes exported as well as the favourable exchange rate, while the increase in exports for beverages was due to increased production from a local brewery.
Imports of goodsDuring 2019, the value of merchandise imports edged lower, as reflected in decreases across most major categories of merchandise imports. Expenditure on merchandise imports fell by 0.9 percent to N$75.4 billion in 2019, when compared to 2018. The decline in the value of imports reflected decreases in major import categories such as machinery and mechanical appliances, products of the chemical
industries, and base metals. The sluggish behaviour of merchandise imports was in line with the weak demand for goods and services, as reflected in depressed wholesale and retail activity, coupled with the decline in construction activity, weak demand for vehicles and negative growth in instalment credit extended to the domestic private sector.
Direction of trade
FIGURE C.26 (A) EXPORTS BY DESTINATION
In 2019, the Eurozone remained the leading destination for Namibia’s merchandise exports, followed by South Africa, China and Botswana.
2019
Eurozone (23.3%)South Africa (22.7%)People’s Republic of China (16.3%)Botswana (13.3%)Canada (6.7%)Democratic Republic of Congo (3.3%)
Zambia (1.9%)United States (1.7%)United Kingdom (0.8%)Rest of the world (6.8%)
23.3%
22.7%
16.3%
13.3%
6.7%
3.3%3.2%
1.9% 1.7%0.8%
6.8%
United Arab Emirates (3.2%)
2018
Eurozone (29.0%)South Africa (21.8%)Botswana (15.3%)People’s Republic of China (11.9%)United Arab Emirates (3.9%)United States (2.3%)Zambia (1.9%)Democratic Republic of Congo (1.7%)Switzerland (1.4%)Israel (1.0%)Rest of the world (9.8%)
29.0%
21.8%.
15.3%
11.9%
3.9% 2.3%
1.9% 1.7% 1.4%
1.0% 9.8%
Source: NSA
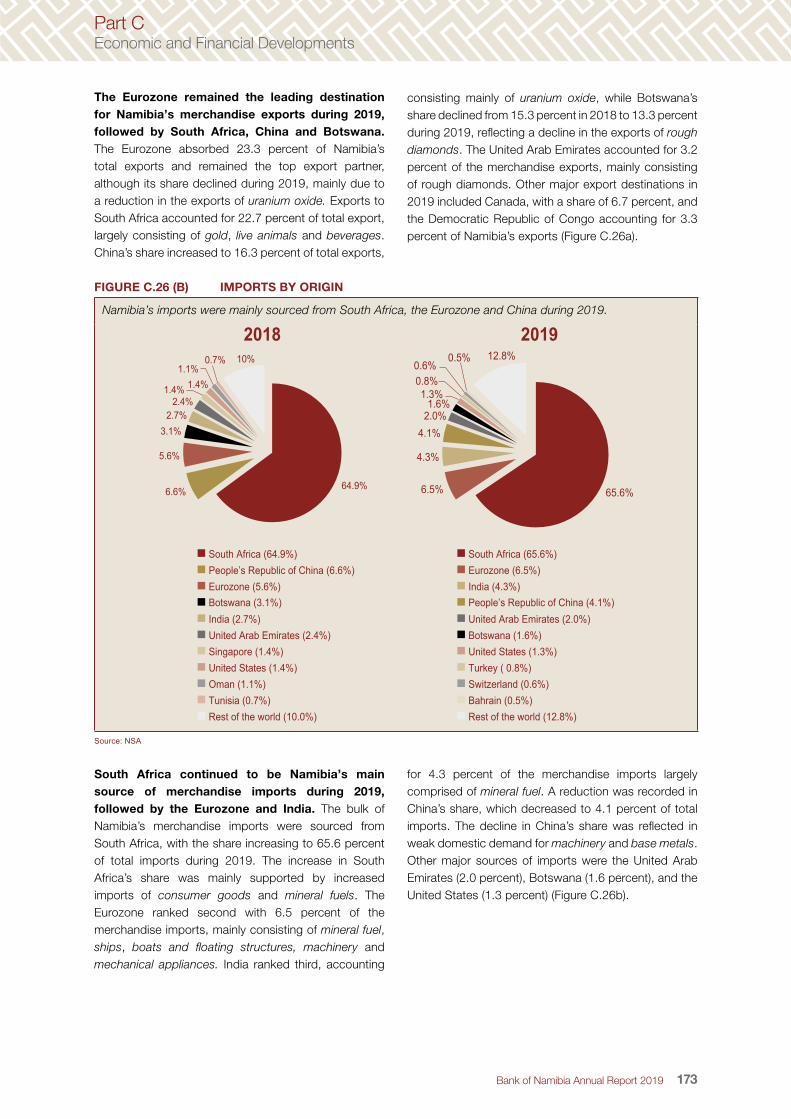
Bank of Namibia Annual Report 2019 173
Part CEconomic and Financial Developments
The Eurozone remained the leading destination for Namibia’s merchandise exports during 2019, followed by South Africa, China and Botswana. The Eurozone absorbed 23.3 percent of Namibia’s total exports and remained the top export partner, although its share declined during 2019, mainly due to a reduction in the exports of uranium oxide. Exports to South Africa accounted for 22.7 percent of total export, largely consisting of gold, live animals and beverages. China’s share increased to 16.3 percent of total exports,
consisting mainly of uranium oxide, while Botswana’s share declined from 15.3 percent in 2018 to 13.3 percent during 2019, reflecting a decline in the exports of rough diamonds. The United Arab Emirates accounted for 3.2 percent of the merchandise exports, mainly consisting of rough diamonds. Other major export destinations in 2019 included Canada, with a share of 6.7 percent, and the Democratic Republic of Congo accounting for 3.3 percent of Namibia’s exports (Figure C.26a).
FIGURE C.26 (B) IMPORTS BY ORIGIN
Namibia’s imports were mainly sourced from South Africa, the Eurozone and China during 2019.
2018
South Africa (64.9%)People’s Republic of China (6.6%)Eurozone (5.6%)Botswana (3.1%)India (2.7%)United Arab Emirates (2.4%)Singapore (1.4%)United States (1.4%)Oman (1.1%)Tunisia (0.7%)Rest of the world (10.0%)
64.9%6.6%
5.6%
3.1%2.7%
2.4%1.4% 1.4%
1.1%0.7% 10%
2019
South Africa (65.6%)Eurozone (6.5%)India (4.3%)People’s Republic of China (4.1%)United Arab Emirates (2.0%)Botswana (1.6%)United States (1.3%)Turkey ( 0.8%)Switzerland (0.6%)Bahrain (0.5%)Rest of the world (12.8%)
65.6%6.5%
4.3%
4.1%2.0%1.6%
1.3%0.8%0.6%
0.5% 12.8%
Source: NSA
South Africa continued to be Namibia’s main source of merchandise imports during 2019, followed by the Eurozone and India. The bulk of Namibia’s merchandise imports were sourced from South Africa, with the share increasing to 65.6 percent of total imports during 2019. The increase in South Africa’s share was mainly supported by increased imports of consumer goods and mineral fuels. The Eurozone ranked second with 6.5 percent of the merchandise imports, mainly consisting of mineral fuel, ships, boats and floating structures, machinery and mechanical appliances. India ranked third, accounting
for 4.3 percent of the merchandise imports largely comprised of mineral fuel. A reduction was recorded in China’s share, which decreased to 4.1 percent of total imports. The decline in China’s share was reflected in weak domestic demand for machinery and base metals. Other major sources of imports were the United Arab Emirates (2.0 percent), Botswana (1.6 percent), and the United States (1.3 percent) (Figure C.26b).

Bank of Namibia Annual Report 2019174
Part CEconomic and Financial Developments
Services, investment income and current transfersFIGURE C.27 (A–C) SERVICES, PRIMARY INCOME AND SECONDARY INCOME
a. The services account registered lower net inflows during 2019, mainly due to decreased receipts from travel and manufacturing services.
b. Net outflows on the primary income account decreased, mainly supported by lower net investment income outflows.
-6 000
-4 000
-2 000
0
2 000
4 000
6 000
2015 2016 2017 2018 2019
N$ m
illio
n
Travel Transportation Manufacturing All other private services
Government services n.i.e. Total net services
-8 000
-6 000
-4 000
-2 000
0
2 000
4 000
2015 2016 2017 2018 2019
N$ m
illio
n
Direct investment income net Portfolio investment income net
Other investment income net Investment income net
c. Namibia’s net secondary income receipts increased during 2019 compared to 2018, largely as a result of higher SACU receipts.
0.0
5.0
10.0
15.0
20.0
25.0
2015 2016 2017 2018 2019
N$ b
illio
n
Secondary income net SACU receipts
Source: Various companies and BoN surveys
Services balance
Namibia’s services account registered lower net inflows in 2019, mainly on account of decreased receipts from travel and manufacturing services. The net services balance recorded a lower inflow of N$1.0 billion in 2019, compared to an inflow of N$2.3 billion in 2018 (Figure C.27a). This was due to the decrease in net inflows of travel and manufacturing services, which
declined by 13.8 percent and 5.1 percent to N$3.7 billion and N$1.7 billion, respectively. The decline in travel receipts was driven by the significant reduction in international and regional tourist arrivals in 2019 whereas the fall in volumes of copper blister processed resulted in lower earnings for manufacturing services.
Net primary income
The primary income account recorded lower net outflows during 2019, largely due to reduced net
investment income outflows. Net outflows on the primary income account declined by 8.2 percent to

Bank of Namibia Annual Report 2019 175
Part CEconomic and Financial Developments
N$5.0 billion in 2019 (Figure C.27b). The decreased outflows were mainly underpinned by reductions in investment income payments to foreign direct investors,
29 BPM6, the interpretation of the financial account particularly on the assets, denotes an increase as positive and a decrease as negative. The interpretation on the
liabilities remains unchanged from BPM5, where an increase or decrease implies just that. Furthermore, the net balances are interpreted in terms of net lending (if
positive (denoting outflows)) or net borrowing (if negative (inflows)). The financial account balance is now presented inclusive of reserve assets according to BPM6
and implies that the financing of the net lending/borrowing position (current account) is fully accounted for above the line (i.e. above the financial account balance).
particularly in the form of retained earnings that declined substantially as foreign direct investment enterprises (FDIE) made lower profits in 2019.
Net secondary income
During 2019, Namibia’s net secondary income receipts increased, primarily due to higher SACU receipts. Inflows on the secondary income account rose by 3.5 percent to N$19.3 billion during 2019 (Figure
C.27c). This was mainly due to moderately higher SACU receipts, which increased by 3.4 percent to N$18.5 billion during the year under review.
CAPITAL ACCOUNTNamibia’s capital account surplus decreased during 2019, largely as a result of lower capital transfers from non-residents. The capital account surplus shrank in 2019 from 2018 by 4.8 percent to
N$1.6 billion. The lower inflows reflected the decrease in capital transfers from foreign governments and private institutions.
NET LENDING (+) AND NET BORROWING (-)
Given the developments on both the current and capital accounts during 2019, Namibia’s net borrowing from the rest of the world declined, when compared to the preceding year. Net
borrowing from the rest of the world declined by 23.5 percent to N$2.5 billion during 2019, mainly supported by an improvement in the current account.
FINANCIAL ACCOUNT29
Based on the developments in the direct and other investment accounts during 2019, the financial account balance registered reduced net borrowing from the rest of the world, when compared to 2018. Namibia’s net borrowing from the rest of the world
declined to N$1.9 billion from N$2.5 billion recorded in 2018; the decline was mainly related to direct and other investment outflows. Moreover, some of the net borrowing from the rest of the world took the form of a drawdown of foreign reserves.

Bank of Namibia Annual Report 2019176
Part CEconomic and Financial Developments
FIGURE C.28 (A–C) FINANCIAL ACCOUNT COMPONENTS
a. Direct investment liabilities recorded an outflow during 2019 due to debt repayments made by enterprises.
b. Namibia’s portfolio investment recorded an inflowduring 2019 due to reduced investment abroad in theform of equity and debt.
-12.0
-7.0
-2.0
3.0
8.0
13.0
18.0
2015 2016 2017 (p) 2018 (p) 2019 (p)
N$ b
illio
n
Equity and investment fund shares Reinvestment of earnings
Debt instruments Net incurrence of liabilities
-16.0
-12.0
-8.0
-4.0
0.0
4.0
8.0
-3.0
0.0
3.0
6.0
9.0
12.0
15.0
2015 2016 2017 (p) 2018 (p) 2019 (p)
N$ b
illio
n
N$ b
illio
n
Net acquisition of assets Net incurrence of liabilities
Portfolio investment (RHS)
c. Other investment registered a small net capital outflow during 2019, partly due to repayments made on foreignloans.
- 20.0
-15.0
-10.0
-5.0
0.0
5.0
10.0
15.0
20.0
2015 2016 2017 (p) 2018 (p) 2019 (p)
N$ b
illio
n
Net acquisition of assets Net incurrence of liabilities Other Investment
Direct investment During 2019, Namibia’s direct investment liabilities registered an outflow due to repayments made by enterprises in the mining sector, switching around from an inflow in 2018. Namibia’s foreign direct investment liabilities registered an outflow of N$251 million, following an inflow of N$2.1 billion recorded in 2018 (Figure C.28a). The outflow in direct investment liabilities was mainly due to debt repayments made by direct investment enterprises in the mining
sector. Enterprises (mainly in the mining sector) made repayments worth N$317 million on their debt compared to the borrowing of N$1.5 billion observed in 2018. In addition, the losses made by foreign direct investment enterprises leading to some instances of negative reinvestment earnings contributed to the outflow, and thus to the reduction of foreign direct investment liabilities.
Portfolio investmentOn a net basis, Namibia’s portfolio investment recorded an inflow during 2019 due to reduced investment abroad in the form of equity and debt. Namibia’s portfolio investment recorded a net capital inflow of N$985 million compared to the outflow of N$2.8 billion during 2018 (Figure C.28b). This development
was mainly due to institutional investors reducing their purchases of foreign assets abroad in the form of equity and debt securities, following the increase in domestic asset requirements to 45 percent by the end of March 2019. Hence, investment abroad by local institutional investors in the form of equity switched to an inflow
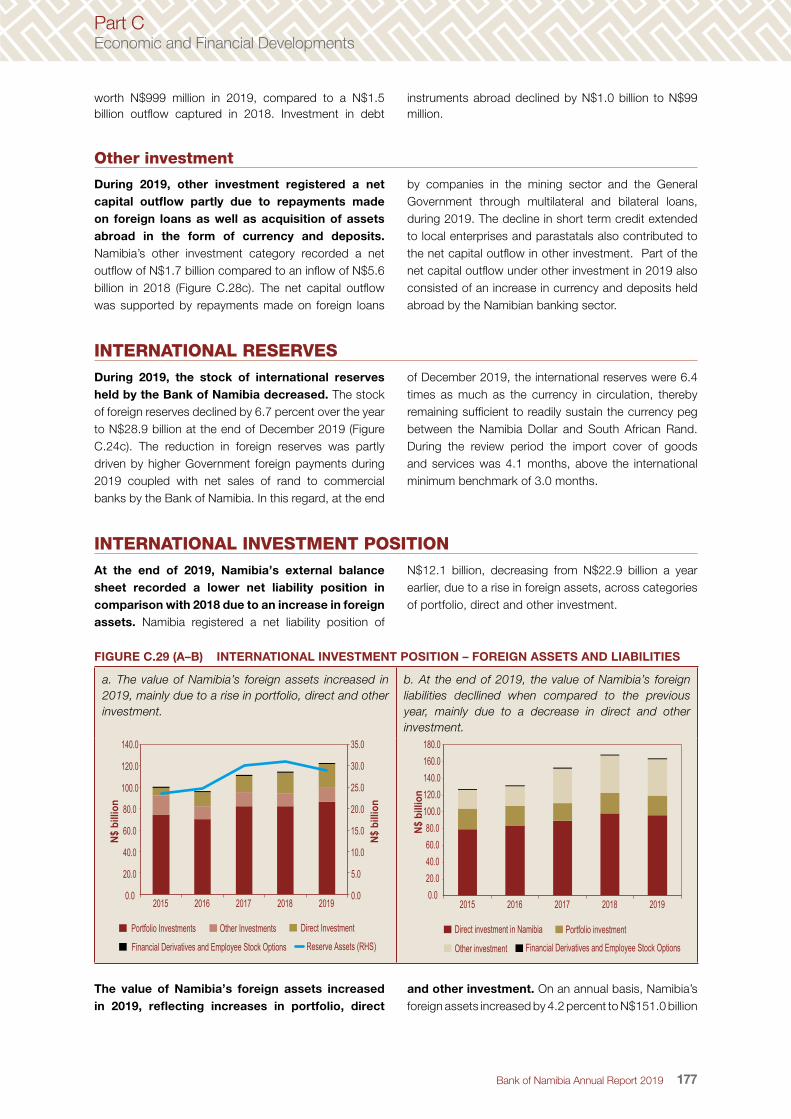
Bank of Namibia Annual Report 2019 177
Part CEconomic and Financial Developments
worth N$999 million in 2019, compared to a N$1.5 billion outflow captured in 2018. Investment in debt
instruments abroad declined by N$1.0 billion to N$99 million.
Other investment
During 2019, other investment registered a net capital outflow partly due to repayments made on foreign loans as well as acquisition of assets abroad in the form of currency and deposits. Namibia’s other investment category recorded a net outflow of N$1.7 billion compared to an inflow of N$5.6 billion in 2018 (Figure C.28c). The net capital outflow was supported by repayments made on foreign loans
by companies in the mining sector and the General Government through multilateral and bilateral loans, during 2019. The decline in short term credit extended to local enterprises and parastatals also contributed to the net capital outflow in other investment. Part of the net capital outflow under other investment in 2019 also consisted of an increase in currency and deposits held abroad by the Namibian banking sector.
INTERNATIONAL RESERVESDuring 2019, the stock of international reserves held by the Bank of Namibia decreased. The stock of foreign reserves declined by 6.7 percent over the year to N$28.9 billion at the end of December 2019 (Figure C.24c). The reduction in foreign reserves was partly driven by higher Government foreign payments during 2019 coupled with net sales of rand to commercial banks by the Bank of Namibia. In this regard, at the end
of December 2019, the international reserves were 6.4 times as much as the currency in circulation, thereby remaining sufficient to readily sustain the currency peg between the Namibia Dollar and South African Rand. During the review period the import cover of goods and services was 4.1 months, above the international minimum benchmark of 3.0 months.
INTERNATIONAL INVESTMENT POSITIONAt the end of 2019, Namibia’s external balance sheet recorded a lower net liability position in comparison with 2018 due to an increase in foreign assets. Namibia registered a net liability position of
N$12.1 billion, decreasing from N$22.9 billion a year earlier, due to a rise in foreign assets, across categories of portfolio, direct and other investment.
FIGURE C.29 (A–B) INTERNATIONAL INVESTMENT POSITION – FOREIGN ASSETS AND LIABILITIES
a. The value of Namibia’s foreign assets increased in 2019, mainly due to a rise in portfolio, direct and other investment.
b. At the end of 2019, the value of Namibia’s foreign liabilities decllined when compared to the previous year, mainly due to a decrease in direct and other investment.
0.0
5.0
10.0
15.0
20.0
25.0
30.0
35.0
0.0
20.0
40.0
60.0
80.0
100.0
120.0
140.0
2015 2016 2017 2018 2019
N$ b
illio
n
N$ b
illio
n
Portfolio Investments Other Investments Direct Investment
Financial Derivatives and Employee Stock Options Reserve Assets (RHS)
0.020.040.060.080.0
100.0120.0140.0160.0180.0
2015 2016 2017 2018 2019
N$ b
illio
n
Direct investment in Namibia Portfolio investment
Other investment Financial Derivatives and Employee Stock Options
The value of Namibia’s foreign assets increased in 2019, reflecting increases in portfolio, direct
and other investment. On an annual basis, Namibia’s foreign assets increased by 4.2 percent to N$151.0 billion

Bank of Namibia Annual Report 2019178
Part CEconomic and Financial Developments
by the end of 2019 (Figure C.29a). The rise in foreign assets was mostly reflected in portfolio investment, which rose by 4.6 percent to N$86.1 billion. The increase in portfolio investment was due to increases in the valuation of equity of Namibian institutional investors abroad. This was due to capital appreciation observed particularly for money market instruments during 2019. Direct investment assets rose by N$3.7 billion to N$22.2 billion, on account of favourable performances by Namibian companies abroad in the financial sector. Other investment assets also rose by 5.9 percent to N$13.3 billion due to increases in currency and deposits of local banks abroad.
By the end of 2019, the value of Namibia’s foreign liabilities declined when compared to a year earlier, mainly due to a decrease in direct investment and other investment. During 2019, Namibia’s foreign liabilities declined by 2.8 percent to N$163.1 billion compared to the previous year (Figure C.29b). The decrease was mainly due to direct investment liabilities that declined by N$2.3 billion, as a result of repayments made by companies in the mining sector as well as the exchange rate appreciation at the end of the period. In addition, other investment liabilities declined by 3.7 percent to N$43.4 billion mainly due to principal repayments made on some multilateral and bilateral loans.
FIGURE C.30 (A) DIRECT INVESTMENT BY SECTOR (PERCENTAGE SHARE AT YEAR END)
2018 2019
54.7%27.1% 54.4%27.6%
9.1% 8.9%
5.0% 5.0%2.4% 2.6%1.4% 1.2%0.1% 0.1%
0.3%0.3%
Mining and quarrying (54.7%)Financial services (27.1%)Manufacturing (9.1%)Wholesale and retail trade, repairs (5.0%)Distribution and selling of petroleum (2.4%)Fishing and fish processing (1.4%)Hotels and restaurants (0.1%)Other sectors (0.3%)
Mining and quarrying (54.4%)Financial services (27.6%)Manufacturing (8.9%)Wholesale and retail trade, repairs (5.0%)Distribution and selling of petroleum (2.6%)Fishing and fish processing (1.2%)Hotels and restaurants (0.1%)Other sectors (0.3%)
Namibia’s FDI liabilities by sector remained concentrated in mining and quarrying. Namibia’s FDI liabilities by sector at the end of 2019 were dominated by mining and quarrying, with N$50.8 billion worth of investment which accounted for a share of 54.4 percent of the total stock (Figure C.30a). The share however, decreased on account of repayments made by direct investment enterprises in the mining sector during 2019.
This was followed by the financial sector, with a share of 27.6 percent, and manufacturing, with a share of 8.9 percent, having declined by 0.2 percentage points due to a decrease in equity on account of losses reported during 2019 by manufacturing companies. Wholesale and retail trade completed the top four with a share of 5.0 percent.

Bank of Namibia Annual Report 2019 179
Part CEconomic and Financial Developments
FIGURE C.30 (B) DIRECT INVESTMENT LIABILITIES BY COUNTRY (PERCENTAGE SHARE)
2018 2019
38.2%33.0%
7.6%
3.4%3.1%
2.4% 5.8%
1.5% 1.5%1.2%
40.6%32.3%
7.2%
3.3%3.2% 2.4%
2.3% 2.0%1.8% 1.6%
1.6%3.9%
People’s Republic of China (38.2%)South Africa (33.0%)Mauritius (7.6%)United Kingdom (3.4%)India (3.1%)Canada (2.4%)Netherlands (2.3%)Germany (1.5%)Malaysia (1.5%)Spain (1.2%)Other (5.8%)
People’s Republic of China (40.6%)South Africa (32.3%)Mauritius (7.2%)United Kingdom (3.3%)India (3.2%)Canada (2.4%)Netherlands (2.0%)Botswana (1.8%)Germany (1.6%)Malaysia (1.6%)Other (3.9%)
Namibia’s Foreign Direct Investment liabilities by source country registered relatively small movements during the course of 2019. The stock of FDI liabilities by source country showed that China and South Africa collectively accounted for 72.9 percent at the end of 2019, compared to 71.2 percent registered a
year earlier (Figure C.30b). The increase in the share of FDI for these countries is a result of increased borrowing emanating from some companies in the mining sector. However, the share of FDI by Mauritius declined by 0.4 percentage points due to debt repayments by companies in the mining sector.
EXTERNAL DEBTAs at end of December 2019, the total external debt stock of Namibia declined compared to the previous year mainly due to a decline in the debt of the Central Government. The stock of external debt
declined by 1.5 percent over the previous year to stand at N$119.4 billion. The decrease was mainly reflected in lower debt of Central Government and other sectors.

Bank of Namibia Annual Report 2019180
Part CEconomic and Financial Developments
TABLE C.16 NAMIBIA’S EXTERNAL DEBT
2015 2016 2017 2018 2019
GROSS EXTERNAL DEBT POSITION (N$ MILLION) 86,582 87,861 105,286 121,145 119,381
1. Central Government 28,331 25,262 26,426 32,156 30,852
2. State Owned Enterprises/Parastatals 4,650 4,751 9,190 10,075 10,047
3. Central Bank30 3,084 2,715 2,469 2,870 2,814
4. Deposit-Taking Corporations, except the Central Bank 7,817 10,126 12,807 10,433 10,400
5. Other Sectors31 2,410 4,101 11,230 12,647 11,776
6. Direct Investment: Intercompany Lending32 40,291 40,907 43,163 52,965 53,492
GROSS EXTERNAL DEBT PAYMENTS 22,564 24,850 16,156 20,259 23,831
1. Central Government 976 1,865 1,952 2,194 2,373
2. State-owned enterprises/parastatals 416 999 1,077 719 1,421
3. Central Bank 2 7 55 104 157
4. Deposit-taking corporations, except the Central Bank 3,075 4,753 3,049 3,621 3,523
5. Other sectors 9,097 4,638 4,209 3,586 4,653
6. Direct investment: intercompany lending 8,998 12,589 5,812 10,036 11,705
Outstanding debt Y-on-Y (percentage change) 36.3 1.5 19.8 15.1 -1.5
Debt servicing Y-on-Y (percentage change) 210.5 10.1 -35.0 25.4 17.6
Exchange rate (end of period) US Dollar 15.5553 13.6240 12.3930 14.4309 14.1235
30 The central bank debt comprises special drawing right (SDR) allocations received from the IMF.
31 The category other sectors consist of Enterprises, Namibian owned companies and EPZ companies.
32 Intercompany lending includes loan transaction (and transactions in other debt securities) between parent companies and their subsidiaries or investee companies and between subsidiaries of the same group, unless the latter are deposit-taking corporations (banks)
By the end of 2019, Namibia’s stock of external debt had declined, mainly due to a lower debt position of the Central Government and other sectors. The Central Government’s total outstanding foreign debt declined by 4.1 percent, year-on-year, to N$30.9 billion, mainly due to revaluation changes arising from the appreciation of the local currency against major trading currencies. Similarly, external debt of other sectors decreased by 6.9 percent to N$11.8 billion. The decline in debt position of other sectors was mainly due to repayment of debt by enterprises in the mining and manufacturing sector. In contrast, foreign borrowing from the direct investors through intercompany lending rose by 1.0 percent to N$53.5 billion, mainly driven by other changes in debt position through interest accrued not yet paid.
At the end of 2019, Namibia’s official reserves relative to its short-term debt declined compared to 2018. The ratio of official reserves to short-term debt
declined from 2.1 to a ratio of 2.0 over the period (Table C.15). The reduction was as a result of a decline in the stock of foreign reserves.
Namibia’s foreign debt servicing rose during 2019, mainly due to increased payments by direct investment enterprises and other sectors. The total value of repayments on Namibia’s foreign debt increased by 17.6 percent to N$23.8 billion in 2019 compared to the previous year (Table C.16). This was mainly due to higher repayments made by enterprises in the mining sector on intercompany lending, as such repayments increased by 16.6 percent to N$11.7 billion in 2019. In addition, state owned enterprises also increased their debt servicing by N$702 million to N$1.4 billion, mainly due to repayments made by companies in the energy and transport sectors. Similarly, other sectors increased their foreign debt servicing mainly due to repayments made by some enterprises in the manufacturing sector.

Bank of Namibia Annual Report 2019 181
Part CEconomic and Financial Developments
In 2019, the ratio of debt servicing to exports33 increased in comparison with 2018. The ratio increased to 36.3 percent in 2019 from 31.0 percent in the preceding year (Table C.15). This increase was
33 Debt service as a percentage of merchandise exports is a good measure of how readily serviceable the debt is. This is due to the fact that higher growth rates in exports build up international reserves, which in turn are used to service foreign debt. Therefore, the lower the percentage, the better.
34 The international benchmark values give an assessment of the country’s risk of debt distress. If the ratio falls below the threshold of 15–25 percent, then the country is seen to meet its debt service obligations and is at low risk. Should the country’s debt burden fall within the threshold, but stress tests indicate a possible breach in the presence of external shocks or abrupt changes in macroeconomic policies, then it would be at a moderate risk. Finally, if the country’s debt burden falls above the threshold, then the country would be considered to be in debt distress and stringent policy interventions would need to be taken.
mainly due to the increase in foreign debt servicing, alongside a relatively smaller increase in exports of goods and services during 2019. The latest ratio falls above the international benchmark34 of 15–25 percent.
FIGURE C.31 (A): EXTERNAL LONG-TERM LOANS BY COUNTRY (PERCENTAGE SHARE)
2018 2019
58.4%17.2%
11.6%
3.9%3.2%
2.3% 3.3%
59.1%16.1%
11.3%
5.6%
3.0%1.3% 3.6%
International Organisations (58.4%)Germany (17.2%)China (11.6%)South Africa (3.9%)Luxembourg (3.2%)United Kingdom (2.3%)Other (3.3%)
International Organisations (59.1%)Germany (16.1%)China (11.3%)South Africa (5.6%)Luxembourg (3.0%)Mauritius (1.3%)Other (3.6%)
Loans from international organisations continued to dominate Namibia’s total long-term external borrowing, during 2019. During the review period, external loans were dominated by international organisations with a share of 59.1 percent of the total (Figure 31.A). The share increased by 0.7 percentage points due to the long-term borrowing by companies in the financial sector as reflected in long-term loans
from South Africa. This was followed by Germany and China with a share of 16.1 percent and 11.3 percent, respectively. The share of loans from Germany and China declined due to principal repayments made on their long-term loans. Furthermore, South Africa, Luxemburg and Mauritius jointly accounted for 9.9 percent of the total external loans.

Bank of Namibia Annual Report 2019182
Part CEconomic and Financial Developments
FIGURE C.31(B): EXTERNAL SHORT-TERM LOANS BY COUNTRY (PERCENTAGE SHARE)
2018 2019
48.9%
39.0%
10.6%1.5% 0.03%
47.6%
40.9%
10.3% 1.0% 0.3%
South Africa (48.9%)British Virgin Islands (39.0%)Mauritius (10.6%)United Kingdom (1.5%)Other (0.03%)
South Africa (47.6%)British Virgin Islands (40.9%)Mauritius (10.3%)United Kingdom (1.0%)Other (0.3%)
During 2019, Namibia’s total short-term external loans were dominated by South Africa. During 2019, Namibia’s total short-term external loans mostly originated from South Africa with a share of 47.6 percent (Figure C.31B). The increase in the share was due to short-term loans extended to some enterprises
and parastatals. This was followed by British Virgin Islands with an increased share of 40.9 percent due to the uptake of short-term loans by companies in the manufacturing sector. Mauritius completed the top three with a share of 10.3 percent.

Bank of Namibia Annual Report 2019 183
Part CEconomic and Financial Developments
FIGURE C.32(A-B): EXTERNAL LONG-TERM AND SHORT-TERM LOANS BY CURRENCY (PERCENTAGE SHARE)
a. During 2019, Namibia’s long-term external debt by currency continued to be mainly in US Dollar.
2018 2019
33.0%
5.5% 5.3% 1.5%
54.3%0.5% 32.5%
6.0% 5.2% 0.9%
55.1%0.4%
USD (54.3%)ZAR (33.0%)RMB (5.5%)EUR (5.3%)JPY (1.5%)Other (0.5%)
USD (55.1%)ZAR (32.5%)EUR (6.0%)RMB (5.2%)JPY (0.9%)Other (0.4%)
b. During the review period, Namibia’s short-term external debt by currency was dominated by the US Dollar.
2018 2019
48.9%
51.1%
0.03%47.6%
52.4%
0.01%
USD (51.1%)ZAR (48.9%)Other (0.03%)
USD (52.4%)ZAR (47.6%)Other (0.01%)
During the review period, the US Dollar dominated both Namibia’s long-term and short-term external debt by currency. Namibia’s total long-term external debt by currency composition was mostly denominated in US Dollar with a share of 55.1 percent. This represents a yearly increase of 0.8 percentage points due to the
decrease in the share of Rand-denominated debt which declined by 0.5 percentage points. The rise in the debt denominated in Rand was owing to a principal repayment made by the financial sector. Similarly, the US Dollar accounted for 52.4 percent of the total short-term external debt by currency during 2019.

Bank of Namibia Annual Report 2019184
Part CEconomic and Financial Developments
EXCHANGE RATE DEVELOPMENTS35
35 The Namibia Dollar (NAD) trades one-to-one against the South African Rand (ZAR) and is therefore referred to interchangeably. This section uses middle exchange rates against foreign currency units, unless otherwise mentioned; period averages are used for the respective exchanges rates.
The Namibia Dollar depreciated on average against all major currencies during 2019 compared to 2018. During 2019, the Namibia Dollar depreciated against the US Dollar by 9.2 percent to an annual average of N$14.45 per US Dollar (Figure C.24e). Similarly, against the Pound Sterling and the Euro the Namibia Dollar depreciated by 4.6 percent and 3.6 percent to annual averages of N$18.44 per Pound Sterling and N$16.17 per Euro, respectively. The depreciation of the Namibia Dollar against these currencies was partly due to slower global growth alongside intensified trade tensions between the US and China that stunted the growth
in global trade volumes and reduced the appetite for emerging market commodity exports. This comes after the USA announced additional tariffs for imports from China during 2019, with the Chinese retaliating swiftly. Uncertainties related to the Brexit process also continued to linger, weighing down confidence. Furthermore, the South African economy remained weak during 2019 and this, together with unresolved political issues related to property rights and problems with electricity supply, remained a concern for investors and thus reduced the appetite for the Rand.
Trade-weighted indexThe nominal effective exchange rate (NEER) appreciated while the real effective exchange rate (REER) index depicted a moderate depreciation during 2019 compared to 2018. During 2019, the NEER appreciated marginally by 0.2 percent to an annual average index level of 101.7 (with a base level of 100.0 in 2015), while the REER index depreciated by 0.9 percent to 104.0 (Figure C.24f). The slight appreciation of the NEER can be attributed to the Angolan Kwanza and Zambian Kwacha that depreciated significantly against
the Namibia Dollar. During the year the Angolan Kwanza particularly registered a sharp depreciation against the Namibia Dollar as the National Bank of Angola opted for a free-floating exchange rate and thus abandoned the trading band regime that was previously in place. The annual depreciation of the REER implies that Namibia’s external competitiveness improved during the year, albeit slightly. Overall volatility of especially the NEER was quite limited in 2019, as larger movement against individual currencies cancelled in the basket.

Bank of Namibia Annual Report 2019 185
Part CEconomic and Financial Developments
THEME CHAPTER
LEVERAGING THE POTENTIAL OF THE SERVICE SECTOR TO SUPPORT ACCELERATED GROWTH IN NAMIBIA
CONTENTS: THEME CHAPTER
I. Introduction 185
II. Service Sector development in Namibia 186
III. Transport and logistics 190A. Growth, trends and impactB. Drivers, Opportunities and Challenges
IV. Tourism service sector 193A. Growth, trends and impactB. Drivers and ConstraintsC. Opportunities and Challenges
V. Financial services 196A. Growth, trends and impactB. Drivers and ConstraintsC. Opportunities and Challenges
VI. Information technology 197A. Growth and new developmentsB. Drivers and ConstraintsC. Opportunities and Challenges
VII. Conclusion and Policy Options 200
VIII. References 201
I. INTRODUCTION
1. Economies around the world have seen theservice sector emerge as the stronghold foreconomic growth. Today, it is estimated that
about two-thirds of economic activity worldwide
consists of services. In high-income countries,
services have accounted for more than two-thirds
of gross domestic product (GDP) since the turn
of the millennium; however, this share has been
increasing at a slower pace. Meanwhile, in low-
and middle-income countries the transformation
towards services is happening rapidly, with
services as a share of the economy increasing
from an average of 48.5 percent in 2007 to 54.3
percent in 2017 (World Bank, 2018).
2. The services sector comprises of a widerange of services such as infrastructureservices, tourism, business, as well associal services. The services sector is highly
diverse, ranging from infrastructure services
such as telecommunications and transportation
to financial services, tourism, business services
(such as real estate, professional, scientific
and technical services and wholesale and
Bank of Namibia Annual Report 2019186
Part CEconomic and Financial Developments
retail trade, repairs) that directly affect firm
competitiveness, and social services such as
health and education. Infrastructure services are
cross-cutting in that they support all types of
enterprises. Education, health, and recreational
services influence the quality of labour available
to enterprises. Business and professional
services provide specialised expertise to
increase enterprise competitiveness.
3. Services are not only increasingly responsible for value addition, but also for job creation. About half of the world’s
workforce is active in the services sector. This
share has increased most rapidly in low- and
middle-income countries, from an average of
28.5 percent in 1995 to 44.8 percent in 2015
(World Employment Social Outlook, 2019).
Similarly, Namibia’s employment in the service
sector grew from 58.8 percent in 2012 to 61.7
percent in 2018 (NSA, 2018).
4. In Namibia, the services sector is the biggest contributor to GDP, contributing over half of the country’s GDP in 2018. The services sector contributed 63.3 percent
to Namibia’s GDP in 2018, compared to 19.4
percent and 17.3 percent of the secondary and
primary industries, respectively. Of the 63.3
percent contribution by the services sector,
private services contributed over 30 percent
to GDP, while the remaining contribution was
from public services (Namibia Statistics Agency
(NSA), 2018).
5. Growth in international trade in services offers the prospect of large economic benefits. International trade can help countries
by strengthening their respective comparative
advantage in services. Moreover, stronger
competition associated with international trade
can reduce production costs and hence prices,
increase efficiency and innovation, and broaden
the range of services being offered. It can also
reduce the fragmentation of services markets.
Several studies by the Organisation for Economic
Cooperation and Development (OECD) (2003;
2005) demonstrates that the growth of trade
in services benefits both developed and
developing countries. In addition, a reduction in
trade barriers for services also benefits goods-
and services-producing industries that use
services in the production process.
6. Technological advancement has led to improved services delivery and enhanced innovation. Recent advances in information
technology (IT) and global connectivity have
drastically changed how services can be
provided and consumed, both within countries
and across borders. In addition, technological
advances have opened new areas for service
providers. The growth potential for services is
very promising and its limits are still unknown.
7. The aim of this theme chapter is to examine the potential to leverage the service sector growth in the Namibian economy. The theme
chapter aims to study several key services
subsectors and offer some policy options to
leverage the potential of the services sector to
support accelerated growth in Namibia. It points
to opportunities and challenges to expand
the scale and scope of the tourism, financial,
transport and logistics and information and
communications technology.
II. SERVICE SECTOR DEVELOPMENT IN NAMIBIA
8. Namibia recorded steady growth in the services sector between 2014 and 2018. The average growth rate of the service sector
in Namibia between 2014 and 2018 was
2.9 percent per annum. The service sector
outperformed the primary industries, which
grew by 1.2 percent, as well as the secondary
industries, which grew by 0.9 percent per
annum over the same period. Despite this
positive average growth rate, the service sector
has shown negative growth figures in recent
years. Growth in services slowed drastically in
2016, before moving into negative territory in
2017 (-0.5 percent) and 2018 (-1.4 percent).
This is despite impressive growth rates that the
sector experienced in 2014 (7.1 percent) and
2015 (7.3 percent). This was caused mainly by
lower government activities due to the fiscal

Bank of Namibia Annual Report 2019 187
Part CEconomic and Financial Developments
consolidation; a reduction in trade between
Namibia and Angola which drove down activities
in the retail and trade services; car sale volumes
reduced due to the low economic growth rates.
TABLE TC.1: GDP BY SECTOR 2014-2018 (ANNUAL GROWTH RATE % CHANGE CONSTANT PRICES)
Industry 2014 2015 2016 2017 2018
Primary industries -1.1 -6.3 -6.0 11.0 8.5
Secondary industries 10.5 4.2 -4.0 -6.9 0.9
Tertiary industries 7.1 7.3 1.9 -0.5 -1.4
Wholesale and retail trade, repairs 12.5 6.9 1.5 -6.9 -6.2
Hotels and restaurants 11.1 4.0 4.3 -1.4 4.9
Transport and storage 9.9 19.5 4.3 -4.8 -3.5
Transport 11.3 25.1 7.4 -4.0 -5.0
Storage 5.8 3.2 -6.6 -8.0 2.6
Information and communication 2.9 11.6 6.0 6.0 -2.2
Financial and insurance service activities 10.7 2.1 1.1 3.6 0.0
Real estate activities 3.1 3.5 2.7 2.6 2.7
Professional, scientific and technical services 5.0 15.8 -5.1 -2.8 -1.1
Administrative and support services -0.4 6.6 -16.1 -2.2 0.9
Arts, entertainment & other service activities 8.0 0.6 3.0 -0.4 0.4
Public administration and defence -0.1 16.1 -0.1 2.2 0.7
Education 8.3 -2.5 3.4 -1.7 0.5
Health 11.2 19.5 9.8 4.4 -8.9
Private households with employed persons 5.5 1.7 1.4 1.0 -2.5
Source: Namibia Statistics Agency (NSA)
9. The contribution of the services sector to GDP in Namibia has increased since 2013. The services sector’s contribution to GDP increased from 62.9 percent in 2013 to 63.3 percent in 2018. The service subsector with the highest contribution to GDP is the public administration and defence subsector, with
an average of 12.4 percent of GDP between 2013 and 2018. The second largest contributor to GDP is the wholesale and retail trade and repairs subsector, with an average of 12.1 percent of GDP. Figure TC.1 shows the biggest contributors to GDP from 2013 to 2018.

Bank of Namibia Annual Report 2019188
Part CEconomic and Financial Developments
TABLE TC.2: GDP BY SECTOR 2013 -2018 (% OF GDP CURRENT PRICES)
Industry 2013 2014 2015 2016 2017 2018
Primary industries 19.2 18.7 16.4 17.1 16.6 17.3
Secondary industries 17.9 18.4 20.3 19.7 19.2 19.4
Tertiary industries 62.9 62.9 63.3 63.2 64.2 63.3
Wholesale and retail trade, repairs 12.5 13.3 12.3 11.6 11.9 10.9
Hotels and restaurants 1.7 1.9 2.1 2 1.9 1.8
Transport 2.8 3 3.5 3.6 3.5 3.5
Transport 2.1 2.3 2.7 2.9 2.8 2.7
Storage 0.7 0.7 0.8 0.7 0.7 0.7
Information and communication 1.6 2 1.6 1.6 1.7 1.5
Financial and insurance service activities 7.1 6.4 7.6 7.5 7.7 8.4
Real estate activities 6.3 5.8 5.5 5.6 5.8 5.8
Professional, scientific and technical services 0.8 0.8 0.9 0.8 0.7 0.7
Administrative and support services 1.6 1.4 1.4 1.2 1.1 1.2
Arts, entertainment & other service activities 1.7 1.8 1.8 1.8 1.8 1.9
Public administration and defence 12.5 11.9 12.5 12.2 12.5 12.6
Education 9.8 10.2 9.6 10.3 10.6 10.6
Health 3.7 3.7 3.9 3.9 4.1 3.7
Private households with employed persons 0.8 0.8 0.8 0.8 0.7 0.7
Source: Namibia Statistics Agency (NSA)
FIGURE TC.1: PERCENTAGE CONTRIBUTION TO GDP PER SERVICE SUBSECTOR
2018 2017 2016 2015 2014 2013
0.0 2.0 4.0 6.0 8.0 10.0 12.0 14.0
Public administration and defence
Wholesale and retail trade, repairs
Education
Financial and insurance service activities
Real estate activities
Health
Transport
Source: Namibia Statistics Agency (NSA)
10. Namibia’s export of services is highlyconcentrated in travel services. In 2018, thebiggest share in exports of services in Namibiawas travel services, recording N$5,066 million,an annual increase of 47 percent from N$3,438million in 2009. The manufacturing servicesincreased significantly since 2009 to become
the second largest export in services, from N$ 231 million in 2009 to N$1,829 million in 2018. Manufacturing services in Namibia are primarily made up of copper ore which is received from abroad and turned into copper blister. Namibia then receives service fees for the service rendered.

Bank of Namibia Annual Report 2019 189
Part CEconomic and Financial Developments
FIGURE TC.2: TOP 3 EXPORT OF SERVICES 2009 – 2018 (N$ MILLION)
0
1000
2000
3000
4000
5000
6000
7000
2009 2010 2011 2012 2013 2014 2015 2016 2017 2018
N$ M
illio
n
Travel Services Manufacturing services Transport services
Source: BON
11. There is a net inflow of services in the financial services subsector, except for insurance and pension services. The export of financial services in Namibia has increased over the years, almost quadrupling in value from N$ 94 million in 2009 to N$ 452 million in 2018. This is a net inflow reflected on the balance of payments of an average of N$ 292.4 million between 2014 and 2018 (Bank of Namibia 2018). However, insurance and pension services reflected a net outflow of services, recording zero inflow of services in certain years.
12. Employment in the service sector has increased since 2012. Employment in the service sector increased from 58.8 percent of total employment in 2012 to 61.7 percent in
2018, with the highest improvement seen in the accommodation and food service activities. The wholesale and retail trade sector was the biggest employer in 2012, employing 11.9 percent of total employment in Namibia. This figure decreased slightly to 11.1 percent in 2018. It was surpassed by the accommodation and food service activities in 2018 which employed 11.4 percent of the total employment. This was a major improvement in the accommodation and food service activities as it employed only 6.6 percent of the population in 2012. It has been argued that employment growth has not kept pace with income growth in the sector (Bosworth and Maertens, 2010) or with the rise in its share of GDP (Kochhar et al. 2006).

Bank of Namibia Annual Report 2019190
Part CEconomic and Financial Developments
TABLE TC.3: EMPLOYMENT BY INDUSTRY (%)
Industrial Classification 2012 2013 2014 2016 2018
Primary industries 29.2 33.4 31.5 22.3 24.7
Agriculture, forestry and fishing 27.4 31.4 29.5 20.1 23.0
Mining & quarrying 1.8 2.0 2.0 2.2 1.7
Secondary industries 12.0 12.5 12.7 17.3 13.5
Manufacturing 4.5 4.8 4.0 6.6 6.2
Electricity, Gas & water / Utilities / Electricity and related industries
0.3 0.7 0.4 0.7 0.5
Water supply and related industries 0.4 0.3 0.7 0.6
Construction 6.8 7.0 8.0 9.3 6.2
Tertiary industries 58.9 54.2 55.6 60.6 61.7
Wholesale & Retail Trade, Repair of motor vehicles 11.9 15.3 13.6 9.7 11.1
Transport and storage 3.6 3.7 3.3 3.4
Accommodation and food services 6.6 5.4 4.1 7.1 11.4
Information and communication 1.0 0.8 0.6 0.9 1.0
Financial and insurance activities 2.0 2.1 1.9 2.3 1.9
Real Estate, Renting & Business Activities 0.3 0.2 0.1 0.2 0.1
Professional, scientific and technical services 1.2 1.8 0.9 1.8 1.2
Administrative and support services 4.7 4.3 4.4 6.0 4.1
Public Administration, Defence & Social Security 5.1 4.7 5.9 4.5 4.7
Education 6.0 6.1 5.8 6.1 6.5
Health & Social Work 3.2 2.4 3.0 2.8 2.7
Arts, entertainment and recreation 0.5 0.3 0.6 0.7
Other Community, Social & Personal Services / other service work
1.6 2.6 1.8 6.4 2.9
Private households with employed persons 11.0 8.4 9.4 8.7 9.9
Extra-territorial organizations & bodies 0.1 0.1 0.2 0.1
Not reported / don’t know 0.1 0.1 0.0 0.0
Source: Namibia Statistics Agency (NSA)36
36 A reclassification of certain sectors may lead to numbers which are bigger in one year than in the previous year/s (eg Other Community, Social & Personal Services to other service work).
I. TRANSPORT AND LOGISTICS
A. GROWTH, TRENDS AND IMPACT
13. The transport and logistics sector is important for economic development and has been prioritised by the government as articulated in its various development plans. Investment in transport infrastructure development has focused on roads, rail, maritime ports, and aviation. The Fifth National Development Plan (NDP5) and the Harambee
Prosperity Plan (HPP) have identified the sector as a strategic sector in achieving Namibia’s social-economic transformation.
14. Namibia is ranked among the top five in SADC in the World Bank Logistics Performance Index (LPI). The World Bank LPI ranks Namibia 4th in SADC in terms of the

Bank of Namibia Annual Report 2019 191
Part CEconomic and Financial Developments
logistics performance index (LPI), with a score of 2.73, and 80th out of 160 countries (World Bank, 2018). It was outperformed by South Africa, Botswana and Tanzania, in order of highest to lowest ranking. The LPI overall score reflects perceptions of a country’s logistics performance based on the efficiency of the customs clearance process, quality of trade and transport-related infrastructure, ease of arranging competitively priced international shipments, quality of logistics services, ability to track and trace consignments and frequency with which shipments reach the consignee within the scheduled time.
15. The logistics sector in Namibia hasgenerally grown during the period 2014 to
2018. The logistics sector grew on average at 5.32 percent per annum between 2014 and 2018; however, the sector recorded negative growth rates in 2017 and 2018. The negative growth was due to reduced freight transport by road, air transportation and port services, which posted negative growth rates in real value added since 2016 (Namibia Planning Commission, 2018). The sector’s contribution to GDP has increased slightly over the last few years averaging 3.05 percent of GDP between 2013 - 2018. The average share of employment in the transport and logistics sector is 3.5 percent of total employment between 2012 - 2018. The sector provided a total of 24,711 jobs or 3.4 percent of total employment in 2018.
FIGURE TC.3: LOGISTICS VALUE ADDED AS A PROPORTION OF GDP (MILLIONS N$)
0.0
2.0
4.0
6.0
8.0
10.0
12.0
14.0
16.0
18.0
0
20000
40000
60000
80000
100000
120000
140000
2007 2008 2009 2010 2011 2012 2013 2014 2015 2016 2017
N$ M
illio
n
GDP Logistics value added % contribution to GDP (RHS)
Source: Namibia state of Logistics Report, 2018
B. DRIVERS, OPPORTUNITIES AND CHALLENGES
16. Transport and logistics costs haveincreased slightly from 2017 to 2018.Transport and logistics costs have increasedfrom N$ 6,436 million in 2017 to N$ 6,163 million in 2018, averaging N$ 6,135 million between2013 – 2018. This is an average of 5.75 percentgrowth over this period. The fuel price is one ofthe main drivers of logistics costs. An increase infuel costs subsequently pushes transport costsupwards resulting in transport inflation, whichremains the leading driver of higher inflationmonth-on-month.
17. Namibia recognizes the need for a fullyfunctional logistics and transport services
sector and thus developed a master plan in 2015 which outlines Namibia’s plans to develop an international logistics hub for SADC countries. The Logistics Hub Project is an ambitious initiative to exploit the country’s latent advantage, its strategic location, to transform Namibia into the preferred logistics and distribution centre for landlocked SADC countries. Namibia has a key position on the west coast of southern Africa and has the potential to service land-locked countries such as Botswana, Zambia, Malawi, Zimbabwe and the Democratic Republic of Congo (DRC). Efficient road transport and improved customs procedures between landlocked and developing

Bank of Namibia Annual Report 2019192
Part CEconomic and Financial Developments
countries can transform their trade potential and overall sustainable development.
18. Well-functioning domestic andinternational logistics is a precondition fornational competitiveness. Products travelhuge distances in Africa and cross multipleborders to reach their end markets. It is thuscrucial for Namibia to employ proper logisticsmanagement, which includes the planning,implementation and effective forward andreverse flow of goods from origin to recipient, inorder to positively influence economic growth.According to the Namibia State of LogisticsReport for 2018, the logistics industry has thepotential to contribute 4.6 percent to Namibia’sGDP, if properly developed.
19. Namibia has a total of 2,682 km of rail, ofwhich 207 km is non-operational. The railwaynetwork and rail services provide strategic linksbetween mines, production hubs, distributioncentres and ports; and connects with the over-border railways of the region. The transportationof bulk freight on rail primarily consists of bulkfuel, bulk liquid, mining, agriculture, buildingmaterial and containers. There are currently1,533 wagons, 49 coaches and a total fleetof 79 locomotives (36 are staged, leaving43 active locomotives) in the TransNamibfleet (TransNamib, 2018). The previouslynon-operational rail of Aus-Lüderitz line wascompleted in January 2018. The rail was thentested in August 2019 by commissioning atrain carrying heavy objects to ascertain thedurability of the railway line up to the harbour. Itis now functional, carrying ore for shipping fromLüderitz
20. There is limited capacity in the existingrailway system which can only manageto haul 15-20 percent of the total freightmarket. The limited capacity has driven manyusers and passengers to road transport.Namibia has an opportunity to increase thecurrent 1.6 million metric tons to 3 millionmetric tons by improving the railway service(Namibia State of the Logistics Report, 2018).This will require significantly increasing railwaypercentage share of various cargos for whichrail has a distinct advantage, such as liquid bulk,dry bulk, containers, and construction material
and project cargo. Increasing capacity will also absorb more traffic generated from seaports, cross-border traffic, mines, agricultural and manufacturing centres.
21. Namibia has two ports, namely, the port ofWalvis Bay and the port of Luderitz, southof Namibia. The old container terminal at thePort of Walvis Bay has a throughput capacity of350,000 TEUs (twenty foot-equivalent unit) perannum. A new container terminal, which wascompleted and inaugurated in August 2019, hasincreased that capacity to 750,000 TEUs perannum. Containers handled at the port amountto an average of 281,706 TEUs per annum. Saltis the biggest export commodity handled bythe Port of Walvis Bay. Other commodities theport processes include fish and fish products,copper, lead and its concentrates, marble andgranite. Total containers handled at the portof Lüderitz for the financial year 2016/2017 is6,320 TEUs, an increase from a yearly averageof 2,280 TEUs. The increase, which translatedinto the port’s first profit, was primarily due toincreased project cargo and repair activitiesfrom Debmarine (Namport, 2018). Commoditieshandled at the port include fish & bait, ice,zinc/zinc concentrates, and lead and leadconcentrates, with the biggest export beingzinc/zinc concentrates.
22. The port of Lüderitz has the opportunity toserve as a catalyst towards SADC Regionaleconomic integration by positioning itselfas a mineral resource gateway port for theNorthern Cape Mining Houses of SouthAfrica. Since August 2019, mining houses in the Northern Cape have been transporting mineralscargo along the Trans Oranje Corridor Route viathe port of Lüderitz. However, the dilapidationof the 42 kilometres from Sandverhaar toBuchholtzbrunn is hindering the port of Lüderitzto utilize its optimal cargo handling capacityof more than 1 million TEU throughput perannum. The improvement of this railway wouldtranslate into an estimated revenue of aboutN$700 million per annum to logistics companiesin Namibia. The rehabilitation of the railwaybetween Sandverhaar and Buchholtzbrunn hashuge positive financial and economic benefit forNamibia.

Bank of Namibia Annual Report 2019 193
Part CEconomic and Financial Developments
23. Namibia is ranked at the top positionon quality roads in Africa by the GlobalCompetitiveness Index. Namibian roadinfrastructure is one of the best in Africa, rankingat number 21 out of 141 countries with a scoreof 5.3. It is followed by Mauritius and SouthAfrica with ranks of 43 and 47, respectively. Thequality of roads infrastructure is any country’seconomic pillar which enhances mobility ofgoods and people thus increasing trade. It istherefore important that Namibia utilizes thisposition to increase trade with neighbouringcountries.
24. When trading across Namibian borders, thetime and cost for documentary complianceand border compliance is much higherfor exports than for imports. Accordingto the World Bank Doing Business report of
37 [1] Covers all documents required by law and in practice, including electronic submissions of information.
38 [2] Handling and inspections that take place at the economy’s port or border.
2019, to clear export consignments, it takes approximately 90 hours (estimated cost of US$ 348) to complete documentary compliance37[1]
with clearing agencies required by customsauthorities and another 120 hours (estimatedcost of US$ 745) for border complianceprocedures38[2] with customs authorities. Thehigher fees might be caused by the presenceof clearing agencies other than customs whohandle and clear documents on behalf of theexporters. By contrast, it takes approximately3 hours (estimated cost of US$ 63) fordocumentary compliance and another 6 hours(at a cost of US$ 145) for border complianceto process import consignments. Reducingthe time and cost associated with bordercompliance is imperative to increase Namibia’scompetitiveness in world logistics markets.
IV. TOURISM SERVICE SECTOR
A. GROWTH, TRENDS AND IMPACT
25. The Namibian accommodation landscapeis made up of diverse hospitalitybusinesses. There are approximately 3,100hospitality businesses that occupy a range ofsegments, including hotels, pensions, lodges,tented lodges, backpackers, B&Bs, campsitesand guest farms (PWC, 2019). Of registeredaccommodation businesses, approximately 580relate to hunting farms, which are considered tobe a separate niche market. The average roomnumber ranges between six and 15 rooms,while only a very few hotels have more than 100rooms.
26. The tourism sector, which is often proxied by the value added by hotels and restaurants,saw consistent growth between 2008 and2016, before the deceleration recordedin 2017. The tourism sector measured in thisway grew by an average of 6.5 percent duringthe period from 2008 to 2016, consistent withsustained growth in the number of touristsarriving in Namibia. Growth, however, slumpedin 2017 to a negative 1.4 percent, while in 2018the tourism sector recovered, posing a slightpositive growth rate of 0.4 percent. The majorityof tourism is made up of domestic and regionaltourists. With the low economic growth in thecountry, growth in this group of tourists slowed.

Bank of Namibia Annual Report 2019194
Part CEconomic and Financial Developments
TABLE TC.4 – SELECTED INDICATORS FOR TOURISM DEVELOPMENT IN NAMIBIA, 2012 -2018
Total tourist arrivalsTourism receipts
Year
Tourism,
% of
GDP
Tourism
Employment,
% of National
employment
Number of
domestic
& regional
tourists
International
tourist
arrivals
Number of
tourists
Growth
rate (%)
Share of
Global
arrivals
(%)
Growth
rate (%)
2012 1.7 6.6 826,688 252,247 1,078,935 0.10% 116%
2013 1.6 5.4 1,056,882 263,180 1,320,062 22.35% 0.12% -43%
2014 1.8 4.1 1,097,185 290,588 1,387,773 5.13% 0.12% 106%
2015 1.9 - 1,164,769 304,489 1,469,258 5.87% 0.12% 26%
2016 1.9 7.1 1,124,043 375,399 1,499,442 2.05% 0.12% -33%
2017 1.8 - 1,148,386 408,893 1,557,279 3.86% 0.12% 10%
2018 1.6 11.4 1,264,648 356,590 1,621,238 4.11% 0.00% 12%
Sources: Bank of Namibia, NSA and MET, various reports.
27. Tourism’s share of GDP and of total employment remained relatively stable from 2012 to 2016, with some notable increases in total contribution to employment between 2016 and 2018. Tourism’s share of GDP at 1.8 percent remained fairly constant from 2012 to 2018, while its share of total employment is, however, significantly more than its share of GDP. The Namibian travel & tourism industry (direct impact) generated 83,056 jobs or 11.4 percent of total employment in 2018, making it the second largest employer in Namibia. As at 2012, the number of workers employed in the tourism industry stood at 41,853 people, which shows that the pace of job creation in the travel and tourism sector rose strongly between 2012 and 2018.
28. In 2018, Namibia attracted a total of 1,621,238 tourists, compared to 1,078,935 in 2012. The total number of tourists increased to 1,621,238 in 2018 compared to 1,078,935 in 2012 The number of domestic and regional tourist reached 1,264,648 in 2018 compared to 826,688 in 2012 (Ministry of Environment and Tourism, 2018). The average annual growth rate
from 2012 to 2018 is 7.2 percent per annum. While tourism continues to grow in Namibia, it fares far behind its peers, the top performers, Mauritius and South Africa (World Economic Forum, 2019).
29. Travel and tourism remain a major exporter of services with international visitors injecting foreign exchange directly into the economy. In 2018, travel and tourism was the biggest foreign exchange earner in the services sector, recording N$ 5,066 million in foreign earnings (Bank of Namibia, 2019). Production of travel and tourism goods for export purposes, by contrast, remains relatively low in Namibia.
30. Namibia encouragingly is already rated relatively high in the World Economic Forum’s Travel and Tourism Competitiveness Index. In 2019 it was ranked fourth most competitive tourism destination among the Sub-Saharan Africa countries, behind Mauritius, South Africa and the Seychelles. Namibia is ranked 81 out of 140 countries, with a score of 3.7 in 2019, an improvement from 3.6 in 2017.
B. DRIVERS AND CONSTRAINTS
31. Although Namibia’s roads are ranked among the best in the world, at times the type of roads leading to some of Namibia’s
tourist centres and attractions are one of the biggest challenges in the sector. This is especially true for road connections to

Bank of Namibia Annual Report 2019 195
Part CEconomic and Financial Developments
Sossusvlei, Waterberg and the Cape Cross areas. If the road network to go to these areas is not good enough or upgraded when necessary, the road network becomes a factor that limits tourists visiting some of these areas. Lack of road marks to the tourist attractions have often been quoted by the industry to be one of the factors affecting easy mobility of tourists, especially international tourists, an aspect that needs to be addressed.
32. Mismanagement and poor infrastructure of resorts and lodges are challenges hindering growth in the tourism sector. Some of the resorts and lodges in the country do not have proper infrastructures or are poorly managed. Limited infrastructures and/or facilities at these resorts and lodges have a
bearing on the performance of the sector, since the performance of the sector is measured by how the resorts and lodges look.
33. Poor customer service and a lack of qualified chefs also contribute to hindering growth in the tourism sector. There is a general lack of customer service amongst workers whilst at the same time there is not enough qualified chefs. This implies that there is a need to promote training in the hospitality industry at vocational training centres, a need to invest in specialised education and skills development for the tourism industry and promote careers in this industry though careers fairs, career guidance in schools in order to enhance passion for the industry.
C. OPPORTUNITIES AND CHALLENGES
34. Tourism has long been a high priority for the government and is considered central for social and economic development and employment in Namibia. Plans to develop the tourism sector are contained in the 5th National Development Plan (NDP5). Namibian hospitality and tourism businesses need to collaborate and invest in a digital transformation strategy in order to gain back control of visibility, reputation and distribution in order to sustain and grow the industry.
35. Namibia ranks higher than all other Southern African countries besides South Africa for both safety and security and tourist service infrastructure. It is third behind Mauritius and South Africa. Further improvements in these areas will help Namibia boost its tourism market, while greater efficiency in its tax regime could help improve the contribution of the sector to the economy.
36. Other factors also need to be addressed to increase Namibia’s attractiveness as a tourist destination. These include safety & security and water supply, together with the overall value for money that the country offers visitors. Roads that are in extremely delipidated
state should be improved, while noting that not all roads require upgrading as certain tourist prefer the roughness of roads.
37. Notwithstanding Namibia’s excellent hotel schools, education and training for the tourism sector still requires focused attention. As the world continues to become smaller (better connected) and more competitive, the quality of the service delivered by the industry becomes increasingly important. It is critical to focus on delivery of quality of experience that is on par with competing destinations.
38. With every thirteen new tourists it is estimated that one new job is created. An increase of 10 percent in tourists (based on current government statistics of 1.6 million annual tourists) would accordingly result in an additional 10 000 jobs (Annual Symposium, 2016). In simplest terms therefore, growth in the number of tourists visiting Namibia can have an immediate and significant impact on the country’s employment. Given that tourism activity tends to primarily take place outside of urban centres, enhanced rural employment would furthermore be a positive consequence of tourism growth.

Bank of Namibia Annual Report 2019196
Part CEconomic and Financial Developments
V. FINANCIAL SERVICES
A. GROWTH, TRENDS AND IMPACT
39. Namibia has a stable, concentrated, andcomplex financial system. The bankingsector in Namibia consisted of 7 commercialbanks by December 2019. The banking sectoris dominated by the big four banks, namely FirstNational Bank, Standard Bank, Bank Windhoekand Nedbank. The four large banking groups(three of them subsidiaries of South Africanbanks) hold about 98 percent of total bankassets (International Monetary Fund, 2018).More than one-half of bank loans are directed toresidential and commercial mortgages, makingbanks vulnerable to housing price corrections.Counterparty concentration of their loanportfolios is high.
40. The non-banking financial institutions(NBFI) sector is large. The NBFI sector hasassets of N$ 287.5 billion recorded in 2017(Namfisa, 2018), reflecting a pre-fundedGovernment Institutions Pension Fund (GIPF),with the assets of about 70 percent of GDP.Accounting for this phenomenon, NBFI netassets amount to approximately 138 percentof GDP. State-Owned Financial Institutions(SOFIs) account for 2.4 percent of total assetsof the financial sector or around 8 percent ofGDP. Institutional investors are required to hold
45 percent of their assets in Namibia, they hold about a third in South Africa, and the rest in advanced economies (International Monetary Fund, 2018).
41. The largest segment of the NBFI sector,the pension system, consisting of auniversal, non-contributory pension, andprivate, occupational schemes, coversapproximately 30 percent of the labourforce, including Government InstitutionsPension Fund (GIPF). Pension funds havetraditionally held well-diversified portfolioscompared to global peers but are likely tochange because of the increase in the domesticasset requirements.
42. The insurance market is concentratedand dominated by subsidiaries of SouthAfrican financial groups. The sector consistsof 14 general insurers, 16 life insurers and onestate-owned reinsurer. Insurance sector assetsinclude insured pension fund products thatprovide an explicit capital guarantee. Thesepension assets are held on the balance sheet ofthe life insurance companies. Medical aid fundsare a small but growing element of the sector.
B. DRIVERS AND CONSTRAINTS
43. An assessment of the status of Namibia’sfinancial system through the NamibiaFinancial Sector Strategy report showedthat although the system is sound and well-functioning, there are a few weaknessesthat need to be addressed. The report showed several weaknesses in the financial system thatneeded to be addressed to enable the financialsector to contribute more meaningfully to theoverall performance of the country’s economy.Key weaknesses identified included: limitedcompetition, limited financial safety nets, under-developed capital market; limited access tofinancial services; low financial literacy and lackof consumer protection; absence of effectiveconsumer activism, limited financial management skills; and low participation by Namibians andthus dominance of foreign ownership of financial
institutions (Namibia Financial Sector Strategy, 2011).
44. To address the weaknesses in theNamibian financial system, a ten-yearStrategy covering the period 2011-2021has been developed. The strategy is gearedtowards enabling the country’s financial sectorto transform and contribute more meaningfullyto the socio-economic objectives as containedin the various development plans (NDPs andVision 2030).
45. Cyber risk is also an important emergingrisk factor. According to the World BankFinancial System Stability Assessment report,Namibia is one of the top cyber-attack targetsin Africa, and cyber risk has been singled out

Bank of Namibia Annual Report 2019 197
Part CEconomic and Financial Developments
as the most significant risk by big banks. The report corresponds with an earlier one done by Deloitte which states that Namibia is one of the top most vulnerable countries in the world to cybercrime. Currently, the banks’ main cyber risk management tool is to build a stronger IT system, but the authorities should promote banks’ financial risk management framework on cyber and closer inter-bank collaboration.
46. Domestic financial markets suffer from a shortage of supply and low liquidity. While the market capitalization of the Namibian Stock
Exchange (NSX) is sizeable at 10 times GDP, there are only 8 domestic equities with a primary listing on the NSX, accounting for 1.85 percent of market capitalization. The rest are dual-listed stocks, most with a primary listing on the Johannesburg Stock Exchange. The secondary market for Treasury Bills (T-Bill) and bonds is illiquid. Institutional investors’ large capital pool has benefitted Namibia’s development needs, but the shortage of assets increases the chances of developing asset bubbles.
C. OPPORTUNITIES AND CHALLENGES
47. Namibia ranks third (after Mauritius and South Africa) among African countries with FinScope surveys in terms of the level of financial inclusion and banked individuals. In fact, the levels of financial inclusion and banked individuals are very similar in Namibia and South Africa. Importantly, the increase in the banked population during 2007-2011 has largely emerged from low income earners who tend to live in rural areas (World Bank, 2016). Despite recent progress, there is still low-income and rural individuals, and micro, small, and medium enterprises (MSMEs) that are not well served by a highly-concentrated and high-cost banking system. There is a trend towards greater market diversity and innovation, yet new entrants have thus far not achieved scale or reached underserved consumers, mostly targeting customers with existing banking relationships.
48. About 40 percent of pension fund assets are invested domestically, with the remainder split between South Africa/CMA and overseas investments. With the announced increase in the minimum domestic investment requirement to 45 percent of assets, this diversification would decrease. The government should support the partial listing of State-Owned Enterprises (SOEs), public-private partnerships in infrastructure, and other market instruments to provide additional investible assets inside Namibia.
49. Tax incentives for the pension industry are limited and could be improved. The preservation of pension benefits is an issue as members can access their funds when changing employer, which allows for early access and leads to leakage from the system. This should be addressed to ensure the pension system meet its strategic objectives.
VI. INFORMATION AND COMMUNICATION TECHNOLOGY
A. GROWTH AND NEW DEVELOPMENTS
50. The telecommunication services improved rapidly since the introduction of mobile phones in the 1990s. Penetration of telecommunication services improved rapidly with the introduction of mobile cell phone services during the mid-1990s in Namibia. Mobile phones have made life much easier for citizens as the related technology contains features that offer a variety of services such as
internet, through which people can send and receive email, do internet payments or transfers, cell phone banking, make use of social media platforms and access educational material.
51. The West Africa Cable System (WACS) was introduced in Namibia in May 2012. The WACS is a 16 000km long submarine cable system connecting 15 countries from Europe to

Bank of Namibia Annual Report 2019198
Part CEconomic and Financial Developments
Southern Africa. WACS is the most important conduit for the west coast of Africa and is an essential artery for the digital connectivity and economic development of countries that connect to the cable. The initial capacity of the WACS cable system is about 5.12Tbits/s, with an amplification capacity of up to 30Tbits/s. Such infrastructure should make it possible for the implementation of e-government and facilitate decentralisation of services.
52. Namibia launched the 4G Long Term Evolution-LTE and established 26 Multi-Purpose Community Centers. The launching of the 4G Long Term Evolution-LTE technologies enables the downloading and uploading of data at a speed almost ten times faster than the previous generation. The Ministry of Information, Communication and Technology (MICT) established a total of 26 Multi-Purpose Community Centers (MPCCs) in all 14 regions which are equipped with basic ICT equipment to ensure that the digital divide is reduced through the introduction of ICT services to rural communities
53. Namibia has two dominant national telecommunications operators which are currently entirely owned by the state. While smaller operators (MTN mobile, Bidvest, SALT and Paratus Telecom) gained market share in terms of assets and revenues, the sector remains highly concentrated with MTC and Telecom Namibia controlling 91% of the assets and 88% of the revenues in the market (Communications Regulatory Authority of Namibia (CRAN), 2018).
54. Despite the increased share in assets and revenue of smaller licensees, there is still insufficient competition. While smaller licensees have increased their share in assets
and revenues, the high market concentration raises the concern of insufficient competition with higher consumer prices and lower quality of service as a result. This is because MTC is dominant for mobile telephony and Telecom Namibia for fixed-lines and national data connectivity. The smaller licensees mainly resell Telecom Namibia’s services and thus are only competing with Telecom Namibia on retail level, not on wholesale level. In 2013 MTC bypassed Telecom in terms of value of total assets, mainly due to their investment in towers to roll out their services on a national level with their 081Every1 campaign.
55. GDP contribution by the information communication sector has remained constant over the years, while employment in the sector has been below 1 percent. The average contribution to GDP is 1.55 percent from 2013 to 2018. Employment in the sector is relatively low. Average employment has been below 1 percent of the national employment from 2012 to 2018. This partly reflects the high level of automation in the industry, since traffic volumes have grown in leaps and bounds.
56. According to the Global ICT ranking index, Namibia ranked number 118th out of 176 countries in 2017, an improvement from 2016, in which it was ranked 123 out of 176 countries. On top of that, the other major players in the Namibian economy, whether the financial services sector, mining or any of the other sectors would not be able to function without ICT. ICT does not contribute to the Namibian economy in the same way that the fishing or mining sectors do; however, indirectly the ICT sector contributes a great deal through knowledge and skills development.
B. DRIVERS AND CONSTRAINTS
57. Fixed-line subscriptions showed a significant decrease, caused by a drop in business connections, which can be partially attributed to recent lower economic growth and wider use of mobile phones. Although fixed lines bring in the most money as per the profit margins, Telecom
did not invest anything in 2017 to widen the customer base (CRAN, 2018). Residential fixed-line subscription still increased, which can partially be a reclassification of a business line into residential line since asymmetric digital subscriber line (ADSL) subscription did not grow in 2018.

Bank of Namibia Annual Report 2019 199
Part CEconomic and Financial Developments
TABLE TC.5: FIXED-LINE SUBSCRIPTION
Fixed-line subscription 2013 2014 2015 2016 2017 2018
BusinessNumber 99,107 121,871 119,976 121,517 123,530 90,050
Change 22.97% -1.55% 1.28% 1.66% -27.10%
ResidentialNumber 84,425 60,722 62,532 66,336 69,213 79,759
Change -28.08% 2.98% 6.08% 4.34% 15.24%
TotalNumber 183,532 182,593 182,508 187,853 192,743 169,809
Change -0.51% -0.05% 2.93% 2.60% -11.90%
Source: CRAN, 2018
58. Telecom Namibia faces declining voicerevenue due to wider use of mobile phonesand Voice Over Internet Protocol (VoIP)applications such as Skype, WhatsAppand Facetime. Telecom Namibia, as Namibia’sonly national fixed-line operator, faces decliningvoice revenues, which is a global trend dueto wider use of mobile phones and the use ofVoIP applications such as Skype WhatsApp
and Facetime. Fixed-to-mobile and voice-to-data substitutions happen at the residential and business level. While fixed-lines are not necessarily disconnected by businesses, business communication traffic has been shifted to mobile and VoIP. This is an international trend which is also reflected in Namibia.
FIGURE TC.4: NUMBER OF BROADBAND SUBSCRIBERS IN MILLIONS
0
0.5
1
1.5
2
2.5
2013 2014 2015 2016 2017 2018
Mill
ions
Fixed Mobile
Source: CRAN
59. Fixed and mobile broadband have showngrowth since 2013 but the growth formobile subscriptions increased by 59percent over the past year. This could be dueto the 081everyone campaign of MTC to ensure
100 percent broadband population coverage. Currently, almost 83 percent of the population has 3G coverage but 4G coverage lags behind at only 36 percent of the population (CRAN, 2019).
C. OPPORTUNITIES AND CHALLENGES
60. One of the challenges in the developmentof the information technology is the lack ofsuitable electricity and telecommunicationinfrastructure. The unavailability of electricity
infrastructure in semi-urban and remote rural areas hinders both the provision and uptake of ICT services. There are also insufficient telecommunication backhaul infrastructure to

Bank of Namibia Annual Report 2019200
Part CEconomic and Financial Developments
very remote rural areas. The unit cost of rolling out infrastructure is high, which negatively influences the affordability and price points of key services. Yet most areas where population is concentrated nowadays have basis infrastructure facilitating the use of ICT services.
61. Another challenge is the lack of ICT literacy in the country. ICT literacy is relatively low in Namibia, which inhibits the uptake of e-commerce and Internet access ICT skills are essential for every day functioning in the world of work and leisure. There is a lack of understanding of the relevance of ICT in Namibia, which results
in low resource provision, and usage of available ICT capacity (Harambee Prosperity Plan, 2016).
62. Namibia recently finalised the broadband policy which aims to reach a greater network of customers by 2024. The Government aims to achieve 95 percent broadband coverage by 2024, with a 100 percent coverage in broadband connections and usage to all primary and secondary schools in the country to enable e-learning. Similarly, the government also intends to have 90 percent broadband connection and usage to 70 percent of the health facilities in the country to ensure e-health by 2024.
VII. CONCLUSION AND POLICY OPTIONS
63. Reducing the cost of doing business through infrastructure investment and regulatory reform would accelerate the growth of services. Electricity and transportation are key components of economy-wide development, but they are especially critical to the services sector. Completing the implementation of new procedures for allocating electricity contracts based on competitive bidding would be a major step toward improving the reliability of the energy supply.
64. Infrastructure improvements could be complemented by legal and administrative reforms targeting property registration, obtaining construction permits and protecting minority investors, areas in which Namibia is currently making progress, although still lags behind many comparable countries. Investment in real estate and factories enabled by these changes would strengthen the base of demand for services.
65. There is a need for further reduction in public monopoly in competitive industries to create new job opportunities and foster innovation and productivity. Further regulatory reform of services markets will create fresh opportunities for firms to develop new services, meet emerging global demands and increase employment. It will also increase the incentives for companies to innovate and improve productivity growth. While much progress has
been made in opening services markets, further steps are needed, e.g. in reducing the degree of public ownership in competitive industries such as telecommunications, in addressing anti-competitive practices in professional services, and in reducing barriers to entrepreneurship.
66. One of the underdeveloped pillars is the education sector. The growing complexity of the information economy requires it to be complemented by a population that is adequately sophisticated. Human capital indices are currently poor, particularly in areas of disease prevention and eradication, and higher education. Development of the human capital necessary for further improvement of the services sector will require a technical, vocational and entrepreneurship training strategy based on private sector leadership. Policy makers must accurately identify mismatches between workforce skills and employer demand and create effective and sustainable strategies to address them.
67. Adapt education and training policies to rapidly changing requirements for new skills. Since most services involve direct contact with customers, human resources are key to services sector performance. Education policies are important to help workers adjust to globalisation and structural change and should help provide the qualifications that are needed in services. However, they need to be supplemented with actions, partnerships and
Bank of Namibia Annual Report 2019 201
Part CEconomic and Financial Developments
co-financing by firms, workers and governments to foster life-long learning. This will require improved incentives for private financing of life-
long learning and actions to ensure equitable access to formal and on-the-job learning.
VIII. REFERENCES
1. Bank of Namibia (2017), annual report, retrieved from https://www.bon.com.na/CMSTemplates/Bon/Files/bon.com.na/92/92d106b2-a920-4168-be80-ec1645e42e95.pdf
2. Bank of Namibia (2018), annual report, retrieved from https://www.bon.com.na/CMSTemplates/Bon/Files/bon.com.na/7c/7c8d9d1a-0cad-4745-ab1b-61991ab32781.pdf
3. Bosworth, B. and Maertens, A. (2010) The role of the service sector in economic growth and employment in South Asia. In: Ghani, Ejaz (ed.) The service revolution in South Asia. Oxford University Press, Oxford. ISBN 9780198065111
4. Calderwood, L.U and Soshkin, M (2019). The Travel & Tourism Competitiveness Report 2019. World Economic Forum 2019
5. Communications Regulatory Authority of Namibia (2019) Telecommunication Sector Performance Review for 2017/18, March 2019, Windhoek, Namibia
6. CRAN (2019) Stats Newsletter March 2019. Retrieved from https://www.cran.na/images/docs/economics/CRAN_Quarterly_Newsletter_Mar_2019.pdf
7. Deloitte (2018) Cyber Security Survey for Namibia Keeping an eye on what matters.
8. Goldbeck, M (2016) Annual Symposium. Reducing Unemployement in Namibia: Creating More Jobs in the Manufacturing and Tourism Sectors. Bank of Namibia
9. International Monetary Fund (2018) Namibia Financial System Stability Assessment. IMF Country Report No. 18/77. Washington, D.C.
10. Kochhar, K., Kumar, U., Rajan, R., Subramanian, A., Tokatlidis, I., 2006. India’s Pattern of Development: What Happened, What Follows? International Monetary Fund Working Paper WP/06/22, https://www.imf.org/external/pubs/ft/wp/2006/wp0622.pdf
11. Merotto, D; Weber, M; Aterido, R. (2018). Pathways to Better Jobs in IDA Countries : Findings from Jobs Diagnostics. Jobs Series;No. 14. World Bank, Washington, DC. © World Bank. https://openknowledge.worldbank.org/handle/10986/30594 License: CC BY 3.0 IGO.”
12. Namfisa (2018) annual report, retrieved from https://www.namfisa.com.na/wp-content/uploads/2018/08/Namfisa_Annual_Report-2018.pdf
13. Namibia Financial Sector Strategy (2011) A Sector Development Document Towards Achieving Vision 2030. Republic of Namibia, Ministry of Finance.
14. Namibia State of Logistics Report for 2018, Walvis Bay Corridor Group
15. Namibian ports authority (2018), annual report, retrieved from https://www.namport.com.na/files/documents/dee_Annual%20Report%2012%20months%20ended%2031%20March%202018.pdf
16. National Planning Commission (2018) Namibia as a service hub: The role of Logistics and Financial services in economic transformation. Republic of Namibia, Windhoek
17. PWC (2019) Hotels outlook: 2019 – 2013 Future resilience. Retrieved from: https://www.pwc.com/na/en/publications/hospitality-outlook.html
18. TransNamib Holdings (2018) annual report, retrieved from http://www.transnamib.com.na/wp-content/uploads/2019/10/TN-Integrated-Annual-Report-201819.pdf
19. World Bank (2016) Financial Inclusion in Namibia: Summary Note. World Bank Group Finance and Markets.
20. World Bank (2019) Doing Business 2019 – Training for Reform. Comparing Business Regulation for Domestic Firms in 190 Economies. World Bank Group

Bank of Namibia Annual Report 2019202
INTRODUCTION 203
PERFORMANCE OF THE BANKING SECTOR 203BALANCE SHEET STRUCTURE 203
ASSET STRUCTURE 204
FUNDING STRUCTURE 205
CAPITAL ADEQUACY 206
CREDIT RISK 207
PROFITABILITY AND EARNINGS 209
FRAUD AND OTHER ECONOMIC CRIME 211
LIQUIDITY 212
INTEREST RATE RISK 213
ON-SITE EXAMINATIONS 214
CUSTOMER COMPLAINTS 214
LICENSING OF BANKING INSTITUTIONS 215
DEVELOPMENTS RELATING TO THE CREDIT BUREAUS 216
DEVELOPMENTS RELATING TO BANKING LEGISLATION 216
PRIMARY LEGISLATIVE CHANGES 217
SECONDARY LEGISLATIVE CHANGES 217
Part DBank Supervision
Contents

Bank of Namibia Annual Report 2019 203
Part DBank Supervision
INTRODUCTION
39 First National Bank of Namibia Limited, Bank Windhoek Limited, Standard Bank Namibia Limited and Nedbank Namibia Limited are considered as DSIBs.
The banking sector performed reasonably well, amidst the weakened domestic economy. Capital of banks remained strong during 2019 and supported balance sheet expansion and risk coverage. The liquid asset holdings remained adequate to meet near-term obligations, while cashflows from other assets, specifically loans and advances and trading and investment securities, were used to cover longer-term needs. The liquidity position improved, due to
a slowdown in the demand for credit, coupled with the non-banking institutions’ local asset requirement changes that caused repatriation of funds by institutional investors back into Namibia. On the downside, asset quality deteriorated, due to an increase in non-performing loans (NPLs) from 3.6 percent of total loans in 2018 to 4.8 percent in 2019. The increase in NPLs was observed in mortgages, overdrafts and other loans and advances, due to unfavourable market conditions.
PERFORMANCE OF THE BANKING SECTOR
The earnings of the banking sector continued to increase, although only moderately, during the period under review, amidst weaker credit appetite among bank customers. Although the banking sector is navigating a severe economic downturn, it continued to generate healthy earnings. The banking sector also recorded an improvement in the efficiency ratio. Despite the banking sector recording a decline in total qualifying
capital, all Domestic Systemically Important Banks (DSIBs)39 remained well capitalised. The Basel III capital requirements are limited to the four DSIBs, which also have the largest share of the asset base in the banking sector. Jointly, these banking institutions held a total share of 98.8 percent of the total banking assets in 2019, almost unchanged from the previous year.
BALANCE SHEET STRUCTURE
The banking industry balance sheet continued to grow during 2019. Year-on-year, total assets of the banking sector grew from N$132.2 billion to N$142.2 billion, as depicted in Figure D.1. This represents overall growth of 7.6 percent for the year 2019, well above
concurrent inflation. Assets grew as a result of increases in net loans and advances, cash and balances with banks, and trading and investment securities, with the asset growth mostly funded by non-bank funding.
FIGURE D.1 TOTAL ASSETS
Balance sheets showed slightly higher growth during 2019, relative to 2018.
0
2
4
6
8
10
12
14
16
0
20
40
60
80
100
120
140
160
2015 2016 2017 2018 2019
Perc
enta
ge
N$ b
illio
n
Balance sheet size Percentage change

Bank of Namibia Annual Report 2019204
Part DBank Supervision
ASSET STRUCTURE
The balance sheet recorded growth in most asset categories of which net loans and advances was the largest contributor to asset growth. The categories of net loans and advances, cash and balances with banks, and trading and investment securities all contributed to the increase in assets. During the review period, net loans and advances increased by 6.7 percent to N$101.2 billion, while cash and balances increased by 10.9 percent to N$13.7 billion. Trading and investment securities increased significantly by 24.5 percent and stood at N$6.5 billion in 2019.
Net loans and advances constituted the largest portion of total banking sector assets in 2019. The composition of total banking sector assets was spearheaded by net loans and advances, with a 71.2 percent share in 2019, a decline from 71.7 percent in 2018. Short-term negotiable instruments were held to the tune of N$15.7 billion, which constituted 11.0 percent of assets, recording a slight decline from 11.7 percent in 2018. Cash and balances accounted for the third largest portion of banking sector assets with a 9.6 percent share in 2019, an increase from the 9.3 percent share held the previous year. The increase in the share of cash and balances with banks could be attributable to the repatriation of funds by institutional investors to Namibia, due to the increase in the domestic asset requirement to the level of 45 percent. These funds partly remained idle in the banking sector, while institutional investors were indentifying suitable investment avenues. The improved cash position also resulted from a lower demand for credit or borrowing
appetite from both households and businesses, given the prevailing adverse economic conditions and high household indebtedness. The categories of trading and investments portfolio, fixed assets and other assets together comprised the remaining 8.3 percent of banking sector assets.
Mortgage loans still dominated the loan book of banks. Mortgage loans grew by 4.6 percent from N$50.4 billion in 2018 to N$53.2 billion in 2019, which constituted 51.3 percent (2018: 51.9 percent) of the total loan book. The residential mortgages constituted 75.6 percent of mortgages, with commercial mortgages responsible for the remaining share of 24.4 percent. The concentration risk is managed through higher capital risk-weighted charges for residential mortgages held in Namibia compared to international standards, and through the Regulation on maximum loan-to-value ratios for non-primary residential properties.
Amongst the other loan categories, personal loans and other loans and advances recorded notable growth. Personal loans increased by 26.4 percent to N$7.3 billion and captured a 7.1 percent share of the loan book in 2019, relative to 5.9 percent in 2018. Other loans and advances recorded an increase of 15.0 percent to N$19.7 billion, having a 19.0 percent share of the loan book. Amongst other loan categories, fixed-term loans and preference shares recorded notable growth. Fixed-term loans increased by 10.9 percent to N$16.7 billion, and preference shares increased by N$0.9 million to N$1.3 billion.
FIGURE D. 2 COMPOSITION OF TOTAL LOANS AND ADVANCES AT YEAR-END
Mortgage loans remained the most important component of loans and advances.
2019Instalment sales
Residential mortgage loans
Commercial mortgageloans
Personal loans
Overdrafts
Other loans and advances
2018
39%39%
13%13%
7%6%
12%12%
18% 19%12% 10%

Bank of Namibia Annual Report 2019 205
Part DBank Supervision
FUNDING STRUCTURE
Non-bank funding and capital and reserves drove the increase in funding sources. Non-bank funding remained the dominant source of funding for the banking sector, with total funding emanating mainly from the mobilisation of demand deposits, fixed and notice deposits, and negotiable certificates of deposit. Non-bank funding grew year-on-year by 9.4 percent to N$107.5 billion in 2019, constituting 75.6 percent of total funding.
Bank funding in turn decreased by 3.2 percent year-on-year to N$5.7 billion and constituted 4.0 percent of total funding in 2019. Capital and reserves increased by 7.7 percent to N$16.4 billion and constituted 11.5 percent of total funding, due to an increase in general reserves (Figure D.3). The remaining 8.9 percent of total funding was comprised of all other liabilities.
FIGURE D.3 (a–b) FUNDING STRUCTURE AT YEAR-END
Sources of funding were mainly supported by non-bank funding and capital and reserves.
a. Composition of funding
0.0
10.0
20.0
30.0
40.0
50.0
60.0
70.0
80.0
90.0
100.0
2014 2015 2016 2017 2018 2019
Perc
ent
Capital and reserves Other liabilities Borrowings Debt instruments Non-bank Interbank
Non-bank funding was mainly sourced from demand deposits and negotiable certificates of deposit.
b. Composition of non-bank deposits
December 2019
Demand deposits
Savings deposits
Fixed and notice deposits
Negotiable
Foreign funding
December 2018
48%
certificates of deposit
47%
3%3%
21%19%
25% 24%
5%5%
Demand deposits remained the most attractive non-bank funding source for banking institutions. Demand deposits increased year-on year by 8.3 percent from N$46.7 billion to N$50.6 billion and constituted 47.1
percent of total non-bank funding. Demand deposits were largely comprised of wholesale deposits, which tend to be volatile as they can be withdrawn at short notice. Negotiable certificates of deposit increased by

Bank of Namibia Annual Report 2019206
Part DBank Supervision
2.8 percent from N$24.9 billion in 2018 to N$25.5 billion and represented 23.8 percent of non-bank funding. Fixed and notice deposits increased by 21.4 percent from N$19.0 billion to N$23.0 billion and accounted for 23.8 percent of total deposits. Compared to 2018, the funding portfolio of banks shifted slightly from demand deposits to fixed and notice deposits.
The Bank has made progress in implementing a new liquidity framework that is based on Basel III standards. The draft Basel III liquidity framework would require banking institutions to diversify their
40 Behavioural adjustment means the modification made to the contractual maturity of assets and liabilities in determining cash inflows,cash outflows and ultimately liquidity mismatches in each successive maturity band, in line with the behaviour of assets.
funding sources and is currently undergoing industry consultation. The banking sector’s current funding sources are largely comprised of wholesale deposits that constitutes 65 percent of total funding and tends to be volatile and short-term in nature, which may cause funding mismatches in maturities between assets and liabilities. The Bank has implemented regulatory limits for maturity mismatches of cash flows for the 0–7 days and 8–31 days’ time buckets, effective September 2019, and these should be calculated on a behavioural40 adjusted basis.
CAPITAL ADEQUACY
The capital levels of the industry remained strong during 2019 to cover the risks associated with banking business to insulate banks against potential losses. During the year under review, all DSIBs reported on the Basel III Capital Adequacy Framework, which will be phased in over a five-year period ending in 2022. All capital ratios stood well above the minimum regulatory requirements. The Common Equity Tier 1 (CET1), Tier 1 and total eligible capital ratios stood well above their minimum regulatory requirements of 6.0 percent, 8.5 percent and 11.0 percent, respectively. The Tier 1 leverage ratio was also well above the regulatory limit of 6.0 percent, indicating that banking institutions are already managing the risk of excessive leveraging in a prudent manner.
Total qualifying capital was slightly lower for the period under review than in 2018, mainly
because of dividend pay-outs and the switch in Tier 2 instruments. The four DSIBs collectively paid out dividends to the value of N$1.6 billion in 2019, compared to N$0.8 billion in 2018, causing a decline in the industry’s qualifying capital level. The transitioning to the Basel III Capital Adequacy standards for DSIBs resulted in Tier 2 capital items (being unaudited profits and revaluation reserves) no longer being eligible for inclusion in capital after a phase-in period of five years. Total qualifying capital decreased by 7.0 percent to N$15.7 billion during 2019. This decrease was largely attributed to Tier 1 capital, which declined by 4.4 percent to N$13.3 billion due to a decrease in retained earnings. In addition, the 19.5 percent decrease in Tier 2 capital to N$2.4 billion also contributed to the contraction in total qualifying capital owing to decreases in subordinated term debt, unaudited profits, loan loss provisions and revaluation reserves (Figure D.4).
FIGURE D.4 (a–b) CAPITAL ADEQUACY ELEMENTS AND RATIOS
The banking industry remained adequately capitalised in 2019 despite the decrease in overall capital levels.
a. Elements of capital funds
-10.0
-5.0
0.0
5.0
10.0
15.0
20.0
25.0
0.0 2,000.0 4,000.0 6,000.0 8,000.0
10,000.0 12,000.0 14,000.0 16,000.0 18,000.0
2015 2016 2017 2018 2019
Perc
enta
ges
N$ m
illio
ns
Tier 2 capital (LHS) Tier 1 capital (LHS)Growth in capital funds (RHS)
b. Capital adequacy ratios
0
5
10
15
20
2015 2016 2017 2018 2019
Perc
enta
ge
Minimum leverage ratio Minimum Tier 1 capital ratioMinimum risk-weighted capital ratio Leverage ratioTier 1 capital ratio Risk-weighted capital ratio-

Bank of Namibia Annual Report 2019 207
Part DBank Supervision
While capital levels decreased during the year, risk-weighted assets increased, resulting in a lower risk-weighted capital ratio for the banking sector. Total qualifying capital recorded a 7.0 percent decrease in 2019, in contrast to the 11.5 percent increase recorded during 2018, while risk-weighted assets increased by 1.4 percent.
The Basel II capital adequacy standards remained applicable to banking institutions that do not
41 A non-performing loan is a loan (capital and/or interest) overdue or unpaid for 90 days or longer.
42 Overdue loans mean any asset for which any portion of the principal and/or interest is due and unpaid for 30 days or more; or interest due equal to 30 days’ interest or more has been capitalised, refinanced or rolled over.
qualify for designation as DSIBs. These banking institutions also remained adequately capitalised, as demonstrated by their average total risk-weighted capital ratio, which stood at 80.5 percent in 2019, well above the regulatory minimum of 10.0 percent. Similarly, the Tier 1 capital ratio and the Tier 1 leverage ratio stood at 76.2 percent and 52.3 percent, respectively, exceeding their corresponding regulatory minima of 7.0 percent and 6.0 percent by a large margin.
CREDIT RISK
Analysis of non-performing loans The banking sector’s asset quality worsened in 2019, due to the slowdown in general economic conditions. This led to a year-on-year increase in non-performing loans (NPLs)41 of 44.0 percent, to N$5.0 billion, as some clients were unable to meet repayment obligations, owing to unfavourable market conditions and cash flow constraints (Figure D.5). Overdue loans42
also increased by 26.1 percent to N$9.1 billion in 2019, up from N$7.2 billion in 2018. The surge in NPLs stemmed mainly from mortgages that increased from N$2.0 billion in 2018 to N$3.3 billion in 2019. Non-performing overdrafts followed, with an increase from N$0.5 billion in 2018 to N$0.6 billion in 2019. The third largest contributor was personal loans, which increased from N$0.1 billion to N$0.2 billion.
Mortgages were the leading component of non-performing loans. Non-performing mortgages increased and accounted for 66.3 percent of NPLs, which is the largest portion of total NPLs. The remaining categories of non-performing loans were represented by overdrafts at 12.9 percent, other loans and advances at 11.1 percent, instalment sales at 5.4 percent, personal loans at 3.6 percent, and credit cards at 0.7 percent. Non-performing loans across all loan product categories increased in 2019, in comparison to 2018.
The corporate sector constituted the largest share of NPLs, an indication that businesses were the most affected by the downturn in the economy. In
terms of sectoral NPLs distributions, corporates had the largest share of N$2.9 billion, whilst individuals recorded NPLs to the value of N$2.1 billion. A further breakdown of NPLs per sectors indicated that the real estate and business services sector recorded N$1.2 billion of NPLs, followed by trade and accommodation with N$0.4 billion and construction with N$0.4 billion. The rest of the sectors that include mining, fishing, manufacturing, agriculture and forestry, transport and communication, finance and insurance, government, electricity, oil and gas and other sectors made up the remaining share of N$0.9 billion.
The worsened repayment capability of customers caused the ratio of NPLs to total loans and advances to escalate in 2019. The trigger point of 4.0 percent for the NPL ratio was breached as the NPL ratio increased from 3.6 percent in 2018 to 4.8 percent in 2019. This indicates a deterioration in the asset quality on the loan book of the banking sector, with values above 4.0 percent in practice triggering more rigorous scrutiny of the loan book by both banking institutions and banking supervisors. Despite the worsening repayment by customers, in order to evaluate the impact of the negative NPLs ratio trend, various interventions such as stress testing were carried out on the loan books of banking institutions, as early stress detection to enable proactive credit risk management. These showed that the banking industry is still sound.

Bank of Namibia Annual Report 2019208
Part DBank Supervision
FIGURE D.5 NON-PERFORMING LOANS
The increase in NPLs stemmed mainly from the non-performing mortgages category.
0
0.5
1
1.5
2
2.5
3
3.5
4
4.5
5
0
1000
2000
3000
4000
5000
6000
2015 2016 2017 2018 2019
Perc
ent
N$ m
illio
n
Other loans Credit cardsOverdrafts Personal loansMortgages Instalment sales and leasesNon-performing loan ratio (RHS)
43 Specific provisions apply to loans graded substandard, doubtful and loss, the net realisable value of collateral shall be deducted from the loan balance before applying provisioning percentages.
Adequacy of provisionsIn 2019, specific provisions were adequate to absorb expected credit losses from NPLs. Specific provisions43 are considered adequate if banks hold minimum specific provisions for the loans classified in the substandard, doubtful and loss categories, to the minimum requirement of 10 percent, 50 percent and 100 percent of the total outstanding loan balances after considering collateral values, respectively. Specific provisions increased year-on-year by 47.0 percent from N$662.6 million to N$974.1 million, a lower increase than the 52.9 percent recorded in 2018. The ratio of specific provisions to non-performing loans increased slightly from 19.1 percent in 2018 to 20.5 percent in 2019.
The purpose of holding specific provisions is to ring-fence part of the banking institutions capital and reserves to bridge the gap between the amount owing to the bank by the non-performing borrower and the realisable value of collateral supporting that loan. The realisable value of collateral increased by 41.4 percent from N$2.4 billion in 2018 to N$3.4 billion in 2019 due to additional collateral provided by customers. The increase in collateral value, supplemented by adequate specific provisions coupled with capital buffers, counteracted the 36.7 percent growth in NPLs.
Loan diversification and statutory large exposures A consequence of weakened economic conditions was a change in the composition of loans and advances across different sectors and counterparties. The concentration of loans to individuals as a share of sectoral loan distributions declined from 49.3 percent in 2018 to 45.9 percent in 2019. Smaller shares were held by the real estate and business services sector with 10.8 percent, finance and insurance trailed with a share of 7.0 percent, trade and accommodation with 6.6 percent, government services with 5.6 percent and agriculture, hunting and forestry with 4.1 percent. The remaining sectors of fishing, mining, manufacturing, construction, electricity, gas
and water, and transport and communication each had shares of less than 4.0 percent, but together making up the residual shares of 20.0 percent.
The value of large exposures for the banking industry remained within the regulatory capital limits. In terms of the Determination on Limits on Exposures to Single Borrowers, Large Exposures and Concentration Risk (BID-4), a large exposure means any exposure to a single person or group of related persons which, in the aggregate, equals or exceeds 10% of a banking institution’s eligible capital funds. The value of large exposures decreased by 16.3 percent year-on-

Bank of Namibia Annual Report 2019 209
Part DBank Supervision
year from N$19.4 billion to N$16.2 billion. Therefore, the industry recorded a decline in the ratio of large exposures to total loans from a level of 20.0 percent to 15.6 percent. Relative to capital, aggregate large
exposures fell from 125.8 percent to 103.5 percent. This ratio was well within the prudential limit of 800 percent of capital funds (Figure D.6).
FIGURE D.6 STATUTORY LARGE EXPOSURES RELATIVE TO TOTAL LOANS AND CAPITAL FUNDS
Large exposures in absolute terms decreased and remained compliant with the prescribed capital limits.
0
100
200
300
400
500
600
700
800
0
10,000
20,000
30,000
2015 2016 2017 2018 2019
Perc
ent
N$ m
illio
n
Statutory large exposures (LHS) Statutory large exposures to qualifying capital (RHS) Statutory large exposures to total loans (RHS) Aggregate exposure limit - % of capital funds (RHS)
PROFITABILITY AND EARNINGS The banking sector continued to generate healthy earnings despite navigating a severe economic downturn that was accompanied by slow growth in bank customers’ credit appetite and an increase in non-performing loans. The banking industry’s total income growth remained positive, as the banking institutions recorded an increase of N$0.7 billion year-on year from N$9.6 billion to N$10.4 billion in 2019. This represents an increase of 7.7 percent, slightly below the 8.1 percent recorded in 2018. Both net interest income
and other operating income contributed to the increase in total income. Net interest income increased by N$0.5 billion to N$5.9 billion during 2019.
On the other hand, other operating (non-interest) income also increased, at a lower absolute value of N$0.2 billion, to stand at N$4.4 billion in 2019 (Figure D.7a). Net interest income captured the largest share of 57.4 percent of total income, while operating income held the remaining share of 42.6 percent.
FIGURE D.7(a) KEY INCOME STATEMENT INDICATORS
The banking sector’s income increased in 2019, although at a slower growth rate when compared to 2018.
1,0002,0003,0004,0005,0006,0007,0008,0009,000
10,00011,00012,00013,000
2015 2016 2017 2018 2019
N$ m
illio
n
Interest income Net interest income Other operating income Interest expenses Other operating expenses

Bank of Namibia Annual Report 2019210
Part DBank Supervision
During 2019, the banking sector managed to keep increases in operating expenses below income growth, and thereby improved the cost-to-income ratio. The operating expenses of banking institutions increased by 4.9 percent to N$5.7 billion in 2019, lower than the increase of 10.3 percent recorded in 2018. The higher operating expenses in 2019 were fuelled by escalating staff costs through annual salary increments and increased leave pay-outs, and depreciation and amortisation through new equipment and systems acquired by banks in line with their digitisation drives.
Staff costs increased by 7.9 percent, while depreciation and amortisation increased by 22.1 percent. Staff costs remained the largest expenditure component, representing 53.7 percent of total operating expenses, followed by administration and overheads at 23.5 percent and depreciation and amortisation at 7.2 percent. Notably, provision charges increased from N$439 million in 2018 to N$727 million in 2019, which is attributed to higher specific provisions relative to the non-performing loan book.
FIGURE D.7(b) EFFICIENCY INDICATORS OF THE BANKING SECTOR
Operating expenses increased less than growth in income, implying improving efficiencies.
5.0
15.0
25.0
35.0
45.0
55.0
65.0
0
2,000
4,000
6,000
8,000
10,000
12,000
2015 2016 2017 2018 2019
Perc
ent
N$ m
illio
n
Total income (LHS) Operating expenses (LHS) Cost -to-income ratio (RHS)
The increase in total income improved the cost efficiency indicators. Despite difficult circumstances, banks managed to decrease the cost-to-income ratio (operating expenses/total income) from 56.9 percent to 55.5 percent owing to a relatively sharper increase in total income (Figure D.7b). However, despite the improved ratio, it remained above the international benchmark of 50.0 percent, but below the Bank’s internal regulatory threshold of 65.0 percent.
During 2019, the after-tax profits improved despite a challenging economic environment. The banking
industry recorded after-tax profits of N$2.7 billion in 2019, an increase of 5.9 percent year-on-year. Notwithstanding the improvement in earnings of the banking sector, both the Return on Assets (ROA) and the Return on Equity (ROE) ratios declined, due to the faster growth in average assets and equity, respectively, compared to earnings or profits. The ROA ratio decreased from 2.02 percent to 1.99 percent, while the ROE ratio declined from 18.5 percent to 17.3 percent (Table D.1).
TABLE D.1 ROA AND ROE
Description 2015 2016 2017 2018 2019
Return on Assets 2.5 2.3 2.1 2.0 2.0
Return on Equity 24.5 24.1 18.6 18.5 17.3

Bank of Namibia Annual Report 2019 211
Part DBank Supervision
The banking sector expanded their agency network, while the number of branches contracted. The number of agencies increased from 64 in 2018 to 82 in 2019, whereas the number of branches in the network decreased by 18 to 149 in 2019 (Table D.2). The reason for this is that one of the newer banking institutions had to reclassify their representative points, as these
points did not meet the description of branches as per the Bank’s Circular BIA4/07: Definition of Branches, Agencies, Specialised units and Head office support units, while some major banking institutions closed a few branches to manage costs and maximise electronic channels.
TABLE D.2 BANK BRANCH NETWORK
Description 2015 2016 2017 2018 2019
Branches 126 139 163 167 149
Agencies 68 61 62 64 82
Total 194 200 225 231 231
The staff complement decreased year-on-year, as reflected most clearly in the number of permanent personnel. The total number of personnel employed by the banking industry decreased from 6 563 to 6 468 in 2019, which represented a decrease of 1.5 percent
over the previous year. The permanent personnel in the banking sector declined by 103 to 6 268 staff members, while the temporary personnel increased by 8 to 200 staff members (Table D.3).
TABLE D.3 BANK STAFF LEVEL
Description 2015 2016 2017 2018 2019
Permanent personnel 5 524 5 902 6 284 6 371 6 268
Temporary personnel 375 331 179 192 200
Total 5 899 6 233 6 463 6 563 6 468
FRAUD AND OTHER ECONOMIC CRIMEThe volumes of fraud and other economic crime in the banking sector decreased in 2019, while the amounts involved also declined. The number of fraud cases reported decreased from 251 in 2018 to 238 in 2019. The amount involved in the fraudulent activities decreased significantly from N$56.7 million in 2018 to N$29.4 million in 2019. The actual financial loss also decreased from N$37.0 million in 2018, to N$19.8 million in 2019 (Figure D.8). The banking sector reported
that N$1.5 million was recovered, with further recoveries of N$1.0 million anticipated pending the successful conclusion of investigations. As a control measure, banks put in place systems and operational risk limits, and operational loss thresholds according to their risk appetite. Further losses are covered through insurance cover that is a requirement in terms of the Determination on Minimum Insurance for Banking Institutions (BID-14).
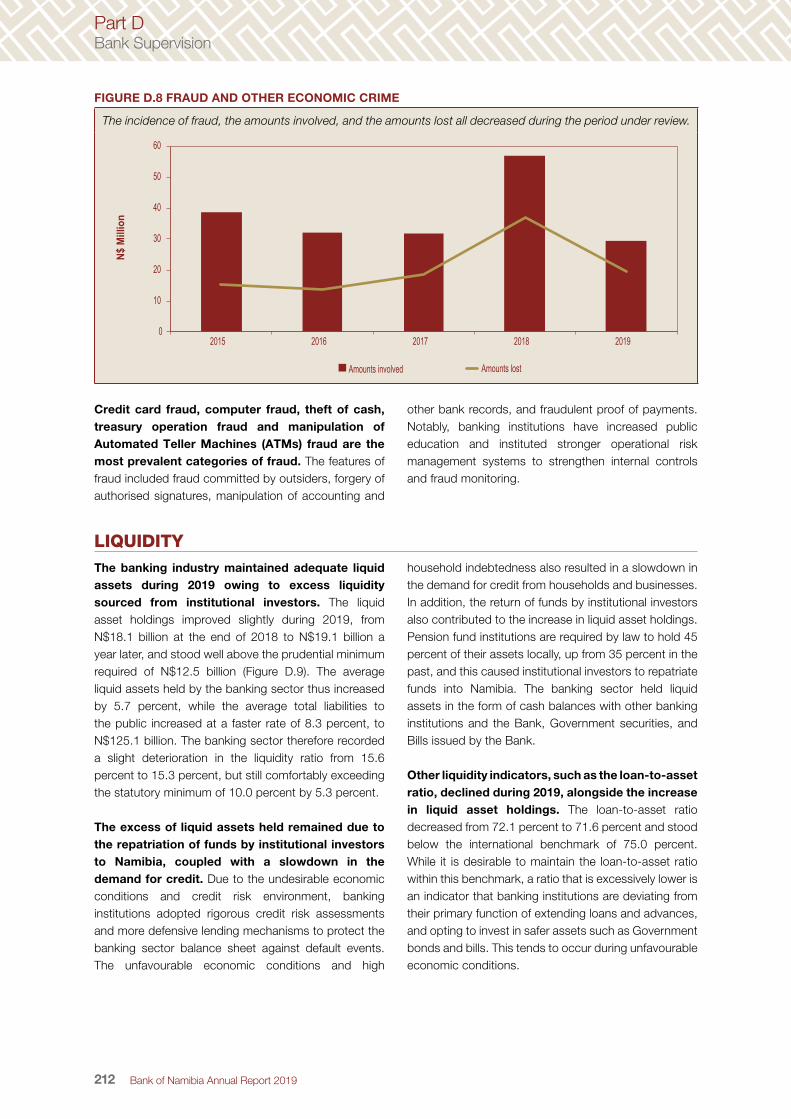
Bank of Namibia Annual Report 2019212
Part DBank Supervision
FIGURE D.8 FRAUD AND OTHER ECONOMIC CRIME
The incidence of fraud, the amounts involved, and the amounts lost all decreased during the period under review.
0
10
20
30
40
50
60
2015 2016 2017 2018 2019
N$ M
illio
n
Amounts involved Amounts lost
Credit card fraud, computer fraud, theft of cash, treasury operation fraud and manipulation of Automated Teller Machines (ATMs) fraud are the most prevalent categories of fraud. The features of fraud included fraud committed by outsiders, forgery of authorised signatures, manipulation of accounting and
other bank records, and fraudulent proof of payments. Notably, banking institutions have increased public education and instituted stronger operational risk management systems to strengthen internal controls and fraud monitoring.
LIQUIDITY The banking industry maintained adequate liquid assets during 2019 owing to excess liquidity sourced from institutional investors. The liquid asset holdings improved slightly during 2019, from N$18.1 billion at the end of 2018 to N$19.1 billion a year later, and stood well above the prudential minimum required of N$12.5 billion (Figure D.9). The average liquid assets held by the banking sector thus increased by 5.7 percent, while the average total liabilities to the public increased at a faster rate of 8.3 percent, to N$125.1 billion. The banking sector therefore recorded a slight deterioration in the liquidity ratio from 15.6 percent to 15.3 percent, but still comfortably exceeding the statutory minimum of 10.0 percent by 5.3 percent.
The excess of liquid assets held remained due to the repatriation of funds by institutional investors to Namibia, coupled with a slowdown in the demand for credit. Due to the undesirable economic conditions and credit risk environment, banking institutions adopted rigorous credit risk assessments and more defensive lending mechanisms to protect the banking sector balance sheet against default events. The unfavourable economic conditions and high
household indebtedness also resulted in a slowdown in the demand for credit from households and businesses. In addition, the return of funds by institutional investors also contributed to the increase in liquid asset holdings. Pension fund institutions are required by law to hold 45 percent of their assets locally, up from 35 percent in the past, and this caused institutional investors to repatriate funds into Namibia. The banking sector held liquid assets in the form of cash balances with other banking institutions and the Bank, Government securities, and Bills issued by the Bank.
Other liquidity indicators, such as the loan-to-asset ratio, declined during 2019, alongside the increase in liquid asset holdings. The loan-to-asset ratio decreased from 72.1 percent to 71.6 percent and stood below the international benchmark of 75.0 percent. While it is desirable to maintain the loan-to-asset ratio within this benchmark, a ratio that is excessively lower is an indicator that banking institutions are deviating from their primary function of extending loans and advances, and opting to invest in safer assets such as Government bonds and bills. This tends to occur during unfavourable economic conditions.

Bank of Namibia Annual Report 2019 213
Part DBank Supervision
FIGURE D.9 (a &b) LIQUIDITY
Liquidity holdings mostly held in Treasury bills were sufficient to meet the statutory minimum levels in 2019.
a. Statutory liquid assets b. Composition of liquid assets
0.0
5,000.0
10,000.0
15,000.0
20,000.0
25,000.0
2015 2016 2017 2018 2019
N$ m
illio
n
Liquid assets held Liquid assets required Surplus
0102030405060708090
100
2015 2016 2017 2018 2019
Perc
ent
Bank of Namibia Securities Net interbank placements and loansOther securities, strips, bonds & bills Stocks, securities, bills & bonds Treasury Bills Balances with Bank of Namibia Notes and coins
The banking sector managed to effectively mobilise more deposits rather than grow their loan portfolio, on the back of low credit appetite. The loan-to-deposit ratio declined from 94.6 percent in 2018 to 92.9 percent in 2019, supported by current market funding conditions. The loan-to-deposit ratio, at the level below 100 percent, signifies that the banking industry’s lending activities are fully funded by the deposit base.
The banking sector increased its holdings of Treasury bills and Government bonds, owing to the relatively high interest offered by these safe-haven instruments. Treasury bills stood at 59.9 percent of total liquid assets, followed by Government bonds, and notes and coins at 23.0 percent and 7.8 percent, respectively. Balances with the Bank stood at 7.4 percent of liquid assets, while net interbank placements stood at 1.4 percent of liquid assets. The
residual portion of liquid assets was in the form of other securities, strips, bonds and bills that accounted for a 0.5 percent share (Figure D.9).
The banking industry’s funding and concentration risk in the top ten depositors decreased during 2019. The share of the top ten depositors in total funding-related liabilities decreased from 27.2 percent to 25.7 percent, year-on-year.
The primary source of funding was from investment management and insurance companies, with shares of 43.4 percent and 30.3 percent, respectively. Funding from the ten largest depositors in the 1–7 days’ time bucket accounted for funding to the tune of N$7.4 billion and represented 5.9 percent of the average total liabilities to the public during 2019, an improvement from the 10.3 percent recorded in 2018.
INTEREST RATE RISKThe banking industry recorded an increase in the net asset sensitive position, which could impact negatively on interest rate margins if interest rates decrease. Liabilities repricing in 30 days increased from N$66.1 billion in 2018 to N$72.5 billion in 2019, while assets repricing in 30 days increased from N$103.7 billion in the previous reporting period to N$111.5 billion for 2019. This resulted in a positive net repricing gap in the 30 days’ time bucket, which increased from N$38.2 billion in 2018 to N$39.9 billion in 2019, indicating an asset-sensitive position. The net repricing gap over 1 year increased from N$2.2 billion in 2018 to N$3.7 billion in 2019. If interest rates decrease due to factors such
as low inflationary pressures and depressed economic conditions, an asset-sensitive position could negatively impact interest rate margins of banking institutions.
Liabilities subjected to variable interest rates continued to dominate the funding side of the balance sheet with even more variable interest rate dominance on the asset side. These variable-rate liabilities constituted 50.1 percent of funding compared to 50.8 percent in 2018, followed by fixed-rate liabilities, which constituted 29.8 percent in 2019 and 27.3 percent in 2018. The remainder was shared between capital and non-rate-sensitive liabilities.

Bank of Namibia Annual Report 2019214
Part DBank Supervision
Following the strong growth in liquid assets relative to loans and advances, the share of variable-rate-sensitive assets declined relative to non-rate-sensitive assets in 2019, but still dominated the asset side of the balance sheet. Assets subjected to variable interest rates
declined marginally from 78.9 percent recorded in 2018 to 78.6 percent in 2019, while the share of fixed rate assets constituted 13.2 percent in 2019, unchanged from 2018. Non-rate earning assets constituted 6.3 percent in 2019, compared to 6.2 percent in 2018.
ON-SITE EXAMINATIONS
During 2019, several supervisory activities were conducted to promote banking sector stability and bolster confidence in the banking sector. Targeted risk-based on-site examinations were carried out to determine the effectiveness of risk management practices, compliance with relevant laws, adequacy of capital, and compliance with supervisory recommendations. Examinations were carried out at two of the smaller banking institutions and one Domestic Systematically Important Bank (DSIB). The examination covered an assessment of the degree of risk and the adequacy of risk management systems for key risk areas such as strategic, credit, liquidity and operational risk. The examination findings determined that the examined institutions were in sound condition and that weaknesses identified in the risk management systems can be addressed in the normal course of business. As part of the supervisory process, examined institutions are required to implement corrective actions and provide quarterly progress reports to the Bank.
The Bank continues to keep pace with emerging risks such as cyber risks and challenges presented by disruptive innovations and technologies. The Bank carried out thematic reviews on the maturity levels at the DSIBs, including the automated clearing house (Namclear), with specific focus on information and cyber security. The purpose of the reviews was to determine the cyber security maturity levels and resilience to
cyber threats of the DSIBs and the clearing house. The weaknesses and vulnerabilities identified during these reviews inform the ongoing supervision of cyber risk and future enhancements to the supervisory framework.
Supervision of cross-border banking groups were conducted during the period under review. The Bank participated in supervisory colleges for coordination, collaboration and sharing of information for effective supervision of components of cross-border banking groups. Supervisory colleges provide a platform for interaction between the banking institutions and regulators which allows the Bank to craft a comprehensive consolidated supervision approach.
Supervisory priority areas identified for 2020 will focus on consolidated supervision and credit risk. The Bank will conduct on-site examinations in line with its consolidated supervision framework to evaluate the strength of three of the banking groups, which will include two DSIBs and one non-DSIB. Thematic reviews on credit risk will also be carried out at two of the DSIBs as part of the ongoing assessment of banking institutions’ compliance with the Determination on Asset Classification, Suspension of Interest and Provisioning (BID-2) to determine the asset quality and adequacy of the credit risk management practices, given the challenging economic environment.
CUSTOMER COMPLAINTS
More customer complaints were lodged against banking institutions during 2019. The total number of complaints represented an increase of 18.4 percent from 1 024 complaints in 2018 to a total of 1 212 complaints during the year 2019. The increase can generally be attributed to the complexity of the banking products and services that are now offered, as these are not always fully understood. In terms of composition, 95.5 percent of complaints were directly lodged at the
respective banking institutions, while 4.5 percent were lodged at the Bank for recourse. In terms of resolution of the complaints, 91.1 percent were resolved, whilst the remaining 8.9 percent remained as work in progress for finalisation during 2020 (Figure D.10). In addition to the complaints received, the Bank also attended to 187 customers’ enquiries during the year through telephone calls, the email platform and physical visits at the Bank’s headquarters.

Bank of Namibia Annual Report 2019 215
Part DBank Supervision
FIGURE D 10 TOTAL NUMBER OF COMPLAINTS
20160
200
400
600
800
1000
1200
2017 2018 2019
Total Complaints 806 986 1,024 1,157
Closed 767 951 939 1,170
Pending 39 35 85 85
Num
ber o
f com
plai
nts
No consistent trend could be observed regarding the types of complaints reported during 2019 as compared to 2018. The majority of the complaints related to concerns regarding bank charges and fees. In addition, the complaints reported also included poor service delivery, disputes related to repossession procedures, credit applications declined by the banking institutions, lack of adequate feedback and
communication from the banking institutions, and listing of customers with the credit bureaus.
The Bank’s mediating role between banking institutions and the customers resulted in two complaints being resolved with monetary refunds. Amongst other resolved cases, these refunds by the banking institution to customers involved a total of N$156 447.49.
LICENSING OF BANKING INSTITUTIONS
The Bank did not receive any new banking license applications during 2019. The number of banking institutions authorised to conduct banking business in Namibia remained at seven, with one branch of a foreign bank and one representative office. During the
period under review the Bank revisited the procedures for bank license applications and took it through the governance processes to ready it for publication on the Bank’s website.
PYRAMID SCHEMES/ILLEGAL BANKING BUSINESS
In terms of section 55A of the Banking Institutions Act (Act No. 2 of 1998), as amended, the Bank investigated several suspected pyramid and illegal financial schemes. These schemes include Longrich Bioscience, Karatbars, Onyx Lifestyle and JamaLife, which were found to be in contravention of section 55A of the Act. The Bank directed the promoters of the above-mentioned schemes to cease operations in
Namibia and to repay money obtained from members of the public in contravention of section 55A of the Act. If these schemes and their promoters fail or refuse to repay money as directed, the Bank may, in terms of section 7(2) of the Act, apply to the High Court to have their assets sequestrated to raise money to repay members of the public who participated in the schemes.

Bank of Namibia Annual Report 2019216
Part DBank Supervision
DEVELOPMENTS RELATING TO THE CREDIT BUREAUS
During 2019, the Bank placed much focus on the effective sharing of credit information by credit information providers, as well as on improving the quality of data submitted to the credit bureaus. The Bank continued to observe the efforts of credit information providers when engaging with the credit bureaus, which is evident in the growth of the number of institutions and the number of records submitted to the credit bureaus. The number of institutions that
are submitting credit performance information to credit bureaus increased by 29 institutions, from 328 institutions in 2018 to 357 institutions in 2019. The records submitted to the credit bureaus also increased from 1.5 million records to 1.6 million records year-on-year. The sectors that submit data to credit bureaus are made up of banking institutions, retailers, microlenders, insurance services and debt collectors. Table 4 illustrates the submission load of credit records year-on-year.
TABLE D.4 CREDIT INFORMATION SUBMISSIONS LOAD
Details Dec 2016 Dec 2017 Dec 2018 Dec 2019
Number of Institutions 183 286 328 357
Number of records submitted 427 461 1 409 314 1 498 726 1 580 448
Percentage of records rejected 2.2% 7.9% 2.6% 0.7%
Moreover, the credit bureaus have succeeded in improving the quality of data submissions to the Bank, since the commencement of the submission process in 2016. The data submission rejection rate, which measures the overall quality of data, stood at 0.7 percent, which is an improvement in the quality of data submitted from a rejection rate of 2.6 percent recorded in 2018. The current rejection rate of 0.7 percent is far below the industry’s benchmark of 5.0 percent. The quality of data has improved over time due to ongoing refinement and validation of data being submitted by credit information providers to credit bureaus.
The Bank continued to achieve a market coverage of 83 percent against a threshold of 80 percent of institutions submitting data to the credit bureaus. Market coverage is vital for the lending institutions as assurance that a complete credit record of an individual is available at bureaus to inform their credit decisions. Credit information sharing from all credit information
providers continues to be a focus area for the Bank. The banking institutions, microlenders and retail sectors made up 83 percent of the market against a measurement target of 80 percent, as outlined in Annexure 3 of the Credit Bureau Regulations. The Bank will therefore continue to engage the other sectors in the industry, such as utilities, state agencies and local authorities, to ensure full participation of all parties with credit performance information in the sharing of such information with credit bureaus.
The Bank hosted its 2nd Credit Information Day during the year under review. The theme for this year was “Effective Sharing of Credit Information”, which served as a forum to provide feedback to the industry, from the statistics received from credit bureaus. The day also served as a platform to discuss challenges faced by industry regarding the effective sharing of credit information.
DEVELOPMENTS RELATING TO BANKING LEGISLATION
The Bank continued to review laws, regulations and policies, and to implement new measures to strengthen its oversight role over institutions under its supervisory ambit. In line with best
practices, the Bank revised its licensing procedures. Notable developments that took place in the banking regulatory landscape are outlined below:
Bank of Namibia Annual Report 2019 217
Part DBank Supervision
PRIMARY LEGISLATIVE CHANGES
The revision of the Banking Institutions Act (Act No. 2 of 1998) continued to ensure that the regulatory framework for the regulation and supervision of banking institutions in Namibia remains effective
and relevant. The Banking Institutions Bill was approved by the Cabinet Committee on Legislation and is expected to be tabled in Parliament during 2020.
SECONDARY LEGISLATIVE CHANGES
During the period under review, the Bank revised some secondary legislation in line with standards for effective prudential regulation and supervision for banks. The following Determinations were issued by the Bank during 2018:
a) Determination on Limits on Exposures to Single Borrowers, Large Exposures and Concentration Risk (BID-4)
This Determination was revised and published in the Government Gazette on 14 March 2019. The Determination sets out conditions and limitations on the borrowing of excessive amounts of a bank’s funds by one person or a group of related persons or group of counterparties, whose performance is determined by common or correlated underlying factors. The Determination was revised to adjust the level of the total of all exposures outstanding at any time to a single person, or a group of related
persons, from 30 percent to 25 percent of a bank’s capital funds. The revision is in line with a standard set by international standard-setting bodies on banking regulation.
b) Determination on Liquidity Risk Management (BID-6)
This Determination is intended to ensure that banking institutions maintain effective liquidity management systems. It was published in the Government Gazette on 28 August 2019. The Determination was revised in order to strengthen the quantitative liquidity risk framework of banking institutions. Its revision is in line with section 31(1) of the Banking Institutions Act of 1998 (Act No. 2 of 1998), as amended, which requires the Bank to determine the minimum liquid assets which a banking institution shall hold at any time, or over the required period.

Bank of Namibia Annual Report 2019218
Part DBank Supervision
CYBERSECURITY AND CYBER RISK
INTRODUCTION
The importance of cybersecurity and cyber risk has come to the forefront of all sectors of industry, where unprecedented amounts of information are collected, processed and stored. Various institutions, including financial institutions, house large amounts of sensitive company information and the personal information of their employees and clients, which has made them attractive targets for information theft. The value of information has heightened the probability of attacks, and the first line of defence against cyber risk therefore rests with these institutions.
The rise in the use of the internet, computers and electronic devices has created a more connected global network, but this has also created a new wave of cybercrimes. Cybercrime has become increasingly common over the past years due to the increase in the use of digital technologies. Globally, there has been a rise in the number of incidents of cybercrime and their complexity, as cyber criminals adapt and change in an attempt to gain access to information with the aim of generating a profit.
The nature of financial services and large-value transaction flows make banking institutions
particularly vulnerable to cybercrimes. Cybersecurity has become even more important over time as banks need to manage the associated risks and protect this information from unauthorised access and use. This is attributed to increases in the cost of dealing with breaches which are suggested to be at USD 3.92 million on average, which equates to N$57 million, as stated by the 2019 IBM report on the cost of a breach. Other factors include the complexity of the cyberattacks, which is brought about by externally exposed systems such as websites that provide new entry points for possible attacks.
There are several reasons why banking institutions should have cybersecurity at the top of their priority list, chief among them being the financial loss and damage to the reputation of the institution that often results from a failure to prevent cyber incidents. Furthermore, cyber incidents can also result in the banking institution receiving hefty fines from the regulatory authority for non-compliance. A large-scale loss of data integrity or prolonged disruption in financial services for large banks may also have systemic consequences.
CYBERSECURITY: WHY IS IT IMPORTANT?
Cybersecurity is the practice of protecting digital data, systems, networks, and programmes from digital attacks. There are a number of definitions for cybersecurity, but it can be defined as the body of technologies, processes, controls, and practices designed to protect networks, devices, programmes, and data from attack, damage, or unauthorised access. Cybersecurity may also be referred to as information technology security and is a subset of information security. Information security generally focuses on maintaining and protecting confidentiality, integrity and availability of information. Cyber risk is defined as the risk of financial loss, disruption or damage to the reputation of an organisation resulting from the failure of its information technology systems.
Although most cyber-crimes are committed by individuals or small groups, in recent years there has been a rise organised crime groups. Cybercriminal individuals or groups share strategies and technologies and combine forces to launch coordinated attacks targeting digital systems or networks with the intention of stealing sensitive company information or personally identifiable information (information that can be used to identify, locate, or contact a specific individual, and in the hands of cybercriminals can have catastrophic consequences for an individual or an institution). Other attacks may cause prolonged major disruption

Bank of Namibia Annual Report 2019 219
Part DBank Supervision
of financial services, leaving banks unable to operate and clients unable to transact.
Cyber risk could originate internally from within the institution or from an external source. Threats may originate from within the institution itself from an unhappy employee or a disgruntled third-party with legitimate access to the institution’s systems. Other attack methods that are common among cybercriminals are the various social engineering attacks such as phishing, whereby an attacker uses email, social media, instant messaging and SMSs
to trick victims into providing personal information or visiting a malicious website in an attempt to compromise their system.
An example of an external source is Formjacking. This uses malicious code to steal credit card details and other information from payment forms on the checkout web pages of e-commerce sites. Formjacking saw an upward trajectory in 2018. Symantec data shows that 4 818 unique websites were compromised with Formjacking code every month in 2018.
REGULATING CYBER RISK IN THE FINANCIAL SECTOR
Financial institutions have become leading targets of cyber attacks. Banks are where the money is, and for cybercriminals, attacking banks offers multiple avenues for profit through extortion, theft, and fraud. Early attacks facing banks by hackers were unsophisticated and aimed at building a reputation within the hacker community. However, cybercriminals became aware of the potential rewards of successfully gaining access to sensitive information, and this has led to more technically savvy cybercriminals and more organised cybercriminal organisations.
High-profile cyber-attacks on financial institutions have focused attention on the need to strengthen cybersecurity regulation and supervision. The Bank of Namibia as the regulatory and supervisory authority for banking institutions has made strides in implementing a framework which includes specific regulation and guidelines to address information and cyber risk in banks. In 2016 the Bank issued the Determination on Information Security (BID-30), which became effective on 1 March 2018. BID-30 outlines principles of effective information security management which banks are required to adhere to in managing information and cyber risk. Subsequently, the Bank issued the Circular on Information Security (BIA 1/30) in 2019, which provided further guidelines on the principles in the Determination BID-30.
Supervision of cyber risk is significantly enhanced by incorporating regulatory expectations for reporting and information sharing. Supervisory reporting provides a view of timeliness of incident detection and response, and also of cyber risk exposure and emerging trends. As the threat landscape is so vast and ever-evolving, information sharing helps institutions to better prepare and defend themselves against attackers and emerging methods of attacks. The Bank has implemented a three-tier reporting and information sharing framework which includes regulatory reporting requirements for banks, an industry information-sharing platform, and information-sharing among regulators across jurisdictions. More recently, as part of its supervisory activities, the Bank partnered with a service provider to conduct maturity assessments to determine the cyber posture of the industry and identify gaps with the aim of improving industry resilience and the regulatory framework.
At the national level, jurisdictions are updating regulatory requirements and developing supervisory practices to promote cyber resilience. With the Circular on Information Security (BIA 1/30), the Bank highlighted the importance of acquiring the relevant skills and cybersecurity education. This is aimed at ensuring that the Bank’s frameworks are aligned towards plugging this gap.

Bank of Namibia Annual Report 2019220
Part DBank Supervision
CONCLUSION
Cybersecurity must be understood as an ongoing process rather than something that can be done once and then forgotten. Understanding that cybersecurity is not a once-off task, but rather an ongoing strategy, is critical for the security and continued existence of an organisation.
As information technology becomes more integrated into society, the incentive to compromise the security of deployed IT systems grows. As innovation produces new information technology applications, new avenues for criminals, terrorists, and other hostile parties also emerge, along with new vulnerabilities that cybercriminals can exploit. As the number of people with access to cyberspace multiplies, so too does the number of possible victims, and also the number of potential cybercriminals.

Bank of Namibia Annual Report 2019 221
Part DBank Supervision
Table D.5 Composition of the balance sheet - N$ ‘000
2015 2016 2017 2018 2019
Interbank Funding 4,073,676 4,708,167 4,928,891 5,859,932 5,670,078
Non-bank Funding: 77,762,133 83,855,085 93,538,828 98,228,237 107,498,106
Demand 39,164,503 40,200,591 43,119,820 46,710,146 50,589,762
Savings 3,501,871 3,383,305 3,390,385 3,322,830 3,514,505
Fixed & notice deposits 11,198,142 16,379,879 18,472,485 18,951,116 23,013,478
Negotiable Certificates of Deposit 20,566,976 21,171,093 23,397,628 24,850,867 25,534,926
Foreign Funding 3,330,641 2,720,217 5,158,509 4,393,278 4,845,435
Loans under repurchase agreement - - - - -
Debt Instruments issued 3,437,993 4,189,830 5,028,350 6,050,339 5,702,393
Other borrowings 1,180,719 1,721,937 2,802,767 2,640,763 2,741,366
Other liabilities 2,852,231 3,418,723 3,012,262 4,199,039 4,185,509
Capital & Reserves 10,626,209 12,166,369 14,376,078 15,219,709 16,397,663
TOTAL FUNDING 99,932,962 110,060,112 123,687,176 132,198,019 142,195,116
Cash and Balances 8,030,748 8,759,938 12,027,513 12,335,401 13,683,533
Short term negotiable securities 7,842,418 8,910,467 11,811,872 15,427,531 15,655,669
Interbank loans and advances - - 37,325 - -
Foreign currency loans and advances 1,194,043 726,207 478,635 183,122 201,641
Instalment debtors and leases 12,476,395 13,123,858 12,409,417 11,535,307 10,895,376
Mortgage loans 40,065,538 43,696,678 47,486,896 50,415,702 53,240,043
Other fixed term loans 8,375,449 9,939,039 12,534,536 15,093,974 16,744,372
Personal loans 3,940,908 4,569,454 5,448,681 5,809,423 7,344,641
Overdraft 9,955,822 10,831,391 11,299,722 11,988,932 12,662,267
Credit card debtors 462,956 522,564 646,978 709,985 728,822
Acknowledgement of debts discounted - - - 198,983 235,195
Loans granted under resale agreement 32,933 43,796 15,511 - 61,075
Investment in Preference Shares 652,219 569,685 554,312 417,910 1,346,814
Other loans and advances 1,016,296 1,041,241 739,344 550,787 406,122
Total loans and advances 78,172,558 85,063,912 91,651,359 96,904,126 103,866,369
Less: Specific provisions 354,359 271,444 399,383 662,610 974,136
Less: General provisions 627,835 657,545 699,492 962,336 1,089,074
Less: Interest-in-suspense 113,372 159,695 269,889 437,229 579,181
Investment portfolio 3,781,590 4,348,061 4,201,077 5,216,581 6,494,533
Trading securities 2,244,822 2,827,188 2,314,082 3,130,939 3,658,952
Available for sale securities 1,520,885 1,500,512 1,863,565 2,056,957 2,798,750
Held to maturity securities - - - - -
Unconsolidated subsidiaries, associates 15,883 20,361 23,430 28,684 36,831
Property, plant and equipment 1,720,398 1,848,851 2,095,836 2,109,830 2,346,834
Other assets 1,480,816 2,217,567 3,268,284 2,266,724 2,790,569
TOTAL ASSETS 99,932,961 110,060,112 123,687,176 132,198,018 142,195,116
Average Assets 84,604,076 104,996,537 116,873,644 127,942,597 137,196,567
Average Equity 9,794,400 11,396,289 13,271,224 14,797,893 15,808,686
Interest earning assets 80,842,698 88,302,927 94,460,242 82,930,932 82,930,933
Average interest earning assets 75,243,801 84,572,813 91,381,585 88,695,587 82,930,933

Bank of Namibia Annual Report 2019222
Part DBank Supervision
Table D.6 Capital adequacy - N$ ‘000
2015 2016 2017 2018 2019
Common Equity Tier 1 capital 9,269,847 10,320,048 12,478,149 13,918,355 13,304,267
Paid up equity capital(ordinary shares) issued
by the bank 23,860 23,861 728,046 808,046 23,861
Share premium resulting from the issue of
Ordinary shares included included in Common
Equity Tier 1 capital
2,262,554 2,262,554 2,322,078 2,322,078 2,462,553
Retained profits after deducting any interim
audited loss or final dividend declared 3,733,820 3,705,283 4,449,877 5,017,541 11,279,103
Accumulated other comprehensive income and
other disclosed reserves , excluding revaluation
of surplus on land and building assets
3,382,818 4,449,763 5,129,071 5,869,213 10,325
Current Interim profits - - - - -
Ordinary shares issued by consolidated
subsidiaries of the bank and held by the third
parties
- - - - -
Less: Regulatory deductions 133,205 121,413 150,923 98,521 471,575
Goodwill and other intangibles 133,205 121,413 150,923 98,521 334,027
Deferred tax assets - - - - 89,989
Defined benefit pension fund assets and
liabilities - - - - 47,559
Additional Tier 1 Capital - - - - -
Total Tier 1 Capital 9,269,847 10,320,048 12,478,149 13,918,355 13,304,267
Tier 2 capital 1,893,492 2,327,928 2,627,261 2,928,511 2,357,284
Instruments issued by banks that meet the
criteria for inclusion in Tier 2 capital* - - - - 761,600
Share premium (stock surplus) resulting from
the issuance of instruments included in Tier 2
capital
- - - - -
Instruments issued by consolidated
subsidiaries of banks - - - - -
Subordinated-term Debt** 782,419 783,169 1,000,256 1,103,375 -
Current Unaudited profits** 281,548 657,702 685,199 799,180 584,098
General Provisions 809,943 867,475 922,225 979,972 989,240
Revaluation Reserves** 19,582 19,582 19,582 45,985 22,346
Less: Investment in unconsolidated subsidiaries - - - - -
Total Qualifying capital 11,163,339 12,647,976 15,105,410 16,846,866 15,661,551
Aggregated Risk-weighted Assets 78,321,755 83,507,641 91,102,229 100,791,271 102,466,062
Total Risk-weighted amount for Credit Risk 68,421,031 73,011,286 79,067,022 87,150,482 88,744,621
Calibrated Risk-weighted amount for
Operational Risk 9,146,259 9,850,340 11,152,167 11,861,507 12,465,695
Calibrated Risk-weighted amount for Market
Risk 754,464 646,015 883,040 1,779,281 1,255,746
Gross Assets 98,620,998 110,867,690 124,625,108 133,720,754 144,978,776
* Instruments issued by banks that meet the criteria for inclusion in Tier 2 capital is an addition under the new Basel III Capital accord (previously subordinated term debt).
** Subordinated-term debt, Current unaudited profits and Revaluation reserves will phase out over a four year period as per Basel III capital accord.

Bank of Namibia Annual Report 2019 223
Part DBank Supervision
Table D.7 Analysis of overdue and non-performing loans - N$ ‘000
2015 2016 2017 2018 2019
Overdue loans 2,798,418 2,493,720 3,741,637 7,227,315 9,116,039
Amounts overdue: 1 to <2 months 708,559 359,286 561,831 2,798,721 2,959,769
Amounts overdue: 2 to < 3 months 879,935 823,363 888,123 960,703 1,160,120
Amounts overdue: 3 to < 6 months 331,466 363,027 825,003 1,097,144 1,042,062
Amounts overdue: 6 to <12 months 150,113 167,687 401,307 621,068 631,019
Amounts overdue: 12 to <18 months 728,346 780,356 1,065,373 1,749,680 3,323,069
Amounts overdue: 18 months and above 0 0 0 0 0
Total Non-performing loans 1,209,772 1,311,071 2,270,009 3,467,892 4,994,204
Instalment sales 193,930 183,381 228,827.5 268,272 268,265
Mortgages 654,651 775,291 1,302,277.3 2,037,825 3,311,363
Personal loans/ Other fixed loans 73,350 70,916 112,034.0 140,768 182,120
Overdrafts 148,971 160,145 317,304.0 525,736 646,301
Other loans & advances 124,092 105,774 290,737.9 472,744 554,692
Credit cards 14,779 15,565 18,828.5 22,547 31,463
Realizable Security 849,150 1,009,911 1,610,865.1 2,382,495 3,369,223
Specific Provisions 368,217 288,106 433,454.6 662,610 974,136

Bank of Namibia Annual Report 2019224
Part DBank Supervision
Table D.8 Sectoral distribution of loans and advances - N$ ‘000
2015 2016 2017 2018 2019
Total loans and advances 78,172,557 85,063,910 91,651,359 96,906,666 103,866,369
Agriculture and Forestry 2,967,529 3,168,669 2,383,368 5,116,113 4,266,864
Fishing 633,924 528,978 495,496 994,897 1,416,122
Mining 1,717,518 1,280,165 1,396,899 2,038,453 1,884,363
Manufacturing 1,974,747 1,891,542 1,429,850 2,244,615 2,816,203
Construction 3,737,230 3,477,639 2,845,316 3,975,097 3,492,510
Electricity, Gas and Water 822,624 758,748 1,198,279 1,477,039 2,643,425
Trade and Accommodation 15,175,448 15,804,622 8,797,065 9,532,382 6,892,056
Transport and Communication 1,191,558 1,287,591 1,056,241 1,547,058 2,262,561
Finance and Insurance 2,491,898 3,834,884 2,328,622 5,584,176 7,234,303
Real Estate and Business Services 9,751,112 10,631,763 8,861,649 12,463,469 11,229,191
Government Services 5,508,926 2,293,339 2,427,380 1,621,711 5,809,435
Individuals 30,178,869 37,886,843 56,245,697 47,806,728 47,649,781
Other 2,021,174 2,219,127 2,185,498 2,504,928 6,269,554

Bank of Namibia Annual Report 2019 225
Part DBank Supervision
Table D.9 Composition of income statement - N$ ‘000
2015 2016 2017 2018 2019
Interest Income 8,174,383 9,636,017 10,951,772 11,656,782 12,705,368
Balances with banks 231,535 203,797 324,054 361,829 534,855
Installment debtors, hire purchase, etc 1,206,936 1,355,517 1,355,904 1,247,620 1,184,155
Mortgage loans: Residential 2,860,417 3,380,145 3,677,013 3,832,544 4,256,462
Mortgage Loans: Commercial 943,188 1,086,612 1,181,567 1,247,651 1,248,493
Personal loans 524,721 624,088 746,206 907,486 984,239
Fixed term loans 746,005 968,009 1,251,986 1,356,036 1,587,031
Overdraft 1,010,026 1,122,997 1,264,730 1,272,635 1,324,901
Other interest related income 651,555 894,852 1,150,311 1,430,980 1,585,232
Interest Expenses 3,811,683 4,856,556 5,771,638 6,207,392 6,765,912
Demand deposits 761,385 773,669 844,915 954,574 1,195,881
Current Accounts 464,088 597,664 636,266 616,459 635,312
Savings deposits 58,065 78,653 97,200 105,585 78,944
Fixed and notice deposits 660,475 927,884 1,328,870 1,457,357 1,537,209
Negotiable certificates of deposits 1,388,620 1,769,524 1,986,816 1,979,177 2,220,380
Debt instruments issued 217,058 327,471 410,341 491,053 536,141
Other interest related expenses 261,993 381,691 467,230 603,186 562,045
Interest Margin 4,362,700 4,779,461 5,180,134 5,449,390 5,939,456
Less: Provisions* 279,858 226,371 361,215 438,850 726,709
Total operating Income 3,352,068 3,515,867 3,720,234 4,168,290 4,416,057
Trading Income 628,392 580,268 406,319 517,021 523,035
Investment Income 158,320 132,593 168,319 183,824 227,124
Transaction-based Fee Income 2,333,504 2,561,890 2,786,720 3,097,543 3,325,586
Knowledge-based Fee Income 158,320 146,029 194,324 178,776 194,657
Other income 73,533 95,088 164,552 191,126 145,655
Total Income 7,714,768 8,295,328 8,900,369 9,617,680 10,355,514
Total Operating Expenses 3,871,719 4,395,144 4,965,781 5,476,774 5,747,584
Staff costs 2,000,350 2,271,230 2,621,600 2,859,971 3,084,773
Administration & Overheads 935,376 1,087,884 1,183,180 1,383,737 1,347,640
Depreciation and amortisation 194,854 232,308 287,049 339,122 414,010
Occupancy expenses 268,758 291,762 323,707 342,043 282,133
Other operating expenses 472,381 511,960 550,244 551,901 619,028
Net Income Before Tax 3,563,192 3,673,813 3,573,373 3,702,056 3,881,221
Taxation 1,094,835 1,145,423 1,105,296 1,119,283 1,144,903
Net Income After Tax 2,468,356 2,528,390 2,468,077 2,582,773 2,736,319
*Excluded in Total Income figures, and deducted from the Net Income before Tax.

Bank of Namibia Annual Report 2019226
Part DBank Supervision
Table D.10 Selected key ratios
2015 2016 2017 2018 2019
Capital
Tier 1 Leverage 9.4% 9.3% 10.0% 10.4% 9.2%
Tier 1 Risk-weighted Capital 11.8% 12.4% 13.7% 13.8% 13.0%
Total Risk-weighted Capital 14.3% 15.1% 16.6% 15.6% 15.3%
Asset Quality
Non-performing loans to Total loans 1.6% 1.5% 2.5% 3.6% 4.8%
Overdue loans to Total loans 3.6% 2.9% 4.1% 7.5% 8.8%
Total Provisions to Total loans 1.1% 1.0% 1.1% 1.3% 1.3%
Specific Provisions to Non-performing loans 29.3% 20.7% 17.3% 19.1% 19.5%
Earnings
Return on Assets 2.5% 2.3% 2.1% 2.0% 2.0%
Return on Equity 24.5% 24.1% 18.6% 18.5% 17.3%
Net Interest Margin 6.1% 5.9% 5.7% 4.3% 6.0%
Other Operating Income: Total Assets 3.4% 2.4% 3.0% 3.2% 3.1%
Other Operating Income: Total Income 36.1% 39.5% 41.8% 43.3% 42.6%
Other Exp: Total Income 51.6% 51.0% 55.8% 56.9% 56.2%
Liquidity
Liquid Assets / Total Assets 11.3% 11.4% 12.9% 13.7% 13.4%
Liquid Assets / Average total liabilities 13.1% 13.3% 14.6% 15.6% 15.3%
Total Loans / Total Assets 77.4% 76.5% 73.5% 72.1% 71.6%
Total Loans / Total Deposits 97.3% 97.6% 93.5% 94.6% 92.9%
Growth Rates
Total Assets 14.6% 10.1% 12.4% 6.9% 7.6%
Total Qualifying Capital 16.4% 13.3% 19.4% 10.7% -7.0%
Tier 1 Capital 19.1% 11.3% 20.9% 11.3% -4.4%
Total Loans 15.0% 8.8% 7.7% 5.7% 7.2%
Total Deposits 11.6% 7.8% 11.5% 5.0% 9.4%
Overdue loans 20.0% -10.9% 50.0% 93.2% 26.1%
Non-performing loans 22.5% 8.4% 73.1% 52.8% 44.0%
Liquid Assets 13.0% 10.5% 25.5% 14.9% 5.7%
Large Exposures 3.9% 1.9% 22.6% -24.8% -16.3%
Off-Balance Sheet Items 9.2% 8.6% 15.3% 24.8% -10.8%

Bank of Namibia Annual Report 2019 227
METHODS AND CONCEPTS 228
STATISTICAL TABLES 232
Part EStatistical Tables
Contents

Bank of Namibia Annual Report 2019228
Part EStatistical Tables
METHODS AND CONCEPTS
BALANCE OF PAYMENTS
Accrual accounting basisThis applies when an international transaction is recorded at the time when ownership changes hands, and not necessarily at the time when payment is made. This principle governs the time of recording for transactions; transactions are recorded when economic value is created, transformed, exchanged, transferred or extinguished.
Double-entry accountingThe basic accounting conversion for a balance of payment statement is that every recorded transaction is represented by two entries with exactly equal values. Each transaction is reflected as a credit (+) and a debit (-) entry. In conformity with business and national accounting, in the balance of payment, the term: credit is used to denote a reduction in assets or an increase in liabilities, and debit a reduction in liabilities or an increase in assets.
Balance of PaymentsThe balance of payments (BOP) is a statistical statement that systematically summarises transactions between residents and non-residents during a period. It consists of the goods and services account, the primary income, the secondary income, the capital account, and the financial account for a specific time period, the economic transactions of an economy with the rest of the world. Transactions, for the most part between residents and non-residents, consist of those involving goods, services, and income; those involving financial claims and liabilities to the rest of the world; and those (such as gifts) classified as transfers. It has two main accounts viz, the current account and financial account. Each transaction in the balance of payments is entered either as a credit/asset or a debit/liability. A credit/asset transaction is one that leads to the receipts of payment from non-residents. Conversely, the debit/liability leads to a payment to non-residents.
ResidencyIn the balance of payments, the concept of residency is based on a sectoral transactor’s center of economic interest. Country boundaries recognised for political purposes may not always be appropriate for economic interest purposes. Therefore, it is necessary to recognise the economic territory of a country as the relevant geographical area to which the concept of residence is
applied. An institutional unit is a resident unit when it has a center of economic interest in the territory from which the unit engages in economic activities and transactions on a significant scale, for a year or more.
Current AccountThe current account balance shows flows of real resources or financial in the goods, services, primary income, secondary income and capital transfers between residents and non-residents. The current account balance shows the difference between the sum of exports and income receivable and the sum of imports and income payable (exports and imports refer to both goods and services, while income refers to both primary and secondary income).
Merchandise Trade BalanceThis is the net balance of the total export and import of goods excluding transactions in services between residents and non-residents.
GoodsThese are real transactions with change in the ownership of physical products and include consumer and capital goods.
Primary IncomeIncome covers two types of transactions between residents and non-residents: (i) those involving compensation of employees, which is paid to non-resident workers (e.g. border, seasonal and other short-term workers), and (ii) those involving investment income receipts and payments on external financial assets and liabilities. Included in the latter are receipts and payments on direct investment, portfolio investment and other investment and receipts on reserve assets. Income derived from the use of a tangible asset e.g., car rental by a non-resident is excluded from income and is classified under services such as travel.
Secondary IncomeThe secondary income account shows current transfers between residents and non-residents. Various types of current transfers are recorded in this account to show their role in the process of income distributions between the economies. Transfers may be made in cash or in kind.

Bank of Namibia Annual Report 2019 229
Part EStatistical Tables
Capital Account The capital account shows credit and debit entries for non-produced non-financial assets and capital transfers between residents and non-residents. It records acquisitions and disposals of non-produced non-financial assets, such as land sold to embassies and sales of leases and licenses, as well as capital transfers, that use the provision of resources for capital purposes by one party without anything of economic value being supplied as a direct return to that party.
Net Lending /Net borrowing The sum of the balances on the current and capital accounts represents the net lending (surplus) or net borrowing (deficit) by the economy with the rest of the world. This is conceptually equal to the net balance of the financial account. In other words, the financial account (net change in financial assets minus net incurrence of liabilities) measures how the net lending to or borrowing from non-residents is financed.
Financial AccountThe financial account of the balance of payments consists of the transactions in foreign financial assets and liabilities of an economy. The foreign financial assets of an economy consist of holdings of monetary gold, IMF Special Drawing Rights and claims on non-residents. The foreign financial liabilities of an economy consist of claims of non-residents on residents. The primary basis for classification of the financial account is by functional category in the following order; direct, portfolio, other investment and reserve assets.
Direct InvestmentDirect investment refers to a lasting interest of an entity resident in one economy (the director investor) in an
entity resident in another economy (the direct investment enterprise), with an ownership of 10 per cent or more of the ordinary shares or voting power (for an incorporated enterprise) or the equivalent (for an unincorporated enterprise).
Portfolio InvestmentPortfolio investment is defined as cross border transactions and positions involving debt or equity securities, other than those included in direct investment or reserve assets.
Other InvestmentOther investment covers all financial instruments other than those classified as direct investment, portfolio investment or reserve assets.
Reserve AssetsReserve assets consist of those external assets that are readily available to and controlled by monetary authority for the direct financing of payments imbalances, for indirectly regulating the magnitude of such balances through intervention in exchange markets to affect the currency exchange rate, and/or for other purposes.
Net Errors and OmissionsTheoretically, balance of payment accounts are in principle “balanced”, however, practically, imbalances will arise due to imperfections in the source of data and its quality. This will usually necessitate a balancing item to measure the difference between recorded credits and or debits and omissions. This is what is referred to as net errors and omissions.
MONETARY AND FINANCIAL STATISTICS
Repo rateThe rate charged by the Bank of Namibia on advances on specific collateral to Commercial banks. The Repo rate is the cost of credit to the banking sector and therefore eventually affects the cost of credit to the general public.
Depository Corporations SurveyThe Depository Corporations Survey is a consolidation of the Central Bank Survey and the Other Depository Corporations Survey.
BondA security that gives the holder the unconditional right to a fixed money income or an income linked to some index, and except for perpetual bonds, an unconditional right to a stated fixed sum or a sum linked to some index on a specified date or dates.
Currency in circulationConsist of notes and coins that are of fixed nominal values and are issued by central banks and governments. Currency is the most liquid financial asset and is included in narrow and broad money aggregates.

Bank of Namibia Annual Report 2019230
Part EStatistical Tables
Narrow Money Supply (M1)Narrow Money Supply (M1) is defined to include currency in circulation and transferable deposits of resident sectors, excluding Central Government and depository corporations.
Broad Money Supply (M2)Broad Money Supply (M2) is defined to include currency outside depository corporations, transferable and other deposits in national currency of the resident sectors, excluding deposits of the Central Government and those of the depository corporations.
Transferable DepositsThese are deposits that are exchangeable without penalty or restriction, on demand and are directly usable for making third party payments.
Other Depository Corporations (ODCs)The ODC sub-sector consists of all resident financial corporations (except the Central Bank) and quasi-corporations that are mainly engaged in financial intermediation and that issue liabilities included in the national definition of broad money. There are currently eighteen financial intermediaries classified as ODCs in Namibia, i.e. First National Bank of Namibia, Standard Bank of Namibia, Nedbank Namibia, Bank Windhoek, Letshego Bank, Banco Atlantico, Trustco Bank Namibia, Agribank of Namibia, National Housing Enterprise, Namibia Post Office Savings Bank, Trustco Bank, Bank BIC, Stanlib Unit Trust, Ashburton, Prudential, Sanlam Unit Trust, Old Mutual Unit Trust, Capricorn Unit Trust and Investec.
Other DepositsThe other deposit category comprises all claims, other than transferable deposits, that are represented by evidence of deposit. Different forms of other deposits are e.g. savings and fixed investments. Other deposits is thus a component of broad money supply.
Other Financial Corporations (OFCs)The OFC sub-sector at this stage consists of a sample of resident pension funds, insurance corporations and development finance institutions.
Deposit rateThe deposit rate refers to the weighted average deposit rate of the Commercial banks i.e. the rate that ODCs declare on other deposits (e.g. time deposits).
Dual-listed CompaniesRefer to those companies listed and trading on two stock exchanges, such as the Johannesburg Stock Exchange as well as on the NSX.
Lending rateThe lending rate refers to the weighted average lending rate, i.e. the rate charged by ODCs to borrowers.
Local Market in terms of NSXOnly local (Namibian) companies listed on the NSX.
Market CapitalisationMarket Capitalisation is the total market value of a company’s issued share capital. It is equal to the number of fully paid shares listed on the NSX multiplied by the share price.
Free-float Market CapitalisationFree-float market capitalisation is the value of shares held by investors who are likely to be willing to trade. It is a measure of how many shares are reasonably liquid.
Market TurnoverVolume of shares traded on the NSX multiplied by the share price.
Market VolumeThe number of shares traded on the NSX.
Money Market rateThe money market rate refers to the inter-bank interest rate; the rate at which ODCs extend credit to each other.
Money Market Unit Trust (MMU)The MMU sub-sector consists of all resident unit trust companies that have money market funds. There are currently seven of those companies in Namibia: Ashburton, Stanlib Unit Trust, Prudential, Sanlam Unit Trust, Old Mutual Unit Trust, Capricorn Unit Trust and Investec.
Mortgage rateThe rate charged on a loan for the purpose of financing construction or purchasing of real estate.
Overall Market in terms of NSXRefers to all companies, local as well as foreign, listed on the NSX.

Bank of Namibia Annual Report 2019 231
Part EStatistical Tables
Prime rateThe rate of interest charged by Other Depository Corporations (ODC’s) for loans made to its most credit-worthy business and industrial customers; it is a benchmark rate that banks establish from time to time in computing an appropriate rate of interest for a particular loan contract.
Real Interest rateThe rate of interest adjusted to allow for inflation; the nominal interest rate less the rate of inflation for Namibia, is the real interest rate.
PUBLIC FINANCE
Social sectorThe social sector is composed of the following sub-sectors:
• Education, arts and culture• Gender equality and child welfare• Health and social services• Sports, Youth and National services• Veterans Affairs• Poverty eradication and social welfare• Higher education, training and innovation
Public safety sectorThe public safety sector is composed of the following sub-sectors:
• Home affairs and immigration• Safety and Security• Defense• Justice• Judiciary• Anti-corruption commission• Attorney General
Infrastructural SectorThe infrastructural sector is composed of the following sub-sectors:
• Works• Transport• Information and communication technology
Administration SectorThe administration sector is composed of the following sub-sectors:
• Office of the President• Office of the Prime Minister• National Assembly• Auditor General• International Relations and Cooperation• National Council• Labour, industrial relations and employment
creation• Urban and rural development• Electoral commission
Economic SectorThe economic sector is composed of the following sub-sectors:
• Finance• Mines and energy• Environment and tourism• Industrialisation, trade and SME development• Agriculture, water and forestry• Fisheries and marine resources• Land reform• National planning commission• Public Enterprises

Bank of Namibia Annual Report 2019232
Part EStatistical Tables
STATISTICAL TABLES
I National Accounts Table I.1 Aggregate Economic Indicators 233Table I.2 Gross Domestic Product and Gross National Income 234Table I.3 National Disposable Income and Saving 235Table I.4(a) Gross Domestic Product by Activity - Current Prices 236Table I.4(b) Gross Domestic Product by Activity - Percentage Contributions 237Table I.5(a) Gross Domestic Product by Activity - Constant Prices 238Table I.5(b) Gross Domestic Product by Activity - Annual Percentage Changes 239Table I.6(a) Expenditure on Gross Domestic Product - Current Prices 240Table I.6(b) Expenditure on Gross Domestic Product - Percentage Contributions 240Table I.7(a) Expenditure on Gross Domestic Product - Constant Prices 241Table I.7(b) Expenditure on Gross Domestic Product - Annual Percentage Changes 241Table I.8 Gross Fixed Capital Formation by Activity - Current Prices 242Table I.9 Gross Fixed Capital Formation by Activity - Constant Prices 242Table I.10 Gross Fixed Capital Formation by Type of Asset - Current Prices 243Table I.11 Gross Fixed Capital Formation by Type of Asset - Constant Prices 243Table I.12 Gross Capital Formation by Type of Ownership - Current Prices 243Table I.13 Gross Capital Formation by Type of Ownership - Constant Prices 243Table I.14 Fixed Capital Stock by Activity - Current Prices 244Table I.15 Fixed Capital Stock by Activity - Constant Prices 244Table I.16(a) National Consumer Price index 245Table I.16(b) National Consumer Price Index 246
II Monetary and Financial Developments Table II.1(a) Central Bank Survey 247Table II.1(b) Central Bank Survey 248Table II.2(a) Other Depository Corporations Survey 249Table II.2(b) Other Depository Corporations Survey 250Table II.3 Depository Corporations Survey 251Table II.4 Other Depository Corporations Claims on Private Sectors 252Table II.5 Deposits with Other Depository Corporations 253Table II.6 Monetary Aggregates 254Table II.7 Monetary Analysis 255Table II.8 Changes in the Determinants of Money Supply 256Table II.9 Selected Interest Rates: Namibia and South Africa 257
III Public Finance Table III.1(a) Treasury Bills Auction 258Table III.1(b) Allotment of Government of Namibia Treasury Bills 259Table III.2(a) Internal Registered Stock Auction 260Table III.2(b) Allotment of Government of Internal Registered Stock 261Table III.2(b) Allotment of Government of Internal Registered Stock 262Table III.3 Government Foreign Debt Type and Currency 263Table III.4(a) Government Domestic Loan Guarantee by Sector 264Table III.4(b) Government Foreign Loan Guarantee by Sector and Currency 265
IV Balance of Payments Table IV.A Major Balance of Payments Aggregates 266Table IV.B Supplementary Table: Balance of Payments Services 268Table IV.C Supplementary Table: Balance of Payments – Primary Income 268 Table IV.D Supplementary Table: Balance of Payments – Secondary Income 269 Table IV.E Supplementary Table: Balance of Payments – Capital Account 269 Table IV.F Supplementary Table: Balance of Payments - Direct Investment 270 Table IV.G Supplementary Table: Balance of Payments - Portfolio Investment 271 Table IV.H Supplementary Table: Balance of Payments - Other Investment 272 Table IV.I International Foreign Exchange Reserves Stock 273 Table IV.J(a) International Investment Position (Assets) 274Table IV.J(b) International Investment Position (Liabilities) 275Table IV.K Foreign Exchange Rates 276Table IV.L Effective Exchange Rate Indices 277Table IV.M Selected minerals monthly average prices 278Table IV.N Selected minerals export volumes 279
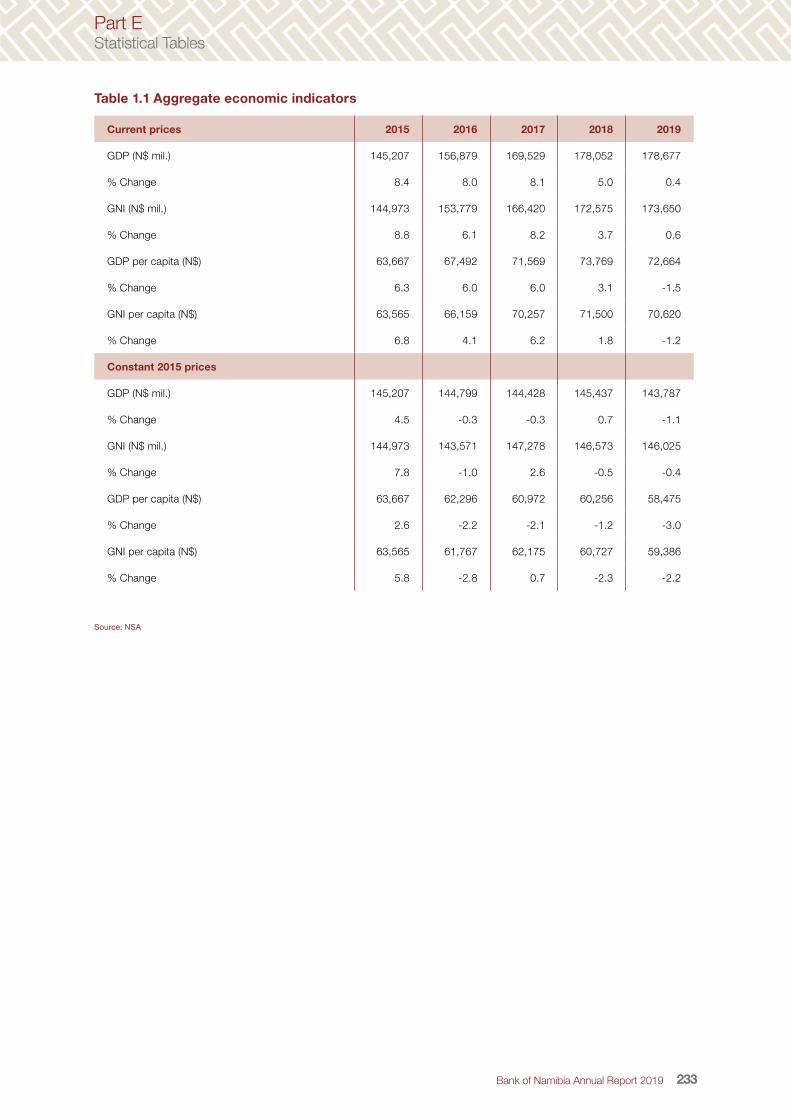
Bank of Namibia Annual Report 2019 233
Part EStatistical Tables
Table 1.1 Aggregate economic indicators
Current prices 2015 2016 2017 2018 2019
GDP (N$ mil.) 145,207 156,879 169,529 178,052 178,677
% Change 8.4 8.0 8.1 5.0 0.4
GNI (N$ mil.) 144,973 153,779 166,420 172,575 173,650
% Change 8.8 6.1 8.2 3.7 0.6
GDP per capita (N$) 63,667 67,492 71,569 73,769 72,664
% Change 6.3 6.0 6.0 3.1 -1.5
GNI per capita (N$) 63,565 66,159 70,257 71,500 70,620
% Change 6.8 4.1 6.2 1.8 -1.2
Constant 2015 prices
GDP (N$ mil.) 145,207 144,799 144,428 145,437 143,787
% Change 4.5 -0.3 -0.3 0.7 -1.1
GNI (N$ mil.) 144,973 143,571 147,278 146,573 146,025
% Change 7.8 -1.0 2.6 -0.5 -0.4
GDP per capita (N$) 63,667 62,296 60,972 60,256 58,475
% Change 2.6 -2.2 -2.1 -1.2 -3.0
GNI per capita (N$) 63,565 61,767 62,175 60,727 59,386
% Change 5.8 -2.8 0.7 -2.3 -2.2
Source: NSA

Bank of Namibia Annual Report 2019234
Part EStatistical Tables
Table I.2 Gross Domestic Product and Gross National Income
Current prices - N$ million 2015 2016 2017 2018 2019
Compensation of employees 63,562 70,297 75,526 79,944 81,437
Consumption of fixed capital 16,024 17,522 18,052 19,512 20,835
Net operating surplus 54,503 56,896 62,785 64,330 61,946
Gross domestic product at factor cost 134,089 144,716 156,363 163,787 164,218
Taxes on production and imports 11,118 12,163 13,166 14,265 14,459
Gross domestic product at market prices 145,207 156,879 169,529 178,052 178,677
Primary incomes
- receivable from the rest of the world 3,926 3,874 3,827 4,535 4,249
- payable to rest of the world -4,159 -6,974 -6,936 -10,012 -9,276
Gross national income at market prices 144,973 153,779 166,420 172,575 173,650
Current transfers
- receivable from the rest of the world 19,934 17,563 20,997 20,541 21,411
- payable to rest of the world -1,990 -1,906 -1,867 -1,931 -2,149
Gross national disposable income 162,917 169,436 185,551 191,186 192,911
Current prices - N$ per capita
Gross domestic product at market prices 63,667 67,492 71,569 73,769 72,664
Gross national income at market prices 63,565 66,159 70,257 71,500 70,620
Constant 2015 prices - N$ millions
Gross domestic product at market prices 145,207 144,799 144,428 145,437 143,787
- Annual percentage change 4.5 -0.3 -0.3 0.7 -1.1
Real gross national income 144,973 143,571 147,278 146,573 146,025
- Annual percentage change 7.8 -1.0 2.6 -0.5 -0.4
Constant 2015 prices - N$ per capita
Gross domestic product at market prices 63,667 62,296 60,972 60,256 58,475
- Annual percentage change 2.6 -2.2 -2.1 -1.2 -3.0
Real gross national income 63,565 61,767 62,175 60,727 59,386
- Annual percentage change 5.8 -2.8 0.7 -2.3 -2.2
Source: NSA

Bank of Namibia Annual Report 2019 235
Part EStatistical Tables
Table I.3 NATIONAL DISPOSABLE INCOME AND SAVINGS
Current prices - N$ million
Current prices - N$ million 2015 2016 2017 2018 2019
Disposable income and saving
Gross national disposable income 162,917 169,436 185,551 191,186 192,911
Consumption of fixed capital 16,024 17,522 18,052 19,512 20,835
Net national disposable income 146,893 151,914 167,499 171,674 172,077
All other sectors 114,692 118,666 131,686 130,538 129,824
General government 32,201 33,248 35,813 41,136 42,252
Final consumption expenditure 139,243 160,987 163,795 169,984 177,087
Private 99,484 118,426 119,867 123,979 130,787
General government 39,759 42,561 43,929 46,005 46,300
Saving, net 7,650 -9,073 3,704 1,689 -5,010
All other sectors 15,207 241 11,819 6,559 -962
General government -7,558 -9,314 -8,116 -4,870 -4,048
Financing of capital formation
Saving, net 7,650 -9,073 3,704 1,689 -5,010
Capital transfers receivable from abroad 1,772 2,104 2,482 1,908 1,783
Capital transfers payable to foreign countries -399 -162 -60 -182 -161
Total 9,022 -7,131 6,125 3,416 -3,388
Capital formation
Gross fixed capital formation 45,020 34,075 30,047 29,702 28,858
All other sectors 38,144 28,774 25,436 24,391 22,614
General government 6,876 5,301 4,611 5,311 6,244
Consumption of fixed capital -16,024 -17,522 -18,052 -19,512 -20,835
All other sectors -14,701 -16,135 -16,559 -17,766 -18,801
General government -1,324 -1,387 -1,493 -1,746 -2,034
Changes in inventories -660 293 -331 -3,724 -6,086
Net lending (+) / Net borrowing(–) -19,314 -23,977 -5,538 -3,051 -5,326
All other sectors -3,578 -7,969 7,542 8,346 4,830
General government -15,736 -16,008 -13,080 -11,397 -10,156
Discrepancy on GDP 1) 0 0 1 1 0
Net lending/borrowing in external transactions 2) -19,314 -23,977 -5,539 -3,051 -5,327
Total 9,022 -7,131 6,125 3,416 -3,388
Source: NSA

Bank of Namibia Annual Report 2019236
Part EStatistical Tables
Table I.4 (a) GROSS DOMESTIC PRODUCT BY ACTIVITY
Current prices - N$ Million
Industry 2015 2016 2017 2018 2019
Agriculture, forestry and fishing 8,967 9,805 11,965 12,397 11,816
Livestock farming 2,613 2,575 3,894 4,213 3,893
Crop farming and forestry 2,489 2,711 3,577 3,664 2,953
Fishing and fish processing on board 3,864 4,519 4,494 4,521 4,970
Mining and quarrying 12,965 14,839 14,007 16,008 16,599
Diamond mining 7,902 7,238 6,717 7,912 7,042
Uranium 1,367 1,429 1,690 2,215 2,539
Metal Ores 2,769 5,161 4,573 4,550 5,608
Other mining and quarrying 928 1,012 1,027 1,332 1,410
Primary industries 21,932 24,645 25,973 28,405 28,415
Manufacturing 16,524 18,333 20,216 21,407 20,982
Meat processing 574 637 536 541 582
Grain Mill products 1,890 1,704 2,308 2,244 2,503
Other food products 3,542 4,247 4,722 5,948 5,252
Beverages 2,498 2,290 2,620 2,723 2,882
Textile and wearing apparel 417 266 463 427 378
Leather and related products 315 298 314 322 309
Wood and wood products 500 505 582 541 538
Publishing and Printing 355 319 399 359 356
Chemical and related products 1,285 1,088 996 1,007 1,021
Rubber and Plastic products 387 352 347 351 347
Non-metallic mineral products 705 603 579 613 590
Basic non-ferrous metals 2,032 2,985 3,069 2,711 2,560
Fabricated Metals 726 631 514 578 605
Diamond processing 784 1,851 2,160 2,421 2,354
Other manufacturing 515 560 604 621 706
Electricity and water 2,545 5,162 5,773 6,667 6,118
Construction 8,061 4,947 3,994 3,828 3,819
Secondary industries 27,130 28,442 29,983 31,902 30,918
Wholesale and retail trade, repairs 16,394 16,759 18,542 17,918 18,182
Hotels and restaurants 2,764 2,956 3,035 2,966 3,893
Transport and Storage 4,626 5,245 5,534 5,709 5,433
Transport 3,614 4,249 4,366 4,493 4,081
Storage 1,012 996 1,169 1,216 1,352
Information Communication 2,107 2,348 2,622 2,459 2,580
Financial and insurance service activities 10,174 10,886 12,094 13,845 12,474
Real estate activities 7,408 8,134 9,136 9,557 10,213
Professional, scientific and techical services 1,197 1,184 1,170 1,214 1,276
Administrative and support services 1,933 1,742 1,799 1,896 1,829
Arts, Entertainment & Other Service activities 2,384 2,637 2,869 3,061 3,109
Public administration and defence 16,707 17,645 19,622 20,777 20,945
Education 12,808 14,884 16,538 17,441 18,839
Health 5,183 5,635 6,353 6,160 6,007
Private households with employed persons 1,007 1,090 1,168 1,188 1,202
Tertiary industries 84,692 91,145 100,485 104,192 105,982
All industries at basic prices 133,754 144,232 156,441 164,499 165,315
Taxes less subsidies on products 11,452 12,647 13,088 13,552 13,362
GDP at market prices 145,207 156,879 169,529 178,052 178,677
Source: NSA
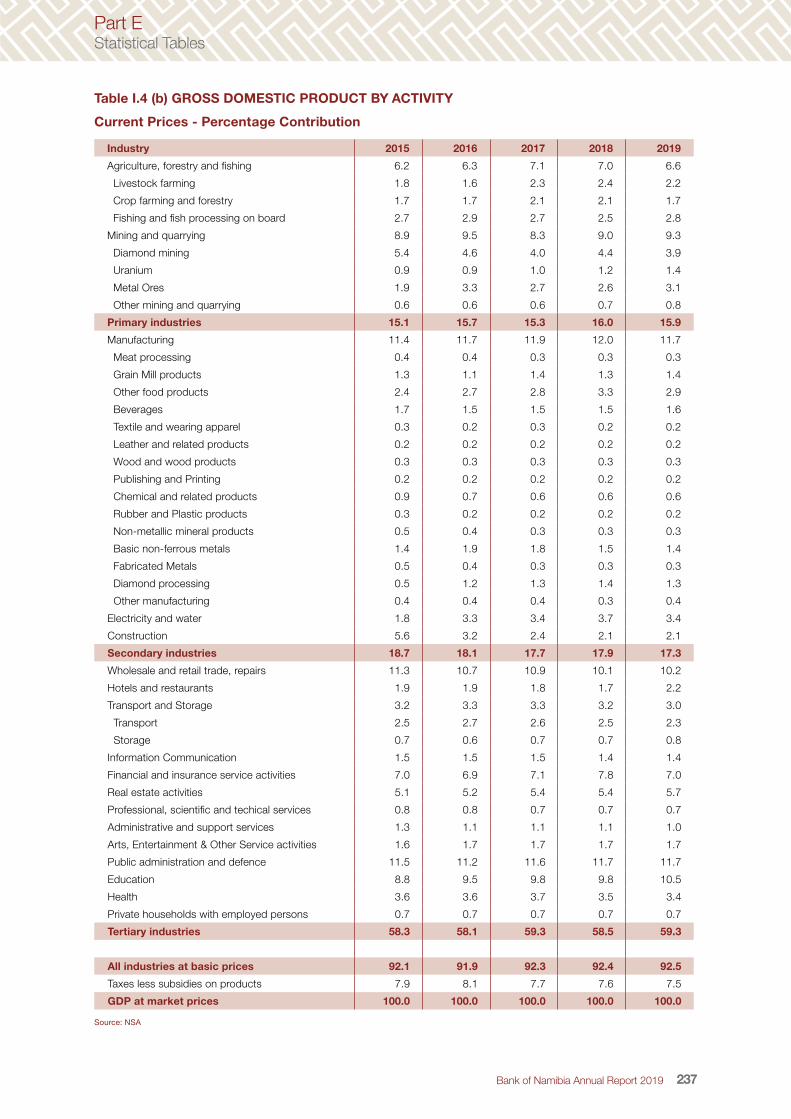
Bank of Namibia Annual Report 2019 237
Part EStatistical Tables
Table I.4 (b) GROSS DOMESTIC PRODUCT BY ACTIVITY
Current Prices - Percentage Contribution
Industry 2015 2016 2017 2018 2019
Agriculture, forestry and fishing 6.2 6.3 7.1 7.0 6.6
Livestock farming 1.8 1.6 2.3 2.4 2.2
Crop farming and forestry 1.7 1.7 2.1 2.1 1.7
Fishing and fish processing on board 2.7 2.9 2.7 2.5 2.8
Mining and quarrying 8.9 9.5 8.3 9.0 9.3
Diamond mining 5.4 4.6 4.0 4.4 3.9
Uranium 0.9 0.9 1.0 1.2 1.4
Metal Ores 1.9 3.3 2.7 2.6 3.1
Other mining and quarrying 0.6 0.6 0.6 0.7 0.8
Primary industries 15.1 15.7 15.3 16.0 15.9
Manufacturing 11.4 11.7 11.9 12.0 11.7
Meat processing 0.4 0.4 0.3 0.3 0.3
Grain Mill products 1.3 1.1 1.4 1.3 1.4
Other food products 2.4 2.7 2.8 3.3 2.9
Beverages 1.7 1.5 1.5 1.5 1.6
Textile and wearing apparel 0.3 0.2 0.3 0.2 0.2
Leather and related products 0.2 0.2 0.2 0.2 0.2
Wood and wood products 0.3 0.3 0.3 0.3 0.3
Publishing and Printing 0.2 0.2 0.2 0.2 0.2
Chemical and related products 0.9 0.7 0.6 0.6 0.6
Rubber and Plastic products 0.3 0.2 0.2 0.2 0.2
Non-metallic mineral products 0.5 0.4 0.3 0.3 0.3
Basic non-ferrous metals 1.4 1.9 1.8 1.5 1.4
Fabricated Metals 0.5 0.4 0.3 0.3 0.3
Diamond processing 0.5 1.2 1.3 1.4 1.3
Other manufacturing 0.4 0.4 0.4 0.3 0.4
Electricity and water 1.8 3.3 3.4 3.7 3.4
Construction 5.6 3.2 2.4 2.1 2.1
Secondary industries 18.7 18.1 17.7 17.9 17.3
Wholesale and retail trade, repairs 11.3 10.7 10.9 10.1 10.2
Hotels and restaurants 1.9 1.9 1.8 1.7 2.2
Transport and Storage 3.2 3.3 3.3 3.2 3.0
Transport 2.5 2.7 2.6 2.5 2.3
Storage 0.7 0.6 0.7 0.7 0.8
Information Communication 1.5 1.5 1.5 1.4 1.4
Financial and insurance service activities 7.0 6.9 7.1 7.8 7.0
Real estate activities 5.1 5.2 5.4 5.4 5.7
Professional, scientific and techical services 0.8 0.8 0.7 0.7 0.7
Administrative and support services 1.3 1.1 1.1 1.1 1.0
Arts, Entertainment & Other Service activities 1.6 1.7 1.7 1.7 1.7
Public administration and defence 11.5 11.2 11.6 11.7 11.7
Education 8.8 9.5 9.8 9.8 10.5
Health 3.6 3.6 3.7 3.5 3.4
Private households with employed persons 0.7 0.7 0.7 0.7 0.7
Tertiary industries 58.3 58.1 59.3 58.5 59.3
All industries at basic prices 92.1 91.9 92.3 92.4 92.5
Taxes less subsidies on products 7.9 8.1 7.7 7.6 7.5
GDP at market prices 100.0 100.0 100.0 100.0 100.0
Source: NSA

Bank of Namibia Annual Report 2019238
Part EStatistical Tables
Table I.5 (a) GROSS DOMESTIC PRODUCT BY ACTIVITY
Constant 2015 Prices - N$ million
Industry 2015 2016 2017 2018 2019
Agriculture, forestry and fishing 8,967 9,030 9,659 9,474 9,232
Livestock farming 2,613 2,483 2,727 2,713 2,531
Crop farming and forestry 2,489 2,231 2,581 2,403 2,078
Fishing and fish processing on board 3,864 4,316 4,352 4,358 4,623
Mining and quarrying 12,965 11,576 13,224 15,349 13,649
Diamond mining 7,902 7,044 8,066 9,283 7,643
Uranium 1,367 1,553 1,919 2,559 2,447
Metal Ores 2,769 1,820 1,342 1,352 1,351
Other mining and quarrying 928 1,159 1,897 2,155 2,208
Primary industries 21,932 20,606 22,883 24,823 22,881
Manufacturing 16,524 18,207 18,025 18,210 18,852
Meat processing 574 594 668 767 906
Grain Mill products 1,890 1,956 2,115 2,156 2,100
Other food products 3,542 3,916 3,713 3,753 3,791
Beverages 2,498 2,622 2,513 2,639 2,968
Textile and wearing apparel 417 409 455 459 449
Leather and related products 315 291 287 300 293
Wood and wood products 500 476 517 453 459
Publishing and Printing 355 324 364 316 294
Chemical and related products 1,285 1,122 910 845 832
Rubber and Plastic products 387 372 327 350 342
Non-metallic mineral products 705 662 545 517 537
Basic non-ferrous metals 2,032 2,554 2,658 2,553 2,867
Fabricated Metals 726 669 505 532 538
Diamond processing 784 1,725 1,921 2,045 1,901
Other manufacturing 515 513 526 527 575
Electricity and water 2,545 3,099 2,590 2,933 2,774
Construction 8,061 4,748 3,652 3,333 3,069
Secondary industries 27,130 26,053 24,267 24,477 24,695
Wholesale and retail trade, repairs 16,394 16,638 15,494 14,526 13,851
Hotels and restaurants 2,764 2,882 2,843 2,983 3,063
Transport and Storage 4,626 4,825 4,592 4,430 4,279
Transport 3,614 3,880 3,723 3,537 3,346
Storage 1,012 945 870 893 932
Information Communication 2,107 2,233 2,367 2,315 2,513
Financial and insurance service activities 10,174 10,288 10,654 10,653 11,295
Real estate activities 7,408 7,609 7,807 8,015 8,228
Professional, scientific and techical services 1,197 1,137 1,105 1,093 1,015
Administrative and support services 1,933 1,622 1,586 1,599 1,501
Arts, Entertainment & Other Service activities 2,384 2,454 2,444 2,453 2,406
Public administration and defence 16,707 16,684 17,046 17,160 17,537
Education 12,808 13,248 13,022 13,089 13,443
Health 5,183 5,689 5,941 5,412 5,154
Private households with employed persons 1,007 1,021 1,031 1,006 980
Tertiary industries 84,692 86,332 85,934 84,736 85,265
All industries at basic prices 133,754 132,991 133,083 134,036 132,841
Taxes less subsidies on products 11,452 11,808 11,345 11,401 10,946
GDP at market prices 145,207 144,799 144,428 145,437 143,787
Source: NSA

Bank of Namibia Annual Report 2019 239
Part EStatistical Tables
Table I.5 (b) GROSS DOMESTIC PRODUCT BY ACTIVITY
Constant 2015 Prices - Annual Percentage Changes
Industry 2015 2016 2017 2018 2019
Agriculture, forestry and fishing -13.3 0.7 7.0 -1.9 -2.6
Livestock farming -18.2 -5.0 9.8 -0.5 -6.7
Crop farming and forestry -13.8 -10.4 15.7 -6.9 -13.5
Fishing and fish processing on board -9.2 11.7 0.8 0.1 6.1
Mining and quarrying -0.9 -10.7 14.2 16.1 -11.1
Diamond mining -6.5 -10.9 14.5 15.1 -17.7
Uranium -18.1 13.6 23.5 33.4 -4.4
Metal Ores 157.1 -34.3 -26.3 0.8 -0.1
Other mining and quarrying -50.7 25.0 63.7 13.6 2.5
Primary industries -6.3 -6.0 11.0 8.5 -7.8
Manufacturing -3.1 10.2 -1.0 1.0 3.5
Meat processing 10.7 3.4 12.5 14.7 18.1
Grain Mill products 25.4 3.5 8.1 1.9 -2.6
Other food products -14.7 10.6 -5.2 1.1 1.0
Beverages 7.0 5.0 -4.2 5.0 12.5
Textile and wearing apparel 8.0 -1.9 11.3 0.9 -2.3
Leather and related products 21.3 -7.6 -1.6 4.5 -2.1
Wood and wood products -1.2 -4.8 8.6 -12.5 1.3
Publishing and Printing 13.7 -8.6 12.1 -13.2 -6.9
Chemical and related products -4.4 -12.7 -18.9 -7.2 -1.6
Rubber and Plastic products 12.6 -3.8 -12.1 7.0 -2.3
Non-metallic mineral products 10.6 -6.1 -17.7 -5.1 3.8
Basic non-ferrous metals -31.6 25.7 4.1 -4.0 12.3
Fabricated Metals 3.4 -7.8 -24.6 5.5 1.1
Diamond processing 35.3 119.9 11.4 6.4 -7.0
Other manufacturing 5.2 -0.4 2.6 0.1 9.2
Electricity and water 5.6 21.8 -16.4 13.2 -5.4
Construction 22.7 -41.1 -23.1 -8.7 -7.9
Secondary industries 4.2 -4.0 -6.9 0.9 0.9
Wholesale and retail trade, repairs 6.9 1.5 -6.9 -6.2 -4.7
Hotels and restaurants 4.0 4.3 -1.4 4.9 2.7
Transport and Storage 19.5 4.3 -4.8 -3.5 -3.4
Transport 25.1 7.4 -4.0 -5.0 -5.4
Storage 3.2 -6.6 -8.0 2.6 4.4
Information Communication 11.6 6.0 6.0 -2.2 8.6
Financial and insurance service activities 2.1 1.1 3.6 -0.0 6.0
Real estate activities 3.5 2.7 2.6 2.7 2.7
Professional, scientific and techical services 15.8 -5.1 -2.8 -1.1 -7.2
Administrative and support services 6.6 -16.1 -2.2 0.9 -6.2
Arts, Entertainment & Other Service activities 0.6 3.0 -0.4 0.4 -1.9
Public administration and defence 16.1 -0.1 2.2 0.7 2.2
Education -2.5 3.4 -1.7 0.5 2.7
Health 19.5 9.8 4.4 -8.9 -4.8
Private households with employed persons 1.7 1.4 1.0 -2.5 -2.5
Tertiary industries 7.3 1.9 -0.5 -1.4 0.6
All industries at basic prices 4.2 -0.6 0.1 0.7 -0.9
Taxes less subsidies on products 8.8 3.1 -3.9 0.5 -4.0
GDP at market prices 4.5 -0.3 -0.3 0.7 -1.1
Source: NSA

Bank of Namibia Annual Report 2019240
Part EStatistical Tables
Table I.6 (a) EXPENDITURE ON GROSS DOMESTIC PRODUCT
Current prices - N$ million
Expenditure category 2015 2016 2017 2018 2019
Final consumption expenditure 139,243 160,987 163,795 169,984 177,087
Private 99,484 118,426 119,867 123,979 130,787
General government 39,759 42,561 43,929 46,005 46,300
Gross fixed capital formation 45,020 34,075 30,047 29,702 28,858
Changes in inventories -660.0 293.2 -331.5 -3723.6 -6085.6
Gross domestic expenditure 183,604 195,355 193,511 195,963 199,859
Exports of goods and services 51,631 55,180 57,683 64,712 63,984
Imports of goods and services 90,028 93,657 81,665 82,624 85,167
Discrepancy 0 0 1 1 0
Gross domestic product at market prices 145,207 156,879 169,529 178,052 178,677
Source: NSA
Table I.6 (b) EXPENDITURE ON GROSS DOMESTIC PRODUCT
Percentage shares of GDP
Expenditure category 2015 2016 2017 2018 2019
Final consumption expenditure 95.9 102.6 96.6 95.5 99.1
Private 68.5 75.5 70.7 69.6 73.2
General government 27.4 27.1 25.9 25.8 25.9
Gross fixed capital formation 31.0 21.7 17.7 16.7 16.2
Changes in inventories -0.5 0.2 -0.2 -2.1 -3.4
Gross domestic expenditure 126.4 124.5 114.1 110.1 111.9
Exports of goods and services 35.6 35.2 34.0 36.3 35.8
Imports of goods and services 62.0 59.7 48.2 46.4 47.7
Discrepancy 0.0 0.0 0.0 0.0 0.0
Gross domestic product at market prices 100.0 100.0 100.0 100.0 100.0
Source: NSA

Bank of Namibia Annual Report 2019 241
Part EStatistical Tables
Table I.7 (a) EXPENDITURE ON GROSS DOMESTIC PRODUCT
Constant 2015 prices - N$ million
Expenditure category 2015 2016 2017 2018 2019
Final consumption expenditure 139,243 150,943 144,063 142,668 147,227
Private 99,484 110,757 104,714 103,344 107,747
General government 39,759 40,186 39,349 39,324 39,480
Gross fixed capital formation 45,020 32,944 29,445 30,334 30,278
Changes in inventories -660 -491 700 -3,171 -5,225
Gross domestic expenditure 183,604 183,396 174,208 169,831 172,281
Exports of goods and services 51,631 51,260 52,394 60,995 59,647
Imports of goods and services 90,028 89,857 82,174 85,389 88,140
Discrepancy 0 -0 -0 -0 -0
Gross domestic product at market prices 145,207 144,799 144,428 145,437 143,787
Source: NSA
Table I.7 (b) EXPENDITURE ON GROSS DOMESTIC PRODUCT
Constant 2015 Prices - Annual Percentage change
Expenditure category 2015 2016 2017 2018 2019
Final consumption expenditure 13.3 8.4 -4.6 -1.0 3.2
Private 13.7 11.3 -5.5 -1.3 4.3
General government 12.1 1.1 -2.1 -0.1 0.4
Gross fixed capital formation -5.6 -26.8 -10.6 3.0 -0.2
Changes in inventories -0.5 0.1 0.8 -2.7 -1.4
Gross domestic expenditure 7.6 -0.1 -5.0 -2.5 1.4
Exports of goods and services -12.0 -0.7 2.2 16.4 -2.2
Imports of goods and services -0.4 -0.2 -8.6 3.9 3.2
Discrepancy 0.0 -0.0 -0.0 0.0 -0.0
Gross domestic product at market prices 4.5 -0.3 -0.3 0.7 -1.1
Source: NSA

Bank of Namibia Annual Report 2019242
Part EStatistical Tables
Table I.8 GROSS FIXED CAPITAL FORMATION BY ACTIVITY
Current prices - N$ Million
Industry 2014 2015 2016 2017 2018
Agriculture 2,334 2,183 1,762 1,887 1,924
Fishing 404 1,141 735 1,123 1,512
Mining and quarrying 21,465 17,381 9,260 5,838 5,787
Manufacturing 4,441 4,675 4,330 4,691 4,614
Electricity and water 592 530 1,324 1,177 761
Construction 669 552 500 907 823
Wholesale and retail trade; hotels, restaurants 1,235 1,596 923 1,224 664
Transport, and communication 6,067 5,368 5,842 4,326 4,297
Finance, real estate, professional, administrative 3,050 3,974 3,579 3,832 4,022
Arts, entertainment, other services; private households 219 235 233 260 284
Producers of government services 6,965 7,383 5,587 5,132 5,853
Total 47,441 45,020 34,075 30,397 30,540
Percentage of GDP 35.4 31.0 21.7 17.9 17.3
Source: NSA
Table I.9 GROSS FIXED CAPITAL FORMATION BY ACTIVTY
Constant 2015 prices - N$ million
Industry 2014 2015 2016 2017 2018
Agriculture 2,410 2,183 1,655 1,836 1,978
Fishing 415 1,141 694 1,090 1,517
Mining and quarrying 21,719 17,381 9,182 6,202 6,887
Manufacturing 4,538 4,675 4,260 4,739 4,910
Electricity and water 589 530 1,276 1,132 750
Construction 695 552 500 975 1,036
Wholesale and retail trade; hotels, restaurants 1,250 1,596 913 1,207 694
Transport, and communication 6,105 5,368 5,402 3,968 3,750
Finance, real estate, professional, administrative 3,062 3,974 3,548 3,715 3,877
Arts, entertainment, other services; private households 222 235 221 248 269
Producers of government services 6,706 7,383 5,293 4,643 5,213
Total 47,710 45,020 32,944 29,755 30,881
Annual change, per cent 22.4 -5.6 -26.8 -9.7 3.8
Source: NSA

Bank of Namibia Annual Report 2019 243
Part EStatistical Tables
Table I.10 GROSS FIXED CAPITAL FORMATION BY TYPE OF ASSET
Current prices - N$ million
Type of Asset 2014 2015 2016 2017 2018
Buildings 7,730 7,957 7,180 7,744 7,610
Construction works 15,116 17,759 10,542 7,328 7,453
Transport equipment 8,498 7,262 6,366 6,218 5,168
Machinery and other equipment 14,207 11,193 9,336 8,522 9,101
Mineral exploration 1,890 851 650 585 1,209
Total 47,441 45,020 34,075 30,397 30,540
Source: NSA
Table I.11 GROSS FIXED CAPITAL FORMATION BY TYPE OF ASSET
Constant 2015 prices - N$ million
Type of Asset 2014 2015 2016 2017 2018
Buildings 7,786 7,957 6,938 7,255 6,752
Construction works 14,334 17,759 9,926 6,309 5,985
Transport equipment 8,863 7,262 6,064 5,954 4,486
Machinery and other equipment 14,769 11,193 9,389 9,650 12,468
Mineral exploration 1,959 851 627 588 1,191
Total 47,710 45,020 32,944 29,755 30,881
Source: NSA
Table I.12 GROSS FIXED CAPITAL FORMATION BY OWNERSHIP
Current prices - N$ million
Ownership 2014 2015 2016 2017 2018
Public 9,817 10,744 9,590 9,209 9,696
Producers of government services 6,965 7,383 5,587 5,132 5,853
Public corporations and enterprises 2,852 3,361 4,003 4,077 3,842
Private 37,624 34,276 24,485 21,188 20,845
Total 47,441 45,020 34,075 30,397 30,540
Source: NSA
Table I.13 GROSS FIXED CAPITAL FORMATION BY OWNERSHIP
Constant 2015 prices - N$ million
Ownership 2014 2015 2016 2017 2018
Public 9,117 10,744 8,992 8,242 8,290
Producers of government services 6,706 7,383 5,293 4,643 5,213
Public corporations and enterprises 2,410 3,361 3,699 3,599 3,077
Private 38,594 34,276 23,952 21,513 22,591
Total 47,710 45,020 32,944 29,755 30,881
Source: NSA

Bank of Namibia Annual Report 2019244
Part EStatistical Tables
Table I.14 FIXED CAPITAL STOCK BY ACTIVITY
Current prices - N$ million
Industry 2014 2015 2016 2017 2018
Agriculture 9,584 9,883 10,541 10,449 10,872
Fishing 51,824 61,042 64,977 64,443 65,412
Mining and quarrying 35,357 36,801 38,048 38,499 40,155
Manufacturing 3,930 4,771 5,633 6,373 7,937
Electricity and water 14,915 14,137 15,474 17,287 18,428
Construction 2,981 2,654 2,348 2,243 2,152
Wholesale and retail trade; hotels, restaurants 9,805 10,328 10,293 10,806 10,797
Transport, and communication 28,584 30,716 35,829 38,131 43,322
Finance, real estate, professional, administrative 47,407 49,622 51,903 55,818 59,375
Arts, entertainment, other services; private households 1,314 1,347 1,461 1,594 1,765
Producers of government services 51,769 55,289 62,156 70,366 78,516
Total 257,470 276,590 298,664 316,009 338,731
Source: NSA
Table I.15 FIXED CAPITAL STOCK BY ACTIVITY
Constant 2015 prices - N$ million
Industry 2014 2015 2016 2017 2018
Agriculture 9,944 9,883 9,766 9,665 9,554
Fishing 52,500 61,042 62,647 61,340 59,984
Mining and quarrying 36,009 36,801 37,180 37,388 37,956
Manufacturing 4,076 4,771 5,259 5,949 7,048
Electricity and water 14,360 14,137 14,582 14,840 14,819
Construction 3,048 2,654 2,320 2,183 2,066
Wholesale and retail trade; hotels, restaurants 9,917 10,328 10,150 10,340 10,021
Transport, and communication 28,419 30,716 32,852 34,021 34,832
Finance, real estate, professional, administrative 47,567 49,622 51,283 52,988 54,736
Arts, entertainment, other services; private households 1,299 1,347 1,400 1,458 1,516
Producers of government services 49,737 55,289 58,964 61,666 64,575
Total 256,877 276,590 286,404 291,838 297,106
Source: NSA

Bank of Namibia Annual Report 2019 245
Part EStatistical Tables
Tabl
e 1.
16 (a
) N
ATIO
NA
L C
ON
SU
ME
R P
RIC
E IN
DE
X (D
ecem
ber
2012
= 1
00)
Food
& n
on-
alco
holic
be
vera
ges
Alco
holic
be
vera
ges
& ta
bacc
o
Clo
thin
g an
d fo
ot d
wea
rH
ousi
ng,w
ater
, el
ectr
icity
, ga
s &
othe
rs
Furn
iture
, ho
useh
old
equi
pmen
t &
mai
nten
ance
Hea
lthTr
ansp
ort
Com
mun
icat
ions
R
ecre
atio
n &
cultu
reEd
ucat
ion
Hot
els,
caf
es &
re
stau
rand
sM
isce
llane
ous
good
s &
serv
ices
All i
tem
sAl
l Ite
ms
Annu
al
perc
enta
ge
chan
ges
wei
ght
s16
.45
12.5
93.
0528
.36
5.47
2.01
14.2
83.
813.
553.
651.
395.
3910
0.0
2015
117.
612
1.5
106.
810
8.3
111.
411
0.5
108.
710
0.6
113.
111
7.3
117.
811
2.2
112.
33.
420
1613
0.2
129.
610
7.0
116.
711
7.8
118.
311
2.2
103.
211
9.6
126.
112
7.0
117.
511
9.8
6.7
2017
Jan-
1713
7.4
132.
610
7.6
126.
712
4.4
123.
611
5.1
106.
912
1.4
135.
913
2.7
123.
212
6.1
8.2
Feb-
1713
7.6
133.
010
7.9
127.
012
3.7
123.
611
5.5
106.
912
2.0
135.
913
2.2
123.
112
6.3
7.8
Mar
-17
136.
813
3.6
107.
912
6.9
123.
412
4.0
117.
110
6.7
122.
213
5.9
134.
312
3.2
126.
47.
0A
pr-1
713
7.0
134.
110
8.4
126.
912
3.2
124.
611
7.4
106.
812
6.0
135.
913
6.7
123.
612
6.8
6.7
May
-17
136.
313
4.2
108.
412
7.3
123.
412
4.7
118.
110
6.8
126.
013
5.9
136.
912
3.8
126.
96.
3Ju
n-17
136.
513
4.6
108.
712
7.3
123.
712
5.1
118.
110
6.6
126.
213
5.9
137.
912
4.2
127.
16.
1Ju
l-17
137.
513
5.0
107.
612
7.7
123.
512
5.4
117.
010
6.5
126.
013
5.9
134.
212
4.1
127.
15.
4A
ug-1
713
7.7
136.
410
7.3
127.
012
4.0
125.
411
7.2
107.
312
5.8
135.
913
6.8
124.
412
7.3
5.4
Sep
-17
138.
413
7.3
106.
012
7.8
124.
012
5.7
118.
010
7.5
124.
813
5.9
138.
212
4.1
127.
85.
6O
ct-1
713
8.5
138.
610
3.0
127.
712
2.9
126.
011
8.6
106.
812
4.7
135.
913
9.6
124.
612
7.9
5.2
Nov
-17
138.
313
9.0
103.
012
7.9
121.
712
6.1
120.
710
6.9
124.
713
5.9
139.
512
4.9
128.
25.
2D
ec-1
713
8.5
138.
010
3.3
128.
612
1.6
126.
112
1.6
106.
912
4.7
135.
913
7.0
125.
012
8.4
5.2
An.
Av
137.
513
5.5
106.
612
7.4
123.
312
5.0
117.
910
6.9
124.
513
5.9
136.
312
4.0
127.
26.
2
2018
Jan-
1814
0.1
138.
210
4.0
131.
312
3.2
131.
212
2.4
106.
912
4.5
149.
513
8.9
129.
013
0.5
3.6
Feb-
1814
0.4
138.
910
3.4
131.
112
3.8
131.
312
3.1
106.
912
4.8
149.
513
8.9
128.
813
0.7
3.5
Mar
-18
140.
513
9.3
101.
813
1.1
124.
513
1.5
123.
510
7.1
125.
614
9.5
139.
412
8.4
130.
93.
5A
pr-1
814
0.9
140.
510
2.1
131.
112
4.5
131.
612
4.1
106.
712
7.9
149.
514
0.1
129.
013
1.3
3.6
May
-18
141.
614
1.5
102.
513
1.5
124.
613
1.8
124.
710
6.8
129.
114
9.5
141.
312
8.9
131.
83.
8Ju
n-18
141.
814
1.5
102.
313
1.4
125.
013
1.8
126.
710
6.9
129.
314
9.5
140.
612
9.3
132.
14.
0Ju
l-18
141.
514
4.2
102.
213
2.4
124.
213
1.7
127.
510
6.7
129.
914
9.5
142.
412
9.2
132.
84.
5A
ug-1
814
1.3
143.
710
1.8
132.
512
4.1
131.
712
8.5
105.
813
0.0
149.
514
3.0
129.
213
2.9
4.4
Sep
-18
141.
814
4.9
102.
613
2.6
124.
413
1.9
133.
210
6.1
131.
014
9.5
143.
212
9.0
133.
94.
8O
ct-1
814
2.5
145.
410
3.3
132.
612
4.0
132.
013
4.8
108.
013
0.7
149.
514
4.5
130.
113
4.4
5.1
Nov
-18
144.
814
6.9
102.
513
2.6
124.
713
2.2
137.
310
8.3
131.
114
9.5
143.
512
9.4
135.
45.
6D
ec-1
814
5.6
146.
110
3.1
132.
612
4.1
132.
213
4.8
108.
213
1.5
149.
514
3.0
130.
113
5.0
5.1
An.
Av
141.
914
2.6
102.
613
1.9
124.
313
1.7
128.
410
7.0
128.
814
9.5
141.
612
9.2
132.
64.
3
2019
Jan-
1914
8.1
147.
110
3.3
135.
112
5.2
133.
913
1.3
108.
213
1.4
167.
414
5.9
131.
113
6.6
4.7
Feb-
1914
8.7
147.
410
2.7
133.
612
5.3
134.
413
2.3
108.
313
2.8
166.
414
6.5
131.
113
6.5
4.4
Mar
-19
148.
714
8.7
102.
713
3.9
125.
213
5.5
132.
010
8.1
133.
416
6.4
146.
713
1.4
136.
84.
5A
pr-1
914
8.4
151.
010
2.7
133.
912
5.8
134.
913
3.0
108.
113
3.7
167.
314
7.5
131.
813
7.2
4.5
May
-19
147.
914
9.3
102.
513
4.0
125.
913
5.2
134.
110
8.2
134.
916
7.3
148.
013
1.7
137.
24.
1Ju
n-19
147.
314
9.2
103.
313
4.1
126.
413
5.3
135.
610
8.1
134.
516
7.3
148.
213
1.7
137.
33.
9Ju
l-19
146.
414
9.1
103.
413
5.3
126.
413
5.6
136.
210
8.1
134.
116
7.3
148.
013
2.1
137.
73.
6A
ug-1
914
7.1
149.
310
3.4
135.
012
7.8
135.
913
6.3
107.
613
4.6
167.
314
7.8
132.
213
7.8
3.7
Sep
-19
148.
014
9.7
104.
013
5.1
128.
213
6.1
136.
610
8.8
136.
216
7.3
147.
213
2.5
138.
23.
3O
ct-1
914
8.4
151.
010
4.2
135.
112
7.7
136.
213
6.9
108.
813
6.7
167.
314
8.6
132.
313
8.5
3.0
Nov
-19
149.
015
0.9
104.
413
5.2
127.
913
5.9
137.
410
8.3
137.
516
7.3
148.
513
2.4
138.
72.
5D
ec-1
914
8.2
150.
710
3.6
135.
212
7.9
136.
413
7.5
108.
513
8.3
167.
314
8.9
131.
713
8.5
2.6
An.
Av
148.
014
9.5
103.
413
4.6
126.
713
5.4
134.
910
8.2
134.
816
7.2
147.
613
1.8
137.
63.
7
So
urce
: NS
A

Bank of Namibia Annual Report 2019246
Part EStatistical Tables
Table 1.16 (b) NATIONAL CONSUMER PRICE INDEX (December 2012=100)
Services Goods
Index Monthly Infl. Rate
Annual infl. rate Index Monthly infl.
rateAnnual infl.
rate
2015 109.0 0.3 3.1 114.8 0.3 3.5
2016 115.9 0.5 6.3 122.8 0.6 7.0
2017
Jan-17 124.5 6.6 8.3 127.3 0.8 8.1
Feb-17 124.6 0.1 8.1 127.6 0.3 7.5
Mar-17 124.6 -0.0 8.1 127.9 0.2 6.3
Apr-17 124.9 0.3 8.2 128.2 0.3 5.6
May-17 125.1 0.2 8.2 128.3 0.1 4.9
Jun-17 125.1 0.0 8.2 128.6 0.2 4.5
Jul-17 125.5 0.3 8.1 128.4 -0.1 3.5
Aug-17 125.7 0.2 8.1 128.4 -0.0 3.4
Sep-17 126.1 0.3 8.4 129.0 0.4 3.6
Oct-17 126.1 0.0 8.0 129.2 0.2 3.1
Nov-16 126.2 0.0 8.0 129.8 0.4 3.1
Dec-16 126.1 -0.0 8.0 130.2 0.3 3.1
An. Av 125.4 0.7 8.2 128.6 0.3 4.7
2018
Jan-18 129.9 3.0 4.4 131.0 0.6 2.9
Feb-18 130.0 0.1 4.4 131.3 0.2 2.9
Mar-18 130.1 0.0 4.4 131.5 0.2 2.8
Apr-18 130.2 0.1 4.3 132.1 0.5 3.1
May-18 130.3 0.0 4.2 132.9 0.6 3.6
Jun-18 130.3 0.0 4.2 133.5 0.4 3.8
Jul-18 130.8 0.4 4.3 134.4 0.6 4.6
Aug-18 130.9 0.1 4.1 134.4 0.0 4.6
Sep-18 132.0 0.9 4.7 135.3 0.7 4.9
Oct-18 132.2 0.2 4.8 136.1 0.6 5.3
Nov-18 132.2 0.0 4.8 137.7 1.2 6.1
Dec-18 132.3 0.0 4.9 137.1 -0.4 5.3
An. Av 130.9 0.4 4.5 133.9 0.4 4.2
2019
Jan-19 135.8 2.7 4.5 137.2 0.1 4.8
Feb-19 136.0 0.1 4.6 136.9 -0.3 4.3
Mar-19 136.1 0.0 4.6 137.3 0.3 4.4
Apr-19 136.3 0.2 4.7 138.0 0.5 4.4
May-19 136.3 0.0 4.6 137.8 -0.1 3.7
Jun-19 136.4 0.1 4.7 138.0 0.2 3.4
Jul-19 136.5 0.1 4.4 138.5 0.4 3.1
Aug-19 136.6 0.1 4.4 138.7 0.1 3.2
Sep-19 136.7 0.0 3.5 139.4 0.5 3.0
Oct-19 136.7 0.0 3.4 139.8 0.3 2.7
Nov-19 136.8 0.0 3.4 140.1 0.2 1.7
Dec-19 136.8 0.0 3.4 139.9 -0.2 2.0
An. Av 136.4 0.3 4.2 138.5 0.2 3.4
Source: NSA

Bank of Namibia Annual Report 2019 247
Part EStatistical Tables
Tabl
e II.
1(a)
Cen
tral
ban
k su
rvey
(end
of p
erio
d in
N$
mill
ion)
Jan- 16
Feb- 16
Mar
-16
Apr-
16M
ay-
16Ju
n- 16Ju
l-16
Aug- 16
Sep- 16
Oct-
16No
v- 16De
c- 16Ja
n- 17Fe
b- 17M
ar-
17Ap
r-17
May
-17
Jun- 17
Jul-
17Au
g- 17Se
p- 17Oc
t-17
Nov- 17
Dec- 17
Jan- 18
Feb- 18
Mar
-18
Apr-
18M
ay-
18Ju
n- 18Ju
l-18
Aug- 18
Sep- 18
Oct-
18No
v- 18De
c- 18Ja
n- 19Fe
b- 19M
ar-
19Ap
r-19
May
-19
Jun- 19
Jul-
19Au
g- 19Se
p- 19Oc
t-19
Nov- 19
Dec- 19
Asse
ts
Net
fore
ign
asse
ts
25,5
3125
,439
27,0
5527
,452
27,7
3023
,639
24,6
6423
,025
20,2
4724
,394
27,1
8124
,028
25,7
8624
,164
22,9
0126
,252
25,1
4825
,986
31,1
1629
,816
29,7
3928
,383
25,7
0226
,122
27,2
7825
,767
22,1
6729
,860
27,3
6328
,192
29,9
2729
,283
28,9
7128
,916
25,8
1828
,114
28,1
3228
,965
29,3
3031
,372
31,1
6929
,170
32,4
2030
,461
28,2
3229
,556
26,7
2124
,746
Cla
ims
on
non
resi
dent
s 28
,740
28,6
5430
,033
30,2
8230
,878
26,6
0827
,487
25,9
0823
,015
27,1
3229
,954
26,7
4328
,479
26,7
5425
,595
28,9
0527
,759
28,5
8433
,744
32,4
1132
,440
31,1
8228
,426
28,5
9129
,660
28,1
0424
,509
32,3
1229
,856
30,9
2632
,549
32,2
1432
,102
31,8
3528
,541
30,9
8530
,792
31,7
4332
,239
34,2
3134
,117
31,9
9335
,246
33,5
1431
,253
32,5
4129
,657
27,5
60
M
onet
ary g
old a
nd
SDR
holdi
ngs
137
138
129
124
137
128
121
124
120
116
116
112
113
108
113
112
111
112
115
114
118
122
119
109
107
105
106
109
109
9588
9995
9794
6258
5356
5449
4747
5049
4936
34
Fore
ign c
urre
ncy
995
984
960
132
171
100
170
6912
690
116
5811
472
1829
4980
2443
6069
7579
105
3435
4344
5265
8017
4268
6811
213
713
872
8836
6282
3154
7789
Depo
sits
11,8
5014
,040
11,0
689,
758
11,4
437,
818
7,85
58,
076
6,88
16,
702
5,52
75,
129
5,47
94,
772
6,17
35,
309
5,48
67,
341
6,82
28,
077
8,23
69,
997
8,71
68,
470
8,09
48,
282
8,42
49,
101
8,72
69,
983
8,96
69,
994
9,97
89,
725
8,47
49,
526
9,28
29,
549
11,1
0911
,966
12,2
0311
,272
10,9
6112
,010
11,8
3511
,723
11,3
1310
,765
Secu
rities
oth
er
th
an sh
ares
13,3
0411
,039
13,7
1314
,780
13,3
3913
,103
14,1
4912
,337
13,8
6218
,250
19,6
5419
,220
18,6
3217
,819
15,8
4920
,054
18,7
6719
,482
25,8
8721
,516
21,9
4820
,779
19,3
0018
,666
20,1
3218
,484
16,9
5122
,430
20,3
3720
,794
23,4
2822
,040
22,0
1121
,970
19,9
0421
,327
21,3
3922
,003
20,9
3522
,137
21,7
7520
,637
24,1
7521
,371
19,3
3720
,714
18,2
3016
,670
Loan
s 0
00
00
00
00
00
00
00
00
00
00
00
00
00
00
00
00
00
00
00
00
00
00
00
0
Finan
cial
deriv
ative
s0
00
00
00
00
00
00
00
00
00
00
00
00
00
00
00
00
00
00
00
00
00
00
00
0
Othe
r For
eign
Asse
ts2,
453
2,45
34,
164
5,48
85,
789
5,46
05,
191
5,30
22,
026
1,97
44,
541
2,22
34,
141
3,98
33,
442
3,40
03,
345
1,56
989
62,
661
2,07
721
621
51,
267
1,22
21,
199
-1,0
0662
964
01
11
11
11
11
11
11
11
11
11
les
s: Lia
bilitie
s to
no
nres
ident
s3,
208
3,21
52,
978
2,83
03,
148
2,96
92,
823
2,88
32,
769
2,73
82,
772
2,71
52,
693
2,59
02,
695
2,65
32,
610
2,59
82,
629
2,59
52,
700
2,80
02,
724
2,46
92,
382
2,33
72,
342
2,45
22,
493
2,73
32,
621
2,93
13,
130
2,91
92,
723
2,87
02,
660
2,77
82,
908
2,85
92,
948
2,82
42,
827
3,05
33,
022
2,98
52,
936
2,81
4
Depo
sits
00
00
00
00
00
00
00
00
00
00
00
00
00
00
00
00
00
00
00
00
00
00
00
00
Secu
rities
oth
e
th
an sh
ares
00
00
00
00
00
00
00
00
00
00
00
00
00
00
00
00
00
00
00
00
00
00
00
00
Loan
s 0
00
00
00
00
00
00
00
00
00
00
00
00
00
00
00
00
00
00
00
00
00
00
00
0
Finan
cial
deriv
ative
s0
00
00
00
00
00
00
00
00
00
00
00
00
00
00
00
00
00
00
00
00
00
00
00
0
Othe
r For
eign
Liabil
ities
3,20
83,
215
2,97
82,
830
3,14
82,
969
2,82
32,
883
2,76
92,
738
2,77
22,
715
2,69
32,
590
2,69
52,
653
2,61
02,
598
2,62
92,
595
2,70
02,
800
2,72
42,
469
2,38
22,
337
2,34
22,
452
2,49
32,
733
2,62
12,
931
3,13
02,
919
2,72
32,
870
2,66
02,
778
2,90
82,
859
2,94
82,
824
2,82
73,
053
3,02
22,
985
2,93
62,
814
Cla
ims
on o
ther
dep
osito
ry
cor
pora
tions
504
5252
5222
872
520
810
177
648
739
277
395
779
31,
293
778
208
741
200
202
9564
5777
992
376
829
820
359
236
304
446
207
494
442
1,89
82,
348
707
541
448
470
451
459
515
269
6434
91,
811
Net
cla
ims
on
cen
tral g
over
nmen
t-1
1,363
-9,1
97-6
,009
-8,5
70-7
,158
-6,7
31-6
,706
-5,1
68-5
,619
-5,2
65-3
,473
-4,5
56-6
,325
-5,8
83-3
,168
-6,8
17-4
,397
-5,1
44-7
,596
-6,5
30-5
,548
-6,5
87-5
,053
-4,7
49-7
,626
-6,8
75-3
,026
-6,3
63-4
,730
-5,8
07-6
,966
-6,0
38-4
,862
-5,0
79-3
,747
-7,2
25-8
,843
-7,3
67-4
,469
-7,9
96-6
,266
-6,6
76-8
,807
-7,0
75-5
,386
-6,5
50-4
,617
-4,5
13
Claim
s on
cent
ral
gove
rnm
ent
083
1,89
70
00
025
70
231
1,33
017
00
01,
795
085
70
00
950
636
00
1,15
90
770
00
235
583
634
411
00
927
00
00
01,
536
662
1,47
61,
365
Se
curiti
es0
00
00
00
00
00
00
00
00
00
00
00
00
00
00
00
00
00
00
00
00
00
00
00
0
O
ther
cla
ims
083
1,89
70
00
025
70
231
1,33
017
00
01,
795
085
70
00
950
636
00
1,15
90
770
00
235
583
634
411
00
927
00
00
01,
536
662
1,47
61,
365
less:
Liabil
ities
to c
entra
l
go
vern
men
t 11
,363
9,28
07,
905
8,57
07,
158
6,73
16,
706
5,42
55,
619
5,49
54,
803
4,72
66,
325
5,88
34,
964
6,81
75,
254
5,14
47,
596
6,53
05,
643
6,58
75,
116
4,75
57,
626
6,87
54,
185
6,36
34,
807
5,80
76,
966
6,03
85,
097
5,66
24,
381
7,63
68,
843
7,36
75,
396
7,99
66,
266
6,67
68,
807
7,07
56,
923
7,21
36,
093
5,87
8
De
posit
s 11
,363
9,28
07,
905
8,57
07,
158
6,73
16,
706
5,42
55,
619
5,49
54,
803
4,72
66,
325
5,88
34,
964
6,81
75,
254
5,14
47,
596
6,53
05,
643
6,58
75,
116
4,75
57,
626
6,87
54,
185
6,36
34,
807
5,80
76,
966
6,03
85,
097
5,66
24,
381
7,63
68,
843
7,36
75,
396
7,99
66,
266
6,67
68,
807
7,07
56,
923
7,21
36,
093
5,87
8
Ot
her li
abilit
ies0
00
00
00
00
00
00
00
00
00
00
00
00
00
00
00
00
00
00
00
00
00
00
00
0
Clai
ms
on o
ther
se
ctor
s43
4141
4240
4040
4142
4243
4343
4445
4645
4545
4546
4646
4647
4849
5050
5455
5556
5858
6363
6666
6570
7075
8180
8283
87
Ot
her fi
nanc
ial
co
rpor
ation
s2
00
00
00
00
00
00
00
00
00
00
00
00
00
00
00
00
00
00
00
00
00
00
00
0
St
ate
and
loc
al
gove
rnm
ent
00
00
00
00
00
00
00
00
00
00
00
00
00
00
00
00
00
00
00
00
00
00
00
00
Pu
blic
no
nfina
ncial
corp
orat
ions
00
00
00
00
00
00
00
00
00
00
00
00
00
00
00
00
00
00
00
00
00
00
00
00
Ot
her
no
nfina
ncial
corp
orat
ions
00
00
00
00
00
00
00
00
00
00
00
00
00
00
00
00
00
00
00
00
00
00
00
00
Ot
her r
eside
nt
sect
ors
4241
4142
4040
4041
4242
4343
4344
4546
4545
4545
4646
4646
4748
4950
5054
5555
5658
5863
6366
6665
7070
7581
8082
8387

Bank of Namibia Annual Report 2019248
Part EStatistical Tables
Tabl
e II.
1(b)
Cen
tral
ban
k su
rvey
(end
of p
erio
d in
N$
mill
ion)
Jan- 16
Feb- 16
Mar
-16
Apr-
16M
ay-
16Ju
n- 16Ju
l-16
Aug- 16
Sep- 16
Oct
-16
Nov
-16
Dec
-16
Jan- 17
Feb- 17
Mar
-17
Apr-
17M
ay-
17Ju
n- 17Ju
l-17
Aug- 17
Sep- 17
Oct
-17
Nov
-17
Dec
-17
Jan- 18
Feb- 18
Mar
-18
Apr-
18M
ay-
18Ju
n- 18Ju
l-18
Aug- 18
Sep- 18
Oct
-18
Nov
-18
Dec
-18
Jan- 19
Feb- 19
Mar
-19
Apr-
19M
ay-
19Ju
n- 19Ju
l-19
Aug- 19
Sep- 19
Oct
-19
Nov
-19
Dec
-19
Liab
ilities
Mon
etar
y ba
se
6,19
5 7,
662
11,10
4 8,
090
8,38
5 6,
888
7,16
8 6,
755
7,02
1 6,
814
8,52
8 7,
945
6,37
1 6,
110
7,68
1 7,
059
7,41
2 6,
581
8,61
3 7,
592
7,62
5 7,
062
7,72
8 8,
761
7,41
9 6,
725
7,35
4 8,
712
8,75
3 7,
656
8,03
8 7,
310
8,60
3 7,
647
7,18
8 8,
256
7,59
6 7,
199
9,94
3 8,
002
8,24
1 6,
838
8,02
1 7,
252
7,06
6 7,
043
7,12
1 7,
081
Cu
rrenc
y in
circu
lation
4,03
2 3,
798
4,01
6 3,
975
4,00
0 3,
922
3,97
5 4,
123
3,96
0 4,
003
4,31
8 4,
394
3,97
7 3,
929
4,00
5 4,
093
4,09
1 4,
056
4,04
8 4,
186
4,17
3 4,
228
4,44
0 4,
658
4,09
5 3,
932
4,12
6 3,
998
3,95
5 3,
946
4,04
7 4,
244
4,19
7 4,
119
4,36
1 4,
521
4,09
5 3,
953
3,98
0 4,
082
4,13
2 4,
014
4,04
8 4,
214
4,04
8 4,
149
4,41
3 4,
518
Li
abilit
ies
to o
ther
depo
sitor
y
corp
orat
ions
2,16
3 3,
864
7,08
9 4,
115
4,38
6 2,
967
3,19
3 2,
631
3,06
1 2,
811
4,21
0 3,
551
2,39
4 2,
181
3,67
7 2,
966
3,32
1 2,
525
4,56
5 3,
406
3,45
3 2,
834
3,28
8 4,
103
3,32
4 2,
793
3,22
8 4,
713
4,79
8 3,
710
3,99
1 3,
066
4,40
7 3,
528
2,82
8 3,
735
3,50
2 3,
246
5,96
3 3,
920
4,10
9 2,
824
3,97
3 3,
037
3,01
8 2,
894
2,70
8 2,
563
Rese
rve d
epos
its 2,
163
3,86
4 7,
089
4,11
5 4,
386
2,96
7 3,
193
2,63
1 3,
061
2,81
1 4,
210
3,55
1 2,
394
2,18
1 3,
677
2,96
6 3,
321
2,52
5 4,
565
3,40
6 3,
453
2,83
4 3,
288
4,10
3 3,
324
2,79
3 3,
228
4,71
3 4,
798
3,71
0 3,
991
3,06
6 4,
407
3,52
8 2,
828
3,73
5 3,
502
3,24
6 5,
963
3,92
0 4,
109
2,82
4 3,
973
3,03
7 3,
018
2,89
4 2,
708
2,56
3
Othe
r liab
ilities
00
00
00
00
00
00
00
00
00
00
00
00
00
00
00
00
00
00
00
00
00
00
00
00
De
posit
s in
clud
ed in
broa
d m
oney
00
00
00
00
00
00
00
00
00
00
00
00
00
00
00
00
00
00
00
00
00
00
00
00
Trans
ferab
le
de
posit
s0
00
00
00
00
00
00
00
00
00
00
00
00
00
00
00
00
00
00
00
00
00
00
00
0
Othe
r dep
osits
00
00
00
00
00
00
00
00
00
00
00
00
00
00
00
00
00
00
00
00
00
00
00
00
Sec
uriti
es o
ther
than
s
hare
s, in
clud
ed in
bro
ad
mon
ey0
00
00
00
00
00
00
00
00
00
00
00
00
00
00
00
00
00
00
00
00
00
00
00
0
Depo
sits e
xclud
ed fr
om
broa
d m
oney
0
0 0
0 0
0 0
0 0
0 0
0 0
0 0
0 0
0 0
0 0
0 0
0 0
0 0
0 0
0 0
0 0
0 0
0 0
0 0
0 0
0 0
0 0
0 0
1
Of
whic
h: O
ther
f
inanc
ial c
orpo
ratio
ns
00
00
00
00
00
00
00
00
00
00
00
00
00
00
00
00
00
00
00
00
00
00
00
00
Secu
rities
oth
er th
an sh
ares
, ex
clude
d fro
m b
road
mon
ey 2,
911
2,91
1 2,
911
2,91
1 3,
061
3,16
4 3,
918
3,89
7 3,
922
8,86
4 8,
796
7,77
2 7,
593
6,88
8 6,
592
6,57
2 6,
606
9,72
2 8,
356
6,74
2 6,
724
6,84
7 6,
877
7,03
6 7,
036
6,88
1 6,
967
7,08
3 7,
112
7,05
9 6,
920
6,98
6 6,
958
6,98
7 7,
006
6,91
7 6,
989
7,12
5 7,
114
7,06
0 7,
304
7,20
1 7,
230
7,20
3 7,
211
7,21
1 6,
930
6,93
2
Of
whic
h: O
ther
finan
cial
co
rpor
ation
s 2,
911
2,91
1 2,
911
2,91
1 3,
061
3,16
4 3,
185
3,15
8 3,
203
8,13
9 8,
146
7,10
6 6,
927
6,22
2 5,
915
5,88
7 5,
911
8,89
5 7,
530
5,90
9 5,
885
5,95
1 5,
876
6,03
4 6,
034
5,86
9 5,
948
6,06
4 6,
079
6,02
0 5,
875
5,93
2 5,
897
5,91
9 5,
929
5,83
3 5,
898
6,02
5 6,
006
5,94
5 6,
181
6,06
9 6,
091
6,05
5 6,
048
6,03
9 5,
952
5,94
6
Loa
ns0
00
00
00
00
00
00
00
00
00
00
00
00
00
00
00
00
00
00
00
00
00
00
00
0
Of
whic
h: O
ther
f
inanc
ial c
orpo
ratio
ns
00
00
00
00
00
00
00
00
00
00
00
00
00
00
00
00
00
00
00
00
00
00
00
00
Fin
anci
al d
eriva
tives
00
00
00
00
00
00
00
00
00
00
00
00
00
00
00
00
00
00
00
00
00
00
00
00
Of
whic
h: O
ther
finan
cial c
orpo
ratio
ns
00
00
00
00
00
00
00
00
00
00
00
00
00
00
00
00
00
00
00
00
00
00
00
00
Sha
res
and
othe
r equ
ity 6,
402
6,43
0 7,
740
7,81
9 8,
999
8,34
0 7,
867
8,10
5 7,
703
7,61
1 7,
740
5,51
1 7,
345
7,00
9 7,
403
7,23
7 7,
116
5,35
3 5,
468
7,19
0 7,
620
6,14
3 5,
875
6,96
0 6,
718
6,57
7 4,
807
6,83
2 7,
004
7,82
3 7,
515
8,49
0 8,
164
8,49
1 8,
001
8,49
2 8,
037
8,39
1 8,
531
8,51
3 8,
866
8,58
8 8,
709
9,40
7 9,
416
9,36
1 9,
273
9,05
1
Fu
nds c
ontri
bute
d by
ow
ners
40
40
40
40
40
40
40
40
40
40
40
40
40
40
40
40
40
40
40
40
40
40
40
40
40
40
40
40
40
40
40
40
40
40
40
40
40
40
40
40
40
40
40
40
40
40
40
40
Re
taine
d ea
rning
s 16
0 16
0 16
0 0
0 0
00
00
00
-2,05
4-2
,054
-2,05
40
00
00
00
0-0
439
439
0 0
0 0
00
00
44
666
620
-7-7
-7-7
-7-7
-0-0
-0-0
Ge
nera
l and
spec
ial
rese
rves
6,11
2 6,
084
7,34
9 7,
571
8,71
5 8,
040
7,49
9 7,
709
7,29
5 7,
192
7,33
5 5,
163
9,27
7 8,
898
9,27
7 7,
007
6,85
6 5,
055
5,12
1 6,
796
7,17
2 5,
673
5,37
9 6,
408
6,14
1 5,
981
4,61
3 6,
587
6,72
4 7,
486
7,12
5 8,
087
7,64
4 7,
899
7,32
2 7,
778
7,23
0 7,
599
8,31
5 8,
221
8,53
9 8,
156
8,20
8 8,
846
8,79
8 8,
700
8,52
2 8,
141
Va
luatio
n ad
justm
ent
00
00
00
00
00
00
00
00
00
00
00
00
00
00
00
00
00
00
00
00
00
00
00
00
Cu
rrent
year
resu
lt 89
14
6 19
1 20
9 24
4 26
0 32
8 35
6 36
8 38
0 36
5 30
8 82
12
4 14
0 18
9 22
0 25
7 30
8 35
4 40
9 43
0 45
6 51
2 98
11
7 15
3 20
5 23
9 29
7 35
0 36
3 48
0 55
2 63
5 67
0 10
1 13
1 18
3 25
9 29
5 39
9 46
8 52
8 57
8 62
0 71
0 87
0
Oth
er it
ems (
net)
905
676
625
651
707
728
756
767
3,56
9 3,
642
927
950
943
984
699
701
718
734
731
742
785
825
830
814
775
519
455
520
593
678
705
751
1,07
4 79
5 83
5 87
3 93
5 55
3 33
0 69
1 77
3 71
5 76
9 83
5 86
2 86
8 89
4 97
1
Un
class
ified
Asse
ts 92
0 69
9 73
1 75
1 77
3 80
1 80
8 82
9 3,
643
3,67
1 91
1 92
6 94
0 98
7 71
4 74
1 77
5 80
0 83
0 86
4 89
0 91
9 94
4 96
0 98
3 72
3 69
2 72
2 75
4 78
3 81
3 83
8 88
3 88
6 94
2 98
2 1,
021
711
761
819
817
864
894
920
947
974
1,00
7 1,
033
Un
class
ified
Liabil
ities
15
23
106
100
66
72
53
62
74
29
-15
-24
-4 4
15
39
57
66
99
122
105
94
114
146
209
204
237
202
161
105
108
87
-191
91
108
108
87
158
431
128
44
149
125
85
85
106
113
63

Bank of Namibia Annual Report 2019 249
Part EStatistical Tables
Tabl
e II.
2(a)
Oth
er d
epos
itory
cor
pora
tions
sur
vey
(end
of p
erio
d in
N$
mill
ion)
Jan- 16
Feb- 16
Mar
-16
Apr-
16M
ay-
16Ju
n- 16Ju
l- 16Au
g- 16Se
p- 16Oc
t-16
Nov- 16
Dec- 16
Jan- 17
Feb- 17
Mar
-17
Apr-
17M
ay-
17Ju
n- 17Ju
l- 17Au
g- 17Se
p- 17Oc
t-17
Nov- 17
Dec- 17
Jan- 18
Feb- 18
Mar
-18
Apr-
18M
ay-
18Ju
n- 18Ju
l- 18Au
g- 18Se
p- 18Oc
t-18
Nov- 18
Dec- 18
Jan- 19
Feb- 19
Mar
-19
Apr-
19M
ay-
19Ju
n- 19Ju
l- 19Au
g- 19Se
p- 19Oc
t-19
Nov- 19
Dec- 19
Asse
ts
Net
fore
ign as
sets
3,94
65,
939
5,75
87,
526
7,15
85,
999
5,13
15,
768
3,91
05,
229
4,63
02,
173
2,86
72,
953
5,17
46,
649
8,22
95,
666
5,91
18,
894
8,34
810
,429
10,3
584,
942
8,59
46,
635
6,29
54,
235
5,12
46,
006
6,13
56,
887
7,62
29,
827
9,25
99,
861
10,7
5510
,895
9,31
413
,023
13,4
4311
,034
12,0
9814
,014
11,2
2414
,024
14,4
1811
,695
Cl
aims o
n no
nresid
ents
9,75
811
,345
10,7
5412
,371
12,5
9711
,344
10,8
0711
,212
9,43
810
,303
10,4
768,
453
8,93
69,
207
11,4
7612
,743
14,2
7612
,368
13,5
5814
,779
14,7
0216
,704
17,3
5911
,819
15,1
5413
,546
12,7
1510
,682
11,5
6412
,597
13,1
7913
,942
15,0
0517
,617
15,7
3516
,868
18,1
7717
,909
17,2
0519
,654
19,9
3517
,350
18,3
0220
,493
19,0
6319
,690
20,9
6918
,663
Forei
gn cu
rrenc
y22
520
722
415
117
716
817
515
112
116
214
912
411
210
910
815
414
610
010
113
911
612
611
192
117
123
108
137
115
134
132
176
175
151
108
141
128
129
167
142
115
122
115
170
182
219
115
119
De
posit
s5,
969
7,33
86,
362
8,40
78,
223
6,77
76,
479
6,45
94,
955
5,83
76,
262
4,67
34,
875
5,25
16,
868
8,19
29,
577
7,84
39,
025
9,98
58,
722
10,3
4510
,978
5,88
59,
096
7,71
07,
603
5,82
66,
778
7,81
68,
115
8,51
29,
085
10,2
647,
750
8,04
38,
279
8,50
47,
861
10,4
5210
,703
8,75
09,
720
10,8
719,
954
10,3
729,
594
7,79
2
Se
curiti
es ot
he
than s
hares
2,88
62,
936
3,10
43,
124
3,05
93,
285
3,28
23,
302
3,23
73,
243
3,32
43,
126
3,26
03,
169
3,78
93,
537
3,56
73,
548
3,58
63,
678
4,88
15,
241
5,42
34,
949
4,94
84,
756
3,37
62,
967
2,91
82,
865
3,17
23,
458
3,98
65,
716
6,36
16,
787
7,34
07,
215
7,24
57,
551
7,71
87,
075
7,08
78,
124
7,64
97,
841
9,77
89,
148
Lo
ans
436
446
462
464
700
642
660
742
585
586
601
403
412
403
435
430
549
436
405
517
496
531
509
516
522
542
1,26
21,
273
1,26
11,
250
1,22
91,
265
1,20
21,
194
1,17
21,
136
1,12
11,
129
1,14
91,
074
1,07
61,
017
1,01
81,
053
1,00
01,
000
961
965
Fin
ancia
l
deriv
ative
s72
5936
3683
3938
9774
8173
6244
3332
2116
1312
2424
147
3057
140
8425
2223
5137
5885
6597
400
958
579
377
401
286
346
326
243
243
215
267
379
Ot
her
170
359
566
189
355
433
174
461
467
393
6765
233
242
244
410
421
428
429
436
463
314
309
320
331
331
341
458
469
481
495
473
472
227
246
361
351
353
406
3636
3935
3134
4425
425
9
less:
Liabil
ities t
o
no
nres
ident
s5,
812
5,40
64,
996
4,84
55,
438
5,34
55,
676
5,44
45,
528
5,07
45,
846
6,28
06,
069
6,25
46,
302
6,09
46,
047
6,70
27,
647
5,88
56,
354
6,27
57,
002
6,87
86,
560
6,91
06,
420
6,44
76,
440
6,59
17,
043
7,05
57,
384
7,78
96,
476
7,00
87,
421
7,01
47,
891
6,63
16,
492
6,31
66,
204
6,48
07,
839
5,66
76,
551
6,96
8
De
posit
s3,
736
3,64
33,
110
2,99
82,
502
2,41
12,
701
2,21
32,
438
2,24
73,
057
2,90
62,
778
2,81
32,
930
2,63
42,
570
3,34
83,
878
2,09
72,
716
2,94
53,
583
3,81
73,
426
3,55
73,
288
3,22
43,
514
3,74
13,
657
3,57
03,
961
4,01
53,
344
3,93
64,
207
3,91
74,
484
4,05
04,
045
3,70
73,
888
3,87
95,
156
3,61
23,
812
4,36
3
Se
curiti
es ot
her
tha
n sha
res10
210
110
210
310
110
210
310
110
210
020
21,
057
1,06
31,
070
1,05
91,
063
1,06
81,
063
1,06
21,
071
1,05
91,
060
1,06
170
955
756
155
755
420
220
355
656
155
755
455
855
555
756
155
755
455
855
555
756
155
710
045
745
3
Lo
ans
1010
1010
850
767
724
758
688
1,05
194
569
563
472
769
859
858
555
995
898
584
765
062
556
977
299
781
878
278
482
01,
022
1,07
91,
052
1,36
976
056
147
246
585
952
446
583
060
673
575
352
477
448
2
Fin
ancia
l
deriv
ative
s45
535
929
224
522
324
717
716
715
816
313
313
512
112
611
511
811
611
612
611
512
514
210
812
812
611
994
8392
113
8613
299
106
4233
755
837
930
729
126
020
719
336
332
725
819
617
5
Ot
her
1,50
91,
293
1,48
31,
490
1,76
31,
819
1,97
12,
205
2,14
21,
513
1,50
91,
487
1,47
31,
518
1,49
91,
681
1,70
71,
615
1,62
21,
618
1,60
71,
478
1,62
51,
655
1,67
91,
676
1,66
21,
804
1,84
81,
713
1,72
11,
714
1,71
41,
746
1,77
21,
619
1,62
81,
692
1,68
31,
212
1,16
31,
018
960
942
1,04
61,
172
1,31
21,
494
Clai
ms o
n cen
tral
bank
4,64
94,
745
8,55
15,
726
6,72
76,
108
6,13
34,
997
5,94
45,
038
7,12
66,
905
5,17
94,
599
5,85
45,
036
6,33
46,
083
8,44
68,
104
9,21
47,
098
6,84
59,
715
5,93
65,
084
7,46
78,
048
7,11
26,
945
8,90
16,
998
8,24
97,
694
6,45
06,
973
6,42
46,
056
8,93
37,
300
7,99
27,
763
7,11
06,
491
5,54
54,
599
4,02
15,
617
Cu
rrenc
y1,
024
907
1,25
11,
054
1,16
11,
082
1,02
21,
244
1,05
51,
039
1,30
91,
510
1,17
81,
100
1,12
81,
113
1,22
11,
134
1,09
41,
155
1,05
21,
220
1,25
21,
562
1,27
31,
128
1,27
01,
180
1,20
696
91,
160
1,21
71,
059
1,16
41,
236
1,58
51,
320
1,22
41,
084
1,25
61,
218
1,01
91,
208
1,20
11,
211
1,50
01,
321
1,64
4
Re
serve
depo
sits
2,15
32,
335
5,78
22,
956
3,05
93,
507
3,57
72,
450
3,52
42,
637
4,54
64,
081
2,74
42,
305
3,47
42,
723
3,80
83,
637
4,99
63,
895
4,80
83,
192
3,58
96,
778
3,32
72,
603
4,14
04,
825
4,14
03,
799
4,96
12,
987
4,36
63,
500
2,80
43,
706
3,40
03,
120
6,13
63,
914
4,14
44,
290
3,98
02,
975
4,08
42,
899
2,70
03,
973
Ot
her c
laims
1,47
21,
503
1,51
81,
716
2,50
81,
519
1,53
51,
302
1,36
51,
363
1,27
11,
315
1,25
61,
194
1,25
21,
200
1,30
41,
311
2,35
73,
053
3,35
42,
686
2,00
41,
375
1,33
61,
353
2,05
72,
043
1,76
72,
176
2,78
02,
795
2,82
33,
030
2,41
01,
682
1,70
31,
712
1,71
32,
130
2,63
02,
454
1,92
22,
315
250
200
00
Ne
t clai
ms o
n
cent
ral g
over
nmen
t8,
169
8,25
28,
296
8,79
58,
992
9,44
59,
551
9,73
210
,099
9,67
48,
280
8,46
18,
667
9,81
210
,197
10,7
1411
,042
10,8
4111
,619
12,0
3212
,228
13,4
7513
,289
14,4
1414
,410
15,1
3915
,427
15,5
7616
,043
16,2
7217
,237
17,5
2717
,682
17,3
8517
,819
17,7
8016
,764
17,2
2017
,753
17,7
9518
,009
18,3
5218
,888
19,1
6720
,947
21,1
2021
,333
21,8
57
Cl
aims o
n
centr
al
gove
rnmen
t9,
965
10,1
0210
,192
10,8
9510
,768
11,0
4211
,068
11,3
6211
,786
11,3
6511
,549
11,6
4511
,798
12,0
7911
,960
12,0
7412
,343
12,2
4112
,880
13,3
3413
,627
14,9
6414
,797
15,6
0515
,555
16,3
2816
,753
16,9
1417
,448
17,7
0818
,465
18,7
3918
,903
18,5
9718
,928
18,9
2719
,262
19,2
5819
,585
20,1
0720
,234
20,4
8721
,075
21,1
5323
,139
23,3
4423
,432
23,8
58
Secu
rities
other
than
Share
s9,
965
10,1
0210
,192
10,8
9510
,768
11,0
4211
,068
11,3
6211
,786
11,3
6511
,549
11,6
4511
,798
12,0
7911
,960
12,0
7412
,343
12,2
4112
,880
13,3
3413
,627
14,9
6414
,797
15,6
0515
,555
16,3
2816
,753
16,9
1417
,448
17,7
0818
,465
18,7
3918
,903
18,5
9718
,928
18,9
2719
,262
19,2
5819
,585
20,1
0720
,234
20,4
8721
,075
21,1
5323
,139
23,3
4423
,432
23,8
58
les
s: Lia
bilitie
s
to ce
ntral
go
vernm
ent
1,79
61,
850
1,89
62,
100
1,77
71,
597
1,51
71,
630
1,68
61,
691
3,26
93,
183
3,13
22,
267
1,76
31,
360
1,30
11,
400
1,26
11,
302
1,39
81,
489
1,50
71,
191
1,14
51,
189
1,32
61,
338
1,40
51,
436
1,22
81,
212
1,22
01,
212
1,10
81,
147
2,49
92,
038
1,83
22,
312
2,22
42,
135
2,18
71,
986
2,19
22,
225
2,09
92,
001
Depo
sits
1,79
61,
850
1,89
62,
100
1,77
71,
597
1,51
71,
630
1,68
61,
691
3,26
93,
183
3,13
22,
267
1,76
31,
360
1,30
11,
400
1,26
11,
302
1,39
81,
489
1,50
71,
191
1,14
51,
189
1,32
61,
338
1,40
51,
436
1,22
81,
212
1,22
01,
212
1,10
81,
147
2,49
92,
038
1,83
22,
312
2,22
42,
135
2,18
71,
986
2,19
22,
225
2,09
92,
001
Clai
ms o
n oth
er se
ctor
s85
,390
85,8
1685
,863
86,3
0886
,417
86,8
8787
,493
88,5
0589
,630
89,7
8491
,006
91,9
3191
,698
92,6
9791
,807
92,0
8392
,990
93,5
6393
,612
94,1
0795
,029
95,3
3795
,937
96,4
9098
,349
99,3
4998
,412
99,3
0599
,117
99,3
1099
,811
101,2
8210
1,844
102,5
7610
2,704
103,5
1710
4,087
104,6
2010
4,422
105,5
0010
6,715
106,7
0510
7,106
107,1
7410
8,496
109,4
4210
9,550
110,1
91
Othe
r
fin
ancia
l
co
rpora
tions
3,37
73,
332
3,27
93,
306
3,22
53,
220
3,29
63,
302
3,32
53,
342
3,52
13,
579
3,62
03,
648
2,94
82,
784
2,94
53,
148
3,03
63,
466
3,63
83,
601
3,57
73,
628
4,37
34,
374
4,93
75,
265
5,15
24,
686
4,91
75,
041
5,09
75,
488
4,89
84,
999
5,52
75,
843
3,89
95,
581
5,41
75,
332
5,61
05,
272
5,81
96,
426
6,27
95,
563
State
and
local
gove
rnmen
t25
922
124
123
926
726
626
827
124
424
024
949
547
147
438
043
940
440
537
442
842
141
041
039
941
940
238
141
238
537
432
844
343
244
241
442
039
341
837
539
938
539
939
634
037
241
538
538
3
Pu
blic
no
nfina
ncial
co
rpora
tions
2,21
52,
308
2,08
02,
054
2,12
21,
974
1,91
11,
895
2,09
01,
934
2,08
12,
294
2,24
42,
249
2,19
22,
454
2,76
92,
819
2,58
62,
376
2,52
92,
707
2,82
22,
607
3,03
63,
069
1,63
81,
953
1,74
02,
005
2,04
91,
892
1,72
41,
628
1,66
91,
775
1,37
61,
002
2,83
61,
069
1,14
11,
401
1,43
11,
362
1,44
11,
289
1,19
61,
121
Ot
her
no
nfina
ncial
corp
oratio
ns33
,391
33,6
1533
,631
33,8
0833
,713
33,9
4034
,323
34,7
1635
,403
35,3
1835
,676
35,4
9035
,372
35,9
2035
,774
35,6
2335
,875
35,8
3735
,985
36,2
0336
,230
36,0
6236
,115
36,3
9636
,493
37,2
0137
,053
37,0
6736
,911
37,4
1237
,240
38,1
5438
,453
38,6
4938
,862
39,0
6841
,932
39,5
5039
,521
40,2
5741
,306
40,7
0640
,489
40,6
6241
,017
41,1
1041
,028
41,6
98
Ot
her
res
ident
se
ctors
46,1
4846
,340
46,6
3146
,901
47,0
9047
,487
47,6
9348
,322
48,5
6848
,951
49,4
7950
,073
49,9
9150
,406
50,5
1450
,783
50,9
9851
,356
51,6
3151
,635
52,2
1252
,557
53,0
1353
,460
54,0
2854
,304
54,4
0354
,608
54,9
2854
,833
55,2
7755
,752
56,1
3856
,370
56,8
6257
,255
54,8
5957
,808
57,7
9058
,194
58,4
6658
,866
59,1
7959
,538
59,8
4760
,201
60,6
6361
,426

Bank of Namibia Annual Report 2019250
Part EStatistical Tables
Tabl
e II
.2(b
) O
ther
dep
osito
ry c
orpo
ratio
ns s
urve
y (e
nd o
f per
iod
in N
$ m
illio
n)Ja
n- 16Fe
b- 16M
ar-
16Ap
r-16
May
-16
Jun- 16
Jul-
16Au
g- 16Se
p- 16Oc
t-16
Nov- 16
Dec- 16
Jan- 17
Feb- 17
Mar
-17
Apr-
17M
ay-
17Ju
n- 17Ju
l-17
Aug- 17
Sep- 17
Oct-
17No
v- 17De
c- 17Ja
n- 18Fe
b- 18M
ar-
18Ap
r-18
May
-18
Jun- 18
Jul-
18Au
g- 18Se
p- 18Oc
t-18
Nov- 18
Dec- 18
Jan- 19
Feb- 19
Mar
-19
Apr-
19M
ay-
19Ju
n- 19Ju
l-19
Aug- 19
Sep- 19
Oct-
19No
v- 19De
c- 19
Liabil
ities
Liab
ilities
to ce
ntra
l b
ank
170
5252
5253
724
207
5372
948
739
267
895
579
11,
285
757
208
712
200
202
5757
5777
992
376
829
820
359
236
304
446
207
494
442
1,90
02,
348
709
542
448
460
451
454
449
267
6262
937
Dep
osits
inclu
ded
in
bro
ad m
oney
77,7
9180
,080
83,6
8684
,951
84,9
0982
,269
83,4
2483
,929
82,0
9683
,377
83,2
7783
,065
81,5
6982
,818
84,9
0787
,045
89,6
8487
,831
91,1
8793
,165
93,6
5694
,844
94,9
4794
,981
93,5
0292
,479
94,9
9394
,425
96,1
0397
,666
99,1
3410
0,448
101,3
2710
4,275
102,3
4310
1,409
100,8
6910
0,796
101,6
9210
4,033
106,7
6410
5,024
105,9
1810
8,779
110,2
8711
1,744
113,5
5911
2,463
Trans
ferab
le
de
posit
s36
,486
38,0
1641
,127
40,6
1738
,739
36,7
6537
,702
37,8
7337
,041
37,2
3936
,538
36,7
6936
,045
36,9
5138
,037
39,9
1940
,433
37,5
7040
,002
41,4
7441
,310
42,0
1042
,056
41,4
3243
,888
42,7
2945
,362
42,7
4744
,390
45,1
0346
,222
47,7
2146
,555
49,8
9348
,406
48,4
7447
,748
48,9
2048
,771
49,1
7250
,879
49,2
3349
,508
50,3
1751
,535
53,1
1954
,676
54,0
93
Othe
r fina
ncial
corp
orati
ons
4,65
94,
766
5,19
85,
310
5,06
54,
408
4,47
24,
405
4,53
74,
918
4,48
94,
349
5,13
24,
935
4,26
24,
126
4,32
04,
505
4,51
44,
801
4,68
15,
106
4,98
96,
057
7,76
57,
130
6,73
26,
598
7,23
77,
168
8,04
27,
905
8,58
97,
941
7,71
58,
157
7,98
48,
144
8,02
66,
975
6,86
66,
604
6,71
66,
605
6,93
17,
424
7,40
77,
715
State
and
local
gove
rnme
nt1,
011
1,10
71,
392
1,04
81,
007
876
873
846
746
828
710
670
587
611
658
695
715
614
786
903
843
911
949
889
900
945
1,03
396
992
186
990
090
794
498
784
685
684
984
986
576
278
573
676
078
373
978
680
075
9
Publi
c
no
nfina
ncial
co
rpor
ation
s1,
972
2,72
12,
877
2,84
12,
447
2,05
52,
366
2,19
32,
248
2,52
42,
429
2,63
43,
078
3,18
63,
249
3,59
33,
965
2,85
24,
032
3,93
34,
173
2,72
22,
458
2,84
63,
917
3,18
13,
863
3,03
23,
257
2,83
73,
174
3,76
33,
548
4,23
03,
790
2,98
43,
877
4,43
44,
131
4,91
94,
721
4,02
84,
405
4,18
13,
941
4,11
44,
566
4,62
0
Othe
r
no
nfina
ncial
co
rpor
ation
s19
,885
20,4
1622
,397
22,3
8721
,388
20,4
3120
,921
21,6
3721
,010
20,1
6919
,911
20,5
4218
,872
19,8
4821
,365
22,7
8422
,825
20,8
2221
,658
22,4
4322
,191
23,3
5023
,426
21,6
4220
,558
20,5
1922
,754
21,0
8922
,062
23,0
2322
,655
23,7
0321
,716
24,8
5723
,702
24,3
9123
,191
23,2
7923
,660
24,7
5226
,441
25,5
2325
,387
26,3
4127
,491
28,1
8828
,944
28,0
75
Othe
r res
ident
secto
rs8,
958
9,00
59,
263
9,03
18,
833
8,99
69,
070
8,79
28,
501
8,80
08,
999
8,57
48,
376
8,37
18,
503
8,72
18,
607
8,77
89,
012
9,39
39,
422
9,92
110
,233
9,99
910
,747
10,9
5310
,981
11,0
6010
,912
11,2
0611
,451
11,4
4211
,758
11,8
7912
,352
12,0
8611
,847
12,2
1512
,089
11,7
6412
,066
12,3
4212
,241
12,4
0812
,434
12,6
0712
,959
12,9
24
Othe
r dep
osits
41,3
0542
,064
42,5
5944
,334
46,1
6945
,504
45,7
2246
,056
45,0
5546
,138
46,7
3946
,297
45,5
2445
,868
46,8
7047
,126
49,2
5150
,261
51,1
8451
,691
52,3
4652
,834
52,8
9253
,549
49,6
1449
,750
49,6
3151
,678
51,7
1352
,563
52,9
1152
,727
54,7
7254
,382
53,9
3852
,935
53,1
2151
,876
52,9
2254
,861
55,8
8555
,790
56,4
1058
,462
58,7
5258
,625
58,8
8358
,370
Othe
r fina
ncial
corp
orati
ons
3,96
44,
155
4,01
04,
232
2,54
94,
865
4,12
74,
076
4,02
14,
099
3,87
13,
930
3,91
33,
751
3,70
23,
656
3,87
03,
769
3,56
73,
683
3,69
33,
425
3,46
53,
641
3,60
23,
860
3,73
14,
058
3,73
53,
997
3,99
73,
693
3,50
63,
387
3,46
23,
306
3,35
83,
562
3,54
43,
889
3,96
14,
495
4,88
65,
165
5,60
05,
518
5,70
15,
300
State
and
local
gove
rnme
nt54
946
948
360
52,
379
550
542
533
509
450
441
362
350
336
275
245
291
189
209
203
216
216
220
226
231
213
230
242
241
280
246
256
309
316
313
320
353
361
354
435
455
475
479
478
514
516
523
545
Publi
c
no
nfina
ncial
co
rpor
ation
s1,
376
1,77
51,
920
2,14
52,
281
1,62
72,
097
2,30
92,
409
2,38
52,
444
2,65
12,
712
2,76
42,
919
2,85
62,
746
2,92
82,
982
3,55
73,
411
3,35
73,
306
3,14
63,
643
3,12
63,
426
3,28
33,
528
3,63
23,
554
3,46
43,
525
3,69
53,
394
3,37
83,
328
3,63
73,
288
3,66
63,
822
3,07
83,
214
3,71
64,
009
4,26
34,
075
4,19
7
Othe
r
no
nfina
ncial
co
rpor
ation
s11
,095
11,2
2611
,295
11,7
9713
,131
12,5
4112
,695
12,6
8111
,102
12,3
8112
,869
11,9
9311
,232
11,2
9311
,727
12,1
4312
,991
13,4
1114
,617
14,6
4015
,135
15,8
6916
,328
16,2
1416
,502
16,8
5016
,509
17,7
0515
,974
16,3
3116
,562
16,8
7418
,793
18,1
8117
,145
16,3
0216
,685
16,7
4017
,834
18,6
5818
,735
18,6
9518
,790
19,3
3419
,508
19,1
4919
,129
19,4
00
Othe
r res
ident
secto
rs24
,322
24,4
3924
,851
25,5
5525
,829
25,9
2126
,260
26,4
5827
,014
26,8
2327
,113
27,3
6127
,316
27,7
2428
,248
28,2
2629
,352
29,9
6529
,809
29,6
0929
,890
29,9
6729
,573
30,3
2225
,636
25,7
0025
,734
26,3
9128
,235
28,3
2328
,552
28,4
3928
,639
28,8
0229
,624
29,6
2829
,397
27,5
7627
,902
28,2
1328
,911
29,0
4729
,040
29,7
7029
,121
29,1
7929
,455
28,9
29
Sec
uriti
es o
ther
than
sh
ares
, inclu
ded
in b
road
mon
ey0
00
00
00
00
00
00
00
00
00
00
00
00
00
00
00
00
00
00
00
00
00
00
00
0
Dep
osits
exclu
ded
fr
om b
road
mon
ey
2,13
32,
234
1,47
61,
313
1,40
02,
709
1,95
51,
779
2,00
11,
865
2,32
11,
777
1,65
21,
915
2,05
62,
118
2,30
02,
168
2,02
32,
186
3,00
92,
213
2,59
42,
837
2,88
02,
795
2,40
92,
106
2,23
72,
363
2,25
92,
236
3,18
43,
258
3,53
73,
390
2,95
02,
929
3,56
83,
318
3,17
43,
112
3,14
33,
482
3,35
92,
947
2,74
02,
831
Sec
uriti
es o
ther
than
sh
ares
, exc
luded
from
b
road
mon
ey21
,488
22,1
3222
,416
22,6
7422
,803
23,2
8723
,117
22,9
2023
,031
22,4
0022
,428
22,0
6921
,700
22,1
4022
,620
22,7
1623
,240
24,7
5425
,095
25,5
0225
,399
25,6
1025
,565
25,4
3925
,665
26,0
8326
,402
26,2
8425
,998
26,2
1727
,501
28,1
0828
,138
26,9
2827
,264
27,7
6127
,087
28,1
1730
,154
30,3
2131
,632
31,5
6231
,399
30,6
9830
,026
30,8
5128
,522
27,6
73
Of w
hich:
Othe
r fin
ancia
l cor
porat
ions
19,7
3020
,374
20,5
6320
,931
20,4
7620
,948
20,5
7620
,426
20,7
3920
,084
19,8
7619
,544
18,8
6119
,301
18,8
7318
,760
19,2
8421
,485
21,4
6422
,214
21,5
1221
,680
21,8
3721
,382
22,0
7722
,238
22,6
5722
,608
22,3
8222
,672
23,3
5024
,006
24,0
8622
,971
23,2
1623
,783
23,1
1224
,139
26,1
2526
,361
27,8
9327
,816
27,6
5927
,052
26,1
8227
,001
25,0
5724
,209
Loa
ns17
1717
1718
1818
1825
18
88
66
66
66
63
33
33
11
11
11
11
11
11
11
183
8383
9132
328
88
Fina
ncial
der
ivativ
es62
4724
2775
3539
109
7377
7478
5461
3126
1711
1328
2414
726
4813
189
2217
2846
3271
8164
132
392
949
562
356
389
257
316
317
182
175
163
213
336
Sha
res a
nd o
ther
eq
uity
14,0
0814
,085
14,4
3214
,245
14,5
5914
,583
14,9
3515
,127
15,0
3515
,358
15,5
4215
,804
15,4
7715
,737
15,8
2915
,821
15,9
9016
,295
16,6
0916
,932
16,6
9816
,812
16,8
8717
,313
18,0
9018
,209
18,3
6418
,474
19,2
7718
,976
18,9
2419
,260
19,4
3819
,995
19,6
9119
,695
19,8
8819
,414
19,5
3319
,888
20,1
8320
,376
21,2
6720
,625
20,6
0320
,871
20,8
7421
,411
Fund
s con
tribute
d by
owne
rs4,
076
4,15
64,
227
4,22
74,
227
4,22
74,
227
4,30
54,
305
4,30
54,
455
4,47
43,
968
3,96
83,
988
3,98
83,
988
3,98
83,
977
3,90
03,
900
3,90
03,
900
3,90
04,
175
4,16
84,
168
4,16
85,
116
4,23
04,
290
4,43
24,
461
4,75
64,
756
4,75
64,
655
4,28
94,
605
4,61
84,
628
4,62
84,
691
4,69
14,
721
4,72
14,
721
5,07
3
Retai
ned
earn
ings
6,01
85,
992
6,00
05,
749
5,74
75,
810
6,44
86,
385
6,44
06,
609
6,49
36,
890
7,41
27,
455
7,44
17,
381
7,42
17,
385
7,90
37,
722
7,73
07,
911
7,90
97,
954
8,79
68,
735
8,74
78,
637
8,36
08,
675
8,93
69,
123
9,17
49,
127
9,42
49,
251
9,92
19,
530
9,46
29,
429
9,66
89,
550
10,9
3410
,946
10,9
4010
,818
11,0
6811
,210
Gene
ral an
dsp
ecial
rese
rves
3,24
23,
239
3,24
53,
246
3,25
13,
254
3,77
03,
774
3,79
23,
787
3,78
73,
799
3,79
23,
793
3,80
73,
812
3,82
13,
805
4,28
44,
665
4,67
94,
711
4,70
04,
652
4,61
64,
711
4,70
94,
732
4,75
44,
777
5,36
75,
386
5,21
75,
216
5,26
25,
196
5,08
75,
019
5,09
25,
122
4,97
45,
142
5,17
55,
213
5,19
65,
206
5,19
75,
184
Valua
tion
adjus
tmen
t14
1830
3434
4955
4945
3533
35-2
1-1
4-9
-11
-6-3
36
81
-13
814
1923
135
-13
1212
1212
1213
1313
1313
146
66
66
66
Curre
nt Ye
ar Re
sult
658
680
930
990
1,30
11,
242
435
614
452
623
774
606
327
535
602
651
767
1,12
144
163
938
229
039
179
848
857
671
892
31,
042
1,30
831
930
957
488
323
647
921
156
236
170
590
01,
051
462
-230
-261
119
-118
-62
Othe
r ite
ms (
net)
-13,
517
-13,
895
-13,
636
-14,
924
-14,
523
-15,
186
-15,
385
-14,
934
-13,
632
-13,
846
-12,
999
-14,
009
-13,
003
-13,
407
-13,
702
-14,
007
-12,
850
-15,
623
-15,
545
-14,
881
-14,
026
-13,
347
-13,
651
-15,
840
-13,
905
-14,
215
-14,
888
-14,
346
-16,
306
-16,
972
-16,
070
-17,
877
-16,
979
-17,
534
-17,
178
-16,
417
-16,
062
-13,
738
-15,
424
-14,
862
-16,
394
-17,
069
-17,
388
-17,
402
-18,
537
-17,
462
-16,
657
-16,
300
Cons
olida
tion a
djustm
ent
15,0
0715
,252
15,3
7915
,677
15,8
5416
,241
15,8
7315
,961
14,8
4714
,991
14,6
7515
,039
14,4
8014
,651
13,9
8714
,043
14,2
8915
,511
15,6
7916
,418
15,1
6514
,511
14,5
9615
,682
14,3
8914
,820
15,6
1716
,053
17,8
7417
,914
18,1
2919
,396
19,4
5218
,322
18,7
1418
,448
17,2
1316
,033
17,4
3116
,729
18,0
8218
,966
18,6
4919
,444
19,2
0619
,065
18,3
3517
,525
Uncla
ssifie
d As
sets
-3
,292
-3,7
09-3
,896
-3,4
12-3
,528
-3,6
18-3
,919
-3,7
80-3
,828
-3,9
88-3
,945
-4,4
62-3
,828
-4,1
30-4
,472
-4,6
35-2
,871
-5,8
55-5
,574
-5,0
03-4
,806
-5,3
17-5
,818
-5,9
89-5
,830
-5,7
62-5
,459
-4,8
66-5
,492
-5,4
18-4
,913
-5,8
26-4
,809
-6,1
56-5
,922
-5,1
44-6
,223
-6,0
53-5
,783
-6,6
52-6
,087
-5,5
71-5
,763
-5,5
79-7
,383
-5,6
98-5
,736
-6,0
69
Uncla
ssifie
d
lia
bilitie
s 4,
783
5,06
55,
640
4,16
44,
859
4,67
34,
406
4,80
75,
043
5,13
35,
621
5,49
25,
305
5,37
44,
757
4,67
14,
310
5,74
45,
708
6,54
05,
945
6,48
26,
762
5,83
16,
314
6,36
76,
188
6,57
37,
060
6,36
06,
972
7,34
57,
282
6,94
47,
458
7,17
47,
374
8,34
87,
790
8,51
97,
776
7,46
87,
024
7,62
18,
053
7,30
07,
413
7,29
4

Bank of Namibia Annual Report 2019 251
Part EStatistical Tables
Tabl
e II.
3 D
epos
itory
cor
pora
tions
sur
vey
(end
of p
erio
d in
N$
mill
ion)
Desc
riptio
nJa
n- 16Fe
b- 16M
ar-
16Ap
r- 16M
ay-
16Ju
n- 16Ju
l- 16Au
g- 16Se
p- 16Oc
t-16
Nov- 16
Dec- 16
Jan- 17
Feb- 17
Mar
-17
Apr- 17
May
-17
Jun- 17
Jul- 17
Aug- 17
Sep- 17
Oct-
17No
v- 17De
c- 17Ja
n- 18Fe
b- 18M
ar-
18Ap
r- 18M
ay-
18Ju
n- 18Ju
l- 18Au
g- 18Se
p- 18Oc
t-18
Nov- 18
Dec- 18
Jan- 19
Feb- 19
Mar
-19
Apr- 19
May
-19
Jun- 19
Jul- 19
Aug- 19
Sep- 19
Oct-
19No
v- 19De
c- 19
Net f
oreig
n as
sets
29
,478
31,37
932
,813
34,97
834
,889
29,63
929
,795
28,79
324
,157
29,62
331
,812
26,20
128
,653
27,11
728
,074
32,90
133
,377
31,65
237
,027
38,71
038
,087
38,81
236
,060
31,06
335
,871
32,40
228
,463
34,09
632
,488
34,19
836
,063
36,17
036
,593
38,74
335
,076
37,97
538
,887
39,86
038
,645
44,39
544
,612
40,20
444
,517
44,47
539
,456
43,58
041
,139
36,44
0
Cl
aims o
n non
reside
nts
38,49
739
,999
40,78
742
,653
43,47
537
,953
38,29
337
,120
32,45
337
,435
40,43
035
,195
37,41
435
,961
37,07
141
,648
42,03
540
,952
47,30
247
,190
47,14
247
,886
45,78
540
,410
44,81
441
,650
37,22
542
,995
41,42
143
,522
45,72
746
,156
47,10
749
,451
44,27
647
,853
48,96
949
,652
49,44
353
,885
54,05
149
,343
53,54
854
,008
50,31
652
,232
50,62
646
,223
les
s: Lia
bilitie
s to
no
nresid
ents
9,020
8,620
7,975
7,676
8,587
8,314
8,499
8,328
8,296
7,812
8,618
8,995
8,762
8,844
8,997
8,747
8,658
9,300
10,27
68,4
809,0
559,0
749,7
259,3
478,9
429,2
478,7
628,8
998,9
339,3
249,6
659,9
8610
,514
10,70
89,2
009,8
7810
,081
9,792
10,79
99,4
909,4
409,1
409,0
319,5
3210
,860
8,651
9,487
9,782
Dom
estic
claim
s82
,239
84,91
188
,191
86,57
588
,291
89,64
090
,378
93,11
094
,152
94,23
595
,856
95,87
994
,083
96,66
998
,880
96,02
699
,681
99,30
697
,681
99,65
410
1,755
102,2
7210
4,219
106,2
0110
5,180
107,6
6211
0,862
108,5
6711
0,480
109,8
2911
0,137
112,8
2611
4,720
114,9
4011
6,835
114,1
3411
2,070
114,5
3911
7,771
115,3
6511
8,528
118,4
5211
7,261
119,3
4612
4,136
124,0
9312
6,348
127,6
22
Ne
t clai
ms o
n ce
ntra
l
gove
rnm
ent
-3,19
4-9
452,2
8822
61,8
342,7
142,8
454,5
644,4
804,4
094,8
073,9
052,3
423,9
297,0
293,8
976,6
455,6
984,0
235,5
026,6
806,8
888,2
379,6
656,7
848,2
6412
,401
9,213
11,31
310
,465
10,27
111
,489
12,82
112
,306
14,07
210
,555
7,920
9,853
13,28
49,7
9911
,744
11,67
610
,081
12,09
215
,560
14,56
916
,715
17,34
4
Claim
s on c
entra
l
go
vern
ment
9,965
10,18
512
,089
10,89
510
,768
11,04
211
,068
11,61
911
,786
11,59
512
,879
11,81
411
,798
12,07
913
,755
12,07
413
,199
12,24
112
,880
13,33
413
,721
14,96
414
,860
15,61
115
,555
16,32
817
,912
16,91
417
,525
17,70
818
,465
18,73
919
,138
19,18
019
,562
19,33
819
,262
19,25
820
,512
20,10
720
,234
20,48
721
,075
21,15
324
,675
24,00
724
,907
25,22
3
less:
Liabil
ities t
o
ce
ntral
gove
rnme
nt 13
,159
11,13
09,8
0110
,670
8,935
8,328
8,223
7,055
7,305
7,186
8,072
7,909
9,456
8,150
6,727
8,177
6,554
6,544
8,857
7,832
7,041
8,075
6,623
5,947
8,771
8,064
5,511
7,701
6,211
7,243
8,194
7,250
6,317
6,874
5,489
8,783
11,34
29,4
057,2
2810
,308
8,490
8,811
10,99
59,0
619,1
159,4
378,1
927,8
79
Clai
ms o
n ot
her s
ecto
rs85
,433
85,85
785
,903
86,35
086
,457
86,92
787
,533
88,54
689
,672
89,82
691
,049
91,97
491
,741
92,74
191
,852
92,12
993
,036
93,60
993
,657
94,15
395
,075
95,38
495
,982
96,53
798
,396
99,39
798
,461
99,35
499
,167
99,36
499
,866
101,3
3710
1,899
102,6
3410
2,762
103,5
8010
4,150
104,6
8610
4,487
105,5
6510
6,785
106,7
7510
7,181
107,2
5510
8,576
109,5
2310
9,633
110,2
78
Ot
her fi
nanc
ial
co
rpor
ation
s3,3
793,3
323,2
793,3
063,2
253,2
203,2
963,3
023,3
253,3
423,5
213,5
793,6
203,6
482,9
482,7
842,9
453,1
483,0
363,4
663,6
383,6
013,5
773,6
284,3
734,3
744,9
375,2
655,1
524,6
864,9
175,0
415,0
975,4
884,8
984,9
995,5
275,8
433,8
995,5
815,4
175,3
325,6
105,2
725,8
196,4
266,2
795,5
63
St
ate an
d loc
al
gove
rnme
nt25
922
124
123
926
726
626
827
124
424
024
949
547
147
438
043
940
440
537
442
842
141
041
039
941
940
238
141
238
537
432
844
343
244
241
442
039
341
837
539
938
539
939
634
037
241
538
538
3
Pu
blic
no
nfina
ncial
corp
orati
ons
2,215
2,308
2,080
2,054
2,122
1,974
1,911
1,895
2,090
1,934
2,081
2,294
2,244
2,249
2,192
2,454
2,769
2,819
2,586
2,376
2,529
2,707
2,822
2,607
3,036
3,069
1,638
1,953
1,740
2,005
2,049
1,892
1,724
1,628
1,669
1,775
1,376
1,002
2,836
1,069
1,141
1,401
1,431
1,362
1,441
1,289
1,196
1,121
Ot
her
no
nfina
ncial
co
rpor
ation
s33
,391
33,61
533
,631
33,80
833
,713
33,94
034
,323
34,71
635
,403
35,31
835
,676
35,49
035
,372
35,92
035
,774
35,62
335
,875
35,83
735
,985
36,20
336
,230
36,06
236
,115
36,39
636
,493
37,20
137
,053
37,06
736
,911
37,41
237
,240
38,15
438
,453
38,64
938
,862
39,06
841
,932
39,55
039
,521
40,25
741
,306
40,70
640
,489
40,66
241
,017
41,11
041
,028
41,69
8
Ot
her r
eside
nt
secto
rs46
,190
46,38
246
,672
46,94
247
,130
47,52
747
,733
48,36
348
,609
48,99
249
,522
50,11
650
,034
50,45
050
,558
50,82
951
,043
51,40
151
,676
51,68
052
,257
52,60
353
,058
53,50
654
,075
54,35
254
,452
54,65
854
,978
54,88
755
,332
55,80
756
,193
56,42
756
,920
57,31
854
,922
57,87
457
,856
58,26
058
,536
58,93
659
,254
59,61
859
,927
60,28
360
,745
61,51
3
Bro
ad m
oney
liabi
lities
80
,799
82,97
086
,450
87,87
287
,748
85,10
986
,377
86,80
885
,001
86,34
186
,286
85,94
984
,368
85,64
887
,783
90,02
592
,554
90,75
394
,141
96,19
696
,777
97,85
398
,135
98,07
896
,324
95,28
497
,849
97,24
398
,852
100,6
4310
2,020
103,4
7510
4,464
107,2
3110
5,468
104,3
4510
3,643
103,5
2510
4,588
106,8
5810
9,678
108,0
1910
8,758
111,7
9211
3,124
114,3
9311
6,651
115,3
36
Cu
rrenc
y outs
ide
de
posit
ory c
orpo
ration
s3,0
082,8
902,7
652,9
212,8
392,8
402,9
532,8
792,9
052,9
643,0
092,8
842,7
992,8
292,8
762,9
802,8
702,9
222,9
543,0
313,1
203,0
093,1
883,0
962,8
232,8
052,8
562,8
182,7
492,9
762,8
873,0
273,1
372,9
553,1
252,9
362,7
742,7
292,8
962,8
252,9
142,9
952,8
403,0
132,8
362,6
493,0
922,8
73
Tra
nsfer
able
depo
sits
36,48
638
,016
41,12
740
,617
38,73
936
,765
37,70
237
,873
37,04
137
,239
36,53
836
,769
36,04
536
,951
38,03
739
,919
40,43
337
,570
40,00
241
,474
41,31
042
,010
42,05
641
,432
43,88
842
,729
45,36
242
,747
44,39
045
,103
46,22
247
,721
46,55
549
,893
48,40
648
,474
47,74
848
,920
48,77
149
,172
50,87
949
,233
49,50
850
,317
51,53
553
,119
54,67
654
,093
Ot
her fi
nanc
ial
co
rpor
ation
s4,6
594,7
665,1
985,3
105,0
654,4
084,4
724,4
054,5
374,9
184,4
894,3
495,1
324,9
354,2
624,1
264,3
204,5
054,5
144,8
014,6
815,1
064,9
896,0
577,7
657,1
306,7
326,5
987,2
377,1
688,0
427,9
058,5
897,9
417,7
158,1
577,9
848,1
448,0
266,9
756,8
666,6
046,7
166,6
056,9
317,4
247,4
077,7
15
St
ate an
d loc
al
gove
rnme
nt1,0
111,1
071,3
921,0
481,0
0787
687
384
674
682
871
067
058
761
165
869
571
561
478
690
384
391
194
988
990
094
51,0
3396
992
186
990
090
794
498
784
685
684
984
986
576
278
573
676
078
373
978
680
075
9
Pu
blic
no
nfina
ncial
co
rpor
ation
s1,9
722,7
212,8
772,8
412,4
472,0
552,3
662,1
932,2
482,5
242,4
292,6
343,0
783,1
863,2
493,5
933,9
652,8
524,0
323,9
334,1
732,7
222,4
582,8
463,9
173,1
813,8
633,0
323,2
572,8
373,1
743,7
633,5
484,2
303,7
902,9
843,8
774,4
344,1
314,9
194,7
214,0
284,4
054,1
813,9
414,1
144,5
664,6
20
Ot
her
no
nfina
ncial
corp
orati
ons
19,88
520
,416
22,39
722
,387
21,38
820
,431
20,92
121
,637
21,01
020
,169
19,91
120
,542
18,87
219
,848
21,36
522
,784
22,82
520
,822
21,65
822
,443
22,19
123
,350
23,42
621
,642
20,55
820
,519
22,75
421
,089
22,06
223
,023
22,65
523
,703
21,71
624
,857
23,70
224
,391
23,19
123
,279
23,66
024
,752
26,44
125
,523
25,38
726
,341
27,49
128
,188
28,94
428
,075
Ot
her r
eside
nt
secto
rs8,9
589,0
059,2
639,0
318,8
338,9
969,0
708,7
928,5
018,8
008,9
998,5
748,3
768,3
718,5
038,7
218,6
078,7
789,0
129,3
939,4
229,9
2110
,233
9,999
10,74
710
,953
10,98
111
,060
10,91
211
,206
11,45
111
,442
11,75
811
,879
12,35
212
,086
11,84
712
,215
12,08
911
,764
12,06
612
,342
12,24
112
,408
12,43
412
,607
12,95
912
,924
Le
ss: C
entra
l
bank
float
00
00
00
00
00
00
00
00
00
00
00
00
00
00
00
00
00
00
00
00
00
00
00
00
Ot
her d
epos
its41
,305
42,06
442
,559
44,33
446
,169
45,50
445
,722
46,05
645
,055
46,13
846
,739
46,29
745
,524
45,86
846
,870
47,12
649
,251
50,26
151
,184
51,69
152
,346
52,83
452
,892
53,54
949
,614
49,75
049
,631
51,67
851
,713
52,56
352
,911
52,72
754
,772
54,38
253
,938
52,93
553
,121
51,87
652
,922
54,86
155
,885
55,79
056
,410
58,46
258
,752
58,62
558
,883
58,37
0
Ot
her fi
nanc
ial
co
rpor
ation
s3,9
644,1
554,0
104,2
322,5
494,8
654,1
274,0
764,0
214,0
993,8
713,9
303,9
133,7
513,7
023,6
563,8
703,7
693,5
673,6
833,6
933,4
253,4
653,6
413,6
023,8
603,7
314,0
583,7
353,9
973,9
973,6
933,5
063,3
873,4
623,3
063,3
583,5
623,5
443,8
893,9
614,4
954,8
865,1
655,6
005,5
185,7
015,3
00
St
ate an
d loc
al
gove
rnme
nt54
946
948
360
52,3
7955
054
253
350
945
044
136
235
033
627
524
529
118
920
920
321
621
622
022
623
121
323
024
224
128
024
625
630
931
631
332
035
336
135
443
545
547
547
947
851
451
652
354
5
Pu
blic
no
nfina
ncial
corp
orati
ons
1,376
1,775
1,920
2,145
2,281
1,627
2,097
2,309
2,409
2,385
2,444
2,651
2,712
2,764
2,919
2,856
2,746
2,928
2,982
3,557
3,411
3,357
3,306
3,146
3,643
3,126
3,426
3,283
3,528
3,632
3,554
3,464
3,525
3,695
3,394
3,378
3,328
3,637
3,288
3,666
3,822
3,078
3,214
3,716
4,009
4,263
4,075
4,197
Ot
her
no
nfina
ncial
corp
orati
ons
11,09
511
,226
11,29
511
,797
13,13
112
,541
12,69
512
,681
11,10
212
,381
12,86
911
,993
11,23
211
,293
11,72
712
,143
12,99
113
,411
14,61
714
,640
15,13
515
,869
16,32
816
,214
16,50
216
,850
16,50
917
,705
15,97
416
,331
16,56
216
,874
18,79
318
,181
17,14
516
,302
16,68
516
,740
17,83
418
,658
18,73
518
,695
18,79
019
,334
19,50
819
,149
19,12
919
,400
Ot
her r
eside
nt
secto
rs24
,322
24,43
924
,851
25,55
525
,829
25,92
126
,260
26,45
827
,014
26,82
327
,113
27,36
127
,316
27,72
428
,248
28,22
629
,352
29,96
529
,809
29,60
929
,890
29,96
729
,573
30,32
225
,636
25,70
025
,734
26,39
128
,235
28,32
328
,552
28,43
928
,639
28,80
229
,624
29,62
829
,397
27,57
627
,902
28,21
328
,911
29,04
729
,040
29,77
029
,121
29,17
929
,455
28,92
9
Secu
rities
othe
r tha
n sha
res,
includ
ed in
bro
ad m
oney
00
00
00
00
00
00
00
00
00
00
00
00
00
00
00
00
00
00
00
00
00
00
00
00
Depo
sits e
xclud
ed fro
m br
oad
mone
y 2,1
332,2
341,4
761,3
131,4
002,7
091,9
551,7
792,0
011,8
652,3
211,7
771,6
521,9
152,0
562,1
182,3
002,1
682,0
232,1
863,0
092,2
132,5
942,8
372,8
802,7
952,4
092,1
062,2
372,3
632,2
592,2
363,1
843,2
583,5
373,3
902,9
502,9
293,5
683,3
183,1
743,1
123,1
433,4
823,3
592,9
472,7
402,8
32
Secu
rities
othe
r tha
n sha
res,
exclu
ded
from
broa
d mo
ney
24,39
925
,042
25,32
725
,584
25,86
426
,451
27,03
426
,817
26,95
331
,264
31,22
429
,842
29,29
329
,027
29,21
229
,288
29,84
634
,476
33,45
132
,244
32,12
332
,457
32,44
232
,475
32,70
132
,964
33,36
833
,367
33,11
033
,276
34,42
135
,094
35,09
633
,915
34,27
034
,678
34,07
735
,242
37,26
837
,381
38,93
638
,763
38,62
937
,901
37,23
738
,062
35,45
234
,605
Loan
s17
1717
1718
1818
1825
18
88
66
66
66
63
33
33
11
11
11
11
11
11
11
183
8383
9132
328
88
Finan
cial d
eriva
tives
6247
2427
7535
3910
973
7774
7854
6131
2617
1113
2824
147
2648
131
8922
1728
4632
7181
6413
239
294
956
235
638
925
731
631
718
217
516
321
333
6
Share
s and
othe
r equ
ity20
,410
20,51
522
,172
22,06
423
,558
22,92
222
,802
23,23
322
,738
22,96
923
,283
21,31
522
,823
22,74
623
,232
23,05
823
,106
21,64
822
,077
24,12
224
,318
22,95
522
,762
24,27
324
,808
24,78
623
,171
25,30
626
,280
26,79
926
,438
27,75
027
,602
28,48
627
,692
28,18
727
,925
27,80
528
,064
28,40
029
,050
28,96
429
,976
30,03
230
,019
30,23
230
,147
30,46
1
Othe
r item
s (ne
t)-1
6,104
-14,5
37-1
4,463
-15,3
25-1
5,483
-17,9
65-1
8,052
-16,8
60-1
8,708
-18,6
65-1
5,529
-16,8
89-1
5,460
-15,6
16-1
5,366
-15,5
94-1
4,771
-18,1
01-1
7,004
-16,4
14-1
6,412
-14,5
44-1
5,684
-20,4
50-1
5,794
-15,8
54-1
7,496
-15,3
77-1
7,541
-19,1
01-1
8,972
-19,6
31-1
9,115
-19,2
73-1
9,189
-18,8
84-1
8,586
-15,6
65-1
7,428
-16,6
70-1
8,037
-20,6
01-1
9,137
-19,6
00-2
0,353
-18,1
31-1
7,724
-19,5
17
Co
nsoli
datio
n adju
stmen
t -1
,693
26-2
1024
3-2
63-2
,060
-1,92
0-1
,168
-1,51
4-1
,185
-1,60
8-1
,939
-1,60
8-1
,320
-1,05
7-9
78-1
,292
-1,83
3-8
16-8
82-1
,690
-463
-1,29
3-3
,818
-1,13
8-1
,143
-2,17
1-5
28-6
60-1
,468
-2,21
6-1
,021
-1,08
0-9
63-1
,193
-1,60
1-1
,601
-1,38
5-1
,685
-1,12
5-8
81-2
,825
-988
-1,37
1-9
6419
2-1
78-2
,283
OI
N -8
95-6
68-6
17-6
43-6
98-7
19-7
47-7
58-3
,561
-3,63
4-9
21-9
41-8
49-8
89-6
07-6
09-6
29-6
45-6
42-6
51-6
96-7
34-7
40-7
91-7
52-4
95-4
37-5
02-5
75-6
60-6
87-7
33-1
,056
-777
-817
-866
-923
-543
-320
-683
-762
-707
-761
-827
-852
-861
-889
-934
OI
N -1
3,517
-13,8
95-1
3,636
-14,9
24-1
4,523
-15,1
86-1
5,385
-14,9
34-1
3,632
-13,8
46-1
2,999
-14,0
09-1
3,003
-13,4
07-1
3,702
-14,0
07-1
2,850
-15,6
23-1
5,545
-14,8
81-1
4,026
-13,3
47-1
3,651
-15,8
40-1
3,905
-14,2
15-1
4,888
-14,3
46-1
6,306
-16,9
72-1
6,070
-17,8
77-1
6,979
-17,5
34-1
7,178
-16,4
17-1
6,062
-13,7
38-1
5,424
-14,8
62-1
6,394
-17,0
69-1
7,388
-17,4
02-1
8,537
-17,4
62-1
6,657
-16,3
00
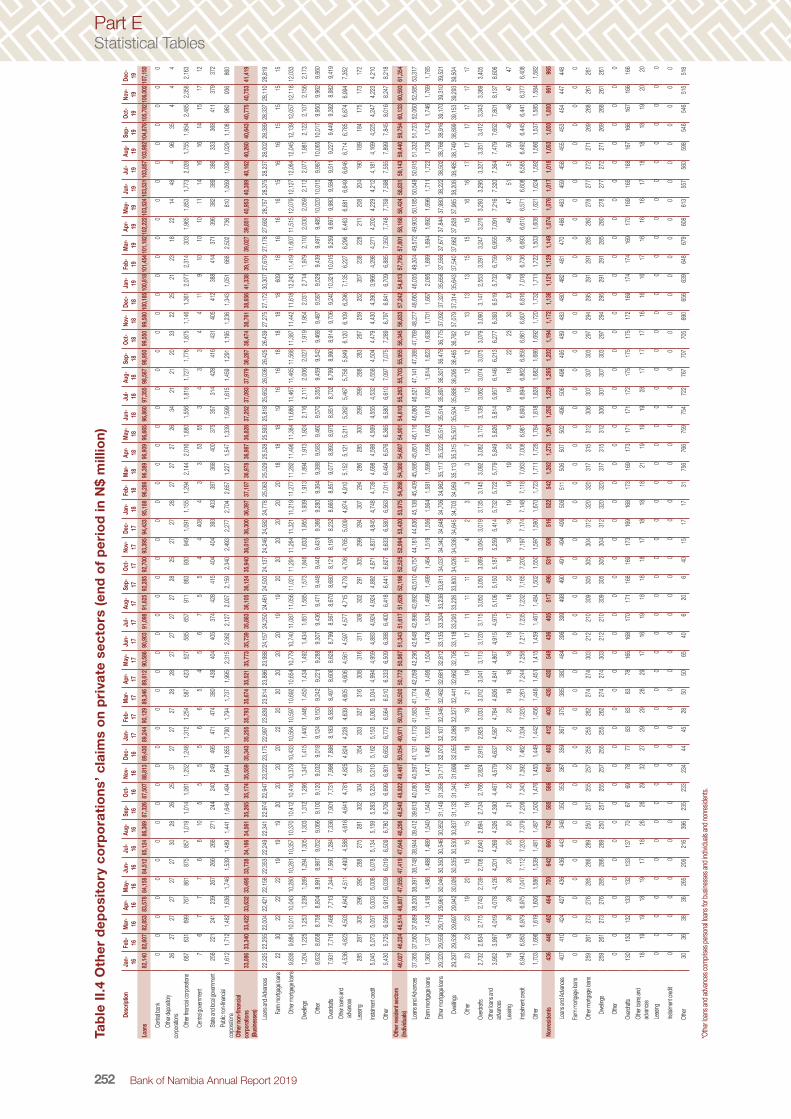
Bank of Namibia Annual Report 2019252
Part EStatistical Tables
Tabl
e II.
4 O
ther
dep
osito
ry c
orpo
ratio
ns’ c
laim
s on
pri
vate
sec
tors
(end
of p
erio
d in
N$
mill
ion)
Desc
riptio
nJa
n- 16Fe
b- 16M
ar-
16Ap
r-16
May
-16
Jun- 16
Jul-
16Au
g- 16Se
p- 16Oc
t-16
Nov- 16
Dec- 16
Jan- 17
Feb- 17
Mar
-17
Apr-
17M
ay-
17Ju
n- 17Ju
l-17
Aug- 17
Sep- 17
Oct-
17No
v- 17De
c- 17Ja
n- 18Fe
b- 18M
ar-
18Ap
r-18
May
-18
Jun- 18
Jul-
18Au
g- 18Se
p- 18Oc
t-18
Nov- 18
Dec- 18
Jan- 19
Feb- 19
Mar
-19
Apr-
19M
ay-
19Ju
n- 19Ju
l-19
Aug- 19
Sep- 19
Oct-
19No
v- 19De
c- 19
Loan
s82
,140
82,6
0782
,853
83,5
7884
,158
84,5
1285
,124
86,3
6987
,326
87,5
0788
,813
89,4
3089
,244
90,1
2989
,346
89,6
1290
,586
90,9
0391
,098
91,6
2592
,285
92,7
0093
,395
94,4
3395
,188
96,2
8696
,389
96,9
0996
,665
96,8
6097
,355
98,5
8798
,950
99,5
5099
,580
100,1
8510
0,818
101,4
5410
1,182
102,2
2210
3,524
103,5
3110
3,857
103,9
8210
4,876
105,7
8210
6,002
107,1
50
Ce
ntral
bank
00
00
00
00
00
00
00
00
00
00
00
00
00
00
00
00
00
00
00
00
00
00
00
00
Ot
her d
epos
itory
corp
orati
ons
2627
2727
2727
3028
2625
3727
2727
2828
2727
2727
2825
2727
2827
2727
2634
2121
2033
2225
2123
1822
1448
496
354
44
Ot
her fi
nanc
ial co
rpor
ation
s68
763
169
976
786
187
585
71,
019
1,01
41,
061
1,25
21,
248
1,31
21,
254
587
423
527
585
657
911
863
930
949
1,09
11,
155
1,29
42,
144
2,01
61,
880
1,55
61,
818
1,72
71,
776
1,87
51,
146
1,36
12,
077
2,31
430
31,
965
1,85
31,
773
2,02
81,
755
1,95
42,
485
2,35
82,
163
Ce
ntral
gove
rnm
ent
76
77
76
610
55
55
66
54
56
75
54
440
84
33
5355
34
33
44
119
1010
1011
1416
1614
1517
12
St
ate an
d loc
al go
vern
men
t25
822
124
123
926
726
626
827
124
424
024
949
547
147
438
043
940
440
537
442
841
540
440
439
340
338
736
840
037
535
731
442
841
643
140
541
238
841
437
139
638
238
938
633
336
841
137
937
2
Pu
blic n
on-fin
ancia
l co
rpor
ation
s1,
612
1,71
21,
482
1,63
61,
746
1,53
91,
489
1,44
11,
646
1,49
41,
644
1,85
51,
790
1,79
41,
737
1,99
52,
315
2,36
22,
127
2,00
72,
159
2,34
02,
493
2,27
72,
704
2,65
71,
227
1,54
71,
339
1,59
91,
615
1,45
91,
291
1,19
51,
236
1,34
31,
051
668
2,50
273
681
01,
069
1,09
91,
029
1,10
896
093
686
0
Oth
er no
n-fin
ancia
l co
rpor
ation
s (B
usine
sses
)33
,086
33,3
4033
,422
33,6
3233
,495
33,7
3834
,166
34,5
6135
,265
35,1
7435
,559
35,3
4335
,255
35,7
9335
,674
35,5
2135
,773
35,7
3935
,883
36,1
0536
,124
35,9
4036
,015
36,3
0036
,397
37,1
0736
,978
36,9
8736
,828
37,2
5237
,093
37,9
7938
,287
38,4
7438
,761
38,6
5641
,338
39,1
0139
,027
39,8
5140
,953
40,3
8940
,162
40,2
6040
,643
40,7
7540
,753
41,4
19
Loan
s and
Adv
ance
s22
,325
22,2
5522
,004
22,4
2122
,158
22,3
5322
,249
22,3
4122
,974
22,9
4723
,222
23,1
7522
,997
23,8
3923
,814
23,8
8623
,988
24,1
5724
,250
24,4
6124
,500
24,1
3724
,246
24,5
8224
,778
25,0
6325
,529
25,5
2825
,593
25,8
1825
,652
26,0
3626
,425
26,4
3927
,275
27,1
7230
,307
27,6
7927
,178
27,6
9228
,757
28,3
7528
,237
28,0
0228
,389
28,3
3728
,110
28,8
19
Fa
rm m
ortga
ge lo
ans
2230
2222
2219
1919
2020
2020
2220
2020
2020
1919
2020
2020
2020
1818
1819
1616
1818
1818
609
1816
1616
1516
1615
1515
15
Ot
her m
ortga
ge lo
ans
9,83
69,
884
10,0
1110
,043
10,2
8010
,281
10,3
5710
,370
10,4
1210
,416
10,3
7910
,433
10,5
6410
,597
10,6
9210
,654
10,7
7910
,740
11,0
8711
,056
11,0
2111
,291
11,2
6411
,321
11,2
1911
,277
11,2
8211
,496
11,3
8411
,686
11,4
6711
,465
11,5
6811
,387
11,4
4211
,618
12,2
4311
,419
11,6
0711
,515
12,0
7912
,127
12,0
6412
,045
12,1
3912
,057
12,1
1812
,033
Dwelli
ngs
1,20
41,
225
1,25
31,
239
1,28
91,
294
1,30
51,
303
1,31
21,
296
1,34
71,
415
1,44
01,
446
1,45
01,
434
1,49
21,
434
1,65
11,
585
1,57
31,
846
1,83
31,
955
1,93
91,
913
1,89
41,
913
1,92
42,
116
2,11
12,
006
2,02
71,
919
1,95
42,
031
2,71
41,
979
2,11
02,
030
2,05
92,
112
2,07
71,
981
2,12
22,
107
2,15
62,
173
Ot
her
8,63
28,
658
8,75
88,
804
8,99
18,
987
9,05
29,
066
9,10
09,
120
9,03
29,
018
9,12
49,
150
9,24
29,
221
9,28
89,
307
9,43
69,
471
9,44
89,
446
9,43
19,
366
9,28
09,
364
9,38
89,
583
9,46
09,
570
9,35
59,
459
9,54
29,
468
9,48
79,
587
9,52
99,
439
9,49
79,
485
10,0
2010
,015
9,98
710
,065
10,0
179,
950
9,96
29,
860
Overd
rafts
7,93
17,
719
7,46
87,
713
7,34
47,
560
7,28
47,
336
7,90
17,
731
7,99
87,
898
8,18
38,
583
8,49
78,
606
8,62
88,
799
8,56
78,
670
8,68
08,
121
8,19
78,
232
8,66
58,
857
9,07
78,
893
8,97
98,
851
8,70
28,
799
8,99
08,
914
9,70
69,
240
10,3
2110
,015
9,25
99,
697
9,98
09,
584
9,51
19,
227
9,44
99,
392
8,98
29,
419
Othe
r loan
s and
adva
nces
4,53
64,
623
4,50
34,
642
4,51
14,
493
4,58
84,
616
4,64
14,
781
4,82
54,
824
4,22
84,
639
4,60
54,
606
4,56
14,
597
4,57
74,
715
4,77
94,
706
4,76
55,
009
4,87
44,
910
5,15
25,
121
5,21
15,
262
5,46
75,
756
5,84
96,
120
6,10
96,
296
7,13
56,
227
6,29
66,
463
6,68
16,
649
6,64
66,
714
6,78
56,
874
6,99
47,
352
Leas
ing28
528
730
529
629
028
827
528
130
230
432
735
433
332
731
630
831
631
130
930
229
130
529
929
430
729
428
628
530
029
929
928
828
326
725
925
235
723
822
821
120
820
419
018
918
417
517
317
2
Instal
men
t cred
it5,
045
5,07
35,
057
5,00
35,
008
5,07
85,
134
5,15
95,
283
5,22
45,
210
5,16
25,
153
5,06
35,
034
4,99
44,
959
4,88
34,
924
4,92
44,
892
4,87
14,
837
4,84
54,
748
4,73
94,
698
4,59
84,
569
4,55
54,
532
4,55
84,
504
4,47
94,
430
4,39
03,
966
4,29
84,
271
4,20
04,
229
4,21
24,
181
4,16
94,
225
4,24
74,
223
4,21
0
Othe
r 5,
430
5,72
56,
056
5,91
26,
039
6,01
96,
509
6,78
06,
706
6,69
96,
801
6,65
26,
772
6,56
46,
510
6,33
36,
509
6,38
86,
400
6,41
86,
441
6,62
76,
633
6,58
06,
563
7,01
16,
464
6,57
66,
365
6,58
06,
610
7,09
77,
075
7,28
96,
797
6,84
16,
709
6,88
57,
350
7,74
87,
759
7,59
87,
555
7,89
97,
845
8,01
68,
247
8,21
8
Oth
er re
siden
t sec
tors
(Indiv
iduals
)46
,027
46,2
2446
,514
46,8
0747
,055
47,4
1947
,648
48,2
9848
,540
48,9
2249
,467
50,0
5449
,971
50,3
7950
,500
50,7
7250
,987
51,3
4351
,617
51,6
2652
,196
52,5
2552
,994
53,4
2053
,975
54,2
6854
,380
54,6
0754
,901
54,8
1055
,263
55,7
0355
,955
56,3
4556
,833
57,2
4254
,813
57,7
9557
,801
58,1
6858
,424
58,8
3159
,143
59,4
4059
,754
60,1
3360
,593
61,3
54
Loan
s and
Adv
ance
s37
,365
37,5
6037
,889
38,2
0038
,397
38,7
4838
,944
39,4
1239
,813
40,0
8040
,597
41,1
2141
,173
41,5
8341
,774
42,0
5942
,296
42,6
4842
,898
42,8
9243
,510
43,7
5744
,181
44,6
3645
,138
45,4
0945
,586
45,8
5146
,116
46,0
8046
,521
47,1
4147
,388
47,7
6948
,277
48,6
6046
,035
49,3
0449
,572
49,9
0350
,185
50,5
4950
,915
51,3
3251
,723
52,0
6052
,585
53,3
17
Farm
mor
tgage
loan
s1,
360
1,37
11,
436
1,41
81,
486
1,48
81,
489
1,54
01,
540
1,49
01,
477
1,49
51,
555
1,41
91,
494
1,49
51,
504
1,47
81,
504
1,49
91,
499
1,46
41,
519
1,55
61,
564
1,58
11,
599
1,59
81,
602
1,61
31,
605
1,61
41,
623
1,63
81,
701
1,66
72,
095
1,69
91,
694
1,69
21,
696
1,71
11,
722
1,73
61,
743
1,74
61,
769
1,78
5
Othe
r mor
tgage
loan
s29
,320
29,5
5929
,719
29,9
6130
,046
30,3
5030
,546
30,8
5231
,149
31,3
5631
,717
32,0
7332
,107
32,3
4632
,462
32,6
8132
,812
33,1
3533
,304
33,2
3633
,811
34,0
3734
,340
34,6
4834
,706
34,9
6235
,117
35,3
2235
,514
35,5
1435
,897
36,3
0736
,478
36,7
7537
,092
37,3
2735
,656
37,5
5637
,677
37,8
4437
,980
38,2
2238
,502
38,7
6638
,916
39,1
7039
,310
39,5
21
Dw
elling
s29
,297
29,5
3629
,697
29,9
4230
,026
30,3
3530
,530
30,8
3731
,133
31,3
4031
,699
32,0
5532
,088
32,3
2732
,441
32,6
6232
,795
33,1
1833
,293
33,2
2633
,800
34,0
2634
,336
34,6
4534
,703
34,9
5935
,113
35,3
1535
,507
35,5
0435
,886
36,2
9536
,465
36,7
6237
,079
37,3
1435
,643
37,5
4037
,662
37,8
2837
,965
38,2
0638
,485
38,7
4938
,899
39,1
5339
,293
39,5
04
Ot
her
2323
2319
2015
1515
1616
1818
1819
2119
1717
1111
1111
42
33
37
710
1212
1212
1313
1315
1515
1616
1717
1717
1717
Overd
rafts
2,73
22,
634
2,71
52,
743
2,73
92,
708
2,64
02,
694
2,73
42,
766
2,82
42,
915
2,92
53,
033
3,01
23,
041
3,11
33,
120
3,11
53,
050
3,05
03,
069
3,06
43,
019
3,13
53,
145
3,09
23,
082
3,17
53,
139
3,06
23,
074
3,07
53,
079
3,09
03,
147
2,55
33,
291
3,24
73,
276
3,29
33,
295
3,32
73,
351
3,41
23,
343
3,36
93,
405
Othe
r loan
s and
ad
vanc
es3,
952
3,99
74,
019
4,07
84,
126
4,20
14,
269
4,32
64,
390
4,46
74,
579
4,63
74,
587
4,78
44,
806
4,84
14,
867
4,91
54,
975
5,10
65,
150
5,18
75,
259
5,41
45,
732
5,72
25,
779
5,84
95,
826
5,81
45,
957
6,14
66,
213
6,27
76,
393
6,51
95,
732
6,75
96,
955
7,09
17,
216
7,32
07,
364
7,47
97,
652
7,80
18,
137
8,60
6
Leas
ing16
1826
2626
2020
2021
2222
2221
2019
1818
1817
1820
1919
1919
1919
2019
1919
1822
2330
3349
3234
4847
5151
5049
4847
47
Instal
men
t cred
it6,
943
6,95
06,
979
6,97
57,
047
7,11
27,
203
7,37
97,
206
7,34
37,
392
7,46
27,
334
7,32
07,
261
7,24
47,
258
7,21
77,
235
7,23
27,
165
7,20
07,
197
7,17
47,
148
7,11
87,
063
7,00
86,
981
6,89
36,
894
6,86
26,
859
6,86
16,
807
6,81
67,
018
6,73
66,
693
6,61
06,
571
6,60
86,
585
6,49
26,
445
6,44
16,
377
6,40
8
Othe
r 1,
703
1,69
61,
619
1,60
61,
586
1,53
91,
481
1,48
71,
500
1,47
61,
455
1,44
91,
442
1,45
61,
446
1,45
11,
415
1,45
91,
467
1,48
41,
502
1,55
01,
597
1,59
01,
670
1,72
31,
711
1,72
81,
784
1,81
81,
828
1,68
21,
686
1,69
21,
720
1,73
21,
711
1,72
21,
503
1,60
81,
621
1,62
41,
592
1,56
61,
537
1,58
51,
584
1,58
2
Non
resid
ents
436
446
462
464
700
642
660
742
585
586
601
403
412
403
435
430
549
436
405
517
496
531
509
516
522
542
1,26
21,
273
1,26
11,
250
1,22
91,
265
1,20
21,
194
1,17
21,
136
1,12
11,
129
1,14
91,
074
1,07
61,
017
1,01
81,
053
1,00
01,
000
961
965
Loan
s and
Adv
ance
s40
741
042
442
743
643
644
334
635
035
336
735
936
737
538
538
048
439
639
949
849
049
149
449
950
651
150
650
750
249
650
649
849
548
948
348
048
248
147
046
646
345
945
845
545
345
444
744
8
Farm
mor
tgage
loan
s0
00
00
00
00
00
00
00
00
00
00
00
00
00
00
00
00
00
00
00
00
00
00
00
0
Othe
r mor
tgage
loan
s25
926
127
327
628
528
628
925
025
725
525
725
525
526
227
427
430
321
221
030
930
530
530
431
232
032
031
731
531
230
630
730
730
329
729
429
529
129
128
528
027
827
727
227
126
926
826
126
1
Dw
elling
s25
926
127
327
628
528
628
925
025
725
525
725
525
526
227
427
430
321
221
030
930
530
530
431
232
032
031
731
531
230
630
730
730
329
729
429
529
129
128
528
027
827
727
227
126
926
826
126
1
Ot
her
00
00
00
00
00
00
00
00
00
00
00
00
00
00
00
00
00
00
00
00
00
00
00
00
Overd
rafts
130
130
132
133
132
133
137
7067
6978
7783
8383
7816
516
817
017
116
816
917
316
916
817
316
917
317
117
117
217
517
517
517
216
917
417
416
917
016
916
516
816
716
616
716
616
6
Othe
r loan
s and
ad
vanc
es18
1919
1819
1718
2626
2932
2729
2928
2917
1619
1818
1817
1818
1821
1919
1928
1717
1716
1616
1716
1616
1718
1818
1920
20
Leas
ing0
00
00
00
00
00
00
00
00
00
00
00
00
00
00
00
00
00
00
00
00
00
00
00
0
Instal
men
t cred
it0
00
00
00
00
00
00
00
00
00
00
00
00
00
00
00
00
00
00
00
00
00
00
00
0
Othe
r 30
3638
3626
520
621
639
623
523
323
444
4528
5050
6540
620
640
1517
1731
756
766
759
754
722
767
707
705
690
656
639
648
679
608
613
557
560
598
546
546
515
518
*Oth
er lo
ans a
nd ad
vanc
es co
mpr
ises p
erso
nal lo
ans f
or b
usine
sses
and
indivi
duals
and
nonr
eside
nts.

Bank of Namibia Annual Report 2019 253
Part EStatistical Tables
Tabl
e II.
5 D
epos
its w
ith o
ther
dep
osito
ry c
orpo
ratio
ns (e
nd p
erio
d in
N$
mill
ion)
Desc
riptio
nJa
n- 16Fe
b- 16M
ar-
16Ap
r- 16M
ay-
16Ju
n- 16Ju
l- 16Au
g- 16Se
p- 16Oc
t-16
Nov- 16
Dec- 16
Jan- 17
Feb- 17
Mar
-17
Apr- 17
May
-17
Jun- 17
Jul- 17
Aug- 17
Sep- 17
Oct-
17No
v- 17De
c- 17Ja
n- 18Fe
b- 18M
ar-
18Ap
r- 18M
ay-
18Ju
n- 18Ju
l- 18Au
g- 18Se
p- 18Oc
t-18
Nov- 18
Dec- 18
Jan- 19
Feb- 19
Mar
-19
Apr- 19
May
-19
Jun- 19
Jul- 19
Aug- 19
Sep- 19
Oct-
19No
v- 19De
c- 19
Tota
l Dep
osits
86,78
688
,762
91,53
992
,544
91,92
690
,268
90,92
190
,806
90,93
691
,502
94,01
893
,700
91,67
092
,392
94,11
695
,704
98,09
997
,341
100,7
2410
1,045
103,5
4410
4,262
105,4
8210
5,670
106,1
0510
4,526
106,8
2910
5,773
108,3
3611
0,000
111,8
0911
2,712
115,4
8711
8,718
115,5
3211
5,936
116,0
9911
5,690
117,2
9912
0,254
122,8
8611
9,981
121,6
5312
4,515
126,9
8112
6,749
128,5
2612
8,455
Dep
osits
inclu
ded
in b
road
mon
ey77
,791
80,08
083
,686
84,95
184
,909
82,26
983
,424
83,92
982
,096
83,37
783
,277
83,06
581
,569
82,81
884
,907
87,04
589
,684
87,83
191
,187
93,16
593
,656
94,84
494
,947
94,98
193
,502
92,47
994
,993
94,42
596
,103
97,66
699
,134
100,4
4810
1,327
104,2
7510
2,343
101,4
0910
0,869
100,7
9610
1,692
104,0
3310
6,764
105,0
2410
5,918
108,7
7911
0,287
111,7
4411
3,559
112,4
63
Tra
nsfer
able
de
posit
s36
,486
38,01
641
,127
40,61
738
,739
36,76
537
,702
37,87
337
,041
37,23
936
,538
36,76
936
,045
36,95
138
,037
39,91
940
,433
37,57
040
,002
41,47
441
,310
42,01
042
,056
41,43
243
,888
42,72
945
,362
42,74
744
,390
45,10
346
,222
47,72
146
,555
49,89
348
,406
48,47
447
,748
48,92
048
,771
49,17
250
,879
49,23
349
,508
50,31
751
,535
53,11
954
,676
54,09
3
In na
tiona
l
curre
ncy
35,65
337
,292
40,23
039
,982
37,80
636
,016
36,93
137
,197
36,24
436
,252
35,71
636
,057
34,68
835
,616
36,13
337
,425
38,59
435
,540
37,84
039
,559
39,19
539
,209
38,47
438
,749
41,27
840
,259
42,72
141
,295
43,13
343
,955
45,01
146
,294
45,28
647
,581
47,01
647
,098
46,19
547
,519
47,36
347
,579
49,05
046
,929
47,61
148
,365
49,37
751
,339
52,63
652
,339
Othe
r
fin
ancia
l
co
rpor
ation
s4,6
594,7
665,1
985,3
105,0
654,4
084,4
724,4
054,5
374,9
184,4
894,3
495,1
324,9
354,2
624,1
264,3
204,5
054,5
144,8
014,6
815,1
064,9
896,0
577,7
657,1
306,7
326,5
987,2
377,1
688,0
427,9
058,5
897,9
417,7
158,1
577,9
848,1
448,0
266,9
756,8
666,6
046,7
166,6
056,9
317,4
247,4
077,7
15
State
and
local
gove
rnme
nt1,0
111,1
071,3
921,0
481,0
0787
687
384
674
682
871
067
058
761
165
869
571
561
478
690
384
391
194
988
990
094
51,0
3396
992
186
990
090
794
498
784
685
684
984
986
576
178
573
676
078
373
978
680
075
9
Publi
c non
-
finan
cial
corp
orati
ons
1,972
2,721
2,877
2,841
2,447
2,055
2,366
2,193
2,248
2,524
2,429
2,634
3,078
3,186
3,249
3,593
3,965
2,852
4,032
3,933
4,173
2,722
2,458
2,846
3,917
3,181
3,863
3,032
3,257
2,837
3,174
3,763
3,548
4,230
3,790
2,984
3,877
4,434
4,131
4,919
4,721
4,028
4,405
4,181
3,941
4,114
4,566
4,620
Othe
r non
-
finan
cial
corp
orati
ons
19,05
219
,693
21,50
021
,753
20,45
419
,682
20,15
020
,962
20,21
319
,182
19,08
919
,830
17,51
518
,513
19,46
120
,290
20,98
618
,792
19,49
620
,528
20,07
720
,549
19,84
418
,958
17,94
918
,050
20,11
219
,637
20,80
621
,874
21,44
322
,276
20,44
722
,545
22,31
423
,016
21,63
921
,879
22,25
323
,161
24,61
423
,220
23,49
124
,390
25,33
426
,410
26,90
526
,322
Othe
r
re
siden
t
se
ctors
8,958
9,005
9,263
9,031
8,833
8,996
9,070
8,792
8,501
8,800
8,999
8,574
8,376
8,371
8,503
8,721
8,607
8,778
9,012
9,393
9,422
9,921
10,23
39,9
9910
,747
10,95
310
,981
11,06
010
,912
11,20
611
,451
11,44
211
,758
11,87
812
,351
12,08
411
,845
12,21
312
,088
11,76
212
,064
12,34
112
,240
12,40
712
,433
12,60
612
,958
12,92
3
In fo
reig
n cu
rrenc
y83
472
489
763
593
474
977
167
579
798
782
271
21,3
571,3
341,9
042,4
951,8
392,0
302,1
621,9
152,1
152,8
013,5
822,6
832,6
102,4
702,6
421,4
521,2
561,1
491,2
111,4
271,2
692,3
131,3
901,3
771,5
531,4
011,4
081,5
931,8
292,3
041,8
971,9
522,1
591,7
802,0
401,7
54
Othe
r dep
osits
41,30
542
,064
42,55
944
,334
46,16
945
,504
45,72
246
,056
45,05
546
,138
46,73
946
,297
45,52
445
,868
46,87
047
,126
49,25
150
,261
51,18
451
,691
52,34
652
,834
52,89
253
,549
49,61
449
,750
49,63
151
,678
51,71
352
,563
52,91
152
,727
54,77
254
,382
53,93
852
,935
53,12
151
,876
52,92
254
,861
55,88
555
,790
56,41
058
,462
58,75
258
,625
58,88
358
,370
In na
tiona
l
curre
ncy
41,30
542
,064
42,55
944
,334
46,16
945
,504
45,72
246
,056
45,05
546
,138
46,73
946
,297
45,52
445
,868
46,87
047
,126
49,25
150
,261
51,18
451
,691
52,34
652
,834
52,89
253
,549
49,61
449
,750
49,63
151
,678
51,71
352
,563
52,91
152
,727
54,77
254
,382
53,93
852
,935
53,12
151
,876
52,92
254
,861
55,88
555
,790
56,41
058
,462
58,75
258
,625
58,88
358
,370
Othe
r
fin
ancia
l
co
rpor
ation
s3,9
644,1
554,0
104,2
322,5
494,8
654,1
274,0
764,0
214,0
993,8
713,9
303,9
133,7
513,7
023,6
563,8
703,7
693,5
673,6
833,6
933,4
253,4
653,6
413,6
023,8
603,7
314,0
583,7
353,9
973,9
973,6
933,5
063,3
873,4
623,3
063,3
583,5
623,5
443,8
893,9
614,4
954,8
865,1
655,6
005,5
185,7
015,3
00
State
and
local
gove
rnme
nt54
946
948
360
52,3
7955
054
253
350
945
044
136
235
033
627
524
529
118
920
920
321
621
622
022
623
121
323
024
224
128
024
625
630
931
631
332
035
336
135
443
545
547
547
947
851
451
652
354
5
Publi
c
no
nfina
ncial
co
rpor
ation
s1,3
761,7
751,9
202,1
452,2
811,6
272,0
972,3
092,4
092,3
852,4
442,6
512,7
122,7
642,9
192,8
562,7
462,9
282,9
823,5
573,4
113,3
573,3
063,1
463,6
433,1
263,4
263,2
833,5
283,6
323,5
543,4
643,5
253,6
953,3
943,3
783,3
283,6
373,2
883,6
663,8
223,0
783,2
143,7
164,0
094,2
634,0
754,1
97
Othe
r
no
nfina
ncial
co
rpor
ation
s11
,095
11,22
611
,295
11,79
713
,131
12,54
112
,695
12,68
111
,102
12,38
112
,869
11,99
311
,232
11,29
311
,727
12,14
312
,991
13,41
114
,617
14,64
015
,135
15,86
916
,328
16,21
416
,502
16,85
016
,509
17,70
515
,974
16,33
116
,562
16,87
418
,793
18,18
117
,145
16,30
216
,685
16,74
017
,834
18,65
818
,735
18,69
518
,790
19,33
419
,508
19,14
919
,129
19,40
0
Othe
r
res
ident
secto
rs24
,322
24,43
924
,851
25,55
525
,829
25,92
126
,260
26,45
827
,014
26,82
327
,113
27,36
127
,316
27,72
428
,248
28,22
629
,352
29,96
529
,809
29,60
929
,890
29,96
729
,573
30,32
225
,636
25,70
025
,734
26,39
128
,235
28,32
328
,552
28,43
928
,639
28,80
229
,624
29,62
829
,397
27,57
627
,902
28,21
328
,911
29,04
729
,040
29,77
029
,121
29,17
929
,455
28,92
9
In for
eign
cu
rrenc
y0
00
00
00
00
00
00
00
00
00
00
00
00
00
00
00
00
00
00
00
00
00
00
00
0
Dep
osits
ex
clude
d fr
om b
road
mon
ey8,9
958,6
827,8
537,5
937,0
177,9
997,4
976,8
778,8
408,1
2510
,741
10,63
410
,101
9,574
9,209
8,659
8,415
9,510
9,537
7,880
9,888
9,418
10,53
410
,689
12,60
312
,047
11,83
611
,348
12,23
312
,334
12,67
512
,264
14,16
014
,442
13,18
814
,527
15,23
114
,894
15,60
716
,221
16,12
214
,957
15,73
515
,736
16,69
315
,005
14,96
715
,992
Tra
nsfer
able
de
posit
s5,2
255,0
014,6
994,5
154,7
764,7
725,0
044,3
174,9
834,2
436,4
475,5
286,0
275,7
754,8
574,2
083,9
434,9
715,1
843,6
294,6
504,5
114,9
554,4
096,7
826,3
705,8
995,8
916,4
456,8
046,8
466,4
597,6
357,3
926,7
047,0
608,7
108,1
587,7
487,8
489,1
238,2
908,7
009,1
289,8
098,2
098,6
349,8
79
In na
tiona
l
curre
ncy
2,089
2,028
2,646
2,279
2,337
2,147
2,143
2,223
2,555
2,102
3,535
3,710
3,755
3,316
2,470
1,944
1,705
2,056
1,780
1,727
2,414
2,303
2,057
2,215
4,244
3,806
4,038
4,159
4,175
4,733
4,641
4,423
4,955
4,839
4,351
5,196
5,616
4,989
4,796
5,029
5,814
5,493
5,765
6,139
5,621
5,597
6,002
6,626
In for
eign
cu
rrenc
y3,1
362,9
732,0
532,2
362,4
392,6
252,8
612,0
942,4
292,1
412,9
121,8
182,2
722,4
592,3
872,2
642,2
372,9
153,4
041,9
022,2
372,2
082,8
982,1
942,5
372,5
651,8
621,7
322,2
692,0
722,2
052,0
362,6
802,5
542,3
531,8
643,0
943,1
692,9
522,8
203,3
092,7
982,9
362,9
894,1
882,6
132,6
323,2
53
Othe
r dep
osits
3,770
3,681
3,155
3,078
2,241
3,227
2,493
2,560
3,857
3,882
4,294
5,106
4,074
3,799
4,352
4,451
4,472
4,539
4,353
4,251
5,238
4,907
5,579
6,280
5,822
5,677
5,937
5,457
5,788
5,530
5,830
5,805
6,525
7,050
6,484
7,467
6,521
6,737
7,859
8,373
6,999
6,667
7,034
6,608
6,884
6,796
6,333
6,113
In na
tiona
l
curre
ncy
1,701
1,432
1,508
1,658
1,603
1,510
1,431
1,425
2,506
2,577
2,512
3,224
2,964
2,790
3,021
3,180
3,111
3,243
3,231
3,224
3,142
3,633
3,759
4,479
4,275
4,233
4,635
4,385
4,868
4,347
4,690
4,568
4,614
5,043
4,192
5,058
4,194
4,708
5,071
5,854
4,672
4,275
4,552
3,963
4,278
4,632
4,314
3,963
In for
eign
cu
rrenc
y2,0
692,2
491,6
461,4
2063
81,7
171,0
621,1
351,3
511,3
061,7
821,8
821,1
101,0
091,3
311,2
711,3
611,2
961,1
221,0
272,0
951,2
731,8
201,8
021,5
471,4
441,3
021,0
7292
01,1
831,1
401,2
361,9
112,0
072,2
922,4
082,3
272,0
292,7
882,5
192,3
262,3
922,4
822,6
452,6
062,1
642,0
192,1
50

Bank of Namibia Annual Report 2019254
Part EStatistical Tables
Table II.6 Monetary aggregates (end of period in N$ million)
Currency in circulation
Transferable deposits
Narrow money (M1) Other deposits Securities included in M2
Broad money supply (M2)
1 2 1+2 = 3 4 5 3+4+5=6
2016 Jan 3,008 36,486 39,494 41,305 0 80,799
Feb 2,890 38,016 40,906 42,064 0 82,970
Mar 2,765 41,127 43,892 42,559 0 86,450
Apr 2,921 40,617 43,537 44,334 0 87,872
May 2,839 38,739 41,578 46,169 0 87,748
Jun 2,840 36,765 39,606 45,504 0 85,109
Jul 2,953 37,702 40,655 45,722 0 86,377
Aug 2,879 37,873 40,752 46,056 0 86,808
Sep 2,905 37,041 39,946 45,055 0 85,001
Oct 2,964 37,239 40,203 46,138 0 86,341
Nov 3,009 36,538 39,548 46,739 0 86,286
Dec 2,884 36,769 39,653 46,297 0 85,949
2017 Jan 2,799 36,045 38,844 45,524 0 84,368
Feb 2,829 36,951 39,780 45,868 0 85,648
Mar 2,876 38,037 40,913 46,870 0 87,783
Apr 2,980 39,919 42,900 47,126 0 90,025
May 2,870 40,433 43,303 49,251 0 92,554
Jun 2,922 37,570 40,492 50,261 0 90,753
Jul 2,954 40,002 42,956 51,184 0 94,141
Aug 3,031 41,474 44,505 51,691 0 96,196
Sep 3,120 41,310 44,431 52,346 0 96,777
Oct 3,009 42,010 45,019 52,834 0 97,853
Nov 3,188 42,056 45,243 52,892 0 98,135
Dec 3,096 41,432 44,528 53,549 0 98,078
2018 Jan 2,823 43,888 46,711 49,614 0 96,324
Feb 2,805 42,729 45,534 49,750 0 95,284
Mar 2,856 45,362 48,219 49,631 0 97,849
Apr 2,818 42,747 45,565 51,678 0 97,243
May 2,749 44,390 47,139 51,713 0 98,852
Jun 2,976 45,103 48,080 52,563 0 100,643
Jul 2,887 46,222 49,109 52,911 0 102,020
Aug 3,027 47,721 50,748 52,727 0 103,475
Sep 3,137 46,555 49,692 54,772 0 104,464
Oct 2,955 49,893 52,849 54,382 0 107,231
Nov 3,125 48,406 51,531 53,938 0 105,468
Dec 2,936 48,474 51,411 52,935 0 104,345
2019 Jan 2,774 47,748 50,522 53,121 0 103,643
Feb 2,729 48,920 51,649 51,876 0 103,525
Mar 2,896 48,771 51,666 52,922 0 104,588
Apr 2,825 49,172 51,998 54,861 0 106,858
May 2,914 50,879 53,793 55,885 0 109,678
Jun 2,995 49,233 52,229 55,790 0 108,019
Jul 2,840 49,508 52,349 56,410 0 108,758
Aug 3,013 50,317 53,330 58,462 0 111,792
Sep 2,836 51,535 54,372 58,752 0 113,124
Oct 2,649 53,119 55,768 58,625 0 114,393
Nov 3,092 54,676 57,768 58,883 0 116,651
Dec 2,873 54,093 56,966 58,370 0 115,336

Bank of Namibia Annual Report 2019 255
Part EStatistical Tables
Table II.7 Monetary analysis (end of period in N$ million)
Determinants of money supply
Broad money supply (M2)
Net foreign assets
Claims on the Central Government Claims on private sectors
Other items net
Gross claims Government deposits
Other liabilities
Net claims on Government
2016 Jan 80,799 29,478 9,965 13,159 0 -3,194 85,433 -30,917
Feb 82,970 31,379 10,185 11,130 0 -945 85,857 -33,320
Mar 86,450 32,813 12,089 9,801 0 2,288 85,903 -34,553
Apr 87,872 34,978 10,895 10,670 0 226 86,350 -33,681
May 87,748 34,889 10,768 8,935 0 1,834 86,457 -35,432
Jun 85,109 29,639 11,042 8,328 0 2,714 86,927 -34,170
Jul 86,377 29,795 11,068 8,223 0 2,845 87,533 -33,795
Aug 86,808 28,793 11,619 7,055 0 4,564 88,546 -35,095
Sep 85,001 24,157 11,786 7,305 0 4,480 89,672 -33,308
Oct 86,341 29,623 11,595 7,186 0 4,409 89,826 -37,518
Nov 86,286 31,812 12,879 8,072 0 4,807 91,049 -41,381
Dec 85,949 26,201 11,814 7,909 0 3,905 91,974 -36,130
2017 Jan 84,368 28,653 11,798 9,456 0 2,342 91,741 -38,367
Feb 85,648 27,117 12,079 8,150 0 3,929 92,741 -38,138
Mar 87,783 28,074 13,755 6,727 0 7,029 91,852 -39,172
Apr 90,025 32,901 12,074 8,177 0 3,897 92,129 -38,901
May 92,554 33,377 13,199 6,554 0 6,645 93,036 -40,504
Jun 90,753 31,652 12,241 6,544 0 5,698 93,609 -40,206
Jul 94,141 37,027 12,880 8,857 0 4,023 93,657 -40,567
Aug 96,196 38,710 13,334 7,832 0 5,502 94,153 -42,169
Sep 96,777 38,087 13,721 7,041 0 6,680 95,075 -43,065
Oct 97,853 38,812 14,964 8,075 0 6,888 95,384 -43,231
Nov 98,135 36,060 14,860 6,623 0 8,237 95,982 -42,144
Dec 98,078 31,063 15,611 5,947 0 9,665 96,537 -39,187
2018 Jan 96,324 35,871 15,555 8,771 0 6,784 98,396 -44,727
Feb 95,284 32,402 16,328 8,064 0 8,264 99,397 -44,780
Mar 97,849 28,463 17,912 5,511 0 12,401 98,461 -41,476
Apr 97,243 34,096 16,914 7,701 0 9,213 99,354 -45,420
May 98,852 32,488 17,525 6,211 0 11,313 99,167 -44,116
Jun 100,643 34,198 17,708 7,243 0 10,465 99,364 -43,384
Jul 102,020 36,063 18,465 8,194 0 10,271 99,866 -44,180
Aug 103,475 36,170 18,739 7,250 0 11,489 101,337 -45,521
Sep 104,464 36,593 19,138 6,317 0 12,821 101,899 -46,849
Oct 107,231 38,743 19,180 6,874 0 12,306 102,634 -46,452
Nov 105,468 35,076 19,562 5,489 0 14,072 102,762 -46,443
Dec 104,345 37,975 19,338 8,783 0 10,555 103,580 -47,764
2019 Jan 103,643 38,887 19,262 11,342 0 7,920 104,150 -47,315
Feb 103,525 39,860 19,258 9,405 0 9,853 104,686 -50,874
Mar 104,588 38,645 20,512 7,228 0 13,284 104,487 -51,828
Apr 106,858 44,395 20,107 10,308 0 9,799 105,565 -52,901
May 109,678 44,612 20,234 8,490 0 11,744 106,785 -53,462
Jun 108,019 40,204 20,487 8,811 0 11,676 106,775 -50,637
Jul 108,758 44,517 21,075 10,995 0 10,081 107,181 -53,020
Aug 111,792 44,475 21,153 9,061 0 12,092 107,255 -52,029
Sep 113,124 39,456 24,675 9,115 0 15,560 108,576 -50,468
Oct 114,393 43,580 24,007 9,437 0 14,569 109,523 -53,280
Nov 116,651 41,139 24,907 8,192 0 16,715 109,633 -50,836
Dec 115,336 36,440 25,223 7,879 0 17,344 110,278 -48,726
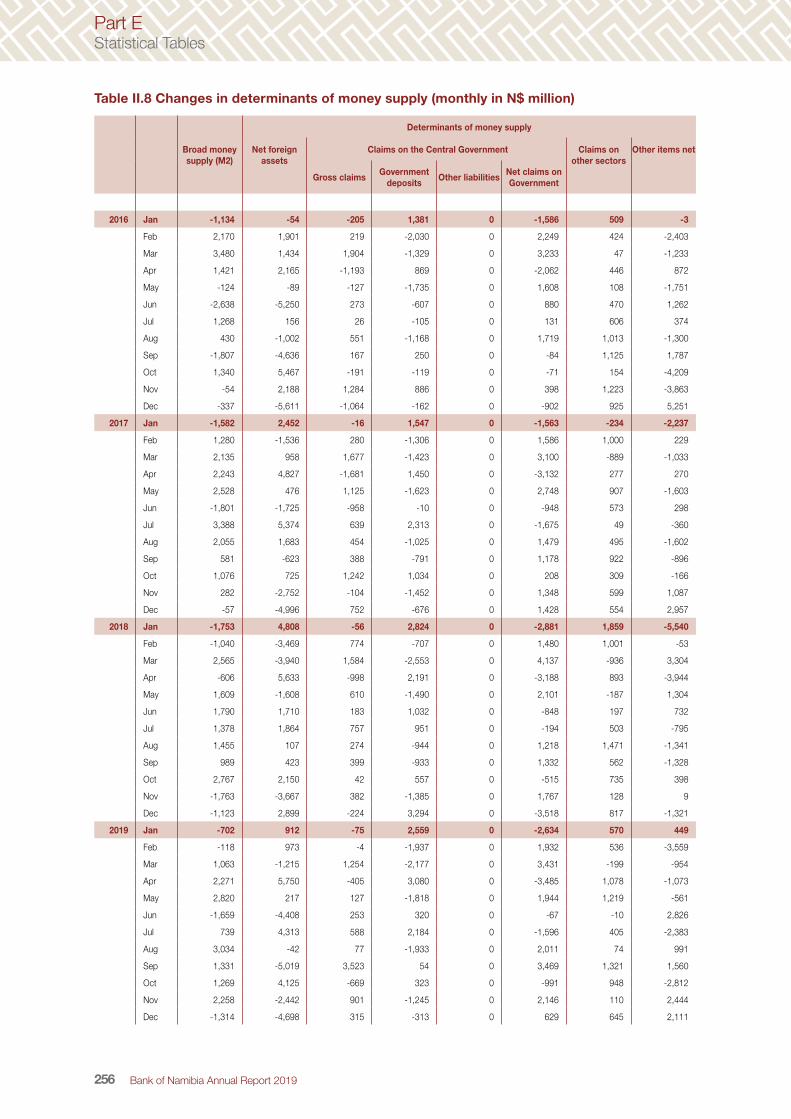
Bank of Namibia Annual Report 2019256
Part EStatistical Tables
Table II.8 Changes in determinants of money supply (monthly in N$ million)
Determinants of money supply
Broad money supply (M2)
Net foreign assets
Claims on the Central Government Claims on other sectors
Other items net
Gross claims Government deposits Other liabilities Net claims on
Government
2016 Jan -1,134 -54 -205 1,381 0 -1,586 509 -3
Feb 2,170 1,901 219 -2,030 0 2,249 424 -2,403
Mar 3,480 1,434 1,904 -1,329 0 3,233 47 -1,233
Apr 1,421 2,165 -1,193 869 0 -2,062 446 872
May -124 -89 -127 -1,735 0 1,608 108 -1,751
Jun -2,638 -5,250 273 -607 0 880 470 1,262
Jul 1,268 156 26 -105 0 131 606 374
Aug 430 -1,002 551 -1,168 0 1,719 1,013 -1,300
Sep -1,807 -4,636 167 250 0 -84 1,125 1,787
Oct 1,340 5,467 -191 -119 0 -71 154 -4,209
Nov -54 2,188 1,284 886 0 398 1,223 -3,863
Dec -337 -5,611 -1,064 -162 0 -902 925 5,251
2017 Jan -1,582 2,452 -16 1,547 0 -1,563 -234 -2,237
Feb 1,280 -1,536 280 -1,306 0 1,586 1,000 229
Mar 2,135 958 1,677 -1,423 0 3,100 -889 -1,033
Apr 2,243 4,827 -1,681 1,450 0 -3,132 277 270
May 2,528 476 1,125 -1,623 0 2,748 907 -1,603
Jun -1,801 -1,725 -958 -10 0 -948 573 298
Jul 3,388 5,374 639 2,313 0 -1,675 49 -360
Aug 2,055 1,683 454 -1,025 0 1,479 495 -1,602
Sep 581 -623 388 -791 0 1,178 922 -896
Oct 1,076 725 1,242 1,034 0 208 309 -166
Nov 282 -2,752 -104 -1,452 0 1,348 599 1,087
Dec -57 -4,996 752 -676 0 1,428 554 2,957
2018 Jan -1,753 4,808 -56 2,824 0 -2,881 1,859 -5,540
Feb -1,040 -3,469 774 -707 0 1,480 1,001 -53
Mar 2,565 -3,940 1,584 -2,553 0 4,137 -936 3,304
Apr -606 5,633 -998 2,191 0 -3,188 893 -3,944
May 1,609 -1,608 610 -1,490 0 2,101 -187 1,304
Jun 1,790 1,710 183 1,032 0 -848 197 732
Jul 1,378 1,864 757 951 0 -194 503 -795
Aug 1,455 107 274 -944 0 1,218 1,471 -1,341
Sep 989 423 399 -933 0 1,332 562 -1,328
Oct 2,767 2,150 42 557 0 -515 735 398
Nov -1,763 -3,667 382 -1,385 0 1,767 128 9
Dec -1,123 2,899 -224 3,294 0 -3,518 817 -1,321
2019 Jan -702 912 -75 2,559 0 -2,634 570 449
Feb -118 973 -4 -1,937 0 1,932 536 -3,559
Mar 1,063 -1,215 1,254 -2,177 0 3,431 -199 -954
Apr 2,271 5,750 -405 3,080 0 -3,485 1,078 -1,073
May 2,820 217 127 -1,818 0 1,944 1,219 -561
Jun -1,659 -4,408 253 320 0 -67 -10 2,826
Jul 739 4,313 588 2,184 0 -1,596 405 -2,383
Aug 3,034 -42 77 -1,933 0 2,011 74 991
Sep 1,331 -5,019 3,523 54 0 3,469 1,321 1,560
Oct 1,269 4,125 -669 323 0 -991 948 -2,812
Nov 2,258 -2,442 901 -1,245 0 2,146 110 2,444
Dec -1,314 -4,698 315 -313 0 629 645 2,111

Bank of Namibia Annual Report 2019 257
Part EStatistical Tables
Table II.9 Selected interest rates: Namibia and South Africa
Repo rate Prime lending rate Average lending rateTreasury bill rate
(3 month) Average deposit rate
Namibia SA Namibia SA Namibia SA Namibia SA Namibia SA
2016 Jan 6.50 6.75 10.25 10.25 9.52 10.06 7.92 6.86 4.80 6.62
Feb 6.75 6.75 10.50 10.25 9.36 10.18 6.93 5.09 6.90
Mar 6.75 7.00 10.50 10.50 9.74 10.36 8.18 7.04 5.00 7.09
Apr 7.00 7.00 10.75 10.50 9.76 10.41 7.94 7.18 5.20 7.25
May 7.00 7.00 10.75 10.50 10.20 10.49 7.16 5.43 7.17
Jun 7.00 7.00 10.75 10.50 10.01 10.49 7.76 7.20 5.41 7.23
Jul 7.00 7.00 10.75 10.50 10.11 10.51 8.00 7.35 5.35 7.20
Aug 7.00 7.00 10.75 10.50 10.12 10.55 7.30 5.53 7.28
Sep 7.00 7.00 10.75 10.50 10.22 10.55 8.08 7.29 5.64 7.33
Oct 7.00 7.00 10.75 10.50 10.19 10.48 8.39 7.35 5.60 7.32
Nov 7.00 7.00 10.75 10.50 10.06 10.45 7.60 5.62 7.38
Dec 7.00 7.00 10.75 10.50 9.87 10.48 8.61 7.64 5.69 7.40
2017 Jan 7.00 7.00 10.75 10.50 10.19 10.47 8.79 7.36 5.86 7.37
Feb 7.00 7.00 10.75 10.50 10.02 10.52 7.19 5.82 7.37
Mar 7.00 7.00 10.75 10.50 10.22 10.50 8.87 7.29 5.78 7.40
Apr 7.00 7.00 10.75 10.50 10.11 10.47 8.77 7.43 5.75 7.34
May 7.00 7.00 10.75 10.50 10.00 10.54 7.39 5.74 7.42
June 7.00 7.00 10.75 10.50 10.21 10.72 7.74 7.44 5.80 7.41
July 7.00 6.75 10.75 10.50 10.18 10.66 7.72 7.15 6.04 7.23
Aug 6.75 6.75 10.50 10.25 9.99 10.64 7.16 6.16 7.13
Sep 6.75 6.75 10.50 10.25 10.04 10.45 7.52 7.11 5.90 7.14
Oct 6.75 6.75 10.50 10.25 9.46 10.60 7.51 7.40 5.69 7.05
Nov 6.75 6.75 10.50 10.25 9.77 10.54 7.56 5.98 7.09
Dec 6.75 6.75 10.50 10.25 10.12 10.55 7.69 7.49 6.11 7.15
2018 Jan 6.75 6.75 10.50 10.25 10.17 10.70 7.42 7.21 6.21 7.16
Feb 6.75 6.75 10.50 10.25 10.14 10.65 7.82 7.04 6.45 7.11
Mar 6.75 6.50 10.50 10.00 10.04 10.61 7.87 6.87 6.45 7.05
Apr 6.75 6.50 10.50 10.00 10.07 10.47 7.96 6.99 6.60 6.95
May 6.75 6.50 10.50 10.00 10.27 10.49 8.02 7.03 5.73 6.91
June 6.75 6.50 10.50 10.00 10.12 10.50 7.94 7.07 5.68 6.92
July 6.75 6.50 10.50 10.00 10.19 10.50 7.70 7.09 5.70 6.95
Aug 6.75 6.50 10.50 10.00 10.11 10.49 7.68 7.16 5.58 6.96
Sep 6.75 6.50 10.50 10.00 10.09 10.46 7.68 7.12 5.52 6.86
Oct 6.75 6.50 10.50 10.00 10.23 10.66 7.67 7.27 5.73 6.89
Nov 6.75 6.75 10.50 10.25 10.09 10.61 7.72 7.43 5.56 7.09
Dec 6.75 6.75 10.50 10.25 10.19 10.64 7.69 7.61 5.57 7.13
2019 Jan 6.75 6.75 10.50 10.25 10.11 10.66 7.68 7.39 5.63 7.16
Feb 6.75 6.75 10.50 10.25 10.01 10.57 7.65 7.13 5.61 7.12
Mar 6.75 6.75 10.50 10.25 10.08 10.63 7.65 6.98 5.93 7.15
Apr 6.75 6.75 10.50 10.25 9.91 10.63 7.55 7.23 5.98 7.17
May 6.75 6.75 10.50 10.25 9.91 10.62 7.13 5.75 7.03
June 6.75 6.75 10.50 10.25 10.04 10.63 7.46 7.10 5.95 7.15
July 6.75 6.50 10.50 10.00 10.06 10.53 7.35 6.99 5.81 7.00
Aug 6.50 6.50 10.25 10.00 9.77 10.45 7.19 6.94 5.77 6.98
Sep 6.50 6.50 10.25 10.00 9.74 10.49 7.11 6.74 5.55 6.92
Oct 6.50 6.50 10.25 10.00 9.65 10.53 7.07 6.90 5.54 6.76
Nov 6.50 6.50 10.25 10.00 9.53 10.55 7.21 7.06 5.49 6.88
Dec 6.50 6.50 10.25 10.00 9.70 10.60 7.43 7.16 5.45 6.78

Bank of Namibia Annual Report 2019258
Part EStatistical Tables
Table III.1(a) Treasury Bill auctions - N$ million
Period Offer Tendered Surplus(+) Effective
Deficit (-) Yield % 91 days 2019
Jan 450.0 807.4 357.4 7.94 Jan 450.0 642.0 192.0 7.86 Feb 450.0 577.9 127.9 7.88 Mar 450.0 745.0 295.0 7.88 Apr 450.0 1,282 831.8 7.76 Apr 450.0 484 34.1 7.77 May 450.0 746 296.4 7.76 Jun 450.0 1,303 853.3 7.67 Jul 450.0 662 211.9 7.57 Jul 450.0 674 224.2 7.54 Aug 450.0 1,167 717.0 7.39 Sep 450.0 1,002 551.6 7.30 Oct 450.0 845 394.6 7.22 Oct 450.0 598 148.0 7.29 Nov 450.0 579 129.3 7.41 Dec 450.0 352 -98.1 7.50 Dec 450.0 517 67.2 7.78
182 days 2019
Jan 450.0 1055.4 605.4 8.28 Jan 450.0 1109.1 659.1 8.18 Feb 450.0 912.3 462.3 8.16 Feb 450.0 1025.7 575.7 8.14 Mar 450.0 1022.4 572.4 8.09 Apr 450.0 508.5 58.5 7.97 Apr 450.0 736.1 286.1 7.96 May 450.0 716 265.7 7.93 Jun 620.0 1,468 848.5 7.81 Jul 450.0 688 238.2 7.67 Jul 450.0 674 224.2 7.57 Aug 450.0 535 85.3 7.43 Aug 450.0 1,199 748.8 7.48 Sep 450.0 935 485.5 7.36 Oct 450.0 462 11.6 7.36 Oct 450.0 830 379.6 7.39 Nov 450.0 530 80.3 7.53 Dec 620.0 694 73.5 7.72
273 days 2019
Jan 450.0 1035.5 585.5 8.34 Feb 450.0 1025.8 575.8 8.34 Feb 400.0 680.2 280.2 8.34 Mar 450.0 740.5 290.5 8.34 Mar 450.0 1249.6 799.6 8.27 Apr 450.0 709 259.1 8.15 May 450.0 1,087 637.2 8.13 May 465.0 957 491.9 8.09 May 460.0 1,192 731.7 7.99 Jun 450.0 754 304.0 7.88 Jul 450.0 949 499.3 7.74 Aug 450.0 934 483.8 7.67 Aug 450.0 1,229 778.9 7.55 Aug 450.0 993 542.7 7.46 Sep 450.0 663 212.8 7.40 Sep 500.0 1,043 542.9 7.38 Oct 450.0 458 7.7 7.42 Nov 460.0 980 519.6 7.50 Nov 500.0 804 304.4 7.50 Nov 500.0 583 83.0 7.72
Dec 450.0 537 87.4 7.86
Dec 450.0 937 487.3 7.89
365 days 2019
Jan 400.0 1409.3 1009.3 8.43 Jan 400.0 702.6 302.6 8.42 Feb 500.0 1269.5 769.5 8.41 Feb 500.0 1257.5 757.47 8.39 Mar 530.0 909.7 379.69 8.37 Apr 450.0 1,660 1,210.15 8.26 Apr 450.0 942 492.12 8.21 May 460.0 1,000 539.85 8.19 May 450.0 1,121 671.02 8.14 Jun 450.0 989 538.88 7.96 Jul 500.0 1,511 1,011.21 7.86 Jul 450.0 1,127 677.06 7.71 Aug 500.0 1,187 686.74 7.67 Aug 450.0 941 491.20 7.54 Sep 500.0 767 266.68 7.46 Oct 500.0 978 478.09 7.46 Nov 460.0 115 (345.46) 7.49 Nov 400.0 793 393.00 7.57 Nov 500.0 675 175.10 7.68 Dec 450.0 1,176 725.79 7.75 Dec 690.0 1,131 440.77 7.84

Bank of Namibia Annual Report 2019 259
Part EStatistical Tables
Table III.1 (b) Allotment of Government of Namibia Treasury Bills - N$ ‘000Date Date Deposit Other Banking Financial Other Private TOTAL Amount
issued due Money Banking Sector Institutions Public Sector OutstandingBanks Institutions Enterprises
2019Jan 04/19 401,220 0 401,220 42,150 0 6,630 450,000 21,788,860
Jan 04/19 450,000 0 450,000 0 0 0 450,000 21,981,650
Jan* 07/19 399,600 0 399,600 47,000 0 3,400 450,000 21,981,650
Jan* 07/19 450,000 0 450,000 0 0 0 450,000 21,981,650
Jan*** 10/19 382,470 0 382,470 46,530 0 21,000 450,000 21,981,650
Jan** 01/19 225,890 0 225,890 174,110 0 0 400,000 21,981,650
Jan** 01/20 298,200 0 298,200 100,990 0 810 400,000 21,981,650
Feb 05/19 413,630 0 413,630 36,370 0 0 450,000 21,981,650
Feb* 08/19 294,710 0 294,710 5,290 0 150,000 450,000 21,981,650
Feb* 08/19 420,500 15,000 435,500 14,500 0 0 450,000 21,981,650
Feb*** 08/19 399,300 0 399,300 20,100 30,000 600 450,000 21,981,650
Feb*** 11/19 373,940 5,000 378,940 20,000 0 1,060 400,000 21,981,650
Feb** 02/20 347,230 65,440 412,670 78,670 8,660 0 500,000 21,981,650
Feb** 02/20 427,530 0 427,530 72,470 0 0 500,000 21,981,650
Mar 06/19 437,620 0 437,620 11,380 0 1,000 450,000 21,981,650
Mar* 09/19 440,000 0 440,000 10,000 0 0 450,000 21,981,650
Mar*** 12/19 432,500 0 432,500 11,700 5,700 100 450,000 21,981,650
Mar*** 12/19 440,040 0 440,040 0 0 9,960 450,000 21,981,650
Mar** 03/20 422,640 0 422,640 107,360 0 0 530,000 21,981,650
Apr 07/19 443,310 0 443,310 0 0 6,690 450,000 21,981,650
Apr 07/19 448,000 0 448,000 2,000 0 0 450,000 21,981,650
Apr* 10/19 432,030 0 432,030 17,970 0 0 450,000 22,055,980
Apr* 10/19 441,540 0 441,540 8,460 0 0 450,000 22,105,980
Apr*** 01/20 418,230 0 418,230 31,770 0 0 450,000 22,105,980
Apr** 04/20 450,000 0 450,000 0 0 0 450,000 22,105,980
Apr** 04/20 356,131 0 356,131 92,939 0 930 450,000 22,105,980
May 08/19 438,670 0 438,670 11,300 0 30 450,000 22,105,980
May* 11/19 449,470 0 449,470 0 0 530 450,000 22,105,980
May*** 01/20 395,380 0 395,380 16,710 37,910 0 450,000 22,105,980
May*** 02/20 390,330 0 390,330 37,180 35,950 1,540 465,000 22,120,980
May*** 02/20 418,250 0 418,250 16,750 25,000 0 460,000 22,130,980
May** 05/20 345,820 0 345,820 46,710 67,470 0 460,000 22,140,980
May** 05/20 377,250 0 377,250 72,650 0 100 450,000 22,140,980
Jun 09/19 444,000 0 444,000 6,000 0 0 450,000 22,140,980
Jun* 12/19 620,000 0 620,000 0 0 0 620,000 22,140,980
Jun*** 03/20 450,000 0 450,000 0 0 0 450,000 22,190,980
Jun** 06/20 300,000 0 300,000 144,080 5,920 450,000 22,190,980
Jul 10/19 433,200 0 433,200 3,020 0 13,780 450,000 22,190,980
Jul 10/19 394,830 10,000 404,830 2,170 40,000 3,000 450,000 22,190,980
Jul* 01/20 362,660 65,000 427,660 21,620 0 720 450,000 22,190,980
Jul* 01/20 408,600 29,810 438,410 11,590 0 0 450,000 22,190,980
Jul*** 04/20 450,000 0 450,000 0 0 0 450,000 22,240,980
Jul** 07/20 498,870 0 498,870 1,130 0 0 500,000 22,290,980
Jul** 07/20 388,780 0 388,780 61,220 0 0 450,000 22,740,980
Aug 11/19 450,000 0 450,000 0 0 0 450,000 22,740,980
Aug* 01/20 350,020 30,000 380,020 65,980 4,000 0 450,000 22,740,980
Aug* 02/20 450,000 0 450,000 0 0 0 450,000 22,740,980
Aug*** 04/20 431,200 0 431,200 18,800 0 0 450,000 22,790,980
Aug*** 05/20 450,000 0 450,000 0 0 0 450,000 22,840,980
Aug*** 05/20 448,000 0 448,000 2,000 0 0 450,000 22,840,980
Aug** 07/20 435,230 0 435,230 64,770 0 0 500,000 22,890,980
Aug** 08/20 413,570 0 413,570 11,700 24,730 0 450,000 22,835,000
Sep 12/19 443,930 0 443,930 6,000 0 70 450,000 22,835,000
Sep* 03/20 436,530 0 436,530 13,470 0 0 450,000 22,835,000
Sep*** 06/20 422,510 0 422,510 27,490 0 0 450,000 22,935,000
Sep*** 06/20 493,140 0 493,140 6,200 0 660 500,000 23,035,000
Sep** 09/20 423,930 0 423,930 76,070 0 0 500,000 23,085,000
Oct 01/20 441,860 0 441,860 0 0 8,140 450,000 23,085,000
Oct 01/20 442,000 5,000 447,000 3,000 0 0 450,000 23,085,000
Oct* 04/20 393,620 5,000 398,620 51,380 0 0 450,000 23,085,000
Oct* 04/20 415,790 0 415,790 34,210 0 0 450,000 23,085,000
Oct*** 07/20 409,530 5,000 414,530 35,470 0 0 450,000 23,085,000
Oct** 10/20 463,010 0 463,010 35,950 0 1,040 500,000 23,135,000
Nov 02/20 410,840 0 410,840 30,000 0 9,160 450,000 23,135,000
Nov* 05/20 425,000 0 425,000 25,000 0 0 450,000 23,135,000
Nov*** 08/20 379,400 0 379,400 80,000 0 600 460,000 23,145,000
Nov*** 08/20 428,640 0 428,640 70,250 0 1,110 500,000 23,245,000
Nov*** 08/20 453,000 0 453,000 47,000 0 0 500,000 23,745,000
Nov** 11/20 390,550 0 390,550 69,450 0 0 460,000 23,795,000
Nov** 11/20 347,300 0 347,300 52,700 0 0 400,000 23,745,000
Nov** 11/20 417,900 0 417,900 82,100 0 0 500,000 23,845,000
Dec 03/20 351,750 0 351,750 100 0 0 351,850 23,746,850
Dec 03/20 484,760 0 484,760 5,000 0 10,240 500,000 24,246,850
Dec* 06/20 588,450 0 588,450 31,550 0 0 620,000 24,246,850
Dec*** 09/20 363,650 0 363,650 86,350 0 0 450,000 24,246,850
Dec*** 09/20 427,800 0 427,800 22,200 0 0 450,000 24,246,850
Dec** 12/20 408,210 0 408,210 41,790 0 0 450,000 24,246,850
Dec** 12/20 599,370 0 599,370 90,630 0 0 690,000 24,246,850
91 days *182 days***274 days**365 days

Bank of Namibia Annual Report 2019260
Part EStatistical Tables
Bond (coupon rate) Period Offer Amount Surplus (+) Weighted Tendered Deficit (-) YTM %
GC20 (8.25%) 2019Jan 15.0 78.3 63.3 8.46 Feb 15.0 100.0 85.0 8.62 Mar 15.0 126.0 111.0 8.34
GI22 (3.55%) 2019Jan 30.0 25.5 -4.5 4.82 Feb 15.0 48.1 33.1 4.79 Mar 15.0 49.6 34.6 4.66 Apr 30.0 76.6 46.6 4.54 May 30.0 70.4 40.4 4.34
GC23 (8.85%) 2019Jan 30.0 148.8 118.8 8.89 Feb 30.0 134.6 104.6 8.66 Mar 30.0 96.7 66.7 8.70 Apr 55.0 36 -19.1 8.66 May 55.0 115 59.5 8.64 Jun 55.0 168 113.0 8.40 Jul 55.0 227 172.0 8.21 Aug 55.0 281 226.1 8.45 Sep 55.0 135 80.3 8.31 Oct 55.0 291 236.0 8.27 Nov 60.0 155 95.2 8.45 Dec 150.0 171 21.0 8.48
GC24 (10.50%) 2018Jul 80.0 293.3 213.3 9.97 Nov 50.0 316.6 266.6 10.34 Dec 50.0 151.5 101.5 9.66
GC25 (8.50%) 2019Feb 25.0 152.0 127.0 9.34 Mar 25.0 101.0 76.0 9.30
GI25 (3.80%) 2019Jan 15.0 17.4 2.4 5.30 Feb 15.0 77.3 62.3 5.21 Mar 15.0 73.0 58.0 5.11 Apr 30.0 40.0 10.0 5.11 May 30.0 90.0 60.0 4.90
GC27 (8.00%) 2019Jan 25.0 169.0 144.0 9.94 Feb 25.0 267.0 242.0 9.68 Mar 25.0 96.0 71.0 9.49 Apr 45.0 149.5 104.5 8.89 May 45.0 135.0 90.0 9.19 Jun 45.0 85.0 40.0 9.02 Jul 45.0 225.0 180.0 8.79 Aug 45.0 95.6 50.6 9.05 Sep 45.0 66.7 21.7 8.98 Oct 45.0 243.0 198.0 8.99 Nov 50.0 116.0 66.0 9.40 Dec 135.0 174.5 39.5 9.45
GI29 (4.5%) 2019Jan 10.0 13.0 3.0 5.85 Feb 10.0 30.1 20.1 5.77 Mar 10.0 25.0 15.0 5.73 Apr 35.0 30.0 -5.0 5.73 May 35.0 0.0 -35.0 6.29 Jun 35.0 55.0 20.0 5.89 Jul 35.0 96.1 61.1 5.83 Aug 35.0 77.5 42.5 5.74 Sep 35.0 121.8 86.8 5.61 Oct 35.0 101.5 66.5 5.61 Nov 40.0 139.0 99.0 5.55 Dec 110.0 33.0 -77.0 5.72
GC30 (8.00%) 2019Jan 15.0 44.9 29.9 10.56 Feb 15.0 66.0 51.0 10.28 Mar 15.0 7.2 -7.8 10.32 Apr 40.0 59.5 19.5 10.02 May 40.0 76.0 36.0 10.04 Jun 40.0 65.0 25.0 10.14 Jul 40.0 50.0 10.0 9.65 Aug 40.0 179.7 139.7 9.82 Sep 40.0 70.7 30.7 9.42 Oct 40.0 107.1 67.1 9.59 Nov 35.0 177.3 142.3 9.64 Dec 130.0 109.6 -20.4 10.04
GC32 (9.00%) 2019Jan 10.0 36.8 26.8 10.61 Feb 10.0 42.0 32.0 10.42 Mar 10.0 15.0 5.0 10.24 Apr 35.0 90.0 55.0 10.05 May 35.0 80.0 45.0 10.01 Jun 35.0 95.0 60.0 10.04 Jul 35.0 90.0 55.0 9.76 Aug 35.0 67.0 32.0 9.76 Sep 35.0 22.0 -13.0 10.06 Oct 35.0 98.0 63.0 10.14 Nov 40.0 93.5 53.5 10.56 Dec 130.0 169.7 39.7 10.59
GI33 (4.50%) 2019Jan 10.0 22.0 12.0 6.49 Feb 10.0 45.0 35.0 6.39
Bond (coupon rate) Period Offer Amount Surplus (+) Weighted Tendered Deficit (-) YTM %
Mar 10.0 25.0 15.0 6.33 Apr 35.0 31.7 -3.4 6.39 May 35.0 20.0 -15.0 6.29 Jun 35.0 25.0 -10.0 6.37 Jul 35.0 40.0 5.0 6.38 Aug 35.0 64.0 29.0 6.35 Sep 35.0 114.7 79.7 6.19 Oct 35.0 101.0 66.0 6.21 Nov 40.0 94.0 54.0 6.15 Dec 110.0 110.6 0.6 6.25
GC35 (9.50%) 2019Jan 10.0 35.0 25.0 10.79 Feb 10.0 69.0 59.0 10.56 Mar 10.0 31.0 21.0 10.56 Apr 35.0 79.7 44.7 10.41 May 35.0 65.0 30.0 10.45 Jun 35.0 25.2 -9.8 10.62 Jul 35.0 58.1 23.1 10.33 Aug 35.0 132.6 97.6 10.68 Sep 35.0 40.4 5.4 10.34 Oct 35.0 36.3 1.3 10.68 Nov 40.0 91.4 51.4 10.58 Dec 120.0 114.4 -5.6 10.95
GI36 (4.8%) 2019Jun 30.0 65.0 35.0 6.75 Jul 30.0 50.0 20.0 6.74 Aug 30.0 84.3 54.3 6.70 Sep 30.0 107.0 77.0 6.54 Oct 30.0 91.5 61.5 6.55 Nov 40.0 151.5 111.5 6.39 Dec 110.0 40.0 -70.0 6.46
GC37 (9.50%) 2019Jan 10.0 55.0 45.0 10.35 Feb 10.0 42.0 32.0 10.83 Mar 10.0 23.0 13.0 10.69 Apr 30.0 70.8 40.8 10.58 May 30.0 57.4 27.4 10.62 Jun 30.0 80.0 50.0 10.57 Jul 30.0 82.1 52.1 10.42 Aug 30.0 106.4 76.4 10.67 Oct 30.0 50.0 20.0 10.65 Nov 40.0 90.5 50.5 11.19 Dec 120.0 95.6 -24.4 11.27
GC40 (9.80%) 2019Jan 10.0 50.5 40.5 11.50 Feb 10.0 67.0 57.0 11.23 Mar 10.0 35.5 25.5 11.22 Apr 30.0 73.5 43.5 10.98 May 30.0 47.6 17.6 11.02 Jun 30.0 80.0 50.0 11.02 Jul 30.0 30.0 0.0 10.87 Aug 30.0 120.8 90.8 11.20 Sep 30.0 40.4 10.4 10.34 Oct 30.0 46.7 16.7 11.09 Nov 40.0 64.6 24.6 11.14 Dec 110.0 74.7 -35.3 11.47
GC43 (10.0%) 2019Jun 25.0 56.3 31.3 11.22 Jul 25.0 97.0 72.0 11.22 Aug 25.0 107.6 82.6 11.07 Sep 25.0 10.0 -15.0 10.90 Oct 25.0 45.0 20.0 11.06 Nov 40.0 15.5 -24.5 11.80 Dec 110.0 52.0 -58.0 11.92
GC45 (9.85%) 2019Jan 10.0 45.0 35.0 12.00 Feb 10.0 46.0 36.0 11.88 Mar 10.0 26.5 16.5 11.71 Apr 25.0 96.4 71.4 11.47 May 25.0 93.1 68.1 11.49 Jun 25.0 58.0 33.0 11.60 Jul 25.0 91.1 66.1 11.23 Aug 25.0 115.0 90.0 11.51 Sep 25.0 79.0 54.0 11.20 Oct 25.0 36.3 11.3 11.46 Nov 30.0 57.2 27.2 11.47 Dec 100.0 60.4 -39.6 12.11
GC50 (10.25%)Jun 20.0 55.8 35.8 11.83 Jul 20.0 62.2 42.2 11.52 Aug 20.0 125.5 105.5 11.81 Sep 20.0 92.0 72.0 11.44 Oct 20.0 41.4 21.4 11.73 Nov 30.0 118.2 88.2 11.74 Dec 100.0 152.7 52.7 12.16 Dec 10.0 30.5 20.5 11.77
Table III. 2 (a) Internal Registered Stock auctions - N$ million

Bank of Namibia Annual Report 2019 261
Part EStatistical Tables
Table lll.2 (b) Allotment of Government of Namibia Internal Registered Stock - N$ ‘000
Date issued
Date due
Coupon rate
Deposit Money Banks
Other Banking Institutions
Banking SectorNon-bank Financial
InstitutionsOther Public Enterprises
Private Sector
TOTALAmount
Outstanding
2019
Jan 04/20 8.25 2,000 0 2,000 13,000 0 0 15,000 32,717,710 Jan 10/22 3.55 4,500 0 4,500 10,000 0 500 15,000 32,732,710 Jan 10/23 8.85 20,000 0 20,000 10,000 0 0 30,000 32,762,710 Jan 07/25 3.80 9,560 0 9,560 5,440 0 0 15,000 32,777,710 Jan 04/25 8.50 5,000 0 5,000 20,000 0 0 25,000 32,802,710 Jan 01/27 8.00 5,000 0 5,000 20,000 0 0 25,000 32,827,710 Jan 01/29 3.80 10,000 0 10,000 0 0 0 10,000 32,837,710 Jan 01/30 8.00 0 0 0 15,000 0 0 15,000 32,852,710 Jan 04/32 9.00 0 0 0 10,000 0 0 10,000 32,862,710 Jan 04/33 4.50 10,000 0 10,000 0 0 0 10,000 32,872,710 Jan 07/35 9.50 10,000 0 10,000 0 0 0 10,000 32,882,710 Jan 07/37 9.50 10,000 0 10,000 0 0 0 10,000 32,892,710 Jan 10/40 9.85 10,000 0 10,000 0 0 0 10,000 32,902,710 Jan 07/45 9.85 0 0 0 10,000 0 0 10,000 32,912,710 Feb 04/20 8.25 10,000 0 10,000 5,000 0 0 15,000 32,927,710 Feb 10/22 3.55 6,920 0 6,920 5,000 0 3,080 15,000 32,942,710 Feb 10/23 8.85 30,000 0 30,000 0 0 0 30,000 32,972,710 Feb 07/25 3.80 5,000 0 5,000 10,000 0 0 15,000 32,987,710 Feb 04/25 8.50 5,000 0 5,000 20,000 0 0 25,000 33,012,710 Feb 01/27 8.00 8,000 0 8,000 17,000 0 0 25,000 33,037,710 Feb 01/29 3.80 0 0 0 10,000 0 0 10,000 33,047,710 Feb 01/30 8.00 0 0 0 15,000 0 0 15,000 33,062,710 Feb 04/32 9.00 0 0 0 10,000 0 0 10,000 33,072,710 Feb 04/33 4.50 10,000 0 10,000 0 0 0 10,000 33,082,710 Feb 07/35 9.50 0 0 0 10,000 0 0 10,000 33,092,710 Feb 07/37 9.50 1,880 0 1,880 8,120 0 0 10,000 33,102,710 Feb 10/40 9.85 0 0 0 10,000 0 0 10,000 33,112,710 Feb 07/45 9.85 0 0 0 10,000 0 0 10,000 33,122,710 Mar 04/20 8.25 15,000 0 15,000 0 0 0 15,000 33,137,710 Mar 10/22 3.55 10,690 0 10,690 4,310 0 0 15,000 33,152,710 Mar 10/23 8.85 12,400 0 12,400 200 17,400 0 30,000 33,182,710 Mar 07/25 3.80 5,000 0 5,000 10,000 0 0 15,000 33,197,710 Mar 04/25 8.50 25,000 0 25,000 0 0 0 25,000 33,222,710 Mar 01/27 8.00 25,000 0 25,000 0 0 0 25,000 33,247,710 Mar 01/29 3.80 4,000 0 4,000 6,000 0 0 10,000 33,257,710 Mar 01/30 8.00 2,000 0 2,000 0 5,200 0 7,200 33,264,910 Mar 04/32 9.00 0 0 0 10,000 0 0 10,000 33,274,910 Mar 04/33 4.50 10,000 0 10,000 0 0 0 10,000 33,284,910 Mar 07/35 9.50 0 0 0 10,000 0 0 10,000 33,294,910 Mar 07/37 9.50 0 0 0 10,000 0 0 10,000 33,304,910 Mar 10/40 9.85 0 0 0 10,000 0 0 10,000 33,314,910 Mar 07/45 9.85 0 0 0 10,000 0 0 10,000 33,324,910 Apr 10/22 3.55 0 0 0 30,000 0 0 30,000 33,354,910 Apr 10/23 8.85 5,000 0 5,000 430 20,000 0 25,430 33,380,340 Apr 07/25 3.80 15,000 0 15,000 15,000 0 0 30,000 33,410,340 Apr 01/27 8.00 20,000 0 20,000 0 25,000 0 45,000 33,455,340 Apr 01/29 3.80 5,000 0 5,000 15,000 10,000 0 30,000 33,485,340 Apr 01/30 8.00 0 0 0 20,000 20,000 0 40,000 33,525,340 Apr 04/32 9.00 0 0 0 35,000 0 0 35,000 33,560,340 Apr 04/33 4.50 20,000 0 20,000 1,650 10,000 0 31,650 33,591,990 Apr 07/35 9.50 300 0 300 34,700 0 0 35,000 33,626,990 Apr 07/37 9.50 0 0 0 29,230 0 770 30,000 33,656,990 Apr 10/40 9.85 0 0 0 30,000 0 0 30,000 33,686,990 Apr 07/45 9.85 1,500 0 1,500 23,500 0 0 25,000 33,711,990 May 04/20 8.25 14,000 0 0 0 0 0 (973,000) 32,738,990 May 10/22 3.55 30,000 0 30,000 0 0 0 30,000 32,768,990 May 10/23 8.85 0 0 0 15,000 40,000 0 55,000 32,823,990 May* 10/23 8.85 72,820 0 72,820 0 49,620 0 122,440 32,946,430 May 07/25 3.80 30,000 0 30,000 0 0 0 30,000 32,976,430 May 01/27 8.00 45,000 0 45,000 0 0 0 45,000 33,021,430 May* 01/27 8.00 13,630 0 13,630 41,940 52,360 0 107,930 33,129,360 May 01/30 8.00 32,000 0 32,000 8,000 0 0 40,000 33,169,360 May* 01/30 8.00 85,920 0 85,920 4,480 56,250 0 146,650 33,316,010 May 04/32 9.00 17,500 0 17,500 17,500 0 0 35,000 33,351,010 May* 04/32 9.00 54,500 0 54,500 0 54,200 0 108,700 33,459,710 May 04/33 4.50 20,000 0 20,000 0 0 0 20,000 33,479,710 May 07/35 9.50 20,000 0 20,000 15,000 0 0 35,000 33,514,710 May* 07/35 9.50 105,740 0 105,740 10,620 42,090 0 158,450 33,673,160 May 07/37 9.50 10,000 0 10,000 19,000 1,000 0 30,000 33,703,160 May* 07/37 9.50 107,410 0 107,410 32,180 0 0 139,590 33,842,750 May 10/40 9.85 8,020 0 8,020 21,980 0 0 30,000 33,872,750 May* 10/40 9.85 0 0 0 33,630 22,100 0 55,730 33,928,480 May 10/45 9.85 1,950 0 1,950 23,050 0 0 25,000 33,953,480 May* 07/45 9.85 0 0 0 187,720 22,460 0 210,180 34,163,660 Jun 10/23 8.85 8,330 0 8,330 10,000 36,670 0 55,000 34,218,660 Jun 01/27 8.00 5,000 10,720 15,720 10,000 19,280 0 45,000 34,263,660 Jun 01/29 3.80 0 0 0 35,000 0 0 35,000 34,298,660 Jun 01/30 8.00 30,000 0 30,000 10,000 0 0 40,000 34,338,660 Jun 04/32 9.00 25,000 0 25,000 10,000 0 0 35,000 34,373,660 Jun 04/33 4.50 0 0 0 25,000 0 0 25,000 34,398,660 Jun 07/35 9.50 0 0 0 25,200 0 0 25,200 34,423,860 Jul 07/36 4.80 0 0 0 10,000 20,000 0 30,000 34,453,860 Jun 07/37 9.50 0 0 0 30,000 0 0 30,000 34,483,860 Jun 10/40 9.85 0 0 0 30,000 0 0 30,000 34,513,860 Jun 07/43 10.00 0 0 0 25,000 0 0 25,000 34,538,860 Jun 07/45 9.85 0 0 0 25,000 0 0 25,000 34,563,860 Jun 07/50 9.85 5,000 0 5,000 14,250 0 750 20,000 34,583,860 Jul 10/23 8.85 30,000 14,200 44,200 1,550 4,250 5,000 55,000 34,638,860 Jul 01/27 8.00 12,230 0 12,230 22,770 10,000 0 45,000 34,683,860 Jul 01/29 3.80 35,000 0 35,000 0 0 0 35,000 34,718,860 Jul 01/30 8.00 0 0 0 40,000 0 0 40,000 34,758,860 Jul 04/32 9.00 0 0 0 35,000 0 0 35,000 34,793,860

Bank of Namibia Annual Report 2019262
Part EStatistical Tables
Table lll.2 (b) Allotment of Government of Namibia Internal Registered Stock - N$ ‘000 (cont...)
Date issued
Date due
Coupon rate
Deposit Money Banks
Other Banking Institutions
Banking SectorNon-bank Financial
InstitutionsOther Public Enterprises
Private Sector
TOTALAmount
Outstanding
2019
Jul 04/33 4.50 35,000 0 35,000 0 0 0 35,000 34,828,860 Jul 07/35 9.50 0 0 0 34,950 0 50 35,000 34,863,860 Jul 07/36 4.80 30,000 0 30,000 0 0 0 30,000 34,893,860 Jul 07/37 9.50 0 0 0 28,540 0 1,460 30,000 34,923,860 Jul 10/40 9.85 0 0 0 30,000 0 0 30,000 34,953,860 Jul 07/43 10.00 0 0 0 13,340 11,660 0 25,000 34,978,860 Jul 07/45 9.85 0 0 0 25,000 0 0 25,000 35,003,860 Jul 07/50 9.85 0 0 0 17,800 0 2,200 20,000 35,023,860 Aug 04/20 8.25 0 0 0 (704,170) 34,319,690 Aug 10/23 8.85 45,000 0 45,000 9,800 0 200 55,000 34,374,690 Aug* 10/23 8.85 48,690 0 48,690 1,980 79,530 2,970 133,170 34,507,860 Aug 01/27 8.00 5,000 0 5,000 40,000 0 0 45,000 34,552,860 Aug* 01/27 8.00 10,910 0 10,910 77,250 32,760 0 120,920 34,673,780 Aug 01/29 3.80 4,440 0 4,440 16,120 14,440 0 35,000 34,708,780 Aug 01/30 8.00 35,000 0 35,000 0 5,000 0 40,000 34,748,780 Aug* 01/30 8.00 2,970 0 2,970 73,180 34,860 0 111,010 34,859,790 Aug 04/32 9.00 0 0 0 35,000 0 0 35,000 34,894,790 Aug* 04/32 9.00 26,870 0 26,870 43,340 0 0 70,210 34,965,000 Aug 04/33 4.50 14,000 0 14,000 0 21,000 0 35,000 35,000,000 Aug 07/35 9.50 20,500 0 20,500 0 14,500 0 35,000 35,035,000 Aug* 07/35 9.50 12,680 0 12,680 33,650 0 0 46,330 35,081,330 Aug 07/36 4.80 10,530 0 10,530 19,300 170 0 30,000 35,111,330 Aug 07/37 9.50 0 0 0 30,000 0 0 30,000 35,141,330 Aug* 07/37 9.50 40,420 0 40,420 33,790 0 0 74,210 35,215,540 Aug 10/40 9.85 0 0 0 30,000 0 0 30,000 35,245,540 Aug* 10/40 9.85 0 0 0 34,310 33,560 0 67,870 35,313,410 Aug 07/43 10.00 11,660 0 11,660 13,340 0 0 25,000 35,338,410 Aug* 07/43 10.00 11,320 0 11,320 22,780 56,550 0 90,650 35,429,060 Aug 07/45 9.85 8,840 0 8,840 16,160 0 0 25,000 35,454,060 Aug* 07/45 9.85 0 0 0 36,730 0 0 36,730 35,490,790 Aug 07/50 9.85 10,000 0 10,000 10,000 0 0 20,000 35,510,790 Aug* 07/50 9.85 10,000 0 10,000 10,000 0 0 23,380 35,534,170 Sep 10/23 8.85 53,700 0 53,700 1,300 0 0 55,000 35,589,170 Sep 01/27 8.00 44,320 0 44,320 680 0 0 45,000 35,634,170 Sep 01/29 3.80 10,000 0 10,000 25,000 0 0 35,000 35,669,170 Sep 01/30 8.00 0 0 0 40,000 0 0 40,000 35,709,170 Sep 04/32 9.00 10,000 0 10,000 12,000 0 0 22,000 35,731,170 Sep 04/33 4.50 0 0 0 35,000 0 0 35,000 35,766,170 Sep 07/35 9.50 5,000 0 5,000 30,000 0 0 35,000 35,801,170 Sep 07/36 4.80 30,000 0 30,000 0 0 0 30,000 35,831,170 Sep 10/40 9.85 10,000 0 10,000 20,000 0 0 30,000 35,861,170 Sep 07/43 10.00 0 0 0 10,000 0 0 10,000 35,871,170 Sep 07/45 9.85 0 0 0 25,000 0 0 25,000 35,896,170 Sep 07/50 9.85 6,800 0 6,800 13,200 0 0 20,000 35,916,170 Oct 10/23 8.85 34,000 0 34,000 18,670 0 2,330 55,000 35,971,170 Oct 01/27 8.00 0 0 0 45,000 0 0 45,000 36,016,170 Oct 01/29 3.80 23,500 0 23,500 11,500 0 0 35,000 36,051,170 Oct 01/30 8.00 40,000 0 40,000 0 0 0 40,000 36,091,170 Oct 04/32 9.00 20,000 0 20,000 0 15,000 0 35,000 36,126,170 Oct 04/33 4.50 35,000 0 35,000 0 0 0 35,000 36,161,170 Oct 07/35 9.50 0 0 0 35,000 0 0 35,000 36,196,170 Oct 07/36 4.80 28,500 0 28,500 1,500 0 0 30,000 36,226,170 Oct 07/37 9.50 0 0 0 30,000 0 0 30,000 36,256,170 Oct 10/40 9.85 0 0 0 30,000 0 0 30,000 36,286,170 Oct 07/43 10.00 0 0 0 25,000 0 0 25,000 36,311,170 Oct 07/45 9.85 5,000 0 5,000 20,000 0 0 25,000 36,336,170 Oct 07/50 9.85 5,000 0 5,000 14,940 0 60 20,000 36,356,170
Nov * 04/20 8.25 0 0 0 0 0 0 (647,530) 35,708,640 Nov 10/23 8.85 60,000 0 60,000 0 0 0 60,000 35,768,640
Nov * 10/23 8.85 241,500 0 241,500 26,940 0 6,880 275,320 36,043,960 Nov 01/27 8.00 0 0 0 50,000 0 0 50,000 36,093,960
Nov * 01/27 8.00 96,760 0 96,760 49,980 5,220 0 151,960 36,245,920 Nov 01/29 3.80 17,500 0 17,500 22,500 0 0 40,000 36,285,920 Nov 01/30 8.00 30,000 0 30,000 15,000 0 0 45,000 36,330,920
Nov * 01/30 9.00 70,760 0 70,760 6,720 0 0 77,480 36,408,400 Nov 04/32 9.00 0 0 0 40,000 0 0 40,000 36,448,400
Nov * 04/32 9.00 0 0 0 38,710 0 0 38,710 36,487,110 Nov 04/33 4.50 11,000 0 11,000 29,000 0 0 40,000 36,527,110 Nov 07/35 9.50 0 0 0 40,000 0 0 40,000 36,567,110
Nov * 07/35 9.50 0 0 0 10,750 0 0 10,750 36,577,860 Nov 07/36 4.80 40,000 0 40,000 0 0 0 40,000 36,617,860 Nov 07/37 9.50 0 0 0 40,000 0 0 40,000 36,657,860
Nov * 07/37 9.50 0 0 0 32,850 0 0 32,850 36,690,710 Nov 10/40 9.85 0 0 0 40,000 0 0 40,000 36,730,710 Nov 07/43 10.00 0 0 0 15,000 0 0 15,000 36,745,710
Nov * 07/43 10.00 0 0 0 22,140 0 0 22,140 36,767,850 Nov 07/45 9.85 0 0 0 30,000 0 0 30,000 36,797,850
Nov * 07/45 9.85 0 0 0 0 0 0 22,970 36,820,820 Nov 07/50 9.85 0 0 0 30,000 0 0 30,000 36,850,820
Nov * 07/50 9.85 3,390 0 3,390 39,170 0 0 42,560 36,893,380 Dec 10/23 8.85 110,160 0 110,160 30,440 0 9,400 150,000 37,043,380 Dec 01/27 8.00 18,200 0 18,200 116,800 0 0 135,000 37,178,380 Dec 01/29 3.80 25,000 0 25,000 8,000 0 0 33,000 37,211,380 Dec 01/30 8.00 43,230 0 43,230 66,380 0 0 109,610 37,320,990 Dec 04/32 9.00 113,220 0 113,220 16,780 0 0 130,000 37,450,990 Dec 04/33 4.50 34,910 0 34,910 75,090 0 0 110,000 37,560,990 Dec 07/35 9.50 49,640 0 49,640 40,810 0 0 90,455 37,651,440 Dec 07/36 4.80 40,000 0 40,000 0 0 0 40,000 37,691,440 Dec 07/37 9.50 27,880 0 27,880 66,400 0 0 94,280 37,785,720 Dec 10/40 9.85 21,550 0 21,550 33,120 0 0 54,670 37,840,390 Dec 07/43 10.00 27,000 0 27,000 25,000 0 0 52,000 37,892,390 Dec 07/45 9.85 15,640 0 15,640 44,760 0 0 60,400 37,952,790 Dec 07/50 9.85 0 0 0 99,300 0 700 100,000 38,052,790

Bank of Namibia Annual Report 2019 263
Part EStatistical Tables
Table III.3 Government Foreign Debt by Type and Currency (N$ million)
End of period 2015 2016 2017 2018 2019
Multilateral 2,938.9 2,342.2 5,163.6 8,198.0 7,582.7
Euro 1,400.4 1,118.9 1,065.8 1,116.9 739.7
US Dollar 254.4 205.7 174.6 191.1 166.9
Pound 0.0 0.0 0.0 0.0 0.0
Rand 320.7 277.5 3,234.2 6,205.2 6,253.3
Franc 48.6 39.2 35.0 39.6 37.3
Dinar 26.1 9.6 55.6 57.1 48.6
SDR 0.0 0.0 0.0 0.0 0.0
Yen 888.5 691.3 598.4 588.1 336.9
Billateral 3,549.2 2,997.5 2,879.0 3,027.0 2,722.7
Euro 1,098.3 866.7 832.6 852.7 746.5
Yuan 2,450.9 2,130.8 2,046.5 2,174.4 1,976.2
Eurobonds 19,444.1 17,029.9 15,491.3 18,038.6 17,654.3
US Dollar 19,444.1 17,029.9 15,491.3 18,038.6 17,654.3
JSE listed bonds 2,400.0 2,892.0 2,892.0 2,892.0 2,892.0
ZAR 2,400.0 2,892.0 2,892.0 2,892.0 2,892.0
Foreign debt stock 28,332.1 25,261.6 26,425.9 32,155.6 30,851.7
Euro 2,498.7 1,985.6 1,898.4 1,969.6 1,486.2
US Dollar 19,698.5 17,235.6 15,665.8 18,229.6 17,821.2
Pound 0.0 0.0 0.0 0.0 0.0
Rand 2,720.7 3,169.5 6,126.2 9,097.2 9,145.3
Franc 48.6 39.2 35.0 39.6 37.3
Dinar 26.1 9.6 55.6 57.1 48.6
SDR 0.0 0.0 0.0 0.0 0.0
Yen 888.5 691.3 598.4 588.1 336.9
Yuan 2450.9 2130.8 2046.5 2174.4 1976.2
Exchange Rates (End of period) - Namibia Dollar per foreign currency unit
Euro 16.9997 14.3403 14.8063 16.4917 15.8247
US Dollar 15.5553 13.6240 12.3930 14.4309 14.1235
Pound 23.0652 16.7264 16.6789 18.3087 18.5220
Rand 1.0000 1.0000 1.0000 1.0000 1.0000
Franc 15.7356 13.3511 12.6743 14.6520 14.5985
Dinar 50.6476 44.7096 41.0204 47.4078 46.0937
SDR 21.5729 18.2482 17.6056 20.0803 19.5313
Yen 0.1292 0.1167 0.1100 0.1308 0.1300
Yuan 2.3961 1.9602 1.9013 2.0982 2.0247
Source: BoN and MoF

Bank of Namibia Annual Report 2019264
Part EStatistical Tables
Table III.4 (a) Government Domestic Loan Guarantees by Sector (N$ million)
End of period 2015 2016 2017 2018 2019
Sectoral allocation
Mining & Quarrying 0.0 0.0 0.0 0.0 0.0
Tourism 94.1 91.1 91.1 91.3 82.1
Agriculture 224.0 223.2 623.2 484.0 484.0
Finance 330.0 0.0 0.0 234.8 234.8
Transport 0.0 0.0 0.0 0.0 16.4
Communication 0.0 0.0 0.0 0.0 0.0
Fisheries 69.7 69.2 65.2 66.3 47.6
Education 64.5 166.2 294.5 202.5 0.0
Energy 670.0 664.3 671.0 671.6 672.6
Total domestic loan guarantees 1,452.3 1,213.9 1,744.9 1,750.4 1,537.4
Proportion of domestic guarantees by sector (percent)
Mining & Quarrying 0.0 0.0 0.0 0.0 0.0
Tourism 6.5 7.5 5.2 5.2 5.3
Agriculture 15.4 18.4 35.7 27.6 31.5
Finance 22.7 0.0 0.0 13.4 15.3
Transport 0.0 0.0 0.0 0.0 1.1
Communication 0.0 0.0 0.0 0.0 0.0
Fisheries 4.8 5.7 3.7 3.8 3.1
Education 4.4 13.7 16.9 11.6 0.0
Energy 46.1 54.7 38.5 38.4 43.7
Total domestic loan guarantees 100.0 100.0 100.0 100.0 100.0
Source: MoF

Bank of Namibia Annual Report 2019 265
Part EStatistical Tables
Table III.4 (b) Government Foreign Loan Guarantees by Sector and Currency (N$ million)
Sectoral allocation, end of period 2015 2016 2017 2018 2019
Energy 435.0 248.8 168.8 86.1 54.6
NAD and ZAR 435.0 248.8 168.8 86.1 54.6
USD 0.0 0.0 0.0 0.0 0.0
Agriculture 0.0 0.0 0.0 0.0 0.0
NAD and ZAR 0.0 0.0 0.0 0.0 0.0
USD 0.0 0.0 0.0 0.0 0.0
Transport 5,433.2 4,954.8 4,881.3 4,351.5 4,693.0
NAD and ZAR 1,681.4 2,085.0 2,643.7 2,196.3 3,019.4
USD 3,751.8 2,869.8 2,237.6 2,155.2 1,673.6
Communication 45.9 38.7 44.8 49.9 47.9
NAD and ZAR 0.0 0.0 0.0 0.0 0.0
USD 0.0 0.0 0.0 0.0 0.0
EUR 45.9 38.7 44.8 49.9 47.9
Finance 2,500.0 3,500.0 4,641.2 4,834.9
NAD and ZAR 2,500.0 3,500.0 4,641.2 4,834.9
Total foreign loan guarantees 5,914.1 7,742.3 8,594.9 9,128.7 9,630.4
Proportion of foreign loan guarantees by sector
Energy 7.4 3.2 2.0 0.9 0.6
NAD and ZAR 7.4 3.2 2.0 0.9 0.6
USD 0.0 0.0 0.0 0.0 0.0
Agriculture 0.0 0.0 0.0 0.0 0.0
NAD and ZAR 0.0 0.0 0.0 0.0 0.0
USD 0.0 0.0 0.0 0.0 0.0
Transport 91.9 64.0 56.8 47.7 48.7
NAD and ZAR 28.4 26.9 30.8 24.1 31.4
USD 63.4 37.1 26.0 23.6 17.4
Communication 0.8 0.5 0.5 0.5 0.5
NAD and ZAR 0.0 0.0 0.0 0.0 0.0
USD 0.0 0.0 0.0 0.0 0.0
EUR 0.8 0.5 0.5 0.5 0.5
Finance 32.3 40.7 50.8 50.2
NAD and ZAR 32.3 40.7 50.8 50.2
Total 100.0 100.0 100.0 100.0 100.0
Foreign loan guarantees per currency
NAD and ZAR 2,116.4 4,833.8 6,312.5 6,923.6 7,908.9
USD 3,751.8 2,869.8 2,237.6 2,155.2 1,673.6
EUR 45.9 38.7 44.8 49.9 47.9
Total foreign loan guarantees 5,914.1 7,742.3 8,594.9 9128.7 9630.4
Currency composition of foreign loan guarantees
NAD and ZAR 35.8 62.1 73.4 75.8 82.1
USD 63.4 37.4 26.0 23.6 17.4
EUR 0.8 0.5 0.5 0.5 0.5
Total 100.0 100.0 100.0 100.0 100.0
Source: MoF

Bank of Namibia Annual Report 2019266
Part EStatistical Tables
Table IV.A1 Balance of Payments aggregates [1] (N$ million)
2015 2016 2017 (p) 2018 (p) 2019 (p) CURRENT ACCOUNT -19,922 -24,868 -6,832 -5,055 -4,137 GOODS AND SERVICES -37,633 -36,679 -21,771 -18,196 -18,372
Total credit 52,638 55,547 59,675 65,652 65,391
Total debit 90,271 92,225 81,446 83,848 83,763
Goods (Trade balance) -40,452 -35,260 -23,673 -20,447 -19,379Export (fob)〗[2] 41,150 46,837 49,865 55,575 55,994
Diamonds 11,195 10,357 9,744 11,014 9,364
Other mineral products 8,569 10,744 11,209 14,784 16,421
Food and live animals 2,447 2,055 3,858 3,774 3,382
Manufactured products 14,917 20,769 21,886 22,931 23,672
of which Processed fish 7,529 9,109 9,234 10,055 10,154
Other commodities 1,761 1,572 1,524 1,679 1,911
Re-exports 2,261 1,341 1,645 1,394 1,243
Imports (fob)〗[2] 81,603 82,096 73,538 76,023 75,373
Consumer goods 18,765 19,659 19,203 19,118 20,282
Mineral fuels, oils and products of their distillation
14,136 11,959 8,894 11,961 12,747
Vehicles, aircraft, vessels 10,579 11,716 8,746 8,726 8,857
Machinery, mechanical, electrical appliances 13,189 12,362 11,455 11,903 10,378
Base metals and articles of base Metal 6,949 5,409 4,614 4,600 4,412
Products of the chemical industries 6,361 7,288 7,018 7,514 6,976
Other imports 11,622 13,703 13,609 12,202 11,721
Services 2,819 -1,419 1,902 2,258 1,007
Total credit 11,488 8,710 9,810 10,084 9,397
Total debit 8,668 10,129 7,908 7,826 8,390
Manufacturing services (net) 1,458 1,516 1,769 1,824 1,731
Maintenance and repair services (net) 187 -57 24 -162 -189
Transportation (net) -970 -936 -252 -467 -404
Travel (net) 5,375 3,065 3,597 4,325 3,729
Insurance and pension (net) -262 -224 -221 -197 -292
Other private services* (net) -3,440 -4,489 -2,988 -2,848 -3,273
Government services, n.i.e. (net) 470 -294 -28 -217 -295
PRIMARY INCOME -233 -3,846 -4,192 -5,477 -5,027
Compensation of employees (net) -142 -22 -117 -10 -28
Investment income (net) 158 -3,714 -3,972 -5,352 -4,957
Other primary income (net) -250 -110 -102 -115 -42
SECONDARY INCOME 17,944 15,657 19,131 18,611 19,261
General government (net) 17,774 15,084 18,349 17,938 18,674
Current taxes on income, wealth etc. 148 225 224 180 309
Current international cooperation (Include: SACU)
17,627 14,859 18,126 17,758 18,365
of which SACU receipts 17,374 14,835 18,216 17,931 18,535
of which SACU pool payments 1,127 1,158 1,257 1,381 1,485
Financial corporations, non-financial corporations, households and NPISHs (net)
170 573 782 673 587
Personal transfers -167 247 -154 -51 48
Other current transfers 337 326 935 724 540
CAPITAL ACCOUNT 1,378 1,943 2,428 1,732 1,649
Gross acuisitions/ disposals of non-produced nonfinancial assets (net)
6 1 7 5 27
Capital transfers (net) 1,372 1,942 2,422 1,727 1,622
Net lending to (+)/borrowing from (-) rest of world -18,544 -22,925 -4,404 -3,323 -2,489
[1] Data for the previous three years are provisional and subject to revision.
[2] Published merchandise trade data from NSA adjusted for BOP purposes.

Bank of Namibia Annual Report 2019 267
Part EStatistical Tables
Table IV.A2 Balance of Payments aggregates (N$ million) [1]
2015 2016 2017 (p) 2018 (p) 2019 (p) FINANCIAL ACCOUNT [inflow (-)/ Outflow (+)] -17,208 -19,121 -4,202 -2,504 -1,942
NET DIRECT INVESTMENT [inflow (-)/ Outflow (+)] -9,728 -5,483 -5,848 -773 401
Net acquisition of financial assets [2] 1,317 -70 -874 1,303 149
Equity and investment fund shares 718 172 -357 724 -48
Equity other than reinvestment of earnings 742 96 -469 762 3
Reinvestment of earnings -24 76 112 -38 -51
Debt instruments 599 -242 -517 579 197
Net incurrence of financial liabilities [3] 11,045 5,413 4,974 2,076 -251
Equity and investment fund shares 10,949 1,277 1,013 564 66
Equity other than reinvestment of earnings 11,023 474 709 -1,572 94
Reinvestment of earnings -74 802 304 2,136 -28
Debt instruments 96 4,136 3,961 1,512 -317
NET PORTFOLIO INVESTMENT [inflow (-)/ Outflow (+)] -14,786 -1,263 5,793 2,787 -985
Net acquisition of financial liabilities [2] -2,809 383 5,172 2,532 -1,098
Equity and investment fund shares -3,106 -363 3,838 1,482 -999
Debt securities 296 746 1,335 1,050 -99
Net incurrence of financial liabilities [3] 11,976 1,645 -621 -255 -113
Equity and investment fund shares 27 -37 28 29 139
Debt securities 11,950 1,682 -649 -283 -252
Net FINANCIAL DERIVATIVES & EMPLOYEE STOCK OPTION [inflow (-)/ Outflow (+)]
-251 271 3 133 140
Net acquisition of financial assets [2] 75 -48 -5 343 -21
Net incurrence of financial liabilities [3] 327 -319 -7 209 -162
NET OTHER INVESTMENT [inflow (-)/ Outflow (+)] -2,456 -14,606 -9,115 -5,672 1,670
Net acquisition of financial assets [2] 1,617 -5,144 1,649 -6 867
Other Equity - - - - -
Currency and Deposits 1,282 -5,097 932 -2,398 812
Loans 268 -475 498 1,758 281
Insurance, pension,standardised guarantees - - - - -
Trade Credits and Advances -141 586 358 371 -47
Other Accounts Receivable 207 -158 -139 264 -180
Net incurrence of liabilities[3] 4,073 9,461 10,764 5,667 -803
Other equity - - - - -
Currency and deposits 1,266 2,268 1,209 1,170 240
Loans 2,051 4,993 8,479 1,975 -121
Insurance, pension,standardised guarantees - - - - -
Trade Credits and Advances 544 457 1,235 1,831 -382
Other Accounts Payable 212 1,744 -159 690 -541
Special Drawing Rights - - - - -
RESERVE ASSETS (Increase (+)/decrease (-)) 10,013 1,959 4,965 1,020 -3,169
NET ERRORS AND OMISSIONS 1,336 3,803 202 819 546
[1] Data for the previous three years are provisional and subject to revision
[2] A net acquisition of assets (outflow of capital) is indicated by a positive (+) sign. A net disposal of assests (inflow of capital) is indicated by a negative (-) sign.
[3] A net incurrence of liabilities (inflow of capital) is indicated by a positive (+) sign. A net disposal of liabilities (outflow of capital) is indicated by a negative (-) sign.

Bank of Namibia Annual Report 2019268
Part EStatistical Tables
Table IV.B Supplementary table: balance of payments - services (N$ million)
2015 2016 2017 2018 2019SERVICES, NET 2,819 -1,419 1,902 2,258 1,007Credit 11,488 8,710 9,810 10,084 9,397
Manufacturing services 1,461 1,523 1,775 1,829 1,737Maintenance & repair services 426 247 309 289 197 Transport services 1,077 1,172 1,540 1,530 1,532
Passenger 969 1,036 1,432 1,428 1,438Other 108 135 109 102 94
Travel Services 6,174 4,118 4,540 5,066 4,891Business 284 59 84 110 296
Personal 5,891 4,059 4,456 4,956 4,595Construction services 181 89 56 124 84Insurance and pension services 0 0 0 0 0Financial services 314 367 363 452 345Charges for the use of intellectual property 4 5 4 18 8Telecommunications, computer & information 286 236 495 237 125Other business services 359 208 95 70 69Personal, cultural & recreational services 23 36 53 67 25Government services, n.i.e. 1,182 710 580 402 383
Debit 8,668 10,129 7,908 7,826 8,390Manufacturing services 3 5 6 5 6Maintenance & repair services 239 304 284 451 386Transport services 2,046 2,107 1,792 1,996 1,936
Passenger 97 145 28 176 134Other 1,949 1,962 1,765 1,820 1,802
Travel services 799 1,053 943 741 1,162Business 273 348 188 170 188Personal 526 706 755 571 974
Construction services 447 1,175 867 880 268Insurance and pension services 262 226 221 197 292Financial services 82 26 84 92 100Charges for the use of intellectual property 87 42 32 18 37Telecommunications, computer & information 1,018 704 626 658 451Other business services 2,968 3,476 2,439 2,165 3,069Personal, cultural & recreational services 3 6 5 3 5Government services, n.i.e. 712 1,004 608 619 678
Table IV.C Supplementary table: balance of payments - primary income (N$ million)
2015 2016 2017 2018 2019 PRIMARY INCOME, NET -233 -3,846 -4,192 -5,477 -5,027 Credit 3,926 3,874 3,827 4,535 4,249 Debit 4,159 7,720 8,019 10,012 9,276 Compensation of employees, net -142 -22 -117 -10 -28 Credit 327 339 365 402 253 Debit 469 361 482 412 281 Investment income, net 158 -3,714 -3,972 -5,352 -4,957 Credit 3,599 3,535 3,462 4,133 3,996
Direct investment 24 80 120 -24 -19 Dividends 2 4 6 6 6 Reinvested earnngs -24 76 112 -38 -51 Interest 46 0 2 8 26
Portfolio investment 3,049 2,784 2,450 2,945 2,804 Dividends 2,078 1,822 1,667 2,056 1,870 Interest 972 962 783 889 934
Other investment 208 254 263 438 378 Reserve assets 318 417 629 774 834
Debit 3,441 7,249 7,434 9,484 8,953 Direct investment 1,651 3,924 3,916 5,632 5,021
Dividends 1,516 2,293 2,275 1,841 3,126 Reinvested earnngs -74 802 304 2,136 -28 Interest 209 829 1,337 1,655 1,923
Portfolio investment 859 1,923 2,310 2,345 2,355 Dividends 11 11 11 11 11 Interest 848 1,912 2,299 2,334 2,344
Other investment 930 1,403 1,208 1,508 1,577 Other primary income, net -250 -110 -102 -115 -42 Credit 0 0 0 0 0 Debit 250 110 102 115 42

Bank of Namibia Annual Report 2019 269
Part EStatistical Tables
Table IV.D Supplementary table: balance of payments - secondary income (N$ million)
2015 2016 2017(p) 2018(p) 2019(p) Secondary income, net 17,944 15,657 19,131 18,611 19,261
Credit 19,934 17,563 20,997 20,541 21,411 General government 19,285 16,311 19,714 19,412 20,247
Current taxes on income, wealth etc. 152 229 228 184 313Social contributions - - - - - Social benefits - - - - - Current international cooperation (include:SACU) 19,134 16,082 19,486 19,228 19,935 of which receipts from SACU 17,374 14,835 18,216 17,931 18,535
Financial corporations, nonfinancial corporations, households, and NPISHs
648.4 1,251.7 1,283.3 1,129.0 1,163.4
Personal transfers (current transfers between resident and nonresident households)
274 625 277 306 482
Other current transfers 373.9 627.1 1,006.5 823.0 680.9
Debit 1,990 1,906 1,867 1,931 2,149 General government 1,511 1,227 1,365 1,474 1,573
Current taxes on income, wealth etc. 4.0 4.0 4.0 4.0 4.0 Social contributions - - - - - Social benefits - - - - - Current international cooperation (include:SACU) 1,507 1,223 1,361 1,470 1,569 of which SACU pool payments 1,127 1,158 1,257 1,381 1,485
Financial corporations, nonfinancial corporation, households and NPISHs
479 678 502 456 576
Personal transfers (current transfers between resident and nonresident households)
442 378 430 357 435
Other current transfers 37 301 71 99 141
Table IV.E Supplementary table: balance of payments - capital account (N$ million)
2015 2016 2017(p) 2018(p) 2019(p) Capital account balance 1,378 1,943 2,428 1,732 1,649
Credit 1,779 2,106 2,489 1,913 1,810 Gross disposals of nonproduced nonfinancial assets
7 2 7 5 27
Capital transfers 1,772 2,104 2,482 1,908 1,783 General government 1,126 1,552 1,541 1,532 1,698 Debt forgiveness - - - - - Other capital transfers 1,126 1,552 1,541 1,532 1,698
Financial corporations, nonfinancial corporations, households, and NPISHs
646 552 941 377 86
Debt forgiveness - - 477 - - Other capital transfers 646 552 464 377 86
Debit 400 163 60 182 161 Gross acquisitions of nonproduced nonfinancial assets
1 0 0 0 -
Capital transfers 399 162 60 182 161 General government 365 30 17 26 66 Debt forgiveness - - - - - Other capital transfers 365 30 17 26 66
Financial corporations, nonfinancial corporations, households, and NPISHs
35 133 43 155 95
Debt forgiveness - - - - - Other capital transfers 35 133 43 155 95

Bank of Namibia Annual Report 2019270
Part EStatistical Tables
Table IV.F Supplementary table: balance of payments -direct investment (N$ million)
2015 2016 2017(p) 2018(p) 2019(p)
DIRECT INVESTMENT, NET -9,728 -5,483 -5,848 -773 401
Net acquisition of financial assets 1,317 -70 -874 1,303 149
Equity and investment fund shares 718 172 -357 724 -48
Equity other than reinvestment of earnings 742 96 -469 762 3
Direct investor in Direct investment enterprise 742 16 -469 762 3
Direct investment enterprise in direct investor (reverse investment)
0 80 0 0 0
Between fellow enterprises 0 0 0 0 0
Reinvestment of earnings -24 76 112 -38 -51
Debt instruments 599 -242 -517 579 197
Short-term -94 23 -190 443 197
Direct investor in Direct investment enterprise -94 23 -192 423 201
Direct investment enterprise in direct investor (reverse investment)
0 -0 0 0 10
Between fellow enterprises 0 0 2 20 -14
Long-term 694 -265 -327 136 0
Direct investor in Direct investment enterprise 745 -211 -327 1 0
Direct investment enterprise in direct investor (reverse investment)
-51 0 0 105 0
Between fellow enterprises 0 -54 0 29 0
Net incurrence of liabilities 11,045 5,413 4,974 2,076 -251
Equity and investment fund shares 10,949 1,277 1,013 564 66
Equity other than reinvestment of earnings 11,023 474 709 -1,572 94
Direct investor in Direct investment enterprise 11,023 474 710 -1,570 94
Direct investment enterprise in direct investor (reverse investment)
0 0 0 0 0
Between fellow enterprises 0 0 -0 -2 0
Reinvestment of earnings -74 802 304 2,136 -28
Debt instruments 96 4,136 3,961 1,512 -317
Short-term 449 -393 275 688 -103
Direct investor in Direct investment enterprise 362 -393 319 647 -109
Direct investment enterprise in direct investor (reverse investment)
0 0 0 0 0
Between fellow enterprises 87 -0 -43 42 6
Long-term -353 4,529 3,685 824 -214
Direct investor in Direct investment enterprise 1,904 -2,492 327 1,092 -172
Direct investment enterprise in direct investor (reverse investment)
0 0 0 -48 -7
Between fellow enterprises -2,257 7,021 3,358 -220 -35

Bank of Namibia Annual Report 2019 271
Part EStatistical Tables
Table IV.G Supplementary table: balance of payments - portfolio investment (N$ million)
2015 2016 2017(p) 2018(p) 2019(p)
PORTFOLIO INVESTMENT, NET -14,786 -1,263 5,793 2,787 -985
Net acquisition of financial assets -2,809 383 5,172 2,532 -1,098
Equity and investment fund shares -3,106 -363 3,838 1,482 -999
Central Bank 0 0 0 0 0
General government 0 0 0 0 0
Deposit-taking corporations except central bank 0 0 0 0 0
Other sectors -3,106 -363 3,838 1,482 -999
Debt Securities 296 746 1,335 1,050 -99
Short-term -353 481 -105 80 89
Central Bank 0 0 0 0 0
General government 0 0 0 0 0
Deposit-taking corporations except central bank -353 481 -105 80 89
Other sectors 0 0 0 0 0
Long-term 649 265 1,440 970 -188
Central Bank 0 0 0 0 0
General government 0 0 0 0 0
Deposit-taking corporations except central bank 393 156 -168 -69 -0
Other sectors 256 109 1,607 1,039 -188
Net incurrence of liabilities 11,976 1,645 -621 -255 -113
Equity and investment fund shares 27 -37 28 29 139
Central Bank 0 0 0 0 0
General government 0 0 0 0 0
Deposit-taking corporations except central bank 0 0 0 0 0
Other sectors 27 -37 28 29 139
Debt Securities 11,950 1,682 -649 -283 -252
Short-term -93 0 0 0 0
Central Bank 0 0 0 0 0
General government 0 0 0 0 0
Deposit-taking corporations except central bank -93 0 0 0 0
Other sectors 0 0 0 0 0
Long-term 12,043 1,682 -649 -283 -252
Central Bank 0 0 0 0 0
General government 11,941 502 10 10 10
Deposit-taking corporations except central bank 102 1,180 -660 -294 -262
Other sectors 0 0 0 0 0
Financial derivatives and employee stock options, net -251 271 3 133 140
Net acquisition of assets 75 -48 -5 343 -21
Net incurrence of liabilities 327 -319 -7 209 -162

Bank of Namibia Annual Report 2019272
Part EStatistical Tables
Table IV.H Supplementary table: balance of payments - other investment (N$ million)
2015 2016 2017 2018 2019
OTHER INVESTMENT, NET -2,456 -14,606 -9,115 -5,672 1,670
Net acquisition of financial assets 1,617 -5,144 1,649 -6 867
Other equity 0 0 0 0 0
Currency and Deposits 1,282 -5,097 932 -2,398 812
Deposit taking except Central Bank 1,435 -2,000 -567 2,411 45
Other sectors -153 -3,097 1,499 -4,808 767
Loans 268 -475 498 1,758 281
Loans - long term -354 489 123 1,491 -12
General Government 40 40 40 40 40
Deposit taking except Central Bank -396 457 84 1,452 -52
Other sectors 2 -8 0 0 0
Loans - short term 623 -964 374 267 294
General Government 0 0 0 0 0
Deposit taking except Central Bank 770 -921 374 267 294
Other sectors -148 -42 0 0 0
Insurance, pension,standardised guarantees 0 0 0 0 0
Trade Credits and Advances -141 586 358 371 -47
Central Bank 0 0 0 0 0
Deposit taking except Central Bank -6 -1 0 0 0
General Government 0 0 0 0 0
Other sectors -135 586 358 371 -47
Other Accounts Receivable 207 -158 -139 264 -180
Net incurrence of liabilities 4,073 9,461 10,764 5,667 -803
Other Equity 0 0 0 0 0
Currency and Deposits 1,266 2,268 1,209 1,170 240
Deposit taking except Central Bank 1,266 2,268 1,209 1,170 240
Other sectors 0 0 0 0 0
Loans 2,051 4,993 8,479 1,975 -121
Loans - long term 37 5,389 7,702 2,045 -468
General Government 388 248 -305 2,692 -249
Deposit taking except Central Bank 1,296 -579 2,623 -2,914 499
Other sectors -1,647 5,720 5,384 2,267 -718
Loans - short term 2,014 -396 777 -70 347
General Government 0 0 0 0 0
Deposit taking except Central Bank 503 -517 -32 -86 123
Other sectors 1,511 121 809 16 224
Insurance, pension,standardised guarantees 0 0 0 0 0
Trade Credits and Advances 544 457 1,235 1,831 -382
Central Bank 0 0 0 0 0
Deposit taking except Central Bank 0 2 -1 -1 -5
General Government 0 0 0 0 0
Other sectors 544 455 1,236 1,832 -376
Other Accounts Payable 212 1,744 -159 690 -541
Special Drawing Rights 0 0 0 0 0

Bank of Namibia Annual Report 2019 273
Part EStatistical Tables
Table IV.I International foreign exchange reserves stock (including valuation adjustments) (N$ million)
End of 2015 2016 2017 2018 2019
January 16,465 25,292 24,631 28,334 30,667
February 14,925 25,216 22,711 26,872 31,638
March 12,302 24,910 22,576 26,778 32,574
April 15,354 24,662 25,676 30,680 34,158
May 13,659 24,769 25,413 28,168 34,125
June 14,784 21,049 28,510 29,626 33,434
July 14,333 22,834 33,674 30,843 35,179
August 14,066 20,538 30,621 32,196 33,425
September 12,830 26,449 31,463 32,517 32,266
October 22,667 25,068 31,602 31,111 32,470
November 24,795 25,857 28,546 29,543 29,752
December 23,577 24,720 30,177 31,024 28,941

Bank of Namibia Annual Report 2019274
Part EStatistical Tables
Table IV.J (a) International investment position - N$ million
2015 2016 2017(p) 2018 (p) 2019(p)
FOREIGN ASSETS 123,387 119,838 140,380 144,919 151,028
1. Direct investment 7,478 12,752 14,319 18,536 22,251 1.1. Equity and investment fund shares 5,576 10,892 11,833 16,103 19,324
1.1.1. Direct investor in direct investment enterprises 5,576 10,892 11,833 16,103 19,324 1.1.2. Direct investment enterprise in direct investor (reverse) - - - - - 1.1.3. Between fellow enterprises - - - - -
1.2. Debt instruments 1,902 1,861 2,485 2,433 2,926 1.2.1. Direct investor in direct investment enterprises 1,842 1,566 2,267 2,063 2,554 Short-term 455 225 1,136 628 794 Long-term 1,387 1,341 1,131 1,435 1,760 1.2.2. Direct investment enterprises in direct investor (reverse) 7 89 30 105 105 Short-term 7 89 30 0 - Long-term - - - 105 105 1.2.3. Between fellow enterprises 54 205 188 264 267 Short-term - - 2 33 19 Long-term 54 205 187 231 248
2. Portfolio investment 74,687 69,976 82,542 82,332 86,086 2.1. Equity and investment fund shares 51,060 46,494 56,165 54,799 57,430
i) Central bank - - - - - ii) Deposit-taking corporations, except the central bank - - - - - iii) General government - - - - - iv) Other sectors 51,060 46,494 56,165 54,799 57,430
2.2. Debt securities 23,627 23,482 26,377 27,533 28,656 i) Central bank - - - - - ii) Deposit-taking corporations, except the central bank 393 1,030 757 768 776 iii) General government - - - - - iv) Other sectors 23,234 22,451 25,619 26,765 27,880
3. Financial derivatives and employee stock options,net 110 62 57 400 379 4. Other investment 17,534 12,328 13,285 12,627 13,371 4.1. Other equity - - - - - 4.2. Currency and deposits 11,851 6,931 7,196 5,758 6,457
i) Central bank - - - - - ii) Deposit-taking corporations, except the central bank 3,673 2,656 1,990 4,400 4,445 iii) General government - - - - - iv) Other sectors 8,178 4,275 5,206 1,358 2,011
4.3. Loans 1,437 922 1,383 3,101 3,343 Short-term 1,156 193 570 836 1,130 i) Central bank - - - - - ii) Deposit-taking corporations, except the central bank 1,114 193 570 836 1,130 iii) General government - - - - - iv) Other sectors 42 - - - - Long-term 282 730 813 2,265 2,213 i) Central bank - - - - - ii) Deposit-taking corporations, except the central bank 272 730 813 2,265 2,213 iii) General government - - - - - iv) Other sectors 9 - - - -
4.4. Insurance, pension,standardised guarantees - - - - - 4.5. Trade credit and advances 337 379 725 1,077 1,030 Short-term 337 379 724 1,070 1,010
i) Central bank - - - - - ii) Deposit-taking corporations, except the central bank 1 - - - - iii) General government - - - - - iv) Other sectors 336 379 724 1,070 1,010
Long-term - - 1 8 20 i) Central bank - - - - - ii) Deposit-taking corporations, except the central bank - - - - - iii) General government - - - - - iv) Other sectors - - 1 8 20
4.6. Other accounts receivable 3,909 4,096 3,981 2,691 2,542
5. Reserve assets 23,577 24,720 30,177 31,024 28,941
5.1. Monetary gold - - - - -
5.2. Special drawing rights 102 124 112 62 34
5.3. Reserve position in the IMF - - - - -
5.4. Other reserve assets 23,476 24,597 30,065 30,962 28,907

Bank of Namibia Annual Report 2019 275
Part EStatistical Tables
Table IV.J (b) International investment position - N$ million
2015 2016 2017(p) 2018 (p) 2019 (p)
FOREIGN LIABILITIES 126,469 130,720 152,215 167,820 163,138
1. Direct investment 79,608 83,512 89,408 98,770 96,430
1.1. Equity and investment fund shares 39,318 42,606 46,244 45,805 42,938
1.1.1. Direct investor in direct investment enterprises 39,316 42,603 46,243 45,805 42,938
1.1.2. Direct investment enterprises in direct investor (reverse) 0 0 0 0 0
1.1.3. Between fellow enterprises 2 2 2 0 0
1.2. Debt instruments 40,291 40,907 43,163 52,965 53,492
1.2.1. Direct investor in direct investment enterprises 17,851 12,127 12,607 15,699 15,481
Short-term 1,863 1,370 1,687 2,342 2,234
Long-term 15,988 10,757 10,920 13,357 13,247
1.2.2. Direct investment enterprises in direct investor (reverse) 0 0 0 45 33
Short-term 0 0 0 0 0
Long-term 0 0 0 45 33
1.2.3. Between fellow enterprises 22,440 28,780 30,556 37,221 37,978
Short-term 129 129 86 131 154
Long-term 22,310 28,650 30,471 37,090 37,825
2. Portfolio investment 23,947 23,208 21,448 23,678 23,141
2.1. Equity and investment fund shares 115 119 557 533 643
i) Central bank 0 0 0 0 0
ii) Deposit-taking corporations, except the central bank 0 0 0 0 0
iii) General government 0 0 0 0 0
iv) Other sectors 115 119 557 533 643
2.2. Debt securities 23,832 23,089 20,891 23,145 22,498
i) Central bank 0 0 0 0 0
ii) Deposit-taking corporations, except the central bank 1,488 2,668 2,008 1,714 1,452
iii) General government 21,844 19,922 18,383 20,931 20,546
iv) Other sectors 500 500 500 500 500
0 0 0 0
3. Financial derivatives and employee stock options,net 454 135 128 337 175
4. Other investment 22,459 23,864 41,231 45,035 43,391
4.1. Other equity 0 0 0 0 0
4.2. Currency and deposits 2,111 3,571 4,480 4,737 4,978
i) Central bank 0 0 0 0 0
ii) Deposit-taking corporations, except the central bank 2,111 3,571 4,480 4,737 4,978
iii) General government 0 0 0 0 0
iv) Other sectors 0 0 0 0 0
4.3. Loans 15,390 13,771 29,458 30,721 29,531
Short-term 3,391 557 1,360 1,134 1,329
i) Central bank 0 0 0 0 0
ii) Deposit-taking corporations, except the central bank 1,945 116 86 0 123
iii) General government 0 0 0 0 0
iv) Other sectors 1,446 441 1,274 1,134 1,206
Long-term 11,999 13,214 28,099 29,586 28,202
i) Central bank 0 0 0 0 0
ii) Deposit-taking corporations, except the central bank 2,059 1,812 4,435 1,521 2,017
iii) General government 6,487 5,340 8,043 11,225 10,305
iv) Other sectors 3,453 6,062 15,622 16,841 15,879
4.4. Insurance, pension,standardised guarantees 0 0 0 0 0
4.5. Trade credit and advances 1,661 1,851 3,025 4,246 4,239
Short-term 1,661 1,851 3,025 3,960 3,957
i) Central bank 0 0 0 0 0
ii) Deposit-taking corporations, except the central bank 0 2 1 0 0
iii) General government 0 0 0 0 0
iv) Other sectors 1,661 1,849 3,024 3,960 3,957
Long-term 0 0 0 287 281
i) Central bank 0 0 0 0 0
ii) Deposit-taking corporations, except the central bank 0 0 0 0 0
iii) General government 0 0 0 0 0
iv) Other sectors 0 0 0 287 281
4.6. Other accounts payable 213 1,957 1,798 2,461 1,830
4.7. Special drawing rights 3,084 2,715 2,469 2,870 2,814
NET ASSET/LIABILITY POSITION -3,081 -10,882 -11,835 -22,901 -12,110

Bank of Namibia Annual Report 2019276
Part EStatistical Tables
Table IV.K Foreign exchange rates Namibia; Dollar per foreign currency unit
Period averages
Period US UK EU Botswana Switzerland Chinese IMF Dollar Pound Euro Pula Franc Yuan SDR
2015 Jan 11.566 17.529 13.457 1.207 12.225 1.860 16.454Feb 11.576 17.921 13.150 1.205 12.379 1.852 16.388Mar 12.064 18.075 13.072 1.218 12.312 1.933 16.709Apr 12.011 17.933 12.940 1.214 12.474 1.937 16.615May 11.969 18.508 13.351 1.221 12.841 1.929 16.794Jun 12.302 19.139 13.797 1.238 13.206 1.982 17.284Jul 12.452 19.379 13.703 1.242 13.067 2.006 17.387Aug 12.912 20.150 14.389 1.268 13.133 2.035 18.096Sep 13.607 20.895 15.297 1.303 14.008 2.137 19.143Oct 13.500 20.705 15.171 1.623 13.947 2.126 18.983Nov 14.123 21.475 15.177 1.316 14.010 2.217 19.493Dec 14.926 22.381 16.226 1.357 14.978 2.314 20.774
2016 Jan 16.380 23.603 17.794 1.418 16.274 2.492 22.562Feb 15.769 22.565 17.503 1.397 15.881 2.408 21.990Mar 15.422 21.915 17.108 1.382 15.660 2.370 21.487Apr 14.632 20.908 16.589 1.354 15.181 2.259 21.573May 15.356 22.312 17.361 1.388 15.705 2.351 21.711Jun 15.056 21.409 16.921 1.374 15.519 2.284 21.224Jul 14.423 18.974 15.962 1.337 14.687 2.160 20.051Aug 13.735 18.003 15.405 1.309 14.162 2.066 19.265Sep 14.037 18.464 15.739 1.322 14.411 2.103 19.666Oct 13.944 17.219 15.377 1.311 14.131 2.072 19.258Nov 13.914 17.292 15.045 1.303 13.980 2.034 19.037Dec 13.836 17.300 14.614 1.291 13.586 2.000 18.658
2017 Jan 13.563 16.724 14.421 1.281 13.456 1.967 18.289Feb 13.196 16.484 14.043 1.263 13.171 1.920 17.964Mar 12.938 15.963 13.824 1.250 12.907 1.876 17.525Apr 13.466 17.003 14.429 1.281 13.456 1.954 18.375May 13.268 17.156 14.665 1.278 13.454 1.927 18.241Jun 12.897 16.506 14.490 1.263 13.326 1.895 17.846Jul 13.138 17.066 15.118 1.282 13.681 1.940 18.318Aug 13.231 17.153 15.634 1.296 13.713 1.983 18.688Sep 13.135 17.442 15.656 1.295 13.656 2.001 18.701Oct 13.676 18.053 16.078 1.318 13.935 2.064 19.324Nov 14.078 18.620 16.527 1.340 14.194 2.126 19.820Dec 13.170 17.658 15.592 1.295 13.342 1.997 18.636
2018 Jan 12.204 16.841 14.872 1.253 12.688 1.898 17.559Feb 11.822 16.536 14.611 1.238 12.657 1.870 17.187Mar 11.836 16.524 14.606 1.239 12.503 1.876 17.193Apr 12.084 17.032 14.854 1.251 12.499 1.919 17.579May 12.529 16.871 14.807 1.263 12.562 1.966 17.828Jun 13.286 17.654 15.517 1.299 13.426 2.055 18.802Jul 13.415 17.668 15.671 1.301 13.487 1.997 18.834Aug 14.089 18.143 16.264 1.331 14.251 2.069 19.657Sep 14.780 19.289 17.235 1.369 15.265 2.156 20.683Oct 14.496 18.860 16.653 1.350 14.592 2.094 20.142Nov 14.087 18.177 16.017 1.325 14.076 2.030 19.564Dec 14.181 17.980 16.146 1.328 14.294 2.060 19.676
2019 Jan 13.862 17.860 15.835 1.317 14.018 2.043 19.316Feb 13.796 17.941 15.656 1.313 13.775 2.047 19.237Mar 14.383 18.954 16.254 1.343 14.364 2.143 20.016Apr 14.154 18.462 15.911 1.330 14.064 2.107 19.638May 14.437 18.523 16.147 1.341 14.287 2.103 19.931Jun 14.567 18.473 16.455 1.351 14.740 2.111 20.200Jul 14.047 17.519 15.762 1.322 14.226 2.042 19.398Aug 15.142 18.392 16.841 1.374 15.455 2.144 20.793Sep 14.849 18.314 16.352 1.357 14.990 2.086 20.308Oct 14.907 18.817 16.471 1.362 15.000 2.101 20.462Nov 14.804 19.078 16.365 1.359 14.910 2.109 20.348Dec 14.436 18.911 16.042 1.343 14.680 2.057 19.914
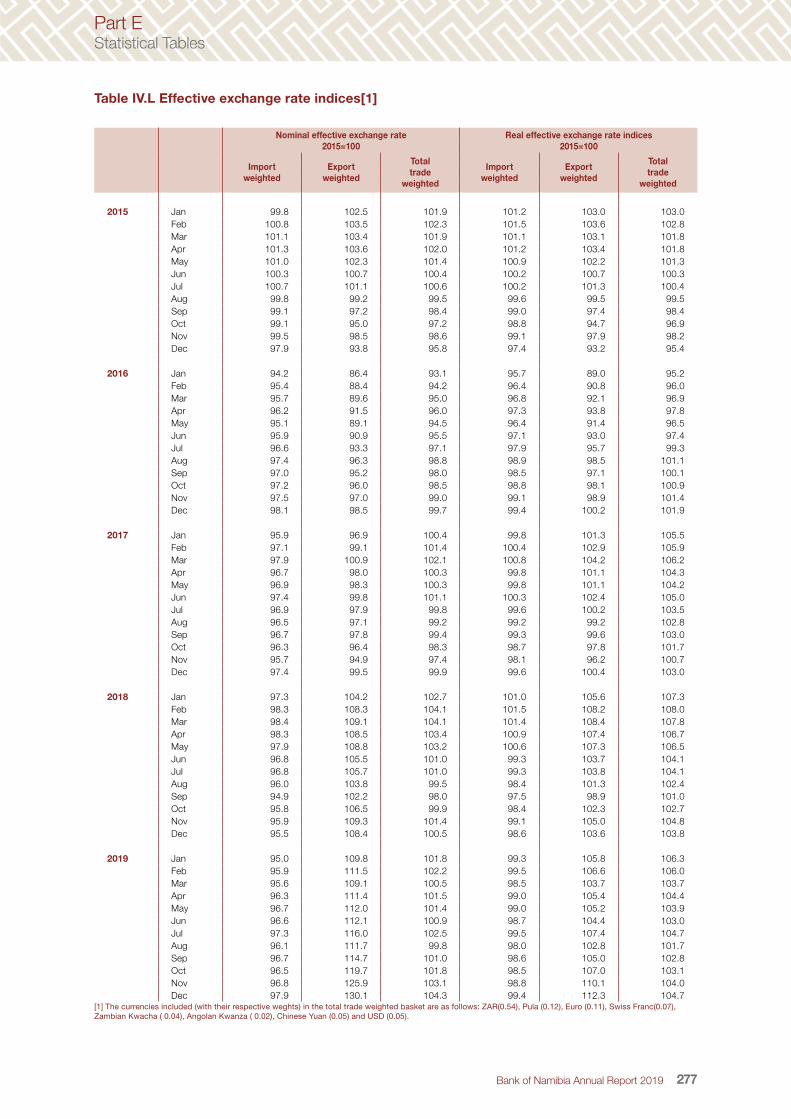
Bank of Namibia Annual Report 2019 277
Part EStatistical Tables
Table IV.L Effective exchange rate indices[1]
Nominal effective exchange rate 2015=100
Real effective exchange rate indices2015=100
Import weighted
Exportweighted
Totaltrade
weighted
Import weighted
Exportweighted
Totaltrade
weighted
2015 Jan 99.8 102.5 101.9 101.2 103.0 103.0Feb 100.8 103.5 102.3 101.5 103.6 102.8Mar 101.1 103.4 101.9 101.1 103.1 101.8Apr 101.3 103.6 102.0 101.2 103.4 101.8May 101.0 102.3 101.4 100.9 102.2 101.3Jun 100.3 100.7 100.4 100.2 100.7 100.3Jul 100.7 101.1 100.6 100.2 101.3 100.4Aug 99.8 99.2 99.5 99.6 99.5 99.5Sep 99.1 97.2 98.4 99.0 97.4 98.4Oct 99.1 95.0 97.2 98.8 94.7 96.9Nov 99.5 98.5 98.6 99.1 97.9 98.2Dec 97.9 93.8 95.8 97.4 93.2 95.4
2016 Jan 94.2 86.4 93.1 95.7 89.0 95.2Feb 95.4 88.4 94.2 96.4 90.8 96.0Mar 95.7 89.6 95.0 96.8 92.1 96.9Apr 96.2 91.5 96.0 97.3 93.8 97.8May 95.1 89.1 94.5 96.4 91.4 96.5Jun 95.9 90.9 95.5 97.1 93.0 97.4Jul 96.6 93.3 97.1 97.9 95.7 99.3Aug 97.4 96.3 98.8 98.9 98.5 101.1Sep 97.0 95.2 98.0 98.5 97.1 100.1Oct 97.2 96.0 98.5 98.8 98.1 100.9Nov 97.5 97.0 99.0 99.1 98.9 101.4Dec 98.1 98.5 99.7 99.4 100.2 101.9
2017 Jan 95.9 96.9 100.4 99.8 101.3 105.5Feb 97.1 99.1 101.4 100.4 102.9 105.9Mar 97.9 100.9 102.1 100.8 104.2 106.2Apr 96.7 98.0 100.3 99.8 101.1 104.3May 96.9 98.3 100.3 99.8 101.1 104.2Jun 97.4 99.8 101.1 100.3 102.4 105.0Jul 96.9 97.9 99.8 99.6 100.2 103.5Aug 96.5 97.1 99.2 99.2 99.2 102.8Sep 96.7 97.8 99.4 99.3 99.6 103.0Oct 96.3 96.4 98.3 98.7 97.8 101.7Nov 95.7 94.9 97.4 98.1 96.2 100.7Dec 97.4 99.5 99.9 99.6 100.4 103.0
2018 Jan 97.3 104.2 102.7 101.0 105.6 107.3Feb 98.3 108.3 104.1 101.5 108.2 108.0Mar 98.4 109.1 104.1 101.4 108.4 107.8Apr 98.3 108.5 103.4 100.9 107.4 106.7May 97.9 108.8 103.2 100.6 107.3 106.5Jun 96.8 105.5 101.0 99.3 103.7 104.1Jul 96.8 105.7 101.0 99.3 103.8 104.1Aug 96.0 103.8 99.5 98.4 101.3 102.4Sep 94.9 102.2 98.0 97.5 98.9 101.0Oct 95.8 106.5 99.9 98.4 102.3 102.7Nov 95.9 109.3 101.4 99.1 105.0 104.8Dec 95.5 108.4 100.5 98.6 103.6 103.8
2019 Jan 95.0 109.8 101.8 99.3 105.8 106.3Feb 95.9 111.5 102.2 99.5 106.6 106.0Mar 95.6 109.1 100.5 98.5 103.7 103.7Apr 96.3 111.4 101.5 99.0 105.4 104.4May 96.7 112.0 101.4 99.0 105.2 103.9Jun 96.6 112.1 100.9 98.7 104.4 103.0Jul 97.3 116.0 102.5 99.5 107.4 104.7Aug 96.1 111.7 99.8 98.0 102.8 101.7Sep 96.7 114.7 101.0 98.6 105.0 102.8Oct 96.5 119.7 101.8 98.5 107.0 103.1Nov 96.8 125.9 103.1 98.8 110.1 104.0Dec 97.9 130.1 104.3 99.4 112.3 104.7
[1] The currencies included (with their respective weghts) in the total trade weighted basket are as follows: ZAR(0.54), Pula (0.12), Euro (0.11), Swiss Franc(0.07), Zambian Kwacha ( 0.04), Angolan Kwanza ( 0.02), Chinese Yuan (0.05) and USD (0.05).

Bank of Namibia Annual Report 2019278
Part EStatistical Tables
Table IV.M Selected minerals’ monthly average prices
U$ Per Metric Tonne US$ Per Ounce US$ Per Pound
Copper Lead Zinc Gold Uranium
2015 Jan 5,830.5 1,795.7 2,113.1 1,251.9 36.0 Feb 5,729.3 1,843.1 2,097.8 1,227.2 38.1 Mar 5,939.7 1,795.7 2,028.7 1,178.6 39.4 Apr 6,042.1 1,792.5 2,212.7 1,197.9 38.7 May 6,294.8 2,005.4 2,281.8 1,199.1 35.6 Jun 5,833.0 1,991.8 2,082.1 1,181.5 36.1 Jul 5,456.8 1,829.5 2,000.7 1,130.0 36.0 Aug 5,127.3 1,763.0 1,807.6 1,117.5 36.1 Sep 5,217.3 1,703.6 1,720.2 1,124.5 36.9 Oct 5,216.1 1,684.3 1,724.3 1,159.3 37.0 Nov 4,799.9 1,720.1 1,583.3 1,085.7 35.9 Dec 4,638.8 1,618.3 1,527.8 1,068.3 35.1
2016 Jan 4,471.8 1,706.6 1,520.4 1,097.4 34.6 Feb 4,598.6 1,646.2 1,709.8 1,199.9 33.6 Mar 4,953.8 1,765.8 1,801.7 1,246.3 29.6 Apr 4,872.7 1,802.2 1,855.4 1,242.3 27.6 May 4,694.5 1,732.3 1,869.0 1,259.4 27.8 Jun 4,642.0 1,707.8 2,026.2 1,276.4 27.2 Jul 4,864.9 1,712.8 2,183.3 1,337.3 25.9 Aug 4,751.7 1,834.8 2,279.1 1,341.1 25.9 Sep 4,722.2 1,835.5 2,292.3 1,326.0 24.7 Oct 4,731.3 1,947.6 2,311.5 1,266.6 21.2 Nov 5,450.9 2,024.5 2,566.2 1,236.0 18.5 Dec 5,660.4 2,180.6 2,664.8 1,151.4 19.1
2017 Jan 5,754.6 2,242.6 2,714.8 1,192.6 22.1 Feb 5,940.9 2,311.5 2,845.6 1,234.4 24.0 Mar 5,824.6 2,280.9 2,776.9 1,231.1 24.6 Apr 5,683.9 2,220.6 2,614.9 1,265.6 23.2 May 5,599.6 2,125.1 2,590.2 1,245.0 21.6 Jun 5,719.8 2,132.9 2,573.4 1,260.3 19.7 Jul 5,985.1 2,269.9 2,787.2 1,236.2 20.2 Aug 6,485.6 2,348.5 2,980.7 1,282.3 20.1 Sep 6,577.2 2,374.4 3,116.9 1,315.0 20.3 Oct 6,807.6 2,498.2 3,264.6 1,279.5 20.1 Nov 6,826.6 2,461.4 3,229.3 1,282.3 22.0 Dec 6,833.9 2,509.9 3,196.0 1,261.3 23.8
2018 Jan 7,065.9 2,584.1 3,441.5 1,331.3 21.9 Feb 7,006.5 2,581.1 3,532.9 1,330.7 21.4 Mar 6,799.2 2,390.0 3,269.2 1,324.7 21.1 Apr 6,851.5 2,352.4 3,188.1 1,334.8 21.0 May 6,825.3 2,360.9 3,059.9 1,303.5 22.7 Jun 6,965.9 2,436.3 3,088.6 1,281.6 22.7 Jul 6,250.8 2,207.0 2,656.1 1,237.7 25.8 Aug 6,051.1 2,053.5 2,512.0 1,201.7 26.3 Sep 6,050.8 2,022.9 2,434.7 1,198.4 27.5 Oct 6,219.6 1,987.6 2,673.7 1,215.4 28.0 Nov 6,195.9 1,937.1 2,595.7 1,220.7 29.1 Dec 6,075.3 1,972.3 2,616.3 1,250.4 27.8
2019 Jan 5,939.1 1,997.1 2,569.7 1,291.8 28.9 Feb 6,300.5 2,062.8 2,707.2 1,320.1 28.0 Mar 6,439.5 2,046.5 2,850.6 1,300.9 25.3 Apr 6,438.4 1,939.0 2,932.7 1,285.9 25.2 May 6,017.9 1,815.2 2,742.8 1,283.7 24.1 Jun 5,882.2 1,899.7 2,601.2 1,359.0 24.6 Jul 5,941.2 1,975.6 2,446.5 1,412.9 25.4 Aug 5,709.4 2,044.6 2,273.0 1,500.4 25.3 Sep 5,759.3 2,071.9 2,331.6 1,510.6 25.7 Oct 5,757.3 2,184.1 2,451.7 1,494.8 24.3 Nov 5,860.0 2,021.2 2,425.5 1,470.8 26.1 Dec 6,077.1 1,900.5 2,272.5 1,479.1 24.9
Source: The Word bank and Cameco

Bank of Namibia Annual Report 2019 279
Part EStatistical Tables
Table IV.N Selected minerals’ export volumes
Diamonds Gold Copper Zinc
Carat ‘000 Kg Tonnes Tonnes
2015 Q1 352 1,384 10,249 31,741
Q2 481 1,568 13,134 48,108
Q3 435 1,526 9,682 52,012
Q4 443 1,422 11,558 34,617
2016 Q1 371 1,546 9,842 56,976
Q2 311 1,423 9,209 27,843
Q3 339 1,727 7,884 36,989
Q4 450 2,004 13,099 49,906
2017 Q1 380 1,589 7,808 42,777
Q2 322 1,755 14,821 31,855
Q3 353 1,885 11,505 57,843
Q4 336 1,888 10,655 47,810
2018 Q1 439 1,549 11,940 53,000
Q2 418 1,430 8,851 29,803
Q3 570 1,523 14,112 22,493
Q4 397 1,682 13,736 61,121
2019 Q1 387 1,446 13,508 66,958
Q2 301 1,406 12,485 38,029
Q3 364 1,780 9,252 53,413
Q4 451 1,820 9,664 35,296Source:BoN surveys

Bank of Namibia Annual Report 2019280
Part EStatistical Tables
LIST OF ABBREVIATIONS
AACB Association of African Central Banks
AD Authorised Dealer
ADLA Authorised Dealer with Limited Authority
AEs Advanced Economies
AFI Alliance for Financial Inclusion
AFRITAC South Regional Technical Assistance Center in Southern Africa
BC business continuity
BMS Building Management System
BOP balance of payments
CABS Community of African Banking Supervisors
CCBG Committee of Central Bank Governors
CMA Common Monetary Area
CNY Chinese Yuan/Renminbi
CSD Centralised Securities Depository
DR Disaster Recovery
DSIB Domestic Systemically Important Bank
ECB European Central Bank
EFT electronic funds transfer
ELF Employee Liaison Forum
EMDEs Emerging Market and Developing Economies
ERP enterprise resource planning
EUR Euro
FDI foreign direct investment
FMI financial market infrastructure
FSR Financial Stability Report
FY Fiscal Year
GBP British Pound Sterling
GDE gross domestic expenditure
GDP gross domestic product
GNDI gross national disposable income
GNI gross national income
GPF Global Policy Forum
IMF International Monetary Fund
IRS Internal Registered Stock
IT information technology
JPY Japanese Yen
JSE Johannesburg Stock Exchange
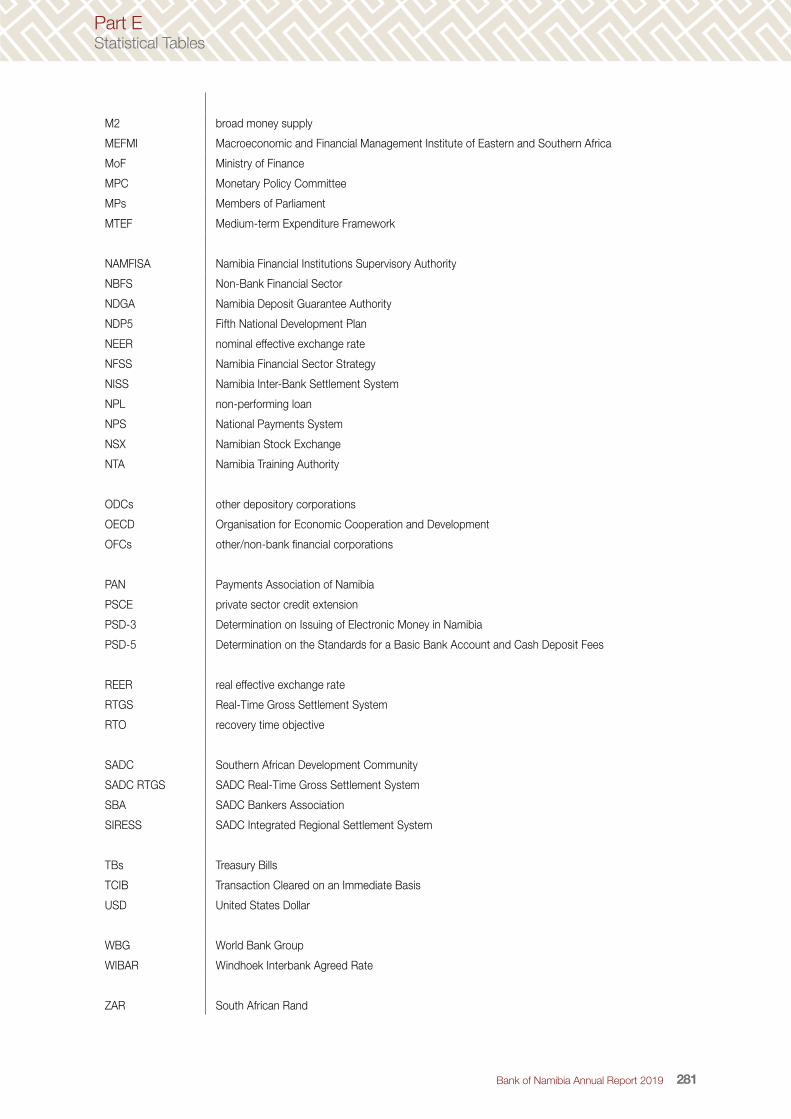
Bank of Namibia Annual Report 2019 281
Part EStatistical Tables
M2 broad money supply
MEFMI Macroeconomic and Financial Management Institute of Eastern and Southern Africa
MoF Ministry of Finance
MPC Monetary Policy Committee
MPs Members of Parliament
MTEF Medium-term Expenditure Framework
NAMFISA Namibia Financial Institutions Supervisory Authority
NBFS Non-Bank Financial Sector
NDGA Namibia Deposit Guarantee Authority
NDP5 Fifth National Development Plan
NEER nominal effective exchange rate
NFSS Namibia Financial Sector Strategy
NISS Namibia Inter-Bank Settlement System
NPL non-performing loan
NPS National Payments System
NSX Namibian Stock Exchange
NTA Namibia Training Authority
ODCs other depository corporations
OECD Organisation for Economic Cooperation and Development
OFCs other/non-bank financial corporations
PAN Payments Association of Namibia
PSCE private sector credit extension
PSD-3 Determination on Issuing of Electronic Money in Namibia
PSD-5 Determination on the Standards for a Basic Bank Account and Cash Deposit Fees
REER real effective exchange rate
RTGS Real-Time Gross Settlement System
RTO recovery time objective
SADC Southern African Development Community
SADC RTGS SADC Real-Time Gross Settlement System
SBA SADC Bankers Association
SIRESS SADC Integrated Regional Settlement System
TBs Treasury Bills
TCIB Transaction Cleared on an Immediate Basis
USD United States Dollar
WBG World Bank Group
WIBAR Windhoek Interbank Agreed Rate
ZAR South African Rand

Bank of Namibia Annual Report 2019282
Part EStatistical Tables
NOTES:
________________________________________________________________________________________
________________________________________________________________________________________
________________________________________________________________________________________
________________________________________________________________________________________
________________________________________________________________________________________
________________________________________________________________________________________
________________________________________________________________________________________
________________________________________________________________________________________
________________________________________________________________________________________
________________________________________________________________________________________
________________________________________________________________________________________
________________________________________________________________________________________
________________________________________________________________________________________
________________________________________________________________________________________
________________________________________________________________________________________
________________________________________________________________________________________
________________________________________________________________________________________
________________________________________________________________________________________
________________________________________________________________________________________
________________________________________________________________________________________
________________________________________________________________________________________
________________________________________________________________________________________
________________________________________________________________________________________
________________________________________________________________________________________
________________________________________________________________________________________
________________________________________________________________________________________
________________________________________________________________________________________
________________________________________________________________________________________
________________________________________________________________________________________
________________________________________________________________________________________
________________________________________________________________________________________

Bank of Namibia Annual Report 2019 283
Part EStatistical Tables
NOTES:
________________________________________________________________________________________
________________________________________________________________________________________
________________________________________________________________________________________
________________________________________________________________________________________
________________________________________________________________________________________
________________________________________________________________________________________
________________________________________________________________________________________
________________________________________________________________________________________
________________________________________________________________________________________
________________________________________________________________________________________
________________________________________________________________________________________
________________________________________________________________________________________
________________________________________________________________________________________
________________________________________________________________________________________
________________________________________________________________________________________
________________________________________________________________________________________
________________________________________________________________________________________
________________________________________________________________________________________
________________________________________________________________________________________
________________________________________________________________________________________
________________________________________________________________________________________
________________________________________________________________________________________
________________________________________________________________________________________
________________________________________________________________________________________
________________________________________________________________________________________
________________________________________________________________________________________
________________________________________________________________________________________
________________________________________________________________________________________
________________________________________________________________________________________
________________________________________________________________________________________
________________________________________________________________________________________

Bank of Namibia Annual Report 2019284
Part EStatistical Tables
NOTES:
________________________________________________________________________________________
________________________________________________________________________________________
________________________________________________________________________________________
________________________________________________________________________________________
________________________________________________________________________________________
________________________________________________________________________________________
________________________________________________________________________________________
________________________________________________________________________________________
________________________________________________________________________________________
________________________________________________________________________________________
________________________________________________________________________________________
________________________________________________________________________________________
________________________________________________________________________________________
________________________________________________________________________________________
________________________________________________________________________________________
________________________________________________________________________________________
________________________________________________________________________________________
________________________________________________________________________________________
________________________________________________________________________________________
________________________________________________________________________________________
________________________________________________________________________________________
________________________________________________________________________________________
________________________________________________________________________________________
________________________________________________________________________________________
________________________________________________________________________________________
________________________________________________________________________________________
________________________________________________________________________________________
________________________________________________________________________________________
________________________________________________________________________________________
________________________________________________________________________________________
________________________________________________________________________________________


ANNUAL REPORT
Bank of Namibia
2019
Bank of Namibia 2019 A
NN
UA
L RE
PO
RT