2017 ANNUAL REPORT - Saurer
166
2017 ANNUAL REPORT
-
Upload
khangminh22 -
Category
Documents
-
view
0 -
download
0
Transcript of 2017 ANNUAL REPORT - Saurer

2017 ANNUAL REPORT

2 2017 ANNUAL REPORT
RMB 8'713 millionGroup highlights Excellent growth in revenue by 37% to RMB 8'713 million Strong earnings generation with profits before tax of RMB 996 million Successful listing in Q3 2017 on the Shanghai Stock Exchange
+37%
Revenues by region in RMB '000
2016 2017 Change YoYChina 2'150'570 3'674'611 71%India 1'001'445 973'602 -3%Turkey 532'366 904'084 70%Asia (excl. China/India) 1'212'421 1'744'952 44%Americas 671'280 740'555 10%Europe/Africa/others (excl. Turkey) 784'672 675'608 -14%
Revenue by segment in RMB '000
2017
2016
Saurer Spinning Solutions 4'897'647 6'977'092
+42%Change YoY
20172016
Saurer Technologies 1'477'864 1'809'697
+22%Change YoY
Outstanding performance in key markets China and Turkey with growth of 70%
+70%Turkey +71%
China
Saurer Intelligent Technolgy Co Ltd.
KEY FIGURES
Key financial data in RMB '000
2015 2016 2017 Change YoYRevenue 6'648'902 6'352'754 8'713'412 37%Profit before tax 446'512 670'518 996'385 49%Net profit 382'162 502'985 749'517 37%Total assets 9'426'260 13'225'243 14'531'772 10%
2017201620151'000'000
800'000
600'000
400'000
200'000
0Net profit
Profit before tax
includes inter-segment revenue
Employees 2017
Germany 41%
China 37%
India 9%
Singapur 4%
Americas 3% Rest of EU 2%
Turkey 1%Switzerland 3%
4484

2017 ANNUAL REPORT 3
IMPORTANT NOTES
1. The Board of Directors, the Board of Supervisors, Directors, Supervisors and Senior Executives of Saurer Intelligent Technology Co., Ltd (“the Company”), hereby confirm that the content set out in this Annual Report is true, accurate and complete, and free from any false representations, misleading statements or material omissions, and are individually and collectively respon-sible for the content therein.
2. All members of the Board of Directors attended the Board meeting to review this Annual Report.
3. PwC Mainland China (special general partnership) presented a standard unqualified Auditor’s Report for the Company.
4. Pan Xueping, Chairman of the Board of Directors, and Lu Yimin, Chief Financial Officer and accountant in charge, confirm the truthfulness, accuracy and completeness of the financial statements in this Annual Report.
5. Proposed profit distribution and capital reserve plan for the reporting period, as reviewed by the Board of Directors.
According to the Articles of Association and the relevant laws and regulations, and considering factors such as sharehold-ers’ returns and the Company’s business development, the Board of Directors reviewed and approved the profit distribu-tion plan for 2017 as follows:
The audit by PwC Mainland China (special general part-nership) confirmed that the net profit in the consolidated statements attributable to the shareholders of the parent company in 2017 was RMB 658,327,000. The parent company realized a net profit of RMB 487,418,000 in 2017. According to the Articles of Association, 10% of the net profit attributable to the parent company, RMB 48,742,000, was set aside as the statutory surplus reserve. After the reserves were set aside, the net profit attributable to the parent com-pany in 2017 was RMB 438,676,000. Taking into account the undistributed profit of RMB 377,048,000 at the begin-ning of the year minus the interim cash dividends of RMB 184,421,938.82 distributed in 2017, the residual profit of the parent company distributable to the shareholders was RMB 631,302,000. According to the relevant laws and regulations
and the Articles of Association, and considering the interests of the shareholders and the long-term development of the Company, the Company’s profit distribution plan for 2017 was based on 1,895,412,995 shares, and cash dividends of RMB 0.1 (before tax) for every 10 shares were distributed to all shareholders from the undistributed profit. Total cash div-idends distributed amounted to RMB 18,954,219.95 (before tax). No other forms of profit distribution or capital reserve plan were implemented.
Cash dividends distributed by the Company mid-2017 amounted to RMB 184,421,938.82 (before tax). Taking into account the cash dividends of RMB 18,954,129.95 (before tax) expected to be distributed for 2017, the Company an-ticipates that total distributed cash dividends will amount to RMB 203,376,068.77 (before tax).
6. Disclaimer with respect to forward-looking statements None of the forward-looking statements contained in this
Report, such as the development strategies or future busi-ness plans, constitute a commitment by the Company to investors. Investors are advised to be aware that investment involves risks.
7. Important risk warning The risks faced by the Company are detailed in “Company’s
Future Development” under Section 4, “Discussion and Anal-ysis of Operations”. Investors are advised that investment involves risks.
8. Other During the reporting period, the Company’s major asset
replacement and issue of shares to purchase assets were completed, and the Company was relisted after restructuring in September 2017. The Company’s Board of Directors and the Board of Supervisors were replaced and changes made to the management. The Company’s principal business was changed from building and construction and real estate de-velopment to R&D, manufacture and sales of intelligent textile equipment and key components, and with that, the company was transformed into a high-end equipment manufacturer. The Company name was changed from “Xinjiang Urban Construction (Group) Co., Ltd” to “Saurer Intelligent Tech-nology Co., Ltd”, and the stock abbreviation was changed from “Xinjiang Urban Construction” to “Saurer Intelligent”. The stock code remains unchanged.

4 2017 ANNUAL REPORT
Pan Xueping Chairman
Clement WoonCEO

2017 ANNUAL REPORT 5
LETTER FROM THE CHAIRMAN AND CEO
Dear Shareholders,
Saurer’s listing on the Shanghai Stock Exchange in the autumn of 2017 marked the highlight of an exciting and very successful year. By taking advan-tage of the favourable economic situation, Saurer successfully strengthened its position as a globally leading supplier of high-end textile equipment, pro-viding customers with a suite of solutions from bale to yarn.
Profitable growthSaurer announced its best performance of the past five years: sales amounted to RMB 8.713 billion, a year-on-year (YoY) increase of 37.2% (2016: RMB 6.352 billion); net profit attributable to shareholders increased by 38.6% YoY, reaching RMB 658 million (2016: RMB 475 million). Saurer was particularly successful in the Chinese and Turkish markets with a growth rate of approximately 70%. After three years of hard work by the Company, Uzbekistan has become its fourth-largest market, with sales of more than RMB 500 million in 2017.
New strategic focus2017 also signalled a year of profound change and a new strategic focus for Saurer. Our mission is to become the preferred supplier of intelligent solutions and services in fibre and yarn processing equip-ment. Our business philosophy is to enable our cus-tomers to make full use of the advantages we offer while creating the best value for their stakeholders. This also reflects our core values: Customer Focus, Quality Excellence, Team Spirit, Entrepreneurship and Results Orientation. These are the drivers that consistently propel Saurer forward.
Our newly created business segments – Spinning Solutions and Technologies – are both dedicated to better serving customers’ needs, improving oper-ational efficiency, and integrating and anticipating technological innovations.
Position in domestic and foreign markets Backed by its global sales and after-sales service system, Saurer is an international company that provides high-end textile machinery and equipment for customers worldwide. As a listed subsidiary of the Jinsheng Group, Saurer is in a very favourable position to benefit from unprecedented economic opportunities across these markets, including China with its vision for the textile industry as well as the “One Belt, One Road”, “Industry 4.0” and “Made in China 2025” initiatives.
Prospects2018 will bring new challenges for Saurer as well as for the entire textile industry. Last year we made sig-nificant progress in business integration, technical innovation and management. In its more than 160 years of history, Saurer has successfully demon-strated that it can effectively grow and adapt to changing conditions in a highly competitive market. We firmly believe that Saurer will achieve sustained growth and stable profits in the future, and create greater value for investors and society.
AcknowledgementsOn behalf of the Board of Directors and manage-ment, we would like to express our heartfelt grati-tude to all our staff around the world for their tireless efforts in challenging times. We would also like to thank all our shareholders for their trust in us, and our customers, suppliers and business partners for their loyalty and cooperation.
Wattwil/Shanghai, 20 April 2018
Pan Xueping Clement WoonChairman CEO

6 2017 ANNUAL REPORT
SOLUTIONS DRIVING CUSTOMER SUCCESS
Jiangsu Yitianxia Textile & Technology Co. Ltd., China
Saurer’s E³ philosophy (Energy, Economics, Ergonomics) reduces production cost significantly while offering the highest yarn quality.
Founded in 2012Number of employees approx. 40Production 7,000 – 8,000 tons of yarnNumber and type of machines 4 ACO 8 sets, 1 ACO 9 setNumber of spindles 2,400Final product CO Ne7-30 (cotton yarn for knitting and weaving)Market requirements Spinning mills ask for lower energy consumption,
high productivity and high yarn quality.
Key feature relating to customer requirements
Competition
Autocoro 9
Personnel Compressed air Energy Space requirement
€ Cent/kg yarn
19% lower spinning costs with E³
0 5 10 15 20 25
–4.8

2017 ANNUAL REPORT 7
“ With the Autocoro 9 we reach a rotor speed of around 150,000 rpm for many yarns in our portfolio. Our customers are very happy with the quality of the weaving yarns they get from us. This allows them to increase profitability in their weaving mills. The Autocoro series is a milestone in rotor spinning technology, and we are very proud that to see our market share increase every year with this innovative technology. We are well-positioned to be competitive in the future.” Mr Pan, General Manager Yitianxia Textile

8 2017 ANNUAL REPORT

2017 ANNUAL REPORT 9
TABLE OF CONTENTS
Section 1. Definitions 11
Section 2. Company Profile and Financial Summary 12
Section 3. Business Overview 16
Section 4. Discussion and Analysis of Operations 20
Section 5. Significant Events 34
Section 6. Changes in Common Shares and Shareholders 50
Section 7. Directors, Supervisors, Senior Executives and Employees 58
Section 8. Corporate Governance Report 66
Section 9. Financial Statements and Auditor's Report 73
Section 10. Catalogue of Documents Available for Inspection 168

10 2017 ANNUAL REPORT

2017 ANNUAL REPORT 11
I. DefinitionsThe following terms in this Report shall have the meanings as shown below unless indicat-ed otherwise:
Definitions of regularly used terms
Saurer Intelligent, the Company, this Company and the Listed Company
Refer to Saurer Intelligent Technology Co., Ltd
Jinsheng Group Refers to Jiangsu Jinsheng Industry Co., LtdState-owned company Refers to Urumqi State-owned Assets Operation (Group) Co., LtdChina Development Bank Finance Refers to China Development Bank Finance Co., LtdKimble Refers to Changzhou Kimble Investment Partnership Firm (limited partnership)Jiangsu Huatai Refers to Jiangsu Huatai Strategic Emerging Industry Investment Fund (limited partnership)Hehe Investment Refers to Changzhou Hehe Investment Partnership Firm (limited partnership)Shenzhen Longding Refers to Shenzhen Longding Shuming Equity Investment Partnership Firm (limited partnership)China Advanced Manufacturing Fund Refers to China Advanced Manufacturing Industry Investment Fund (limited partnership)Huashan Investment Refers to Huashan Investment Co., LtdShanghai Yongjun Refers to Shanghai Yongjun Equity Investment Partnership Firm (limited partnership)Ningbo Yukang Refers to Ningbo Yukang Equity Investment Centre (limited partnership)Tibet Jiaze Refers to Tibet Jiaze Venture Investment FirmHezhong Investment Refers to Changzhou Hezhong Investment Partnership (limited partnership)Shanghai Jinye Refers to Shanghai Jinye Equity Investment Partnership Firm (limited partnership)Shanghai Hongcheng Refers to Shanghai Hongcheng Equity Investment Partnership Firm (limited liability)Beijing Zhongtai Refers to Beijing Zhongtai Financial Investment Co., LtdNanjing Daofeng Refers to Nanjing Daofeng Investment Management Centre (general partnership)Saurer Intelligent Machinery Refers to Saurer Intelligent Machinery Co., LtdSaurer Jiangsu Refers to Saurer (Jiangsu) Textile Machinery Co., LtdSaurer Changzhou Refers to Saurer (Changzhou) Textile Machinery Co., LtdChangzhou Saurer Refers to Changzhou Saurer (Jintan) Textile Machinery Co., LtdSaurer Xinjiang Refers to Saurer Xinjiang Intelligent Machinery Co., LtdSaurer Germany Refers to Saurer Germany GmbH & Co. KGSaurer Technologies Refers to Saurer Technologies GmbH & Co. KGSaurer Switzerland Refers to SAURER AGAd hoc Refers to Public announcements of listed companies published online by the Shanghai Stock ExchangeAGM Refers to Annual Shareholders’ General MeetingCSRC Refers to China Securities Regulatory CommissionE³ – Triple Added Value Refers to Energy, Economics, ErgonomicsEGM Refers to Extraordinary Shareholders’ General MeetingPwC Refers to PwC Mainland China (special general partnership)
SECTION 1.DEFINITIONS

12 2017 ANNUAL REPORT
I. Company Information
Chinese name 卓郎智能技术股份有限公司
Chinese abbreviation 卓郎智能
English name Saurer Intelligent Technology Co., LtdEnglish abbreviation Saurer IntelligentLegal representative Pan Xueping
II. Contact Information
Secretary to Board of Directors Representative of Securities AffairsName Zeng Zhengping Li XiaohuiAddress 100 Zunyi Road, Hongqiao The Place,
Changning District, Shanghai100 Zunyi Road, Hongqiao The Place, Changning District, Shanghai
Tel. 021-22262549 021-22262549Fax 021-22262586 021-22262586Email [email protected] [email protected]
III. Basic Profile
Registered address 133 Nanhu Road, Urban Construction Building 1, 22nd Floor, Shuimogou District, Urumqi, Xinjiang
Zip code 830063Office address 133 Nanhu Road, Urban Construction Building 1, 18th Floor, Shuimogou District,
Urumqi, XinjiangZip code 830063Company website www.saurer.comEmail [email protected]
IV. Information Disclosure and Place of Collection
Designated newspapers for disclosure of the Company’s information
Securities Times, Securities Daily and Shanghai Securities News
Website designated by the CSRC for publishing the Annual Report
http://www.sse.com.cn/
Place of collection of Annual Report Office of the Board of Directors
SECTION 2.COMPANY PROFILE AND FINANCIAL SUMMARY

2017 ANNUAL REPORT 13
V. Information on the Company’s Shares
Shares of the Company
Type of shares Place of listing Stock abbreviation Stock code Stock abbreviation before change
A shares Shanghai Stock Exchange
Saurer Intelligent 600545 Xinjiang Urban Construction
VI. Other Relevant Information
Accounting firm (Mainland China)
Name PwC (special general partnership)Office address 202 Hubin Road, Corporate Avenue 2nd Bldg., PwC Centre 11th Floor,
Huangpu District, ShanghaiSigning accountants Jiang Songyi, Rao Shenghua
Sponsor performing continuous supervision duties in the reporting period
Name ZTF Securities Co., Ltd (formerly Haiji Securities Co., Ltd)Office address: China Chuneng Building 50th Floor, Nanshan District, ShenzhenAuthorized sponsor representatives Chang Jiang, Chen HuaweiContinuous supervision period 28 July 2017 – 31 December 2020
VII. Major Accounting Data and Financial Indicators of the Company for the Last Three Years
(1). Major Accounting Data Unit: Thousand Yuan; Currency: RMB
Major accounting data 2017 2016 Change (%) YoY 2015Revenue 8,713,412 6,352,754 37.2 6,648,902Net profit attributable to shareholders of the Listed Company 658,327 474,917 38.6 379,852Net profit attributable to shareholders of the Listed Company less non-recurring gains and losses 649,046 332,392 95.3 277,664Net cash flows from operating activities 676,157 2,204,738 –69.3 –73,387
Year end 2017
Year end 2016
Change (%) YoY Year end 2015
Net assets attributable to shareholders of the Listed Company 2,207,034 2,530,033 –12.8 2,028,095Total assets 14,531,772 13,225,243 9.9 9,426,260
(2). Major Financial Indicators
Major financial indicators 2017 2016 Change (%) YoY 2015Basic earnings per share (yuan/share) 0.4556 0.3894 17.0 0.3114Diluted earnings per share (yuan/share) 0.4556 0.3894 17.0 0.3114Basic earnings per share less non-recurring gains and losses (yuan/share) 0.4492 0.2725 64.8 0.2277Weighted average return on equity (%) 23.67 20.95 2.72 20.97Weighted average return on equity less non-recurring gains and losses (%) 23.34 14.66 8.68 15.33
SECTION 2.COMPANY PROFILE AND FINANCIAL SUMMARY

14 2017 ANNUAL REPORT
Following completion of restructuring in September 2017, the Company’s consolidated financial statements for 2015–2017 were prepared on the basis of the financial data of the legal subsidiary (i.e. the buyer, Saurer Intelligent Machinery), according to the reverse purchase principle.
The favourable economic situation and promotion of the “One Belt, One Road” initiative have helped drive demand for textile machinery. In 2017, the Company’s revenue grew by 37.2% YoY, and net profit attributable to the shareholders of the Listed Company increased by 38.6%.
In 2017, net profit attributable to shareholders of the Listed Company less non-recurring gains and losses grew by 95.3% YoY, which is higher than the growth in net profit attrib-utable to shareholders of the Listed Company of 38.6%. Subsequently, the basic earn-ings per share less non-recurring gains and losses show a higher growth rate of 64.8% YoY, compared with growth in basic earnings per share of 17.0%. Similarly, the weighted average return-on-equity less non-recurring gains and losses shows a higher growth rate of 8.68% YoY, compared with the weighted average return-on-equity of 2.72%. This was mainly caused by a decrease in non-recurring net earnings of RMB 130 million YoY, which included a decrease in guarantee fee income in 2017 of RMB 60 million YoY, a decrease in received payment for use of state funds of RMB 50 million YoY, a decrease in government subsidies of RMB 30 million YoY and an increase in investment income from the disposal of overseas subsidiaries of RMB 10 million YoY.
Net cash flow from operating activities in 2017 decreased by 69.3% YoY, mainly as a result of fluctuations in the balance of operating receivables and payables.
Net assets attributable to shareholders of the Listed Company for 2017 decreased by 12.8% YoY, including the increase in net profit attributable to the parent company in the current year of RMB 660 million, a decrease resulting from restructuring transactions of RMB 240 million, a decrease due to the acquisition of the minority shareholders’ equity from the subsidiaries of RMB 580 million and a decrease in other combined income of RMB 160 million.
In 2017, the Company issued shares to acquire the assets to facilitate the indirect listing of Saurer Intelligent Machinery. This constituted a reverse purchase. The weighted average number of common shares for 2017 was used to calculate earnings per share according to “Rule 9 for Information Disclosure and Reporting for Companies Offering Securities to the Public – Calculation and Disclosure of Net Return-on-Equity and Earnings Per Share” of the China Securities Regulatory Commission (CSRC).
VIII. Major Financial Data for Each Quarter in 2017Unit: Thousand Yuan; Currency: RMB
First quarter(Jan. – Mar.)
Second quarter(Apr. – Jun.)
Third quarter(Jul. – Sept.)
Fourth quarter(Oct. – Dec.)
Revenue 1,775,808 2,283,799 2,028,192 2,625,613Net profit attributable to shareholders of Listed Company 108,461 170,080 176,456 203,330Net profit attributable to shareholders of the Listed Company less non- recurring gains and losses
108,511 182,550 176,180 181,805
Net cash flows from operating activities –206,934 –353,387 1,166,583 69,895
SECTION 2.COMPANY PROFILE AND FINANCIAL SUMMARY

2017 ANNUAL REPORT 15
IX. Items and Amounts of Non-recurring Gains and LossesUnit: Thousand Yuan; Currency: RMB
Non-recurring gains and losses 2017 Note (if applicable) 2016 2015Income and losses arising from disposal of non-current assets –1,318 Gains and losses generated from disposals of fixed
assets1,282 –53
Government subsidies calculated in current gains and losses, except those that are closely related to normal operating activities and in compliance with national policies, which are based on a certain standard quota or amount
2,511 / 31,816 370
Paid or received payment for use of state funds recorded in current gains and losses
23,775 Interest income generated from temporary supplier loans provided to third-party companies
71,851 133,864
Expected employee severance expenses and other costs resulting from shut-downs of overseas operations
–8,539 Severance expenses from overseas business integration
0 –61,683
Earnings from currency swap agreements and interest rate swap agreements 0 / 9,588 –45,544Other net non-operating income and expenditure other than the above –21,068 Including a donation to poverty relief efforts of RMB
20 million58,622 17,949
Income generated from the disposal of subsidiary companies 12,082 Investment income generated from the disposal of overseas subsidiary companies
0 64,774
Amounts attributable to minority shareholders –92 / –132 –410Income tax effects 1,930 / –30,502 –7,079Total 9,281 / 142,525 102,188
X. Items Using Fair Value MeasurementUnit: Thousand Yuan; Currency: RMB
Item Beginning balance
Ending balance Change in current period
Amount affecting balance in
current periodFinancial assets at fair value with change factored into gains/losses of the current period
1,860 6,178 4,318 0
Financial liabilities at fair value with changes factored into gains/losses of the current period
1,082 7,532 6,450 0
Total 2,942 13,710 10,768 0
SECTION 2.COMPANY PROFILE AND FINANCIAL SUMMARY

16 2017 ANNUAL REPORT
I. Main Business, Operating Models and Core CompetitivenessSaurer is a global leader in high-end textile equipment with a history going back over a hundred years. Its main businesses involve R&D and the production and sale of intelligent textile equipment sets and their key components. As a world leader in the textile machinery industry, through sound management and technological advances over the years, Saurer has united textile machinery brands such as Schlafhorst, Zinser, Allma and Volkmann, each with its own rich his-tory. Saurer is one of the few suppliers in the staple fibre processing industry that is able to deliver a suite of solutions, comprising blow-ing machines, cotton carding machines, roving frames, spinning frames, winding machines, twisting machines, two-for-one twisting machines as well as fully automated rotor spinning machines. The Company has production bases and sales companies in 12 coun-tries and regions, including China, Germany, Switzerland and India, and its users are distributed across 130 countries and regions. All its key products have significant competitive advantages and are in leading positions in the global market.
(1). Main Business Saurer is divided into two business segments, Spinning Solutions and Technologies.
1. Spinning Solutions Segment Saurer Spinning Solutions provides customers with a suite
of solutions required for processing fibre from bale to yarn, including pre-spinning processing, ring spinning and rotor spin-ning machines and their key components. The segment owns machinery brands such as Schlafhorst, Zinser and Texparts, and its flagship products include the Autocoro 9 automatic and BD7 semiautomatic rotor spinning machine and the Autoconer 6 automatic winder.
2. Saurer Technologies Segment With its Twisting Solutions, Saurer Embroidery, Elastomer
Components and Engineered Bearing Solutions business units, the Technologies Segment concentrates on high-value-added technologies, components and solutions in the textile manu-facturing process for staple as well as man-made fibres. It also specializes in technological innovations that go beyond textile. Brands include Volkmann, Allma and Saurer Embroidery as well as Accotex, Fibrevision and Temco, and signature products include Volkmann’s VGT-9/11 glass fibre twister, Allma’s Cable-Corder CC4 tire cord twister and the Epoca 7 shuttle embroidery machine.
(2). Business ModelThroughout its long history, Saurer has established a unique pattern of adapting to market developments and corporate positioning in R&D, production and procurement, and assembly/integration and sales.
1. R&D Model Saurer has a specialized product R&D department that under-
takes both standard and customized projects, and has set up R&D centres in China, Germany and Switzerland. In its R&D work, Saurer is committed to the “E³ – Triple Added Value” principle, which aims at improving product performance in terms of Energy, Economics and Ergonomics. The Company also adheres to the time-to-market principle to increase the efficiency of product development and new product launches. The R&D workflows follow a specific development process. The product management together with the sales and after-sales service departments gather and sort information on customer needs. The product management defines the product requirements according to the customer needs. Interdisciplinary development teams, led by professional project managers, take responsibility to set up product development projects. A prototype for the new product is created, taking into account technical and E³ – Triple Added Value parameters as well as the required customer features. In a next step, other departments carry out a range of activities relating to the new product:
a. The marketing department initiates a comprehensive mar-ket survey to assess market demand for the new product, acceptance of it among potential customers, and the initial projected sales.
b. The technical department assesses all the possible techni-cal “paths” and risks.
c. The production and operations management departments assess the supply of raw materials, and production and oper-ations.
d. The finance department conducts a business and financial analysis of the product.
After the departments have confirmed the feasibility of the new product, tests are performed on the most up-to-date product prototype. These tests not only evaluate the technical options but also include assessments of design optimization, indus-trial engineering, user-friendliness and the economics of the product. Once the technology has taken shape, the product enters production and market-testing stages. The entire product development process is a closed-loop, iterative process aimed at continuous improvement.
During the reporting period, the Company successfully launched the Zinser 72XL and received the first batch of orders for it. This super-long ring spinning machine,with more powerful drives is intended to enhance customers’ production capacity.
2. Production and Procurement Model Saurer implements order-based (Make to Order) production,
which means that it performs in-depth design based on the spe-cific needs of customers. These customer needs are met with independent modules developed by Saurer. Each model com-prises a set of individually developed design, detailed solutions
SECTION 3.BUSINESS OVERVIEW

2017 ANNUAL REPORT 17
and corresponding design drawings, which describe in detail how each system, specialized stand-alone machine and equip-ment, or information and control system works. Every modular component and specialized part corresponds to a detailed bill of materials. The processing required for the key parts, and control and information systems for each modular assembly is performed independently within the Company; general standard parts are acquired by the procurement department from qualified suppliers.
In order to improve efficiency, machining in Ebersbach, Germany, has been partially transferred to the Company’s production base in India and partly outsourced to other suppliers. In addition, two manufacturing bases for roving frames in India have been consoli-dated to optimize production. At the same time, the Company has reduced procurement costs for non-key parts by further increas-ing the percentage of procurement from emerging countries.
3. Assembly Model Once the procurement or production of key components is com-
plete, Saurer needs to complete the assembly of stand-alone machines and entire production lines for final testing. Specialized stand-alone machines are assembled at Saurer, while assembly of complete production lines for final testing is completed at the customer’s site. Final acceptance testing is then performed at the customer’s site in strict compliance with the design protocol. Once all the equipment in the line has been connected, powered up and fitted with samples, the equipment must pass test production, small-batch production and continuous, stable pro-duction before it may be accepted. Final acceptance indicates that Saurer’s product meets the requirements of the technical protocol, and the agreement and tender documents.
4. Sales Saurer employs two sales models – direct sales and distribution,
respectively – for different-sized markets. Saurer’s direct sales model is geared to large markets and involves acquiring informa-tion about the needs of potential customers through monitor-ing industrial and market information (such as the distribution of textile industries and lists of operators within the industry); participating in professional textile seminars, exhibitions and other information-exchange events, use of consultative-selling techniques by sales personnel, referral by existing customers, and other methods. After confirming the needs of the custom-ers, Saurer relies on collaboration between its R&D and technical personnel to design customized products for its customers, and then to strive to make the sale through open tenders, business negotiations and so forth. For smaller and less-popu-lated markets, Saurer adopts the distribution approach to reach out to its customers. Using this approach, Saurer evaluates its distributors each year and scores them based, for example, on past cooperation experiences, size, distribution capacity and service. Selected distributors are asked to sign a “distribution agreement”, which authorizes them to develop new markets and
contact customers to facilitate transactions between Saurer and customers. For orders that are acceptable to Saurer, the final sales agreement is signed between Saurer and the customer, who makes payment directly to Saurer by letter of credit or other recognized payment methods. The distributor makes a com-mission on the transaction which is usually determined on the basis of prices in the distributor’s sales region, and the type and quantity of product sold.
(3). State of the IndustryIn 2017, China’s textile industry actively embraced the “One Belt, One Road” initiative by accelerating transformation and upgrades, promoting smart and green manufacturing, and by continuously innovating to drive development of the industry forward. With the steady progress of the market reform and the effective implemen-tation of the three nationwide initiatives – “One Belt, One Road”, “Industry 4.0” and “Made in China 2025” – as well as the continued and positive progress of China’s macroeconomic development, China’s textile industry is generally described as showing “steady growth led by improvement in quality and efficiency”.
Intelligent manufacturing and Industry 4.0 are expected to drive textile machinery technologies towards higher flexibility, intelligence and precision, as well as to increase variety and personalized or customized small-batch production. Indeed, Saurer believes that low carbon, green and recycling will be the main trends in the textile industry in future. The industry is expected to step up development of green production systems and will move towards lower energy and water consumption and reduced pollutant emissions.
II. Significant Changes in Major AssetsSaurer’s balance of projects under construction increased by RMB 170 million during the reporting period and added RMB 220 million this year, including RMB 140 million resulting from Saurer Xinjian’s newly built plant, which is intended to further expand production capacity.
The Company has overseas assets of RMB 6,204,924, which account for 42.7% of total assets. The Company’s overseas assets developed in the following way. On 3 December 2012, Saurer Textile Machinery Co., Ltd (currently Saurer Intelligent Machinery) entered into an assets and stock acquisition agreement with OC Oerlikon Corporation AG, Oerlikon Textile GmbH & Co. KG and W. Reiners Verwaltungs-GmbH, with Saurer Germany GmbH & Co. KG as the buyer and Jinsheng Group as the guarantor, to acquire all the assets and stocks of the staple fibre business and original parts business from Oerlikon. Since 30 June 2013, all economic benefits from these businesses are officially owned by Saurer Intelligent Machinery. The production bases and sales companies acquired are located in 12 countries and regions, including China, Germany, Switzerland and India.
SECTION 3.BUSINESS OVERVIEW

18 2017 ANNUAL REPORT
III. Core CompetitivenessAs a company steeped in tradition, Saurer has always been a pioneer in the textile machinery industry. Passion for its products lies at the heart of the Company’s history of innovation. With more than 1,100 patents registered, and currently more than 410 R&D employees worldwide, Saurer’s R&D teams are a driving force for development in the textile industry. Today, Saurer is one of the few suppliers in the staple fibre processing industry able to deliver a suite of solutions, from blowing machines, cotton carding ma-chines, roving frames and spinning frames, to winding machines, twisting machines, two-for-one twisting machines and fully auto-mated rotor spinning machines.
(1). Competing on the Basis of E³ – Triple Added ValueSaurer’s R&D departments use their resources and capabilities to design product solutions that are compatible with customers’ requirements for energy savings, economical production and ergonomics, embodied in the Company’s philosophy of E³ – Triple Added Value.
ENERGYOne of the most important cost factors in the manufacturing indus-try today is the cost of energy. Consequently, our customers rightly demand products that optimize energy consumption.
ECONOMICSLabour costs are increasing worldwide. To maximize our custom-ers’ profitability, Saurer offers high-quality, productivity-enhancing machines with attractive options for automation.
ERGONOMICSHow do you optimize the operating conditions of a machine and the time needed for settings and adjustments? What is the ideal workflow? These are questions for which Saurer products deliver ideal solutions.
SECTION 3.BUSINESS OVERVIEW

2017 ANNUAL REPORT 19
(2). Competing through Technological InnovationFully Automated Intelligent Winding SolutionsSaurer is the inventor of the Autoconer automatic package-winding machine. For more than half a century, the Company has defined the course of development of technologies and processes in the package-winding sector. In early 2017, the 2.5-millionth Autoconer winding unit was put into operation at a textile company in India. This record, unmatched in the sector, showed how much trust the textile industry has in Saurer’s technological leadership. Its revolutionary splicing technology, innovative sensor technology and control systems, unique “FX” technologies and intelligent automa-tion systems have all become state of the art.
The PreciFX is a case in point. This drumless yarn-laying system not only enhances package unwinding performance but also ena-bles spinning mills to create a large variety of customized package formats depending on downstream requirements.
The E³ – Triple Added Value-certified Autoconer 6 automated wind-ing machine offers maximum energy savings, greater productivity and minimized personnel requirements in a single system. Unique features, including an Eco-Drum-Drive system, “power-on-demand” vacuum control and MultiJet cleaning, reduce energy consumption by up to 20%. In addition, the SmartCycle, SmartJet and slip-free acceleration LaunchControl features ensure improved productivity by up to 6%.
High-Performance Twisting and Cabling MachinesSaurer’s twisting and cabling machines are applicable to a wide range of industrial yarns, tire cords, staple fibre yarns, carpet yarns and glass filament yarns. For example, the Allma direct cabling machine for tire cord uses an innovative outer yarn delivery system that effectively controls ballooning of the yarn. This reduces energy consumption by up to 50%, compared with conventional equip-ment, and yarn breakage by up to 50%. Machine operators benefit from a significant decrease in noise pollution. The highly accurate yarn tensioner inside the machine maximizes reliability, while precise online monitoring of yarn tension at each spindle ensures product quality. In the combined version, the machine is suitable for direct cabling as well as for two-for-one twisting.
Automatic and Semi-automatic Rotor Spinning MachinesStriving to set the standard for intelligent solutions, Saurer’s R&D departments are responsible for the design of automatic and semi-automatic rotor spinning machines, such as the Autocoro and BD series of rotor spinning machines. With integrated quality control and high-productivity components and automation features, these machines are the most advanced on the market.
The Autocoro 9 fully automated rotor spinning machine features the world’s fastest rotor spinning technology. It offers yarn take-off at a speed of up to 300 metres per minute and rotor speeds
of up to 180,000 rpm, The package diameter reaches up to 350 mm. In addition, the machine offers a new individual drive, and can accommodate as many as 720 spinning positions. The Autocoro 9 is equipped with several doffing and cleaning units. It can reduce energy costs by up to 25% and maintenance costs by 60%.
(3). Competing on the Strength of Saurer BrandsFor over 160 years, Saurer’s engineering experience has been a driving force for innovation in the textile industry. The continu-ous development of the Company’s core competencies provides customers with optimal solutions to meet their needs. Saurer plays a key role at many stages along the textile value chain. The Company-owned brands Schlafhorst and Zinser are leaders in spin-ning technology, while Saurer Embroidery is an exemplar of skill in embroidery. Brands such as Allma and Volkmann supply high-qual-ity threading and cabling systems for tire cords, and carpet and glass-filament yarns. Texparts is the technology leader in textile machine components in the area of spinning and twisting, including drafting systems, spindles and spindle drives, and spinning rings and travellers. Accotex’s glass-forming aprons and Temco’s special bearings help to explain Saurer’s reputation for expertise beyond textile.
Saurer’s strong standing and reputation are the Company’s back-bone for growth in both domestic and overseas markets.
(4). Competing through Combined Local Know-How and Global ReachIn 2013, Jinsheng Group acquired Saurer. As a Chinese business, Saurer has a significant advantage in regional development. China’s vision for the textile industry is having a profound impact on the Company’s growth strategy. Saurer is well-positioned to reap the rewards of investments along the re-invigorated trade route from east to west at the heart of the “One Belt, One Road” initiative.
Saurer is further strengthened by its global reach in all major mar-kets. Because a short response time is a key factor for success, Saurer has production bases as well as sales and service com-panies in 12 countries and regions, including China, Germany, Switzerland, India, Turkey and the USA. It provides excellent service to its customers in over 130 countries worldwide.
SECTION 3.BUSINESS OVERVIEW

20 2017 ANNUAL REPORT
I. Overview of Operations
(1). As the economic situation continues to improve, industri-al development is also progressing steadily2017 was an important year in the implementation of China’s cen-tral government’s 13th Five-Year Plan and in the country’s market reforms. Against the backdrop of a recovering global economy, China’s economic transformation and development have gradually stabilized. Confronted with high overall costs and fierce competitive pressure internationally, the textile industry has conscientiously put into practice its new development concept, accelerating trans-formation and upgrades, promoting intelligent manufacturing and green production, and continuing to push industrial development forward. Industry has managed to maintain a developmental trend characterized by steady growth and quality improvement.
According to China’s National Bureau of Statistics, the quality and efficiency of the textile industry are basically sound, and investment in transformation and upgrades continues to increase. In 2017, the cumulative main business revenues of textile companies above a certain size was RMB 6,893.56 billion, an increase of 4.2% YoY, which is 0.1% more than the previous year. Total profits amounted to RMB 376.88 billion, an increase of 6.9% YoY, which is 2.4% more than the previous year. Sales profits for this group reached 5.5%, 0.2% higher than last year. With solid operations and good quality and performance, textile companies enjoyed stable overall invest-ment confidence. Fixed-asset investment projects in the industry with a value of RMB 5 million or above totalled RMB 1,350.73 billion in 2017, an increase of 5.2% YoY. This included an investment increase of 7.9% YoY in the eastern region, which was 2.4% higher than last year and accounted for 87.2% of investment nationwide. According to the China Textile Economic Information Network, the rapid growth of investment in the eastern region, where production capacity was previously low, indicates companies’ increased enthu-siasm for corporate transformation and upgrading. Moreover, the China Textile Machinery Association has reported that China’s textile machinery industry as a whole achieved primary business revenues of RMB 114.927 billion in 2017, an increase of 9.42% YoY, with total profits of RMB 8.36 billion, an increase of 23.11% YoY.
(2). Systematic and efficient implementation of strategy delivers strong performance and growthIn 2017, Saurer responded to both the industry’s stable growth trend, and China’s 13th Five-Year Plan for the textile industry and “One Belt, One Road” initiative, with its own new strategy of innovation and development. Combining a series of measures that included systematic integration of existing brands, improved customer service, R&D and innovation as well as implementation of a plan for purchasing from developing countries, the Company further consolidated its position as a global leading supplier of high-end textile equipment solutions, and expanded its market share in China and other traditional textile markets, such as Turkey.
It also achieved significant growth in emerging markets, including Uzbekistan, Mexico, Iran and Vietnam, with highest sales growth in China and Turkey reaching 70.9% and 69.8% YoY, respectively. In the past three years, Uzbekistan has become Saurer’s fourth-larg-est market with sales of over RMB 500 million.
During the reporting period, the Company successfully completed a major asset restructuring. Jinsheng Group, Kimble, Hezhong Invest-ment and Hehe Investment all made the following commitments. In the year that the restructuring is completed and the following two fiscal years, i.e. 2017, 2018 and 2019, the net profits attributable to the shareholders of the parent company realized by Saurer (as shown in the consolidated financial statements less non-recurring gains and losses) shall not be less than RMB 583 million, RMB 766 million and RMB 1,003 million, respectively, while the total shall not be less than RMB 2,352 million. The “Special Audit Report with Explanations about the Differences between the Actual Net Profits and Committed Net Profits of Saurer Intelligent Machinery” (PwC Special Audit No. 1868 [2018]) shows that Saurer’s net profit attributable to the owners of the parent company less non-recurring gains and losses in 2017 was RMB 684 million, which exceeds and is 117% of the committed net profit of RMB 583 million.
1. Spinning Solutions Segment In 2017, the Spinning Solutions Segment had revenue of RMB
6.98 billion, an increase of 42.5% YoY. In 2017, Saurer delivered a modern spinning mill to Uzbekistan that included a full suite of “turnkey” solutions, encompassing every production step ranging from roving to spinning to automated winding, all the way to the construction of an integrated operating centre. At the “Turkmenistan Textile 2017” trade fair, the Turkmenistan Ministry of the Textile Industry honoured Saurer with an award for its technological and business expertise as well as for its excellent spinning and winding machines, and exemplary service on-site at the spinning mill. 2017 also marked the 30th anniversary of Corolab – the Saurer yarn clearer – which was first introduced in 1987. It has since been used more than 2 million times in rotor spinning machines. Corolab is especially appreciated for its relia-bility and durability and is indispensable for assuring yarn quality in rotor spinning mills. Saurer’s Texparts achieved the highest sales volume ever in 2017 for the PK2025+ series of ring spin-ning weighting arms. To meet ever-increasing market demand and further grow its market share in China and the surrounding countries, Saurer Jiangsu has expanded its production capacity to more than 150,000 spindles per month.
SECTION 4.DISCUSSION AND ANALYSIS OF OPERATIONS

2017 ANNUAL REPORT 21
2. Technologies Segment In 2017, the Technologies Segment realized revenue of RMB
1.81 billion, representing an increase of 22.5% YoY. The Twisting Solutions unit, with its Volkmann and Allma brands, is a global leader in twisting and cabling technology, and by 2017 it had achieved cumulative sales of more than 4 million spindles. In Turkey, a key market for embroidery, Saurer Embroidery’s latest generation of Epoca 7 machines have been well received. At the beginning of 2017, the first two extra-long Epoca 7 machines went into operation and have been producing the finest embroi-dery at speeds of up to 600 rpm ever since. In August 2017, Saurer shipped its 50th Epoca 7 machine to Turkey.
(3). The Xinjiang plant is under constructionIn Xinjiang, a province ideally located on the Silk Road Economic Belt, Xinjiang has entered a phase in which the “One Belt, One Road” initiative is in full swing. According to China’s National Bureau of Statistics, in 2017 Xinjiang’s cotton output reached 4.082 million tons, an increase of 13.6% YoY, which accounted for more than 74% of total cotton production in China. The concentration of cotton production in Xinjiang has enabled quick expansion of textile production capacity in this region, where Saurer seized a devel-opment opportunity to set up its wholly owned subsidiary, Saurer Xinjiang, which began construction on a plant in 2017. Construction was proceeding smoothly during the reporting period, and it is es-timated that the facility will go into operation in the middle of 2018. This will result in additional production capacity of 2 million spindles (including carding, roving frame, winding spinning and rotor spin-ning systems), to meet growing demand. Saurer Xinjiang’s plant is expected to be a highly efficient, state-of-the-art Industry 4.0 manu-facturing base. Its high-quality production capacity, coupled with its proximity to the market, will help the Company to rapidly develop in emerging markets such as Uzbekistan, Pakistan and Turkmenistan.
(4). Customer relationships and service quality are being enhancedSaurer’s latest-generation SECOS 2.0, a secure online ordering system for original parts, provides customers with all the infor-mation they need for machine maintenance, care and operation. SECOS 2.0 also offers a convenient “one-click ordering” feature that enables customers to access their order history to facilitate purchasing and cost control and to track new orders online at any time to reduce machine downtime to a minimum. Customers can also use the system to obtain information on system updates and upgrades, technical manuals and special product offers, and enjoy more comprehensive and responsive customer service.
During the reporting period, Saurer organized a number of Supplier Days and Customer Days , as well as training and exchange activi-ties based at Saurer technology centres across the world. In March 2017, Saurer held Customer Days in Vietnam and Indonesia. More
than 400 management-level customer employees attended these events, which helped to strengthen partnerships between Saurer and its customers and to promote the exchange of knowledge. On 9 May 2017, the New Yarn Academy Turkey held its first Compe-tence Day at the Saurer Turkey technology centre, where experts from Saurer presented a series of lectures and workshops on im-portant issues in ring spinning to around 70 participants. The aim of the Yarn Academy is to share technical and technological expertise in ring and rotor spinning and to strengthen customer contact at the operational management level. On 20 October 2017, Saurer organized a Customer Day in Wenzhou, focusing on total solutions textile recycling. Saurer technology centres also provide customers’ employees with customized training to help them better under-stand technical processes and to improve their operating skills. This not only aids customers’ production but also helps to reduce their training costs. Saurer has been an active participant in various textile industry exhibitions in Asia, such as ShanghaiTex, ITMA Asia, ITMACH India, DTG and Domotex Asia, where it presents ideas on innovation and sustainable development.
Saurer firmly believes that reliable and responsive customer service is essential to long-term customer relationships and that high-quali-ty service helps customers to generate revenues.
II. Results of Main Operations during the Reporting PeriodDuring the reporting period the Company achieved revenue of RMB 8.71 billion, which represents an increase of 37.2% YoY. Net profit attributable to the shareholders of the Listed Company was RMB 658 million, representing an increase of 38.6% YoY. Net cash flow from operating activities was RMB 680 million, which represents a decrease of 69.3% YoY. As of 31 December 2017, the total assets of the Company amounted to RMB 14.53 billion, and net assets attributable to the shareholders of the Listed Company were RMB 2.21 billion.
SECTION 4.DISCUSSION AND ANALYSIS OF OPERATIONS

22 2017 ANNUAL REPORT
(1). Analysis of Main Business
1. Changes in Income and Cash Flow Unit: Thousand Yuan; Currency: RMB
Item 2017 2016 Change (%)Revenue 8,713,412 6,352,754 37.2Operating expenses 6,389,179 4,735,487 34.9Cost of sales 595,694 444,839 33.9Administrative expenses 686,425 598,310 14.7Financial expenses –52,989 –48,830 N/ANet cash flow from operating activities 676,157 2,204,738 –69.3Net cash flow from investing activities 329,608 –3,030,460 N/ANet cash flow from financing activities –1,095,337 2,727,332 –140.2
2. Revenue and Expenses During the reporting period the Company achieved revenue of RMB 8.71 billion, an
increase of 37.2% YoY. The Spinning Solutions Segment was a significant contributor to this growth. Operating expenses were RMB 6.39 billion, an increase of 34.9% YoY, mainly due to the increased cost of operations resulting from business expansion.
(1) Operating Activities by Industry, Segment and Region
Primary business by industry Unit: Thousand Yuan; Currency: RMB
By industry Revenue Operating expenses
Gross margin (%)
Change in revenue YoY (%)
Change in expenses YoY (%)
Change in gross margin YoY (%)
Textile machinery 8,713,412 6,389,179 26.7 37.2 34.9 1.2
Primary business by segment
By segment Revenue Operating expenses
Gross margin (%)
Change in revenue YoY (%)
Change in expenses YoY (%)
Change in gross margin YoY (%)
Spinning Solu-tions Segment
6,977,092 5,153,195 26.10 42.5 39.8 1.4
Technologies Segment
1,809,697 1,309,475 27.60 22.5 22.3 0.0
The revenue and operating costs by segment include internal revenue and expenses.
Primary business by region
Revenue by region 2017 2016 Change (%)China 3,674,611 2,150,570 70.9India 973,602 1,001,445 –2.8Turkey 904,084 532,366 69.8Other Asia regions 1,744,952 1,212,421 43.9Americas 740,555 671,280 10.3Europe, Africa and others
675,608 784,672 –13.9
Total 8,713,412 6,352,754 37.2
SECTION 4.DISCUSSION AND ANALYSIS OF OPERATIONS

2017 ANNUAL REPORT 23
Saurer is divided into a Spinning Solutions Segment and a Technologies Segment based on its product structure. With efficient, stable intelligent and customized products, the Company is widely recognized by customers in the industry across the world. The textile machinery industry enjoyed steady growth in 2017. Promotion of the “One Belt, One Road” initiative helped to drive development of the textile industry in Xinjiang, Turkey and the Central Asia regions, stimulating demand for textile ma-chinery products in these regions. Tax reform in India affected the local investment and sales environment, resulting in a slight decline in revenue.
(2) Production and Sales Analysis
Main products Production Sales Inventory Increase or decrease in production YoY (%)
Change in sales YoY (%)
Change in inventory YoY (%)
Ring spinning 1,306 sets 1,316 sets 44 sets 106.32 107.57 –18.52Rotor spinning 489 sets 491 sets 6 sets 64.65 57.88 –25.00Winder 1,725 sets 1,664 sets 102 sets 51.72 36.73 148.78Two-for-one twister
1,037 sets 1,040 sets 9 sets 0.29 3.69 –25.00
As the industry continued its upward trajectory, the “One Belt, One Road” initiative helped to drive demand for spinning machines. In 2017, the manufacture and sales of the Company’s main products increased substantially over the previous year.
(3) Cost Analysis Unit: Thousand Yuan
Industry Cost breakdown 2017 % of total costs in 2017
2016 % of total costs in 2016
Change YoY (%)
Note
Textile machinery
Raw material costs
4,798,205 75.1 3,485,369 73.6 37.7 Sales growth in the reporting period increased raw material costs
Other 1,590,974 24.9 1,250,118 26.4 27.3 /Total 6,389,179 100.0 4,735,487 100.0 34.9 /
(4) Major Customers and Suppliers Sales to the top five customers amounted to RMB 2,827,908,000, accounting for
32.5% of total annual sales, including sales to related parties of the top five custom-ers amounting to RMB 820,203,000, which represent 9.4% of total annual sales.
Purchases from the top five suppliers amounted to RMB 785,434,000, accounting for 12.4% of total annual purchases, including purchases from related parties of the top five suppliers amounting to RMB 0, which represent 0% of total annual purchases.
3. Selling and Distribution Expenses Unit: Thousand Yuan
Item 2017 2016 Change YoY (%)Sales expenses 595,694 444,839 33.9Administrative expenses 686,425 598,310 14.7Financial expenses –52,989 –48,830 8.5
Selling and distribution expenses during the current period increased mainly because of higher shipping costs due to business growth.
SECTION 4.DISCUSSION AND ANALYSIS OF OPERATIONS

24 2017 ANNUAL REPORT
4. Expenditures on R&D Unit: Thousand Yuan
Expenditures on R&D 275,325Capitalization of R&D expenditures 46,757Total R&D expenditures 322,082Total R&D expenditures as % of revenue 3.7Number of R&D employees 416R&D employees as % of total employees 9.3Capitalization of R&D expenditures (%) 14.5
In 2017, the Company continued to expand its textile machinery business. It increased R&D investment and strengthened its technology expertise, with the objective of making Saurer a global leader in product design, production processes, precision processing, and monitoring and controlling technologies.
5. Cash Flow Unit: Thousand Yuan
Item 2017 2016 Change (%)Net cash flow from operating activities 676,157 2,204,738 –69.3Net cash flow from investing activities 329,608 –3,030,460 N/ANet cash flow from financing activities –1,095,337 2,727,332 –140.2
Cash flow generated in the reporting period decreased by RMB 1.53 billion over the previous year, primarily for the following reasons:a) Net profit in 2017 was RMB 750 million (2016: RMB 500 million), an increase of RMB 250 million YoY.b) Operating receivables in 2017 increased to RMB 1.22 billion (2016: RMB -820 million), a change of RMB 2.04 billion YoY.c) Operating payables in 2017 amounted to RMB 1.4 billion (2016: RMB 410 million), an increase of RMB 990 million YoY.d) Inventory in 2017 reached RMB 430 million (2016: RMB -190 million), a difference of RMB 620 million YoY.e) Net loss from investment in 2017 was RMB 10 million (2016: RMB 50 million), a de-crease of RMB 60 million YoY. f) Financial net income 2017 was RMB -60 million (2016: RMB 30 million), a change of RMB 90 million YoY.
Cash flow generated from investing activities in the reporting period increased by RMB 3.36 billion over the previous year, primarily for the following reasons:a) Cash flow was affected by the net cash change from the acquisition and redemption of financial products. Net cash inflow from other investment-related activities in 2017 was RMB 70 million, and net outflow reached RMB 4.55 billion, an change of RMB 4.62 billion YoY.b) Cash flow resulting from lending and repayment of related party loans in 2017 was RMB 0 (2016: net cash inflow amounted to RMB 970 million), a decrease of RMB 970 million YoY.
SECTION 4.DISCUSSION AND ANALYSIS OF OPERATIONS

2017 ANNUAL REPORT 25
c) Net cash inflow resulting from cash received from and cash paid for restricted cash and deposits in 2017 was RMB 560 million (2016: RMB 80 million), an increase of RMB 480 million YoY.d) Net cash inflow from disposals of subsidiaries in 2017 amounted to RMB 30 million (2016: RMB 370 million), a decrease of RMB 340 million YoY.e) Cash outflow from acquisitions of fixed assets and intangible assets as well as other long-term assets in 2017 reached RMB 400 million (2016: RMB 240 million), a change of RMB 160 million YoY.f) Cash inflow from interest income in 2017 was RMB 190 million (2016: RMB 320 mil-lion), a decrease of RMB 130 million YoY.g) Net cash outflow from repayment by and loans to third parties in 2017 was RMB 130 million (2016: 0), a change of RMB 130 million YoY.
Cash flow from financing activities in the reporting period decreased by RMB 3.82 billion over last year, primarily for the following reasons:a) Cash inflow generated from investment in minority shares by subsidiaries was RMB 0 in the current year (2016: RMB 4.2 billion), a decrease of RMB 4.2 billion YoY.b) Net cash outflow due to repayment of and receipts from bank borrowings in 2017 was RMB 270 million (2016: RMB 970 million), a decrease of RMB 700 million YoY.c) Cash outflow from acquisitions of minority shareholders’ equity in 2017 was RMB 720 million (2016: RMB 60 million), a change of RMB 660 million YoY.d) Net cash inflow from related party loans or repayment of related party loans in 2017 was RMB 0 (2016: net cash outflow of RMB 280 million), resulting in an increase of RMB 280 million YoY.
(2). Gains and Losses from Non-operating Business Unit: Thousand Yuan
Item 2017 2016 Change YoY (%) NotesAsset impairment losses 52,697 32,103 64.1 Provision for asset impairment loss increased due to an increase
in inventory caused by business expansion during the reporting periodNon-operating expenses 31,290 11,661 168.3 Mainly due to the donations made during the reporting period
SECTION 4.DISCUSSION AND ANALYSIS OF OPERATIONS

26 2017 ANNUAL REPORT
(3). Assets and Liabilities 1. Assets and Liabilities
Unit: Thousand Yuan
Item 31 Decem-ber 2017
As % of total assets
31 Decem-ber 2016
As % of total assets
Change YoY (%)
Notes
Financial assets at fair value with change factored into current gains/losses
6,178 0.0 1,860 0.0 232.2 Mainly due to fluctuations in the balance of foreign exchange forward contracts that have not yet expired
Notes receivable 127,383 0.9 30,893 0.2 312.3 Mainly the result of an increase in acceptance bills not yet due at the end of the reporting period
Accounts receivable 2,042,921 14.1 966,126 7.3 111.5 Mainly due to an increase in business volumeInterest receivable 8,565 0.1 24,676 0.2 –65.3 Mainly due to interest payments for fixed deposits during the
reporting periodOther accounts receivable 157,455 1.1 36,054 0.3 336.7 Mainly due to new third-party supplier loans during the reporting
periodAvailable-for-sale financial assets
0 0.0 51 0.0 –100.0 Mainly due to disposals of available-for-sale financial assets during the reporting period
Long-term receivables 35,240 0.2 51,127 0.4 –31.1 Mainly due to a trade-related decrease in long-term receivables during the reporting period
Long-term equity investments
350 0.0 1,082 0.0 –67.7 Mainly due to losses from joint ventures during the reporting period
Construction in progress 208,767 1.4 38,727 0.3 439.1 Mainly due to construction of plants and related supporting equipment
R&D expenditures 51,655 0.4 74,569 0.6 –30.7 Mainly due to the conversion of completed R&D projects into intangible assets during the reporting period
Deferred tax assets 67,187 0.5 26,738 0.2 151.3 Mainly due to changes in temporary differences during the reporting period
Short-term borrowings 267,001 1.8 878,882 6.6 –69.6 Mainly the result of partial repayments of short-term borrowings due during the reporting period
Financial liabilities at fair value with change factored into the current gains/losses
7,532 0.1 1,082 0.0 596.1 Mainly due to fluctuations in the balance of foreign exchange forward contracts that have not yet expired during the reporting period
Accounts payable 1,492,701 10.3 823,976 6.2 81.2 Mainly due to an increase in business volumeReceipts in advance 1,374,279 9.5 843,492 6.4 62.9 Mainly due to an increase in business volumeTaxes payable 255,681 1.8 118,594 0.9 115.6 Mainly due to an increase in corporate income tax payable resulting
from an increase in business volumeOther accounts payable 330,368 2.3 228,574 1.7 44.5 Mainly due to construction of plants and related equipment during
the reporting periodNon-current liabilities due within one year
733,286 5.0 431,448 3.3 70.0 Mainly the result of an increase in long-term borrowing now due within one year and an increase in the balance of the warranty due to increased business volume
Capital stock 1,895,413 13.0 1,219,627 9.2 55.4 According to the principle of reverse purchase, the capital stock in the beginning of the year reflected the number of shares issued to acquire Saurer Intelligent Machinery (1,219,627,217) during the re-structuring; there were 1,895,412,995 outstanding shares of capital stock issued by the Company at the end of the reporting period
Other comprehensive income
–123,388 –0.8 33,250 –0.3 –471.1 Mainly the result of variation in foreign exchange calculations due to fluctuations in foreign exchange rates
Retained earnings 386,267 2.7 1,253,134 9.5 –69.2 Mainly due to indirect listing, reorganization and acquisition of minor-ity shareholders’ equity during the reporting period
SECTION 4.DISCUSSION AND ANALYSIS OF OPERATIONS

2017 ANNUAL REPORT 27
2. Restriction on Assets at the End of the Reporting Period Unit: Thousand Yuan
Item Carrying value at year end
Reason for restriction
Cash and cash equivalents
64,182 Security deposit put aside for letters of guarantee and letters of credit issued
(4). Investments
1. External Equity Investments Please refer to “Major Equity Investments” and “Major Non-Equity Investments”.
(1) Major Equity Investments During the reporting period, the Company spent RMB 715,342,466 to acquire 5% of
the shares of Saurer Intelligent Machinery held by the Shanghai Yongyun Huachuang Equity Investment Partnership Firm. After the acquisition, Saurer Intelligent Machinery became the wholly owned subsidiary of the Listed Company. This was approved at the third meeting of the 9th Board of Directors of the Company and disclosed accordingly (for details, please refer to Ad hoc 2017-098, 2017-099 and 2017-114).
(2) Significant Non-equity Investments In 2017, the fixed assets of the Company increased by RMB 130 million, of which
RMB 60 million was transferred from construction in progress. Construction in progress increased by RMB 220 million in 2017, including RMB 140 million from the Xinjiang Intelligent plant under construction for the purpose of further expanding production capacity.
(3) Financial Assets at Fair Value� Unit: Thousand Yuan
Item Beginning balance Ending balance Change during the reporting period
Impact on current profit
Financial assets at fair value with changes factored into current gains/losses
1,860 6,178 4,318 0
(5). Major Controlling Subsidiaries and Shareholding Companies
1. Saurer Germany As of the end of 2017, the Company owned 100% of its equities. Its registered capi-
tal is EUR 40,000,100. It is mainly engaged in the manufacture, sale and servicing of textile machinery and components. As of the end of 2017, its total assets were EUR 588,287,000, and its net assets were EUR 85,466,000. Net profit realized this year was EUR 33,957,000. Revenue was EUR 718,906,000. Operating profit was EUR 45,679,000.
2. Saurer Technologies As of the end of 2017, the Company owned 100% of its equities. Its registered capi-
tal is EUR 10,000,100. It is mainly engaged in the manufacture, sale and servicing of textile machinery and components. As of the end of 2017, its total assets were EUR 125,976,000, and its net assets were EUR 49,015,000. Net profit realized this year was EUR 13,417,000. Revenue was EUR 163,963,000. Operating profit was EUR 14,963,000.
SECTION 4.DISCUSSION AND ANALYSIS OF OPERATIONS

28 2017 ANNUAL REPORT
3. Saurer Switzerland As of the end of 2017, the Company owned 100% of its equi-
ties. Its registered capital is CHF 1,000,000. It is mainly engaged in the manufacture, sale and servicing of textile machinery. As of the end of 2017, its total assets were CHF 441,677,000, and its net assets were CHF 230,470,000. Net profit realized this year was CHF 20,262,000. Revenues amounted to CHF 41,926,000. Operating profit was CHF 23,890,000.
4. Saurer Jiangsu As of the end of 2017, the Company owned 100% of its
equities. Its registered capital is USD 50,000,000. It is main-ly engaged in the manufacture, sale and servicing of textile machinery. As of the end of 2017, its total assets were RMB 2,308,247,000, and its net assets were RMB 820,935,000. Net profit realized this year was RMB 211,322,000. Revenue was RMB 2,104,538,000. Operating profit was RMB 341,169,000.
5. Saurer Changzhou As of the end of 2017, the Company owned 100% of its
equities. Its registered capital is USD 22,482,422. It is main-ly engaged in the manufacture, sale and servicing of textile machinery. As of the end of 2017, its total assets were RMB 517,595,000, and its net assets were RMB 206,752,000. Net profit realized this year was RMB 33,092,000. Revenues was RMB 386,544,000. Operating profit was RMB 36,429,000.
III. The Company’s Future Development
(1). Competitive Landscape and OutlookDuring the reporting period, China’s GDP growth rate of 6.9% exceeded expectations. The increase in personal income of 7.3% exceeded that of 2016. The global economy, too, extended its recovery. Among the major textile producers, India grew at a rapid rate of 6.7%, as forecast by the International Monetary Fund. In the European Union and the USA, the growth rate increased by 2.4% and 2.3%, respectively. Turkey had also recovered to some extent. According to the UN’s World Population Prospects, 2017 Revision, the world population numbered 7.6 billion and is expected to reach 8.6 billion by 2030. In 2024, India’s population will surpass that of China 2024, making it the world’s most populous country. Accord-ing to estimates, from 2017 to 2050 half of the world’s population increase will be concentrated in nine major countries – India, Nigeria, the Democratic Republic of the Congo, Pakistan, Ethiopia, Tanzania, Uganda, the US and Indonesia – all of which fall within the area covered by the “One Belt, One Road” initiative. For the textile industry, aside from raw material prices, the primary forces driving development are growth of GDP, population and per capita income. The stable, improving world economy and the increasing population together are driving demand for fibre and, in turn, textile industry growth.
National strategies and industrial planning policies such as “One Belt, One Road”, “Industry 4.0” and “Made in China 2025”, have ushered in two significant opportunities for the textile industry: industrial transfer and technology upgrading.
Current trends in industrial transfer include China’s domestic shift from east to west and its global reorientation from East Asia to Central Asia, and from Southeast Asia to the world. According to the Central Committee’s guidelines on safeguarding social stability and long-term stability in Xinjiang and the “Guiding Opinions of the General Office of the State Council on Supporting the Development of the Textile and Clothing Industry and Promoting Employment in Xinjiang”, the textile and garment industries will become the “pillar” industries for effecting industrial transformation in the east and driv-ing employment in Xinjiang. According to China’s National Bureau of Statistics, Xinjiang’s yarn output for 2017 was 1,510,200 tons, an increase of 39.4% over 2016, and 3.8 times the output for 2010. Increasingly, high-quality companies attracted by the promise of electrical power and other resources are moving to Xinjiang to es-tablish factories. This makes it possible to pursue the government’s strategy while relieving some of the pressure from ever-increasing costs, including labour, and remaining profitable. In addition, as a result of the “One Belt, One Road” initiative, economic links between China and large textile countries like India, Pakistan, Uzbekistan, Turkey and Bangladesh are gradually becoming closer. In the future, the area within a 2,000-kilometer radius of Urumqi will be key to the world’s cotton production, and textile and garment processing, and there will be greater high-end demand for smart textiles.
To promote technology upgrading, in 2016 the Ministry of Industry and Information Technology (MIIT) released its own five-year plan for the textile industry, which prioritizes development of intelligent equipment and production lines, construction of intelligent work-shops and plants, and piloting and development of large-scale customization. Mounting labour costs are accelerating the turnover of skilled workers, and there is an urgent demand among textile companies for automated, intelligent machines. Accordingly, the MIIT’s development plan has set targets for intelligent spinning, for example, that specify fully automated production, digital monitoring and intelligent management of the spinning process, with 20 work-ers each managing 10,000 spindles. Meeting this target necessarily implies automated, digital and intelligent technology upgrading of the entire industry.
Saving energy and reducing emissions and consumption are man-dated by China’s macroeconomic policies, but these measures are also part of an inexorable trend toward industrial development. In 2017, the country posted a sharp increase in green development. Energy use per unit of GDP decreased by 3.7%. Greater numbers of companies have begun upgrading, using more environmentally friendly raw materials and energy-saving equipment for green pro-duction, and anticipating a concomitant increase in profitability.
SECTION 4.DISCUSSION AND ANALYSIS OF OPERATIONS

2017 ANNUAL REPORT 29
(2). Strategy
1. Adapt and Integrate Industrial Production To enhance operational efficiency, the Company’s main business
activities in Europe will focus on product R&D and the manufac-ture of key components, as well as assembly of certain high-end products. In procurement, the company will exploit the strength of the local Chinese market and proceed with plans to integrate the supply chain as a basis for ensuring product quality. Together with the transfer of production to Asia, selection of high-quality suppliers in China, India and other lower-cost regions will gradu-ally decrease reliance on purchasing parts from Europe.
2. Continue to Expand the Business The company plans to strengthen R&D efforts, exploit its lead-
ership in developing innovative and cutting-edge technologies and its worldwide customer resources to expand its business into other industrial sectors and to grow its machinery business beyond textile, for example in the area of glass filament yarns. Global demand for LCD TVs, smartphones and electric vehicles is on the rise, contributing to the stable growth of glass filament manufacture globally. Saurer’s two-for-one twisting solutions have sufficient capacity to meet the challenges of rapid growth in this market.
3. Promote R&D and Innovation Based on E³ – Triple Added Value
Saurer enjoys the highest level of R&D and technical innova-tion in the area of smart textile equipment, with a staff of more than 410 R&D experts around the world. Saurer also has more than 1,100 registered patents. The Company aims not only to enhance ergonomic applications and to make operations more efficient but also to reduce the energy consumption of its solutions and to provide the best working environment for operators. The Company will strengthen its focus on finding total solutions that reduce waste and consumption of resources and increase machine intelligence to improve quality and output. The Company will also become more dynamic through cooperation with Industry 4.0 experts and specialists in other relevant areas or through active M&A, enhancing its development capabilities and bringing its operations and services more in line with trends in automation, digitization and “smart” development.
4. Improve Sales of Accessories and Increase Service Revenue Saurer’s sales of accessories and services focus mainly on
customers who use its machinery and equipment, but some components have broader appeal. The steady growth in sales of the Company’s traditional products has boosted its inventory of intelligent equipment. Increasing sales of accessories and services is not only in line with trends in industrial development but also helps the Company to grow revenue. Sales of acces-sories and services are recession-proof, extensive and enhance customer “stickiness”, and margins are relatively high. This is an
important part of the Company’s future development strategy. Saurer plans to adopt a unique patented design and to set up independent equipment and service sales teams to win more customers with high-quality, reliable and cost-effective products and services.
(3). Operating PlanThe continued recovery of the global economy, further market reforms, and accelerated transformation and upgrading all indicate a favourable development trend for the textile industry in 2018. Saurer also expects to maintain growth in 2018 through system-atic deployment of its strategy and operating plan. To achieve this growth target, the Company will focus on the following aspects:
1. Customer Focus (Market-In Approach) The Company will continue to increase its focus on custom-
ers and, in accordance with its results-oriented approach, will provide them with both functional and profitable products and responsive service. The Company will offer more training centres and related courses to provide customers and their employees with practical training. While helping customers to better under-stand its products, the Company will enrich its process knowl-edge and improve its operations.
2. Innovative Product Development The Company will continue to maintain R&D input, closely follow
customer needs and product performance, promote innovation and R&D from outside to inside and introduce new products. The Company also plans to consolidate its position as a global leading supplier of high-end equipment manufacturing solutions.
3. Stable Growth of Market Share The Company will actively expand and develop new markets
through an accurate grasp of changes in market development, effectively and efficiently adjusting sales strategies while stabi-lizing the existing markets. Saurer Xinjiang Factory will go into production in mid-2018, helping the Company to further expand into emerging markets along the “One Belt, One Road” route.
4. Systematic and Effective Cost Control The Company is continuing to implement its industrial redistribu-
tion and integration plan, increase the proportion of procurement from developing countries and pursue the gradual shift of pro-duction lines from higher-cost areas regions to lower-cost areas to systematically and effectively reduce the cost of production.
5. Corporate Social Responsibility The Company will actively practice its corporate social respon-
sibility in several ways. It will continue to promote the concept of E³ – Triple Added Value for its products, improving product performance indicators in terms of energy savings, economic benefits and ergonomics. With respect to social issues, the
SECTION 4.DISCUSSION AND ANALYSIS OF OPERATIONS

30 2017 ANNUAL REPORT
Company will actively take up and implement the government’s strategic policy with regard to poverty alleviation. Finally, the Company will implement employee benefits such as production safety, providing a healthy working environment and training to enhance personal skills.
(4). Potential Risks
1. Economic Risk Fluctuation in demand resulting from slow economic growth may
occur from time to time. Textile products are consumer goods, and personal income level and future expectations of income may influence the purchase of textile products such as garments and home textile products. Slow economic growth decreases the purchasing power of consumers, and adversely affects industrial growth.
2. Risk to Competitive Advantage The pace of product updates and technology upgrades in the
textile equipment industry is accelerating all the time. If Saur-er cannot maintain its leading science and technology design capability, improve its level of technology, protect IP (intellectual property) rights, acquire excellent talent, expand its share of high-quality customers, increase the scale of its business and improve its risk resilience, accurately grasp industrial develop-ment trends and adjust its corporate strategies in a timely man-ner by making the most of its own advantages, the Company will not be able to maintain its competitive advantage, which would adversely affect its business.
3. Overseas Business Risk Saurer’s production base and sales companies are distributed
across 12 countries and regions around the world. Owing to the nature of global operations, the overseas business risks faced by Saurer during its daily operations include those relating to management, investment decisions, politics, terrorism and other risks, including those that might result from regional cultural differences.
4. Production Safety Risk Saurer’s main products include intelligent textile equipment and
key components. The production processes involve complex procedures that are dangerous to some extent. Although Saurer has formulated a relatively comprehensive set of guidelines and protocols, including rules and operational directives on manu-facturing safety, to promote industrial safety, it is impossible to preclude personal injury or even death due to operational error or accidents in the course of production activities. Such events can result in suspension of business and also in the Company being subject to penalties that affect the Company’s daily operations and safety.
5. Foreign Exchange Fluctuation Risk Saurer’s production and sales are distributed across different
countries and regions of the world and involve the settlement of different currencies, including USD, EUR and RMB. Because foreign exchange rate fluctuations are unpredictable, they may represent risks for Saurer’s future operations, which in turn could affect business and profitability, as well as draw the attention and concern of investors to such risks.
SECTION 4.DISCUSSION AND ANALYSIS OF OPERATIONS


32 2017 ANNUAL REPORT
SOLUTIONS DRIVING CUSTOMER SUCCESS

2017 ANNUAL REPORT 33
“ We have to let customer demand guide us, and keep up our focus on technology innovation. The desire to promote China’s industrial progress has been a strong motivator going forward. And not only China. With its top-ranking electronic yarn and fabric products, Guangyuan has its sights set on the global market.”
Mr Ning, General Manager, Linzhou Guangyuan
Linzhou Guangyuan New Material Technology Co. Ltd., Linzhou, China
Founded in 2011
Number of employees 1,500
Turnover RMB 5 billion
Number of spindles 22,300
Final product PCBs for iPhones, electric cars, LCD screens
Market and customer requirements
The glass filament yarn industry is increasingly focusing on finer yarn counts for use in thinner printed circuit boards (PCBs) with greater func-tionality. Saurer’s customer Linzhou underwent a painstaking process to qualify as a supplier for PCBs suitable for iPhones. PCBs for electric cars are also becoming a growth industry.
What makes Saurer’s Volkmann GlassTwister so special is its high performance and efficiency thanks to the state-of-the-art design of the machine’s key components. For example, the VGT 9 and VGT 11 machines offer precise control during the twisting process for optimal production and quality. That was enough to convince Linzhou Guangyuan to buy 158 VGT 9 and VGT 11 machines from Saurer. Start-up for the new production line is foreseen for June 2018.

34 2017 ANNUAL REPORT
I. Proposed Plan for Distribution of Profit to Common Shareholders or Capital Reserve
(1). Formulation, Implementation or Adjustment of Cash Dividend Policy
1. Formulation or Adjustment of Cash Dividend Policies During the reporting period, the Company did not formulate any new cash dividend
policies, nor were the cash dividend policies adjusted as stipulated in the Articles of As-sociation. Please refer to the Articles of Association for the specific content of the cash dividend policies.
2. Implementation of Cash Dividend Policies During the reporting period, the Company implemented the interim dividend distribu-
tion plan for 2017 in accordance with a resolution passed at the fourth Extraordinary Shareholders’ General Meeting (EGM) in 2017. Based on the Company’s total equity of 675,785,778 as of 30 June 2017, cash dividends amounting to RMB 2.729 (before tax) for every ten shares (to a total of RMB 184,421,938.82) were distributed to all shareholders.
The dividend distribution plan for mid- 2017 was in accordance with the Articles of As-sociation and the relevant laws and regulations. After review and approval by the Board of Directors, the Independent Directors expressed their opinions and gave their approval. After review and implementation by the fourth EGM, arrangements were made for small and medium-sized shareholders to participate in the decision-making by means of on-site and online voting, and ensured that the related decision-making and implementation were legal and effective.
3. Profit Distribution Plan for 2017 According to the Articles of Association and the relevant laws and regulations as well
as consideration of factors such as shareholders’ returns and the Company’s capital requirements for business development, the Board of Directors reviewed and approved the profit distribution plan for 2017 as follows:
The audit by PwC Mainland China (special general partnership) confirmed that the net profit in the consolidated statements attributable to the shareholders of the parent company in 2017 was RMB 65.8327 million. The parent company achieved a net profit of RMB 48.7418 million in 2017. According to the Articles of Association, 10% of the net profit attributable to the parent company, RMB 48.742 million, was retained as a statuto-ry surplus reserve.
After the statutory surplus reserve had been allocated, the net profit attributable to the parent company in 2017 was RMB 438,676,000. Adding the undistributed profit of RMB 377,048,000 from the beginning of the year minus the interim cash dividends of RMB 18,442,193,882 distributed in 2017, the residual profit of the parent company distributa-ble to the shareholders was RMB 631,302,000. According to the Articles of Association and the relevant laws and regulations as well as the interests of the shareholders and the long-term development of the Company, the profit distribution plan for 2017 was as follows: the number of shares, amounting to 1,895,412,995, was the basis for the allotment of a cash dividend of RMB 0.1 per ten shares (before tax) to all sharehold-ers from the undistributed profit. The total cash dividend to be distributed was RMB 18,954,219.95 (before tax). No other form of profit distribution or capital reserve plan was implemented.
SECTION 5.SIGNIFICANT EVENTS

2017 ANNUAL REPORT 35
The Company distributed an interim total cash dividend of RMB 184.42 million (before tax) in 2017. Adding the total cash dividend of RMB 18.95 million to be distributed in 2017 (before tax), the expected total cash dividend for distribution was RMB 203.38 million (before tax).
The independent directors expressed their consent to the plan, subject to approval by the Annual Shareholders' General Meeting. The Company’s Annual General Meeting (AGM) was conducted by means of on-site and online voting to ensure that the small and medium-sized shareholders had the opportunity to fully express their opinions and to make requests. This ensured that the legal rights and interests of the small and medium-sized shareholders were fully protected.
(2). Plan or Proposed Plan for Distribution of Profit to Common Shareholders or Capital Reserve over the Last Three Years (including the Reporting Period) � Unit: Thousand Yuan; Currency: RMB
Dividend year Stock dividend per 10 shares
Cash dividend per 10 shares (yuan, before
tax)
Capital reserve transferred into
share capital per 10 shares
Amount of cash dividend
(before tax)
Net profit attributable to shareholders of the Listed
Company in the consolidated financial statements for the year of dividend distribution
Percentage of net profit attributable to the shareholders
of the Listed Company in the consolidated financial
statements (%)2017 0 2.829 0 203,376.07 658,327 30.892016 0 0 0 0 –227,994.01 02015 0 0.500 0 33,789.29 31,190.74 108.33
SECTION 5.SIGNIFICANT EVENTS

36 2017 ANNUAL REPORT
II. Fulfilment of Commitments
(1). Commitments of the Actual Controller, Shareholders, Affiliates, Purchaser and Related Parties of the Company in the Reporting Period or Renewal Period
Com-mitment back-ground
Com-mitment type
Committer Commitments Commitment date and period
Fulfilment period Was the commitment fulfilled in a timely manner
If not fulfilled in a timely manner, state the specific reasons for non-fulfilment
If not fulfilled in a timely manner, state the next work plan
Com
mitm
ent r
elatin
g to
the
rest
ruct
urin
g of
sig
nific
ant a
sset
s
Rest
ricte
d sa
le of
sh
ares Jinsheng Group,
state-owned company
From the date upon issuance by the Shanghai Stock Exchange of the acknowledgement in respect of the transfer of shares to the expiration of 6 months after completion of transfer of shares, the parties shall not reduce the shares of the Listed Company. For details, please refer to the “Announcement of Xinjiang Urban Construction (Group), Co. Ltd [the previous name of the Company] on Letter of Promise on Contractual Transfer of Shareholder’s Shares” (Ad hoc 2017-090) published on the Shanghai Stock Exchange website on 26 September 2017.
Up to 6 months after completion of transfer of shares
Yes Yes / /
Rest
ricte
d sa
le of
sha
res State-owned
company1. Within 36 months after completion of restructuring, the remaining shares of the Listed Company shall not be transferred. 2. For the remaining shares of the Listed Company, the shares derived from the Listed Company’s distribution of the stock dividends, capital reserve and the increase of share capital shall also comply with the above commitments. 3. If the applicable laws and regulations provide otherwise for the restricted sale period for the remaining shares of the Listed Company held by the state-owned company, or the CSRC has other requirements, the state-owned company shall comply with such regulations or requirements. If the state-owned company is in breach of the said commitments, it shall bear the corresponding legal liabilities, and indemnify the Listed Company or investors for any and all losses caused thereby according to law.
Within 36 months after completion of restructuring
Yes Yes / /
Rest
ricte
d sa
le of
sha
res Jinsheng Group The newly issued shares of the Listed Company subscribed by Saurer Intelligent Machinery shall not be transferred within 36
months after completion of issuance. Within 36 months after completion of issuance
Yes Yes / /
Rest
ricte
d sa
le of
sha
res Jinsheng Group 1. The shares of the Listed Company assigned by Jinsheng Group from the state-owned company shall not be transferred within
36 months after completion of restructuring. 2. Within 6 months after completion of restructuring, if the closing price of the shares of the Listed Company is lower than the issuing price for 20 consecutive business days, or if at the end of 6 months after completion of restructuring the closing price is lower than the issuing price, the lock-up period of the shares of the Listed Company obtained due to the said restructuring (including the shares obtained resulting from assignment and issuance, similarly hereinafter) shall be automatically extended for 6 months. 3. Upon expiration of the said lock-up period, if the results commitment period as specified in the Results Commitment and Compensation Agreement signed by Jinsheng Group for the purpose of restructuring has not expired, or the obligations for shared compensation under the Results Commitment and Compensation Agreement have not been completed, the said lock-up period shall be extended to the date of expiration of the results commitment period and the date of completion of the share compensation obligations (if it is not necessary to make compensation, then it shall be the date of release of the Announcement on the special auditing report on the committed results). 4. For shares of the Listed Company acquired by restructuring, shares derived from distribution by the Listed Company of dividends and capital reserve converted to equities etc. shall also comply with the above commitments. 5. If the applicable laws and regulations otherwise specify the restriction period for the shares of the Listed Company obtained by Jinsheng Group, or the CSRC has other requirements, Jinsheng Group shall comply with such regulations or requirements. If Jinsheng Group is in breach of the said commitments, it shall bear the corresponding legal liabilities, and indemnify the Listed Company or investors for any and all losses caused thereby according to law.
Within 36 months after completion of issuance
Yes Yes / /
Rest
ricte
d sa
le of
sha
res Guokai Finance,
Zhao Hongxiu, Jinbuer, Jiangsu Huatai, Hehe In-vestment, Shen-zhen Longding, Advanced Manu-facturing Industry Investment Fund, Huashan Invest-ment, Shanghai Yongjun, Ningbo Yukang, Tibet Jiaze, Hezhong Investment, Shanghai Jinye, Shanghai Hong-cheng, Beijing Zhongtai, Nanjing Daofeng
1. If, upon completion of issuance, the Committer holds the equities of Saurer Intelligent Machinery for less than 12 months (subject to those as at the date upon completion of the industrial and commercial registration), the Committer shall not transfer the shares as issued by the Listed Company and subscribed by the Committer in such shares within 36 months after completion of issuance. If, upon completion of issuance, the Committer holds the shares of Saurer Intelligent Machinery for not less than 12 months (ac-cording to the date of completion of industrial and commercial registration), the Committer shall not transfer the shares as issued by the Listed Company and subscribed by the Committer in such shares within 24 months after completion of issuance. 2. Within 6 months after completion of restructuring, if the closing price of the shares of the Listed Company is lower than the issuing price for 20 consecutive business days, or if at the end of 6 months after completion of restructuring the closing price is lower than the issuing price, the lock-up period of the shares of the Listed Company obtained by the Committer due to issuance shall be automat-ically extended for 6 months. 3. For the shares of the Listed Company obtained by the Committer from issuance, shares derived from distribution by the Listed Company of dividends and capital reserve converted to equities etc. shall also comply with the above commitments. 4. If the applicable laws and regulations provide otherwise for the restriction period for the shares of the Listed Company obtained by the Committer due to issuance, or the CSRC has other requirements, the Committer shall comply with such regulations or requirements. 5. If the Committer is in breach of the said commitments, it shall bear the corresponding legal liabilities, and indemnify the Listed Company or investors for any and all losses caused thereby according to law.
Within 24 or 36 months after completion of issuance
Yes Yes / /
SECTION 5.SIGNIFICANT EVENTS

2017 ANNUAL REPORT 37
II. Fulfilment of Commitments
(1). Commitments of the Actual Controller, Shareholders, Affiliates, Purchaser and Related Parties of the Company in the Reporting Period or Renewal Period
Com-mitment back-ground
Com-mitment type
Committer Commitments Commitment date and period
Fulfilment period Was the commitment fulfilled in a timely manner
If not fulfilled in a timely manner, state the specific reasons for non-fulfilment
If not fulfilled in a timely manner, state the next work plan
Com
mitm
ent r
elatin
g to
the
rest
ruct
urin
g of
sig
nific
ant a
sset
s
Rest
ricte
d sa
le of
sh
ares Jinsheng Group,
state-owned company
From the date upon issuance by the Shanghai Stock Exchange of the acknowledgement in respect of the transfer of shares to the expiration of 6 months after completion of transfer of shares, the parties shall not reduce the shares of the Listed Company. For details, please refer to the “Announcement of Xinjiang Urban Construction (Group), Co. Ltd [the previous name of the Company] on Letter of Promise on Contractual Transfer of Shareholder’s Shares” (Ad hoc 2017-090) published on the Shanghai Stock Exchange website on 26 September 2017.
Up to 6 months after completion of transfer of shares
Yes Yes / /
Rest
ricte
d sa
le of
sha
res State-owned
company1. Within 36 months after completion of restructuring, the remaining shares of the Listed Company shall not be transferred. 2. For the remaining shares of the Listed Company, the shares derived from the Listed Company’s distribution of the stock dividends, capital reserve and the increase of share capital shall also comply with the above commitments. 3. If the applicable laws and regulations provide otherwise for the restricted sale period for the remaining shares of the Listed Company held by the state-owned company, or the CSRC has other requirements, the state-owned company shall comply with such regulations or requirements. If the state-owned company is in breach of the said commitments, it shall bear the corresponding legal liabilities, and indemnify the Listed Company or investors for any and all losses caused thereby according to law.
Within 36 months after completion of restructuring
Yes Yes / /
Rest
ricte
d sa
le of
sha
res Jinsheng Group The newly issued shares of the Listed Company subscribed by Saurer Intelligent Machinery shall not be transferred within 36
months after completion of issuance. Within 36 months after completion of issuance
Yes Yes / /
Rest
ricte
d sa
le of
sha
res Jinsheng Group 1. The shares of the Listed Company assigned by Jinsheng Group from the state-owned company shall not be transferred within
36 months after completion of restructuring. 2. Within 6 months after completion of restructuring, if the closing price of the shares of the Listed Company is lower than the issuing price for 20 consecutive business days, or if at the end of 6 months after completion of restructuring the closing price is lower than the issuing price, the lock-up period of the shares of the Listed Company obtained due to the said restructuring (including the shares obtained resulting from assignment and issuance, similarly hereinafter) shall be automatically extended for 6 months. 3. Upon expiration of the said lock-up period, if the results commitment period as specified in the Results Commitment and Compensation Agreement signed by Jinsheng Group for the purpose of restructuring has not expired, or the obligations for shared compensation under the Results Commitment and Compensation Agreement have not been completed, the said lock-up period shall be extended to the date of expiration of the results commitment period and the date of completion of the share compensation obligations (if it is not necessary to make compensation, then it shall be the date of release of the Announcement on the special auditing report on the committed results). 4. For shares of the Listed Company acquired by restructuring, shares derived from distribution by the Listed Company of dividends and capital reserve converted to equities etc. shall also comply with the above commitments. 5. If the applicable laws and regulations otherwise specify the restriction period for the shares of the Listed Company obtained by Jinsheng Group, or the CSRC has other requirements, Jinsheng Group shall comply with such regulations or requirements. If Jinsheng Group is in breach of the said commitments, it shall bear the corresponding legal liabilities, and indemnify the Listed Company or investors for any and all losses caused thereby according to law.
Within 36 months after completion of issuance
Yes Yes / /
Rest
ricte
d sa
le of
sha
res Guokai Finance,
Zhao Hongxiu, Jinbuer, Jiangsu Huatai, Hehe In-vestment, Shen-zhen Longding, Advanced Manu-facturing Industry Investment Fund, Huashan Invest-ment, Shanghai Yongjun, Ningbo Yukang, Tibet Jiaze, Hezhong Investment, Shanghai Jinye, Shanghai Hong-cheng, Beijing Zhongtai, Nanjing Daofeng
1. If, upon completion of issuance, the Committer holds the equities of Saurer Intelligent Machinery for less than 12 months (subject to those as at the date upon completion of the industrial and commercial registration), the Committer shall not transfer the shares as issued by the Listed Company and subscribed by the Committer in such shares within 36 months after completion of issuance. If, upon completion of issuance, the Committer holds the shares of Saurer Intelligent Machinery for not less than 12 months (ac-cording to the date of completion of industrial and commercial registration), the Committer shall not transfer the shares as issued by the Listed Company and subscribed by the Committer in such shares within 24 months after completion of issuance. 2. Within 6 months after completion of restructuring, if the closing price of the shares of the Listed Company is lower than the issuing price for 20 consecutive business days, or if at the end of 6 months after completion of restructuring the closing price is lower than the issuing price, the lock-up period of the shares of the Listed Company obtained by the Committer due to issuance shall be automat-ically extended for 6 months. 3. For the shares of the Listed Company obtained by the Committer from issuance, shares derived from distribution by the Listed Company of dividends and capital reserve converted to equities etc. shall also comply with the above commitments. 4. If the applicable laws and regulations provide otherwise for the restriction period for the shares of the Listed Company obtained by the Committer due to issuance, or the CSRC has other requirements, the Committer shall comply with such regulations or requirements. 5. If the Committer is in breach of the said commitments, it shall bear the corresponding legal liabilities, and indemnify the Listed Company or investors for any and all losses caused thereby according to law.
Within 24 or 36 months after completion of issuance
Yes Yes / /
SECTION 5.SIGNIFICANT EVENTS

38 2017 ANNUAL REPORT
Com-mitment back-ground
Com-mitment type
Committer Commitments Commitment date and period
Fulfilment period? Was the commitment fulfilled in a timely manner?
If not fulfilled in a timely manner, state the specific reasons for non-fulfilment
If not fulfilled in a timely manner, state the next work plan
Com
mitm
ent r
elatin
g to
the
rest
ruct
urin
g of
sig
nific
ant a
sset
s
Other Jinsheng Group, Pan Yueping
After completion of the transaction, Jinsheng Group, as the controlling shareholder of the listed company, and Pan Yueping, as the actual controller, are committed to ensuring the following: I. Guarantee that the staff of the Listed Company are independent. 1. The Senior Officers of the Listed Company (CEO, COO, CFO, Board Secretary etc.) shall work in the Listed Company, and receive remuneration from the Listed Company, and shall not act in any position other than Director or Supervisor in any enterprises other than the listed company and its subsidiaries as controlled by the Committer (“Committer’s Controlled Other Enterprises”). 2. The financial staff of the Listed Company shall not hold a concurrent office in or receive salaries from the Committer/Committer’s Con-trolled Other Enterprises. 3. The personnel relationship and labour relationship of the Listed Company shall be independent of the Committer/Committer’s Controlled Other Enterprises. 4. The Directors, Supervisors and Senior Officers of the Listed Company are elected, replaced, dismissed, employed or removed according to the applicable laws and regulations and the Company’s Articles of Association. The Committer will not interfere in personnel appointments or dismissal of the above persons by exceeding the powers of the Board of Directors and the AGM of the Listed Company. II. Guarantee that the assets of the Listed Company are independ-ent. 1. The Listed Company has independent and complete assets; and such assets are completely under the control of the Listed Company, and are independently owned and operated by the Listed Company. 2. The Committer/Committer’s Controlled Other Enterprises will not illegally occupy the funds and assets of the Listed Company in any form. 3. No guarantees shall be provided to the Committer or the Committer’s Controlled Other Enterprises for their violation by using the assets of the Listed Company. III. Guarantee that the organizations of the Listed Company are independent. 1. The Listed Company establishes and improves corpo-rate governance structures in accordance with the law, and establishes an independent and complete organizational structure that is completely separate from the organizations of the Committer/Committer’s Controlled Other Enterprises 2. The Listed Company and the Committer/Committer’s Controlled Other Enterprises are separate in terms of office organization and production and place of operation, free of any mixing circumstances. IV. Guarantee that the business of the Listed Company is independent. 1. The Listed Company has the assets, staff and qualifications for independently conducting business activities, and has the ability to inde-pendently operate in the market. 2. Except that relevant rights are exercised in accordance with applicable laws and regulations and the Listed Company’s Articles of Association, it will not interfere in the operations of the Listed Company by exceeding the powers of the Board of Directors and the AGM and the management of the listed company. 3. The Committer will regulate and try its best to reduce related-party transactions with the Listed Company. For the related-party transactions that cannot be avoided or that are necessary, it will establish transaction conditions according to fair, reasonable and market principles. For the related-party transac-tions, the Listed Company will strictly carry out decision-making procedures and fulfil information disclosure obligations in a timely manner, according to the applicable laws and regulations and the Articles of Association of the Listed Company, and the manage-ment rules for related-party transactions. V. Guarantee the financial independence of the Listed Company. 1. The Listed Company shall establish an independent finance and accounting department, and establish independent financial accounting systems and financial management systems. 2. The Listed Company shall open a separate bank account, and will not share any bank account with the Committer or the Committer’s Controlled Other Enterprises. 3. The Listed Company will make its financial decisions inde-pendently. The Committer will not interfere in the use of the funds of the Listed Company by exceeding the powers of the Board of Directors and the AGM and the operational management of the Listed Company. 4. The Listed Company shall pay taxes legally and independently. If the Committer is in breach of the said commitments, it shall bear the corresponding legal liabilities, and indemnify the Listed Company or investors for any and all losses caused thereby according to law.
Long term No Yes / /
Avoi
danc
e of
relat
ed-p
arty
tra
nsac
tions Jinsheng Group,
Pan Yueping1. The Committer will try its best to reduce related-party transactions between the Committer and the Committer’s Controlled Other Enterprises and the Listed Company. For the related-party transactions that cannot be avoided or that are necessary, it will establish transaction conditions according to fair and reasonable market principles. For related-party transactions, the Listed Company will strictly perform its decision-making procedures and fulfil its information disclosure obligations in a timely manner, according to the applicable laws and regulations and the Articles of Association of the Listed Company, and the management rules for related-party transactions. 2. The Committer and the Committer’s Controlled Other Enterprises will not illegally occupy the funds and assets of the Listed Company in any form, and no guarantees shall be provided to the Committer and the Committer’s Controlled Other Enterprises for their violation by using the assets of the listed company. 3. The Committer will exercise its rights and perform its obligations according to the applicable laws and regulations and the Articles of Association of the Listed Company, and will not use the control and influence to impair the legal rights and interests of the Listed Company and other shareholders by means of the related-party transactions. If the Committer is in breach of the said commitments, it shall bear the corresponding legal liabilities, and indemnify the Listed Company or investors for any and all losses caused thereby according to law.
Long term No Yes / /
Other Jinsheng Group, Pan Yueping
After completion of restructuring, the Committer will strictly comply with the provisions of the “Notice on Numerous Issues about Regularizing the Funds between the Listed Company and Related Parties and External Guarantee of the Listed Company”, and the “Notice on Regularizing the External Guarantee of Listed Companies”, and will not occupy the funds of the Listed Company and its controlled subsidiaries, and regularize the external guarantee of the Listed Company and its controlled subsidiaries. If the Committer is in breach of the said commitments, it shall bear the corresponding legal liabilities, and indemnify the Listed Company or investors for any and all losses caused thereby according to law.
Long term No Yes / /
Other Jinsheng Group, Pan Yueping
1. After completion of transactions, the Committer will not interfere in the operational and management activities of the company, nor seize the interests of the company, by exceeding its powers. 2. The Committer is aware of the legal consequences that may arise from the said commitments, and the company will bear the joint and several liabilities for violation of the said commitments.
Long term No Yes / /
SECTION 5.SIGNIFICANT EVENTS

2017 ANNUAL REPORT 39
Com-mitment back-ground
Com-mitment type
Committer Commitments Commitment date and period
Fulfilment period? Was the commitment fulfilled in a timely manner?
If not fulfilled in a timely manner, state the specific reasons for non-fulfilment
If not fulfilled in a timely manner, state the next work plan
Com
mitm
ent r
elatin
g to
the
rest
ruct
urin
g of
sig
nific
ant a
sset
s
Other Jinsheng Group, Pan Yueping
After completion of the transaction, Jinsheng Group, as the controlling shareholder of the listed company, and Pan Yueping, as the actual controller, are committed to ensuring the following: I. Guarantee that the staff of the Listed Company are independent. 1. The Senior Officers of the Listed Company (CEO, COO, CFO, Board Secretary etc.) shall work in the Listed Company, and receive remuneration from the Listed Company, and shall not act in any position other than Director or Supervisor in any enterprises other than the listed company and its subsidiaries as controlled by the Committer (“Committer’s Controlled Other Enterprises”). 2. The financial staff of the Listed Company shall not hold a concurrent office in or receive salaries from the Committer/Committer’s Con-trolled Other Enterprises. 3. The personnel relationship and labour relationship of the Listed Company shall be independent of the Committer/Committer’s Controlled Other Enterprises. 4. The Directors, Supervisors and Senior Officers of the Listed Company are elected, replaced, dismissed, employed or removed according to the applicable laws and regulations and the Company’s Articles of Association. The Committer will not interfere in personnel appointments or dismissal of the above persons by exceeding the powers of the Board of Directors and the AGM of the Listed Company. II. Guarantee that the assets of the Listed Company are independ-ent. 1. The Listed Company has independent and complete assets; and such assets are completely under the control of the Listed Company, and are independently owned and operated by the Listed Company. 2. The Committer/Committer’s Controlled Other Enterprises will not illegally occupy the funds and assets of the Listed Company in any form. 3. No guarantees shall be provided to the Committer or the Committer’s Controlled Other Enterprises for their violation by using the assets of the Listed Company. III. Guarantee that the organizations of the Listed Company are independent. 1. The Listed Company establishes and improves corpo-rate governance structures in accordance with the law, and establishes an independent and complete organizational structure that is completely separate from the organizations of the Committer/Committer’s Controlled Other Enterprises 2. The Listed Company and the Committer/Committer’s Controlled Other Enterprises are separate in terms of office organization and production and place of operation, free of any mixing circumstances. IV. Guarantee that the business of the Listed Company is independent. 1. The Listed Company has the assets, staff and qualifications for independently conducting business activities, and has the ability to inde-pendently operate in the market. 2. Except that relevant rights are exercised in accordance with applicable laws and regulations and the Listed Company’s Articles of Association, it will not interfere in the operations of the Listed Company by exceeding the powers of the Board of Directors and the AGM and the management of the listed company. 3. The Committer will regulate and try its best to reduce related-party transactions with the Listed Company. For the related-party transactions that cannot be avoided or that are necessary, it will establish transaction conditions according to fair, reasonable and market principles. For the related-party transac-tions, the Listed Company will strictly carry out decision-making procedures and fulfil information disclosure obligations in a timely manner, according to the applicable laws and regulations and the Articles of Association of the Listed Company, and the manage-ment rules for related-party transactions. V. Guarantee the financial independence of the Listed Company. 1. The Listed Company shall establish an independent finance and accounting department, and establish independent financial accounting systems and financial management systems. 2. The Listed Company shall open a separate bank account, and will not share any bank account with the Committer or the Committer’s Controlled Other Enterprises. 3. The Listed Company will make its financial decisions inde-pendently. The Committer will not interfere in the use of the funds of the Listed Company by exceeding the powers of the Board of Directors and the AGM and the operational management of the Listed Company. 4. The Listed Company shall pay taxes legally and independently. If the Committer is in breach of the said commitments, it shall bear the corresponding legal liabilities, and indemnify the Listed Company or investors for any and all losses caused thereby according to law.
Long term No Yes / /
Avoi
danc
e of
relat
ed-p
arty
tra
nsac
tions Jinsheng Group,
Pan Yueping1. The Committer will try its best to reduce related-party transactions between the Committer and the Committer’s Controlled Other Enterprises and the Listed Company. For the related-party transactions that cannot be avoided or that are necessary, it will establish transaction conditions according to fair and reasonable market principles. For related-party transactions, the Listed Company will strictly perform its decision-making procedures and fulfil its information disclosure obligations in a timely manner, according to the applicable laws and regulations and the Articles of Association of the Listed Company, and the management rules for related-party transactions. 2. The Committer and the Committer’s Controlled Other Enterprises will not illegally occupy the funds and assets of the Listed Company in any form, and no guarantees shall be provided to the Committer and the Committer’s Controlled Other Enterprises for their violation by using the assets of the listed company. 3. The Committer will exercise its rights and perform its obligations according to the applicable laws and regulations and the Articles of Association of the Listed Company, and will not use the control and influence to impair the legal rights and interests of the Listed Company and other shareholders by means of the related-party transactions. If the Committer is in breach of the said commitments, it shall bear the corresponding legal liabilities, and indemnify the Listed Company or investors for any and all losses caused thereby according to law.
Long term No Yes / /
Other Jinsheng Group, Pan Yueping
After completion of restructuring, the Committer will strictly comply with the provisions of the “Notice on Numerous Issues about Regularizing the Funds between the Listed Company and Related Parties and External Guarantee of the Listed Company”, and the “Notice on Regularizing the External Guarantee of Listed Companies”, and will not occupy the funds of the Listed Company and its controlled subsidiaries, and regularize the external guarantee of the Listed Company and its controlled subsidiaries. If the Committer is in breach of the said commitments, it shall bear the corresponding legal liabilities, and indemnify the Listed Company or investors for any and all losses caused thereby according to law.
Long term No Yes / /
Other Jinsheng Group, Pan Yueping
1. After completion of transactions, the Committer will not interfere in the operational and management activities of the company, nor seize the interests of the company, by exceeding its powers. 2. The Committer is aware of the legal consequences that may arise from the said commitments, and the company will bear the joint and several liabilities for violation of the said commitments.
Long term No Yes / /
SECTION 5.SIGNIFICANT EVENTS

40 2017 ANNUAL REPORT
Com-mitment back-ground
Com-mitment type
Committer Commitments Commitment date and period
Fulfilment period? Was the commitment fulfilled in a timely manner?
If not fulfilled in a timely manner, state the specific reasons for non-fulfilment
If not fulfilled in a timely manner, state the next work plan
Com
mitm
ent r
elatin
g to
the
rest
ruct
urin
g of
sig
nific
ant a
sset
s
Other Hezhong Investment and its partners, Hehe Investment and its partners, Jinbuer and its partners, Ningbo Yukang and its partners, Shen-zhen Longding and its partners
1. The Committer, as the partner of Hezhong Investment/Hehe Investment/Jinbuer/Ningbo Yukang/Shenzhen Longding (including the limited partner and general partner), is committed to ensuring that within the lock-up period of the shares of Hezhong Invest-ment/Hehe Investment/Jinbuer/Ningbo Yukang/Shenzhen Longding, it will not transfer any assets of the partners held by the Com-mitter. 2. Hezhong Investment/Hehe Investment/Jinbuer/Ningbo Yukang/Shenzhen Longding and their general partners are further committed to ensuring that within the lock-up period of the shares of the partners, it will not handle the formalities for transfer of properties for the partners. 3. If the Committer is in breach of the said commitments, it shall bear the corresponding legal liabilities, and indemnify the Listed Company or investors for any and all losses caused thereby according to law.
Within 36 months after completion of issuance
Yes Yes / /
Gua
rant
ee a
nd
com
pens
atio
n of
valu
e of
ass
ets
purc
hase
d Jinsheng Group, Hezhong Investment, Hehe Investment and Jinbuer
The Committer is committed to ensuring that, in the year when the restructuring is done and two entire accounting years thereafter, i.e. 2017, 2018 and 2019, the net profits attributable to the owners of the parent company as realized by Saurer Intelligent Machin-ery (according to the consolidated statements, net of the non-recurring profits and losses, similarly hereinafter) shall not be less than RMB 583 million, RMB 766 million and RMB 1,003 million, respectively, and the total shall not be less than RMB 2,352 million.
2017, 2018, 2019 Yes Yes / /
Gua
rant
ee a
nd
com
pens
atio
n of
valu
e of
ass
ets
purc
hase
d Pan Xueping Pan Yueping, as the controlling shareholder of Jinsheng Group, is unconditionally and irrevocably committed to bearing the unlimit-ed joint and several guarantee liabilities to Jinsheng Group for the results compensation obligations under the results compensation agreement.
2017, 2018, 2019 Yes Yes / /
Avoi
danc
e of
indu
stria
l com
petit
ion Jinsheng Group,
Pan Yueping1. As at the date of issuance of this commitment letter, the Committer has not invested in any company, enterprise or other oper-ating entities that are identical or similar to Saurer Intelligent Machinery; and the Committer and the Committer’s Controlled Other Enterprises will not operate for themselves or others any business that is identical or similar to that of Saurer Intelligent Machinery, and there is no industrial competition against Saurer Intelligent Machinery. 2. After completion of restructuring, during the period when the Committer acts as the controlling shareholder/actual controller of the Listed Company, it will not engage in any business that is competitive with that of the listed company currently or in the future in any form. 3. After completion of restructuring, during the period when the Committer acts as the controlling shareholder/actual controller of the Listed Company, if the Committer’s Controlled Other Enterprises plan to engage in any business that is competitive with that of the Listed Company, the Committer will exercise its veto power, in order to ensure that they are not engaged in any direct or indirect competition against the Listed Com-pany. If there is any commercial opportunity that is related to the scope of business of the Listed Company, the Committer will first assign or introduce it to the Listed Company. 4. After completion of restructuring, during the period when the Committer acts as the controlling shareholder/actual controller of the Listed Company, if the listed company changes its scope of business, thereby caus-ing any competition against the Committer and the Committer’s Controlled Other Enterprises, the Committer will (and will ensure that the Committer’s Controlled Other Enterprises will) take the following measures to eliminate the competition: stop operating the business that is competitive with that of the Listed Company; transfer the competitive business to the Listed Company; or transfer the competitive business to any unrelated third parties. 5. The Committer will not provide any confidential information relating to the business of the Listed Company to any third parties, or assist any third parties in engaging in any business competing with that of the Listed Company, by using its control or influences over the listed company. 6. If the Committer is in breach of the said commit-ments, it shall bear the corresponding legal liabilities, and indemnify the Listed Company or investors for any and all losses caused thereby according to law.
Long term No Yes / /
Other commit-ments
Other Jinsheng Group Within 12 months from 7 December 2017, through the centralized auction trading system of the Shanghai Stock Exchange, accord-ing to fluctuations of the company’s share price and the overall trend of the capital market, the Company will increase its holdings of the Company’s shares at a total amount of not less than RMB 50 million and not more than RMB 100 million. For details, please refer to the Saurer “Announcement on Future Shareholding Increase Plan by the Controlling Shareholder” and the “Supplementary Announcement on Future Shareholding Increase Plan by the Controlling Shareholder” (Ad hoc 2017-107 and Ad hoc 2017-109) released on the Shanghai Stock Exchange website 7 December 2017 and 8 December 2017, respectively.
Within 12 months from 7 December 2017
Yes Yes / /
SECTION 5.SIGNIFICANT EVENTS

2017 ANNUAL REPORT 41
Com-mitment back-ground
Com-mitment type
Committer Commitments Commitment date and period
Fulfilment period? Was the commitment fulfilled in a timely manner?
If not fulfilled in a timely manner, state the specific reasons for non-fulfilment
If not fulfilled in a timely manner, state the next work plan
Com
mitm
ent r
elatin
g to
the
rest
ruct
urin
g of
sig
nific
ant a
sset
s
Other Hezhong Investment and its partners, Hehe Investment and its partners, Jinbuer and its partners, Ningbo Yukang and its partners, Shen-zhen Longding and its partners
1. The Committer, as the partner of Hezhong Investment/Hehe Investment/Jinbuer/Ningbo Yukang/Shenzhen Longding (including the limited partner and general partner), is committed to ensuring that within the lock-up period of the shares of Hezhong Invest-ment/Hehe Investment/Jinbuer/Ningbo Yukang/Shenzhen Longding, it will not transfer any assets of the partners held by the Com-mitter. 2. Hezhong Investment/Hehe Investment/Jinbuer/Ningbo Yukang/Shenzhen Longding and their general partners are further committed to ensuring that within the lock-up period of the shares of the partners, it will not handle the formalities for transfer of properties for the partners. 3. If the Committer is in breach of the said commitments, it shall bear the corresponding legal liabilities, and indemnify the Listed Company or investors for any and all losses caused thereby according to law.
Within 36 months after completion of issuance
Yes Yes / /
Gua
rant
ee a
nd
com
pens
atio
n of
valu
e of
ass
ets
purc
hase
d Jinsheng Group, Hezhong Investment, Hehe Investment and Jinbuer
The Committer is committed to ensuring that, in the year when the restructuring is done and two entire accounting years thereafter, i.e. 2017, 2018 and 2019, the net profits attributable to the owners of the parent company as realized by Saurer Intelligent Machin-ery (according to the consolidated statements, net of the non-recurring profits and losses, similarly hereinafter) shall not be less than RMB 583 million, RMB 766 million and RMB 1,003 million, respectively, and the total shall not be less than RMB 2,352 million.
2017, 2018, 2019 Yes Yes / /
Gua
rant
ee a
nd
com
pens
atio
n of
valu
e of
ass
ets
purc
hase
d Pan Xueping Pan Yueping, as the controlling shareholder of Jinsheng Group, is unconditionally and irrevocably committed to bearing the unlimit-ed joint and several guarantee liabilities to Jinsheng Group for the results compensation obligations under the results compensation agreement.
2017, 2018, 2019 Yes Yes / /
Avoi
danc
e of
indu
stria
l com
petit
ion Jinsheng Group,
Pan Yueping1. As at the date of issuance of this commitment letter, the Committer has not invested in any company, enterprise or other oper-ating entities that are identical or similar to Saurer Intelligent Machinery; and the Committer and the Committer’s Controlled Other Enterprises will not operate for themselves or others any business that is identical or similar to that of Saurer Intelligent Machinery, and there is no industrial competition against Saurer Intelligent Machinery. 2. After completion of restructuring, during the period when the Committer acts as the controlling shareholder/actual controller of the Listed Company, it will not engage in any business that is competitive with that of the listed company currently or in the future in any form. 3. After completion of restructuring, during the period when the Committer acts as the controlling shareholder/actual controller of the Listed Company, if the Committer’s Controlled Other Enterprises plan to engage in any business that is competitive with that of the Listed Company, the Committer will exercise its veto power, in order to ensure that they are not engaged in any direct or indirect competition against the Listed Com-pany. If there is any commercial opportunity that is related to the scope of business of the Listed Company, the Committer will first assign or introduce it to the Listed Company. 4. After completion of restructuring, during the period when the Committer acts as the controlling shareholder/actual controller of the Listed Company, if the listed company changes its scope of business, thereby caus-ing any competition against the Committer and the Committer’s Controlled Other Enterprises, the Committer will (and will ensure that the Committer’s Controlled Other Enterprises will) take the following measures to eliminate the competition: stop operating the business that is competitive with that of the Listed Company; transfer the competitive business to the Listed Company; or transfer the competitive business to any unrelated third parties. 5. The Committer will not provide any confidential information relating to the business of the Listed Company to any third parties, or assist any third parties in engaging in any business competing with that of the Listed Company, by using its control or influences over the listed company. 6. If the Committer is in breach of the said commit-ments, it shall bear the corresponding legal liabilities, and indemnify the Listed Company or investors for any and all losses caused thereby according to law.
Long term No Yes / /
Other commit-ments
Other Jinsheng Group Within 12 months from 7 December 2017, through the centralized auction trading system of the Shanghai Stock Exchange, accord-ing to fluctuations of the company’s share price and the overall trend of the capital market, the Company will increase its holdings of the Company’s shares at a total amount of not less than RMB 50 million and not more than RMB 100 million. For details, please refer to the Saurer “Announcement on Future Shareholding Increase Plan by the Controlling Shareholder” and the “Supplementary Announcement on Future Shareholding Increase Plan by the Controlling Shareholder” (Ad hoc 2017-107 and Ad hoc 2017-109) released on the Shanghai Stock Exchange website 7 December 2017 and 8 December 2017, respectively.
Within 12 months from 7 December 2017
Yes Yes / /
SECTION 5.SIGNIFICANT EVENTS

42 2017 ANNUAL REPORT
(2). Profit ForecastThe Company and Jinsheng Group, Jinbuer, Hezhong Investment and Hehe Investment signed the Results Commitment and Compensation Agreement, a Supplementary Agree-ment and a second Supplementary Agreement II. Jinsheng Group, Jinbuer, Hezhong In-vestment and Hehe Investment are committed to ensuring that the net profits attributable to the owners of the parent company in 2017, 2018 and 2019 as realized by Saurer Intelligent Machinery (according to the consolidated statements, net of the non-recurring profits and losses, similarly hereinafter) shall not be less than RMB 583 million, RMB 766 million and RMB 1,003 million, respectively, and the total shall not be less than RMB 2,352 million.
The “Special Audit Report for Explanation of Difference between Actual Net Profit and Committed Net Profit of Saurer Intelligent Machinery” (PwC Special Audit No. 1868 [2018]) showed that the net profit attributable to the owners of the parent company realized by Saurer less non-recurring gains and losses in 2017 was RMB 684 million, RMB 101 million more than the committed RMB 583 million, resulting in a performance commitment com-pletion rate of 117%.
III. Changes in Accounting Policies and Estimates The Company completed the restructuring of significant assets in the reporting period, and after completion, the Company’s assets, main business and equity structure were changed. In order to truly and accurately reflect the financial status of the company, once this had been approved by the Board of Directors, the Board of Supervisors and the AGM, the Company changed its original accounting policies and accounting estimates. For details, please refer to the “Announcement on Changing Accounting Policy and Accounting Estimation” (Ad hoc 2017-081) issued by the Company on 12 September 2017 and the “Special Report on Changes of Accounting Policies and Accounting Estimates of Xinjiang Urban Construction (Group) Company Limited” (PricewaterhouseCoopers TSZ [2017] No. 2310) as issued by PricewaterhouseCoopers CPAs Firm (special ordinary partnership). The changes in the accounting policies and accounting estimates have no influence on the financial status and operating results of the Company.
IV. Employment and Dismissal of CPA Firm� Unit: 10 Thousand Yuan; Currency: RMB
Original employment Current employmentName of domestic CPA firm CAC CPA Limited Liability
Partnership (special ordinary partnership)
PricewaterhouseCoopers Zhong Tian CPAs Firm (special ordinary partnership)
Remuneration of domestic CPA firm 85 390Auditing years of domestic CPA Firm 16 years 1 year
Name RemunerationInternal control auditing CPA firm PricewaterhouseCoopers Zhong
Tian CPAs Firm (special ordinary partnership)
180
Financial adviser ZTF Securities Company Limited 2,500
Note: The company completed the restructuring of significant assets in the reporting period. To guarantee a smooth completion of Company auditing in 2017, the Board of Di-rectors, the Board of Supervisors and the AGM agreed to appoint PricewaterhouseCoopers
SECTION 5.SIGNIFICANT EVENTS

2017 ANNUAL REPORT 43
CPAs Firm (special ordinary partnership) as the financial auditor and internal control auditor of the Company in 2017, effective for one year. For details, please refer to the “Announce-ment on Changing Accountant Firm” (Ad hoc 2017-080) as issued by the Company on 12 September 2017.
V. The Good Faith of the Company and Its Controlling Shareholders and Actual ControllersDuring the reporting period, the Company and its controlling shareholders and actual con-troller were in good faith, and have no large debts that are due, as judged by the court.
VI. Significant Related-Party Transactions
(1). Related-Party Transactions Relevant to Daily Operations
1. Issues Not Disclosed in Ad Hoc Announcements� Unit: Thousand Yuan; Currency: RMB
Related- party transaction parties
Affiliation Type of related- party trans-action
Content of related- party trans-action
Pricing principles of related- party trans-action
Price of related- party trans-action
Contract amount of
related- party
transaction
Same kinds of transac-
tions (%)
Mode of settlement of related- party trans-action
Market price
Reason for larger difference between the transaction price and the market reference price
Xinjiang Litai Silk Road Investment Co. Ltd
Share-holder’s subsidiary
Sale of goods
Sale of ma-chinery and equipment
Mark-up of costs
/ 320,627 3.7 According to the agreement
/ /
Kuitun Litai Silk Road Investment Co. Ltd
Share-holder’s subsidiary
Sale of goods
Sale of ma-chinery and equipment
Mark-up of costs
/ 359,586 4.1 According to the agreement
/ /
LT Textile International Co. Ltd
Share-holder’s subsidiary
Sale of goods
Sale of ma-chinery and equipment
Mark-up of costs
/ 139,990 1.6 According to the agreement
/ /
Total / / 820,203 9.4 / / /Notes on related-party transactions The Company completed the restructuring of significant assets in September 2017.
After listing on completion of restructuring, the Company made a disclosure according to the provisions of the Trading Rules of Shanghai Stock Exchange for stock listing.
SECTION 5.SIGNIFICANT EVENTS

44 2017 ANNUAL REPORT
(2). Related-Party Transactions Associated with the Acquisition or Sale of Assets or Equities
1. Issues That Have Been Disclosed in Ad Hoc Announcements for Which There Was No Progress or Change in Follow-up Implementation
Overview ReferenceThe replacement of major assets, issuance of shares and purchasing of assets in the reporting period shall constitute the related-party transactions. On 30 June 2017, the Company received a notice. After being reviewed by the M&A and Restructuring Auditing Committee of the CSRC at the 35th Working Meeting on 30 June 2017, the replacement of the major assets, issuance of shares and purchase of assets (i.e. related-party transactions) of the Company were unconditionally approved. On 31 July 2017, the Company received the formal approval documents from the CSRC regarding the restructuring of the Compa-ny’s major assets. On 10 August 2017, the formalities for transfer of assets and equities purchased and the industrial and commercial registration relating to the restructuring of the Company’s major assets were completed. On 25 August 2017, asset settlement was completed. On 4 September 2017, the formalities for issuance of new shares were completed. On 22 Sept 2017, the transfer registration from the state-owned capital company to Jinsheng Group was completed. During the reporting period, the Company’s major asset replacement and issuance of shares and purchase of assets were completed.
For details, please refer to the “Announcement on Obtaining Unconditional Approval of Restructuring of Significant Assets Reorganization by Committee of CSRC upon Verification and Trading Resumption of Its Shares” (Ad hoc 2017-050), the “Announcement on Obtaining Written Reply to Connected Transac-tion of Significant Assets Replacement and Assets Purchase through Shares Issuance from CSRC upon Verification” (Ad hoc 2017-056), the “Announcement on Completing Transfer of Purchased Assets in Connected Transaction of Significant Assets Replacement and Assets Purchase through Shares Issuance”, (Ad hoc 2017-064), the “Announcement on Delivery of Withdrawn Assets in Connected Transaction of Significant Assets Replacement and Assets Purchase through Shares Issuance” (Ad hoc 2017-073), the “Xinjiang Urban Construction (Group) Co., Ltd [the Company’s previous name] Announcement on Issuance Result of Connected Transaction of Significant Assets Replacement and Assets Purchase through Shares Issuance and Change in Shares” (Ad hoc 2017-074), and the “Xinjiang Urban Construction (Group) Co., Ltd [the Company’s previous name] Announcement on Completing Contractual Transfer of Shareholder’s Shares” (Ad hoc 2017-089).
2. Disclosure of Realization of Results in the Reporting Period If Relating to Provisions on Results
For details, please refer to the relevant statements regarding the profit forecast in this section.
VII. Significant Contracts and Their Implementation
(1). Guarantees
Information on external guarantees (excluding guarantees to subsidiaries)� Unit: Thousand Yuan; Currency: RMB
Gua
rant
or
Rel
atio
nshi
p be
twee
n th
e gu
aran
tor a
nd th
e Li
sted
Com
pany
Gua
rant
ee
Amou
nt o
f gua
rant
ee
Sign
ed d
ate
of
guar
ante
e
Gua
rant
ee s
tart
dat
e
Gua
rant
ee e
nd d
ate
Type
of g
uara
ntee
Com
plet
ion
of
guar
ante
e
Ove
rdue
gua
rant
ee
Ove
rdue
am
ount
of
guar
ante
e
Cou
nter
-gua
rant
ee
Rel
ated
-par
ty
guar
ante
e
Rel
atio
nshi
p
NoneTotal amount of guarantee incurred in the reporting period (excluding guarantees to subsidiaries)
0
Total balance of guarantee at the end of the reporting period (A) (excluding guarantees to subsidiaries)
0
SECTION 5.SIGNIFICANT EVENTS

2017 ANNUAL REPORT 45
Guarantee provided for subsidiaries from the Company and its subsidiaries
Gua
rant
or
Rel
atio
nshi
p be
twee
n th
e gu
aran
tor a
nd th
e Li
sted
Com
pany
Gua
rant
ee
Amou
nt o
f gua
rant
ee
Sign
ed d
ate
of
guar
ante
e
Gua
rant
ee s
tart
dat
e
Gua
rant
ee e
nd d
ate
Type
of g
uara
ntee
Com
plet
ion
of
guar
ante
e
Ove
rdue
gua
rant
ee
Ove
rdue
am
ount
of
guar
ante
e
Cou
nter
-gua
rant
ee
Rel
ated
-par
ty
guar
ante
e
Rel
atio
nshi
p
Total amount of guarantees provided for subsidiaries in the reporting period
1,037,789
Total balance of guarantees provided for subsidiaries at the end of the reporting period (B)
1,218,639
Total amount of guarantees provided (including guarantees provided for subsidiaries)
Total amount of guarantees provided (A + B) 1,218,639Percentage of total amount of guarantee against net assets of the Company (%)
55.22
Including: Amount of guarantee provided for shareholders, actual controllers and related parties (C)
0
Direct or indirect debt guarantees provided for guaranteed parties whose asset/liability ratio exceeds 70% (D)
961,481
Amount of total guarantee exceeding 50% of net assets (E) 115,122Total amount of guarantee of C + D + E 1,076,603Instructions on possible joint and several clearance liabilities for undue guarantees
None
Instructions on guarantee For details, please refer to Ad hoc 2017-84, 2017-096, 2017-102 and 2017-105
(2). Cash Asset Management Entrusted to Others
1. Entrusted Wealth Management
(1) Overview of Entrusted Wealth Management� Unit: 10 Thousand Yuan; Currency: RMB
Type Source of funds Amount entrusted
Outstanding balance
Unrecovered amount overdue
Wealth man-agement bank products
Own funds 476,300 450,000 0
SECTION 5.SIGNIFICANT EVENTS

46 2017 ANNUAL REPORT
(2) Individual Entrusted Wealth Management� Unit: 10 Thousand Yuan; Currency: RMB
Trus
tee
Entr
uste
d w
ealth
m
anag
emen
t pro
duct
Entr
uste
d w
ealth
m
anag
emen
t am
ount
Star
ting
date
of e
ntru
sted
w
ealth
man
agem
ent
Endi
ng d
ate
of e
ntru
sted
w
ealth
man
agem
ent
Sour
ce o
f fun
ds
Fund
s in
vest
men
t dire
ctio
n
Det
erm
inat
ion
of
rem
uner
atio
n
Annu
aliz
ed ra
te
of re
turn
Expe
cted
retu
rn (i
f any
)
Actu
al re
turn
or l
oss
Actu
al re
cove
ry
Hav
e St
atut
ory
proc
edur
es
been
com
plet
edIs
any
ent
rust
ed w
ealth
man
-ag
emen
t pla
nned
in th
e fu
ture
Accr
ual o
f im
pairm
ent
prov
isio
n (if
any
)
Bank of Nanjing
Principal guaran-teed earning
450,000 2017-9-28 2018-2-27 Own funds
Zhu Lian Bi He – Ji Ji Wen Xin No. 1BB RMB wealth management product
Calcu-lated per day
3.5% / 6,558.90 Recovery of principal and interest
Yes Yes /
Bank of Nanjing
Principal guaran-teed earning
450,000 2016-9-14 2017-9-13 Own funds
Zhu Lian Bi He – Nian Wen Xin No. 1BB RMB wealth management product
Calcu-lated per day
3% / 13,463.01 Recovery of principal and interest
Yes Yes /
CHINA CITIC BANK
Non-prin-cipal guar-anteed floating earning
5,000 2017-5-22 2017-6-30 Own funds
CITIC Wealth Manage-ment – Double Win – Bu Bu Gao Sheng B RMB wealth manage-ment product
Calcu-lated per day
4% / 31.93 Recovery of principal and interest
Yes No /
ICBC Principal guaran-teed floating earning
20,000 2017-1-13 2017-2-17 Own funds
ICBC – Principal Guar-anteed Legal Person 35-day Steady Profits RMB wealth manage-ment product
Calcu-lated per day
2.6% / 49.86 Recovery of principal and interest
Yes No /
ICBC Principal guaran-teed earning
5,900 2016-12-30 2017-1-23 Own funds
Super-short RMB wealth management product without fixed term –0701CDQB
Calcu-lated per day
2.3% / 8.6 Recovery of principal and interest
Yes No /
CHINA CITIC BANK
Principal guaran-teed earning
400 2016-11-11 2017-1-24 Own funds
CITIC Wealth Manage-ment – Double Win – Tian Tian Kuai Che B RMB wealth manage-ment product
Calcu-lated per day
2.75% / 2.1 Recovery of principal and interest
Yes No /
Additional Information The company’s subsidiary Saurer Changzhou and Bank of Nanjing (Changzhou
Branch) signed a contract on 28 February 2018 for entrusted wealth management of principal guaranteed earnings amounting to RMB 4.5 billion, with an expected annualized rate of return of 4%. For details, please refer to the “Announcement on Progress in Entrusted Wealth Management by Subsidiary” issued by the Company on 2 March 2018 (Ad hoc 2018-008).
(3). Other Major ContractsSaurer Intelligent Machinery and Shandong Ruyi Technology Group Co. Ltd signed a frame-work contract amounting to RMB 2,177.93 million on 10 March 2017. By the end of the reporting period, RMB 1,517.28 million had been committed. The commitment remaining unfulfilled under this contract is expected not to exceed RMB 660.65 million.
SECTION 5.SIGNIFICANT EVENTS

2017 ANNUAL REPORT 47
VIII. Active Corporate Social Responsibility
(1). Poverty Alleviation
1. Poverty Alleviation Strategy The Company actively responds to and implements China's strategic plan for poverty
alleviation (“precise poverty alleviation”), attaches importance to poverty alleviation work, actively cooperates with local governments, and develops targeted plans for alleviating industrial and educational poverty. These efforts help to improve the living environment, enhance income levels, and promote science and culture.
2. Targeted Measures towards Poverty Alleviation during the Reporting Year In 2017, the Company spent RMB 20 million on poverty alleviation, used mainly to pur-
chase livestock and fodder, provide vocational skills training, finance low-income college students and extend microloans. The aim of these and other measures is to support the development of low-income districts in Xinjiang, help students improve their job pros-pects and provide them with financial assistance, and to make it possible for recipients of microloans to repay them.
3. Achievements of Poverty Alleviation Projects� Unit: 10 Thousand Yuan; Currency: RMB
Indicators Number supported or extent of support
I. Summary information 1. Funds 2,000 2 . No. of persons who received poverty alleviation support 4,321II. Breakdown of support 1. Industrial poverty alleviation 1.1 Types of industrial poverty alleviation projects " Agricultural and Forestry Poverty
Alleviation" " Travel Poverty Alleviation" " E-commerce Poverty Alleviation" " Return on Assets Poverty Alleviation"
" S&T Poverty Alleviation" " Others"
1.2 Number of industrial poverty alleviation projects 42 1.3 Amount invested in industrial poverty alleviation projects 1,350 1.4 Number of persons who received industrial poverty
alleviation support3,247
2. Jobs promotion 2.1 Amount invested in vocational skills training 100 2.2 Number of trainees who acquired vocational skills 400 2.3 Number of trainees who obtained jobs 400 4. Educational poverty alleviation 4.1 Funds provided to low-income students 300 4.2 Number of low-income students financed 674 9. Other projects 9.1. Number of projects 1 9.2. Amount invested 250 9.3. Description of other projects Deposits for micro loans
SECTION 5.SIGNIFICANT EVENTS

48 2017 ANNUAL REPORT
4. Next Steps in Poverty Alleviation The company will continue to carefully carry out and implement
poverty alleviation along the lines set out by the central govern-ment, actively implement precise poverty alleviation and adopt measures that include taking a multilayer, multichannel and multi-faceted approach to alleviating poverty in the intended spirit of active corporate social responsibility.
(2). Corporate Social ResponsibilityDuring the reporting period, the Company was engaged in active corporate social responsibility while continuing to develop its own business.
1. Focus on Protection of Investor Rights and Interests The Company carefully fulfils its information disclosure obli-
gations to ensure true, accurate and complete disclosure of information, enabling investors to keep abreast of the Compa-ny’s operations and progress on major issues in a timely manner. The Company actively develops investor relations management, and maintains communications with institutional investors, small and medium-sized shareholders as well as potential investors through phone, email, the Shanghai Stock Exchange e-interac-tion platform, institutional surveys and investor exchange meet-ings, all based on the principle of openness and fairness with the aim of enhancing investor relations. Both on-site and online vot-ing provide a convenient means for shareholders to participate in decision-making at the AGM. The Company strives to generate reasonable returns for shareholders, in line with the provisions of the Articles of Association on the distribution of profits, while also looking to achieve robust and sustainable development of the Company.
2. Strengthen Production Safety and Prevent Accidents The Company has established improved production safety
management systems, assigning responsibility to environmental health and safety managers for production safety in the many different lines and departments. Production safety meetings are held regularly, as are training sessions. Management has estab-lished a risk evaluation and identification system for evaluating and controlling production risks. Checks on production safety are carried out using the evaluation system, and a proposal for implementing an emergency response system has also been established.
3. Focus on Protection of the Rights and Interests of Employees, and Building a Corporate Culture
Saurer is a people-oriented company and acts to protect the rights and interests of its employees by building constructive labour relations. The Company has established systems such as on-board training, nurturing talent and other similar mech-anisms to encourage employees to continue their studies and enhance their skills. This also provides motivation for their own
personal growth as well as for future corporate development. The Company provides comprehensive employee benefits, for example employer’s liability insurance and business travel insur-ance. The Company organizes a range of professional training and team-building activities, and has established an atmosphere conducive to the rapid growth and development of talent. This careful attention to employee development helps to build the skills needed for specific jobs, while facilitating transmission of the Company’s culture and values, fostering a sense of mission and enabling recognition of key employees, all of which in turn serves to reinforce team spirit.
4. Strengthen Quality Control through Quality Management and Environmental Management System Certification
The Company’s subsidiaries all hold ISO 9001:2008 quality man-agement system certification and ISO 14001:2004 environmen-tal management system certification, and adhere to the quality management philosophy of “Quality First, Customer Satisfaction, Continuous Improvement”. This enhances the establishment of quality management rules and systems, supplier quality engineering and product quality, as well as measuring tools and equipment calibration and other quality management procedures and systems.
5. Focus on Environmental Protection and Proposed Environ-mental Protection Philosophy
Company R&D is guided by the E³ – Triple Added Value concept. This philosophy improves product performance indicators for energy saving, economic efficiency and ergonomics. This in turn lowers energy consumption, reduces resource costs, and makes production more efficient, lowering demand for labour. The Company advocates the paperless office, and saving energy and reducing consumption, to achieve coordinated development of all operations in an environmentally friendly way.
6. Develop Social Benefit Activities and the Practice of Corporate Social Responsibility
The Company has both developed and participated in various social benefit activities during the reporting period. These include assistance to the Karjan Primary School, Vadodara, India, sup-porting the education of students. The Company also financed fruit tree planting projects in the African Republic of Malawi. This involved training farmers to plant and take care of fruit trees, thereby helping to alleviate food scarcity in the country and con-tributing to the economy.
SECTION 5.SIGNIFICANT EVENTS

2017 ANNUAL REPORT 49
(3). Environmental Information
1. Companies Not on the List of Major Pollutant-Discharging Entities
The Company and its major subsidiaries are not listed as major pollutant discharge entities by the environmental protection department. The Company is engaged mainly in R&D and the production and sale of intelligent textile equipment and key components. The Company is not among industries that are responsible for heavy pollution. The major pollutants discharged by the Company include wastewater, waste gas, some waste residue and a certain amount of noise generated by the pro-duction processes. The Company strictly enforces all laws and regulations related to environmental protection, and its major subsidiaries hold ISO 14001:2004 environmental management system certification.
SECTION 5.SIGNIFICANT EVENTS

50 2017 ANNUAL REPORT
I. Changes in Common Share Capital
(1). Table of Changes in Common Share Capital
1. Table of Changes in Common Share Capital� Unit: Share
Before change Changes in the period (+, –) After changeQuantity Ratio
(%)Shares newly
issuedDivi-dend share
Shares transferred
from reserves
Others Subtotal Quantity Ratio (%)
I. Shares subject to conditional sales 0 0 1,219,627,217 0 0 0 1,219,627,217 1,219,627,217 64.351. State-owned shares 0 0 0 0 0 0 0 0 02. State-owned legal person shares 0 0 99,675,850 0 0 0 99,675,850 99,675,850 5.263. Other domestic shares 0 0 1,119,951,367 0 0 0 1,119,951,367 1,119,951,367 59.09Among which: domestic non-state-owned legal person shares
0 0 1,045,194,479 0 0 0 1,045,194,479 1,045,194,479 55.15
Domestic natural person shares 0 0 74,756,888 0 0 0 74,756,888 74,756,888 3.944. Foreign shares 0 0 0 0 0 0 0 0 0Among which: foreign legal person shares
0 0 0 0 0 0 0 0 0
Foreign natural person shares 0 0 0 0 0 0 0 0 0II. Tradable shares 675,785,778 100 0 0 0 0 0 675,785,778 35.65
1. RMB common shares 675,785,778 100 0 0 0 0 0 675,785,778 35.652. Domestic listed international investment shares
0 0 0 0 0 0 0 0 0
3. Overseas listed international investment shares
0 0 0 0 0 0 0 0 0
4. Other 0 0 0 0 0 0 0 0 0III. Total of common shares 675,785,778 100 1,219,627,217 0 0 0 1,219,627,217 1,895,412,995 100
2. Changes in Common Shares On 23 January 2017, the Company held the first EGM for the year. The resolution on the
Company’s major asset swap and asset purchase via share issuance and related-par-ty transaction (Ad hoc 2017-006) was examined and approved at the meeting. At the 35th Working Meeting of the Expert Advisory Committee for the Merger, Acquisition and Restructuring of Listed Companies of the CSRC on 30 June 2017, the Company’s major asset swap and asset purchase via share issuance and related-party transaction was unconditionally approved (Ad hoc 2017-050). On 31 July 2017, the Company received the “Approval of Major Asset Restructuring of Xinjiang Urban Construction (Group) Co., Ltd (the Company’s previous name) and Its Asset Purchase via Share Issuance to Jiangsu Jinsheng Industry Co., Ltd and Other Companies” issued by the CSRC (Approval No. [2017] 1397). The Company was given approval to carry out major asset restructuring and to purchase related assets through the issue of 1,219,627,217 shares to 17 shareholders, including Jiangsu Jinsheng Industry Co., Ltd (Ad hoc 2017-056). On 4 September 2017, the Company completed the registration procedures for the 1,219,627,217 issued shares (Ad hoc 2017-074), subsequently the total number of shares of the Company changed to 1,895,412,995 shares.
SECTION 6.CHANGES IN COMMON SHARES AND SHAREHOLDERS

2017 ANNUAL REPORT 51
3. Impact of Common Stock Changes on Financial Indicators Such as Earnings Per Share and Net Assets Per Share
The impact of common stock changes on financial indicators such as earnings per share and net assets per share for last year and the latest reporting period, which resulted from new shares issued in the Company’s major asset swap and asset purchase and related-party transaction, is detailed under “Major Financial Data for Each Quarter in 2017”.
(2). Change of Shares Subject to Conditional Sales� Unit: Share
Name of shareholder Shares at the begin-
ning of year
Shares unlocked
in the year
Shares added in the year
Shares at the end of
the year
Reason Unlocking date
Jiangsu Jinsheng Industry Co., Ltd 0 0 721,247,974 721,247,974 Asset purchase via share issuance 4 September 2020China Development Bank Capital Co., Ltd 0 0 16,612,641 16,612,641 Asset purchase via share issuance 4 September 2020China Development Bank Capital Co., Ltd 0 0 83,063,209 83,063,209 Asset purchase via share issuance 4 September 2019Zhao Hongxiu 0 0 74,756,888 74,756,888 Asset purchase via share issuance 4 September 2019Changzhou Kimble Investment Partnership Firm (limited partnership)
0 0 66,450,567 66,450,567 Asset purchase via share issuance 4 September 2019
Jiangsu Huatai Strategic Emerging Industry Investment Fund (limited partnership)
0 0 49,688,858 49,688,858 Asset purchase via share issuance 4 September 2019
Changzhou Hehe Investment Partnership Firm (limited partnership)
0 0 38,513,087 38,513,087 Asset purchase via share issuance 4 September 2019
Shenzhen Longding Shuming Equity Invest-ment Partnership Firm (limited partnership)
0 0 34,886,547 34,886,547 Asset purchase via share issuance 4 September 2019
China Advanced Manufacturing Industry Investment Fund (limited partnership)
0 0 33,225,283 33,225,283 Asset purchase via share issuance 4 September 2020
Huashan Investment Co., Ltd 0 0 16,612,641 16,612,641 Asset purchase via share issuance 4 September 2019Shanghai Yongjun Equity Investment Partner-ship Firm (limited partnership)
0 0 16,612,641 16,612,641 Asset purchase via share issuance 4 September 2019
Ningbo Yukang Equity Investment Centre (limited partnership)
0 0 16,612,641 16,612,641 Asset purchase via share issuance 4 September 2019
Tibet Jiaze Venture Investment Firm 0 0 16,612,641 16,612,641 Asset purchase via share issuance 4 September 2019Changzhou Hezhong Investment Partnership (limited partnership)
0 0 11,324,837 11,324,837 Asset purchase via share issuance 4 September 2019
Shanghai Jinye Equity Investment Partnership Firm (limited partnership)
0 0 8,306,320 8,306,320 Asset purchase via share issuance 4 September 2019
Shanghai Hongcheng Equity Investment Part-nership Firm (limited liability)
0 0 8,306,320 8,306,320 Asset purchase via share issuance 4 September 2019
Beijing Zhongtai Financial Investment Co., Ltd 0 0 6,645,056 6,645,056 Asset purchase via share issuance 4 September 2019Nanjing Daofeng Investment Management Centre (general partnership)
0 0 149,066 149,066 Asset purchase via share issuance 4 September 2019
Total 0 0 1,219,627,217 1,219,627,217 / /
SECTION 6.CHANGES IN COMMON SHARES AND SHAREHOLDERS

52 2017 ANNUAL REPORT
II. Issuance of Securities and Listing
(1). Issuance of Securities During the Reporting Period Unit: Share; Currency: RMB
Stocks and deriva-tives/Types of securities
Issue date Issue price (or interest rate)
Number of issuance Listing date Permitted issuance Closing date of transaction
Common stocksRMB common shares 2017-09-04 6.17 1,219,627,217 2019-09-05 448,541,319 /RMB common shares 2017-09-04 6.17 1,219,627,217 2020-09-07 771,085,898 /Convertible bonds, bonds with warrants and corporate bondsNoneOther derivative securitiesNone
(2). Total Common Shares of the Company and Changes in Shareholder Structure and Asset and Liability StructureDuring the reporting period, both the total number of common shares and shareholder structure of the Company changed. Refer to “Changes in Common Share Capital” under this section for details. After the completion of major asset restructuring and asset pur-chase via share issuance, the Company’s level of assets, sustainability and profitability all significantly increased.
III. Shareholders and Actual Controllers
(1). Total Shareholders
Total number of common shareholders at the end of the reporting period (persons) 89,711Total number of common shareholders at the end of the last trading month before the disclosure date of the Annual Report (persons)
83,810
Total number of preferred shareholders with restored voting rights at the end of the reporting period (persons) 0
Total number of preferred shareholders with restored voting rights at the end of the last trading month before the disclosure date of the Annual Report (persons)
0
SECTION 6.CHANGES IN COMMON SHARES AND SHAREHOLDERS

2017 ANNUAL REPORT 53
(2). Top 10 Shareholders and Top 10 Tradable Shareholders (or Holders of Shares Not Subject to Conditional Sales) by the End of the Reporting Period
Top 10 shareholders Unit: Share
Name of shareholder Increase or de-crease during
the period
Shares at the end of the re-
porting period
Ratio (%)
Shares subject to
conditional sales
Pledged or frozen Nature of shareholderShare status
Quantity
Jiangsu Jinsheng Industry Co., Ltd 879,016,106 879,016,106 46.38 721,247,974 Pledged 804,727,808 Domestic non-state-owned legal person
China Development Bank Capital Co., Ltd 99,675,850 99,675,850 5.26 99,675,850 None 0 State-owned legal personZhao Hongxiu 74,756,888 74,756,888 3.94 74,756,888 Pledged 69,055,000 Domestic natural personChangzhou Kimble Investment Partnership Firm (limited partnership)
66,450,567 66,450,567 3.51 66,450,567 None 0 Others
Jiangsu Huatai Strategic Emerging Industry Investment Fund (limited partnership)
49,688,858 49,688,858 2.62 49,688,858 None 0 Others
Changzhou Hehe Investment Partnership Firm (limited partnership)
38,513,087 38,513,087 2.03 38,513,087 None 0 Others
Shenzhen Longding Shuming Equity Invest-ment Partnership Firm (limited partnership)
34,886,547 34,886,547 1.84 34,886,547 None 0 Others
China Advanced Manufacturing Industry Investment Fund (limited partnership)
33,225,283 33,225,283 1.75 33,225,283 None 0 Others
Urumqi State-owned Assets Operation (Group) Co., Ltd
149,400,432 30,072,467 1.59 0 None 0 State-owned legal person
Tibet Jiaze Venture Investment Firm 16,612,641 16,612,641 0.88 16,612,641 None 0 Domestic non-state-owned legal person
Shanghai Yongjun Equity Investment Partnership Firm (limited partnership)
16,612,641 16,612,641 0.88 16,612,641 None 0 Others
Ningbo Yukang Equity Investment Centre (limited partnership)
16,612,641 16,612,641 0.88 16,612,641 None 0 Others
Huashan Investment Co., Ltd 16,612,641 16,612,641 0.88 16,612,641 None 0 Domestic non-state-owned legal person
Top 10 holders of shares not subject to conditional sales
Name of shareholder Number of shares not subject to conditional sales
Type and number of sharesType Quantity
Jiangsu Jinsheng Industry Co., Ltd 157,768,132 RMB common shares 157,768,132Urumqi State-owned Assets Operation (Group) Co., Ltd 30,072,467 RMB common shares 30,072,467Central Huijin Investment Ltd 15,129,700 RMB common shares 15,129,700Shaanxi International Trust Co., Ltd – Shaanxi International Trust · Chiying No. 96 Securities Investment Collective Fund Trust Scheme
14,757,831 RMB common shares 14,757,831
Liao Wei 10,174,282 RMB common shares 10,174,282Wang Fang 6,135,300 RMB common shares 6,135,300Yang Wenting 4,521,993 RMB common shares 4,521,993Wang Qiudong 4,130,882 RMB common shares 4,130,882Urumqi Urban Construction and Investment (Group) Co., Ltd 3,122,139 RMB common shares 3,122,139Agricultural Bank of China Limited – CSI 500 Index Exchange Traded Open-Ended Securities Investment Fund
2,465,291 RMB common shares 2,465,291
Notes on affiliation, alliance or collusion among the aforemen-tioned shareholders
Among the top 10 holders of shares not subject to conditional sales, the actual controller of Urumqi State-owned Asset Management (Group) Company Ltd and Urumqi Urban Construction and Investment (Group) Co., Ltd is in both cases the State-owned Assets Supervision and Administra-tion Commission of Urumqi Municipality. Apart from this, whether there is an associated relationship between the above-mentioned shareholders is unknown, and whether they act in concert is also unknown.
SECTION 6.CHANGES IN COMMON SHARES AND SHAREHOLDERS

54 2017 ANNUAL REPORT
(3). Top 10 Holders of Shares Subject to Conditional Sales, and the Conditions for Sale Unit: Share
No. Holder’s name of shares subject to conditional sales Number of shares held
Condition for listing and trading of shares subject to conditional sales
Conditions of sale
Tradable time Newly added tradable shares
1 Jiangsu Jinsheng Industry Co., Ltd 721,247,974 7 September 2020 721,247,974 Asset purchase via share issuance2 China Development Bank Capital Co., Ltd 16,612,641 7 September 2020 16,612,641 Asset purchase via share issuance2 China Development Bank Capital Co., Ltd 83,063,209 5 September 2019 83,063,209 Asset purchase via share issuance3 Zhao Hongxiu 74,756,888 5 September 2019 74,756,888 Asset purchase via share issuance4 Changzhou Kimble Investment Partnership Firm (limited part-
nership)66,450,567 5 September 2019 66,450,567 Asset purchase via share issuance
5 Jiangsu Huatai Strategic Emerging Industry Investment Fund (limited partnership)
49,688,858 5 September 2019 49,688,858 Asset purchase via share issuance
6 Changzhou Hehe Investment Partnership Firm (limited partner-ship)
38,513,087 5 September 2019 38,513,087 Asset purchase via share issuance
7 Shenzhen Longding Shuming Equity Investment Partnership Firm (limited partnership)
34,886,547 5 September 2019 34,886,547 Asset purchase via share issuance
8 China Advanced Manufacturing Industry Investment Fund (limited partnership)
33,225,283 7 September 2020 33,225,283 Asset purchase via share issuance
9 Tibet Jiaze Venture Investment Firm 16,612,641 5 September 2019 16,612,641 Asset purchase via share issuance9 Shanghai Yongjun Equity Investment Partnership Firm (limited
partnership)16,612,641 5 September 2019 16,612,641 Asset purchase via share issuance
9 Ningbo Yukang Equity Investment Centre (limited partnership) 16,612,641 5 September 2019 16,612,641 Asset purchase via share issuance9 Huashan Investment Co., Ltd 16,612,641 5 September 2019 16,612,641 Asset purchase via share issuanceRemarks on affiliation, alliance or collusion among the aforementioned shareholders
Not applicable
IV. Controlling Shareholder and Actual Controller
(1). Controlling Shareholder >30%
1. Legal Person
Name Jiangsu Jinsheng Industry Co., LtdThe person in charge or legal representative Pan XuepingDate of incorporation 25 December 2000Principal businesses and operations Manufacture of agricultural machinery, auto parts, electronic products (except satellite ground reception facil-
ities), construction machinery and garments; sales of self-produced products; import, export and domestic wholesale high-end CNC machine tools and key components; domestic procurement and wholesale cotton, cotton yarn and textiles. (For projects that are subject to approval according to law, the operating activities can only be carried out after the approval of the relevant department has been obtained.)
Shareholdings of other listed companies at home and abroad in the period
None
Other explanations None
SECTION 6.CHANGES IN COMMON SHARES AND SHAREHOLDERS

2017 ANNUAL REPORT 55
2. Reference and Date of Change in Controlling Shareholders in the Reporting Period The Company carried out a major asset restructuring during the reporting period. Prior
to the major asset restructuring, the Company’s controlling shareholder was Urumqi State-owned Asset Management (Group) Co. Ltd. After the major asset restructuring, the Company’s controlling shareholder changed to Jiangsu Jinsheng Industry Co., Ltd. For details of the above-mentioned change of controlling shareholder, please refer to “Xinjiang Urban Construction (Group) Co., Ltd [the Company’s previous name] Announcement on Issuance Result of Connected Transaction of Significant Assets Replacement and Assets Purchase through Shares Issuance and Change in Shares” (Ad hoc 2017-074) and “Xinjiang Urban Construction (Group) Co., Ltd [the Company’s previous name] Announcement on Completing Contractual Transfer of Shareholder’s Shares” (Ad hoc 2017-089), disclosed by the Company via the Shanghai Stock Ex-change (www.sse.com.cn) and its designated information disclosure media, Shanghai Securities News, Securities Times and Securities Daily, on 7 September 2017 and 26 September 2017, respectively.
3. Equity and Controlling Relationship between the Company and its Controlling Shareholder
Jiangsu Jinsheng Industry Co., Ltd
46.38%
Saurer Intelligent Technology Co., Ltd
(2). Actual Controller
1. Natural Person
Name Pan XuepingNationality ChinaWhether the right of abode in other countries or regions is obtained
No
Occupation and job title Chairman of the Board of Jiangsu Jinsheng Industry Co., Ltd
Control of domestic or foreign listed companies in the past decade
None
SECTION 6.CHANGES IN COMMON SHARES AND SHAREHOLDERS

56 2017 ANNUAL REPORT
2. Reference and Date of Change in Actual Controller in the Reporting Period
The Company carried out a major asset restructuring during the reporting period. Prior to the major asset restructuring, the Company’s actual controller was State-owned Assets Supervi-sion and Administration Commission of the Urumqi Municipality. Following the major asset restructuring, the Company’s actual controller changed to Pan Xueping. For details of the above-men-tioned change of actual controller, please refer to “Xinjiang Urban Construction (Group) Co., Ltd [the Company’s previous name] Announcement on Issuance Result of Connected Transaction of Significant Assets Replacement and Assets Purchase through Shares Issuance and Change in Shares” (Ad hoc 2017-074) and “Xinjiang Urban Construction (Group) Co., Ltd [the Company’s previous name] Announcement on Completing Contractual Transfer of Shareholder’s Shares” (Ad hoc 2017-089), disclosed by the Company via the Shanghai Stock Exchange (www.sse.com.cn) and its designated information disclosure me-dia, Shanghai Securities News, Securities Times and Securities Daily, on 7 September 2017 and 26 September 2017, respec-tively.
3. Enterprise Property Rights and Controlling Relationship between the Company and its Actual Controller
Pan Xueping
Changzhou Jintan Changsheng Investment Co., Ltd 15.525%
46.38%
70%
Jiangsu Jinsheng Industry Co., Ltd
Saurer Intelligent Technology Co., Ltd
69%
SECTION 6.CHANGES IN COMMON SHARES AND SHAREHOLDERS


58 2017 ANNUAL REPORT
I. Shareholding Changes and Remuneration
(1). Shareholding Changes and Remuneration of Directors, Supervisors and Senior Executives in Service or Leaving the Company during the Reporting Period Unit: Share
Name Position (note) Gender Age Start of term End of term Shares held at beginning of the year
Shares held at end of the year
Share change in the year
Reason for change
Remuneration from the Company in reporting period (before tax) (RMB 10,000)
Remuneration from related parties in reporting period
Pan Xueping Chairman Male 54 2017-09-11 2020-09-10 0 0 0 / 27.62 YesStefan Kross Director Male 62 2017-09-11 2020-09-10 0 0 0 / 27.62 No
Clement WoonDirector
Male 582017-09-11 2020-09-10
0 0 0 /0
NoCEO 2017-09-11 / 234.16
Chen Jieping Independent Director Male 64 2017-09-11 2020-09-10 0 0 0 / 27.62 NoXie Manlin Independent Director Male 54 2017-09-11 2020-09-10 0 0 0 / 27.62 NoZhang Yueping Chairman of the Board of Supervisors Male 47 2017-09-11 2020-09-10 0 0 0 / 15.34 YesJin Hao Supervisor Male 42 2017-09-11 2020-09-10 0 0 0 / 15.34 YesPei Guoqing Employee Supervisor Male 50 2017-09-11 2020-09-10 0 0 0 / 18.95 NoGuan Ye Chief Operating Officer Male 47 2017-09-11 / 0 0 0 / 143.63 No
Zeng ZhengpingSecretary to Board of Directors
Male 552017-09-11 /
0 0 0 /158.17 No
Chief Finance Officer 2017-09-11 2017-11-29 0 NoLu Yimin Chief Financial Officer Female 44 2017-11-29 / 0 0 0 / 33.33 NoPeter Moser Chief Human Resources Officer Male 56 2017-09-11 / 0 0 0 / 195.56 NoLiu Jun Former Chairman Male 61 2014-05-12 2017-09-11 5,411 5,411 0 / 38.22 NoYi Yongqin Former Director Male 50 2014-05-12 2017-06-20 0 0 0 / 0 YesLi Zhijun Former Director Male 64 2014-05-11 2017-09-11 0 0 0 / 0 YesYin Weige Former Director Male 57 2014-05-12 2017-09-11 0 0 0 / 0 YesLan Jianxin Former Director Male 57 2014-05-12 2017-09-11 0 0 0 / 0 YesWang Changhui Former Director Male 40 2017-07-12 2017-09-11 0 0 0 / 0 Yes
Wu TaoFormer Director
Male 482017-07-12 2017-09-11
0 0 0 / 6.17No
Former General Manager 2017-05-26 2017-09-11 NoWang Xin’an Former Independent Director Male 54 2014-05-12 2017-09-11 0 0 0 / 5 NoZhan Lei Former Independent Director Male 51 2014-05-12 2017-09-11 0 0 0 / 5 NoLi Ting Former Independent Director Female 42 2014-05-12 2017-09-11 0 0 0 / 5 NoZhang Yuhe Former Chairman of the Board of Supervisors Male 62 2014-05-12 2017-09-11 0 0 0 / 7.98 NoZhao Mingfang Former Supervisor Male 50 2014-05-12 2017-09-11 0 0 0 / 0 YesLong Xia Former Supervisor Female 47 2014-05-12 2017-09-11 0 0 0 / 0 YesLv Jiangmin Former Supervisor Female 54 2014-05-12 2017-09-11 0 0 0 / 0 NoXu Yan Former Supervisor Female 52 2015-04-22 2017-09-11 0 0 0 / 20.64 NoLi Zhongliang Former Deputy General Manager Male 52 2014-05-12 2017-09-11 0 0 0 / 22.31 NoMo Chunlei Former Deputy General Manager Male 51 2014-05-12 2017-09-11 0 0 0 / 20.66 NoXie Qiang Former Deputy General Manager Male 55 2014-05-12 2017-09-11 0 0 0 / 20.98 NoZhao Yonggang Former Deputy General Manager Male 54 2014-05-12 2017-09-11 0 0 0 / 20.89 NoLi Ruofan Former Board Secretary Male 42 2014-04-20 2017-09-11 0 0 0 / 20.14 NoZhang Bo Former Chief Accountant Male 43 2014-04-20 2017-09-11 0 0 0 / 16.87 NoAn Zhonghong Former Chief Economist Female 51 2016-04-27 2017-09-11 0 0 0 / 17.89 NoTotal / / / / / 5,411 5,411 / / 1,152.71 /
SECTION 7.DIRECTORS, SUPERVISORS, SENIOR EXECUTIVES AND EMPLOYEES

2017 ANNUAL REPORT 59
I. Shareholding Changes and Remuneration
(1). Shareholding Changes and Remuneration of Directors, Supervisors and Senior Executives in Service or Leaving the Company during the Reporting Period Unit: Share
Name Position (note) Gender Age Start of term End of term Shares held at beginning of the year
Shares held at end of the year
Share change in the year
Reason for change
Remuneration from the Company in reporting period (before tax) (RMB 10,000)
Remuneration from related parties in reporting period
Pan Xueping Chairman Male 54 2017-09-11 2020-09-10 0 0 0 / 27.62 YesStefan Kross Director Male 62 2017-09-11 2020-09-10 0 0 0 / 27.62 No
Clement WoonDirector
Male 582017-09-11 2020-09-10
0 0 0 /0
NoCEO 2017-09-11 / 234.16
Chen Jieping Independent Director Male 64 2017-09-11 2020-09-10 0 0 0 / 27.62 NoXie Manlin Independent Director Male 54 2017-09-11 2020-09-10 0 0 0 / 27.62 NoZhang Yueping Chairman of the Board of Supervisors Male 47 2017-09-11 2020-09-10 0 0 0 / 15.34 YesJin Hao Supervisor Male 42 2017-09-11 2020-09-10 0 0 0 / 15.34 YesPei Guoqing Employee Supervisor Male 50 2017-09-11 2020-09-10 0 0 0 / 18.95 NoGuan Ye Chief Operating Officer Male 47 2017-09-11 / 0 0 0 / 143.63 No
Zeng ZhengpingSecretary to Board of Directors
Male 552017-09-11 /
0 0 0 /158.17 No
Chief Finance Officer 2017-09-11 2017-11-29 0 NoLu Yimin Chief Financial Officer Female 44 2017-11-29 / 0 0 0 / 33.33 NoPeter Moser Chief Human Resources Officer Male 56 2017-09-11 / 0 0 0 / 195.56 NoLiu Jun Former Chairman Male 61 2014-05-12 2017-09-11 5,411 5,411 0 / 38.22 NoYi Yongqin Former Director Male 50 2014-05-12 2017-06-20 0 0 0 / 0 YesLi Zhijun Former Director Male 64 2014-05-11 2017-09-11 0 0 0 / 0 YesYin Weige Former Director Male 57 2014-05-12 2017-09-11 0 0 0 / 0 YesLan Jianxin Former Director Male 57 2014-05-12 2017-09-11 0 0 0 / 0 YesWang Changhui Former Director Male 40 2017-07-12 2017-09-11 0 0 0 / 0 Yes
Wu TaoFormer Director
Male 482017-07-12 2017-09-11
0 0 0 / 6.17No
Former General Manager 2017-05-26 2017-09-11 NoWang Xin’an Former Independent Director Male 54 2014-05-12 2017-09-11 0 0 0 / 5 NoZhan Lei Former Independent Director Male 51 2014-05-12 2017-09-11 0 0 0 / 5 NoLi Ting Former Independent Director Female 42 2014-05-12 2017-09-11 0 0 0 / 5 NoZhang Yuhe Former Chairman of the Board of Supervisors Male 62 2014-05-12 2017-09-11 0 0 0 / 7.98 NoZhao Mingfang Former Supervisor Male 50 2014-05-12 2017-09-11 0 0 0 / 0 YesLong Xia Former Supervisor Female 47 2014-05-12 2017-09-11 0 0 0 / 0 YesLv Jiangmin Former Supervisor Female 54 2014-05-12 2017-09-11 0 0 0 / 0 NoXu Yan Former Supervisor Female 52 2015-04-22 2017-09-11 0 0 0 / 20.64 NoLi Zhongliang Former Deputy General Manager Male 52 2014-05-12 2017-09-11 0 0 0 / 22.31 NoMo Chunlei Former Deputy General Manager Male 51 2014-05-12 2017-09-11 0 0 0 / 20.66 NoXie Qiang Former Deputy General Manager Male 55 2014-05-12 2017-09-11 0 0 0 / 20.98 NoZhao Yonggang Former Deputy General Manager Male 54 2014-05-12 2017-09-11 0 0 0 / 20.89 NoLi Ruofan Former Board Secretary Male 42 2014-04-20 2017-09-11 0 0 0 / 20.14 NoZhang Bo Former Chief Accountant Male 43 2014-04-20 2017-09-11 0 0 0 / 16.87 NoAn Zhonghong Former Chief Economist Female 51 2016-04-27 2017-09-11 0 0 0 / 17.89 NoTotal / / / / / 5,411 5,411 / / 1,152.71 /
SECTION 7.DIRECTORS, SUPERVISORS, SENIOR EXECUTIVES AND EMPLOYEES

60 2017 ANNUAL REPORT
Name Main work experiencePan Xueping Chairman of the Company, and Chairman and Chief Executive Officer of Jiangsu Jinsheng Industry Co., Ltd. Mr Pan also serves as Vice-President of
the China Textile Machinery Association, China Textile Engineering Society, China Textile Enterprise Association and Changzhou General Chamber of Commerce. Before founding Jiangsu Jinsheng Industry, Mr Pan worked as General Manager of Steel Manufacturing Co., Ltd. (part of Pacific Group's Shanghai Textile Machinery Plant), Director and Secretary of the Party Committee of Jiangsu Jintan Textile Machinery Factory, Director and Secretary of the Party Committee of Jintan Huajin Machinery Factory and Chief Executive Officer of the Pre-spinning Division of Saurer in Switzerland.
Stefan Kross Director of the Company. Mr Kross was formerly Chief Operating Officer of Volkmann GmbH & Co KG, member of the Board of W. Schlafhorst AG & Co., Chief Technology Officer of Spinning Solutions for Saurer GmbH & Co KG, Chief Executive Officer of Oerlikon Barmag, Chief Executive Officer of the Oerlikon Manmade Fibres Segment and a member of the Oerlikon Executive Committee.
Clement Woon Director and Chief Executive Officer of the Company. Mr Woon previously worked at Oerlikon (Switzerland), SATS Ltd (Singapore) and Hexagon Metrol-ogy AB (Switzerland). He formerly served as Chief Executive Officer of the Oerlikon textile machinery business, President and Chief Executive Officer of SATS Ltd and President of the geodetic surveying business of Leica Geosystems AG.
Chen Jieping Independent Director of the Company. Mr Chen is also a Professor of Accounting at China Europe International Business School (CEIBS) and an Inde-pendent Non-executive Director of Shenzhen World Union Properties Consultancy Incorporated, Jinmao (China) Hotel Investments and Management Limited, HJ Capital (International) Holdings Company Limited and Shanghai La Chapelle Fashion Co., Ltd. When working at CEIBS, Mr Chen was the Deputy Dean of CEIBS and Director of the EMBA course. Before joining CEIBS, he had 13 years of coaching experience at the City University of Hong Kong, serving as a Tenured Professor and Head of the Accounting Department of the university.
Xie Manlin Independent Director of the Company. Mr Xie is also the Director of the Jiangsu Xie Manlin Law Firm, Independent Director of Jiangsu NandaSoft Tech-nology Company Limited and Nanjing Putian Telecommunications Co., Ltd, Legal Adviser to the Jiangsu Provincial People’s Government and Nanjing Municipal People’s Government and Chief Supervisor of the Nanjing Bar Association. Mr Xie was previously a lawyer at Nanjing Secondary Law Firm and Nanjing Jinling Law Firm, and an Independent Director of the Bank of Nanjing Co., Ltd.
Zhang Yueping Chairman of the Board of Supervisors of the Company. Mr Zhang is also the Co-Chief Executive Officer and President of Jiangsu Jinsheng Industry Co., Ltd. Mr Zhang previously worked as Deputy General Manager and Executive Deputy General Manager of Jiangsu Jinsheng Industry, Executive Deputy General Manager of Saurer (Jintan), and Technical Director and Executive Deputy Director of Jintan Textile Machinery General Plant. Mr Zhang has extensive experience in both R&D and management. Before joining Jinsheng, he worked for the Jintan Diesel Engine plant under Changzhou Diesel Engine Group and was in charge of the design of processes and special process equipment, factory technical upgrading and technical manage-ment.
Jin Hao Supervisor of the Company and Vice-President and Chief Legal Officer of Jiangsu Jinsheng Industry Co., Ltd. Mr Jin has worked as a lawyer in a number of well-known Chinese and foreign law firms.
Pei Guoqing Employee Supervisor of the Company. Mr Pei concurrently serves as Deputy General Manager of Saurer (Changzhou) Textile Machinery Co., Ltd. Mr Pei previously worked at Jintan Textile Machinery General Plant, Jiangsu Province, and Jiangsu Jinsheng Industry Co., Ltd.
Guan Ye Chief Operating Officer of the Company. Mr Guan once worked in internationally renowned companies such as the US company Ingersoll Rand, TI Automotive and P&G, serving as President of Ingersoll-Rand Fu Hsing Holdings., Ltd, Director of Asia Pacific Operations for Ingersoll Rand Industrial Technologies and Ingersoll Rand Security Technologies, two divisions of Ingersoll Rand, and Vice-President of TI Automotive’s China business.
Zeng Zhengping Secretary of the Board of Directors of the Company. Mr Zeng used to be Chief Financial Officer of ZF (China) Investment Co., Ltd. Lu Yimin Chief Financial Officer of the Company. Ms Lu previously worked at Jiangsu Jinsheng Industry Co., Ltd, where she was Vice-President of the company
and Chief Financial Officer of the Overseas Segment. She also worked for PwC China and PwC USA, holding the posts of M&A Consulting Director, Senior Manager and Manager.
Peter Moser Chief Human Resources Officer of the Company. Peter Moser formerly worked as Senior Vice President Human Resources for Leica Geosystems (Switzerland). Prior to joining Saurer he served as Executive Vice-President of Human Resources at Swissport International Ltd. (Switzerland)
Note: The Company completed its major asset restructuring and asset purchase via share issuance in September 2017. During the same month, the re-election of the Board of Direc-tors and the replacement of Senior Executives was completed as well.
SECTION 7.DIRECTORS, SUPERVISORS, SENIOR EXECUTIVES AND EMPLOYEES

2017 ANNUAL REPORT 61
II. Employment of Directors, Supervisors and Senior Executives in Service or Leaving the Company During the Reporting Period
(1). Posts in the Shareholding Company
Name Name of shareholding company Post held Start of term End of termPan Xueping Jiangsu Jinsheng Industry Co., Ltd Chairman and Chief Executive Officer 2000-12 /Zhang Yueping Jiangsu Jinsheng Industry Co., Ltd Director and Deputy General Manager 2000-12 /Jin Hao Jiangsu Jinsheng Industry Co., Ltd Supervisor, Vice President, Chief Legal Officer 2013-3 /Pei Guoqing Jiangsu Jinsheng Industry Co., Ltd Supervisor 2000-12 /Lu Yimin Jiangsu Jinsheng Industry Co., Ltd Vice President and Chief Financial Officer of Overseas Segment 2014-9 2017-11-28
(2). Posts in Other Entities
Name Name of other entities Post held Start of term End of termPan Xueping Xinjiang Litai Silk Road Investment Co., Ltd Chairman 2015-4 /Pan Xueping Kuitun Litai Silk Road Investment Co., Ltd Chairman 2015-5 /Pan Xueping Litai Xingshi (Taicang) Holding Co., Ltd Chairman 2015-3 /Pan Xueping Jiangsu Jintan Zhonghe Investment Co., Ltd Deputy Chairman 2015-1 /Pan Xueping Taicang Litai Textile Factory Co., Ltd Chairman 2008-6 /Pan Xueping EMAG (China) Machinery Co., Ltd Chairman 2010-11 /Pan Xueping Jiangsu Weier Technology Co., Ltd Chairman 2006-3 /Pan Xueping Litai Silk Road Holding Co., Ltd Chairman 2015-3 /Pan Xueping Heberlein Ceramic Materials Co., Ltd Executive Director 2015-1 /Pan Xueping Jiangsu Changjin Investment Co., Ltd Chairman and General Manager 2009-10 /Pan Xueping JIangsu Jinsheng Automobile Air Conditioner Pipe Parts Co., Ltd Executive Director 2003-4 /Pan Xueping Jiangsu Jinsheng Asset Management Co., Ltd Executive Director 2015-10 /Pan Xueping Changzhou Jintan Changsheng Investment Co., Ltd Chairman 2017-11 /Pan Xueping KOEPFER (Changzhou) Transmission Technology Co., Ltd Chairman 2013-11 /Pan Xueping KOEPFER (Jintan) Transmission Technology Co., Ltd Chairman 2013-11 /Pan Xueping Xinjiang Jinsheng Enterprise Management Co., Ltd Executive Director 2017-4 /Pan Xueping Shanghai Shenglun Enterprise Management Co., Ltd Executive Director 2018-2 /Zhang Yueping Xinjiang Litai Silk Road Investment Co., Ltd Director 2015-4 /Zhang Yueping Jiangnan Financial Leasing Co., Ltd Supervisor 2015-5 /Zhang Yueping Litai Xingshi (Taicang) Holding Co., Ltd Director 2015-3 /Zhang Yueping EMAG (China) Machinery Co., Ltd Director 2010-11 /Zhang Yueping Taicang Litai Textile Factory Co., Ltd Deputy Chairman 2008-6 /Zhang Yueping Kuitun Litai Silk Road Investment Co., Ltd Director 2015-5 /Zhang Yueping Jiangsu Jintan Zhonghe Investment Co., Ltd Chairman of the Board of Supervisors 2015-1 /Zhang Yueping Jintan Huamao Jinsheng Technology Development Co., Ltd Chairman and General Manager 2010-10 /Zhang Yueping Jiangsu Well Biotech Co., Ltd Chairman and General Manager 2010-9 /Zhang Yueping KOEPFER (Changzhou) Transmission Technology Co., Ltd Director 2013-11 /Zhang Yueping Taicang Litai Textile Technology Co., Ltd Executive Director 2014-5 /Zhang Yueping Litai Silk Road Holding Co., Ltd Director 2015-3 /Zhang Yueping Changzhou Jintan Changsheng Investment Co., Ltd Director 2017-11 /Zhang Yueping Jiangsu Fine Work Auto Parts Co., Ltd Director 2006-12 /Zhang Yueping Jiangsu Changjin Investment Co., Ltd Director 2009-10 /Zhang Yueping Jiangsu Weier Technology Co., Ltd Director 2006-3 /Zhang Yueping Xinjiang Jinsheng Enterprise Management Co., Ltd General Manager 2017-4 /Zhang Yueping Jiangsu Jinsheng International Industries Co., Ltd Executive Director 2017-6 /Zhang Yueping KOEPFER (Jintan) Transmission Technology Co., Ltd Director 2013-11 /
SECTION 7.DIRECTORS, SUPERVISORS, SENIOR EXECUTIVES AND EMPLOYEES

62 2017 ANNUAL REPORT
Name Name of other entities Post held Start of term End of termJin Hao Xinjiang Litai Silk Road Investment Co., Ltd Supervisor 2015-4 /Jin Hao Litai Xingshi (Taicang) Holding Co., Ltd Supervisor 2015-3 /Jin Hao Kuitun Litai Silk Road Investment Co., Ltd Supervisor 2015-5 /Jin Hao Jiangsu Jinsheng Asset Management Co., Ltd Supervisor 2015-10 /Jin Hao Litai Silk Road Holding Co., Ltd Supervisor 2015-3 /Jin Hao Heberlein Ceramic Materials Co., Ltd Supervisor 2015-1 /Jin Hao Xinjiang Jinsheng Enterprise Management Co., Ltd Supervisor 2017-4 /Jin Hao Jiangsu Jinsheng International Industries Co., Ltd Supervisor 2017-6 /Pei Guoqing Jiangsu Fine Work Auto Parts Co., Ltd Supervisor 2006-12 /Pei Guoqing Jiangsu Weier Technology Co., Ltd Supervisor 2006-3 /Chen Jieping Shanghai La Chapelle Fashion Co., Ltd Independent Non-executive Director 2017-5-12 2020-5-11Chen Jieping Shenzhen WorldUnion Properties Consultancy Incorporated Independent Non-executive Director 2013-9-12 2019-9-7Chen Jieping HJ Capital (International) Holdings Company Limited (formerly iOne Holdings
Limited)Independent Non-executive Director 2014-7-21 2020-7-20
Chen Jieping Jinmao (China) Hotel Investments and Management Limited Independent Non-executive Director 2014-3-25 2020-4-24Xie Manlin Jiangsu Xie Manlin Law Firm Director of Law Firm 1994-12 /Xie Manlin Nanjing Putian Telecommunications Co., Ltd Independent Director 2017-8-23 2020-8-23Xie Manlin Jiangsu NandaSoft Technology Company Limited Independent Director 2011-6-10 2020-12-29
III. Annual Remuneration of the Directors, Supervisors and Senior Executives
Decision-making procedure The annual payable remuneration of Directors, Supervisors and Senior Executives is proposed by the Remuneration and Nomination Committee and submitted to the Board of Directors for approval. The remuneration of Directors, Supervisors and Senior Executives shall also be examined and approved by the AGM if it’s within AGM’s approval scope.
Basis Members of the 9th Board of Directors receive a Director’s allowance from the Company. However, if a Non-independent Director holds a position in the Company, he will receive remuneration according to his post and will not be granted an additional allowance. Members of the 9th Board of Supervisors receive a Supervisor’s allowance from the Company. However, if a Supervisor holds a position in the Company, he will receive remuneration according to his post and will not be granted an additional allowance. Senior Executives of the Company receive remuneration according to the related personnel regulations for their posts, and the remuneration is composed of the base pay plus performance bonus.
Remuneration payable For details, please refer to “Shareholding Changes and Remuneration of Directors, Supervisors and Senior Executives in Service or Leaving the Company During the Reporting Period”
Total remuneration actually received by the Directors, Supervi-sors and Senior Executives by the end of reporting period
RMB 11.5271 million (before tax)
SECTION 7.DIRECTORS, SUPERVISORS, SENIOR EXECUTIVES AND EMPLOYEES

2017 ANNUAL REPORT 63
IV. Change in Directors, Superiors and Senior Executives
Name Position Change Reason of changePan Xueping Chairman Elected RestructuringClement Woon Director Elected RestructuringStefan Kross Director Elected RestructuringChen Jieping Independent Director Elected RestructuringXie Manlin Independent Director Elected RestructuringZhang Yueping Chairman of the Board of Supervisors Elected RestructuringJin Hao Supervisor Elected RestructuringPei Guoqing Supervisor Elected RestructuringClement Woon CEO Hired RestructuringGuan Ye Chief Operating Officer Hired RestructuringZeng Zhengping Chief Financial Officer and Secretary of the Board Hired RestructuringZeng Zhengping Chief Financial Officer Left office Operating needs of the CompanyPeter Moser Chief Human Resources Officer Hired RestructuringLu Yimin Chief Financial Officer Hired Operating needs of the CompanyWu Tao Former General Manager Hired Operating needs of the CompanyWu Tao Former Director Elected Operating needs of the CompanyWang Changhui Former Director Elected Operating needs of the CompanyLiu Jun Former Chairman Left office RestructuringYi Yongqin Former Director Left office Resigned from the postLi Zhijun Former Director Left office RestructuringYin Weige Former Director Left office RestructuringLan Jianxin Former Director Left office RestructuringWu Tao Former Director Left office RestructuringWang Changhui Former Director Left office RestructuringWang Xin’an Former Independent Director Left office RestructuringZhan Lei Former Independent Director Left office RestructuringLi Ting Former Independent Director Left office RestructuringZhang Yuhe Former Chairman of the Board of Supervisors Left office RestructuringZhao Mingfang Former Supervisor Left office RestructuringLong Xia Former Supervisor Left office RestructuringLv Jiangmin Former Supervisor Left office RestructuringXu Yan Former Supervisor Left office RestructuringWu Tao Former General Manager Left office RestructuringLi Zhongliang Former Deputy General Manager, former Chief Engineer Left office RestructuringMo Chunlei Former Deputy General Manager Left office RestructuringXie Qiang Former Deputy General Manager Left office RestructuringZhao Yonggang Former Deputy General Manager Left office RestructuringLi Ruofan Former Board Secretary Left office RestructuringZhang Bo Former Chief Accountant Left office RestructuringAn Zhonghong Former Chief Economist Left office Restructuring
SECTION 7.DIRECTORS, SUPERVISORS, SENIOR EXECUTIVES AND EMPLOYEES

64 2017 ANNUAL REPORT
V. Profile of Employees of the Parent Company and Major Subsidiaries
(1). Employees
Number of employees in service in the parent company 13Number of employees in service in the main subsidiaries 4,471Total number of employees in service 4,484Number of retired employees to be covered by the parent company and main subsidiaries
0
Professional composition
Category of professional composition Number of professionalsProduction personnel 1,917Procurement personnel 148Warehousing and logistics personnel 295Quality personnel 213Customer service personnel 628Sales personnel 457R&D personnel 416Administrative personnel 410Total 4,484
Educational background
Category of educational background Number (people)Master’s degree or above 452Bachelor’s degree 742Other education below university level 3,290Total 4,484
Note: The number of employees does not include outsourced workers.
(2). Compensation PolicySaurer provides employees with market-competitive compensation and social benefits. The Company awards annual performance bonuses based both on individual performance and that of the Company. For employees achieving an outstanding performance, the Company offers promotion as well as salary adjustments. At the same time, the Company also pro-vides long-term incentives for employees. In Europe, for example, in addition to contribu-tions made for statutory pension schemes, the Company funds additional pension plans based on local labour market regulations. It also strives to motivate employees in a number of different ways, including developing strategies for employee retention and profit sharing.
SECTION 7.DIRECTORS, SUPERVISORS, SENIOR EXECUTIVES AND EMPLOYEES

2017 ANNUAL REPORT 65
(3). Training Scheme
1. Saurer has set up a training system to help employees acquire new knowledge and skills and to grow their careers. In addition to a multichannel strategy to facilitate employee communication, the Company has established training and succession plans based on identification of internal key talent and has put career development programmes in place.
2. The Company has improved its training system for new employees. Newly recruited employees are given instruction and training by experienced staff. Instruction includes on-the-job training, technical skills training, and appraisal and evaluation. The Compa-ny also makes arrangements for employees to participate in a wide range of industrial management training opportunities, and technical exchange meetings are held regularly to encourage employees to expand their contacts in the industry while enhancing their business skills. These events raise employees’ awareness of the needs of both the industry and the Company.
3. The Company has set up professional training programmes based on the identifica-tion of internal key talent in collaboration with globally reputed institutions such as SinaLingua, Metaplan and the China Europe International Business School. The Company has also established training courses in leadership, strategic planning and organizational capacity building to help key employees better manage their teams and to cultivate personnel with management potential. To foster development of mid-level employees, Saurer has organized international management training programmes focus-ing on project management and working across cultures. The Company has also set up a series of training courses for new managers focused on encouraging leadership and collaborative skills.
(4). Labour Outsourcing
Total working hours of labour outsourcing 1,993,536Total remuneration paid for labour outsourcing RMB 153,379,080
SECTION 7.DIRECTORS, SUPERVISORS, SENIOR EXECUTIVES AND EMPLOYEES

66 2017 ANNUAL REPORT
I. Corporate Governance
(1). Corporate GovernanceDuring the reporting period, the Company formulated the Articles of Association and other rules and regulations based on the actual situation of the Company. These measures improved the corpo-rate governance structure and standardized operations in strict accordance with the Company Law and Securities Law, the Code of Corporate Governance for Listed Companies and the Rules Governing the Listing of Stocks on Shanghai Stock Exchange. The Shareholders' General Meeting, the Board of Directors, the Board of Supervisors, the Special Committees of the Board of Directors and the Senior Executives of the Company did their part in accord-ance with the law to safeguard the interests of investors and the Company. Corporate governance is in line with the requirements of the Code of Corporate Governance for Listed Companies and other relevant regulations.
1. Shareholders and Shareholders’ General Meetings During the reporting period, the Company convened and held
shareholders’ meetings in strict accordance with the relevant laws and regulations, the Articles of Association and the Rules of Procedure of the Shareholders' General Meeting. Matters given careful consideration included voting procedures, the equal treatment of all investors, effective protection of the legitimate rights and interests of small and medium-sized shareholders as well as ensuring that every shareholder had the right to know and participate in company matters and exercise their voting rights in accordance with the law.
2. Controlling Shareholder and the Listed Company During the reporting period, the controlling shareholder of the
Company conscientiously performed his fiduciary duty, acted legally and compliantly, exercised his right as a shareholder at shareholders’ meetings and did not directly, or indirectly, interfere with Company business activities and decision-making beyond the Shareholders' General Meeting and of the Board of Directors.
3. Directors and the Board of Directors During the reporting period, the Company successfully com-
pleted the re-election of the Board of Directors. The number of members and composition of the Board of Directors complies with all the relevant laws and regulations and requirements of the Articles of Association. The Board of Directors carried out its work in strict accordance with all the relevant laws and regulations, the Articles of Association, the Rules of Procedure of the Board, the Work System for Independent Directors and the Implementation Details for the Special Committees of the Board of Directors. All Directors performed their duties in good faith and diligence and received related training. Independent Directors performed their duties independently to safeguard the overall interests of the Company and shareholders, and issued independent opinions on important and significant issues. The
Strategy, Audit and Remuneration and Nomination Committees under the Board of Directors fulfilled their remits, providing ade-quate protection for the scientific decision-making of the Board and reducing risks.
4. Supervisors and the Board of Supervisors During the reporting period, the Company successfully complet-
ed the re-election of the Board of Supervisors. The number of members and composition of the Board of Supervisors complied with all the relevant laws and regulations and the requirements of the Articles of Association. The Board of Supervisors carried out work in strict accordance with the relevant laws and regulations, the Articles of Association and the Rules of Procedure for the Board of Supervisors. They effectively supervised the Company’s financial operations and ensured the lawful compliance of Direc-tors and Senior Executives in the performance of their duties and acted to safeguard the overall interests of the Company and its shareholders.
5. Information Disclosure Management and Investor Relations Management
During the reporting period, the Company disclosed all infor-mation that might have had a significant impact on the pro-duction, operation and share price of the Company in a true, accurate, complete, timely and fair manner. This was done in strict accordance with the relevant laws and regulations, such as the Company Law and Securities Law, the Administrative Measures for the Disclosure of Information by Listed Companies and the Rules Governing the Listing of Stocks on Shanghai Stock Exchange. Disclosures included the provisions regarding company regulations, such as the Articles of Association, the Information Disclosure Management System, the Information Disclosure Delay and Exemption Business Management System and Investor Relations Management. These disclosures were made to ensure full Company transparency and also to warrant that all shareholders of the Company have equal access to company information. The Company attaches great importance to the management of investor relations and has strengthened its communication with investors through various channels such as the investor hotline, email, the Shanghai Stock Exchange’s e-interaction platform and investor meetings or road shows. The Company values the opinions and suggestions of investors and safeguards the legitimate rights and interests of all investors.
6. Improvements to governance systems To comply with the latest laws, regulations and requirements, as
well as the actual situation of the Company, revisions, improve-ments and additions were made to the Company governance systems during the reporting period in a timely manner. These included the Articles of Association, the Rules of Procedure of the Shareholders' General Meetings, the Rules of Procedure of the Board of Directors, and External Investment Management, Related-Party Transaction Management, Investor Relations
SECTION 8.CORPORATE GOVERNANCE REPORT

2017 ANNUAL REPORT 67
Management and an Information Disclosure Management System. These changes laid a solid foundation for the legality, compliance and orderliness of Company operations and those of the Boards of Directors and Supervisors, the Shareholder's General Meetings, information disclosure, investor relations management and other corporate governance work.
(2). Insider Information Registration ManagementDuring the reporting period, the Company was in strict compliance with the relevant laws and regulations governing insider information and the Insider Registration Management System, the registration and recording of relevant personnel involved with insider informa-tion about periodic Company reports, major asset restructuring and other relevant issues. During the reporting period, there was no occurrence of the use of insider information to buy or sell Company shares before disclosure of material and sensitive information that might have affected the Company share price. No investigations were made of the Com-pany by the regulatory authorities, and there were no requests made for any rectification during this period.
II. Extraordinary Shareholders’ General Meetings and Annual Shareholders’ General Meeting
Session Date Reference website Disclosure dateFirst EGM in 2017 23 January 2017 Website of Shanghai Stock Exchange (www.sse.com.cn),
Ad hoc 2017-00624 January 2017
Second EGM in 2017 20 March 2017 Website of Shanghai Stock Exchange (www.sse.com.cn), Ad hoc 2017-018
21 March 2017
AGM for 2016 21 April 2017 Website of Shanghai Stock Exchange (www.sse.com.cn), Ad hoc 2017-028
22 April 2017
Third EGM in 2017 12 July 2017 Website of Shanghai Stock Exchange (www.sse.com.cn), Ad hoc 2017-052
13 July 2017
Fourth EGM in 2017 21 August 2017 Website of Shanghai Stock Exchange (www.sse.com.cn), Ad hoc 2017-065
22 August 2017
Fifth EGM in 2017 11 September 2017 Website of Shanghai Stock Exchange (www.sse.com.cn), Ad hoc 2017-075
12 September 2017
Sixth EGM in 2017 27 September 2017 Website of Shanghai Stock Exchange (www.sse.com.cn), Ad hoc 2017-091
28 September 2017
Note: The Company held one AGM and six EGMs during the reporting period. All proposals submitted by the Company’s Board of Directors to the shareholders were approved at the AGM and EGMs.
SECTION 8.CORPORATE GOVERNANCE REPORT

68 2017 ANNUAL REPORT
III. Board Matters
(1). Directors’ Attendance at Board Meetings and Shareholders’ Meetings
Directorname
Independent Director
Attendance at Board meetings Attendance at share-holders’ meetings
Required number of Board meetings for the year
Attendance in person
Attendance by correspondence
Represented by proxy
Absences Two succes-sive absences
Attendances
Pan Xueping No 3 3 1 0 0 No 1Clement Woon No 3 3 1 0 0 No 0Stefan Kross No 3 3 1 0 0 No 0Chen Jieping Yes 3 3 1 0 0 No 1Xie Manlin Yes 3 3 1 0 0 No 0Liu Jun No 13 13 4 0 0 No 6Yin Weige No 13 13 4 0 0 No 6Li Zhijun No 13 13 4 0 0 No 6Lan Jianxin No 13 13 4 0 0 No 5Wang Xin’an Yes 13 13 6 0 0 No 4Zhan Lei Yes 13 13 4 0 0 No 6Li Ting Yes 13 13 6 0 0 No 5Yi Yongqin No 8 6 3 1 1 No 3Wu Tao No 4 4 0 0 0 No 2Wang Changhui No 4 4 0 0 0 No 1
Number of Board meetings held in 2017 16Including: number of on-site meetings 8Number of meetings by correspondence 5Number of on-site meetings combined with other methods of correspondence 3
IV. Important Opinions and Suggestions Put Forward by the Special Com-mittees Attached to the Board of Directors during the Reporting PeriodDuring the reporting period, the Special Committees attached to the Board of Directors performed their duties conscientiously in accordance with the provisions of their respective work rules, actively and effectively supported the Company’s standard operations and pro-moted the productive development of the Company. During the reporting period, the Spe-cial Committees raised no objections to any matters considered by the Board of Directors.
V. Establishment and Implementation of the Appraisal and Incentive Mechanisms for Senior ExecutivesDuring the Reporting Period, the Company determined the remuneration for Senior Ex-ecutives according to the existing plan, which was examined and approved by the Board of Directors. Senior Executives received their remuneration according to the relevant requirements for the positions held, and the remuneration was composed of base pay plus performance bonus. The Company appraised the performance of Senior Executives based on completion of the Company’s annual operating plan and the completion of personal work goals. All assessments were made objectively and correctly, and Company perfor-mance appraisal plans were co-implemented with the rules and regulations on incentives and penalties.
SECTION 8.CORPORATE GOVERNANCE REPORT

2017 ANNUAL REPORT 69
VI. Disclosure of Internal Control Self-Assessment ReportIn accordance with Internal Enterprise Control System and Norms and other related internal control regulations, the Board of Directors assessed the effectiveness of the Company’s internal controls in 2017. For details, please refer to the “Saurer Intelligent Technology 2017 Internal Control Evaluation Report” disclosed by the Company through the Shanghai Stock Exchange, the Securities Times, Secu-rities Daily and Shanghai Securities News on 21 April 2018.
VII. Audit Report for the Company’s Internal ControlThe Company employed PricewaterhouseCoopers to provide an audit opinion on the effectiveness of its internal control on financial reporting. According to the “Saurer Intelligent Technology 2017 Internal Control Audit Report” issued by PricewaterhouseCoop-ers, the Company maintained effective internal control on financial reporting in all material aspects in accordance with the Internal Enterprise Control System and Norms and related regulations on 31 December 2017. For details, please refer to "Saurer Intelligent Technology 2017 Internal Control Audit Report” via the Shanghai Stock Exchange, Securities Times, Securities Daily and Shanghai Securities News on 21 April 2018.
SECTION 8.CORPORATE GOVERNANCE REPORT

70 2017 ANNUAL REPORT
Linz Textil Holding AG, Linz, Austria
Founded in 1838
Number of employees 2016: 597
Turnover 2016: 113.5 million euro
Number and type of machines/Number of spindles
4 Zinser roving frames = 672 spindlesZinser FixFlow roving bobbin package transport system with CimTrack 122 Zinser compact spinning machines = 32,784 spindles22 Autoconer 6 = 660 winding units
Production 5,400 tonnes of the finest cotton yarn
Final product Linz Textil offers first-class products in the areas of textiles, weaving, technical fabrics and yarns, processing top-grade fibres using state-of-the-art spinning technology to form premium yarns.
Market and customer requirements
European spinning and weaving mills employ highly efficient automation and a very small yet highly skilled team in the minimum amount of space to produce quality that very few competi-tors can match.
“We have opted for the advantages of compact spinning for maximum raw material utilisation, and the Zinser compact spinning system makes this possible through adjustable compacting. We can thus raise the spinning limit for each raw material, permitting better utilisation of the fibre substance. With compact spinning technology from Zinser, we increase productivity by reduc-ing twist while maintaining the tenacity of the yarn. The Zinser self-cleaning compact system is the most economical solution here, because we don’t have to factor in downtime for cleaning and servicing and we attain top machine efficiency ratings.”
SOLUTIONS DRIVING CUSTOMER SUCCESS

2017 ANNUAL REPORT 71
“ With the new, highly efficient cotton spinning mill in Landeck we are one of the most competitive companies in the global market for quality yarns. We are now extremely well equipped to become even more successful in the future.” Christian Ascher, Manager Operations and Production, Spinning Mills Landeck (Linz Textil Holding AG)

72 2017 ANNUAL REPORT
Important NotesEnglish translation of Financial StatementsThe English translation is for reference only. Should there beany inconsistency between the Chinese and English versions,the Chinese version shall prevail.The English names of certain Chinese Companies represent theEnglish translation. They are used for identification purposes only asno English names have been registered.
Financial Figures/AmountsAll amounts in the report are in RMB'000 Yuan unless otherwisestated.
SECTION 9.FINANCIAL STATEMENTS AND AUDITOR'S REPORT

2017 ANNUAL REPORT 73
To the Shareholders of Saurer Intelligent Technology Co., Ltd,
OpinionWhat we have auditedWe have audited the accompanying financial statements of Saurer Intelligent Technology Co., Ltd (hereinafter “Saurer Intelligent”), which comprise:
�� the consolidated and company balance sheets as at 31 December 2017; �� the consolidated and company income statements for the year then ended;�� the consolidated and company cash flow statements for the year then ended;�� the consolidated and company statements of changes in shareholders’ equity for the year then ended; and�� notes to the financial statements.
Our opinionIn our opinion, the accompanying financial statements present fairly, in all material respects, the consolidated and company’s financial position of Saurer Intelligent as at 31 December 2017, and their financial performance and cash flows for the year then ended in accordance with the requirements of Accounting Standards for Business Enterprises (“CASs”).
Basis for Opinion We conducted our audit in accordance with China Standards on Auditing (“CSAs”). Our responsibilities under those standards are further described in the Auditor’s Responsibilities for the Audit of the Financial Statements section of our report. We believe that the audit evidence we have obtained is sufficient and appropriate to provide a basis for our opinion. We are independent of Saurer Intelligent in accordance with the Code of Ethics for Professional Accountants of the Chinese Institute of Certified Public Accountants (“CICPA Code”), and we have ful-filled our other ethical responsibilities in accordance with the CICPA Code.
Key Audit Matters Key audit matters are those matters that, in our professional judgment, were of most significance in our audit of the financial statements of the current period. These matters were addressed in the context of our audit of the financial statements as a whole, and in forming our opinion thereon, and we do not provide a separate opinion on these matters.
Auditor’s Report
PwC ZT Shen Zi (2018) No.10083
SECTION 9.FINANCIAL STATEMENTS AND AUDITOR'S REPORT

74 2017 ANNUAL REPORT
Key audit matters identified in our audit are summarised as follows:�� Impairment of goodwill and intangible assets with indefinite useful lives;�� Related party sales.
Key Audit Matter How our audit addressed the Key Audit Matter(A) Impairment of goodwill and Intangible assets with indefi-nite useful lives
Refer to note 4 (15), note 4 (16) and note 2 (29) (a) to the consolidated financial statements
The goodwill and intangible assets with indefinite useful lives (trademarks) of Saurer Intelligent Machinery Co., Ltd was rec-ognised for the acquisition of staple fibre spinning business and component business from OC Oerlikon in 2013. As at 31 December 2017, the carrying value of goodwill and trade-marks amounted to RMB 604million and RMB 836million, respectively. Their carrying values represented 4.16% and 5.75% to total assets, and 9.28% and 12.84% to net assets of Saurer Intelligent, respectively.
In carrying out the impairment assessment of goodwill and trademarks, Saurer Intelligent use discounted cash flow fore-cast (“DCF”) to determine the recoverable amount of goodwill and trademarks every year. Management assessed whether the recoverable amount of the cash generating unit (“CGU”) is lower than its carrying amount. Key assumptions adopted and judgements exercised in the preparation of the DCF mainly included revenue growth rate and discounted rate.
We focused on this area because of the significance of good-will and trademarks balances and the significant judgements and assumptions involved in determining the recoverable amount of the CGU.
In testing the impairment of goodwill and trademark, we performed the procedures as set out below:
– Understood, evaluated and tested internal process and key controls implemented by management of Saurer Intelligent for the impairment testing of goodwill and trademarks;
– Evaluated the reasonableness of financial budget prepared by management by comparing the actual financial performance of current year with the budget used in last years’ impairment test;
– Evaluated whether the methodology adopted by management to determine CGU is appropriate;
– Obtained the DCF model from management, understood and evaluated whether the methodology adopted by management is appropriate;
– Obtained key assumptions adopted and judgements exercised in preparation of the DCF model, in-cluding sales growth rate and discounting rates. In respect of the financial budget used in the model, we compared it with the actual financial performance of current year, as well as did benchmarking against industry practice and data; in respect of the sales growth rate, we compared them to the historical sales growth rate and industry data. In respect of the discount rates, we compared them to the range independently estimated by us. In addition, we performed sensitivity analysis to evaluate the reasonableness of the key assumptions and parameters adopted by management; and
– Tested the mathematical accuracy of underlying DCF calculations.
Based on the above audit procedures performed, we found the key assumptions adopted and esti-mates made by management in determining the recoverable amounts of goodwill and trademarks to be supportable based on the evidences we gathered.
(B) Related party sales
Refer to note 2 (23) and note 8 (4) (b) to the consolidated financial statements
In 2017, the total sales of Saurer Intelligent to its related par-ties, Litai Lions (Taicang) Holdings Co., Ltd and its subsidiar-ies (collectively known as “Litai Lions”) amounted to RMB 820 million, accounting for 9.41% of Saurer Intelligent’s total sales of the year. Litai Lions purchased equipments from Saurer Intelligent for its own production and operation.
We focused on this area because of the significance of the amount of the related party sales from Saurer Intelligent to Litai Lions, and comparing to third party sales, related party transaction (including transaction pricing) are an audit focus area.
In auditing Saurer Intelligent's sales to Litai Lions, we performed the procedures as set out below:
– Understood, evaluated and tested the processes of related party transactions and key management internal controls;
– Reviewed the sales contracts and interviewed the management to understand and evaluate the pric-ing policy of related party transactions and its reasonableness and consistency, we also compared the sales to related party with the sales to third parties;
– Performed on-site visit to Litai Lions, inspected on the machines purchased from Saurer Intelligent in 2017 on a sample basis, understood the construction plan and progress of Litai Lions’ plants, and compared its demand of machines and the installation progress of those machines purchased from Saurer Intelligent;
– Conducted tests on the sales from Saurer Intelligent to Litai Lions on a sample basis, by tracing to the risk and rewards clauses in the relevant sales contracts and corresponding supporting docu-ments such as customs declaration documents, invoices, and goods-in-receipts. Tested the revenue recognized before and post year-end to ensure that the relevant sales were recorded in the correct financial period; and
– Sent confirmations to Litai Lions to confirm the amount of sales transactions in 2017 and balances as at 31 December 2017 between Saurer Intelligent and Litai Lions.
Based on the above audit procedures we performed, we found Saurer Intelligent’s revenue recognition for sales to Litai Lions is in compliance with its revenue recognition accounting policies.
SECTION 9.FINANCIAL STATEMENTS AND AUDITOR'S REPORT

2017 ANNUAL REPORT 75
Other Information Management of Saurer Intelligent is responsible for the other information. The other information comprises all of the information included in 2017 annual report of Saurer Intelligent other than the financial statements and our auditor’s report thereon.
Our opinion on the financial statements does not cover the other information and we do not express any form of assurance conclu-sion thereon.
In connection with our audit of the financial statements, our respon-sibility is to read the other information and, in doing so, consider whether the other information is materially inconsistent with the financial statements or our knowledge obtained in the audit or oth-erwise appears to be materially misstated. If, based on the work we have performed, we conclude that there is a material misstatement of this other information, we are required to report that fact. We have nothing to report in this regard.
Responsibilities of Management and The Audit Com-mittee for the Financial Statements Management of Saurer Intelligent is responsible for the preparation and fair presentation of these financial statements in accordance with the CASs, and for such internal control as management determines is necessary to enable the preparation of financial statements that are free from material misstatement, whether due to fraud or error.
In preparing these financial statements, management is respon-sible for assessing Saurer Intelligent’s ability to continue as a going concern, disclosing, as applicable, matters related to going concern and using the going concern basis of accounting unless management either intend to liquidate Saurer Intelligent or to cease operations, or have no realistic alternative but to do so.
The Audit Committee are responsible for overseeing Saurer Intelli-gent’s financial reporting process.
Auditor’s Responsibilities for the Audit of the Financial Statements Our objectives are to obtain reasonable assurance about whether these financial statements as a whole are free from material mis-statement, whether due to fraud or error, and to issue an auditor’s report that includes our opinion. Reasonable assurance is a high level of assurance, but is not a guarantee that an audit conducted in accordance with CSAs will always detect a material misstate-ment when it exists. Misstatements can arise from fraud or error and are considered material if, individually or in the aggregate, they could reasonably be expected to influence the economic decisions of users taken on the basis of these financial statements.
As part of an audit in accordance with CSAs, we exercise profes-sional judgment and maintain professional scepticism throughout the audit. We also:
�� Identify and assess the risks of material misstatement of the financial statements, whether due to fraud or error, design and perform audit procedures responsive to those risks, and obtain audit evidence that is sufficient and appropriate to provide a ba-sis for our opinion. The risk of not detecting a material misstate-ment resulting from fraud is higher than for one resulting from error, as fraud may involve collusion, forgery, intentional omis-sions, misrepresentations, or the override of internal control.
�� Obtain an understanding of internal control relevant to the audit in order to design audit procedures that are appropriate in the circumstances.
�� Evaluate the appropriateness of accounting policies used and the reasonableness of accounting estimates and related disclo-sures made by management.
�� Conclude on the appropriateness of management’s use of the going concern basis of accounting and, based on the audit evidence obtained, whether a material uncertainty exists related to events or conditions that may cast significant doubt on Saurer Intelligent’s ability to continue as a going concern. If we con-clude that a material uncertainty exists, we are required to draw attention in our auditor’s report to the related disclosures in these financial statements or, if such disclosures are inadequate, to modify our opinion. Our conclusions are based on the audit evi-dence obtained up to the date of our auditor’s report. However, future events or conditions may cause Saurer Intelligent to cease to continue as a going concern.
�� Evaluate the overall presentation, structure and content of the financial statements, including the disclosures, and whether the financial statements represent the underlying transactions and events in a manner that achieves fair presentation.
�� Obtain sufficient appropriate audit evidence regarding the financial information of the entities or business activities within the Saurer Intelligent to express an opinion on the consolidated financial statements. We are responsible for the direction, su-pervision and performance of the Group audit. We remain solely responsible for our audit opinion.
We communicate with the Audit Committee regarding, among other matters, the planned scope and timing of the audit and significant audit findings, including any significant deficiencies in internal con-trol that we identify during our audit.
SECTION 9.FINANCIAL STATEMENTS AND AUDITOR'S REPORT

76 2017 ANNUAL REPORT
Auditor’s Responsibilities for the Audit of the Financial Statements (cont’d)
We also provide the Audit Committee with a statement that we have complied with relevant ethical requirements regarding independence, and to communicate with them all relationships and other matters that may reasonably be thought to bear on our independence, and where applicable, related safeguards.
From the matters communicated with the Audit Committee, we de-termine those matters that were of most significance in the audit of the financial statements of the current period and are therefore the key audit matters. We describe these matters in our auditor’s report unless law or regulation precludes public disclosure about the matter or when, in extremely rare circumstances, we determine that a matter should not be communicated in our report because the adverse consequences of doing so would reasonably be expected to outweigh the public interest benefits of such communication.
PricewaterhouseCoopers Zhong Tian LLP Signing CPA Shanghai , the People’s Republic of China Jiang Songyi (Engagement Partner)
20 April 2018 Signing CPA Rao Shenghua
SECTION 9.FINANCIAL STATEMENTS AND AUDITOR'S REPORT

2017 ANNUAL REPORT 77
FINANCIAL STATEMENTS
CONSOLIDATED AND COMPANY BALANCE SHEETSAS AT 31 DECEMBER 2017
All amounts in RMB'000 Yuan unless otherwise stated
ASSETS Note 31 December 2017Consolidated
31 December 2016Consolidated
31 December 2017Company
31 December 2016Company
Current assetsCash at bank and on hand 4 (1), 15 (1) 2,473,431 3,103,780 1,572 693,119Financial assets at fair value through profit or loss 4 (2) 6,178 1,860 0 0Notes receivable 4 (3) 127,383 30,893 0 500Accounts receivable 4 (5), 15 (2) 2,042,921 966,126 0 3,028,724Advances to suppliers 4 (7), 15 (3) 76,265 63,643 0 33,039Interest receivable 4 (4) 8,565 24,676 0 0Dividends receivable / 0 0 0 37Other receivables 4 (6), 15 (4) 157,455 36,054 0 2,197,327Inventories 4 (8) 1,574,625 1,213,840 0 760,248Other current assets 4 (10) 4,726,641 4,710,506 0 19,837
Total current assets / 11,193,464 10,151,378 1,572 6,732,831Non-current assets
Available-for-sale financial assets 4 (11) 0 51 0 20,000Long-term receivables 4 (9) 35,240 51,127 0 1,170,042Long-term equity investments 4 (12), 15 (5) 350 1,082 10,452,842 193,910Investment property / 0 0 0 520,417Fixed assets 4 (13), 15 (6) 846,896 871,519 0 55,677Construction in progress 4 (14) 208,767 38,727 0 450Intangible assets 4 (15), 15 (7) 1,315,639 1,208,058 0 16,072Development costs 4 (15) 51,655 74,569 0 400Goodwill 4 (16) 603,812 583,884 0 0Long-term prepaid expenses 4 (17), 15 (8) 3,454 3,705 0 414Deferred tax assets 4 (18) 67,187 26,738 0 504,762Other non-current assets 4 (20) 205,308 214,405 0 85,907
Total non-current assets / 3,338,308 3,073,865 10,452,842 2,568,051TOTAL ASSETS / 14,531,772 13,225,243 10,454,414 9,300,882
SECTION 9.FINANCIAL STATEMENTS AND AUDITOR'S REPORT

78 2017 ANNUAL REPORT
LIABILITIES AND OWNERS’ EQUITY Note 31 December 2017Consolidated
31 December 2016Consolidated
31 December 2017Company
31 December 2016Company
Current liabilitiesShort-term borrowings 4 (21) 267,001 878,882 0 1,510,000Financial liabilities at fair value through profit or loss 4 (2) 7,532 1,082 0 0Notes payable / 0 0 0 104,050Accounts payable 4 (22), 15 (9) 1,492,701 823,976 0 578,655Advances from customers 4 (23), 8 (5) (b) 1,374,279 843,492 0 268,473Employee benefits payable 4 (24),15 (11) 259,705 231,278 308 12,641Taxes payable 4 (25) 255,681 118,594 33,049 19,258Interest payable 4 (26) 2,395 2,300 671 5,348Dividends payable / 0 0 0 405Other payables 4 (27), 15 (10) 330,368 228,574 827,547 901,718Current portion of non-current liabilities 4 (28) 733,286 431,448 0 1,308,250Other current liabilities / 0 0 0 1,547,847
Total current liabilities / 4,722,948 3,559,626 861,575 6,256,645Non-current liabilities
Long-term borrowings 4 (29) 2,729,389 2,356,705 0 1,159,125Provisions 4 (30) 7,770 7,385 0 0Long-term employee benefits payable 4 (31) 328,688 293,881 0 9,108Deferred tax liabilities 4 (18) 168,323 150,398 0 0Special payable / 0 0 0 59,060Deferred revenue 4 (32) 69,290 69,290 0 52,190
Total non-current liabilities / 3,303,460 2,877,659 0 1,279,483Total liabilities / 8,026,408 6,437,285 861,575 7,536,128Owners' equity
Paid-in capital 4 (33) 1,895,413 1,219,627 1,895,413 675,786Capital surplus 4 (35) (a) 0 24,022 6,857,481 552,019Other comprehensive income 4 (34) –123,388 33,250 1,534 1,534Special reserve / 0 0 1,447 1,447Surplus reserve 4 (35) (b) 48,742 0 205,662 156,920Retained earnings 4 (36) 386,267 1,253,134 631,302 377,048
Total equity attributable to equity holders of the Company
/ 2,207,034 2,530,033 9,592,839 1,764,754
Non-controlling interests / 4,298,330 4,257,925 0 0Total owners' equity / 6,505,364 6,787,958 9,592,839 1,764,754TOTAL LIABILITIES AND OWNERS' EQUITY / 14,531,772 13,225,243 10,454,414 9,300,882
The accompanying notes form an integral part of these financial statements.
Legal representative: Pan XuepingPrincipal in charge of accounting: Lu YiminHead of accounting department: Lu Yimin
SECTION 9.FINANCIAL STATEMENTS AND AUDITOR'S REPORT

2017 ANNUAL REPORT 79
CONSOLIDATED AND COMPANY INCOME STATEMENTS FOR THE YEAR ENDED 31 DECEMBER 2017
All amounts in RMB'000 Yuan unless otherwise stated
Item Note 31 December 2017Consolidated
31 December 2016Consolidated
31 December 2017Company
31 December 2016Company
1. Revenue 4 (38), 15 (12) 8,713,412 6,352,754 853,275 2,900,577Less: Cost of Sales 4 (38), 4 (43)
15 (12)–6,389,179 –4,735,487 –801,045 –2,753,685
Taxes and surcharges 4 (39) –28,947 –21,240 –40,791 –9,241Selling and distribution expenses 4 (40), 4 (43) –595,694 –444,839 –6,047 –14,058General and administrative expenses 4 (41), 4 (43) –686,425 –598,310 –154,502 –86,301Financial income - net 4 (42), 15 (13) 52,989 48,830 –114,837 –154,107Asset impairment losses 4 (46) –52,697 –32,103 –54,173 –453,147
Add: Gains/(losses) on changes in fair value 4 (44) 0 64,101 0 0Investment income/(losses) 4 (45) 11,342 –54,908 770,591 6,314Including: Shares of (losses)/income in associates and joint ventures
/ –740 –395 0 156
(Losses)/income of assets disposal 4 (48) –1,318 1,282 278 –90Other income / 0 0 0 02. Operating profit / 1,023,483 580,080 452,749 -563,738Add: Non-operating income 4 (47) 4,192 102,099 8,242 12,984Less: Non-operating expenses 4 (48) –31,290 –11,661 –1,156 –1,3863. Profit before tax / 996,385 670,518 -459,835 -552,140Less: Income tax expenses 4 (49) –246,868 –167,533 27,583 89,8184. Net profit / 749,517 502,985 487,418 -462,322Classification by business continuity
- Net income from continuing operations / 749,157 502,985 487,418 –462,322- Net income from discontinuing operations / 0 0 0 0
Classification by attribution of the ownership- Attributable to equity holders of the Company / 658,327 474,917- Non-controlling interests / 91,190 28,068
5. Other comprehensive income, net of tax 4 (34) -156,147 3,528 0 1,534Other compreshensive income attributable to equity holders of the CompanyOther comprehensive income items which will not be reclassified subsequently to profit or loss
/ 10,077 –19,587 0 1,534
- Changes in measurement of defined benefit plans assets/liabilities
/ 10,077 –19,587 0 1,534
Other comprehensive income items which will be reclassified subsequently to profit or loss
/ –166,715 22,586 0 0
- Effective part of cash flow hedges / 249 –271 0 0- Foreign currency translation difference / –166,964 22,857 0 0
Other comprehensive income attributable to non- controlling interests, net of tax
/ 491 529 0 0
6. Total comprehensive income / 593,370 506,513 487,418 -460,788- Attributable to equity holders of the Company / 501,689 477,916 0 0- Attributable to non-controlling interests / 91,681 28,597 0 0
7. Earnings per shareBasic earnings per share (in yuan) / 0.4556 0.3894 0 0Diluted earnings per share (in yuan) / 0.4556 0.3894 0 0
The accompanying notes form an integral part of these financial statements.
Legal representative: Pan XuepingPrincipal in charge of accounting: Lu YiminHead of accounting department: Lu Yimin
SECTION 9.FINANCIAL STATEMENTS AND AUDITOR'S REPORT

80 2017 ANNUAL REPORT
CONSOLIDATED AND COMPANY CASH FLOW STATEMENTFOR THE YEAR ENDED 31 DECEMBER 2017
All amounts in RMB'000 Yuan unless otherwise stated
Item Note 31 December 2017Consolidated
31 December 2016Consolidated
31 December 2017Company
31 December 2016Company
1. Cash flows from operating activitiesCash received from sales of goods or rendering of services
/ 8,560,567 8,197,139 1,621,297 3,816,449
Cash received relating to other operating activities 4 (50) (a) 15,654 110,796 98,993 120,742Sub-total of cash inflows / 8,576,221 8,307,935 1,720,290 3,937,191Cash paid for goods and services / –5,367,987 –4,181,023 –1,324,318 –3,164,977Cash paid to and on behalf of employees / –1,571,943 –1,344,039 –75,254 –96,472Payments of taxes and surcharges / –315,033 –181,398 –62,856 –184,366Cash paid relating to other operating activities 4 (50) (b) –645,101 –396,737 –127,131 –786,809Sub-total of cash outflows / –7,900,064 –6,103,197 –1,589,559 –4,232,624
Net cash flows from/(used in) operating activities 4 (51) (a), 15 (14) (a)
676,157 2,204,738 130,731 –295,433
2. Cash flows from investing activitiesCash received from restricted cash and deposit / 914,297 976,589 0 0Cash received from investment income / 0 0 1,326 6,120Net cash received from disposal of fixed assets, intangible assets and other long-term assets
/ 1,324 16,779 297 138,770
Cash received from disposal of subsidiaries and other operating units
4 (51) (c) 30,585 368,118 0 63,581
Interest received / 192,638 322,335 0 0Cash received from repayment by related parties / 0 2,780,798 0 0Cash received from repayment by third parties / 800,000 0 0 0Cash received relating to other investing activities 4 (50) (c) 9,315,396 8,568 0 0Sub-total of cash inflows / 11,254,240 4,473,187 1,623 208,471Cash paid to acquire fixed assets, intangible assets and other long-term assets
/ –396,885 –240,460 –1,244 –5,890
Cash paid to acquire investments / 0 0 –715,342 –51,000Cash paid for loans to related parties / 0 –1,808,160 0 0Cash paid for loans to third parties / –926,077 0 0 0Cash paid for restricted cash and deposit / –351,670 –892,027 0 0Cash paid relating to other investing activities 4 (50) (d) –9,250,000 –4,563,000 –601,091 –18,206Sub-total of cash outflows / –10,924,632 –7,503,647 –1,317,677 –75,096
Net cash flows from/(used in) investing activities / 329,608 –3,030,460 –1,316,054 133,375
SECTION 9.FINANCIAL STATEMENTS AND AUDITOR'S REPORT

2017 ANNUAL REPORT 81
3. Cash flows from financing activitiesCash received from capital contributions / 0 4,200,000 0 0Including: Cash received from capital contributions by non-controlling shareholders of subsidiaries
/ 0 4,200,000 0 0
Cash received from bank borrowings / 1,564,858 1,217,046 2,555,000 2,845,000Cash received from related party borrowings / 0 319,665 811,789 0Cash received from other financing acivities 4 (50) (e) 184,422 0 480,000 500,000Sub-total of cash inflows / 1,749,280 5,736,711 3,846,789 3,345,000Cash repayments of bank borrowings / –1,834,182 –2,183,361 –2,228,425 –2,659,750Cash paid for repayment of related party borrowings / 0 –603,104 0 0Dividend distributed to non-controlling interests of subsidiaries
/ –295,093 –166,917 –311,693 –231,301
Including: Dividend distributed to non-controlling interests of subsidiaries
/ 0 0 0 0
Cash paid to acquire non-controlling interests of subsidiaries
4 (37) –715,342 –55,997 0 0
Cash paid for other financing activities / 0 0 –780,000 –839,680Sub-total of cash outflows / –2,844,617 –3,009,379 –3,320,118 –3,730,731
Net cash flows from/(used in) financing activities / –1,095,337 2,727,332 526,671 –385,7314. Effect of foreign exchange rate changes on cash and cash equivalents
/ 21,850 11,833 0 0
5. Net increase/(decrease) in cash and cash equivalents
4 (51) (e), 15 (14) (c)
-67,722 1,913,443 -658,652 -547,789
Add: Cash and cash equivalents at the beginning of the year
/ 2,125,438 211,995 660,224 1,208,013
6. Cash and cash equivalents at the end of the year
4 (51) (d), 15 (14) (d)
2,057,716 2,125,438 1,572 660,224
The accompanying notes form an integral part of these financial statements.
Legal representative: Pan XuepingPrincipal in charge of accounting: Lu YiminHead of accounting department: Lu Yimin
SECTION 9.FINANCIAL STATEMENTS AND AUDITOR'S REPORT

82 2017 ANNUAL REPORT
CONSOLIDATED STATEMENT OF CHANGES IN OWNERS' EQUITY (Cont’d)FOR THE YEAR ENDED 31 DECEMBER 2017
All amounts in RMB'000 Yuan unless otherwise stated
Item Note Equity attributable to the parent company Non- controlling
interests
Total owners'
equityPaid-in capital
Capital surplus
Other compre-hensive income
Surplus reserve
Undis-tributed
profits
Balance at 1 January 2016 4 (33) 1,219,627 0 30,251 0 778,217 29,328 2,057,423Movements for the year ended 31 December 2016Comprehensive income
Net profit / 0 0 0 0 474,917 28,068 502,985Other comprehensive income 4 (34) 0 0 2,999 0 0 529 3,528
Total comprehensive income 0 0 2,999 0 474,917 28,597 506,513Capital contribution and withdrawal by owners
Capital investment of minority shareholders of subsidiaries
6 (1) (b) 0 0 0 0 0 4,200,000 4,200,000
Expenses paid by the parent company on behalf of the Group
4 (35) 0 24,022 0 0 0 0 24,022
Balance at 31 December 2016 / 1,219,627 24,022 33,250 0 1,253,134 4,257,925 6,787,958
The accompanying notes form an integral part of these financial statements.
Legal representative: Pan Xueping Principal in charge of accounting: Lu Yimin Head of accounting department: Lu Yimin
CONSOLIDATED STATEMENT OF CHANGES IN OWNERS' EQUITY (Cont’d)FOR THE YEAR ENDED 31 DECEMBER 2017
All amounts in RMB'000 Yuan unless otherwise stated
Item Note Equity attributable to the parent company Non- controlling
interests
Total owners'
equityPaid-in capital
Capital surplus
Other compre-hensive income
Surplus reserve
Undis-tributed
profits
Balance at 1 January 2017 1,219,627 24,022 33,250 0 1,253,134 4,257,925 6,787,958Movements for the year ended 31 December 2017Comprehensive income
Net profit / 0 0 0 0 658,327 91,190 749,517Other comprehensive income 4 (34) 0 0 –156,030 0 0 491 –155,539Transfer out from disposal of subsidiaries / 0 0 –608 0 0 –34,619 –35,227
Total comprehensive income / 0 0 –156,638 0 658,327 57,062 558,751Capital contribution and withdrawal by owners
The impact of restructuring deals 5 (1) 675,786 –24,022 0 0 –891,100 113,333 –126,003Purchase of non-controlling interests of subsidiaries 4 (37) 0 0 0 0 –585,352 –129,990 –715,342
Profit distributionAppropriation to surplus reserves 4 (35) (b) 0 0 0 48,742 –48,742 0 0
Balance at 31 December 2017 / 1,895,413 0 -123,388 48,742 386,267 4,298,330 6,505,364
The accompanying notes form an integral part of these financial statements.
Legal representative: Pan Xueping Principal in charge of accounting: Lu Yimin Head of accounting department: Lu Yimin
SECTION 9.FINANCIAL STATEMENTS AND AUDITOR'S REPORT

2017 ANNUAL REPORT 83
COMPANY STATEMENT OF CHANGES IN OWNERS' EQUITYFOR THE YEAR ENDED 31 DECEMBER 2017
All amounts in RMB'000 Yuan unless otherwise stated
Item Note Paid-in capital
Capital surplus
Other compre-hensive income
Special Reserve
Surplus reserve
Undis-tributed
profits
Total owners'
equity
Balance at 1 January 2016 / 675,786 551,092 0 1,556 156,920 873,159 2,258,513Movements for the year ended 31 December 2016Total comprehensive income
Net profit / 0 0 0 0 0 –462,322 –462,322Other comprehensive income / 0 0 1,534 0 0 0 1,534
Total comprehensive income / 0 0 1,534 0 0 –462,322 –460,788Profit distribution
Distribution to shareholders / 0 0 0 0 0 –33,789 –33,789Special reserve
Withdrawal in current period / 0 0 0 52,964 0 0 52,964Utilization in current period / 0 0 0 –53,073 0 0 –53,073Others / 0 927 0 0 0 0 927
Balance at 31 December 2016 / 675,786 552,019 1,534 1,447 156,920 377,048 1,764,754
Item Note Paid-in capital
Capital surplus
Other compre-hensive income
Special Reserve
Surplus reserve
Undis-tributed
profits
Total owners'
equity
Balance at 1 January 2017 / 675,786 552,019 1,534 1,447 156,920 377,048 1,764,754Movements for the year ended 31 December 2017Total comprehensive income
Net profit / 0 0 0 0 0 487,418 487,418Other comprehensive income / 0 0 0 0 0 0 0
Total comprehensive income / 0 0 0 0 0 487,418 487,418Capital contribution and withdrawal by owners
Capital contribution by owners 5 (1) 1,219,627 6,305,462 0 0 0 0 7,525,089Profit distribution
Distribution to shareholders 5 (1) 0 0 0 0 0 –184,422 –184,422Appropriate surplus reserve 4 (35) (b) 0 0 0 0 48,742 –48,742 0
Special reserveWithdrawal in current period / 0 0 0 1,109 0 0 1,109Utilization in current period / 0 0 0 –1,109 0 0 –1,109
Balance at 31 December 2017 / 1,895,413 6,857,481 1,534 1,447 205,662 631,302 9,592,839
The accompanying notes form an integral part of these financial statements.
Legal representative: Pan Xueping Principal in charge of accounting: Lu Yimin Head of accounting department: Lu Yimin
SECTION 9.FINANCIAL STATEMENTS AND AUDITOR'S REPORT

84 2017 ANNUAL REPORT
1 General informationSaurer Intelligent Technology Company Limited (formerly known as “Xinjiang City Construction (Group) Company Limited”, hereinafter “the Company”) is a limited liability company incorporated in 22nd floor, 1st Chengjian Building Urumqi City, Xinjiang Uygur Autono-mous Region of the People’s Republic of China.
With the approval from The Committee of Economic System Reform of the Xinjiang Uygur Autonomous Region regarding Article 1992 No.58 “The Approval for ‘The Request to Set Up City Construction and Development Company Limited in Urumqi City’”, the Company was set up by 6 companies or organizations including Urumqi Water Supply Company, Urumqi Municipal Con-struction Company, Urumqi Municipal Construction Department, The Office of Water Conservation in Urumqi, Urumqi Municipal Construction and Maintenance Department, and Urumqi Suburbs Road Maintenance Department, with target placement to its other legal persons and internal employees.The Company submitted its registration with Urumqi Administration for Industry and Commerce on 25 Feburary 1993, and obtained the “License of the business corporation” No.6500001000005. The registered capital was RMB 7,500,000.00. After 5 times of rights issue and 2 times of capital injection and ownership enlargement, the capital was increased to RMB 100,541,029.00 on 29 August 2000.
In 2003, with the approval from China Securities Regulatory Com-mission (CSRC) regarding the “Announcement for Public Offering of Xinjiang City Construction Company Limited” (CSRC) Issued [2003]75, the Company issued A-shares common stock amounting to 60,000,000.00 shares with face value of RMB 1.00 by fixed pric-ing to the public in secondary market. The registered total capital has increased to RMB 160,541,029.00.
In 2006, after the resolutions of second Extraordinary General Meeting (EGM) the Company decided to privately issue shares to specific investors. The plan was approved by CSRC in July 2007 in “The Announcement Regarding The Approval For Private Issuing of Shares by Xinjiang City Construction (Group) Company Limited” (CSRC Issued [2007] 177). With the private issuing of 43,000,000.00 common shares, total share capital increased to RMB 203,541,029.00.
With the resolutions of the 2007 Annual General Meeting (AGM), the Company issued 2 bonus shares for every 10 shares; and used the capital reserve to transfer 6 shares for every 10 shares. Upon accomplishing of the issuing, total share capital has increased to RMB 366,373,852.00.
In 2008, after the resolutions of the third Extraordinary General Meeting (EGM) the Company decided to privately issue shares to specific investors. The plan was approved by CSRC in “The Approval For Private Issuing of Shares by Xinjiang City Construction (Group) Company Limited” (CSRC Issued [2008]1450). With private
issuing of 84,150,000.00 common shares, total share capital increased to RMB 450,523,852.00.
With the resolutions of the 2008 AGM, the Company transferred every 10 shares of the capital surplus into 5 shares of paid-in capi-tal. Total share capital increased to RMB 675,785,778.00.
With the resolution from the 17th EGM on 28 December 2016 and the first Extraordinary General Meeting (EGM) on 23 January 2017, the approval was given for the “Proposal on the Company's major asset replacement and issuance of shares to purchase assets and the associated trading scheme”, “Draft report on the Company’s major asset replacement and issuance of shares to purchase assets and the associated trading scheme” and the “Approval of Jiangsu Jinsheng Company Limited being exempted from the offer of increase in shareholdings”, the Company went through a series of major asset restructuring, with plans as follows:
(1) Major asset replacementIn August 2017, the Company used all the assets and liabilities as at 31 August 2016 (base date of assets evaluation) excluding cash of RMB 185,000,000.00 (hereinafter “exchange-out assets”) in exchange for 95% of shareholdings held by the 17 sharehold-ers of Saurer Intelligent Machinery Company Limited (hereinaf-ter “Saurer Intelligent Machinery”) excluding Shanghai Yongyun Huachuang Equity Investment Partnership (hereinafter “Shanghai Yongyun”). In this transaction, the assets disposed were valued at RMB 2,212,400,000, and the assets acquired were valued at RMB 9,737,500,000. The above mentioned cash of RMB 185,000,000 were distributed as cash dividends to all former shareholders before the Company issued stocks and purchased assets.
(2) Undertaking of the assets disposed and transfer of sharesJiangsu Jinsheng Industry Co. Ltd (hereinafter Jinsheng Industrial) exchange parts of shares of Saurer Intelligent Machinery for the ex-change-out assets of the Company. The exchange-out assets were undertaken by the Company’s original shareholder Urumqi State-owned Asset Management Company (hereinafter “Guo-zi Compa-ny”) or the designated third party (hereinafter “Assets Receiver”). As the consideration of the exchange-out assets, Guo-zi Company transferred its 22.11% shares of the Company to Jiangsu Jinsheng Industry Co. Ltd (149,400,432 shares of RMB common share).
(3) Issue shares and purchase assetsIn August 2017, regarding the difference amounting to RMB 7,525,100,000 arising from major assets exchange mentioned above, Xinjiang City Construction issued to 17 shareholders of Saurer Intelligent Machinery, excluding Shanghai Yongyun, 1,219,627,217 common shares at face value of RMB 1.00 and at an issue price of RMB 6.17. The difference between face value and issue price amounting to RMB 6,305,472,712 was recognised as
SECTION 9.FINANCIAL STATEMENTS AND AUDITOR'S REPORT

2017 ANNUAL REPORT 85
capital reserve. Therefore, the total number of shares increased to 1,895,412,995.
In August 2017, the settlement of exchange-out assets was completed. Meanwhile the exchange of assets in the major asset replacement was completed. Therefore, 25 August 2017 was the settlement day of the major asset replacement.
With the resolutions of the 5th meeting of the 8th term of Board on 25 August 2017 and 5th EGM on 11 September 2017, Xinjiang City Construction was renamed as Saurer Intelligent Technology Company Limited.
The additional registered capital and paid-in capital arising from deals mentioned above was verified by Pricewaterhouse Coopers Zhong Tian LLP with Pricewaterhouse Coopers Zhong Tian LLP Yan Zi (2017) No. 801 capital verification report issued.
The business scope of the Company and its subsidiaries after major assets restructuring covers: production, research and development, and selling of the complete set of intelligent textile equipment; production, research and development, and selling of robot, robot system, robot application technology, and software production; design, production, research, development and sales of automated intelligence equipment; production, research and development, and selling of intelligent packaging machinery; design, production and selling of intelligent electromechanical and information product; providing the related technical consultancy service and technology service; import and export of agent products and technology.
On 29 November 2017, the Company held the third board meeting and passed the resolution regarding “Acquisition of 5% shares of Saurer Intelligent Machinery by cash”. The Company spent RMB 715,342,466 to acquire 5% shares of Saurer Intelligent Machinery held by Shanghai Yongyun. Saurer Intelligent Machinery becomes the wholly-owned subsidiary of the Company after the acquisition.
Upon completion of deals above, Jiangsu Jinsheng Industry Co. Ltd and other shareholders were holding 45.39% and 54.07% of the Company’s equity respectively.
Please refer to Note 6 (1) for relevant information on the Company’s subsidiaries.
On 31 December 2017, Jiangsu Jinsheng Industry Co. Ltd is the Company’s parent and Changzhou Jintan Changsheng Investment Company was the ultimate holding company.
The financial statements were authorised by the Company’s Board of Directors on 20 April 2018.
2 Summary of significant accounting policies and ac-counting estimatesThe specific accounting policies and accounting estimates are determined based on the production and management features of the Group, and mainly reflected in inventory valuation method (Note 2 (12)), depreciation of fixed assets and amortization of intan-gible assets (Note 2 (14), (17)), criteria for capitalisation of devel-opment expenditure (Note 2 (17)), the time for revenue recognition (Note 2 (23)), etc. The significant accounting policies listed in these financial statements are consistent with the accounting policies executed by Saurer Intelligent Machinery Co., Ltd.
Key judgements applied by the Group in determining significant accounting policies are stated in Note 2 (29). (1) Basis of preparation (a) The financial statements were prepared in accordance with
the Accounting Standard for Business Enterprises - Basic Stand-ard, and the specific accounting standards and other relevant regulations (hereafter collectively referred to as “CAS”) issued by the Ministry of Finance on 15 February 2006 and in subsequent periods and the disclosure requirements in the Preparation Con-vention of Information Disclosure by Companies Offering Securi-ties to the Public No. 15 - General Rules on Financial Reporting issued by China Securities Regulatory Commission.
The financial statements are prepared on a going concern basis.
Based on the “Announcement regarding the implementation of accounting standards 2008” and the “Reply on the accounting standards relating to the indirect listing of a private company acquiring the shareholdings of a public company” issued by The Ministry of Finance, this major asset replacement and the acqui-sition of assets by share issue is a reverse purchase outside of the Company’s scope of business, and it should be recorded as equity transaction. Therefore, the consolidated financial state-ments have been prepared according to the following account-ing principles, and please refer to details in Note 5 (1).
The Group’s consolidated financial statement is the continuation of the financial statement of the acquirer (legally the subsidiary), i.e. Saurer Intelligent Machinery, regarding the confirmation and measurement of the book value of the identifiable assets and liabilities before restructuring.
(b) All the identifiable assets and liabilities of the Company (legally the parent company) after asset replacement are recognized and measured at fair value as at the date of restructuring. The dif-ference between the cost of acquisition and the fair value of the identifiable net assets of the Company is adjusted in the capital reserve in the consolidated financial statement, not recognized as goodwill or current period profit or loss.
SECTION 9.FINANCIAL STATEMENTS AND AUDITOR'S REPORT

86 2017 ANNUAL REPORT
(c) The opening balance of the share capital in the consolidated financial statement reflects the amount issued to acquire Saurer Intelligent Machinery.
(d) Except for the opening balance of the share capital, the com-parative information in the consolidated financial statement is the comparative information of Saurer Intelligent Machinery and its subsidiaries, the consolidated financial statement of the parent company is recognized and measured at historical book value of the Company.
(2) Statement of compliance with the Accounting Standards for Business EnterprisesThe financial statements of the Company for the year ended 31 De-cember 2017 are in compliance with the Accounting Standards for Business Enterprises, and truly and completely present the financial position of the consolidated and the Company as at 31 December 2017 and their financial performance, cash flows and other informa-tion for the year ended 31 December 2017.
(3) Accounting yearThe Company’s accounting year starts on 1 January and ends on 31 December.
(4) Functional currencyThe recording currency of the Company and its domestic sub-sidiaries is Renminbi (RMB). The Company’s subordinate foreign subsidiaries, joint ventures and associates can determine their functional currencies according to the primary economic locations. Foreign currencies are translated into RMB when preparing financial statements. The financial statements are presented in RMB.
In preparing the financial statements, the Group regards RMB as its presentation currency in accordance with the translation method detailed in Note 2 (8) (b).
(5) Business combinations (a) Business combinations involving enterprises under common
control The consideration paid and net assets obtained by the absorb-
ing party in a business combination are measured at the carrying amount. If the party being absorbed is acquired from a third party in prior years by the ultimate controlling party, it is based on the book value of the assets and liabilities (including any goodwill generated from the business combination) in the consolidated fi-nancial statement of the ultimate controlling party. The difference between the carrying amount of the net assets obtained from the combination and the carrying amount of the consideration
paid for the combination is treated as an adjustment to capital surplus (share premium). If the capital surplus (share premium) is not sufficient to absorb the difference, the remaining balance is adjusted against retained earnings. Costs directly attributable to the combination are included in profit or loss in the period in which they are incurred. Transaction costs associated with the issue of equity or debt securities for the business combination are included in the initially recognised amounts of the equity or debt securities.
(b) Business combinations involving enterprises not under common control
The cost of combination and identifiable net assets obtained by the acquirer in a business combination are measured at fair value at the acquisition date. The acquirer shall recognise the positive difference between the combination cost and the fair value of the identifiable net assets it obtains from the acquiree as goodwill and recognise the negative difference in profit or loss for the current period. Costs directly attributable to the combination are included in profit or loss in the period in which they are incurred. Transaction costs associated with the issue of equity or debt se-curities for the business combination are included in the initially recognised amounts of the equity or debt securities.
(6) Preparation of consolidated financial statementsThe consolidated financial statements comprise the financial state-ments of the Company and all of its subsidiaries.
Subsidiaries are consolidated from the date on which the Group obtains control and are de-consolidated from the date that such control ceases. For a subsidiary that is acquired in a business combination involving enterprises under common control, it is in-cluded in the consolidated financial statements from the date when it, together with the Company, comes under common control of the ultimate controlling party. The portion of the net profits realised before the combination date is presented separately in the consoli-dated income statement.
In preparing the consolidated financial statements, the difference between the long-term equity investment from the acquisition of non-controlling interests from a subsidiary and the net asset share of the subsidiary continuously calculated from the date of acquisi-tion (or the consolidation date) based on the new shareholding is treated as an adjustment to owners’ equity (capital surplus). If the capital surplus is not sufficient to absorb the difference, the remain-ing balance is adjusted against retained earnings.
In preparing the consolidated financial statements, where the ac-counting policies and the accounting periods of the Company and subsidiaries are inconsistent, the financial statements of the subsid-iaries are adjusted in accordance with the accounting policies and
SECTION 9.FINANCIAL STATEMENTS AND AUDITOR'S REPORT

2017 ANNUAL REPORT 87
the accounting period of the Company. For subsidiaries acquired from business combinations involving enterprises not under com-mon control, the individual financial statements of the subsidiaries are adjusted based on the fair value of the identifiable net assets at the acquisition date.
All significant intra-group balances, transactions and unrealised profits are eliminated in the consolidated financial statements. The portion of subsidiaries’ equity and the portion of a subsidiaries’ net profits and losses and comprehensive incomes for the period not attributable to Company are recognised as minority interests and presented separately in the consolidated financial statements under equity, net profits and total comprehensive income respectively. Intra-group unrealised gains and losses due to the sales from the Company to its subsidiaries are fully offset net profit attributable to shareholders of the parent company; Unrealised profits and losses resulting from the sale of assets by a subsidiary to the Company are eliminated and allocated between net profit attributable to owners of the parent and minority interests in accordance with the alloca-tion proportion of the Company in the subsidiary. Unrealised profits and losses resulting from the sale of assets by one subsidiary to another are eliminated and allocated between net profit attributable to owners of the parent and minority interests in accordance with the allocation proportion of the parent in the subsidiary.
Under the circumstances that the Group and its subsidiaries have different accounting policy on a single identical transaction, the subsidiaries will uniform with the Group's accounting policy under consolidation basis.
(7) Cash and cash equivalentsCash and cash equivalents comprise cash on hand, deposits that can be readily drawn on demand, and short-term and highly liquid investments that are readily convertible to known amounts of cash and which are subject to an insignificant risk of changes in value.
(8) Foreign currency translation (a) Foreign currency transaction Foreign currency transactions are translated into RMB using the
approximate exchange rates of the spot exchange rate prevailing at the dates of the transactions.
At the balance sheet date, monetary items denominated in for-eign currencies are translated into RMB using the spot exchange rates on the balance sheet date; exchange differences arising from these translations are recognised in profit or loss for the current period directly, except that the exchange differences arising from specific foreign currency borrowings obtained for the acquisition or construction of an asset qualifying for capitalisa-tion. Non-monetary items denominated in foreign currencies that
are measured at historical costs are translated at the balance sheet date using the spot exchange rates at the date of the transactions. The effect of exchange rate changes on cash is presented separately in the cash flow statement.
(b) Translation of foreign currency financial statements The asset and liability items in the balance sheets for overseas
operations are translated at the spot exchange rates on the balance sheet date. Among the shareholders’ equity items, the items other than “undistributed profits” are translated at the spot exchange rates of the transaction dates. The income and expense items in the income statements of overseas operations are translated at the spot exchange rates or the approximate ex-change rates of the spot exchange rate at the transaction dates. The differences arising from the above translation are presented separately in the shareholders’ equity. The cash flows of over-seas operations are translated at the spot exchange rates on the dates of the cash flows. The effect of exchange rate changes on cash is presented separately in the cash flow statement.
(9) Financial instruments (a) Financial assets (i) Classification of financial assets Financial assets are classified into the following categories at
initial recognition: financial assets at fair value through profit or loss, receivables, available-for-sale financial assets and held-to-maturity investments. The classification of financial assets depends on the Group’s intention and ability to hold the financial assets. The Group's financial assets mainly represent financial assets at fair value through profit or loss, receivables and available-for-sale financial assets.
- Financial assets at fair value through profit or loss
Financial assets at fair value through profit or loss include financial assets held for the purpose of selling in the short term.
- Receivables Receivables are non-derivative financial assets with fixed or determinable payments that are not quoted in an active market.
- Available-for-sale financial assets Available-for-sale financial assets are non-derivative financial assets that are either designated in this category or not classified in any of the other categories at initial recognition. Available-for-sale financial assets are included in other current assets on the balance sheet if management intends to dispose of them within 12 months after the balance sheet date.
SECTION 9.FINANCIAL STATEMENTS AND AUDITOR'S REPORT

88 2017 ANNUAL REPORT
(ii) Recognition and measurement Financial assets are recognised at fair value on the balance
sheet when the Group becomes a party to the contractual provisions of the financial instrument. In the case of financial assets at fair value through profit or loss, the related transac-tion costs incurred at the time of acquisition are recognised in profit or loss for the current period. For other financial assets, transaction costs that are attributable to the acquisition of the financial assets are included in their initially recognised amounts.
Financial assets at fair value through profit or loss and avail-able-for-sale financial assets are subsequently measured at fair value. Investments in equity instruments are measured at cost when they do not have a quoted market price in an ac-tive market and whose fair value cannot be reliably measured. Receivables and held-to-maturity investments are measured at amortised cost using the effective interest method.
Gains or losses arising from change in the fair value of finan-cial assets at fair value through profit or loss are recognised in profit or loss. Interests and cash dividends received during the period in which such financial assets are held, as well as the gains or losses arising from disposal of these assets are recognised in profit or loss for the current period.
Gains or losses arising from change in fair value of availa-ble-for-sale financial assets are recognised directly in equity, except for impairment losses and foreign exchange gains and losses arising from translation of monetary financial assets. When such financial assets are derecognised, the cumulative gains or losses previously recognised directly into equity are changed into profit or loss for the current period. Interests on available-for-sale investments in debt instruments calculated using the effective interest method during the period in which such investments are held and cash dividends declared by the investee on available-for-sale investments in equity instruments are recognised as investment income, which is recognised in profit or loss for the period.
(iii) Impairment of financial assets The Group assesses the carrying amounts of financial assets
other than those at fair value through profit or loss at each balance sheet date. If there is objective evidence that a finan-cial asset is impaired, an impairment loss is provided for.
Objective evidence indicating impairment of financial assets refers to the matter that actually occurs after the initial recognition of financial assets. It will affect estimated future cash flows of financial assets, and its impact can be reliably measured.
When an impairment loss on a financial asset carried at am-ortised cost occurs, the amount of loss is provided for at the difference between the asset’s carrying amount and the pres-ent value of its estimated future cash flows (excluding future credit losses that have not been incurred). If there is objective evidence that the value of the financial asset recovered and the recovery is related objectively to an event occurring after the impairment was recognised, the previously recognised impairment loss is reversed and the amount of reversal is recognised in profit or loss.
If an impairment loss on available-for-sale financial assets measured at fair value incurs, the cumulative losses aris-ing from the decline in fair value that had been recognised directly in owners’ equity are transferred out from equity and into impairment loss. For an investment in debt instrument classified as available-for-sale on which impairment losses have been recognised, if, in a subsequent period, its fair value increases and the increase can be objectively related to an event occurring after the impairment loss was recog-nised in profit or loss, the previously recognised impairment loss is reversed into profit or loss for the current period. For an investment in an equity instrument classified as availa-ble-for-sale on which impairment losses have been recog-nised, the increase in its fair value in a subsequent period is recognised directly in equity.
If an impairment loss on an available-for-sale financial asset measured at cost incurs, the amount of loss is measured at the difference between the asset’s carrying amount and the present value of estimated future cash flows discounted at the current market rate of return for a similar financial asset, and is recognised in profit or loss for the current period. The previously recognised impairment loss will not be reversed in subsequent periods.
(iv) Derecognition of financial assets A financial asset is derecognised when any of the following
criteria is met: (1) the contractual rights to receive the cash flows from the financial asset expire; (2) the financial asset has been transferred and the Group transfers substantially all the risks and rewards of ownership of the financial asset to the transferee; or (3) the financial asset has been transferred and the Group has not retained control of the financial asset, although the Group neither transfers nor retains substantially all the risks and rewards of ownership of the financial asset.
On derecognition of a financial asset, the difference be-tween the carrying amount and the sum of the consideration received and the cumulative changes in fair value that had been recognised directly in equity, is recognised in profit or loss.
SECTION 9.FINANCIAL STATEMENTS AND AUDITOR'S REPORT

2017 ANNUAL REPORT 89
(b) Financial liabilities Financial liabilities are classified into two categories at initial
recognition: financial liabilities at fair value through profit or loss and other financial liabilities. Financial liabilities at fair value through profit or loss mainly include derivative financial instru-ment liabilities which are presented as “financial liabilities held for trading” in the balance sheet. The financial liabilities of the Group mainly comprise other financial liabilities, including payables, borrowings.
Payables comprise accounts payables and other payables and are recognised at fair value at initial recognition. Payables are measured at amortised cost using the effective interest method.
Borrowings are recognised initially at fair value, net of transaction costs incurred, and subsequently measured at amortised cost using the effective interest method.
Other financial liabilities with an initial maturity period of less than one year (including one year) are classified as current liabilities; those with an initial maturity period of over one year which will be due within one year (including one year) at the balance sheet date are classified as current portion of non-current liabilities; and the others are classified as non-current liabilities.
A financial liability (or a part of a financial liability) is derecognised when all or part of the obligation is extinguished. The difference between the carrying amount of a financial liability (or part of a financial liability) extinguished and the consideration paid, shall be recognised in profit or loss.
(c) Determination of fair value of financial instruments The fair value of a financial instrument that is traded in an active
market is determined at the quoted price in the active market. The fair value of a financial instrument that is not traded in an active market is determined by using a valuation technique. The Group adopts the most appropriate valuation technique for the situation that have enough available data and other information supports and selects assets or liabilities inputs with consistent characteristics as other market participants in related transac-tions. Observable inputs are preferred. In the case that relevant observable inputs cannot be obtained or are not feasible to procure in the situation, unobservable inputs are applied.
(10) Hedging instrumentsHedging instruments represent derivative instruments designated by the Group for hedging to avoid foreign exchange risk and inter-est rate risk, the changes in the fair value or cash flows of which are expected to offset the changes in the fair value or cash flows of hedged items. Hedging instruments of the Group comprise fair val-ue hedges and cash flow hedges. When hedging instruments meet the following criteria, the Group applies hedge accounting:
(i) At the inception of the transaction, the Group officially designates the hedging relations between hedging instruments and hedged items; and also documents the hedging relations, risk management objectives and hedging strategies; (ii) The hedging expectation is highly effective and is in compliance with the risk management strategy designated initially for the hedging relation by the Group; (iii) The cash flow hedge is applied when the hedged item is highly probable, and the risk of changes on cash flow will finally impact the Group's income statement; (iv) The effectiveness of the hedge can be reliably measured; (v) The Group is able to make contin-uous assessment of the effectiveness of the hedge and ensures the hedging is highly effective in the designated term of hedging relations.
For fair value hedges meeting the above conditions, the gains or losses arising from changes in the fair value of hedging instruments and hedged items are recognised in profit or loss for the current period.
For cash flow hedges meeting the above conditions, the effec-tive hedge of the hedging gains or losses is recognised in other comprehensive income and the ineffective part is recognised in profit or loss for the current period. For hedged items representing expected transactions which made the Company subsequently recognise a financial asset or financial liability, gains or losses orig-inally recognised as other comprehensive income are transferred out in the same period when the financial asset or financial liability impacts the profit or loss of the Group, and recorded in profit or loss for the current period. For hedged items representing expect-ed transactions which made the Group subsequently recognise a non-financial asset or non-financial liability, gains or losses originally recognised as other comprehensive income are transferred out in the same period when the non-financial asset or non-financial liabil-ity impacts the profit or loss of the Group, and recorded in profit or loss for the current period.
(11) ReceivablesReceivables comprise accounts receivable other receivables and notes receivable. Accounts receivable arising from sales of goods or rendering of services are initially recognised at fair value of the contractual payments from the buyers or service recipients. (a) Accounts receivable (i) Accounts receivable with amounts that are individually
significant and subject to provision for bad debts on the individual basis
Accounts receivable with amounts that are individually signif-icant are subject to separate assessment for impairment. If there exists objective evidence that the Group will not be able to collect the amount under the original terms, a provision for bad debts of that account receivable is made.
SECTION 9.FINANCIAL STATEMENTS AND AUDITOR'S REPORT

90 2017 ANNUAL REPORT
The criteria for amount that is individually significant: the individual amount exceeds RMB 6 million.
The method of making provision for bad debts for those individually significant amounts is as follows: the provision is determined based on the negative difference between the present value of the future cash flows expected to be derived from the account receivable and its carrying amount.
(ii) Accounts receivable that are subject to provision for bad debts on the grouping basis
Accounts receivable with amounts that are not individually significant and those accounts receivable that have been individually assessed for impairment and have not been found impaired are classified into certain groupings based on their credit risk characteristics. The provision for bad debts is determined based on the historical loss experience for the groupings of receivables with similar credit risk characteris-tics, taking into consideration of the current circumstances.
The basis for determining the groupings: Grouping 1 Accounts receivable from related parties Grouping 2 Accounts receivable from non-related
parties that are overdue but with no impairment risk
Grouping 3 Other accounts receivable from non-re-lated parties
Bank Acceptance Banks with low credit risk
The method of making provision for bad debts on the group-ing basis is as follows:
Grouping 1 Pursuant to the previous bad debt loss rate, the provision rate is 0%
Grouping 2 Pursuant to the previous bad debt loss rate and the assessment of manage-ment, the provision rate is 0%
Grouping 3 Aging analysis method Bank acceptance Not accrued
In grouping 3, the provision rates of using the aging analysis method are shown below:
The provision rate for accounts receivable
The provision rate for accounts receivable
Not due 0%Overdue within 3 months 0%Overdue between 3 and 6 months 5%Overdue between 6 and 12 months 20%Overdue more than 1 year 50%-100%
(iii) Accounts receivable with amounts that are not individu-ally significant but subject to provision for bad debts on the individual basis:
The reason for provision for bad debts on the individual basis: there exists objective evidence that the Group will not be able to collect the amount under the original terms.
The method of making provision for bad debts: the provision is determined based on the negative difference between the present value of the future cash flows expected to be derived from the account receivable and its carrying amount.
(b) Other receivables other than accounts receivable Other receivables other than accounts receivable are subject
to separate assessment for impairment. If there exists objective evidence that the Group will not be able to collect the amount under the original terms, a provision for bad debts of that receiv-able is made. The method of making provision for bad debts: the provision is determined based on the negative difference between the present value of the future cash flows expected to be derived from the receivable and its carrying amount.
(c) When the Group transfers the receivables to the financial in-stitutions without recourse, the difference between the proceeds received from the transaction and their carrying amounts and the related taxes is recognised in profit or loss for the current period.
(12) Inventories (a) Classification Inventories include raw materials, work in process, finished
goods, spare parts and turnover materials, and are measured at the lower of cost and net realisable value.
(b) Costing of inventories Cost is determined using the weighted average method. The
cost of finished goods and work in process comprise raw materials, direct labour and systematically allocated production overhead based on the normal production capacity.
(c) Basis for determining net realisable values of inventories and method for making provision for decline in the value of invento-ries
Provision for decline in the value of inventories is determined at the excess amount of the carrying amounts of the inventories over their net realisable value. Net realisable value is determined based on the estimated selling price in the ordinary course of business, less the estimated costs to completion and estimated costs necessary to make the sale and related taxes.
(d) The Group adopts the perpetual inventory system.
SECTION 9.FINANCIAL STATEMENTS AND AUDITOR'S REPORT

2017 ANNUAL REPORT 91
(e) Amortisation method of low value consumables Turnover materials include low value consumables. Low value
consumables are expensed when issued.
(13) Long-term equity investmentsLong-term equity investments comprise the Company’s long-term equity investments in its subsidiaries, and the Group’s long-term equity investments in its joint ventures and associates.
Subsidiaries are the investees over which the Company is able to exercise control. A joint venture is a joint arrangement which is structured through a separate vehicle over which the Group has joint control together with other parties and only has rights to the net assets of the arrangement based on legal forms, contractual terms and other facts and circumstances. An associate is the inves-tee over which the Group has significant influence by participating in the financial and operating policy decisions.
Investments in subsidiaries are presented in the Company’s finan-cial statements using the cost method, and are adjusted to the equity method when preparing the consolidated financial state-ments; investments in joint ventures and associates are accounted for using the equity method.
(a) Determination of investment cost For long-term equity investments acquired through a business
combination: for long-term equity investments acquired through a business combination involving enterprises under common control, the investment cost shall be the absorbing party’s share of the carrying amount of owners’ equity of the party being ab-sorbed at the combination date; for long-term equity investment acquired through a business combination involving enterprises not under common control, the investment cost shall be the combination cost.
For long-term equity investments acquired not through a busi-ness combination: for long-term equity investment acquired by payment in cash, the initial investment cost shall be the purchase price actually paid; for long-term equity investments acquired by issuing equity securities, the initial investment cost shall be the fair value of the equity securities issued.
(b) Subsequent measurement and recognition of related profit and loss
Long-term equity investments accounted for using the cost method are measured at the initial investment costs, and cash dividends or profit distribution declared by the investees are recognised as investment income in profit or loss.
For long-term equity investments accounted for using the equity method, where the initial investment cost exceeds the Group’s share of the fair value of the investee’s identifiable net assets at
the time of acquisition, the investment is initially measured at cost. Where the initial investment cost is less than the Group’s share of the fair value of the investee’s identifiable net assets at the time of acquisition, the difference is included in profit or loss for the current period and the cost of the long-term equity invest-ment is adjusted upwards accordingly.
For long-term equity investments accounted for using the equity method, the Group recognises the investment income accord-ing to its share of net profit or loss of the investee. The Group discontinues recognising its share of net losses of an investee after the carrying amount of the long-term equity investment together with any long-term interests that, in substance, form part of the investor’s net investment in the investee are reduced to zero. However, if the Group has obligations for additional losses and the criteria with respect to recognition of provisions under the accounting standards on contingencies are satisfied, the Group continues recognising the investment losses and the provisions. For changes in owners’ equity of the investee other than those arising from its net profit or loss, the Group records its proportionate share directly into capital surplus, provided that the Group’s proportion of shareholding in the investee remains unchanged. The carrying amount of the investment is reduced by the Group’s share of the profit distribution or cash dividends declared by an investee. The unrealised profits or losses arising from the intra-group transactions amongst the Group and its investees are eliminated in proportion to the Group’s equity interest in the investees, and then based on which the invest-ment gains or losses are recognised. For losses on intra-group transactions amongst the Group and its investees attributable to asset impairment, any unrealised loss is not eliminated.
(c) Basis for determining existence of control, joint control or significant influence over investees
Control is the power over the investee so that the Company is entitled to variable return through participating in related activities of the investee and is able to exercise power over the investee to affect the amount of return.
Joint control is the contractually agreed sharing of control over an arrangement, and the decision of activities relating to such arrangement requires the unanimous consent of the Group and other parties sharing control.
Significant influence is the power to participate in the financial and operating policy decisions of the investee, but is not control or joint control over those policies.
(d) Impairment of long-term equity investments The carrying amounts of long-term equity investments in subsid-
iaries, joint ventures and associates are reduced to the recov-erable amounts when the recoverable amounts are below their carrying amounts (Note 2 (19)).
SECTION 9.FINANCIAL STATEMENTS AND AUDITOR'S REPORT

92 2017 ANNUAL REPORT
(14) Fixed assets (a) Recognition and initial measurement of fixed assets Fixed assets comprise buildings, machinery and equipment,
other equipment and land ownership.
Fixed assets are recognised when it is probable that the related economic benefits will flow to the Group and the costs can be reliably measured. Fixed assets purchased or constructed by the Group are initially measured at cost at the time of acquisition.
Subsequent expenditures incurred for a fixed asset are includ-ed in the cost of the fixed asset when it is probable that the associated economic benefits will flow to the Group and the related cost can be reliably measured. The carrying amount of the replaced part is derecognised. All the other subsequent ex-penditures are recognised in profit or loss in the period in which they are incurred.
(b) Depreciation method of fixed assets Fixed assets are depreciated using the straight-line method to
allocate the cost of the assets to their estimated residual values over their estimated useful lives. For the fixed assets that have been provided for impairment loss, the related depreciation charge is prospectively determined based upon the adjusted carrying amounts over their remaining useful lives.
The estimated useful lives, the estimated residual values ex-pressed as a percentage of cost and the annual depreciation rates of fixed assets are as follows:
Estimated useful lives
Estimated net residual
values
Annual depreciation
ratesBuildings 20–60 years 0%–5% 1.58%–5%Machinery equipment and other equipment
3–15 years 0%–5% 6.33%–33.33%
Land ownership (outside China) Infinite 0 0
The estimated useful life and the estimated net residual value of a fixed asset and the depreciation method applied to the asset are reviewed, and adjusted as appropriate at each year-end.
The Group's land ownership is located in Switzerland, Germany, India and America held by overseas subsidiaries. Such land own-ership has infinite useful lives, thus no depreciation is recognised.
(c) The carrying amount of a fixed asset is reduced to the recoverable amount when the recoverable amount is below the carrying amount (Note 2 (19)).
(d) Disposal of fixed assets A fixed asset is derecognised on disposal or when no future
economic benefits are expected from its use or disposal. The
amount of proceeds from disposals on sale, transfer, retirement or damage of a fixed asset net of its carrying amount and related taxes and expenses is recognised in profit or loss for the current period.
(15) Construction in progressConstruction in progress is measured at actual cost. Actual cost comprises construction costs, installation costs, borrowing costs that are eligible for capitalisation and other costs necessary to bring the fixed assets ready for their intended use. Construction in progress is transferred to fixed assets when the assets are ready for their intended use, and depreciation begins from the following month. The carrying amount of construction in progress is reduced to the recoverable amount when the recoverable amount is below the carrying amount (Note 2 (19)).
(16) Borrowing costsThe borrowing costs that are directly attributable to the acquisition and construction of a fixed asset that needs a substantially long period of time for its intended use commence to be capitalised and recorded as part of the cost of the asset when expenditures for the asset and borrowing costs have been incurred, and the activities relating to the acquisition and construction that are necessary to prepare the asset for its intended use have commenced. The cap-italisation of borrowing costs ceases when the asset under acqui-sition or construction becomes ready for its intended use and the borrowing costs incurred thereafter are recognised in profit or loss for the current period. Capitalisation of borrowing costs is suspend-ed during periods in which the acquisition or construction of a fixed asset is interrupted abnormally and the interruption lasts for more than 3 months, until the acquisition or construction is resumed.
For the specific borrowings obtained for the acquisition or con-struction of a fixed asset qualifying for capitalisation, the amount of borrowing costs eligible for capitalisation is determined by deduct-ing any interest income earned from depositing the unused specific borrowings in the banks or any investment income arising on the temporary investment of those borrowings during the capitalisation period.
For the general borrowings obtained for the acquisition or construc-tion of a fixed asset qualifying for capitalisation, the amount of bor-rowing costs eligible for capitalisation is determined by applying the weighted average effective interest rate of general borrowings, to the weighted average of the excess amount of cumulative expendi-tures on the asset over the amount of specific borrowings. The effective interest rate is the rate at which the estimated future cash flows during the period of expected duration of the borrowings or applicable shorter period are discounted to the initial amount of the borrowings.
SECTION 9.FINANCIAL STATEMENTS AND AUDITOR'S REPORT

2017 ANNUAL REPORT 93
(17) Intangible assetsIntangible assets include land use rights, customer relationships, patents, trademarks, computer software and development cost, etc., which are measured at cost, except for intangible assets obtained from business combinations involving enterprises not under common control, which are measured at fair value at the acquisition date.
(a) Land use rights Land use rights located in PRC are amortised on the straight-
line basis over their approved use period of 40.5 years. If the acquisition costs of the land use rights and the buildings located thereon cannot be reasonably allocated between the land use rights and the buildings, all of the acquisition costs are recog-nised as fixed assets.
(b) Customer relations Customer relationships are amortised on the straight-line basis
over their benefit period of 7-10 years.
(c) Patents Patents are amortised on a straight-line basis over the patent
protection period of 7-10 years as stipulated by the laws.
(d) Trademarks Trademarks include registered trademarks, etc. Trademarks have
infinite useful lives, thus no amortization recognised.
(e) Computer software Computer software is amortised on the straight-line basis over
its useful life of 2-5 years.
(f) Periodical review of useful life and amortisation method For an intangible asset with a finite useful life, review of its useful
life and amortisation method is performed at each year-end, with adjustment made as appropriate.
(g) Research and development The expenditure on an internal research and development
project is classified into expenditure on the research phase and expenditure on the development phase based on its nature and whether there is material uncertainty that the research and development activities can form an intangible asset at end of the project.
Expenditure on the research phase is recognised in profit or loss in the period in which it is incurred. Expenditure on the develop-ment phase is capitalised only if all of the following conditions are satisfied:
�� it is technically feasible to complete the intangible asset so that it will be available for use or sale;�� management intends to complete the intangible asset, and use or sell it;
�� it can be demonstrated how the intangible asset will generate economic benefits;�� there are adequate technical, financial and other resources to complete the development and the ability to use or sell the intangible asset; and�� the expenditure attributable to the intangible asset during its development phase can be measured reliably.
Other development expenditures that do not meet the conditions above are recognised in profit or loss in the period in which they are incurred. Development costs previously recognised as ex-penses are not recognised as an asset in a subsequent period. Capitalised expenditure on the development phase is presented as development costs in the balance sheet and transferred to intangible assets at the date that the asset is ready for its in-tended use - capitalisation for expenditures of development and research.
(h) Impairment of intangible assets The carrying amount of an intangible is reduced to the recover-
able amount when the recoverable amount is below the carrying amount (Note 2 (19)).
(18) Long-term prepaid expensesLong-term prepaid expenses include the expenditure for improve-ments to fixed assets held under operating leases, and other expenditures that have been incurred but should be recognised as expenses over more than one year in the current and subse-quent periods. Long-term prepaid expenses are amortised on the straight-line basis over the expected beneficial period and are presented at actual expenditure net of accumulated amortisation.
(19) Impairment of long-term assetsFixed assets (excluding land with indefinite useful life), construction in progress, intangible assets with finite useful lives and long-term equity investments in subsidiaries, joint ventures and associates are tested for impairment if there is any indication that the assets may be impaired at the balance sheet date; land and intangible assets with indefinite useful lives and intangible assets not ready for their intended use are tested at least annually for impairment, irrespec-tive of whether there is any indication that they may be impaired. If the result of the impairment test indicates that the recoverable amount of an asset is less than its carrying amount, a provision for impairment and an impairment loss are recognised for the amount by which the asset’s carrying amount exceeds its recoverable amount. The recoverable amount is the higher of an asset’s fair val-ue less costs to sell and the present value of the future cash flows expected to be derived from the asset. Provision for asset impair-ment is determined and recognised on the individual asset basis. If it is not possible to estimate the recoverable amount of an individual asset, the recoverable amount of a group of assets to which the as-
SECTION 9.FINANCIAL STATEMENTS AND AUDITOR'S REPORT

94 2017 ANNUAL REPORT
set belongs is determined. A group of assets is the smallest group of assets that is able to generate independent cash inflows.
Goodwill that is separately presented in the financial statements is tested at least annually for impairment, irrespective of whether there is any indication that it may be impaired. In conducting the test, the carrying value of goodwill is allocated to the related asset groups or groups of asset groups which are expected to benefit from the syn-ergies of the business combination. If the result of the test indicates that the recoverable amount of an asset group or group of asset groups, including the allocated goodwill, is lower than its carrying amount, the corresponding impairment loss is recognised. The im-pairment loss is first deducted from the carrying amount of goodwill that is allocated to the asset group or group of asset groups, and then deducted from the carrying amounts of other assets within the asset groups or groups of asset groups in proportion to the carrying amounts of assets other than goodwill.
Other fixed assets (land ownership) and intangible assets with indef-inite useful lives, and intangible assets not ready for their intended use are tested for impairment at least annually, irrespective of whether there is any indication that it may be impaired.
Once the above asset impairment loss is recognised, it will not be reversed for the value recovered in the subsequent periods.
(20) Employee benefitsEmployee benefits include short-term employee benefits, post-em-ployment benefits, termination benefits and other long-term employee benefits provided in various forms of consideration in exchange for service rendered by employees or compensations for the termination of employment relationship.
(a) Short-term employee benefits Short-term employee benefits include employee wages or sala-
ries, bonus, allowances and subsidies, staff welfare, premiums or contributions on medical insurance, work injury insurance and maternity insurance, housing funds, union running costs and employee education costs, short-term paid absences. The employee benefit liabilities are recognised in the accounting period in which the service is rendered by the employees, with a corresponding charge to the profit or loss for the current period or the cost of relevant assets.
(b) Post-employment benefits The Group provides various pension plans and other post-em-
ployment benefits in China, Germany, Switzerland and other places. The plans include defined benefit plans and defined contribution plans.
The Group classifies post-employment benefit plans as either defined contribution plans or defined benefit plans. A defined
contribution plan is a pension plan that the Group has no further payment obligations once the fixed contributions have been paid to a separate fund. The amounts based on the defined contribu-tion plan are recognised as liabilities in the accounting period in which the service has been rendered by the employees, with a corresponding charge to the profit or loss for the current period or the cost of relevant assets. Defined benefit plans are post-em-ployment benefit plans other than defined contribution plans.
The liability recognised in the balance sheet in respect of defined benefit pension plans is the present value of the defined benefit obligation less the fair value of plan assets. The defined benefit obligation is calculated annually by independent actuaries using the projected unit credit method at the similar interest rates of high-quality corporate bonds and state bonds with similar obli-gation terms and currency. Service costs (including current-ser-vice costs, past-service costs and settlement gains or losses) related to the defined benefit plan and net interest are recorded in profit or loss for the current period or related asset costs. When employees' services for the subsequent years may lead the defined benefit level enjoyed significantly higher than the pre-vious years, the Group recognises the cumulative defined benefit plan obligations on a straight-line basis over the period from the services provided by employees causing the enterprise to firstly resume the defined benefit obligation to such services no longer causing significant increase in the benefit obligation. In determin-ing the vesting period, the significant increase in defined benefit obligation only due to the increase of future salary is not taken into consideration. Changes in the remeasurement of net liability or net asset related to the defined benefit plan are charged to other comprehensive income.
Basic pensions The Group contributes fixed expenses to local labour and social
security authority or independent fund, and the social security authority or independent fund bears the responsibility to pay pensions and other retirement benefits to the retired employees. The amounts based on the defined contribution plan are recog-nised as liabilities in the accounting period in which the service has been rendered by the employees, with a corresponding charge to the profit or loss for the current period or the cost of relevant assets.
(c) Termination benefits The Group provides compensation for terminating the em-
ployment relationship with employees before the end of the employment contracts or as an offer to encourage employees to accept voluntary redundancy before the end of the employ-ment contracts. The Group recognises a liability arising from compensation for termination of the employment relationship with employees, with a corresponding charge to profit or loss at the earlier of the following dates: 1) when the Group cannot unilaterally withdraw the offer of termination benefits because
SECTION 9.FINANCIAL STATEMENTS AND AUDITOR'S REPORT

2017 ANNUAL REPORT 95
of an employment termination plan or a curtailment proposal; 2) when the Group recognises costs or expenses related to the restructuring that involves the payment of termination benefits.
(d) Employee leave entitlements The Group recognises the employee benefits related to accu-
mulated paid leave when the employee provides service and thereby increases his/her rights to enjoy the paid leave, and measured at the increased amount expected to be paid due to accumulated rights to be exercised.
The Group recognises the employee benefits related to non-cu-mulative paid leave in the accounting period when the leave is actually taken.
(21) Dividend distributionCash dividend is recognised as a liability in the period in which it is approved by the shareholders.
(22) ProvisionsProvisions for external guarantees, legal proceedings, product warranties, onerous contracts are recognised when the Group has a present obligation, and it is probable that an outflow of economic benefits will be required to settle the obligation, and the amount of the obligation can be measured reliably.
A provision is initially measured at the best estimate of the ex-penditure required to settle the related present obligation. Factors surrounding a contingency, such as the risks, uncertainties and the time value of money, are taken into account as a whole in reaching the best estimate of a provision. Where the effect of the time value of money is material, the best estimate is determined by discount-ing the related future cash outflows. The increase in the discounted amount of the provision arising from passage of time is recognised as interest expense.
The carrying amount of provisions is reviewed at each balance sheet date and adjusted to reflect the current best estimate.
Provisions expected to be paid within one year since the balance sheet date are classified as current liabilities.
(23) Revenue recognitionThe amount of revenue is determined in accordance with the fair value of the consideration received or receivable for the sales of goods and services in the ordinary course of the Group’s activities. Revenue is shown net of discounts, rebates and returns.
Revenue is recognised when it is probable that the economic benefits associated with the transaction will flow to the Group, the
related revenue can be reliably measured, and the specific revenue recognition criteria have been met for each type of the Group’s activities as described below:
(a) Sales of products Pursuant to the timing for risk transfer or delivery terms as
agreed in the sales contract/agreement, revenue from the sales of goods is recognised when significant risks and rewards of ownership of the goods are transferred to the buyer, the Group retains neither continuing managerial involvement to the degree usually associated with ownership nor effective control over the goods sold, and it is probable that the economic benefit associ-ated with the transaction will flow to the Group and the relevant revenue and costs can be measured reliably.
(b) Rendering of services Services mainly include technical services and after-sales ser-
vices. The related revenue is recognised when the services have been rendered, costs of related revenue can be reliably meas-ured and the economic benefits associated with services may flow into the Group.
(24) Government grantsGovernment grants refer to the monetary or non-monetary assets obtained by the Group from the government, including tax refund, financial subsidies, etc.
Government grants are recognised when the grants can be re-ceived and the Group can comply with all attached conditions. If a government grant is a monetary asset, it will be measured at the amount received or receivable. If a government grant is a non-mon-etary asset, it will be measured at its fair value. If it is unable to ob-tain its fair value reliably, it will be measured at its nominal amount.
Government grants related to assets refer to government grants which are obtained by the Group for the purposes of purchase, construction or acquisition of the long-term assets. Government grants related to income refer to the government grants other than those related to assets.
Government grants related to assets will be recorded to net off the book value of the assets, or recognized as deferred revenue and amortized in a reasonable and systematic method in income state-ment within the useful life of the asset; government grants related to income will be recorded as deferred income and recognised in profit or loss in the period in which the related expenses are recog-nised if the grants are intended to compensate for future expenses or losses, and otherwise recognised in profit or loss for the current period if the grants are used to compensate for expenses or losses that have been incurred. The Group adopts the same reporting method for the same type of government grants.
SECTION 9.FINANCIAL STATEMENTS AND AUDITOR'S REPORT

96 2017 ANNUAL REPORT
Government grants related to operating activities are recorded as operating income, and government grants not related to operating activities are recorded as non-operating income.
The loans that the Group received with concessional interest rate are recorded at the amount actually received. The borrowing cost is calculated with the loan principal and the concessional interest rate. The financial discount received by the Group is recorded to reduce the borrowing cost.
(25) Deferred tax assets and deferred tax liabilitiesDeferred tax assets and deferred tax liabilities are calculated and recognised based on the differences arising between the tax bases of assets and liabilities and their carrying amounts (temporary differ-ences). Deferred tax asset is recognised for the deductible losses that can be carried forward to subsequent years for deduction of the taxable profit in accordance with the tax laws. No deferred tax liability is recognised for a temporary difference arising from the initial recognition of goodwill. No deferred tax asset or deferred tax liability is recognised for the temporary differences resulting from the initial recognition of assets or liabilities due to a transaction other than a business combination, which affects neither accounting prof-it nor taxable profit (or deductible loss). At the balance sheet date, deferred tax assets and deferred tax liabilities are measured at the tax rates that are expected to apply to the period when the asset is realised or the liability is settled.
Deferred tax assets are only recognised for deductible temporary differences, deductible losses and tax credits to the extent that it is probable that taxable profit will be available in the future against which the deductible temporary differences, deductible losses and tax credits can be utilised.
Deferred tax liabilities are recognised for temporary differences aris-ing from investments in subsidiaries, associates and joint ventures, except where the Group is able to control the timing of reversal of the temporary difference, and it is probable that the temporary difference will not reverse in the foreseeable future. When it is probable that the temporary differences arising from investments in subsidiaries, associates and joint ventures will be reversed in the foreseeable future and that the taxable profit will be available in the future against which the temporary differences can be utilised, the corresponding deferred tax assets are recognised.
Deferred tax assets and liabilities are offset when:�� the deferred taxes are related to the same tax payer within the Group and the same taxation authority; and,�� that tax payer within the Group has a legally enforceable right to offset current tax assets against current tax liabilities.
(26) LeasesA lease that transfers substantially all the risks and rewards inciden-tal to ownership of an asset is a finance lease. An operating lease is a lease other than a finance lease.
(a) Operating leases Lease payments under an operating lease are recognised on
a straight-line basis over the period of the lease, and are either capitalised as part of the cost of related assets, or charged as an expense for the current period.
Rental income from an operating lease is recognised on a straight-line basis over the period of the lease.
(b) Finance leases The leased asset is recognised at the lower of the fair value of
the leased asset and the present value of the minimum lease payments. The difference between the recorded amount of the leased asset and the minimum lease payments is accounted for as unrecognised finance charge and is amortised using the ef-fective interest method over the period of the lease. A long-term payable is recorded at the amount equal to the minimum lease payments less the unrecognised finance charge.
(27) Held for sale and discontinued operationsNon-current assets or held-for-sale assets that meet the following conditions: (1) the assets are available for immediate sale in other similar transactions; (2) the Group has sales agreement with other parties and the agreement is legally binding with appropriate au-thorization, the asset will be sold within one year.
Non-current assets (except for financial assets, investment proper-ties measured at fair value and deferred tax assets) that meet the recognition criteria for held for sale are recognised at the amount equal to the lower of the fair value less costs to sell and the carrying amount. Any excess of the original carrying amount over the fair value less the costs to sell is recognised as asset impairment loss.
Such non-current assets and assets included in disposal groups classified as held for sale are accounted for as current assets; while liabilities included in disposal groups classified as held for sale are accounted for as current liabilities, and are individually presented in the balance sheet.
A discontinued operation is a component of the Group that either has been disposed of or is classified as held for sale, and is sep-arately identifiable operationally and for financial reporting purpos-es, and satisfies one of the following conditions: (1) represents a separate major line of business or geographical area of operations; (2) is part of a single co-ordinated plan to dispose of a separate major line of business or geographical area of operations; and (3) is a subsidiary acquired exclusively with a view to resale.
SECTION 9.FINANCIAL STATEMENTS AND AUDITOR'S REPORT

2017 ANNUAL REPORT 97
The discontinued net profit in the income statement includes the operating profit and loss, and profit and loss on disposal.
(28) Segment informationThe Group identifies operating segments based on the internal organisation structure, management requirements and internal reporting system, and discloses segment information of reportable segments which is determined on the basis of operating segments.
An operating segment is a component of the Group that satisfies all of the following conditions: (1) the component is able to earn revenue and incur expenses from its ordinary activities; (2) whose operating results are regularly reviewed by the Group’s manage-ment to make decisions about resources to be allocated to the segment and to assess its performance, and (3) for which the information on financial position, operating results and cash flows is available to the Group. If two or more operating segments have similar economic characteristics and satisfy certain conditions, they are aggregated into one single operating segment.
(29) Critical accounting estimates and judgementsThe Group continually evaluates the critical accounting estimates and key judgements applied based on historical experience and other factors, including expectations of future events that are be-lieved to be reasonable.
Critical accounting estimates and key assumptionsThe critical accounting estimates and key assumptions that have a significant risk of causing a material adjustment to the carrying amounts of assets and liabilities within the next accounting year are outlined below:
(a) Accounting estimates for impairment provision of goodwill, fixed assets and intangible assets with indefinite useful lives
The Group tests for impairment of goodwill, fixed assets and in-tangible assets with indefinite useful lives annually. The recovera-ble amount of asset groups and combinations of asset groups is the present value of the future cash flows expected to be derived from them. The recoverable amount of fixed assets and intangi-ble assets with indefinite useful lives is the higher of an asset’s fair value less costs to sell and the present value of the future cash flows expected to be derived from the asset. The calcula-tions of the recoverable amounts require the use of estimates.
If management revises the growth rate that is used in the calcu-lation of the future cash flows of asset groups and combinations of asset groups, the Group would need to adjust the provision for impairment against goodwill and fixed assets and intangible assets with infinite useful lives. If management revises the pre-tax discount rate applied to the discounted cash flows, and the revised pre-tax discount rate is higher than the one currently
applied, the Group would need to recognise further impairment against goodwill and fixed assets and intangible assets with infinite useful lives.
If the actual growth rate/pre-tax discount rate is higher/lower than management’s estimates, the impairment loss of goodwill and fixed assets and intangible assets with indefinite useful lives previously provided for is not allowed to be reversed by the Group.
(b) Accounting estimates for provision for decline in the value of inventories
The Group periodically evaluates the net realizable value of inventories and recognises decline in the value of inventories at the excess of their costs over their net realizable value. When making estimates of the net realisable value, the Group takes into consideration the use of inventories on hand and other infor-mation available to form the underlying assumptions, including the inventories’ expected selling price. The net realisable value of inventories may vary based on changes in the market price and actual use of the inventories, resulting in changes in the provision for decline in the value of inventories and thereby affecting the profit or loss.
(c) Useful lives and residual values of fixed assets (excluding overseas land ownership)
The Group's management estimates the expected useful lives and residual values of fixed assets with finite useful lives. The estimates are based on the actual useful lives of past and in-dustry practices of fixed assets with similar nature and function. The economic environment, technical environment and other environment may have a significant impact on the useful lives and expected net residual values of fixed assets; and chang-es in the economic environment, technical environment and other environment may also lead to significant changes in the expected realisation method of economic benefits related to fixed assets. Different estimates may affect the depreciation of fixed assets and profit or loss for the current period. Fixed assets of the Group also include certain developed land located outside China, which has indefinite useful lives and is not subject to amortization.
(d) Useful lives and residual values of intangible assets (excluding trademarks)
The Group's management estimates the expected useful lives of intangible assets with finite useful lives. The estimates are based on the actual useful lives of past and industry practices of intan-gible assets with similar nature and function. The economic envi-ronment, technical environment and other environment may have a significant impact on the useful lives of intangible assets; and changes in the economic environment, technical environment and other environment may also lead to significant changes in the expected realisation method of economic benefits related to
SECTION 9.FINANCIAL STATEMENTS AND AUDITOR'S REPORT

98 2017 ANNUAL REPORT
intangible assets. Different estimates may affect the amortisation of intangible assets and profit or loss for the current period.
(e) Income tax and deferred income tax The Group is subject to income taxes in numerous countries/
jurisdictions. There are some transactions and events for which the ultimate tax determination is uncertain during the ordinary course of business. Significant judgement is required from the Group in determining the provision for income taxes in each of these countries/jurisdictions. Where the final tax outcome of these matters is different from the amounts that were initially re-corded, such differences will impact the income tax and deferred tax provisions in the period in which such determination is made.
Deferred tax assets and deferred tax liabilities are measured at applicable rate at the time of realisation of estimated deferred tax assets or settlement of deferred tax liabilities. Deferred tax assets are only recognised for deductible temporary differences, deductible losses and tax credits to the extent that it is probable that taxable profit will be available in the future against which the deductible temporary differences, deductible losses and tax credits can be utilised.
The Group’s management recognises deferred tax assets in accordance with the enacted or substantially enacted tax laws and the best estimate of the Group's realisable earnings in the expected future year in which the deferred tax assets will be realised. However, estimate of future earnings or future taxable income requires a large number of judgements and estimates, together with tax planning strategies. Different judgements and estimates will affect the amount of deferred tax assets recog-nised. Management will re-assess the estimate of earnings and other estimates at each balance sheet date.
(f) Provisions It is probable that there will be an outflow of economic ben-
efits due to product warranties and the amount is uncertain. The Group recognises provisions in accordance with the best estimate of the outflow to perform the related present obligation. The carrying amount of provisions is reviewed at each balance sheet date and adjusted to reflect the current best estimate.
The Group's management makes estimates of the warranty cost based on the historical experience of similar projects or the costs expected to be incurred. However, the evaluation of the future actual warranty cost requires a large number of judgements and estimates. Different judgements and estimates will affect the amount of provisions recognised. During the warranty process, the Group continues to review and revaluate the expected war-ranty cost.
(30) Significant change in accounting policiesThe Ministry of Finance has issued in 2007 the “Accounting princi-ple No. 42 – non-current assets held for sale, disposal group and discontinued operation”, “Accounting principle No.16 – government grant” and “the announcement regarding the amendment and printing of the revised financial statement template”. The Group has adopted the above accounting principles to prepare the financial statements in 2017, the impact to the Group’s financial statements listed as follows:
Content and reason of accounting policies changes
Impacted accounts
Impacted amount
1 January 2017The Group records the book value on 1 January 2017 of the Government grants related to assets in deferred income to net off the relevant book value of the assets. The comparative financial statements of the year 2016 were not restated.
Fixed assets 0Deferred income
0
The Group records the Government grants related to the daily business activities of the enterprise which received in 2017 in other income.The comparative financial statements of the year 2016 were not restated.
NA NA
The Group directly reduces costs/losses when receiving profits related to government subsidies in 2017. The comparative financial statements of the year 2016 were not restated.
NA NA
The group records the gains and losses arising from the disposal of fixed assets and intangible assets to gain/losses of asset disposal in 2017. The comparative financial statements of the year 2016 are adjusted accordingly.
Income of asset disposal
1,282
Non-operating income
2,448
Non-operating expenses
–1,166
SECTION 9.FINANCIAL STATEMENTS AND AUDITOR'S REPORT

2017 ANNUAL REPORT 99
3 Taxation
(1) The main categories and rates of taxes applicable to the Group for the year ended 31 December 2016 and 31 December 2017 are set out below:
Category Tax rate Corresponding countries/regions Tax baseCorporate income tax (a) Note 3 (1) (a) Corresponding countries/regions where the Group locates Taxable incomeValue-added tax (“VAT”) (b) 1.5%-35% Corresponding countries/regions where the Group locates VAT payableUrban maintenance and construction tax
(c) 7% China Turnover tax paid
Educational surcharge (c) 3% China Turnover tax paidLocal educational surcharges (c) 2% China Turnover tax paid
(a) Corporate income taxThe corporate income tax rates applicable to the Group and its main subsidiaries are set out below:
Countries and regions
Tax rate for 2017
Tax rate for 2016
The Company (Note 1) China 25.00% 15.00%Saurer Intelligent Machinery Company Limited China 25.00% 25.00%Saurer Hong Kong Machinery Company Limited Hong Kong 16.50% 16.50%Saurer Asia Machinery Co., Ltd Hong Kong 16.50% 16.50%Saurer (Jiangsu) Textile Machinery Co. Ltd (Note 3 (2)) China 15.00% 15.00%Saurer (Changzhou) Textile Machinery Co., Ltd (Note 3 (2)) China 15.00% 15.00%Saurer (Changzhou) Texparts Components Co. Ltd China 25.00% 25.00%Saurer (Shanghai) Textile Machinery Technology Co., Ltd China 25.00% 25.00%Saurer Finance Lease Co. Ltd China 25.00% 25.00%Changzhou Jintan Saurer Textile Machinery Technology Co., Ltd China 25.00% 25.00%Changzhou Saurer Textile Machinery Technology Co., Ltd China 25.00% 25.00%Changzhou Jintan Saurer Investment Co., Ltd China 25.00% 25.00%Saurer Xinjiang Intelligent Machinery Company Limited China 25.00% 25.00%Saurer Têxtil Soluções Ltda. Brazil 34.00% 34.00%SAURER AG (Note 3 (2)) Switzerland 17.40% 17.40%Saurer Czech s.r.o. Czech Republic 19.00% 19.00%Saurer Technologies GmbH & Co KG Germany 31.26% 31.52%Saurer Germany GmbH & Co KG Germany 31.87% 31.52%Saurer Fibrevision Ltd UK 19.00% 20.00%Schlafhorst Machines LLP (Original name: Schlafhorst Machines Private Ltd )
India 32.44% 30.90%
Saurer Textile Solutions Pvt. Ltd India 32.44% 32.44%Peass Industrial Engineers Pvt. Ltd (Note 5 (2)) India 32.44% 32.44%Zinser Textile Machines LLP (Note 2) India N/A N/ASaurer México S.A. de C.V. Mexico 30.00% 30.00%Saurer Components Pte. Ltd Singapore 17.00% 17.00%Saurer Tekstil A.S. Turkey 20.00% 20.00%Saurer Inc. USA 38.58% 38.58%Saurer Technologies Management Austria 31.27% N/A
Note 1: For the year 2016 and the 8-month period ended 31 August 2017, the income tax rate applicable to the Company was 15%. Upon the completion of major assets re-structuring mentioned in Note 1, the income tax rate applicable to the Company is 25%.
Note 2: Zinser Textile Machines was incorporated in November 2016, and was still in the start-up period.
SECTION 9.FINANCIAL STATEMENTS AND AUDITOR'S REPORT

100 2017 ANNUAL REPORT
(b) Value-added tax (“VAT”) The Group's sales of products are subject to VAT.
The Company and domestic subsidiaries have been approved to use the “exempt, credit, refund” method on goods exported. VAT input on purchase of raw materials, fuels, power and certain fixed assets can be deducted from VAT output. Tax payable is calculated using the taxable sales amount multiplied by the ap-plicable tax rate less deductible VAT input of the current period. Tax payable of the Company’s overseas subsidiaries is calculat-ed using the taxable sales amount multiplied by the applicable tax rate in each country less deductible VAT input of the current period. In 2017 and 2016, the applicable tax rate of the Compa-ny was ranging from 1.5% to 35%.
(c) Taxes and surcharges Pursuant to relevant regulations of Provision on the Accounting
Treatments of Value-Added Tax (Cai-Kuai [2016] No. 22 ) issued by Ministry of Finance, property tax, land use tax, stamp tax and vehicle and vessel tax incurred in the Group’s ordinary course of activities are reclassified from “general and administrative ex-penses” to “taxes and surcharges” from 1 May 2016. Expenses incurred after 1 May 2016 are not subject to adjustment. Com-parative figures would not be adjusted.
(2) Tax preferenceAccording to “Announcement on issues concerning corporate income tax of fully implementing the strategy of development in China’s western region” (2012, No.12), from 1 January 2011 to 31 December 2020, the enterprise located at western region with main business listed in “Catalogue of encouraged industries in western region” and the amount of main operating revenue greater than 70% of that total revenue in current year, shall be subject to enterprise income tax rate at the reduced rate of 15%. According to the letter promulgated by Xinjiang Uygur Autonomous Region Economic and Informatization Council, “Letter of confirmation that the main operating business of Xinjiang City Construction complies with the requirements of the catalogue of encouraged industries”, the Company for the year of 2016 and the 8-month period ended 31 August 2017 was subjected to enterprise income tax rate at the rate of 15%. Upon completion of major assets restructuring mentioned in Note 1, the Company applicable enterprise income tax rate is 25%.
On 6 July 2015, Saurer (Jiangsu) Textile Machinery Co., Ltd ("Sau-rer Jiangsu"), a subsidiary of the Group, obtained Advance High Technology Enterprise Approval Certificate, with a validity period of 3 years. As a result, the enterprise income tax rate of Saurer Jiangsu reduced to 15% from 1 January 2015 after approval from SAT, Jintan Office, Changzhou City, Jiangsu Province, PRC on 28 December 2015. In 2017, the applicable enterprise income tax rate of the Company was 15%.
On 10 October 2015, Saurer (Changzhou) Textile Machinery Co., Ltd ("Saurer Changzhou"), a subsidiary of the Group, obtained Advance High Technology Enterprise Approval Certificate, with a validity period of 3 years. As a result, the enterprise income tax rate of Saurer Changzhou reduced to 15% from 1 January 2015 after approval from SAT, Jintan Office, Changzhou City, Jiangsu Province, PRC on 22 September 2016. In 2017, the applicable tax enterprise income tax rate of the Company was 15%.
Pursuant to the relevant regulations of Circular on the Overall Promotion of Pilot Program of Levying VAT in place of Business Tax (Cai Zheng [2016] No. 36) jointly issued by the Ministry of Finance and the State Administration of Taxation, for exemplary service out-sourcing enterprises registered in the pilot area, the taxable services in offshore service outsourcing business are exempted from VAT. Pursuant to the approval from SAT, Jintan Office, Changzhou City, Jiangsu Province, PRC, relevant technical services and after-sales services of Saurer Jiangsu, a subsidiary of the Company, are ex-empted from VAT from 1 May 2016.
SAURER AG, a subsidiary of the Company, has obtained a tax break from the local state government of Switzerland. From 1 July 2013 to 30 June 2018, the taxable amount of SAURER AG is re-duced by 50% according to the tax levels of the state when certain conditions are satisfied, with a ceiling of CHF 10 million taxable net profit. In the condition that SAURER AG goes bankrupt or relo-cates to other state or other country, the local state government can retroactively revoke the tax breaks. In addition, SAURER AG has obtained a tax break from the local commerce, education and research departments of Switzerland. From 1 July 2013 to 30 June 2018, the taxable amount of SAURER AG is reduced by 50% according to the tax levels of the state when certain conditions are satisfied, with a ceiling of CHF 10 million taxable net profit. In the condition that SAURER AG fails to satisfy the relevant stand-ards, such departments can retroactively revoke the tax breaks. When further conditions are satisfied, the above tax breaks can be respectively extended to the next five years.
SECTION 9.FINANCIAL STATEMENTS AND AUDITOR'S REPORT

2017 ANNUAL REPORT 101
4 Notes to the consolidated financial statements
(1) Cash at bank and on hand
31 December 2017 31 December 2016Cash on hand 53 44Cash at bank 2,409,196 2,354,012Other cash balances 64,182 749,724
2,473,431 3,103,780Including: Total overseas deposits 350,632 850,891
As at 31 December 2017, other cash balances included:
(i) The deposit for the issuance of letter of credit applied by the Group's subsidiary Saur-er Jiangsu amounting to RMB 17,442,000 (31 December 2016:RMB 14,853,000);
(ii) The deposit for the issuance of letter of guarantee for early retirement ("Altersteilzeit") and overtime accounts governed by the German law AltTZG §8a applied by the Group’s subsidiary Saurer Germany GmbH & Co KG, amounting to EUR 5,843,000 (equivalent to RMB 45,604,000) (31 December 2016: EUR 5,843,000, equivalent to RMB 42,688,000);
(iii) Other deposits amounting to RMB 1,136,000 (31 December 2016: RMB 2,183,000);
(iv) As at 31 December 2016, the Group’s other monetary funds also including the bank guarantee of RMB 690,000,000 provided by its subsidiary Saurer Intelligent Machin-ery Company Limited to its subsidiary Saurer Hongkong Machinery Company Limited regarding the bank loan of EUR 88,485,000 (equivalent to RMB 613,741,000).
(2) Financial assets/financial liabilities at fair value through profit or loss
31 December 2017 31 December 2016Financial assets at fair value through profit or loss
- Forward foreign exchange contract - cash flow hedging (a)
6,178 1,860
6,178 1,860Financial liabilities at fair value through profit or loss
- Forward foreign exchange contract - cash flow hedging (b)
7,532 1,067
- Interest rate swap contract 0 157,532 1,082
(a) The Company’s subsidiaries Saurer Germany GmbH & Co KG and Saurer Inc. en-tered into foreign exchange forward contracts to mitigate foreign exchange risk arising from the collection and payment in foreign currency for the year ended 31 December 2017 and 31 December 2016. Some foreign exchange forward contracts entered into by the Group meet the conditions for applying hedge accounting. Those foreign exchange forward contracts, made to sell EUR and buy foreign currencies including USD, GBP, SGD and CHF at fixed exchange rate or sell USD and buy EUR at fixed exchange rate, are cash flow hedging.
SECTION 9.FINANCIAL STATEMENTS AND AUDITOR'S REPORT

102 2017 ANNUAL REPORT
For the year ended 31 December 2017, net gains arising from changes in fair value of effective portion of cash flow hedging amounting to RMB 249,000 (31 December 2016: net losses equivalent to RMB 271,000) was included in other comprehensive income. The cash flow hedging had no non-effective portion.
As at 31 December 2017 the unsettled foreign exchange forward contracts held by the Group amounted to RMB 1,025,047,000 (2016: RMB 215,655,000).
(b) In 2016, the Company’s subsidiary Saurer Hong Kong Machinery Company Limited entered into interest rate swap contracts to mitigate interest rate risks relating to foreign currency denominated borrowings. The principal of relevant borrowings amounted to EUR 88,485,000 (equivalent to RMB 668,760,000). Those interest rate swap contracts are measured at fair value. In 2017, the interest rate swap contracts had expired.
(3) Notes receivable
31 December 2017 31 December 2016Bank acceptance notes 127,383 30,893
(a) As at 31 December 2017 and 31 December 2016, pledged notes receivable of the Group are set out below:
31 December 2017 31 December 2016Bank acceptance notes 5,500 1,000
As at 31 December 2017, the Group’s subsidiary Saurer Jiangsu pledged notes receiv-able of RMB 5,500,000 (31 December 2016: equivalent to RMB 1,000,000) to bank for letter of guarantee of RMB 4,399,000 (31 December 2016: equivalent to RMB 860,000).
(b) As at 31 December 2017 and 31 December 2016, notes receivable that have been endorsed or discounted but are not mature yet are as follows:
31 December 2017 31 December 2016Derecognised Not derecognised Derecognised Not derecognised
Bank acceptance notes 147,448 0 83,475 0
All the bank acceptance notes receivable will expire within 12 months after the year end.
SECTION 9.FINANCIAL STATEMENTS AND AUDITOR'S REPORT

2017 ANNUAL REPORT 103
(4) Interest receivable
31 December 2017 31 December 2016Interest of bank deposit/ other interest 8,565 24,676
(5) Accounts receivable
31 December 2017 31 December 2016Accounts receivable 2,088,816 1,039,114Less: long-term receivable (Note 4 (9)) –35,240 –51,127
2,053,576 987,987Less: provision for bad debts –10,655 –21,861
2,042,921 966,126
Accounts receivable falling due after one year are presented in long-term receivables.
(a) The aging of accounts receivable is analysed as follows:
31 December 2017 31 December 2016Not due 900,091 386,056Overdue within 3 months 109,235 312,009Overdue between 3 and 6 months 330,868 233,147Overdue between 6 and 12 months 209,365 9,956Overdue more than 1 year 504,017 46,819
2,053,576 987,987
(b) Accounts receivable are analysed by categories as follows:
31 December 2017Carrying amount Provision for bad debtsAmount Percentage of total
balance (%)Amount Ratio
Amounts that are individually significant and the related provision for bad debts is provided on the individual basis
0 0 0 0
Amounts that the related provision for bad debts is provided on the grouping basisGrouping 1 1,023,300 50 0 0Grouping 2 22,200 1 0 0Grouping 3 1,008,076 49 –10,655 1%Amounts that are not individually significant but the related provision for bad debts is provided on the individual basis
0 0 0 0
2,053,576 100 –10,655 1%
SECTION 9.FINANCIAL STATEMENTS AND AUDITOR'S REPORT

104 2017 ANNUAL REPORT
31 December 2016Carrying amount Provision for bad debtsAmount Percentage of total
balance (%)Amount Ratio
Amounts that are individually significant and the related provision for bad debts is provided on the individual basis
0 0 0 0
Amounts that the related provision for bad debts is provided on the grouping basisGrouping 1 429,044 43 0 0Grouping 2 21,075 2 0 0Grouping 3 537,868 55 –21,861 4%Amounts that are not individually significant but the related provision for bad debts is provided on the individual basis
0 0 0 0
987,987 100 –21,861 2%
(c) As at 31 December 2017 and 31 December 2016, the Group had no accounts re-ceivable with amounts that were individually significant and the related provision for bad debts is provided on the individual basis.
(d) As at 31 December 2017 and 31 December 2016, Accounts receivable of grouping
2 that were overdue amounted to RMB 22,200,000 and RMB 21,075,000 respective-ly. The Group expected such accounts receivable to be recoverable and not impaired based on clients' financial position and credit history, and thus no provision was made individually.
(e) Accounts receivable that the related provision for bad debts is provided on the basis of grouping 3 using the aging method are analysed as follows:
31 December 2017Amount Percentage of total
balance (%)Provision for bad debts Ratio
Not due 900,091 89% 0 0Overdue within 3 months 77,989 8% 0 0Overdue between 3 and 6 months 10,531 1% –533 5%Overdue between 6 and 12 months 4,893 0% –979 20%Overdue more than 1 year 14,572 2% –9,143 63%
1,008,076 100% –10,655 1%
31 December 2016Amount Percentage of total
balance (%)Provision for bad debts Ratio
Not due 376,691 70% –146 0%Overdue within 3 months 111,159 20% –126 0%Overdue between 3 and 6 months 14,776 3% –850 6%Overdue between 6 and 12 months 9,753 2% –2,162 22%Overdue more than 1 year 25,489 5% –18,577 73%
537,868 100% –21,861 4%
SECTION 9.FINANCIAL STATEMENTS AND AUDITOR'S REPORT

2017 ANNUAL REPORT 105
In 2017, the provision for bad debts was RMB 6,476,000 (2016: equivalent to RMB 16,308,000). The reversal or write-off of provision for bad debts amounted to RMB 9,819,000 (2016: equivalent to RMB 13,186,000). Significant reversal or write-off is presented below:
2017 Reason for reversal or write-off
Basis and rationality in determining the original provision for bad debts
Amount Recovery mode
Overseas customer A Business recovery Provide on the basis of aging 3,944 Cash collected
2016 Reason for reversal or write-off
Basis and rationality in determining the original provision for bad debts
Amount Recovery mode
Domestic customer B Win a lawsuit Provide on the basis of aging 5,519 Object collected back
(f) Accounts receivable that are written-off In 2017, the accounts receivable that were written-off amounted to RMB 8,092,000
(2016: equivalent to RMB 584,000).
2017 Reason Nature Amount Whether arising from related party transactions
Overseas customer C Can not be recovered after many times of collection, and write-off according to the policies of the Company
Payment for goods 6,492 No
(g) The top 5 accounts receivable are analysed by balance as follows:
Balance Provision for bad debts Percentage of total balance of accounts receivable (%)31 December 2017 1,311,128 0 6431 December 2016 534,831 0 55
(h) Please refer to Note 4 (21) (a) for detailed pledging information of accounts receivable as at 31 December 2017 and 31 December 2016.
(6) Other receivables
31 December 2017 31 December 2016Account receivable from third parties (i) 125,808 0Deposits receivable 7,476 8,351Loans receivable from employees 6,100 6,485Tax refund receivable 1,792 3,248Others 16,279 17,970
157,455 36,054Less: Provision for bad debts 0 0
157,455 36,054
(i) As at May 2017, Saurer Hongkong Machinery Company Limited has provided supplier loans amounting to RMB 125,808,000. The repayment has been received on January and March 2018.
SECTION 9.FINANCIAL STATEMENTS AND AUDITOR'S REPORT

106 2017 ANNUAL REPORT
(7) Advances to suppliers (a) The aging of advances to suppliers is analysed as follows:
31 December 2017 31 December 2016Amount % total balance Amount % total balance
Within 6 months 54,007 71 53,124 836 to 12 months 17,654 23 2,430 4Over 1 year 4,604 6 8,089 13
76,265 100 63,643 100
As at 31 December 2017, advances with the aging over 1 year were unsettled advances for procurement, amounting to RMB 4,604,000 (31 December 2016: equivalent to RMB 8,089,000 respectively).
(b) As at 31 December 2017 and 31 December 2016, the top 5 advances to suppliers are analysed by balance as follows:
Total balance of the top 5 advances to suppliers
% of total advances to suppliers
31 December 2017 24,944 3331 December 2016 20,298 32
(8) Inventories (a) Inventories are summarised by categories as follows:
31 December 2017 31 December 2016Carrying amount
Provision for decline in
inventories
Carrying amount
Carrying amount
Provision for decline in
inventories
Carrying amount
Raw materials 850,181 –74,227 775,954 620,951 –49,216 571,735Work in progress 153,489 –2,378 151,111 130,012 –1,188 128,824Finished goods 373,773 –6,759 367,014 250,570 –3,188 247,382Spare parts 315,898 –35,352 280,546 294,448 –28,549 265,899
1,693,341 –118,716 1,574,625 1,295,981 –82,141 1,213,840
(b) Provision for decline in inventories is analysed as follows:
31 Decem-ber 2016
Increase in the current
year
Decrease in the current year
Foreign currency
translation difference
31 December 2017
Accrual Reversal Write-offRaw materials 49,216 61,574 –23,696 –15,191 2,324 74,227Work in progress 1,188 1,592 –557 0 155 2,378Finished goods 3,188 3,789 0 –326 108 6,759Spare parts 28,549 15,784 –2,446 –7,652 1,117 35,352
82,141 82,739 –26,699 –23,169 3,704 118,716
SECTION 9.FINANCIAL STATEMENTS AND AUDITOR'S REPORT

2017 ANNUAL REPORT 107
(c) Provision for decline in inventories in 2017 is as follows:
Specific determining basis for net realisable value The reason for reversal or write-off of provision for decline in the value of inventories
Raw materials Net realisable value is determined based on the estimated selling price in the ordinary course of business, less the estimated costs to completion and estimated costs necessary to make the sale and related taxes.
The difference between the accrued provision for the decline in the value of inventories in the current year and prior year is reversed; the provision for decline in the value of inventories in prior year is written-off based on the physical disposal of the inventories in the current year.
Work in progressFinished goods Spare parts
(d) Please refer to Note 4 (21) (a) for detail pledging information of inventories 31 December 2016.
(9) Long-term receivables
31 December 2017 31 December 2016Accounts receivable (Note 4 (5)) 2,088,816 1,039,114Less: Accounts receivable due within one year –2,053,576 –987,987
35,240 51,127
Long-term receivables are the undued receivables from installment sales of the subsidiaries.
(10) Other current assets
31 December 2017 31 December 2016VAT input 179,221 95,138Enterprise income tax prepaid 8,289 12,053Wealth management products (a) (WMPs) 4,539,131 4,603,315
4,726,641 4,710,506
(a) The balance of WMPs on 31 December 2017 comprises: - Saurer Textile (Changzhou) Machinery Technology Co. Ltd, the subsidiary of the
Company, purchased interest-guaranteed and principal-guaranteed RMB WMP issued by Bank of Nanjing Jintan Branch in September 2017, amounting to RMB 4,500,000,000, with an expected annual yield of 3.5%. The WMPs were due on 27 February 2018 (as at 31 December 2016, RMB 4,500,000,000 of WMP with an expected annual yield of 3%. The WMPs were due in September 2017.)
The balance of WMPs on 31 December 2016 comprises: - Saurer (Changzhou) Textile Machinery Co. Ltd, the subsidiary of the Company,
purchased WMPs issued by ICBC Jintan Branch and CITIC Bank Jintan Branch, amounting to RMB 59,000,000 and RMB 4,000,000, with expected annual yields of 2.30% and 2.75% respectively. The WMPs were due and collected in January 2017.
SECTION 9.FINANCIAL STATEMENTS AND AUDITOR'S REPORT

108 2017 ANNUAL REPORT
(11) Available-for-sale financial assets
31 December 2017 31 December 2016Measured at fair value
- Fund products 0 51Less: Provisions for impairment 0 0Less: Available-for-sale financial assets included in other current assets
0 0
0 51
The fair value of available-for-sale financial assets is based on the quoted market price at the balance sheet date.
(12) Long-term equity investments
31 December 2017 31 December 2016Joint ventures 350 1,082Total 350 1,082Less: Provision for impairment of long-term equity investments
0 0
350 1,082
On 2 March 2015, the Company’s Switzerland subsidiary SAURER AG entered into a joint venture agreement with a third party to establish Saurer Premier Technologies Private Limited in India. The registered capital of the joint venture was INR 30,000,000. According to the agreement, SAURER AG and the third party hold 50% equity and 50% voting rights in the joint venture, respectively. The main operations of the joint venture are production and sales of clearers and accessories. The long-term equity investments are subject to foreign exchange control of India, where the investments are located.
(a) Joint ventures
31 De-cember
2016
Movements in the current year 31 De-cember
2017
Provision for im-
pairment Invest-
ment in-creased
Invest-ment de-creased
Share of net prof-
it/(loss) under equity
method
Adjust-ment of
other compre-hensive income
Share of other
changes in equity
Profit/cash div-
idends declared
by joint venture
Provision for im-
pairment
Others
Saurer Premier Technologies Private Limited
1,082 0 0 –740 0 0 0 0 8 350 0
SECTION 9.FINANCIAL STATEMENTS AND AUDITOR'S REPORT

2017 ANNUAL REPORT 109
(13) Fixed assets
31 December 2016 Increase in the current year Decrease in the current year
Foreign currency translation differ-ence
31 December 2017Transfers from construction in progress
Other increases
Total cost 1,354,590 55,886 69,238 –55,847 52,794 1,476,661Buildings 421,243 5,762 1,269 –2,085 17,153 443,342Machinery equipment and other equipment
784,706 50,124 67,969 –22,713 34,069 914,155
Land ownership 148,641 0 0 –31,049 1,572 119,164Total accumulated depreciation
–476,057 0 –138,447 14,846 –22,616 –622,274
Buildings –80,175 0 –21,548 1,131 –3,482 –104,074Machinery equipment and other equipment
–395,882 0 –116,899 13,715 19,134 –518,200
Land ownership 0 0 0 0 0 0Total impairment –7,014 0 0 0 –477 –7,491
Buildings 0 0 0 0 0 0Machinery equipment and other equipment
–7,014 0 0 0 –477 –7,491
Land ownership 0 0 0 0 0 0Carrying amount 871,519 0 0 0 0 846,896
Buildings 341,068 0 0 0 0 339,268Machinery equipment and other equipment
381,810 0 0 0 0 388,464
Land ownership 148,641 0 0 0 0 119,164
(a) In 2017, depreciation of fixed assets was RMB 138,447,000 (in 2016: equivalent to
RMB 141,036,000), of which RMB 115,251,000, RMB 5,311,000 and RMB 17,885,000 (in 2016: of which RMB 121,336,000, RMB 5,038,000 and RMB 14,662,000) were charged in cost of sales, operating expenses and general and administrative expenses.
In 2017, the cost of fixed assets transfers from construction in progress were RMB 55,886,000 (in 2016: RMB 51,322,000).
As at 31 December 2017, the balances of impairment provision were equivalent to RMB 7,491,000 (31 December 2016: equivalent to RMB 7,014,000).
(b) Information of mortgage and pledge Refer to Note 4 (21) (a) for mortgage information of fixed assets.
(c) In 2017 and 2016, the Company had no idle fixed assets, fixed assets held under financial lease, fixed assets used for operating lease or fixed assets without property certificate.
SECTION 9.FINANCIAL STATEMENTS AND AUDITOR'S REPORT

110 2017 ANNUAL REPORT
(14) Construction in progress
31 December 2017 31 December 2016Book balance Provision for
impairment Carrying amount Book balance Provision for
impairment Carrying amount
Xinjiang Plant Con-struction Project
136,134 0 136,134 0 0 0
Other plant and equipment
72,633 0 72,633 38,727 0 38,727
208,767 0 208,767 38,727 0 38,727
(a) Changes in major construction in progress
Project name Budget 31
Dec
embe
r 201
6
Incr
ease
in th
e cu
rren
t yea
r
Tran
sfer
to fi
xed
asse
ts
Tran
sfer
to
inta
ngib
le a
sset
s
Fore
ign
curr
ency
tr
ansl
atio
n
diffe
renc
e
31 D
ecem
ber 2
017
% o
f eng
inee
ring
Inve
stm
ent t
o bu
dget
Prog
ress
of w
orks
Cum
ulat
ive
amou
nt
of c
apita
lised
bo
rrow
ing
cost
s
Incl
udin
g:
Borr
owin
g co
sts
capi
talis
ed in
the
curr
ent y
ear
Cap
italis
atio
n ra
te
for b
orro
win
g co
sts
in th
e
curr
ent y
ear
Sour
ce
of fu
nd
Xinjiang Plant Con-struction Project
475,766 0 136,134 0 0 0 136,134 29 29% 0 0 0 Self–raised
Other plant and equipment
138,597 38,727 88,016 –55,886 –856 2,632 72,633 52 52% 0 0 0 Self–raised
Total 614,363 38,727 224,150 –55,886 –856 2,632 208,767 0 0 0 0 0 /
Project name Budget 31
Dec
embe
r 201
5
Incr
ease
in th
e cu
rren
t yea
r
Tran
sfer
to fi
xed
asse
ts
Tran
sfer
to
inta
ngib
le a
sset
s
Fore
ign
curr
ency
tr
ansl
atio
n
diffe
renc
e
31 D
ecem
ber 2
016
% o
f eng
inee
ring
Inve
stm
ent t
o bu
dget
Prog
ress
of w
orks
Cum
ulat
ive
amou
nt
of c
apita
lised
bo
rrow
ing
cost
s
Incl
udin
g:
Borr
owin
g co
sts
capi
talis
ed in
the
curr
ent y
ear
Cap
italis
atio
n ra
te
for b
orro
win
g co
sts
in th
e
curr
ent y
ear
Sour
ce o
f fun
d
Plant and equipment
196,783 28,418 62,553 –51,322 –1,760 838 38,727 20 20% 0 0 0 Self–raised
As at 31 December 2017 and 2016, the Group believed that there was no indication that any construction in progress may be impaired, therefore no provision was made.
SECTION 9.FINANCIAL STATEMENTS AND AUDITOR'S REPORT

2017 ANNUAL REPORT 111
(15) Intangible assets/development expenditure
31 December 2016 Increase in the current year
Decrease in the current year
Foreign currency translation difference
31 December 2017
Cost- Development cost 74,569 46,757 –72,473 2,802 51,655- Total intangible assets 1,399,700 177,304 –783 19,969 1,596,190
Land use rights 25,625 92,802 0 0 118,427Customer relations 98,675 0 0 5,449 104,124Patents 335,437 0 0 18,014 353,451Trademarks 844,648 0 0 –8,700 835,948Software and others 36,146 12,029 –783 1,786 49,178Capitalising R&D expenditure - technology 59,169 72,473 0 3,420 135,062
Accumulated amortisation- Development cost 0 0 0 0 0- Total intangible assets –186,446 –75,812 765 –13,952 –275,445
Land use rights –2,141 –2,067 0 0 –4,208Customer relations –35,808 –11,486 0 –2,110 –49,404Patents –123,254 –36,654 0 –7,336 –167,244Trademarks 0 0 0 0 0Software and others –18,196 –7,110 765 –908 –25,449Capitalising R&D expenditure - technology –7,047 –18,495 0 –3,598 –29,140
ImpairmentCapitalising R&D expenditure - technology –5,196 0 0 90 –5,106
Carrying amount- Development cost 74,569 0 0 0 51,655- Total intangible assets 1,208,058 0 0 0 1,315,639
Land use rights 23,484 0 0 0 114,219Customer relations 62,867 0 0 0 54,720Patents 212,183 0 0 0 186,207Trademarks 844,648 0 0 0 835,948Software and others 17,950 0 0 0 23,729Capitalising R&D expenditure - technology 46,926 0 0 0 100,816
(a) In 2017, the amortisation of intangible assets amounted to RMB 75,812,000 (2016: equivalent to RMB 60,603,000).
(b) Expenditures on research and development of the Group are as follows:
Project name
31 December 2016 Increase in the current year
Decrease in the current year Foreign currency translation difference
31 December 2017
Expenditures on research and development
Recognised in profit or loss
Recognised as intangible assets
Project 1 3,068 336 0 0 217 3,621Project 2 0 2,693 0 0 62 2,755Project 3 36,322 28,951 –19,836 –38,273 111 7,275Project 4 10,710 23 0 –11,207 474 0Project 5 0 20,400 0 0 470 20,870Others 24,469 269,679 –255,489 –22,993 1,468 17,134
74,569 322,082 –275,325 –72,473 2,802 51,655
Expenditures on research and development incurred in 2017 and 2016 amount-ing to RMB 322,082,000 and RMB 296,049,000 in total respectively, of which RMB 275,325,000 and RMB 263,543,000 were the expenditure incurred on the research phase and recognised in profit or loss during the current year, RMB 72,473,000
SECTION 9.FINANCIAL STATEMENTS AND AUDITOR'S REPORT

112 2017 ANNUAL REPORT
and RMB 47,649,000 were recognised as intangible assets respectively, and RMB 51,655,000 and RMB 74,569,000 were incurred on the development phase and includ-ed in the year end balance of development costs respectively.
Development cost incurred in 2017 and 2016 accounted for 14% and 11% respectively of total expenditures on research and development.
As at 31 December 2017 and 31 December 2016, intangible assets resulting from inter-nal research and development of the Group comprised of 3.8% and 3.9% of the carrying amount of intangible assets.
As at 31 December 2017 and 31 December 2016, the Company’s subsidiary, SAURER AG, made a provision of CHF 753,000 (equivalent to RMB 5,106,000) and CHF 753,000 (equiv-alent to RMB 5,196,000) respectively for impairment of part of R&D projects.
(16) Goodwill
31 December 2016 Movement in the current year Foreign currency translation difference 31 December 2017Goodwill -
Acquisition of staple fibres and textile components business from the Oerlikon Group
569,506 0 18,950 588,456
Acquisition of Verdol twisting operations
14,378 0 978 15,356
583,884 0 19,928 603,812Less: Impairment (a) 0 0 0 0
583,884 0 19,928 603,812
Goodwill is the result of acquisition of staple fibres and textile components business from the Oerlikon Group in 2013 and the acquisition of Verdol twisting operations in 2015.
(a) Impairment The goodwill allocated to the asset groups and groups of asset groups are summarised
by operating segments as follows:
31 December 2017 31 December 2016Spinning Solutions 502,805 475,403Textile Technologies 101,007 108,481
603,812 583,884
The recoverable amount of asset groups or asset group portfolio is calculated using the estimated cash flows determined according to the three-year budget approved by management. Fixed growth rates will be used as basis of estimation after three years. The cash flows beyond the three-year period are calculated based on the estimated growth rates. The estimated growth rates are determined based on the estimated data of the market by management. Management determines budgeted gross margins based on past experience and forecast on future market development and adopts the discount rate of 13% in both 2017 and 2016. The above assumptions are used to assess the recoverable amount of each asset group or asset group protfolio within the correspond-ing business segment. According to the result of the impairment test, the recoverable amount of an asset group or group of asset groups is higher than its carrying amount. Thus, no impairment loss is recognised.
SECTION 9.FINANCIAL STATEMENTS AND AUDITOR'S REPORT

2017 ANNUAL REPORT 113
(17) Long-term prepaid expenses
31 December 2016
Increase in cur-rent year
Amortisation in current year
Foreign currency translation difference
31 December 2017
Leasehold improvement 3,705 1,062 (1,252) (61) 3,454
(18) Deferred tax assets and deferred tax liabilities (a) Deferred tax assets without taking into consideration the offsetting of balances
31 December 2017 31 December 2016Deductible temporary differ-ences and deductible losses
Deferred tax assets Deductible temporary differ-ences and deductible losses
Deferred tax assets
Bad debts provision for account receivables 1,076 310 3,036 999Provision for decline in inventories 38,455 8,862 24,592 5,785Defined benefit plan 176,555 54,137 139,701 42,474Other payables and accrued expenses 52,187 10,570 29,477 6,133Provisions 1,146 317 2,950 857Depreciation of fixed assets 42 13 4,456 1,399Amortisation of intangible assets 67,701 13,930 79,121 16,176Deductible losses 49,029 15,970 23,469 7,494Elimination of intra-group unrealised profit 89,747 23,813 44,827 11,945Others 0 0 3,090 798
475,938 127,922 354,719 94,060Including:
Expected to reverse within one year (inclusive)
0 59,842 0 33,478
Expected to reverse after one year 0 68,080 0 60,5820 127,922 0 94,060
(b) Deferred tax liabilities without taking into consideration the offsetting of balances
31 December 2017 31 December 2016Taxable temporary
differencesDeferred tax
liabilitiesTaxable temporary
differencesDeferred tax
liabilitiesDepreciation of fixed assets 121,208 25,697 152,458 33,346Amortisation of intangible assets 330,019 75,808 284,844 67,018Capitalised development cost 113,532 36,049 85,173 26,847Defined benefit plan 138,844 24,395 119,511 20,999Bad debts provision for account receivables 8,529 1,506 8,103 1,414Provision for decline in inventories 15,355 2,738 15,055 3,207Withholding income tax of profit not remitted by overseas subsidiaries
418,396 41,083 368,295 35,426
Interest receivable 4,522 1,131 24,833 6,297Others 96,857 20,651 117,301 23,166
1,247,262 229,058 1,175,573 217,720Including:
Expected to reverse within one year (inclu-sive)
0 18,470 0 24,165
Expected to reverse after one year 0 210,588 0 193,5550 229,058 0 217,720
SECTION 9.FINANCIAL STATEMENTS AND AUDITOR'S REPORT

114 2017 ANNUAL REPORT
(c) Deductible temporary differences and deductible losses that are not recognised as deferred tax assets are analysed as follows:
31 December 2017 31 December 2016Deductible temporary differences 68,451 79,135Deductible losses 15,824 12,413
84,275 91,548
(d) Deductible losses that are not recognised as deferred tax assets will expire in the following years:
31 December 2017 31 December 20162018 0 02019 0 02020 1,198 02021 2,210 1,1982022 and beyond 12,416 11,215
15,824 12,413
(e) The net balances of deferred tax assets and liabilities after offsetting are as follows:
31 December 2017 31 December 2016Offsetting amount After offsetting Offsetting amount After offsetting
Deferred tax assets –60,735 67,187 –67,322 26,738Deferred tax liabilities –60,735 168,323 –67,322 150,398
(f) Temporary differences that are not recognised as deferred tax liabilities and related to investment to subsidiaries
31 December 2017 31 December 2016Retained earnings of subsidiaries 173,425 0
(19) Allowance for assets impairment
31 December 2016
Increase in the current year
Decrease in the current year Foreign currency translation
31 December 2017
Reversal Write-off DifferenceProvision for/(reversal of) bad debts 21,861 6,476 –9,819 –8,092 229 10,655Including: Provision for bad debts of accounts receivable
21,861 6,476 –9,819 –8,092 229 10,655
Provision for decline in the value of inventories 82,141 82,739 –26,699 –23,169 3,704 118,716Provision for impairment of fixed assets 7,014 0 0 0 477 7,491Provision for impairment of intangible assets 5,196 0 0 0 –90 5,106
116,212 89,215 –36,518 –31,261 4,320 141,968
SECTION 9.FINANCIAL STATEMENTS AND AUDITOR'S REPORT

2017 ANNUAL REPORT 115
(20) Other non-current assets
31 December 2017 31 December 2016Defined benefit plan assets (Note 4 (31)) 138,844 119,511Prepayment for machinery equipment 54,757 0Land bidding deposits and transfer fees (a) 0 83,723Others 11,707 11,171
205,308 214,405
(a) As at 31 December 2016, the balance comprised deposits, transfer fees and related expenses which the Company’s subsidiary Saurer Xinjiang Intelligent Machinery Com-pany Limited paid to Ministry of Land and Resources of Urumqi Municipality, Xinjiang Uygur Autonomous Region in December 2016, for purchase of plant construction land. In 2017, the expenditure was transferred to intangible asset as land cost.
(21) Short-term borrowings
Original currency 31 December 2017 31 December 2016Pledged borrowings (a) INR 0 2,548Guaranteed borrowings CNY 181,000 192,974Guaranteed borrowings EUR 64,842 682,946Guaranteed borrowings INR 21,159 414
/ 267,001 878,882
(a) As at 31 December 2016, accounts receivable with a carrying amount equivalent to RMB 9,704,000, inventories with a carrying amount equivalent to RMB 7,880,000 and fixed assets with a carrying amount equivalent to RMB 2,717,000 of the Company’s subsidiary, Peass Industrial Engineers Pvt. Ltd, were pledged as collateral to acquire the credit line of INR 45,942,000 (equivalent to RMB 4,685,000) from the local bank. As at 31 December 2016, credit line used to obtain short-term amounted to INR 24,985,000 (equivalent to RMB 2,548,000), and the credit line used to obtain current portion of long-term borrowings amounted to INR 396,000 (equivalent to RMB 40,000) (Note 4 (29)). Peass Industrial Engineers Pvt. Ltd, subsidiary of the Company, was disposed in June 2017 (Note 5 (2)).
As at 31 December 2017 and 31 December 2016, there were no overdue short-term borrowings.
(22) Accounts payable
31 December 2017 31 December 2016Trade payable 1,492,701 823,976
As at 31 December 2017, accounts payable with the aging over 1 year amounted to RMB 33,805,000 (31 December 2016: equivalent to RMB 26,008,000), and mainly comprised unsettled trade payable.
SECTION 9.FINANCIAL STATEMENTS AND AUDITOR'S REPORT

116 2017 ANNUAL REPORT
(23) Advances from customers
31 December 2017 31 December 2016Advances from customers 1,374,279 843,492
As at 31 December 2017, advances from customers with the aging over 1 year amounted to RMB 47,818,000 (31 December 2016: equivalent to RMB 48,214,000), and mainly com-prised advances for machinery orders. Such payments are not settled because the orders have not been completed yet.
(24) Employee benefits payable
31 December 2017 31 December 2016Short-term employee benefits (a) 198,528 165,239Defined contribution plans (b) 2,670 1,037Termination benefits (c) 2,162 18,310Long-term employee benefits payable within one year (Note 4 (31))
56,345 46,692
259,705 231,278
(a) Short-term employee benefits
31 December 2016 Increase in the current year
Decrease in the current year
Foreign currency translation difference
31 December 2017
Wages and salaries, bonus, allowances and subsidies
110,692 1,167,150 –1,145,076 2,895 135,661
Welfare of epmloyee 994 22,666 –23,725 65 0Social security contributions 379 20,751 –20,299 23 854Including:
Medical insurance 296 16,830 –16,700 12 438Work injury insurance 75 3,479 –3,165 11 400Maternity insurance 8 442 –434 0 16
Housing funds 162 12,356 –12,375 0 143Labour union funds and employee education funds
4,223 744 –846 0 4,121
Other short-term employee benefits 48,789 242,448 –236,252 2,764 57,749165,239 1,466,115 –1,438,573 5,747 198,528
(b) Defined contribution plans
31 December 2016 Increase in the current year
Decrease in the current year
Foreign currency translation difference
31 December 2017
Basic pensions 822 35,396 –33,770 –35 2,413Unemployment insurance 215 1,957 –1,908 –7 257
1,037 37,353 –35,678 –42 2,670
SECTION 9.FINANCIAL STATEMENTS AND AUDITOR'S REPORT

2017 ANNUAL REPORT 117
(c) Termination benefits payable
31 December 2017 31 December 2016Other termination benefits 2,162 18,310
(25) Taxes payable
31 December 2017 31 December 2016Enterprise income tax payable 186,827 72,106Land value increment tax payable 22,689 0Individual income tax payable 17,901 12,983Withholding taxes payable 10,738 11,935Stamp tax 10,388 4,339Unpaid value-added tax 3,398 12,867Others 3,740 4,364
255,681 118,594
(26) Interest payable
31 December 2017 31 December 2016Interest payable on bank borrowings 1,923 2,039Interest payable to related parties (Note 8 (5) (e)) 472 261
2,395 2,300
(27) Other payables
31 December 2017 31 December 2016Overpayment from customers 86,613 82,862Project payment payable 49,957 1,600Accrued expenses 49,730 36,990Accrued agent fee 44,221 45,278Freight payable 31,109 7,290Professional service fee payable 15,038 9,181Payables to related parties (Note 8 (5) (d)) 11,999 14,517Accrued rebate 10,142 9,491IT maintenance fee 5,257 5,245Fixed assets procurement 3,455 1,010Others 22,847 15,110
330,368 228,574
As at 31 December 2017, other payables with an aging over one year amounted to RMB 72,846,000 (31 December 2016: equivalent to RMB 72,338,000), and mainly comprised non-trade payables. Such payables are not paid because they have not been settled yet.
SECTION 9.FINANCIAL STATEMENTS AND AUDITOR'S REPORT

118 2017 ANNUAL REPORT
(28) Current portion of non-current liabilities
31 December 2017 31 December 2016Current portion of long-term borrowings (a) 459,516 285,702Current portion of provisions (Note 4 (30)) 273,770 145,746
733,286 431,448
(a) Current portion of long-term borrowings
Original currency
31 December 2017
31 December 2016
Pledged borrowings (Note 4 (29)) EUR 459,516 285,662Secured borrowings (Note 4 (29)) INR 0 40
/ 459,516 285,702
As at 31 December 2017 and 31 December 2016, the Group had no overdue current portion of long-term borrowings.
(29) Long-term borrowings
Original currency
31 December 2017
31 December 2016
Pledged borrowings (a) EUR 2,517,680 2,642,367Guaranteed borrowings EUR 671,225 0Pledged borrowings (Note 4 (21) (a)) INR 0 40
/ 3,188,905 2,642,407Less: Current portion of long-term borrowings (Note 4 (28) (a))
EUR –459,516 –285,662INR 0 –40/ 2,729,389 2,356,705
(a) As at 31 December 2017, pledged borrowings balance of EUR 322,575,000 (equiva-lent to RMB 2,517,680,000) (including the current portion of long-term borrowings EUR 48,875,000, equivalent to RMB 381,476,000) (31 December 2016: EUR 361,675,000, equivalent to RMB 2,642,367,000 (including the current portion of long-term borrowings EUR 39,100,000, equivalent to RMB 285,662,000)) were borrowed from China Devel-opment Bank by the Company's subsidiary Saurer Hong Kong Machinery Company Limited in 2013, which was secured by long-term equity investments held by the Group in SAURER AG, Saurer Netherlands Machinery Company B.V., Saurer (Jiangsu) Textile Machinery Co. Ltd., Saurer (Changzhou) Textile Machinery Co., Ltd. and Saurer (Chang-zhou) Texparts Components Co. Ltd.
SECTION 9.FINANCIAL STATEMENTS AND AUDITOR'S REPORT

2017 ANNUAL REPORT 119
(30) Provisions
31 December 2016 Increase in the current year
Usage/other decreases
Foreign currency translation difference
31 December 2017
Product warranties 110,057 119,789 –23,357 6,555 213,044Expenses of overseas plant shutdown 18,630 8,539 –27,963 794 0Others 24,444 44,196 –1,331 1,187 68,496
153,131 172,524 –52,651 8,536 281,540Less: Provision due within one yearProduct warranties –103,403 –119,583 23,357 –6,425 –206,054Expenses of overseas plant shutdown –18,630 –8,539 27,963 –794 0Others –23,713 –44,196 1,331 –1,138 –67,716
–145,746 –172,318 52,651 –8,357 –273,770Non-current portion of provisionsProduct warranties 6,654 206 0 130 6,990Others 731 0 0 49 780
7,385 206 0 179 7,770
(31) Long-term employee benefits payable
31 December 2017 31 December 2016Defined benefit plan (a) 352,153 307,480Other employee benefits 32,880 33,093
385,033 340,573Less: Payables within one year –56,345 –46,692
328,688 293,881
Retirement benefits supposed to be paid within 1 year are presented in employee benefits payable (Note 4 (24)).
(a) Defined benefit pension plans The Group's defined benefit pension plans are mainly adopted in subsidiaries located in
Germany and Switzerland. The Group's defined benefit pension plan assets are mainly held by independent entities (such as foundations) separated from the Group. The plans are reviewed by qualified actuaries according to local practices and the required frequency. Actuarial assumptions adopted in the calculation of defined retirement benefit liabilities and current service cost will vary due to the economic conditions of countries or regions where the plans are located.
SECTION 9.FINANCIAL STATEMENTS AND AUDITOR'S REPORT

120 2017 ANNUAL REPORT
(i) Changes of current value of defined benefit pension and fair value of plan assets This note was listed according to the total value of defined benefit pension plans and
fair value of plan asset. The consolidation is not applied in subsidiary level.
Current value of defined benefit pension
Fair value of plan assets
31 December 2016 832,549 644,580Defined benefit cost recorded in profit or loss for the current period
- Service cost for the current period 37,371 6,909- Past service cost 0 0- Gain on settlement 173 0- Net interest 10,711 0
48,255 6,909Defined benefit cost recorded in other comprehensive income for the current period
- Actuarial gain 23,475 33,113- Return on plan assets 0 0
23,475 33,113Other movement
- Consideration paid upon settlement 5,657 27,756- Benefit (accrual)/paid –24,317 –16,870
–18,660 10,886Foreign currency translation difference 28,085 4,90731 December 2017 913,704 700,395
Current value of defined benefit pension
Fair value of plan assets
31 December 2015 703,927 562,568Defined benefit cost recorded in profit or loss for the current period
- Service cost for the current period 35,979 0- Past service cost 369 0- Gain on settlement 147 0- Net interest 12,479 8,144
48,974 8,144Defined benefit cost recorded in other comprehensive income for the current period
- Actuarial gain 21,458 0- Return on plan assets 0 –8,488
21,458 –8,488Other movement
- Consideration paid upon settlement 5,254 26,025- Benefit (accrual)/paid 12,397 16,541
17,651 42,566Foreign currency translation difference 40,539 39,79031 December 2016 832,549 644,580
SECTION 9.FINANCIAL STATEMENTS AND AUDITOR'S REPORT

2017 ANNUAL REPORT 121
(ii)Thenetamountofdefinedbenefitplansafteroffsettingispresentedinthebalancesheetasfollows:
31 December 2017 31 December 2016Definedbenefitplanassets(Note4(20))
Presentvalueofdefinedbenefitplanobligations
–312,131 –302,711
Less:Fairvalueofplanassets 450,975 422,222Less:Upperlimitofplanassets 0 0
138,844 119,511Definedbenefitplanliabilities
Presentvalueofdefinedbenefitplanobligations
–601,573 –529,822
Less:Fairvalueofplanassets 249,420 222,342–352,153 –307,480–213,309 –187,969
(iii)ChangesinretirementbenefitsoftheGroupareasfollows: Thisnotewaslistedaccordingtothenetvalueofdefinedbenefitpensionplansand
fairvalueofplanasset.Theconsolidationisappliedatsubsidiarylevel.
Defined benefit plan assets
Defined benefit plan liabilities
Net liabilities of the Group
31December2016 119,511 –307,480 –187,969Definedbenefitcostincludedinprofitorlossforthecurrentperiod
-Servicecostforthecurrentperiod –8,547 –28,824 –37,371-Pastservicecost 0 0 0-Gainonsettlement –151 –22 –173-Netinterest 952 –4,754 –3,802
–7,746 –33,600 –41,346Remeasurementofdefinedbenefitplanliabilities
-Actuarialgain-Differencefromactuarialassumption –2,947 –12,000 –14,947-Differencefromexperienceadjustments –3,592 –4,939 –8,531
-Returnonplanassets(excludingthatincludedinnetinterest) 31,761 1,355 33,116 25,222 –15,584 9,638Otherchanges
-Considerationpaiduponsettlement-Fromcompanies 4,496 17,603 22,099-Fromemployeesparticipatingintheplan 0 0 0
-Benefitpaid 0 7,447 7,4474,496 25,050 29,546
Foreigncurrencytranslationdifference –2,639 –20,539 –23,17831December2017 138,844 –352,153 –213,309
SECTION 9.FINANCIAL STATEMENTS AND AUDITOR'S REPORT

122 2017 ANNUAL REPORT
Defined benefit plan assets
Defined benefit plan liabilities
Net liabilities of the Group
31 December 2015 109,616 –250,975 –141,359Defined benefit cost included in profit or loss for the current period
- Service cost for the current period –7,773 –28,206 –35,979- Past service cost –369 0 –369- Gain on settlement –127 –20 –147- Net interest 1,020 –5,355 –4,335
–7,249 –33,581 –40,830Remeasurement of defined benefit plan liabilities
- Actuarial gain- Difference from actuarial assumption –1,126 –25,137 –26,263- Difference from experience adjustments 4,427 378 4,805
- Return on plan assets (excluding that included in net interest) 2,461 –10,949 –8,4885,762 –35,708 –29,946
Other changes- Consideration paid upon settlement
- From companies 4,480 16,291 20,771- From employees participating in the plan 0 0 0
- Benefit paid 0 4,144 4,1444,480 20,435 24,915
Foreign currency translation difference 6,902 –7,651 –74931 December 2016 119,511 –307,480 –187,969
(iv) The main actuarial assumptions used in estimating the liabilities at the balance sheet date were as follows:
31 December 2017 31 December 2016Germany Switzerland Germany Switzerland
Discount rate 1.35% 0.80% 1.60% 0.80%Salary growth rate N/A 1.00% N/A 0.50%Pension growth rate 1.55% 0.00% 1.55% 0.00%
(v) The sensitivity of principal actuarial assumptions adopted in determining the present value of defined benefit plan obligations in 2017 is analysed as follows:
Change in assumption
Impact on defined benefit obligationsIncrease in assumption
Decrease in assumption
Discount rate Change of 0.5 percentage point
Decrease by 5.93% Increase by 6.67%
Salary growth rate Change of 0.5 percentage point
Increase by 0.32% Decrease by 0.38%
Pension growth rate Change of 0.5 percentage point
Increase by 0.38% Decrease by 0.25%
Life expectancy Change of 1 year Increase by 1.20% Decrease by 1.26%
SECTION 9.FINANCIAL STATEMENTS AND AUDITOR'S REPORT

2017 ANNUAL REPORT 123
The sensitivity of principal actuarial assumptions adopted in determining the present value of defined benefit plan obligations in 2016 is analysed as follows:
Change in assumption
Impact on defined benefit obligationsIncrease in assumption
Decrease in assumption
Discount rate Change of 0.5 percentage point
Decrease by 6.06% Increase by 6.86%
Salary growth rate Change of 0.5 percentage point
Increase by 0.43% Decrease by 0.46%
Pension growth rate Change of 0.5 percentage point
Increase by 0.35% Decrease by 0.22%
Life expectancy Change of 1 year Increase by 1.23% Decrease by 1.25%
(vi) The plan assets portfolio of the Group is mainly composed of the following investment products:
31 December 2017 31 December 2016Cash and cash equivalents 12,191 17,390Equity instruments 148,203 122,767Debt instruments 115,331 118,797Real estate 153,621 146,805Investment funds 220,684 193,650Others 50,365 45,171
700,395 644,580
(32) Deferred revenue
2017 2016Enterprise development special fund 69,290 69,290
Finance Bureau of Urumqi Economic and Technological Development Zone (Toutunhe District), Xinjiang Uygur Autonomous Region, appropriates enterprise development special fund amounting to RMB 69,290,000 through Construction Investment and Development Co., Ltd of Urumqi Economic and Technological Development Zone, to support the development of the Company’s subsidiary Saurer Xinjiang Intelligent Machinery Company Limited, and promote industrial transformation and upgrading and expand the business scope. The special fund shall be used exclusively for its intended purposes as expenses in production and operation, expanded reproduction, etc., and may not be misused for expenses incurred in non-production business, construction of fixed assets, etc. Saurer Xinjiang Intelligent Machinery Company Limited had not started production and operation yet in 2017. As a result, the fund was recognised as deferred revenue in 2017 and 2016.
SECTION 9.FINANCIAL STATEMENTS AND AUDITOR'S REPORT

124 2017 ANNUAL REPORT
(a) Government grants
31 D
ecem
ber 2
016
Cha
nges
in
acco
untin
g
polic
ies
1 Ja
nuar
y 20
17
Incr
ease
in th
e cu
rren
t yea
r
Decrease in the current year
31 D
ecem
ber 2
017
Rel
ated
to a
sset
s/re
late
d to
inco
me
Offs
et fi
xed
asse
ts
Rec
ogni
se in
ot
her
inco
me
Offs
et g
ener
al
and
adm
inis
tra-
tive
expe
nses
Offs
et fi
nanc
ial
expe
nse
Rec
ogni
se in
no
n-op
erat
ing
inco
me
Offs
et
non-
oper
atin
g ex
ense
s
Enterprise development special fund 69,290 0 69,290 0 0 0 0 0 0 0 69,290 Related to Income
69,290 0 69,290 0 0 0 0 0 0 0 69,290
31 D
ecem
ber 2
015
Cha
nges
in
acco
untin
g
polic
ies
1 Ja
nuar
y 20
16
Incr
ease
in th
e cu
rren
t yea
r
Decrease in the current year
31 D
ecem
ber 2
016
Rel
ated
to a
sset
s/re
late
d to
inco
me
Offs
et fi
xed
asse
ts
Rec
ogni
se in
ot
her
inco
me
Offs
et g
ener
al
and
adm
inis
tra-
tive
expe
nses
Offs
et fi
nanc
ial
expe
nse
Rec
ogni
se in
no
n-op
erat
ing
inco
me
Offs
et
non-
oper
atin
g ex
ense
s
Enterprise development special fund 0 0 0 69,290 0 0 0 0 0 0 69,290 Related to Income
0 0 0 69,290 0 0 0 0 0 0 69,290 Related to Income
(33) Paid-in capital
31 December 2016
Movement in the current year 31 December 2017Issue of new
shares Issue of bonus
sharesProvident funds
to equityInfluence of
restructuring deal (Note 5 (1))
Sub-total
RMB ordinary shares 1,219,627 0 0 0 675,786 675,786 1,895,413
31 December 2015
Movement in the current year 31 December 2016Issue of new
shares Issue of bonus
sharesProvident funds
to equityOthers Sub-total
RMB ordinary shares 1,219,627 0 0 0 0 0 1,219,627
According to [2017] No.1397 the approval of major assets restructuring of Xinjiang Urban Construction Co. Ltd. by issuing new shares to Jiangsu Jinsheng Industries Co. Ltd. and other investors promulgated by CSRS on 28 July 2017, the Company obtained permission to issue 1,219,627 (in thousand) common shares to the public with an offering price of RMB 6.17 per share. The paid-in capital as at 1 January 2016 in the Group’s consolidated financial statements reflects the amount for acquiring Saurer Intelligent Machinery by issuing shares in this restructuring process.
SECTION 9.FINANCIAL STATEMENTS AND AUDITOR'S REPORT

2017 ANNUAL REPORT 125
(34) Other comprehensive income
Other comprehensive income in balance sheet
Other comprehensive income in income statement for the year ended 31 December 2017
31 December
2016
Attributable to the parent company, net
of tax
31 December
2017
Amount be-fore income
tax of the year
Less: Trans-fer from pre-
vious other comprehen-sive income
Less: Income tax expenses
Attributable to the parent company, net
of tax
Attributable to non-
controlling interest, net
of taxItems that will not be reclassified subsequently to profit or loss
Defined benefit plan actuarial losses or gains
–16,549 10,077 –6,472 9,638 0 439 10,077 0
Items that may be reclassified to profit or loss
Cash flow hedge losses 693 249 942 164 0 85 249 0Foreign currency translation difference
49,106 –166,964 –117,858 –165,865 –608 0 –166,964 491
33,250 –156,638 –123,388 –156,063 –608 524 –156,638 491
Other comprehensive income in balance sheet
Other comprehensive income in income statement for the year ended 31 December 2016
31 December
2015
Attributable to the parent company, net
of tax
31 December
2016
Amount be-fore income
tax of the year
Less: Trans-fer from pre-
vious other comprehen-sive income
Less: Income tax expenses
Attributable to the parent company, net
of tax
Attributable to non-con-
trolling interest, net
of taxItems that will not be reclassified subsequently to profit or loss
Defined benefit plan actuarial losses or gains
3,038 –19,587 –16,549 –29,946 0 10,359 –19,587 0
Items that may be reclassified to profit or loss
Cash flow hedge losses 964 –271 693 –236 0 –35 –271 0Foreign currency translation difference
26,249 22,857 49,106 23,386 0 0 22,857 529
30,251 2,999 33,250 –6,796 0 10,324 2,999 529
Reconciliation of other comprehensive income
Equity attributable to the parent company Non-controlling interests
Total other comprehensive
incomeLosses arising
from cash flow hedging
instrument
Defined benefit plan actuarial
gains or losses
Differences on translation of
foreign cur-rency financial
statements
Sub-total
31 December 2015 964 3,038 26,249 30,251 821 31,072Movements for the year ended 31 December 2016 –271 –19,587 22,857 2,999 529 3,52831 December 2016 693 –16,549 49,106 33,250 1,350 34,600Movements for the year ended 31 December 2017 249 10,077 –166,964 –156,638 491 –156,14731 December 2017 942 –6,472 –117,858 –123,388 1,841 –121,547
SECTION 9.FINANCIAL STATEMENTS AND AUDITOR'S REPORT

126 2017 ANNUAL REPORT
(35) Capital surplus and surplus reserve
(a) Capital surplus
31 December 2016 Increase in the current year
Decrease in the current year (Note 5 (1))
31 December 2017
Expenses paid by the parent company on behalf of the Group (Note 4 (29) (a))
24,022 0 –24,022 0
31 December 2015 Increase in the current year
Decrease in the current year
31 December 2016
Expenses paid by the parent company on behalf of the Group (Note 4 (29) (a))
0 24,022 0 24,022
(b) Surplus reserve
31 December 2016 Increase in the current year
Decrease in the current year
31 December 2017
Statutory surplus reserve 0 48,742 0 48,742
In accordance with the Company Law of the People's Republic of China, the Company should appropriate net profit (after offsetting accumulated losses of previous years) to the Statutory Surplus Reserve, in which the Statutory Surplus Reserve accounts for no less than 10% of net profit. The Company can cease appropriation when the statutory surplus reserve accumulated to more than 50% of the registered capital. The statutory surplus reserve can be used to make up for the loss or increase the paid-in capital after approval from the appropriate authorities. No surplus reserve was appropriated by the Company due to net losses in 2016.
In 2017, the Company apropriated 10% of the current year profit to its statutory surplus reserve and did not appropriate discretionary surplus reserve.
(36) Retained earnings
2017 2016Undistributed profit at the beginning of the year 1,253,134 778,217Add: Net profit attributable to shareholders of the Company for the current year
658,327 474,917
Less: Appropriate statutory surplus reserve –48,742 0Less: Impact of restructuring deal (Note 5 (1)) –891,100 0Less: Purchase non-controlling interests of subsidi-aries (Note 4 (37))
–585,352 0
Undistributed profits at the end of the year 386,267 1,253,134
(37) Purchase non-controlling interests of subsidiariesOn 29 November 2017, the Company held the third board meeting and passed the resolu-tion regarding “Acquisition of 5% shares of Saurer Intelligent Machinery by cash”. The Com-pany spent RMB 715,342,466 to acquire 5% shares of Saurer Intelligent Machinery held by Shanghai Yongyun. Saurer Intelligent Machinery becomes the wholly-owned subsidiary of the Company after the acquisition.
SECTION 9.FINANCIAL STATEMENTS AND AUDITOR'S REPORT

2017 ANNUAL REPORT 127
The difference between the consideration amounting to RMB 715,342,000 paid by the Company and the share of net assets of Saurer Intelligent Machinery Co., Ltd calculated continuously since the acquisiation day regarding the increased shareholding ratio, amount-ing to RMB 129,990,000, was RMB 585,352,000. The Company offset the capital surplus, surplus reserve and retained earings in sequence, and adjusted retained earnings due to insuffiency of capital surplus and surplus reserve.
(38) Revenue and cost of sales
2017 2016Main operating income 8,706,683 6,347,251Other operating income 6,729 5,503
8,713,412 6,352,754
2017 2016Cost of goods sold 6,389,179 4,735,487Other operating cost 0 0
6,389,179 4,735,487
(a) Revenue from main operations and cost of main operations
2017 2016Revenue
from main operations
Cost of main operations
Revenue from main
operations
Cost of main operations
- Sale of machinery and equipment and components
7,608,732 5,810,349 5,195,805 4,181,957
- Sales of spare parts and rendering of services
1,097,951 578,830 1,151,446 553,530
8,706,683 6,389,179 6,347,251 4,735,487
(b) Revenue from other operations and cost of other operations
2017 2016Revenue
from other operations
Cost of other operations
Revenue from other operations
Cost of other operations
Sales of raw materials 4,284 0 3,053 0Rental income 2,445 0 2,450 0
6,729 0 5,503 0
SECTION 9.FINANCIAL STATEMENTS AND AUDITOR'S REPORT

128 2017 ANNUAL REPORT
(39) Taxes and surcharges
2017 2016 Calculating standardStamp tax 12,047 9,111 /City maintenance and construction tax 9,101 6,403 Refer to Note 3 (1)Educational surcharge 6,698 4,123 Refer to Note 3 (1)Business tax 0 555 /Others 1,101 1,048 /
28,947 21,240 /
(40) Selling and distribution expenses
2017 2016Employee benefits 287,057 271,482Freight/ Insurance 187,436 66,904Travelling expenses 39,110 33,637Exhibition and advertising fees 17,964 18,405Depreciation and amortisation expenses 16,761 16,219Rental and related expenses 14,723 10,584IT cost 5,994 4,789Others 26,649 22,819
595,694 444,839
(41) General and administrative expenses
2017 2016Employee benefits 418,165 360,527Depreciation and amortisation expenses 80,717 67,215Professional service fees 54,497 40,658Rental and related expenses 34,020 35,816Travelling expenses 18,466 13,219Transportation insurance 9,412 7,212IT cost 8,862 8,838Tax expenses 5,453 8,992Others 56,833 55,833
686,425 598,310
(42) Financial income - net
2017 2016Interest expenses, including:
Interest expenses of borrowings 106,964 142,388Interest expenses of benefit plans 3,802 4,335
Sub-total of interest expenses 110,766 146,723Interest income –175,438 –148,485Interest income - net –64,672 –1,762Net exchange gains –30,042 –92,743Charges for letter of guarantee (Note 4 (29) (a)) 23,513 24,022Others 18,212 21,653
–52,989 –48,830
SECTION 9.FINANCIAL STATEMENTS AND AUDITOR'S REPORT

2017 ANNUAL REPORT 129
(43) Expenses by natureThe cost of sales, selling expenses, general and administrative expenses in the income statements are listed as follows by nature:
2017 2016Cost of raw materials sold and consumed 4,798,205 3,485,369Employee benefits 1,607,457 1,384,331Freight/Insurance 266,156 109,866Depreciation and amortisation expenses 215,511 203,926Warranties 174,113 52,633Rental and related expenses 157,396 158,179Travelling expenses 89,222 78,160IT cost 25,092 21,640Professional service fees 58,966 43,048Exhibition and advertising fees 17,964 18,405Tax expenses 10,304 13,775Others 250,912 209,304
7,671,298 5,778,636
(44) Gains/(losses) on changes in fair value
2017 2016 Income from fair value change of currency swap contracts and interest rate swap contracts (Note 4 (2))
0 64,101
(45) Investment income/(losses)
2017 2016Proceeds from disposal of subsidiaries (Note 5 (2)) 12,082 0Share of investee’s net loss under equity method –740 –395Losses arising from currency swap contract (Note 4 (2)) 0 –54,513
11,342 –54,908
(46) Asset impairment losses
2017 2016(Reversal)/ Provision for bad debts –3,343 3,122Provision for decline in the value of inventories 56,040 28,981
52,697 32,103
SECTION 9.FINANCIAL STATEMENTS AND AUDITOR'S REPORT

130 2017 ANNUAL REPORT
(47) Non-operating income
2017 2016 The amount included in non-recurring profit
or loss in 2017
The amount included in non-recurring profit
or loss in 2016Asset write-downs 411 383 411 383Government grants (a) 2,511 31,816 2,511 31,816Income from guarantees for related parties
0 61,174 0 61,174
Others 1,270 8,726 1,270 8,7264,192 102,099 4,192 102,099
(a) Detail of government grants
2017 2016 Asset related/income relatedFinancial subsidies 1,519 0 Income relatedOther government grants 992 299 Income relatedContribution rewards 0 31,517 Income related
2,511 31,816 /
In 2016, the subsidiary of the Company, Saurer (Jiangsu) received contribution rewards of RMB 31,517,000 from Finance Bureau of Jintan Economic Development Zone, Jiangsu Province.
(48) Non-operating expenses
2017 2016 The amount included in non-recurring profit
or loss in 2017
The amount included in non-recurring profit
or loss in 2016Penalty and overdue fine 234 634 234 634Expenditures for donations (Note) 20,000 0 20,000 0Others 11,056 11,027 11,056 11,027
31,290 11,661 31,290 11,661
Note: In 2017, the subsidiary of the Company, Saurer (Jiangsu) Textile Machinery Co., Ltd donated poverty alleviation funds to Wuqia County and Cele County of Xinjiang Uygur Au-tonomous Region amounting to RMB 10,000,000 and RMB 10,000,000 respectively.
(b) (Losses)/gains of assets disposal
2017 2016 The amount included in non-recurring profit
or loss in 2017
The amount included in non-recurring profit
or loss in 2016Income of fixed assets disposal
285 2,448 285 2,448
Abandoment loss of fixed assets disposal
–1,603 –1,166 –1,603 –1,166
–1,318 1,282 –1,318 1,282
SECTION 9.FINANCIAL STATEMENTS AND AUDITOR'S REPORT

2017 ANNUAL REPORT 131
(49) Income tax expenses
2017 2016Current income tax calculated according to tax law and relevant regulations 265,330 138,206Deferred income tax –18,462 29,327
246,868 167,533
The reconciliation from income tax calculated based on the applicable tax rates and total profit presented in the income statement to the income tax expenses is as follows:
2017 2016Total profit 996,385 670,518Income tax expenses calculated at the Company's applicable tax rate of 25% 249,096 167,630Effect of different tax rates of subsidiaries (Note 3 (1)) –9,438 –13,808Income not subject to tax –3,905 –13,419Other costs, expenses and losses not deductible for tax purposes 11,385 17,737Utilisation of previously unrecognised tax losses –2,251 –1,378Tax losses for which no deferred income tax asset was recognised in the current period
2,404 2,804
Withholding income tax of profit not remitted by overseas subsidiaries 3,433 8,165Tax clearance difference in prior years –8,475 –2,566Others 4,619 2,368Income tax expenses 246,868 167,533
(50) Notes to the cash flow statement (a) Cash received relating to other operating activities
2017 2016Government grants 2,511 101,106Others 13,143 9,690
15,654 110,796
SECTION 9.FINANCIAL STATEMENTS AND AUDITOR'S REPORT

132 2017 ANNUAL REPORT
(b) Cash paid relating to other operating activities
2017 2016Transportation/Insurance 173,029 74,116Expenses related to major asset restructuring 88,125 0Warranties 63,508 82,761Professional service fees 48,640 42,182Rental and related expenses 48,743 46,400Guarantee charges 23,513 0Expenditures for donations 20,000 0Bank charges 18,212 21,653Exhibition and advertising fees 17,964 18,729IT cost 17,504 13,628Others 125,863 97,268
645,101 396,737
(c) Cash received relating to other investing activities
2017 2016Recovery of mature Bank WMPs (Note 4 (10) (a)) 9,313,000 0Net cash inflows from actual income of foreign exchange forward contracts
2,396 4,778
Recovery of mutual fund - net 0 3,7909,315,396 8,568
As at 13 September 2017, the subsidiary of the Company, Saurer (Changzhou) Textile Machinery Co., Ltd, collected the receivable of Bank WMP purchased in 2016 amount-ing to RMB 4,500,000,000 and deposited in Nanjing Bank as 7-day notified deposit. The deposit was returned on 28 September 2017 and was used to purchase Bank WMP amounting to RMB 4,500,000,000 on the same day.
(d) Cash paid relating to other investing activities
2017 2016Purchase of WMPs issued by banks (Note 4 (50) (c))
9,250,000 4,563,000
(e) Cash received from other financing activities
2017 2016Cash received in the restructuring deals 184,422 0
SECTION 9.FINANCIAL STATEMENTS AND AUDITOR'S REPORT

2017 ANNUAL REPORT 133
(51) Supplementary information to the cash flow statement (a) Reconciliation from net profit to cash flows from operating activities
2017 2016Net profit 749,517 502,985Add/(Less): Provision for asset impairment (Note 4 (46)) 52,697 32,103
Depreciation of fixed assets (Note 4 (13)) 138,447 141,036Amortisation of intangible assets (Note 4 (15)) 75,812 60,603Amortisation of long-term prepaid expenses (Note 4 (17)) 1,252 2,287Net losses on disposal of fixed assets, intangible assets and other non-current assets
1,318 –1,282
Financial expenses - net –64,967 27,621Investment (income)/losses –11,342 54,908Gains or losses on changes in fair value 0 –64,101Increase in deferred tax assets –40,449 –1,700Increase in deferred tax liabilities 23,966 24,494(Increase)/decrease in inventories –429,481 189,907Increase/(decrease) in operating receivables –1,218,665 824,698Increase in operating payables 1,398,052 411,179Net cash flows from operating activities 676,157 2,204,738
(b) In 2017, the Group's major investing activities that do not involve cash receipts and payments included major asset restructuring and part of deals of equity issue and assets acquirement, details refer to Note 1.
In 2016, there was no significant investing and financing activities that did not involve cash receipts and payments.
(c) Acquisition or disposal of subsidiaries On 22 June 2017, the Group’s subsidiary SAURER AG transferred all of its equity in
Peass Industrial Engineers Pvt. Ltd (51%) to an overseas third party company at a consideration of INR 360,825,000. According to the agreement, the equity transfer took effect on 22 June 2017. The related information at the date of disposal is as follows:
2017Cash and cash equivalents received from disposal of subsidiaries in the current year
35,741
Less: Cash and cash equivalents held by the Company under disposition –5,156Net proceeds from disposal of subsidiaries 30,585Consideration received from disposal of subsidiaries in 2017 35,741
At the date of disposal, the assets and liabilities of Peass Industrial Engineers Pvt. Ltd held by the Company at consolidation level are listed as follows:
Disposal dayCurrent assets 60,439Non-current assets 13,648Current liabilities –20,463Non-current liabilities –6,041
47,583
SECTION 9.FINANCIAL STATEMENTS AND AUDITOR'S REPORT

134 2017 ANNUAL REPORT
(d) Cash and cash equivalents
31 December 2017 31 December 2016Cash 2,473,431 3,103,780Including: Cash on hand 53 44
Bank deposits on demand 2,409,196 2,354,012Other cash balances 64,182 749,724
Less: Restricted cash at bank –64,182 –749,724Term deposits with the original term over 3 months –351,533 –228,618
Cash and cash equivalents at the end of the year 2,057,716 2,125,438
(e) Net decrease /(increase) in cash and cash equivalents
2017 2016Cash and cash equivalents at the end of the year 2,057,716 2,125,438Less: Cash and cash equivalents at the beginning of the year –2,125,438 –211,995Net (decrease)/increase in cash and cash equivalents –67,222 1,913,443
SECTION 9.FINANCIAL STATEMENTS AND AUDITOR'S REPORT

2017 ANNUAL REPORT 135
5 Changes of consolidation scope
(1) Reverse purchaseBased on the “Announcement regarding the implementation of accounting standards 2008” (Cai Kuai Han [2008] No.60) and the “Reply on the accounting standards relating to the indirect listing of a private company acquiring the shareholdings of a public company” (Cai Kuai Bian [2009] No.17) promulgated by The Ministry of Finance, the major asset re-structuring and the acquisition of assets by share issuing completed on 25 August 2017 is a reverse purchase outside of the Company’s scope of business, and it should be recorded as equity transaction.
All the identifiable assets and liabilities of the Company (legally the parent company) after asset replacement are recognized and measured at fair value as at the date of restruc-turing. The difference between the cost of acquisition and the fair value of the identifiable net assets of the Company is adjusted in the capital reserve in the consolidated financial statement, not recognized as goodwill or current period profit or loss.
(a) Merging costs
AmountFair value of obtained identifiable net assets (b) –126,003Shares of the compay existed at the date of major restructuring –675,786Added minority equity from major assets restructuring –113,333Undistributed profits adjusted in consolidated statements –915,122
- Reduced capital reserve on consolidated statement (Note 4 (35) (a)) –24,022- Reduced surplus reserve on consolidated statement (Note 4 (35) (b)) 0- Reduced retained earnings on consolidated financial statement
(Note 4 (36)) –891,100
As of August 2017, in the progress of major assets restructuring and acquisition of as-sets by share issuing, the difference between the paid-in capital of the Company (Parent company in law, the aquiree in accounting) and the fair value of exchange-out assests amounted to RMB 801,789,000. The added minority equity from major assets restruc-turing (5% equity of Saurer Intelligent Machinery amounting to RMB 113,333,000 holding by Shanghai Yongyun). The total amount of the two parts mentioned above was offset the capital reserve, surplus reserve and retained reserve at the date of the aquisition in sequence.
SECTION 9.FINANCIAL STATEMENTS AND AUDITOR'S REPORT

136 2017 ANNUAL REPORT
(b) The assets and liabilities of acquiree at the date of restructuring are listed below:
Fair value at date of
restructuring
Book value at date of
restructuring
Book value on 31 December
2016Cash at bank and on hand 184,422 184,422 693,119Notes receivable 0 0 500Accounts receivable 0 0 3,028,724Advances to suppliers 0 0 33,039Dividend receivable 0 0 37Other receivables 0 0 2,197,327Inventories 0 0 760,248Other current assets 0 0 19,837Available-for-sale financial assets 0 0 20,000Long-term receivables 0 0 1,170,042Long-term equity investments 0 0 193,910Investment property 0 0 520,417Fixed assets 0 0 55,677Construction in progress 0 0 450Intangible assets 0 0 16,072Development costs 0 0 400Long-term prepaid expenes 0 0 414Deferred tax assets 0 0 504,762Other non-current assets 0 0 85,907Less: Short-term borrowings 0 0 –1,510,000
Notes payable 0 0 –104,050Accounts payable 0 0 –578,655Advances from customers 0 0 –268,473Employee benefits payable 0 0 –12,641Taxes payable (Note 1) –37,878 –37,878 –19,258Interest payable 0 0 –5,348Dividends payable –184,422 –184,422 –405Other payables (Note 1) –88,125 –88,125 –901,718Current portion of non-current liabilities 0 0 –1,308,250Other current liabilities 0 0 –1,547,847Long-term borrowings 0 0 –1,159,125Long-term employee benefits payable 0 0 –9,108Special payable 0 0 –59,060Deferred revenue 0 0 –52,190
Net assets –126,003 –126,003 1,764,754
Note 1: The expenses mentioned above mainly were the tax fee and service fee related to major assets restructuring that are supposed to be paid by the listed company.
SECTION 9.FINANCIAL STATEMENTS AND AUDITOR'S REPORT

2017 ANNUAL REPORT 137
(2) Disposal of subsidiaryOn 22 June 2017, the Group’s subsidiary SAURER AG transferred all of its equity in Peass Industrial Engineers Pvt. Ltd (51%) to an overseas third party. According to the transfer agreement, the equity transfer took effect on 22 June 2017 with the total amount of transfer price and tax related expenses at a consideration of INR 360,825,000 (equivalent to RMB 35,741,000). At date of disposal, the net assets held by the Group at the consolidation level amounts to INR 225,139,000 (equivalent to RMB 24,267,000).
AmountDisposal price 35,741Less: Net assets of Peass Industrial Engineers Private Limited owned on consol-idated statement
–24,267
Other comprehensive income transferred to profits and losses at current period 608Investment income from disposal 12,082
SECTION 9.FINANCIAL STATEMENTS AND AUDITOR'S REPORT

138 2017 ANNUAL REPORT
Note 1: Changzhou Jintan Saurer Textile Machinery Technology Co., Ltd is a limited liability company established on 18 August 2016 in Changzhou City, Jiangsu Province, PRC, with an approved operating period of 30 years. The reg-istered capital is RMB 100,000,000, 100% of which is contributed by the Company. On 30 August 2016, the registered capital was increased to RMB 2,810,000,000. After the capital increase, the contribution proportions of the Company and Changzhou Qiuling Textile Science and Technology Co., Ltd (former name: Changzhou Qiuling Gardening Co., Ltd) were 50.18% and 49.82% respectively. Pursuant to the Articles of Association, the Company has control over Changzhou Jintan Saurer Investment Co., Ltd, and Chang-zhou Jintan Saurer Investment Co., Ltd is accounted for as a subsidiary of the Company since the incorporation date.
6 Equity in other entities
(1) Equity in subsidiaries (a) Structure of the Group (i) Major subsidiaries obtained through incorporation or investment
Type Major business location Place of registration Date of incorporation Nature of business 31 December 2017 31 December 2016Direct/indirect
shareholding (%)Voting rights (%) Direct/indirect
shareholding (%)Voting rights (%)
1 Saurer Hong Kong Machinery Company Limited Directly held Hong Kong, China Hong Kong, China 25 October 2012 Investment holding 100 100 100 100 2 Saurer Asia Machinery Co., Ltd Indirectly held Hong Kong, China Hong Kong, China 28 February 2013 Investment holding 100 100 100 100 3 Saurer (Jiangsu) Textile Machinery Co. Ltd Indirectly held China China 01 April 2013 Manufacturing and sales of textile machinery 100 100 100 100 4 Saurer Têxtil Soluções Ltda. Indirectly held Brazil Brazil 08 March 2013 Sales and services of textile machinery 100 100 100 100 5 SAURER AG Indirectly held Switzerland Switzerland 06 March 2013 Manufacturing and sales of textile machinery 100 100 100 100 6 Saurer Germany Management GmbH Indirectly held Germany Germany 21 December 2012 Investment holding 100 100 100 100 7 Saurer Germany GmbH & Co KG Indirectly held Germany Germany 27 November 2012 Manufacturing, sales and services of textile machinery 100 100 100 100 8 Saurer Technologies Gmbh &Co KG Indirectly held Germany Germany 14 November 2017 Manufacturing and sales of textile machinery 100 100 100 100 9 Saurer Textile Solutions Pvt. Ltd Indirectly held India India 18 April 2013 Sales and services of textile machinery 100 100 100 10010 Saurer Netherlands Machinery Company B.V. Indirectly held Netherlands Netherlands 22 November 2012 Investment holding 100 100 100 10011 Saurer Inc. Indirectly held USA USA 25 March 2013 Sales and services of textile machinery 100 100 100 10012 Saurer (Shanghai) Textile Machinery Technology Co., Ltd Indirectly held China China 11 April 2014 Sales and services of textile machinery 100 100 100 10013 Saurer Finance Lease Co. Ltd Indirectly held China China 16 December 2014 Leasing 100 100 100 10014 Changzhou Jintan Saurer Textile Machinery Technology Co., Ltd (Note 1) Directly held China China 18 August 2016 Consulting, investment and import and export business 50.18 50.18 50.18 50.1815 Changzhou Saurer Textile Machinery Technology Co., Ltd (Note 2) Indirectly held China China 17 August 2016 Consulting, investment and import and export business 50.09 50.09 50.09 50.0916 Changzhou Jintan Saurer Investment Co., Ltd Directly held China China 08 April 2016 Investment holding 100 100 100 10017 Saurer Xinjiang Intelligent Machinery Company Limited (Note 3) Directly held China China 05 August 2016 Manufacturing and sales of intelligent textile machinery 100 100 100 10018 Zinser Textile Machines LLP Indirectly held India India 18 November 2016 Manufacturing and sales of textile machinery 100 100 N/A N/A19 Saurer Industries AG Directly held Switzerland Switzerland 21 December 2017 Manufacturing and sales of textile machinery 100 100 N/A N/A20 Saurer Technologies Management GmbH Indirectly held Austria Austria 01 July 2017 Investment holding 100 100 N/A N/A
SECTION 9.FINANCIAL STATEMENTS AND AUDITOR'S REPORT

2017 ANNUAL REPORT 139
Note 2: Changzhou Saurer Textile Machinery Technology Co., Ltd is a limited liability company established on 17 August 2016 in Changzhou City, Jiangsu Province, PRC, with an approved operating period of 30 years. The registered capital is RMB 100,000,000, 100% of which is contributed by the Company’s subsidiary, Changzhou Jintan Saurer Textile Machinery Technology Co., Ltd. On 30 August 2016, the registered capital was increased to RMB 5,610,000,000. After the capital increase, the contribution proportions of Chang-zhou Jintan Saurer Textile Machinery Technology Co., Ltd and Jiangsu Jintan Economic and Technological Development Co., Ltd were 50.09% and 49.91% respectively. Pursuant to the Articles of Association, the Company has control over Changzhou Saurer Textile Machinery Technology Co., Ltd, and Changzhou Saurer Textile Machinery Technology Co., Ltd is accounted for as a subsidiary of the Company since the incorporation date.
Note 3: Saurer Xinjiang Intelligent Machinery Company Limited is a limited liability company incorporated on 5 August 2016 in Urumqi Municipality, Xinjiang Uygur Autonomous Region, PRC. The registered capital of Saurer Xinjiang Intelligent Machinery Company Limited amounted to RMB 50,000,000.
6 Equity in other entities
(1) Equity in subsidiaries (a) Structure of the Group (i) Major subsidiaries obtained through incorporation or investment
Type Major business location Place of registration Date of incorporation Nature of business 31 December 2017 31 December 2016Direct/indirect
shareholding (%)Voting rights (%) Direct/indirect
shareholding (%)Voting rights (%)
1 Saurer Hong Kong Machinery Company Limited Directly held Hong Kong, China Hong Kong, China 25 October 2012 Investment holding 100 100 100 100 2 Saurer Asia Machinery Co., Ltd Indirectly held Hong Kong, China Hong Kong, China 28 February 2013 Investment holding 100 100 100 100 3 Saurer (Jiangsu) Textile Machinery Co. Ltd Indirectly held China China 01 April 2013 Manufacturing and sales of textile machinery 100 100 100 100 4 Saurer Têxtil Soluções Ltda. Indirectly held Brazil Brazil 08 March 2013 Sales and services of textile machinery 100 100 100 100 5 SAURER AG Indirectly held Switzerland Switzerland 06 March 2013 Manufacturing and sales of textile machinery 100 100 100 100 6 Saurer Germany Management GmbH Indirectly held Germany Germany 21 December 2012 Investment holding 100 100 100 100 7 Saurer Germany GmbH & Co KG Indirectly held Germany Germany 27 November 2012 Manufacturing, sales and services of textile machinery 100 100 100 100 8 Saurer Technologies Gmbh &Co KG Indirectly held Germany Germany 14 November 2017 Manufacturing and sales of textile machinery 100 100 100 100 9 Saurer Textile Solutions Pvt. Ltd Indirectly held India India 18 April 2013 Sales and services of textile machinery 100 100 100 10010 Saurer Netherlands Machinery Company B.V. Indirectly held Netherlands Netherlands 22 November 2012 Investment holding 100 100 100 10011 Saurer Inc. Indirectly held USA USA 25 March 2013 Sales and services of textile machinery 100 100 100 10012 Saurer (Shanghai) Textile Machinery Technology Co., Ltd Indirectly held China China 11 April 2014 Sales and services of textile machinery 100 100 100 10013 Saurer Finance Lease Co. Ltd Indirectly held China China 16 December 2014 Leasing 100 100 100 10014 Changzhou Jintan Saurer Textile Machinery Technology Co., Ltd (Note 1) Directly held China China 18 August 2016 Consulting, investment and import and export business 50.18 50.18 50.18 50.1815 Changzhou Saurer Textile Machinery Technology Co., Ltd (Note 2) Indirectly held China China 17 August 2016 Consulting, investment and import and export business 50.09 50.09 50.09 50.0916 Changzhou Jintan Saurer Investment Co., Ltd Directly held China China 08 April 2016 Investment holding 100 100 100 10017 Saurer Xinjiang Intelligent Machinery Company Limited (Note 3) Directly held China China 05 August 2016 Manufacturing and sales of intelligent textile machinery 100 100 100 10018 Zinser Textile Machines LLP Indirectly held India India 18 November 2016 Manufacturing and sales of textile machinery 100 100 N/A N/A19 Saurer Industries AG Directly held Switzerland Switzerland 21 December 2017 Manufacturing and sales of textile machinery 100 100 N/A N/A20 Saurer Technologies Management GmbH Indirectly held Austria Austria 01 July 2017 Investment holding 100 100 N/A N/A
SECTION 9.FINANCIAL STATEMENTS AND AUDITOR'S REPORT

140 2017 ANNUAL REPORT
(ii) Major subsidiaries obtained through acquisition involving enterprises not under common control
Type Major business location Place of registration Nature of business 31 December 2017 31 December 2016Direct/indirect shareholding (%) Voting rights (%) Direct/indirect shareholding (%) Voting rights (%)
1 Saurer (Changzhou) Textile Machinery Co., Ltd Indirectly held China China Manufacturing and sales of textile machinery 100 100 100 100 2 Saurer (Changzhou) Texparts Components Co. Ltd Indirectly held China China Manufacturing and sales of textile machinery 100 100 100 100 3 Aktiengesellschaft Adolph Saurer (Note 1) Indirectly held Switzerland Switzerland Investment holding N/A N/A N/A N/A 4 Saurer Czech s.r.o. Indirectly held Czech Republic Czech Republic Manufacturing and sales of textile machinery 100 100 100 100 5 Saurer Fibrevision Ltd Indirectly held UK UK Manufacturing and sales of textile machinery 100 100 100 100 6 Schlafhorst Machines LLP. Indirectly held India India Investment holding 100 100 100 100 7 Zinser Textile Systems Pvt. Ltd (Note 2) Indirectly held India India Manufacturing and sales of textile machinery 100 100 100 100 8 Peass Industrial Engineers Pvt. Ltd Indirectly held India India Manufacturing, sales and services of textile machinery 51 51 51 51 9 Saurer México S.A. de C.V. Indirectly held Mexico Mexico Sales and services of textile machinery 100 100 100 10010 Saurer Components Pte. Ltd Indirectly held Singapore Singapore Manufacturing of textile machinery 100 100 100 10011 Saurer Tekstil A.S. Indirectly held Turkey Turkey Sales and services of textile machinery 100 100 100 100
Note 1: Aktiengesellschaft Adolph Saurer was merged into another subsidiary of the Group, SAURER AG, in the first half year of 2016, and was cancelled in June 2016.
Note 2: Zinser Textile Systems Pvt. Ltd was merged into another subsidiary of the Group, Saurer Textile Solutions Pvt. Ltd, on 27 Oct 2016.
(b) Subsidiaries with significant non-controlling interests
Subsidiaries Shareholding of non-controlling
shareholders
Total profit or loss attributable to
non-controlling shareholders for
the year ended 31 December 2016
Other compre-hensive income
attributable to non-controlling interests for the
year ended 31 December 2016
Dividends paid to non-controlling interests for the
year ended 31 December 2016
Accumulated non-controlling
interests as at 31 December 2016
Peass Industrial Engineers Pvt. Ltd 49% 3,033 529 0 32,890Changzhou Jintan Saurer Textile Machinery Technology Co., Ltd
49.82% –700 0 0 1,399,300
Changzhou Saurer Textile Machinery Technol-ogy Co., Ltd
49.91% 25,735 0 0 2,825,735
0 28,068 529 0 4,257,925
Subsidiaries Shareholding of non-controlling
shareholders
Total profit or loss attributable to
non-controlling shareholders for
the year ended 31 December 2017
Other compre-hensive income
attributable to non-controlling interests for the
year ended 31 December 2017
Dividends paid to non-controlling interests for the
year ended 31 December 2017
Accumulated non-controlling
interests as at 31 December 2017
Changzhou Jintan Saurer Textile Machinery Technology Co., Ltd
49.82% –16 0 0 1,399,284
Changzhou Saurer Textile Machinery Technology Co., Ltd
49.91% 73,311 0 0 2,899,046
0 73,295 0 0 4,298,330
SECTION 9.FINANCIAL STATEMENTS AND AUDITOR'S REPORT

2017 ANNUAL REPORT 141
(ii) Major subsidiaries obtained through acquisition involving enterprises not under common control
Type Major business location Place of registration Nature of business 31 December 2017 31 December 2016Direct/indirect shareholding (%) Voting rights (%) Direct/indirect shareholding (%) Voting rights (%)
1 Saurer (Changzhou) Textile Machinery Co., Ltd Indirectly held China China Manufacturing and sales of textile machinery 100 100 100 100 2 Saurer (Changzhou) Texparts Components Co. Ltd Indirectly held China China Manufacturing and sales of textile machinery 100 100 100 100 3 Aktiengesellschaft Adolph Saurer (Note 1) Indirectly held Switzerland Switzerland Investment holding N/A N/A N/A N/A 4 Saurer Czech s.r.o. Indirectly held Czech Republic Czech Republic Manufacturing and sales of textile machinery 100 100 100 100 5 Saurer Fibrevision Ltd Indirectly held UK UK Manufacturing and sales of textile machinery 100 100 100 100 6 Schlafhorst Machines LLP. Indirectly held India India Investment holding 100 100 100 100 7 Zinser Textile Systems Pvt. Ltd (Note 2) Indirectly held India India Manufacturing and sales of textile machinery 100 100 100 100 8 Peass Industrial Engineers Pvt. Ltd Indirectly held India India Manufacturing, sales and services of textile machinery 51 51 51 51 9 Saurer México S.A. de C.V. Indirectly held Mexico Mexico Sales and services of textile machinery 100 100 100 10010 Saurer Components Pte. Ltd Indirectly held Singapore Singapore Manufacturing of textile machinery 100 100 100 10011 Saurer Tekstil A.S. Indirectly held Turkey Turkey Sales and services of textile machinery 100 100 100 100
Note 1: Aktiengesellschaft Adolph Saurer was merged into another subsidiary of the Group, SAURER AG, in the first half year of 2016, and was cancelled in June 2016.
Note 2: Zinser Textile Systems Pvt. Ltd was merged into another subsidiary of the Group, Saurer Textile Solutions Pvt. Ltd, on 27 Oct 2016.
(b) Subsidiaries with significant non-controlling interests
Subsidiaries Shareholding of non-controlling
shareholders
Total profit or loss attributable to
non-controlling shareholders for
the year ended 31 December 2016
Other compre-hensive income
attributable to non-controlling interests for the
year ended 31 December 2016
Dividends paid to non-controlling interests for the
year ended 31 December 2016
Accumulated non-controlling
interests as at 31 December 2016
Peass Industrial Engineers Pvt. Ltd 49% 3,033 529 0 32,890Changzhou Jintan Saurer Textile Machinery Technology Co., Ltd
49.82% –700 0 0 1,399,300
Changzhou Saurer Textile Machinery Technol-ogy Co., Ltd
49.91% 25,735 0 0 2,825,735
0 28,068 529 0 4,257,925
Subsidiaries Shareholding of non-controlling
shareholders
Total profit or loss attributable to
non-controlling shareholders for
the year ended 31 December 2017
Other compre-hensive income
attributable to non-controlling interests for the
year ended 31 December 2017
Dividends paid to non-controlling interests for the
year ended 31 December 2017
Accumulated non-controlling
interests as at 31 December 2017
Changzhou Jintan Saurer Textile Machinery Technology Co., Ltd
49.82% –16 0 0 1,399,284
Changzhou Saurer Textile Machinery Technology Co., Ltd
49.91% 73,311 0 0 2,899,046
0 73,295 0 0 4,298,330
SECTION 9.FINANCIAL STATEMENTS AND AUDITOR'S REPORT

142 2017 ANNUAL REPORT
The major financial information of the significant non-fully-owned subsidiaries of the Group is listed below:
31 December 2017 31 December 2016Current assets Non-current assets Total assets Current liabilities Non-current liabilities Total liabilities Current assets Non-current assets Total assets Current liabilities Non-current liabilities Total liabilities
Peass Industrial Engineers Pvt. Ltd 0 0 0 0 0 0 54,358 38,350 92,708 19,657 5,928 25,585Changzhou Jintan Saurer Textile Machinery Technology Co., Ltd 14 2,810,000 2,810,014 1,452 0 1,452 9 2,810,000 2,810,009 1,415 0 1,415Changzhou Saurer Textile Machinery Technology Co., Ltd 5,783,427 0 5,783,427 41,129 0 41,129 5,658,647 0 5,658,647 14,273 0 14,273
2017 2016Revenue Net profit/(loss) Total comprehensive income Cash flows from operating activities Revenue Net profit/(loss) Total comprehensive income Cash flows from operating activities
Peass Industrial Engineers Pvt. Ltd 0 0 0 0 78,998 6,189 7,226 3,225Changzhou Jintan Saurer Textile Machinery Technology Co., Ltd 0 –32 –32 –1,405 0 –1,406 –1,406 9Changzhou Saurer Textile Machinery Technology Co., Ltd 0 97,924 97,924 –35,862 0 34,374 34,374 11
(2) Equity in joint ventures (a) General information of significant joint ventures
Major business location
Place of registration
Nature of business
Whether strategic to the Group's activities
Shareholding (%)Direct Indirect
Joint ventures -Saurer Premier Technologies Private Limited India India Production and
sales of clearers and accessories
Yes 0 50
The above equity investment is accounted for using the equity method.
(b) Summarised financial information of significant joint ventures
31 December 2017 31 December 2016Current assets 3,484 3,060Including: Cash and cash equivalents 261 106Non-current assets 424 108Total assets 3,908 3,168Current liabilities 3,205 864Non-current liabilities 0 146Total liabilities 3,205 1,010Non-controlling interests 0 0Equity attributable to the parent company 703 2,158Shares of net assets in proportion 352 1,079Carrying amount of investment in joint ventures 350 1,082
SECTION 9.FINANCIAL STATEMENTS AND AUDITOR'S REPORT

2017 ANNUAL REPORT 143
The major financial information of the significant non-fully-owned subsidiaries of the Group is listed below:
31 December 2017 31 December 2016Current assets Non-current assets Total assets Current liabilities Non-current liabilities Total liabilities Current assets Non-current assets Total assets Current liabilities Non-current liabilities Total liabilities
Peass Industrial Engineers Pvt. Ltd 0 0 0 0 0 0 54,358 38,350 92,708 19,657 5,928 25,585Changzhou Jintan Saurer Textile Machinery Technology Co., Ltd 14 2,810,000 2,810,014 1,452 0 1,452 9 2,810,000 2,810,009 1,415 0 1,415Changzhou Saurer Textile Machinery Technology Co., Ltd 5,783,427 0 5,783,427 41,129 0 41,129 5,658,647 0 5,658,647 14,273 0 14,273
2017 2016Revenue Net profit/(loss) Total comprehensive income Cash flows from operating activities Revenue Net profit/(loss) Total comprehensive income Cash flows from operating activities
Peass Industrial Engineers Pvt. Ltd 0 0 0 0 78,998 6,189 7,226 3,225Changzhou Jintan Saurer Textile Machinery Technology Co., Ltd 0 –32 –32 –1,405 0 –1,406 –1,406 9Changzhou Saurer Textile Machinery Technology Co., Ltd 0 97,924 97,924 –35,862 0 34,374 34,374 11
(2) Equity in joint ventures (a) General information of significant joint ventures
Major business location
Place of registration
Nature of business
Whether strategic to the Group's activities
Shareholding (%)Direct Indirect
Joint ventures -Saurer Premier Technologies Private Limited India India Production and
sales of clearers and accessories
Yes 0 50
The above equity investment is accounted for using the equity method.
(b) Summarised financial information of significant joint ventures
31 December 2017 31 December 2016Current assets 3,484 3,060Including: Cash and cash equivalents 261 106Non-current assets 424 108Total assets 3,908 3,168Current liabilities 3,205 864Non-current liabilities 0 146Total liabilities 3,205 1,010Non-controlling interests 0 0Equity attributable to the parent company 703 2,158Shares of net assets in proportion 352 1,079Carrying amount of investment in joint ventures 350 1,082
2017 2016Revenue 1,493 3,202Financial income 71 73Income tax expenses 0 –141Net loss –1,479 –788Other comprehensive income 0 0Total comprehensive income –1,479 –788Dividends received from joint ventures by the Group for the current year
0 0
7 Segment informationThe reportable segments of the Group are the business units that provide different products or service, or operate in the different areas. Different businesses or areas require different technologies and marketing strategies, the Group, therefore, separately manages the production and operation of each reportable segment and evaluates their operating results respectively, in order to make decisions about resources to be allocated to these segments and to assess their performance.
The Group identified 2 reportable segments as follows:- Spinning Solutions (SPIN) is mainly engaged in manufacturing and sales of carding,
combing machines, roving machine, drawing frame and new textile machinery; R&D and manufacturing of ring spinning machines, rotor spinning and winders; and providing related mechanical spare parts required.
- Techonologies (TECH) is mainly engaged in R&D, designing and manufacturing of twist-ing machines and embroidery machines; providing mechanical spare parts required; and sales of a variety of spare parts.
Inter-segment transfer prices are measured by reference to selling prices to third parties.
The assets are allocated based on the operations of the segment and the physical location of the asset. The liabilities are allocated based on the operations of the segment. Expenses indirectly attributable to each segment are allocated to the segments based on the propor-tion of each segment’s revenue.
SECTION 9.FINANCIAL STATEMENTS AND AUDITOR'S REPORT

144 2017 ANNUAL REPORT
(a) Segment information as at and for the year ended 31 December 2017 is as follows:
Spinning Solutions Technologies Unallocated Elimination TotalRevenue from external customers 6,954,509 1,758,577 326 0 8,713,412Inter-segment revenue 22,583 51,120 0 –73,703 0Asset impairment losses –48,420 –4,268 –9 0 –52,697Depreciation and amortisation expenses –159,729 –53,823 –1,959 0 –215,511Earnings/(losses) before interest and tax 815,166 187,650 –71,103 0 931,713Interest income 0 0 175,438 0 175,438Interest expenses 0 0 –110,766 0 –110,766Total profit 815,166 187,650 –6,431 0 996,385Income tax expenses 0 0 –246,868 0 –246,868Net profit/(loss) 815,166 187,650 –253,299 0 749,517Total assets 5,869,723 1,297,666 7,406,337 –41,954 14,531,772Total liabilities 3,410,259 726,937 3,931,166 –41,954 8,026,408Addition of fixed assets, construction in progress, long-term prepaid expenses and intangible assets
355,744 53,112 5,807 0 414,663
(a) Segment information as at and for the year ended 31 December 2016 is as follows:
Spinning Solutions Technologies Unallocated Elimination TotalRevenue from external customers 4,897,507 1,454,712 535 0 6,352,754Inter-segment revenue 140 23,152 0 –23,292 0Asset impairment losses –19,320 –12,762 –21 0 –32,103Depreciation and amortisation expenses –156,193 –40,291 –6,865 0 –203,349Earnings/(losses) before interest and tax 464,686 132,654 71,416 0 668,756Interest income 0 0 148,485 0 148,485Interest expenses 0 0 –146,723 0 –146,723Total profit 464,686 132,654 73,178 0 670,518Income tax expenses 0 0 –167,533 0 –167,533Net profit/(loss) 464,686 132,654 –94,355 0 502,985Total assets 4,264,533 1,145,712 7,841,345 –26,347 13,225,243Total liabilities 2,138,857 446,533 3,878,242 –26,347 6,437,285Addition of fixed assets, construction in progress, long- term prepaid expenses, intangible assets and goodwill
194,179 47,156 118 0 241,453
The Group’s sales revenue from external customers in China and in foreign countries or ge-ographical areas, and the total non-current assets other than financial assets and deferred tax assets located in China and in foreign countries or geographical areas are as follows:
Sales revenue from external customers 2017 2016Germany 5,254,702 4,267,888China 2,598,140 1,268,564United States of America 291,242 285,228Switzerland 278,869 212,308India 152,450 208,121Turkey 45,213 32,964England 43,454 34,680Brazil 35,947 28,506Mexico 7,529 11,514Singapore 5,866 2,981
8,713,412 6,352,754
SECTION 9.FINANCIAL STATEMENTS AND AUDITOR'S REPORT

2017 ANNUAL REPORT 145
Total non-current assets 2017 2016Switzerland 1,266,495 1,261,661Germany 1,098,915 1,022,355China 576,999 377,565India 154,019 180,498United of Kingdom 54,818 55,237Singapore 51,884 66,118United States of America 27,538 28,480Czech Republic 2,861 2,668Brazil 1,186 0Turkey 723 1,070Mexico 441 297
3,235,879 2,995,949
8 Related parties and related party transactions
(1) Information of the parent company (a) General information of the controlling shareholder (2016: parent company)
Type Place of registration Legal representative Nature of businessJiangsu Jinsheng Industry Co. Ltd Limited company Jintan, China Pan Xueping Manufacturing of textile machinery
(b) Registered capital and changes in registered capital of the parent company
31 December 2016 Increase in the current year Decrease in the current year
31 December 2017
Jiangsu Jinsheng Industry Co. Ltd 30,000 70,000 0 100,000
31 December 2015 Increase in the current year Decrease in the current year
31 December 2016
Jiangsu Jinsheng Industry Co. Ltd 30,000 0 0 30,000
(c) The percentages of shareholding and voting rights in the Company held by the parent company
31 December 2017Percentage of shareholdings Percentage of voting rights
Jiangsu Jinsheng Industry Co. Ltd 46.38% 46.38%
In August 2017, the process of major assets restructuring (Note 1) was accomplished. As of 31 December 2016, the percentage of shareholdings and voting rights were same as the percentage before the completion of the major restructuring which were 65% and 65% respectively.
SECTION 9.FINANCIAL STATEMENTS AND AUDITOR'S REPORT

146 2017 ANNUAL REPORT
(2) Information of subsidiariesThe general information and other related information of the major subsidiaries are set out in Note 6 (1).
(3) Information of other related parties
Name of related party Relationship with the GroupShanghai Textile Machinery Parts Factory Steel Ring Manufacturing Co., Ltd Controlled by Jiangsu Jinsheng Industry Co. LtdTaicang Li Tai Textile Co., Ltd Controlled by Jiangsu Jinsheng Industry Co. LtdJiangsu Jin Hong Textile Co., Ltd Controlled by Jiangsu Jinsheng Industry Co. LtdVictory Rich Success Co., Ltd Controlled by Jiangsu Jinsheng Industry Co. LtdChangzhou Jintan Changrun Trading Co., Ltd (former name: Jintan Changrun Trading Co., Ltd)
Controlled by Jiangsu Jinsheng Industry Co. Ltd
EMAG (China) Machinery Co., Ltd Controlled by Jiangsu Jinsheng Industry Co. LtdShanghai Huayuan Mechatronics Co.,Ltd Controlled by Jiangsu Jinsheng Industry Co. LtdLitai Xingshi (Taicang) Holding Co. Ltd (Note) Controlled by Jiangsu Jinsheng Industry Co. LtdXinjiang Litai Silk-Road Investment Co., Ltd (Note) Controlled by Jiangsu Jinsheng Industry Co. LtdKuitun Litai Silk-Road Investment Co., Ltd (Note) Controlled by Jiangsu Jinsheng Industry Co. LtdLT Textile International Limited Liability Company (Note) Controlled by Jiangsu Jinsheng Industry Co. LtdHeberlein Ceramic Technology Ltd Controlled by Jiangsu Jinsheng Industry Co. LtdHeberlein AG (former name: Saurer Components AG) Controlled by Jiangsu Jinsheng Industry Co. LtdSea Dynamic International Co., Ltd Controlled by Jiangsu Jinsheng Industry Co. LtdSaurer Premier Technologies Private Limited Joint venturesChen Meifang Close family member of the ultimate controlling shareholderChangzhou Jintan Huamao Jinsheng Technology Development Co., Ltd (former name: Jintan Huamao Jinsheng Technology Development Co., Ltd)
Controlled by the close family member of the ultimate controlling shareholder
Jintan Garden Hotel Controlled by the close family member of the ultimate controlling shareholder
Note: Xinjiang Litai Silk-Road Investment Co., Ltd, Kuitun Litai Silk-Road Investment Co., Ltd and LT Textile International Limited Liability Company are subsidiaries of Litai Xingshi (Taicang) Holding Co. Ltd The financial statements disclose Litai Xingshi (Taicang) Holding Co. Ltd and its subsidiaries as a whole.
(4) Related party transactions (a) Pricing policy and decision-making procedure The transaction price between the Group and related parties is based on the market
price and agreed price between both parties. Lease expenses are negotiated by both parties involved in the lease and by making reference to the market price.
(b) Sales of goods and rendering of services
2017 2016Litai Xingshi (Taicang) Holding Co. Ltd and its subsidiaries 820,203 1,032,073Taicang Li Tai Textile Co., Ltd 131 233Saurer Premier Technologies Private Limited 96 51EMAG (China) Machinery Co., Ltd 80 45Changzhou Jintan Huamao Jinsheng Technology Development Co., Ltd 13 20Jiangsu Jin Hong Textile Co., Ltd 0 132
820,523 1,032,554
SECTION 9.FINANCIAL STATEMENTS AND AUDITOR'S REPORT

2017 ANNUAL REPORT 147
(c) Purchase of goods
2017 2016Heberlein AG 3,227 3,553Saurer Premier Technologies Private Limited 418 2,429Jiangsu Jin Hong Textile Co., Ltd 68 0Changzhou Jintan Huamao Jinsheng Technology Development Co., Ltd 24 0
3,737 5,982
(d) Other service provided
2017 2016Heberlein AG 741 3,435Jiangsu Jinsheng Industry Co. Ltd 0 51
741 3,486
(e) Other service received
2017 2016Shanghai Huayuan Mechatronics Co.,Ltd 1,382 4,919Heberlein AG 377 148Jintan Garden Hotel 176 177Changzhou Jintan Huamao Jinsheng Technology Development Co., Ltd 24 0
1,959 5,244
(f) Interest income
2017 2016Jiangsu Jinsheng Industry Co. Ltd 0 61,697Heberlein Ceramic Technology Ltd 0 9,805Victory Rich Success Co., Ltd 0 288Shanghai Textile Machinery Parts Factory Steel Ring Manufacturing Co., Ltd 0 61
0 71,851
(g) Interest expenses
2017 2016Jiangsu Jinsheng Industry Co. Ltd 211 2,128Sea Dynamic International Co., Ltd 0 2,131Victory Rich Success Co., Ltd 0 1,425Heberlein AG 0 7
211 5,691
(h) Remuneration of key management
2017 2016Remuneration of key management 18,022 34,556
SECTION 9.FINANCIAL STATEMENTS AND AUDITOR'S REPORT

148 2017 ANNUAL REPORT
(i) Financing - Lending out
2017 2016Jiangsu Jinsheng Industry Co. Ltd 0 1,864,934Victory Rich Success Co., Ltd 0 43,316Changzhou Jintan Changrun Trading Co., Ltd 0 7,000Jiangsu Jin Hong Textile Co., Ltd 0 1,300
0 1,916,550
- Borrowing in
2017 2016Jiangsu Jinsheng Industry Co. Ltd 0 260,845Sea Dynamic International Co., Ltd 0 58,850
0 319,695
(j) Income from providing guarantees for related parties
2017 2016Sea Dynamic International Co., Ltd (Note 4 (47) (b)) 0 61,174
(k) Guarantee charges paid by related parties
2017 2016Jiangsu Jinsheng Industry Co. Ltd (Note 4 (29) (a)) 0 24,022
(l) Disposal of non-current assets
2017 2016Jiangsu Jinsheng Industry Co. Ltd 0 2,037
(m) Acquisition of fixed assets
2017 2016Shanghai Huayuan Mechatronics Co.,Ltd 314 0
SECTION 9.FINANCIAL STATEMENTS AND AUDITOR'S REPORT

2017 ANNUAL REPORT 149
(5) Receivables from and payables to related parties (a) Accounts receivable
31 December 2017 31 December 2016Litai Xingshi (Taicang) Holding Co. Ltd and its subsidiaries 1,023,204 425,768Saurer Premier Technologies Private Limited 55 51Taicang Li Tai Textile Co., Ltd 41 315Jiangsu Jin Hong Textile Co., Ltd 0 217EMAG (China) Machinery Co., Ltd 0 53Heberlein AG 0 2,539Changzhou Jintan Huamao Jinsheng Technology Develop-ment Co., Ltd
0 101
1,023,300 429,044
(b) Advances from customers
31 December 2017 31 December 2016Litai Xingshi (Taicang) Holding Co. Ltd and its subsidiaries 698,238 0
(c) Accounts payable
31 December 2017 31 December 2016Heberlein AG 523 446Jiangsu Jin Hong Textile Co., Ltd (iv) 68 0
591 446
(d) Other payables
31 December 2017 31 December 2016Jiangsu Jinsheng Industry Co. Ltd (i) 11,916 11,916Jintan Garden Hotel 45 0Shanghai Huayuan Mechatronics Co.,Ltd 32 2,601Changzhou Jintan Huamao Jinsheng Technology Development Co., Ltd
6 0
11,999 14,517
(i) As at 31 December 2017 and 31 December 2016, the balance of payables to Jiangsu Jinsheng Industry Co. Ltd also included: the balance of RMB 9,278,000 represented the consideration the Company should pay to Jinsheng Industirial for the acquisition of its 30% equity of Saurer (Changzhou) Textile Machinery Co., Ltd and 30% equity of Saurer (Changzhou) Texparts Components Co., Ltd, respectively; the repayment to Jiangsu Jinsheng Industry Co. Ltd was RMB 2,608,000, with annual interest rate of 8%, will be due in one year; the remaining balance of RMB 30,000 was payments paid on behalf of the Company.
SECTION 9.FINANCIAL STATEMENTS AND AUDITOR'S REPORT

150 2017 ANNUAL REPORT
(e) Interest payable
31 December 2017 31 December 2016Jiangsu Jinsheng Industry Co., Ltd 472 261
(f) Advance to suppliers
31 December 2017 31 December 2016Saurer Premier Technologies Private Limited 2,006 0
(g) Employee benefits payable
31 December 2017 31 December 2016Pan Xueping 2,100 2,100
(6) Commitments in relation to related partiesAs at each balance sheet date, the Group’s commitments in relation to Litai Xingshi (Taicang) Holding Co. Ltd and its subsidiaries that have been contracted for but not yet performed are as follows:
31 December 2017 31 December 2016Litai Xingshi (Taicang) Holding Co. Ltd and its subsidiaries
1,544,176 1,622,147
9 ContingenciesAs at 31 December 2017 and 31 December 2016, the Group did not have significant contingencies.
SECTION 9.FINANCIAL STATEMENTS AND AUDITOR'S REPORT

2017 ANNUAL REPORT 151
10 Commitments
(1) Capital commitmentsCapital expenditures contracted for by the Group at the balance sheet date but are not yet necessary to be recognised on the balance sheet are as follows:
31 December 2017 31 December 2016Buildings, machinery and equipment 370,389 13,384Intangible assets 732 0
371,121 13,384
(2) Operating lease commitmentsAs at the balance sheet date, the future minimum lease payments due under the signed irrevocable operating leases contracts are summarised as follows:
31 December 2017 31 December 2016Within 1 year 70,833 63,0171 to 2 years 46,119 44,2772 to 3 years 37,963 40,582Over 3 years 163,866 193,750
318,781 341,626
11 Events after the balance sheet date
(a) At time of report issuing, Saurer Textile (Changzhou) Machinery Technology Co. Ltd, the subsidiary of the Company, purchased interest-guaranteed and principal-guaranteed RMB WMP issued by Bank of Nanjing Jintan Branch on 28 February 2018, amounting to RMB 4,500,000,000, with an expected annual yield of 4.5%. The WMPs are due in June 2018.
(b) On 20 April 2018, the Board of Directors proposed that cash dividend of RMB 0.1 (before tax) be paid out for every 10 shares of all shareholders on undistributed prof-it with the total share capital of 1,895,412,995 shares as a base. Apart from above mentioned cash dividend, no other form of profit distribution was proposed and no share premium should be converted into share capital. This proposal is yet to be approved at the AGM of shareholders. Cash dividends proposed after the balance sheet date are not recognized as a liability on the balance sheet date.
SECTION 9.FINANCIAL STATEMENTS AND AUDITOR'S REPORT

152 2017 ANNUAL REPORT
12 Financial riskThe Group's activities expose it to a variety of financial risks: market risk (primarily currency risk and interest rate risk), credit risk and liquidity risk. The Group's overall risk management programme focuses on the unpredictability of financial markets and seeks to minimise potential adverse effects on the Group's financial performance.
(1) Market risk (a) Foreign exchange risk The Group operates in China and some overseas countries such as Germany, Swit-
zerland and USA, etc. Thus it is exposed to foreign exchange risk arising from various currency exposures, primarily with respect to EUR, CHF and USD. Foreign exchange risk arises from future commercial transactions, recognised assets and liabilities and net investments in foreign operations. Foreign exchange risk mainly arises from finan-cial instruments with non-functional currency. The Group’s finance department at its headquarters makes policies, monitors and manages the foreign exchange risk related to its functional currency. Therefore, the Group has signed a number of forward foreign exchange contracts in order to achieve the purpose of avoiding foreign exchange risk (Note 4 (2)). The Group holds several foreign business investments, of which the net as-sets are exposed to foreign currency risk. The Group manages the exchange risk arising from net assets of foreign business mainly through the relevant foreign currency loans.
As at 31 December 2017 and 31 December 2016, the foreign exchange risk of the Group primarily arose from USD and CHF financial assets and liabilities of the subsidiar-ies whose functional currency is the EUR.
If the EUR had strengthened/weakened by 10% against the USD while all other variables had been held constant, the Group’s net profit for the year ended 31 December 2017 would have been approximately RMB 11,903,000 higher/lower for various financial as-sets and liabilities denominated in USD; and net profit for the year ended 31 December 2016 would have been approximately RMB 48,152,000 higher/lower for various financial assets and liabilities denominated in USD.
If the EUR had strengthened/weakened by 10% against the RMB while all other vari-ables had been held constant, the Group’s net profit for the year ended 31 December 2017 would have been approximately RMB 51,389,000 lower/higher for various financial assets and liabilities denominated in RMB; and net profit for the year ended 31 Decem-ber 2016 would have been approximately RMB 16,776,000 lower/higher for various financial assets and liabilities denominated in RMB.
SECTION 9.FINANCIAL STATEMENTS AND AUDITOR'S REPORT

2017 ANNUAL REPORT 153
(b) Interest rate risk The Group's interest rate risk mainly arises from interest-bearing borrowings including
bank borrowings. Financial liabilities issued at floating rates expose the Group to cash flow interest rate risk. Financial liabilities issued at fixed rates expose the Group to fair value interest rate risk. As at 31 December 2017 and 31 December 2016, the Group's interest-bearing assets and borrowings classified by floating rate and fixed rate were as follows:
31 December 2017 31 December 2016Floating interest rate
- Short-term borrowings 0 2,548- Long-term borrowings (including current portion of long-term borrowings)
2,751,828 2,642,400
2,751,828 2,644,948Fixed interest rate
- Short-term borrowings 267,001 876,334- Other payables 2,608 2,608- Long-term borrowings (including current portion of long-term borrowings)
437,077 7
706,686 878,949
To mitigate the impact of interest rate fluctuations, the Group continuously assesses and monitors its exposure to interest rate risk to take measures to control relevant risks.
As at 31 December 2017, if the floating rate had strengthened/weakened by 50 points, while all other variables had been held constant, the Group’s net profit for the year would have been approximately decreased/increased RMB 13,759,000 (31 December 2016: equivalent to RMB 13,225,000).
(2) Credit riskCredit risk is managed on the Group basis. Credit risk mainly arises from cash at bank, accounts receivable, other receivables, notes receivable etc.
The Group expects that there is no significant credit risk associated with cash at bank since they are deposited at state-owned banks and other domestic and foreign medium or large size banks. Management does not expect that there will be any significant losses from non-performance by these counterparties.
In addition, the Group has policies to limit the credit exposure on accounts receivable, other receivables and notes receivable. The Group assesses the credit quality of and sets credit limits on its customers by taking into account their financial position, the availability of guar-antee from third parties, their credit history and other factors such as current market con-ditions. The credit history of the customers is regularly monitored by the Group. In respect of customers with a poor credit history, the Group will use written payment reminders, or shorten or cancel credit periods, to ensure the overall credit risk of the Group is limited to a controllable extent.
SECTION 9.FINANCIAL STATEMENTS AND AUDITOR'S REPORT

154 2017 ANNUAL REPORT
(3) Liquidity riskCash flow forecasting is performed by each subsidiary of the Group and aggregated by the Group’s finance department in its headquarters. The Group’s finance department at its headquarters monitors rolling forecasts of the Group's short-term and long-term liquidity re-quirements to ensure it has sufficient cash and securities that are readily convertible to cash to meet operational needs, while maintaining sufficient headroom on its undrawn commit-ted borrowing facilities from major financial institutions so that the Group does not breach borrowing limits or covenants on any of its borrowing facilities to meet the short-term and long-term liquidity requirements.
Except for financial liabilities at fair value through profit or loss that have been disclosed in Note 4 (2), the financial liabilities of the Group at the balance sheet date are analysed by their maturity date below at their undiscounted contractual cash flows:
31 December 2017Within 1 year 1 to 2 years 2 to 5 years Over 5 years Total
Short-term borrowings 270,652 0 0 0 270,652Accounts payable 1,492,701 0 0 0 1,492,701Interest payable 2,395 0 0 0 2,395Other payables 330,368 0 0 0 330,368Long-term borrowings (Including: Current portion of non-current liabilities) 812,178 526,084 1,916,468 464,253 3,719,131
2,908,294 526,084 1,916,616 464,253 5,815,247
31 December 2016Within 1 year 1 to 2 years 2 to 5 years Over 5 years Total
Short-term borrowings 888,644 0 0 0 888,644Accounts payable 823,976 0 0 0 823,976Interest payable 2,300 0 0 0 2,300Other payables 228,574 0 0 0 228,574Long-term borrowings (Including: Current portion of non-current liabilities) 530,451 431,679 1,290,626 886,335 3,139,091
2,473,945 431,679 1,290,626 886,335 5,082,585
As at 31 December 2017 and 31 December 2016, the Group had no external financial guarantee.
SECTION 9.FINANCIAL STATEMENTS AND AUDITOR'S REPORT

2017 ANNUAL REPORT 155
13 Fair value estimatesThe level in which fair value measurement is categorised is determined by the level of the fair value hierarchy of the lowest level input that is significant to the entire fair value meas-urement:
Level 1: Quoted prices (unadjusted) in active markets for identical assets or liabilities.
Level 2: Inputs other than quoted prices included within Level 1 that are observable for the asset or liability, either directly or indirectly.
Level 3: Unobservable inputs for the asset or liability.
(1) Financial instruments measured at fair value on recurring basisAs at 31 December 2017, the financial assets measured at fair value on a recurring basis by the above three levels are analysed below:
Level 1 Level 2 Level 3 TotalFinancial assets
Financial assets at fair value through profit or loss 0 6,178 0 6,178Available-for-sale financial assets 0 0 0 0
Total financial assets/total assets 0 6,178 0 6,178Financial liabilities
Financial liabilities at fair value through profit or loss 0 7,532 0 7,532
As at 31 December 2016, the assets measured at fair value on a recurring basis by the above three levels are analysed below:
Level 1 Level 2 Level 3 TotalFinancial assets
Financial assets at fair value through profit or loss 0 1,860 0 1,860Available-for-sale financial assets 51 0 0 51Other current assets 0 0 63,000 63,000
Total financial assets/total assets 51 1,860 63,000 64,911Financial liabilities
Financial liabilities at fair value through profit or loss 0 1,067 15 1,082
The Group takes the date on which events causing the transfers between the levels take place as the timing specific for recognising the transfers. In 2017 and 2016, there was no shift among the first, second and third level.
The fair value of financial instruments traded in an active market is determined at the quot-ed market price; and the fair value of those not traded in an active market is determined by the Group using valuation technique. For the valuation of hedging instruments, the discounted cash flow method is used with significant input being the observable exchange rate; for the valuation of currency swap contracts, the discounted cash flow method is used with significant input being the observable forward exchange rate and swap rate of the related currency.
SECTION 9.FINANCIAL STATEMENTS AND AUDITOR'S REPORT

156 2017 ANNUAL REPORT
The changes in Level 3 financial assets are analysed below:
Financial assets/(liabilities) and WMPs at fair value through profit or loss 2017 2016Balance at the beginning of the year 63,000 0Purchases 250,000 63,000Retract –313,818 0Transfer into Level 3 0 0Transfer out of Level 3 0 0Total gains or losses for the current period 0 0
- (Losses) recognised in profit or loss 818 0- Gains or losses recognised in other comprehensive income 0 0
Balance at the end of the year 0 63,000Changes in unrealised gains or losses included in profit or loss for the current period with respect to assets still held at the end of the year
- (Losses) on changes in interest of WMPs 818 0- (Losses) on changes in fair value 0 –15
Gains or losses recognised in profit or loss are included in the income statement under the items of gains on changes in fair value, investment income and asset impairment losses respectively.
(2) Assets measured at fair value on a non-recurring basisAs at 31 December 2017 and 31 December 2016, the Group had no assets measured at fair value on a non-recurring basis.
(3) Assets and liabilities not measured at fair value but disclosedFinancial assets and liabilities measured at amortised cost mainly include receivables, short-term borrowings, payables, long-term borrowings and long-term payables. The carrying amount of the financial assets and liabilities not measured at fair value is a reasonable approximation of their fair value.
14 Capital managementThe Group’s capital management policies aim to safeguard the Group’s ability to continue as a going concern in order to provide returns for owners and benefits for other stakehold-ers, and to maintain an optimal capital structure to reduce the cost of capital.
In order to maintain or adjust the capital structure, the Group can adjust the dividends pay-ment to the owners, inject capital or dispose the assets to net-off the debts.
The total capital of the Group is the total owners’ equity listed in the consolidated balance sheet. The Group is not subject to external mandatory capital requirements, and monitors capital on the basis of gearing ratio.
SECTION 9.FINANCIAL STATEMENTS AND AUDITOR'S REPORT

2017 ANNUAL REPORT 157
As at 31 December 2017 and 31 December 2016, the Group's gearing ratios are as follows:
31 December 2017 31 December 2016Gearing ratio 55% 49%
15 Notes to the Company financial statements
(1) Cash at bank and on hand
31 December 2017 31 December 2016Cash on hand 0 12Cash at bank 1,572 680,464Other cash balances 0 12,643
1,572 693,119
(2) Accounts receivable
31 December 2017 31 December 2016Accounts receivable 0 3,268,661Less: Provision for bad debts 0 –239,937Net book value 0 3,028,724
(a) The aging of accounts receivable is analysed as follows:
31 December 2017 31 December 2016Within 1 year 0 1,018,809Overdue for 1-2 years 0 1,304,493Overdue for 2-3 years 0 341,566Overdue for 3-4 years 0 277,884Overdue for 4-5 years 0 76,231Overdue for more than 5 years 0 9,741
0 3,028,724
(3) Advances to suppliers
31 December 2017 31 December 2016Advances to suppliers 0 33,039
SECTION 9.FINANCIAL STATEMENTS AND AUDITOR'S REPORT

158 2017 ANNUAL REPORT
(4) Other receivables
31 December 2017 31 December 2016Loan 0 1,816,707Collateral 0 368,321Trade receivables and payables 0 330,718Labour insurance 0 31,783Deposit 0 2,181Receivable from asset transfer 0 1,162Transfer from prepayment 0 356Others 0 18,939Total 0 2,570,167Less: Provision for bad debts 0 –372,840Net book value 0 2,197,327
The aging of other receivable is analysed as follows:
31 December 2017 31 December 2016Within 1 year 0 1,084,585Overdue for 1 to 2 years 0 311,940Overdue for more than 2 years 0 800,802
0 2,197,327
(5) Long-term equity investments
31 December 2017 31 December 2016Subsidiaries 10,452,842 403,282Total 10,452,842 403,282Less: Provision for impairment of long-term equity investments
0 –209,372
Net book value 10,452,842 193,910
As at 31 December 2017, the Company’s directly holding subsidiary is Saurer Intelligent Machinery Company Limited (Note 6 (1) (a)) which holds certain long-term equity invest-ments in subsidiaries in Hong Kong and overseas. Those long-term equity investments are subject to applicable foreign exchange control in Mainland China, Hong Kong and overseas where the investment locates.
The invested organization 31 December 2016
Increase in the current year
Decrease in the current year
(Exchange-out assets)
31 December 2017
Provision for impairment
Provision for impairment at
year end
- Saurer Intelligent Machinery 0 10,452,842 0 10,452,842 0 0- Others 193,910 0 –193,910 0 0 0
193,910 10,452,842 –193,910 10,452,842 0 0
SECTION 9.FINANCIAL STATEMENTS AND AUDITOR'S REPORT
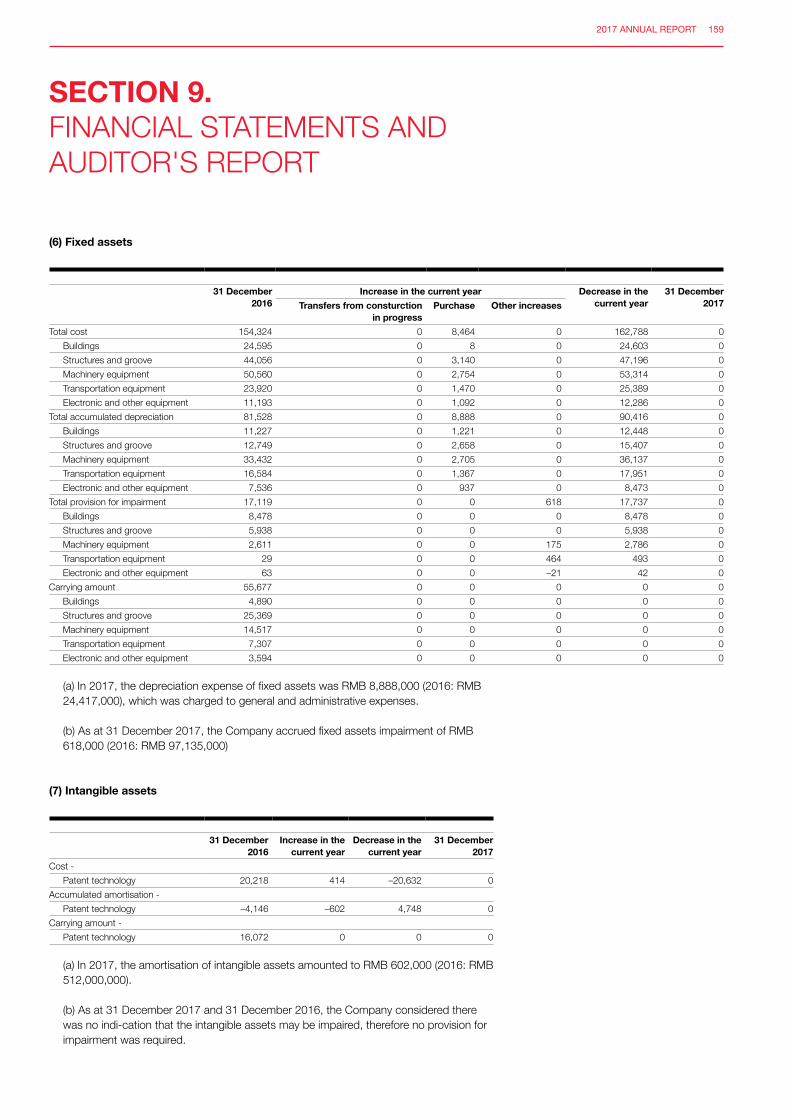
2017 ANNUAL REPORT 159
(6) Fixed assets
31 December 2016
Increase in the current year Decrease in the current year
31 December 2017Transfers from consturction
in progressPurchase Other increases
Total cost 154,324 0 8,464 0 162,788 0Buildings 24,595 0 8 0 24,603 0Structures and groove 44,056 0 3,140 0 47,196 0Machinery equipment 50,560 0 2,754 0 53,314 0Transportation equipment 23,920 0 1,470 0 25,389 0Electronic and other equipment 11,193 0 1,092 0 12,286 0
Total accumulated depreciation 81,528 0 8,888 0 90,416 0Buildings 11,227 0 1,221 0 12,448 0Structures and groove 12,749 0 2,658 0 15,407 0Machinery equipment 33,432 0 2,705 0 36,137 0Transportation equipment 16,584 0 1,367 0 17,951 0Electronic and other equipment 7,536 0 937 0 8,473 0
Total provision for impairment 17,119 0 0 618 17,737 0Buildings 8,478 0 0 0 8,478 0Structures and groove 5,938 0 0 0 5,938 0Machinery equipment 2,611 0 0 175 2,786 0Transportation equipment 29 0 0 464 493 0Electronic and other equipment 63 0 0 –21 42 0
Carrying amount 55,677 0 0 0 0 0Buildings 4,890 0 0 0 0 0Structures and groove 25,369 0 0 0 0 0Machinery equipment 14,517 0 0 0 0 0Transportation equipment 7,307 0 0 0 0 0Electronic and other equipment 3,594 0 0 0 0 0
(a) In 2017, the depreciation expense of fixed assets was RMB 8,888,000 (2016: RMB 24,417,000), which was charged to general and administrative expenses.
(b) As at 31 December 2017, the Company accrued fixed assets impairment of RMB
618,000 (2016: RMB 97,135,000)
(7) Intangible assets
31 December 2016
Increase in the current year
Decrease in the current year
31 December 2017
Cost -Patent technology 20,218 414 –20,632 0
Accumulated amortisation -Patent technology –4,146 –602 4,748 0
Carrying amount -Patent technology 16,072 0 0 0
(a) In 2017, the amortisation of intangible assets amounted to RMB 602,000 (2016: RMB 512,000,000).
(b) As at 31 December 2017 and 31 December 2016, the Company considered there was no indi-cation that the intangible assets may be impaired, therefore no provision for impairment was required.
SECTION 9.FINANCIAL STATEMENTS AND AUDITOR'S REPORT

160 2017 ANNUAL REPORT
(8) Long-term prepaid expenses
31 December 2016
Increase in the current year
Decrease in the current year
31 December 2017
Improvements to fixed assets held under operating leases
414 119 –533 0
(9) Accounts payable
31 December 2017 31 December 2016Accounts payable 0 578,655
(10) Other payables
31 December 2017 31 December 2016Accounts payable to subsidiaries (a) 820,809 0Agency fee 6,738 0Borrowing 0 501,666Construction payment 0 298,616Collateral 0 47,215Internal receivables and payables 0 23,385Investment 0 8,118Trade receivables and payables 0 6,802Deposit 0 5,368Receivables and payables on behalf of other companies 0 4,443Production reward fund 0 200Equipment procurement 0 60Land compensation 0 20Others 0 5,825
827,547 901,718
(a) Payables to subsidiaries
31 December 2017 31 December 2016Saurer Intelligent Machinery Co., Ltd 704,469 0Saurer Xinjiang Intelligent Machinery Co., Ltd 110,000 0Saurer (Jiangsu) Textile Machinery Co., Ltd 5,140 0Saurer (Shanghai) Textile Machinery Technology Co., Ltd 1,200 0
820,809 0
SECTION 9.FINANCIAL STATEMENTS AND AUDITOR'S REPORT

2017 ANNUAL REPORT 161
(11) Employee benefits payable
31 December 2017 31 December 2016Short-term employee benefits payable (a) 308 11,903Termination benefits 0 560Other benefits within one year 0 178
308 12,641
Short-term employee benefits
31 December 2016 Increase in the current year
Decrease in the current year
31 December 2017
Payroll 11,288 45,957 –56,937 308Social security contributions 0 4,101 –4,101 0Including: Medical insurance 0 3,425 –3,425 0Work injury insurance 0 404 –404 0Maternity insurance 0 272 –272 0Housing funds 1 4,096 –4,097 0Labour union funds and employee education funds 614 1,479 –2,093 0Other short-term employee benefits 0 104 –104 0
11,903 55,737 –67,332 308
(12) Revenue and cost of sales
2017 2016Main operating income 832,918 2,873,630Other operating income 20,357 26,946
853,275 2,900,577
2017 2016Main operating cost 789,872 2,736,483Other operating cost 11,173 17,202
801,045 2,753,685
(a) Revenue from main operations and cost of main operations
2017 2016Main operating income Main operating cost Main operating income Main operating cost
Engineering Construction 831,640 788,960 2,771,342 2,658,074House Sales 348 84 94,116 71,712Construction Materials 930 828 8,172 6,697
832,918 789,872 2,873,630 2,736,483
Note: In 2017, the operation revenue of the Company was the revenue from January to August 2017. Upon completion of the major asset restructuring in August 2017, the business of engineering construction, house sales and construction materials was exchanged out.
SECTION 9.FINANCIAL STATEMENTS AND AUDITOR'S REPORT

162 2017 ANNUAL REPORT
(13) Financial income - net
2017 2016Interest income –45,214 –54,102Interest expenses 158,567 207,405Commission 1,369 431Others 115 373Net book value 114,837 154,107
(14) Supplementary information to the cash flow statement (a) Reconciliation from net (loss)/profit to cash flows from operating activities
2017 2016Net (loss)/profit 487,418 –462,322Add/(less):
Impairment of assets 54,173 453,147Depreciation of fixed assets (Note 15 (6)) 18,891 24,417Amortisation of intangible assets (Note 15 (7)) 602 512Amortisation of long-term prepaid expenses (Note 15 (8)) 119 124Disposal loss on fixed assets, intangible assets and other non-current assets
–278 90
Financial income - net 158,682 207,579Investment losses –770,591 –6,314Increase in inventories –64,982 –109,459Decrease/(increase) in operating receivables 808,132 512,720Increase in operating payables –532,217 –804,739Deferred tax –29,218 –111,188
Net cash flows from operating activities 130,731 –295,433
(b) In 2017, the activities that do not involve cash receipts and payments included parts of transactions of the Company refer to Note 1.
In 2016, the Company had no significant investment and financing activities that do not involve cash receipts and payments.
(c) Net increase/(decrease) in cash and cash equivalents
2017 2016Cash and cash equivalents at the end of the year 1,572 660,224Less: Cash and cash equivalents at the beginning of the year –660,224 –1,208,013Net decrease in cash and cash equivalents –658,652 –547,789
(d) Cash and cash equivalents
2017 2016Cash at bank and on hand 1,572 693,119Less: Restricted cash at bank 0 –32,895Cash and cash equivalents at the end of the year 1,572 660,224
SECTION 9.FINANCIAL STATEMENTS AND AUDITOR'S REPORT

2017 ANNUAL REPORT 163
16 SUPPLEMENTRAY INFORMATION FROM THE MANGAMENT
(1) Detailed list of non-recurring gain and loss
Amounts (RMB’000) 2017 2016(Loss)/income from disposal of non-current assets –1,318 1,282Governmental subsidy included in the current profits and losses 2,511 31,816Paid or received payment for use of state funds recorded in current profits and losses 23,775 71,851Estimated expenses of employee dismission caused by the overseas plant shutdown and others –8,539 0Income of currency swap and interest rate swap 0 9,588Income of subsidiary disposal 12,082 0Net value of other non-operating income and expense –21,068 58,622Subtotal 7,443 173,159Less: Impact of income tax 1,930 –30,502Less: Extraordinary profit and loss attributable to minority shareholders –92 –132Extraordinary profit and loss attributable to parent company shareholders 9,281 142,525
Compiling foundation of extraordinary profit and loss detailed statements
According to the regulations of “Standards For Content And Format Of Information Disclo-sure Of Companies Issuing Securities Publicly No.1—Extraodinary profit and loss [2008]” promulgated by CSRC, extraordinary profit and loss arises in various trading and issues that have no direct relation with the normal operations of a company, or that are related with normal operations but affect the users of the statement to make reasonable judgment of the company’s operation performance and profitability due to the special and occasional nature of such trading and issues.
2 Net assets income and earnings per share
Weighted average net assets income rate (%)2017 2016
Net profits attributable to shareholders of the parent company
23.67% 20.95%
Net profits attributable to parent company share-holders excluded extraordinary profit and loss
23.33% 14.66%
Earnings per shareBasic earnings
per shareDiluted earnings
per share2017 2016 2017 2016
Net profits attributable to shareholders of the parent company
0.4556 0.3894 0.4556 0.3894
Net profits attributable to parent company share-holders excluded extraordinary profit and loss
0.4492 0.2725 0.4492 0.2725
SECTION 9.FINANCIAL STATEMENTS AND AUDITOR'S REPORT

164 2017 ANNUAL REPORT
Catalogue of documents available for inspection
Financial statements bearing the signatures and seals of the Company’s legal representative, Chief Financial Officer and the person in charge of accounting.
Catalogue of documents available for inspection
Original of the audit report bearing the seal of PwC and the signature and seal of a certified public accountant.
Catalogue of documents available for inspection
Originals of all documents and announcements publicly disclosed by the Company in newspapers designated by the CSRC within the reporting period.
Chairman: Pan XuepingApproval and submission date of the Board of Directors: 20 April 2018
SECTION 10.CATALOGUE OF DOCUMENTS AVAILABLE FOR INSPECTION


Parts of the Saurer Annual Report 2017 have been translated into English. Please note that the Chinese-language version of the Saurer Annual Report is the binding version.
Caution concerning forward-looking statementsThis report contains forward-looking statements. These forward-looking statements reflect the views of the management of Saurer Intelligent Technology Co. Ltd as of the date of publication. The forward-looking statements may involve risks and uncertainties, including technological advances, product demand and market acceptance, the effect of economic conditions, the impact of competitive products and pricing, foreign currency exchange rates, changes in legal requirements, political measures and other risks. All of these forward- looking statements are based on estimates and assumptions made by the Saurer management and are believed to be reasonable, but are inherently uncertain and difficult to predict. Actual results or experience could differ materially from the forward-looking statements. Saurer disclaims any intention or obligation to update these forward-looking statements because of new information, future events or otherwise. It should also be noted that past performance is not a guide to future performance.
SAURER AGCorporate CommunicationsBleikenstrasse 119630 [email protected]
Saurer Intelligent Technology Co. LtdInvestor Relations100 Zunyi RoadShanghai 200051China [email protected]
DISCLAIMER