2016 ANNUAL REPORT - Activision Blizzard | Investor Relations
108
® ® 2016 ANNUAL REPORT
-
Upload
khangminh22 -
Category
Documents
-
view
0 -
download
0
Transcript of 2016 ANNUAL REPORT - Activision Blizzard | Investor Relations

®
®
2016 ANNUAL REPORT
AC
TIVISIO
N B
LIZZAR
D 2016 A
NN
UA
L RE
PO
RT
ACTIVISION BLIZZARD, INC.3100 OCEAN PARK BOULEVARDSANTA MONICA, CALIFORNIA 90405
ACTIVISIONBLIZZARD.COM
CORPORATE INFORMATION
BOARD OF DIRECTORS
Robert Corti Retired CFO,Avon Products Foundation
Hendrik Hartong IIIChairman and Chief Executive Officer,Brynwood Partners
Brian G. Kelly Chairman of the Board, Activision Blizzard
Robert A. Kotick President and Chief Executive Officer, Activision Blizzard
Barry Meyer Retired Chairman and CEO, Warner Bros. Entertainment
Robert Morgado Retired Chairman and CEO, Warner Music Group
Peter Nolan Senior Advisor, Leonard Green & Partners
Casey WassermanChairman and Chief Executive Officer,Wasserman
Elaine Wynn Co-founder, Wynn Resorts
OFFICERSRobert A. Kotick President and Chief Executive Officer, Activision Blizzard
Thomas Tippl Chief Operating Officer, Activision Blizzard
Dennis Durkin Chief Financial Officer, Activision Blizzard
Eric Hirshberg President and Chief Executive Officer, Activision Publishing
Mike Morhaime President and Chief Executive Officer, Blizzard Entertainment
Brian Stolz Chief People Officer, Activision Blizzard
Chris Walther Chief Legal Officer, Activision Blizzard
Riccardo ZacconiChief Executive Officer,King Digital Entertainment
SPECIAL ADVISORS
Michael Griffith Vice Chairman, Activision Blizzard
TRANSFER AGENT
Continental Stock Transfer & Trust Company17 Battery Place New York, New York 10004(800) 509-5586
AUDITOR
PricewaterhouseCoopers LLPLos Angeles, California
CORPORATE HEADQUARTERS
Activision Blizzard, Inc.3100 Ocean Park BoulevardSanta Monica, CA 90405(310) 255-2000
WORLD WIDE WEB SITEwww.activisionblizzard.com
ANNUAL MEETING
June 1, 2017, 9:00 am PDTEquity Office3200 Ocean Park BoulevardSanta Monica, California 90405
ANNUAL REPORT ON FORM 10-K
Activision Blizzard’s Annual Report on Form 10-K for the year ended December 31, 2016 is available to shareholders without charge upon request by calling our Investor Relations department at (310) 255-2000 or by mailing a request to our Corporate Secretary at our corporate headquarters.
NON-INCORPORATION
Portions of the Company’s 2016 Form 10-K, as filed with the SEC, are included within this Annual Report. Other than these portions of the Form 10-K, all other portions of this Annual Report are not “filed” with the SEC and shall not be deemed so.
Annual Report Design: Andra Design LLC / andradesignllc.com Printer: Phoenix Lithographing, USA © Copyright 2017 Activision Blizzard, Inc.
DOMESTIC OFFICES
Austin, Texas Bloomington, MinnesotaBothell, WashingtonBoulder, ColoradoCarlsbad, CaliforniaChampaign, IllinoisColumbus, OhioDallas, TexasEden Prairie, MinnesotaEl Segundo, California Foster City, CaliforniaFresno, CaliforniaHilliard, OhioIrvine, CaliforniaLos Angeles, CaliforniaMenands, New YorkMiddleton, WisconsinNew York, New York
Novato, CaliforniaPortland, MaineRedmond, WashingtonRogers, ArkansasSan Francisco, California San Jose, CaliforniaSanta Monica, CaliforniaSeattle, WashingtonWoodland Hills, California
Barcelona, SpainBerlin, GermanyBirmingham, United KingdomBucharest, RomaniaBurglengenfeld, GermanyMilan, ItalyCork, IrelandDatchet, United KingdomDublin, IrelandHong Kong SAR, ChinaLeamington Spa, United KingdomLondon, United KingdomMadrid, Spain Malmö, SwedenSt. Julians, MaltaMexico City, Mexico Mississauga, Canada
Munich, GermanyParis, FranceQuebec City, CanadaSão Paulo, BrazilSchiphol, The NetherlandsSeoul, South KoreaShanghai, ChinaShenzhen, ChinaSingaporeStockholm, SwedenSydney, AustraliaTaipei, Region of Taiwan Tokyo, JapanVancouver, CanadaVenlo, The NetherlandsVersailles, FranceWarrington, United Kingdom
INTERNATIONAL OFFICES
1 For full reconciliation, please see tables at the end of the annual report.
COVER: IT TAKES HEROES TO MAKE HEROES.
ACTIVISION BLIZZARD HAS THE MOST
TALENTED, PASSIONATE AND DEDICATED
TEAM IN ENTERTAINMENT.
UP 42% YEAR-OVER-YEAR
74% OF TOTAL REVENUES, UP 94% YEAR-OVER-YEAR
54% OF TOTAL REVENUES, UP 126% YEAR-OVER-YEAR
UP 68% YEAR-OVER-YEAR
UP 71% YEAR-OVER-YEAR
$6.6BILLION
$4.9BILLION
$3.6 BILLION
35%
$2.18
$2.2 BILLION
RECORD REVENUES
RECORD DIGITAL REVENUES
RECORD IN-GAME REVENUES
RECORD NON-GAAP (REDEFINED1)
OPERATING MARGIN
RECORD NON-GAAP (REDEFINED1) EARNINGS PER SHARE
RECORD OPERATING CASH FLOW
2016… A RECORD YEAR
▼▼
▼▼
▼▼
1
24
3
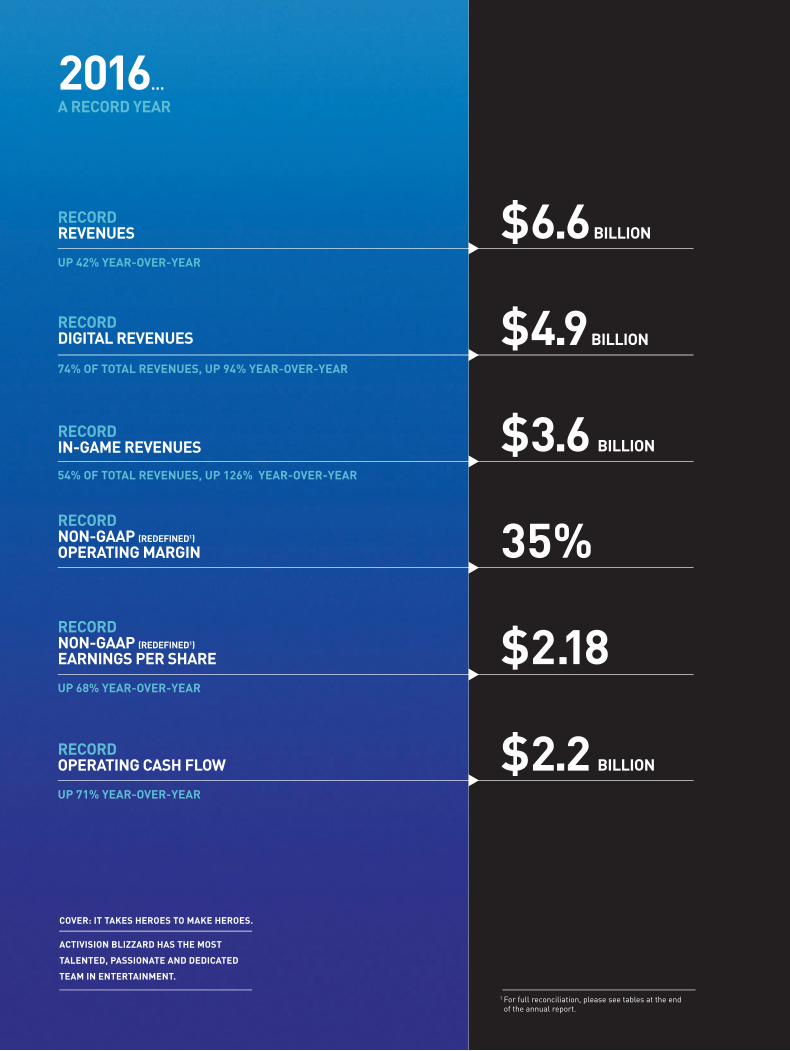
AUDIENCEREACH
TIME SPENT
PLAYERINVESTMENT
CASHFLOW
1 AUDIENCE REACH 2 TIME SPENT 3 PLAYER INVESTMENT 4 CASH FLOW
▼ ▼ ▼ ▼
CASH
FLOW AND RE-INVESTMENT
RECURRING PLAYER INVESTM
ENT
PLAYER
INVESTM
ENT DRIVES PREDICTABLE ENGAGEMENT DRIV
ES PREM
IUM
DEL
IVER
HIG
H QUALITY CONTENT DRIVES ENGAGEM
ENT
TALE
NT, T
ECHNOLOGY & PROCESSES HIGH QUALITY CONTEN
T
1 MAUs stands for Monthly Active Users and is defined as number of individuals who played a particular game in a given month averaged across the number of months in a respective period. Refer to definition included in press release for additional details. 2 Includes King for full period. King acquisition closed on February 23, 2016.
FRAMEWORK FOR FRANCHISE GROWTH
Delivered a record
$2.2 billion of operating
cash flow in 2016, up
71% year-over-year
Digital in-game revenues
were a record $3.6 billion
in 2016, more than
doubled year over-year,
and represented over
half of total revenues
In 2016, people played
and watched our games
for roughly 43 billion hours2
We have one of the
largest networks in the
world with roughly 450
million MAUs1 globally
1

®
®
THE MOST SUCCESSFUL NEW INTELLECTUAL PROPERTY IN COMPANY’S HISTORY
OVER 25 MILLION REGISTERED PLAYERS GLOBALLY
THE OVERWATCH LEAGUE, A PROFESSIONAL ESPORTS
ECOSYSTEM DEBUTING IN 2017
2

®
®
3

®
®
6TH EXPANSION, LEGION, HAD A SUCCESSFUL LAUNCH IN 2016
AND MAUs1 GREW IN THE YEAR
1 MAUs stands for Monthly Active Users and is defined as number of individuals who played a particular game in a given month averaged across the number of months in a respective period. Refer to definition included in press release for additional details.
4

®
®
RECORD MAUs1 IN 2016
1 MAUs stands for Monthly Active Users and is defined as number of individuals who played a particular game in a given month averaged across the number of months in a respective period. Refer to definition included in press release for additional details.
5

®
®
6

®
®
THE MOST SUCCESSFUL VIDEO GAME FRANCHISE OF THE LAST 20 YEARS1
#1 TOP-SELLING CONSOLE VIDEO GAME FRANCHISE GLOBALLY FOR 2016 BASED ON REVENUE1
1NPD, Gfk
7

®
®
DESTINY 2 SET FOR RELEASE ON SEPTEMBER 8, 2017
8

®
®
1 NPD, Chart-Track, including toys and accessories, in NA & EU.
11TH BIGGEST CONSOLE FRANCHISE OF ALL TIME WITH MORE THAN 300 MILLION TOYS SOLD1
SKYLANDERS ACADEMY ANIMATED SHOW DEBUTED ON NETFLIX
9

2 OF TOP-10-GROSSING MOBILE GAMES FOR THE 13TH QUARTER IN A ROW1, 2
OVER 350M MAUs3
1 U.S. rankings for Apple App Store and Google Play Store, per App Annie Intelligence for fourth quarter 2016.2 King acquisition closed on February 23, 2016. Metrics as of fourth quarter 2016.
3 MAUs stands for Monthly Active Users and is defined as number of individuals who played a particular game in a given month averaged across the number of months in a respective period. Refer to definition included in press release for additional details.10

A giant Candy Factoryhas produced every
piece of candyin the Candy Kingdom!
Candy Crush Sagais played on all
seven continents,even Antarctica!
The Candy Kingdomis one of the vastestlands known to man!
1 Gross bookings is an operating metric that represents the total cash spent by players in the period for the purchase of virtual items. Refer to definition included in press release for additional details.
CANDY CRUSH FRANCHISE MOBILE GROSS BOOKINGS GREW IN 20161
11

12
DEVOTED TO CREATING ORIGINAL CONTENT BASED ON THE COMPANY’S
EXTENSIVE LIBRARY OF ICONIC AND GLOBALLY-RECOGNIZED INTELLECTUAL PROPERTIES.
®
®
S T U D I O S
®
®
C O N S U M E R P R O D U C T S
MAJOR LEAGUE GAMING
A LEADER IN CREATING AND STREAMING PREMIUM LIVE GAMING EVENTS
AND SERVES AS THE FOUNDATION FOR ACTIVISION BLIZZARD’S ESPORTS BROADCAST NETWORK.
DEDICATED TO PROVIDING OUR PASSIONATE COMMUNITIES WITH NEW WAYS TO
EXPERIENCE OUR FRANCHISES AND CHARACTERS IN THEIR EVERYDAY LIVES.
1212
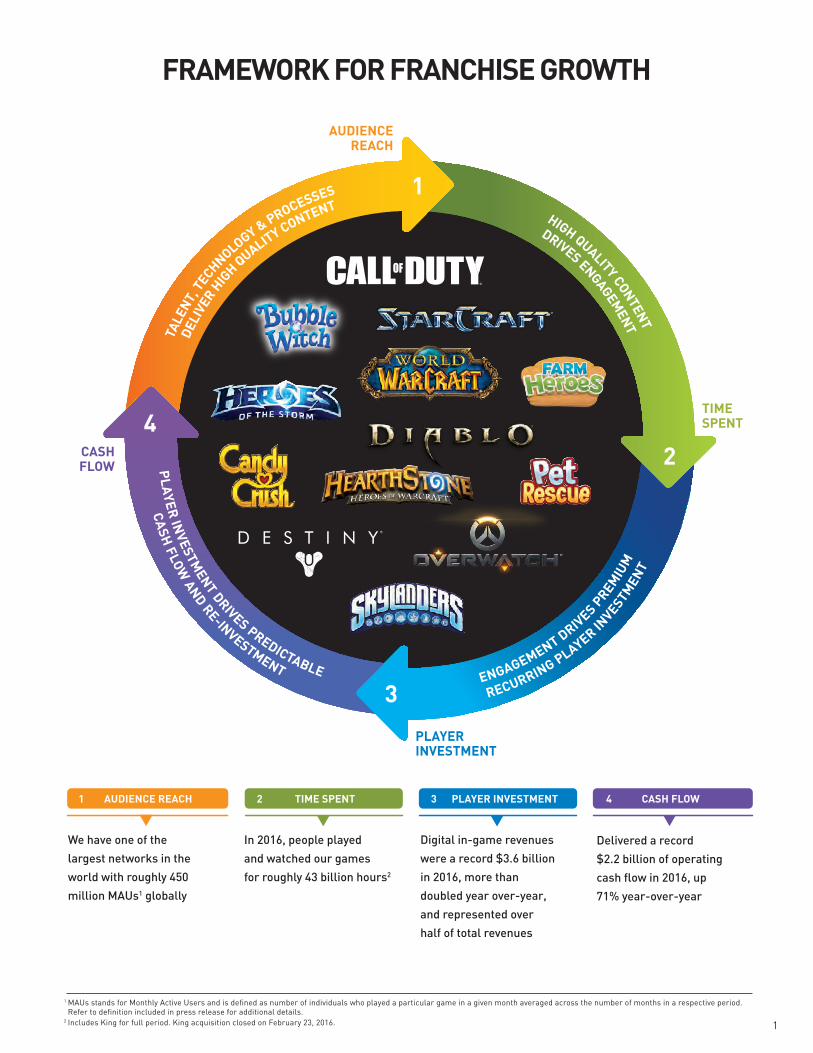
BOARD OF DIRECTORS
AUTHORIZED A NEW 2-YEAR
$1 BILLION STOCK
REPURCHASE PROGRAM
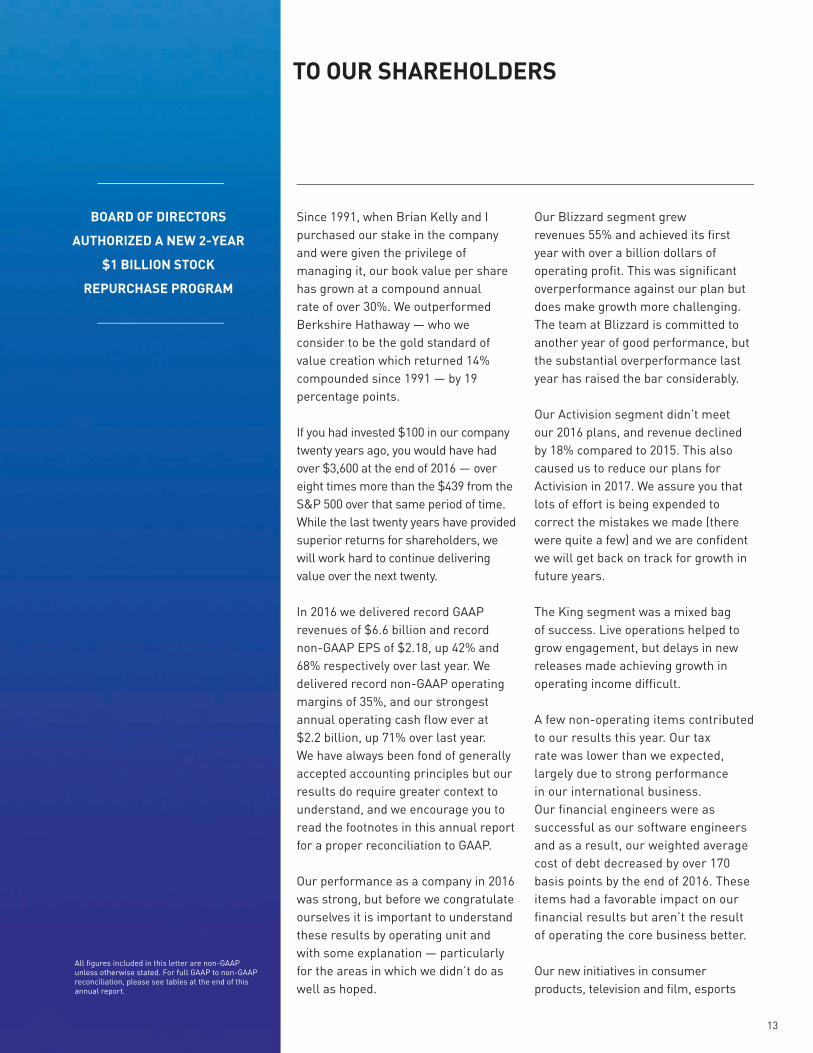
Since 1991, when Brian Kelly and I purchased our stake in the company and were given the privilege of managing it, our book value per share has grown at a compound annual rate of over 30%. We outperformed Berkshire Hathaway — who we consider to be the gold standard of value creation which returned 14% compounded since 1991 — by 19 percentage points.
If you had invested $100 in our company twenty years ago, you would have had over $3,600 at the end of 2016 — over eight times more than the $439 from the S&P 500 over that same period of time. While the last twenty years have provided superior returns for shareholders, we will work hard to continue delivering value over the next twenty.
In 2016 we delivered record GAAP revenues of $6.6 billion and record non-GAAP EPS of $2.18, up 42% and 68% respectively over last year. We delivered record non-GAAP operating margins of 35%, and our strongest annual operating cash flow ever at $2.2 billion, up 71% over last year. We have always been fond of generally accepted accounting principles but our results do require greater context to understand, and we encourage you to read the footnotes in this annual report for a proper reconciliation to GAAP.
Our performance as a company in 2016 was strong, but before we congratulate ourselves it is important to understand these results by operating unit and with some explanation — particularly for the areas in which we didn’t do as well as hoped.
Our Blizzard segment grewrevenues 55% and achieved its first year with over a billion dollars of operating profit. This was significant overperformance against our plan but does make growth more challenging. The team at Blizzard is committed to another year of good performance, but the substantial overperformance last year has raised the bar considerably.
Our Activision segment didn’t meet our 2016 plans, and revenue declined by 18% compared to 2015. This also caused us to reduce our plans for Activision in 2017. We assure you that lots of effort is being expended to correct the mistakes we made (there were quite a few) and we are confident we will get back on track for growth in future years.
The King segment was a mixed bag of success. Live operations helped to grow engagement, but delays in new releases made achieving growth in operating income difficult.
A few non-operating items contributed to our results this year. Our tax rate was lower than we expected, largely due to strong performance in our international business. Our financial engineers were as successful as our software engineers and as a result, our weighted average cost of debt decreased by over 170 basis points by the end of 2016. These items had a favorable impact on our financial results but aren’t the result of operating the core business better.
Our new initiatives in consumer products, television and film, esports
TO OUR SHAREHOLDERS
All figures included in this letter are non-GAAP unless otherwise stated. For full GAAP to non-GAAP reconciliation, please see tables at the end of this annual report.
13

leagues and networks are all off to good starts. None of these are delivering operating profits yet, but they will one day — and we think they could be significant over the long-term.
Overall, we’re pleased with our company’s progress in 2016, and our financial results reflect the unwavering commitment we have to provide a superior return to our shareholders. We deliver these results through an equally unwavering commitment to our players.
Our audiences invest billions of hours a year consuming our content — roughly 43 billion hours in 2016. Hundreds of millions of people in 196 countries play our games, watch our spectator content, buy consumer products inspired by our franchises, compete in tournaments and connect with communities inspired by our games each month. Our content gives our audiences joy, and a greater sense of purpose and belonging. It satisfies a universal urge for competition, and adds unique value to people’s lives.
One person whose life has been touched by our work is Aaron Soetaert, a 29-year-old U.S. Air Force veteran. A few years ago, he suffered a terrible injury and lost his right arm. Aaron fought to get healthy, and sought new ways to express his intense competitive spirit.
Aaron started playing Overwatch. He plays as the winged hero, Pharah, and he dominates the skies with jump jets and hover abilities. Aaron competes with a team, and is part
of a community that recognizes and celebrates his skills, allows him to meet new friends, and enables him to inspire so many. Watching Aaron’s character play is thrilling; he talks to his team, pushes them forward, and always plays to win. His injury doesn’t hold him back in Overwatch, it propels him forward.
This is just one example of the time-less power of communities anchored through organized competition.
In the 19th century, sports like football, baseball and basketball were the hobbies of gifted amateurs. Then they became professional leagues organized by bodies like FIFA, the NFL and NBA. By investing in developing the games, talent and community, the value of sport only grew for our society. The professionalization of sports kickstarted a virtuous cycle — deepening the opportunities to recognize, reward and celebrate the achievements of players, by deepening fans’ sense of belonging to a community, which in turn gave us new ways to deepen players’ sense of achievement. Sport got better, and sport made our lives better.
Our franchises deliver competitive experiences as enduring as any traditional sport. But unlike many sports, we’ve built experiences that are broadly accessible — competition that allows every spectator to be a competitor, and for almost anyone to be a star. Our competition is more global, we reach more people,
RECORD TOTAL REVENUES($ billions of dollars)
2015 2016
6.6
4.7
42% GROWTH
RECORD NON-GAAP (REDEFINED)
EARNINGS PER SHARE
2015 2016
$2.18
$1.30
UP 68% YEAR-OVER-YEAR
RECORD DIGITAL REVENUES($ billions of dollars)
2015 2016
4.9
2.5
74% OF TOTAL REVENUES
94% GROWTH
RECORD OPERATING CASH FLOW($ billions of dollars)
2015 2016
2.2
1.3
71% GROWTH
RECORD IN-GAME REVENUES($ billions of dollars)
2015 2016
3.6
1.6
2017 DIVIDEND($ per share)
2015 2016
0.30
0.26UP 15%
126% GROWTH
14

RECORD TOTAL REVENUES($ billions of dollars)
2015 2016
6.6
4.7
42% GROWTH
RECORD NON-GAAP (REDEFINED)
EARNINGS PER SHARE
2015 2016
$2.18
$1.30
UP 68% YEAR-OVER-YEAR
RECORD DIGITAL REVENUES($ billions of dollars)
2015 2016
4.9
2.5
74% OF TOTAL REVENUES
94% GROWTH
RECORD OPERATING CASH FLOW($ billions of dollars)
2015 2016
2.2
1.3
71% GROWTH
RECORD IN-GAME REVENUES($ billions of dollars)
2015 2016
3.6
1.6
2017 DIVIDEND($ per share)
2015 2016
0.30
0.26UP 15%
126% GROWTH
engage them more deeply, and create more powerful, lasting connections thanks to the visceral nature of play and the breadth of the communities we support.
This is the thinking that inspired us when we created Overwatch, a game designed for online competition, with memorable characters, an immersive world, and fast-paced gameplay designed for the most accessible competition and compelling viewing. That world is now a platform in which millions of people can engage in gameplay, competition, and connecting with their friends and community — and through that platform, we have the opportunity to create a superior return to our shareholders through player investment, and our own investment in delivering even greater experiences for the community. This is how we’ve tapped into the timeless appeal of sports to create something really valuable for our players, spectators, company and investors — and we’ve been able to do this over and over again, with Call of Duty, Destiny, StarCraft and World of Warcraft. It took many years, and a lot of innovation and iteration. But we are building the sports of the future.
The size of the opportunity ahead for us is vast. Around 240 million people watch around 7 billion hours of NFL content annually1, generating $12.0 billion in revenues including $6.1 billion in media rights revenue2; the NBA has 176 million viewers watching 2.1 billion hours each year1, creating $5.2 billion in revenues and $1.8 billion in media rights.2
To broadcast the organized competition we are creating, we are building MLG.tv into the first dedicated channel for professionally produced esports and the adjacent content that celebrates and recognizes our players for their accomplishments. We liken this to the ESPN of videogames.
We are also working on an advertising model fit for that future. The quickly-growing esports audience includes some of the hardest to reach and most sought after demographics, with a share of millennials two to three times higher than any of the ‘Big Four’ US sports.3 We will be able to provide advertisers with direct access to these fans and better targeting and analytics than traditional forms of advertising. Our efforts began with the idea of providing our King mobile players with a chance to interact with high-quality advertising that is native to the gameplay experience, without detracting from what our audiences like best — playing our games.
There are now around 450 million players in our community. More than forty billion hours were spent playing our franchises last year. A record three billion hours were spent viewing our games.
Blizzard achieved their most success-ful new IP launch ever with Overwatch, their fastest game to reach 25 million users. World of Warcraft’s Legion expansion reinvigorated the commu-nity, which in the fourth quarter grew over 20% versus the previous year. For Activision, Call of Duty: Infinite Warfare may have got a little lost in
1 Source: Optimum Sports.2 Source: Barclays.3 Source: Esports audience demographic from Blizzard Consumer Insights proprietary survey of 5,000 global esports viewers, 2015; US professional sports demographics from Barclays.
15

Bobby KotickPresident and Chief Executive OfficerActivision Blizzard
Brian KellyChairman of the BoardActivision Blizzard
space, but Call of Duty remained the number one console franchise globally, and we’re looking forward to new Call of Duty content and Destiny 2 later this year. King continued to deliver stable performance on the strength of a loyal user base.
Each of these results reflects our consistent focus on serving our audience. By prioritizing what allows us to best deliver the values of play, competition and community, we’ve worked to do what’s right for our community today, while also delivering better experiences into the future.
And that’s how we’re approaching the opportunities for growth in 2017.
This year, we are focused on unleashing the full potential of professional esports by opening up the sale of teams and media rights of our leagues. We’re taking the next step in the evolution of our company and our community by creating even more engaging experiences for teams, players and fans — something we believe will create immense new value for our business in the same way that traditional sports do, through viewers, broadcast revenues, licensing, sponsorship and ticket sales.
We also have the opportunity to connect people in new ways around our experiences. Through online advertising, we’re working to serve our players and global brands, and early tests of our ad platform on King have already generated impressive results in-line with industry leaders. And with our recently announced
consumer products division, we can give people more ways to interact with the franchises they love.
We will continue to stay true to our principles:n Delivering innovative and compelling entertainment experiences with continuous investment in our franchises and communitiesn Focusing on the largest and most promising opportunitiesn Recruiting, rewarding and retaining diverse world-class talent, while maintaining our shared valuesn Remaining disciplined in our commitment to deliver shareholder value
It remains a great privilege to lead our company and the extraordinarily talented people around the world who are so committed to excellence. We thank all our stakeholders for their continuing support and encouragement, and especially the players like Aaron Soetaert who inspire us every day.
Sincerely,
1 MAUs stands for Monthly Active Users and is defined as number of individuals who played a particular game in a given month averaged across the number of months in a respective period. Refer to definition included in press release for additional details.2 Pro-forma for King acquisition closed on February 23, 2016.
WE HAVE ONE OF THE
LARGEST ENTERTAINMENT
NETWORKS IN THE WORLD
WITH ROUGHLY 450 MILLION
MAUs1 GLOBALLY
IN 2016, PEOPLE
PLAYED AND WATCHED
OUR GAMES FOR ROUGHLY
43 BILLION HOURS2
16

FINANCIAL REVIEW
®
®
2 SELECTED FINANCIAL DATA
3 MANAGEMENT’S DISCUSSION AND ANALYSIS OF FINANCIAL CONDITION
AND RESULTS OF OPERATIONS
34 QUANTITATIVE AND QUALITATIVE DISCLOSURES ABOUT MARKET RISK
36 CONTROLS AND PROCEDURES
37 REPORT OF INDEPENDENT REGISTERED PUBLIC ACCOUNTING FIRM
38 CONSOLIDATED BALANCE SHEETS
39 CONSOLIDATED STATEMENTS OF OPERATIONS
40 CONSOLIDATED STATEMENTS OF COMPREHENSIVE INCOME
41 CONSOLIDATED STATEMENTS OF CHANGES IN SHAREHOLDERS’ EQUITY
42 CONSOLIDATED STATEMENTS OF CASH FLOWS
43 NOTES TO CONSOLIDATED FINANCIAL STATEMENTS
76 MARKET FOR REGISTRANT’S COMMON EQUITY, RELATED STOCKHOLDER
MATTERS, AND ISSUER PURCHASES OF EQUITY SECURITIES
79 CAUTIONARY STATEMENT
80 FINANCIAL TABLES

2
SELECTED FINANCIAL DATA
The terms “Activision Blizzard,” the “Company,” “we,” “us,” and “our” are used to refer collectively to Activision Blizzard, Inc. and its subsidiaries.
The following table summarizes certain selected consolidated financial data, which should be read in conjunction with our Consolidated Financial Statements and Notes thereto and with Management’s Discussion and Analysis of Financial Condition and Results of Operations included elsewhere in this Annual Report. The selected consolidated financial data presented below at and for each of the years in the five-year period ended December 31, 2016 is derived from our Consolidated Financial Statements. All amounts set forth in the following tables are in millions, except per share data.
For the Years Ended December 31, 2016 2015 2014 2013 2012
Statement of Operations Data: Net revenues ..................................................................................... $ 6,608 $ 4,664 $ 4,408 $ 4,583 $ 4,856 Net income ....................................................................................... 966 892 835 1,010 1,149 Basic net income per share ............................................................... 1.30 1.21 1.14 0.96 1.01 Diluted net income per share ............................................................ 1.28 1.19 1.13 0.95 1.01 Cash dividends declared per share ................................................... 0.26 0.23 0.20 0.19 0.18 Operating cash flows(1) ................................................................... $ 2,155 $ 1,259 $ 1,331 $ 1,293 $ 1,350 Balance Sheet Data: Cash and investments(2) .................................................................. $ 3,271 $ 1,840 $ 4,867 $ 4,452 $ 4,383 Total assets ....................................................................................... 17,452 15,246 14,637 13,947 14,181 Long-term debt, net(3) ..................................................................... 4,887 4,074 4,319 4,687 — Long-term debt, gross ...................................................................... 4,940 4,119 4,369 4,744 — Net debt(4) ....................................................................................... 1,669 2,279 — 292 —
(1) During the third quarter of 2016, we early adopted an accounting standard which simplifies the accounting for share-based
payments. The standard, among other things, requires excess tax benefits and shortfalls associated with share-based payments to be reported within operating activities instead of financing activities, as was required under previous guidance. We elected to apply this guidance retrospectively for all periods presented resulting in increases in our operating cash flows of $67 million, $39 million, $29 million, and $5 million, for the years ended December 31, 2015, 2014, 2013, and 2012, respectively, when compared to prior periods.
(2) Cash and investments consists of cash and cash equivalents along with short-term and long-term investments. We had short-term and long-term investments of $13 million and $13 million, respectively, as of December 31, 2016, $8 million and $9 million, respectively, as of December 31, 2015, $10 million and $9 million, respectively, as of December 31, 2014, $33 million and $9 million, respectively, as of December 31, 2013, and $416 million and $8 million, respectively, as of December 31, 2012. Cash and investments as of December 31, 2015 excludes $3,561 million of cash placed in escrow for the acquisition of King Digital Entertainment (“King”).
(3) For discussion on our debt obligations, see Note 11 of the notes to consolidated financial statements included in this Annual Report.
(4) Net debt is defined as long-term debt, gross less cash and investments.
2
3
MANAGEMENT’S DISCUSSION AND ANALYSIS OF FINANCIAL CONDITION AND RESULTS OF OPERATIONS
Business Overview
Activision Blizzard, Inc. is a leading global developer and publisher of interactive entertainment content and services. We develop and distribute content and services across all of the major gaming platforms, including video game consoles, personal computer (“PC”), and mobile devices.
The King Acquisition
On February 23, 2016 (the “King Closing Date”), we completed the acquisition of King for an aggregate purchase price of approximately $5.8 billion (the “King Acquisition”), as further described in Note 21 of the notes to the consolidated financial statements. Our consolidated financial statements include the operations of King commencing on February 23, 2016.
Reportable Segments
Based upon our organizational structure, we conduct our business through three reportable operating segments: Activision, Blizzard, and King.
(i) Activision
Activision Publishing, Inc. (“Activision”), is a leading global developer and publisher of interactive software products and entertainment content, particularly in console gaming. Activision primarily delivers content through retail channels or digital downloads, including full-game sales and in-game purchases, as well as licenses of software to third-party or related-party companies that distribute Activision products. Activision develops, markets and sells products which are principally based on our internally developed intellectual properties, as well as some licensed properties. Additionally, we have established a long-term alliance with Bungie to publish its game universe, Destiny.
Activision’s key product franchises include: Call of Duty®, a first-person shooter for the console and PC platforms; Destiny, an online universe of first-person action gameplay (which we call a “shared-world shooter”) for console platforms; and Skylanders®, a kid’s game franchise that brings physical toys to life digitally in the game primarily for console platforms. Call of Duty, Activision’s leading franchise, was the number one console franchise globally in 2016, and in North America for the 8th year in a row, according to The NPD Group, GfK Chart-Track, and our internal estimates.
(ii) Blizzard
Blizzard Entertainment, Inc. (“Blizzard”) is a leading global developer and publisher of interactive software products and entertainment content, particularly in PC gaming. Blizzard primarily delivers content through retail channels or digital downloads, including subscriptions, full-game sales, and in-game purchases, as well as licenses of software to third-party or related-party companies that distribute Blizzard products. Blizzard also maintains a proprietary online gaming service which facilitates digital distribution of Blizzard content, online social connectivity across all Blizzard games, and the creation of user-generated content for Blizzard’s games.
Blizzard’s key product franchises include: World of Warcraft®, a subscription-based massive multi-player online role-playing game (“MMORPG”) for the PC; StarCraft®, a real-time strategy PC franchise; Diablo®, an action role-playing franchise for PC and console platforms; Hearthstone®, an online collectible card franchise for the PC and mobile platforms; Heroes of the Storm®, a free-to-play team brawler for the PC; and Overwatch®, a team-based first person shooter for the PC and console platforms. World of Warcraft is the leading subscription-based MMORPG and was initially launched in November 2004.
(iii) King
King Digital Entertainment (“King”) is a leading global developer and publisher of interactive entertainment content and services, particularly on mobile platforms, such as Android and iOS. King also distributes its content and services on online social platforms, such as Facebook and the king.com websites. King’s games are free-to-play, however players can acquire in-game virtual items, either with virtual currency the players purchase, or directly using real currency.
King’s key product franchises, all of which are for the PC and mobile platforms, include: Candy Crush™, which features “match three” games; Farm Heroes™, which also features “match three” games; Pet Rescue™, which is a “clicker” game; and Bubble Witch™, which features “bubble shooter” games. King had two of the top 10 highest-grossing titles in the United States of America
3
(“U.S.”) mobile app stores for the last thirteen quarters in a row, according to App Annie Intelligence and internal estimates for Apple App Store and Google Play Store combined.
(iv) Other
We also engage in other businesses that do not represent reportable segments, including:
• The Major League Gaming (“MLG”) business (which we formerly referred to as Activision Blizzard Media Networks orMedia Networks), which is devoted to esports and builds on our competitive gaming efforts by creating ways to deliver abest-in-class fan experience across games, platforms, and geographies with a long-term strategy of monetization throughadvertising, sponsorships, tournaments, and premium content.
• The Activision Blizzard Studios (“Studios”) business, which is devoted to creating original film and television contentbased on our library of globally recognized intellectual properties, and, in October 2016, released the first season of theanimated TV series Skylanders™ Academy on Netflix.
• The Activision Blizzard Distribution (“Distribution”) business, which consists of operations in Europe that providewarehousing, logistics, and sales distribution services to third-party publishers of interactive entertainment software, ourown publishing operations, and manufacturers of interactive entertainment hardware.
Business Results and Highlights
Financial Results
The Company’s 2016 financial highlights include:
• 2016 consolidated net revenues increased 42% to $6.6 billion and 2016 consolidated operating income increased 7% to$1.4 billion, inclusive of King’s results of operations since the King Closing Date, as compared to consolidated netrevenues of $4.7 billion and consolidated operating income of $1.3 billion in 2015.
• Revenues from digital online channels increased 94% to $4.9 billion in 2016, as compared to $2.5 billion in 2015.
• Operating margin was 21.4% for 2016, compared with 28.3% in 2015. The lower margin was driven primarily byamortization of intangible assets acquired in the King Acquisition.
• We generated cash flows from operating activities of approximately $2.2 billion in 2016, an increase of 71% ascompared to $1.3 billion in 2015.
• Consolidated net income increased 8% to $966 million in 2016, as compared to $892 million in 2015.
• Our diluted earnings per common share increased 8% to $1.28 in 2016, as compared to $1.19 in 2015.
Since certain of our games are hosted or include online functionality that represents an essential component of gameplay and, as a result, a more-than-inconsequential separate deliverable, we initially defer the software-related revenues from the sale of these games and recognize the attributable revenues over the relevant estimated service periods, which are generally less than a year. Net revenues for the year ended December 31, 2016 include a net effect of $9 million from the recognition of deferred net revenues.
Also, for the year ended December 31, 2016, as a result of the King Acquisition, our net revenues include $1.5 billion and our net income includes a net loss of $230 million from King’s operations, after adjustments for purchase price accounting, inclusive of amortization of intangible assets, share-based payments, and deferral of revenues and related cost of revenues. The majority of these accounting charges under accounting principals generally accepted in the United States of America ("U.S. GAAP”) do not impact the economics or operating cash flows of our business, although they had a material impact on our 2016 U.S. GAAP results and will have a material impact on our 2017 U.S. GAAP results.
Release Highlights
Games and digital downloadable content released, among others, during the year ended December 31, 2016 included:
• Four downloadable content packs for Call of Duty: Black Ops III;
• Three content packs for Hearthstone;
• Overwatch;
• Farm Heroes Super Saga™;
4

5
• World of Warcraft: Legion™;
• Destiny: Rise of Iron (expansion pack for Destiny);
• Skylanders Imaginators; and
• Call of Duty: Infinite Warfare™, featuring Modern Warfare® Remastered.
Monthly Active Users (“MAUs”): Measuring the Size and Engagement of Our User Base
We monitor MAUs as a key measure of the overall size of our user base and its regular engagement with our portfolio of games. MAUs are the number of individuals who played a particular game in a given month. We calculate average MAUs in a period by adding the total number of MAUs in each of the months in a given period and dividing that total by the number of months in the period. An individual who plays two of our games would be counted as two users. In addition, due to technical limitations, for Activision and King, an individual who plays the same game on two platforms or devices in the relevant period would be counted as two users. For Blizzard, an individual who plays the same game on two platforms or devices in the relevant period would generally be counted as a single user.
The number of MAUs for a given period can be significantly impacted by the timing of new content releases, since new releases may cause a temporary surge in MAUs. Accordingly, although we believe that overall trending in the number of MAUs can be a meaningful performance metric, period-to-period fluctuations may not be indicative of longer-term trends. The following table details our average MAUs on a sequential quarterly basis for our reportable segments (amounts in millions):
2016 September 30,
2016 June 30,
2016 March 31,
2016 December 31,
2015 September 30,
2015 Activision ........................................................ 46 49 55 55 46 Blizzard ........................................................... 41 42 33 26 26 28 King ................................................................. 355 394 409 463 449 474 Total ................................................................ 447 482 491 544 530 548
Average MAUs decreased by 35 million, or 7%, for the quarter ended December 31, 2016, as compared to the quarter ended September 30, 2016. The decrease in King’s average MAUs is due to decreases across King’s franchises that are largely attributable to less engaged users leaving the network. The increase in Activision’s average MAUs is reflective of the launch of Call of Duty: Infinite Warfare in November 2016 along with Call of Duty: Black Ops III continuing to have strong MAU retention relative to previous releases.
Average MAUs decreased by 83 million, or 16%, for the quarter ended December 31, 2016, as compared to the quarter ended December 31, 2015. The decrease in King’s average MAUs is due to decreases across King’s franchises that are largely attributable to less engaged users leaving the network. This decrease is partially offset by the increase in Blizzard’s average MAUs, driven by the release of Overwatch in May 2016.
International Sales
International sales are a fundamental part of our business. An important element of our international strategy is to develop content that is specifically directed toward local cultures and customs. Net revenues from international sales accounted for approximately 48%, 48%, and 50% of our total consolidated net revenues for the years ended December 31, 2016, 2015, and 2014, respectively. The majority of our net revenues from foreign countries is generated by consumers in Australia, Canada, China, France, Germany, Italy, Japan, the Netherlands, South Korea, Spain, Sweden, and the United Kingdom. Our international business is subject to risks typical of an international business, including, but not limited to, foreign currency exchange rate volatility and changes in local economies. Accordingly, our future results could be materially and adversely affected by changes in foreign currency exchange rates and changes in local economies.
Management’s Overview of Business Trends
Interactive Entertainment and Mobile Gaming Growth
Our business participates in the global interactive entertainment industry. Games have become an increasingly popular form of entertainment, and we estimate the total industry has grown, on average, 19% annually over the last four years. The industry continues to benefit from additional players entering the market as interactive entertainment becomes more common place across age groups and as more developing regions gain access to this form of entertainment.
Further, the wide adoption of smart phones globally and the free-to-play business model on those platforms has increased the total addressable market for gaming significantly. Smart phones and associated free-to-play games have introduced gaming to new age groups and new regions and allowed gaming to occur more widely outside the home. Mobile gaming is now estimated to be larger than console and PC gaming and continues to grow at a significant rate. King is a leading developer of mobile and free-to-play games.
December 31,
5

In addition, our other segments have mobile efforts underway that present the opportunity for us to drive additional player investment from our franchises.
Opportunities To Expand Franchises Outside of Games
Our fans spend significant time investing in our franchises through purchases of our game content, whether through purchases of full games or downloadable content or via microtransactions. Given the passion our players have for our franchises, we believe there are emerging opportunities to drive player investment outside of game purchases. These opportunities include esports, film and television, and consumer products. Our efforts to build these additional opportunities are still relatively nascent, but we view them as potentially significant sources of future revenues.
Concentration of Sales Among the Most Popular Franchises
The concentration of retail revenues among key titles has continued as a trend in the overall interactive software industry. According to The NPD Group, the top 10 titles accounted for 32% of the retail sales in the U.S. interactive entertainment industry in 2016. Similarly, a significant portion of our revenues has historically been derived from video games based on a few popular franchises and these video games were responsible for a disproportionately high percentage of our profits. For example, the Call of Duty, Candy Crush, World of Warcraft, and Overwatch franchises, collectively, accounted for 69% of our consolidated net revenues, and a significantly higher percentage of our operating income, for 2016.
The top titles in the industry are also becoming more consistent as players and revenues concentrate more heavily in established franchises. Of the top 10 console franchises in 2016, all 10 are from established franchises. Similarly, according to U.S rankings for the Apple App Store and Google Play store per App Annie Intelligence, the top 10 mobile games have an average tenure of 24 months.
In addition to investing in and developing sequels and content for our top titles, we are continually exploring additional ways to expand those franchises. Further, we invest in new properties in an effort to develop the future top franchises. In 2014, we released Hearthstone and Destiny, in 2015, we released Heroes of the Storm, and on May 24, 2016, we released Overwatch. There is no guarantee these investments will result in established franchises. Additionally, to diversify our portfolio of key franchises and increase our presence in the mobile market, on February 23, 2016, we acquired King.
Overall, we do expect that a limited number of popular franchises will continue to produce a disproportionately high percentage of our, and the industry’s, revenues and profits in the near future. Accordingly, our ability to maintain our top franchises and our ability to successfully compete against our competitors’ top franchises can significantly impact our performance.
Recurring Revenue Business Models and Seasonality
Increased consumer online connectivity has allowed us to offer players new investment opportunities and to shift our business to a more recurring and year-round model. Offering downloadable content and microtransactions, in addition to full games, allows our players to access and invest in new content throughout the year. This incremental content not only provides additional high-margin revenue, it can also increase engagement. Also, mobile games, and free-to-play games more broadly, are generally less seasonal.
While our business is transitioning to a year-round engagement model, the interactive entertainment industry remains somewhat seasonal. We have historically experienced our highest sales volume, particularly for Activision, in the year-end holiday buying season, which occurs in the fourth quarter. As we make the shift to a year-round model and also now include the operating results of King, which focuses on free-to-play games, less of our revenues are coming from the fourth quarter. For our reportable segments—Activision, Blizzard, and King—the percentage of our revenue represented by the fourth quarter in 2016 decreased by 10% year-over-year to 36%, compared with 46% in 2015.
Outlook
In 2017, we will have a lighter slate of full-game releases than 2016, which we expect to result in lower revenues and earnings per share than we had in 2016. For Activision, we do expect to release the first sequel to Destiny and a new Call of Duty title in the second half of the year, however, our Skylanders franchise will not have a new full console game launch in 2017. Across our businesses, we will continue to focus on our opportunities for year-round player engagement and investment.
While our results for 2017 will include the full-year operations of King, the expected results will continue to be impacted by additional accounting charges associated with the King Acquisition, which include, among other things, integration and acquisition-related costs, the amortization of intangible assets resulting from purchase price accounting adjustments, and the related tax impact from the King Acquisition. While the majority of these GAAP accounting charges will not impact the economics or operating cash flows of our business, they will have a material impact on our GAAP results.
Finally, one of our current initiatives is to create an esports equivalent of the world’s established major professional sport leagues. This may provide for additional opportunities in 2017 through strategically important emerging new revenue streams, including possible team sales for the Overwatch League™, the associated media rights, and in-game advertising.
6
Consolidated Statements of Operations Data
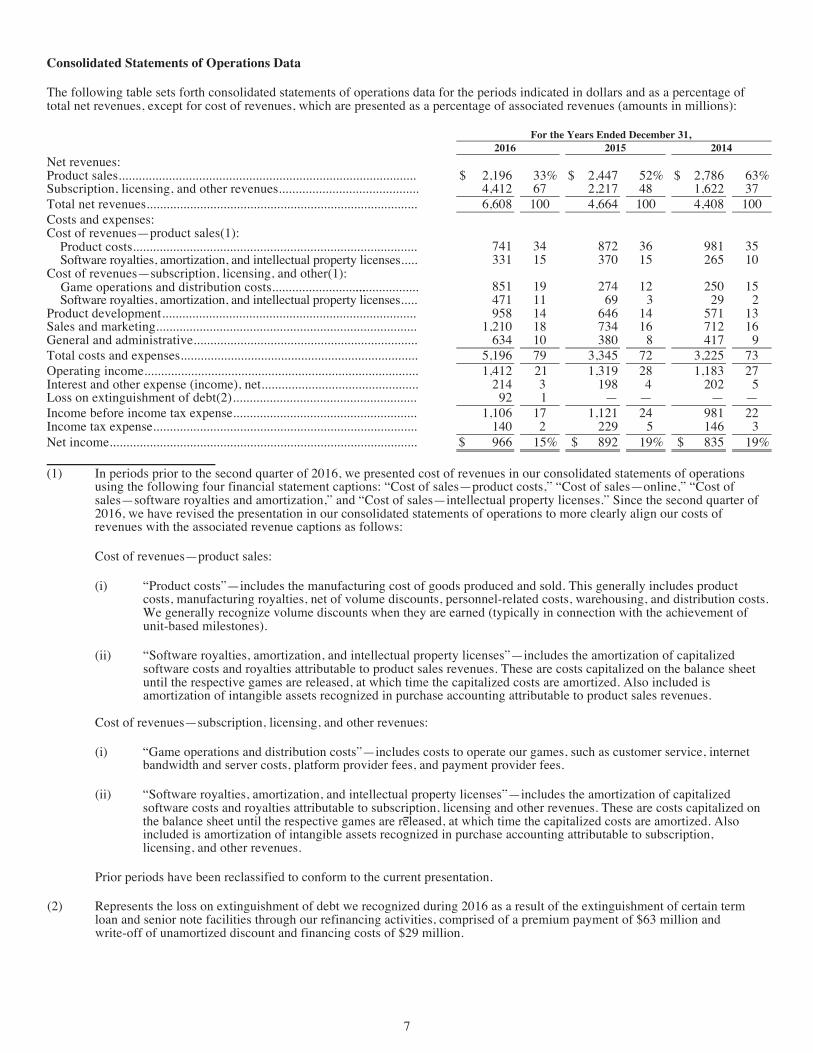
The following table sets forth consolidated statements of operations data for the periods indicated in dollars and as a percentage of total net revenues, except for cost of revenues, which are presented as a percentage of associated revenues (amounts in millions):
For the Years Ended December 31, 2016 2015 2014
Net revenues: Product sales ............................................................................................ $ 2,196 33% $ 2,447 52% $ 2,786 63% Subscription, licensing, and other revenues............................................. 4,412 67 2,217 48 1,622 37 Total net revenues.................................................................................... 6,608 100 4,664 100 4,408 100 Costs and expenses: Cost of revenues—product sales(1):
741 34 872 36 981 35 331 15 370 15 265 10 Software royalties, amortization, and intellectual property licenses ........
Cost of revenues—subscription, licensing, and other(1):Game operations and distribution costs............................
...................... 851 19 274 12 250 15
Software royalties, amortization, and intellectual property licenses ......... 471 11 69 3 29 2 Product development ............................................................................... 958 14 646 14 571 13 Sales and marketing................................................................................. 1,210 18 734 16 712 16 General and administrative...................................................................... 634 10 380 8 417 9 Total costs and expenses.......................................................................... 5,196 79 3,345 72 3,225 73 Operating income..................................................................................... 1,412 21 1,319 28 1,183 27 Interest and other expense (income), net ................................................. 214 3 198 4 202 5 Loss on extinguishment of debt(2) .......................................................... 92 1 — — — — Income before income tax expense.......................................................... 1,106 17 1,121 24 981 22 Income tax expense.................................................................................. 140 2 229 5 146 3 Net income............................................................................................... $ 966 15% $ 892 19% $ 835 19%
(1) In periods prior to the second quarter of 2016, we presented cost of revenues in our consolidated statements of operationsusing the following four financial statement captions: “Cost of sales—product costs,” “Cost of sales—online,” “Cost ofsales—software royalties and amortization,” and “Cost of sales—intellectual property licenses.” Since the second quarter of2016, we have revised the presentation in our consolidated statements of operations to more clearly align our costs ofrevenues with the associated revenue captions as follows:
Cost of revenues—product sales:
(i) “Product costs”—includes the manufacturing cost of goods produced and sold. This generally includes productcosts, manufacturing royalties, net of volume discounts, personnel-related costs, warehousing, and distribution costs.We generally recognize volume discounts when they are earned (typically in connection with the achievement ofunit-based milestones).
(ii) “Software royalties, amortization, and intellectual property licenses”—includes the amortization of capitalizedsoftware costs and royalties attributable to product sales revenues. These are costs capitalized on the balance sheetuntil the respective games are released, at which time the capitalized costs are amortized. Also included isamortization of intangible assets recognized in purchase accounting attributable to product sales revenues.
Cost of revenues—subscription, licensing, and other revenues:
(i) “Game operations and distribution costs”—includes costs to operate our games, such as customer service, internetbandwidth and server costs, platform provider fees, and payment provider fees.
(ii) “Software royalties, amortization, and intellectual property licenses”—includes the amortization of capitalizedsoftware costs and royalties attributable to subscription, licensing and other revenues. These are costs capitalized on
........................................................................................
the balance sheet until the respective games are released, at which time the capitalized costs are amortized. Also included is amortization of intangible assets recognized in purchase accounting attributable to subscription, licensing, and other revenues.
Prior periods have been reclassified to conform to the current presentation.
(2) Represents the loss on extinguishment of debt we recognized during 2016 as a result of the extinguishment of certain term loan and senior note facilities through our refinancing activities, comprised of a premium payment of $63 million and write-off of unamortized discount and financing costs of $29 million.
7
Product sales ........................................................................................... $ 2,196 33% $ 2,447 52% $ 2,786 63% Subscription, licensing, and other revenues ........................................... 4,412 67 2,217 48 1,622 37 Total net revenues .................................................................................. 6,608 100 4,664 100 4,408 100 Costs and expenses: Cost of revenues—product sales(1):
Product costs ...................................................................................... 741 34 872 36 981 35 Software royalties, amortization, and intellectual property licenses .. 331 15 370 15 265 10
Cost of revenues—subscription, licensing, and other(1): Game operations and distribution costs ............................................. 851 19 274 12 250 15 Software royalties, amortization, and intellectual property licenses .. 471 11 69 3 29 2
Product development .............................................................................. 958 14 646 14 571 13 Sales and marketing ............................................................................... 1,210 18 734 16 712 16 General and administrative .................................................................... 634 10 380 8 417 9 Total costs and expenses ........................................................................ 5,196 79 3,345 72 3,225 73 Operating income ................................................................................... 1,412 21 1,319 28 1,183 27 Interest and other expense (income), net ................................................ 214 3 198 4 202 5 Loss on extinguishment of debt(2) ......................................................... 92 1 — — — — Income before income tax expense ........................................................ 1,106 17 1,121 24 981 22 Income tax expense ................................................................................ 140 2 229 5 146 3 Net income ............................................................................................. $ 966 15% $ 892 19% $ 835 19%
(1) In periods prior to the second quarter of 2016, we presented cost of revenues in our consolidated statements of operations
using the following four financial statement captions: “Cost of sales—product costs,” “Cost of sales—online,” “Cost of sales—software royalties and amortization,” and “Cost of sales—intellectual property licenses.” Since the second quarter of 2016, we have revised the presentation in our consolidated statements of operations to more clearly align our costs of revenues with the associated revenue captions as follows:
Cost of revenues—product sales:
(i) “Product costs”—includes the manufacturing cost of goods produced and sold. This generally includes product costs, manufacturing royalties, net of volume discounts, personnel-related costs, warehousing, and distribution costs. We generally recognize volume discounts when they are earned (typically in connection with the achievement of unit-based milestones).
(ii) “Software royalties, amortization, and intellectual property licenses”—includes the amortization of capitalized software costs and royalties attributable to product sales revenues. These are costs capitalized on the balance sheet until the respective games are released, at which time the capitalized costs are amortized. Also included is amortization of intangible assets recognized in purchase accounting attributable to product sales revenues.
Cost of revenues—subscription, licensing, and other revenues:
(i) “Game operations and distribution costs”—includes costs to operate our games, such as customer service, internet bandwidth and server costs, platform provider fees, and payment provider fees.
(ii) “Software royalties, amortization, and intellectual property licenses”—includes the amortization of capitalized software costs and royalties attributable to subscription, licensing and other revenues. These are costs capitalized on
7
9
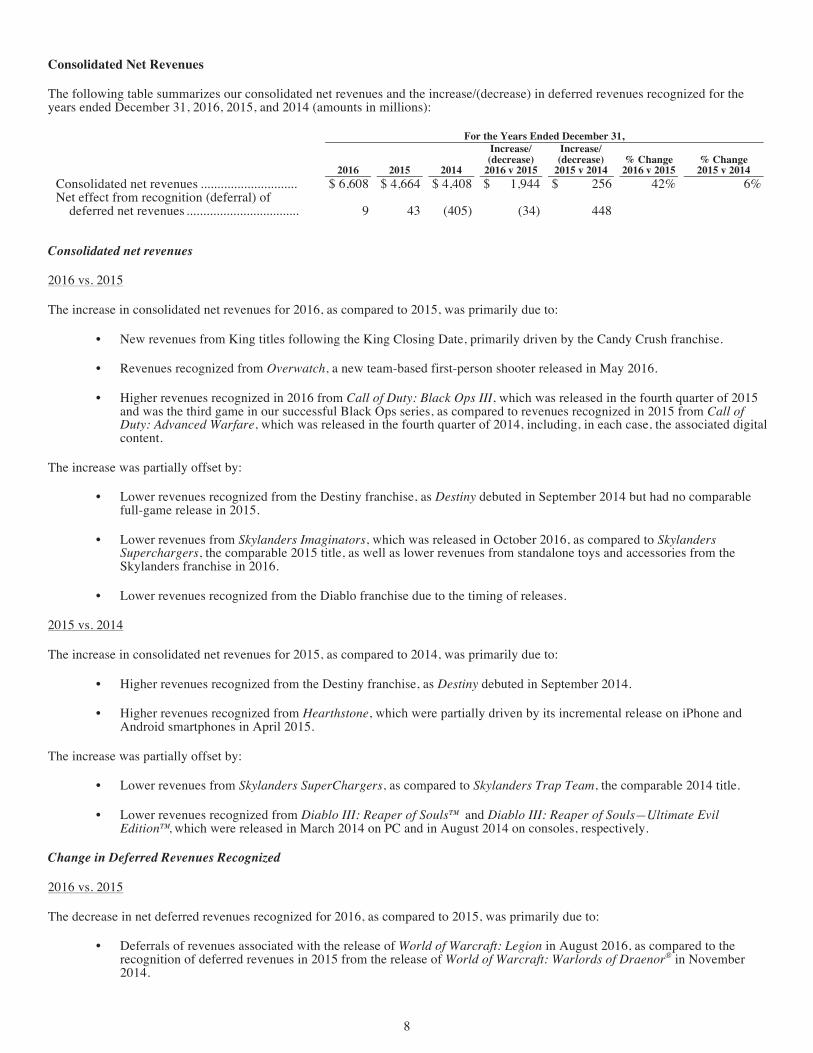
Consolidated Net Revenues
The following table summarizes our consolidated net revenues and the increase/(decrease) in deferred revenues recognized for the years ended December 31, 2016, 2015, and 2014 (amounts in millions):
For the Years Ended December 31,
2016 2015 2014
Increase/ (decrease)
2016 v 2015
Increase/ (decrease)
2015 v 2014 % Change 2016 v 2015
% Change 2015 v 2014
Consolidated net revenues ............................. $ 6,608 $ 4,664 $ 4,408 $ 1,944 $ 256 42% 6% Net effect from recognition (deferral) of
deferred net revenues .................................. 9 43 (405) (34) 448
Consolidated net revenues
2016 vs. 2015
The increase in consolidated net revenues for 2016, as compared to 2015, was primarily due to:
• New revenues from King titles following the King Closing Date, primarily driven by the Candy Crush franchise.
• Revenues recognized from Overwatch, a new team-based first-person shooter released in May 2016.
• Higher revenues recognized in 2016 from Call of Duty: Black Ops III, which was released in the fourth quarter of 2015and was the third game in our successful Black Ops series, as compared to revenues recognized in 2015 from Call ofDuty: Advanced Warfare, which was released in the fourth quarter of 2014, including, in each case, the associated digitalcontent.
The increase was partially offset by:
• Lower revenues recognized from the Destiny franchise, as Destiny debuted in September 2014 but had no comparablefull-game release in 2015.
• Lower revenues from Skylanders Imaginators, which was released in October 2016, as compared to SkylandersSuperchargers, the comparable 2015 title, as well as lower revenues from standalone toys and accessories from theSkylanders franchise in 2016.
• Lower revenues recognized from the Diablo franchise due to the timing of releases.
2015 vs. 2014
The increase in consolidated net revenues for 2015, as compared to 2014, was primarily due to:
• Higher revenues recognized from the Destiny franchise, as Destiny debuted in September 2014.
• Higher revenues recognized from Hearthstone, which were partially driven by its incremental release on iPhone andAndroid smartphones in April 2015.
The increase was partially offset by:
• Lower revenues from Skylanders SuperChargers, as compared to Skylanders Trap Team, the comparable 2014 title.
• Lower revenues recognized from Diablo III: Reaper of Souls™ and Diablo III: Reaper of Souls—Ultimate Evil Edition™, which were released in March 2014 on PC and in August 2014 on consoles, respectively.
Change in Deferred Revenues Recognized
2016 vs. 2015
The decrease in net deferred revenues recognized for 2016, as compared to 2015, was primarily due to:
• Deferrals of revenues associated with the release of World of Warcraft: Legion in August 2016, as compared to therecognition of deferred revenues in 2015 from the release of World of Warcraft: Warlords of Draenor® in November2014.
8

10
• Deferrals of revenues associated with Overwatch.
The decrease was partially offset by lower deferrals of revenues associated with the Call of Duty franchise, driven by lower revenue deferrals from Call of Duty: Infinite Warfare, which was released in the fourth quarter of 2016, as compared to Call of Duty: Black Ops III, the comparable 2015 title.
2015 vs. 2014
The increase in net deferred revenues recognized for 2015, as compared to 2014, was primarily due to:
• Lower deferrals of revenues from the Destiny franchise, which debuted in September 2014.
• Lower deferrals of revenues from World of Warcraft, primarily associated with World of Warcraft: Warlords ofDraenor, which was released in November 2014, and value-added services
The increase was partially offset by higher deferrals of revenues from the Call of Duty franchise.
Foreign Exchange Impact
Changes in foreign exchange rates had a negative impact of $81 million, $373 million, and $2 million on Activision Blizzard’s consolidated net revenues in 2016, 2015, and 2014, respectively, as compared to the same periods in the previous year. The changes are primarily due to changes in the value of the U.S. dollar relative to the euro and British pound.
9

11
Operating Segment Results
Currently, we have three reportable operating segments. Our operating segments are consistent with the manner in which our operations are reviewed and managed by our Chief Executive Officer, who is our chief operating decision maker (“CODM”). The CODM reviews segment performance exclusive of: the impact of the change in deferred revenues and related cost of revenues with respect to certain of our online-enabled games; share-based compensation expense; amortization of intangible assets as a result of purchase price accounting; and fees and other expenses (including legal fees, expenses and accruals) related to acquisitions, associated integration activities, and financings. The CODM does not review any information regarding total assets on an operating segment basis, and accordingly, no disclosure is made with respect thereto.
Our operating segments are also consistent with our internal organization structure, the way we assess operating performance and allocate resources, and the availability of separate financial information. We do not aggregate operating segments.
Information on the operating segments and reconciliations of total segment net revenues and total segment operating income to consolidated net revenues from external customers and consolidated income before income tax expense for the years ended December 31, 2016, 2015, and 2014 are presented in the table below (amounts in millions):
For the Years Ended December 31,
2016 2015 2014
Increase/ (decrease)
2016 v 2015
Increase/ (decrease)
2015 v 2014 Segment net revenues:
Activision ............................................................................ $ 2,220 $ 2,700 $ 2,686 $ 480) $ 14 Blizzard ............................................................................... 2,428 1,565 1,720 863 (155) King ..................................................................................... 1,586 — — 1,586 —
Reportable segments net revenues total .......................... 6,234 4,265 4,406 1,969 (141) Reconciliation to consolidated net revenues:
Other segments(1) ............................................................... 365 356 407 9 (51) Net effect from recognition (deferral) of deferred net revenues(2) 9 43 (405) (34) 448
Consolidated net revenues .............................................. $ 6,608 $ 4,664 $ 4,408 $ 1,944 $ 256 Segment income from operations:
Activision ............................................................................ 788 868 762 (80) 106 Blizzard ............................................................................... 1,013 561 756 452 (195) King ..................................................................................... 537 — — 537 —
Reportable segments income from operations total ........ 2,338 1,429 1,518 909 (89) Reconciliation to consolidated operating income and consolidated
income before income tax expense: Other segments(1) ............................................................... (4) 37 9 (41) 28 Net effect from recognition (deferral) of deferred net revenues and
related cost of revenues(2) .............................................. (10) (39) (215) 29 176 Share-based compensation expense(3) ............................... (159) (92) (104) (67) 12 Amortization of intangible assets(4) ................................... (706) (11) (12) (695) 1 Fees and other expenses related to acquisitions and the Purchase
Transaction(5) ................................................................. (47) (5) (13) (42) 8 Consolidated operating income ............................................... 1,412 1,319 1,183 93 136
Interest and other expense, net ............................................ 214 198 202 16 (4) Loss on extinguishment of debt .......................................... 92 — — 92 —
Consolidated income before income tax expense ................... $ 1,106 $ 1,121 $ 981 $ (15) $ 140
(1) Other segments include other income and expenses from operating segments managed outside the reportable segments, including our MLG, Studios, and Distribution businesses. Other segments also include unallocated corporate income and expenses.
(2) We have determined that some of our titles’ online functionality represents an essential component of gameplay and as a result, represents a more-than-inconsequential separate deliverable. As such, we are required to recognize revenues from these titles over the estimated service periods, which are generally less than one year. The related cost of revenues are deferred and recognized when the related revenues are recognized. In the operating segment results table, we reflect the net effect from the deferral of revenues and (recognition) of deferred revenues, along with the related cost of revenues, on certain of our online enabled products.
(3) We expense our share-based awards using the grant date fair value over the vesting periods of the stock awards. In the case of liability awards, the liability is subject to revaluation based on the stock price at the end of the relevant period. Included within this share-based compensation are the net effects of capitalization, deferral, and amortization.
(4) We amortize intangible assets over their estimated useful lives based on the pattern of consumption of the underlying economic benefits. The amounts presented in the table represent the effect of the amortization of intangible assets, as well as other purchase price accounting adjustments, where applicable, in our consolidated statements of operations.
11
Operating Segment Results
Currently, we have three reportable operating segments. Our operating segments are consistent with the manner in which our operations are reviewed and managed by our Chief Executive Officer, who is our chief operating decision maker (“CODM”). The CODM reviews segment performance exclusive of: the impact of the change in deferred revenues and related cost of revenues with respect to certain of our online-enabled games; share-based compensation expense; amortization of intangible assets as a result of purchase price accounting; and fees and other expenses (including legal fees, expenses and accruals) related to acquisitions, associated integration activities, and financings. The CODM does not review any information regarding total assets on an operating segment basis, and accordingly, no disclosure is made with respect thereto.
Our operating segments are also consistent with our internal organization structure, the way we assess operating performance and allocate resources, and the availability of separate financial information. We do not aggregate operating segments.
Information on the operating segments and reconciliations of total segment net revenues and total segment operating income to consolidated net revenues from external customers and consolidated income before income tax expense for the years ended December 31, 2016, 2015, and 2014 are presented in the table below (amounts in millions):
For the Years Ended December 31,
2015 2014
Increase/ (decrease)
2016 v 2015
Increase/ (decrease)
2015 v 2014 Segment net revenues:
Activision ............................................................................................... $ 2,700 $ 2,686 $ 480) $ 14 Blizzard .................................................................................................. 1,565 1,720 863 (155) King ........................................................................................................ — — 1,586 —
Reportable segments net revenues total ............................................. 4,265 4,406 1,969 (141) Reconciliation to consolidated net revenues:
356 407 9 (51) Other segments(1) ..................................................................................Net effect from recognition (deferral) of deferred net revenues(2)....... 43 (405) (34) 448
Consolidated net revenues ................................................................. $ 4,664 $ 4,408 $ 1,944 $ 256 Segment income from operations:
Activision ............................................................................................... 868 762 (80) 106Blizzard .................................................................................................. 561 756 452 (195) King ........................................................................................................ — — 537 —
Reportable segments income from operations total ........................... 1,429 1,518 909 (89) Reconciliation to consolidated operating income and consolidated
income before income tax expense: Other segments(1) .................................................................................. 9 (41) 28 Net effect from recognition (deferral) of deferred net revenues and
related cost of revenues(2) ................................................................. (215) 29 176 Share-based compensation expense(3) .................................................. (104) (67) 12 Amortization of intangible assets(4) ...................................................... (12) (695) 1 Fees and other expenses related to acquisitions and the Purchase
Transaction(5) .................................................................................... (13) (42) 8 Consolidated operating income .................................................................. 1,319 1,183 93 136
Interest and other expense, net ............................................................... 198 202 16 (4) Loss on extinguishment of debt ............................................................. — — 92 —
Consolidated income before income tax expense ...................................... $ 1,121 $ 981 $ (15) $ 140
(1) Other segments include other income and expenses from operating segments managed outside the reportable segments,including our MLG, Studios, and Distribution businesses. Other segments also include unallocated corporate income andexpenses.
(2) We have determined that some of our titles’ online functionality represents an essential component of gameplay and as aresult, represents a more-than-inconsequential separate deliverable. As such, we are required to recognize revenues fromthese titles over the estimated service periods, which are generally less than one year. The related cost of revenues aredeferred and recognized when the related revenues are recognized. In the operating segment results table, we reflect the neteffect from the deferral of revenues and (recognition) of deferred revenues, along with the related cost of revenues, on certainof our online enabled products.
(3) We expense our share-based awards using the grant date fair value over the vesting periods of the stock awards. In the case ofliability awards, the liability is subject to revaluation based on the stock price at the end of the relevant period. Includedwithin this share-based compensation are the net effects of capitalization, deferral, and amortization.
(4) We amortize intangible assets over their estimated useful lives based on the pattern of consumption of the underlyingeconomic benefits. The amounts presented in the table represent the effect of the amortization of intangible assets, as well asother purchase price accounting adjustments, where applicable, in our consolidated statements of operations.
$ 2,220 $ 2,700 $ 2,686 $ (480) $ 14 2,428 1,565 1,720 863 (155) 1,586 — — 1,586 — 6,234 4,265 4,406 1,969 (141) 365 356 407 9 (51) 9 43 (405) (34) 448 $ 6,608 $ 4,664 $ 4,408 $ 1,944 $ 256 788 868 762 (80) 106 1,013 561 756 452 (195) 537 — — 537 — 2,338 1,429 1,518 909 (89) (4) 37 9 (41) 28 (10) (39) (215) 29 176 (159) (92) (104) (67) 12 (706) (11) (12) (695) 1
(47) (5) (13) (42) 8 1,412 1,319 1,183 93 136 214 198 202 16 (4) 92 — — 92 — $ 1,106 $ 1,121 $ 981 $ (15) $ 140
For the Years Ended December 31, Increase/ Increase/ (decrease) (decrease) 2016 2015 2014 2016 v 2015 2015 v2014
10
(5) We incurred fees and other expenses, such as legal, banking and professional services fees, related to (a) the October 11,2013 repurchase of approximately 429 million shares of our common stock (the “Purchase Transaction”), pursuant to a stockpurchase agreement among us, Vivendi and ASAC II LP, an exempted limited partnership established under the laws of theCayman Islands, acting by its general partner, ASAC II LLC, (b) the King Acquisition, and (c) other business acquisitionsand associated integration activities, in each case, inclusive of any related debt financings. Such expenses are not reviewed bythe CODM as part of segment performance.
Segment Net Revenues
Activision
2016 vs. 2015
The decrease in Activision’s net revenues for 2016, as compared to 2015, was primarily due to:
• Lower revenues from Call of Duty: Infinite Warfare, which was released in the fourth quarter of 2016, as compared toCall of Duty: Black Ops III, the comparable 2015 title, which was the third game in our successful Black Ops series.
• Lower revenues from the Destiny franchise, as there were two expansion packs in 2015—House of Wolves and TheTaken King—but only one in 2016—Rise of Iron.
• Lower revenues from Skylanders Imaginators, which was released in October 2016, as compared to SkylandersSuperchargers, the comparable 2015 title, as well as lower revenues from standalone Skylanders toys and accessories in2016.
• Lower revenues from Guitar Hero® Live, which was released in 2015 with no comparable release in 2016.
The decrease was partially offset by higher revenues from digital content associated with Call of Duty: Black Ops III, as compared to Call of Duty: Advanced Warfare, the comparable 2014 title.
2015 vs. 2014
The increase in Activision’s net revenues for 2015, as compared to 2014, was primarily due to:
• Higher revenues from the Call of Duty franchise, specifically from Call of Duty: Black Ops III, which was released inthe fourth quarter of 2015, as compared to Call of Duty: Advanced Warfare, which was released in the fourth quarter of2014.
• Strong digital content performance, including expansion packs and supply drops for Call of Duty: Advanced Warfare.
• Revenues from Guitar Hero Live, which was released in the fourth quarter of 2015, with no comparable release in 2014.
The increase was partially offset by:
• Lower revenues from Skylanders SuperChargers, which was released in 2015, as compared to Skylanders Trap Team,the comparable 2014 title.
• Lower revenues from the Destiny franchise, as Destiny debuted in September 2014 with no comparable full-game releasein 2015.
• Lower revenues from The Amazing Spider-Man™ 2, which was released during 2014, with no corresponding releasesduring 2015.
Blizzard
2016 vs. 2015
The increase in Blizzard’s net revenues for 2016, as compared to 2015, was primarily due to:
• Revenues from Overwatch, a new team-based first-person shooter released in May 2016.
• Higher revenues from World of Warcraft, driven by the release of World of Warcraft: Legion in August 2016, with nocomparable release in 2015.
11
13
2015 vs. 2014
The decrease in Blizzard’s net revenues for 2015, as compared to 2014, was primarily due to the timing of releases, including:
• Diablo III: Reaper of Souls, which was released in March 2014 on the PC, and Diablo III: Reaper of Souls-Ultimate Evil Edition, which was released in August 2014 on consoles.
• World of Warcraft: Warlords of Draenor, which was released in November 2014, along with the overall lower revenues from World of Warcraft due to a smaller subscriber base.
The decrease was partially offset by:
• Higher revenues from Hearthstone, which had multiple content releases throughout the year, and benefited from its incremental release on iPhone and Android smartphones in April 2015.
• Revenues from Heroes of the Storm and StarCraft II: Legacy of the Void™, which were released in 2015.
King
King’s net revenues represent the net revenues from the King Closing Date through December 31, 2016. The revenues were primarily driven by the Candy Crush franchise, which included the release of Candy Crush Jelly Saga™ in January 2016.
Segment Income from Operations
Activision
2016 vs. 2015
The decrease in Activision’s operating income for 2016, as compared to 2015, was primarily due to lower revenues. This was partially offset by:
• Lower sales and marketing spend on Guitar Hero Live and the Destiny franchise given the timing of game launches.
• The relative increase in revenues coming from the digital online channel, which typically has a higher profit margin.
2015 vs. 2014
The increase in Activision’s operating income for 2015, as compared to 2014, was primarily due to:
• The relative increase in revenues coming from the digital online channel, which typically has a higher profit margin.
• Lower sales and marketing spending on the Destiny franchise because of the September 2014 launch of Destiny, with no comparable full-game release in 2015.
The increase was partially offset by:
• Operating losses from Guitar Hero Live, which was released in the fourth quarter of 2015, with no comparable release in 2014.
• Lower revenues from Skylanders SuperChargers, as compared to Skylanders Trap Team.
Blizzard
2016 vs. 2015
The increase in Blizzard’s operating income for 2016, as compared to 2015, was primarily due to higher revenues. This was partially offset by:
• New sales and marketing spending to support Overwatch.
• Higher personnel costs due to segment performance bonuses and increased headcount to support the business growth.
9
• aginatorsSuperchargersSkylanders franchise in 2016.
• Lower revenues recognized from the Di
2015 vs. 2014
• Higher revenues recognized from the Destiny franchise, as Destiny
• Higher revenues recognized from HearthstoneAndroid smartphones in April 2015.
The increase was partially offset by:
• Lower revenues from Skylanders SuperChargers, as compared to
• Lower revenues recognized from Diablo III: Reaper of Souls™ and Edition™, which were released in March 2014 on PC and in August 2014 on consoles, respectively.
Change in Deferred Revenues Recognized
2016 vs. 2015
• Deferrals of revenues associated with the release of recognition of deferred revenues in 2015 from the release of 2014.
12

14
2015 vs. 2014
The decrease in Blizzard’s operating income for 2015, as compared to 2014, was primarily due to:
• Lower revenues.
• Higher cost of revenues from Hearthstone related to commissions on mobile purchases following the launch on iPhone and Android smartphones in April 2015.
• Higher sales and marketing spending for releases, including Hearthstone and Heroes of the Storm.
• Lower capitalization of software development costs and higher software amortization.
King
King’s operating income for the year ended December 31, 2016 represents the operating income from the King Closing Date through December 31, 2016.
Foreign Exchange Impact
Changes in foreign exchange rates had a negative impact of $30 million and $338 million on reportable segment net revenues for 2016 and 2015, respectively, as compared to the same periods in the previous year. The changes are primarily due to changes in the value of the U.S. dollar relative to the euro and British pound.
13

Consolidated Results
Net Revenues by Distribution Channel
The following table details our consolidated net revenues by distribution channel for the years ended December 31, 2016, 2015, and 2014 (amounts in millions):
For the Years Ended December 31,
2015 2014
Increase/ (decrease)
2016 v 2015
Increase/ (decrease)
2015 v 2014 % Change 2016 v 2015
% Change 2015 v 2014
Net revenues by distribution channel Digital online channels(1) ................................ 2,363 $ 605 94% 32% Retail channels ................................................. 1,806 2,104 (420) (298) (23) (14)Other(2) ............................................................ 356 407 1 (51) — (13)Total consolidated net revenues ....................... 1,944 $ 256 42% 6%
The increase/(decrease) in deferred revenues recognized by distribution channel for the years ended December 31, 2016, 2015, and 2014, was as follows (amounts in millions):
For the Years Ended December 31,
2016 2015 2014
Increase/ (decrease)
2016 v 2015
Increase/ (decrease)
2015 v 2014 Increase/(decrease) in deferred revenues recognized by
channel: Digital online channels(1) .............................................................. $ (351) $ (126) $ (301) $ (225) $ 175 Retail channels ............................................................................... 368 169 (104) 199 273 Other(2) .......................................................................................... (8) — — (8) —Net (deferral)/recognition impact on consolidated net revenues............ $ 9 $ 43 $ (405) $ (34) $ 448
(1) We define revenues from digital online channels as revenues from digitally distributed subscriptions, licensing royalties,value-added services, downloadable content, microtransactions, and products.
(2) Net revenues from Other include revenues from our MLG, Studios, and Distribution businesses.
Digital Online Channel Net Revenues
Net Revenues
2016 vs 2015
The increase in net revenues from digital online channels for 2016, as compared to 2015, was primarily due to:
• New revenues from King titles following the King Closing Date, primarily driven by the Candy Crush franchise.
• Revenues recognized from Overwatch, a new team-based first-person shooter released in May 2016.
• Higher revenues recognized in 2016 from digital content associated with Call of Duty: Black Ops III, as compared torevenues recognized in 2015 from digital content associated with Call of Duty: Advanced Warfare, the comparable 2015title.
2015 vs 2014
The increase in net revenues from digital online channels for 2015, as compared to 2014, was primarily due to:
• Higher revenues recognized from the Destiny franchise.
• Higher revenues recognized from Hearthstone.
• Higher revenues recognized from Call of Duty: Advanced Warfare and its digital content released during 2015, ascompared to Call of Duty: Ghosts and its digital content released during 2014, including revenues recognized from theintroduction of microtransactions in Call of Duty: Advanced Warfare.
• Revenues recognized from Heroes of the Storm, which was released in June 2015, with no comparable release during theprior periods.
15
Consolidated Results
Net Revenues by Distribution Channel
The following table details our consolidated net revenues by distribution channel for the years ended December 31, 2016, 2015, and 2014 (amounts in millions):
For the Years Ended December 31,
2015 2014
Increase/ (decrease)
2016 v 2015
Increase/ (decrease)
2015 v 2014 % Change 2016 v 2015
% Change 2015 v 2014
Net revenues by distribution channel Digital online channels(1) ................................ 2,363 $ 605 94% 32% Retail channels ................................................. 1,806 2,104 (420) (298) (23) (14)Other(2) ............................................................ 356 407 1 (51) — (13)Total consolidated net revenues ....................... 1,944 $ 256 42% 6%
The increase/(decrease) in deferred revenues recognized by distribution channel for the years ended December 31, 2016, 2015, and 2014, was as follows (amounts in millions):
For the Years Ended December 31,
2016 2015 2014
Increase/ (decrease)
2016 v 2015
Increase/ (decrease)
2015 v 2014 Increase/(decrease) in deferred revenues recognized by distribution
channel: Digital online channels(1) .............................................................. $ (351) $ (126) $ (301) $ (225) $ 175 Retail channels ............................................................................... 368 169 (104) 199 273 Other(2) .......................................................................................... (8) — — (8) —Net (deferral)/recognition impact on consolidated net revenues... $ 9 $ 43 $ (405) $ (34) $ 448
(1) We define revenues from digital online channels as revenues from digitally distributed subscriptions, licensing royalties,value-added services, downloadable content, microtransactions, and products.
(2) Net revenues from Other include revenues from our MLG, Studios, and Distribution businesses.
Digital Online Channel Net Revenues
Net Revenues
2016 vs 2015
The increase in net revenues from digital online channels for 2016, as compared to 2015, was primarily due to:
• New revenues from King titles following the King Closing Date, primarily driven by the Candy Crush franchise.
• Revenues recognized from Overwatch, a new team-based first-person shooter released in May 2016.
• Higher revenues recognized in 2016 from digital content associated with Call of Duty: Black Ops III, as compared torevenues recognized in 2015 from digital content associated with Call of Duty: Advanced Warfare, the comparable 2015title.
2015 vs 2014
The increase in net revenues from digital online channels for 2015, as compared to 2014, was primarily due to:
• Higher revenues recognized from the Destiny franchise.
• Higher revenues recognized from Hearthstone.
• Higher revenues recognized from Call of Duty: Advanced Warfare and its digital content released during 2015, ascompared to Call of Duty: Ghosts and its digital content released during 2014, including revenues recognized from theintroduction of microtransactions in Call of Duty: Advanced Warfare.
• Revenues recognized from Heroes of the Storm, which was released in June 2015, with no comparable release during theprior periods.
Consolidated Results
Net Revenues by Distribution Channel
The following table details our consolidated net revenues by distribution channel for the years ended December 31, 2016, 2015, and 2014 (amounts in millions):
For the Years Ended December 31,
2015 2014
Increase/ (decrease)
2016 v 2015
Increase/ (decrease)
2015 v 2014 % Change 2016 v 2015
% Change 2015 v 2014
Net revenues by distribution channelDigital online channels(1)................................. 2,363 $ 605 94% 32% Retail channels.................................................. 1,806 2,104 (420) (298) (23) (14)Other(2)............................................................. 356 407 1 (51) — (13)Total consolidated net revenues........................ 1,944 $ 256 42% 6%
The increase/(decrease) in deferred revenues recognized by distribution channel for the years ended December 31, 2016, 2015, and 2014, was as follows (amounts in millions):
For the Years Ended December 31,
2016 2015 2014
Increase/ (decrease)
2016 v 2015
Increase/ (decrease)
2015 v 2014 Increase/(decrease) in deferred revenues recognized by
channel:Digital online channels(1) .............................................................. $ (351) $ (126) $ (301) $ (225) $ 175 Retail channels ............................................................................... 368 169 (104) 199 273 Other(2) .......................................................................................... (8) — — (8) —Net (deferral)/recognition impact on consolidated net revenues........ $ 9 $ 43 $ (405) $ (34) $ 448
(1) We define revenues from digital online channels as revenues from digitally distributed subscriptions, licensing royalties,value-added services, downloadable content, microtransactions, and products.
(2) Net revenues from Other include revenues from our MLG, Studios, and Distribution businesses.
Digital Online Channel Net Revenues
Net Revenues
2016 vs 2015
The increase in net revenues from digital online channels for 2016, as compared to 2015, was primarily due to:
• New revenues from King titles following the King Closing Date, primarily driven by the Candy Crush franchise.
• Revenues recognized from Overwatch, a new team-based first-person shooter released in May 2016.
• Higher revenues recognized in 2016 from digital content associated with Call of Duty: Black Ops III, as compared torevenues recognized in 2015 from digital content associated with Call of Duty: Advanced Warfare, the comparable 2015title.
2015 vs 2014
The increase in net revenues from digital online channels for 2015, as compared to 2014, was primarily due to:
• Higher revenues recognized from the Destiny franchise.
• Higher revenues recognized from Hearthstone.
• Higher revenues recognized from Call of Duty: Advanced Warfare and its digital content released during 2015, ascompared to Call of Duty: Ghosts and its digital content released during 2014, including revenues recognized from theintroduction of microtransactions in Call of Duty: Advanced Warfare.
• Revenues recognized from Heroes of the Storm, which was released in June 2015, with no comparable release during theprior periods.
ACTIVISION ANNUAL REPORT 10-K THURSDAY, MARCH 16, 2019 9:00AM PST ANDRA DESIGN LLC
15
Consolidated Results
Net Revenues by Distribution Channel
The following table details our consolidated net revenues by distribution channel for the years ended December 31, 2016, 2015, and 2014 (amounts in millions):
For the Years Ended December 31,
2016 2015 2014
Increase/ (decrease)
2016 v 2015
Increase/ (decrease)
2015 v 2014 % Change 2016 v 2015
% Change 2015 v 2014
Net revenues by distribution channel Digital online channels(1) ................ $ 4,865 $ 2,502 $ 1,897 $ 2,363 $ 605 94% 32% Retail channels ................................. 1,386 1,806 2,104 (420) (298) (23) (14) Other(2) ............................................ 357 356 407 1 (51) — (13) Total consolidated net revenues ....... $ 6,608 $ 4,664 $ 4,408 $ 1,944 $ 256 42% 6%
The increase/(decrease) in deferred revenues recognized by distribution channel for the years ended December 31, 2016, 2015, and 2014, was as follows (amounts in millions):
For the Years Ended December 31,
2016 2015 2014
Increase/ (decrease)
2016 v 2015
Increase/ (decrease)
2015 v 2014 Increase/(decrease) in deferred revenues recognized by distribution
channel: Digital online channels(1) .................................................. $ (351) $ (126) $ (301) $ (225) $ 175 Retail channels ................................................................... 368 169 (104) 199 273 Other(2) .............................................................................. (8) — — (8) — Net (deferral)/recognition impact on consolidated net revenues $ 9 $ 43 $ (405) $ (34) $ 448
(1) We define revenues from digital online channels as revenues from digitally distributed subscriptions, licensing royalties,
value-added services, downloadable content, microtransactions, and products.
(2) Net revenues from Other include revenues from our MLG, Studios, and Distribution businesses.
Digital Online Channel Net Revenues
Net Revenues
2016 vs 2015
The increase in net revenues from digital online channels for 2016, as compared to 2015, was primarily due to:
• New revenues from King titles following the King Closing Date, primarily driven by the Candy Crush franchise.
• Revenues recognized from Overwatch, a new team-based first-person shooter released in May 2016.
• Higher revenues recognized in 2016 from digital content associated with Call of Duty: Black Ops III, as compared to revenues recognized in 2015 from digital content associated with Call of Duty: Advanced Warfare, the comparable 2015 title.
2015 vs 2014
The increase in net revenues from digital online channels for 2015, as compared to 2014, was primarily due to:
• Higher revenues recognized from the Destiny franchise.
• Higher revenues recognized from Hearthstone.
• Higher revenues recognized from Call of Duty: Advanced Warfare and its digital content released during 2015, as compared to Call of Duty: Ghosts and its digital content released during 2014, including revenues recognized from the introduction of microtransactions in Call of Duty: Advanced Warfare.
• Revenues recognized from Heroes of the Storm, which was released in June 2015, with no comparable release during the prior periods.
9
Consolidated Net Revenues
The following table summarizes our consolidated net revenues and the increase/(decrease) in deferred revenues recognized for the years ended December 31, 2016, 2015, and 2014 (amounts in millions):
For the Years Ended December 31,
2016 2015 2014
Increase/ (decrease)
2016 v 2015
Increase/ (decrease)
2015 v 2014 % Change 2016 v 2015
% Change 2015 v 2014
Consolidated net revenues .............. $ 6,608 $ 4,664 $ 4,408 $ 1,944 $ 256 42% 6% Net effect from recognition (deferral) of
deferred net revenues .................. 9 43 (405) (34) 448
Consolidated net revenues
2016 vs. 2015
The increase in consolidated net revenues for 2016, as compared to 2015, was primarily due to:
• New revenues from King titles following the King Closing Date, primarily driven by the Candy Crush franchise.
• Revenues recognized from Overwatch, a new team-based first-person shooter released in May 2016.
• Higher revenues recognized in 2016 from Call of Duty: Black Ops III, which was released in the fourth quarter of 2015 and was the third game in our successful Black Ops series, as compared to revenues recognized in 2015 from Call of Duty: Advanced Warfare, which was released in the fourth quarter of 2014, including, in each case, the associated digital content.
The increase was partially offset by:
• Lower revenues recognized from the Destiny franchise, as Destiny debuted in September 2014 but had no comparable full-game release in 2015.
• Lower revenues from Skylanders Imaginators, which was released in October 2016, as compared to Skylanders Superchargers, the comparable 2015 title, as well as lower revenues from standalone toys and accessories from the Skylanders franchise in 2016.
• Lower revenues recognized from the Diablo franchise due to the timing of releases.
2015 vs. 2014
The increase in consolidated net revenues for 2015, as compared to 2014, was primarily due to:
• Higher revenues recognized from the Destiny franchise, as Destiny debuted in September 2014.
• Higher revenues recognized from Hearthstone, which were partially driven by its incremental release on iPhone and Android smartphones in April 2015.
The increase was partially offset by:
• Lower revenues from Skylanders SuperChargers, as compared to Skylanders Trap Team, the comparable 2014 title.
• Lower revenues recognized from Diablo III: Reaper of Souls™ and Diablo III: Reaper of Souls—Ultimate Evil Edition™, which were released in March 2014 on PC and in August 2014 on consoles, respectively.
Change in Deferred Revenues Recognized
2016 vs. 2015
The decrease in net deferred revenues recognized for 2016, as compared to 2015, was primarily due to:
• Deferrals of revenues associated with the release of World of Warcraft: Legion in August 2016, as compared to the recognition of deferred revenues in 2015 from the release of World of Warcraft: Warlords of Draenor® in November 2014.
94% 32% (23) (14) — (13) 42% 6%
15
Consolidated Results
Net Revenues by Distribution Channel
The following table details our consolidated net revenues by distribution channel for the years ended December 31, 2016, 2015, and 2014 (amounts in millions):
For the Years Ended December 31,
2016 2015 2014
Increase/ (decrease)
2016 v 2015
Increase/ (decrease)
2015 v 2014 % Change 2016 v 2015
% Change 2015 v 2014
Net revenues by distribution channel Digital online channels(1) ................ $ 4,865 $ 2,502 $ 1,897 $ 2,363 $ 605 94% 32% Retail channels ................................. 1,386 1,806 2,104 (420) (298) (23) (14) Other(2) ............................................ 357 356 407 1 (51) — (13) Total consolidated net revenues ....... $ 6,608 $ 4,664 $ 4,408 $ 1,944 $ 256 42% 6%
The increase/(decrease) in deferred revenues recognized by distribution channel for the years ended December 31, 2016, 2015, and 2014, was as follows (amounts in millions):
For the Years Ended December 31,
2016 2015 2014
Increase/ (decrease)
2016 v 2015
Increase/ (decrease)
2015 v 2014 Increase/(decrease) in deferred revenues recognized by distribution
channel: Digital online channels(1) .................................................. $ (351) $ (126) $ (301) $ (225) $ 175 Retail channels ................................................................... 368 169 (104) 199 273 Other(2) .............................................................................. (8) — — (8) — Net (deferral)/recognition impact on consolidated net revenues $ 9 $ 43 $ (405) $ (34) $ 448
(1) We define revenues from digital online channels as revenues from digitally distributed subscriptions, licensing royalties,
value-added services, downloadable content, microtransactions, and products.
(2) Net revenues from Other include revenues from our MLG, Studios, and Distribution businesses.
Digital Online Channel Net Revenues
Net Revenues
2016 vs 2015
The increase in net revenues from digital online channels for 2016, as compared to 2015, was primarily due to:
• New revenues from King titles following the King Closing Date, primarily driven by the Candy Crush franchise.
• Revenues recognized from Overwatch, a new team-based first-person shooter released in May 2016.
• Higher revenues recognized in 2016 from digital content associated with Call of Duty: Black Ops III, as compared to revenues recognized in 2015 from digital content associated with Call of Duty: Advanced Warfare, the comparable 2015 title.
2015 vs 2014
The increase in net revenues from digital online channels for 2015, as compared to 2014, was primarily due to:
• Higher revenues recognized from the Destiny franchise.
• Higher revenues recognized from Hearthstone.
• Higher revenues recognized from Call of Duty: Advanced Warfare and its digital content released during 2015, as compared to Call of Duty: Ghosts and its digital content released during 2014, including revenues recognized from the introduction of microtransactions in Call of Duty: Advanced Warfare.
• Revenues recognized from Heroes of the Storm, which was released in June 2015, with no comparable release during the prior periods.
149
Consolidated Net Revenues
The following table summarizes our consolidated net revenues and the increase/(decrease) in deferred revenues recognized for the years ended December 31, 2016, 2015, and 2014 (amounts in millions):
For the Years Ended December 31,
2016 2015 2014
Increase/ (decrease)
2016 v 2015
Increase/ (decrease)
2015 v 2014 % Change 2016 v 2015
% Change 2015 v 2014
Consolidated net revenues .............. $ 6,608 $ 4,664 $ 4,408 $ 1,944 $ 256 42% 6% Net effect from recognition (deferral) of
deferred net revenues .................. 9 43 (405) (34) 448
Consolidated net revenues
2016 vs. 2015
The increase in consolidated net revenues for 2016, as compared to 2015, was primarily due to:
• New revenues from King titles following the King Closing Date, primarily driven by the Candy Crush franchise.
• Revenues recognized from Overwatch, a new team-based first-person shooter released in May 2016.
• Higher revenues recognized in 2016 from Call of Duty: Black Ops III, which was released in the fourth quarter of 2015 and was the third game in our successful Black Ops series, as compared to revenues recognized in 2015 from Call of Duty: Advanced Warfare, which was released in the fourth quarter of 2014, including, in each case, the associated digital content.
The increase was partially offset by:
• Lower revenues recognized from the Destiny franchise, as Destiny debuted in September 2014 but had no comparable full-game release in 2015.
• Lower revenues from Skylanders Imaginators, which was released in October 2016, as compared to Skylanders Superchargers, the comparable 2015 title, as well as lower revenues from standalone toys and accessories from the Skylanders franchise in 2016.
• Lower revenues recognized from the Diablo franchise due to the timing of releases.
2015 vs. 2014
The increase in consolidated net revenues for 2015, as compared to 2014, was primarily due to:
• Higher revenues recognized from the Destiny franchise, as Destiny debuted in September 2014.
• Higher revenues recognized from Hearthstone, which were partially driven by its incremental release on iPhone and Android smartphones in April 2015.
The increase was partially offset by:
• Lower revenues from Skylanders SuperChargers, as compared to Skylanders Trap Team, the comparable 2014 title.
• Lower revenues recognized from Diablo III: Reaper of Souls™ and Diablo III: Reaper of Souls—Ultimate Evil Edition™, which were released in March 2014 on PC and in August 2014 on consoles, respectively.
Change in Deferred Revenues Recognized
2016 vs. 2015
The decrease in net deferred revenues recognized for 2016, as compared to 2015, was primarily due to:
• Deferrals of revenues associated with the release of World of Warcraft: Legion in August 2016, as compared to the recognition of deferred revenues in 2015 from the release of World of Warcraft: Warlords of Draenor® in November 2014.
9
Consolidated Net Revenues
The following table summarizes our consolidated net revenues and the increase/(decrease) in deferred revenues recognized for the years ended December 31, 2016, 2015, and 2014 (amounts in millions):
For the Years Ended December 31,
2016 2015 2014
Increase/ (decrease)
2016 v 2015
Increase/ (decrease)
2015 v 2014 % Change 2016 v 2015
% Change 2015 v 2014
Consolidated net revenues .............. $ 6,608 $ 4,664 $ 4,408 $ 1,944 $ 256 42% 6% Net effect from recognition (deferral) of
deferred net revenues .................. 9 43 (405) (34) 448
Consolidated net revenues
2016 vs. 2015
The increase in consolidated net revenues for 2016, as compared to 2015, was primarily due to:
• New revenues from King titles following the King Closing Date, primarily driven by the Candy Crush franchise.
• Revenues recognized from Overwatch, a new team-based first-person shooter released in May 2016.
• Higher revenues recognized in 2016 from Call of Duty: Black Ops III, which was released in the fourth quarter of 2015 and was the third game in our successful Black Ops series, as compared to revenues recognized in 2015 from Call of Duty: Advanced Warfare, which was released in the fourth quarter of 2014, including, in each case, the associated digital content.
The increase was partially offset by:
• Lower revenues recognized from the Destiny franchise, as Destiny debuted in September 2014 but had no comparable full-game release in 2015.
• Lower revenues from Skylanders Imaginators, which was released in October 2016, as compared to Skylanders Superchargers, the comparable 2015 title, as well as lower revenues from standalone toys and accessories from the Skylanders franchise in 2016.
• Lower revenues recognized from the Diablo franchise due to the timing of releases.
2015 vs. 2014
The increase in consolidated net revenues for 2015, as compared to 2014, was primarily due to:
• Higher revenues recognized from the Destiny franchise, as Destiny debuted in September 2014.
• Higher revenues recognized from Hearthstone, which were partially driven by its incremental release on iPhone and Android smartphones in April 2015.
The increase was partially offset by:
• Lower revenues from Skylanders SuperChargers, as compared to Skylanders Trap Team, the comparable 2014 title.
• Lower revenues recognized from Diablo III: Reaper of Souls™ and Diablo III: Reaper of Souls—Ultimate Evil Edition™, which were released in March 2014 on PC and in August 2014 on consoles, respectively.
Change in Deferred Revenues Recognized
2016 vs. 2015
The decrease in net deferred revenues recognized for 2016, as compared to 2015, was primarily due to:
• Deferrals of revenues associated with the release of World of Warcraft: Legion in August 2016, as compared to the recognition of deferred revenues in 2015 from the release of World of Warcraft: Warlords of Draenor® in November 2014.
94% 32% (23) (14) — (13) 42% 6%
15
Consolidated Results
Net Revenues by Distribution Channel
The following table details our consolidated net revenues by distribution channel for the years ended December 31, 2016, 2015, and 2014 (amounts in millions):
For the Years Ended December 31,
2015 2014
Increase/ (decrease)
2016 v 2015
Increase/ (decrease)
2015 v 2014 % Change 2016 v 2015
% Change 2015 v 2014
Net revenues by distribution channel Digital online channels(1) ................................ 2,363 $ 605 94% 32% Retail channels ................................................. 1,806 2,104 (420) (298) (23) (14)Other(2) ............................................................ 356 407 1 (51) — (13)Total consolidated net revenues ....................... 1,944 $ 256 42% 6%
The increase/(decrease) in deferred revenues recognized by distribution channel for the years ended December 31, 2016, 2015, and 2014, was as follows (amounts in millions):
For the Years Ended December 31,
2016 2015 2014
Increase/ (decrease)
2016 v 2015
Increase/ (decrease)
2015 v 2014 Increase/(decrease) in deferred revenues recognized by distribution
channel: Digital online channels(1) .............................................................. $ (351) $ (126) $ (301) $ (225) $ 175 Retail channels ............................................................................... 368 169 (104) 199 273 Other(2) .......................................................................................... (8) — — (8) —Net (deferral)/recognition impact on consolidated net revenues... $ 9 $ 43 $ (405) $ (34) $ 448
(1) We define revenues from digital online channels as revenues from digitally distributed subscriptions, licensing royalties,value-added services, downloadable content, microtransactions, and products.
(2) Net revenues from Other include revenues from our MLG, Studios, and Distribution businesses.
Digital Online Channel Net Revenues
Net Revenues
2016 vs 2015
The increase in net revenues from digital online channels for 2016, as compared to 2015, was primarily due to:
• New revenues from King titles following the King Closing Date, primarily driven by the Candy Crush franchise.
• Revenues recognized from Overwatch, a new team-based first-person shooter released in May 2016.
• Higher revenues recognized in 2016 from digital content associated with Call of Duty: Black Ops III, as compared torevenues recognized in 2015 from digital content associated with Call of Duty: Advanced Warfare, the comparable 2015title.
2015 vs 2014
The increase in net revenues from digital online channels for 2015, as compared to 2014, was primarily due to:
• Higher revenues recognized from the Destiny franchise.
• Higher revenues recognized from Hearthstone.
• Higher revenues recognized from Call of Duty: Advanced Warfare and its digital content released during 2015, ascompared to Call of Duty: Ghosts and its digital content released during 2014, including revenues recognized from theintroduction of microtransactions in Call of Duty: Advanced Warfare.
• Revenues recognized from Heroes of the Storm, which was released in June 2015, with no comparable release during theprior periods.
14
16
The increase was partially offset by lower revenues from the Diablo franchise due to the timing of title releases.
Change in Deferred Revenues Recognized
2016 vs 2015
The decrease in net deferred revenues recognized for 2016, as compared to 2015, was primarily due to:
• Deferrals of revenues associated with the release of World of Warcraft: Legion in August 2016, as compared to therecognition of deferred revenues from the release of World of Warcraft: Warlords of Draenor in 2015.
• Deferrals of revenues associated with Overwatch.
The decrease was partially offset by higher deferred revenues recognized from Hearthstone.
2015 vs 2014
The increase in net deferred revenues recognized for 2015, as compared to 2014, was primarily due to lower deferrals of revenues from World of Warcraft, primarily associated with World of Warcraft: Warlords of Draenor and value-added services. The increases were partially offset by higher deferrals of revenues from the Call of Duty franchise.
Retail Channel Net Revenues
Net Revenues
2016 vs 2015
The decrease in net revenues from retail channels for 2016, as compared to 2015, was primarily due to:
• Lower revenues recognized from the Destiny franchise, as Destiny debuted in September 2014 but had no comparablefull-game release in 2015.
• Lower revenues from Skylanders Imaginators, which was released in October 2016, as compared to SkylandersSuperchargers, the comparable 2015 title, as well as lower revenues from standalone Skylanders toys and accessories in2016.
• Lower revenues recognized from Call of Duty: Infinite Warfare, which was released in the fourth quarter of 2016, ascompared to Call of Duty: Black Ops III, which was released in the fourth quarter of 2015.
The decrease was partially offset by:
• Revenues recognized from Overwatch, a new team-based first-person shooter released in May 2016.
• Higher revenues recognized in 2016 from Call of Duty: Black Ops III, which was released in the fourth quarter of 2015,as compared to revenues recognized in 2015 from Call of Duty: Advanced Warfare, which was released in the fourthquarter of 2014.
2015 vs 2014
The decrease in net revenues from retail channels for 2015, as compared to 2014, was primarily due to:
• Lower revenues from Skylanders SuperChargers, which was released in 2015, as compared to Skylanders Trap Team,the comparable 2014 title.
• Lower revenues recognized from Call of Duty: Advanced Warfare, which was released in the fourth quarter of 2014, ascompared to Call of Duty: Ghosts, which was released in the fourth quarter of 2013.
• Lower revenues recognized from Diablo III: Reaper of Souls and Diablo III: Reaper of Souls—Ultimate Evil Edition,which were released in March 2014 on PC and in August 2014 on consoles, respectively.
The decrease was partially offset by higher revenues recognized from the Destiny franchise and revenues from Guitar Hero Live, which was released in October 2015.
15

17
Change in Deferred Revenues Recognized
2016 vs 2015
The increase in net deferred revenues recognized for 2016, as compared to 2015, was primarily due to:
• Lower deferrals of revenues associated with the Call of Duty franchise, driven by lower revenue deferrals from Call of Duty: Infinite Warfare, which was released in the fourth quarter of 2016, as compared to Call of Duty: Black Ops III, the comparable 2015 title.
• Deferred revenues recognized from Guitar Hero Live, which was released in the fourth quarter of 2015.
The decrease was partially offset by lower deferred revenues recognized from the Destiny franchise, as Destiny debuted in September 2014 but had no comparable full-game release in 2015.
2015 vs 2014
The increase in net deferred revenues recognized for 2015, as compared to 2014, was primarily due to lower deferrals of revenues from Destiny. The increase was partially offset by higher deferrals of revenues from the Call of Duty franchise.
Net Revenues by Geographic Region
The following table details our consolidated net revenues by geographic region for the years ended December 31, 2016, 2015, and 2014 (amounts in millions):
For the Years Ended December 31,
2016 2015 2014
Increase/ (decrease)
2016 v 2015
Increase/ (decrease)
2015 v 2014 % Change 2016 v 2015
% Change 2015 v 2014
Geographic region net revenues: Americas ............................................. $ 3,423 $ 2,409 $ 2,190 $ 1,014 $ 219 42% 10% EMEA(1) ............................................ 2,221 1,741 1,824 480 (83) 28 (5) Asia Pacific ......................................... 964 514 394 450 120 88 30
Consolidated net revenues ...................... $ 6,608 $ 4,664 $ 4,408 $ 1,944 $ 256 42 6
(1) EMEA consists of the Europe, Middle East, and Africa geographic regions.
Americas
2016 vs 2015
The increase in net revenues in the Americas region for 2016, as compared to 2015, was primarily due to:
• New revenues from King titles following the King Closing Date, primarily driven by the Candy Crush franchise.
• Revenues recognized from Overwatch, a new team-based first-person shooter released in May 2016.
• Higher revenues recognized in 2016 from Call of Duty: Black Ops III, which was released in the fourth quarter of 2015, as compared to revenues recognized in 2015 from Call of Duty: Advanced Warfare, which was released in the fourth quarter of 2014, including, in each case, the associated digital content.
The increase was partially offset by:
• Lower revenues recognized from the Destiny franchise, as Destiny debuted in September 2014 but had no comparable full-game release in 2015.
• Lower revenues from Skylanders Imaginators, which was released in October 2016, as compared to Skylanders Superchargers, the comparable 2015 title, as well as lower revenues from standalone toys and accessories from the Skylanders franchise in 2016.
2015 vs 2014
The increase in net revenues in the Americas region for 2015, as compared to 2014, was primarily due to:
• Higher revenues recognized from the Destiny franchise. 17
Change in Deferred Revenues Recognized
2016 vs 2015
The increase in net deferred revenues recognized for 2016, as compared to 2015, was primarily due to:
• Lower deferrals of revenues associated with the Call of Duty franchise, driven by lower revenue deferrals from Call of Duty: Infinite Warfare, which was released in the fourth quarter of 2016, as compared to Call of Duty: Black Ops III, the comparable 2015 title.
• Deferred revenues recognized from Guitar Hero Live, which was released in the fourth quarter of 2015.
The decrease was partially offset by lower deferred revenues recognized from the Destiny franchise, as Destiny debuted in September 2014 but had no comparable full-game release in 2015.
2015 vs 2014
The increase in net deferred revenues recognized for 2015, as compared to 2014, was primarily due to lower deferrals of revenues from Destiny. The increase was partially offset by higher deferrals of revenues from the Call of Duty franchise.
Net Revenues by Geographic Region
The following table details our consolidated net revenues by geographic region for the years ended December 31, 2016, 2015, and 2014 (amounts in millions):
For the Years Ended December 31,
2016 2015 2014
Increase/ (decrease)
2016 v 2015
Increase/ (decrease)
2015 v 2014 % Change 2016 v 2015
% Change 2015 v 2014
Geographic region net revenues: Americas ............................................. $ 3,423 $ 2,409 $ 2,190 $ 1,014 $ 219 42% 10% EMEA(1) ............................................ 2,221 1,741 1,824 480 (83) 28 (5) Asia Pacific ......................................... 964 514 394 450 120 88 30
Consolidated net revenues ...................... $ 6,608 $ 4,664 $ 4,408 $ 1,944 $ 256 42 6
(1) EMEA consists of the Europe, Middle East, and Africa geographic regions.
Americas
2016 vs 2015
The increase in net revenues in the Americas region for 2016, as compared to 2015, was primarily due to:
• New revenues from King titles following the King Closing Date, primarily driven by the Candy Crush franchise.
• Revenues recognized from Overwatch, a new team-based first-person shooter released in May 2016.
• Higher revenues recognized in 2016 from Call of Duty: Black Ops III, which was released in the fourth quarter of 2015, as compared to revenues recognized in 2015 from Call of Duty: Advanced Warfare, which was released in the fourth quarter of 2014, including, in each case, the associated digital content.
The increase was partially offset by:
• Lower revenues recognized from the Destiny franchise, as Destiny debuted in September 2014 but had no comparable full-game release in 2015.
• Lower revenues from Skylanders Imaginators, which was released in October 2016, as compared to Skylanders Superchargers, the comparable 2015 title, as well as lower revenues from standalone toys and accessories from the Skylanders franchise in 2016.
2015 vs 2014
The increase in net revenues in the Americas region for 2015, as compared to 2014, was primarily due to:
• Higher revenues recognized from the Destiny franchise.
17
Change in Deferred Revenues Recognized
2016 vs 2015
The increase in net deferred revenues recognized for 2016, as compared to 2015, was primarily due to:
• Lower deferrals of revenues associated with the Call of Duty franchise, driven by lower revenue deferrals from Call ofDuty: Infinite Warfare, which was released in the fourth quarter of 2016, as compared to Call of Duty: Black Ops III, thecomparable 2015 title.
• Deferred revenues recognized from Guitar Hero Live, which was released in the fourth quarter of 2015.
The decrease was partially offset by lower deferred revenues recognized from the Destiny franchise, as Destiny debuted in September 2014 but had no comparable full-game release in 2015.
2015 vs 2014
The increase in net deferred revenues recognized for 2015, as compared to 2014, was primarily due to lower deferrals of revenues from Destiny. The increase was partially offset by higher deferrals of revenues from the Call of Duty franchise.
Net Revenues by Geographic Region
The following table details our consolidated net revenues by geographic region for the years ended December 31, 2016, 2015, and 2014 (amounts in millions):
For the Years Ended December 31,
2015 2014
Increase/ (decrease)
2016 v 2015
Increase/ (decrease)
2015 v 2014 % Change 2016 v 2015
% Change 2015 v 2014
Geographic region net revenues: Americas .............................................................. $ 2,409 $ 2,190 $ 1,014 $ 219 42% 10% EMEA(1) ............................................................. 1,741 1,824 480 (83) 28 (5) Asia Pacific .......................................................... 514 394 450 120 88 30
Consolidated net revenues ....................................... $ 4,664 $ 4,408 $ 1,944 $ 256 42 6
(1) EMEA consists of the Europe, Middle East, and Africa geographic regions.
Americas
2016 vs 2015
The increase in net revenues in the Americas region for 2016, as compared to 2015, was primarily due to:
• New revenues from King titles following the King Closing Date, primarily driven by the Candy Crush franchise.
• Revenues recognized from Overwatch, a new team-based first-person shooter released in May 2016.
• Higher revenues recognized in 2016 from Call of Duty: Black Ops III, which was released in the fourth quarter of 2015,as compared to revenues recognized in 2015 from Call of Duty: Advanced Warfare, which was released in the fourthquarter of 2014, including, in each case, the associated digital content.
The increase was partially offset by:
• Lower revenues recognized from the Destiny franchise, as Destiny debuted in September 2014 but had no comparablefull-game release in 2015.
• Lower revenues from Skylanders Imaginators, which was released in October 2016, as compared to SkylandersSuperchargers, the comparable 2015 title, as well as lower revenues from standalone toys and accessories from theSkylanders franchise in 2016.
2015 vs 2014
The increase in net revenues in the Americas region for 2015, as compared to 2014, was primarily due to:
• Higher revenues recognized from the Destiny franchise.
Consolidated Results
Net Revenues by Distribution Channel
The following table details our consolidated net revenues by distribution channel for the years ended December 31, 2016, 2015, and 2014 (amounts in millions):
For the Years Ended December 31,
2015 2014
Increase/ (decrease)
2016 v 2015
Increase/ (decrease)
2015 v 2014 % Change 2016 v 2015
% Change 2015 v 2014
Net revenues by distribution channel Digital online channels(1) ................................ 2,363 $ 605 94% 32% Retail channels ................................................. 1,806 2,104 (420) (298) (23) (14)Other(2) ............................................................ 356 407 1 (51) — (13)Total consolidated net revenues ....................... 1,944 $ 256 42% 6%
The increase/(decrease) in deferred revenues recognized by distribution channel for the years ended December 31, 2016, 2015, and 2014, was as follows (amounts in millions):
For the Years Ended December 31,
2016 2015 2014
Increase/ (decrease)
2016 v 2015
Increase/ (decrease)
2015 v 2014 Increase/(decrease) in deferred revenues recognized by distribution
channel: Digital online channels(1) .............................................................. $ (351) $ (126) $ (301) $ (225) $ 175 Retail channels ............................................................................... 368 169 (104) 199 273 Other(2) .......................................................................................... (8) — — (8) —Net (deferral)/recognition impact on consolidated net revenues... $ 9 $ 43 $ (405) $ (34) $ 448
(1) We define revenues from digital online channels as revenues from digitally distributed subscriptions, licensing royalties,value-added services, downloadable content, microtransactions, and products.
(2) Net revenues from Other include revenues from our MLG, Studios, and Distribution businesses.
Digital Online Channel Net Revenues
Net Revenues
2016 vs 2015
The increase in net revenues from digital online channels for 2016, as compared to 2015, was primarily due to:
• New revenues from King titles following the King Closing Date, primarily driven by the Candy Crush franchise.
• Revenues recognized from Overwatch, a new team-based first-person shooter released in May 2016.
• Higher revenues recognized in 2016 from digital content associated with Call of Duty: Black Ops III, as compared torevenues recognized in 2015 from digital content associated with Call of Duty: Advanced Warfare, the comparable 2015title.
Consolidated Net Revenues
The following table summarizes our consolidated net revenues and the increase/(decrease) in deferred revenues recognized for the years ended December 31, 2016, 2015, and 2014 (amounts in millions):
For the Years Ended December 31,
2016 2015 2014
Increase/ (decrease)
2016 v 2015
Increase/ (decrease)
2015 v 2014 % Change 2016 v 2015
% Change 2015 v 2014
Consolidated net revenues .............. $ 6,608 $ 4,664 $ 4,408 $ 1,944 $ 256 42% 6% Net effect from recognition (deferral) of
deferred net revenues .................. 9 43 (405) (34) 448
Consolidated net revenues
2016 vs. 2015
The increase in consolidated net revenues for 2016, as compared to 2015, was primarily due to:
• New revenues from King titles following the King Closing Date, primarily driven by the Candy Crush franchise.
• Revenues recognized from Overwatch, a new team-based first-person shooter released in May 2016.
• Higher revenues recognized in 2016 from Call of Duty: Black Ops III, which was released in the fourth quarter of 2015 and was the third game in our successful Black Ops series, as compared to revenues recognized in 2015 from Call of Duty: Advanced Warfare, which was released in the fourth quarter of 2014, including, in each case, the associated digital content.
The increase was partially offset by:
• Lower revenues recognized from the Destiny franchise, as Destiny debuted in September 2014 but had no comparable full-game release in 2015.
• Lower revenues from Skylanders Imaginators, which was released in October 2016, as compared to Skylanders Superchargers, the comparable 2015 title, as well as lower revenues from standalone toys and accessories from the Skylanders franchise in 2016.
• Lower revenues recognized from the Diablo franchise due to the timing of releases.
2015 vs. 2014
The increase in consolidated net revenues for 2015, as compared to 2014, was primarily due to:
• Higher revenues recognized from the Destiny franchise, as Destiny debuted in September 2014.
• Higher revenues recognized from Hearthstone, which were partially driven by its incremental release on iPhone and Android smartphones in April 2015.
The increase was partially offset by:
42% 10% 28 (5) 88 30 42 6
16
18
• Higher revenues recognized from Hearthstone.
• Revenues recognized from Heroes of the Storm and Guitar Hero Live, which were both released in 2015 with no comparable releases during the prior periods.
The increase was partially offset by:
• Lower revenues from Skylanders SuperChargers, which was released in 2015, as compared to Skylanders Trap Team, the comparable 2014 title.
• Lower revenues recognized from the Diablo franchise due to the timing of title releases.
EMEA
2016 vs 2015
The increase in net revenues in the EMEA region for 2016, as compared to 2015, was primarily due to the same drivers and partially offsetting factors as the Americas region discussed above.
2015 vs 2014
The decrease in net revenues in the EMEA region for 2015, as compared to 2014, was primarily due to:
• Lower revenues recognized from the Diablo and Call of Duty franchises.
• Lower revenues from Skylanders SuperChargers, which was released in 2015, as compared to Skylanders Trap Team, the comparable 2014 title.
• Lower revenues from our Distribution business.
The decrease was partially offset by:
• Higher revenues recognized from the Destiny franchise.
• Higher revenues recognized from Hearthstone.
• Revenues recognized from Heroes of the Storm.
Asia Pacific
2016 vs 2015
The increase in net revenues in the Asia Pacific region for 2016, as compared to 2015, was primarily due to:
• New revenues from King titles following the King Closing Date, primarily driven by the Candy Crush franchise.
• Revenues recognized from Overwatch, a new team-based first-person shooter released in May 2016.
• Higher revenues recognized from Hearthstone.
The increase was partially offset by lower revenues recognized from the Diablo franchise due to the timing of releases.
2015 vs 2014
The increase in net revenues in the Asia Pacific region for 2015, as compared to 2014, was primarily due to:
• Higher revenues recognized from Hearthstone and Call of Duty Online.
• Revenues recognized from Heroes of the Storm, which launched in China in 2015.
The increase was partially offset by lower revenues recognized from the Diablo franchise.
17
2015 vs 2014
The increase in net revenues in the Americas region for 2015, as compared to 2014, was primarily due to:
• Higher revenues recognized from the Destiny franchise.
17
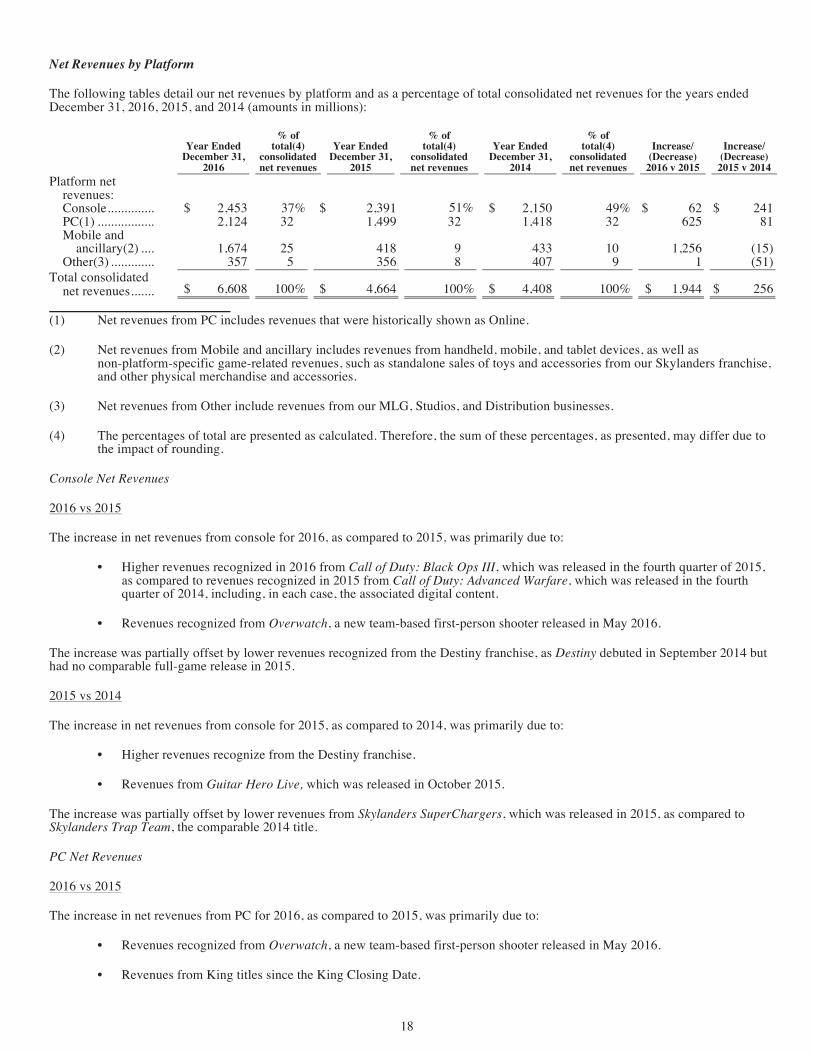
Net Revenues by Platform
The following tables detail our net revenues by platform and as a percentage of total consolidated net revenues for the years ended December 31, 2016, 2015, and 2014 (amounts in millions):
Year Ended December 31,
2016
% of total(4)
consolidated net revenues
Year Ended December 31,
2015
% of total(4)
consolidated net revenues
Year Ended December 31,
2014
% of total(4)
consolidated net revenues
Increase/ (Decrease)
2016 v 2015
Increase/ (Decrease)
2015 v 2014 Platform net
revenues: Console ...............................$ 2,453 37% $ 2,391 51% $ 2,150 49% $ 62 $ 241 PC(1) .................................. 2,124 32 1,499 32 1,418 32 625 81 Mobile and
ancillary(2) ..................... 1,674 25 418 9 433 10 1,256 (15) Other(3) .............................. 357 5 356 8 407 9 1 (51)
Total consolidated net revenues ........................$ 6,608 100% $ 4,664 100% $ 4,408 100% $ 1,944 $ 256
(1) Net revenues from PC includes revenues that were historically shown as Online.
(2) Net revenues from Mobile and ancillary includes revenues from handheld, mobile, and tablet devices, as well asnon-platform-specific game-related revenues, such as standalone sales of toys and accessories from our Skylanders franchise,and other physical merchandise and accessories.
(3) Net revenues from Other include revenues from our MLG, Studios, and Distribution businesses.
(4) The percentages of total are presented as calculated. Therefore, the sum of these percentages, as presented, may differ due tothe impact of rounding.
Console Net Revenues
2016 vs 2015
The increase in net revenues from console for 2016, as compared to 2015, was primarily due to:
• Higher revenues recognized in 2016 from Call of Duty: Black Ops III, which was released in the fourth quarter of 2015,as compared to revenues recognized in 2015 from Call of Duty: Advanced Warfare, which was released in the fourthquarter of 2014, including, in each case, the associated digital content.
• Revenues recognized from Overwatch, a new team-based first-person shooter released in May 2016.
The increase was partially offset by lower revenues recognized from the Destiny franchise, as Destiny debuted in September 2014 but had no comparable full-game release in 2015.
2015 vs 2014
The increase in net revenues from console for 2015, as compared to 2014, was primarily due to:
• Higher revenues recognize from the Destiny franchise.
• Revenues from Guitar Hero Live, which was released in October 2015.
The increase was partially offset by lower revenues from Skylanders SuperChargers, which was released in 2015, as compared to Skylanders Trap Team, the comparable 2014 title.
PC Net Revenues
2016 vs 2015
The increase in net revenues from PC for 2016, as compared to 2015, was primarily due to:
• Revenues recognized from Overwatch, a new team-based first-person shooter released in May 2016.
• Revenues from King titles since the King Closing Date.
18
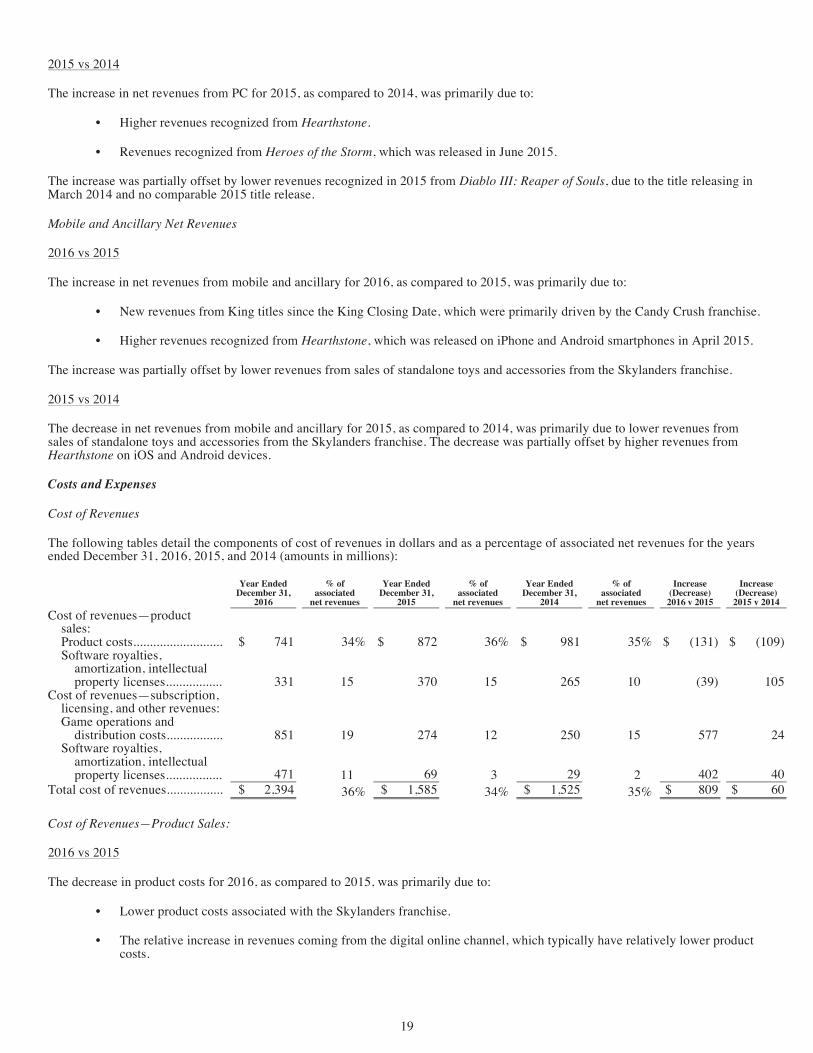
2015 vs 2014
The increase in net revenues from PC for 2015, as compared to 2014, was primarily due to:
• Higher revenues recognized from Hearthstone.
• Revenues recognized from Heroes of the Storm, which was released in June 2015.
The increase was partially offset by lower revenues recognized in 2015 from Diablo III: Reaper of Souls, due to the title releasing in March 2014 and no comparable 2015 title release.
Mobile and Ancillary Net Revenues
2016 vs 2015
The increase in net revenues from mobile and ancillary for 2016, as compared to 2015, was primarily due to:
• New revenues from King titles since the King Closing Date, which were primarily driven by the Candy Crush franchise.
• Higher revenues recognized from Hearthstone, which was released on iPhone and Android smartphones in April 2015.
The increase was partially offset by lower revenues from sales of standalone toys and accessories from the Skylanders franchise.
2015 vs 2014
The decrease in net revenues from mobile and ancillary for 2015, as compared to 2014, was primarily due to lower revenues from sales of standalone toys and accessories from the Skylanders franchise. The decrease was partially offset by higher revenues from Hearthstone on iOS and Android devices.
Costs and Expenses
Cost of Revenues
The following tables detail the components of cost of revenues in dollars and as a percentage of associated net revenues for the years ended December 31, 2016, 2015, and 2014 (amounts in millions):
Year Ended December 31,
2016
% of associated
net revenues
Year Ended December 31,
2015
% of associated
net revenues
Year Ended December 31,
2014
% of associated
net revenues
Increase (Decrease)
2016 v 2015
Increase (Decrease)
2015 v 2014 Cost of revenues—product
sales: Product costs........................... $ 741 34% $ 872 36% $ 981 35% $ (131) $ (109) Software royalties,
amortization, intellectual property licenses ................. 331 15 370 15 265 10 (39) 105
Cost of revenues—subscription, licensing, and other revenues: Game operations and
distribution costs................. 851 19 274 12 250 15 577 24 Software royalties,
amortization, intellectual property licenses ................. 471 11 69 3 29 2 402 40
Total cost of revenues................. $ 2,394 36% $ 1,585 34% $ 1,525 35% $ 809 $ 60
Cost of Revenues—Product Sales:
2016 vs 2015
The decrease in product costs for 2016, as compared to 2015, was primarily due to:
• Lower product costs associated with the Skylanders franchise.
• The relative increase in revenues coming from the digital online channel, which typically have relatively lower productcosts.
19
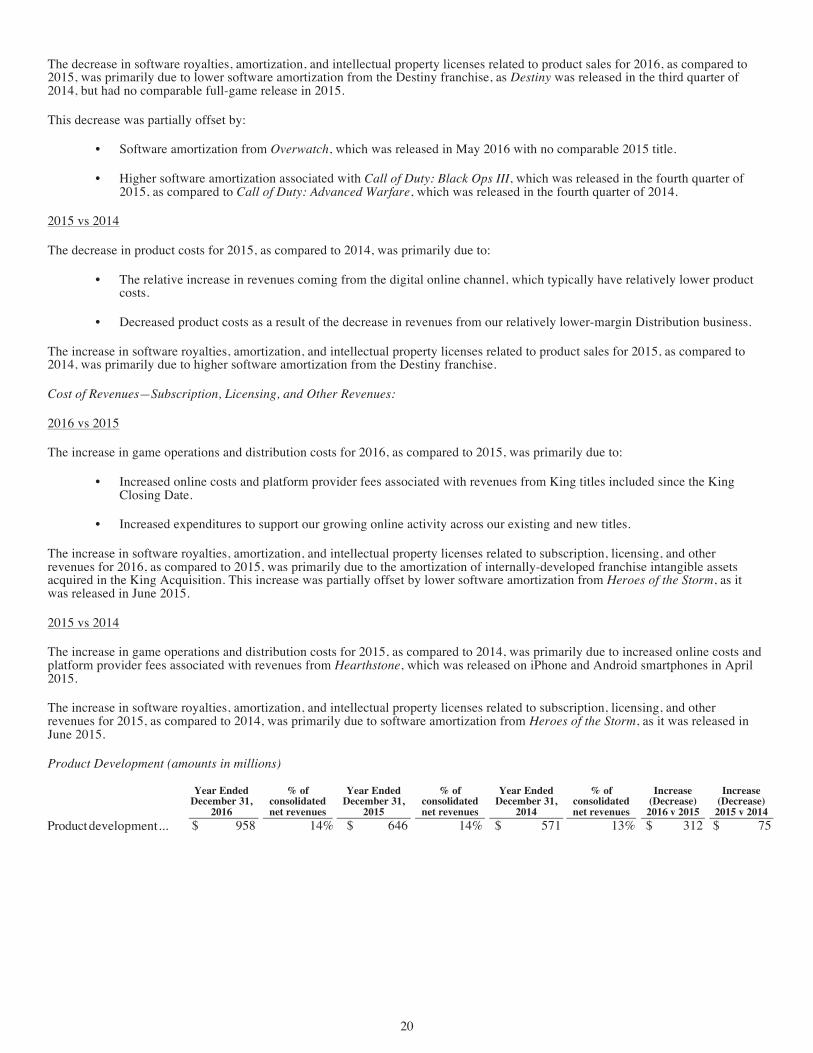
21
The decrease in software royalties, amortization, and intellectual property licenses related to product sales for 2016, as compared to 2015, was primarily due to lower software amortization from the Destiny franchise, as Destiny was released in the third quarter of 2014, but had no comparable full-game release in 2015.
This decrease was partially offset by:
• Software amortization from Overwatch, which was released in May 2016 with no comparable 2015 title.
• Higher software amortization associated with Call of Duty: Black Ops III, which was released in the fourth quarter of 2015, as compared to Call of Duty: Advanced Warfare, which was released in the fourth quarter of 2014.
2015 vs 2014
The decrease in product costs for 2015, as compared to 2014, was primarily due to:
• The relative increase in revenues coming from the digital online channel, which typically have relatively lower product costs.
• Decreased product costs as a result of the decrease in revenues from our relatively lower-margin Distribution business.
The increase in software royalties, amortization, and intellectual property licenses related to product sales for 2015, as compared to 2014, was primarily due to higher software amortization from the Destiny franchise.
Cost of Revenues—Subscription, Licensing, and Other Revenues:
2016 vs 2015
The increase in game operations and distribution costs for 2016, as compared to 2015, was primarily due to:
• Increased online costs and platform provider fees associated with revenues from King titles included since the King Closing Date.
• Increased expenditures to support our growing online activity across our existing and new titles.
The increase in software royalties, amortization, and intellectual property licenses related to subscription, licensing, and other revenues for 2016, as compared to 2015, was primarily due to the amortization of internally-developed franchise intangible assets acquired in the King Acquisition. This increase was partially offset by lower software amortization from Heroes of the Storm, as it was released in June 2015.
2015 vs 2014
The increase in game operations and distribution costs for 2015, as compared to 2014, was primarily due to increased online costs and platform provider fees associated with revenues from Hearthstone, which was released on iPhone and Android smartphones in April 2015.
The increase in software royalties, amortization, and intellectual property licenses related to subscription, licensing, and other revenues for 2015, as compared to 2014, was primarily due to software amortization from Heroes of the Storm, as it was released in June 2015.
Product Development (amounts in millions)
Year Ended December 31,
2016
% of consolidated net revenues
Year Ended December 31,
2015
% of consolidated net revenues
Year Ended December 31,
2014
% of consolidated net revenues
Increase (Decrease)
2016 v 2015
Increase (Decrease)
2015 v 2014 Product development . $ 958 14% $ 646 14% $ 571 13% $ 312 $ 75
2016 vs 2015
The increase in product development costs for 2016, as compared to 2015, was primarily due to:
• Product development costs associated with King’s titles.
• Increased product development costs for Activision and Blizzard’s current and upcoming releases.
The decrease in software royalties, amortization, and intellectual property licenses related to product sales for 2016, as compared to 2015, was primarily due to lower software amortization from the Destiny franchise, as Destiny was released in the third quarter of 2014, but had no comparable full-game release in 2015.
This decrease was partially offset by:
• Software amortization from Overwatch, which was released in May 2016 with no comparable 2015 title.
• Higher software amortization associated with Call of Duty: Black Ops III, which was released in the fourth quarter of2015, as compared to Call of Duty: Advanced Warfare, which was released in the fourth quarter of 2014.
2015 vs 2014
The decrease in product costs for 2015, as compared to 2014, was primarily due to:
• The relative increase in revenues coming from the digital online channel, which typically have relatively lower productcosts.
• Decreased product costs as a result of the decrease in revenues from our relatively lower-margin Distribution business.
The increase in software royalties, amortization, and intellectual property licenses related to product sales for 2015, as compared to 2014, was primarily due to higher software amortization from the Destiny franchise.
Cost of Revenues—Subscription, Licensing, and Other Revenues:
2016 vs 2015
The increase in game operations and distribution costs for 2016, as compared to 2015, was primarily due to:
• Increased online costs and platform provider fees associated with revenues from King titles included since the KingClosing Date.
• Increased expenditures to support our growing online activity across our existing and new titles.
The increase in software royalties, amortization, and intellectual property licenses related to subscription, licensing, and other revenues for 2016, as compared to 2015, was primarily due to the amortization of internally-developed franchise intangible assets acquired in the King Acquisition. This increase was partially offset by lower software amortization from Heroes of the Storm, as it was released in June 2015.
2015 vs 2014
The increase in game operations and distribution costs for 2015, as compared to 2014, was primarily due to increased online costs and platform provider fees associated with revenues from Hearthstone, which was released on iPhone and Android smartphones in April 2015.
The increase in software royalties, amortization, and intellectual property licenses related to subscription, licensing, and other revenues for 2015, as compared to 2014, was primarily due to software amortization from Heroes of the Storm, as it was released in June 2015.
Product Development (amounts in millions)
Year Ended December 31,
2016
% of consolidated net revenues
Year Ended December 31,
2015
% of consolidated net revenues
Year Ended December 31,
2014
% of consolidated net revenues
Increase (Decrease)
2016 v 2015
Increase (Decrease)
2015 v 2014 $ 958 14% $ 646 14% $ 571 13% $ 312 $ 75
2016 vs 2015
The increase in product development costs for 2016, as compared to 2015, was primarily due to:
• Product development costs associated with King’s titles.
• Increased product development costs for Activision and Blizzard’s current and upcoming releases.
Product development ...
20
2015 vs 2014
The increase in product development costs for 2015, as compared to 2014, was primarily due to increased costs to support our future title releases and increased Blizzard product development costs, primarily associated with higher payroll costs and bonuses to studio personnel.
Sales and Marketing (amounts in millions)
Year Ended December 31,
2016
% of consolidated net revenues
Year Ended December 31,
2015
% of consolidated net revenues
Year Ended December 31,
2014
% of consolidated net revenues
Increase (Decrease)
2016 v 2015
Increase (Decrease)
2015 v 2014 Sales and marketing... $ 1,210 18% $ 734 16% $ 712 16% $ 476 $ 22
2016 vs 2015
The increase in sales and marketing expenses for 2016, as compared to 2015, was primarily due to:
• Amortization of the customer base intangible assets acquired in the King Acquisition.
• Sales and marketing spending to support King’s titles and new launches, including Candy Crush Jelly Saga and FarmHeroes Super Saga.
• Sales and marketing spending to support Blizzard’s new title, Overwatch.
The increase was partially offset by lower sales and marketing expenditures on Guitar Hero Live and the Destiny franchise given the timing of game launches.
2015 vs 2014
The increase in sales and marketing expenses for 2015, as compared to 2014, was primarily due to increased spending on sales and marketing activities to support the launches of Guitar Hero Live and Heroes of the Storm during the year. The increase was partially offset by lower media spending on the World of Warcraft, Destiny, and Diablo franchises due to the timing of title releases.
General and Administrative (amounts in millions)
Year Ended December 31,
2016
% of consolidated net revenues
Year Ended December 31,
2015
% of consolidated net revenues
Year Ended December 31,
2014
% of consolidated net revenues
Increase (Decrease)
2016 v 2015
Increase (Decrease)
2015 v 2014 General and
administrative... $ 634 10% $ 380 8% $ 417 9% $ 254 $ (37)
2016 vs 2015
The increase in general and administrative expenses for 2016, as compared to 2015, was primarily due to:
• King’s general and administrative costs, which are included from the King Closing Date.
• Higher Blizzard personnel costs due to segment performance bonuses and increased headcount to support the growth ofthe Blizzard business.
• Higher professional and transaction-related fees due to the King Acquisition, which closed on February 23, 2016.
• Lower foreign currency transaction and derivative contract gains.
2015 vs 2014
The decrease in general and administrative expenses for 2015, as compared to 2014, was primarily due to realized and unrealized gains from our foreign currency derivative contracts and lower share-based compensation expense. This decrease was partially offset by increased professional service fees incurred, primarily in connection with the King Acquisition.
Interest and Other Expense (Income), Net (amounts in millions)
21
Year Ended December 31,
2016
% of consolidated net revenues
Year Ended December 31,
2015
% of consolidated net revenues
Year Ended December 31,
2014
% of consolidated net revenues
Increase (Decrease)
2016 v 2015
Increase (Decrease)
2015 v 2014 Product development . $ 958 14% $ 646 14% $ 571 13% $ 312 $ 75
2016 vs 2015
The increase in product development costs for 2016, as compared to 2015, was primarily due to:
• Product development costs associated with King’s titles.
• Increased product development costs for Activision and Blizzard’s current and upcoming releases.
21
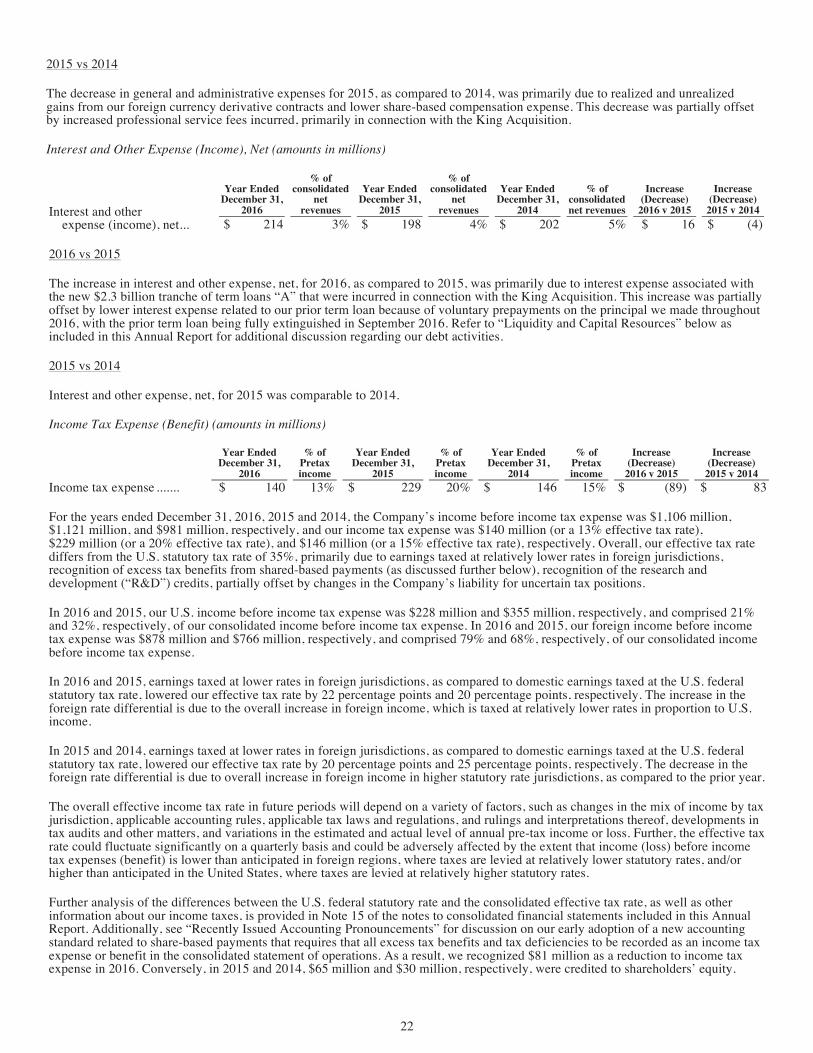
Interest and other expense (income), net.........
2016 vs 2015
The increase in interest and other expense, net, for 2016, as compared to 2015, was primarily due to interest expense associated with the new $2.3 billion tranche of term loans “A” that were incurred in connection with the King Acquisition. This increase was partially offset by lower interest expense related to our prior term loan because of voluntary prepayments on the principal we made throughout 2016, with the prior term loan being fully extinguished in September 2016. Refer to “Liquidity and Capital Resources” below as included in this Annual Report for additional discussion regarding our debt activities.
2015 vs 2014
Interest and other expense, net, for 2015 was comparable to 2014.
Income Tax Expense (Benefit) (amounts in millions)
Year Ended December 31,
2016
% of Pretax income
Year Ended December 31,
2015
% of Pretax income
Year Ended December 31,
2014
% of Pretax income
Increase (Decrease)
2016 v 2015
Increase (Decrease)
2015 v 2014 Income tax expense ......... $ 140 13% $ 229 20% $ 146 15% $ (89) $ 83
For the years ended December 31, 2016, 2015 and 2014, the Company’s income before income tax expense was $1,106 million, $1,121 million, and $981 million, respectively, and our income tax expense was $140 million (or a 13% effective tax rate), $229 million (or a 20% effective tax rate), and $146 million (or a 15% effective tax rate), respectively. Overall, our effective tax rate differs from the U.S. statutory tax rate of 35%, primarily due to earnings taxed at relatively lower rates in foreign jurisdictions, recognition of excess tax benefits from shared-based payments (as discussed further below), recognition of the research and development (“R&D”) credits, partially offset by changes in the Company’s liability for uncertain tax positions.
In 2016 and 2015, our U.S. income before income tax expense was $228 million and $355 million, respectively, and comprised 21% and 32%, respectively, of our consolidated income before income tax expense. In 2016 and 2015, our foreign income before income tax expense was $878 million and $766 million, respectively, and comprised 79% and 68%, respectively, of our consolidated income before income tax expense.
In 2016 and 2015, earnings taxed at lower rates in foreign jurisdictions, as compared to domestic earnings taxed at the U.S. federal statutory tax rate, lowered our effective tax rate by 22 percentage points and 20 percentage points, respectively. The increase in the foreign rate differential is due to the overall increase in foreign income, which is taxed at relatively lower rates in proportion to U.S. income.
In 2015 and 2014, earnings taxed at lower rates in foreign jurisdictions, as compared to domestic earnings taxed at the U.S. federal statutory tax rate, lowered our effective tax rate by 20 percentage points and 25 percentage points, respectively. The decrease in the foreign rate differential is due to overall increase in foreign income in higher statutory rate jurisdictions, as compared to the prior year.
The overall effective income tax rate in future periods will depend on a variety of factors, such as changes in the mix of income by tax jurisdiction, applicable accounting rules, applicable tax laws and regulations, and rulings and interpretations thereof, developments in tax audits and other matters, and variations in the estimated and actual level of annual pre-tax income or loss. Further, the effective tax rate could fluctuate significantly on a quarterly basis and could be adversely affected by the extent that income (loss) before income tax expenses (benefit) is lower than anticipated in foreign regions, where taxes are levied at relatively lower statutory rates, and/or higher than anticipated in the United States, where taxes are levied at relatively higher statutory rates.
Further analysis of the differences between the U.S. federal statutory rate and the consolidated effective tax rate, as well as other information about our income taxes, is provided in Note 15 of the notes to consolidated financial statements included in this Annual Report. Additionally, see “Recently Issued Accounting Pronouncements” for discussion on our early adoption of a new accounting standard related to share-based payments that requires that all excess tax benefits and tax deficiencies to be recorded as an income tax expense or benefit in the consolidated statement of operations. As a result, we recognized $81 million as a reduction to income tax expense in 2016. Conversely, in 2015 and 2014, $65 million and $30 million, respectively, were credited to shareholders’ equity.
Foreign Exchange Impact
Changes in foreign exchange rates had a positive impact of $10 million, a negative impact of $242 million, and a negative impact of $8 million on Activision Blizzard’s consolidated operating income in 2016, 2015 and 2014, respectively. The changes are primarily due to changes in the value of the U.S. dollar relative to the euro and British pound and its impact on our foreign operating income.
22
• Higher professional and transaction-related fees due to the King Acquisition, which closed on February 23, 2016.
• Lower foreign currency transaction and derivative contract gains.
2015 vs 2014
The decrease in general and administrative expenses for 2015, as compared to 2014, was primarily due to realized and unrealized gains from our foreign currency derivative contracts and lower share-based compensation expense. This decrease was partially offset by increased professional service fees incurred, primarily in connection with the King Acquisition.
Interest and Other Expense (Income), Net (amounts in millions)
Year Ended December 31,
2016
% of consolidated
net revenues
Year Ended December 31,
2015
% of consolidated
net revenues
Year Ended December 31,
2014
% of consolidated net revenues
Increase (Decrease)
2016 v 2015
Increase (Decrease)
2015 v 2014 22
• Higher professional and transaction-related fees due to the King Acquisition, which closed on February 23, 2016.
• Lower foreign currency transaction and derivative contract gains.
2015 vs 2014
The decrease in general and administrative expenses for 2015, as compared to 2014, was primarily due to realized and unrealized gains from our foreign currency derivative contracts and lower share-based compensation expense. This decrease was partially offset by increased professional service fees incurred, primarily in connection with the King Acquisition.
Interest and Other Expense (Income), Net (amounts in millions)
Year Ended December 31,
2016
% of consolidated
net revenues
Year Ended December 31,
2015
% of consolidated
net revenues
Year Ended December 31,
2014
% of consolidated net revenues
Increase (Decrease)
2016 v 2015
Increase (Decrease)
2015 v 2014 Interest and other expense (income), net $ 214 3% $ 198 4% $ 202 5% $ 16 $ (4)
2016 vs 2015
The increase in interest and other expense, net, for 2016, as compared to 2015, was primarily due to interest expense associated with the new $2.3 billion tranche of term loans “A” that were incurred in connection with the King Acquisition. This increase was partially offset by lower interest expense related to our prior term loan because of voluntary prepayments on the principal we made throughout 2016, with the prior term loan being fully extinguished in September 2016. Refer to “Liquidity and Capital Resources” below as included in this Annual Report for additional discussion regarding our debt activities.
2015 vs 2014
Interest and other expense, net, for 2015 was comparable to 2014.
Income Tax Expense (Benefit) (amounts in millions)
Year Ended December 31,
2016
% of Pretax income
Year Ended December 31,
2015
% of Pretax income
Year Ended December 31,
2014
% of Pretax income
Increase (Decrease)
2016 v 2015
Increase (Decrease)
2015 v 2014 Income tax expense ......... $ 140 13% $ 229 20% $ 146 15% $ (89) $ 83
For the years ended December 31, 2016, 2015 and 2014, the Company’s income before income tax expense was $1,106 million, $1,121 million, and $981 million, respectively, and our income tax expense was $140 million (or a 13% effective tax rate), $229 million (or a 20% effective tax rate), and $146 million (or a 15% effective tax rate), respectively. Overall, our effective tax rate differs from the U.S. statutory tax rate of 35%, primarily due to earnings taxed at relatively lower rates in foreign jurisdictions, recognition of excess tax benefits from shared-based payments (as discussed further below), recognition of the research and development (“R&D”) credits, partially offset by changes in the Company’s liability for uncertain tax positions.
In 2016 and 2015, our U.S. income before income tax expense was $228 million and $355 million, respectively, and comprised 21% and 32%, respectively, of our consolidated income before income tax expense. In 2016 and 2015, our foreign income before income tax expense was $878 million and $766 million, respectively, and comprised 79% and 68%, respectively, of our consolidated income before income tax expense.
In 2016 and 2015, earnings taxed at lower rates in foreign jurisdictions, as compared to domestic earnings taxed at the U.S. federal statutory tax rate, lowered our effective tax rate by 22 percentage points and 20 percentage points, respectively. The increase in the foreign rate differential is due to the overall increase in foreign income, which is taxed at relatively lower rates in proportion to U.S. income.
In 2015 and 2014, earnings taxed at lower rates in foreign jurisdictions, as compared to domestic earnings taxed at the U.S. federal statutory tax rate, lowered our effective tax rate by 20 percentage points and 25 percentage points, respectively. The decrease in the foreign rate differential is due to overall increase in foreign income in higher statutory rate jurisdictions, as compared to the prior year.
The overall effective income tax rate in future periods will depend on a variety of factors, such as changes in the mix of income by tax jurisdiction, applicable accounting rules, applicable tax laws and regulations, and rulings and interpretations thereof, developments in tax audits and other matters, and variations in the estimated and actual level of annual pre-tax income or loss. Further, the effective tax rate could fluctuate significantly on a quarterly basis and could be adversely affected by the extent that income (loss) before income tax expenses (benefit) is lower than anticipated in foreign regions, where taxes are levied at relatively lower statutory rates, and/or higher than anticipated in the United States, where taxes are levied at relatively higher statutory rates.
Further analysis of the differences between the U.S. federal statutory rate and the consolidated effective tax rate, as well as other information about our income taxes, is provided in Note 15 of the notes to consolidated financial statements included in this Annual Report. Additionally, see “Recently Issued Accounting Pronouncements” for discussion on our early adoption of a new accounting standard related to share-based payments that requires that all excess tax benefits and tax deficiencies to be recorded as an income tax expense or benefit in the consolidated statement of operations. As a result, we recognized $81 million as a reduction to income tax expense in 2016. Conversely, in 2015 and 2014, $65 million and $30 million, respectively, were credited to shareholders’ equity.
Foreign Exchange Impact
Changes in foreign exchange rates had a positive impact of $10 million, a negative impact of $242 million, and a negative impact of $8 million on Activision Blizzard’s consolidated operating income in 2016, 2015 and 2014, respectively. The changes are primarily due to changes in the value of the U.S. dollar relative to the euro and British pound and its impact on our foreign operating income.
22

Liquidity and Capital Resources
We believe our ability to generate cash flows from operating activities is one of our fundamental financial strengths. In the near term, we expect our business to remain strong and to continue to generate significant operating cash flows. Our primary sources of liquidity, which are available to us to fund cash outflows such as our anticipated dividend payments, share repurchases and scheduled debt maturities, include our cash and cash equivalents, short- and long-term investments, and cash flows provided by operating activities. With our cash and cash equivalents and short-term investments of $3.3 billion at December 31, 2016, and the expected cash flows provided by our operating activities, we believe that we have sufficient liquidity to meet daily operations for the foreseeable future. We also believe that we have sufficient working capital ($2.2 billion at December 31, 2016) to finance our operational and financing requirements for at least the next twelve months. Additionally, we have the availability of a $250 million revolving credit facility.
As of December 31, 2016, the amount of cash and cash equivalents held outside of the U.S. by our foreign subsidiaries was $1.9 billion, as compared to $0.5 billion as of December 31, 2015. If the cash and cash equivalents held outside of the U.S. are needed in the future for our operations in the U.S., we would accrue and pay the required U.S. taxes to repatriate these funds. However, our intent is to permanently reinvest these funds outside of the U.S. and our current plans do not demonstrate a need to repatriate them to fund our U.S. operations.
Furthermore, our cash provided from operating activities is somewhat impacted by seasonality. Working capital needs are impacted by weekly sales, which are generally highest in the fourth quarter due to seasonal and holiday-related sales patterns. On a continuing basis, we consider various transactions to increase shareholder value and enhance our business results, including acquisitions, divestitures, joint ventures, share repurchases, and other structural changes. These transactions may result in future cash proceeds or payments.
Sources of Liquidity (amounts in millions)
For the Years Ended December 31,
2016 2015
Increase (Decrease)
2016 v 2015 . and cash equivalents .......................................................................... $ 3,245 $ 1,823 $ 1,422
......-term investments ............................................................................... 13 8 5 $ 3,258 $ 1,831 $ 1,427
...Percentage of total assets ............................................................................ 12%
For the Years Ended December 31,
2016 2015 2014
Increase (Decrease)
2016 v 2015
Increase (Decrease)
2015 v 2014 Cash flows provided by operating activities ....................... $ 2,155 $ 1,259 $ 1,331 $ 896 $ (72) Cash flows used in investing activities ............................... (1,177) (3,716) (84) 2,539 (3,632) Cash flows provided by (used in) financing activities ........ 500 (202) (413) 702 211 Effect of foreign exchange rate changes ............................. (56) (366) (396) 310 30 Net increase (decrease) in cash and cash equivalents ......... $ 1,422 $ (3,025) $ 438 $ 4,447 (3,463)
Cash Flows Provided by Operating Activities
The primary drivers of cash flows associated with our operating activities include the collection of customer receivables generated from the sale of our products and services. These collections are typically partially offset by: payments to vendors for the manufacturing, distribution, and marketing of our products; payments for customer service support for our consumers; payments to third-party developers and intellectual property holders; payments for interest on our debt; payments for software development; payments for tax liabilities; and payments to our workforce.
2016 vs 2015
Cash flows provided by operating activities for 2016 were $2.16 billion, as compared $1.26 billion for 2015. The increase was primarily due to:
• New operating cash flows contributed by King.
• Higher net income in 2016, as compared to 2015, along with larger adjustments to net income for non-cash charges,primarily associated with the amortization of the acquired intangibles in the King Acquisition, higher stockcompensation expense due to converted awards for King personnel in the acquisition, and other non-cash ornon-operating costs associated with our debt-related activities during the year.
Cash flows provided by operating activities for the year ended December 31, 2016 included $209 million of interest paid on our
1 %
$
23
Report. Additionally, see “Recently Issued Accounting Pronouncements” for discussion on our early adoption of a new accounting standard related to share-based payments that requires that all excess tax benefits and tax deficiencies to be recorded as an income tax expense or benefit in the consolidated statement of operations. As a result, we recognized $81 million as a reduction to income tax expense in 2016. Conversely, in 2015 and 2014, $65 million and $30 million, respectively, were credited to shareholders’ equity.
Foreign Exchange Impact
Changes in foreign exchange rates had a positive impact of $10 million, a negative impact of $242 million, and a negative impact of $8 million on Activision Blizzard’s consolidated operating income in 2016, 2015 and 2014, respectively. The changes are primarily due to changes in the value of the U.S. dollar relative to the euro and British pound and its impact on our foreign operating income.
Liquidity and Capital Resources
We believe our ability to generate cash flows from operating activities is one of our fundamental financial strengths. In the near term, we expect our business to remain strong and to continue to generate significant operating cash flows. Our primary sources of liquidity, which are available to us to fund cash outflows such as our anticipated dividend payments, share repurchases and scheduled debt maturities, include our cash and cash equivalents, short- and long-term investments, and cash flows provided by operating activities. With our cash and cash equivalents and short-term investments of $3.3 billion at December 31, 2016, and the expected cash flows provided by our operating activities, we believe that we have sufficient liquidity to meet daily operations for the foreseeable future. We also believe that we have sufficient working capital ($2.2 billion at December 31, 2016) to finance our operational and financing requirements for at least the next twelve months. Additionally, we have the availability of a $250 million revolving credit facility.
As of December 31, 2016, the amount of cash and cash equivalents held outside of the U.S. by our foreign subsidiaries was $1.9 billion, as compared to $0.5 billion as of December 31, 2015. If the cash and cash equivalents held outside of the U.S. are needed in the future for our operations in the U.S., we would accrue and pay the required U.S. taxes to repatriate these funds. However, our intent is to permanently reinvest these funds outside of the U.S. and our current plans do not demonstrate a need to repatriate them to fund our U.S. operations.
Furthermore, our cash provided from operating activities is somewhat impacted by seasonality. Working capital needs are impacted by weekly sales, which are generally highest in the fourth quarter due to seasonal and holiday-related sales patterns. On a continuing basis, we consider various transactions to increase shareholder value and enhance our business results, including acquisitions, divestitures, joint ventures, share repurchases, and other structural changes. These transactions may result in future cash proceeds or payments.
Sources of Liquidity (amounts in millions)
For the Years Ended
December 31,
2016 2015
Increase (Decrease)
2016 v 2015 Cash and cash equivalents ................................................................................................. $ 3,245 $ 1,823 $ 1,422 Short-term investments ...................................................................................................... 13 8 5 $ 3,258 $ 1,831 $ 1,427 Percentage of total assets ................................................................................................... 19% 12%
For the Years Ended December 31,
2016 2015 2014
Increase (Decrease)
2016 v 2015
Increase (Decrease)
2015 v 2014 Cash flows provided by operating activities .................... $ 2,155 $ 1,259 $ 1,331 $ 896 $ (72) Cash flows used in investing activities ............................ (1,177) (3,716) (84) 2,539 (3,632) Cash flows provided by (used in) financing activities ..... 500 (202) (413) 702 211 Effect of foreign exchange rate changes .......................... (56) (366) (396) 310 30 Net increase (decrease) in cash and cash equivalents ...... $ 1,422 $ (3,025) $ 438 $ 4,447 $ (3,463)
Cash Flows Provided by Operating Activities
The primary drivers of cash flows associated with our operating activities include the collection of customer receivables generated from the sale of our products and services. These collections are typically partially offset by: payments to vendors for the manufacturing, distribution, and marketing of our products; payments for customer service support for our consumers; payments to third-party developers and intellectual property holders; payments for interest on our debt; payments for software development; payments for tax liabilities; and payments to our workforce.
2016 vs 2015
Cash flows provided by operating activities for 2016 were $2.16 billion, as compared $1.26 billion for 2015. The increase was primarily due to:
• New operating cash flows contributed by King.
• Higher net income in 2016, as compared to 2015, along with larger adjustments to net income for non-cash charges, primarily associated with the amortization of the acquired intangibles in the King Acquisition, higher stock compensation expense due to converted awards for King personnel in the acquisition, and other non-cash or non-operating costs associated with our debt-related activities during the year.
Cash flows provided by operating activities for the year ended December 31, 2016 included $209 million of interest paid on our
23
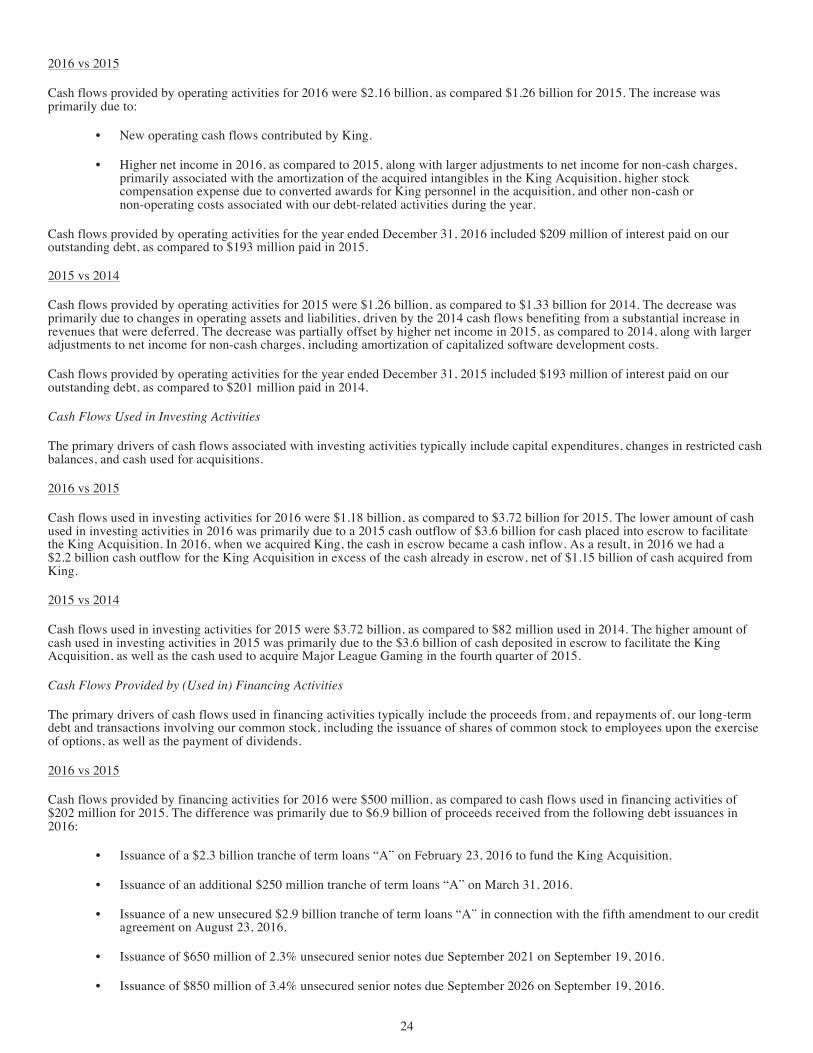
2015 vs 2014
Cash flows provided by operating activities for 2015 were $1.26 billion, as compared to $1.33 billion for 2014. The decrease was primarily due to changes in operating assets and liabilities, driven by the 2014 cash flows benefiting from a substantial increase in revenues that were deferred. The decrease was partially offset by higher net income in 2015, as compared to 2014, along with larger adjustments to net income for non-cash charges, including amortization of capitalized software development costs.
Cash flows provided by operating activities for the year ended December 31, 2015 included $193 million of interest paid on our outstanding debt, as compared to $201 million paid in 2014.
Cash Flows Used in Investing Activities
The primary drivers of cash flows associated with investing activities typically include capital expenditures, changes in restricted cash balances, and cash used for acquisitions.
2016 vs 2015
Cash flows used in investing activities for 2016 were $1.18 billion, as compared to $3.72 billion for 2015. The lower amount of cash used in investing activities in 2016 was primarily due to a 2015 cash outflow of $3.6 billion for cash placed into escrow to facilitate the King Acquisition. In 2016, when we acquired King, the cash in escrow became a cash inflow. As a result, in 2016 we had a $2.2 billion cash outflow for the King Acquisition in excess of the cash already in escrow, net of $1.15 billion of cash acquired from King.
2015 vs 2014
Cash flows used in investing activities for 2015 were $3.72 billion, as compared to $82 million used in 2014. The higher amount of cash used in investing activities in 2015 was primarily due to the $3.6 billion of cash deposited in escrow to facilitate the King Acquisition, as well as the cash used to acquire Major League Gaming in the fourth quarter of 2015.
Cash Flows Provided by (Used in) Financing Activities
The primary drivers of cash flows used in financing activities typically include the proceeds from, and repayments of, our long-term debt and transactions involving our common stock, including the issuance of shares of common stock to employees upon the exercise of options, as well as the payment of dividends.
2016 vs 2015
Cash flows provided by financing activities for 2016 were $500 million, as compared to cash flows used in financing activities of $202 million for 2015. The difference was primarily due to $6.9 billion of proceeds received from the following debt issuances in 2016:
• Issuance of a $2.3 billion tranche of term loans “A” on February 23, 2016 to fund the King Acquisition.
• Issuance of an additional $250 million tranche of term loans “A” on March 31, 2016.
• Issuance of a new unsecured $2.9 billion tranche of term loans “A” in connection with the fifth amendment to our credit agreement on August 23, 2016.
• Issuance of $650 million of 2.3% unsecured senior notes due September 2021 on September 19, 2016.
• Issuance of $850 million of 3.4% unsecured senior notes due September 2026 on September 19, 2016.
These issuances were partially offset by:
• Repayments of $1.9 billion to extinguish our term loan outstanding at December 31, 2015 (the “Original Term Loan”).
24
from the sale of our products and services. These collections are typically partially offset by: payments to vendors for the manufacturing, distribution, and marketing of our products; payments for customer service support for our consumers; payments to third-party developers and intellectual property holders; payments for interest on our debt; payments for software development; payments for tax liabilities; and payments to our workforce.
2016 vs 2015
Cash flows provided by operating activities for 2016 were $2.16 billion, as compared $1.26 billion for 2015. The increase was primarily due to:
• New operating cash flows contributed by King.
• Higher net income in 2016, as compared to 2015, along with larger adjustments to net income for non-cash charges, primarily associated with the amortization of the acquired intangibles in the King Acquisition, higher stock compensation expense due to converted awards for King personnel in the acquisition, and other non-cash or non-operating costs associated with our debt-related activities during the year.
Cash flows provided by operating activities for the year ended December 31, 2016 included $209 million of interest paid on our outstanding debt, as compared to $193 million paid in 2015.
24

• Higher cash dividend payments made during 2016, as compared to 2015.
Cash flows used in financing activities for 2015 also included proceeds of $202 million received in the settlement of the litigation related to the Purchase Transaction. There were no such proceeds received in 2016.
2015 vs 2014
Cash flows used in financing activities for 2015 were $202 million, as compared to $413 million for 2014. The lower amount of cash flows used in financing activities was primarily due to:
• Proceeds of $202 million received in the settlement of the litigation related to the Purchase Transaction.
• A lower partial repayment of our Original Term Loan during 2015 of $250 million, as compared to the $375 million partial repayment of our Original Term Loan during 2014.
These decreases were partially offset by:
• Lower proceeds from stock options exercised by our employees during 2015 than during 2014.
• Higher cash dividend payments made during 2015, as compared to 2014.
Effect of Foreign Exchange Rate Changes
Changes in foreign exchange rates had negative impacts of $56 million, $366 million, and $396 million on our cash and cash equivalents for the years ended December 31, 2016, 2015, and 2014, respectively. The change is primarily due to changes in the value of the U.S. dollar relative to the Euro and British pound.
Debt
As of December 31, 2016, our total outstanding debt was $4.9 billion, bearing interest at a weighted average rate of 2.92%, as compared to $4.1 billion at December 31, 2015, bearing interest at a weighted average rate of 4.63%. During 2016, we had the following significant debt activities:
• Entered into three amendments to our credit agreement to provide for a $2.3 billion tranche of term loans “A” on February 23, 2016, to fund the King Acquisition.
• Entered into a fourth amendment to our credit agreement on March 31, 2016, to provide for an additional tranche of term loans “A” in the amount of $250 million (together with the $2.3 billion tranche of term loans “A”, the “Original TLA”).
• Made voluntary principal prepayments on the remaining balance of our Original Term Loan of $500 million, $250 million, and $800 million on February 25, March 31, and May 26, 2016, respectively, to reduce the remaining outstanding principal balance to $319 million.
• On August 23, 2016, entered into a fifth amendment to our credit agreement to provide for (1) a new unsecured tranche of term loans “A” of approximately $2.9 billion (the “2016 TLA”), the proceeds of which were primarily used to extinguish the remaining outstanding principal balances of $319 million on the Original Term Loan and $2.5 billion on the Original TLA, resulting in a write-off of unamortized discount and deferred financing costs of $10 million, and (2) a new unsecured revolving credit facility of $250 million.
• On September 19, 2016, issued $650 million of 2.3% unsecured senior notes due September 2021 (the “New 2021 Notes”) and $850 million of 3.4% unsecured senior notes due September 2026 (the “2026 Notes” and, together with the New 2021 Notes, the “New Notes”).
• On October 19, 2016, using the proceeds from the New Notes, redeemed the Original 2021 Notes in full for $1.6 billion, which resulted in a loss on extinguishment of approximately $82 million, comprised of a premium payment of $63 million and a write-off of unamortized discount and deferred financing costs of $19 million.
25
• Issuance of $650 million of 2.3% unsecured senior notes due September 2021 on September 19, 2016.
• Issuance of $850 million of 3.4% unsecured senior notes due September 2026 on September 19, 2016.
These issuances were partially offset by:
• Repayments of $1.9 billion to extinguish our term loan outstanding at December 31, 2015 (the “Original Term Loan”).
• Repayments of $2.5 billion in connection with the refinancing of our tranche of term loans “A” that were provided in the first quarter of 2016.
• Repayments of $185 million on our new tranche of term loans “A” that were provided on August 23, 2016, which included $167 million of voluntary prepayments, as compared to the $250 million partial repayment of our Original Term Loan in 2015.
• Cash payment to redeem our 5.625% unsecured senior notes due September 2021 (the “Original 2021 Notes”) of $1.5 billion, as well as the associated $63 million premium.
25
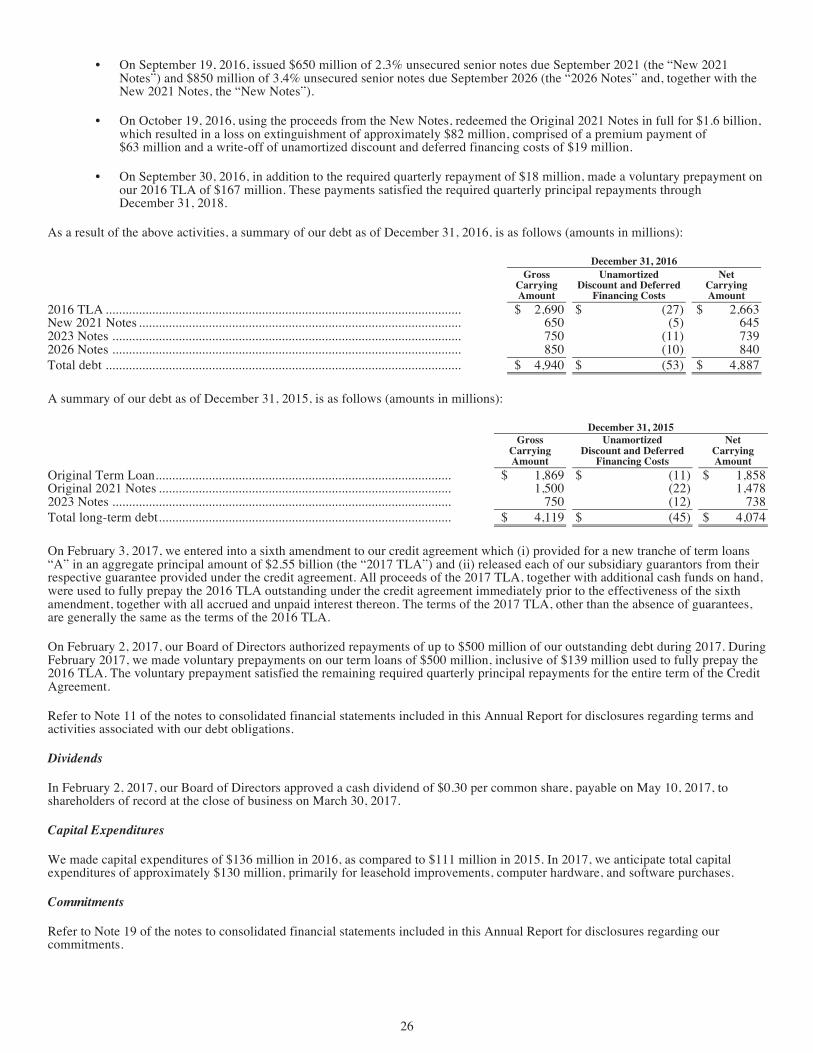
Gross Carrying Amount
Unamortized Discount and Deferred
Financing Costs
Net Carrying Amount
2016 TLA ........................................................................................................... $ 2,690 $ (27) $ 2,663 New 2021 Notes ................................................................................................. 650 (5) 645 2023 Notes ......................................................................................................... 750 (11) 739 2026 Notes ......................................................................................................... 850 (10) 840 Total debt ........................................................................................................... $ 4,940 $ (53) $ 4,887
A summary of our debt as of December 31, 2015, is as follows (amounts in millions):
December 31, 2015
Gross Carrying Amount
Unamortized Discount and Deferred
Financing Costs
Net Carrying Amount
Original Term Loan ......................................................................................... $ 1,869 $ (11) $ 1,858 Original 2021 Notes ........................................................................................ 1,500 (22) 1,478 2023 Notes ...................................................................................................... 750 (12) 738 Total long-term debt ........................................................................................ $ 4,119 $ (45) $ 4,074
On February 3, 2017, we entered into a sixth amendment to our credit agreement which (i) provided for a new tranche of term loans “A” in an aggregate principal amount of $2.55 billion (the “2017 TLA”) and (ii) released each of our subsidiary guarantors from their respective guarantee provided under the credit agreement. All proceeds of the 2017 TLA, together with additional cash funds on hand, were used to fully prepay the 2016 TLA outstanding under the credit agreement immediately prior to the effectiveness of the sixth amendment, together with all accrued and unpaid interest thereon. The terms of the 2017 TLA, other than the absence of guarantees, are generally the same as the terms of the 2016 TLA.
On February 2, 2017, our Board of Directors authorized repayments of up to $500 million of our outstanding debt during 2017. During February 2017, we made voluntary prepayments on our term loans of $500 million, inclusive of $139 million used to fully prepay the 2016 TLA. The voluntary prepayment satisfied the remaining required quarterly principal repayments for the entire term of the Credit Agreement.
Refer to Note 11 of the notes to consolidated financial statements included in this Annual Report for disclosures regarding terms and activities associated with our debt obligations.
Dividends
In February 2, 2017, our Board of Directors approved a cash dividend of $0.30 per common share, payable on May 10, 2017, to shareholders of record at the close of business on March 30, 2017.
Capital Expenditures
We made capital expenditures of $136 million in 2016, as compared to $111 million in 2015. In 2017, we anticipate total capital expenditures of approximately $130 million, primarily for leasehold improvements, computer hardware, and software purchases.
Commitments
Refer to Note 19 of the notes to consolidated financial statements included in this Annual Report for disclosures regarding our commitments.
Off-balance Sheet Arrangements
At December 31, 2016 and 2015, Activision Blizzard had no significant relationships with unconsolidated entities or financial parties, often referred to as “structured finance” or “special purpose” entities, established for the purpose of facilitating off-balance sheet arrangements or other contractually narrow or limited purposes, that have or are reasonably likely to have a material current or future effect on our financial condition, changes in financial condition, revenues or expenses, results of operations, liquidity, capital expenditures, or capital resources.
26
tranche of term loans “A” of approximately $2.9 billion (the “2016 TLA”), the proceeds of which were primarily used to extinguish the remaining outstanding principal balances of $319 million on the Original Term Loan and $2.5 billion on the Original TLA, resulting in a write-off of unamortized discount and deferred financing costs of $10 million, and (2) a new unsecured revolving credit facility of $250 million.
• On September 19, 2016, issued $650 million of 2.3% unsecured senior notes due September 2021 (the “New 2021 Notes”) and $850 million of 3.4% unsecured senior notes due September 2026 (the “2026 Notes” and, together with the New 2021 Notes, the “New Notes”).
• On October 19, 2016, using the proceeds from the New Notes, redeemed the Original 2021 Notes in full for $1.6 billion, which resulted in a loss on extinguishment of approximately $82 million, comprised of a premium payment of $63 million and a write-off of unamortized discount and deferred financing costs of $19 million.
• On September 30, 2016, in addition to the required quarterly repayment of $18 million, made a voluntary prepayment on our 2016 TLA of $167 million. These payments satisfied the required quarterly principal repayments through December 31, 2018.
As a result of the above activities, a summary of our debt as of December 31, 2016, is as follows (amounts in millions):
December 31, 2016
Gross Carrying Amount
Unamortized Discount and Deferred
Financing Costs
Net Carrying Amount
2016 TLA ........................................................................................................... $ 2,690 $ (27) $ 2,663 New 2021 Notes ................................................................................................. 650 (5) 645 2023 Notes ......................................................................................................... 750 (11) 739 2026 Notes ......................................................................................................... 850 (10) 840 Total debt ........................................................................................................... $ 4,940 $ (53) $ 4,887
A summary of our debt as of December 31, 2015, is as follows (amounts in millions):
December 31, 2015
Gross Carrying Amount
Unamortized Discount and Deferred
Financing Costs
Net Carrying Amount
Original Term Loan ......................................................................................... $ 1,869 $ (11) $ 1,858 Original 2021 Notes ........................................................................................ 1,500 (22) 1,478 2023 Notes ...................................................................................................... 750 (12) 738 Total long-term debt ........................................................................................ $ 4,119 $ (45) $ 4,074
On February 3, 2017, we entered into a sixth amendment to our credit agreement which (i) provided for a new tranche of term loans “A” in an aggregate principal amount of $2.55 billion (the “2017 TLA”) and (ii) released each of our subsidiary guarantors from their respective guarantee provided under the credit agreement. All proceeds of the 2017 TLA, together with additional cash funds on hand, were used to fully prepay the 2016 TLA outstanding under the credit agreement immediately prior to the effectiveness of the sixth amendment, together with all accrued and unpaid interest thereon. The terms of the 2017 TLA, other than the absence of guarantees, are generally the same as the terms of the 2016 TLA.
On February 2, 2017, our Board of Directors authorized repayments of up to $500 million of our outstanding debt during 2017. During February 2017, we made voluntary prepayments on our term loans of $500 million, inclusive of $139 million used to fully prepay the 2016 TLA. The voluntary prepayment satisfied the remaining required quarterly principal repayments for the entire term of the Credit Agreement.
Refer to Note 11 of the notes to consolidated financial statements included in this Annual Report for disclosures regarding terms and activities associated with our debt obligations.
Dividends
In February 2, 2017, our Board of Directors approved a cash dividend of $0.30 per common share, payable on May 10, 2017, to shareholders of record at the close of business on March 30, 2017.
Capital Expenditures
We made capital expenditures of $136 million in 2016, as compared to $111 million in 2015. In 2017, we anticipate total capital expenditures of approximately $130 million, primarily for leasehold improvements, computer hardware, and software purchases.
Commitments
Refer to Note 19 of the notes to consolidated financial statements included in this Annual Report for disclosures regarding our commitments.
Off-balance Sheet Arrangements
At December 31, 2016 and 2015, Activision Blizzard had no significant relationships with unconsolidated entities or financial parties, often referred to as “structured finance” or “special purpose” entities, established for the purpose of facilitating off-balance sheet arrangements or other contractually narrow or limited purposes, that have or are reasonably likely to have a material current or future effect on our financial condition, changes in financial condition, revenues or expenses, results of operations, liquidity, capital expenditures, or capital resources.
26
judgment, with financial reporting results relying on estimates and assumptions about the effect of matters that are inherently uncertain. Specific risks for these critical accounting policies, estimates, and assumptions are described in the following paragraphs.
Revenue Recognition
We recognize revenues when there is persuasive evidence of an arrangement, the product or service has been provided to the customer, the collection of our fees is reasonably assured, and the amount of fees to be paid by the customer is fixed or determinable. Certain products are sold to customers with a “street date” (which is the earliest date these products may be sold by retailers). For these products, we recognize revenues on the later of the street date or the date the product is sold to the customer.
Revenue Arrangements with Multiple Deliverables
Certain of our revenue arrangements have multiple deliverables, which we account for in accordance with Accounting Standards Codification (“ASC”) Topic 605. These revenue arrangements include product sales consisting of both software, service (such as ongoing hosting arrangements), and hardware deliverables (such as peripherals or other ancillary collectors’ items sold together with physical “boxed” software).
When a revenue arrangement contains multiple elements, such as hardware and software products, licenses and/or services, we allocate revenue to each element based on a selling price hierarchy. The selling price for a deliverable is based on its vendor-specific objective evidence (“VSOE”) if it is available, third-party evidence (“TPE”) if VSOE is not available, or best estimated selling price (“BESP”) if neither VSOE nor TPE is available. In multiple element arrangements where more-than-incidental software deliverables are included, revenue is allocated to each separate unit of accounting for each of the non-software deliverables and to the software deliverables as a group using the relative selling prices of each of the deliverables in the arrangement based on the aforementioned selling price hierarchy. Further, if the arrangement contains more than one software deliverable, the arrangement consideration allocated to the software deliverables as a group is then allocated to each software deliverable using the guidance for recognizing software revenue.
As noted above, when neither VSOE nor TPE is available for a deliverable, we use BESP. We did not have significant revenue arrangements that required using BESP for the years ended December 31, 2016, 2015, and 2014. The inputs we use to determine the selling price of our significant deliverables include the actual price charged by the Company for deliverables that the Company sells separately (which represents VSOE) and the wholesale prices of the same or similar products for deliverables not sold separately (which represents TPE).
Product Sales
Product sales consists of sales of our games, including physical products and digital full-game downloads. We recognize revenues from the sale of our products after both (1) title and risk of loss have been transferred to our customers and (2) all performance obligations have been completed. With respect to digital full-game downloads, this is when the product is available for download or is activated for gameplay. Revenues from product sales are recognized after deducting the estimated allowance for returns and price protection.
Product with Online Functionality or Hosted Service Arrangements
For our software products with online functionality or that are part of a hosted service arrangement, we evaluate whether that online functionality constitutes a more-than-inconsequential separate deliverable in addition to the software product. This evaluation is performed for each software product or product add-on (including downloadable content), when it is released. Determining whether the online functionality for a particular product constitutes a more-than-inconsequential deliverable is subjective and requires management’s judgment. When we determine that the online functionality constitutes a more-than-inconsequential separate service deliverable in addition to the product, which is principally because of the online functionality’s importance to gameplay, we consider our performance obligation for this title to extend beyond the sale of the game. In addition, VSOE of fair value does not exist for the online functionality of some products, as we do not separately charge for this component. As a result, we initially defer all of the software-related revenues from the sale of any such title (including downloadable content) and recognize the revenues ratably over the estimated service period of the title. In addition, we initially defer the cost of revenues for the title and recognize the cost of revenues as the related revenues are recognized. The cost of revenues that are initially deferred include manufacturing costs, software royalties and amortization, and intellectual property licenses and exclude intangible asset amortization.
27
Refer to Note 19 of the notes to consolidated financial statements included in this Annual Report for disclosures regarding our commitments.
Off-balance Sheet Arrangements
At December 31, 2016 and 2015, Activision Blizzard had no significant relationships with unconsolidated entities or financial parties, often referred to as “structured finance” or “special purpose” entities, established for the purpose of facilitating off-balance sheet arrangements or other contractually narrow or limited purposes, that have or are reasonably likely to have a material current or future effect on our financial condition, changes in financial condition, revenues or expenses, results of operations, liquidity, capital expenditures, or capital resources.
Critical Accounting Policies and Estimates
The preparation of financial statements in conformity with U.S. GAAP requires management to make estimates and assumptions that affect the reported amounts of assets and liabilities at the date of the financial statements and the reported amounts of revenues and expenses during the reporting period. Actual results could differ from those estimates and assumptions. The impact and any associated risks related to these policies on our business operations are discussed throughout Management’s Discussion and Analysis of Financial Condition and Results of Operations where such policies affect our reported and expected financial results. The policies, estimates, and assumptions discussed below are considered by management to be critical because they are both important to the portrayal of our financial condition and results of operations and because their application places the most significant demands on management’s
27

Microtransaction Revenues
Microtransaction revenues are derived from the sale of virtual goods and currencies to our players to enhance their gameplay experience. Proceeds from the sales of virtual goods and currencies are initially recorded in deferred revenues. Proceeds from the sales of virtual currencies are recognized as revenues when a player uses the virtual goods purchased with the virtual currency. Proceeds from the sales of virtual goods directly are also recognized as revenues when a player uses the virtual goods. We categorize our virtual goods as either consumable or durable. Consumable virtual goods represent goods that can be consumed by a specific player action; accordingly, we recognize revenues from the sale of consumable virtual goods as the goods are consumed. Durable virtual goods represent goods that are accessible to the player over an extended period of time; accordingly, we recognize revenues from the sale of durable virtual goods ratably over the period of time the goods are available to the player, which is generally the estimated service period of the game.
Estimated Service Period
We determine the estimated service period for players of our games with consideration of various data points, including the weighted-average number of days between players’ first and last date played online, the average total hours played, the average number of days in which player activity stabilizes, and the weighted-average number of days between players’ first purchase date and last date played online. We also consider known online trends, the service periods of our previously released games, and the service periods of our competitors’ games that are similar in nature to ours, to the extent they are publicly available. Determining the estimated service period is subjective and requires management’s judgment. Future usage patterns may differ from historical usage patterns and therefore the estimated service period may change in the future. The estimated service periods for players of our current games are generally less than twelve months.
Allowances for Returns and Price Protection
We closely monitor and analyze the historical performance of our various titles, the performance of products released by other publishers, market conditions, and the anticipated timing of other releases to assess future demand of current and upcoming titles. Initial volumes shipped upon title launch and subsequent reorders are evaluated with the goal of ensuring that quantities are sufficient to meet the demand from the retail markets, but at the same time are controlled to prevent excess inventory in the channel. We benchmark units to be shipped to our customers using historical and industry data.
We may permit product returns from, or grant price protection to, our customers under certain conditions. In general, price protection refers to the circumstances in which we elect to decrease, on a short- or longer-term basis, the wholesale price of a product by a certain amount and, when granted and applicable, allow customers a credit against amounts owed by such customers to us with respect to open and/or future invoices. The conditions our customers must meet to be granted the right to return products or receive price protection credits include, among other things, compliance with applicable trading and payment terms and consistent return of inventory and delivery of sell-through reports to us. We may also consider other factors, including achievement of sell-through performance targets in certain instances, the facilitation of slow-moving inventory, and other market factors.
Significant management judgments and estimates with respect to potential future product returns and price protection related to current period product revenues must be made and used when establishing the allowance for returns and price protection in any accounting period. We estimate the amount of future returns and price protection for current period product revenues utilizing historical experience and information regarding inventory levels and the demand and acceptance of our products by the end consumer. The following factors are used to estimate the amount of future returns and price protection for a particular title: historical performance of titles in similar genres; historical performance of the hardware platform; historical performance of the franchise; console hardware life cycle; sales force and retail customer feedback; industry pricing; future pricing assumptions; weeks of on-hand retail channel inventory; absolute quantity of on-hand retail channel inventory; our warehouse on-hand inventory levels; the title’s recent sell-through history (if available); marketing trade programs; and the performance of competing titles. The relative importance
28
from the sale of our products after both (1) title and risk of loss have been transferred to our customers and (2) all performance obligations have been completed. With respect to digital full-game downloads, this is when the product is available for download or is activated for gameplay. Revenues from product sales are recognized after deducting the estimated allowance for returns and price protection.
Product with Online Functionality or Hosted Service Arrangements
For our software products with online functionality or that are part of a hosted service arrangement, we evaluate whether that online functionality constitutes a more-than-inconsequential separate deliverable in addition to the software product. This evaluation is performed for each software product or product add-on (including downloadable content), when it is released. Determining whether the online functionality for a particular product constitutes a more-than-inconsequential deliverable is subjective and requires management’s judgment. When we determine that the online functionality constitutes a more-than-inconsequential separate service deliverable in addition to the product, which is principally because of the online functionality’s importance to gameplay, we consider our performance obligation for this title to extend beyond the sale of the game. In addition, VSOE of fair value does not exist for the online functionality of some products, as we do not separately charge for this component. As a result, we initially defer all of the software-related revenues from the sale of any such title (including downloadable content) and recognize the revenues ratably over the estimated service period of the title. In addition, we initially defer the cost of revenues for the title and recognize the cost of revenues as the related revenues are recognized. The cost of revenues that are initially deferred include manufacturing costs, software royalties and amortization, and intellectual property licenses and exclude intangible asset amortization.
For our software products with online functionality that are considered to be incidental to the overall product offering and are inconsequential deliverables, we recognize the related revenues when the revenue recognition criteria described above have been met.
For our World of Warcraft boxed products, expansion packs and value-added services, we recognize revenues in each case with the related subscription service revenues ratably over the estimated service period, beginning upon the activation of the software and delivery of the related services. For revenues associated with the sales of subscriptions, the revenues are deferred until the subscription service is activated by the consumer and are then recognized ratably over the subscription period. Revenues attributed to the sale of World of Warcraft boxed software and related expansion packs are classified as “Product sales,” whereas revenues attributable to subscriptions and other value-added services are classified as “Subscription, licensing, and other revenues.”
28

Software Development Costs
Software development costs include payments made to independent software developers under development agreements, as well as direct costs incurred for internally developed products. Software development costs are capitalized once the technological feasibility of a product is established and such costs are determined to be recoverable. Technological feasibility of a product requires both technical design documentation and game design documentation, or the completed and tested product design and a working model. Significant management judgments and estimates are utilized in the assessment of when technological feasibility is established and the evaluation is performed on a product-by-product basis. For products where proven technology exists, this may occur early in the development cycle. Software development costs related to hosted service revenue arrangements are capitalized after the preliminary project phase is complete and it is probable that the project will be completed and the software will be used to perform the function intended. Prior to a product’s release, if and when we believe capitalized costs are not recoverable, we expense the amounts as part of “Cost of revenues—software royalties, amortization, and intellectual property licenses.” Capitalized costs for products that are cancelled or are expected to be abandoned are charged to “Product development” in the period of cancellation. Amounts related to software development which are not capitalized are charged immediately to “Product development.”
Commencing upon a product’s release, capitalized software development costs are amortized to “Cost of revenues—software royalties, amortization, and intellectual property licenses” based on the ratio of current revenues to total projected revenues for the specific product, generally resulting in an amortization period of six months to approximately two years.
We evaluate the future recoverability of capitalized software development costs on a quarterly basis. For products that have been released in prior periods, the primary evaluation criterion is the actual performance of the title to which the costs relate. For products that are scheduled to be released in future periods, recoverability is evaluated based on the expected performance of the specific products to which the costs relate. Criteria used to evaluate expected product performance include: historical performance of comparable products developed with comparable technology; market performance of comparable titles; orders for the product prior to its release; general market conditions; and, for any sequel product, estimated performance based on the performance of the product on which the sequel is based.
Significant management judgments and estimates are utilized in assessing the recoverability of capitalized costs. In evaluating the recoverability of capitalized costs, the assessment of expected product performance utilizes forecasted sales amounts and estimates of additional costs to be incurred. If revised forecasted or actual product sales are less than the originally forecasted amounts utilized in the initial recoverability analysis, the net realizable value may be lower than originally estimated in any given quarter, which could result in an impairment charge. Material differences may result in the amount and timing of expenses for any period if matters resolve in a manner that is inconsistent with management’s expectations.
Income Taxes
We record a tax provision for the anticipated tax consequences of the reported results of operations. In accordance with ASC Topic 740, the provision for income taxes is computed using the asset and liability method, under which deferred tax assets and liabilities are recognized for the expected future tax consequences attributable to differences between the financial statement carrying amounts of existing assets and liabilities and their respective tax bases and operating losses and tax credit carryforwards. Deferred tax assets and liabilities are measured using enacted tax rates expected to apply to taxable income in the years in which those temporary differences are expected to be recovered or settled. The effect on deferred tax assets and liabilities due to a change in tax rates is recognized in income in the period that includes the enactment date. We evaluate deferred tax assets each period for recoverability. For those assets that do not meet the threshold of “more likely than not” that they will be realized in the future, a valuation allowance is recorded.
29
open and/or future invoices. The conditions our customers must meet to be granted the right to return products or receive price protection credits include, among other things, compliance with applicable trading and payment terms and consistent return of inventory and delivery of sell-through reports to us. We may also consider other factors, including achievement of sell-through performance targets in certain instances, the facilitation of slow-moving inventory, and other market factors.
Significant management judgments and estimates with respect to potential future product returns and price protection related to current period product revenues must be made and used when establishing the allowance for returns and price protection in any accounting period. We estimate the amount of future returns and price protection for current period product revenues utilizing historical experience and information regarding inventory levels and the demand and acceptance of our products by the end consumer. The following factors are used to estimate the amount of future returns and price protection for a particular title: historical performance of titles in similar genres; historical performance of the hardware platform; historical performance of the franchise; console hardware life cycle; sales force and retail customer feedback; industry pricing; future pricing assumptions; weeks of on-hand retail channel inventory; absolute quantity of on-hand retail channel inventory; our warehouse on-hand inventory levels; the title’s recent sell-through history (if available); marketing trade programs; and the performance of competing titles. The relative importance of these factors varies among titles depending upon, among other things, genre, platform, seasonality, and sales strategy.
Based upon historical experience, we believe that our estimates are reasonable. However, actual returns and price protection could vary materially from our allowance estimates due to a number of reasons, including, among others: a lack of consumer acceptance of a title, the release in the same period of a similarly themed title by a competitor, or technological obsolescence due to the emergence of new hardware platforms. There may be material differences in the amount and timing of our revenues for any period if factors or market conditions change or if matters resolve in a manner that is inconsistent with management’s assumptions utilized in determining the allowances for returns and price protection. For example, a 1% change in our December 31, 2016 allowance for sales returns, price protection, and other allowances would have impacted net revenues by approximately $3 million.
Allowance for Inventory Obsolescence
We regularly review inventory quantities on-hand and in the retail channels. We write down inventory based on excess or obsolete inventories determined primarily by future anticipated demand for our products. Inventory write-downs are measured as the difference between the cost of the inventory and net realizable value, based upon assumptions about future demand, which are inherently difficult to assess and dependent on market conditions. At the point of loss recognition, a new, lower cost basis for that inventory is established, and subsequent changes in facts and circumstances do not result in the restoration or increase in that newly established basis.
29
other countries. Significant judgment is required to determine the recognition and measurement attributes prescribed in the accounting guidance for uncertainty in income taxes. The accounting guidance for uncertainty in income taxes applies to all income tax positions, including the potential recovery of previously paid taxes, which if settled unfavorably could adversely impact our provision for income taxes. In addition, we are subject to the continuous examination of our income tax returns by the IRS and are regularly subject to audit by other tax authorities. We regularly assess the likelihood of adverse outcomes resulting from these examinations to determine the adequacy of our provision for income taxes. There can be no assurance that the outcomes from these continuous examinations will not have an adverse impact on our operating results and financial condition.
Fair Value Estimates
The preparation of financial statements in conformity with U.S. GAAP often requires us to determine the fair value of a particular item to fairly present our consolidated financial statements. Without an independent market or another representative transaction, determining the fair value of a particular item requires us to make several assumptions that are inherently difficult to predict and can have a material impact on the conclusion of the appropriate accounting.
There are various valuation techniques used to estimate fair value. These include: (1) the market approach, where market transactions for identical or comparable assets or liabilities are used to determine the fair value; (2) the income approach, which uses valuation techniques to convert future amounts (for example, future cash flows or future earnings) to a single present amount; and (3) the cost approach, which is based on the amount that would be required to replace an asset. For many of our fair value estimates, including our estimates of the fair value of acquired intangible assets, we use the income approach. Using the income approach requires the use of financial models, which require us to make various estimates including, but not limited to: (1) the potential future cash flows for the asset, liability or equity instrument being measured; (2) the timing of receipt or payment of those future cash flows; (3) the time value of money associated with the delayed receipt or payment of such cash flows; and (4) the inherent risk associated with the cash flows (that is, the risk premium). Determining these cash flow estimates is inherently difficult and subjective, and, if any of the estimates used to determine the fair value using the income approach turns out to be inaccurate, our financial results may be negatively impacted. Furthermore, relatively small changes in many of these estimates can have a significant impact on the estimated fair value resulting from the financial models or the related accounting conclusion reached. For example, a relatively small change in the estimated fair value of an asset may change a conclusion as to whether an asset is impaired. While we are required to make certain fair value assessments associated with the accounting for several types of transactions, the following areas are the most sensitive to the assessments:
Business Combinations. We must estimate the fair value of assets acquired and liabilities assumed in a business combination. Our assessment of the estimated fair value of each of these can have a material effect on our reported results as intangible assets are amortized over various estimated useful lives. Furthermore, a change in the estimated fair value of an asset or liability often has a direct impact on the amount to recognize as goodwill, which is an asset that is not amortized. Often determining the fair value of these assets and liabilities assumed requires an assessment of the expected use of the asset, the expected cost to extinguish the liability or our expectations related to the timing and the successful completion of development of an acquired in-process technology. Such estimates are inherently difficult and subjective and can have a material impact on our financial statements.
30
additional costs to be incurred. If revised forecasted or actual product sales are less than the originally forecasted amounts utilized in the initial recoverability analysis, the net realizable value may be lower than originally estimated in any given quarter, which could result in an impairment charge. Material differences may result in the amount and timing of expenses for any period if matters resolve in a manner that is inconsistent with management’s expectations.
Income Taxes
We record a tax provision for the anticipated tax consequences of the reported results of operations. In accordance with ASC Topic 740, the provision for income taxes is computed using the asset and liability method, under which deferred tax assets and liabilities are recognized for the expected future tax consequences attributable to differences between the financial statement carrying amounts of existing assets and liabilities and their respective tax bases and operating losses and tax credit carryforwards. Deferred tax assets and liabilities are measured using enacted tax rates expected to apply to taxable income in the years in which those temporary differences are expected to be recovered or settled. The effect on deferred tax assets and liabilities due to a change in tax rates is recognized in income in the period that includes the enactment date. We evaluate deferred tax assets each period for recoverability. For those assets that do not meet the threshold of “more likely than not” that they will be realized in the future, a valuation allowance is recorded.
Management believes it is more likely than not that forecasted income, including income that may be generated as a result of certain tax planning strategies, together with the tax effects of the deferred tax liabilities, will be sufficient to fully recover the remaining deferred tax assets. In the event that all or part of the net deferred tax assets are determined not to be realizable in the future, an adjustment to the valuation allowance would be charged to tax expenses in the period such determination is made. The calculation of tax liabilities involves significant judgment in estimating the impact of uncertainties in the application of ASC Topic 740 and complex tax laws. Resolution of these uncertainties in a manner inconsistent with management’s expectations could have a material impact on our business and results of operations in an interim period in which the uncertainties are ultimately resolved.
Significant judgment is required in evaluating our uncertain tax positions and determining our provision for income taxes. Although we believe our reserves are reasonable, no assurance can be given that the final tax outcome of these matters will not be different from that which is reflected in our historical income tax provisions and accruals. We adjust these reserves in light of changing facts and circumstances, such as the closing of a tax audit or the refinement of an estimate. To the extent that the final tax outcome of these matters is different than the amounts recorded, such differences will impact the provision for income taxes in the period in which such determination is made. The provision for income taxes includes the impact of reserve provisions and changes to reserves that are considered appropriate, as well as the related net interest and penalties.
Our provision for income taxes is subject to volatility and could be adversely impacted by: (1) earnings being lower than anticipated in foreign regions where taxes are levied at relatively lower statutory rates and/or higher than anticipated in the United States where taxes are levied at relatively higher statutory rates; (2) changes in the valuation of our deferred tax assets and liabilities; (3) tax effects of nondeductible compensation; (4) tax costs related to intercompany realignments; (5) differences between amounts included in our tax filings and the estimate of such amounts included in our tax expenses; (6) changes in accounting principles; or (7) changes in tax laws, regulations, administrative practices, principles or interpretations, including fundamental changes to the tax laws applicable to multinational corporations, such as changes currently being considered in the U.S., the European Union and its member states, and
30

31
resulting from the financial models or the related accounting conclusion reached. For example, a relatively small change in the estimated fair value of an asset may change a conclusion as to whether an asset is impaired. While we are required to make certain fair value assessments associated with the accounting for several types of transactions, the following areas are the most sensitive to the assessments:
Business Combinations. We must estimate the fair value of assets acquired and liabilities assumed in a business combination. Our assessment of the estimated fair value of each of these can have a material effect on our reported results as intangible assets are amortized over various estimated useful lives. Furthermore, a change in the estimated fair value of an asset or liability often has a direct impact on the amount to recognize as goodwill, which is an asset that is not amortized. Often determining the fair value of these assets and liabilities assumed requires an assessment of the expected use of the asset, the expected cost to extinguish the liability or our expectations related to the timing and the successful completion of development of an acquired in-process technology. Such estimates are inherently difficult and subjective and can have a material impact on our financial statements.
Assessment of Impairment of Assets. We evaluate the recoverability of our identifiable amortizable intangible assets and other long-lived assets in accordance with ASC Subtopic 360-10, which generally requires the assessment of these assets for recoverability when events or circumstances indicate a potential impairment exists. We consider certain events and circumstances in determining whether the carrying value of identifiable intangible assets and other long-lived assets, other than indefinite-lived intangible assets, may not be recoverable, including, but not limited to: (1) significant changes in performance relative to expected operating results; (2) significant changes in the use of the assets; (3) significant negative industry or economic trends; (4) a significant decline in our stock price for a sustained period of time; and (5) changes in our business strategy. In determining whether an impairment exists, we estimate the undiscounted cash flows to be generated from the use and ultimate disposition of these assets. If an impairment is indicated based on a comparison of the assets’ carrying values and the undiscounted cash flows, the impairment loss is measured as the amount by which the carrying amount of the assets exceeds the fair value of the assets. We did not record an impairment charge to our definite-lived intangible assets as of December 31, 2016, 2015 or 2014.
Financial Accounting Standards Board (“FASB”) literature related to the accounting for goodwill and other indefinite lived intangibles provides companies an option to first perform a qualitative assessment to determine whether it is more likely than not that the fair value of a reporting unit is less than its carrying value before performing a two-step approach to testing goodwill for impairment for each reporting unit as part of our annual impairment test performed as of December 31. Our reporting units are determined by the components of our operating segments that constitute a business for which both (1) discrete financial information is available and (2) segment management regularly reviews the operating results of that component. ASC Topic 350 requires that the impairment test be performed at least annually by applying a fair value-based test. The first step measures for impairment by applying fair value-based tests at the reporting unit level. The second step (if necessary) measures the amount of impairment by applying fair value-based tests to the individual assets and liabilities within each reporting unit.
To determine the fair values of the reporting units used in the first step, we use a discounted cash flow approach. Each step requires us to make judgments and involves the use of significant estimates and assumptions. These estimates and assumptions include long-term growth rates and operating margins used to calculate projected future cash flows, risk-adjusted discount rates based on our weighted average cost of capital, and future economic and market conditions. These estimates and assumptions must be made for each reporting unit evaluated for impairment. Our estimates for market growth, our market share and costs are based on historical data, various internal estimates and certain external sources, and are based on assumptions that are consistent with the plans and estimates we are using to manage the underlying business. If future forecasts are revised, they may indicate or require future impairment charges. We base our fair value estimates on assumptions we believe to be reasonable but that are unpredictable and inherently uncertain. Actual future results may differ from those estimates.
In determining the fair value of our significant reporting units—namely Activision, Blizzard, and King—we assumed discount rates ranging from 8.5% to 11.5% and terminal growth rates of 0.0% to 4.0%, depending on the reporting unit and its specific characteristics and risk profiles. Based on our quantitative evaluation, we determined the estimated fair value of all of the reporting units exceeded their carrying values as of December 31, 2016. For our King reporting unit, which includes $2.7 billion of goodwill, the estimated fair value exceeded the book value by approximately 18%, while the remaining reporting units had excesses of at least 100%. However, changes in our assumptions underlying our estimates of fair value, which will be a function of our future financial performance, our ability to successfully release new products and maintain our existing franchises, monetization of our user network, and changes in economic conditions, including those which may change our discount rates and are outside of our control, could result in future impairment charges. For example, as of December 31, 2016, a 100 basis point increase in the discount rate for our King reporting unit would reduce the percentage by which the fair value of the reporting unit exceeded its carrying value to 10%.
We test our acquired trade names for possible impairment by using a discounted cash flow model to estimate fair value. At December 31, 2016 and 2015, we concluded that no impairment had occurred and that no impairment was reasonably likely to occur. In determining the fair value of these trade names, we assumed a discount rate of 8.5%, and royalty saving rates of approximately 1.5%-2.0%. Changes in our assumptions underlying our estimates of fair value, which will be a function of our future financial performance and changes in economic conditions, could result in future impairment charges.
Share-Based Payments
We account for share-based payments in accordance with ASC Subtopic 718-10 and ASC Subtopic 505-50. Share-based compensation expense for a given grant is recognized over the requisite service period (that is, the period for which the employee is being compensated) and is based on the value of share-based payment awards after a reduction for estimated forfeitures. Forfeitures are estimated at the time of grant and are revised, if necessary, in subsequent periods if actual forfeitures differ from those estimates.
We generally estimate the value of stock options using a binomial-lattice model. This estimate is affected by our stock price, as well as assumptions regarding a number of highly complex and subjective variables, including our expected stock price volatility over the term of the awards, and actual and projected employee stock option exercise behaviors.
We generally determine the fair value of restricted stock rights based on the closing market price of the Company’s common stock on the date of grant, reduced by the present value of the estimated future dividends during the vesting period in which the restricted stock rights holder will not participate. Certain restricted stock rights granted to our employees and senior management vest based on the achievement of pre-established performance or market conditions. For performance-based restricted stock rights, each quarter we update our assessment of the probability that the specified performance criteria will be achieved. We amortize the fair values of performance-based restricted stock rights over the requisite service period, adjusting for estimated forfeitures for each separately
31

• requires excess tax benefits from share-based payments to be reported as operating activities on the statement of cash flows; and
• permits an accounting policy election to either estimate the number of awards that are expected to vest using an estimated forfeiture rate, as currently required, or account for forfeitures when they occur.
We elected to early adopt this new standard in the third quarter of 2016, which requires us to reflect any adjustments as of January 1, 2016. As part of the adoption, we made certain elections, including the following:
• to apply the presentation requirements for our consolidated statement of cash flows related to excess tax benefits retrospectively to all periods presented; and
• to continue to estimate the number of awards that are expected to vest using an estimated forfeiture rate.
As a result of the adoption, we recognized excess tax benefits of $81 million as a reduction to income tax expense in our consolidated statement of operations for the year ended December 31, 2016. Further, given our retrospective application of the presentation requirements for our consolidated statement of cash flows related to excess tax benefits, our net cash provided by operating activities and net cash used in financing activities increased by $67 million and $39 million for the years ended December 31, 2015, and December 31, 2014, respectively. The other provisions of the standard did not have a material impact on our consolidated financial statements.
Statement of Cash Flows
In August 2016, the FASB issued new guidance related to the classification of certain cash items in the statement of cash flows. The
32
December 31, 2016 and 2015, we concluded that no impairment had occurred and that no impairment was reasonably likely to occur. In determining the fair value of these trade names, we assumed a discount rate of 8.5%, and royalty saving rates of approximately 1.5%-2.0%. Changes in our assumptions underlying our estimates of fair value, which will be a function of our future financial performance and changes in economic conditions, could result in future impairment charges.
Share-Based Payments
We account for share-based payments in accordance with ASC Subtopic 718-10 and ASC Subtopic 505-50. Share-based compensation expense for a given grant is recognized over the requisite service period (that is, the period for which the employee is being compensated) and is based on the value of share-based payment awards after a reduction for estimated forfeitures. Forfeitures are estimated at the time of grant and are revised, if necessary, in subsequent periods if actual forfeitures differ from those estimates.
We generally estimate the value of stock options using a binomial-lattice model. This estimate is affected by our stock price, as well as assumptions regarding a number of highly complex and subjective variables, including our expected stock price volatility over the term of the awards, and actual and projected employee stock option exercise behaviors.
We generally determine the fair value of restricted stock rights based on the closing market price of the Company’s common stock on the date of grant, reduced by the present value of the estimated future dividends during the vesting period in which the restricted stock rights holder will not participate. Certain restricted stock rights granted to our employees and senior management vest based on the achievement of pre-established performance or market conditions. For performance-based restricted stock rights, each quarter we update our assessment of the probability that the specified performance criteria will be achieved. We amortize the fair values of performance-based restricted stock rights over the requisite service period, adjusting for estimated forfeitures for each separately vesting tranche of the award. For market-based restricted stock rights, we estimate the fair value at the date of grant using a Monte Carlo valuation methodology and amortize those fair values over the requisite service period, adjusting for estimated forfeitures for each separately vesting tranche of the award. The Monte Carlo methodology that we use to estimate the fair value of market-based restricted stock rights at the date of grant incorporates into the valuation the possibility that the market condition may not be satisfied. Provided that the requisite service is rendered, the total fair value of the market-based restricted stock rights at the date of grant must be recognized as compensation expense even if the market condition is not achieved. However, the number of shares that ultimately vest can vary significantly with the performance of the specified market criteria.
For share-based compensation grants that are liability classified, we update our grant date valuation at each reporting period and recognize a cumulative catch-up adjustment for changes in the value related to the requisite service already rendered.
For a detailed discussion of the application of these and other accounting policies, see Note 2 of the notes to consolidated financial statements included in this Annual Report.
Recently Issued Accounting Pronouncements
Below are recently issued accounting pronouncements that were most significant to our accounting policy activities for fiscal 2016. For a detailed discussion of recently issued accounting pronouncements, see Note 22 of the notes to consolidated financial statements included in this Annual Report.
Recently adopted accounting pronouncements
Share-Based Payments
In March 2016, the FASB issued new guidance to simplify accounting for share-based payments. The new standard, amongst other things:
• requires that all excess tax benefits and tax deficiencies be recorded as an income tax expense or benefit in the consolidated statement of operations and that the tax effects of exercised or vested awards be treated as discrete items in the reporting period in which they occur;
32
Statement of Cash Flows—Restricted Cash
In November 2016, the FASB issued new guidance related to the classification of restricted cash in the statement of cash flows. The new standard requires that a statement of cash flows explain the change during the period in total cash, cash equivalents, and restricted cash. Therefore, restricted cash will be included with cash and cash equivalents when reconciling the beginning-of-period and end-of-period total amounts shown on the statement of cash flows. The new standard is effective for fiscal years beginning after December 15, 2018 and should be applied retrospectively. Early adoption is permitted.
We are evaluating the impact, if any, of adopting this new accounting guidance on our financial statements. We expect there would be a significant impact to the consolidated statements of cash flows for the years ended December 31, 2015 and 2016, as those years include, as an investing activity, the $3.6 billion movement in restricted cash as a result of transferring cash into escrow at December 31, 2015 to facilitate the King Acquisition and the subsequent release of that cash in 2016 in connection with the King Acquisition. Under this new standard, the restricted cash balance would be included in the beginning and ending total cash, cash equivalents, and restricted cash balances and hence would not be included as an investing activity in the statement of cash flows.
33
requirements for our consolidated statement of cash flows related to excess tax benefits, our net cash provided by operating activities and net cash used in financing activities increased by $67 million and $39 million for the years ended December 31, 2015, and December 31, 2014, respectively. The other provisions of the standard did not have a material impact on our consolidated financial statements.
Statement of Cash Flows
In August 2016, the FASB issued new guidance related to the classification of certain cash items in the statement of cash flows. The new standard requires, among other things, that cash payments for debt prepayment or debt extinguishment costs should be classified as cash outflows for financing activities, as opposed to operating activities as is required under existing guidance. We elected to early adopt this standard in the third quarter of 2016 and applied it retrospectively. As a result of the adoption of this standard, our cash flows from financing activities for the year ended December 31, 2016 included the $63 million premium payment from the October 19, 2016 redemption of our Original 2021 Notes. The adoption of this standard did not have a material impact on our consolidated statements of cash flows upon adoption for the years ended December 31, 2015 and 2014.
Recent accounting pronouncements not yet adopted
Revenue recognition
In May 2014, the FASB issued new accounting guidance related to revenue recognition. The new standard will replace all current U.S. GAAP guidance on this topic and eliminate all industry-specific guidance, providing a unified model to determine when and how revenue is recognized. The core principle is that a company should recognize revenue upon the transfer of promised goods or services to customers in an amount that reflects the consideration the company expects to be entitled to in exchange for those goods or services. This guidance will be effective for fiscal years and interim periods within those years beginning after December 15, 2017, and can be applied either retrospectively to each period presented or as a cumulative-effect adjustment as of the date of adoption. We are evaluating the adoption method, as well as the impact of this new accounting guidance on our financial statements and related disclosures. As previously disclosed, we believe the adoption of the new revenue recognition standard may have a significant impact on the accounting for our sales of our games with significant online functionality for which we do not have VSOE for unspecified future updates and ongoing online services provided. Under the current accounting standards, VSOE for undelivered elements is required. This requirement will be eliminated under the new standard. Accordingly, we may be required to recognize as revenue a portion of the sales price upon delivery of the software, as compared to the current requirement of recognizing the entire sales price ratably over an estimated offering period. This potential difference may have a material impact on our consolidated financial statements upon adoption of this new guidance. As accounting implementation guidance and clarifications regarding this matter are still evolving, we continue to evaluate the impact this guidance will have on our consolidated financial statements and related disclosures.
Leases
In February 2016, the FASB issued new guidance related to the accounting for leases. The new standard will replace all current U.S. GAAP guidance on this topic. The new standard, among other things, requires a lessee to classify a lease as either an operating or financing lease and lessees will need to recognize a lease liability and a right-of-use asset for their leases. The liability will be equal to the present value of lease payments. The asset will be based on the liability, subject to adjustment for initial direct costs, lease incentives received and any prepaid lease payments. Operating leases will result in straight-line expense, while finance leases will result in a front-loaded expense pattern. Classification will be based on criteria that are largely similar to those applied in current lease accounting. The standard is effective for fiscal years, and interim periods within those fiscal years, beginning after December 15, 2018. Early adoption is permitted. The new standard must be adopted using a modified retrospective transition and will require application of the new guidance at the beginning of the earliest comparative period presented. We are evaluating the impact of this new accounting guidance on our consolidated financial statements.
33

35
QUANTITATIVE AND QUALITATIVE DISCLOSURES ABOUT MARKET RISK
Market risk is the potential loss arising from fluctuations in market rates and prices. Our market risk exposures primarily include fluctuations in foreign currency exchange rates and interest rates.
Foreign Currency Exchange Rate Risk
We transact business in many different foreign currencies and may be exposed to financial market risk resulting from fluctuations in foreign currency exchange rates. Revenues and related expenses generated from our international operations are generally denominated in their respective local currencies. Primary currencies include euros, British pounds, Australian dollars, South Korean won, Chinese yuan, and Swedish krona. To the extent the U.S. dollar strengthens against foreign currencies, the translation of these foreign currency-denominated transactions results in reduced revenues, operating expenses, net income and cash flows from our international operations. Similarly, our revenues, operating expenses, net income and cash flows will increase for our international operations if the U.S. dollar weakens against foreign currencies. Since we have significant international sales, but incur the majority of our costs in the United States, the impact of foreign currency fluctuations, particularly the strengthening of the U.S. dollar, may have an asymmetric and disproportional impact on our business. We monitor currency volatility throughout the year.
To mitigate our foreign currency risk resulting from our foreign currency-denominated monetary assets, liabilities and earnings and our foreign currency risk related to functional currency-equivalent cash flows resulting from our intercompany transactions, we periodically enter into currency derivative contracts, principally forward contracts. These forward contracts generally have a maturity of less than one year. The counterparties for our currency derivative contracts are large and reputable commercial or investment banks.
The fair value of foreign currency contracts are estimated based on the prevailing exchange rates of the various hedged currencies as of the end of the period.
We do not hold or purchase any foreign currency forward contracts for trading or speculative purposes.
For a detailed discussion of our accounting policies for our foreign currency forward contracts, see Note 2 of the notes to consolidated financial statements included in this Annual Report.
Foreign Currency Forward Contracts Not Designated as Hedges
At December 31, 2016, we did not have any outstanding foreign currency forward contracts not designated as hedges.
At December 31, 2015, the gross notional amount of outstanding foreign currency forward contracts not designated as hedges was approximately $489 million. During the year ended December 31, 2015, we reclassified $8 million of unrealized gains out of “Accumulated other comprehensive loss” and into earnings due to dedesignating $250 million notional euro to U.S. dollar cash flow hedges when it was determined the hedged transaction would not occur. As a result of the dedesignation, we entered into offsetting foreign currency forward contracts. The dedesignated and offsetting foreign currency forward contracts remained outstanding as of December 31, 2015. The fair value of these foreign currency forward contracts was $11 million as of December 31, 2015.
For the years ended December 31, 2016, 2015, and 2014, pre-tax net gains associated with these forward contracts were not material.
Foreign Currency Forward Contracts Designated as Hedges (“Cash Flow Hedges”)
At December 31, 2016, the gross notional amount of outstanding Cash Flow Hedges was approximately $346 million. The fair value of these contracts was $22 million of net unrealized gains with remaining maturities of 12 months or less. Additionally, at December 31, 2016, we had $7 million of net realized but unrecognized gains recorded within “Accumulated other comprehensive income (loss)” associated with contracts that settled during the year but were deferred and will be amortized into earnings along with the associated hedged revenues. Such amounts will be reclassified into earnings within the next twelve months.
At December 31, 2015, the gross notional amount of all outstanding Cash Flow Hedges was approximately $381 million. The fair value of these contracts was $4 million of net unrealized losses as of December 31, 2015.
During the years ended December 31, 2016 and 2015, there was no ineffectiveness relating to our Cash Flow Hedges. During the years ended December 31, 2016 and 2015, the amount of pre-tax net realized gains associated with these contracts that were reclassified out of “Accumulated other comprehensive loss” and into earnings was not material.
In the absence of hedging activities for the year ended December 31, 2016, a hypothetical adverse foreign currency exchange rate movement of 10% would have resulted in potential declines of our net income of approximately $105 million. This sensitivity analysis 35
QUANTITATIVE AND QUALITATIVE DISCLOSURES ABOUT MARKET RISK
Market risk is the potential loss arising from fluctuations in market rates and prices. Our market risk exposures primarily include fluctuations in foreign currency exchange rates and interest rates.
Foreign Currency Exchange Rate Risk
We transact business in many different foreign currencies and may be exposed to financial market risk resulting from fluctuations in foreign currency exchange rates. Revenues and related expenses generated from our international operations are generally denominated in their respective local currencies. Primary currencies include euros, British pounds, Australian dollars, South Korean won, Chinese yuan, and Swedish krona. To the extent the U.S. dollar strengthens against foreign currencies, the translation of these foreign currency-denominated transactions results in reduced revenues, operating expenses, net income and cash flows from our international operations. Similarly, our revenues, operating expenses, net income and cash flows will increase for our international operations if the U.S. dollar weakens against foreign currencies. Since we have significant international sales, but incur the majority of our costs in the United States, the impact of foreign currency fluctuations, particularly the strengthening of the U.S. dollar, may have an asymmetric and disproportional impact on our business. We monitor currency volatility throughout the year.
To mitigate our foreign currency risk resulting from our foreign currency-denominated monetary assets, liabilities and earnings and our foreign currency risk related to functional currency-equivalent cash flows resulting from our intercompany transactions, we periodically enter into currency derivative contracts, principally forward contracts. These forward contracts generally have a maturity of less than one year. The counterparties for our currency derivative contracts are large and reputable commercial or investment banks.
The fair value of foreign currency contracts are estimated based on the prevailing exchange rates of the various hedged currencies as of the end of the period.
We do not hold or purchase any foreign currency forward contracts for trading or speculative purposes.
For a detailed discussion of our accounting policies for our foreign currency forward contracts, see Note 2 of the notes to consolidated financial statements included in this Annual Report.
Foreign Currency Forward Contracts Not Designated as Hedges
At December 31, 2016, we did not have any outstanding foreign currency forward contracts not designated as hedges.
At December 31, 2015, the gross notional amount of outstanding foreign currency forward contracts not designated as hedges was approximately $489 million. During the year ended December 31, 2015, we reclassified $8 million of unrealized gains out of “Accumulated other comprehensive loss” and into earnings due to dedesignating $250 million notional euro to U.S. dollar cash flow hedges when it was determined the hedged transaction would not occur. As a result of the dedesignation, we entered into offsetting foreign currency forward contracts. The dedesignated and offsetting foreign currency forward contracts remained outstanding as of December 31, 2015. The fair value of these foreign currency forward contracts was $11 million as of December 31, 2015.
For the years ended December 31, 2016, 2015, and 2014, pre-tax net gains associated with these forward contracts were not material.
Foreign Currency Forward Contracts Designated as Hedges (“Cash Flow Hedges”)
At December 31, 2016, the gross notional amount of outstanding Cash Flow Hedges was approximately $346 million. The fair value of these contracts was $22 million of net unrealized gains with remaining maturities of 12 months or less. Additionally, at December 31, 2016, we had $7 million of net realized but unrecognized gains recorded within “Accumulated other comprehensive income (loss)” associated with contracts that settled during the year but were deferred and will be amortized into earnings along with the associated hedged revenues. Such amounts will be reclassified into earnings within the next twelve months.
At December 31, 2015, the gross notional amount of all outstanding Cash Flow Hedges was approximately $381 million. The fair value of these contracts was $4 million of net unrealized losses as of December 31, 2015.
During the years ended December 31, 2016 and 2015, there was no ineffectiveness relating to our Cash Flow Hedges. During the years ended December 31, 2016 and 2015, the amount of pre-tax net realized gains associated with these contracts that were reclassified out of “Accumulated other comprehensive loss” and into earnings was not material.
In the absence of hedging activities for the year ended December 31, 2016, a hypothetical adverse foreign currency exchange rate movement of 10% would have resulted in potential declines of our net income of approximately $105 million. This sensitivity analysis
34

assumes a parallel adverse shift of all foreign currency exchange rates against the U.S. dollar; however, all foreign currency exchange rates do not always move in such manner and actual results may differ materially.
Interest Rate Risk
Our exposure to market rate risk for changes in interest rates relates primarily to our investment portfolio and variable rate debt under our credit agreement. We do not currently use derivative financial instruments to manage interest rate risk. As of December 31, 2016 and 2015, a hypothetical interest rate change on our variable rate debt of one percent (100 basis points) would have changed interest expense on an annual basis by approximately $27 million and $19 million, respectively. This estimate does not include a change in interest income from our investment portfolio that may result from such a hypothetical interest rate change nor does it include the effects of other actions that we may take in the future to mitigate this risk or any changes in our financial structure. Refer to Note 11 of the notes to consolidated financial statements included in this Annual Report for disclosures regarding terms and interest rates associated with our debt obligations.
Our investment portfolio consists primarily of money market funds and government securities with high credit quality and short average maturities. Because short-term securities mature relatively quickly and must be reinvested at the then-current market rates, interest income on a portfolio consisting of cash, cash equivalents, or short-term securities is more subject to market fluctuations than a portfolio of longer-term securities. Conversely, the fair value of such a portfolio is less sensitive to market fluctuations than a portfolio of longer-term securities. At December 31, 2016, our $3.25 billion of cash and cash equivalents was comprised primarily of money market funds.
The Company has determined that, based on the composition of our investment portfolio as of December 31, 2016, there was no material interest rate risk exposure to the Company’s consolidated financial condition, results of operations, or liquidity as of that date.
35
For the years ended December 31, 2016, 2015, and 2014, pre-tax net gains associated with these forward contracts were not material.
Foreign Currency Forward Contracts Designated as Hedges (“Cash Flow Hedges”)
At December 31, 2016, the gross notional amount of outstanding Cash Flow Hedges was approximately $346 million. The fair value of these contracts was $22 million of net unrealized gains with remaining maturities of 12 months or less. Additionally, at December 31, 2016, we had $7 million of net realized but unrecognized gains recorded within “Accumulated other comprehensive income (loss)” associated with contracts that settled during the year but were deferred and will be amortized into earnings along with the associated hedged revenues. Such amounts will be reclassified into earnings within the next twelve months.
At December 31, 2015, the gross notional amount of all outstanding Cash Flow Hedges was approximately $381 million. The fair value of these contracts was $4 million of net unrealized losses as of December 31, 2015.
During the years ended December 31, 2016 and 2015, there was no ineffectiveness relating to our Cash Flow Hedges. During the years ended December 31, 2016 and 2015, the amount of pre-tax net realized gains associated with these contracts that were reclassified out of “Accumulated other comprehensive loss” and into earnings was not material.
In the absence of hedging activities for the year ended December 31, 2016, a hypothetical adverse foreign currency exchange rate movement of 10% would have resulted in potential declines of our net income of approximately $105 million. This sensitivity analysis
35
37
CONTROLS AND PROCEDURES
Definition and Limitations of Disclosure Controls and Procedures.
Our disclosure controls and procedures (as such term is defined in Rules 13a-15(e) and 15d-15(e) under the Exchange Act) are designed to reasonably ensure that information required to be disclosed in our reports filed under the Exchange Act is: (1) recorded, processed, summarized, and reported within the time periods specified in the SEC’s rules and forms, and (2) accumulated and communicated to management, including our principal executive officer and principal financial officer, as appropriate, to allow timely decisions regarding required disclosures. A control system, no matter how well designed and operated, can provide only reasonable assurance that it will detect or uncover failures within the Company to disclose material information otherwise required to be set forth in our periodic reports. Inherent limitations to any system of disclosure controls and procedures include, but are not limited to, the possibility of human error and the circumvention or overriding of such controls by one or more persons. In addition, we have designed our system of controls based on certain assumptions, which we believe are reasonable, about the likelihood of future events, and our system of controls may therefore not achieve its desired objectives under all possible future events.
Evaluation of Disclosure Controls and Procedures.
Our management, with the participation of our principal executive officer and principal financial officer, has evaluated the effectiveness of our disclosure controls and procedures at December 31, 2016, the end of the period covered by this report. Based on this evaluation, the principal executive officer and principal financial officer concluded that, at December 31, 2016, our disclosure controls and procedures were effective to provide reasonable assurance that information required to be disclosed by the Company in the reports that it files or submits under the Exchange Act is (i) recorded, processed, summarized, and reported on a timely basis, and (ii) accumulated and communicated to management, including our principal executive officer and principal financial officer, as appropriate to allow timely decisions regarding required disclosures.
Management’s Report on Internal Control Over Financial Reporting.
Our management is responsible for establishing and maintaining adequate internal control over financial reporting (as such term is defined in Rules 13a-15(f) and 15d-15(f) under the Exchange Act). Our management, with the participation of our principal executive officer and principal financial officer, conducted an evaluation of the effectiveness, as of December 31, 2016, of our internal control over financial reporting using the criteria set forth by the Committee of Sponsoring Organizations of the Treadway Commission in Internal Control—Integrated Framework (2013). Based on this evaluation, our management concluded that our internal control over financial reporting was effective as of December 31, 2016.
Because of its inherent limitations, internal control over financial reporting may not prevent or detect misstatements. Also, projections of any evaluation of effectiveness to future periods are subject to the risks that controls may become inadequate because of changes in conditions, or that the degree of compliance with the policies and procedures may deteriorate.
On February 23, 2016, we completed our acquisition of King. The acquired business constituted approximately 7% of total assets and 23% of net revenues of the consolidated financial statement amounts as of and for the year ended December 31, 2016. In accordance with SEC staff guidance permitting a company to exclude an acquired business from management’s assessment of the effectiveness of internal control over financial reporting for the year in which the acquisition is completed, we excluded King from our assessment of the effectiveness of internal control over financial reporting as of December 31, 2016.
The effectiveness of our internal control over financial reporting as of December 31, 2016 has been audited by PricewaterhouseCoopers LLP, an independent registered public accounting firm, as stated in their report included in this Annual Report.
Changes in Internal Control Over Financial Reporting.
There have not been any changes in our internal control over financial reporting during the most recent fiscal quarter that have materially affected, or are reasonably likely to materially affect, our internal control over financial reporting.
36

38
REPORT OF INDEPENDENT REGISTERED PUBLIC ACCOUNTING FIRM
To the Board of Directors and Shareholders of Activision Blizzard, Inc.:
In our opinion, the accompanying consolidated balance sheets and the related consolidated statements of operations, of comprehensive income, of changes in shareholders’ equity and of cash flows, present fairly, in all material respects, the financial position of Activision Blizzard, Inc. and its subsidiaries at December 31, 2016 and 2015, and the results of their operations and their cash flows for each of the three years in the period ended December 31, 2016 in conformity with accounting principles generally accepted in the United States of America. In addition, in our opinion, the financial statement schedule listed in the accompanying index appearing under Item 15(a)(2) presents fairly, in all material respects, the information set forth therein when read in conjunction with the related consolidated financial statements. Also in our opinion, the Company maintained, in all material respects, effective internal control over financial reporting as of December 31, 2016, based on criteria established in Internal Control—Integrated Framework (2013) issued by the Committee of Sponsoring Organizations of the Treadway Commission (COSO). The Company’s management is responsible for these financial statements and financial statement schedule, for maintaining effective internal control over financial reporting and for its assessment of the effectiveness of internal control over financial reporting, included in Management’s Report on Internal Control over Financial Reporting appearing . Our responsibility is to express opinions on these financial statements, on the financial statement schedule, and on the Company’s internal control over financial reporting based on our integrated audits. We conducted our audits in accordance with the standards of the Public Company Accounting Oversight Board (United States). Those standards require that we plan and perform the audits to obtain reasonable assurance about whether the financial statements are free of material misstatement and whether effective internal control over financial reporting was maintained in all material respects. Our audits of the financial statements included examining, on a test basis, evidence supporting the amounts and disclosures in the financial statements, assessing the accounting principles used and significant estimates made by management, and evaluating the overall financial statement presentation. Our audit of internal control over financial reporting included obtaining an understanding of internal control over financial reporting, assessing the risk that a material weakness exists, and testing and evaluating the design and operating effectiveness of internal control based on the assessed risk. Our audits also included performing such other procedures as we considered necessary in the circumstances. We believe that our audits provide a reasonable basis for our opinions.
As discussed in Note 22 to the consolidated financial statements, the Company changed the manner in which it accounts for income taxes related to share-based payments and the manner in which it classifies certain items in the statement of cash flows in 2016.
A company’s internal control over financial reporting is a process designed to provide reasonable assurance regarding the reliability of financial reporting and the preparation of financial statements for external purposes in accordance with generally accepted accounting principles. A company’s internal control over financial reporting includes those policies and procedures that (i) pertain to the maintenance of records that, in reasonable detail, accurately and fairly reflect the transactions and dispositions of the assets of the company; (ii) provide reasonable assurance that transactions are recorded as necessary to permit preparation of financial statements in accordance with generally accepted accounting principles, and that receipts and expenditures of the company are being made only in accordance with authorizations of management and directors of the company; and (iii) provide reasonable assurance regarding prevention or timely detection of unauthorized acquisition, use, or disposition of the company’s assets that could have a material effect on the financial statements.
Because of its inherent limitations, internal control over financial reporting may not prevent or detect misstatements. Also, projections of any evaluation of effectiveness to future periods are subject to the risk that controls may become inadequate because of changes in conditions, or that the degree of compliance with the policies or procedures may deteriorate.
As described in Management’s Report on Internal Control over Financial Reporting, management has excluded King Digital Entertainment (“King”) from its assessment of internal control over financial reporting as of December 31, 2016 because it was acquired by the Company in a purchase business combination during 2016. We have also excluded King from our audit of internal control over financial reporting. King is a wholly-owned subsidiary of Activision Blizzard, Inc. whose total assets and total net revenues represent 7% and 23%, respectively, of the related consolidated financial statement amounts as of and for the year ended December 31, 2016.
Los Angeles, California February 28, 2017
To the Board of Directors and Shareholders of Activision Blizzard, Inc.:
In our opinion, the accompanying consolidated balance sheets and the related consolidated statements of operations, of comprehensive income, of changes in shareholders’ equity and of cash flows, present fairly, in all material respects, the financial position of Activision Blizzard, Inc. and its subsidiaries at December 31, 2016 and 2015, and the results of their operations and their cash flows for each of the three years in the period ended December 31, 2016 in conformity with accounting principles generally accepted in the United States of America. Also in our opinion, the Company maintained, in all material respects, effective internal control over financial reporting as of December 31, 2016, based on criteria established in Internal Control—Integrated Framework (2013) issued by the Committee of Sponsoring Organizations of the Treadway Commission (COSO). The Company’s management is responsible for these financial statements, for maintaining effective internal control over financial reporting and for its assessment of the effectiveness of internal control over financial reporting, included in Management’s Report on Internal Control over Financial Reporting appearing on page 36 of this Annual Report to Shareholders. Our responsibility is to express opinions on these financial statements and on the Company’s internal control over financial reporting based on our integrated audits. We conducted our audits in accordance with the standards of the Public Company Accounting Oversight Board (United States). Those standards require that we plan and perform the audits to obtain reasonable assurance about whether the financial statements are free of material misstatement and whether effective internal control over financial reporting was maintained in all material respects. Our audits of the financial statements included examining, on a test basis, evidence supporting the amounts and disclosures in the financial statements, assessing the accounting principles used and significant estimates made by management, and evaluating the overall financial statement presentation. Our audit of internal control over financial reporting included obtaining an understanding of internal control over financial reporting, assessing the risk that a material weakness exists, and testing and evaluating the design and operating effectiveness of internal control based on the assessed risk. Our audits also included performing such other procedures as we considered necessary in the circumstances. We believe that our audits provide a reasonable basis for our opinions.
As discussed in Note 22 to the consolidated financial statements, the Company changed the manner in which it accounts for income taxes related to share-based payments and the manner in which it classifies certain items in the statement of cash flows in 2016.
A company’s internal control over financial reporting is a process designed to provide reasonable assurance regarding the reliability of financial reporting and the preparation of financial statements for external purposes in accordance with generally accepted accounting principles. A company’s internal control over financial reporting includes those policies and procedures that (i) pertain to the maintenance of records that, in reasonable detail, accurately and fairly reflect the transactions and dispositions of the assets of the company; (ii) provide reasonable assurance that transactions are recorded as necessary to permit preparation of financial statements in accordance with generally accepted accounting principles, and that receipts and expenditures of the company are being made only in accordance with authorizations of management and directors of the company; and (iii) provide reasonable assurance regarding prevention or timely detection of unauthorized acquisition, use, or disposition of the company’s assets that could have a material effect on the financial statements.
Because of its inherent limitations, internal control over financial reporting may not prevent or detect misstatements. Also, projections of any evaluation of effectiveness to future periods are subject to the risk that controls may become inadequate because of changes in conditions, or that the degree of compliance with the policies or procedures may deteriorate.
As described in Management’s Report on Internal Control over Financial Reporting, management has excluded King Digital Entertainment (“King”) from its assessment of internal control over financial reporting as of December 31, 2016 because it was acquired by the Company in a purchase business combination during 2016. We have also excluded King from our audit of internal control over financial reporting. King is a wholly-owned subsidiary of Activision Blizzard, Inc. whose total assets and total net revenues represent 7% and 23%, respectively, of the related consolidated financial statement amounts as of and for the year ended December 31, 2016.
Los Angeles, California February 28, 2017
37
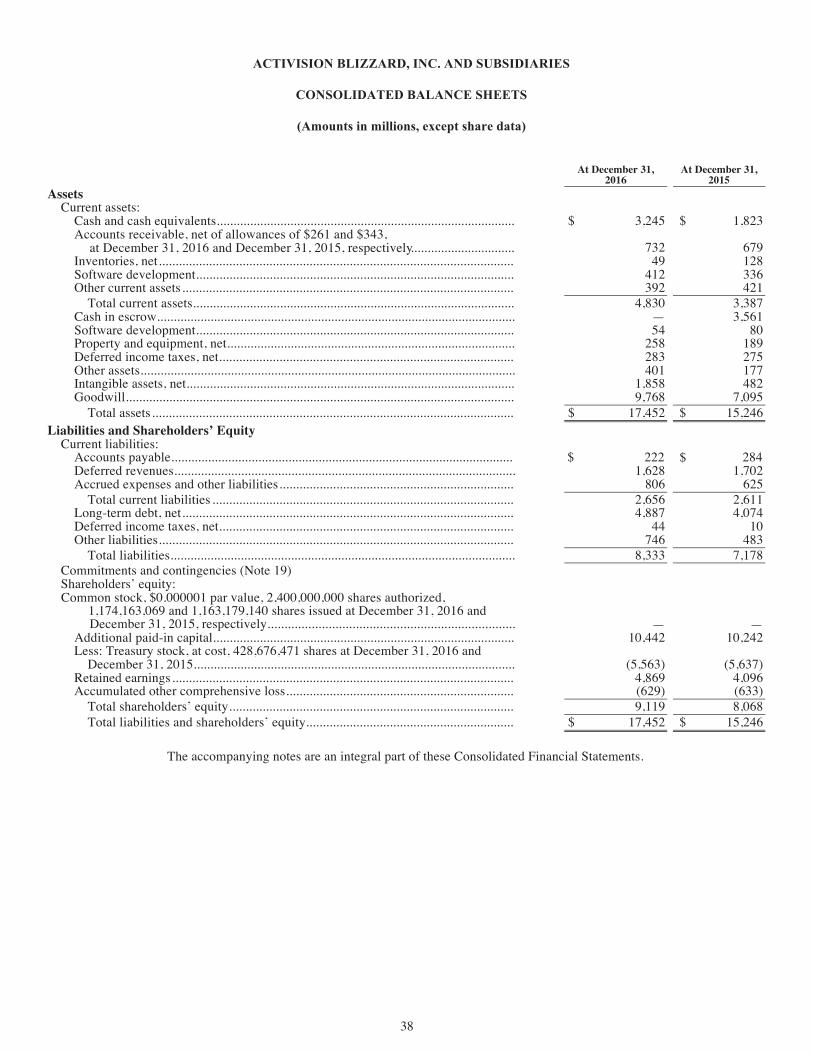
At December 31, 2016
At December 31, 2015
Assets Current assets:
Cash and cash equivalents......................................................................................... $ 3,245 $ 1,823 Accounts receivable, net of allowances of $261 and $343,
732 679 Inventories, net .......................................................................................................... 49 128 Software development............................................................................................... 412 336 Other current assets ................................................................................................... 392 421
Total current assets................................................................................................ 4,830 3,387 Cash in escrow........................................................................................................... — 3,561 Software development............................................................................................... 54 80 Property and equipment, net...................................................................................... 258 189 Deferred income taxes, net ........................................................................................ 283 275 Other assets................................................................................................................ 401 177 Intangible assets, net.................................................................................................. 1,858 482 Goodwill.................................................................................................................... 9,768 7,095
Total assets ............................................................................................................ $ 17,452 $ 15,246 Liabilities and Shareholders’ Equity
Current liabilities: Accounts payable...................................................................................................... $ 222 284 Deferred revenues...................................................................................................... 1,628 1,702 Accrued expenses and other liabilities ...................................................................... 806 625
Total current liabilities .......................................................................................... 2,656 2,611 Long-term debt, net ................................................................................................... 4,887 4,074 Deferred income taxes, net ........................................................................................ 44 10 Other liabilities .......................................................................................................... 746 483
Total liabilities....................................................................................................... 8,333 7,178 Commitments and contingencies (Note 19) Shareholders’ equity: Common stock, $0.000001 par value, 2,400,000,000 shares authorized,
and 1,163,179,140 shares issued at December 31, 2016 and— —
Additional paid-in capital.......................................................................................... 10,442 10,242 Less: Treasury stock, at cost, 428,676,471 shares at December 31, 2016 and
December 31, 2015................................................................................................ (5,563) (5,637) Retained earnings ...................................................................................................... 4,869 4,096 Accumulated other comprehensive loss .................................................................... (629) (633)
Total shareholders’ equity ..................................................................................... 9,119 8,068 Total liabilities and shareholders’ equity.............................................................. $ 17,452 $ 15,246
The accompanying notes are an integral part of these Consolidated Financial Statements.
$
December 31, 2015, respectively ...............................
December 31, 2015, .........................................................................
42
ACTIVISION BLIZZARD, INC. AND SUBSIDIARIES
CONSOLIDATED BALANCE SHEETS
(Amounts in millions, except share data)
At December 31,
2016 At December 31,
2015 Assets
Current assets: Cash and cash equivalents ........................................................................................ $ 3,245 $ 1,823 Accounts receivable, net of allowances of $261 and $343, at December 31, 2016 and
December 31, 2015, respectively .......................................................................... 732 679 Inventories, net .......................................................................................................... 49 128 Software development .............................................................................................. 412 336 Other current assets ................................................................................................... 392 421
Total current assets ............................................................................................... 4,830 3,387 Cash in escrow .......................................................................................................... — 3,561 Software development .............................................................................................. 54 80 Property and equipment, net ..................................................................................... 258 189 Deferred income taxes, net ....................................................................................... 283 275 Other assets ............................................................................................................... 401 177 Intangible assets, net ................................................................................................. 1,858 482 Goodwill ................................................................................................................... 9,768 7,095
Total assets ............................................................................................................ $ 17,452 $ 15,246 Liabilities and Shareholders’ Equity
Current liabilities: Accounts payable ...................................................................................................... $ 222 $ 284 Deferred revenues ..................................................................................................... 1,628 1,702 Accrued expenses and other liabilities ...................................................................... 806 625
Total current liabilities .......................................................................................... 2,656 2,611 Long-term debt, net ................................................................................................... 4,887 4,074 Deferred income taxes, net ....................................................................................... 44 10 Other liabilities .......................................................................................................... 746 483
Total liabilities ...................................................................................................... 8,333 7,178 Commitments and contingencies (Note 19) Shareholders’ equity:
Common stock, $0.000001 par value, 2,400,000,000 shares authorized, 1,174,163,069 and 1,163,179,140 shares issued at December 31, 2016 and December 31, 2015, respectively ........................................................................................................... — —
Additional paid-in capital ......................................................................................... 10,442 10,242 Less: Treasury stock, at cost, 428,676,471 shares at December 31, 2016 and
December 31, 2015 ............................................................................................... (5,563) (5,637) Retained earnings ...................................................................................................... 4,869 4,096 Accumulated other comprehensive loss .................................................................... (629) (633)
Total shareholders’ equity ..................................................................................... 9,119 8,068 Total liabilities and shareholders’ equity .............................................................. $ 17,452 $ 15,246
The accompanying notes are an integral part of these Consolidated Financial Statements.
38

40
ACTIVISION BLIZZARD, INC. AND SUBSIDIARIES
CONSOLIDATED STATEMENTS OF OPERATIONS
(Amounts in millions, except per share data)
For the Years Ended December 31,
2016 2015 2014 Net revenues
Product sales ................................................................................................................................ $ 2,196 $ 2,447 $ 2,786 Subscription, licensing, and other revenues ................................................................................. 4,412 2,217 1,622
Total net revenues ............................................................................................................................ 6,608 4,664 4,408 Costs and expenses
Cost of revenues—product sales: Product costs ............................................................................................................................ 741 872 981 Software royalties, amortization, and intellectual property licenses ....................................... 331 370 265
Cost of revenues—subscription, licensing, and other revenues: Game operations and distribution costs ................................................................................... 851 274 250 Software royalties, amortization, and intellectual property licenses ....................................... 471 69 29
Product development ................................................................................................................... 958 646 571 Sales and marketing ..................................................................................................................... 1,210 734 712 General and administrative .......................................................................................................... 634 380 417
Total costs and expenses .................................................................................................................. 5,196 3,345 3,225 Operating income ............................................................................................................................. 1,412 1,319 1,183 Interest and other expense (income), net ......................................................................................... 214 198 202 Loss on extinguishment of debt ....................................................................................................... 92 — — Income before income tax expense .................................................................................................. 1,106 1,121 981 Income tax expense .......................................................................................................................... 140 229 146 Net income ...................................................................................................................................... 966 $ 892 $ 835 Earnings per common share
Basic ............................................................................................................................................. $ 1.30 $ 1.21 $ 1.14 Diluted ......................................................................................................................................... $ 1.28 $ 1.19 $ 1.13
Weighted-average number of shares outstanding Basic ............................................................................................................................................. 740 728 716 Diluted ......................................................................................................................................... 754 739 726
Dividends per common share .......................................................................................................... $ 0.26 0.23 $ 0.20
The accompanying notes are an integral part of these Consolidated Financial Statements.
$
$
40
ACTIVISION BLIZZARD, INC. AND SUBSIDIARIES
CONSOLIDATED STATEMENTS OF OPERATIONS
(Amounts in millions, except per share data)
For the Years Ended
December 31, 2016 2015 2014
Net revenues Product sales ................................................................................................................................ $ 2,196 $ 2,447 $ 2,786 Subscription, licensing, and other revenues ................................................................................. 4,412 2,217 1,622
Total net revenues ............................................................................................................................ 6,608 4,664 4,408 Costs and expenses
Cost of revenues—product sales: Product costs ............................................................................................................................ 741 872 981 Software royalties, amortization, and intellectual property licenses ....................................... 331 370 265
Cost of revenues—subscription, licensing, and other revenues: Game operations and distribution costs ................................................................................... 851 274 250 Software royalties, amortization, and intellectual property licenses ....................................... 471 69 29
Product development ................................................................................................................... 958 646 571 Sales and marketing ..................................................................................................................... 1,210 734 712 General and administrative .......................................................................................................... 634 380 417
Total costs and expenses .................................................................................................................. 5,196 3,345 3,225 Operating income ............................................................................................................................. 1,412 1,319 1,183 Interest and other expense (income), net ......................................................................................... 214 198 202 Loss on extinguishment of debt ....................................................................................................... 92 — — Income before income tax expense .................................................................................................. 1,106 1,121 981 Income tax expense .......................................................................................................................... 140 229 146 Net income ....................................................................................................................................... $ 966 $ 892 $ 835 Earnings per common share
Basic ............................................................................................................................................. $ 1.30 $ 1.21 $ 1.14 Diluted ......................................................................................................................................... $ 1.28 $ 1.19 $ 1.13
Weighted-average number of shares outstanding Basic ............................................................................................................................................. 740 728 716 Diluted ......................................................................................................................................... 754 739 726
Dividends per common share .......................................................................................................... $ 0.26 $ 0.23 $ 0.20
The accompanying notes are an integral part of these Consolidated Financial Statements.
39

41
ACTIVISION BLIZZARD, INC. AND SUBSIDIARIES
CONSOLIDATED STATEMENTS OF COMPREHENSIVE INCOME
(Amounts in millions)
For the Years Ended December 31,
2016 2015 2014 Net income........................................................................................................................... 966 892 $ 835 Other comprehensive income (loss):
Foreign currency translation adjustments........................................................................ (29) (326) (371) Unrealized gains (losses) on forward contracts designated as hedges, net of tax .......... 33 (4) —
Total other comprehensive income (loss)............................................................................ 4 $ (330) $ (371)Comprehensive income........................................................................................................ 970 $ 562 $ 464
The accompanying notes are an integral part of these Consolidated Financial Statements.
$
$ $
$
41
ACTIVISION BLIZZARD, INC. AND SUBSIDIARIES
CONSOLIDATED STATEMENTS OF COMPREHENSIVE INCOME
(Amounts in millions)
For the Years Ended
December 31, 2016 2015 2014
Net income ....................................................................................................................................... $ 966 $ 892 $ 835 Other comprehensive income (loss):
Foreign currency translation adjustments .................................................................................... (29) (326) (371) Unrealized gains (losses) on forward contracts designated as hedges, net of tax ........................ 33 (4) —
Total other comprehensive income (loss) ........................................................................................ $ 4 $ (330) $ (371) Comprehensive income .................................................................................................................... $ 970 $ 562 $ 464
The accompanying notes are an integral part of these Consolidated Financial Statements.
40

42
ACTIVISION BLIZZARD, INC. AND SUBSIDIARIES CONSOLIDATED STATEMENTS OF CHANGES IN SHAREHOLDERS’ EQUITY
For the Years Ended December 31, 2016, 2015, and 2014 (Amounts and shares in millions, except per share data)
Common Stock Treasury Stock Additional
Paid-In Retained
Accumulated Other
Comprehensive Total
Shareholders’ Shares Amount Shares Amount Capital Earnings Income (Loss) Equity
Balance at December 31, 2013 ........... 1,132 $ — (429) $ (5,814) $ 9,682 $ 2,686 $ 68 $ 6,622 Components of comprehensive income:
Net income ............................................ — — — — — 835 — 835 Other comprehensive income (loss) ..... — — — — — — (371) (371)
Issuance of common stock pursuant to employee stock options ........................ 14 — — — 172 — — 172
Issuance of common stock pursuant to 7 — — — — — — —
restricted stock rights ............................
(2) — — — (66) — — (66)
Tax benefit associated with awards .........................
— — — — 30 — — 30 Share-based compensation expense
employee stock options stock rights ...................... — — — — 106 — — 106
Dividends ($0.20 per common share) ....... — — — — — (147) — (147) Indemnity on tax attributes assumed in
connection with the Purchase (see Note 15) ..................... — — — 52 — — — 52
Balance at December 31, 2014 ........... 1,151 $ — (429) $ (5,762) $ 9,924 $ 3,374 $ (303) $ 7,233 Components of comprehensive income:
Net income ............................................ — — — — — 892 — 892 Other comprehensive income (loss) ..... — — — — — — (330) (330)
Issuance of common stock pursuant to employee stock options ........................ 8 — — — 106 — — 106
Issuance of common stock pursuant to 7 — — — — — — —
(3) — — — (83) — — (83)
— — — — 65 — — 65 Share-based compensation expense
employee stock options stock rights ..................... — — — — 95 — — 95
Dividends ($0.23 per common share) ....... — — — — — (170) — (170) Indemnity on tax attributes assumed in
connection with the Purchase (see Note 15) ..................... — — — 58 — — — 58
Shareholder settlement in connection with Purchase Transaction (see Note 19) ..... — — — 67 135 — — 202
Balance at December 31, 2015 ........... 1,163 $ — (429) $ (5,637) $ 10,242 $ 4,096 $ (633) $ 8,068 Components of comprehensive income:
Net income ............................................ — — — — — 966 — 966 Other comprehensive income (loss) ..... — — — — — — 4 4
Issuance of common stock pursuant to employee stock options ........................ 7 — — — 105 — — 105
Issuance of common stock pursuant to restricted stock rights ............................ 7 — — — — — — —
Restricted stock surrendered for tax liability ......................... (3) — — — (116) — — (116)
Share-based compensation expense employee stock options
stock rights ...................... — — — — 135 — — 135 Share-based compensation assumed in
acquisition (see Note 21) ...................... — — — — 76 — — 76 Dividends ($0.26 per common share)........ — — — — — (193) — (193) Indemnity on tax attributes assumed in
connection with the Purchase (see Note 15) ..................... — — — 74 — — — 74
Balance at December 31, 2016 ........... 1,174 $ — (429) $ (5,563) $ 10,442 $ 4,869 $ (629) $ 9,119
The accompanying notes are an integral part of these Consolidated Financial Statements.
Restricted stock surrendered for ta liability ..........................
restricted stock rights ............................
Tax benefit associated with awards .........................
Restricted stock surrendered for ta liability ..........................
42
ACTIVISION BLIZZARD, INC. AND SUBSIDIARIES CONSOLIDATED STATEMENTS OF CHANGES IN SHAREHOLDERS’ EQUITY
For the Years Ended December 31, 2016, 2015, and 2014 (Amounts and shares in millions, except per share data)
Common Stock Treasury Stock Additional
Paid-In Retained
Accumulated Other
Comprehensive Total
Shareholders’ Shares Amount Shares Amount Capital Earnings Income (Loss) Equity
Balance at December 31, 2013 ........... 1,132 $ — (429) $ (5,814) $ 9,682 $ 2,686 $ 68 $ 6,622 Components of comprehensive income:
Net income ............................................ — — — — — 835 — 835 Other comprehensive income (loss) ..... — — — — — — (371) (371)
Issuance of common stock pursuant to employee stock options ........................ 14 — — — 172 — — 172
Issuance of common stock pursuant to restricted stock rights ............................ 7 — — — — — — —
Restricted stock surrendered for employees’ tax liability ............................................ (2) — — — (66) — — (66)
Tax benefit associated with employee stock awards ................................................... — — — — 30 — — 30
Share-based compensation expense related to employee stock options and restricted stock rights ............................................ — — — — 106 — — 106
Dividends ($0.20 per common share) ....... — — — — — (147) — (147) Indemnity on tax attributes assumed in
connection with the Purchase Transaction (see Note 15) ......................................... — — — 52 — — — 52 Balance at December 31, 2014 ........... 1,151 $ — (429) $ (5,762) $ 9,924 $ 3,374 $ (303) $ 7,233
Components of comprehensive income: Net income ............................................ — — — — — 892 — 892 Other comprehensive income (loss) ..... — — — — — — (330) (330)
Issuance of common stock pursuant to employee stock options ........................ 8 — — — 106 — — 106
Issuance of common stock pursuant to restricted stock rights ............................ 7 — — — — — — —
Restricted stock surrendered for employees’ tax liability ............................................ (3) — — — (83) — — (83)
Tax benefit associated with employee stock awards ................................................... — — — — 65 — — 65
Share-based compensation expense related to employee stock options and restricted stock rights ............................................ — — — — 95 — — 95
Dividends ($0.23 per common share) ....... — — — — — (170) — (170) Indemnity on tax attributes assumed in
connection with the Purchase Transaction (see Note 15) ......................................... — — — 58 — — — 58
Shareholder settlement in connection with the Purchase Transaction (see Note 19) ..... — — — 67 135 — — 202 Balance at December 31, 2015 ........... 1,163 $ — (429) $ (5,637) $ 10,242 $ 4,096 $ (633) $ 8,068
Components of comprehensive income: Net income ............................................ — — — — — 966 — 966 Other comprehensive income (loss) ..... — — — — — — 4 4
Issuance of common stock pursuant to employee stock options ........................ 7 — — — 105 — — 105
Issuance of common stock pursuant to restricted stock rights ............................ 7 — — — — — — —
Restricted stock surrendered for employees’ tax liability ............................................ (3) — — — (116) — — (116)
Share-based compensation expense related to employee stock options and restricted stock rights ............................................ — — — — 135 — — 135
Share-based compensation assumed in acquisition (see Note 21) ...................... — — — — 76 — — 76
Dividends ($0.26 per common share) ....... — — — — — (193) — (193) Indemnity on tax attributes assumed in
connection with the Purchase Transaction (see Note 15) ......................................... — — — 74 — — — 74 Balance at December 31, 2016 ........... 1,174 $ — (429) $ (5,563) $ 10,442 $ 4,869 $ (629) $ 9,119
The accompanying notes are an integral part of these Consolidated Financial Statements.
42
ACTIVISION BLIZZARD, INC. AND SUBSIDIARIES CONSOLIDATED STATEMENTS OF CHANGES IN SHAREHOLDERS’ EQUITY
For the Years Ended December 31, 2016, 2015, and 2014 (Amounts and shares in millions, except per share data)
Common Stock Treasury Stock Additional
Paid-In Retained
Accumulated Other
Comprehensive Total
Shareholders’ Shares Amount Shares Amount Capital Earnings Income (Loss) Equity
Balance at December 31, 2013 ........... 1,132 $ — (429) $ (5,814) $ 9,682 $ 2,686 $ 68 $ 6,622 Components of comprehensive income:
Net income ............................................ — — — — — 835 — 835 Other comprehensive income (loss) ..... — — — — — — (371) (371)
Issuance of common stock pursuant to employee stock options ........................ 14 — — — 172 — — 172
Issuance of common stock pursuant to 7 — — — — — — —
restricted stock rights ............................
(2) — — — (66) — — (66)
Tax benefit associated with awards .........................
— — — — 30 — — 30 Share-based compensation expense
employee stock options stock rights ...................... — — — — 106 — — 106
Dividends ($0.20 per common share) ....... — — — — — (147) — (147) Indemnity on tax attributes assumed in
connection with the Purchase (see Note 15) ..................... — — — 52 — — — 52
Balance at December 31, 2014 ........... 1,151 $ — (429) $ (5,762) $ 9,924 $ 3,374 $ (303) $ 7,233 Components of comprehensive income:
Net income ............................................ — — — — — 892 — 892 Other comprehensive income (loss) ..... — — — — — — (330) (330)
Issuance of common stock pursuant to employee stock options ........................ 8 — — — 106 — — 106
Issuance of common stock pursuant to 7 — — — — — — —
(3) — — — (83) — — (83)
— — — — 65 — — 65 Share-based compensation expense
employee stock options stock rights ..................... — — — — 95 — — 95
Dividends ($0.23 per common share) ....... — — — — — (170) — (170) Indemnity on tax attributes assumed in
connection with the Purchase (see Note 15) ..................... — — — 58 — — — 58
Shareholder settlement in connection with Purchase Transaction (see Note 19) ..... — — — 67 135 — — 202
Balance at December 31, 2015 ........... 1,163 $ — (429) $ (5,637) $ 10,242 $ 4,096 $ (633) $ 8,068 Components of comprehensive income:
Net income ............................................ — — — — — 966 — 966 Other comprehensive income (loss) ..... — — — — — — 4 4
Issuance of common stock pursuant to employee stock options ........................ 7 — — — 105 — — 105
Issuance of common stock pursuant to restricted stock rights ............................ 7 — — — — — — —
Restricted stock surrendered for tax liability ......................... (3) — — — (116) — — (116)
Share-based compensation expense employee stock options
stock rights ...................... — — — — 135 — — 135 Share-based compensation assumed in
acquisition (see Note 21) ...................... — — — — 76 — — 76 Dividends ($0.26 per common share)........ — — — — — (193) — (193) Indemnity on tax attributes assumed in
connection with the Purchase (see Note 15) ..................... — — — 74 — — — 74
Balance at December 31, 2016 ........... 1,174 $ — (429) $ (5,563) $ 10,442 $ 4,869 $ (629) $ 9,119
The accompanying notes are an integral part of these Consolidated Financial Statements.
Restricted stock surrendered for ta liability ..........................
restricted stock rights ............................
Tax benefit associated with awards .........................
Restricted stock surrendered for ta liability ..........................
42
ACTIVISION BLIZZARD, INC. AND SUBSIDIARIES CONSOLIDATED STATEMENTS OF CHANGES IN SHAREHOLDERS’ EQUITY
For the Years Ended December 31, 2016, 2015, and 2014 (Amounts and shares in millions, except per share data)
Common Stock Treasury Stock Additional
Paid-In Retained
Accumulated Other
Comprehensive Total
Shareholders’ Shares Amount Shares Amount Capital Earnings Income (Loss) Equity
Balance at December 31, 2013 ........... 1,132 $ — (429) $ (5,814) $ 9,682 $ 2,686 $ 68 $ 6,622 Components of comprehensive income:
Net income ............................................ — — — — — 835 — 835 Other comprehensive income (loss) ..... — — — — — — (371) (371)
Issuance of common stock pursuant to employee stock options ........................ 14 — — — 172 — — 172
Issuance of common stock pursuant to 7 — — — — — — —
restricted stock rights ............................
(2) — — — (66) — — (66)
Tax benefit associated with awards .........................
— — — — 30 — — 30 Share-based compensation expense
employee stock options stock rights ...................... — — — — 106 — — 106
Dividends ($0.20 per common share) ....... — — — — — (147) — (147) Indemnity on tax attributes assumed in
connection with the Purchase (see Note 15) ..................... — — — 52 — — — 52
Balance at December 31, 2014 ........... 1,151 $ — (429) $ (5,762) $ 9,924 $ 3,374 $ (303) $ 7,233 Components of comprehensive income:
Net income ............................................ — — — — — 892 — 892 Other comprehensive income (loss) ..... — — — — — — (330) (330)
Issuance of common stock pursuant to employee stock options ........................ 8 — — — 106 — — 106
Issuance of common stock pursuant to 7 — — — — — — —
(3) — — — (83) — — (83)
— — — — 65 — — 65 Share-based compensation expense
employee stock options stock rights ..................... — — — — 95 — — 95
Dividends ($0.23 per common share) ....... — — — — — (170) — (170) Indemnity on tax attributes assumed in
connection with the Purchase (see Note 15) ..................... — — — 58 — — — 58
Shareholder settlement in connection with Purchase Transaction (see Note 19) ..... — — — 67 135 — — 202
Balance at December 31, 2015 ........... 1,163 $ — (429) $ (5,637) $ 10,242 $ 4,096 $ (633) $ 8,068 Components of comprehensive income:
Net income ............................................ — — — — — 966 — 966 Other comprehensive income (loss) ..... — — — — — — 4 4
Issuance of common stock pursuant to employee stock options ........................ 7 — — — 105 — — 105
Issuance of common stock pursuant to restricted stock rights ............................ 7 — — — — — — —
Restricted stock surrendered for tax liability ......................... (3) — — — (116) — — (116)
Share-based compensation expense employee stock options
stock rights ...................... — — — — 135 — — 135 Share-based compensation assumed in
acquisition (see Note 21) ...................... — — — — 76 — — 76 Dividends ($0.26 per common share)........ — — — — — (193) — (193) Indemnity on tax attributes assumed in
connection with the Purchase (see Note 15) ..................... — — — 74 — — — 74
Balance at December 31, 2016 ........... 1,174 $ — (429) $ (5,563) $ 10,442 $ 4,869 $ (629) $ 9,119
The accompanying notes are an integral part of these Consolidated Financial Statements.
Restricted stock surrendered for ta liability ..........................
restricted stock rights ............................
Tax benefit associated with awards .........................
Restricted stock surrendered for ta liability ..........................
4141
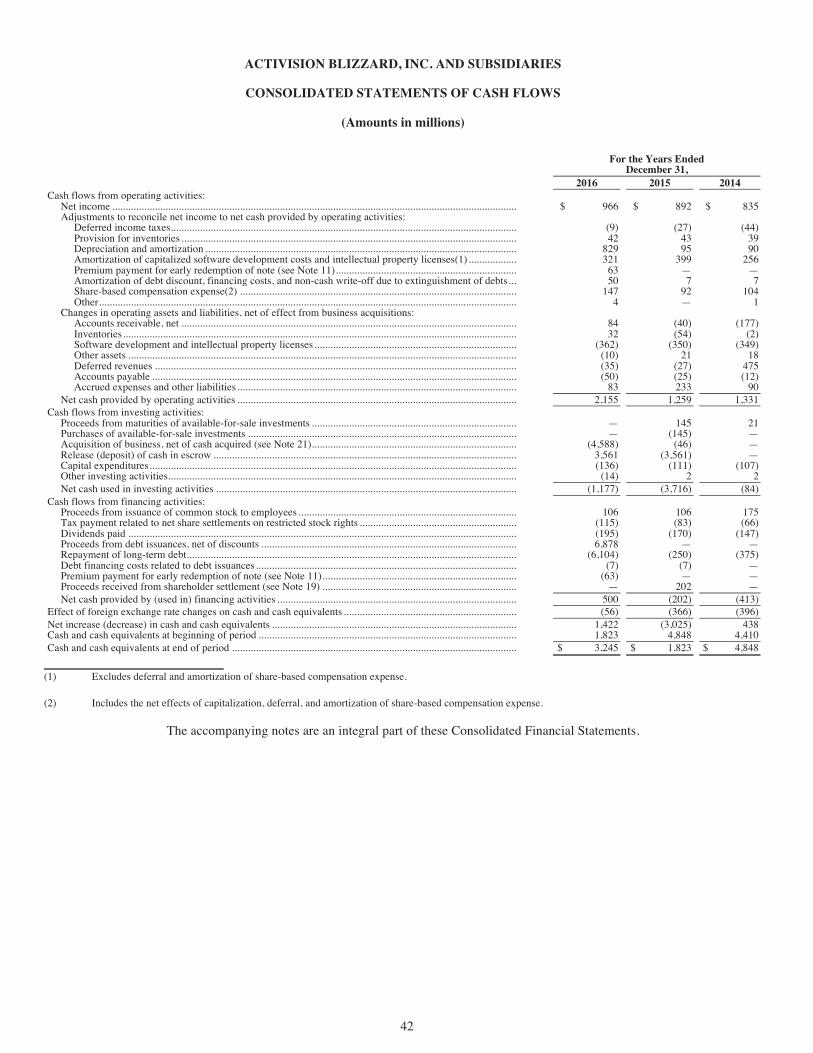
43
ACTIVISION BLIZZARD, INC. AND SUBSIDIARIES
CONSOLIDATED STATEMENTS OF CASH FLOWS
(Amounts in millions)
For the Years Ended
December 31, 2016 2015 2014
Cash flows from operating activities: Net income ............................................................................................................................................................ $ 966 $ 892 $ 835 Adjustments to reconcile net income to net cash provided by operating activities:
Deferred income taxes ...................................................................................................................................... (9) (27) (44) Provision for inventories .................................................................................................................................. 42 43 39 Depreciation and amortization ......................................................................................................................... 829 95 90 Amortization of capitalized software development costs and intellectual property licenses(1) ...................... 321 399 256 Premium payment for early redemption of note (see Note 11) ........................................................................ 63 — — Amortization of debt discount, financing costs, and non-cash write-off due to extinguishment of debts ....... 50 7 7 Share-based compensation expense(2) ............................................................................................................ 147 92 104 Other ................................................................................................................................................................. 4 — 1
Changes in operating assets and liabilities, net of effect from business acquisitions: Accounts receivable, net .................................................................................................................................. 84 (40) (177) Inventories ........................................................................................................................................................ 32 (54) (2) Software development and intellectual property licenses ................................................................................ (362) (350) (349) Other assets ...................................................................................................................................................... (10) 21 18 Deferred revenues ............................................................................................................................................ (35) (27) 475 Accounts payable ............................................................................................................................................. (50) (25) (12) Accrued expenses and other liabilities ............................................................................................................. 83 233 90
Net cash provided by operating activities ............................................................................................................. 2,155 1,259 1,331 Cash flows from investing activities:
Proceeds from maturities of available-for-sale investments ................................................................................. — 145 21 Purchases of available-for-sale investments ......................................................................................................... — (145) — Acquisition of business, net of cash acquired (see Note 21) ................................................................................. (4,588) (46) — Release (deposit) of cash in escrow ...................................................................................................................... 3,561 (3,561) — Capital expenditures .............................................................................................................................................. (136) (111) (107) Other investing activities ....................................................................................................................................... (14) 2 2 Net cash used in investing activities ..................................................................................................................... (1,177) (3,716) (84)
Cash flows from financing activities: Proceeds from issuance of common stock to employees ...................................................................................... 106 106 175 Tax payment related to net share settlements on restricted stock rights ............................................................... (115) (83) (66) Dividends paid ...................................................................................................................................................... (195) (170) (147) Proceeds from debt issuances, net of discounts .................................................................................................... 6,878 — — Repayment of long-term debt ................................................................................................................................ (6,104) (250) (375) Debt financing costs related to debt issuances ...................................................................................................... (7) (7) — Premium payment for early redemption of note (see Note 11) ............................................................................. (63) — — Proceeds received from shareholder settlement (see Note 19) ............................................................................. — 202 — Net cash provided by (used in) financing activities .............................................................................................. 500 (202) (413)
Effect of foreign exchange rate changes on cash and cash equivalents ..................................................................... (56) (366) (396) Net increase (decrease) in cash and cash equivalents ................................................................................................ 1,422 (3,025) 438 Cash and cash equivalents at beginning of period ..................................................................................................... 1,823 4,848 4,410 Cash and cash equivalents at end of period ............................................................................................................... $ 3,245 $ 1,823 $ 4,848
(1) Excludes deferral and amortization of share-based compensation expense.
(2) Includes the net effects of capitalization, deferral, and amortization of share-based compensation expense.
The accompanying notes are an integral part of these Consolidated Financial Statements.
42
44
ACTIVISION BLIZZARD, INC. AND SUBSIDIARIES
Notes to Consolidated Financial Statements
1. Description of Business
Activision Blizzard, Inc. is a leading global developer and publisher of interactive entertainment content and services. We develop and distribute content and services across all of the major gaming platforms including video game consoles, personal computers (“PC”), and mobile devices. The terms “Activision Blizzard,” the “Company,” “we,” “us,” and “our” are used to refer collectively to Activision Blizzard, Inc. and its subsidiaries.
The Company was originally incorporated in California in 1979 and was reincorporated in Delaware in December 1992. We are the result of the 2008 business combination (the “Business Combination”) by and among the Company (then known as Activision, Inc.), Vivendi S.A. (“Vivendi”), and Vivendi Games, Inc. (“Vivendi Games”), an indirect wholly-owned subsidiary of Vivendi. In connection with the consummation of the Business Combination, Activision, Inc., was renamed Activision Blizzard, Inc.
The common stock of Activision Blizzard is traded on The NASDAQ Stock Market under the ticker symbol “ATVI.”
The King Acquisition
On February 23, 2016 (the “King Closing Date”), we acquired King Digital Entertainment, a leading interactive mobile entertainment company (“King”), by purchasing all of its outstanding shares (the “King Acquisition”), as further described in Note 21. Our consolidated financial statements include the operations of King commencing on the King Closing Date.
Our Reportable Segments
Based on our organizational structure, we conduct our business through three reportable operating segments as follows:
(i) Activision Publishing, Inc.
Activision Publishing, Inc. (“Activision”) is a leading global developer and publisher of interactive software products and entertainment content, particularly in console gaming. Activision primarily delivers content through retail channels or digital downloads, including full-game sales and in-game purchases, as well as licenses of software to third-party or related-party companies that distribute Activision products. Activision develops, markets and sells products which are principally based on our internally-developed intellectual properties, as well as some licensed properties. Additionally, we have established a long-term alliance with Bungie to publish its game universe, Destiny.
Activision’s key product franchises include: Call of Duty®, a first-person shooter for the console and PC platforms; Destiny, an online universe of first-person action gameplay (which we call a “shared-world shooter”) for console platforms; and Skylanders®, a kid’s game franchise that brings physical toys to life digitally in the game primarily for console platforms.
(ii) Blizzard Entertainment, Inc.
Blizzard Entertainment, Inc. (“Blizzard”) is a leading global developer and publisher of interactive software products and entertainment content, particularly in PC gaming. Blizzard primarily delivers content through retail channels or digital downloads, including subscriptions, full-game sales, and in-game purchases, as well as licenses of software to third-party or related party companies that distribute Blizzard products. Blizzard also maintains a proprietary online gaming service which facilitates digital distribution of Blizzard content, online social connectivity across all Blizzard games, and the creation of user-generated content for Blizzard’s games.
Blizzard’s key product franchises include: World of Warcraft®, a subscription-based massive multi-player online role-playing game for the PC; StarCraft®, a real-time strategy PC franchise; Diablo®, an action role-playing franchise for PC and console platforms; Hearthstone®, an online collectible card franchise for the PC and mobile platforms; Heroes of the Storm®, a free-to-play team brawler for the PC; and Overwatch®, a team-based first person shooter for the PC and console platforms.
(iii) King Digital Entertainment
King Digital Entertainment (“King”) is a leading global developer and publisher of interactive entertainment content and services, particularly on mobile platforms, such as Android and iOS. King also distributes its content and services on online social platforms, such as Facebook and the king.com websites. King’s games are free-to-play, however players can acquire in-game virtual items, either with virtual currency the players purchase, or directly using real currency.
43
45
King’s key product franchises, all of which are for the PC and mobile platforms, include: Candy Crush™, which features “match three” games; Farm Heroes™, which also features “match three” games; Pet Rescue™, which is a “clicker” game; and Bubble Witch™, which features “bubble shooter” games.
(iv) Other
We also engage in other businesses that do not represent reportable segments, including:
• The Major League Gaming (“MLG”) business (which we formerly referred to as Activision Blizzard Media Networks orMedia Networks), which is devoted to esports and builds on our competitive gaming efforts by creating ways to deliver abest-in-class fan experience across games, platforms, and geographies with a long-term strategy of monetization throughadvertising, sponsorships, tournaments, and premium content.
• The Activision Blizzard Studios (“Studios”) business, which is devoted to creating original film and television contentbased on our library of globally recognized intellectual properties, and, in October 2016, released the first season of theanimated TV series Skylanders™ Academy on Netflix.
• The Activision Blizzard Distribution (“Distribution”) business, which consists of operations in Europe that providewarehousing, logistics, and sales distribution services to third-party publishers of interactive entertainment software, ourown publishing operations, and manufacturers of interactive entertainment hardware.
2. Summary of Significant Accounting Policies
Basis of Consolidation and Presentation
The accompanying consolidated financial statements include the accounts and operations of the Company. All intercompany accounts and transactions have been eliminated. The consolidated financial statements have been prepared in conformity with accounting principles generally accepted in the United States of America (“U.S. GAAP”). The preparation of the consolidated financial statements in conformity with U.S. GAAP requires management to make estimates and assumptions that affect the amounts reported in the consolidated financial statements and accompanying notes. Actual results could differ from these estimates and assumptions.
Certain reclassifications have been made to prior-year amounts to conform to the current period presentation.
The Company considers events or transactions that occur after the balance sheet date, but before the financial statements are issued, to provide additional evidence relative to certain estimates or to identify matters that require additional disclosures.
Cost of revenues presentation
In periods prior to the second quarter of 2016, we presented cost of revenues in our consolidated statements of operations in four financial statement captions: “Cost of sales—product costs,” “Cost of sales—online,” “Cost of sales—software royalties and amortization,” and “Cost of sales—intellectual property licenses.” Since the second quarter of 2016, we have revised the presentation in our consolidated statements of operations to more clearly align our costs of revenues with the associated revenue captions as follows:
Cost of revenues—product sales:
(i) “Product costs”—includes the manufacturing costs of goods produced and sold. These generally include productcosts, manufacturing royalties, net of volume discounts, personnel-related costs, warehousing, and distribution costs.We generally recognize volume discounts when they are earned (typically in connection with the achievement ofunit-based milestones).
(ii) “Software royalties, amortization, and intellectual property licenses”—includes the amortization of capitalizedsoftware costs and royalties attributable to product sales revenues. These are costs capitalized on the balance sheetuntil the respective games are released, at which time the capitalized costs are amortized. Also included isamortization of intangible assets recognized in purchase accounting attributable to product sales revenues.
Cost of revenues—subscription, licensing, and other revenues:
(i) “Game operations and distribution costs”—includes costs to operate our games, such as customer service, internetbandwidth and server costs, platform provider fee, and payment provider fees.
(ii) “Software royalties, amortization, and intellectual property licenses”—includes the amortization of capitalizedsoftware costs and royalties attributable to subscription, licensing and other revenues. These are costs capitalized onthe balance sheet until the respective games are released, at which time the capitalized costs are amortized. Alsoincluded is amortization of intangible assets recognized in purchase accounting attributable to subscription, licensingand other revenues.
44
46
Prior periods have been reclassified to conform to the current presentation.
Cash and Cash Equivalents
We consider all money market funds and highly liquid investments with original maturities of three months or less at the time of purchase to be “Cash and cash equivalents.”
Investment Securities
Investments designated as available-for-sale securities are carried at fair value, which is based on quoted market prices for such securities, if available, or is estimated on the basis of quoted market prices of financial instruments with similar characteristics. Unrealized gains and losses of the Company’s available-for-sale securities are excluded from earnings and are reported as a component of “Other comprehensive income (loss).”
Investments with original maturities greater than 90 days and remaining maturities of less than one year are normally classified within “Other current assets.” In addition, investments with maturities beyond one year may be classified within “Other current assets” if they are highly liquid in nature and represent the investment of cash that is available for current operations.
The specific identification method is used to determine the cost of securities disposed of, with realized gains and losses reflected in “Interest and other expense (income), net” in our consolidated statements of operations.
Cash in Escrow
As part of the King Acquisition, we were required to deposit $3.56 billion in cash to be held in an escrow account until the earlier of (i) the completion of the King Acquisition, or (ii) the termination of the transaction agreement. The cash was not accessible to the Company for operating cash needs as its use had been administratively restricted for use in the consummation of the King Acquisition. At December 31, 2015, we recorded the balance of the escrow account as a non-current asset, “Cash in escrow,” in our consolidated balance sheet.
Financial Instruments
The carrying amounts of “Cash and cash equivalents,” “Accounts receivable, net of allowances,” “Accounts payable,” and “Accrued expenses and other liabilities” approximate fair value due to the short-term nature of these accounts. Our investments in the United States of America (“U.S.”) treasuries, government agency securities, and corporate bonds, if any, are carried at fair value, which is based on quoted market prices for such securities, if available, or is estimated on the basis of quoted market prices of financial instruments with similar characteristics.
The Company transacts business in various foreign currencies and has significant international sales and expenses denominated in foreign currencies, subjecting us to foreign currency risk. To mitigate our foreign currency risk resulting from our foreign currency-denominated monetary assets, liabilities and earnings and our foreign currency risk related to functional currency-equivalent cash flows resulting from our intercompany transactions, we periodically enter into currency derivative contracts, principally forward contracts. These forward contracts generally have a maturity of less than one year. The counterparties for our currency derivative contracts are large and reputable commercial or investment banks.
We assess the nature of these derivatives under Financial Accounting Standards Board (“FASB”) Accounting Standards Codification (“ASC”) Topic 815 to determine whether such derivatives should be designated as hedging instruments. The fair value of foreign currency contracts are estimated based on the prevailing exchange rates of the various hedged currencies as of the end of the period. We report the fair value of these contracts within “Other current assets,” “Accrued expense and other liabilities,” “Other assets,” or “Other liabilities,” as applicable, in our consolidated balance sheets based on the prevailing exchange rates of the various hedged currencies as of the end of the relevant period.
We do not hold or purchase any foreign currency forward contracts for trading or speculative purposes.
For foreign currency forward contracts entered into to mitigate risk from foreign currency-denominated monetary assets, liabilities, and earnings that are not designated as hedging instruments under ASC 815, changes in the estimated fair value of these derivatives are recorded within “General and administrative expenses” and “Interest and other expense, net” in our consolidated statements of operations, consistent with the nature of the underlying transactions.
For foreign currency forward contracts that we entered into to hedge forecasted intercompany cash flows that are subject to foreign currency risk and which have been designated as cash flow hedges in accordance with ASC 815, we assess the effectiveness of these cash flow hedges at inception and on an ongoing basis and determine if the hedges are effective at providing offsetting changes in cash flows of the hedged items. The Company records the effective portion of changes in the estimated fair value of these derivatives in “Accumulated other comprehensive loss” and subsequently reclassifies the related amount of accumulated other comprehensive loss to earnings within “General and administrative” or “Net revenues” when the hedged item impacts earnings, consistent with the nature and timing of the underlying transactions. Cash flows from these foreign currency forward contracts are classified in the same category as the cash flows associated with the hedged item in the consolidated statements of cash flows. We measure hedge ineffectiveness, if any, and if it is determined that a derivative has ceased to be a highly effective hedge, the Company will discontinue hedge accounting for the derivative.
45
47
Concentration of Credit Risk
Our concentration of credit risk relates to depositors holding the Company’s cash and cash equivalents and customers with significant accounts receivable balances.
Our cash and cash equivalents are invested primarily in money market funds consisting of short-term, high-quality debt instruments issued by governments and governmental organizations, financial institutions and industrial companies.Our customer base includes retailers and distributors, including mass-market retailers, consumer electronics stores, discount warehouses, and game specialty stores in the U.S. and other countries worldwide. We perform ongoing credit evaluations of our customers and maintain allowances for potential credit losses. We generally do not require collateral or other security from our customers.
For the year ended December 31, 2016, we had two customers, Sony Interactive Entertainment Inc. (“Sony”), and Apple, Inc., who each accounted for 13% of net revenues. For the year ended December 31, 2015, we had two customers, Sony and Microsoft Corporation (“Microsoft”), who accounted for 12% and 10%, respectively, of net revenues. We did not have any single customer that accounted for 10% or more of net revenues for the year ended December 31, 2014.
We had three customers—Sony, Microsoft, and Wal-Mart Stores, Inc.—who accounted for 17%, 10%, and 10%, respectively, of consolidated gross receivables at December 31, 2016, and 18%, 13%, and 11%, respectively, of consolidated gross receivables at December 31, 2015.
Software Development Costs and Intellectual Property Licenses
Software development costs include payments made to independent software developers under development agreements, as well as direct costs incurred for internally developed products. Software development costs are capitalized once technological feasibility of a product is established and such costs are determined to be recoverable. Technological feasibility of a product requires both technical design documentation and game design documentation, or the completed and tested product design and a working model. Significant management judgments and estimates are utilized in the assessment of when technological feasibility is established and the evaluation is performed on a product-by-product basis. For products where proven technology exists, this may occur early in the development cycle. Software development costs related to hosted service revenue arrangements are capitalized after the preliminary project phase is complete and it is probable that the project will be completed and the software will be used to perform the function intended. Prior to a product’s release, if and when we believe capitalized costs are not recoverable, we expense the amounts as part of “Cost of revenues—software royalties, amortization, and intellectual property licenses.” Capitalized costs for products that are canceled or are expected to be abandoned are charged to “Product development” in the period of cancellation. Amounts related to software development which are not capitalized are charged immediately to “Product development.”
Commencing upon a product’s release, capitalized software development costs are amortized to “Cost of revenues—software royalties, amortization, and intellectual property licenses” based on the ratio of current revenues to total projected revenues for the specific product, generally resulting in an amortization period of six months to approximately two years.
Intellectual property license costs represent license fees paid to intellectual property rights holders for use of their trademarks, copyrights, software, technology, music or other intellectual property or proprietary rights in the development of our products. Depending upon the agreement with the rights holder, we may obtain the right to use the intellectual property in multiple products over a number of years, or alternatively, for a single product. Prior to a product’s release, if and when we believe capitalized costs are not recoverable, we expense the amounts as part of “Cost of revenues—software royalties, amortization, and intellectual property licenses.” Capitalized intellectual property costs for products that are canceled or are expected to be abandoned are charged to “Product development” in the period of cancellation.
Commencing upon a product’s release, capitalized intellectual property license costs are amortized to “Cost of revenues—software royalties, amortization, and intellectual property licenses” based on the ratio of current revenues for the specific product to total projected revenues for all products in which the licensed property will be utilized. As intellectual property license contracts may extend for multiple years and can be used in multiple products to be released over a period beyond one year, the amortization of capitalized intellectual property license costs relating to such contracts may extend beyond one year.
We evaluate the future recoverability of capitalized software development costs and intellectual property licenses on a quarterly basis. For products that have been released in prior periods, the primary evaluation criterion is the actual performance of the title to which the costs relate. For products that are scheduled to be released in future periods, recoverability is evaluated based on the expected performance of the specific products to which the costs relate or in which the licensed trademark or copyright is to be used. Criteria used to evaluate expected product performance include: historical performance of comparable products developed with comparable technology; market performance of comparable titles; orders for the product prior to its release; general market conditions; and, for any sequel product, estimated performance based on the performance of the product on which the sequel is based. Further, as many of our capitalized intellectual property licenses extend for multiple products over multiple years, we also assess the recoverability of capitalized intellectual property license costs based on certain qualitative factors, such as the success of other products and/or entertainment vehicles utilizing the intellectual property, whether there are any future planned theatrical releases or television series based on the intellectual property, and the rights holder’s continued promotion and exploitation of the intellectual property.
Significant management judgments and estimates are utilized in assessing the recoverability of capitalized costs. In evaluating the recoverability of capitalized costs, the assessment of expected product performance utilizes forecasted sales amounts and estimates of additional costs to be incurred. If revised forecasted or actual product sales are less than the originally forecasted amounts utilized in the initial recoverability analysis, the net realizable value may be lower than originally estimated in any given quarter, which could
47
Concentration of Credit Risk
Our concentration of credit risk relates to depositors holding the Company’s cash and cash equivalents and customers with significant accounts receivable balances.
Our cash and cash equivalents are invested primarily in money market funds consisting of short-term, high-quality debt instruments issued by governments and governmental organizations, financial institutions and industrial companies.
Our customer base includes retailers and distributors, including mass-market retailers, consumer electronics stores, discount warehouses, and game specialty stores in the U.S. and other countries worldwide. We perform ongoing credit evaluations of our customers and maintain allowances for potential credit losses. We generally do not require collateral or other security from our customers.
For the year ended December 31, 2016, we had two customers, Sony Interactive Entertainment Inc. (“Sony”), and Apple, Inc., who each accounted for 13% of net revenues. For the year ended December 31, 2015, we had two customers, Sony and Microsoft Corporation (“Microsoft”), who accounted for 12% and 10%, respectively, of net revenues. We did not have any single customer that accounted for 10% or more of net revenues for the year ended December 31, 2014.
We had three customers—Sony, Microsoft, and Wal-Mart Stores, Inc.—who accounted for 17%, 10%, and 10%, respectively, of consolidated gross receivables at December 31, 2016, and 18%, 13%, and 11%, respectively, of consolidated gross receivables at December 31, 2015.
Software Development Costs and Intellectual Property Licenses
Software development costs include payments made to independent software developers under development agreements, as well as direct costs incurred for internally developed products. Software development costs are capitalized once technological feasibility of a product is established and such costs are determined to be recoverable. Technological feasibility of a product requires both technical design documentation and game design documentation, or the completed and tested product design and a working model. Significant management judgments and estimates are utilized in the assessment of when technological feasibility is established and the evaluation is performed on a product-by-product basis. For products where proven technology exists, this may occur early in the development cycle. Software development costs related to hosted service revenue arrangements are capitalized after the preliminary project phase is complete and it is probable that the project will be completed and the software will be used to perform the function intended. Prior to a product’s release, if and when we believe capitalized costs are not recoverable, we expense the amounts as part of “Cost of revenues—software royalties, amortization, and intellectual property licenses.” Capitalized costs for products that are canceled or are expected to be abandoned are charged to “Product development” in the period of cancellation. Amounts related to software development which are not capitalized are charged immediately to “Product development.”
Commencing upon a product’s release, capitalized software development costs are amortized to “Cost of revenues—software royalties, amortization, and intellectual property licenses” based on the ratio of current revenues to total projected revenues for the specific product, generally resulting in an amortization period of six months to approximately two years.
Intellectual property license costs represent license fees paid to intellectual property rights holders for use of their trademarks, copyrights, software, technology, music or other intellectual property or proprietary rights in the development of our products. Depending upon the agreement with the rights holder, we may obtain the right to use the intellectual property in multiple products over a number of years, or alternatively, for a single product. Prior to a product’s release, if and when we believe capitalized costs are not recoverable, we expense the amounts as part of “Cost of revenues—software royalties, amortization, and intellectual property licenses.” Capitalized intellectual property costs for products that are canceled or are expected to be abandoned are charged to “Product development” in the period of cancellation.
Commencing upon a product’s release, capitalized intellectual property license costs are amortized to “Cost of revenues—software royalties, amortization, and intellectual property licenses” based on the ratio of current revenues for the specific product to total projected revenues for all products in which the licensed property will be utilized. As intellectual property license contracts may extend for multiple years and can be used in multiple products to be released over a period beyond one year, the amortization of capitalized intellectual property license costs relating to such contracts may extend beyond one year.
We evaluate the future recoverability of capitalized software development costs and intellectual property licenses on a quarterly basis. For products that have been released in prior periods, the primary evaluation criterion is the actual performance of the title to which the costs relate. For products that are scheduled to be released in future periods, recoverability is evaluated based on the expected performance of the specific products to which the costs relate or in which the licensed trademark or copyright is to be used. Criteria used to evaluate expected product performance include: historical performance of comparable products developed with comparable technology; market performance of comparable titles; orders for the product prior to its release; general marketconditions; and, for any sequel product, estimated performance based on the performance of the product on which the sequel is based. Further, as many of our capitalized intellectual property licenses extend for multiple products over multiple years, we also assess the recoverability of capitalized intellectual property license costs based on certain qualitative factors, such as the success of other products and/or entertainment vehicles utilizing the intellectual property, whether there are any future planned theatrical releases or television series based on the intellectual property, and the rights holder’s continued promotion and exploitation of the intellectual property.
Significant management judgments and estimates are utilized in assessing the recoverability of capitalized costs. In evaluating the recoverability of capitalized costs, the assessment of expected product performance utilizes forecasted sales amounts and estimates of additional costs to be incurred. If revised forecasted or actual product sales are less than the originally forecasted amounts utilized in the initial recoverability analysis, the net realizable value may be lower than originally estimated in any given quarter, which could
46

result in an impairment charge. Material differences may result in the amount and timing of expenses for any period if matters resolve in a manner that is inconsistent with management’s expectations.
Inventories
Inventories consist of materials (including manufacturing royalties paid to console manufacturers), labor, and freight-in and are stated at the lower of cost (weighted-average method) or net realizable value. Inventories are relieved on a weighted-average cost method.
Long-Lived Assets
Property and Equipment. Property and equipment are recorded at cost and depreciated on a straight-line basis over the estimated useful life (i.e., 25 to 33 years for buildings, and 2 to 5 years for computer equipment, office furniture and other equipment) of the asset. When assets are retired or disposed of, the cost and accumulated depreciation thereon are removed and any resulting gains or losses are included in the consolidated statements of operations. Leasehold improvements are amortized using the straight-line method over the estimated life of the asset, not to exceed the length of the lease. Repair and maintenance costs are expensed as incurred.
Goodwill and Other Indefinite-Lived Assets. We account for goodwill in accordance with ASC Topic 350. Under ASC Topic 350, goodwill is considered to have an indefinite life, and is carried at cost. Acquired trade names are assessed as indefinite lived assets if there is no foreseeable limits on the periods of time over which they are expected to contribute cash flows. Goodwill and indefinite-lived assets are not amortized, but are subject to an annual impairment test, as well as between annual tests when events or circumstances indicate that the carrying value may not be recoverable. We perform our annual impairment testing at December 31.
Our annual goodwill impairment test is performed at the reporting unit level. We have determined our reporting units based on the guidance within ASC Subtopic 350-20. As of December 31, 2016 and 2015, our reporting units are the same as our operating segments. We test goodwill for possible impairment by first determining the fair value of the related reporting unit and comparing this value to the recorded net assets of the reporting unit, including goodwill. The fair value of our reporting units is determined using an income approach based on discounted cash flow models. In the event the recorded net assets of the reporting unit exceed the estimated fair value of such assets, we perform a second step to measure the amount of the impairment, which is equal to the amount by which the recorded goodwill exceeds the implied fair value of the goodwill after assessing the fair value of each of the assets and liabilities within the reporting unit. We have determined that no impairment has occurred at December 31, 2016, 2015 and 2014 based upon a set of assumptions regarding discounted future cash flows, which represent our best estimate of future performance at this time.
We test indefinite-lived acquired trade names for possible impairment by using a discounted cash flow model to estimate fair value. We have determined that no impairment has occurred at December 31, 2016, 2015 and 2014 based upon a set of assumptions regarding discounted future cash flows, which represent our best estimate of future performance at this time.
Changes in our assumptions underlying our estimates of fair value, which will be a function of our future financial performance and changes in economic conditions, could result in future impairment charges.
Amortizable Intangible Assets. Intangible assets subject to amortization are carried at cost less accumulated amortization, and amortized over the estimated useful life in proportion to the economic benefits received.
We evaluate the recoverability of our identifiable intangible assets and other long-lived assets in accordance with ASC Subtopic 360-10, which generally requires the assessment of these assets for recoverability when events or circumstances indicate a potential impairment exists. We considered certain events and circumstances in determining whether the carrying value of identifiable intangible assets and other long-lived assets, other than indefinite-lived intangible assets, may not be recoverable including, but not limited to: significant changes in performance relative to expected operating results; significant changes in the use of the assets; significant negative industry or economic trends; a significant decline in our stock price for a sustained period of time; and changes in our business strategy. If we determine that the carrying value may not be recoverable, we estimate the undiscounted cash flows to be generated from the use and ultimate disposition of these assets to determine whether an impairment exists. If an impairment is indicated based on a comparison of the assets’ carrying values and the undiscounted cash flows, the impairment loss is measured as the amount by which the carrying amount of the assets exceeds the fair value of the assets. We did not record an impairment charge to our definite-lived intangible assets as of December 31, 2016, 2015, and 2014.
Revenue Recognition
We recognize revenues when there is persuasive evidence of an arrangement, the product or service has been provided to the customer, the collection of our fees is reasonably assured and the amount of fees to be paid by the customer is fixed or determinable. Certain products are sold to customers with a “street date” (which is the earliest date these products may be sold by retailers). For these products, we recognize revenues on the later of the street date or the date the product is sold to the customer. Revenues are recorded net of taxes assessed by governmental authorities that are both imposed on and concurrent with the specific revenue-producing transaction between us and our customer, such as sales and value-added taxes.
47
our capitalized intellectual property licenses extend for multiple products over multiple years, we also assess the recoverability of capitalized intellectual property license costs based on certain qualitative factors, such as the success of other products and/or entertainment vehicles utilizing the intellectual property, whether there are any future planned theatrical releases or television series based on the intellectual property, and the rights holder’s continued promotion and exploitation of the intellectual property.
Significant management judgments and estimates are utilized in assessing the recoverability of capitalized costs. In evaluating the recoverability of capitalized costs, the assessment of expected product performance utilizes forecasted sales amounts and estimates of additional costs to be incurred. If revised forecasted or actual product sales are less than the originally forecasted amounts utilized in the initial recoverability analysis, the net realizable value may be lower than originally estimated in any given quarter, which could
47

49
Revenue Arrangements with Multiple Deliverables
Certain of our revenue arrangements have multiple deliverables, which we account for in accordance with ASC Topic 605. These revenue arrangements include product sales consisting of both software, service (such as ongoing hosting arrangements), and hardware deliverables (such as peripherals or other ancillary collectors’ items sold together with physical “boxed” software).
When a revenue arrangement contains multiple elements, such as hardware and software products, licenses and/or services, we allocate revenue to each element based on a selling price hierarchy. The selling price for a deliverable is based on its vendor-specific objective evidence (“VSOE”) if it is available, third-party evidence (“TPE”) if VSOE is not available, or best estimated selling price (“BESP”) if neither VSOE nor TPE is available. In multiple element arrangements where more-than-incidental software deliverables are included, revenue is allocated to each separate unit of accounting for each of the non-software deliverables and to the software deliverables as a group using the relative selling prices of each of the deliverables in the arrangement based on the aforementioned selling price hierarchy. Further, if the arrangement contains more than one software deliverable, the arrangement consideration allocated to the software deliverables as a group is then allocated to each software deliverable using the guidance for recognizing software revenue.
As noted above, when neither VSOE nor TPE is available for a deliverable, we use BESP. We did not have significant revenue arrangements that required using BESP for the years ended December 31, 2016, 2015, and 2014. The inputs we use to determine the selling price of our significant deliverables include the actual price charged by the Company for deliverables that the Company sells separately (which represents VSOE) and the wholesale prices of the same or similar products for deliverables not sold separately (which represents TPE).
Product Sales
Product sales consist of sales of our games, including physical products and digital full-game downloads. We recognize revenues from the sale of our products after both (1) title and risk of loss have been transferred to our customers and (2) all performance obligations have been completed. With respect to digital full-game downloads, this is when the product is available for download or is activated for gameplay. Revenues from product sales are recognized after deducting the estimated allowance for returns and price protection. Sales incentives and other consideration given by us to our customers, such as rebates and product placement fees, are considered adjustments of the selling price of our products and are reflected as reductions to revenues. Sales incentives and other consideration that represent costs incurred by us for assets or services received, such as the appearance of our products in a customer’s national circular ad, are reflected as sales and marketing expenses when the benefit from the sales incentive is separable from sales to the same customer and we can reasonably estimate the fair value of the benefit.
Products with Online Functionality or Hosted Service Arrangements
For our software products with online functionality or that are part of a hosted service agreement, we evaluate whether that online functionality constitutes a more-than-inconsequential separate deliverable in addition to the software product. This evaluation is performed for each software product or product add-on (including downloadable content), when it is released. Determining whether the online functionality for a particular product constitutes a more-than-inconsequential deliverable is subjective and requires management’s judgment. When we determine that the online functionality constitutes a more-than-inconsequential separate service deliverable in addition to the product, which is principally because of the online functionality’s importance to gameplay, we consider our performance obligation for this title to extend beyond the sale of the game. In addition, VSOE of fair value does not exist for the online functionality of some products, as we do not separately charge for this component. As a result, we initially defer all of the software-related revenues from the sale of any such title (including downloadable content) and recognize the revenues ratably over the estimated service period of the title. In addition, we initially defer the cost of revenues for the title and recognize the costs of sales as the related revenues are recognized. The cost of revenues that are initially deferred include manufacturing costs, software royalties and amortization, and intellectual property licenses and exclude intangible asset amortization.
For our software products with online functionality that we consider to be incidental to the overall product offering and are inconsequential deliverables, we recognize the related revenues when the revenue recognition criteria described above have been met.
For our World of Warcraft boxed products, expansion packs and value-added services, we recognize revenues in each case with the related subscription service revenues ratably over the estimated service period, beginning upon the activation of the software and delivery of the related services. Revenues attributed to the sale of World of Warcraft boxed software and related expansion packs are classified as “Product sales,” whereas revenues attributable to subscriptions and other value-added services are classified as “Subscription, licensing, and other revenues.”
Subscription Revenues
Subscription revenues are mostly derived from World of Warcraft. World of Warcraft is a game that is playable through Blizzard’s servers and is generally sold on a subscription-only basis.
For World of Warcraft, after the first month of free usage that is included with the World of Warcraft boxed software, the World of Warcraft end user may enter into a subscription agreement for additional future access. Revenues associated with the sales of subscriptions via boxed software and prepaid subscription cards, as well as prepaid subscriptions sales, are deferred until the
48

50
subscription service is activated by the consumer and are then recognized ratably over the subscription period. Value-added service revenues associated with subscriptions are recognized ratably over the estimated service periods.
Licensing Revenues
In certain countries, we utilize third-party licensees to distribute and host our games in accordance with license agreements, for which the licensees pay the Company a royalty. We recognize these royalties as revenues based on usage by the end user and over the estimated service period when we have continuing service obligations. We recognize any upfront licensing fees received over the term of the agreements.
With respect to license agreements that provide customers the right to make multiple copies in exchange for guaranteed amounts, revenues are generally recognized upon delivery of a master copy if all other performance obligations have been completed or over the estimated service period when we have continuing service obligations. Per copy royalties on sales that exceed the guarantee are recognized as earned. In addition, persuasive evidence of an arrangement must exist and collection of the related receivable must be probable.
Other Revenues
Other revenues primarily include revenues from digital downloadable content (e.g., multi-player content packs), microtransactions and the licensing of intellectual property other than software to third-parties.
Microtransaction revenues are derived from the sale of virtual goods and currencies to our players to enhance their gameplay experience. Proceeds from the sales of virtual goods and currencies are initially recorded in deferred revenues. Proceeds from the sales of virtual currencies are recognized as revenues when a player uses the virtual goods purchased with the virtual currency. Proceeds from the sales of virtual goods directly are also recognized as revenues when a player uses the virtual goods. We categorize our virtual goods as either consumable or durable. Consumable virtual goods represent goods that can be consumed by a specific player action; accordingly, we recognize revenues from the sale of consumable virtual goods as the goods are consumed. Durable virtual goods represent goods that are accessible to the player over an extended period of time; accordingly, we recognize revenues from the sale of durable virtual goods ratably over the period of time the goods are available to the player, which is generally the estimated service period of the game.
Revenues from the licensing of intellectual property other than software to third-parties are recorded upon the receipt of licensee statements, or upon the receipt of cash, provided the license period has begun and all performance obligations have been completed.
Estimated Service Period
We determine the estimated service period for players of our games with consideration of various data points, including the weighted average number of days between players’ first and last days played online, the average total hours played, the average number of days in which player activity stabilizes, and the weighted-average number of days between players’ first purchase date and last date played online. We also consider known online trends, the service periods of our previously released games, and the service periods of our competitors’ games that are similar in nature to ours, to the extent they are publicly available. Determining the estimated service period is subjective and requires management’s judgment. Future usage patterns may differ from historical usage patterns and therefore the estimated service period may change in the future. The estimated service periods for players of our current games are generally less than 12 months.
Allowances for Returns, Price Protection, and Doubtful Accounts
We closely monitor and analyze the historical performance of our various titles, the performance of products released by other publishers, market conditions, and the anticipated timing of other releases to assess future demand of current and upcoming titles. Initial volumes shipped upon title launch and subsequent reorders are evaluated with the goal of ensuring that quantities are sufficient to meet the demand from the retail markets, but at the same time are controlled to prevent excess inventory in the channel. We benchmark units to be shipped to our customers using historical and industry data.
We may permit product returns from, or grant price protection to, our customers under certain conditions. In general, price protection refers to the circumstances in which we elect to decrease, on a short- or longer-term basis, the wholesale price of a product by a certain amount and, when granted and applicable, allow customers a credit against amounts owed by such customers to us with respect to open and/or future invoices. The conditions our customers must meet to be granted the right to return products or receive price protection credits include, among other things, compliance with applicable trading and payment terms and consistent return of inventory and delivery of sell-through reports to us. We may also consider other factors, including achievement of sell-through performance targets in certain instances, the facilitation of slow-moving inventory, and other market factors.
Significant management judgments and estimates with respect to potential future product returns and price protection related to current period product revenues must be made and used when establishing the allowance for returns and price protection in any accounting period. We estimate the amount of future returns and price protection for current period product revenues utilizing historical experience and information regarding inventory levels and the demand and acceptance of our products by the end consumer. The following factors are used to estimate the amount of future returns and price protection for a particular title: historical performance of titles in similar genres; historical performance of the hardware platform; historical performance of the franchise;
49
51
console hardware life cycle; sales force and retail customer feedback; industry pricing; future pricing assumptions; weeks of on-hand retail channel inventory; absolute quantity of on-hand retail channel inventory; our warehouse on-hand inventory levels; the title’s recent sell-through history (if available); marketing trade programs; and the performance of competing titles. The relative importance of these factors varies among titles depending upon, among other things, genre, platform, seasonality, and sales strategy.
Based upon historical experience, we believe that our estimates are reasonable. However, actual returns and price protection could vary materially from our allowance estimates due to a number of reasons, including, among others: a lack of consumer acceptance of a title, the release in the same period of a similarly themed title by a competitor, or technological obsolescence due to the emergence of new hardware platforms. There may be material differences in the amount and timing of our revenues for any period if factors or market conditions change or if matters resolve in a manner that is inconsistent with management’s assumptions utilized in determining the allowances for returns and price protection.
Similarly, management must make estimates as to the collectability of our accounts receivable. In estimating the allowance for doubtful accounts, we analyze the age of current outstanding account balances, historical bad debts, customer concentrations, customer creditworthiness, current economic trends, and changes in our customers’ payment terms and their economic condition, as well as whether we can obtain sufficient credit insurance. Any significant changes in any of these criteria would affect management’s estimates in establishing our allowance for doubtful accounts.
Allowance for Inventory Obsolescence
We regularly review inventory quantities on-hand and in the retail channels. We write down inventory based on excess or obsolete inventories determined primarily by future anticipated demand for our products. Inventory write-downs are measured as the difference between the cost of the inventory and net realizable value, based upon assumptions about future demand, which are inherently difficult to assess and dependent on market conditions. At the point of a loss recognition, a new, lower cost basis for that inventory is established, and subsequent changes in facts and circumstances do not result in the restoration or increase in that newly established basis.
Shipping and Handling
Shipping and handling costs, which consist primarily of packaging and transportation charges incurred to move finished goods to customers, are included in “Cost of revenues—product costs.”
Advertising Expenses
We expense advertising as incurred, except for production costs associated with media advertising, which are deferred and charged to expense when the related advertisement is run for the first time. Advertising expenses for the years ended December 31, 2016, 2015, and 2014 were $641 million, $523 million, and $495 million, respectively, and are included in “Sales and marketing” in the consolidated statements of operations.
Income Taxes
We record a tax provision for the anticipated tax consequences of the reported results of operations. In accordance with ASC Topic 740, the provision for income taxes is computed using the asset and liability method, under which deferred tax assets and liabilities are recognized for the expected future tax consequences attributable to differences between the financial statement carrying amounts of existing assets and liabilities and their respective tax bases and operating losses and tax credit carryforwards. Deferred tax assets and liabilities are measured using enacted tax rates expected to apply to taxable income in the years in which the temporary differences are expected to be recovered or settled. The effect on deferred tax assets and liabilities of a change in tax rates is recognized in income in the period that includes the enactment date. We evaluate deferred tax assets each period for recoverability. For those assets that do not meet the threshold of “more likely than not” that they will be realized in the future, a valuation allowance is recorded.
We report a liability for unrecognized tax benefits resulting from uncertain tax positions taken or expected to be taken in a tax return. We recognize interest and penalties, if any, related to unrecognized tax benefits in “Income tax expense.”
Foreign Currency Translation
All assets and liabilities of our foreign subsidiaries who have a functional currency other than U.S. dollars are translated into U.S. dollars at the exchange rate in effect at the balance sheet date, and revenue and expenses are translated at average exchange rates during the period. The resulting translation adjustments are reflected as a component of “Accumulated other comprehensive loss” in shareholders’ equity.
Earnings Per Common Share
“Basic earnings per common share” is computed by dividing income (loss) available to common shareholders by the weighted-average number of common shares outstanding for the periods presented. “Diluted earnings per share” is computed by dividing income (loss) available to common shareholders by the weighted-average number of common shares outstanding, increased by the weighted-average number of common stock equivalents. Common stock equivalents are calculated using the treasury stock method and represent incremental shares issuable upon exercise of our outstanding options. However, potential common shares are not included in the denominator of the diluted earnings (loss) per share calculation when inclusion of such shares would be anti-dilutive, such as in a period in which a net loss is recorded.
50
52
When we determine whether instruments granted in share-based payment transactions are participating securities, unvested share-based awards which include the right to receive non-forfeitable dividends or dividend equivalents are considered to participate with common stock in undistributed earnings. With participating securities, we are required to calculate basic and diluted earnings per common share amounts under the two-class method. The two-class method excludes from the earnings per common share calculation any dividends paid or owed to participating securities and any undistributed earnings considered to be attributable to participating securities.
Share-Based Payments
We account for share-based payments in accordance with ASC Subtopic 718-10 and ASC Subtopic 505-50. Share-based compensation expense for a given grant is recognized over the requisite service period (that is, the period for which the employee is being compensated) and is based on the value of share-based payment awards after a reduction for estimated forfeitures. Forfeitures are estimated at the time of grant and are revised, if necessary, in subsequent periods if actual forfeitures differ from those estimates.
We generally estimate the value of stock options using a binomial-lattice model. This estimate is affected by our stock price, as well as assumptions regarding a number of highly complex and subjective variables, including our expected stock price volatility over the term of the awards, and actual and projected employee stock option exercise behaviors.
We generally determine the fair value of restricted stock rights based on the closing market price of the Company’s common stock on the date of grant, reduced by the present value of the estimated future dividends during the vesting period in which the restricted stock rights holder will not participate. Certain restricted stock rights granted to our employees and senior management vest based on the achievement of pre-established performance or market conditions. For performance-based restricted stock rights, each quarter we update our assessment of the probability that the specified performance criteria will be achieved. We amortize the fair values of performance-based restricted stock rights over the requisite service period, adjusting for estimated forfeitures for each separately vesting tranche of the award. For market-based restricted stock rights, we estimate the fair value at the date of grant using a Monte Carlo valuation methodology and amortize those fair values over the requisite service period, adjusting for estimated forfeitures for each separately vesting tranche of the award. The Monte Carlo methodology that we use to estimate the fair value of market-based restricted stock rights at the date of grant incorporates into the valuation the possibility that the market condition may not be satisfied. Provided that the requisite service is rendered, the total fair value of the market-based restricted stock rights at the date of grant must be recognized as compensation expense even if the market condition is not achieved. However, the number of shares that ultimately vest can vary significantly with the performance of the specified market criteria.
For share-based compensation grants that are liability classified, we update our grant date valuation at each reporting period and recognize a cumulative catch-up adjustment for changes in the value related to the requisite service already rendered.
Loss Contingencies
ASC Topic 450 governs the disclosure of loss contingencies and accrual of loss contingencies in respect of litigation and other claims. We record an accrual for a potential loss when it is probable that a loss will occur and the amount of the loss can be reasonably estimated. When the reasonable estimate of the potential loss is within a range of amounts, the minimum of the range of potential loss is accrued, unless a higher amount within the range is a better estimate than any other amount within the range. Moreover, even if an accrual is not required, we provide additional disclosure related to litigation and other claims when it is reasonably possible (i.e., more than remote) that the outcomes of such litigation and other claims include potential material adverse impacts on us.
3. Cash and Cash Equivalents
The following table summarizes the components of our cash and cash equivalents (amounts in millions):
At December 31, 2016 2015
Cash ..................................................................................................................................$ 286 $ 176 Foreign government treasury bills .................................................................................... 38 34 Money market funds .........................................................................................................2,921 1,613 Cash and cash equivalents ...................................................................................... $ 3,245 $ 1,823
4. Inventories, Net
Our inventories, net consist of the following (amounts in millions):
At
December 31, 2016 2015
Finished goods ........................................................................................................................... $ 40 $ 101 Purchased parts and components ............................................................................................... 9 27 Inventories, net .......................................................................................................................... $ 49 $ 128
At December 31, 2016 and 2015, inventory reserves were $45 million and $54 million, respectively.
5. Software Development and Intellectual Property Licenses
The following table summarizes the components of our capitalized software development costs and intellectual property licenses
51
53
Inventories, net ..........................................................................................................................$ 49 $ 128
At December 31, 2016 and 2015, inventory reserves were $45 million and $54 million, respectively.
5. Software Development and Intellectual Property Licenses
The following table summarizes the components of our capitalized software development costs and intellectual property licenses (amounts in millions):
At December 31,
2016 2015 Internally-developed software costs ..........................................................................................$ 277 $ 266 Payments made to third-party software developers ..................................................................189 150 Total software development costs .............................................................................................$ 466 $ 416 Intellectual property licenses .....................................................................................................$ 2 $ 30
Intellectual property licenses are classified within “Other current assets” and “Other assets” in our consolidated balance sheets.
Amortization of capitalized software development costs and intellectual property was the following (amounts in millions):
For the Years Ended December 31,
2016 2015 2014 Amortization of capitalized software development costs and intellectual property licenses...... $ 335 $ 410 $ 272
Write-offs and impairments of capitalized software development costs and intellectual property licenses were not material for the years ended December 31, 2016, 2015, and 2014.
6. Property and Equipment, Net
Property and equipment, net was comprised of the following (amounts in millions):
At December 31, 2016 2015
Land ..................................................................................................................................$ 1 $ 1 Buildings ........................................................................................................................... 4 4 Leasehold improvements .................................................................................................. 162 109 Computer equipment ........................................................................................................ 560 431 Office furniture and other equipment ............................................................................... 78 52
Total cost of property and equipment ........................................................................... 805 597 Less accumulated depreciation .........................................................................................(547) (408)
Property and equipment, net .........................................................................................$ 258 $ 189
Depreciation expense for the years ended December 31, 2016, 2015, and 2014 was $121 million, $82 million, and $76 million, respectively.
Rental expense was $65 million, $39 million and $38 million for the years ended December 31, 2016, 2015, and 2014, respectively.
7. Intangible Assets, Net
Intangible assets, net consist of the following (amounts in millions):
At December 31, 2016
52
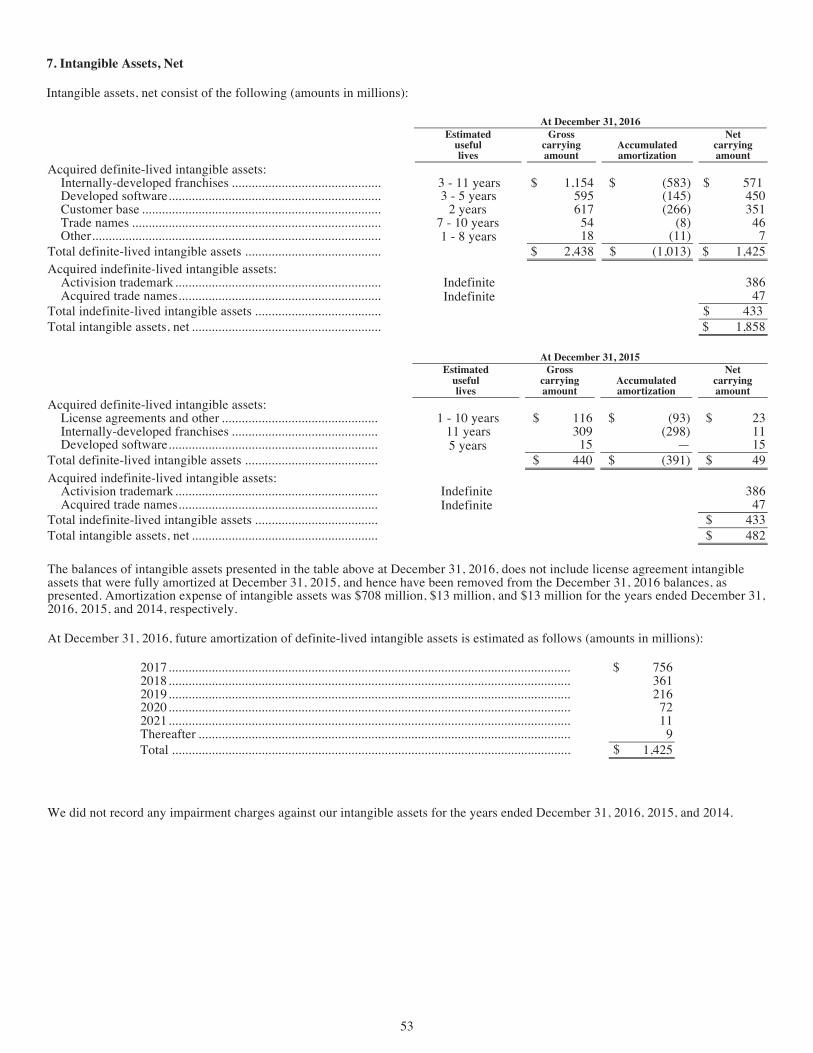
53
respectively.
Rental expense was $65 million, $39 million and $38 million for the years ended December 31, 2016, 2015, and 2014, respectively.
7. Intangible Assets, Net
Intangible assets, net consist of the following (amounts in millions):
At December 31, 2016 Estimated
useful lives
Gross carrying amount
Accumulated amortization
Net carrying amount
Acquired definite-lived intangible assets: Internally-developed franchises ............................................. 3 - 11 years $ 1,154 $ (583) $ 571 Developed software ................................................................ 3 - 5 years 595 (145) 450Customer base ........................................................................ 2 years 617 (266) 351Trade names ........................................................................... 7 - 10 years 54 (8) 46Other ....................................................................................... 1 - 8 years 18 (11) 7
Total definite-lived intangible assets ......................................... $ 2,438 (1,013) $ 1,425 Acquired indefinite-lived intangible assets:
Activision trademark .............................................................. Indefinite 386 Acquired trade names ............................................................. Indefinite 47
Total indefinite-lived intangible assets ...................................... $ 433 Total intangible assets, net ......................................................... $ 1,858
At December 31, 2015 Estimated
useful lives
Gross carrying amount
Accumulated amortization
Net carrying amount
Acquired definite-lived intangible assets: License agreements and other ............................................... 1 - 10 years $ 116 $ (93) $ 23 Internally-developed franchises ............................................ 11 years 309 (298) 11Developed software ............................................................... 5 years 15 — 15
Total definite-lived intangible assets ........................................ $ 440 $ (391) $ 49 Acquired indefinite-lived intangible assets:
Activision trademark ............................................................. Indefinite 386 Acquired trade names ............................................................ Indefinite 47
Total indefinite-lived intangible assets ..................................... $ 433 Total intangible assets, net ........................................................ $ 482
The balances of intangible assets presented in the table above at December 31, 2016, does not include license agreement intangible assets that were fully amortized at December 31, 2015, and hence have been removed from the December 31, 2016 balances, as presented. Amortization expense of intangible assets was $708 million, $13 million, and $13 million for the years ended December 31, 2016, 2015, and 2014, respectively.
At December 31, 2016, future amortization of definite-lived intangible assets is estimated as follows (amounts in millions):
2017 ....................................................................................................................................................$ 756 2018 ....................................................................................................................................................361 2019 ....................................................................................................................................................216 2020 ....................................................................................................................................................72 2021 ....................................................................................................................................................11 Thereafter ........................................................................................................................................... 9 Total ..................................................................................................................................
We did not record any impairment charges against our intangible assets for the years ended December 31, 2016, 2015, and 2014.
8. Goodwill
The changes in the carrying amount of goodwill by operating segment for the years ended December 31, 2016 and 2015, are as follows (amounts in millions):
Activision Blizzard King Other Total Balance at December 31, 2014 ......................................................... $ 6,908 $ 178 $ — $ — $ 7,086
Additions through acquisition ....................................................... — — — 12 12 Other ............................................................................................. (3) — — — (3)
Balance at December 31, 2015 ......................................................... $ 6,905 $ 178 $ — $ 12 $ 7,095 Additions through acquisition ....................................................... — — 2,675 — 2,675 Other ............................................................................................. (2) — — — (2)
Balance at December 31, 2016 ......................................................... $ 6,903 $ 178 $ 2,675 $ 12 $ 9,768
$
$
53
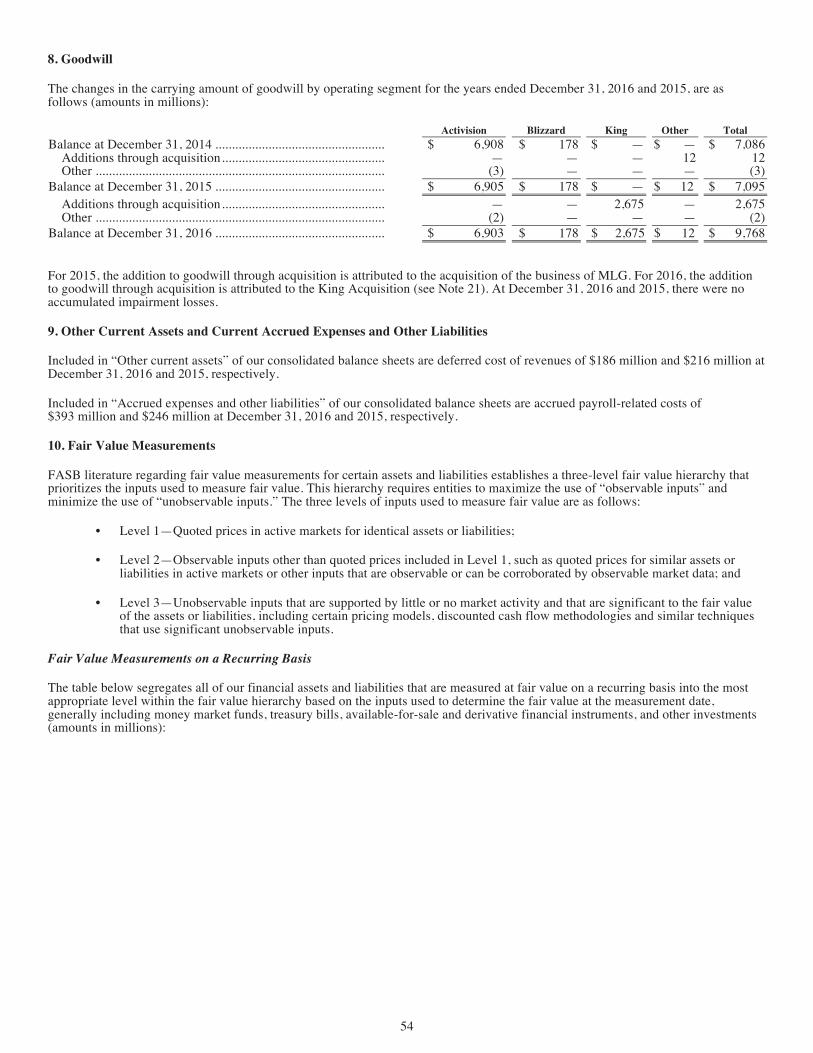
For 2015, the addition to goodwill through acquisition is attributed to the acquisition of the business of MLG. For 2016, the addition to goodwill through acquisition is attributed to the King Acquisition (see Note 21). At December 31, 2016 and 2015, there were no accumulated impairment losses.
9. Other Current Assets and Current Accrued Expenses and Other Liabilities
Included in “Other current assets” of our consolidated balance sheets are deferred cost of revenues of $186 million and $216 million at December 31, 2016 and 2015, respectively.
Included in “Accrued expenses and other liabilities” of our consolidated balance sheets are accrued payroll-related costs of $393 million and $246 million at December 31, 2016 and 2015, respectively.
10. Fair Value Measurements
FASB literature regarding fair value measurements for certain assets and liabilities establishes a three-level fair value hierarchy that prioritizes the inputs used to measure fair value. This hierarchy requires entities to maximize the use of “observable inputs” and minimize the use of “unobservable inputs.” The three levels of inputs used to measure fair value are as follows:
• Level 1—Quoted prices in active markets for identical assets or liabilities;
• Level 2—Observable inputs other than quoted prices included in Level 1, such as quoted prices for similar assets or liabilities in active markets or other inputs that are observable or can be corroborated by observable market data; and
• Level 3—Unobservable inputs that are supported by little or no market activity and that are significant to the fair value of the assets or liabilities, including certain pricing models, discounted cash flow methodologies and similar techniques that use significant unobservable inputs.
Fair Value Measurements on a Recurring Basis
The table below segregates all of our financial assets and liabilities that are measured at fair value on a recurring basis into the most appropriate level within the fair value hierarchy based on the inputs used to determine the fair value at the measurement date, generally including money market funds, treasury bills, available-for-sale and derivative financial instruments, and other investments (amounts in millions):
54
We did not record any impairment charges against our intangible assets for the years ended December 31, 2016, 2015, and 2014.
8. Goodwill
The changes in the carrying amount of goodwill by operating segment for the years ended December 31, 2016 and 2015, are as follows (amounts in millions):
Activision Blizzard King Other Total Balance at December 31, 2014 ......................................................... $ 6,908 $ 178 $ — $ — $ 7,086
Additions through acquisition ....................................................... — — — 12 12 Other ............................................................................................. (3) — — — (3)
Balance at December 31, 2015 ......................................................... $ 6,905 $ 178 $ — $ 12 $ 7,095 Additions through acquisition ....................................................... — — 2,675 — 2,675 Other ............................................................................................. (2) — — — (2)
Balance at December 31, 2016 ......................................................... $ 6,903 $ 178 $ 2,675 12 $ 9,768 $
54
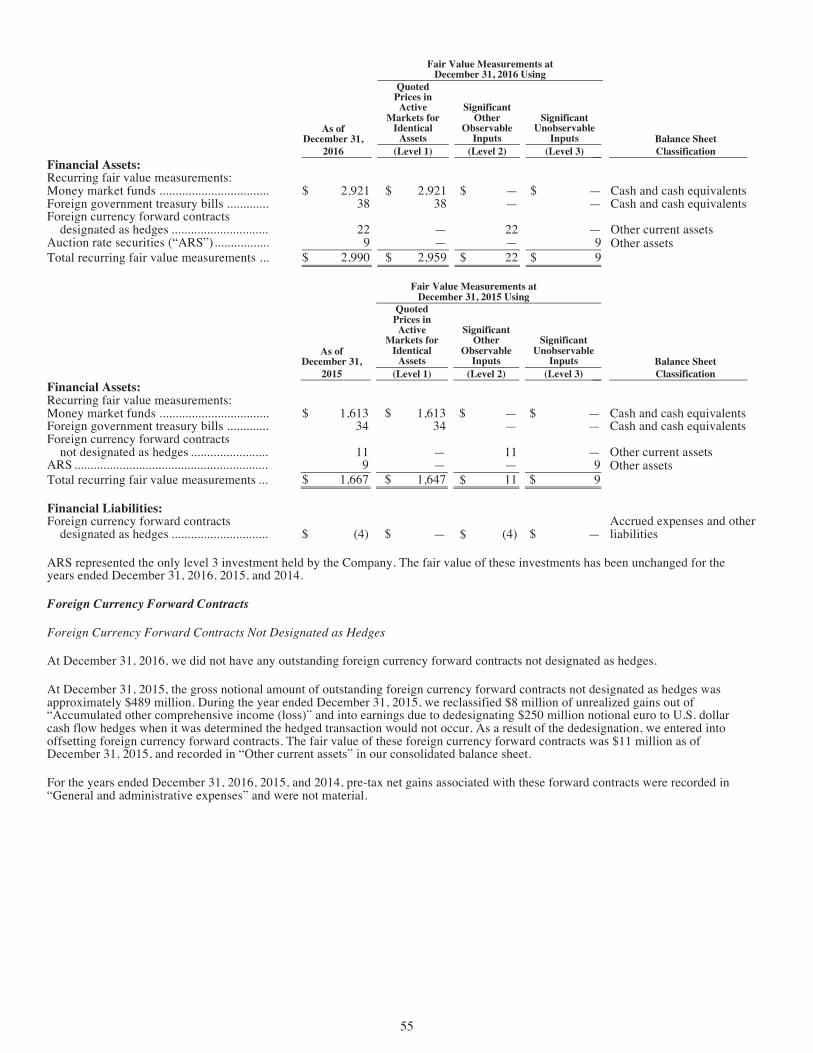
56
Fair Value Measurements at December 31, 2016 Using
As of December 31,
Quoted Prices in Active
Markets for Identical
Assets
Significant Other
Observable Inputs
Significant Unobservable
Inputs Balance Sheet 2016 (Level 1) (Level 2) (Level 3) Classification
Financial Assets: Recurring fair value measurements: Money market funds ..................................... $ 2,921 $ 2,921 $ — $ — Cash and cash equivalents Foreign government treasury bills ................ 38 38 — — Cash and cash equivalents Foreign currency forward contracts
designated as hedges ................................. 22 — 22 — Other current assets Auction rate securities (“ARS”) .................... 9 — — 9 Other assets Total recurring fair value measurements ...... $ 2,990 $ 2,959 $ 22 $ 9
Fair Value Measurements at December 31, 2015 Using
As of December 31,
Quoted Prices in Active
Markets for Identical
Assets
Significant Other
Observable Inputs
Significant Unobservable
Inputs Balance Sheet 2015 (Level 1) (Level 2) (Level 3) Classification
Financial Assets: Recurring fair value measurements: Money market funds ..................................... $ 1,613 1,613 $ — $ — Cash and cash equivalents Foreign government treasury bills ................ 34 34 — — Cash and cash equivalents Foreign currency forward contracts
not designated as hedges ........................... 11 — 11 — Other current assets ARS ............................................................... 9 — — 9 Other assets
$ 1,667 1,647 $ 11 $ 9 Total recurring fair value measurements.......
Financial Liabilities: Foreign currency forward contracts
designated as hedges ................................. $ (4) — (4) $ — Accrued expenses and other liabilities
ARS represented the only level 3 investment held by the Company. The fair value of these investments has been unchanged for the years ended December 31, 2016, 2015, and 2014.
Foreign Currency Forward Contracts
Foreign Currency Forward Contracts Not Designated as Hedges
At December 31, 2016, we did not have any outstanding foreign currency forward contracts not designated as hedges.
At December 31, 2015, the gross notional amount of outstanding foreign currency forward contracts not designated as hedges was approximately $489 million. During the year ended December 31, 2015, we reclassified $8 million of unrealized gains out of “Accumulated other comprehensive income (loss)” and into earnings due to dedesignating $250 million notional euro to U.S. dollar cash flow hedges when it was determined the hedged transaction would not occur. As a result of the dedesignation, we entered into offsetting foreign currency forward contracts. The fair value of these foreign currency forward contracts was $11 million as of December 31, 2015, and recorded in “Other current assets” in our consolidated balance sheet.
For the years ended December 31, 2016, 2015, and 2014, pre-tax net gains associated with these forward contracts were recorded in “General and administrative expenses” and were not material.
Foreign Currency Forward Contracts Designated as Hedges (“Cash Flow Hedges”)
At December 31, 2016, the gross notional amount of outstanding Cash Flow Hedges was approximately $346 million. The fair value of these contracts was $22 million of net unrealized gains with remaining maturities of 12 months or less. Additionally, at December 31, 2016, we had $7 million of net realized but unrecognized gains recorded within “Accumulated other comprehensive income (loss)” associated with contracts that settled during the year but were deferred and will be amortized into earnings along with the associated hedged revenues. Such amounts will be reclassified into earnings within the next twelve months.
At December 31, 2015, the gross notional amount of all outstanding Cash Flow Hedges was approximately $381 million. The fair value of these contracts was $4 million of net unrealized losses as of December 31, 2015.
$
$
$
$
Fair ValDecember 31, 2016 Using
As of December 31,
Quoted Prices in Active
Markets for Identical
Assets
Significant Other
Observable Inputs
2016 (Level 1) (Level 2) Financial Assets: Recurring fair value measurements: Money market funds .....................................$ 2,921 $ 2,921Foreign government treasury bills ................38 38 — Foreign currency forward contracts
designated as hedges .................................22 — 22 Auction rate securities (“ARS”) ....................9 — — Total recurring fair value measurements ......$ 2,990 $ 2,959 $22
Fair Value Measurements at December 31, 2015 Using
As of December 31,
Quoted Prices in Active
Markets for Identical
Assets
Significant Other
Observable Inputs
2015 (Level 1) (Level 2) Financial Assets: Recurring fair value measurements: Money market funds .....................................$ 1,613 1,613Foreign government treasury bills ................34 34 — Foreign currency forward contracts
not designated as hedges ...........................11 — 11 ARS ...............................................................9 — —
$ 1,667 1,647 $11 Total recurring fair value measurements.......
Financial Liabilities: Foreign currency forward contracts
designated as hedges .................................$(4) —(4)
ARS represented the only level years ended December 31, 2016, 2015, and 2014.
Foreign Currency Forward Contracts
Foreign Currency Forward Contracts Not Designated as Hedges
At December
At December 31, 2015, the gross notional amount of outstanding approximately $489 million. During the year ended December 31, 2015, we reclassified $8 “Accumulated other comprehensive income (loss)” and into earnings due to dedesignating $250
December 31, 2015, and recorded in “Other current assets” in our consolidated balance sheet.
For the years ended December 31, 2016, 2015, and 2014, pre-“General and administrative expenses” and were not material.
Foreign Currency Forward Contracts Designated as Hedges (“Cash Flow Hedges”)
At December of these contracts was $22 million of net unrealized gains with remaining maturities of 12 December 31, 2016, we had $7 million of net realized but unrecognized gains recorded within income (loss)” the associated hedged revenues. Such amounts will be reclassified into earnings within the
At December value of these contracts was $4 million of net unrealized losses as of December 31, 2015.
$
$
$
$
55

During the years ended December 31, 2016 and 2015, there was no ineffectiveness relating to our Cash Flow Hedges. During the years ended December 31, 2016 and 2015, the amount of pre-tax net realized gains associated with these contracts that were reclassified out of “Accumulated other comprehensive income (loss)” and into earnings was not material.
Fair Value Measurements on a Non-Recurring Basis
We measure the fair value of certain assets on a non-recurring basis, generally annually or when events or changes in circumstances indicate that the carrying amount of the assets may not be recoverable.
For the years ended December 31, 2016, 2015, and 2014, there were no impairment charges related to assets that are measured on a non-recurring basis.
11. Debt
Credit Facilities
On October 11, 2013, we entered into a credit agreement (the “Credit Agreement”) for a $2.5 billion secured term loan facility maturing in October 2020 (the “Original Term Loan”), and a $250 million secured revolving credit facility (the “Original Revolver”). As of December 31, 2015, as a result of repayments and prepayments during the prior periods, we had $1.9 billion outstanding under the Original Term Loan.
In conjunction with the King Acquisition, we entered into three amendments to the Credit Agreement (the “Amendments”). The Amendments, among other things, provided for an incremental tranche of term loans “A” in an aggregate principal amount of approximately $2.3 billion. The proceeds were provided on February 23, 2016 and were used to fund the King Acquisition. On March 31, 2016, we entered into a fourth amendment to the Credit Agreement which provided for an incremental tranche of term loans “A” in the aggregate principal amount of $250 million (together with the $2.3 billion tranche of term loans “A”, the “Original TLA”); the proceeds from the incremental borrowing were used to make a voluntary prepayment on our Original Term Loan on March 31, 2016. In addition to this prepayment, we made voluntary prepayments on our Original Term Loan of $500 million and $800 million on February 25 and May 26, 2016, respectively.
On August 23, 2016 we entered into a fifth amendment to the Credit Agreement (the “Fifth Amendment”) that provided for a new tranche of term loans “A” of approximately $2.9 billion (the “2016 TLA”) and an amended revolving credit facility of $250 million (the “Revolver” and together with the 2016 TLA, the “Credit Facilities”). The proceeds from the 2016 TLA were primarily used to pay off the remaining outstanding principal balance on the Original Term Loan of $319 million and the Original TLA of $2.5 billion. As a result of the payments to extinguish the Original Term Loan and Original TLA, we wrote-off unamortized discount and deferred financing costs of $10 million, which is included in “Loss on extinguishment of debt” in the consolidated statements of operations. The remaining unamortized discount and deferred financing costs were deferred, along with new fees paid to the 2016 TLA lenders, and will continue to be amortized over the maturity of the 2016 TLA. As a result of the Fifth Amendment, both the 2016 TLA and the Revolver became unsecured loans. As described below, the 2016 TLA was fully prepaid in February 2017. The Revolver is scheduled to nature on August 23, 2021. Debt discounts and deferred financing costs incurred in relation to the Fifth Amendment were not material.
Borrowings under the Revolver may be borrowed, repaid, and re-borrowed by the Company, and are available for working capital and other general corporate purposes. Up to $50 million of the Revolver may be used for letters of credit. To date, we have not drawn on the Revolver. Borrowings under the 2016 TLA and the Revolver will bear interest, at the Company’s option, at either (a) a base rate equal to the highest of (i) the federal funds rate, plus 0.5%, (ii) the prime commercial lending rate of Bank of America, N.A. and (iii) the London Interbank Offered Rate (“LIBOR”) for an interest period of one month beginning on such day plus 1.00%, or (b) LIBOR, in each case, plus an applicable interest margin. LIBOR will be subject to a floor of 0% and the base rate will be subject to an effective floor of 1.00%. The applicable interest margin for borrowings under the 2016 TLA and Revolver will range from 1.125% to 2.00% for LIBOR borrowings and from 0.125% to 1.00% for base rate borrowings and will be determined by reference to a pricing grid based on the Company’s credit ratings. At December 31, 2016, the 2016 TLA bore interest at 2.02%.
The Credit Agreement requires quarterly principal payments of 0.625% of the stated principal amount of the 2016 TLA commencing on September 30, 2016, with increases to 1.250% starting on September 30, 2019 and 3.125% starting on September 30, 2020, with the remaining balance payable on the 2016 TLA’s scheduled maturity date of August 23, 2021. On September 30, 2016, in addition to the required quarterly repayment of $18 million, we made a voluntary prepayment on our 2016 TLA of $167 million. These payments satisfied the required quarterly principal repayments through December 31, 2018.
The Company is subject to a financial covenant requiring the Company’s Consolidated Total Net Debt Ratio (as defined in the Credit Agreement) not to exceed (i) 4.00:1.00 on or prior to March 31, 2017, and (ii) thereafter, 3.50:1.00. The Fifth Amendment contains other covenants that are customary for issuers with similar credit ratings. A violation of any of these covenants could result in an event
56
For the years ended December 31, 2016, 2015, and 2014, pre-tax net gains associated with these forward contracts were recorded in “General and administrative expenses” and were not material.
Foreign Currency Forward Contracts Designated as Hedges (“Cash Flow Hedges”)
At December 31, 2016, the gross notional amount of outstanding Cash Flow Hedges was approximately $346 million. The fair value of these contracts was $22 million of net unrealized gains with remaining maturities of 12 months or less. Additionally, at December 31, 2016, we had $7 million of net realized but unrecognized gains recorded within “Accumulated other comprehensive income (loss)” associated with contracts that settled during the year but were deferred and will be amortized into earnings along with the associated hedged revenues. Such amounts will be reclassified into earnings within the next twelve months.
At December 31, 2015, the gross notional amount of all outstanding Cash Flow Hedges was approximately $381 million. The fair value of these contracts was $4 million of net unrealized losses as of December 31, 2015.
56

As of December 31, 2016, the Credit Facilities were guaranteed by certain of our U.S. subsidiaries, whose assets represented approximately 67% of our consolidated assets.
On February 3, 2017, we entered into a sixth amendment to our Credit Agreement. The amendment (i) provided for a new tranche of term loans “A” in an aggregate principal amount of $2.55 billion (the “2017 TLA”) and (ii) released each of our subsidiary guarantors from their respective guarantee provided under the Credit Agreement. All proceeds of the 2017 TLA, together with additional cash funds on hand, were used to fully prepay the 2016 TLA outstanding under the Credit Agreement immediately prior to the effectiveness of the sixth amendment, together with all accrued and unpaid interest thereon. The terms of the 2017 TLA, other than the absence of guarantees, are generally the same as the terms of the 2016 TLA.
On February 2, 2017, our Board of Directors authorized repayments of up to $500 million of the company’s outstanding debt during 2017. During February 2017, we made voluntary prepayments on our term loans of $500 million, inclusive of $139 million used to fully prepay the 2016 TLA as discussed above. The voluntary prepayment satisfied the remaining required quarterly principal repayments for the entire term of the Credit Agreement.
Unsecured Senior Notes
On September 19, 2013, we issued, at par, $1.5 billion of 5.625% unsecured senior notes due September 2021 (the “Original 2021 Notes”) and $750 million of 6.125% unsecured senior notes due September 2023 (the “2023 Notes” and, together with the Original 2021 Notes, the “Notes”) in a private offering to qualified institutional buyers made in accordance with Rule 144A under the Securities Act of 1933, as amended (the “Securities Act”).
The Original 2021 Notes became eligible for redemption on September 15, 2016 (and, as described below, were redeemed on October 19, 2016). We may redeem the 2023 Notes on or after September 15, 2018, in whole or in part on any one or more occasions, at specified redemption prices, plus accrued and unpaid interest. In addition, we may redeem some or all of the 2023 Notes prior to September 15, 2018, at a price equal to 100% of the aggregate principal amount thereof plus a “make-whole premium” and accrued and unpaid interest. Further, upon the occurrence of one or more qualified equity offerings, we may also redeem up to 35% of the aggregate principal amount of the 2023 Notes outstanding with the net cash proceeds from such offerings.
On September 19, 2016, we issued $650 million of 2.3% unsecured senior notes due September 2021 (the “New 2021 Notes”) and $850 million of 3.4% unsecured senior notes due September 2026 (the “2026 Notes” and, together with the New 2021 Notes, the “New Notes”) in a private offering made in accordance with Rule 144A and Regulation S under the Securities Act.
In connection with the issuance of the New Notes, we entered into a registration rights agreement (the “Registration Rights Agreement”), among the Company, the subsidiary guarantors, and the representatives of the initial purchasers of the New Notes. Under the Registration Rights Agreement, we are required to use commercially reasonable efforts to within one year of the issue date of the New Notes, among other things, (1) file a registration statement with respect to an offer to exchange each series of the New Notes for new notes that are substantially identical in all material respects, (except for the provisions relating to the transfer restrictions and payment of additional interest) and (2) cause the registration statement to be declared effective by the SEC under the Securities Act.
We may redeem some or all of the New 2021 Notes prior to August 15, 2021 and some or all of the 2026 Notes prior to June 15, 2026, in each case at a price equal to 100% of the aggregate principal amount thereof plus a “make-whole” premium and accrued and unpaid interest. In addition, we may redeem the New 2021 Notes on or after August 15, 2021, and the 2026 Notes on or after June 15, 2026, in each case in whole or in part on any one or more occasions and at a price equal to 100% of the aggregate principal amount thereof plus accrued and unpaid interest.
Upon the occurrence of certain change of control events, we will be required to offer to repurchase the 2023 Notes and New Notes at a purchase price equal to 101% of the principal amount thereof, plus accrued and unpaid interest. These repurchase requirements are considered clearly and closely related to the 2023 Notes and New Notes and are not accounted for separately upon issuance.
The 2023 Notes and New Notes are general senior obligations of the Company and rank pari passu in right of payment to all of the Company’s existing and future senior indebtedness, including the Credit Facilities described above. As of December 31, 2016, the 2023 Notes and New Notes were guaranteed on a senior basis by certain of our U.S. subsidiaries. Pursuant to the terms of the indentures underlying the 2023 Notes and New Notes, the guarantees by certain subsidiaries were automatically released when the 2017 TLA guarantees were removed in connection with the sixth amendment to the Credit Agreement. The 2023 Notes and New Notes are not secured and are effectively subordinated to any of the Company’s existing and future indebtedness that is secured.
On October 19, 2016, we redeemed the Original 2021 Notes in full for $1.6 billion, which resulted in a loss on extinguishment of approximately $82 million, comprised of a premium payment of $63 million and write off of unamortized discount and financing costs of $19 million. This loss is included in “Loss on extinguishment of debt” in the consolidated statements of operations.
The 2023 Notes contain customary covenants that place restrictions in certain circumstances on, among other things, the incurrence of debt, granting of liens, payment of dividends, sales of assets, and certain merger and consolidation transactions. The New Notes
57
on September 30, 2016, with increases to 1.250% starting on September 30, 2019 and 3.125% starting on September 30, 2020, with the remaining balance payable on the 2016 TLA’s scheduled maturity date of August 23, 2021. On September 30, 2016, in addition to the required quarterly repayment of $18 million, we made a voluntary prepayment on our 2016 TLA of $167 million. These payments satisfied the required quarterly principal repayments through December 31, 2018.
The Company is subject to a financial covenant requiring the Company’s Consolidated Total Net Debt Ratio (as defined in the Credit Agreement) not to exceed (i) 4.00:1.00 on or prior to March 31, 2017, and (ii) thereafter, 3.50:1.00. The Fifth Amendment contains other covenants that are customary for issuers with similar credit ratings. A violation of any of these covenants could result in an event of default under the Credit Agreement. Upon the occurrence of an event of default, payment of any outstanding amounts under the Credit Agreement may be accelerated, and the lenders’ commitments to extend credit under the Credit Agreement may be terminated. In addition, an event of default under the Credit Agreement could, under certain circumstances, permit the holders of other outstanding unsecured debt, including the debt holders described below, to accelerate the repayment of such obligations. The Company was in compliance with the terms of the Credit Facilities as of December 31, 2016.
57
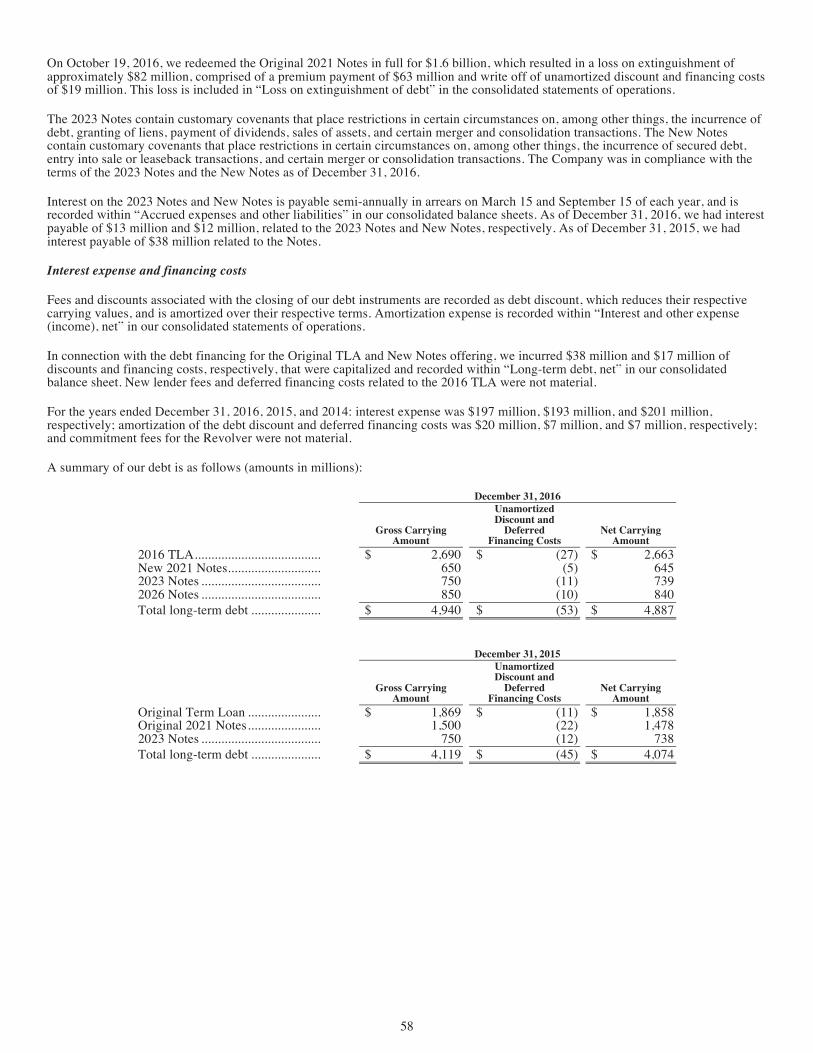
Interest on the 2023 Notes and New Notes is payable semi-annually in arrears on March 15 and September 15 of each year, and is recorded within “Accrued expenses and other liabilities” in our consolidated balance sheets. As of December 31, 2016, we had interest payable of $13 million and $12 million, related to the 2023 Notes and New Notes, respectively. As of December 31, 2015, we had interest payable of $38 million related to the Notes.
Interest expense and financing costs
Fees and discounts associated with the closing of our debt instruments are recorded as debt discount, which reduces their respective carrying values, and is amortized over their respective terms. Amortization expense is recorded within “Interest and other expense (income), net” in our consolidated statements of operations.
In connection with the debt financing for the Original TLA and New Notes offering, we incurred $38 million and $17 million of discounts and financing costs, respectively, that were capitalized and recorded within “Long-term debt, net” in our consolidated balance sheet. New lender fees and deferred financing costs related to the 2016 TLA were not material.
For the years ended December 31, 2016, 2015, and 2014: interest expense was $197 million, $193 million, and $201 million, respectively; amortization of the debt discount and deferred financing costs was $20 million, $7 million, and $7 million, respectively; and commitment fees for the Revolver were not material.
A summary of our debt is as follows (amounts in millions):
December 31, 2016
Gross Carrying
Amount
Unamortized Discount and
Deferred Financing Costs
Net Carrying Amount
2016 TLA .................................................... $ 2,690 $ (27) $ 2,663 New 2021 Notes .......................................... 650 (5) 645 2023 Notes .................................................. 750 (11) 739 2026 Notes .................................................. 850 (10) 840 Total long-term debt ................................... $ 4,940 $ (53) $ 4,887
December 31, 2015
Gross Carrying
Amount
Unamortized Discount and
Deferred Financing Costs
Net Carrying Amount
Original Term Loan .................................... $ 1,869 $ (11) $ 1,858 Original 2021 Notes .................................... 1,500 (22) 1,478 2023 Notes .................................................. 750 (12) 738 Total long-term debt ................................... $ 4,119 $ (45) $ 4,074
As of December 31, 2016, without consideration to the voluntary prepayments made in February 2017, as discussed above, the scheduled maturities and contractual principal repayments of our debt for each of the five succeeding years are as follows (amounts in millions):
For the year ending December 31, 2017 ................................................................................................................................................ $ — 2018 ................................................................................................................................................ — 2019 ................................................................................................................................................ 103 2020 ................................................................................................................................................ 252 2021 ................................................................................................................................................ 2,985 Thereafter ....................................................................................................................................... 1,600
Total ........................................................................................................................................... $ 4,940
As of December 31, 2016 and 2015, the carrying values of the 2016 TLA and the Original Term Loan approximate their fair value, based on Level 2 inputs (observable market prices in less than active markets), as the interest rate is variable over the selected interest period and is similar to current rates at which we can borrow funds. Based on Level 2 inputs, the fair values of the 2023 Notes, New 2021 Notes, and 2026 Notes were $818 million, $635 million, and $808 million, respectively, as of December 31, 2016. Based on Level 2 inputs, the fair values of the Original 2021 Notes and 2023 Notes were $1,571 million and $795 million, respectively, as of December 31, 2015.
58
2023 Notes and New Notes were guaranteed on a senior basis by certain of our U.S. subsidiaries. Pursuant to the terms of the indentures underlying the 2023 Notes and New Notes, the guarantees by certain subsidiaries were automatically released when the 2017 TLA guarantees were removed in connection with the sixth amendment to the Credit Agreement. The 2023 Notes and New Notes are not secured and are effectively subordinated to any of the Company’s existing and future indebtedness that is secured.
On October 19, 2016, we redeemed the Original 2021 Notes in full for $1.6 billion, which resulted in a loss on extinguishment of approximately $82 million, comprised of a premium payment of $63 million and write off of unamortized discount and financing costs of $19 million. This loss is included in “Loss on extinguishment of debt” in the consolidated statements of operations.
The 2023 Notes contain customary covenants that place restrictions in certain circumstances on, among other things, the incurrence of debt, granting of liens, payment of dividends, sales of assets, and certain merger and consolidation transactions. The New Notes contain customary covenants that place restrictions in certain circumstances on, among other things, the incurrence of secured debt, entry into sale or leaseback transactions, and certain merger or consolidation transactions. The Company was in compliance with the terms of the 2023 Notes and the New Notes as of December 31, 2016.
58

12. Accumulated Other Comprehensive Income (Loss)
The components of accumulated other comprehensive income (loss) at December 31, 2016 and 2015, were as follows (amounts in millions):
For the Year Ended December 31, 2016
Foreign currency translation
adjustments
Unrealized gain (loss)
on available-for- sale securities
Unrealized gain (loss)
on forward contracts Total
Balance at December 31, 2015 ........................................... $ (630) $ 1 $ (4) $ (633)Other comprehensive income (loss) before reclassifications (29) — 37 8Amounts reclassified from accumulated other
comprehensive income (loss) into earnings ............... — — (4) (4)Balance at December 31, 2016 ........................................... $ (659) $ 1 $ 29 $ (629)
For the Year Ended December 31, 2015
Foreign currency translation
adjustments
Unrealized gain (loss)
on available-for- sale securities
Unrealized gain (loss)
on forward contracts Total
Balance at December 31, 2014 ........................................... $ (304) $ 1 $ — $ (303)Other comprehensive income (loss) before reclassifications (326) 1 10 (315) Amounts reclassified from accumulated other
comprehensive income (loss) into earnings ............... — (1) (14) (15) Balance at December 31, 2015 ........................................... $ (630) $ 1 $ (4) $ (633)
Income taxes were not provided for foreign currency translation items as these are considered indefinite investments in non-U.S. subsidiaries.
13. Operating Segments and Geographic Region
Currently, we have three reportable operating segments. Our operating segments are consistent with the manner in which our operations are reviewed and managed by our Chief Executive Officer, who is our chief operating decision maker (“CODM”). The CODM reviews segment performance exclusive of: the impact of the change in deferred revenues and related cost of revenues with respect to certain of our online-enabled games; share-based compensation expense; amortization of intangible assets as a result of purchase price accounting; and fees and other expenses (including legal fees, expenses and accruals) related to acquisitions, associated integration activities, and financings. The CODM does not review any information regarding total assets on an operating segment basis, and accordingly, no disclosure is made with respect thereto.
Our operating segments are also consistent with our internal organization structure, the way we assess operating performance and allocate resources, and the availability of separate financial information. We do not aggregate operating segments.
Information on the operating segments and reconciliations of total segment net revenues and total segment operating income to consolidated net revenues from external customers and consolidated income before income tax expense for the years ended December 31, 2016, 2015 and 2014 are presented below (amounts in millions):
Years Ended December 31, 2016 2015 2014 2016 2015 2014
59
.................................... Original 2021 Notes .................................... 1,500 (22) 1,478 2023 Notes .................................................. 750 (12) 738 Total long-term debt ................................... $ 4,119 $ (45) $ 4,074
As of December 31, 2016, without consideration to the voluntary prepayments made in February 2017, as discussed above, the scheduled maturities and contractual principal repayments of our debt for each of the five succeeding years are as follows (amounts in millions):
For the year ending December 31, 2017 ................................................................................................................................................ $ — 2018 ................................................................................................................................................ — 2019 ................................................................................................................................................ 103 2020 ................................................................................................................................................ 252 2021 ................................................................................................................................................ 2,985 Thereafter ....................................................................................................................................... 1,600
Total ........................................................................................................................................... $ 4,940
As of December 31, 2016 and 2015, the carrying values of the 2016 TLA and the Original Term Loan approximate their fair value, based on Level 2 inputs (observable market prices in less than active markets), as the interest rate is variable over the selected interest period and is similar to current rates at which we can borrow funds. Based on Level 2 inputs, the fair values of the 2023 Notes, New 2021 Notes, and 2026 Notes were $818 million, $635 million, and $808 million, respectively, as of December 31, 2016. Based on Level 2 inputs, the fair values of the Original 2021 Notes and 2023 Notes were $1,571 million and $795 million, respectively, as of December 31, 2015.
12. Accumulated Other Comprehensive Income (Loss)
The components of accumulated other comprehensive income (loss) at December 31, 2016 and 2015, were as follows (amounts in millions):
For the Year Ended December 31, 2016
Foreign currency translation
adjustments
Unrealized gain (loss)
on available-for- sale securities
Unrealized gain (loss)
on forward contracts Total
Balance at December 31, 2015 ........................................... $ (630) $ 1 $ (4) $ (633)Other comprehensive income (loss) before reclassifications (29) — 37 8Amounts reclassified from accumulated other
comprehensive income (loss) into earnings ............... — — (4) (4)Balance at December 31, 2016 ........................................... $ (659) $ 1 $ 29 $ (629)
For the Year Ended December 31, 2015
Foreign currency translation
adjustments
Unrealized gain (loss)
on available-for- sale securities
Unrealized gain (loss)
on forward contracts Total
Balance at December 31, 2014 ........................................... $ (304) $ 1 $ — $ (303)Other comprehensive income (loss) before reclassifications (326) 1 10 (315) Amounts reclassified from accumulated other
comprehensive income (loss) into earnings ............... — (1) (14) (15) Balance at December 31, 2015 ........................................... $ (630) $ 1 $ (4) $ (633)
Income taxes were not provided for foreign currency translation items as these are considered indefinite investments in non-U.S. subsidiaries.
13. Operating Segments and Geographic Region
Currently, we have three reportable operating segments. Our operating segments are consistent with the manner in which our operations are reviewed and managed by our Chief Executive Officer, who is our chief operating decision maker (“CODM”). The CODM reviews segment performance exclusive of: the impact of the change in deferred revenues and related cost of revenues with respect to certain of our online-enabled games; share-based compensation expense; amortization of intangible assets as a result of purchase price accounting; and fees and other expenses (including legal fees, expenses and accruals) related to acquisitions, associated integration activities, and financings. The CODM does not review any information regarding total assets on an operating segment basis, and accordingly, no disclosure is made with respect thereto.
Our operating segments are also consistent with our internal organization structure, the way we assess operating performance and allocate resources, and the availability of separate financial information. We do not aggregate operating segments.
Information on the operating segments and reconciliations of total segment net revenues and total segment operating income to consolidated net revenues from external customers and consolidated income before income tax expense for the years ended December 31, 2016, 2015 and 2014 are presented below (amounts in millions):
Years Ended December 31, 2016 2015 2014 2016 2015 2014
Operating income
12. Accumulated Other Comprehensive Income (Loss)
The components of accumulated other comprehensive income (loss) at December 31, 2016 and 2015, were as follows (amounts in millions):
For the Year Ended December 31, 2016
Foreign currency translation
adjustments
Unrealized gain (loss)
on available-for- sale securities
Unrealized gain (loss)
on forward contracts Total
Balance at December 31, 2015 ........................................... $ (630) $ 1 $ (4) $ (633)(29) — 37 8Other comprehensive income (loss) before
reclassifications ....................................................... Amounts reclassified from accumulated other — — (4) (4)
$ (659) $ 1 $ 29 $ (629)
For the Year Ended December 31, 2015
Foreign currency translation
adjustments
Unrealized gain (loss)
on available-for- sale securities
Unrealized gain (loss)
on forward contracts Total
Balance at December 31, 2014 ........................................... $ 1 $ — $ (303)(304) $(326) 1 10 (315)
......................................................... — (1) (14) (15)
Balance at December 31, 2015 ........................................... $ (630) $ 1 $ (4) $ (633)
Income taxes were not provided for foreign currency translation items as these are considered indefinite investments in non-U.S. subsidiaries.
13. Operating Segments and Geographic Region
Currently, we have three reportable operating segments. Our operating segments are consistent with the manner in which our operations are reviewed and managed by our Chief Executive Officer, who is our chief operating decision maker (“CODM”). The CODM reviews segment performance exclusive of: the impact of the change in deferred revenues and related cost of revenues with respect to certain of our online-enabled games; share-based compensation expense; amortization of intangible assets as a result of purchase price accounting; and fees and other expenses (including legal fees, expenses and accruals) related to acquisitions, associated integration activities, and financings. The CODM does not review any information regarding total assets on an operating segment basis, and accordingly, no disclosure is made with respect thereto.
Our operating segments are also consistent with our internal organization structure, the way we assess operating performance and allocate resources, and the availability of separate financial information. We do not aggregate operating segments.
Information on the operating segments and reconciliations of total segment net revenues and total segment operating income to consolidated net revenues from external customers and consolidated income before income tax expense for the years ended
Years Ended December 31, 2016 2015 2014 2016 2015 2014
Operating income and income before income
Balance at December 31, 2016 ........................................... comprehensive income (loss) into earnings ...............
comprehensive income (loss) into earnings ...............
12. Accumulated Other Comprehensive Income (Loss)
The components of accumulated other comprehensive income (loss) at December 31, 2016 and 2015, were as follows (amounts in millions):
For the Year Ended December 31, 2016
Foreign currency translation
adjustments
Unrealized gain (loss)
on available-for- sale securities
Unrealized gain (loss)
on forward contracts Total
Balance at December 31, 2015 ........................................... $ (630) $ 1 $ (4) $ (633)Other comprehensive income (loss) before reclassifications (29) — 37 8Amounts reclassified from accumulated other
comprehensive income (loss) into earnings ............... — — (4) (4)Balance at December 31, 2016 ........................................... $ (659) $ 1 $ 29 $ (629)
For the Year Ended December 31, 2015
Foreign currency translation
adjustments
Unrealized gain (loss)
on available-for- sale securities
Unrealized gain (loss)
on forward contracts Total
Balance at December 31, 2014 ........................................... $ (304) $ 1 $ — $ (303)Other comprehensive income (loss) before reclassifications (326) 1 10 (315) Amounts reclassified from accumulated other
comprehensive income (loss) into earnings ............... — (1) (14) (15) Balance at December 31, 2015 ........................................... $ (630) $ 1 $ (4) $ (633)
Income taxes were not provided for foreign currency translation items as these are considered indefinite investments in non-U.S. subsidiaries.
13. Operating Segments and Geographic Region
Currently, we have three reportable operating segments. Our operating segments are consistent with the manner in which our operations are reviewed and managed by our Chief Executive Officer, who is our chief operating decision maker (“CODM”). The CODM reviews segment performance exclusive of: the impact of the change in deferred revenues and related cost of revenues with respect to certain of our online-enabled games; share-based compensation expense; amortization of intangible assets as a result of purchase price accounting; and fees and other expenses (including legal fees, expenses and accruals) related to acquisitions, associated integration activities, and financings. The CODM does not review any information regarding total assets on an operating segment basis, and accordingly, no disclosure is made with respect thereto.
Our operating segments are also consistent with our internal organization structure, the way we assess operating performance and allocate resources, and the availability of separate financial information. We do not aggregate operating segments.
Information on the operating segments and reconciliations of total segment net revenues and total segment operating income to consolidated net revenues from external customers and consolidated income before income tax expense for the years ended December 31, 2016, 2015 and 2014 are presented below (amounts in millions):
Years Ended December 31, 2016 2015 2014 2016 2015 2014
Net revenues
Operating income and income before income
tax expense
12. Accumulated Other Comprehensive Income (Loss)
The components of accumulated other comprehensive income (loss) at December 31, 2016 and 2015, were as follows (amounts in millions):
For the Year Ended December 31, 2016
Foreign currency translation
adjustments
Unrealized gain (loss)
on available-for- sale securities
Unrealized gain (loss)
on forward contracts Total
Balance at December 31, 2015 ........................................... $ (630) $ 1 $ (4) $ (633)(29) — 37 8Other comprehensive income (loss) before
reclassifications ....................................................... Amounts reclassified from accumulated other — — (4) (4)
$ (659) $ 1 $ 29 $ (629)
For the Year Ended December 31, 2015
Foreign currency translation
adjustments
Unrealized gain (loss)
on available-for- sale securities
Unrealized gain (loss)
on forward contracts Total
Balance at December 31, 2014 ........................................... $ 1 $ — $ (303)(304) $(326) 1 10 (315)
......................................................... — (1) (14) (15)
Balance at December 31, 2015 ........................................... $ (630) $ 1 $ (4) $ (633)
Income taxes were not provided for foreign currency translation items as these are considered indefinite investments in non-U.S. subsidiaries.
13. Operating Segments and Geographic Region
Currently, we have three reportable operating segments. Our operating segments are consistent with the manner in which our operations are reviewed and managed by our Chief Executive Officer, who is our chief operating decision maker (“CODM”). The CODM reviews segment performance exclusive of: the impact of the change in deferred revenues and related cost of revenues with respect to certain of our online-enabled games; share-based compensation expense; amortization of intangible assets as a result of purchase price accounting; and fees and other expenses (including legal fees, expenses and accruals) related to acquisitions, associated integration activities, and financings. The CODM does not review any information regarding total assets on an operating segment basis, and accordingly, no disclosure is made with respect thereto.
Our operating segments are also consistent with our internal organization structure, the way we assess operating performance and allocate resources, and the availability of separate financial information. We do not aggregate operating segments.
Information on the operating segments and reconciliations of total segment net revenues and total segment operating income to consolidated net revenues from external customers and consolidated income before income tax expense for the years ended December 31, 2016, 2015 and 2014 are presented below (amounts in millions):
Years Ended December 31, 2016 2015 2014 2016 2015 2014
Net revenues
Operating income and income before income
tax expense
Balance at December 31, 2016 ........................................... comprehensive income (loss) into earnings ...............
comprehensive income (loss) into earnings ...............
12. Accumulated Other Comprehensive Income (Loss)
The components of accumulated other comprehensive income (loss) at December 31, 2016 and 2015, were as follows (amounts in millions):
For the Year Ended December 31, 2016
Foreign currency translation
adjustments
Unrealized gain (loss)
on available-for- sale securities
Unrealized gain (loss)
on forward contracts Total
Balance at December 31, 2015 ........................................... $ (630) $ 1 $ (4) $ (633)Other comprehensive income (loss) before reclassifications (29) — 37 8Amounts reclassified from accumulated other
comprehensive income (loss) into earnings ............... — — (4) (4)Balance at December 31, 2016 ........................................... $ (659) $ 1 $ 29 $ (629)
For the Year Ended December 31, 2015
Foreign currency translation
adjustments
Unrealized gain (loss)
on available-for- sale securities
Unrealized gain (loss)
on forward contracts Total
Balance at December 31, 2014 ........................................... $ (304) $ 1 $ — $ (303)Other comprehensive income (loss) before reclassifications (326) 1 10 (315) Amounts reclassified from accumulated other
comprehensive income (loss) into earnings ............... — (1) (14) (15) Balance at December 31, 2015 ........................................... $ (630) $ 1 $ (4) $ (633)
Income taxes were not provided for foreign currency translation items as these are considered indefinite investments in non-U.S. subsidiaries.
13. Operating Segments and Geographic Region
Currently, we have three reportable operating segments. Our operating segments are consistent with the manner in which our operations are reviewed and managed by our Chief Executive Officer, who is our chief operating decision maker (“CODM”). The CODM reviews segment performance exclusive of: the impact of the change in deferred revenues and related cost of revenues with respect to certain of our online-enabled games; share-based compensation expense; amortization of intangible assets as a result of purchase price accounting; and fees and other expenses (including legal fees, expenses and accruals) related to acquisitions, associated integration activities, and financings. The CODM does not review any information regarding total assets on an operating segment basis, and accordingly, no disclosure is made with respect thereto.
Our operating segments are also consistent with our internal organization structure, the way we assess operating performance and allocate resources, and the availability of separate financial information. We do not aggregate operating segments.
Information on the operating segments and reconciliations of total segment net revenues and total segment operating income to consolidated net revenues from external customers and consolidated income before income tax expense for the years ended December 31, 2016, 2015 and 2014 are presented below (amounts in millions):
Years Ended December 31, 2016 2015 2014 2016 2015 2014
Operating income and income before income
12. Accumulated Other Comprehensive Income (Loss)
The components of accumulated other comprehensive income (loss) at December 31, 2016 and 2015, were as follows (amounts in millions):
For the Year Ended December 31, 2016
Foreign currency translation
adjustments
Unrealized gain (loss)
on available-for- sale securities
Unrealized gain (loss)
on forward contracts Total
Balance at December 31, 2015 ........................................... $ (630) $ 1 $ (4) $ (633)Other comprehensive income (loss) before reclassifications (29) — 37 8Amounts reclassified from accumulated other
comprehensive income (loss) into earnings ............... — — (4) (4)Balance at December 31, 2016 ........................................... $ (659) $ 1 $ 29 $ (629)
For the Year Ended December 31, 2015
Foreign currency translation
adjustments
Unrealized gain (loss)
on available-for- sale securities
Unrealized gain (loss)
on forward contracts Total
Balance at December 31, 2014 ........................................... $ (304) $ 1 $ — $ (303)Other comprehensive income (loss) before reclassifications (326) 1 10 (315) Amounts reclassified from accumulated other
comprehensive income (loss) into earnings ............... — (1) (14) (15) Balance at December 31, 2015 ........................................... $ (630) $ 1 $ (4) $ (633)
Income taxes were not provided for foreign currency translation items as these are considered indefinite investments in non-U.S. subsidiaries.
13. Operating Segments and Geographic Region
Currently, we have three reportable operating segments. Our operating segments are consistent with the manner in which our operations are reviewed and managed by our Chief Executive Officer, who is our chief operating decision maker (“CODM”). The CODM reviews segment performance exclusive of: the impact of the change in deferred revenues and related cost of revenues with respect to certain of our online-enabled games; share-based compensation expense; amortization of intangible assets as a result of purchase price accounting; and fees and other expenses (including legal fees, expenses and accruals) related to acquisitions, associated integration activities, and financings. The CODM does not review any information regarding total assets on an operating segment basis, and accordingly, no disclosure is made with respect thereto.
Our operating segments are also consistent with our internal organization structure, the way we assess operating performance and allocate resources, and the availability of separate financial information. We do not aggregate operating segments.
Information on the operating segments and reconciliations of total segment net revenues and total segment operating income to consolidated net revenues from external customers and consolidated income before income tax expense for the years ended December 31, 2016, 2015 and 2014 are presented below (amounts in millions):
Years Ended December 31, 2016 2015 2014 2016 2015 2014
Net revenues
Operating income and income before income
tax expense Activision ................................................................................... $ 2,220 $ 2,700 $ 2,686 $ 788 $ 868 $ 762 Blizzard ...................................................................................... 2,428 1,565 1,720 1,013 561 756 King ............................................................................................ 1,586 — — 537 — —
Reportable segments total ...................................................... 6,234 4,265 4,406 2,338 1,429 1,518 Reconciliation to consolidated net revenues / consolidated
income before income tax expense: Other segments(1) .................................................................. 365 356 407 (4) 37 9 Net effect from recognition (deferral) of deferred net
and related cost of revenues ................................ 9 43 (405) (10) (39) (215)Share-based compensation expense ....................................... — — — (159) (92) (104)
12. Accumulated Other Comprehensive Income (Loss)
The components of accumulated other comprehensive income (loss) at December 31, 2016 and 2015, were as follows (amounts in millions):
For the Year Ended December 31, 2016
Foreign currency translation
adjustments
Unrealized gain (loss)
on available-for- sale securities
Unrealized gain (loss)
on forward contracts Total
Balance at December 31, 2015 ........................................... $ (630) $ 1 $ (4) $ (633)(29) — 37 8Other comprehensive income (loss) before
reclassifications ....................................................... Amounts reclassified from accumulated other — — (4) (4)
$ (659) $ 1 $ 29 $ (629)
For the Year Ended December 31, 2015
Foreign currency translation
adjustments
Unrealized gain (loss)
on available-for- sale securities
Unrealized gain (loss)
on forward contracts Total
Balance at December 31, 2014 ........................................... $ 1 $ — $ (303)(304) $(326) 1 10 (315)
......................................................... — (1) (14) (15)
Balance at December 31, 2015 ........................................... $ (630) $ 1 $ (4) $ (633)
Income taxes were not provided for foreign currency translation items as these are considered indefinite investments in non-U.S. subsidiaries.
13. Operating Segments and Geographic Region
Currently, we have three reportable operating segments. Our operating segments are consistent with the manner in which our operations are reviewed and managed by our Chief Executive Officer, who is our chief operating decision maker (“CODM”). The CODM reviews segment performance exclusive of: the impact of the change in deferred revenues and related cost of revenues with respect to certain of our online-enabled games; share-based compensation expense; amortization of intangible assets as a result of purchase price accounting; and fees and other expenses (including legal fees, expenses and accruals) related to acquisitions, associated integration activities, and financings. The CODM does not review any information regarding total assets on an operating segment basis, and accordingly, no disclosure is made with respect thereto.
Our operating segments are also consistent with our internal organization structure, the way we assess operating performance and allocate resources, and the availability of separate financial information. We do not aggregate operating segments.
Information on the operating segments and reconciliations of total segment net revenues and total segment operating income to consolidated net revenues from external customers and consolidated income before income tax expense for the years ended December 31, 2016, 2015 and 2014 are presented below (amounts in millions):
Years Ended December 31, 2016 2015 2014 2016 2015 2014
Net revenues
Operating income and income before income
tax expense
Balance at December 31, 2016 ........................................... comprehensive income (loss) into earnings ...............
comprehensive income (loss) into earnings ...............
59
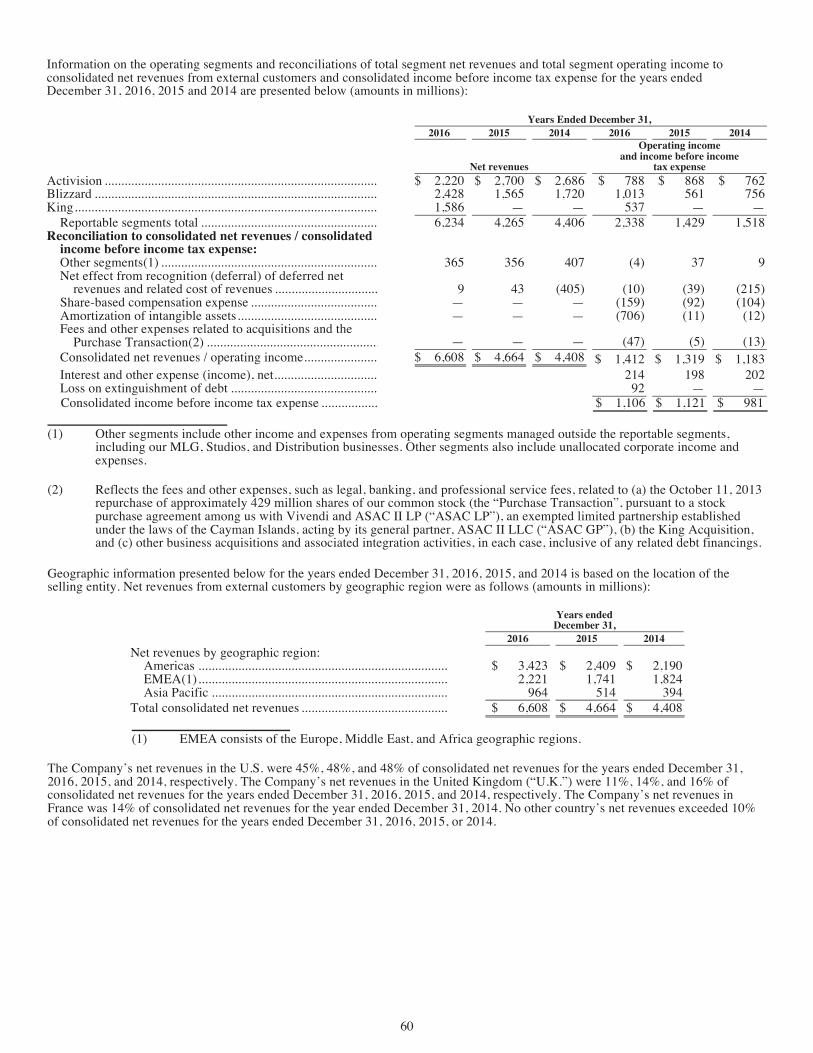
Consolidated income before income tax expense .................. $ 1,106 $ 1,121 $ 981
(1) Other segments include other income and expenses from operating segments managed outside the reportable segments,
including our MLG, Studios, and Distribution businesses. Other segments also include unallocated corporate income and expenses.
(2) Reflects the fees and other expenses, such as legal, banking, and professional service fees, related to (a) the October 11, 2013 repurchase of approximately 429 million shares of our common stock (the “Purchase Transaction”, pursuant to a stock purchase agreement among us with Vivendi and ASAC II LP (“ASAC LP”), an exempted limited partnership established under the laws of the Cayman Islands, acting by its general partner, ASAC II LLC (“ASAC GP”), (b) the King Acquisition, and (c) other business acquisitions and associated integration activities, in each case, inclusive of any related debt financings.
Geographic information presented below for the years ended December 31, 2016, 2015, and 2014 is based on the location of the selling entity. Net revenues from external customers by geographic region were as follows (amounts in millions):
Years ended
December 31, 2016 2015 2014
Net revenues by geographic region: Americas .................................................................................................... $ 3,423 $ 2,409 $ 2,190 EMEA(1) .................................................................................................... 2,221 1,741 1,824 Asia Pacific ................................................................................................ 964 514 394
Total consolidated net revenues ..................................................................... $ 6,608 $ 4,664 $ 4,408
(1) EMEA consists of the Europe, Middle East, and Africa geographic regions.
The Company’s net revenues in the U.S. were 45%, 48%, and 48% of consolidated net revenues for the years ended December 31, 2016, 2015, and 2014, respectively. The Company’s net revenues in the United Kingdom (“U.K.”) were 11%, 14%, and 16% of consolidated net revenues for the years ended December 31, 2016, 2015, and 2014, respectively. The Company’s net revenues in France was 14% of consolidated net revenues for the year ended December 31, 2014. No other country’s net revenues exceeded 10% of consolidated net revenues for the years ended December 31, 2016, 2015, or 2014.
Net revenues by platform were as follows (amounts in millions):
Years Ended December 31,
2016 2015 2014 Net revenues by platform:
Console ........................................................................................................ $ 2,453 $ 2,391 $ 2,150 PC(1) ........................................................................................................... 2,124 1,499 1,418 Mobile and ancillary(2) ............................................................................... 1,674 418 433 Other(3) ....................................................................................................... 357 356 407
Total consolidated net revenues ...................................................................... $ 6,608 $ 4,664 $ 4,408
(1) Net revenues from PC includes revenues that were historically shown as Online.
(2) Net revenues from mobile and ancillary includes revenues from handheld, mobile and tablet devices, as well as non-platform specific game-related revenues, such as standalone sales of toys and accessories from our
60
Our operating segments are also consistent with our internal organization structure, the way we assess operating performance and allocate resources, and the availability of separate financial information. We do not aggregate operating segments.
Information on the operating segments and reconciliations of total segment net revenues and total segment operating income to consolidated net revenues from external customers and consolidated income before income tax expense for the years ended December 31, 2016, 2015 and 2014 are presented below (amounts in millions):
Years Ended December 31, 2016 2015 2014 2016 2015 2014
Net revenues
Operating income and income before income
tax expense Activision ................................................................................... $ 2,220 $ 2,700 $ 2,686 $ 788 $ 868 $ 762 Blizzard ...................................................................................... 2,428 1,565 1,720 1,013 561 756 King ............................................................................................ 1,586 — — 537 — —
Reportable segments total ...................................................... 6,234 4,265 4,406 2,338 1,429 1,518 Reconciliation to consolidated net revenues / consolidated
income before income tax expense: Other segments(1) .................................................................. 365 356 407 (4) 37 9 Net effect from recognition (deferral) of deferred net
and related cost of revenues ................................ 9 43 (405) (10) (39) (215)Share-based compensation expense ....................................... — — — (159) (92) (104)Amortization of intangible assets ........................................... — — — (706) (11) (12)Fees and other expenses related to acquisitions and the
Transaction(2) .................................................... — — — (47) (5) (13)Consolidated net revenues / operating income ....................... $ 6,608 $ 4,664 $ 4,408 $ 1,412 $ 1,319 $ 1,183 Interest and other expense (income), net ................................ 214 198 202 Loss on extinguishment of debt ............................................. 92 — — Consolidated income before income tax expense .................. $ 1,106 $ 1,121 $ 981
(1) Other segments include other income and expenses from operating segments managed outside the reportable segments,
including our MLG, Studios, and Distribution businesses. Other segments also include unallocated corporate income and expenses.
(2) Reflects the fees and other expenses, such as legal, banking, and professional service fees, related to (a) the October 11, 2013 repurchase of approximately 429 million shares of our common stock (the “Purchase Transaction”, pursuant to a stock purchase agreement among us with Vivendi and ASAC II LP (“ASAC LP”), an exempted limited partnership established under the laws of the Cayman Islands, acting by its general partner, ASAC II LLC (“ASAC GP”), (b) the King Acquisition, and (c) other business acquisitions and associated integration activities, in each case, inclusive of any related debt financings.
Geographic information presented below for the years ended December 31, 2016, 2015, and 2014 is based on the location of the selling entity. Net revenues from external customers by geographic region were as follows (amounts in millions):
Years ended
December 31, 2016 2015 2014
Net revenues by geographic region: Americas .................................................................................................... $ 3,423 $ 2,409 $ 2,190 EMEA(1) .................................................................................................... 2,221 1,741 1,824 Asia Pacific ................................................................................................ 964 514 394
Total consolidated net revenues ..................................................................... $ 6,608 $ 4,664 $ 4,408
(1) EMEA consists of the Europe, Middle East, and Africa geographic regions.
The Company’s net revenues in the U.S. were 45%, 48%, and 48% of consolidated net revenues for the years ended December 31, 2016, 2015, and 2014, respectively. The Company’s net revenues in the United Kingdom (“U.K.”) were 11%, 14%, and 16% of consolidated net revenues for the years ended December 31, 2016, 2015, and 2014, respectively. The Company’s net revenues in France was 14% of consolidated net revenues for the year ended December 31, 2014. No other country’s net revenues exceeded 10% of consolidated net revenues for the years ended December 31, 2016, 2015, or 2014.
Net revenues by platform were as follows (amounts in millions):
Years Ended December 31,
2016 2015 2014 Net revenues by platform:
Console ........................................................................................................ $ 2,453 $ 2,391 $ 2,150 ........................................................................................................... 2,124 1,499 1,418
60
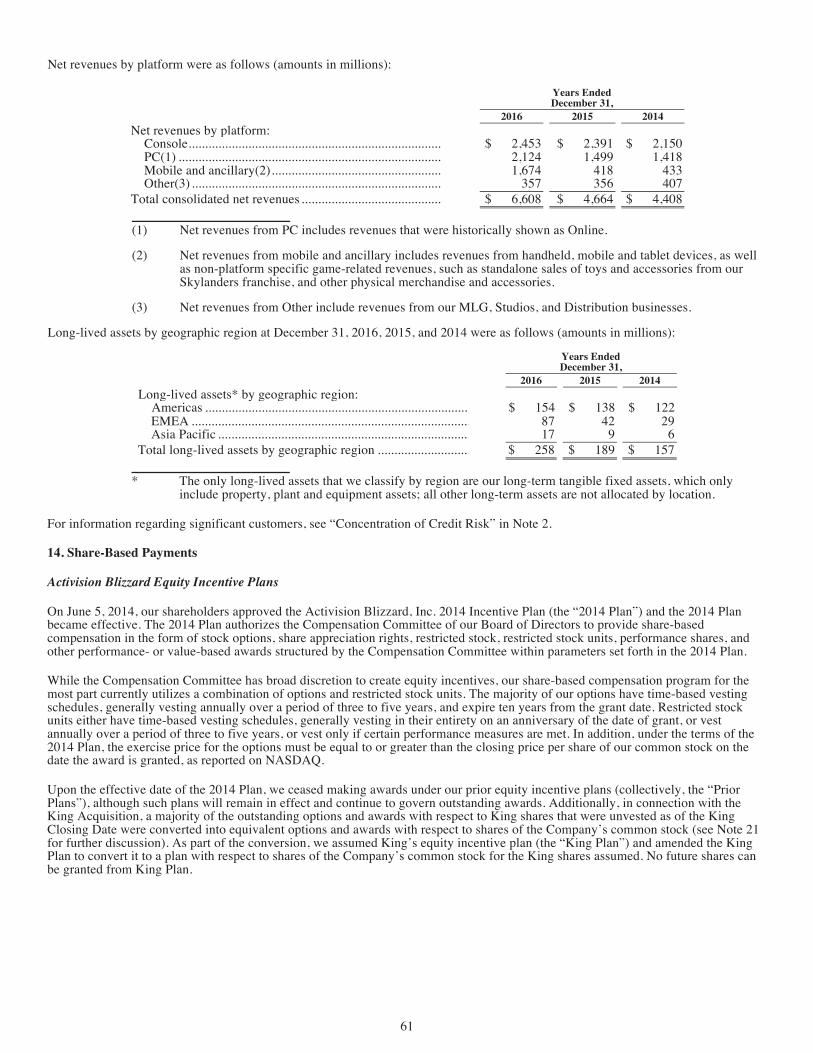
EMEA ...................................................................................................................... 87 42 29 Asia Pacific .............................................................................................................. 17 9 6
Total long-lived assets by geographic region .............................................................. $ 258 $ 189 $ 157
* The only long-lived assets that we classify by region are our long-term tangible fixed assets, which only include property, plant and equipment assets; all other long-term assets are not allocated by location.
For information regarding significant customers, see “Concentration of Credit Risk” in Note 2.
14. Share-Based Payments
Activision Blizzard Equity Incentive Plans
On June 5, 2014, our shareholders approved the Activision Blizzard, Inc. 2014 Incentive Plan (the “2014 Plan”) and the 2014 Plan became effective. The 2014 Plan authorizes the Compensation Committee of our Board of Directors to provide share-based compensation in the form of stock options, share appreciation rights, restricted stock, restricted stock units, performance shares, and other performance- or value-based awards structured by the Compensation Committee within parameters set forth in the 2014 Plan.
While the Compensation Committee has broad discretion to create equity incentives, our share-based compensation program for the most part currently utilizes a combination of options and restricted stock units. The majority of our options have time-based vesting schedules, generally vesting annually over a period of three to five years, and expire ten years from the grant date. Restricted stock units either have time-based vesting schedules, generally vesting in their entirety on an anniversary of the date of grant, or vest annually over a period of three to five years, or vest only if certain performance measures are met. In addition, under the terms of the 2014 Plan, the exercise price for the options must be equal to or greater than the closing price per share of our common stock on the date the award is granted, as reported on NASDAQ.
Upon the effective date of the 2014 Plan, we ceased making awards under our prior equity incentive plans (collectively, the “Prior Plans”), although such plans will remain in effect and continue to govern outstanding awards. Additionally, in connection with the King Acquisition, a majority of the outstanding options and awards with respect to King shares that were unvested as of the King Closing Date were converted into equivalent options and awards with respect to shares of the Company’s common stock (see Note 21 for further discussion). As part of the conversion, we assumed King’s equity incentive plan (the “King Plan”) and amended the King Plan to convert it to a plan with respect to shares of the Company’s common stock for the King shares assumed. No future shares can be granted from King Plan.
As of the date it was approved by our shareholders, there were 46 million shares available for issuance under the 2014 Plan. The number of shares of our common stock reserved for issuance under the 2014 Plan has been, and may be further, increased from time to time by: (i) the number of shares relating to awards outstanding under any Prior Plan that: (a) expire, or are forfeited, terminated or canceled, without the issuance of shares; (b) are settled in cash in lieu of shares; or (c) are exchanged, prior to the issuance of shares of our common stock, for awards not involving our common stock; (ii) if the exercise price of any option outstanding under any Prior Plans is, or the tax withholding requirements with respect to any award outstanding under any Prior Plans are, satisfied by withholding shares otherwise then deliverable in respect of the award or the actual or constructive transfer to the Company of shares already owned, the number of shares equal to the withheld or transferred shares; and (iii) if a share appreciation right is exercised and settled in shares, a number of shares equal to the difference between the total number of shares with respect to which the award is exercised and the number of shares actually issued or transferred. As of December 31, 2016, we had approximately 34 million shares of our common stock reserved for future issuance under the 2014 Plan. Shares issued in connection with awards made under the 2014 Plan are generally issued as new stock issuances.
61
2016, 2015, and 2014, respectively. The Company’s net revenues in the United Kingdom (“U.K.”) were 11%, 14%, and 16% of consolidated net revenues for the years ended December 31, 2016, 2015, and 2014, respectively. The Company’s net revenues in France was 14% of consolidated net revenues for the year ended December 31, 2014. No other country’s net revenues exceeded 10% of consolidated net revenues for the years ended December 31, 2016, 2015, or 2014.
Net revenues by platform were as follows (amounts in millions):
Years Ended December 31,
2016 2015 2014 Net revenues by platform:
Console ........................................................................................................ $ 2,453 $ 2,391 $ 2,150 PC(1) ........................................................................................................... 2,124 1,499 1,418 Mobile and ancillary(2) ............................................................................... 1,674 418 433 Other(3) ....................................................................................................... 357 356 407
Total consolidated net revenues ...................................................................... $ 6,608 $ 4,664 $ 4,408
(1) Net revenues from PC includes revenues that were historically shown as Online.
(2) Net revenues from mobile and ancillary includes revenues from handheld, mobile and tablet devices, as well as non-platform specific game-related revenues, such as standalone sales of toys and accessories from our Skylanders franchise, and other physical merchandise and accessories.
(3) Net revenues from Other include revenues from our MLG, Studios, and Distribution businesses.
Long-lived assets by geographic region at December 31, 2016, 2015, and 2014 were as follows (amounts in millions):
Years Ended December 31,
2016 2015 2014 Long-lived assets* by geographic region:
Americas .................................................................................................................. $ 154 $ 138 $ 122
61
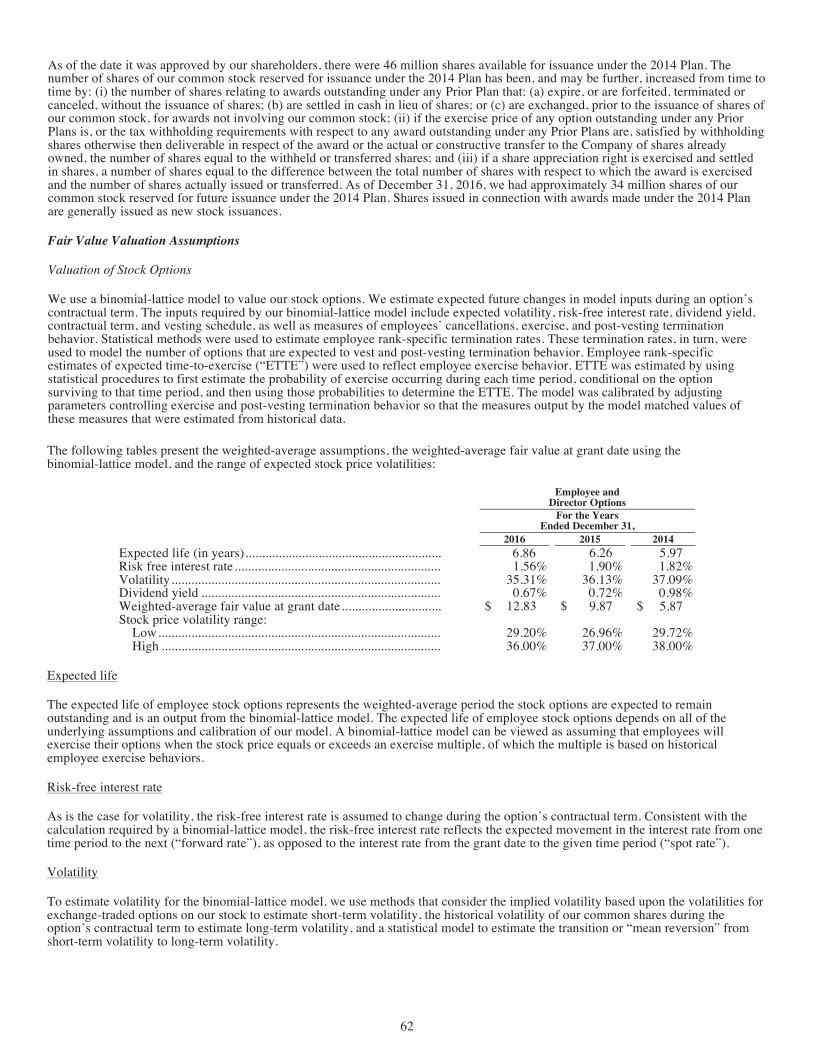
The following tables present the weighted-average assumptions, the weighted-average fair value at grant date using the binomial-lattice model, and the range of expected stock price volatilities:
Employee and Director Options
For the Years Ended December 31,
2016 2015 2014 Expected life (in years) ...................................................................... 6.26 5.97 Risk free interest rate ......................................................................................1.56% 1.90% 1.82% Volatility .........................................................................................................35.31% 36.13% 37.09% Dividend yield ................................................................................................0.67% 0.72% 0.98% Weighted-average fair value at grant date ......................................... $ 9.87 $ 5.87 Stock price volatility range:
Low .............................................................................................................29.20% 26.96% 29.72% High ............................................................................................................36.00% 37.00% 38.00%
Expected life
The expected life of employee stock options represents the weighted-average period the stock options are expected to remain outstanding and is an output from the binomial-lattice model. The expected life of employee stock options depends on all of the underlying assumptions and calibration of our model. A binomial-lattice model can be viewed as assuming that employees will exercise their options when the stock price equals or exceeds an exercise multiple, of which the multiple is based on historical employee exercise behaviors.
Risk-free interest rate
As is the case for volatility, the risk-free interest rate is assumed to change during the option’s contractual term. Consistent with the calculation required by a binomial-lattice model, the risk-free interest rate reflects the expected movement in the interest rate from one time period to the next (“forward rate”), as opposed to the interest rate from the grant date to the given time period (“spot rate”).
Volatility
To estimate volatility for the binomial-lattice model, we use methods that consider the implied volatility based upon the volatilities for exchange-traded options on our stock to estimate short-term volatility, the historical volatility of our common shares during the option’s contractual term to estimate long-term volatility, and a statistical model to estimate the transition or “mean reversion” from short-term volatility to long-term volatility.
Dividend yield
The expected dividend yield assumption for options granted during the year ended December 31, 2016 is based on our historical and expected future amount of dividend payouts.
As share-based compensation expense recognized in the consolidated statement of operations for the years ended December 31, 2016, 2015, and 2014 is based on awards ultimately expected to vest, it has been reduced for estimated forfeitures. Forfeitures are estimated
6. 6
. $
62
Closing Date were converted into equivalent options and awards with respect to shares of the Company’s common stock (see Note 21 for further discussion). As part of the conversion, we assumed King’s equity incentive plan (the “King Plan”) and amended the King Plan to convert it to a plan with respect to shares of the Company’s common stock for the King shares assumed. No future shares can be granted from King Plan.
As of the date it was approved by our shareholders, there were 46 million shares available for issuance under the 2014 Plan. The number of shares of our common stock reserved for issuance under the 2014 Plan has been, and may be further, increased from time to time by: (i) the number of shares relating to awards outstanding under any Prior Plan that: (a) expire, or are forfeited, terminated or canceled, without the issuance of shares; (b) are settled in cash in lieu of shares; or (c) are exchanged, prior to the issuance of shares of our common stock, for awards not involving our common stock; (ii) if the exercise price of any option outstanding under any Prior Plans is, or the tax withholding requirements with respect to any award outstanding under any Prior Plans are, satisfied by withholding shares otherwise then deliverable in respect of the award or the actual or constructive transfer to the Company of shares already owned, the number of shares equal to the withheld or transferred shares; and (iii) if a share appreciation right is exercised and settled in shares, a number of shares equal to the difference between the total number of shares with respect to which the award is exercised and the number of shares actually issued or transferred. As of December 31, 2016, we had approximately 34 million shares of our common stock reserved for future issuance under the 2014 Plan. Shares issued in connection with awards made under the 2014 Plan are generally issued as new stock issuances.
Fair Value Valuation Assumptions
Valuation of Stock Options
We use a binomial-lattice model to value our stock options. We estimate expected future changes in model inputs during an option’s contractual term. The inputs required by our binomial-lattice model include expected volatility, risk-free interest rate, dividend yield, contractual term, and vesting schedule, as well as measures of employees’ cancellations, exercise, and post-vesting termination behavior. Statistical methods were used to estimate employee rank-specific termination rates. These termination rates, in turn, were used to model the number of options that are expected to vest and post-vesting termination behavior. Employee rank-specific estimates of expected time-to-exercise (“ETTE”) were used to reflect employee exercise behavior. ETTE was estimated by using statistical procedures to first estimate the probability of exercise occurring during each time period, conditional on the option surviving to that time period, and then using those probabilities to determine the ETTE. The model was calibrated by adjusting parameters controlling exercise and post-vesting termination behavior so that the measures output by the model matched values of these measures that were estimated from historical data.
62
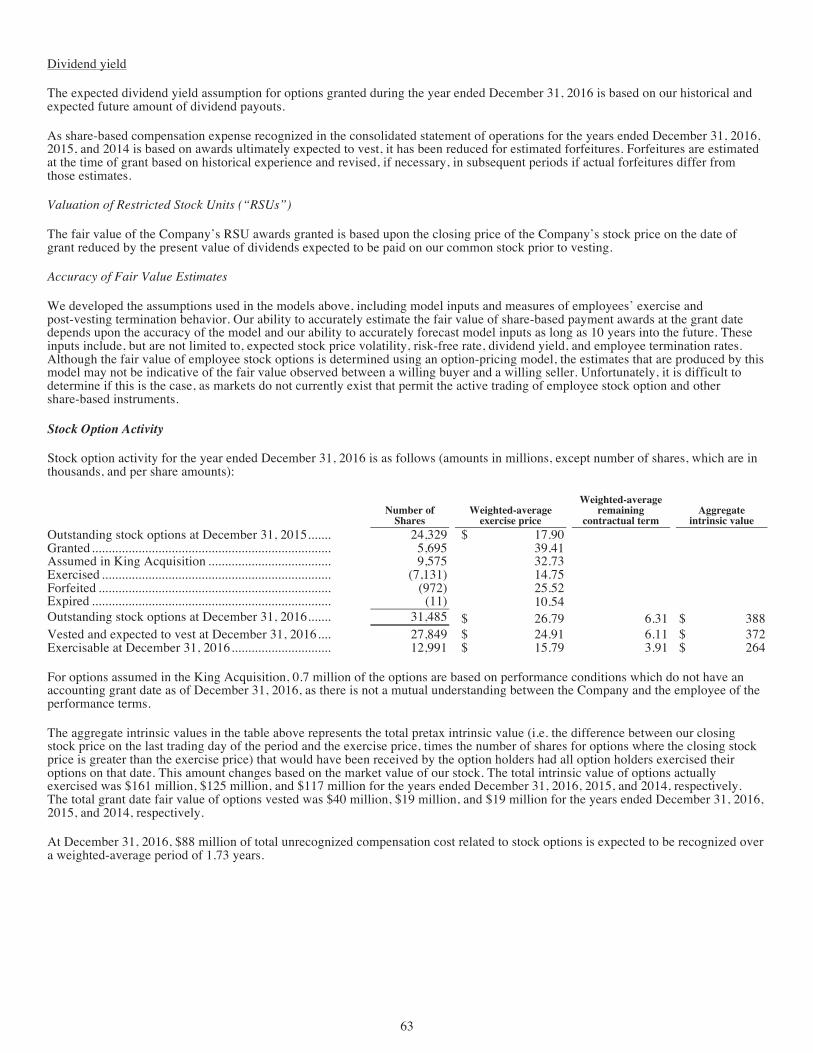
Stock Option Activity
Stock option activity for the year ended December 31, 2016 is as follows (amounts in millions, except number of shares, which are in thousands, and per share amounts):
Number of
Shares Weighted-average
exercise price
Weighted-average remaining
contractual term Aggregate
intrinsic value Outstanding stock options at December 31, 2015 ........ 24,329 $ 17.90 Granted ......................................................................... 5,695 39.41 Assumed in King Acquisition ...................................... 9,575 32.73 Exercised ...................................................................... (7,131) 14.75 Forfeited ....................................................................... (972) 25.52 Expired ......................................................................... (11) 10.54 Outstanding stock options at December 31, 2016 ........ 31,485 $ 26.79 6.31 $ 388 Vested and expected to vest at December 31, 2016 ..... 27,849 $ 24.91 6.11 $ 372 Exercisable at December 31, 2016 ............................... 12,991 $ 15.79 3.91 $ 264
For options assumed in the King Acquisition, 0.7 million of the options are based on performance conditions which do not have an accounting grant date as of December 31, 2016, as there is not a mutual understanding between the Company and the employee of the performance terms.
The aggregate intrinsic values in the table above represents the total pretax intrinsic value (i.e. the difference between our closing stock price on the last trading day of the period and the exercise price, times the number of shares for options where the closing stock price is greater than the exercise price) that would have been received by the option holders had all option holders exercised their options on that date. This amount changes based on the market value of our stock. The total intrinsic value of options actually exercised was $161 million, $125 million, and $117 million for the years ended December 31, 2016, 2015, and 2014, respectively. The total grant date fair value of options vested was $40 million, $19 million, and $19 million for the years ended December 31, 2016, 2015, and 2014, respectively.
At December 31, 2016, $88 million of total unrecognized compensation cost related to stock options is expected to be recognized over a weighted-average period of 1.73 years.
RSU Activity
We grant RSUs, which represent the right to receive shares of our common stock. Vesting for RSUs is contingent upon the holders’ continued employment with us and may be subject to other conditions (which may include the satisfaction of a performance measure). Also, certain of our performance-based RSUs include a range of shares that may be released at vesting which are above or below the targeted number of RSUs based on actual performance relative to the grant date performance measure. If the vesting conditions are not met, unvested RSUs will be forfeited. Upon vesting of the RSUs, we may withhold shares otherwise deliverable to satisfy tax withholding requirements.
The following table summarizes our RSU activity for the year ended December 31, 2016, with performance-based RSUs presented at the maximum potential shares that could be earned and issued at vesting (amounts in thousands except per share amounts):
Weighted-
63
To estimate volatility for the binomial-lattice model, we use methods that consider the implied volatility based upon the volatilities for exchange-traded options on our stock to estimate short-term volatility, the historical volatility of our common shares during the option’s contractual term to estimate long-term volatility, and a statistical model to estimate the transition or “mean reversion” from short-term volatility to long-term volatility.
Dividend yield
The expected dividend yield assumption for options granted during the year ended December 31, 2016 is based on our historical and expected future amount of dividend payouts.
As share-based compensation expense recognized in the consolidated statement of operations for the years ended December 31, 2016, 2015, and 2014 is based on awards ultimately expected to vest, it has been reduced for estimated forfeitures. Forfeitures are estimated at the time of grant based on historical experience and revised, if necessary, in subsequent periods if actual forfeitures differ from those estimates.
Valuation of Restricted Stock Units (“RSUs”)
The fair value of the Company’s RSU awards granted is based upon the closing price of the Company’s stock price on the date of grant reduced by the present value of dividends expected to be paid on our common stock prior to vesting.
Accuracy of Fair Value Estimates
We developed the assumptions used in the models above, including model inputs and measures of employees’ exercise and post-vesting termination behavior. Our ability to accurately estimate the fair value of share-based payment awards at the grant date depends upon the accuracy of the model and our ability to accurately forecast model inputs as long as 10 years into the future. These inputs include, but are not limited to, expected stock price volatility, risk-free rate, dividend yield, and employee termination rates. Although the fair value of employee stock options is determined using an option-pricing model, the estimates that are produced by this model may not be indicative of the fair value observed between a willing buyer and a willing seller. Unfortunately, it is difficult to determine if this is the case, as markets do not currently exist that permit the active trading of employee stock option and other share-based instruments.
63

64
2015, and 2014, respectively.
At December 31, 2016, $88 million of total unrecognized compensation cost related to stock options is expected to be recognized over a weighted-average period of 1.73 years.
RSU Activity
We grant RSUs, which represent the right to receive shares of our common stock. Vesting for RSUs is contingent upon the holders’ continued employment with us and may be subject to other conditions (which may include the satisfaction of a performance measure). Also, certain of our performance-based RSUs include a range of shares that may be released at vesting which are above or below the targeted number of RSUs based on actual performance relative to the grant date performance measure. If the vesting conditions are not met, unvested RSUs will be forfeited. Upon vesting of the RSUs, we may withhold shares otherwise deliverable to satisfy tax withholding requirements.
The following table summarizes our RSU activity for the year ended December 31, 2016, with performance-based RSUs presented at the maximum potential shares that could be earned and issued at vesting (amounts in thousands except per share amounts):
Number of
shares
Weighted- Average
Grant Date Fair Value
Unvested RSUs at December 31, 2015 ............................................................. 11,930 $ 12.74 Granted .............................................................................................................. 5,320 36.92 Assumed in King Acquisition ........................................................................... 3,349 30.18 Vested ............................................................................................................... (7,109) 18.34 Forfeited ............................................................................................................ (1,513) 20.84 Unvested RSUs at December 31, 2016 ............................................................. 11,977 $ 17.44
Certain of our performance-based RSUs did not have an accounting grant date as of December 31, 2016, as there is not a mutual understanding between the Company and the employee of the performance terms. Generally, these performance terms relate to revenue and operating income performance for future years where the performance goals have not yet been set. As of December 31, 2016, there were 5.1 million performance-based RSUs outstanding for which the accounting grant date has not been set, of which 3.6 million were 2016 grants. Accordingly, no grant date fair value was established and the weighted average grant date fair value calculated above for 2016 grants excludes these RSUs.
At December 31, 2016, approximately $89 million of total unrecognized compensation cost was related to RSUs and is expected to be recognized over a weighted-average period of 1.65 years. Of the total unrecognized compensation cost, $56 million was related to performance-based RSUs, which is expected to be recognized over a weighted-average period of 1.85 years. The total grant date fair value of vested RSUs was $123 million, $93 million and $92 million for the years ended December 31, 2016, 2015 and 2014, respectively.
The income tax benefit from stock option exercises and RSUs was $134 million, $109 million, and $89 million for the years ended December 31, 2016, 2015, and 2014, respectively.
Share-Based Compensation Expense
The following table sets forth the total share-based compensation expense included in our consolidated statements of operations for the years ended December 31, 2016, 2015, and 2014 (amounts in millions):
For the Years Ended December 31,
2016 2015 2014 Cost of revenues—product sales: Software royalties, amortization, and intellectual property
licenses ................................................................................................................................................$ 20 $ 12 $ 15 Cost of revenues—subscription, licensing, and other revenues: Game perations and
istribution osts ............................................................................................................................... 2 — 1 Cost of revenues—subscription, licensing, and other revenues: Software royalties, amortization,
and intellectual property licenses ........................................................................................................ 2 3 2 Product development .............................................................................................................................. 47 25 22 Sales and marketing ................................................................................................................................ 15 9 8 General and administrative ..................................................................................................................... 73 43 56 Share-based compensation expense before income taxes ....................................................................... 159 92 104 Income tax benefit ................................................................................................................................... (42) (27) (38)Total share-based compensation expense, net of income tax benefit .....................................................$ 117 $ 65 $ 66
The following table summarizes share-based compensation included in our consolidated balance sheets as a component of “Software development” (amounts in millions):
Software Development
Balance at December 31, 2013 ............................................................................................................................ $ 22 Share-based compensation expense capitalized and deferred during period ...................................................... 27 Amortization of capitalized and deferred share-based compensation expense ................................................... (23) Balance at December 31, 2014 ............................................................................................................................ $ 26 Share-based compensation expense capitalized and deferred during period ...................................................... 36 Amortization of capitalized and deferred share-based compensation expense ................................................... (34) Balance at December 31, 2015 ............................................................................................................................ $ 28 Share-based compensation expense capitalized and deferred during period ...................................................... 25
value of vested RSUs was $123 million, $93 million and $92 million for the years ended December 31, 2016, 2015 and 2014, respectively.
The income tax benefit from stock option exercises and RSUs was $134 million, $109 million, and $89 million for the years ended December 31, 2016, 2015, and 2014, respectively.
Share-Based Compensation Expense
The following table sets forth the total share-based compensation expense included in our consolidated statements of operations for the years ended December 31, 2016, 2015, and 2014 (amounts in millions):
For the Years Ended December 31,
2016 2015 2014 Cost of revenues—product sales: Software royalties, amortization, and
licenses ........................................................................................................... $ 20 $ 12 $ 15 Cost of revenues—subscription, licensing, and other revenues: Game perations and
istribution osts ............................................................................................................................. 2 — 1 Cost of revenues—subscription, licensing, and other revenues: Software royalties,
and intellectual property licenses .............................................................................. 2 3 2 Product development............................................................................................................................ 47 25 22 Sales and marketing.............................................................................................................................. 15 9 8 General and administrative................................................................................................................... 73 43 56 Share-based compensation expense before income taxes ....................................................................... 159 92 104 Income tax benefit ................................................................................................................................... (42) (27) (38)Total share-based compensation expense, net of income tax benefit .....................................................$ 117 $ 65 $ 66
The following table summarizes share-based compensation included in our consolidated balance sheets as a component of “Software development” (amounts in millions):
Software Development
Balance at December 31, 2013 ............................................................................................................................ $ 22 Share-based compensation expense capitalized and deferred during period ...................................................... 27 Amortization of capitalized and deferred share-based compensation expense ................................................... (23) Balance at December 31, 2014 ............................................................................................................................ $ 26 Share-based compensation expense capitalized and deferred during period ...................................................... 36 Amortization of capitalized and deferred share-based compensation expense ................................................... (34) Balance at December 31, 2015 ............................................................................................................................ $ 28 Share-based compensation expense capitalized and deferred during period ...................................................... 25
value of vested RSUs was $123 million, $93 million and $92 million for the years ended December 31, 2016, 2015 and 2014, respectively.
The income tax benefit from stock option exercises and RSUs was $134 million, $109 million, and $89 million for the years ended December 31, 2016, 2015, and 2014, respectively.
Share-Based Compensation Expense
The following table sets forth the total share-based compensation expense included in our consolidated statements of operations for the years ended December 31, 2016, 2015, and 2014 (amounts in millions):
For the Years Ended December 31,
2016 2015 2014 Cost of revenues—product sales: Software royalties, amortization, and intellectual property
licenses ................................................................................................................................................$ 20 $ 12 $ 15 Cost of revenues—subscription, licensing, and other revenues: Game perations and
istribution osts ............................................................................................................................... 2 — 1 Cost of revenues—subscription, licensing, and other revenues: Software royalties, amortization,
and intellectual property licenses ........................................................................................................ 2 3 2 Product development .............................................................................................................................. 47 25 22 Sales and marketing ................................................................................................................................ 15 9 8 General and administrative ..................................................................................................................... 73 43 56 Share-based compensation expense before income taxes ....................................................................... 159 92 104 Income tax benefit ................................................................................................................................... (42) (27) (38)Total share-based compensation expense, net of income tax benefit .....................................................$ 117 $ 65 $ 66
The following table summarizes share-based compensation included in our consolidated balance sheets as a component of “Software development” (amounts in millions):
Software Development
Balance at December 31, 2013 ............................................................................................................................ $ 22 Share-based compensation expense capitalized and deferred during period ...................................................... 27 Amortization of capitalized and deferred share-based compensation expense ................................................... (23) Balance at December 31, 2014 ............................................................................................................................ $ 26 Share-based compensation expense capitalized and deferred during period ...................................................... 36 Amortization of capitalized and deferred share-based compensation expense ................................................... (34) Balance at December 31, 2015 ............................................................................................................................ $ 28 Share-based compensation expense capitalized and deferred during period ...................................................... 25
64
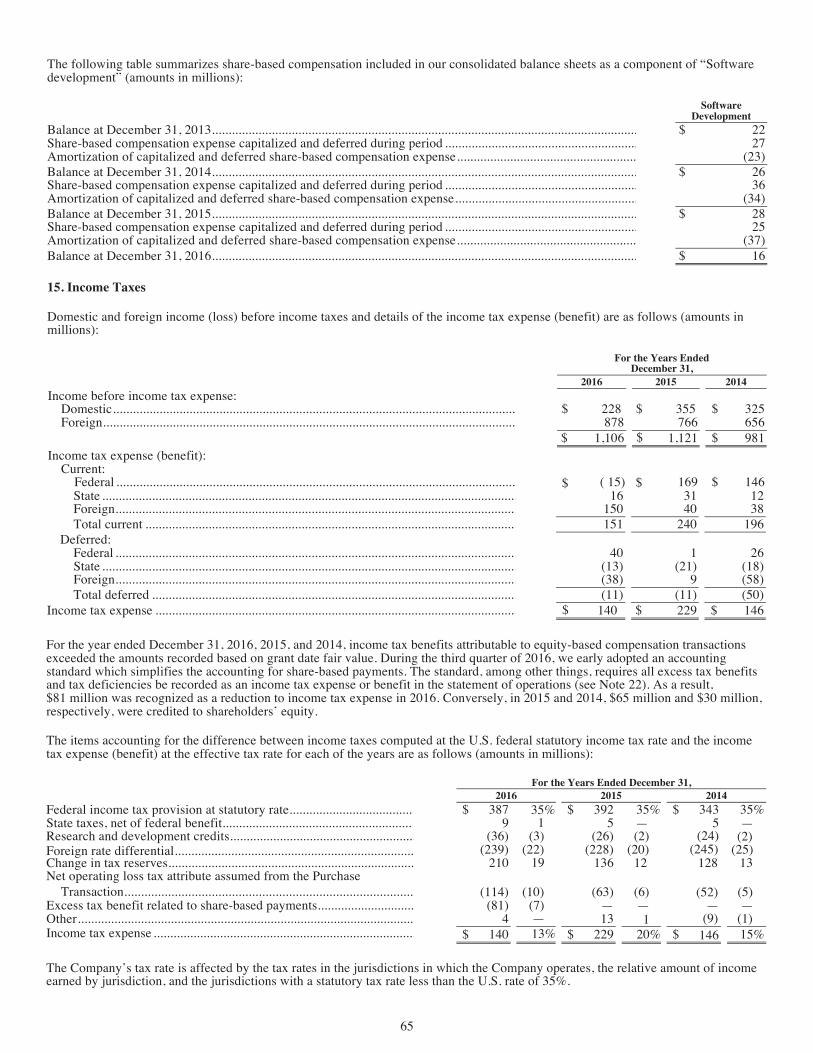
65
..................................................................................................................... Share-based compensation expense before income taxes ....................................................................... 159 92 104 Income tax benefit ................................................................................................................................... (42) (27) (38)Total share-based compensation expense, net of income tax benefit .....................................................$ 117 $ 65 $ 66
The following table summarizes share-based compensation included in our consolidated balance sheets as a component of “Software development” (amounts in millions):
Software Development
Balance at December 31, 2013 ...................................................................................................................................... $ 22 Share-based compensation expense capitalized and deferred during period ................................................................ 27 Amortization of capitalized and deferred share-based compensation expense ............................................................. (23) Balance at December 31, 2014 ...................................................................................................................................... $ 26 Share-based compensation expense capitalized and deferred during period ................................................................ 36 Amortization of capitalized and deferred share-based compensation expense ............................................................. (34) Balance at December 31, 2015 ...................................................................................................................................... $ 28 Share-based compensation expense capitalized and deferred during period ................................................................ 25 Amortization of capitalized and deferred share-based compensation expense ............................................................. (37) Balance at December 31, 2016 ...................................................................................................................................... $ 16
15. Income Taxes
Domestic and foreign income (loss) before income taxes and details of the income tax expense (benefit) are as follows (amounts in millions):
For the Years Ended December 31,
2016 2015 2014 Income before income tax expense:
Domestic ............................................................................................................................................$ 228 $ 355 $ 325 Foreign ...............................................................................................................................................878 766 656
$ 1,106 $ 1,121 $ 981 Income tax expense (benefit):
Current: Federal ...........................................................................................................................................$ (15) $ 169 $ 146
$
65
Development
Balance at December 31, 2013 ............................................................................................................................ $ 22 Share-based compensation expense capitalized and deferred during period ...................................................... 27 Amortization of capitalized and deferred share-based compensation expense ................................................... (23) Balance at December 31, 2014 ............................................................................................................................ $ 26 Share-based compensation expense capitalized and deferred during period ...................................................... 36 Amortization of capitalized and deferred share-based compensation expense ................................................... (34) Balance at December 31, 2015 ............................................................................................................................ $ 28 Share-based compensation expense capitalized and deferred during period ...................................................... 25 Amortization of capitalized and deferred share-based compensation expense ................................................... (37) Balance at December 31, 2016 ............................................................................................................................ $ 16
15. Income Taxes
Domestic and foreign income (loss) before income taxes and details of the income tax expense (benefit) are as follows (amounts in millions):
For the Years Ended December 31,
2016 2015 2014 Income before income tax expense:
Domestic ............................................................................................................................................$ 228 $ 355 $ 325 Foreign ...............................................................................................................................................878 766 656
$ 1,106 $ 1,121 $ 981 Income tax expense (benefit):
Current: Federal ...........................................................................................................................................$ (15) $ 169 $ 146
State ...............................................................................................................................................16 31 12 Foreign ...........................................................................................................................................150 40 38 Total current ..................................................................................................................................151 240 196
Deferred: Federal ...........................................................................................................................................40 1 26 State ...............................................................................................................................................(13) (21) (18)Foreign ...........................................................................................................................................(38) 9 (58) Total deferred ................................................................................................................................(11) (11) (50)
Income tax expense ...............................................................................................................................$ 140 $ 229 $ 146
For the year ended December 31, 2016, 2015, and 2014, income tax benefits attributable to equity-based compensation transactions exceeded the amounts recorded based on grant date fair value. During the third quarter of 2016, we early adopted an accounting standard which simplifies the accounting for share-based payments. The standard, among other things, requires all excess tax benefits and tax deficiencies be recorded as an income tax expense or benefit in the statement of operations (see Note 22). As a result, $81 million was recognized as a reduction to income tax expense in 2016. Conversely, in 2015 and 2014, $65 million and $30 million, respectively, were credited to shareholders’ equity.
The items accounting for the difference between income taxes computed at the U.S. federal statutory income tax rate and the income tax expense (benefit) at the effective tax rate for each of the years are as follows (amounts in millions):
For the Years Ended December 31, 2016 2015 2014
Federal income tax provision at statutory rate ........................................... $ 387 35% $ 392 35% $ 343 35% State taxes, net of federal benefit ............................................................... 9 1 5 — 5 — Research and development credits ............................................................. (36) (3) (26) (2) (24)Foreign rate differential .............................................................................. (239) (22) (228) (20) (245)Change in tax reserves ............................................................................... 210 19 136 12 128 13 Net operating loss tax attribute assumed from the Purchase Transaction (114) (10) (63) (6) (5)Excess tax benefit related to share-based payments .................................. (81) (7) — — — — Other ........................................................................................................... 4 — 13 1 (9) (1)Income tax expense .................................................................................... $ 140 13% $ 229 20% $ 146 15%
The Company’s tax rate is affected by the tax rates in the jurisdictions in which the Company operates, the relative amount of income earned by jurisdiction, and the jurisdictions with a statutory tax rate less than the U.S. rate of 35%.
In 2013, in connection with the Purchase Transaction, we assumed certain tax attributes, generally consisting of net operating loss (“NOL”) carryforwards of approximately $760 million, which represent a potential tax benefit of approximately $266 million. The utilization of such NOL carryforwards will be subject to certain annual limitations and will begin to expire in 2021. The Company also obtained indemnification from Vivendi against losses attributable to the disallowance of claimed utilization of such NOL carryforwards of up to $200 million in unrealized tax benefits in the aggregate, limited to taxable years ending on or prior to December
(52)
(25)(2)
65
Development
Balance at December 31, 2013 ............................................................................................................................ $ 22 Share-based compensation expense capitalized and deferred during period ...................................................... 27 Amortization of capitalized and deferred share-based compensation expense ................................................... (23) Balance at December 31, 2014 ............................................................................................................................ $ 26 Share-based compensation expense capitalized and deferred during period ...................................................... 36 Amortization of capitalized and deferred share-based compensation expense ................................................... (34) Balance at December 31, 2015 ............................................................................................................................ $ 28 Share-based compensation expense capitalized and deferred during period ...................................................... 25 Amortization of capitalized and deferred share-based compensation expense ................................................... (37) Balance at December 31, 2016 ............................................................................................................................ $ 16
15. Income Taxes
Domestic and foreign income (loss) before income taxes and details of the income tax expense (benefit) are as follows (amounts in millions):
For the Years Ended December 31,
2016 2015 2014 Income before income tax expense:
Domestic ............................................................................................................................................$ 228 $ 355 $ 325 Foreign ...............................................................................................................................................878 766 656
$ 1,106 $ 1,121 $ 981 Income tax expense (benefit):
Current: Federal ...........................................................................................................................................$ (15) $ 169 $ 146
State ...............................................................................................................................................16 31 12 Foreign ...........................................................................................................................................150 40 38 Total current ..................................................................................................................................151 240 196
Deferred: Federal ...........................................................................................................................................40 1 26 State ...............................................................................................................................................(13) (21) (18)Foreign ...........................................................................................................................................(38) 9 (58) Total deferred ................................................................................................................................(11) (11) (50)
Income tax expense ......................................................................................................... 140 229 $ 146
For the year ended December 31, 2016, 2015, and 2014, income tax benefits attributable to equity-based compensation transactions exceeded the amounts recorded based on grant date fair value. During the third quarter of 2016, we early adopted an accounting standard which simplifies the accounting for share-based payments. The standard, among other things, requires all excess tax benefits and tax deficiencies be recorded as an income tax expense or benefit in the statement of operations (see Note 22). As a result, $81 million was recognized as a reduction to income tax expense in 2016. Conversely, in 2015 and 2014, $65 million and $30 million, respectively, were credited to shareholders’ equity.
The items accounting for the difference between income taxes computed at the U.S. federal statutory income tax rate and the income tax expense (benefit) at the effective tax rate for each of the years are as follows (amounts in millions):
For the Years Ended December 31, 2016 2015 2014
Federal income tax provision at statutory rate ........................................... $ 387 35% $ 392 35% $ 343 35% State taxes, net of federal benefit ............................................................... 9 1 5 — 5 — Research and development credits ............................................................. (36) (3) (26) (2) (24)Foreign rate differential .............................................................................. (239) (22) (228) (20) (245)Change in tax reserves ............................................................................... 210 19 136 12 128 13 Net operating loss tax attribute assumed from the Purchase Transaction (114) (10) (63) (6) (5)Excess tax benefit related to share-based payments .................................. (81) (7) — — — — Other ........................................................................................................... 4 — 13 1 (9) (1)Income tax expense .................................................................................... $ 140 13% $ 229 20% $ 146 15%
The Company’s tax rate is affected by the tax rates in the jurisdictions in which the Company operates, the relative amount of income earned by jurisdiction, and the jurisdictions with a statutory tax rate less than the U.S. rate of 35%.
In 2013, in connection with the Purchase Transaction, we assumed certain tax attributes, generally consisting of net operating loss (“NOL”) carryforwards of approximately $760 million, which represent a potential tax benefit of approximately $266 million. The utilization of such NOL carryforwards will be subject to certain annual limitations and will begin to expire in 2021. The Company also obtained indemnification from Vivendi against losses attributable to the disallowance of claimed utilization of such NOL carryforwards of up to $200 million in unrealized tax benefits in the aggregate, limited to taxable years ending on or prior to December
(52)
(25)(2)
$ $
65
Development
Balance at December 31, 2013 ............................................................................................................................ $ 22 Share-based compensation expense capitalized and deferred during period ...................................................... 27 Amortization of capitalized and deferred share-based compensation expense ................................................... (23) Balance at December 31, 2014 ............................................................................................................................ $ 26 Share-based compensation expense capitalized and deferred during period ...................................................... 36 Amortization of capitalized and deferred share-based compensation expense ................................................... (34) Balance at December 31, 2015 ............................................................................................................................ $ 28 Share-based compensation expense capitalized and deferred during period ...................................................... 25 Amortization of capitalized and deferred share-based compensation expense ................................................... (37) Balance at December 31, 2016 ............................................................................................................................ $ 16
15. Income Taxes
Domestic and foreign income (loss) before income taxes and details of the income tax expense (benefit) are as follows (amounts in millions):
For the Years Ended December 31,
2016 2015 2014 Income before income tax expense:
Domestic ............................................................................................................................................$ 228 $ 355 $ 325 Foreign ...............................................................................................................................................878 766 656
$ 1,106 1,121 $ 981 Income tax expense (benefit):
Current: ...........Federal .................................................................................................................... 15) 169 $ 146
$
$ $
65
Development
Balance at December 31, 2013 ............................................................................................................................ $ 22 Share-based compensation expense capitalized and deferred during period ...................................................... 27 Amortization of capitalized and deferred share-based compensation expense ................................................... (23) Balance at December 31, 2014 ............................................................................................................................ $ 26 Share-based compensation expense capitalized and deferred during period ...................................................... 36 Amortization of capitalized and deferred share-based compensation expense ................................................... (34) Balance at December 31, 2015 ............................................................................................................................ $ 28 Share-based compensation expense capitalized and deferred during period ...................................................... 25 Amortization of capitalized and deferred share-based compensation expense ................................................... (37) Balance at December 31, 2016 ............................................................................................................................ $ 16
15. Income Taxes
Domestic and foreign income (loss) before income taxes and details of the income tax expense (benefit) are as follows (amounts in millions):
For the Years Ended December 31,
2016 2015 2014 Income before income tax expense:
Domestic ............................................................................................................................................$ 228 $ 355 $ 325 Foreign ...............................................................................................................................................878 766 656
$ 1,106 $ 1,121 $ 981 Income tax expense (benefit):
Current: Federal ...........................................................................................................................................$ (15) $ 169 $ 146 State ...............................................................................................................................................16 31 12 Foreign ...........................................................................................................................................150 40 38 Total current ..................................................................................................................................151 240 196
Deferred: Federal ...........................................................................................................................................40 1 26 State ...............................................................................................................................................(13) (21) (18)Foreign ...........................................................................................................................................(38) 9 (58) Total deferred ................................................................................................................................(11) (11) (50)
Income tax expense ...............................................................................................................................$ 140 $ 229 $ 146
For the year ended December 31, 2016, 2015, and 2014, income tax benefits attributable to equity-based compensation transactions exceeded the amounts recorded based on grant date fair value. During the third quarter of 2016, we early adopted an accounting standard which simplifies the accounting for share-based payments. The standard, among other things, requires all excess tax benefits and tax deficiencies be recorded as an income tax expense or benefit in the statement of operations (see Note 22). As a result, $81 million was recognized as a reduction to income tax expense in 2016. Conversely, in 2015 and 2014, $65 million and $30 million, respectively, were credited to shareholders’ equity.
The items accounting for the difference between income taxes computed at the U.S. federal statutory income tax rate and the income tax expense (benefit) at the effective tax rate for each of the years are as follows (amounts in millions):
For the Years Ended December 31, 2016 2015 2014
Federal income tax provision at statutory rate ........................................... $ 387 35% $ 392 35% $ 343 35% State taxes, net of federal benefit ............................................................... 9 1 5 — 5 — Research and development credits ............................................................. (36) (3) (26) (2) (24)Foreign rate differential .............................................................................. (239) (22) (228) (20) (245)Change in tax reserves ............................................................................... 210 19 136 12 128 13 Net operating loss tax attribute assumed from the Purchase Transaction (114) (10) (63) (6) (5)Excess tax benefit related to share-based payments .................................. (81) (7) — — — — Other ........................................................................................................... 4 — 13 1 (9) (1)Income tax expense .................................................................................... $ 140 13% $ 229 20% $ 146 15%
The Company’s tax rate is affected by the tax rates in the jurisdictions in which the Company operates, the relative amount of income earned by jurisdiction, and the jurisdictions with a statutory tax rate less than the U.S. rate of 35%.
In 2013, in connection with the Purchase Transaction, we assumed certain tax attributes, generally consisting of net operating loss (“NOL”) carryforwards of approximately $760 million, which represent a potential tax benefit of approximately $266 million. The utilization of such NOL carryforwards will be subject to certain annual limitations and will begin to expire in 2021. The Company also obtained indemnification from Vivendi against losses attributable to the disallowance of claimed utilization of such NOL carryforwards of up to $200 million in unrealized tax benefits in the aggregate, limited to taxable years ending on or prior to December
(52)
(25)(2)
State ...............................................................................................................................................16 31 12 Foreign ...........................................................................................................................................150 40 38 Total current ..................................................................................................................................151 240 196
Deferred: Federal ...........................................................................................................................................40 1 26 State ...............................................................................................................................................(13) (21) (18)Foreign ...........................................................................................................................................(38) 9 (58) Total deferred ................................................................................................................................(11) (11) (50)
Income tax expense ...............................................................................................................................$ 140 $ 229 $ 146
For the year ended December 31, 2016, 2015, and 2014, income tax benefits attributable to equity-based compensation transactions exceeded the amounts recorded based on grant date fair value. During the third quarter of 2016, we early adopted an accounting standard which simplifies the accounting for share-based payments. The standard, among other things, requires all excess tax benefits and tax deficiencies be recorded as an income tax expense or benefit in the statement of operations (see Note 22). As a result, $81 million was recognized as a reduction to income tax expense in 2016. Conversely, in 2015 and 2014, $65 million and $30 million, respectively, were credited to shareholders’ equity.
The items accounting for the difference between income taxes computed at the U.S. federal statutory income tax rate and the income tax expense (benefit) at the effective tax rate for each of the years are as follows (amounts in millions):
For the Years Ended December 31, 2016 2015 2014
Federal income tax provision at statutory rate................................................ $ 387 35% $ 392 35% $ 343 35% State taxes, net of federal benefi .................................................................... 9 1 5 — 5 — Research and development credits.................................................................. (36) (3) (26) (2) (24)Foreign rate differential .................................................................................. (239) (22) (228) (20) (245)Change in tax reserves.................................................................................... 210 19 136 12 128 13 Net operating loss tax attribute assumed from the Purchase
Transaction.................................................................................................. (114) (10) (63) (6) (5)Excess tax benefit related to share-based payments....................................... (81) (7) — — — — Other ............................................................................................................... 4 — 13 (9)Income tax expense ........................................................................................ $ 140 13% $ 229 20% $ 146 15%
The Company’s tax rate is affected by the tax rates in the jurisdictions in which the Company operates, the relative amount of income earned by jurisdiction, and the jurisdictions with a statutory tax rate less than the U.S. rate of 35%.
In 2013, in connection with the Purchase Transaction, we assumed certain tax attributes, generally consisting of net operating loss (“NOL”) carryforwards of approximately $760 million, which represent a potential tax benefit of approximately $266 million. The utilization of such NOL carryforwards will be subject to certain annual limitations and will begin to expire in 2021. The Company also obtained indemnification from Vivendi against losses attributable to the disallowance of claimed utilization of such NOL
(52)
(25)(2)
( )
65

Deferred tax liabilities:
Acquired intangibles ..................................................................................................... (226) (166) Prepaid royalties ........................................................................................................... (62) (30) Capitalized software development expenses ................................................................ (94) (81) State taxes ..................................................................................................................... (1) (7) Other ............................................................................................................................. (5) (6)
Deferred tax liabilities ...................................................................................................... (388) (290) Net deferred tax assets ...................................................................................................... $ 239 $ 265
As of December 31, 2016, we had gross tax credit carryforwards of $240 million and $137 million for federal and state purposes, respectively, which begin to expire in fiscal 2025. The tax credit carryforwards are presented in “Deferred tax assets” net of unrealized tax benefits that would apply upon the realization of uncertain tax positions. In addition, we had state NOL carryforwards of $9 million which begin to expire in fiscal 2027. Through our foreign operations, we had approximately $6 million in NOL carryforwards at December 31, 2016, attributed mainly to losses in France which can be carried forward indefinitely.
We evaluate our deferred tax assets, including net operating losses and tax credits, to determine if a valuation allowance is required. We assess whether a valuation allowance should be established or released based on the consideration of all available evidence using a “more-likely-than-not” standard. Realization of the U.S. deferred tax assets is dependent upon the continued generation of sufficient taxable income. In making such judgments, significant weight is given to evidence that can be objectively verified. Although realization is not assured, management believes it is more likely than not that the net carrying value of the U.S. deferred tax assets will be realized. At December 31, 2016 and 2015, there are no valuation allowances on deferred tax assets.
Cumulative undistributed earnings of foreign subsidiaries for which no deferred taxes have been provided approximated $5,127 million at December 31, 2016. Deferred income taxes on these earnings have not been provided as these amounts are considered to be permanent in duration. Determination of the unrecognized deferred tax liability on unremitted foreign earnings is not practicable because of the complexity of the hypothetical calculation. In the event of a distribution of these earnings to the U.S. in the form of a dividend, we may be subject to both foreign withholding taxes and U.S. income taxes net of allowable foreign tax credits.
Activision Blizzard’s tax years 2009 through 2015 remain open to examination by the major taxing jurisdictions to which we are subject. The IRS is currently examining the Company’s federal tax returns for the 2009 through 2011 tax years. During the second quarter of 2015, the Company transitioned the review of its transfer pricing methodology from the advanced pricing agreement review process to the IRS examination team. Their review could result in a different allocation of profits and losses under the Company’s transfer pricing agreements. Such allocation could have a positive or negative impact on our provision for the period in which such a determination is reached and the relevant periods thereafter. The Company also has several state and non-U.S. audits pending. In addition, as part of purchase price accounting for the King Acquisition, the Company assumed $74 million of uncertain tax positions
negotiations with the relevant jurisdictions and taxing authorities with respect to King’s transfer pricing, which could result in a different allocation of profits and losses between the relevant jurisdictions.
Vivendi Games’ results for the period from January 1, 2008 through July 9, 2008 are included in the consolidated federal and certain
66
The Company’s tax rate is affected by the tax rates in the jurisdictions in which the Company operates, the relative amount of income earned by jurisdiction, and the jurisdictions with a statutory tax rate less than the U.S. rate of 35%.
In 2013, in connection with the Purchase Transaction, we assumed certain tax attributes, generally consisting of net operating loss (“NOL”) carryforwards of approximately $760 million, which represent a potential tax benefit of approximately $266 million. The utilization of such NOL carryforwards will be subject to certain annual limitations and will begin to expire in 2021. The Company also obtained indemnification from Vivendi against losses attributable to the disallowance of claimed utilization of such NOL carryforwards of up to $200 million in unrealized tax benefits in the aggregate, limited to taxable years ending on or prior to December 31, 2016. No benefit for these tax attributes or indemnification was recorded upon the close of the Purchase Transaction. As of December 31, 2016, we had utilized approximately $657 million of the original NOL and had recorded an indemnification asset of $200 million in “Other assets.” Correspondingly, the same amount was recorded as a reduction to the consideration paid for the shares repurchased in “Treasury stock.” In each of the years ended December 31, 2016 and 2015, we utilized $326 million and $180 million of the NOL and recognized a corresponding reserve of $114 million and $63 million in each of those years ended, respectively.
Deferred income taxes reflect the net tax effects of temporary differences between the amounts of assets and liabilities for accounting purposes and the amounts used for income tax purposes. The components of the net deferred tax assets (liabilities) are as follows (amounts in millions):
December 31,2016 2015
Deferred tax assets: Allowance for sales returns and price protection .........................................................$ 66 $ 66 Inventory reserve ..........................................................................................................9 11 Accrued expenses .........................................................................................................26 40 Deferred revenue ..........................................................................................................238 288 Tax credit carryforwards ..............................................................................................71 58 Net operating loss carryforwards ..................................................................................10 10 Share-based compensation ...........................................................................................63 54 Acquired intangibles .....................................................................................................115 — Other .............................................................................................................................29 28
Deferred tax assets ............................................................................................................627 555 Valuation allowance .........................................................................................................— — Deferred tax assets, net of valuation allowance ...............................................................627 555
66

67
quarter of 2015, the Company transitioned the review of its transfer pricing methodology from the advanced pricing agreement review process to the IRS examination team. Their review could result in a different allocation of profits and losses under the Company’s transfer pricing agreements. Such allocation could have a positive or negative impact on our provision for the period in which such a determination is reached and the relevant periods thereafter. The Company also has several state and non-U.S. audits pending. In addition, as part of purchase price accounting for the King Acquisition, the Company assumed $74 million of uncertain tax positions primarily related to the transfer pricing on King tax years occurring prior to the King Acquisition. The Company is currently in negotiations with the relevant jurisdictions and taxing authorities with respect to King’s transfer pricing, which could result in a different allocation of profits and losses between the relevant jurisdictions.
Vivendi Games’ results for the period from January 1, 2008 through July 9, 2008 are included in the consolidated federal and certain foreign, state and local income tax returns filed by Vivendi or its affiliates, while Vivendi Games’ results for the period from July 10, 2008 through December 31, 2008 are included in the consolidated federal and certain foreign, state and local income tax returns filed by Activision Blizzard. IRS Appeals proceedings concerning Vivendi Games’ tax return for the 2008 tax year were concluded during July 2016 but that year remains open to examination by other major taxing authorities. The resolution of the 2008 IRS Appeals process did not have a material impact on the Company’s consolidated financial statements.
Certain of our subsidiaries are under examination or investigation or may be subject to examination or investigation by tax authorities in various jurisdictions, including France. These proceedings may lead to adjustments or proposed adjustments to our taxes or provisions for uncertain tax positions. Such proceedings may have a material adverse effect on the Company’s consolidated financial position, liquidity or results of operations in the period or periods in which the matters are resolved or in which appropriate tax provisions are taken into account in our financial statements. If we were to receive a materially adverse assessment from a taxing jurisdiction, we would plan to vigorously contest it and consider all of our options, including the pursuit of judicial remedies.
As of December 31, 2016, we had approximately $846 million of gross unrecognized tax benefits, of which $812 million would affect our effective tax rate, if recognized. A reconciliation of total gross unrecognized tax benefits for the years ended December 31, 2016, 2015, and 2014 is as follows (amounts in millions):
For the Years Ended
December 31, 2016 2015 2014
Unrecognized tax benefits balance at January 1 ......................................................... $ 552 $ 419 $ 294 Gross increase for tax positions of prior-years ............................................................ 89 8 2 Gross decrease for tax positions of prior-years ........................................................... (17) (11) — Gross increase for tax positions of current year .......................................................... 240 136 125 Settlement with taxing authorities ............................................................................... (18) — (2) Lapse of statute of limitations ..................................................................................... — — — Unrecognized tax benefits balance at December 31 ................................................... $ 846 $ 552 $ 419
We recognize interest and penalties related to uncertain tax positions in “Income tax expense”. As of December 31, 2016 and 2015, we had approximately $71 million and $41 million, respectively, of accrued interest and penalties related to uncertain tax positions. For the year ended December 31, 2016, 2015, and 2014, we recorded $17 million, $10 million, and $5 million, respectively, of interest expense related to uncertain tax positions.
The final resolution of the Company’s global tax disputes is uncertain. There is significant judgment required in the analysis of disputes, including the probability determination and estimation of the potential exposure. Based on current information, in the opinion of the Company’s management, the ultimate resolution of these matters is not expected to have a material adverse effect on the Company’s consolidated financial position, liquidity or results of operations, except as noted above.
16. Computation of Basic/Diluted Earnings Per Common Share
The following table sets forth the computation of basic and diluted earnings per common share (amounts in millions, except per share data):
For the Years Ended December 31,
2016 2015 2014 Numerator:
Consolidated net income ................................................................................................................$ 966 $ 892 $ 835 Less: Distributed earnings to unvested share-based awards that participate in earnings ........... (2) (4) (4)Less: Undistributed earnings allocated to unvested share-based awards that participate
in earnings .............................................................................................................................. (2) (7) (14)
We recognize interest and penalties related to uncertain tax positions in “Income tax expense”. As of December 31, 2016 and 2015, we had approximately $71 million and $41 million, respectively, of accrued interest and penalties related to uncertain tax positions. For the year ended December 31, 2016, 2015, and 2014, we recorded $17 million, $10 million, and $5 million, respectively, of interest expense related to uncertain tax positions.
The final resolution of the Company’s global tax disputes is uncertain. There is significant judgment required in the analysis of disputes, including the probability determination and estimation of the potential exposure. Based on current information, in the opinion of the Company’s management, the ultimate resolution of these matters is not expected to have a material adverse effect on the Company’s consolidated financial position, liquidity or results of operations, except as noted above.
16. Computation of Basic/Diluted Earnings Per Common Share
The following table sets forth the computation of basic and diluted earnings per common share (amounts in millions, except per share data):
For the Years Ended December 31,
2016 2015 2014 Numerator:
Consolidated net income ................................................................................................................$ 966 $ 892 $ 835 Less: Distributed earnings to unvested share-based awards that participate in earnings .......... (2) (4) (4)Less: Undistributed earnings allocated to unvested share-based awards
............................................................................................ Numerator for basic and diluted earnings per common share—
common shareholders ........................................................................ 881 817 Denominator:
Denominator for basic earnings per common share— . outstanding ................................................................. 740 728 716
Effect of potential dilutive common shares under the treasury stock method: Employee stock options and awards .............................................................................................. 14 11 10
Denominator for diluted earnings per common share—weighted-average common .. outstanding plus dilutive common shares under the treasury stock method ............... 754 739 726
......Basic earnings per common share .............................................................................................. $ 1.21 $ 1.14 ...Diluted earnings per common share ........................................................................................... $ 1.19 $ 1.13
Certain of our unvested restricted stock rights (including certain restricted stock units and performance shares) met the definition of participating securities as they participate in earnings based on their rights to dividends or dividend equivalents. Therefore, we are required to use the two-class method in our computation of basic and diluted earnings per common share. For the years ended December 31 -
$ 1.$ 1.
(7) (14)
$ $ $
67
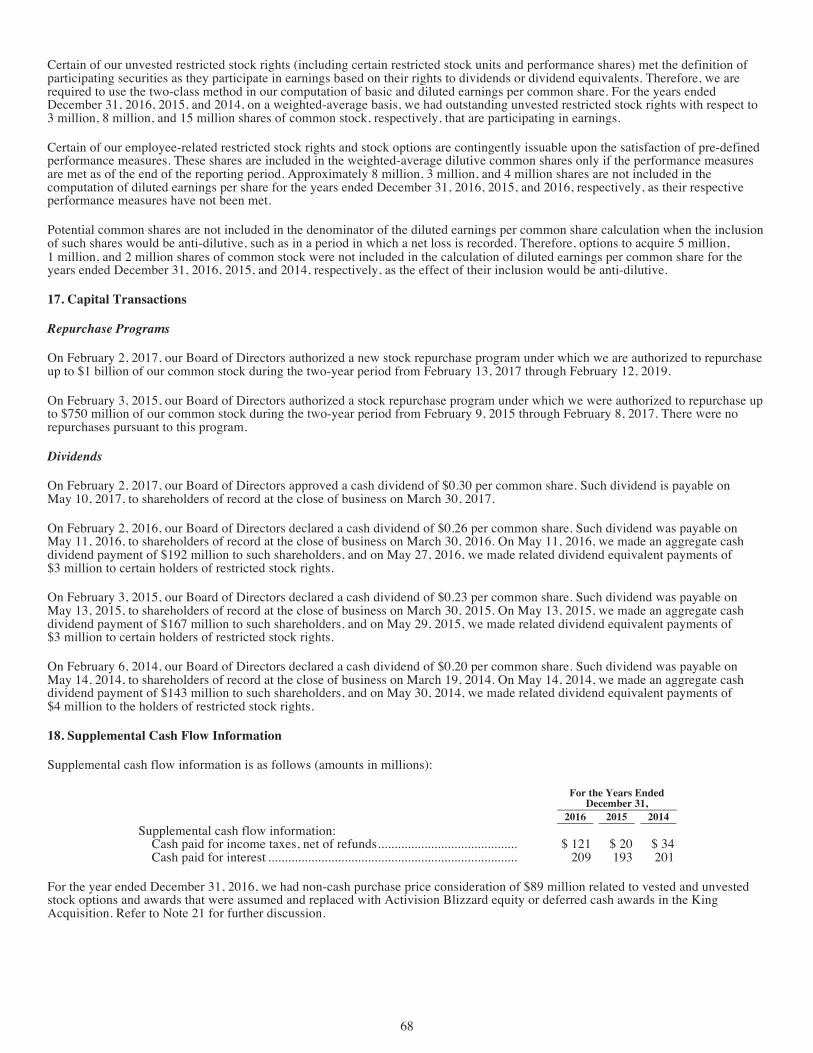
1 million, and 2 million shares of common stock were not included in the calculation of diluted earnings per common share for the years ended December 31, 2016, 2015, and 2014, respectively, as the effect of their inclusion would be anti-dilutive.
17. Capital Transactions
Repurchase Programs
On February 2, 2017, our Board of Directors authorized a new stock repurchase program under which we are authorized to repurchase up to $1 billion of our common stock during the two-year period from February 13, 2017 through February 12, 2019.
On February 3, 2015, our Board of Directors authorized a stock repurchase program under which we were authorized to repurchase up to $750 million of our common stock during the two-year period from February 9, 2015 through February 8, 2017. There were no repurchases pursuant to this program.
Dividends
On February 2, 2017, our Board of Directors approved a cash dividend of $0.30 per common share. Such dividend is payable on May 10, 2017, to shareholders of record at the close of business on March 30, 2017.
On February 2, 2016, our Board of Directors declared a cash dividend of $0.26 per common share. Such dividend was payable on May 11, 2016, to shareholders of record at the close of business on March 30, 2016. On May 11, 2016, we made an aggregate cash dividend payment of $192 million to such shareholders, and on May 27, 2016, we made related dividend equivalent payments of $3 million to certain holders of restricted stock rights.
On February 3, 2015, our Board of Directors declared a cash dividend of $0.23 per common share. Such dividend was payable on May 13, 2015, to shareholders of record at the close of business on March 30, 2015. On May 13, 2015, we made an aggregate cash dividend payment of $167 million to such shareholders, and on May 29, 2015, we made related dividend equivalent payments of $3 million to certain holders of restricted stock rights.
On February 6, 2014, our Board of Directors declared a cash dividend of $0.20 per common share. Such dividend was payable on May 14, 2014, to shareholders of record at the close of business on March 19, 2014. On May 14, 2014, we made an aggregate cash dividend payment of $143 million to such shareholders, and on May 30, 2014, we made related dividend equivalent payments of $4 million to the holders of restricted stock rights.
18. Supplemental Cash Flow Information
Supplemental cash flow information is as follows (amounts in millions):
For the Years Ended
December 31, 2016 2015 2014
Supplemental cash flow information: Cash paid for income taxes, net of refunds .............................................................. $ 121 $ 20 $ 34 Cash paid for interest ............................................................................................... 209 193 201
For the year ended December 31, 2016, we had non-cash purchase price consideration of $89 million related to vested and unvested stock options and awards that were assumed and replaced with Activision Blizzard equity or deferred cash awards in the King Acquisition. Refer to Note 21 for further discussion.
19. Commitments and Contingencies
Letters of Credit
As described in Note 11, a portion of our Revolver can be used to issue letters of credit of up to $50 million, subject to the availability of the Revolver. At December 31, 2016, we did not have any letters of credit issued or outstanding under the Revolver.
Commitments
68
outstanding plus dilutive common shares under the treasury stock method ..................................754 739 726 ......Basic earnings per common share .............................................................................................. $ 1.21 $ 1.14
...Diluted earnings per common share ........................................................................................... $ 1.19 $ 1.13
Certain of our unvested restricted stock rights (including certain restricted stock units and performance shares) met the definition of participating securities as they participate in earnings based on their rights to dividends or dividend equivalents. Therefore, we are required to use the two-class method in our computation of basic and diluted earnings per common share. For the years ended December 31, 2016, 2015, and 2014, on a weighted-average basis, we had outstanding unvested restricted stock rights with respect to 3 million, 8 million, and 15 million shares of common stock, respectively, that are participating in earnings.
Certain of our employee-related restricted stock rights and stock options are contingently issuable upon the satisfaction of pre-defined performance measures. These shares are included in the weighted-average dilutive common shares only if the performance measures are met as of the end of the reporting period. Approximately 8 million, 3 million, and 4 million shares are not included in the computation of diluted earnings per share for the years ended December 31, 2016, 2015, and 2016, respectively, as their respective performance measures have not been met.
Potential common shares are not included in the denominator of the diluted earnings per common share calculation when the inclusion of such shares would be anti-dilutive, such as in a period in which a net loss is recorded. Therefore, options to acquire 5 million,
$ 1. $ 1.
68
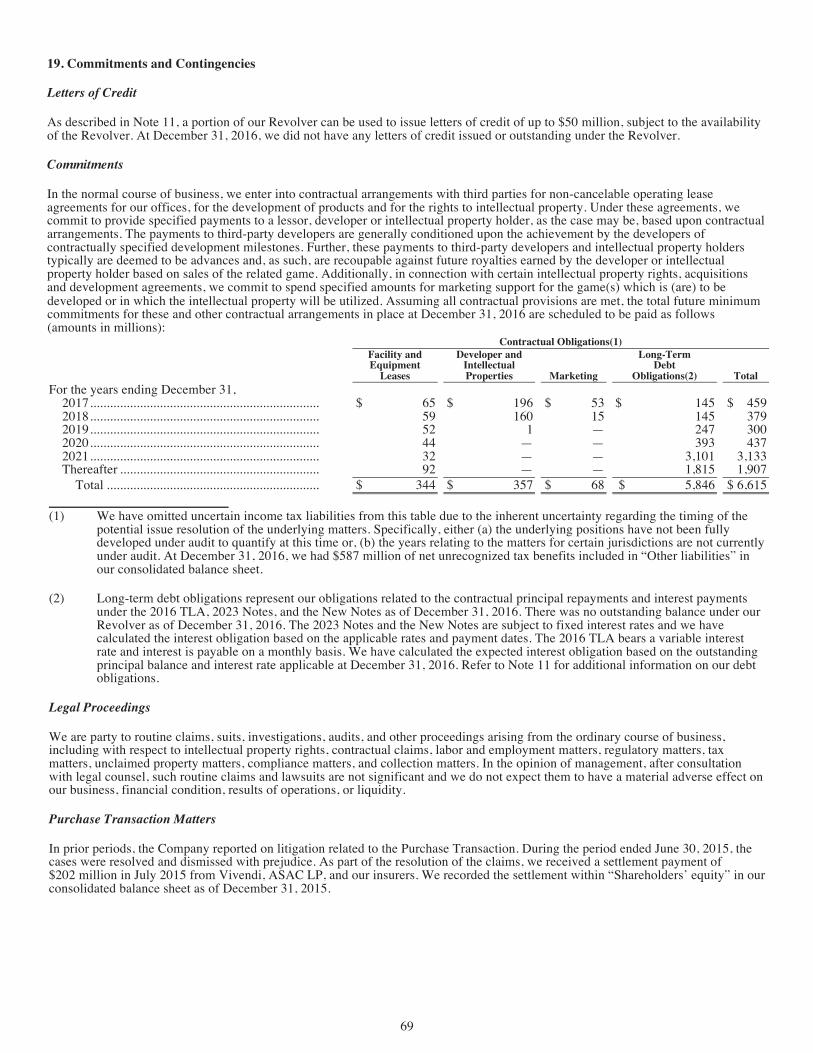
69
For the year ended December 31, 2016, we had non-cash purchase price consideration of $89 million related to vested and unvested stock options and awards that were assumed and replaced with Activision Blizzard equity or deferred cash awards in the King Acquisition. Refer to Note 21 for further discussion.
19. Commitments and Contingencies
Letters of Credit
As described in Note 11, a portion of our Revolver can be used to issue letters of credit of up to $50 million, subject to the availability of the Revolver. At December 31, 2016, we did not have any letters of credit issued or outstanding under the Revolver.
Commitments
In the normal course of business, we enter into contractual arrangements with third parties for non-cancelable operating lease agreements for our offices, for the development of products and for the rights to intellectual property. Under these agreements, we commit to provide specified payments to a lessor, developer or intellectual property holder, as the case may be, based upon contractual arrangements. The payments to third-party developers are generally conditioned upon the achievement by the developers of contractually specified development milestones. Further, these payments to third-party developers and intellectual property holders typically are deemed to be advances and, as such, are recoupable against future royalties earned by the developer or intellectual property holder based on sales of the related game. Additionally, in connection with certain intellectual property rights, acquisitions and development agreements, we commit to spend specified amounts for marketing support for the game(s) which is (are) to be developed or in which the intellectual property will be utilized. Assuming all contractual provisions are met, the total future minimum commitments for these and other contractual arrangements in place at December 31, 2016 are scheduled to be paid as follows (amounts in millions):
Contractual Obligations(1)
Facility and Equipment
Leases
Developer and Intellectual Properties Marketing
Long-Term Debt
Obligations(2) Total For the years ending December 31,
2017 ..................................................................... $ 65 $ 196 $ 53 $ 145 $ 459 2018 ..................................................................... 59 160 15 145 379 2019 ..................................................................... 52 1 — 247 300 2020 ..................................................................... 44 — — 393 437 2021 ..................................................................... 32 — — 3,101 3,133 Thereafter ............................................................ 92 — — 1,815 1,907
Total ................................................................ $ 344 $ 357 $ 68 $ 5,846 $ 6,615
(1) We have omitted uncertain income tax liabilities from this table due to the inherent uncertainty regarding the timing of the potential issue resolution of the underlying matters. Specifically, either (a) the underlying positions have not been fully developed under audit to quantify at this time or, (b) the years relating to the matters for certain jurisdictions are not currently under audit. At December 31, 2016, we had $587 million of net unrecognized tax benefits included in “Other liabilities” in our consolidated balance sheet.
(2) Long-term debt obligations represent our obligations related to the contractual principal repayments and interest payments under the 2016 TLA, 2023 Notes, and the New Notes as of December 31, 2016. There was no outstanding balance under our Revolver as of December 31, 2016. The 2023 Notes and the New Notes are subject to fixed interest rates and we have calculated the interest obligation based on the applicable rates and payment dates. The 2016 TLA bears a variable interest rate and interest is payable on a monthly basis. We have calculated the expected interest obligation based on the outstanding principal balance and interest rate applicable at December 31, 2016. Refer to Note 11 for additional information on our debt obligations.
Legal Proceedings
We are party to routine claims, suits, investigations, audits, and other proceedings arising from the ordinary course of business, including with respect to intellectual property rights, contractual claims, labor and employment matters, regulatory matters, tax matters, unclaimed property matters, compliance matters, and collection matters. In the opinion of management, after consultation with legal counsel, such routine claims and lawsuits are not significant and we do not expect them to have a material adverse effect on our business, financial condition, results of operations, or liquidity.
Purchase Transaction Matters
70
developed or in which the intellectual property will be utilized. Assuming all contractual provisions are met, the total future minimum commitments for these and other contractual arrangements in place at December 31, 2016 are scheduled to be paid as follows (amounts in millions):
Contractual Obligations(1)
Facility and Equipment
Leases
Developer and Intellectual Properties Marketing
Long-Term Debt
Obligations(2) Total For the years ending December 31,
2017 ..................................................................... $ 65 $ 196 $ 53 $ 145 $ 459 2018 ..................................................................... 59 160 15 145 379 2019 ..................................................................... 52 1 — 247 300 2020 ..................................................................... 44 — — 393 437 2021 ..................................................................... 32 — — 3,101 3,133 Thereafter ............................................................ 92 — — 1,815 1,907
Total ................................................................ $ 344 $ 357 $ 68 $ 5,846 $ 6,615
(1) We have omitted uncertain income tax liabilities from this table due to the inherent uncertainty regarding the timing of the potential issue resolution of the underlying matters. Specifically, either (a) the underlying positions have not been fully developed under audit to quantify at this time or, (b) the years relating to the matters for certain jurisdictions are not currently under audit. At December 31, 2016, we had $587 million of net unrecognized tax benefits included in “Other liabilities” in our consolidated balance sheet.
(2) Long-term debt obligations represent our obligations related to the contractual principal repayments and interest payments under the 2016 TLA, 2023 Notes, and the New Notes as of December 31, 2016. There was no outstanding balance under our Revolver as of December 31, 2016. The 2023 Notes and the New Notes are subject to fixed interest rates and we have calculated the interest obligation based on the applicable rates and payment dates. The 2016 TLA bears a variable interest rate and interest is payable on a monthly basis. We have calculated the expected interest obligation based on the outstanding principal balance and interest rate applicable at December 31, 2016. Refer to Note 11 for additional information on our debt obligations.
Legal Proceedings
We are party to routine claims, suits, investigations, audits, and other proceedings arising from the ordinary course of business, including with respect to intellectual property rights, contractual claims, labor and employment matters, regulatory matters, tax matters, unclaimed property matters, compliance matters, and collection matters. In the opinion of management, after consultation with legal counsel, such routine claims and lawsuits are not significant and we do not expect them to have a material adverse effect on our business, financial condition, results of operations, or liquidity.
Purchase Transaction Matters
In prior periods, the Company reported on litigation related to the Purchase Transaction. During the period ended June 30, 2015, the cases were resolved and dismissed with prejudice. As part of the resolution of the claims, we received a settlement payment of $202 million in July 2015 from Vivendi, ASAC LP, and our insurers. We recorded the settlement within “Shareholders’ equity” in our consolidated balance sheet as of December 31, 2015.
20. Related Party Transactions
Transactions with Vivendi and Its Affiliates
As part of the Business Combination in 2008, we entered into various transactions and agreements, including cash management services agreements, a tax sharing agreement and an investor agreement, with Vivendi and its subsidiaries. In connection with the
69
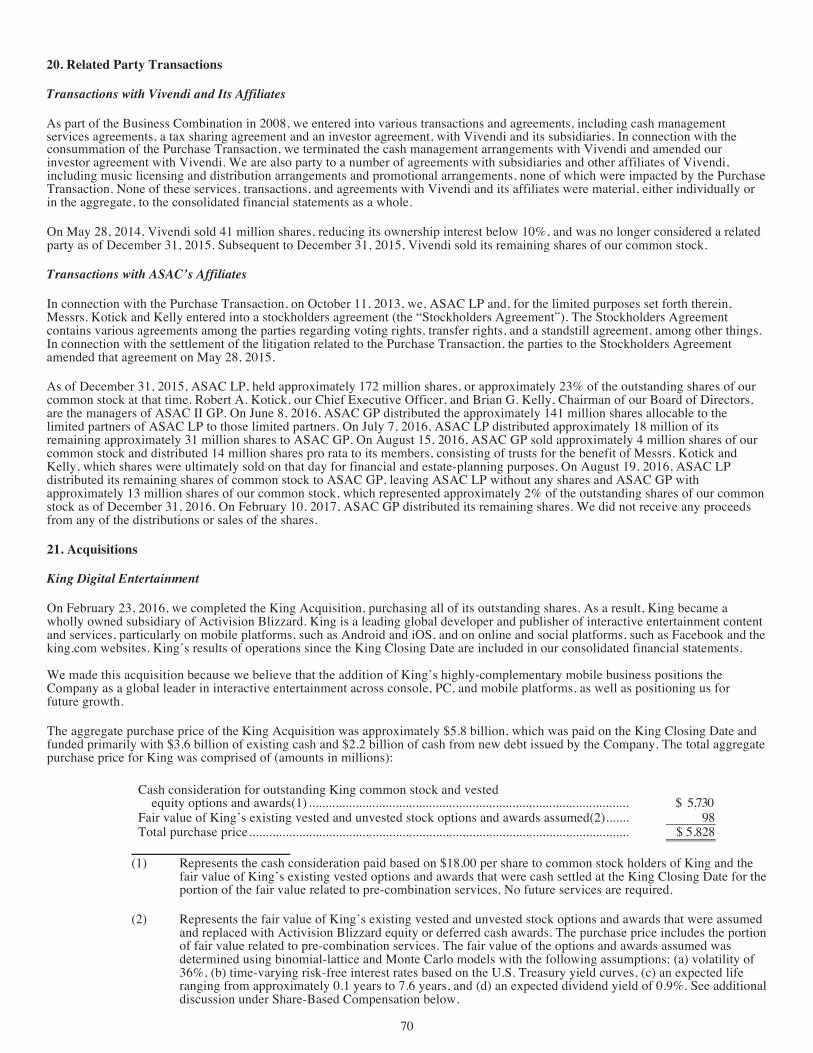
70
In prior periods, the Company reported on litigation related to the Purchase Transaction. During the period ended June 30, 2015, the cases were resolved and dismissed with prejudice. As part of the resolution of the claims, we received a settlement payment of $202 million in July 2015 from Vivendi, ASAC LP, and our insurers. We recorded the settlement within “Shareholders’ equity” in our consolidated balance sheet as of December 31, 2015.
20. Related Party Transactions
Transactions with Vivendi and Its Affiliates
As part of the Business Combination in 2008, we entered into various transactions and agreements, including cash management services agreements, a tax sharing agreement and an investor agreement, with Vivendi and its subsidiaries. In connection with the consummation of the Purchase Transaction, we terminated the cash management arrangements with Vivendi and amended our investor agreement with Vivendi. We are also party to a number of agreements with subsidiaries and other affiliates of Vivendi, including music licensing and distribution arrangements and promotional arrangements, none of which were impacted by the Purchase Transaction. None of these services, transactions, and agreements with Vivendi and its affiliates were material, either individually or in the aggregate, to the consolidated financial statements as a whole.
On May 28, 2014, Vivendi sold 41 million shares, reducing its ownership interest below 10%, and was no longer considered a related party as of December 31, 2015. Subsequent to December 31, 2015, Vivendi sold its remaining shares of our common stock.
Transactions with ASAC’s Affiliates
In connection with the Purchase Transaction, on October 11, 2013, we, ASAC LP and, for the limited purposes set forth therein, Messrs. Kotick and Kelly entered into a stockholders agreement (the “Stockholders Agreement”). The Stockholders Agreement contains various agreements among the parties regarding voting rights, transfer rights, and a standstill agreement, among other things. In connection with the settlement of the litigation related to the Purchase Transaction, the parties to the Stockholders Agreement amended that agreement on May 28, 2015.
As of December 31, 2015, ASAC LP, held approximately 172 million shares, or approximately 23% of the outstanding shares of our common stock at that time. Robert A. Kotick, our Chief Executive Officer, and Brian G. Kelly, Chairman of our Board of Directors, are the managers of ASAC II GP. On June 8, 2016, ASAC GP distributed the approximately 141 million shares allocable to the limited partners of ASAC LP to those limited partners. On July 7, 2016, ASAC LP distributed approximately 18 million of its remaining approximately 31 million shares to ASAC GP. On August 15, 2016, ASAC GP sold approximately 4 million shares of our common stock and distributed 14 million shares pro rata to its members, consisting of trusts for the benefit of Messrs. Kotick and Kelly, which shares were ultimately sold on that day for financial and estate-planning purposes. On August 19, 2016, ASAC LP distributed its remaining shares of common stock to ASAC GP, leaving ASAC LP without any shares and ASAC GP with approximately 13 million shares of our common stock, which represented approximately 2% of the outstanding shares of our common stock as of December 31, 2016. On February 10, 2017, ASAC GP distributed its remaining shares. We did not receive any proceeds from any of the distributions or sales of the shares.
21. Acquisitions
King Digital Entertainment
On February 23, 2016, we completed the King Acquisition, purchasing all of its outstanding shares. As a result, King became a wholly owned subsidiary of Activision Blizzard. King is a leading global developer and publisher of interactive entertainment content and services, particularly on mobile platforms, such as Android and iOS, and on online and social platforms, such as Facebook and the king.com websites. King’s results of operations since the King Closing Date are included in our consolidated financial statements.
We made this acquisition because we believe that the addition of King’s highly-complementary mobile business positions the Company as a global leader in interactive entertainment across console, PC, and mobile platforms, as well as positioning us for future growth.
The aggregate purchase price of the King Acquisition was approximately $5.8 billion, which was paid on the King Closing Date and funded primarily with $3.6 billion of existing cash and $2.2 billion of cash from new debt issued by the Company. The total aggregate purchase price for King was comprised of (amounts in millions):
Cash consideration for outstanding King common stock and vested ....... awards(1) .......................................................................................................... $ 5,730
Fair value of King’s existing vested and unvested stock options and awards assumed(2) ................. 98 Total purchase price ............................................................................................................................. $ 5,828
(1) Represents the cash consideration paid based on $18.00 per share to common stock holders of King and thefair value of King’s existing vested options and awards that were cash settled at the King Closing Date for theportion of the fair value related to pre-combination services. No future services are required.
(2) Represents the fair value of King’s existing vested and unvested stock options and awards that were assumedand replaced with Activision Blizzard equity or deferred cash awards. The purchase price includes the portionof fair value related to pre-combination services. The fair value of the options and awards assumed wasdetermined using binomial-lattice and Monte Carlo models with the following assumptions: (a) volatility of36%, (b) time-varying risk-free interest rates based on the U.S. Treasury yield curves, (c) an expected liferanging from approximately 0.1 years to 7.6 years, and (d) an expected dividend yield of 0.9%. See additionaldiscussion under Share-Based Compensation below.
We identified and recorded assets acquired and liabilities assumed at their estimated fair values at the King Closing Date, and allocated the remaining value of approximately $2.7 billion to goodwill. During the year ended December 31, 2016, we recorded certain immaterial measurement period adjustments to our preliminary purchase price allocation based on additional analysis of facts
consummation of the Purchase Transaction, we terminated the cash management arrangements with Vivendi and amended our investor agreement with Vivendi. We are also party to a number of agreements with subsidiaries and other affiliates of Vivendi, including music licensing and distribution arrangements and promotional arrangements, none of which were impacted by the Purchase Transaction. None of these services, transactions, and agreements with Vivendi and its affiliates were material, either individually or in the aggregate, to the consolidated financial statements as a whole.
On May 28, 2014, Vivendi sold 41 million shares, reducing its ownership interest below 10%, and was no longer considered a related party as of December 31, 2015. Subsequent to December 31, 2015, Vivendi sold its remaining shares of our common stock.
Transactions with ASAC’s Affiliates
In connection with the Purchase Transaction, on October 11, 2013, we, ASAC LP and, for the limited purposes set forth therein, Messrs. Kotick and Kelly entered into a stockholders agreement (the “Stockholders Agreement”). The Stockholders Agreement contains various agreements among the parties regarding voting rights, transfer rights, and a standstill agreement, among other things. In connection with the settlement of the litigation related to the Purchase Transaction, the parties to the Stockholders Agreement amended that agreement on May 28, 2015.
As of December 31, 2015, ASAC LP, held approximately 172 million shares, or approximately 23% of the outstanding shares of our common stock at that time. Robert A. Kotick, our Chief Executive Officer, and Brian G. Kelly, Chairman of our Board of Directors, are the managers of ASAC II GP. On June 8, 2016, ASAC GP distributed the approximately 141 million shares allocable to the limited partners of ASAC LP to those limited partners. On July 7, 2016, ASAC LP distributed approximately 18 million of its remaining approximately 31 million shares to ASAC GP. On August 15, 2016, ASAC GP sold approximately 4 million shares of our common stock and distributed 14 million shares pro rata to its members, consisting of trusts for the benefit of Messrs. Kotick and Kelly, which shares were ultimately sold on that day for financial and estate-planning purposes. On August 19, 2016, ASAC LP distributed its remaining shares of common stock to ASAC GP, leaving ASAC LP without any shares and ASAC GP with approximately 13 million shares of our common stock, which represented approximately 2% of the outstanding shares of our common stock as of December 31, 2016. On February 10, 2017, ASAC GP distributed its remaining shares. We did not receive any proceeds from any of the distributions or sales of the shares.
21. Acquisitions
King Digital Entertainment
On February 23, 2016, we completed the King Acquisition, purchasing all of its outstanding shares. As a result, King became a wholly owned subsidiary of Activision Blizzard. King is a leading global developer and publisher of interactive entertainment content and services, particularly on mobile platforms, such as Android and iOS, and on online and social platforms, such as Facebook and the king.com websites. King’s results of operations since the King Closing Date are included in our consolidated financial statements.
We made this acquisition because we believe that the addition of King’s highly-complementary mobile business positions the Company as a global leader in interactive entertainment across console, PC, and mobile platforms, as well as positioning us for future growth.
The aggregate purchase price of the King Acquisition was approximately $5.8 billion, which was paid on the King Closing Date and funded primarily with $3.6 billion of existing cash and $2.2 billion of cash from new debt issued by the Company. The total aggregate purchase price for King was comprised of (amounts in millions):
Cash consideration for outstanding King common stock and vested ....... awards(1) .......................................................................................................... $ 5,730
Fair value of King’s existing vested and unvested stock options and awards assumed(2) ................. 98 Total purchase price ............................................................................................................................. $ 5,828
(1) Represents the cash consideration paid based on $18.00 per share to common stock holders of King and thefair value of King’s existing vested options and awards that were cash settled at the King Closing Date for theportion of the fair value related to pre-combination services. No future services are required.
(2) Represents the fair value of King’s existing vested and unvested stock options and awards that were assumedand replaced with Activision Blizzard equity or deferred cash awards. The purchase price includes the portionof fair value related to pre-combination services. The fair value of the options and awards assumed wasdetermined using binomial-lattice and Monte Carlo models with the following assumptions: (a) volatility of36%, (b) time-varying risk-free interest rates based on the U.S. Treasury yield curves, (c) an expected liferanging from approximately 0.1 years to 7.6 years, and (d) an expected dividend yield of 0.9%. See additionaldiscussion under Share-Based Compensation below.
We identified and recorded assets acquired and liabilities assumed at their estimated fair values at the King Closing Date, and allocated the remaining value of approximately $2.7 billion to goodwill. During the year ended December 31, 2016, we recorded certain immaterial measurement period adjustments to our preliminary purchase price allocation based on additional analysis of facts
70
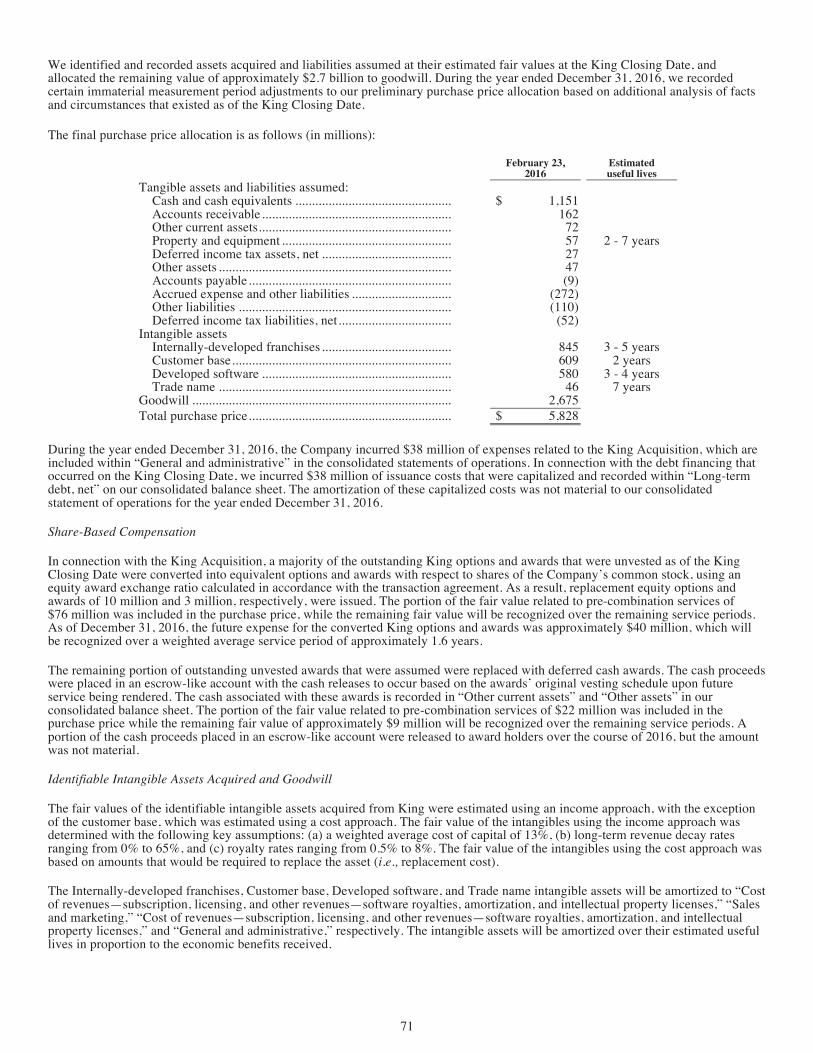
The final purchase price allocation is as follows (in millions):
February 23,
2016 Estimated useful lives
Tangible assets and liabilities assumed: Cash and cash equivalents ................................................................. $ 1,151 Accounts receivable ........................................................................... 162 Other current assets ............................................................................ 72 Property and equipment ..................................................................... 57 2 - 7 years Deferred income tax assets, net ......................................................... 27 Other assets ........................................................................................ 47 Accounts payable ............................................................................... (9) Accrued expense and other liabilities ................................................ (272) Other liabilities .................................................................................. (110) Deferred income tax liabilities, net .................................................... (52)
Intangible assets Internally-developed franchises ......................................................... 845 3 - 5 years Customer base .................................................................................... 609 2 years Developed software ........................................................................... 580 3 - 4 years Trade name ........................................................................................ 46 7 years
Goodwill ................................................................................................ 2,675 Total purchase price ............................................................................... $ 5,828
During the year ended December 31, 2016, the Company incurred $38 million of expenses related to the King Acquisition, which are included within “General and administrative” in the consolidated statements of operations. In connection with the debt financing that occurred on the King Closing Date, we incurred $38 million of issuance costs that were capitalized and recorded within “Long-term debt, net” on our consolidated balance sheet. The amortization of these capitalized costs was not material to our consolidated statement of operations for the year ended December 31, 2016.
Share-Based Compensation
In connection with the King Acquisition, a majority of the outstanding King options and awards that were unvested as of the King Closing Date were converted into equivalent options and awards with respect to shares of the Company’s common stock, using an equity award exchange ratio calculated in accordance with the transaction agreement. As a result, replacement equity options and awards of 10 million and 3 million, respectively, were issued. The portion of the fair value related to pre-combination services of $76 million was included in the purchase price, while the remaining fair value will be recognized over the remaining service periods. As of December 31, 2016, the future expense for the converted King options and awards was approximately $40 million, which will be recognized over a weighted average service period of approximately 1.6 years.
The remaining portion of outstanding unvested awards that were assumed were replaced with deferred cash awards. The cash proceeds were placed in an escrow-like account with the cash releases to occur based on the awards’ original vesting schedule upon future service being rendered. The cash associated with these awards is recorded in “Other current assets” and “Other assets” in our consolidated balance sheet. The portion of the fair value related to pre-combination services of $22 million was included in the purchase price while the remaining fair value of approximately $9 million will be recognized over the remaining service periods. A portion of the cash proceeds placed in an escrow-like account were released to award holders over the course of 2016, but the amount was not material.
Identifiable Intangible Assets Acquired and Goodwill
The fair values of the identifiable intangible assets acquired from King were estimated using an income approach, with the exception of the customer base, which was estimated using a cost approach. The fair value of the intangibles using the income approach was determined with the following key assumptions: (a) a weighted average cost of capital of 13%, (b) long-term revenue decay rates ranging from 0% to 65%, and (c) royalty rates ranging from 0.5% to 8%. The fair value of the intangibles using the cost approach was based on amounts that would be required to replace the asset (i.e., replacement cost).
The Internally-developed franchises, Customer base, Developed software, and Trade name intangible assets will be amortized to “Cost of revenues—subscription, licensing, and other revenues—software royalties, amortization, and intellectual property licenses,” “Sales and marketing,” “Cost of revenues—subscription, licensing, and other revenues—software royalties, amortization, and intellectual property licenses,” and “General and administrative,” respectively. The intangible assets will be amortized over their estimated useful lives in proportion to the economic benefits received.
The $2.7 billion of goodwill recognized is primarily attributable to the benefits the Company expects to derive from accelerated expansion as an interactive entertainment provider in the mobile sector, future franchises, and technology, as well as the management team’s proven ability to create future games and franchises. Approximately $620 million of the goodwill is expected to be deductible for tax purposes in the U.S.
71
determined using binomial-lattice and Monte Carlo models with the following assumptions: (a) volatility of 36%, (b) time-varying risk-free interest rates based on the U.S. Treasury yield curves, (c) an expected life ranging from approximately 0.1 years to 7.6 years, and (d) an expected dividend yield of 0.9%. See additional discussion under Share-Based Compensation below.
We identified and recorded assets acquired and liabilities assumed at their estimated fair values at the King Closing Date, and allocated the remaining value of approximately $2.7 billion to goodwill. During the year ended December 31, 2016, we recorded certain immaterial measurement period adjustments to our preliminary purchase price allocation based on additional analysis of facts and circumstances that existed as of the King Closing Date.
71
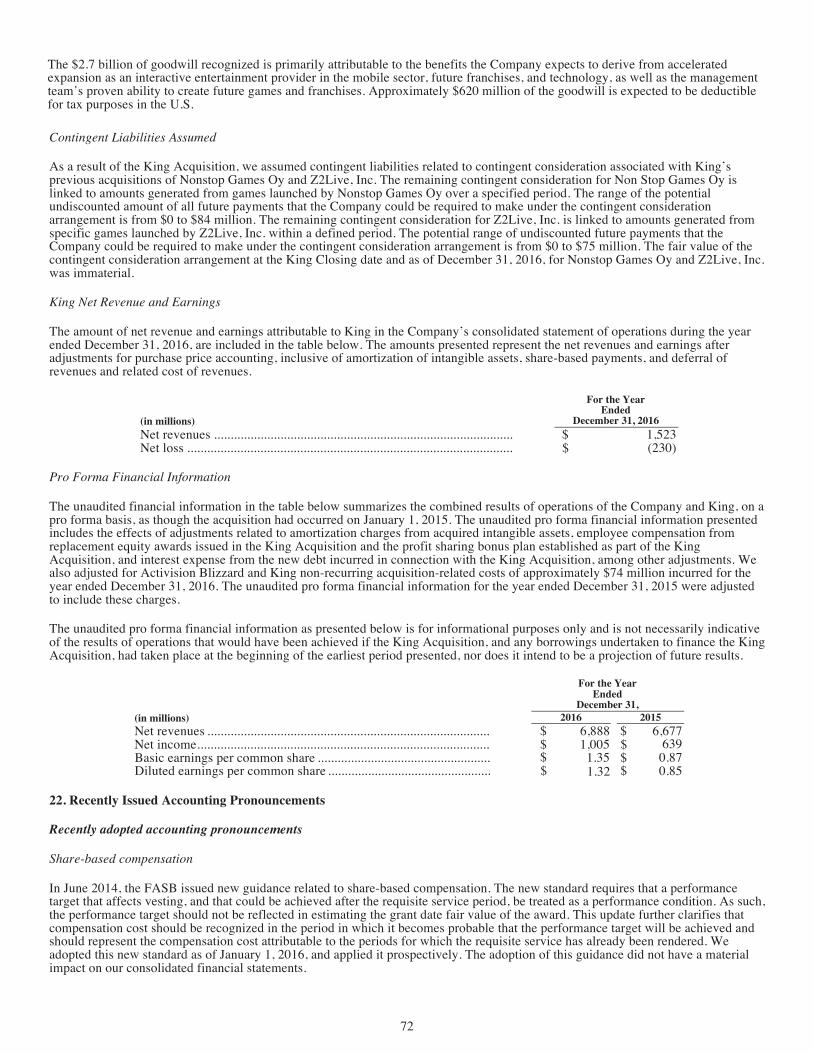
72
of revenues—subscription, licensing, and other revenues—software royalties, amortization, and intellectual property licenses,” “Sales and marketing,” “Cost of revenues—subscription, licensing, and other revenues—software royalties, amortization, and intellectual property licenses,” and “General and administrative,” respectively. The intangible assets will be amortized over their estimated useful lives in proportion to the economic benefits received.
The $2.7 billion of goodwill recognized is primarily attributable to the benefits the Company expects to derive from accelerated expansion as an interactive entertainment provider in the mobile sector, future franchises, and technology, as well as the management team’s proven ability to create future games and franchises. Approximately $620 million of the goodwill is expected to be deductible for tax purposes in the U.S.
Contingent Liabilities Assumed
As a result of the King Acquisition, we assumed contingent liabilities related to contingent consideration associated with King’s previous acquisitions of Nonstop Games Oy and Z2Live, Inc. The remaining contingent consideration for Non Stop Games Oy is linked to amounts generated from games launched by Nonstop Games Oy over a specified period. The range of the potential undiscounted amount of all future payments that the Company could be required to make under the contingent consideration arrangement is from $0 to $84 million. The remaining contingent consideration for Z2Live, Inc. is linked to amounts generated from specific games launched by Z2Live, Inc. within a defined period. The potential range of undiscounted future payments that the Company could be required to make under the contingent consideration arrangement is from $0 to $75 million. The fair value of the contingent consideration arrangement at the King Closing date and as of December 31, 2016, for Nonstop Games Oy and Z2Live, Inc. was immaterial.
King Net Revenue and Earnings
The amount of net revenue and earnings attributable to King in the Company’s consolidated statement of operations during the year ended December 31, 2016, are included in the table below. The amounts presented represent the net revenues and earnings after adjustments for purchase price accounting, inclusive of amortization of intangible assets, share-based payments, and deferral of revenues and related cost of revenues.
(in millions)
For the Year Ended
December 31, 2016 Net revenues ...................................................................................................... $ 1,523
(230)
Pro Forma Financial Information
The unaudited financial information in the table below summarizes the combined results of operations of the Company and King, on a pro forma basis, as though the acquisition had occurred on January 1, 2015. The unaudited pro forma financial information presented includes the effects of adjustments related to amortization charges from acquired intangible assets, employee compensation from replacement equity awards issued in the King Acquisition and the profit sharing bonus plan established as part of the King Acquisition, and interest expense from the new debt incurred in connection with the King Acquisition, among other adjustments. We also adjusted for Activision Blizzard and King non-recurring acquisition-related costs of approximately $74 million incurred for the year ended December 31, 2016. The unaudited pro forma financial information for the year ended December 31, 2015 were adjusted to include these charges.
The unaudited pro forma financial information as presented below is for informational purposes only and is not necessarily indicative of the results of operations that would have been achieved if the King Acquisition, and any borrowings undertaken to finance the King Acquisition, had taken place at the beginning of the earliest period presented, nor does it intend to be a projection of future results.
For the Year Ended
December 31, (in millions) 2016 2015 Net revenues ................................................................................................. $ 6,888 $ 6,677 Net income .................................................................................................... 1,005 639 Basic earnings per common share ................................................................ 0.87
.................Diluted earnings per common share ............................................................. $ 0.85
22. Recently Issued Accounting Pronouncements
Recently adopted accounting pronouncements
Share-based compensation
In June 2014, the FASB issued new guidance related to share-based compensation. The new standard requires that a performance target that affects vesting, and that could be achieved after the requisite service period, be treated as a performance condition. As such, the performance target should not be reflected in estimating the grant date fair value of the award. This update further clarifies that compensation cost should be recognized in the period in which it becomes probable that the performance target will be achieved and should represent the compensation cost attributable to the periods for which the requisite service has already been rendered. We adopted this new standard as of January 1, 2016, and applied it prospectively. The adoption of this guidance did not have a material impact on our consolidated financial statements.
Consolidations
In February 2015, the FASB issued new guidance related to consolidations. The new standard amends certain requirements for determining whether a variable interest entity must be consolidated. We adopted this new standard as of January 1, 2016. The adoption of this guidance did not have a material impact on our consolidated financial statements.
Net loss .............................................................................................................. $
1.35 1.32
$ $ $
$ $
72
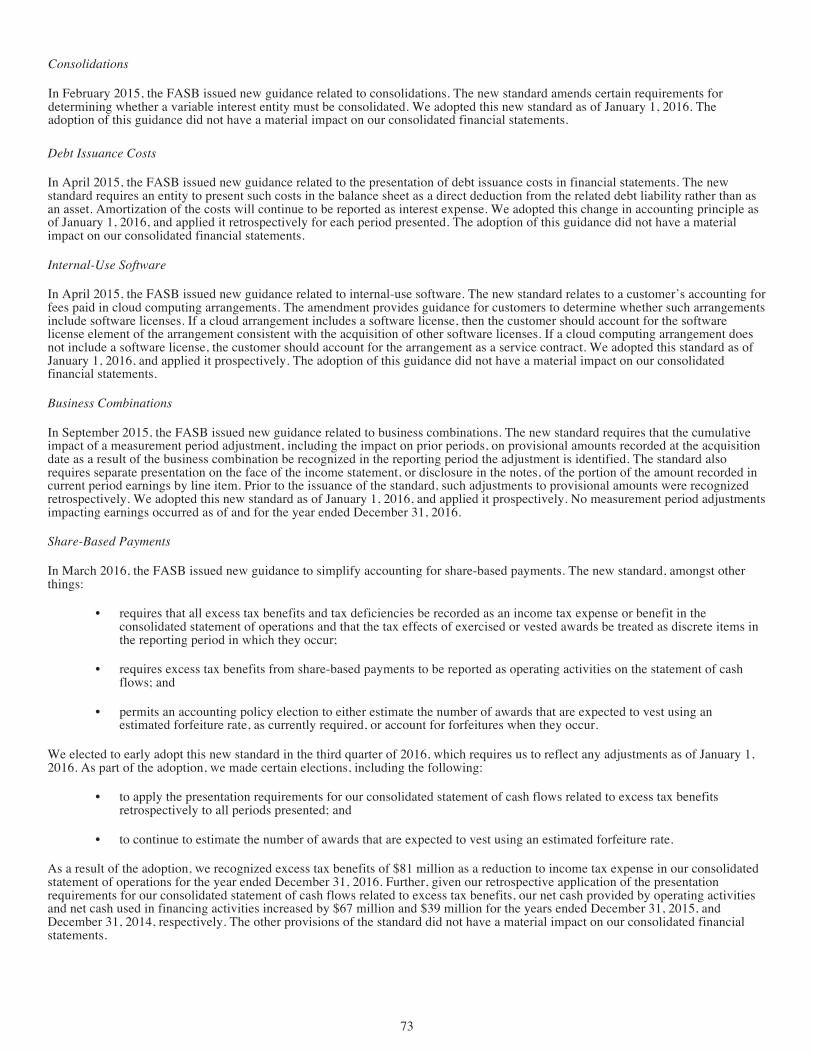
73
compensation cost should be recognized in the period in which it becomes probable that the performance target will be achieved and should represent the compensation cost attributable to the periods for which the requisite service has already been rendered. We adopted this new standard as of January 1, 2016, and applied it prospectively. The adoption of this guidance did not have a material impact on our consolidated financial statements.
Consolidations
In February 2015, the FASB issued new guidance related to consolidations. The new standard amends certain requirements for determining whether a variable interest entity must be consolidated. We adopted this new standard as of January 1, 2016. The adoption of this guidance did not have a material impact on our consolidated financial statements. Debt Issuance Costs
In April 2015, the FASB issued new guidance related to the presentation of debt issuance costs in financial statements. The new standard requires an entity to present such costs in the balance sheet as a direct deduction from the related debt liability rather than as an asset. Amortization of the costs will continue to be reported as interest expense. We adopted this change in accounting principle as of January 1, 2016, and applied it retrospectively for each period presented. The adoption of this guidance did not have a material impact on our consolidated financial statements.
Internal-Use Software
In April 2015, the FASB issued new guidance related to internal-use software. The new standard relates to a customer’s accounting for fees paid in cloud computing arrangements. The amendment provides guidance for customers to determine whether such arrangements include software licenses. If a cloud arrangement includes a software license, then the customer should account for the software license element of the arrangement consistent with the acquisition of other software licenses. If a cloud computing arrangement does not include a software license, the customer should account for the arrangement as a service contract. We adopted this standard as of January 1, 2016, and applied it prospectively. The adoption of this guidance did not have a material impact on our consolidated financial statements.
Business Combinations
In September 2015, the FASB issued new guidance related to business combinations. The new standard requires that the cumulative impact of a measurement period adjustment, including the impact on prior periods, on provisional amounts recorded at the acquisition date as a result of the business combination be recognized in the reporting period the adjustment is identified. The standard also requires separate presentation on the face of the income statement, or disclosure in the notes, of the portion of the amount recorded in current period earnings by line item. Prior to the issuance of the standard, such adjustments to provisional amounts were recognized retrospectively. We adopted this new standard as of January 1, 2016, and applied it prospectively. No measurement period adjustments impacting earnings occurred as of and for the year ended December 31, 2016.
Share-Based Payments
In March 2016, the FASB issued new guidance to simplify accounting for share-based payments. The new standard, amongst other things:
• requires that all excess tax benefits and tax deficiencies be recorded as an income tax expense or benefit in the consolidated statement of operations and that the tax effects of exercised or vested awards be treated as discrete items in the reporting period in which they occur;
• requires excess tax benefits from share-based payments to be reported as operating activities on the statement of cash flows; and
• permits an accounting policy election to either estimate the number of awards that are expected to vest using an estimated forfeiture rate, as currently required, or account for forfeitures when they occur.
We elected to early adopt this new standard in the third quarter of 2016, which requires us to reflect any adjustments as of January 1, 2016. As part of the adoption, we made certain elections, including the following:
• to apply the presentation requirements for our consolidated statement of cash flows related to excess tax benefits retrospectively to all periods presented; and
• to continue to estimate the number of awards that are expected to vest using an estimated forfeiture rate.
As a result of the adoption, we recognized excess tax benefits of $81 million as a reduction to income tax expense in our consolidated statement of operations for the year ended December 31, 2016. Further, given our retrospective application of the presentation requirements for our consolidated statement of cash flows related to excess tax benefits, our net cash provided by operating activities and net cash used in financing activities increased by $67 million and $39 million for the years ended December 31, 2015, and December 31, 2014, respectively. The other provisions of the standard did not have a material impact on our consolidated financial statements.
Statement of Cash Flows
In August 2016, the FASB issued new guidance related to the classification of certain cash items in the statement of cash flows. The new standard requires, among other things, that cash payments for debt prepayment or debt extinguishment costs should be classified as cash outflows for financing activities, as opposed to operating activities as is required under existing guidance. We elected to early adopt this standard in the third quarter of 2016 and applied it retrospectively. As a result of the adoption of this standard, our cash flows from financing activities for the year ended December 31, 2016 included the $63 million premium payment from the
73

October 19, 2016 redemption of our Original 2021 Notes. The adoption of this standard did not have a material impact on our consolidated statements of cash flows upon adoption for the years ended December 31, 2015 and 2014.
Recent accounting pronouncements not yet adopted
Revenue recognition
In May 2014, the FASB issued new accounting guidance related to revenue recognition. The new standard will replace all current U.S. GAAP guidance on this topic and eliminate all industry-specific guidance, providing a unified model to determine when and how revenue is recognized. The core principle is that a company should recognize revenue upon the transfer of promised goods or services to customers in an amount that reflects the consideration the company expects to be entitled to in exchange for those goods or services. This guidance will be effective for fiscal years and interim periods within those years beginning after December 15, 2017, and can be applied either retrospectively to each period presented or as a cumulative-effect adjustment as of the date of adoption. We are evaluating the adoption method as well as the impact of this new accounting guidance on our financial statements and related disclosures. As previously disclosed, we believe the adoption of the new revenue recognition standard may have a significant impact on the accounting for our sales of our games with significant online functionality for which we do not have VSOE for unspecified future updates and ongoing online services provided. Under the current accounting standards, VSOE for undelivered elements is required. This requirement will be eliminated under the new standard. Accordingly, we may be required to recognize as revenue a portion of the sales price upon delivery of the software, as compared to the current requirement of recognizing the entire sales price ratably over an estimated offering period. This potential difference may have a material impact on our consolidated financial statements upon adoption of this new guidance. As accounting implementation guidance and clarifications regarding this matter is still evolving, we continue to evaluate the impact this guidance will have on our consolidated financial statements and related disclosures.
Leases
In February 2016, the FASB issued new guidance related to the accounting for leases. The new standard will replace all current U.S. GAAP guidance on this topic. The new standard, among other things, requires a lessee to classify a lease as either an operating or financing lease and lessees will need to recognize a lease liability and a right-of-use asset for their leases. The liability will be equal to the present value of lease payments. The asset will be based on the liability, subject to adjustment for initial direct costs, lease incentives received and any prepaid lease payments. Operating leases will result in straight-line expense, while finance leases will result in a front-loaded expense pattern. Classification will be based on criteria that are largely similar to those applied in current lease accounting. The standard is effective for fiscal years, and interim periods within those fiscal years, beginning after December 15, 2018. Early adoption is permitted. The new standard must be adopted using a modified retrospective transition and will require application of the new guidance at the beginning of the earliest comparative period presented. We are evaluating the impact of this new accounting guidance on our consolidated financial statements.
Inventory
In July 2015, the FASB issued new guidance related to the measurement of inventory which requires inventory within the scope of the guidance to be measured at the lower of cost and net realizable value. Net realizable value is defined as the estimated selling prices in the ordinary course of business, less reasonably predictable costs of completion, disposal, and transportation. The new standard is effective for fiscal years beginning after December 15, 2016 and should be applied prospectively. Early adoption is permitted. The impact this new standard is not expected to have a material impact on our consolidated financial statements.
Financial Instruments
In January 2016, the FASB issued new guidance related to the recognition and measurement of financial assets and financial liabilities. The new standard, amongst other things, generally requires companies to measure investments in other entities, except those accounted for under the equity method, at fair value and recognize any changes in fair value in net income. The new standard also simplifies the impairment assessment of equity investments without readily determinable fair values. The new standard is effective for fiscal years beginning after December 15, 2017, and the guidance should be applied by means of a cumulative-effect adjustment to the balance sheet as of the beginning of the fiscal year of adoption. The amendments related to equity investments without readily determinable fair values (including disclosure requirements) should be applied prospectively to equity investments that exist as of the date of adoption. We are evaluating the impact, if any, of adopting this new accounting guidance on our financial statements.
Statement of Cash Flows—Restricted Cash
In November 2016, the FASB issued new guidance related to the classification of restricted cash in the statement of cash flows. The new standard requires that a statement of cash flows explain any change during the period in total cash, cash equivalents, and restricted cash. Therefore, restricted cash will be included with cash and cash equivalents when reconciling the beginning-of-period and end-of-period total amounts shown on the statement of cash flows. The new standard is effective for fiscal years beginning after December 15, 2018 and should be applied retrospectively. Early adoption is permitted.
We are evaluating the impact, if any, of adopting this new accounting guidance on our financial statements. We expect there would be a significant impact to the consolidated statements of cash flows for the years ended December 31, 2015 and 2016, as those years
74
requirements for our consolidated statement of cash flows related to excess tax benefits, our net cash provided by operating activities and net cash used in financing activities increased by $67 million and $39 million for the years ended December 31, 2015, and December 31, 2014, respectively. The other provisions of the standard did not have a material impact on our consolidated financial statements.
Statement of Cash Flows
In August 2016, the FASB issued new guidance related to the classification of certain cash items in the statement of cash flows. The new standard requires, among other things, that cash payments for debt prepayment or debt extinguishment costs should be classified as cash outflows for financing activities, as opposed to operating activities as is required under existing guidance. We elected to early adopt this standard in the third quarter of 2016 and applied it retrospectively. As a result of the adoption of this standard, our cash flows from financing activities for the year ended December 31, 2016 included the $63 million premium payment from the
74
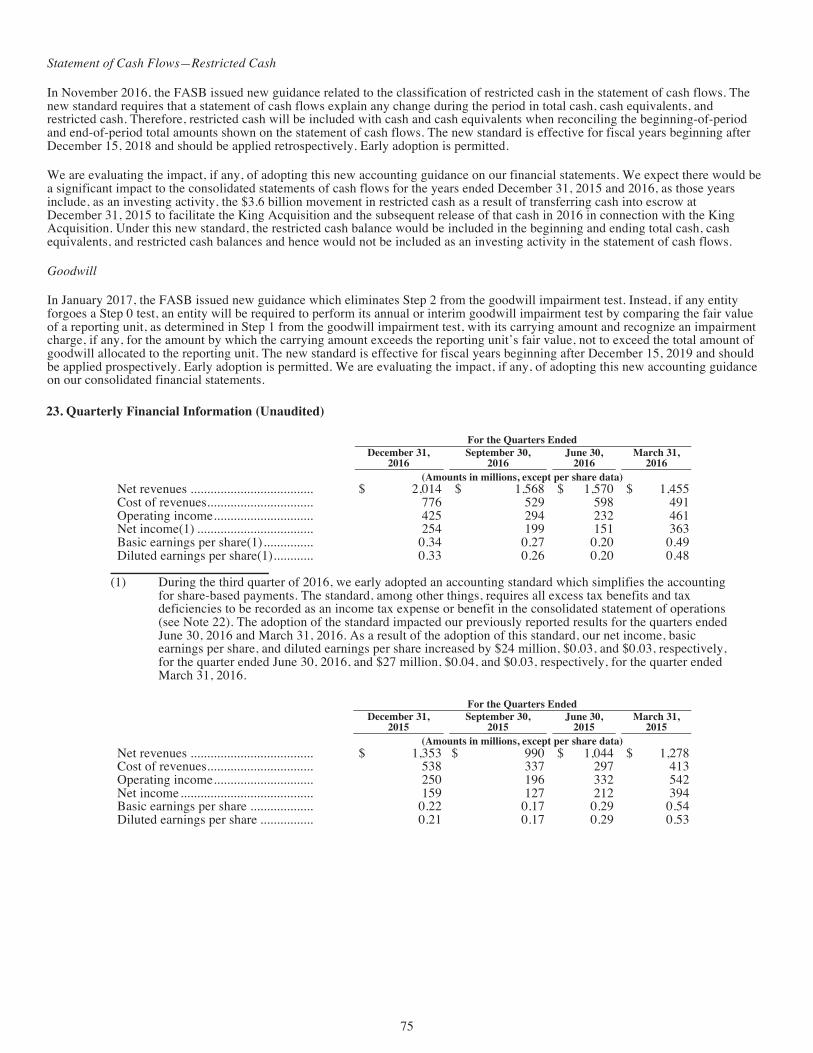
75
adjustment to the balance sheet as of the beginning of the fiscal year of adoption. The amendments related to equity investments without readily determinable fair values (including disclosure requirements) should be applied prospectively to equity investments that exist as of the date of adoption. We are evaluating the impact, if any, of adopting this new accounting guidance on our financial statements.
Statement of Cash Flows—Restricted Cash
In November 2016, the FASB issued new guidance related to the classification of restricted cash in the statement of cash flows. The new standard requires that a statement of cash flows explain any change during the period in total cash, cash equivalents, and restricted cash. Therefore, restricted cash will be included with cash and cash equivalents when reconciling the beginning-of-period and end-of-period total amounts shown on the statement of cash flows. The new standard is effective for fiscal years beginning after December 15, 2018 and should be applied retrospectively. Early adoption is permitted.
We are evaluating the impact, if any, of adopting this new accounting guidance on our financial statements. We expect there would be a significant impact to the consolidated statements of cash flows for the years ended December 31, 2015 and 2016, as those years include, as an investing activity, the $3.6 billion movement in restricted cash as a result of transferring cash into escrow at December 31, 2015 to facilitate the King Acquisition and the subsequent release of that cash in 2016 in connection with the King Acquisition. Under this new standard, the restricted cash balance would be included in the beginning and ending total cash, cash equivalents, and restricted cash balances and hence would not be included as an investing activity in the statement of cash flows.
Goodwill
In January 2017, the FASB issued new guidance which eliminates Step 2 from the goodwill impairment test. Instead, if any entity forgoes a Step 0 test, an entity will be required to perform its annual or interim goodwill impairment test by comparing the fair value of a reporting unit, as determined in Step 1 from the goodwill impairment test, with its carrying amount and recognize an impairment charge, if any, for the amount by which the carrying amount exceeds the reporting unit’s fair value, not to exceed the total amount of goodwill allocated to the reporting unit. The new standard is effective for fiscal years beginning after December 15, 2019 and should be applied prospectively. Early adoption is permitted. We are evaluating the impact, if any, of adopting this new accounting guidance on our consolidated financial statements.
23. Quarterly Financial Information (Unaudited)
For the Quarters Ended
December 31,
2016 September 30,
2016 June 30,
2016 March 31,
2016 (Amounts in millions, except per share data)
Net revenues ......................................... $ 2,014 $ 1,568 $ 1,570 $ 1,455 Cost of revenues .................................... 776 529 598 491 Operating income .................................. 425 294 232 461 Net income(1) ....................................... 254 199 151 363 Basic earnings per share(1) ................... 0.34 0.27 0.20 0.49 Diluted earnings per share(1) ................ 0.33 0.26 0.20 0.48
(1) During the third quarter of 2016, we early adopted an accounting standard which simplifies the accounting
for share-based payments. The standard, among other things, requires all excess tax benefits and tax deficiencies to be recorded as an income tax expense or benefit in the consolidated statement of operations (see Note 22). The adoption of the standard impacted our previously reported results for the quarters ended June 30, 2016 and March 31, 2016. As a result of the adoption of this standard, our net income, basic earnings per share, and diluted earnings per share increased by $24 million, $0.03, and $0.03, respectively, for the quarter ended June 30, 2016, and $27 million, $0.04, and $0.03, respectively, for the quarter ended March 31, 2016.
For the Quarters Ended
December 31,
2015 September 30,
2015 June 30,
2015 March 31,
2015 (Amounts in millions, except per share data)
Net revenues ......................................... $ 1,353 $ 990 $ 1,044 $ 1,278 Cost of revenues .................................... 538 337 297 413 Operating income .................................. 250 196 332 542 Net income ............................................ 159 127 212 394 Basic earnings per share ....................... 0.22 0.17 0.29 0.54 Diluted earnings per share .................... 0.21 0.17 0.29 0.53
76
December 31, 2015 to facilitate the King Acquisition and the subsequent release of that cash in 2016 in connection with the King Acquisition. Under this new standard, the restricted cash balance would be included in the beginning and ending total cash, cash equivalents, and restricted cash balances and hence would not be included as an investing activity in the statement of cash flows.
Goodwill
In January 2017, the FASB issued new guidance which eliminates Step 2 from the goodwill impairment test. Instead, if any entity forgoes a Step 0 test, an entity will be required to perform its annual or interim goodwill impairment test by comparing the fair value of a reporting unit, as determined in Step 1 from the goodwill impairment test, with its carrying amount and recognize an impairment charge, if any, for the amount by which the carrying amount exceeds the reporting unit’s fair value, not to exceed the total amount of goodwill allocated to the reporting unit. The new standard is effective for fiscal years beginning after December 15, 2019 and should be applied prospectively. Early adoption is permitted. We are evaluating the impact, if any, of adopting this new accounting guidance on our consolidated financial statements.
23. Quarterly Financial Information (Unaudited)
For the Quarters Ended
December 31,
2016 September 30,
2016 June 30,
2016 March 31,
2016 (Amounts in millions, except per share data)
Net revenues ......................................... $ 2,014 $ 1,568 $ 1,570 $ 1,455 Cost of revenues .................................... 776 529 598 491 Operating income .................................. 425 294 232 461 Net income(1) ....................................... 254 199 151 363 Basic earnings per share(1) ................... 0.34 0.27 0.20 0.49 Diluted earnings per share(1) ................ 0.33 0.26 0.20 0.48
(1) During the third quarter of 2016, we early adopted an accounting standard which simplifies the accounting
for share-based payments. The standard, among other things, requires all excess tax benefits and tax deficiencies to be recorded as an income tax expense or benefit in the consolidated statement of operations (see Note 22). The adoption of the standard impacted our previously reported results for the quarters ended June 30, 2016 and March 31, 2016. As a result of the adoption of this standard, our net income, basic earnings per share, and diluted earnings per share increased by $24 million, $0.03, and $0.03, respectively, for the quarter ended June 30, 2016, and $27 million, $0.04, and $0.03, respectively, for the quarter ended March 31, 2016.
For the Quarters Ended
December 31,
2015 September 30,
2015 June 30,
2015 March 31,
2015 (Amounts in millions, except per share data)
Net revenues ......................................... $ 1,353 $ 990 $ 1,044 $ 1,278 Cost of revenues .................................... 538 337 297 413 Operating income .................................. 250 196 332 542 Net income ............................................ 159 127 212 394 Basic earnings per share ....................... 0.22 0.17 0.29 0.54 Diluted earnings per share .................... 0.21 0.17 0.29 0.53
75
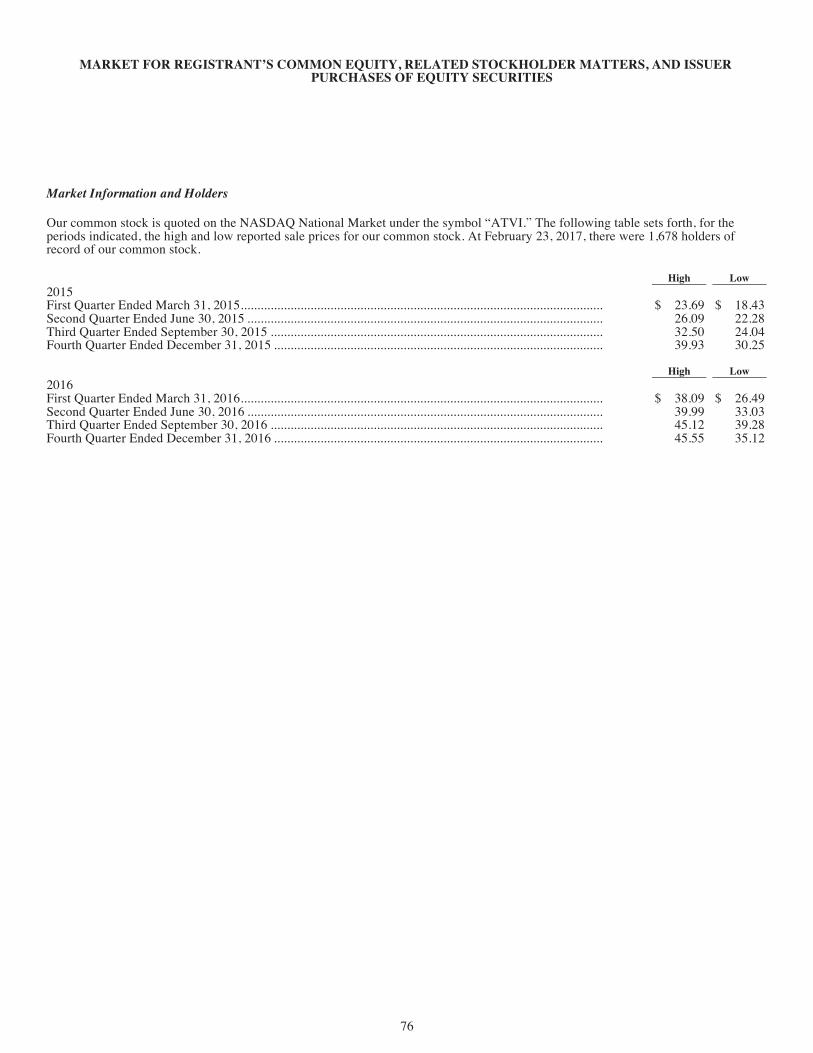
77
MARKET FOR REGISTRANT’S COMMON EQUITY, RELATED STOCKHOLDER MATTERS, AND ISSUER PURCHASES OF EQUITY SECURITIES
Market Information and Holders
Our common stock is quoted on the NASDAQ National Market under the symbol “ATVI.” The following table sets forth, for the periods indicated, the high and low reported sale prices for our common stock. At February 23, 2017, there were 1,678 holders of record of our common stock.
High Low 2015 First Quarter Ended March 31, 2015 ............................................................................................................. $ 23.69 $ 18.43 Second Quarter Ended June 30, 2015 ........................................................................................................... 26.09 22.28 Third Quarter Ended September 30, 2015 .................................................................................................... 32.50 24.04 Fourth Quarter Ended December 31, 2015 ................................................................................................... 39.93 30.25
High Low 2016 First Quarter Ended March 31, 2016 ............................................................................................................. $ 38.09 $ 26.49 Second Quarter Ended June 30, 2016 ........................................................................................................... 39.99 33.03 Third Quarter Ended September 30, 2016 .................................................................................................... 45.12 39.28 Fourth Quarter Ended December 31, 2016 ................................................................................................... 45.55 35.12
76

Stock Performance Graph
This performance graph shall not be deemed “filed” for purposes of Section 18 of the Exchange Act or otherwise subject to the liabilities under that Section, and shall not be deemed to be incorporated by reference into any filing of Activision Blizzard, Inc. under the Exchange Act or the Securities Act of 1933.
COMPARISON OF 5-YEAR CUMULATIVE TOTAL RETURN among Activision Blizzard, Inc., the NASDAQ Composite Index, the S&P 500 Index,
and the RDG Technology Composite Index
The following graph and table compare the cumulative total stockholder return on our common stock, the NASDAQ Composite Index, the S&P 500 Index, and the RDG Technology Composite Index. The graph and table assume that $100 was invested on December 31, 2011 and that dividends were reinvested daily. The stock price performance on the following graph and table is not necessarily indicative of future stock price performance.
Fiscal year ending December 31: 12/11 12/12 12/13 12/14 12/15 12/16 Activision Blizzard, Inc. .............................................. $ 100.00 $ 87.44 $ 148.75 $ 169.68 $ 329.31 $ 309.68 NASDAQ Composite ................................................... 100.00 116.41 165.47 188.69 200.32 216.54 S&P 500 ........................................................................ 100.00 116.00 153.58 174.60 177.01 198.18 RDG Technology Composite ...................................... 100.00 114.61 152.95 178.50 183.08 206.81
Cash Dividends
We have paid a dividend annually since 2010. Below is a summary of cash dividends paid over the past three fiscal years, along with the most recent dividend declared by the Board of Directors that will be paid in 2017:
Year Per Share Amount
Record Date
Dividend Payment
Date 2017 ...................................................................................................................................... $ 0.30 3/30/2017 5/10/2017 2016 ...................................................................................................................................... $ 0.26 3/30/2016 5/11/2016 2015 ...................................................................................................................................... $ 0.23 3/30/2015 5/13/2015 2014 ...................................................................................................................................... $ 0.20 3/19/2014 5/14/2014
Future dividends will depend upon our earnings, financial condition, cash requirements, anticipated future prospects, and other factors deemed relevant by our Board of Directors. Further, agreements governing certain of our indebtedness, as described in Note 11 of the notes to consolidated financial statements included in this Annual Report, may, under certain circumstances, limit our ability to pay distributions or dividends. There can be no assurances that dividends will be declared in the future.
78
Stock Performance Graph
This performance graph shall not be deemed “filed” for purposes of Section 18 of the Exchange Act or otherwise subject to the liabilities under that Section, and shall not be deemed to be incorporated by reference into any filing of Activision Blizzard, Inc. under the Exchange Act or the Securities Act of 1933.
COMPARISON OF 5-YEAR CUMULATIVE TOTAL RETURN among Activision Blizzard, Inc., the NASDAQ Composite Index, the S&P 500 Index,
and the RDG Technology Composite Index
The following graph and table compare the cumulative total stockholder return on our common stock, the NASDAQ Composite Index, the S&P 500 Index, and the RDG Technology Composite Index. The graph and table assume that $100 was invested on December 31, 2011 and that dividends were reinvested daily. The stock price performance on the following graph and table is not necessarily indicative of future stock price performance.
Fiscal year ending December 31: 12/11 12/12 12/13 12/14 12/15 12/16 Activision Blizzard, Inc. .............................................. $ 100.00 $ 87.44 $ 148.75 $ 169.68 $ 329.31 $ 309.68 NASDAQ Composite ................................................... 100.00 116.41 165.47 188.69 200.32 216.54 S&P 500 ........................................................................ 100.00 116.00 153.58 174.60 177.01 198.18 RDG Technology Composite ...................................... 100.00 114.61 152.95 178.50 183.08 206.81
Cash Dividends
We have paid a dividend annually since 2010. Below is a summary of cash dividends paid over the past three fiscal years, along with the most recent dividend declared by the Board of Directors that will be paid in 2017:
Year Per Share Amount
Record Date
Dividend Payment
Date 2017 ...................................................................................................................................... $ 0.30 3/30/2017 5/10/2017 2016 ...................................................................................................................................... $ 0.26 3/30/2016 5/11/2016 2015 ...................................................................................................................................... $ 0.23 3/30/2015 5/13/2015 2014 ...................................................................................................................................... $ 0.20 3/19/2014 5/14/2014
Future dividends will depend upon our earnings, financial condition, cash requirements, anticipated future prospects, and other factors deemed relevant by our Board of Directors. Further, agreements governing certain of our indebtedness, as described in Note 11 of the notes to consolidated financial statements included in this Annual Report, may, under certain circumstances, limit our ability to pay distributions or dividends. There can be no assurances that dividends will be declared in the future.
10b5-1 Stock Trading Plans
The Company’s directors and employees may, at a time they are not aware of material non-public information, enter into plans to purchase or sell shares of our common stock that satisfy the requirements of Exchange Act Rule 10b5-1 (“Rule 10b5-1 Plans”). Rule 10b5-1 Plans permit persons whose ability to purchase or sell our common stock may otherwise be substantially restricted (by quarterly and special stock-trading blackouts and by their possession from time to time of material nonpublic information) to trade on a pre-arranged, “automatic-pilot” basis.
77
12/11 12/12 12/13 12/14 12/15 12/16
$350
$300
$250
$200
$150
$100
$50
$0
Activision Blizzard, Inc. NASDAQ Composite S&P 500 RDG Technology Composite

Trading under Rule 10b5-1 Plans is subject to certain conditions, including that the person for whom the plan is created (or anyone else aware of material non-public information acting on such person’s behalf) not exercise any subsequent influence regarding the amount, price and dates of transactions under the plan. In addition, the Company requires Rule 10b5-1 Plans to be established and maintained in accordance with the Company’s “Policy on Establishing and Maintaining 10b5-1 Trading Plans.”
Trades under a Rule 10b5-1 Plan by our directors and employees are not necessarily indicative of their respective opinions of our current or potential future performance at the time of the trade. Trades by our directors and executive officers pursuant to a Rule 10b5-1 Plan will be disclosed publicly through Form 144 and Form 4 filings with the SEC, in accordance with applicable laws, rules, and regulations.
Issuer Purchase of Equity Securities
On February 2, 2017, our Board of Directors authorized a new stock repurchase program under which we are authorized to repurchase up to $1 billion of our common stock during the two-year period from February 13, 2017 through February 12, 2019.
On February 3, 2015, our Board of Directors authorized a stock repurchase program pursuant under which we were authorized to repurchase up to $750 million of the Company’s common stock during the two-year period from February 9, 2015 through February 8, 2017. There were no repurchases pursuant to this program.
78
Activision Blizzard, Inc. .............................................. $ 100.00 $ 87.44 $ 148.75 $ 169.68 $ 329.31 $ 309.68 NASDAQ Composite ................................................... 100.00 116.41 165.47 188.69 200.32 216.54 S&P 500 ........................................................................ 100.00 116.00 153.58 174.60 177.01 198.18 RDG Technology Composite ...................................... 100.00 114.61 152.95 178.50 183.08 206.81
Cash Dividends
We have paid a dividend annually since 2010. Below is a summary of cash dividends paid over the past three fiscal years, along with the most recent dividend declared by the Board of Directors that will be paid in 2017:
Year Per Share Amount
Record Date
Dividend Payment
Date 2017 ...................................................................................................................................... $ 0.30 3/30/2017 5/10/2017 2016 ...................................................................................................................................... $ 0.26 3/30/2016 5/11/2016 2015 ...................................................................................................................................... $ 0.23 3/30/2015 5/13/2015 2014 ...................................................................................................................................... $ 0.20 3/19/2014 5/14/2014
Future dividends will depend upon our earnings, financial condition, cash requirements, anticipated future prospects, and other factors deemed relevant by our Board of Directors. Further, agreements governing certain of our indebtedness, as described in Note 11 of the notes to consolidated financial statements included in this Annual Report, may, under certain circumstances, limit our ability to pay distributions or dividends. There can be no assurances that dividends will be declared in the future.
10b5-1 Stock Trading Plans
The Company’s directors and employees may, at a time they are not aware of material non-public information, enter into plans to purchase or sell shares of our common stock that satisfy the requirements of Exchange Act Rule 10b5-1 (“Rule 10b5-1 Plans”). Rule 10b5-1 Plans permit persons whose ability to purchase or sell our common stock may otherwise be substantially restricted (by quarterly and special stock-trading blackouts and by their possession from time to time of material nonpublic information) to trade on a pre-arranged, “automatic-pilot” basis.
78

80
CAUTIONARY STATEMENT
This Annual Report contains, or incorporates by reference, certain forward-looking statements within the meaning of the Private Securities Litigation Reform Act of 1995. Such statements consist of any statement other than a recitation of historical facts and include, but are not limited to: (1) projections of revenues, expenses, income or loss, earnings or loss per share, cash flow or other financial items; (2) statements of our plans and objectives, including those relating to releases of products or services; (3) statements of future financial or operating performance; and (4) statements of assumptions underlying such statements. Activision Blizzard, Inc. generally uses words such as “outlook,” “forecast,” “will,” “could,” “should,” “would,” “to be,” “plan,” “plans,” “believes,” “may,” “might,” “expects,” “intends,” “intends as,” “anticipates,” “estimate,” “future,” “positioned,” “potential,” “project,” “remain,” “scheduled,” “set to,” “subject to,” “upcoming” and other similar expressions to help identify forward-looking statements. Forward-looking statements are subject to business and economic risks, reflect management’s current expectations, estimates and projections about our business, and are inherently uncertain and difficult to predict. Our actual results could differ materially from expectations stated in forward-looking statements. Some of the risk factors that could cause our actual results to differ from those stated in forward-looking statements can be found in “Risk Factors” included in Part I, Item 1A of our Annual Report on Form 10-K for the year ended December 31, 2016. The forward-looking statements contained herein are based upon information available to us as of the date of our Annual Report on Form 10-K and we assume no obligation to update any such forward-looking statements. Although these forward-looking statements are believed to be true when made, they may ultimately prove to be incorrect. These statements are not guarantees of our future performance and are subject to risks, uncertainties and other factors, some of which are beyond our control and may cause actual results to differ materially from current expectations.
Activision Blizzard Inc.’s names, abbreviations thereof, logos, and product and service designators are all either the registered or unregistered trademarks or trade names of Activision Blizzard. All other product or service names are the property of their respective owners.
79
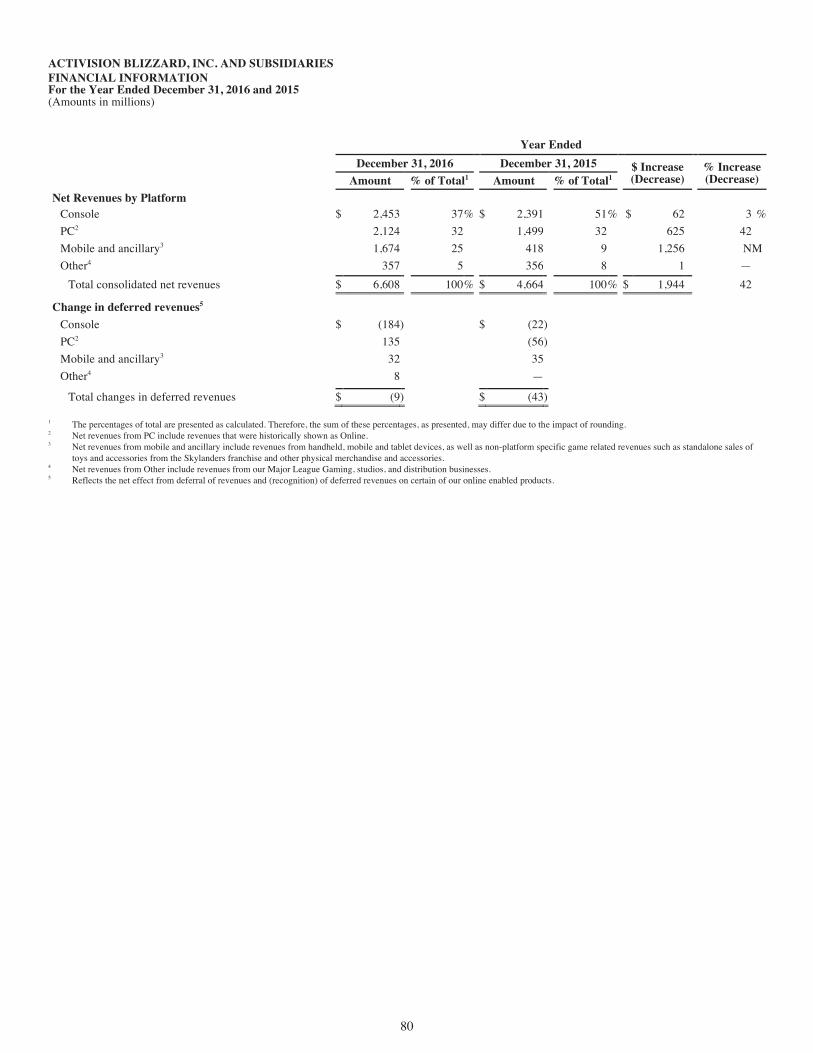
81
ACTIVISION BLIZZARD, INC. AND SUBSIDIARIES FINANCIAL INFORMATION For the Year Ended December 31, 2016 and 2015 (Amounts in millions)
Year Ended December 31, 2016 December 31, 2015 $ Increase
(Decrease) % Increase (Decrease) Amount % of Total1 Amount % of Total1
Net Revenues by Platform Console $ 2,453 37 % $ 2,391 51 % $ 62 3 % PC2 2,124 32 1,499 32 625 42 Mobile and ancillary3 1,674 25 418 9 1,256 NM Other4 357 5 356 8 1 —
Total consolidated net revenues $ 6,608 100 % $ 4,664 100 % $ 1,944 42
Change in deferred revenues5 Console $ (184 ) $ (22 ) PC2 135 (56 ) Mobile and ancillary3 32 35 Other4 8 —
Total changes in deferred revenues $ (9 ) $ (43 )
1 The percentages of total are presented as calculated. Therefore, the sum of these percentages, as presented, may differ due to the impact of rounding.
2 Net revenues from PC include revenues that were historically shown as Online.
3 Net revenues from mobile and ancillary include revenues from handheld, mobile and tablet devices, as well as non-platform specific game related revenues such as standalone sales of toys and accessories from the Skylanders franchise and other physical merchandise and accessories.
4 Net revenues from Other include revenues from our Major League Gaming, studios, and distribution businesses.
5 Reflects the net effect from deferral of revenues and (recognition) of deferred revenues on certain of our online enabled products.
80
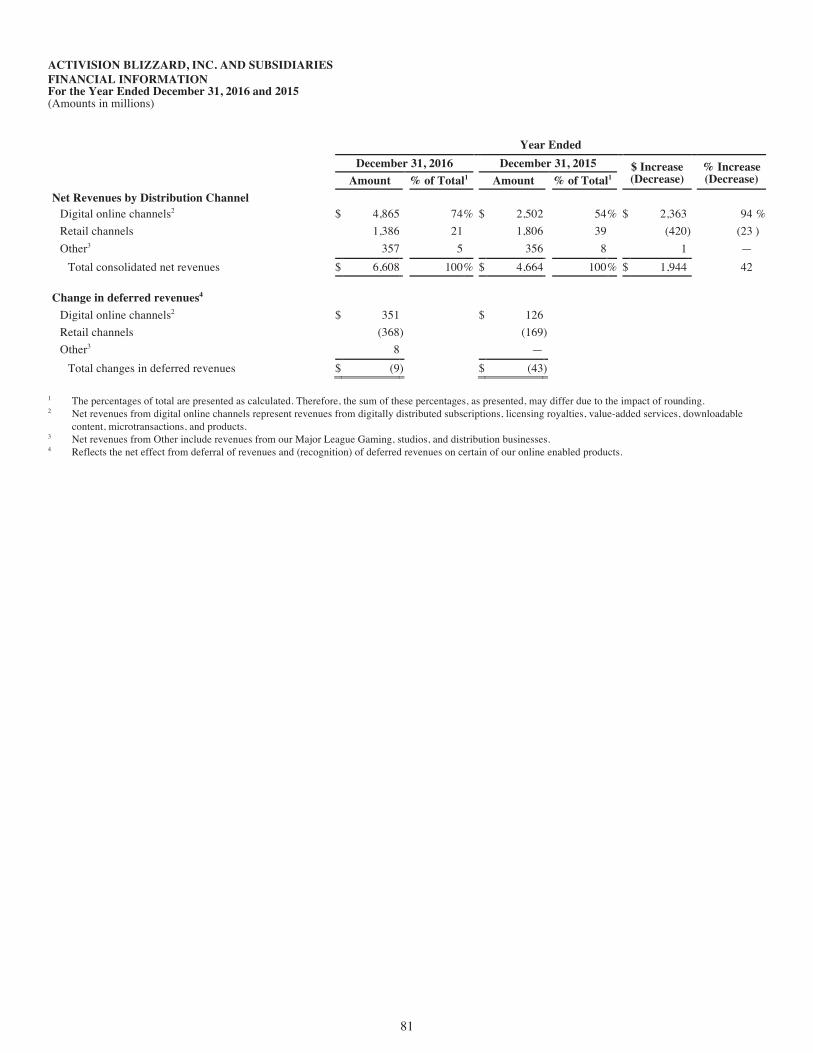
82
ACTIVISION BLIZZARD, INC. AND SUBSIDIARIES FINANCIAL INFORMATION For the Year Ended December 31, 2016 and 2015 (Amounts in millions) Year Ended December 31, 2016 December 31, 2015 $ Increase
(Decrease) % Increase
(Decrease) Amount % of Total1 Amount % of Total1 Net Revenues by Distribution Channel
Digital online channels2 $ 4,865 74 % $ 2,502 54 % $ 2,363 94 % Retail channels 1,386 21 1,806 39 (420 ) (23 ) Other3 357 5 356 8 1 —
Total consolidated net revenues $ 6,608 100 % $ 4,664 100 % $ 1,944 42 Change in deferred revenues4
Digital online channels2 $ 351 $ 126 Retail channels (368 ) (169 ) Other3 8 —
Total changes in deferred revenues $ (9 ) $ (43 )
1 The percentages of total are presented as calculated. Therefore, the sum of these percentages, as presented, may differ due to the impact of rounding.
2 Net revenues from digital online channels represent revenues from digitally distributed subscriptions, licensing royalties, value-added services, downloadable content, microtransactions, and products.
3 Net revenues from Other include revenues from our Major League Gaming, studios, and distribution businesses.
4 Reflects the net effect from deferral of revenues and (recognition) of deferred revenues on certain of our online enabled products.
81
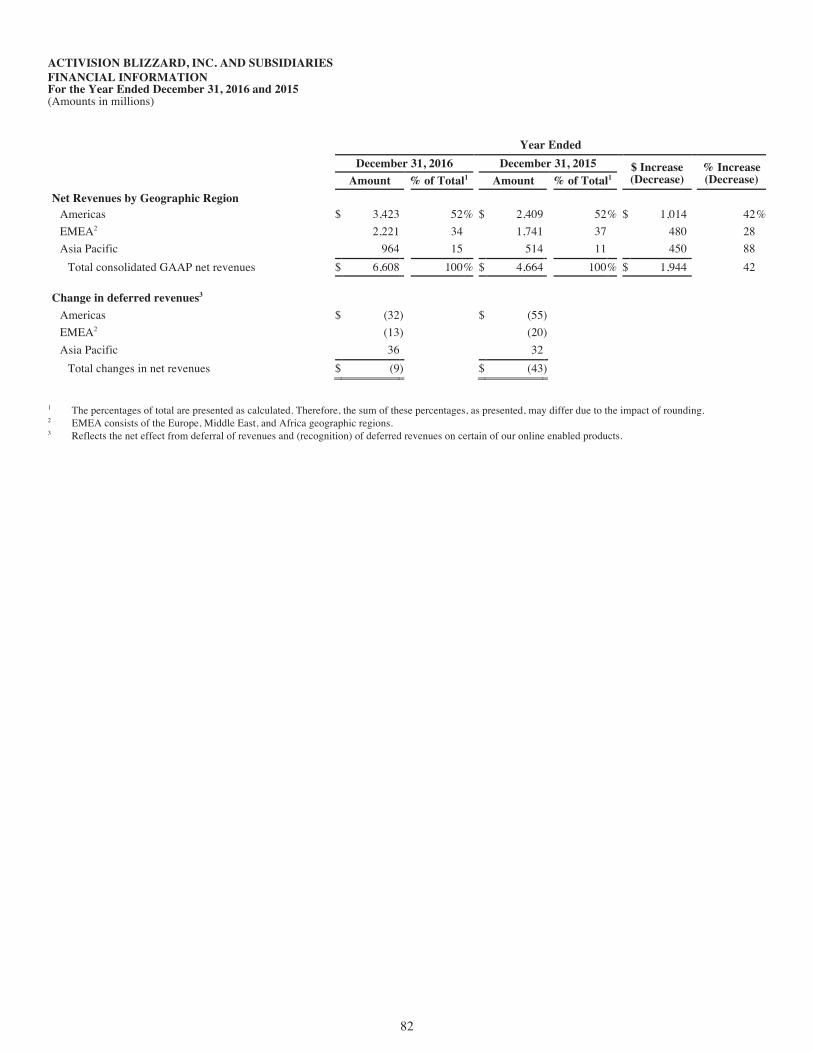
83
ACTIVISION BLIZZARD, INC. AND SUBSIDIARIES FINANCIAL INFORMATION For the Year Ended December 31, 2016 and 2015 (Amounts in millions)
Year Ended December 31, 2016 December 31, 2015 $ Increase
(Decrease) % Increase (Decrease) Amount % of Total1 Amount % of Total1
Net Revenues by Geographic Region Americas $ 3,423 52 % $ 2,409 52 % $ 1,014 42 % EMEA2 2,221 34 1,741 37 480 28 Asia Pacific 964 15 514 11 450 88
Total consolidated GAAP net revenues $ 6,608 100 % $ 4,664 100 % $ 1,944 42
Change in deferred revenues3 Americas $ (32 ) $ (55 ) EMEA2 (13 ) (20 ) Asia Pacific 36 32
Total changes in net revenues $ (9 ) $ (43 )
1 The percentages of total are presented as calculated. Therefore, the sum of these percentages, as presented, may differ due to the impact of rounding.2 EMEA consists of the Europe, Middle East, and Africa geographic regions.3 Reflects the net effect from deferral of revenues and (recognition) of deferred revenues on certain of our online enabled products.
82

84
ACTIVISION BLIZZARD, INC. AND SUBSIDIARIES SEGMENT INFORMATION For the Year Ended December 31, 2016 and 2015 (Amounts in millions) Year Ended
December 31, 2016 December 31, 2015 $ Increase (Decrease)
% Increase (Decrease) Amount % of Total1 Amount % of Total1
Segment net revenues: Activision2 $ 2,220 36 % $ 2,700 63 % $ (480 ) (18 )%
Blizzard3 2,428 39 1,565 37 863 55 King4 1,586 25 — — 1,586 NM
Reportable segments total 6,234 100 % 4,265 100 % 1,969 46 Reconciliation to consolidated net revenues:
Other segments5 365 356 Net effect from deferral of net revenues6 9 43 Consolidated net revenues $ 6,608 $ 4,664 $ 1,944 42 %
Segment income from operations: Activision2 $ 788 $ 868 $ (80 ) (9 )%
Blizzard3 1,013 561 452 81 King4 537 — 537 NM
Reportable segments total 2,338 1,429 909 64 Reconciliation to consolidated operating income and consolidated income before income tax expense
Other segments5 (4 ) 37 Net effect from certain revenues deferrals accounting treatment6 (10 ) (39 ) Stock-based compensation expense (159 ) (92 ) Amortization of intangible assets (706 ) (11 ) Fees and other expenses related to acquisitions7 (47 ) (5 )
Consolidated operating income 1,412 1,319 93 7 Interest and other expense (income), net 214 198 Loss on extinguishment of debt 92 — Consolidated income before income tax expense $ 1,106 $ 1,121 $ (15 ) (1 )%
Operating margin from total reportable segments 37.5 % 33.5 %
1 The percentages of total are presented as calculated. Therefore, the sum of these percentages, as presented, may differ due to the impact of rounding.
2 Activision Publishing (“Activision”) — publishes interactive entertainment products and content.
3 Blizzard Entertainment, Inc. (“Blizzard”) — publishes interactive entertainment products and online subscription-based games.
4 King Digital Entertainment plc (“King”) — publishes interactive mobile entertainment products.
5 Other includes other income and expenses from operating segments managed outside the reportable segments, including our Major League Gaming, studios, and distribution businesses. Other also includes unallocated corporate income and expenses.
6 Reflects the net effect from deferral of revenues and (recognition) of deferred revenues, along with related cost of revenues, on certain of our online enabled products.
7 Reflects fees and other expenses related to the King Acquisition, inclusive of related debt financings and integration costs.
83
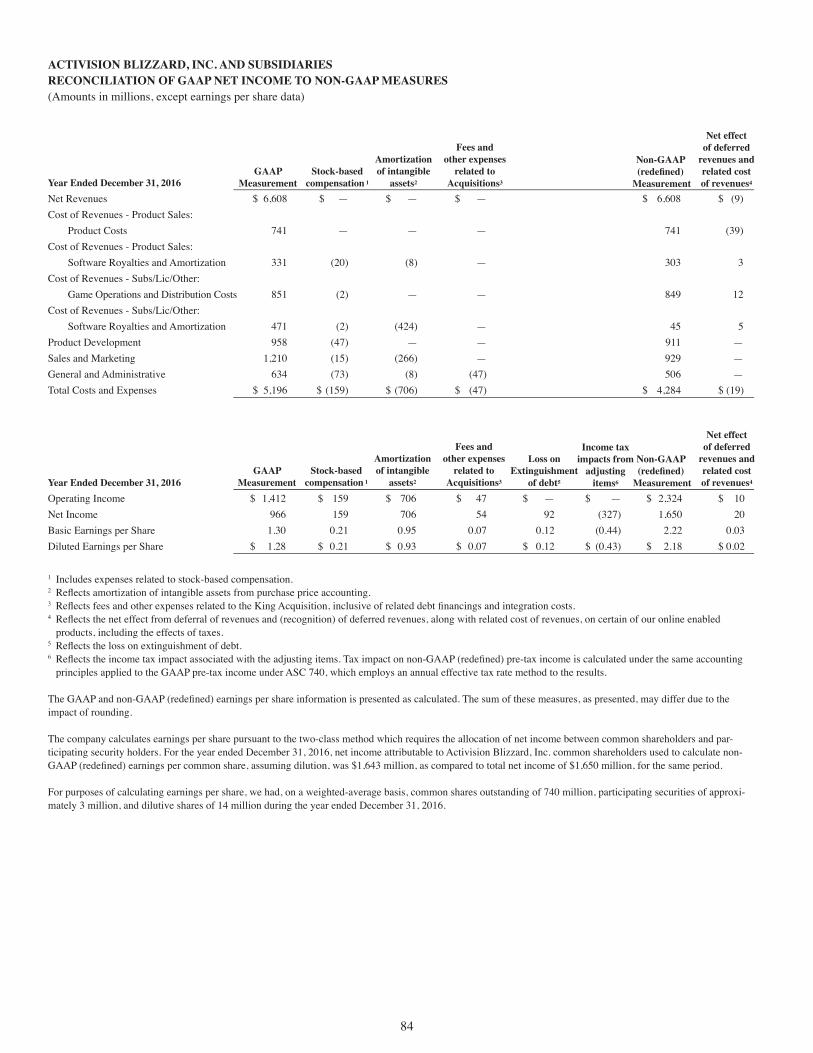
1 Includes expenses related to stock-based compensation.2 Reflects amortization of intangible assets from purchase price accounting. 3 Reflects fees and other expenses related to the King Acquisition, inclusive of related debt financings and integration costs.4 Reflects the net effect from deferral of revenues and (recognition) of deferred revenues, along with related cost of revenues, on certain of our online enabled
products, including the effects of taxes.5 Reflects the loss on extinguishment of debt.6 Reflects the income tax impact associated with the adjusting items. Tax impact on non-GAAP (redefined) pre-tax income is calculated under the same accounting
principles applied to the GAAP pre-tax income under ASC 740, which employs an annual effective tax rate method to the results.
The GAAP and non-GAAP (redefined) earnings per share information is presented as calculated. The sum of these measures, as presented, may differ due to the impact of rounding.
The company calculates earnings per share pursuant to the two-class method which requires the allocation of net income between common shareholders and par-ticipating security holders. For the year ended December 31, 2016, net income attributable to Activision Blizzard, Inc. common shareholders used to calculate non-GAAP (redefined) earnings per common share, assuming dilution, was $1,643 million, as compared to total net income of $1,650 million, for the same period.
For purposes of calculating earnings per share, we had, on a weighted-average basis, common shares outstanding of 740 million, participating securities of approxi-mately 3 million, and dilutive shares of 14 million during the year ended December 31, 2016.
ACTIVISION BLIZZARD, INC. AND SUBSIDIARIESRECONCILIATION OF GAAP NET INCOME TO NON-GAAP MEASURES(Amounts in millions, except earnings per share data)
Year Ended December 31, 2016 Net Revenues $ 6,608 $ — $ — $ — $ 6,608 $ (9)Cost of Revenues - Product Sales:
Product Costs 741 — — — 741 (39)Cost of Revenues - Product Sales:
Software Royalties and Amortization 331 (20) (8) — 303 3Cost of Revenues - Subs/Lic/Other:
Game Operations and Distribution Costs 851 (2) — — 849 12Cost of Revenues - Subs/Lic/Other:
Software Royalties and Amortization 471 (2) (424) — 45 5Product Development 958 (47) — — 911 — Sales and Marketing 1,210 (15) (266) — 929 — General and Administrative 634 (73) (8) (47) 506 —Total Costs and Expenses $ 5,196 $ (159) $ (706) $ (47) $ 4,284 $ (19)
Year Ended December 31, 2016Operating Income $ 1,412 $ 159 $ 706 $ 47 $ — $ — $ 2,324 $ 10Net Income 966 159 706 54 92 (327) 1,650 20Basic Earnings per Share 1.30 0.21 0.95 0.07 0.12 (0.44) 2.22 0.03Diluted Earnings per Share $ 1.28 $ 0.21 $ 0.93 $ 0.07 $ 0.12 $ (0.43) $ 2.18 $ 0.02
Stock-basedcompensation 1
Amortizationof intangible
assets2
Fees and other expenses
related to Acquisitions3
Income tax impacts from
adjustingitems6
Loss onExtinguishment
of debt5
GAAPMeasurement
Net effect of deferred
revenues and related cost of revenues4
Non-GAAP(redefined)
Measurement
Stock-basedcompensation 1
Amortizationof intangible
assets2
Fees and other expenses
related to Acquisitions3
GAAPMeasurement
Net effect of deferred
revenues and related cost of revenues4
Non-GAAP(redefined)
Measurement
84
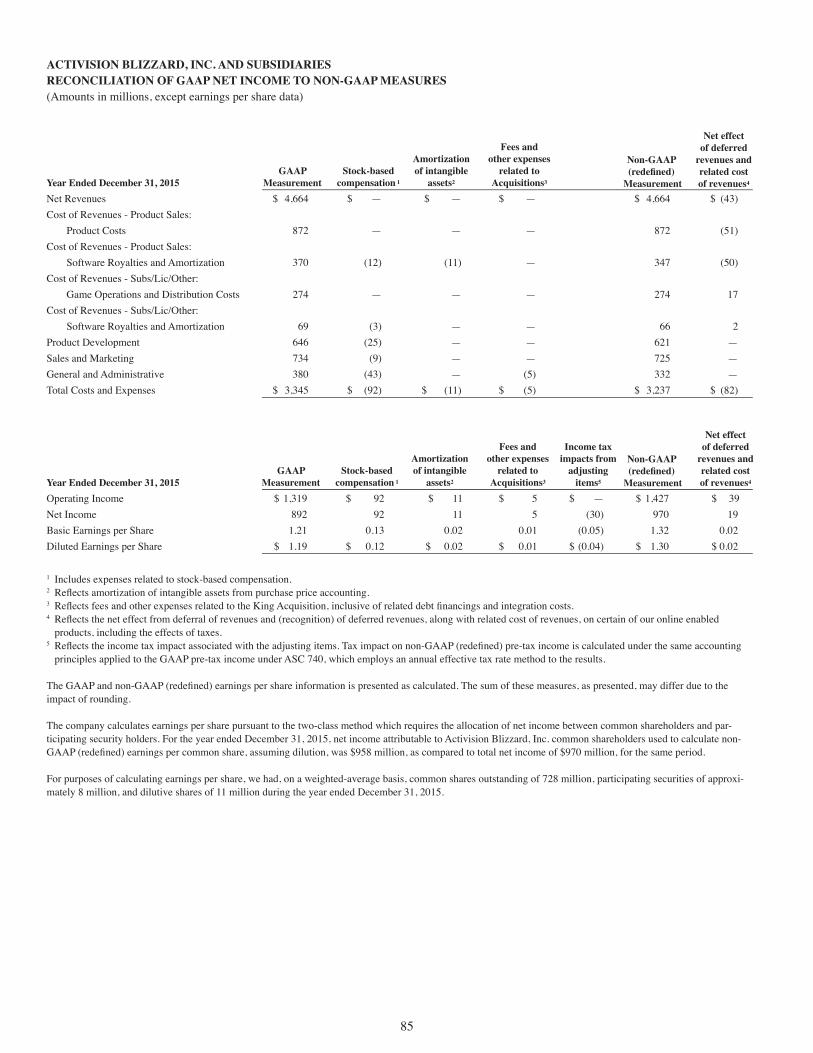
1 Includes expenses related to stock-based compensation.2 Reflects amortization of intangible assets from purchase price accounting. 3 Reflects fees and other expenses related to the King Acquisition, inclusive of related debt financings and integration costs.4 Reflects the net effect from deferral of revenues and (recognition) of deferred revenues, along with related cost of revenues, on certain of our online enabled
products, including the effects of taxes.5 Reflects the income tax impact associated with the adjusting items. Tax impact on non-GAAP (redefined) pre-tax income is calculated under the same accounting
principles applied to the GAAP pre-tax income under ASC 740, which employs an annual effective tax rate method to the results.
The GAAP and non-GAAP (redefined) earnings per share information is presented as calculated. The sum of these measures, as presented, may differ due to the impact of rounding.
The company calculates earnings per share pursuant to the two-class method which requires the allocation of net income between common shareholders and par-ticipating security holders. For the year ended December 31, 2015, net income attributable to Activision Blizzard, Inc. common shareholders used to calculate non-GAAP (redefined) earnings per common share, assuming dilution, was $958 million, as compared to total net income of $970 million, for the same period.
For purposes of calculating earnings per share, we had, on a weighted-average basis, common shares outstanding of 728 million, participating securities of approxi-mately 8 million, and dilutive shares of 11 million during the year ended December 31, 2015.
ACTIVISION BLIZZARD, INC. AND SUBSIDIARIESRECONCILIATION OF GAAP NET INCOME TO NON-GAAP MEASURES(Amounts in millions, except earnings per share data)
Year Ended December 31, 2015 Net Revenues $ 4,664 $ — $ — $ — $ 4,664 $ (43)Cost of Revenues - Product Sales:
Product Costs 872 — — — 872 (51)Cost of Revenues - Product Sales:
Software Royalties and Amortization 370 (12) (11) — 347 (50)Cost of Revenues - Subs/Lic/Other:
Game Operations and Distribution Costs 274 — — — 274 17Cost of Revenues - Subs/Lic/Other:
Software Royalties and Amortization 69 (3) — — 66 2Product Development 646 (25) — — 621 — Sales and Marketing 734 (9) — — 725 — General and Administrative 380 (43) — (5) 332 —Total Costs and Expenses $ 3,345 $ (92) $ (11) $ (5) $ 3,237 $ (82)
Year Ended December 31, 2015Operating Income $ 1,319 $ 92 $ 11 $ 5 $ — $ 1,427 $ 39Net Income 892 92 11 5 (30) 970 19Basic Earnings per Share 1.21 0.13 0.02 0.01 (0.05) 1.32 0.02Diluted Earnings per Share $ 1.19 $ 0.12 $ 0.02 $ 0.01 $ (0.04) $ 1.30 $ 0.02
Stock-basedcompensation 1
Amortizationof intangible
assets2
Fees and other expenses
related to Acquisitions3
Net effect of deferred
revenues and related cost of revenues4
GAAPMeasurement
Non-GAAP(redefined)
Measurement
Stock-basedcompensation 1
Amortizationof intangible
assets2
Fees and other expenses
related to Acquisitions3
Income tax impacts from
adjustingitems5
GAAPMeasurement
Net effect of deferred
revenues and related cost of revenues4
Non-GAAP(redefined)
Measurement
85

1 Includes expenses related to stock-based compensation.2 Reflects amortization of intangible assets from purchase price accounting. 3 Reflects fees and other expenses related to the Purchase Transaction, inclusive of related debt financings.4 Reflects the net effect from deferral of revenues and (recognition) of deferred revenues, along with related cost of revenues, on certain of our online enabled
products, including the effects of taxes.5 Reflects the income tax impact associated with the adjusting items. Tax impact on non-GAAP (redefined) pre-tax income is calculated under the same accounting
principles applied to the GAAP pre-tax income under ASC 740, which employs an annual effective tax rate method to the results.
The GAAP and non-GAAP (redefined) earnings per share information is presented as calculated. The sum of these measures, as presented, may differ due to the impact of rounding.
The company calculates earnings per share pursuant to the two-class method which requires the allocation of net income between common shareholders and participating security holders. For the year ended December 31, 2014, net income attributable to Activision Blizzard, Inc. common shareholders used to calculate non-GAAP (redefined) earnings per common share, assuming dilution, was $901 million, as compared to total net income of $921 million, for the same period.
For purposes of calculating earnings per share, we had, on a weighted-average basis, common shares outstanding of 716 million, participating securities of approximately 15 million, and dilutive shares of 10 million during the year ended December 31, 2014.
ACTIVISION BLIZZARD, INC. AND SUBSIDIARIESRECONCILIATION OF GAAP NET INCOME TO NON-GAAP MEASURES(Amounts in millions, except earnings per share data)
Year Ended December 31, 2014 Net Revenues $ 4,408 $ — $ — $ — $ 4,408 $ 405Cost of Revenues - Product Sales:
Product Costs 981 — — — 981 24Cost of Revenues - Product Sales:
Software Royalties and Amortization 265 (15) (12) — 238 157Cost of Revenues - Subs/Lic/Other:
Game Operations and Distribution Costs 250 (1) — — 249 5Cost of Revenues - Subs/Lic/Other:
Software Royalties and Amortization 29 (2) — — 27 4Product Development 571 (22) — — 549 — Sales and Marketing 712 (8) — — 704 — General and Administrative 417 (56) — (13) 348 —Total Costs and Expenses $ 3,225 $ (104) $ (12) $ (13) $ 3,096 $ 190
Year Ended December 31, 2014Operating Income $ 1,183 $ 104 $ 12 $ 13 $ — $ 1,312 $ 215Net Income 835 104 12 13 (43) 921 136Basic Earnings per Share 1.14 0.14 0.02 0.02 (0.07) 1.25 0.19Diluted Earnings per Share $ 1.13 $ 0.14 $ 0.02 $ 0.02 $ (0.07) $ 1.24 $ 0.18
Stock-basedcompensation 1
Amortizationof intangible
assets2
Fees and other expenses related to the Purchase
Transaction3
Net effect of deferred
revenues and related cost of revenues4
GAAPMeasurement
Non-GAAP(redefined)
Measurement
Stock-basedcompensation 1
Amortizationof intangible
assets2
Fees and other expenses related to the Purchase
Transaction3
Income tax impacts from
adjustingitems5
GAAPMeasurement
Net effect of deferred
revenues and related cost of revenues4
Non-GAAP(redefined)
Measurement
86

1 Non-GAAP free cash flow represents operating cash flow minus capital expenditures.
2 TTM represents trailing twelve months. Operating Cash Flow for the three months ended March 31, 2014, three months ended June 30, 2014, and three months ended September 30, 2014 was $153 million, $112 million, and $(139) million, respectively. Capital Expenditures for the three months ended March 31, 2014, three months ended June 30, 2014, and three months ended September 30, 2014, was $37 million, $25 million, and $28 million, respectively.
Year over Year December 31, March 31, June 30, September 30, December 31, % Increase 2014 2015 2015 2015 2015 (Decrease)Cash Flow Data Operating Cash Flow $ 1,205 $ 233 $ 144 $ (171) $ 1,063 (12)% Capital Expenditures 17 21 28 46 16 (6) Non-GAAP Free Cash Flow1 1,188 202 116 (217) 1,047 (12) Operating Cash Flow - TTM2 1,331 1,401 1,433 1,401 1,259 (5) Capital Expenditures - TTM2 107 91 94 112 111 4 Non-GAAP Free Cash Flow - TTM2 $ 1,224 $ 1,310 $ 1,339 $ 1,289 $ 1,148 (6)%
Year over Year March 31, June 30, September 30, December 31, % Increase 2016 2016 2016 2016 (Decrease)Cash Flow Data Operating Cash Flow $ 337 $ 503 $ 456 $ 859 (19)% Capital Expenditures 27 44 28 37 131 Non-GAAP Free Cash Flow1 310 459 428 822 (21) Operating Cash Flow - TTM2 1,373 1,732 2,359 2,155 71 Capital Expenditures - TTM2 117 133 115 136 23 Non-GAAP Free Cash Flow - TTM2 $ 1,256 $ 1,599 $ 2,244 $ 2,019 76%
ACTIVISION BLIZZARD, INC. AND SUBSIDIARIESSUPPLEMENTAL FINANCIAL INFORMATION(Amounts in millions)
Three Months Ended
Three Months Ended
87
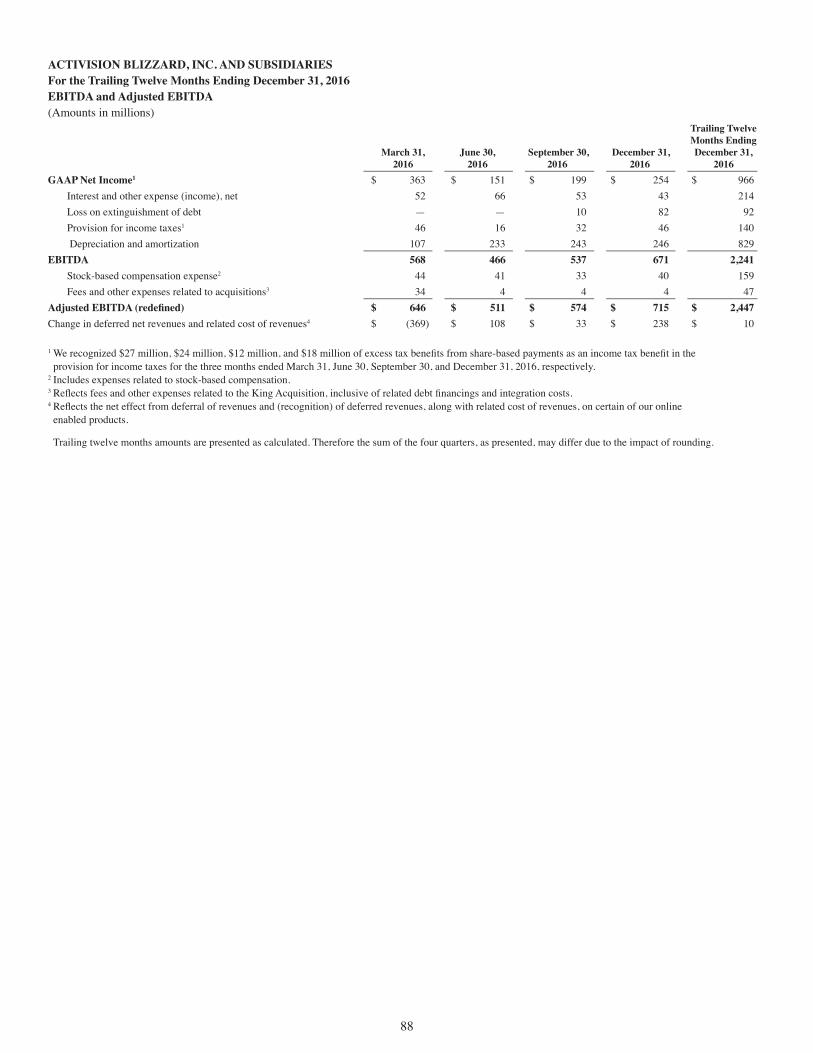
ACTIVISION BLIZZARD, INC. AND SUBSIDIARIESFor the Trailing Twelve Months Ending December 31, 2016EBITDA and Adjusted EBITDA(Amounts in millions)
1 We recognized $27 million, $24 million, $12 million, and $18 million of excess tax benefits from share-based payments as an income tax benefit in the provision for income taxes for the three months ended March 31, June 30, September 30, and December 31, 2016, respectively.
2 Includes expenses related to stock-based compensation.3 Reflects fees and other expenses related to the King Acquisition, inclusive of related debt financings and integration costs. 4 Reflects the net effect from deferral of revenues and (recognition) of deferred revenues, along with related cost of revenues, on certain of our online
enabled products.
Trailing twelve months amounts are presented as calculated. Therefore the sum of the four quarters, as presented, may differ due to the impact of rounding.
Trailing Twelve Months Ending
March 31, June 30, September 30, December 31, December 31, 2016 2016 2016 2016 2016
GAAP Net Income1 $ 363 $ 151 $ 199 $ 254 $ 966 Interest and other expense (income), net 52 66 53 43 214 Loss on extinguishment of debt — — 10 82 92 Provision for income taxes1 46 16 32 46 140 Depreciation and amortization 107 233 243 246 829
EBITDA 568 466 537 671 2,241 Stock-based compensation expense2 44 41 33 40 159 Fees and other expenses related to acquisitions3 34 4 4 4 47
Adjusted EBITDA (redefined) $ 646 $ 511 $ 574 $ 715 $ 2,447 Change in deferred net revenues and related cost of revenues4 $ (369) $ 108 $ 33 $ 238 $ 10
88

CORPORATE INFORMATION
BOARD OF DIRECTORS
Robert Corti Retired CFO,Avon Products Foundation
Hendrik Hartong IIIChairman and Chief Executive Officer,Brynwood Partners
Brian G. Kelly Chairman of the Board, Activision Blizzard
Robert A. Kotick President and Chief Executive Officer, Activision Blizzard
Barry Meyer Retired Chairman and CEO, Warner Bros. Entertainment
Robert Morgado Retired Chairman and CEO, Warner Music Group
Peter Nolan Senior Advisor, Leonard Green & Partners
Casey WassermanChairman and Chief Executive Officer,Wasserman
Elaine Wynn Co-founder, Wynn Resorts
OFFICERSRobert A. Kotick President and Chief Executive Officer, Activision Blizzard
Thomas Tippl Chief Operating Officer, Activision Blizzard
Dennis Durkin Chief Financial Officer, Activision Blizzard
Eric Hirshberg President and Chief Executive Officer, Activision Publishing
Mike Morhaime President and Chief Executive Officer, Blizzard Entertainment
Brian Stolz Chief People Officer, Activision Blizzard
Chris Walther Chief Legal Officer, Activision Blizzard
Riccardo ZacconiChief Executive Officer,King Digital Entertainment
SPECIAL ADVISORS
Michael Griffith Vice Chairman, Activision Blizzard
TRANSFER AGENT
Continental Stock Transfer & Trust Company17 Battery Place New York, New York 10004(800) 509-5586
AUDITOR
PricewaterhouseCoopers LLPLos Angeles, California
CORPORATE HEADQUARTERS
Activision Blizzard, Inc.3100 Ocean Park BoulevardSanta Monica, CA 90405(310) 255-2000
WORLD WIDE WEB SITEwww.activisionblizzard.com
ANNUAL MEETING
June 1, 2017, 9:00 am PDTEquity Office3200 Ocean Park BoulevardSanta Monica, California 90405
ANNUAL REPORT ON FORM 10-K
Activision Blizzard’s Annual Report on Form 10-K for the year ended December 31, 2016 is available to shareholders without charge upon request by calling our Investor Relations department at (310) 255-2000 or by mailing a request to our Corporate Secretary at our corporate headquarters.
NON-INCORPORATION
Portions of the Company’s 2016 Form 10-K, as filed with the SEC, are included within this Annual Report. Other than these portions of the Form 10-K, all other portions of this Annual Report are not “filed” with the SEC and shall not be deemed so.
Annual Report Design: Andra Design LLC / andradesignllc.com Printer: Phoenix Lithographing, USA © Copyright 2017 Activision Blizzard, Inc.
DOMESTIC OFFICES
Austin, Texas Bloomington, MinnesotaBothell, WashingtonBoulder, ColoradoCarlsbad, CaliforniaChampaign, IllinoisColumbus, OhioDallas, TexasEden Prairie, MinnesotaEl Segundo, California Foster City, CaliforniaFresno, CaliforniaHilliard, OhioIrvine, CaliforniaLos Angeles, CaliforniaMenands, New YorkMiddleton, WisconsinNew York, New York
Novato, CaliforniaPortland, MaineRedmond, WashingtonRogers, ArkansasSan Francisco, California San Jose, CaliforniaSanta Monica, CaliforniaSeattle, WashingtonWoodland Hills, California
Barcelona, SpainBerlin, GermanyBirmingham, United KingdomBucharest, RomaniaBurglengenfeld, GermanyMilan, ItalyCork, IrelandDatchet, United KingdomDublin, IrelandHong Kong SAR, ChinaLeamington Spa, United KingdomLondon, United KingdomMadrid, Spain Malmö, SwedenSt. Julians, MaltaMexico City, Mexico Mississauga, Canada
Munich, GermanyParis, FranceQuebec City, CanadaSão Paulo, BrazilSchiphol, The NetherlandsSeoul, South KoreaShanghai, ChinaShenzhen, ChinaSingaporeStockholm, SwedenSydney, AustraliaTaipei, Region of Taiwan Tokyo, JapanVancouver, CanadaVenlo, The NetherlandsVersailles, FranceWarrington, United Kingdom
INTERNATIONAL OFFICES
1 For full reconciliation, please see tables at the end of the annual report.
COVER: IT TAKES HEROES TO MAKE HEROES.
ACTIVISION BLIZZARD HAS THE MOST
TALENTED, PASSIONATE AND DEDICATED
TEAM IN ENTERTAINMENT.
UP 42% YEAR-OVER-YEAR
74% OF TOTAL REVENUES, UP 94% YEAR-OVER-YEAR
54% OF TOTAL REVENUES, UP 126% YEAR-OVER-YEAR
UP 68% YEAR-OVER-YEAR
UP 71% YEAR-OVER-YEAR
$6.6BILLION
$4.9BILLION
$3.6 BILLION
35%
$2.18
$2.2 BILLION
RECORD REVENUES
RECORD DIGITAL REVENUES
RECORD IN-GAME REVENUES
RECORD NON-GAAP (REDEFINED1)
OPERATING MARGIN
RECORD NON-GAAP (REDEFINED1) EARNINGS PER SHARE
RECORD OPERATING CASH FLOW
2016… A RECORD YEAR
▼▼
▼▼
▼▼

®
®
2016 ANNUAL REPORT
AC
TIVISIO
N B
LIZZAR
D 2016 A
NN
UA
L RE
PO
RT
ACTIVISION BLIZZARD, INC.3100 OCEAN PARK BOULEVARDSANTA MONICA, CALIFORNIA 90405
ACTIVISIONBLIZZARD.COM