The influence of customer brand identification on hotel brand ...
Upload
khangminh22Category
view
0download
0

12015 Reference Document ~ Kering
TABLE OF CONTENTS
CHAPTER 1Kering in 2015 3
CHAPTER 2Our activities 15
CHAPTER 3Sustainability 57
CHAPTER 4Corporate governance 133
CHAPTER 5Financial information 175
CHAPTER 6Share capital and ownership structure 327
CHAPTER 7Additional information 339
This is a free translation into English of the 2015 Reference Document issued in French and is provided solely for the convenience of English speaking users.
01_VA_V5 07/04/2016 10:31 Page1

2 Kering ~ 2015 Reference Document
01_VA_V5 06/04/2016 17:31 Page2
32015 Reference Document ~ Kering
Chapter 1
Kering in 2015
1. History 4
2. Key consolidated figures 6
3. Kering Empowering Imagination 8
4. Kering Group Simplified Organisational Chart as of December 31, 2015 14
01_VA_V5 06/04/2016 17:31 Page3
The Kering group was founded by François Pinault in1963, as a timber and building materials business. In themid-1990s, the Group repositioned itself on the retailmarket and soon became one of the leading players inthe sector.
The acquisition of a controlling stake in Gucci Group in 1999and the establishment of a multi-brand Luxury Goodsgroup marked a new stage in the Group’s development.
In 2007, the Group seized a new growth opportunity withthe purchase of a controlling stake in PUMA, a worldleader and benchmark in Sport & Lifestyle.
Having fully aligned the Group around its Luxury andSport & Lifestyle activities, since 2014 Kering has continuedits growth story aimed at unlocking the potential of itsbrands.
1963• François Pinault establishes the Pinault group,
specialising in timber trading.
1988• Flotation on the Paris Stock Market’s Second Marché of
Pinault SA, a company specialising in timber trading,distribution and processing.
1990• Acquisition of Cfao, a group specialising in electrical
equipment distribution (through CDME, which becameRexel in 1993) and in trading with Africa.
1991• The Group acquires Conforama and enters the retail
market.
1992• The Pinault-Printemps Group is born with the takeover
of Au Printemps SA, which held 54% of La Redoute andFinaref.
1994• La Redoute is merged into Pinault-Printemps, and the
Group is subsequently renamed Pinault-Printemps-Redoute.
• Takeover of Fnac.
1995• Launch of the Group’s first website, laredoute.fr.
1996• Creation of Orcanta, a women’s lingerie chain.
1997• Takeover by Redcats (Kering’s home shopping business)
of Ellos, the leader on the Scandinavian mail ordermarket.
• Creation of Fnac Junior, a concept store for childrenunder 12.
1998• Takeover of Guilbert, the European leader in office
supplies and furnishings.• Acquisition by Redcats of 49.9% of Brylane, the fourth-
largest home shopping company in the US.• Creation of Made in Sport, a chain of stores dedicated
to sports enthusiasts.
1999• Purchase of the remaining stake in Brylane.• The Group enters the Luxury Goods sector with the
acquisition of 42% of Gucci Group NV.• First steps towards the creation of a multi-brand Luxury
Goods group, with the acquisition by Gucci Group ofYves Saint Laurent, YSL Beauté and Sergio Rossi.
• Launch of fnac.com, the Fnac website.
2000• Acquisition of Surcouf, a specialised PC retailer.• Acquisition by Gucci Group of Boucheron.• Launch of Citadium, the new Printemps sports store.
2001• Gucci Group acquires Bottega Veneta and Balenciaga
and signs partnership agreements with Stella McCartneyand Alexander McQueen.
• Pinault-Printemps-Redoute raises its stake in GucciGroup to 53.2%.
2002• The Group raises its stake in Gucci Group to 54.4%.• Sale of the Guilbert home shopping business to Staples Inc.• Partial disposal of the Credit and Financial Services
division in France and Scandinavia to Crédit Agricole SA(61% of Finaref) and BNP Paribas (90% of Facet).
2003• The Group raises its stake in Gucci Group to 67.6%.• Sale of Pinault Bois & Matériaux to the Wolseley group
in the UK.• Sale of an additional 14.5% stake in Finaref.
1. HISTORy
1 KERING IN 2015 ~ HISTORY
4 Kering ~ 2015 Reference Document
01_VA_V5 06/04/2016 17:31 Page4
2004• The Group raises its stake in Gucci Group to 99.4%
further to a tender offer.• Sale of Rexel.• Sale of the residual 24.5% stake in Finaref.
2005• Change of corporate name: Pinault-Printemps-Redoute
becomes PPR.• Sale of the residual 10% stake in Facet.
2006• Sale of 51% of France Printemps to RREEF and the
Borletti group.• Sale of Orcanta to the Chantelle group.• Sale of the Bernay industrial site (YSL Beauté Recherche
et Industrie).• Discontinuation of Fnac Service’s activities.• Acquisition by Conforama of a majority stake in Sodice
Expansion.• Acquisition by Redcats group of The Sportsman’s
Guide, Inc.
2007• Sale of the residual 49% stake in France Printemps to
RREEF and the Borletti group.• Sale of Kadéos to the Accor group.• Acquisition of a 27.1% controlling stake in PUMA. This
stake was increased to 62.1% further to a tender offer.
2008• Sale of YSL Beauté to L’Oréal.• Sale of Conforama Poland.• Sale by Redcats UK of Empire Stores and by Redcats
USA of the Missy division.• Acquisition of a 23% stake in Girard-Perregaux.
2009• Acquisition by PUMA of Dobotex International BV.• Acquisition by PUMA of Brandon AB.• Sale of Bédat & Co.• Sale of Surcouf.• Flotation of 58% of Cfao.
2010• Acquisition by PUMA of a 20% stake in Wilderness
Holdings Ltd.• Acquisition by PUMA of COBRA.• Sale of Fnac éveil & jeux.• Sale of the controlling stake in Conforama to Steinhoff.
2011• Closing of the sale of Conforama to Steinhoff.• New organisation of the Luxury Division.• Acquisition of Volcom.• Increased stake (50.1%) in Sowind Group (Girard-
Perregaux and JEANRICHARD).• Announced acquisition of Brioni.
2012• Closing of the acquisition of Brioni.• Sale of the remaining 42% stake in Cfao to TTC.• Creation of a joint venture with Yoox S.p.A. dedicated to
e-commerce for several brands of the Luxury Division.• Announced project to demerge and list Fnac.• Sale of Fnac Italy.• Sale of Redcats USA business (The Sportsman’s Guide and
The Golf Warehouse, announced sale of OneStopPlus).• Announced acquisition of a majority stake in Chinese
fine jewellery brand Qeelin.
2013• Closing of the acquisition of a majority stake in Chinese
fine jewellery brand Qeelin.• Acquisition of a majority stake in the luxury designer
brand Christopher Kane.• Closing of the sale of OneStopPlus.• Sale of the Children and Family division of Redcats,
Cyrillus and Vertbaudet.• Acquisition of a majority stake in tannery France Croco.• Sale of the Nordic brands of Redcats, Ellos and Jotex.• Listing of Groupe Fnac.• Change of corporate name: PPR becomes Kering.• Acquisition of a majority stake in Italian jewellery group
Pomellato.• Kering enters into exclusive negotiations for the disposal
of La Redoute and Relais Colis.
2014• Closing of the sale of La Redoute and Relais Colis.• Announced project of internalisation of the Eyewear
business value chain.• Acquisition of the haute horlogerie brand Ulysse Nardin.
2015• Sale of the industrial property rights of the Tretorn
group (which include trademark rights, patents anddesigns) by PUMA (June 2015).
• Launch of Kering Eyewear (June 2015).• Sale of the Italian luxury shoemaker Sergio Rossi
(December 2015).
1HISTORY ~ KERING IN 2015
52015 Reference Document ~ Kering
01_VA_V5 06/04/2016 17:31 Page5
1 KERING IN 2015 ~ KEY CONSOLIDATED FIGURES
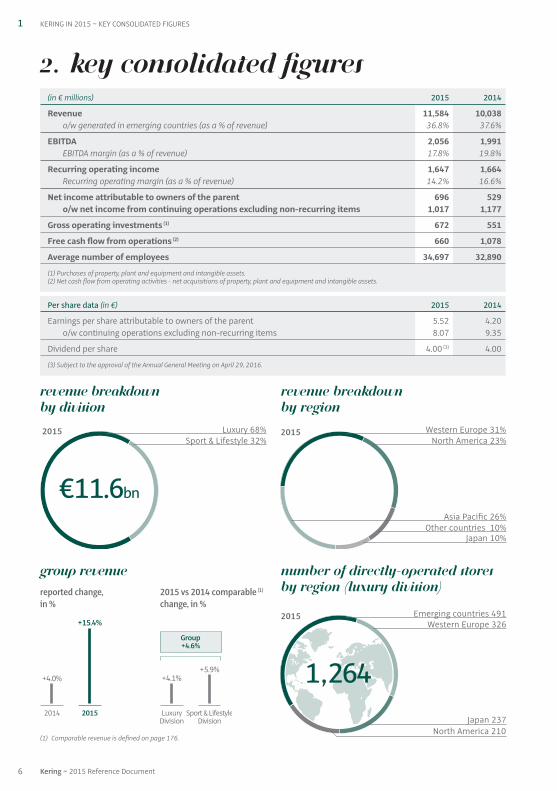
2. Key consolidated figures(in € millions) 2015 2014
Revenue 11,584 10,038o/w generated in emerging countries (as a % of revenue) 36.8% 37.6%
EBITDA 2,056 1,991EBITDA margin (as a % of revenue) 17.8% 19.8%
Recurring operating income 1,647 1,664Recurring operating margin (as a % of revenue) 14.2% 16.6%
Net income attributable to owners of the parent 696 529o/w net income from continuing operations excluding non-recurring items 1,017 1,177
Gross operating investments (1) 672 551
Free cash flow from operations (2) 660 1,078
Average number of employees 34,697 32,890
(1) Purchases of property, plant and equipment and intangible assets.(2) Net cash flow from operating activities - net acquisitions of property, plant and equipment and intangible assets.
Per share data (in €) 2015 2014
Earnings per share attributable to owners of the parent 5.52 4.20o/w continuing operations excluding non-recurring items 8.07 9.35
Dividend per share 4.00 (3) 4.00
(3) Subject to the approval of the Annual General Meeting on April 29, 2016.
6 Kering ~ 2015 Reference Document
Luxury 68%2015Sport & Lifestyle 32%
€11.6bn
Western Europe 31%North America 23%
Asia Pacific 26%Other countries 10%
Japan 10%
2015
Emerging countries 491
Japan 237North America 210
Western Europe 326
1,264
2015
Revenue breakdown by Division
Revenue breakdown by region
Number of directly-operated storesby region (luxury division)
Group revenue
2014 2015
+15.4%
+4.0%
LuxuryDivision
Sport & LifestyleDivision
+5.9%+4.1%
Group+4.6%
reported change,in %
2015 vs 2014 comparable (1)
change, in %
(1) Comparable revenue is defined on page 176.
01_VA_V5 06/04/2016 17:31 Page6
1KEY CONSOLIDATED FIGURES ~ KERING IN 2015
(1) Net debt is defined on page 176.
72015 Reference Document ~ Kering
Undrawnconfirmedcredit lines
(in € millions)
Maturity schedule of net debt (1)
(€4,679 million)
2016* 2017** 2018** 2019** 2020** Beyond**
* Gross borrowings after deduction of cash equivalents.** Gross borrowings.
639
4,132
448 593 536693
1,770
Liquidity
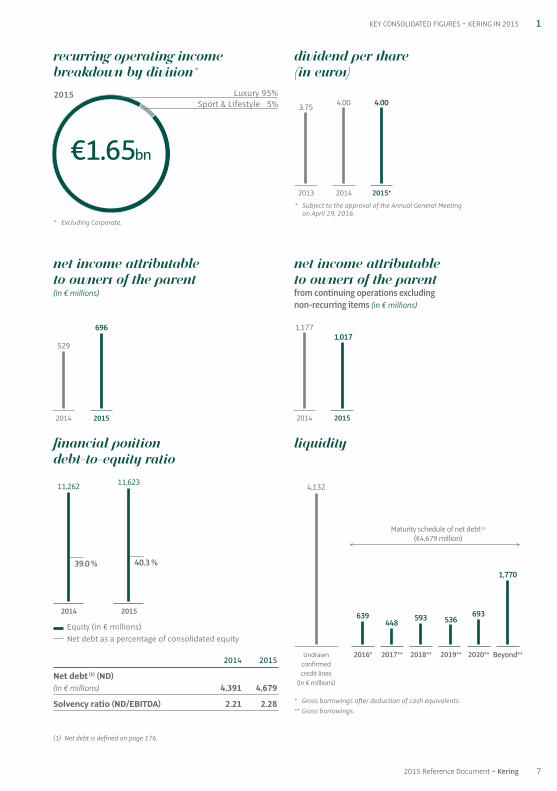
* Excluding Corporate.
Luxury 95%2015Sport & Lifestyle 5%
€1.65bn
Recurring operating incomeBreakdown by Division *
Net income attributable to owners of the parentfrom continuing operations excluding non-recurring items (in € millions)
Dividend per share(in euros)
Equity (in € millions)
2014
Net debt as a percentage of consolidated equity
2015
40.3 %
11,623
39.0 %
11,262
2014 2015
1,0171,177
Net income attributable to owners of the parent(in € millions)
2014 2015
696
529
* Subject to the approval of the Annual General Meeting on April 29, 2016.
2013
3.75
2014 2015*
4.004.00
Financial position debt-to-equity ratio
2014 2015
Net debt (1) (ND) (in € millions) 4,391 4,679
Solvency ratio (ND/EBITDA) 2.21 2.28
01_VA_V5 06/04/2016 17:31 Page7
The first phase of the Group’s transformation, through 2015,involved expanding and strengthening Kering’s brandportfolio, both through organic growth and targetedacquisitions, with the aim of building a complementaryensemble of powerful brands.
Adopting a multi-brand strategy is virtuous in manyregards. Taken individually, each brand has its owndistinctive identity, know-how, positioning and growthpotential enabling it to reach critical mass at a globallevel. Together, they form a coherent and complementaryensemble, particularly in terms of market segments,
stages of maturity and geographic base. There is nocompetition between the brands but rather a focus onidentifying and harnessing synergies.
From a financial and operational standpoint, Kering’sbalanced and diversified business model helps the Groupresist changes in the economic environment affecting agiven activity or region. It combines growth and profitability,as the Group allocates operating investments on the basisof each brand’s business cycle, enabling them to preserveexclusivity while maximising growth – what the Groupcalls “Empowering Imagination”.
A COMPLEMENTARY ENSEMBLE OF POWERfuL BRANDS AND A VIRtuOUS GROWTH MODEL
1
8 Kering ~ 2015 Reference Document
The Group began transforming its portfolio of assets andactivities in 2005 with the aim of gradually phasing outits legacy mass-retail businesses located mainly in Franceand Europe, in order to become a front-ranking group ofglobal brands in the Luxury and Sport & Lifestyle segments.
These changes are in line with the Group’s strategic visionof focusing future development on new growth drivers bycapitalising on changes in the global economy andharnessing the potential and growth cycles in emergingand mature markets. These growth drivers include:
• a global economy, which will continue to be led bymature markets but will also be shaped by the growinginfluence of emerging markets;
• growth in emerging markets, underpinned by demographictrends and rapid urbanisation, creating a middle classwith levels of income that will gradually drive updiscretionary consumer spending;
• a gradual convergence in consumer patterns, propelledby growing aspirational demand in new markets forworld-renowned brands, and supported by thedevelopment of international tourism and the digitaleconomy;
• robust demand in both mature and emerging marketsfor branded Sport & Lifestyle and Luxury products, asegment in which the Group has been well positionedsince its 1999 acquisition of Gucci Group.
From 2005 onwards, the Group began refocusing itsactivities, gradually withdrawing from mass-marketretailing activities with the sale of Printemps, Cfao,Conforama, Surcouf, certain international businesses, thechildren’s division of Redcats and La Redoute, as well aslisting Fnac on the stock market.
At the same time, the Group embarked upon an ambitiousexpansion programme to grow its portfolio of Luxury andSport & Lifestyle brands.
frOM PPR TO Kering: BUILDING A GROUP ON A GLOBAL SCALE
Since its inception in 1963, Kering (then PPR) has continuouslytransformed itself, constantly seeking growth andcreating value with an entrepreneurial spirit.
Between 2005 and 2014, Kering undertook an in-depthstrategic transformation, from a diverse conglomerate intoa cohesive international group entirely dedicated to acomplementary ensemble of apparel and accessories brands.
The change in the name of the Group from PPR to Keringin 2013 reflects this new identity. Pronounced “caring”, thenew corporate identity symbolises the way in which theGroup nurtures its brands, employees and customers, aswell as the environment.
KERING IN 2015 ~ KERING EMPOWERING IMAGINATION
3. Kering Empowering Imagination
01_VA_V5 06/04/2016 17:31 Page8
1. The organic growth of the Group’s brands
The brands’ worldwide standing, desirability and hugeconsumer appeal are key assets, which drive their organicgrowth potential.
The growth of Kering’s brands is underpinned by a seriesof clearly identified drivers:
(i) Launching new product categories and refining existing lines
The Group’s brands work continuously to produce creative,attractive and innovative products for existing ranges andto introduce new product lines with untapped potential.They are careful to constantly adapt and improve thestructure and performance of their collections to meet thespecific needs of their clientele in terms of functionality,trends and price, and to draw in new generations ofcustomers.
(ii) Improving performance in existing sales networks
In their network of directly-operated stores, the brandsdeploy initiatives to boost sales performance, capitalisingon increasingly effective merchandising, in-storeoperational excellence, an in-depth knowledge of theircustomers, customer loyalty and development programmes,and targeted communications.
(iii) Strengthening distribution channels through the selective expansion of directly-operated storenetworks, close relationships with third-party retailers, and the implementation of a dynamic e-commerce strategy
The Group is permanently fine-tuning its network ofdirectly-operated stores to optimise the distribution of itsbrands and seize growth opportunities around the globe.Taking into account the characteristics and maturity ofeach brand, this strategy translates into targeted storeopenings to broaden penetration in certain markets, or storerelocations to occupy the very best locations available.Adapting the Group’s retail network also entails storerenovation and expansion projects, as well as occasional
store closures when brand criteria are no longer met. Inaddition, the Group’s brands are constantly seeking toenhance the quality of their third-party distribution, achannel that has particular strategic significance forSport & Lifestyle activities. Kering has also invested indigital platforms alongside traditional channels in responseto new consumer and purchasing practices. Lastly, thegrowth potential in the Travel Retail channel is graduallybeing tapped.
2. A portfolio of brands rounded out by targeted acquisitions
While focusing on organic growth, Kering has strengthenedits portfolio in recent years through the acquisition ofbrands set to play a key role in the Group’s future growthand value creation. As part of this strategy, Brioni,Pomellato group, Qeelin, Christopher Kane and UlysseNardin have joined the Group.
Strict criteria are applied to these acquisitions:
• Potential targets must enjoy exceptional brand identity,strong values and a sought-after heritage; a unique scopeof expression through lasting codes and language –often referred to as their “DNA”; and an ability to broadentheir geographic footprint and to gradually expand theirmarket coverage.
• Targets must have genuine potential for significantimprovements in financial performance that Kering isable to identify and deploy in the long term, above andbeyond their potential prior to joining the Group. Aswell as seeking revenue synergies derived from theincreased capacity of newly acquired brands to expandtheir geographic presence or product categories oncethey join the Group, Kering also looks for synergies arisingfrom brand expertise in terms of technical, commercialand innovation know-how. Finally, the Group evaluatesthe potential for savings at operational (purchasing,supply chain, real estate, etc.) and financial levels. Thesesynergies are analysed and appraised during theacquisition process, giving rise to a financial andoperational roadmap to value creation drawn up at theoutset of the integration process.
1
92015 Reference Document ~ Kering
KERING EMPOWERING IMAGINATION ~ KERING IN 2015
01_VA_V5 06/04/2016 17:31 Page9

Kering sets the strategic and financial framework withinwhich the brands operate, and provides the structures,organisations and means to protect and support thesustainable growth of its brands.
Kering first deployed a number of horizontal functionsand services for its Luxury brands, including real estate, e-commerce, indirect purchasing, intellectual property,strategic marketing and media buying, to allow them tofocus on their individual business objectives and supporttheir growth, especially internationally.
Shared services platforms have been set up in the Group’sthree biggest regions – Europe, America, and Asia-Pacific.These centres employ experts in communications, audit,human resources, tax, property, legal affairs, IT systems,accounting and cash management, providing brandswith appropriate support for the local context.
More recently, important new steps have been taken on theroad to becoming an integrated Group. The finalisation ofthe Group’s transformation, combined with recent changesin its markets, consumer trends and the competitiveenvironment, have led Kering to set new milestones.
(i) In 2014 and 2015, Kering adapted its organisation tobetter reflect the areas of activity of the Group’s Luxurybrands and strengthen the operational oversight of itsbusinesses. Two new divisions were set up:
• Luxury – Couture & Leather Goods, comprising Gucci,Bottega Veneta, Saint Laurent, as well as emerging brandsAlexander McQueen, Balenciaga, Brioni, ChristopherKane, McQ, Stella McCartney and Tomas Maier;
• Luxury – Watches & Jewellery, encompassing Boucheron,Girard-Perregaux, JEANRICHARD, Pomellato, Dodo, Qeelinand Ulysse Nardin.
(ii) From 2013, the Group strengthened its upstreampositioning in the Luxury value chain, with the targetedacquisition of leather tanneries to secure raw materialssourcing. Logistics activities for its Couture & LeatherGoods brands have long been centralised, much likeready-to-wear prototyping, which is pooled in a sharedunit in Italy. In order to make this vertical integration evenmore effective and efficient in terms of services, synergiesand scale, in 2015 all of these operations were placedunder the direct governance and oversight of Kering.
(iii) In 2014, Kering also launched a key strategic initiativeaimed at growing in-house expertise in Eyewear for itsLuxury and Sport & Lifestyle brands. The worldwide marketfor frames and sunglasses is vast and its premium segment
is enjoying substantial growth. To maximise thedevelopment of its portfolio of brands in this importantcategory, Kering has decided to internalise the valuechain for its Eyewear activities, from product creation anddevelopment to supply chain management, brandstrategy, sales and marketing. This innovative managementmodel will give rise to significant value creationopportunities and help the Eyewear brands step up thepace of growth. In June 2015, Kering Eyewear unveiled itsfirst collections under brand licences that are nowdirectly managed.
(iv) The digital challenge: e-commerce is a strategic priorityfor Kering, not only for the business the Group’s brandsconduct online but also because it influences demandacross all sales channels. Gucci is a pioneer in Luxury e-commerce. Launched in 2002, its website has set thestandard in this field and the brand’s digital know-how iswidely recognised. Since the Other Luxury brands did notenjoy internal capabilities comparable to Gucci’s, in 2012the Group set up a Kering e-commerce platform toprovide the Couture & Leather Goods division brands withthe necessary technical competence to develop theironline business and digital strategy. All the brand sitesnow feature mobile- and tablet-optimised browsing,shared performance-measurement tools and a dedicatedteam of specialists to help continually improve siteperformance, conversion rates and customer satisfaction.
Our customers are increasingly connected, geographicallymobile and sensitive to the fluidity of their shoppingexperience spanning traditional physical stores andonline. In this context, the Group’s e-commerce teamshave set out a cross-channel services strategy adapted tothe characteristics of each brand. The Group now benefitsfrom several cross-channel service features, such asonline visibility of retail inventory (geo-localised for Gucci)and online sales, which are gradually being extended toin-store pickup and online reservation. A host of additionalfeatures are in the pipeline. Kering is encouraging itsbrands to try out new solutions, with pilot projects to testnew technologies such as a new online fitting solution forready-to-wear and shoes, and to share the results withthe brands as a prelude to Group-wide rollout.
With the aim of ultimately offering a seamless omni-channelapproach covering both bricks and mortar and onlineboutiques, Kering is currently assessing a large-scale projectto establish a single shared customer database acrossdistribution channels and to modernise, harmonise andoptimise its information systems and operational processes.
AN INTEGRATED GROUP, StrUCtuRED TO TAP INTO GROWTH POTENtiAL
1
10 Kering ~ 2015 Reference Document
KERING IN 2015 ~ KERING EMPOWERING IMAGINATION
01_VA_V5 06/04/2016 17:31 Page10
Kering believes that sustainable business is smartbusiness. Sustainability is both a business and leadershipopportunity for Kering, allowing the Group to create value.It stimulates growth, innovation and competitiveadvantage in the medium to long term, whilst simultaneouslyreducing costs. It also constitutes a motivational factorfor employees, enabling the Group to attract and retainthe best talents.
Sustainability is a key component of the Group brands’strategy. Kering empowers all of its brands to developproducts that meet the utmost standards of innovation,quality and sustainability.
Kering Corporate’s Sustainability Department supportseach of the Group’s brands with the development andoperational roll-out of their brand-specific action plans.Comprising around 15 experts, the team’s expertiseincludes everything from environmental footprintanalysis, raw material sourcing, ecosystem conservation,energy efficiency as well as social compliance. Thedepartment drives change within the Group by providingthe brands with the necessary know-how, guidance,collaboration and economies of scale needed in orderto develop more sustainable business models. The ChiefSustainability Officer sits on Kering’s Executive Committeeand ensures a cohesive and integrated approach tosustainability across the Group.
Kering’s sustainability strategy centres on a series of self-imposed targets, which the Group has publicly committedto achieving by 2016. Deliberately ambitious, thesetargets focus on the specific challenges of the Group’sbusiness: from the sustainable sourcing of leather, goldand diamonds to the reduction of carbon emissions, water,waste and hazardous chemicals.
Another integral part of the Group’s strategy is itsEnvironmental Profit & Loss account (E P&L), which nowcovers all the Group’s brands and their respective supplychains. Over the course of 2015, the 2013 and 2014 resultsof the group-wide E P&L were published. This innovativemanagement tool, developed by Kering, monitors andmeasures in € value the environmental impact of theGroup’s operations and those of its supply chain; from thesource of raw materials right up to the boutique floor.
Insights gathered from the Group’s E P&L serve to fortifyKering’s sourcing strategy, highlight environmental risksand economic opportunities within the supply chain,whilst also enabling the Group to track progress towardsits 2016 targets. The Group has now open-sourced its E P&L methodology (available on www.kering.com) so asto encourage other corporations to start taking accountfor their activities’ reliance on natural capital.
Collaboration is seen a key lever of sustainable innovationwithin the Group, a case in point being the MaterialsInnovation Lab. This internal research hub offers the Group’sbrands a comprehensive library of over 2,000 sustainablefabrics and a team of experts to support the integrationof these materials into their product offerings. Kering hasalso established partnerships with suppliers andinternational NGOs, so as to develop more responsiblesourcing methods for the Group’s key raw materials,including precious skins, furs and gold. An internal ethicalgold purchasing platform was also launched in 2015, viawhich Luxury Division brands have already managed toacquire 220 kilograms of ethical gold.
With regards to social compliance, a new worldwidesupplier management programme was also launched inthe past twelve months. The system is designed toimprove supplier relations, be it with regards to contracts,invoicing, traceability or auditing. With the support of thesustainability department, this programme will alsoenable the Group’s brands to monitor compliance withsocial, environmental and ethical issues, be it at suppliers’or their sub-contractors’.
Convinced that sustainability will play an ever moreprominent role in fashion going forward, Kering iscommitted to nurturing young talents and upcomingdesigners. Reflective of this, the Group launched a five-year partnership with the London College of Fashion’sCentre for Sustainable Fashion to promote sustainabledesign and innovation within the fashion industry. Similareducation programmes have also been launched withTsinghua University in China, and the Parsons School ofDesign and the Fashion Institute of Technology in theUnited States.
SUSTAINABILIty AT THE HEART OF Kering’S GROUP AND BRAND StrATEGY
1
112015 Reference Document ~ Kering
The Sport & Lifestyle brands are also working on optimisingand revitalising e-commerce, against the backdrop ofextremely rapid online growth in the sector.
(v) Recognising that its teams are the driving force behindits future success, Kering has developed an ambitious,
integrated, worldwide human resources framework, basedon ever-greater mobility across the brands. The ideabehind the HR strategy is to help brands flourish by givingthem access to shared talent pools, expertise, standards,information systems and best practices.
KERING EMPOWERING IMAGINATION ~ KERING IN 2015
01_VA_V5 06/04/2016 17:31 Page11
Against a backdrop of slower economic growth in certainkey emerging markets, notably China, and a modestrecovery in Europe, and despite a satisfactory economicperformance in the US, the global economy postedmoderate growth in 2015.
In this unfavourable environment, intensified by sharpcurrency fluctuations, Kering has demonstrated therelevance of its multi-brand model. The Group’s strategyis consistent: to nurture each brand’s long-term potential,with priority given to organic growth and operating cashflow generation.
True to its entrepreneurial and responsible vision, Keringwill continue to promote long-term value-creation,combining boldness and imagination, creativity andmeasured risk-taking, adaptability and agility.
The Group intends to leverage these values as Keringenters a new phase of its development, with a brandportfolio that now covers all key segments of its markets.
In a worldwide Luxury market: (i) where growth is normalising,(ii) shaped by more changeable and less predictableconsumer habits and locations (tourism, internet), (iii) and by significant increases in investments andoperating costs for all players in recent years as part of thedevelopment of directly-operated distribution networks;Kering possesses a number of strengths to help it unlockthe potential value and profitability of each of its brands.
Structured and organised to bring more expertise, valueand operational support to its brands, Kering focuses onincreasing return on capital employed by enhancingprofit margins and optimising capital allocation forinvestments as well as working capital.
Concrete action plans are implemented at brand level.Gucci undertook a major transformation programme inearly 2015 to overhaul its creative drive, organisation andcollections, and early indicators suggest that the brand,soon-to-be 100 year old, has lost none of its agility orability to reinvent itself and climb back to the forefront ofthe worldwide Luxury industry. PUMA, under the directionof a new management team since 2013, continues to deployof its strategic plan, aimed at renewing and streamliningits product line-up and refocusing its positioning aroundSport Performance. The results of these initiatives arealready apparent in PUMA’s top-line performance andshould gradually make a mark on profitability.
Across all Group brands, a range of cross-businessinitiatives has been drawn up with the support of Keringand dedicated teams to optimise comparable-storesales performance. The emphasis is on strengtheningstore productivity through a series of upstream anddownstream initiatives, including: improving supplychain capacity and the efficiency of product allocationcriteria by region and type; redefining ranges and theirdepth and breadth; training sales staff in best practicesfor customer service; loyalty and experience; and
IN AN ECONOMIC ENVIRONMENT THAT REMAINS UNSEttLEDIN THE SHORT TERM, Kering IS CONfiDENT IN ITS OUTLOOK
1
12 Kering ~ 2015 Reference Document
Embodying the Group’s social commitment, the KeringFoundation was launched in 2009 by François-HenriPinault. The Foundation combats violence against womenvia projects run by NGOs and social entrepreneurs and theengagement of the Group’s employees. The Foundation’sactions focus on three regions and are helping to fightagainst:
• sexual violence in America (the United States, Brazil andArgentina);
• harmful traditional practices in Western Europe(France, Italy and the United Kingdom);
• domestic violence in Asia (China).
Also central to the Foundation’s combat is awarenessraising, via campaigns including “White Ribbon forWomen” which was launched in 2012 as a call to actionon the occasion of the International Day for theElimination of Violence against Women on November 25.The campaign’s 2015 edition saw 125,000 White Ribbonbrooches distributed in over 800 stores operated by
Kering brands across 41 countries. In parallel, the Foundationran digital campaign #BeHerVoice across social mediaand reached nearly 320 million internet users.
In recognition of the Group’s continued efforts, Kering isreferenced as a leader by several bodies including theDow Jones Sustainability Index, which has ranked Keringin first place within the Textiles, Apparel & Luxury Goodsindustry for the past two years. This index tracks the best-in-class sustainability performers amongst the 2,500 largest companies in the Dow Jones Global TotalStock Market Index. Each year, participating companiesare assessed based on a specific questionnaire for eachbusiness sector, with only the top 10% in terms ofsustainability performance listed in the ranking.
In 2015, Kering was also named one of the Global 100 mostsustainable companies in the world for the first time,ranking 43rd. Compiled by Corporate Knights since 2005,the Global 100 is unveiled annually at the World EconomicForum in Davos.
KERING IN 2015 ~ KERING EMPOWERING IMAGINATION
01_VA_V5 06/04/2016 17:31 Page12
1
132015 Reference Document ~ Kering
developing CRM and clienteling tools. These initiativeswill generate cost reductions, improve profitability andoptimise capital employed. Complementing this effort,directly-operated store networks will be reviewed brand bybrand, and consolidated as necessary, as part of a broaderalignment of the allocation of investments to strictreturn guidelines. These initiatives will also be roundedout by the realisation of additional revenue and costsynergies, especially in terms of sourcing, productionand logistics. Lastly, Kering continues to promote itsbrands’ digital strategies by coordinating e-commerceprojects, encouraging knowledge sharing and drivingnew ambitious developments with the aim of increasingthe share of internet sales in the brands’ revenue andleveraging e-commerce to drive growth.
In a more volatile and unsettled short-term environment,the Group is moving into this new phase with confidenceand determination. Kering remains fully committed toenvironmental and social sustainability and diversity, allof which are crucial to its business objectives and to itslong-term performance.
KERING EMPOWERING IMAGINATION ~ KERING IN 2015
01_VA_V5 06/04/2016 17:31 Page13
1
14 Kering ~ 2015 Reference Document
KERING IN 2015 ~ KERING GROUP SIMPLIFIED ORGANISATIONAL CHART AS OF DECEMBER 31, 2015
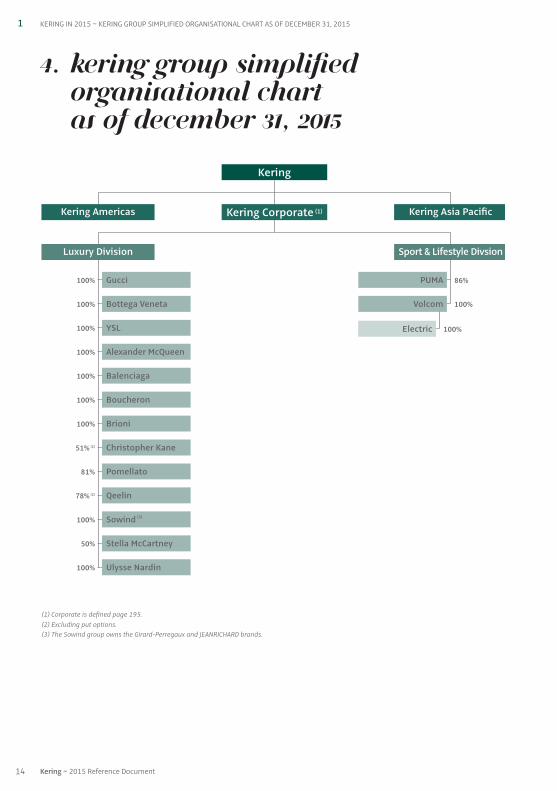
4. Kering Group SimplifiedOrganisational Chart as of December 31, 2015
Luxury Division
Gucci100%
Sport & Lifestyle Divsion
Kering
Kering Americas Kering Asia Pacific
Bottega Veneta100%
PUMA 86%
Volcom 100%
Electric 100%YSL100%
Alexander McQueen100%
Balenciaga100%
Boucheron100%
Brioni100%
51% (2) Christopher Kane
Pomellato
Qeelin
81%
78% (2)
100%
(1) Corporate is defined page 195.(2) Excluding put options.(3) The Sowind group owns the Girard-Perregaux and JEANRICHARD brands.
Ulysse Nardin
Sowind (3)
Stella McCartney50%
100%
Kering Corporate (1)
01_VA_V5 06/04/2016 17:31 Page14
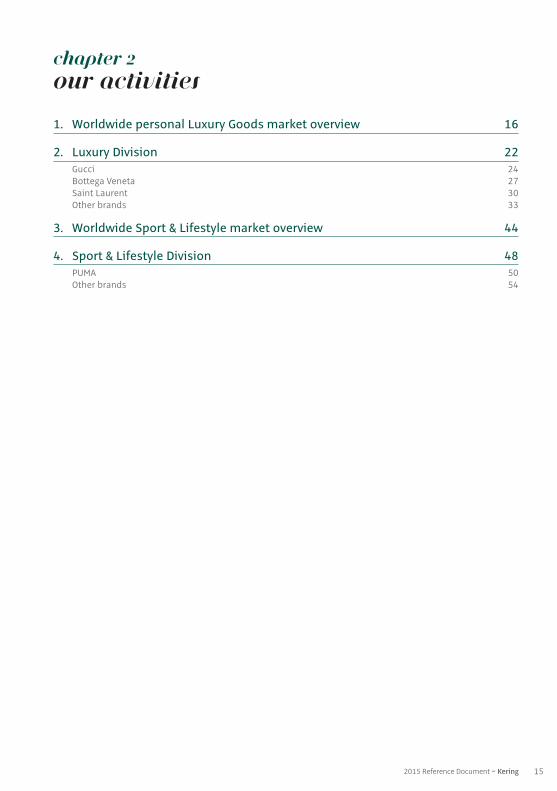
CHAPTer 2
Our activities
1. Worldwide personal Luxury Goods market overview 16
2. Luxury Division 22Gucci 24Bottega Veneta 27Saint Laurent 30Other brands 33
3. Worldwide Sport & Lifestyle market overview 44
4. Sport & Lifestyle Division 48PUMA 50Other brands 54
152015 Reference Document ~ Kering
02_VA_V5 07/04/2016 10:37 Page15

2 OUR ACTIVITIES ~ WORLDWIDE PERSONAL LUXURY GOODS MARKET OVERVIEW
MARKET OVERVIEW: SIZE, trENDS AND MAINGROWTH DRIVERS
The global personal Luxury Goods market has enjoyedsignificant growth over the past few years (double-digitgrowth in 2010, 2011 and 2012). Since 2013, the markethas decelerated and entered a more “normalised” growthphase. In 2015, it generated revenue of €253 billion, up 13% reported and up 1 to 2% at comparable exchange rates.
In 2015, exogenous factors, especially strong currencyvolatility and moves, have created major challenges forthe luxury market. Euro weakening has led price gapsbetween regions to reach new heights, with a strongimpact on tourism flows and local consumption trends.Price differentials have contributed to boosting for exampleChinese customers’ spending abroad, somewhat at theexpense of the domestic market.
Worldwide personal Luxury Goods market trend (2007-2015e, in € billions)
Although the personal Luxury Goods market has seenstrong growth since 2010, outpacing the global economy,it is however tied to changes in worldwide GDP, asevidenced by the fall seen in the luxury market in 2009.
In addition to economic factors, structural factors arealso impacting demand and growth on the personalLuxury Goods market, including:
• positive demographic trends, especially in emergingmarkets;
• the emerging middle-class in these countries, wherethe average disposable income and purchasing powerof consumers has continued to grow;
• rising number of super-rich consumers;
• increased tourism flows and the growing relevance oftourist spending on Luxury Goods. As an example, Chineseoutbound tourist flows increased from c. 5 million a yearin 1995 to 116 million in 2014.
By destination, the weight of tourism spending differs:Europe is a market where luxury purchases are made bylocals but also by tourists. In Asia, Mainland Chineseconsumers tend to purchase luxury personal goods bothin Greater China and also abroad, notably in Japan, and toa lesser extent in the Americas, where purchases are stillmade mainly by locals.
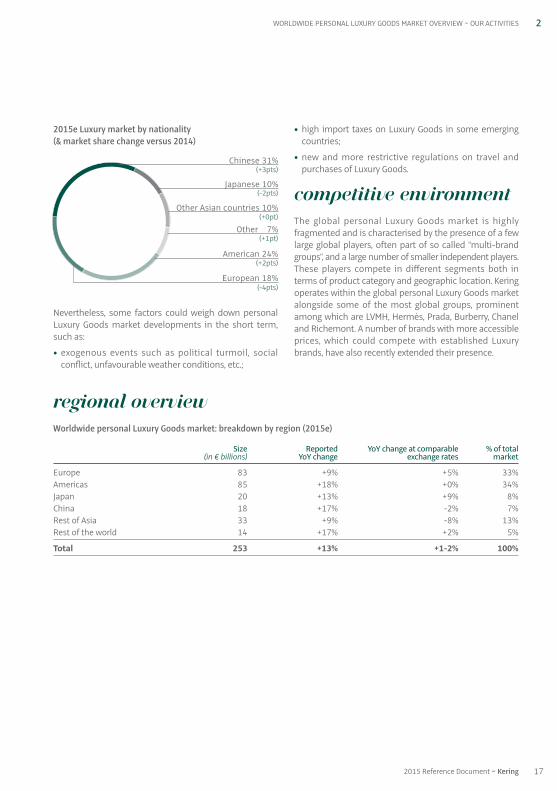
In 2015, currency fluctuations changed the picture withincreasing price differentials leading “globe-shoppers” toadapt their consuming habits and spending patterns withMainland Chinese favouring Europe, Japan and to a lesserextent South Korea as main destinations. The Chinesenationality now accounts for 31% of the total market (up3ppts vs 2014).
This section contains information derived from studies conducted by organisations, such as Altagamma andBain & Company. Unless otherwise indicated, all historical and forecast statistical information, including trends, sales,market shares and growth levels, comes from the Bain Luxury Study – Altagamma Worldwide Market Monitor, publishedin October 2015. Luxury Goods industry segments and product categories correspond to the definitions used in theBain Luxury Study – Altagamma Worldwide Market Monitor.
In this document the global personal Luxury Goods market includes the “soft luxury” area such as apparel, accessories,perfumes and cosmetics, and the “hard luxury” area such as watches and jewellery.
Worldwide personalLuxury Goods marketoverview
(%): Annual change at reported exchange rates(%): Change at currency-neutral growth
15e
253(+13%)(+1-2%)
14
224(+3%)
07
170
08
167
09
153
10
173
11
192
12
212
13
218(+3%)(+10%)
(+11%)(+13%)
(+3%)(+7%)(+5%)(+13%)
(+8%)
16 Kering ~ 2015 Reference Document
02_VA_V5 06/04/2016 17:31 Page16
REGIONAL OVERVIEW
Worldwide personal Luxury Goods market: breakdown by region (2015e)
Size Reported YoY change at comparable % of total(in € billions) YoY change exchange rates market
Europe 83 +9% +5% 33%Americas 85 +18% +0% 34%Japan 20 +13% +9% 8%China 18 +17% -2% 7%Rest of Asia 33 +9% -8% 13%Rest of the world 14 +17% +2% 5%
Total 253 +13% +1-2% 100%
2015e Luxury market by nationality (& market share change versus 2014)
Nevertheless, some factors could weigh down personalLuxury Goods market developments in the short term,such as:
• exogenous events such as political turmoil, socialconflict, unfavourable weather conditions, etc.;
• high import taxes on Luxury Goods in some emergingcountries;
• new and more restrictive regulations on travel andpurchases of Luxury Goods.
COMPEtitiVE ENVIRONMENT
The global personal Luxury Goods market is highlyfragmented and is characterised by the presence of a fewlarge global players, often part of so called “multi-brandgroups”, and a large number of smaller independent players.These players compete in different segments both interms of product category and geographic location. Keringoperates within the global personal Luxury Goods marketalongside some of the most global groups, prominentamong which are LVMH, Hermès, Prada, Burberry, Chaneland Richemont. A number of brands with more accessibleprices, which could compete with established Luxurybrands, have also recently extended their presence.
2WORLDWIDE PERSONAL LUXURY GOODS MARKET OVERVIEW ~ OUR ACTIVITIES
172015 Reference Document ~ Kering
Chinese 31%
Japanese 10%
Other 7%
European 18%
American 24%
Other Asian countries 10%
(-2pts)
(+3pts)
(+2pts)
(+1pt)
(+0pt)
(-4pts)
02_VA_V5 06/04/2016 17:31 Page17
In 2015, the Americas region was the largest market, withthe United States accounting for the vast majority of revenue(c. 92%). The region did not perform as initially expected,registering flat growth at comparable exchange rates. Themomentum was mainly held back by the strong dollar,which had a double negative effect: significant drop intouristic spending, insufficiently counterbalanced by localconsumption, partly redirected towards Europe.
Europe, with 33% of the total worldwide market, was thesecond largest luxury market in 2015, with revenue up 5%vs 2014 at comparable exchange rates. In 2015, eurozoneregistered a strong performance with a weak euro fuellingthe increase of inbound tourists(1), which now account for60% of luxury sales in the region. Outside the eurozone, theUnited Kingdom was solid but not buoyant due to a strongGBP while Switzerland was weak due to the strong CHF.
Japan represented 8% of the global personal LuxuryGoods market in 2015. Japan is the second largest singlecountry in terms of personal Luxury Goods consumptionafter the United States, and posted a solid performancefor the third consecutive year, up 9% comparable. In2015, Japan became a key destination for Chinesetourists coupled with good local demand.
China was down 1% at comparable exchange rates, andrepresented 7% of the global personal Luxury Goodsmarket. The luxury market was under pressure again withonly 20% of Chinese spending made at home, as pricedifferentials appeared as a key issue. The rest of AsiaPacific was also weak in 2015 with Hong Kong and Macaubeing the worst performers, both down 25% atcomparable exchange rates, suffering from decreasingpopularity among Chinese tourists.
The rest of the world – mainly comprising the Middle Eastand African markets – represented 5% of the personalLuxury Goods market, with €14 billion in revenue in 2015.In the Middle East, Qataris are the biggest buyers ofLuxury Goods, making their luxury purchases mainly inDubai. In Africa, South Africa and Morocco are the mostdeveloped luxury retail markets accounting for c. 85% ofdirectly-operated stores in the region.
2 OUR ACTIVITIES ~ WORLDWIDE PERSONAL LUXURY GOODS MARKET OVERVIEW
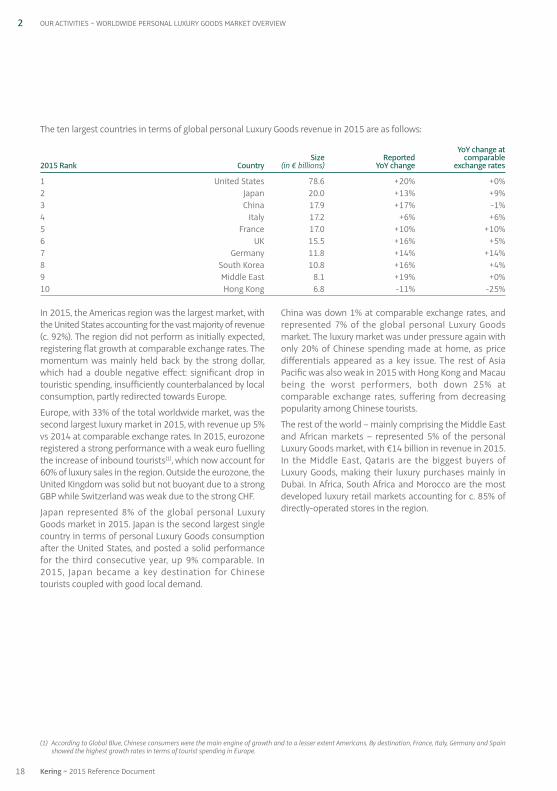
The ten largest countries in terms of global personal Luxury Goods revenue in 2015 are as follows:
YoY change atSize Reported comparable
2015 Rank Country (in € billions) YoY change exchange rates
1 United States 78.6 +20% +0%2 Japan 20.0 +13% +9%3 China 17.9 +17% -1%4 Italy 17.2 +6% +6%5 France 17.0 +10% +10%6 UK 15.5 +16% +5%7 Germany 11.8 +14% +14%8 South Korea 10.8 +16% +4%9 Middle East 8.1 +19% +0%10 Hong Kong 6.8 -11% -25%
18 Kering ~ 2015 Reference Document
(1) According to Global Blue, Chinese consumers were the main engine of growth and to a lesser extent Americans. By destination, France, Italy, Germany and Spainshowed the highest growth rates in terms of tourist spending in Europe.
02_VA_V5 06/04/2016 17:31 Page18
Accessories
This category includes shoes, leather goods (includinghandbags and wallets, and other leather products),eyewear and textile accessories.
In 2015, this category represented 30% of the total personalLuxury Goods market with total sales of €76 billion. Itrecorded the strongest growth in 2015.
The two main sub-categories were:
a) Leather goods, with estimated revenue of €43 billionin 2015. This sub-category grew at a rate of 2% atcomparable exchange rates between 2014 and 2015,driven by the outperformance of the “absolutesegment” while the “aspirational segment” showedmixed performance. Kering operates in this productcategory mainly through the Gucci and Bottega Venetabrands, as well as Saint Laurent and Balenciaga;
b) Shoes, with estimated 2015 revenue of €16 billion,were again the fastest growing sub-category between2014 and 2015 with 4% growth at constant exchangerates. Shoes have been outperforming the broaderleather goods segment since 2012 as the categoryenables consumers to access a status symbol at alower price positioning. Kering operates in this productcategory with most of the larger brands, includingGucci, Bottega Veneta, Saint Laurent and Balenciaga,which offer shoes as part of their product assortment.
Eyewear
The Eyewear category represented 5% of the totalpersonal Luxury Goods market in 2015 and was worth anestimated €12 billion, up 15% in reported terms. Keringoperates in this product category through the majority ofthe Group’s brands. In 2014 Kering announced it willinternalise this category, previously operated throughlicences, and will in-house design, develop and distributeeyewear collections.
Apparel
This category includes ready-to-wear for both womenand men, and is almost equally spread between the two.It represented 24% of the total personal Luxury Goodsmarket in 2015, totalling an estimated €61 billion. Men’sready-to-wear was driven by casualwear (i.e., outerwear,denim and cashmere) while formalwear was more subdued.In women’s ready-to-wear, Bain noticed a polarisedperformance with activewear / denim and haute coutureshowing buoyant dynamism. In contrast, the “aspirationalsegment” faced some pressure from premium playersand contemporary brands playing with luxury codes.
All Kering “soft luxury” brands operate in this productcategory, especially Gucci, Balenciaga, Stella McCartney,Alexander McQueen, Christopher Kane and Saint Laurent,in addition to Brioni for menswear.
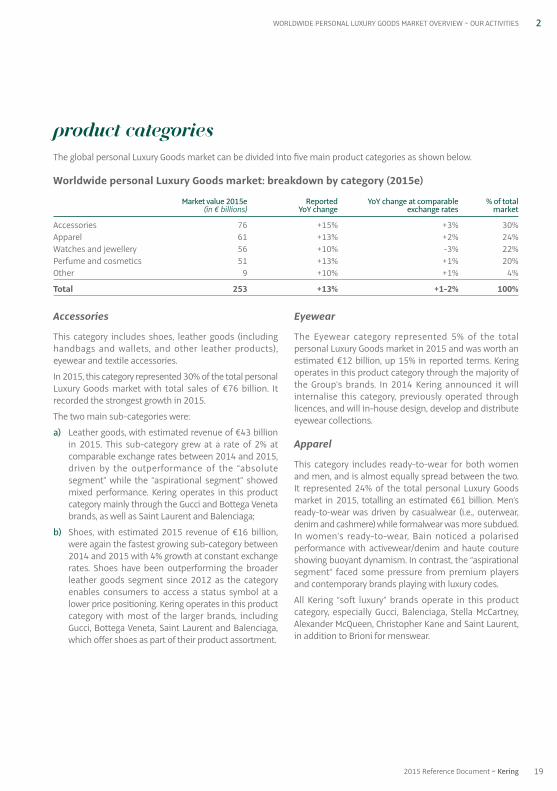
PRODUCT CATEGORIES
The global personal Luxury Goods market can be divided into five main product categories as shown below.
Worldwide personal Luxury Goods market: breakdown by category (2015e)
Market value 2015e Reported YoY change at comparable % of total(in € billions) YoY change exchange rates market
Accessories 76 +15% +3% 30%Apparel 61 +13% +2% 24%Watches and jewellery 56 +10% -3% 22%Perfume and cosmetics 51 +13% +1% 20%Other 9 +10% +1% 4%
Total 253 +13% +1-2% 100%
2WORLDWIDE PERSONAL LUXURY GOODS MARKET OVERVIEW ~ OUR ACTIVITIES
192015 Reference Document ~ Kering
02_VA_V5 06/04/2016 17:31 Page19
Watches and jewellery
The watches and jewellery category generated revenue of€56 billion in 2015, representing 22% of the totalpersonal Luxury Goods market, and decreased by 3%between 2014 and 2015 at comparable exchange rates.In 2015, there was a significant polarised performanceacross the two main sub-categories with watches down6% and jewellery up 6% at comparable exchange rates.High-end watches were hit by negative Asian performancewhile jewellery was driven by high-ticket items as it isperceived as a safe investment in the context of a toughmacro environment.
Kering operates in this category across different pricepoints with Gucci Timepieces, Girard-Perregaux, andUlysse Nardin for watches, and Boucheron, Pomellatoand Qeelin for jewellery.
Perfume and cosmetics
The perfume and cosmetics category represented 20% ofthe total personal Luxury Goods market in 2015 and wasworth an estimated €51 billion.
Kering operates in this product category through royaltylicencing agreements between its main brands andleading industry players such as L’Oréal, Coty (incl. P&GPrestige) and Interparfums to develop and sell fragrancesand cosmetics.
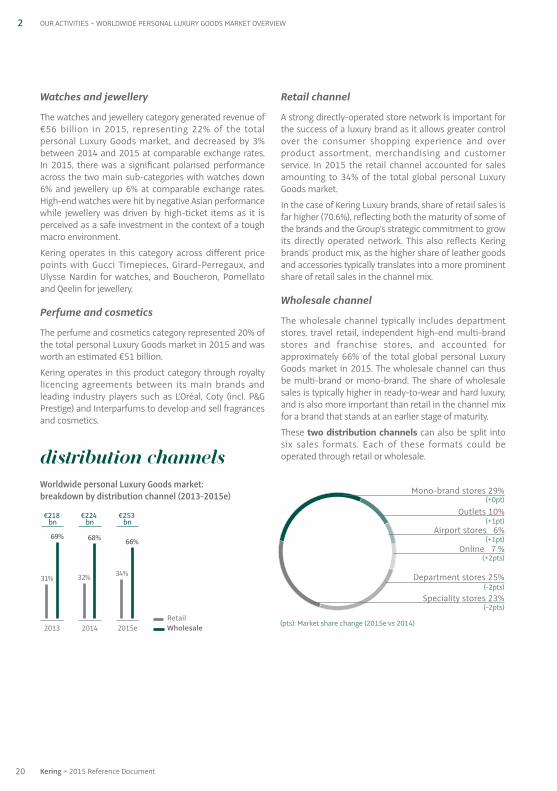
DIStrIBUtiON CHANNELS
Worldwide personal Luxury Goods market: breakdown by distribution channel (2013-2015e)
Retail channel
A strong directly-operated store network is important forthe success of a luxury brand as it allows greater controlover the consumer shopping experience and overproduct assortment, merchandising and customerservice. In 2015 the retail channel accounted for salesamounting to 34% of the total global personal LuxuryGoods market.
In the case of Kering Luxury brands, share of retail sales isfar higher (70.6%), reflecting both the maturity of some ofthe brands and the Group’s strategic commitment to growits directly operated network. This also reflects Keringbrands’ product mix, as the higher share of leather goodsand accessories typically translates into a more prominentshare of retail sales in the channel mix.
Wholesale channel
The wholesale channel typically includes departmentstores, travel retail, independent high-end multi-brandstores and franchise stores, and accounted forapproximately 66% of the total global personal LuxuryGoods market in 2015. The wholesale channel can thusbe multi-brand or mono-brand. The share of wholesalesales is typically higher in ready-to-wear and hard luxury,and is also more important than retail in the channel mixfor a brand that stands at an earlier stage of maturity.
These two distribution channels can also be split intosix sales formats. Each of these formats could beoperated through retail or wholesale.
20 Kering ~ 2015 Reference Document
2 OUR ACTIVITIES ~ WORLDWIDE PERSONAL LUXURY GOODS MARKET OVERVIEW
RetailWholesale2015e
€253 bn
34%
66%
2013 2014
€224 bn
32%
68%
€218 bn
31%
69%
Mono-brand stores 29%
Outlets 10%
Speciality stores 23%
Airport stores 6%
Online 7 %
Department stores 25%
(+2pts)
(+1pt)
(+1pt)
(+0pt)
(-2pts)
(-2pts)
(pts): Market share change (2015e vs 2014)
02_VA_V5 06/04/2016 17:31 Page20

E-commerceOnline sales of Luxury Goods reached a record of around€17 billion in 2015 (up 22% at comparable exchangerates), representing about 7% of total global personal LuxuryGoods sales. This penetration is especially driven by therapid development of online business of wholesalers(department stores) and e-commerce pure players (e-tailers).
All Kering brands are directly present online with theirown e-commerce websites, either operated internally, asis the case for Gucci, or through a joint venture.
Kering brands are also distributed online by selectedpartners.
MARKET OUTLOOK
For 2016, Bain and Altagamma forecast overall growth of 3% to 3.5% excluding currency effects for the personalLuxury Goods markets, with the sector entering a phaseof “new normal” growth.
Growth should be driven by:
• new emerging countries: in addition to South EastAsian countries (Indonesia, Thailand, etc.), Brazil, Australia,Africa and India are expected to be increasingly key tothe growth of the global personal Luxury Goods market;
• emerging consumers: a booming upper-middle classespecially benefiting the accessible luxury segment,particularly in China. In fact, according to McKinsey, by2022, the Chinese upper-middle class should accountfor 54% of urban households and 56% of urban privateconsumption (up from 14% and 20% in 2012 respectively);
• the continued expansion of tourism flows with theemergence of new winners (Japan, South Korea, etc.),which could, however, come partly at the expense ofsome of the more traditional destinations;
• the development of key distribution channels such asoutlets, travel retail or e-commerce. The latter generated€17 billion in revenue in 2015, and is expected to growat an annual average rate of 24% over the 2013-2020period;
• an increase in high-spending consumer classes such ashigh-net-worth individuals (HNWIs);
• the development of new high-end products and services;
• the potential of the American market due to the under-penetration of European luxury brands in the region.
21
2
2015 Reference Document ~ Kering
WORLDWIDE PERSONAL LUXURY GOODS MARKET OVERVIEW ~ OUR ACTIVITIES
02_VA_V5 06/04/2016 17:31 Page21
22 Kering ~ 2015 Reference Document
2 OUR ACTIVITIES ~ LUXURY DIVISION
Gucci 24Bottega Veneta 27Saint Laurent 30Other brands 33
Alexander McQueenBalenciagaBoucheronBrioniChristopher KaneGirard-Perregaux and JEANRICHARDPomellato and DodoQeelinStella McCartneyUlysse Nardin
Luxury Division
02_VA_V5 06/04/2016 17:31 Page22
2LUXURY DIVISION ~ OUR ACTIVITIES
Breakdown by brand
Revenue and recurringoperating income
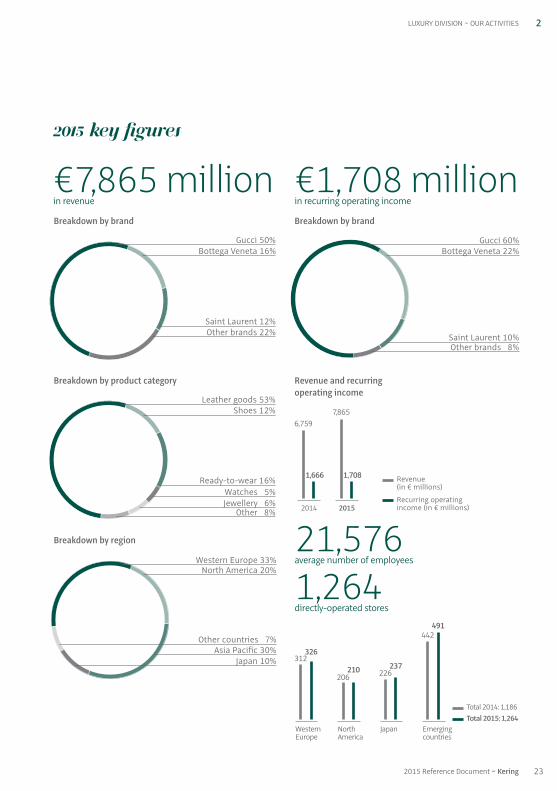
€7,865 millionin revenue
21,576average number of employees
1,264directly-operated stores
€1,708 millionin recurring operating income
Breakdown by brand
Breakdown by product category
Breakdown by region
Gucci 50%Bottega Veneta 16%
Saint Laurent 12%Other brands 22%
Leather goods 53%Shoes 12%
Ready-to-wear 16%Watches 5%Jewellery 6%
Other 8%
Western Europe 33%North America 20%
Japan 10%Asia Pacific 30%
Other countries 7%
2015 key figures
Gucci 60%Bottega Veneta 22%
Saint Laurent 10%Other brands 8%
Revenue (in € millions)
Recurring operating income (in € millions)2015
7,865
1,708
2014
6,759
1,666
WesternEurope
NorthAmerica
Japan Emergingcountries
Total 2014: 1,186Total 2015: 1,264
237210
326
491
226206
312
442
232015 Reference Document ~ Kering
02_VA_V5 06/04/2016 17:31 Page23
2
2015 key figures
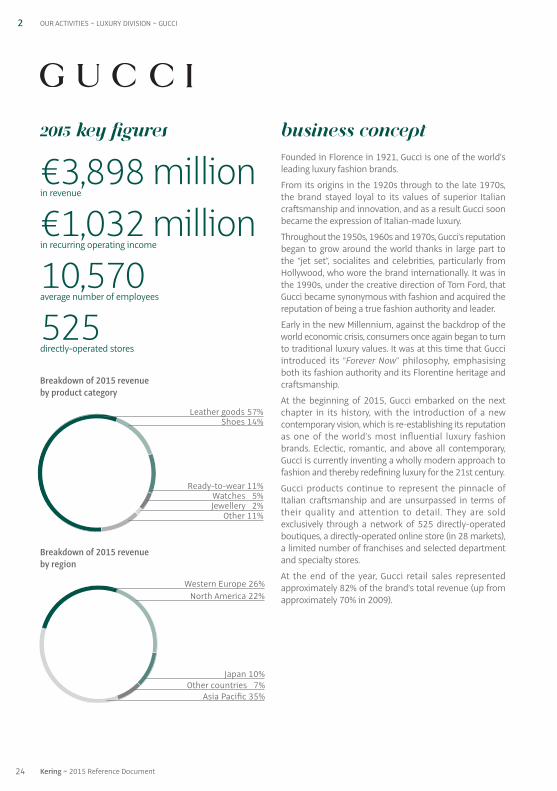
€3,898 millionin revenue
€1,032 millionin recurring operating income
10,570average number of employees
525directly-operated stores
Breakdown of 2015 revenueby product category
Breakdown of 2015 revenueby region
Leather goods 57%Shoes 14%
Ready-to-wear 11%Watches 5%Jewellery 2%
Other 11%
Western Europe 26%North America 22%
Other countries 7%Japan 10%
Asia Pacific 35%
BUSINESS CONCEPT
Founded in Florence in 1921, Gucci is one of the world’sleading luxury fashion brands.
From its origins in the 1920s through to the late 1970s,the brand stayed loyal to its values of superior Italiancraftsmanship and innovation, and as a result Gucci soonbecame the expression of Italian-made luxury.
Throughout the 1950s, 1960s and 1970s, Gucci’s reputationbegan to grow around the world thanks in large part tothe “jet set”, socialites and celebrities, particularly fromHollywood, who wore the brand internationally. It was inthe 1990s, under the creative direction of Tom Ford, thatGucci became synonymous with fashion and acquired thereputation of being a true fashion authority and leader.
Early in the new Millennium, against the backdrop of theworld economic crisis, consumers once again began to turnto traditional luxury values. It was at this time that Gucciintroduced its “Forever Now” philosophy, emphasisingboth its fashion authority and its Florentine heritage andcraftsmanship.
At the beginning of 2015, Gucci embarked on the nextchapter in its history, with the introduction of a newcontemporary vision, which is re-establishing its reputationas one of the world’s most influential luxury fashionbrands. Eclectic, romantic, and above all contemporary,Gucci is currently inventing a wholly modern approach tofashion and thereby redefining luxury for the 21st century.
Gucci products continue to represent the pinnacle ofItalian craftsmanship and are unsurpassed in terms oftheir quality and attention to detail. They are soldexclusively through a network of 525 directly-operatedboutiques, a directly-operated online store (in 28 markets),a limited number of franchises and selected departmentand specialty stores.
At the end of the year, Gucci retail sales representedapproximately 82% of the brand’s total revenue (up fromapproximately 70% in 2009).
OUR ACTIVITIES ~ LUXURY DIVISION ~ GUCCI
24 Kering ~ 2015 Reference Document
02_VA_V5 06/04/2016 17:31 Page24
2
COMPEtitiVE ENVIRONMENT
Gucci is one of the few luxury brands with truly worldwideoperations, alongside Hermès, Dior, Chanel, Louis Vuittonand Prada. Gucci is maintaining its leadership position asone of the world’s leading luxury fashion brands both interms of revenue and profitability.
StrATEGY
With the ambition of re-establishing Gucci’s position as apivotal Italian luxury fashion brand – leading the industryby setting the tone with innovative runway collectionsand ground-breaking creativity – the strategic visionconceived by Marco Bizzarri, the brand’s new Presidentand CEO, aims to identify a new image for Gucci, more inline with the world of today, more relevant, and moreattractive for new, younger luxury consumers.
The product offering will be fully repositioned over two orthree seasons, gradually substituting all the units that arenot consistent with the new creative direction, reducingthe number of models and variations of product in eachstore, while balancing the price range by rationalisingentry prices and exploiting opportunities in the high range.
The GG signature is considered a highly valuable assetwith unlimited potential. The reinvention, in line with thecontemporary vision of Gucci’s new Creative Director,Alessandro Michele, will allow it to regain the strong andcontemporary stature it deserves.
In terms of distribution, the focus will be on optimisingthe existing store network and the online experience, withthe implementation of a program of initiatives designedto achieve retail excellence and, as a consequence,enhanced productivity.
GUCCI ~ LUXURY DIVISION ~ OUR ACTIVITIES
2015 HIGHLIGHTS AND OUTLOOK FOR 2016
For Gucci, this has been a year of reinvention. New CEOMarco Bizzarri was tasked with reinvigorating the brand,and under his leadership Gucci is now undergoing acomprehensive transformation.
Bizzarri’s first decision upon taking on this role inJanuary 2015 was to appoint Alessandro Michele,previously Associate Creative Director and AccessoriesDesigner, as Gucci’s new Creative Director. Michele’s new,contemporary vision for the brand has been criticallyacclaimed, quickly establishing him as one of the mostinfluential creative directors in the industry today – whichwas affirmed by the British Fashion Council’s decision topresent him with its 2015 International Designer of theYear award. This is a remarkable achievement after justten months in the role.
Press and buyers alike from around the world haveresponded enthusiastically to Michele’s collections,heralding them as indicative of a fresh, new direction forGucci that remoulds the brand’s legacy into a new styleand aesthetic.
Following the Fall / Winter 2015 fashion shows, AlessandroMichele presented his Cruise 2016 collection with anunprecedented fashion show in New York’s Chelseadistrict, in what has been acknowledged as the seminalmoment in the emergence of the reinvented Gucci.
Alessandro Michele’s first full collection – Cruise 2016 –began to arrive in selected stores from mid-September,two months ahead of the usual timing for the industry. Atthe same time, Michele’s new store concept was unveiledat the house’s Montenapoleone flagship store duringMilan Fashion Week. Striking new windows, visualdisplays and packaging all help bring the brand’s new,contemporary vision to life.
In terms of products, the assortment was rationalisedand given more clarity through consistent and concisemerchandising. New lines were introduced featuringcontemporary interpretations of the GG signature, andother iconic symbols and house motifs. The Dionysus –launched at the Fall / Winter 2015 fashion show – isalready on its way to becoming an iconic bag.
252015 Reference Document ~ Kering
02_VA_V5 06/04/2016 17:31 Page25
2 OUR ACTIVITIES ~ LUXURY DIVISION ~ GUCCI
On the distribution side, during the year Gucci opened 20 net directly-operated stores, mainly located in Asia-Pacific and America. The new store concept wasprogressively rolled out (in more than 30 stores) duringthe last semester of the year, and this process will continuenext year.
In October, a completely re-designed and re-platformedversion of gucci.com was launched in the US and Canada,and this will be rolled out in other regions during 2016.The site brings Alessandro Michele’s new aesthetic to lifethrough beautiful design, rich imagery, engagingstorytelling and exclusive brand content, combined with asmart user experience. With over 100 million visitors peryear, gucci.com represents the most important customertouch-point for the brand, offering significant potentialfor continued dynamic growth in online revenue.
In the second part of the year, a series of new strategiccollaborations with specialty stores including DoverStreet Market (in Tokyo, New York, London and Beijing),Boon the Shop (Seoul, Korea), Antonia (Milan, Italy) andColette (Paris, France) were finalised. Representing someof the most fashion-forward retail destinations, thepresence of Alessandro Michele’s collections within theseunique locations has created further excitement andinterest around the brand in its new direction.
A series of strategic organisational changes wereimplemented in the first months of the year, with the aimof creating a simpler and leaner structure and acceleratingthe decision-making process, while providing a promptand effective support system for the regions fromcorporate headquarters. Meanwhile, a new omni-channeldepartment was established to further increase theproximity of the brand to all of its customers.
A number of key executives joined the company duringthe year, including the new Executive Vice President andChief Merchandising and Licensing Officer, with the aimof implementing an effective merchandising strategy thatperfectly matches the creative spirit of the collectionswith market needs.
The initial dynamic trend for new Creative DirectorAlessandro Michele’s highly acclaimed Cruise 2016 andSpring / Summer 2016 collections confirms the brand’srenewed momentum. At the same time, key drivers toimprove store productivity have been identified, andduring the year management put in place the foundationsnecessary for Gucci to return to sustained growth in theyears ahead.
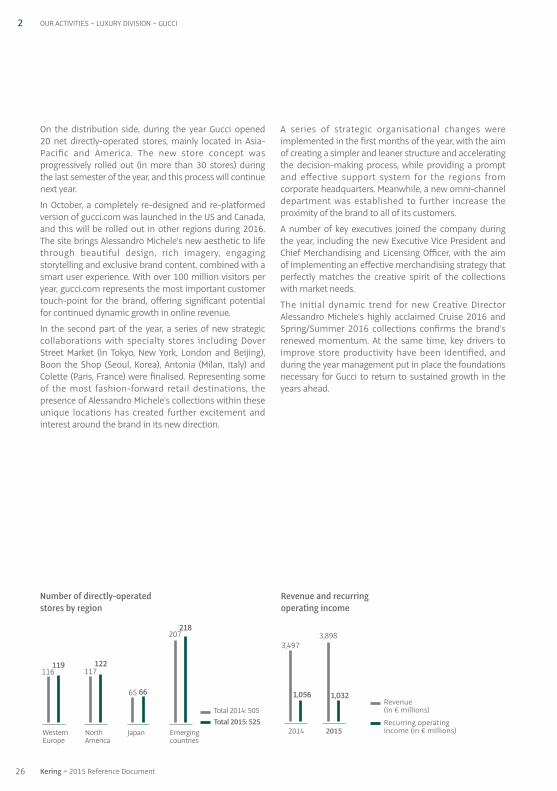
Revenue and recurringoperating income
Revenue (in € millions)
Recurring operating income (in € millions)2014 2015
3,898
1,032
3,497
1,056
Number of directly-operatedstores by region
WesternEurope
NorthAmerica
Japan Emergingcountries
Total 2014: 505Total 2015: 525
66
122119
218
65
117116
207
26 Kering ~ 2015 Reference Document
02_VA_V5 06/04/2016 17:31 Page26
2BOTTEGA VENETA ~ LUXURY DIVISION ~ OUR ACTIVITIES
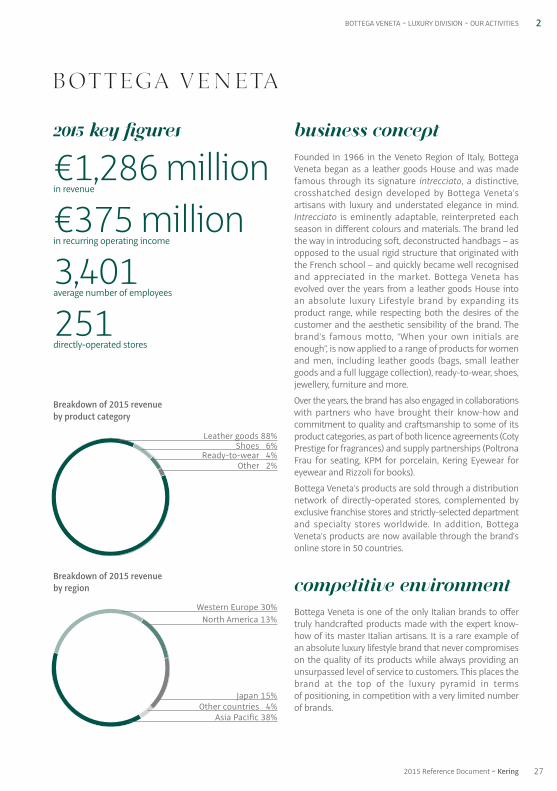
2015 key figures
€1,286 millionin revenue
€375 millionin recurring operating income
3,401average number of employees
251directly-operated stores
Breakdown of 2015 revenueby product category
Breakdown of 2015 revenueby region
Leather goods 88%Shoes 6%
Ready-to-wear 4%Other 2%
Western Europe 30%North America 13%
Asia Pacific 38%
Japan 15%Other countries 4%
BUSINESS CONCEPT
Founded in 1966 in the Veneto Region of Italy, BottegaVeneta began as a leather goods House and was madefamous through its signature intrecciato, a distinctive,crosshatched design developed by Bottega Veneta’sartisans with luxury and understated elegance in mind.Intrecciato is eminently adaptable, reinterpreted eachseason in different colours and materials. The brand ledthe way in introducing soft, deconstructed handbags – asopposed to the usual rigid structure that originated withthe French school – and quickly became well recognisedand appreciated in the market. Bottega Veneta hasevolved over the years from a leather goods House intoan absolute luxury Lifestyle brand by expanding itsproduct range, while respecting both the desires of thecustomer and the aesthetic sensibility of the brand. Thebrand’s famous motto, “When your own initials areenough”, is now applied to a range of products for womenand men, including leather goods (bags, small leathergoods and a full luggage collection), ready-to-wear, shoes,jewellery, furniture and more.
Over the years, the brand has also engaged in collaborationswith partners who have brought their know-how andcommitment to quality and craftsmanship to some of itsproduct categories, as part of both licence agreements (CotyPrestige for fragrances) and supply partnerships (PoltronaFrau for seating, KPM for porcelain, Kering Eyewear foreyewear and Rizzoli for books).
Bottega Veneta’s products are sold through a distributionnetwork of directly-operated stores, complemented byexclusive franchise stores and strictly-selected departmentand specialty stores worldwide. In addition, BottegaVeneta’s products are now available through the brand’sonline store in 50 countries.
COMPEtitiVE ENVIRONMENT
Bottega Veneta is one of the only Italian brands to offertruly handcrafted products made with the expert know-how of its master Italian artisans. It is a rare example ofan absolute luxury lifestyle brand that never compromiseson the quality of its products while always providing anunsurpassed level of service to customers. This places thebrand at the top of the luxury pyramid in terms of positioning, in competition with a very limited numberof brands.
272015 Reference Document ~ Kering
02_VA_V5 06/04/2016 17:31 Page27
StrATEGY
Bottega Veneta’s strategy, implemented under thecreative direction of Tomas Maier and the businessleadership of Carlo Alberto Beretta who joined thecompany in January 2015, aims to reinforce BottegaVeneta’s position as a high-end and exclusive luxurylifestyle brand, for which consistency and continuity arethe key elements to maintaining differentiation in theindustry. Business and creativity will continue to worktogether as an essential part of Bottega Veneta’s success,as they always have in the past.
Historically, the brand’s core business was leather goods(88% of sales), characterised by attention to detail andthe use of the highest quality materials. A wider range ofproducts appealing to an international clientele of menand women was gradually integrated, with the emphasison contemporary functionality and timeless yetinnovative design.
The brand’s predominant trait of exclusivity has beentransferred to the distribution network. Through itsworldwide expansion, Bottega Veneta has consolidatedits presence in emerging markets, without compromisingits investments in mature markets, particularly the US,but also Europe, where Bottega Veneta’s story andcraftsmanship began.
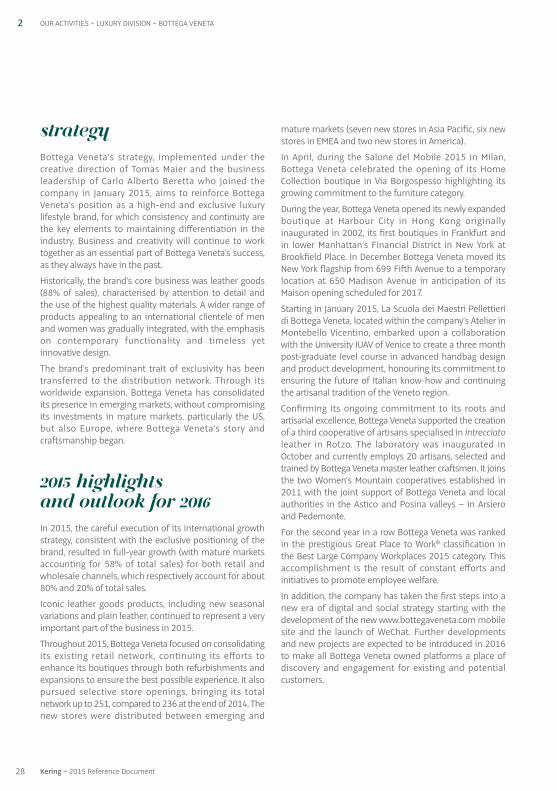
2015 HIGHLIGHTS AND OUTLOOK FOR 2016
In 2015, the careful execution of its international growthstrategy, consistent with the exclusive positioning of thebrand, resulted in full-year growth (with mature marketsaccounting for 58% of total sales) for both retail andwholesale channels, which respectively account for about80% and 20% of total sales.
Iconic leather goods products, including new seasonalvariations and plain leather, continued to represent a veryimportant part of the business in 2015.
Throughout 2015, Bottega Veneta focused on consolidatingits existing retail network, continuing its efforts toenhance its boutiques through both refurbishments andexpansions to ensure the best possible experience. It alsopursued selective store openings, bringing its totalnetwork up to 251, compared to 236 at the end of 2014. Thenew stores were distributed between emerging and
mature markets (seven new stores in Asia Pacific, six newstores in EMEA and two new stores in America).
In April, during the Salone del Mobile 2015 in Milan,Bottega Veneta celebrated the opening of its HomeCollection boutique in Via Borgospesso highlighting itsgrowing commitment to the furniture category.
During the year, Bottega Veneta opened its newly expandedboutique at Harbour City in Hong Kong originallyinaugurated in 2002, its first boutiques in Frankfurt andin lower Manhattan’s Financial District in New York atBrookfield Place. In December Bottega Veneta moved itsNew York flagship from 699 Fifth Avenue to a temporarylocation at 650 Madison Avenue in anticipation of itsMaison opening scheduled for 2017.
Starting in January 2015, La Scuola dei Maestri Pellettieridi Bottega Veneta, located within the company’s Atelier inMontebello Vicentino, embarked upon a collaborationwith the University IUAV of Venice to create a three monthpost-graduate level course in advanced handbag designand product development, honouring its commitment toensuring the future of Italian know-how and continuingthe artisanal tradition of the Veneto region.
Confirming its ongoing commitment to its roots andartisanal excellence, Bottega Veneta supported the creationof a third cooperative of artisans specialised in intrecciatoleather in Rotzo. The laboratory was inaugurated inOctober and currently employs 20 artisans, selected andtrained by Bottega Veneta master leather craftsmen. It joinsthe two Women’s Mountain cooperatives established in2011 with the joint support of Bottega Veneta and localauthorities in the Astico and Posina valleys – in Arsieroand Pedemonte.
For the second year in a row Bottega Veneta was rankedin the prestigious Great Place to Work® classification inthe Best Large Company Workplaces 2015 category. Thisaccomplishment is the result of constant efforts andinitiatives to promote employee welfare.
In addition, the company has taken the first steps into anew era of digital and social strategy starting with thedevelopment of the new www.bottegaveneta.com mobilesite and the launch of WeChat. Further developmentsand new projects are expected to be introduced in 2016to make all Bottega Veneta owned platforms a place ofdiscovery and engagement for existing and potentialcustomers.
28 Kering ~ 2015 Reference Document
2 OUR ACTIVITIES ~ LUXURY DIVISION ~ BOTTEGA VENETA
02_VA_V5 06/04/2016 17:31 Page28

Lastly, in October Bottega Veneta introduced its secondbook, “Bottega Veneta: Art of Collaboration”, which isdedicated to honouring the collaborations between TomasMaier and the artists who have contributed to the creationof the brand’s advertising portfolio season after season.
In 2016, Bottega Veneta will continue to build on itsachievements and positioning, supported by furtherstrategic retail openings worldwide.
Particularly in the US, further investments will be made toreinforce the existing retail network. Moreover in AsiaPacific, especially in China, some reshuffling andconsolidation of the network will be implemented inorder to increase the dimension of the stores and to hostthe complete range of product categories. The objective
is to grow through all product categories such as shoes,ready-to-wear, jewellery and eyewear, which have in thepast been seen as merely complementing the BottegaVeneta offering, and give them the same standing as thecore leather goods business.
Finally, Bottega Veneta will continue to focus onstrengthening and pursuing the execution of retailexcellence through further reinforcement of the bestpractices already implemented at worldwide level,conscious that guaranteeing the best luxury experiencein stores – from the selling ceremony to customer service,from windows to events – is key to maintaining theuniqueness of the brand and achieving its long-termobjectives.
29
2
2015 Reference Document ~ Kering
BOTTEGA VENETA ~ LUXURY DIVISION ~ OUR ACTIVITIES
Revenue and recurringoperating income
Revenue (in € millions)
Recurring operating income (in € millions)2014 2015
1,286
375
1,131
357
Number of directly-operatedstores by region
WesternEurope
NorthAmerica
Japan Emergingcountries
Total 2014: 236Total 2015: 251
58
30
53
110
58
29
52
97
02_VA_V5 06/04/2016 17:31 Page29
2 OUR ACTIVITIES ~ LUXURY DIVISION ~ SAINT LAURENT
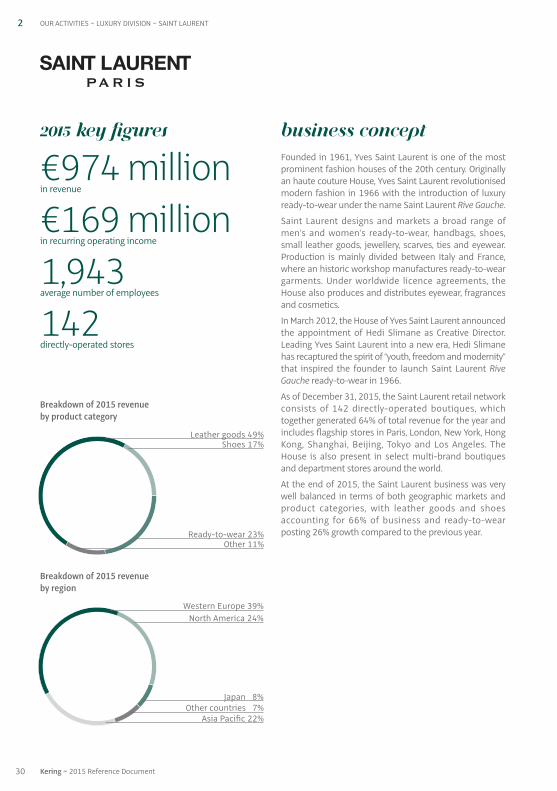
2015 key figures
€974 millionin revenue
€169 millionin recurring operating income
1,943average number of employees
142directly-operated stores
Breakdown of 2015 revenueby product category
Breakdown of 2015 revenueby region
Leather goods 49%Shoes 17%
Ready-to-wear 23%Other 11%
Western Europe 39%North America 24%
Asia Pacific 22%
Japan 8%Other countries 7%
BUSINESS CONCEPT
Founded in 1961, Yves Saint Laurent is one of the mostprominent fashion houses of the 20th century. Originallyan haute couture House, Yves Saint Laurent revolutionisedmodern fashion in 1966 with the introduction of luxuryready-to-wear under the name Saint Laurent Rive Gauche.
Saint Laurent designs and markets a broad range ofmen’s and women’s ready-to-wear, handbags, shoes,small leather goods, jewellery, scarves, ties and eyewear.Production is mainly divided between Italy and France,where an historic workshop manufactures ready-to-weargarments. Under worldwide licence agreements, theHouse also produces and distributes eyewear, fragrancesand cosmetics.
In March 2012, the House of Yves Saint Laurent announcedthe appointment of Hedi Slimane as Creative Director.Leading Yves Saint Laurent into a new era, Hedi Slimanehas recaptured the spirit of “youth, freedom and modernity”that inspired the founder to launch Saint Laurent RiveGauche ready-to-wear in 1966.
As of December 31, 2015, the Saint Laurent retail networkconsists of 142 directly-operated boutiques, whichtogether generated 64% of total revenue for the year andincludes flagship stores in Paris, London, New York, HongKong, Shanghai, Beijing, Tokyo and Los Angeles. TheHouse is also present in select multi-brand boutiquesand department stores around the world.
At the end of 2015, the Saint Laurent business was verywell balanced in terms of both geographic markets andproduct categories, with leather goods and shoesaccounting for 66% of business and ready-to-wearposting 26% growth compared to the previous year.
30 Kering ~ 2015 Reference Document
02_VA_V5 06/04/2016 17:31 Page30
31
2
2015 Reference Document ~ Kering
SAINT LAURENT ~ LUXURY DIVISION ~ OUR ACTIVITIES
COMPEtitiVE ENVIRONMENT
Since its inception, Yves Saint Laurent has held enormousinfluence both within and outside the fashion industry.Over the years, its founder, the couturier Yves SaintLaurent secured a reputation as one of the 20th century’sforemost designers and personalities.
Saint Laurent now competes globally with other Frenchhigh-end exclusive luxury brands and occupies a leadingposition in ready-to-wear, fashion and leather goods sectors.
StrATEGY
Saint Laurent’s primary objective is to create and markethighly desirable products, which embody the core valuesof the brand through innovation and unparalleled qualityand design.
Since his arrival, Hedi Slimane has entirely redefined themen’s and women’s collections and worked on new linesfor all categories. The men’s and women’s collectionshave been repositioned and made even in terms of depthof offer and product ranges, making a strong move on men’scategories including ready-to-wear, shoes and luggage.This repositioning was accompanied by a rejuvenation ofthe style, in line with Yves Saint Laurent’s originalmessage when creating the Saint Laurent Rive Gauche“Prêt-à-Porter” brand in 1966. Ready-to-wear is thereforeonce again a strong component of Saint Laurent’s overallproduct offering, across both genders. At the same time,Saint Laurent aims to further strengthen the growth of itsleather goods, shoes and other accessories offerings.
2015 HIGHLIGHTS AND OUTLOOK FOR 2016
Under the leadership of Hedi Slimane and FrancescaBellettini, the company’s CEO, 2015 has been another veryrich year for Saint Laurent, with a particular focus on theintroduction of new collections and new store openings.
During the year, the brand’s sales were fuelled by extremelystrong growth figures across the main product categories,which fully transitioned into the new brand aesthetic. Overallgrowth was driven by the success of both permanent lines(including the Sac de Jour and Monogram handbags andParis and Janis shoes), and new, successful introductionsacross all channels and categories.
Recognised as a great success, Saint Laurent’s advertisingcampaigns and fashion collections won critical acclaimand the collections received significant exposure fromeditorials and global celebrities throughout the year.
Saint Laurent also made 2015 another year of investment,enhancing its retail network with selective store openingsworldwide, in both emerging and mature markets, andkey refurbishments and relocations.
In December 2015, Saint Laurent opened its largest Japanesewomen’s and men’s boutique in Tokyo, located inOmotesando. In addition throughout the year the brandhas been opening boutiques in new markets (i.e., Qatar,Mexico and Brazil) and investing in refurbishmentsworldwide, such as its Paris Faubourg Saint Honoré men’sand women’s stores, Bond Street in London, 57th Streetin New York and Ion in Singapore, which demonstrates itscontinuous development in key capital cities.
The further establishment of the ysl.com website alsoplayed a key role in 2015. Redesigned at the end of 2012,it features rich content and is a dynamic e-commerceplatform that also forms part of the overall cross channelretail strategy. There are seven local versions of ysl.com,in languages including simplified Chinese. The website ise-commerce enabled in over 60 countries, includingSouth Korea and Hong Kong. Traffic was strongly up in2015, showing the increased interest in the brand online.
02_VA_V5 06/04/2016 17:31 Page31
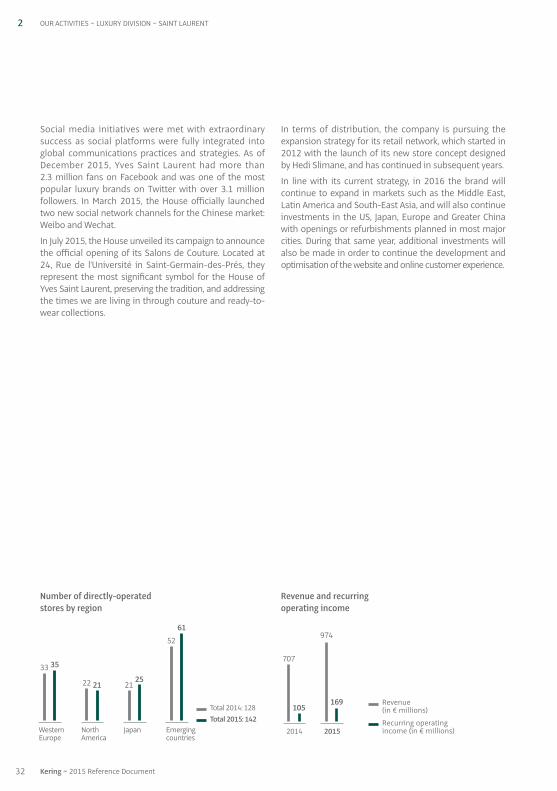
Social media initiatives were met with extraordinarysuccess as social platforms were fully integrated intoglobal communications practices and strategies. As ofDecember 2015, Yves Saint Laurent had more than2.3 million fans on Facebook and was one of the mostpopular luxury brands on Twitter with over 3.1 millionfollowers. In March 2015, the House officially launchedtwo new social network channels for the Chinese market:Weibo and Wechat.
In July 2015, the House unveiled its campaign to announcethe official opening of its Salons de Couture. Located at24, Rue de l’Université in Saint-Germain-des-Prés, theyrepresent the most significant symbol for the House ofYves Saint Laurent, preserving the tradition, and addressingthe times we are living in through couture and ready-to-wear collections.
In terms of distribution, the company is pursuing theexpansion strategy for its retail network, which started in2012 with the launch of its new store concept designedby Hedi Slimane, and has continued in subsequent years.
In line with its current strategy, in 2016 the brand willcontinue to expand in markets such as the Middle East,Latin America and South-East Asia, and will also continueinvestments in the US, Japan, Europe and Greater Chinawith openings or refurbishments planned in most majorcities. During that same year, additional investments willalso be made in order to continue the development andoptimisation of the website and online customer experience.
32 Kering ~ 2015 Reference Document
2 OUR ACTIVITIES ~ LUXURY DIVISION ~ SAINT LAURENT
Revenue and recurringoperating income
Revenue (in € millions)
Recurring operating income (in € millions)2014 2015
974
169
707
105
Number of directly-operatedstores by region
WesternEurope
NorthAmerica
Japan Emergingcountries
Total 2014: 128Total 2015: 142
2521
35
61
2122
33
52
02_VA_V5 06/04/2016 17:31 Page32
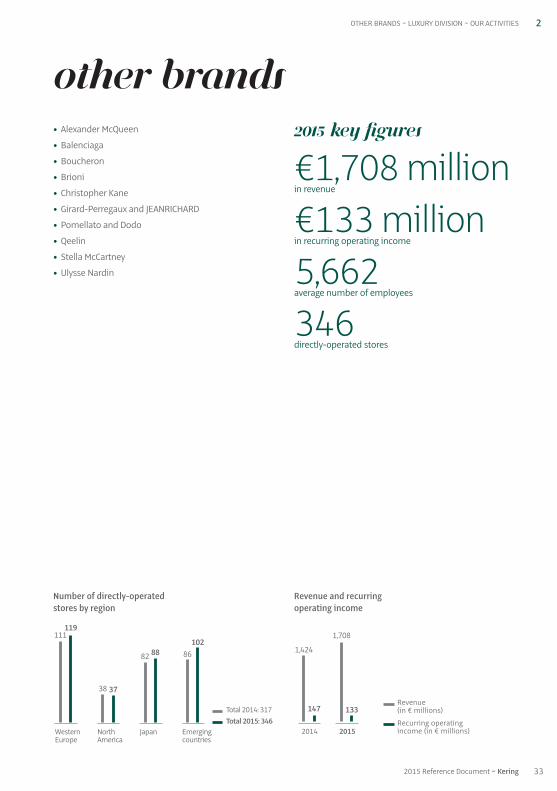
33
2
2015 Reference Document ~ Kering
OTHER BRANDS ~ LUXURY DIVISION ~ OUR ACTIVITIES
Revenue and recurringoperating income
Revenue (in € millions)
Recurring operating income (in € millions)2014 2015
1,708
133
1,424
147
Number of directly-operatedstores by region
WesternEurope
NorthAmerica
Japan Emergingcountries
Total 2014: 317Total 2015: 346
88
37
119
102
82
38
111
86
Other brands2015 key figures
€1,708 millionin revenue
€133 millionin recurring operating income
5,662average number of employees
346directly-operated stores
• Alexander McQueen
• Balenciaga
• Boucheron
• Brioni
• Christopher Kane
• Girard-Perregaux and JEANRICHARD
• Pomellato and Dodo
• Qeelin
• Stella McCartney
• Ulysse Nardin
02_VA_V5 06/04/2016 17:31 Page33
Founded in 1992 by Lee Alexander McQueen, theAlexander McQueen brand quickly gained a reputation forconceptual design and forged a strong brand identitywhich led to a partnership with Kering in 2001. Since thedeath of Lee Alexander McQueen in 2010, the brand hasbeen fully owned by Kering.
Renowned for its unbridled creativity, Alexander McQueen –under the leadership of CEO Jonathan Akeroyd and thecreative direction of Sarah Burton since 2010 – hasexpanded internationally through both wholesale andretail channels over the past decade, with wholesalebeing a key growth driver. In recent years, an accelerationin new store openings has enabled the brand to strengthenits position in the luxury sector.
Alexander McQueen and McQ currently have a total networkof 47 directly-operated stores across all regions. In 2015there were 12 net new store openings including Macau,Singapore and the first Alexander McQueen flagship inParis. The 4,000 square foot, carefully curated, bespokespace on Rue Saint-Honoré will further enhance the brand’sglobal positioning. All collections are also sold online inmost countries.
On the distribution side, Alexander McQueen is sold inover 50 countries, in more than 450 doors. Working withkey partners including Saks and Neiman Marcus in the US,Harrods and Selfridges in the UK and Lane Crawford inAsia, the brand has opened numerous shop-in-shopsover recent years, which have helped strengthen its brandimage and business.
There are currently 14 franchise boutiques – an importantpart of the distribution channel – most of which areconcentrated in the Middle East, Eastern Europe and Asia.
While its main product categories are women’s ready-to-wear and leather goods, the brand’s strength lies in itspresence across all categories, which gives it the opportunityto expand in many areas. Silks and menswear have bothenjoyed growth in recent years and two menswear onlystores opened in 2012 to underpin this growth. Thebrand also has an eyewear licence.
In March 2015, Alexander McQueen sponsored “SavageBeauty”, a retrospective of McQueen’s work at the V&AMuseum, in London. The exhibition was the most visitedshow in the V&A’s history with more than 480,000 ticketssold. This has enabled the brand to build on LeeMcQueen’s legacy and further enhance brand awareness.
The company has also successfully developed McQ, whichstarted out as a licence in 2006 and was re-launched asan in-house brand in 2011. It has quickly establisheditself in the popular contemporary market and is not onlyan important contributor to the overall AlexanderMcQueen business but is also becoming a relevant playerin the contemporary sector.
McQ is more broadly distributed, primarily as a wholesalebusiness internationally with a total of more than 500 doors.Franchises represent an important part of the business.In November 2015, a second freestanding, directly-operated store was opened in Spitalfields, London, whichwill help clarify McQ’s position as a younger, dynamicbrand in the contemporary market. At the end of 2015,McQ had 15 franchise stores mainly located in Asia and inthe Middle East. In the longer-term, the development ofMcQ will enable the brand to expand further in thegrowing contemporary market, while enabling theAlexander McQueen brand to remain very exclusive.
In 2016, both Alexander McQueen and McQ will continueto expand. Alexander McQueen plans to open additionalfreestanding stores and McQ will continue to build on itsfranchise network. In February 2016, Alexander McQueenwill show its Fall / Winter 2016 collection in London,marking a landmark return to its home city.
34 Kering ~ 2015 Reference Document
2 OUR ACTIVITIES ~ LUXURY DIVISION ~ OTHER BRANDS
02_VA_V5 06/04/2016 17:31 Page34
Founded in 1919 by Cristóbal Balenciaga and establishedin Paris in 1936, the Balenciaga brand defined many ofthe greatest movements in fashion from the 1930s to the1960s. Balenciaga’s exquisite technique, masterful cutand constant fabric innovation has helped it to carve outa special place in the hearts and minds of its customersand followers.
In the 1990s and early 2000s, the brand experienced a re-birth, which saw an extension of its product universe to abroader range of products, focusing particularly on iconichandbag launches, together with increased focus onfashion shoes as well as accessories, without compromisingthe core ready-to-wear segment. The brand significantlyexpanded its retail network, helping to bolster brandawareness around the globe.
While the brand’s identity is firmly anchored in highlysymbolic ready-to-wear collections, its bag and shoelines have also enjoyed phenomenal worldwide success.The women’s and men’s ready-to-wear collections span awide price range, from the most emblematic items tomore universal products that open up Balenciaga’s styleto a wider public.
In fragrances, the brand has established a solid licencepartnership with Coty Prestige and has released somesuccessful perfumes: Balenciaga Paris, L’Essence andFlorabotanica. And, since the end of 2013, a similarpartnership with Marcolin has been developed in eyewear.
Demna Gvasalia was appointed Artistic Director of Balenciagain October 2015. His mastery of techniques, expertise andfashion knowledge, combined with his innovativeapproach, make him a powerful force in today’s creativeworld. As Artistic Director, Demna Gvasalia will write a newchapter in Balenciaga’s history and consolidate the House’sstatus as a ready-to-wear authority. Demna Gvasalia hasembraced Balenciaga’s core values and is developingthem in harmony with today’s global changes.
Over the past years, under CEO Isabelle Guichot’s leadership,Balenciaga has been consolidating its directly-operatedstore network worldwide. Today Balenciaga has a well-developed retail network of 103 stores in both maturemarkets (Western Europe, US and Japan) and Asia (GreaterChina and South Korea). In addition, Balenciaga’s e-commercenetwork currently covers 95 countries.
In 2015, Balenciaga pursued its retail expansion strategywith the opening of its first flagship store in Spain (Madrid)as well as its first stores in Macau (Galaxy) and Florence.Several stores were renovated in line with its new conceptduring the year. Additionally, the brand extended its retailpresence in upscale department stores with the netopening of eight shop-in-shops.
Balenciaga is now distributed through directly-operatedstores and e-commerce, as well as through franchiseesand leading multi-brand stores.
In 2016, the brand will continue to benefit from theimpetus provided by new product launches. Franchisesand selective distribution remain important contributorsto the brand’s activity, but retail and e-commercedevelopment will continue to be the priority for the brand,with new store openings planned in strategic locations inmature markets and in Asia.
35
2
2015 Reference Document ~ Kering
OTHER BRANDS ~ LUXURY DIVISION ~ OUR ACTIVITIES
02_VA_V5 06/04/2016 17:31 Page35
Founded in Paris in 1858 by Frédéric Boucheron, theeponymous Maison was built up by four generations ofthe founder’s direct descendants and soon acquiredfame for its expertise in precious stones and its savoir-faire in creating innovative jewellery and watches. Thejeweller moved to Place Vendôme in 1893, becoming thefirst of the watch and jewellery brands to open aboutique in this iconic location. For more than 155 years,Boucheron has been synonymous with excellence injewellery, high jewellery and watchmaking.
Today, Boucheron creates and markets jewellery (bijoux,jewellery as well as high jewellery) and watches through39 directly-operated stores across the world, including itsflagship Place Vendôme store, franchise boutiques, anddepartment stores. It also has a selective network ofadditional points of sale in exclusive multi-brand stores.
In 2015, the brand’s main focus was the consolidation ofits existing retail network. During the year the Maisonopened its first (franchise) boutique in Saudi Arabia(Jeddah El-Khayyat Center).
This year marked the success of the new High Jewellerycollection, Bleu de Jodhpur. This unique collection presentedunder the patronage of the current Maharajah of India, HisHighness Gaj Singh II, celebrates Boucheron’s close linkswith India. The collection has proved to be an immediateoutstanding success with both the press and clients.
The brand’s famous Quatre jewellery collection maintainedits iconic position and the Serpent Bohème jewellerycollection, which was relaunched in 2013, has become anew pillar in terms of sales.
Regarding the watch business, the new stainless steel,round-case Epure watch was successfully launchedduring Baselworld Watch Fair 2015.
In September 2015, Hélène Poulit-Duquesne was appointedas Boucheron’s new CEO. Benefiting from her 20-yearexperience in the luxury and jewellery industry, the Maisonis planning to further strengthen the growth of its iconiccollections by optimizing visibility and distribution in 2016.
Boucheron will again play an important role in the Biennaledes Antiquaires in September 2016 alongside the bestinternational jewellery brands.
36 Kering ~ 2015 Reference Document
2 OUR ACTIVITIES ~ LUXURY DIVISION ~ OTHER BRANDS
02_VA_V5 06/04/2016 17:31 Page36

Brioni was founded in Rome in 1945 by Italian tailorNazareno Fonticoli and entrepreneur Gaetano Savini.
Revolutionary since the beginning, in 1952 Brioni was thefirst men’s couture House to stage a fashion show and tointroduce bright colours and new fabrics to its tailoringcollections, pushing back the boundaries of menswearand embracing new interpretations.
Over the years, Brioni strengthened its global reputation,obtaining recognition in America, where it was namedthe most prestigious men’s luxury fashion brand by theLuxury Institute of New York in 2007 and 2011.
Part of Kering since 2012, Brioni develops sartorial ready-to-wear collections, shoes, bags, small leather goods,jewellery, eyewear and fragrances.
In November 2014, the brand appointed a new CEO,Gianluca Flore, to lead the brand’s continued internationalexpansion and consolidate its position in the luxury industry.
Innovation and contemporary functionality are Brioni’sguiding values. The new management wants to revitalisethe brand by making it relevant and attractive to thecontemporary man – who is successful and influential,between 35 and 65 years old, with charismatic charm, acreative mind, and is passionate and knowledgeableabout luxury products.
All of the brand’s products are “Made in Italy”, andmeticulously handcrafted by expert artisans. Most of theproduction is made in-house in Brioni’s ateliers in Penne,a small town in the Abruzzo region, with a rich, longstandingtailoring tradition. The art of Brioni products comes fromthe genuine workmanship of Brioni’s tailors. These menand women, with many years of experience, shape eachgarment with the rigorous observance of Brioni’s method.They are all educated at the Scuola di Alta Sartoria tailoringschool, founded by the company in 1985 to perpetuate thesartorial tradition and train new generations of tailors.
While wholesale represents an important distributionchannel for the brand, Brioni is continuously expandingits retail network by opening new strategic stores.
At the end of 2015, Brioni had 46 directly-operated stores,mainly located in Western Europe, North America andJapan. During the year, the company fine-tuned its retailnetwork footprint, as reflected by the relocation of itsPrague boutique to a strategic new venue in the heart ofthe city’s commercial district, as well as in the US, with therenovation of its Las Vegas store. 2015 also marked thecompany’s 70th anniversary and its return to the catwalk.
Moving forward, its ambitions for 2016 include consolidatingthe company’s business in the US and Asia as well asstrengthening brand awareness and visibility worldwide.Over the course of the year, the company will unveil a newstore concept and a redesigned website in line with thenew brand strategy to revitalise Brioni’s positioning in themenswear luxury market.
37
2
2015 Reference Document ~ Kering
OTHER BRANDS ~ LUXURY DIVISION ~ OUR ACTIVITIES
02_VA_V5 06/04/2016 17:31 Page37
Founded in 2006 by the eponymous designer, ChristopherKane is a brand which is widely acknowledged to havespearheaded a revival of British high fashion, through thelaunch of innovative ready-to-wear styles. After havingcompleting his Master of Arts (MA) in Fashion Design atCentral Saint Martins College, Christopher Kane realisedhis ambition to start his own label, in partnership with hisolder sister, Tammy Kane.
In 2013, Kering acquired 51% of the company and inNovember 2014, Sarah Crook was appointed CEO ofChristopher Kane with the goal of enhancing the brand’sglobal expansion and reinforcing its organisational structure.
Christopher Kane has received several industry recognitionsin recent years, including the highly acclaimed WomenswearDesigner of the Year by the British Fashion Council (BFC)in 2013. Christopher Kane was nominated again this yearby the BFC for two prestigious awards: WomenswearDesigner of the Year and the Red Carpet Award.
On the distribution side, Christopher Kane’s collections arecurrently distributed in over 30 countries across morethan 150 wholesale accounts. Its primary product categoryis women’s ready-to-wear, with recent expansion intomenswear, accessories and shoes. In the shoe category,Christopher Kane launched this year a line of sneakers (thesafety buckle sneakers), which has been well received byboth the market and the press.
Christopher Kane’s first retail store, on Mount Street inMayfair, London, opened in February 2015 and representsa strong statement of the brand’s image and identity. Aswell as helping increase brand awareness, the storeprovides significant leverage for strategic partnershipswith third parties. In 2016, the brand expects to furtherstrengthen its wholesale presence worldwide.
38 Kering ~ 2015 Reference Document
2 OUR ACTIVITIES ~ LUXURY DIVISION ~ OTHER BRANDS
02_VA_V5 06/04/2016 17:31 Page38
Girard-Perregaux is one of the oldest high-end watchmanufacturers still in operation. Founded in 1791, thecompany is headquartered in La-Chaux-de-Fonds,Switzerland.
The history of the brand is marked by watches thatcombine sharp design with innovative technology, such asthe renowned Tourbillon with three Gold Bridges presentedby Constant Girard-Perregaux in 1889 at the ParisUniversal exhibition, where he was awarded a gold medal.
Combining a passion for state-of-the-art Haute Horlogerieand a relentless quest for precision, Girard-Perregaux isone of the few Swiss watchmakers that designs andmanufactures its own movements and cases in-house.
Since 2011, when Kering acquired a majority stake inSowind Group, owner of Girard-Perregaux, the brand hasimplemented a strategy aimed at creating a bridgebetween its rich past and its bright future.
To bolster its position in Western and Middle Easternmarkets, Girard-Perregaux recently revamped andrelaunched several of its signature collections that embodyits heritage, craftsmanship and watchmaking culture. TheGirard-Perregaux 1966 collection is now offered in a steeledition, while the Vintage 1945 line has been reinventedwith titanium and other innovative materials. Byintroducing variations on two iconic models, Girard-Perregaux is targeting a younger customer base.
Haute Horlogerie continues to be the brand’s mostemblematic segment. In 2015, it received another award,the Prix de la Montre à Sonnerie 2015, for its MinuteRepeater Tourbillon with Gold Bridges model at the GrandPrix d’Horlogerie de Genève. For the first time, this elegantwatch combines the legendary Tourbillon and the minuterepeater, considered to be at the foundation of thetimepiece complication.
As part of its ongoing innovation drive, Girard-Perregauxwill introduce a number of unique timepieces in 2016,thus confirming its top ranking among Switzerland’s elitewatchmakers.
Girard-Perregaux is present in over 60 countries throughindependent points of sale, prestigious departmentstores and specialist boutiques.
The watches are also sold through a franchise network of18 mono-brand franchise stores located primarily in Asiaand Europe.
In 2016, the new product offering will be accompanied bya refounded communication strategy focused on thebrand’s history and heritage. Another key brand developmentinitiative will be to overhaul the distribution network.
Also based in La-Chaux-de-Fonds, JEANRICHARD sells itscollections through independent points of sale andspecialist multi-brand boutiques. Its four main markets areMainland China, Japan, France and the United Kingdom.
39
2
2015 Reference Document ~ Kering
OTHER BRANDS ~ LUXURY DIVISION ~ OUR ACTIVITIES
02_VA_V5 06/04/2016 17:31 Page39

2 OUR ACTIVITIES ~ LUXURY DIVISION ~ OTHER BRANDS
40 Kering ~ 2015 Reference Document
Synonymous with creativity and character in theinternational jewellery scene, Pomellato was establishedin Milan in 1967, and was the first to introduce the prêt-à-porter philosophy to the world of jewellery.
Pomellato’s creations – unique in their blend of colourfulstones, stone cutting techniques and setting know-how – are immediately recognisable and have built aconsistent, iconic style over the years. Jewels are craftedby the expert hands of goldsmiths, who transform thespirit of the brand into outstanding creations.
The Nudo collection remains the most iconic line thanks torings that embody the very essence of Pomellato fusingdesign, colour and link to fashion. In 2016 Pomellato willcelebrate the 15th anniversary of its iconic line.
Over the last few years the Pomellato brand hasreinforced its most iconic lines with product extensionsin more precious creations, such as the new NudoDiamond line. In 2015, the new Milano line was launchedtogether with the first Pomellato eyewear collection.
Following its strategic international expansion, thePomellato brand currently has a distribution network thatincludes 40 directly-operated stores, 22 franchise boutiquesand over 500 wholesale points of sale.
With a unisex and multi-generational appeal, the brandDodo was created in 1995 as the first jewellery line tocombine a decorative function with a message.
Over the past years, Dodo has launched successful newjewellery lines such as the Sea Collection and broadenedits core activities with the launch of a new watch. In 2015the watch business saw the introduction of new coloursand a capsule collection of women’s watches forChristmas. Dodo also launched a new precious collection,the Starfish line, and the Lucky Chef capsule to celebratethe Expo Milan 2015.
The Dodo distribution network currently includes 19 directly-operated stores, 13 franchise boutiques andapproximately 400 wholesale partners, most of which areshared with the Pomellato brand. In 2014 Dodo opened aflagship located at the heart of the luxury quarter in Paris,rue Saint Honoré.
In December 2015 Kering announced the appointment ofSabina Belli as the new CEO of the Pomellato Group. Inher new role she will have the responsibility of supportingPomellato’s and Dodo’s further development and ofstrengthening their unique positioning globally.
In 2016 the group’s strategy will feature the introductionof new product lines as well as the consolidation of existingcollections for both the Pomellato and Dodo brands. Inaddition, the group plans to further enhance its retail networkwith targeted stores openings, especially in matureregions: Europe, the US and Japan.
02_VA_V5 06/04/2016 17:31 Page40

2OTHER BRANDS ~ LUXURY DIVISION ~ OUR ACTIVITIES
412015 Reference Document ~ Kering
Created in 2004 by designer Dennis Chan, Qeelin hasembraced the evocative myths of the East, creating lavishfine jewellery that is rich in symbolism. In each collection,iconic designs, carefully selected materials and exceptionalcraftsmanship deliver a combination of playfulness andenchanting oriental beauty.
The brand’s identity is reflected in its name, a reference tothe “Qilin”, a Chinese mythical animal and rooted symbolof love, understanding and protection. The brand’s iconicWulu collection is inspired by the legendary Chinese gourdfilled with auspicious associations. Qeelin is also well-known for its Bo Bo collection, featuring an articulatedand playful representation of a diamond panda bear,China’s treasured national hero.
Since Qeelin’s acquisition by Kering in December 2012,the brand has accelerated its growth, through both retailand wholesale channels. Its boutique network expansioncontinued in 2015 primarily in Mainland China with Qeelinnow counting 21 stores (14 directly-operated boutiques andseven franchise stores). To reinforce its internationalexpansion the brand has also made its first steps in theUS market, where business development will be driven bya selective network of independent retailers anddepartment stores.
For its major advertising campaign this year, Qeelincommissioned the famous Chinese photographer ChenMan to present the Wulu collection as well as its new finejewellery collection, Wang Wang, which is inspired by theCreative Director’s love of animals.
In 2016, Qeelin will continue to invest in its expansion,primarily focusing on the Asian and US markets. Theproduct offering will also be reinforced with a moreaccessible price point.
02_VA_V5 06/04/2016 17:31 Page41
Stella McCartney is an eponymous luxury Lifestyle brand,which was launched under the designer’s name inpartnership with Kering in 2001.
Since the brand’s foundation, women’s ready-to-wearhas always been its core business, but during recent yearsthe brand has been successfully extending its portfolio toinclude other product categories such as handbags andshoes, and has diversified in Kids. Product diversificationhas also been fuelled by long-lasting successfulcollaborations, such as the design of sportswear apparelwith Adidas or lingerie with Bendon. The brand has alsodeveloped eyewear and fragrance lines through licenceagreements.
Stella McCartney, a lifelong vegetarian, has been committedto reflecting her ethical values in the collections rightfrom the early days of the brand. The company believesthat its responsibility is to be a sustainable company,responsible for all the resources it uses and for theimpact they have on the environment. Therefore, it isconstantly exploring new and innovative ways to becomemore sustainable at every stage of its activity, from thedesign phase, to store openings and product manufacturing.
After starting out as primarily a wholesale business andbuilding up more than 650 doors worldwide in over 50countries, more recently it has focused its strategy on theexpansion of its retail channel. Following a significantincrease in the number of stores in 2012, the brand hasmostly concentrated on consolidating and nurturing theorganic growth potential of its existing retail network overthe past three years. However, it has still carried out somevery selective store openings.
At the end of 2015, the brand owned a retail network of35 directly-operated stores, with five new net openingstaking place over the year, mainly in Japan, the US andChina. Its online presence has helped to significantlyenhance and reinforce the brand’s market penetrationboth in terms of image and revenue.
Wholesale remains a prominent part of Stella McCartney’soverall business and the brand will continue to optimisethis channel by skimming it and engaging with key onlineplayers. During the year, two franchise boutiques wereadded to the network, bringing the total up to 22 franchisestores worldwide. This approach continues to represent avaluable tool for entering specific regions where brandawareness is not yet consolidated.
In 2016, the brand’s priority will be to continue strengtheningits product offering, fostering its retail operations andorganisation to pursue its selective retail expansion. Thebrand will also consolidate its omni-channel approach tofurther increase the proximity of the brand to all of itscustomers. In addition, Stella McCartney wants to expandbrand awareness particularly in China, and in other Asiancountries.
42 Kering ~ 2015 Reference Document
2 OUR ACTIVITIES ~ LUXURY DIVISION ~ OTHER BRANDS
02_VA_V5 06/04/2016 17:31 Page42

43
2
2015 Reference Document ~ Kering
OTHER BRANDS ~ LUXURY DIVISION ~ OUR ACTIVITIES
Founded by Ulysse Nardin in 1846, this watchmakingHouse, with roots in the nautical world, joined Kering inNovember 2014.
Building on its strong identity and expertise in the high-end segment of marine chronometers and complicationtimepieces, Ulysse Nardin continues to introduce cutting-edge technologies and state-of-the-art materials,including silicium and other innovative materials. Inaddition, Ulysse Nardin is one of the few Swiss watchmakersto have in-house production capacity for high-precisionmovement components, particularly the regulating organs.
Ulysse Nardin’s current distribution network includes 18 mono-brand boutiques (of which one directly-operatedstore) and more than 500 watch and jewellery selectedpoints of sale around the world.
In 2015, under the leadership of CEO Patrik Hoffmann,the brand’s sales organisation has been reinforced andnew doors have been opened with a particular focus onthe Chinese clientele.
In terms of products, in 2015 Ulysse Nardin launched itsinnovative Anchor Tourbillon watch, an example of avant-garde silicium based technology, which is the outcome ofeight years of research and development. In Fall 2015,the watch received three very prestigious awards frominternational juries of industry experts: the Tourbillon WatchPrize at the Grand Prix d’Horlogerie de Genève (GPHG), theWatch of the Year Prize at the International Salon ofHaute Horlogerie (SIAR) in Mexico, and the Prix Orologiodell’Anno 2015, from Italian watch magazine L’Orologio.
During the year, Ulysse Nardin strengthened andreaffirmed its roots with the marine world thanks to thesponsorship of the Artemis Racing team, challengers inthe 35th America’s Cup.
In 2016, Ulysse Nardin plans to streamline its productportfolio as well as to consolidate and upgrade itsworldwide distribution network. A new global communicationplan will also be introduced in 2016 to increase andsupport brand visibility and awareness.
02_VA_V5 06/04/2016 17:31 Page43
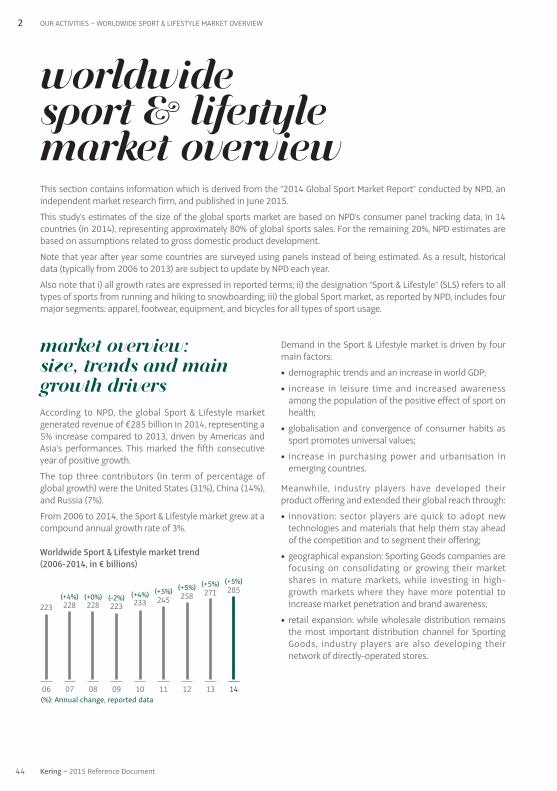
2 OUR ACTIVITIES ~ WORLDWIDE SPORT & LIFESTYLE MARKET OVERVIEW
MARKET OVERVIEW: SIZE, trENDS and MAINGROWTH DRIVERS
According to NPD, the global Sport & Lifestyle marketgenerated revenue of €285 billion in 2014, representing a5% increase compared to 2013, driven by Americas andAsia’s performances. This marked the fifth consecutiveyear of positive growth.
The top three contributors (in term of percentage ofglobal growth) were the United States (31%), China (14%),and Russia (7%).
From 2006 to 2014, the Sport & Lifestyle market grew at acompound annual growth rate of 3%.
Worldwide Sport & Lifestyle market trend (2006-2014, in € billions)
Demand in the Sport & Lifestyle market is driven by fourmain factors:
• demographic trends and an increase in world GDP;
• increase in leisure time and increased awarenessamong the population of the positive effect of sport onhealth;
• globalisation and convergence of consumer habits assport promotes universal values;
• increase in purchasing power and urbanisation inemerging countries.
Meanwhile, industry players have developed theirproduct offering and extended their global reach through:
• innovation: sector players are quick to adopt newtechnologies and materials that help them stay aheadof the competition and to segment their offering;
• geographical expansion: Sporting Goods companies arefocusing on consolidating or growing their marketshares in mature markets, while investing in high-growth markets where they have more potential toincrease market penetration and brand awareness;
• retail expansion: while wholesale distribution remainsthe most important distribution channel for SportingGoods, industry players are also developing theirnetwork of directly-operated stores.
This section contains information which is derived from the “2014 Global Sport Market Report” conducted by NPD, anindependent market research firm, and published in June 2015.
This study’s estimates of the size of the global sports market are based on NPD’s consumer panel tracking data, in 14countries (in 2014), representing approximately 80% of global sports sales. For the remaining 20%, NPD estimates arebased on assumptions related to gross domestic product development.
Note that year after year some countries are surveyed using panels instead of being estimated. As a result, historicaldata (typically from 2006 to 2013) are subject to update by NPD each year.
Also note that i) all growth rates are expressed in reported terms; ii) the designation “Sport & Lifestyle” (SLS) refers to alltypes of sports from running and hiking to snowboarding; iii) the global Sport market, as reported by NPD, includes fourmajor segments: apparel, footwear, equipment, and bicycles for all types of sport usage.
WORLDWIDE Sport & Lifestyle MARKET OVERVIEW
(%): Annual change, reported data14
285(+5%)
13
271(+5%)
07
228
08
228
09
223
10
233
11
245
12
258(+5%)(+5%)(+4%)(-2%)(+0%)(+4%)
06
223
44 Kering ~ 2015 Reference Document
02_VA_V5 06/04/2016 17:31 Page44
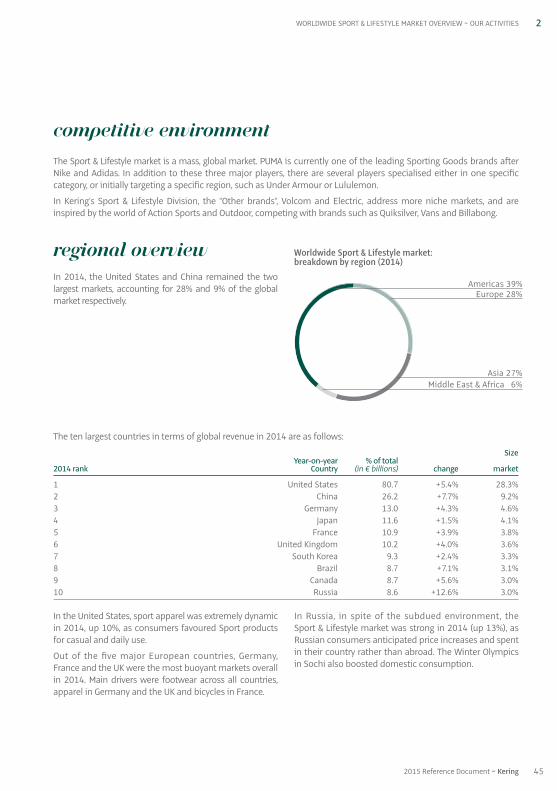
In the United States, sport apparel was extremely dynamicin 2014, up 10%, as consumers favoured Sport productsfor casual and daily use.
Out of the five major European countries, Germany,France and the UK were the most buoyant markets overallin 2014. Main drivers were footwear across all countries,apparel in Germany and the UK and bicycles in France.
In Russia, in spite of the subdued environment, theSport & Lifestyle market was strong in 2014 (up 13%), asRussian consumers anticipated price increases and spentin their country rather than abroad. The Winter Olympicsin Sochi also boosted domestic consumption.
The ten largest countries in terms of global revenue in 2014 are as follows:
Size Year-on-year % of total 2014 rank Country (in € billions) change market
1 United States 80.7 +5.4% 28.3%2 China 26.2 +7.7% 9.2%3 Germany 13.0 +4.3% 4.6%4 Japan 11.6 +1.5% 4.1%5 France 10.9 +3.9% 3.8%6 United Kingdom 10.2 +4.0% 3.6%7 South Korea 9.3 +2.4% 3.3%8 Brazil 8.7 +7.1% 3.1%9 Canada 8.7 +5.6% 3.0%10 Russia 8.6 +12.6% 3.0%
REGIONAL OVERVIEW
In 2014, the United States and China remained the twolargest markets, accounting for 28% and 9% of the globalmarket respectively.
Worldwide Sport & Lifestyle market: breakdown by region (2014)
2WORLDWIDE SPORT & LIFESTYLE MARKET OVERVIEW ~ OUR ACTIVITIES
COMPEtitiVE ENVIRONMENT
The Sport & Lifestyle market is a mass, global market. PUMA is currently one of the leading Sporting Goods brands afterNike and Adidas. In addition to these three major players, there are several players specialised either in one specificcategory, or initially targeting a specific region, such as Under Armour or Lululemon.
In Kering’s Sport & Lifestyle Division, the “Other brands”, Volcom and Electric, address more niche markets, and areinspired by the world of Action Sports and Outdoor, competing with brands such as Quiksilver, Vans and Billabong.
452015 Reference Document ~ Kering
Americas 39%
Asia 27%
Europe 28%
Middle East & Africa 6%
02_VA_V5 06/04/2016 17:31 Page45
PRODUCT CATEGORIES
According to NPD, the global Sport market can be divided into three main product categories – footwear, apparel andequipment (excluding the market for bicycles and accessories) – which correspond to the key product areas in whichKering Sport & Lifestyle brands operate.
In 2014, all categories grew, with footwear and apparel registering the highest growth (up 6% for both), driven by theWorld Cup and “non-football textiles”.
Worldwide Sport & Lifestyle market: breakdown by category (in 2014)
Market value Reported % of total (in € billions) year-on-year change market
Footwear 79 +6% 28%Apparel 96 +6% 34%Equipment 74 +3% 26%Bicycle and accessories 36 +2% 12%
Total 285 +5% 100%
In 2014, fitness, running and soccer were the sports that enjoyed the highest growth rates. Five main sports represented44% of the Sport & Lifestyle market:
Sport 2014 value Reported(in € billions) year-on-year change
Cycling 38 +2%Fitness 31 +7%Walking / Hiking 25 +3%Running 20 +5%Football / Soccer 11 +11%
NB: as mentioned in the introduction to this section, NPD updates historical data each year (2013 data have been updated).
In Japan, footwear sales were strong, led by walking / hiking,running and soccer. This year, golf and cycling sales (whichrepresent 35% of the total Japanese Sport & Lifestylemarket) decreased 4% and 3% respectively.
South Korea, which entered the top ten countries in2014, saw a 3% drop in walking/hiking sales in 2014.Running, a key market, was soft. In contrast, cycling wasup 5%.
2 OUR ACTIVITIES ~ WORLDWIDE SPORT & LIFESTYLE MARKET OVERVIEW
46 Kering ~ 2015 Reference Document
02_VA_V5 06/04/2016 17:31 Page46
DIStrIBUtiON CHANNELS
The Sport & Lifestyle industry predominantly operatesthrough the wholesale channel. Key distributors ofSporting Goods brands include retailers such as FootLocker and Finish Line in the United States, andIntersport and Decathlon in Europe. In the United States,Action sports & Outdoor brands are primarily distributedat Pacsun, Zumiez and Tilly’s, along with otherindependent multi-brand accounts. Sporting Goodsbrands are also looking to upgrade the shoppingexperience through dedicated partnerships with the keyretailers, notably by creating shop-in-shops and joint-venture agreements with the largest chains.
Along with wholesale distribution, most Sporting Goodsbrands, including PUMA, have selectively developeddirectly-operated stores operations (which representapproximately 20% to 30% of sales mix across mostbrands) and are consistently looking to enhance overtime the retail experience within their own stores.
E-commerce is also gaining momentum, yet stillaccounts for a fraction of total sales. Euromonitorestimates global online sales at 7% of total SportingGoods market sales in 2014. However, in the UnitedStates, e-commerce penetration is relatively higher andthus presents positive prospects for industry players.
MARKET OUTLOOK
In the long term, NPD forecasts a compound annualgrowth rate of 4% for 2014 to 2020e. The Sport & Lifestylemarket is therefore expected to reach sales in excess of€355 billion by 2020e, assuming continued positiveglobal GDP growth. Therefore, the longer-term growthrate in the Sport & Lifestyle market is expected to remainclosely tied to the more general trend in discretionaryconsumer spending across the world.
According to NPD, two trends will contribute equally tolong-term growth:
• Consumer trends: the casual-use market will expandthrough increased penetration of branded sport-styledapparel and athletic footwear in daily life. The marketfor sport use will grow through increased concern forhealth considerations.
• Sports trends: within major sports, urbanisation willspecifically foster running, basketball and all fitnessactivities. Paradoxically, urbanisation should also nurturea return in demand for outdoor activities and brands.
2WORLDWIDE SPORT & LIFESTYLE MARKET OVERVIEW ~ OUR ACTIVITIES
472015 Reference Document ~ Kering
02_VA_V5 06/04/2016 17:31 Page47
48 Kering ~ 2015 Reference Document
2 OUR ACTIVITIES ~ SPORT & LIFESTYLE DIVISION
PUMA 50Other brands 54
VolcomElectric
sport & lifestyle division
02_VA_V5 06/04/2016 17:31 Page48
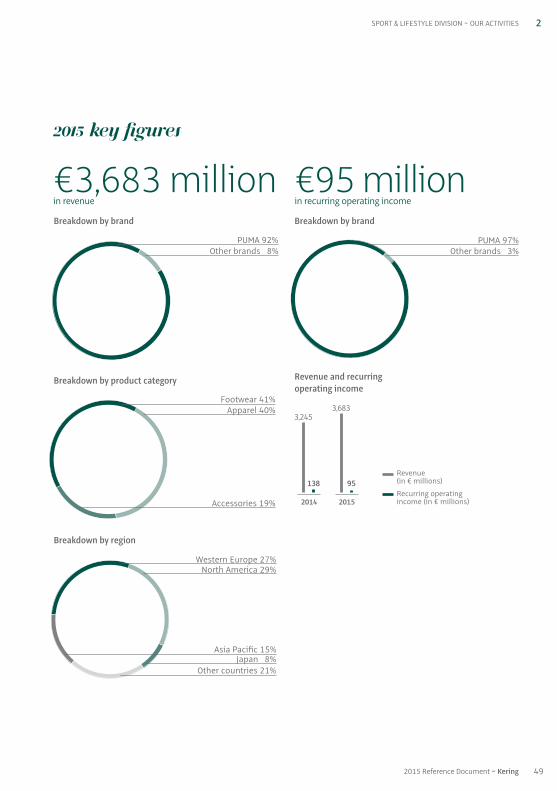
49
2
2015 Reference Document ~ Kering
SPORT & LIFESTYLE DIVISION ~ OUR ACTIVITIES
Breakdown by brand
Revenue and recurring operating income
€3,683 millionin revenue
€95 millionin recurring operating income
Breakdown by brand
Breakdown by product category
Breakdown by region
PUMA 92%Other brands 8%
Footwear 41%Apparel 40%
Accessories 19%
Western Europe 27%North America 29%
Japan 8%Other countries 21%
Asia Pacific 15%
2015 key figures
PUMA 97%Other brands 3%
Revenue (in € millions)
Recurring operating income (in € millions)2015
3,683
95
2014
3,245
138
02_VA_V5 06/04/2016 17:31 Page49

2 OUR ACTIVITIES ~ SPORT & LIFESTYLE DIVISION ~ PUMA
2015 key figures
€3,403 millionin revenue
€92 millionin recurring operating income
10,988average number of employees
Breakdown of 2015 revenueby product category
Breakdown of 2015 revenueby region
Footwear 44%Apparel 37%
Accessories 19%
Western Europe 28%North America 26%
Japan 8%Other countries 22%
Asia Pacific 16%
Business concept
PUMA is one of the world’s leading sports brands anddesigns, develops, and markets footwear, apparel andaccessories. For over 65 years, PUMA has established areputation for its fast product designs for the fastestathletes on the planet.
PUMA offers performance and sport-inspired Lifestyleproducts in categories such as Teamsport, Running andTraining, Golf, and Motorsport. It has formed a series ofexciting partnerships with renowned brands to bringinnovative and fast designs to the world of sport. ThePUMA Group owns the PUMA, COBRA Golf and Dobotexbrands. The company distributes its products in more than120 countries, employs about 11,000 people worldwide,and is headquartered in Herzogenaurach, Germany.
In 2013, CEO Bjørn Gulden introduced PUMA’s new missionstatement: to be the fastest sports brand in the world.This not only reflects PUMA’s brand positioning of being“ Forever Faster ”, but also serves as the company’s guidingprinciple, which is expressed through all of its actions anddecisions. PUMA’s objective is to be fast in reacting to newtrends, fast in bringing new innovations to market, fast indecision-making and fast in solving problems for itspartners and retailers.
50 Kering ~ 2015 Reference Document
02_VA_V5 06/04/2016 17:31 Page50
51
2
2015 Reference Document ~ Kering
PUMA ~ SPORT & LIFESTYLE DIVISION ~ OUR ACTIVITIES
Competitive environment
The Sporting Goods industry is continuing to grow, drivenby an increase in disposable income as well as a rise inthe number of health-conscious people. The fact thatmore women are taking up sports is also contributing tothis growth. From a distribution channel perspective, e-commerce is continuing to rapidly expand.
Volatile currencies and the strength of the US dollar inparticular have continued to weigh on the profitability ofcompanies within the Sporting Goods industry. Themacro-economic environment has also been dampenedby ongoing political tensions in eastern Ukraine and theMiddle East.
Strategy
PUMA’s strategy encompasses five priorities: repositioningPUMA as the world’s fastest sports brand and creatingexcitement around the brand, improving the productengine, optimising PUMA’s revenue and distributionquality, increasing the speed of the organisation, andrenewing the IT infrastructure. In 2015, PUMA continuedto make progress in all of these key strategic priorities.
In terms of its repositioning as a sports brand, PUMAcontinued to enhance its product communication by givingconsumers a stronger, simpler brand story and by betterutilising its assets. Its new positioning is reflected in thecompany’s ongoing marketing campaign “Forever Faster”.The second wave of this brand campaign had a dedicatedfocus on Training and was brought to life through theunique training stories of PUMA’s most elite brandambassadors including Usain Bolt, Rihanna, SergioAgüero, Arsenal Football Club, and the Cuban National Boxingteam. The campaign was underpinned by IGNITE XT, PUMA’slatest innovative footwear offering within the IGNITEfranchise. The training shoe’s responsive design maximisesenergy and movement during high intensity workouts.
PUMA’s new multi-year partnership with Rihanna hasgenerated a lot of positive press coverage and socialmedia buzz. Rihanna was featured in in-store marketingcampaigns promoting PUMA’s key training styles of theseason. She also played an important role in PUMA’sbrand campaign “Forever Faster” and has been a keyelement in PUMA’s strategy to improve its productoffering for women. Furthermore, PUMA and Rihannahave launched a series of Rihanna-inspired footwear andapparel styles. The first sneaker from PUMA BY RIHANNAbrought out under her FENTY label was the Creeper. It
generated unprecedented social media and presscoverage for PUMA. The limited edition black and whitecolourway sold out within hours.
PUMA’s 2015 sales performance also proved that PUMA iswell on the way to improve its product engine. Strongersales for its performance collections, especially in Footwear,underlined the increased commercial appeal of PUMA’sproducts. The launch of PUMA’s new running technologyIGNITE was an important initiative, which delivered solidsell-in and sell-through performances in both wholesaleand the company’s own retail network. Positive feedbackfrom retailers around the world regarding PUMA’s newproducts as well as the order book for the comingseasons confirm that PUMA is on the right track.
In terms of improving the quality of distribution, PUMA’ssales organisations continued to consolidate theirrelationships with key strategic accounts and to buildnew partnerships with strong retailers in both establishedand emerging markets. In the North American market, forexample, PUMA reinforced its presence with shop-in-shops, special wall units and permanent in-storecommunication at major sports accounts, includingFinish Line and Champs. The roll-out of the new “ ForeverFaster ” store layout has continued worldwide for PUMAowned and operated stores.
In 2015, PUMA also made progress in simplifying itsorganisational structure and setup. The consolidation ofthe Europe and EEMEA regions (Eastern Europe, MiddleEast and Africa) under one leadership is a good exampleof this. In addition, synergies were generated in many areas,leading to a faster and more effective organisation. Interms of overall IT enhancement, PUMA continued to makeprogress in key areas, including standardising ERP systems,improving overall IT infrastructure and developing tools tomake the design and planning processes more efficient.
Social, economic and environmental sustainability remainsa core value for PUMA. As a company that offsets all carbonemissions from its own entities, PUMA was an officialpartner of the COP21, 2015 UN Climate Change Conferencein Paris, and provided the uniforms for 180 students incharge of welcoming visitors from all over the world.These trainee hosts and hostesses wore specificallydesigned PUMA outfits, made entirely from organiccotton. Furthermore, PUMA helped 35 key suppliers inBangladesh, Cambodia, China and Indonesia improvetheir energy efficiency and reduce their carbon footprint.The project, which was co-financed by the GermanDevelopment Bank, identified over 200 measures with thepotential to save a total of approximately 100,000 tonnesof CO2 and generate an attractive return on investment.
02_VA_V5 06/04/2016 17:31 Page51
2015 highlights and outlook for 2016
The launch of PUMA’s IGNITE running innovation, whichwas presented by the World’s Fastest Man Usain Bolt onNew York City’s Times Square in February, got 2015 off toa good start. The breaking new IGNITE foam technologyoffers maximised energy return and strongly representsPUMA’s “Forever Faster” positioning. The sell-through ofthis cutting-edge footwear technology was a hugesuccess throughout the year. The introduction of IGNITEwas supported by PUMA’s “Ignite Your City” film series,featuring ten global running crews wearing the newPUMA IGNITE in their respective cities. The campaign wentviral on social media and created lots of positive buzz for PUMA.
Underlining its strong position in Football, PUMAachieved great visibility at both the Copa América in Chileand the FIFA Women’s World Cup in Canada. At the CopaAmérica, PUMA partnered host nation Chile, whose stellarperformance throughout the tournament was rewardedwith their first continental trophy. The PUMA team securedtheir victory with a penalty shootout over archrivalArgentina and PUMA ambassador Sergio Agüero wasamongst the tournament’s best scorers with three goals.
At the FIFA Women’s World Cup, PUMA star Marta madeheadlines by becoming the all-time leading scorer inWomen’s World Cup history, while Germany’s Célia Šašićfinished the tournament as the top scorer with six goals.Together with PUMA’s three participating teams, Cameroon,Ivory Coast and Switzerland, more than 50 PUMA playershelped give PUMA a strong on-pitch presence.
During the 2015 IAAF World Championships in Beijing,PUMA benefitted from excellent athlete and teamperformances with 18 podium positions for PUMAsponsored athletes and teams. The world’s fastest manUsain Bolt once again proved his status as the greatestathlete of all time with triumphs in the 100 m, 200 m and4x100 m relays, extending his record-breaking personalhaul of IAAF World Championship gold medals to 11. Theoutstanding performance of the Jamaican Team, whichfinished second in the medals table after Kenya, as wellas the performance of the other PUMA teams including theBahamas, Cuba, Grenada, Cayman Islands, Switzerlandand the Dominican Republic, ensured strong brandvisibility for PUMA throughout the competition.
In our successful Motorsports category, PUMA continuedto be a leading supplier with its exceptional MercedesAMG Petronas and Scuderia Ferrari F1 teams. TheMercedes team’s Lewis Hamilton won his third Formula 1Drivers’ World Championship, while Mercedes also wonthe Constructors’ Championship title for the secondconsecutive year, marking the most dominant season forthe “Silver Arrows” in more than 60 years.
In September, COBRA PUMA GOLF golfer Rickie Fowlerenjoyed another victory in the Deutsche Bank Championshipat TPC Boston. Wearing his signature orange apparel andequipped with his Fly-Z+ Driver, Fowler powered his wayto victory. He wore PUMA apparel and footwear from the2015 Autumn / Winter collection, including the Titantour,the coolest shoe in golf. COBRA PUMA GOLF athlete LexiThompson also proved her outstanding talent by winningthe LPGA KEG Hana Bank Championship in South Korea,amongst others.
In 2016, PUMA will continue to invest in marketing,extending its own retail store network and upgrading itsIT infrastructure to become a faster, leaner and moreefficient company in the future. Furthermore, thedevelopment of innovative and commercial products andclose collaboration with key retailers will remain animportant focus in PUMA’s go-to-market strategy.
PUMA’s “Forever Faster” brand campaign will see continuousinvestments accompanied by exciting product launches,as well as new partnerships with globally relevant brandambassadors. Building on its strong heritage andcredibility with women, PUMA has emphasised femaleconsumers as a key growth segment. Its partnership withworld-famous artist Rihanna, who is acting as a brandambassador and Creative Director, underlines the brand’scontinued commitment to the female athletic consumer.PUMA will further optimise its product offering forwomen across its Performance and Lifestyle categories inthe coming seasons. This improved product line-up forwomen includes the “Fierce”, a training shoe withrevolutionary specifications and aesthetics, and a completecollection of footwear and apparel styles by Rihanna.
52 Kering ~ 2015 Reference Document
2 OUR ACTIVITIES ~ SPORT & LIFESTYLE DIVISION ~ PUMA
02_VA_V5 06/04/2016 17:31 Page52
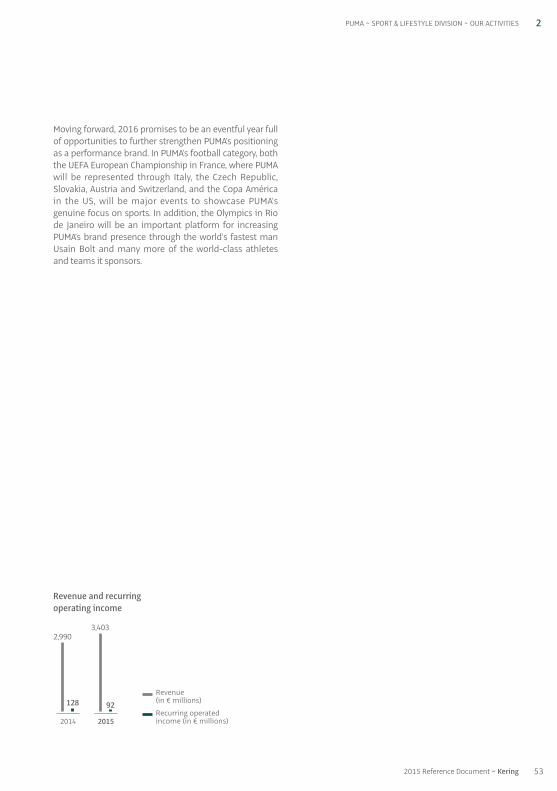
53
2
2015 Reference Document ~ Kering
PUMA ~ SPORT & LIFESTYLE DIVISION ~ OUR ACTIVITIES
Moving forward, 2016 promises to be an eventful year fullof opportunities to further strengthen PUMA’s positioningas a performance brand. In PUMA’s football category, boththe UEFA European Championship in France, where PUMAwill be represented through Italy, the Czech Republic,Slovakia, Austria and Switzerland, and the Copa Américain the US, will be major events to showcase PUMA’sgenuine focus on sports. In addition, the Olympics in Riode Janeiro will be an important platform for increasingPUMA’s brand presence through the world’s fastest manUsain Bolt and many more of the world-class athletesand teams it sponsors.
Revenue and recurringoperating income
Revenue (in € millions)
Recurring operated income (in € millions)2014 2015
3,403
92
2,990
128
02_VA_V5 06/04/2016 17:31 Page53
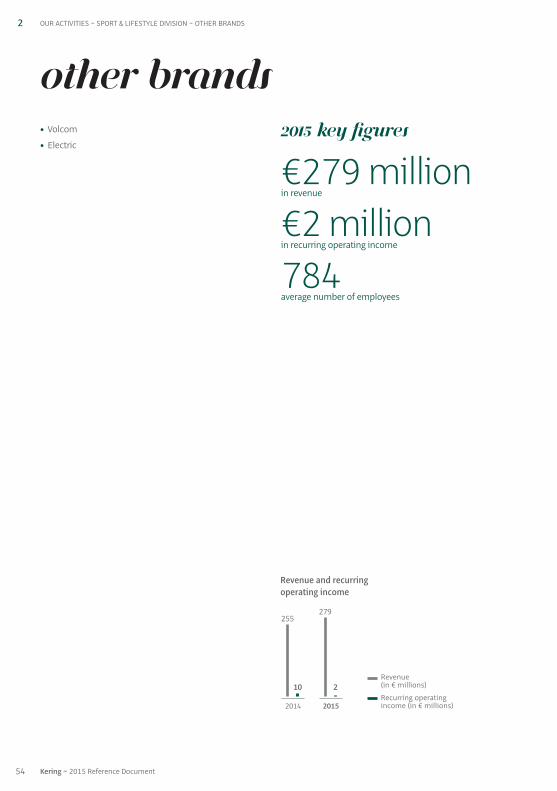
54 Kering ~ 2015 Reference Document
2 OUR ACTIVITIES ~ SPORT & LIFESTYLE DIVISION ~ OTHER BRANDS
Revenue and recurringoperating income
Revenue(in € millions)
Recurring operating income (in € millions)2014 2015
279
2
255
10
Other brands2015 key figures
€279 millionin revenue
€2 millionin recurring operating income
784average number of employees
• Volcom
• Electric
02_VA_V5 06/04/2016 17:31 Page54
55
2
2015 Reference Document ~ Kering
OTHER BRANDS ~ SPORT & LIFESTYLE DIVISION ~ OUR ACTIVITIES
Founded in the early 1990s, Volcom was created on thebelief that there is a higher level of consciousness to befound within oneself through the internal and externaljourneys that board sports, music, art and film provide.These finite moments of enlightenment are referred to as“Spiritual Intoxication”. Built on liberation, innovation andexperimentation, Volcom provides lifestyle-enhancingapparel, outerwear, accessories and footwear to people whoshare their passion. It is the only company in its categoryfounded on all three board sports: skate, surf and snow.
During the year, Volcom reinforced its efforts to strengthenboth its products and marketing, and has implemented aglobal organisation structure to improve its performanceand relevance to its markets and clients.
Volcom has continued to experience positive sell-throughin wholesale distribution and has continued to gainmarket share in core retail accounts. Branded retail wasalso a key focus for Volcom, with store openings particularlyin France and the United States during the year, and someinitiatives to optimise the network where needed. Volcomexpanded the reach of its e-commerce platform, which isinstrumental to foster online presence and drive sales.
Volcom has pursued its investments in marketing andoperations in the Asia Pacific and Latin America regions,which are key markets for the brand and provide potentialgrowth opportunities.
Volcom is continuously reinforcing its brand image throughthe sponsorship of world-class athletes, targeted grassrootsmarketing events, distinctive advertising and the productionof board sport and youth lifestyle-related films, art andmusic under the “True To This” brand mantra. In 2015,Volcom launched several new campaigns, including itsnew surf movie, “Psychic Migrations”, as well as two newmajor marketing campaigns, “Real Life Happening” and“Welcome to Water”.
Founded in 2000, Electric is a premium Lifestyle brandrooted in southern California’s action sports, music, art andcustomisation culture. It designs and markets sunglasses,snow goggles, backpacks, luggage, watches and accessoriesthrough the Americas, Europe, Japan, China and Australasia.Electric sells in Lifestyle boutiques, department stores, sportsshops and online, including its own e-commerce website.
02_VA_V5 06/04/2016 17:31 Page55

Kering ~ 2015 Reference Document56
02_VA_V5 06/04/2016 17:31 Page56

572015 Reference Document ~ Kering
CHAPTer 3
Sustainability
1. Sustainability at Kering 581.1. A long-standing commitment 581.2. 2015 highlights 591.3. Vision and strategic challenges 611.4. Reporting, recognition and SRI ratings 641.5. Key figures 64
2. Supporting our employees 652.1. The Group’s human resources profile 652.2. Remuneration and employee benefits 682.3. Promotion and respect of ethics within the Group 692.4. Enhancement of talent and skills 712.5. Promotion of diversity 762.6. Quality of life at work 782.7. Social dialogue 81
3. Reducing our environmental impact 833.1. Environmental management 833.2. Environmental Profit & Loss account (EP&L) 873.3. Measurement and reduction of our carbon footprint 943.4. Sustainable use of resources 1013.5. Waste management 1073.6. Protection of biodiversity 109
4. Supporting community development 1124.1. Community impact 1124.2. Stakeholder dialogue 1134.3. Relationships with suppliers 1164.4. Risk management and development of responsible products 1194.5. Initiatives carried out by the Kering Foundation and sponsorship programmes 122
5. Cross-reference table pursuant to Articles R. 225-104 and R. 225-105 of the French Commercial Code (Code de commerce) / Global Compact / GRI G4 126
6. Report by one of the Statutory Auditors 129
03_VA_V5 06/04/2016 17:31 Page57
For more than 15 years, Kering has pursued and improvedon its sustainability strategy, with the following keymilestones:
1996• Group’s first Ethics Charter.
2001• Creation of the SolidarCité association, promoting
solidarity-based initiatives among employees.
• First employee opinion survey.
2003• Creation of a Group Sustainability Department.
• Establishment of an environmental reporting platform.
2004• Signature of the Diversity Charter by PPR’s Chairman
and creation of the Diversity Committee and the MissionHandicap project.
2005• Signature of a partnership agreement with Agefiph, a
French association promoting job placement andvocational training for the disabled.
• Deployment of the Code of Business Practices and creationof the Ethics and Corporate Social ResponsibilityCommittee (ECSRC).
• Creation of the Télémaque Institute.
2006• Definition of the Group’s CSR commitments.
2007• Creation of a Group Corporate Social Responsibility
Department, represented on the Executive Committeeand reporting directly to the Chairman.
• Definition of seven strategic priorities for the Groupwith respect to CSR for 2008-2010.
• Signature of a second agreement with Agefiph tosupport the employment of people with disabilities.
2008• Membership of the UN Global Compact.
• Creation of the PPR Corporate Foundation for Women’sDignity and Rights.
2009• Worldwide release of Yann Arthus-Bertrand’s documentary
Home, co-produced by EuropaCorp and Elzévir Films,and financed primarily by PPR.
• Dissemination of the updated Code of BusinessPractices to all Group employees.
• Signature of a third agreement with Agefiph.
2010• Launch of PPR’s Innovation and Sustainability Awards.
• Sustainability criteria included in performanceevaluations of PPR group leaders.
• Adoption of the Charter of Commitments on the qualityof life at work and the prevention of work-related stressfor employees of the PPR group in Europe.
2011• Launch of PPR HOME, the new initiative and
organisation dedicated to sustainability.
• Publication of the first Environmental Profit & LossAccount (EP&L) by PUMA.
• Formalisation of the strategic “Gender Equality inLeadership” programme.
2012• Formalisation and publication of a set of ambitious
sustainability targets to be achieved by the Group’sbrands by 2016.
• Creation of a Sustainability Committee within the Boardof Directors.
• Launch of a mentoring programme as part of thestrategic “Gender Equality in Leadership” programme.
• Third edition of the Foundation’s Social EntrepreneursAwards.
1. Sustainability at Kering
1.1. A long-standing commitment
3 SUSTAINABILITY ~ SUSTAINABILITY AT KERING
58 Kering ~ 2015 Reference Document
03_VA_V5 06/04/2016 17:31 Page58

Kering publishes the results of its EnvironmentalProfit & Loss Account (EP&L), one year ahead of schedule
Kering released two sets of EP&L results in 2015 – thoserelated to the 2013 reporting year in May and to the 2014reporting year in November – fulfilling the publiccommitment taken by the Group in 2012. Amounting to€776 million and €793 million respectively, these initialresults confirm the pertinence of the Group’ssustainability strategy and policies, which specificallytarget the issues highlighted by the EP&L. Noteworthyfindings include:
• 93% of the Group’s total environmental impact isattributable to the supply chain, half of which to theproduction of raw materials (Tier 4);
• within the supply chain, a quarter of the totalenvironmental impact is attributable to the processingof raw materials (Tier 3), and nearly 20% to productmanufacture and assembly (Tiers 1 and 2);
• 7% of environmental impacts are directly attributable toKering’s activities, including retailing and sales (Tier 0);
• approximately 35% of the total environmental impactcomes from greenhouse gas emissions, and more thana quarter from land use;
• over a quarter of the Group’s environmental impactresults from the use of leather.
The 2013 and 2014 results were the subject of detailedreports published on the Kering website, with the disclosureof the EP&L methodology used within the Group. Keringdecided to open-source its EP&L methodology in thehope that other corporations, both within the Group’sindustry and adjacent industries, will adopt similarnatural capital accounting methods and work together toaddress shared issues.
Kering and BSR analyse the resilience of the fashion and luxury industry to climate change
Kering and Business for Social Responsability (BSR), a global business network and consultancy dedicated tosustainability, published a groundbreaking report onclimate change and the luxury industry in November 2015,during the COP21 summit in Paris. The report, entitledClimate Change: Implications and Strategies for the LuxuryFashion Sector, provides the first analysis of the impactof climate change on the luxury sector. It aims to helpindustry players see where their specific vulnerabilities lie,and makes recommendations promoting the developmentof more resilient business models.
1.2. 2015 highlights
2013• Kering was listed on the Dow Jones Sustainability World
and Europe Indices (DJSI World and Europe) andqualified for the Climate Disclosure Leadership Index(CDLI) in France.
• Launch of a new Group platform devoted to internalmobility and career management.
• Creation of the Materials Innovation Lab (MIL).
• Strengthening the Group’s ethics organisation andupdating the Code of ethics.
• PPR Corporate Foundation for Women’s Dignity andRights becomes the Kering Corporate Foundation, withthe slogan “Stop violence. Improve women’s lives”.
2014• Extension of the EP&L process to cover the entire
Group.
• Intensification of initiatives aimed at meetingsustainability targets for 2016, and publication of amid-term progress report.
• Redefinition of the Group’s materiality analysis, by arange of internal and external stakeholders.
• Signature by Kering of a five-year strategic partnershipwith the London College of Fashion’s Centre forSustainable Fashion to promote more sustainable andinnovative design practices in the fashion industry andamong its future practitioners.
• Kering named industry leader of the DJSI (Dow JonesSustainability Indices) within the Textile, Apparel & LuxuryGoods sector.
2015 provided further testimony to Kering’s convictionthat sustainable business is smart business, and thatsustainability contributes to creating value within theCompany. Kering reaffirmed its commitment to achievingfundamental change in its modus operandi in respect ofethics and in the fight against climate change and, morebroadly, environmental pollution of all sorts. Internally, itcontinued to rally employees around the Group’s keyvalues and skills, while also working to win the support ofits external stakeholders for its flagship commitments. Tothis end, Kering has turned its focus on innovation, onpartnerships with key members of civil society committedto sustainability, and on the sharing of knowledge andmethods, with a view to achieving ever greater mobilisationof all of its external stakeholders in the service of a moresustainable world. The 2015 highlights are a faithfulreflection of this spirit and conviction.
3SUSTAINABILITY AT KERING ~ SUSTAINABILITY
592015 Reference Document ~ Kering
03_VA_V5 06/04/2016 17:31 Page59
Kering rolls out its Leadership Model to all Group employees
To allow all Kering employees to become leaders, regardlessof their role or position, the Group distributed itsLeadership Model widely among employees in 2015. TheKering Leadership Model works as a compass, shaping amanagement culture and a shared language around fourcardinal points: Create with a vision; Drive and deliver;Engage with all; and Build from heritage to legacy. Thebalance between these four themes is embodied on aday-to-day basis in the Group’s corporate signature,“Empowering Imagination”. To encourage the Group’semployees to appropriate the themes of the KeringLeadership Model, employees each had the opportunityto form a team to make a creative contribution – video,photos, text or the like – illustrating their vision of theKering Leadership Model.
The Kering Foundation’s annual campaign to raiseawareness about violence against women potentiallyreaches over 300 million Internet users
The Kering Foundation renewed its White Ribbon forWomen campaign in 2015, in the aim of promoting greaterawareness of the issue in the lead-up to the InternationalDay for the Elimination of Violence against Women onNovember 25, in partnership with Condé Nast International.
This year, 125,000 badges designed by Stella McCartney, amember of the Kering Foundation’s Board of Directors,were given away in more than 800 stores in 41 countries.From November 21 to 28, the badges were given tocustomers in nine of Kering group’s Luxury Goods houses:Gucci, Alexander McQueen, Balenciaga, Brioni, StellaMcCartney, Boucheron, Dodo, Pomellato and Qeelin.
At the same time, the Kering Foundation ran a digitalcampaign with the hashtag #BeHerVoice to encourageeveryone to play a part in ending violence against women.The campaign potentially reached over 319 million Internetusers worldwide.
Kering strengthens its ethics and compliance organisation
In 2015, the Group started down a new road with thecreation of a Compliance structure, led by a Group ChiefCompliance Officer (CCO) backed up by an internationalnetwork of Compliance Officers appointed by the CEOs ofeach brand. The Compliance team will be tasked withassisting and guiding employees at all levels of the Groupto ensure compliance with prevailing legal requirements,including those relating to the fight against corruptionand those relating to competition law.
Kering maintains its position as industry leader of the DJSI (Dow Jones Sustainability Index)
For the second consecutive year, Kering was namedindustry leader of the Dow Jones Sustainability Index (DJSI)World and Europe in 2015, retaining the top spot withinthe Textile, Apparel & Luxury Goods sector.
Improving its overall performance compared with theprevious year, Kering received the best scores in its sectoron supply chain management, stakeholder dialogue,environmental reporting and social reporting. The Groupalso obtained the maximum score for its approach in threeareas, namely responsible product stewardship, codes ofconduct and compliance, and corporate citizenship andphilanthropy.
Kering co-produced Luc Jacquet’s new movie, Ice and the Sky (La Glace et le Ciel).
In 2015, Kering co-produced Luc Jacquet’s new movie, Iceand the Sky, which recounts the adventures of ClaudeLorius, a climatologist, glaciologist and one of the firstscientists to discover global warming. Kering’s decision toco-produce this climate change documentary is areflection of the Group’s dual commitment to bothsustainability and cinema. The movie, directed by LucJacquet who previously directed March of the Penguins in2005, drew much attention due to its timely releasewhich coincided with COP21 Paris summit. Selected toclose the 68th edition of the Cannes Film Festival, Ice andthe Sky was released in French cinemas in October 2015.
3 SUSTAINABILITY ~ SUSTAINABILITY AT KERING
60 Kering ~ 2015 Reference Document
03_VA_V5 06/04/2016 17:31 Page60
Vision
Kering firmly believes that sustainable business is smartbusiness. It is this commitment to sustainability in its socialand environmental dimensions that informs the Group’sstrategy in this area. Sustainability creates value andcompetitive advantage, for it enables Kering to lead withnew business models and innovative practices, whilst oftenreducing costs. It is also a motivating factor for the Group’semployees, helping to attract and retain the best talent.
Sustainability is a key component of the Group’s brands’strategy. Kering serves as a catalyst, encouraging them to develop increasingly innovative, high-quality andsustainable products.
Through the Kering Foundation, Kering is also firmlycommitted to combating violence against women. Withthe help of its employees, the foundation supports localand international NGOs, distributes grants to socialentrepreneurs and organises awareness campaigns.
Targets
To nurture this vision, Kering builds on a set of ambitioustargets laid down in 2012 to achieve by 2016:
• roll out the EP&L across all Luxury and Sport & Lifestylebrands;
• assess our key suppliers at least every two years, mainlyto monitor their application of the Group’s Code ofethics;
• reduce our carbon emissions, waste and water usageresulting from the production of goods and services by25%, without compromising our growth;
• offset all remaining CO2 emissions from Scope 1 andScope 2 of the Greenhouse Gas Protocol throughprogrammes contributing to the conservation ofbiodiversity and the welfare of local communities in thegeographic areas where the Group operates;
• 100% of paper and packaging will be sourced fromcertified sustainably managed forests with a minimumof 50% recycled content;
• eliminate PVC from all our collections;
• ensure that all hazardous chemicals have been phasedout and eliminated from our production by 2020;
• 100% of gold and diamonds will be sourced fromverified operations that do not have a harmful impacton local communities, wildlife or the ecosystems thatsupport them;
• 100% of leather from domestic livestock will be sourcedfrom responsible and verified sources that do notresult in converting sensitive ecosystems into grazingland or agricultural land used to produce livestock feed;
• 100% of precious skins and furs will be sourced fromverified captive breeding operations or from sustainablymanaged wild populations. Additionally, suppliers willbe required to employ accepted animal welfare practicesand humane treatment in sourcing.
The achievement of these targets is factored into thecalculation of the variable remuneration of key executives.
As transparency is central to Kering’s approach, the Groupregularly shares updates on its progress towards thesetargets with all its stakeholders. A progress report wasgiven at the April 2014 Annual General Meeting, and a reviewcovering the 2012-2016 period will be published in 2016.
Some key objectives have already been achieved. Theyinclude the EP&L which has been rolled out across all ofthe Group’s brands, and was the subject of two detailedreports published in 2015, presenting the results for2013 and 2014.
EP&L, a cornerstone of the measurement and the achievement of targets set by Kering
Faced with accelerating ecosystem degradation, andaware that corporations and society as a whole arereliant on natural resources, Kering developed theEnvironmental Profit & Loss Account (EP&L), an innovativetool enabling companies to identify and monetise theimpacts of their activities.
The EP&L measures the environmental footprint of allsupply chains for the Group’s brands, and highlights theenvironmental risks and economic opportunities linkedto its activities, making it a crucial tool in deployingresponsible sourcing strategies and measuring progresstowards the Group’s targets.
Kering used the two reports published in 2015 to sharethe results and lessons of its 2013 and 2014 EP&L, as wellas the methodology developed by the Group. Kering aimsto encourage other organisations, both private andpublic, to identify and control their impacts on naturalresources.
Materiality Matrix: prioritising our challenges
The materiality principle, which is at the heart of theKering sustainability approach, on an equal footing withthe EP&L, allows Kering to focus on activities with themost extensive environmental footprint. The materialityapproach, laid out in the guidelines of the Global ReportingInitiative (GRI), allows Kering to identify its key challenges(based on their economic, environmental and socialimpacts) and governance issues, and to gauge theirassessment by the Company’s key stakeholders.
1.3. Vision and strategic challenges
3SUSTAINABILITY AT KERING ~ SUSTAINABILITY
612015 Reference Document ~ Kering
03_VA_V5 06/04/2016 17:31 Page61
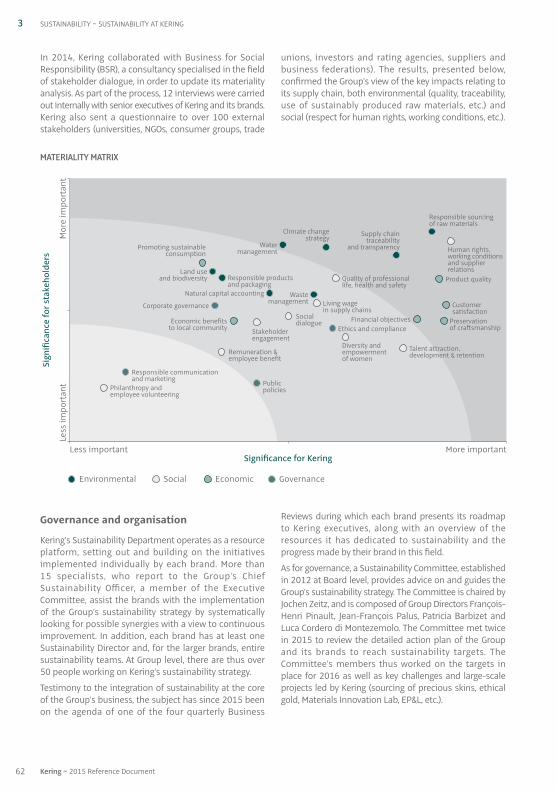
Governance and organisation
Kering’s Sustainability Department operates as a resourceplatform, setting out and building on the initiativesimplemented individually by each brand. More than 15 specialists, who report to the Group’s ChiefSustainability Officer, a member of the ExecutiveCommittee, assist the brands with the implementationof the Group’s sustainability strategy by systematicallylooking for possible synergies with a view to continuousimprovement. In addition, each brand has at least oneSustainability Director and, for the larger brands, entiresustainability teams. At Group level, there are thus over50 people working on Kering’s sustainability strategy.
Testimony to the integration of sustainability at the coreof the Group’s business, the subject has since 2015 beenon the agenda of one of the four quarterly Business
Reviews during which each brand presents its roadmapto Kering executives, along with an overview of theresources it has dedicated to sustainability and theprogress made by their brand in this field.
As for governance, a Sustainability Committee, establishedin 2012 at Board level, provides advice on and guides theGroup’s sustainability strategy. The Committee is chaired byJochen Zeitz, and is composed of Group Directors François-Henri Pinault, Jean-François Palus, Patricia Barbizet andLuca Cordero di Montezemolo. The Committee met twicein 2015 to review the detailed action plan of the Groupand its brands to reach sustainability targets. TheCommittee’s members thus worked on the targets inplace for 2016 as well as key challenges and large-scaleprojects led by Kering (sourcing of precious skins, ethicalgold, Materials Innovation Lab, EP&L, etc.).
MATERIALITY MATRIX
In 2014, Kering collaborated with Business for SocialResponsibility (BSR), a consultancy specialised in the fieldof stakeholder dialogue, in order to update its materialityanalysis. As part of the process, 12 interviews were carriedout internally with senior executives of Kering and its brands.Kering also sent a questionnaire to over 100 externalstakeholders (universities, NGOs, consumer groups, trade
unions, investors and rating agencies, suppliers andbusiness federations). The results, presented below,confirmed the Group’s view of the key impacts relating toits supply chain, both environmental (quality, traceability,use of sustainably produced raw materials, etc.) andsocial (respect for human rights, working conditions, etc.).
3 SUSTAINABILITY ~ SUSTAINABILITY AT KERING
62 Kering ~ 2015 Reference Document
Less important
Less
importan
t
Signifi
canc
e for s
take
hold
ers
Significance for KeringMore important
Mor
e importan
t
Environmental
Climate changestrategy
Responsible productsand packaging
Responsible sourcingof raw materials
Supply chaintraceability
and transparency
Land useand biodiversity
Watermanagement
Wastemanagement
Natural capital accounting
Social
Philanthropy andemployee volunteering
Remuneration &employee benefit
Stakeholderengagement
Quality of professionallife, health and safety
Human rights,working conditionsand supplierrelations
Diversity andempowermentof women
Talent attraction,development & retention
Socialdialogue
Living wagein supply chains
Economic
Customersatisfaction
Preservationof craftsmanship
Product quality
Governance
Responsible communication and marketing
Ethics and compliance
Corporate governance
Promoting sustainableconsumption
Financial objectivesEconomic benefitsto local community
Publicpolicies
03_VA_V5 06/04/2016 17:31 Page62

In addition, the Sustainability Technical Advisory Group(STAG) provides the Committee with technical expertiseon the challenges faced by Kering in its sustainabilityinitiatives. This Group is composed of members of Kering(Jean-François Palus, Group Managing Director, JochenZeitz, Director and Chairman of the SustainabilityCommittee, and a Chief Executive Officer from a brand ona rotating basis) as well as external advisors.
In 2015, Kering strengthened the compliance organisationat Group level with the creation of an internationalnetwork of Compliance Officers appointed by the CEO ofeach brand. Reporting to the Group Chief ComplianceOfficer, the network is tasked with assisting and guidingemployees at all levels of the Group to ensure compliancewith prevailing legal requirements, including thoserelating to the fight against corruption and those relatingto competition law. The Group Chief Compliance Officerreports directly to the Chairman of the Group EthicsCommittee.
3SUSTAINABILITY AT KERING ~ SUSTAINABILITY
(1) STAG: Sustainability Technical Advisory Group.
ETHICS NETWORK
Chair of the Groupethics network
Sustainability Committee
FRANÇOIS-HENRI PINAULTCHAIRMAN AND CHIEF EXECUTIVE OFFICER
JEAN-FRANÇOIS PALUSGROUP MANAGING DIRECTOR
RemunerationCommittee
AppointmentsCommittee
AuditCommittee
Sustainability HumanResources Communication Finance
15 people
LuxuryDivision
Sport & LifestyleDivision
Strategy andDevelopmentCommittee
BOARD OF DIRECTORS
BRANDS
Network of Brand Compliance Officers (BCOs) Teams committed to sustainability within each brand (35 people)
EXECUTIVE COMMITTEE
Brand Compliance
officer
APACEthics
Committee
GroupEthics
Committee
Group ChiefCompliance
Officer
AmericasEthics
Committee
Brand Compliance
officer
Brand Compliance
officer
Brand Compliance
officerSustainability Sustainability Sustainability Sustainability
STAG (1)
Ethicscode
632015 Reference Document ~ Kering
03_VA_V5 06/04/2016 17:31 Page63
• 38,801 employees as of December 31, 2015, 57.87% of whom are women;
• 90.84% of employees on permanent contracts;
• 50.57% of Group managers are women;
• 11.27% of permanent employees work part time;
• 35 years is the average age of permanent employees;
• 5 years is the average length of service of permanentemployees;
• 379 workers with disabilities;
• 393,906 hours of training, or 20,628 employees trained;
• 11,888 permanent employees hired;
• over 300 million Internet users potentially reached bythe Kering Foundation’s annual campaign to raiseawareness about violence against women;
• 2 consecutive years of results published as part of thedeployment of the EP&L across the entire Group;
• 75% of the environmental impacts generated by theGroup’s activities are related to the production andinitial processing of raw materials (Tiers 4 and 3);
• 2,849 social audits carried out among the Group’ssuppliers;
• 317,532 tonnes of CO2 emitted by the Group in 2015attributable to energy consumption and transport;
• 23.7% is the share of electricity purchased fromrenewable sources in 2015;
• 85% of paper consumed by the Group is PEFC or FSC-certified or recycled;
• 99% of the Group’s reference products contain no PVC.
1.5. Key figures
In recognition of its sustainability strategy and its mainachievements, Kering received several distinctions in 2015:
• DJSI (Dow Jones Sustainability Indices): for thesecond consecutive year, Kering was named industryleader of the Dow Jones Sustainability Index (DJSI)World and Europe in 2015, retaining the top spot in theTextile, Apparel & Luxury Goods sector.
• Global 100: in 2015, Kering also earned its first listing in the Global 100 ranking of the 100 most sustainablecompanies worldwide. This ranking, created by CorporateKnights magazine in 2005, is unveiled at the WorldEconomic Forum in Davos each year. Kering was theonly luxury group in the Global 100 ranking, and rankedsecond in the Textile, Apparel & Luxury Goods sector.
• CDP: with a score of 95B, Kering did not make it into theA-List of the CDP Climate Performance Leadership Indexthis year, although it remained the top player in the Textile,Apparel & Luxury Goods sector. Kering did, however,enter the CDP Forest ranking for the first time in 2015,receiving a commendation for its work in the managementof deforestation risk associated with the use of rawmaterials such as leather or wood derivatives such as viscose.
• Enjeux Les Echos ranking: Kering ranked sixth in theTop 10 most sustainable CAC 40 companies, a distinctionit owed largely to the rollout of its EP&L.
• Other SRI indices: Kering has been included in themain benchmark indices: FTSE4Good, Euronext VigeoEurozone 120 Ethibel Sustainability Index Excellence,MSCI Global Sustainability Indices and STOXX Global ESG Leaders indices and Triodos SustainableInvestment Funds.
1.4. Reporting, recognition and SRI (1) ratings
3 SUSTAINABILITY ~ SUSTAINABILITY AT KERING
(1) Socially Responsible Investing.
64 Kering ~ 2015 Reference Document
03_VA_V5 06/04/2016 17:31 Page64
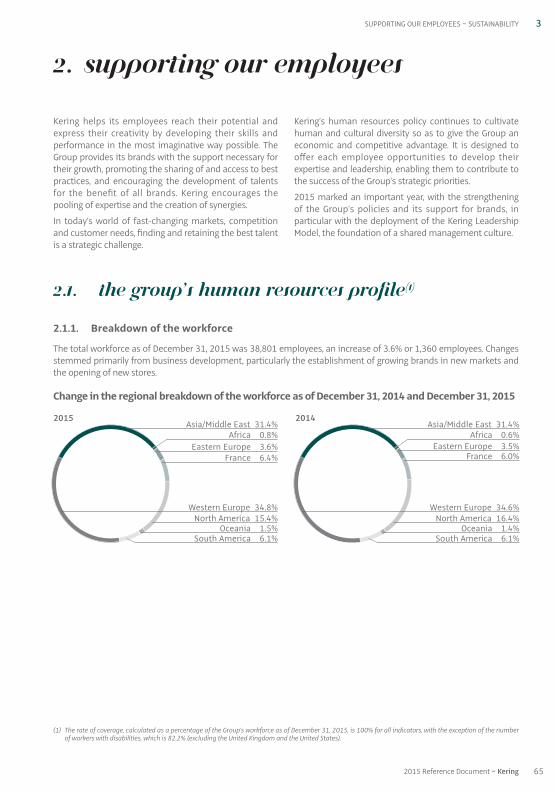
2.1. The Group’s human resources profile(1)
2.1.1. Breakdown of the workforce
The total workforce as of December 31, 2015 was 38,801 employees, an increase of 3.6% or 1,360 employees. Changesstemmed primarily from business development, particularly the establishment of growing brands in new markets andthe opening of new stores.
Change in the regional breakdown of the workforce as of December 31, 2014 and December 31, 2015
Kering helps its employees reach their potential andexpress their creativity by developing their skills andperformance in the most imaginative way possible. TheGroup provides its brands with the support necessary fortheir growth, promoting the sharing of and access to bestpractices, and encouraging the development of talentsfor the benefit of all brands. Kering encourages thepooling of expertise and the creation of synergies.
In today’s world of fast-changing markets, competitionand customer needs, finding and retaining the best talentis a strategic challenge.
Kering’s human resources policy continues to cultivatehuman and cultural diversity so as to give the Group aneconomic and competitive advantage. It is designed tooffer each employee opportunities to develop theirexpertise and leadership, enabling them to contribute tothe success of the Group’s strategic priorities.
2015 marked an important year, with the strengtheningof the Group’s policies and its support for brands, inparticular with the deployment of the Kering LeadershipModel, the foundation of a shared management culture.
2. Supporting our employees
3SUPPORTING OUR EMPLOYEES ~ SUSTAINABILITY
(1) The rate of coverage, calculated as a percentage of the Group's workforce as of December 31, 2015, is 100% for all indicators, with the exception of the numberof workers with disabilities, which is 82.2% (excluding the United Kingdom and the United States).
20142015Asia/Middle East 31.4%
Eastern Europe 3.6%Africa 0.8%
France 6.4%
North America 15.4%Oceania 1.5%
South America 6.1%
Western Europe 34.8%
Asia/Middle East 31.4%
Eastern Europe 3.5%Africa 0.6%
France 6.0%
North America 16.4%Oceania 1.4%
South America 6.1%
Western Europe 34.6%
652015 Reference Document ~ Kering
03_VA_V5 06/04/2016 17:31 Page65
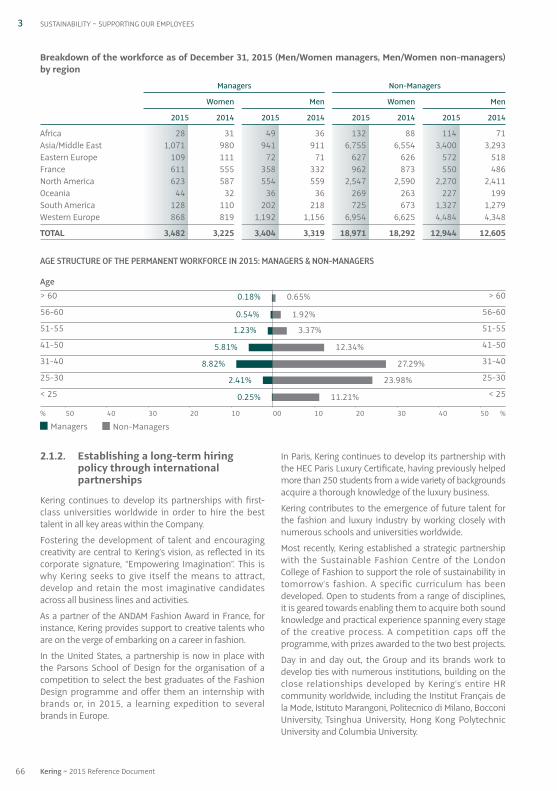
2.1.2. Establishing a long-term hiring policy through international partnerships
Kering continues to develop its partnerships with first-class universities worldwide in order to hire the besttalent in all key areas within the Company.
Fostering the development of talent and encouragingcreativity are central to Kering’s vision, as reflected in itscorporate signature, “Empowering Imagination”. This iswhy Kering seeks to give itself the means to attract,develop and retain the most imaginative candidatesacross all business lines and activities.
As a partner of the ANDAM Fashion Award in France, forinstance, Kering provides support to creative talents whoare on the verge of embarking on a career in fashion.
In the United States, a partnership is now in place withthe Parsons School of Design for the organisation of acompetition to select the best graduates of the FashionDesign programme and offer them an internship withbrands or, in 2015, a learning expedition to severalbrands in Europe.
In Paris, Kering continues to develop its partnership withthe HEC Paris Luxury Certificate, having previously helpedmore than 250 students from a wide variety of backgroundsacquire a thorough knowledge of the luxury business.
Kering contributes to the emergence of future talent forthe fashion and luxury industry by working closely withnumerous schools and universities worldwide.
Most recently, Kering established a strategic partnershipwith the Sustainable Fashion Centre of the LondonCollege of Fashion to support the role of sustainability intomorrow’s fashion. A specific curriculum has beendeveloped. Open to students from a range of disciplines,it is geared towards enabling them to acquire both soundknowledge and practical experience spanning every stageof the creative process. A competition caps off theprogramme, with prizes awarded to the two best projects.
Day in and day out, the Group and its brands work todevelop ties with numerous institutions, building on theclose relationships developed by Kering’s entire HRcommunity worldwide, including the Institut Français dela Mode, Istituto Marangoni, Politecnico di Milano, BocconiUniversity, Tsinghua University, Hong Kong PolytechnicUniversity and Columbia University.
Breakdown of the workforce as of December 31, 2015 (Men/Women managers, Men/Women non-managers)by region
Managers Non-Managers
Women Men Women Men
2015 2014 2015 2014 2015 2014 2015 2014
Africa 28 31 49 36 132 88 114 71Asia / Middle East 1,071 980 941 911 6,755 6,554 3,400 3,293Eastern Europe 109 111 72 71 627 626 572 518France 611 555 358 332 962 873 550 486North America 623 587 554 559 2,547 2,590 2,270 2,411Oceania 44 32 36 36 269 263 227 199South America 128 110 202 218 725 673 1,327 1,279Western Europe 868 819 1,192 1,156 6,954 6,625 4,484 4,348
TOTAL 3,482 3,225 3,404 3,319 18,971 18,292 12,944 12,605
AGE STRUCTURE OF THE PERMANENT WORKFORCE IN 2015: MANAGERS & NON-MANAGERS
3 SUSTAINABILITY ~ SUPPORTING OUR EMPLOYEES
50% 40 30 20 10 00 10 20 30 40 50 %
< 25
25-30
31-40
41-50
56-60
51-55
> 60
< 25
25-30
31-40
41-50
56-60
51-55
> 60Age
Non-ManagersManagers
0.25%
2.41%
8.82%
5.81%
1.23%
0.54%
0.18%
11.21%
23.98%
27.29%
12.34%
3.37%
1.92%
0.65%
66 Kering ~ 2015 Reference Document
03_VA_V5 06/04/2016 17:31 Page66
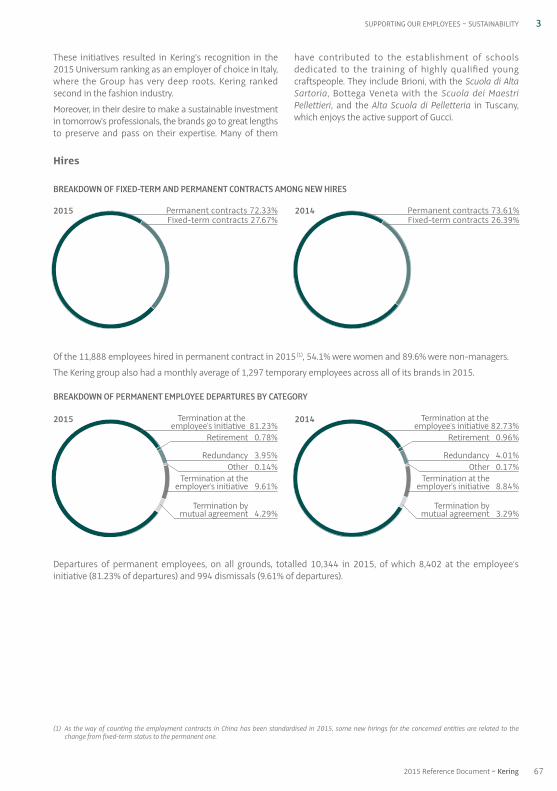
Hires
BREAKDOWN OF FIXED-TERM AND PERMANENT CONTRACTS AMONG NEW HIRES
Of the 11,888 employees hired in permanent contract in 2015(1), 54.1% were women and 89.6% were non-managers.
The Kering group also had a monthly average of 1,297 temporary employees across all of its brands in 2015.
BREAKDOWN OF PERMANENT EMPLOYEE DEPARTURES BY CATEGORY
Departures of permanent employees, on all grounds, totalled 10,344 in 2015, of which 8,402 at the employee’sinitiative (81.23% of departures) and 994 dismissals (9.61% of departures).
These initiatives resulted in Kering’s recognition in the2015 Universum ranking as an employer of choice in Italy,where the Group has very deep roots. Kering rankedsecond in the fashion industry.
Moreover, in their desire to make a sustainable investmentin tomorrow’s professionals, the brands go to great lengthsto preserve and pass on their expertise. Many of them
have contributed to the establishment of schoolsdedicated to the training of highly qualified youngcraftspeople. They include Brioni, with the Scuola di AltaSartoria, Bottega Veneta with the Scuola dei MaestriPellettieri, and the Alta Scuola di Pelletteria in Tuscany,which enjoys the active support of Gucci.
3SUPPORTING OUR EMPLOYEES ~ SUSTAINABILITY
2015 Permanent contracts 72.33%Fixed-term contracts 27.67%
2014 Permanent contracts 73.61%Fixed-term contracts 26.39%
2015 Termination at the 81.23%employee's initiative 81.23%
Termination at the 9.61%employer's initiative 9.61%
Termination by 4.29%mutual agreement 4.29%
Redundancy 3.95%
Retirement 0.78%
Other 0.14%
2014 Termination at the 82.73%employee's initiative 82.73%
Termination at the 8.84%employer's initiative 8.84%
Termination by 3.29%mutual agreement 3.29%
Redundancy 4.01%
Retirement 0.96%
Other 0.17%
(1) As the way of counting the employment contracts in China has been standardised in 2015, some new hirings for the concerned entities are related to thechange from fixed-term status to the permanent one.
672015 Reference Document ~ Kering
03_VA_V5 06/04/2016 17:31 Page67
Remuneration and employee benefits
• Total Group payroll in 2015: €1.56 billion;
• €68.124 million in employer contributions from thebrands in Metropolitan France in 2015.
Kering’s remuneration policy
Remuneration is a key component that managers can useto reward the commitment and the individual and collectiveperformance of their teams.
Remuneration is structured around the guidelines set bythe Group, including the principle of variable remunerationstarting at a certain level of responsibility. Accordingly,almost 90% of the Group’s employees have variableremuneration subject to the achievement of individualand / or collective objectives.
In 2015, many brands continued talks on the harmonisationof the incentive systems offered to their sales forces soas to make them more effective or more consistent fromone geographic area to another. In each case, change inthe mechanism is based on an analysis of practice withinthe market and among the competition.
For non-retail teams, the widespread introduction ofperformance appraisals helps strengthen the link betweenremuneration and the achievement of predefined objectives.
Efforts are made to ensure that the amount of individualremuneration for each employee is both fair internallyand competitive within the market. It is reviewed annuallyon the proposal of line managers.
Executive pay
The remuneration of the Group’s 300 senior executives ismonitored by the Group’s Human Resources Department,with the aim of ensuring consistency and competitivenessin light of industry practice.
The structure of remuneration for senior executives (basepay, short-term variable remuneration, long-term profit-sharing) is set out by the Group based on their level ofresponsibility.
The policy for short-term variable remuneration (annualbonus) aims to reward senior executives for meetingobjectives – in part financial and in part individual – set inline with the strategy of the Group and the brands. Twoindicators that show performance in terms of the brands’profitability and cash flow management (EBIT and freecash flow) are used to assess financial objectives. Moreover,some individual objectives set for senior executives aresubject to the achievement of sustainability targets.
Long-term profit-sharing granted to the Group’s seniorexecutives in 2015 draws on the new system put in placein 2013. The goal is twofold: to compensate executiveteams for their performance over time, and reward themfor their loyalty.
The amounts granted and the means used (KeringMonetary Units and Cash Plans) are directly linked to theposition held by the beneficiary and the level of his or herresponsibility within the Group.
At the end of a three-year vesting period, Kering MonetaryUnits received by executives can be exchanged on twooccasions over each of the subsequent two years.Executives benefiting from a Cash Plan receive all or part ofthe corresponding payment, subject to the achievementof the three-year EBIT and free cash flow objectives laiddown in the award.
As regards the remuneration of Directors and executivecorporate officers, the Board of Directors complied withthe say-on-pay requirements set out in the revised AFEP-MEDEF Code in its proposals to the Annual GeneralMeeting of April 23, 2015.
2.2. Remuneration and employee benefits
2.1.3. Supporting responsible change within the organisation
In 2015, Kering pursued its policy of supporting andredeploying employees, striving to help employees findother positions within the Group. In France, this policyinvolves support from the Social DevelopmentCoordination, a body of brand HR representatives led byKering’s Human Resources Department, for individual
redeployment solutions. It aims to assist employeeswhen an organisational change such as a store transferor closure is liable to have an impact on jobs.
In all countries and for all brands, when departures arebeing considered following reorganisations (for examplea store closure or transfer), efforts are made that gobeyond what is required by law to find employeesanother position.
3 SUSTAINABILITY ~ SUPPORTING OUR EMPLOYEES
68 Kering ~ 2015 Reference Document
03_VA_V5 06/04/2016 17:31 Page68
Kering’s Code of ethics, the foundation for ethics within the Group and for allemployees
Set out since 1996 in the Group’s first Ethics Charter,Kering’s ethical principles apply to everyone within theGroup and reflect the Group’s strong convictions aboutbusiness practices. Kering’s Code of ethics, which wasestablished in 2005 and first updated in 2009, wasoverhauled again in 2013. It fits in firmly with the majorinternational reference texts (United Nations UniversalDeclaration of Human Rights, European Convention onHuman Rights, the main conventions of the InternationalLabour Organization, OECD Guidelines for MultinationalEnterprises, United Nations Convention on the Rights ofthe Child, United Nations Global Compact) and demonstrateshow the Group continually strengthens its commitmentsand the systems in place to ensure compliance.Sustainability for Kering is not attainable without theCode of ethics, which is used as the sole set of standardsimplemented by all throughout the Group, regardless oftheir level of responsibility, position held or location. TheCode of ethics is available in the 12 most widely spokenlanguages in the Group on the Group’s intranet, and onKering’s website for readers from outside the Group.
An ethics structure reinforced in late 2013and again in 2015
Initially based on a single body (ECSRC – Ethics andCorporate Social Responsibility Committee, set up in2005), the ethics organisation has since late 2013 drawnon the work of three Ethics Committees, a Group committeeand two regional Committees (Asia Pacific and theAmericas), thereby dovetailing with the policy appliedwithin the Group of delegating responsibility to ensurethe existence of bodies that can act effectively in the lightof actual operating conditions, within a shared referenceframework applied throughout the Group.
Each of the three Committees is made up of representativesfrom Kering and representatives from the Group’s brandsto ensure greater diversity.
Employees are able to call on these Committees torequest clarification or ask a question regarding theinterpretation of the Code, if they are unsure how tobehave in a specific situation or if they wish to submit acomplaint to the Committee for alleged non-compliancewith one of the principles of the Code for examination.
An ethics hotline was also set up for all Group employeesin their country or area of operation. The hotline assiststhe Ethics Committees in reporting information,questions and complaints from employees and can becalled by anyone in the Group who prefers this systemover contacting one of the three Committees directly.
2.3. Promotion and respect of ethics within the Group
Employee benefits within the Group
In addition to monetary remuneration, the Kering grouphas always valued the social benefits offered to its employeesthrough healthcare, disability / life and pension benefits.Therefore, virtually all employees have supplementaryinsurance coverage in addition to coverage provided bylaw through the various schemes put in place by theGroup’s brands.
Some brands (Gucci, Bottega Veneta and Pomellato inItaly, as well as PUMA) have for several years offered morecomprehensive benefit schemes allowing employees tobalance their work and personal lives. Such schemesoften take the form of an offer of education, recreation,transport or family support. Very popular, they are constantlychanging to better meet employees’ expectations.
In the same spirit, a “Professional Life / Personal Life” portalwas launched in 2015 to facilitate the daily lives of Kering
Corporate employees. Thus, in addition to the informationavailable online, employees at headquarters now benefitfrom personalised services accessible via the 360° internalplatform, through a network of experts who can be contactedvia a toll-free number for practical questions regardingtheir everyday lives.
These schemes all demonstrate the Group’s commitmentto social responsibility.
Profit-sharing, incentive and employee savings agreements
In accordance with national legislation, almost all of theGroup’s employees in France benefit from profit-sharingand incentive schemes governed by agreements specificto their legal entity. Tax and payroll deductions may applyto the amounts derived from these schemes inaccordance with the applicable regulations.
3SUPPORTING OUR EMPLOYEES ~ SUSTAINABILITY
692015 Reference Document ~ Kering
03_VA_V5 06/04/2016 17:31 Page69
In 2015, the Group started down a new road with thecreation of a Compliance structure, led by a Group ChiefCompliance Officer (CCO) backed up by an internationalnetwork of Compliance Officers appointed by the CEOs ofeach brand. The Compliance team will be tasked withassisting and guiding employees at all levels of the Groupto ensure compliance with prevailing legal requirements,including those relating to the fight against corruptionand those relating to competition law.
2015: addressing employee comments and improving procedures to increase efficiency, speed and objectivity
After 2014, a year dedicated to the re-release of the Codethroughout the Group and the initiation of new ethicsmeasures, particularly the establishment of the AsiaPacific (APAC) and Americas regional Committees andtheir interaction with the Group committee, 2015 wasused to test the robustness of the procedures in place. Thefindings resulted in changes in the complaint handlingprocedure, which is the Committees’ key procedure. Indeed,the processing of a number of complaints or questionsfrom Group employees highlighted:
• the insufficient scope left to the claimant to respond tothe investigation conducted by the Ethics Committeebefore its findings are handed down. The procedurenow allows certain information to be shared with theclaimant prior to the issuance of statements andrecommandations, in order to allow the claimant toreact to this information or elaborate on his complaint;
• the difficulty in some cases of conducting an investigationthat is both fast and, above all, completely impartial, eventhough the people questioned during an investigationcan be wholly or partially party with the complainant tothe complaint itself. Kering’s Executive Management hasaccordingly decided to leave the possibility for EthicsCommittees to carry out the investigation themselvesor to mandate one of the various departments sitting onsuch Committees (Internal Audit, Legal, Compliance, HumanResources) to instigate an on-site audit within a maximumof three weeks, during which time the brand concernedby the complaint is required to suspend any action ordecision in respect of the question under investigation.
The complaint handling procedure has been amendedaccordingly.
Training employees on ethics and asking the right questions when dealing with situations and dilemmas they may face at work
In 2013, the Group decided to put in place a trainingprogramme on ethics and the Code for all Groupemployees worldwide. The programme was developed in2013 and introduced throughout Kering in February 2014.
Available in nine languages, it sets out the ethical groundrules in place at Kering, and presents case studies andethical dilemmas that help employees ask themselvesthe right questions. It will be updated annually, and willcover all the major ethics principles upheld by theGroup’s Code of ethics, with a module dedicated to thefight against corruption. The topics covered in 2014included corruption, fraud, conflicts of interest and theconfidentiality of information on social media.
In 2015, the second year of the programme coveredtopics related to diversity, corruption, respect for humanrights and protection of the environment. In 2016, thethemes of corruption, conduct in the workplace, responsiblesourcing of raw materials, traceability and compliancewith business confidentiality, will be highlighted.
Over the course of the various meetings held in 2015,Kering’s three Ethics Committees handled 27 requests(13 complaints, two of which from suppliers, and 14 questions from employees who wanted to make surethat they had properly understood the Code’s provisionson a specific topic or who wished to report a potentialconflict of interest or the receipt of a gift). These issueswere brought to the attention of the Committees eitherdirectly or through the ethics hotline.
For each complaint, an enquiry involving both sides wasconducted under the responsibility of the Committeecontacted, and three violations of the Code wereidentified. The other enquiries did not show a failure tocomply with the Code of ethics; rather, they generallyrevealed management issues or differences inassessments between an employee and his or hermanager, without constituting an ethics violation of any sort.
3 SUSTAINABILITY ~ SUPPORTING OUR EMPLOYEES
70 Kering ~ 2015 Reference Document
03_VA_V5 06/04/2016 17:31 Page70
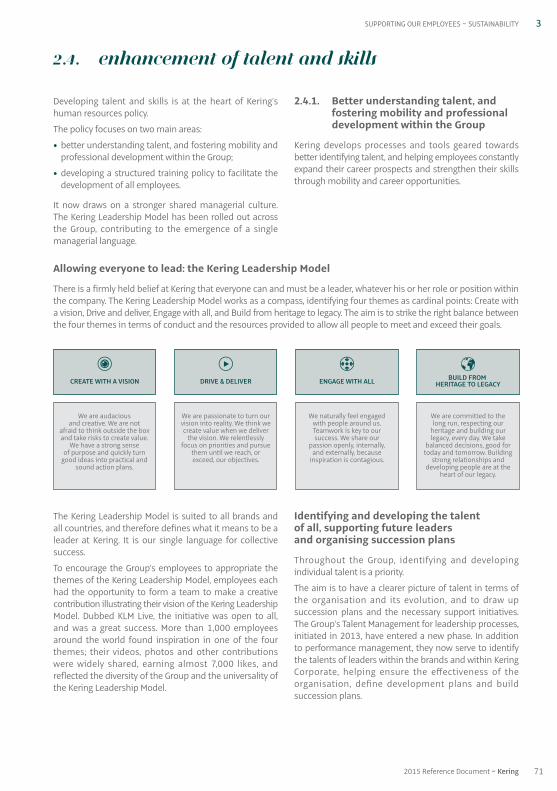
The Kering Leadership Model is suited to all brands andall countries, and therefore defines what it means to be aleader at Kering. It is our single language for collectivesuccess.
To encourage the Group’s employees to appropriate thethemes of the Kering Leadership Model, employees eachhad the opportunity to form a team to make a creativecontribution illustrating their vision of the Kering LeadershipModel. Dubbed KLM Live, the initiative was open to all,and was a great success. More than 1,000 employeesaround the world found inspiration in one of the fourthemes; their videos, photos and other contributionswere widely shared, earning almost 7,000 likes, andreflected the diversity of the Group and the universality ofthe Kering Leadership Model.
Identifying and developing the talent of all, supporting future leaders and organising succession plans
Throughout the Group, identifying and developingindividual talent is a priority.
The aim is to have a clearer picture of talent in terms ofthe organisation and its evolution, and to draw upsuccession plans and the necessary support initiatives.The Group’s Talent Management for leadership processes,initiated in 2013, have entered a new phase. In additionto performance management, they now serve to identifythe talents of leaders within the brands and within KeringCorporate, helping ensure the effectiveness of theorganisation, define development plans and buildsuccession plans.
Allowing everyone to lead: the Kering Leadership Model
There is a firmly held belief at Kering that everyone can and must be a leader, whatever his or her role or position withinthe company. The Kering Leadership Model works as a compass, identifying four themes as cardinal points: Create witha vision, Drive and deliver, Engage with all, and Build from heritage to legacy. The aim is to strike the right balance betweenthe four themes in terms of conduct and the resources provided to allow all people to meet and exceed their goals.
Developing talent and skills is at the heart of Kering’shuman resources policy.
The policy focuses on two main areas:
• better understanding talent, and fostering mobility andprofessional development within the Group;
• developing a structured training policy to facilitate thedevelopment of all employees.
It now draws on a stronger shared managerial culture.The Kering Leadership Model has been rolled out acrossthe Group, contributing to the emergence of a singlemanagerial language.
2.4.1. Better understanding talent, and fostering mobility and professionaldevelopment within the Group
Kering develops processes and tools geared towardsbetter identifying talent, and helping employees constantlyexpand their career prospects and strengthen their skillsthrough mobility and career opportunities.
2.4. Enhancement of talent and skills
3SUPPORTING OUR EMPLOYEES ~ SUSTAINABILITY
712015 Reference Document ~ Kering
CREATE WITH A VISION DRIVE & DELIVER ENGAGE WITH ALL BUILD FROM HERITAGE TO LEGACY
We are audacious and creative. We are not
afraid to think outside the box and take risks to create value. We have a strong sense
of purpose and quickly turn good ideas into practical and
sound action plans.
We are passionate to turn our vision into reality. We think we create value when we deliver
the vision. We relentlessly focus on priorities and pursue
them until we reach, or exceed, our objectives.
We naturally feel engaged with people around us. Teamwork is key to our success. We share our
passion openly, internally,and externally, because inspiration is contagious.
We are committed to thelong run, respecting our
heritage and building our legacy, every day. We take
balanced decisions, good for today and tomorrow. Building
strong relationships and developing people are at the
heart of our legacy.
03_VA_V5 06/04/2016 17:31 Page71

In 2015, a new global and digital People Performance andDevelopment process was established for Kering Corporate.It was designed to promote managerial dialogue throughoutthe year, in acknowledgment of the fact that the qualityof this dialogue, more than simply its tools and processes,is key to making a difference and creating value. Morethan 600 people attended coaching workshops spanninga day and a half in order to better prepare the criticalannual appraisal. These workshops included core elements(performance evaluation, Kering Leadership Model) and achoice of workshops (driving motivation, feedback, etc.) toallow individual employees to play an active role in theirperformance and development, through an ongoingprocess throughout the year.
In addition to this Group approach, individual brands havemechanisms in place for all of their employees.
Gucci continued to implement its programme to identifyand develop talent. The process is designed to establishsuccession plans, identify needs and implement thenecessary hiring and development initiatives.
People@PUMA is the backbone of the talent managementculture shared across PUMA. In 2015, more than 5,000 employees worldwide used People@PUMA and itstalent management modules (performance management,skills, training, career development, etc.).
Promoting mobility and careers within the Group and its brands
Professional mobility is a pivotal means to help developskills, offer career prospects and give everyone theopportunity to grow within the Group.
After its launch in July 2013, the internal mobility platformon the 360° Group intranet was rolled out for all brandsand all countries. Its aim is to allow employees to viewjob opportunities published by each brand within theGroup. This internal platform allows employees to beactive players in their professional development bywriting and posting their CV, sharing their career plansand promoting their skills.
It also helps HR professionals to be more proactive andcloser to managers in managing talent and job mobility.This makes it possible to offer the Group’s brands ashared pool of talent and expertise, and to promotesynergy and the sharing of best practices.
Regular meetings of the brands’ talent managers wereheld in 2015 within Talent Watch Committees designedto search for internal talent liable to progress and to fillkey positions vacant at all levels of the organisation.
In 2015, over 2,300 job vacancies were posted on theplatform, and approximately 100 employees tookadvantage of internal mobility opportunities madepossible directly through it. All the brands are present onthe platform and post job offers to provide greatervisibility for their organisation and possibilities for careerdevelopment. All positions are now posted, includingjobs available in stores.
2.4.2. Developing a structured training policy for all employees
In 2015, the Kering group devoted a budget of€17.28 million to employee training, corresponding to1.1% of the total Group payroll. On this basis, 393,906hours of training (excluding safety training) wereprovided across the Kering group brands in 2015, and20,628 employees took at least one training course. Overone in two employees received training in 2015.
Women accounted for 57.2% of the workforce trained in2015 (excluding safety training). Furthermore, 79.2% ofemployees trained in 2015 were non-managers.
In light of the brands’ new operations and Kering’s newprojects, the increase in the number of people trainedillustrates the Group’s desire to give employees themeans to promote their development, and to assist newstaff members.
3 SUSTAINABILITY ~ SUPPORTING OUR EMPLOYEES
72 Kering ~ 2015 Reference Document
03_VA_V5 06/04/2016 17:31 Page72
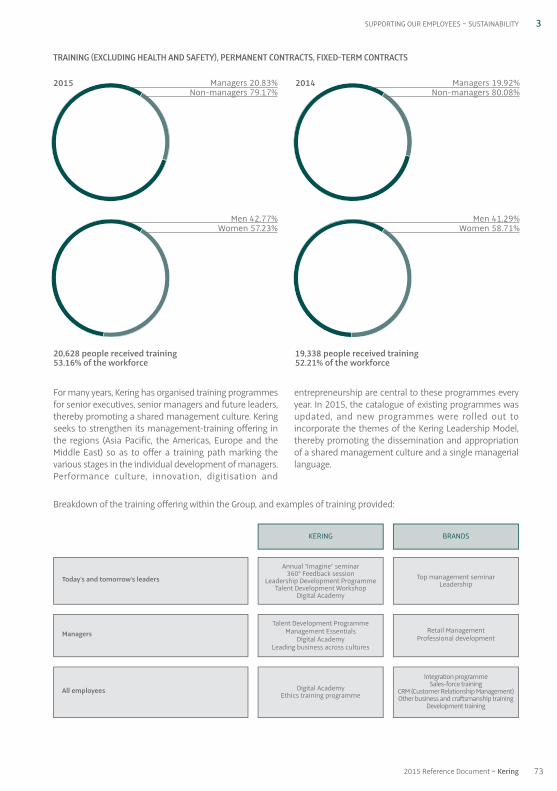
Breakdown of the training offering within the Group, and examples of training provided:
For many years, Kering has organised training programmesfor senior executives, senior managers and future leaders,thereby promoting a shared management culture. Keringseeks to strengthen its management-training offering inthe regions (Asia Pacific, the Americas, Europe and theMiddle East) so as to offer a training path marking thevarious stages in the individual development of managers.Performance culture, innovation, digitisation and
entrepreneurship are central to these programmes everyyear. In 2015, the catalogue of existing programmes wasupdated, and new programmes were rolled out toincorporate the themes of the Kering Leadership Model,thereby promoting the dissemination and appropriationof a shared management culture and a single manageriallanguage.
TRAINING (EXCLUDING HEALTH AND SAFETY), PERMANENT CONTRACTS, FIXED-TERM CONTRACTS
3SUPPORTING OUR EMPLOYEES ~ SUSTAINABILITY
2015 Managers 20.83%Non-managers 79.17%
20,628 people received training 53.16% of the workforce
19,338 people received training 52.21% of the workforce
Men 42.77%Women 57.23%
2014 Managers 19.92%Non-managers 80.08%
Men 41.29%Women 58.71%
KERING BRANDS
Managers
All employees
Today’s and tomorrow’s leaders
Talent Development ProgrammeManagement Essentials
Digital AcademyLeading business across cultures
Digital AcademyEthics training programme
Annual “Imagine” seminar360° Feedback session
Leadership Development ProgrammeTalent Development Workshop
Digital Academy
Retail ManagementProfessional development
Integration programmeSales-force training
CRM (Customer Relationship Management)Other business and craftsmanship training
Development training
Top management seminarLeadership
732015 Reference Document ~ Kering
03_VA_V5 06/04/2016 17:31 Page73

3 SUSTAINABILITY ~ SUPPORTING OUR EMPLOYEES
74 Kering ~ 2015 Reference Document
These ongoing changes aimed at broadening andupdating the training offering are the result of regulardiscussions within the Kering Learning Community, whichconsists of the Directors and Learning and Developmentmanagers of the brands and Kering Corporate, andinvolves identifying needs and sharing best practices.More than simply sharing, the idea is to give Kering themeans to promote the best innovations globally, for all ofits brands. At the same time, the brands develop trainingrelated to their individual needs.
The 360° feedback project: developing senior executives
The work undertaken in 2012 on 360° feedback wascontinued with brand and Corporate senior executives in2015 to help support their development. The processaims to gather information on the perception of a person’sskills from several sources (supervisors, colleagues,employees, customers, etc.), with a view to enhancingthese skills and promoting progress. At the end of theprocess, each leader has a one-on-one coaching sessionto analyse the results and define an action plan forpersonal and professional development.
The Kering group Leadership DevelopmentProgramme
In 2015, Kering continued its development programmesfor the Group’s future leaders (Leadership DevelopmentProgramme), with three classes representing more than30 participants from Luxury and Sport & Lifestyle brandscurrently receiving training. The training involves 360°feedback, a learning expedition in the Group’s key growthareas, finance seminars at the IMD Business School inLausanne, and leadership sessions at Columbia Universityin New York. It is designed to allow participants to shareprofessional experience and improve their grasp of theGroup’s strategic challenges.
One of the 2015 classes completed its 18-month coursewith a practical project in Cambodia involving theprovision of support for a social enterprise specialising innatural silk production and working for the professionalintegration of women who have been victims of violence.A second class travelled to New Zealand to develop abusiness case in connection with the SustainabilityDepartment and the Materials Innovation Lab.
In 2015, the Group also developed a new internationalprogramme known as the Talent Development Workshop,targeting young talents. Twelve managers from sevendifferent brands took part in the pilot two-day session in
New York in April 2015. The training, which comes beforethe Leadership Development Programme, is intended tobe a first step in leadership development. Its goal is tocultivate participants’ understanding of their personalnature so as to foster their individual leadership style(peer coaching methods, etc.).
An addition to the Group’s managementtraining offering
A wealth of training is offered to all managers across theworld, particularly to support the fast-growing brands.
International Talent Development Programme seminarshave been implemented, helping the Company’smanagers bolster their strengths and develop their skills.Each session begins with 360° feedback allowingparticipants to better understand how they are perceivedby their colleagues. The seminar continues with role playsand the drafting of a personal development plan. Two sessions took place in 2015: one in Europe and forthe first time another in the United States, bringingtogether a total of 24 people from all brands.
To provide management training to as many people aspossible, Kering has adopted Management Essentials, thetraining programme initiated by Gucci, offering it to allbrands. The first to benefit in 2015 were Saint Laurent,Kering APAC and Stella McCartney. In 2014, Gucci used thismodule to train 350 managers, to help them gain a betterunderstanding of Gucci’s talent management strategyand to strengthen their HR development skills: hiring,employee development and fostering employee loyalty.
Kering Corporate World has introduced a new annualPeople Performance and Development process into itsperformance management processes. Its implementationwas accompanied by a global training and supportprogramme. After a half-day presentation and discussionsession in the presence of top managers, the programmecontinues in the form of practical workshops lasting a fullday devoted to key management roles (evaluating goals,giving feedback, etc.), all in connection with the KeringLeadership Model and its four themes. More than 600 people have benefited from the programme worldwide.
Kering University continued to roll out Leading BusinessAcross Cultures seminars to help employees graspmulticultural differences and work better togetherinternationally by taking them into account. Thesesessions, led by INSEAD, involved more than 70 people inAsia and the United States in 2015, whereas the 2014sessions were conducted in Europe.
03_VA_V5 06/04/2016 17:31 Page74

Kering Digital Academy
The Digital Academy – an integral part of Kering’s digitalstrategy since 2011 – is designed to instil a digital culturewithin the Group, support the brands’ businessperformance and help make Kering a major digital player.
In June 2014, the Digital Academy also launched theDigital Academy eCampus, a virtual platform for all Keringemployees that is accessible through the Group’s intranet.In 2015, the focus was placed on the development ofcontent. With daily news, digital initiatives put in place bythe brands and e-learning courses (creation of six newmodules), the Digital Academy eCampus aims to becomethe go-to place to discover, learn and share all types ofdigital content, while fostering collaborative behaviour.
2.4.3. Training by the brands
To accelerate the Group’s transformation and growth, theGroup has put in place training in each of its brands on topicsthat are important for the growth of Kering’s employeesand its sales. This involves both integrating a number of newtalented employees and strengthening business skills.
Integrating new talent
In order to improve the retention of new employees, thebrands have put in place training and programmes fornew hires. This involves offering training on the values andheritage of the brands and initial development training tofoster integration and develop brand culture.
Gucci, for example, has harmonised its retail trainingstrategy by focusing on four main areas, namely salestechniques, integration and Gucci’s DNA, product trainingand leadership.
Balenciaga has created an induction programme run bythe HR and retail training departments for all employees inFrance before they are sent abroad. The programme coversthe history of Balenciaga, its values and its know-how.
In London, Kering provides induction sessions for allemployees, regardless of their brand.
Developing the managerial skills of teams and store managers
In addition to the Group’s training sessions for talentedemployees and senior managers, the brands organisetraining for retail and / or corporate managers within theregions. The goal is to train these managers so they canbe better integrated, and to enable them to progress,thereby supporting the growth of the brands in theirmarkets in a spirit of retail excellence. The approach hasreceived support at Group level since 2015, with the aimof ensuring more effective sharing of knowledge and bestpractices.
Thus, Brioni ran its maiden international session in Milan,hosting 20 new managers, with the support of Kering. Thesession included a digital customer service component.
Stella McCartney has launched a three-part two-yeartraining programme for more than 90 managers worldwide.Known as Superheroes, the programme is designed togive participants a better understanding of the values ofthe brand and the conduct expected of managers, beforeturning the focus to challenging individual managementstyles.
Gucci continued the Management Essentials programmeinitiated in 2014.
Lastly, PUMA continued its International LeadershipProgramme (ILP), with 123 managers benefiting worldwidein 2015.
Allowing each employee to gain and reinforcebusiness skills
In addition to management training, the brands andKering Corporate have strengthened the training offeringin various areas.
Gucci undertook a thorough review of both the contentand the resources of its training courses in 2015.Everything was redesigned to ensure that training trulyserves the professional development of all, with shortercourses, digitally enhanced resources and methodsgeared towards giving employees an active role in theirtraining request. By the end of October 2015, more than1,100 people in Italy had enrolled in courses, with sixmodules created and 46 courses scheduled.
Volcom Europe sought ways to offer more training tailoredto its various functions (English, management, backoffice). The number of people trained increased from 75 to127, and the number of training hours increased by 70%.
Other brands have strengthened their organisation tomeet the challenges emerging in their various markets.They include Saint Laurent, which now has dedicatedtraining teams for APAC and Europe.
Preparing for the future in craftsmanship
The brands also implement training with a view tocontinuing to develop craftsmanship and know-howessential to the Group’s activities.
Bottega Veneta continues to support the next generationof designers and craftsmen at the Scuola dei MaestriPellettieri, created in 2006. The aim is to maintain thetechnical excellence, culture, passion and skills requiredby the brand among its craftsmen and designers. Theactivities organised with the Scuola dei Maestri Pellettieritake place at Bottega Veneta’s offices, at the MontebelloVicentino Atelier.
3SUPPORTING OUR EMPLOYEES ~ SUSTAINABILITY
752015 Reference Document ~ Kering
03_VA_V5 06/04/2016 17:31 Page75
Kering has long been committed to diversity, and wasamong the first signatories of the French CorporateDiversity Charter in 2004. Equivalent charters were alsosigned by PUMA in Germany in 2010, and by Gucci in Italyin 2011.
In early 2015, the Executive Management of Kering and the European Works Council signed their firstEmpowering Talent agreement. It provides a forceful andcomprehensive reassertion of Kering’s commitment toequal opportunities.
It is a commitment that goes beyond social responsibilityand compliance, rooted in the Group’s belief that diversityis a source of creativity and innovation, and as such ofeconomic performance. The Code of ethics, implementedin 2005 and whose third version was made available toall employees at the end of 2013, demonstrates theGroup’s commitment to ethics.
The policy has resulted in practical initiatives in the Group’svarious geographies: Kering Asia Pacific received the goldtrophy for diversity at the inaugural Asia RecruitmentAwards in 2015, organised by Human Resources magazine.The award acknowledges the company’s ability to createa diverse environment in terms of age, culture andbackgrounds.
2.5.1. Establishing a culture of genderequality within the Group
While Kering addresses the issue of diversity in all itsaspects, particular emphasis is placed on equalopportunities. In 2010, the Group was one of the firstcompanies in France to sign the Women’s EmpowermentPrinciples, drafted by UN Women and the United NationsGlobal Compact. These principles offer guidance on howto promote the presence and progression of women inbusiness and, more generally, in society. The brands havealso made commitments at national level: in Italy, Gucciis a signatory of the Carta per le pari opportunità el’uguaglianza sul lavoro, initiated at the same time basedon the model of the French Charter.
The same year, Kering launched the Gender Equality inLeadership programme, the aim of which is to stem theloss of female talent at all levels of authority, and moregenerally to establish a culture of equality within theGroup. This strategic programme focuses on three keypriorities:
• ensuring transparency and equal opportunity throughoutmen’s and women’s careers, thanks to human resourcespolicies and processes that treat all employees fairly;
• promoting the advancement of talented women in theorganisation through special development andnetworking programmes;
• having managers take an active role in thiscommitment to gender equality during their day-to-day team management, particularly regarding the issueof work / life balance.
In 2015, with 33% women on its Executive Committeeand 36% on its Board of Directors, Kering was one of theCAC 40 companies with the highest proportion of womenDirectors.
• Ensuring transparency and equal opportunitythroughout men’s and women’s careers
A culture of equality cannot be built without regularlyraising awareness among employees and managers. Tocoincide with International Women’s Day, Keringorganised a series of events to rally its employees aroundits commitment to the empowerment of women. Knownas Kering for Women, this multi site and multi-mediaprogramme covered the three pillars of the Group’scommitment in favour of women: the Kering Foundationfor the fight to end violence against women, the GenderEquality in Leadership programme to make Kering theemployer of choice for women, and Women in Motion topromote the role of women in the film industry,particularly through a partnership with the Cannes FilmFestival.
The Kering for Women programme resulted in 10 days ofinitiatives at the global and regional levels, including livewebchats with women representatives of the KeringExecutive Committee, talks by recognised experts on thesubject (filmmakers, sociologists), involvement in a UNround table and breakfasts with Group executives. Theunderlying goal was to involve employees in collectivethinking on the status of women in the Group and withinthe broader community.
At the same time, Kering strives to ensure that theobjective of equal opportunity is fully integrated into itshuman resources processes. The main quantitative dataare reported and broken down by gender to monitor thiscommitment over time. In 2015, women represented54.1% of new hires and 50.57% of managers.
2.5. Promotion of diversity
3 SUSTAINABILITY ~ SUPPORTING OUR EMPLOYEES
76 Kering ~ 2015 Reference Document
03_VA_V5 06/04/2016 17:31 Page76
• Promoting the advancement of talented womenin the organisation through development andnetworking programmes
In 2013, Kering launched a pilot session of inter-brandand inter-business mentoring in France for talentedwomen, putting them in contact with male and femalesenior executives. The programme was organised again in2014 and 2015 for 14 women, and also accepted a fewmen. The 18 mentors and 18 mentees from this secondround of Kering Mentoring met again in June andSeptember for mid-way assessments, assisted by aspecial project team and external coaches. The scheme,which has been very positively received, was taken in late2015 to the United Kingdom, Italy and Asia Pacific, whereit will be rolled out in 2016.
In France, the Group regularly invites female talent to takepart in events promoting gender equality (Printemps desFemmes, Jump Forum, Happy Training) in order to supporttheir personal development through assertiveness andleadership training, seminars and networking opportunities.In 2015, Leadership au Féminin saw 13 women fromseveral brands in France attend a specific event.
• Promoting a better work / life balance
The brands and Kering Corporate take initiatives toensure that Group policy directly benefits employees,both men and women, by promoting work / life balance.Kering also made this commitment official in 2014 bysigning the 15 commitments for work / life balanceintroduced by the French Ministry of Social Affairs, Healthand Women’s Rights in order to promote a managementculture that is more respectful of the private life of allemployees.
Ongoing brand initiatives to promote better work / lifebalance have been in place for several years, and newinitiatives are added regularly.
Kering Corporate France takes part in the approach byoffering women and men new ways of reconciling workand their personal lives: a telework pilot started inSeptember 2015 has been extended for several years owingto its success. In parallel, a Professional Life / Personal Lifeweb portal has been launched. Its purpose is to simplifythe daily lives of employees by giving them access to arange of information about life at work, leisure, 360°parenthood and administrative procedures. The portal,which can be accessed from the office or from home,also offers toll-free numbers to reserve temporarychildcare. Both initiatives are aimed at making it easierfor employees to strike a balance between their personaland professional lives.
Wellbeing@PUMA illustrates PUMA’s commitment tocontinuing to promote the welfare of parents working at
its headquarters in Germany. Further improvements weremade in 2015. They include two-week summer campsfor employees’ children (40 children in 2015), featuringsports and games supervised by qualified instructors,and cooperation with the Nuremberg city authority’sfamily welfare service. In addition to child minding, thecompany offers places in nurseries and retirementhomes. This programme is subject to a federalBeruf & Familie audit that rewards initiatives related to thedifferent phases of life.
Similarly, PUMA signed a company-level agreement ontele-working in 2014 to offer employees greater jobflexibility and thereby improve work / life balance. In 2015,440 employees at PUMA’s headquarters were providedwith equipment allowing them to work remotely.
In the United Kingdom, Stella McCartney and AlexanderMcQueen offer female employees more favourable parentalleave conditions than those imposed by law, maintainingtheir full salary for three to six months of leave. Bothbrands help young parents and employees withdependent parents through a partnership with My FamilyCare, which offers support and advice.
In the United States, Bottega Veneta has introduced anew family and sick leave policy, which is particularlyadvantageous in comparison with practices in the NorthAmerican market. Employees can (if they have at leastone year of service) take 12 weeks’ paid leave for thearrival of a child (birth or adoption), to take care of a sickfamily member or if a spouse in the military reserves iscalled to duty.
In Italy, since 2013, children of Pomellato employeesbetween the ages of six and ten have had the opportunityto attend a one- or two-week summer camp organisedby a school that gives English classes near Pomellato’shead office. In 2015, 11 children took advantage of thisoffer, which was paid for by Pomellato.
2.5.2. Promoting the integration of people with disabilities
As of December 31, 2015, the Kering group employed 379 workers with disabilities (rate of coverage: 82.2% – excluding the United Kingdom and the United States).
Kering has been committed to the integration of peoplewith disabilities for over 10 years. Its Mission Handicapproject, established in 2004, conducts regular campaignsagainst stereotypes and provides support for initiatives infavour of the employment of people with disabilities.
In 2015, Mission Handicap launched a global awarenesscampaign on the 360° intranet under the heading “Alldifferent, all competent”, timed to coincide with theEuropean week for the employment of disabled people.
3SUPPORTING OUR EMPLOYEES ~ SUSTAINABILITY
772015 Reference Document ~ Kering
03_VA_V5 06/04/2016 17:31 Page77
Providing its employees with a quality of life ensuring thehealth and safety of all is a fundamental duty performedby all of Kering’s brands. In 2010, the European WorksCouncil and Kering group’s management signed a“Charter framework of commitments on quality of life atwork and prevention of work-related stress”. In 2015,health, safety and the quality of working life were the keythrusts of Kering’s commitments under the Europeanagreement signed with the European Works Council onFebruary 19, 2015.
Within its framework, the brands are adopting proceduresand taking action to identify, assess, reduce and preventthe key risks associated with their activities. They are alsotaking initiatives designed to achieve continuous
improvements in the quality of working life. Kering has inturn undertaken to develop a working environment andworking relationships that ensure wellbeing at work inorder to promote the development of all employees andcontribute to the Group’s performance.
The in-house social climate survey carried out every twoyears, “What’s the weather like where you are?”, is a criticaltool for defining priorities as regards the quality of worklife. It serves to identify and assess the causes of stressand the sources of wellbeing at work, with questions onwork organisation, working conditions and the workenvironment, communication and subjective factors. Anew edition was launched in October 2015, covering allGroup employees.
2.6. Quality of life at work
Targeting all Group employees, the project was designedto foster the emergence of a culture of diversity andinclusion across all brands by showing disability in apositive and fun light. The campaign, focused on thetheme of skills recognition, included an exhibition ondisability throughout the world, practical information forthe right attitude to adopt with a disabled customer orcolleague, and an online quiz highlighting the names ofdisabled personalities.
The headquarters in France and the various brands werealso involved in this Group campaign, organising otherevents devoted to disability. The list includes apartnership with the organisation Accolade for itsplanned web documentary Look at Me for KeringCorporate, the production of bags from fabric offcuts bypeople working in vocational rehabilitation centres, withthe visit of seamstresses to their workshop, andawareness raising among retail staff at Balenciaga.
The Group’s brands in France and Italy also continue tooutsource to the sheltered sector to promote theemployment of people with disabilities. Special serviceproviders using workers recognised as disabled can beused for such services as printing, data entry, archiving,catering, preparing mailshots and responding to mail.Several brands outsource responses to unsolicitedapplications.
To create a pool of candidates, the brands continued theirpartnerships with institutional players and specialisedrecruiting firms. In France, Volcom participates twiceyearly in job dating sessions organised by the disabilitynetwork of the Bayonne Chamber of Commerce andIndustry, which presents CVs matching vacant positions.
2.5.3. Supporting young people fromdisadvantaged backgrounds and those struggling at school
In France, the Group is a founding partner of TélémaqueInstitute (created in 2005), which, through a dualprogramme of academic and business tutoring, helpstalented and motivated young people from underprivilegedbackgrounds complete their secondary schooling. In 2015,10 employees of the Group in France tutored studentsattending Télémaque middle school or high school. Theirrole is to help students – through feedback, meetings andevents – expand their sociocultural horizons and feelconfident and ambitious about their studies. At the endof October 2015, the Kering tutors and their students hadthe opportunity to visit Boucheron to learn about itshistory and heritage.
The brands are also actively involved in social responsibilityinitiatives. Boucheron has developed relationships withassociations that help young people, providing financialsupport and also involving employees who participatedin a sporting competition, as part of the Sport in the Cityinitiative for example.
3 SUSTAINABILITY ~ SUPPORTING OUR EMPLOYEES
78 Kering ~ 2015 Reference Document
03_VA_V5 06/04/2016 17:31 Page78
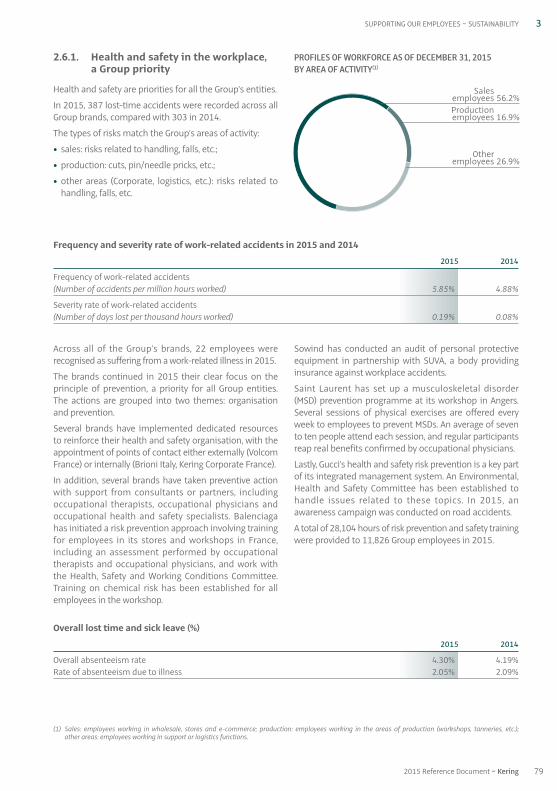
Overall lost time and sick leave (%)
2015 2014
Overall absenteeism rate 4.30% 4.19%Rate of absenteeism due to illness 2.05% 2.09%
Across all of the Group’s brands, 22 employees wererecognised as suffering from a work-related illness in 2015.
The brands continued in 2015 their clear focus on theprinciple of prevention, a priority for all Group entities.The actions are grouped into two themes: organisationand prevention.
Several brands have implemented dedicated resourcesto reinforce their health and safety organisation, with theappointment of points of contact either externally (VolcomFrance) or internally (Brioni Italy, Kering Corporate France).
In addition, several brands have taken preventive actionwith support from consultants or partners, includingoccupational therapists, occupational physicians andoccupational health and safety specialists. Balenciagahas initiated a risk prevention approach involving trainingfor employees in its stores and workshops in France,including an assessment performed by occupationaltherapists and occupational physicians, and work withthe Health, Safety and Working Conditions Committee.Training on chemical risk has been established for allemployees in the workshop.
Sowind has conducted an audit of personal protectiveequipment in partnership with SUVA, a body providinginsurance against workplace accidents.
Saint Laurent has set up a musculoskeletal disorder(MSD) prevention programme at its workshop in Angers.Several sessions of physical exercises are offered everyweek to employees to prevent MSDs. An average of sevento ten people attend each session, and regular participantsreap real benefits confirmed by occupational physicians.
Lastly, Gucci’s health and safety risk prevention is a key partof its integrated management system. An Environmental,Health and Safety Committee has been established tohandle issues related to these topics. In 2015, anawareness campaign was conducted on road accidents.
A total of 28,104 hours of risk prevention and safety trainingwere provided to 11,826 Group employees in 2015.
Frequency and severity rate of work-related accidents in 2015 and 2014
2015 2014
Frequency of work-related accidents(Number of accidents per million hours worked) 5.85% 4.88%
Severity rate of work-related accidents(Number of days lost per thousand hours worked) 0.19% 0.08%
2.6.1. Health and safety in the workplace, a Group priority
Health and safety are priorities for all the Group’s entities.
In 2015, 387 lost-time accidents were recorded across allGroup brands, compared with 303 in 2014.
The types of risks match the Group’s areas of activity:
• sales: risks related to handling, falls, etc.;
• production: cuts, pin / needle pricks, etc.;
• other areas (Corporate, logistics, etc.): risks related tohandling, falls, etc.
PROFILES OF WORKFORCE AS OF DECEMBER 31, 2015 BY AREA OF ACTIVITY(1)
3SUPPORTING OUR EMPLOYEES ~ SUSTAINABILITY
Sales 56.2%employees 56.2%Production 16.9%employees 16.9%
Other 26.9%employees 26.9%
(1) Sales: employees working in wholesale, stores and e-commerce; production: employees working in the areas of production (workshops, tanneries, etc.); other areas: employees working in support or logistics functions.
792015 Reference Document ~ Kering
03_VA_V5 06/04/2016 17:31 Page79
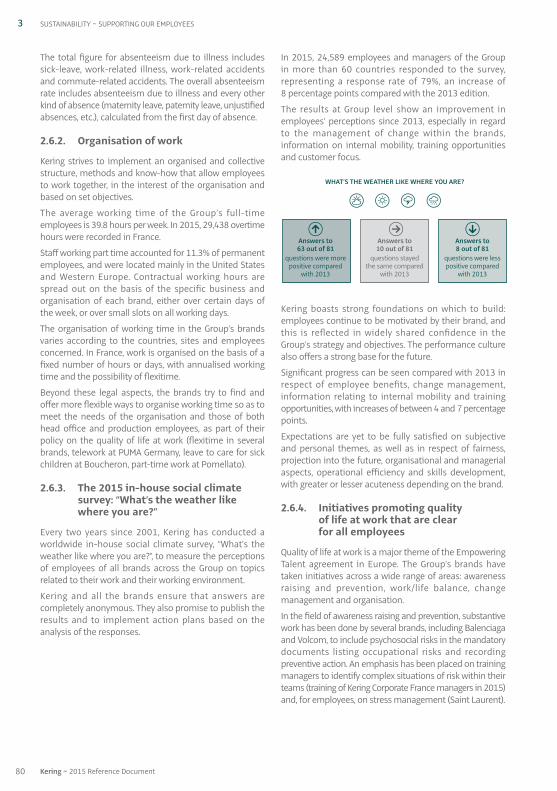
The total figure for absenteeism due to illness includessick-leave, work-related illness, work-related accidentsand commute-related accidents. The overall absenteeismrate includes absenteeism due to illness and every otherkind of absence (maternity leave, paternity leave, unjustifiedabsences, etc.), calculated from the first day of absence.
2.6.2. Organisation of work
Kering strives to implement an organised and collectivestructure, methods and know-how that allow employeesto work together, in the interest of the organisation andbased on set objectives.
The average working time of the Group’s full-timeemployees is 39.8 hours per week. In 2015, 29,438 overtimehours were recorded in France.
Staff working part time accounted for 11.3% of permanentemployees, and were located mainly in the United Statesand Western Europe. Contractual working hours arespread out on the basis of the specific business andorganisation of each brand, either over certain days ofthe week, or over small slots on all working days.
The organisation of working time in the Group’s brandsvaries according to the countries, sites and employeesconcerned. In France, work is organised on the basis of afixed number of hours or days, with annualised workingtime and the possibility of flexitime.
Beyond these legal aspects, the brands try to find andoffer more flexible ways to organise working time so as tomeet the needs of the organisation and those of bothhead office and production employees, as part of theirpolicy on the quality of life at work (flexitime in severalbrands, telework at PUMA Germany, leave to care for sickchildren at Boucheron, part-time work at Pomellato).
2.6.3. The 2015 in-house social climatesurvey: “What’s the weather likewhere you are?”
Every two years since 2001, Kering has conducted aworldwide in-house social climate survey, “What’s theweather like where you are?”, to measure the perceptionsof employees of all brands across the Group on topicsrelated to their work and their working environment.
Kering and all the brands ensure that answers arecompletely anonymous. They also promise to publish theresults and to implement action plans based on theanalysis of the responses.
In 2015, 24,589 employees and managers of the Group in more than 60 countries responded to the survey,representing a response rate of 79%, an increase of 8 percentage points compared with the 2013 edition.
The results at Group level show an improvement inemployees’ perceptions since 2013, especially in regardto the management of change within the brands,information on internal mobility, training opportunitiesand customer focus.
Kering boasts strong foundations on which to build:employees continue to be motivated by their brand, andthis is reflected in widely shared confidence in theGroup’s strategy and objectives. The performance culturealso offers a strong base for the future.
Significant progress can be seen compared with 2013 inrespect of employee benefits, change management,information relating to internal mobility and trainingopportunities, with increases of between 4 and 7 percentagepoints.
Expectations are yet to be fully satisfied on subjectiveand personal themes, as well as in respect of fairness,projection into the future, organisational and managerialaspects, operational efficiency and skills development,with greater or lesser acuteness depending on the brand.
2.6.4. Initiatives promoting quality of life at work that are clear for all employees
Quality of life at work is a major theme of the EmpoweringTalent agreement in Europe. The Group’s brands havetaken initiatives across a wide range of areas: awarenessraising and prevention, work / life balance, changemanagement and organisation.
In the field of awareness raising and prevention, substantivework has been done by several brands, including Balenciagaand Volcom, to include psychosocial risks in the mandatorydocuments listing occupational risks and recordingpreventive action. An emphasis has been placed on trainingmanagers to identify complex situations of risk within theirteams (training of Kering Corporate France managers in 2015)and, for employees, on stress management (Saint Laurent).
3 SUSTAINABILITY ~ SUPPORTING OUR EMPLOYEES
80 Kering ~ 2015 Reference Document
WHAT’S THE WEATHER LIKE WHERE YOU ARE?
Answers to63 out of 81
Answers to10 out of 81
Answers to8 out of 81
questions were morepositive compared
with 2013
questions stayedthe same compared
with 2013
questions were lesspositive compared
with 2013
03_VA_V5 06/04/2016 17:31 Page80
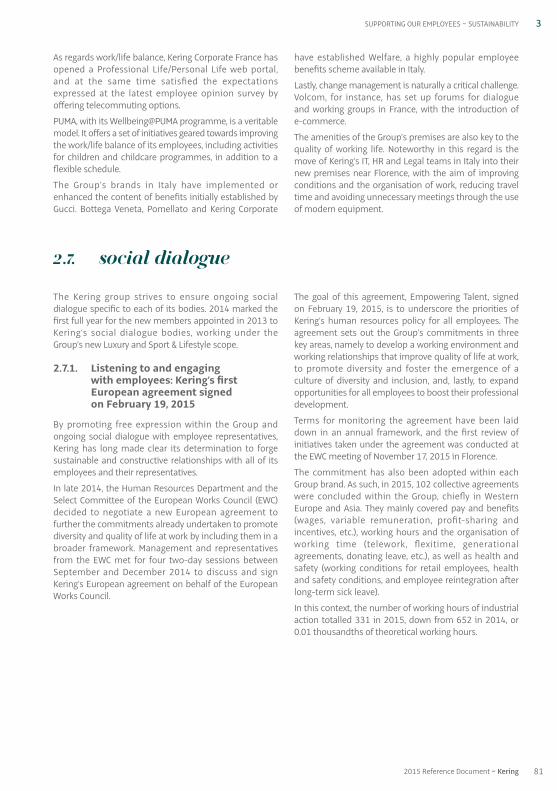
3SUPPORTING OUR EMPLOYEES ~ SUSTAINABILITY
812015 Reference Document ~ Kering
The Kering group strives to ensure ongoing socialdialogue specific to each of its bodies. 2014 marked thefirst full year for the new members appointed in 2013 toKering’s social dialogue bodies, working under theGroup’s new Luxury and Sport & Lifestyle scope.
2.7.1. Listening to and engaging with employees: Kering’s firstEuropean agreement signed on February 19, 2015
By promoting free expression within the Group andongoing social dialogue with employee representatives,Kering has long made clear its determination to forgesustainable and constructive relationships with all of itsemployees and their representatives.
In late 2014, the Human Resources Department and theSelect Committee of the European Works Council (EWC)decided to negotiate a new European agreement tofurther the commitments already undertaken to promotediversity and quality of life at work by including them in abroader framework. Management and representativesfrom the EWC met for four two-day sessions betweenSeptember and December 2014 to discuss and signKering’s European agreement on behalf of the EuropeanWorks Council.
The goal of this agreement, Empowering Talent, signedon February 19, 2015, is to underscore the priorities ofKering’s human resources policy for all employees. Theagreement sets out the Group’s commitments in threekey areas, namely to develop a working environment andworking relationships that improve quality of life at work,to promote diversity and foster the emergence of aculture of diversity and inclusion, and, lastly, to expandopportunities for all employees to boost their professionaldevelopment.
Terms for monitoring the agreement have been laiddown in an annual framework, and the first review ofinitiatives taken under the agreement was conducted atthe EWC meeting of November 17, 2015 in Florence.
The commitment has also been adopted within eachGroup brand. As such, in 2015, 102 collective agreementswere concluded within the Group, chiefly in WesternEurope and Asia. They mainly covered pay and benefits(wages, variable remuneration, profit-sharing andincentives, etc.), working hours and the organisation ofworking time (telework, flexitime, generationalagreements, donating leave, etc.), as well as health andsafety (working conditions for retail employees, healthand safety conditions, and employee reintegration afterlong-term sick leave).
In this context, the number of working hours of industrialaction totalled 331 in 2015, down from 652 in 2014, or0.01 thousandths of theoretical working hours.
2.7. Social dialogue
As regards work / life balance, Kering Corporate France hasopened a Professional Life / Personal Life web portal, and at the same time satisfied the expectationsexpressed at the latest employee opinion survey byoffering telecommuting options.
PUMA, with its Wellbeing@PUMA programme, is a veritablemodel. It offers a set of initiatives geared towards improvingthe work / life balance of its employees, including activitiesfor children and childcare programmes, in addition to aflexible schedule.
The Group’s brands in Italy have implemented orenhanced the content of benefits initially established byGucci. Bottega Veneta, Pomellato and Kering Corporate
have established Welfare, a highly popular employeebenefits scheme available in Italy.
Lastly, change management is naturally a critical challenge.Volcom, for instance, has set up forums for dialogue and working groups in France, with the introduction of e-commerce.
The amenities of the Group’s premises are also key to thequality of working life. Noteworthy in this regard is themove of Kering’s IT, HR and Legal teams in Italy into theirnew premises near Florence, with the aim of improvingconditions and the organisation of work, reducing traveltime and avoiding unnecessary meetings through the useof modern equipment.
03_VA_V5 06/04/2016 17:31 Page81
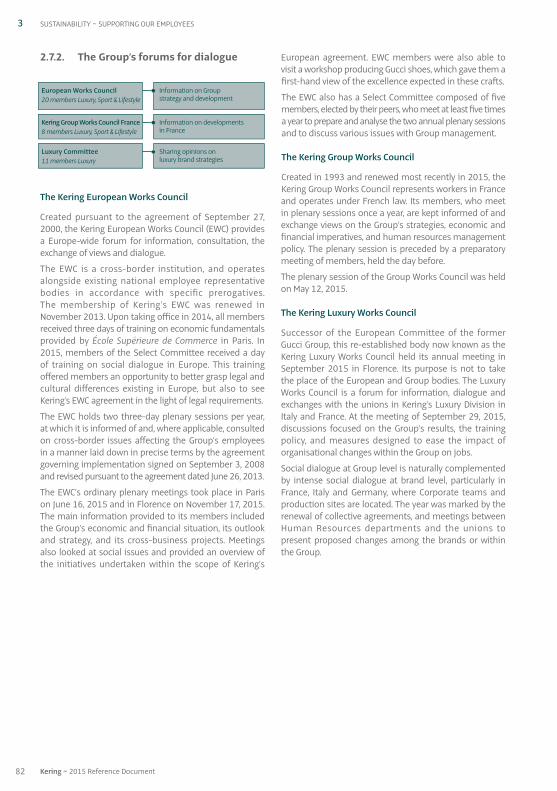
2.7.2. The Group’s forums for dialogue
The Kering European Works Council
Created pursuant to the agreement of September 27,2000, the Kering European Works Council (EWC) providesa Europe-wide forum for information, consultation, theexchange of views and dialogue.
The EWC is a cross-border institution, and operatesalongside existing national employee representativebodies in accordance with specific prerogatives. The membership of Kering’s EWC was renewed inNovember 2013. Upon taking office in 2014, all membersreceived three days of training on economic fundamentalsprovided by École Supérieure de Commerce in Paris. In2015, members of the Select Committee received a dayof training on social dialogue in Europe. This trainingoffered members an opportunity to better grasp legal andcultural differences existing in Europe, but also to seeKering’s EWC agreement in the light of legal requirements.
The EWC holds two three-day plenary sessions per year,at which it is informed of and, where applicable, consultedon cross-border issues affecting the Group’s employeesin a manner laid down in precise terms by the agreementgoverning implementation signed on September 3, 2008and revised pursuant to the agreement dated June 26, 2013.
The EWC’s ordinary plenary meetings took place in Parison June 16, 2015 and in Florence on November 17, 2015.The main information provided to its members includedthe Group’s economic and financial situation, its outlookand strategy, and its cross-business projects. Meetingsalso looked at social issues and provided an overview ofthe initiatives undertaken within the scope of Kering’s
European agreement. EWC members were also able tovisit a workshop producing Gucci shoes, which gave them afirst-hand view of the excellence expected in these crafts.
The EWC also has a Select Committee composed of fivemembers, elected by their peers, who meet at least five timesa year to prepare and analyse the two annual plenary sessionsand to discuss various issues with Group management.
The Kering Group Works Council
Created in 1993 and renewed most recently in 2015, theKering Group Works Council represents workers in Franceand operates under French law. Its members, who meetin plenary sessions once a year, are kept informed of andexchange views on the Group’s strategies, economic andfinancial imperatives, and human resources managementpolicy. The plenary session is preceded by a preparatorymeeting of members, held the day before.
The plenary session of the Group Works Council was heldon May 12, 2015.
The Kering Luxury Works Council
Successor of the European Committee of the formerGucci Group, this re-established body now known as theKering Luxury Works Council held its annual meeting inSeptember 2015 in Florence. Its purpose is not to takethe place of the European and Group bodies. The LuxuryWorks Council is a forum for information, dialogue andexchanges with the unions in Kering’s Luxury Division inItaly and France. At the meeting of September 29, 2015,discussions focused on the Group’s results, the trainingpolicy, and measures designed to ease the impact oforganisational changes within the Group on jobs.
Social dialogue at Group level is naturally complementedby intense social dialogue at brand level, particularly inFrance, Italy and Germany, where Corporate teams andproduction sites are located. The year was marked by therenewal of collective agreements, and meetings betweenHuman Resources departments and the unions topresent proposed changes among the brands or withinthe Group.
3 SUSTAINABILITY ~ SUPPORTING OUR EMPLOYEES
European Works Council20 members Luxury, Sport & Lifestyle
Kering Group Works Council France8 members Luxury, Sport & Lifestyle
Luxury Committee11 members Luxury
Information on Groupstrategy and development
Information on developmentsin France
Sharing opinions onluxury brand strategies
82 Kering ~ 2015 Reference Document
03_VA_V5 06/04/2016 17:31 Page82

3REDUCING OUR ENVIRONMENTAL IMPACT ~ SUSTAINABILITY
Strategy and objectives
In April 2012, Kering announced a set of ambitious targetsfor all Luxury and Sport & Lifestyle brands to achieve by2016. The main issues covered by these targets were thereduction of CO2 emissions, waste production and waterconsumption; responsible sourcing of raw materials,optimisation of the use of chemicals, paper and packaging,and last of all, the reinforcement of the compliance of thesupply chain on labour-related issues.
Since the publication of these targets in 2012, under thedirection of François-Henri Pinault, Chairman and ChiefExecutive Officer of the Group, the Group’s brands haveadopted roadmaps to track their progress on each target.This ongoing, collaborative process is used to prepare aninventory of all projects currently in progress and toidentify their contribution to the objectives. The brands’progress in relation to the roadmaps is measured againstmilestones at regular intervals by the Group’s ChiefSustainability Officer and the brand CEOs.
Sustainability is fully integrated to all aspects of theGroup’s business, and since 2005 it has been included inthe agenda of one of the quarterly Business Reviewsduring which each brand presents its roadmap to Keringexecutives, along with an overview of the resources it hasdedicated to sustainability and the progress made bytheir brand in this field.
Internal organisation for environmental management
The Kering Sustainability Department comprises around15 specialists tasked with planning the deployment ofGroup environmental policy on a daily basis and helpingthe brands identify priority focuses and implement theaction plans necessary for achieving the targets set by theGroup for 2016. To this end, Kering has provided its
brands with a set of tools such as the environmentalreporting system or the EP&L, as well as practicaldocuments laying down principles and guidelines aimedat helping the brands manage their environmentalimpacts. This is the case, for example, for energy and waterconsumption, waste treatment and raw material supplies.These tools are regularly updated and expanded to coverthe broadest range of subjects in view of the latest research.
Group-brand coordination of operations is ensured througha network of managers dedicated to sustainability issues,and each brand has at least a Sustainability Lead tospearhead the drive towards sustainability. In total, over50 people work on implementing sustainability policy atboth Group and brand level.
The brands have also set up in-house structures tocoordinate their sustainability policies and work towardsachieving their targets. Most of them have Green Teams,i.e., cross-cutting and collaborative bodies representingthe key departments involved in the deployment of thecompany’s sustainability projects. Highlights of 2015included:
• the establishment of a Green Team at Ulysse Nardin, abrand that recently joined the Group, whose first taskwas to draw up its roadmap (ethical sourcing of gold,energy conservation, etc.);
• the update of Gucci’s key sustainability policies;
• the performance by Volcom of a wide-ranging consultationof key stakeholders aimed at aligning the brand’ssustainability policy with the Group’s strategy;
• regular interaction at Saint Laurent between more than20 people belonging to various key brand functions(design studio, production, logistics, merchandising,human resources, sales, etc.) and regions with thebrand’s sustainability team.
3.1. Environmental management
The Kering group’s environmental strategy is based onfour key goals:
• maximize environmental strategy;
• make environmental concerns central to the activity ofthe brands by involving all stakeholders along the entirevalue chain;
• exceed mere compliance with legal environmentalobligations, through a macro-environment approachsuch as that of the EP&L;
• drive the Group’s sustainability leadership, through acollaborative approach that favours the sharing ofknowledge, progress and results with competitors andstakeholders.
3. Reducing our environmental impact
832015 Reference Document ~ Kering
03_VA_V5 06/04/2016 17:31 Page83

Environmental reporting is also backed up by a substantialglobal network of nearly 400 contributors working in theGroup’s brands. It guarantees optimal precision of thedata, and enables the Group to monitor its environmentalimpact and performance extremely closely.
Managing the network
The Sustainability Leads and the Kering SustainabilityDepartment meet monthly to coordinate deployment ofthe sustainability strategy and to share best practicesdeveloped at brand level. In addition to sharingexperiences, these meetings enable participants to drawup action plans to deal with cross-company issues withinthe Group, as well as more specific issues affectingindividual brands. Kering’s sustainability network, whichbrings together Corporate and brand teams, meetsphysically once every year for two days of working groupsand idea sharing. The 2015 Sustainability NetworkMeeting provided the forum for an update on actionstaken as part of the 2012-2016 sustainability strategyand to share preliminary ideas about the next stage.Jean-François Palus, Kering Deputy Chief Executive Officer,outlined the Group’s business strategy and growthoutlook to participants, while the Kering Human ResourcesDepartment presented the new Kering Leadership Model.
In 2015, Kering reinforced its Idea Labs, which are workinggroups bringing together experts and operational stafffrom several brands with a view to sharing knowledge,nurturing and structuring new ideas, and implementingpractical solutions, notably in terms of improving theenvironmental and social footprints of raw materialsupplies and controlling the use of harmful chemicals. In2015, eight Idea Labs involving a total of 50 employeesmet regularly around the following themes:
• leather;• fur;• gold;• diamonds;• chemicals.
And, newly created in 2015:
• precious skins;• wool, cashmere and other noble fibres;• silk.
In 2016, Kering plans to create new Idea Labs devoted tocotton, viscose and energy efficiency.
The Group also offers its brands tools to help them adoptthe best environmental management practices. TheSmart Sustainable Store, aimed at stores, provides a guideto best management practices in respect of energy, waste,paper, water and other resource consumption, packagingand shipping, as well as maintenance and servicing. It is available in six languages: English, French, Italian,Japanese, simplified Chinese and traditional Chinese. Amore detailed version is also available, focused on the life
cycles of stores and their fittings. A similar best practicesguide, entitled Smart Sustainable Office, was prepared in2015. Designed by Kering and the Group’s brands, this guideprovides office workers with solutions and recommendations,encouraging them to implement environmentally friendlypractices in their daily tasks. A checklist is also providedto help them monitor their progress. The guide is availablein English, French and Italian.
Informing and raising awareness among employees
As part of Kering’s policy of engaging all employees aroundits sustainability policies and making it part of the Group’scorporate culture, Kering regularly organises awarenessinitiatives and training.
The sustainability team gathers news on sustainabilitywithin the Group and circulates it through a variety ofmedia, including the Group’s intranet 360°. This sharedplatform contains a dedicated sustainability space whereemployees of all brands can exchange information onmulti-brand initiatives like the EP&L or individual brandroadmaps.
In addition, two internal newsletters dedicated tosustainability are circulated twice a month: SustainabilityMonitoring, which contains all national and internationalpress articles citing the achievements of Kering and itsbrands in favour of sustainability, and Regulatory Watch,which summarises the latest regulatory news in the fieldof sustainability.
Digital technology is regularly used to train employees in theuse of these tools. Five webinars were organised by theKering team to train and inform network members througha detailed presentation of Group-wide environmentalreporting objectives, guidelines and applications, as wellas the specifics of 2015. These webinars addressednetwork contributors and validators.
Four webinars designed for training in responsible sourcingwere also organised around the purchase of python skins,cotton, cashmere and wool, as well as nanotechnology. Eachof them attracted between 10 and 20 people, essentiallySustainability Leads and brand production managers.
Store sales consultants are also a prime target for trainingand awareness raising about Kering’s sustainabilitystrategy so that they act as effective spokespeople withcustomers. A specific guide entitled Sustainability in Retailwas drafted in 2015 for Kering and brand teams taskedwith training staff in customer relations. It is composed ofmodules covering the key raw materials used by the Group,and aims to help employees (and ultimately customers)understand where and how products are made, thechallenges facing the supply chain, their key impacts and the strategy implemented by Kering and the brandsto meet these challenges. The guide will be adapted byeach brand to reflect its own needs, and used as atraining tool for retail teams in 2016.
3 SUSTAINABILITY ~ REDUCING OUR ENVIRONMENTAL IMPACT
84 Kering ~ 2015 Reference Document
03_VA_V5 06/04/2016 17:31 Page84

3REDUCING OUR ENVIRONMENTAL IMPACT ~ SUSTAINABILITY
852015 Reference Document ~ Kering
The Kering Sustainability Awards are another ideal way ofraising awareness. Since 2010, the Awards have allowedGroup employees to showcase their sense of initiative,their creativity and their values. Launched inOctober 2014, the fifth edition of the Awards – completewith a dedicated website – allowed the Group’semployees to submit and vote for projects in thefollowing categories:
• product innovation;
• efficiency increase;
• stakeholder communication;
• community empowerment.
The winning projects were announced at a ceremonyheld on June 2, 2015 in Hong Kong , as part of theFashioning the Future event organized by Kering.François-Henri Pinault and Marie-Claire Daveu presidedover the ceremony, held for the first time in Asia, withboth internal and external stakeholders in attendance.The awards ceremony was preceded by Q&A sessionswith Francois-Henri Pinault, then Marie-Claire Daveu andDennis Chan, Chairman and Creative Director of Qeelin,who each testified to the close and growing link betweensustainability and fashion. The prize went to StellaMcCartney for its sustainable viscose project aimed atdeveloping a fully traceable and sustainable supply ofcellulose fibres. A material widely used in the brand’sready-to-wear collections. The manufacture of thesefibres from dissolving wood pulp represents a significantrisk in terms of deforestation. The awards ceremony wasfollowed by Caring Day on June 5, 2015. This event, heldto coincide with World Environment Day, seeks to raiseemployees’ awareness of environmental issues, with arange of activities organized at Kering headquarters, fromHong Kong to Paris.
The brands also determine their own initiatives aimed atraising their employees’ awareness and encouraging themto play a part. Saint Laurent uses various communicationchannels to raise employee awareness on sustainabilityissues: newsletters, intranet, talks by outside experts aspart of events, and one-hour training modules nowregularly organised ahead of new store openings inEurope and as part of the integration programme for newhires. Brioni has developed a training portal dedicated to
sustainability aimed at in-store staff. In addition, aconference on sustainability for the MerchandisingDepartment and buyers was organised to coincide withan internal showroom. In the same vein, three trainingsessions devoted to major sustainability challenges wereorganised for the Pomellato Green Team on the followingtopics: “What is sustainable business?”, “Measuringenvironmental impacts” and “The Kering Foundation forWomen’s Rights”. To coincide with World EnvironmentDay on June 5, Balenciaga conducted awareness-raisingcampaigns with its employees in France to reinforce thecommitment of all to protect the environment, and toencourage them to act in simple ways. For this, bestpractices allowing people to be “green in the office” werecirculated, and environmentally friendly bottles wereoffered to each employee in order to reduce consumptionof paper cups. These initiatives were also conducted withemployees of the Novara product development platformin Italy. At Gucci, an operational guide was prepared anddistributed to General Services managers to assist themin the implementation of good environmental practices.Gucci shares all key sustainability-related documentswith its employees through a new dedicated space on itsintranet. The brand also offers its employees specifictraining on topics such as RJC (Responsible JewelleryCouncil) certification and environmental reporting.Volcom, as part of its 2015 Earth Day campaign,organised a Surf -Yoga-Bike-Walk-Clean Up event foremployees on a beach near its premises. Meanwhile,Stella McCartney accompanied the release of each newcollection with a document highlighting the responsiblenature of its products (organic cotton, sustainable wool,FSC wood, recycled polyester, etc.). Such documents areshared with management and sales teams before thecollection’s launch. The brand also organises two annualawareness-raising meetings devoted to key elements ofsustainability for production teams and to fair trade forpurchasing teams. Lastly, Boucheron published a doublepage dedicated to sustainability in its winter 2014-2015Family Album, describing current projects on such topicsas ethical gold, RJC certification, or responsible practicesin the office.
03_VA_V5 07/04/2016 10:19 Page85
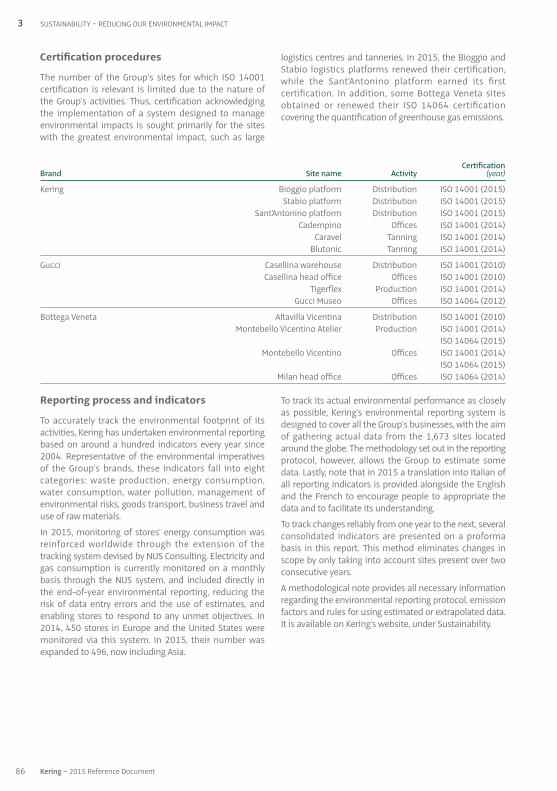
Reporting process and indicators
To accurately track the environmental footprint of itsactivities, Kering has undertaken environmental reportingbased on around a hundred indicators every year since2004. Representative of the environmental imperativesof the Group’s brands, these indicators fall into eightcategories: waste production, energy consumption, water consumption, water pollution, management ofenvironmental risks, goods transport, business travel anduse of raw materials.
In 2015, monitoring of stores’ energy consumption wasreinforced worldwide through the extension of thetracking system devised by NUS Consulting. Electricity andgas consumption is currently monitored on a monthlybasis through the NUS system, and included directly inthe end-of-year environmental reporting, reducing therisk of data entry errors and the use of estimates, andenabling stores to respond to any unmet objectives. In2014, 450 stores in Europe and the United States weremonitored via this system. In 2015, their number wasexpanded to 496, now including Asia.
To track its actual environmental performance as closelyas possible, Kering’s environmental reporting system isdesigned to cover all the Group’s businesses, with the aimof gathering actual data from the 1,673 sites locatedaround the globe. The methodology set out in the reportingprotocol, however, allows the Group to estimate somedata. Lastly, note that in 2015 a translation into Italian ofall reporting indicators is provided alongside the Englishand the French to encourage people to appropriate thedata and to facilitate its understanding.
To track changes reliably from one year to the next, severalconsolidated indicators are presented on a proformabasis in this report. This method eliminates changes inscope by only taking into account sites present over twoconsecutive years.
A methodological note provides all necessary informationregarding the environmental reporting protocol, emissionfactors and rules for using estimated or extrapolated data.It is available on Kering’s website, under Sustainability.
CertificationBrand Site name Activity (year)
Kering Bioggio platform Distribution ISO 14001 (2015) Stabio platform Distribution ISO 14001 (2015) Sant’Antonino platform Distribution ISO 14001 (2015) Cadempino Offices ISO 14001 (2014) Caravel Tanning ISO 14001 (2014) Blutonic Tanning ISO 14001 (2014)
Gucci Casellina warehouse Distribution ISO 14001 (2010) Casellina head office Offices ISO 14001 (2010) Tigerflex Production ISO 14001 (2014) Gucci Museo Offices ISO 14064 (2012)
Bottega Veneta Altavilla Vicentina Distribution ISO 14001 (2010) Montebello Vicentino Atelier Production ISO 14001 (2014) ISO 14064 (2015) Montebello Vicentino Offices ISO 14001 (2014) ISO 14064 (2015) Milan head office Offices ISO 14064 (2014)
Certification procedures
The number of the Group’s sites for which ISO 14001certification is relevant is limited due to the nature of the Group’s activities. Thus, certification acknowledgingthe implementation of a system designed to manageenvironmental impacts is sought primarily for the siteswith the greatest environmental impact, such as large
logistics centres and tanneries. In 2015, the Bioggio andStabio logistics platforms renewed their certification,while the Sant’Antonino platform earned its firstcertification. In addition, some Bottega Veneta sitesobtained or renewed their ISO 14064 certificationcovering the quantification of greenhouse gas emissions.
3 SUSTAINABILITY ~ REDUCING OUR ENVIRONMENTAL IMPACT
86 Kering ~ 2015 Reference Document
03_VA_V5 06/04/2016 17:31 Page86
3REDUCING OUR ENVIRONMENTAL IMPACT ~ SUSTAINABILITY
Since 2012, Kering has been working on the creation anddeployment of its Environmental Profit and Loss account(EP&L), the stated objective given in 2012 being to cover100% of the Group’s activities by 2015. In 2013, sixbrands were covered by the EP&L (on the basis of their2012 data), which allowed the Group to report thefindings of the project in relation to 73% of the Group’s2012 revenue. Kering successfully covered all of itsactivities(1) in 2013. In 2015, the Group renewed the processon the 2013 data. Having two consecutive years of resultscovering the Group’s entire scope will allow Kering tomeasure trends in its environmental performance goingforward.
In 2015, Kering worked on three major projects: thepublication of its results for 2013 and 2014, thestandardisation of its calculations and methodology, and,lastly, widespread sharing of its methodology and itslessons with its peers.
In May 2015, Kering released the results of its EP&L(based on 2013 data) at a press conference. At this time,Kering also shared its methodology, with a view toencouraging other companies to adopt a natural capitalaccounting approach. A few months later, in November2015, a new report outlining the EP&L based on the Group’s2014 results was published, and discussed during a Twitterchat. The publication of the results of natural capitalaccounting for two consecutive years was a world first.
The results were the subject of detailed reports availableon the kering.com website in the Sustainability section.
The EP&L is intended to serve as a decision-making toolto spur the Group’s sustainability projects and guide theday-to-day choices of decision-makers, with the ultimategoal of reducing and limiting the environmental impact ofboth Kering and its supply chains. Kering has developedcalculation software that allows users to determine theenvironmental footprint of its operations in the space ofminutes – not counting the time needed to gather thedata for the preparation of the EP&L – as opposed to effortsspanning several months before. The standardisation ofthe calculation process is intended to allow betterappropriation of the subject by operational teams, whichcan compare the impact of their decisions much morequickly. 2016 will see a continuation of these efforts andthe implementation of software developed to simulateand visualise the impacts of different scenarios (changein sourcing, improvement in the efficiency of productionprocesses, use of a different raw material, etc.). The EP&Lwill then be able to take its place among the standarddecision-making tools used by Kering’s brands.
The results and lessons of the EP&L were widely sharedand clarified by Kering in 2015. Internally, all Group brandsraised awareness among their key decision-makers(Executive Committee members, design studio, buyers, etc.)as to the main lessons of the EP&L, and above all thevarious decisions that can help improve results. Keringalso shared its experience with several partners duringthe year, including the WBCSD, the European Union, theWorld Climate Summit during COP21, the RI EuropeConference, the CBD Business & Biodiversity Forum, theSustainable Leaders Forum, the Systems Thinking roundtable organised by The Guardian, the French Ministry forthe Environment and Sustainability, the BLC Leather &Sustainability in Retail Conference, the Leather WorkingGroup, the École des Mines de Paris and the Tata Group.
Additionally, through its participation in the TechnicalGroup of the Natural Capital Coalition, Kering contributed tothe creation of the working version of the Natural CapitalProtocol, which will give rise to a final version in May 2016.
What is an EP&L?
The EP&L is an innovative tool designed to assess impactsand reliance on natural resources. It makes it possible toattribute a monetary value to the consequences onpopulation groups of the Company’s environmentalimpacts throughout its supply chain. The use of a singleunit for all types of impact makes it possible to compare,and as such prioritise them. It is a vital tool in reducingimpacts by efficiently prioritising action in areas wherethe prospective return on investment is most promising.
The results of the EP&L allow the Group to:
• translate its environmental impacts into a language ofbusiness;
• compare different environmental impacts with eachother, which was not directly possible previously;
• compare the magnitude of the impact of production orsourcing of raw materials in each location (this isparticularly relevant to the availability of fresh waterresources which is specific to each location);
• facilitate comparisons between its brands and businessunits.
Although the process is conducted in a world wherecompanies do not have to bear the cost of their negativeexternalities, Kering believes that responsible businessesneed to minimise their impact on natural resources. Moreover,many of the lessons provided by the EP&L foster a betterunderstanding and improved management by Kering ofdifficulties in the supply of essential raw materials for itsproducts, taking into account their region of origin.
3.2. Environmental Profit & Loss account (EP&L)
(1) Excluding the Bottega Veneta furniture and Brandon activities (0.4% of consolidated revenue). Licensed activities (fragrances, cosmetics and eyewear) are notpart of the consolidation scope (Kering does not have operational control).
872015 Reference Document ~ Kering
03_VA_V5 07/04/2016 10:19 Page87
The results should not be seen as a liability or a cost forKering. Rather, they represent a new way of assessing thecost for society of environmental changes stemmingfrom the activities of the Group and its suppliers. As thisfield of accounting is very new, it is important to note thatno official standards have been proposed to estimate allof these values.
Why develop an EP&L?
For Kering and its brands, the EP&L represents a new wayof looking at its activities. It reveals areas for improvementwhere the Group can deploy solutions, using innovativenew technologies and materials that significantly reducethe environmental impact caused by the way in whichraw materials are processed and goods manufactured. Ithelps to show:
• the source of key environmental impacts: the EP&Ldeepens the understanding of comparisons betweenenvironmental impacts. Quantifying and valuing allenvironmental impacts in financial terms can helpshape decisions between different types of impactsand their location, and ultimately the choice of materialsand technologies;
• the variety and complexity of the Group’s operationsand its supply chains: the Group has used its EP&Lapproach to survey over a thousand key suppliers onfive continents, ranging from product assembly tosuppliers of raw materials, including notably silkwormfarms in China, textile workshops in Asia, sheep farmsin Argentina and tanneries in Italy. Working withsuppliers and helping them better manage their ownenvironmental challenges has strengthened theGroup’s relationships with key suppliers and contributedto securing its supply of key raw materials;
• the impact of the Group’s decisions: sharing theresults and lessons learned with the Group’s variousdepartments has fostered awareness of the potentialimpact and consequences a single decision can haveon the other side of the planet. The EP&L also providesa straightforward methodology for assessing theenvironmental performance of the Group’s projectsand investments, and for setting the Group’s prioritiesso that it can minimise its environmental impact asmuch as possible.
Summary of the methodology
The EP&L approach goes beyond standard environmentalreporting, producing a much fuller picture of the impactsof Kering’s activities.
3 SUSTAINABILITY ~ REDUCING OUR ENVIRONMENTAL IMPACT
88 Kering ~ 2015 Reference Document
03_VA_V5 06/04/2016 17:31 Page88
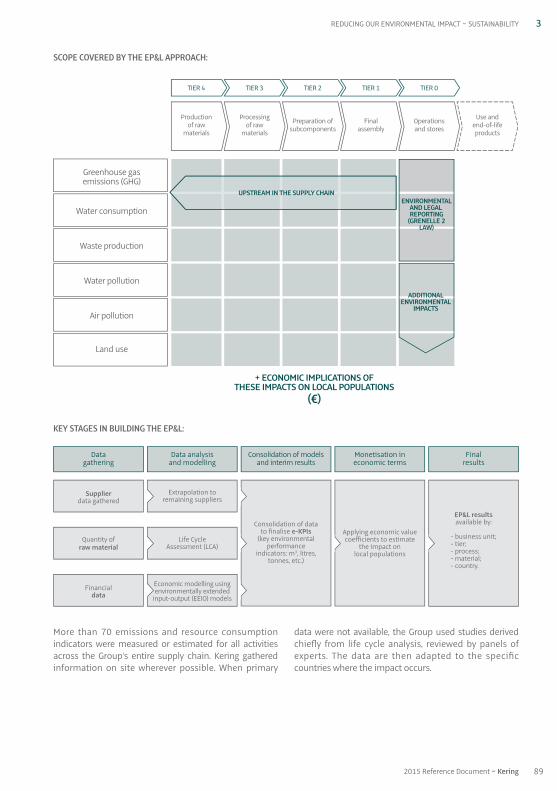
3REDUCING OUR ENVIRONMENTAL IMPACT ~ SUSTAINABILITY
More than 70 emissions and resource consumptionindicators were measured or estimated for all activitiesacross the Group’s entire supply chain. Kering gatheredinformation on site wherever possible. When primary
data were not available, the Group used studies derivedchiefly from life cycle analysis, reviewed by panels ofexperts. The data are then adapted to the specificcountries where the impact occurs.
KEY STAGES IN BUILDING THE EP&L:
SCOPE COVERED BY THE EP&L APPROACH:
Productionof rawmaterials
Greenhouse gasemissions (GHG)
Water consumption
Waste production
Water pollution
Air pollution
Land use
Processingof rawmaterials
Preparation ofsubcomponents
Finalassembly
Operationsand stores
Use andend-of-lifeproducts
UPSTREAM IN THE SUPPLY CHAIN
+ ECONOMIC IMPLICATIONS OFTHESE IMPACTS ON LOCAL POPULATIONS
(€)
ENVIRONMENTALAND LEGAL REPORTING
(GRENELLE 2LAW)
ADDITIONALENVIRONMENTAL
IMPACTS
TIER 4 TIER 3 TIER 2 TIER 1 TIER 0
Datagathering
Data analysisand modelling
Consolidation of modelsand interim results
Monetisation ineconomic terms
EP&L resultsavailable by:
Finalresults
- business unit;- tier;- process;- material;- country.
Applying economic valuecoefficients to estimate
the impact onlocal populations
Consolidation of datato finalise e-KPIs
(key environmentalperformance
indicators: m3, litres,tonnes, etc.)
Extrapolation toremaining suppliers
Life CycleAssessment (LCA)
Economic modelling usingenvironmentally extendedinput-output (EEIO) models
Quantity ofraw material
Financialdata
Supplierdata gathered
892015 Reference Document ~ Kering
03_VA_V5 06/04/2016 17:31 Page89
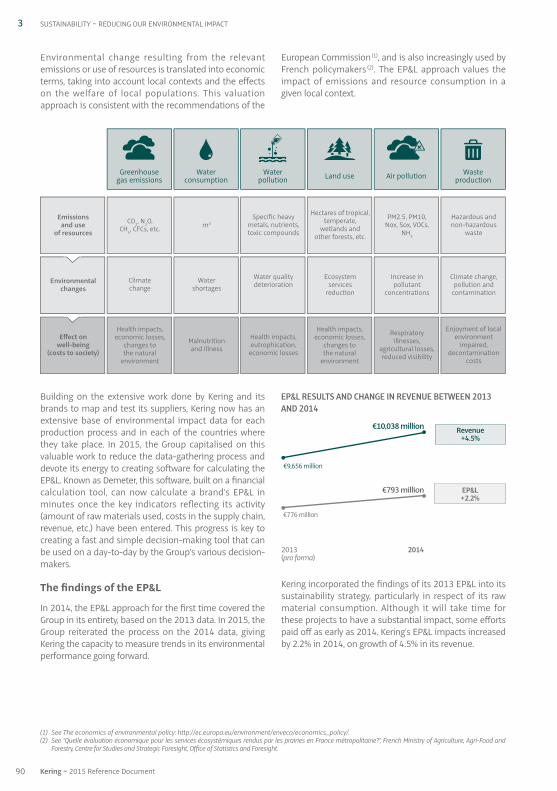
Building on the extensive work done by Kering and itsbrands to map and test its suppliers, Kering now has anextensive base of environmental impact data for eachproduction process and in each of the countries wherethey take place. In 2015, the Group capitalised on thisvaluable work to reduce the data-gathering process anddevote its energy to creating software for calculating theEP&L. Known as Demeter, this software, built on a financialcalculation tool, can now calculate a brand’s EP&L inminutes once the key indicators reflecting its activity(amount of raw materials used, costs in the supply chain,revenue, etc.) have been entered. This progress is key tocreating a fast and simple decision-making tool that canbe used on a day-to-day by the Group’s various decision-makers.
The findings of the EP&L
In 2014, the EP&L approach for the first time covered theGroup in its entirety, based on the 2013 data. In 2015, theGroup reiterated the process on the 2014 data, givingKering the capacity to measure trends in its environmentalperformance going forward.
EP&L RESULTS AND CHANGE IN REVENUE BETWEEN 2013AND 2014
Kering incorporated the findings of its 2013 EP&L into itssustainability strategy, particularly in respect of its rawmaterial consumption. Although it will take time forthese projects to have a substantial impact, some effortspaid off as early as 2014. Kering’s EP&L impacts increasedby 2.2% in 2014, on growth of 4.5% in its revenue.
Environmental change resulting from the relevantemissions or use of resources is translated into economicterms, taking into account local contexts and the effectson the welfare of local populations. This valuationapproach is consistent with the recommendations of the
European Commission(1), and is also increasingly used byFrench policymakers (2). The EP&L approach values theimpact of emissions and resource consumption in agiven local context.
3 SUSTAINABILITY ~ REDUCING OUR ENVIRONMENTAL IMPACT
Greenhousegas emissions
Effect onwell-being
(costs to society)
Waterconsumption
Waterpollution Land use Air pollution Waste
production
Environmentalchanges
Health impacts,economic losses,
changes tothe natural
environment
Climatechange
CO2, N2O,CH4, CFCs, etc.
Malnutritionand illness
Watershortages
m3
Health impacts,eutrophication,
economic losses
Water qualitydeterioration
Specific heavymetals, nutrients,toxic compounds
Ecosystemservicesreduction
Hectares of tropical,temperate,
wetlands andother forests, etc.
Respiratoryillnesses,
agricultural losses,reduced visibility
Increase inpollutant
concentrations
PM2.5, PM10,Nox, Sox, VOCs,
NH3
Enjoyment of localenvironmentimpaired,
decontaminationcosts
Climate change,pollution and
contamination
Hazardous andnon-hazardous
waste
Health impacts,economic losses,
changes tothe natural
environment
Emissionsand use
of resources
2013(pro forma)
2014
€10,038 million
€9,656 million
Revenue+4.5%
€793 million
€776 million
EP&L+2.2%
(1) See The economics of environmental policy: http://ec.europa.eu/environment/enveco/economics_policy/.(2) See “Quelle évaluation économique pour les services écosystémiques rendus par les prairies en France métropolitaine?”, French Ministry of Agriculture, Agri-Food and
Forestry, Centre for Studies and Strategic Foresight, Office of Statistics and Foresight.
90 Kering ~ 2015 Reference Document
03_VA_V5 06/04/2016 17:31 Page90

3REDUCING OUR ENVIRONMENTAL IMPACT ~ SUSTAINABILITY
The production of raw materials (T4) and their processing(T3) generated the biggest impacts in Kering’s 2014 EP&L,together representing more than 75% of total impacts.Similarly, water pollution, greenhouse gas (GHG)emissions and land use account for 76% of the Group’simpacts. This mapping, virtually unchanged compared
with 2013, shows the typical profile of the impact ofKering’s activities.
The details of the environmental impacts of rawmaterials shed particular light on the Group’s activitiesgenerating the biggest Tier 3 and Tier 4 impacts.
The EP&L allows us to map the following impacts:
THE KERING GROUP’S 2014 EP&L BY TIER AND ENVIRONMENTAL IMPACT:
The improved energy efficiency (Tier 0 in the EP&L) ofKering’s sites enabled the Group to reduce its footprint.Also, the Group’s support of key direct suppliers is startingto pay off, as the impact of textile factories is diminishing.For raw materials, although the substitution of certain
metals by less polluting plastics and the deployment ofresponsible sourcing projects have allowed Kering toreduce its environmental impact at constant revenue, theeffort has not been sufficient to fully offset growth in theGroup’s manufacturing volume.
CHANGE IN KERING’S EP&L RESULTS BETWEEN 2013 AND 2014 (IN € MILLIONS)
2014
793-2776 +15-9
+12
OtherManufacturingefficiency
improvement
Operationsand stores
2013(proforma)
Raw materialproduction &processing
Increasedmanufacturing
volume
+1
Decrease in impactIncrease in impact
Air pollution9.5%
Greenhouse gasemissions 36.4%
Land use28.2%
Waste production5.1%
Water consumption10.1%
Water pollution10.7%
Tier 06.6%
Tier 114.1%
Tier 24.6%
Tier 325.5%
Tier 449.1%
912015 Reference Document ~ Kering
03_VA_V5 06/04/2016 17:31 Page91
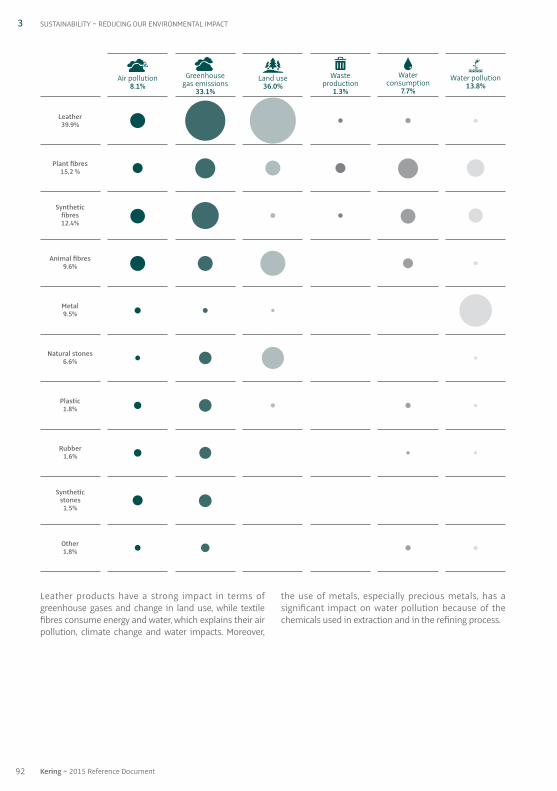
Leather products have a strong impact in terms ofgreenhouse gases and change in land use, while textilefibres consume energy and water, which explains their airpollution, climate change and water impacts. Moreover,
the use of metals, especially precious metals, has asignificant impact on water pollution because of thechemicals used in extraction and in the refining process.
3 SUSTAINABILITY ~ REDUCING OUR ENVIRONMENTAL IMPACT
Leather39.9%
Plant fibres15,2 %
Syntheticfibres12.4%
Animal fibres9.6%
Metal9.5%
Natural stones6.6%
Plastic1.8%
Rubber1.6%
Other1.8%
Syntheticstones1.5%
Air pollution8.1%
Greenhousegas emissions
33.1%
Land use36.0%
Wasteproduction
1.3%
Waterconsumption
7.7%
Water pollution13.8%
92 Kering ~ 2015 Reference Document
03_VA_V5 06/04/2016 17:31 Page92
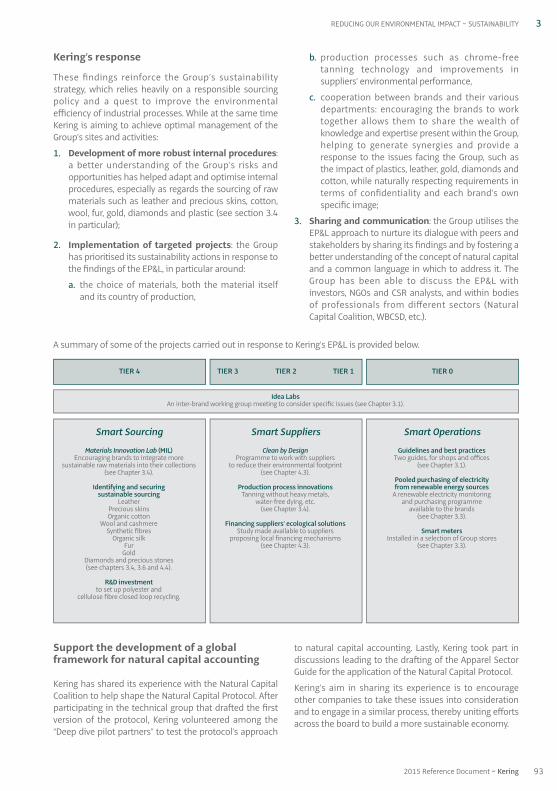
3REDUCING OUR ENVIRONMENTAL IMPACT ~ SUSTAINABILITY
Support the development of a globalframework for natural capital accounting
Kering has shared its experience with the Natural CapitalCoalition to help shape the Natural Capital Protocol. Afterparticipating in the technical group that drafted the firstversion of the protocol, Kering volunteered among the“Deep dive pilot partners” to test the protocol’s approach
to natural capital accounting. Lastly, Kering took part indiscussions leading to the drafting of the Apparel SectorGuide for the application of the Natural Capital Protocol.
Kering’s aim in sharing its experience is to encourageother companies to take these issues into considerationand to engage in a similar process, thereby uniting effortsacross the board to build a more sustainable economy.
A summary of some of the projects carried out in response to Kering’s EP&L is provided below.
Kering’s response
These findings reinforce the Group’s sustainabilitystrategy, which relies heavily on a responsible sourcingpolicy and a quest to improve the environmentalefficiency of industrial processes. While at the same timeKering is aiming to achieve optimal management of theGroup’s sites and activities:
1. Development of more robust internal procedures:a better understanding of the Group’s risks andopportunities has helped adapt and optimise internalprocedures, especially as regards the sourcing of rawmaterials such as leather and precious skins, cotton,wool, fur, gold, diamonds and plastic (see section 3.4in particular);
2. Implementation of targeted projects: the Grouphas prioritised its sustainability actions in response tothe findings of the EP&L, in particular around:
a. the choice of materials, both the material itselfand its country of production,
b. production processes such as chrome-freetanning technology and improvements insuppliers’ environmental performance,
c. cooperation between brands and their variousdepartments: encouraging the brands to worktogether allows them to share the wealth ofknowledge and expertise present within the Group,helping to generate synergies and provide aresponse to the issues facing the Group, such asthe impact of plastics, leather, gold, diamonds andcotton, while naturally respecting requirements interms of confidentiality and each brand’s ownspecific image;
3. Sharing and communication: the Group utilises theEP&L approach to nurture its dialogue with peers andstakeholders by sharing its findings and by fostering abetter understanding of the concept of natural capitaland a common language in which to address it. TheGroup has been able to discuss the EP&L withinvestors, NGOs and CSR analysts, and within bodiesof professionals from different sectors (NaturalCapital Coalition, WBCSD, etc.).
TIER 4 TIER 3 TIER 2 TIER 1 TIER 0
Smart Sourcing
Materials Innovation Lab (MIL)Encouraging brands to integrate more
sustainable raw materials into their collections(see Chapter 3.4).
Identifying and securingsustainable sourcing
LeatherPrecious skinsOrganic cotton
Wool and cashmereSynthetic fibres
Organic silkFur
GoldDiamonds and precious stones(see chapters 3.4, 3.6 and 4.4).
R&D investment to set up polyester and
cellulose fibre closed loop recycling.
Idea Labs An inter-brand working group meeting to consider specific issues (see Chapter 3.1).
Clean by DesignProgramme to work with suppliers
to reduce their environmental footprint(see Chapter 4.3).
Production process innovationsTanning without heavy metals,
water-free dying, etc.(see Chapter 3.4).
Financing suppliers’ ecological solutionsStudy made available to suppliers
proposing local financing mechanisms(see Chapter 4.3).
Guidelines and best practicesTwo guides, for shops and offices
(see Chapter 3.1).
Pooled purchasing of electricityfrom renewable energy sourcesA renewable electricity monitoringand purchasing programmeavailable to the brands
(see Chapter 3.3).
Smart metersInstalled in a selection of Group stores
(see Chapter 3.3).
Smart Suppliers Smart Operations
932015 Reference Document ~ Kering
03_VA_V5 06/04/2016 17:31 Page93
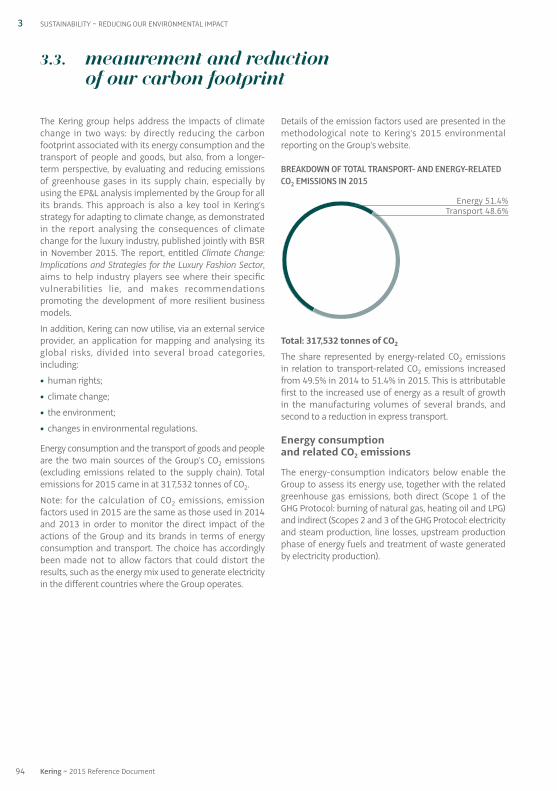
The Kering group helps address the impacts of climatechange in two ways: by directly reducing the carbonfootprint associated with its energy consumption and thetransport of people and goods, but also, from a longer-term perspective, by evaluating and reducing emissionsof greenhouse gases in its supply chain, especially byusing the EP&L analysis implemented by the Group for allits brands. This approach is also a key tool in Kering’sstrategy for adapting to climate change, as demonstratedin the report analysing the consequences of climatechange for the luxury industry, published jointly with BSRin November 2015. The report, entitled Climate Change:Implications and Strategies for the Luxury Fashion Sector,aims to help industry players see where their specificvulnerabilities lie, and makes recommendationspromoting the development of more resilient businessmodels.
In addition, Kering can now utilise, via an external serviceprovider, an application for mapping and analysing itsglobal risks, divided into several broad categories,including:
• human rights;
• climate change;
• the environment;
• changes in environmental regulations.
Energy consumption and the transport of goods and peopleare the two main sources of the Group’s CO2 emissions(excluding emissions related to the supply chain). Totalemissions for 2015 came in at 317,532 tonnes of CO2.
Note: for the calculation of CO2 emissions, emissionfactors used in 2015 are the same as those used in 2014and 2013 in order to monitor the direct impact of theactions of the Group and its brands in terms of energyconsumption and transport. The choice has accordinglybeen made not to allow factors that could distort theresults, such as the energy mix used to generate electricityin the different countries where the Group operates.
Details of the emission factors used are presented in themethodological note to Kering’s 2015 environmentalreporting on the Group’s website.
BREAKDOWN OF TOTAL TRANSPORT- AND ENERGY-RELATEDCO2 EMISSIONS IN 2015
Total: 317,532 tonnes of CO2
The share represented by energy-related CO2 emissionsin relation to transport-related CO2 emissions increasedfrom 49.5% in 2014 to 51.4% in 2015. This is attributablefirst to the increased use of energy as a result of growthin the manufacturing volumes of several brands, andsecond to a reduction in express transport.
Energy consumption and related CO2 emissions
The energy-consumption indicators below enable theGroup to assess its energy use, together with the relatedgreenhouse gas emissions, both direct (Scope 1 of theGHG Protocol: burning of natural gas, heating oil and LPG)and indirect (Scopes 2 and 3 of the GHG Protocol: electricityand steam production, line losses, upstream productionphase of energy fuels and treatment of waste generatedby electricity production).
3.3. Measurement and reduction of our carbon footprint
3 SUSTAINABILITY ~ REDUCING OUR ENVIRONMENTAL IMPACT
94 Kering ~ 2015 Reference Document
Energy 51.4%Transport 48.6%
03_VA_V5 06/04/2016 17:31 Page94
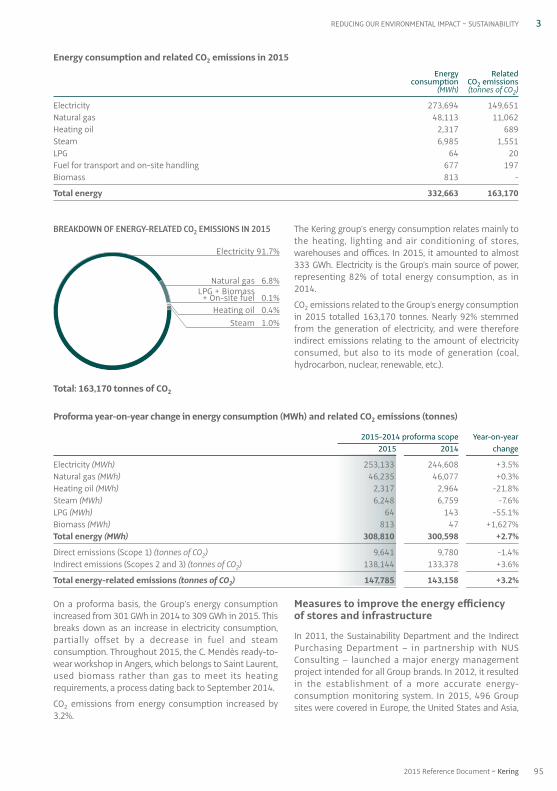
3REDUCING OUR ENVIRONMENTAL IMPACT ~ SUSTAINABILITY
952015 Reference Document ~ Kering
On a proforma basis, the Group’s energy consumptionincreased from 301 GWh in 2014 to 309 GWh in 2015. Thisbreaks down as an increase in electricity consumption,partially offset by a decrease in fuel and steamconsumption. Throughout 2015, the C. Mendès ready-to-wear workshop in Angers, which belongs to Saint Laurent,used biomass rather than gas to meet its heatingrequirements, a process dating back to September 2014.
CO2 emissions from energy consumption increased by3.2%.
Measures to improve the energy efficiency of stores and infrastructure
In 2011, the Sustainability Department and the IndirectPurchasing Department – in partnership with NUSConsulting – launched a major energy managementproject intended for all Group brands. In 2012, it resultedin the establishment of a more accurate energy-consumption monitoring system. In 2015, 496 Groupsites were covered in Europe, the United States and Asia,
Proforma year-on-year change in energy consumption (MWh) and related CO2 emissions (tonnes)
20 15-20 14 proforma scope Year-on-year 20 15 20 14 change
Electricity (MWh) 253,133 244,608 +3.5%Natural gas (MWh) 46,235 46,077 +0.3%Heating oil (MWh) 2,317 2,964 -21.8%Steam (MWh) 6,248 6,759 -7.6%LPG (MWh) 64 143 -55.1%Biomass (MWh) 813 47 +1,627%Total energy (MWh) 308,810 300,598 +2.7%
Direct emissions (Scope 1) (tonnes of CO2) 9,641 9,780 -1.4%Indirect emissions (Scopes 2 and 3) (tonnes of CO2) 138,144 133,378 +3.6%
Total energy-related emissions (tonnes of CO2) 147,785 143,158 +3.2%
BREAKDOWN OF ENERGY-RELATED CO2 EMISSIONS IN 2015
Total: 163,170 tonnes of CO2
The Kering group’s energy consumption relates mainly tothe heating, lighting and air conditioning of stores,warehouses and offices. In 2015, it amounted to almost333 GWh. Electricity is the Group’s main source of power,representing 82% of total energy consumption, as in2014.
CO2 emissions related to the Group’s energy consumptionin 2015 totalled 163,170 tonnes. Nearly 92% stemmedfrom the generation of electricity, and were thereforeindirect emissions relating to the amount of electricityconsumed, but also to its mode of generation (coal,hydrocarbon, nuclear, renewable, etc.).
Energy consumption and related CO2 emissions in 2015
Energy Related consumption CO2 emissions (MWh) (tonnes of CO2)
Electricity 273,694 149,651Natural gas 48,113 11,062Heating oil 2,317 689Steam 6,985 1,551LPG 64 20Fuel for transport and on-site handling 677 197Biomass 813 -
Total energy 332,663 163,170
Electricity 91.7%
LPG + Biomass 0.1% + On-site fuel 0.1%
Natural gas 6.8%
Heating oil 0.4%Steam 1.0%
03_VA_V5 06/04/2016 17:31 Page95
46 more than in 2014. The project focuses on streamliningthe energy procurement process by pooling andconsolidating energy consumption, increasing the use ofrenewable energy and centralising energy procurementmanagement. The project has generated tangible energysavings and cost reductions for the Group. A module thattrains people how to use this energy management toolhas been deployed in most brands, aimed above all atfacility managers.
To achieve further improvement, sub-metering of differenttypes of consumption (lighting, air conditioning, etc.) wasimplemented at the end of 2013 in six Parisian pilotstores in partnership with Schneider Electric. The Parisianflagships of Saint Laurent, Bottega Veneta, Boucheron,PUMA, Balenciaga and Stella McCartney were chosen forthe project. The initial analysis of energy consumptionmonitored in real time has highlighted the most energy-intensive items and areas, and identified store managementbest practices to optimise both energy performance andcomfort. The study has identified a potential 5% to 20%reduction in energy costs, depending on the site, whichcan be implemented immediately without changingequipment. Monitoring continued in 2015 with a view toconfirming the actual gain, and will be operated inpartnership with the brands from early 2016.
In compliance with the European Directive on energyefficiency, Kering commissioned 51 energy audits on itssites in 2015, of which 7 in Italy, 9 in the United Kingdom,11 in Germany and 24 in France. This took the Group beyondthe minimum requirements in terms of scope covered. Theaudits identified potential to reduce energy consumptionby between 15% and 20% for stores, offices and warehouses,often just by adjusting lighting and air conditioningsystems. Similar or better potential savings have beenidentified for the industrial sites audited in Italy.
In the Luxury Division, LEED certification (Leadership inEnergy and Environmental Design) for New Constructionand Major Renovations is a concrete example of what isbeing done to cut energy consumption. The certificationprogramme is based on six evaluation criteria, of whichenergy is the most important (optimising energyperformance, using renewable energies, etc.). Gucci had10 LEED-certified stores in late 2015, while Saint Laurenthas had four stores certified, three of which to Platinumlevel, the most demanding defined under the certification.
On top of certification, the Group’s brands are striving toimprove the environmental performance of their facilities.The Stella McCartney Green Guide, initially released in
2012 and updated annually, helps stores manage theirenergy consumption sustainably. Saint Laurent continuedto deploy its Environmental Management programme inits store network, with an implementation rate of 84% atthe end of 2015 (excluding shopping centres anddepartment stores). The brand has also prepared a guidecontaining architectural best practices, based on theLEED standard. Among other aspects, it covers lightingand heating and air conditioning systems. These actionsenabled Saint Laurent to improve the energy efficiency ofits stores by 37% between 2012 and 2015. Saint Laurentalso assists its main stores in the management of theirenergy consumption, sending them a personaliseddashboard each quarter. Using invoice data, this toolmonitors the store’s consumption, providing a calculationof its energy efficiency and a regional performanceranking. Also in 2015, Boucheron conducted a feasibilitystudy devoted to water lost in cooling at its historic homeat 26 Place Vendôme, with a view to installing a moreeconomical water system and a more efficient energysystem.
Girard-Perregaux and JEANRICHARD became officialmembers of the Energy Agency of the Swiss PrivateSector (Agence de l’Énergie pour l’Économie – AEnEC) inJanuary 2014, and have established a ten-year energyefficiency improvement programme. In 2015, the roof ofthe Villa JEANRICHARD was insulated, the boiler of themain workshop building was replaced, and maintenancepersonnel were trained in boiler settings. Together, thethree initiatives are expected to save about 200 MWh and45 tonnes of CO2 each year. Ulysse Nardin has also signedup to the energy conservation programme of the EnergyAgency, and met its energy consumption reductiontargets several years ahead of schedule.
Lastly, the deployment of LED technology for lighting, asource of significant energy savings (up to 90% on lighting),continues in the stores of various brands. In 2015, Gucciinvested €2.4 million to continue the replacement of lightingin its stores with LED fixtures. All new Stella McCartneyoutlets are LED-lit, and the brand completed the renovationof its Parisian boutique in 2015, replacing all lights withLED equipment. The result was a saving of 164 MWh.
Saint Laurent is following the same approach for thebrand’s new boutique concept, and all new or renovatedstores are 100% LED-lit, cutting their energy consumptionby an average of more than 30%. At the end of 2015, morethan 70% of Saint Laurent’s directly owned stores were100% LED-lit.
3 SUSTAINABILITY ~ REDUCING OUR ENVIRONMENTAL IMPACT
96 Kering ~ 2015 Reference Document
03_VA_V5 06/04/2016 17:31 Page96
3REDUCING OUR ENVIRONMENTAL IMPACT ~ SUSTAINABILITY
972015 Reference Document ~ Kering
In 2014, Balenciaga laid down 10 golden rules for theenvironmentally friendly management of its stores. Eachof the brand’s stores then selected three golden rules,with a view to applying them in 2015. The rules set outactions focused notably on optimising the managementof lighting, heating and air conditioning, on paperconsumption, and on the reuse of transport packaging. In2015, Balenciaga also undertook to fully equip all of itsnew stores with LED lighting, and has done so in Madrid,Florence and South Coast Plaza.
LED installation programmes also continued inBoucheron and Bottega Veneta stores in 2015. To gofurther, the Italian House is mapping the use of LEDtechnology in its facilities worldwide. The process will becompleted in 2016. This type of lighting was also used inthe four stores opened by the brand in 2015, resulting ina saving of between 20% and 25% on energy bills.Alexander McQueen also opened eight stores litexclusively by LEDs in 2015.
On the Sport & Lifestyle side, Volcom pledged in 2015that LEDs would account for at least 75% of lighting in allnew stores going forward. In its existing stores and itsheadquarters in Costa Mesa, the brand is continuing toreplace more energy-intensive lighting systems with LEDsystems. At PUMA, the new store concept provides forexclusive use of LED technology for lighting.
The gradual shift towards renewable energy
The proportion of renewable electricity used within theGroup is growing thanks to numerous green energycontracts implemented by the brands with the Group’ssupport. It amounted to 24.5% in 2015, compared with22.8% in 2014 on a pro forma basis.
In 2015, Kering renewed its master energy agreementsfor all brands in Italy and France, as it had already done inthe United Kingdom, to ensure that electricity consumedin both countries is fully renewable in origin. Sites poweredexclusively by green electricity numbered 132 in Italy, 38 inFrance and 26 in the United Kingdom from the third quarterof 2015. Thus, electricity from renewable sources accountedfor 85% of the mix in Italy (up 7 points compared with 2014),63% in the United Kingdom (up 27 points) and 30% in France(up 14 points). Moreover, green electricity accounts for 89%of consumption on the Group’s German sites. Gucci hasalso increased the use of green electricity in Switzerlandand Austria, while Girard-Perregaux and JEANRICHARDopted exclusively for green electricity for their Swiss sites,which represent over 93% of their total consumption, in2015. Similarly, 55% of Stella McCartney’s total electricitysupply is renewable. Bottega Veneta, which is also takingpart in the project, extended the initiative to its Austrianand Swiss sites in 2015. More than 86% of the electricityconsumed by the brand’s European sites is renewable.
In 2015, the share of electricity derived from renewablesources rose to 19% of PUMA’s total electricity consumption,thanks notably to the significant increase since 2012 inthe use of this type of energy in Germany and Italy, wherenearly 100% of electricity consumed is renewable, and inAustria (66%), the United Kingdom (60%) and the Beneluxcountries (26%).
On top of external purchases, the brands have beenboosting their reliance on renewable energies, forinstance by installing photovoltaic panels. Some brandshave already installed panels on the roofs of theirbuildings, such as PUMA’s head office in Germany, awarehouse operated by the Luxury Division in the UnitedStates and two Bottega Veneta sites in Italy. Volcom plansto install solar panels on the roof of its team house at theBanzai Pipeline surf spot in Hawaii by 2016.
Since September 2014, the C. Mendès ready-to-wearworkshop in Angers, which belongs to Saint Laurent, hasused biomass rather than gas to meet its heatingrequirements, and renewable electricity has covered all ofthe site’s consumption since November 2015. Usinggreen energy has significantly reduced the site’s carbonfootprint, saving 180 tonnes of CO2 in 2015, a reductionof 70% compared with 2014.
Transport-related impacts and emissions
Methodology
Data on transport are divided into three main categories:
• B2B transport: this includes all transport of goods paidfor by the brands between suppliers and logisticsplatforms or industrial sites, and between logisticscentres and points of sale. The transport of goodsbetween logistics centres also falls into this category. B2Btransport includes road freight, rail freight, shippingand air freight. Express transport includes goods thatare delivered by express transport service providers viaroad and air freight;
• B2C transport: this covers all deliveries of finishedproducts between logistics platforms or points of saleand customers. These deliveries can be carried outeither by the brands’ own fleets or by subcontractors’vehicles. As with B2B, only transport that is paid for bythe brands is taken into account. B2C transportincludes road freight;
• business travel: this covers business air travel and theuse of company cars.
All the emission factors used in the reporting process arederived from internationally recognised public sources,i.e., internationally recognised academic establishmentsor institutions. These emission factors are also alignedwith those used in the EP&L. Details of the methodologyused are available in the methodological note to Kering’senvironmental reporting on the Group’s website.
03_VA_V5 06/04/2016 17:31 Page97
The Group’s proforma B2B transport emissions werestable. This was attributable to a decline in air transport,both standard and express, as well as an increased use of
sea, road and rail transport, which emit less CO2.Emissions from express transport fell by 17.7%.
Proforma year-on-year change in CO2 emissions from B2B transport (in tonnes of CO2)
20 15-20 14 proforma scope Year-on-year 20 15 20 14 change
Road freight 11,744 10,660 +10.2%Shipping 29,601 26,232 +12.8%Air freight 57,435 58,700 -2.2%Rail freight 643 548 +17.5%
Express air delivery 14,062 17,863 -21.3%Express road delivery 3,727 3,751 -0.6%
Total emissions 117,212 117,754 -0.5%
Within the Group, the most frequently used means oftransport for goods in volume terms is shipping. Airtransport is also frequently used to move goods
manufactured in Europe to faraway destinations quickly.It accounts for 61% of CO2 emissions from B2B transport.
Emissions related to transport and travel
Transport and business travel-related CO2 emissions in 2015 (in tonnes of CO2)
2015
B2B transport 117,283B2C transport 5Business travel 37,074
Total 154,362
In 2015, the Group’s transport- and business travel-related CO2 emissions totalled 154,362 tonnes. B2B transportaccounted for 76% of these emissions.
B2B transport volumes in 2015 and related CO2 emissions
Total 20 15 Related (In t / km or teu / km CO2 emissions
for shipping) (tonnes)
Road freight 76,301,607 11,744Shipping 348,067,722 29,602Air freight 84,811,703 57,505Rail freight 22,623,742 643
Express air delivery 17,679,926 14,062Express road delivery 24,194,680 3,727
Total emissions 117,283
3 SUSTAINABILITY ~ REDUCING OUR ENVIRONMENTAL IMPACT
98 Kering ~ 2015 Reference Document
03_VA_V5 06/04/2016 17:31 Page98
3REDUCING OUR ENVIRONMENTAL IMPACT ~ SUSTAINABILITY
992015 Reference Document ~ Kering
CO2 emissions from B2C transport totalled 5.2 tonnes in2015. On a proforma basis, B2C transport emissions fellby 95.3%, but this covers only a very small scope, and theabsence of subcontracted B2C transport in one countryfor a brand was equivalent to the entire decline.
Optimising logistics flows and switching to alternative means of transport
Goods transport has a significant impact on the Group’sCO2 emissions, and the brands have been working toreduce the distances covered during the supply anddelivery of goods, to improve truck load factors and theperformance of truck fleets, and to develop alternativemeans of transport.
In 2015, further efforts were made to optimise freightload factors on the multi-brand logistics platform inSwitzerland. After careful evaluation of rounds and theoptimal load factor, cardboard was reformatted in threenew types. Several other initiatives were performed onthe platform in 2015:
• further work on the truck load factors and introductionof reusable cardboard;
• selection of aircraft from transport service providersbased on maximum fuel efficiency;
• review of all transport contracts to ensure that theyrequire the provider to leave the smallest possiblefootprint in performing the service. For example, inroad transport, contracts include the obligation toperform the transport with euro 5 trucks. In 2015, thesystem was extended to air transport, with a provisioncapping air emissions added to the contract.
Several brands are working on reducing packaging, whichcan result in an improvement in the load factor of trucks,and ultimately a reduction in the number of trucks on theroads. The optimisation of deliveries is also an importantfocus, particularly as part of the pooling of deliveries tothe stores of the Group’s various brands in major urbancentres. Another source of improvement is to change themode of transport wherever possible. PUMA uses railrather than road for some shipments, an option that wasextended in 2015, as evidenced by emissions from railtransport. The substitution of air transport for seatransport is also a critical issue, especially when there isno obvious urgency as is the case with non-marketproducts such as point-of-sale advertising, packaging andmerchandising items. The Luxury Division boutiques inthe Middle East already apply this policy by routing allpackaging by sea. When air freight is required, the Group’sbrands favour direct connections.
Gucci continued its “High Street Fashion” partnershipwith TNT and ND Logistics to deploy sustainable deliverystrategies in major European shopping districts usingelectric cars. Launched in 2012 in Amsterdam, Milan,Florence and the entire distribution chain in Switzerland,the project has now been extended to Paris. Within thisframework, Gucci sharply increased its fleet of clean carsto 19 hybrid cars and three electric cars in 2015, comparedwith five and two respectively in 2014. Stella McCartney isinvolved in the same programme in Italy.
In Paris, electric vehicles now perform the daily shuttlesbetween the various Saint Laurent stores. Chargingstations have been installed at the brand’s headquartersin the French capital. Overall, the use of clean vehiclesenabled Saint Laurent to save 650 litres of fuel in 2015.
B2C transport-related CO2 emissions in 2015 and proforma year-on-year change (in tonnes)
Related CO2 emissions 2015-2014 proforma scope Year-on-year(tonnes of CO2) 20 15 20 14 change
B2C – own vehicle fleets 1.6 1.6 1.9 -13.7%
B2C – subcontractors’ vehicles 3.6 3.6 108.1 -96.7%
Total 5.2 5.2 110 -95.3%
03_VA_V5 06/04/2016 17:31 Page99
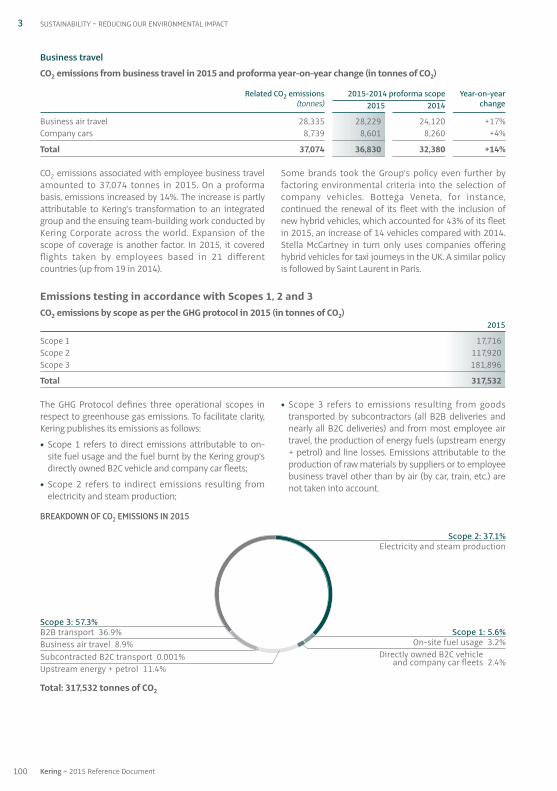
BREAKDOWN OF CO2 EMISSIONS IN 2015
Total: 317,532 tonnes of CO2
The GHG Protocol defines three operational scopes inrespect to greenhouse gas emissions. To facilitate clarity,Kering publishes its emissions as follows:
• Scope 1 refers to direct emissions attributable to on-site fuel usage and the fuel burnt by the Kering group’sdirectly owned B2C vehicle and company car fleets;
• Scope 2 refers to indirect emissions resulting fromelectricity and steam production;
• Scope 3 refers to emissions resulting from goodstransported by subcontractors (all B2B deliveries andnearly all B2C deliveries) and from most employee airtravel, the production of energy fuels (upstream energy+ petrol) and line losses. Emissions attributable to theproduction of raw materials by suppliers or to employeebusiness travel other than by air (by car, train, etc.) arenot taken into account.
Emissions testing in accordance with Scopes 1, 2 and 3CO2 emissions by scope as per the GHG protocol in 2015 (in tonnes of CO2) 2015
Scope 1 17,716Scope 2 117,920Scope 3 181,896
Total 317,532
CO2 emissions associated with employee business travelamounted to 37,074 tonnes in 2015. On a proformabasis, emissions increased by 14%. The increase is partlyattributable to Kering’s transformation to an integratedgroup and the ensuing team-building work conducted byKering Corporate across the world. Expansion of thescope of coverage is another factor. In 2015, it coveredflights taken by employees based in 21 differentcountries (up from 19 in 2014).
Some brands took the Group’s policy even further byfactoring environmental criteria into the selection ofcompany vehicles. Bottega Veneta, for instance,continued the renewal of its fleet with the inclusion ofnew hybrid vehicles, which accounted for 43% of its fleetin 2015, an increase of 14 vehicles compared with 2014.Stella McCartney in turn only uses companies offeringhybrid vehicles for taxi journeys in the UK. A similar policyis followed by Saint Laurent in Paris.
Business travel
CO2 emissions from business travel in 2015 and proforma year-on-year change (in tonnes of CO2)
Related CO2 emissions 2015-2014 proforma scope Year-on-year(tonnes) 20 15 20 14 change
Business air travel 28,335 28,229 24,120 +17%Company cars 8,739 8,601 8,260 +4%
Total 37,074 36,830 32,380 +14%
3 SUSTAINABILITY ~ REDUCING OUR ENVIRONMENTAL IMPACT
100 Kering ~ 2015 Reference Document
Scope 2: 37.1%Electricity and steam production
Scope 1: 5.6%On-site fuel usage 3.2%
Directly owned B2C vehicle 2.4%and company car fleets 2.4%
Scope 3: 57.3%B2B transport 36.9%Business air travel 8.9%Subcontracted B2C transport 0.001%Upstream energy + petrol 11.4%
03_VA_V5 06/04/2016 17:31 Page100
3REDUCING OUR ENVIRONMENTAL IMPACT ~ SUSTAINABILITY
1012015 Reference Document ~ Kering
The Group’s EP&L clearly shows that most environmentalimpacts (75%) are caused upstream of the supply chainby the extraction and production of raw materials andthe initial transformation stage (Tiers 3 and 4). For Kering,critical impacts are generated by the raw materials usedin large quantities and whose production can have asignificant impact on the environment (leather, cotton,synthetic fibres, etc.), or by raw materials used in smallquantities but whose extraction or production can have aheavy impact. This is the case for animal fibres such aswool, cashmere and silk, and for metals and preciousstones (gold and diamonds).
Kering has committed to reducing its environmentalfootprint in the pre-operations phase, starting with theproduction of its raw materials. To this end, the SmartSourcing programme, launched in 2013, providesrecommendations and guidance for brands, allowingthem to use raw materials produced sustainably andresponsibly. This project involves supply chain management,R&D and sustainability teams working closely with theGroup and the brands to come up with responsiblesourcing solutions tailored to the specific needs of eachbrand.
3.4. Sustainable use of resources
On a proforma basis, the Group’s total emissions edgedup due to increased power consumption and increasedB2B transport and business travel.
The carbon-offset programme
As defined in 2012 as part of its sustainability targets, Keringcontinues to offset its residual Scope 1 and 2 greenhousegas emissions, and was able to offset the 123,560 tonnesof CO2 emissions that it generated in 2014. Carbon creditshave been purchased with the support of several REDD+(Reducing Emissions from Deforestation and ForestDegradation) programmes, and subject to VCS (VerifiedCarbon Standard) and CCBA (Certification of Competencyin Business Analysis) certification and audit. Thisguarantees not only the generation of carbon credits, butalso their benefits for biodiversity and local populations.They have been purchased from Wildlife Works Carbon,of which Kering has been a shareholder since 2012, andsupport the protection and restoration of the KasigauCorridor in Kenya, as well as other REDD+ projects in
Brazil and Indonesia. These projects contribute to theprotection of more than 440,000 hectares of particularlybiodiversity-rich ecosystems, which represent a resourcefor more than 100,000 people.
The brands also develop their own carbon-offset initiatives.In 2015, Volcom’s most widely publicised event in Hawaii,the Volcom Pipe Pro, was once again a certified Deep BlueSurf EventTM. This label, verified by Sustainable Surf, anNGO, is awarded on the basis of respect for the environmentand the ocean. The greenhouse gas emissions generatedby the event are fully offset. To take its commitment astep further, the brand certified a second major event, theVolcom TCT Championships, in 2015.
In turn, 2015 saw Bottega Veneta once again offset all of the 2014 GHG emissions of its Milan head office, i.e.,435 tonnes of CO2, of which 182 offset by Kering. Similarly,987 tonnes corresponding to the emissions of the newMontebello workshop were offset through Wildlife Worksin 2015, including 338 tonnes of CO2 offset by Kering.
Proforma year-on-year change in CO2 emissions (in tonnes)
20 15-20 14 proforma scope Year-on-year 20 15 20 14 change
Scope 1 17,200 17,211 -0.1%Scope 2 106,206 102,696 +3.4%Scope 3 178,427 173,290 +3%
Total 301,833 293,197 +2.9%
In 2015, 94% of the Kering group’s CO2 emissions werenot under its direct control. Reducing electricityconsumption, switching to renewable energy sources,
optimising transport and opting for alternative forms oftransport that emit less CO2 all constitute effective waysof reducing the Group’s carbon footprint.
03_VA_V5 06/04/2016 17:31 Page101
Within this framework, a set of basic principles andguidelines has been in place since 2013, in line with theGroup’s overall sustainability policy, targets and existingbest practices. In 2015, these guidelines covered:
• cowhide and sheepskin leather;
• precious skins;
• cotton;
• wool;
• fur;
• gold;
• diamonds;
• coloured gemstones;
• plastics;
• paper and wood (including cellulose-based materials);
• rubber.
These principles and guidelines have all been establishedin consultation with all the brands, and have been thesubject of dedicated information, notably via webinars orthrough the Idea Labs. They are updated annually andpublished on the Group’s intranet. A series of tools alsoprovides detailed information and advice on specificsourcing issues, such as the sustainability of certaintextile fibres, CITES (Convention on International Trade inEndangered Species of Wild Fauna and Flora) informationabout precious skins, or certification. In addition to theseinternal documents, specific codes applicable tosuppliers of gold and diamonds were drafted in 2015 toensure that suppliers also incorporate Kering’s standardsfor raw materials.
To better assess the impact of its supplies of raw materialsand develop sustainable solutions, Kering contributed tothe publication of several collaborative research projectsin 2015.
Thus, in 2015, Kering co-wrote and published a reportentitled Climate Change: Implications and Strategies for theLuxury Fashion Sector with BSR. The analysis contained inthe report covers six critical raw materials for the fashionand luxury industry: cotton, cowhide, sheep- andlambskin leather, vicuna wool, cashmere and silk. Itassesses the impact of climate change on productionand on the areas where suppliers operate. The reportaims to help luxury brands, and more broadly the fashionindustry, understand and address their specific risks inrelation to climate change.
Kering also contributed, as a member of the NexusNetwork initiative coordinated by the University ofCambridge and supported by the United KingdomEconomic and Social Research Council, to the preparationof a scholarly article, “Managing the Impacts andDependencies of Business upon Food, Energy, Water andthe Environment: What are the Research Priorities?”,which highlights the critical sustainability challenges that
should be prioritised by research programmes aimed atdeveloping innovative and sustainable approaches.
Leather
Leather is one of the key raw materials used by Keringbrands. Cattle and sheep farming and leather processingoperations (including tanning) together represent one ofthe most significant environmental impacts across theGroup’s supply chains (more than 25% of the totalimpact). A specific working group (Idea Lab) on leather,involving most of Kering’s brands, met three times in2015 to identify solutions for reducing the environmentalimpact of the production of leather and share bestpractices (husbandry practices, traceability, tanningwithout heavy metals, recycling of offcuts, etc.).
One of Kering’s commitments is to avoid the conversionof sensitive ecosystems into grazing land or agriculturalland used to produce livestock feed. In 2015, Keringcontinued its collaboration with Origem, a consulting firmspecialising in responsible sourcing, to further explorethe environmental and social challenges facing the cattleand sheep industries. This study will allow the Group andits brands to assess the risks and opportunities stemmingfrom leather supplies in each of its sourcing countries.These actions in 2015 allowed Kering to identify newsources of leather with controlled and / or certifiedproduction, ensuring the highest animal welfare standardsand reduced environmental impact through sustainablepasture management and the implementation ofbiodiversity protection measures.
Many brands also have projects to reduce the environmentalimpact of leather tanning. In 2015, Gucci continued theuse of a tanning process eliminating the need for metalto produce three of its iconic bags and wallets. BottegaVeneta also made progress on this issue by increasing theamount of leather produced without chromium. The newprocess reduces water consumption during the tanningprocess by about 30%, and energy requirements by about20%. Stella McCartney does not use leather or fur in itsproducts, in keeping with the commitments of the brandand its Creative Director. An alternative bioplastic leatherwith a coating created from 50% non-edible vegetable oilis used to produce Stella McCartney shoes and bags.
PUMA is also striving to reduce the environmental footprintof its leather production by encouraging its footwearsuppliers to work with tanneries that belong to the LeatherWorking Group, which brings together a wide range ofstakeholders committed to improving environmentalstewardship in the Leather Goods industry. The LeatherWorking Group has developed a dual rating system formember tanneries: Gold, Silver or Bronze to describeenvironmental performance; and A, B or C for the qualityof the traceability of skins. More than 90% of leather usedby PUMA comes from certified tanneries. In 2015, forPUMA suppliers that are members of the working group,
3 SUSTAINABILITY ~ REDUCING OUR ENVIRONMENTAL IMPACT
102 Kering ~ 2015 Reference Document
03_VA_V5 06/04/2016 17:31 Page102
3REDUCING OUR ENVIRONMENTAL IMPACT ~ SUSTAINABILITY
1032015 Reference Document ~ Kering
89% of leather came from Gold-rated tanneries, while 4%and 6% respectively came from Silver- and Bronze-ratedtanneries.
Textile fibres
As part of the Group’s Smart Sourcing programme, Keringfounded the Materials Innovation Lab (MIL) in 2013.Based in Italy, the MIL provides technical support to theGroup's brands in order to identify sustainable rawmaterials for their collections. In addition to their closecollaboration with Kering Sustainability Department, theMIL's team of experts work with individual brands andtheir respective suppliers in order to integrate these newmore sustainable textiles into the brand's supply chain.The MIL now boasts a library of over 2,000 certifiedfabrics and an in-house evaluation tool, which is basedon EP&L learnings and assesses fabrics’ environmentalimpacts. The MIL primarily focuses on supporting theGroup's Luxury ready-to-wear brands, and as of 2015 hasextended its services to now also cater to the Group'sSport & Lifestyle brands on an adhoc basis.
In 2015, a particular focus was placed on organic cotton.A key material for the Group, cotton causes a significantenvironmental impact, as shown in the EP&L.Conventional cotton is grown using pesticides andfertilisers, and organic cotton can reduce the resultingenvironmental impact by up to 80%. Kering thereforeencourages its brands to use more organic cotton in theircollections. To this end, a thorough study of conventionaland organic cotton sourcing practices across the Groupwas conducted in 2015 to identify constraints andrecommend effective arrangements in the aim ofachieving a significant increase in the share of organiccotton products in 2016. To back up the effort, CottonConnect, an NGO specialised in organic cotton supplychains, produced a detailed report on the variouspotential sources available to the brands.
To the same end, Kering partnered with Cotton Connectand the Heritage Cotton Project in India in 2015 to workdirectly with organic cotton farmers to improve cottonyield and quality through training and agricultural advice.In addition, as co-founder alongside Textile Exchange,Kering continued its support for the Organic CottonAccelerator (OCA) in 2015, in the aim of expandingorganic cotton farming and the market for such cotton.Companies joining the OCA undertake to comply with anumber of guiding principles, such as promoting organiccotton and improving the environmental, social andeconomic aspects of production conditions. Kering also
contributed to the work of the Organic Cotton RoundTable, led by Textile Exchange, on innovative productionmethods, as well as the Cotton ARC initiative launched bythe Cambridge Institute for Sustainability Leadership(CISL) to develop guidelines on the relationship betweencotton production and natural capital.
These initiatives have paid off, allowing the Group’sbrands to continue to increase their use of organic cottonin 2015. PUMA is one of the ten biggest users of organiccotton worldwide, and is committed to adhering to theBetter Cotton Initiative (BCI) in 2016. The BCI’s purpose isto connect stakeholders across the cotton sector, fromfarm to store, to promote measurable and continuousimprovements for the environment, farming communitiesand the economies of cotton-producing regions.Alexander McQueen used more than 20,000 kg of organiccotton for its men’s ready-to-wear collections. StellaMcCartney continues to use organic cotton – with themore than 87,000 kg used in 2015 accounting for 65% ofits total cotton use – focusing on GOTS (Global OrganicTextile Standard) and OCS (Organic Cotton Standard)certifications to ensure the highest standards in terms oftraceability and environmental impact along the entiretextile production chain. For the first time in 2015, children’scollections with GOTS and OCS certification were givenspecific labelling, and in-store sales consultants weretrained to explain the principle of the two labels tocustomers. Bottega Veneta used nearly 700 kg of organiccotton to make over 3,000 accessories in its men’s ready-to-wear collections.
For wool, Kering and the MIL continued to identify newsources of high-quality fibre that meets the Group’ssustainability standards, and also contributed, along withmany stakeholders, to the development of a new woolstandard, Responsible Wool Standard (RWS). The sameapproach has been taken for mohair, camel and vicuna wool.
A fabric synonymous with luxury, cashmere has been thesubject of research and experimentation to improve theenvironmental impact of its production. In 2015, inspiredby a Wildlife Conservation Society study, Kering launcheda programme in the Gobi Desert to promote responsibleproduction of high-quality cashmere in partnership withseveral cooperatives of nomadic shepherds, with particularattention to grazing practices, as well as the protection ofbiodiversity and the improvement of animal welfare. Tostrengthen the promotion and development of responsiblecashmere within the sector in Mongolia, the Group is alsoa founding member of the Sustainable Fibre Alliance(SFA).
03_VA_V5 06/04/2016 17:31 Page103

Gold, and precious metals and stones
Illegal or unregulated mining activity leads to devastatingsocial conflict and corruption, and poses a serious threatto local biodiversity. This is why Kering pledged that itwould only use gold and diamonds sourced from verifiedoperations that do not have a harmful impact on localcommunities, wildlife or the ecosystems that supportthem.
Taking a first step in the right direction, Kering purchased55 kg of Fairmined-certified artisanal gold in 2014.Fairmined gold is extracted by artisanal miners in accordance with the standards developed by theAlliance for Responsible Mining (ARM). The stringent ARMstandards cover the social and economic development ofcommunities, working conditions and best practices forthe handling of chemical substances.
To further this initiative, in 2015 an internal platform wascreated that allows all brands to buy responsibly-sourced, traceable gold. Kering’s gold purchasingplatform is based on the Responsible Jewellery Council’s(RJC) Chain-of-Custody certification, which guaranteesthe origin and traceability of the gold used. Goldpurchased through the platform is made from recycledgold that meets the RJC’s Chain-of-Custody Standard.Additionally, it is extracted from RJC-certified mines orfrom artisanal mines that are Fairmined or Fairtradecertified. For every kilogramme of gold purchased throughthe platform by Kering brands, gold refineries offeringethical gold receive special compensation that helpsthem carry out certification procedures and invest insustainability projects launched by Fairmined- orFairtrade-certified artisanal and small-scale mines.
The system resulted in the aggregate purchase of 220 kgof responsibly-sourced gold in 2015, and the participatingbrands (Gucci, Boucheron, Girard-Perregaux, JEANRICHARDand Ulysse Nardin) have pledged to increase the volumepurchased through the platform in 2016. SinceNovember 2015, Gucci has limited gold purchases for itsjewellery to sources with RJC Chain-of-Custody certification.
In March 2015, Kering organised a field trip for several Gucci,Pomellato and Boucheron employees, giving them thechance to meet artisanal miners working at Fairmined-certified mines in Peru. The trip helped employees gainknowledge on how artisanal mines operate and establishprinciples governing the pooled purchasing platform atGroup level. Lastly, Kering was quick to help finance therepair of damage caused by a fire that destroyed Macdesa,an artisanal mining town, during the summer.
As for diamonds, all brands strive to ensure that theKimberley Process is respected, which serves as aguarantee that the proceeds from the sale of roughdiamonds on the international market are not used tofinance armed conflict. Some brands have, as it happens,joined the RJC (Responsible Jewellery Council), anorganisation that promotes responsible and transparentsocial and environmental practices throughout thejewellery and watch sector, from the mine to the point ofsale. In 2012, Bottega Veneta, Girard-Perregaux andJEANRICHARD obtained RJC certification for their gold anddiamond activities, following Gucci and Boucheron, bothcertified in 2011. In 2015, Gucci upgraded its certificationto the RJC Chain-of-Custody Standard, the aim of which isto promote the purchase of precious metals fromresponsible sources. In 2015, Bottega Veneta, Girard-Perregaux and JEANRICHARD renewed their RJCcertification for a three-year period.
Plastic
A working group on alternative plastics was set up inMarch 2013 to help the brands pool their research andshare their needs in terms of sustainable plastics. To thisend, Kering has developed, in partnership with theFraunhofer Institute, an innovative tool known as SAMPlastic, which compares the environmental performanceof different types of plastics. This tool is based on asimplified life cycle analysis of environmental impacts(CO2 emissions, discharges into water, water consumptionand waste production) consistent with the methodologyapplied in the EP&L and backed up by qualitative analysis(average fossil fuel content, food competition, essentialingredients, etc.). The results obtained using this toolshow that bioplastics are a credible alternative to fossil-based plastics, and that the industry still has significantscope for improvement in terms of the optimisation of itsproduction processes. Five types of plastics used in theshoes made by the Group’s various brands have alreadyundergone a comparative environmental impactassessment using this method, as part of continuedefforts to improve sourcing.
Furthermore, consistent with the Group’s objective ofeliminating PVC by 2016, the brands are working tosubstitute this material where it is still used. Gucci, forinstance, expanded its use of recycled ABS in shoe heelsin 2015.
3 SUSTAINABILITY ~ REDUCING OUR ENVIRONMENTAL IMPACT
104 Kering ~ 2015 Reference Document
03_VA_V5 06/04/2016 17:31 Page104
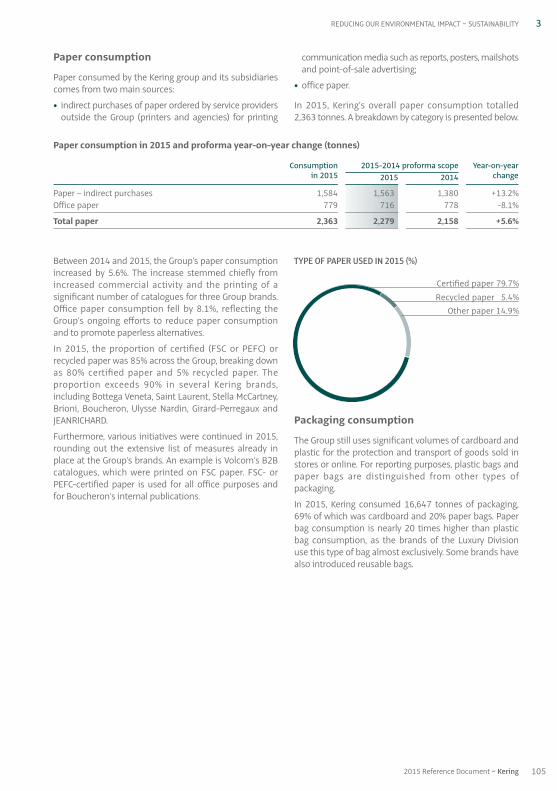
3REDUCING OUR ENVIRONMENTAL IMPACT ~ SUSTAINABILITY
1052015 Reference Document ~ Kering
Between 2014 and 2015, the Group’s paper consumptionincreased by 5.6%. The increase stemmed chiefly fromincreased commercial activity and the printing of asignificant number of catalogues for three Group brands.Office paper consumption fell by 8.1%, reflecting theGroup’s ongoing efforts to reduce paper consumptionand to promote paperless alternatives.
In 2015, the proportion of certified (FSC or PEFC) orrecycled paper was 85% across the Group, breaking downas 80% certified paper and 5% recycled paper. Theproportion exceeds 90% in several Kering brands,including Bottega Veneta, Saint Laurent, Stella McCartney,Brioni, Boucheron, Ulysse Nardin, Girard-Perregaux andJEANRICHARD.
Furthermore, various initiatives were continued in 2015,rounding out the extensive list of measures already inplace at the Group’s brands. An example is Volcom’s B2Bcatalogues, which were printed on FSC paper. FSC- orPEFC-certified paper is used for all office purposes andfor Boucheron’s internal publications.
TYPE OF PAPER USED IN 2015 (%)
Packaging consumption
The Group still uses significant volumes of cardboard andplastic for the protection and transport of goods sold instores or online. For reporting purposes, plastic bags andpaper bags are distinguished from other types ofpackaging.
In 2015, Kering consumed 16,647 tonnes of packaging,69% of which was cardboard and 20% paper bags. Paperbag consumption is nearly 20 times higher than plasticbag consumption, as the brands of the Luxury Divisionuse this type of bag almost exclusively. Some brands havealso introduced reusable bags.
Paper consumption in 2015 and proforma year-on-year change (tonnes)
Consumption 2015-2014 proforma scope Year-on-yearin 20 15 2015 2014 change
Paper – indirect purchases 1,584 1,563 1,380 +13.2%Office paper 779 716 778 -8.1%
Total paper 2,363 2,279 2,158 +5.6%
Paper consumption
Paper consumed by the Kering group and its subsidiariescomes from two main sources:
• indirect purchases of paper ordered by service providersoutside the Group (printers and agencies) for printing
communication media such as reports, posters, mailshotsand point-of-sale advertising;
• office paper.
In 2015, Kering’s overall paper consumption totalled2,363 tonnes. A breakdown by category is presented below.
Certified paper 79.7%Recycled paper 5.4%
Other paper 14.9%
03_VA_V5 06/04/2016 17:31 Page105
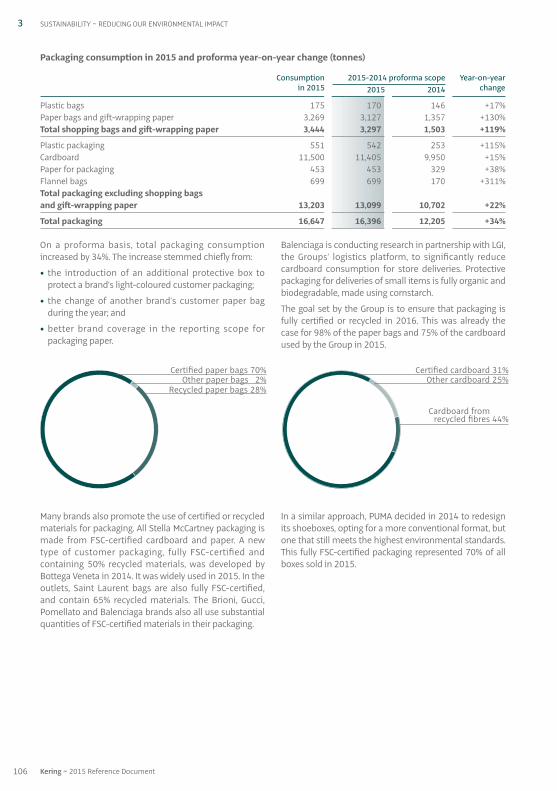
Many brands also promote the use of certified or recycledmaterials for packaging. All Stella McCartney packaging ismade from FSC-certified cardboard and paper. A newtype of customer packaging, fully FSC-certified andcontaining 50% recycled materials, was developed byBottega Veneta in 2014. It was widely used in 2015. In theoutlets, Saint Laurent bags are also fully FSC-certified,and contain 65% recycled materials. The Brioni, Gucci,Pomellato and Balenciaga brands also all use substantialquantities of FSC-certified materials in their packaging.
In a similar approach, PUMA decided in 2014 to redesignits shoeboxes, opting for a more conventional format, butone that still meets the highest environmental standards.This fully FSC-certified packaging represented 70% of allboxes sold in 2015.
On a proforma basis, total packaging consumptionincreased by 34%. The increase stemmed chiefly from:
• the introduction of an additional protective box toprotect a brand’s light-coloured customer packaging;
• the change of another brand’s customer paper bagduring the year; and
• better brand coverage in the reporting scope forpackaging paper.
Balenciaga is conducting research in partnership with LGI,the Groups’ logistics platform, to significantly reducecardboard consumption for store deliveries. Protectivepackaging for deliveries of small items is fully organic andbiodegradable, made using cornstarch.
The goal set by the Group is to ensure that packaging isfully certified or recycled in 2016. This was already thecase for 98% of the paper bags and 75% of the cardboardused by the Group in 2015.
Packaging consumption in 2015 and proforma year-on-year change (tonnes)
Consumption 20 15-20 14 proforma scope Year-on-yearin 20 15 20 15 20 14 change
Plastic bags 175 170 146 +17%Paper bags and gift-wrapping paper 3,269 3,127 1,357 +130%Total shopping bags and gift-wrapping paper 3,444 3,297 1,503 +119%
Plastic packaging 551 542 253 +115%Cardboard 11,500 11,405 9,950 +15%Paper for packaging 453 453 329 +38%Flannel bags 699 699 170 +311%Total packaging excluding shopping bags and gift-wrapping paper 13,203 13,099 10,702 +22%
Total packaging 16,647 16,396 12,205 +34%
3 SUSTAINABILITY ~ REDUCING OUR ENVIRONMENTAL IMPACT
Certified paper bags 70%Other paper bags 2%
Recycled paper bags 28%
Certified cardboard 31%Other cardboard 25%
Cardboard from 44%recycled fibres 44%
106 Kering ~ 2015 Reference Document
03_VA_V5 06/04/2016 17:31 Page106
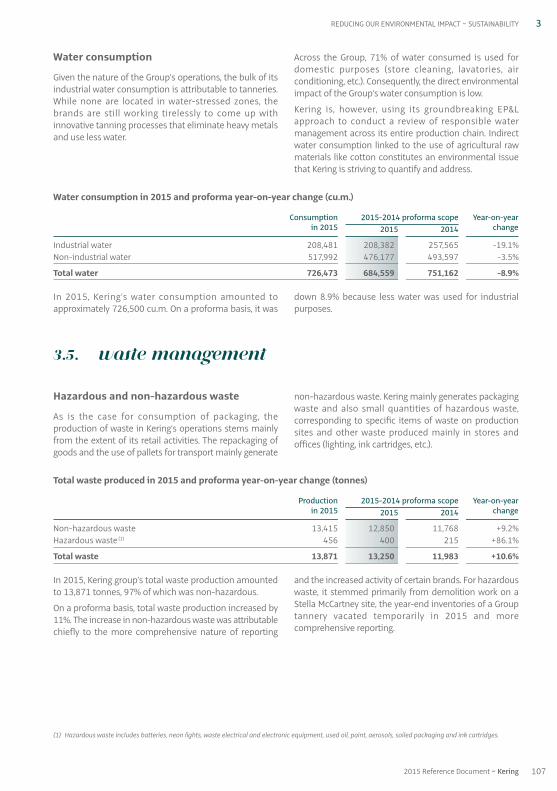
3REDUCING OUR ENVIRONMENTAL IMPACT ~ SUSTAINABILITY
In 2015, Kering group’s total waste production amountedto 13,871 tonnes, 97% of which was non-hazardous.
On a proforma basis, total waste production increased by11%. The increase in non-hazardous waste was attributablechiefly to the more comprehensive nature of reporting
and the increased activity of certain brands. For hazardouswaste, it stemmed primarily from demolition work on aStella McCartney site, the year-end inventories of a Grouptannery vacated temporarily in 2015 and morecomprehensive reporting.
Total waste produced in 2015 and proforma year-on-year change (tonnes)
Production 20 15-20 14 proforma scope Year-on-yearin 20 15 20 15 20 14 change
Non-hazardous waste 13,415 12,850 11,768 +9.2%Hazardous waste (1) 456 400 215 +86.1%
Total waste 13,871 13,250 11,983 +10.6%
Hazardous and non-hazardous waste
As is the case for consumption of packaging, theproduction of waste in Kering’s operations stems mainlyfrom the extent of its retail activities. The repackaging ofgoods and the use of pallets for transport mainly generate
non-hazardous waste. Kering mainly generates packagingwaste and also small quantities of hazardous waste,corresponding to specific items of waste on productionsites and other waste produced mainly in stores andoffices (lighting, ink cartridges, etc.).
3.5. Waste management
In 2015, Kering’s water consumption amounted toapproximately 726,500 cu.m. On a proforma basis, it was
down 8.9% because less water was used for industrialpurposes.
Water consumption in 2015 and proforma year-on-year change (cu.m.)
Consumption 20 15-20 14 proforma scope Year-on-yearin 20 15 20 15 20 14 change
Industrial water 208,481 208,382 257,565 -19.1%Non-industrial water 517,992 476,177 493,597 -3.5%
Total water 726,473 684,559 751,162 -8.9%
Water consumption
Given the nature of the Group’s operations, the bulk of itsindustrial water consumption is attributable to tanneries.While none are located in water-stressed zones, thebrands are still working tirelessly to come up withinnovative tanning processes that eliminate heavy metalsand use less water.
Across the Group, 71% of water consumed is used fordomestic purposes (store cleaning, lavatories, airconditioning, etc.). Consequently, the direct environmentalimpact of the Group’s water consumption is low.
Kering is, however, using its groundbreaking EP&Lapproach to conduct a review of responsible watermanagement across its entire production chain. Indirectwater consumption linked to the use of agricultural rawmaterials like cotton constitutes an environmental issuethat Kering is striving to quantify and address.
(1) Hazardous waste includes batteries, neon lights, waste electrical and electronic equipment, used oil, paint, aerosols, soiled packaging and ink cartridges.
1072015 Reference Document ~ Kering
03_VA_V5 06/04/2016 17:31 Page107
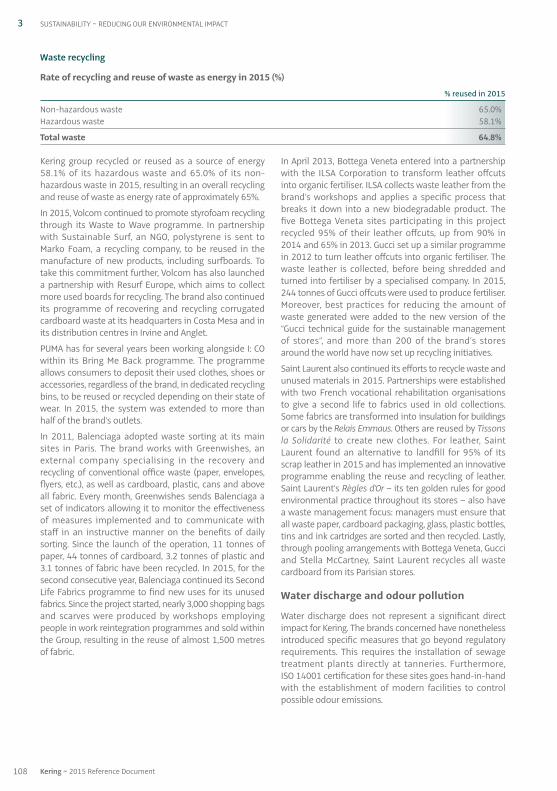
Kering group recycled or reused as a source of energy58.1% of its hazardous waste and 65.0% of its non-hazardous waste in 2015, resulting in an overall recyclingand reuse of waste as energy rate of approximately 65%.
In 2015, Volcom continued to promote styrofoam recyclingthrough its Waste to Wave programme. In partnershipwith Sustainable Surf, an NGO, polystyrene is sent toMarko Foam, a recycling company, to be reused in themanufacture of new products, including surfboards. Totake this commitment further, Volcom has also launcheda partnership with Resurf Europe, which aims to collectmore used boards for recycling. The brand also continuedits programme of recovering and recycling corrugatedcardboard waste at its headquarters in Costa Mesa and inits distribution centres in Irvine and Anglet.
PUMA has for several years been working alongside I: COwithin its Bring Me Back programme. The programmeallows consumers to deposit their used clothes, shoes oraccessories, regardless of the brand, in dedicated recyclingbins, to be reused or recycled depending on their state ofwear. In 2015, the system was extended to more thanhalf of the brand’s outlets.
In 2011, Balenciaga adopted waste sorting at its mainsites in Paris. The brand works with Greenwishes, anexternal company specialising in the recovery andrecycling of conventional office waste (paper, envelopes,flyers, etc.), as well as cardboard, plastic, cans and aboveall fabric. Every month, Greenwishes sends Balenciaga aset of indicators allowing it to monitor the effectivenessof measures implemented and to communicate withstaff in an instructive manner on the benefits of dailysorting. Since the launch of the operation, 11 tonnes ofpaper, 44 tonnes of cardboard, 3.2 tonnes of plastic and3.1 tonnes of fabric have been recycled. In 2015, for thesecond consecutive year, Balenciaga continued its SecondLife Fabrics programme to find new uses for its unusedfabrics. Since the project started, nearly 3,000 shopping bagsand scarves were produced by workshops employingpeople in work reintegration programmes and sold withinthe Group, resulting in the reuse of almost 1,500 metresof fabric.
In April 2013, Bottega Veneta entered into a partnershipwith the ILSA Corporation to transform leather offcutsinto organic fertiliser. ILSA collects waste leather from thebrand’s workshops and applies a specific process thatbreaks it down into a new biodegradable product. Thefive Bottega Veneta sites participating in this projectrecycled 95% of their leather offcuts, up from 90% in2014 and 65% in 2013. Gucci set up a similar programmein 2012 to turn leather offcuts into organic fertiliser. Thewaste leather is collected, before being shredded andturned into fertiliser by a specialised company. In 2015,244 tonnes of Gucci offcuts were used to produce fertiliser.Moreover, best practices for reducing the amount ofwaste generated were added to the new version of the“Gucci technical guide for the sustainable managementof stores”, and more than 200 of the brand’s storesaround the world have now set up recycling initiatives.
Saint Laurent also continued its efforts to recycle waste andunused materials in 2015. Partnerships were establishedwith two French vocational rehabilitation organisationsto give a second life to fabrics used in old collections.Some fabrics are transformed into insulation for buildingsor cars by the Relais Emmaus. Others are reused by Tissonsla Solidarité to create new clothes. For leather, SaintLaurent found an alternative to landfill for 95% of itsscrap leather in 2015 and has implemented an innovativeprogramme enabling the reuse and recycling of leather.Saint Laurent’s Règles d’Or – its ten golden rules for goodenvironmental practice throughout its stores – also havea waste management focus: managers must ensure thatall waste paper, cardboard packaging, glass, plastic bottles,tins and ink cartridges are sorted and then recycled. Lastly,through pooling arrangements with Bottega Veneta, Gucciand Stella McCartney, Saint Laurent recycles all wastecardboard from its Parisian stores.
Water discharge and odour pollution
Water discharge does not represent a significant directimpact for Kering. The brands concerned have nonethelessintroduced specific measures that go beyond regulatoryrequirements. This requires the installation of sewagetreatment plants directly at tanneries. Furthermore, ISO 14001 certification for these sites goes hand-in-handwith the establishment of modern facilities to controlpossible odour emissions.
Waste recycling
Rate of recycling and reuse of waste as energy in 2015 (%)
% reused in 2015
Non-hazardous waste 65.0%Hazardous waste 58.1%
Total waste 64.8%
3 SUSTAINABILITY ~ REDUCING OUR ENVIRONMENTAL IMPACT
108 Kering ~ 2015 Reference Document
03_VA_V5 06/04/2016 17:31 Page108
3REDUCING OUR ENVIRONMENTAL IMPACT ~ SUSTAINABILITY
1092015 Reference Document ~ Kering
Preservation of biodiversity is a key component ofKering’s environmental policy. Kering strives to protectand respect it in three major ways: by understanding thesustainable origin and assuring traceability of rawmaterials, by promoting nature conservation and byraising awareness among its employees and consumers.
Use of precious skins, leather and fur
The sourcing of precious skins is a key challenge for theGroup. Kering makes tireless efforts across several supplychains to ensure that the sourcing of animal skins suchas python, crocodile and alligator does not have anegative impact on wild populations and is conducted inaccordance with the highest standards of animal welfare.To this end, Kering’s Sustainability Department worksclosely with the Group’s industrial operations overseeingprecious-skin tanneries owned by Kering and thepurchasing departments of various brands. On top of thisinternal effort, Kering works with countless experts todiscuss ongoing initiatives.
3.6. Protection of biodiversity
As water discharges during textile and leather processingor mining can potentially have considerable environmentalimpacts, they are subject to specific, targeted questionnairesduring the data-gathering phase of the EP&L approach.
In 2011, PUMA publicly committed to removing allhazardous chemicals from its entire production chain by2020, under the Detox campaign launched by Greenpeace,an NGO, especially as regards water discharge. To achievethis, PUMA has actively participated since 2012 in theZero Discharge of Hazardous Chemicals Group (ZDHC), abody committed to communicating regularly and publiclyon the progress of its member brands (around 20 majorinternational textile brands). In 2015, PUMA carried outenvironmental audits of 12 of its key suppliers, followingthe protocol developed at the ZDHC’s initiative. Several ofthe brand’s other suppliers have already undergonesimilar environmental audits conducted by bluesign or bythe Leather Working Group. PUMA also continued to workwith the Institute of Public and Environmental Affairs(IPE), a Chinese NGO, to communicate transparently withall local stakeholders on the chemicals used and releasedinto the environment by the brand’s suppliers andsubcontractors. By the end of 2015, 80% of PUMAsuppliers with significant impacts in terms of waterdischarge (dyeing, tanning, etc.) disclosed their use anddischarges of chemicals on IPE’s online platform.
Management of chemicals
In addition to compliance with core local and internationalregulations such as REACH, Kering has set itself the targetof completely eliminating hazardous chemicals from its
production by 2020, covering both production processesand the products themselves. To do so, the Group hasestablished two types of lists of substances subject to restrictions: one for production processes, theManufacturing Restricted Substance List (MRSL), andone for products, the Restricted Substance List (RSL).There is a single MRSL covering the entire Group, andseveral RSLs, one for the Luxury Division and one foreach Sport & Lifestyle brand.
The MRSL is focused on discontinuing the use of toxicchemicals in the manufacturing process, first to ensurethat workers in the supply chain of the Group’s brands arenot exposed to hazardous substances such as endocrinedisruptors, and second to stop toxic discharges intowater. The implementation of the MRSL, launched in2014, continued in 2015. The Group’s four tanneries andnine other tanneries used by the brands each verifiedtheir compliance with Kering’s MRSL, involving a review ofthe more than 3,500 chemical products on theirinventory. The review was complemented by extensivechemical tests on 23 types of leather and on waterdischarges from nine tanneries, as well as 63 tests onchemical inputs. It helped to identify the processesinvolving the greatest risk, the substances to be removed,those to be substituted and those for which research anddevelopment efforts will be necessary. Similar work waslaunched with ready-to-wear suppliers in late 2015.
Kering also joined the Zero Discharge of HazardousChemicals Group (ZDHC) in 2015 as an on-boardingmember (observer) to share knowledge and bestpractices.
03_VA_V5 06/04/2016 17:31 Page109

Kering and its brands comply with national and internationalrequirements and regulations for trade in precious skins:the skins of all species listed by CITES as endangered orvulnerable and used by the Group must be accompaniedby a certificate of legal origin issued by the CITESmanagement authority of the exporting country in orderto ensure that endangered species are not threatened.Kering’s brands have also joined forces with the LuxuryGoods working group, Business for Social Responsibility(BSR), to work on the issue of traceability.
Some brands go further, setting out specific policies. In2012, for instance, PUMA adopted a specific and restrictivepolicy on the use of leather, skins, furs, feathers and wool.In this document, PUMA states that it does not use anyraw material derived from endangered species as definedby the International Union for Conservation of Nature(IUCN). This policy also prohibits the use of feathers, leatherand skins obtained from abused animals, whether theyare farmed or not. PUMA has also banned the use ofcertain species such as crocodiles and snakes, and certainpractices such as mulesing in merino sheep. Moreover,since 2010, the brand has been working alongside othercompanies and several NGOs within the Leather WorkingGroup (LWG), a platform that brings together representativesof the leather industry, with the aim of drawing up andpromoting a protocol of sustainable and responsiblepractices for the sector. While the main tanneries withwhich PUMA works have been certified by the LWG, thebrand now wants to further increase the traceability of theleather used in its products through the LWG’s protocol.
Bottega Veneta has opted not to use fur or coral in itscollections and to limit its sourcing of python skins tosuppliers who are members of the Python ConservationPartnership (PCP). Stella McCartney totally excludes the useof fur products, leather, precious skins and feathers.
Measures are also taken at Group and brand level incooperation with international stakeholders to combatillegal trade in precious skins and to help improvescientific knowledge of certain species, and to improveanimal welfare. 2015 saw Kering continue its work with the IUCN / SSC Boa and Python Specialist Group and the International Trade Centre (ITC) on the PythonConservation Partnership (PCP) to structure the trade inpythons and help move the sector towards moresustainable practices. The goal of this three-year researchprogramme is to draw up recommendations onsustainable python breeding practices, animal welfare,the monitoring of wild populations and the resources oflocal populations involved in the trade in python skins. In2015, a series of recommendations on how to improvepython trade in Southeast Asia was shared with theindustry following the results of various studies. It will bepublished in 2016.
In 2015, Kering continued its commitment to theMadagascar Crocodile Conservation and Sustainable UseProgram (MCCSUP). This partnership aims to develop
responsible trade in Nile crocodiles in Madagascar. Duringthe year, the programme created a Crocodile ManagementUnit in Madagascar, and developed a structure to improvethe monitoring of wild populations of crocodiles and thecollection of eggs by farmers.
Although the amount of fur used by the Luxury Divisionbrands is minimal, Kering is working closely with itssuppliers and with BSR experts to develop a programmethat guarantees the traceability of any fur used andensures animal welfare throughout its supply chains. TheGroup has established guidelines for sourcing fur andissued a practical guide on its use for design teams.These guidelines provide a list of the species covered andimpose the obligation to minimise the negative impactson them, to ensure the welfare of animals bred in captivityand to comply with the prevailing laws and regulations.Kering and BSR also held a meeting with the InternationalFur Federation and Fur Europe to address issues oftransparency and how to improve practices in the furindustry together. Gucci, Alexander McQueen, Balenciagaand Saint Laurent took an active part alongside Kering inthe round table.
Nature conservation
In addition to initiatives related to the use and preservationof animal and plant resources used by the Group, Keringand its brands have made a commitment in favour ofbiodiversity by developing initiatives to protect thenatural heritage and raise the awareness of employees andconsumers. This commitment features three major planks:
• Kering has partnered with the Stanford University NaturalCapital Project to focus on improving the measurementof the impact of business activities on biodiversity andecosystem services. Studies emanating from thisprogramme will, among other benefits, allow Kering toimprove its EP&L methodology through the inclusion ofthe biodiversity component;
• the Group continues to work with the Wildlife FriendlyEnterprise Network (WFEN) to analyse the impacts ofthe production of materials such as wool, leather andcashmere on biodiversity and wildlife. In 2015, a WFENstudy identified producers of natural fibres in Patagoniaeligible for Wildlife Friendly® certification by virtue oftheir good practices and their ability to coexist withendangered species;
• Kering continues to offset its residual Scope 1 and 2greenhouse gas emissions. In 2015, 123,560 tonnes ofCO2 corresponding to its residual emissions in 2014 wereoffset through various projects designed to safeguardand protect primary forests in Kenya, Indonesia andBrazil. These REDD+ projects (Reducing Emissions fromDeforestation and Forest Degradation) contribute to theprotection of more than 440,000 hectares of ecosystems,which support a population of over 100,000 people.
3 SUSTAINABILITY ~ REDUCING OUR ENVIRONMENTAL IMPACT
110 Kering ~ 2015 Reference Document
03_VA_V5 06/04/2016 17:31 Page110
3REDUCING OUR ENVIRONMENTAL IMPACT ~ SUSTAINABILITY
1112015 Reference Document ~ Kering
Among the brands, Stella McCartney made a strongcommitment in 2015 alongside the NGO Canopy and otherbrands to ensure that all viscose and other cellulose-based materials (i.e., those made from wood pulp) usedby the brand are traceable and certified, ensuring that theirproduction is not the cause of deforestation in areas withhigh ecosystem value such as Indonesia. Since 2012, thebrand has been partnering with the NGOs BioPlanet USAand million Trees Miami to support the planting of1 million trees by 2020 in the forests of Miami-DadeCounty in the United States.
Gucci joined the Treedom initiative facilitating the adoptionof trees by employees as part of internal training onsustainability issues. Treedom is an association that aimsto promote tree planting in developing countries throughphilanthropic projects for communities, farmers andNGOs seeking resources for planting.
Volcom strives to promote clean beaches through publicawareness and clean-up campaigns. For the past sixyears, the brand has partnered with the Keepers of theCoast NGO and its Day After initiative to clean up Florida’sbeaches after the Fourth of July festivities. In the UnitedStates, the brand has partnered with the Newport BayConservancy and the Surfrider Foundation throughvarious events to bring together volunteers and clean upa number of West Coast beaches. In Japan, Volcom tookpart in a post-winter mountain clean-up in partnershipwith the Patagonia brand and JEAN (Japan EnvironmentalAction Network), a Japanese NGO. The brand alsosponsors many other clean-up events.
03_VA_V5 06/04/2016 17:31 Page111
Kering and its brands play a major role in the economicand social fabric of the regions where their sites arelocated. The sustainability of the Group’s brands, particularlyin the Luxury Division, stems from traditional know-how,often rooted in a given region. The Jura valley, for instance,is synonymous with watches, Tuscany with leatherworkand London with artistic creation. Kering sees it as essentialto preserve these skills and this excellence in craftsmanship,both through specific training and local partnerships tosupport training in traditional artisanal skills:
• Gucci continued its partnership with the Made in ItalyTuscany Academy and the Alta Scuola di PelletteriaItaliana to contribute to the preservation of know-howspecific to leather;
• Bottega Veneta supports the Giovanni Fontana vocationaltraining centre and the IUAV University of Venice. Thebrand is involved in drawing up three-year educationalprogrammes to train leather craftspeople, and providestutors for classes and apprenticeships for students.Meanwhile, Bottega Veneta organises training sessionson its own premises as part of the Scuola dei MaestriPellettieri to spread and transmit traditional leatherworkingtechniques that are so specific and essential to thebrand. In 2015, 137 people from inside and outside theCompany were able to refine their techniques in the fieldof leatherwork (tanning, cutting, sewing, finishing, etc.);
• Bottega Veneta also continued to offer funding andsupport to two community craft cooperatives, theComunità Montane Femminili and launched in early 2011in Alto Astico and Posina, located in an Italian valley withhigh unemployment among women. Given the successof these first two cooperatives, a third workshop openedin 2015, the Santa Margherita cooperative located inRotzo. Trained in intreccio infilato, a traditional weavingtechnique used in the production of Bottega Veneta’sproducts, more than 70 women are now able to runtheir workshops independently, and have accordinglybecome direct suppliers to the brand;
• Boucheron is heavily involved in the Paris-based Écolede la Joaillerie jewellery school through its activeparticipation as a member of the school’s Board ofDirectors. It offers internships within its workshops, hasestablished an apprenticeship contract and is sponsoringthe class of 2016;
• Stella McCartney offered one scholarship place at CentralSaint Martins College of Art and Design, provided thatthe student commits to an ethical policy of not usingfur or leather.
In addition to these partnerships, some brands have setup their own schools to help preserve both rare know-how and local employment. Brioni, for instance, offerstraining to 16 young people every year in a three-yeartailoring course at its Scuola di Alta Sartoria, and thenemploys them in its own workshops.
The Group and its brands also sometimes take action inthe form of partnerships with local schools or universitiesin more broadly based programmes, with the aim ofintegrating a sustainability component into the variouscourses.
Since 2014, Kering has participated in a strategic five-yearpartnership with the Centre for Sustainable Fashion (CSF)at the London College of Fashion (LCF) to promotesustainable practices and innovation in the fashionindustry. This partnership focuses on three main areas:
• the Kering Talks: each year, visionaries and businessleaders from the fashion industry speak on the latestdevelopments in the area of sustainable fashion, sharingtheir vision of the sector and its most innovative advances.After the inaugural talk by François-Henri Pinault,Chairman and Chief Executive Officer of Kering, in 2014,Kelly Slater, world surfing champion and founder ofresponsible fashion brand Outerknown, this year sharedhis convictions and his vision of sustainability in fashion;
• the joint development of teaching modules for theSustainable Design programme: Kering and the CSF, incollaboration with a community of experts, researchersand professors, have pooled their skills to create a fullcourse module taught at the LCF. After a first yeardedicated to the themes of supply chains and theenvironmental impact related to sourcing strategies,Kering plans to develop digital content in addition tothe LCF courses in 2016;
4. Supporting communitydevelopment
4.1. Community impact
3 SUSTAINABILITY ~ SUPPORTING COMMUNITY DEVELOPMENT
112 Kering ~ 2015 Reference Document
03_VA_V5 06/04/2016 17:31 Page112
3SUPPORTING COMMUNITY DEVELOPMENT ~ SUSTAINABILITY
In an increasingly interconnected world, players in theprivate sector need to pay attention to and maintainrelationships with their partners and stakeholders. Keringtherefore aims to establish quality relationships built ontrust with all its partners, regardless of location, with aview to gaining a full appreciation of their concerns andexpectations, and, as far as possible, incorporating theseaspects into its strategy. For Kering, this means:
• defining a policy for consultation and analysis ofstakeholder expectations at the Group level;
• encouraging brands to develop their own stakeholderdialogue platforms at a more operational level.
Group approach
Materiality
In 2014, Kering called on the expertise of Business forSocial Responsibility (BSR), a consultancy specialised inthe field of stakeholder dialogue, to update its materialityanalysis. To this end, 12 interviews were carried outinternally with senior executives of Kering and its brands.Kering also sent a questionnaire to over 100 externalstakeholders (universities, NGOs, consumer groups, tradeunions, investors and rating agencies, suppliers andbusiness federations). The results, presented below,confirmed the Group’s view of the key impacts relating toits supply chain, both environmental (quality, traceability,use of sustainably produced raw materials, etc.) andsocial (respect for human rights, working conditions, etc.).The structuring and formalisation of this policy werereviewed by the Group Ethics Committee, and will befinalised in 2016.
4.2. Stakeholder dialogue
• the Kering Award for Sustainable Fashion: each year,Kering brands and the CSF run a competition open tothird-year BA and MA students. The 2015 winners wereeach awarded a grant of €10,000 for their project andgiven internships at Alexander McQueen and StellaMcCartney, where they benefited from the two brands’expertise as they worked further on their projects. StellaMcCartney and Brioni will sponsor the awards in 2016.
Kering has also partnered with two schools, Parsons and Tsinghua, through the organisation of conferences,competitions, scholarship programmes and knowledgesharing involving Kering executives.
Among Kering’s brands, Gucci sponsors the IMLUX(International Master in Luxury Management) programmeat MIP Politecnico di Milano and works with the MAFED(Master in Fashion, Experience & Design Management)programme at the University of Bocconi. The mainthemes promoted by Gucci as part of this partnership are“retailing and CSR in Luxury Goods”.
In 2015, Brioni continued its A Scuola di Sostenibilitàprogramme, which aims to welcome students from thePenne region, home to most of its production sites, to raiseawareness on sustainability challenges and to show howthese issues are taken into account in the brand’s activities.Brioni continued a similar programme at the Scuola diAlta Sartoria in 2015 to raise awareness on sustainabilitychallenges among future tailors and craftspeople.
Lastly, Kering sought to allow fashion and design schoolsto benefit from the unused fabrics of its ready-to-wearbrands. More than 20,000 metres of fabric were given to
nine different schools in the United Kingdom, Italy, Franceand Belgium thanks to the participation of Gucci, BottegaVeneta, Alexander McQueen, Balenciaga, Brioni and StellaMcCartney.
In another area, the Group’s brands are committed in thefight against food waste, especially in Italy, where Gucciand Bottega Veneta support the Sticibo programme thatredistributes leftover canteen meals to people in need.Gucci distributed more than 11,000 meals in 2015. As ofOctober 2015, a similar programme was implemented atBottega Veneta’s workshops in Montebello.
When it comes to sourcing, Kering’s strategy aims to ensurea responsible approach. Practically, this means reducingthe environmental footprint stemming from the productionof raw materials used by Kering and making a positiveimpact on the communities involved in their production.The importance of this approach is particularly acute inthe field of gold mining, an activity that carries significantrisks for the environment and local communities alike.Through the purchase of “ethical” gold with Fairminedcertification, Kering has worked closely with the NGOSolidaridad to provide support to mining communities,notably through training or the funding of local infrastructuresuch as schools, transport and drinking water networks.Kering also works with the Alliance for Responsible Mining(ARM), the body tasked with monitoring the Fairminedcertification, which guarantees that the gold used byKering is “ethical”, or in other words that it comes fromsmall-scale mines that meet strict standards in terms ofsocial development, environmental protection, workingconditions and local economic development.
1132015 Reference Document ~ Kering
03_VA_V5 06/04/2016 17:31 Page113
Platforms of dialogue and exchange
In order to remain constantly attentive to the key issuesaffecting its stakeholders, Kering participates in a numberof international initiatives:
• SAC: in 2012, Kering became a member of theSustainable Apparel Coalition, which brings togethermajor players (brands, retailers, suppliers, NGOs, etc.)from the textile, footwear and accessories sector, whowork together to reduce the negative environmentaland social impacts caused by the industry worldwide. TheGroup and its brands made a substantial contributionto the creation and implementation of the HIGG Index,a tool that tracks the environmental and social impacts ofthe textile, footwear and accessories sector, notably atthe supply chain level. PUMA, Volcom and Stella McCartneyare also stakeholders in the SAC’s work. Of particularnote in 2015 was the Convergence project, partneredby Kering, which aims to lay down a framework ofharmonised and global social audit procedures;
• WBCSD: in 2011, Kering joined the World Business Councilfor Sustainable Development, a multi-sector platformof 200 global companies that aims to promote the roleof the business community in achieving sustainabilitybased on economic growth, ecological equilibrium andsocial progress. In 2015, Kering shared the results of itsEP&L and provided feedback on the implementation ofthe approach to the WBCSD’s Executive Committee;
• Natural Capital Coalition: the NCC is a group of playerscommitted to developing a Natural Capital Protocol,whose publication is scheduled for May 2016. Thisdocument, which will be broken down by sector, willprovide a common framework for accounting for naturalcapital, in the same way as the GHG Protocol provides aframework for carbon accounting. Kering is an activemember of this working group, both by sharing its EP&Lmethodology with other members and by playing adirect role in drafting the protocol through itsmembership in the coalition’s Technical Group. Keringalso featured among companies that tested thepractical implementation of the Natural CapitalProtocol in 2015, notably through the steps involved inintegrating it into the business. Lastly, Kering is activelyinvolved in the development of the textile and apparelsector guide;
• Leather Working Group: the LWG unites players in the leather industry in the aim of improving theenvironmental performance and traceability of itsmember tanneries. Following PUMA’s commitment tothe LWG, Kering chose to join the organisation in 2014in order to speed up the work related to leathertraceability and improve the environmental footprint ofits tanneries. Kering also shared, at the LWG’s 2015annual conference, the results of its EP&L and the
various actions undertaken within this project toensure the traceability of leather;
• Textile Exchange: Kering is a member of Textile ExchangeEurope, and sits on the Board of Directors of this body,which is committed to promoting the production anduse of more sustainable textiles throughout the clothingindustry;
• European Commission: Kering is taking part in twoinitiatives launched by the European Commission. Thefirst is the Product Environmental Footprint pilot aimedat setting joint standards for the display of theenvironmental impact of certain product categories.Stella McCartney is leading Kering’s participation in thisinitiative, focusing on shoes. The brand is preparing totest the project’s communication phase in 2016,providing customers with information about theenvironmental footprint of some models of shoesthrough the use of specific displays in stores. The secondinitiative is a European working group aimed atpromoting the measurement and recognition ofnatural capital by companies and administrations;
• IUCN: the International Union for Conservation of Naturedevelops and maintains cutting-edge conservationscience, particularly with respect to species, ecosystemsand biodiversity, and their impact on human livelihoods.Kering initiated a strong partnership with the IUCN in2013, together with the International Trade Centre (ITC)on python breeding and trading in Asia. An initial reporton this work was issued in 2014. Entitled Assessment ofpython breeding farms supplying the international high-end leather industry, it evaluates the economic feasibilityand viability of captive breeding of pythons as apossible factor in the sustainable use and conservationof the species. In 2015, Kering organised the annualmeeting of the IUCN / CCI Python Conservation PartnershipSteering Committee;
• Wildlife Friendly Enterprise Network: Kering is amember of the Board of Directors, and supportscertification initiatives for key raw materials such aswool and cashmere through the Stella McCartneybrand;
• ITC: in 2014, Kering and the International Trade Centre(ITC) announced their collaboration to develop a multi-year programme to support the monitoring andsustainable management of trade in Nile crocodilesfrom Madagascar. The formation of the MadagascarCrocodile Conservation and Sustainable Use Programmefollows the recommendation by the Standing Committeeof the Convention on International Trade in EndangeredSpecies of Wild Fauna and Flora (CITES) to re-open tradein Nile crocodiles from Madagascar. The programme’sgoal is to support sustainable trade that contributes toeconomic opportunities, local livelihoods and the long-term conservation of crocodiles and their habitats.
3 SUSTAINABILITY ~ SUPPORTING COMMUNITY DEVELOPMENT
114 Kering ~ 2015 Reference Document
03_VA_V5 06/04/2016 17:31 Page114
3SUPPORTING COMMUNITY DEVELOPMENT ~ SUSTAINABILITY
1152015 Reference Document ~ Kering
In 2015, this work led to the creation of a nationalCrocodile Management Unit in Madagascar, whosepurpose is to focus on market monitoring and researchin terms of conservation of the species;
• BSR (Business for Social Responsibility): Kering is a member of BSR’s Sustainable Luxury working group wich unites more than 300 companies to promotetransparency and cooperation between Luxury Goodscompanies, particularly with regard to supply chains. In2015, BSR and Kering published a landmark report onclimate change and the luxury industry. Entitled ClimateChange: Implications and Strategies for the LuxuryFashion Sector, it provides the first analysis of theimpact of climate change on the luxury sector. Thereport aims to help industry players see where theirspecific vulnerabilities lie, and makes recommendationspromoting the development of more resilient businessmodels;
At the national level in France, Kering is also involved incross-sector dialogue and sharing best practices through:
• EpE: in 2012, Kering joined Entreprises pour l’Environnement,an association of approximately 40 French andinternational companies committed to working togetherto give environmental considerations more weight intheir strategies;
• Comité Colbert: the Comité Colbert brings togetherFrench Luxury Goods houses and cultural institutions,and aims to promote the international influence of theFrench art de vivre. Some Group brands, such asBoucheron, regularly attend meetings of the Committeedealing with sustainability issues.
Brands’ sector approach
In the same way as Kering, the brands are activemembers of bodies representing their specific sectors.The Luxury Division brands specialised in leather goods,such as Gucci and Bottega Veneta, are very active in thework of Italy’s Unione Nazionale Industria Conciaria (UNIC)to improve the environmental footprint of tanningprocesses, as well as health and safety conditions intanneries. The association of Italian tanners is in turn amember of Cotance, the body representing the leatherindustry in Europe, which contributes to the EuropeanCommission initiative aimed at defining a standard formeasuring the environmental footprint of leather goods.
Also at the European level, the Group’s brands take part intalks held by the European Cultural and Creative IndustriesAlliance (ECCIA), which brings together Europe’s fiveLuxury Goods and creative industry federations, includingComité Colbert for France, Fondazione Altagamma for Italyand Walpole for the UK.
Some brands go further by creating their own dialogueand exchange mechanisms with their stakeholders. Thisis the case for PUMA, which organised its twelfth annualTalks at Banz, an event attended by nearly 40 participants(suppliers, industry and government representatives,NGOs, sustainability experts, etc.) to address the theme of“Mainstreaming Sustainability”. In addition to this annualevent, PUMA has developed a local dialogue mechanismto bring it closer to the issues on the ground. Oneexample is the new partnership PUMA forged in 2015with the Maquila Solidarity Network to engage inconstructive dialogue on working conditions in the textilesector in Mexico.
Another emblematic example of stakeholder dialogue isthe formation of the Zero Discharge of HazardousChemicals (ZDHC) Group in response to the GreenpeaceDetox campaign in 2011. PUMA is a leading force in ZDHC,and publicly pledged in 2011 to remove toxic residuesfrom its entire production chain by 2020.
This initiative is one of many examples of partnershipsformed by the Group’s brands with NGOs. Gucci regularlyengages with Solidaridad, the Anti Vivisection Society, theHumane Society, the Clean Clothes Campaign, Greenpeace,the National Wildlife Federation and the RainforestAlliance.
Stella McCartney committed in 2015 to the SCAP 2020initiative that unites the main public and privatestakeholders in the apparel sector in the United Kingdomaround the goal of reducing environmental impactsassociated with the sector.
For the third consecutive year, Volcom organised, inpartnership with the NGO SOY (Save Our Youth), a three-day surf camp for underprivileged children in Costa Mesa.Volcom also opened the doors to its skate park inpartnership with the organisation TACA (Talk About CuringAutism) for an event that brought together more than250 people and enabled young people with autism andtheir families to express themselves through skateboarding.
Dialogue with customers, particularly on aspects ofsustainability, is another strong focus. Brioni has launcheda pilot study in its stores in Europe, giving the brandgreater insight into how much its customers know aboutits actions and those of the Group, and allowing it toidentify their expectations on the implementation ofenvironmental and social initiatives. In view of the valueof the results drawn from the pilot study, the brand hasdecided to reiterate the trial in 2016, on a broadergeographical scope. Although customers know fairly littleabout the actions undertaken by Kering and Brioni interms of sustainability, the study shows that the sourcingof textile fibres and the conditions under which they areproduced are particularly important to customers.
03_VA_V5 06/04/2016 17:31 Page115
Responsible purchasing policy
For non-retail (indirect) purchases, the Group’s IndirectPurchasing Department remains committed toresponsible sourcing based on a reciprocal undertakingwith suppliers to respect the Kering Code of ethics. It alsohas specific commitments tailored to each category ofpurchases, with buyers identifying the most relevantsustainability criteria. To formalise this process, aresponsible purchasing policy has been implemented atGroup-level. It sets out the priorities to be shared andapplied by all Group employees to manage purchasingethically and responsibly. It has been distributed to allKering employees. Kering further formalised thesecommitments in 2014 by signing the 2010 “ResponsibleSupplier Relations” Charter framed by the French Ministryof the Economy and Finance, and the Compagnie desdirigeants et acheteurs de France (French purchasingmanagers body – CDAF). The Charter’s purpose is topromote the implementation of and compliance withbest practices in relation to suppliers in France, and toencourage the major signatory contractors to implementa progress approach with their suppliers, especially smalland medium-sized enterprises, in order to develop a truepartnership through mutual knowledge and the respectfor each party’s rights and duties.
Training and support of suppliers in favour of best practices
Training and raising the awareness of suppliers is thepreferred avenue taken by Group brands to achievetangible improvement in practices across their valuechains.
In October 2015, Kering and its Luxury brands invitedtheir main European suppliers to a full day of talks anddebate around the Group’s sustainability approach. Themeeting was held in Novara, near Milan, and broughttogether 235 suppliers. The agenda covered productquality, Group and brand sustainability strategies, animalwelfare, management of chemicals, social audits, traceability,responsible sourcing through the Materials InnovationLab and energy efficiency with Clean by Design.
In Sport & Lifestyle, the five-year SAVE programme(Sustainable Action and Vision for a Better Environment),initiated by PUMA in 2011, was wound up in 2015. Thispublic-private partnership between PUMA and innovativefinancial institution DEG (Deutsche Investitions- undEntwicklungsgesellschaft) in collaboration with H&M andASSIST (Asia Society for Social Improvement andSustainable Transformation) allowed 35 of the brand’smain suppliers in Cambodia, China, Bangladesh andIndonesia to be trained in the environmental managementtechniques laid down by the United Nations IndustrialDevelopment Organization. A total of 261 measuresoffering a return on investment within one year and atotal reduction of approximately 100,000 tonnes in theCO2 emissions of these suppliers in the relevant activitieswere identified. PUMA plans to establish a follow-up tothis programme in 2016.
In the same spirit, Stella McCartney made a commitmentin 2013 to the National Resource Defence Council (NRDC)as part of the Clean by Design programme aimed atreducing textile manufacturers’ environmental footprint.In 2014, under the Group’s impetus, Gucci, AlexanderMcQueen, Saint Laurent, Balenciaga, Bottega Veneta and Brioni also joined the programme. A total of 25suppliers, mostly weaving, printing and dyeing companiesbased in Italy, are involved in the programme. Supplieraudits have identified simple changes that could reducetheir energy costs and greenhouse gas emissions by 15%to 25% without affecting production, and with a return oninvestment in less than five years. In 2015, Kering sharedthe findings of these audits with suppliers, and confirmedwith them the action plans set up to reduce water andenergy consumption. As these action plans are oftenexpensive, Kering has resolved to provide suppliers wishingto undertake an audit with a review of existing domesticand European funding arrangements, thereby enablingthem to make the investment necessary to improve theirindustrial processes and reap the ensuing savings.
More broadly, the Group’s brands hold regular trainingsessions to discuss with their suppliers the keysustainability projects likely to involve them.
4.3. Relationships with suppliers
3 SUSTAINABILITY ~ SUPPORTING COMMUNITY DEVELOPMENT
116 Kering ~ 2015 Reference Document
03_VA_V5 06/04/2016 17:31 Page116
3SUPPORTING COMMUNITY DEVELOPMENT ~ SUSTAINABILITY
1172015 Reference Document ~ Kering
Bottega Veneta gathered more than a hundred supplierson its Montebello Vicentino site in 2015 around thethemes of traceability, chrome-free tanning and themanagement of chemicals. Gucci conducted nineawareness-raising meetings in 2015, bringing togethernearly 375 suppliers on issues ranging from theprotection of human rights to the fight against corruption,but also covering the sustainability principles that are anintegral part of contracts signed by suppliers. PUMAorganised round tables with 270 suppliers in Turkey,India, Indonesia, Vietnam, Cambodia, China, Argentinaand Bangladesh. This allowed nearly 500 people to bemade aware of local environmental and social issues, andto be trained in the brand’s policies and processes.
Protecting human rights and combattingcorruption
Kering’s Code of ethics is the foundation on which theGroup’s commitment to ensuring respect for fundamentalrights is built. It is based on international reference textssuch as the Universal Declaration of Human Rights, theOECD Guidelines for Multinational Enterprises, the UnitedNations Convention on the Rights of the Child, the mainILO Conventions and the ten principles of the UN GlobalCompact, which Kering signed in 2008. In 2013, duringthe overhaul of its Code of ethics, Kering decided to insertits Suppliers’ Charter in order to bolster the Group’semphasis on compliance by its suppliers with the key socialand environmental standards laid down in the Code.
On the issue of preventing corruption, Kering prohibitsany political, trade union, cultural or charitable financingbeing carried out in exchange for direct or indirectmaterial, commercial or personal advantages. The Groupcomplies with national and international regulations inthe fight against direct and indirect corruption. TheGroup’s Ethics Committees seek to ensure compliancewith the Code of ethics, and may have matters referred tothem by any employee, notably issues relating tocorruption, either directly or via the ethics hotline set upfor all Group employees worldwide in 2013.
A new milestone was reached in 2015 with the creationof a Compliance structure, led by a Group Chief ComplianceOfficer (CCO) backed up by an international network ofBrand Compliance Officers (BCO) appointed by the CEOsof each brand, to ensure compliance with prevailing legalrequirements, including those relating to the fight againstcorruption and those relating to competition law.
In its second year, the e-learning training programme willcover topics related to diversity, corruption, human rightsand environmental protection. In 2016, the themes ofcorruption, conduct in the workplace, responsible sourcing
and traceability of raw materials, and lastly compliancewith business confidentiality will be on the agenda.
The principles contained in the Kering Code of ethicsnaturally apply to all Group brands, and can besupplemented by additional commitments more in tunewith the various brands’ operational issues. This is thecase for instance with PUMA, which has had its own Codeof Conduct for suppliers since 1993. Since 2005, thebrand has also issued PUMA.Safe pocket guides for itsemployees and suppliers. These guides present PUMA’ssocial, environmental and health and safety standards. ASocial Handbook is also available, with contact details toenable factory employees to reach the PUMA.Safe teamdirectly in case of breaches of the PUMA Code of Conduct.PUMA’s membership of the Fair Labor Association (FLA)means that third parties are also entitled to file officialcomplaints with the FLA if they feel that there has been abreach of the Code. The cooperation between PUMA andFLA dates back to 2004, and aims to manage andimplement the required standards in terms of workingconditions at suppliers. PUMA.Safe has been certified bythe Fair Labor Association since 2007. In 2005, PUMA alsoundertook to publish an annual update of its supplier list.An example is PUMA’s 2015 commitment alongside theFLA and other contractor brands to implement a nationalminimum wage policy in Georgia with local stakeholders.2015 also saw PUMA continue its work on the integrationof the Ruggie Framework (also known as the United NationsGuiding Principles on Business and Human Rights) intoits approach to human rights. The Ruggie Frameworkdefines the set of Guiding Principles on Business andHuman Rights, and is the reference framework issued bythe United Nations on human rights.
Volcom is also developing its code of conduct that itssuppliers undertake to follow when they work for the brand.
In the Luxury Division, in 2007 and 2009 respectively, Gucciand Bottega Veneta embarked on the process of obtainingSA 8000 (Social Accountability 8000) certification. Thisglobal standard takes into account not only the companyitself, but also the companies in its production chain. Itrequires the certified company and its suppliers to respectnine corporate responsibility requirements relating tochild labour, forced labour, health and safety, freedom ofassociation and collective bargaining, discrimination,disciplinary practices, working hours, remuneration andmanagement systems, and to set up a specific managementsystem for this purpose.
In 2013, Gucci and Bottega Veneta received SA 8000certification for all their activities. Kering’s internationallogistics platform for its Luxury brands (Luxury GoodsInternational, LGI) also enjoys SA 8000 certification.
03_VA_V5 06/04/2016 17:31 Page117
Supplier assessment systems
No control system, regardless of how mature and testedit is, can guarantee the absence of risk, and it is up to theGroup and its brands to develop with suppliers the mostefficient collaborative and control systems in order tokeep risk to a minimum and implement any correctiveaction in cases where non-compliance is identified.
The management of suppliers’ social compliance alsotakes into account the Group’s growth, and is movingtowards a more integrated model. Kering accordinglylaunched an ambitious project in 2015 to harmonise andcombine resources for each stage in the supplierrelationship process (contract, invoicing, traceability,audit, etc.). The sustainability team is involved in thisproject, which will also help brands implement andmonitor social and environmental criteria for brandsuppliers and subcontractors. More specifically, theproject enabled the establishment in 2015 of a team ofinternal auditors at Group level, which will ultimately allowthe integration of social and safety audits for all Luxurybrands, the harmonisation of the standards used in theseaudits and the appropriate response to non-compliance.
The implementation of this new organisation resulted ina decline in the number of audits carried out by Gucci in2015, due to the time needed for Gucci to update its riskmapping and its roadmap of suppliers to be audited onthe following criteria: location, revenue, number ofemployees, industrial processes used, social andenvironmental risks. In 2015, the brand accordinglyconducted 1,120 audits of 659 suppliers, 602 of whichalso covered environmental aspects.
Meanwhile, and based on the same broad risk assessmentprinciples, Bottega Veneta performed 819 social andsafety audits across its various business units in 2015.These audits brought to light two cases of non-compliancerelated to payroll management and implementation ofthe work contracts, as well as opportunities that willultimately improve the health and safety conditions andthe ergonomics of workstations.
In 2015, Saint Laurent completed 350 audits (mainly social,but also incorporating health and safety aspects) of directsuppliers covering all product categories, but with aparticular focus on leather goods suppliers. The selectionof suppliers to be audited is based on a risk matrixdeveloped by the brand; all cases of non-complianceidentified by the audits are addressed using correctiveactions monitored closely by Saint Laurent teams.
A similar approach is taken by Balenciaga’s LeatherGoods division, which in 2014 undertook an externalaudit programme covering social and safety aspects (inaccordance with the Workplace Conditions Assessmentstandard) of all its direct and indirect leather goodssuppliers located in Italy. A total of 69 audits wereperformed in 2015, with corrective action plans drawn upto address any cases of non-compliance.
Stella McCartney performed 73 audits in 2015, using thereference framework designed by SMETA (SEDEX MembersEthical Trade Audit), which, in addition to compliancewith the principles of the ETI (Ethical Trading Initiative),analyses working conditions, health and safety at work,and environmental and ethical practices, including bysubcontractors.
In the Sport & Lifestyle Division, PUMA’s audits are performedby PUMA.Safe (Social Accountability and FundamentalEnvironmental Standards, a team of nine internal auditorsdedicated to these issues). A total of 384 audits wereconducted in 332 factories in 2015, covering more than95% of the factories that PUMA works with. Supplierperformance in relation to the social and environmentalstandards of the PUMA audit criteria is expressed by a graderanging from A to D, A being the best. 34 factories failedthe audit, with a grade of C or D, and were consequentlysuspended. The three main causes of non-compliancewere health and safety, wages and freedom of association.
Volcom follows a mixed approach by conducting someaudits with its own teams, others being conducted by anexternal firm commissioned by Volcom directly or byanother of the supplier’s clients. Of the 34 factoriescovered in 2015, 9 were audited by teams from Volcomor by an audit firm representing the brand, and 25 byanother of the supplier’s clients.
3 SUSTAINABILITY ~ SUPPORTING COMMUNITY DEVELOPMENT
118 Kering ~ 2015 Reference Document
03_VA_V5 06/04/2016 17:31 Page118
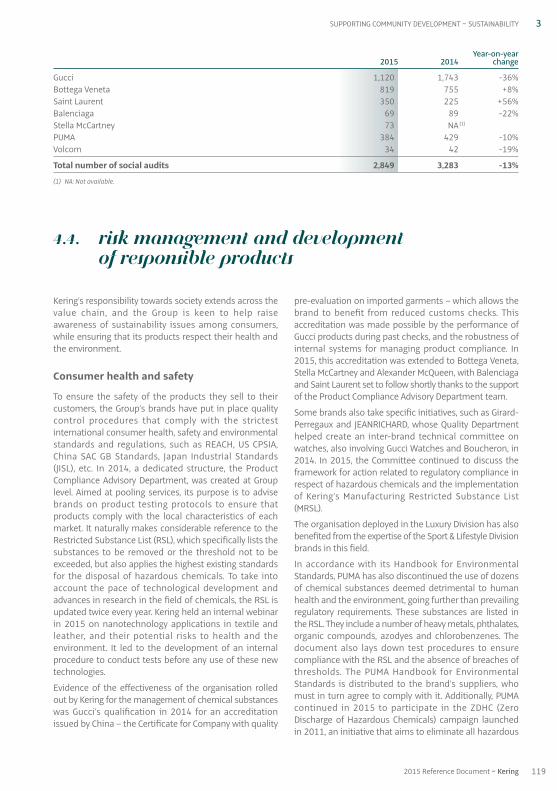
3SUPPORTING COMMUNITY DEVELOPMENT ~ SUSTAINABILITY
Kering’s responsibility towards society extends across thevalue chain, and the Group is keen to help raiseawareness of sustainability issues among consumers,while ensuring that its products respect their health andthe environment.
Consumer health and safety
To ensure the safety of the products they sell to theircustomers, the Group’s brands have put in place qualitycontrol procedures that comply with the strictestinternational consumer health, safety and environmentalstandards and regulations, such as REACH, US CPSIA,China SAC GB Standards, Japan Industrial Standards(JISL), etc. In 2014, a dedicated structure, the ProductCompliance Advisory Department, was created at Grouplevel. Aimed at pooling services, its purpose is to advisebrands on product testing protocols to ensure thatproducts comply with the local characteristics of eachmarket. It naturally makes considerable reference to theRestricted Substance List (RSL), which specifically lists thesubstances to be removed or the threshold not to beexceeded, but also applies the highest existing standardsfor the disposal of hazardous chemicals. To take intoaccount the pace of technological development andadvances in research in the field of chemicals, the RSL isupdated twice every year. Kering held an internal webinarin 2015 on nanotechnology applications in textile andleather, and their potential risks to health and theenvironment. It led to the development of an internalprocedure to conduct tests before any use of these newtechnologies.
Evidence of the effectiveness of the organisation rolledout by Kering for the management of chemical substanceswas Gucci’s qualification in 2014 for an accreditationissued by China – the Certificate for Company with quality
pre-evaluation on imported garments – which allows thebrand to benefit from reduced customs checks. Thisaccreditation was made possible by the performance ofGucci products during past checks, and the robustness ofinternal systems for managing product compliance. In2015, this accreditation was extended to Bottega Veneta,Stella McCartney and Alexander McQueen, with Balenciagaand Saint Laurent set to follow shortly thanks to the supportof the Product Compliance Advisory Department team.
Some brands also take specific initiatives, such as Girard-Perregaux and JEANRICHARD, whose Quality Departmenthelped create an inter-brand technical committee onwatches, also involving Gucci Watches and Boucheron, in2014. In 2015, the Committee continued to discuss theframework for action related to regulatory compliance inrespect of hazardous chemicals and the implementationof Kering’s Manufacturing Restricted Substance List(MRSL).
The organisation deployed in the Luxury Division has alsobenefited from the expertise of the Sport & Lifestyle Divisionbrands in this field.
In accordance with its Handbook for EnvironmentalStandards, PUMA has also discontinued the use of dozensof chemical substances deemed detrimental to humanhealth and the environment, going further than prevailingregulatory requirements. These substances are listed inthe RSL. They include a number of heavy metals, phthalates,organic compounds, azodyes and chlorobenzenes. Thedocument also lays down test procedures to ensurecompliance with the RSL and the absence of breaches ofthresholds. The PUMA Handbook for EnvironmentalStandards is distributed to the brand’s suppliers, whomust in turn agree to comply with it. Additionally, PUMAcontinued in 2015 to participate in the ZDHC (ZeroDischarge of Hazardous Chemicals) campaign launchedin 2011, an initiative that aims to eliminate all hazardous
Year-on-year 2015 2014 change
Gucci 1,120 1,743 -36%Bottega Veneta 819 755 +8%Saint Laurent 350 225 +56%Balenciaga 69 89 -22%Stella McCartney 73 NA (1) PUMA 384 429 -10%Volcom 34 42 -19%
Total number of social audits 2,849 3,283 -13%
(1) NA: Not available.
4.4. Risk management and development of responsible products
1192015 Reference Document ~ Kering
03_VA_V5 06/04/2016 17:31 Page119
chemical waste in the textile industry by 2020. ZDHCposts regular updates on the progress made with thisprogramme on its website.
Developing responsible products: a long-term strategy
Broadly speaking, Kering’s strategy is to seek to influencethe way in which products are designed as far up thesupply chain as possible. This is due to two key factors:
• the results of the EP&L carried out at the Group levelclearly show that the biggest environmental concerns arelocated far upstream, at the raw material productionstage of the value chain (farming, cultivation and mining),rather than on the Group’s own operations and sites;
• designing more environmentally friendly productsdepends on sustainable materials and processes. Interms of sustainability, the most important advancesare likely to be achieved in sourcing and by focusing onthe processing technologies used in the supply chain.
In 2015, the brands therefore continued to focus theirefforts mainly on sustainable sourcing and processinnovation. Given the time it takes to effect such a majortransformation, the portion of the Group’s responsibleproduction in its various collections remains modest. TheGroup’s brands nevertheless strive each year to createnew lines of sustainable products in order to generatenew sources of revenue. These initiatives are developedas pilot ranges to test a desired result, or as part ofconsumer awareness-raising campaigns to cultivate themarket’s appetite for sustainable products, or with a viewto sharing the results of their labours with the charitiesand associations with which they wish to collaborate.
To this end, the Group’s brands can leverage the MaterialsInnovation Lab (MIL), which offers the brands, two yearsafter its launch, a library of more than 2,000 ecologicalfabrics and fibres to use in their collections.
Working with Kering’s Sustainability Department, the MILteam shares its expertise with the brands and works withstrategic suppliers to identify materials that are better forthe environment. In 2015, the MIL developed thefollowing noteworthy projects:
• informing fabric suppliers about the various existing orpending environmental and social certifications,supporting them if necessary in obtaining certification;
• improving the MIL’s online database of 2,000 alternativefabrics and fibres (easier to read, faster searches);
• analysing regulations and practices regardingenvironmental and social disclosures on product labelsin various countries, and analysing the certificationsrequired before environmental and social claims be puton a label.
The MIL is also continuing its work aimed at integratingrecycled material into synthetic fibres such as polyesterand nylon. In particular, 2015 saw the MIL begin acollaboration with Aquafil, the producer of Econyl®, asustainable and innovative nylon fibre made from fishingnets or other waste nylon.
Following its entry into the Sport & Lifestyle collectionsthanks to PUMA, organic cotton is being used more widelyby the Luxury brands. Alexander McQueen, for instance,used more than 20,000 kg of organic cotton in its spring-summer 2015 men’s ready-to-wear collection (poloshirts and sweatshirts), while Bottega Veneta used morethan 700 kg of organic cotton in its 2015 / 2016 ready-to-wear collections. Stella McCartney continues to useorganic cotton, which accounted for 65% of its totalcotton use in 2015, focusing on GOTS (Global OrganicTextile Standard) and OCS (Organic Cotton Standard)certifications to ensure the highest standards in terms oftraceability and environmental impact along the entiretextile production chain. For the first time in 2015,children’s collections with GOTS and OCS certificationwere given specific labelling, and in-store sales consultantswere specifically trained to explain the principle of thetwo labels to customers. Kering conducted a thoroughstudy of conventional and organic cotton sourcing practiceacross the Group in 2015 to identify constraints andrecommend effective arrangements to allow the proportionof organic cotton products to increase significantly in 2016.
Another fabric synonymous with luxury, cellulosic fibressuch as viscose are the subject of great attention,because they are made from wood pulp and as suchcarry significant risks in terms of deforestation. This iswhy Stella McCartney has made a commitment alongsidethe NGO Canopy to ensure that all cellulose fibres used bythe brand are traceable and sustainably sourced by 2017,ensuring that their production is not the cause ofdeforestation in areas with high ecosystem value such asIndonesia.
In 2015, Brioni developed a special collection made fromthe highest quality merino wool (Super 150s and Super200s), whose production meets very stringent environmentaland animal welfare criteria.
At the end of 2015, over 30% of fabrics purchased bySaint Laurent to produce its ready-to-wear collectionswere covered by responsible sourcing projects, mainly forwool, cotton and silk.
The reuse of fabric offcuts can also help reconcile creativityand waste reduction. In 2015, for the second consecutiveyear, Balenciaga’s ready-to-wear division continued its Second Life Fabrics programme to find new uses for its unused fabrics. Since the project started, nearly3,000 shopping bags and scarves were produced byworkshops employing people in work reintegrationprogrammes and sold within the Group, resulting in thereuse of almost 1,500 metres of fabric.
3 SUSTAINABILITY ~ SUPPORTING COMMUNITY DEVELOPMENT
120 Kering ~ 2015 Reference Document
03_VA_V5 06/04/2016 17:31 Page120
3SUPPORTING COMMUNITY DEVELOPMENT ~ SUSTAINABILITY
Meanwhile, Gucci developed an innovative system forrecovering cashmere fabric production offcuts, which aresorted by colour and quality, and then processed into“recycled” cashmere fibre. Depending on the collectionand the level of quality required, a certain percentage ofvirgin fibre can be added before the spinning stage. Thewhole process takes place in Italy; it is environmentallyfriendly, fully traceable and enabled the reuse of 11 tonnes of cashmere offcuts in 2015. Gucci introducedthis innovative cashmere fibre in its autumn / winter 2015ready-to-wear collections for men, women and children.In the same vein, Stella McCartney has undertaken to useexclusively “recycled” cashmere fibre for all of its autumn2016 knitwear collection.
In leather goods, brands continued the move to chrome-and metal-free tanning. The switch has now been madefor three iconic Gucci handbags and customisable smallleather items, while Bottega Veneta doubled its productionof leather tanned without the use of chrome and metal in2015, with almost 100,000 square metres used in its leathergoods and shoes. In 2015, to further the work conductedby the brands on various environmentally friendlytanning techniques, Kering initiated a comprehensive life-cycle assessment for each technique (chrome-based,metal-free, plant-based, etc.). The study is based on fiveproduction cycles carried out internally or with externalpartners, such as tanneries in Italy, and aims to provide abetter insight into the environmental impacts and healthrisks of the various options. The results will be available in 2016.
All brands also worked to improve the traceability ofhides back to the slaughterhouse, and where possible allthe way back to the farm, to ensure that skins meet theGroup’s responsible sourcing objectives. Bottega Veneta,for instance, guarantees the traceability of leather usedfor nine versions of its iconic Cabat bag back through thevarious production and distribution stages to the farm.Traceability is achieved in large part through theapplication of the ICEC standard in tanneries, which aresubject to external audits. PUMA achieves the traceabilityof leather through its use of the Leather Working Grouprating system, which covers 90% of leather used.
In 2015, Gucci launched a special edition of a ring madefrom Fairmined certified gold. The Gucci Good Gold Ringis made from gold sourced from artisanal mines insouthern Peru. This certification means that the gold
used is ethical, or in other words that its extractioncomplies with stringent safety conditions, that it has alimited environmental footprint, particularly as regardsthe use of chemicals, and that a portion of the profit isdonated to local communities in order to improve theirliving conditions (building schools, transport and drinkingwater networks, etc.). Moreover, this certification requirestraceability along the entire production chain, guaranteeingthe provenance of the gold used.
In addition to the product itself, packaging is an importantpart of the approach taken by the brands. On the heels ofthe switch to FSC-certified paper for packaging, thebrands have made progress in integrating recycled fibres.As such, Bottega Veneta’s customer packaging andshopping bags include 50% recycled fibres. Similarly, the new packaging adopted by Gucci in October 2015 isFSC-certified.
The development of responsible products is also hingedon customer demand. For Kering, this implies a need tocontribute to raising customers’ awareness by educatingthem on the environmental and social issues related tothe manufacture of its products. To this end, StellaMcCartney has committed to the Clevercare initiative,which involves giving maintenance tips using pictogramson product labels and via a dedicated website. Thisallows customers to reduce the product’s environmentalfootprint during the use phase, and at the same time toextend its lifespan. Generally, responsible product linesare identified through specific labelling allowingcustomers to see how the items in question are responsible.Brand websites offer a valuable communication mediumfor customers who want more details.
To get a better grasp of customer expectations concerningresponsible products, Brioni has launched a pilot study inits stores in Europe, giving the brand greater insight intohow much its customers know about its actions andthose of the Group, and allowing it to identify theirexpectations on the implementation of environmentaland social initiatives. In view of the value of the resultsdrawn from the pilot study, the brand has decided tocontinue the study in 2016, so as to cover a broadergeographical scope.
No stage of the customer relationship should be forgotten,and Gucci’s after-sales service extended the use ofecological products to its stores in Europe in 2015, for themaintenance or repair of products returned by customers.
1212015 Reference Document ~ Kering
03_VA_V5 06/04/2016 17:31 Page121

The Kering Foundation: a renewedcommitment to combating violence against women
Established in 2008, the Kering Foundation – formerly PPRCorporate Foundation for Women’s Dignity and Rights –combats violence against women. The Foundationcommits Kering to a key issue that ties in with itsactivities and its brands’ customers, and an area wherethe Group can play a vital role alongside governmentsand communities.
Since 2014, the Kering Foundation has focused its actionson three geographic areas: the Americas, Western Europeand Asia. In each of these regions, the Foundation willfocus on a main cause (sexual violence, harmfultraditional practices and domestic violence, respectively)and on targeted partnerships with NGOs and socialentrepreneurs. The Foundation also enlists the support ofthe Group’s 38,800 employees for its actions designed toraise awareness and combat violence against women.
As part of the development of the Foundation’s activitiesin Asia, the first meeting of the Asia Steering Committeewas held on April 14, 2015 in Beijing. This committee hasthe following members: Yuan Feng, board member of theKering Foundation since June 17, 2014 in her capacity asan expert on women’s rights in the Asia-Pacific region;Alessandro Paparelli, Senior Vice-President, HumanResources, Kering Asia Pacific; Wu Qing, an expert in theChinese voluntary sector; Zhang Wenqi, Senior ProgrammeManager at Give2Asia, partner of the Foundation for thepre-selection of community projects; and Céline Bonnaire,Executive Director of the Foundation.
The purpose of the Steering Committee is to create aframework for exchange and cooperation with partnerassociations to assess and advance projects receivingsupport.
• Working alongside NGOs
Active in Europe in the fight against harmful traditionalpractices such as female genital mutilation (FGM) andforced marriage, the Foundation supports the creation ofthe Maison des Femmes in France. Faced with the factthat 16% of patients at its maternity clinic have sufferedgenital mutilation, the team of the Centre Hospitalier deSaint-Denis has decided to House specific servicesrelating to FGM – and more broadly social and legal servicesto support women who are victims of violence – in asingle location. The first stone was symbolically laid on
March 8, 2014, and construction is slated for completionon March 8, 2016. In addition to providing financialsupport, the Kering Foundation has also secured long-term commitments to the Maison des Femmes project fromseveral corporate foundations (Elle, Raja, Sanofi, etc.).
In the United Kingdom, the Foundation has joined forceswith Trust For London, the Esmée Fairbairn Foundation,Comic Relief and the Rosa Fund in supporting the TacklingFGM Initiative launched in 2010 to coordinate the work ofgrassroots organisations involved in the prevention ofFGM through interaction with communities. The Foundationprovides particular support to a capacity-buildingprogramme between grassroots organisations and to thecreation of psychosocial services for women victims.
Initial contacts have been made with NGOs in Italy; projectsare in the process of being drawn up.
In Asia, the Foundation has opted to focus its action ondomestic violence in China, which affects 25% to 30% ofwomen according to a study conducted by the All-ChinaWomen’s Federation in 2004. The Board of Directors hasvoted to support two projects over three years:
• the Maple Women’s Psychological Counselling Center inBeijing, to provide telephone support and multi-servicecoordination (accommodation, medical, psychologicaland legal assistance);
• the Zhongze Women’s Legal Counselling and ServiceCentre, for its pilot project of legal aid and advocacy forvictims in the province of Hubei, to promote nationallegislation.
Both projects receive financial support from theFoundation, as well as assistance for capacity building,particularly in the context of the Steering Committeesheld on April 14 and December 15, 2015.
Projects are also in the process of being identified inHong Kong.
In the Americas, the Foundation announced in June 2015its support for the fight against rape on campuses, and inparticular its partnership with the It’s On Us campaign ledby Generation Progress. One in five women are sexuallyassaulted on American campuses. The It’s On Us campaignis a movement aiming to achieve a cultural sea change byfundamentally shifting the perspective on sexual assaulton campuses. The project involves a range of partners, withcollaborative work alongside student leaders to promoteawareness campaigns and implement policy changes on campuses.
4.5. Initiatives carried out by the Kering Foundationand sponsorship programmes
3 SUSTAINABILITY ~ SUPPORTING COMMUNITY DEVELOPMENT
122 Kering ~ 2015 Reference Document
03_VA_V5 06/04/2016 17:31 Page122
3SUPPORTING COMMUNITY DEVELOPMENT ~ SUSTAINABILITY
The Kering Foundation supported Generation Progress’sproduction of a public service announcement videoentitled One Thing, as well as the action week it held onAmerican campuses from November 9 to 13, 2015. Thevideo, which came with a discussion and awarenessguide, focuses on the importance of consent to sexualintercourse. The video was shown throughout the UnitedStates between August (the back-to-school period onAmerican campuses) and December 2015, and wasviewed over 4 million times on YouTube and Facebook.90 committed partners including Facebook andMicrosoft added their support, giving it the potential toreach nearly 210 million people.
Lastly, the Kering Foundation continued its support forthe project backed by RESTART, an organisation thatworks to promote the socioeconomic integration ofsome 200 Syrian refugee women in Lebanon.
• Partnering with social entrepreneurs acting for the benefit of women
Since 2008, in line with Kering’s entrepreneurial values, theFoundation has provided support to social entrepreneurscombining sustainable business models and solutions tosocial issues. In 2015, after the pre-selection of projectswith three partners specialising in social entrepreneurship,namely FYSE in China, Geneva Global in the Americas andUnltd in Europe, the Kering Foundation awarded twosocial entrepreneur awards, one in China and the other inthe United States:
• Starfish Project, a social enterprise created by JennyMcGee, specialising in the design and production ofjewellery in Beijing. Starfish Project is managedexclusively by and for women victims of violence; profitsare used to provide a full range of services includingcounselling, vocational training, literacy, educationalscholarships, access to care and accommodation. Since2006, it has helped more than 100 women throughregional and global programmes. The support of theKering Foundation will help consolidate StarfishProject’s social impact in China. The project won both agrant of €30,000 and two years’ mentoring by a Keringgroup executive. This support will enable StarfishProject to entrench its position in the Chinese market,and will offer leadership training allowing the femalebeneficiaries to develop Starfish’s activities and fosterjob opportunities for women;
• We End Violence, a social enterprise dedicated to theprevention of sexual violence in the United States. It offersan innovative model to raise awareness and change thetypes of behaviour that lead to gender violence: createa culture where victims of sexual violence feel safe toshare their experiences and rebuild; change culturalnorms; encourage men to become aware of their role inthe prevention of violence; and build alliances thatempower more people to make their voices heard.Since 2006, We End Violence has provided direct
assistance to 10,000 beneficiaries. The project won twoyears’ support from the Foundation, including a grantof €30,000, and mentoring by a Kering group executiveto strengthen its marketing and communicationsstrategy.
• Raising awareness among staff and the generalpublic
Combating violence against women means buildingawareness with a view to changing social representationsand behaviour. The Kering Foundation has made raisingawareness, both among its employees and the generalpublic, a key part of its programme.
When François-Henri Pinault joined forces withFédération Nationale Solidarité Femmes (FNSF) in 2010 tosign a Charter to prevent and combat domestic violence,the Group pledged to inform and train employees withinits brands to provide better help for potential victims.This was done first in France and then in Italy, in 2013, inpartnership with Donne in Rete contro la violenza (D.i.Re).In 2015, 56 employees in France and Italy attended fourawareness-raising sessions. In addition, in January 2015,the Kering Foundation joined forces with British NGOWomen’s Aid to prevent and combat violence againstwomen. The Charter, signed by François-Henri Pinault,commits Kering’s 1,400 employees based in the UnitedKingdom to a two-year programme combating domesticviolence. This will better equip them to ensure theprevention of this phenomenon, which affects all socialclasses. By the end of 2015, four training sessions hadbeen held in the United Kingdom, involving a total of 63 employees.
Since 2011, 353 employees have been trained on domesticviolence issues.
In January 2015, the Board of Directors decided to end thepartnership linking the Foundation to the Tribeca FilmInstitute since 2011. The decision was made to devote thefunds to projects more in tune with the causes supportedby the Foundation, and whose impact can be assessedmore readily. Kering also announced a partnership withthe Cannes Film Festival and the launch of its Kering forWomen programme in 2015.
The Foundation organised a round table timed to coincidewith the festival, in May 2015. Three speakers addressedthe following theme: “How can cinema help improvewomen’s rights? Cinema as a platform to raise awarenessabout women’s causes”:
• Linor Abargil for Brave Miss World, a documentarysupported by the Kering Foundation;
• Leslee Udwin, Director of India’s Daughter, winner of the2014 Spotlighting Women Documentary Awardawarded by the Foundation in partnership with theGucci Tribeca Documentary Fund;
• Deniz Gamze, Director of Mustang, in competition atCannes.
1232015 Reference Document ~ Kering
03_VA_V5 06/04/2016 17:31 Page123
On November 25, International Day for the Elimination ofViolence against Women, the Foundation launched thefourth edition of its White Ribbon for Women campaign.
In 2015, 125,000 copies of the badge designed by StellaMcCartney, in reference to the men’s White Ribbonmovement against violence towards women, weredistributed in 41 countries between November 21 and 28.Customers of over 800 Alexander McQueen, Balenciaga,Boucheron, Brioni, Dodo, Gucci, Pomellato, Qeelin andStella McCartney boutiques and their related e-commercewebsites, as well as the majority of the Group’s employeesand countless partners, journalists and opinion leaders,had their awareness raised in this way.
At the same time, from November 7 to 28, the KeringFoundation ran a digital campaign with the hashtag#BeHerVoice to encourage everyone to play a part inending violence against women.
The social media campaign potentially reached morethan 319 million Internet users, thanks to the support ofthe Group’s brands and celebrities like Kelly Slater, RichardBranson, Johnny Depp, Chen Man and Negin Mirsalehi.
In conjunction with this programme, the Kering Foundationunites the Group’s employees around its commitment towomen: their skills, both professional and personal, are avaluable source of support for NGOs and social entrepreneurs.
Since 2014, employees who take two weeks’ solidarity leavefor an assignment in a foreign country have been giventwo to four days’ paid leave pursuant to the InternationalVolunteering Programme. Employees who offer moreregular support to local organisations are given six days.In 2015, the Group gave 70 days’ paid leave for volunteerwork in support of women, including eight days’ pre-departure training. An example is offered by two Gucciand Saint Laurent employees who worked to bolster thehuman resources management skills of the team of EndaEl Alto, an NGO that provides a shelter for young girls whohave been victims of violence in the suburbs of La Paz,offering them vocational training and activities.
The Kering group brands support women’sempowerment projects, including health, education and cultural heritage
The support of the Group’s brands is a real lever forcommunity projects, mobilising a wide range of resources.Each brand develops its own community initiatives to tiein with its activities and locations, to encourage thesharing of best practices and to offer support to thebrands in developing initiatives for women.
Multiple initiatives benefiting women
The Kering group brands demonstrated their commitmentto women’s rights through some 50 initiatives in 2015.Gucci, founder of the Chime For Change movement in 2013,this year raised more than €386,000, allowing its totalcontribution to roughly 400 projects favouring women’saccess to education, healthcare and justice to top €7 million,with a special focus on the plight of Syrian refugees. In 2015,Chime for Change established a partnership with GlobalCitizen, supporting its Global Citizen Festival held in CentralPark and working to make the voices of girls and womenacross the globe heard. The Italian brand has also been acommitted partner of UNICEF for several years via itschildren’s collections. Alexander McQueen also providesactive support for this project. Stella McCartney raised€27,800 through special sales dedicated to Heart, anassociation that helps victims of sexual abuse in theUnited States. Bottega Veneta opted to raise the profile ofAfghanistan’s emblematic female cycling team byorganising a charity race with its employees from Milan toits Vicentino workshop in Montebello. Brands are alsocommitted to women in their home markets: Qeelin,Alexander McQueen and Stella McCartney donated goodsfor auction to benefit the Women’s Foundation in HongKong and Women’s Aid in the United Kingdom. In itshome city of Penne, Brioni has funded a nursery topromote the employment of women. Oxfam was givensome €20,000 for its women’s programme in Italy, raisedby Gucci through the sale of special edition bracelets.
A strong commitment to health and medical research
Broadly speaking, health and medical research benefitfrom more than 35% of brands’ philanthropy. Sowindcontributed €35,000 for research on Duchenne musculardystrophy by auctioning a watch, while Saint Laurentcontinued to support Sidaction, raising more than€12,000. In women’s health, a total of over €100,000 wasraised to fight breast cancer through initiatives taken bythe majority of brands around the world, includingPomellato in Italy and Boucheron in France, as well asGucci in South Korea and China. Children’s health isanother special focus, with more than €190,000 devotedto various causes: Gucci, for instance, renewed its supportof more than €100,000 to the China Children andTeenagers’ Foundation (CCTF) to help disadvantagedchildren suffering from amblyopia, a condition that leadsto impaired vision. In 2015, Gucci completed a three-yearinternational cooperation project to renovate thepharmacy of the Thiès Hospital as part of its fight againstmaternal and infant mortality in Senegal.
3 SUSTAINABILITY ~ SUPPORTING COMMUNITY DEVELOPMENT
124 Kering ~ 2015 Reference Document
03_VA_V5 06/04/2016 17:31 Page124
3SUPPORTING COMMUNITY DEVELOPMENT ~ SUSTAINABILITY
Diversified resources for education and training
In Sport & Lifestyle, PUMA opted to support initiatives byprofessional footballers in favour of disadvantagedchildren by donating over €140,000 to the StiftungProfifussballer helfen Kindern foundation. Volcom, whichfor eight years has been committed to the education ofyoung people alongside the Boys and Girls Club of Hawaii,raised over €45,000, notably through the Give Back Seriescollections, in which a percentage of profits is donated.
While Balenciaga provided €90,000 in sponsorship to thegala of the Boys Club of New York, which provideseducational programmes to over 4,000 disadvantagedyoung people, the Luxury brands tend to focus their workwith young people on numerous partnerships developedto train young generations in the fields of artistic creationand the preservation of know-how. Brioni contributedover €209,000 through fabric donations to the LondonCollege of Fashion and Central Saint Martins, assistingstudents of the Royal College of Arts and supportingeducation through art with Artists for Peace and Justice.Since 2012, Bottega Veneta has undertaken to trainyoung people from the Veneto region to preserveleathercraft know-how, dedicating €247,000 to theprogramme. The money funds training for 70 students at
the Centre for Professional Training of Vicenza and providesaccess to 12 students from the University of Venice IUAVfor three months’ training at both the university and theScuola dei Maestri Pellettieri in the brand’s MontebelloVicentino workshops. Gucci continued to support youngmusicians from the Recording Academy by donating partof the profits of several dedicated products in theamount of nearly €700,000.
Resources made available in support of culturalheritage
The brands are also committed to the preservation ofheritage alongside cultural institutions. Boucheron,patron of the arts at the Comédie Française since 2011,renewed its support in the amount of €30,000. The PalaisGalliera fashion museum received donations of itemsfrom Balenciaga and Saint Laurent. The MetropolitanMuseum of Art also received the support of Balenciagaand Saint Laurent for its annual gala. Bottega Veneta inturn this year devoted more than €330,000 to museums,including the Metropolitan Museum of Art and theHammer Museum in the United States, and collaboratedwith Casa Brutus magazine to raise awareness aboutJapanese modernist architecture.
1252015 Reference Document ~ Kering
03_VA_V5 06/04/2016 17:31 Page125

3 SUSTAINABILITY ~ CROSS-REFERENCE TABLE
Grenelle 2 Articles R. 225-104 and R. 225-105 of Section of thethe French Commercial Code (Code de commerce) GRI Global compact Reference Document
1° Social information
Employment
Total number of employees and breakdown of employees by gender, age and region G4-10 3 to 6 Section 2.1.Hires and redundancies G4-LA1 Section 2.1.Remuneration and changes in remuneration G4-LA13 Section 2.2.
Work organisation
Organisation of working time G4-LA2 3 to 6 Section 2.6.Absenteeism G4-LA6 Section 2.6.
Labour relations
Organisation of social dialogue, proceduresfor informing, consulting and negotiating with employees G4-LA4 3 to 6 Section 2.7.Collective bargaining agreements G4-LA4 Section 2.7.
Health and safety
Health and safety in the workplace G4-LA6 to 8 3 to 6 Section 2.6.Bargaining agreements signed with trade unions and employee representatives concerning health and safety in the workplace G4-LA6 Section 2.6.Work-related accidents, in particular frequency and severity, and work-related illnesses G4-LA7 Section 2.6.
Training
Training policies G4-LA11 3 to 6 Section 2.4.Total number of training hours G4-LA10 Section 2.4.
Diversity
Measures taken to promote gender equality G4-LA10 3 to 6 Section 2.5.Measures taken to promote the employment and integration of people with disabilities G4-LA12 Section 2.5.Policy concerning the fight against discrimination G4-LA12, G4-HR3 Section 2.5.
Justification of exclusions
This report contains information on all social,environmental and societal issues required by the decreegoverning the application of Article 225 of the Grenelle 2law, with the exception of:
• noise, which is not applicable to Kering’s sectors of activity;
• the amount of provisions and guarantees forenvironmental risk, which is not consolidated at Group
level and concerns only a very small number of sites(tanneries and production sites).
This information relates to the activities and brands ofthe Group’s Luxury and Sport & Lifestyle Divisions.Subsidiaries whose activities are considered to bediscontinued under IFRS rules have been deliberatelyexcluded from the scope of the published information.
5. Cross-reference tablepursuant to Articles R. 225-104 and R. 225-105 of the French Commercial Code (Code de commerce) / Global Compact / GRI G4
126 Kering ~ 2015 Reference Document
03_VA_V5 06/04/2016 17:31 Page126
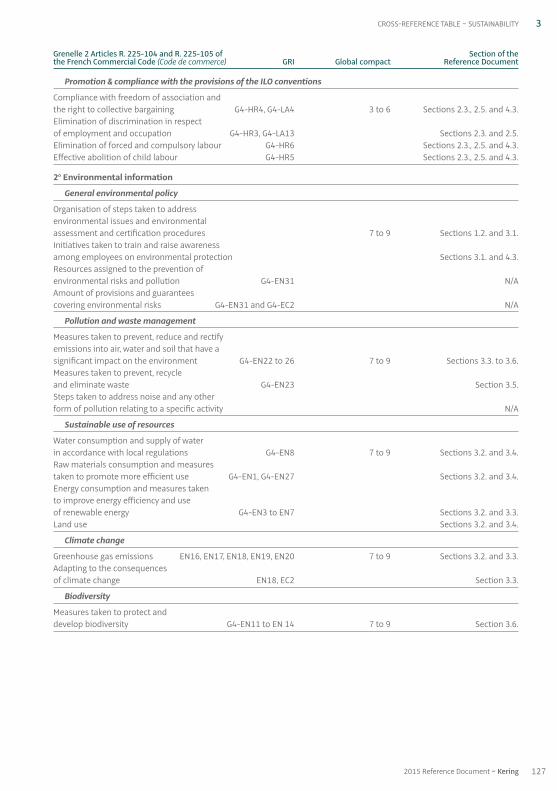
3CROSS-REFERENCE TABLE ~ SUSTAINABILITY
Promotion & compliance with the provisions of the ILO conventions
Compliance with freedom of association and the right to collective bargaining G4-HR4, G4-LA4 3 to 6 Sections 2.3., 2.5. and 4.3.Elimination of discrimination in respect of employment and occupation G4-HR3, G4-LA13 Sections 2.3. and 2.5.Elimination of forced and compulsory labour G4-HR6 Sections 2.3., 2.5. and 4.3.Effective abolition of child labour G4-HR5 Sections 2.3., 2.5. and 4.3.
2° Environmental information
General environmental policy
Organisation of steps taken to address environmental issues and environmental assessment and certification procedures 7 to 9 Sections 1.2. and 3.1.Initiatives taken to train and raise awareness among employees on environmental protection Sections 3.1. and 4.3.Resources assigned to the prevention of environmental risks and pollution G4-EN31 N / AAmount of provisions and guarantees covering environmental risks G4-EN31 and G4-EC2 N / A
Pollution and waste management
Measures taken to prevent, reduce and rectify emissions into air, water and soil that have a significant impact on the environment G4-EN22 to 26 7 to 9 Sections 3.3. to 3.6.Measures taken to prevent, recycle and eliminate waste G4-EN23 Section 3.5.Steps taken to address noise and any other form of pollution relating to a specific activity N / A
Sustainable use of resources
Water consumption and supply of water in accordance with local regulations G4-EN8 7 to 9 Sections 3.2. and 3.4.Raw materials consumption and measures taken to promote more efficient use G4-EN1, G4-EN27 Sections 3.2. and 3.4.Energy consumption and measures taken to improve energy efficiency and use of renewable energy G4-EN3 to EN7 Sections 3.2. and 3.3.Land use Sections 3.2. and 3.4.
Climate change
Greenhouse gas emissions EN16, EN17, EN18, EN19, EN20 7 to 9 Sections 3.2. and 3.3.Adapting to the consequences of climate change EN18, EC2 Section 3.3.
Biodiversity
Measures taken to protect and develop biodiversity G4-EN11 to EN 14 7 to 9 Section 3.6.
Grenelle 2 Articles R. 225-104 and R. 225-105 of Section of thethe French Commercial Code (Code de commerce) GRI Global compact Reference Document
1272015 Reference Document ~ Kering
03_VA_V5 06/04/2016 17:31 Page127
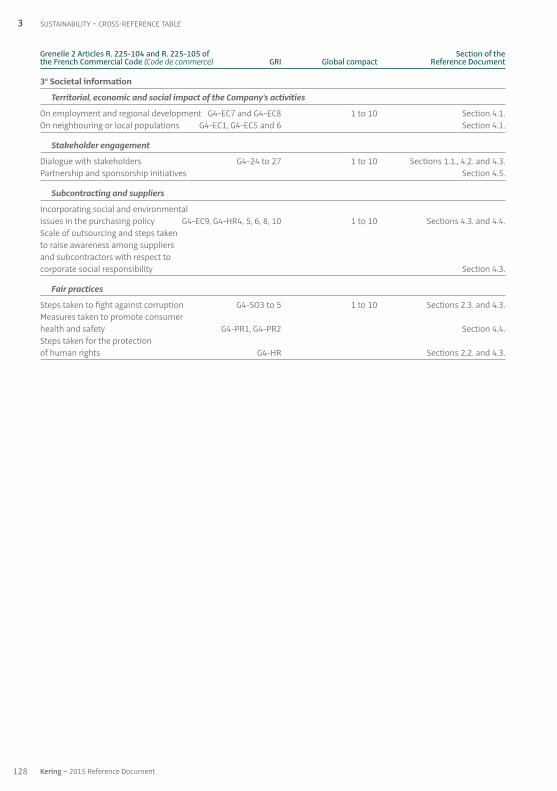
3° Societal information
Territorial, economic and social impact of the Company’s activities
On employment and regional development G4-EC7 and G4-EC8 1 to 10 Section 4.1.On neighbouring or local populations G4-EC1, G4-EC5 and 6 Section 4.1.
Stakeholder engagement
Dialogue with stakeholders G4-24 to 27 1 to 10 Sections 1.1., 4.2. and 4.3.Partnership and sponsorship initiatives Section 4.5.
Subcontracting and suppliers
Incorporating social and environmental issues in the purchasing policy G4-EC9, G4-HR4, 5, 6, 8, 10 1 to 10 Sections 4.3. and 4.4.Scale of outsourcing and steps taken to raise awareness among suppliers and subcontractors with respect to corporate social responsibility Section 4.3.
Fair practices
Steps taken to fight against corruption G4-SO3 to 5 1 to 10 Sections 2.3. and 4.3.Measures taken to promote consumer health and safety G4-PR1, G4-PR2 Section 4.4.Steps taken for the protection of human rights G4-HR Sections 2.2. and 4.3.
3 SUSTAINABILITY ~ CROSS-REFERENCE TABLE
Grenelle 2 Articles R. 225-104 and R. 225-105 of Section of thethe French Commercial Code (Code de commerce) GRI Global compact Reference Document
128 Kering ~ 2015 Reference Document
03_VA_V5 06/04/2016 17:31 Page128
3REPORT BY ONE OF THE STATUTORY AUDITORS ~ SUSTAINABILITY
6. Report by one of the Statutory Auditors, appointed as independent third party, on the consolidatedhuman resources, environmental and social information included in the Management Report For the year ended 2015
This is a free English translation of the Statutory Auditors’ report issued in French and is provided solely for the convenienceof English-speaking readers. This report should be read in conjunction with, and construed in accordance with, French lawand professional standards applicable in France.
To the Shareholders,
In our capacity as Statutory Auditor of Kering, (the “Company”), appointed as independent third party and certified byCOFRAC under number(s) 3-1048(1), we hereby report to you on the consolidated human resources, environmental andsocial information for the year ended December 31st, 2015 included in the Management Report within the ReferenceDocument (hereinafter named “CSR Information”), pursuant to article L. 225-102-1 of the French Commercial Code(Code de commerce).
Company’s responsibility
The Board of Directors is responsible for preparing a company’s Management Report including the CSR Informationrequired by article R. 225-105-1 of the French Commercial Code in accordance with the protocol used by the Company(hereinafter the “Guidelines”), summarised on Kering Internet website (www.kering.com).
Independence and quality control
Our independence is defined by regulatory texts, the French Code of ethics (Code de déontologie) of our profession andthe requirements of article L. 822-11 of the French Commercial Code. In addition, we have implemented a system ofquality control including documented policies and procedures regarding compliance with the ethical requirements,French professional standards and applicable legal and regulatory requirements.
Statutory Auditor(s)’s responsibility
On the basis of our work, our responsibility is to:
• attest that the required CSR Information is included in the Management Report or, in the event of non-disclosure of apart or all of the CSR Information, that an explanation is provided in accordance with the third paragraph of articleR. 225-105 of the French Commercial Code (Attestation regarding the completeness of CSR Information);
• express a limited assurance conclusion that the CSR Information taken as a whole is, in all material respects, fairlypresented in accordance with the Guidelines (Conclusion on the fairness of CSR Information).
Our work involved six persons and was conducted between October 2015 and March 2016 during a four week period.We were assisted in our work by our sustainability experts.
We performed our work in accordance with the French professional standards and with the order dated 13 May 2013defining the conditions under which the independent third party performs its engagement and with ISAE 3000(2)
concerning our conclusion on the fairness of CSR Information.
(1) Whose scope is available at www.cofrac.fr(2) ISAE 3000 – Assurance engagements other than audits or reviews of historical financial information.
1292015 Reference Document ~ Kering
03_VA_V5 06/04/2016 17:31 Page129
1. Attestation regarding the completeness of CSR Information
Nature and scope of our work
On the basis of interviews with the individuals in charge of the relevant departments, we obtained an understanding ofthe Company’s sustainability strategy regarding human resources and environmental impacts of its activities and itssocial commitments and, where applicable, any actions or programmes arising from them.
We compared the CSR Information presented in the Management Report with the list provided in article R. 225-105-1of the French Commercial Code.
For any consolidated information that is not disclosed, we verified that explanations were provided in accordance witharticle R. 225-105, paragraph 3 of the French Commercial Code.
We verified that the CSR Information covers the scope of consolidation, i.e., the Company, its subsidiaries as defined byarticle L. 233-1 and the controlled entities as defined by article L. 233-3 of the French Commercial Code within thelimitations set out in the methodological note, presented on the Company’s website.
Conclusion
Based on the work performed and given the limitations mentioned above, we attest that the required CSR Informationhas been disclosed in the Management Report.
2. Conclusion on the fairness of CSR Information
Nature and scope of our work
We conducted around ten interviews with the persons responsible for preparing the CSR Information in thedepartments in charge of collecting the information and, where appropriate, responsible for internal control and riskmanagement procedures, in order to:
• assess the suitability of the Guidelines in terms of their relevance, completeness, reliability, neutrality andunderstandability, and taking into account industry best practices where appropriate ;
• verify the implementation of data-collection, compilation, processing and control process to reach completeness andconsistency of the CSR Information and obtain an understanding of the internal control and risk managementprocedures used to prepare the CSR Information.
We determined the nature and scope of our tests and procedures based on the nature and importance of the CSR Information with respect to the characteristics of the Company, the human resources and environmentalchallenges of its activities, its sustainability strategy and industry best practices.
Regarding the CSR Information that we considered to be the most important(1):
• at parent entity level, we referred to documentary sources and conducted interviews to corroborate the qualitativeinformation (organisation, policies, actions), performed analytical procedures on the quantitative information andverified, using sampling techniques, the calculations and the consolidation of the data. We also verified that theinformation was consistent and in agreement with the other information in the Management Report;
• at the level of a representative sample of entities selected by us(2) on the basis of their activity, their contribution tothe consolidated indicators, their location and a risk analysis, we conducted interviews to verify that procedures areproperly, and we performed tests of details, using sampling techniques, in order to verify the calculations andreconcile the data with the supporting documents. The selected sample represents on average of 28% of headcountand between 25% and 82% of quantitative environmental data disclosed.
3 SUSTAINABILITY ~ REPORT BY ONE OF THE STATUTORY AUDITORS
(1) The concerned quantitative and qualitative information are listed in the annex of this report.(2) PUMA Germany, PUMA US, PUMA Japan, Gucci Italy, Gucci US, Gucci Japan, LGI (for environmental indicators only), Kering Foundation, Sowind Group,
Stella McCartney, Alexander McQueen.
130 Kering ~ 2015 Reference Document
03_VA_V5 06/04/2016 17:31 Page130
3REPORT BY ONE OF THE STATUTORY AUDITORS ~ SUSTAINABILITY
For the remaining consolidated CSR Information, we assessed its consistency based on our understanding of the Company.
We also assessed the relevance of explanations provided for any information that was not disclosed, either in whole orin part.
We believe that the sampling methods and sample sizes we have used, based on our professional judgement, aresufficient to provide a basis for our limited assurance conclusion; a higher level of assurance would have required us tocarry out more extensive procedures. Due to the use of sampling techniques and other limitations inherent toinformation and internal control systems, the risk of not detecting a material misstatement in the CSR informationcannot be totally eliminated.
Conclusion
Based on the work performed, no material misstatement has come to our attention that causes us to believe that theCSR Information, taken as a whole, is not presented fairly in accordance with the Guidelines.
Neuilly-sur-Seine, March 30, 2016One of the Statutory Auditors
Deloitte & Associés
Frédéric Moulin Julien RivalsPartner Partner, Sustainability Services
1312015 Reference Document ~ Kering
03_VA_V5 06/04/2016 17:31 Page131
3 SUSTAINABILITY ~ APPENDIX
AppendixCSR information selected by the independent third party
Quantitative social information
Workforce registered as of December 31 (breakdown by sex, status, type of contract, geographical region)Worked hoursHiring permanent / non-permanentAllocation of permanent leavings by reasonNumber of training hours (excluding safety training)Number of trained peopleNumber of disabled workersFrequency rate and severity rate of work accidentsOverall rate of absenteeism and illnessNumber of collective agreements signed
Qualitative Social information
Promotion and respect of ethicsDevelopment of skills and talentsInitiatives on diversitySocial dialogue initiatives
Quantitative Environmental information
Energy consumption and associated CO2 emissionsRenewable electricity proportion at Group levelEmissions associated with “B2B”, “B2C” and business travelsTonnes of CO2 offsetPaper consumption and percentage of paper from a sustainable sourcePackaging consumptionIndustrial water consumption
Qualitative Environmental information
Implementation of the EP&LGovernance & Organisation on sustainability issuesISR index and certifications
Societal information
Number of social audits conducted with the Group’s suppliersPartnerships with the Foundation and number of women involved and informed Number of trained employees as part of Kering’s Charter to prevent and combat domestic violencePVC elimination initiativesInitiatives for the elimination of hazardous chemicalsGold and official diamonds responsible purchasingInitiatives for responsible purchasing of leatherInitiatives for the purchase of precious skins and furs
132 Kering ~ 2015 Reference Document
03_VA_V5 06/04/2016 17:31 Page132
1332015 Reference Document ~ Kering
CHAPTer 4
Corporate Governance
1. Kering governance 134
2. Information on Directors and executive corporate officers 135
3. Remuneration of corporate officers 1473.1. Remuneration of executive corporate officers (Chief Executive Officer and Group Managing Director) 1473.2. Remuneration of non-executive corporate officers – Directors’ fees 1523.3. Regulatory information on Directors and executive corporate officers 1533.4. Other information on the Company’s Board of Directors 154
4. Group management 155
5. Report by the Chairman of the Board of Directors 1565.1. Membership of the Board of Directors 1565.2. Conditions of preparation and organisation of the work of the Board of Directors 1585.3. Internal control and risk management procedures implemented by the Company 165
6. Statutory Auditors’ report 174
04_VA_V5 06/04/2016 17:31 Page133
At the Combined General Meeting on May 19, 2005, the shareholders adopted the new Articles of Association of PPR(since renamed Kering) establishing a system of management with a Board of Directors instead of a Supervisory Boardand an Executive Board. François-Henri Pinault is Chairman of the Board of Directors and Chief Executive Officer of the Company.
The Board opted to combine the roles of Chairman of the Board and Chief Executive Officer and retained this optionfollowing the renewal by the Combined General Meeting on June 18, 2013 of the directorship of François-Henri Pinault,who is both related to the controlling shareholder and very involved in conducting the business of the Group of whichhe has very strong in-depth knowledge and experience.
The Combined General Meeting on June 18, 2013 renewed the term of office of Jean-François Palus, Group ManagingDirector of the Kering group, as a Director for four years.
The Company refers to the Corporate Governance Code of Listed Corporations resulting from the consolidation of theOctober 2003 AFEP and MEDEF report, the January 2007 and October 2008 AFEP and MEDEF recommendations on theremuneration of Directors and executive corporate officers and the April 2010 AFEP-MEDEF recommendationconcerning the strengthening of women representation within the boards, as amended in November 2015 (the revisedAFEP-MEDEF Code). The Board of Directors has a diverse, international composition, with a total of eleven members ofFrench, German and Italian nationalities. Four Directors are women, including a Director representing the employees. In2015, four of the ten Directors, excluding the Director representing the employees, were independent according to theindependence criteria defined by the Board.
Mr. François Pinault is Honorary Chairman but is not a Director.
The operating rules and procedures of the Board of Directors are defined by law, the Company’s Articles of Association, theinternal rules of the Board and the specialised Committees provided for in those rules (see Chairman’s report, page 156).
The provisions of the Company’s Articles of Association regarding Directors do not in general deviate from the basiclegal standards. There are special provisions for the term of office of Directors (four years, renewable), the age limit (nomore than one-third of the Directors may be over 70), the Director representing the employees (appointed by the KeringWorks Council) and the minimum number of shares that each Director must own (500). Concerning this last point, itshould be added that, in accordance with Article L. 225-25 of the French Commercial Code (Code de commerce), theDirector representing employees is exempt from the obligation to hold shares.
In order to avoid having to reappoint all Board members at the same time and to streamline the reappointmentprocess, the Combined General Meeting on May 7, 2009 amended the Company’s Articles of Association in order toimplement the staggered renewal of the Board of Directors.
The Directors’ duties and individual remuneration are described below.
1. Kering governance
4 CORPORATE GOVERNANCE ~ KERING GOVERNANCE
134 Kering ~ 2015 Reference Document
04_VA_V5 06/04/2016 17:31 Page134
As of December 31, 2015, the Board of Directors was composed of ten members, four of whom were independentDirectors according to the Board of Directors’ criteria.
In addition, there is one Director representing the employees appointed by the Kering Works Council.
List of members of the Board of Directors with information on their positions in other companies
The following information is presented separately for each Director:
• professional experience and expertise in the area of business management;
• directorships and positions held in 2015;
• other directorships and positions held in the last five years.
Among Kering’s Directors and executive corporate officers, only François-Henri Pinault, Jean-François Palus, Patricia Barbizetand Jochen Zeitz hold or have held legal representative or corporate executive functions in the Group’s mainsubsidiaries.
2. Information on Directors and executive corporate officers
135
4
2015 Reference Document ~ Kering
INFORMATION ON DIRECTORS AND EXECUTIVE CORPORATE OFFICERS ~ CORPORATE GOVERNANCE
04_VA_V5 06/04/2016 17:31 Page135
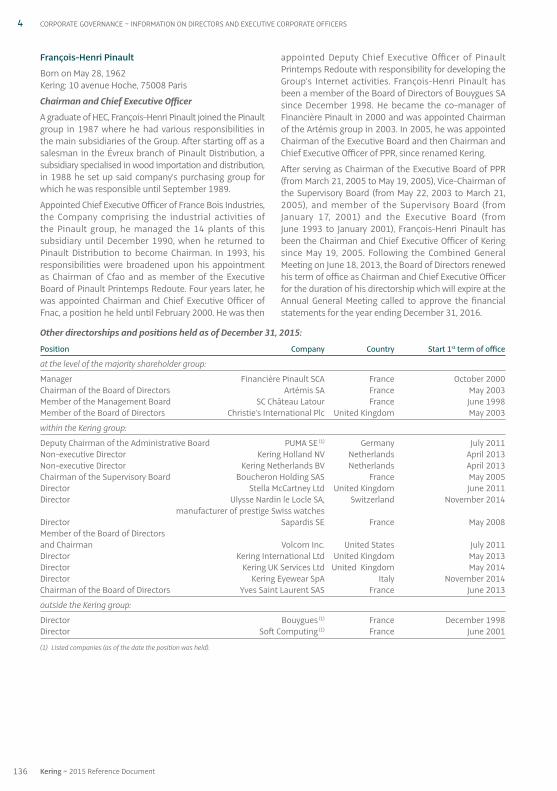
Other directorships and positions held as of December 31, 2015:
Position Company Country Start 1st term of office
at the level of the majority shareholder group:
Manager Financière Pinault SCA France October 2000Chairman of the Board of Directors Artémis SA France May 2003Member of the Management Board SC Château Latour France June 1998Member of the Board of Directors Christie’s International Plc United Kingdom May 2003
within the Kering group:
Deputy Chairman of the Administrative Board PUMA SE (1) Germany July 2011Non-executive Director Kering Holland NV Netherlands April 2013Non-executive Director Kering Netherlands BV Netherlands April 2013Chairman of the Supervisory Board Boucheron Holding SAS France May 2005Director Stella McCartney Ltd United Kingdom June 2011Director Ulysse Nardin le Locle SA, Switzerland November 2014 manufacturer of prestige Swiss watchesDirector Sapardis SE France May 2008Member of the Board of Directors and Chairman Volcom Inc. United States July 2011Director Kering International Ltd United Kingdom May 2013Director Kering UK Services Ltd United Kingdom May 2014Director Kering Eyewear SpA Italy November 2014Chairman of the Board of Directors Yves Saint Laurent SAS France June 2013
outside the Kering group:
Director Bouygues (1) France December 1998Director Soft Computing (1) France June 2001
(1) Listed companies (as of the date the position was held).
François-Henri Pinault
Born on May 28, 1962Kering: 10 avenue Hoche, 75008 Paris
Chairman and Chief Executive Officer
A graduate of HEC, François-Henri Pinault joined the Pinaultgroup in 1987 where he had various responsibilities inthe main subsidiaries of the Group. After starting off as asalesman in the Évreux branch of Pinault Distribution, asubsidiary specialised in wood importation and distribution,in 1988 he set up said company’s purchasing group forwhich he was responsible until September 1989.
Appointed Chief Executive Officer of France Bois Industries,the Company comprising the industrial activities of the Pinault group, he managed the 14 plants of thissubsidiary until December 1990, when he returned toPinault Distribution to become Chairman. In 1993, hisresponsibilities were broadened upon his appointmentas Chairman of Cfao and as member of the ExecutiveBoard of Pinault Printemps Redoute. Four years later, hewas appointed Chairman and Chief Executive Officer ofFnac, a position he held until February 2000. He was then
appointed Deputy Chief Executive Officer of PinaultPrintemps Redoute with responsibility for developing theGroup’s Internet activities. François-Henri Pinault hasbeen a member of the Board of Directors of Bouygues SAsince December 1998. He became the co-manager ofFinancière Pinault in 2000 and was appointed Chairmanof the Artémis group in 2003. In 2005, he was appointedChairman of the Executive Board and then Chairman andChief Executive Officer of PPR, since renamed Kering.
After serving as Chairman of the Executive Board of PPR(from March 21, 2005 to May 19, 2005), Vice-Chairman ofthe Supervisory Board (from May 22, 2003 to March 21,2005), and member of the Supervisory Board (fromJanuary 17, 2001) and the Executive Board (fromJune 1993 to January 2001), François-Henri Pinault hasbeen the Chairman and Chief Executive Officer of Keringsince May 19, 2005. Following the Combined GeneralMeeting on June 18, 2013, the Board of Directors renewedhis term of office as Chairman and Chief Executive Officerfor the duration of his directorship which will expire at theAnnual General Meeting called to approve the financialstatements for the year ending December 31, 2016.
4 CORPORATE GOVERNANCE ~ INFORMATION ON DIRECTORS AND EXECUTIVE CORPORATE OFFICERS
136 Kering ~ 2015 Reference Document
04_VA_V5 06/04/2016 17:31 Page136
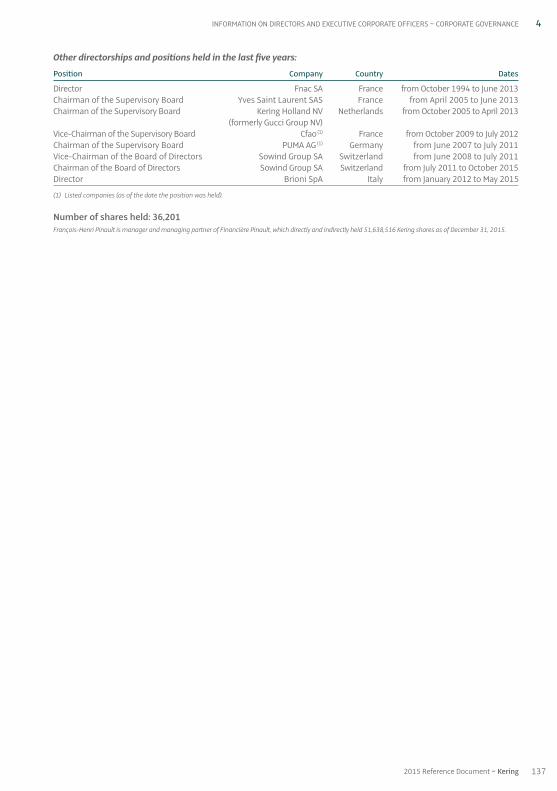
Other directorships and positions held in the last five years:
Position Company Country Dates
Director Fnac SA France from October 1994 to June 2013Chairman of the Supervisory Board Yves Saint Laurent SAS France from April 2005 to June 2013Chairman of the Supervisory Board Kering Holland NV Netherlands from October 2005 to April 2013 (formerly Gucci Group NV) Vice-Chairman of the Supervisory Board Cfao(1) France from October 2009 to July 2012Chairman of the Supervisory Board PUMA AG (1) Germany from June 2007 to July 2011Vice-Chairman of the Board of Directors Sowind Group SA Switzerland from June 2008 to July 2011Chairman of the Board of Directors Sowind Group SA Switzerland from July 2011 to October 2015Director Brioni SpA Italy from January 2012 to May 2015
(1) Listed companies (as of the date the position was held).
Number of shares held: 36,201François-Henri Pinault is manager and managing partner of Financière Pinault, which directly and indirectly held 51,638,516 Kering shares as of December 31, 2015.
4INFORMATION ON DIRECTORS AND EXECUTIVE CORPORATE OFFICERS ~ CORPORATE GOVERNANCE
1372015 Reference Document ~ Kering
04_VA_V5 06/04/2016 17:31 Page137
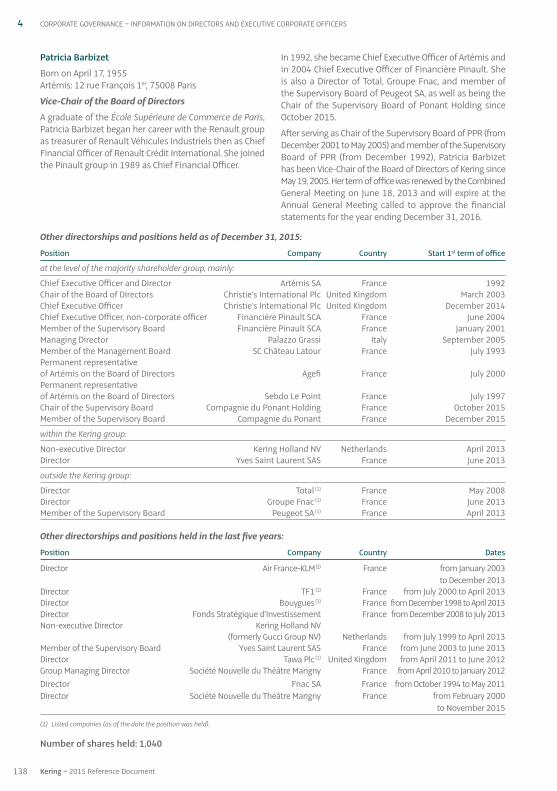
Other directorships and positions held as of December 31, 2015:
Position Company Country Start 1st term of office
at the level of the majority shareholder group, mainly:
Chief Executive Officer and Director Artémis SA France 1992Chair of the Board of Directors Christie’s International Plc United Kingdom March 2003Chief Executive Officer Christie’s International Plc United Kingdom December 2014Chief Executive Officer, non-corporate officer Financière Pinault SCA France June 2004Member of the Supervisory Board Financière Pinault SCA France January 2001Managing Director Palazzo Grassi Italy September 2005Member of the Management Board SC Château Latour France July 1993Permanent representative of Artémis on the Board of Directors Agefi France July 2000Permanent representative of Artémis on the Board of Directors Sebdo Le Point France July 1997Chair of the Supervisory Board Compagnie du Ponant Holding France October 2015Member of the Supervisory Board Compagnie du Ponant France December 2015
within the Kering group:
Non-executive Director Kering Holland NV Netherlands April 2013Director Yves Saint Laurent SAS France June 2013
outside the Kering group:
Director Total (1) France May 2008Director Groupe Fnac (1) France June 2013Member of the Supervisory Board Peugeot SA (1) France April 2013
Other directorships and positions held in the last five years:
Position Company Country Dates
Director Air France-KLM(1) France from January 2003 to December 2013Director TF1(1) France from July 2000 to April 2013Director Bouygues(1) France from December 1998 to April 2013Director Fonds Stratégique d’Investissement France from December 2008 to July 2013Non-executive Director Kering Holland NV (formerly Gucci Group NV) Netherlands from July 1999 to April 2013
Member of the Supervisory Board Yves Saint Laurent SAS France from June 2003 to June 2013Director Tawa Plc(1) United Kingdom from April 2011 to June 2012Group Managing Director Société Nouvelle du Théâtre Marigny France from April 2010 to January 2012Director Fnac SA France from October 1994 to May 2011Director Société Nouvelle du Théâtre Marigny France from February 2000 to November 2015
(1) Listed companies (as of the date the position was held).
Number of shares held: 1,040
Patricia Barbizet
Born on April 17, 1955Artémis: 12 rue François 1er, 75008 Paris
Vice-Chair of the Board of Directors
A graduate of the École Supérieure de Commerce de Paris,Patricia Barbizet began her career with the Renault groupas treasurer of Renault Véhicules Industriels then as ChiefFinancial Officer of Renault Crédit International. She joinedthe Pinault group in 1989 as Chief Financial Officer.
In 1992, she became Chief Executive Officer of Artémis andin 2004 Chief Executive Officer of Financière Pinault. Sheis also a Director of Total, Groupe Fnac, and member ofthe Supervisory Board of Peugeot SA, as well as being theChair of the Supervisory Board of Ponant Holding sinceOctober 2015.
After serving as Chair of the Supervisory Board of PPR (fromDecember 2001 to May 2005) and member of the SupervisoryBoard of PPR (from December 1992), Patricia Barbizethas been Vice-Chair of the Board of Directors of Kering sinceMay 19, 2005. Her term of office was renewed by the CombinedGeneral Meeting on June 18, 2013 and will expire at theAnnual General Meeting called to approve the financialstatements for the year ending December 31, 2016.
4 CORPORATE GOVERNANCE ~ INFORMATION ON DIRECTORS AND EXECUTIVE CORPORATE OFFICERS
138 Kering ~ 2015 Reference Document
04_VA_V5 06/04/2016 17:31 Page138
Other directorships and positions held as of December 31, 2015:
Position Company Country Start 1st term of office
within the Kering group:
Chairman of the Administrative Board PUMA SE (1) Germany December 2012Director Pomellato SpA Italy July 2013Director Sowind Group SA Switzerland December 2013Director Kering Luxembourg SA Luxembourg May 2011Member of the Board of Directors Volcom LLC United States July 2011Member of the Board of Directors Kering Americas Inc. United States June 2011Chairman of the Board of Directors LGI SA Switzerland April 2011Director Volcom Luxembourg Holding SA Luxembourg October 2012Director Kering Tokyo Investment Japan November 2013Director Guccio Gucci SpA Italy June 2014Member of the Board of Directors Gucci America Inc. United States May 2014Director Kering Asia Pacific Ltd Hong Kong May 2014Director Yugen Kaisha Gucci Japan May 2014Member of the Board of Directors Kering South East Asia Singapore October 2014Member of the Board of Directors Birdswan Solutions Ltd United Kingdom May 2014Member of the Board of Directors Paintgate Ltd United Kingdom May 2014Member of the Board of Directors Christopher Kane Ltd United Kingdom June 2014Director Ulysse Nardin le Locle SA, Switzerland November 2014 manufacturer of prestige Swiss watches
Director Kering Eyewear SpA Italy November 2014
(1) Listed companies (as of the date the position was held).
Jean-François Palus
Born on October 28, 1961Kering International: 6 Carlos Place, W1K 3AP London,United Kingdom
Director and Group Managing Director
A graduate of HEC (class of 1984), Jean-François Palus beganhis career in 1985 with Arthur Andersen where he carriedout audit and financial advisory duties.
Before joining Artémis in 2001 as corporate officer andDirector, he spent ten years within the PPR group, holdingsuccessively the positions of Deputy Chief FinancialOfficer of the wood industry branch of Pinault SA (from1991 to 1993), Group Financial Control Director (from1993 to 1997), then store manager at Fnac (from 1997 to1998) and lastly Corporate Secretary and member of theExecutive Board of Conforama (from 1998 to 2001).
Since March 2005, Jean-François Palus has been in chargeof mergers and acquisitions at PPR (since renamed Kering),reporting to François-Henri Pinault, Chairman and ChiefExecutive Officer of the Group.
He was Chief Financial Officer of the PPR group fromDecember 2005 to January 2012 and he has been GroupManaging Director (Directeur Général délégué) of PPR (sincerenamed Kering) since February 26, 2008. Following theCombined General Meeting on June 18, 2013, the Board ofDirectors renewed his term of office as Group ManagingDirector for a term of four years.
Since October 2012, Jean-François Palus has headed Kering’sSport & Lifestyle Division. He has also held the position ofChairman of the Administrative Board of PUMA SE sinceDecember 1, 2012.
Jean-François Palus has been a Director of Kering since May 7,2009. His term of office will expire at the Annual GeneralMeeting called to approve the financial statements forthe year ending December 31, 2016.
139
4
2015 Reference Document ~ Kering
INFORMATION ON DIRECTORS AND EXECUTIVE CORPORATE OFFICERS ~ CORPORATE GOVERNANCE
04_VA_V5 06/04/2016 17:31 Page139
Other directorships and positions held in the last five years:Position Company Country Dates
Director Fnac SA France from November 2007 to June 2013Director Groupe Fnac France from September 2012 to June 2013Chairman and Chief Executive Officer Sapardis SE France from March 2007 to June 2013Member of the Supervisory Board Kering Holland NV Netherlands from May 2006 to April 2013 (formerly Gucci Group NV)
Member of the Supervisory Board Yves Saint Laurent SAS France from March 2011 to March 2013Permanent representative of Kering Redcats SA France from April 2006 on the Board of Directors to February 2013Member of the Supervisory Board Cfao (1) France from October 2009 to July 2012Director Caumartin Participations SAS France from June 2008 to September 2012Director Conforama Holding SA France from April 2006 to March 2011Member of the Supervisory Board PUMA AG (1) Germany from June 2007 to July 2011Representative of Sapardis on the Management Board SC Zinnia France from December 2009 to June 2013Director Brioni SpA Italy from January 2012 to October 2015
Chairman of the Board of Directors Brioni SpA Italy from May 2014 to October 2015
(1) Listed companies (as of the date the position was held).
Number of shares held: 69,426, of which 6,492 are locked in, from the 2012-I performance share plan.
4 CORPORATE GOVERNANCE ~ INFORMATION ON DIRECTORS AND EXECUTIVE CORPORATE OFFICERS
140 Kering ~ 2015 Reference Document
04_VA_V5 06/04/2016 17:31 Page140
Other directorships and positions held as of December 31, 2015:Position Company Country Start 1st term of office
Chairman Montezemolo & Partners SGR Italy 2007Vice-Chairman Unicredit SpA (1) Italy October 2012Director Nuovo Trasporto Viaggiatori SpA Italy October 2008Chairman Telethon Italy January 2009Director Poltrona Frau SpA Italy December 2003Director Tod’s SpA (1) Italy April 2001Director Delta Topco Ltd United Kingdom March 2012Director Coesia SpA Italy 2014Chairman Alitalia SAI (1) Italy November 2014Chairman Alitalia CAI Italy January 2015
Other directorships and positions held in the last five years:Position Company Country Dates
Chairman Ferrari SpA Italy from 1991 to 2014Director Fiat SpA (1) Italy from 2004 to 2014Director Editrice La Stampa Italy from 2002 to 2014Director Octo Telematics SpA Italy from 2010 to 2014Director Citigroup (1) United States from 2004 to 2012Chairman Charme Management Srl Italy from 2007 to 2015
(1) Listed companies (as of the date the position was held).
Number of shares held: 500
Luca Cordero di Montezemolo
Born on August 31, 1947Via Giuseppe Mangili, 38 / a, 00197 Rome, Italy
Director
A graduate of the law faculty of the University of Romeand of Columbia University in New York, Luca Cordero diMontezemolo began his career in 1973 as an assistant tothe Chairman of Ferrari and manager of the Formula 1 teamthat won the world championships in 1975 and 1977. Hewas then appointed Director of Public Relations of Fiat in1977, then in 1981 Chairman and Chief Executive Officerof ITEDI, which manages the press activities of the Fiatgroup, including the daily newspaper, La Stampa. In 1984,he was appointed Chairman and Chief Executive Officerof Cinzano SpA in charge of the Azzurra Organisation,Italy’s first involvement in the America’s Cup. From 1985to 1990, he was the manager of the Italia 90 Football World
Cup organisation committee. From 1991 to 2014, he wasChairman of Ferrari SpA, of which he was also the ChiefExecutive Officer until 2006.
Luca Cordero di Montezemolo is President of Alitalia,Chairman of the Promoting Committee for Rome’scandidacy for the 2024 Olympic Games, Vice-Chairman ofUnicredit and Chairman of Telethon, one of Italy’s mostprominent charities that aims to fund research intomuscular dystrophies and genetic diseases. He is aCommander of the Legion of Honour.
Luca Cordero di Montezemolo has been a Director of Keringsince May 19, 2005, after having served as a member of theSupervisory Board (from December 19, 2001 to May 19,2005). His term of office was renewed by the CombinedGeneral Meeting on April 27, 2012 and will expire at theAnnual General Meeting called to approve the financialstatements for the year ended December 31, 2015.
141
4
2015 Reference Document ~ Kering
INFORMATION ON DIRECTORS AND EXECUTIVE CORPORATE OFFICERS ~ CORPORATE GOVERNANCE
04_VA_V5 06/04/2016 17:31 Page141
Other directorships and positions held as of December 31, 2015:Position Company Country Start 1st term of office
Chair and Chief Executive Officer 1000mercis SA (1) France October 2000Chair of the Supervisory Board Ocito SAS (1000mercis group) France 2010Member of the Supervisory Board Numergy France 2012Member of the Supervisory Board Vivendi (1) France April 2013Director SEB group (1) France May 2013
Other directorships and positions held in the last five years:Position Company Country Dates
Member of the Supervisory Board Made in Presse SAS France from 2010 to 2012
(1) Listed companies (as of the date the position was held).
Number of shares held: 500
Yseulys Costes
Born on December 5, 19721000mercis: 28 rue de Châteaudun, 75009 Paris
Independent Director
Yseulys Costes holds a Master’s degree in ManagementSciences from Paris I-Panthéon University, a postgraduatedegree in marketing and strategy from Paris IX-DauphineUniversity and an MBA from Robert O. Anderson School (USA).
Author of a number of works and articles on the topics of online marketing and databases, she was also thecoordinator of IAB France (Interactive Advertising Bureau)for two years before founding 1000mercis.com inFebruary 2000, of which she is now the Chair and ChiefExecutive Officer. The 1000mercis group, present in Parisand in London, and listed on the Alternext market of
NYSE Euronext Paris since January 2006, offers innovativesolutions to companies seeking to optimise their advertisingand marketing campaigns on interactive media (Internet,mobile phones, etc.). The 1000mercis group currently has300 employees and posted consolidated revenues of€45.2 million in 2014.
A researcher in interactive marketing, Yseulys Costes wasreceived as a guest researcher at Harvard Business Schooland is a lecturer in interactive marketing at several prestigiousFrench higher education establishments (HEC, ESSEC,Paris IX-Dauphine University).
Yseulys Costes has been a Director of Kering since May 19, 2010.Her term of office was renewed by the Combined GeneralMeeting on May 6, 2014 and will expire at the Annual GeneralMeeting called to approve the financial statements forthe year ending December 31, 2017.
4 CORPORATE GOVERNANCE ~ INFORMATION ON DIRECTORS AND EXECUTIVE CORPORATE OFFICERS
142 Kering ~ 2015 Reference Document
04_VA_V5 06/04/2016 17:31 Page142
Other directorships and positions held as of December 31, 2015:Position Company Country
Chairman Fédération du Crédit Mutuel de Bretagne FranceChairman Crédit Mutuel Arkéa FranceDirector Avril Gestion FranceDirector Caisse de Crédit Mutuel de Cap Sizun FranceDirector Altrad FranceChairman of the Board of Directors Château Calon-Ségur SAS FranceDirector Nexity (1) FranceDirector Paprec FranceDirector and General Treasurer French professional football league (association) France
Other directorships and positions held in the last five years:
Position Company Country Dates
Chairman Arkéa Capital Partenaire France -Member of the Supervisory Board Oséo Bretagne France -Representative of Crédit Mutuel Arkéa Crédit Foncier et Communal on the Board of Directors d’Alsace et de Lorraine France until 2011Representative of Crédit Mutuel Arkéa on the Board of Directors CFCAL SCF France until 2011Director Glon Sanders France until 2013Director Soprol France until 2015Director Newport France until 2015
(1) Listed companies (as of the date the position was held).
Number of shares held: 500
Jean-Pierre Denis
Born on July 12, 1960Arkéa group: 29808 Brest Cedex 09
Independent Director
Jean-Pierre Denis is a Finance Inspector (inspecteur desfinances) and a graduate of HEC and ENA. He served asChairman and Chief Executive Officer of the Oséo groupfrom 2005 to 2007, and member of the Executive Boardof Vivendi Environnement, which became VeoliaEnvironnement (from 2000 to 2003), Chairman of Dalkia
(Vivendi group then Veolia Environnement) (from 1999 to2003), Advisor to the Chair of CGE, which became Vivendi(from 1997 to 1999) and Deputy General Secretary of theFrench President’s cabinet (from 1995 to 1997). He iscurrently Chairman of Crédit Mutuel Arkéa and CréditMutuel de Bretagne.
Jean-Pierre Denis has been a Director of Kering sinceJune 9, 2008. His term of office was renewed by the CombinedGeneral Meeting on April 27, 2012 and will expire at theAnnual General Meeting called to approve the financialstatements for the year ended December 31, 2015.
143
4
2015 Reference Document ~ Kering
INFORMATION ON DIRECTORS AND EXECUTIVE CORPORATE OFFICERS ~ CORPORATE GOVERNANCE
04_VA_V5 06/04/2016 17:31 Page143
Other directorships and positions held as of December 31, 2015:
Position Company Country Start 1st term of office
Senior Advisor Barclays France March 2011Chairman Fondation de France France October 2010Director Fondation de France France 2009Chairman Fondation de coopération scientifique
pour la recherche sur la maladie d’Alzheimer France November 2008Director Fimalac (1) France May 2003Director Renault SA (1) France May 2007
Other directorships and positions held in the last five years:
Position Company Country Dates
Chairman Institut des Hautes Études Scientifiques France from November 1994 to May 2014
(1) Listed companies (as of the date the position was held).
Number of shares held: 500
Philippe Lagayette
Born on June 16, 1943Fondation de France: 40 avenue Hoche, 75008 Paris
Independent Director
A graduate of the École Polytechnique and ENA, PhilippeLagayette managed the activities of JP Morgan in Francefrom July 1998 to August 2008. He was then Vice-Chairman of JP Morgan in EMEA from September 2008 toJanuary 2010. He began his career within the FrenchMinistry of Finance in 1970. In 1974, he joined the TreasuryDepartment of the French Ministry of Economy andFinance and was appointed Deputy Director of thatDepartment in 1980. He became Cabinet Director of theMinister of Economy and Finance in 1981, then joinedBanque de France in 1984 as Deputy Governor. AppointedChief Executive Officer of Caisse des dépôts et consignationsin 1992, he held this position until December 1997.Philippe Lagayette is also Chairman of the Fondation de
France and Chairman of the Fondation de coopérationscientifique pour la recherche sur la maladie d’Alzheimer,specialised in research into Alzheimer’s disease. He wasChairman of the French American Foundation from 2003to 2010 and Chairman of the Institut des Hautes ÉtudesScientifiques, where he researched in the fields ofmathematics and theoretical physics from 1994 to May2014. He is a Commander of the Legion of Honour and aCommander of the National Order of Merit. He wasappointed Senior Advisor for France at Barclays inMarch 2011 and is Chairman of PL Conseils.
Philippe Lagayette has been a Director of Kering sinceMay 19, 2005, after having served as a member of theSupervisory Board (from January 20, 1999 to May 19,2005). His term of office was renewed by the CombinedGeneral Meeting on April 27, 2012 and will expire at theAnnual General Meeting called to approve the financialstatements for the year ended December 31, 2015.
144 Kering ~ 2015 Reference Document
4 CORPORATE GOVERNANCE ~ INFORMATION ON DIRECTORS AND EXECUTIVE CORPORATE OFFICERS
04_VA_V5 06/04/2016 17:31 Page144
Other directorships and positions held as of December 31, 2015:
Position Company Country Start 1st term of office
Chief Executive Officer Baccarat (1) France May 2013Director WPP Plc (1) United Kingdom September 2013
(1) Listed companies (as of the date the position was held).
Number of shares held: 500
Daniela Riccardi
Born on April 4, 1960Baccarat: 11 place des États-Unis, 75116 Paris
Independent Director
Daniela Riccardi, an Italian national, is the Chief ExecutiveOfficer of Baccarat. She has recognised experience inbusiness development and branding in consumer retailand distribution. She joined Baccarat in May 2013 afterhaving served as Chief Executive Officer of the internationallifestyle brand Diesel since 2010. Daniela Riccardi wasresponsible for the creation and implementation of astrategic plan at Diesel which resulted in greater revenuegrowth and product exposure through an ambitious
distribution policy. Prior to Diesel, Daniela served 25 yearsat Procter & Gamble in various senior management roles,including Vice-President of P&G Colombia, Mexico andVenezuela, Vice-President and Chief Executive OfficerManager of P&G Eastern Europe and Russia, based inMoscow from 2001 to 2004, and from 2005 to 2010,President of P&G Greater China.
Daniela Riccardi studied political science and internationalrelations at Sapienza University of Rome, in Italy.
She has been a Director of Kering since May 6, 2014. Herterm of office will expire at the Annual General Meetingcalled to approve the financial statements for the yearending December 31, 2017.
Other directorships and positions held as of December 31, 2015:
Position Company Country Start 1st term of office
Director Lafarge SA (1) France May 2011Director Veolia Environnement SA (1) France April 2003Director BGL BNP Paribas (1) Luxembourg April 2015
Other directorships and positions held in the last five years:
Position Company Country Dates
Chairman of the Board of Directors BNP Paribas SA (1) France from December 2011 to December 2014Director Erbe SA Belgium from June 2004 to December 2013Director Pargesa Holding SA (1) Switzerland from May 2004 to December 2013Director and Chief Executive Officer BNP Paribas SA (1) France from May 2003 to December 2011
(1) Listed companies (as of the date the position was held).
Number of shares held: 600
Baudouin Prot
Born on May 24, 1951BNP Paribas: 3 rue d’Antin, 75002 Paris
Director
After graduating from HEC in 1972 and from ENA in 1976,Baudouin Prot joined the French Ministry of Finance wherehe spent four years before serving as Deputy Director ofEnergy and Raw Materials at the French Ministry ofIndustry for three years. He joined BNP in 1983 as DeputyDirector of Banque Nationale de Paris Intercontinentale,before becoming the Director for Europe in 1985. Hejoined the Central Networks Department in 1987 and waspromoted to Central Director in 1990 then Deputy ChiefExecutive Officer of BNP in charge of networks in 1992.
He became Chief Executive Officer of BNP in 1996 andDeputy Chief Executive Officer of BNP Paribas in 1999. InMarch 2000, he was appointed Director and Deputy ChiefExecutive Officer of BNP Paribas then Director and ChiefExecutive Officer of BNP Paribas in May 2003. FromDecember 2011 to December 2014, he served as non-executive Chairman of BNP Paribas. He is an Officer of theNational Order of Merit and a Knight of the Legion of Honour.
Baudouin Prot has been a Director of Kering since May 19,2005, after having served as a member of the SupervisoryBoard (from March 11, 1998 to May 19, 2005). His term ofoffice was renewed by the Combined General Meeting onJune 18, 2013 and will expire at the Annual General Meetingcalled to approve the financial statements for the yearending December 31, 2016.
145
4
2015 Reference Document ~ Kering
INFORMATION ON DIRECTORS AND EXECUTIVE CORPORATE OFFICERS ~ CORPORATE GOVERNANCE
04_VA_V5 06/04/2016 17:31 Page145
Sophie Bouchillou
Born on March 1, 1962Kering: 10 avenue Hoche, 75008 Paris
Director representing the employees
Sophie Bouchillou is Human Resources Project Coordinatorat Kering SA. She joined the Group in 1981 working forConforama as a sales and administrative agent andsubsequently executive sales assistant. From 2001 to2009, she held the position of executive purchasing
assistant at PPR Purchasing. She has been working in theHuman Resources Department of Kering SA since 2009.
Following the amendment of the Company’s Articles ofAssociation adopted by the Combined General Meetingon May 6, 2014, which provides for the appointment of aDirector representing the employees in accordance withthe law of June 14, 2013, Sophie Bouchillou was electedas a Director for a term of four years by the Kering WorksCouncil on July 10, 2014.
Her term of office will expire in July 2018.
Other directorships and positions held as of December 31, 2015:
Position Company Country Start 1st term of office
Director Harley Davidson Inc. (1) United States August 2007Director Wilderness Holdings Ltd. (1) Botswana 2010
Other directorships and positions held in the last five years:
Position Company Country Dates
Chairman and Chief Executive Officer PUMA AG (1) Germany from 1993 to July 2011
Chairman of the Administrative Board PUMA SE(1) Germany from July 2011 to November 2012
(1) Listed companies (as of the date the position was held).
Number of shares held: 500
Jochen Zeitz
Born on April 6, 19636 ruelle du Four, 1147 Montriches, Switzerland
Director
Jochen Zeitz graduated in International Marketing andFinance from the European Business School in 1986after having studied in Germany, France and the UnitedStates. He began his professional career with Colgate-Palmolive in New York and Hamburg. After joining PUMAin 1990, he was appointed Chairman and CEO of PUMA in1993 at the age of 30, becoming the youngest Chairmanin German history to head a listed European company.Jochen Zeitz spearheaded the restructuring of PUMA,which was in financial difficulty. He transformed PUMAinto a leading Sport & Lifestyle company and one of thetop three brands in footwear, apparel and accessories bysticking to a long-term development plan that heintroduced in 1993.
He previously held the positions of Chief Executive Officerof the Sport & Lifestyle Division of PPR (since renamedKering) and Chief Sustainability Officer of PPR and wasChairman of the Administrative Board of PUMA SE untilNovember 2012.
He has received numerous awards during hisprofessional career, including “2001 Entrepreneur of theYear”, “Strategist of the Year” for three years in a row bythe Financial Times, “Trendsetter of the Year” and “Best ofEuropean Business Award 2006”. In 2004, the GermanFederal President awarded him with the Federal Cross ofMerit of the Federal Republic of Germany.
Jochen Zeitz has been a Director of Kering since April 27,2012. His term of office will expire at the Annual GeneralMeeting called to approve the financial statements forthe year ended December 31, 2015.
4 CORPORATE GOVERNANCE ~ INFORMATION ON DIRECTORS AND EXECUTIVE CORPORATE OFFICERS
146 Kering ~ 2015 Reference Document
04_VA_V5 06/04/2016 17:31 Page146
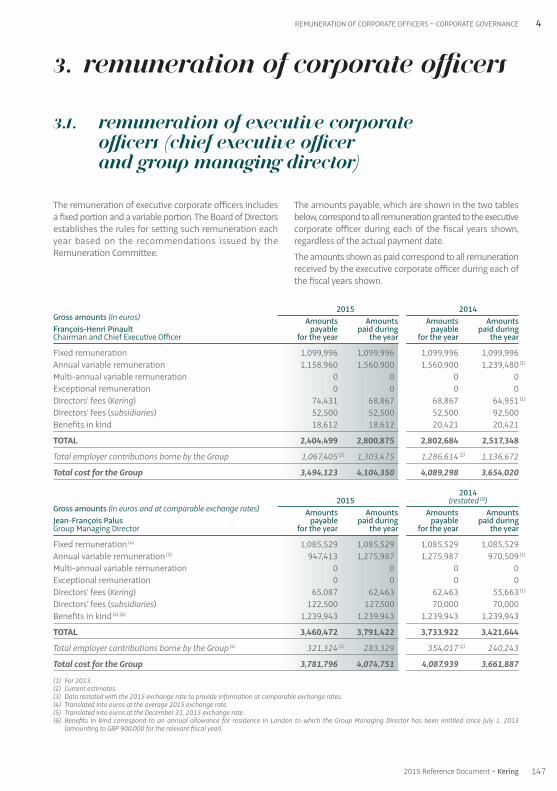
20 15 20 14Gross amounts (in euros) Amounts Amounts Amounts AmountsFrançois-Henri Pinault payable paid during payable paid duringChairman and Chief Executive Officer for the year the year for the year the year
Fixed remuneration 1,099,996 1,099,996 1,099,996 1,099,996Annual variable remuneration 1,158,960 1,560,900 1,560,900 1,239,480 (1)
Multi-annual variable remuneration 0 0 0 0Exceptional remuneration 0 0 0 0Directors’ fees (Kering) 74,431 68,867 68,867 64,951 (1)
Directors’ fees (subsidiaries) 52,500 52,500 52,500 92,500Benefits in kind 18,612 18,612 20,421 20,421
TOTAL 2,404,499 2,800,875 2,802,684 2,517,348
Total employer contributions borne by the Group 1,067,405 (2) 1,303,475 1,286,614 (2) 1,136,672
Total cost for the Group 3,494,123 4,104,350 4,089,298 3,654,020
20 1420 15 (restated (3))
Gross amounts (in euros and at comparable exchange rates) Amounts Amounts Amounts AmountsJean-François Palus payable paid during payable paid duringGroup Managing Director for the year the year for the year the year
Fixed remuneration (4) 1,085,529 1,085,529 1,085,529 1,085,529Annual variable remuneration (5) 947,413 1,275,987 1,275,987 970,509 (1)
Multi-annual variable remuneration 0 0 0 0Exceptional remuneration 0 0 0 0Directors’ fees (Kering) 65,087 62,463 62,463 55,663 (1)
Directors’ fees (subsidiaries) 122,500 127,500 70,000 70,000Benefits in kind (4) (6) 1,239,943 1,239,943 1,239,943 1,239,943
TOTAL 3,460,472 3,791,422 3,733,922 3,421,644
Total employer contributions borne by the Group (4) 321,324 (2) 283,329 354,017 (2) 240,243
Total cost for the Group 3,781,796 4,074,751 4,087,939 3,661,887
(1) For 2013.(2) Current estimates.(3) Data restated with the 2015 exchange rate to provide information at comparable exchange rates.(4) Translated into euros at the average 2015 exchange rate.(5) Translated into euros at the December 31, 2015 exchange rate.(6) Benefits in kind correspond to an annual allowance for residence in London to which the Group Managing Director has been entitled since July 1, 2013
(amounting to GBP 900,000 for the relevant fiscal year).
The remuneration of executive corporate officers includesa fixed portion and a variable portion. The Board of Directorsestablishes the rules for setting such remuneration eachyear based on the recommendations issued by theRemuneration Committee.
The amounts payable, which are shown in the two tablesbelow, correspond to all remuneration granted to the executivecorporate officer during each of the fiscal years shown,regardless of the actual payment date.
The amounts shown as paid correspond to all remunerationreceived by the executive corporate officer during each ofthe fiscal years shown.
4REMUNERATION OF CORPORATE OFFICERS ~ CORPORATE GOVERNANCE
3. Remuneration of corporate officers
3.1. Remuneration of executive corporate officers (Chief Executive Officer and Group Managing Director)
1472015 Reference Document ~ Kering
04_VA_V5 06/04/2016 17:31 Page147

Annual variable remuneration payable for 2014 was paidduring the first quarter of 2015 and the annual variableremuneration payable for 2015 was paid during the firstquarter of 2016. Fees payable to Directors in respect oftheir duties as members of the Board of Directors ofKering for 2014 were paid in February 2015 and thosepayable for 2015 were paid in March 2016.
For 2015, the Board of Directors set the remuneration ofthe Chairman and Chief Executive Officer and of the GroupManaging Director on the basis of the recommendationsof the Remuneration Committee. The structure ofremuneration – the amount of the fixed portion and therate of the variable portion – is decided based on an analysisof market practices observed for senior executives of CAC 40 companies.
Fixed remuneration
The Board of Directors, acting on the recommendation ofthe Remuneration Committee, resolved to maintainunchanged the fixed remuneration for the Chairman andChief Executive Officer and the Group Managing Directorfor 2015.
The Board of Directors set the Chairman and Chief ExecutiveOfficer’s fixed remuneration at €1,099,996 at its meetingof February 16, 2011.
At its meeting on June 18, 2013, the Board of Directorsnoted, on the recommendation of the RemunerationCommittee and, in the context of the deployment of the Group’s international activities, the location of part of the Group Managing Director’s activities in London.Consequently, the Board decided to implement for theGroup Managing Director with effect from July 1, 2013, anEmployment Agreement with Kering Netherlands BV, aGroup subsidiary governed by Dutch law, as well as a ServiceAgreement (similar to an employment agreement) withKering International Ltd, a Group subsidiary governed byEnglish law. Under the terms of these two agreements,
which correspond to the management of the Group’s Divisionsand the coordination of the Group’s international supportfunctions respectively, these two companies will each payhalf of his fixed annual remuneration (€500,000 for KeringNetherlands BV and GBP 425,000 for Kering InternationalLtd), of his variable remuneration and, where appropriate,of the amounts due in respect of his multi-annualremuneration, the final allotment of which is decided bythe Board of Directors.
These two employment agreements are related to andwill remain in force during the Group Managing Director’sterm of office and will lapse on the termination thereof.
Annual variable remuneration
The variable remuneration of the Chairman and ChiefExecutive Officer is based on the achievement of preciselydefined targets, assessed on the basis of the Group’s resultsafter the closing of the relevant fiscal year. For 2014 and2015, the variable portion is equal to 120% of the fixedportion when targets are exactly met, and up to 180% of thefixed portion (excluding any remuneration from KMUs)when they are exceeded. In 2014 and 2015, there were twotargets, each accounting for 50% of the variable portionof remuneration, i.e., the Group’s recurring operatingincome and the Group’s free cash flow from operations.The rate of achievement of each of these targets must beat least 90% for variable remuneration to be paid.
In view of the fact that these two targets for 2014 wereexceeded, the rate of variable remuneration was 118.25%of the amount of variable remuneration when targets areexactly met, i.e., the Chairman and Chief ExecutiveOfficer’s variable remuneration amounted to €1,560,900.In respect of 2015, the rate of achievement of the targetsfor recurring operating income and free operating cashflow was 98.3% and 91.9%, respectively, leading to acombined rate of variable remuneration of 87.8% of thetarget amount when targets are exactly met, i.e., the variableremuneration amounted to €1,158,960. The minimum
In the 2014 Reference Document, this data was presented as follows(1):
2014Gross amounts (in euros) Amounts AmountsJean-François Palus payable paid duringGroup Managing Director for the year the year
Fixed remuneration 1,039,135 1,039,135Annual variable remuneration 1,236,471 948,820 (2)
Multi-annual variable remuneration 0 0Exceptional remuneration 0 0Directors’ fees (Kering) 62,463 55,663 (2)
Directors’ fees (subsidiaries) 70,000 70,000Benefits in kind 1,141,967 1,141,697
TOTAL 3,550,036 3,255,315
Total employer contributions borne by the Group 318,762 221,208
Total cost for the Group 3,868,798 3,476,523
(1) Table provided by reference to restated data in the table on page 147.(2) For 2013.
148 Kering ~ 2015 Reference Document
4 CORPORATE GOVERNANCE ~ REMUNERATION OF CORPORATE OFFICERS
04_VA_V5 06/04/2016 17:31 Page148
rate of achievement of each of these targets is 90%,leading to a rate of variable remuneration of 75% of thetarget amount when targets are exactly met. If the rate ofachievement reaches 115%, the rate of variableremuneration is increased to 150% of the target amount.
As in 2014, the Group Managing Director’s variableremuneration for 2015 can be as much as 100% of thefixed portion of remuneration when targets are exactlymet, and up to 150% of the fixed portion when they areexceeded, on the basis of the same quantitative criteria,in the same proportions and with the same minimumachievement rate as those applied to the variableremuneration of the Chairman and Chief Executive Officer.In view of the abovementioned rate of achievement ofthe targets for 2014 and 2015, the Group ManagingDirector’s variable remuneration amounted to €1,275,987for 2014 and €947,413 for 2015, based on the year-endclosing exchange rate.
On the recommendation of the Remuneration Committee,the Board of Directors also decided to apply newqualitative performance criteria, as of 2016, that wouldmake 30% of annual variable remuneration proportionallybased on three indicators: organisation and talentmanagement, social corporate responsibility andsustainability.
Multi-annual variable remuneration
A new long-term incentive system was launched with effectfrom 2013. The scheme is based on Kering monetaryunits (and no longer on performance shares) known as“KMUs”, whose value is indexed equally to both absolutechanges in the Kering share and changes in the Keringshare price relative to a basket of nine Luxury and Sport &Lifestyle securities. These KMUs have a vesting period ofthree years as from January 1 of the year in which theyare granted, after which they may be cashed by thebeneficiaries over a two-year period (during two “windows”each year), when the beneficiaries may receive the cashequivalent of their KMUs based on the last assessed value.
On March 18, 2014, the Board of Directors also granted11,372 and 9,426 KMUs to the Chairman and Chief ExecutiveOfficer and the Group Managing Director respectively,equal to a grant value of €1,637,568 and €1,357,344 (at a unit value of €144 as of December 31, 2013).
It should also be noted that on December 8, 2014, theBoard of Directors, acting on the recommendation of theRemuneration Committee, decided to exceptionallyaward a long-term performance bonus to the Chairman andChief Executive Officer in recognition of the completionof the Group’s transformation into a Luxury and Sport &Lifestyle company. The grant value of this bonus made upof KMUs was equal to 70% of his total annual cash-basedremuneration paid in 2014, which amounted to €2,339,480.On this basis, 9,900 KMUs, with a unit value of €166 as ofJune 30, 2014, were granted, corresponding to a value of€1,643,400.
At its meeting on March 18, 2015, the Board of Directors,acting on the recommendation of the RemunerationCommittee, decided to maintain this incentive providing fora long-term performance bonus for the Chairman andChief Executive Officer and the Group Managing Director.Accordingly, the grant value of this remuneration is equalto 70% of their total annual cash-based remunerationpaid in 2015 (total annual cash-based remuneration isdetermined by adding together the annual fixedremuneration and variable remuneration for the prior year).
On this basis, and in accordance with the decision of theBoard of Directors’ meeting on March 18, 2015, 11,153 and9,758 KMUs, with a unit value of €167 as of December 31,2014, were granted to the Chairman and Chief ExecutiveOfficer and to the Group Managing Director, respectively,equal to a value of €1,862,630 and €1,629,600.
For the Chairman and Chief Executive Officer and GroupManaging Director, final vesting of the KMUs is subject tothe condition of a minimum average increase in earningsper share from continuing operations attributable toowners over the vesting period. If the average increase isabove or equal to 5%, all vested KMUs may be cashed in.If the increase is between 2.5% and 5%, fewer KMUs may becashed in. If it is below 2.5%, no KMUs may be cashed in.
In accordance with the purpose of long-term remunerationschemes such as performance shares, and by analogywith the AFEP-MEDEF recommendations on deferredremuneration, the Board of Directors has set an obligationfor each beneficiary to purchase Kering shares at the endof the three-year vesting period. Under this obligation,the beneficiaries must invest 30% of the fully vested netvalue of their KMUs in Kering shares and hold, for theduration of their term of office, a number of Kering sharescorresponding to at least 30% of the sum of the amountsvested.
As with many other issuers, the Remuneration Committeeassessed the potential impacts of this obligation, as itparadoxically results in the excessive exposure of thebeneficiaries’ assets to a single market value, especially incompanies with stable management, such as Kering.
Following a benchmarking study, at its meeting ofDecember 8, 2014, the Board of Directors, acting on therecommendation of the Remuneration Committee,decided to set a ceiling equal to the total of the last twoyears of cash-based remuneration (fixed remunerationplus variable remuneration) at the date of assessment.
The KMUs awarded to the Chairman and Chief ExecutiveOfficer and the Group Managing Director in 2013, havingvested, may be cashed in, though this is subject to theperformance condition of a minimum average increasein earnings per share from continuing operationsattributable to owners over the vesting period, asmentioned above.
149
4
2015 Reference Document ~ Kering
REMUNERATION OF CORPORATE OFFICERS ~ CORPORATE GOVERNANCE
04_VA_V5 07/04/2016 10:28 Page149

150 Kering ~ 2015 Reference Document
4 CORPORATE GOVERNANCE ~ REMUNERATION OF CORPORATE OFFICERS
Indemnitiesor benefits owed
or that may be Indemnitiespayable on the relating to a
Employment Supplementary termination or non-competitioncontract pension plan change of duties clause
Executive corporate officers Yes No Yes No Yes No Yes No
François-Henri PinaultChairman and Chief Executive OfficerTerm of office began on: May 19, 2005Term of office expires on: Annual General Meeting of 2017 X X X X
Jean-François PalusGroup Managing DirectorTerm of office began on: February 26, 2008Term of office expires on: Annual General Meeting of 2017 X X (1) X X
(1) At the beginning of 2010 the Board of Directors authorised the grant of a pension benefit to Jean-François Palus. This benefit takes the form of a capital transferof an amount of €3.568 million to a fund entitling him to payment of a full pension (with a right of reversion) from the legal retirement age, and is not subject tohis presence within the Group. However, to benefit from the plan, Jean-François Palus must not have left the Group for personal reasons before December 31,2014 and the performance criteria for entitlement to the variable portion of his remuneration for 2009 and 2010 must be fulfilled.This amount would finance a target pension annuity, of a non-guaranteed amount, set at approximately 25% of his annual remuneration paid in 2009according to the actuarial rates applied within the Group.On March 18, 2015, the Board of Directors acknowledged that Jean-François Palus had not left the Group for personal reasons and that his performance conditionsfor 2009 and 2010 had been fulfilled. Consequently the condition no longer applied. In addition, on March 11, 2016, the Board of Directors reassessed theagreement and agreed on its implementation, based on a total payment of €4,724,540 (following application of a 5% interest rate to the initial capital of€3,568,000 for the relevant period), and acknowledged the extinguishment of the Group’s debt in respect to the aforementioned agreement.It should be added that this benefit is not a pension plan within the meaning of Decree No. 2016-182 of February 23, 2016 in application of the provision of the“Macron” law contained in Article L. 225-102-1 of the French Commercial Code (Code de commerce), but the final payment of a fixed amount to an institution whichwill pay the deferred pension generated by this amount when Jean-François Palus reaches the legal retirement age.
Other information and commitments
No stock options were granted to executive corporate officers in 2015.
60,000 stock purchase options were exercised by François-Henri Pinault on March 25, 2015.
9,800 stock purchase options were exercised by Jean-François Palus on March 25, 2015.
In this case, the abovementioned condition was not metsince the minimum average increase in earnings pershare from continuing operations attributable to ownerswas 1.7% over the last three years. Accordingly, theChairman and Chief Executive Officer and the GroupManaging Director will not be able to cash in their KMUsand will not receive any payment as part of the long-termincentive plan set up in 2013.
Benefits in kind
The benefits in kind of the Chairman and Chief ExecutiveOfficer correspond to the provision of a company car.Since July 1, 2013, the Group Managing Director has beenentitled to an annual allowance for residence in London
(amounting to GBP 900,000 for the relevant fiscal year).The allowance provides the Group Managing Director andhis family with a residence in London in the context ofthe location of his coordination activities of the Group’sinternational support functions and the managementactivities of the Group’s Divisions. The residence meetsthe standards of the London real estate market toaccommodate members of the top management of aninternational corporation.
No indemnity is payable to the Chairman and ChiefExecutive Officer or the Group Managing Director in theevent of termination of their duties as corporate officers.
There are no supplementary defined benefit pensionplans for the executive corporate officers.
04_VA_V5 06/04/2016 17:31 Page150
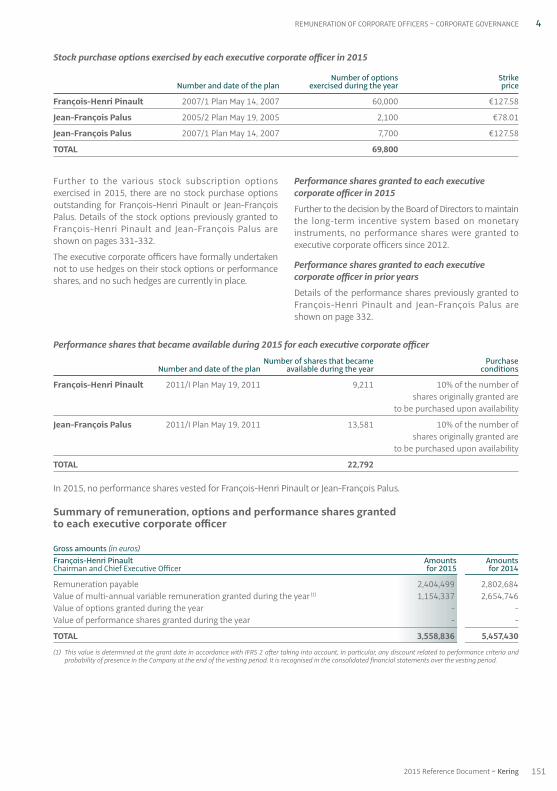
Performance shares that became available during 2015 for each executive corporate officer
Number of shares that became PurchaseNumber and date of the plan available during the year conditions
François-Henri Pinault 2011 / I Plan May 19, 2011 9,211 10% of the number of shares originally granted are
to be purchased upon availability
Jean-François Palus 2011 / I Plan May 19, 2011 13,581 10% of the number of shares originally granted are
to be purchased upon availability
TOTAL 22,792
In 2015, no performance shares vested for François-Henri Pinault or Jean-François Palus.
Summary of remuneration, options and performance shares granted to each executive corporate officer
Gross amounts (in euros) François-Henri Pinault Amounts AmountsChairman and Chief Executive Officer for 2015 for 2014
Remuneration payable 2,404,499 2,802,684Value of multi-annual variable remuneration granted during the year (1) 1,154,337 2,654,746Value of options granted during the year - -Value of performance shares granted during the year - -
TOTAL 3,558,836 5,457,430
(1) This value is determined at the grant date in accordance with IFRS 2 after taking into account, in particular, any discount related to performance criteria andprobability of presence in the Company at the end of the vesting period. It is recognised in the consolidated financial statements over the vesting period.
Further to the various stock subscription optionsexercised in 2015, there are no stock purchase optionsoutstanding for François-Henri Pinault or Jean-FrançoisPalus. Details of the stock options previously granted toFrançois-Henri Pinault and Jean-François Palus areshown on pages 331-332.
The executive corporate officers have formally undertakennot to use hedges on their stock options or performanceshares, and no such hedges are currently in place.
Performance shares granted to each executivecorporate officer in 2015
Further to the decision by the Board of Directors to maintainthe long-term incentive system based on monetaryinstruments, no performance shares were granted toexecutive corporate officers since 2012.
Performance shares granted to each executivecorporate officer in prior years
Details of the performance shares previously granted toFrançois-Henri Pinault and Jean-François Palus areshown on page 332.
Stock purchase options exercised by each executive corporate officer in 2015
Number of options Strike Number and date of the plan exercised during the year price
François-Henri Pinault 2007 / 1 Plan May 14, 2007 60,000 €127.58
Jean-François Palus 2005 / 2 Plan May 19, 2005 2,100 €78.01
Jean-François Palus 2007 / 1 Plan May 14, 2007 7,700 €127.58
TOTAL 69,800
151
4
2015 Reference Document ~ Kering
REMUNERATION OF CORPORATE OFFICERS ~ CORPORATE GOVERNANCE
04_VA_V5 06/04/2016 17:31 Page151
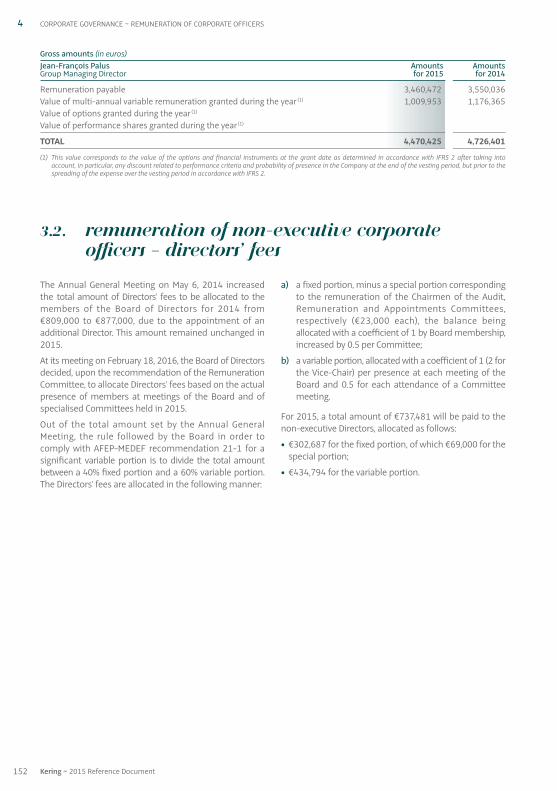
The Annual General Meeting on May 6, 2014 increasedthe total amount of Directors’ fees to be allocated to themembers of the Board of Directors for 2014 from€809,000 to €877,000, due to the appointment of anadditional Director. This amount remained unchanged in2015.
At its meeting on February 18, 2016, the Board of Directorsdecided, upon the recommendation of the RemunerationCommittee, to allocate Directors’ fees based on the actualpresence of members at meetings of the Board and ofspecialised Committees held in 2015.
Out of the total amount set by the Annual GeneralMeeting, the rule followed by the Board in order tocomply with AFEP-MEDEF recommendation 21-1 for asignificant variable portion is to divide the total amountbetween a 40% fixed portion and a 60% variable portion.The Directors’ fees are allocated in the following manner:
a) a fixed portion, minus a special portion correspondingto the remuneration of the Chairmen of the Audit,Remuneration and Appointments Committees,respectively (€23,000 each), the balance beingallocated with a coefficient of 1 by Board membership,increased by 0.5 per Committee;
b) a variable portion, allocated with a coefficient of 1 (2 forthe Vice-Chair) per presence at each meeting of theBoard and 0.5 for each attendance of a Committeemeeting.
For 2015, a total amount of €737,481 will be paid to thenon-executive Directors, allocated as follows:
• €302,687 for the fixed portion, of which €69,000 for thespecial portion;
• €434,794 for the variable portion.
Gross amounts (in euros)Jean-François Palus Amounts AmountsGroup Managing Director for 2015 for 2014
Remuneration payable 3,460,472 3,550,036Value of multi-annual variable remuneration granted during the year (1) 1,009,953 1,176,365Value of options granted during the year (1) Value of performance shares granted during the year (1)
TOTAL 4,470,425 4,726,401
(1) This value corresponds to the value of the options and financial instruments at the grant date as determined in accordance with IFRS 2 after taking intoaccount, in particular, any discount related to performance criteria and probability of presence in the Company at the end of the vesting period, but prior to thespreading of the expense over the vesting period in accordance with IFRS 2.
3.2. Remuneration of non-executive corporateofficers – Directors’ fees
152 Kering ~ 2015 Reference Document
4 CORPORATE GOVERNANCE ~ REMUNERATION OF CORPORATE OFFICERS
04_VA_V5 06/04/2016 17:31 Page152

To the Company’s knowledge:
• none of the Directors or executive corporate officershave been convicted for fraud in the last five years;
• none of the Directors or executive corporate officers havebeen associated in the last five years with bankruptcy,receivership or liquidation proceedings as a member ofan administrative, management or supervisory body oras Chief Executive Officer;
• no court order has been entered over the last five yearsagainst any of the Directors or executive corporate officersthat prohibits them from acting as a member of anadministrative, management or supervisory body of anissuer or from intervening in the management orrunning of the business of an issuer;
• no incrimination and / or official public penalty has beenentered against any of the Directors or executive corporateofficers by statutory or regulatory authorities (includingdesignated professional bodies);
• none of the Directors or executive corporate officers havebeen given a commitment by the Company or any of itssubsidiaries corresponding to items of remuneration,indemnities or benefits payable or potentially payableon account of the commencement, termination of orchange in his or her duties or subsequent thereto;
• none of the Directors or executive corporate officershave indicated the existence of an agreement with amain shareholder, customer or supplier of the Companypursuant to which he or she was designated as Directoror executive corporate officer.
153
4
2015 Reference Document ~ Kering
REMUNERATION OF CORPORATE OFFICERS ~ CORPORATE GOVERNANCE
3.3. Regulatory information on Directors and executive corporate officers
Neither the Company, nor any company that it controls, hasmade any commitment vis-à-vis its Directors or executivecorporate officers on account of the commencement,termination of or change in their duties or subsequent thereto.
No Director or non-executive corporate officer benefitsfrom any particular benefit or specific pension plan. Thereis no conditional or deferred remuneration.
Other than the remuneration set out above, neither theCompany, nor Artémis or Financière Pinault which control it,has paid any remuneration or granted any benefits, directlyor indirectly, to its Directors or executive corporateofficers in connection with their term of office, duties orassignments performed in or on behalf of the Company,and any company that it controls.
The table below shows Directors’ fees paid in 2014 and 2015 for fiscal years 2013 and 2014:
Members of the Board of Directors Director’s fees paid during
other than the Chief Executive Officer the year (in euros)
and Group Managing Director 20 15 20 14
Patricia Barbizet 173,552 121,374Laurence Boone (1) 40,842 57,053Luca Cordero di Montezemolo 54,451 53,831Yseulys Costes 87,286 77,019Jean-Pierre Denis 108,687 93,511Philippe Lagayette 99,076 89,341Aditya Mittal (2) - 7,898Baudoin Prot 45,644 36,203Caroline Puel (3) 23,449 46,375Sophie Bouchillou (4) 16,016 -Daniela Riccardi (5) 2,804 25,000Jochen Zeitz 52,852 52,883
TOTAL 704,659 660,488
(1) The term of office of Laurence Boone expired on July 15, 2014.(2) The term of office of Aditya Mittal expired on June 18, 2013.(3) The term of office of Caroline Puel expired on May 6, 2014.(4) Sophie Bouchillou, Director representing the employees, was appointed on July 10, 2014.(5) The term of office of Daniela Riccardi started on May 6, 2014. In December 2014, Mrs. Riccardi received an advance of €25,000 on her Directors’ fees for 2014.
04_VA_V5 06/04/2016 17:31 Page153
Honorary Chairman of the Board of Directors
In accordance with the possibility provided for under theCompany’s Articles of Association, in its meeting onJune 18, 2013, which followed the Combined GeneralMeeting, the Board of Directors decided to confirm Mr. François Pinault, founder of the PPR group, sincerenamed Kering, as Honorary Chairman of the Board ofDirectors. In this capacity, Mr. François Pinault is invited toparticipate in the meetings of the Board of Directors andof the Strategy and Development Committee on aconsultative basis.
Vice-Chairman of the Board of Directors
In accordance with the possibility provided for under theCompany’s Articles of Association, in its meeting onJune 18, 2013, which followed the Combined GeneralMeeting, the Board of Directors renewed Patricia Barbizet’sterm of office as Vice-Chair of the Board of Directors forthe same duration as her term of office as Director. In thiscapacity, Patricia Barbizet prepares and coordinates thework of the Board of Directors and may chair Boardmeetings when the Chairman is absent.
Non-voting Directors
• Marco Bizzarri, Chairman and Chief Executive Officer ofGucci (appointed by the Board of Directors at itsmeeting on February 14, 2013);
• Björn Gulden, Chief Executive Officer of PUMA (appointedby the Board of Directors at its meeting on October 24, 2013);
• Albert Bensoussan, CEO of Kering’s “ Luxury – Watches &Jewellery ” division (appointed by the Board of Directorsat its meeting on July 30, 2014);
• Grita Loebsack, CEO of Kering’s Luxury – Couture &Leather Goods ’ emerging brands (appointed by theBoard of Directors at its meeting on October 23, 2015).
The main role of non-voting Directors is to attend Strategyand Development Committee meetings and, as required,Board of Directors’ meetings, to provide the necessaryinformation, expertise and knowledge of the Group’svarious businesses. They serve on a consultative basis. InMay 2007, the Annual General Meeting deemed appropriatethat the Board be allowed to decide on the number ofnon-voting Directors and amended Article 18 of Kering’sArticles of Association accordingly.
3.4. Other information on the Company’s Board of Directors
Moreover, no service contract providing for the grantingof benefits binds the Directors with the Kering group.
No assets belonging directly or indirectly to the Company’ssenior executives are used in Group operations.
In general, to the Company’s knowledge, none of theDirectors or executive corporate officers are in a positionof potential conflict of interest between their duties withregards to the Company and their private interests orother duties or have existing family ties with anotherDirector or executive corporate officer of the Company.
154 Kering ~ 2015 Reference Document
4 CORPORATE GOVERNANCE ~ REMUNERATION OF CORPORATE OFFICERS
04_VA_V5 06/04/2016 17:31 Page154
Group management is composed of the Group ExecutiveCommittee headed by François-Henri Pinault, Chairmanand Chief Executive Officer, and Jean-François Palus,Group Managing Director.
The Executive Committee
The Executive Committee meets regularly, with the ChiefExecutive Officers of the Group’s major brands andKering’s main operating officers. The twelve-memberExecutive Committee is the Group’s key operational bodyand reflects Kering’s transformation into a more streamlinedgroup. It affords the Chief Executive Officers of itsDivisions and major brands the opportunity to be moreclosely involved in the Group’s key strategic decision-makingprocesses, alongside Kering’s main operating officers.
Members of the Executive Committee
• François-Henri Pinault (since March 2005), Chairmanand Chief Executive Officer, Kering;
• Jean-François Palus (since December 2005), GroupManaging Director, Kering;
• Francesca Bellettini (since October 2015), ChiefExecutive Officer, Saint Laurent;
• Carlo Alberto Beretta (since October 2015), ChiefExecutive Officer, Bottega Veneta;
• Marco Bizzarri (since February 2012), Chairman andChief Executive Officer, Gucci;
• Jean-Marc Duplaix (since February 2012), Group ChiefFinancial Officer, Kering;
• Béatrice Lazat (since March 2016), Senior Vice-President, Group Human Resources, Kering;
• Grita Loebsack (since September 2015), Chief ExecutiveOfficer of Kering’s Luxury – Couture & Leather Goods’emerging brands;
• Marie-Claire Daveu (since September 2012), GroupChief Sustainability Officer and Head of InternationalAffairs, Kering;
• Björn Gulden (since July 2013), Chief Executive Officer, PUMA;
• Albert Bensoussan (since June 2014), Chief ExecutiveOfficer of Kering’s “ Luxury – Watches & Jewellery ” division;
• Roberto Vedovotto (since March 2015), CEO of KeringEyewear.
Monthly activity and budget review meetings
The Executive Management of Kering, and the ChiefExecutive Officers of the major brands of the Divisions,hold monthly meetings to assess developments in the
activities. This assessment is based on operational andfinancial factors.
Insider Good Practices Committee
Composed of the Group Managing Director and the Headof the Legal Department, the Insider Good PracticesCommittee draws up the timetable of black-out periodsfor trading in Kering securities, lists of insiders, letters ofinformation and monitoring in relation to rules on insiderdealing, which are sent to the relevant managers and seniorexecutives of the Group as well as to occasional andpermanent insiders, in accordance with the GeneralRegulations of the French financial markets authority(Autorité des marchés financiers – AMF). The members ofthe Group’s Executive Committee are required to consultthe Insider Good Practices Committee before trading inCompany shares or similar financial instruments.
Pursuant to the provisions of Article 223-26 of the AMF’sGeneral Regulations, to the Company’s knowledge, notransactions were carried out by the individuals referredto in Article L. 621-18-2 of the French Monetary andFinancial Code (Code monétaire et financier) on Kering’sfinancial instruments during 2015, with the exception ofthe following transactions.
On March 25, 2015, François-Henri Pinault exercised60,000 purchase options at a strike price of €127.58 andsold all of the shares resulting from the exercise of thesesubscription options (i.e., 60,000 shares) at a price of€184.81 per share.
On March 25, 2015, Jean-François Palus exercised 7,700 purchase options at a strike price of €127.58 and sold5,320 shares resulting from the exercise of these optionsat a price of €185.57 per share. On the same day, Jean-François Palus exercised 2,100 purchase options at a strikeprice of €78.01 and sold 920 shares resulting from theexercise of these options at a price of €180.55 per share.
Ethics Committee
Kering’s Ethics Committee was set up in 2005, and is nowsupported by two regional Ethics Committees – the Asia-Pacific Ethics Committee and the Americas EthicsCommittee – and an international hotline available for allGroup staff. The Ethics Committees are composed ofrepresentatives of the Group’s brands and Kering staff.Their regional organisation reflects the Group’s policy ofdelegating responsibility, which results in better qualityresponses to queries. Operating on a “last resort” basisunder the authority of the Group Ethics Committee towhich they report, these Committees ensure that theGroup’s ethical principles are applied consistently.
4. Group management
155
4
2015 Reference Document ~ Kering
GROUP MANAGEMENT ~ CORPORATE GOVERNANCE
04_VA_V5 06/04/2016 17:31 Page155

5.1.1. Current membership of the Board
The Board is composed of Directors with wide anddiversified experience, relating in particular to corporatestrategy, finance, insurance, economics, the retail sector,industry, accounting, management and supervision ofcommercial and financial corporations. The Articles ofAssociation provide for a renewable four-year term ofoffice for Directors.
In order to avoid reappointing the entire Boardsimultaneously and to facilitate a smooth renewalprocess, the Combined General Meeting on May 7, 2009
adopted an amendment to Article 10 of the Company’sArticles of Association implementing the staggeredrenewal of the Board of Directors.
After having considered the Board of Directors’ report andthe favourable opinion issued by the Company’s WorksCouncil, the Combined General Meeting on May 6, 2014decided to amend Article 10 of the Articles of Associationin order to establish the procedures for appointing Directorsrepresenting the employees in accordance with theFrench law dated June 14, 2013 in relation to job security.
5.1. Membership of the Board of Directors
Pursuant to Article L. 225-37, paragraph 6 of the FrenchCommercial Code (Code de commerce) amended by ActNo. 2008-649 of July 3, 2008, Ordinance No. 2009-80 ofJanuary 22, 2009 and Act No. 2011-103 of January 27,2011, the composition of the Board of Directors, theapplication of the principle of the balanced representationof women and men on the Board, and the conditions ofpreparation and organisation of the work performed bythe Board of Directors and the internal control and riskmanagement procedures implemented by the Companyare reported hereinafter. This report specifies, inparticular, the procedures relating to the preparation andprocessing of financial and accounting information for the
consolidated financial statements and the parentcompany financial statements. In addition, this reportindicates any potential limitations set by the Board on thepowers of the Chairman and Chief Executive Officer. The firstpart of this report was presented to the AppointmentsCommittee on February 11, 2016 and the second partwas the subject of deliberations by the Company’s AuditCommittee on February 15, 2016.
The Board of Directors approved the entire report at itsmeeting on February 18, 2016 in accordance with theprovisions of Article L. 225-37 of the French Commercial Code.
5. Report by the Chairman of the Board of Directorson its composition, the application of the principle of the balanced representation of women and men, on the conditions of preparation and organisation of the work performed by the Board, and on the internal control and risk management proceduresimplemented by the Company
4 CORPORATE GOVERNANCE ~ REPORT BY THE CHAIRMAN OF THE BOARD OF DIRECTORS
156 Kering ~ 2015 Reference Document
04_VA_V5 06/04/2016 17:31 Page156

Four non-voting Directors appointed by the Board ofDirectors for a term of four years pursuant to Article 18 ofthe Company’s Articles of Association attend meetings of theBoard of Directors, as required, on a consultative basis.
The Board has set up five Committees responsible forassisting it in performing its task: the Audit Committee, theRemuneration Committee, the Appointments Committee,the Strategy and Development Committee and theSustainability Committee.
A detailed list of the Directors and the non-voting Directorsis set out in a previous section of the Reference Document,on pages 136 to 146 and 154.
5.1.2. Changes in the membership of the Board of Directors
The composition of the Board of Directors did not changein 2015.
The Board is currently made up of eleven Directors:
Participation in a committee End ofInde- Start 1st current
pendent Remune- Appoin- Strat. Sustain- term of term ofName Position Age Director (1) Audit ration tments & Dev. ability office office Nationality
François-Henri Chairman and Chief 53 √ √ 1993 (2) 2017 FrenchPinault Executive Officer
Patricia Barbizet Vice-Chair 60 √ √ √ √ √ 1992 (3) 2017 French
Jean-François Group Managing 54 √ 2009 2017 FrenchPalus Director
Yseulys Costes Director 43 √ √ √ √ 2010 2018 French
Luca Cordero Director 68 √ √ 2001 (3) 2016 Italiandi Montezemolo
Jean-Pierre Denis Director 55 √ √ √ 2008 2016 French
Philippe Lagayette Director 72 √ √ √ 1999 (3) 2016 French
Baudouin Prot Director 64 √ 1998 (3) 2017 French
Daniela Riccardi Director 55 √ 2014 2018 Italian
Jochen Zeitz Director 52 √ 2012 2016 German
Sophie Bouchillou Director 53 2014 2018 Frenchrepresenting
the employees
(1) According to the criteria of the revised AFEP-MEDEF Code and the Board of Directors set out below.(2) Member of the Executive Board from 1993 to 2001 and the Supervisory Board from 2001 to 2005.(3) Member of the Supervisory Board until 2005.
157
4
2015 Reference Document ~ Kering
REPORT BY THE CHAIRMAN OF THE BOARD OF DIRECTORS ~ CORPORATE GOVERNANCE
04_VA_V5 06/04/2016 17:31 Page157
5.2.1. Internal rules of the Board
The Board of Directors performs the duties and exercisesthe powers granted to it by law and the Articles ofAssociation.
It determines and assesses the strategy, objectives andperformance of the Company and ensures theirimplementation. Subject to the powers expressly grantedto Annual General Meetings and within the limit of thecorporate purpose, the Board reviews all issuesconcerning the smooth running of the Company and actson all matters over which it has authority.
The Board carries out the controls and verifications itdeems appropriate.
The conditions of preparation and organisation of the workof the Board of Directors are defined by law, the Company’sArticles of Association, the internal rules of the Board andthe work of its specialised Committees. The Board hasestablished internal rules for each committee.
Pursuant to its internal rules and the law, the Board ofDirectors meets at least four times a year. To enableDirectors to prepare in the best possible way for thetopics to be examined during the meeting, acomprehensive file is sent to them in due time ahead ofthe meeting; it includes, per topic addressed, thenecessary information on all items on the agenda.
In line with the relevant regulatory requirements, theinternal rules also set the rules applicable to Directors inrelation to restrictions on trading in the securities of theCompany, or more generally the Group, by establishingblack-out periods:
• the Directors must refrain from trading directly orindirectly in the listed securities and financialinstruments of the Company and the Group for a periodof 30 calendar days preceding each of the periodicpublications relating to the annual and half-yearconsolidated financial statements and 15 calendardays preceding each of the quarterly publicationsrelating to consolidated revenue and ending at theclose of the trading day following the publication of therelevant official press release. In no way does thisblack-out period replace the legal and regulatoryprovisions regarding insider trading with which eachmember of the Board must comply at the time he / shedecides to trade, no matter when this might occuroutside the defined black-out periods;
• the same obligations apply to each Director insofar asthe Director has knowledge of inside information relatingto any financial instrument listed on a regulated market,where the issuer of those financial instruments has an
insider relationship with the Group. Consequently, theinternal rules require the reporting of all dealings inthese securities.
The internal rules set the frequency and conditions ofBoard meetings and provide for meeting participation byvideoconference and / or conference call.
They also establish the principle of regular assessment ofthe functioning of the Board and set the terms andconditions by which Directors’ fees are allocated.
According to the internal rules, Directors are required toinform the Chairman of the Board of any conflicts ofinterest, or of any possible conflicts, between their dutiestowards the Company and their private interests and / orother duties, and they may not vote on any matters thatconcern them directly or indirectly.
The Chairman of the Board of Directors may ask theDirectors at any time for a written statement confirmingthat they are not involved in any conflicts of interest.
In order to reinforce its methods of functioning and inthe interest of good governance, the internal rules of theBoard of Directors set forth and formally lay down therules governing the organisation and operating methodsof the Board as well as the missions of its fiveCommittees: the Audit Committee, the RemunerationCommittee, the Appointments Committee, the Strategyand Development Committee and the SustainabilityCommittee.
Executive Management may in all circumstances beheard within said Committees.
5.2.2. Executive Management
After the Combined General Meeting on May 19, 2005adopted the new Articles of Association of Kering (thenPPR), introducing governance by a Board of Directors, theBoard of Directors opted to have the duties of Chairmanand Chief Executive Officer held by one person, andmaintained this option in May 2009. This choice hascontributed to efficient governance in light of theorganisation of the Kering group within which François-Henri Pinault is the Chairman and Chief Executive Officerof Kering, the Group’s parent company. He is related tothe controlling shareholder, is closely involved inconducting the Group’s business and has in-depthknowledge and experience of this business. Themanagement of the Luxury and Sport & Lifestyle Divisionsis entrusted to the Chairman and Chief Executive Officerand to the Group Managing Director, respectively. TheChairmen and Chief Executive Officers of the main brands(Gucci and PUMA), as well as the Chief Executive Officer of
5.2. Conditions of preparation and organisation of the work of the Board of Directors
4 CORPORATE GOVERNANCE ~ REPORT BY THE CHAIRMAN OF THE BOARD OF DIRECTORS
158 Kering ~ 2015 Reference Document
04_VA_V5 06/04/2016 17:31 Page158
Kering’s “Luxury – Watches & Jewellery” division, and theChief Executive Officer of Kering’s Luxury – Couture &Leather Goods’ emerging brands are members of theExecutive Committee and attend Board of Directors’meetings as non-voting Directors. They are all thus ableto provide, at those Board meetings which they areinvited to attend, their views and information concerningthe Group’s Divisions and brands so that the non-executive Directors and more generally the Board may bewell-informed.
On the proposal of the Chairman and Chief ExecutiveOfficer, the Board of Directors’ meeting on February 22,2008 appointed a Group Managing Director (DirecteurGénéral délégué) whose term of office was renewed onJune 18, 2013 and who has the same powers with regardto third parties as the Chief Executive Officer. The GroupManaging Director was appointed as Director by theCombined General Meeting on May 7, 2009 for a four-yearterm, renewed on June 18, 2013 for another four years.
The Chairman and Chief Executive Officer and the GroupManaging Director both take part, on an equal level, in thework of the Board of Directors, 40% of whose membersare independent Directors. The Board operates smoothlythanks to frequent meetings, the regular attendance ofits members and the assistance of its specialisedCommittees, as described below.
5.2.3. Limitations by the Board of Directorson the powers of the Chief ExecutiveOfficer and Group Managing Director
In connection with the Board of Directors’ statutory roleof determining the business orientation of the Companyand ensuring its implementation, and without prejudiceto the legal provisions governing the authorisationsrequired to be granted by the Board (related-partyagreements, endorsements, suretyships and guarantees,divestments of shareholdings or sale of realproperty, etc.), the Company’s Articles of Associationprovide that certain decisions of the Chief ExecutiveOfficer and Group Managing Director, by virtue of theirnature or significance, require the prior approval of theBoard of Directors:
a) matters and transactions that have a substantiveeffect on the strategy of the Group, its financialstructure or its scope of business activity;
b) except in the event of a decision by the AnnualGeneral Meeting, issues of securities, regardless of thenature thereof, that are liable to cause a change inthe share capital;
c) the following transactions by the Company or anyentity controlled by the Group, insofar as they eachexceed an amount set annually by the Board ofDirectors (which was €500 million in 2015):
- all investments or divestments, including theacquisition, sale or exchange of holdings in allexisting or future businesses,
- all purchases or sales of Company real property.
These transactions are regularly submitted to the Boardof Directors, which examines them carefully.
5.2.4. Compliance with a code of corporategovernance
On October 22, 2008, the Board of Directors announcedthat it had examined and adopted, as a reference corporategovernance framework, the AFEP-MEDEF recommendationsof October 6, 2008 on the remuneration of executivecorporate officers of listed companies and deemed thatthe corporate governance policies already implementedby the Company complied with all the aforementionedrecommendations.
Accordingly, the Company now refers to the CorporateGovernance Code of Listed Corporations resulting fromthe consolidation of the October 2003 AFEP and MEDEF report, the aforementioned January 2007 andOctober 2008 AFEP-MEDEF recommendations and theApril 2010 AFEP-MEDEF recommendation concerning thestrengthening of women representation within theboards, as amended in June 2013 and November 2015(“the revised AFEP-MEDEF Code”) and its November 2015implementing guidelines, and has done so, in particular,for the preparation of this report. The revised AFEP-MEDEF Code is available in English on the AFEP websiteat http: / / www.afep.com / en / content / focus / corporate-governance-code-listed-corporations.
159
4
2015 Reference Document ~ Kering
REPORT BY THE CHAIRMAN OF THE BOARD OF DIRECTORS ~ CORPORATE GOVERNANCE
04_VA_V5 06/04/2016 17:31 Page159
5.2.5. Independence of Directors
In order to assess the independence of a Director and toavoid possible risks of conflicts of interest, the Boardapplied the criteria defined in the revised AFEP-MEDEFCode, whereby a Director cannot:
• be an employee or executive corporate officer of theCompany, an employee or Director of its parent or acompany that the latter consolidates and not havebeen in such position in the past five years;
• be a Director or executive corporate officer of a companyin which the Company holds a directorship, directly orindirectly, or in which an employee appointed as such
or a Director or executive corporate officer of theCompany (currently in office or having held officewithin the past five years) is a Director;
• be a significant customer, supplier, investment banker,or commercial banker of the Company or the Group, orfor which the Company or the Group represents asignificant portion of the activity;
• have any close family ties with a Director or executivecorporate officer;
• have been the auditor of the Company within the pastfive years;
• have been a Director of the Company for more than 12 years.
Two provisions of the revised AFEP-MEDEF Code were not adopted:
AFEP-MEDEF recommendations Kering practice and explanations
Director independence criteria (section 9-4 of the Code) – In the case of Philippe Lagayette, the Board of Directors One of the criteria to be reviewed in order for a Director decided not to apply the independence criterion limiting ato qualify as independent is not to have been a Director Director’s term of office to 12 years.of the Company for more than 12 years.
On the recommendations of the Appointments Committee,the Board of Directors noted that Philippe Lagayette (a memberof the Supervisory Board and then, as from January 1999, amember of the Board of Directors), has had no responsibilitiesin the banking sector since early 2010. Following the letter sentby the High Committee on Corporate Governance (HautComité de Gouvernement d’Entreprise) in July 2014, the Boardof Directors reassessed Philippe Lagayette’s situation andremains unanimous in agreeing that his first-class expertise,his other duties outside the Group (including directorshipsin prestigious companies that also require independentrepresentation) and his acknowledged moral authority show thathis many years of service on the Board have had a positiveimpact on his knowledge of the Group, its background andits activities, and reflect a continuous and outstandingcontribution to the work of the Board of Directors and, priorto that, the Supervisory Board, which has had several Chairssince his initial appointment. This belief is further supportedby Philippe Lagayette’s role on the Boards of two other listedcompanies, as Senior Director and chairman of audit Committees.
Lastly, the Board has begun to examine the matter ofindependence of Directors in the context of the expiry of termsof office of four serving independent Directors, includingPhilippe Lagayette.
Composition of the Appointments Committee The Committee currently comprises three Directors:(section 17.1 of the Code) – the Committee should have Patricia Barbizet, Chair of the Committee, Luca Cordero dia majority of independent Directors. Montezemolo and Baudouin Prot.
The Company does not comply with the AFEP-MEDEFrecommendations regarding the proportion of independentmembers within the Appointments Committee. Thecomposition of the Committees of the Board of Directors, andparticularly that of the Appointments Committee, remainedunder examination, as part of discussions on possibleforthcoming changes in the composition of the Board itself.
4 CORPORATE GOVERNANCE ~ REPORT BY THE CHAIRMAN OF THE BOARD OF DIRECTORS
160 Kering ~ 2015 Reference Document
04_VA_V5 06/04/2016 17:31 Page160
Upon analysing the situation of each Director with regardto these criteria and following a review by theAppointments Committee on February 11, 2016, theBoard of Directors classified as independent Directors,without prejudging the independence of the otherDirectors, the following members: Yseulys Costes, DanielaRiccardi, Jean-Pierre Denis and Philippe Lagayette.
Regarding Baudouin Prot, the Board confirmed thatBaudouin Prot gave up all responsibilities in the BNPParibas group in December 2014. However, the Board ofDirectors decided that Baudouin Prot does not qualify asan independent Director.
Accordingly, four Directors out of the ten(1) Directors currentlyserving on the Board are classified as independentDirectors, it being noted that the revised AFEP-MEDEF Coderecommends that those companies with a controllingshareholder, which is the case of Kering, comply with therule that at least one-third of the Board members shouldbe independent Directors.
5.2.6. Activity of the Board of Directors and its specialised Committees
Activity of the Board of Directors in 2015 and up to February 18, 2016
Activity of the Board of Directors in 2015
During 2015, the Board met eight times with an averageattendance rate of 92%; the Chairman of the Board chairedall Board meetings. Directors present
Dates (attendance rate)
January 14 11 / 11 (100%)February 16 8 / 11 (72.7%)March 18 11 / 11 (100%)April 23 (before the Combined General Meeting) 10 / 11 (90.9%)April 23 (after the Combined General Meeting) 10 / 11 (90.9%)July 27 10 / 11 (90.9%)October 23 11 / 11 (100%)December 16 10 / 11 (90.9%)
The work of the Board of Directors mainly involvedreviewing the annual and interim financial statements,the Group’s business activity and strategic issues.
During its meeting on January 14, 2015, the Board reviewedthe work of the Audit Committee on key focus points forthe closing of the 2014 financial statements and the Group’sInternal Audit activity and heard a presentation on businessactivity in 2014. The Board granted and allocated theDirectors’ fees for 2014 in accordance with the terms andconditions of its internal rules. The Board also decided onthe modification of Article 6 of Kering’s Articles ofAssociation (“Article 6: Share Capital”) further to the capitalincrease following the exercise of stock subscriptionoptions during 2014.
On February 16, 2015, following a review by the AuditCommittee on February 13, 2015, the Board of Directorsadopted the 2014 financial statements and reports inview of the Annual General Meeting. It adopted the draftManagement Report of the Board of Directors to theAnnual General Meeting and approved the Chairman’sreport on corporate governance, internal control and riskmanagement. It also heard a report on the Group’sfinancial position.
On March 18, 2015, the Board met to deliberate on theGroup’s 2015 budget. The Board heard a presentation onthe work of the Remuneration Committee concerning theproposed policy for 2015 with regard to the long-termremuneration of the Group’s senior executives and, on therecommendation of the same Committee, determinedthe variable components of the remuneration for 2015. Italso awarded a long-term performance bonus to theChairman and Chief Executive Officer as well as to theGroup Managing Director.
It also heard the report on the work of the AppointmentsCommittee, following which it convened the CombinedGeneral Meeting of April 23, 2015.
In addition, the Board examined and approved the newInternal Control Charter.
On April 23, 2015, the Board met prior to the CombinedGeneral Meeting held on the same day. Further to abriefing on the preparation of the Annual GeneralMeeting, the Board received a presentation on the KeringEyewear business, which was previously operated underlicence but has now been internalised.
The Board of Directors met again after the CombinedGeneral Meeting on April 23, 2015. The Board renewedthe authorisation given to the Chief Executive Officer, withthe possibility to sub-delegate such authorisation, tocarry out certain transactions, in particular those referredto in Article 15-II of the Company’s Articles of Association,with a ceiling set at €500 million. The Board approved theimplementation of the share buy-back programmeauthorised by the Annual General Meeting on the same day.The Board also approved the sale by Kering Netherlands BVof an interest in Global Fashion Holding SA to Témaris SA(French company and subsidiary of Artémis), the transactionqualifying as a regulated related-party agreement.
On July 27, 2015, the Board reviewed the work of the AuditCommittee, which had met on July 23, 2015, heard thefindings of the Statutory Auditors and a report on businessactivity for the first half of 2015, and adopted the interimfinancial statements and reports. During the review of theinterim financial statements, the Board was given a progressreport on the sale of Sergio Rossi to Investindutrial. Thesale completed on December 30, 2015, and concerned allthe industrial assets of Sergio Rossi, the rights attachedto the brand and the entire distribution network.
4REPORT BY THE CHAIRMAN OF THE BOARD OF DIRECTORS ~ CORPORATE GOVERNANCE
(1) The AFEP-MEDEF Code does not include Directors representing employees when calculating the percentage of independent Directors on Board Committees. Thisexplains why the proportion of independent Directors on the Board is calculated based on 10 Directors instead of 11.
1612015 Reference Document ~ Kering
04_VA_V5 06/04/2016 17:31 Page161
During the meeting on October 23, 2015, a report waspresented to the Board on the Group’s business activitiesand strategic issues. The Board’s discussions focusedmainly on how to strengthen the Group’s positioning andit underscored the key importance of sustainability aspart of this strategy. The Board also discussed the launchof Kering’s new Eyewear business and the repositioningof the PUMA brand that was begun several monthsearlier. In addition, the Board addressed the subject ofGucci’s new Creative Director and the aim of making theGucci brand restore its fashion authority status. TheSustainability Committee’s work was then also presented.Lastly, the Board noted the need to undertake a freshassessment of its work prior to the publication of Kering’sforthcoming Reference Document.
On December 16, 2015, the Board decided to pay aninterim dividend for 2015 as from January 25, 2016. TheRisk Committee’s work was then presented.
Activity of the Board of Directors in 2016 up to February 18, 2015
Between January 1, 2016 and February 18, 2016, theBoard of Directors met once.
On February 18, 2016, the Board of Directors met to adoptthe 2015 annual financial statements and reports to besubmitted to the Annual General Meeting as well as toapprove this report. It also heard a report on the Group’sfinancial position. The Board then granted and allocatedthe Directors’ fees for 2015 in accordance with the criteriaadopted in March 2014. Lastly, it has been proposed tothe Board of Directors to reappoint Laurence Boone andto submit this new appointment to the approval of theshareholders at the next Annual General Meeting.
Assessment of the Board of Directors
In accordance with its internal rules, since 2004 theBoard of Directors carries out an annual self-assessment.At least once every three years, an independent Directoror third-party expert appointed by the Board assessesand reports on its members and activity. The previousassessment was carried out by a specialised firm whichreported to the Board on July 25, 2013 and the same firmlaunched a new assessment in January 2016 that will besubmitted to the Board at the end of the first quarter of2016. This assessment will take account of therecommendations of the revised AFEP-MEDEF Code.
Audit Committee
Set up in December 2002, the main assignment of the AuditCommittee, within the limit of the duties of the Board ofDirectors, is to review the annual and interim financialstatements, to verify the relevance, continuity and reliabilityof accounting methods applied within the Company andthe main subsidiaries and the implementation of internalcontrol and risk management procedures in the Group, tobe familiar with the policies implemented within the Groupin relation to sustainability and respect for the environment,
and to listen to and question the Statutory Auditors. TheCommittee is notified of the main problems identified bythe Kering group’s Internal Audit Department.
The Audit Committee reports to the Board on a regular basisand provides it with its opinions or recommendations onall matters within its scope of duties. Meetings of theAudit Committee give rise to a written and approved report.
The Committee may call on external experts and hear anyperson.
Each year it reviews the fees charged by the Company’sStatutory Auditors and assesses their independence. TheAudit Committee also considers potential StatutoryAuditors for appointment.
The Committee currently comprises three Directors: Jean-Pierre Denis, Chairman of the Committee, and YseulysCostes, both of whom are independent Directors, andPatricia Barbizet.
The Audit Committee members all have recognised financialor accounting skills, combining their expertise in generaland operational management of banks and businessesas confirmed by their professional careers (see pages138, 142 and 143 of the Reference Document).
In accordance with the revised AFEP-MEDEF Code, two-thirds of the members of the Committee areindependent Directors.
Activities of the Audit Committee in 2015 and up to February 15, 2016
In 2015, the Committee met four times, with an averageattendance rate of 100%.
During 2015, the Chief Financial Officer and GroupInternal Audit Director were regularly invited to presenttheir work and answer questions at meetings of theCommittee.
On January 12, 2015, the Head of the Internal AuditDepartment reported to the Committee on the InternalAudit activities (audit assignments and monitoring ofaction plans) and the Group’s risk exposure; the Committeereviewed the accounting options for the annual financialstatements, off-balance sheet commitments and thescope of the Statutory Auditors’ assignment as well as theirindependence and general programme for audit work inorder to make its recommendations to the Board of Directors.
On February 13, 2015, the Committee met prior to themeeting of the Board held to adopt the 2014 financialstatements, a topic to which it devoted most of its work,and heard the Statutory Auditors in relation to theirreports on the financial statements. It also reviewed theservices provided by Artémis in 2014.
On June 4, 2015, the Internal Audit missions for the Groupwere presented to the Committee, along with a progressreport on the dispute with Alibaba.
With a view to the meeting of the Board on July 27, 2015to adopt the interim financial statements, the Committee
4 CORPORATE GOVERNANCE ~ REPORT BY THE CHAIRMAN OF THE BOARD OF DIRECTORS
162 Kering ~ 2015 Reference Document
04_VA_V5 06/04/2016 17:31 Page162
met on July 23, 2015 to review the interim financialstatements and gave a favourable opinion to theproposed renewal of one of the Statutory Auditors, KPMG.
Since the beginning of 2016, the Audit Committee hasmet twice, with all of its members present.
On January 18, 2016, the Head of the Internal AuditDepartment reported to the Committee on the InternalAudit activities and the Group’s risk exposure; theCommittee reviewed the accounting options for the annual financial statements, off-balance sheetcommitments and the scope of the Statutory Auditors’assignment as well as their independence and generalprogramme for audit work in order to make itsrecommendations to the Board of Directors.
On February 15, 2016, the Committee met before themeeting of the Board to adopt the 2015 financialstatements, a topic to which it devoted most of its work,and heard the Statutory Auditors in relation to theirreports on the financial statements. It also reviewed theservices provided by Artémis in 2015 and was given areport on the performance of the Kering share.
On February 18, 2016, the Committee informed theBoard of its work and recommendations.
Remuneration Committee
The Remuneration Committee’s role is to review andmake proposals to the Board of Directors on all items andterms of remuneration of the Chairman and Chief ExecutiveOfficer and the Group Managing Director (as explainedabove in the section “Remuneration of executive corporateofficers”) and the method of allocating Directors’ feesgranted to the Board by the Annual General Meeting. Itreviews and assesses the remuneration policy for seniorexecutives as well as the remuneration and benefitsreceived or deferred, stock options, free share grantsand / or similar benefits including retirement benefits andany other benefits granted to members of the Keringgroup Executive Committee.
The Remuneration Committee currently comprises fourDirectors: Philippe Lagayette, Chairman of the Committee,independent Director, Patricia Barbizet, Yseulys Costesand Jean-Pierre Denis, both of whom are independentDirectors. Accordingly, with regard to the criteria of therevised AFEP-MEDEF Code, independent Directorsrepresented the majority of the Remuneration Committee’smembers.
Activities of the Remuneration Committee in 2015 and up to February 15, 2016
In 2015, the Committee met twice, with an averageattendance rate of 100%.
On February 13, 2015, all the members of the RemunerationCommittee met to discuss the remuneration of themembers of the Executive Committee for 2014. It alsodeliberated on the provisions of the “Macron” law in Francerelating to performance share grants.
On March 12, 2015, all the members of the Committeemet to review and determine the variable components ofthe remuneration for 2014 awarded to the Chairman andChief Executive Officer and to the Group ManagingDirector, as well as the components of remuneration for2015. The Committee also decided on the performancecondition for the performance share plan of April 27,2012.
On February 15, 2016, all the members of the Committeemet to review the variable remuneration for 2015 andthe fixed remuneration of the Executive Committee. Thisreview was carried out based on estimates; theCommittee will determine the rate of achievement for allremuneration at its next meeting, based on the Group’s2015 results. The Board discussed various proposedchanges to the variable remuneration of corporateofficers and debated changes to the components oflong-term remuneration.
The Remuneration Committee reported on its work andrecommendations to the Board of Directors.
Appointments Committee
Set up in March 2003, the Appointments Committeereviews the proposed appointment of Directors as well astheir situation with regard to the independence criteriadefined by the Board. This review must be carried outprior to each appointment and at any time deemedappropriate by the Committee. It provides its opinionsand recommendations in these matters to the Board.
The Committee comprises three Directors: PatriciaBarbizet, Chair of the Committee, Luca Cordero diMontezemolo and Baudouin Prot.
Activities of the Appointments Committee in 2015 andup to February 11, 2016
In 2015, the Appointments Committee met once and allof its members were present.
On February 16, 2015, the Committee met to discuss the succession plan for the Group’s senior executives, the assessment of the independence of Directors, thecomposition of the Board and its Committees and the revised draft of the Board’s internal rules, the aim ofwhich is to align them with the AFEP-MEDEF Code.
On February 11, 2016, all of the members of the Committeemet for a progress report on the assessment of the Boardand to review proposals for the renewal of the Board andits Committees in view of the expiry of the terms of officeof Jean-Pierre Denis, Philippe Lagayette, Luca Cordero diMontezemolo, and Jochen Zeitz, and of the seat vacatedby Laurence Boone. In addition, it reviewed a draft of thesection of this report dealing with corporate governance.
163
4
2015 Reference Document ~ Kering
REPORT BY THE CHAIRMAN OF THE BOARD OF DIRECTORS ~ CORPORATE GOVERNANCE
04_VA_V5 06/04/2016 17:31 Page163
The Appointments Committee reported on its work andmade its recommendations to the Board of Directors.
Strategy and Development Committee
Within the limits of the duties of the Board of Directors,the Strategy and Development Committee’s role is toidentify, analyse and support the Kering group’s strategicdevelopment initiatives.
The Committee comprises four Directors: PatriciaBarbizet, Chair of the Committee, François-Henri Pinault,and Yseulys Costes and Philippe Lagayette, the last twobeing independent Directors.
Activities of the Strategy and Development Committee in2015 and 2016
The Strategy and Development Committee met onceduring the year on the occasion of the Board of Directors‘meeting of October 23. 2015. All the members of theCommittee attended the meeting. The unusual format ofthe meeting was intended to give all of the Directors the opportunity to take part in the discussion followingthe sale of the Group’s retail assets and the finalisation ofthe creation of an integrated luxury group organisedaround a coherent brand portfolio.
The Committee did not meet in early 2016.
Sustainability Committee
The Sustainability Committee’s role is to support theCompany and the Group in establishing, implementingand monitoring good corporate governance, taking intoaccount the aim of the Board and Executive Managementto maintain a high level of sustainability in their economic,social and environmental context, the Group’s clearambitions in terms of ethics and the corporate citizenshippolicies and practices upheld by the Group, its seniorexecutives and employees.
The Committee comprises five Directors: Jochen Zeitz,Chairman of the Committee, François-Henri Pinault,Patricia Barbizet, Jean-François Palus and Luca Cordero diMontezemolo.
Activities of the Sustainability Committee in 2015 and 2016
In 2015, the Committee met twice, with an averageattendance rate of 100%.
The Committee met on March 18, 2015 and discussedthe priorities of the Group with regard to sustainability(EP&L, innovative projects and sustainable sourcing). Thissession was also an opportunity to inform the Committeeabout the main current activities. Finally, a progress reporthas been prepared on the Group’s Ethics Committee activities.
A second meeting was held in London on December 1, 2015.In addition to a review of ongoing projects, this sessionwas mainly devoted to the analysis of the objectives andparameters of the new Group strategy for sustainability.
The Committee did not meet in early 2016.
5.2.7. Shareholder participation
All shareholders are entitled to attend Annual GeneralMeetings in accordance with the conditions provided forby law. The terms and conditions of said attendance arespecified in the provisions of Article 20 of the Articles ofAssociation and are set out again on page 341 of theReference Document.
5.2.8. Information likely to have an impactin the event of a public offer
No information other than that related to (i) the currentshareholding structure (Artémis being the majorityshareholder, with 40.89% of the capital and 57.41% ofvoting rights of Kering), (ii) the double voting rightprovided for under the Articles of Association, (iii) theshare buy-back programme, and (iv) the authorisationsgiven by the Annual General Meeting to increase thecapital, as expressly described in the Reference Document,is liable to have an impact in the event of a public offer orcan have the effect of delaying, deferring or preventing achange of control.
To the Company’s knowledge, there are no agreementsbetween shareholders that could restrict the transfer ofshares or the exercise of voting rights.
5.2.9. Remuneration policy with regard to Directors and executive corporateofficers
Directors’ fees paid to the members of the Board of Directors
The Annual General Meeting determines the total amountof Directors’ fees allocated to members of the Board ofDirectors.
Based on the recommendations of the RemunerationCommittee, the Board of Directors allocates Directors’fees according to the actual presence of members atmeetings of the Board and of specialised Committeesheld during the relevant fiscal year.
Out of the total amount set by the Annual General Meeting,the rule followed by the Board in order to comply withAFEP-MEDEF recommendation 21-1 for a significantvariable portion is to divide the total amount between a40% fixed portion and a 60% variable portion. TheDirectors’ fees are allocated in the following manner:
a) a fixed portion, minus a specific amount correspondingto the remuneration of the Chairmen of the Audit,Remuneration and Appointments Committees,respectively (€23,000 each), the balance beingallocated with a coefficient of 1 by Board membership,increased by 0.5 per Committee;
b) a variable portion, allocated with a coefficient of 1 (2 forthe Vice-Chair) per presence at each meeting of theBoard and 0.5 for each attendance of a Committeemeeting.
4 CORPORATE GOVERNANCE ~ REPORT BY THE CHAIRMAN OF THE BOARD OF DIRECTORS
164 Kering ~ 2015 Reference Document
04_VA_V5 06/04/2016 17:31 Page164

This part of the Report by the Chairman of the Board ofDirectors on the risk management and internal controlsystem within the Group is based on the AMF’s ReferenceFramework published in July 2010. The ReferenceFramework takes into account the legislative andregulatory changes since it was first published in 2007,including Act No. 2008-649 of July 3, 2008 and theOrdinance of December 8, 2008, which adapted Frenchlaw to EU Directives 2006 / 46 / EC and 2006/43/CE andalso supplemented Financial Security Act No. 2003-706of August 1, 2003.
The AMF’s framework is based not only on theaforementioned French and EU legislation and regulations,but also on internal control and risk management goodpractices and international standards, in particular ISO 31000 and COSO II. The COSO II internal controlframework was analysed in depth when the riskmanagement policy was drafted. This policy is set out inthe section “The components of risk management”.
5.3.1. Scope and principles of organisation
Kering is the parent company of the Kering group, whosemain entities are the Luxury Division and the Sport &Lifestyle Division. The following report aims to describethe internal control procedures in the Group, in particular,the procedures relating to the preparation and processingof financial and accounting information. The scope of theGroup covered by the report includes all fully-consolidated subsidiaries, i.e., the companies in whichthe Group directly or indirectly exercises exclusive control.
As a holding company, Kering’s own activity consists ofdefining and implementing its strategy, organising andmanaging its holdings, stimulating the development ofits Divisions, coordinating the financing of their activities,providing support and communication functions, and
defining and implementing the insurance cover policy.
The internal control function follows the generalorganisation of the Group. It is both:
• decentralised at the level of the Divisions: ExecutiveManagement of the operational and legal entities isresponsible for managing and coordinating theinternal control process;
• unified around a common methodology and a singleset of standards. The Kering holding companycoordinates its deployment across the Group,supported by teams at Kering APAC and KeringAmericas.
The section dedicated to internal control procedurescovers the Luxury Division. PUMA AG, listed on theGerman stock market, is subject to regulatory obligationsapplicable to internal control and risk reporting, whichare described in the Company’s annual report and whichmay be consulted to supplement this report. It should benoted that the Kering group’s best practices in this areahave been adopted by the PUMA group. PUMA SE’s AuditCommittee keeps the Kering Audit Committee regularlyinformed.
5.3.2. General principles of risk management
According to the definition of the AMF, risks represent thepossibility that an event may occur and could have animpact on people, assets, the environment, theCompany’s objectives and its reputation.
Risk management covers areas that are much wider thanjust financial risks: for example, strategic, operational,reputational and compliance risk. Risk management is akey management tool that helps:
5.3. Internal control and risk managementprocedures implemented by the Company
In respect of 2015, Kering paid the members of its Boardof Directors €877,000 in Directors’ fees.
Other remuneration
The remuneration and benefits granted to executivecorporate officers primarily depend on the level ofresponsibilities attached to their position, the Group’sresults and achievement of the targets pursued. They alsotake into account the remuneration paid by companiesthat are comparable in terms of size, business sector andinternational presence.
The variable portion of the remuneration paid toexecutive corporate officers is exclusively based on theachievement of financial targets. The Board of Directors
adopted two financial criteria for 2015, which are basedon Group performance indicators in terms of free cashflow and recurring operating income generation, each ofthese items accounting for one half. When targets areexactly met, the variable portion is equal to 120% of thefixed remuneration of the Chairman and Chief ExecutiveOfficer and 100% of that of the Group Managing Director.
None of Kering’s executive corporate officers benefit fromprovisions granting them a specific indemnity in theevent that they leave the Group.
The individual remuneration of the Directors andexecutive corporate officers of Kering is detailed on pages147 to 153 of the Reference Document.
165
4
2015 Reference Document ~ Kering
REPORT BY THE CHAIRMAN OF THE BOARD OF DIRECTORS ~ CORPORATE GOVERNANCE
04_VA_V5 06/04/2016 17:31 Page165
• create and preserve the value, assets and reputation ofthe Company;
• render the Company’s decision-making and processessecure in order to support the achievement of itsobjectives;
• ensure that initiatives are consistent with theCompany’s values;
• bring Company employees together to develop ashared view of the main risks.
5.3.3. The components of risk management
The Group constantly strives to make its operations moresecure and to improve its methodology to identify anddeal with risks. In 2015, the Group pressed ahead withchanges to its risk management methodology initiated in2011 and the means used for its risk managementsystem. The Group’s risk management system provides anorganisational framework, a three-step risk managementprocess and continuous monitoring of the system.
5.3.3.1. Organisational framework
This organisational framework includes:
• an organisation that sets out the roles andresponsibilities of the various persons involved andsets out procedures, as well as consistent and clearstandards, for the system;
• a risk management policy that sets out the objectivesof the system in line with the Company’s culture, theshared language used, and the process to identify,analyse and deal with risks;
• an IT system that makes it possible to share informationabout risks internally.
Risk Committee
Within the scope of the Group’s risk management policyand in accordance with Kering’s corporate governance,Kering’s Executive Management created a “Kering groupRisk Committee” in 2011. This Committee comprises theGroup Managing Director, the Chief Financial Officer, theHead of the Legal Department, the Head of the InternalAudit Department and the Head of the Security Department.As the Group’s operations and activities expand, andbecome more complex and more international, the RiskCommittee helps identify and manage strategic, operational,reporting, reputational and compliance risks that couldhave an impact on the Group’s business operations.Internal rules establish the rules for the Committee andhow it operates.
The Risk Committee reviews (i) the validation and monitoringprocess for the Group’s risk management policy, (ii) themonitoring of the topicality and relevance of the analysisof strategic, operational, reporting, reputational and
compliance risks, (iii) the analysis summaries of generaland specific risks, and (iv) the validation and monitoringof the roll-out of action plans aimed at better controllingidentified risks.
The Risk Committee’s work is brought to the attention of theAudit Committee, which is informed of the Committee’sinternal rules and has access to the reports from itsmeetings.
Risk manager
The risk manager function was also created within theCompany to coordinate this reinforced risk managementsystem, ensure that the Executive Management teams ofthe Divisions analyse the main risks within their scope ofbusiness, and provide the members of the Risk Committee,prior to each meeting, with the information and documentsnecessary for their work and their discussions.
Risk management policy
After reviewing in particular the COSO II internal controlframework, the Group implemented a risk managementpolicy that was sent to the Kering and PUMA internalcontrol departments as well as the Executive Managementteams of the divisions and brands. This documentdescribes the methods used by the Group for the riskanalysis work that it conducts every two years.
5.3.3.2. A three-step risk management process
The risk management process involves:
• identifying risks: this step makes it possible to identifyand centralise the main risks. A risk is characterised byan event, one or more internal or external sources, andone or more consequences. Risk identification withinthe Group is part of a continuous effort with assessmentsin principle on a twice-yearly basis;
• analysing risks: this step involves reviewing the potentialconsequences of the main risks (for example, financial,human, legal or reputational consequences) andassessing their impact, whether they may occur as wellas the level of risk control. This is also a continuous effort,and assessments are conducted in principle twice ayear during work group sessions with the main managersof the Divisions; the risk management policy describes indetail the criteria and procedures for these assessments;
• dealing with risk: during this last step, the mostappropriate action plan(s) for the Company is (are)identified.
This risk mapping system was put in place several yearsago and has been strengthened since 2011 with thepresentation made to the Risk Committee of a consolidatedrisk map for each Division. The risk management processis monitored over the long-term.
4 CORPORATE GOVERNANCE ~ REPORT BY THE CHAIRMAN OF THE BOARD OF DIRECTORS
166 Kering ~ 2015 Reference Document
04_VA_V5 06/04/2016 17:31 Page166
In 2013, the Group deployed special software for themanagement of risk identification and analysis whichguarantees a common methodology across bothDivisions and extends the responsibilities of themanagers included in these workshops.
In 2014, the Group extended its risk identification processthrough work sessions with the holding company’s mainmanagers.
In 2015, the Group extended its risk identification processthrough work sessions with the key managers of Kering’sregional divisions in the Americas and Asia-Pacific.
5.3.3.3. Oversight of the risk management system
The risk management system is monitored and reviewedon a regular basis to help continuously improve thesystem. The objective is to identify and analyse the mainrisks and to learn from risks that have materialised.
The Risk Committee meets in principle at least twice ayear to review the risk maps drawn up by the InternalAudit Department of the Group and of PUMA, and tomonitor the progress of the specific action plans.
The Committee discusses its self-assessment once a year.
The Risk Committee met once in 2015 and the AuditCommittee and Board of Directors were apprised of itswork in December of that year.
5.3.4. Link between risk management and internal control
The risk management and internal control systems arecomplementary, and together help control the Group’sactivities:
• the risk management system is designed to identifyand analyse the main risks. Risks are dealt with andaddressed in action plans that can be adapted to theorganisation, may include project management, andmay also involve implementing controls. The controlsto be implemented are part of the internal controlsystem and may be reviewed based on the risk maps;
• the internal control system uses the risk managementsystem to identify the main risks to be controlled;
• the audit plan uses the risk map to test the assessmentof the level of control of the risks identified.
The link between and the combined balance of the twosystems depend on the control environment, which istheir common base, particularly the risk and controlculture of each company and the ethical values of the Group.
5.3.5. General principles of internal control
5.3.5.1. Definition of internal control
The internal control procedures applicable within theKering group rely on a set of means, policies, conduct,procedures and appropriate actions to ensure that thenecessary measures are taken in order to control:
• activities, operational effectiveness and the efficientuse of resources;
• strategic, operational, financial, reputational or compliancerisks that could have a significant impact on theCompany’s assets or the achievement of its objectives.
Internal control is defined as a process conducted byExecutive Management, under the supervision of theBoard of Directors, and implemented by senior executivesand all employees. Regardless of its quality and its degreeof application, it cannot provide an absolute guarantee ofthe achievement of goals falling within the followingcategories:
• compliance with laws and regulations in force;
• application of guidelines and directions set by ExecutiveManagement;
• smooth operation of internal processes, particularlythose contributing to the safeguarding of assets;
• reliability of financial and accounting information.
5.3.5.2. Limits of internal control
The probability of meeting such objectives is subject tothe limits inherent in any internal control system, such as:
• human errors or malfunctions occurring when decisionsare made or applied;
• deliberate collusion amongst several individuals,enabling them to elude the control system;
• situations in which implementing or maintaining acontrol would be more expensive than the risk that it issupposed to remedy.
Furthermore, it is understood that in pursuing theobjectives indicated above, companies are faced withevents and uncertainties beyond their control (unexpectedchanges in the markets, competitive environment orgeopolitical situation, or error in forecasting or assessingthe effects of such changes on the organisation, etc.).
167
4
2015 Reference Document ~ Kering
REPORT BY THE CHAIRMAN OF THE BOARD OF DIRECTORS ~ CORPORATE GOVERNANCE
04_VA_V5 06/04/2016 17:31 Page167
5.3.6. Components of internal control
The quality of the internal control system is based on thefollowing components:
• the control environment based on rules of conduct andintegrity supported by Management and communicatedto all employees;
• an organisation that clearly defines responsibilities andhas adequate resources and skills;
• a system to identify, analyse and manage the mainrisks;
• ongoing oversight of the internal control system andregular review of the functioning of the system.
5.3.6.1. Internal control environment
The Group’s internal control system is based on a decentralised organisation that clearly definesresponsibilities through the Group Charter. It includesprinciples and values governing the conduct and ethics ofall its employees, presented in the Code of ethics. It alsoincludes an Internal Control Charter. Moreover, it relies onhuman resources management that ensures thecompetency, ethical conduct and involvement of itsemployees.
The Group Charter
The Kering group adopted a Group Charter several yearsago which was updated in 2012 and provides theframework for the decentralisation of the organisationand the responsibility of senior executives. The Charterdefines the guiding principles governing the relationsbetween Kering and the Divisions. It also defines, withineach functional area, (i) the matters that fall within thedelegated responsibility of the Divisions, (ii) those thatmust be communicated to Kering within sufficienttimeframes, and (iii) those requiring the prior authorisationof Kering.
Group principles and values
The ethical principles of the Kering group are set out inthe Code of ethics, first circulated in 2005 and thenrecirculated in 2009 and 2013 to all Kering groupemployees.
The third edition of the Code of ethics included a Suppliers’Charter and the adoption of the precautionary principle,especially in environmental protection. It also presentsnew developments in the Group’s ethics organisation andthe steps to take in cases of suspected non-compliancewith key Kering commitments.
The Code sets out the Group’s commitments and rules ofconduct towards its main stakeholders:
• employees;
• customers and consumers;
• business partners and competitors;
• the environment;
• civil society;
• shareholders and financial markets.
This intensification of promotion and respect for ethicswithin the Group has also seen the implementation of anonline training programme in ethics and code compliancefor all Kering employees worldwide. It is based on casestudies that show ethics in the light of daily professionallife, and will be updated annually.
In addition to the first circulation of its Code of ethics in2005, Kering has also set up a Group Ethics Committee.This Committee is now supported by two regional EthicsCommittees: the Asia-Pacific (APAC) Ethics Committeeand the Americas Ethics Committee. A global hotline isalso available to all staff in all 12 of the Code’s languages.
The Ethics Committees are composed of representativesof the Group’s brands and Kering staff (Corporate, KeringAPAC and Kering Americas). This entire structure ismanaged by Kering’s Chief Sustainability Officer and Headof International Affairs.
The Ethics Committees have three main functions:
• supervising the circulation and application of the Codeof ethics and the principles that it defends;
• responding to any issues raised by a Group employee,be it a simple request for clarification or a questionrelating to the interpretation of the Code and itsapplication, or a claim submitted to the Committee dueto alleged non-compliance with one of the Group’sethical principles;
• generating initiatives for developing the Group’ssustainable development policy and activities.
The changes made to the Code and the organisation of ethics within the Group are examined in detail in Chapter 3 “Sustainability” of this report.
The Divisions may in addition set up their own specificadditional procedures and guidelines, such as suppliergift charters.
Moreover, the Insider Good Practices Committee, madeup of the Group Managing Director and the Head of theLegal Department, implements preventive measures toprotect against insider trading activities (e.g., a calendarof black-out periods, a list of permanent and occasionalinsiders, newsletters, etc.).
4 CORPORATE GOVERNANCE ~ REPORT BY THE CHAIRMAN OF THE BOARD OF DIRECTORS
168 Kering ~ 2015 Reference Document
04_VA_V5 06/04/2016 17:31 Page168
The Internal Control Charter
The Kering group adopted an Internal Control Charter in2010 that was circulated throughout the Group. In orderto adapt the Charter to changes in the Group since itsinitial publication, a new edition was published in 2015.The Charter defines internal control and sets out itsobjectives as presented in the AMF’s ReferenceFramework. It also specifies the limits of internal control,which cannot under any circumstances provide anabsolute guarantee that the Company’s objectives will beachieved. The Charter specifies that the holding companyserves to unite the various entities. It also sets out theresponsibilities of each Division and brand inimplementing an internal control system that is adaptedto their activities.
The Charter defines the role of each person involved inthe internal control system and the bodies responsiblefor oversight and assessment.
Furthermore, the Charter specifies the existing tools forassessing internal control and risks which are self-assessment of internal control and mapping of majorrisks, as well as setting out the basic principles forcreating new procedures.
Human resources policy
Quality of human resources and cohesion of managementare key success factors of the Group. Kering makes surethat the various Divisions apply human resources policiesthat are adapted to their context and the challenges theyface, while meeting the highest local standards. Theprinciple of autonomy and empowerment of the Divisionsis also applied, but the Group guarantees the consistencyof the policies implemented and their alignment withKering’s values and actions defined centrally.
With regard to social policy, the Divisions apply highstandards of dialogue and participation of employees inthe Company, while the Group engages in dialogue at thelevel of the Group’s employee representative bodies, theGroup Works Council and the European Works Council. In2010, the European Works Council and Kering’s Groupmanagement adopted a “Framework of Commitment onthe quality of life at work and the prevention of work-related stress”. Kering has also set up an employeeopinion survey conducted every two years, which alsoconcerns the Divisions. The survey was conducted againin 2015. The Group develops cross-functional trainingprogrammes and carries out talent reviews every year ofthe Divisions’ managerial resources. Kering thus ensuresthat there is a good match both now and in futurebetween the managerial resources and the challengesfacing the Divisions. Furthermore, the Group maintainsan active market monitoring policy for all key positionsfor which the internal succession plan does not appearsufficiently strong.
5.3.6.2. Organisation and resources
The organisation of internal control depends on actively-involved persons at every level of the chain of responsibility,from Executive Management to all employees, as well asthe bodies responsible for oversight and assessment: theBoard of Directors, the Audit Committees, the InternalAudit and Risk Management Departments and theStatutory Auditors.
Executive Committee
The Kering group Executive Committee, which is anExecutive Management body, comprises the Chairmanand Chief Executive Officer, the Group Managing Director,the Chief Executive Officer of Kering’s “ Luxury – Watches &Jewellery ” division, the Chief Executive Officer of Kering’sLuxury – Couture & Leather Goods’ emerging brands, theChief Executive Officer of Gucci, the Chief ExecutiveOfficers of Saint Laurent, Bottega Veneta, PUMA SE andKering Eyewear, and the Kering functional Directors(Human Resources, Finance, Sustainability andInternational Institutional Affairs, Communications).
The Executive Committee meets regularly, frequently, andwhenever required, in accordance with the policies of theStrategy and Development Committee, in order to:
• draw up and coordinate the Group’s operating strategy;
• define the priorities through objectives assigned to theDivisions and the main functional projects;
• develop synergies between the Divisions;
• propose acquisitions and disposals to the Board ofDirectors;
• ensure proper implementation of the policies andprojects defined within the framework of KeringSustainability.
Kering group strategies and goals are discussed each yearvia the medium-term plans and the budgets of thebusiness units of each of the Divisions.
Executive Management teams
The Executive Management teams define, coordinate andoversee the Group’s internal control system. They are alsoin charge of initiating the necessary corrective measures.The Executive Management teams’ involvement is of keyimportance to the internal control system, given theKering group’s organisation.
Oversight of the system results in an annual report oninternal control prepared by the Chief Executive Officer of PUMA.
169
4
2015 Reference Document ~ Kering
REPORT BY THE CHAIRMAN OF THE BOARD OF DIRECTORS ~ CORPORATE GOVERNANCE
04_VA_V5 06/04/2016 17:31 Page169
Management and employees
Management is the key operational player of internalcontrol; it relies on internal control to perform its dutiesand reach its objectives. In this respect, managementimplements the internal control operations related to itsarea of responsibility and ensures that the internalcontrol system is adapted to its activities.
Employees must have the knowledge and informationnecessary to set up, operate and oversee the internalcontrol system, with regard to the assigned objectives. Intheir day-to-day activities, they must follow the principlesand rules of control and may suggest ways to improveand detect malfunctions.
The bodies responsible for oversight and assessment are:
The Board of Directors
The Board of Directors contributes to the overall controlenvironment through the skills of its members. TheBoard is regularly informed about the methodologiesused for internal control and the management of majorrisks, which it presents in its Board report.
Audit Committees
Under the responsibility of the Board of Directors, towhich it regularly reports on these matters, the KeringAudit Committee comprises three members, two ofwhom are independent. It is in charge of monitoring:
• the procedures for preparing financial information;
• the effectiveness of internal control and risk managementsystems;
• the statutory audits of annual financial statements and,if need be, consolidated financial statementsperformed by the Statutory Auditors;
• the independence of the Statutory Auditors.
The Kering Audit Committee also carries out the followingactions:
• verifies that the Group has Internal Audit Departmentsthat are structured and adapted to the tasks ofidentifying, detecting and preventing risks, anomaliesor irregularities in the management of the Group’saffairs;
• assesses the relevance and quality of the methods andprocedures used;
• reviews the Internal Audit reports and therecommendations issued;
• approves the annual Internal Audit plan;
• reviews the work conducted by the Risk Committee andhas access to the minutes of its meetings.
Kering’s Audit Committee meets at least four times a year.Similarly, there is an Audit Committee within PUMA,whose methods of operating and actions are identical tothose of Kering’s Audit Committee; it meets prior to themeeting of Kering’s Audit Committee.
Internal Audit and Risk Management Departments
PUMA, as a company listed in Germany, is required tohave an Internal Audit Department. This Departmentworks with the Kering group’s Internal Audit Departmentto ensure that the audit teams are provided with fullcoverage of the Group.
Through their work the Internal Audit and Risk ManagementDepartments help assess the internal control system andmake recommendations for its improvement. TheInternal Audit and Risk Management Departments arealso in charge of coordinating risk management, inparticular through risk mapping and monitoring theaction plans. The Heads of the Internal Audit Departmentsreport the main results of their assessments to ExecutiveManagement and the Audit Committee.
At the level of Kering, the Group Internal Audit Departmentreports to the Chairman. It coordinates, harmonises andoptimises the working methods and tools, as well asproviding services (regulatory intelligence, expertise,resources, etc.) and conducting audit assignments withinthe scope of the annual audit plan.
The Group Internal Audit Department centrally administersand analyses internal control pursuant to the FinancialSecurity Act, supplemented by the Act of July 3, 2008 andthe Ordinance of December 8, 2008, as well as the newAMF Reference Framework described in more detail inthe section below entitled “Oversight of the system”.
The Group Internal Audit Department also performsactive intelligence monitoring with regard to best internalcontrol practices.
The Internal Audit Departments check the controlprocedures implemented by other Departments andconduct operational and financial audits within theirremit. During 2015, the Internal Audit teams takentogether conducted around sixty audit assignments,including special assignments.
The Internal Audit Departments draw up the audit plans,relying, in particular, on the Group’s process guidelinesand based on the major risks identified for the brands.They take account of special requests from seniormanagement and other operational departments. Theseprojects are discussed with the main persons in charge.The Audit Committees review and approve the auditplans thus drawn up.
The main issues identified by the Internal AuditDepartments are reported to the Audit Committees. Inthis way, the Audit Committees are informed of the issuesidentified and the action plans set up by the entitiesconcerned.
Apart from these assignments, all of the Internal Auditresources in the Kering group are dedicated to promotinginternal control on all business processes and activities,be they operational or financial, related to stores,warehouses or headquarters, distribution or manufacturingactivities.
4 CORPORATE GOVERNANCE ~ REPORT BY THE CHAIRMAN OF THE BOARD OF DIRECTORS
170 Kering ~ 2015 Reference Document
04_VA_V5 06/04/2016 17:31 Page170
At the end of 2015, the Internal Audit Department of theKering group consisted of 19 employees, versus 20 in2014 and 17 in 2013. Their rules of conduct are describedin their Audit Charter which stipulates that:
• at the end of each audit, the findings andrecommendations are presented to the managers ofthe area or areas concerned;
• any agreements or disagreements made known by the audited parties concerning the proposedrecommendations are included in the final report thatspecifies any action plan, as well as responsibilities andthe deadlines for implementation;
• the operational staff members concerned areresponsible for implementing recommendations;
• the Internal Audit Department is in charge of verifyingtheir implementation.
The Internal Audit activities performed are consistentwith the work of the Audit Committees and the results ofthe work performed by the Statutory Auditors.
The Internal Audit Departments update their AuditCommittee on progress made on the audit plan and thefollow-up of their action plans at least twice a year.
In 2013, Kering’s Internal Audit Department published itscharters that establish the methodology shared by bothDivisions: the audit manual and the two audit approachdocuments. The development of the two auditapproaches reflects the differences between theDivisions.
The Statutory Auditors
The Statutory Auditors review the internal controlsystems in order to certify the financial statements, byidentifying the strengths and weaknesses, by assessingthe risk of material misstatement, and where applicable,by making recommendations. Under no circumstancesdo the Statutory Auditors take the place of the Companyin implementing the internal control system.
The role of the Statutory Auditors is to annually certify thecompleteness, accuracy and fair presentation of theparent company and consolidated financial statementsand issue a review report on the Group’s interimconsolidated financial statements.
The audit assignments are allocated between the jointStatutory Auditors: Deloitte and KPMG.
The main issues covered by the Auditors are as follows:
• identification of the risk areas and performance of testsby sampling in order to validate the completeness,accuracy and fair presentation of the financial statementswith regard to their company or consolidated materialitylevel;
• validation of the main accounting treatments andoptions throughout the year, in coordination with themanagement of the Divisions and Kering;
• application of the accounting standards defined byKering for the Divisions;
• preparation of an audit report for each brand, in orderto certify Kering’s consolidated financial statements,including any comments on internal control;
• presentation of a general overview of the Kering grouppresented to Kering’s Management and to the AuditCommittee;
• preparation of the Statutory Auditors’ reports for Kering’sshareholders. These reports appear in the ReferenceDocument on pages 129, 174, 303, 321 and 323.
5.3.6.3. Risk management
The risk management system is described in the section“Risk management” (see pages 207 to 214).
5.3.6.4. Oversight of the system
The ongoing oversight of the internal control system andregular review of its functioning are carried out by threemeans: the work performed by Internal Audit, theremarks made by the Statutory Auditors and the annualself-assessments.
With regard to the annual self-assessments carried outwithin each Division for each process identified, themanagers in charge are asked to assess the level ofinternal control through key controls for their operations,in order to identify any weaknesses and implementcorrective measures.
Self-assessment is not simply a reporting tool intended forthe Internal Audit departments or the audit Committees;it is also a system that allows the Executive Managementteams of each Division to obtain reasonable assuranceregarding the strength of the internal control system.Self-assessment makes it possible to strengthen the levelof internal control through operational action plans.
The internal control analysis methodology is based onthe following principles:
• a self-assessment, using questionnaires, conductedwith the key operational staff members in each of theDivisions following the breakdown of activities into key processes. An overhaul of the self-assessmentquestionnaires was begun in 2011 and continued in2012 in order to make them more effective and betteradapted to business operations. In 2015, all of thequestionnaires were reviewed in light of participants’responses during the previous annual assessment andthe comments of those making the assessments. Keycontrols as well as fraud risk controls were alsoidentified and added to these questionnaires in orderto strengthen the effectiveness of the action plans. Theself-assessment campaign was extended in 2015 tocover 100% of Kering’s and the Divisions’ identified activities;
• these questionnaires provide operational staff with anadditional indicator for assessing the quality of the
171
4
2015 Reference Document ~ Kering
REPORT BY THE CHAIRMAN OF THE BOARD OF DIRECTORS ~ CORPORATE GOVERNANCE
04_VA_V5 06/04/2016 17:31 Page171
4 CORPORATE GOVERNANCE ~ REPORT BY THE CHAIRMAN OF THE BOARD OF DIRECTORS
internal control procedures of which they are in charge.They make it possible to harmonise the level of internalcontrol applied throughout the Group and for allactivities to benefit from best practices, in particularnewly-acquired entities. They allow action plans to belaunched based on the results of these self-assessments;
• the questionnaire regarding the finance, accountingand management process is circulated each year. Ittakes into account the AMF’s Reference Framework and,in particular, its application guide. This questionnaireincludes 60 or so questions on the Group’s mandatorykey controls. It is circulated among the largest subsidiariesin the Luxury and Sport & Lifestyle Divisions. The cashmanagement section of the questionnaire wassupplemented in 2014. Thanks to a dedicated application,in 2014 there was an increase in the number ofprocesses covered and the number of subsidiariesincluded in the self-assessment campaigns concerningeach of these processes. This expanded coveragereflected the changes in the organisation of the Group’sbusinesses and the acquisition of new companies.
In 2013, the Group’s Internal Audit Department began toextend its self-assessment procedures to directly-ownedstores throughout the Luxury Division. These quarterlyself-assessments give the sales network managers anidea of the effectiveness of their internal control and ateaching tool that helps store managers to meet theirinternal control obligations.
In 2015, the Group Internal Audit Department continuedto roll out this dedicated tool throughout the LuxuryDivision’s stores.
This approach was presented and approved by the KeringAudit Committee.
5.3.7. Description of internal controlprocedures relating to the preparation of financial and accounting information
Organisation of the accounting and management function
Financial and accounting information is prepared by theFinance Department. At the level of Kering, thisdepartment supervises the Financial Control Department,the Financing and Treasury Department, the InsuranceDepartment, the Tax Department and the FinancialCommunications Department.
The production and analysis of financial information isbased on a set of financial management proceduresincluding:
• medium-term plans, which measure the impact ofstrategic decisions on the Group’s key financial andmanagement balances. They are also used for theannual assessment by the Group of the value in use ofassets for the various cash-generating units;
• budgets, which are drawn up in two phases on the basisof discussions between the operating Departments andthe members of the Group’s Executive Management.The first phase takes place in the fourth quarter of thefiscal year when a preliminary budget sets out the mainfinancial balances and operating action plans. Thesecond stage which finalises the budget takes place inthe first quarter of the following year and takes intoaccount any significant events that may have occurredin the meantime;
• monthly reporting that monitors the performance ofthe Luxury and Sport & Lifestyle Divisions throughoutthe fiscal year via specific indicators whose consistencyand reliability are reviewed by the Financial ControlDepartment. This Department also oversees theconsistency of the accounting treatment applied by theDivisions with Group rules and carries out, incollaboration with the Divisions’ financial controllers,an analytical review by comparison with the budgetand the previous year;
• monthly meetings of the Executive Management ofKering and the senior executives of the Group’sDivisions to assess changes in activities on the basis offinancial and operational data provided by themeetings’ participants;
• the Group’s regular monitoring of the Divisions’ off-balance sheet commitments. This check is carried out,in particular, as part of the statutory consolidationprocess insofar as the Divisions are required to providean exhaustive list of their commercial or financialcommitments and to monitor them from year to year.
172 Kering ~ 2015 Reference Document
04_VA_V5 06/04/2016 17:31 Page172
The Chairman of the Board of Directors
Consolidation procedures
The statutory consolidation of the financial statements iscarried out at the end of June and December using theGroup consolidation tool. It enables financial informationto be transferred from the Divisions in real time after fullvalidation of the consolidation reporting packages by theDivisions’ Statutory Auditors and by the Chief ExecutiveOfficers and Chief Financial Officers of the brands whocommit themselves via a signed representation letter, thusstrengthening the quality of the financial informationtransferred.
Consolidation levels within the Divisions guarantee a firstlevel of control and consistency.
Kering’s Financial Control Department coordinates theprocess and is in charge of producing the Group’sconsolidated financial statements. For this purpose, thedepartment sends instructions to the Divisions specifyingthe reports to be sent, the assumptions to be applied aswell as the specific points to be taken into account.
Financial Communications
The purpose of the Financial Communications Departmentis to provide information on an ongoing or periodic basiswhich conveys a consistent and clear message as well asto respect the principle of equality between shareholdersin relation to information.
Financial communication is meant for a diversifiedpublic composed mainly of institutional investors,individuals and employees. Executive Management, theFinance Department and the Financial CommunicationsDepartment are the contacts for analysts and institutionalinvestors. The Human Resources Department managesthe information provided to employees alongside theFinancial Communications Department.
Financial information is provided through Annual GeneralMeetings, periodic publications, press releases, etc., andall means of communication, including press, Internet,direct telephone contact and individual meetings.
Financing and Treasury Department
The Financing and Treasury Department managesliquidity, counterparty, foreign exchange and interest ratefinancial risks. It also coordinates the Group’s cashmanagement. It manages the Group’s banking policy,establishes guidelines regarding the allocation of activityby bank and coordinates Group calls for tender. It ensuresconsistency between published financial information
and policies governing interest rate, foreign exchange andliquidity risk management. Almost all of the financing isset up by Kering or Kering Finance. Exceptions are analysedon a case-by-case basis according to specific opportunitiesor constraints and require Kering’s agreement.
Internal control is strengthened by the centralisation ofcertain functions within Kering:
The Legal Department
Apart from its specific function at Company level, theLegal Department assists the entire Group with importantlegal matters and coordinates analyses or studiescommon to the Divisions or of significant interest for theGroup. It also formulates Group policy and oversees itsapplication. It provides the Divisions with a methodologyfor identifying standard risks enabling them to anticipatesuch risks and inform the Legal Department.
The Tax Department
The Tax Department coordinates the Group’s tax policy,and advises and assists the Divisions on all issues relatedto tax law as well as on the implementation of taxconsolidation in France.
The Insurance Department
The Insurance Department sets up and manages theGroup’s insurance policy. It is responsible for identifying,quantifying and handling risks (prevention, self-insuranceor transfer to insurers or reinsurers).
The Communications Department
The Communications Department is involved in theGroup’s development by enhancing its image andreputation both internally and externally.
The Information Systems Department
The Information Systems Department is responsible forproviding optimal operational performance, controlling ITrisk and improving the Group’s information systems.
This report on internal control, resulting from thecontribution of the various internal control playersmentioned in the first section of this document, waspresented in draft form to Kering’s Audit Committee forits opinion and was approved by Kering’s Board ofDirectors on February 18, 2016.
173
4
2015 Reference Document ~ Kering
REPORT BY THE CHAIRMAN OF THE BOARD OF DIRECTORS ~ CORPORATE GOVERNANCE
04_VA_V5 07/04/2016 10:20 Page173
6. Statutory Auditors’ reportprepared in accordance with Article L. 225-235 of the French Commercial Code (Code de commerce) on the Report of the Chairman of the Board of DirectorsYear ended December 31, 2015
This is a free translation into English of the Statutory Auditors’ report issued in French prepared in accordance with ArticleL. 225-235 of the French Commercial Code on the report prepared by the Chairman of the Board of Directors of Kering S.A. onthe internal control and risk management procedures relating to the preparation and processing of accounting and financialinformation issued in French and is provided solely for the convenience of English speaking users. This report should be readin conjunction and construed in accordance with French law and the relevant professional standards applicable in France.
To the Shareholders,
In our capacity as Statutory Auditors of Kering S.A. and in accordance with Article L. 225-235 of the French CommercialCode (Code de commerce), we hereby report to you on the report prepared by the Chairman of your Company inaccordance with Article L. 225-37 of the French Commercial Code for the year ended December 31, 2015.
It is the Chairman’s responsibility to prepare, and submit to the Board of Directors for approval, a report on the internalcontrol and risk management procedures implemented by the Company and containing the other disclosures requiredby Article L. 225-37 of the French Commercial Code, particularly in terms of corporate governance.
It is our responsibility:
• to report to you on the information contained in the Chairman’s report in respect of the internal control and riskmanagement procedures relating to the preparation and processing of accounting and financial information, and
• to attest that this report contains the other disclosures required by Article L. 225-37 of the French Commercial Code,it being specified that we are not responsible for verifying the fairness of these disclosures.
We conducted our work in accordance with professional standards applicable in France.
Information on the internal control and risk management procedures relating to the preparation and processingof accounting and financial information
The professional standards require that we perform the necessary procedures to assess the fairness of the informationprovided in the Chairman’s report in respect of the internal control and risk management procedures relating to thepreparation and processing of accounting and financial information. These procedures mainly consisted in:
• obtaining an understanding of the internal control and risk management procedures relating to the preparation andprocessing of accounting and financial information on which the information presented in the Chairman’s report isbased and the existing documentation;
• obtaining an understanding of the work involved in the preparation of this information and the existing documentation;
• determining whether any significant weaknesses in the internal control procedures relating to the preparation andprocessing of accounting and financial information that we would have noted in the course of our engagement areproperly disclosed in the Chairman’s report.
On the basis of our procedures, we have nothing to report on the information on the Company’s internal control and riskmanagement procedures relating to the preparation and processing of accounting and financial information contained in thereport prepared by the Chairman of the Board of Directors in accordance with Article L. 225-37 of the French Commercial code.
Other disclosures
We hereby attest that the Report of the Chairman of the Board of Directors includes the other disclosures required byArticle L. 225-37 of the French Commercial code.
Paris La Défense and Neuilly-sur-Seine, March 30, 2016The Statutory Auditors
KPMG Audit Deloitte & AssociésDivision of KPMG SA
Hervé Chopin Isabelle Allen Frédéric Moulin
4 CORPORATE GOVERNANCE ~ STATUTORY AUDITORS’ REPORT
174 Kering ~ 2015 Reference Document
04_VA_V5 06/04/2016 17:31 Page174
1752015 Reference Document ~ Kering
CHAPTer 5
Financial information
1. Activity report 1761.1. Foreword – Definitions 1761.2. 2015 highlights 1771.3. 2015 business review 1781.4. Analysis of operating performances by brand 1841.5. Comments on the Group’s financial position 1951.6. Parent company net income and dividend payment 2021.7. Transactions with related parties 2031.8. Subsequent events 2031.9. Outlook 203
2. Investment policy 2042.1. Financial investments 2042.2. Operating investments 204
3. Risk management 2073.1. Financial risks 2073.2. Strategic and operational risks 2093.3. Compliance risks 2133.4. Risk management 213
4. Consolidated financial statements 2154.1. Consolidated income statement 2154.2. Consolidated statement of comprehensive income 2164.3. Consolidated statement of financial position 2174.4. Consolidated statement of cash flows 2184.5. Consolidated statement of changes in equity 219
Notes to the consolidated financial statements 220
5. Statutory Auditors’ reporton the consolidated financial statements 303
6. Parent company financial statements 3046.1. Balance sheet – assets 3046.2. Balance sheet – shareholders’ equity and liabilities 3056.3. Income statement 3066.4. Statement of cash flows 3066.5. Statement of changes in shareholders’ equity 3076.6. Notes to the parent company financial statements 3076.7. Five-year financial summary 320
7. Statutory Auditors’ report on the Financial Statements 321
8. Statutory Auditors’ special report on regulated agreementsand commitments with third parties 323
9. Fees paid by the Group to the Statutory Auditors and members of their networks in 2015 326
05_A_VA_V5 06/04/2016 17:30 Page175
IFRS 5 – Non-current assets held for sale and discontinued operations
In accordance with IFRS 5 – Non-current assets held forsale and discontinued operations, the Group has presentedcertain activities as “Non-current assets held for sale anddiscontinued operations”. The net income or loss fromthese activities is shown on a separate line of the incomestatement, “Net income (loss) from discontinued operations”,and is restated in the statement of cash flows and incomestatement for all reported periods.
Assets and liabilities relating to assets held for sale anddiscontinued operations are presented on separate linesin the Group’s statement of financial position, withoutrestatement for previous periods.
As stated in Note 12 to the consolidated financialstatements, Redcats and Sergio Rossi are classified as“Non-current assets held for sale and discontinuedoperations”.
Definition of “reported” and “comparable” revenue
The Group’s “reported” revenue corresponds to publishedrevenue. The Group also uses “comparable” data to measureorganic growth. “Comparable” revenue is 2014 revenuerestated for the impact of changes in Group structure in2014 or 2015, and for translation differences relating toforeign subsidiaries’ revenue in 2014.
Definition of recurring operating income
The Group’s total operating income includes all revenuesand expenses directly related to Group activities, whetherthese revenues and expenses are recurring or arise fromnon-recurring decisions or transactions.
Other non-recurring operating income and expensesconsists of items, which by their nature, amount orfrequency, could distort the assessment of Group entities’operating performance. Other non-recurring operatingincome and expenses include impairment of goodwilland other intangible assets, gains or losses on disposalsof non-current assets, restructuring costs and costsrelating to employee adaptation measures.
Consequently, Kering monitors its operating performanceusing “Recurring operating income”, defined as thedifference between total operating income and othernon-recurring operating income and expenses (see Notes8 and 9 to the consolidated financial statements).
Recurring operating income is an intermediate line itemintended to facilitate the understanding of the entity’soperating performance and which can be used as a way toestimate recurring performance. This indicator is presentedin a manner that is consistent and stable over the long-term in order to ensure the continuity and relevance offinancial information.
Recurring operating income at comparable exchange ratesfor 2014 takes into account the currency impact on revenueand Group acquisitions, the effective portion of currencyhedges and the impact of changes in exchange rates onthe translation of the recurring operating income ofconsolidated entities located outside the eurozone.
Definition of EBITDA
The Group uses EBITDA to monitor its operating performance.This financial indicator corresponds to recurring operatingincome plus net charges to depreciation, amortisation andprovisions on non-current operating assets recognised inrecurring operating income.
EBITDA at comparable exchange rates is defined usingthe same principles as for recurring operating income atcomparable exchange rates.
Definition of free cash flow from operationsand available cash flow
The Group also uses an intermediate line item, “Free cashflow from operations”, to monitor its financial performance.This financial indicator measures net operating cash flowless net operating investments (defined as purchases andsales of non-current assets).
“Available cash flow” corresponds to free cash flow fromoperations plus interest and dividends received lessinterest paid and equivalent.
Definition of net debt
As defined by French accounting standards authority(Autorité des Normes Comptables – ANC) recommendationNo. 2013-03, net debt comprises gross borrowings,including accrued interest, less net cash.
Net debt includes fair value hedging instruments recordedin the statement of financial position relating to bankborrowings and bonds whose interest rate risk is fully orpartly hedged as part of a fair value relationship (see Note32 to the consolidated financial statements).
176 Kering ~ 2015 Reference Document
5 FINANCIAL INFORMATION ~ 2015 ACTIVITY REPORT
1. Activity report
1.1. Foreword – Definitions
05_A_VA_V5 06/04/2016 17:30 Page176
Change in management and creativeresponsibility at Gucci
On January 21, 2015, Marco Bizzarri – Gucci’s President andCEO who succeeded Patrizio di Marco on January 1, 2015 –announced that Alessandro Michele had been appointedas the brand’s new Creative Director following the departureof his predecessor Frida Giannini.
Alessandro Michele has been given total creative responsibilityfor all of Gucci’s collections and its brand image. The firstcollection fully designed by Alessandro Michele is the 2016Cruise collection, which was unveiled in New York onJune 4, 2015 and has been available in stores since theend of the third quarter of 2015.
Finalisation of the partnership with Safilo and launch of Kering Eyewear
In 2014, Kering announced its plan to invest in a dedicatedentity specialised in luxury, high-end and sport Eyewear,managed by a skilled team of experienced professionalsunder the direction of Roberto Vedovotto. This innovativemanagement model for the Group’s Eyewear businesswill allow it to fully leverage the growth potential of itsbrands in this category.
As part of this strategic move, Kering and Safilo agreed tofurther their partnership and jointly intend to terminatethe current Gucci licence agreement two years in advance,i.e., by December 31, 2016, which will result in totalcompensation of €90 million to be paid to Safilo. OnJanuary 12, 2015, Kering announced that it had signed apartnership agreement with Safilo covering thedevelopment, manufacture and supply of Gucci Eyewearproducts. The agreement took effect as from fourth-quarter 2015 in order to ensure a seamless transition forGucci’s Eyewear business.
On March 18, 2015, Kering announced the appointmentof Roberto Vedovotto, CEO of Kering Eyewear, as a newmember of its Executive Committee. Kering Eyewearwas officially launched on June 30, 2015 when its firstcollection, Collezione Uno was presented at the PalazzoGrassi in Venice.
The overall €90 million in compensation due to Safilohas been recognised as an intangible asset in the 2015financial statements and will be amortised as fromJanuary 1, 2017. The compensation will be paid in threeequal instalments, with the first payment made onJanuary 12, 2015 and the following two due inDecember 2016 and September 2018.
Reorganisation of the Couture & LeatherGoods and Watches & Jewellery divisions and brands
On July 27, 2015, Kering announced that Grita Loebsackhad been appointed Chief Executive Officer of Kering’sLuxury – Couture & Leather Goods’ emerging brands,effective September 14, 2015. The CEOs of AlexanderMcQueen, Balenciaga, Brioni, Christopher Kane, StellaMcCartney and Tomas Maier will report to her. Kering’sLuxury – Couture & Leather Goods division also includesGucci, Bottega Veneta and Saint Laurent, which will remainunder François-Henri Pinault’s direct supervision.
The autonomy of each of Kering’s brands will continue tobe fully respected in the expansion of the Group’s Luxurybusiness and the brands will remain under the operationalresponsibility of their respective CEOs.
The second half of the year also saw the arrival of new CEOswithin the Luxury – Watches & Jewellery division headed byAlbert Bensoussan: Hélène Poulit-Duquesne was appointedCEO of Boucheron, effective September 28, 2015, andSabina Belli was named CEO of the Pomellato group,effective December 10, 2015.
On July 31, 2015, Balenciaga and Alexander Wangannounced their joint decision not to renew their contractbeyond its initial term. Alexander Wang showed his finalcollection for Balenciaga in Paris on October 2, 2015. OnOctober 7, 2015, Demna Gvasalia was appointed as thenew Artistic Director of Balenciaga’s collections. DemnaGvasalia has creative responsibility for the brand’s collectionsand image and will present his first collection for the brandat the women’s ready-to-wear autumn / winter 2016-17show in Paris.
Sale of Italian luxury shoemaker Sergio Rossi
On December 30, 2015 Kering announced that it hadclosed the sale of the Italian luxury shoemaker, SergioRossi, to Investindustrial, in accordance with the termsannounced on December 9, 2015.
The transaction included all the industrial assets ofSergio Rossi, the rights attached to the brand and theentire distribution network. The sale will allow the SergioRossi brand to continue its development with a strategicpartner that can support the brand solidly and withprospects for long-term growth. Investindustrial is one ofEurope’s best-known industrial groups, which providessolutions and capital to mid-sized companies in order toaccelerate their international expansion and improvetheir operational efficiency. Among the companiesmanaged by Investindustrial today are brands such asAston Martin, B&B Italia and Flos, which are internationallyrecognised for their excellence in Italian design. By choosing
1.2. 2015 highlights
177
5
2015 Reference Document ~ Kering
2015 ACTIVITY REPORT ~ FINANCIAL INFORMATION
05_A_VA_V5 06/04/2016 17:30 Page177
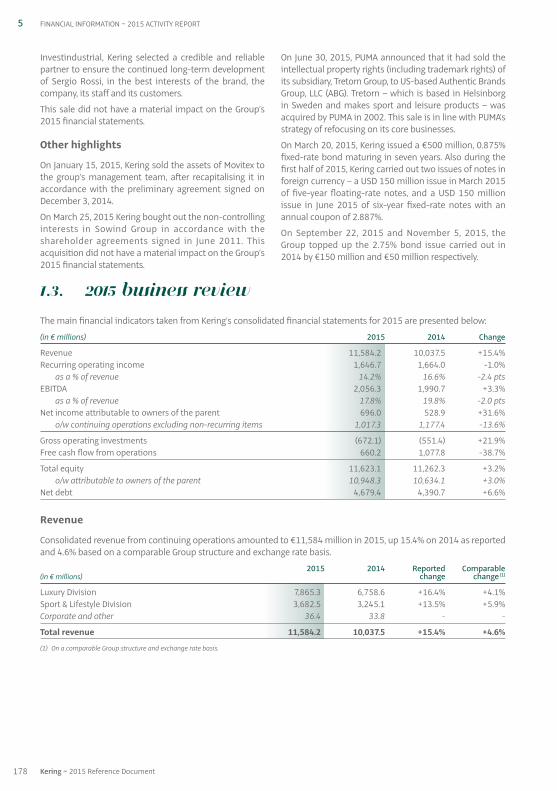
1.3. 2015 business review
The main financial indicators taken from Kering’s consolidated financial statements for 2015 are presented below:
(in € millions) 2015 2014 Change
Revenue 11,584.2 10,037.5 +15.4%Recurring operating income 1,646.7 1,664.0 -1.0%
as a % of revenue 14.2% 16.6% -2.4 ptsEBITDA 2,056.3 1,990.7 +3.3%
as a % of revenue 17.8% 19.8% -2.0 ptsNet income attributable to owners of the parent 696.0 528.9 +31.6%
o / w continuing operations excluding non-recurring items 1,017.3 1,177.4 -13.6%
Gross operating investments (672.1) (551.4) +21.9%Free cash flow from operations 660.2 1,077.8 -38.7%
Total equity 11,623.1 11,262.3 +3.2%o / w attributable to owners of the parent 10,948.3 10,634.1 +3.0%
Net debt 4,679.4 4,390.7 +6.6%
Revenue
Consolidated revenue from continuing operations amounted to €11,584 million in 2015, up 15.4% on 2014 as reportedand 4.6% based on a comparable Group structure and exchange rate basis.
2015 2014 Reported Comparable(in € millions) change change (1)
Luxury Division 7,865.3 6,758.6 +16.4% +4.1%Sport & Lifestyle Division 3,682.5 3,245.1 +13.5% +5.9%Corporate and other 36.4 33.8 - -
Total revenue 11,584.2 10,037.5 +15.4% +4.6%
(1) On a comparable Group structure and exchange rate basis.
Investindustrial, Kering selected a credible and reliablepartner to ensure the continued long-term developmentof Sergio Rossi, in the best interests of the brand, thecompany, its staff and its customers.
This sale did not have a material impact on the Group’s2015 financial statements.
Other highlights
On January 15, 2015, Kering sold the assets of Movitex tothe group’s management team, after recapitalising it inaccordance with the preliminary agreement signed onDecember 3, 2014.
On March 25, 2015 Kering bought out the non-controllinginterests in Sowind Group in accordance with theshareholder agreements signed in June 2011. Thisacquisition did not have a material impact on the Group’s2015 financial statements.
On June 30, 2015, PUMA announced that it had sold theintellectual property rights (including trademark rights) ofits subsidiary, Tretorn Group, to US-based Authentic BrandsGroup, LLC (ABG). Tretorn – which is based in Helsinborgin Sweden and makes sport and leisure products – wasacquired by PUMA in 2002. This sale is in line with PUMA’sstrategy of refocusing on its core businesses.
On March 20, 2015, Kering issued a €500 million, 0.875%fixed-rate bond maturing in seven years. Also during thefirst half of 2015, Kering carried out two issues of notes inforeign currency – a USD 150 million issue in March 2015of five-year floating-rate notes, and a USD 150 millionissue in June 2015 of six-year fixed-rate notes with anannual coupon of 2.887%.
On September 22, 2015 and November 5, 2015, theGroup topped up the 2.75% bond issue carried out in2014 by €150 million and €50 million respectively.
178 Kering ~ 2015 Reference Document
5 FINANCIAL INFORMATION ~ 2015 ACTIVITY REPORT
05_A_VA_V5 06/04/2016 17:30 Page178

The sharp fluctuations in exchange rates experienced inlate 2014 and throughout 2015 had two consequencesfor the Group. Firstly, revenue growth expressed in euros issignificantly higher than the figure at constant exchangerates. And secondly, price differences between countriesincreased, leading to adjustments in the pricing structureof the Group’s Luxury brands and directly impactingtourist travel between different geographic regions.
During 2015, revenue growth in mature markets was onceagain buoyant (7.3% based on comparable data), drivenby dynamic markets such as Western Europe and Japan. Inemerging markets – which accounted for 37% of consolidatedsales, with 26% generated in the Asia-Pacific region(excluding Japan) – overall revenue was slightly down yearon year, except in South America where the Group reporteda strong increase. Revenue generated outside the eurozoneaccounted for 79% of the consolidated total in 2015.
Revenue by geographic area
2015 2014 Reported Comparable(in € millions) change change (1)
Western Europe 3,562.4 3,152.3 +13.0% +9.9%North America 2,652.0 2,146.7 +23.5% +3.2%Japan 1,101.1 962.5 +14.4% +9.4%
Sub-total – mature markets 7,315.5 6,261.5 +16.8% +7.3%
Eastern Europe, Middle East and Africa 773.7 728.5 +6.2% -2.1%South America 538.8 464.7 +15.9% +11.1%Asia-Pacific (excluding Japan) 2,956.2 2,582.8 +14.5% -0.9%
Sub-total – emerging markets 4,268.7 3,776.0 +13.0% +0.3%
Total revenue 11,584.2 10,037.5 +15.4% +4.6%
(1) On a comparable Group structure and exchange rate basis.
Revenue generated by the Luxury Division rose by a solid16.4% year on year as reported and 4.1% on acomparable basis. In a volatile macroeconomic andmonetary environment characterised by sharp contrastsacross regions, the Luxury Division’s well-balanced brandportfolio enabled it to deliver healthy performances, lednotably by momentum in the directly operated storenetwork as well as high tourist numbers in WesternEurope and Japan.
Revenue for the Sport & Lifestyle Division was up 13.5%as reported. Comparable-basis growth came to 5.9%,driven by strong sales levels achieved due to the actionplans implemented at PUMA which are delivering theexpected results.
The overall year-on-year increase in reportedconsolidated revenue includes an €87 million positiveimpact from changes in Group structure during the year,primarily due to the acquisition of Ulysse Nardin, whichhas been consolidated since November 1, 2014.
Exchange rate fluctuations had a €924 million positiveeffect on revenue in 2015, of which €439 million wasattributable to the rise in the US dollar against the euroand €322 million to the appreciation of Asian currencies(particularly the Hong Kong dollar and Chinese yuan).
179
5
2015 Reference Document ~ Kering
2015 ACTIVITY REPORT ~ FINANCIAL INFORMATION
05_A_VA_V5 06/04/2016 17:30 Page179
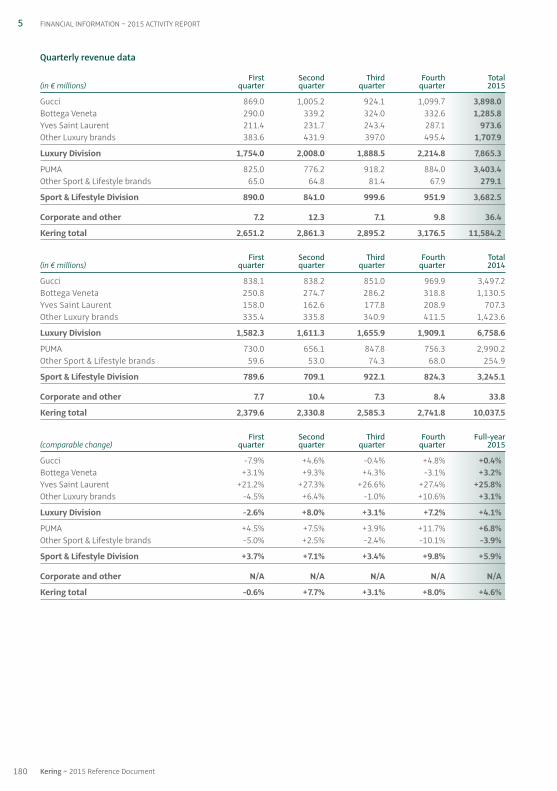
Quarterly revenue data
First Second Third Fourth Total(in € millions) quarter quarter quarter quarter 2015
Gucci 869.0 1,005.2 924.1 1,099.7 3,898.0Bottega Veneta 290.0 339.2 324.0 332.6 1,285.8Yves Saint Laurent 211.4 231.7 243.4 287.1 973.6Other Luxury brands 383.6 431.9 397.0 495.4 1,707.9
Luxury Division 1,754.0 2,008.0 1,888.5 2,214.8 7,865.3
PUMA 825.0 776.2 918.2 884.0 3,403.4Other Sport & Lifestyle brands 65.0 64.8 81.4 67.9 279.1
Sport & Lifestyle Division 890.0 841.0 999.6 951.9 3,682.5
Corporate and other 7.2 12.3 7.1 9.8 36.4
Kering total 2,651.2 2,861.3 2,895.2 3,176.5 11,584.2
First Second Third Fourth Total(in € millions) quarter quarter quarter quarter 2014
Gucci 838.1 838.2 851.0 969.9 3,497.2Bottega Veneta 250.8 274.7 286.2 318.8 1,130.5Yves Saint Laurent 158.0 162.6 177.8 208.9 707.3Other Luxury brands 335.4 335.8 340.9 411.5 1,423.6
Luxury Division 1,582.3 1,611.3 1,655.9 1,909.1 6,758.6
PUMA 730.0 656.1 847.8 756.3 2,990.2Other Sport & Lifestyle brands 59.6 53.0 74.3 68.0 254.9
Sport & Lifestyle Division 789.6 709.1 922.1 824.3 3,245.1
Corporate and other 7.7 10.4 7.3 8.4 33.8
Kering total 2,379.6 2,330.8 2,585.3 2,741.8 10,037.5
First Second Third Fourth Full-year(comparable change) quarter quarter quarter quarter 2015
Gucci -7.9% +4.6% -0.4% +4.8% +0.4%Bottega Veneta +3.1% +9.3% +4.3% -3.1% +3.2%Yves Saint Laurent +21.2% +27.3% +26.6% +27.4% +25.8%Other Luxury brands -4.5% +6.4% -1.0% +10.6% +3.1%
Luxury Division -2.6% +8.0% +3.1% +7.2% +4.1%
PUMA +4.5% +7.5% +3.9% +11.7% +6.8%Other Sport & Lifestyle brands -5.0% +2.5% -2.4% -10.1% -3.9%
Sport & Lifestyle Division +3.7% +7.1% +3.4% +9.8% +5.9%
Corporate and other N / A N / A N / A N / A N / A
Kering total -0.6% +7.7% +3.1% +8.0% +4.6%
180 Kering ~ 2015 Reference Document
5 FINANCIAL INFORMATION ~ 2015 ACTIVITY REPORT
05_A_VA_V5 06/04/2016 17:30 Page180
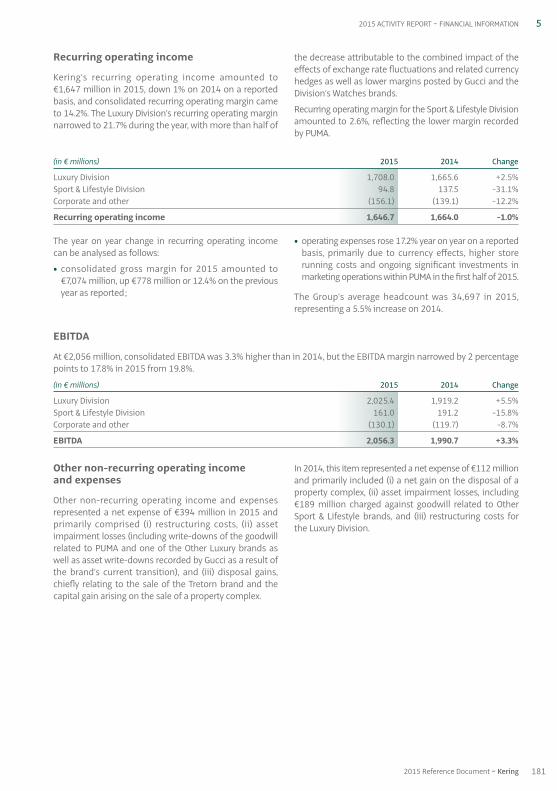
Other non-recurring operating income and expenses
Other non-recurring operating income and expensesrepresented a net expense of €394 million in 2015 andprimarily comprised (i) restructuring costs, (ii) assetimpairment losses (including write-downs of the goodwillrelated to PUMA and one of the Other Luxury brands aswell as asset write-downs recorded by Gucci as a result ofthe brand’s current transition), and (iii) disposal gains,chiefly relating to the sale of the Tretorn brand and thecapital gain arising on the sale of a property complex.
In 2014, this item represented a net expense of €112 millionand primarily included (i) a net gain on the disposal of aproperty complex, (ii) asset impairment losses, including€189 million charged against goodwill related to OtherSport & Lifestyle brands, and (iii) restructuring costs forthe Luxury Division.
EBITDA
At €2,056 million, consolidated EBITDA was 3.3% higher than in 2014, but the EBITDA margin narrowed by 2 percentagepoints to 17.8% in 2015 from 19.8%.
(in € millions) 2015 2014 Change
Luxury Division 2,025.4 1,919.2 +5.5%Sport & Lifestyle Division 161.0 191.2 -15.8%Corporate and other (130.1) (119.7) -8.7%
EBITDA 2,056.3 1,990.7 +3.3%
The year on year change in recurring operating incomecan be analysed as follows:
• consolidated gross margin for 2015 amounted to€7,074 million, up €778 million or 12.4% on the previousyear as reported;
• operating expenses rose 17.2% year on year on a reportedbasis, primarily due to currency effects, higher storerunning costs and ongoing significant investments inmarketing operations within PUMA in the first half of 2015.
The Group’s average headcount was 34,697 in 2015,representing a 5.5% increase on 2014.
(in € millions) 2015 2014 Change
Luxury Division 1,708.0 1,665.6 +2.5%Sport & Lifestyle Division 94.8 137.5 -31.1%Corporate and other (156.1) (139.1) -12.2%
Recurring operating income 1,646.7 1,664.0 -1.0%
Recurring operating income
Kering’s recurring operating income amounted to€1,647 million in 2015, down 1% on 2014 on a reportedbasis, and consolidated recurring operating margin cameto 14.2%. The Luxury Division’s recurring operating marginnarrowed to 21.7% during the year, with more than half of
the decrease attributable to the combined impact of theeffects of exchange rate fluctuations and related currencyhedges as well as lower margins posted by Gucci and theDivision’s Watches brands.
Recurring operating margin for the Sport & Lifestyle Divisionamounted to 2.6%, reflecting the lower margin recordedby PUMA.
181
5
2015 Reference Document ~ Kering
2015 ACTIVITY REPORT ~ FINANCIAL INFORMATION
05_A_VA_V5 06/04/2016 17:30 Page181
Kering’s effective tax rate rose sharply in 2015 notablydue to the fact that a number of non-recurring operatinglosses were recorded during the year which did not havea corresponding positive tax effect, notably goodwillimpairment losses.
Adjusted for the effect of non-recurring items and the relatedtaxes, the recurring tax rate increased by 5.7 percentagepoints to 24.0% due chiefly to the one-off impact ofcurrency hedging.
Corporate income tax
The Group’s income tax charge breaks down as follows:
(in € millions) 2015 2014 Change
Tax on recurring income (336.5) (268.0) +25.6%Tax on non-recurring items 14.8 (57.6) -125.7%
Total tax charge (321.7) (325.6) -1.2%
Effective tax rate 32.0% 24.0% +8.0 ptsRecurring tax rate 24.0% 18.3% +5.7 pts
In 2015, the Group’s cost of net debt was just under€129 million, 15% lower than in 2014.
This year-on-year improvement was primarily due to alower average cost of borrowing on the Group’s long-termdebt correlated with the reduction in the referenceinterest rates applicable to its short-term debt, as ratesremained at an historic low.
However, this positive effect was partly offset by a year-on-year increase in the Group’s average outstanding net
debt, which was chiefly attributable to changes in Groupstructure resulting notably from (i) the recapitalisation ofLa Redoute and Relais Colis in 2014 and of Movitex inearly 2015, and (ii) the acquisition of Ulysse Nardin in thelast quarter of 2014.
“Other financial income and expenses” represented a netexpense that was €74 million higher than in 2014, mainlydue to the application of IAS 39, and notably the adverseimpact of the ineffective portion of cash flow hedges.
Net finance costs
The Group’s net finance costs can be analysed as follows:
(in € millions) 2015 2014 Change
Cost of net debt (128.8) (151.3) -14.9%Other financial income and expenses (120.3) (46.1) +161.0%
Finance costs, net (249.1) (197.4) +26.2%
182 Kering ~ 2015 Reference Document
5 FINANCIAL INFORMATION ~ 2015 ACTIVITY REPORT
05_A_VA_V5 06/04/2016 17:30 Page182
Share in earnings (losses) of equity-accounted companies
This item represented a negative €2.2 million in 2015and mainly included the contribution of Wilderness,Tomas Maier and Altuzarra.
Net income from continuing operations
Consolidated net income from continuing operationscame to €680 million in 2015 versus €1,028 million forthe previous year.
Attributable net income from continuing operationsamounted to €655 million compared with €1,008 millionin 2014.
Net income (loss) from discontinued operations
This item includes the income statement contributionsfrom all assets (or groups of assets) accounted for inaccordance with IFRS 5 – Non-current Assets Held forSale and Discontinued Operations (see Note 12 to theconsolidated financial statements).
In 2015, the Group reported net income of €41 millionfrom discontinued operations, notably including theimpacts of the sale of Sergio Rossi as well as the positiveimpact of the termination of commitments given underprevious sale agreements.
In 2014, the Group reported a €479 million net loss fromdiscontinued operations. This included (i) a €355 millionloss related to Redcats, mainly comprising the cost offinancing the social guarantees granted to the employeesconcerned by the modernisation measures at La Redouteand Relais Colis as well as a provision for vendorwarranties given in connection with the sale of these twocompanies, and (ii) the net loss posted by Sergio Rossi, inparticular a €52 million write-down recorded against theresidual value of the brand.
Net income attributable to non-controlling interests
Net income attributable to non-controlling intereststotalled €25 million in 2015 compared with €20 millionin 2014.
Net income attributable to owners of the parent
Net income attributable to owners of the parent amountedto around €696 million in 2015 versus €529 million in 2014.
Adjusted for non-recurring items net of tax, attributablenet income from continuing operations decreased 13.6%,coming in at €1,017 million versus €1,177 million in 2014.
Earnings per share
The weighted average number of Kering shares used tocalculate earnings per share was approximately 126 millionin 2015, virtually unchanged from the number used for 2014.
Earnings per share stood at €5.52 versus €4.20 for theprevious year.
Earnings per share from continuing operations totalled€5.20 in 2015, compared with €8.00 for 2014.
Excluding non-recurring items, earnings per share fromcontinuing operations amounted to €8.07, down 13.7%on the 2014 figure.
The impact of dilutive instruments on the calculation ofearnings per share was almost neutral in 2015.
183
5
2015 Reference Document ~ Kering
2015 ACTIVITY REPORT ~ FINANCIAL INFORMATION
05_A_VA_V5 06/04/2016 17:30 Page183
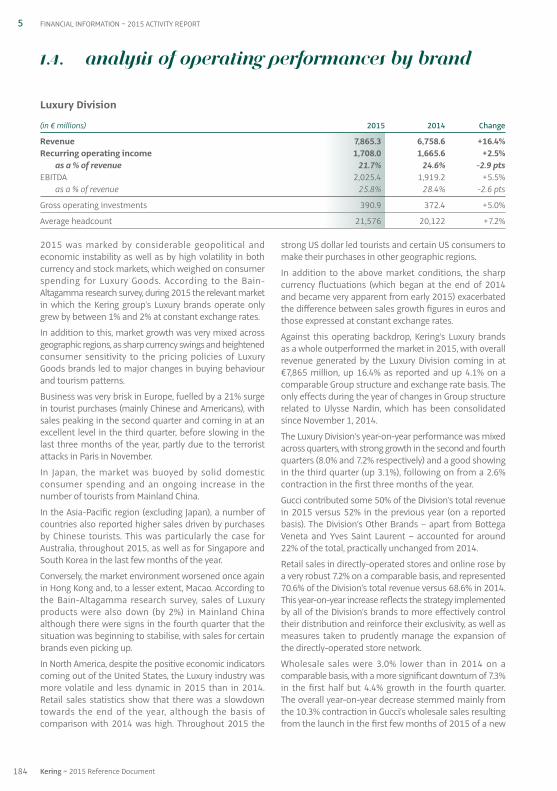
2015 was marked by considerable geopolitical andeconomic instability as well as by high volatility in bothcurrency and stock markets, which weighed on consumerspending for Luxury Goods. According to the Bain-Altagamma research survey, during 2015 the relevant marketin which the Kering group’s Luxury brands operate onlygrew by between 1% and 2% at constant exchange rates.
In addition to this, market growth was very mixed acrossgeographic regions, as sharp currency swings and heightenedconsumer sensitivity to the pricing policies of LuxuryGoods brands led to major changes in buying behaviourand tourism patterns.
Business was very brisk in Europe, fuelled by a 21% surgein tourist purchases (mainly Chinese and Americans), withsales peaking in the second quarter and coming in at anexcellent level in the third quarter, before slowing in thelast three months of the year, partly due to the terroristattacks in Paris in November.
In Japan, the market was buoyed by solid domesticconsumer spending and an ongoing increase in thenumber of tourists from Mainland China.
In the Asia-Pacific region (excluding Japan), a number ofcountries also reported higher sales driven by purchasesby Chinese tourists. This was particularly the case forAustralia, throughout 2015, as well as for Singapore andSouth Korea in the last few months of the year.
Conversely, the market environment worsened once againin Hong Kong and, to a lesser extent, Macao. According tothe Bain-Altagamma research survey, sales of Luxuryproducts were also down (by 2%) in Mainland Chinaalthough there were signs in the fourth quarter that thesituation was beginning to stabilise, with sales for certainbrands even picking up.
In North America, despite the positive economic indicatorscoming out of the United States, the Luxury industry wasmore volatile and less dynamic in 2015 than in 2014.Retail sales statistics show that there was a slowdowntowards the end of the year, although the basis ofcomparison with 2014 was high. Throughout 2015 the
strong US dollar led tourists and certain US consumers tomake their purchases in other geographic regions.
In addition to the above market conditions, the sharpcurrency fluctuations (which began at the end of 2014and became very apparent from early 2015) exacerbatedthe difference between sales growth figures in euros andthose expressed at constant exchange rates.
Against this operating backdrop, Kering’s Luxury brandsas a whole outperformed the market in 2015, with overallrevenue generated by the Luxury Division coming in at€7,865 million, up 16.4% as reported and up 4.1% on acomparable Group structure and exchange rate basis. Theonly effects during the year of changes in Group structurerelated to Ulysse Nardin, which has been consolidatedsince November 1, 2014.
The Luxury Division’s year-on-year performance was mixedacross quarters, with strong growth in the second and fourthquarters (8.0% and 7.2% respectively) and a good showingin the third quarter (up 3.1%), following on from a 2.6%contraction in the first three months of the year.
Gucci contributed some 50% of the Division’s total revenuein 2015 versus 52% in the previous year (on a reportedbasis). The Division’s Other Brands – apart from BottegaVeneta and Yves Saint Laurent – accounted for around22% of the total, practically unchanged from 2014.
Retail sales in directly-operated stores and online rose bya very robust 7.2% on a comparable basis, and represented70.6% of the Division’s total revenue versus 68.6% in 2014.This year-on-year increase reflects the strategy implementedby all of the Division’s brands to more effectively controltheir distribution and reinforce their exclusivity, as well asmeasures taken to prudently manage the expansion ofthe directly-operated store network.
Wholesale sales were 3.0% lower than in 2014 on acomparable basis, with a more significant downturn of 7.3%in the first half but 4.4% growth in the fourth quarter. The overall year-on-year decrease stemmed mainly fromthe 10.3% contraction in Gucci’s wholesale sales resultingfrom the launch in the first few months of 2015 of a new
1.4. Analysis of operating performances by brand
Luxury Division
(in € millions) 2015 2014 Change
Revenue 7,865.3 6,758.6 +16.4%Recurring operating income 1,708.0 1,665.6 +2.5%
as a % of revenue 21.7% 24.6% -2.9 ptsEBITDA 2,025.4 1,919.2 +5.5%
as a % of revenue 25.8% 28.4% -2.6 pts
Gross operating investments 390.9 372.4 +5.0%
Average headcount 21,576 20,122 +7.2%
184 Kering ~ 2015 Reference Document
5 FINANCIAL INFORMATION ~ 2015 ACTIVITY REPORT
05_A_VA_V5 06/04/2016 17:30 Page184
phase in its plan to streamline its wholesale distributionnetwork. This plan forms part of the organisational andcreative transition process underway within the brandand involves drastically reducing its exposure to multi-brand distributors in Europe.
By product category, the Division’s overall revenue isbecoming increasingly balanced. This reflects thecomplementarity of the brands in the portfolio, withLeather Goods, Ready-to-Wear and Shoes representing53%, 16% and 12%, respectively and Watches & Jewelleryaccounting for 10%. Apart from Watches – which wereadversely affected by a lacklustre market and the sharpappreciation of the Swiss franc – revenue was up in eachof the Division’s main product categories.
By geographic region, business for the Group’s Luxurybrands reflected the market trends described above.Consequently, growth was highest in the Division’straditional, more mature markets, coming in at 9.2% on acomparable basis, and even reaching 13.7% for thedirectly-operated store network.
Western Europe (which made up 32.6% of the Division’srevenue) posted a very strong 13.0% increase, driven byrobust sales in eurozone countries (up 18.6%). Thesefigures were achieved thanks to high tourist numbers inEurope and steadily rising sales to local customers.
The Japanese market experienced a third year of stronggrowth, with revenue up 13.7% on a comparable basisfollowing on from the 12.6% and 11.9% increasesrecorded in 2014 and 2013, respectively. This performancewas fuelled by both robust sales in the domestic marketand a massive influx of Chinese tourists.
In North America (which contributed 20.1% of theDivision’s sales) revenue was up 1.7%. The rise in the USdollar against many of the world’s other major currencieshad an adverse effect on sales to tourists and, to a lesserextent, domestic sales. At the same time, consumerspending on Luxury Goods in the United States seemedto be affected by the uncertainty in the global stockmarkets that prevailed during the year.
The Luxury Division’s sales in emerging markets (whichrepresented around 37.1% of its total revenue) weredown 3.7% on a comparable basis.
In the Asia-Pacific region (excluding Japan) revenuedeclined 3.4%. In parallel, Hong Kong and Macao reporteda sharp revenue decline, which could not be offset by thehigh levels of purchases by Chinese customers in some ofthe region’s countries – including South Korea and
especially Australia – or the sales growth, albeit moderate,achieved in Mainland China. Business in Mainland Chinawas more buoyant in the fourth quarter of 2015, whichdrove a 0.8% revenue rise for the year as a whole.
Sales also decreased in the Division’s other emergingmarkets, except for Latin America, which saw a jump inrevenue, although part of this increase was to thedetriment of sales in the United States.
The Luxury Division’s recurring operating income amountedto around €1,708 million in 2015, up 2.5% as reported.
Recurring operating margin came in at 21.7%, down 290 basis points as reported. This decrease was due to (i) the combined effects of exchange rate fluctuationsand currency hedges, which had a major dilutive impact in 2015, and (ii) the contraction in recurring operatingincome at constant exchange rates reported by several ofthe Division’s brands.
In the second half of the year, the increase in recurringoperating income was more pronounced (approximately5%) and the dilutive effect on recurring operating marginwas contained (down 210 basis points compared with380 basis points in the first six months). This improvedsecond-half performance was due to both an increase inrevenue and tighter control over costs.
EBITDA rose 5.5% year on year and topped the €2 billionmark, coming in at €2,025 million. EBITDA margin stoodat 25.8%. The year-on-year change in EBITDA was morefavourable than for EBIT, reflecting the growing weight ofdepreciation and amortisation within operating income(up 25.2% on 2014) as a result of the Division’s capitalexpenditure strategy implemented over the past several years.
The Luxury Division’s gross operating investmentstotalled €391 million for 2015, 5.0% higher than in 2014.The increase mainly stemmed from currency effects, as atconstant exchange rates gross operating investments roseonly slightly year on year, reflecting – as in 2014 – theDivision’s focus on achieving organic growth on a same-store basis and consolidating the network of existing stores,while taking into consideration the more unsettledoperating context for the Luxury industry. As a proportionof revenue, gross operating investments represented5.0% in 2015 versus 5.5% in 2014.
As of December 31, 2015, the Luxury Division had a networkof 1,264 directly-operated stores, including 773 (61%) inmature markets and 491 in emerging markets. Net storeadditions during the year totalled 78, compared with 90in 2014.
185
5
2015 Reference Document ~ Kering
2015 ACTIVITY REPORT ~ FINANCIAL INFORMATION
05_A_VA_V5 06/04/2016 17:30 Page185

Under the leadership of Marco Bizzarri, Gucci began amajor transformation process in 2015, aimed at givingthe brand new impetus.
The year also saw a new creative momentum take hold atGucci, with the appointment of Alessandro Michele asCreative Director. Alessandro’s collections have beenresounding successes with both buyers and the press,which has led to a resurgence in the brand’s customerappeal. These changes were accompanied by a new,more consistent communications strategy, with a greateremphasis on digital communications.
From a product perspective, the offering was streamlinedand made clearer in 2015, thanks to a reworked merchandisingapproach that is more in touch with the brand’s customers.New lines were successfully introduced, comprisingcontemporary interpretations of the GG signature andother iconic Gucci symbols and motifs.
Customer experience is one of the major focal points ofGucci’s new strategy, and in October 2015 it launched acompletely reconfigured version of the gucci.com websitein the United States and Canada which it intends to rollout in other geographic regions throughout the course of2016. With respect to physical distribution, 34 storeswere opened or refurbished during 2015 based on a newstore concept, and the plan for streamlining and improvingthe wholesale distribution network entered a new phase.Lastly, particular attention was given to service excellenceand clienteling – two areas that are key to enhancing in-store productivity and reinforcing Gucci’s renewed brandperception.
Gucci’s performance in 2015 was, however, largely based onsales of collections presented in 2014 and does not thereforefully reflect the effects of the measures and initiatives putin place by Gucci’s new management. For example, thefirst collection fully designed by Alessandro Michele is theCruise 2016 collection, which was shown in New York inJune 2015 and has been available in stores since the endof the third quarter of 2015. The initial positive signs ofGucci’s transformation can be seen in the brand’sperformance for the last three months of the year andare expected to become even more apparent in 2016.
Gucci posted €3,898 million in revenue in 2015, up 11.5%year-on-year as reported and 0.4% at comparableexchange rates.
After a 1.6% comparable-basis contraction in the first half,when revenue was very adversely affected by the newphase of the plan to streamline the brand’s wholesaledistribution network, business picked up again in thesecond half, with growth of 2.4%, thanks notably to astrong rise in retail sales in directly-operated stores andwholesale sales coming in at more or less the same levelas in the previous year.
Retail sales generated in directly-operated stores accountedfor 81.8% of the brand’s total sales in 2015 versus 79.0%in 2014 (on a reported basis).
At constant exchange rates, sales from this distributionchannel increased 3.2% year on year, fuelled by strongrevenue growth both in the second and fourth quarters(10.4% and 5.5% respectively). The robust second-quartershowing was due to an increase in promotions aimed atreducing inventory levels of collections released beforethe arrival of Alessandro Michele as Gucci’s new CreativeDirector. The fourth-quarter sales figures were veryencouraging as they reflect, to a certain extent, the brand’srenewed appeal and the success of its new collections,even though their contribution to overall revenue for thequarter was still relatively modest, at just over 30%.
In the brand’s mature markets, the year-on-year increasein revenue generated in directly-operated stores wasmost pronounced in Western Europe, where growthcame to 18%. This revenue surge was fuelled by high touristnumbers, particularly Chinese and Americans, as well asvery robust revenue growth in the domestic market,demonstrating the brand’s enhanced appeal.
In Japan, where the Gucci brand is well established, salesin directly-operated stores were up 9.2% on a comparablebasis, with a sharp acceleration in the second quarter ledby an increase in sales to tourists.
In North America, sales increased only slightly on acomparable basis as they were weighed down by lowertourist numbers.
In emerging markets (which accounted for 43.7% of Gucci’ssales in directly-operated stores versus 45.5% in 2014, asreported), sales dropped 3.3% on a comparable exchangerate basis, primarily as a result of a 5.6% contraction inthe Asia-Pacific region. This region’s downward trendwas almost entirely due to the worsening consumer
Gucci
(in € millions) 2015 2014 Change
Revenue 3,898.0 3,497.2 +11.5%Recurring operating income 1,032.3 1,056.0 -2.2%
as a % of revenue 26.5% 30.2% -3.7 ptsEBITDA 1,206.1 1,199.2 +0.6%
as a % of revenue 30.9% 34.3% -3.4 pts
Gross operating investments 192.8 186.4 +3.4%
Average headcount 10,570 9,623 +9.8%
186 Kering ~ 2015 Reference Document
5 FINANCIAL INFORMATION ~ 2015 ACTIVITY REPORT
05_A_VA_V5 06/04/2016 17:30 Page186
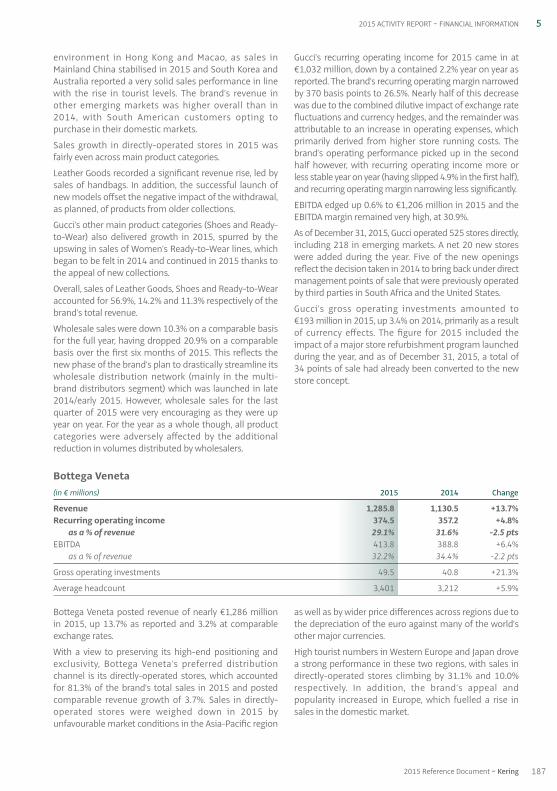
Bottega Veneta posted revenue of nearly €1,286 millionin 2015, up 13.7% as reported and 3.2% at comparableexchange rates.
With a view to preserving its high-end positioning andexclusivity, Bottega Veneta’s preferred distributionchannel is its directly-operated stores, which accountedfor 81.3% of the brand’s total sales in 2015 and postedcomparable revenue growth of 3.7%. Sales in directly-operated stores were weighed down in 2015 byunfavourable market conditions in the Asia-Pacific region
as well as by wider price differences across regions due tothe depreciation of the euro against many of the world’sother major currencies.
High tourist numbers in Western Europe and Japan drovea strong performance in these two regions, with sales indirectly-operated stores climbing by 31.1% and 10.0%respectively. In addition, the brand’s appeal andpopularity increased in Europe, which fuelled a rise insales in the domestic market.
Bottega Veneta(in € millions) 2015 2014 Change
Revenue 1,285.8 1,130.5 +13.7%Recurring operating income 374.5 357.2 +4.8%
as a % of revenue 29.1% 31.6% -2.5 ptsEBITDA 413.8 388.8 +6.4%
as a % of revenue 32.2% 34.4% -2.2 pts
Gross operating investments 49.5 40.8 +21.3%
Average headcount 3,401 3,212 +5.9%
environment in Hong Kong and Macao, as sales inMainland China stabilised in 2015 and South Korea andAustralia reported a very solid sales performance in linewith the rise in tourist levels. The brand’s revenue inother emerging markets was higher overall than in2014, with South American customers opting topurchase in their domestic markets.
Sales growth in directly-operated stores in 2015 wasfairly even across main product categories.
Leather Goods recorded a significant revenue rise, led bysales of handbags. In addition, the successful launch ofnew models offset the negative impact of the withdrawal,as planned, of products from older collections.
Gucci’s other main product categories (Shoes and Ready-to-Wear) also delivered growth in 2015, spurred by theupswing in sales of Women’s Ready-to-Wear lines, whichbegan to be felt in 2014 and continued in 2015 thanks tothe appeal of new collections.
Overall, sales of Leather Goods, Shoes and Ready-to-Wearaccounted for 56.9%, 14.2% and 11.3% respectively of thebrand’s total revenue.
Wholesale sales were down 10.3% on a comparable basisfor the full year, having dropped 20.9% on a comparablebasis over the first six months of 2015. This reflects thenew phase of the brand’s plan to drastically streamline itswholesale distribution network (mainly in the multi-brand distributors segment) which was launched in late2014 / early 2015. However, wholesale sales for the lastquarter of 2015 were very encouraging as they were upyear on year. For the year as a whole though, all productcategories were adversely affected by the additionalreduction in volumes distributed by wholesalers.
Gucci’s recurring operating income for 2015 came in at€1,032 million, down by a contained 2.2% year on year asreported. The brand’s recurring operating margin narrowedby 370 basis points to 26.5%. Nearly half of this decreasewas due to the combined dilutive impact of exchange ratefluctuations and currency hedges, and the remainder wasattributable to an increase in operating expenses, whichprimarily derived from higher store running costs. Thebrand’s operating performance picked up in the secondhalf however, with recurring operating income more orless stable year on year (having slipped 4.9% in the first half),and recurring operating margin narrowing less significantly.
EBITDA edged up 0.6% to €1,206 million in 2015 and theEBITDA margin remained very high, at 30.9%.
As of December 31, 2015, Gucci operated 525 stores directly,including 218 in emerging markets. A net 20 new storeswere added during the year. Five of the new openingsreflect the decision taken in 2014 to bring back under directmanagement points of sale that were previously operatedby third parties in South Africa and the United States.
Gucci’s gross operating investments amounted to€193 million in 2015, up 3.4% on 2014, primarily as a resultof currency effects. The figure for 2015 included theimpact of a major store refurbishment program launchedduring the year, and as of December 31, 2015, a total of34 points of sale had already been converted to the newstore concept.
187
5
2015 Reference Document ~ Kering
2015 ACTIVITY REPORT ~ FINANCIAL INFORMATION
05_A_VA_V5 06/04/2016 17:30 Page187

In 2015, the success of the collections designed by HediSlimane – Creative Director with total responsibility for thebrand’s image – and the strategic relevance of its productoffering helped further strengthen Yves Saint Laurent’sbrand appeal. This appeal – which was given an additionalboost by continued investments in the brand’s stores anda 360° communication strategy – resulted in very robustrevenue growth for Yves Saint Laurent during the year.
The brand’s revenue jumped 37.7% year on year as reported,or 25.8% based on comparable exchange rates, comingin just under the €1 billion mark at €974 million. Growthwas even across the year, spurred both by strong demand
from domestic customers in all countries and a massiveinflux of tourists in its European and Japanese stores.
The investments undertaken for the directly-operated storenetwork since 2012 have enabled Yves Saint Laurent toincrease the portion of sales generated through thisexclusive distribution channel, which accounted for around64% of the brand’s total sales in 2015 versus 61.5% in 2014.Revenue from retail sales in directly-operated storesadvanced by 28.7% during the year, primarily led by a strongincrease in same-store sales. This performance alsoreflects the excellence of the brand’s teams in allocatingand restocking items within the store network.
Yves Saint Laurent
(in € millions) 2015 2014 Change
Revenue 973.6 707.3 +37.7%Recurring operating income 168.5 105.1 +60.3%
as a % of revenue 17.3% 14.9% +2.4 ptsEBITDA 207.9 130.9 +58.8%
as a % of revenue 21.4% 18.5% +2.9 pts
Gross operating investments 63.1 54.2 +16.4%
Average headcount 1,943 1,712 +13.5%
The strong dollar directly affected sales in North America,leading to an 8.3% contraction in revenue generated bydirectly-operated stores in this region.
In the Asia-Pacific region (excluding Japan) – which onceagain accounted for over 90% of Bottega Veneta’s businessin emerging markets – sales were hampered by a lacklustreLuxury Goods market in Greater China, despite the verypositive trends seen in the region’s other countries. Overall,revenue from directly-operated stores in emergingmarkets was down 8.4% year on year.
Sales generated in the wholesale network edged up 1.1%in 2015, although this figure masks very mixed trends.Excluding Western Europe – where Bottega Veneta isreorganizing its distribution with the aim of becomingmore selective and exclusive – wholesale revenueadvanced by around 14%.
Leather Goods once again constituted the brand’s corebusiness, making up 87.6% of total sales in 2015. BottegaVeneta is currently paying particular attention to increasingcustomer engagement for its handbag offering, bycreating seasonal variations of its iconic pieces as well asintroducing new models. Furthermore, with a view toconsolidating its exclusive positioning, the brand isworking on making its offering even more creative andluxurious, while at the same time ensuring that pricegaps across regions are gradually reduced.
Bottega Veneta’s performance in its other major productcategories was also positive in 2015, particularly forShoes. Nevertheless, in order to speed up short- and
medium-term growth, during the year the brand reinforcedits creative teams in charge of diversification for thiscategory. It also increased the number of product referencesand expanded the amount of space allocated to theShoes category within its stores.
All of the initiatives undertaken throughout the year topropel Bottega Veneta into a new stage of its developmentinitially had a dilutive effect on recurring operating margin,as recurring operating income rose 4.8% to just below€375 million but recurring operating margin narrowedby 250 basis points to 29.1% as reported. The combinedeffect of exchange rate fluctuations and currency hedgesalso contributed to this decrease in profitability.
EBITDA climbed 6.4% to nearly €414 million in 2015. Thisrepresents a higher rise than that for recurring operatingincome, due to an increase in depreciation and amortisationexpenses resulting from the brand’s investments inrecent years.
Bottega Veneta’s network of directly-operated storestotalled 251 as of December 31, 2015, including 110 inemerging markets. There were 15 net store additionsduring the year.
The brand’s gross operating investments totalled nearly€50 million in 2015, up €9 million, or 21.3% on the previousyear, as 2014 represented a trough in its capital expenditurecycle. Overall gross operating investments for 2015represented 3.8% of Bottega Veneta’s revenue, a relativelylow ratio compared with Kering’s other luxury brands.
188 Kering ~ 2015 Reference Document
5 FINANCIAL INFORMATION ~ 2015 ACTIVITY REPORT
05_A_VA_V5 06/04/2016 17:30 Page188

Other Luxury brands include Ulysse Nardin sinceNovember 1, 2014. Consequently, year-on-year comparisonsbetween 2015 and 2014 need to take into account thischange in Group structure. In addition, due to SergioRossi’s reclassification under assets held for sale atDecember 31, 2014, this brand’s results in 2015 were nolonger included under Other Luxury brands and the 2014figures have been restated accordingly.
Total revenue generated by Other Luxury brands amountedto €1,708 million in 2015, up 20.0% year on year as reported
and 3.1% on a comparable Group structure and exchangerate basis. Growth was particularly pronounced in the secondand last quarters, with revenue rising 6.3% and 10.6%respectively based on comparable exchange rates. OtherLuxury brands contributed nearly 21.7% of the LuxuryDivision’s total revenue during the year.
The Couture & Leather Goods brands posted a particularlystrong revenue rise of 7.7% on a comparable basis (withan 11.6% increase in the fourth quarter).
189
5
2015 Reference Document ~ Kering
2015 ACTIVITY REPORT ~ FINANCIAL INFORMATION
Other Luxury brands
(in € millions) 2015 2014 Change
Revenue 1,707.9 1,423.6 +20.0%Recurring operating income 132.7 147.3 -9.9%
as a % of revenue 7.8% 10.3% -2.5 ptsEBITDA 197.6 200.3 -1.3%
as a % of revenue 11.6% 14.1% -2.5 pts
Gross operating investments 85.5 91.0 -6.0%
Average headcount 5,662 5,575 +1.6%
Wholesale sales were up 21.3% based on comparabledata, illustrating how wholesalers see the brand as a majorgrowth driver for their business. This distribution channelalso remains strategically important for Yves Saint Laurentas it represents a perfect fit with its retail channel.
The efforts undertaken since 2014 to align the performancesof licensed product categories began to pay off in 2015,with revenue from royalties climbing 18.5% during the year.
As in 2014, all of Yves Saint Laurent’s main productcategories registered very strong sales growth.
The brand’s Leather Goods offering remained highlypopular, both with long-standing and new customers,and throughout the year Yves Saint Laurent carefullymanaged its price structure in order to factor in the effectof changes in exchange rates and market conditions incertain regions. Sales posted by this category rose 29.4%at constant exchange rates.
Revenue from Ready-to-Wear sales jumped by 26.2% atconstant exchange rates and this category once againoccupied an essential place in the brand’s productoffering, with well-balanced sales of Women’s and Men’scollections.
Yves Saint Laurent notched up revenue increases acrossall of its geographic regions in 2015.
In emerging markets – which contributed 28.9% of thebrand’s total revenue for the year – sales growth came to17.5%. The economic climate in Hong Kong and MainlandChina weighed on the brand’s performance in GreaterChina, but the region’s revenue figures nonethelessremained impressive. Yves Saint Laurent also reported avery robust revenue performance in the rest of the Asia-Pacific region as well as in Latin America.
Sales in Yves Saint Laurent’s traditional markets soaredby 29.5% on a comparable basis, reflecting the brand’srenewed appeal both with local customers and withtourists from emerging markets. Revenue growthreached extremely high levels across all of these regions,coming in at 47.2% in Japan, where the brand was inremarkably high demand, 27.8% in North America, and27.5% in Western Europe.
Yves Saint Laurent ended 2015 with recurring operatingincome of €169 million, versus around €105 million in2014, representing a year-on-year increase of 60.3%.Recurring operating margin reached 17.3%, up 240 basispoints as reported. This year-on-year improvementdemonstrates how the brand has now reached a size thatenhanced the positive impact of its operating leverage.Costs incurred to develop the brand by extending thestore network and implementing an active brandmarketing policy have not prevented the brand frombetter absorbing its fixed costs.
EBITDA amounted to €208 million, and EBITDA margintopped 20%, coming in at 21.4% (up 290 basis points on 2014).
As of December 31, 2015, the Yves Saint Laurent branddirectly operated 142 stores, including 61 in emergingmarkets. There were 14 net store openings during theyear, including the Tokyo flagship store in the Omotesandodistrict.
Overall, the brand’s gross operating investments rose toaround €63 million in 2015, representing a 16.4% increaseon 2014 although the pace of the increase was slowerthan that of the brand’s revenue and operating income,which had a positive impact on cash flow generation.
05_A_VA_V5 06/04/2016 17:30 Page189

Jewellery brands reported a double-digit increase inrevenue on a comparable basis, fuelled by very highbusiness volumes in the last quarter. On the other hand,despite picking up steadily quarter after quarter, revenueof the Division’s Watches brands contracted sharply in anunfavourable market environment. As a result, Sowind andUlysse Nardin took steps to adapt their product offeringsand organisational structures to the difficult operatingcontext. These measures are also aimed at rapidly achievingoperational synergies between the various Watchesbrands, particularly in terms of corporate support functions.
The wholesale network was once again the main distributionchannel for Other Luxury brands, accounting for 53.8%of sales. This proportion reflects the differing stages ofdevelopment of the Couture & Leather Goods brands aswell as the specific distribution characteristics of Watches& Jewellery. Sales generated in the wholesale networkdecreased 4.9% year on year on a comparable basis,reflecting a contraction in wholesale sales of Watches andthe restructuring measures currently underway in Brioni’sdistribution network. Although revenue trends weregenerally better for Other Luxury brands, wholesalersnevertheless showed a tendency to remain prudent in2015 in terms of volumes purchased, due to thevolatility of certain of the markets in which they operate.
Retail sales in directly-operated stores advanced 16.3%based on comparable data, led by the strong performanceof Couture & Leather Goods brands as well as by growthof the Jewellery brands. Developing an exclusive distributionnetwork remains a strategic objective for all of the brandsbut the pace of this development needs to be adapted toeach brand’s maturity, as well as its positioning in itstraditional markets and the depth and scope of itsproduct offering.
Ready-to-Wear remained the best-selling productcategory, making up 30.5% of total Other Luxury brandsrevenue, and also reported year-on-year growth, particularlyfor women’s collections. Watches & Jewellery representedthe second largest revenue generator, accounting for 30.4%of the total, but this category saw contrasting trendsduring the year between its two different segments (year-on-year growth in Jewellery and a contraction inWatches). Leather Goods and Shoes posted the highestyear-on-year increase in revenue among Other Luxurybrands for 2015.
Other Luxury brands saw mixed trends across geographicregions in 2015, with high growth in mature markets (up 8.0% on a comparable basis) and an 8.0% revenuecontraction in emerging markets.
This reflects the fact that the performance of certain brands(particularly Brioni and Ulysse Nardin) was weighed downby weak demand in Eastern Europe and the Middle East.Conversely, sales remained stable in the Asia-Pacificregion, edging up 0.6%. Revenue from Couture & LeatherGoods brands climbed by a steep 12.6% on a comparablebasis in this region (with particularly brisk momentumin the fourth quarter), thanks to their increasing appealand renown, especially in Mainland China. Sales declinedoverall in Hong Kong, particularly for Watches.
In the Other Luxury brands’ mature markets – which madeanother significant contribution to sales, representing72.5% of the total – Japan and Western Europe were themain growth drivers, reporting revenue rises of 18.5% and12.1%, respectively, thanks to resilient spending by localcustomers and a steep increase in tourist numbers. InNorth America, the market environment worsenedthroughout the year and revenue for Other Luxury brandswas down on 2014.
Recurring operating income for Other Luxury brandsretreated 9.9% year on year to €133 million, and recurringoperating margin narrowed by 250 basis points to 7.8%,partly due to the adverse impact of currency hedges. Theseoverall figures also reflect the decrease in profitabilityreported by the Watches brands, which suffered a steepdrop in gross margins due to the sharp rise in the Swissfranc and persistently unsettled market conditions.
EBITDA came in at just under €198 million, down approximately€3 million, or 1.3%, on 2014 as reported.
The network of directly-operated stores owned by OtherLuxury brands totalled 346 units as of December 31, 2015,including 244 in mature markets and 102 in emergingmarkets. Altogether, there were 29 net store additionsduring the year.
Despite a negative currency effect arising from the conversionof foreign currency denominated capital expenditure,gross operating investments decreased year on year to€85 million. As in 2014, this reflects the brands’ highlyselective and disciplined capital spending strategies.
The Group’s Couture & Leather Goods brands performedas follows in 2015:
Alexander McQueen posted very solid sales growth, fuelledby the performance of directly-operated stores. One ofthe highlights of 2015 for this brand’s store network wasthe opening of a flagship store in Paris. The brand’s rapidgrowth and increasing visibility – which was boostedduring the year by the success of the “Savage Beauty”exhibition at the Victoria and Albert Museum in London –clearly justifies the capital expenditure drive undertakenin both 2015 and 2014. However, these investments havehad a short-term dilutive impact on Alexander McQueen’srecurring operating income.
190 Kering ~ 2015 Reference Document
5 FINANCIAL INFORMATION ~ 2015 ACTIVITY REPORT
05_A_VA_V5 06/04/2016 17:30 Page190
The McQ brand – which is positioned in the accessibleluxury segment – reported satisfactory results in 2015and maintained solid margins.
Balenciaga saw its revenue increase by over 10% in 2015for the second year in a row, led by the expansion of itsdirectly-operated network, which now accounts for some60% of revenue. With the October 2015 appointment ofDemna Gvasalia as Artistic Director for Balenciaga’scollections, the brand has embarked on a new phase inits development.
In 2015, Brioni was once again adversely affected by thedecline in purchases by Russian tourists in WesternEurope and the Middle East. The brand pursued itsmeasures to streamline distribution channels, byoptimising its store network and being more selective inits choice of third-party distributors. These measures,combined with the difficult economic context, weighedon the brand’s profitability for the year.
For Christopher Kane, 2015 marked the brand’s first-everstore opening, which took place in London – its home city.Steps were also taken to speed up synergies within theGroup and Christopher Kane’s teams were strengthenedwith a view to accompanying the brand in the next stagesof its growth.
Stella McCartney experienced another year of stronggrowth in 2015. Sales were up in all product categories andacross all distribution channels. This momentum helpedto offset the adverse impact of the expenditure incurred fornew store openings and drove an increase in both recurringoperating income and recurring operating margin.
For the Watches & Jewellery brands, performance wasmore mixed:
Boucheron reported a sharp revenue increase in 2015,powered by the success of both its jewellery and high-jewellery collections, particularly the Quatre and SerpentBohème lines. High-jewellery sales were outstanding, whichreinforced Boucheron’s position in this segment.Boucheron’s revenue growth led to a further increase in itsrecurring operating income and recurring operating margin.
Similarly, Pomellato and Dodo delivered very robust growthin 2015, mainly in their traditional markets in Europe.These brands’ successful performance during the yearprimarily reflect measures put in place to completelyrework their offerings and collections, as well as a wideningof its customer base, which now includes a larger proportionof tourists. This steady rise in the brands’ non-Europeancustomers as well as their solid recurring operatingincome figures demonstrate their growth potential.
As was the case for other jewellery brands, Qeelin experiencedstrong growth in the last quarter of 2015 and ended theyear with solid revenue gains in Mainland China and newregions (in Asia and North America).
For both Girard-Perregaux and Ulysse Nardin, businessvolumes were hampered in 2015 by the morose operatingenvironment and currency fluctuations which had ahighly negative effect on the watch industry. The focus forthese two brands during the year was therefore on seekingsynergies, optimising production, streamlining offers andreorganising the distribution network. These initiativesenabled the brands to contain the drop in recurringoperating income, which remained positive, and weretaken to ensure that their strong potential can be exploitedin 2016. Both Girard-Perregaux and Ulysse Nardin remainbenchmark players in the watch industry, as demonstratedby the awards won by Ulysse Nardin in 2015 for its AnchorTourbillon innovation.
191
5
2015 Reference Document ~ Kering
2015 ACTIVITY REPORT ~ FINANCIAL INFORMATION
05_A_VA_V5 06/04/2016 17:30 Page191
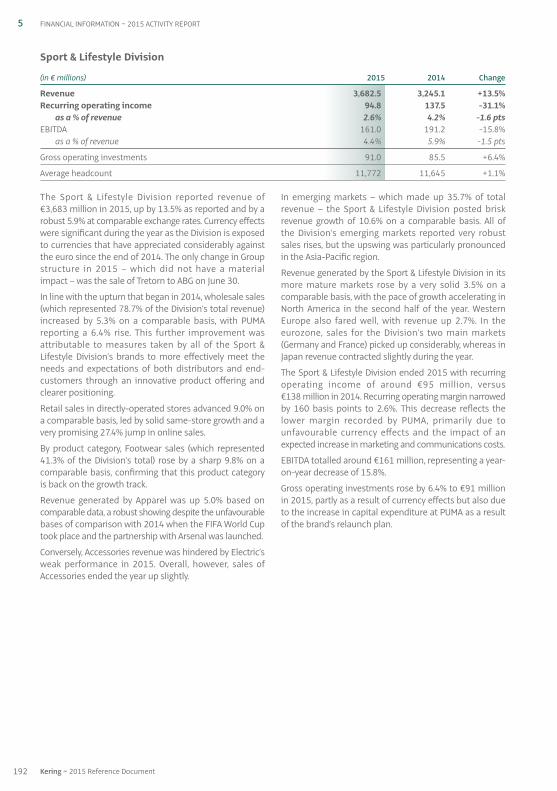
The Sport & Lifestyle Division reported revenue of€3,683 million in 2015, up by 13.5% as reported and by arobust 5.9% at comparable exchange rates. Currency effectswere significant during the year as the Division is exposedto currencies that have appreciated considerably againstthe euro since the end of 2014. The only change in Groupstructure in 2015 – which did not have a materialimpact – was the sale of Tretorn to ABG on June 30.
In line with the upturn that began in 2014, wholesale sales(which represented 78.7% of the Division’s total revenue)increased by 5.3% on a comparable basis, with PUMAreporting a 6.4% rise. This further improvement wasattributable to measures taken by all of the Sport &Lifestyle Division’s brands to more effectively meet theneeds and expectations of both distributors and end-customers through an innovative product offering andclearer positioning.
Retail sales in directly-operated stores advanced 9.0% ona comparable basis, led by solid same-store growth and avery promising 27.4% jump in online sales.
By product category, Footwear sales (which represented41.3% of the Division’s total) rose by a sharp 9.8% on acomparable basis, confirming that this product categoryis back on the growth track.
Revenue generated by Apparel was up 5.0% based oncomparable data, a robust showing despite the unfavourablebases of comparison with 2014 when the FIFA World Cuptook place and the partnership with Arsenal was launched.
Conversely, Accessories revenue was hindered by Electric’sweak performance in 2015. Overall, however, sales ofAccessories ended the year up slightly.
In emerging markets – which made up 35.7% of totalrevenue – the Sport & Lifestyle Division posted briskrevenue growth of 10.6% on a comparable basis. All ofthe Division’s emerging markets reported very robustsales rises, but the upswing was particularly pronouncedin the Asia-Pacific region.
Revenue generated by the Sport & Lifestyle Division in itsmore mature markets rose by a very solid 3.5% on acomparable basis, with the pace of growth accelerating inNorth America in the second half of the year. WesternEurope also fared well, with revenue up 2.7%. In theeurozone, sales for the Division’s two main markets(Germany and France) picked up considerably, whereas inJapan revenue contracted slightly during the year.
The Sport & Lifestyle Division ended 2015 with recurringoperating income of around €95 million, versus€138 million in 2014. Recurring operating margin narrowedby 160 basis points to 2.6%. This decrease reflects thelower margin recorded by PUMA, primarily due tounfavourable currency effects and the impact of anexpected increase in marketing and communications costs.
EBITDA totalled around €161 million, representing a year-on-year decrease of 15.8%.
Gross operating investments rose by 6.4% to €91 millionin 2015, partly as a result of currency effects but also dueto the increase in capital expenditure at PUMA as a resultof the brand’s relaunch plan.
Sport & Lifestyle Division
(in € millions) 2015 2014 Change
Revenue 3,682.5 3,245.1 +13.5%Recurring operating income 94.8 137.5 -31.1%
as a % of revenue 2.6% 4.2% -1.6 ptsEBITDA 161.0 191.2 -15.8%
as a % of revenue 4.4% 5.9% -1.5 pts
Gross operating investments 91.0 85.5 +6.4%
Average headcount 11,772 11,645 +1.1%
192 Kering ~ 2015 Reference Document
5 FINANCIAL INFORMATION ~ 2015 ACTIVITY REPORT
05_A_VA_V5 06/04/2016 17:30 Page192
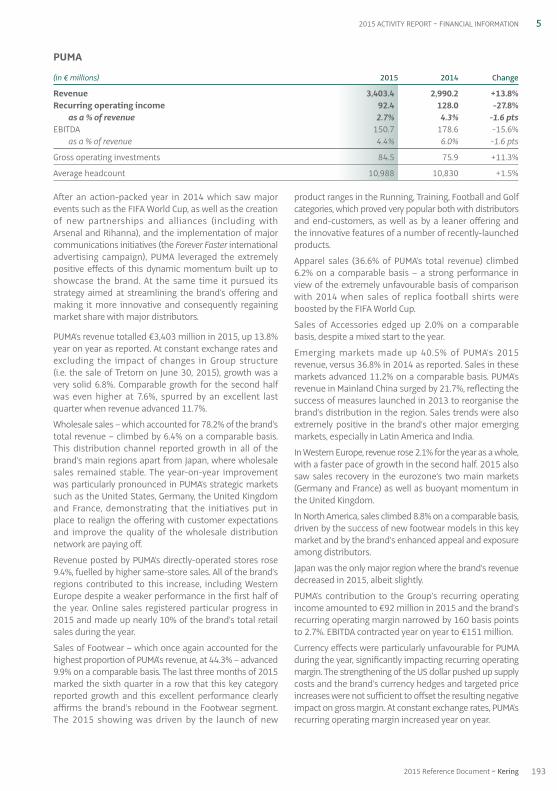
After an action-packed year in 2014 which saw majorevents such as the FIFA World Cup, as well as the creationof new partnerships and alliances (including with Arsenal and Rihanna), and the implementation of majorcommunications initiatives (the Forever Faster internationaladvertising campaign), PUMA leveraged the extremelypositive effects of this dynamic momentum built up toshowcase the brand. At the same time it pursued itsstrategy aimed at streamlining the brand’s offering andmaking it more innovative and consequently regainingmarket share with major distributors.
PUMA’s revenue totalled €3,403 million in 2015, up 13.8%year on year as reported. At constant exchange rates andexcluding the impact of changes in Group structure (i.e. the sale of Tretorn on June 30, 2015), growth was avery solid 6.8%. Comparable growth for the second halfwas even higher at 7.6%, spurred by an excellent lastquarter when revenue advanced 11.7%.
Wholesale sales – which accounted for 78.2% of the brand’stotal revenue – climbed by 6.4% on a comparable basis.This distribution channel reported growth in all of thebrand’s main regions apart from Japan, where wholesalesales remained stable. The year-on-year improvementwas particularly pronounced in PUMA’s strategic marketssuch as the United States, Germany, the United Kingdomand France, demonstrating that the initiatives put inplace to realign the offering with customer expectationsand improve the quality of the wholesale distributionnetwork are paying off.
Revenue posted by PUMA’s directly-operated stores rose9.4%, fuelled by higher same-store sales. All of the brand’sregions contributed to this increase, including WesternEurope despite a weaker performance in the first half ofthe year. Online sales registered particular progress in2015 and made up nearly 10% of the brand’s total retailsales during the year.
Sales of Footwear – which once again accounted for thehighest proportion of PUMA’s revenue, at 44.3% – advanced9.9% on a comparable basis. The last three months of 2015marked the sixth quarter in a row that this key categoryreported growth and this excellent performance clearlyaffirms the brand’s rebound in the Footwear segment.The 2015 showing was driven by the launch of new
product ranges in the Running, Training, Football and Golfcategories, which proved very popular both with distributorsand end-customers, as well as by a leaner offering andthe innovative features of a number of recently-launchedproducts.
Apparel sales (36.6% of PUMA’s total revenue) climbed6.2% on a comparable basis – a strong performance inview of the extremely unfavourable basis of comparisonwith 2014 when sales of replica football shirts wereboosted by the FIFA World Cup.
Sales of Accessories edged up 2.0% on a comparablebasis, despite a mixed start to the year.
Emerging markets made up 40.5% of PUMA’s 2015revenue, versus 36.8% in 2014 as reported. Sales in thesemarkets advanced 11.2% on a comparable basis. PUMA’srevenue in Mainland China surged by 21.7%, reflecting thesuccess of measures launched in 2013 to reorganise thebrand’s distribution in the region. Sales trends were alsoextremely positive in the brand’s other major emergingmarkets, especially in Latin America and India.
In Western Europe, revenue rose 2.1% for the year as a whole,with a faster pace of growth in the second half. 2015 alsosaw sales recovery in the eurozone’s two main markets(Germany and France) as well as buoyant momentum inthe United Kingdom.
In North America, sales climbed 8.8% on a comparable basis,driven by the success of new footwear models in this keymarket and by the brand’s enhanced appeal and exposureamong distributors.
Japan was the only major region where the brand’s revenuedecreased in 2015, albeit slightly.
PUMA’s contribution to the Group’s recurring operatingincome amounted to €92 million in 2015 and the brand’srecurring operating margin narrowed by 160 basis pointsto 2.7%. EBITDA contracted year on year to €151 million.
Currency effects were particularly unfavourable for PUMAduring the year, significantly impacting recurring operatingmargin. The strengthening of the US dollar pushed up supplycosts and the brand’s currency hedges and targeted priceincreases were not sufficient to offset the resulting negativeimpact on gross margin. At constant exchange rates, PUMA’srecurring operating margin increased year on year.
PUMA
(in € millions) 2015 2014 Change
Revenue 3,403.4 2,990.2 +13.8%Recurring operating income 92.4 128.0 -27.8%
as a % of revenue 2.7% 4.3% -1.6 ptsEBITDA 150.7 178.6 -15.6%
as a % of revenue 4.4% 6.0% -1.6 pts
Gross operating investments 84.5 75.9 +11.3%
Average headcount 10,988 10,830 +1.5%
193
5
2015 Reference Document ~ Kering
2015 ACTIVITY REPORT ~ FINANCIAL INFORMATION
05_A_VA_V5 06/04/2016 17:30 Page193
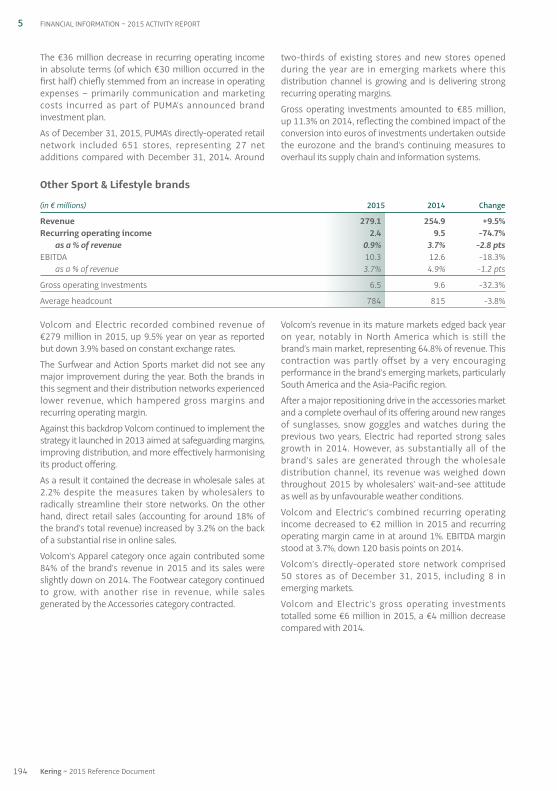
Volcom and Electric recorded combined revenue of€279 million in 2015, up 9.5% year on year as reportedbut down 3.9% based on constant exchange rates.
The Surfwear and Action Sports market did not see anymajor improvement during the year. Both the brands inthis segment and their distribution networks experiencedlower revenue, which hampered gross margins andrecurring operating margin.
Against this backdrop Volcom continued to implement thestrategy it launched in 2013 aimed at safeguarding margins,improving distribution, and more effectively harmonisingits product offering.
As a result it contained the decrease in wholesale sales at2.2% despite the measures taken by wholesalers toradically streamline their store networks. On the otherhand, direct retail sales (accounting for around 18% ofthe brand’s total revenue) increased by 3.2% on the backof a substantial rise in online sales.
Volcom’s Apparel category once again contributed some84% of the brand’s revenue in 2015 and its sales wereslightly down on 2014. The Footwear category continuedto grow, with another rise in revenue, while salesgenerated by the Accessories category contracted.
Volcom’s revenue in its mature markets edged back yearon year, notably in North America which is still thebrand’s main market, representing 64.8% of revenue. Thiscontraction was partly offset by a very encouragingperformance in the brand’s emerging markets, particularlySouth America and the Asia-Pacific region.
After a major repositioning drive in the accessories marketand a complete overhaul of its offering around new rangesof sunglasses, snow goggles and watches during theprevious two years, Electric had reported strong salesgrowth in 2014. However, as substantially all of thebrand’s sales are generated through the wholesaledistribution channel, its revenue was weighed downthroughout 2015 by wholesalers’ wait-and-see attitudeas well as by unfavourable weather conditions.
Volcom and Electric’s combined recurring operatingincome decreased to €2 million in 2015 and recurringoperating margin came in at around 1%. EBITDA marginstood at 3.7%, down 120 basis points on 2014.
Volcom’s directly-operated store network comprised 50 stores as of December 31, 2015, including 8 inemerging markets.
Volcom and Electric’s gross operating investmentstotalled some €6 million in 2015, a €4 million decreasecompared with 2014.
Other Sport & Lifestyle brands
(in € millions) 2015 2014 Change
Revenue 279.1 254.9 +9.5%Recurring operating income 2.4 9.5 -74.7%
as a % of revenue 0.9% 3.7% -2.8 ptsEBITDA 10.3 12.6 -18.3%
as a % of revenue 3.7% 4.9% -1.2 pts
Gross operating investments 6.5 9.6 -32.3%
Average headcount 784 815 -3.8%
The €36 million decrease in recurring operating incomein absolute terms (of which €30 million occurred in thefirst half) chiefly stemmed from an increase in operatingexpenses – primarily communication and marketingcosts incurred as part of PUMA’s announced brandinvestment plan.
As of December 31, 2015, PUMA’s directly-operated retailnetwork included 651 stores, representing 27 netadditions compared with December 31, 2014. Around
two-thirds of existing stores and new stores openedduring the year are in emerging markets where thisdistribution channel is growing and is delivering strongrecurring operating margins.
Gross operating investments amounted to €85 million,up 11.3% on 2014, reflecting the combined impact of theconversion into euros of investments undertaken outsidethe eurozone and the brand’s continuing measures tooverhaul its supply chain and information systems.
194 Kering ~ 2015 Reference Document
5 FINANCIAL INFORMATION ~ 2015 ACTIVITY REPORT
05_A_VA_V5 06/04/2016 17:30 Page194

Capital employed
As of December 31, 2015, capital employed was€674 million higher than at the previous year-end.
Goodwill, brands and other intangible assets, net
As of December 31, 2015, “Goodwill, brands and otherintangible assets, net” represented 63% of total assets(versus 64% as of December 31, 2014) and mainlycomprised:
• goodwill amounting to €3,759 million, of which€2,788 million related to the Luxury Division and€971 million to the Sport & Lifestyle Division. Goodwill
decreased in 2015 due to the completion during theyear of the purchase price allocation process for UlysseNardin and the recognition of a €150 million impairmentloss against goodwill related to PUMA and one of theOther Luxury brands;
• brands valued at €10,851 million, of which €6,944 millionfor the Luxury Division and €3,907 million for theSport & Lifestyle Division.
Net of deferred tax liabilities relating to brands (which are recorded under “Other non-current assets, net” asshown below), this item came to €12,302 million as ofDecember 31, 2015.
1.5. Comments on the Group’s financial position
(in € millions) Dec. 31, 2015 Dec. 31, 2014 Change
Goodwill, brands and other intangible assets, net 15,044.3 14,788.0 +256.3Other non-current assets, net 569.1 310.0 +259.1Current assets, net 1,071.0 924.4 +146.6Provisions (381.9) (394.0) +12.1
Capital employed 16,302.5 15,628.4 +674.1
Net assets held for sale 0.0 24.6 -24.6
Total equity 11,623.1 11,262.3 +360.8
Net debt 4,679.4 4,390.7 +288.7
Corporate and other
The “Corporate and other” segment comprises (i) Kering’scorporate departments and headquarters teams, (ii) Shared Services, which provide services to the brands,(iii) the Kering Sustainability Department, which isresponsible for the sustainability initiative launched byKering in 2011, and (iv) Kering’s Sourcing Department(KGS), a profit centre for services that it provides on behalfof non-Group brands, such as companies from the formerRedcats group.
It also incorporates Kering Eyewear, responsible forbringing the Group’s Eyewear business (sunglasses andframes) in-house. However, for the 2014-2016 ramp-upperiod of this business (the first year of operations for theGucci license being 2017), the losses associated withKering Eyewear are being recognised as non-recurringoperating expenses.
Net costs recorded by the “Corporate and other” segmentin 2015 totalled around €156 million, up only 12.2%compared with 2014. This increase was due to thetransfer to this segment of new assignments and cross-business projects carried out on behalf of the Group’sbrands, notably in relation to the maintenance andupgrading of information systems.
Gross operating investments recorded by the “Corporateand other” segment came to €190 million, up €97 millionyear on year. This increase was almost entirely due to twonon-recurring transactions: (i) the payment of the firstinstalment of the compensation due to Safilo for earlytermination of the Gucci eyewear licence, and (ii) property-related investments concerning Kering’s Paris head office,Gucci’s offices in Milan, and the building located inTokyo’s Omotesando district which houses Yves SaintLaurent’s flagship store in Japan.
195
5
2015 Reference Document ~ Kering
2015 ACTIVITY REPORT ~ FINANCIAL INFORMATION
05_A_VA_V5 06/04/2016 17:30 Page195
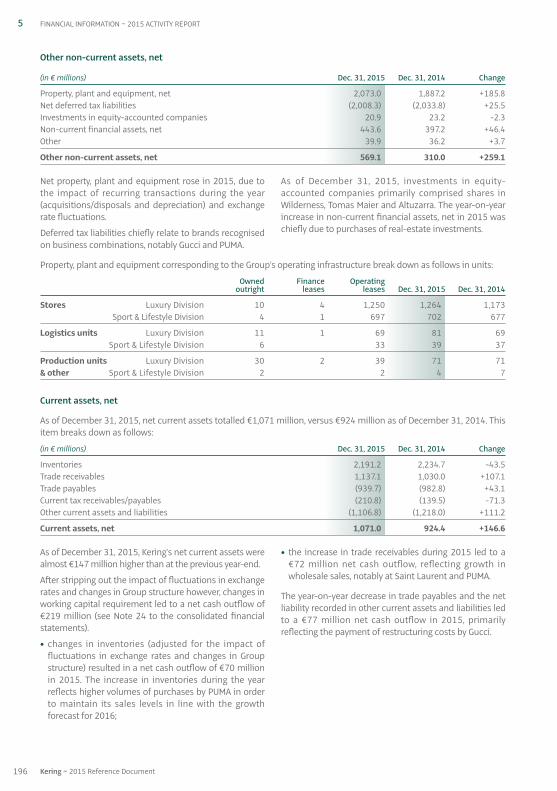
As of December 31, 2015, Kering’s net current assets werealmost €147 million higher than at the previous year-end.
After stripping out the impact of fluctuations in exchangerates and changes in Group structure however, changes inworking capital requirement led to a net cash outflow of€219 million (see Note 24 to the consolidated financialstatements).
• changes in inventories (adjusted for the impact offluctuations in exchange rates and changes in Groupstructure) resulted in a net cash outflow of €70 millionin 2015. The increase in inventories during the yearreflects higher volumes of purchases by PUMA in orderto maintain its sales levels in line with the growthforecast for 2016;
• the increase in trade receivables during 2015 led to a€72 million net cash outflow, reflecting growth inwholesale sales, notably at Saint Laurent and PUMA.
The year-on-year decrease in trade payables and the netliability recorded in other current assets and liabilities ledto a €77 million net cash outflow in 2015, primarilyreflecting the payment of restructuring costs by Gucci.
Property, plant and equipment corresponding to the Group’s operating infrastructure break down as follows in units:
Owned Finance Operating outright leases leases Dec. 31, 2015 Dec. 31, 2014
Stores Luxury Division 10 4 1,250 1,264 1,173 Sport & Lifestyle Division 4 1 697 702 677
Logistics units Luxury Division 11 1 69 81 69 Sport & Lifestyle Division 6 33 39 37
Production units Luxury Division 30 2 39 71 71& other Sport & Lifestyle Division 2 2 4 7
Current assets, net
As of December 31, 2015, net current assets totalled €1,071 million, versus €924 million as of December 31, 2014. Thisitem breaks down as follows:
(in € millions) Dec. 31, 2015 Dec. 31, 2014 Change
Inventories 2,191.2 2,234.7 -43.5Trade receivables 1,137.1 1,030.0 +107.1Trade payables (939.7) (982.8) +43.1Current tax receivables / payables (210.8) (139.5) -71.3Other current assets and liabilities (1,106.8) (1,218.0) +111.2
Current assets, net 1,071.0 924.4 +146.6
5 FINANCIAL INFORMATION ~ 2015 ACTIVITY REPORT
Net property, plant and equipment rose in 2015, due tothe impact of recurring transactions during the year(acquisitions / disposals and depreciation) and exchangerate fluctuations.
Deferred tax liabilities chiefly relate to brands recognisedon business combinations, notably Gucci and PUMA.
As of December 31, 2015, investments in equity-accounted companies primarily comprised shares inWilderness, Tomas Maier and Altuzarra. The year-on-yearincrease in non-current financial assets, net in 2015 waschiefly due to purchases of real-estate investments.
196 Kering ~ 2015 Reference Document
Other non-current assets, net
(in € millions) Dec. 31, 2015 Dec. 31, 2014 Change
Property, plant and equipment, net 2,073.0 1,887.2 +185.8Net deferred tax liabilities (2,008.3) (2,033.8) +25.5Investments in equity-accounted companies 20.9 23.2 -2.3Non-current financial assets, net 443.6 397.2 +46.4Other 39.9 36.2 +3.7
Other non-current assets, net 569.1 310.0 +259.1
05_A_VA_V5 06/04/2016 17:30 Page196
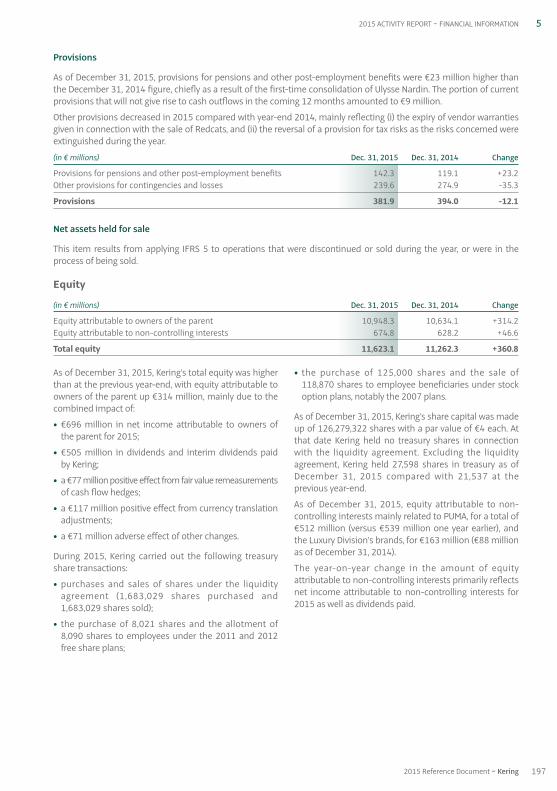
As of December 31, 2015, Kering’s total equity was higherthan at the previous year-end, with equity attributable toowners of the parent up €314 million, mainly due to thecombined impact of:
• €696 million in net income attributable to owners ofthe parent for 2015;
• €505 million in dividends and interim dividends paidby Kering;
• a €77 million positive effect from fair value remeasurementsof cash flow hedges;
• a €117 million positive effect from currency translationadjustments;
• a €71 million adverse effect of other changes.
During 2015, Kering carried out the following treasuryshare transactions:
• purchases and sales of shares under the liquidityagreement (1,683,029 shares purchased and 1,683,029 shares sold);
• the purchase of 8,021 shares and the allotment of8,090 shares to employees under the 2011 and 2012free share plans;
• the purchase of 125,000 shares and the sale of 118,870 shares to employee beneficiaries under stockoption plans, notably the 2007 plans.
As of December 31, 2015, Kering’s share capital was madeup of 126,279,322 shares with a par value of €4 each. Atthat date Kering held no treasury shares in connectionwith the liquidity agreement. Excluding the liquidityagreement, Kering held 27,598 shares in treasury as ofDecember 31, 2015 compared with 21,537 at theprevious year-end.
As of December 31, 2015, equity attributable to non-controlling interests mainly related to PUMA, for a total of€512 million (versus €539 million one year earlier), andthe Luxury Division’s brands, for €163 million (€88 millionas of December 31, 2014).
The year-on-year change in the amount of equityattributable to non-controlling interests primarily reflectsnet income attributable to non-controlling interests for2015 as well as dividends paid.
197
5
2015 Reference Document ~ Kering
2015 ACTIVITY REPORT ~ FINANCIAL INFORMATION
Provisions
As of December 31, 2015, provisions for pensions and other post-employment benefits were €23 million higher thanthe December 31, 2014 figure, chiefly as a result of the first-time consolidation of Ulysse Nardin. The portion of currentprovisions that will not give rise to cash outflows in the coming 12 months amounted to €9 million.
Other provisions decreased in 2015 compared with year-end 2014, mainly reflecting (i) the expiry of vendor warrantiesgiven in connection with the sale of Redcats, and (ii) the reversal of a provision for tax risks as the risks concerned wereextinguished during the year.
(in € millions) Dec. 31, 2015 Dec. 31, 2014 Change
Provisions for pensions and other post-employment benefits 142.3 119.1 +23.2Other provisions for contingencies and losses 239.6 274.9 -35.3
Provisions 381.9 394.0 -12.1
Net assets held for sale
This item results from applying IFRS 5 to operations that were discontinued or sold during the year, or were in theprocess of being sold.
Equity
(in € millions) Dec. 31, 2015 Dec. 31, 2014 Change
Equity attributable to owners of the parent 10,948.3 10,634.1 +314.2Equity attributable to non-controlling interests 674.8 628.2 +46.6
Total equity 11,623.1 11,262.3 +360.8
05_A_VA_V5 06/04/2016 17:30 Page197
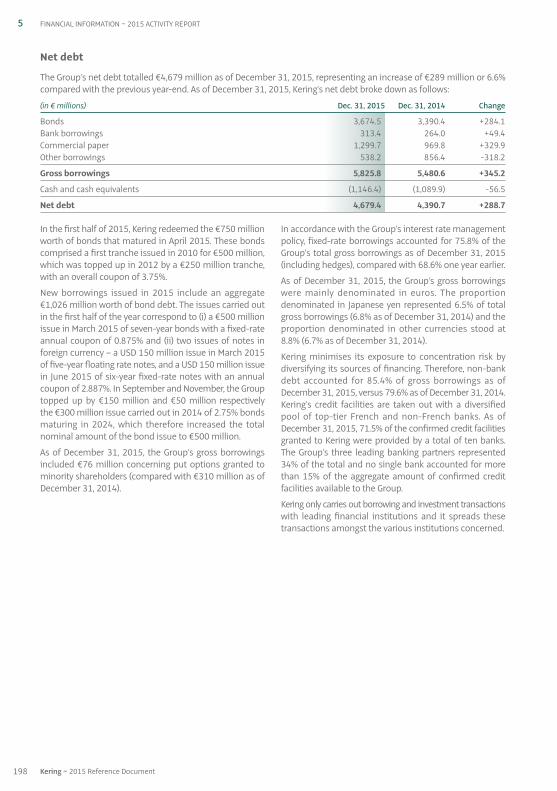
In the first half of 2015, Kering redeemed the €750 millionworth of bonds that matured in April 2015. These bondscomprised a first tranche issued in 2010 for €500 million,which was topped up in 2012 by a €250 million tranche,with an overall coupon of 3.75%.
New borrowings issued in 2015 include an aggregate€1,026 million worth of bond debt. The issues carried outin the first half of the year correspond to (i) a €500 millionissue in March 2015 of seven-year bonds with a fixed-rateannual coupon of 0.875% and (ii) two issues of notes inforeign currency – a USD 150 million issue in March 2015of five-year floating rate notes, and a USD 150 million issuein June 2015 of six-year fixed-rate notes with an annualcoupon of 2.887%. In September and November, the Grouptopped up by €150 million and €50 million respectivelythe €300 million issue carried out in 2014 of 2.75% bondsmaturing in 2024, which therefore increased the totalnominal amount of the bond issue to €500 million.
As of December 31, 2015, the Group’s gross borrowingsincluded €76 million concerning put options granted tominority shareholders (compared with €310 million as ofDecember 31, 2014).
In accordance with the Group’s interest rate managementpolicy, fixed-rate borrowings accounted for 75.8% of theGroup’s total gross borrowings as of December 31, 2015(including hedges), compared with 68.6% one year earlier.
As of December 31, 2015, the Group’s gross borrowingswere mainly denominated in euros. The proportiondenominated in Japanese yen represented 6.5% of totalgross borrowings (6.8% as of December 31, 2014) and theproportion denominated in other currencies stood at8.8% (6.7% as of December 31, 2014).
Kering minimises its exposure to concentration risk bydiversifying its sources of financing. Therefore, non-bankdebt accounted for 85.4% of gross borrowings as ofDecember 31, 2015, versus 79.6% as of December 31, 2014.Kering’s credit facilities are taken out with a diversifiedpool of top-tier French and non-French banks. As ofDecember 31, 2015, 71.5% of the confirmed credit facilitiesgranted to Kering were provided by a total of ten banks.The Group’s three leading banking partners represented34% of the total and no single bank accounted for morethan 15% of the aggregate amount of confirmed creditfacilities available to the Group.
Kering only carries out borrowing and investment transactionswith leading financial institutions and it spreads thesetransactions amongst the various institutions concerned.
Net debt
The Group’s net debt totalled €4,679 million as of December 31, 2015, representing an increase of €289 million or 6.6%compared with the previous year-end. As of December 31, 2015, Kering’s net debt broke down as follows:
(in € millions) Dec. 31, 2015 Dec. 31, 2014 Change
Bonds 3,674.5 3,390.4 +284.1Bank borrowings 313.4 264.0 +49.4Commercial paper 1,299.7 969.8 +329.9Other borrowings 538.2 856.4 -318.2
Gross borrowings 5,825.8 5,480.6 +345.2
Cash and cash equivalents (1,146.4) (1,089.9) -56.5
Net debt 4,679.4 4,390.7 +288.7
198 Kering ~ 2015 Reference Document
5 FINANCIAL INFORMATION ~ 2015 ACTIVITY REPORT
05_A_VA_V5 06/04/2016 17:30 Page198
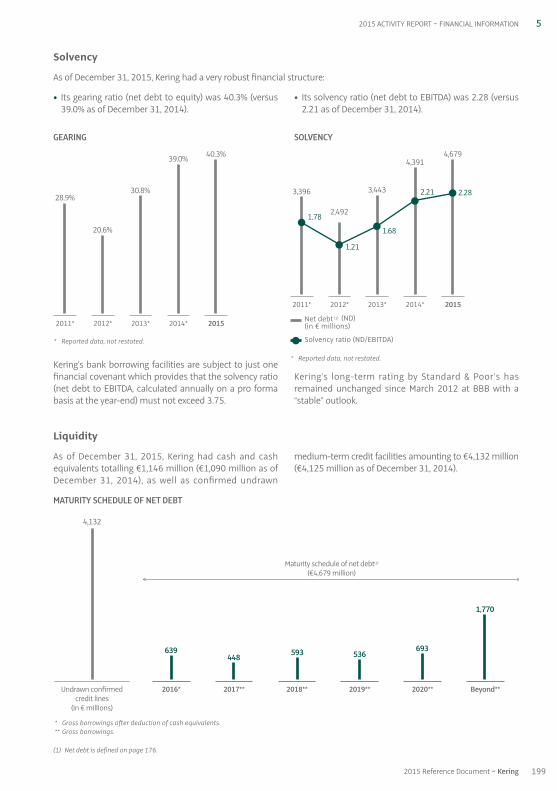
MATURITY SCHEDULE OF NET DEBT
As of December 31, 2015, Kering had cash and cashequivalents totalling €1,146 million (€1,090 million as ofDecember 31, 2014), as well as confirmed undrawn
medium-term credit facilities amounting to €4,132 million(€4,125 million as of December 31, 2014).
Liquidity
• Its gearing ratio (net debt to equity) was 40.3% (versus39.0% as of December 31, 2014).
GEARING
Kering’s bank borrowing facilities are subject to just onefinancial covenant which provides that the solvency ratio(net debt to EBITDA, calculated annually on a pro formabasis at the year-end) must not exceed 3.75.
• Its solvency ratio (net debt to EBITDA) was 2.28 (versus2.21 as of December 31, 2014).
SOLVENCY
Kering’s long-term rating by Standard & Poor’s hasremained unchanged since March 2012 at BBB with a“stable” outlook.
Solvency
As of December 31, 2015, Kering had a very robust financial structure:
52015 ACTIVITY REPORT ~ FINANCIAL INFORMATION
* Reported data, not restated.
20152011* 2012* 2013*
40.3%39.0%
28.9%
20.6%
30.8%
2014*
* Reported data, not restated.
Net debt (1) (ND)(in € millions)
Solvency ratio (ND/EBITDA)
2015
4,679
2.28
2011* 2012* 2013* 2014*
4,391
2.213,396
2,492
3,443
1.78
1.21
1.68
Undrawn confirmedcredit lines
(in € millions)
Maturity schedule of net debt(1)
(€4,679 million)
Beyond**
* Gross borrowings after deduction of cash equivalents.** Gross borrowings.
639
4,132
448 593 536693
1,770
2016* 2017** 2018** 2019** 2020**
1992015 Reference Document ~ Kering
(1) Net debt is defined on page 176.
05_A_VA_V5 06/04/2016 17:30 Page199
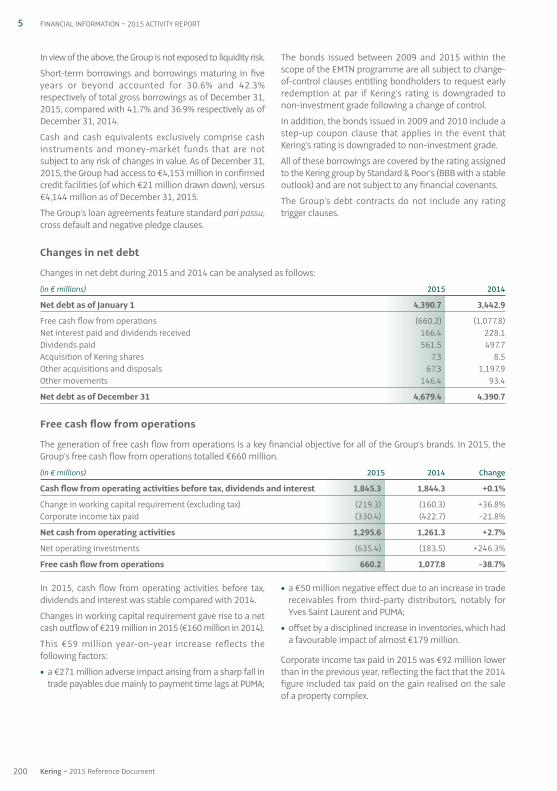
In 2015, cash flow from operating activities before tax,dividends and interest was stable compared with 2014.
Changes in working capital requirement gave rise to a netcash outflow of €219 million in 2015 (€160 million in 2014).
This €59 million year-on-year increase reflects thefollowing factors:
• a €271 million adverse impact arising from a sharp fall intrade payables due mainly to payment time lags at PUMA;
• a €50 million negative effect due to an increase in tradereceivables from third-party distributors, notably forYves Saint Laurent and PUMA;
• offset by a disciplined increase in inventories, which hada favourable impact of almost €179 million.
Corporate income tax paid in 2015 was €92 million lowerthan in the previous year, reflecting the fact that the 2014figure included tax paid on the gain realised on the saleof a property complex.
Changes in net debt
Changes in net debt during 2015 and 2014 can be analysed as follows:
(in € millions) 2015 2014
Net debt as of January 1 4,390.7 3,442.9
Free cash flow from operations (660.2) (1,077.8)Net interest paid and dividends received 166.4 228.1Dividends paid 561.5 497.7Acquisition of Kering shares 7.3 8.5Other acquisitions and disposals 67.3 1,197.9Other movements 146.4 93.4
Net debt as of December 31 4,679.4 4,390.7
Free cash flow from operations
The generation of free cash flow from operations is a key financial objective for all of the Group’s brands. In 2015, theGroup’s free cash flow from operations totalled €660 million.
(in € millions) 2015 2014 Change
Cash flow from operating activities before tax, dividends and interest 1,845.3 1,844.3 +0.1%
Change in working capital requirement (excluding tax) (219.3) (160.3) +36.8%Corporate income tax paid (330.4) (422.7) -21.8%
Net cash from operating activities 1,295.6 1,261.3 +2.7%
Net operating investments (635.4) (183.5) +246.3%
Free cash flow from operations 660.2 1,077.8 -38.7%
In view of the above, the Group is not exposed to liquidity risk.
Short-term borrowings and borrowings maturing in fiveyears or beyond accounted for 30.6% and 42.3%respectively of total gross borrowings as of December 31,2015, compared with 41.7% and 36.9% respectively as ofDecember 31, 2014.
Cash and cash equivalents exclusively comprise cashinstruments and money-market funds that are notsubject to any risk of changes in value. As of December 31,2015, the Group had access to €4,153 million in confirmedcredit facilities (of which €21 million drawn down), versus€4,144 million as of December 31, 2015.
The Group’s loan agreements feature standard pari passu,cross default and negative pledge clauses.
The bonds issued between 2009 and 2015 within thescope of the EMTN programme are all subject to change-of-control clauses entitling bondholders to request earlyredemption at par if Kering’s rating is downgraded tonon-investment grade following a change of control.
In addition, the bonds issued in 2009 and 2010 include astep-up coupon clause that applies in the event thatKering’s rating is downgraded to non-investment grade.
All of these borrowings are covered by the rating assignedto the Kering group by Standard & Poor’s (BBB with a stableoutlook) and are not subject to any financial covenants.
The Group’s debt contracts do not include any ratingtrigger clauses.
200 Kering ~ 2015 Reference Document
5 FINANCIAL INFORMATION ~ 2015 ACTIVITY REPORT
05_A_VA_V5 06/04/2016 17:30 Page200

The 5.0% increase in this item recorded by the LuxuryDivision was mainly attributable to currency effects. Theyear-on-year stability at constant exchange rates reflectsthe Division’s focus on organic growth on a same-storebasis and on consolidating its existing store network. Theincrease for the Sport & Lifestyle Division was alsoprimarily due to currency effects. In 2015, 46% of theGroup’s gross operating investments concerned the storenetwork (versus 59% in 2014).
The year-on-year increase in gross operating investmentsfor the “Corporate and other” segment chiefly correspondsto the aforementioned compensation paid to Safilo aswell as to investments in information systems and realestate projects, notably in Milan, Paris and Tokyo.
Available cash flow
In 2015, net cash outflows relating to net finance costsincluded €12 million in interest paid and dividendsreceived versus €5 million in 2014.
Available cash flow for the year amounted to €494 millioncompared with €850 million in 2014.
Dividends paid
Dividends paid in 2015 were slightly higher than in 2014.The 2015 figure included €57 million paid to minorityshareholders of consolidated subsidiaries (€24 million in2014), of which almost €43 million related to PUMA. Thecash dividend paid by Kering to its own shareholders in2015 amounted to €505 million (including the interimcash dividend paid on January 26, 2015), representing aslight increase compared with 2014.
Acquisitions and disposals
The €7 million recorded under “Acquisition of Keringshares” – which corresponds to purchases net of sales –primarily relates to the purchase of 133,021 shares forthe Group’s stock option and free share plans.
During 2015 Kering did not purchase any PUMA shares andkept its interest in the company at 85.81%, unchangedfrom year-end 2014.
The impact of other acquisitions and disposals of securitiesduring 2015 mainly includes (i) nearly €84 million in financialinvestments made by the Group, primarily concerningreal estate entities and (ii) nearly €4 million in net financialcash flows related to discontinued operations.
In 2014, the impact of other acquisitions and disposals ofsecurities mainly concerned (i) the acquisition of UlysseNardin during the year and (ii) €488 million in financialcash flows related to discontinued operations, includingcash outflows to finance the trust set up at the time ofthe sale of La Redoute.
Other movements
This item primarily includes the impact of fluctuations inexchange rates and fair value remeasurements of financialinstruments in accordance with IAS 32 and IAS 39.
(in € millions) 2015 2014 Change
Luxury Division 390.9 372.4 +5.0%Sport & Lifestyle Division 91.0 85.5 +6.4%Corporate and other 190.2 93.5 +103.4%
Gross operating investments 672.1 551.4 +21.9%
The net cash outflow relating to net operating investmentstotalled €635 million in 2015. Net of €368 million inproceeds from disposals of property, plant and equipmentand intangible assets (primarily from the sale of a propertycomplex), the figure recorded for 2014 came out at€552 million.
Gross operating investments totalled €672 million in2015, up 22% compared with 2014. Adjusted for the firstinstalment paid in January 2015 of the compensationdue to Safilo, the year-on-year increase amounted to16.1%. This item breaks down as follows:
201
5
2015 Reference Document ~ Kering
2015 ACTIVITY REPORT ~ FINANCIAL INFORMATION
05_A_VA_V5 06/04/2016 17:30 Page201
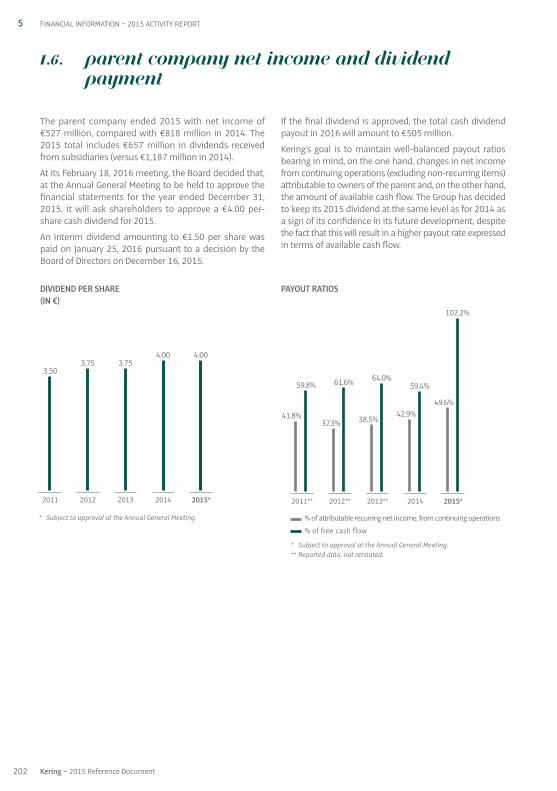
202 Kering ~ 2015 Reference Document
5 FINANCIAL INFORMATION ~ 2015 ACTIVITY REPORT
DIVIDEND PER SHARE (IN €)
PAYOUT RATIOS
The parent company ended 2015 with net income of€527 million, compared with €818 million in 2014. The2015 total includes €657 million in dividends receivedfrom subsidiaries (versus €1,187 million in 2014).
At its February 18, 2016 meeting, the Board decided that,at the Annual General Meeting to be held to approve thefinancial statements for the year ended December 31,2015, it will ask shareholders to approve a €4.00 per-share cash dividend for 2015.
An interim dividend amounting to €1.50 per share waspaid on January 25, 2016 pursuant to a decision by theBoard of Directors on December 16, 2015.
If the final dividend is approved, the total cash dividendpayout in 2016 will amount to €505 million.
Kering’s goal is to maintain well-balanced payout ratiosbearing in mind, on the one hand, changes in net incomefrom continuing operations (excluding non-recurring items)attributable to owners of the parent and, on the other hand,the amount of available cash flow. The Group has decidedto keep its 2015 dividend at the same level as for 2014 asa sign of its confidence in its future development, despitethe fact that this will result in a higher payout rate expressedin terms of available cash flow.
1.6. Parent company net income and dividendpayment
* Subject to approval at the Annual General Meeting.
2015*
4.00
2011 2012 2013 2014
4.00
3.503.75 3.75
* Subject to approval at the Annual General Meeting.** Reported data, not retstated.
% of attributable recurring net income, from continuing operations
% of free cash flow
2015*
49.6%
102.2%
2011** 2012** 2013** 2014
42.9%
59.4%
41.8%
59.8%
37.3% 38.5%
61.6% 64.0%
05_A_VA_V5 06/04/2016 17:31 Page202
Positioned in structurally high-growth markets, Keringhas very solid fundamentals and a portfolio of powerfulbrands with strong potential.
In 2016, the Luxury activities will focus on achieving same-store revenue growth, with a targeted and selectiveexpansion strategy for the store network, which will leadto a slower pace of net store openings. At Gucci, thechanges put in place since 2015 in terms of both creativevision and the brand’s product offering will be stepped upand bear fruit during the course of the year. With regards
to the Sport & Lifestyle activities, PUMA expects to capitaliseon its successful repositioning and achieve further revenuegrowth as well as an increase in recurring operating income.
In an unsettled economic environment, with currencyfluctuations that could once again lead to volatility in theshort term, Kering intends to pursue its strategy of rigorouslymanaging and allocating its resources in order toenhance its operating performance, cash flow generationand return on capital employed.
1.9. Outlook
On March 16, 2016, Volcom, part of Kering’s Sport & Lifestyleactivities, has sold the Electric brand via a managementbuyout (MBO) to a group led by Eric Crane, Electric’s ChiefExecutive Officer.
The transaction includes all the assets of Electric and therights attached to the brand.
Electric, a Californian premium sports and Lifestyle brandthat sells accessories including sunglasses, goggles andwatches, was acquired by Volcom in 2008.
1.7. Transactions with related parties
Transactions with related parties are described in Note 35 to the consolidated financial statements.
1.8. Subsequent events
203
5
2015 Reference Document ~ Kering
2015 ACTIVITY REPORT ~ FINANCIAL INFORMATION
05_A_VA_V5 06/04/2016 17:31 Page203
204 Kering ~ 2015 Reference Document
5 FINANCIAL INFORMATION ~ INVESTMENT POLICY
The Group conducts a targeted investment policydesigned to reinforce both its image and the uniquepositioning of its brands, as well as to increase its returnon capital employed.
The Group’s investment policy is focused on thedevelopment of its store network, the conversion andrenovation of its existing points of sale, the establishmentand maintenance of manufacturing units in the Luxurysector, and the development of IT systems.
Gross operating investments amounted to €672 millionas of December 31, 2015, up 22% on 2014. In the LuxuryDivision, the 5.0% rise in investments primarily resultsfrom currency effects. Investments were stable atconstant exchange rates, reflecting the Division’s focus onachieving organic growth on a same-store basis and onconsolidating the existing store network. The increase forthe Sport & Lifestyle Division was also primarily due tocurrency effects.
In 2015, 46% of the Group’s gross operating investmentsconcerned the store network (versus 59% in 2014).
2.2. Operating investments
2015
The Group has a balanced portfolio of complementarybrands and did not undertake any major investments in2015. Financial investments represented net cashoutflows of €25.6 million for the year.
The cash impact of the sale of business restated inaccordance with IFRS 5 (Sergio Rossi and the Redcatsgroup) is shown on the line “Net cash from (used in)discontinued operations” and detailed in Note 12 to theconsolidated financial statements.
2014
Financial investments represented net cash outflows of€590.2 million for 2014 and chiefly included the acquisitionof the Ulysse Nardin group. Acquisitions exceededdisposals of financial assets, taking into accountrecapitalisations and refinancing, asset disposals anddiscontinued operations.
Kering strengthens its portfolio of Luxury brands
On November 19, 2014, Kering announced that it hadfinalised the acquisition of 100% of Ulysse Nardin. Thebrand is now part of Kering’s Luxury – Watches & JewelleryDivision, which is headed by Albert Bensoussan.
Founded in 1846 by Ulysse Nardin with its roots in thenautical world, the eponymous watchmaking house wastaken over and relaunched in 1983 by Rolf W. Schnyderwho transformed it into a highly profitable business witha strong financial structure. The company has a verystrong brand identity based on its historical expertise inmarine chronometers and ultra-complex timepieces.
Ulysse Nardin has been consolidated in the Group’sfinancial statements with effect from November 1, 2014.The provisional purchase price accounting for thisacquisition was finalised at end-December 2015.
2.1. Financial investments
Kering’s investment policy is designed to support andenhance the Group’s growth potential on its markets and is focused on financial investments (acquisitions anddisposals of assets) and investments related to operations(organic growth).
Financial investments reflect the Group’s strategy ofreinforcing its profitable high-growth activities in the
Luxury market by acquiring attractive brands with stronggrowth potential and market positions that perfectlycomplement its existing assets.
Operating investments are designed to accelerate organicgrowth for the Group’s brands. This is achieved by, forexample, developing and renovating the store networkand by investing in logistics centres or IT systems.
2. Investment policy
05_B_VA_V5 06/04/2016 17:30 Page204
2052015 Reference Document ~ Kering
5INVESTMENT POLICY ~ FINANCIAL INFORMATION
The year-on-year increase in gross operating investmentsfor the “Corporate and other” segment chiefly correspondsto the compensation due to Safilo as well as to investmentsin information systems and real estate projects, notablyin Milan, Paris and Tokyo.
In 2015, net operating investments included €37 millionin proceeds from disposals of property, plant andequipment and intangible assets (€368 million in 2014).
Luxury Division
The Luxury Division’s gross operating investmentstotalled €391 million for 2015, 5.0% higher than in 2014.The increase mainly stemmed from currency effects,since gross operating investments rose only slightly year-on-year at constant exchange rates, reflecting – as in2014 – the Division’s focus on achieving organic growthon a same-store basis and consolidating the network ofexisting stores, while taking into consideration the moreunsettled operating context for the Luxury industry. As aproportion of revenue, gross operating investmentsrepresented 5.0% in 2015 versus 5.5% in 2014.
As of December 31, 2015 the Luxury Division had a network of 1,264 directly-operated stores, including773 (61%) in mature markets and 491 in emergingmarkets. Net store additions during the year totalled 78,compared to 90 in 2014.
Gucci
Gucci’s gross operating investments amounted to€193 million in 2015, up 3.4% on 2014 driven mainly bycurrency effects. The figure for 2015 included the impactof a major store refurbishment program launched duringthe year, and as of December 31, 2015, a total of 34 points of sale had already been remodelled based onthe new store concept.
As of December 31, 2015, Gucci operated 525 storesdirectly, including 218 in emerging markets. A net 20 newstores were added during the year. Five of the newopenings reflect the decision taken in 2014 to bring backunder direct management points of sale that werepreviously operated by third parties in South Africa andthe United States.
Bottega Veneta
The brand’s gross operating investments totalled almost€50 million in 2015, up by €9 million, or 21.3% on theprevious year, although 2014 represented a trough in itscapital expenditure cycle. In addition, the overall grossoperating investments figure for 2015 represented 3.8%of Bottega Veneta’s revenue, which is quite a low ratiocompared with Kering’s other Luxury brands.
Bottega Veneta’s network of directly-operated storestotalled 251 as of December 31, 2015, including 110 inemerging markets. There were 15 net store additionsduring the year.
Yves Saint Laurent
Gross operating investments climbed 16.4% to around€63 million in 2015. However, the pace of growth ininvestments was slower than revenue or operatingincome growth. This had a positive impact on cash flowgeneration for the brand.
As of December 31, 2015, the Yves Saint Laurent branddirectly operated 142 stores, including 61 in emergingmarkets. There were 14 net store openings during the year,including the Tokyo flagship store in the Omotesando district.
Other Luxury brands
The network of directly-operated stores owned by OtherLuxury brands totalled 346 stores as of December 31,2015. There were 29 net store additions during the year.The network comprises 244 stores in mature marketsand 102 stores in emerging markets.
Despite a negative currency effect arising from theconversion of foreign currency denominated capitalexpenditure, gross operating investments decreasedyear-on-year to €85 million. As in 2014, this reflects thebrands’ highly selective and disciplined capital spendingstrategies.
Sport & Lifestyle Division
Gross operating investments totalled €91 million in 2015,up 6.4% compared with 2014. The increase reflectscurrency effects as well as the rise in investments atPUMA in connection with the brand’s relaunch.
As of December 31, 2015, the Sport & Lifestyle Division’snetwork of directly-operated stores had 702 points ofsale. There were 25 net store additions during the year, ofwhich 16 in emerging markets.
PUMA
Gross operating investments amounted to €85 million,up 11.3% on 2014, reflecting the combined impact of theconversion into euros of investments undertaken outsidethe eurozone and the brand’s continuing measures tooverhaul its supply chain and information systems.
As of December 31, 2015, PUMA’s directly-operated retailnetwork included 651 stores, representing 27 netadditions compared with December 31, 2014. Aroundtwo-thirds of existing stores and new stores openedduring the year are in emerging markets where thisdistribution channel is growing and delivering a goodlevel of profitability.
05_B_VA_V5 06/04/2016 17:30 Page205

Other Sport & Lifestyle brands
Volcom and Electric’s gross operating investments totalledsome €6 million in 2015, a €4 million decrease comparedwith 2014.
Volcom’s directly-operated store network comprised 50 stores as of December 31, 2015, including 8 inemerging markets.
5 FINANCIAL INFORMATION ~ INVESTMENT POLICY
206 Kering ~ 2015 Reference Document
05_B_VA_V5 06/04/2016 17:30 Page206
The Kering group has established a centralised structurefor the management of liquidity, exchange rate andinterest rate risks. The Group’s Financing and TreasuryDepartment, which reports to the Finance Department, isresponsible for this organisation and has the necessaryexpertise, resources (particularly technical) andinformation systems to carry out the necessary tasks. Itexecutes transactions in various financial markets withoptimum efficiency and security via Kering Finance SNC,which is dedicated to cash management and financing.The Financing and Treasury Department also coordinatescash management for the subsidiaries and sets out theGroup’s banking policy.
The financial risks identified by the Group aresummarised below:
Counterparty risk
Kering minimises its exposure to counterparty risk bydealing only with investment grade companies and byspreading its exposure among its various counterparties,up to their respective exposure and maturity limits.Counterparties to derivative transactions are included inthe Group’s counterparty risk management procedures.Each of these transactions requires approval and isgoverned by limits and maturities that are reviewed on aregular basis. Counterparties are assessed using aninternal classification system based on the rating theyhave received from rating agencies. Counterparties mustbe rated at least “BBB” by Standard & Poor’s and theequivalent by Moody’s.
Equity risk
In the normal course of business, the Group enters intotransactions involving shares in consolidated companiesor shares issued by Kering. The Group trades in its ownsecurities either directly or through derivatives as part ofits share buy-back programme and in accordance withapplicable regulations. Kering has also signed anagreement with a financial broker in order to improve theliquidity of the Group’s shares and ensure share pricestability. This agreement complies with the Professional
Code of Conduct drawn up by the French association offinancial and investment firms (Association française desmarchés financiers – AMAFI) and approved by the Frenchfinancial markets authority (Autorité des marchésfinanciers – AMF).
Shares held in connection with non-consolidatedinvestments represent a low exposure risk for the Groupand are not hedged.
When Kering enters into financial investments in theform of open-ended investment funds or equivalentfunds, it systematically uses liquid monetary instrumentswith maturities of less than three months in order tomitigate risk. Consequently, the price risk borne by Keringis deemed not to be material.
Additional information on equity risk is provided in Note 30.3 to the annual consolidated financial statements.
Foreign exchange risk
The Group uses hedging instruments to reduce its exposureto currency risk based on the specific requirements ofeach Division.
These instruments are used either to hedge foreigncurrency trade receivables and payables, or to hedge highlyprobable forecast exposures and / or firm commitments.Each entity hedges the risk generated by using a currencyother than its functional currency in its commercialdealings.
Companies in the Sport & Lifestyle Division primarily hedgethe foreign exchange risk generated by firm purchasecommitments in foreign currencies and highly probablepurchase flows. Periods depend on the activity specific toeach company. Hedging flows may also be generated byinter-company flows through purchasing offices.
Foreign exchange risk hedging by the Luxury Division’sentities mainly covers sales made to their retail subsidiaries,and to a lesser extent purchase flows. These are essentiallyinter-company flows.
Future foreign exchange exposures are determined usinga regularly updated budget procedure.
3.1. Financial risks
Risk management forms part of the ongoing identificationand evaluation process of Group risks (see section
“Internal control and risk management procedures” in theChairman’s report, page 165 of the Reference Document).
3. Risk management
207
5
2015 Reference Document ~ Kering
RISK MANAGEMENT ~ FINANCIAL INFORMATION
05_C_VA_V5 06/04/2016 17:30 Page207

Hedging periods are adapted to each brand’s businesscycle and only marginally exceed one year at eachreporting date.
Foreign exchange policies and procedures are set out byeach company’s Executive Committee and are validatedby Kering.
Each brand hedges its own foreign exchange risks inaccordance with policies and procedures reflecting itsspecific requirements.
These procedures incorporate Group policies as definedby Kering:
• Kering Finance SNC is the sole counterparty in currencytransactions, except where specific regulatory oroperating constraints rule this out;
• the amounts and maturities of all currency hedgingtransactions are backed by an economic underlying toprevent any speculative dealing;
• all highly probable exposures are at least 80% - hedgedwhere they concern forecast amounts, or fully hedgedin the case of firm commitments;
• Kering has strictly limited the type of financialinstruments that may be used for hedging purposes;
• each brand implements its own internal control systemand conducts audits on a regular basis.
Kering ensures that each brand’s currency riskmanagement policy is consistent with its underlyingforeign exchange exposure, notably through a monthlycurrency reporting procedure. Kering also conductsperiodic audits at Group level.
The Group also hedges foreign exchange risk on financialassets and liabilities issued in foreign currencies by usingcurrency swaps for refinancing purposes or by investingcash in euros or local currency.
Note 30.2 to the annual consolidated financial statementssets out the nature of the hedging instruments held bythe Group and its exposure to foreign exchange risk (seepage 277, “Exposure to foreign exchange risk”).
Kering Finance SNC processes, controls and providesadministrative support for foreign exchange transactionson behalf of Group companies. Front-office, middle-office, back-office and accounting tasks are separated forsecurity reasons, as well as to ensure that derivativescontracted internally are unwound on the market. KeringFinance SNC uses market-standard techniques andinformation systems to price currency instruments.
Interest rate risk
Interest rate risk policy falls within Kering’s remit, and ismanaged on a consolidated basis by Kering Finance SNC.Kering has set a 70% - fixed / 30% - floating target rate mixfor Group consolidated net debt.
Interest rate risk is measured based on current andprojected consolidated net debt, the schedule of hedgingpositions and fixed-rate / floating-rate debt issuances.This enables interest-rate hedging in accordance with theGroup’s target fixed / floating rate mix. Appropriatehedging products are set up through Kering Finance SNC,in close liaison with Kering’s Executive Management.Kering mainly uses (i) interest rate swaps to convert all ora portion of its fixed-rate bonds to a floating rate and (ii) caps and collars in order to protect floating-ratefinancing against rises in interest rates.
Kering Finance SNC processes, controls and providesadministrative support for interest rate transactions onbehalf of Group companies. Front-office, middle-office,back-office and accounting tasks are separated forsecurity reasons. Kering Finance SNC uses market-standard techniques and information systems to priceinterest rate instruments.
Note 30.1 to the annual consolidated financial statementssets out the nature of the hedging instruments held by the Group and its exposure to interest rate risk (seepage 275, “Exposure to interest rate risk”).
Liquidity risk
Liquidity risk management for the Group and each of itssubsidiaries is closely monitored and periodicallyassessed by Kering, based on Group- and brand-levelfinancial reporting procedures.
In order to manage liquidity risk that may arise when itsfinancial liabilities fall due, the Group’s financing policy isgeared towards optimising its maturity schedule andavoiding the concentration of redemptions andrepayments.
The Group’s active risk management policy also seeks todiversify sources of funding and limit reliance onindividual lenders.
The Group had undrawn confirmed lines of credit totalling€4,131.8 million as of December 31, 2015 compared to€4,125.5 million as of December 31, 2014.
Kering has a Euro Medium Term Notes (EMTN) programme inLuxembourg for its bond issuances, representing €5 billion.As of December 31, 2015, €3,675.6 million of this amounthad been used, of which €275.6 million issued in US dollars.The EMTN programme was extended on December 2, 2015for a further one-year period. Kering’s short-term debt israted “A2” by Standard & Poor’s, while its long-term debtis rated “BBB” with a stable outlook.
The Group’s bonds and bank lines of credit are governedby the standard commitment and default clausescustomarily included in this type of agreement: paripassu ranking, a negative-pledge clause that limits thesecurity that can be granted to other lenders, and a cross-default obligation. The bonds issued within the scope of
5 FINANCIAL INFORMATION ~ RISK MANAGEMENT
208 Kering ~ 2015 Reference Document
05_C_VA_V5 06/04/2016 17:30 Page208
In accordance with the AMF’s recommendations, thissection deals only with risks identified by the Group ashaving a potentially significant impact.
Macro-economic instability
Limited growth in the global economy and politicalinstability in certain countries both contribute to adeteriorating macro-economic environment.
The balanced geographical coverage of its Luxury andSport & Lifestyle Divisions limits the Kering group’sexposure to the impact of local recessions and enables itto benefit from growth in emerging countries.
The diversity of the Group’s product offering reduces itsdependence on a specific range. The distribution networkalso benefits from a balanced geographical footprint, withLuxury Division sales made through over 1,200 directly-operated stores in 42 countries.
Raw materials and strategic skills
To meet its customers’ expectations, the Luxury Divisionneeds unhindered availability of raw materials thatcomply with its quality criteria, and sustained skill levelsacross its production teams. To this end, the Kering grouphas forged special partnerships with key suppliers, andpursues a policy of actively seeking new partners. It alsodevelops vertical integration throughout the productionchain by means of acquisitions or strategic businesspartnerships in the subcontracting market.
To maintain the know-how of its Luxury Division businessesover the long term, Kering runs personnel training andskills preservation initiatives, and internalises a numberof functions that were previously subcontracted.
Fluctuation in raw materials prices
The rising price of raw materials used by the Kering LuxuryDivision correlates with high demand for leather, skinsand precious stones. Rising prices of the raw materialsused by the Sport & Lifestyle Division stem from variationsin outsourcing costs and in the prices of rubber, cottonand polyester. Rises in production costs can be wholly orpartially offset by corresponding rises in the sale prices offinished products.
Kering pays careful attention to the traceability of supplies,and insists that suppliers and subcontractors complywith legislation and the Group’s Code of ethics. The LuxuryDivision is especially attentive to ensuring that suppliescomply with international standards on mining conditionsfor gold, diamonds and precious stones. These factorstend to restrict the scope of alternative sourcing optionsfor certain materials. The Group is nevertheless structuredin order to regularly seek new suppliers capable ofmeeting its requirements on these issues.
Commercial appeal and brand value
Kering’s activities are underpinned by powerful globalbrands in the Group’s Luxury and Sport & Lifestyle Divisions.One of the Group’s main operational risks thereforeconcerns the loss of commercial appeal and brand valuethat could arise from poor consideration of consumerexpectations, market changes, loss of key partnerships,problems with product quality, or failure to comply withthe Group’s Sustainability principles. The accountingimpacts of impairment losses are described in Note 19 tothe consolidated financial statements for the year endedDecember 31, 2015 on page 258.
3.2. Strategic and operational risks
the EMTN programme are all subject to change-of-control clauses entitling bondholders to request earlyredemption at par if Kering’s rating is downgraded tonon-investment grade following a change of control.
The bonds issued in 2009 and 2010 also include a step-upcoupon clause that applies in the event that Kering’s ratingis downgraded to non-investment grade (see Note 29.4).
Kering and Kering Finance SNC confirmed lines of creditinclude a default clause (early repayment) in the event offailure to comply with the following financial covenant:consolidated net debt / EBITDA less than or equal to 3.75(see Note 29.5.3 to the annual consolidated financialstatements). This ratio is calculated based on pro formadata. As of December 31, 2015, Kering and Kering Finance
SNC had not drawn down any of the confirmed lines ofcredit subject to this covenant.
Euro bond issues are not subject to any financial covenants.
The Group was in compliance with all these covenants asof December 31, 2015 and there is no foreseeable risk ofbreach.
Information relating to liquidity risk is presented in Note 29to the annual consolidated financial statements, includingthe breakdown of Group debt by maturity and currency,and in Note 30.6 to the annual consolidated financialstatements, which describes liquidity risk in accordancewith IFRS 7.39.
5RISK MANAGEMENT ~ FINANCIAL INFORMATION
2092015 Reference Document ~ Kering
05_C_VA_V5 06/04/2016 17:30 Page209
Consumer expectations
The brands’ creative leadership and the success of itscollections and resulting commercial appeal aremanaged by Creative Departments and their world-renowned designers, and perpetuated by remaining trueto the identity and fundamental values of the brand.Kering’s Sport & Lifestyle brands also play a major role astrend setters for consumers, by investing in R&D andoffering new products and services.
The inability to anticipate changes in consumerexpectations represents a major risk to Kering’s businessdevelopment. To counter this risk, Kering endeavours tostreamline the supply cycle, cutting lead times betweenproduct design and launch phases.
Kering also encourages its Divisions to stay ahead ofconsumer trends by keeping a constant watch overmarket shifts (attending trade fairs, working with trendforecasting agencies, running consumer surveys, etc.).
The Luxury Division brands are therefore broadeningtheir offerings, increasing the number of collections anddeveloping new partnerships with renowned designers.
Loss of key partnerships
Partnerships with celebrities, athletes, sports teams andother brands make a significant contribution to enhancingthe Group’s image. The risk of losing strategic partnershipsis mitigated by renewing major contracts in advance,extending the partnership portfolio, and paying carefulattention to the quality of relationships with figureheadsand brand representatives.
Product quality, health and safety risks
Ensuring the quality of goods and compliance with stringentsafety standards are among the Group’s main priorities.
In order to bring high-quality products to market that arecompliant with these standards, the Group implementsquality control processes covering all of the stages in theproduct lifecycle, from design through to marketing.Products are classified using quality and safety standards,while suppliers are referenced on the basis of technicalaudits and adherence to the Group Suppliers’ Charter inthe Code of ethics. Product quality and safety controls arecarried out at all stages of the production process byquality engineers and accredited laboratories.
Procedures relating to product control are explained ingreater depth in Chapter 3 “Sustainability” of the ReferenceDocument, pages 119 to 121.
All Kering Divisions have a “product” crisis managementunit. In the event of known risk, they follow proceduresensuring that immediate and transparent information isprovided to the public, and that defective products arerecalled.
The Group has also taken out civil liability insurance tocover bodily harm or property damage to third partiescaused by products considered defective (see section 3.4“Main existing insurance programmes” page 213).
Image and reputation, respect for ethicalrules and integrity
The Group carefully safeguards its image and reputationalassets, and consequently seeks to ensure that noincident arises due to unethical behaviour on the part ofentities or individuals under its control, or those withwhich it has business dealings.
All Kering Divisions have a crisis management policy anda unit that liaises with Kering head office.
The Group also monitors adherence by personnel to theKering group Charter, which defines the framework for thedecentralisation of the organisation, and to the Code ofethics (the third edition of which is available in 12 languagesand was circulated to all of the Group’s employees in 2013).A Group Ethics Committee has been established and issupported by two regional counterparts, the Asia-PacificEthics Committee and the Americas Ethics Committee. All three Committees can be contacted via a hotline from74 countries, operating in 12 languages.
The Group regularly examines ways to adapt thesedocuments to its organisation, ensures that suppliersadhere to the Group Suppliers’ Charter, which they arerequired to promote within their production units, andmonitors compliance by means of social audits atproduction sites (see Chapter 3 “Sustainability” of theReference Document, pages 116 to 119).
All Luxury Division brands implement appropriatemethods and steps to ensure their activities comply withthe Group’s Sustainability standards: SA8000 and RJCcertification, social audits and supplier training programmesare examples of the actions and programmes that thebrands have put in place in their day-to-day operations.
The Sport & Lifestyle Division also ensures that its suppliersrespect the Group’s Sustainability standards. PUMA forexample monitors its suppliers’ observance of its SocialAccountability and Fundamental Environmental (SAFE)standards, which forbid child labour, unethical employmentconditions, environmental damage and any businessrelationships with criminal organisations.
5 FINANCIAL INFORMATION ~ RISK MANAGEMENT
210 Kering ~ 2015 Reference Document
05_C_VA_V5 06/04/2016 17:30 Page210
Counterfeiting and parallel distribution networks
Kering owns a large array of brands, models, copyrights,patents, designs and know-how, largely through its Luxuryand Sport & Lifestyle Divisions. This portfolio constitutesintellectual property and a strategic asset for the Group.
The Group’s legal departments manage the brandportfolio and other intellectual property rights, andimplement active and diversified policies to counterbreaches of these rights. Kering actively opposes paralleldistribution networks and illicit networks that sellcounterfeit or copied goods, in particular by working toincrease the traceability of its goods.
Protection of the Group’s intellectual property takes manyforms, from upstream practices of the brand portfolios, todownstream practices, including anti-counterfeitingcustom or police raids or legal action. The costs of monitoringmarkets and tackling counterfeiting, within the brandsand at the Group’s head office, are divided between legaland security functions, or among the stores. These costsare however relatively insignificant at Group level.
Kering also participates in bodies that represent the leadingLuxury industry players. The Group prevents sales of itsproducts by parallel distribution networks by working toincrease the traceability of its goods, prohibiting directsales to these networks and implementing specific measuresto tighten control over its distribution channels.
Dependence on patents, licences and supply contracts
The Group is not significantly dependent on any patents,licences or third-party supply sources.
The Group owns or has licence rights to the trademarks,patents and intellectual property rights that it exploits,free of any restrictions as to right of priority or use (and ofrights likely to restrict such exploitation) in all relevantmarkets. The same applies to the corporate names anddomain names of the subsidiaries or entities, to thenames of the Group’s stores and points of sale and to thetrademarks and signs of the goods and productsmanufactured and marketed by the various Groupentities. This situation does not preclude any of thetrademarks belonging to the Group being licensed tothird parties for the sale of goods or services under itstrademark enhancement policy, as has been the case inperfumes and cosmetics. In all cases, such licensingagreements have been entered into under fair commercialand financial terms and conditions, and have no impacton the ownership of the trademarks and signs belongingto the Group. Further information on contractualobligations and other commitments is provided in Notes34.2.1 and 34.2.3 to the 2015 consolidated financialstatements on pages 291 and 292.
Litigation
Group companies are involved or are likely to be involvedin a number of lawsuits or disputes arising in the normalcourse of business, including litigation with tax, socialsecurity and customs authorities, as well as variousgovernmental and competition authorities. Provisionshave been set aside by the companies for the probablecosts, as estimated by the entities and their experts.According to the Group entities’ experts and advisors, nolitigation currently in progress concerning Groupcompanies presents a risk for the normal operations ofthe Group, or for its future development. Provisions havebeen set aside in the Group’s 2015 consolidated financialstatements to cover all of the abovementioned legalrisks, including the impact of commitments given on thedisposal of controlling interests. None of these risks havebeen qualified as arising outside the scope of normalbusiness for Group companies.
The Group considers that the effective methods andprocedures for identifying and managing its industrialand environmental risks within each of the entitiesconcerned, which rely chiefly on the advice of dulyauthorised external organisations and advisors, meet, inrelevance and proportion, customary technical andprofessional standards under the prevailing regulatoryframework. An active prevention and safety policy is anintegral part of these methods and procedures.
Furthermore, the Group has granted various sellers’representations and vendor warranties in connectionwith disposals of controlling interests in subsidiariesmade over the last ten years (see Note 34.1 to the 2015consolidated financial statements, page 289).
As regards the laws and regulations applicable to theGroup’s activities (excluding possible internationalsanctions that may be imposed against certain countriesbut have no impact on the Group’s activities), Kering’sbusinesses are subject to the same constraints andobligations as those directly applicable to its competitorson its different markets. None of its businesses aresubject to specific rules or exemptions in any of therelevant territories.
The Company is not aware of any foreseeable regulatoryor legislative changes in contradiction with the foregoing.
To the Company’s knowledge, during the last 12 monthsor more, there have been no governmental, legal orarbitration proceedings (including any pending orthreatened proceedings of which the issuer is aware) thathave had in the recent past or are likely to have in thefuture, a significant impact on the financial position orearnings of the Company or the Group.
5RISK MANAGEMENT ~ FINANCIAL INFORMATION
2112015 Reference Document ~ Kering
05_C_VA_V5 06/04/2016 17:30 Page211
Legal risks
The Group has a vast array of brands and domain names,as well as know-how and production processes that areunique to Kering. In particular, Kering has establishedlicensing agreements with its subsidiaries and partnerswho use its intellectual property rights, which make up asignificant portion of the Group’s assets.
Kering works to protect these rights and is active in thefight against counterfeiting, as counterfeiting can have animpact on revenue and damage the reputation of theGroup and its products. Initiatives are carried out by theLegal Department of the Group and its brands with thehelp of external advisors and in conjunction with therelevant local authorities.
The Company, aware that some of its employees haveaccess to confidential information, ensures that they receiveinformation on best practices and the Internal ControlCharter, which help minimise this risk, particularly withregard to the use of information systems and social media.
Lastly, the Group has formed legal organisations on theregional (Asia, the Americas and Europe), local (subsidiaries)and central levels in order to monitor its observance ofvarious applicable laws and regulations.
Talent management
The Group recognises that the talent and creativity of itsemployees are one of the keys to its success. Its capacityto identify, attract and retain staff and nurture their skillsis critical for the Group.
Kering’s human resources policy therefore seeks to promote a stimulating and rewarding workingenvironment, and to foster attachment to the Group andits values. This is done by means of training programmesand profit-sharing. Kering also aims to boost its staff’semployability, to encourage internal mobility and to openup prospects for professional and personal development(see Chapter 3 “Sustainability” of the Reference Document,pages 65 to 68).
Special attention is given to the creative teams, todevelop powerful, lasting brand identities.
Information systems
Most of the Group’s production and transaction processesrely on information systems. The maturity of theinformation systems in use across the Group, as regardssuitability, security, rollout and functionality, is fairlyheterogeneous. The Group runs an ongoing investmentprogramme on the adaptation, improvement, securityand durability of its information systems. Businesscontinuity and recovery plans are regularly updated, andtheir efficacy closely monitored.
With the support of the Divisions’ brand securitydepartments, the Group is introducing data protectionand business continuity plans.
Credit risk
Because of the nature of its businesses, a large proportionof Kering sales is not exposed to customer payment risks.This is true of direct customer sales by the Luxury Division.For sales through wholesalers, there is no strong dependencywhereby loss of particular customers might have asignificant impact on the Group’s business or earnings.
The Sport & Lifestyle Division is more exposed to paymentdefault risks because a significant proportion of itsproducts is distributed through wholesalers. It managesthese risks by constant monitoring of amounts outstanding.As applicable, provisions are set aside against the value ofthe Division’s assets. Credit risk is also minimised byappropriate insurance coverage.
Seasonality of sales
Following the disposals of the retail businesses in 2012and 2013, the Group has focused on the Luxury andSport & Lifestyle sectors. The seasonality of the Group’sactivities has decreased since this repositioning and is nolonger considered a significant risk.
However, for the Group’s Luxury brands, the fourthquarter is the most important in terms of revenue due toyear-end holiday purchases in western countries,although fourth-quarter revenue does not significantlyexceed revenue generated during the first three quartersof the year. In addition, the activity of the Luxury andSport & Lifestyle Divisions generally revolves around thetwice-yearly nature of their collections and changes indelivery dates to wholesalers can result in sales beingdeferred from one quarter to the next.
Exceptional factors likely to have major consequences onthe political or macro-economic environment of one ormore of the Group’s main markets can also impact theGroup’s activities and quarterly results and consequentlychange the usual seasonality pattern in a given fiscal year.
5 FINANCIAL INFORMATION ~ RISK MANAGEMENT
212 Kering ~ 2015 Reference Document
05_C_VA_V5 06/04/2016 17:30 Page212
The Kering risk management policy is based on theongoing identification and evaluation of risks, riskprevention, protection of people and property, and safetyand business continuity plans.
The risk management policy also includes the transfer ofrisks to insurance companies.
Insurance against risks
The Group’s policy of transferring significant risks toinsurance companies is based on:
• achieving the best economic balance between riskcoverage, premiums and self-insurance;
and,
• the insurance available, insurance market constraintsand local regulations.
Coverage is based on the “All risks except” approach,determined by assessing the financial consequences for theCompany of a possible claim, especially in the areas of:
• civil liability: bodily harm or property damage to thirdparties caused by products, fittings and equipment;
• fire, explosions, water damage, etc;
• operating losses following direct damage.
Insurance coverage is purchased based on an assessmentby site and company of the level of coverage necessary toface reasonably estimated potential occurrences ofdiverse risks (liability, damage and third-party retailercounterparty). This assessment takes account of theanalyses of the insurers underwriting the Group’s risks.
The insurance schemes now in force in the Group, whichcentralises most purchases of insurance policies such asproperty and casualty risks for subsidiaries, were takenout with the assistance of internationally recognisedinsurance brokers specialised in covering major risks, withreputable insurers in the industrial risk insurance sector.
Main existing insurance programmes:
• property damage from fire, explosion, floods, machinebreakage, natural disasters affecting its own property:property, furnishings, equipment, merchandise, ITinstallations, and property for which it is responsible, as well as any resulting operating losses, for any perioddeemed necessary for normal business activities toresume;
• damage and loss of equipment, merchandise and / orgoods in transit;
• damage resulting from theft, fraud, embezzlement, oracts of malice to valuable assets, data and / or property;
• bodily harm or property damage following constructionwork carried out as project owner (new buildings,renovations, refurbishments, etc.);
• liability for bodily or property damage to third partiesby motorised vehicles belonging to the differentcompanies;
• liability under general and environmental civil liabilityfor “operating risk”, “post-delivery risk” and “risk afterservices rendered”, due to damages caused to thirdparties in the course of the Group’s business;
• non-payment of receivables by third-party retailers,particularly in the event of default or insolvency.
Other insurance contracts are taken out by Groupcompanies to cover specific risks or to comply with localregulations.
Uninsured risks are exposures for which there is noinsurance coverage offered on the insurance market, or forwhich the cost of available insurance is disproportionatecompared to the potential benefits of the coverage.
The Kering group handles known and manageable risksgiven the current scientific and medical understanding ina manner consistent with other French and internationalindustrial groups with similar types of exposures. This isone of the reasons why the Group is able to place its riskswith insurers ready to deal with the unforeseeable anduncertain consequences of accidents.
3.4. Risk management
Kering’s international presence exposes it to risks regardingnon-compliance with legislation and national regulations,owing to the complexity and changing nature of regulationschiefly arising from corporate and tax law, customs dutiesand import restrictions applied by certain countries.
To guard against risks of non-compliance due to a lack ofawareness of legislative change, Kering provides its Divisionswith a regulatory intelligence service, through head officeand support centres in the regions in which the Groupoperates.
3.3. Compliance risks
5RISK MANAGEMENT ~ FINANCIAL INFORMATION
2132015 Reference Document ~ Kering
05_C_VA_V5 06/04/2016 17:30 Page213
Insurance coverage concerns all Group companies.
The levels of coverage in place for the main potential risksfacing the Group as a whole as of January 1, 2015, were asfollows:
• damages, fire, explosions or water damage and theensuing operating losses: €300 million;
• civil liability: €145 million;
• damage to or loss of goods in transit: €25 million;
• fraud and acts of malice to goods and valuables:€20 million.
In order to diversify the sources of its policies and securelasting coverage for highly volatile risks such as theearthquake in Japan, the Group has taken out insurancewith investors against natural disasters, which is bothindemnity-based and parametric.
The total risk financing cost for Kering includes three mainitems (in addition to “physical” protection and preventionexpenditure):
• cost of deductibles and non-insured losses retained orself-insured by the subsidiaries in 2015: €1.153 million;
• claims covered by the Group itself through its reinsurancecompanies in 2015: €8.6 million (total estimated atyear-end 2015).
Taking out self-insurance through the Group’s reinsurancesubsidiary reduces insurance costs and enhancesperformance because (i) frequently occurring risks arepooled within the Group and insured for an amount thatis fixed per claim and (ii) exceptionally frequent claimsmade in a given year are covered by reinsurance.
Since July 1, 2015, the Group’s reinsurance company hascovered damage and operating losses of up to €5 millionper claim (for the period from July 1 to June 30):
• insurance premiums and management fees includingengineering visits and brokers fees, etc. (final 2015expenses): €17.335 million.
Specific additional policies may also be taken out by certaincompanies or businesses or by virtue of local specificitiesin certain countries (occupational accidents, contributionsto natural disaster funds, etc.). These are managed at thelevel of each company and / or country.
5 FINANCIAL INFORMATION ~ RISK MANAGEMENT
214 Kering ~ 2015 Reference Document
05_C_VA_V5 06/04/2016 17:30 Page214
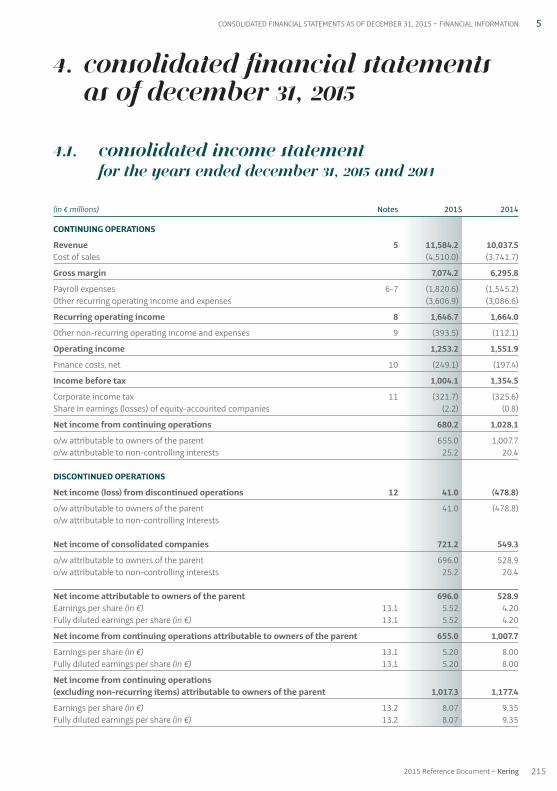
4. Consolidated financial statementsas of December 31, 2015
4.1. Consolidated income statement for the years ended December 31, 2015 and 2014
(in € millions) Notes 2015 2014
CONTINUING OPERATIONS
Revenue 5 11,584.2 10,037.5Cost of sales (4,510.0) (3,741.7)
Gross margin 7,074.2 6,295.8
Payroll expenses 6-7 (1,820.6) (1,545.2)Other recurring operating income and expenses (3,606.9) (3,086.6)
Recurring operating income 8 1,646.7 1,664.0
Other non-recurring operating income and expenses 9 (393.5) (112.1)
Operating income 1,253.2 1,551.9
Finance costs, net 10 (249.1) (197.4)
Income before tax 1,004.1 1,354.5
Corporate income tax 11 (321.7) (325.6)Share in earnings (losses) of equity-accounted companies (2.2) (0.8)
Net income from continuing operations 680.2 1,028.1
o / w attributable to owners of the parent 655.0 1,007.7o / w attributable to non-controlling interests 25.2 20.4
DISCONTINUED OPERATIONS
Net income (loss) from discontinued operations 12 41.0 (478.8)
o / w attributable to owners of the parent 41.0 (478.8)o / w attributable to non-controlling interests
Net income of consolidated companies 721.2 549.3
o / w attributable to owners of the parent 696.0 528.9o / w attributable to non-controlling interests 25.2 20.4
Net income attributable to owners of the parent 696.0 528.9Earnings per share (in €) 13.1 5.52 4.20Fully diluted earnings per share (in €) 13.1 5.52 4.20
Net income from continuing operations attributable to owners of the parent 655.0 1,007.7
Earnings per share (in €) 13.1 5.20 8.00Fully diluted earnings per share (in €) 13.1 5.20 8.00
Net income from continuing operations(excluding non-recurring items) attributable to owners of the parent 1,017.3 1,177.4
Earnings per share (in €) 13.2 8.07 9.35Fully diluted earnings per share (in €) 13.2 8.07 9.35
215
5
2015 Reference Document ~ Kering
CONSOLIDATED FINANCIAL STATEMENTS AS OF DECEMBER 31, 2015 ~ FINANCIAL INFORMATION
05_D_VA_V5 06/04/2016 17:29 Page215
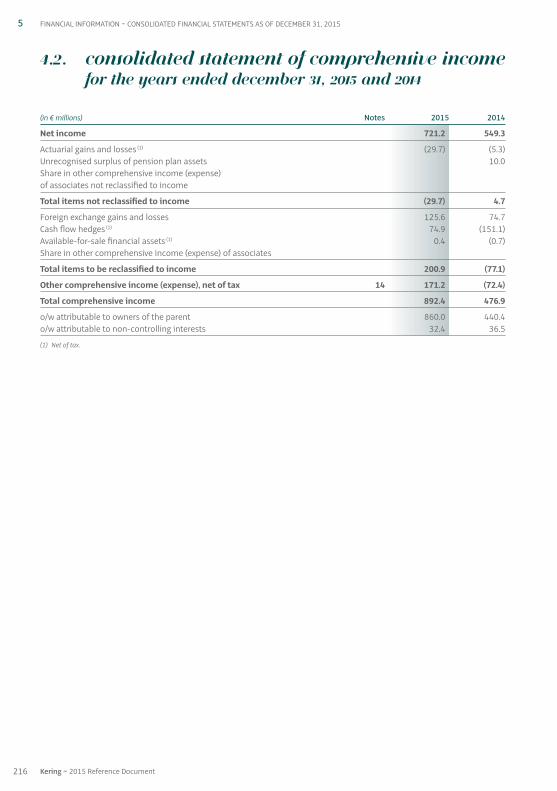
4.2. Consolidated statement of comprehensive incomefor the years ended December 31, 2015 and 2014
(in € millions) Notes 2015 2014
Net income 721.2 549.3
Actuarial gains and losses (1) (29.7) (5.3)Unrecognised surplus of pension plan assets 10.0Share in other comprehensive income (expense) of associates not reclassified to income
Total items not reclassified to income (29.7) 4.7
Foreign exchange gains and losses 125.6 74.7Cash flow hedges (1) 74.9 (151.1)Available-for-sale financial assets (1) 0.4 (0.7)Share in other comprehensive income (expense) of associates
Total items to be reclassified to income 200.9 (77.1)
Other comprehensive income (expense), net of tax 14 171.2 (72.4)
Total comprehensive income 892.4 476.9
o / w attributable to owners of the parent 860.0 440.4o / w attributable to non-controlling interests 32.4 36.5
(1) Net of tax.
216 Kering ~ 2015 Reference Document
5 FINANCIAL INFORMATION ~ CONSOLIDATED FINANCIAL STATEMENTS AS OF DECEMBER 31, 2015
05_D_VA_V5 06/04/2016 17:29 Page216
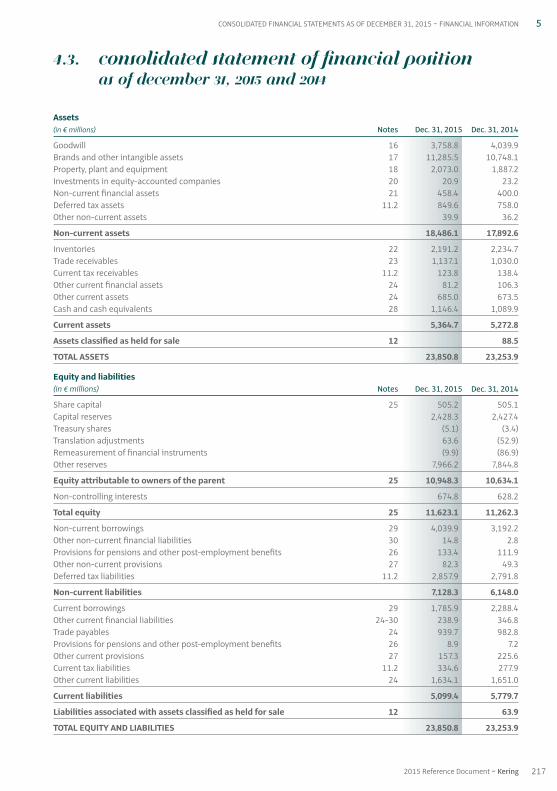
4.3. Consolidated statement of financial positionas of December 31, 2015 and 2014
Assets(in € millions) Notes Dec. 31, 2015 Dec. 31, 2014
Goodwill 16 3,758.8 4,039.9Brands and other intangible assets 17 11,285.5 10,748.1Property, plant and equipment 18 2,073.0 1,887.2Investments in equity-accounted companies 20 20.9 23.2Non-current financial assets 21 458.4 400.0Deferred tax assets 11.2 849.6 758.0Other non-current assets 39.9 36.2
Non-current assets 18,486.1 17,892.6
Inventories 22 2,191.2 2,234.7Trade receivables 23 1,137.1 1,030.0Current tax receivables 11.2 123.8 138.4Other current financial assets 24 81.2 106.3Other current assets 24 685.0 673.5Cash and cash equivalents 28 1,146.4 1,089.9
Current assets 5,364.7 5,272.8
Assets classified as held for sale 12 88.5
TOTAL ASSETS 23,850.8 23,253.9
Equity and liabilities(in € millions) Notes Dec. 31, 2015 Dec. 31, 2014
Share capital 25 505.2 505.1Capital reserves 2,428.3 2,427.4Treasury shares (5.1) (3.4)Translation adjustments 63.6 (52.9)Remeasurement of financial instruments (9.9) (86.9)Other reserves 7,966.2 7,844.8
Equity attributable to owners of the parent 25 10,948.3 10,634.1
Non-controlling interests 674.8 628.2
Total equity 25 11,623.1 11,262.3
Non-current borrowings 29 4,039.9 3,192.2Other non-current financial liabilities 30 14.8 2.8Provisions for pensions and other post-employment benefits 26 133.4 111.9Other non-current provisions 27 82.3 49.3Deferred tax liabilities 11.2 2,857.9 2,791.8
Non-current liabilities 7,128.3 6,148.0
Current borrowings 29 1,785.9 2,288.4Other current financial liabilities 24-30 238.9 346.8Trade payables 24 939.7 982.8Provisions for pensions and other post-employment benefits 26 8.9 7.2Other current provisions 27 157.3 225.6Current tax liabilities 11.2 334.6 277.9Other current liabilities 24 1,634.1 1,651.0
Current liabilities 5,099.4 5,779.7
Liabilities associated with assets classified as held for sale 12 63.9
TOTAL EQUITY AND LIABILITIES 23,850.8 23,253.9
217
5
2015 Reference Document ~ Kering
CONSOLIDATED FINANCIAL STATEMENTS AS OF DECEMBER 31, 2015 ~ FINANCIAL INFORMATION
05_D_VA_V5 06/04/2016 17:29 Page217
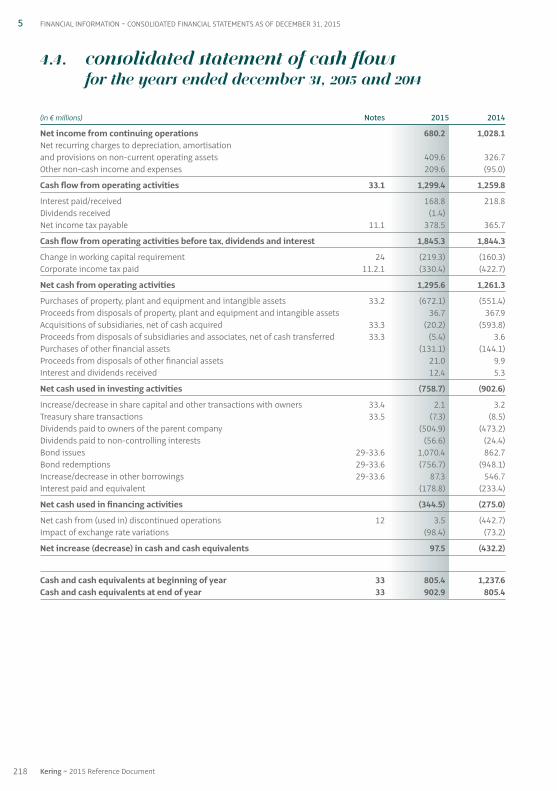
4.4. Consolidated statement of cash flowsfor the years ended December 31, 2015 and 2014
(in € millions) Notes 2015 2014
Net income from continuing operations 680.2 1,028.1Net recurring charges to depreciation, amortisation and provisions on non-current operating assets 409.6 326.7Other non-cash income and expenses 209.6 (95.0)
Cash flow from operating activities 33.1 1,299.4 1,259.8
Interest paid / received 168.8 218.8Dividends received (1.4) Net income tax payable 11.1 378.5 365.7
Cash flow from operating activities before tax, dividends and interest 1,845.3 1,844.3
Change in working capital requirement 24 (219.3) (160.3)Corporate income tax paid 11.2.1 (330.4) (422.7)
Net cash from operating activities 1,295.6 1,261.3
Purchases of property, plant and equipment and intangible assets 33.2 (672.1) (551.4)Proceeds from disposals of property, plant and equipment and intangible assets 36.7 367.9Acquisitions of subsidiaries, net of cash acquired 33.3 (20.2) (593.8)Proceeds from disposals of subsidiaries and associates, net of cash transferred 33.3 (5.4) 3.6Purchases of other financial assets (131.1) (144.1)Proceeds from disposals of other financial assets 21.0 9.9Interest and dividends received 12.4 5.3
Net cash used in investing activities (758.7) (902.6)
Increase / decrease in share capital and other transactions with owners 33.4 2.1 3.2Treasury share transactions 33.5 (7.3) (8.5)Dividends paid to owners of the parent company (504.9) (473.2)Dividends paid to non-controlling interests (56.6) (24.4)Bond issues 29-33.6 1,070.4 862.7Bond redemptions 29-33.6 (756.7) (948.1)Increase / decrease in other borrowings 29-33.6 87.3 546.7Interest paid and equivalent (178.8) (233.4)
Net cash used in financing activities (344.5) (275.0)
Net cash from (used in) discontinued operations 12 3.5 (442.7)Impact of exchange rate variations (98.4) (73.2)
Net increase (decrease) in cash and cash equivalents 97.5 (432.2)
Cash and cash equivalents at beginning of year 33 805.4 1,237.6Cash and cash equivalents at end of year 33 902.9 805.4
218 Kering ~ 2015 Reference Document
5 FINANCIAL INFORMATION ~ CONSOLIDATED FINANCIAL STATEMENTS AS OF DECEMBER 31, 2015
05_D_VA_V5 06/04/2016 17:29 Page218
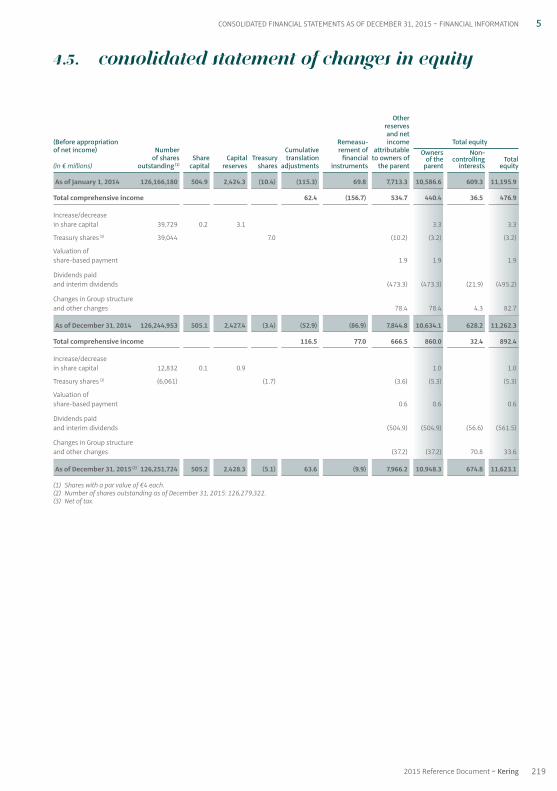
4.5. Consolidated statement of changes in equity
Other reserves and net
(Before appropriation Remeasu- income Total equityof net income) Number Cumulative rement of attributable Owners Non-
of shares Share Capital Treasury translation financial to owners of of the controlling Total(in € millions) outstanding (1) capital reserves shares adjustments instruments the parent parent interests equity
As of January 1, 2014 126,166,180 504.9 2,424.3 (10.4) (115.3) 69.8 7,713.3 10,586.6 609.3 11,195.9
Total comprehensive income 62.4 (156.7) 534.7 440.4 36.5 476.9
Increase / decreasein share capital 39,729 0.2 3.1 3.3 3.3
Treasury shares (3) 39,044 7.0 (10.2) (3.2) (3.2)
Valuation of share-based payment 1.9 1.9 1.9
Dividends paid and interim dividends (473.3) (473.3) (21.9) (495.2)
Changes in Group structure and other changes 78.4 78.4 4.3 82.7
As of December 31, 2014 126,244,953 505.1 2,427.4 (3.4) (52.9) (86.9) 7,844.8 10,634.1 628.2 11,262.3
Total comprehensive income 116.5 77.0 666.5 860.0 32.4 892.4
Increase / decreasein share capital 12,832 0.1 0.9 1.0 1.0
Treasury shares (3) (6,061) (1.7) (3.6) (5.3) (5.3)
Valuation of share-based payment 0.6 0.6 0.6
Dividends paid and interim dividends (504.9) (504.9) (56.6) (561.5)
Changes in Group structure and other changes (37.2) (37.2) 70.8 33.6
As of December 31, 2015 (2) 126,251,724 505.2 2,428.3 (5.1) 63.6 (9.9) 7,966.2 10,948.3 674.8 11,623.1
(1) Shares with a par value of €4 each.(2) Number of shares outstanding as of December 31, 2015: 126,279,322.(3) Net of tax.
219
5
2015 Reference Document ~ Kering
CONSOLIDATED FINANCIAL STATEMENTS AS OF DECEMBER 31, 2015 ~ FINANCIAL INFORMATION
05_D_VA_V5 06/04/2016 17:29 Page219

Notes to the consolidated financial statementsfor the year ended December 31, 2015
Note 1 – Introduction 221
Note 2 – Accounting policies and methods 221
Note 3 – Highlights 233
Note 4 – Operating segments 235
Note 5 – Revenue 239
Note 6 – Payroll expenses 240
Note 7 – Share-based payment 241
Note 8 – Recurring operating income 244
Note 9 – Other non-recurring operating income and expenses 245
Note 10 – Finance costs (net) 246
Note 11 – Income taxes 246
Note 12 – Non-current assets held for sale and discontinued operations 249
Note 13 – Earnings per share 251
Note 14 – Other comprehensive income 252
Note 15 – Non-controlling interests 253
Note 16 – Goodwill 253
Note 17 – Brands and other intangible assets 254
Note 18 – Property, plant and equipment 256
Note 19 – Impairment tests on non-financial assets 258
Note 20 – Investments in equity-accounted companies 259
Note 21 – Non-current financial assets 260
Note 22 – Inventories 260
Note 23 – Trade receivables 261
Note 24 – Other current assets and liabilities 261
Note 25 – Equity 262
Note 26 – Employee benefits 262
Note 27 – Provisions 267
Note 28 – Cash and cash equivalents 268
Note 29 – Borrowings 269
Note 30 – Exposure to interest rate, foreign exchange and equity risk 275
Note 31 – Accounting classification and market value of financial instruments 284
Note 32 – Net debt 287
Note 33 – Statement of cash flows 287
Note 34 – Contingent liabilities, contractual commitments not recognised and other contingencies 289
Note 35 – Transactions with related parties 293
Note 36 – Subsequent events 293
Note 37 – List of consolidated subsidiaries as of December 31, 2015 294
220 Kering ~ 2015 Reference Document
5 FINANCIAL INFORMATION ~ CONSOLIDATED FINANCIAL STATEMENTS AS OF DECEMBER 31, 2015
05_D_VA_V5 06/04/2016 17:29 Page220
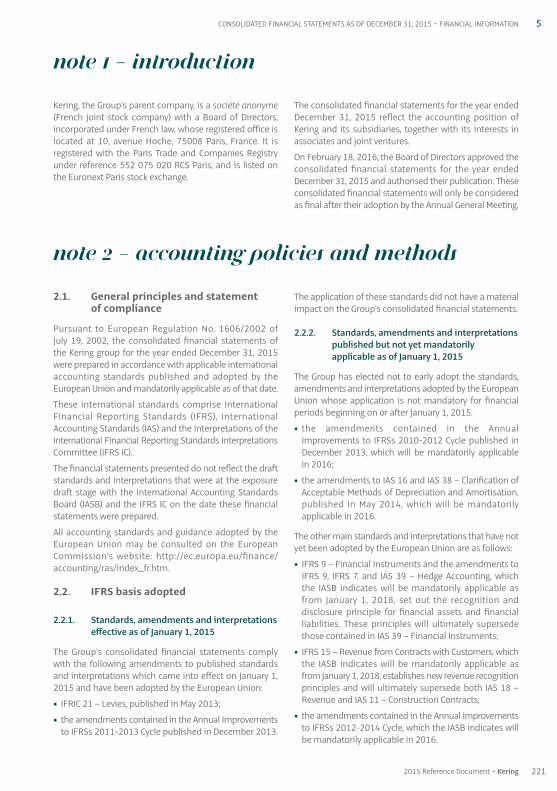
2.1. General principles and statement of compliance
Pursuant to European Regulation No. 1606 / 2002 ofJuly 19, 2002, the consolidated financial statements ofthe Kering group for the year ended December 31, 2015were prepared in accordance with applicable internationalaccounting standards published and adopted by theEuropean Union and mandatorily applicable as of that date.
These international standards comprise InternationalFinancial Reporting Standards (IFRS), InternationalAccounting Standards (IAS) and the interpretations of theInternational Financial Reporting Standards InterpretationsCommittee (IFRS IC).
The financial statements presented do not reflect the draftstandards and interpretations that were at the exposuredraft stage with the International Accounting StandardsBoard (IASB) and the IFRS IC on the date these financialstatements were prepared.
All accounting standards and guidance adopted by theEuropean Union may be consulted on the EuropeanCommission’s website: http://ec.europa.eu/finance/accounting/ras/index_fr.htm.
2.2. IFRS basis adopted
2.2.1. Standards, amendments and interpretationseffective as of January 1, 2015
The Group’s consolidated financial statements complywith the following amendments to published standardsand interpretations which came into effect on January 1,2015 and have been adopted by the European Union:
• IFRIC 21 – Levies, published in May 2013;
• the amendments contained in the Annual Improvementsto IFRSs 2011-2013 Cycle published in December 2013.
The application of these standards did not have a materialimpact on the Group’s consolidated financial statements.
2.2.2. Standards, amendments and interpretationspublished but not yet mandatorilyapplicable as of January 1, 2015
The Group has elected not to early adopt the standards,amendments and interpretations adopted by the EuropeanUnion whose application is not mandatory for financialperiods beginning on or after January 1, 2015.
• the amendments contained in the AnnualImprovements to IFRSs 2010-2012 Cycle published inDecember 2013, which will be mandatorily applicablein 2016;
• the amendments to IAS 16 and IAS 38 – Clarification ofAcceptable Methods of Depreciation and Amortisation,published in May 2014, which will be mandatorilyapplicable in 2016.
The other main standards and interpretations that have notyet been adopted by the European Union are as follows:
• IFRS 9 – Financial Instruments and the amendments toIFRS 9, IFRS 7, and IAS 39 – Hedge Accounting, whichthe IASB indicates will be mandatorily applicable asfrom January 1, 2018, set out the recognition anddisclosure principle for financial assets and financialliabilities. These principles will ultimately supersedethose contained in IAS 39 – Financial Instruments;
• IFRS 15 – Revenue from Contracts with Customers, whichthe IASB indicates will be mandatorily applicable asfrom January 1, 2018, establishes new revenue recognitionprinciples and will ultimately supersede both IAS 18 –Revenue and IAS 11 – Construction Contracts;
• the amendments contained in the Annual Improvementsto IFRSs 2012-2014 Cycle, which the IASB indicates willbe mandatorily applicable in 2016.
Note 2 – Accounting policies and methods
Kering, the Group’s parent company, is a société anonyme(French joint stock company) with a Board of Directors,incorporated under French law, whose registered office islocated at 10, avenue Hoche, 75008 Paris, France. It isregistered with the Paris Trade and Companies Registryunder reference 552 075 020 RCS Paris, and is listed onthe Euronext Paris stock exchange.
The consolidated financial statements for the year endedDecember 31, 2015 reflect the accounting position ofKering and its subsidiaries, together with its interests inassociates and joint ventures.
On February 18, 2016, the Board of Directors approved theconsolidated financial statements for the year endedDecember 31, 2015 and authorised their publication. Theseconsolidated financial statements will only be consideredas final after their adoption by the Annual General Meeting.
Note 1 – Introduction
221
5
2015 Reference Document ~ Kering
CONSOLIDATED FINANCIAL STATEMENTS AS OF DECEMBER 31, 2015 ~ FINANCIAL INFORMATION
05_D_VA_V5 06/04/2016 17:29 Page221
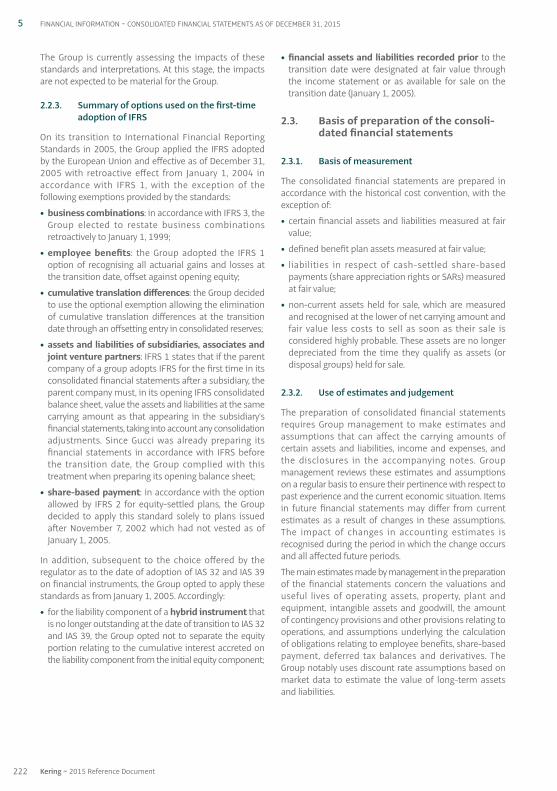
The Group is currently assessing the impacts of thesestandards and interpretations. At this stage, the impactsare not expected to be material for the Group.
2.2.3. Summary of options used on the first-timeadoption of IFRS
On its transition to International Financial ReportingStandards in 2005, the Group applied the IFRS adoptedby the European Union and effective as of December 31,2005 with retroactive effect from January 1, 2004 inaccordance with IFRS 1, with the exception of thefollowing exemptions provided by the standards:
• business combinations: in accordance with IFRS 3, theGroup elected to restate business combinationsretroactively to January 1, 1999;
• employee benefits: the Group adopted the IFRS 1option of recognising all actuarial gains and losses atthe transition date, offset against opening equity;
• cumulative translation differences: the Group decidedto use the optional exemption allowing the eliminationof cumulative translation differences at the transitiondate through an offsetting entry in consolidated reserves;
• assets and liabilities of subsidiaries, associates andjoint venture partners: IFRS 1 states that if the parentcompany of a group adopts IFRS for the first time in itsconsolidated financial statements after a subsidiary, theparent company must, in its opening IFRS consolidatedbalance sheet, value the assets and liabilities at the samecarrying amount as that appearing in the subsidiary’sfinancial statements, taking into account any consolidationadjustments. Since Gucci was already preparing itsfinancial statements in accordance with IFRS beforethe transition date, the Group complied with thistreatment when preparing its opening balance sheet;
• share-based payment: in accordance with the optionallowed by IFRS 2 for equity-settled plans, the Groupdecided to apply this standard solely to plans issuedafter November 7, 2002 which had not vested as ofJanuary 1, 2005.
In addition, subsequent to the choice offered by theregulator as to the date of adoption of IAS 32 and IAS 39on financial instruments, the Group opted to apply thesestandards as from January 1, 2005. Accordingly:
• for the liability component of a hybrid instrument thatis no longer outstanding at the date of transition to IAS 32and IAS 39, the Group opted not to separate the equityportion relating to the cumulative interest accreted onthe liability component from the initial equity component;
• financial assets and liabilities recorded prior to thetransition date were designated at fair value throughthe income statement or as available for sale on thetransition date (January 1, 2005).
2.3. Basis of preparation of the consoli-dated financial statements
2.3.1. Basis of measurement
The consolidated financial statements are prepared inaccordance with the historical cost convention, with theexception of:
• certain financial assets and liabilities measured at fairvalue;
• defined benefit plan assets measured at fair value;
• liabilities in respect of cash-settled share-basedpayments (share appreciation rights or SARs) measuredat fair value;
• non-current assets held for sale, which are measuredand recognised at the lower of net carrying amount andfair value less costs to sell as soon as their sale isconsidered highly probable. These assets are no longerdepreciated from the time they qualify as assets (ordisposal groups) held for sale.
2.3.2. Use of estimates and judgement
The preparation of consolidated financial statementsrequires Group management to make estimates andassumptions that can affect the carrying amounts ofcertain assets and liabilities, income and expenses, andthe disclosures in the accompanying notes. Groupmanagement reviews these estimates and assumptionson a regular basis to ensure their pertinence with respect topast experience and the current economic situation. Itemsin future financial statements may differ from currentestimates as a result of changes in these assumptions.The impact of changes in accounting estimates isrecognised during the period in which the change occursand all affected future periods.
The main estimates made by management in the preparationof the financial statements concern the valuations anduseful lives of operating assets, property, plant andequipment, intangible assets and goodwill, the amountof contingency provisions and other provisions relating tooperations, and assumptions underlying the calculationof obligations relating to employee benefits, share-basedpayment, deferred tax balances and derivatives. TheGroup notably uses discount rate assumptions based onmarket data to estimate the value of long-term assetsand liabilities.
222 Kering ~ 2015 Reference Document
5 FINANCIAL INFORMATION ~ CONSOLIDATED FINANCIAL STATEMENTS AS OF DECEMBER 31, 2015
05_D_VA_V5 06/04/2016 17:29 Page222
The main assumptions made by the Group are detailed inspecific sections of the notes to the consolidatedfinancial statements, and in particular:
• Note 7 – Share-based payment;
• Note 11 – Income taxes;
• Note 19 – Impairment tests on non-financial assets;
• Note 26 – Employee benefits;
• Note 27 – Provisions;
• Note 30 – Exposure to interest rate, foreign exchangeand equity risk;
• Note 31 – Accounting classification and market value offinancial instruments.
In addition to the use of estimates, Group managementuses judgement to determine the appropriate accountingtreatment for certain transactions, pending the clarificationof certain IFRS or where prevailing standards do not coverthe issue at hand. This is notably the case for put optionsgranted to non-controlling interests.
Put options granted to non-controlling interests
The Group has undertaken to repurchase the non-controllinginterests of shareholders of certain subsidiaries. The strikeprice of these put options may be set or determinedaccording to a predefined calculation formula, and theoptions may be exercised at any time or on a specific date.
The appropriate accounting treatment for acquisitions ofadditional shares in a subsidiary after control is obtainedis prescribed by IFRS. As permitted by the Frenchfinancial markets authority (Autorité des marchésfinanciers – AMF), the Group has decided to apply twodifferent accounting methods to these put options,depending on whether they were granted before or afterthe date the revised IFRS 3 first came into effect.
Put options granted before January 1, 2009: existing goodwill method retained
The Group records a financial liability in respect of theput options granted to holders of non-controllinginterests in the entities concerned. The correspondingnon-controlling interests are derecognised, with anoffsetting entry to the financial liability. The differencebetween the debt representing the commitment torepurchase the non-controlling interests and the carryingamount of reclassified non-controlling interests isrecorded as goodwill.
This liability is initially recognised at the present value ofthe strike price. Subsequent changes in the value of thecommitment are recorded by an adjustment to goodwill.
Put options granted after January 1, 2009
The Group records a financial liability at the present valueof the strike price in respect of the put options granted toholders of non-controlling interests in the entitiesconcerned.
The offsetting entry for this financial liability will differdepending on whether the non-controlling interests havemaintained access at present to the economic benefits ofthe entity.
In the first case (access at present to the economicbenefits), non-controlling interests are maintained in thestatement of financial position and the liability isrecognised against equity attributable to owners of theparent. In the second case, the corresponding non-controlling interests are derecognised. The differencebetween the debt representing the commitment torepurchase the non-controlling interests and the carryingamount of derecognised non-controlling interests isrecorded as a deduction from equity attributable toowners of the parent.
Subsequent changes in the value of the commitment arerecorded by an adjustment to equity.
2.3.3. Statement of cash flows
The Group’s statement of cash flows is prepared inaccordance with IAS 7 – Statement of Cash Flows. TheGroup prepares its statement of cash flows using theindirect method.
2.4. Consolidation principles
The consolidated financial statements include thefinancial statements of companies acquired as from theacquisition date and companies sold up until the date ofdisposal.
2.4.1. Subsidiaries
Subsidiaries are all entities (including structured entities)over which the Group exercises control. Control is definedaccording to three criteria: (i) power over the investee; (ii) exposure, or rights, to variable returns from involvementwith the investee; and (iii) the ability to use power overthe investee to affect the amount of the investor’s returns.This definition of control implies that power over aninvestee can take many forms other than simply holdingvoting rights. The existence and effect of potential votingrights are considered when assessing control, if the rights aresubstantive. Control generally implies directly or indirectlyholding more than 50% of the voting rights but can alsoexist when less than 50% of the voting rights are held.
Subsidiaries are consolidated from the effective date ofcontrol.
Inter-company assets and liabilities and transactionsbetween consolidated companies are eliminated. Gainsand losses on internal transactions with controlledcompanies are fully eliminated.
Accounting policies and methods are modified wherenecessary to ensure consistency of accounting treatmentat Group level.
223
5
2015 Reference Document ~ Kering
CONSOLIDATED FINANCIAL STATEMENTS AS OF DECEMBER 31, 2015 ~ FINANCIAL INFORMATION
05_D_VA_V5 06/04/2016 17:29 Page223

2.4.2. Associates
Associates are all entities in which the Group exercises asignificant influence over the entity’s management andfinancial policy, without exercising control or jointcontrol, and generally implies holding 20% to 50% of thevoting rights.
Associates are recognised using the equity method andinitially measured at cost, except when the associateswere previously controlled by the Group, in which casethey are measured at fair value through the incomestatement as of the date control is lost.
Subsequently, the share in profits or losses of the associateattributable to owners of the parent is recognised in“Share in earnings of associates”, and the share in othercomprehensive income of associates is carried on aseparate line of the statement of comprehensive income.If the Group’s share in the losses of an associate equals orexceeds its investment in that associate, the Group nolonger recognises its share of losses, unless it has legal orconstructive obligations to make payments on behalf ofthe associate.
Goodwill related to an associate is included in the carryingamount of the investment, presented separately within“Investments in associates” in the statement of financialposition.
Gains or losses on internal transactions with equity-accounted associates are eliminated in the amount ofthe Group’s investment in these companies.
The accounting policies and methods of associates aremodified where necessary to ensure consistency ofaccounting treatment at Group level.
2.4.3. Business combinations
Business combinations, where the Group acquires controlof one or more other activities, are recognised using theacquisition method.
Business combinations are recognised and measured inaccordance with the provisions of the revised IFRS 3.Accordingly, the consideration transferred (acquisitionprice) is measured at the fair value of the assets transferred,equity interests issued and liabilities incurred by theacquirer at the date of exchange. Identifiable assets andliabilities are generally measured at their fair value on theacquisition date. Costs directly attributable to thebusiness combination are recognised in expenses.
The excess of the consideration transferred plus theamount of any non-controlling interest in the acquireeover the net fair value of the identifiable assets andliabilities acquired is recognised as goodwill. If thedifference is negative, the gain on the bargain purchase isimmediately recognised in income.
The Group may choose to measure any non-controllinginterests resulting from each business combination atfair value (full goodwill method) or at the proportionateshare in the identifiable net assets acquired, which arealso generally measured at fair value (partial goodwillmethod).
Goodwill is determined at the date control over theacquired entity is obtained and may not be adjusted afterthe measurement period. No additional goodwill isrecognised on any subsequent acquisition of non-controlling interests. Acquisitions and disposals of non-controlling interests are recognised directly inconsolidated equity.
The accounting for a business combination must becompleted within 12 months of the acquisition date. Thisapplies to the measurement of identifiable assets andliabilities, consideration transferred and non-controllinginterests.
2.5. Foreign currency translation
2.5.1. Functional and presentation currency
Items included in the financial statements of each Groupentity are valued using the currency of the primaryeconomic environment in which the entity operates(functional currency). The Group’s consolidated financialstatements are presented in euros, which serves as thepresentation currency.
2.5.2. Foreign currency transactions
Transactions denominated in foreign currencies arerecognised in the entity’s functional currency at theexchange rate prevailing on the transaction date.
Monetary items in foreign currencies are translated at theend of each reporting period using the closing rate.Translation adjustments arising from the settlement ofthese items are recognised in income or expenses for theperiod.
Non-monetary items in foreign currencies valued athistorical cost are translated at the rate prevailing on thetransaction date, and non-monetary items in foreigncurrencies measured at fair value are translated at therate prevailing on the date the fair value is determined.When a gain or loss on a non-monetary item is recogniseddirectly in other comprehensive income, the foreignexchange component is also recognised in othercomprehensive income. Otherwise, the component isrecognised in income or expenses for the period.
The treatment of foreign exchange rate hedges in the formof derivatives is described in the section on derivativeinstruments in Note 2.11 – Financial assets and liabilities.
224 Kering ~ 2015 Reference Document
5 FINANCIAL INFORMATION ~ CONSOLIDATED FINANCIAL STATEMENTS AS OF DECEMBER 31, 2015
05_D_VA_V5 06/04/2016 17:29 Page224
2.5.3. Translation of the financial statements of foreign subsidiaries
The results and financial statements of Group entities witha functional currency that differs from the presentationcurrency are translated into euros as follows:
• items recorded in the statement of financial positionother than equity are translated at the exchange rate atthe end of the reporting period;
• income and cash flow statement items are translatedat the average rate for the period, corresponding to anapproximate value for the rate at the transaction datein the absence of significant fluctuations;
• foreign exchange differences are recognised as translationadjustments in the statement of comprehensiveincome under other comprehensive income.
Goodwill and fair value adjustments arising from a businesscombination with a foreign activity are recognised in thefunctional currency of the entity acquired. They aresubsequently translated at the closing exchange rate intothe Group’s presentation currency, and any resultingdifferences transferred to other comprehensive incomewithin the statement of comprehensive income.
2.5.4. Net investment in a foreign subsidiary
Foreign exchange gains or losses arising on the translationof a net investment in a foreign subsidiary are recognisedin the consolidated financial statements as a separatecomponent within the statement of comprehensiveincome, and in income on disposal of the net investment.Foreign exchange gains or losses in respect of foreigncurrency borrowings designated as a net investment in aforeign subsidiary are recognised in other comprehensiveincome (to the extent that the hedge is effective), withinthe statement of comprehensive income, and in incomeon disposal of the net investment.
2.6. Goodwill
Goodwill is determined as indicated in Note 2.4.3.
Goodwill is allocated as of the acquisition date to cash-generating units (CGUs) or groups of CGUs defined by theGroup based on the characteristics of the core business,market or geographical segment of each brand. The CGUsor groups of CGUs to which goodwill has been allocatedare tested for impairment during the second half of eachfiscal year or whenever events or circumstances indicatethat an impairment loss is likely.
Impairment tests are described in Note 2.10.
2.7. Brands and other intangible assets
Intangible assets are recognised at cost less accumulatedamortisation and impairment losses.
Intangible assets acquired as part of a businesscombination, which are controlled by the Group and areseparable or arise from contractual or other legal rights,are recognised separately from goodwill.
Intangible assets are amortised over their useful lifewhere this is finite and are tested for impairment whenthere is an indication that it may be impaired. Intangibleassets with indefinite useful lives are not amortised butare tested for impairment at least annually or morefrequently when there is an indication that animpairment loss is likely.
Brands representing a predominant category of theGroup’s intangible assets are recognised separately fromgoodwill when they meet the criteria set out in IAS 38.Recognition and durability criteria are then taken intoaccount to assess the useful life of the brand. Most of theGroup’s brands are intangible assets with indefiniteuseful lives.
Impairment tests are described in Note 2.10.
In addition to the projected future cash flows method,the Group applies the royalties method, which consists ofdetermining the value of a brand based on future royaltyrevenue receivable where it is assumed that the brandwill be operated under licence by a third party.
Software acquired as part of recurring operations is usuallyamortised over a period not exceeding 12 months.
Software developed in-house by the Group and meetingall the criteria set out in IAS 38 is capitalised andamortised on a straight-line basis over its useful life,which is generally between three and ten years.
2.8. Property, plant and equipment
Property, plant and equipment are recognised at cost lessaccumulated depreciation and impairment losses withthe exception of land, which is presented at cost lessimpairment losses. The various components of property,plant and equipment are recognised separately whentheir estimated useful life and therefore their depreciationperiods are significantly different. The cost of an assetincludes the expenses that are directly attributable to itsacquisition.
Subsequent costs are included in the carrying amount ofthe asset or recognised as a separate component, wherenecessary, if it is probable that future economic benefitswill flow to the Group and the cost of the asset can be reliablymeasured. All other routine repair and maintenancecosts are expensed in the year they are incurred.
225
5
2015 Reference Document ~ Kering
CONSOLIDATED FINANCIAL STATEMENTS AS OF DECEMBER 31, 2015 ~ FINANCIAL INFORMATION
05_D_VA_V5 06/04/2016 17:29 Page225

Depreciation is calculated using the straight-line method,based on the purchase or production cost, less anyresidual value which is reviewed annually if consideredmaterial, over a period corresponding to the useful life ofeach asset category, i.e., 10 to 40 years for buildings andimprovements to land and buildings, and 3 to 10 yearsfor equipment.
Property, plant and equipment are tested for impairmentwhen an indication of impairment loss exists, such as ascheduled closure, a redundancy plan or a downwardrevision of market forecasts. When the asset’s recoverableamount is less than its net carrying amount, an impairmentloss is recognised. Where the recoverable amount of anindividual asset cannot be determined precisely, theGroup determines the recoverable amount of the CGU orgroup of CGUs to which the asset belongs.
Lease contracts
Agreements whose fulfilment depends on the use of oneor more specific assets and which transfer the right touse the asset are classified as lease contracts.
Lease contracts which transfer to the Group substantiallyall the risks and rewards incidental to ownership of anasset are classified as finance leases.
Assets acquired under finance leases are recognised inproperty, plant and equipment against the correspondingdebt recognised in borrowings for the same amount, atthe lower of the fair value of the asset and the presentvalue of minimum lease payments. The correspondingassets are depreciated over a useful life identical to thatof property, plant and equipment acquired outright, orover the term of the lease, whichever is shorter.
Lease contracts that do not transfer substantially all therisks and rewards incidental to ownership are classifiedas operating leases. Payments made under operatingleases are recognised in recurring operating expenses ona straight-line basis over the term of the lease.
Capital gains on the sale and leaseback of assets arerecognised in full in income at the time of disposal whenthe lease qualifies as an operating lease and the transactionis performed at fair value.
The same accounting treatment is applied to agreementsthat, while not presenting the legal form of a lease contract,confer on the Group the right to use a specific asset inexchange for a payment or series of payments.
2.9. Inventories
Inventories are valued at the lower of cost and net realisablevalue. Net realisable value is the estimated sale price inthe normal course of operations, net of costs to beincurred to complete the sale.
The same method for determining costs is adopted forinventories of a similar nature and use within the Group.
Inventories are valued using the retail, first-in-first-out(FIFO) or weighted average cost method, depending onthe Group activity.
Interest expenses are excluded from inventories andexpensed as finance costs in the year they are incurred.
The Group may recognise an inventory allowance basedon expected turnover, if inventory items are damaged,have become wholly or partially obsolete, the selling pricehas declined, or if the estimated costs to completion orto be incurred to make the sale have increased.
2.10. Asset impairment
For the purposes of impairment testing, assets are groupedinto cash-generating units (CGUs), i.e., the smallest groupof assets that generates cash inflows from continuinguse, that are largely independent of the cash inflows fromother assets or CGUs. Goodwill arising from a businesscombination is allocated to CGUs or groups of CGUs that areexpected to benefit from the synergies of the combination.
CGUs comprising goodwill and / or intangible assets withindefinite useful lives, such as certain brands, are testedfor impairment at least annually during the second halfof each reporting period.
An impairment test is also performed for all CGUs whenevents or circumstances indicate that they may be impaired.Such events or circumstances concern material unfavourablechanges of a permanent nature affecting either theeconomic environment or the assumptions or objectivesused on the acquisition date of the assets.
Impairment tests seek to determine whether the recoverableamount of a CGU is less than its net carrying amount.
The recoverable amount of a CGU is the higher of its fairvalue less costs to sell and its value in use.
The value in use is determined with respect to futurecash flow projections, taking into account the time valueof money and the specific risks attributable to the assetor CGU or group of CGUs.
Future cash flow projections are based on medium-termbudgets and plans. These plans are drawn up for a periodof four years with the exception of certain CGUs or groupsof CGUs undergoing strategic repositioning, for which alonger period may be applied. To calculate value in use, aterminal value equal to the perpetual capitalisation of anormative annual cash flow is added to the estimatedfuture cash flows.
Fair value corresponds to the price that would bereceived to sell an asset or paid to transfer a liability in anorderly transaction between market participants at themeasurement date. These values are determined basedon market data (comparison with similar listedcompanies, values adopted in recent transactions andstock market prices).
226 Kering ~ 2015 Reference Document
5 FINANCIAL INFORMATION ~ CONSOLIDATED FINANCIAL STATEMENTS AS OF DECEMBER 31, 2015
05_D_VA_V5 06/04/2016 17:29 Page226
When the CGU’s recoverable amount is less than its netcarrying amount, an impairment loss is recognised.
Impairment is charged first to goodwill where appropriate,and recognised under “Other non-recurring operatingincome and expenses” in the income statement as partof operating income.
Impairment losses recognised in respect of property, plantand equipment and other intangible assets may be reversedat a later date if there is an indication that the impairmentloss no longer exists or has decreased. Impairment lossesin respect of goodwill may not be reversed.
Goodwill relating to the partial disposal of a CGU is measuredon a proportionate basis, except where an alternativemethod is more appropriate.
2.11. Financial assets and liabilities
Derivative instruments are recognised in the statement offinancial position at fair value, in assets (positive fairvalue) or liabilities (negative fair value).
2.11.1. Financial assets
Pursuant to IAS 39, financial assets are classified withinone of the following four categories:
• financial assets at fair value through the income statement;
• loans and receivables;
• held-to-maturity investments;
• available-for-sale financial assets.
The classification determines the accounting treatmentfor the instrument. It is defined by the Group on the initialrecognition date, based on the objective behind theasset’s purchase. Purchases and sales of financial assetsare recognised on the trade date, which is the date theGroup is committed to the purchase or sale of the asset.A financial asset is derecognised if the contractual rightsto the cash flows from the financial asset expire or theasset is transferred.
1. Financial assets at fair value through the income statement
These are financial assets held by the Group for short-term profit, or assets voluntarily classified in this category.
These assets are measured at fair value, with changes infair value recognised in income.
They primarily comprise eligible money-market funds(OPCVMs) classified as current assets under cashequivalents, as well as derivatives not designated ashedging instruments within a hedging relationship.
2. Loans and receivables
Loans and receivables are non-derivative financial assetswith fixed or determinable payments that are not listed inan active market and are not held for trading purposes orclassified as available for sale.
These assets are initially recognised at fair value andsubsequently at amortised cost using the effectiveinterest method. For short-term receivables without astated interest rate, fair value and amortised costapproximate the amount of the original invoice unlessthe effective interest rate has a material impact.
These assets are subject to impairment tests when thereis an indication of impairment loss. An impairment loss isrecognised if the carrying amount exceeds the estimatedrecoverable amount.
Loans and receivables due from non-consolidatedinvestments, deposits and guarantees, trade receivablesand other short-term receivables are included in thiscategory and are presented in non-current financialassets, trade receivables and other current financialassets in the statement of financial position.
3. Held-to-maturity investments
Held-to-maturity investments are non-derivativefinancial assets, other than loans or receivables, withfixed or determinable payments and fixed maturity thatthe Group has the positive intention and ability to hold tomaturity. These assets are initially recognised at fair valueand subsequently at amortised cost using the effectiveinterest method.
These assets are subject to impairment tests when thereis an indication of impairment loss. An impairment loss isrecognised if the carrying amount exceeds the estimatedrecoverable amount.
Held-to-maturity investments are presented in non-current financial assets.
4. Available-for-sale financial assets
Available-for-sale financial assets are non-derivative financialassets that are not included in the aforementionedcategories. They are recognised at fair value. Unrealisedcapital gains or losses are recognised in other comprehensiveincome until the disposal of the assets. However, wherethere is an objective indication of loss in value of anavailable-for-sale financial asset, the accumulated loss isrecognised in income. Impairment losses recognised inrespect of shares cannot be reversed through the incomestatement at the end of a subsequent reporting period.
227
5
2015 Reference Document ~ Kering
CONSOLIDATED FINANCIAL STATEMENTS AS OF DECEMBER 31, 2015 ~ FINANCIAL INFORMATION
05_D_VA_V5 06/04/2016 17:29 Page227
For listed securities, fair value corresponds to a marketprice. For unlisted securities, fair value is determined byreference to recent transactions or using valuationtechniques based on reliable and objective indicators.However, when the fair value of a security cannot bereasonably estimated, it is recorded at historical cost.These assets are subject to impairment tests in order toassess whether they are recoverable.
This category mainly comprises non-consolidatedinvestments and marketable securities that do not meetthe definitions of other financial asset categories. Theyare presented in non-current financial assets.
2.11.2. Financial liabilities
The measurement of financial liabilities depends on theirIAS 39 classification. Excluding put options granted tonon-controlling interests, derivative liabilities andfinancial liabilities accounted for under the fair valueoption, the Group recognises all financial liabilities andparticularly borrowings, trade payables and otherliabilities initially at fair value less transaction costs andsubsequently at amortised cost, using the effectiveinterest method.
The effective interest rate is determined for each transactionand corresponds to the rate that would provide the netcarrying amount of the financial liability by discountingits estimated future cash flows until maturity or thenearest date the price is reset to the market rate. Thecalculation includes transaction costs and any premiumsand / or discounts. Transaction costs correspond to thecosts directly attributable to the acquisition or issue of afinancial liability.
The net carrying amount of financial liabilities that qualifyas hedged items as part of a fair value hedging relationshipand are valued at amortised cost, is adjusted with respectto the hedged risk.
Hedging relationships are described in the section onderivative instruments.
Financial liabilities accounted for under the fair valueoption, other than derivative liabilities, are carried at fairvalue. Changes in fair value are taken to the incomestatement. Transaction costs incurred in setting up thesefinancial liabilities are recognised immediately in expenses.
2.11.3. Hybrid instruments
Certain financial instruments have both a standard debtcomponent and an equity component.
For the Group, this concerns in particular OCEANE bonds(bonds convertible or exchangeable into new or existingshares).
Under IAS 32, convertible bonds are considered hybridinstruments insofar as the conversion option provides forthe repayment of the instrument against a fixed numberof equity instruments. There are several components:
• a financial liability (corresponding to the contractualcommitment to pay cash), representing the debtcomponent;
• the option converting the bonds into a fixed number ofordinary shares, offered to the subscriber, similar to acall option written by the issuer, representing an equityinstrument;
• potentially one or more embedded derivatives.
The accounting policies applicable to each of thesecomponents, at the issue date and at the end of eachsubsequent reporting period, are as follows:
• debt component: the amount initially recognised asdebt corresponds to the present value of the futurecash flows arising from interest and principal paymentsat the market rate for a similar bond with no conversionoption. If the convertible bond contains embeddedderivatives closely related to the borrowing within themeaning of IAS 39, the value of these components isallocated to the debt in order to determine the value ofthe equity component. The debt component issubsequently recognised at amortised cost;
• embedded derivatives not closely related to the debtare recognised at fair value with changes in fair valuerecognised in income;
• equity component: the value of the conversion optionis determined by deducting the value of any embeddedderivatives from the amount of the issue less thecarrying amount of the debt component. The conversionoption continues to be recorded in equity at its initialvalue. Changes in value are not recognised;
• transaction costs are allocated pro rata to each component.
2.11.4. Derivative instruments
The Group uses various financial instruments to reduceits exposure to foreign exchange, interest rate and equityrisk. These instruments are listed on organised marketsor traded over the counter with leading counterparties.
All derivatives are recognised in the statement of financialposition under other current or non-current assets andliabilities depending on their maturity and accountingclassification, and are valued at fair value as of the tradedate. Changes in the fair value of derivatives are alwaysrecorded in income except in the case of cash flow andnet investment hedges.
228 Kering ~ 2015 Reference Document
5 FINANCIAL INFORMATION ~ CONSOLIDATED FINANCIAL STATEMENTS AS OF DECEMBER 31, 2015
05_D_VA_V5 06/04/2016 17:29 Page228
Derivatives designated as hedging instruments areclassified by category of hedge based on the nature of therisks being hedged:
• a cash flow hedge is used to hedge the risk of changesin cash flow from recognised assets or liabilities or ahighly probable transaction that would impactconsolidated net income;
• a fair value hedge is used to hedge the risk of changesin the fair value of recognised assets or liabilities or afirm commitment not yet recognised that wouldimpact consolidated net income;
• a net investment hedge is used to hedge the foreignexchange risk arising on foreign activities.
Hedge accounting can only be applied if all the followingconditions are met:
• there is a clearly identified, formalised and documentedhedging relationship as of the date of inception;
• the effectiveness of the hedging relationship can bedemonstrated on a prospective and retrospective basis.The results obtained must attain a confidence level ofbetween 80% and 125%.
The accounting treatment of financial instrumentsqualified as hedging instruments, and their impact on theincome statement and the statement of financialposition, depends on the type of hedging relationship:
• cash flow and net investment hedges:- the effective portion of fair value gains and losses on
the hedging instrument is recognised directly in othercomprehensive income. These amounts are releasedto the income statement to match the recognition ofthe hedged items, mainly in gross profit for tradingtransaction hedges and in net finance costs forfinancial transaction hedges,
- the ineffective portion of the hedge is recognised inthe income statement;
• for fair value hedges, the hedged component of theseitems is measured on the statement of financial positionat fair value with respect to the hedged risk. Fair valuegains and losses are recorded in the income statementand offset, to the extent effective, by matching fairvalue gains and losses on the hedging instrument.
2.11.5. Cash and cash equivalents
The “Cash and cash equivalents” line item recorded onthe assets side of the consolidated statement of financialposition comprises cash, mutual or similar funds, short-term investments and other highly liquid instrumentsthat are readily convertible to known amounts of cash,subject to an insignificant risk of changes in value, andhave a maximum maturity of three months as of thepurchase date.
Investments with a maturity exceeding three months, andblocked or pledged bank accounts, are excluded fromcash. Bank overdrafts are presented in borrowings on theliabilities side of the statement of financial position.
In the statement of cash flows, cash and cash equivalentsinclude accrued interest receivable on assets presentedin cash and cash equivalents and bank overdrafts. Aschedule reconciling cash per the statement of cashflows and per the statement of financial position isprovided in Note 33.
2.11.6. Definition of consolidated net debt
The concept of net debt used by Group companies comprisesgross debt including accrued interest receivable less netcash as defined by French accounting standards authority(Autorité des Normes Comptables – ANC) recommendationNo. 2013-03. Net debt includes fair value hedging instrumentsrecorded in the statement of financial position relating tobank borrowings and bonds whose interest rate risk isfully or partly hedged as part of a fair value hedgingrelationship.
2.12. Treasury shares
Treasury shares, whether specifically allocated for grantto employees or allocated to the liquidity agreement or inany other case, as well as directly related transaction costs,are deducted from consolidated equity. On disposal, theconsideration received for these shares, net of transactioncosts and the related tax impacts, is recognised in equity.
2.13. Treasury share options
Treasury share options are treated according to theircharacteristics as derivative instruments, equity instrumentsor non-derivative financial liabilities.
Options classified as derivatives are recorded at fair valuethrough the income statement. Options classified asequity instruments are recorded in equity for their initialamount. Changes in value are not recognised. Theaccounting treatment of financial liabilities is describedin Note 2.11.2.
229
5
2015 Reference Document ~ Kering
CONSOLIDATED FINANCIAL STATEMENTS AS OF DECEMBER 31, 2015 ~ FINANCIAL INFORMATION
05_D_VA_V5 06/04/2016 17:29 Page229

2.14. Share-based payment
Free share plans, stock purchase plans and stock subscriptionplans are awarded by the Group and settled in shares. Inaccordance with IFRS 2 – Share-based Payment, the fairvalue of these plans, determined by reference to the fairvalue of services rendered by the beneficiaries, is assessedat the grant date. The mathematical models used inthese calculations are described in Note 7.
During the rights vesting period, the fair value of optionsand free shares calculated as described above isamortised in proportion to the vesting of rights. Thisexpense is recorded in payroll expenses with anoffsetting increase in equity.
Share appreciation rights (SARs) granted by the Groupalso result in the recognition of payroll expenses spreadover the rights vesting period and a matching liabilitywhich is measured at fair value through income at theend of each reporting period.
2.15. Income taxes
The income tax charge for the period comprises thecurrent and deferred tax charge.
Deferred tax is calculated using the liability method on alltemporary differences between the carrying amountrecorded in the consolidated statement of financialposition and the tax value of assets and liabilities, exceptfor goodwill that is not deductible for tax purposes andcertain other exceptions. The valuation of deferred taxbalances depends on the way in which the Group intendsto recover or settle the carrying amount of assets andliabilities, using tax rates that have been enacted orsubstantively enacted at the end of the reporting period.
Deferred tax assets and liabilities are not discounted andare classified in the statement of financial position withinnon-current assets and liabilities.
A deferred tax asset is recognised on deductibletemporary differences and for tax loss carry-forwards andtax credits to the extent that their future offset isprobable.
A deferred tax liability is recognised on taxable temporarydifferences relating to investments in subsidiaries,associates and joint ventures unless the Group is able tocontrol the timing of the reversal of the temporarydifference, and it is probable that the temporarydifference will not reverse in the foreseeable future.
2.16. Provisions
Provisions for litigation and disputes, and miscellaneouscontingencies and losses are recognised as soon as apresent obligation arises from past events, which is likelyto result in an outflow of resources embodying economicbenefits, the amount of which can be reliably estimated.
Provisions maturing in more than one year are valued atthe discounted amount representing the best estimate ofthe expense necessary to extinguish the current obligationat the end of the reporting period. The discount rate usedreflects current assessments of the time value of moneyand specific risks related to the liability.
A restructuring provision is recognised when there is aformal and detailed restructuring plan and the plan hasbegun to be implemented or its main features have beenannounced before the end of the reporting period.Restructuring costs for which a provision is madeessentially represent employee costs (severance pay,early retirement plans, payment in lieu of notice, etc.),work stoppages and compensation for breaches ofcontract with third parties.
2.17. Post-employment benefits and otherlong-term employee benefits
Based on the laws and practices of each country, theGroup recognises various types of employee benefits.
Under defined contribution plans, the Group is not obligedto make additional payments over and above contributionsalready made to a fund, if the fund does not have sufficientassets to cover the benefits corresponding to servicesrendered by personnel during the current period andprior periods. Contributions paid into these plans areexpensed as incurred.
Under defined benefit plans, obligations are valued usingthe projected unit credit method based on agreements ineffect in each company. Under this method, each period ofservice gives rise to an additional unit of benefit entitlementand each unit is measured separately to build up the finalobligation. The obligation is then discounted. Theactuarial assumptions used to determine the obligationsvary according to the economic conditions of the countrywhere the plan is established. These plans are valued byindependent actuaries on an annual basis for the mostsignificant plans and at regular intervals for the other plans.The valuations take into account the level of futurecompensation, the probable active life of employees, lifeexpectancy and staff turnover.
230 Kering ~ 2015 Reference Document
5 FINANCIAL INFORMATION ~ CONSOLIDATED FINANCIAL STATEMENTS AS OF DECEMBER 31, 2015
05_D_VA_V5 06/04/2016 17:29 Page230
Actuarial gains and losses are primarily due to changes inassumptions and the difference between estimated resultsbased on actuarial assumptions and actual results. Allactuarial differences in respect of defined benefit plansare recognised in other comprehensive income.
The past service cost designating the increase in an obligationfollowing the introduction of a new plan or changes to anexisting plan, is expensed immediately whether thebenefit entitlement has already vested or is still vesting.
Expenses relating to this type of plan are recognised inrecurring operating income (service cost) and net financecosts (net interest on the net defined benefit liability orasset). Curtailments, settlements and past service costsare recognised in recurring operating income. The provisionrecognised in the statement of financial position correspondsto the present value of the obligations calculated asdescribed above, less the fair value of plan assets.
2.18. Non-current assets (and disposalgroups) held for sale
The Group applies IFRS 5 – Non-current Assets Held forSale and Discontinued Operations. This requires theseparate recognition and presentation of non-currentassets (or disposal groups) held for sale and discontinuedoperations.
Non-current assets, or groups of assets and liabilitiesdirectly associated with those assets, are considered asheld for sale if it is highly probable that their carryingamount will be recovered principally through a salerather than through continuing use. Non-current assets(or disposal groups) held for sale are measured andrecognised at the lower of their net carrying amount andtheir fair value less the costs of disposal. These assets areno longer depreciated from the time they qualify asassets (or disposal groups) held for sale. They arepresented on separate lines in the consolidatedstatement of financial position, without restatement forprevious periods.
A discontinued operation is defined as a component of agroup that generates cash flows that can be clearlydistinguished from the rest of the group and represents aseparate major line of business or geographical area ofoperations. For all periods presented, the net income(loss) from these activities is shown on a separate line ofthe income statement (“Discontinued operations”), and isrestated in the statement of cash flows.
2.19. Revenue recognition
Revenue mainly comprises sales of goods for resale, consumergoods and Luxury Goods, together with income fromsales-related services, royalties and operating licences.
Revenue is valued at the fair value of the considerationreceived for goods and services sold, royalties and licences,excluding taxes, net of rebates and discounts and afterelimination of inter-company sales.
In the event of deferred payment beyond the usual creditterms that is not assumed by a financing institution, therevenue from the sale is equal to the discounted price,with the difference between the discounted price and thecash payment recognised in financial income over thelife of the deferred payment if the transaction is material.
Sales of goods are recognised when a Group entity hastransferred the risks and rewards incidental to ownershipto the buyer (generally on delivery), when revenue can bereliably measured, when recovery is reasonably assuredand when the probability of the goods being returned canbe estimated with sufficient reliability.
Services such as those directly related to the sale ofgoods are recognised over the period in which suchservices are rendered or, if the Group company acts as anintermediary in the sale of these services, as of the datethe contractual agreement is signed by the customer.
2.20. Operating income
Operating income includes all revenue and expensesdirectly related to Group activities, whether these revenueand expenses are recurring or arise from non-recurringdecisions or transactions.
Recurring operating income is an analytical balanceintended to facilitate the understanding of the entity’soperating performance.
Other non-recurring operating income and expensesconsists of items, which by their nature, amount or frequency,could distort the assessment of Group entities’ operatingperformance. Other non-recurring operating income andexpenses include:
• impairment of goodwill and other intangible assets;
• gains or losses on disposals of non-current assets;
• restructuring costs and costs relating to employeeadaptation measures.
231
5
2015 Reference Document ~ Kering
CONSOLIDATED FINANCIAL STATEMENTS AS OF DECEMBER 31, 2015 ~ FINANCIAL INFORMATION
05_D_VA_V5 06/04/2016 17:29 Page231
2.21. Earnings per share
Earnings per share is calculated by dividing net incomeattributable to owners of the parent by the weightedaverage number of outstanding shares during the year,after deduction of the weighted average number oftreasury shares held by consolidated companies.
Fully diluted earnings per share is calculated by adjustingnet income attributable to owners of the parent and thenumber of outstanding shares for all instrumentsgranting deferred access to the share capital of theCompany, whether issued by Kering or one of itssubsidiaries. Dilution is determined separately for eachinstrument based on the following conditions:
• when the proceeds corresponding to potential futureshare issues are received at the time dilutive securitiesare issued (e.g., convertible bonds), the numerator isequal to net income before dilution plus the interestexpense that would be saved in the event ofconversion, net of tax;
• when the proceeds are received at the time the rightsare exercised (e.g., stock subscription options), thedilution attached to the options is determined using thetreasury shares method (theoretical number of sharespurchased at market price [average over the period]based on the proceeds received at the time the rightsare exercised).
In the case of material non-recurring items, earnings pershare excluding non-recurring items is calculated byadjusting net income attributable to owners of the parentfor non-recurring items net of taxes and non-controllinginterests. Non-recurring items taken into account for thiscalculation correspond to all the items included under“Other non-recurring operating income and expenses” inthe income statement.
2.22. Operating segments
In accordance with IFRS 8 – Operating Segments, segmentinformation is reported on the same basis as usedinternally by the Chairman and Chief Executive Officerand Deputy CEO – the Group’s chief operating decisionmakers – in order to allocate resources to segments andassess their performance.
An operating segment is a component of the Group thatengages in business activities from which it may earnrevenues and incur expenses, whose operating results areregularly reviewed by the entity’s chief operating decisionmaker, and for which discrete financial information isavailable.
Each operating segment is monitored separately forinternal reporting purposes, according to performanceindicators common to all of the Group’s segments.
The segments presented are operating segments or groupsof similar operating segments.
232 Kering ~ 2015 Reference Document
5 FINANCIAL INFORMATION ~ CONSOLIDATED FINANCIAL STATEMENTS AS OF DECEMBER 31, 2015
05_D_VA_V5 06/04/2016 17:29 Page232
The Kering group consolidated financial statements forthe year ended December 31, 2015 include the financialstatements of the companies listed in Note 37.
3.1. Change in management and creativeresponsibility at Gucci
On January 21, 2015, Marco Bizzarri – Gucci’s President andCEO who succeeded Patrizio di Marco on January 1, 2015 –announced that Alessandro Michele had been appointedas the brand’s new Creative Director following the departureof his predecessor Frida Giannini.
Alessandro Michele has been given total creative responsibilityfor all of Gucci’s collections and its brand image. The firstcollection fully designed by Alessandro Michele is the2016 Cruise collection, which was unveiled in New Yorkon June 4, 2015 and has been available in stores sincethe end of the third quarter of 2015.
3.2. Finalisation of the partnership withSafilo and launch of Kering Eyewear
In 2014, Kering announced its plan to invest in adedicated entity specialised in luxury, high-end and sportEyewear, managed by a skilled team of experiencedprofessionals under the direction of Roberto Vedovotto.This innovative management model for the Group’sEyewear business will allow it to fully leverage the growthpotential of its brands in this category.
As part of this strategic move, Kering and Safilo agreed tofurther their partnership and jointly intend to terminatethe current Gucci licence agreement two years inadvance, i.e., by December 31, 2016, which will result intotal compensation of €90 million to be paid to Safilo. OnJanuary 12, 2015, Kering announced that it had signed apartnership agreement with Safilo covering thedevelopment, manufacture and supply of Gucci Eyewearproducts. The agreement took effect as from fourth-quarter 2015 in order to ensure a seamless transition forGucci’s Eyewear business.
On March 18, 2015, Kering announced the appointmentof Roberto Vedovotto, CEO of Kering Eyewear, as a newmember of its Executive Committee. Kering Eyewear wasofficially launched on June 30, 2015 when its first collection,Collezione Uno, was presented at the Palazzo Grassi in Venice.
The overall €90 million in compensation due to Safilo hasbeen recognised as an intangible asset in the 2015 financialstatements and will be amortised as from January 1, 2017.The compensation will be paid in three equal instalments,with the first payment made on January 12, 2015 and thefollowing two due in December 2016 and September 2018.
3.3. Reorganisation of theCouture & Leather Goods andWatches & Jewellery brands
On July 27, 2015, Kering announced that Grita Loebsackhad been appointed Chief Executive Officer of Kering’sLuxury – Couture & Leather Goods’ emerging brands,effective September 14, 2015. The CEOs of AlexanderMcQueen, Balenciaga, Brioni, Christopher Kane, StellaMcCartney and Tomas Maier will report to her. Kering’sLuxury – Couture & Leather Goods division also includesGucci, Bottega Veneta and Saint Laurent, which willremain under François-Henri Pinault’s direct supervision.
The autonomy of each of Kering’s brands will continue tobe fully respected in the expansion of the Group’s Luxurybusiness and the brands will remain under theoperational responsibility of their respective CEOs.
The second half of the year also saw the arrival of new CEOswithin the Luxury – Watches & Jewellery division headed byAlbert Bensoussan: Hélène Poulit-Duquesne was appointedCEO of Boucheron, effective September 28, 2015, andSabina Belli was named CEO of Pomellato, effectiveDecember 10, 2015.
On July 31, 2015, Balenciaga and Alexander Wang announcedtheir joint decision not to renew their contract beyond itsinitial term. Alexander Wang showed his final collection forBalenciaga in Paris on October 2, 2015. On October 7, 2015,Demna Gvasalia was appointed as the new Artistic Directorof Balenciaga’s collections. Demna Gvasalia has creativeresponsibility for the brand’s collections and image andwill present his first collection for the brand at the women’sready-to-wear autumn / winter 2016-17 show in Paris.
3.4. Sale of Italian luxury shoemakerSergio Rossi
On December 30, 2015 Kering announced that it hadclosed the sale of the Italian luxury shoemaker, SergioRossi, to Investindustrial, in accordance with the termsannounced on December 9, 2015.
The transaction included all the industrial assets of SergioRossi, the rights attached to the brand and the entiredistribution network. The sale will allow the Sergio Rossibrand to continue its development with a strategicpartner that can support the brand solidly and withprospects for long-term growth. Investindustrial is one ofEurope’s best-known industrial groups, which providessolutions and capital to mid-sized companies in order toaccelerate their international expansion and improvetheir operational efficiency. Among the companiesmanaged by Investindustrial today are brands such asAston Martin, B&B Italia and Flos, which are internationallyrecognised for their excellence in Italian design.
Note 3 – Highlights
233
5
2015 Reference Document ~ Kering
CONSOLIDATED FINANCIAL STATEMENTS AS OF DECEMBER 31, 2015 ~ FINANCIAL INFORMATION
05_D_VA_V5 06/04/2016 17:29 Page233
By choosing Investindustrial, Kering selected a credibleand reliable partner to ensure the continued long-termdevelopment of Sergio Rossi, in the best interests of thebrand, the company, its staff and its customers.
This sale did not have a material impact on the Group’s2015 financial statements.
3.5. Other highlights
On January 15, 2015, Kering sold the assets of Movitex tothe group’s management team, after recapitalising it inaccordance with the preliminary agreement signed onDecember 3, 2014.
On March 25, 2015 Kering bought out the non-controllinginterests in Sowind Group in accordance with the shareholderagreements signed in June 2011. This acquisition did nothave a material impact on the Group’s 2015 financialstatements.
On June 30, 2015, PUMA announced that it had sold theintellectual property rights (including trademark rights) ofits subsidiary, Tretorn Group, to US-based AuthenticBrands Group, LLC (ABG). Tretorn – which is based inHelsinborg in Sweden and makes sport and leisureproducts – was acquired by PUMA in 2002. This sale is inline with PUMA’s strategy of refocusing on its corebusinesses.
On March 20, 2015, Kering issued a €500 million, 0.875%fixed-rate bond maturing in seven years. Also during thefirst half of 2015, Kering carried out two issues of notes inforeign currency – a USD 150 million issue in March 2015of five-year floating-rate notes, and a USD 150 millionissue in June 2015 of six-year fixed-rate notes with anannual coupon of 2.887%.
On September 22, 2015 and November 5, 2015, the Grouptopped up the 2.75% bond issue carried out in 2014 by€150 million and €50 million respectively.
234 Kering ~ 2015 Reference Document
5 FINANCIAL INFORMATION ~ CONSOLIDATED FINANCIAL STATEMENTS AS OF DECEMBER 31, 2015
05_D_VA_V5 06/04/2016 17:29 Page234
The policies applied to determine the operatingsegments presented are set out in Note 2.22.
Information provided on operating segments is preparedin accordance with the same accounting rules as in theconsolidated financial statements and set out in thenotes thereto.
The performance of each operating segment is measuredbased on recurring operating income, which is the methodused by the Group’s chief operating decision maker.
Net recurring charges to depreciation, amortisation andprovisions on non-current operating assets reflect netcharges to depreciation, amortisation and provisions onintangible assets and property, plant and equipmentrecognised in recurring operating income.
Purchases of property, plant and equipment and intangibleassets correspond to gross non-current asset purchases,including cash timing differences but excluding purchasesof assets under finance leases.
Non-current segment assets comprise goodwill, brandsand other intangible assets, property, plant and equipmentand other non-current assets.
Segment assets comprise non-current segment assets,inventories, trade receivables and other current assets.
Segment liabilities comprise deferred tax liabilities onbrands, trade payables and other current liabilities.
Note 4 – Operating segments
235
5
2015 Reference Document ~ Kering
CONSOLIDATED FINANCIAL STATEMENTS AS OF DECEMBER 31, 2015 ~ FINANCIAL INFORMATION
05_D_VA_V5 06/04/2016 17:29 Page235
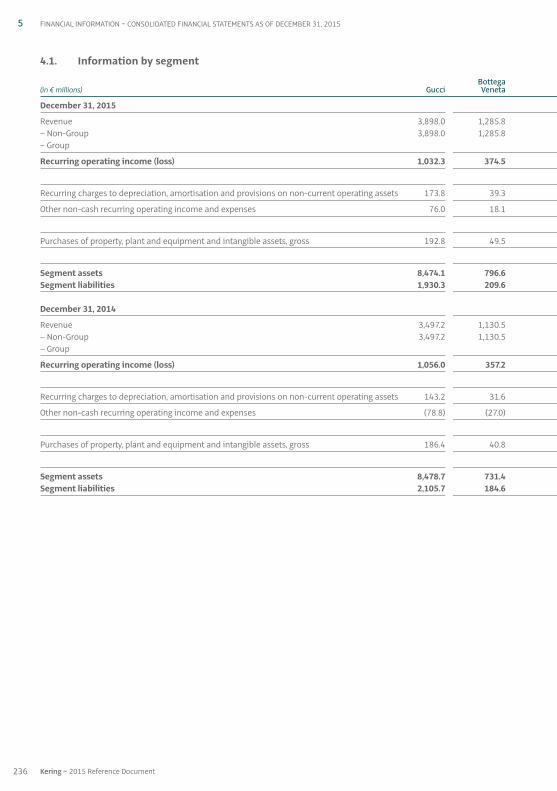
4.1. Information by segment
Bottega (in € millions) Gucci Veneta
December 31, 2015
Revenue 3,898.0 1,285.8 – Non-Group 3,898.0 1,285.8 – Group
Recurring operating income (loss) 1,032.3 374.5
Recurring charges to depreciation, amortisation and provisions on non-current operating assets 173.8 39.3
Other non-cash recurring operating income and expenses 76.0 18.1
Purchases of property, plant and equipment and intangible assets, gross 192.8 49.5
Segment assets 8,474.1 796.6 Segment liabilities 1,930.3 209.6
December 31, 2014
Revenue 3,497.2 1,130.5 – Non-Group 3,497.2 1,130.5 – Group
Recurring operating income (loss) 1,056.0 357.2
Recurring charges to depreciation, amortisation and provisions on non-current operating assets 143.2 31.6
Other non-cash recurring operating income and expenses (78.8) (27.0)
Purchases of property, plant and equipment and intangible assets, gross 186.4 40.8
Segment assets 8,478.7 731.4 Segment liabilities 2,105.7 184.6
236 Kering ~ 2015 Reference Document
5 FINANCIAL INFORMATION ~ CONSOLIDATED FINANCIAL STATEMENTS AS OF DECEMBER 31, 2015
05_D_VA_V5 06/04/2016 17:29 Page236
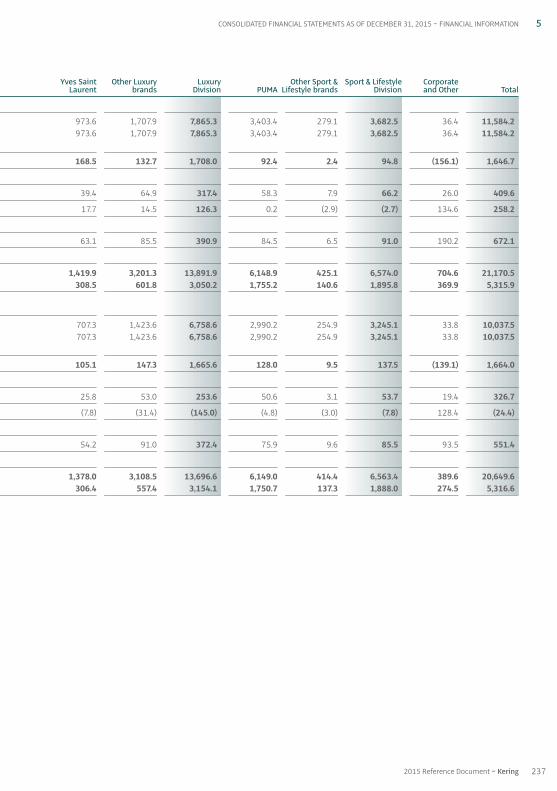
237
5
2015 Reference Document ~ Kering
CONSOLIDATED FINANCIAL STATEMENTS AS OF DECEMBER 31, 2015 ~ FINANCIAL INFORMATION
Yves Saint Other Luxury Luxury Other Sport & Sport & Lifestyle Corporate Laurent brands Division PUMA Lifestyle brands Division and Other Total
973.6 1,707.9 7,865.3 3,403.4 279.1 3,682.5 36.4 11,584.2 973.6 1,707.9 7,865.3 3,403.4 279.1 3,682.5 36.4 11,584.2
168.5 132.7 1,708.0 92.4 2.4 94.8 (156.1) 1,646.7
39.4 64.9 317.4 58.3 7.9 66.2 26.0 409.6
17.7 14.5 126.3 0.2 (2.9) (2.7) 134.6 258.2
63.1 85.5 390.9 84.5 6.5 91.0 190.2 672.1
1,419.9 3,201.3 13,891.9 6,148.9 425.1 6,574.0 704.6 21,170.5 308.5 601.8 3,050.2 1,755.2 140.6 1,895.8 369.9 5,315.9
707.3 1,423.6 6,758.6 2,990.2 254.9 3,245.1 33.8 10,037.5 707.3 1,423.6 6,758.6 2,990.2 254.9 3,245.1 33.8 10,037.5
105.1 147.3 1,665.6 128.0 9.5 137.5 (139.1) 1,664.0
25.8 53.0 253.6 50.6 3.1 53.7 19.4 326.7
(7.8) (31.4) (145.0) (4.8) (3.0) (7.8) 128.4 (24.4)
54.2 91.0 372.4 75.9 9.6 85.5 93.5 551.4
1,378.0 3,108.5 13,696.6 6,149.0 414.4 6,563.4 389.6 20,649.6 306.4 557.4 3,154.1 1,750.7 137.3 1,888.0 274.5 5,316.6
05_D_VA_V5 06/04/2016 17:29 Page237
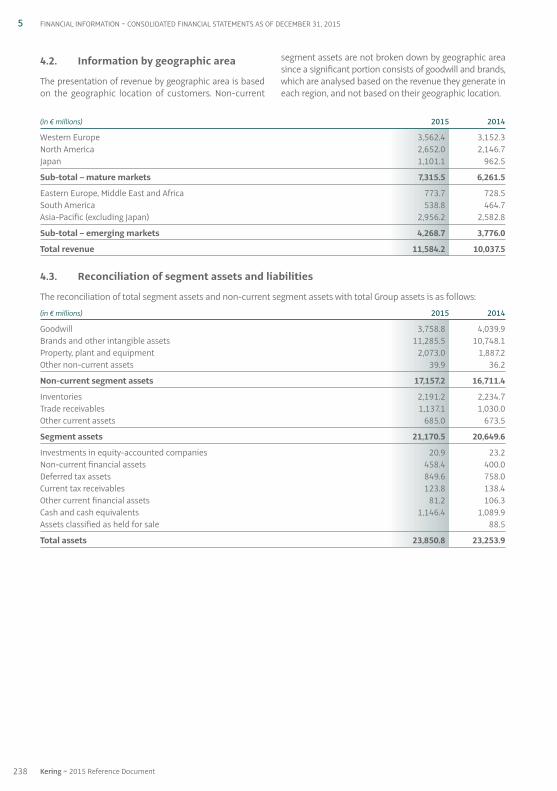
(in € millions) 2015 2014
Western Europe 3,562.4 3,152.3North America 2,652.0 2,146.7Japan 1,101.1 962.5
Sub-total – mature markets 7,315.5 6,261.5
Eastern Europe, Middle East and Africa 773.7 728.5South America 538.8 464.7Asia-Pacific (excluding Japan) 2,956.2 2,582.8
Sub-total – emerging markets 4,268.7 3,776.0
Total revenue 11,584.2 10,037.5
4.3. Reconciliation of segment assets and liabilities
The reconciliation of total segment assets and non-current segment assets with total Group assets is as follows:
(in € millions) 2015 2014
Goodwill 3,758.8 4,039.9Brands and other intangible assets 11,285.5 10,748.1Property, plant and equipment 2,073.0 1,887.2Other non-current assets 39.9 36.2
Non-current segment assets 17,157.2 16,711.4
Inventories 2,191.2 2,234.7Trade receivables 1,137.1 1,030.0Other current assets 685.0 673.5
Segment assets 21,170.5 20,649.6
Investments in equity-accounted companies 20.9 23.2Non-current financial assets 458.4 400.0Deferred tax assets 849.6 758.0Current tax receivables 123.8 138.4Other current financial assets 81.2 106.3Cash and cash equivalents 1,146.4 1,089.9Assets classified as held for sale 88.5
Total assets 23,850.8 23,253.9
4.2. Information by geographic area
The presentation of revenue by geographic area is basedon the geographic location of customers. Non-current
segment assets are not broken down by geographic areasince a significant portion consists of goodwill and brands,which are analysed based on the revenue they generate ineach region, and not based on their geographic location.
238 Kering ~ 2015 Reference Document
5 FINANCIAL INFORMATION ~ CONSOLIDATED FINANCIAL STATEMENTS AS OF DECEMBER 31, 2015
05_D_VA_V5 06/04/2016 17:29 Page238

The reconciliation of total segment liabilities with total Group equity and liabilities is as follows:
(in € millions) 2015 2014
Deferred tax liabilities on brands 2,742.1 2,682.8Trade payables 939.7 982.8Other current liabilities 1,634.1 1,651.0
Segment liabilities 5,315.9 5,316.6
Total equity 11,623.1 11,262.3Non-current borrowings 4,039.9 3,192.2Other non-current financial liabilities 14.8 2.8Non-current provisions for pensions and other post-employment benefits 133.4 111.9Other non-current provisions 82.3 49.3Other deferred tax liabilities 115.8 109.0Current borrowings 1,785.9 2,288.4Other current financial liabilities 238.9 346.8Current provisions for pensions and other post-employment benefits 8.9 7.2Other current provisions 157.3 225.6Current tax liabilities 334.6 277.9Liabilities associated with assets classified as held for sale 63.9
Total equity and liabilities 23,850.8 23,253.9
Note 5 – Revenue
(in € millions) 2015 2014
Net sales of goods 11,368.1 9,829.3Net sales of services 3.9 1.9Revenue from concessions and licences 164.0 163.5Other revenue 48.2 42.8
Total 11,584.2 10,037.5
239
5
2015 Reference Document ~ Kering
CONSOLIDATED FINANCIAL STATEMENTS AS OF DECEMBER 31, 2015 ~ FINANCIAL INFORMATION
05_D_VA_V5 06/04/2016 17:29 Page239
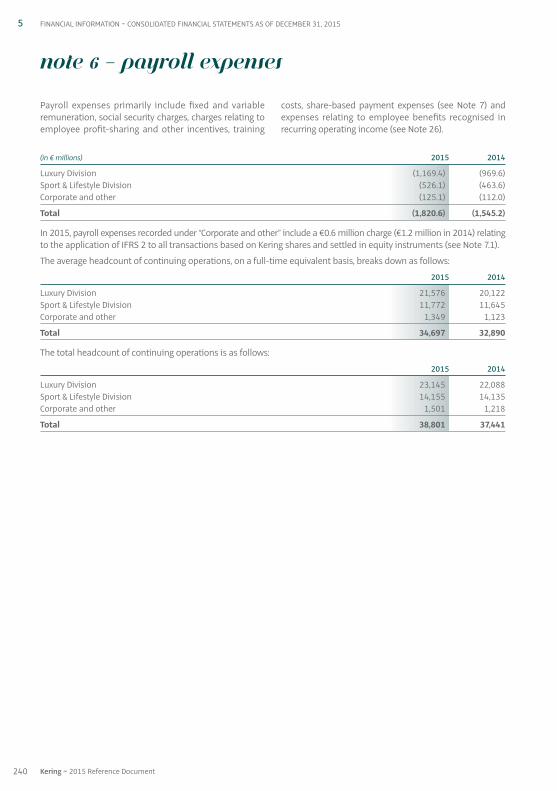
(in € millions) 2015 2014
Luxury Division (1,169.4) (969.6)Sport & Lifestyle Division (526.1) (463.6)Corporate and other (125.1) (112.0)
Total (1,820.6) (1,545.2)
In 2015, payroll expenses recorded under “Corporate and other” include a €0.6 million charge (€1.2 million in 2014) relatingto the application of IFRS 2 to all transactions based on Kering shares and settled in equity instruments (see Note 7.1).
The average headcount of continuing operations, on a full-time equivalent basis, breaks down as follows:
2015 2014
Luxury Division 21,576 20,122Sport & Lifestyle Division 11,772 11,645Corporate and other 1,349 1,123
Total 34,697 32,890
The total headcount of continuing operations is as follows:
2015 2014
Luxury Division 23,145 22,088Sport & Lifestyle Division 14,155 14,135Corporate and other 1,501 1,218
Total 38,801 37,441
Payroll expenses primarily include fixed and variableremuneration, social security charges, charges relating toemployee profit-sharing and other incentives, training
costs, share-based payment expenses (see Note 7) andexpenses relating to employee benefits recognised inrecurring operating income (see Note 26).
Note 6 – Payroll expenses
240 Kering ~ 2015 Reference Document
5 FINANCIAL INFORMATION ~ CONSOLIDATED FINANCIAL STATEMENTS AS OF DECEMBER 31, 2015
05_D_VA_V5 06/04/2016 17:29 Page240
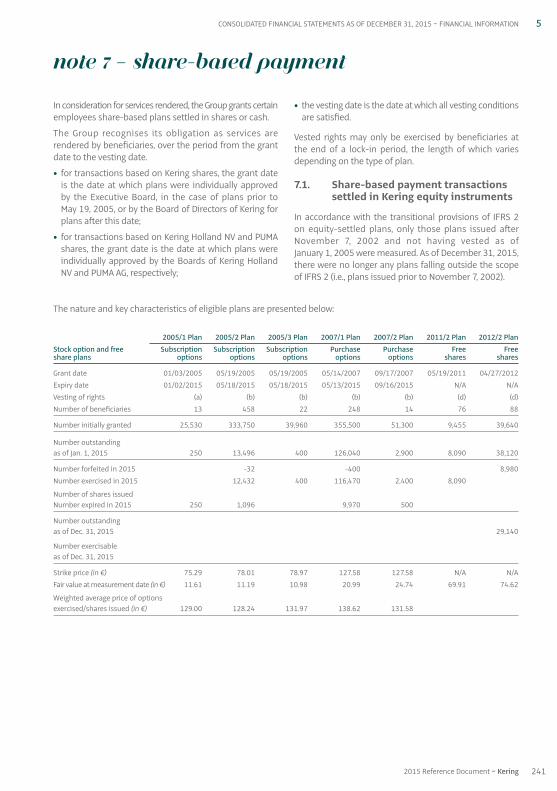
The nature and key characteristics of eligible plans are presented below:
2005/1 Plan 2005/2 Plan 2005/3 Plan 2007/1 Plan 2007/2 Plan 2011/2 Plan 2012/2 PlanStock option and free Subscription Subscription Subscription Purchase Purchase Free Freeshare plans options options options options options shares shares
Grant date 01 / 03 / 2005 05 / 19 / 2005 05 / 19 / 2005 05 / 14 / 2007 09 / 17 / 2007 05 / 19 / 2011 04 / 27 / 2012Expiry date 01 / 02 / 2015 05 / 18 / 2015 05 / 18 / 2015 05 / 13 / 2015 09 / 16 / 2015 N / A N / AVesting of rights (a) (b) (b) (b) (b) (d) (d)Number of beneficiaries 13 458 22 248 14 76 88
Number initially granted 25,530 333,750 39,960 355,500 51,300 9,455 39,640
Number outstanding as of Jan. 1, 2015 250 13,496 400 126,040 2,900 8,090 38,120
Number forfeited in 2015 -32 -400 8,980Number exercised in 2015 12,432 400 116,470 2,400 8,090
Number of shares issued Number expired in 2015 250 1,096 9,970 500
Number outstanding as of Dec. 31, 2015 29,140
Number exercisable as of Dec. 31, 2015
Strike price (in €) 75.29 78.01 78.97 127.58 127.58 N / A N / AFair value at measurement date (in €) 11.61 11.19 10.98 20.99 24.74 69.91 74.62
Weighted average price of options exercised / shares issued (in €) 129.00 128.24 131.97 138.62 131.58
In consideration for services rendered, the Group grants certainemployees share-based plans settled in shares or cash.
The Group recognises its obligation as services arerendered by beneficiaries, over the period from the grantdate to the vesting date.
• for transactions based on Kering shares, the grant dateis the date at which plans were individually approvedby the Executive Board, in the case of plans prior to May 19, 2005, or by the Board of Directors of Kering forplans after this date;
• for transactions based on Kering Holland NV and PUMAshares, the grant date is the date at which plans wereindividually approved by the Boards of Kering HollandNV and PUMA AG, respectively;
• the vesting date is the date at which all vesting conditionsare satisfied.
Vested rights may only be exercised by beneficiaries atthe end of a lock-in period, the length of which variesdepending on the type of plan.
7.1. Share-based payment transactionssettled in Kering equity instruments
In accordance with the transitional provisions of IFRS 2on equity-settled plans, only those plans issued afterNovember 7, 2002 and not having vested as of January 1, 2005 were measured. As of December 31, 2015,there were no longer any plans falling outside the scopeof IFRS 2 (i.e., plans issued prior to November 7, 2002).
Note 7 – Share-based payment
241
5
2015 Reference Document ~ Kering
CONSOLIDATED FINANCIAL STATEMENTS AS OF DECEMBER 31, 2015 ~ FINANCIAL INFORMATION
05_D_VA_V5 06/04/2016 17:29 Page241
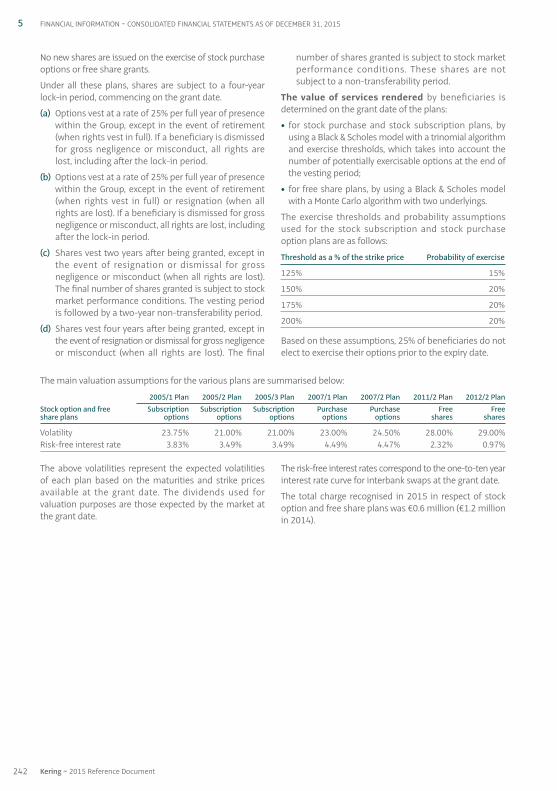
The above volatilities represent the expected volatilitiesof each plan based on the maturities and strike pricesavailable at the grant date. The dividends used forvaluation purposes are those expected by the market atthe grant date.
The risk-free interest rates correspond to the one-to-ten yearinterest rate curve for interbank swaps at the grant date.
The total charge recognised in 2015 in respect of stockoption and free share plans was €0.6 million (€1.2 millionin 2014).
The main valuation assumptions for the various plans are summarised below:
2005/1 Plan 2005/2 Plan 2005 / 3 Plan 2007/1 Plan 2007/2 Plan 2011/2 Plan 2012 / 2 PlanStock option and free Subscription Subscription Subscription Purchase Purchase Free Freeshare plans options options options options options shares shares
Volatility 23.75% 21.00% 21.00% 23.00% 24.50% 28.00% 29.00%Risk-free interest rate 3.83% 3.49% 3.49% 4.49% 4.47% 2.32% 0.97%
No new shares are issued on the exercise of stock purchaseoptions or free share grants.
Under all these plans, shares are subject to a four-yearlock-in period, commencing on the grant date.
(a) Options vest at a rate of 25% per full year of presencewithin the Group, except in the event of retirement(when rights vest in full). If a beneficiary is dismissedfor gross negligence or misconduct, all rights arelost, including after the lock-in period.
(b) Options vest at a rate of 25% per full year of presencewithin the Group, except in the event of retirement(when rights vest in full) or resignation (when allrights are lost). If a beneficiary is dismissed for grossnegligence or misconduct, all rights are lost, includingafter the lock-in period.
(c) Shares vest two years after being granted, except inthe event of resignation or dismissal for grossnegligence or misconduct (when all rights are lost).The final number of shares granted is subject to stockmarket performance conditions. The vesting periodis followed by a two-year non-transferability period.
(d) Shares vest four years after being granted, except inthe event of resignation or dismissal for gross negligenceor misconduct (when all rights are lost). The final
number of shares granted is subject to stock marketperformance conditions. These shares are notsubject to a non-transferability period.
The value of services rendered by beneficiaries isdetermined on the grant date of the plans:
• for stock purchase and stock subscription plans, byusing a Black & Scholes model with a trinomial algorithmand exercise thresholds, which takes into account thenumber of potentially exercisable options at the end ofthe vesting period;
• for free share plans, by using a Black & Scholes modelwith a Monte Carlo algorithm with two underlyings.
The exercise thresholds and probability assumptionsused for the stock subscription and stock purchaseoption plans are as follows:
Threshold as a % of the strike price Probability of exercise
125% 15%
150% 20%
175% 20%
200% 20%
Based on these assumptions, 25% of beneficiaries do notelect to exercise their options prior to the expiry date.
242 Kering ~ 2015 Reference Document
5 FINANCIAL INFORMATION ~ CONSOLIDATED FINANCIAL STATEMENTS AS OF DECEMBER 31, 2015
05_D_VA_V5 06/04/2016 17:29 Page242
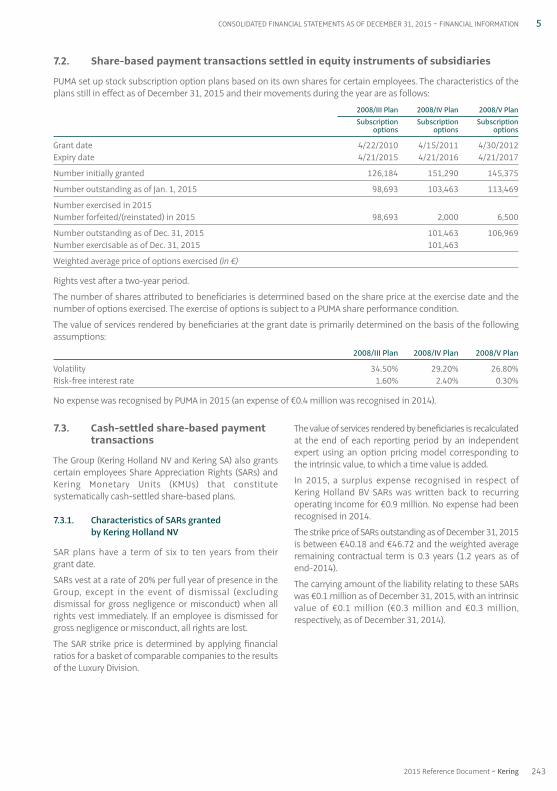
7.3. Cash-settled share-based paymenttransactions
The Group (Kering Holland NV and Kering SA) also grantscertain employees Share Appreciation Rights (SARs) andKering Monetary Units (KMUs) that constitutesystematically cash-settled share-based plans.
7.3.1. Characteristics of SARs granted by Kering Holland NV
SAR plans have a term of six to ten years from their grant date.
SARs vest at a rate of 20% per full year of presence in theGroup, except in the event of dismissal (excludingdismissal for gross negligence or misconduct) when allrights vest immediately. If an employee is dismissed forgross negligence or misconduct, all rights are lost.
The SAR strike price is determined by applying financialratios for a basket of comparable companies to the resultsof the Luxury Division.
The value of services rendered by beneficiaries is recalculatedat the end of each reporting period by an independentexpert using an option pricing model corresponding tothe intrinsic value, to which a time value is added.
In 2015, a surplus expense recognised in respect ofKering Holland BV SARs was written back to recurringoperating income for €0.9 million. No expense had beenrecognised in 2014.
The strike price of SARs outstanding as of December 31, 2015is between €40.18 and €46.72 and the weighted averageremaining contractual term is 0.3 years (1.2 years as ofend-2014).
The carrying amount of the liability relating to these SARswas €0.1 million as of December 31, 2015, with an intrinsicvalue of €0.1 million (€0.3 million and €0.3 million,respectively, as of December 31, 2014).
7.2. Share-based payment transactions settled in equity instruments of subsidiaries
PUMA set up stock subscription option plans based on its own shares for certain employees. The characteristics of theplans still in effect as of December 31, 2015 and their movements during the year are as follows:
2008/III Plan 2008/IV Plan 2008 / V Plan Subscription Subscription Subscription options options options
Grant date 4 / 22 / 2010 4 / 15 / 2011 4 / 30 / 2012Expiry date 4 / 21 / 2015 4 / 21 / 2016 4 / 21 / 2017
Number initially granted 126,184 151,290 145,375
Number outstanding as of Jan. 1, 2015 98,693 103,463 113,469
Number exercised in 2015 Number forfeited / (reinstated) in 2015 98,693 2,000 6,500
Number outstanding as of Dec. 31, 2015 101,463 106,969Number exercisable as of Dec. 31, 2015 101,463
Weighted average price of options exercised (in €)
Rights vest after a two-year period.
The number of shares attributed to beneficiaries is determined based on the share price at the exercise date and thenumber of options exercised. The exercise of options is subject to a PUMA share performance condition.
The value of services rendered by beneficiaries at the grant date is primarily determined on the basis of the followingassumptions:
2008 / III Plan 2008 / IV Plan 2008 / V Plan
Volatility 34.50% 29.20% 26.80%Risk-free interest rate 1.60% 2.40% 0.30%
No expense was recognised by PUMA in 2015 (an expense of €0.4 million was recognised in 2014).
243
5
2015 Reference Document ~ Kering
CONSOLIDATED FINANCIAL STATEMENTS AS OF DECEMBER 31, 2015 ~ FINANCIAL INFORMATION
05_D_VA_V5 06/04/2016 17:29 Page243

Charges to depreciation, amortisation and provisions onnon-current operating assets included in recurringoperating income amounted to €409.6 million in 2015(€326.7 million in 2014). Other net non-cash recurring
operating income amounted to €258.2 million in 2015compared to other net non-cash operating expense of€24.4 million in 2014.
Note 8 – Recurring operating income
Recurring operating income is the primary indicator of the Group’s operating performance, and breaks down as follows:
(in € millions) 2015 2014
Luxury Division 1,708.0 1,665.6Sport & Lifestyle Division 94.8 137.5Corporate and other (156.1) (139.1)
Total 1,646.7 1,664.0
7.3.2. Characteristics of KMUs granted by Kering SA
Since 2013, the Group has granted Kering Monetary Units(KMUs) instead of free shares.
The unit value of the KMUs awarded (and any changes inthat value) is determined based on the intrinsic value ofthe Kering share price and in comparison with theaverage increase in a basket of stocks from the Luxuryand Sports industries.
On July 21, 2013, 124,126 KMUs were granted, with a unitvalue of €152.
On April 22, 2014, 122,643 KMUs were granted, with aunit value of €144.
On May 22, 2015, 114,997 KMUs were granted, with a unitvalue of €167.
Subject to the beneficiaries’ continued presence withinthe Group, the KMUs granted will be settled in cash at theend of the three-year vesting period. The vesting periodwill be followed by a two-year period (January toDecember) during which beneficiaries may opt, in April orOctober, to cash out some or all of their KMUs, at theirdiscretion, based on the most recently determined value.
In accordance with IFRS 2, the value of services renderedby beneficiaries is recalculated by an independent expertat the end of each reporting period.
In 2015, the Group recognised a €15.2 million expense inrespect of KMUs within recurring operating income(€10.1 million expense in 2014).
Plan movements 2015 2014
SARs outstanding as of January 1 1,404 17,004Weighted average strike price (in €) 42.25 79.84
SARs granted during the year Weighted average strike price (in €)
SARs exercised during the year 1,000 15,600Weighted average strike price (in €) 43.08 83.30
SARs forfeited during the year Weighted average strike price (in €)
SARs outstanding as of December 31 404 1,404Weighted average strike price (in €) 40.23 46.26
SARs exercisable as of December 31 400 1,400Weighted average strike price (in €) 40.18 42.25
244 Kering ~ 2015 Reference Document
5 FINANCIAL INFORMATION ~ CONSOLIDATED FINANCIAL STATEMENTS AS OF DECEMBER 31, 2015
05_D_VA_V5 06/04/2016 17:29 Page244

The Group’s other non-recurring operating income andexpenses consist of unusual items that could distort theassessment of each brand’s economic performance. The netbalance of this caption was an expense of €393.5 millionin 2015 and included the following items:
• restructuring costs of €39.6 million, mainly concerningthe Luxury Division;
• asset impairment totalling €501.8 million, including€123.0 million charged against PUMA goodwill, €27.0 millioncharged against the goodwill of one of the other LuxuryDivision brands, and €192.0 million charged againstGucci assets in connection with the brand’s current periodof transition;
• net capital gains on disposals totalling €148.3 million,mainly including the sale of a property complex.
The net balance of this caption was an expense of€112.1 million in 2014 and included the following items:
• restructuring costs of €61.1 million, mainly concerningthe Luxury Division;
• asset impairment totalling €247.5 million, including€189.0 million charged against the goodwill of OtherSport & Lifestyle brands;
• net capital gains on disposals totalling €191.6 million,mainly including the sale of a property complex.
Note 9 – Other non-recurring operating income and expenses
(in € millions) 2015 2014
Non-recurring operating expenses (541.8) (309.2)
Restructuring costs (39.6) (61.1)Asset impairment (501.8) (247.5)Capital losses on disposals (0.6)Other (0.4)
Non-recurring operating income 148.3 197.1
Capital gains on disposals 148.3 192.2Other 4.9
Total (393.5) (112.1)
245
5
2015 Reference Document ~ Kering
CONSOLIDATED FINANCIAL STATEMENTS AS OF DECEMBER 31, 2015 ~ FINANCIAL INFORMATION
05_D_VA_V5 06/04/2016 17:29 Page245
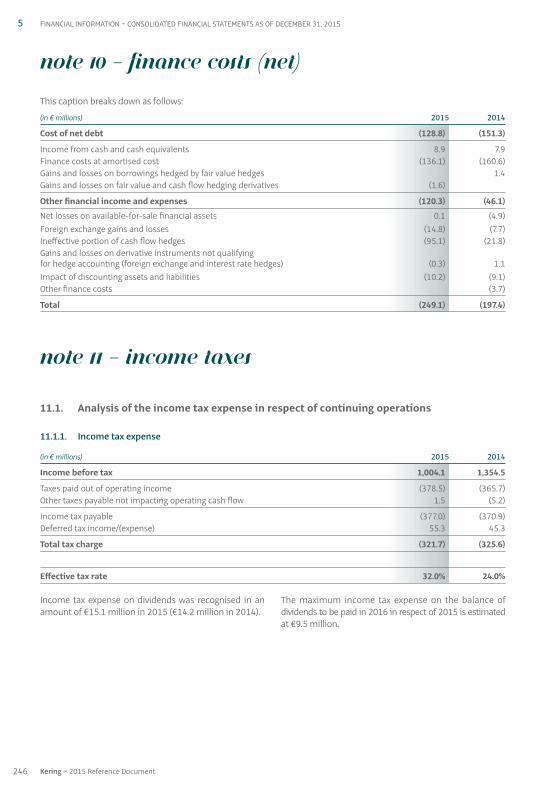
Income tax expense on dividends was recognised in anamount of €15.1 million in 2015 (€14.2 million in 2014).
The maximum income tax expense on the balance ofdividends to be paid in 2016 in respect of 2015 is estimatedat €9.5 million.
Note 10 – Finance costs (net)
This caption breaks down as follows:
(in € millions) 2015 2014
Cost of net debt (128.8) (151.3)
Income from cash and cash equivalents 8.9 7.9Finance costs at amortised cost (136.1) (160.6)Gains and losses on borrowings hedged by fair value hedges 1.4Gains and losses on fair value and cash flow hedging derivatives (1.6)
Other financial income and expenses (120.3) (46.1)
Net losses on available-for-sale financial assets 0.1 (4.9)Foreign exchange gains and losses (14.8) (7.7)Ineffective portion of cash flow hedges (95.1) (21.8)Gains and losses on derivative instruments not qualifying for hedge accounting (foreign exchange and interest rate hedges) (0.3) 1.1Impact of discounting assets and liabilities (10.2) (9.1)Other finance costs (3.7)
Total (249.1) (197.4)
Note 11 – Income taxes
11.1. Analysis of the income tax expense in respect of continuing operations
11.1.1. Income tax expense
(in € millions) 2015 2014
Income before tax 1,004.1 1,354.5
Taxes paid out of operating income (378.5) (365.7)Other taxes payable not impacting operating cash flow 1.5 (5.2)
Income tax payable (377.0) (370.9)Deferred tax income / (expense) 55.3 45.3
Total tax charge (321.7) (325.6)
Effective tax rate 32.0% 24.0%
246 Kering ~ 2015 Reference Document
5 FINANCIAL INFORMATION ~ CONSOLIDATED FINANCIAL STATEMENTS AS OF DECEMBER 31, 2015
05_D_VA_V5 06/04/2016 17:29 Page246

11.1.3. Recurring tax rate
Excluding non-recurring items, the Group income tax rate is as follows:
(in € millions) 2015 2014
Income before tax 1,004.1 1,354.5Non-recurring items (393.5) (112.1)
Recurring income before tax 1,397.6 1,466.6
Total tax charge (321.7) (325.6)Tax on non-recurring items 14.8 (57.6)
Recurring tax charge (336.5) (268.0)
Recurring tax rate 24.0% 18.3%
In 2015, the income tax rate applicable in France was thestandard rate of 33.33%, plus the social surtax of 3.3%and a 10.7% one-off levy for French companies withrevenue over €250 million, bringing the total to 38%.
The “Other” line in 2015 mainly includes the tax ondividends, the impact of tax reassessments and variousforeign taxes.
11.1.2. Reconciliation of the tax rate
(as a % of pre-tax income) 2015 2014
Tax rate applicable in France 38.0% 38.0%
Impact of taxation of foreign subsidiaries -18.4% -17.9%
Theoretical tax rate 19.6% 20.1%
Effect of items taxed at reduced rates 0.0% 0.7%Effect of permanent differences 2.6% -0.5%Effect of unrecognised temporary differences 1.3% 1.5%Effect of unrecognised tax losses carried forward 4.1% -2.7%Effect of changes in tax rates 0.2% 0.2%Other 4.2% 4.8%
Effective tax rate 32.0% 24.0%
247
5
2015 Reference Document ~ Kering
CONSOLIDATED FINANCIAL STATEMENTS AS OF DECEMBER 31, 2015 ~ FINANCIAL INFORMATION
05_D_VA_V5 06/04/2016 17:29 Page247

11.2. Movement in statement of financial position headings
11.2.1. Net current tax liabilities
Changes in net current tax liabilities are set out in the table below:
Cash Cash outflows outflows relating to relating to Other items Net operating investing recognised (in € millions) 2014 income activities activities Other(1) in equity 2015
Current tax receivables 138.4 123.8Current tax liabilities (277.9) (334.6)
Net current tax liabilities (139.5) (378.5) 330.4 (7.9) (13.5) (1.8) (210.8)
(1) “Other” includes changes in Group structure, currency effects and reclassifications of statement of financial position items.
The impact on income tax expense for the periods presented is described in Note 11.1.1.
11.2.2. Deferred tax
Changes in deferred taxes as shown in the consolidated statement of financial position are set out below:
Other items Net recognised (in € millions) 2014 income Other(1) in equity 2015
Intangible assets (2,675.8) 12.2 (76.0) 0.5 (2,739.1)Property, plant and equipment 17.0 38.5 0.6 (0.5) 55.6Other non-current assets 89.0 (53.4) (0.9) (0.2) 34.5Other current assets 284.4 43.0 21.2 (0.5) 348.1Total equity 1.0 (1.4) (0.4)Borrowings (0.1) (5.0) 0.2 (4.9)Provisions for pensions and other post-employment benefits 62.5 3.9 3.4 69.8Other provisions (13.4) (24.4) 42.0 4.2Other current liabilities 83.9 20.8 (25.5) 5.5 84.7Recognised tax losses and tax credits 117.7 19.7 1.8 139.2
Net deferred tax assets (liabilities) (2,033.8) 55.3 (34.6) 4.8 (2,008.3)
Deferred tax assets 758.0 849.6Deferred tax liabilities (2,791.8) (2,857.9)
Deferred tax (2,033.8) 55.3 (34.6) 4.8 (2,008.3)
(1) “Other” includes changes in Group structure, currency effects and reclassifications of different types of deferred tax items.
The impact on income tax expense for the periods presented is described in Note 11.1.1.
248 Kering ~ 2015 Reference Document
5 FINANCIAL INFORMATION ~ CONSOLIDATED FINANCIAL STATEMENTS AS OF DECEMBER 31, 2015
05_D_VA_V5 06/04/2016 17:29 Page248

During 2014 and January 2015, Kering completed the saleof the Redcats group by disposing of La Redoute, RelaisColis, Diam and the assets of the Movitex group.
In addition, on December 30, 2015, Kering sold SergioRossi to Investindustrial under the terms announced onDecember 9, 2015.
For all periods presented, assets held for sale and discontinuedoperations mainly comprise Redcats and Sergio Rossi.Assets held for sale also include the proceeds from GroupeFnac’s redemption of its undated deeply subordinated
notes (TSSDI) on December 30, 2015. The net income orloss from these activities is shown separately on the faceof the income statement within “Discontinued operations”,and is restated in the statement of cash flows.
Assets and liabilities relating to assets held for sale arepresented on separate lines in the Group’s statement offinancial position, without restatement for previous periods.
Assets and liabilities relating to discontinued operationsare not presented on separate lines in the Group’s statementof financial position.
11.3. Unrecognised deferred tax
Tax losses and tax credits not recognised as deferred tax assets amounted to €2,274.7 million as of December 31, 2015(€2,471.2 million as of December 31, 2014).
Changes in unused tax losses and tax credits and the associated expiry schedule are set out below:
(in € millions)
As of January 1, 2014 2,234.1
Losses generated during the year 386.5Losses utilised and time barred during the year (100.4)Effect of changes in Group structure and exchange rate adjustments (49.0)
As of December 31, 2014 2,471.2
Losses generated during the year 110.3Losses utilised and time barred during the year (260.0)Effect of changes in Group structure and exchange rate adjustments (46.8)
As of December 31, 2015 2,274.7
Ordinary tax loss carry-forwards 438.8Less than five years 274.4More than five years 164.4
Indefinite tax loss carry-forwards 1,835.9
Total 2,274.7
There were no unrecognised deferred taxes in respect of temporary differences relating to investments in subsidiaries,associates and joint ventures as of December 31, 2015.
Note 12 – Non-current assets held for sale and discontinued operations
249
5
2015 Reference Document ~ Kering
CONSOLIDATED FINANCIAL STATEMENTS AS OF DECEMBER 31, 2015 ~ FINANCIAL INFORMATION
05_D_VA_V5 06/04/2016 17:29 Page249
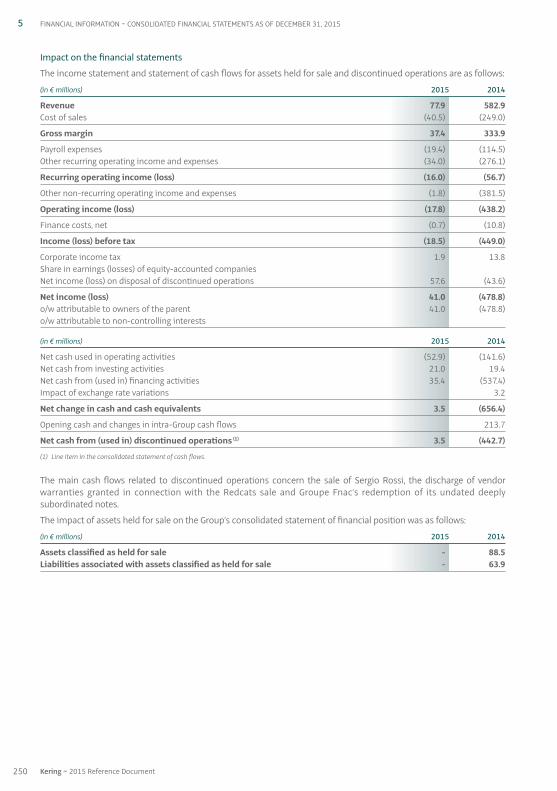
Impact on the financial statements
The income statement and statement of cash flows for assets held for sale and discontinued operations are as follows:
(in € millions) 2015 2014
Revenue 77.9 582.9Cost of sales (40.5) (249.0)
Gross margin 37.4 333.9
Payroll expenses (19.4) (114.5)Other recurring operating income and expenses (34.0) (276.1)
Recurring operating income (loss) (16.0) (56.7)
Other non-recurring operating income and expenses (1.8) (381.5)
Operating income (loss) (17.8) (438.2)
Finance costs, net (0.7) (10.8)
Income (loss) before tax (18.5) (449.0)
Corporate income tax 1.9 13.8Share in earnings (losses) of equity-accounted companies Net income (loss) on disposal of discontinued operations 57.6 (43.6)
Net income (loss) 41.0 (478.8)o / w attributable to owners of the parent 41.0 (478.8) o / w attributable to non-controlling interests
(in € millions) 2015 2014
Net cash used in operating activities (52.9) (141.6)Net cash from investing activities 21.0 19.4Net cash from (used in) financing activities 35.4 (537.4)Impact of exchange rate variations 3.2
Net change in cash and cash equivalents 3.5 (656.4)
Opening cash and changes in intra-Group cash flows 213.7
Net cash from (used in) discontinued operations (1) 3.5 (442.7)
(1) Line item in the consolidated statement of cash flows.
The main cash flows related to discontinued operations concern the sale of Sergio Rossi, the discharge of vendorwarranties granted in connection with the Redcats sale and Groupe Fnac’s redemption of its undated deeplysubordinated notes.
The impact of assets held for sale on the Group’s consolidated statement of financial position was as follows:
(in € millions) 2015 2014
Assets classified as held for sale - 88.5Liabilities associated with assets classified as held for sale - 63.9
250 Kering ~ 2015 Reference Document
5 FINANCIAL INFORMATION ~ CONSOLIDATED FINANCIAL STATEMENTS AS OF DECEMBER 31, 2015
05_D_VA_V5 06/04/2016 17:29 Page250
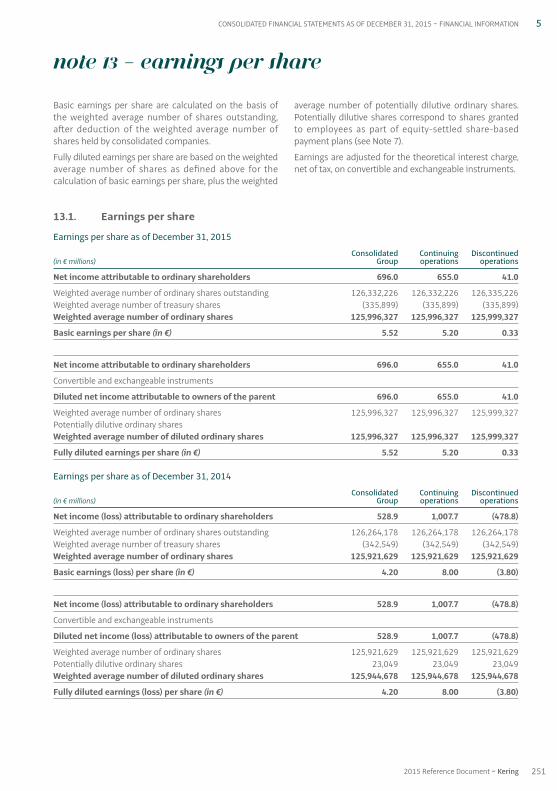
13.1. Earnings per share
Earnings per share as of December 31, 2015
Consolidated Continuing Discontinued(in € millions) Group operations operations
Net income attributable to ordinary shareholders 696.0 655.0 41.0
Weighted average number of ordinary shares outstanding 126,332,226 126,332,226 126,335,226Weighted average number of treasury shares (335,899) (335,899) (335,899)Weighted average number of ordinary shares 125,996,327 125,996,327 125,999,327
Basic earnings per share (in €) 5.52 5.20 0.33
Net income attributable to ordinary shareholders 696.0 655.0 41.0
Convertible and exchangeable instruments
Diluted net income attributable to owners of the parent 696.0 655.0 41.0
Weighted average number of ordinary shares 125,996,327 125,996,327 125,999,327Potentially dilutive ordinary shares Weighted average number of diluted ordinary shares 125,996,327 125,996,327 125,999,327
Fully diluted earnings per share (in €) 5.52 5.20 0.33
Earnings per share as of December 31, 2014
Consolidated Continuing Discontinued(in € millions) Group operations operations
Net income (loss) attributable to ordinary shareholders 528.9 1,007.7 (478.8)
Weighted average number of ordinary shares outstanding 126,264,178 126,264,178 126,264,178Weighted average number of treasury shares (342,549) (342,549) (342,549)Weighted average number of ordinary shares 125,921,629 125,921,629 125,921,629
Basic earnings (loss) per share (in €) 4.20 8.00 (3.80)
Net income (loss) attributable to ordinary shareholders 528.9 1,007.7 (478.8)
Convertible and exchangeable instruments
Diluted net income (loss) attributable to owners of the parent 528.9 1,007.7 (478.8)
Weighted average number of ordinary shares 125,921,629 125,921,629 125,921,629Potentially dilutive ordinary shares 23,049 23,049 23,049Weighted average number of diluted ordinary shares 125,944,678 125,944,678 125,944,678
Fully diluted earnings (loss) per share (in €) 4.20 8.00 (3.80)
Basic earnings per share are calculated on the basis ofthe weighted average number of shares outstanding,after deduction of the weighted average number ofshares held by consolidated companies.
Fully diluted earnings per share are based on the weightedaverage number of shares as defined above for thecalculation of basic earnings per share, plus the weighted
average number of potentially dilutive ordinary shares.Potentially dilutive shares correspond to shares grantedto employees as part of equity-settled share-basedpayment plans (see Note 7).
Earnings are adjusted for the theoretical interest charge,net of tax, on convertible and exchangeable instruments.
Note 13 – Earnings per share
251
5
2015 Reference Document ~ Kering
CONSOLIDATED FINANCIAL STATEMENTS AS OF DECEMBER 31, 2015 ~ FINANCIAL INFORMATION
05_D_VA_V5 06/04/2016 17:29 Page251
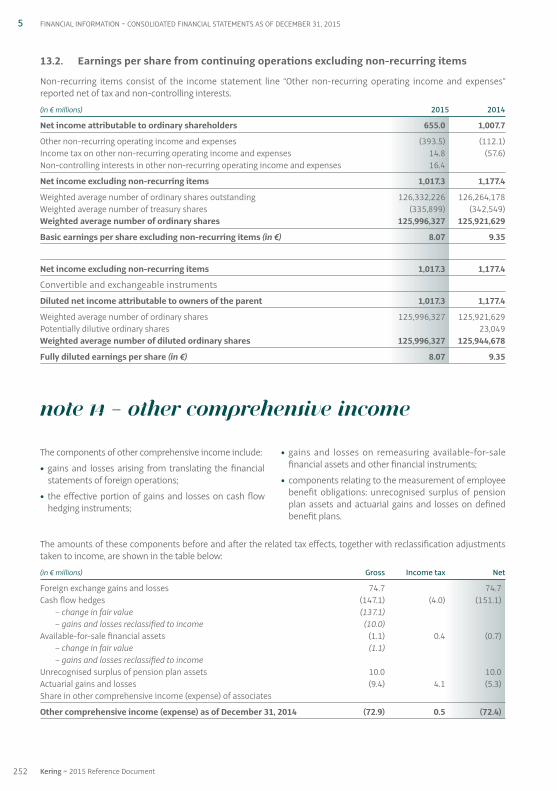
The amounts of these components before and after the related tax effects, together with reclassification adjustmentstaken to income, are shown in the table below:
(in € millions) Gross Income tax Net
Foreign exchange gains and losses 74.7 74.7Cash flow hedges (147.1) (4.0) (151.1)
– change in fair value (137.1) – gains and losses reclassified to income (10.0)
Available-for-sale financial assets (1.1) 0.4 (0.7)– change in fair value (1.1) – gains and losses reclassified to income
Unrecognised surplus of pension plan assets 10.0 10.0Actuarial gains and losses (9.4) 4.1 (5.3)Share in other comprehensive income (expense) of associates
Other comprehensive income (expense) as of December 31, 2014 (72.9) 0.5 (72.4)
The components of other comprehensive income include:
• gains and losses arising from translating the financialstatements of foreign operations;
• the effective portion of gains and losses on cash flowhedging instruments;
• gains and losses on remeasuring available-for-salefinancial assets and other financial instruments;
• components relating to the measurement of employeebenefit obligations: unrecognised surplus of pensionplan assets and actuarial gains and losses on definedbenefit plans.
13.2. Earnings per share from continuing operations excluding non-recurring items
Non-recurring items consist of the income statement line “Other non-recurring operating income and expenses”reported net of tax and non-controlling interests.
(in € millions) 2015 2014
Net income attributable to ordinary shareholders 655.0 1,007.7
Other non-recurring operating income and expenses (393.5) (112.1)Income tax on other non-recurring operating income and expenses 14.8 (57.6)Non-controlling interests in other non-recurring operating income and expenses 16.4
Net income excluding non-recurring items 1,017.3 1,177.4
Weighted average number of ordinary shares outstanding 126,332,226 126,264,178Weighted average number of treasury shares (335,899) (342,549)Weighted average number of ordinary shares 125,996,327 125,921,629
Basic earnings per share excluding non-recurring items (in €) 8.07 9.35
Net income excluding non-recurring items 1,017.3 1,177.4
Convertible and exchangeable instruments
Diluted net income attributable to owners of the parent 1,017.3 1,177.4
Weighted average number of ordinary shares 125,996,327 125,921,629Potentially dilutive ordinary shares 23,049Weighted average number of diluted ordinary shares 125,996,327 125,944,678
Fully diluted earnings per share (in €) 8.07 9.35
Note 14 – Other comprehensive income
252 Kering ~ 2015 Reference Document
5 FINANCIAL INFORMATION ~ CONSOLIDATED FINANCIAL STATEMENTS AS OF DECEMBER 31, 2015
05_D_VA_V5 06/04/2016 17:29 Page252
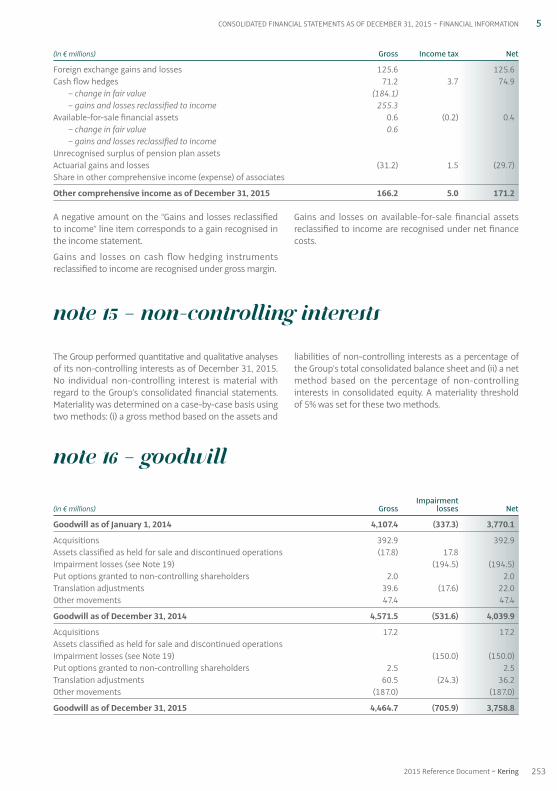
Note 16 – Goodwill
Impairment (in € millions) Gross losses Net
Goodwill as of January 1, 2014 4,107.4 (337.3) 3,770.1
Acquisitions 392.9 392.9Assets classified as held for sale and discontinued operations (17.8) 17.8 Impairment losses (see Note 19) (194.5) (194.5)Put options granted to non-controlling shareholders 2.0 2.0Translation adjustments 39.6 (17.6) 22.0Other movements 47.4 47.4
Goodwill as of December 31, 2014 4,571.5 (531.6) 4,039.9
Acquisitions 17.2 17.2Assets classified as held for sale and discontinued operations Impairment losses (see Note 19) (150.0) (150.0)Put options granted to non-controlling shareholders 2.5 2.5Translation adjustments 60.5 (24.3) 36.2Other movements (187.0) (187.0)
Goodwill as of December 31, 2015 4,464.7 (705.9) 3,758.8
The Group performed quantitative and qualitative analysesof its non-controlling interests as of December 31, 2015.No individual non-controlling interest is material withregard to the Group’s consolidated financial statements.Materiality was determined on a case-by-case basis usingtwo methods: (i) a gross method based on the assets and
liabilities of non-controlling interests as a percentage ofthe Group’s total consolidated balance sheet and (ii) a netmethod based on the percentage of non-controllinginterests in consolidated equity. A materiality thresholdof 5% was set for these two methods.
Note 15 – Non-controlling interests
A negative amount on the “Gains and losses reclassifiedto income” line item corresponds to a gain recognised inthe income statement.
Gains and losses on cash flow hedging instrumentsreclassified to income are recognised under gross margin.
Gains and losses on available-for-sale financial assetsreclassified to income are recognised under net financecosts.
(in € millions) Gross Income tax Net
Foreign exchange gains and losses 125.6 125.6Cash flow hedges 71.2 3.7 74.9
– change in fair value (184.1) – gains and losses reclassified to income 255.3
Available-for-sale financial assets 0.6 (0.2) 0.4– change in fair value 0.6 – gains and losses reclassified to income
Unrecognised surplus of pension plan assets Actuarial gains and losses (31.2) 1.5 (29.7)Share in other comprehensive income (expense) of associates
Other comprehensive income as of December 31, 2015 166.2 5.0 171.2
253
5
2015 Reference Document ~ Kering
CONSOLIDATED FINANCIAL STATEMENTS AS OF DECEMBER 31, 2015 ~ FINANCIAL INFORMATION
05_D_VA_V5 06/04/2016 17:29 Page253
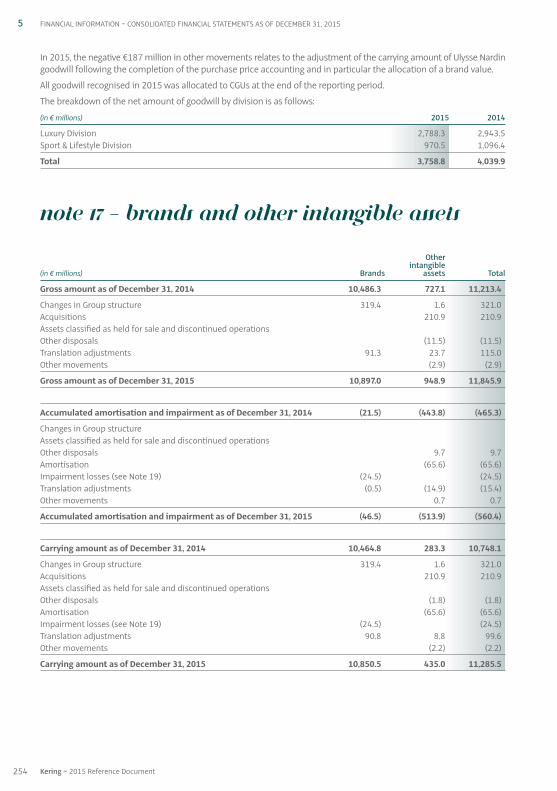
In 2015, the negative €187 million in other movements relates to the adjustment of the carrying amount of Ulysse Nardingoodwill following the completion of the purchase price accounting and in particular the allocation of a brand value.
All goodwill recognised in 2015 was allocated to CGUs at the end of the reporting period.
The breakdown of the net amount of goodwill by division is as follows:
(in € millions) 2015 2014
Luxury Division 2,788.3 2,943.5Sport & Lifestyle Division 970.5 1,096.4
Total 3,758.8 4,039.9
Note 17 – Brands and other intangible assets
Other intangible
(in € millions) Brands assets Total
Gross amount as of December 31, 2014 10,486.3 727.1 11,213.4
Changes in Group structure 319.4 1.6 321.0Acquisitions 210.9 210.9Assets classified as held for sale and discontinued operations Other disposals (11.5) (11.5)Translation adjustments 91.3 23.7 115.0Other movements (2.9) (2.9)
Gross amount as of December 31, 2015 10,897.0 948.9 11,845.9
Accumulated amortisation and impairment as of December 31, 2014 (21.5) (443.8) (465.3)
Changes in Group structure Assets classified as held for sale and discontinued operations Other disposals 9.7 9.7Amortisation (65.6) (65.6)Impairment losses (see Note 19) (24.5) (24.5)Translation adjustments (0.5) (14.9) (15.4)Other movements 0.7 0.7
Accumulated amortisation and impairment as of December 31, 2015 (46.5) (513.9) (560.4)
Carrying amount as of December 31, 2014 10,464.8 283.3 10,748.1
Changes in Group structure 319.4 1.6 321.0Acquisitions 210.9 210.9Assets classified as held for sale and discontinued operations Other disposals (1.8) (1.8)Amortisation (65.6) (65.6)Impairment losses (see Note 19) (24.5) (24.5)Translation adjustments 90.8 8.8 99.6Other movements (2.2) (2.2)
Carrying amount as of December 31, 2015 10,850.5 435.0 11,285.5
254 Kering ~ 2015 Reference Document
5 FINANCIAL INFORMATION ~ CONSOLIDATED FINANCIAL STATEMENTS AS OF DECEMBER 31, 2015
05_D_VA_V5 06/04/2016 17:29 Page254
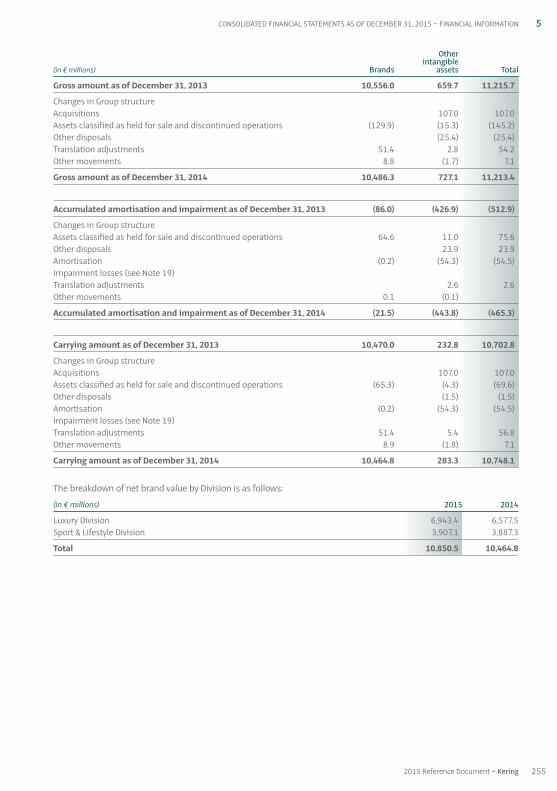
Other intangible
(in € millions) Brands assets Total
Gross amount as of December 31, 2013 10,556.0 659.7 11,215.7
Changes in Group structure Acquisitions 107.0 107.0Assets classified as held for sale and discontinued operations (129.9) (15.3) (145.2)Other disposals (25.4) (25.4)Translation adjustments 51.4 2.8 54.2Other movements 8.8 (1.7) 7.1
Gross amount as of December 31, 2014 10,486.3 727.1 11,213.4
Accumulated amortisation and impairment as of December 31, 2013 (86.0) (426.9) (512.9)
Changes in Group structure Assets classified as held for sale and discontinued operations 64.6 11.0 75.6Other disposals 23.9 23.9Amortisation (0.2) (54.3) (54.5)Impairment losses (see Note 19) Translation adjustments 2.6 2.6Other movements 0.1 (0.1)
Accumulated amortisation and impairment as of December 31, 2014 (21.5) (443.8) (465.3)
Carrying amount as of December 31, 2013 10,470.0 232.8 10,702.8
Changes in Group structure Acquisitions 107.0 107.0Assets classified as held for sale and discontinued operations (65.3) (4.3) (69.6)Other disposals (1.5) (1.5)Amortisation (0.2) (54.3) (54.5)Impairment losses (see Note 19) Translation adjustments 51.4 5.4 56.8Other movements 8.9 (1.8) 7.1
Carrying amount as of December 31, 2014 10,464.8 283.3 10,748.1
The breakdown of net brand value by Division is as follows:
(in € millions) 2015 2014
Luxury Division 6,943.4 6,577.5Sport & Lifestyle Division 3,907.1 3,887.3
Total 10,850.5 10,464.8
255
5
2015 Reference Document ~ Kering
CONSOLIDATED FINANCIAL STATEMENTS AS OF DECEMBER 31, 2015 ~ FINANCIAL INFORMATION
05_D_VA_V5 06/04/2016 17:29 Page255
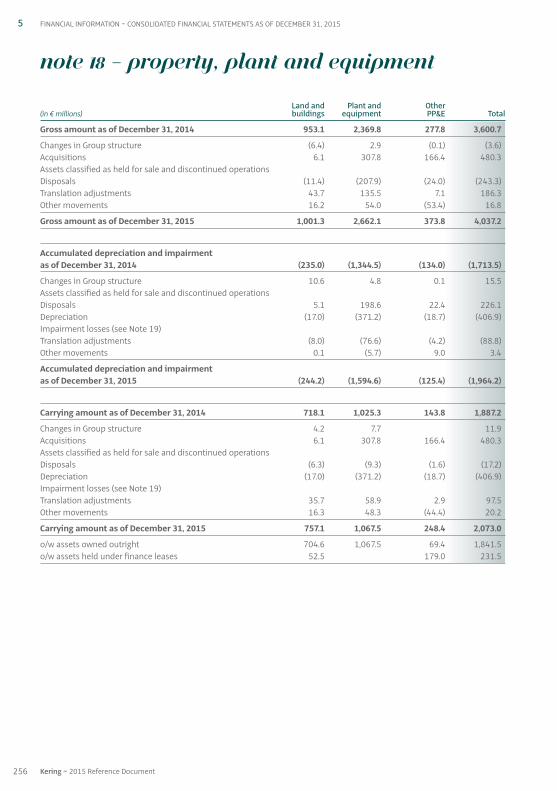
Note 18 – Property, plant and equipment
Land and Plant and Other (in € millions) buildings equipment PP&E Total
Gross amount as of December 31, 2014 953.1 2,369.8 277.8 3,600.7
Changes in Group structure (6.4) 2.9 (0.1) (3.6)Acquisitions 6.1 307.8 166.4 480.3Assets classified as held for sale and discontinued operations Disposals (11.4) (207.9) (24.0) (243.3)Translation adjustments 43.7 135.5 7.1 186.3Other movements 16.2 54.0 (53.4) 16.8
Gross amount as of December 31, 2015 1,001.3 2,662.1 373.8 4,037.2
Accumulated depreciation and impairment as of December 31, 2014 (235.0) (1,344.5) (134.0) (1,713.5)
Changes in Group structure 10.6 4.8 0.1 15.5Assets classified as held for sale and discontinued operations Disposals 5.1 198.6 22.4 226.1Depreciation (17.0) (371.2) (18.7) (406.9)Impairment losses (see Note 19) Translation adjustments (8.0) (76.6) (4.2) (88.8)Other movements 0.1 (5.7) 9.0 3.4
Accumulated depreciation and impairment as of December 31, 2015 (244.2) (1,594.6) (125.4) (1,964.2)
Carrying amount as of December 31, 2014 718.1 1,025.3 143.8 1,887.2
Changes in Group structure 4.2 7.7 11.9Acquisitions 6.1 307.8 166.4 480.3Assets classified as held for sale and discontinued operations Disposals (6.3) (9.3) (1.6) (17.2)Depreciation (17.0) (371.2) (18.7) (406.9)Impairment losses (see Note 19) Translation adjustments 35.7 58.9 2.9 97.5Other movements 16.3 48.3 (44.4) 20.2
Carrying amount as of December 31, 2015 757.1 1,067.5 248.4 2,073.0
o / w assets owned outright 704.6 1,067.5 69.4 1,841.5o / w assets held under finance leases 52.5 179.0 231.5
256 Kering ~ 2015 Reference Document
5 FINANCIAL INFORMATION ~ CONSOLIDATED FINANCIAL STATEMENTS AS OF DECEMBER 31, 2015
05_D_VA_V5 06/04/2016 17:29 Page256
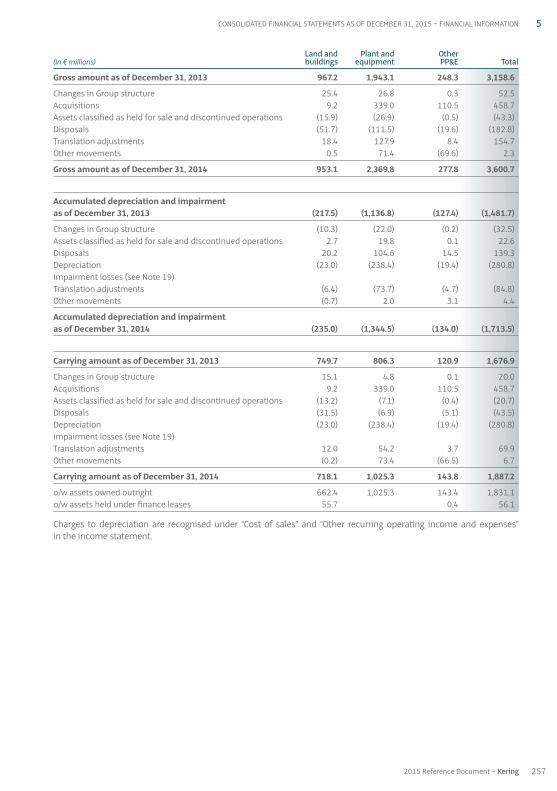
Land and Plant and Other (in € millions) buildings equipment PP&E Total
Gross amount as of December 31, 2013 967.2 1,943.1 248.3 3,158.6
Changes in Group structure 25.4 26.8 0.3 52.5Acquisitions 9.2 339.0 110.5 458.7Assets classified as held for sale and discontinued operations (15.9) (26.9) (0.5) (43.3)Disposals (51.7) (111.5) (19.6) (182.8)Translation adjustments 18.4 127.9 8.4 154.7Other movements 0.5 71.4 (69.6) 2.3
Gross amount as of December 31, 2014 953.1 2,369.8 277.8 3,600.7
Accumulated depreciation and impairment as of December 31, 2013 (217.5) (1,136.8) (127.4) (1,481.7)
Changes in Group structure (10.3) (22.0) (0.2) (32.5)Assets classified as held for sale and discontinued operations 2.7 19.8 0.1 22.6Disposals 20.2 104.6 14.5 139.3Depreciation (23.0) (238.4) (19.4) (280.8)Impairment losses (see Note 19) Translation adjustments (6.4) (73.7) (4.7) (84.8)Other movements (0.7) 2.0 3.1 4.4
Accumulated depreciation and impairment as of December 31, 2014 (235.0) (1,344.5) (134.0) (1,713.5)
Carrying amount as of December 31, 2013 749.7 806.3 120.9 1,676.9
Changes in Group structure 15.1 4.8 0.1 20.0Acquisitions 9.2 339.0 110.5 458.7Assets classified as held for sale and discontinued operations (13.2) (7.1) (0.4) (20.7)Disposals (31.5) (6.9) (5.1) (43.5)Depreciation (23.0) (238.4) (19.4) (280.8)Impairment losses (see Note 19) Translation adjustments 12.0 54.2 3.7 69.9Other movements (0.2) 73.4 (66.5) 6.7
Carrying amount as of December 31, 2014 718.1 1,025.3 143.8 1,887.2
o / w assets owned outright 662.4 1,025.3 143.4 1,831.1o / w assets held under finance leases 55.7 0.4 56.1
Charges to depreciation are recognised under “Cost of sales” and “Other recurring operating income and expenses” in the income statement.
257
5
2015 Reference Document ~ Kering
CONSOLIDATED FINANCIAL STATEMENTS AS OF DECEMBER 31, 2015 ~ FINANCIAL INFORMATION
05_D_VA_V5 06/04/2016 17:29 Page257
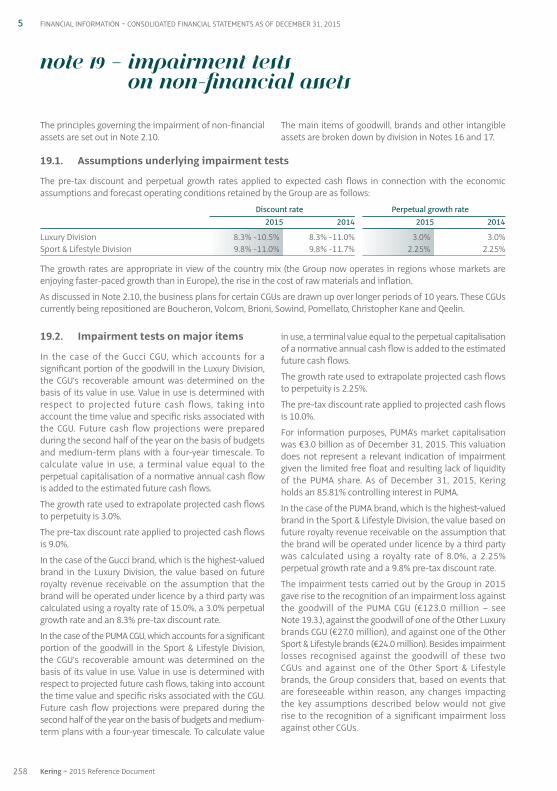
19.2. Impairment tests on major items
In the case of the Gucci CGU, which accounts for asignificant portion of the goodwill in the Luxury Division,the CGU’s recoverable amount was determined on thebasis of its value in use. Value in use is determined withrespect to projected future cash flows, taking intoaccount the time value and specific risks associated withthe CGU. Future cash flow projections were preparedduring the second half of the year on the basis of budgetsand medium-term plans with a four-year timescale. Tocalculate value in use, a terminal value equal to theperpetual capitalisation of a normative annual cash flowis added to the estimated future cash flows.
The growth rate used to extrapolate projected cash flowsto perpetuity is 3.0%.
The pre-tax discount rate applied to projected cash flowsis 9.0%.
In the case of the Gucci brand, which is the highest-valuedbrand in the Luxury Division, the value based on futureroyalty revenue receivable on the assumption that thebrand will be operated under licence by a third party wascalculated using a royalty rate of 15.0%, a 3.0% perpetualgrowth rate and an 8.3% pre-tax discount rate.
In the case of the PUMA CGU, which accounts for a significantportion of the goodwill in the Sport & Lifestyle Division,the CGU’s recoverable amount was determined on thebasis of its value in use. Value in use is determined withrespect to projected future cash flows, taking into accountthe time value and specific risks associated with the CGU.Future cash flow projections were prepared during thesecond half of the year on the basis of budgets and medium-term plans with a four-year timescale. To calculate value
in use, a terminal value equal to the perpetual capitalisationof a normative annual cash flow is added to the estimatedfuture cash flows.
The growth rate used to extrapolate projected cash flowsto perpetuity is 2.25%.
The pre-tax discount rate applied to projected cash flowsis 10.0%.
For information purposes, PUMA’s market capitalisationwas €3.0 billion as of December 31, 2015. This valuationdoes not represent a relevant indication of impairmentgiven the limited free float and resulting lack of liquidityof the PUMA share. As of December 31, 2015, Keringholds an 85.81% controlling interest in PUMA.
In the case of the PUMA brand, which is the highest-valuedbrand in the Sport & Lifestyle Division, the value based onfuture royalty revenue receivable on the assumption thatthe brand will be operated under licence by a third partywas calculated using a royalty rate of 8.0%, a 2.25%perpetual growth rate and a 9.8% pre-tax discount rate.
The impairment tests carried out by the Group in 2015gave rise to the recognition of an impairment loss againstthe goodwill of the PUMA CGU (€123.0 million – seeNote 19.3.), against the goodwill of one of the Other Luxurybrands CGU (€27.0 million), and against one of the OtherSport & Lifestyle brands (€24.0 million). Besides impairmentlosses recognised against the goodwill of these twoCGUs and against one of the Other Sport & Lifestylebrands, the Group considers that, based on events thatare foreseeable within reason, any changes impactingthe key assumptions described below would not giverise to the recognition of a significant impairment lossagainst other CGUs.
19.1. Assumptions underlying impairment tests
The pre-tax discount and perpetual growth rates applied to expected cash flows in connection with the economicassumptions and forecast operating conditions retained by the Group are as follows:
Discount rate Perpetual growth rate2015 2014 2015 2014
Luxury Division 8.3% -10.5% 8.3% -11.0% 3.0% 3.0%Sport & Lifestyle Division 9.8% -11.0% 9.8% -11.7% 2.25% 2.25%
The growth rates are appropriate in view of the country mix (the Group now operates in regions whose markets areenjoying faster-paced growth than in Europe), the rise in the cost of raw materials and inflation.
As discussed in Note 2.10, the business plans for certain CGUs are drawn up over longer periods of 10 years. These CGUscurrently being repositioned are Boucheron, Volcom, Brioni, Sowind, Pomellato, Christopher Kane and Qeelin.
The principles governing the impairment of non-financialassets are set out in Note 2.10.
The main items of goodwill, brands and other intangibleassets are broken down by division in Notes 16 and 17.
Note 19 – Impairment tests on non-financial assets
258 Kering ~ 2015 Reference Document
5 FINANCIAL INFORMATION ~ CONSOLIDATED FINANCIAL STATEMENTS AS OF DECEMBER 31, 2015
05_D_VA_V5 06/04/2016 17:29 Page258
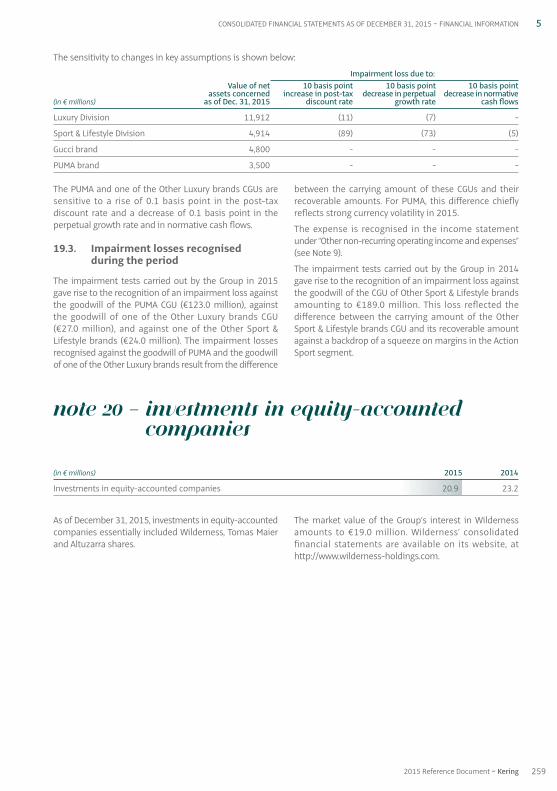
As of December 31, 2015, investments in equity-accountedcompanies essentially included Wilderness, Tomas Maierand Altuzarra shares.
The market value of the Group’s interest in Wildernessamounts to €19.0 million. Wilderness’ consolidatedfinancial statements are available on its website, athttp: / / www.wilderness-holdings.com.
Note 20 – Investments in equity-accountedcompanies
(in € millions) 2015 2014
Investments in equity-accounted companies 20.9 23.2
The PUMA and one of the Other Luxury brands CGUs aresensitive to a rise of 0.1 basis point in the post-taxdiscount rate and a decrease of 0.1 basis point in theperpetual growth rate and in normative cash flows.
19.3. Impairment losses recognised during the period
The impairment tests carried out by the Group in 2015gave rise to the recognition of an impairment loss againstthe goodwill of the PUMA CGU (€123.0 million), againstthe goodwill of one of the Other Luxury brands CGU(€27.0 million), and against one of the Other Sport &Lifestyle brands (€24.0 million). The impairment lossesrecognised against the goodwill of PUMA and the goodwillof one of the Other Luxury brands result from the difference
between the carrying amount of these CGUs and theirrecoverable amounts. For PUMA, this difference chieflyreflects strong currency volatility in 2015.
The expense is recognised in the income statementunder “Other non-recurring operating income and expenses”(see Note 9).
The impairment tests carried out by the Group in 2014gave rise to the recognition of an impairment loss againstthe goodwill of the CGU of Other Sport & Lifestyle brandsamounting to €189.0 million. This loss reflected thedifference between the carrying amount of the OtherSport & Lifestyle brands CGU and its recoverable amountagainst a backdrop of a squeeze on margins in the ActionSport segment.
The sensitivity to changes in key assumptions is shown below:
Impairment loss due to: Value of net 10 basis point 10 basis point 10 basis point assets concerned increase in post-tax decrease in perpetual decrease in normative
(in € millions) as of Dec. 31, 2015 discount rate growth rate cash flows
Luxury Division 11,912 (11) (7) -
Sport & Lifestyle Division 4,914 (89) (73) (5)
Gucci brand 4,800 - - -
PUMA brand 3,500 - - -
259
5
2015 Reference Document ~ Kering
CONSOLIDATED FINANCIAL STATEMENTS AS OF DECEMBER 31, 2015 ~ FINANCIAL INFORMATION
05_D_VA_V5 06/04/2016 17:29 Page259
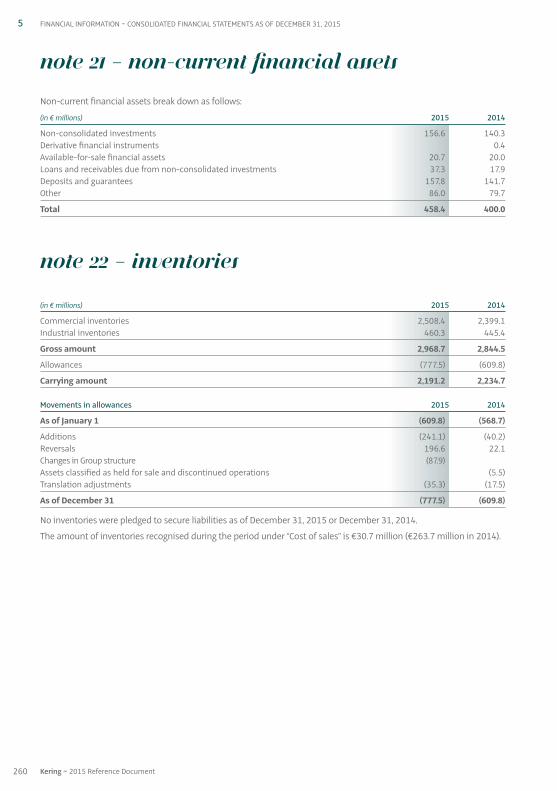
Note 21 – Non-current financial assets
Non-current financial assets break down as follows:
(in € millions) 2015 2014
Non-consolidated investments 156.6 140.3Derivative financial instruments 0.4Available-for-sale financial assets 20.7 20.0Loans and receivables due from non-consolidated investments 37.3 17.9Deposits and guarantees 157.8 141.7Other 86.0 79.7
Total 458.4 400.0
Note 22 – Inventories
(in € millions) 2015 2014
Commercial inventories 2,508.4 2,399.1Industrial inventories 460.3 445.4
Gross amount 2,968.7 2,844.5
Allowances (777.5) (609.8)
Carrying amount 2,191.2 2,234.7
Movements in allowances 2015 2014
As of January 1 (609.8) (568.7)
Additions (241.1) (40.2)Reversals 196.6 22.1Changes in Group structure (87.9) Assets classified as held for sale and discontinued operations (5.5)Translation adjustments (35.3) (17.5)
As of December 31 (777.5) (609.8)
No inventories were pledged to secure liabilities as of December 31, 2015 or December 31, 2014.
The amount of inventories recognised during the period under “Cost of sales” is €30.7 million (€263.7 million in 2014).
260 Kering ~ 2015 Reference Document
5 FINANCIAL INFORMATION ~ CONSOLIDATED FINANCIAL STATEMENTS AS OF DECEMBER 31, 2015
05_D_VA_V5 06/04/2016 17:29 Page260
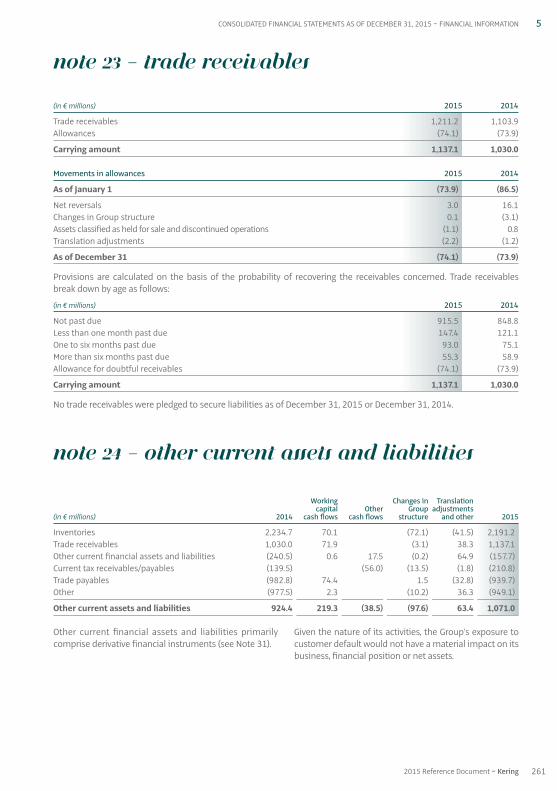
Other current financial assets and liabilities primarilycomprise derivative financial instruments (see Note 31).
Given the nature of its activities, the Group’s exposure tocustomer default would not have a material impact on itsbusiness, financial position or net assets.
Note 23 – Trade receivables
(in € millions) 2015 2014
Trade receivables 1,211.2 1,103.9Allowances (74.1) (73.9)
Carrying amount 1,137.1 1,030.0
Movements in allowances 2015 2014
As of January 1 (73.9) (86.5)
Net reversals 3.0 16.1Changes in Group structure 0.1 (3.1)Assets classified as held for sale and discontinued operations (1.1) 0.8Translation adjustments (2.2) (1.2)
As of December 31 (74.1) (73.9)
Provisions are calculated on the basis of the probability of recovering the receivables concerned. Trade receivablesbreak down by age as follows:
(in € millions) 2015 2014
Not past due 915.5 848.8Less than one month past due 147.4 121.1One to six months past due 93.0 75.1More than six months past due 55.3 58.9Allowance for doubtful receivables (74.1) (73.9)
Carrying amount 1,137.1 1,030.0
No trade receivables were pledged to secure liabilities as of December 31, 2015 or December 31, 2014.
Note 24 – Other current assets and liabilities
Working Changes in Translation capital Other Group adjustments (in € millions) 2014 cash flows cash flows structure and other 2015
Inventories 2,234.7 70.1 (72.1) (41.5) 2,191.2Trade receivables 1,030.0 71.9 (3.1) 38.3 1,137.1Other current financial assets and liabilities (240.5) 0.6 17.5 (0.2) 64.9 (157.7)Current tax receivables / payables (139.5) (56.0) (13.5) (1.8) (210.8)Trade payables (982.8) 74.4 1.5 (32.8) (939.7)Other (977.5) 2.3 (10.2) 36.3 (949.1)
Other current assets and liabilities 924.4 219.3 (38.5) (97.6) 63.4 1,071.0
261
5
2015 Reference Document ~ Kering
CONSOLIDATED FINANCIAL STATEMENTS AS OF DECEMBER 31, 2015 ~ FINANCIAL INFORMATION
05_D_VA_V5 06/04/2016 17:29 Page261
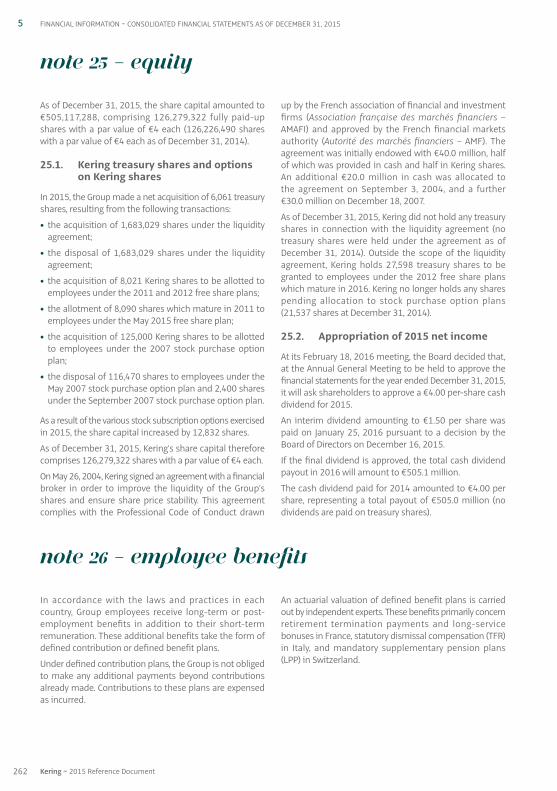
In accordance with the laws and practices in eachcountry, Group employees receive long-term or post-employment benefits in addition to their short-termremuneration. These additional benefits take the form ofdefined contribution or defined benefit plans.
Under defined contribution plans, the Group is not obligedto make any additional payments beyond contributionsalready made. Contributions to these plans are expensedas incurred.
An actuarial valuation of defined benefit plans is carriedout by independent experts. These benefits primarily concernretirement termination payments and long-servicebonuses in France, statutory dismissal compensation (TFR)in Italy, and mandatory supplementary pension plans(LPP) in Switzerland.
Note 26 – Employee benefits
As of December 31, 2015, the share capital amounted to€505,117,288, comprising 126,279,322 fully paid-upshares with a par value of €4 each (126,226,490 shareswith a par value of €4 each as of December 31, 2014).
25.1. Kering treasury shares and optionson Kering shares
In 2015, the Group made a net acquisition of 6,061 treasuryshares, resulting from the following transactions:
• the acquisition of 1,683,029 shares under the liquidityagreement;
• the disposal of 1,683,029 shares under the liquidityagreement;
• the acquisition of 8,021 Kering shares to be allotted toemployees under the 2011 and 2012 free share plans;
• the allotment of 8,090 shares which mature in 2011 toemployees under the May 2015 free share plan;
• the acquisition of 125,000 Kering shares to be allottedto employees under the 2007 stock purchase optionplan;
• the disposal of 116,470 shares to employees under theMay 2007 stock purchase option plan and 2,400 sharesunder the September 2007 stock purchase option plan.
As a result of the various stock subscription options exercisedin 2015, the share capital increased by 12,832 shares.
As of December 31, 2015, Kering’s share capital thereforecomprises 126,279,322 shares with a par value of €4 each.
On May 26, 2004, Kering signed an agreement with a financialbroker in order to improve the liquidity of the Group’sshares and ensure share price stability. This agreementcomplies with the Professional Code of Conduct drawn
up by the French association of financial and investmentfirms (Association française des marchés financiers –AMAFI) and approved by the French financial marketsauthority (Autorité des marchés financiers – AMF). Theagreement was initially endowed with €40.0 million, halfof which was provided in cash and half in Kering shares.An additional €20.0 million in cash was allocated to the agreement on September 3, 2004, and a further€30.0 million on December 18, 2007.
As of December 31, 2015, Kering did not hold any treasuryshares in connection with the liquidity agreement (notreasury shares were held under the agreement as ofDecember 31, 2014). Outside the scope of the liquidityagreement, Kering holds 27,598 treasury shares to begranted to employees under the 2012 free share planswhich mature in 2016. Kering no longer holds any sharespending allocation to stock purchase option plans(21,537 shares at December 31, 2014).
25.2. Appropriation of 2015 net income
At its February 18, 2016 meeting, the Board decided that,at the Annual General Meeting to be held to approve thefinancial statements for the year ended December 31, 2015,it will ask shareholders to approve a €4.00 per-share cashdividend for 2015.
An interim dividend amounting to €1.50 per share waspaid on January 25, 2016 pursuant to a decision by theBoard of Directors on December 16, 2015.
If the final dividend is approved, the total cash dividendpayout in 2016 will amount to €505.1 million.
The cash dividend paid for 2014 amounted to €4.00 pershare, representing a total payout of €505.0 million (nodividends are paid on treasury shares).
Note 25 – Equity
262 Kering ~ 2015 Reference Document
5 FINANCIAL INFORMATION ~ CONSOLIDATED FINANCIAL STATEMENTS AS OF DECEMBER 31, 2015
05_D_VA_V5 06/04/2016 17:29 Page262
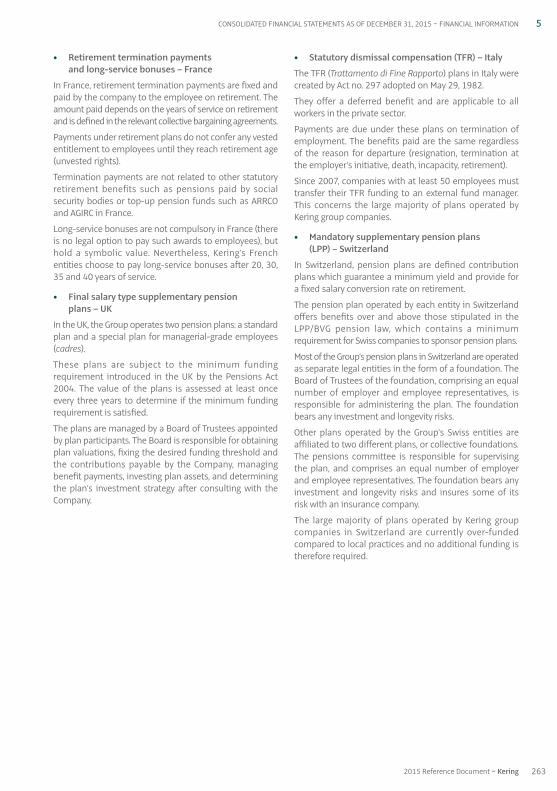
• Retirement termination payments and long-service bonuses – France
In France, retirement termination payments are fixed andpaid by the company to the employee on retirement. Theamount paid depends on the years of service on retirementand is defined in the relevant collective bargaining agreements.
Payments under retirement plans do not confer any vestedentitlement to employees until they reach retirement age(unvested rights).
Termination payments are not related to other statutoryretirement benefits such as pensions paid by socialsecurity bodies or top-up pension funds such as ARRCOand AGIRC in France.
Long-service bonuses are not compulsory in France (thereis no legal option to pay such awards to employees), buthold a symbolic value. Nevertheless, Kering’s Frenchentities choose to pay long-service bonuses after 20, 30,35 and 40 years of service.
• Final salary type supplementary pensionplans – UK
In the UK, the Group operates two pension plans: a standardplan and a special plan for managerial-grade employees(cadres).
These plans are subject to the minimum fundingrequirement introduced in the UK by the Pensions Act2004. The value of the plans is assessed at least onceevery three years to determine if the minimum fundingrequirement is satisfied.
The plans are managed by a Board of Trustees appointedby plan participants. The Board is responsible for obtainingplan valuations, fixing the desired funding threshold andthe contributions payable by the Company, managingbenefit payments, investing plan assets, and determiningthe plan’s investment strategy after consulting with theCompany.
• Statutory dismissal compensation (TFR) – Italy
The TFR (Trattamento di Fine Rapporto) plans in Italy werecreated by Act no. 297 adopted on May 29, 1982.
They offer a deferred benefit and are applicable to allworkers in the private sector.
Payments are due under these plans on termination ofemployment. The benefits paid are the same regardlessof the reason for departure (resignation, termination atthe employer’s initiative, death, incapacity, retirement).
Since 2007, companies with at least 50 employees musttransfer their TFR funding to an external fund manager.This concerns the large majority of plans operated byKering group companies.
• Mandatory supplementary pension plans(LPP) – Switzerland
In Switzerland, pension plans are defined contributionplans which guarantee a minimum yield and provide fora fixed salary conversion rate on retirement.
The pension plan operated by each entity in Switzerlandoffers benefits over and above those stipulated in theLPP / BVG pension law, which contains a minimumrequirement for Swiss companies to sponsor pension plans.
Most of the Group’s pension plans in Switzerland are operatedas separate legal entities in the form of a foundation. TheBoard of Trustees of the foundation, comprising an equalnumber of employer and employee representatives, isresponsible for administering the plan. The foundationbears any investment and longevity risks.
Other plans operated by the Group’s Swiss entities areaffiliated to two different plans, or collective foundations.The pensions committee is responsible for supervisingthe plan, and comprises an equal number of employerand employee representatives. The foundation bears anyinvestment and longevity risks and insures some of itsrisk with an insurance company.
The large majority of plans operated by Kering groupcompanies in Switzerland are currently over-fundedcompared to local practices and no additional funding istherefore required.
263
5
2015 Reference Document ~ Kering
CONSOLIDATED FINANCIAL STATEMENTS AS OF DECEMBER 31, 2015 ~ FINANCIAL INFORMATION
05_D_VA_V5 06/04/2016 17:29 Page263

26.1. Changes during the year
Changes in the present value of the defined benefit obligation and the fair value of plan assets in the year are shown below:
(in € millions) Dec. 31, 2015 Other Present Fair value compre- value of plan Financial hensive Expense of obligation assets position Change Provision income recognised
As of January 1 227.3 106.6 120.7 120.7
Current service cost 16.0 16.0 16.0 (16.0)Curtailments and settlements (3.2) (3.2) Interest cost 5.4 5.4 5.4 (5.4)Interest income on plan assets 3.0 (3.0) (3.0) 3.0Past service cost (1.1) (1.1) (1.1) 1.1Actuarial gains and losses
Impact of changes in demographic assumptions (1.7) (1.7) (1.7) 1.7
Impact of changes in financial assumptions 9.3 9.3 9.3 (9.3)
Impact of experience adjustments (0.5) (0.5) (0.5) 0.5 Return on plan assets
(excluding interest income) 3.2 (3.2) (3.2) 3.2 Effect of asset ceiling
Benefits paid (14.5) (8.3) (6.2) (6.2) Contributions paid by beneficiaries 5.0 5.0 Contributions paid by employer 7.3 (7.3) (7.3) Changes in Group structure 32.7 20.3 12.4 12.4 Assets classified as held for sale and discontinued operations (1.6) (1.6) (1.6) (27.3) Insurance premium for risk benefits (1.2) (1.2) Administrative expense (0.7) 0.7 0.7 (0.7)Exchange differences 10.6 8.2 2.4 2.4
As of December 31 282.5 140.2 142.3 142.3 (31.2) (18.1)
o / w continuing operations 142.3 (18.1)o / w discontinued operations
264 Kering ~ 2015 Reference Document
5 FINANCIAL INFORMATION ~ CONSOLIDATED FINANCIAL STATEMENTS AS OF DECEMBER 31, 2015
05_D_VA_V5 06/04/2016 17:29 Page264

The breakdown of the present value of the benefit obligation by type of plan and country as of December 31, 2015 wasas follows:
(in € millions) 2015 2014
Retirement gratuities – France 19.9 22.2Long-service awards – France 0.1Statutory dismissal compensation (TFR) – Italy 33.5 35.9Supplementary pension plans – United Kingdom 37.9 35.2Supplementary pension plans (LPP) – Switzerland 157.6 100.6Other 33.6 33.3
Present value of benefit obligation as of December 31 282.5 227.3
The Group expects to pay an estimated €7.3 million in contributions in 2016.
As of December 31, 2015, the present value of the benefitobligation amounted to €282.5 million, breaking down as:
• €57.3 million in respect of wholly unfunded plans(€60.7 million as of end-2014);
• €225.2 million in respect of fully or partially fundedplans (€166.6 million as of end-2014).
(in € millions) Dec. 31, 2014 Other Present Fair value compre- value of plan Financial hensive Expense of obligation assets position Change Provision income recognised
As of January 1 328.9 214.7 114.2 9.3 123.5
Current service cost 9.0 9.0 9.0 (9.0)Curtailments and settlements (3.1) (1.4) (1.7) (1.7) 3.1Interest cost 5.6 5.6 5.6 (5.6)Interest income on plan assets 2.8 (2.8) (2.8) 2.8Past service cost (1.5) (1.5) (1.5) 1.5Actuarial gains and losses
Impact of changes in demographic assumptions (0.2) (0.2) (0.2) 0.2
Impact of changes in financial assumptions 25.0 25.0 25.0 (25.0)
Impact of experience adjustments 4.4 4.4 4.4 (4.4) Return on plan assets
(excluding interest income) 2.5 (2.5) (2.5) 2.5 Effect of asset ceiling
Benefits paid (12.8) 1.1 (13.9) (13.9) Contributions paid by beneficiaries 4.8 4.8 4.8 Contributions paid by employer 6.8 (6.8) (6.8) Changes in Group structure (25.5) (0.3) (25.2) (25.2) Assets classified as held for sale and discontinued operations (110.4) (121.3) 10.9 (9.3) 1.6 27.3 (27.3)Insurance premium for risk benefits (0.9) (0.9) Administrative expense (0.6) 0.6 0.6 (0.5)Exchange differences 4.0 3.2 0.8 0.8
As of December 31 227.3 106.6 120.7 120.7 0.6 (35.0)
o / w continuing operations 119.1 (7.7)o / w discontinued operations 1.6 (27.3)
265
5
2015 Reference Document ~ Kering
CONSOLIDATED FINANCIAL STATEMENTS AS OF DECEMBER 31, 2015 ~ FINANCIAL INFORMATION
05_D_VA_V5 06/04/2016 17:29 Page265
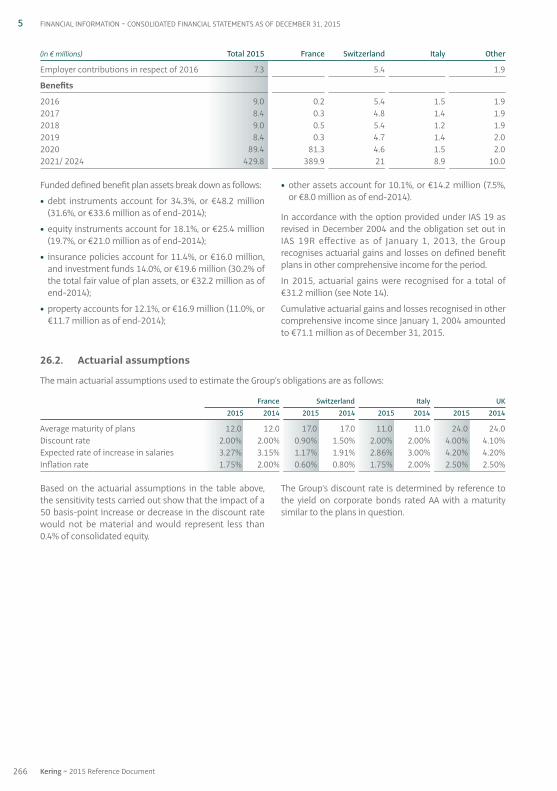
Based on the actuarial assumptions in the table above,the sensitivity tests carried out show that the impact of a50 basis-point increase or decrease in the discount ratewould not be material and would represent less than0.4% of consolidated equity.
The Group’s discount rate is determined by reference tothe yield on corporate bonds rated AA with a maturitysimilar to the plans in question.
26.2. Actuarial assumptions
The main actuarial assumptions used to estimate the Group’s obligations are as follows:
France Switzerland Italy UK 20 15 20 14 20 15 20 14 20 15 20 14 20 15 20 14
Average maturity of plans 12.0 12.0 17.0 17.0 11.0 11.0 24.0 24.0Discount rate 2.00% 2.00% 0.90% 1.50% 2.00% 2.00% 4.00% 4.10%Expected rate of increase in salaries 3.27% 3.15% 1.17% 1.91% 2.86% 3.00% 4.20% 4.20%Inflation rate 1.75% 2.00% 0.60% 0.80% 1.75% 2.00% 2.50% 2.50%
Funded defined benefit plan assets break down as follows:
• debt instruments account for 34.3%, or €48.2 million(31.6%, or €33.6 million as of end-2014);
• equity instruments account for 18.1%, or €25.4 million(19.7%, or €21.0 million as of end-2014);
• insurance policies account for 11.4%, or €16.0 million,and investment funds 14.0%, or €19.6 million (30.2% ofthe total fair value of plan assets, or €32.2 million as ofend-2014);
• property accounts for 12.1%, or €16.9 million (11.0%, or€11.7 million as of end-2014);
• other assets account for 10.1%, or €14.2 million (7.5%,or €8.0 million as of end-2014).
In accordance with the option provided under IAS 19 asrevised in December 2004 and the obligation set out inIAS 19R effective as of January 1, 2013, the Grouprecognises actuarial gains and losses on defined benefitplans in other comprehensive income for the period.
In 2015, actuarial gains were recognised for a total of€31.2 million (see Note 14).
Cumulative actuarial gains and losses recognised in othercomprehensive income since January 1, 2004 amountedto €71.1 million as of December 31, 2015.
(in € millions) Total 2015 France Switzerland Italy Other
Employer contributions in respect of 2016 7.3 5.4 1.9
Benefits
2016 9.0 0.2 5.4 1.5 1.92017 8.4 0.3 4.8 1.4 1.92018 9.0 0.5 5.4 1.2 1.92019 8.4 0.3 4.7 1.4 2.02020 89.4 81.3 4.6 1.5 2.02021 / 2024 429.8 389.9 21 8.9 10.0
266 Kering ~ 2015 Reference Document
5 FINANCIAL INFORMATION ~ CONSOLIDATED FINANCIAL STATEMENTS AS OF DECEMBER 31, 2015
05_D_VA_V5 06/04/2016 17:29 Page266
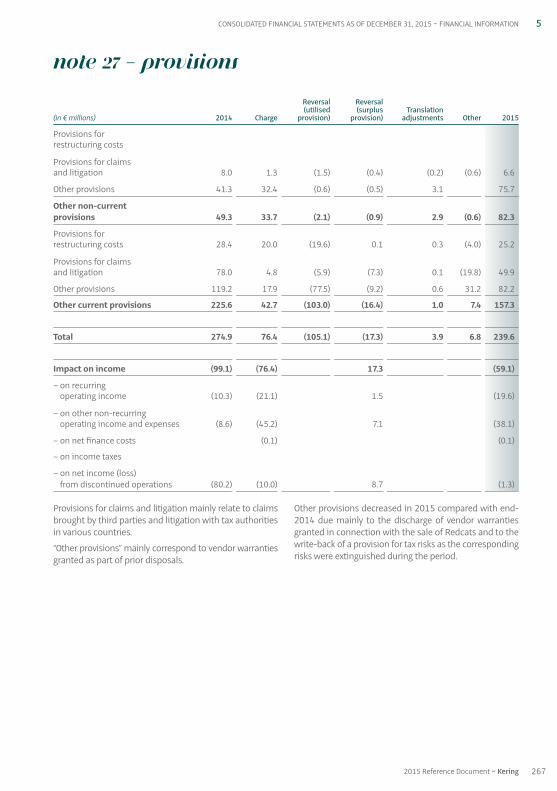
Provisions for claims and litigation mainly relate to claimsbrought by third parties and litigation with tax authoritiesin various countries.
“ Other provisions ” mainly correspond to vendor warrantiesgranted as part of prior disposals.
Other provisions decreased in 2015 compared with end-2014 due mainly to the discharge of vendor warrantiesgranted in connection with the sale of Redcats and to thewrite-back of a provision for tax risks as the correspondingrisks were extinguished during the period.
Note 27 – Provisions
Reversal Reversal(utilised (surplus Translation
(in € millions) 2014 Charge provision) provision) adjustments Other 2015
Provisions for restructuring costs
Provisions for claims and litigation 8.0 1.3 (1.5) (0.4) (0.2) (0.6) 6.6
Other provisions 41.3 32.4 (0.6) (0.5) 3.1 75.7
Other non-current provisions 49.3 33.7 (2.1) (0.9) 2.9 (0.6) 82.3
Provisions for restructuring costs 28.4 20.0 (19.6) 0.1 0.3 (4.0) 25.2
Provisions for claims and litigation 78.0 4.8 (5.9) (7.3) 0.1 (19.8) 49.9
Other provisions 119.2 17.9 (77.5) (9.2) 0.6 31.2 82.2
Other current provisions 225.6 42.7 (103.0) (16.4) 1.0 7.4 157.3
Total 274.9 76.4 (105.1) (17.3) 3.9 6.8 239.6
Impact on income (99.1) (76.4) 17.3 (59.1)
– on recurring operating income (10.3) (21.1) 1.5 (19.6)
– on other non-recurring operating income and expenses (8.6) (45.2) 7.1 (38.1)
– on net finance costs (0.1) (0.1)
– on income taxes
– on net income (loss) from discontinued operations (80.2) (10.0) 8.7 (1.3)
267
5
2015 Reference Document ~ Kering
CONSOLIDATED FINANCIAL STATEMENTS AS OF DECEMBER 31, 2015 ~ FINANCIAL INFORMATION
05_D_VA_V5 06/04/2016 17:29 Page267
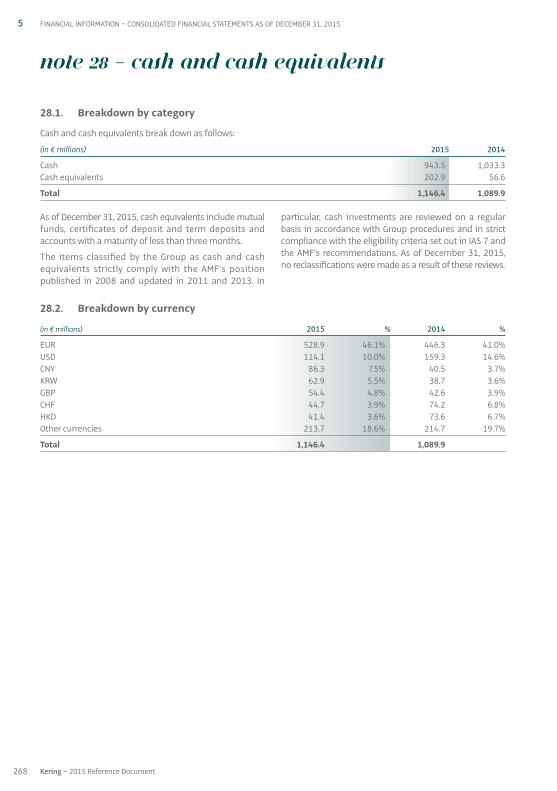
28.2. Breakdown by currency
(in € millions) 2015 % 2014 %
EUR 528.9 46.1% 446.3 41.0%USD 114.1 10.0% 159.3 14.6%CNY 86.3 7.5% 40.5 3.7%KRW 62.9 5.5% 38.7 3.6%GBP 54.4 4.8% 42.6 3.9%CHF 44.7 3.9% 74.2 6.8%HKD 41.4 3.6% 73.6 6.7%Other currencies 213.7 18.6% 214.7 19.7%
Total 1,146.4 1,089.9
As of December 31, 2015, cash equivalents include mutualfunds, certificates of deposit and term deposits andaccounts with a maturity of less than three months.
The items classified by the Group as cash and cashequivalents strictly comply with the AMF’s positionpublished in 2008 and updated in 2011 and 2013. In
particular, cash investments are reviewed on a regularbasis in accordance with Group procedures and in strictcompliance with the eligibility criteria set out in IAS 7 andthe AMF’s recommendations. As of December 31, 2015,no reclassifications were made as a result of these reviews.
Note 28 – Cash and cash equivalents
28.1. Breakdown by category
Cash and cash equivalents break down as follows:
(in € millions) 2015 2014
Cash 943.5 1,033.3Cash equivalents 202.9 56.6
Total 1,146.4 1,089.9
268 Kering ~ 2015 Reference Document
5 FINANCIAL INFORMATION ~ CONSOLIDATED FINANCIAL STATEMENTS AS OF DECEMBER 31, 2015
05_D_VA_V5 06/04/2016 17:29 Page268
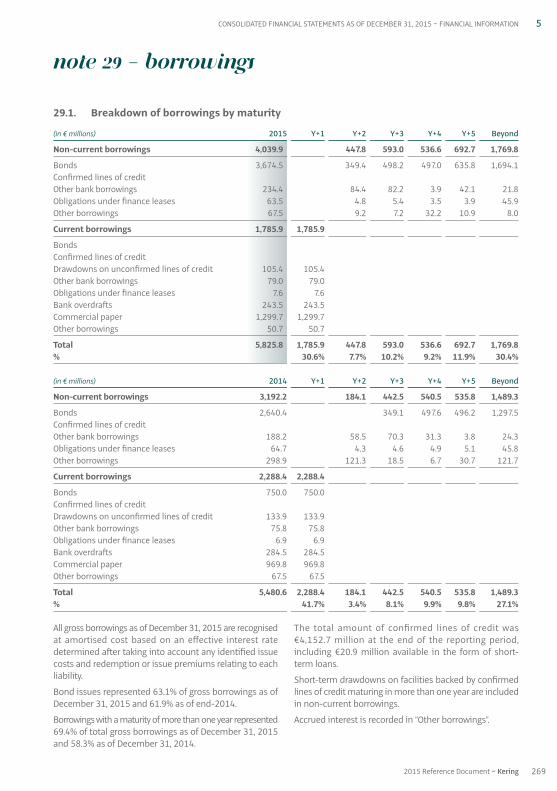
All gross borrowings as of December 31, 2015 are recognisedat amortised cost based on an effective interest ratedetermined after taking into account any identified issuecosts and redemption or issue premiums relating to eachliability.
Bond issues represented 63.1% of gross borrowings as ofDecember 31, 2015 and 61.9% as of end-2014.
Borrowings with a maturity of more than one year represented69.4% of total gross borrowings as of December 31, 2015and 58.3% as of December 31, 2014.
The total amount of confirmed lines of credit was€4,152.7 million at the end of the reporting period,including €20.9 million available in the form of short-term loans.
Short-term drawdowns on facilities backed by confirmedlines of credit maturing in more than one year are includedin non-current borrowings.
Accrued interest is recorded in “Other borrowings”.
Note 29 – Borrowings
29.1. Breakdown of borrowings by maturity
(in € millions) 2015 Y+1 Y+2 Y+3 Y+4 Y+5 Beyond
Non-current borrowings 4,039.9 447.8 593.0 536.6 692.7 1,769.8
Bonds 3,674.5 349.4 498.2 497.0 635.8 1,694.1Confirmed lines of credit Other bank borrowings 234.4 84.4 82.2 3.9 42.1 21.8Obligations under finance leases 63.5 4.8 5.4 3.5 3.9 45.9Other borrowings 67.5 9.2 7.2 32.2 10.9 8.0
Current borrowings 1,785.9 1,785.9
Bonds Confirmed lines of credit Drawdowns on unconfirmed lines of credit 105.4 105.4 Other bank borrowings 79.0 79.0 Obligations under finance leases 7.6 7.6 Bank overdrafts 243.5 243.5 Commercial paper 1,299.7 1,299.7 Other borrowings 50.7 50.7
Total 5,825.8 1,785.9 447.8 593.0 536.6 692.7 1,769.8% 30.6% 7.7% 10.2% 9.2% 11.9% 30.4%
(in € millions) 2014 Y+1 Y+2 Y+3 Y+4 Y+5 Beyond
Non-current borrowings 3,192.2 184.1 442.5 540.5 535.8 1,489.3
Bonds 2,640.4 349.1 497.6 496.2 1,297.5Confirmed lines of credit Other bank borrowings 188.2 58.5 70.3 31.3 3.8 24.3Obligations under finance leases 64.7 4.3 4.6 4.9 5.1 45.8Other borrowings 298.9 121.3 18.5 6.7 30.7 121.7
Current borrowings 2,288.4 2,288.4
Bonds 750.0 750.0 Confirmed lines of credit Drawdowns on unconfirmed lines of credit 133.9 133.9 Other bank borrowings 75.8 75.8 Obligations under finance leases 6.9 6.9 Bank overdrafts 284.5 284.5 Commercial paper 969.8 969.8 Other borrowings 67.5 67.5
Total 5,480.6 2,288.4 184.1 442.5 540.5 535.8 1,489.3% 41.7% 3.4% 8.1% 9.9% 9.8% 27.1%
269
5
2015 Reference Document ~ Kering
CONSOLIDATED FINANCIAL STATEMENTS AS OF DECEMBER 31, 2015 ~ FINANCIAL INFORMATION
05_D_VA_V5 06/04/2016 17:29 Page269
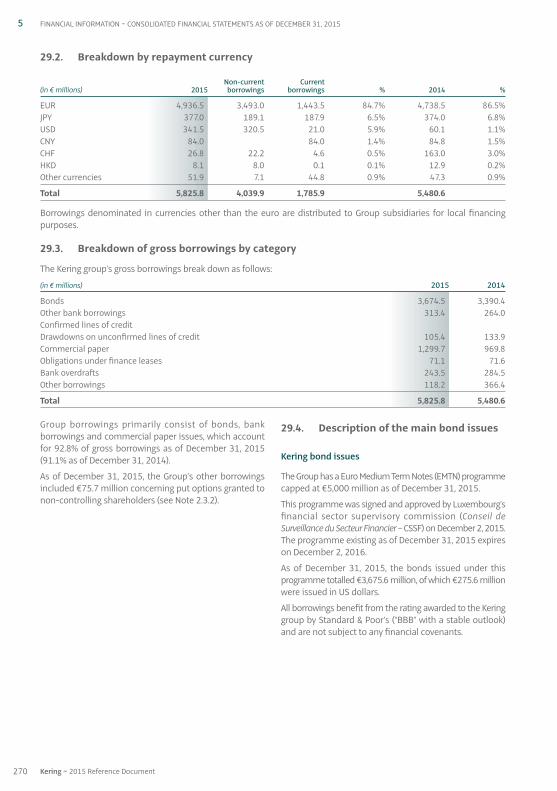
Group borrowings primarily consist of bonds, bankborrowings and commercial paper issues, which accountfor 92.8% of gross borrowings as of December 31, 2015(91.1% as of December 31, 2014).
As of December 31, 2015, the Group’s other borrowingsincluded €75.7 million concerning put options granted tonon-controlling shareholders (see Note 2.3.2).
29.4. Description of the main bond issues
Kering bond issues
The Group has a Euro Medium Term Notes (EMTN) programmecapped at €5,000 million as of December 31, 2015.
This programme was signed and approved by Luxembourg’sfinancial sector supervisory commission (Conseil deSurveillance du Secteur Financier – CSSF) on December 2, 2015.The programme existing as of December 31, 2015 expireson December 2, 2016.
As of December 31, 2015, the bonds issued under thisprogramme totalled €3,675.6 million, of which €275.6 millionwere issued in US dollars.
All borrowings benefit from the rating awarded to the Keringgroup by Standard & Poor’s (“BBB” with a stable outlook)and are not subject to any financial covenants.
29.2. Breakdown by repayment currency
Non-current Current(in € millions) 2015 borrowings borrowings % 2014 %
EUR 4,936.5 3,493.0 1,443.5 84.7% 4,738.5 86.5%JPY 377.0 189.1 187.9 6.5% 374.0 6.8%USD 341.5 320.5 21.0 5.9% 60.1 1.1%CNY 84.0 84.0 1.4% 84.8 1.5%CHF 26.8 22.2 4.6 0.5% 163.0 3.0%HKD 8.1 8.0 0.1 0.1% 12.9 0.2%Other currencies 51.9 7.1 44.8 0.9% 47.3 0.9%
Total 5,825.8 4,039.9 1,785.9 5,480.6
Borrowings denominated in currencies other than the euro are distributed to Group subsidiaries for local financingpurposes.
29.3. Breakdown of gross borrowings by category
The Kering group’s gross borrowings break down as follows:
(in € millions) 2015 2014
Bonds 3,674.5 3,390.4Other bank borrowings 313.4 264.0Confirmed lines of credit Drawdowns on unconfirmed lines of credit 105.4 133.9Commercial paper 1,299.7 969.8Obligations under finance leases 71.1 71.6Bank overdrafts 243.5 284.5Other borrowings 118.2 366.4
Total 5,825.8 5,480.6
270 Kering ~ 2015 Reference Document
5 FINANCIAL INFORMATION ~ CONSOLIDATED FINANCIAL STATEMENTS AS OF DECEMBER 31, 2015
05_D_VA_V5 06/04/2016 17:30 Page270
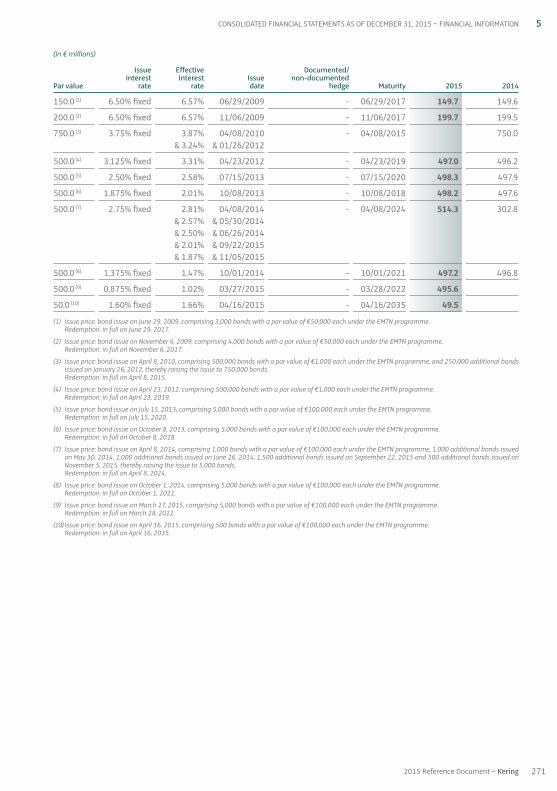
(in € millions)
Issue Effective Documented/interest interest Issue non-documented
Par value rate rate date hedge Maturity 2015 2014
150.0 (1) 6.50% fixed 6.57% 06 / 29 / 2009 - 06 / 29 / 2017 149.7 149.6
200.0 (2) 6.50% fixed 6.57% 11 /0 6 / 2009 - 11 /0 6 / 2017 199.7 199.5
750.0 (3) 3.75% fixed 3.87% 04 / 08 / 2010 - 04 /0 8 / 2015 750.0 & 3.24% & 01 / 26 / 2012
500.0 (4) 3.125% fixed 3.31% 04 / 23 / 2012 - 04 / 23 / 2019 497.0 496.2
500.0 (5) 2.50% fixed 2.58% 07 / 15 / 2013 - 07 / 15 / 2020 498.3 497.9
500.0 (6) 1.875% fixed 2.01% 10 /0 8 / 2013 - 10 /0 8 / 2018 498.2 497.6
500.0 (7) 2.75% fixed 2.81% 04 / 08 / 2014 - 04 / 08 / 2024 514.3 302.8 & 2.57% & 05 / 30 / 2014 & 2.50% & 06 / 26 / 2014 & 2.01% & 09 / 22 / 2015 & 1.87% & 11 / 05 / 2015
500.0 (8) 1.375% fixed 1.47% 10 / 01 / 2014 - 10 / 01 / 2021 497.2 496.8
500.0 (9) 0.875% fixed 1.02% 03 / 27 / 2015 - 03 / 28 / 2022 495.6
50.0 (10) 1.60% fixed 1.66% 04 / 16 / 2015 - 04 / 16 / 2035 49.5
(1) Issue price: bond issue on June 29, 2009, comprising 3,000 bonds with a par value of €50,000 each under the EMTN programme.Redemption: in full on June 29, 2017.
(2) Issue price: bond issue on November 6, 2009, comprising 4,000 bonds with a par value of €50,000 each under the EMTN programme.Redemption: in full on November 6, 2017.
(3) Issue price: bond issue on April 8, 2010, comprising 500,000 bonds with a par value of €1,000 each under the EMTN programme, and 250,000 additional bondsissued on January 26, 2012, thereby raising the issue to 750,000 bonds.Redemption: in full on April 8, 2015.
(4) Issue price: bond issue on April 23, 2012, comprising 500,000 bonds with a par value of €1,000 each under the EMTN programme.Redemption: in full on April 23, 2019.
(5) Issue price: bond issue on July 15, 2013, comprising 5,000 bonds with a par value of €100,000 each under the EMTN programme.Redemption: in full on July 15, 2020.
(6) Issue price: bond issue on October 8, 2013, comprising 5,000 bonds with a par value of €100,000 each under the EMTN programme.Redemption: in full on October 8, 2018.
(7) Issue price: bond issue on April 8, 2014, comprising 1,000 bonds with a par value of €100,000 each under the EMTN programme, 1,000 additional bonds issuedon May 30, 2014, 1,000 additional bonds issued on June 26, 2014, 1,500 additional bonds issued on September 22, 2015 and 500 additional bonds issued onNovember 5, 2015, thereby raising the issue to 5,000 bonds.Redemption: in full on April 8, 2024.
(8) Issue price: bond issue on October 1, 2014, comprising 5,000 bonds with a par value of €100,000 each under the EMTN programme.Redemption: in full on October 1, 2021.
(9) Issue price: bond issue on March 27, 2015, comprising 5,000 bonds with a par value of €100,000 each under the EMTN programme.Redemption: in full on March 28, 2022.
(10) Issue price: bond issue on April 16, 2015, comprising 500 bonds with a par value of €100,000 each under the EMTN programme.Redemption: in full on April 16, 2035.
271
5
2015 Reference Document ~ Kering
CONSOLIDATED FINANCIAL STATEMENTS AS OF DECEMBER 31, 2015 ~ FINANCIAL INFORMATION
05_D_VA_V5 06/04/2016 17:30 Page271
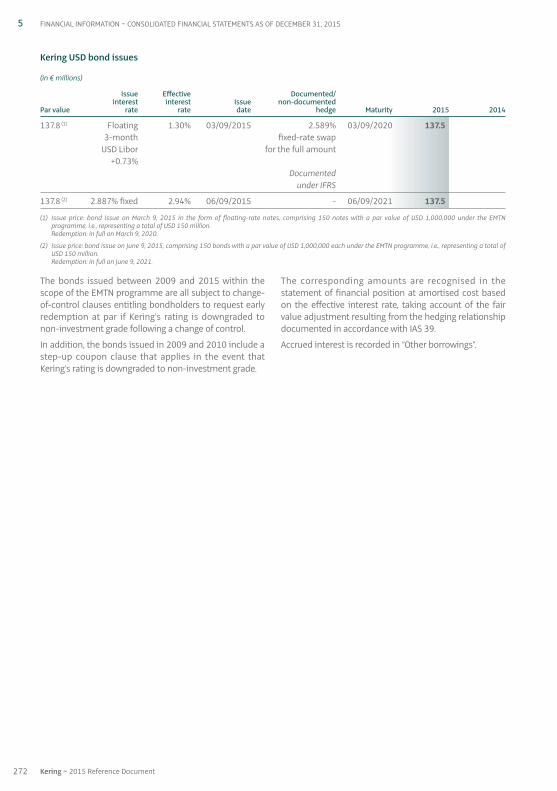
The bonds issued between 2009 and 2015 within thescope of the EMTN programme are all subject to change-of-control clauses entitling bondholders to request earlyredemption at par if Kering’s rating is downgraded tonon-investment grade following a change of control.
In addition, the bonds issued in 2009 and 2010 include astep-up coupon clause that applies in the event thatKering’s rating is downgraded to non-investment grade.
The corresponding amounts are recognised in thestatement of financial position at amortised cost basedon the effective interest rate, taking account of the fairvalue adjustment resulting from the hedging relationshipdocumented in accordance with IAS 39.
Accrued interest is recorded in “Other borrowings”.
Kering USD bond issues
(in € millions)
Issue Effective Documented/ interest interest Issue non-documented Par value rate rate date hedge Maturity 2015 2014
137.8 (1) Floating 1.30% 03 / 09 / 2015 2.589% 03 / 09 / 2020 137.5 3-month fixed-rate swap
USD Libor for the full amount +0.73% Documented under IFRS
137.8 (2) 2.887% fixed 2.94% 06 /0 9 / 2015 - 06 / 09 / 2021 137.5
(1) Issue price: bond issue on March 9, 2015 in the form of floating-rate notes, comprising 150 notes with a par value of USD 1,000,000 under the EMTNprogramme, i.e., representing a total of USD 150 million.Redemption: in full on March 9, 2020.
(2) Issue price: bond issue on June 9, 2015, comprising 150 bonds with a par value of USD 1,000,000 each under the EMTN programme, i.e., representing a total ofUSD 150 million.Redemption: in full on June 9, 2021.
272 Kering ~ 2015 Reference Document
5 FINANCIAL INFORMATION ~ CONSOLIDATED FINANCIAL STATEMENTS AS OF DECEMBER 31, 2015
05_D_VA_V5 06/04/2016 17:30 Page272
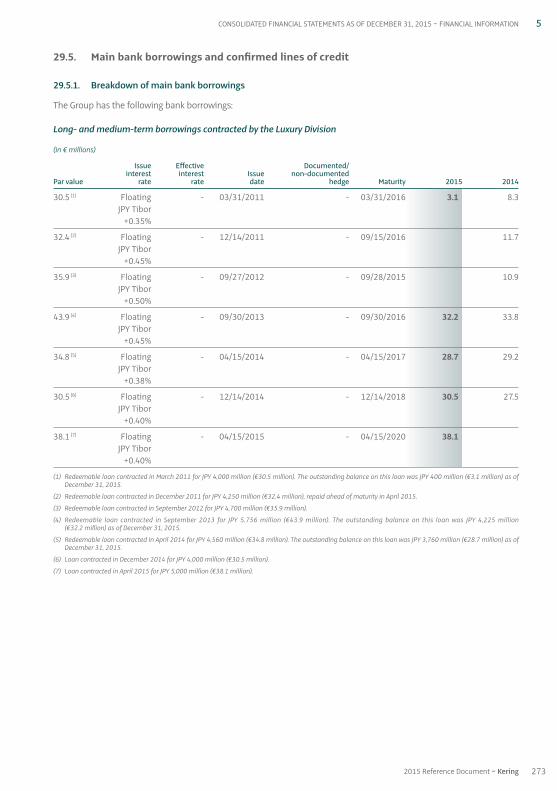
29.5. Main bank borrowings and confirmed lines of credit
29.5.1. Breakdown of main bank borrowings
The Group has the following bank borrowings:
Long- and medium-term borrowings contracted by the Luxury Division
(in € millions)
Issue Effective Documented/ interest interest Issue non-documented Par value rate rate date hedge Maturity 2015 2014
30.5 (1) Floating - 03 / 31 / 2011 - 03 / 31 / 2016 3.1 8.3JPY Tibor
+0.35%
32.4 (2) Floating - 12 / 14 / 2011 - 09 / 15 / 2016 11.7JPY Tibor
+0.45%
35.9 (3) Floating - 09 / 27 / 2012 - 09 / 28 / 2015 10.9JPY Tibor
+0.50%
43.9 (4) Floating - 09 / 30 / 2013 - 09 / 30 / 2016 32.2 33.8JPY Tibor
+0.45%
34.8 (5) Floating - 04 / 15 / 2014 - 04 / 15 / 2017 28.7 29.2JPY Tibor
+0.38%
30.5 (6) Floating - 12 / 14 / 2014 - 12 / 14 / 2018 30.5 27.5JPY Tibor
+0.40%
38.1 (7) Floating - 04 / 15 / 2015 - 04 / 15 / 2020 38.1JPY Tibor
+0.40%
(1) Redeemable loan contracted in March 2011 for JPY 4,000 million (€30.5 million). The outstanding balance on this loan was JPY 400 million (€3.1 million) as ofDecember 31, 2015.
(2) Redeemable loan contracted in December 2011 for JPY 4,250 million (€32.4 million), repaid ahead of maturity in April 2015.
(3) Redeemable loan contracted in September 2012 for JPY 4,700 million (€35.9 million).
(4) Redeemable loan contracted in September 2013 for JPY 5,756 million (€43.9 million). The outstanding balance on this loan was JPY 4,225 million(€32.2 million) as of December 31, 2015.
(5) Redeemable loan contracted in April 2014 for JPY 4,560 million (€34.8 million). The outstanding balance on this loan was JPY 3,760 million (€28.7 million) as ofDecember 31, 2015.
(6) Loan contracted in December 2014 for JPY 4,000 million (€30.5 million).
(7) Loan contracted in April 2015 for JPY 5,000 million (€38.1 million).
273
5
2015 Reference Document ~ Kering
CONSOLIDATED FINANCIAL STATEMENTS AS OF DECEMBER 31, 2015 ~ FINANCIAL INFORMATION
05_D_VA_V5 06/04/2016 17:30 Page273
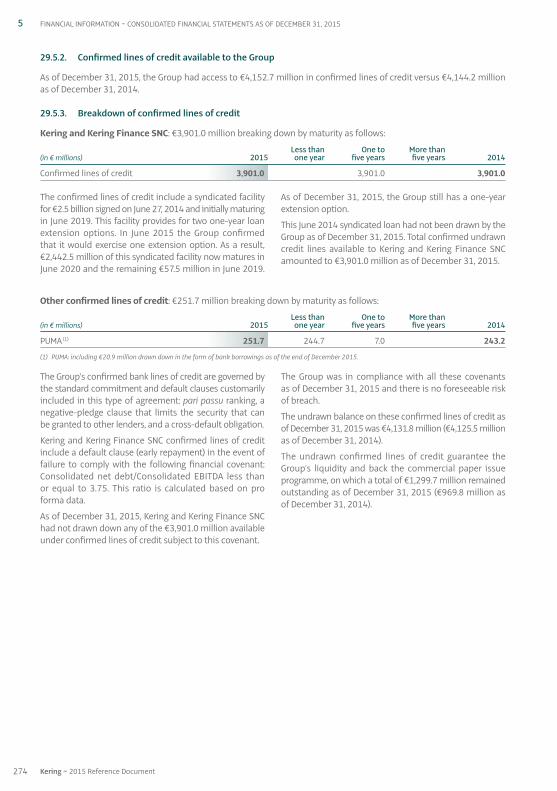
The Group’s confirmed bank lines of credit are governed bythe standard commitment and default clauses customarilyincluded in this type of agreement: pari passu ranking, anegative-pledge clause that limits the security that canbe granted to other lenders, and a cross-default obligation.
Kering and Kering Finance SNC confirmed lines of creditinclude a default clause (early repayment) in the event offailure to comply with the following financial covenant:Consolidated net debt / Consolidated EBITDA less than or equal to 3.75. This ratio is calculated based on proforma data.
As of December 31, 2015, Kering and Kering Finance SNChad not drawn down any of the €3,901.0 million availableunder confirmed lines of credit subject to this covenant.
The Group was in compliance with all these covenants as of December 31, 2015 and there is no foreseeable riskof breach.
The undrawn balance on these confirmed lines of credit asof December 31, 2015 was €4,131.8 million (€4,125.5 millionas of December 31, 2014).
The undrawn confirmed lines of credit guarantee theGroup’s liquidity and back the commercial paper issueprogramme, on which a total of €1,299.7 million remainedoutstanding as of December 31, 2015 (€969.8 million asof December 31, 2014).
Other confirmed lines of credit: €251.7 million breaking down by maturity as follows:
Less than One to More than (in € millions) 2015 one year five years five years 2014
PUMA (1) 251.7 244.7 7.0 243.2
(1) PUMA: including €20.9 million drawn down in the form of bank borrowings as of the end of December 2015.
The confirmed lines of credit include a syndicated facilityfor €2.5 billion signed on June 27, 2014 and initially maturingin June 2019. This facility provides for two one-year loanextension options. In June 2015 the Group confirmedthat it would exercise one extension option. As a result,€2,442.5 million of this syndicated facility now matures inJune 2020 and the remaining €57.5 million in June 2019.
As of December 31, 2015, the Group still has a one-yearextension option.
This June 2014 syndicated loan had not been drawn by theGroup as of December 31, 2015. Total confirmed undrawncredit lines available to Kering and Kering Finance SNCamounted to €3,901.0 million as of December 31, 2015.
29.5.2. Confirmed lines of credit available to the Group
As of December 31, 2015, the Group had access to €4,152.7 million in confirmed lines of credit versus €4,144.2 millionas of December 31, 2014.
29.5.3. Breakdown of confirmed lines of credit
Kering and Kering Finance SNC: €3,901.0 million breaking down by maturity as follows:
Less than One to More than (in € millions) 2015 one year five years five years 2014
Confirmed lines of credit 3,901.0 3,901.0 3,901.0
274 Kering ~ 2015 Reference Document
5 FINANCIAL INFORMATION ~ CONSOLIDATED FINANCIAL STATEMENTS AS OF DECEMBER 31, 2015
05_D_VA_V5 06/04/2016 17:30 Page274
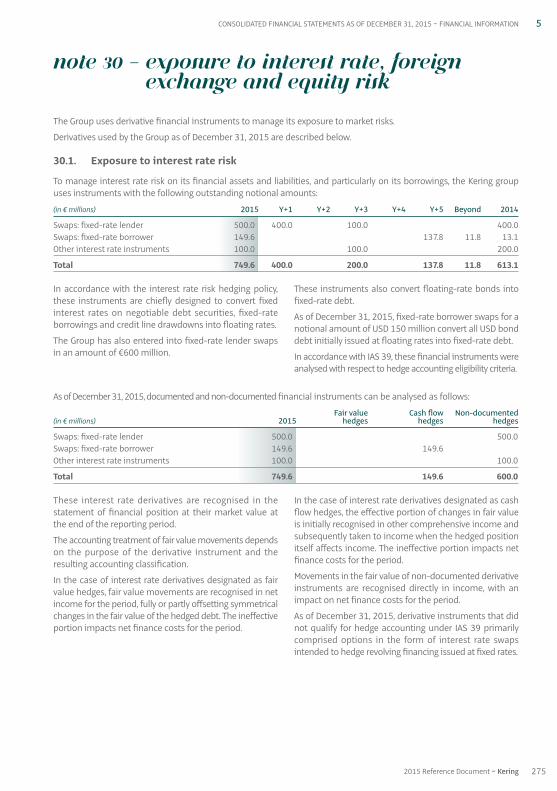
These interest rate derivatives are recognised in thestatement of financial position at their market value atthe end of the reporting period.
The accounting treatment of fair value movements dependson the purpose of the derivative instrument and theresulting accounting classification.
In the case of interest rate derivatives designated as fairvalue hedges, fair value movements are recognised in netincome for the period, fully or partly offsetting symmetricalchanges in the fair value of the hedged debt. The ineffectiveportion impacts net finance costs for the period.
In the case of interest rate derivatives designated as cashflow hedges, the effective portion of changes in fair valueis initially recognised in other comprehensive income andsubsequently taken to income when the hedged positionitself affects income. The ineffective portion impacts netfinance costs for the period.
Movements in the fair value of non-documented derivativeinstruments are recognised directly in income, with animpact on net finance costs for the period.
As of December 31, 2015, derivative instruments that didnot qualify for hedge accounting under IAS 39 primarilycomprised options in the form of interest rate swapsintended to hedge revolving financing issued at fixed rates.
As of December 31, 2015, documented and non-documented financial instruments can be analysed as follows:
Fair value Cash flow Non-documented(in € millions) 2015 hedges hedges hedges
Swaps: fixed-rate lender 500.0 500.0Swaps: fixed-rate borrower 149.6 149.6 Other interest rate instruments 100.0 100.0
Total 749.6 149.6 600.0
In accordance with the interest rate risk hedging policy,these instruments are chiefly designed to convert fixedinterest rates on negotiable debt securities, fixed-rateborrowings and credit line drawdowns into floating rates.
The Group has also entered into fixed-rate lender swapsin an amount of €600 million.
These instruments also convert floating-rate bonds intofixed-rate debt.
As of December 31, 2015, fixed-rate borrower swaps for anotional amount of USD 150 million convert all USD bonddebt initially issued at floating rates into fixed-rate debt.
In accordance with IAS 39, these financial instruments wereanalysed with respect to hedge accounting eligibility criteria.
Note 30 – Exposure to interest rate, foreignexchange and equity risk
The Group uses derivative financial instruments to manage its exposure to market risks.
Derivatives used by the Group as of December 31, 2015 are described below.
30.1. Exposure to interest rate risk
To manage interest rate risk on its financial assets and liabilities, and particularly on its borrowings, the Kering groupuses instruments with the following outstanding notional amounts:
(in € millions) 2015 Y+1 Y+2 Y+3 Y+4 Y+5 Beyond 2014
Swaps: fixed-rate lender 500.0 400.0 100.0 400.0Swaps: fixed-rate borrower 149.6 137.8 11.8 13.1Other interest rate instruments 100.0 100.0 200.0
Total 749.6 400.0 200.0 137.8 11.8 613.1
275
5
2015 Reference Document ~ Kering
CONSOLIDATED FINANCIAL STATEMENTS AS OF DECEMBER 31, 2015 ~ FINANCIAL INFORMATION
05_D_VA_V5 06/04/2016 17:30 Page275

The Group’s exposure to interest rate risk before the impact of hedging is presented below, with a distinction made between:
• fixed-rate financial assets and liabilities, exposed to a price risk before hedging:
2015 maturitiesLess than One to More than
(in € millions) 2015 one year five years five years 2014
Fixed-rate financial assets 58.1 14.3 43.8 60.1
Bonds 3,537.0 1,842.9 1,694.1 3,390.4Commercial paper 1,299.7 1,299.7 929.8Other borrowings 28.4 3.1 25.0 0.3 28.1
Fixed-rate financial liabilities 4,865.1 1,302.8 1,867.9 1,694.4 4,348.3
• floating-rate financial assets and liabilities, exposed to a cash flow risk before hedging:
2015 maturitiesLess than One to More than
(in € millions) 2015 one year five years five years 2014
Floating-rate financial assets 1,271.2 1,140.7 25.5 105.0 1,125.2
Bonds 137.5 137.5 Commercial paper 40.0Other borrowings 823.2 483.1 264.7 75.4 1,092.3
Floating-rate financial liabilities 960.7 483.1 402.2 75.4 1,132.3
The Group’s exposure to interest rate risk after the impact of hedging is presented below, with a distinction madebetween:
• fixed-rate financial assets and liabilities, exposed to a price risk after hedging:
2015 maturitiesLess than One to More than
(in € millions) 2015 one year five years five years 2014
Fixed-rate financial assets 58.1 14.3 43.8 60.1
Bonds 3,474.5 1,780.4 1,694.1 3,190.4Commercial paper 899.7 899.7 529.8Other borrowings 40.3 4.4 30.6 5.3 41.2
Fixed-rate financial liabilities 4,414.5 904.1 1,811.0 1,699.4 3,761.4
• floating-rate financial assets and liabilities, exposed to a cash flow risk after hedging:
2015 maturitiesLess than One to More than
(in € millions) 2015 one year five years five years 2014
Floating-rate financial assets 1,271.2 1,140.7 25.5 105.0 1,125.2
Bonds 200.0 200.0 200.0Commercial paper 400.0 400.0 440.0Other borrowings 811.3 481.8 259.1 70.4 1,079.2
Floating-rate financial liabilities 1,411.3 881.8 459.1 70.4 1,719.2
Financial assets and liabilities consist of interest-bearing items recorded in the statement of financial position.
The breakdown of gross borrowings by type of interest rate before and after hedging transactions is as follows:
Before hedging After hedging(in € millions) 2015 Fixed-rate Floating-rate Fixed-rate Floating-rate
Gross borrowings 5,825.8 4,865.1 960.7 4,414.5 1,411.3
% 83.5% 16.5% 75.8% 24.2%
276 Kering ~ 2015 Reference Document
5 FINANCIAL INFORMATION ~ CONSOLIDATED FINANCIAL STATEMENTS AS OF DECEMBER 31, 2015
05_D_VA_V5 06/04/2016 17:30 Page276
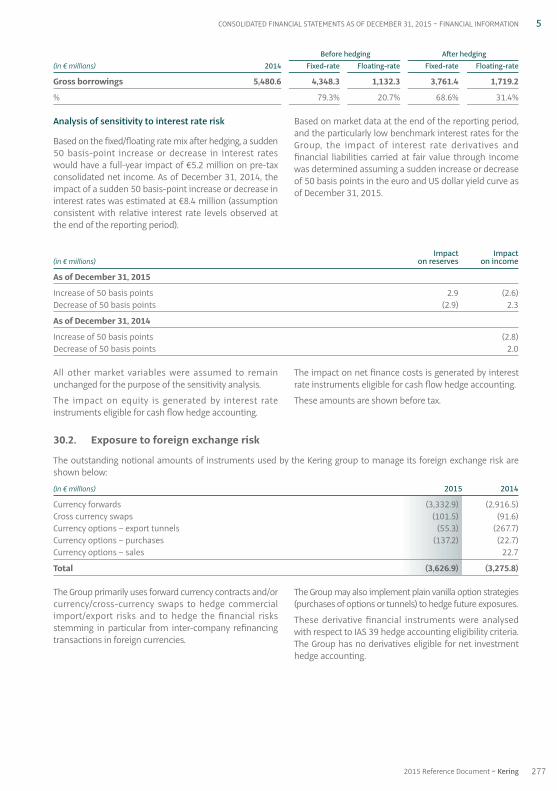
The Group primarily uses forward currency contracts and / orcurrency / cross-currency swaps to hedge commercialimport / export risks and to hedge the financial risksstemming in particular from inter-company refinancingtransactions in foreign currencies.
The Group may also implement plain vanilla option strategies(purchases of options or tunnels) to hedge future exposures.
These derivative financial instruments were analysedwith respect to IAS 39 hedge accounting eligibility criteria.The Group has no derivatives eligible for net investmenthedge accounting.
30.2. Exposure to foreign exchange risk
The outstanding notional amounts of instruments used by the Kering group to manage its foreign exchange risk areshown below:
(in € millions) 2015 2014
Currency forwards (3,332.9) (2,916.5)Cross currency swaps (101.5) (91.6)Currency options – export tunnels (55.3) (267.7)Currency options – purchases (137.2) (22.7)Currency options – sales 22.7
Total (3,626.9) (3,275.8)
All other market variables were assumed to remainunchanged for the purpose of the sensitivity analysis.
The impact on equity is generated by interest rateinstruments eligible for cash flow hedge accounting.
The impact on net finance costs is generated by interestrate instruments eligible for cash flow hedge accounting.
These amounts are shown before tax.
Impact Impact(in € millions) on reserves on income
As of December 31, 2015
Increase of 50 basis points 2.9 (2.6)Decrease of 50 basis points (2.9) 2.3
As of December 31, 2014
Increase of 50 basis points (2.8)Decrease of 50 basis points 2.0
Analysis of sensitivity to interest rate risk
Based on the fixed / floating rate mix after hedging, a sudden50 basis-point increase or decrease in interest rateswould have a full-year impact of €5.2 million on pre-taxconsolidated net income. As of December 31, 2014, theimpact of a sudden 50 basis-point increase or decrease ininterest rates was estimated at €8.4 million (assumptionconsistent with relative interest rate levels observed atthe end of the reporting period).
Based on market data at the end of the reporting period,and the particularly low benchmark interest rates for theGroup, the impact of interest rate derivatives andfinancial liabilities carried at fair value through incomewas determined assuming a sudden increase or decreaseof 50 basis points in the euro and US dollar yield curve asof December 31, 2015.
Before hedging After hedging(in € millions) 2014 Fixed-rate Floating-rate Fixed-rate Floating-rate
Gross borrowings 5,480.6 4,348.3 1,132.3 3,761.4 1,719.2
% 79.3% 20.7% 68.6% 31.4%
277
5
2015 Reference Document ~ Kering
CONSOLIDATED FINANCIAL STATEMENTS AS OF DECEMBER 31, 2015 ~ FINANCIAL INFORMATION
05_D_VA_V5 06/04/2016 17:30 Page277
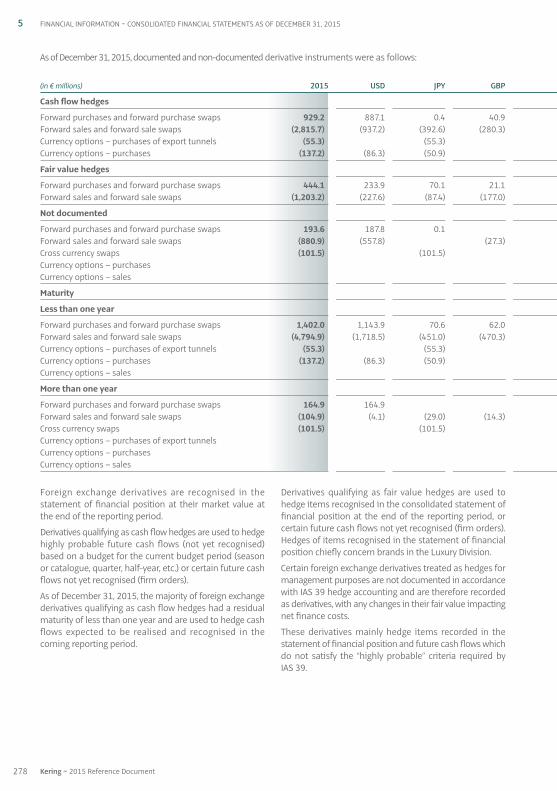
Foreign exchange derivatives are recognised in thestatement of financial position at their market value atthe end of the reporting period.
Derivatives qualifying as cash flow hedges are used to hedgehighly probable future cash flows (not yet recognised)based on a budget for the current budget period (seasonor catalogue, quarter, half-year, etc.) or certain future cashflows not yet recognised (firm orders).
As of December 31, 2015, the majority of foreign exchangederivatives qualifying as cash flow hedges had a residualmaturity of less than one year and are used to hedge cashflows expected to be realised and recognised in thecoming reporting period.
Derivatives qualifying as fair value hedges are used tohedge items recognised in the consolidated statement offinancial position at the end of the reporting period, orcertain future cash flows not yet recognised (firm orders).Hedges of items recognised in the statement of financialposition chiefly concern brands in the Luxury Division.
Certain foreign exchange derivatives treated as hedges formanagement purposes are not documented in accordancewith IAS 39 hedge accounting and are therefore recordedas derivatives, with any changes in their fair value impactingnet finance costs.
These derivatives mainly hedge items recorded in thestatement of financial position and future cash flows whichdo not satisfy the “ highly probable ” criteria required byIAS 39.
(in € millions) 2015 USD JPY GBP
Cash flow hedges
Forward purchases and forward purchase swaps 929.2 887.1 0.4 40.9 Forward sales and forward sale swaps (2,815.7) (937.2) (392.6) (280.3) Currency options – purchases of export tunnels (55.3) (55.3) Currency options – purchases (137.2) (86.3) (50.9)
Fair value hedges
Forward purchases and forward purchase swaps 444.1 233.9 70.1 21.1 Forward sales and forward sale swaps (1,203.2) (227.6) (87.4) (177.0)
Not documented
Forward purchases and forward purchase swaps 193.6 187.8 0.1 Forward sales and forward sale swaps (880.9) (557.8) (27.3) Cross currency swaps (101.5) (101.5) Currency options – purchases Currency options – sales
Maturity
Less than one year
Forward purchases and forward purchase swaps 1,402.0 1,143.9 70.6 62.0 Forward sales and forward sale swaps (4,794.9) (1,718.5) (451.0) (470.3) Currency options – purchases of export tunnels (55.3) (55.3) Currency options – purchases (137.2) (86.3) (50.9) Currency options – sales
More than one year
Forward purchases and forward purchase swaps 164.9 164.9 Forward sales and forward sale swaps (104.9) (4.1) (29.0) (14.3) Cross currency swaps (101.5) (101.5) Currency options – purchases of export tunnels Currency options – purchases Currency options – sales
As of December 31, 2015, documented and non-documented derivative instruments were as follows:
278 Kering ~ 2015 Reference Document
5 FINANCIAL INFORMATION ~ CONSOLIDATED FINANCIAL STATEMENTS AS OF DECEMBER 31, 2015
05_D_VA_V5 06/04/2016 17:30 Page278
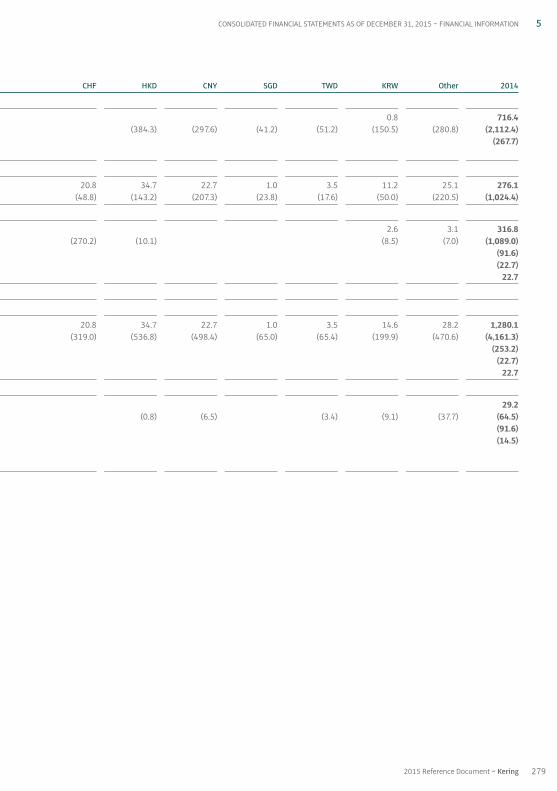
279
5
2015 Reference Document ~ Kering
CONSOLIDATED FINANCIAL STATEMENTS AS OF DECEMBER 31, 2015 ~ FINANCIAL INFORMATION
CHF HKD CNY SGD TWD KRW Other 2014
0.8 716.4 (384.3) (297.6) (41.2) (51.2) (150.5) (280.8) (2,112.4) (267.7)
20.8 34.7 22.7 1.0 3.5 11.2 25.1 276.1 (48.8) (143.2) (207.3) (23.8) (17.6) (50.0) (220.5) (1,024.4)
2.6 3.1 316.8 (270.2) (10.1) (8.5) (7.0) (1,089.0) (91.6) (22.7) 22.7
20.8 34.7 22.7 1.0 3.5 14.6 28.2 1,280.1 (319.0) (536.8) (498.4) (65.0) (65.4) (199.9) (470.6) (4,161.3) (253.2) (22.7) 22.7
29.2 (0.8) (6.5) (3.4) (9.1) (37.7) (64.5) (91.6) (14.5)
05_D_VA_V5 06/04/2016 17:30 Page279
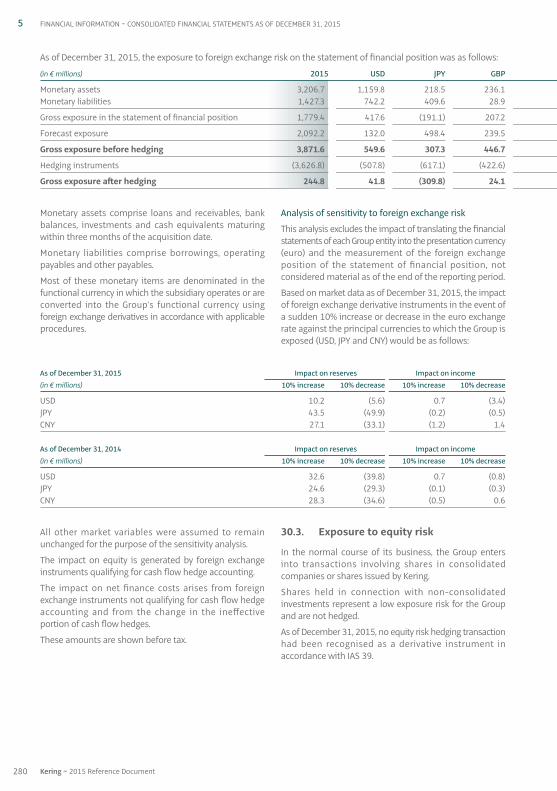
All other market variables were assumed to remainunchanged for the purpose of the sensitivity analysis.
The impact on equity is generated by foreign exchangeinstruments qualifying for cash flow hedge accounting.
The impact on net finance costs arises from foreignexchange instruments not qualifying for cash flow hedgeaccounting and from the change in the ineffectiveportion of cash flow hedges.
These amounts are shown before tax.
30.3. Exposure to equity risk
In the normal course of its business, the Group entersinto transactions involving shares in consolidatedcompanies or shares issued by Kering.
Shares held in connection with non-consolidatedinvestments represent a low exposure risk for the Groupand are not hedged.
As of December 31, 2015, no equity risk hedging transactionhad been recognised as a derivative instrument inaccordance with IAS 39.
As of December 31, 2015 Impact on reserves Impact on income(in € millions) 10% increase 10% decrease 10% increase 10% decrease
USD 10.2 (5.6) 0.7 (3.4)JPY 43.5 (49.9) (0.2) (0.5)CNY 27.1 (33.1) (1.2) 1.4
As of December 31, 2014 Impact on reserves Impact on income(in € millions) 10% increase 10% decrease 10% increase 10% decrease
USD 32.6 (39.8) 0.7 (0.8)JPY 24.6 (29.3) (0.1) (0.3)CNY 28.3 (34.6) (0.5) 0.6
Monetary assets comprise loans and receivables, bankbalances, investments and cash equivalents maturingwithin three months of the acquisition date.
Monetary liabilities comprise borrowings, operatingpayables and other payables.
Most of these monetary items are denominated in thefunctional currency in which the subsidiary operates or areconverted into the Group’s functional currency usingforeign exchange derivatives in accordance with applicableprocedures.
Analysis of sensitivity to foreign exchange risk
This analysis excludes the impact of translating the financialstatements of each Group entity into the presentation currency(euro) and the measurement of the foreign exchangeposition of the statement of financial position, notconsidered material as of the end of the reporting period.
Based on market data as of December 31, 2015, the impactof foreign exchange derivative instruments in the event ofa sudden 10% increase or decrease in the euro exchangerate against the principal currencies to which the Group isexposed (USD, JPY and CNY) would be as follows:
As of December 31, 2015, the exposure to foreign exchange risk on the statement of financial position was as follows:
(in € millions) 2015 USD JPY GBP
Monetary assets 3,206.7 1,159.8 218.5 236.1 Monetary liabilities 1,427.3 742.2 409.6 28.9
Gross exposure in the statement of financial position 1,779.4 417.6 (191.1) 207.2
Forecast exposure 2,092.2 132.0 498.4 239.5
Gross exposure before hedging 3,871.6 549.6 307.3 446.7
Hedging instruments (3,626.8) (507.8) (617.1) (422.6)
Gross exposure after hedging 244.8 41.8 (309.8) 24.1
280 Kering ~ 2015 Reference Document
5 FINANCIAL INFORMATION ~ CONSOLIDATED FINANCIAL STATEMENTS AS OF DECEMBER 31, 2015
05_D_VA_V5 06/04/2016 17:30 Page280
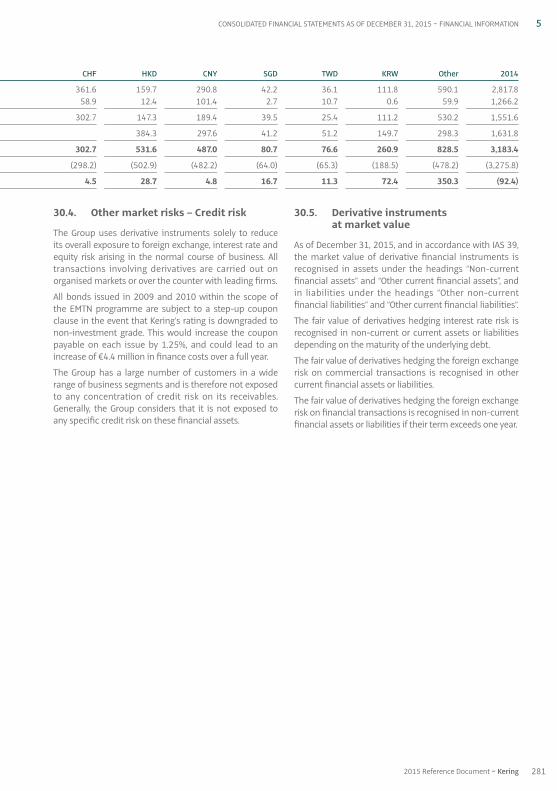
30.4. Other market risks – Credit risk
The Group uses derivative instruments solely to reduceits overall exposure to foreign exchange, interest rate andequity risk arising in the normal course of business. Alltransactions involving derivatives are carried out onorganised markets or over the counter with leading firms.
All bonds issued in 2009 and 2010 within the scope ofthe EMTN programme are subject to a step-up couponclause in the event that Kering’s rating is downgraded tonon-investment grade. This would increase the couponpayable on each issue by 1.25%, and could lead to anincrease of €4.4 million in finance costs over a full year.
The Group has a large number of customers in a widerange of business segments and is therefore not exposedto any concentration of credit risk on its receivables.Generally, the Group considers that it is not exposed toany specific credit risk on these financial assets.
30.5. Derivative instruments at market value
As of December 31, 2015, and in accordance with IAS 39,the market value of derivative financial instruments isrecognised in assets under the headings “Non-currentfinancial assets” and “Other current financial assets”, andin liabilities under the headings “Other non-currentfinancial liabilities” and “Other current financial liabilities”.
The fair value of derivatives hedging interest rate risk isrecognised in non-current or current assets or liabilitiesdepending on the maturity of the underlying debt.
The fair value of derivatives hedging the foreign exchangerisk on commercial transactions is recognised in othercurrent financial assets or liabilities.
The fair value of derivatives hedging the foreign exchangerisk on financial transactions is recognised in non-currentfinancial assets or liabilities if their term exceeds one year.
281
5
2015 Reference Document ~ Kering
CONSOLIDATED FINANCIAL STATEMENTS AS OF DECEMBER 31, 2015 ~ FINANCIAL INFORMATION
CHF HKD CNY SGD TWD KRW Other 2014
361.6 159.7 290.8 42.2 36.1 111.8 590.1 2,817.8 58.9 12.4 101.4 2.7 10.7 0.6 59.9 1,266.2
302.7 147.3 189.4 39.5 25.4 111.2 530.2 1,551.6
384.3 297.6 41.2 51.2 149.7 298.3 1,631.8
302.7 531.6 487.0 80.7 76.6 260.9 828.5 3,183.4
(298.2) (502.9) (482.2) (64.0) (65.3) (188.5) (478.2) (3,275.8)
4.5 28.7 4.8 16.7 11.3 72.4 350.3 (92.4)
05_D_VA_V5 06/04/2016 17:30 Page281
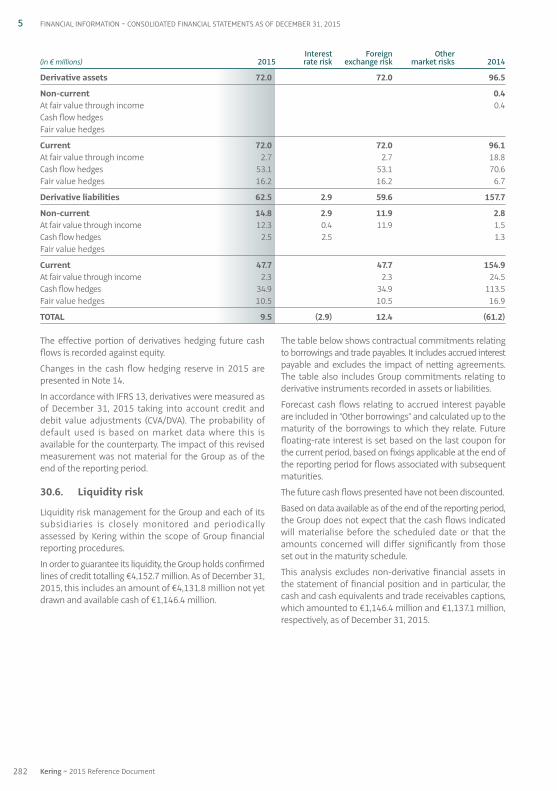
The effective portion of derivatives hedging future cashflows is recorded against equity.
Changes in the cash flow hedging reserve in 2015 arepresented in Note 14.
In accordance with IFRS 13, derivatives were measured asof December 31, 2015 taking into account credit anddebit value adjustments (CVA / DVA). The probability ofdefault used is based on market data where this isavailable for the counterparty. The impact of this revisedmeasurement was not material for the Group as of theend of the reporting period.
30.6. Liquidity risk
Liquidity risk management for the Group and each of itssubsidiaries is closely monitored and periodicallyassessed by Kering within the scope of Group financialreporting procedures.
In order to guarantee its liquidity, the Group holds confirmedlines of credit totalling €4,152.7 million. As of December 31,2015, this includes an amount of €4,131.8 million not yetdrawn and available cash of €1,146.4 million.
The table below shows contractual commitments relatingto borrowings and trade payables. It includes accrued interestpayable and excludes the impact of netting agreements.The table also includes Group commitments relating toderivative instruments recorded in assets or liabilities.
Forecast cash flows relating to accrued interest payableare included in “Other borrowings” and calculated up to thematurity of the borrowings to which they relate. Futurefloating-rate interest is set based on the last coupon forthe current period, based on fixings applicable at the end ofthe reporting period for flows associated with subsequentmaturities.
The future cash flows presented have not been discounted.
Based on data available as of the end of the reporting period,the Group does not expect that the cash flows indicatedwill materialise before the scheduled date or that theamounts concerned will differ significantly from thoseset out in the maturity schedule.
This analysis excludes non-derivative financial assets inthe statement of financial position and in particular, thecash and cash equivalents and trade receivables captions,which amounted to €1,146.4 million and €1,137.1 million,respectively, as of December 31, 2015.
Interest Foreign Other (in € millions) 2015 rate risk exchange risk market risks 2014
Derivative assets 72.0 72.0 96.5
Non-current 0.4At fair value through income 0.4Cash flow hedges Fair value hedges
Current 72.0 72.0 96.1At fair value through income 2.7 2.7 18.8Cash flow hedges 53.1 53.1 70.6Fair value hedges 16.2 16.2 6.7
Derivative liabilities 62.5 2.9 59.6 157.7
Non-current 14.8 2.9 11.9 2.8At fair value through income 12.3 0.4 11.9 1.5Cash flow hedges 2.5 2.5 1.3Fair value hedges
Current 47.7 47.7 154.9At fair value through income 2.3 2.3 24.5Cash flow hedges 34.9 34.9 113.5Fair value hedges 10.5 10.5 16.9
TOTAL 9.5 (2.9) 12.4 (61.2)
282 Kering ~ 2015 Reference Document
5 FINANCIAL INFORMATION ~ CONSOLIDATED FINANCIAL STATEMENTS AS OF DECEMBER 31, 2015
05_D_VA_V5 06/04/2016 17:30 Page282
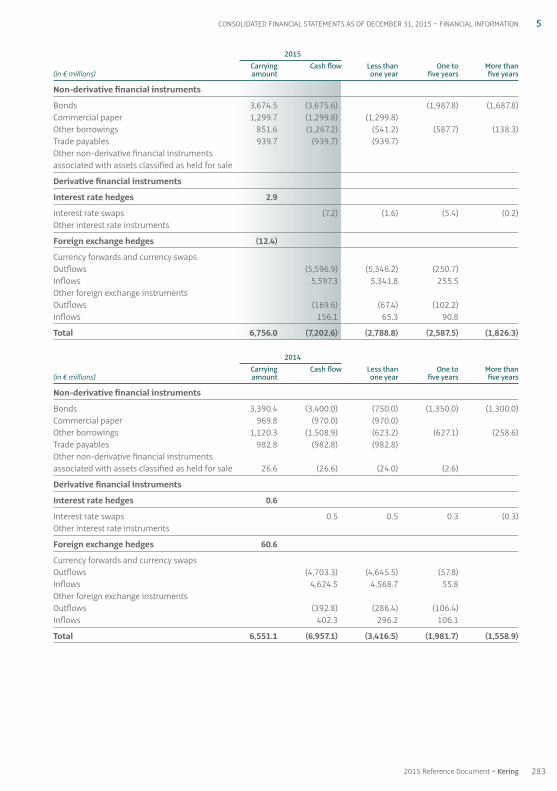
2015 Carrying Cash flow Less than One to More than
(in € millions) amount one year five years five years
Non-derivative financial instruments
Bonds 3,674.5 (3,675.6) (1,987.8) (1,687.8)Commercial paper 1,299.7 (1,299.8) (1,299.8) Other borrowings 851.6 (1,267.2) (541.2) (587.7) (138.3)Trade payables 939.7 (939.7) (939.7) Other non-derivative financial instruments associated with assets classified as held for sale
Derivative financial instruments
Interest rate hedges 2.9
Interest rate swaps (7.2) (1.6) (5.4) (0.2)Other interest rate instruments
Foreign exchange hedges (12.4)
Currency forwards and currency swaps Outflows (5,596.9) (5,346.2) (250.7) Inflows 5,597.3 5,341.8 255.5 Other foreign exchange instruments Outflows (169.6) (67.4) (102.2) Inflows 156.1 65.3 90.8
Total 6,756.0 (7,202.6) (2,788.8) (2,587.5) (1,826.3)
2014 Carrying Cash flow Less than One to More than
(in € millions) amount one year five years five years
Non-derivative financial instruments
Bonds 3,390.4 (3,400.0) (750.0) (1,350.0) (1,300.0)Commercial paper 969.8 (970.0) (970.0) Other borrowings 1,120.3 (1,508.9) (623.2) (627.1) (258.6)Trade payables 982.8 (982.8) (982.8) Other non-derivative financial instruments associated with assets classified as held for sale 26.6 (26.6) (24.0) (2.6)
Derivative financial instruments
Interest rate hedges 0.6
Interest rate swaps 0.5 0.5 0.3 (0.3)Other interest rate instruments
Foreign exchange hedges 60.6
Currency forwards and currency swaps Outflows (4,703.3) (4,645.5) (57.8) Inflows 4,624.5 4,568.7 55.8 Other foreign exchange instruments Outflows (392.8) (286.4) (106.4) Inflows 402.3 296.2 106.1
Total 6,551.1 (6,957.1) (3,416.5) (1,981.7) (1,558.9)
283
5
2015 Reference Document ~ Kering
CONSOLIDATED FINANCIAL STATEMENTS AS OF DECEMBER 31, 2015 ~ FINANCIAL INFORMATION
05_D_VA_V5 06/04/2016 17:30 Page283
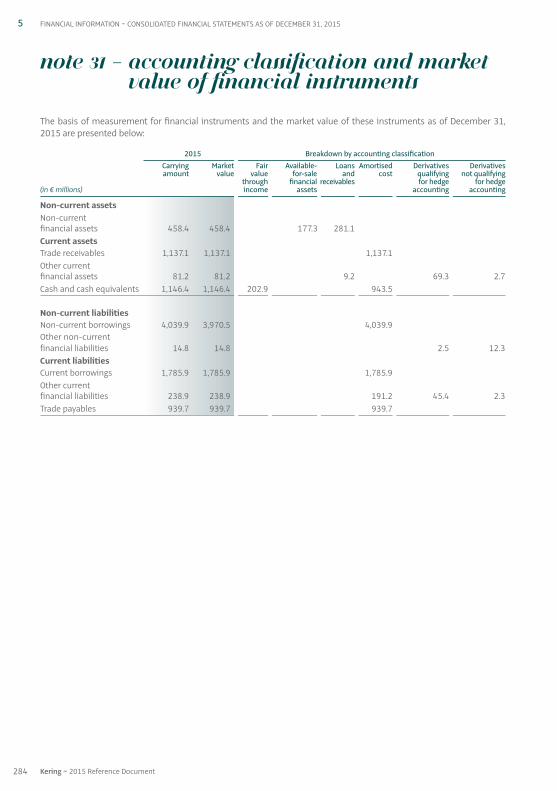
Note 31 – Accounting classification and marketvalue of financial instruments
The basis of measurement for financial instruments and the market value of these instruments as of December 31,2015 are presented below:
2015 Breakdown by accounting classificationCarrying Market Fair Available- Loans Amortised Derivatives Derivativesamount value value for-sale and cost qualifying not qualifying
through financial receivables for hedge for hedge(in € millions) income assets accounting accounting
Non-current assets Non-current financial assets 458.4 458.4 177.3 281.1 Current assets Trade receivables 1,137.1 1,137.1 1,137.1 Other current financial assets 81.2 81.2 9.2 69.3 2.7Cash and cash equivalents 1,146.4 1,146.4 202.9 943.5
Non-current liabilities Non-current borrowings 4,039.9 3,970.5 4,039.9 Other non-current financial liabilities 14.8 14.8 2.5 12.3Current liabilities Current borrowings 1,785.9 1,785.9 1,785.9 Other current financial liabilities 238.9 238.9 191.2 45.4 2.3Trade payables 939.7 939.7 939.7
284 Kering ~ 2015 Reference Document
5 FINANCIAL INFORMATION ~ CONSOLIDATED FINANCIAL STATEMENTS AS OF DECEMBER 31, 2015
05_D_VA_V5 06/04/2016 17:30 Page284
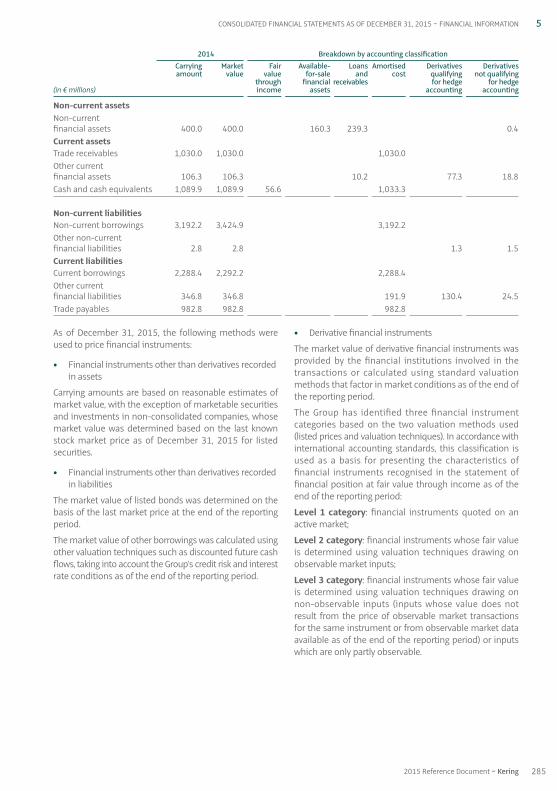
As of December 31, 2015, the following methods wereused to price financial instruments:
• Financial instruments other than derivatives recordedin assets
Carrying amounts are based on reasonable estimates ofmarket value, with the exception of marketable securitiesand investments in non-consolidated companies, whosemarket value was determined based on the last knownstock market price as of December 31, 2015 for listedsecurities.
• Financial instruments other than derivatives recordedin liabilities
The market value of listed bonds was determined on thebasis of the last market price at the end of the reportingperiod.
The market value of other borrowings was calculated usingother valuation techniques such as discounted future cashflows, taking into account the Group’s credit risk and interestrate conditions as of the end of the reporting period.
• Derivative financial instruments
The market value of derivative financial instruments wasprovided by the financial institutions involved in thetransactions or calculated using standard valuationmethods that factor in market conditions as of the end ofthe reporting period.
The Group has identified three financial instrumentcategories based on the two valuation methods used(listed prices and valuation techniques). In accordance withinternational accounting standards, this classification isused as a basis for presenting the characteristics offinancial instruments recognised in the statement offinancial position at fair value through income as of theend of the reporting period:
Level 1 category: financial instruments quoted on anactive market;
Level 2 category: financial instruments whose fair valueis determined using valuation techniques drawing onobservable market inputs;
Level 3 category: financial instruments whose fair valueis determined using valuation techniques drawing onnon-observable inputs (inputs whose value does notresult from the price of observable market transactionsfor the same instrument or from observable market dataavailable as of the end of the reporting period) or inputswhich are only partly observable.
2014 Breakdown by accounting classificationCarrying Market Fair Available- Loans Amortised Derivatives Derivativesamount value value for-sale and cost qualifying not qualifying
through financial receivables for hedge for hedge(in € millions) income assets accounting accounting
Non-current assets Non-current financial assets 400.0 400.0 160.3 239.3 0.4Current assets Trade receivables 1,030.0 1,030.0 1,030.0 Other current financial assets 106.3 106.3 10.2 77.3 18.8Cash and cash equivalents 1,089.9 1,089.9 56.6 1,033.3
Non-current liabilities Non-current borrowings 3,192.2 3,424.9 3,192.2 Other non-current financial liabilities 2.8 2.8 1.3 1.5Current liabilities Current borrowings 2,288.4 2,292.2 2,288.4 Other current financial liabilities 346.8 346.8 191.9 130.4 24.5Trade payables 982.8 982.8 982.8
285
5
2015 Reference Document ~ Kering
CONSOLIDATED FINANCIAL STATEMENTS AS OF DECEMBER 31, 2015 ~ FINANCIAL INFORMATION
05_D_VA_V5 06/04/2016 17:30 Page285
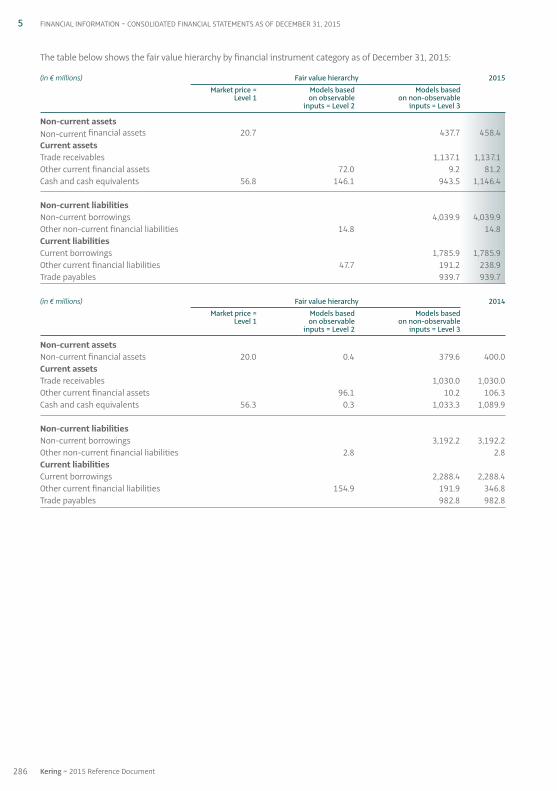
The table below shows the fair value hierarchy by financial instrument category as of December 31, 2015:
(in € millions) Fair value hierarchy 2015Market price = Models based Models based
Level 1 on observable on non-observable inputs = Level 2 inputs = Level 3
Non-current assets Non-current financial assets 20.7 437.7 458.4Current assets Trade receivables 1,137.1 1,137.1Other current financial assets 72.0 9.2 81.2Cash and cash equivalents 56.8 146.1 943.5 1,146.4
Non-current liabilities Non-current borrowings 4,039.9 4,039.9Other non-current financial liabilities 14.8 14.8Current liabilities Current borrowings 1,785.9 1,785.9Other current financial liabilities 47.7 191.2 238.9Trade payables 939.7 939.7
(in € millions) Fair value hierarchy 2014 Market price = Models based Models based Level 1 on observable on non-observable inputs = Level 2 inputs = Level 3
Non-current assets Non-current financial assets 20.0 0.4 379.6 400.0Current assets Trade receivables 1,030.0 1,030.0Other current financial assets 96.1 10.2 106.3Cash and cash equivalents 56.3 0.3 1,033.3 1,089.9
Non-current liabilities Non-current borrowings 3,192.2 3,192.2Other non-current financial liabilities 2.8 2.8Current liabilities Current borrowings 2,288.4 2,288.4Other current financial liabilities 154.9 191.9 346.8Trade payables 982.8 982.8
286 Kering ~ 2015 Reference Document
5 FINANCIAL INFORMATION ~ CONSOLIDATED FINANCIAL STATEMENTS AS OF DECEMBER 31, 2015
05_D_VA_V5 06/04/2016 17:30 Page286

Note 32 – Net debt
Group net debt breaks down as follows:
(in € millions) 2015 2014
Gross borrowings 5,825.8 5,480.6Fair value hedges (interest rate) Cash and cash equivalents (1,146.4) (1,089.9)
Net debt 4,679.4 4,390.7
Note 33 – Statement of cash flows
Cash and cash equivalents net of bank overdrafts amounted to €902.9 million as of December 31, 2015, reflecting totalcash and cash equivalents presented in the statement of cash flows.
(in € millions) 2015 2014
Cash and cash equivalents as reported in the statement of financial position 1,146.4 1,089.9
Bank overdrafts (243.5) (284.5)
Cash and cash equivalents as reported in the statement of cash flows 902.9 805.4
33.1. Cash flow from operating activities
Cash flow from operating activities breaks down as follows:
(in € millions) 2015 2014
Net income from continuing operations 680.2 1,028.1Net recurring charges to depreciation, amortisation and provisions on non-current operating assets 409.6 326.7Income / expenses relating to share-based payment 0.6 (1.9)Impairment losses on non-current operating assets 501.8 247.5Gains / losses on asset disposals, net of tax (148.3) (191.6)Income / expenses in respect of fair value movements 39.5 30.1Deferred tax (55.3) (45.3)Share in earnings (losses) of equity-accounted companies 2.2 0.8Other non-cash income and expenses (130.9) (134.6)
Cash flow from operating activities 1,299.4 1,259.8
33.2. Purchases of property, plant and equipment and intangible assets
Purchases of property, plant and equipment and intangible assets totalled €672.1 million in 2015 and €551.4 million in2014 (see section 1.5 of the Activity Report).
33.3. Acquisitions and disposals of subsidiaries
(in € millions) 2015 2014
Acquisitions of subsidiaries, net of cash acquired (20.2) (593.8)Proceeds from disposals of subsidiaries and associates, net of cash transferred (5.4) 3.6
Total (25.6) (590.2)
287
5
2015 Reference Document ~ Kering
CONSOLIDATED FINANCIAL STATEMENTS AS OF DECEMBER 31, 2015 ~ FINANCIAL INFORMATION
05_D_VA_V5 06/04/2016 17:30 Page287
New borrowings during the period included the new bondfinancing put in place in 2015 for a total of €1,026 million.
This mainly comprises two fixed-rate bonds issued in euros:a €500 million issue of seven-year bonds in March 2015with an annual coupon of 0.875% and a €50 million issueof 20-year bonds in April 2015 with an annual coupon of1.60%. The Group also carried out two foreign currencyissues during the year: a USD 150 million issue in March 2015of five-year floating-rate notes and a USD 150 million issuein June 2015 of six-year fixed-rate notes with an annualcoupon of 2.887%. In September and November 2015,
the Group topped up by €150 million and €50 millionrespectively the €300 million issue carried out in 2014 of2.75% bonds maturing in 2024, which therefore increasedthe total nominal amount of the bond issue to €500 million.
Kering redeemed the €750 million worth of bonds thatmatured in April 2015. These bonds comprised a firsttranche issued in 2010 for €500 million, which wastopped up in 2012 by a €250 million tranche when theoverall coupon was raised to 3.75%.
Changes in other borrowings chiefly comprise issues andredemptions of Kering Finance commercial paper.
33.6. Debt issues and redemptions
(in € millions) 2015 2014
Bond issues 1,070.4 862.7Bond redemptions (756.7) (948.1)Increase / decrease in other borrowings 87.3 546.7
Total 401.0 461.3
In 2015, acquisitions and disposals of subsidiaries werenot material. In 2014, acquisitions of subsidiaries mainlyconcerned the Ulysse Nardin group.
The cash flow relating to businesses sold that wererestated in accordance with IFRS 5 is shown on the line“Net cash from (used in) discontinued operations”.
33.4. Increase / decrease in share capitaland other transactions with owners
Transactions with owners were not material in either2015 or 2014.
33.5. Treasury share transactions
In 2015, the impact of acquisitions and disposals oftreasury shares resulted from (see Note 25.1):
• the acquisition of 1,683,029 shares and the disposal of1,683,029 shares held under the liquidity agreement,resulting in a net inflow of €0.4 million;
• the disposal of 118,870 shares following the exercise ofstock purchase options under the 2007 stock purchaseoption plans for €15.2 million;
• the acquisition of 125,000 shares in connection withfuture subscriptions under the 2007 stock purchaseoption plans for €21.6 million;
• the acquisition of 8,021 shares in connection with the2011 and 2012 free share plans for €1.3 million.
In 2014, the impact of acquisitions and disposals oftreasury shares resulted from (see Note 25.1):
• the acquisition of 1,726,437 shares and the disposal of1,726,437 shares held under the liquidity agreement,resulting in a net inflow of €0.5 million;
• the disposal of 134,838 shares following the exercise ofstock purchase options under the 2006 and 2007 stockpurchase option plans for €14.8 million;
• the acquisition of 100,000 shares in connection withfuture subscriptions under the 2006 and 2007 stockpurchase option plans for €15.6 million;
• the acquisition of 55,000 shares in connection with the2010 and 2012 free share plans for €8.3 million.
288 Kering ~ 2015 Reference Document
5 FINANCIAL INFORMATION ~ CONSOLIDATED FINANCIAL STATEMENTS AS OF DECEMBER 31, 2015
05_D_VA_V5 06/04/2016 17:30 Page288

Note 34 – Contingent liabilities, contractualcommitments not recognised andother contingencies
34.1. Commitments given and received following asset disposals
Vendor warranties given by the Group on the sale of companies are summarised below:
Disposals Vendor warranties
December 2010 Sale of Conforama Vendor warranties covering tax-related or similar claims expiring when the period
becomes time-barred, capped at €120 million. This disposal is related to thecommitment by Kering to continue commercial relations between Conforama andthe BNP Paribas group as regards customer loans.
December 2012 Sale of The Sportsman’s Guide Vendor warranties covering (i) tax-related or similar claims expiring when the period and The Golf Warehouse becomes time-barred, (ii) certain fundamental representations (including with
respect to organisation, capitalisation and authority) which survive indefinitely and(iii) representations with respect to employment and benefit plans which terminatesix months after the applicable statute of limitations. The warranty is capped at USD 21.5 million.
February 2013 Sale of OneStopPlus Vendor warranty covering (i) tax-related or similar claims expiring when the period
becomes time-barred, (ii) certain fundamental representations (including withrespect to organisation, capitalisation and authority) which survive indefinitely and(iii) certain environmental obligations. The warranty is capped at USD 52.5 million.
March 2013 Sale of Redcats’ Children Vendor warranty concerning (i) tax-related or similar claims which expire when the and Family division period becomes time-barred; and (ii) representations with respect to employment
and benefit plans, trademark and title ownership, which expires five years after thesale transaction date. The warranty is capped at €10 million.
June 2013 Sale of Ellos Customary vendor warranty expiring after December 31, 2014, except for certain
fundamental representations (including with respect to organisation, capitalisationand authority), which survive indefinitely. The warranty is capped at €29 million.
Specific vendor warranty covering tax-related or similar claims which expires on June 2, 2019and is capped at €40 million.
This was accompanied by a commitment received as regards the continuation ofcommercial relations with Finaref, covered by a €70 million bank guarantee expiringin 2023.
289
5
2015 Reference Document ~ Kering
CONSOLIDATED FINANCIAL STATEMENTS AS OF DECEMBER 31, 2015 ~ FINANCIAL INFORMATION
05_D_VA_V5 06/04/2016 17:30 Page289
In addition to the vendor warranties described above, minor vendor warranty agreements with standard terms were setup for the purchasers of the other companies sold by the Group.
June 2014 Sale of La Redoute Customary vendor warranty covering certain fundamental representations (in particularand Relais Colis as regards the existence of the companies sold, the availability of the shares sold and
the power to complete the sale), which expire as applicable when the periodbecomes time-barred, or on December 31, 2017. This general warranty is capped at€10 million.
Vendor warranties covering tax-related claims capped at €10 million, expiring whenthe period becomes time-barred.
Specific vendor warranties for an indefinite amount covering the Group’srestructuring operations prior to its sale, commercial litigation and environmentalrisks, expiring on December 31, 2021.
December 2015 Sale of Sergio Rossi Vendor warranties concerning (i) tax-related or similar claims expiring when the
period becomes time-barred in each jurisdiction concerned; (ii) certain fundamentalrepresentations (including with respect to organisation, capitalisation, securities andauthority) which survive indefinitely; (iii) employment and employee benefit plans,and (iv) certain environmental obligations, guarantees relating to intellectual propertyrights and other customary business warranties; with (iii) and (iv) expiring 18 monthsafter the date of the sale. These general warranties are capped at €15 million with theexception of (ii), which is capped at the sale price.
Specific vendor warranties concerning (i) tax audits in progress for the years 2010and 2012; (ii) the tax impact of the group’s restructuring operations prior to its sale;and (iii) certain intellectual property claims and personnel disputes, which surviveindefinitely. These warranties are not capped.
Disposals Vendor warranties
290 Kering ~ 2015 Reference Document
5 FINANCIAL INFORMATION ~ CONSOLIDATED FINANCIAL STATEMENTS AS OF DECEMBER 31, 2015
05_D_VA_V5 06/04/2016 17:30 Page290
Finance leases
The present value of future lease payments included in “Borrowings” and relating to capitalised assets meeting thedefinition of a finance lease set out in IAS 17 is as follows:
(in € millions) 2015 2014
Less than one year 10.3 14.9One to five years 49.6 37.7More than five years 23.4 43.9 83.3 96.5
Finance costs included (12.2) (24.9)
Present value of future minimum lease payments 71.1 71.6
As of December 31, 2015, the Group does not expect to receive future minimum lease payments under non-cancellablesub-lease agreements.
Operating leases
The amount of contractual obligations presented on theline “Operating lease agreements” represents futureminimum lease payments under operating leaseagreements for the period, which cannot be cancelled bythe lessee. These mainly include non-cancellable rentalpayments in respect of stores, logistics hubs and otherbuildings (head offices and administrative offices).
As of December 31, 2015, total future minimum leasepayments which the Group expects to receive under non-cancellable sub-lease agreements amounted to€8.0 million (€2.3 million as of December 31, 2014).
The 2015 rental charge in respect of minimum lease paymentsamounted to €669.1 million (€566.0 million in 2014), andthe charge for contingent payments was €393.1 million(€364.6 million in 2014), based on actual revenue.
Sub-lease revenue totalled €2.7 million in 2015 (€0.5 millionin 2014).
34.2. Other commitments given
34.2.1. Contractual obligations
The table below shows all the Group’s contractual commitments and obligations, excluding employee benefitobligations presented in the previous notes.
Payments due by periodLess than One to More than
(in € millions) one year five years five years 2015 2014
Gross borrowings (Note 29) 1,785.9 2,270.1 1,769.8 5,825.8 5,480.6Operating lease agreements 642.3 1,593.6 1,081.7 3,317.6 2,612.8Binding purchase commitments 47.1 264.2 311.3 72.3
Total commitments given 2,475.3 4,127.9 2,851.5 9,454.7 8,165.7
291
5
2015 Reference Document ~ Kering
CONSOLIDATED FINANCIAL STATEMENTS AS OF DECEMBER 31, 2015 ~ FINANCIAL INFORMATION
05_D_VA_V5 06/04/2016 17:30 Page291
Other commitments given primarily include customswarranties and operating guarantees.
To the best of the Group’s knowledge, there are no othersignificant commitments given or contingent liabilities.
34.3. Dependence on patents, licences and supply contracts
The Group is not significantly dependent on any patents,licences or supply contracts.
34.4. Litigation
Group companies are involved in a number of lawsuits ordisputes arising in the normal course of business,including litigation with tax, social security and customsauthorities. Provisions have been set aside for the probablecosts, as estimated by the Group’s entities and their counsel.
According to the Group’s legal counsel, no litigation currentlyin progress is likely to have a material impact on normalor foreseeable operations or the planned development ofthe Group or any of its subsidiaries.
The Group believes there is no known litigation likely to havea potential material impact on its net assets, earnings orfinancial position that is not adequately covered byprovisions recorded at the end of the reporting period. Noindividual claim is material to the Company or the Group.
The Group is not aware of any other dispute or arbitration,which has had in the recent past, or is likely to have in thefuture, a significant impact on the financial position,activity or earnings of the Company or Group.
34.2.2. Guarantees and other collateral
Guarantees and other collateral granted by the Group break down as follows:
StatementAmount of financial Amount
of assets position total of assetsPledge Pledge pledged as of (carrying Corresponding pledged as of
(in € millions) start date expiry date Dec. 31, 2015 amount) % Dec. 31, 2014
Intangible assets 11,285.5 Property, plant and equipment 04 / 14 / 2004 12/ 06 / 2022 101.6 2,073.0 4.9% 162.4Non-current financial assets 458.4 0.0
Total non-current assets pledged as collateral 101.6 13,816.9 0.7% 162.4
34.2.3. Other commitments
Other commitments break down as follows:
Payments due by periodLess than One to More than
(in € millions) one year five years five years 2015 2014
Confirmed lines of credit (see Note 29) 244.7 3,908.0 4,152.7 4,144.2Letters of credit 20.4 20.4 22.4Other guarantees received 18.7 10.1 0.7 29.5 17.7
Total commitments received 283.8 3,918.1 0.7 4,202.6 4,184.3
Guarantees given to banks responsible for cash pooling arrangements 2.0 1.9 23.4 27.3 24.9Rent guarantees, property guarantees 10.6 2.0 1.2 13.8 14.7Sponsoring and advertising commitments 161.6 366.7 68.4 596.7 622.7Other commitments 34.6 13.1 7.4 55.1 51.8
Total commitments given 208.8 383.7 100.4 692.9 714.1
292 Kering ~ 2015 Reference Document
5 FINANCIAL INFORMATION ~ CONSOLIDATED FINANCIAL STATEMENTS AS OF DECEMBER 31, 2015
05_D_VA_V5 06/04/2016 17:30 Page292
On March 16, 2016, Volcom, part of Kering’s Sport &Lifestyle activities, has sold the Electric brand via amanagement buyout (MBO) to a group led by Eric Crane,Electric’s Chief Executive Officer.
The transaction includes all the assets of Electric and therights attached to the brand.
Electric, a Californian premium sports and Lifestyle brandthat sells accessories including sunglasses, goggles andwatches, was acquired by Volcom in 2008.
Note 36 – Subsequent events
Short-term benefits, long-term benefits and terminationbenefits correspond to amounts paid during the year;post-employment benefits and share-based paymentcorrespond to the amounts recognised as expenses.
A list of the members of the Board of Directors andExecutive Committee is provided in the “CorporateGovernance” section of the Reference Document.
35.3. Senior executive remuneration
The table below shows remuneration paid to members of the Board of Directors and the Group’s Executive Committee:
(in € millions) 2015 2014
Short-term benefits 24.5 18.9Payroll taxes 5.2 3.6High-income tax 1.8Post-employment benefits 1.0 1.1Other long-term benefits 2.0 2.9Termination indemnities 16.6 2.5Share-based payment 7.2 5.9
Total 56.5 36.7
35.1. Related party controlling the Group
Kering is controlled by Artémis, which in turn is wholly ownedby Société Financière Pinault. As of December 31, 2015,the Artémis group held 40.9% of Kering’s share capitaland 57.4% of its voting rights.
The main transactions carried out between Kering’sconsolidated companies and Artémis in 2015 aredescribed below:
• payment of an interim dividend in respect of 2015totalling €77.5 million in January 2016;
• balancing payment of the dividend for 2014 of€130.1 million, further to the payment of an interimdividend of €77.5 million in January 2015 (€193.6 millionfor 2013);
• recognition of fees totalling €3.0 million (€2.5 million in2014) for (i) business development consulting servicesand complex transaction support, and (ii) the supply ofdevelopment opportunities, new business and costreduction solutions. These fees are governed by anagreement reviewed by the Audit Committee andapproved by the Board of Directors.
35.2. Associates
In the normal course of business, the Group enters intotransactions with associates on an arm’s length basis.
The main transactions with associates are not material.
Note 35 – Transactions with related parties
293
5
2015 Reference Document ~ Kering
CONSOLIDATED FINANCIAL STATEMENTS AS OF DECEMBER 31, 2015 ~ FINANCIAL INFORMATION
05_D_VA_V5 06/04/2016 17:30 Page293
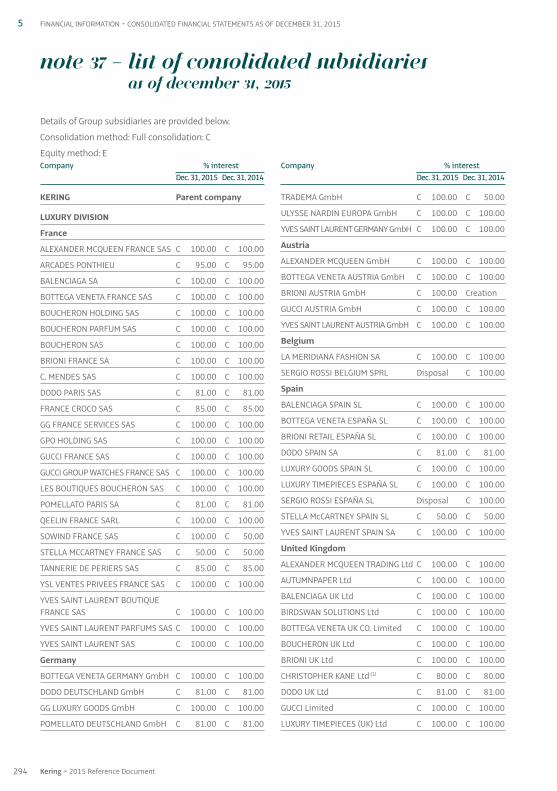
KERING Parent company
LUXURY DIVISION
France
ALEXANDER MCQUEEN FRANCE SAS C 100.00 C 100.00
ARCADES PONTHIEU C 95.00 C 95.00
BALENCIAGA SA C 100.00 C 100.00
BOTTEGA VENETA FRANCE SAS C 100.00 C 100.00
BOUCHERON HOLDING SAS C 100.00 C 100.00
BOUCHERON PARFUM SAS C 100.00 C 100.00
BOUCHERON SAS C 100.00 C 100.00
BRIONI FRANCE SA C 100.00 C 100.00
C. MENDES SAS C 100.00 C 100.00
DODO PARIS SAS C 81.00 C 81.00
FRANCE CROCO SAS C 85.00 C 85.00
GG FRANCE SERVICES SAS C 100.00 C 100.00
GPO HOLDING SAS C 100.00 C 100.00
GUCCI FRANCE SAS C 100.00 C 100.00
GUCCI GROUP WATCHES FRANCE SAS C 100.00 C 100.00
LES BOUTIQUES BOUCHERON SAS C 100.00 C 100.00
POMELLATO PARIS SA C 81.00 C 81.00
QEELIN FRANCE SARL C 100.00 C 100.00
SOWIND FRANCE SAS C 100.00 C 50.00
STELLA MCCARTNEY FRANCE SAS C 50.00 C 50.00
TANNERIE DE PERIERS SAS C 85.00 C 85.00
YSL VENTES PRIVEES FRANCE SAS C 100.00 C 100.00
YVES SAINT LAURENT BOUTIQUEFRANCE SAS C 100.00 C 100.00
YVES SAINT LAURENT PARFUMS SAS C 100.00 C 100.00
YVES SAINT LAURENT SAS C 100.00 C 100.00
Germany
BOTTEGA VENETA GERMANY GmbH C 100.00 C 100.00
DODO DEUTSCHLAND GmbH C 81.00 C 81.00
GG LUXURY GOODS GmbH C 100.00 C 100.00
POMELLATO DEUTSCHLAND GmbH C 81.00 C 81.00
TRADEMA GmbH C 100.00 C 50.00
ULYSSE NARDIN EUROPA GmbH C 100.00 C 100.00
YVES SAINT LAURENT GERMANY GmbH C 100.00 C 100.00
Austria
ALEXANDER MCQUEEN GmbH C 100.00 C 100.00
BOTTEGA VENETA AUSTRIA GmbH C 100.00 C 100.00
BRIONI AUSTRIA GmbH C 100.00 Creation
GUCCI AUSTRIA GmbH C 100.00 C 100.00
YVES SAINT LAURENT AUSTRIA GmbH C 100.00 C 100.00
Belgium
LA MERIDIANA FASHION SA C 100.00 C 100.00
SERGIO ROSSI BELGIUM SPRL Disposal C 100.00
Spain
BALENCIAGA SPAIN SL C 100.00 C 100.00
BOTTEGA VENETA ESPAÑA SL C 100.00 C 100.00
BRIONI RETAIL ESPAÑA SL C 100.00 C 100.00
DODO SPAIN SA C 81.00 C 81.00
LUXURY GOODS SPAIN SL C 100.00 C 100.00
LUXURY TIMEPIECES ESPAÑA SL C 100.00 C 100.00
SERGIO ROSSI ESPAÑA SL Disposal C 100.00
STELLA McCARTNEY SPAIN SL C 50.00 C 50.00
YVES SAINT LAURENT SPAIN SA C 100.00 C 100.00
United Kingdom
ALEXANDER MCQUEEN TRADING Ltd C 100.00 C 100.00
AUTUMNPAPER Ltd C 100.00 C 100.00
BALENCIAGA UK Ltd C 100.00 C 100.00
BIRDSWAN SOLUTIONS Ltd C 100.00 C 100.00
BOTTEGA VENETA UK CO. Limited C 100.00 C 100.00
BOUCHERON UK Ltd C 100.00 C 100.00
BRIONI UK Ltd C 100.00 C 100.00
CHRISTOPHER KANE Ltd (1) C 80.00 C 80.00
DODO UK Ltd C 81.00 C 81.00
GUCCI Limited C 100.00 C 100.00
LUXURY TIMEPIECES (UK) Ltd C 100.00 C 100.00
Company % interestDec. 31, 2015 Dec. 31, 2014
Company % interestDec. 31, 2015 Dec. 31, 2014
Note 37 – List of consolidated subsidiaries as of December 31, 2015
Details of Group subsidiaries are provided below.
Consolidation method: Full consolidation: C
Equity method: E
294 Kering ~ 2015 Reference Document
5 FINANCIAL INFORMATION ~ CONSOLIDATED FINANCIAL STATEMENTS AS OF DECEMBER 31, 2015
05_D_VA_V5 06/04/2016 17:30 Page294
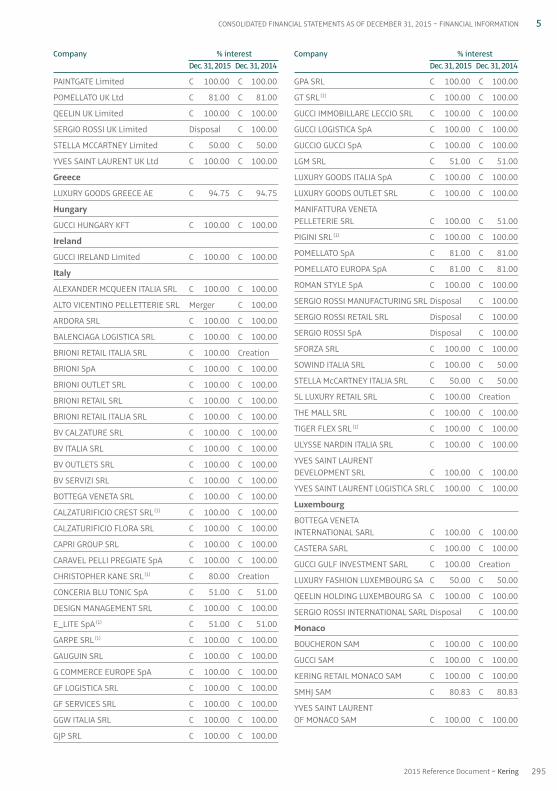
PAINTGATE Limited C 100.00 C 100.00
POMELLATO UK Ltd C 81.00 C 81.00
QEELIN UK Limited C 100.00 C 100.00
SERGIO ROSSI UK Limited Disposal C 100.00
STELLA MCCARTNEY Limited C 50.00 C 50.00
YVES SAINT LAURENT UK Ltd C 100.00 C 100.00
Greece
LUXURY GOODS GREECE AE C 94.75 C 94.75
Hungary
GUCCI HUNGARY KFT C 100.00 C 100.00
Ireland
GUCCI IRELAND Limited C 100.00 C 100.00
Italy
ALEXANDER MCQUEEN ITALIA SRL C 100.00 C 100.00
ALTO VICENTINO PELLETTERIE SRL Merger C 100.00
ARDORA SRL C 100.00 C 100.00
BALENCIAGA LOGISTICA SRL C 100.00 C 100.00
BRIONI RETAIL ITALIA SRL C 100.00 Creation
BRIONI SpA C 100.00 C 100.00
BRIONI OUTLET SRL C 100.00 C 100.00
BRIONI RETAIL SRL C 100.00 C 100.00
BRIONI RETAIL ITALIA SRL C 100.00 C 100.00
BV CALZATURE SRL C 100.00 C 100.00
BV ITALIA SRL C 100.00 C 100.00
BV OUTLETS SRL C 100.00 C 100.00
BV SERVIZI SRL C 100.00 C 100.00
BOTTEGA VENETA SRL C 100.00 C 100.00
CALZATURIFICIO CREST SRL (1) C 100.00 C 100.00
CALZATURIFICIO FLORA SRL C 100.00 C 100.00
CAPRI GROUP SRL C 100.00 C 100.00
CARAVEL PELLI PREGIATE SpA C 100.00 C 100.00
CHRISTOPHER KANE SRL (1) C 80.00 Creation
CONCERIA BLU TONIC SpA C 51.00 C 51.00
DESIGN MANAGEMENT SRL C 100.00 C 100.00
E_LITE SpA (1) C 51.00 C 51.00
GARPE SRL (1) C 100.00 C 100.00
GAUGUIN SRL C 100.00 C 100.00
G COMMERCE EUROPE SpA C 100.00 C 100.00
GF LOGISTICA SRL C 100.00 C 100.00
GF SERVICES SRL C 100.00 C 100.00
GGW ITALIA SRL C 100.00 C 100.00
GJP SRL C 100.00 C 100.00
GPA SRL C 100.00 C 100.00
GT SRL (1) C 100.00 C 100.00
GUCCI IMMOBILLARE LECCIO SRL C 100.00 C 100.00
GUCCI LOGISTICA SpA C 100.00 C 100.00
GUCCIO GUCCI SpA C 100.00 C 100.00
LGM SRL C 51.00 C 51.00
LUXURY GOODS ITALIA SpA C 100.00 C 100.00
LUXURY GOODS OUTLET SRL C 100.00 C 100.00
MANIFATTURA VENETA PELLETERIE SRL C 100.00 C 51.00
PIGINI SRL (1) C 100.00 C 100.00
POMELLATO SpA C 81.00 C 81.00
POMELLATO EUROPA SpA C 81.00 C 81.00
ROMAN STYLE SpA C 100.00 C 100.00
SERGIO ROSSI MANUFACTURING SRL Disposal C 100.00
SERGIO ROSSI RETAIL SRL Disposal C 100.00
SERGIO ROSSI SpA Disposal C 100.00
SFORZA SRL C 100.00 C 100.00
SOWIND ITALIA SRL C 100.00 C 50.00
STELLA McCARTNEY ITALIA SRL C 50.00 C 50.00
SL LUXURY RETAIL SRL C 100.00 Creation
THE MALL SRL C 100.00 C 100.00
TIGER FLEX SRL (1) C 100.00 C 100.00
ULYSSE NARDIN ITALIA SRL C 100.00 C 100.00
YVES SAINT LAURENT DEVELOPMENT SRL C 100.00 C 100.00
YVES SAINT LAURENT LOGISTICA SRL C 100.00 C 100.00
Luxembourg
BOTTEGA VENETA INTERNATIONAL SARL C 100.00 C 100.00
CASTERA SARL C 100.00 C 100.00
GUCCI GULF INVESTMENT SARL C 100.00 Creation
LUXURY FASHION LUXEMBOURG SA C 50.00 C 50.00
QEELIN HOLDING LUXEMBOURG SA C 100.00 C 100.00
SERGIO ROSSI INTERNATIONAL SARL Disposal C 100.00
Monaco
BOUCHERON SAM C 100.00 C 100.00
GUCCI SAM C 100.00 C 100.00
KERING RETAIL MONACO SAM C 100.00 C 100.00
SMHJ SAM C 80.83 C 80.83
YVES SAINT LAURENT OF MONACO SAM C 100.00 C 100.00
295
5
2015 Reference Document ~ Kering
CONSOLIDATED FINANCIAL STATEMENTS AS OF DECEMBER 31, 2015 ~ FINANCIAL INFORMATION
Company % interestDec. 31, 2015 Dec. 31, 2014
Company % interestDec. 31, 2015 Dec. 31, 2014
05_D_VA_V5 06/04/2016 17:30 Page295
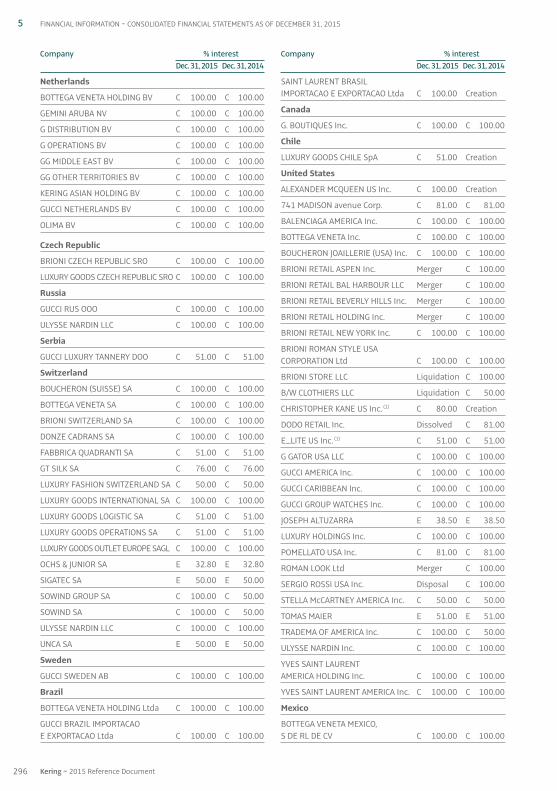
Netherlands
BOTTEGA VENETA HOLDING BV C 100.00 C 100.00
GEMINI ARUBA NV C 100.00 C 100.00
G DISTRIBUTION BV C 100.00 C 100.00
G OPERATIONS BV C 100.00 C 100.00
GG MIDDLE EAST BV C 100.00 C 100.00
GG OTHER TERRITORIES BV C 100.00 C 100.00
KERING ASIAN HOLDING BV C 100.00 C 100.00
GUCCI NETHERLANDS BV C 100.00 C 100.00
OLIMA BV C 100.00 C 100.00
Czech Republic
BRIONI CZECH REPUBLIC SRO C 100.00 C 100.00
LUXURY GOODS CZECH REPUBLIC SRO C 100.00 C 100.00
Russia
GUCCI RUS OOO C 100.00 C 100.00
ULYSSE NARDIN LLC C 100.00 C 100.00
Serbia
GUCCI LUXURY TANNERY DOO C 51.00 C 51.00
Switzerland
BOUCHERON (SUISSE) SA C 100.00 C 100.00
BOTTEGA VENETA SA C 100.00 C 100.00
BRIONI SWITZERLAND SA C 100.00 C 100.00
DONZE CADRANS SA C 100.00 C 100.00
FABBRICA QUADRANTI SA C 51.00 C 51.00
GT SILK SA C 76.00 C 76.00
LUXURY FASHION SWITZERLAND SA C 50.00 C 50.00
LUXURY GOODS INTERNATIONAL SA C 100.00 C 100.00
LUXURY GOODS LOGISTIC SA C 51.00 C 51.00
LUXURY GOODS OPERATIONS SA C 51.00 C 51.00
LUXURY GOODS OUTLET EUROPE SAGL C 100.00 C 100.00
OCHS & JUNIOR SA E 32.80 E 32.80
SIGATEC SA E 50.00 E 50.00
SOWIND GROUP SA C 100.00 C 50.00
SOWIND SA C 100.00 C 50.00
ULYSSE NARDIN LLC C 100.00 C 100.00
UNCA SA E 50.00 E 50.00
Sweden
GUCCI SWEDEN AB C 100.00 C 100.00
Brazil
BOTTEGA VENETA HOLDING Ltda C 100.00 C 100.00
GUCCI BRAZIL IMPORTACAO E EXPORTACAO Ltda C 100.00 C 100.00
SAINT LAURENT BRASIL IMPORTACAO E EXPORTACAO Ltda C 100.00 Creation
Canada
G. BOUTIQUES Inc. C 100.00 C 100.00
Chile
LUXURY GOODS CHILE SpA C 51.00 Creation
United States
ALEXANDER MCQUEEN US Inc. C 100.00 Creation
741 MADISON avenue Corp. C 81.00 C 81.00
BALENCIAGA AMERICA Inc. C 100.00 C 100.00
BOTTEGA VENETA Inc. C 100.00 C 100.00
BOUCHERON JOAILLERIE (USA) Inc. C 100.00 C 100.00
BRIONI RETAIL ASPEN Inc. Merger C 100.00
BRIONI RETAIL BAL HARBOUR LLC Merger C 100.00
BRIONI RETAIL BEVERLY HILLS Inc. Merger C 100.00
BRIONI RETAIL HOLDING Inc. Merger C 100.00
BRIONI RETAIL NEW YORK Inc. C 100.00 C 100.00
BRIONI ROMAN STYLE USA CORPORATION Ltd C 100.00 C 100.00
BRIONI STORE LLC Liquidation C 100.00
B / W CLOTHIERS LLC Liquidation C 50.00
CHRISTOPHER KANE US Inc. (1) C 80.00 Creation
DODO RETAIL Inc. Dissolved C 81.00
E_LITE US Inc. (1) C 51.00 C 51.00
G GATOR USA LLC C 100.00 C 100.00
GUCCI AMERICA Inc. C 100.00 C 100.00
GUCCI CARIBBEAN Inc. C 100.00 C 100.00
GUCCI GROUP WATCHES Inc. C 100.00 C 100.00
JOSEPH ALTUZARRA E 38.50 E 38.50
LUXURY HOLDINGS Inc. C 100.00 C 100.00
POMELLATO USA Inc. C 81.00 C 81.00
ROMAN LOOK Ltd Merger C 100.00
SERGIO ROSSI USA Inc. Disposal C 100.00
STELLA McCARTNEY AMERICA Inc. C 50.00 C 50.00
TOMAS MAIER E 51.00 E 51.00
TRADEMA OF AMERICA Inc. C 100.00 C 50.00
ULYSSE NARDIN Inc. C 100.00 C 100.00
YVES SAINT LAURENT AMERICA HOLDING Inc. C 100.00 C 100.00
YVES SAINT LAURENT AMERICA Inc. C 100.00 C 100.00
Mexico
BOTTEGA VENETA MEXICO, S DE RL DE CV C 100.00 C 100.00
296 Kering ~ 2015 Reference Document
5 FINANCIAL INFORMATION ~ CONSOLIDATED FINANCIAL STATEMENTS AS OF DECEMBER 31, 2015
Company % interestDec. 31, 2015 Dec. 31, 2014
Company % interestDec. 31, 2015 Dec. 31, 2014
05_D_VA_V5 06/04/2016 17:30 Page296
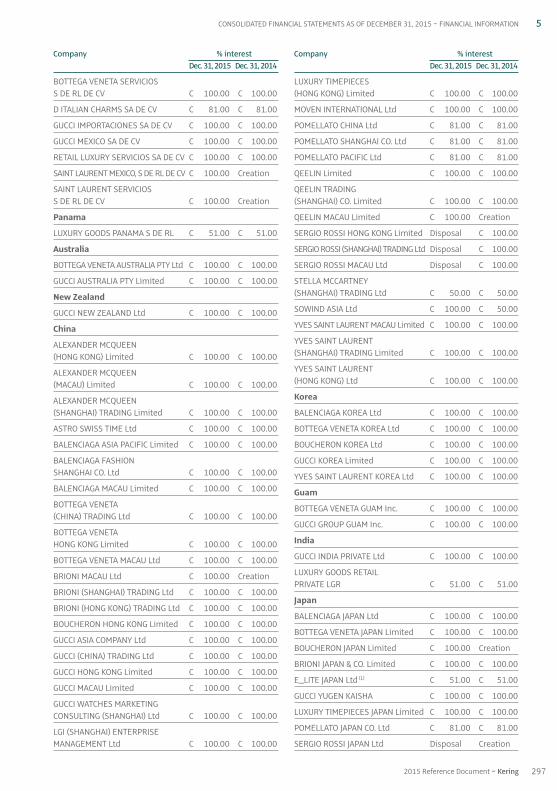
BOTTEGA VENETA SERVICIOS S DE RL DE CV C 100.00 C 100.00
D ITALIAN CHARMS SA DE CV C 81.00 C 81.00
GUCCI IMPORTACIONES SA DE CV C 100.00 C 100.00
GUCCI MEXICO SA DE CV C 100.00 C 100.00
RETAIL LUXURY SERVICIOS SA DE CV C 100.00 C 100.00
SAINT LAURENT MEXICO, S DE RL DE CV C 100.00 Creation
SAINT LAURENT SERVICIOS S DE RL DE CV C 100.00 Creation
Panama
LUXURY GOODS PANAMA S DE RL C 51.00 C 51.00
Australia
BOTTEGA VENETA AUSTRALIA PTY Ltd C 100.00 C 100.00
GUCCI AUSTRALIA PTY Limited C 100.00 C 100.00
New Zealand
GUCCI NEW ZEALAND Ltd C 100.00 C 100.00
China
ALEXANDER MCQUEEN (HONG KONG) Limited C 100.00 C 100.00
ALEXANDER MCQUEEN (MACAU) Limited C 100.00 C 100.00
ALEXANDER MCQUEEN (SHANGHAI) TRADING Limited C 100.00 C 100.00
ASTRO SWISS TIME Ltd C 100.00 C 100.00
BALENCIAGA ASIA PACIFIC Limited C 100.00 C 100.00
BALENCIAGA FASHION SHANGHAI CO. Ltd C 100.00 C 100.00
BALENCIAGA MACAU Limited C 100.00 C 100.00
BOTTEGA VENETA (CHINA) TRADING Ltd C 100.00 C 100.00
BOTTEGA VENETA HONG KONG Limited C 100.00 C 100.00
BOTTEGA VENETA MACAU Ltd C 100.00 C 100.00
BRIONI MACAU Ltd C 100.00 Creation
BRIONI (SHANGHAI) TRADING Ltd C 100.00 C 100.00
BRIONI (HONG KONG) TRADING Ltd C 100.00 C 100.00
BOUCHERON HONG KONG Limited C 100.00 C 100.00
GUCCI ASIA COMPANY Ltd C 100.00 C 100.00
GUCCI (CHINA) TRADING Ltd C 100.00 C 100.00
GUCCI HONG KONG Limited C 100.00 C 100.00
GUCCI MACAU Limited C 100.00 C 100.00
GUCCI WATCHES MARKETING CONSULTING (SHANGHAI) Ltd C 100.00 C 100.00
LGI (SHANGHAI) ENTERPRISE MANAGEMENT Ltd C 100.00 C 100.00
LUXURY TIMEPIECES (HONG KONG) Limited C 100.00 C 100.00
MOVEN INTERNATIONAL Ltd C 100.00 C 100.00
POMELLATO CHINA Ltd C 81.00 C 81.00
POMELLATO SHANGHAI CO. Ltd C 81.00 C 81.00
POMELLATO PACIFIC Ltd C 81.00 C 81.00
QEELIN Limited C 100.00 C 100.00
QEELIN TRADING (SHANGHAI) CO. Limited C 100.00 C 100.00
QEELIN MACAU Limited C 100.00 Creation
SERGIO ROSSI HONG KONG Limited Disposal C 100.00
SERGIO ROSSI (SHANGHAI) TRADING Ltd Disposal C 100.00
SERGIO ROSSI MACAU Ltd Disposal C 100.00
STELLA MCCARTNEY (SHANGHAI) TRADING Ltd C 50.00 C 50.00
SOWIND ASIA Ltd C 100.00 C 50.00
YVES SAINT LAURENT MACAU Limited C 100.00 C 100.00
YVES SAINT LAURENT (SHANGHAI) TRADING Limited C 100.00 C 100.00
YVES SAINT LAURENT (HONG KONG) Ltd C 100.00 C 100.00
Korea
BALENCIAGA KOREA Ltd C 100.00 C 100.00
BOTTEGA VENETA KOREA Ltd C 100.00 C 100.00
BOUCHERON KOREA Ltd C 100.00 C 100.00
GUCCI KOREA Limited C 100.00 C 100.00
YVES SAINT LAURENT KOREA Ltd C 100.00 C 100.00
Guam
BOTTEGA VENETA GUAM Inc. C 100.00 C 100.00
GUCCI GROUP GUAM Inc. C 100.00 C 100.00
India
GUCCI INDIA PRIVATE Ltd C 100.00 C 100.00
LUXURY GOODS RETAIL PRIVATE LGR C 51.00 C 51.00
Japan
BALENCIAGA JAPAN Ltd C 100.00 C 100.00
BOTTEGA VENETA JAPAN Limited C 100.00 C 100.00
BOUCHERON JAPAN Limited C 100.00 Creation
BRIONI JAPAN & CO. Limited C 100.00 C 100.00
E_LITE JAPAN Ltd (1) C 51.00 C 51.00
GUCCI YUGEN KAISHA C 100.00 C 100.00
LUXURY TIMEPIECES JAPAN Limited C 100.00 C 100.00
POMELLATO JAPAN CO. Ltd C 81.00 C 81.00
SERGIO ROSSI JAPAN Ltd Disposal Creation
297
5
2015 Reference Document ~ Kering
CONSOLIDATED FINANCIAL STATEMENTS AS OF DECEMBER 31, 2015 ~ FINANCIAL INFORMATION
Company % interestDec. 31, 2015 Dec. 31, 2014
Company % interestDec. 31, 2015 Dec. 31, 2014
05_D_VA_V5 06/04/2016 17:30 Page297
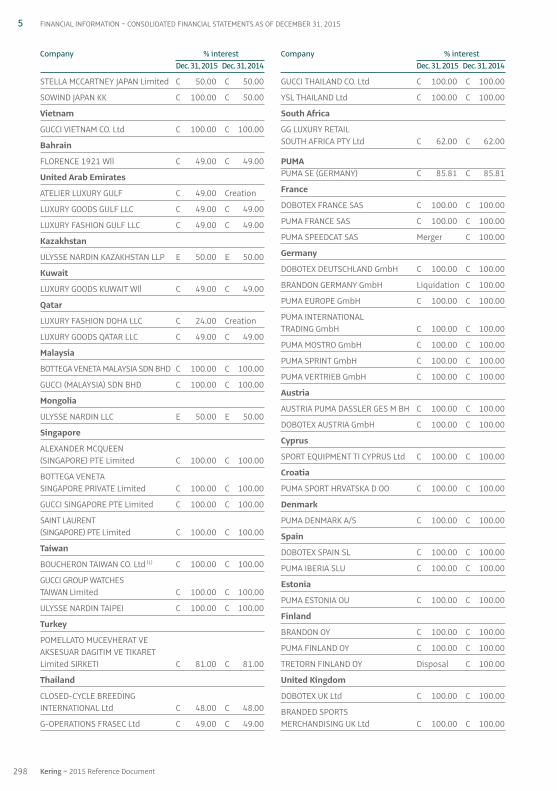
STELLA MCCARTNEY JAPAN Limited C 50.00 C 50.00
SOWIND JAPAN KK C 100.00 C 50.00
Vietnam
GUCCI VIETNAM CO. Ltd C 100.00 C 100.00
Bahrain
FLORENCE 1921 Wll C 49.00 C 49.00
United Arab Emirates
ATELIER LUXURY GULF C 49.00 Creation
LUXURY GOODS GULF LLC C 49.00 C 49.00
LUXURY FASHION GULF LLC C 49.00 C 49.00
Kazakhstan
ULYSSE NARDIN KAZAKHSTAN LLP E 50.00 E 50.00
Kuwait
LUXURY GOODS KUWAIT Wll C 49.00 C 49.00
Qatar
LUXURY FASHION DOHA LLC C 24.00 Creation
LUXURY GOODS QATAR LLC C 49.00 C 49.00
Malaysia
BOTTEGA VENETA MALAYSIA SDN BHD C 100.00 C 100.00
GUCCI (MALAYSIA) SDN BHD C 100.00 C 100.00
Mongolia
ULYSSE NARDIN LLC E 50.00 E 50.00
Singapore
ALEXANDER MCQUEEN (SINGAPORE) PTE Limited C 100.00 C 100.00
BOTTEGA VENETA SINGAPORE PRIVATE Limited C 100.00 C 100.00
GUCCI SINGAPORE PTE Limited C 100.00 C 100.00
SAINT LAURENT (SINGAPORE) PTE Limited C 100.00 C 100.00
Taiwan
BOUCHERON TAIWAN CO. Ltd (1) C 100.00 C 100.00
GUCCI GROUP WATCHES TAIWAN Limited C 100.00 C 100.00
ULYSSE NARDIN TAIPEI C 100.00 C 100.00
Turkey
POMELLATO MUCEVHERAT VE AKSESUAR DAGITIM VE TIKARET Limited SIRKETI C 81.00 C 81.00
Thailand
CLOSED-CYCLE BREEDING INTERNATIONAL Ltd C 48.00 C 48.00
G-OPERATIONS FRASEC Ltd C 49.00 C 49.00
GUCCI THAILAND CO. Ltd C 100.00 C 100.00
YSL THAILAND Ltd C 100.00 C 100.00
South Africa
GG LUXURY RETAIL SOUTH AFRICA PTY Ltd C 62.00 C 62.00
PUMAPUMA SE (GERMANY) C 85.81 C 85.81
France
DOBOTEX FRANCE SAS C 100.00 C 100.00
PUMA FRANCE SAS C 100.00 C 100.00
PUMA SPEEDCAT SAS Merger C 100.00
Germany
DOBOTEX DEUTSCHLAND GmbH C 100.00 C 100.00
BRANDON GERMANY GmbH Liquidation C 100.00
PUMA EUROPE GmbH C 100.00 C 100.00
PUMA INTERNATIONAL TRADING GmbH C 100.00 C 100.00
PUMA MOSTRO GmbH C 100.00 C 100.00
PUMA SPRINT GmbH C 100.00 C 100.00
PUMA VERTRIEB GmbH C 100.00 C 100.00
Austria
AUSTRIA PUMA DASSLER GES M BH C 100.00 C 100.00
DOBOTEX AUSTRIA GmbH C 100.00 C 100.00
Cyprus
SPORT EQUIPMENT TI CYPRUS Ltd C 100.00 C 100.00
Croatia
PUMA SPORT HRVATSKA D OO C 100.00 C 100.00
Denmark
PUMA DENMARK A / S C 100.00 C 100.00
Spain
DOBOTEX SPAIN SL C 100.00 C 100.00
PUMA IBERIA SLU C 100.00 C 100.00
Estonia
PUMA ESTONIA OU C 100.00 C 100.00
Finland
BRANDON OY C 100.00 C 100.00
PUMA FINLAND OY C 100.00 C 100.00
TRETORN FINLAND OY Disposal C 100.00
United Kingdom
DOBOTEX UK Ltd C 100.00 C 100.00
BRANDED SPORTS MERCHANDISING UK Ltd C 100.00 C 100.00
298 Kering ~ 2015 Reference Document
5 FINANCIAL INFORMATION ~ CONSOLIDATED FINANCIAL STATEMENTS AS OF DECEMBER 31, 2015
Company % interestDec. 31, 2015 Dec. 31, 2014
Company % interestDec. 31, 2015 Dec. 31, 2014
05_D_VA_V5 06/04/2016 17:30 Page298
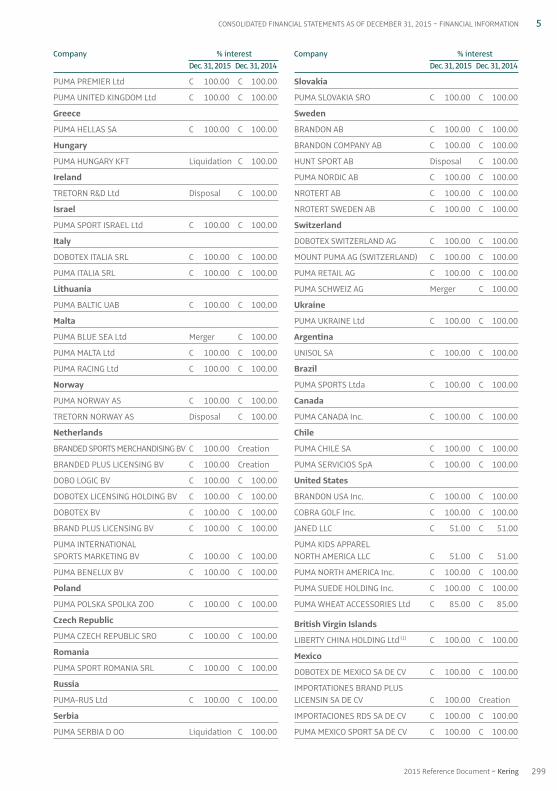
PUMA PREMIER Ltd C 100.00 C 100.00
PUMA UNITED KINGDOM Ltd C 100.00 C 100.00
Greece
PUMA HELLAS SA C 100.00 C 100.00
Hungary
PUMA HUNGARY KFT Liquidation C 100.00
Ireland
TRETORN R&D Ltd Disposal C 100.00
Israel
PUMA SPORT ISRAEL Ltd C 100.00 C 100.00
Italy
DOBOTEX ITALIA SRL C 100.00 C 100.00
PUMA ITALIA SRL C 100.00 C 100.00
Lithuania
PUMA BALTIC UAB C 100.00 C 100.00
Malta
PUMA BLUE SEA Ltd Merger C 100.00
PUMA MALTA Ltd C 100.00 C 100.00
PUMA RACING Ltd C 100.00 C 100.00
Norway
PUMA NORWAY AS C 100.00 C 100.00
TRETORN NORWAY AS Disposal C 100.00
Netherlands
BRANDED SPORTS MERCHANDISING BV C 100.00 Creation
BRANDED PLUS LICENSING BV C 100.00 Creation
DOBO LOGIC BV C 100.00 C 100.00
DOBOTEX LICENSING HOLDING BV C 100.00 C 100.00
DOBOTEX BV C 100.00 C 100.00
BRAND PLUS LICENSING BV C 100.00 C 100.00
PUMA INTERNATIONAL SPORTS MARKETING BV C 100.00 C 100.00
PUMA BENELUX BV C 100.00 C 100.00
Poland
PUMA POLSKA SPOLKA ZOO C 100.00 C 100.00
Czech Republic
PUMA CZECH REPUBLIC SRO C 100.00 C 100.00
Romania
PUMA SPORT ROMANIA SRL C 100.00 C 100.00
Russia
PUMA-RUS Ltd C 100.00 C 100.00
Serbia
PUMA SERBIA D OO Liquidation C 100.00
Slovakia
PUMA SLOVAKIA SRO C 100.00 C 100.00
Sweden
BRANDON AB C 100.00 C 100.00
BRANDON COMPANY AB C 100.00 C 100.00
HUNT SPORT AB Disposal C 100.00
PUMA NORDIC AB C 100.00 C 100.00
NROTERT AB C 100.00 C 100.00
NROTERT SWEDEN AB C 100.00 C 100.00
Switzerland
DOBOTEX SWITZERLAND AG C 100.00 C 100.00
MOUNT PUMA AG (SWITZERLAND) C 100.00 C 100.00
PUMA RETAIL AG C 100.00 C 100.00
PUMA SCHWEIZ AG Merger C 100.00
Ukraine
PUMA UKRAINE Ltd C 100.00 C 100.00
Argentina
UNISOL SA C 100.00 C 100.00
Brazil
PUMA SPORTS Ltda C 100.00 C 100.00
Canada
PUMA CANADA Inc. C 100.00 C 100.00
Chile
PUMA CHILE SA C 100.00 C 100.00
PUMA SERVICIOS SpA C 100.00 C 100.00
United States
BRANDON USA Inc. C 100.00 C 100.00
COBRA GOLF Inc. C 100.00 C 100.00
JANED LLC C 51.00 C 51.00
PUMA KIDS APPAREL NORTH AMERICA LLC C 51.00 C 51.00
PUMA NORTH AMERICA Inc. C 100.00 C 100.00
PUMA SUEDE HOLDING Inc. C 100.00 C 100.00
PUMA WHEAT ACCESSORIES Ltd C 85.00 C 85.00
British Virgin Islands
LIBERTY CHINA HOLDING Ltd (1) C 100.00 C 100.00
Mexico
DOBOTEX DE MEXICO SA DE CV C 100.00 C 100.00
IMPORTATIONES BRAND PLUS LICENSIN SA DE CV C 100.00 Creation
IMPORTACIONES RDS SA DE CV C 100.00 C 100.00
PUMA MEXICO SPORT SA DE CV C 100.00 C 100.00
299
5
2015 Reference Document ~ Kering
CONSOLIDATED FINANCIAL STATEMENTS AS OF DECEMBER 31, 2015 ~ FINANCIAL INFORMATION
Company % interestDec. 31, 2015 Dec. 31, 2014
Company % interestDec. 31, 2015 Dec. 31, 2014
05_D_VA_V5 06/04/2016 17:30 Page299
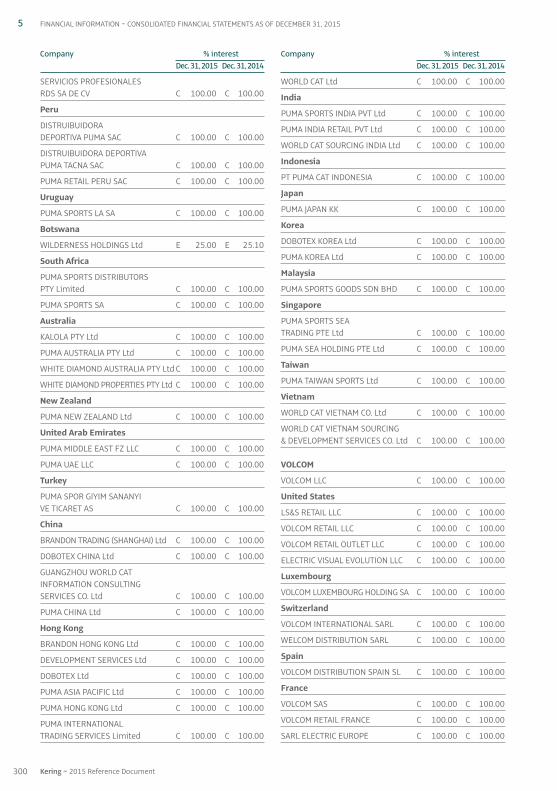
SERVICIOS PROFESIONALES RDS SA DE CV C 100.00 C 100.00
Peru
DISTRUIBUIDORA DEPORTIVA PUMA SAC C 100.00 C 100.00
DISTRUIBUIDORA DEPORTIVA PUMA TACNA SAC C 100.00 C 100.00
PUMA RETAIL PERU SAC C 100.00 C 100.00
Uruguay
PUMA SPORTS LA SA C 100.00 C 100.00
Botswana
WILDERNESS HOLDINGS Ltd E 25.00 E 25.10
South Africa
PUMA SPORTS DISTRIBUTORS PTY Limited C 100.00 C 100.00
PUMA SPORTS SA C 100.00 C 100.00
Australia
KALOLA PTY Ltd C 100.00 C 100.00
PUMA AUSTRALIA PTY Ltd C 100.00 C 100.00
WHITE DIAMOND AUSTRALIA PTY Ltd C 100.00 C 100.00
WHITE DIAMOND PROPERTIES PTY Ltd C 100.00 C 100.00
New Zealand
PUMA NEW ZEALAND Ltd C 100.00 C 100.00
United Arab Emirates
PUMA MIDDLE EAST FZ LLC C 100.00 C 100.00
PUMA UAE LLC C 100.00 C 100.00
Turkey
PUMA SPOR GIYIM SANANYI VE TICARET AS C 100.00 C 100.00
China
BRANDON TRADING (SHANGHAI) Ltd C 100.00 C 100.00
DOBOTEX CHINA Ltd C 100.00 C 100.00
GUANGZHOU WORLD CAT INFORMATION CONSULTING SERVICES CO. Ltd C 100.00 C 100.00
PUMA CHINA Ltd C 100.00 C 100.00
Hong Kong
BRANDON HONG KONG Ltd C 100.00 C 100.00
DEVELOPMENT SERVICES Ltd C 100.00 C 100.00
DOBOTEX Ltd C 100.00 C 100.00
PUMA ASIA PACIFIC Ltd C 100.00 C 100.00
PUMA HONG KONG Ltd C 100.00 C 100.00
PUMA INTERNATIONAL TRADING SERVICES Limited C 100.00 C 100.00
WORLD CAT Ltd C 100.00 C 100.00
India
PUMA SPORTS INDIA PVT Ltd C 100.00 C 100.00
PUMA INDIA RETAIL PVT Ltd C 100.00 C 100.00
WORLD CAT SOURCING INDIA Ltd C 100.00 C 100.00
Indonesia
PT PUMA CAT INDONESIA C 100.00 C 100.00
Japan
PUMA JAPAN KK C 100.00 C 100.00
Korea
DOBOTEX KOREA Ltd C 100.00 C 100.00
PUMA KOREA Ltd C 100.00 C 100.00
Malaysia
PUMA SPORTS GOODS SDN BHD C 100.00 C 100.00
Singapore
PUMA SPORTS SEA TRADING PTE Ltd C 100.00 C 100.00
PUMA SEA HOLDING PTE Ltd C 100.00 C 100.00
Taiwan
PUMA TAIWAN SPORTS Ltd C 100.00 C 100.00
Vietnam
WORLD CAT VIETNAM CO. Ltd C 100.00 C 100.00
WORLD CAT VIETNAM SOURCING & DEVELOPMENT SERVICES CO. Ltd C 100.00 C 100.00
VOLCOM
VOLCOM LLC C 100.00 C 100.00
United States
LS&S RETAIL LLC C 100.00 C 100.00
VOLCOM RETAIL LLC C 100.00 C 100.00
VOLCOM RETAIL OUTLET LLC C 100.00 C 100.00
ELECTRIC VISUAL EVOLUTION LLC C 100.00 C 100.00
Luxembourg
VOLCOM LUXEMBOURG HOLDING SA C 100.00 C 100.00
Switzerland
VOLCOM INTERNATIONAL SARL C 100.00 C 100.00
WELCOM DISTRIBUTION SARL C 100.00 C 100.00
Spain
VOLCOM DISTRIBUTION SPAIN SL C 100.00 C 100.00
France
VOLCOM SAS C 100.00 C 100.00
VOLCOM RETAIL FRANCE C 100.00 C 100.00
SARL ELECTRIC EUROPE C 100.00 C 100.00
300 Kering ~ 2015 Reference Document
5 FINANCIAL INFORMATION ~ CONSOLIDATED FINANCIAL STATEMENTS AS OF DECEMBER 31, 2015
Company % interestDec. 31, 2015 Dec. 31, 2014
Company % interestDec. 31, 2015 Dec. 31, 2014
05_D_VA_V5 06/04/2016 17:30 Page300

United Kingdom
VOLCOM DISTRIBUTION (UK) Limited C 100.00 C 100.00
VOLCOM RETAIL (UK) Limited C 100.00 C 100.00
Australia
VOLCOM AUSTRALIA HOLDING COMPANY PTY Ltd C 100.00 C 100.00
VOLCOM AUSTRALIA PTY Ltd C 100.00 C 100.00
ELECTRIC VISUAL EVOLUTION AUSTRALIA PTY Ltd C 100.00 C 100.00
Canada
VOLCOM CANADA Inc. C 100.00 Creation
New Zealand
VOLCOM NEW ZEALAND Limited C 100.00 C 100.00
Japan
VOLCOM JAPAN GODOGAISHIYA C 100.00 C 100.00
China
VOLCOM ASIA PACIFIC Limited C 100.00 C 100.00
HOLDING COMPANIES AND OTHER
France
CONSEIL ET ASSISTANCE C 100.00 C 100.00
DISCODIS C 100.00 C 100.00
GG FRANCE 13 SAS C 100.00 C 100.00
GG FRANCE 14 C 100.00 C 100.00
GG FRANCE HOLDING SAS C 100.00 C 100.00
KERING EYEWEAR FRANCE SASU C 80.00 Creation
KERING FINANCE C 100.00 C 100.00
SAPARDIS C 100.00 C 100.00
SAPRODIS SERVICES SAS C 100.00 C 100.00
Germany
KERING EYEWEAR DACH GmbH C 80.00 Creation
SAPARDIS DEUTSCHLAND SE C 100.00 C 100.00
Spain
KERING EYEWEAR ESPANA SL C 80.00 Creation
NOGA LUXE SL C 100.00 C 100.00
United Kingdom
KERING EYEWEAR UK Ltd C 80.00 Creation
KERING INTERNATIONAL Limited C 100.00 C 100.00
KERING UK SERVICES Limited C 100.00 C 100.00
Italy
KERING EYEWEAR SpA C 80.00 Creation
KERING ITALIA SpA C 100.00 C 100.00
KERING SERVICE ITALIA SpA C 100.00 C 100.00
Luxembourg
BOUCHERON LUXEMBOURG SARL C 100.00 C 100.00
KERING RE C 100.00 C 100.00
KERING LUXEMBOURG SA C 100.00 C 100.00
E-KERING LUX SA C 100.00 C 100.00
PPR DISTRI LUX SA C 100.00 C 100.00
PPR INTERNATIONAL C 100.00 C 100.00
Netherlands
GUCCI INTERNATIONAL NV C 100.00 C 100.00
GUCCI PARTICIPATION BV C 100.00 C 100.00
KERING HOLLAND NV C 100.00 C 100.00
KERING NETHERLANDS BV C 100.00 C 100.00
KERING INVESTMENTS EUROPE BV C 100.00 C 100.00
Switzerland
LUXURY GOODS SERVICES SA C 100.00 C 100.00
THE MALL LUXURY OUTLET SA C 100.00 C 100.00
China
GUANGZHOU KGS CORPORATE MANAGEMENT & CONSULTANCY Limited C 100.00 C 100.00
KERING ASIA PACIFIC Ltd C 100.00 C 100.00
KERING (CHINA) ENTERPRISE MANAGEMENT Ltd C 100.00 C 100.00
KERING EYEWEAR APAC Ltd C 80.00 Creation
KERING EYEWEAR SHANGHAI TRADING ENTERPRISES Ltd C 80.00 Creation
KERING EYEWEAR SINGAPORE PTE Ltd C 80.00 Creation
KERING HOLDING Limited C 100.00 C 100.00
KERING SOUTH EAST ASIA PTE Ltd C 100.00 C 100.00
KGS GLOBAL MANAGEMENT SERVICES Ltd C 100.00 C 100.00
KGS SOURCING Limited C 100.00 C 100.00
REDCATS COMMERCE ET TRADING (SHANGHAI) CO. Ltd C 100.00 C 100.00
REDCATS SOURCING (SHANGHAI) Ltd C 100.00 C 100.00
Korea
KERING KOREA Limited C 100.00 C 100.00
India
KGS SOURCING INDIA PRIVATE Limited C 100.00 C 100.00
301
5
2015 Reference Document ~ Kering
CONSOLIDATED FINANCIAL STATEMENTS AS OF DECEMBER 31, 2015 ~ FINANCIAL INFORMATION
Company % interestDec. 31, 2015 Dec. 31, 2014
Company % interestDec. 31, 2015 Dec. 31, 2014
05_D_VA_V5 06/04/2016 17:30 Page301

Turkey
KGS SOURCING TURKEY Limited C 100.00 C 100.00
Japan
KERING EYEWEAR JAPAN KK C 80.00 Creation
KERING JAPAN Limited C 100.00 C 100.00
KERING TOKYO INVESTMENTS C 100.00 C 100.00
United States
KERING AMERICAS C 100.00 C 100.00
KERING EYEWEAR USA Inc. C 80.00 Creation
Mexico
BOTTEGA VENETA MEXICO, S DE RL DE CV C 100.00 Creation
(1) The results of these companies are consolidated based on the Group’scontractual share in their operations, which may differ from its percentageinterest.
302 Kering ~ 2015 Reference Document
5 FINANCIAL INFORMATION ~ CONSOLIDATED FINANCIAL STATEMENTS AS OF DECEMBER 31, 2015
Company % interestDec. 31, 2015 Dec. 31, 2014
Company % interestDec. 31, 2015 Dec. 31, 2014
05_D_VA_V5 06/04/2016 17:30 Page302
5. Statutory Auditors’ reporton the consolidated financial statementsfor the year ended December 31, 2015
This is a free translation into English of the Statutory Auditors’ report issued in French and is provided solely for the convenience ofEnglish speaking readers. The Statutory Auditors’ report includes information specifically required by French law in such reports, whethermodified or not. This information is presented below the opinion on the consolidated financial statements and includes an explanatoryparagraph discussing the Auditors’ assessments of certain significant accounting and auditing matters. These assessments were consideredfor the purpose of issuing an audit opinion on the consolidated financial statements taken as a whole and not to provide separateassurance on individual account captions or on information taken outside of the consolidated financial statements. This report shouldbe read in conjunction with, and construed in accordance with, French law and professional auditing standards applicable in France.
To the Shareholders,In accordance with our appointment as Statutory Auditors at your Annual General Meetings, we hereby report to you for the yearended December 31, 2015 on:
• the audit of the accompanying consolidated financial statements of Kering S.A.;• the justification of our assessments;• the specific verification required by law.These consolidated financial statements have been approved by the Board of Directors. Our role is to express an opinion onthese consolidated financial statements based on our audit.
1. Opinion on the consolidated financial statementsWe conducted our audit in accordance with professional standards applicable in France. These standards require that we planand perform the audit to obtain reasonable assurance about whether the consolidated financial statements are free of materialmisstatement. An audit includes examining, using sample testing techniques or other selection methods, evidence supporting theamounts and disclosures in the consolidated financial statements. An audit also includes assessing the accounting principlesused and significant estimates made, as well as evaluating the overall financial statement presentation. We believe that the auditevidence we have obtained is sufficient and appropriate to provide a reasonable basis for our opinion.In our opinion, the consolidated financial statements give a true and fair view of the financial position and assets and liabilitiesof the Group as of December 31, 2015 and of the results of its operations for the year then ended in accordance with InternationalFinancial Reporting Standards as adopted by the European Union.
2. Justification of our assessmentsPursuant to Article L. 823-9 of the French Commercial Code (Code de commerce) governing the justification of our assessments,we hereby report on the following:
• During the second half of the year, your Company systematically tests goodwill and assets with an indefinite useful life for impairment,and also assesses whether there is indication of impairment of long-term assets, in accordance with the methods described in Note 2.10to the consolidated financial statements. We examined the methods used to implement these impairment tests, the cash flow forecastsand assumptions used and verified that Note 19 to the consolidated financial statements provides the appropriate disclosure.
• Your Company recognizes provisions, as described in Note 2.16 to the consolidated financial statements. Our procedures mainly consistedin assessing the data and assumptions underlying such estimates, verifying, on a test basis, the Company’s calculations and examiningthe Management approval procedures for these estimates. We have assessed the reasonableness of those estimates based on this work.
• Note 2.17 to the consolidated financial statements sets out the methods used to measure post-employment and other long-term employee benefit obligations. These obligations were measured by independent actuaries. Our procedures consisted inexamining the data used, assessing the underlying assumptions and verifying that Note 26 to the consolidated financial statementsprovides the appropriate disclosures.
These assessments were performed as part of our audit approach for the consolidated financial statements taken as a wholeand therefore contributed to the expression of our opinion in the first part of this report.
3. Specific verificationWe have also performed the other procedures required by law on the information relating to the Group given in theManagement Report, in accordance with professional standards applicable in France.We have no matters to report as to its fair presentation and its consistency with the consolidated financial statements.
Paris La Défense and Neuilly-sur-Seine, March 30, 2016The Statutory Auditors
KPMG Audit Deloitte & AssociésDivision of KPMG SA
Hervé Chopin Isabelle Allen Frédéric Moulin
303
5
2015 Reference Document ~ Kering
STATUTORY AUDITORS’ REPORT ON THE CONSOLIDATED FINANCIAL STATEMENTS ~ FINANCIAL INFORMATION
05_D_VA_V5 06/04/2016 17:30 Page303
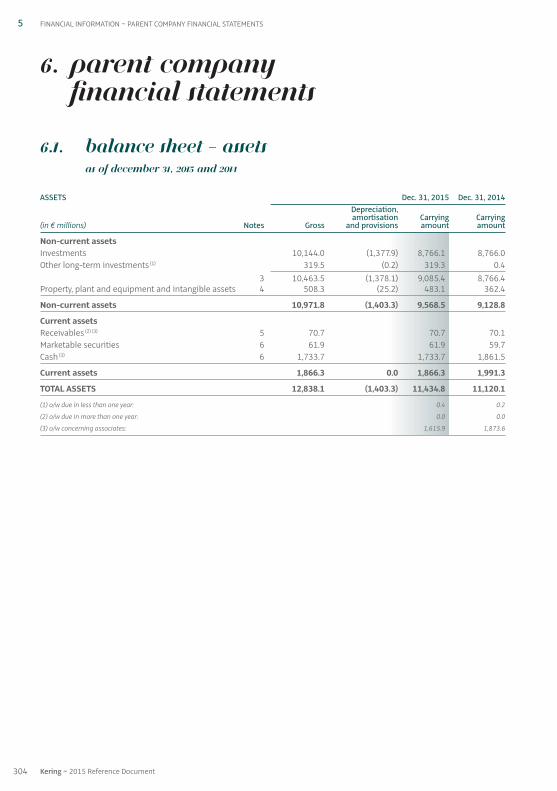
6. Parent company financial statements
6.1. Balance sheet – assets as of December 31, 2015 and 2014
ASSETS Dec. 31, 2015 Dec. 31, 2014 Depreciation, amortisation Carrying Carrying
(in € millions) Notes Gross and provisions amount amount
Non-current assets Investments 10,144.0 (1,377.9) 8,766.1 8,766.0Other long-term investments (1) 319.5 (0.2) 319.3 0.4 3 10,463.5 (1,378.1) 9,085.4 8,766.4Property, plant and equipment and intangible assets 4 508.3 (25.2) 483.1 362.4
Non-current assets 10,971.8 (1,403.3) 9,568.5 9,128.8
Current assets Receivables (2) (3) 5 70.7 70.7 70.1Marketable securities 6 61.9 61.9 59.7Cash (3) 6 1,733.7 1,733.7 1,861.5
Current assets 1,866.3 0.0 1,866.3 1,991.3
TOTAL ASSETS 12,838.1 (1,403.3) 11,434.8 11,120.1
(1) o / w due in less than one year: 0.4 0.2
(2) o / w due in more than one year: 0.0 0.0
(3) o / w concerning associates: 1,615.9 1,873.6
304 Kering ~ 2015 Reference Document
5 FINANCIAL INFORMATION ~ PARENT COMPANY FINANCIAL STATEMENTS
05_E_VA_V5 06/04/2016 17:28 Page304
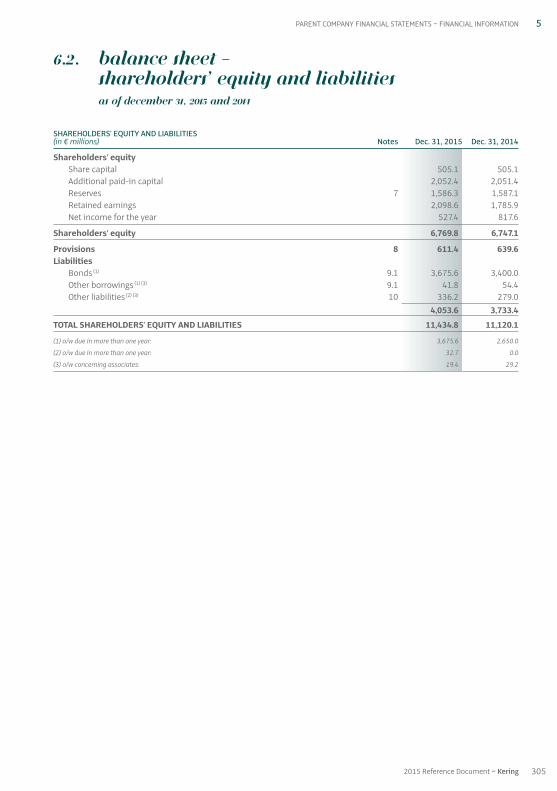
6.2. Balance sheet – shareholders’ equity and liabilities as of December 31, 2015 and 2014
SHAREHOLDERS’ EQUITY AND LIABILITIES (in € millions) Notes Dec. 31, 2015 Dec. 31, 2014
Shareholders’ equity Share capital 505.1 505.1Additional paid-in capital 2,052.4 2,051.4Reserves 7 1,586.3 1,587.1Retained earnings 2,098.6 1,785.9Net income for the year 527.4 817.6
Shareholders’ equity 6,769.8 6,747.1
Provisions 8 611.4 639.6Liabilities
Bonds (1) 9.1 3,675.6 3,400.0Other borrowings (1) (3) 9.1 41.8 54.4Other liabilities (2) (3) 10 336.2 279.0
4,053.6 3,733.4
TOTAL SHAREHOLDERS’ EQUITY AND LIABILITIES 11,434.8 11,120.1
(1) o / w due in more than one year: 3,675.6 2,650.0
(2) o / w due in more than one year: 32.7 0.0
(3) o / w concerning associates: 19.4 29.2
305
5
2015 Reference Document ~ Kering
PARENT COMPANY FINANCIAL STATEMENTS ~ FINANCIAL INFORMATION
05_E_VA_V5 06/04/2016 17:28 Page305
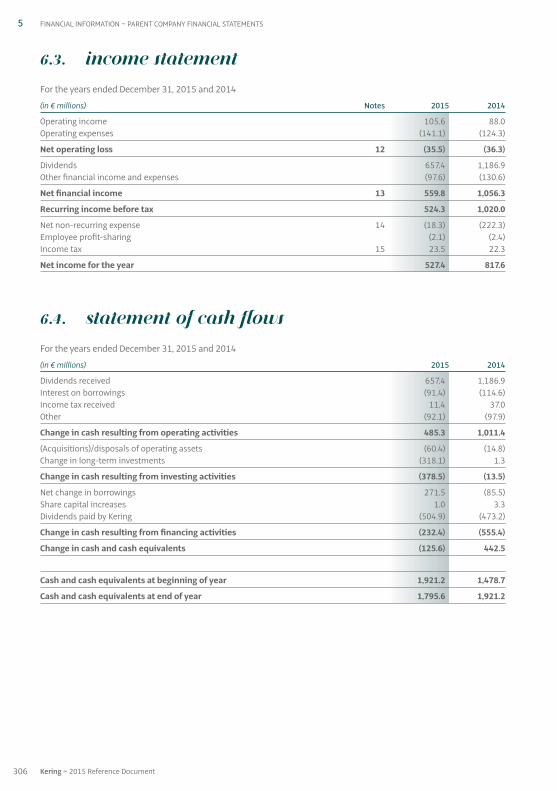
6.3. Income statement
For the years ended December 31, 2015 and 2014
(in € millions) Notes 20 15 20 14
Operating income 105.6 88.0Operating expenses (141.1) (124.3)
Net operating loss 12 (35.5) (36.3)
Dividends 657.4 1,186.9Other financial income and expenses (97.6) (130.6)
Net financial income 13 559.8 1,056.3
Recurring income before tax 524.3 1,020.0
Net non-recurring expense 14 (18.3) (222.3)Employee profit-sharing (2.1) (2.4)Income tax 15 23.5 22.3
Net income for the year 527.4 817.6
6.4. Statement of cash flows
For the years ended December 31, 2015 and 2014
(in € millions) 20 15 20 14
Dividends received 657.4 1,186.9Interest on borrowings (91.4) (114.6)Income tax received 11.4 37.0Other (92.1) (97.9)
Change in cash resulting from operating activities 485.3 1,011.4
(Acquisitions) / disposals of operating assets (60.4) (14.8)Change in long-term investments (318.1) 1.3
Change in cash resulting from investing activities (378.5) (13.5)
Net change in borrowings 271.5 (85.5)Share capital increases 1.0 3.3Dividends paid by Kering (504.9) (473.2)
Change in cash resulting from financing activities (232.4) (555.4)
Change in cash and cash equivalents (125.6) 442.5
Cash and cash equivalents at beginning of year 1,921.2 1,478.7
Cash and cash equivalents at end of year 1,795.6 1,921.2
306 Kering ~ 2015 Reference Document
5 FINANCIAL INFORMATION ~ PARENT COMPANY FINANCIAL STATEMENTS
05_E_VA_V5 06/04/2016 17:28 Page306

Note 1. 2015 highlights
On January 12, 2015, Kering and Safilo decided to terminatethe Gucci licence agreement two years in advance, whichwill result in compensation of €90 million to be paid toSafilo. This compensation has been recognised as anintangible asset in the statutory financial statements.
Kering issued USD 150 million worth of five-year floatingrate notes paying a floating-rate coupon of 3– month USDLibor +0.73% on March 9, 2015, €500 million worth ofseven-year bonds with a fixed-rate coupon of 0.875% onMarch 27, 2015, €50 million worth of twenty-year bondswith a fixed-rate coupon of 1.60% on April 16, 2015, andUSD 150 million worth of six-year bonds with a fixed-ratecoupon of 2.887% on June 9, 2015.
In addition, the April 8, 2014 bond issue was topped up by€150 million and €50 million respectively on September 22,2015 and November 5, 2015, which therefore increasedthe total amount of the bond issue to €500 million.
In April 2015, Kering redeemed at maturity the€750 million bond issued in April 2010 and topped up inJanuary 2012.
Note 2. Accounting policies and methods
The annual financial statements are prepared inaccordance with the provisions of the French accountingstandards setter (Autorité des normes comptables – ANC)regulation no. 2014-03.
2.1. Property, plant and equipment and intangible assets
Property, plant and equipment and intangible assets arerecorded in the balance sheet at their acquisition cost.Depreciation and amortisation are calculated using thestraight-line method based on the nature and useful lifeof each component.
2.2. Long-term investments
Investments
Securities classified as “Investments” are those considerednecessary for the Company’s activities, particularlybecause they provide the Company with influence over,or control of, the issuer.
6.5. Statement of changes in shareholders’ equity
Additional Reserves(in € millions) Number Share paid-in and retained Net income Shareholders’(before appropriation of net income) of shares capital capital earnings for the year equity
As of December 31, 2013 126,226,761 504.9 2,048.3 3,014.2 832.9 6,400.3
Appropriation of 2013 net income 832.9 (832.9) -Dividends paid (283.9) (283.9)Interim dividend (189.4) (189.4)Exercise of stock options 39,729 0.2 3.1 3.3Changes in tax-driven provisions (0.8) (0.8)2014 net income 817.6 817.6
As of December 31, 2014 126,266,490 505.1 2,051.4 3,373.0 817.6 6,747.1
Appropriation of 2014 net income 817.6 (817.6) -Dividends paid (315.5) (315.5)Interim dividend (189.4) (189.4)Exercise of stock options 12,832 1.0 1.0Changes in tax-driven provisions (0.8) (0.8)2015 net income 527.4 527.4
As of December 31, 2015 126,279,322 505.1 2,052.4 3,684.9 527.4 6,769.8
As of December 31, 2015, Kering’s share capital comprised 126,279,322 shares with a par value of €4 each.
6.6. Notes to the parent company financial statements
307
5
2015 Reference Document ~ Kering
PARENT COMPANY FINANCIAL STATEMENTS ~ FINANCIAL INFORMATION
05_E_VA_V5 06/04/2016 17:28 Page307
Pursuant to notice no. 2007-C issued by the EmergingIssues Taskforce of the French accounting standardsauthority (Conseil national de la comptabilité – CNC) onJune 15, 2007, the Company elected to recogniseacquisition fees as part of the cost of investments.
As of the end of the reporting period, the gross amount ofinvestments is compared to their value in use to theCompany, determined with reference to the subsidiary’sestimated economic value and taking into considerationthe purpose of the original transaction. Value in use isdetermined using a multi-criteria approach based onfuture cash flow projections, the revised asset value, andthe share of consolidated or revalued shareholders’equity. Other methods are used where necessary.
An impairment loss is recorded when market value fallsbelow the gross value.
Other long-term investments
Other long-term investments include other investmentsand certain treasury shares.
Other investments (excluding treasury shares)
Other investments are investments that the Company plansor is required to hold on a long-term basis, but which arenot deemed necessary for the Company’s activities.
The gross amount of such investments is equal to theacquisition cost plus any related acquisition fees.
An impairment loss is recognised based on the value inuse of these securities to the Company.
Treasury shares
Treasury shares acquired under liquidity agreements arerecorded under “Other long-term investments”. Theseshares are written down where necessary to reflect theaverage share price over the last month of the fiscal year.
Treasury shares acquired for the express purpose of beingused in a future capital reduction are also classified under“Other long-term investments”. These shares are notwritten down to reflect the share price.
2.3. Receivables
Receivables are recorded in the balance sheet at theirnominal value, and are written down where they presenta risk of non-recovery.
2.4. Marketable securities and negotiable debt securities
Treasury shares
Treasury shares acquired for the express purpose of beingsubsequently granted to employees under stock purchaseoption plans and free share plans are recorded under“Marketable securities”. No impairment is recognised ontreasury shares to reflect the share price.
Other shares
Shares are recorded at their acquisition cost. An impairmentloss is recognised when their closing price falls below theircarrying amount.
Bonds
Bonds are recorded on the acquisition date at their parvalue adjusted by the premium or discount. Accrued interestas of the acquisition date and as of the end of the reportingperiod is recorded in an accrued interest account.
As of the end of the reporting period, the cost of the bondsis compared to the market value of the principal over thelast month of the year, excluding accrued interest. Animpairment loss is recorded when market value fallsbelow the gross value.
Mutual funds (Sicav)
Shares in mutual funds are recorded at their acquisitioncost excluding subscription fees, and their net asset valueis estimated as of the end of the reporting period. Aprovision for impairment is recorded in respect of anyunrealised capital losses. No unrealised capital gains arerecognised.
Negotiable certificates of deposit, certificates of deposit and notes issued by financing companies
These negotiable debt securities are subscribed on theprimary market or purchased on the secondary market. Theyare recorded at acquisition cost less accrued interest as ofthe acquisition date when purchased on the secondary market.
Prepaid interest is recognised as financial income on aproportional basis for the fiscal year.
2.5. Financial instruments
All foreign currency and interest rate positions are takenvia instruments listed on exchange-traded or over- the-counter markets representing minimal counterparty risk.Any gains or losses generated on financial instrumentsused in hedging transactions are offset against thecorresponding gain or loss on the hedged items.
Where financial instruments do not qualify as hedges, anygains or losses resulting from changes in their market valueare recorded in the income statement, except for over-the-counter transactions. For these transactions, a provisionis recorded for any unrealised losses, while unrealisedgains are not recognised.
2.6. Foreign currency transactions
Income and expenses denominated in foreign currencies arerecorded at their euro-equivalent value on the transactiondate. Borrowings, receivables and liquidity positionsdenominated in foreign currencies are translated at theclosing exchange rate. In the case of foreign currencyhedging, borrowings and receivables are translated at thehedging rate.
308 Kering ~ 2015 Reference Document
5 FINANCIAL INFORMATION ~ PARENT COMPANY FINANCIAL STATEMENTS
05_E_VA_V5 06/04/2016 17:28 Page308

Any translation differences resulting from the valuation offoreign currency borrowings and receivables are recordedin accrual accounts, as an asset for unrealised losses andas a liability for unrealised gains. A contingency provision isrecorded to cover any unhedged unrealised losses. Whereborrowings and receivables are hedged by financialinstruments, any foreign currency gains or losses areimmediately recorded in the income statement.
2.7. Bond issue and capital increase fees – Bond redemption premiums
Bond issue fees are recognised as of the issue date.
Costs associated with increases in capital, mergers orrestructuring are charged against the additional paid- incapital arising from the merger or restructuring.
Bonds are recorded at their par value.
Any issue or redemption premiums are assigned to therelevant balance sheet item and amortised over the termof the bond.
For convertible bonds, the redemption premium isrecognised over the term of the bond, in accordance withthe benchmark accounting treatment.
In the case of an indexed bond issue, a contingency provisionmust be recorded in respect of redemption when theestimated amount required to redeem the bonds as ofthe end of the reporting period exceeds the amount ofthe issue. This provision is calculated on a proportionalbasis over the term of the bond.
2.8. Provisions
Provisions are recognised in accordance with CNC regulationno. 2000.06 and include pension and other employeebenefit obligations pursuant to ANC recommendation no. 2013-02.
Under defined benefit plans, obligations are valued usingthe projected unit credit method based on agreements ineffect in the Company. Under this method, each period ofservice gives rise to an additional unit of benefitentitlement and each unit is measured separately to buildup the final obligation. The obligation is then discounted.The actuarial assumptions used to determine theobligations vary depending on economic conditions.
These benefit obligations are assessed by independentactuaries on an annual basis. The valuations take intoaccount the level of future compensation, the probableactive life of employees, life expectancy and staff turnover.
Kering applies the notice relating to CRC regulation no. 2008-15 of December 4, 2008 on the accountingtreatment of stock option plans and employee free shareplans.
2.9. Tax consolidation
Kering has set up a tax consolidation group in France withseveral sub-groups and subsidiaries.
Each subsidiary recognises a tax expense for the amountof tax it would have paid on a stand-alone basis. The taxsavings generated by the Group as a result of taxconsolidation are retained by Kering as parent companyof the tax consolidation group.
309
5
2015 Reference Document ~ Kering
PARENT COMPANY FINANCIAL STATEMENTS ~ FINANCIAL INFORMATION
05_E_VA_V5 06/04/2016 17:28 Page309
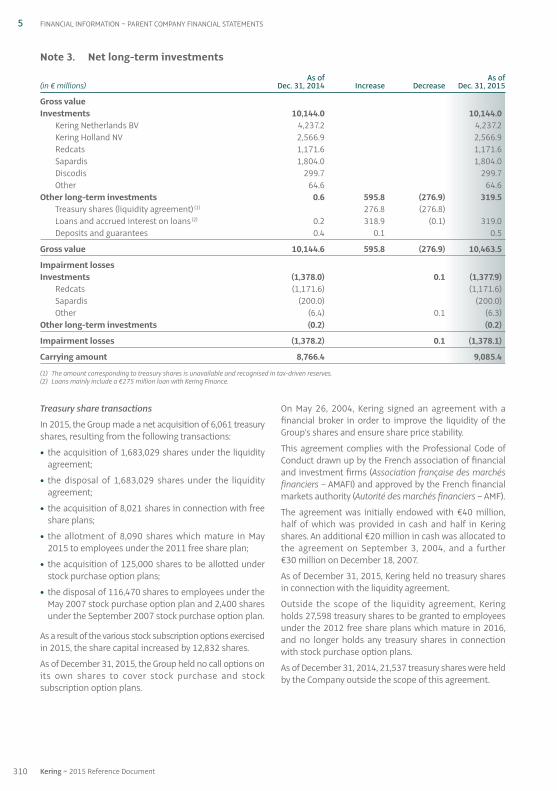
Treasury share transactions
In 2015, the Group made a net acquisition of 6,061 treasuryshares, resulting from the following transactions:
• the acquisition of 1,683,029 shares under the liquidityagreement;
• the disposal of 1,683,029 shares under the liquidityagreement;
• the acquisition of 8,021 shares in connection with freeshare plans;
• the allotment of 8,090 shares which mature in May2015 to employees under the 2011 free share plan;
• the acquisition of 125,000 shares to be allotted understock purchase option plans;
• the disposal of 116,470 shares to employees under theMay 2007 stock purchase option plan and 2,400 sharesunder the September 2007 stock purchase option plan.
As a result of the various stock subscription options exercisedin 2015, the share capital increased by 12,832 shares.
As of December 31, 2015, the Group held no call options onits own shares to cover stock purchase and stocksubscription option plans.
On May 26, 2004, Kering signed an agreement with afinancial broker in order to improve the liquidity of theGroup’s shares and ensure share price stability.
This agreement complies with the Professional Code ofConduct drawn up by the French association of financialand investment firms (Association française des marchésfinanciers – AMAFI) and approved by the French financialmarkets authority (Autorité des marchés financiers – AMF).
The agreement was initially endowed with €40 million,half of which was provided in cash and half in Keringshares. An additional €20 million in cash was allocated tothe agreement on September 3, 2004, and a further€30 million on December 18, 2007.
As of December 31, 2015, Kering held no treasury sharesin connection with the liquidity agreement.
Outside the scope of the liquidity agreement, Keringholds 27,598 treasury shares to be granted to employeesunder the 2012 free share plans which mature in 2016,and no longer holds any treasury shares in connectionwith stock purchase option plans.
As of December 31, 2014, 21,537 treasury shares were heldby the Company outside the scope of this agreement.
Note 3. Net long-term investments
As of As of(in € millions) Dec. 31, 2014 Increase Decrease Dec. 31, 2015
Gross value Investments 10,144.0 10,144.0
Kering Netherlands BV 4,237.2 4,237.2Kering Holland NV 2,566.9 2,566.9Redcats 1,171.6 1,171.6Sapardis 1,804.0 1,804.0Discodis 299.7 299.7Other 64.6 64.6
Other long-term investments 0.6 595.8 (276.9) 319.5Treasury shares (liquidity agreement) (1) 276.8 (276.8) Loans and accrued interest on loans (2) 0.2 318.9 (0.1) 319.0Deposits and guarantees 0.4 0.1 0.5
Gross value 10,144.6 595.8 (276.9) 10,463.5
Impairment losses Investments (1,378.0) 0.1 (1,377.9)
Redcats (1,171.6) (1,171.6)Sapardis (200.0) (200.0)Other (6.4) 0.1 (6.3)
Other long-term investments (0.2) (0.2)
Impairment losses (1,378.2) 0.1 (1,378.1)
Carrying amount 8,766.4 9,085.4
(1) The amount corresponding to treasury shares is unavailable and recognised in tax-driven reserves.(2) Loans mainly include a €275 million loan with Kering Finance.
310 Kering ~ 2015 Reference Document
5 FINANCIAL INFORMATION ~ PARENT COMPANY FINANCIAL STATEMENTS
05_E_VA_V5 06/04/2016 17:28 Page310
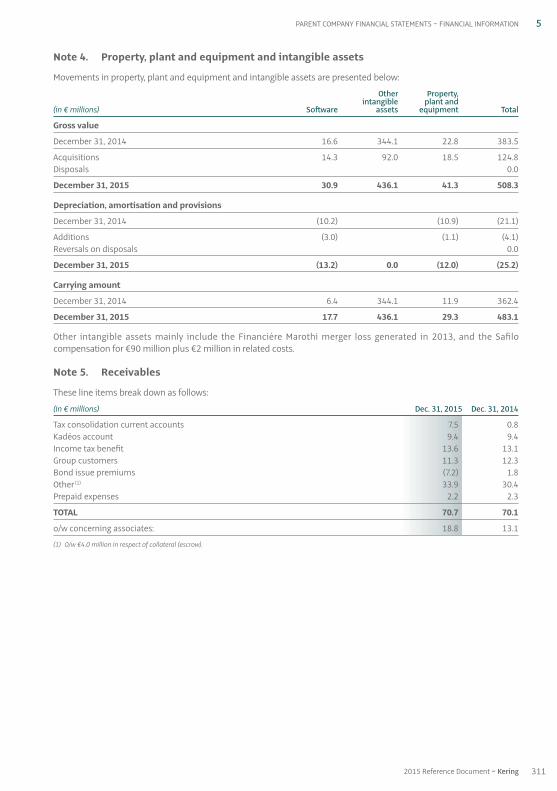
Note 4. Property, plant and equipment and intangible assets
Movements in property, plant and equipment and intangible assets are presented below:
Other Property, intangible plant and
(in € millions) Software assets equipment Total
Gross value
December 31, 2014 16.6 344.1 22.8 383.5
Acquisitions 14.3 92.0 18.5 124.8Disposals 0.0
December 31, 2015 30.9 436.1 41.3 508.3
Depreciation, amortisation and provisions
December 31, 2014 (10.2) (10.9) (21.1)
Additions (3.0) (1.1) (4.1)Reversals on disposals 0.0
December 31, 2015 (13.2) 0.0 (12.0) (25.2)
Carrying amount
December 31, 2014 6.4 344.1 11.9 362.4
December 31, 2015 17.7 436.1 29.3 483.1
Other intangible assets mainly include the Financière Marothi merger loss generated in 2013, and the Safilocompensation for €90 million plus €2 million in related costs.
Note 5. Receivables
These line items break down as follows:
(in € millions) Dec. 31, 2015 Dec. 31, 2014
Tax consolidation current accounts 7.5 0.8Kadéos account 9.4 9.4Income tax benefit 13.6 13.1Group customers 11.3 12.3Bond issue premiums (7.2) 1.8Other (1) 33.9 30.4Prepaid expenses 2.2 2.3
TOTAL 70.7 70.1
o / w concerning associates: 18.8 13.1
(1) O / w €4.0 million in respect of collateral (escrow).
311
5
2015 Reference Document ~ Kering
PARENT COMPANY FINANCIAL STATEMENTS ~ FINANCIAL INFORMATION
05_E_VA_V5 06/04/2016 17:28 Page311
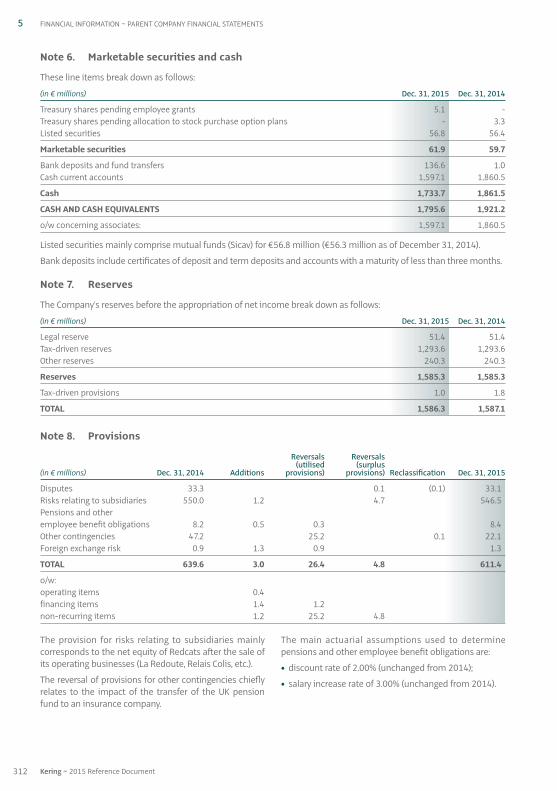
The provision for risks relating to subsidiaries mainlycorresponds to the net equity of Redcats after the sale ofits operating businesses (La Redoute, Relais Colis, etc.).
The reversal of provisions for other contingencies chieflyrelates to the impact of the transfer of the UK pensionfund to an insurance company.
The main actuarial assumptions used to determinepensions and other employee benefit obligations are:
• discount rate of 2.00% (unchanged from 2014);
• salary increase rate of 3.00% (unchanged from 2014).
Note 6. Marketable securities and cash
These line items break down as follows:
(in € millions) Dec. 31, 2015 Dec. 31, 2014
Treasury shares pending employee grants 5.1 -Treasury shares pending allocation to stock purchase option plans - 3.3Listed securities 56.8 56.4
Marketable securities 61.9 59.7
Bank deposits and fund transfers 136.6 1.0Cash current accounts 1,597.1 1,860.5
Cash 1,733.7 1,861.5
CASH AND CASH EQUIVALENTS 1,795.6 1,921.2
o / w concerning associates: 1,597.1 1,860.5
Listed securities mainly comprise mutual funds (Sicav) for €56.8 million (€56.3 million as of December 31, 2014).
Bank deposits include certificates of deposit and term deposits and accounts with a maturity of less than three months.
Note 7. Reserves
The Company’s reserves before the appropriation of net income break down as follows:
(in € millions) Dec. 31, 2015 Dec. 31, 2014
Legal reserve 51.4 51.4Tax-driven reserves 1,293.6 1,293.6Other reserves 240.3 240.3
Reserves 1,585.3 1,585.3
Tax-driven provisions 1.0 1.8
TOTAL 1,586.3 1,587.1
Note 8. Provisions
Reversals Reversals (utilised (surplus(in € millions) Dec. 31, 2014 Additions provisions) provisions) Reclassification Dec. 31, 2015
Disputes 33.3 0.1 (0.1) 33.1Risks relating to subsidiaries 550.0 1.2 4.7 546.5Pensions and other employee benefit obligations 8.2 0.5 0.3 8.4Other contingencies 47.2 25.2 0.1 22.1Foreign exchange risk 0.9 1.3 0.9 1.3
TOTAL 639.6 3.0 26.4 4.8 611.4
o / w: operating items 0.4 financing items 1.4 1.2 non-recurring items 1.2 25.2 4.8
312 Kering ~ 2015 Reference Document
5 FINANCIAL INFORMATION ~ PARENT COMPANY FINANCIAL STATEMENTS
05_E_VA_V5 06/04/2016 17:28 Page312

Note 9. Borrowings
Bond issues
Euro-denominated bond issues(in € millions) Interest rate Issue date Hedge Maturity Dec. 31, 2015 Dec. 31, 2014
Bond issue (1) 6.50% fixed 06 / 29 / 2009 - 06 / 29 / 2017 150.0 150.0
Bond issue (2) 6.50% fixed 11 /0 6 / 2009 - 11 /0 6 / 2017 200.0 200.0
Bond issue (3) 3.75% fixed 04 / 08 / 2010 & - 04 /0 8 / 2015 750.0 01 / 26 / 2012
Bond issue (4) 3.125% fixed 04 / 23 / 2012 - 04 / 23 / 2019 500.0 500.0
Bond issue (5) 2.50% fixed 07 / 15 / 2013 - 07 / 15 / 2020 500.0 500.0
Bond issue (6) 1.875% fixed 10 / 08 / 2013 - 10 / 08 / 2018 500.0 500.0
Bond issue (7) 2.75% fixed 04 / 08 / 2014 & - 04 /0 8 / 2024 500.0 300.0 05 / 30 / 2014 & 06 / 26 / 2014 & 09 / 22 / 2015 & 11 /0 5 / 2015
Bond issue (8) 1.375% fixed 10 / 01 / 2014 - 10 / 01 / 2021 500.0 500.0
Bond issue (9) 0.875% fixed 03 / 27 / 2015 - 03 / 28 / 2022 500.0
Bond issue (10) 1.60% fixed 04 / 16 / 2015 - 04 / 16 / 2035 50.0
(1) Issue price: bond issue on June 29, 2009, comprising 3,000 bonds with a par value of €50,000 each under the EMTN programme.Redemption: in full on June 29, 2017.
(2) Issue price: bond issue on November 6, 2009, comprising 4,000 bonds with a par value of €50,000 each under the EMTN programme.Redemption: in full on November 6, 2017.
(3) Issue price: bond issue on April 8, 2010, comprising 500,000 bonds with a par value of €1,000 each under the EMTN programme, and 250,000 additional bondsissued on January 26, 2012, thereby raising the issue to 750,000 bonds.Redemption: in full on April 8, 2015.
(4) Issue price: bond issue on April 23, 2012, comprising 500,000 bonds with a par value of €1,000 each under the EMTN programme.Redemption: in full on April 23, 2019.
(5) Issue price: bond issue on July 15, 2013, comprising 5,000 bonds with a par value of €100,000 each under the EMTN programme.Redemption: in full on July 15, 2020.
(6) Issue price: bond issue on October 8, 2013, comprising 5,000 bonds with a par value of €100,000 each under the EMTN programme.Redemption: in full on October 8, 2018.
(7) Issue price: bond issue on April 8, 2014, comprising 1,000 bonds with a par value of €100,000 each under the EMTN programme, 1,000 additional bonds issuedon May 30, 2014, 1,000 additional bonds issued on June 26, 2014, 1,500 additional bonds issued on September 22, 2015 and 500 additional bonds issued onNovember 5, 2015, thereby raising the issue to 5,000 bonds.Redemption: in full on April 8, 2024.
(8) Issue price: bond issue on October 1, 2014, comprising 5,000 bonds with a par value of €100,000 each under the EMTN programme.Redemption: in full on October 1, 2021.
(9) Issue price: bond issue on March 27, 2015, comprising 5,000 bonds with a par value of €100,000 each under the EMTN programme.Redemption: in full on March 28, 2022.
(10) Issue price: bond issue on April 16, 2015, comprising 500 bonds with a par value of €100,000 each under the EMTN programme.Redemption: in full on April 16, 2035.
USD-denominated bond issues(in € millions) Interest rate Issue date Hedge Maturity Dec. 31, 2015 Dec. 31, 2014
Bond issue (1) Floating 03 / 09 / 2015 - 03 /0 9 / 2020 137.8 3-month USD Libor +0.73%
Bond issue (2) 2.887% fixed 06 / 09 / 2015 - 06 / 09 / 2021 137.8
(1) Issue price: bond issue on March 9, 2015 in the form of floating-rate notes, comprising 150 notes with a par value of USD 1,000,000 under the EMTNprogramme, i.e., representing a total of USD 150 million.Redemption: in full on March 9, 2020.
(2) Issue price: bond issue on June 9, 2015, comprising 150 bonds with a par value of USD 1,000,000 each under the EMTN programme, i.e., representing a total ofUSD 150 million.Redemption: in full on June 9, 2021.
313
5
2015 Reference Document ~ Kering
PARENT COMPANY FINANCIAL STATEMENTS ~ FINANCIAL INFORMATION
05_E_VA_V5 06/04/2016 17:28 Page313
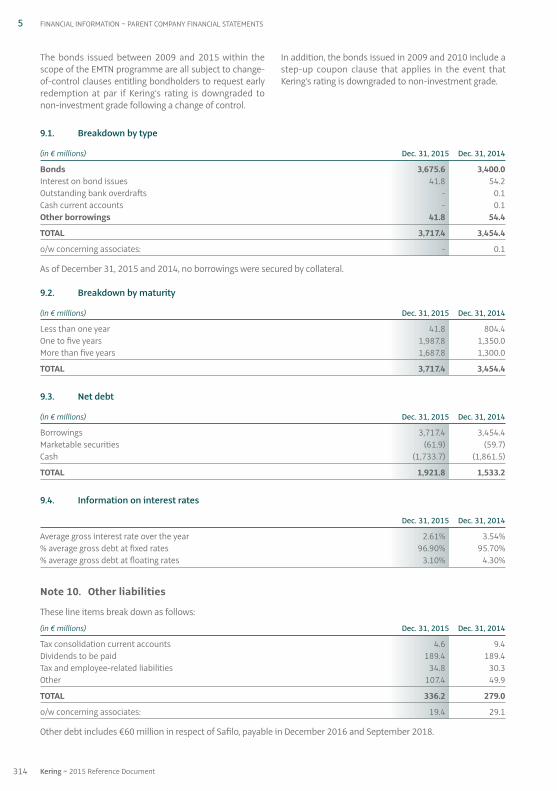
9.1. Breakdown by type
(in € millions) Dec. 31, 2015 Dec. 31, 2014
Bonds 3,675.6 3,400.0Interest on bond issues 41.8 54.2Outstanding bank overdrafts - 0.1Cash current accounts - 0.1Other borrowings 41.8 54.4
TOTAL 3,717.4 3,454.4
o / w concerning associates: - 0.1
As of December 31, 2015 and 2014, no borrowings were secured by collateral.
9.2. Breakdown by maturity
(in € millions) Dec. 31, 2015 Dec. 31, 2014
Less than one year 41.8 804.4One to five years 1,987.8 1,350.0More than five years 1,687.8 1,300.0
TOTAL 3,717.4 3,454.4
9.3. Net debt
(in € millions) Dec. 31, 2015 Dec. 31, 2014
Borrowings 3,717.4 3,454.4Marketable securities (61.9) (59.7)Cash (1,733.7) (1,861.5)
TOTAL 1,921.8 1,533.2
9.4. Information on interest rates
Dec. 31, 2015 Dec. 31, 2014
Average gross interest rate over the year 2.61% 3.54%% average gross debt at fixed rates 96.90% 95.70%% average gross debt at floating rates 3.10% 4.30%
Note 10. Other liabilities
These line items break down as follows:
(in € millions) Dec. 31, 2015 Dec. 31, 2014
Tax consolidation current accounts 4.6 9.4Dividends to be paid 189.4 189.4Tax and employee-related liabilities 34.8 30.3Other 107.4 49.9
TOTAL 336.2 279.0
o / w concerning associates: 19.4 29.1
Other debt includes €60 million in respect of Safilo, payable in December 2016 and September 2018.
The bonds issued between 2009 and 2015 within thescope of the EMTN programme are all subject to change- of -control clauses entitling bondholders to request earlyredemption at par if Kering’s rating is downgraded tonon-investment grade following a change of control.
In addition, the bonds issued in 2009 and 2010 include astep-up coupon clause that applies in the event thatKering’s rating is downgraded to non-investment grade.
314 Kering ~ 2015 Reference Document
5 FINANCIAL INFORMATION ~ PARENT COMPANY FINANCIAL STATEMENTS
05_E_VA_V5 06/04/2016 17:28 Page314
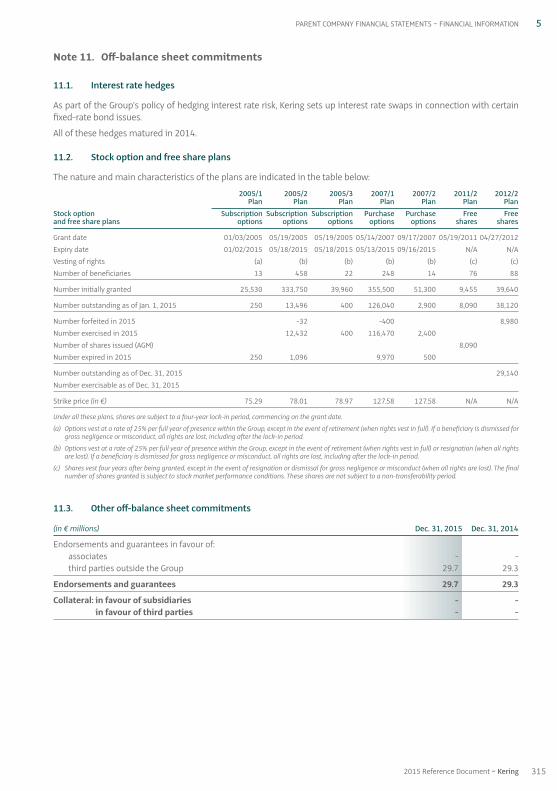
Note 11. Off-balance sheet commitments
11.1. Interest rate hedges
As part of the Group’s policy of hedging interest rate risk, Kering sets up interest rate swaps in connection with certainfixed-rate bond issues.
All of these hedges matured in 2014.
11.2. Stock option and free share plans
The nature and main characteristics of the plans are indicated in the table below:
2005 / 1 2005 / 2 2005 / 3 2007 / 1 2007 / 2 2011 / 2 2012 / 2 Plan Plan Plan Plan Plan Plan PlanStock option Subscription Subscription Subscription Purchase Purchase Free Freeand free share plans options options options options options shares shares
Grant date 01 /0 3 / 2005 05 / 19 / 2005 05 / 19 / 2005 05 / 14 / 2007 09 / 17 / 2007 05 / 19 / 2011 04 / 27 / 2012Expiry date 01 / 02 / 2015 05 / 18 / 2015 05 / 18 / 2015 05 / 13 / 2015 09 / 16 / 2015 N / A N / AVesting of rights (a) (b) (b) (b) (b) (c) (c)Number of beneficiaries 13 458 22 248 14 76 88
Number initially granted 25,530 333,750 39,960 355,500 51,300 9,455 39,640
Number outstanding as of Jan. 1, 2015 250 13,496 400 126,040 2,900 8,090 38,120
Number forfeited in 2015 -32 -400 8,980Number exercised in 2015 12,432 400 116,470 2,400 Number of shares issued (AGM) 8,090 Number expired in 2015 250 1,096 9,970 500
Number outstanding as of Dec. 31, 2015 29,140Number exercisable as of Dec. 31, 2015
Strike price (in €) 75.29 78.01 78.97 127.58 127.58 N / A N / A
Under all these plans, shares are subject to a four-year lock-in period, commencing on the grant date.
(a) Options vest at a rate of 25% per full year of presence within the Group, except in the event of retirement (when rights vest in full). If a beneficiary is dismissed forgross negligence or misconduct, all rights are lost, including after the lock-in period.
(b) Options vest at a rate of 25% per full year of presence within the Group, except in the event of retirement (when rights vest in full) or resignation (when all rightsare lost). If a beneficiary is dismissed for gross negligence or misconduct, all rights are lost, including after the lock-in period.
(c) Shares vest four years after being granted, except in the event of resignation or dismissal for gross negligence or misconduct (when all rights are lost). The finalnumber of shares granted is subject to stock market performance conditions. These shares are not subject to a non-transferability period.
11.3. Other off-balance sheet commitments
(in € millions) Dec. 31, 2015 Dec. 31, 2014
Endorsements and guarantees in favour of: associates - -third parties outside the Group 29.7 29.3
Endorsements and guarantees 29.7 29.3
Collateral: in favour of subsidiaries - -in favour of third parties - -
315
5
2015 Reference Document ~ Kering
PARENT COMPANY FINANCIAL STATEMENTS ~ FINANCIAL INFORMATION
05_E_VA_V5 06/04/2016 17:28 Page315
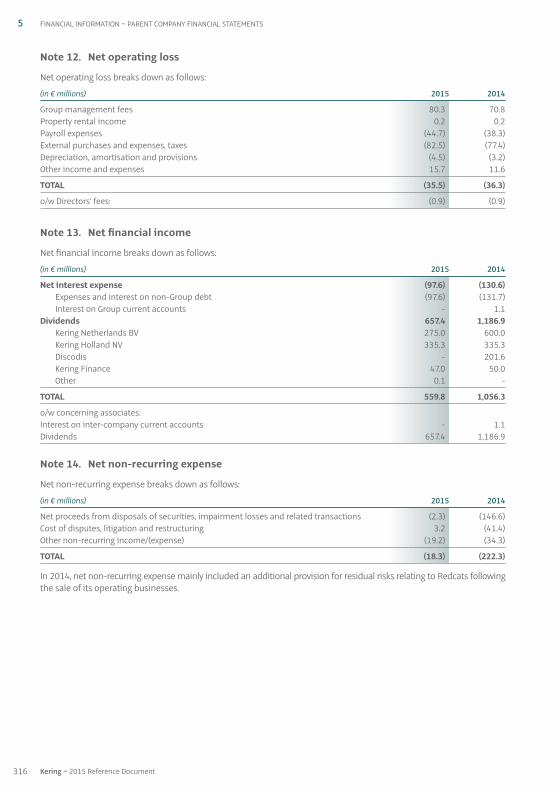
Note 12. Net operating loss
Net operating loss breaks down as follows:
(in € millions) 20 15 20 14
Group management fees 80.3 70.8Property rental income 0.2 0.2Payroll expenses (44.7) (38.3)External purchases and expenses, taxes (82.5) (77.4)Depreciation, amortisation and provisions (4.5) (3.2)Other income and expenses 15.7 11.6
TOTAL (35.5) (36.3)
o / w Directors’ fees: (0.9) (0.9)
Note 13. Net financial income
Net financial income breaks down as follows:
(in € millions) 20 15 20 14
Net interest expense (97.6) (130.6)Expenses and interest on non-Group debt (97.6) (131.7)Interest on Group current accounts - 1.1
Dividends 657.4 1,186.9Kering Netherlands BV 275.0 600.0Kering Holland NV 335.3 335.3Discodis - 201.6Kering Finance 47.0 50.0Other 0.1 -
TOTAL 559.8 1,056.3
o / w concerning associates: Interest on inter-company current accounts - 1.1Dividends 657.4 1,186.9
Note 14. Net non-recurring expense
Net non-recurring expense breaks down as follows:
(in € millions) 20 15 20 14
Net proceeds from disposals of securities, impairment losses and related transactions (2.3) (146.6)Cost of disputes, litigation and restructuring 3.2 (41.4)Other non-recurring income / (expense) (19.2) (34.3)
TOTAL (18.3) (222.3)
In 2014, net non-recurring expense mainly included an additional provision for residual risks relating to Redcats followingthe sale of its operating businesses.
316 Kering ~ 2015 Reference Document
5 FINANCIAL INFORMATION ~ PARENT COMPANY FINANCIAL STATEMENTS
05_E_VA_V5 06/04/2016 17:28 Page316
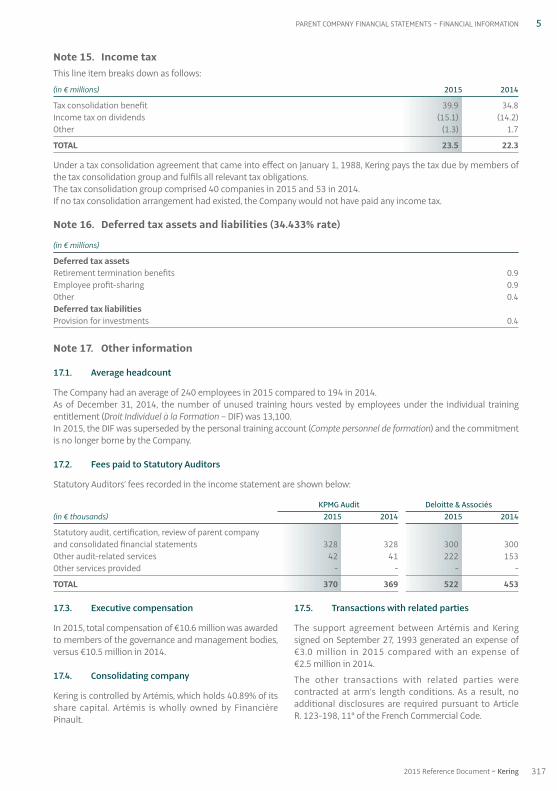
17.3. Executive compensation
In 2015, total compensation of €10.6 million was awardedto members of the governance and management bodies,versus €10.5 million in 2014.
17.4. Consolidating company
Kering is controlled by Artémis, which holds 40.89% of itsshare capital. Artémis is wholly owned by FinancièrePinault.
17.5. Transactions with related parties
The support agreement between Artémis and Keringsigned on September 27, 1993 generated an expense of€3.0 million in 2015 compared with an expense of€2.5 million in 2014.
The other transactions with related parties werecontracted at arm’s length conditions. As a result, noadditional disclosures are required pursuant to ArticleR. 123-198, 11° of the French Commercial Code.
Note 15. Income taxThis line item breaks down as follows:
(in € millions) 20 15 20 14
Tax consolidation benefit 39.9 34.8Income tax on dividends (15.1) (14.2)Other (1.3) 1.7
TOTAL 23.5 22.3
Under a tax consolidation agreement that came into effect on January 1, 1988, Kering pays the tax due by members ofthe tax consolidation group and fulfils all relevant tax obligations.The tax consolidation group comprised 40 companies in 2015 and 53 in 2014.If no tax consolidation arrangement had existed, the Company would not have paid any income tax.
Note 16. Deferred tax assets and liabilities (34.433% rate)
(in € millions)
Deferred tax assets Retirement termination benefits 0.9Employee profit-sharing 0.9Other 0.4Deferred tax liabilities Provision for investments 0.4
Note 17. Other information
17.1. Average headcount
The Company had an average of 240 employees in 2015 compared to 194 in 2014.As of December 31, 2014, the number of unused training hours vested by employees under the individual trainingentitlement (Droit Individuel à la Formation – DIF) was 13,100.In 2015, the DIF was superseded by the personal training account (Compte personnel de formation) and the commitmentis no longer borne by the Company.
17.2. Fees paid to Statutory Auditors
Statutory Auditors’ fees recorded in the income statement are shown below:
KPMG Audit Deloitte & Associés(in € thousands) 20 15 20 14 20 15 20 14
Statutory audit, certification, review of parent company and consolidated financial statements 328 328 300 300Other audit-related services 42 41 222 153Other services provided - - - -
TOTAL 370 369 522 453
317
5
2015 Reference Document ~ Kering
PARENT COMPANY FINANCIAL STATEMENTS ~ FINANCIAL INFORMATION
05_E_VA_V5 06/04/2016 17:28 Page317
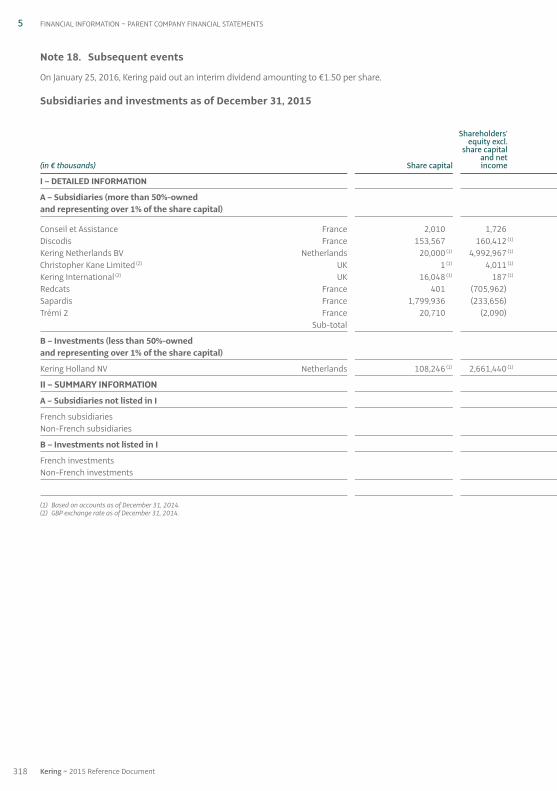
Note 18. Subsequent events
On January 25, 2016, Kering paid out an interim dividend amounting to €1.50 per share.
Subsidiaries and investments as of December 31, 2015
Shareholders’equity excl.
share capital and net
(in € thousands) Share capital income
I – DETAILED INFORMATION
A – Subsidiaries (more than 50%-ownedand representing over 1% of the share capital)
Conseil et Assistance France 2,010 1,726 Discodis France 153,567 160,412 (1) Kering Netherlands BV Netherlands 20,000 (1) 4,992,967 (1) Christopher Kane Limited (2) UK 1 (1) 4,011 (1) Kering International (2) UK 16,048 (1) 187 (1) Redcats France 401 (705,962) Sapardis France 1,799,936 (233,656) Trémi 2 France 20,710 (2,090) Sub-total
B – Investments (less than 50%-ownedand representing over 1% of the share capital)
Kering Holland NV Netherlands 108,246 (1) 2,661,440 (1)
II – SUMMARY INFORMATION
A – Subsidiaries not listed in I
French subsidiaries Non-French subsidiaries
B – Investments not listed in I
French investments Non-French investments
(1) Based on accounts as of December 31, 2014.(2) GBP exchange rate as of December 31, 2014.
318 Kering ~ 2015 Reference Document
5 FINANCIAL INFORMATION ~ PARENT COMPANY FINANCIAL STATEMENTS
05_E_VA_V5 06/04/2016 17:28 Page318
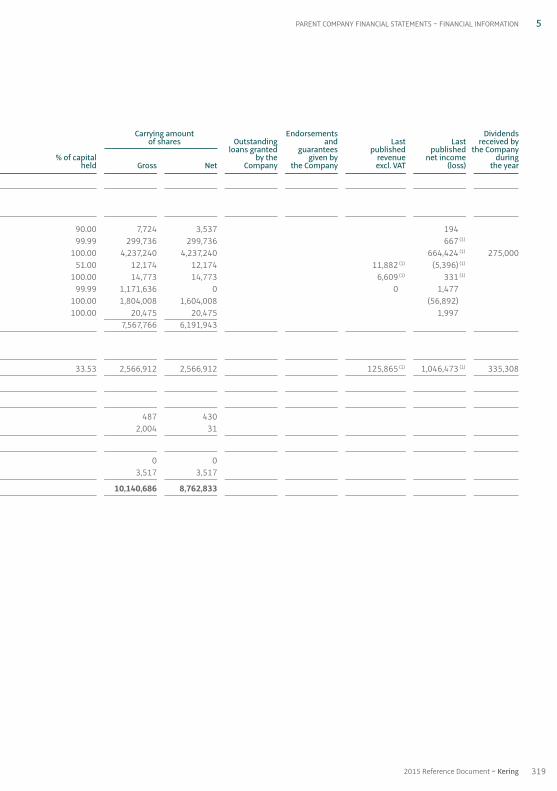
319
5
2015 Reference Document ~ Kering
PARENT COMPANY FINANCIAL STATEMENTS ~ FINANCIAL INFORMATION
Carrying amount Endorsements Dividendsof shares Outstanding and Last Last received by
loans granted guarantees published published the Company % of capital by the given by revenue net income during held Gross Net Company the Company excl. VAT (loss) the year
90.00 7,724 3,537 194 99.99 299,736 299,736 667 (1) 100.00 4,237,240 4,237,240 664,424 (1) 275,000 51.00 12,174 12,174 11,882 (1) (5,396) (1) 100.00 14,773 14,773 6,609 (1) 331 (1) 99.99 1,171,636 0 0 1,477 100.00 1,804,008 1,604,008 (56,892) 100.00 20,475 20,475 1,997 7,567,766 6,191,943
33.53 2,566,912 2,566,912 125,865 (1) 1,046,473 (1) 335,308
487 430 2,004 31
0 0 3,517 3,517
10,140,686 8,762,833
05_E_VA_V5 06/04/2016 17:28 Page319
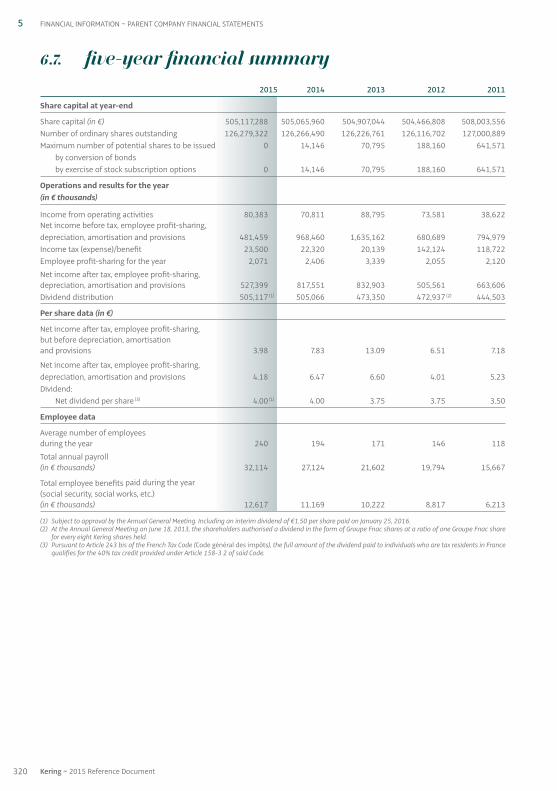
6.7. Five-year financial summary
2015 2014 2013 2012 2011
Share capital at year-end
Share capital (in €) 505,117,288 505,065,960 504,907,044 504,466,808 508,003,556Number of ordinary shares outstanding 126,279,322 126,266,490 126,226,761 126,116,702 127,000,889Maximum number of potential shares to be issued 0 14,146 70,795 188,160 641,571
by conversion of bondsby exercise of stock subscription options 0 14,146 70,795 188,160 641,571
Operations and results for the year(in € thousands)
Income from operating activities 80,383 70,811 88,795 73,581 38,622Net income before tax, employee profit-sharing,depreciation, amortisation and provisions 481,459 968,460 1,635,162 680,689 794,979Income tax (expense) / benefit 23,500 22,320 20,139 142,124 118,722Employee profit-sharing for the year 2,071 2,406 3,339 2,055 2,120Net income after tax, employee profit-sharing, depreciation, amortisation and provisions 527,399 817,551 832,903 505,561 663,606Dividend distribution 505,117 (1) 505,066 473,350 472,937 (2) 444,503
Per share data (in €)
Net income after tax, employee profit-sharing,but before depreciation, amortisationand provisions 3.98 7.83 13.09 6.51 7.18
Net income after tax, employee profit-sharing,depreciation, amortisation and provisions 4.18 6.47 6.60 4.01 5.23Dividend:
Net dividend per share (3) 4.00 (1) 4.00 3.75 3.75 3.50
Employee data
Average number of employees during the year 240 194 171 146 118Total annual payroll (in € thousands) 32,114 27,124 21,602 19,794 15,667
Total employee benefits paid during the year(social security, social works, etc.)(in € thousands) 12,617 11,169 10,222 8,817 6,213
(1) Subject to approval by the Annual General Meeting. Including an interim dividend of €1.50 per share paid on January 25, 2016.(2) At the Annual General Meeting on June 18, 2013, the shareholders authorised a dividend in the form of Groupe Fnac shares at a ratio of one Groupe Fnac share
for every eight Kering shares held.(3) Pursuant to Article 243 bis of the French Tax Code (Code général des impôts), the full amount of the dividend paid to individuals who are tax residents in France
qualifies for the 40% tax credit provided under Article 158-3 2 of said Code.
320 Kering ~ 2015 Reference Document
5 FINANCIAL INFORMATION ~ PARENT COMPANY FINANCIAL STATEMENTS
05_E_VA_V5 06/04/2016 17:28 Page320

7. Statutory Auditors’ reporton the Financial Statementsfor the year ended December 31, 2015
This is a free translation into English of the Statutory Auditors’ report issued in French and is provided solely for theconvenience of English speaking users. The Statutory Auditors’ report includes information specifically required by Frenchlaw in such reports, whether modified or not. This information is presented below the opinion on the Company financialstatements and includes an explanatory paragraph discussing the auditors’ assessments of certain significant accountingand auditing matters. These assessments were considered for the purpose of issuing an audit opinion on the Companyfinancial statements taken as a whole and not to provide separate assurance on individual account captions or oninformation taken outside of the Company financial statements. This report should be read in conjunction and construed inaccordance with French law and professional auditing standards applicable in France.
To the Shareholders,
In accordance with our appointment as Statutory Auditors at your Annual General Meetings, we hereby report to you forthe year ended December 31, 2015 on:
• the audit of the accompanying financial statements of Kering S.A.;
• the justification of our assessments;
• the specific procedures and disclosures required by law.
The financial statements have been approved by the Board of Directors. Our role is to express an opinion on thesefinancial statements, based on our audit.
1. Opinion on the financial statements
We conducted our audit in accordance with professional standards applicable in France. These standards require thatwe plan and perform the audit to obtain reasonable assurance about whether the financial statements are free ofmaterial misstatement. An audit includes examining, using sample testing techniques or other selection methods,evidence supporting the amounts and disclosures in the financial statements. An audit also includes assessing theaccounting principles used and significant estimates made, as well as evaluating the overall financial statementpresentation. We believe that the audit evidence we have obtained is sufficient and appropriate to provide a reasonablebasis for our opinion.
In our opinion, the financial statements give a true and fair view of the financial position and the assets and liabilities ofthe Company as of December 31, 2015 and the results of its operations for the year then ended in accordance withaccounting principles generally accepted in France.
2. Justification of our assessments
Pursuant to Article L. 823-9 of the French Commercial Code (Code de commerce) governing the justification of ourassessments, we hereby report on the following:
Note 2.2 to the financial statements describes the accounting policies relating to the measurement of long-terminvestments.
As part of our assessment of the accounting policies implemented by your Company, we have verified theappropriateness of the above-mentioned accounting methods and their proper application.
These assessments were performed as part of our audit approach for the financial statements taken as a whole andtherefore contributed to the expression of our opinion in the first part of this report.
321
5
2015 Reference Document ~ Kering
STATUTORY AUDITORS’ REPORT ON THE FINANCIAL STATEMENTS ~ FINANCIAL INFORMATION
05_E_VA_V5 06/04/2016 17:28 Page321

3. Specific procedures and disclosures
We have also performed the other procedures required by law, in accordance with professional standards applicable inFrance.
We have no matters to report regarding the fair presentation and consistency with the financial statements of theinformation given in the Management Report of the Board of Directors and in the documents addressed to theshareholders in respect of the financial position and the financial statements.
Concerning the information given in accordance with the requirements of Article L. 225-102-1 of the FrenchCommercial Code relating to remunerations and benefits received by the corporate officers and any othercommitments made in their favor, we have verified its consistency with the financial statements, or with the underlyinginformation used to prepare these financial statements and, where applicable, with the information obtained by yourcompany from companies controlling your company or controlled by it.
Based on these procedures, we have the following comment on the accuracy and fair presentation of this information:As indicated in the Board of Directors’ Management Report, this information represents the remunerations andbenefits paid by the Kering group and the companies controlling it to the corporate officers concerned with respect tothe mandates, duties or tasks carried out within or on behalf of the Kering group. The information does not include theremunerations and benefits paid with respect to mandates, duties or tasks other than those carried out within or onbehalf of the Kering group.
Pursuant to the law, we have verified that the Management Report contains the appropriate disclosures as to theidentity of and voting rights held by shareholders.
Paris La Défense and Neuilly-sur-Seine, March 30, 2016
The Statutory Auditors
KPMG Audit Deloitte & AssociésDivision of KPMG SA
Hervé Chopin Isabelle Allen Frédéric Moulin
322 Kering ~ 2015 Reference Document
5 FINANCIAL INFORMATION ~ STATUTORY AUDITORS’ REPORT ON THE FINANCIAL STATEMENTS
05_E_VA_V5 06/04/2016 17:28 Page322

8. Statutory Auditors’ special reporton regulated agreements andcommitments with third partiesShareholders’ Meeting held to approve the financial statementsfor the year ended December 31, 2015
This is a free translation into English of the Statutory Auditors’ special report on regulated agreements and commitmentswith third parties that is issued in the French language and is provided solely for the convenience of English speakingreaders. This report on regulated agreements and commitments should be read in conjunction and construed inaccordance with French law and professional auditing standards applicable in France. It should be understood that theagreements reported on are only those provided by the French Commercial Code (Code de commerce) and that the reportdoes not apply to those related party transactions described in IAS 24 or other equivalent accounting standards
To the Shareholders,
In our capacity as Statutory Auditors of your Company, we hereby report to you on regulated agreements andcommitments with third parties.
The terms of our engagement require us to communicate to you, based on information provided to us, the principal termsand conditions of those agreements and commitments brought to our attention or which we may have discovered duringthe course of our audit, and the reasons justifying that these commitments and agreements are in the company’sinterest, without expressing an opinion on their usefulness and appropriateness or identifying such other agreements,if any. It is your responsibility, pursuant to Article R. 225-31 of the French Commercial Code (Code de commerce), toassess the interest involved in respect of the conclusion of these agreements for the purpose of approving them.
Our role is also to provide you with the information provided for in Article R. 225-31 of the French Commercial Code inrespect of the performance of the agreements and commitments, already authorized by the shareholders’ meeting andhaving continuing effect during the year, if any.
We conducted the procedures we deemed necessary in accordance with the professional guidelines of the French NationalInstitute of Statutory Auditors (Compagnie Nationale des Commissaires aux Comptes) relating to this engagement. Theseprocedures consisted in agreeing the information provided to us with the relevant source documents.
Agreements and commitments submitted to the approval of the shareholders’ meeting
Agreements and commitments authorized during the year
We have been advised of the following agreements and commitments which received the prior approval of your Boardof Directors pursuant to Article L. 225-40 of the French Commercial Code.
• Sale of an investment held by a subsidiary of Kering SA to a subsidiary of Artémis SA
On April 23, 2015, your Board of Directors authorized the sale of an investment held by Kering Netherlands BV in GlobalFashion Holding SA (“GFH”) to Témaris, a subsidiary of Artémis SA.
Under the sale agreement signed on June 8, 2015, the investment’s sale price totaled €12,836,980, keeping in mind thatyour Company’s 2012 investment in GFH, then known as Bigfoot GmbH, had amounted to €9,994,466. The sale pricethus authorized took into account the valuation of GFH based on recent structuring operations and a capital increasecarried out in early April 2015.
Pursuant to the law, we hereby inform you that the prior approval of your Board of Directors on April 23, 2015 did notinclude the reasons justifying that this agreement was in the Company’s interest, as stipulated in Article L. 225-38 ofthe French Commercial Code. However, at its meeting on February 18, 2016, the Board considered that the sale was inthe Company’s interest insofar as the GFH activity was not aligned with the Company’s core business, and thetransaction resulted in a capital gain for the Company.
Persons involved: Mrs. Patricia Barbizet and Mr. François-Henri Pinault, members of the Board of Directors ofArtémis S.A., a Kering SA shareholder with more than 10% of voting rights.
323
5
2015 Reference Document ~ Kering
STATUTORY AUDITORS’ SPECIAL REPORT ON REGULATED AGREEMENTS AND COMMITMENTS WITH THIRD PARTIES ~ FINANCIAL INFORMATION
05_E_VA_V5 06/04/2016 17:28 Page323
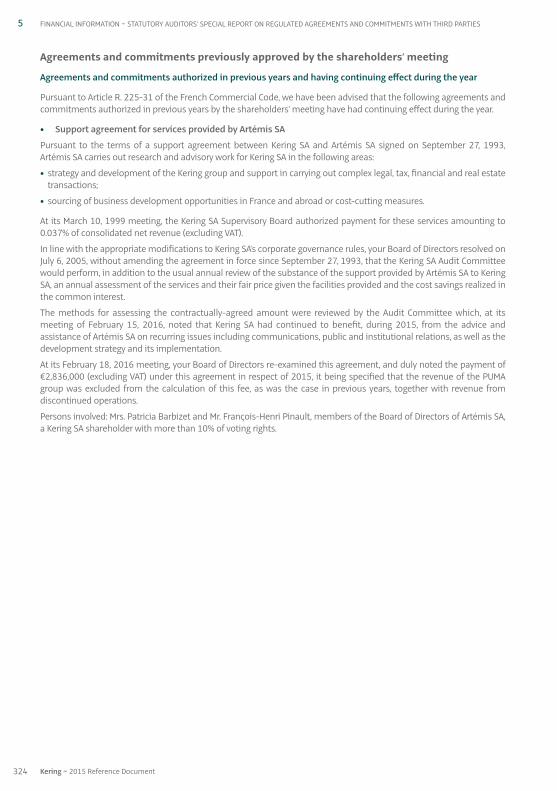
Agreements and commitments previously approved by the shareholders’ meeting
Agreements and commitments authorized in previous years and having continuing effect during the year
Pursuant to Article R. 225-31 of the French Commercial Code, we have been advised that the following agreements andcommitments authorized in previous years by the shareholders’ meeting have had continuing effect during the year.
• Support agreement for services provided by Artémis SA
Pursuant to the terms of a support agreement between Kering SA and Artémis SA signed on September 27, 1993,Artémis SA carries out research and advisory work for Kering SA in the following areas:
• strategy and development of the Kering group and support in carrying out complex legal, tax, financial and real estatetransactions;
• sourcing of business development opportunities in France and abroad or cost-cutting measures.
At its March 10, 1999 meeting, the Kering SA Supervisory Board authorized payment for these services amounting to0.037% of consolidated net revenue (excluding VAT).
In line with the appropriate modifications to Kering SA’s corporate governance rules, your Board of Directors resolved onJuly 6, 2005, without amending the agreement in force since September 27, 1993, that the Kering SA Audit Committeewould perform, in addition to the usual annual review of the substance of the support provided by Artémis SA to KeringSA, an annual assessment of the services and their fair price given the facilities provided and the cost savings realized inthe common interest.
The methods for assessing the contractually-agreed amount were reviewed by the Audit Committee which, at itsmeeting of February 15, 2016, noted that Kering SA had continued to benefit, during 2015, from the advice andassistance of Artémis SA on recurring issues including communications, public and institutional relations, as well as thedevelopment strategy and its implementation.
At its February 18, 2016 meeting, your Board of Directors re-examined this agreement, and duly noted the payment of€2,836,000 (excluding VAT) under this agreement in respect of 2015, it being specified that the revenue of the PUMAgroup was excluded from the calculation of this fee, as was the case in previous years, together with revenue fromdiscontinued operations.
Persons involved: Mrs. Patricia Barbizet and Mr. François-Henri Pinault, members of the Board of Directors of Artémis SA,a Kering SA shareholder with more than 10% of voting rights.
324 Kering ~ 2015 Reference Document
5 FINANCIAL INFORMATION ~ STATUTORY AUDITORS’ SPECIAL REPORT ON REGULATED AGREEMENTS AND COMMITMENTS WITH THIRD PARTIES
05_E_VA_V5 06/04/2016 17:28 Page324
• Retirement commitment in favor of Mr. Jean-François Palus, Deputy CEO of Kering SA
On January 22 and April 8, 2010, the Board of Directors authorized Kering SA and the companies controlled by it within themeaning of Article L. 233-16 of the French Commercial Code to grant specific retirement benefits to Mr. Jean-FrançoisPalus, Deputy CEO of Kering SA, due to his exceptional contribution to the business development of the Luxury GoodsDivision. This authorization resulted in the allocation of €3,568,000 (this capital being either managed by Kering SA or acompany controlled by it, or invested in a top-tier asset management company) to fund his retirement benefits (withreversion rights to his beneficiaries in the event of death) payable as from the legal retirement age. His presence in theKering group was not a requirement at that date, provided that he had not left the Group before December 31, 2014 forpersonal reasons.
To receive these retirement benefits, Mr. Jean-François Palus had to satisfy the performance conditions attached to hisvariable compensation, for fiscal years 2009 and 2010, in his capacity as Deputy CEO of Kering SA. On April 8, 2010 andFebruary 16, 2011, your Board of Directors duly noted that the performance conditions were met for fiscal years 2009and 2010, respectively.
Pursuant to these Board of Directors’ authorizations, the Supervisory Board of Gucci Group NV (now Kering Holland NV),wholly-owned directly and indirectly by Kering SA, decided, on December 10, 2010, to grant Mr. Jean-François Palus, inhis capacity at that date as a member of the Supervisory Board of Gucci Group NV since May 30, 2006, an irrevocablepension right in respect of retirement benefits, in accordance with the terms and conditions provided for in your Boardof Directors’ authorization, based on a capital of €3,568,000, in so much as Kering SA acknowledged, at the given time,that this right was no longer subject to the fulfillment of any conditions.
On March 18, 2015, your Board of Directors noted that Mr. Jean-François Palus had not left the Group for personal reasonsand therefore the right was no longer subject to the fulfillment of any conditions.
On February 22, 2016, the Board of Kering Holland NV approved the release of the capital by transfer to a financial institutiondesignated by Mr. Jean-François Palus.
On March 11, 2016, your Board of Directors re-examined this agreement and approved the implementation, based on atotal payment of €4,724,540 (following application of a 5% interest rate to the initial capital of €3,568,000 for therelevant period).
This payment was made on March 29, 2016 and thus the extinction of the Kering SA and Group debt with respect to thesaid commitment was acknowledged.
Paris La Défense and Neuilly-sur-Seine, March 30, 2016The Statutory Auditors
KPMG Audit Deloitte & AssociésDivision of KPMG SA
Hervé Chopin Isabelle Allen Frédéric Moulin
325
5
2015 Reference Document ~ Kering
STATUTORY AUDITORS’ SPECIAL REPORT ON REGULATED AGREEMENTS AND COMMITMENTS WITH THIRD PARTIES ~ FINANCIAL INFORMATION
05_E_VA_V5 06/04/2016 17:28 Page325
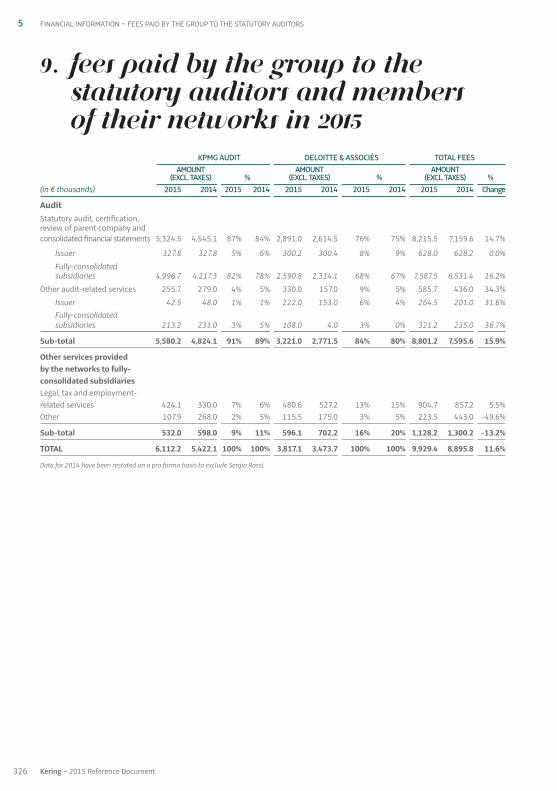
326 Kering ~ 2015 Reference Document
5 FINANCIAL INFORMATION ~ FEES PAID BY THE GROUP TO THE STATUTORY AUDITORS
9. Fees paid by the Group to theStatutory Auditors and members of their networks in 2015
KPMG AUDIT DELOITTE & ASSOCIÉS TOTAL FEESAMOUNT AMOUNT AMOUNT
(EXCL. TAXES) % (EXCL. TAXES) % (EXCL. TAXES) %(in € thousands) 20 15 20 14 20 15 20 14 20 15 20 14 20 15 20 14 20 15 20 14 Change
AuditStatutory audit, certification, review of parent company and consolidated financial statements 5,324.5 4,545.1 87% 84% 2,891.0 2,614.5 76% 75% 8,215.5 7,159.6 14.7%
Issuer 327.8 327.8 5% 6% 300.2 300.4 8% 9% 628.0 628.2 0.0%Fully-consolidatedsubsidiaries 4,996.7 4,217.3 82% 78% 2,590.8 2,314.1 68% 67% 7,587.5 6,531.4 16.2%
Other audit-related services 255.7 279.0 4% 5% 330.0 157.0 9% 5% 585.7 436.0 34.3%Issuer 42.5 48.0 1% 1% 222.0 153.0 6% 4% 264.5 201.0 31.6%Fully-consolidated subsidiaries 213.2 231.0 3% 5% 108.0 4.0 3% 0% 321.2 235.0 36.7%
Sub-total 5,580.2 4,824.1 91% 89% 3,221.0 2,771.5 84% 80% 8,801.2 7,595.6 15.9%
Other services provided by the networks to fully-consolidated subsidiariesLegal, tax and employment-related services 424.1 330.0 7% 6% 480.6 527.2 13% 15% 904.7 857.2 5.5%Other 107.9 268.0 2% 5% 115.5 175.0 3% 5% 223.5 443.0 -49.6%
Sub-total 532.0 598.0 9% 11% 596.1 702.2 16% 20% 1,128.2 1,300.2 -13.2%
TOTAL 6,112.2 5,422.1 100% 100% 3,817.1 3,473.7 100% 100% 9,929.4 8,895.8 11.6%
Data for 2014 have been restated on a pro forma basis to exclude Sergio Rossi.
05_E_VA_V5 06/04/2016 17:28 Page326
3272015 Reference Document ~ Kering
CHAPTer 6
Share capital and ownership structure
1. Share capital 3281.1. Share capital 3281.2. Treasury shares held by the Company and its subsidiaries 3281.3. Authorisations to issue securities giving access to the share capital 3301.4. Employee share ownership 3331.5. Appropriation of net income – Dividends paid by the Company 3331.6. Share pledges 3341.7. Exchangeable bonds issued by the majority shareholder 3341.8. Arrangements and agreements 334
2. Share ownership structure 335
06_VA_V5 06/04/2016 17:28 Page327
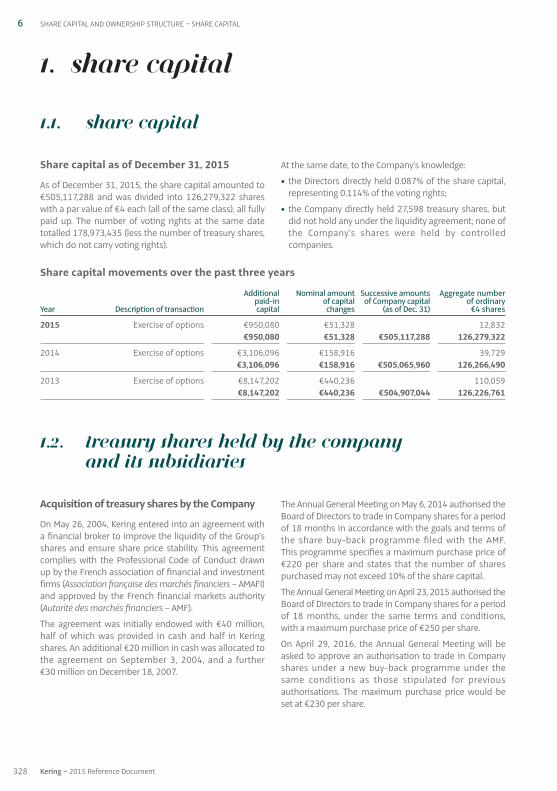
Acquisition of treasury shares by the Company
On May 26, 2004, Kering entered into an agreement witha financial broker to improve the liquidity of the Group’sshares and ensure share price stability. This agreementcomplies with the Professional Code of Conduct drawnup by the French association of financial and investmentfirms (Association française des marchés financiers – AMAFI)and approved by the French financial markets authority(Autorité des marchés financiers – AMF).
The agreement was initially endowed with €40 million,half of which was provided in cash and half in Keringshares. An additional €20 million in cash was allocated tothe agreement on September 3, 2004, and a further€30 million on December 18, 2007.
The Annual General Meeting on May 6, 2014 authorised theBoard of Directors to trade in Company shares for a periodof 18 months in accordance with the goals and terms ofthe share buy-back programme filed with the AMF. This programme specifies a maximum purchase price of€220 per share and states that the number of sharespurchased may not exceed 10% of the share capital.
The Annual General Meeting on April 23, 2015 authorised theBoard of Directors to trade in Company shares for a periodof 18 months, under the same terms and conditions,with a maximum purchase price of €250 per share.
On April 29, 2016, the Annual General Meeting will beasked to approve an authorisation to trade in Companyshares under a new buy-back programme under thesame conditions as those stipulated for previousauthorisations. The maximum purchase price would beset at €230 per share.
Share capital movements over the past three years
Additional Nominal amount Successive amounts Aggregate number paid-in of capital of Company capital of ordinary
Year Description of transaction capital changes (as of Dec. 31) €4 shares
2015 Exercise of options €950,080 €51,328 12,832 €950,080 €51,328 €505,117,288 126,279,322
2014 Exercise of options €3,106,096 €158,916 39,729 €3,106,096 €158,916 €505,065,960 126,266,490
2013 Exercise of options €8,147,202 €440,236 110,059 €8,147,202 €440,236 €504,907,044 126,226,761
1.2. Treasury shares held by the Company and its subsidiaries
Share capital as of December 31, 2015
As of December 31, 2015, the share capital amounted to€505,117,288 and was divided into 126,279,322 shareswith a par value of €4 each (all of the same class), all fullypaid up. The number of voting rights at the same datetotalled 178,973,435 (less the number of treasury shares,which do not carry voting rights).
At the same date, to the Company’s knowledge:
• the Directors directly held 0.087% of the share capital,representing 0.114% of the voting rights;
• the Company directly held 27,598 treasury shares, butdid not hold any under the liquidity agreement; none ofthe Company’s shares were held by controlledcompanies.
1. Share capital
1.1. Share capital
328 Kering ~ 2015 Reference Document
6 SHARE CAPITAL AND OWNERSHIP STRUCTURE ~ SHARE CAPITAL
06_VA_V5 06/04/2016 17:28 Page328
Buy-backs and sales of shares during 2015 – Trading costs – Number of treasury shares held as of December 31, 2015
Share buy-backs
• 752,405 shares were bought back pursuant to theauthorisation given by the Annual General Meeting onMay 6, 2014, at an average price of €174.78;
• 1,063,645 shares were bought back by the Companypursuant to the authorisation given by the AnnualGeneral Meeting on April 23, 2015, at an average priceof €158.17.
In 2015, Kering therefore bought back a total of1,816,050 shares at an average price of €165.05 for thefollowing purposes:
• 8,021 shares to be granted to employees under the2011 and 2012 free share plans;
• 125,000 shares to be granted under stock option plans,in particular the May and September 2007 plans;
• 1,683,029 shares purchased under the liquidityagreement.
Sales of treasury shares
In 2015, Kering sold 1,683,029 shares at an average price of€164.73, under the aforementioned liquidity agreement.
118,870 shares were sold to employees under the Mayand September 2007 stock purchase option plans.
An additional 8,090 shares were granted to employeesunder the 2011 free share plans, maturing in May 2015.
Trading costs
Total share trading costs for buy-backs and sales amountedto €0.5 million in 2015.
Share cancellations in 2015
No shares were cancelled during the year.
As of the end of the reporting period, the Company did nothold any treasury shares under the liquidity agreement. Itdirectly held 27,598 shares with a par value of €4 each anda carrying amount of €5,075,824.16 representing 0.02%of the share capital.
Buy-backs and sales of Kering shares carried out between January 1 and March 17, 2016
Since January 1, 2016, the Company has acquired673,715 shares at an average price of €151.95 and hassold 608,715 shares at an average price of €151.38, inconnection with the liquidity agreement.
As of March 17, 2016, the Company held 65,000 sharesunder the liquidity agreement.
Outside the scope of the liquidity agreement, theCompany did not acquire any Kering shares.
The number of treasury shares held by Kering as of March 17, 2016 therefore totals 92,598 shares with a parvalue of €4 per share and a carrying amount of€15,512,124.16.
Share cancellations in 2016
No shares were cancelled between January 1 and March 17, 2016.
Use of derivatives in 2015
Kering did not buy any call options on its own shares in 2015.
As of December 31, 2015, Kering did not hold any call optionson its own shares.
329
6
2015 Reference Document ~ Kering
SHARE CAPITAL ~ SHARE CAPITAL AND OWNERSHIP STRUCTURE
06_VA_V5 06/04/2016 17:28 Page329
As indicated in the above table, the Extraordinary GeneralMeeting on April 23, 2015 authorised the Board of Directorsto issue, with or without pre emptive subscription rights,securities giving access to the Company’s share capital,either immediately or in the future, to increase the sharecapital by capitalising reserves, profits or additional paid-in capital and to grant free shares.
These delegations of authority were not used during the year.
Other securities giving access to the share capital
Special report on stock subscription and purchase options and free share grants
The policy governing stock subscription and purchaseoptions and free share grants forms part of the Group’shuman resources policy and is determined each year bythe Board of Directors based on preparatory work andproposals from the Remuneration Committee.
Overall, this programme aims to recognise the contributionof employees to Kering’s past and future results, to
1.3. Authorisations to issue securities giving access to the share capital
Authorisations to issue shares or other securities in force as of December 31, 2015
Pursuant to the decisions of the Extraordinary General Meeting, the Board of Directors has the following authorisations:
Date of Annual Maximum General Meeting Term of validity authorised CurrentDescription of authorisation (resolution No.) (expiry date) nominal amount use
Share capital increases with pre-emptive subscription rights
Share capital increase via the issue, with pre-emptive April 23, 2015 (8th) 26 months €200 million Unusedsubscription rights, of shares, warrants and / or securities (June 2017) giving access, either immediately or in the future, to shares or to debt securities (1)
Share capital increase via the capitalisation of April 23, 2015 (9th) 26 months €200 million (2) Unusedreserves, profits or additional paid-in capital (June 2017)Share capital increases without pre-emptive subscription rights
Share capital increase via the issue, without pre-emptive April 23, 2015 (10th) 26 months €50 million (2) Unusedsubscription rights, by public offering, of shares, warrants (June 2017)and / or securities giving access, either immediately or inthe future, to shares in the Company, including as consideration for shares tendered in a public exchange offer, or to debt securities
Share capital increase via the issue, without pre- April 23, 2015 (11th) 26 months €50 million (1) (3) Unusedemptive subscription rights, by private placement, of shares, (June 2017) warrants and / or securities giving access, either immediately or in the future, to shares in the Company or to debt securities
Authorisation to set the issue price for a share capital April 23, 2015 (12th) 26 months €25.3 million Unusedincrease, without pre-emptive subscription rights, (related to the 10th (June 2017) per year by public offering or private placement, limited to and 11th resolutions5% of the share capital per year above)
Share capital increase in consideration for in-kind April 23, 2015 (14th) 26 months €50 million (3) Unusedcontributions, limited to 10% of the share capital (June 2017)
Share capital increase with or without pre-emptive subscription rights
Increase in the number of shares or securities to be April 23, 2015 (13th) 26 months 15% Unusedissued within the scope of a share capital increase, (June 2017) of the amount ofwith or without pre-emptive subscription rights, in the the initial issueevent of excess demandShare capital reductions by cancelling shares
Authorisation to reduce the share capital by April 23, 2015 (7th) 24 months 10% of the share Unusedcancelling shares (April 2017) capital per 24-month period(1) Limited by law to 20% of the share capital per year in all cases.(2) This amount is deductible from the overall €200 million cap for issues of shares and / or securities giving access to the share capital set by the 8th resolution.(3) This amount is deductible from the €200 million and €50 million caps for issues of shares and / or securities giving access to the share capital set by the 8th and
10th resolutions.
330 Kering ~ 2015 Reference Document
6 SHARE CAPITAL AND OWNERSHIP STRUCTURE ~ SHARE CAPITAL
06_VA_V5 06/04/2016 17:28 Page330
Kering stock option plans as of December 31, 2015
2005/1 Plan 2005/2 Plan 2005/3 Plan 2007/1 Plan 2007/2 PlanSubscription Subscription Subscription Purchase Purchase
options options options options options
Date of Annual General Meeting 05/21/2002 05/19/2005 05/19/2005 05/14/2007 05/14/2007Date of Executive Board / Board of Directors’ Meeting 01/03/2005 05/19/2005 05/19/2005 05/14/2007 09/17/2007Number of beneficiaries 13 458 22 248 14
Number of options initially granted 25,530 333,750 39,960 355,500 51,300
o/w : to members of the Executive Board (1)
and executive corporate officers - 50,000 - 60,000 -François-Henri Pinault - 50,000 - 60,000 -Jean-François Palus - 2,100 - 7,700 -o/w to the top ten employee beneficiaries - 23,828 - 20,780 -
Number of options exercised as of Dec. 31, 2015 23,880 248,318 33,960 219,512 37,300
Options forfeited as of Dec. 31, 2015 1,400 84,336 6,000 126,018 13,500
Options expired as of Dec. 31, 2015 250 1,096 0 9,970 500
Number of outstanding options as of Dec. 31, 2015 0 0 0 0 0
Plan start date 01/03/2005 05/19/2005 05/19/2005 05/14/2007 09/17/2007
Plan expiry date 01/02/2015 05/18/2015 05/18/2015 05/13/2015 09/16/2015
Strike price €75.29 €78.01 €78.97 €127.58 €127.58
NB: each option confers entitlement to one share.(1) Membership as of May 19, 2005.
Stock options granted by Kering and by associated companies to the top ten employee beneficiaries (excluding Directors and executive corporate officers) and options exercised by them
Stock options granted to the top ten employee beneficiaries (excluding Directors and executive corporate officers) Total number of options Weightedand options exercised by them granted or subscribed average price
Options granted during the year by the issuer or any other company within the scope 0 -of the option grant, to the ten employees of the issuer receiving the most options
Options in respect of the issuer or any of the aforementioned companies exercised during 5,574 167.13the year by the ten employees of the issuer purchasing or subscribing to the most shares
encourage long-term commitment to the Group andenable Kering group employees to benefit from increasesin Kering’s stock market value. Stock options are designedto foster employee loyalty, while free share grants seek torecognise an employee’s contribution to Kering’s results.
Eligible employees include managers holding key positionsand with major responsibilities within the Group who,selected at the suggestion of each brand, play a key partin the development and implementation of the Group’sstrategy.
No new free shares were granted in 2014 or in 2015.
Stock option plans
Grants are, in principle, made annually. However, no stocksubscription and purchase option plans have been set upsince 2007.
The plans set up in 2006 and 2007 have terms of eightyears (compared to terms of ten years for previous plans)and the options granted are purchase options. As they
have no impact on the number of shares comprising theshare capital, they are not dilutive.
Since 2001, stock options have been granted without anydiscount with regard to the price and with a four-yearlock-in period.
Employees, Directors and executive corporate officerswho leave the Group before exercising their options losepart of their entitlement, determined on the basis of theirlength of service with the Group since the grant date andthe nature of their departure.
Twenty-five percent of options are vested per full year ofservice. All rights vest upon retirement. Since 2005, if abeneficiary resigns, he or she loses all rights vestedsubject to exceptions made by the Company. If a beneficiaryis dismissed for gross negligence or misconduct, all rightsare lost, including after the lock-in period.
As of December 31, 2015, there were no stock subscriptionor purchase options outstanding.
331
6
2015 Reference Document ~ Kering
SHARE CAPITAL ~ SHARE CAPITAL AND OWNERSHIP STRUCTURE
06_VA_V5 06/04/2016 17:28 Page331

Changes in share capital and rights attached to shares
Any changes in the share capital and the rights attachedto shares are governed by the legal requirements and thespecific provisions of the Articles of Association as set outbelow.
Under Article 15 of the Articles of Association, in theCompany’s internal organisation, decisions by the ChiefExecutive Officer relating to the issue of securities,regardless of their nature, require the prior approval bythe Board of Directors when such issues are likely tochange the share capital.
Kering free shares plan as of Dec. 31, 2015 2011-II Plan 2012-II Plan
Date of Annual General Meeting 05/19/2010 05/19/2010
Date of Board meeting 05/19/2011 04/27/2012
Number of shares initially granted 9,455 39,640
to François-Henri Pinault to Jean-François Palus
Shares forfeited as of Dec. 31, 2015 1,365 10,500
Number of shares issued as of Dec. 31, 2015 8,090 0
Number of shares outstanding as of Dec. 31, 2015 0 29,140
Number of beneficiaries 76 88
Vesting date 05/19/2015 04/27/2016
Date on which shares may be sold 05/19/2015 04/27/2016
Performance shares granted to the top ten employee beneficiaries Total number of (excluding Directors and executive corporate officers) of the Company free shares granted
Free shares granted during the year by the issuer or any other company within the scope 0of the share grant, to the ten employees (excluding Directors and executive corporate officers) of the issuer receiving the most shares
Performance share plans
No performance shares were granted in 2015.
The Group granted Kering Monetary Units (KMUs) instead ofperformance shares, as described on pages 149 and 244.
A free share policy was introduced in 2005 to replace theprevious option grants for employees based in France.
Grants were in principle made annually at the same timeof year.
Performance shares vest fully at the end of a two-year vestingperiod, which is followed by a two-year lock-in period duringwhich the performance shares granted may not be sold.
Grants made before 2009 are subject to a performancecondition, which states that if the Kering share priceunderperforms the CAC 40 index during the two-year
vesting period (four years for foreign residents), thenumber of shares effectively granted is reduced in proportionto this underperformance.
The grants carried out since 2009 are subject to aperformance condition, which states that if the Keringshare price underperforms an index of listed Europeanstocks from the luxury and retail sectors during the two-year vesting period (four years for foreign residents for2009 and 2010 plans), the number of shares effectivelygranted is reduced in proportion to this underperformance.
Unless an exception is granted by the Company, beneficiarieswho are no longer employees, Directors or executivecorporate officers in the Group at the end of the vestingperiod lose part of their entitlement, determined on thebasis of the nature of their departure from the Group.
332 Kering ~ 2015 Reference Document
6 SHARE CAPITAL AND OWNERSHIP STRUCTURE ~ SHARE CAPITAL
06_VA_V5 06/04/2016 17:28 Page332
Dividends paid out over the past three fiscal years
Year of payment Net dividend Qualifying for a tax allowance of
2015 €4 40%2014 €3.75 40%2013 €3.75 (1) 40%
(1) Plus an in-kind dividend in the form of a right to the allotment of Groupe Fnac shares (one Groupe Fnac share for every eight Kering shares held) based on avalue of €20.03 per Groupe Fnac share as of June 20, 2013, the day the shares were first listed.
The Board of Directors will propose to the Annual GeneralMeeting on April 29, 2016 the payment of a dividend of €4.00 per share eligible for dividends as of January 1, 2015.
An interim dividend in the amount of €1.50 per share waspaid on January 25, 2016 pursuant to a decision by theBoard of Directors on December 16, 2015.
If this dividend is approved, the balance of €2.50 per sharewill have an ex-dividend date of May 4, 2016 and will bepayable as from May 6, 2016.
1.5. Appropriation of net income – Dividends paid by the Company
Appropriation of net income
At its meeting on February 18, 2016, the Board of Directors acknowledged and proposed the following net incomeappropriation to the Annual General Meeting:
(in €)
Source
Retained earnings 2,098,608,563.65Net income for the year 527,398,535.74Total for appropriation 2,626,007,099.39
Appropriation
Legal reserve (1) -Dividend (2) 505,117,288.00Retained earnings 2,120,889,811.39Total 2,626,007,099.39
(1) No further charge to the legal reserve is proposed since the reserve stood at €51,354,910 as of December 31, 2015, i.e., above the minimum amount required bylaw (10% of the share capital).
(2) Representing a dividend of €4.00 per share qualifying for the 40% tax allowance, payable on May 6, 2016. This amount corresponds to the interim dividend(€1.50 per share) paid on January 25, 2016 (€189,418,983.00) plus the final dividend of €315,698,305.00, equal to €2.50 per share, calculated on the basis ofthe maximum number of shares carrying dividend rights.
As of December 31, 2015, Company and Group employeesheld 492,059 shares, representing 0.39% of the sharecapital, under the provisions of Article L. 225-102 of theFrench Commercial Code (Code de commerce). Of those
shares, 29,140 were free shares that are still locked-inand represent 0.02% of the share capital. Companyemployees also held 18,320 shares via an employeeinvestment fund, representing 0.01% of the share capital.
1.4. Employee share ownership
333
6
2015 Reference Document ~ Kering
SHARE CAPITAL ~ SHARE CAPITAL AND OWNERSHIP STRUCTURE
06_VA_V5 06/04/2016 17:28 Page333
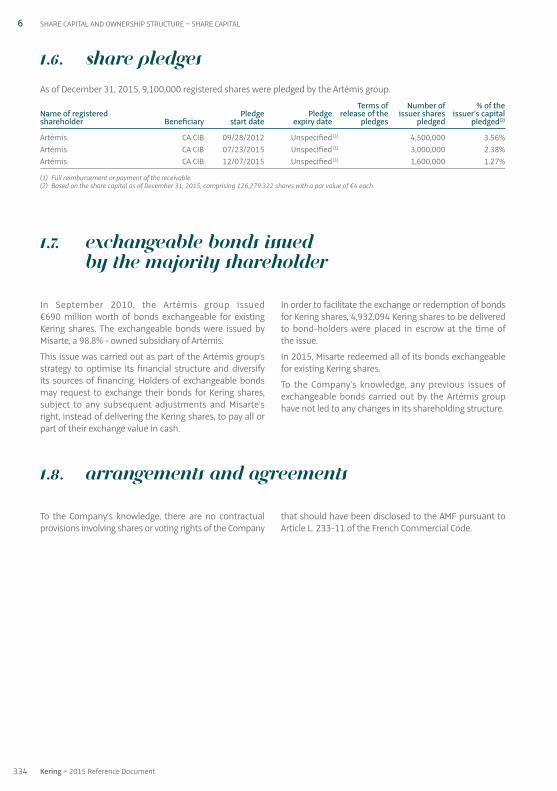
To the Company’s knowledge, there are no contractualprovisions involving shares or voting rights of the Company
that should have been disclosed to the AMF pursuant toArticle L. 233-11 of the French Commercial Code.
1.8. Arrangements and agreements
In September 2010, the Artémis group issued€690 million worth of bonds exchangeable for existingKering shares. The exchangeable bonds were issued byMisarte, a 98.8% - owned subsidiary of Artémis.
This issue was carried out as part of the Artémis group’sstrategy to optimise its financial structure and diversifyits sources of financing. Holders of exchangeable bondsmay request to exchange their bonds for Kering shares,subject to any subsequent adjustments and Misarte’sright, instead of delivering the Kering shares, to pay all orpart of their exchange value in cash.
In order to facilitate the exchange or redemption of bondsfor Kering shares, 4,932,094 Kering shares to be deliveredto bond-holders were placed in escrow at the time of the issue.
In 2015, Misarte redeemed all of its bonds exchangeablefor existing Kering shares.
To the Company’s knowledge, any previous issues ofexchangeable bonds carried out by the Artémis grouphave not led to any changes in its shareholding structure.
1.6. Share pledges
As of December 31, 2015, 9,100,000 registered shares were pledged by the Artémis group.
Terms of Number of % of theName of registered Pledge Pledge release of the issuer shares issuer’s capitalshareholder Beneficiary start date expiry date pledges pledged pledged(2)
Artémis CA CIB 09 / 28 / 2012 Unspecified (1) 4,500,000 3.56%Artémis CA CIB 07 / 23 / 2015 Unspecified (1) 3,000,000 2.38%Artémis CA CIB 12 / 07 / 2015 Unspecified (1) 1,600,000 1.27%
(1) Full reimbursement or payment of the receivable.(2) Based on the share capital as of December 31, 2015, comprising 126,279,322 shares with a par value of €4 each.
1.7. Exchangeable bonds issued by the majority shareholder
334 Kering ~ 2015 Reference Document
6 SHARE CAPITAL AND OWNERSHIP STRUCTURE ~ SHARE CAPITAL
06_VA_V5 06/04/2016 17:28 Page334

Artémis is wholly owned by Financière Pinault, itselfcontrolled by the Pinault family. Artémis holds 57.41% ofthe Company’s voting rights and as such has de jurecontrol of the Company within the meaning of ArticleL. 233-3-I of the French Commercial Code.
On April 7, 2015, Harris Associates L. P. (5), based in Chicago(United States) and acting on behalf of funds and clientsfor whom it provides asset management services, reportedthat it had crossed above the 5% threshold of Kering’sshare capital on March 31, 2015, and that it held, onbehalf of said funds and clients, 6,318,723 Kering shares.On February 11, 2016, Harris Associates L. P., reported thatit had crossed below the 5% threshold of Kering’s sharecapital on February 9, 2016 and that it held, on behalf ofsaid funds and clients, 6,275,730 shares representing anequal number of voting rights, i.e., 4.97% of the share capitaland 3.51% of the Company’s voting rights. This thresholdwas crossed as a result of a sale of Kering shares on theopen market.
On November 20, 2015, The Capital Group Companies, Inc.(6),based in Los Angeles (United States), reported that it had
crossed above the 5% threshold of Kering’s share capitalon November 19, 2015 and that it held 6,348,513 sharesrepresenting an equal number of voting rights, i.e., 5.03%of the share capital and 3.54% of the Company’s votingrights. This threshold was crossed as a result of anacquisition of Kering shares on the open market.
To the Company’s knowledge, no other shareholder directly,indirectly, or jointly holds 5% or more of the share capitalor voting rights.
Regarding the majority shareholder’s control of the Company,the organisation and operating rules of the Board and ofits specialised Committees, the number of independentDirectors – representing (i) more than one-third of the Boardmembers (who oversee the prevention of conflicts of interestand regularly carry out a self-assessment), (ii) two-thirdsof the Audit Committee, and (iii) the majority of theRemuneration Committee, it being specified that no executivecorporate officer is a member of these Committees – andgeneral compliance with current rules, internal rules andgood governance practices all contribute to maintainingbalanced control (see Chapter 4 “Corporate governance”).
Change in share ownership and voting rights as of December 31, 2015
As of December 31, 2015 As of December 31, 2014
Number of % of share Number of % of voting Number of % of share Number of % of voting shares capital voting rights rights (1) shares capital voting rights rights (1)
Artémis group 51,638,516 40.89% 102,746,612 57.41% 51,675,702 40.93% 103,216,483 57.56%Harris Associates (3) 6,318,723 5.00% 6,318,723 3.53% -The Capital Group (4) 6,348,513 5.03% 6,348,513 3.55% -Kering 27,598 0.02% 27,598 (2) 0.00% 21,537 0.02% 21,537 (2) 0.00%Employees 510,379 0.41% 929,288 0.52% 542,579 0.43% 904,522 0.51%Free float 61,435,593 48.65% 62,630,299 34.99% 74,026,672 58.62% 75,195,125 41.93%Total 126,279,322 100.00% 179,001,033 100.00% 126,266,490 100.00% 179,337,667 100.00%
As of December 31, 2013
Number % of share Number of % of voting of shares capital voting rights rights (1)
Artémis group 51,614,762 40.89% 103,155,543 57.53%Harris Associates -The Capital Group -Kering 60,581 0.05% 60,581 (2) 0.00%Employees 501,256 0.40% 800,417 0.45%Free float 74,050,162 58.66% 75,302,913 42.02%
Total 126,226,761 100.00% 179,319,454 100.00%
(1) Shares held for more than two years in a registered account in the name of the same shareholder carry double voting rights (see the section entitled “Generalinformation – Annual General Meetings” on page 341).
(2) Theoretical voting rights, in the Annual General Meeting these shares lose their voting rights.(3) As declared by Harris Associates on April 7, 2015.(4) As declared by The Capital Group on November 20, 2015.
2. Share ownership structure
6SHARE OWNERSHIP STRUCTURE ~ SHARE CAPITAL AND OWNERSHIP STRUCTURE
(5) Controlled by Natixis Global Asset Management, L. P., itself controlled by Natixis. Harris Associates L. P. states that it acts independently from the person that controlsit, in accordance with the conditions laid down in Article L. 233-9 II of the French Commercial Code and Articles 223-12 and 223-12-1 of the General Regulations ofthe French financial markets authority (Autorité des marchés financiers – AMF).
(6) Acting as an investment adviser on behalf of the funds. The Capital Group Companies, Inc. combines the positions held by Capital Research and ManagementCompany (CRMC) and Capital Group International (CGI).
3352015 Reference Document ~ Kering
06_VA_V5 06/04/2016 17:28 Page335
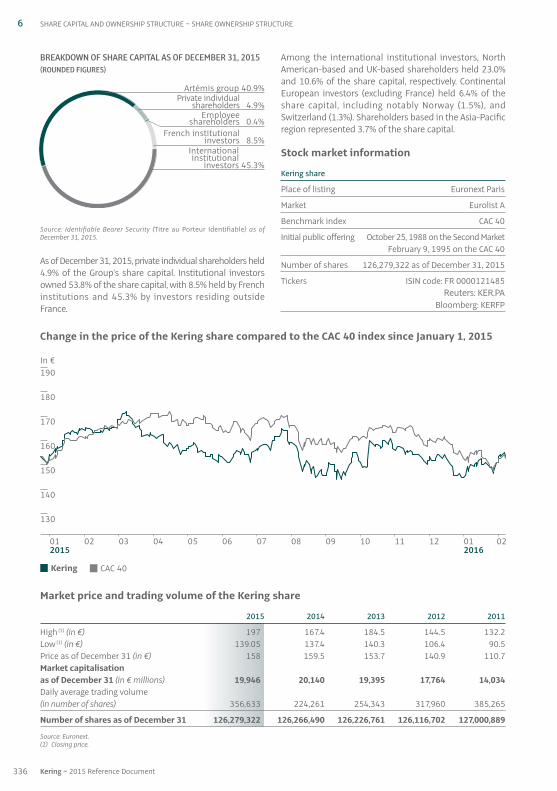
Change in the price of the Kering share compared to the CAC 40 index since January 1, 2015
Market price and trading volume of the Kering share
20 15 20 14 20 13 20 12 20 11
High (1) (in €) 197 167.4 184.5 144.5 132.2Low (1) (in €) 139.05 137.4 140.3 106.4 90.5Price as of December 31 (in €) 158 159.5 153.7 140.9 110.7Market capitalisation as of December 31 (in € millions) 19,946 20,140 19,395 17,764 14,034Daily average trading volume (in number of shares) 356,633 224,261 254,343 317,960 385,265
Number of shares as of December 31 126,279,322 126,266,490 126,226,761 126,116,702 127,000,889
Source: Euronext.(1) Closing price.
BREAKDOWN OF SHARE CAPITAL AS OF DECEMBER 31, 2015(ROUNDED FIGURES)
Source: Identifiable Bearer Security (Titre au Porteur Identifiable) as ofDecember 31, 2015.
As of December 31, 2015, private individual shareholders held4.9% of the Group’s share capital. Institutional investorsowned 53.8% of the share capital, with 8.5% held by Frenchinstitutions and 45.3% by investors residing outsideFrance.
Among the international institutional investors, NorthAmerican-based and UK-based shareholders held 23.0%and 10.6% of the share capital, respectively. ContinentalEuropean investors (excluding France) held 6.4% of theshare capital, including notably Norway (1.5%), andSwitzerland (1.3%). Shareholders based in the Asia-Pacificregion represented 3.7% of the share capital.
Stock market information
Kering share
Place of listing Euronext Paris
Market Eurolist A
Benchmark index CAC 40
Initial public offering October 25, 1988 on the Second MarketFebruary 9, 1995 on the CAC 40
Number of shares 126,279,322 as of December 31, 2015
Tickers ISIN code: FR 0000121485Reuters: KER.PA
Bloomberg: KERFP
6 SHARE CAPITAL AND OWNERSHIP STRUCTURE ~ SHARE OWNERSHIP STRUCTURE
336 Kering ~ 2015 Reference Document
Artémis group 40.9%Private individual 4.9%
shareholders 4.9%Employee 0.4%
shareholders 0.4%
International 45.3%institutional 45.3%
investors 45.3%
French institutional 8.5%investors 8.5%
201501 02 03 04 05 06 07 08 09 10 11 12 01 02
2016
140
150
160
130
170
180
190In €
CAC 40Kering
06_VA_V5 06/04/2016 17:28 Page336
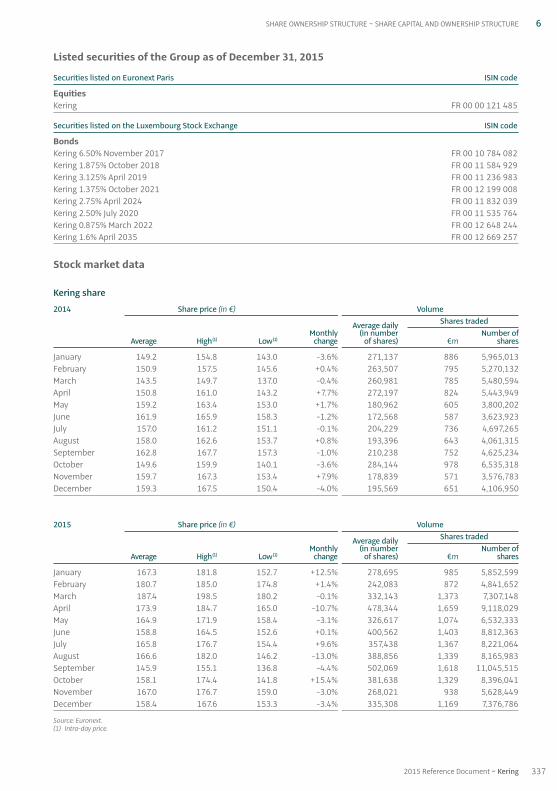
Listed securities of the Group as of December 31, 2015
Securities listed on Euronext Paris ISIN code
EquitiesKering FR 00 00 121 485
Securities listed on the Luxembourg Stock Exchange ISIN code
BondsKering 6.50% November 2017 FR 00 10 784 082Kering 1.875% October 2018 FR 00 11 584 929Kering 3.125% April 2019 FR 00 11 236 983Kering 1.375% October 2021 FR 00 12 199 008Kering 2.75% April 2024 FR 00 11 832 039Kering 2.50% July 2020 FR 00 11 535 764Kering 0.875% March 2022 FR 00 12 648 244Kering 1.6% April 2035 FR 00 12 669 257
Stock market data
Kering share
20 14 Share price (in €) Volume
Average daily Shares traded Monthly (in number Number of Average High(1) Low(1) change of shares) €m shares
January 149.2 154.8 143.0 -3.6% 271,137 886 5,965,013February 150.9 157.5 145.6 +0.4% 263,507 795 5,270,132March 143.5 149.7 137.0 -0.4% 260,981 785 5,480,594April 150.8 161.0 143.2 +7.7% 272,197 824 5,443,949May 159.2 163.4 153.0 +1.7% 180,962 605 3,800,202June 161.9 165.9 158.3 -1.2% 172,568 587 3,623,923July 157.0 161.2 151.1 -0.1% 204,229 736 4,697,265August 158.0 162.6 153.7 +0.8% 193,396 643 4,061,315September 162.8 167.7 157.3 -1.0% 210,238 752 4,625,234October 149.6 159.9 140.1 -3.6% 284,144 978 6,535,318November 159.7 167.3 153.4 +7.9% 178,839 571 3,576,783December 159.3 167.5 150.4 -4.0% 195,569 651 4,106,950
20 15 Share price (in €) Volume
Average daily Shares traded Monthly (in number Number of Average High(1) Low(1) change of shares) €m shares
January 167.3 181.8 152.7 +12.5% 278,695 985 5,852,599February 180.7 185.0 174.8 +1.4% 242,083 872 4,841,652March 187.4 198.5 180.2 -0.1% 332,143 1,373 7,307,148April 173.9 184.7 165.0 -10.7% 478,344 1,659 9,118,029May 164.9 171.9 158.4 -3.1% 326,617 1,074 6,532,333June 158.8 164.5 152.6 +0.1% 400,562 1,403 8,812,363July 165.8 176.7 154.4 +9.6% 357,438 1,367 8,221,064August 166.6 182.0 146.2 -13.0% 388,856 1,339 8,165,983September 145.9 155.1 136.8 -4.4% 502,069 1,618 11,045,515October 158.1 174.4 141.8 +15.4% 381,638 1,329 8,396,041November 167.0 176.7 159.0 -3.0% 268,021 938 5,628,449December 158.4 167.6 153.3 -3.4% 335,308 1,169 7,376,786
Source: Euronext.(1) Intra-day price.
337
6
2015 Reference Document ~ Kering
SHARE OWNERSHIP STRUCTURE ~ SHARE CAPITAL AND OWNERSHIP STRUCTURE
06_VA_V5 06/04/2016 17:28 Page337

2016 shareholders’ agenda
April 21, 2016 2016 first-quarter revenue
April 29, 2016 Combined General Meeting
July 2016 2016 half-year results
October 2016 2016 third-quarter revenue
Financial communications policy
Kering’s financial communications policy endeavours todisseminate accurate and reliable information. Its actionsare targeted and customised to offer different audiences,private individual shareholders and the financial community,messages suited to their respective expectations whilecomplying with the principle of equal access to information.
Towards individual shareholders
Private individual shareholders have access to numerousmedia and tools to keep themselves informed on theGroup and on the life of the security. These include thetwice-yearly Letter to Shareholders, the Shareholders’Guide (in French only), the shareholders’ hotline in France (+33 1 45 64 65 64), the email address([email protected]), financial notices in the pressand on the Internet, and the annual report.
Towards the financial community
The Group maintains close relationships with the Frenchand international financial community. A number ofinitiatives are designed to keep the financial communityinformed about its businesses, strategy and outlook.Kering has expanded its communication by organisingconference calls upon the release of quarterly revenueand half-year results, and a meeting to present its annualresults. Kering also participates in industry conferencesheld by major banks. All of the presentation material is
available on the Group’s website. Kering also meets withinvestors during roadshows held in the major financialcentres around the world. In addition, the Group meetswith individual investors and analysts upon request andmaintains proactive relationships in terms of reporting tothe AMF.
Procedures for communicating regulatory information
Pursuant to obligations – applicable since January 20, 2007 –to disclose regulatory information resulting from theimplementation of the Transparency Directive in theAMF’s General Regulations, Kering’s Financial CommunicationsDepartment oversees the proper and full disclosure ofregulatory information. This information is filed with theAMF at the time of its disclosure and stored on the Keringwebsite.
Full and effective communication is carried out electronicallyin compliance with the criteria defined by the AMF’sGeneral Regulations which require communication to awide audience within the European Union and accordingto terms and conditions guaranteeing the security of thecommunication and information. Accordingly, Kering’sFinancial Communications Department has chosen to callon a professional communications agency satisfying thecommunication criteria set by the General Regulationsand featured on the list published by the AMF, thusbenefiting from a presumption of full and effectivecommunication.
20 16 Share price (in €) Volume
Average daily Shares traded Monthly (in number Number of Average High(1) Low(1) change of shares) €m shares
January 147.9 156.5 138.7 -1.8% 317,834 938 6,356,677February 155.0 165.4 143.2 +3.6% 399,321 1,304 8,385,740
Source: Euronext.(1) Intra-day price.
338 Kering ~ 2015 Reference Document
6 SHARE CAPITAL AND OWNERSHIP STRUCTURE ~ SHARE OWNERSHIP STRUCTURE
06_VA_V5 06/04/2016 17:28 Page338
3392015 Reference Document ~ Kering
CHAPTer 7
Additional information
1. Additional information 3401.1. General information 3401.2. Information on trade payables – payment terms 3421.3. Information on trade receivables – payment terms 342
2. Person responsible for the Reference Document 3432.1. Declaration by the person responsible for the Reference Document
and for the Annual Financial Report 343
3. Statutory Auditors 3443.1. Principal Statutory Auditors 3443.2. Substitute Statutory Auditors 344
4. Documents incorporated by reference 345
5. Cross-reference table to the disclosure requirements set out in Annex 1 of European Regulation No. 809 / 2004 346
6. Cross-reference table for the Management Report 349
7. Cross-reference table for the Annual Financial Report 351
8. Index 352
07_VA_V5 06/04/2016 17:28 Page339
Company name and registered office
Company name: Kering
Registered office: 10 avenue Hoche -75008 Paris – France
Legal form
A French joint stock company (société anonyme)
Applicable law
French law
Date of incorporation and term
The Company was incorporated on June 24, 1881 for aterm of 99 years. The term was extended to May 26, 2066by the Extraordinary General Meeting on May 26, 1967,except in the case of an early dissolution or of anextension approved by the Extraordinary General Meeting.
Corporate purpose
• the purchase, retail sale or wholesale, either directly orindirectly, by all means and using all existing or futuretechniques, of all goods, products, commodities orservices;
• the creation, acquisition, leasing, operating or sale,either directly or indirectly, of all establishments, storesor warehouses, by all means and using all existing or futuretechniques, for the retail sale or wholesale of all goods,products, commodities or services;
• the direct or indirect manufacture of all goods, productsor commodities that are useful for corporate operations;
• the direct or indirect supply of all services;
• the purchase, operation and sale of all buildings thatare useful for corporate operations;
• the creation of all commercial, non-trading, industrialand financial concerns, whether in moveable or realproperty, service or other businesses, the acquisition ofparticipating interests by all means, subscription,acquisition, contribution, merger or otherwise in, to orof such concerns and businesses and the managementof its participating interests;
• and, in general, all commercial, non-trading, industrial andfinancial operations, whether in moveable or real property,service or other businesses that can be directly orindirectly connected to the purposes specified above or
to all similar, complementary or related purposes orpurposes that are liable to favour the creation ordevelopment thereof.
(Article 5 of the Articles of Association)
Trade and Companies Registry
552 075 020 RCS Paris
APE code: 741 J
Consultation of legal documents
The Articles of Association, the minutes of Annual GeneralMeetings and other corporate documents may beconsulted at the registered office under the conditionsprovided for by law.
Fiscal year
The Company’s fiscal year begins on January 1 and endson December 31 of the same year.
Appropriation of earnings
From the profit for the fiscal year, less deferred losseswhere applicable, a minimum withdrawal of one-twentiethis made and paid into a reserve fund known as the “legalreserve”. Said withdrawal ceases to be mandatory oncesaid reserve reaches one-tenth of the share capital.
From the distributable profit, which is made up of theprofit for the fiscal year less the deferred losses and thewithdrawal referred to above, as well as the amounts tobe paid into the reserves in accordance with the law, plusdeferred profits, the Annual General Meeting, pursuant toa proposal by the Board of Directors, may withdraw allamounts it deems appropriate, either to be deferred tothe subsequent fiscal year, or to be entered into one ormore extraordinary, general or special reserve funds, theallocation and use of which is determined by the AnnualGeneral Meeting.
The balance, if any, is allocated among the shareholders.
The Annual General Meeting that votes on the financialstatements for the fiscal year has the option of grantingeach shareholder, for all or part of the dividend or interimdividend distributed, an option between the payment ofthe dividend or the interim dividend in cash, in kind or inshares. The Annual General Meeting may also decide, forall or part of the dividend, interim dividends, reserves, or
1.1. General information
1. Additional information
7 ADDITIONAL INFORMATION ~ ADDITIONAL INFORMATION
340 Kering ~ 2015 Reference Document
07_VA_V5 06/04/2016 17:28 Page340
premiums distributed, or for any capital reduction, thatthe distribution of dividends, reserves or premiums or thecapital reduction will be made in kind in the form ofcorporate assets, including securities.(Article 22 of the Articles of Association)
Dividends not claimed after five years are paid to theFrench State.
Dividends paid over the last three fiscal years are presentedin the Management Report.
Administrative and management bodies
Information regarding administrative and managementbodies is presented in the “Corporate governance” chapter.
Annual General Meetings – Double voting rights
Annual General Meetings are convened by the Board ofDirectors and deliberate on their agenda under theconditions provided for by the law and the regulations.
Meetings are held at the registered office or in any otherplace specified in the convening notice.
All shareholders may attend meetings, either in person orvia a proxy, under the conditions laid down by law, subjectto providing proof of their identity and of the title to theirsecurities, by the recognition of said securities in theaccounts in their name within the regulatory timeframes,either in the accounts of registered securities held by theCompany, or in the accounts of bearer securities held byan accredited intermediary. Proof of the capacity of ashareholder can be provided electronically, under theconditions set by the regulations in force. Pursuant to adecision of the Board of Directors, shareholders mayparticipate in meetings via video-conference or viatelecommunications means that make it possible toidentify them under the conditions laid down by theregulations in force. All shareholders may vote bycorrespondence using a form filled out and sent to theCompany under the conditions laid down by theregulations in force, including electronically, pursuant to adecision by the Board of Directors. This form must reachthe Company in accordance with the regulatoryconditions in order to be taken into account. The Boardof Directors may reduce said timeframe for the benefit ofall shareholders. The owners of securities who are notresident on French territory may be represented by anintermediary who is registered in accordance with theconditions laid down by the regulations in force.
Meetings are chaired by the Chairman of the Board ofDirectors or, in his / her absence, by the member of theBoard who is specifically appointed for this purpose bythe Board. Failing this, the meeting elects its own chair.
Meeting minutes are prepared and copies thereof arecertified and issued in accordance with the law.
In all Annual General Meetings, a voting right that isdouble that conferred on the other shares is granted to
all shares that are fully paid up and for which proof isprovided that they have been held in registered form forat least two years in the name of the same shareholder.This double voting right, which existed in the Articles ofAssociation of Pinault SA prior to its merger withPrintemps SA, was restated at the time of their 1992 merger.
This double voting right may be withdrawn outright atany time pursuant to a decision of the ExtraordinaryGeneral Meeting and after ratification by a specialmeeting of the beneficiary shareholders.(Article 20 of the Articles of Association)
The double voting right existed in Pinault SA andPrintemps SA prior to their 1992 merger. The Company’sArticles of Association do not provide that, in the event ofa free allocation of registered shares to a shareholder inrespect of old shares for which he / she / it had a doublevoting right, the new shares are also entitled to a doublevoting right.
Pursuant to the relevant legislation, double voting rightsare cancelled for any share converted to a bearer share orin the event of a transfer of ownership except in the case ofa transfer following inheritance, liquidation of joint propertybetween spouses, or donation between living familymembers (spouse or relative) with legal inheritance rights.
Voting rights are not limited under the Articles ofAssociation.
The legal and regulatory provisions relating to the crossingof thresholds by shareholders apply. The Company’sArticles of Association do not include any special provisionin this regard.
There are no shares not representing capital.
The steps required to amend shareholder rights are thoseprovided for by law.
Share capital
The Company is authorised to use the provisions of thelaw and regulations regarding the identification of theholders of securities that grant immediate or deferred accessto voting rights at its own Annual General Meetings.(Article 7 of the Articles of Association)
In addition to the voting right that is granted to each shareby the law and by the specific provisions of Article 20below, each share confers the right to a percentage,which is proportional to the number and par value of theexisting shares, of the corporate assets, profits afterdeduction of the withdrawals provided for by law and theArticles of Association, and liquidating dividend.
In order for all the shares to receive the same netamount, without distinction, and to be listed on the sameline, the Company shall, unless prohibited by law, pay theamount of any proportional tax that may be owed oncertain shares only, in particular upon a winding up of theCompany or capital reduction; however, the Company willnot make this payment when the tax applies under the
7ADDITIONAL INFORMATION ~ ADDITIONAL INFORMATION
3412015 Reference Document ~ Kering
07_VA_V5 06/04/2016 17:28 Page341
1.2. Information on trade payables – payment terms
Kering’s trade payables, amounting to €17.0 million as of December 31, 2015 (€7.8 million as of December 31, 2014),fall due in less than 60 days.
1.3. Information on trade receivables – payment terms
Kering’s trade receivables, amounting to €16.6 million as of December 31, 2015 (€13.6 million as of December 31,2014), fall due 30 days after the invoice date.
same conditions to all the shares in the same class, ifthere are several classes of shares to which different rightsare attached.
Each time it is necessary to possess more than one sharein order to exercise a right, it is the responsibility of theowners who do not possess such number to makearrangements to regroup the required number of shares.(Article 8 of the Articles of Association)
In the event of liquidation of the Company, the remainingshareholders’ equity after repayment of the par value ofthe shares will be allocated among the shareholders inthe same proportions as their holdings in the capital.
(Article 24 of the Articles of Association)
Any changes in the share capital or the rights attached toshares are governed by the legal requirements and the specific provisions of the Articles of Association as setout below.
Under Article 15 of the Articles of Association, in theCompany’s internal organisation, decisions by the ChiefExecutive Officer relating to the issue of securities,regardless of their nature, require the prior approval bythe Board of Directors when such issues are likely tochange the share capital.
7 ADDITIONAL INFORMATION ~ ADDITIONAL INFORMATION
342 Kering ~ 2015 Reference Document
07_VA_V5 06/04/2016 17:28 Page342
2.1. Declaration by the person responsible for the Reference Document and for the Annual Financial Report
Having taken all reasonable measures to that effect, I hereby attest that the information in this Reference Document is,to my knowledge, in accordance with the facts and contains no omission likely to affect its import.
I certify that, to my knowledge, the financial statements have been prepared in accordance with applicable accountingstandards and give a true and fair view of the assets, liabilities, financial position and results of the Company and theundertakings included in the consolidation, and that the Management Report (the cross-reference table for which isshown on page 349) includes a fair review of the development of the business, the results of operations and thefinancial position of the Company and of all the undertakings included in the consolidation and also describes themain risks and uncertainties to which they are exposed.
I have obtained a statement from the Statutory Auditors, KPMG Audit and Deloitte & Associés, confirming that they haveaudited the information contained in this document relating to the financial position and the financial statementscontained herein, and that they have read this document in its entirety.
The annual consolidated and parent company financial statements of Kering SA for the year ended December 31, 2015shown in the Reference Document are subject to reports by the Statutory Auditors on pages 303 and 321-322respectively of said document. The Statutory Auditors’ report on the parent company financial statements contains anemphasis of matter regarding the information presented in the Management Report on remuneration paid andbenefits granted to corporate officers.
Paris, April 1, 2016
Jean-François Palus
Group Managing Director (Directeur Général délégué)
2. Person responsible for the Reference Document
Jean-François Palus
Group Managing Director
7PERSON RESPONSIBLE FOR THE REFERENCE DOCUMENT ~ ADDITIONAL INFORMATION
3432015 Reference Document ~ Kering
07_VA_V5 06/04/2016 17:28 Page343
3.1. Principal Statutory Auditors
KPMG Audit, a division of KPMG SA
Tour EQHO, 2 avenue Gambetta, CS 60055, 92066 Paris-La Défense
Hervé Chopin and Isabelle Allen
Date of first appointment: Annual General Meeting of June 18, 1992.
Term and expiry: from May 19, 2010 until the Annual General Meeting called to approve the 2015 financial statements.
Deloitte & Associés
185 avenue Charles-de-Gaulle, 92524 Neuilly-sur-Seine Cedex
Frédéric Moulin
Date of first appointment: Annual General Meeting of May 18, 1994.
Term and expiry: from May 6, 2014 until the Annual General Meeting called to approve the 2019 financial statements.
3.2. Substitute Statutory Auditors
KPMG Audit IS
Tour EQHO, 2 avenue Gambetta, CS 60055, 92066 Paris-La Défense
Date of first appointment: Annual General Meeting of May 19, 2010.
Term and expiry: from May 19, 2010 until the Annual General Meeting called to approve the 2015 financial statements.
BEAS
7-9 Villa Houssay, 92524 Neuilly-sur-Seine Cedex
Date of first appointment: Annual General Meeting of May 19, 2005.
Term and expiry: from May 6, 2014 until the Annual General Meeting called to approve the 2019 financial statements.
7 ADDITIONAL INFORMATION ~ STATUTORY AUDITORS
3. Statutory Auditors
344 Kering ~ 2015 Reference Document
07_VA_V5 06/04/2016 17:28 Page344
7DOCUMENTS INCORPORATED BY REFERENCE ~ ADDITIONAL INFORMATION
In compliance with Article 28 of European Regulation No. 809 / 2004 dated April 29, 2004, this ReferenceDocument incorporates by reference the followinginformation, to which the reader is invited to refer:
• for the fiscal year ended on December 31, 2014: key figures,activities of the Group, activity report, investment policy,consolidated financial statements, parent companyfinancial statements and the related Statutory Auditors’reports, set out on pages 6-7, 15-55, 168-193, 195-198,207-294, 298-316, 295 and 317 respectively of theReference Document filed on April 1, 2015 with the AMF;
• for the fiscal year ended on December 31, 2013: keyfigures, activities of the Group, activity report, investmentpolicy, consolidated financial statements, parentcompany financial statements and the related StatutoryAuditors’ reports, set out on pages 6-7, 15-53, 156-182,183-186, 195-282, 284-302, 283 and 303 respectivelyof the Reference Document filed on April 9, 2014 withthe AMF.
Information included in these two Reference Documentsother than that listed above is, where relevant, replacedor updated by the information included in this ReferenceDocument. These two Reference Documents are availableat the Group’s registered office and on its website:www.kering.com, under the Finance section.
4. Documents incorporated by reference
3452015 Reference Document ~ Kering
07_VA_V5 06/04/2016 17:28 Page345
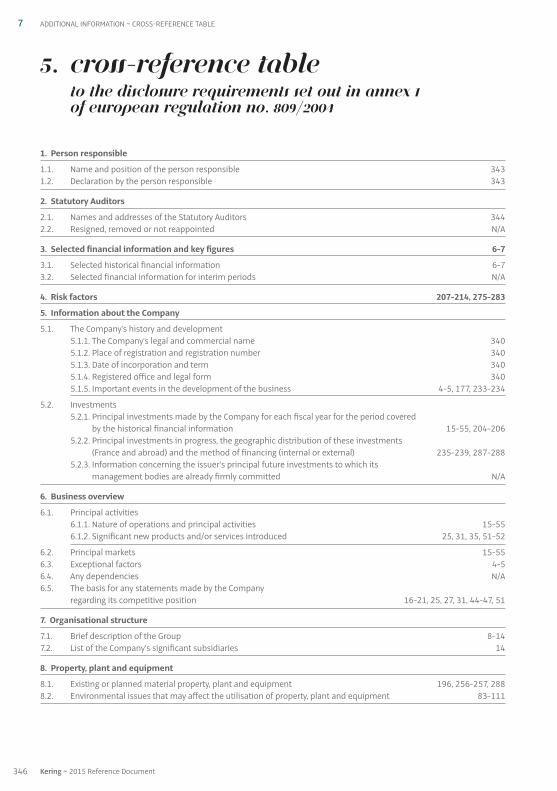
5. Cross-reference tableto the disclosure requirements set out in Annex 1 of European Regulation No. 809 / 2004
1. Person responsible
1.1. Name and position of the person responsible 3431.2. Declaration by the person responsible 343
2. Statutory Auditors
2.1. Names and addresses of the Statutory Auditors 3442.2. Resigned, removed or not reappointed N / A
3. Selected financial information and key figures 6-7
3.1. Selected historical financial information 6-73.2. Selected financial information for interim periods N / A
4. Risk factors 207-214, 275-283
5. Information about the Company
5.1. The Company’s history and development5.1.1. The Company’s legal and commercial name 3405.1.2. Place of registration and registration number 3405.1.3. Date of incorporation and term 3405.1.4. Registered office and legal form 3405.1.5. Important events in the development of the business 4-5, 177, 233-234
5.2. Investments5.2.1. Principal investments made by the Company for each fiscal year for the period covered
by the historical financial information 15-55, 204-2065.2.2. Principal investments in progress, the geographic distribution of these investments
(France and abroad) and the method of financing (internal or external) 235-239, 287-2885.2.3. Information concerning the issuer’s principal future investments to which its
management bodies are already firmly committed N / A
6. Business overview
6.1. Principal activities6.1.1. Nature of operations and principal activities 15-556.1.2. Significant new products and / or services introduced 25, 31, 35, 51-52
6.2. Principal markets 15-556.3. Exceptional factors 4-56.4. Any dependencies N / A6.5. The basis for any statements made by the Company
regarding its competitive position 16-21, 25, 27, 31, 44-47, 51
7. Organisational structure
7.1. Brief description of the Group 8-147.2. List of the Company’s significant subsidiaries 14
8. Property, plant and equipment
8.1. Existing or planned material property, plant and equipment 196, 256-257, 2888.2. Environmental issues that may affect the utilisation of property, plant and equipment 83-111
7 ADDITIONAL INFORMATION ~ CROSS-REFERENCE TABLE
346 Kering ~ 2015 Reference Document
07_VA_V5 06/04/2016 17:28 Page346

9. Operating and financial review
9.1. Financial position 176-2039.2. Operating results
9.2.1. Significant factors 1769.2.2. Material changes in revenue 178-1819.2.3. Any policy or factor that could affect the Company’s operations 8-14
10. Capital resources
10.1. Information concerning the Company’s capital resources (both short and long term) 195-197, 219, 26210.2. Sources and amounts of the Company’s cash flows 200-201, 218, 28710.3. Information on the borrowing terms and the funding structure of the Company 7, 198-200, 26810.4. Information regarding any restrictions on the use of capital resources that have
materially affected, or could materially affect, directly or indirectly, the Company’s operations 27510.5. Information regarding the anticipated sources of funds 269-274
11. Research and development, patents and licences N / A (1)
12. Trend information 203
13. Profit forecasts and estimates N / A (2)
14. Administrative, management and supervisory bodies and Executive Management
14.1. Members of administrative, management and supervisory bodies 135-146, 154-15514.2. Administrative, management and supervisory bodies and Executive Management conflicts of interest 153-154
15. Remuneration and benefits
15.1. Remuneration of Directors and executive corporate officers 147-15315.2. Total amounts set aside or accrued to provide pension, retirement or similar benefits 262-266
16. Board practices
16.1. Expiry date of the current terms of office 136-14616.2. Members of the administrative, management or supervisory bodies’ service contracts 14716.3. Information on the Company’s Audit Committee and Remuneration Committee 162-16316.4. Statement of compliance with corporate governance rules in force in France 159
17. Employees
17.1. Number of employees 65-6717.2. Shareholdings and stock options 68-69, 330-332,17.3. Arrangements for involving the employees in the capital of the Company 330-331
18. Major shareholders
18.1. Shareholders owning more than 5% of the share capital or voting rights 33518.2. Existence of different voting rights 335, 34118.3. Control of the Company 33518.4. Any arrangements, known to the Company, the operation of which may
at a subsequent date result in a change in its control N / A
19. Related-party transactions 293, 317
7CROSS-REFERENCE TABLE ~ ADDITIONAL INFORMATION
(1) Not material given the Group’s business.(2) This Reference Document does not include any profit forecasts.
3472015 Reference Document ~ Kering
07_VA_V5 06/04/2016 17:28 Page347
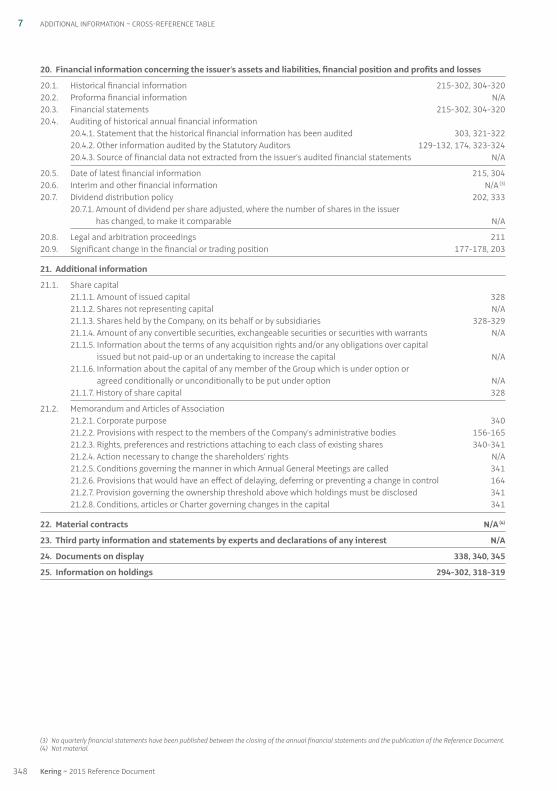
20. Financial information concerning the issuer’s assets and liabilities, financial position and profits and losses
20.1. Historical financial information 215-302, 304-32020.2. Proforma financial information N/A20.3. Financial statements 215-302, 304-32020.4. Auditing of historical annual financial information
20.4.1. Statement that the historical financial information has been audited 303, 321-32220.4.2. Other information audited by the Statutory Auditors 129-132, 174, 323-32420.4.3. Source of financial data not extracted from the issuer’s audited financial statements N / A
20.5. Date of latest financial information 215, 30420.6. Interim and other financial information N / A (3)
20.7. Dividend distribution policy 202, 33320.7.1. Amount of dividend per share adjusted, where the number of shares in the issuer
has changed, to make it comparable N / A
20.8. Legal and arbitration proceedings 21120.9. Significant change in the financial or trading position 177-178, 203
21. Additional information
21.1. Share capital21.1.1. Amount of issued capital 32821.1.2. Shares not representing capital N / A21.1.3. Shares held by the Company, on its behalf or by subsidiaries 328-32921.1.4. Amount of any convertible securities, exchangeable securities or securities with warrants N / A21.1.5. Information about the terms of any acquisition rights and / or any obligations over capital
issued but not paid-up or an undertaking to increase the capital N / A21.1.6. Information about the capital of any member of the Group which is under option or
agreed conditionally or unconditionally to be put under option N / A21.1.7. History of share capital 328
21.2. Memorandum and Articles of Association21.2.1. Corporate purpose 34021.2.2. Provisions with respect to the members of the Company’s administrative bodies 156-16521.2.3. Rights, preferences and restrictions attaching to each class of existing shares 340-34121.2.4. Action necessary to change the shareholders’ rights N / A21.2.5. Conditions governing the manner in which Annual General Meetings are called 34121.2.6. Provisions that would have an effect of delaying, deferring or preventing a change in control 16421.2.7. Provision governing the ownership threshold above which holdings must be disclosed 34121.2.8. Conditions, articles or Charter governing changes in the capital 341
22. Material contracts N / A (4)
23. Third party information and statements by experts and declarations of any interest N / A
24. Documents on display 338, 340, 345
25. Information on holdings 294-302, 318-319
7 ADDITIONAL INFORMATION ~ CROSS-REFERENCE TABLE
(3) No quarterly financial statements have been published between the closing of the annual financial statements and the publication of the Reference Document.(4) Not material.
348 Kering ~ 2015 Reference Document
07_VA_V5 06/04/2016 17:28 Page348
6. Cross-reference table for the Management Report(Articles L. 225-100 et seq., l. 232-1 and R. 225-102 of the French Commercial Code)
Position of the Company and activity over the past fiscal year 176-203
Results of operations of the Company, its subsidiaries and companies under their control 176-195
Key financial performance indicators 6-7
Review of the business, results of operations and financial position 176-203
Trade payables and trade receivables – Payment terms 340
Progress achieved and problems encountered 177, 198-201
Description of main risks and uncertainties 207-214, 275-283
Notes on the use of financial instruments: the Company’s financial risk management policies and objectives 275-283
Information on market risks (interest rate, foreign exchange and equity) 275-283
Information on country risks N / A
Significant events that have occurred between the end of the reporting period and the date of the Management Report 203
Planned development of the Company and of entities within the scope of the consolidation and outlook 203
List of positions held and duties performed by each Director (or equivalent) and executive corporate officer in all companies 136-146
Total remuneration and benefits in kind paid to each Director and executive corporate officer during the year (including the principles and rules used to determine the remuneration and benefits allocated to them) 147-153
Commitments of any kind entered into by the Company in favour of its Directors and executive corporate officers 147-153
Transactions by management, Directors and executive corporate officers in the Company’s securities 155
Key environmental and social indicators 64
Employee information 65-82
Employee share-ownership 333, 336
Environmental information 83-111
Information on the risk-reduction policy for technological accidents N / A
Significant shareholdings in companies with registered offices in France N / A
Changes in the presentation of the annual parent company or consolidated financial statements 176
Major shareholders, share ownership structure and voting rights as of December 31, 2015 335
Information on factors likely to have an impact in the event of a public offering 164
Company’s management structure 158-159
Special report on stock subscription and purchase options and free share grants 330-332
Information on the share buy-back programme – transactions carried out by the Company in its own shares (number and average exchange price of purchases and sales, reasons for acquisitions and proportion of the capital they represent, etc.) 328-329
7CROSS-REFERENCE TABLE FOR THE MANAGEMENT REPORT ~ ADDITIONAL INFORMATION
3492015 Reference Document ~ Kering
07_VA_V5 06/04/2016 17:28 Page349
Summary table showing the authorisations currently in force to increase the share capital 330
Five-year financial summary 320
Net income for the year and proposed appropriation of net income 333
Dividends paid during the last three fiscal years 333
Information on related-party agreements 317, 323
Information on the renewal of the terms of office of the Statutory Auditors 162
Research and development activity N / A
Works Council’s observations on the economic and employment situation N / A
Expenses that are not deductible for tax purposes N / A
7 ADDITIONAL INFORMATION ~ CROSS-REFERENCE TABLE FOR THE MANAGEMENT REPORT
350 Kering ~ 2015 Reference Document
07_VA_V5 06/04/2016 17:28 Page350
7. Cross-reference table for the Annual Financial Report(Article 222-3 of the AMF’s general regulations)
Kering SA parent company financial statements 304-320
Kering group consolidated financial statements 215-302
Management Report refer to the cross-reference table for the Management Report
Statement by the person responsible for the Annual Financial Report 343
Statutory Auditors’ report on the financial statements 321-322
Statutory Auditors’ report on the consolidated financial statements 303
Fees paid to Statutory Auditors 326
Report by the Chairman of the Board of Directors on the conditions of preparation and organisation of the work performed by the Board, and on the internal control and risk management procedures implemented by the Company 156-173
Statutory Auditors’ report prepared in accordance with Article L. 225-235 of the French Commercial Code on the report prepared by the Chairman of the Board of Directors 174
7CROSS-REFERENCE TABLE FOR THE ANNUAL FINANCIAL REPORT ~ ADDITIONAL INFORMATION
3512015 Reference Document ~ Kering
07_VA_V5 06/04/2016 17:28 Page351
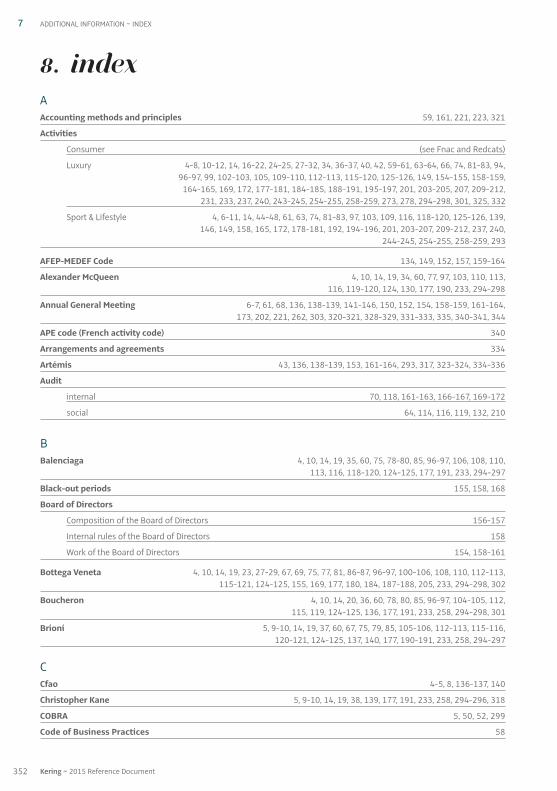
8. IndexAAccounting methods and principles 59, 161, 221, 223, 321
Activities
Consumer (see Fnac and Redcats)
Luxury 4-8, 10-12, 14, 16-22, 24-25, 27-32, 34, 36-37, 40, 42, 59-61, 63-64, 66, 74, 81-83, 94,96-97, 99, 102-103, 105, 109-110, 112-113, 115-120, 125-126, 149, 154-155, 158-159,164-165, 169, 172, 177-181, 184-185, 188-191, 195-197, 201, 203-205, 207, 209-212,
231, 233, 237, 240, 243-245, 254-255, 258-259, 273, 278, 294-298, 301, 325, 332
Sport & Lifestyle 4, 6-11, 14, 44-48, 61, 63, 74, 81-83, 97, 103, 109, 116, 118-120, 125-126, 139,146, 149, 158, 165, 172, 178-181, 192, 194-196, 201, 203-207, 209-212, 237, 240,
244-245, 254-255, 258-259, 293
AFEP-MEDEF Code 134, 149, 152, 157, 159-164
Alexander McQueen 4, 10, 14, 19, 34, 60, 77, 97, 103, 110, 113,116, 119-120, 124, 130, 177, 190, 233, 294-298
Annual General Meeting 6-7, 61, 68, 136, 138-139, 141-146, 150, 152, 154, 158-159, 161-164, 173, 202, 221, 262, 303, 320-321, 328-329, 331-333, 335, 340-341, 344
APE code (French activity code) 340
Arrangements and agreements 334
Artémis 43, 136, 138-139, 153, 161-164, 293, 317, 323-324, 334-336
Audit
internal 70, 118, 161-163, 166-167, 169-172
social 64, 114, 116, 119, 132, 210
BBalenciaga 4, 10, 14, 19, 35, 60, 75, 78-80, 85, 96-97, 106, 108, 110,
113, 116, 118-120, 124-125, 177, 191, 233, 294-297
Black-out periods 155, 158, 168
Board of Directors
Composition of the Board of Directors 156-157
Internal rules of the Board of Directors 158
Work of the Board of Directors 154, 158-161
Bottega Veneta 4, 10, 14, 19, 23, 27-29, 67, 69, 75, 77, 81, 86-87, 96-97, 100-106, 108, 110, 112-113, 115-121, 124-125, 155, 169, 177, 180, 184, 187-188, 205, 233, 294-298, 302
Boucheron 4, 10, 14, 20, 36, 60, 78, 80, 85, 96-97, 104-105, 112,115, 119, 124-125, 136, 177, 191, 233, 258, 294-298, 301
Brioni 5, 9-10, 14, 19, 37, 60, 67, 75, 79, 85, 105-106, 112-113, 115-116, 120-121, 124-125, 137, 140, 177, 190-191, 233, 258, 294-297
CCfao 4-5, 8, 136-137, 140
Christopher Kane 5, 9-10, 14, 19, 38, 139, 177, 191, 233, 258, 294-296, 318
COBRA 5, 50, 52, 299
Code of Business Practices 58
352 Kering ~ 2015 Reference Document
7 ADDITIONAL INFORMATION ~ INDEX
07_VA_V5 06/04/2016 17:28 Page352
Code of ethics 59, 61, 69-70, 76, 116-117, 129, 168, 209-210
Committees
Appointments 63, 152, 156-158, 160-161, 163-164
Audit 63, 156-158, 160-163, 165-167, 169-173, 293, 324, 335
Ethics and Corporate Social Responsibility Committee (ECSRC) 58, 69
European Works Council 76, 78, 81-82, 169
Executive 11, 58, 62-63, 76, 87, 114, 155, 159, 163, 169, 177, 208, 233, 293
Insider Good Practices 155, 168
Remuneration 63, 147-149, 152, 157-158, 161, 163-164, 330, 335
Strategy and Development 63, 154, 157-158, 164, 169
Sustainability 58, 62-63, 157-158, 162, 164
Commodities / Raw materials 10-11, 59, 62, 64, 70, 83-84, 86-91, 93, 100-103,107, 109, 113-114, 117, 127, 145, 209, 258, 340
Control of the Company 335
Corporate governance 62, 133-134, 159-161, 163-164, 166, 174, 293, 324, 335, 341
Corporate Social Responsibility 58, 69, 117, 128, 149
DDebt 7, 150, 176, 178, 182, 195, 198-200, 208-209, 223, 226, 228-229,
246, 266, 274-275, 281, 287-288, 308, 314, 316, 325, 330
Directors 25, 58, 60, 62-63, 68, 74, 76, 112, 114, 122-123, 129, 134-140, 143, 145, 149-151, 154, 156-157, 159-160, 162-163, 167, 169-170, 173-174,
202, 221, 241, 262, 293, 303, 321-325, 328, 330-333, 335, 340-342
Directors’ fees 147-148, 152-153, 158, 161-165, 316
Dividend 6-7, 162, 176, 197, 200-202, 218-219, 242, 246-247, 262, 293, 306-307, 314, 316-320, 333, 340-341
Documents on display 338, 340, 344
Dodo (see Pomellato)
EEBITDA 6-7, 176, 178, 181, 184-190, 192-194, 199, 209, 274
Electric 14, 45, 54-55, 96, 99, 194, 203, 293, 300-301
Employees (see Human resources)
Employee benefits 68-69, 80-81, 222-223, 230, 240, 262, 320
Employee profit-sharing 240, 306, 317, 320
Employee savings plan 69
EMTN 200, 208-209, 270-272, 281, 313-314
Environment
Paper 61, 64, 83-85, 97, 102, 105-106, 108, 121, 132, 141, 198, 269, 270, 274, 276, 283, 288
Transport and energy policy 11, 51-52, 64, 69, 83-84, 86, 90-102, 105, 107-108, 113, 116, 121, 127, 132, 145
Waste recycling 108
Water 11, 55, 61-62, 83-84, 86, 89-93, 96, 102, 104, 107-109, 113, 116, 121, 127, 132, 213-214
Equity 7, 178, 195-197, 199, 207, 215, 217, 219, 222-225, 228-230, 238-241, 243, 248, 250-251, 253, 259, 262, 266, 275, 277, 280-282, 287, 294, 305, 307-308, 312, 318, 342
Executive Management 70, 76, 155, 158, 164-167, 169-173, 208
353
7
2015 Reference Document ~ Kering
INDEX ~ ADDITIONAL INFORMATION
07_VA_V5 06/04/2016 17:28 Page353
FFinancial and accounting information 156, 165, 167, 172
Financial communications 172-173, 338
Financial statements
consolidated 151, 156, 158, 170-171, 173, 176, 178, 183, 196, 203-204, 207-209, 211, 215, 220-225, 233, 235, 253, 259, 303, 317, 326, 345
parent company 156, 304, 307, 343, 345
Five-year financial summary 320
Fnac 4-5, 8, 136-140, 249-250, 320, 333
Free share grants 163, 242, 330-331
GGeneral information 340
Girard-Perregaux 5, 10, 14, 20, 39, 96-97, 104-105, 119, 191
Gucci 4-5, 8, 10, 12, 14, 19-21, 23-26, 60, 67, 69, 72, 74-76, 79, 81-83, 85-86, 96-97, 99, 102, 104, 106, 108, 110-113, 115-119, 121, 123-125, 130, 137-140, 154-155, 158, 162, 169, 177,
180-181, 184, 186-187, 195-196, 203, 205, 222, 233, 236, 245, 258-259, 294-298, 301, 307, 325
Gucci Group 4-5, 8, 82, 137-138, 140, 294, 296-298, 325
HHighlights 25, 28, 31, 52, 59, 61, 83, 102, 177-178, 190, 233-234, 307
History 4
Human resources 10-11, 63, 65, 68, 70-71, 76, 81-84, 122, 124, 129-130, 146, 155, 168-169, 173, 212, 330
IIFRS 126, 151-152, 176, 183, 197, 204, 209, 221-224, 230-232, 240-241, 244, 272, 282, 288
Insurance 69, 79, 156, 165, 172-173, 210, 212-214, 263-266, 312
Internal control
Chairman’s report (section on internal control) 134, 161, 174, 207
Internal control procedures 165, 167, 172, 174
Internal rules 134, 158, 161-163, 166, 335
Investment policy 204, 345
JJEANRICHARD 5, 10, 14, 39, 96-97, 104-105, 119
KKering Foundation 12, 60-61, 64, 76, 85, 122-124, 130
Kering share
Pledges 334
Share performance 243
Stock market prices 226
Treasury shares 197, 217, 219, 229, 232, 251-252, 262, 288, 308, 310, 312, 328-329
Key figures 23-24, 27, 30, 33, 49-50, 54, 64, 345
354 Kering ~ 2015 Reference Document
7 ADDITIONAL INFORMATION ~ INDEX
07_VA_V5 06/04/2016 17:28 Page354
LLa Redoute 4-5, 8, 182-183, 201, 249, 290, 312
Luxury (see Activities)
MMcQ (see Alexander McQueen)
NNon-controlling interests 178, 183, 197, 215-218, 223-224, 228, 232, 234, 250, 252-253
Non-voting Directors 154, 157, 159
OOCEANE bonds 228
Organisational structure of the Group 14
Ownership structure 327, 335
PPension plan 150, 153, 216, 252-253, 262-263, 265
Pomellato 5, 9-10, 14, 20, 40, 60, 69, 77, 80-81, 85, 104, 106, 124, 139, 177, 191, 233, 258, 294-298
Public offer (impact) 164
PUMA 4-5, 12, 14, 45, 47, 49-53, 58, 69, 72, 75-77, 80-81, 96-97, 99, 102-103, 106, 108-110, 114-121, 125, 130, 136-137, 139-140, 146, 154-155, 158, 162, 165-167, 169-170, 178-181, 192, 193-197, 200-201, 203, 205, 210, 234, 237, 241, 243, 245, 258-259, 274, 298-300, 324
QQeelin 5, 9-10, 14, 20, 41, 60, 85, 124, 191, 258, 294-295, 297
RRedcats 4-5, 8, 140, 176, 183, 195, 197, 204, 249-250, 267, 289, 301, 310, 312, 316, 318
Remuneration
paid to executive corporate officers 68, 134, 147-153, 159, 161, 163-165, 293, 335
paid to other corporate officers (see Directors’ fees)
Reports
business review 83, 178
Chairman’s report 134, 161, 174, 207
Statutory Auditors’ report (see Statutory Auditors)
355
7
2015 Reference Document ~ Kering
INDEX ~ ADDITIONAL INFORMATION
07_VA_V5 06/04/2016 17:28 Page355
Risk
credit 212, 281, 285
equity 207, 223, 228, 275, 280-281
financial 165, 173, 207, 277
foreign exchange 207-208, 229, 277, 280-281, 312
insurance 210
interest rate 176, 207-208, 229, 275-277, 281, 315
legal 211-212
operational 209
prevention (see Risk prevention)
Risk prevention 79, 213
SSaint Laurent (see Yves Saint Laurent)
Securities market 335-336
Seller’s warranties 183, 197, 211, 250, 267, 289-290, 292
Sergio Rossi 4-5, 161, 176, 177-178, 183, 189, 204, 233-234, 249-250, 290, 294-297, 326
Share buy-back (programme) 161, 164, 207, 328-329
Share capital 159, 161, 197, 217-219, 232, 262, 288, 293, 305-307, 310, 317-318, 320, 327-336, 340-342
Share capital structure 335-336
Share capital transactions 328-329
Sport & Lifestyle (see Activities)
Staff 12, 72, 78, 80, 84-85, 108, 123, 155, 168, 171, 178, 212, 230, 234, 309
Statutory Auditors 129, 131, 161-163, 169-171, 173-174, 303, 317, 321-323, 325-326, 343-345
Engagement 129, 174, 323
Fees 317, 326
Reports
by the Chairman 156on related-party agreements and commitments 323on the consolidated financial statements 303on the financial statements 321
Stella McCartney 4, 10, 14, 19, 42, 60, 74-75, 77, 85, 96-97, 99-100, 102-103, 105-108, 110-116, 118-121, 124, 130, 136, 177, 191, 233, 294-298
Subsidiaries and investments 318-319
Suppliers 11, 51, 61-62, 64, 70, 88-91, 93, 97, 100, 102-103, 109-110, 112-120, 128, 132, 168, 209-210
Stock market prices 4, 8, 12, 165, 184-185, 226, 242, 285, 315, 331, 336-337
Stock options (see Stock subscription and purchase options)
Stock subscription and purchase options 330
Strategy 8-12, 25-26, 28, 31-32, 35, 37, 39-40, 42, 51-52, 58-59, 61-64, 68, 74-75, 80, 82-84, 90, 93-94, 113, 120, 123, 130, 142, 154, 156-159, 162, 164-165,
169, 178, 184-186, 188, 193-194, 203-204, 234, 263, 324, 331, 334, 338
356 Kering ~ 2015 Reference Document
7 ADDITIONAL INFORMATION ~ INDEX
07_VA_V5 06/04/2016 17:28 Page356

TThresholds 119, 242, 341
Tomas Maier 10, 28-29, 177, 183, 196, 233, 259, 296
Trade and Companies Registry 221, 340
Tretorn 5, 178, 181, 192-193, 234, 298-299
UUlysse Nardin 5, 9-10, 14, 20, 43, 83, 96, 104-105, 136, 139, 179, 182,
184, 189-191, 195, 197, 201, 204, 254, 288, 294-296, 298
VVolcom 5, 14, 45, 54-55, 75, 78, 79-81, 83, 85, 97, 101, 105, 108, 111,
114-115, 117-119, 125, 136, 139, 194, 203, 206, 258, 293, 300-301
Voting rights 164, 223-224, 293, 322-324, 328, 334-335, 341
YYves Saint Laurent 4, 10, 19, 23, 30-32, 74-75, 79-80, 83, 85, 95-97, 99-100,
105-106, 108, 110, 116, 118-120, 124-125, 136-138, 140, 155, 169, 177, 180, 184, 188-189, 195-196, 200, 205, 233, 294-298
357
7
2015 Reference Document ~ Kering
INDEX ~ ADDITIONAL INFORMATION
07_VA_V5 06/04/2016 17:28 Page357
Kering
Société anonyme (a French corporation) with a share capital of €505,117,288Registered office: 10 avenue Hoche – 75381 Paris Cedex 08
552 075 020 RCS Paris
Tel.: +33 1 45 64 61 00 – Fax: +33 1 45 64 60 00kering.com
This document was produced by an “Imprim’Vert” eco-responsible printer on PEFC certified paper from sustainably managed forests.
Design and Production: Agence Marc Praquin
07_VA_V5 06/04/2016 17:28 Page358

Copyright © 2022 FDOKUMEN